| UNITED STATES |
| SECURITIES AND EXCHANGE COMMISSION |
| Washington, D.C. 20549 |
| FORM N-CSR |
| CERTIFIED SHAREHOLDER REPORT OF REGISTERED MANAGEMENT |
| INVESTMENT COMPANIES |
| Investment Company Act file number 811-09903 |
| BNY Mellon Funds Trust |
| (Exact name of Registrant as specified in charter) |
| c/o The Dreyfus Corporation |
| 200 Park Avenue |
| New York, New York 10166 |
| (Address of principal executive offices) (Zip code) |
| Michael Rosenberg, Esq. |
| 200 Park Avenue |
| New York, New York 10166 |
| (Name and address of agent for service) |
| Registrant's telephone number, including area code: (212) 922-6000 |
| Date of fiscal year end: | 08/31 | |
| Date of reporting period: | 02/29/2008 |
FORM N-CSR
| Item 1. | Reports to Stockholders. |
The BNY Mellon Funds
| BNY Mellon Large Cap Stock Fund |
| BNY Mellon Income Stock Fund |
| BNY Mellon Mid Cap Stock Fund |
| BNY Mellon Small Cap Stock Fund |
| BNY Mellon U.S. Core Equity 130/30 Fund |
| BNY Mellon International Fund |
| BNY Mellon Emerging Markets Fund |
| BNY Mellon Balanced Fund |
| SEMIANNUAL REPORT | February 29, 2008 |
| Contents | ||
| The Funds | ||
| Letter from the President | 2 | |
| Discussion of Funds’ Performance | ||
| BNY Mellon Large Cap Stock Fund | 3 | |
| BNY Mellon Income Stock Fund | 5 | |
| BNY Mellon Mid Cap Stock Fund | 7 | |
| BNY Mellon Small Cap Stock Fund | 9 | |
| BNY Mellon U.S. Core | ||
| Equity 130/30 Fund | 11 | |
| BNY Mellon International Fund | 13 | |
| BNY Mellon Emerging Markets Fund | 15 | |
| BNY Mellon Balanced Fund | 17 | |
| Understanding Your Fund’s Expenses | 19 | |
| Comparing Your Fund’s Expenses | ||
| With Those of Other Funds | 20 | |
| Statements of Investments | 21 | |
| Statement of Options Written | 25 | |
| Statement of Securities Sold Short | 34 | |
| Statements of Assets and Liabilities | 50 | |
| Statements of Operations | 54 | |
| Statement of Cash Flows | 56 | |
| Statements of Changes in Net Assets | 57 | |
| Financial Highlights | 62 | |
| Notes to Financial Statements | 79 | |
For More Information
Back cover
The views expressed herein are current to the date of this report. These views and the composition of the funds’ portfolios are subject to change at any time based on market and other conditions.
- Not FDIC-Insured
- Not Bank-Guaranteed
- May Lose Value
| The | Funds |

| LETTER FROM |
| THE PRESIDENT |
Dear Shareholder:
We are pleased to present this semiannual report for the BNY Mellon Funds Trust, covering the six-month period from September 1, 2007, through February 29, 2008.
The past six months proved to be one of the more challenging periods for equity investors in recent memory.The U.S. economy sputtered under the weight of plunging housing values, and credit concerns that originated in the bond market’s sub-prime mortgage sector spread to other areas of the financial markets.These developments dampened investor sentiment and produced heightened volatility in most segments of the stock market. Financial stocks were hit particularly hard due to sub-prime related write-downs, as were other market sectors that historically have been considered sensitive to economic downturns.
Recently, the Fed and the U.S. government have adopted accommodative monetary and fiscal policies in an effort to stimulate the U.S. economy, boost market liquidity and forestall a potential recession.While it’s too early to know if their actions will be effective, we believe that the best defense against any economic volatility is to maintain a long-term perspective. To benefit from this focus, talk to your portfolio manager today about your specific portfolio to ensure that your investments are best suited to capture the potential opportunities and manage the risks that may continue to surface during this current economic cycle.
For information about how each fund performed during the reporting period, as well as market perspectives, we have provided a Discussion of Fund Performance.
Thank you for your continued confidence and support.

| DISCUSSION OF |
| FUND PERFORMANCE |

For the reporting period of September 1, 2007, through
February 29, 2008, as provided by Sean P. Fitzgibbon,
Portfolio Manager
Fund and Market Performance Overview
For the six-month period ended February 29, 2008, BNY Mellon Large Cap Stock Fund’s Class M shares produced a total return of –7.09% while Investor shares produced a total return of –7.20% . 1 In comparison, the total return of the Standard & Poor’s 500 Composite Stock Price Index (“S&P 500 Index”), the fund’s benchmark, was –8.79% for the same period.2
Slowing U.S. economic growth took a toll on stocks during the reporting period, with most market sectors declining in response to turmoil in the credit markets and signs of a possible recession. Favorable individual stock selections in the areas of technology, energy, consumer discretionary and financials helped limit the fund’s losses, enabling it to outperform its benchmark.
The Fund’s Investment Approach
The fund seeks capital appreciation.To pursue its goal, the fund normally invests at least 80% of its assets in stocks of large-cap companies. We choose stocks through a disciplined investment process that uses computer modeling techniques to identify and rank companies based on value, growth and other financial characteristics. Next, we use fundamental analysis to select the most attractive of the higher ranked securities, drawing on a variety of internal and Wall Street research sources.We also attempt to manage risks by diversifying the fund’s investments across companies and industries, maintaining weightings and risk characteristics that generally are similar to those of the S&P 500 Index.
| Key Sectors Supported the Fund’s |
| Outperformance |
U.S. stocks generally posted negative absolute returns over the reporting period due to a sharp downturn in the U.S. economy and an intensifying credit crunch that began in the sub-prime mortgage market and spread throughout the financial markets. Concerns regarding declining U.S. housing values, surging energy and food prices and their impact on consumer spending weighed heavily on investor psychology.
Technology stocks were among the strongest contributors to the fund’s relative performance, bolstered by a significant shift in sector weighting and good individual stock picks. Although the fund began the period with an overweighted position in the sector, weakening business momentum led us to reduce the fund’s exposure to a below-market weighting as the reporting period progressed. As a result, the fund was in a relatively strong position to preserve capital when technology stocks declined sharply in late 2007 and early 2008.The fund’s relative performance was further enhanced by the timely sale of some of its top technology performers, such as electronics producer Apple and BlackBerry maker Research In Motion.
Investments in several other market sectors also bolstered the fund’s relative performance. In the energy sector, one of the few sectors to generate positive absolute returns, the fund benefited from its emphasis on independent oil and gas producers, such as XTO Energy and Chesapeake Energy. Such holdings rose in response to high oil prices and rising gas prices.Another energy holding, Hess, hit new highs during the reporting period on the strength of important oilfield
The Funds 3
DISCUSSION OF FUND PERFORMANCE (continued)
discoveries off the coast of Brazil. In the consumer discretionary sector, the fund focused on companies undergoing operational turnarounds, such as retailers The Gap and The TJX Companies, while avoiding most retailers with greater sensitivity to tightening consumer spending. Finally, in the hard-hit financials sector, while the fund experienced some losses, it successfully avoided some of the companies most deeply undermined by exposure to sub-prime mortgage-backed securities.
Relative Weakness Limited to the Health Care
Sector
The only sector in which the fund significantly under-performed its benchmark was health care, largely due to the fund’s holdings of pharmaceutical giants Merck & Co. and Schering-Plough. Stocks of both companies declined steeply in January 2008 after they released disappointing interim results of trials of key cholesterol lowering drugs.The impact of these declines was offset to a degree by gains in another health care holding, medical device maker Becton, Dickinson and Co., which reported strong earnings and guidance.
A Return to Greater Tax Efficiency
As of the end of the reporting period, the fund’s composition fully reflected the investment style and strategy of the current portfolio manager, who assumed management of
the fund in February 2007.The higher-than-usual realized capital gains distributions made by the fund during the reporting period were a consequence of stock turnover as we completed the fund’s transition. We believe investors can now anticipate a return to more tax-efficient investment practices.
Regarding the market’s recent weakness and volatility, we believe that aggressive actions undertaken by the Federal Reserve Board reduce the likelihood of a deep or sustained U.S. recession. Since financial markets generally are more sensitive to future prospects than current conditions, we would not be surprised to see stocks rebound in anticipation of economic recovery. We believe the fund is well positioned to weather the current storm and to participate in a market rebound when it occurs. The fund currently holds roughly market-weighted positions in all sectors except technology, where it remains mildly underweighted.
March 17, 2008
| 1 | Total return includes reinvestment of dividends and any capital gains paid. | |
| Past performance is no guarantee of future results. Share price and investment | ||
| return fluctuate such that upon redemption, fund shares may be worth more or | ||
| less than their original cost. | ||
| 2 | SOURCE: LIPPER INC. — Reflects the monthly reinvestment of | |
| dividends and, where applicable, capital gain distributions.The Standard & | ||
| Poor’s 500 Composite Stock Price Index is a widely accepted, unmanaged | ||
| index of U.S. stock market performance. |
4
| DISCUSSION OF |
| FUND PERFORMANCE |

For the period of September 1, 2007, through February 29,
2008, as provided by Brian C. Ferguson, Portfolio Manager
Fund and Market Performance Overview
For the six-month period ended February 29, 2008, BNY Mellon Income Stock Fund’s Class M shares produced a total return of –8.24%, and Investor shares produced a total return of –8.30% .1 In comparison, the Russell 1000 Value Index (the “Index”), the fund’s benchmark, provided a total return of –10.38% .2
Stocks declined sharply over the reporting period as a credit crisis, reduced market liquidity and an economic slowdown dampened investor sentiment. In this challenging environment, the fund outperformed its benchmark, mainly due to favorable security selections in a number of market sectors.
The Fund’s Investment Approach
The fund seeks total return consisting of capital appreciation and income.To pursue its goal, the fund normally invests at least 80% of its assets in stocks. The fund seeks to focus on dividend-paying stocks and other investment techniques that produce income.We choose stocks through a disciplined investment process that combines quantitative modeling techniques, fundamental analysis and risk management. While we attempt to manage risks by diversifying broadly across companies and industries, the fund may at times overweight certain sectors in an attempt to earn higher yields.The fund may also use derivatives as a substitute for taking a position in an underlying asset, to increase returns or income, or as part of a hedging strategy.
Strong Stock Selections Bolstered Relative
Performance
The U.S. stock market generally posted negative absolute returns over the reporting period due to a sharp downturn in the U.S. economy and an intensifying credit crunch that began in the sub-prime mortgage
market and spread throughout the financial markets. Concerns regarding declining U.S. housing values, surging energy and food prices and weaker employment trends weighed heavily on investor psychology. The Federal Reserve Board (the “Fed”) attempted to promote greater market liquidity and forestall a potential recession by reducing short-term interest rates from 5.25% to 3% by the reporting period’s end.
The fund’s absolute performance suffered along with the overall market in this difficult investment climate, but strong stock selections supported the fund’s performance compared to its benchmark.We attribute the fund’s relative outperformance, in part, to our Core Research Group, whose insightful analyses led to favorable timing in the purchases and sales of individual stocks.
In the consumer discretionary sector, media stocks proved to be especially beneficial to the fund’s relative performance. For example, Viacom’s share price advanced as the global entertainment company encountered heightened demand for its cable programming during an industry-wide strike by the Writers Guild of America. Lack of exposure to Time Warner also added to the fund’s relative outperformance, as the company’s AOL division continued to weigh on its financial results.The consumer staples area also boosted the fund’s results compared to its bench-mark.Altria Group, the tobacco giant, initiated plans to spin off its international unit, allowing for tighter focus on U.S. operations and cost containment. Among energy stocks, strong supply-and-demand dynamics in the natural gas market produced higher revenues for exploration-and-production companies such as Devon Energy, XTO Energy and EOG Resources.
Mortgage-Related Woes Hurt Financial Stocks
Turmoil in the mortgage market and its adverse effects on the broader financials sector proved insurmountable for the fund and its benchmark. Although we trimmed
The Funds 5
DISCUSSION OF FUND PERFORMANCE (continued)
some of the fund’s financials holdings and exited certain mortgage-oriented and credit-sensitive stocks, these actions could not fully offset pervasive weakness in the sector.We believed that government-sponsored enterprises such as Freddie Mac and Fannie Mae would be somewhat insulated from the credit crisis due to additional regulatory scrutiny and their exposure to higher-quality mortgages. However, even the more fundamentally sound mortgage-related stocks were derailed by the credit crisis.Investments in insurer American International Group, as well as banking giants Bank of America and Citigroup, also detracted from the fund’s performance.
In the health care sector,a joint drug-development venture between Merck & Company and Schering-Plough produced a drop in both pharmaceutical companies’ share prices when speculation arose that a cholesterol-lowering medicine may create health risks in patients. Lack of exposure to Johnson & Johnson, a component of the benchmark,also hampered the fund’s relative performance.
Finding Opportunities in a Volatile Market
In our judgment, credit issues are likely to persist over the near term. However, we believe that stimulus packages
announced by the Fed should provide the necessary liquidity to prevent a financial system collapse,potentially providing valuation support for equities as conditions stabilize.
As of the reporting period’s end, we have continued to favor natural gas exploration-and-production companies, and we have found several opportunities in media and retail stocks. Conversely, spending and demand trends have slowed for information technology companies, causing us to reduce the fund’s exposure to the sector. We have continued to monitor other industry groups, and we are prepared to adjust our strategies should we detect evidence of fundamental deterioration in the fund’s current holdings.
March 17, 2008
| 1 | Total return includes reinvestment of dividends and any capital gains paid. | |
| Past performance is no guarantee of future results. Share price and investment | ||
| return fluctuate such that upon redemption, fund shares may be worth more or | ||
| less than their original cost. | ||
| 2 | SOURCE: LIPPER, INC. – Reflects the reinvestment of net dividends | |
| and, where applicable, capital gain distributions.The Russell 1000 Value | ||
| Index is an unmanaged index which measures the performance of those | ||
| Russell 1000 companies with lower price-to-book ratios and lower forecasted | ||
| growth values. Index return does not reflect fees and expenses associated with | ||
| operating a mutual fund. |
6
| DISCUSSION OF |
| FUND PERFORMANCE |

For the period of September 1, 2007, through February 29,
2008, as provided by James C.Wadsworth, Portfolio Manager
Fund and Market Performance Overview
For the six-month period ended February 29, 2008, BNY Mellon Mid Cap Stock Fund produced total returns of –5.17% for Class M shares, –5.25% for Investor shares and –5.65% for Dreyfus Premier shares.1 In comparison, the Standard & Poor’s MidCap 400 Index (“S&P 400 Index”), the fund’s benchmark, produced a total return of –8.05% for the same period.2
Similar to stocks in other market capitalization ranges, midcap stocks encountered heightened volatility during the reporting period, losing value as economic growth slowed and a credit crunch intensified. The fund outperformed its benchmark, primarily due to the success of our security selection strategy in seven of the benchmark’s 10 market sectors.
The Fund’s Investment Approach
The fund seeks capital appreciation by normally investing at least 80% of its assets in stocks of domestic companies with market capitalizations of companies included in the S&P 400 Index at the time of purchase. When selecting securities, we begin with quantitative analysis to screen and rank stocks within each industry and sector based on valuation, earnings growth and financial health.We then use fundamental analysis to evaluate and select individual stocks, drawing on research by internal analysts and external Wall Street sources. Finally, we use portfolio construction techniques to manage sector and industry risks. Our goal is to keep those risks at levels that are similar to those of the S&P 400 Index.
Investors Punished Midcap Stocks During the
Downturn
U.S. stocks generally posted negative absolute returns over the reporting period due to a sharp downturn in the U.S. economy and an intensifying credit crunch that began in the sub-prime mortgage market and spread
throughout the financial markets. Concerns regarding declining U.S. housing values, surging energy and food prices and their impact on consumer spending weighed on the U.S. economy. A number of major banks and bond insurers reported massive sub-prime related losses, roiling the financial sector and exacerbating the credit crunch.The Federal Reserve Board attempted to promote improved market conditions and forestall a potential recession by injecting liquidity into the banking system and reducing short-term interest rates from 5.25% to 3% by the end of the reporting period.
In contrast to the weakening U.S. economy, global economic growth remained relatively strong. In addition, equity investors responded to market developments by shifting their focus from smaller, more speculative companies to well-established market leaders with a history of consistent earnings under a variety of economic conditions. Consequently, some of the market’s greater gains stemmed from companies that produce products or services that have remained in demand among customers in overseas markets, such as producers of the raw materials and industrial commodities used in construction.
Health Care, Industrials and Energy Holdings
Boosted Performance
The fund proved to be relatively well positioned for the shift in investor sentiment, enabling it to weather the downturn better than its benchmark. The fund received particularly strong contributions to relative performance from the health care sector, which historically has held up well during periods of economic weakness. Although we maintained a generally sector-neutral asset allocation strategy, we established a slightly overweighted position in health care stocks. Holdings contributing positively to the fund’s relative performance included biotechnology firm MGI Pharma, which was acquired by another company during the reporting period, and private-label over-the-counter drug maker Perrigo, which benefited from a heavy flu season and issues affecting a key competitor.
The Funds 7
DISCUSSION OF FUND PERFORMANCE (continued)
In the industrials area, a number of companies benefited from robust overseas growth, including engineering-and-construction firm Chicago Bridge & Iron and pump manufacturer Flowserve.
In the energy sector, coal company Consol Energy was the fund’s best performer. Natural gas producers Range Resources and Southwestern Energy also enhanced returns. Good results in these market sectors were offset to a degree by disappointments in other areas. In the telecommunications services sector, wireless provider NII Holdings encountered competitive pressures in its Latin American markets. However, we have retained the fund’s position in NII Holdings, which we expect to rebound as more investors recognize its high rates of revenue and subscriber growth.Among consumer discretionary stocks, Lifetime Fitness reported slowing growth in recent quarters, but we expect this development to be temporary as the company opens additional fitness centers.
Finding Growth Opportunities in a Distressed
Market
As of the reporting period’s end, the credit crisis has intensified, and the U.S. economy has continued to fal-
ter. We believe the full magnitude of damage caused by the housing downturn and credit crisis has not yet been determined, and investors have remained risk-averse. Therefore, over the near term, we intend to maintain a relatively defensive investment posture, including a modestly underweighted position in the hard-hit financials sector and a mild emphasis on health care and energy stocks. Still, we remain optimistic regarding the longer-term prospects for midcap stocks, which we feel could fare well in an environment in which earnings growth has become increasingly scarce.
March 17, 2008
| 1 | Total return includes reinvestment of dividends and any capital gains paid. | |
| Past performance is no guarantee of future results. Share price and investment | ||
| return fluctuate such that upon redemption, fund shares may be worth more or | ||
| less than their original cost. | ||
| Part of the fund’s recent performance is attributable to positive returns from | ||
| its initial public offering (IPO) investments. There can be no guarantee that | ||
| IPOs will have or continue to have a positive effect on fund performance. | ||
| 2 | SOURCE: LIPPER INC. — Reflects reinvestment of dividends and, | |
| where applicable, capital gain distributions.The Standard & Poor’s MidCap | ||
| 400 Index is a widely accepted, unmanaged total return index measuring the | ||
| performance of the midsize company segment of the U.S. stock market. Index | ||
| return does not reflect the fees and expenses associated with operating a | ||
| mutual fund. |
8
| DISCUSSION OF |
| FUND PERFORMANCE |

For the period of September 1, 2007, through February 29,
2008, as provided by Dwight E. Cowden, Portfolio Manager
Fund and Market Performance Overview
For the six-month period ended February 29, 2008, BNY Mellon Small Cap Stock Fund’s Class M shares produced a total return of –10.10%, and Investor shares produced a total return of –10.26% .1 In comparison, the fund’s benchmark, the Standard & Poor’s SmallCap 600 Index (the “Index”), produced a total return of –12.48% for the same period.2
Small-cap stocks declined sharply over the reporting period as a credit crisis and economic slowdown dampened investor sentiment, especially with regard to smaller companies. The fund outperformed its benchmark, primarily due to its relatively defensive sector-allocation strategy and a focus on stocks toward the larger end of the small-cap range.
The Fund’s Investment Approach
The fund seeks capital appreciation. To pursue its goal, the fund normally invests at least 80% of its assets in stocks of small capitalization companies whose market capitalizations are generally in the range of companies included in the Index at the time of purchase.We choose growth and value stocks using a disciplined process that combines computer modeling, fundamental analysis and risk management. We use a computer model to rank stocks within an industry or sector based on valuation, earnings growth and the company’s financial profile.We examine the fundamentals of the higher-ranked securities, and we select those we believe to be the most attractive. We use portfolio construction techniques to manage sector and industry risks,and we attempt to keep those risks at levels that are similar to those of the Index.
Small-Cap Stocks Declined in a Broad Downturn
U.S. stocks generally posted negative absolute returns over the reporting period due to a sharp downturn in the U.S. economy and an intensifying credit crunch that began in the sub-prime mortgage market and
spread throughout the financial markets. Concerns regarding declining U.S. housing values, surging energy and food prices and their impact on consumer spending weighed heavily on investor psychology.The Federal Reserve Board attempted to promote greater market liquidity and forestall a potential recession by reducing short-term interest rates from 5.25% to 3% by the reporting period’s end.
The downturn was particularly severe among small-cap stocks, which fared worse than their large-cap counterparts over the reporting period. The financials sector was punished particularly severely due to its ample exposure to troubled sub-prime loans. Conversely, traditionally recession-resistant market sectors, such as consumer staples, held up relatively well.
Allocation and Selection Strategies Boosted
Relative Returns
While the fund’s performance was influenced by the market downturn, it outperformed its benchmark as a result of our relatively defensive sector allocation and stock selection strategies. Indeed, the fund produced higher returns than its benchmark in nine out of 10 economic sectors.
From a sector allocation perspective, the fund benefited from relatively light exposure to the financials sector, where we tended to favor companies outside of the troubled banking and real estate industries. For example, Waddell & Reed Financial and FC Stone Group enjoyed relatively favorable business fundamentals in the asset management and commodities brokerage industries, respectively.
Our stock selection strategy proved especially effective in the consumer staples sector, an area of relatively heavy emphasis during the reporting period. Chiquita Brands International benefited from higher prices for bananas and success with pre-packaged salads. Darling International also commanded higher prices for its animal byproducts, including some used in biofuels. Health and beauty products company Chattem
The Funds 9
DISCUSSION OF FUND PERFORMANCE (continued)
boosted earnings with the acquisition of several products lines from Johnson & Johnson. In the materials sector, metals-and-mining companies such as Steel Dynamics and Coeur d’Alene Mines prospered amid rising steel and silver prices, respectively.
The energy sector was the only area in which the fund did not outperform its benchmark, but produced returns that were roughly in line with the Index’s energy component, as the fund did not own some of the benchmark’s better performing energy stocks. The fund also did not participate in a handful of the benchmark’s top consumer stocks, but other consumer holdings more than made up for the difference.
Maintaining Caution in a Troubled Market
As of the reporting period’s end, the credit crisis has intensified, and the U.S. economy has continued to falter.We believe the full magnitude of damage from the housing downturn and credit crisis has not yet been determined, and investors have remained risk-averse.
Therefore, we currently intend to maintain a relatively cautious investment posture, including an emphasis on more seasoned small-cap companies with international businesses as well as the traditionally defensive utilities, health care and consumer staples sectors.
While we also are aware that recent price declines may have created value-oriented opportunities in a number of sectors, we have held off on taking greater advantage of them until we see more convincing signs that the worst of the downturn is behind us. In our view, this is a prudent strategy for today’s unsettled market environment.
| March 17, 2008 |
| 1 | Total return includes reinvestment of dividends and any capital gains paid. | |
| Past performance is no guarantee of future results. Share price and investment | ||
| return fluctuate such that upon redemption, fund shares may be worth more or | ||
| less than their original cost. | ||
| 2 | SOURCE: LIPPER INC. — Reflects the reinvestment of dividends and, | |
| where applicable, capital gain distributions.The Standard & Poor’s SmallCap | ||
| 600 Index is a broad-based index and a widely accepted, unmanaged index of | ||
| overall small-cap stock market performance.The index does not take into | ||
| account fees and expenses to which the fund is subject. |
10
| DISCUSSION OF |
| FUND PERFORMANCE |
For the reporting period of September 1, 2007, through
February 29, 2008, as provided by Sean P. Fitzgibbon and
Jeffrey D. McGrew, Portfolio Managers
Fund and Market Performance Overview
For the six-month period ended February 29, 2008, BNY Mellon U.S. Core Equity 130/30 Fund’s Class M shares produced a total return of –5.14% while Investor shares produced a total return of –5.23% ..1 In comparison, the total return of the Standard & Poor’s 500 Composite Stock Price Index (“S&P 500 Index”), the fund’s benchmark, was –8.79% for the same period.2
Stock markets were driven lower during the reporting period by a variety of economic concerns, including slowing U.S. growth, a surge in sub-prime mortgage defaults and a credit crunch affecting both consumers and business borrowers.While these conditions took a toll on the fund’s returns, the relative strength of many of the fund’s long positions and our strategy of adopting short positions in less attractive stocks enabled us to limit the fund’s losses. As a result, the fund outperformed its benchmark.
The Fund’s Investment Approach
The fund seeks capital appreciation, normally investing at least 80% of its assets in stocks of large-cap companies. We choose stocks through a disciplined investment process that uses computer modeling techniques to identify and rank companies based on value, growth and other financial characteristics. Next, based on fundamental analysis, the portfolio managers generally buy “long” the most attractive of the higher ranked securities and sell “short” those stocks identified by the computer model and fundamental analysis as being likely to underperform. Normally, up to 130% of the fund’s assets will be in long positions, and approximately 30% of the fund’s assets will be in short positions.
Long/Short Strategies Proved Effective in
Several Sectors
U.S. stocks generally posted negative absolute returns over the reporting period due to a sharp downturn in the U.S. economy and an intensifying credit crunch that began in the sub-prime mortgage market and spread throughout the financial markets. Concerns regarding declining U.S. housing values, surging energy and food prices and their impact on consumer spending weighed heavily on investor psychology.
Technology proved to be the fund’s top-performing market sector compared to its benchmark, adding value on both the long and short investment sides.The fund began the period significantly overweighted in the technology sector. However, in light of weakening business momentum, the fund moved gradually to a significantly underweighted position by the end of the reporting period. This shift helped preserve capital when the benchmark’s technology component experienced sharp declines. Timely sales of long positions in some of the fund’s better technology performers, including BlackBerry maker Research In Motion and consumer electronics innovator Apple, further bolstered relative performance. The fund’s results also benefited from short sales of several telecommunications equipment makers experiencing slowing order growth, such as Riverbed Technology and Ciena.
Investments in several other sectors also enhanced returns.The fund held long positions in consumer discretionary companies conducting effective operational turnarounds, such as retailers The Gap and The TJX Companies. At the same time, the fund established short positions in other retailers with greater exposure to reduced consumer spending, such as Sears Holding and Bed Bath & Beyond. In the telecommunications services sector, the fund emphasized regional opera-
The Funds 11
DISCUSSION OF FUND PERFORMANCE (continued)
tors, such as Verizon Communications and AT&T, that have increased market share on the strength of bundled services offerings, while shorting less competitive players, such as Comcast and Sprint Nextel.
A Difficult Environment for Financial Stocks
The fund outperformed its benchmark in most sectors, but the financials sector was a notable exception. Under pressure from sub-prime related turmoil and recession fears, the financial sector produced sharp declines for both the fund and its benchmark.The fund experienced losses from long positions in brokerage firms, such as JPMorgan Chase and Merrill Lynch; diversified financials, such as CIT Group; and credit services providers, such as American Express. In the basic materials sector, the fund also suffered a significant decline in its holdings of steel fabricator Allegheny Technologies, which was hurt by a weak pricing environment.
Positioned for Recovery
As of the end of the reporting period, the fund held a mildly underweighted position in the technology sector compared to its benchmark and roughly market-weighted exposure to other sectors. More generally, we believe the fund is well positioned to benefit from a
recovery in stock markets when it occurs.While it is not possible to predict when the financial markets will turn around, such rebounds historically have occurred rapidly and with little or no warning to the detriment of overly defensive investors. At the same time, the fund’s long/ short strategy seeks to provide a degree of protection against continued volatility or a protracted downward trend in the market.As a result, in today’s uncertain environment, we have a high degree of confidence in our approach of seeking to add value through carefully chosen long positions and the judicious use of short positions in stocks we believe are likely to underperform.
March 17, 2008
| 1 | Total return includes reinvestment of dividends and any capital gains paid. | |
| Past performance is no guarantee of future results. Share price and investment | ||
| return fluctuate such that upon redemption, fund shares may be worth more or | ||
| less than their original cost. Return figures provided reflect the absorption of | ||
| certain fund expenses by Mellon Fund Advisors pursuant to an agreement in | ||
| effect through August 31, 2008, at which time it may be extended, terminated | ||
| or modified. Had these expenses not been absorbed, the fund’s returns would | ||
| have been lower. | ||
| 2 | SOURCE: LIPPER INC. — Reflects the monthly reinvestment of | |
| dividends and, where applicable, capital gain distributions.The Standard & | ||
| Poor’s 500 Composite Stock Price Index is a widely accepted, unmanaged | ||
| index of U.S. stock market performance. Index return does not reflect fees and | ||
| expenses associated with operating a mutual fund. |
12
| DISCUSSION OF |
| FUND PERFORMANCE |

For the period of September 1, 2007, through February 29,
2008, as provided by D. Kirk Henry and William S. Patzer,
Portfolio Managers
Fund and Market Performance Overview
For the six-month period ended February 29, 2008, BNY Mellon International Fund’s Class M shares produced a total return of –8.88%, and Investor shares produced a total return of –9.09% .1 In comparison, the fund’s benchmark, the Morgan Stanley Capital International Europe, Australasia, Far East Index (“MSCI EAFE Index” or the “Index”), produced a total return of –4.71% for the same period.2
International equities produced disappointing results in a turbulent market environment. The fund’s returns lagged its benchmark, primarily due to its overweighted exposure to and weak stock selections in Japan.
The Fund’s Investment Approach
The fund seeks long-term capital growth. To pursue this goal, the fund normally invests at least 65% of its total assets in equity securities of foreign issuers.
Since June 30, 2005, the fund generally invests most of its cash inflows (purchases of fund shares and reinvested distributions) in accordance with a core investment style. The fund’s portfolio as of June 30, 2005, will continue to be managed in accordance with the value-oriented investment style. Pursuant to the core investment style, under normal circumstances, at least 80% of the fund’s cash inflows allocated to this style are invested in equity securities of companies located in the foreign countries represented in the MSCI EAFE Index and Canada.
The allocation of cash inflows and outflows will be at the discretion of the investment adviser depending on the circumstances; however, under normal circumstances, generally between 90% and 100% of cash inflows will be allocated to the core investment style.
We believe that by implementing a core investment style with respect to such assets, the fund may take advantage of investment opportunities in international markets that may not fall within the value-oriented investment style previously employed for the fund’s entire portfolio.
The fund will continue to invest in stocks that appear to be undervalued (as measured by their price/earnings ratios), but stocks purchased pursuant to the core investment style may have value and/or growth characteristics. The core investment style portfolio manager employs a “bottom-up” investment approach, which emphasizes individual stock selection. The core investment style stock selection process is designed to produce a diversified portfolio that, relative to the MSCI EAFE Index, has a below-average price/earnings ratio and an above-average earnings growth trend.
The fund’s investment approach for the portion of the fund using the value-oriented investment style is research-driven and risk-averse. When selecting stocks, we identify potential investments through extensive quantitative and fundamental research. Emphasizing individual stock selection over economic or industry trends,the fund focuses on three key factors: value, business health and business momentum.
International Equities Pulled Back in a Turbulent Market
After enjoying double-digit returns over each of the past five years, international equities lost value during the reporting period due to intensifying economic concerns, rising commodities prices and a global credit crisis originating in the U.S. sub-prime mortgage sector. International markets also responded negatively to a $7 billion loss caused by trading fraud at France’s second largest bank, Societe Generale. These factors contributed to a turbulent investment environment in which investors turned away from stocks and flocked to gold, oil and other “hard assets.”
The Funds 13
DISCUSSION OF FUND PERFORMANCE (continued)
Japanese and Swiss Stocks Weighed on Relative
Performance
The bulk of the fund’s underperformance can be attributed to its relatively heavy exposure to Japanese stocks. For example, diversified retailer Aeon was hurt by sluggish domestic consumption, the performance of its credit card division and exposure to U.S.-based apparel retailer Talbots. Sumitomo Mitsui Financial Group sold off sharply along with other financial stocks. Homebuilder Sekisui House lost value due to a massive backlog of housing permits required by new earthquake regulations.
In Switzerland, the fund’s relative performance was hurt by holdings in two chemical companies, Clariant and Ciba Specialty Chemicals, which were unable to pass on rising oil costs to its customers. Swiss banking giant UBS declined sharply due to its exposure to troubled mortgage-backed securities and other credits.
The fund achieved better results in Greece, where the dominant electric utility, Public Power Corporation, posted gains due to tariff increases and fuel surcharges. In Germany, electronics firm Siemens helped the fund’s performance after restructuring efforts by a new management team. Sporting goods firm adidas advanced
based on its acquisition of Reebok and upcoming sponsorship of the 2008 Olympic Games in Beijing.
Maintaining Our Value-Oriented Discipline
As of the end of the reporting period, corporate earnings downgrades have outnumbered upgrades, causing a negative turn in market momentum. If this trend persists, we believe the markets could remain under pressure until greater earnings visibility emerges. As always, we have remained true to our value-oriented approach, which seeks opportunities among stocks of fundamentally sound companies we believe are selling at attractive prices.
March 17, 2008
| 1 | Total return includes reinvestment of dividends and any capital gains paid. | |
| Past performance is no guarantee of future results. Share price and investment | ||
| return fluctuate such that upon redemption, fund shares may be worth more or | ||
| less than their original cost. | ||
| 2 | SOURCE: LIPPER INC.— Reflects reinvestment of net dividends and, | |
| where applicable, capital gain distributions.The Morgan Stanley Capital | ||
| International Europe,Australasia, Far East (MSCI EAFE) Index is an | ||
| unmanaged index composed of a sample of companies representative of the | ||
| market structure of European and Pacific Basin countries. Index return does | ||
| not reflect fees and expenses associated with operating a mutual fund. |
14
| DISCUSSION OF |
| FUND PERFORMANCE |

For the period of September 1, 2007, through February 29,
2008, as provided by D. Kirk Henry and William S. Patzer,
Portfolio Managers
Fund and Market Performance Overview
For the six-month period ended February 29, 2008, BNY Mellon Emerging Markets Fund’s Class M shares produced a total return of 3.32%, and the fund’s Investor shares produced a total return of 3.21% ..1 In comparison, the Morgan Stanley Capital International Emerging Markets Index (the “Index”), the fund’s benchmark, provided a total return of 8.26% for the same period.2
The emerging equity markets represented one of the few bright spots in the global financial markets during the reporting period, as robust regional economic growth stood in stark contrast to slowing U.S. and European economies. The fund’s returns fell short of its benchmark, primarily due to disappointing security selection in Taiwan and South Korea and limited exposure to Brazilian materials stocks.
The Fund’s Investment Approach
The fund seeks long-term capital growth.To pursue its goal, the fund invests at least 80% of its assets in equity securities of companies organized, or with a majority of assets or operations, in countries considered to be emerging markets.
Since June 30, 2005, the fund generally invests most of its cash inflows (purchases of fund shares and reinvested distributions) in accordance with a core investment style. The fund’s portfolio as of June 30, 2005, was invested in companies the investment adviser considered to be “value” companies. Pursuant to the core investment style, under normal circumstances, at least 80% of the fund’s cash inflows allocated to this style are invested in equity securities of companies located in the foreign countries represented in the Index.
The allocation of cash inflows and outflows will be at the discretion of the investment adviser depending on
the circumstances; however, under normal circumstances, generally between 90% and 100% of cash inflows will be allocated to the core investment style.We believe that by implementing a core investment style with respect to such assets, the fund may take advantage of investment opportunities in emerging markets that may not fall within the value-oriented investment style previously employed for the fund’s entire portfolio.
The fund will continue to invest in stocks that appear to be undervalued (as measured by their price/earnings ratios), but stocks purchased pursuant to the core investment style may have value and/or growth characteristics. The core investment style portfolio manager employs a “bottom-up” investment approach, which emphasizes individual stock selec-tion.The core investment style stock selection process is designed to produce a diversified portfolio that, relative to the Index, has a below-average price/earnings ratio and an above-average earnings growth trend.
When choosing stocks for the portion of the fund using the value-oriented investment style, we use a research-driven and risk-averse approach.We identify potential investments through extensive quantitative and fundamental research. Emphasizing individual stock selection rather than economic and industry trends, we focus on three key factors: value, business health and business momentum.
Strong Domestic Economies Bolstered the
Emerging Markets
After producing stellar returns over the past five years, emerging equity markets moderated during the reporting period, largely in response to uncertainty surrounding deteriorating economies and a credit crisis in the developed world. However, because many emerging markets have built new industrial infrastructures and increased domestic consumption, they appear to be less sensitive to economic conditions occurring in developed markets.
The Funds 15
DISCUSSION OF FUND PERFORMANCE (continued)
Although the fund participated in the emerging markets’ rise, it lagged its benchmark due to disappointments in several markets. In Taiwan, United Microelectronics and Quanta Computer came under pressure due to weaker customer demand. Among Taiwanese banks, Sinopac Financial’s exposure to structured debt overshadowed stronger brokerage operations. In South Korea, banks such as Kookmin Bank and Korea Exchange Bank generally faltered amid speculation that the government would increase the general provision threshold for loans. Retailer Lotte Shopping suffered as a result of slower consumer spending. In Brazil, the fund’s limited exposure to richly valued metals-and-mining stocks hindered its relative performance.
The fund achieved better results in India, Russia and Malaysia. The State Bank of India gained value as local interest rates appeared to peak while credit demand and economic forecasts remain above trend. In addition, Indian oil refiners BPCL and HPCL advanced on rumors of a significant gasoline price increase. The fund fared well in Russia, largely through underweighted positions in oil and gas companies that retreated in early 2008. Malaysia’s stock market rallied when the government adopted plans to expand investments in infrastructure projects and public works. In addition, Malaysian planta-
tion owner Sime Darby gained value due to higher demand for palm oil as an alternative energy source.
Emerging Markets in Transition
Since November 2007, we have seen a considerable shift in the emerging markets as investors responded to developments in other parts of the world. As of the reporting period’s end, the emerging markets appear to be in a transition phase.While it is possible for the markets’ recently stellar returns to continue or for sharp price declines to occur, it seems more likely to us that broad rotations within the market may lead to more normalized returns. In our judgment, the fund’s current tilt toward smaller companies we believe are attractively valued positions it well for a more moderate investment environment.
March 17, 2008
| 1 | Total return includes reinvestment of dividends and any capital gains paid. | |
| Past performance is no guarantee of future results. Share price and investment | ||
| return fluctuate such that upon redemption, fund shares may be worth more or | ||
| less than their original cost. | ||
| 2 | SOURCE: LIPPER INC. — Reflects reinvestment of gross dividends and, | |
| where applicable, capital gain distributions.The Morgan Stanley Capital | ||
| International Emerging Markets Index is a market capitalization-weighted index | ||
| composed of companies representative of the market structure of 26 emerging | ||
| market countries in Europe, Latin America and the Pacific Basin. Index return | ||
| does not reflect fees and expenses associated with operating a mutual fund. |
16
| DISCUSSION OF |
| FUND PERFORMANCE |

For the period of September 1, 2007, through February 29,
2008, as provided by Sean P. Fitzgibbon and John F.
Flahive, Portfolio Managers
Fund and Market Performance Overview
For the six-month period ended February 29, 2008, BNY Mellon Balanced Fund’s Class M shares produced a total return of –1.57% and Investor shares produced –1.73% .1 In comparison, the fund’s benchmark, a blended index composed of 60% Standard & Poor’s 500 Composite Stock Price Index (“S&P 500 Index”) and 40% Lehman Brothers U.S. Aggregate Index, produced a –3.01% total return for the same period.2 Separately, the S&P 500 Index and the Lehman Brothers U.S. Aggregate Index produced total returns of –8.79% and 5.67%, respectively, for the same period.
Stocks and many sectors of the bond market suffered during the reporting period amid an intensifying credit crisis and U.S. economic slowdown. Riskier asset classes were particularly hard hit, while U.S.Treasury securities fared relatively well.The fund outperformed its blended benchmark, primarily due to our stock selection strategy and a defensive fixed-income posture.
The Fund’s Investment Approach
The fund seeks long-term growth of principal in conjunction with current income. To pursue its goal, the fund may invest in equity securities, income producing bonds, Mellon Small Cap Stock Fund, Mellon Mid Cap Stock Fund, Mellon International Fund and Mellon Emerging Markets Fund (collectively, the “Mellon Funds”).The fund has established target allocations of 60% to equity securities and 40% to bonds and money market instruments.The fund may deviate from these targets within ranges of 15% above or below the target amount. The fund’s investments in each of the Mellon Funds are subject to a separate limit of 20% of the fund’s total assets, as is the fund’s investment in money market instruments.
In the fund’s equity portfolio, individual stocks are chosen using a computer model, fundamental analysis and risk management techniques. Our computer model identifies and ranks stocks within each industry or sector based on value, earnings growth and the financial health of the company.
In the fund’s fixed-income portfolio, investments in debt securities must be of investment-grade quality at the time of purchase3 or, if unrated, deemed of comparable quality by the investment adviser. Generally, the fund’s average effective portfolio duration of bonds will not exceed eight years.We choose debt securities based on their yields, credit quality, the level of interest rates and inflation, general economic and financial trends and our outlook for the securities markets.
Stocks and Bonds Suffered in a Credit Crisis
Stocks generally posted negative absolute returns and higher-yielding sectors of the bond market produced lackluster results over the reporting period due to a sharp downturn in the U.S. economy and an intensifying credit crunch stemming from turmoil among sub-prime mortgages. Declining housing values, surging energy and food prices and slower consumer spending weighed on investor psychology. However, the ensuing “flight to quality” supported greater demand for U.S. Treasury securities, which gained value for the fund and its fixed-income benchmark.
Stock and Bond Portfolios Bolstered Relative
Performance
Technology stocks ranked among the stronger contributors to the fund’s relative performance. Weakening business momentum led us to reduce the fund’s exposure to the technology sector over the reporting period, enabling the fund to avoid the brunt of its weakness. In the energy sector, the fund benefited from independent oil and gas producers, such as XTO Energy and Chesapeake Energy, which rose in
The Funds 17
DISCUSSION OF FUND PERFORMANCE (continued)
response to soaring oil prices. The fund also achieved strong results from consumer discretionary companies experiencing turnarounds, such as retailers The Gap and The TJX Companies, while avoiding those with greater sensitivity to consumer spending. In the hard-hit financials sector, the fund avoided many of the companies most undermined by exposure to sub-prime mortgages. The health care sector was the fund’s only significantly underperforming sector, largely due to disappointing clinical trials of a cholesterol drug from pharmaceutical giants Merck & Co. and Schering-Plough.
Among the fund’s allocation to bonds, a generally neutral sector allocation strategy enabled the fund to participate fully in the strength of U.S.Treasury securities.We also focused on higher-quality securities in other areas, including investment-grade corporate bonds and highly rated mortgage-backed “pass-through” securities that held up relatively well during the downturn. The fund held no sub-prime or “Alt-A” mortgage-backed securities, which were at the epicenter of the credit crisis. Our interest-rate strategies also added value as yield differences narrowed along the bond market’s maturity range. Relatively short durations among corporate bonds and slightly long durations among U.S. Treasury
securities boosted the fund’s exposure to the stronger-performing segments of each market.
Maintaining Caution in Volatile Markets
As of the reporting period’s end, the U.S. economy has continued to deteriorate and the credit crisis has intensi-fied.Therefore, we have maintained defensive investment postures in the fund’s stock and bond portfolios. While we have begun to find value-oriented opportunities in both markets, we have held off on taking advantage of them until we see more convincing evidence that the worst of the downturn is behind us.
March 17, 2008
| 1 | Total return includes reinvestment of dividends and any capital gains paid. | |
| Past performance is no guarantee of future results. Share price and investment | ||
| return fluctuate such that upon redemption, fund shares may be worth more or | ||
| less than their original cost. | ||
| 2 | SOURCE: LIPPER INC. — Reflects reinvestment of dividends and, where | |
| applicable, capital gain distributions.The Standard & Poor’s 500 Composite | ||
| Stock Price Index is a widely accepted, unmanaged index of U.S. stock market | ||
| performance.The Lehman Brothers U.S.Aggregate Index is a widely accepted, | ||
| unmanaged total return index of corporate, U.S. government and U.S. | ||
| government agency debt instruments, mortgage-backed securities and asset- | ||
| backed securities with an average maturity of 1-10 years.The indices’ returns | ||
| do not reflect the fees and expenses associated with operating a mutual fund. | ||
| 3 | The fund may continue to own investment-grade bonds (at the time of | |
| purchase), which are subsequently downgraded to below |
18
UNDERSTANDING YOUR FUND’S EXPENSES (Unaudited)
As a mutual fund investor, you pay ongoing expenses, such as management fees and other expenses. Using the information below, you can estimate how these expenses affect your investment and compare them with the expenses of other funds.You also may pay one-time transaction expenses, including sales charges (loads) and redemptions fees, which are not shown in this section and would have resulted in higher total expenses. For more information, see your fund’s prospectus or talk to your financial adviser.
Review your fund’s expenses
The table below shows the expenses you would have paid on a $1,000 investment in each class of each BNY Mellon equity fund from September 1, 2007 to February 29, 2008. It also shows how much a $1,000 investment would be worth at the close of the period, assuming actual returns and expenses.
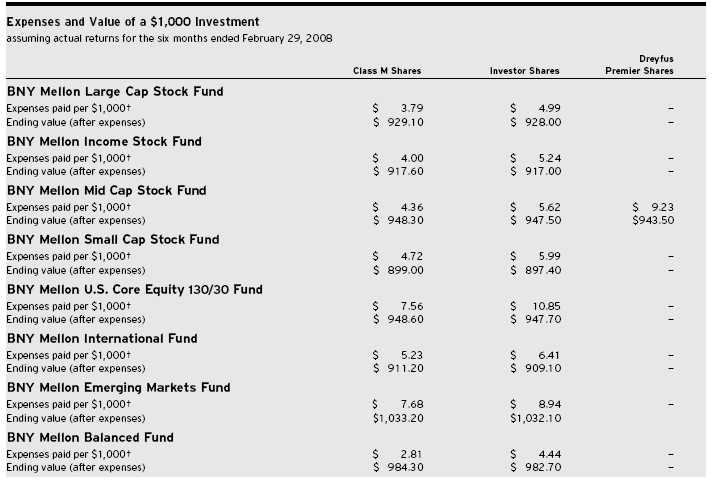
| † Expenses are equal to the BNY Mellon Large Cap Stock Fund’s annualized expense ratio of .79% for Class M and 1.04% for Investor Shares, BNY Mellon Income Stock |
| Fund .84% for Class M and 1.10% for Investor Shares, BNY Mellon Mid Cap Stock Fund .90% for Class M, 1.16% for Investor Shares and 1.91% for Dreyfus Premier |
| Shares, BNY Mellon Small Cap Stock Fund 1.00% for Class M and 1.27% for Investor Shares, BNY Mellon U.S. Core Equity 130/30 Fund 1.56% for Class M and |
| 2.24% for Investor Shares, BNY Mellon International Fund 1.10% for Class M and 1.35% for Investor Shares, BNY Mellon Emerging Markets Fund 1.52% for Class M and |
| 1.77% for Investor Shares and BNY Mellon Balanced Fund .57% for Class M and .90% for Investor Shares, multiplied by the respective fund's average account value over the |
| period, multiplied by 182/366 (to reflect the one-half year period). |
The Funds 19
COMPARING YOUR FUND’S EXPENSES WITH THOSE OF OTHER FUNDS (Unaudited)
Using the SEC’s method to compare expenses
The Securities and Exchange Commission (SEC) has established guidelines to help investors assess fund expenses. Per these guidelines, the table below shows your fund’s expenses based on a $1,000 investment, assuming a hypothetical 5% annualized return.You can use this information to compare the ongoing expenses (but not transaction expenses or total cost) of investing in the fund with those of other funds.All mutual fund shareholder reports will provide this information to help you make this comparison. Please note that you cannot use this information to estimate your actual ending account balance and expenses paid during the period.
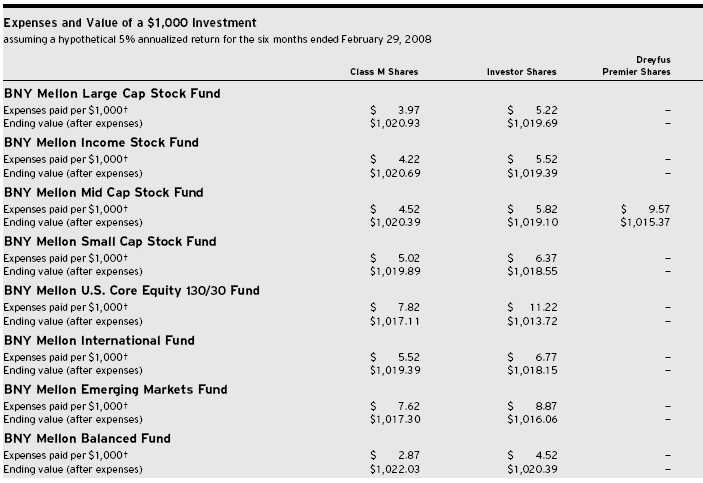
| † Expenses are equal to the BNY Mellon Large Cap Stock Fund’s annualized expense ratio of .79% for Class M and 1.04% for Investor Shares, BNY Mellon Income Stock |
| Fund .84% for Class M and 1.10% for Investor Shares, BNY Mellon Mid Cap Stock Fund .90% for Class M, 1.16% for Investor Shares and 1.91% for Dreyfus Premier |
| Shares, BNY Mellon Small Cap Stock Fund 1.00% for Class M and 1.27% for Investor Shares, BNY Mellon U.S. Core Equity 130/30 Fund 1.56% for Class M and |
| 2.24% for Investor Shares, BNY Mellon International Fund 1.10% for Class M and 1.35% for Investor Shares, BNY Mellon Emerging Markets Fund 1.52% for Class M and |
| 1.77% for Investor Shares and BNY Mellon Balanced Fund .57% for Class M and .90% for Investor Shares, multiplied by the respective fund's average account value over the |
| period, multiplied by 182/366 (to reflect the one-half year period). |
20
| STATEMENT OF INVESTMENTS | ||
| February 29, 2008 (Unaudited) |
| BNY Mellon Large Cap Stock Fund | ||||||||||
| Common Stocks—99.4% | Shares | Value ($) | Shares | Value ($) | ||||||
| Consumer Discretionary—10.4% | Financial (continued) | |||||||||
| Apollo Group, Cl. A | 243,730 a,b | 14,960,147 | Citigroup | 499,699 | 11,847,863 | |||||
| Best Buy | 330,080 a | 14,196,741 | CME Group | 37,880 | 19,443,804 | |||||
| Discovery Holding, Cl. A | 372,920 b | 8,416,804 | Goldman Sachs Group | 155,280 | 26,340,146 | |||||
| Gap | 838,040 | 16,903,267 | JPMorgan Chase & Co. | 1,057,286 | 42,978,676 | |||||
| Johnson Controls | 385,470 a | 12,666,544 | MetLife | 494,880 | 28,831,709 | |||||
| McDonald’s | 196,500 | 10,632,615 | Morgan Stanley | 383,610 | 16,157,653 | |||||
| News, Cl. B | 1,220,960 a | 23,332,546 | PNC Financial | |||||||
| NIKE, Cl. B | 148,990 | 8,969,198 | Services Group | 235,160 | 14,445,879 | |||||
| Omnicom Group | 624,950 | 27,916,517 | State Street | 220,560 | 17,324,988 | |||||
| Ross Stores | 277,510 | 7,728,653 | U.S. Bancorp | 558,400 | 17,879,968 | |||||
| Starwood Hotels | Wells Fargo & Co. | 825,240 a | 24,121,765 | |||||||
| & Resorts Worldwide | 287,600 | 13,612,108 | 303,802,235 | |||||||
| TJX Cos. | 504,080 a | 16,130,560 | Health Care—12.3% | |||||||
| Viacom, Cl. B | 306,010 b | 12,163,897 | Baxter International | 385,490 | 22,751,620 | |||||
| 187,629,597 | Becton, Dickinson & Co. | 131,080 | 11,852,254 | |||||||
| Consumer Staples—10.8% | CIGNA | 335,880 | 14,973,530 | |||||||
| Altria Group | 544,760 | 39,843,746 | Covidien | 212,490 | 9,092,447 | |||||
| Coca-Cola Enterprises | 659,830 | 16,119,647 | Hospira | 382,500 b | 16,279,200 | |||||
| ConAgra Foods | 647,780 | 14,315,938 | Johnson & Johnson | 468,000 | 28,997,280 | |||||
| CVS Caremark | 743,200 | 30,010,416 | Medtronic | 315,840 | 15,589,862 | |||||
| Kroger | 938,810 | 22,766,143 | Merck & Co. | 659,320 | 29,207,876 | |||||
| PepsiCo | 191,847 | 13,344,877 | Pfizer | 1,129,670 | 25,169,048 | |||||
| Procter & Gamble | 1 | 66 | Schering-Plough | 689,190 | 14,955,423 | |||||
| SUPERVALU | 354,490 | 9,305,362 | St. Jude Medical | 259,260 b | 11,142,995 | |||||
| SYSCO | 320,800 | 9,001,648 | Thermo Fisher Scientific | 395,790 b | 22,136,535 | |||||
| Wal-Mart Stores | 803,314 | 39,836,341 | 222,148,070 | |||||||
| 194,544,184 | Industrial—12.4% | |||||||||
| Energy—13.0% | Cooper Industries, Cl. A | 195,740 a | 8,207,378 | |||||||
| Anadarko Petroleum | 179,560 | 11,445,154 | Eaton | 256,180 | 20,655,793 | |||||
| Chesapeake Energy | 560,620 | 25,351,236 | Emerson Electric | 403,220 | 20,548,091 | |||||
| Chevron | 363,130 | 31,468,846 | General Electric | 1,323,246 | 43,852,372 | |||||
| ConocoPhillips | 601,440 | 49,745,102 | Goodrich | 250,490 | 14,836,523 | |||||
| ENSCO International | 382,390 a | 22,882,218 | L-3 Communications Holdings | 248,390 | 26,401,373 | |||||
| Hess | 262,700 | 24,478,386 | Lockheed Martin | 174,900 | 18,049,680 | |||||
| Marathon Oil | 336,930 | 17,911,199 | Terex | 183,810 b | 12,397,985 | |||||
| National Oilwell Varco | 202,670 a,b | 12,626,341 | Textron | 396,520 | 21,479,488 | |||||
| Valero Energy | 145,470 | 8,403,802 | Tyco International | 544,370 | 21,807,462 | |||||
| XTO Energy | 481,075 | 29,687,138 | United Technologies | 149,670 | 10,553,232 | |||||
| 233,999,422 | US Airways Group | 438,680 b | 5,439,632 | |||||||
| Financial—16.8% | 224,229,009 | |||||||||
| American International Group | 500,930 | 23,473,580 | Information Technology—13.6% | |||||||
| Bank of America | 920,155 a | 36,566,960 | Accenture, Cl. A | 266,530 | 9,395,182 | |||||
| Chubb | 479,160 | 24,389,244 | Amphenol, Cl. A | 231,310 | 8,551,531 | |||||
The Funds 21

| ADR—American Depository Receipts |
| a All or a portion of these securities are on loan.At February 29, 2008, the total market value of the fund’s securities on loan is $52,356,262 and the total market value of the collateral held by the fund is $56,817,266. |
| b Non-income producing security. |
| c Investment in affiliated money market mutual fund. |
| Portfolio Summary (Unaudited) | † | |||||||
| Value (%) | Value (%) | |||||||
| Financial | 16.8 | Consumer Discretionary | 10.4 | |||||
| Information Technology | 13.6 | Money Market Investments | 4.9 | |||||
| Energy | 13.0 | Materials | 3.7 | |||||
| Industrial | 12.4 | Telecommunication Services | 3.2 | |||||
| Health Care | 12.3 | Utilities | 3.2 | |||||
| Consumer Staples | 10.8 | 104.3 | ||||||
| † Based on net assets. |
| See notes to financial statements. |
| 22 |
| STATEMENT OF INVESTMENTS | ||
| February 29, 2008 (Unaudited) |
| BNY Mellon Income Stock Fund | ||||||||||
| Common Stocks—100.0% | Shares | Value ($) | Shares | Value ($) | ||||||
| Banking—3.2% | Financial (continued) | |||||||||
| Bank of America | 213,588 | 8,487,987 | Freddie Mac | 22,780 | 573,600 | |||||
| Consumer Discretionary—8.3% | Genworth Financial, Cl. A | 56,900 | 1,318,942 | |||||||
| Johnson Controls | 47,430 | 1,558,550 | Goldman Sachs Group | 14,490 | 2,457,939 | |||||
| Lowe’s Cos. | 54,200 | 1,299,174 | Invesco | 57,880 b | 1,482,306 | |||||
| Macy’s | 42,110 | 1,039,275 | JPMorgan Chase & Co. | 185,749 | 7,550,697 | |||||
| McDonald’s | 26,940 | 1,457,723 | Lincoln National | 86,210 | 4,406,193 | |||||
| News, Cl. A | 396,910 | 7,307,113 | Merrill Lynch & Co. | 50,970 b | 2,526,073 | |||||
| Omnicom Group | 114,710 | 5,124,096 | Morgan Stanley | 36,170 | 1,523,480 | |||||
| TJX Cos. | 73,910 | 2,365,120 | PNC Financial Services Group | 35,390 | 2,174,008 | |||||
| Viacom, Cl. B | 37,230 a | 1,479,893 | Principal Financial Group | 33,200 b | 1,833,636 | |||||
| 21,630,944 | Prudential Financial | 22,490 b | 1,641,095 | |||||||
| Consumer Staples—11.4% | State Street | 35,980 b | 2,826,229 | |||||||
| Altria Group | 136,610 | 9,991,655 | T. Rowe Price Group | 26,640 | 1,346,119 | |||||
| Cadbury Schweppes, ADR | 81,320 | 3,647,202 | Travelers Cos. | 61,331 | 2,846,372 | |||||
| Coca-Cola | 22,850 | 1,335,811 | U.S. Bancorp | 58,286 | 1,866,318 | |||||
| CVS Caremark | 77,070 | 3,112,087 | Wachovia | 44,540 | 1,363,815 | |||||
| Kraft Foods, Cl. A | 149,930 | 4,673,318 | Wells Fargo & Co. | 177,340 b | 5,183,648 | |||||
| Procter & Gamble | 75,950 | 5,026,371 | 59,501,376 | |||||||
| Wal-Mart Stores | 40,940 | 2,030,215 | Health Care—9.0% | |||||||
| 29,816,659 | Abbott Laboratories | 134,240 | 7,188,552 | |||||||
| Energy—16.1% | Baxter International | 60,550 | 3,573,661 | |||||||
| Chevron | 69,486 | 6,021,657 | Merck & Co. | 120,470 | 5,336,821 | |||||
| Devon Energy | 67,080 | 6,890,458 | Pfizer | 141,018 | 3,141,881 | |||||
| EOG Resources | 18,640 | 2,217,974 | Wyeth | 96,629 | 4,214,957 | |||||
| Exxon Mobil | 97,946 | 8,522,281 | 23,455,872 | |||||||
| Marathon Oil | 75,250 | 4,000,290 | Industrial—8.4% | |||||||
| Occidental Petroleum | 82,370 | 6,372,967 | Eaton | 37,830 | 3,050,233 | |||||
| Schlumberger | 17,520 | 1,514,604 | Emerson Electric | 50,280 | 2,562,269 | |||||
| Valero Energy | 25,200 | 1,455,804 | General Electric | 210,912 | 6,989,624 | |||||
| XTO Energy | 80,687 | 4,979,195 | Honeywell International | 61,040 | 3,512,242 | |||||
| 41,975,230 | United Technologies | 38,906 | 2,743,262 | |||||||
| Financial—22.7% | Waste Management | 98,630 | 3,238,023 | |||||||
| American International Group | 99,470 | 4,661,164 | 22,095,653 | |||||||
| Ameriprise Financial | 27,100 | 1,372,344 | Information Technology—5.2% | |||||||
| Capital One Financial | 17,507 b | 805,847 | Accenture, Cl. A | 42,980 | 1,515,045 | |||||
| Chubb | 40,750 | 2,074,175 | Automatic Data Processing | 70,950 | 2,834,453 | |||||
| Citigroup | 198,455 | 4,705,368 | Cisco Systems | 90,830 a | 2,213,527 | |||||
| Fannie Mae | 47,060 | 1,301,209 | Hewlett-Packard | 29,700 | 1,418,769 | |||||
| Fidelity National Financial, Cl. A | 94,310 | 1,660,799 | Intel | 67,420 | 1,345,029 | |||||
The Funds 23
STATEMENT OF INVESTMENTS (Unaudited) (continued)
| BNY Mellon Income Stock Fund (continued) | ||||||||||||
| Common Stocks (continued) | Shares | Value ($) | Shares | Value ($) | ||||||||
| Information Technology (continued) | Utilities (continued) | |||||||||||
| International Business Machines | 13,420 | 1,528,001 | FPL Group | 56,660 | 3,416,031 | |||||||
| Microsoft | 46,660 | 1,270,085 | NRG Energy | 82,910 a,b | 3,421,696 | |||||||
| QUALCOMM | 33,000 | 1,398,210 | Southern | 105,270 b | 3,634,973 | |||||||
| 13,523,119 | 19,747,305 | |||||||||||
| Materials—2.3% | Total Common Stocks | |||||||||||
| Air Products & Chemicals | 16,100 | 1,470,413 | (cost $231,673,206) | 261,448,790 | ||||||||
| Dow Chemical | 44,170 | 1,664,767 | Investment of Cash Collateral | |||||||||
| Freeport-McMoRan Copper & Gold | 20,060 b | 2,023,252 | for Securities Loaned—7.9% | |||||||||
| Monsanto | 6,750 | 780,840 | Registered Investment Company; | |||||||||
| 5,939,272 | Dreyfus Institutional Cash | |||||||||||
| Telecommunication Services—5.8% | Advantage Plus Fund | |||||||||||
| AT & T | 285,215 | 9,934,038 | (cost $20,579,864) | 20,579,864 c | 20,579,864 | |||||||
| Verizon Communications | 120,881 | 4,390,398 | ||||||||||
| Total Investments | ||||||||||||
| Windstream | 80,862 | 950,937 | (cost $252,253,070) | 107.9% | 282,028,654 | |||||||
| 15,275,373 | ||||||||||||
| Utilities—7.6% | Liabilities, Less Cash | |||||||||||
| and Receivables | (7.9%) | (20,533,073) | ||||||||||
| Entergy | 40,630 | 4,174,326 | ||||||||||
| Exelon | 68,140 | 5,100,279 | Net Assets | 100.0% | 261,495,581 | |||||||
| ADR—American Depository Receipts |
| a Non-income producing security. |
| b All or a portion of these securities are on loan.At February 29, 2008, the total market value of the fund’s securities on loan is $19,177,554 and the total market value of the |
| collateral held by the fund is $20,579,864. |
| c Investment in affiliated money market mutual fund. |
| Portfolio Summary (Unaudited) † | ||||||
| Value (%) | Value (%) | |||||
| Financial | 22.7 | Utilities | 7.6 | |||
| Energy | 16.1 | Telecommunication Services | 5.8 | |||
| Consumer Staples | 11.4 | Information Technology | 5.2 | |||
| Health Care | 9.0 | Banking | 3.2 | |||
| Industrial | 8.4 | Materials | 2.3 | |||
| Consumer Discretionary | 8.3 | |||||
| Money Market Investment | 7.9 | 107.9 | ||||
| † Based on net assets. |
| See notes to financial statements. |
| 24 |
| STATEMENT OF OPTIONS WRITTEN | ||||
| February 29, 2008 (Unaudited) |
| Face Amount | ||||
| Covered by | ||||
| BNY Mellon Income Stock | Contracts (S) | Value ($) | ||
| Call Options: | ||||
| Exxon Mobil, April 2008 @ 90 | 97,000 | (213,400) | ||
| Verizon Communications, March 2008 @ 40 | 12,800 | (1,536) | ||
| Verizon Communications, April 2008 @ 40 | 108,000 | (39,960) | ||
| (Premiums received $215,111) | (254,896) |
| See notes to financial statements. |
The Funds 25
| STATEMENT OF INVESTMENTS | ||
| February 29, 2008 (Unaudited) |
| BNY Mellon Mid Cap Stock Fund | ||||||||||
| Common Stocks—98.5% | Shares | Value ($) | Shares | Value ($) | ||||||
| Consumer Discretionary—13.1% | Energy (continued) | |||||||||
| Abercrombie & Fitch, Cl. A | 104,300 | 8,086,379 | Frontier Oil | 160,700 | 5,738,597 | |||||
| Apollo Group, Cl. A | 68,610 a,b | 4,211,282 | Newfield Exploration | 154,160 a,b | 8,537,381 | |||||
| Children’s Place Retail Stores | 360,200 a,b | 7,693,872 | Oceaneering International | 119,750 b | 7,185,000 | |||||
| Darden Restaurants | 463,000 | 14,274,290 | PetroHawk Energy | 501,500 b | 9,067,120 | |||||
| Dick’s Sporting Goods | 395,800 a,b | 10,916,164 | Plains Exploration & Production | 164,800 a,b | 8,899,200 | |||||
| Dollar Tree Stores | 435,600 b | 11,687,148 | Quicksilver Resources | 381,200 b | 13,113,280 | |||||
| Focus Media Holding, ADR | 165,700 b | 8,346,309 | Range Resources | 176,800 a | 10,816,624 | |||||
| Gentex | 587,110 a | 9,464,213 | Southwestern Energy | 395,600 b | 25,804,988 | |||||
| Gildan Activewear | 321,500 b | 12,123,765 | Superior Energy Services | 288,500 b | 11,739,065 | |||||
| ITT Educational Services | 41,900 a,b | 2,313,718 | 174,800,517 | |||||||
| Life Time Fitness | 379,300 a,b | 11,022,458 | Financial—14.8% | |||||||
| MDC Holdings | 120,200 | 5,033,976 | AllianceBernstein Holding | 104,400 | 6,478,020 | |||||
| New Oriental Education & | Allied World | |||||||||
| Technology Group, ADR | 140,100 b | 8,735,235 | Assurance Holdings | 158,100 | 6,885,255 | |||||
| O’Reilly Automotive | 287,800 a,b | 7,759,088 | AMB Property | 168,900 a | 8,475,402 | |||||
| Penn National Gaming | 180,100 a,b | 8,253,983 | Annaly Capital Management | 448,300 | 9,275,327 | |||||
| Phillips-Van Heusen | 253,500 a | 9,255,285 | Astoria Financial | 289,550 a | 7,577,523 | |||||
| Ryland Group | 192,310 a | 5,440,450 | Bank of Hawaii | 235,300 a | 11,299,106 | |||||
| Saks | 499,700 a,b | 7,775,332 | Digital Realty Trust | 285,100 a | 10,235,090 | |||||
| Scientific Games, Cl. A | 345,200 a,b | 7,135,284 | E*TRADE FINANCIAL | 775,700 a,b | 3,312,239 | |||||
| Tenneco | 176,100 b | 4,446,525 | FCStone Group | 181,400 a,b | 8,460,496 | |||||
| Texas Roadhouse, Cl. A | 512,900 a,b | 4,769,970 | Federated Investors, Cl. B | 174,820 a | 7,094,196 | |||||
| Thor Industries | 303,890 a | 9,262,567 | FelCor Lodging Trust | 395,901 | 4,996,271 | |||||
| Tupperware Brands | 355,700 a | 12,975,936 | Fidelity National | |||||||
| Urban Outfitters | 495,970 a,b | 14,274,017 | Financial, Cl. A | 537,700 | 9,468,897 | |||||
| 205,257,246 | First Industrial Realty Trust | 177,800 a | 5,401,564 | |||||||
| Consumer Staples—2.7% | Hudson City Bancorp | 489,600 | 7,769,952 | |||||||
| Clorox | 118,400 | 6,889,696 | IntercontinentalExchange | 64,900 a,b | 8,456,470 | |||||
| Energizer Holdings | 128,400 b | 11,919,372 | Nationwide Health Properties | 377,400 a | 11,446,542 | |||||
| Hansen Natural | 296,590 a,b | 12,308,485 | New York Community Bancorp | 924,800 | 15,101,984 | |||||
| Smithfield Foods | 425,000 a,b | 11,708,750 | Old Republic International | 857,860 | 11,769,839 | |||||
| 42,826,303 | Rayonier | 326,186 a | 13,879,214 | |||||||
| Energy—11.2% | Reinsurance Group of America | 156,500 a | 8,562,115 | |||||||
| Arch Coal | 119,900 a | 6,125,691 | Synovus Financial | 1,072,000 a | 12,360,160 | |||||
| Cameron International | 197,830 b | 8,403,818 | Taubman Centers | 143,300 a | 6,985,875 | |||||
| Consol Energy | 148,210 | 11,260,996 | Validus Holdings | 492,900 a | 12,243,636 | |||||
| Denbury Resources | 581,900 a,b | 18,556,791 | W.R. Berkley | 430,950 a | 12,407,050 | |||||
| Dril-Quip | 129,100 a,b | 6,039,298 | Waddell & Reed | |||||||
| FMC Technologies | 191,400 a,b | 10,844,724 | Financial, Cl. A | 345,500 | 10,827,970 | |||||
| Forest Oil | 256,800 a,b | 12,667,944 | 230,770,193 | |||||||
26
| BNY Mellon Mid Cap Stock Fund (continued) | ||||||||||
| Common Stocks (continued) | Shares | Value ($) | Shares | Value ($) | ||||||
| Health Care—13.4% | Industrial (continued) | |||||||||
| Barr Pharmaceuticals | 185,900 b | 8,765,185 | Textron | 173,400 | 9,393,078 | |||||
| C.R. Bard | 93,800 a | 8,891,302 | URS | 309,330 b | 12,459,812 | |||||
| Cephalon | 223,900 a,b | 13,510,126 | 236,228,426 | |||||||
| Community Health Systems | 374,900 a,b | 11,648,143 | Information Technology—12.9% | |||||||
| Covance | 155,650 b | 13,138,416 | Activision | 418,200 b | 11,395,950 | |||||
| Dentsply International | 393,630 | 15,367,315 | Akamai Technologies | 181,300 a,b | 6,374,508 | |||||
| Health Net | 332,900 b | 14,627,626 | Alliance Data Systems | 293,300 a,b | 14,849,779 | |||||
| Henry Schein | 132,430 a,b | 7,921,963 | Amphenol, Cl. A | 514,020 | 19,003,319 | |||||
| Hologic | 336,004 a,b | 20,264,401 | Atheros Communications | 283,900 a,b | 6,904,448 | |||||
| Intuitive Surgical | 46,400 b | 13,081,088 | Avnet | 335,400 a,b | 11,306,334 | |||||
| Invitrogen | 158,710 a,b | 13,409,408 | CommScope | 275,800 a,b | 11,550,504 | |||||
| Millennium Pharmaceuticals | 1,020,100 a,b | 14,271,199 | Cypress Semiconductor | 426,100 a,b | 9,263,414 | |||||
| Owens & Minor | 173,010 | 7,434,240 | DST Systems | 177,200 a,b | 12,450,072 | |||||
| Pediatrix Medical Group | 131,430 b | 8,675,694 | Equinix | 60,100 a,b | 4,167,935 | |||||
| Perrigo | 341,550 a | 11,414,601 | FactSet Research Systems | 65,620 a | 3,454,237 | |||||
| Pharmaceutical Product Development | 342,600 a | 15,440,982 | Global Payments | 300,500 a | 11,920,835 | |||||
| WellCare Health Plans | 224,100 a,b | 10,698,534 | Harris | 333,900 | 16,304,337 | |||||
| 208,560,223 | McAfee | 471,600 b | 15,690,132 | |||||||
| Industrial—15.1% | National Semiconductor | 376,600 | 6,202,602 | |||||||
| AGCO | 250,860 b | 16,270,780 | NCR | 283,800 a,b | 6,289,008 | |||||
| Alliant Techsystems | 112,700 a,b | 11,826,738 | Synopsys | 486,300 b | 11,287,023 | |||||
| AMETEK | 319,750 | 13,618,153 | Western Digital | 511,500 a,b | 15,790,005 | |||||
| BE Aerospace | 281,700 b | 9,662,310 | Wright Express | 270,400 a,b | 7,825,376 | |||||
| Brink’s | 199,300 | 13,339,149 | 202,029,818 | |||||||
| Chicago Bridge & Iron | Materials—7.0% | |||||||||
| (NY Shares) | 190,760 | 8,874,155 | Airgas | 281,600 | 13,682,944 | |||||
| Con-way | 132,400 | 5,999,044 | Albemarle | 309,800 | 11,753,812 | |||||
| Corrections Corp. of America | 454,700 b | 12,213,242 | Carpenter Technology | 179,800 | 11,296,834 | |||||
| Dun & Bradstreet | 125,900 | 10,996,106 | Celanese, Ser. A | 260,100 a | 10,117,890 | |||||
| Equifax | 191,100 a | 6,539,442 | CF Industries Holdings | 130,500 | 15,931,440 | |||||
| Flowserve | 180,800 | 19,689,120 | Cleveland-Cliffs | 142,000 a | 16,963,320 | |||||
| Goodrich | 97,400 | 5,769,002 | Martin Marietta Materials | 62,590 a | 6,734,684 | |||||
| Lincoln Electric Holdings | 63,160 | 4,240,562 | Pactiv | 284,300 b | 7,198,476 | |||||
| Manitowoc | 183,290 a | 7,467,235 | Steel Dynamics | 142,030 a | 8,274,668 | |||||
| Quanta Services | 232,000 a,b | 5,540,160 | Terra Industries | 150,300 a,b | 6,795,063 | |||||
| Republic Services | 511,280 | 15,609,378 | 108,749,131 | |||||||
| Rockwell Collins | 132,700 | 7,816,030 | Telecommunication Services—1.0% | |||||||
| Roper Industries | 250,900 a | 14,150,760 | NII Holdings | 204,200 b | 8,112,866 | |||||
| SPX | 158,900 | 16,255,470 | SBA Communications, Cl. A | 243,000 b | 7,545,150 | |||||
| Terex | 126,000 a,b | 8,498,700 | 15,658,016 | |||||||
The Funds 27
STATEMENT OF INVESTMENTS (Unaudited) (continued)
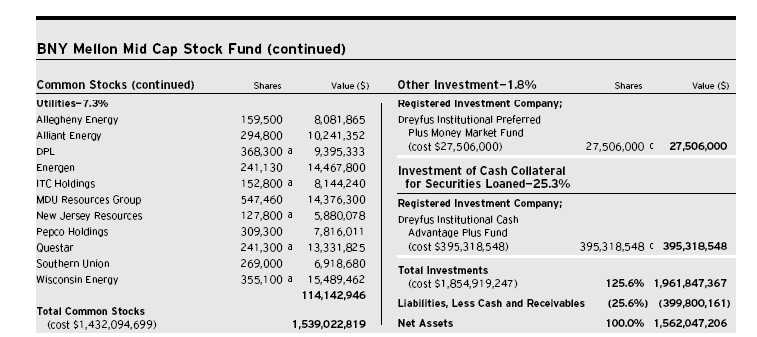
| ADR—American Depository Receipts |
| a All or a portion of these securities are on loan.At February 29, 2008, the total market value of the fund’s securities on loan is $372,408,903 and the total market value of the |
| collateral held by the fund is $395,495,248, consisting of cash collateral of $395,318,548 and U.S. Government and agency securities valued at $176,700. |
| b Non-income producing security. |
| c Investment in affiliated money market mutual fund. |
| Portfolio Summary (Unaudited) † | ||||||
| Value (%) | Value (%) | |||||
| Money Market Investments | 27.1 | Energy | 11.2 | |||
| Industrial | 15.1 | Utilities | 7.3 | |||
| Financial | 14.8 | Materials | 7.0 | |||
| Health Care | 13.4 | Consumer Staples | 2.7 | |||
| Consumer Discretionary | 13.1 | Telecommunication Services | 1.0 | |||
| Information Technology | 12.9 | 125.6 | ||||
| † Based on net assets. |
| See notes to financial statements. |
28
| STATEMENT OF INVESTMENTS | ||
| February 29, 2008 (Unaudited) |
| BNY Mellon Small Cap Stock Fund | ||||||||||
| Common Stocks—94.2% | Shares | Value ($) | Shares | Value ($) | ||||||
| Consumer Discretionary—12.8% | Energy (continued) | |||||||||
| Aeropostale | 106,900 a | 2,871,334 | Helix Energy Solutions Group | 88,500 a,b | 3,116,970 | |||||
| BJ’s Restaurants | 120,000 a,b | 1,627,200 | ION Geophysical | 359,600 a,b | 4,779,084 | |||||
| Children’s Place Retail Stores | 128,600 a,b | 2,746,896 | Massey Energy | 94,200 b | 3,604,092 | |||||
| Coldwater Creek | 445,200 a,b | 2,461,956 | Matrix Service | 187,600 a | 3,815,784 | |||||
| Deckers Outdoor | 41,700 a,b | 4,613,688 | Oceaneering International | 107,000 a | 6,420,000 | |||||
| DeVry | 59,600 b | 2,618,824 | Patriot Coal | 66,900 a,b | 3,592,530 | |||||
| Exide Technologies | 445,700 a,b | 4,555,054 | St. Mary Land & Exploration | 74,990 | 2,765,631 | |||||
| Fossil | 165,900 a,b | 5,338,662 | Tetra Technologies | 82,900 a,b | 1,424,222 | |||||
| Gaylord Entertainment | 69,600 a,b | 2,094,264 | Unit | 109,030 a | 6,013,004 | |||||
| Iconix Brand Group | 233,500 a,b | 4,852,130 | W-H Energy Services | 38,000 a,b | 2,389,060 | |||||
| INVESTools | 221,000 a,b | 2,556,970 | Willbros Group | 116,900 a,b | 4,004,994 | |||||
| Jack in the Box | 152,600 a | 4,008,802 | 58,593,346 | |||||||
| Life Time Fitness | 160,600 a,b | 4,667,036 | Financial—12.4% | |||||||
| LKQ | 144,900 a,b | 3,077,676 | AmTrust Financial Services | 181,800 | 3,036,060 | |||||
| MDC Holdings | 61,600 | 2,579,808 | Aspen Insurance Holdings | 203,100 | 5,877,714 | |||||
| Men’s Wearhouse | 59,100 b | 1,361,664 | Astoria Financial | 191,750 | 5,018,097 | |||||
| Morgans Hotel Group | 156,800 a,b | 2,405,312 | Bank of Hawaii | 65,100 b | 3,126,102 | |||||
| New Oriental Education & | E*TRADE FINANCIAL | 593,700 a,b | 2,535,099 | |||||||
| Technology Group, ADR | 42,700 a | 2,662,345 | East West Bancorp | 113,900 b | 2,142,459 | |||||
| Phillips-Van Heusen | 62,800 b | 2,292,828 | Entertainment Properties Trust | 32,000 b | 1,499,840 | |||||
| Ryland Group | 62,800 b | 1,776,612 | Essex Property Trust | 27,400 b | 2,878,096 | |||||
| Tupperware Brands | 190,700 b | 6,956,736 | FCStone Group | 79,300 a,b | 3,698,552 | |||||
| Vail Resorts | 102,300 a,b | 4,629,075 | FelCor Lodging Trust | 282,020 b | 3,559,092 | |||||
| WMS Industries | 146,300 a,b | 5,555,011 | First Midwest Bancorp | 81,940 b | 2,134,537 | |||||
| 78,309,883 | Investment Technology Group | 81,300 a,b | 3,786,954 | |||||||
| Consumer Staples—5.2% | Kilroy Realty | 38,800 b | 1,840,284 | |||||||
| Boston Beer, Cl. A | 87,200 a,b | 3,109,552 | Lexington Realty Trust | 73,800 b | 1,067,886 | |||||
| Chattem | 87,700 a,b | 6,831,830 | National Retail Properties | 243,800 b | 5,046,660 | |||||
| Chiquita Brands International | 301,500 a,b | 6,171,705 | Philadelphia Consolidated Holding | 60,500 a | 2,052,160 | |||||
| Darling International | 198,800 a,b | 2,763,320 | Senior Housing Properties Trust | 83,400 b | 1,773,918 | |||||
| Flowers Foods | 87,200 b | 1,975,952 | Signature Bank | 147,840 a,b | 3,917,760 | |||||
| Hain Celestial Group | 41,900 a,b | 1,131,300 | StanCorp Financial Group | 68,850 b | 3,379,847 | |||||
| Herbalife | 79,100 | 3,308,753 | Susquehanna Bancshares | 169,900 b | 3,379,311 | |||||
| Ralcorp Holdings | 31,500 a,b | 1,746,675 | Texas Capital Bancshares | 222,600 a,b | 3,330,096 | |||||
| TreeHouse Foods | 144,200 a,b | 3,196,914 | Trustco Bank | 317,300 b | 2,744,645 | |||||
| United Natural Foods | 101,700 a,b | 1,720,764 | UCBH Holdings | 277,400 b | 3,131,846 | |||||
| 31,956,765 | Washington Federal | 134,300 b | 3,048,610 | |||||||
| Energy—9.6% | Whitney Holding | 68,100 b | 1,635,081 | |||||||
| Atwood Oceanics | 36,800 a,b | 3,425,712 | 75,640,706 | |||||||
| Cabot Oil & Gas | 126,200 | 6,278,450 | Health Care—10.7% | |||||||
| Forest Oil | 79,100 a | 3,902,003 | Alpharma, Cl. A | 137,100 a,b | 3,452,178 | |||||
| Foundation Coal Holdings | 53,000 | 3,061,810 | Amedisys | 28,000 a | 1,197,840 | |||||
The Funds 29
STATEMENT OF INVESTMENTS (Unaudited) (continued)
| BNY Mellon Small Cap Stock Fund (continued) | ||||||||||
| Common Stocks (continued) | Shares | Value ($) | Shares | Value ($) | ||||||
| Health Care (continued) | Industrial (continued) | |||||||||
| American Medical Systems Holdings | 78,700 a,b | 1,148,233 | Manitowoc | 68,820 b | 2,803,727 | |||||
| AMERIGROUP | 61,300 a,b | 2,206,800 | Shaw Group | 117,290 a,b | 7,551,130 | |||||
| AmSurg | 175,100 a,b | 4,218,159 | Taser International | 169,300 a,b | 1,908,011 | |||||
| ArthroCare | 33,700 a,b | 1,353,055 | Teledyne Technologies | 37,230 a,b | 1,653,012 | |||||
| Chemed | 31,500 | 1,502,865 | Toro | 53,600 b | 2,582,448 | |||||
| Dionex | 19,200 a | 1,417,344 | United Stationers | 50,900 a,b | 2,512,424 | |||||
| Haemonetics | 27,100 a | 1,574,510 | URS | 130,270 a,b | 5,247,276 | |||||
| Healthways | 40,000 a,b | 1,374,000 | Waste Connections | 180,900 a,b | 5,492,124 | |||||
| IDEXX Laboratories | 65,880 a,b | 3,654,364 | Watson Wyatt Worldwide, Cl. A | 104,300 b | 5,533,115 | |||||
| Immucor | 76,000 a,b | 2,264,800 | 93,596,862 | |||||||
| Inventiv Health | 139,100 a,b | 4,423,380 | Information Technology—15.9% | |||||||
| Lifecell | 40,100 a,b | 1,618,035 | Anixter International | 37,360 a,b | 2,442,970 | |||||
| Meridian Bioscience | 54,900 b | 1,881,423 | ANSYS | 166,060 a,b | 6,205,662 | |||||
| Merit Medical Systems | 216,400 a | 3,429,940 | Arris Group | 227,800 a,b | 1,309,850 | |||||
| Owens & Minor | 162,600 | 6,986,922 | Atheros Communications | 79,840 a,b | 1,941,709 | |||||
| Pediatrix Medical Group | 165,400 a | 10,918,054 | Blackbaud | 175,100 | 4,577,114 | |||||
| Regeneron Pharmaceuticals | 67,900 a,b | 1,342,383 | Blue Coat Systems | 45,500 a,b | 1,068,340 | |||||
| Sunrise Senior Living | 51,500 a,b | 1,410,070 | Brightpoint | 329,460 a,b | 3,406,616 | |||||
| WellCare Health Plans | 103,400 a,b | 4,936,316 | Checkpoint Systems | 120,800 a | 2,923,360 | |||||
| West Pharmaceutical Services | 72,900 | 3,010,770 | Comtech Telecommunications | 94,500 a,b | 4,099,410 | |||||
| 65,321,441 | Concur Technologies | 53,100 a | 1,552,644 | |||||||
| Index—.8% | Equinix | 37,800 a,b | 2,621,430 | |||||||
| iShares Nasdaq Biotechnology | FactSet Research Systems | 41,050 b | 2,160,872 | |||||||
| Index Fund | 61,100 b | 4,658,264 | FLIR Systems | 144,000 a,b | 4,098,240 | |||||
| Industrial—15.4% | Harmonic | 306,500 a | 2,730,915 | |||||||
| Acuity Brands | 98,900 b | 4,392,149 | Informatica | 358,200 a,b | 6,254,172 | |||||
| Alaska Air Group | 105,400 a,b | 2,571,760 | Itron | 88,100 a,b | 8,398,573 | |||||
| AZZ | 58,100 a | 2,057,902 | j2 Global Communications | 58,200 a,b | 1,252,464 | |||||
| Barnes Group | 107,000 b | 2,433,180 | JDA Software Group | 163,100 a,b | 2,784,117 | |||||
| BE Aerospace | 74,000 a | 2,538,200 | ManTech International, Cl. A | 92,900 a | 4,095,032 | |||||
| Brady, Cl. A | 66,700 b | 2,039,686 | Micros Systems | 76,600 a | 2,454,264 | |||||
| Corrections Corp. of America | 123,700 a | 3,322,582 | Microsemi | 218,900 a,b | 4,761,075 | |||||
| Curtiss-Wright | 97,300 b | 4,092,438 | Moog, Cl. A | 48,100 a,b | 1,974,024 | |||||
| DRS Technologies | 59,500 b | 3,337,355 | Net 1 UEPS Technologies | 116,800 a,b | 3,398,880 | |||||
| EMCOR Group | 111,100 a,b | 2,676,399 | Skyworks Solutions | 653,600 a,b | 5,398,736 | |||||
| EnPro Industries | 108,000 a,b | 3,189,240 | Synaptics | 73,000 a,b | 1,955,670 | |||||
| FTI Consulting | 53,500 a | 3,397,250 | THQ | 93,600 a,b | 1,751,256 | |||||
| Healthcare Services Group | 162,800 b | 3,220,184 | Trimble Navigation | 134,400 a | 3,674,496 | |||||
| Kaydon | 98,200 b | 4,194,122 | Varian Semiconductor | |||||||
| Kirby | 125,000 a | 5,635,000 | Equipment Associates | 89,405 a,b | 3,020,101 | |||||
| Landstar System | 66,020 | 3,062,008 | Wright Express | 155,440 a,b | 4,498,434 | |||||
| Lennox International | 163,500 | 6,154,140 | 96,810,426 | |||||||
30
| BNY Mellon Small Cap Stock Fund (continued) | ||||||||||
| Common Stocks (continued) | Shares | Value ($) | Shares | Value ($) | ||||||
| Materials—4.4% | Utilities (continued) | |||||||||
| AptarGroup | 70,000 b | 2,623,600 | UGI | 242,900 | 6,220,669 | |||||
| Century Aluminum | 32,000 a,b | 2,116,160 | 33,118,142 | |||||||
| Coeur d’Alene Mines | 808,100 a,b | 3,895,042 | Total Common Stocks | |||||||
| H.B. Fuller | 150,300 b | 3,419,325 | (cost $569,085,710) | 574,224,940 | ||||||
| OM Group | 115,500 a,b | 6,991,215 | ||||||||
| RTI International Metals | 29,000 a | 1,591,230 | Other Investment—4.6% | |||||||
| Steel Dynamics | 60,400 b | 3,518,904 | Registered Investment Company; | |||||||
| Texas Industries | 41,800 b | 2,407,680 | Dreyfus Institutional Preferred | |||||||
| 26,563,156 | Plus Money Market Fund | |||||||||
| Telecommunication Services—1.6% | (cost $27,998,000) | 27,998,000 c | 27,998,000 | |||||||
| Alaska Communications | Investment of Cash Collateral | |||||||||
| Systems Group | 455,420 b | 5,159,909 | for Securities Loaned—35.9% | |||||||
| SBA Communications, Cl. A | 144,800 a,b | 4,496,040 | ||||||||
| Registered Investment Company; | ||||||||||
| 9,655,949 | ||||||||||
| Dreyfus Institutional Cash | ||||||||||
| Utilities—5.4% | Advantage Plus Fund | |||||||||
| Atmos Energy | 102,100 b | 2,654,600 | (cost $218,782,655) | 218,782,655 c | 218,782,655 | |||||
| Cleco | 228,800 b | 5,241,808 | ||||||||
| El Paso Electric | 196,600 a,b | 4,022,436 | Total Investments | |||||||
| (cost $815,866,365) | 134.7% | 821,005,595 | ||||||||
| IDACORP | 159,700 b | 4,759,060 | ||||||||
| ITC Holdings | 113,960 b | 6,074,068 | Liabilities, Less Cash and Receivables (34.7%) | (211,501,605) | ||||||
| New Jersey Resources | 90,100 b | 4,145,501 | Net Assets | 100.0% | 609,503,990 | |||||
| ADR—American Depository Receipts |
| a Non-income producing security. |
| b All or a portion of these securities are on loan.At Febuary 29, 2008, the total market value of the fund’s securities on loan is $200,007,686 and the total market value of the |
| collateral held by the fund is $219,072,755, consisting of cash collateral of $218,782,655 and U.S. Government and agency securities valued at $290,100. |
| c Investment in affiliated money market mutual fund. |
| Portfolio Summary (Unaudited) † | ||||||
| Value (%) | Value (%) | |||||
| Money Market Investments | 40.5 | Utilities | 5.4 | |||
| Information Technology | 15.9 | Consumer Staples | 5.2 | |||
| Industrial | 15.4 | Materials | 4.4 | |||
| Consumer Discretionary | 12.8 | Telecommunication Services | 1.6 | |||
| Financial | 12.4 | Index | .8 | |||
| Health Care | 10.7 | |||||
| Energy | 9.6 | 134.7 | ||||
| † Based on net assets. |
| See notes to financial statements. |
The Funds 31
| STATEMENT OF INVESTMENTS | ||
| February 29, 2008 (Unaudited) |
| BNY Mellon U.S. Core Equity 130/30 Fund | ||||||||||
| Common Stocks—123.3% | Shares | Value ($) | Shares | Value ($) | ||||||
| Consumer Discretionary—13.9% | Energy (continued) | |||||||||
| Apollo Group, Cl. A | 13,530 a | 830,471 | Unit | 12,990 a,b | 716,398 | |||||
| Autoliv | 10,960 b | 546,904 | Valero Energy | 17,180 b | 992,489 | |||||
| Best Buy | 17,750 b | 763,427 | XTO Energy | 38,657 | 2,385,523 | |||||
| Discovery Holding, Cl. A | 20,110 a,b | 453,883 | 16,086,312 | |||||||
| Gap | 74,540 b | 1,503,472 | Exchange Traded Funds—4.3% | |||||||
| Gildan Activewear | 18,520 a,b | 698,389 | Standard & Poor’s Depository | |||||||
| Johnson Controls | 34,960 b | 1,148,786 | Receipts (Tr. Ser. 1) | 32,780 | 4,386,620 | |||||
| Marriott International, Cl. A | 14,390 b | 490,699 | Financial—16.9% | |||||||
| McDonald’s | 10,670 b | 577,354 | American International Group | 27,310 b | 1,279,747 | |||||
| News, Cl. A | 25,920 | 477,187 | Bank of America | 50,410 b | 2,003,293 | |||||
| News, Cl. B | 22,830 | 436,281 | Chubb | 27,540 b | 1,401,786 | |||||
| O’Reilly Automotive | 19,700 a,b | 531,112 | Citigroup | 28,720 b | 680,951 | |||||
| Omnicom Group | 40,430 b | 1,806,008 | CME Group | 1,960 b | 1,006,068 | |||||
| Phillips-Van Heusen | 5,670 b | 207,012 | Goldman Sachs Group | 8,930 b | 1,514,796 | |||||
| Ross Stores | 22,020 b | 613,257 | JPMorgan Chase & Co. | 54,030 b | 2,196,319 | |||||
| TJX Cos. | 39,380 b | 1,260,160 | MetLife | 28,450 b | 1,657,497 | |||||
| Viacom, Cl. B | 16,890 a | 671,377 | Moody’s | 15,500 | 588,690 | |||||
| Walt Disney | 36,330 b | 1,177,455 | Morgan Stanley | 20,830 b | 877,360 | |||||
| 14,193,234 | PNC Financial Services Group | 12,820 | 787,533 | |||||||
| Consumer Staples—13.8% | State Street | 12,420 | 975,591 | |||||||
| Altria Group | 34,260 b | 2,505,776 | U.S. Bancorp | 30,450 | 975,009 | |||||
| Cadbury Schweppes, ADR | 15,420 b | 691,587 | Wells Fargo & Co. | 46,280 | 1,352,764 | |||||
| Coca-Cola Enterprises | 39,090 b | 954,969 | 17,297,404 | |||||||
| ConAgra Foods | 58,400 b | 1,290,640 | Health Care—16.1% | |||||||
| CVS Caremark | 55,470 b | 2,239,879 | Baxter International | 31,510 b | 1,859,720 | |||||
| Kroger | 48,430 b | 1,174,427 | Becton, Dickinson & Co. | 14,210 b | 1,284,868 | |||||
| Procter & Gamble | 16,070 b | 1,063,513 | Charles River Laboratories | |||||||
| SUPERVALU | 37,620 b | 987,525 | International | 10,660 a,b | 624,463 | |||||
| SYSCO | 37,100 b | 1,041,026 | CIGNA | 17,500 b | 780,150 | |||||
| Wal-Mart Stores | 43,170 b | 2,140,800 | Covidien | 18,540 b | 793,327 | |||||
| 14,090,142 | Gilead Sciences | 19,490 a,b | 922,267 | |||||||
| Energy—15.7% | Hospira | 41,650 a,b | 1,772,624 | |||||||
| Anadarko Petroleum | 8,330 b | 530,954 | Invitrogen | 7,530 a,b | 636,210 | |||||
| Chesapeake Energy | 29,350 b | 1,327,207 | Johnson & Johnson | 16,120 b | 998,795 | |||||
| Chevron | 29,830 b | 2,585,068 | Merck & Co. | 35,080 b | 1,554,044 | |||||
| ConocoPhillips | 51,550 b | 4,263,700 | Pfizer | 62,090 b | 1,383,365 | |||||
| ENSCO International | 19,740 b | 1,181,242 | Schering-Plough | 37,690 b | 817,873 | |||||
| Marathon Oil | 11,700 b | 621,972 | St. Jude Medical | 14,110 a | 606,448 | |||||
| Nabors Industries | 24,470 a,b | 771,539 | Thermo Fisher Scientific | 42,610 a,b | 2,383,177 | |||||
| National Oilwell Varco | 11,400 a,b | 710,220 | 16,417,331 | |||||||
32
| BNY Mellon U.S. Core Equity 130/30 Fund (continued) | ||||||||||
| Common Stocks (continued) | Shares | Value ($) | Shares | Value ($) | ||||||
| Industrials—15.1% | Information Technology (continued) | |||||||||
| Allied Waste Industries | 47,220 a,b | 488,255 | McAfee | 42,520 a,b | 1,414,640 | |||||
| Dover | 15,330 b | 636,348 | Microsoft | 84,290 b | 2,294,374 | |||||
| Eaton | 22,250 b | 1,794,017 | Oracle | 51,050 a,b | 959,740 | |||||
| Emerson Electric | 30,780 b | 1,568,549 | QUALCOMM | 27,260 b | 1,155,006 | |||||
| General Electric | 77,330 b | 2,562,716 | Symantec | 16,990 a | 286,112 | |||||
| Goodrich | 25,670 b | 1,520,434 | 17,930,595 | |||||||
| L-3 Communications Holdings | 7,350 b | 781,232 | Materials—3.0% | |||||||
| Lockheed Martin | 15,030 b | 1,551,096 | Air Products & Chemicals | 7,955 b | 726,530 | |||||
| Raytheon | 8,830 b | 572,537 | Allegheny Technologies | 9,970 b | 771,180 | |||||
| Terex | 12,230 a,b | 824,914 | Freeport-McMoRan Copper & Gold | 5,540 b | 558,764 | |||||
| Textron | 21,360 b | 1,157,071 | Rohm & Haas | 18,300 b | 981,063 | |||||
| Tyco International | 42,480 b | 1,701,749 | 3,037,537 | |||||||
| US Airways Group | 24,840 a,b | 308,016 | Telecommunication Services—4.1% | |||||||
| 15,466,934 | AT & T | 74,750 b | 2,603,543 | |||||||
| Information Technology—17.5% | Verizon Communications | 44,280 b | 1,608,250 | |||||||
| Accenture, Cl. A | 14,530 b | 512,183 | 4,211,793 | |||||||
| Amphenol, Cl. A | 31,000 b | 1,146,070 | Utilities—2.9% | |||||||
| BMC Software | 19,010 a,b | 613,643 | PG & E | 26,580 b | 1,001,003 | |||||
| Check Point Software Technologies | 29,060 a,b | 636,995 | Sempra Energy | 36,440 b | 1,936,057 | |||||
| Cisco Systems | 52,670 a,b | 1,283,568 | 2,937,060 | |||||||
| EMC | 89,280 a,b | 1,387,411 | ||||||||
| Total Investments | ||||||||||
| Global Payments | 19,540 b | 775,152 | (cost $131,709,878) | 123.3% | 126,054,962 | |||||
| Hewlett-Packard | 34,810 b | 1,662,874 | ||||||||
| Intel | 61,120 b | 1,219,344 | Liabilities, Less Cash and Receivables | (23.3%) | (23,852,074) | |||||
| International Business Machines | 22,690 | 2,583,483 | Net Assets | 100.0% | 102,202,888 | |||||
| ADR—American Depository Receipts |
| a Non-income producing security. |
| b Partially held by the custodian in a segregated account as collateral for open short positions. |
| Portfolio Summary | (Unaudited) † | |||||||
| Value (%) | Value (%) | |||||||
| Information Technology | 17.5 | Consumer Staples | 13.8 | |||||
| Financial | 16.9 | Exchange Traded Funds | 4.3 | |||||
| Health Care | 16.1 | Telecommunication Services | 4.1 | |||||
| Energy | 15.7 | Materials | 3.0 | |||||
| Industrials | 15.1 | Utilities | 2.9 | |||||
| Consumer Discretionary | 13.9 | 123.3 | ||||||
| † Based on net assets. |
| See notes to financial statements. |
The Funds 33
| STATEMENT OF SECURITIES SOLD SHORT | ||||||
| February 29, 2008 (Unaudited) |
| BNY Mellon U.S. Core Equity 130/30 Fund | ||||||||||
| Common Stocks—27.1% | Shares | Value ($) | Shares | Value ($) | ||||||
| Consumer Discretionary—6.0% | Health Care (continued) | |||||||||
| Carmax | 26,620 a | 488,743 | Idexx Laboratories | 27,410 | 1,520,433 | |||||
| CBS, Cl. B | 21,250 | 484,925 | Resmed | 30,270 a | 1,225,632 | |||||
| Comcast, Cl. A | 50,900 | 994,586 | Stryker | 15,110 | 983,812 | |||||
| Harley-Davidson | 19,430 | 722,019 | 5,476,367 | |||||||
| Lamar Advertising, Cl. A | 13,390 | 510,293 | Industrials—3.6% | |||||||
| Orient-Express Hotels | 9,540 | 516,782 | Alaska Air Group | 12,450 a | 303,780 | |||||
| Pool | 11,010 | 209,741 | Alexander & Baldwin | 7,650 | 336,906 | |||||
| Sally Beauty Holdings | 103,290 a | 790,169 | Boeing | 10,100 | 836,179 | |||||
| Sears Holdings | 2,850 a | 272,517 | Caterpillar | 7,800 | 564,174 | |||||
| Starbucks | 28,160 a | 506,035 | Donaldson | 9,840 | 414,854 | |||||
| Target | 12,940 | 680,773 | Fastenal | 12,230 | 497,272 | |||||
| 6,176,583 | Fluor | 2,690 | 374,583 | |||||||
| Consumer Staples—4.1% | Southwest Airlines | 26,720 | 327,587 | |||||||
| Brown-Forman, Cl. B | 13,930 | 888,316 | 3,655,335 | |||||||
| Constellation Brands, Cl. A | 24,140 a | 463,729 | Information Technology—4.0% | |||||||
| Flowers Foods | 49,750 | 1,127,335 | CommScope | 8,020 a | 335,878 | |||||
| Hain Celestial Group | 27,480 a | 741,960 | Juniper Networks | 19,580 a | 525,136 | |||||
| Hormel Foods | 21,640 | 884,210 | JDS Uniphase | 33,270 a | 437,501 | |||||
| 4,105,550 | Google, Cl. A | 1,010 a | 475,892 | |||||||
| Energy—2.2% | Equinix | 11,310 a | 784,349 | |||||||
| Baker Hughes | 10,370 | 697,797 | Network Appliance | 15,420 a | 333,380 | |||||
| FMC Technologies | 17,630 a | 998,916 | National Semiconductor | 22,480 | 370,246 | |||||
| Pioneer Natural Resources | 12,360 | 553,604 | Research In Motion | 5,490 a | 569,862 | |||||
| 2,250,317 | Riverbed Technology | 14,690 a | 294,681 | |||||||
| Financial—.8% | 4,126,925 | |||||||||
| Genworth Financial, Cl. A | 16,290 | 377,602 | Materials—.5% | |||||||
| Lehman Brothers Hioldings | 9,420 | 480,326 | United States Steel | 4,830 | 523,813 | |||||
| 857,928 | Telecommunication Services—.5% | |||||||||
| Health Care—5.4% | Metropcs Communications | 32,600 a | 519,970 | |||||||
| C.R. Bard | 8,910 | 844,579 | Total Securities Sold Short | |||||||
| GlaxoSmithKline, ADR | 20,540 | 901,911 | (proceeds $29,830,089) | 27.1% | 27,692,788 | |||||
| ADR—American Depository Receipts |
| a Non-income producing security. |
| See notes to financial statements. |
34
| STATEMENT OF INVESTMENTS | ||
| February 29, 2008 (Unaudited) |
| BNY Mellon International Fund | ||||||||||
| Common Stocks—96.7% | Shares | Value ($) | Shares | Value ($) | ||||||
| Australia—4.3% | France (continued) | |||||||||
| Amcor | 2,470,652 | 16,174,180 | Compagnie Generale des | |||||||
| ASX | 110,750 | 4,273,780 | Etablissements Michelin, Cl. B | 870 | 85,762 | |||||
| BHP Billiton | 421,105 | 15,419,228 | Credit Agricole | 674,621 | 18,358,670 | |||||
| Commonwealth Bank of Australia | 90,500 | 3,499,216 | France Telecom | 653,351 | 21,971,857 | |||||
| Computershare | 266,491 | 2,083,911 | Lafarge | 21,170 | 3,662,319 | |||||
| Goodman Fielder | 1,674,072 | 2,884,650 | Lagardere | 127,217 | 10,036,091 | |||||
| Insurance Australia Group | 2,843,133 | 9,865,473 | Peugeot | 3,030 | 230,647 | |||||
| Macquarie Group | 30,900 | 1,505,186 | Rhodia | 6,651 a | 166,104 | |||||
| National Australia Bank | 573,015 | 15,148,039 | Sanofi-Aventis | 587,705 | 43,601,233 | |||||
| Santos | 173,700 | 2,058,893 | Scor | 174,920 | 3,976,759 | |||||
| Sonic Healthcare | 142,060 | 1,880,441 | Suez | 75,302 | 4,786,108 | |||||
| Suncorp-Metway | 616,018 | 7,895,959 | Thomson | 239,155 | 1,844,016 | |||||
| Tabcorp Holdings | 1,048,701 | 14,788,040 | Total | 625,232 | 47,251,074 | |||||
| Westpac Banking | 85,200 | 1,820,496 | Total, ADR | 11,272 | 849,796 | |||||
| 99,297,492 | Unibail-Rodamco | 13,586 | 3,318,952 | |||||||
| Austria—.2% | Valeo | 2,862 | 108,258 | |||||||
| OMV | 57,600 | 4,162,569 | Vinci | 58,600 | 4,044,124 | |||||
| Belgium—2.3% | Vivendi | 202,900 | 8,018,503 | |||||||
| AGFA-Gevaert | 3,552 | 34,207 | 202,573,851 | |||||||
| Colruyt | 19,060 | 4,661,222 | Germany—9.3% | |||||||
| Delhaize Group | 233,520 | 17,731,682 | Adidas | 55,802 | 3,503,805 | |||||
| Fortis (Strip) | 312,558 a | 4,749 | Allianz | 75,811 | 13,308,636 | |||||
| Fortis Group | 847,826 | 18,588,743 | BASF | 45,743 | 5,798,137 | |||||
| InBev | 71,900 | 6,481,954 | Bayer | 46,900 | 3,574,106 | |||||
| KBC Groep | 41,100 | 5,153,046 | Bayerische Motoren Werke | 394,100 | 21,591,154 | |||||
| 52,655,603 | Daimler | 232,822 | 19,592,003 | |||||||
| Denmark—.5% | Deutsche Bank | 34,680 | 3,857,939 | |||||||
| Carlsberg, Cl. B | 46,531 | 5,792,032 | Deutsche Post | 749,198 | 24,754,182 | |||||
| Danske Bank | 71,900 | 2,755,639 | Deutsche Telekom | 831,500 | 15,809,491 | |||||
| Sydbank | 61,750 | 2,236,269 | E.ON | 89,252 | 16,784,962 | |||||
| 10,783,940 | Hannover Rueckversicherung | 2,960 | 140,475 | |||||||
| Finland—1.2% | Heidelberger Druckmaschinen | 384,172 | 9,127,946 | |||||||
| M-real, Cl. B | 28,940 | 97,778 | Linde | 29,498 | 3,913,632 | |||||
| Nokia | 306,130 | 11,020,317 | MAN | 30,100 | 3,900,348 | |||||
| UPM-Kymmene | 921,451 | 15,932,785 | Merck | 22,893 | 2,844,617 | |||||
| 27,050,880 | Muenchener | |||||||||
| France—8.9% | Rueckversicherungs | 110,150 | 19,249,417 | |||||||
| Air France-KLM | 67,800 | 1,825,451 | RWE | 141,111 | 17,034,822 | |||||
| AXA | 150,630 | 5,083,232 | Salzgitter | 13,304 | 2,330,900 | |||||
| BNP Paribas | 172,389 | 15,498,517 | Siemens | 126,245 | 16,127,636 | |||||
| Bouygues | 42,850 | 2,930,674 | ThyssenKrupp | 96,700 | 5,552,901 | |||||
| Cap Gemini | 87,344 | 4,799,787 | Wincor Nixdorf | 42,330 | 3,378,065 | |||||
| Carrefour | 1,790 | 125,917 | 212,175,174 | |||||||
The Funds 35
STATEMENT OF INVESTMENTS (Unaudited) (continued)
| BNY Mellon International Fund (continued) | ||||||||||
| Common Stocks (continued) | Shares | Value ($) | Shares | Value ($) | ||||||
| Greece—1.2% | Japan (continued) | |||||||||
| Alpha Bank | 141,390 | 4,282,984 | Dentsu | 1,430 | 3,291,767 | |||||
| Coca-Cola Hellenic Bottling | 105,400 | 4,640,091 | FamilyMart | 127,900 | 3,793,634 | |||||
| National Bank of Greece | 99,940 | 5,441,513 | Gunma Bank | 382,000 | 2,591,620 | |||||
| Public Power | 280,854 | 11,974,267 | Hokuhoku Financial Group | 669,100 | 1,892,531 | |||||
| 26,338,855 | JS Group | 510,200 | 8,667,362 | |||||||
| Hong Kong—2.5% | KDDI | 992 | 6,004,048 | |||||||
| BOC Hong Kong Holdings | 8,186,600 | 19,727,289 | Kobe Steel | 657,000 | 2,042,595 | |||||
| Esprit Holdings | 182,600 | 2,285,435 | Konami | 72,100 | 2,385,041 | |||||
| HongKong Electric Holdings | 701,000 | 3,942,775 | Kubota | 2,743,500 | 18,344,299 | |||||
| Hutchison Whampoa | 1,674,700 | 15,700,895 | Marubeni | 709,000 | 5,352,114 | |||||
| Johnson Electric Holdings | 10,799,500 | 4,997,060 | Mitsubishi Gas Chemical | 301,000 | 2,229,977 | |||||
| Wharf Holdings | 786,500 | 3,961,543 | Mitsubishi UFJ Financial Group | 3,256,300 | 28,647,090 | |||||
| Yue Yuen Industrial Holdings | 2,388,500 | 7,023,395 | Mitsubishi UFJ Lease & Finance | 100,180 | 3,588,436 | |||||
| 57,638,392 | Mitsui & Co | 315,000 | 6,833,240 | |||||||
| Ireland—.6% | Mitsui OSK Lines | 368,000 | 4,783,462 | |||||||
| Allied Irish Banks | 223,800 | 4,577,840 | NGK Spark Plug | 371,100 | 5,839,254 | |||||
| Bank of Ireland | 308,664 | 4,415,517 | Nikon | 207,000 | 5,809,034 | |||||
| Kerry Group, Cl. A | 165,784 | 5,210,480 | Nintendo | 16,900 | 8,393,547 | |||||
| 14,203,837 | Nippon Express | 1,104,200 | 5,917,354 | |||||||
| Italy—5.5% | Nippon Paper Group | 3,278 | 7,763,775 | |||||||
| Banca Popolare di Milano | 130,100 | 1,545,544 | Nippon Telegraph & Telephone | 679 | 2,948,339 | |||||
| Banco Popolare | 625,030 a | 11,743,143 | Nissan Motor | 1,048,900 | 9,515,314 | |||||
| Enel | 614,050 | 6,607,139 | NOK | 312,100 | 6,490,922 | |||||
| ENI | 578,714 | 19,963,151 | Nomura Holdings | 1,432,100 | 22,438,912 | |||||
| Fondiaria-SAI | 75,200 | 3,328,814 | Ricoh | 316,800 | 5,091,450 | |||||
| Mediaset | 1,828,588 | 16,431,603 | Rohm | 159,600 | 11,600,308 | |||||
| Prysmian | 84,420 a | 1,648,660 | Sekisui Chemical | 1,188,700 | 8,313,324 | |||||
| Saras | 2,458,022 | 12,590,554 | Sekisui House | 1,228,800 | 12,675,305 | |||||
| Telecom Italia | 9,205,059 | 22,998,844 | Seven & I Holdings | 703,700 | 17,482,316 | |||||
| UniCredit | 2,318,120 | 16,978,276 | Shimamura | 162,000 | 11,766,171 | |||||
| Unipol Gruppo Finanziario | 3,947,623 | 11,098,424 | Shin-Etsu Chemical | 140,900 | 7,616,954 | |||||
| 124,934,152 | Shizuoka Bank | 183,600 | 1,937,781 | |||||||
| Japan—22.3% | Sony | 134,900 | 6,307,378 | |||||||
| 77 Bank | 367,900 | 2,165,510 | Sumitomo | 692,200 | 9,945,362 | |||||
| Aeon | 1,578,900 | 19,023,228 | Sumitomo Electric Industries | 413,300 | 6,125,791 | |||||
| Aisin Seiki | 95,000 | 3,792,446 | Sumitomo Metal Industries | 951,000 | 4,035,100 | |||||
| Astellas Pharma | 44,000 | 1,930,502 | Sumitomo Metal Mining | 178,900 | 3,757,624 | |||||
| Bank of Kyoto | 295,200 | 3,422,114 | Sumitomo Mitsui Financial Group | 3,597 | 25,885,687 | |||||
| Canon | 356,451 | 15,958,918 | Taiheiyo Cement | 2,151,000 | 4,956,710 | |||||
| Central Japan Railway | 1,548 | 14,742,233 | Takeda Pharmaceutical | 477,300 | 26,539,163 | |||||
| Chiba Bank | 487,000 | 3,098,703 | Teijin | 2,954,800 | 11,431,772 | |||||
| Chiyoda | 1,863,600 | 18,724,785 | Terumo | 48,900 | 2,655,524 | |||||
| Chuo Mitsui Trust Holdings | 1,393,700 | 9,554,586 | THK | 493,400 | 9,317,998 | |||||
36
| BNY Mellon International Fund (continued) | ||||||||||
| Common Stocks (continued) | Shares | Value ($) | Shares | Value ($) | ||||||
| Japan (continued) | Sweden (continued) | |||||||||
| Tokyo Electron | 129,500 | 8,007,871 | Telefonaktiebolaget | |||||||
| Tokyo Gas | 2,040,400 | 9,158,454 | LM Ericsson, Cl. B | 7,014,900 | 15,131,385 | |||||
| Toppan Printing | 264,000 | 2,871,069 | 32,576,031 | |||||||
| Toshiba | 489,000 | 3,672,399 | Switzerland—8.5% | |||||||
| Toyota Motor | 601,200 | 32,728,415 | Baloise Holding | 37,080 | 3,346,330 | |||||
| 511,856,618 | Ciba Specialty Chemicals | 472,794 | 18,889,219 | |||||||
| Netherlands—3.9% | Clariant | 1,146,838 a | 9,772,997 | |||||||
| Aegon | 876,798 | 13,099,564 | Credit Suisse Group | 126,490 | 6,210,535 | |||||
| Akzo Nobel | 2,960 | 216,934 | Holcim | 35,054 | 3,570,926 | |||||
| European Aeronautic | Lonza Group | 14,945 | 1,970,633 | |||||||
| Defence and Space | 362,175 | 9,535,642 | Nestle | 99,878 | 47,728,958 | |||||
| ING Groep | 287,300 | 9,577,276 | Novartis | 907,758 | 44,609,232 | |||||
| Koninklijke BAM Groep | 169,125 | 3,708,938 | Roche Holding | 45,630 | 8,960,060 | |||||
| Koninklijke DSM | 237,020 | 10,426,352 | Swatch Group | 18,718 | 5,479,952 | |||||
| Koninklijke Philips Electronics | 126,190 | 4,935,692 | Swiss Reinsurance | 224,541 | 18,013,984 | |||||
| Koninklijke Philips Electronics | UBS | 514,561 | 16,846,110 | |||||||
| (NY Shares) | 4,620 | 179,810 | Zurich Financial Services | 30,310 | 9,498,103 | |||||
| Royal Dutch Shell, Cl. A | 812,135 | 29,257,142 | 194,897,039 | |||||||
| Royal KPN | 273,285 | 5,164,567 | United Kingdom—20.4% | |||||||
| TNT | 8,780 | 345,996 | Amlin | 696,880 | 3,816,506 | |||||
| Vedior | 17,280 | 433,032 | Anglo American | 282,956 | 18,125,183 | |||||
| Wolters Kluwer | 91,861 | 2,380,257 | Antofagasta | 145,600 | 2,317,326 | |||||
| 89,261,202 | AstraZeneca | 43,770 | 1,658,634 | |||||||
| Norway—.3% | Barclays | 382,440 | 3,487,104 | |||||||
| DNB NOR | 217,500 | 3,183,121 | BP | 5,565,962 | 61,144,731 | |||||
| StatoilHydro | 107,200 | 3,283,850 | British American Tobacco | 246,386 | 9,278,514 | |||||
| 6,466,971 | British Energy Group | 239,030 | 2,736,785 | |||||||
| Singapore—1.1% | BT Group | 403,628 | 1,828,072 | |||||||
| DBS Group Holdings | 2,045,844 | 24,908,837 | Carnival | 2,424 | 95,786 | |||||
| Spain—2.0% | Centrica | 2,210,660 | 14,103,555 | |||||||
| Banco Bilbao | Charter | 164,150 a | 2,679,273 | |||||||
| Vizcaya Argentaria | 11,040 | 228,616 | Cookson Group | 284,452 | 3,365,914 | |||||
| Banco Santander | 652,292 | 11,668,878 | Dairy Crest Group | 274,890 | 2,864,794 | |||||
| Mapfre | 403,500 | 1,820,696 | Dana Petroleum | 86,380 a | 2,280,512 | |||||
| Repsol | 533,970 | 18,396,576 | De La Rue | 249,844 | 4,519,425 | |||||
| Telefonica | 271,300 | 7,859,786 | Debenhams | 4,552,900 | 6,123,359 | |||||
| Union Fenosa | 80,440 | 5,299,700 | Friends Provident | 2,654,638 | 7,071,848 | |||||
| 45,274,252 | GlaxoSmithKline | 1,440,423 | 31,973,855 | |||||||
| Sweden—1.4% | Greene King | 273,900 | 3,517,399 | |||||||
| Alfa Laval | 46,100 | 2,481,519 | HBOS | 1,242,862 | 14,918,582 | |||||
| NCC, Cl. B | 194,900 | 5,100,997 | HSBC Holdings | 2,191,686 | 33,220,649 | |||||
| Skanska, Cl. B | 121,400 | 2,340,002 | Kingfisher | 4,760,166 | 12,384,842 | |||||
| Svenska Cellulosa, Cl. B | 457,920 | 7,522,128 | Land Securities Group | 107,750 | 3,438,425 | |||||
The Funds 37
STATEMENT OF INVESTMENTS (Unaudited) (continued)
| BNY Mellon International Fund (continued) | ||||||||||
| Common Stocks (continued) | Shares | Value ($) | Shares | Value ($) | ||||||
| United Kingdom (continued) | United Kingdom (continued) | |||||||||
| Man Group | 303,768 | 3,422,710 | William Morrison Supermarkets | 546,694 | 3,162,967 | |||||
| National Grid | 318,290 | 4,613,622 | WPP Group | 910,310 | 10,943,378 | |||||
| Next | 136,220 | 3,535,144 | Xstrata | 68,250 | 5,375,827 | |||||
| Old Mutual | 4,764,032 | 11,930,032 | 469,944,347 | |||||||
| Prudential | 152,434 | 1,882,194 | United States—.3% | |||||||
| Punch Taverns | 888,727 | 11,369,632 | iShares MSCI EAFE Index Fund | 95,600 | 6,852,608 | |||||
| Reed Elsevier | 580,175 | 7,283,749 | Total Common Stocks | |||||||
| Rentokil Initial | 1,816,081 | 2,998,862 | (cost $2,366,198,593) | 2,213,852,650 | ||||||
| Rexam | 18,512 | 160,867 | Preferred Stocks—1.3% | |||||||
| Royal Bank of Scotland Group | 1,822,621 | 13,872,396 | ||||||||
| Royal Dutch Shell, Cl. A | 44,513 | 1,620,895 | Germany | |||||||
| Royal Dutch Shell, Cl. B | 283,800 | 10,112,137 | Fresenius | 72,040 | 6,061,710 | |||||
| SABMiller | 462,840 | 9,676,856 | Henkel | 531,560 | 23,539,904 | |||||
| Schroders | 114,190 | 2,154,090 | Total Preferred Stocks | |||||||
| (cost $30,538,424) | 29,601,614 | |||||||||
| Scottish & Southern Energy | 120,900 | 3,550,074 | ||||||||
| Shire | 152,630 | 3,037,928 | Other Investment—1.0% | |||||||
| Smiths Group | 5,131 | 100,332 | ||||||||
| Registered Investment Company; | ||||||||||
| SSL International | 268,700 | 2,588,155 | ||||||||
| Dreyfus Institutional Preferred | ||||||||||
| Stagecoach Group | 993,040 | 4,940,274 | Plus Money Market Fund | |||||||
| Tesco | 1,521,711 | 12,017,105 | (cost $22,900,000) | 22,900,000 b | 22,900,000 | |||||
| Thomas Cook Group | 941,060 | 5,688,046 | ||||||||
| Trinity Mirror | 998,420 | 5,602,093 | Total Investments | |||||||
| (cost $2,419,637,017) | 99.0% | 2,266,354,264 | ||||||||
| Unilever | 1,216,734 | 38,718,319 | ||||||||
| Vedanta Resources | 71,351 | 3,067,923 | Cash and Receivables (Net) | 1.0% | 22,379,308 | |||||
| Vodafone Group | 12,320,876 | 39,567,667 | Net Assets | 100.0% | 2,288,733,572 | |||||
| ADR—American Depository Receipts | ||
| a | Non-income producing security. | |
| b | Investment in affiliated money market mutual fund. | |
| Portfolio Summary | (Unaudited) † | |||||||
| Value (%) | Value (%) | |||||||
| Financial | 19.7 | Telecommunication Services | 5.6 | |||||
| Consumer Discretionary | 14.3 | Insurance | 5.4 | |||||
| Industrial | 10.1 | Utilities | 4.4 | |||||
| Energy | 9.3 | Information Technology | 4.2 | |||||
| Consumer Staples | 8.7 | Money Market Investment | 1.0 | |||||
| Health Care | 8.0 | Index | .3 | |||||
| Materials | 8.0 | 99.0 | ||||||
| † Based on net assets. |
| See notes to financial statements. |
38
| STATEMENT OF INVESTMENTS | ||
| February 29, 2008 (Unaudited) |
| BNY Mellon Emerging Markets Fund | ||||||||||
| Common Stocks—93.3% | Shares | Value ($) | Shares | Value ($) | ||||||
| Brazil—9.3% | China (continued) | |||||||||
| Aracruz Celulose, ADR | 85,000 | 6,157,400 | Shanda Interactive | |||||||
| Banco do Brasil | 145,700 | 2,436,089 | Entertainment, ADR | 31,670 a | 1,047,644 | |||||
| Banco Itau Holding Financeira, ADR | 212,670 | 5,389,058 | Sinopec Shanghai | |||||||
| Banco Nossa Caixa | 335,200 | 4,857,109 | Petrochemical, Cl. H | 11,220,000 | 5,291,171 | |||||
| Braskem, ADR | 40,000 | 675,600 | Sinotrans, Cl. H | 10,249,600 | 3,186,951 | |||||
| Centrais Eletricas Brasileiras | 383,303 | 5,638,009 | TPV Technology | 10,060,000 | 6,015,091 | |||||
| Cia Brasileira de Distribuicao | Weiqiao Textile, Cl. H | 8,819,900 | 12,212,493 | |||||||
| Grupo Pao de Acucar, ADR | 131,570 | 5,708,822 | 94,048,611 | |||||||
| Cia de Saneamento Basico | Czech Republic—.5% | |||||||||
| do Estado de Sao Paulo | 85,508 | 2,033,015 | CEZ | 8,910 | 665,479 | |||||
| Cia de Saneamento Basico | Komercni Banka | 22,880 | 5,640,417 | |||||||
| do Estado de Sao Paulo, ADR | 12,400 | 580,940 | 6,305,896 | |||||||
| Cia Energetica de Minas Gerais, ADR | 245,850 | 4,678,526 | Egypt—.1% | |||||||
| Empresa Brasileira | Commercial International Bank | 46,700 | 789,931 | |||||||
| de Aeronautica, ADR | 62,430 | 2,766,898 | Telecom Egypt | 277,600 | 1,156,604 | |||||
| Grendene | 678,400 | 8,165,034 | 1,946,535 | |||||||
| Perdigao | 35,500 | 863,145 | Hong Kong—5.1% | |||||||
| Petroleo Brasileiro, ADR | 456,120 | 44,667,832 | Brilliance China | |||||||
| Tam, ADR | 246,375 | 5,159,093 | Automotive Holdings | 24,311,000 a | 4,814,568 | |||||
| Tele Norte Leste Participacoes, ADR | 582,938 | 14,590,938 | China Mobile | 644,400 | 9,687,963 | |||||
| Unibanco—Uniao de | China Mobile, ADR | 19,260 | 1,437,181 | |||||||
| Bancos Brasileiros (Units) | 74,500 | 1,009,019 | China Netcom Group | 1,859,000 | 5,667,532 | |||||
| Unibanco—Uniao de | China Power International | |||||||||
| Bancos Brasileiros, GDR | 73,670 | 9,991,125 | Development | 27,343,400 | 10,307,977 | |||||
| Votorantim Celulose e Papel, ADR | 10,810 | 340,083 | CNOOC | 1,678,000 | 2,795,895 | |||||
| 125,707,735 | Cosco Pacific | 2,658,000 | 5,616,806 | |||||||
| Chile—.7% | Denway Motors | 12,674,700 | 6,378,087 | |||||||
| Cia Cervecerias Unidas | 670,340 | 4,644,388 | Global Bio-Chem | |||||||
| CorpBanca | 819,797,168 | 5,409,417 | Technology Group | 19,660,800 | 8,102,143 | |||||
| 10,053,805 | Hopson Development Holdings | 2,354,000 | 3,947,739 | |||||||
| China—7.0% | NWS Holdings | 1,460,302 | 4,256,714 | |||||||
| Anhui Expressway, Cl. H | 2,870,000 | 2,401,420 | Shenzhen Investment | 1,567,000 | 835,873 | |||||
| Bank of China, Cl. H | 27,527,000 | 11,518,388 | Texwinca Holdings | 6,953,600 | 5,358,774 | |||||
| Bosideng International Holdings | 13,918,000 a | 2,754,098 | 69,207,252 | |||||||
| China Shipping Development, Cl. H | 598,000 | 1,845,601 | Hungary—.5% | |||||||
| China Telecom, Cl. H | 12,111,000 | 8,999,629 | Magyar Telekom | |||||||
| CNPC Hong Kong | 1,756,000 | 970,511 | Telecommunications | 1,206,480 | 5,835,563 | |||||
| Huaneng Power International, Cl. H | 9,934,200 | 8,133,616 | MOL Hungarian Oil and Gas | 6,310 | 860,652 | |||||
| Industrial & Commercial | 6,696,215 | |||||||||
| Bank of China, Cl. H | 9,480,000 | 6,563,429 | India—7.0% | |||||||
| PetroChina, ADR | 8,120 | 1,192,178 | Andhra Bank | 1,512,250 | 3,360,201 | |||||
| PetroChina, Cl. H | 13,822,000 | 20,338,379 | Bharat Petroleum | 1,007,427 | 11,322,401 | |||||
| Ping An Insurance | Grasim Industries | 20,782 | 1,484,924 | |||||||
| (Group) of China, Cl. H | 209,500 | 1,578,012 | ||||||||
The Funds 39
STATEMENT OF INVESTMENTS (Unaudited) (continued)
| BNY Mellon Emerging Markets Fund (continued) | ||||||||||||
| Common Stocks (continued) | Shares | Value ($) | Shares | Value ($) | ||||||||
| India (continued) | Mexico—4.8% | |||||||||||
| Hindalco Industries | 230,250 | 1,121,708 | Alfa, Cl. A | 328,700 | 2,055,679 | |||||||
| Hindalco Industries, GDR | 1,613,070 b | 7,791,128 | America Movil, ADR, Ser. L | 14,300 | 864,578 | |||||||
| Hindustan Petroleum | 1,276,043 | 9,353,822 | Cemex (Units) | 3,097,525 a | 8,500,470 | |||||||
| India Cements | 939,610 | 4,819,618 | Cemex, ADR | 132,880 a | 3,660,844 | |||||||
| Jet Airways India | 114,495 | 2,087,656 | Consorcio ARA | 1,589,300 | 1,652,616 | |||||||
| Mahanagar Telephone Nigam | 719,088 | 2,092,256 | Controladora Comercial | |||||||||
| Mahanagar Telephone Nigam, ADR | 257,840 | 1,575,402 | Mexicana (Units) | 2,656,400 | 6,818,784 | |||||||
| Mahindra & Mahindra | 273,622 | 4,665,215 | Embotelladoras Arca | 1,509,000 | 5,915,879 | |||||||
| Maruti Suzuki India | 29,040 | 619,723 | Fomento Economico | |||||||||
| Oil & Natural Gas | 458,564 | 11,253,121 | Mexicano, ADR | 42,640 | 1,705,600 | |||||||
| Reliance Industries | 11,490 | 703,383 | Gruma, Cl. B | 1,592,700 | 4,589,352 | |||||||
| Rolta India | 97,100 | 711,005 | Grupo Aeroportuario | |||||||||
| del Sureste, Cl. B | 214,700 | 1,110,655 | ||||||||||
| Satyam Computer Services | 490,510 | 5,218,062 | ||||||||||
| Grupo Continental | 4,175,300 | 10,327,955 | ||||||||||
| Satyam Computer Services, ADR | 31,070 | 776,129 | ||||||||||
| Grupo Financiero Banorte, Cl. O | 155,200 | 644,663 | ||||||||||
| State Bank of India, GDR | 135,710 b | 14,826,318 | ||||||||||
| Grupo Modelo, Ser. C | 1,372,400 | 6,275,798 | ||||||||||
| Tata Consultancy Services | 201,290 | 4,384,174 | ||||||||||
| Grupo Televisa | 169,600 | 749,437 | ||||||||||
| Tata Motors | 316,240 | 5,434,178 | ||||||||||
| Kimberly-Clark de Mexico, Cl. A | 864,900 | 3,570,784 | ||||||||||
| Tata Steel | 33,220 | 658,898 | ||||||||||
| Telefonos de Mexico, ADR, Ser. L | 212,500 | 7,055,000 | ||||||||||
| 94,259,322 | ||||||||||||
| 65,498,094 | ||||||||||||
| Indonesia—.8% | ||||||||||||
| Philippines—.9% | ||||||||||||
| Bank Pan Indonesia | 13,749,000 a | 966,951 | ||||||||||
| ABS-CBN Holdings | 1,568,300 | 1,075,365 | ||||||||||
| Gudang Garam | 6,404,700 | 5,538,562 | ||||||||||
| Bank of the Philippine Islands | 4,401,051 | 5,960,738 | ||||||||||
| Kalbe Farma | 15,020,500 | 1,715,225 | ||||||||||
| Manila Electric | 1,422,110 a | 2,734,936 | ||||||||||
| Telekomunikasi Indonesia | 1,971,000 | 2,093,332 | ||||||||||
| Metropolitan Bank & Trust | 332,400 | 349,678 | ||||||||||
| 10,314,070 | ||||||||||||
| Union Bank of the Philippines | 1,880,400 | 1,688,238 | ||||||||||
| Israel—2.1% | ||||||||||||
| 11,808,955 | ||||||||||||
| Bank Hapoalim | 175,092 | 772,429 | ||||||||||
| Poland—1.3% | ||||||||||||
| Bank Leumi Le-Israel | 674,600 | 3,182,685 | ||||||||||
| BRE Bank | 8,930 a | 1,585,931 | ||||||||||
| Cellcom Israel | 30,300 | 972,024 | ||||||||||
| KGHM Polska Miedz | 16,120 | 755,145 | ||||||||||
| Check Point Software Technologies | 56,100 a | 1,229,712 | ||||||||||
| Polski Koncern Naftowy Orlen | 301,670 a | 5,177,873 | ||||||||||
| Israel Discount Bank, Cl. A | 3,129,016 a | 8,217,272 | ||||||||||
| Telekomunikacja Polska | 1,114,227 | 10,428,231 | ||||||||||
| Teva Pharmaceutical Industries, ADR | 290,360 | 14,247,965 | ||||||||||
| 17,947,180 | ||||||||||||
| 28,622,087 | ||||||||||||
| Russia—7.3% | ||||||||||||
| Malaysia—3.5% | ||||||||||||
| Gazprom, ADR | 957,890 | 48,660,812 | ||||||||||
| AMMB Holdings | 5,318,462 | 6,117,581 | ||||||||||
| LUKOIL, ADR | 398,510 | 29,569,442 | ||||||||||
| Gamuda | 850,400 | 1,035,748 | ||||||||||
| Mechel, ADR | 14,900 | 1,967,545 | ||||||||||
| Hong Leong Bank | 961,200 | 1,666,215 | ||||||||||
| MMC Norilsk Nickel, ADR | 320,090 | 9,219,552 | ||||||||||
| Malayan Banking | 7,061,250 | 19,965,105 | ||||||||||
| Mobile Telesystems, ADR | 21,600 | 1,772,496 | ||||||||||
| Resorts World | 5,406,900 | 6,262,569 | ||||||||||
| Surgutneftegaz, ADR | 67,500 | 3,145,500 | ||||||||||
| RHB Capital | 625,200 | 960,780 | ||||||||||
| VTB Bank, GDR | 496,600 a,b | 3,764,228 | ||||||||||
| Tenaga Nasional | 3,995,800 | 11,194,856 | ||||||||||
| 98,099,575 | ||||||||||||
| 47,202,854 | ||||||||||||
40
| BNY Mellon Emerging Markets Fund (continued) | ||||||||||||
| Common Stocks (continued) | Shares | Value ($) | Shares | Value ($) | ||||||||
| South Africa—7.9% | South Korea (continued) | |||||||||||
| ABSA Group | 38,600 | 549,828 | LG Electronics | 12,045 | 1,293,791 | |||||||
| AngloGold Ashanti, ADR | 353,260 | 12,759,751 | LG.Philips LCD | 29,430 | 1,396,940 | |||||||
| ArcelorMittal South Africa | 51,687 | 1,239,435 | Lotte Shopping | 32,015 | 10,861,901 | |||||||
| Aspen Pharmacare Holdings | 1,929,455 a | 7,616,249 | Meritz Fire & Marine Insurance | 63,250 | 604,284 | |||||||
| Aveng | 227,381 | 1,731,173 | Nong Shim | 38,603 | 7,861,684 | |||||||
| Bidvest Group | 358,415 | 5,306,239 | POSCO | 26,069 | 14,309,070 | |||||||
| Gold Fields, ADR | 494,970 | 7,023,624 | POSCO, ADR | 9,050 | 1,224,465 | |||||||
| JD Group | 716,838 | 3,881,800 | S-Oil | 71,166 | 5,032,259 | |||||||
| Metropolitan Holdings | 354,300 | 645,606 | Samsung Electronics | 68,461 | 40,190,950 | |||||||
| MTN Group | 56,500 | 895,702 | Shinhan Financial Group | 157,412 | 8,486,962 | |||||||
| Nampak | 3,140,137 | 7,381,075 | SK Telecom, ADR | 833,850 | 18,678,240 | |||||||
| Nedbank Group | 1,075,066 | 16,119,277 | 226,772,411 | |||||||||
| Remgro | 42,000 | 1,083,599 | Taiwan—11.6% | |||||||||
| Sanlam | 1,799,001 | 4,292,871 | Asia Cement | 732,213 | 1,216,773 | |||||||
| Sappi | 783,467 | 9,720,358 | AU Optronics, ADR | 89,970 | 1,716,627 | |||||||
| Sasol | 182,893 | 9,386,900 | Chi Mei Optoelectronics | 2,210,560 | 2,933,359 | |||||||
| Shoprite Holdings | 129,800 | 669,499 | China Motor | 7,298,413 | 5,524,247 | |||||||
| Standard Bank Group | 254,608 | 3,066,063 | China Steel | 1,438,000 | 2,150,870 | |||||||
| Steinhoff International Holdings | 2,275,386 | 5,143,857 | Chinatrust Financial Holding | 10,995,458 a | 9,915,117 | |||||||
| Telkom | 427,269 | 7,651,562 | Chunghwa Telecom, ADR | 432,638 | 10,616,936 | |||||||
| 106,164,468 | Compal Electronics | 17,434,434 | 15,699,584 | |||||||||
| South Korea—16.8% | First Financial Holding | 9,421,065 | 8,532,519 | |||||||||
| Cheil Industries | 60,170 | 2,697,354 | High Tech Computer | 60,000 | 1,247,818 | |||||||
| Dongbu Insurance | 16,420 | 651,244 | Mega Financial Holding | 8,752,000 | 6,250,838 | |||||||
| Dongkuk Steel Mill | 20,260 | 907,100 | Nan Ya Printed Circuit Board | 907,971 | 4,486,967 | |||||||
| Hana Financial Group | 162,105 | 7,197,070 | Nien Hsing Textile | 1,846,000 | 1,195,655 | |||||||
| Hanwha Chemical | 345,692 | 6,340,448 | Polaris Securities | 1,126,000 a | 639,698 | |||||||
| Honam Petrochemical | 6,999 | 680,793 | Powerchip Semiconductor | 14,128,393 | 5,668,226 | |||||||
| Hynix Semiconductor | 129,367 a | 3,324,891 | Powertech Technology | 485,000 | 1,631,013 | |||||||
| Hyundai Department Store | 6,688 | 626,050 | Quanta Computer | 12,919,216 | 17,049,427 | |||||||
| Hyundai Heavy Industries | 2,833 | 1,121,406 | Radiant Opto-Electronics | 3,699,151 | 4,578,163 | |||||||
| Hyundai Marine & Fire Insurance | 42,990 | 962,008 | Siliconware Precision Industries | 382,600 | 622,169 | |||||||
| Hyundai Mobis | 171,822 | 13,212,587 | SinoPac Financial Holdings | 31,900,225 | 13,908,848 | |||||||
| Hyundai Motor | 176,437 | 12,362,219 | Taiwan Mobile | 715,999 | 1,197,383 | |||||||
| Kookmin Bank | 371,939 | 22,979,110 | Taiwan Semiconductor | |||||||||
| Korea Electric Power | 392,425 | 13,779,232 | Manufacturing | 5,079,008 | 9,929,544 | |||||||
| Korea Zinc | 39,775 | 5,994,514 | Taiwan Semiconductor | |||||||||
| KT | 40,250 | 1,979,998 | Manufacturing, ADR | 433,569 | 4,222,962 | |||||||
| KT, ADR | 443,620 | 10,775,530 | Tong Yang Industry | 722,480 | 665,096 | |||||||
| Kumho Tire | 708,580 | 8,339,943 | Unimicron Technology | 464,000 | 704,751 | |||||||
| LG | 24,476 | 1,700,569 | United Microelectronics | 30,141,050 | 17,587,187 | |||||||
| LG Chem | 14,367 | 1,199,799 | Wistron | 405,971 | 660,902 | |||||||
The Funds 41
STATEMENT OF INVESTMENTS (Unaudited) (continued)
| BNY Mellon Emerging Markets Fund (continued) | ||||||||||||
| Common Stocks (continued) | Shares | Value ($) | Preferred Stocks—3.4% | Shares | Value ($) | |||||||
| Taiwan (continued) | Brazil | |||||||||||
| Yageo | 18,818,960 | 5,787,109 | Braskem, Cl. A | 1,108,400 | 9,400,554 | |||||||
| 156,339,788 | Centrais Eletricas | |||||||||||
| Thailand—4.5% | Brasileiras, Cl. B | 365,009 | 5,353,811 | |||||||||
| Bangkok Bank | 3,486,800 | 14,406,480 | Cia de Tecidos do Norte | |||||||||
| Charoen Pokphand Foods | 52,068,200 | 7,612,927 | de Minas—Coteminas | 1,204,160 | 6,801,353 | |||||||
| Delta Electronics Thai | 831,200 | 612,628 | Cia Energetica de Minas Gerais | 318,002 | 6,056,106 | |||||||
| Electricity Generating | 268,500 | 831,178 | Cia Paranaense de Energia, Cl. B | 89,400 | 1,454,574 | |||||||
| Italian-Thai Development | 4,649,600 a | 1,243,279 | Cia Vale do Rio Doce, Cl. A | 134,400 | 3,963,322 | |||||||
| Kasikornbank | 2,818,200 | 7,658,809 | Petroleo Brasileiro | 93,500 | 4,504,125 | |||||||
| Krung Thai Bank | 21,150,600 | 7,108,088 | Sadia | 156,000 | 882,044 | |||||||
| PTT | 58,700 | 633,997 | Tele Norte Leste Participacoes | 63,900 | 1,595,232 | |||||||
| Siam Cement | 1,384,700 | 9,470,267 | Telemig Celular Participacoes | 162,685 | 5,051,433 | |||||||
| Siam Makro | 331,800 | 956,987 | Usinas Siderurgicas | |||||||||
| Thai Airways International | 5,286,700 | 5,426,554 | de Minas Gerais, Cl. A | 15,200 | 881,003 | |||||||
| Thai Oil | 289,800 | 723,235 | Total Preferred Stocks | |||||||||
| Thai Union Frozen Products | 5,910,100 | 3,867,589 | (cost $29,523,821) | 45,943,557 | ||||||||
| Thanachart Capital | 1,228,800 | 601,464 | ||||||||||
| 61,153,482 | Other Investment—1.7% | |||||||||||
| Turkey—1.6% | Registered Investment Company; | |||||||||||
| Anadolu Efes Biracilik ve Malt Sanayii | 78,970 | 880,737 | Dreyfus Institutional Preferred | |||||||||
| Selcuk Ecza Deposu Ticaret ve Sanayi | 309,800 a | 549,447 | Plus Money Market Fund | |||||||||
| Tupras Turkiye Petrol Rafine | 28,900 | 732,757 | (cost $23,000,000) | 23,000,000c | 23,000,000 | |||||||
| Turk Sise ve Cam Fabrikalari | 3,501,623 | 5,440,546 | ||||||||||
| Total Investments | ||||||||||||
| Turkcell Iletisim Hizmet | 147,720 | 1,487,546 | (cost $1,161,528,805) | 98.4% | 1,328,577,879 | |||||||
| Turkiye Is Bankasi, Cl. C | 2,687,525 | 12,394,954 | ||||||||||
| 21,485,987 | Cash and Receivables (Net) | 1.6% | 22,252,369 | |||||||||
| Total Common Stocks | Net Assets | 100.0% | 1,350,830,248 | |||||||||
| (cost $1,109,004,984) | 1,259,634,322 | |||||||||||
| ADR—American Depository Receipts |
| GDR—Global Depository Receipts |
| a Non-income producing security. |
| b Securities exempt from registration under Rule 144A of the Securities Act of 1933.These securities may be resold in transactions exempt from registration, normally to qualified |
| institutional buyers.At February 29, 2008, these securities amounted to $26,381,674 or 2% of net assets. |
| c Investment in affiliated money market mutual fund. |
| Portfolio Summary (Unaudited) † | ||||||
| Value (%) | Value (%) | |||||
| Financial | 21.0 | Consumer Staples | 6.4 | |||
| Energy | 15.6 | Utilities | 5.4 | |||
| Information Technology | 11.8 | Industrial | 4.0 | |||
| Materials | 11.0 | Health Care | 1.8 | |||
| Telecommunication Services | 9.9 | Money Market Investment | 1.7 | |||
| Consumer Discretionary | 9.8 | 98.4 | ||||
† Based on net assets.
See notes to financial statements.
42
| STATEMENT OF INVESTMENTS | ||
| February 29, 2008 (Unaudited) |
| BNY Mellon Balanced Fund | ||||||||||
| Common Stocks—37.2% | Shares | Value ($) | Shares | Value ($) | ||||||
| Consumer Discretionary—3.9% | Energy (continued) | |||||||||
| Apollo Group, Cl. A | 17,990 a | 1,104,226 | Chevron | 24,630 | 2,134,436 | |||||
| Best Buy | 22,340 | 960,843 | ConocoPhillips | 38,610 | 3,193,433 | |||||
| Discovery Holding, Cl. A | 26,640 a | 601,265 | ENSCO International | 26,440 b | 1,582,170 | |||||
| Gap | 56,980 | 1,149,287 | Hess | 17,390 | 1,620,400 | |||||
| Johnson Controls | 26,700 | 877,362 | Marathon Oil | 23,790 | 1,264,676 | |||||
| McDonald’s | 14,480 | 783,513 | National Oilwell Varco | 14,990 a | 933,877 | |||||
| News, Cl. B | 80,160 | 1,531,858 | Valero Energy | 10,820 | 625,071 | |||||
| NIKE, Cl. B | 10,990 | 661,598 | XTO Energy | 31,620 | 1,951,270 | |||||
| Omnicom Group | 45,600 | 2,036,952 | 15,909,894 | |||||||
| Ross Stores | 20,050 | 558,393 | Financial—6.4% | |||||||
| Starwood Hotels | American International Group | 36,576 | 1,713,951 | |||||||
| & Resorts Worldwide | 18,290 | 865,666 | Bank of America | 62,421 | 2,480,610 | |||||
| TJX Cos. | 34,860 | 1,115,520 | Chubb | 35,530 | 1,808,477 | |||||
| Viacom, Cl. B | 22,590 a | 897,953 | Citigroup | 37,056 | 878,598 | |||||
| 13,144,436 | CME Group | 2,570 | 1,319,181 | |||||||
| Consumer Staples—4.1% | Goldman Sachs Group | 11,520 | 1,954,138 | |||||||
| Altria Group | 40,200 | 2,940,228 | JPMorgan Chase & Co. | 78,412 | 3,187,448 | |||||
| Coca-Cola Enterprises | 47,920 b | 1,170,686 | MetLife | 36,700 | 2,138,142 | |||||
| ConAgra Foods | 44,140 | 975,494 | Morgan Stanley | 25,970 | 1,093,856 | |||||
| CVS Caremark | 55,600 | 2,245,128 | PNC Financial Services Group | 17,170 | 1,054,753 | |||||
| Kroger | 58,990 | 1,430,508 | State Street | 16,150 | 1,268,583 | |||||
| PepsiCo | 14,430 | 1,003,751 | U.S. Bancorp | 40,780 | 1,305,776 | |||||
| Procter & Gamble | 1 | 66 | Wells Fargo & Co. | 54,940 | 1,605,896 | |||||
| SUPERVALU | 25,870 | 679,088 | 21,809,409 | |||||||
| SYSCO | 23,500 | 659,410 | Health Care—4.7% | |||||||
| Wal-Mart Stores | 54,690 | 2,712,077 | Baxter International | 26,670 | 1,574,063 | |||||
| 13,816,436 | Becton, Dickinson & Co. | 9,470 | 856,277 | |||||||
| Energy—4.7% | CIGNA | 23,220 | 1,035,147 | |||||||
| Anadarko Petroleum | 13,350 | 850,929 | Covidien | 15,652 | 669,749 | |||||
| Chesapeake Energy | 38,780 | 1,753,632 | Hospira | 27,630 a | 1,175,933 | |||||
The Funds 43
STATEMENT OF INVESTMENTS (Unaudited) (continued)
| BNY Mellon Balanced Fund (continued) | ||||||||||
| Common Stocks (continued) | Shares | Value ($) | Shares | Value ($) | ||||||
| Health Care (continued) | Information Technology (continued) | |||||||||
| Johnson & Johnson | 34,460 | 2,135,142 | EMC | 67,370 a | 1,046,930 | |||||
| Medtronic | 20,930 | 1,033,105 | Hewlett-Packard | 43,920 | 2,098,058 | |||||
| Merck & Co. | 48,720 | 2,158,296 | Intel | 80,990 | 1,615,751 | |||||
| Pfizer | 94,490 | 2,105,237 | International Business Machines | 29,280 | 3,333,821 | |||||
| Schering-Plough | 47,050 | 1,020,985 | McAfee | 27,910 a | 928,566 | |||||
| St. Jude Medical | 17,680 a | 759,886 | Microsoft | 103,600 | 2,819,992 | |||||
| Thermo Fisher Scientific | 27,990 a | 1,565,481 | Oracle | 64,710 a | 1,216,548 | |||||
| 16,089,301 | QUALCOMM | 35,030 | 1,484,221 | |||||||
| Industrial—4.5% | 17,479,128 | |||||||||
| Cooper Industries, Cl. A | 13,030 | 546,348 | Materials—1.4% | |||||||
| Eaton | 17,710 | 1,427,957 | Air Products & Chemicals | 14,230 | 1,299,626 | |||||
| Emerson Electric | 27,450 | 1,398,852 | Allegheny Technologies | 12,310 | 952,178 | |||||
| General Electric | 87,860 | 2,911,680 | Cia Vale do Rio Doce (CVRD), ADR | 50,360 | 1,754,542 | |||||
| Goodrich | 16,060 | 951,234 | Freeport-McMoRan Copper & Gold | 7,650 | 771,579 | |||||
| L-3 Communications Holdings | 17,170 | 1,824,999 | 4,777,925 | |||||||
| Lockheed Martin | 12,900 | 1,331,280 | Telecommunication Services—1.2% | |||||||
| Terex | 13,690 a | 923,391 | AT & T | 79,437 | 2,766,790 | |||||
| Textron | 25,260 | 1,368,334 | Sprint Nextel | 2 | 14 | |||||
| Tyco International | 40,122 | 1,607,287 | Verizon Communications | 40,860 | 1,484,035 | |||||
| United Technologies | 9,810 | 691,703 | 4,250,839 | |||||||
| US Airways Group | 32,560 a | 403,744 | Utilities—1.2% | |||||||
| 15,386,809 | Exelon | 20,510 | 1,535,174 | |||||||
| Information Technology—5.1% | Sempra Energy | 47,120 | 2,503,486 | |||||||
| Accenture, Cl. A | 19,480 | 686,670 | 4,038,660 | |||||||
| Amphenol, Cl. A | 15,740 | 581,907 | Total Common Stocks | |||||||
| Cisco Systems | 68,390 a | 1,666,664 | (cost $109,769,194) | 126,702,837 | ||||||
44
| BNY Mellon Balanced Fund (continued) | ||||||||||
| Coupon | Maturity | Principal | ||||||||
| Bonds and Notes—41.4% | Rate (%) | Date | Amount ($) | Value ($) | ||||||
| Asset—Backed Ctfs.—.5% | ||||||||||
| Caterpillar Financial Asset Trust, Ser. 2005-A, Cl. A4 | 4.10 | 6/25/10 | 322,359 | 323,499 | ||||||
| CIT Equipment Collateral, Ser. 2006-VT2, Cl. A4 | 5.05 | 4/20/14 | 195,000 | 198,388 | ||||||
| CNH Equipment Trust, Ser. 2005-A, Cl. A4B | 4.29 | 6/15/12 | 356,966 | 358,130 | ||||||
| MP Environmental Funding, Ser. 2007-A, Cl. A1 | 4.98 | 7/15/16 | 694,610 | 678,605 | ||||||
| 1,558,622 | ||||||||||
| Asset-Backed Ctfs./Auto Receivables—1.4% | ||||||||||
| Franklin Auto Trust, Ser. 2007-1, Cl. A4 | 5.03 | 2/16/15 | 860,000 | 884,927 | ||||||
| Harley-Davidson Motorcycle Trust, Ser. 2005-3, Cl. A2 | 4.41 | 6/15/12 | 275,000 | 278,041 | ||||||
| Harley-Davidson Motorcycle Trust, Ser. 2007-1, Cl. A4 | 5.21 | 6/17/13 | 440,000 | 455,694 | ||||||
| Honda Auto Receivables Owner Trust, Ser. 2006-3, Cl. A4 | 5.11 | 4/15/12 | 955,000 | 984,649 | ||||||
| Household Automotive Trust, Ser. 2007-1, Cl. A4 | 5.33 | 11/17/13 | 495,000 | 511,689 | ||||||
| Hyundai Auto Receivables Trust, Ser. 2006-B, Cl. A4 | 5.15 | 5/15/13 | 550,000 | 568,208 | ||||||
| Nissan Auto Lease Trust, Ser. 2006-A, Cl. A4 | 5.10 | 7/16/12 | 1,145,000 | 1,175,818 | ||||||
| 4,859,026 | ||||||||||
| Commercial & Professional Services—.5% | ||||||||||
| Seminole Tribe of Florida, Notes | 5.80 | 10/1/13 | 1,460,000 c | 1,546,372 | ||||||
| Commercial Mortgage Pass-Through Ctfs.—2.2% | ||||||||||
| Citigroup/Deutsche Bank Commercial | ||||||||||
| Mortgage Trust, Ser. 2007-CD4, Cl. A2B | 5.21 | 12/11/49 | 455,000 | 442,009 | ||||||
| Citigroup/Deutsche Bank Commercial | ||||||||||
| Mortgage Trust, Ser. 2006-CD2, Cl. A3 | 5.43 | 1/15/46 | 690,000 d | 669,790 | ||||||
| Credit Suisse Mortgage Capital Certificates, Ser. 2007-C2, Cl. A2 | 5.45 | 1/15/49 | 660,000 d | 646,363 | ||||||
| CWCapital Cobalt, Ser. 2007-C2, Cl. A2 | 5.33 | 4/15/47 | 705,000 | 687,226 | ||||||
| Four Times Square Trust, Ser. 2006-4TS, Cl. A | 5.40 | 12/13/28 | 2,000,000 c | 1,788,037 | ||||||
| JP Morgan Chase Commercial Mortgage | ||||||||||
| Securities, Ser. 2007-CB19, Cl. A2 | 5.75 | 2/12/49 | 1,180,000 d | 1,162,802 | ||||||
| LB Commercial Conduit Mortgage Trust, Ser. 2007-C3, Cl. A2 | 5.84 | 7/15/44 | 985,000 d | 974,963 | ||||||
| LB-UBS Commercial Mortgage Trust, Ser. 2007-C2, Cl. A2 | 5.30 | 2/15/40 | 620,000 | 604,175 | ||||||
| Merrill Lynch/Countrywide Commericial | ||||||||||
| Mortgage Trust, Ser. 2007-6, Cl. A2 | 5.33 | 3/12/51 | 560,000 | 545,165 | ||||||
| 7,520,530 | ||||||||||
| Diversified Financial Services—4.3% | ||||||||||
| AEP Texas Central Transition Funding, Sr. Scd. Bonds, Ser. A-4 | 5.17 | 1/1/18 | 1,075,000 | 1,085,154 | ||||||
| Agua Caliente Band of Cahuilla Indians, Sr. Scd. Notes | 6.08 | 10/1/16 | 400,000 c | 422,664 | ||||||
| Agua Caliente Band of Cahuilla Indians, Sr. Scd. Notes | 6.44 | 10/1/16 | 455,000 c | 469,970 | ||||||
| AXA Financial, Sr. Notes | 7.75 | 8/1/10 | 840,000 | 920,564 | ||||||
| Bank of America, Sub. Notes | 5.49 | 3/15/19 | 1,000,000 | 982,091 | ||||||
| Bear Stearns, Notes | 4.50 | 10/28/10 | 980,000 | 967,086 | ||||||
The Funds 45
STATEMENT OF INVESTMENTS (Unaudited) (continued)
| BNY Mellon Balanced Fund (continued) | ||||||||||
| Coupon | Maturity | Principal | ||||||||
| Bonds and Notes (continued) | Rate (%) | Date | Amount ($) | Value ($) | ||||||
| Diversified Financial Services (continued) | ||||||||||
| Blackrock, Sr. Unsub. Notes | 6.25 | 9/15/17 | 710,000 | 750,224 | ||||||
| Caterpillar Financial Services, Sr. Unscd. Notes | 5.05 | 12/1/10 | 730,000 | 765,555 | ||||||
| CIT Group, Sr. Unscd. Notes | 5.40 | 3/7/13 | 600,000 | 549,153 | ||||||
| Citigroup, Sr. Unscd. Notes | 6.13 | 11/21/17 | 470,000 | 483,358 | ||||||
| Countrywide Home Loan, Gtd. Notes, Ser. K | 5.63 | 7/15/09 | 430,000 | 394,521 | ||||||
| Countrywide Home Loan, Gtd. Notes, Ser. H | 6.25 | 4/15/09 | 220,000 b | 205,135 | ||||||
| Diageo Finance, Gtd. Notes | 5.50 | 4/1/13 | 590,000 | 620,881 | ||||||
| Goldman Sachs Group, Sub. Notes | 6.75 | 10/1/37 | 600,000 | 561,890 | ||||||
| HSBC Finance, Notes | 5.00 | 6/30/15 | 420,000 | 405,949 | ||||||
| HSBC Holdings, Sub. Notes | 6.50 | 9/15/37 | 500,000 | 468,659 | ||||||
| International Lease Finance, Sr. Unscd. Notes | 5.75 | 6/15/11 | 855,000 | 883,075 | ||||||
| John Deere Capital, Sr. Unscd. Notes | 7.00 | 3/15/12 | 680,000 | 764,128 | ||||||
| JP Morgan Chase & Co., Sr. Unscd. Notes | 5.38 | 10/1/12 | 750,000 | 788,490 | ||||||
| Morgan Stanley, Sub. Notes | 4.75 | 4/1/14 | 1,185,000 | 1,143,649 | ||||||
| PNC Funding, Bank Gtd. Notes | 4.50 | 3/10/10 | 900,000 | 919,319 | ||||||
| 14,551,515 | ||||||||||
| Foreign/Governmental—.5% | ||||||||||
| Hydro-Quebec, Gov’t. Gtd. Bonds, Ser. IF | 8.00 | 2/1/13 | 580,000 | 704,938 | ||||||
| United Mexican States, Notes | 5.63 | 1/15/17 | 825,000 b | 861,300 | ||||||
| United Mexican States, Notes | 6.63 | 3/3/15 | 185,000 | 205,443 | ||||||
| 1,771,681 | ||||||||||
| Health Care—.2% | ||||||||||
| Aetna, Sr. Unscd. Notes | 5.75 | 6/15/11 | 545,000 | 573,426 | ||||||
| Industrials—.9% | ||||||||||
| CRH America, Gtd. Notes | 5.30 | 10/15/13 | 615,000 | 603,350 | ||||||
| Devon Financing, Gtd. Notes | 6.88 | 9/30/11 | 600,000 | 660,696 | ||||||
| Emerson Electric, Sr. Unscd. Notes | 4.75 | 10/15/15 | 670,000 | 672,891 | ||||||
| Johnson Controls, Sr. Unscd. Notes | 5.25 | 1/15/11 | 1,080,000 | 1,125,284 | ||||||
| 3,062,221 | ||||||||||
| Media & Telecommunications—1.6% | ||||||||||
| AT&T, Sr. Unscd. Notes | 6.50 | 9/1/37 | 420,000 | 426,319 | ||||||
| British Sky Broadcasting, Gtd. Notes | 6.88 | 2/23/09 | 600,000 | 620,431 | ||||||
| Comcast, Gtd. Notes | 5.90 | 3/15/16 | 1,045,000 | 1,051,280 | ||||||
| News America Holdings, Gtd. Debs. | 7.60 | 10/11/15 | 665,000 | 755,558 | ||||||
| News America, Gtd. Notes | 6.15 | 3/1/37 | 350,000 | 333,009 | ||||||
| SBC Communications, Sr. Unscd. Notes | 5.88 | 8/15/12 | 695,000 | 742,690 | ||||||
| Sprint Capital, Gtd. Notes | 6.90 | 5/1/19 | 715,000 | 526,442 | ||||||
| Time Warner, Gtd. Debs. | 6.50 | 11/15/36 | 315,000 | 294,627 | ||||||
| Verizon Communications, Sr. Unscd. Notes | 5.50 | 2/15/18 | 615,000 | 618,487 | ||||||
| 5,368,843 | ||||||||||
46
| BNY Mellon Balanced Fund (continued) | ||||||||
| Coupon | Maturity | Principal | ||||||
| Bonds and Notes (continued) | Rate (%) | Date | Amount ($) | Value ($) | ||||
| Real Estate Investment Trusts—.5% | ||||||||
| ERP Operating, Sr. Unscd. Notes | 6.95 | 3/2/11 | 750,000 | 780,927 | ||||
| Simon Property Group, Sr. Unscd. Notes | 5.75 | 5/1/12 | 750,000 | 758,621 | ||||
| 1,539,548 | ||||||||
| Residential Mortgage Pass-Through Ctfs.—.3% | ||||||||
| WaMu Mortgage Pass Through Certificates, Ser. 2003-S4, Cl. 4A1 | 4.00 | 2/25/32 | 133,798 | 127,161 | ||||
| WaMu Mortgage Pass Through Certificates, Ser. 2004-AR9, Cl. A6 | 4.14 | 8/25/34 | 845,000 d | 853,327 | ||||
| 980,488 | ||||||||
| Retailing—.3% | ||||||||
| Wal-Mart Stores, Sr. Unscd. Notes | 6.50 | 8/15/37 | 1,105,000 | 1,183,283 | ||||
| Technology—1.0% | ||||||||
| Cisco Systems, Sr. Unscd. Notes | 5.50 | 2/22/16 | 800,000 | 827,822 | ||||
| International Business Machines, Sr. Unscd. Debs. | 7.00 | 10/30/25 | 650,000 | 721,995 | ||||
| Intuit, Sr. Unscd. Notes | 5.40 | 3/15/12 | 710,000 | 731,577 | ||||
| Oracle, Sr. Unscd. Notes | 5.00 | 1/15/11 | 750,000 | 777,434 | ||||
| Oracle, Sr. Unscd. Notes | 5.25 | 1/15/16 | 250,000 | 254,581 | ||||
| 3,313,409 | ||||||||
| U.S. Government Agencies—2.6% | ||||||||
| Federal Farm Credit Banks, Bonds | 5.25 | 9/13/10 | 635,000 | 675,484 | ||||
| Federal Home Loan Banks, Bonds | 5.65 | 4/20/22 | 1,175,000 | 1,231,554 | ||||
| Federal Home Loan Mortgage Corp., Notes | 5.38 | 1/9/14 | 440,000 | 446,964 | ||||
| Federal Home Loan Mortgage Corp., Notes | 5.40 | 2/2/12 | 700,000 | 717,228 | ||||
| Federal Home Loan Mortgage Corp., Notes | 5.40 | 3/2/12 | 850,000 | 862,348 | ||||
| Federal Home Loan Mortgage Corp., Notes | 5.50 | 3/22/22 | 660,000 | 685,305 | ||||
| Federal Home Loan Mortgage Corp., Notes | 5.90 | 6/15/22 | 1,175,000 | 1,240,373 | ||||
| Federal National Mortgage Association, Notes | 5.25 | 3/5/14 | 2,030,000 | 2,122,513 | ||||
| Federal National Mortgage Association, Notes | 5.38 | 4/11/22 | 1,010,000 | 1,039,206 | ||||
| 9,020,975 | ||||||||
| U.S. Government Agencies/ | ||||||||
| Mortgage-Backed—16.6% | ||||||||
| Federal Home Loan Mortgage Corp.: | ||||||||
| 4.50%, 3/1/21 | 2,312,912 | 2,312,122 | ||||||
| 5.00%, 10/1/18 | 872,628 | 886,041 | ||||||
| 5.08%, 10/1/35 | 986,481 d | 1,005,485 | ||||||
| 5.50%, 3/1/35—12/1/37 | 3,896,697 | 3,922,540 | ||||||
| 5.77%, 4/1/37 | 1,288,970 d | 1,324,433 | ||||||
| 5.94%, 5/1/37 | 1,153,807 d | 1,184,558 | ||||||
| 6.00%, 5/1/37—12/1/37 | 4,106,511 | 4,197,023 | ||||||
| 7.00%, 8/1/29—8/1/36 | 570,559 | 601,424 | ||||||
| Federal National Mortgage Association: | ||||||||
| 4.03%, 3/1/35 | 805,331 d | 824,378 | ||||||
| 4.50%, 1/1/36 | 1,339,837 | 1,284,109 | ||||||
| 4.57%, 3/1/35 | 310,595 d | 315,432 |
The Funds 47
STATEMENT OF INVESTMENTS (Unaudited) (continued)
| BNY Mellon Balanced Fund (continued) | ||||||||||
| Coupon | Maturity | Principal | ||||||||
| Bonds and Notes (continued) | Rate (%) | Date | Amount ($) | Value ($) | ||||||
| U.S. Government Agencies/Mortgage-Backed (continued) | ||||||||||
| Federal National Mortgage Association (continued): | ||||||||||
| 4.93%, 9/1/35 | 1,027,379 d | 1,044,422 | ||||||||
| 5.00%, 11/1/19 | 367,808 | 373,121 | ||||||||
| 5.01%, 10/1/35 | 859,346 d | 876,866 | ||||||||
| 5.50%, 7/1/35—2/1/38 | 9,883,225 | 9,952,910 | ||||||||
| 5.70%, 4/1/37 | 1,143,718 d | 1,175,309 | ||||||||
| 5.72%, 5/1/37 | 1,320,232 d | 1,355,958 | ||||||||
| 5.97%, 5/1/37 | 1,262,993 d | 1,312,724 | ||||||||
| 6.00%, 4/1/33—10/1/37 | 4,558,822 | 4,666,370 | ||||||||
| 6.02%, 8/1/37 | 1,963,548 d | 2,004,296 | ||||||||
| 6.50%, 10/1/36—12/1/37 | 6,035,083 | 6,258,579 | ||||||||
| 7.00%, 6/1/32 | 183,960 | 196,106 | ||||||||
| 7.50%, 7/1/32 | 115,496 | 124,525 | ||||||||
| Government National Mortgage Association I: | ||||||||||
| 5.00%, 11/15/34—3/15/36 | 4,043,907 | 4,055,392 | ||||||||
| 5.50%, 2/15/36 | 967,750 | 990,160 | ||||||||
| 6.00%, 10/15/08—7/15/34 | 1,679,319 | 1,740,765 | ||||||||
| 7.00%, 5/15/23—11/15/23 | 270,402 | 290,892 | ||||||||
| 9.00%, 12/15/09 | 56,898 | 57,313 | ||||||||
| Government National Mortgage Association II; | ||||||||||
| 5.00%, 1/20/37 | 2,580,460 | 2,574,466 | ||||||||
| 56,907,719 | ||||||||||
| U.S. Government Securities—8.0% | ||||||||||
| U.S. Treasury Bonds | 4.50 | 2/15/36 | 3,680,000 b | 3,728,013 | ||||||
| U.S. Treasury Inflation Protected Securities, Bonds | 2.38 | 1/15/27 | 1,348,975 b,e | 1,487,668 | ||||||
| U.S. Treasury Inflation Protected Securities, Notes | 2.38 | 1/15/17 | 1,348,975 b,e | 1,505,689 | ||||||
| U.S. Treasury Notes | 4.00 | 11/15/12 | 3,315,000 b | 3,543,944 | ||||||
| U.S. Treasury Notes | 4.00 | 2/15/14 | 5,655,000 b | 6,042,017 | ||||||
| U.S. Treasury Notes | 4.50 | 5/15/17 | 3,455,000 b | 3,723,035 | ||||||
| U.S. Treasury Notes | 4.63 | 3/31/08 | 1,505,000 b | 1,508,410 | ||||||
| U.S. Treasury Notes | 4.63 | 2/29/12 | 5,475,000 b | 5,978,021 | ||||||
| 27,516,797 | ||||||||||
| Total Bonds and Notes | ||||||||||
| (cost $137,494,855) | 141,274,455 | |||||||||
48
| BNY Mellon Balanced Fund (continued) | ||||||||||
| Investment of Cash Collateral | ||||||||||
| Other Investments—22.1% | Shares | Value ($) | for Securities Loaned—8.0% | Shares | Value ($) | |||||
| Registered Investment Company; | Registered Investment Company; | |||||||||
| Dreyfus Institutional Preferred | Dreyfus Institutional Cash | |||||||||
| Plus Money Market Fund | 4,532,000 f | 4,532,000 | Advantage Plus Fund | |||||||
| Mellon Emerging Markets Fund | 631,848 g | 12,131,484 | (cost $27,249,262) | 27,249,262 f | 27,249,262 | |||||
| Mellon International Fund | 2,145,525 g | 29,114,773 | Total Investments | |||||||
| Mellon Mid Cap Stock Fund | 1,776,526 g | 19,861,557 | (cost $353,433,753) | 108.7% | 370,499,779 | |||||
| Mellon Small Cap Stock Fund | 851,760 g | 9,633,411 | Liabilities, Less Cash and Receivables | (8.7%) | (29,717,269) | |||||
| Total Other Investment | ||||||||||
| (cost $78,920,442) | 75,273,225 | Net Assets | 100.0% | 340,782,510 | ||||||
| ADR—American Depository Receipts |
| a Non-income producing security. |
| b All or a portion of these securities are on loan.At February 29, 2008, the total market value of the fund’s securities on loan is $27,259,992 and the total market value of the |
| collateral held by the fund is $27,592,753, consisting of cash collateral of $27,249,262 and U.S. Government and Agency securities valued at $343,491. |
| c Securities exempt from registration under Rule 144A of the Securities Act of 1933.These securities may be resold in transactions exempt from registration, normally to qualified |
| institutional buyers.At February 29, 2008, these securities amounted to $4,227,043 or 1.2% of net assets. |
| d Variable rate security—interest rate subject to periodic change. |
| e Principal amount for accrual purposes is periodically adjusted based on changes in the Consumer Price Index. |
| f Investment in affiliated money market mutual fund. |
| g Investment in affiliated mutual fund. |
| Portfolio Summary (Unaudited) † | ||||||
| Value (%) | Value (%) | |||||
| U.S. Government & Agencies | 27.2 | Asset/Mortgage-Backed | 4.4 | |||
| Affiliated Mutual Funds | 20.8 | Consumer Staples | 4.1 | |||
| Corporate Bonds | 9.3 | Consumer Discretionary | 3.9 | |||
| Money Market Investments | 9.3 | Materials | 1.4 | |||
| Financial | 6.4 | Telecommunication Services | 1.2 | |||
| Information Technology | 5.1 | Utilities | 1.2 | |||
| Health Care | 4.7 | Foreign/Governmental | .5 | |||
| Energy | 4.7 | |||||
| Industrial | 4.5 | 108.7 | ||||
| † Based on net assets. |
| See notes to financial statements. |
The Funds 49
| STATEMENTS OF ASSETS AND LIABILITIES | ||||
| February 29, 2008 (Unaudited) |
| BNY Mellon | BNY Mellon | BNY Mellon | BNY Mellon | |||||
| Large Cap | Income | Mid Cap | Small Cap | |||||
| Stock Fund | Stock Fund | Stock Fund | Stock Fund | |||||
| Assets ($): | ||||||||
| Investments in securities— | ||||||||
| See Statement of Investments † | ||||||||
| (including securities on loan) ††—Note 2(b): | ||||||||
| Unaffiliated issuers | 1,793,709,192 | 261,448,790 | 1,539,022,819 | 574,224,940 | ||||
| Affiliated issuers | 89,004,266 | 20,579,864 | 422,824,548 | 246,780,655 | ||||
| Cash | — | — | 5,195,762 | — | ||||
| Receivable for investment securities sold | 30,887,367 | 2,198,270 | 41,912,628 | 12,188,253 | ||||
| Dividends and interest receivable | 3,190,912 | 550,597 | 1,229,796 | 388,908 | ||||
| Receivable for shares of | ||||||||
| Beneficial Interest subscribed | 1,316,008 | 39,595 | 1,647,150 | 2,114,043 | ||||
| Prepaid expenses | 35,893 | 11,931 | 30,819 | 14,806 | ||||
| 1,918,143,638 | 284,829,047 | 2,011,863,522 | 835,711,605 | |||||
| Liabilities ($): | ||||||||
| Due to The Dreyfus Corporation and affiliates—Note 4(c) | 1,002,341 | 155,947 | 1,003,363 | 439,563 | ||||
| Due to Administrator—Note 4(a) | 185,081 | 27,427 | 159,346 | 62,041 | ||||
| Cash overdraft due to Custodian | 730,864 | 396,466 | — | 367,353 | ||||
| Liability for securities on loan—Note 2(b) | 56,817,266 | 20,579,864 | 395,318,548 | 218,782,655 | ||||
| Payable for investment securities purchased | 54,335,368 | 237,086 | 52,978,480 | 6,286,165 | ||||
| Outstanding options written, at value | ||||||||
| (premiums received $215,111) | ||||||||
| —See Statement of Options Written—Note 5 | — | 254,896 | — | — | ||||
| Payable for shares of Beneficial Interest redeemed | 449,088 | 6,310 | 300,798 | 241,166 | ||||
| Bank loan payable—Note 3 | — | 1,650,000 | — | — | ||||
| Interest payable—Note 3 | 4 | 2,667 | — | — | ||||
| Accrued expenses | 42,495 | 22,803 | 55,781 | 28,672 | ||||
| 113,562,507 | 23,333,466 | 449,816,316 | 226,207,615 | |||||
| Net Assets ($) | 1,804,581,131 | 261,495,581 | 1,562,047,206 | 609,503,990 | ||||
| Composition of Net Assets ($): | ||||||||
| Paid-in capital | 1,520,470,101 | 217,610,404 | 1,454,773,727 | 616,290,038 | ||||
| Accumulated undistributed investment income—net | 314,343 | 121,753 | 3,632,602 | 871,436 | ||||
| Accumulated net realized gain (loss) on investments | 46,981,125 | 14,027,625 | (3,287,243) | (12,796,714) | ||||
| Accumulated net unrealized appreciation | ||||||||
| (depreciation) on investments | 236,815,562 | — | 106,928,120 | 5,139,230 | ||||
| Accumulated net unrealized appreciation (depreciation) | ||||||||
| on investments and options transactions | — | 29,735,799 | — | — | ||||
| Net Assets ($) | 1,804,581,131 | 261,495,581 | 1,562,047,206 | 609,503,990 |
50
| BNY Mellon | BNY Mellon | BNY Mellon | BNY Mellon | |||||
| Large Cap | Income | Mid Cap | Small Cap | |||||
| Stock Fund | Stock Fund | Stock Fund | Stock Fund | |||||
| Net Asset Value Per Share | ||||||||
| Class M Shares | ||||||||
| Net Assets ($) | 1,794,126,602 | 260,163,582 | 1,529,199,241 | 605,556,146 | ||||
| Shares Outstanding | 197,049,053 | 33,507,197 | 136,723,230 | 53,538,697 | ||||
| Net Asset Value Per Share ($) | 9.10 | 7.76 | 11.18 | 11.31 | ||||
| Investor Shares | ||||||||
| Net Assets ($) | 10,454,529 | 1,331,999 | 30,414,292 | 3,947,844 | ||||
| Shares Outstanding | 1,146,698 | 170,290 | 2,745,197 | 358,759 | ||||
| Net Asset Value Per Share ($) | 9.12 | 7.82 | 11.08 | 11.00 | ||||
| Dreyfus Premier Shares | ||||||||
| Net Assets ($) | — | — | 2,433,673 | — | ||||
| Shares Outstanding | — | — | 231,459 | — | ||||
| Net Asset Value Per Share ($) | — | — | 10.51 | — | ||||
| † Investments at cost ($): | ||||||||
| Unaffiliated issuers | 1,556,893,630 | 231,673,206 | 1,432,094,699 | 569,085,710 | ||||
| Affiliated issuers | 89,004,266 | 20,579,864 | 422,824,548 | 246,780,655 | ||||
| †† Value of securities on loan ($) | 52,356,262 | 19,177,554 | 372,408,903 | 200,007,686 |
See notes to financial statements.
The Funds 51
STATEMENTS OF ASSETS AND LIABILITIES (continued)
| BNY Mellon | BNY Mellon | BNY Mellon | BNY Mellon | |||||
| U.S. Core Equity | International | Emerging | Balanced | |||||
| 130/30 Fund | Fund | Markets Fund | Fund | |||||
| Assets ($): | ||||||||
| Investments in securities— | ||||||||
| See Statement of Investments† | ||||||||
| (including securities on loan)††—Note 2(b): | ||||||||
| Unaffiliated issuers | 126,054,962 | 2,243,454,264 | 1,305,577,879 | 267,977,292 | ||||
| Affiliated issuers | — | 22,900,000 | 23,000,000 | 102,522,487 | ||||
| Cash | 3,697,923 | 4,471,550 | 3,078,023 | — | ||||
| Cash denominated in foreign currencies††† | — | 11,174,881 | 21,154,087 | — | ||||
| Receivable for investment securities sold | 1,801,970 | 33,670,856 | 8,252,591 | 2,438,998 | ||||
| Receivable for shares of | ||||||||
| Beneficial Interest subscribed | 1,293,000 | 2,486,638 | 1,199,069 | 88,051 | ||||
| Receivable from brokers for | ||||||||
| proceeds on securities sold short | 1,246,710 | — | — | — | ||||
| Paydowns receivable | — | — | — | 52,567 | ||||
| Unrealized appreciation on foreign currency | ||||||||
| exchange contracts—Note 2(e) | — | 33,345 | 5 | — | ||||
| Dividends and interest receivable | 182,095 | 7,295,709 | 2,374,334 | 1,463,375 | ||||
| Prepaid expenses | 66,833 | 26,434 | 20,533 | 10,446 | ||||
| 134,343,493 | 2,325,513,677 | 1,364,656,521 | 374,553,216 | |||||
| Liabilities ($): | ||||||||
| Due to The Dreyfus Corporation and affiliates—Note 4(c) | 53,504 | 2,291,390 | 2,108,981 | 139,518 | ||||
| Due to Administrator—Note 4(a) | 9,730 | 228,323 | 135,452 | 27,221 | ||||
| Due to Broker | 21,068 | — | — | — | ||||
| Cash overdraft due to Custodian | — | — | — | 475,208 | ||||
| Securities sold short, at value (proceeds $29,830,089) | ||||||||
| —See Statement of Securities Sold Short | 27,692,788 | — | — | — | ||||
| Payable for investment securities purchased | 4,287,107 | 32,338,283 | 10,366,837 | 5,821,065 | ||||
| Liability for securities on loan—Note 2(b) | — | — | — | 27,249,262 | ||||
| Payable for shares of Beneficial Interest redeemed | — | 1,810,403 | 1,176,719 | 11,518 | ||||
| Dividends payable on securities sold short | 33,068 | — | — | — | ||||
| Unrealized depreciation on foreign currency | ||||||||
| exchange contracts—Note 2(e) | — | 45,762 | 5,696 | — | ||||
| Interest payable—Note 3 | — | — | — | 360 | ||||
| Accrued expenses | 43,340 | 65,944 | 32,588 | 46,554 | ||||
| 32,140,605 | 36,780,105 | 13,826,273 | 33,770,706 | |||||
| Net Assets ($) | 102,202,888 | 2,288,733,572 | 1,350,830,248 | 340,782,510 | ||||
| Composition of Net Assets ($): | ||||||||
| Paid-in capital | 108,281,653 | 2,316,320,869 | 1,008,891,258 | 305,048,235 | ||||
| Accumulated undistributed investment income (loss)—net | 210,653 | 8,742,506 | (994,293) | 646,212 | ||||
| Accumulated net realized gain (loss) on investments | (2,771,803) | 116,257,616 | 175,582,186 | 18,022,037 | ||||
| Accumulated net unrealized appreciation | ||||||||
| (depreciation) on investments | — | — | — | 17,066,026 | ||||
| Accumulated net unrealized appreciation (depreciation) | ||||||||
| on investments and foreign currency transactions | — | (152,587,419) | 167,351,097 | — | ||||
| Accumulated net unrealized appreciation (depreciation) | ||||||||
| on investments and securities sold short | (3,517,615) | — | — | — | ||||
| Net Assets ($) | 102,202,888 | 2,288,733,572 | 1,350,830,248 | 340,782,510 |
52
| BNY Mellon | BNY Mellon | BNY Mellon | BNY Mellon | |||||||
| U.S. Core Equity | International | Emerging | Balanced | |||||||
| 130/30 Fund | Fund | Markets Fund | Fund | |||||||
| Net Asset Value Per Share | ||||||||||
| Class M Shares | ||||||||||
| Net Assets ($) | 102,193,310 | 2,280,825,673 | 1,340,293,173 | 336,511,168 | ||||||
| Shares Outstanding | 8,522,924 | 168,137,792 | 69,810,246 | 29,682,392 | ||||||
| Net Asset Value Per Share ($) | 11.99 | 13.57 | 19.20 | 11.34 | ||||||
| Investor Shares | ||||||||||
| Net Assets ($) | 9,578 | 7,907,899 | 10,537,075 | 4,271,342 | ||||||
| Shares Outstanding | 800 | 555,646 | 542,970 | 375,211 | ||||||
| Net Asset Value Per Share ($) | 11.97 | 14.23 | 19.41 | 11.38 | ||||||
| † | Investments at cost ($): | |||||||||
| Unaffiliated issuers | 131,709,878 | 2,396,737,017 | 1,138,528,805 | 247,264,049 | ||||||
| Affiliated issuers | — | 22,900,000 | 23,000,000 | 106,169,704 | ||||||
| †† | Value of securities on loan ($) | — | — | — | 27,259,992 | |||||
| ††† Cash denominated in foreign currencies (cost) ($) | — | 11,081,255 | 20,889,878 | — | ||||||
See notes to financial statements.
The Funds 53
| STATEMENTS OF OPERATIONS | ||
| Six Months Ended February 29, 2008 (Unaudited) |
| BNY Mellon | BNY Mellon | BNY Mellon | BNY Mellon | |||||
| Large Cap | Income | Mid Cap | Small Cap | |||||
| Stock Fund | Stock Fund | Stock Fund | Stock Fund | |||||
| Investment Income ($): | ||||||||
| Income: | ||||||||
| Cash dividends (net of $36,572 and $3,299 foreign taxes | ||||||||
| withheld at source for BNY Mellon Large Cap Stock Fund | ||||||||
| and BNY Mellon Mid Cap Stock Fund, respectively): | ||||||||
| Unaffiliated issuers | 18,294,298 | 4,651,053 | 7,892,105 | 3,072,907 | ||||
| Affiliated issuers | 729,126 | 4,396 | 524,637 | 579,921 | ||||
| Income from securities lending | 59,316 | 3,819 | 755,025 | 217,108 | ||||
| Total Income | 19,082,740 | 4,659,268 | 9,171,767 | 3,869,936 | ||||
| Expenses: | ||||||||
| Investment advisory fees—Note 4(a) | 6,357,279 | 1,155,556 | 6,375,785 | 2,751,605 | ||||
| Administration fees—Note 4(a) | 1,244,760 | 226,139 | 1,081,806 | 411,959 | ||||
| Custodian fees—Note 4(c) | 72,325 | 20,619 | 61,692 | 33,767 | ||||
| Trustees’ fees and expenses—Note 4(d) | 26,516 | 6,253 | 27,872 | 10,728 | ||||
| Shareholder servicing costs—Note 4(c) | 16,363 | 2,433 | 74,704 | 8,767 | ||||
| Auditing fees | 16,093 | 3,596 | 18,580 | 14,718 | ||||
| Registration fees | 12,271 | 12,559 | 24,955 | 12,555 | ||||
| Legal fees | 12,195 | 2,882 | 16,690 | 4,077 | ||||
| Interest expense—Note 3 | 7,425 | 57,401 | — | — | ||||
| Prospectus and shareholders’ reports | 2,684 | 1,877 | 17,014 | 4,188 | ||||
| Distribution fees—Note 4(b) | — | — | 11,882 | — | ||||
| Miscellaneous | 19,518 | 8,186 | 16,758 | 12,140 | ||||
| Total Expenses | 7,787,429 | 1,497,501 | 7,727,738 | 3,264,504 | ||||
| Less—reduction in fees due to | ||||||||
| earnings credits—Note 2(b) | (286) | (93) | (12,810) | (7,959) | ||||
| Net Expenses | 7,787,143 | 1,497,408 | 7,714,928 | 3,256,545 | ||||
| Investment Income—Net | 11,295,597 | 3,161,860 | 1,456,839 | 613,391 | ||||
| Realized and Unrealized Gain (Loss) | ||||||||
| on Investments—Note 5 ($): | ||||||||
| Net realized gain (loss) on investments | 73,019,182 | 22,047,023 | 48,349,099 | (1,991,193) | ||||
| Net unrealized appreciation | ||||||||
| (depreciation) on investments | (218,306,147) | — | (124,197,619) | (63,004,948) | ||||
| Net unrealized appreciation (depreciation) | ||||||||
| on investments and options transactions | — | (49,660,198) | — | — | ||||
| Net Realized and Unrealized | ||||||||
| Gain (Loss) on Investments | (145,286,965) | (27,613,175) | (75,848,520) | (64,996,141) | ||||
| Net (Decrease) in Net Assets | ||||||||
| Resulting from Operations | (133,991,368) | (24,451,315) | (74,391,681) | (64,382,750) | ||||
See notes to financial statements.
54
| BNY Mellon | BNY Mellon | BNY Mellon | BNY Mellon | |||||
| U.S. Core Equity | International | Emerging | Balanced | |||||
| 130/30 Fund | Fund | Markets Fund | Fund | |||||
| Investment Income ($): | ||||||||
| Income: | ||||||||
| Cash dividends (net of $1,312,640, $1,259,748 and | ||||||||
| $2,783 foreign taxes withheld at source for BNY Mellon | ||||||||
| International Fund, BNY Mellon Emerging Markets Fund | ||||||||
| and BNY Mellon Balanced Fund, respectively): | ||||||||
| Unaffiliated issuers | 704,131 | 22,393,040 | 10,169,957 | 1,983,155 | ||||
| Affiliated issuers | — | 701,193 | 233,832 | 45,377 | ||||
| Interest | — | 151,024 | 56,439 | 3,730,971 | ||||
| Income from securities lending | — | — | 15,599 | 79,780 | ||||
| Total Income | 704,131 | 23,245,257 | 10,475,827 | 5,839,283 | ||||
| Expenses: | ||||||||
| Investment advisory fees—Note 4(a) | 253,658 | 11,134,448 | 8,649,269 | 786,375 | ||||
| Dividends on securities sold short | 98,405 | — | — | — | ||||
| Interest on securities sold short | 79,405 | — | — | — | ||||
| Administration fees—Note 4(a) | 40,417 | 1,666,763 | 957,038 | 177,102 | ||||
| Custodian fees—Note 4(c) | 23,899 | 1,396,408 | 1,723,079 | 18,533 | ||||
| Legal fees | 22,439 | 18,309 | 10,456 | — | ||||
| Registration fees | 22,052 | 13,888 | 17,726 | 12,134 | ||||
| Auditing fees | 9,564 | 18,330 | 21,914 | 12,431 | ||||
| Prospectus and shareholders’ reports | 8,861 | 6,660 | 5,542 | 558 | ||||
| Shareholder servicing costs—Note 4(c) | 269 | 18,152 | 15,363 | 6,946 | ||||
| Trustees’ fees and expenses—Note 4(d) | — | 54,691 | 26,015 | 6,012 | ||||
| Interest expense—Note 3 | — | 48,509 | 20,043 | 360 | ||||
| Miscellaneous | 2,255 | 38,119 | 22,378 | 12,286 | ||||
| Total Expenses | 561,224 | 14,414,277 | 11,468,823 | 1,032,737 | ||||
| Less—reduction in investment advisory fee | ||||||||
| due to undertaking—Note 4(a) | (32,922) | — | — | — | ||||
| Less—reduction in fees due to earnings credits—Note 2(b) | (34,824) | (37,871) | (46,388) | (46) | ||||
| Net Expenses | 493,478 | 14,376,406 | 11,422,435 | 1,032,691 | ||||
| Investment Income (Loss)—Net | 210,653 | 8,868,851 | (946,608) | 4,806,592 | ||||
| Realized and Unrealized Gain (Loss) | ||||||||
| on Investments—Note 5 ($): | ||||||||
| Net realized gain (loss) on investments | — | — | — | 6,803,129 | ||||
| Net realized gain distributions from affiliated issuers | — | — | — | 13,125,231 | ||||
| Net realized gain (loss) on investments | ||||||||
| and foreign currency transactions | — | 169,101,917 | 265,723,903 | — | ||||
| Net realized gain (loss) on foreign | ||||||||
| currency exchange contracts | — | 1,807,250 | (377,905) | — | ||||
| Net realized gain (loss) on investments: | ||||||||
| Long transactions | (3,839,483) | — | — | — | ||||
| Short sale transactions | 1,126,292 | — | — | — | ||||
| Net Realized Gain (Loss) | (2,713,191) | 170,909,167 | 265,345,998 | 19,928,360 | ||||
| Net unrealized appreciation (depreciation) on investments | — | — | — | (29,958,602) | ||||
| Net unrealized appreciation (depreciation) on | ||||||||
| investments and foreign currency transactions | — | (389,980,416) | (203,262,990) | — | ||||
| Net unrealized appreciation (depreciation) on | ||||||||
| investments and securities sold short | (4,074,498) | — | — | — | ||||
| Net Realized and Unrealized Gain (Loss) on Investments | (6,787,689) | (219,071,249) | 62,083,008 | (10,030,242) | ||||
| Net Increase (Decrease) in Net Assets | ||||||||
| Resulting from Operations | (6,577,036) | (210,202,398) | 61,136,400 | (5,223,650) | ||||
See notes to financial statements.
The Funds 55
| STATEMENT OF CASH FLOWS | ||
| Six Months Ended February 29, 2008 (Unaudited) |
| BNY Mellon U.S. Core Equity 130/30 Fund | ||||
| Cash Flows from Operating Activities ($): | ||||
| Dividends received | 563,935 | |||
| Interest and loan fees paid | (131,968) | |||
| Operating expenses paid | (132,105) | |||
| Paid to The Dreyfus Corporation | (149,731) | 150,131 | ||
| Cash Flows from Investing Activities ($): | ||||
| Purchases of portfolio securities | (180,977,492) | |||
| Proceeds from sales of portfolio securities | 77,949,090 | |||
| Net beneficial interest transactions | 81,573,137 | |||
| Proceeds from securities sold short | 23,530,417 | 2,075,152 | ||
| Cash Flows from Financing Activities ($): | ||||
| Increase in cash | 2,225,283 | |||
| Cash at beginning of period | 1,472,640 | |||
| Cash at end of period | 3,697,923 | |||
| Reconciliation of Net Increase in Net Assets Resulting from | ||||
| Operations to Net Cash Used by Operating Activities ($): | ||||
| Net Increase in Net Assets Resulting From Operations | (6,577,036) | |||
| Adjustments to reconcile net increase in net assets resulting | ||||
| from operations to net cash used by operating activities ($): | ||||
| Increase in dividends payable on securities | ||||
| sold short and loan commitment fees | 20,293 | |||
| Increase in accrued operating expenses | 23,635 | |||
| Increase in prepaid expenses | (35,260) | |||
| Increase in Due to The Dreyfus Corporation | 71,005 | |||
| Net realized gains on investments | 2,713,191 | |||
| Net unrealized depreciation on investments | 4,074,498 | |||
| Increase in dividends and income receivable | (140,195) | |||
| Net Cash Used by Operating Activities | 150,131 | |||
See notes to financial statements.
56
STATEMENTS OF CHANGES IN NET ASSETS
| BNY Mellon Large Cap Stock Fund | BNY Mellon Income Stock Fund | |||||||
| Six Months Ended | Six Months Ended | |||||||
| February 29, 2008 | Year Ended | February 29, 2008 | Year Ended | |||||
| (Unaudited) | August 31, 2007 | (Unaudited) | August 31, 2007 | |||||
| Operations ($): | ||||||||
| Investment income—net | 11,295,597 | 14,690,077 | 3,161,860 | 7,960,738 | ||||
| Net realized gain (loss) on investments | 73,019,182 | 289,295,291 | 22,047,023 | 64,683,917 | ||||
| Net unrealized appreciation (depreciation) on investments | (218,306,147) | (28,034,523) | (49,660,198) | (21,599,065) | ||||
| Net Increase (Decrease) in Net Assets | ||||||||
| Resulting from Operations | (133,991,368) | 275,950,845 | (24,451,315) | 51,045,590 | ||||
| Dividends to Shareholders from ($): | ||||||||
| Investment income—net: | ||||||||
| Class M Shares | (11,365,302) | (14,513,891) | (3,173,248) | (7,708,280) | ||||
| Investor Shares | (56,420) | (52,457) | (13,058) | (25,719) | ||||
| Net realized gain on investments: | ||||||||
| Class M Shares | (292,549,129) | (42,915,907) | (68,094,883) | (35,419,719) | ||||
| Investor Shares | (1,786,575) | (216,079) | (355,903) | (127,542) | ||||
| Total Dividends | (305,757,426) | (57,698,334) | (71,637,092) | (43,281,260) | ||||
| Beneficial Interest Transactions ($): | ||||||||
| Net proceeds from shares sold: | ||||||||
| Class M Shares | 175,959,468 | 226,642,767 | 8,269,920 | 76,012,981 | ||||
| Investor Shares | 3,964,347 | 6,833,158 | 651,407 | 410,294 | ||||
| Dividends reinvested: | ||||||||
| Class M Shares | 217,852,384 | 33,600,082 | 45,673,984 | 24,078,831 | ||||
| Investor Shares | 1,588,435 | 240,358 | 333,268 | 135,866 | ||||
| Cost of shares redeemed: | ||||||||
| Class M Shares | (133,035,618) | (273,005,675) | (113,065,783) | (114,219,942) | ||||
| Investor Shares | (4,185,185) | (4,111,344) | (863,872) | (331,362) | ||||
| Increase (Decrease) in Net Assets from | ||||||||
| Beneficial Interest Transactions | 262,143,831 | (9,800,654) | (59,001,076) | (13,913,332) | ||||
| Total Increase (Decrease) in Net Assets | (177,604,963) | 208,451,857 | (155,089,483) | (6,149,002) | ||||
| Net Assets ($): | ||||||||
| Beginning of Period | 1,982,186,094 | 1,773,734,237 | 416,585,064 | 422,734,066 | ||||
| End of Period | 1,804,581,131 | 1,982,186,094 | 261,495,581 | 416,585,064 | ||||
| Undistributed investment income—net | 314,343 | 440,468 | 121,753 | 146,199 | ||||
| Capital Share Transactions (Shares): | ||||||||
| Class M Shares | ||||||||
| Shares sold | 17,039,851 | 20,318,937 | 901,067 | 7,139,757 | ||||
| Shares issued for dividends reinvested | 21,842,139 | 3,073,298 | 5,443,109 | 2,326,716 | ||||
| Shares redeemed | (12,315,389) | (24,279,996) | (11,935,502) | (10,762,331) | ||||
| Net Increase (Decrease) in Shares Outstanding | 26,566,601 | (887,761) | (5,591,326) | (1,295,858) | ||||
| Investor Shares | ||||||||
| Shares sold | 353,864 | 611,162 | 64,158 | 38,623 | ||||
| Shares issued for dividends reinvested | 159,854 | 21,855 | 39,335 | 12,989 | ||||
| Shares redeemed | (377,300) | (361,527) | (94,242) | (30,537) | ||||
| Net Increase (Decrease) in Shares Outstanding | 136,418 | 271,490 | 9,251 | 21,075 | ||||
See notes to financial statements.
The Funds 57
STATEMENTS OF CHANGES IN NET ASSETS (continued)
| BNY Mellon Mid Cap Stock Fund | BNY Mellon Small Cap Stock Fund | |||||||
| Six Months Ended | Six Months Ended | |||||||
| February 29, 2008 | Year Ended | February 29, 2008 | Year Ended | |||||
| (Unaudited) | August 31, 2007 | (Unaudited) | August 31, 2007 | |||||
| Operations ($): | ||||||||
| Investment income—net | 1,456,839 | 6,990,751 | 613,391 | 108,639 | ||||
| Net realized gain (loss) on investments | 48,349,099 | 267,156,006 | (1,991,193) | 111,126,355 | ||||
| Net unrealized appreciation (depreciation) on investments | (124,197,619) | (13,565,718) | (63,004,948) | (31,334,249) | ||||
| Net Increase (Decrease) in Net Assets | ||||||||
| Resulting from Operations | (74,391,681) | 260,581,039 | (64,382,750) | 79,900,745 | ||||
| Dividends to Shareholders from ($): | ||||||||
| Investment income—net: | ||||||||
| Class M Shares | (3,279,780) | (7,932,371) | — | — | ||||
| Investor Shares | — | (86,011) | — | — | ||||
| Net realized gain on investments: | ||||||||
| Class M Shares | (290,742,198) | (234,597,218) | (93,553,168) | (95,370,568) | ||||
| Investor Shares | (6,187,293) | (4,769,554) | (779,054) | (978,502) | ||||
| Dreyfus Premier Shares | (585,373) | (828,723) | — | — | ||||
| Total Dividends | (300,794,644) | (248,213,877) | (94,332,222) | (96,349,070) | ||||
| Beneficial Interest Transactions ($): | ||||||||
| Net proceeds from shares sold: | ||||||||
| Class M Shares | 204,899,454 | 281,940,037 | 136,668,449 | 139,163,228 | ||||
| Investor Shares | 4,497,989 | 12,902,810 | 1,081,870 | 3,514,777 | ||||
| Dreyfus Premier Shares | 9,000 | 25,446 | — | — | ||||
| Dividends reinvested: | ||||||||
| Class M Shares | 193,944,931 | 150,145,577 | 64,066,796 | 61,106,520 | ||||
| Investor Shares | 5,593,861 | 4,570,406 | 715,704 | 810,943 | ||||
| Dreyfus Premier Shares | 484,613 | 715,679 | — | — | ||||
| Cost of shares redeemed: | ||||||||
| Class M Shares | (211,760,838) | (296,418,896) | (107,977,547) | (181,135,260) | ||||
| Investor Shares | (6,958,845) | (12,668,316) | (1,915,312) | (5,292,529) | ||||
| Dreyfus Premier Shares | (996,534) | (3,237,779) | — | — | ||||
| Increase (Decrease) in Net Assets from | ||||||||
| Beneficial Interest Transactions | 189,713,631 | 137,974,964 | 92,639,960 | 18,167,679 | ||||
| Total Increase (Decrease) in Net Assets | (185,472,694) | 150,342,126 | (66,075,012) | 1,719,354 | ||||
| Net Assets ($): | ||||||||
| Beginning of Period | 1,747,519,900 | 1,597,177,774 | 675,579,002 | 673,859,648 | ||||
| End of Period | 1,562,047,206 | 1,747,519,900 | 609,503,990 | 675,579,002 | ||||
| Undistributed investment income—net | 3,632,602 | 5,455,543 | 871,436 | 258,045 | ||||
58
| BNY Mellon Mid Cap Stock Fund | BNY Mellon Small Cap Stock Fund | |||||||
| Six Months Ended | Six Months Ended | |||||||
| February 29, 2008 | Year Ended | February 29, 2008 | Year Ended | |||||
| (Unaudited) | August 31, 2007 | (Unaudited) | August 31, 2007 | |||||
| Capital Share Transactions: | ||||||||
| Class M Shares | ||||||||
| Shares sold | 16,713,338 | 20,373,901 | 10,946,313 | 9,447,857 | ||||
| Shares issued for dividends reinvested | 15,404,681 | 11,348,872 | 5,048,605 | 4,297,223 | ||||
| Shares redeemed | (15,809,340) | (20,747,563) | (7,676,941) | (11,874,638) | ||||
| Net Increase (Decrease) in Shares Outstanding | 16,308,679 | 10,975,210 | 8,317,977 | 1,870,442 | ||||
| Investor Shares a | ||||||||
| Shares sold | 343,818 | 905,663 | 82,275 | 236,350 | ||||
| Shares issued for dividends reinvested | 448,282 | 347,893 | 57,952 | 57,630 | ||||
| Shares redeemed | (544,558) | (905,828) | (149,853) | (362,914) | ||||
| Net Increase (Decrease) in Shares Outstanding | 247,542 | 347,728 | (9,626) | (68,934) | ||||
| Dreyfus Premier Shares a | ||||||||
| Shares sold | 618 | 1,928 | — | — | ||||
| Shares issued for dividends reinvested | 40,861 | 56,351 | — | — | ||||
| Shares redeemed | (78,875) | (238,498) | — | — | ||||
| Net Increase (Decrease) in Shares Outstanding | (37,396) | (180,219) | — | — | ||||
| a During the period ended February 29, 2008, 50,766, Dreyfus Premier shares of BNY Mellon Mid Cap Stock Fund representing $652,442 were automatically converted to |
| 48,502 Investor shares and during the period ended August 31, 2007, 148,230 Dreyfus Premier shares of BNY Mellon Mid Cap Stock Fund representing $2,024,244 were |
| automatically converted to 143,127 Investor shares. |
| See notes to financial statements. |
The Funds 59
STATEMENTS OF CHANGES IN NET ASSETS (continued)
| BNY Mellon U.S. Core Equity 130/30 Fund | BNY Mellon International Fund | |||||||
| Six Months Ended | Six Months Ended | |||||||
| February 29, 2008 | Year Ended | February 29, 2008 | Year Ended | |||||
| (Unaudited) | August 31, 2007a | (Unaudited) | August 31, 2007 | |||||
| Operations ($): | ||||||||
| Investment income (loss)—net | 210,653 | (4,626) | 8,868,851 | 43,954,152 | ||||
| Net realized gain (loss) on investments | (2,713,191) | (58,612) | 170,909,167 | 361,316,981 | ||||
| Net unrealized appreciation (depreciation) on investments | (4,074,498) | 556,883 | (389,980,416) | (79,730,236) | ||||
| Net Increase (Decrease) in Net Assets | ||||||||
| Resulting from Operations | (6,577,036) | 493,645 | (210,202,398) | 325,540,897 | ||||
| Dividends to Shareholders from ($): | ||||||||
| Investment income—net: | ||||||||
| Class M Shares | — | — | (42,716,814) | (42,865,752) | ||||
| Investor Shares | — | — | (205,294) | (135,397) | ||||
| Net realized gain on investments: | ||||||||
| Class M Shares | — | — | (345,711,591) | (297,965,799) | ||||
| Investor Shares | — | — | (1,860,329) | (1,072,533) | ||||
| Total Dividends | — | — | (390,494,028) | (342,039,481) | ||||
| Beneficial Interest Transactions ($): | ||||||||
| Net proceeds from shares sold: | ||||||||
| Class M Shares | 87,211,847 | 25,975,600 | 312,942,311 | 499,791,572 | ||||
| Investor Shares | — | 10,000 | 6,688,478 | 13,554,606 | ||||
| Dividends reinvested: | ||||||||
| Class M Shares | — | — | 230,869,382 | 194,224,145 | ||||
| Investor Shares | — | — | 1,480,972 | 915,648 | ||||
| Cost of shares redeemed: | ||||||||
| Class M Shares | (4,505,711) | (405,457) | (502,417,118) | (375,343,055) | ||||
| Investor Shares | — | — | (10,735,292) | (10,052,185) | ||||
| Increase (Decrease) in Net Assets from | ||||||||
| Beneficial Interest Transactions | 82,706,136 | 25,580,143 | 38,828,733 | 323,090,731 | ||||
| Total Increase (Decrease) in Net Assets | 76,129,100 | 26,073,788 | (561,867,693) | 306,592,147 | ||||
| Net Assets ($): | ||||||||
| Beginning of Period | 26,073,788 | — | 2,850,601,265 | 2,544,009,118 | ||||
| End of Period | 102,202,888 | 26,073,788 | 2,288,733,572 | 2,850,601,265 | ||||
| Undistributed investment income—net | 210,653 | — | 8,742,506 | 42,795,763 | ||||
| Capital Share Transactions (Shares): | ||||||||
| Class M Shares | ||||||||
| Shares sold | 6,813,925 | 2,094,556 | 21,120,181 | 28,452,070 | ||||
| Shares issued for dividends reinvested | — | — | 15,684,061 | 11,512,990 | ||||
| Shares redeemed | (353,454) | (32,103) | (30,200,653) | (21,099,016) | ||||
| Net Increase (Decrease) in Shares Outstanding | 6,460,471 | 2,062,453 | 6,603,589 | 18,866,044 | ||||
| Investor Shares | ||||||||
| Shares sold | — | 800 | 390,225 | 731,940 | ||||
| Shares issued for dividends reinvested | — | — | 95,732 | 52,026 | ||||
| Shares redeemed | — | — | (675,784) | (541,199) | ||||
| Net Increase (Decrease) in Shares Outstanding | — | 800 | (189,827) | 242,767 | ||||
a From August 1, 2007 (commencement of operations) to August 31, 2007.
See notes to financial statements.
60
| BNY Mellon Emerging Markets Fund | BNY Mellon Balanced Fund | |||||||
| Six Months Ended | Six Months Ended | |||||||
| February 29, 2008 | Year Ended | February 29, 2008 | Year Ended | |||||
| (Unaudited) | August 31, 2007 | (Unaudited) | August 31, 2007 | |||||
| Operations ($): | ||||||||
| Investment income (loss)—net | (946,608) | 14,989,685 | 4,806,592 | 8,161,745 | ||||
| Net realized gain (loss) on investments | 265,345,998 | 298,691,541 | 19,928,360 | 34,944,176 | ||||
| Net unrealized appreciation (depreciation) on investments | (203,262,990) | 125,896,899 | (29,958,602) | (2,011,921) | ||||
| Net Increase (Decrease) in Net Assets | ||||||||
| Resulting from Operations | 61,136,400 | 439,578,125 | (5,223,650) | 41,094,000 | ||||
| Dividends to Shareholders from ($): | ||||||||
| Investment income—net: | ||||||||
| Class M Shares | (12,065,738) | (11,143,002) | (6,304,708) | (8,588,393) | ||||
| Investor Shares | (65,697) | (55,920) | (67,435) | (87,689) | ||||
| Net realized gain on investments: | ||||||||
| Class M Shares | (353,792,959) | (373,891,351) | (32,629,458) | (37,309,689) | ||||
| Investor Shares | (2,618,833) | (2,695,847) | (387,034) | (410,941) | ||||
| Total Dividends | (368,543,227) | (387,786,120) | (39,388,635) | (46,396,712) | ||||
| Beneficial Interest Transactions ($): | ||||||||
| Net proceeds from shares sold: | ||||||||
| Class M Shares | 110,078,475 | 229,712,148 | 9,079,594 | 18,552,789 | ||||
| Investor Shares | 5,240,120 | 8,957,255 | 701,340 | 2,627,739 | ||||
| Dividends reinvested: | ||||||||
| Class M Shares | 243,684,211 | 241,635,492 | 28,703,242 | 32,351,111 | ||||
| Investor Shares | 2,132,234 | 2,299,129 | 450,486 | 450,228 | ||||
| Cost of shares redeemed: | ||||||||
| Class M Shares | (229,284,637) | (314,129,360) | (15,260,544) | (29,698,540) | ||||
| Investor Shares | (5,483,118) | (12,212,487) | (620,764) | (2,475,801) | ||||
| Increase (Decrease) in Net Assets from | ||||||||
| Beneficial Interest Transactions | 126,367,285 | 156,262,177 | 23,053,354 | 21,807,526 | ||||
| Total Increase (Decrease) in Net Assets | (181,039,542) | 208,054,182 | (21,558,931) | 16,504,814 | ||||
| Net Assets ($): | ||||||||
| Beginning of Period | 1,531,869,790 | 1,323,815,608 | 362,341,441 | 345,836,627 | ||||
| End of Period | 1,350,830,248 | 1,531,869,790 | 340,782,510 | 362,341,441 | ||||
| Undistributed investment income (loss)—net | (994,293) | 12,083,750 | 646,212 | 2,211,763 | ||||
| Capital Share Transactions (Shares): | ||||||||
| Class M Shares | ||||||||
| Shares sold | 5,223,838 | 10,259,259 | 747,133 | 1,442,105 | ||||
| Shares issued for dividends reinvested | 12,117,564 | 11,695,813 | 2,429,772 | 2,608,038 | ||||
| Shares redeemed | (9,810,729) | (13,164,193) | (1,235,870) | (2,286,103) | ||||
| Net Increase (Decrease) in Shares Outstanding | 7,530,673 | 8,790,879 | 1,941,035 | 1,764,040 | ||||
| Investor Shares | ||||||||
| Shares sold | 247,079 | 378,468 | 54,670 | 201,131 | ||||
| Shares issued for dividends reinvested | 104,881 | 110,323 | 37,849 | 35,958 | ||||
| Shares redeemed | (249,900) | (525,054) | (47,169) | (189,290) | ||||
| Net Increase (Decrease) in Shares Outstanding | 102,060 | (36,263) | 45,350 | 47,799 | ||||
See notes to financial statements.
The Funds 61
FINANCIAL HIGHLIGHTS
The following tables describe the performance for each share class of each BNY Mellon equity fund for the fiscal periods
indicated. All information (except portfolio turnover rate) reflects financial results for a single fund share.Total return shows
how much your investment in each fund would have increased (or decreased) during the period, assuming you had reinvested
all dividends and distributions.These figures have been derived from each fund’s financial statements.
| Class M Shares | ||||||||||||
| Six Months Ended | ||||||||||||
| February 29, 2008 | Year Ended August 31, | |||||||||||
| BNY Mellon Large Cap Stock Fund | (Unaudited) | 2007 | 2006 | 2005 | 2004 | 2003 a | ||||||
| Per Share Data ($): | ||||||||||||
| Net asset value, beginning of period | 11.56 | 10.31 | 9.79 | 8.74 | 8.16 | 7.77 | ||||||
| Investment Operations: | ||||||||||||
| Investment income—net b | .06 | .09 | .10 | .11 | .07 | .06 | ||||||
| Net realized and unrealized | ||||||||||||
| gain (loss) on investments | (.73) | 1.49 | .52 | 1.05 | .58 | .39 | ||||||
| Total from Investment Operations | (.67) | 1.58 | .62 | 1.16 | .65 | .45 | ||||||
| Distributions: | ||||||||||||
| Dividends from investment income—net | (.06) | (.08) | (.10) | (.11) | (.07) | (.06) | ||||||
| Dividends from net realized gain on investments | (1.73) | (.25) | — | — | — | — | ||||||
| Total Distributions | (1.79) | (.33) | (.10) | (.11) | (.07) | (.06) | ||||||
| Net asset value, end of period | 9.10 | 11.56 | 10.31 | 9.79 | 8.74 | 8.16 | ||||||
| Total Return (%) | (7.09)c | 15.60 | 6.32 | 13.27 | 7.95 | 5.76 | ||||||
| Ratios/Supplemental Data (%): | ||||||||||||
| Ratio of total expenses to average net assets | .79d | .80 | .80 | .80 | .81 | .81 | ||||||
| Ratio of net expenses to average net assets | .79d,e | .79 | .80e | .80e | .81 | .81 | ||||||
| Ratio of net investment income | ||||||||||||
| to average net assets | 1.16d | .76 | .96 | 1.13 | .77 | .83 | ||||||
| Portfolio Turnover Rate | 30.55c | 77.46 | 19.08 | 23.49 | 43.52 | 56.96 | ||||||
| Net Assets, end of period ($ x 1,000) | 1,794,127 | 1,970,482 | 1,766,105 | 1,733,531 | 1,545,002 | 1,479,855 | ||||||
| a | Effective December 16, 2002, MPAM shares were redesignated as Class M shares. | |
| b | Based on average shares outstanding at each month end. | |
| c | Not annualized. | |
| d | Annualized. | |
| e | The difference for the period represents less than .01%. | |
| See notes to financial statements. | ||
62
| Investor Shares | ||||||||||||
| Six Months Ended | ||||||||||||
| February 29, 2008 | Year Ended August 31, | |||||||||||
| BNY Mellon Large Cap Stock Fund | (Unaudited) | 2007 | 2006 | 2005 | 2004 | 2003 | ||||||
| Per Share Data ($): | ||||||||||||
| Net asset value, beginning of period | 11.58 | 10.33 | 9.82 | 8.76 | 8.16 | 7.77 | ||||||
| Investment Operations: | ||||||||||||
| Investment income—net a | .05 | .06 | .07 | .08 | .06 | .04 | ||||||
| Net realized and unrealized | ||||||||||||
| gain (loss) on investments | (.73) | 1.50 | .51 | 1.06 | .58 | .39 | ||||||
| Total from Investment Operations | (.68) | 1.56 | .58 | 1.14 | .64 | .43 | ||||||
| Distributions: | ||||||||||||
| Dividends from investment income—net | (.05) | (.06) | (.07) | (.08) | (.04) | (.04) | ||||||
| Dividends from net realized gain on investments | (1.73) | (.25) | — | — | — | — | ||||||
| Total Distributions | (1.78) | (.31) | (.07) | (.08) | (.04) | (.04) | ||||||
| Net asset value, end of period | 9.12 | 11.58 | 10.33 | 9.82 | 8.76 | 8.16 | ||||||
| Total Return (%) | (7.20)b | 15.29 | 5.95 | 13.08 | 7.88 | 5.50 | ||||||
| Ratios/Supplemental Data (%): | ||||||||||||
| Ratio of total expenses to average net assets | 1.04c | 1.05 | 1.06 | 1.05 | 1.06 | 1.07 | ||||||
| Ratio of net expenses to average net assets | 1.04c,d | 1.04 | 1.06d | 1.05d | 1.06 | 1.07 | ||||||
| Ratio of net investment income | ||||||||||||
| to average net assets | .88c | .51 | .72 | .87 | .59 | .56 | ||||||
| Portfolio Turnover Rate | 30.55b | 77.46 | 19.08 | 23.49 | 43.52 | 56.96 | ||||||
| Net Assets, end of period ($ x 1,000) | 10,455 | 11,704 | 7,629 | 3,985 | 3,356 | 2,121 | ||||||
| a | Based on average shares outstanding at each month end. | |
| b | Not annualized. | |
| c | Annualized. | |
| d | The difference for the period represents less than .01%. | |
| See notes to financial statements. | ||
The Funds 63
FINANCIAL HIGHLIGHTS (continued)
| Class M Shares | ||||||||||||
| Six Months Ended | ||||||||||||
| February 29, 2008 | Year Ended August 31, | |||||||||||
| BNY Mellon Income Stock Fund | (Unaudited) | 2007 | 2006 | 2005 | 2004 | 2003 a | ||||||
| Per Share Data ($): | ||||||||||||
| Net asset value, beginning of period | 10.61 | 10.43 | 9.92 | 9.50 | 8.56 | 8.24 | ||||||
| Investment Operations: | ||||||||||||
| Investment income—net b | .09 | .19 | .22 | .21 | .16 | .12 | ||||||
| Net realized and unrealized | ||||||||||||
| gain (loss) on investments | (.81) | 1.04 | .75 | 1.27 | 1.09 | .37 | ||||||
| Total from Investment Operations | (.72) | 1.23 | .97 | 1.48 | 1.25 | .49 | ||||||
| Distributions: | ||||||||||||
| Dividends from investment income—net | (.09) | (.19) | (.22) | (.20) | (.17) | (.12) | ||||||
| Dividends from net realized gain on investments | (2.04) | (.86) | (.24) | (.86) | (.14) | (.05) | ||||||
| Total Distributions | (2.13) | (1.05) | (.46) | (1.06) | (.31) | (.17) | ||||||
| Net asset value, end of period | 7.76 | 10.61 | 10.43 | 9.92 | 9.50 | 8.56 | ||||||
| Total Return (%) | (8.24)c | 12.11 | 10.00 | 16.23 | 14.68 | 6.19 | ||||||
| Ratios/Supplemental Data (%): | ||||||||||||
| Ratio of total expenses to average net assets | .84d | .81 | .81 | .82 | .83 | .83 | ||||||
| Ratio of net expenses to average net assets | .84d,e | .81 | .81e | .82e | .83 | .83 | ||||||
| Ratio of net investment income | ||||||||||||
| to average net assets | 1.78d | 1.81 | 2.14 | 2.12 | 1.75 | 1.48 | ||||||
| Portfolio Turnover Rate | 11.50c | 62.06 | 40.75 | 34.61 | 52.47 | 12.82 | ||||||
| Net Assets, end of period ($ x 1,000) | 260,164 | 414,866 | 421,266 | 394,977 | 274,881 | 271,085 | ||||||
| a | Effective December 16, 2002, MPAM shares were redesignated as Class M shares. | |
| b | Based on average shares outstanding at each month end. | |
| c | Not annualized. | |
| d | Annualized. | |
| e | The difference for the period represents less than .01%. | |
| See notes to financial statements. | ||
64
| Investor Shares | ||||||||||||
| Six Months Ended | ||||||||||||
| February 29, 2008 | Year Ended August 31, | |||||||||||
| BNY Mellon Income Stock Fund | (Unaudited) | 2007 | 2006 | 2005 | 2004 | 2003 | ||||||
| Per Share Data ($): | ||||||||||||
| Net asset value, beginning of period | 10.67 | 10.49 | 9.98 | 9.53 | 8.58 | 8.25 | ||||||
| Investment Operations: | ||||||||||||
| Investment income—net a | .08 | .17 | .19 | .18 | .14 | .10 | ||||||
| Net realized and unrealized | ||||||||||||
| gain (loss) on investments | (.81) | 1.04 | .75 | 1.29 | 1.08 | .38 | ||||||
| Total from Investment Operations | (.73) | 1.21 | .94 | 1.47 | 1.22 | .48 | ||||||
| Distributions: | ||||||||||||
| Dividends from investment income—net | (.08) | (.17) | (.19) | (.16) | (.13) | (.10) | ||||||
| Dividends from net realized gain on investments | (2.04) | (.86) | (.24) | (.86) | (.14) | (.05) | ||||||
| Total Distributions | (2.12) | (1.03) | (.43) | (1.02) | (.27) | (.15) | ||||||
| Net asset value, end of period | 7.82 | 10.67 | 10.49 | 9.98 | 9.53 | 8.58 | ||||||
| Total Return (%) | (8.30)b | 11.78 | 9.68 | 16.00 | 14.26 | 6.03 | ||||||
| Ratios/Supplemental Data (%): | ||||||||||||
| Ratio of total expenses to average net assets | 1.10c | 1.06 | 1.06 | 1.07 | 1.08 | 1.09 | ||||||
| Ratio of net expenses to average net assets | 1.10c,d | 1.06 | 1.06d | 1.07d | 1.08 | 1.09 | ||||||
| Ratio of net investment income | ||||||||||||
| to average net assets | 1.53c | 1.55 | 1.92 | 1.88 | 1.49 | 1.21 | ||||||
| Portfolio Turnover Rate | 11.50b | 62.06 | 40.75 | 34.61 | 52.47 | 12.82 | ||||||
| Net Assets, end of period ($ x 1,000) | 1,332 | 1,719 | 1,468 | 1,092 | 756 | 1,080 | ||||||
| a | Based on average shares outstanding at each month end. | |
| b | Not annualized. | |
| c | Annualized. | |
| d | The difference for the period represents less than .01%. | |
| See notes to financial statements. | ||
The Funds 65
FINANCIAL HIGHLIGHTS (continued)
| Class M Shares | ||||||||||||
| Six Months Ended | ||||||||||||
| February 29, 2008 | Year Ended August 31, | |||||||||||
| BNY Mellon Mid Cap Stock Fund | (Unaudited) | 2007 | 2006 | 2005 | 2004 | 2003 a | ||||||
| Per Share Data ($): | ||||||||||||
| Net asset value, beginning of period | 14.19 | 14.26 | 14.80 | 12.29 | 11.07 | 9.92 | ||||||
| Investment Operations: | ||||||||||||
| Investment income—net b | .01 | .06 | .08 | .04 | .04 | .05 | ||||||
| Net realized and unrealized | ||||||||||||
| gain (loss) on investments | (.45) | 2.17 | 1.21 | 3.33 | 1.21 | 1.13 | ||||||
| Total from Investment Operations | (.44) | 2.23 | 1.29 | 3.37 | 1.25 | 1.18 | ||||||
| Distributions: | ||||||||||||
| Dividends from investment income—net | (.03) | (.08) | (.01) | (.04) | (.03) | (.03) | ||||||
| Dividends from net realized gain on investments | (2.54) | (2.22) | (1.82) | (.82) | — | — | ||||||
| Total Distributions | (2.57) | (2.30) | (1.83) | (.86) | (.03) | (.03) | ||||||
| Net asset value, end of period | 11.18 | 14.19 | 14.26 | 14.80 | 12.29 | 11.07 | ||||||
| Total Return (%) | (5.17)c | 16.76 | 9.14 | 28.41 | 11.33 | 11.94 | ||||||
| Ratios/Supplemental Data (%): | ||||||||||||
| Ratio of total expenses to average net assets | .90d | .90 | .91 | .91 | .91 | .92 | ||||||
| Ratio of net expenses to average net assets | .90d,e | .90e | .91e | .91 | .91 | .92 | ||||||
| Ratio of net investment income | ||||||||||||
| to average net assets | .18d | .42 | .51 | .26 | .34 | .47 | ||||||
| Portfolio Turnover Rate | 64.16c | 112.31 | 93.33 | 83.57 | 69.03 | 67.97 | ||||||
| Net Assets, end of period ($ x 1,000) | 1,529,199 | 1,708,747 | 1,560,575 | 1,458,952 | 1,159,657 | 1,073,837 | ||||||
| a | Effective December 16, 2002, MPAM shares were redesignated as Class M shares. | |
| b | Based on average shares outstanding at each month end. | |
| c | Not annualized. | |
| d | Annualized. | |
| e | The difference for the period represents less than .01%. | |
| See notes to financial statements. | ||
66
| Investor Shares | ||||||||||||
| Six Months Ended | ||||||||||||
| February 29, 2008 | Year Ended August 31, | |||||||||||
| BNY Mellon Mid Cap Stock Fund | (Unaudited) | 2007 | 2006 | 2005 | 2004 | 2003 | ||||||
| Per Share Data ($): | ||||||||||||
| Net asset value, beginning of period | 14.07 | 14.16 | 14.73 | 12.24 | 11.03 | 9.90 | ||||||
| Investment Operations: | ||||||||||||
| Investment income (loss)—net a | (.00)b | .02 | .04 | .00b | .01 | .02 | ||||||
| Net realized and unrealized | ||||||||||||
| gain (loss) on investments | (.45) | 2.15 | 1.21 | 3.32 | 1.21 | 1.13 | ||||||
| Total from Investment Operations | (.45) | 2.17 | 1.25 | 3.32 | 1.22 | 1.15 | ||||||
| Distributions: | ||||||||||||
| Dividends from investment income—net | — | (.04) | — | (.01) | (.01) | (.02) | ||||||
| Dividends from net realized gain on investments | (2.54) | (2.22) | (1.82) | (.82) | — | — | ||||||
| Total Distributions | (2.54) | (2.26) | (1.82) | (.83) | (.01) | (.02) | ||||||
| Net asset value, end of period | 11.08 | 14.07 | 14.16 | 14.73 | 12.24 | 11.03 | ||||||
| Total Return (%) | (5.25)c | 16.44 | 8.93 | 28.05 | 11.02 | 11.66 | ||||||
| Ratios/Supplemental Data (%): | ||||||||||||
| Ratio of total expenses to average net assets | 1.16d | 1.15 | 1.15 | 1.15 | 1.16 | 1.20 | ||||||
| Ratio of net expenses to average net assets | 1.16d,e | 1.15e | 1.15e | 1.15 | 1.16 | 1.20 | ||||||
| Ratio of net investment income | ||||||||||||
| (loss) to average net assets | (.07)d | .16 | .26 | .02 | .10 | .19 | ||||||
| Portfolio Turnover Rate | 64.16c | 112.31 | 93.33 | 83.57 | 69.03 | 67.97 | ||||||
| Net Assets, end of period ($ x 1,000) | 30,414 | 35,139 | 30,433 | 26,445 | 21,810 | 18,117 | ||||||
| a | Based on average shares outstanding at each month end. | |
| b | Amount represents less than $.01 per share. | |
| c | Not annualized. | |
| d | Annualized. | |
| e | The difference for the period represents less than .01%. | |
| See notes to financial statements. | ||
The Funds 67
FINANCIAL HIGHLIGHTS (continued)
| Dreyfus Premier Shares | ||||||||||||
| Six Months Ended | ||||||||||||
| February 29, 2008 | Year Ended August 31, | |||||||||||
| BNY Mellon Mid Cap Stock Fund | (Unaudited) | 2007 | 2006 | 2005 | 2004 | 2003 a | ||||||
| Per Share Data ($): | ||||||||||||
| Net asset value, beginning of period | 13.52 | 13.74 | 14.44 | 12.09 | 10.96 | 9.81 | ||||||
| Investment Operations: | ||||||||||||
| Investment (loss)—net b | (.05) | (.07) | (.07) | (.09) | (.08) | (.06) | ||||||
| Net realized and unrealized | ||||||||||||
| gain (loss) on investments | (.42) | 2.07 | 1.19 | 3.26 | 1.21 | 1.21 | ||||||
| Total from Investment Operations | (.47) | 2.00 | 1.12 | 3.17 | 1.13 | 1.15 | ||||||
| Distributions: | ||||||||||||
| Dividends from net realized gain on investments | (2.54) | (2.22) | (1.82) | (.82) | — | — | ||||||
| Net asset value, end of period | 10.51 | 13.52 | 13.74 | 14.44 | 12.09 | 10.96 | ||||||
| Total Return (%) | (5.65)c | 15.58 | 8.13 | 27.11 | 10.31 | 11.72c | ||||||
| Ratios/Supplemental Data (%): | ||||||||||||
| Ratio of total expenses to average net assets | 1.91d | 1.90 | 1.90 | 1.88 | 1.91 | 1.95c | ||||||
| Ratio of net expenses to average net assets | 1.91d,e | 1.90e | 1.90e | 1.88 | 1.91 | 1.95c | ||||||
| Ratio of net investment (loss) | ||||||||||||
| to average net assets | (.82)d | (.53) | (.48) | (.71) | (.65) | (.58)c | ||||||
| Portfolio Turnover Rate | 64.16c | 112.31 | 93.33 | 83.57 | 69.03 | 67.97 | ||||||
| Net Assets, end of period ($ x 1,000) | 2,434 | 3,635 | 6,170 | 8,113 | 9,682 | 14,996 | ||||||
| a From the close of business on September 6, 2002 (date the fund began offering Dreyfus Premier shares) to August 31, 2003. |
| b Based on average shares outstanding at each month end. |
| c Not annualized. |
| d Annualized. |
| e The difference for the period represents less than .01%. |
| See notes to financial statements. |
68
| Class M Shares | ||||||||||||
| Six Months Ended | ||||||||||||
| February 29, 2008 | Year Ended August 31, | |||||||||||
| BNY Mellon Small Cap Stock Fund | (Unaudited) | 2007 | 2006 | 2005 | 2004 | 2003 a | ||||||
| Per Share Data ($): | ||||||||||||
| Net asset value, beginning of period | 14.82 | 15.39 | 17.18 | 14.92 | 13.17 | 10.95 | ||||||
| Investment Operations: | ||||||||||||
| Investment income (loss)—net b | .01 | .00c | (.01) | (.01) | (.02) | (.00)c | ||||||
| Net realized and unrealized | ||||||||||||
| gain (loss) on investments | (1.26) | 1.83 | .80 | 2.66 | 1.77 | 2.22 | ||||||
| Total from Investment Operations | (1.25) | 1.83 | .79 | 2.65 | 1.75 | 2.22 | ||||||
| Distributions: | ||||||||||||
| Dividends from net realized gain on investments | (2.26) | (2.40) | (2.58) | (.39) | — | — | ||||||
| Net asset value, end of period | 11.31 | 14.82 | 15.39 | 17.18 | 14.92 | 13.17 | ||||||
| Total Return (%) | (10.10)d | 12.53 | 5.04 | 17.86 | 13.29 | 20.27 | ||||||
| Ratios/Supplemental Data (%): | ||||||||||||
| Ratio of total expenses to average net assets | 1.01e | 1.01 | 1.01 | 1.01 | 1.02 | 1.04 | ||||||
| Ratio of net expenses to average net assets | 1.00e | 1.00 | 1.01f | 1.01f | 1.02f | 1.03 | ||||||
| Ratio of net investment income | ||||||||||||
| (loss) to average net assets | .19e | .02 | (.08) | (.07) | (.11) | (.02) | ||||||
| Portfolio Turnover Rate | 61.41d | 167.04 | 108.79 | 148.54 | 91.71 | 91.99 | ||||||
| Net Assets, end of period ($ x 1,000) | 605,556 | 670,238 | 667,241 | 797,808 | 747,637 | 558,172 | ||||||
| a | Effective December 16, 2002, MPAM shares were redesignated as Class M shares. | |
| b | Based on average shares outstanding at each month end. | |
| c | Amount represents less than $.01 per share. | |
| d | Not annualized. | |
| e | Annualized. | |
| f | The difference for the period represents less than .01%. | |
| See notes to financial statements. | ||
The Funds 69
FINANCIAL HIGHLIGHTS (continued)
| Investor Shares | ||||||||||||
| Six Months Ended | ||||||||||||
| February 29, 2008 | Year Ended August 31, | |||||||||||
| BNY Mellon Small Cap Stock Fund | (Unaudited) | 2007 | 2006 | 2005 | 2004 | 2003 | ||||||
| Per Share Data ($): | ||||||||||||
| Net asset value, beginning of period | 14.50 | 15.13 | 16.97 | 14.78 | 13.08 | 10.90 | ||||||
| Investment Operations: | ||||||||||||
| Investment (loss)—net a | (.00)b | (.03) | (.05) | (.05) | (.05) | (.03) | ||||||
| Net realized and unrealized | ||||||||||||
| gain (loss) on investments | (1.24) | 1.80 | .79 | 2.63 | 1.75 | 2.21 | ||||||
| Total from Investment Operations | (1.24) | 1.77 | .74 | 2.58 | 1.70 | 2.18 | ||||||
| Distributions: | ||||||||||||
| Dividends from net realized gain on investments | (2.26) | (2.40) | (2.58) | (.39) | — | — | ||||||
| Net asset value, end of period | 11.00 | 14.50 | 15.13 | 16.97 | 14.78 | 13.08 | ||||||
| Total Return (%) | (10.26)c | 12.33 | 4.78 | 17.55 | 13.00 | 20.00 | ||||||
| Ratios/Supplemental Data (%): | ||||||||||||
| Ratio of total expenses to average net assets | 1.27d | 1.26 | 1.26 | 1.26 | 1.26 | 1.29 | ||||||
| Ratio of net expenses to average net assets | 1.27d,e | 1.25 | 1.26e | 1.26e | 1.26e | 1.28 | ||||||
| Ratio of net investment (loss) | ||||||||||||
| to average net assets | (.06)d | (.23) | (.35) | (.33) | (.35) | (.27) | ||||||
| Portfolio Turnover Rate | 61.41c | 167.04 | 108.79 | 148.54 | 91.71 | 91.99 | ||||||
| Net Assets, end of period ($ x 1,000) | 3,948 | 5,341 | 6,618 | 4,692 | 3,310 | 3,578 | ||||||
| a | Based on average shares outstanding at each month end. | |
| b | Amount represents less than $.01 per share. | |
| c | Not annualized. | |
| d | Annualized. | |
| e | The difference for the period represents less than .01%. | |
| See notes to financial statements. | ||
70
| Class M Shares | ||||
| Six Months Ended | ||||
| February 29, 2008 | Year Ended | |||
| BNY Mellon U.S. Core Equity 130/30 Fund | (Unaudited) | August 31, 2007a | ||
| Per Share Data ($): | ||||
| Net asset value, beginning of period | 12.64 | 12.50 | ||
| Investment Operations: | ||||
| Investment income (loss)—netb | .04 | (.00)c | ||
| Net realized and unrealized | ||||
| gain (loss) on investments | (.69) | .14 | ||
| Total from Investment Operations | (.65) | .14 | ||
| Net asset value, end of period | 11.99 | 12.64 | ||
| Total Return (%) d | (5.14) | 1.12 | ||
| Ratios/Supplemental Data (%): | ||||
| Ratio of total expenses to average net assets | 1.77e | .50d | ||
| Ratio of net expenses to average net assets | 1.56e | .28d | ||
| Ratio of net investment income (loss) | ||||
| to average net assets | .66e | (.03)d | ||
| Portfolio Turnover Rate d | 96.22 | 11.94 | ||
| Net Assets, end of period ($ x 1,000) | 102,193 | 26,064 | ||
| a | From August 1, 2007 (commencement of operations) to August 31, 2007. | |
| b | Based on average shares outstanding at each month end. | |
| c | Amount represents less than $.01 per share. | |
| d | Not annualized. | |
| e | Annualized. | |
| See notes to financial statements. | ||
The Funds 71
FINANCIAL HIGHLIGHTS (continued)
| Investor Shares | ||||
| Six Months Ended | ||||
| February 29, 2008 | Year Ended | |||
| BNY Mellon U.S. Core Equity 130/30 Fund | (Unaudited) | August 31, 2007a | ||
| Per Share Data ($): | ||||
| Net asset value, beginning of period | 12.63 | 12.50 | ||
| Investment Operations: | ||||
| Investment income (loss)—netb,c | .00 | (.00) | ||
| Net realized and unrealized | ||||
| gain (loss) on investments | (.66) | .13 | ||
| Total from Investment Operations | (.66) | .13 | ||
| Net asset value, end of period | 11.97 | 12.63 | ||
| Total Return (%) d | (5.23) | 1.04 | ||
| Ratios/Supplemental Data (%): | ||||
| Ratio of total expenses to average net assets | 2.47e | .50d | ||
| Ratio of net expenses to average net assets | 2.24e | .28d | ||
| Ratio of net investment income | ||||
| (loss) to average net assets | .01e | (.03)d | ||
| Portfolio Turnover Rate d | 96.22 | 11.94 | ||
| Net Assets, end of period ($ x 1,000) | 10 | 10 | ||
| a | From August 1, 2007 (commencement of operations) to August 31, 2007. | |
| b | Based on average shares outstanding at each month end. | |
| c | Amount represents less than $.01 per share. | |
| d | Not annualized. | |
| e | Annualized. | |
| See notes to financial statements. | ||
72
| Class M Shares | ||||||||||||
| Six Months Ended | ||||||||||||
| February 29, 2008 | Year Ended August 31, | |||||||||||
| BNY Mellon International Fund | (Unaudited) | 2007 | 2006 | 2005 | 2004 | 2003 a | ||||||
| Per Share Data ($): | ||||||||||||
| Net asset value, beginning of period | 17.56 | 17.77 | 16.20 | 14.29 | 11.77 | 11.03 | ||||||
| Investment Operations: | ||||||||||||
| Investment income—net b | .05 | .28 | .28 | .22 | .20 | .20 | ||||||
| Net realized and unrealized | ||||||||||||
| gain (loss) on investments | (1.40) | 1.92 | 3.02 | 2.52 | 2.51 | .68 | ||||||
| Total from Investment Operations | (1.35) | 2.20 | 3.30 | 2.74 | 2.71 | .88 | ||||||
| Distributions: | ||||||||||||
| Dividends from investment income—net | (.29) | (.30) | (.23) | (.20) | (.19) | (.14) | ||||||
| Dividends from net realized gain on investments | (2.35) | (2.11) | (1.50) | (.63) | — | — | ||||||
| Total Distributions | (2.64) | (2.41) | (1.73) | (.83) | (.19) | (.14) | ||||||
| Net asset value, end of period | 13.57 | 17.56 | 17.77 | 16.20 | 14.29 | 11.77 | ||||||
| Total Return (%) | (8.88)c | 12.93 | 21.86 | 19.51 | 23.15 | 8.19 | ||||||
| Ratios/Supplemental Data (%): | ||||||||||||
| Ratio of total expenses to average net assets | 1.10d | 1.08 | 1.10 | 1.09 | 1.11 | 1.12 | ||||||
| Ratio of net expenses to average net assets | 1.10d,e | 1.08e | 1.10e | 1.09 | 1.10 | 1.05 | ||||||
| Ratio of net investment income | ||||||||||||
| to average net assets | .68d | 1.59 | 1.68 | 1.40 | 1.46 | 1.99 | ||||||
| Portfolio Turnover Rate | 40.15c | 72.83 | 70.02 | 44.92 | 45.60 | 36.52 | ||||||
| Net Assets, end of period ($ x 1,000) | 2,280,826 | 2,836,968 | 2,534,753 | 1,857,398 | 1,265,004 | 820,568 | ||||||
| a | Effective December 16, 2002, MPAM shares were redesignated as Class M shares. | |
| b | Based on average shares outstanding at each month end. | |
| c | Not annualized. | |
| d | Annualized. | |
| e | The difference for the period represents less than .01%. | |
| See notes to financial statements. | ||
The Funds 73
FINANCIAL HIGHLIGHTS (continued)
| Investor Shares | ||||||||||||
| Six Months Ended | ||||||||||||
| February 29, 2008 | Year Ended August 31, | |||||||||||
| BNY Mellon International Fund | (Unaudited) | 2007 | 2006 | 2005 | 2004 | 2003 | ||||||
| Per Share Data ($): | ||||||||||||
| Net asset value, beginning of period | 18.29 | 18.41 | 16.74 | 14.74 | 12.13 | 11.34 | ||||||
| Investment Operations: | ||||||||||||
| Investment income—net a | .03 | .23 | .26 | .24 | .49 | .13 | ||||||
| Net realized and unrealized | ||||||||||||
| gain (loss) on investments | (1.48) | 2.03 | 3.11 | 2.55 | 2.20 | .78 | ||||||
| Total from Investment Operations | (1.45) | 2.26 | 3.37 | 2.79 | 2.69 | .91 | ||||||
| Distributions: | ||||||||||||
| Dividends from investment income—net | (.26) | (.27) | (.20) | (.16) | (.08) | (.12) | ||||||
| Dividends from net realized gain on investments | (2.35) | (2.11) | (1.50) | (.63) | — | — | ||||||
| Total Distributions | (2.61) | (2.38) | (1.70) | (.79) | (.08) | (.12) | ||||||
| Net asset value, end of period | 14.23 | 18.29 | 18.41 | 16.74 | 14.74 | 12.13 | ||||||
| Total Return (%) | (9.09)b | 12.73 | 21.49 | 19.24 | 22.28 | 8.24 | ||||||
| Ratios/Supplemental Data (%): | ||||||||||||
| Ratio of total expenses to average net assets | 1.35c | 1.33 | 1.36 | 1.34 | 1.35 | 1.36 | ||||||
| Ratio of net expenses to average net assets | 1.35c,d | 1.32 | 1.36d | 1.34 | 1.35d | 1.30 | ||||||
| Ratio of net investment income | ||||||||||||
| to average net assets | .40c | 1.26 | 1.50 | 1.50 | 2.63 | 1.10 | ||||||
| Portfolio Turnover Rate | 40.15b | 72.83 | 70.02 | 44.92 | 45.60 | 36.52 | ||||||
| Net Assets, end of period ($ x 1,000) | 7,908 | 13,634 | 9,256 | 3,466 | 900 | 308 | ||||||
| a | Based on average shares outstanding at each month end. | |
| b | Not annualized. | |
| c | Annualized. | |
| d | The difference for the period represents less than .01%. | |
| See notes to financial statements. | ||
74
| Class M Shares | ||||||||||||
| Six Months Ended | ||||||||||||
| February 29, 2008 | Year Ended August 31, | |||||||||||
| BNY Mellon Emerging Markets Fund | (Unaudited) | 2007 | 2006 | 2005 | 2004 | 2003 a | ||||||
| Per Share Data ($): | ||||||||||||
| Net asset value, beginning of period | 24.42 | 24.53 | 22.69 | 17.98 | 14.92 | 12.33 | ||||||
| Investment Operations: | ||||||||||||
| Investment income (loss)—net b | (.01) | .25 | .29 | .32 | .25 | .22 | ||||||
| Net realized and unrealized | ||||||||||||
| gain (loss) on investments | 1.10 | 7.18 | 4.96 | 6.09 | 3.16 | 2.77 | ||||||
| Total from Investment Operations | 1.09 | 7.43 | 5.25 | 6.41 | 3.41 | 2.99 | ||||||
| Distributions: | ||||||||||||
| Dividends from investment income—net | (.21) | (.22) | (.44) | (.12) | (.12) | (.12) | ||||||
| Dividends from net realized gain on investments | (6.10) | (7.32) | (2.97) | (1.58) | (.23) | (.28) | ||||||
| Total Distributions | (6.31) | (7.54) | (3.41) | (1.70) | (.35) | (.40) | ||||||
| Net asset value, end of period | 19.20 | 24.42 | 24.53 | 22.69 | 17.98 | 14.92 | ||||||
| Total Return (%) | 3.32c | 35.81 | 24.59 | 36.62 | 22.93 | 25.18 | ||||||
| Ratios/Supplemental Data (%): | ||||||||||||
| Ratio of total expenses to average net assets | 1.52d | 1.50 | 1.52 | 1.51 | 1.51 | 1.61 | ||||||
| Ratio of net expenses to average net assets | 1.52d,e | 1.50e | 1.52 | 1.51e | 1.50 | 1.35 | ||||||
| Ratio of net investment income (loss) | ||||||||||||
| to average net assets | (.12)d | 1.05 | 1.18 | 1.52 | 1.39 | 1.77 | ||||||
| Portfolio Turnover Rate | 34.80c | 60.72 | 49.06 | 42.97 | 46.36 | 26.43 | ||||||
| Net Assets, end of period ($ x 1,000) | 1,340,293 | 1,521,024 | 1,312,055 | 1,337,801 | 1,001,344 | 526,049 | ||||||
| a | Effective December 16, 2002, MPAM shares were redesignated as Class M shares. | |
| b | Based on average shares outstanding at each month end. | |
| c | Not annualized. | |
| d | Annualized. | |
| e | The difference for the period represents less than .01%. | |
| See notes to financial statements. | ||
The Funds 75
FINANCIAL HIGHLIGHTS (continued)
| Investor Shares | ||||||||||||
| Six Months Ended | ||||||||||||
| February 29, 2008 | Year Ended August 31, | |||||||||||
| BNY Mellon Emerging Markets Fund | (Unaudited) | 2007 | 2006 | 2005 | 2004 | 2003 | ||||||
| Per Share Data ($): | ||||||||||||
| Net asset value, beginning of period | 24.60 | 24.65 | 22.79 | 18.08 | 15.00 | 12.38 | ||||||
| Investment Operations: | ||||||||||||
| Investment income (loss)—net a | (.04) | .15 | .26 | .30 | .17 | .17 | ||||||
| Net realized and unrealized | ||||||||||||
| gain (loss) on investments | 1.10 | 7.27 | 4.96 | 6.09 | 3.22 | 2.82 | ||||||
| Total from Investment Operations | 1.06 | 7.42 | 5.22 | 6.39 | 3.39 | 2.99 | ||||||
| Distributions: | ||||||||||||
| Dividends from investment income—net | (.15) | (.15) | (.39) | (.10) | (.08) | (.09) | ||||||
| Dividends from net realized gain on investments | (6.10) | (7.32) | (2.97) | (1.58) | (.23) | (.28) | ||||||
| Total Distributions | (6.25) | (7.47) | (3.36) | (1.68) | (.31) | (.37) | ||||||
| Net asset value, end of period | 19.41 | 24.60 | 24.65 | 22.79 | 18.08 | 15.00 | ||||||
| Total Return (%) | 3.21b | 35.52 | 24.29 | 36.26 | 22.68 | 24.99 | ||||||
| Ratios/Supplemental Data (%): | ||||||||||||
| Ratio of total expenses to average net assets | 1.77c | 1.75 | 1.78 | 1.72 | 1.84 | 1.85 | ||||||
| Ratio of net expenses to average net assets | 1.77c,d | 1.74 | 1.78 | 1.72d | 1.83 | 1.60 | ||||||
| Ratio of net investment income | ||||||||||||
| (loss) to average net assets | (.38)c | .65 | 1.07 | 1.48 | 1.14 | 1.12 | ||||||
| Portfolio Turnover Rate | 34.80b | 60.72 | 49.06 | 42.97 | 46.36 | 26.43 | ||||||
| Net Assets, end of period ($ x 1,000) | 10,537 | 10,846 | 11,761 | 4,557 | 3,424 | 313 | ||||||
| a | Based on average shares outstanding at each month end. | |
| b | Not annualized. | |
| c | Annualized. | |
| d | The difference for the period represents less than .01%. | |
| See notes to financial statements. | ||
76
| Class M Shares | ||||||||||||
| Six Months Ended | ||||||||||||
| February 29, 2008 | Year Ended August 31, | |||||||||||
| BNY Mellon Balanced Fund | (Unaudited) | 2007 | 2006 | 2005 | 2004 | 2003 a | ||||||
| Per Share Data ($): | ||||||||||||
| Net asset value, beginning of period | 12.91 | 13.17 | 12.79 | 11.56 | 10.79 | 10.28 | ||||||
| Investment Operations: | ||||||||||||
| Investment income—net b | .17 | .29 | .27 | .22 | .20 | .25 | ||||||
| Net realized and unrealized | ||||||||||||
| gain (loss) on investments | (.32) | 1.21 | .64 | 1.25 | .78 | .51 | ||||||
| Total from Investment Operations | (.15) | 1.50 | .91 | 1.47 | .98 | .76 | ||||||
| Distributions: | ||||||||||||
| Dividends from investment income—net | (.23) | (.32) | (.30) | (.24) | (.21) | (.25) | ||||||
| Dividends from net realized gain on investments | (1.19) | (1.44) | (.23) | — | — | — | ||||||
| Total Distributions | (1.42) | (1.76) | (.53) | (.24) | (.21) | (.25) | ||||||
| Net asset value, end of period | 11.34 | 12.91 | 13.17 | 12.79 | 11.56 | 10.79 | ||||||
| Total Return (%) | (1.57)c | 12.09 | 7.22 | 12.78 | 9.13 | 7.68 | ||||||
| Ratios/Supplemental Data (%): | ||||||||||||
| Ratio of total expenses to average net assets | .57d | .58 | .60 | .58 | .59 | .62 | ||||||
| Ratio of net expenses to average net assets | .57d,e | .58e | .60 | .58 | .59e | .62 | ||||||
| Ratio of net investment income | ||||||||||||
| to average net assets | 2.69d | 2.26 | 2.10 | 1.81 | 1.77 | 2.41 | ||||||
| Portfolio Turnover Rate | 29.97c,f | 89.78f | 64.43f | 62.64f | 61.77f | 83.22 | ||||||
| Net Assets, end of period ($ x 1,000) | 336,511 | 358,068 | 342,110 | 351,525 | 342,326 | 348,402 | ||||||
| a Effective December 16, 2002, MPAM shares were redesignated as Class M shares. |
| b Based on average shares outstanding at each month end. |
| c Not annualized. |
| d Annualized. |
| e The difference for the period represents less than .01%. |
| f The portfolio turnover rates excluding mortgage dollar roll transactions for the periods ended February 29, 2008, August 31, 2007,August 31, 2006,August 31, 2005 and |
| August 31, 2004 were 29.50%, 75.75%, 61.53%, 45.79% and 55.45%, respectively. |
| See notes to financial statements. |
The Funds 77
FINANCIAL HIGHLIGHTS (continued)
| Investor Shares | ||||||||||||
| Six Months Ended | ||||||||||||
| February 29, 2008 | Year Ended August 31, | |||||||||||
| BNY Mellon Balanced Fund | (Unaudited) | 2007 | 2006 | 2005 | 2004 | 2003 | ||||||
| Per Share Data ($): | ||||||||||||
| Net asset value, beginning of period | 12.96 | 13.21 | 12.83 | 11.57 | 10.79 | 10.27 | ||||||
| Investment Operations: | ||||||||||||
| Investment income—net a | .15 | .26 | .24 | .18 | .17 | .23 | ||||||
| Net realized and unrealized | ||||||||||||
| gain (loss) on investments | (.33) | 1.21 | .63 | 1.26 | .77 | .51 | ||||||
| Total from Investment Operations | (.18) | 1.47 | .87 | 1.44 | .94 | .74 | ||||||
| Distributions: | ||||||||||||
| Dividends from investment income—net | (.21) | (.28) | (.26) | (.18) | (.16) | (.22) | ||||||
| Dividends from net realized gain on investments | (1.19) | (1.44) | (.23) | — | — | — | ||||||
| Total Distributions | (1.40) | (1.72) | (.49) | (.18) | (.16) | (.22) | ||||||
| Net asset value, end of period | 11.38 | 12.96 | 13.21 | 12.83 | 11.57 | 10.79 | ||||||
| Total Return (%) | (1.73)b | 11.73 | 6.93 | 12.55 | 8.76 | 7.52 | ||||||
| Ratios/Supplemental Data (%): | ||||||||||||
| Ratio of total expenses to average net assets | .90c | .86 | .85 | .85 | .85 | .87 | ||||||
| Ratio of net expenses to average net assets | .90c,d | .86d | .85 | .85 | .85d | .87 | ||||||
| Ratio of net investment income | ||||||||||||
| to average net assets | 2.37c | 1.98 | 1.86 | 1.45 | 1.45 | 2.13 | ||||||
| Portfolio Turnover Rate | 29.97b,e | 89.78e | 64.43e | 62.64e | 61.77e | 83.22 | ||||||
| Net Assets, end of period ($ x 1,000) | 4,271 | 4,274 | 3,727 | 1,848 | 665 | 431 | ||||||
| a Based on average shares outstanding at each month end. |
| b Not annualized. |
| c Annualized. |
| d The difference for the period represents less than .01%. |
| e The portfolio turnover rates excluding mortgage dollar roll transactions for the periods ended February 29, 2008, August 31, 2007,August 31, 2006,August 31, 2005 and |
| August 31, 2004 were 29.50%, 75.75%, 61.53%, 45.79% and 55.45%, respectively. |
| See notes to financial statements. |
78
NOTES TO FINANCIAL STATEMENTS (Unaudited)
NOTE 1—General:
BNY Mellon Funds Trust (the “Trust”) was organized as a Massachusetts business trust which is registered under the Investment Company Act of 1940, as amended (the “Act”), as an open-end management investment company and operates as a series company currently comprised of seventeen series including the following diversified equity funds and balanced fund: BNY Mellon Large Cap Stock Fund, BNY Mellon Income Stock Fund, BNY Mellon Mid Cap Stock Fund, BNY Mellon Small Cap Stock Fund, BNY Mellon U.S. Core Equity 130/30 Fund, BNY Mellon International Fund, BNY Mellon Emerging Markets Fund and BNY Mellon Balanced Fund (each, a “fund” and collectively, the “funds”). Effective March, 31, 2008, the Trust changed its name from “Mellon Funds Trust” to its current name and each fund added “BNY” to the beginning of its name. BNY Mellon Large Cap Stock Fund, BNY Mellon Mid Cap Stock Fund, BNY Mellon Small Cap Stock Fund and BNY Mellon U.S. Core Equity 130/30 Fund seek capital appreciation and BNY Mellon Income Stock Fund seeks total return (consisting of capital appreciation and income). BNY Mellon International Fund and BNY Mellon Emerging Markets Fund seek long-term capital growth. BNY Mellon Balanced Fund seeks long-term growth of principal in conjunction with current income.
Mellon Fund Advisers, a division of The Dreyfus Corporation (the “Manager” or “Dreyfus”), serves as each fund’s investment adviser (“Investment Adviser”). Mellon Bank, N.A. (“Mellon Bank”), an affiliate of Dreyfus, serves as administrator for the funds pursuant to an Administration Agreement with the Trust (the “Administration Agreement”). Mellon Bank has entered into a Sub-Administration Agreement with Dreyfus pursuant to which Mellon Bank pays Dreyfus for performing certain administrative services. Dreyfus and Mellon Bank are wholly-owned subsidiaries of The Bank of New York Mellon Corporation (“BNY Mellon”). MBSC Securities Corporation (the “Distributor”), a wholly-owned sub-
sidiary of Dreyfus, is the distributor of each fund’s shares, which are sold without a sales charge.
The Trust is authorized to issue an unlimited number of shares of beneficial interest, par value $.001 per share, in each of the Class M and Investor class shares of each fund and in the Dreyfus Premier class shares of BNY Mellon Mid Cap Stock Fund. Dreyfus Premier shares of BNY Mellon Mid Cap Stock Fund are subject to a contingent deferred sales charge (“CDSC”) imposed on redemptions of Dreyfus Premier shares made within six years of purchase and automatically convert to Investor class shares after six years. BNY Mellon Mid Cap Stock Fund does not offer Dreyfus Premier shares, except in connection with dividend reinvestment and permitted exchanges of Dreyfus Premier shares. Each class of shares has similar rights and privileges, except with respect to the expenses borne by and the shareholder services offered to each class, the shareholder services plan applicable to the Investor shares and Dreyfus Premier shares and the Rule 12b-1 plan applicable to the Dreyfus Premier shares, the allocation of certain transfer agency costs and certain voting rights. Income, expenses (other than expenses attributable to a specific class), and realized and unrealized gains or losses on investments are allocated to each class of shares based on its relative net assets.
As of February 29, 2008, MBC Investments Corp., an indirect subsidiary of BNY Mellon, held all of the outstanding Investor shares of BNY Mellon U.S. Core Equity 130/30 Fund.
The Trust accounts separately for the assets, liabilities and operations of each series. Expenses directly attributable to each series are charged to that series’ operations; expenses that are applicable to all series are allocated among them on a pro rata basis.
The funds’ financial statements are prepared in accordance with U.S. generally accepted accounting principles, which may require the use of management estimates and assumptions. Actual results could differ from those estimates.
The Funds 79
NOTES TO FINANCIAL STATEMENTS (Unaudited) (continued)
NOTE 2—Significant Accounting Policies:
(a) Portfolio valuation: Investments in equity securities are valued at the last sales price on the securities exchange or national securities market on which such securities are primarily traded. Securities listed on the National Market System for which market quotations are available are valued at the official closing price or, if there is no official closing price that day, at the last sales price. Securities not listed on an exchange or the national securities market, or securities for which there were no transactions, are valued at the average of the most recent bid and asked prices, except for open short positions, where the asked price is used for valuation purposes. Bid price is used when no asked price is available. Registered open-end investment companies that are not traded on an exchange are valued at their net asset value. When market quotations or official closing prices are not readily available, or are determined not to reflect accurately fair value, such as when the value of the security has been significantly affected by events after the close of the exchange or market on which the security is principally traded (for example, a foreign exchange or market), but before the funds calculate their net asset values, the funds may value these investments at fair value as determined in accordance with the procedures approved by the Trust’s Board. Fair valuing of securities may be determined with the assistance of a pricing service using calculations based on indices of domestic securities and other appropriate indicators, such as prices of relevant ADRs and futures contracts. For other securities that are fair valued by the Trust’s Board, certain factors may be considered such as: fundamental analytical data, the nature and duration of restrictions on disposition, an evaluation of the forces that influence the market in which securities are purchased and sold and public trading in similar securities of the issuer or comparable issuers. Financial futures and options, which are traded on an exchange, are valued at the last sales
price on the securities exchange on which such securities are primarily traded or at the last sales price on the national securities market on each business day. Options traded over-the-counter are priced at the mean between the bid and asked price. Investments denominated in foreign currencies are translated to U.S. dollars at the prevailing rates of exchange. Forward currency exchange contracts are valued at the forward rate.
BNY Mellon Balanced Fund
Most debt securities are valued each business day by an independent pricing service (the “Service”) approved by the Trust’s Board. Securities listed on the National Market System for which market quotations are available are valued at the official closing price or, if there is no official closing price that day, at the last sales price. Debt securities for which quoted bid prices are readily available and are representative of the bid side of the market in the judgment of the Service are valued at the mean between the quoted bid prices (as obtained by the Service from dealers in such securities) and asked prices (as calculated by the Service based upon its evaluation of the market for such securities). Other debt securities (which constitute a majority of the portfolio securities) are valued as determined by the Service, based on methods which include consideration of: yields or prices of securities of comparable quality, coupon, maturity and type; indications as to values from dealers; and general market conditions. Restricted securities, as well as securities or other assets for which recent market quotations are not readily available, that are not valued by a pricing service approved by the Trust’s Board, or are determined by the fund not to reflect accurately fair value, are valued at fair value as determined in good faith under the direction of the Trust’s Board. The factors that may be considered when fair valuing a security include fundamental analytical data, the nature and duration of restrictions on disposition, an evaluation of the forces that influence the market in which the securities are purchased and sold and public trading in similar securities of the issuer or comparable issuers.
80
The Financial Accounting Standards Board (“FASB”) released Statement of Financial Accounting Standards No. 157 “Fair Value Measurements” (“FAS 157”). FAS 157 establishes an authoritative definition of fair value, sets out a framework for measuring fair value, and requires additional disclosures about fair-value measure-ments.The application of FAS 157 is required for fiscal years beginning after November 15, 2007 and interim periods within those fiscal years. Management does not believe that the application of this standard will have a material impact on the financial statements of the funds.
(b) Securities transactions and investment income: Securities transactions are recorded on a trade date basis. Realized gains and losses from securities transactions are recorded on the identified cost basis. Dividend income is recorded on the ex-dividend date and interest income, including accretion of discount and amortization of premium on investments, is recognized on the accrual basis.
The funds have arrangements with the custodian and cash management banks whereby the funds may receive earnings credits when positive cash balances are maintained, which are used to offset custody and cash management fees. For financial reporting purposes, the funds include net earnings credits as expense offsets in the Statements of Operations.
Pursuant to a securities lending agreement with Mellon Bank, the funds may lend securities to certain qualified institutions. It is the funds’ policy, that at origination, all loans are secured by collateral of at least 102% of the value of U.S. securities loaned and 105% of the value of foreign securities loaned. Collateral equivalent to at least 100% of the market value of securities on loan is maintained at all times. Collateral is either in the form of cash, which can be invested in certain money market mutual funds managed by Dreyfus, U.S. Government and Agency securities or Letters of Credit. The funds are entitled to receive all income on securities loaned, in addition to income earned as a result of the lending transaction. Although each secu-
rity loaned is fully collateralized, the funds bear the risk of delay in recovery of, or loss of rights in, the securities loaned should a borrower fail to return the securities in a timely manner. Table 1 summarizes the amount Mellon Bank earned from each relevant fund from lending portfolio securities, pursuant to the securities lending agreement during the period ended February 29, 2008.
| Table 1. | ||
| BNY Mellon Large Cap Stock Fund | $ 25,421 | |
| BNY Mellon Income Stock Fund | 1,637 | |
| BNY Mellon Mid Cap Stock Fund | 251,675 | |
| BNY Mellon Small Cap Stock Fund | 72,369 | |
| BNY Mellon Emerging Markets Fund | 8,399 | |
| BNY Mellon Balanced Fund | 34,191 |
(c) Affiliated issuers: Investments in other investment companies advised by Dreyfus are defined as “affiliated” in the Act.
(d) Foreign currency transactions: BNY Mellon Emerging Markets Fund and BNY Mellon International Fund do not isolate that portion of the results of operations resulting from changes in foreign exchange rates on investments from the fluctuations arising from changes in the market prices of securities held. Such fluctuations are included with the net realized and unrealized gains or losses from investments.
Net realized foreign exchange gains or losses arise from sales and maturities of short-term securities, sales of foreign currencies, currency gains or losses realized on securities transactions and the difference between the amounts of dividends, interest, and foreign withholding taxes recorded on the fund’s books and the U.S. dollar equivalent of the amounts actually received or paid. Net unrealized foreign exchange gains and losses arise from changes in the value of assets and liabilities other than investments in securities, resulting from changes in exchange rates. Such gains and losses are included with net realized and unrealized gain or loss on investments.
The Funds 81
NOTES TO FINANCIAL STATEMENTS (Unaudited) (continued)
(e) Foreign currency exchange contracts: Certain funds may enter into forward currency exchange contracts to hedge their exposure to changes in foreign currency exchange rates on their foreign portfolio holdings and to settle foreign currency transactions. When executing forward currency exchange contracts, a fund is obligated to buy or sell a foreign currency at a specified rate on a certain date in the future.With respect to sales of forward currency exchange contracts, a fund would incur a loss if the value of the contract increases between the date the forward contract is opened and the date the forward contract is closed.The fund realizes a gain if the value of the contract decreases between those dates. With respect to purchases of forward currency exchange contracts, a fund would incur a loss if the value of the contract decreases between the date the forward contract is opened and the date the forward contract is closed. A fund realizes a gain if the value of the contract increases between those dates.The fund is also exposed to credit risk associated with counterparty nonperformance on these forward currency exchange contracts, which is typically limited to the unrealized gain on each open contract. As of February 29, 2008, there were no open forward currency exchange contracts. Funds may also enter into foreign exchange contracts at the prevailing spot rate in order to facilitate the settlement of purchases and sales of foreign securities. Table 2 summarizes open foreign exchange contracts for BNY Mellon International Fund and BNY Mellon Emerging Markets Fund at February 29, 2008.
(f) Concentration of risk: BNY Mellon U. S. Core Equity 130/30 Fund enters into short sales. Short sales involve selling a security the fund does not own in anticipation that the security’s price will decline. Short sales may involve substantial risk and “leverage.” The fund may be required to buy the security sold short at a time when the security has appreciated in value, thus resulting in a loss to the fund. Short positions in stocks involve more risk than long positions in stocks. In theory, stocks sold short have unlimited risk. BNY Mellon Emerging
Markets Fund invests in equity securities traded on the stock markets of emerging market countries, which can be extremely volatile due to political, social and economic factors. Risks include changes in currency exchange rates, a lack of comprehensive company information, political instability, differing auditing and legal standards, less diverse, less mature economic structures and less liquidity. BNY Mellon Balanced Fund invests in debt securities. Failure of an issuer of the debt securities to make timely interest or principal payments, or a decline or the perception of a decline in the credit quality of a debt security, can cause the debt security’s price to fall, potentially lowering the fund’s share price. In addition, the value of debt securities may decline due to general market conditions that are not specifically related to a particular company, such as real or perceived adverse economic conditions, changes in outlook for corporate earnings, changes in interest or currency rates or adverse investor sentiment. They may also decline because of factors that affect a particular industry.
(g) Dividends to shareholders: Dividends payable to shareholders are recorded by the funds on the ex-dividend date. BNY Mellon Large Cap Stock Fund, BNY Mellon Income Stock Fund and BNY Mellon Balanced Fund declare and pay dividends from investment income-net monthly. BNY Mellon Mid Cap Stock Fund, BNY Mellon Small Cap Stock Fund, BNY Mellon U.S. Core Equity Fund 130/30 Fund, BNY Mellon International Fund and BNY Mellon Emerging Markets Fund declare and pay dividends from investment income-net annually. With respect to each series, dividends from net realized capital gains, if any, are normally declared and paid annually, but the funds may make distributions on a more frequent basis to comply with the distribution requirements of the Internal Revenue Code of 1986, as amended (the “Code”). To the extent that net realized capital gains can be offset by capital loss carryovers of that fund, it is the policy of the fund not to distribute such gains. Income and capital gain distributions are determined in accordance with
82
income tax regulations, which may differ from U.S. generally accepted accounting principles.
(h) Federal income taxes: It is the policy of each fund to continue to qualify as a regulated investment company, if such qualification is in the best interests of its shareholders, by complying with the applicable provisions of the Code, and to make distributions of taxable income sufficient to relieve it from substantially all federal income and excise taxes. For federal income tax purposes, each series is treated as a single entity for the purpose of determining such qualification.
During the current year, the funds adopted FASB Interpretation No. 48 “Accounting for Uncertainty in Income Taxes” (“FIN 48”). FIN 48 provides guidance for how uncertain tax positions should be recognized, measured, presented and disclosed in the financial statements. FIN 48 requires the evaluation of tax positions taken or expected to be taken in the course of preparing the funds’ tax returns to determine whether the tax positions are “more-likely-than-not” of being sustained by the applicable tax authority.Tax positions not deemed to meet the more-likely-than-not threshold would be recorded as a
| Table 2. | ||||||||
| BNY Mellon International Fund | ||||||||
| Foreign | Unrealized | |||||||
| Currency | Appreciation | |||||||
| Foreign Currency Exchange Contracts | Amounts | Cost ($) | Value ($) | (Depreciation) ($) | ||||
| Purchases: | ||||||||
| Euro, expiring 3/3/2008 | 3,146,058 | 4,768,912 | 4,780,121 | 11,209 | ||||
| Japanese Yen, expiring 3/3/2008 | 74,573,725 | 703,991 | 718,022 | 14,031 | ||||
| Norwegian Krone, expiring 3/4/2008 | 17,388,628 | 3,336,268 | 3,338,125 | 1,857 | ||||
| Swiss Franc, expiring 3/4/2008 | 2,125,281 | 2,033,761 | 2,040,009 | 6,248 | ||||
| Sales: | Proceeds ($) | |||||||
| Australian Dollar, expiring 3/4/2008 | 1,649,122 | 1,536,652 | 1,538,301 | (1,649) | ||||
| British Pound, expiring 3/3/2008 | 745,630 | 1,481,045 | 1,482,536 | (1,491) | ||||
| British Pound, expiring 3/4/2008 | 1,705,489 | 3,386,760 | 3,391,024 | (4,264) | ||||
| Euro, expiring 3/3/2008 | 2,685,723 | 4,061,619 | 4,080,688 | (19,069) | ||||
| Euro, expiring 3/3/2008 | 89,014 | 134,616 | 135,248 | (632) | ||||
| Euro, expiring 3/4/2008 | 751,908 | 1,140,118 | 1,142,449 | (2,331) | ||||
| Japanese Yen, expiring 3/4/2008 | 234,516,942 | 2,254,537 | 2,258,010 | (3,473) | ||||
| Japanese Yen, expiring 3/4/2008 | 867,878,030 | 8,343,377 | 8,356,230 | (12,853) | ||||
| Total | (12,417) | |||||||
| BNY Mellon Emerging Markets Fund | ||||||||
| Foreign | Unrealized | |||||||
| Currency | Appreciation | |||||||
| Foreign Currency Exchange Contracts | Amounts | Cost ($) | Value ($) | (Depreciation) ($) | ||||
| Purchases: | ||||||||
| Philippines Peso, expiring 3/3/2008 | 10,691,335 | 267,618 | 264,637 | (2,981) | ||||
| Philippines Peso, expiring 3/4/2008 | 1,527,090 | 38,273 | 37,799 | (474) | ||||
| Sales: | Proceeds ($) | |||||||
| Hong Kong Dollar, expiring 3/3/2008 | 1,890,499 | 242,956 | 242,964 | (8) | ||||
| Mexican Peso, expiring 3/3/2008 | 375,665 | 35,071 | 35,066 | 5 | ||||
| Thai Baht, expiring 3/3/2008 | 4,934,114 | 153,951 | 156,184 | (2,233) | ||||
| Total | (5,691) | |||||||
The Funds 83
NOTES TO FINANCIAL STATEMENTS (Unaudited) (continued)
tax benefit or expense in the current year. The adoption of FIN 48 had no impact on the operations of the funds for the period ended February 29, 2008.
Each of the tax years in the three-year period ended August 31, 2007, remains subject to examination by the Internal Revenue Service and state taxing authorities.
Table 3 summarizes each relevant fund’s tax character of distributions paid to shareholders during the fiscal year ended August 31, 2007.The tax character of current year distributions will be determined at the end of the current fiscal year.
NOTE 3—Bank Line of Credit:
The funds (except for BNY Mellon U.S. Core Equity 130/30 Fund) participate with other Dreyfus-managed funds in a $100 million unsecured line of credit primarily to be utilized for temporary or emergency purposes, including the financing of redemptions. Interest is charged to the funds based on prevailing market rates in effect at the time of borrowing. During the period ended February 29, 2008, BNY Mellon Mid Cap Stock Fund and BNY Mellon Small Cap Stock did not borrow under the line of credit.
The average daily amount of borrowings outstanding under the line of credit during the period ended February 29, 2008 for BNY Mellon Large Cap Stock Fund was approximately $326,400, with a related weighted average annualized interest rate of 4.58% .
The average daily amount of borrowings outstanding under the line of credit during the period ended
February 29, 2008 for BNY Mellon Income Stock Fund was approximately $2,245,700, with a related weighted average annualized interest rate of 5.14% .
Prime broker fees charged on BNY Mellon U.S. Core Equity 130/30 Fund are included in interest expense.
The average daily amount of borrowings outstanding under the line of credit during the period ended February 29, 2008 for BNY Mellon International Fund was approximately $2,076,900, with a related weighted average annualized interest rate of 4.75% .
The average daily amount of borrowings outstanding under the line of credit during the period ended February 29, 2008 for BNY Mellon Emerging Markets Fund was approximately $909,300, with a related weighted average annualized interest rate of 4.72% .
The average daily amount of borrowings outstanding under the line of credit during the period ended February 29, 2008 for BNY Mellon Balanced Fund was approximately $19,100, with a related weighted average annualized interest rate of 3.78% .
NOTE 4—Investment Advisory Fee, Administration
Fee and Other Transactions With Affiliates:
(a) Fees payable by the funds pursuant to the provisions of an Investment Advisory Agreement with the Investment Adviser are payable monthly, computed on the average daily value of each fund’s net assets at the following annual rates: .65% of BNY Mellon Large Cap Stock Fund, .65% of BNY Mellon Income Stock Fund, .75% of BNY Mellon Mid Cap Stock Fund, .85% of BNY Mellon Small
| Table 3. | ||||
| Ordinary | Long-Term | |||
| Income ($) | Capital Gains ($) | |||
| BNY Mellon Large Cap Stock Fund | 14,566,348 | 43,131,986 | ||
| BNY Mellon Income Stock Fund | 7,733,999 | 35,547,261 | ||
| BNY Mellon Mid Cap Stock Fund | 44,446,751 | 203,767,126 | ||
| BNY Mellon Small Cap Stock Fund | 4,019,569 | 92,329,501 | ||
| BNY Mellon International Fund | 105,535,739 | 236,503,742 | ||
| BNY Mellon Emerging Markets Fund | 73,233,513 | 314,552,607 | ||
| BNY Mellon Balanced Fund | 9,747,839 | 36,648,873 | ||
| 84 |
Cap Stock Fund, .80% of BNY Mellon U.S. Core Equity 130/30 Fund, .85% of BNY Mellon International Fund, 1.15% of BNY Mellon Emerging Markets Fund and .65% (equity investments), .40% (debt securities) and .15% (money market investments and other underlying BNY Mellon funds) of BNY Mellon Balanced Fund.
For BNY Mellon U.S. Core Equity 130/30 Fund, the Investment Adviser has contractually agreed through August 31, 2008, to waive receipt of its fees and/or assume the expenses of the fund so that the direct expenses of neither class, exclusive of taxes, brokerage commissions, interest on borrowings, shareholder services fees, prime broker fees, substitute dividend expenses on securities sold short and extraordinary expenses, exceed an annual rate of 1.05% of the value of the average daily net assets of the respective class.The reduction in investment advisory fee, pursuant to the undertaking, amounted to $32,922 during the period ended February 29, 2008.
Pursuant to the Administration Agreement with Mellon Bank, Mellon Bank provides or arranges for fund accounting, transfer agency and other fund administration services and receives a fee based on the total net assets of the Trust based on the following rates:
| 0 up to $6 billion | .15% | |
| $6 billion up to $12 billion | .12% | |
| In excess of $12 billion | .10% |
No administration fee is applied to assets held by BNY Mellon Balanced Fund, which are invested in cash or money market instruments or shares of certain other series of the Trust.
Mellon Bank has entered into a Sub-Administration Agreement with Dreyfus pursuant to which Mellon Bank pays Dreyfus for performing certain administrative services.
During the period ended February 29, 2008, the Distributor retained $1,761 from CDSC on redemptions of BNY Mellon Mid Cap Stock Fund’s Dreyfus Premier shares.
(b) BNY Mellon Mid Cap Stock Fund has adopted a Distribution Plan (the “Plan”) pursuant to Rule 12b-1 under the Act for distributing its Dreyfus Premier shares.
BNY Mellon Mid Cap Stock Fund pays the Distributor a fee at an annual rate of .75% of the value of the fund’s average daily net assets attributable to its Dreyfus Premier shares. During the period ended February 29, 2008, BNY Mellon Mid Cap Stock Fund’s Dreyfus Premier shares were charged $11,882 pursuant to the Plan.
(c) The funds have adopted a Shareholder Services Plan with respect to their Investor shares and BNY Mellon Mid Cap Stock Fund has adopted a Shareholder Services Plan with respect to its Dreyfus Premier shares. Each fund pays the Distributor for the provision of certain services to holders of Investor shares and Dreyfus Premier shares a fee at an annual rate of .25% of the value of the average daily net assets attributable to Investor shares and Dreyfus Premier shares, respectively. The services provided may include personal services relating to shareholder accounts, such as answering shareholder inquiries regarding a fund, and providing reports and other information, and services related to the maintenance of such shareholder accounts. The Shareholder Services Plan allows the Distributor to make payments from the shareholder services fees it collects from each fund to compensate service agents (certain banks, securities brokers or dealers and other financial institutions) in respect of these services. Table 4 summarizes the amounts Investor shares and Dreyfus Premier shares were charged during the period ended February 29, 2008, pursuant to the Shareholder Services Plan. Additional fees included in shareholder servicing costs in the Statements of Operations include fees paid to the transfer agent.
| Table 4. | ||
| BNY Mellon Large Cap Stock Fund | $15,276 | |
| BNY Mellon Income Stock Fund | 2,112 | |
| BNY Mellon Mid Cap Stock Fund, | ||
| Investor shares | 42,917 | |
| BNY Mellon Mid Cap Stock Fund, | ||
| Dreyfus Premier shares | 3,961 | |
| BNY Mellon Small Cap Stock Fund | 6,258 | |
| BNY Mellon U.S. Core Equity 130/30 Fund | 13 | |
| BNY Mellon International Fund | 16,187 | |
| BNY Mellon Emerging Markets Fund | 13,530 | |
| BNY Mellon Balanced Fund | 5,204 |
The Funds 85
NOTES TO FINANCIAL STATEMENTS (Unaudited) (continued)
The funds compensate The Bank of New York, a subsidiary of BNY Mellon and a Dreyfus affiliate, under a cash management agreement for performing cash management services related to fund subscriptions and redemptions. Table 5 summarizes the amount each fund was charged during the period ended February 29, 2008, pursuant to the cash management agreement.
| Table 5. | ||||
| BNY Mellon Large Cap Stock Fund | $ | 59 | ||
| BNY Mellon Income Stock Fund | 21 | |||
| BNY Mellon Mid Cap Stock Fund | 2,959 | |||
| BNY Mellon Small Cap Stock Fund | 178 | |||
| BNY Mellon U.S. Core Equity 130/30 Fund | 4 | |||
| BNY Mellon International Fund | 121 | |||
| BNY Mellon Emerging Markets Fund | 144 | |||
| BNY Mellon Balanced Fund | 9 |
The funds compensate Mellon Bank under a cash management agreement for performing cash management services related to fund subscriptions and redemptions. Table 6 summarizes the amount each fund was charged during the period ended February 29, 2008, pursuant to the cash management agreement.
| Table 6. | ||
| BNY Mellon Large Cap Stock Fund | $ 227 | |
| BNY Mellon Income Stock Fund | 72 | |
| BNY Mellon Mid Cap Stock Fund | 9,851 | |
| BNY Mellon Small Cap Stock Fund | 632 | |
| BNY Mellon U.S. Core Equity 130/30 Fund | 15 | |
| BNY Mellon International Fund | 521 | |
| BNY Mellon Emerging Markets Fund | 596 | |
| BNY Mellon Balanced Fund | 37 |
All funds except BNY Mellon International Fund and BNY Mellon Emerging Markets Fund compensate Mellon Bank under a custody agreement with Mellon Bank and BNY Mellon International Fund and BNY Mellon Emerging Markets Fund compensate Mellon Trust of New England, N.A. under a custody agreement with Mellon Trust of New England, N.A. for providing custo-
dial services for the relevant funds. Table 7 summarizes the amount each fund was charged during the period ended February 29, 2008, pursuant to the custody agreements.
| Table 7. | ||||
| BNY Mellon Large Cap Stock Fund | $ | 72,325 | ||
| BNY Mellon Income Stock Fund | 20,619 | |||
| BNY Mellon Mid Cap Stock Fund | 61,692 | |||
| BNY Mellon Small Cap Stock Fund | 33,767 | |||
| BNY Mellon U.S. Core Equity 130/30 Fund | 23,899 | |||
| BNY Mellon International Fund | 1,396,408 | |||
| BNY Mellon Emerging Markets Fund | 1,723,079 | |||
| BNY Mellon Balanced Fund | 18,533 |
During the period ended February 29, 2008, each fund was charged $2,411 for services performed by the Chief Compliance Officer.
Table 8 summarizes the components of “Due to the Dreyfus Corporation and affiliates” in the Statements of Assets and Liabilities for each fund.
(d) Each trustee who is not an “affiliated person” as defined in the Act receives from the Trust an annual fee of $48,000 and an attendance fee of $5,000 for each in-person meeting attended and $500 for telephone meetings and is reimbursed for travel and out-of-pocket expenses.The Chairman of the Trust’s Board receives an additional annual fee of $10,000 and the Chairman of the Trust’s Audit Committee receives an additional annual fee of $8,000.
NOTE 5—Securities Transactions:
Table 9 summarizes each fund’s aggregate amount of purchases and sales (including paydowns) of investment securities and securities sold short, excluding short-term securities, options transactions and foreign currency exchange contracts, during the period ended February 29, 2008, of which $1,693,087 in purchases and $1,686,743 in sales were from mortgage dollar roll transactions in BNY Mellon Balanced Fund.
86
A mortgage dollar roll transaction involves a sale by the fund of mortgage related securities that it holds with an agreement by the fund to repurchase similar securities at an agreed upon price and date.The securities purchased will bear the same interest rate as those sold, but generally will be collateralized by pools of mortgages with different prepayment histories than those securities sold.
BNY Mellon U.S. Core Equity 130/30 Fund is engaged in short selling which obligates the fund to replace the security borrowed by purchasing the security at current market value.The fund would incur a loss if the price of the security increases between the date of the short sale and the date on which the fund replaces the borrowed
security. The fund would realize a gain if the price of the security declines between those dates. The fund’s long security positions serve as collateral for the open short positions. Securities sold short at February 29, 2008, and their related market values and proceeds are set forth in the Statement of Securities Sold Short for BNY Mellon U.S. Core Equity 130/30 Fund.
BNY Mellon Income Stock Fund may purchase and write (sell) put and call options in order to gain exposure to or to protect against changes in the market.
As a writer of call options, the fund receives a premium at the outset and then bears the market risk of unfavorable
| Table 8. | ||||||||||
| Investment | Rule 12b-1 | Shareholder | Chief | |||||||
| Advisory | Distribution | Services | Custodian | Compliance | ||||||
| Fees ($) | Plan Fees ($) | Plan Fees ($) | Fees ($) | Officer Fees ($) | ||||||
| BNY Mellon Large Cap Stock Fund | 938,926 | — | 2,098 | 56,898 | 4,419 | |||||
| BNY Mellon Income Stock Fund | 139,141 | — | 273 | 12,114 | 4,419 | |||||
| BNY Mellon Mid Cap Stock Fund | 932,740 | 1,486 | 6,628 | 58,090 | 4,419 | |||||
| BNY Mellon Small Cap Stock Fund | 411,576 | — | 845 | 22,723 | 4,419 | |||||
| BNY Mellon U.S. Core Equity 130/30 Fund | 50,690 | — | 2 | — | 2,812 | |||||
| BNY Mellon International Fund | 1,514,693 | — | 1,779 | 770,499 | 4,419 | |||||
| BNY Mellon Emerging Markets Fund | 1,215,739 | — | 1,928 | 886,895 | 4,419 | |||||
| BNY Mellon Balanced Fund | 118,811 | — | 835 | 15,453 | 4,419 | |||||
| Table 9. | ||||
| Purchases ($) | Sales ($) | |||
| BNY Mellon Large Cap Stock Fund | 594,711,497 | 610,686,303 | ||
| BNY Mellon Income Stock Fund | 41,044,915 | 166,624,081 | ||
| BNY Mellon Mid Cap Stock Fund | 1,093,246,676 | 1,205,141,860 | ||
| BNY Mellon Small Cap Stock Fund | 386,096,683 | 412,310,947 | ||
| BNY Mellon International Fund | 1,043,863,270 | 1,348,326,181 | ||
| BNY Mellon Emerging Markets Fund | 511,937,726 | 741,281,141 | ||
| BNY Mellon Balanced Fund | 109,205,035 | 107,687,681 | ||
| BNY Mellon U.S. Core Equity 130/30 Fund | ||||
| Long transactions | 181,158,319 | 78,847,870 | ||
| Short sale transactions | 16,176,823 | 40,024,333 | ||
| Total | 197,335,142 | 118,872,203 | ||
The Funds 87
NOTES TO FINANCIAL STATEMENTS (Unaudited) (continued)
changes in the price of the financial instrument underlying the option. Generally, the fund would incur a gain, to the extent of the premium, if the price of the underlying financial instrument decreases between the date the option is written and the date on which the option is terminated. Generally, the fund would realize a loss, if the price of the financial instrument increases between those dates.
As a writer of put options, the fund receives a premium at the outset and then bears the market risk of unfavorable changes in the price of the financial instrument underlying the option. Generally, the fund would incur a gain, to the extent of the premium, if the price of the underlying financial instrument increases between the date the option is written and the date on which the option is terminated. Generally, the fund would realize a loss, if the price of the financial instrument decreases between those dates.
The following summarizes BNY Mellon Income Stock Fund’s call/put options written for the period ended February 29, 2008:
| Face Amount | ||||
| Covered by | Premiums | |||
| Options Written | Contracts ($) | Received ($) | ||
| Contracts outstanding | ||||
| August 31, 2007 | — | — | ||
| Contracts written | 217,800 | 215,111 | ||
| Contracts outstanding | ||||
| February 29, 2008 | 217,800 | 215,111 |
Table 10 summarizes accumulated net unrealized appreciation (depreciation) on investments for each fund at February 29, 2008.
At February 29, 2008, the cost of investments for each fund for federal income tax purposes was substantially the same as the cost for financial reporting purposes (see the Statements of Investments).
| Table 10. | ||||||
| Gross | Gross | |||||
| Appreciation ($) | Depreciation ($) | Net ($) | ||||
| BNY Mellon Large Cap Stock Fund | 320,912,665 | 84,097,103 | 236,815,562 | |||
| BNY Mellon Income Stock Fund | 49,428,806 | 19,653,222 | 29,775,584 | |||
| BNY Mellon Mid Cap Stock Fund | 205,034,483 | 98,106,363 | 106,928,120 | |||
| BNY Mellon Small Cap Stock Fund | 59,728,166 | 54,588,936 | 5,139,230 | |||
| BNY Mellon U.S. Core Equity 130/30 Fund | 2,789,522 | 8,444,438 | (5,654,916) | |||
| BNY Mellon International Fund | 121,717,713 | 275,000,466 | (153,282,753) | |||
| BNY Mellon Emerging Markets Fund | 234,920,821 | 67,871,747 | 167,049,074 | |||
| BNY Mellon Balanced Fund | 28,939,174 | 11,873,148 | 17,066,026 | |||
88
N O T E S
| Ticker Symbols: | ||||||
| BNY Mellon Large Cap Stock Fund | Class M: MPLCX | Investor: MILCX | ||||
| BNY Mellon Income Stock Fund | Class M: MPISX | Investor: MIISX | ||||
| BNY Mellon Mid Cap Stock Fund | Class M: MPMCX | Investor: MIMSX | Dreyfus Premier: MMSPX | |||
| BNY Mellon Small Cap Stock Fund | Class M: MPSSX | Investor: MISCX | ||||
| BNY Mellon U.S. Core Equity 130/30 Fund | Class M: MUCMX | Investor: MUCIX | ||||
| BNY Mellon International Fund | Class M: MPITX | Investor: MIINX | ||||
| BNY Mellon Emerging Markets Fund | Class M: MEMKX | Investor: MIEGX | ||||
| BNY Mellon Balanced Fund | Class M: MPBLX | Investor: MIBLX |
Telephone Wealth Management (WM) Clients, please contact your Account Officer or call 1-888-281-7350.
Brokerage Clients of BNY Mellon Wealth Advisors (BNYMWA), please contact your financial representative
or call 1-800-830-0549, Option 2. Individual Account holders, please call Dreyfus at 1-800-645-6561.
Mail WM Clients, write to your Account Officer, c/o Mellon Bank, N.A., One Mellon Bank Center, Pittsburgh, PA 15258
BNYMWA Brokerage Clients, write to your financial representative, P.O. Box 9012, Hicksville, NY 11802–9012
Individual Account Holders, write to: BNY Mellon Funds, P.O. Box 55268, Boston, MA 02205–8502
The fund files its complete schedule of portfolio holdings with the Securities and Exchange Commission (“SEC”) for the first and third quarters of each fiscal year on Form N-Q. The fund’s Forms N-Q are available on the SEC’s website at http://www.sec.gov and may be reviewed and copied at the SEC’s Public Reference Room in Washington, DC. Information on the operation of the Public Reference Room may be obtained by calling 1-202-551-8090.
A description of the policies and procedures that the fund uses to determine how to vote proxies relating to portfolio securities, and information regarding how the fund voted these proxies for the 12-month period ended June 30, 2007, is available at http://www.dreyfus.com and on the SEC’s website at http://www.sec.gov. The description of the policies and procedures is also available without charge, upon request, by calling 1-800-645-6561.
©2008 MBSC Securities Corporation
MFTSA0208-EQ
| Contents | ||
| The Funds | ||
| Letter from the President | 2 | |
| Discussion of Funds’ Performance | ||
| BNY Mellon National Intermediate | ||
| Municipal Bond Fund | 3 | |
| BNY Mellon National Short-Term | ||
| Municipal Bond Fund | 5 | |
| BNY Mellon Pennsylvania | ||
| Intermediate Municipal Bond Fund | 7 | |
| BNY Mellon Massachusetts | ||
| Intermediate Municipal Bond Fund | 9 | |
| Understanding Your Fund’s Expenses | 11 | |
| Comparing Your Fund’s Expenses | ||
| With Those of Other Funds | 12 | |
| Statements of Investments | 13 | |
| Statements of Financial Futures 27, 43, 54 | ||
| Statements of Assets and Liabilities | 55 | |
| Statements of Operations | 56 | |
| Statements of Changes in Net Assets | 57 | |
| Financial Highlights | 62 | |
| Notes to Financial Statements | 72 | |
For More Information
| Back cover |
The views expressed herein are current to the date of this report.These views and the composition of the funds’ portfolios are subject to change at any time based on market and other conditions.
- Not FDIC-Insured
- Not Bank-Guaranteed
- May Lose Value
The Funds

| LETTER FROM |
| THE PRESIDENT |
Dear Shareholder:
We are pleased to present this semiannual report for the BNY Mellon Funds Trust, covering the six-month period from September 1, 2007, through February 29, 2008.
The past six months proved to be one of the more challenging periods for fixed-income investors in recent memory.The U.S. economy sputtered under the weight of plunging housing values, and credit concerns that originated in the U.S. sub-prime mortgage sector spread to other areas of the global financial markets.These developments dampened investor sentiment and produced heightened volatility in many segments of the municipal bond market. Particularly hard hit were lower-rated municipal bonds and those carrying third-party insurance from independent bond insurers.
Recently, the Fed and the U.S. government have adopted accommodative monetary and fiscal policies in an effort to stimulate the U.S. economy, boost market liquidity and forestall a potential recession.While it’s too early to know if their actions will be effective, we believe that the best defense against any economic volatility is to maintain a long-term perspective. To benefit from this focus, talk to your portfolio manager today about your specific portfolio to ensure that your investments are best suited to capture the potential opportunities and manage the risks that may continue to surface during this current economic cycle.
For information about how each fund performed during the reporting period, as well as market perspectives, we have provided a Discussion of Fund Performance.
Thank you for your continued confidence and support.


| DISCUSSION OF |
| FUND PERFORMANCE |
For the period of September 1, 2007, through February 29,
2008, as provided by John F. Flahive and Mary Collette
O’Brien, Portfolio Managers
Fund and Market Performance Overview
For the six-month period ended February 29, 2008, BNY Mellon National Intermediate Municipal Bond Fund achieved total returns of 0.11% for Class M shares, –0.10% for Investor shares and –0.35% for Dreyfus Premier shares.1 In comparison, the Lehman Brothers 7-Year Municipal Bond Index (the “Index”), the fund’s benchmark, achieved a total return of 2.19% for the same period.2
Municipal bonds suffered during the reporting period in an intensifying credit crisis and economic slowdown. The fund produced lower returns than its benchmark, primarily due to relatively weak results from its holdings of longer-term and “triple-B” rated securities.
The Fund’s Investment Approach
The fund seeks to maximize current income exempt from federal income tax to the extent consistent with the preservation of capital.To pursue its goal, the fund normally invests at least 80% of its assets in municipal bonds that provide income exempt from federal income tax. The fund may occasionally, including for temporary defensive purposes, invest in taxable bonds. The fund’s investments in municipal and taxable bonds must be rated investment grade at the time of purchase or, if unrated, deemed of comparable quality by the investment adviser.3 Generally, the fund’s average effective portfolio maturity will be between three and 10 years, and the average effective duration of the fund’s portfolio will not exceed eight years.
Rather than focusing on economic or market trends, we search for securities that, in our opinion, will help
us enhance the fund’s yield without sacrificing quality. We use a more tactical approach with respect to the fund’s average duration. If we expect the supply of securities to increase temporarily, we may reduce the fund’s average duration to make cash available for the purchase of higher-yielding securities. This is due to the fact that yields generally tend to rise if issuers are competing for investor interest. If we expect demand to surge at a time when we anticipate little issuance and therefore lower yields, we may increase the fund’s average duration to maintain current yields for as long as practical. At other times, we typically try to maintain a neutral average duration.
Municipal Bonds Suffered in the Credit Crisis
The reporting period began amid a credit crisis that had originated in the sub-prime mortgage sector of the U.S. bond market, as a higher-than-expected number of homeowners defaulted on their loans. When evidence of an impending economic slowdown began to accumulate over the summer of 2007, investors’ credit concerns spread to other areas of the financial markets, including municipal bonds. The credit crunch intensified in the fall, when a number of commercial and investment banks reported massive sub-prime related losses. These developments prompted the Federal Reserve Board (the “Fed”) to attempt to improve market conditions and forestall a potential recession by injecting liquidity into the banking system and reducing short-term interest rates. Between September 1, 2007, and year-end, the Fed reduced the overnight federal funds rate three times, driving it from 5.25% to 4.25%.
Yet, disappointing economic news continued to surface in January and February, including the first monthly U.S. job losses in more than four years.What’s
The Funds 3
DISCUSSION OF FUND PERFORMANCE (continued)
more, many of the nation’s bond insurers announced that they had suffered ample exposure to the sub-prime mortgage debacle. Because these companies insured both mortgage-backed securities and municipal bonds, insured municipal bonds declined sharply despite little or no deterioration in their underlying credit funda-mentals.The Fed again took aggressive action, reducing the federal funds rate to 3% in two moves in late January.
Fund Strategies Produced Mixed Results
We attempted to maintain competitive yields in the declining interest-rate environment through investments in municipal bonds in the 10- to 15-year maturity range. We also allocated a portion of the fund’s assets to municipal bonds with triple-B credit ratings, at the lower end of the investment-grade range. While we succeeded in achieving a higher yield than the benchmark, this strategy exposed the fund to heightened price volatility.We also set the fund’s average duration in a range that was shorter than industry averages, preventing it from participating more fully in the beneficial effects of falling interest rates.
The fund achieved better results from its yield curve strategy, which was positioned for narrowing yield differences along the market’s maturity range.
Positioned for an Eventual Recovery
As of the reporting period’s end, the U.S. economy has continued to falter, and the credit crisis has worsened. Although the economic slowdown is likely to have an adverse impact on the fiscal health of certain states and municipalities, it appears to us that some areas of the municipal bond market have been punished too severely. Therefore, we have maintained the fund’s positions in triple-B rated and longer-term bonds, which we believe position the fund to participate fully in a market rebound when the economic and credit cycles move to their next phases.
March 17, 2008
| 1 | Total return includes reinvestment of dividends and any capital gains paid. Past | |
| performance is no guarantee of future results. Share price, yield and investment | ||
| return fluctuate such that upon redemption, fund shares may be worth more or | ||
| less than their original cost. Income may be subject to state and local taxes, and | ||
| some income may be subject to the federal alternative minimum tax (AMT) for | ||
| certain investors. Capital gains, if any, are fully taxable. | ||
| 2 | SOURCE: LIPPER INC. — Reflects reinvestment of dividends and, where | |
| applicable, capital gain distributions.The Lehman Brothers 7-Year Municipal | ||
| Bond Index is an unmanaged total return performance benchmark for the | ||
| investment-grade, geographically unrestricted 7-year tax-exempt bond market, | ||
| consisting of municipal bonds with maturities of 6-8 years. Index return does | ||
| not reflect the fees and expenses associated with operating a mutual fund. | ||
| 3 | The fund may continue to own investment-grade bonds (at the time of | |
| purchase), which are subsequently downgraded to below investment grade. |
4

| DISCUSSION OF |
| FUND PERFORMANCE |
For the period of September 1, 2007, through February 29,
2008, as provided by Timothy J. Sanville and Jeremy N.
Baker, Portfolio Managers
Fund and Market Performance Overview
For the six-month period ended February 29, 2008, BNY Mellon National Short-Term Municipal Bond Fund achieved total returns of 2.12% for Class M shares and 2.00% for Investor shares.1 In comparison, the Lehman Brothers 3-Year Municipal Bond Index (the “Index”), the fund’s benchmark, which is not subject to fees and expenses like a mutual fund, achieved a total return of 3.28% for the same period.2
Although municipal bonds generally suffered during the reporting period in an intensifying credit crisis and economic slowdown, shorter-term securities held up relatively well.The fund produced lower returns than its benchmark, primarily due to its relatively short weighted average maturity.
The Fund’s Investment Approach
The fund seeks to maximize current income exempt from federal income tax to the extent consistent with the preservation of capital.To pursue its goal, the fund normally invests at least 80% of its assets in municipal bonds that provide income exempt from federal income tax.The fund occasionally may invest in taxable bonds, including for temporary defensive purposes.The fund’s investments in municipal and taxable bonds must be rated investment grade at the time of purchase or, if unrated, deemed of comparable quality by the investment adviser.3 Generally, the average effective portfolio maturity and the average effective portfolio duration of the fund’s portfolio will be less than three years.
Rather than focusing on economic or market trends, we search for securities that, in our opinion, will help
us enhance the fund’s yield without sacrificing quality. We use a more tactical approach with respect to the fund’s average duration. If we expect the supply of securities to increase temporarily, we may reduce the fund’s average duration to make cash available for the purchase of higher-yielding securities. This is due to the fact that yields generally tend to rise if issuers are competing for investor interest. If we expect demand to surge at a time when we anticipate little issuance and therefore lower yields, we may increase the fund’s average duration to maintain current yields for as long as practical. At other times, we typically try to maintain a neutral average duration.
Municipal Bonds Suffered in the Credit Crisis
The reporting period began amid a credit crisis that had originated in the sub-prime mortgage sector of the U.S. bond market, as a higher-than-expected number of homeowners defaulted on their loans. When evidence of an impending economic slowdown began to accumulate over the summer of 2007, investors’ credit concerns spread to other areas of the financial markets, including municipal bonds. The credit crunch intensified in the fall, when a number of commercial and investment banks reported massive sub-prime related losses. These developments prompted the Federal Reserve Board (the “Fed”) to attempt to improve market conditions and forestall a potential recession by injecting liquidity into the banking system and reducing short-term interest rates. Between September 1, 2007, and year-end, the Fed reduced the overnight federal funds rate three times, driving it from 5.25% to 4.25%.
The Funds 5
DISCUSSION OF FUND PERFORMANCE (continued)
Yet, disappointing economic news continued to surface in January and February, including the first monthly U.S. job losses in more than four years. The Fed again took aggressive action, reducing the federal funds rate to 3% in two moves in late January.
What’s more, many of the nation’s bond insurers announced that they had incurred ample sub-prime losses. Because these companies insured both mortgage-backed securities and municipal bonds, longer-term municipal bond prices declined sharply despite little or no deterioration in their underlying credit fundamentals. However, shorter-term municipal bonds, which tend to be less sensitive to credit quality concerns, held up relatively well.
Fund Strategies Produced Mixed Results
Because the fund is limited to a maximum average maturity of three years, it produced lower returns than its benchmark, which has greater flexibility to participate more fully in potential gains among longer-dated securities. Nonetheless, the fund’s holdings benefited during the reporting period from the sharp decline in short-term interest rates, which supported prices.
Although we maintained the fund’s strong credit profile during the reporting period, we attempted to boost yields in the declining interest-rate environment by allocating a modest portion of the fund’s assets to short-term municipal bonds with triple-B credit ratings, which is at the lower
end of the investment-grade range.This strategy succeeded in achieving a higher yield than the benchmark, but it exposed the fund to heightened price volatility.
Positioned for an Eventual Recovery
As of the reporting period’s end, the U.S. economy has continued to falter, and the credit crisis has worsened. Although the economic slowdown is likely to have an adverse impact on the fiscal health of certain states and municipalities,it appears to us that some areas of the municipal bond market have been punished too severely. Therefore, we have maintained the fund’s positions in short-term,triple-B rated bonds,which we believe position the fund to participate fully in a market rebound when the economic and credit cycles move to their next phases.
March 17, 2008
| 1 | Total return includes reinvestment of dividends and any capital gains paid. Past | |
| performance is no guarantee of future results. Share price, yield and investment | ||
| return fluctuate such that upon redemption, fund shares may be worth more or | ||
| less than their original cost. Income may be subject to state and local taxes, and | ||
| some income may be subject to the federal alternative minimum tax (AMT) for | ||
| certain investors. Capital gains, if any, are fully taxable. | ||
| 2 | SOURCE: LIPPER INC. — Reflects reinvestment of dividends and, where | |
| applicable, capital gain distributions.The Lehman Brothers 3-Year Municipal | ||
| Bond Index is an unmanaged total return performance benchmark for the | ||
| investment-grade, geographically unrestricted 3-year tax-exempt bond market, | ||
| consisting of municipal bonds with maturities of 2-4 years. Index return does | ||
| not reflect the fees and expenses associated with operating a mutual fund. | ||
| 3 | The fund may continue to own investment-grade bonds (at the time of | |
| purchase), which are subsequently downgraded to below investment grade. |
6

| DISCUSSION OF |
| FUND PERFORMANCE |
For the period of September 1, 2007, through February 29,
2008, as provided by Mary Collette O’Brien and Jeremy
N. Baker, Portfolio Managers
Fund and Market Performance Overview
For the six-month period ended February 29, 2008, BNY Mellon Pennsylvania Intermediate Municipal Bond Fund achieved total returns of 0.22% for Class M shares and 0.17% for Investor shares.1 In comparison, the Lehman Brothers 7-Year Municipal Bond Index (the “Index”), the fund’s benchmark, achieved a total return of 2.19% for the same period.2
Municipal bonds suffered during the reporting period in an intensifying credit crisis and economic slowdown. The fund produced lower returns than its benchmark, primarily due to relatively weak results from its holdings of longer-term and “triple-B” rated securities.
The Fund’s Investment Approach
The fund seeks as high a level of income exempt from federal and Pennsylvania state income taxes as is consistent with the preservation of capital. To pursue its goal, the fund normally invests at least 80% of its assets in municipal bonds, the interest from which is exempt from federal and Pennsylvania state personal income taxes. The fund may also invest in municipal bonds that are exempt from federal income taxes, but not Pennsylvania personal income taxes, and in taxable bonds. The fund’s investments in municipal and taxable bonds must be rated investment grade at the time of purchase or, if unrated, deemed of comparable quality by the investment adviser.3 Generally, the fund’s average effective portfolio maturity will be between three and 10 years, and the average effective duration of the fund’s portfolio will not exceed eight years.
Rather than focusing on economic or market trends, we search for securities that, in our opinion, will help
us enhance the fund’s yield without sacrificing quality. We use a more tactical approach with respect to the fund’s average duration. If we expect the supply of securities to increase temporarily, we may reduce the fund’s average duration to make cash available for the purchase of higher-yielding securities. This is due to the fact that yields generally tend to rise if issuers are competing for investor interest. If we expect demand to surge at a time when we anticipate little issuance and therefore lower yields, we may increase the fund’s average duration to maintain current yields for as long as practical. At other times, we typically try to maintain a neutral average duration.
Municipal Bonds Suffered in the Credit Crisis
The reporting period began amid a credit crisis that had originated in the sub-prime mortgage sector of the U.S. bond market, as a higher-than-expected number of homeowners defaulted on their loans. When evidence of an impending economic slowdown began to accumulate over the summer of 2007, investors’ credit concerns spread to other areas of the financial markets, including municipal bonds. The credit crunch intensified in the fall, when a number of commercial and investment banks reported massive sub-prime related losses. These developments prompted the Federal Reserve Board (the “Fed”) to attempt to improve market conditions and forestall a potential recession by injecting liquidity into the banking system and reducing short-term interest rates. Between September 1, 2007, and year-end, the Fed reduced the overnight federal funds rate three times, driving it from 5.25% to 4.25%.
Yet, disappointing economic news continued to surface in January and February, including the first monthly U.S. job losses in more than four years.What’s more, many of the nation’s bond insurers announced
The Funds 7
DISCUSSION OF FUND PERFORMANCE (continued)
that they had suffered ample exposure to the sub-prime mortgage debacle. Because these companies insured both mortgage-backed securities and municipal bonds, insured municipal bonds declined sharply despite little or no deterioration in their underlying fundamentals. The Fed again took aggressive action, reducing the federal funds rate to 3% in two moves in late January.
Fund Strategies Produced Mixed Results
We attempted to maintain competitive yields in the declining interest-rate environment through investments in Pennsylvania municipal bonds in the 10- to 15-year maturity range.We also allocated a portion of the fund’s assets to municipal bonds with triple-B credit ratings, which are at the lower end of the investment-grade range. While we succeeded in achieving a higher yield than the benchmark, this strategy exposed the fund to heightened price volatility.We also set the fund’s average duration in a range that was shorter than industry averages, preventing it from participating more fully in the beneficial effects of falling interest rates.
The fund achieved better results from its yield curve strategy, which was positioned for narrowing yield differences along the market’s maturity range.
Positioned for an Eventual Recovery
As of the reporting period’s end, the U.S. economy has continued to falter, and the credit crisis has worsened. Although the economic slowdown is likely to have an adverse impact on the fiscal health of Pennsylvania and its municipalities, it appears that some areas of the municipal bond market have been punished too severely.Therefore, we have maintained the fund’s positions in triple-B rated and longer-term bonds, which we believe position the fund to participate fully in a market rebound when the economic and credit cycles move to their next phases.
March 17, 2008
| 1 | Total return includes reinvestment of dividends and any capital gains paid. | |
| Past performance is no guarantee of future results. Share price, yield and | ||
| investment return fluctuate such that upon redemption, fund shares may be | ||
| worth more or less than their original cost. Income may be subject to state and | ||
| local taxes for non-Pennsylvania residents, and some income may be subject to | ||
| the federal alternative minimum tax (AMT) for certain investors. Capital | ||
| gains, if any, are fully taxable. | ||
| 2 | SOURCE: LIPPER INC. — Reflects reinvestment of dividends and, where | |
| applicable, capital gain distributions.The Lehman Brothers 7-Year Municipal | ||
| Bond Index is an unmanaged total return performance benchmark for the | ||
| investment-grade, geographically unrestricted 7-year tax-exempt bond market, | ||
| consisting of municipal bonds with maturities of 6-8 years. Index return does | ||
| not reflect the fees and expenses associated with operating a mutual fund. | ||
| 3 | The fund may continue to own investment-grade bonds (at the time of | |
| purchase), which are subsequently downgraded to below investment grade. |
8

| DISCUSSION OF |
| FUND PERFORMANCE |
For the period of September 1, 2007, through February 29,
2008, as provided by John F. Flahive and Mary Collette
O’Brien, Portfolio Managers
Fund and Market Performance Overview
For the six-month period ended February 29, 2008, BNY Mellon Massachusetts Intermediate Municipal Bond Fund achieved total returns of 0.80% for Class M shares, 0.67% for Investor shares and 0.43% for Dreyfus Premier shares.1 In comparison, the Lehman Brothers 7-Year Municipal Bond Index (the “Index”), the fund’s benchmark, achieved a total return of 2.19% for the same period.2
Municipal bonds suffered during the reporting period in an intensifying credit crisis and economic slowdown. The fund produced lower returns than its benchmark, primarily due to relatively weak results from its holdings of longer-term and “triple-B” rated securities.
The Fund’s Investment Approach
The fund seeks as high a level of income exempt from federal and Massachusetts state income taxes as is consistent with the preservation of capital. To pursue its goal, the fund normally invests at least 80% of its assets in municipal bonds, the interest from which is exempt from federal and Massachusetts state personal income taxes. The fund may also invest in municipal bonds that are exempt from federal income taxes, but not Massachusetts personal income taxes, and in taxable bonds. The fund’s investments in municipal and taxable bonds must be rated investment grade at the time of purchase or, if unrated, deemed of comparable quality by the investment adviser.3 Generally, the fund’s average effective portfolio maturity will be between three and 10 years, and the average effective duration of the fund’s portfolio will not exceed eight years.
Rather than focusing on economic or market trends, we search for securities that, in our opinion, will help us enhance the fund’s yield without sacrificing quality.We use a more tactical approach with respect to the fund’s average duration. If we expect the supply of securities to increase temporarily, we may reduce the fund’s average duration to make cash available for the purchase of higher-yielding securities.This is because yields generally tend to rise if issuers are competing for investor interest. If we expect demand to surge at a time when we anticipate little issuance and therefore lower yields, we may increase the fund’s average duration to maintain current yields for as long as practical.At other times, we typically try to maintain a neutral average duration.
Municipal Bonds Suffered in the Credit Crisis
The reporting period began amid a credit crisis that had originated in the sub-prime mortgage sector of the U.S. bond market, as a higher-than-expected number of homeowners defaulted on their loans. When evidence of an impending economic slowdown began to accumulate over the summer of 2007, investors’ credit concerns spread to other areas of the financial markets, including municipal bonds. The credit crunch intensified in the fall, when a number of commercial and investment banks reported massive sub-prime related losses. These developments prompted the Federal Reserve Board (the “Fed”) to attempt to improve market conditions and forestall a potential recession by injecting liquidity into the banking system and reducing short-term interest rates. Between September 1, 2007, and year-end, the Fed reduced the overnight federal funds rate three times, driving it from 5.25% to 4.25%.
Yet, disappointing economic news continued to surface in January and February, including the first
The Funds 9
DISCUSSION OF FUND PERFORMANCE (continued)
monthly U.S. job losses in more than four years.What’s more, many of the nation’s bond insurers announced that they had suffered ample exposure to the sub-prime mortgage debacle. Because these companies insured both mortgage-backed securities and municipal bonds, insured municipal bonds declined sharply despite little or no deterioration in their underlying fundamentals. The Fed again took aggressive action, reducing the federal funds rate to 3% in two moves in late January.
Fund Strategies Produced Mixed Results
We attempted to maintain competitive yields in the declining interest-rate environment through investments in Massachusetts municipal bonds in the 10- to 15-year maturity range.When possible, we also allocated a portion of the fund’s assets to municipal bonds with triple-B credit ratings, at the lower end of the investment-grade range. While we succeeded in achieving a higher yield than the benchmark, this strategy exposed the fund to heightened price volatility.We also set the fund’s average duration in a range that was shorter than industry averages, preventing it from participating more fully in the beneficial effects of falling interest rates.
The fund achieved better results from its yield curve strategy, which was positioned for narrowing yield differences along the market’s maturity range.
Positioned for an Eventual Recovery
As of the reporting period’s end, the U.S. economy has continued to falter, and the credit crisis has worsened. Although the economic slowdown is likely to have an adverse impact on the fiscal health of Massachusetts and its municipalities, it appears that some areas of the municipal bond market have been punished too severely.Therefore, we have maintained the fund’s positions in triple-B rated and longer-term bonds, which we believe position the fund to participate fully in a market rebound when the economic and credit cycles move to their next phases.
March 17, 2008
| 1 | Total return includes reinvestment of dividends and any capital gains paid. | |
| Past performance is no guarantee of future results. Share price, yield and | ||
| investment return fluctuate such that upon redemption, fund shares may be | ||
| worth more or less than their original cost. Income may be subject to state and | ||
| local taxes for non-Massachusetts residents, and some income may be subject to | ||
| the federal alternative minimum tax (AMT) for certain investors. Capital | ||
| gains, if any, are fully taxable. Return figures provided reflect the absorption of | ||
| certain fund expenses by Mellon Fund Advisors pursuant to an agreement in | ||
| effect through September 30, 2007, at which time it was terminated. Had | ||
| these expenses not been absorbed, the fund’s returns would have been lower. | ||
| 2 | SOURCE: LIPPER INC. — Reflects reinvestment of dividends and, where | |
| applicable, capital gain distributions.The Lehman Brothers 7-Year Municipal | ||
| Bond Index is an unmanaged total return performance benchmark for the | ||
| investment-grade, geographically unrestricted 7-year tax-exempt bond market, | ||
| consisting of municipal bonds with maturities of 6-8 years. Index return does | ||
| not reflect the fees and expenses associated with operating a mutual fund. | ||
| 3 | The fund may continue to own investment-grade bonds (at the time of | |
| purchase), which are subsequently downgraded to below investment grade. |
10
UNDERSTANDING YOUR FUND’S EXPENSES ( U n a u d i t e d )
As a mutual fund investor, you pay ongoing expenses, such as management fees and other expenses. Using the information below, you can estimate how these expenses affect your investment and compare them with the expenses of other funds.You also may pay one-time transaction expenses, including sales charges (loads) and redemptions fees, which are not shown in this section and would have resulted in higher total expenses. For more information, see your fund’s prospectus or talk to your financial adviser.
Review your fund’s expenses
The table below shows the expenses you would have paid on a $1,000 investment in each class of each Mellon municipal bond fund from September 1, 2007 to February 29, 2008. It also shows how much a $1,000 investment would be worth at the close of the period, assuming actual returns and expenses.
| Expenses and Value of a $1,000 Investment | ||||||||
| assuming actual returns for the six months ended February 29, 2008 | ||||||||
| Dreyfus | ||||||||
| Class M Shares | Investor Shares | Premier Shares | ||||||
| BNY Mellon National Intermediate | ||||||||
| Municipal Bond Fund | ||||||||
| Expenses paid per $1,000 † | $ 2.49 | $ 3.73 | $ 6.20 | |||||
| Ending value (after expenses) | $1,001.10 | $999.00 | $996.50 | |||||
| BNY Mellon National Short-Term | ||||||||
| Municipal Bond Fund | ||||||||
| Expenses paid per $1,000 † | $ 2.71 | $ 4.02 | — | |||||
| Ending value (after expenses) | $1,021.20 | $1,020.00 | — | |||||
| BNY Mellon Pennsylvania | ||||||||
| Intermediate Municipal Bond Fund | ||||||||
| Expenses paid per $1,000 † | $ 3.24 | $ 4.53 | — | |||||
| Ending value (after expenses) | $1,002.20 | $1,001.70 | — | |||||
| BNY Mellon Massachusetts | ||||||||
| Intermediate Municipal Bond Fund | ||||||||
| Expenses paid per $1,000 † | $ 2.60 | $ 3.84 | $6.33 | |||||
| Ending value (after expenses) | $1,008.00 | $1,006.70 | $1,004.30 | |||||
| † Expenses are equal to the BNY Mellon National Intermediate Municipal Bond Fund annualized expense ratio of .50% for Class M, .75% for Investor shares and 1.25% for |
| Dreyfus Premier shares, BNY Mellon National Short-Term Municipal Bond Fund .54% for Class M and .80% for Investor shares, BNY Mellon Pennsylvania Intermediate |
| Municipal Bond Fund .65% for Class M and .91% for Investor shares and BNY Mellon Massachusetts Intermediate Municipal Bond Fund .52% for Class M, .77% for Investor |
| shares and 1.27% for Dreyfus Premier shares, multiplied by the respective fund's average account value over the period, multiplied by 182/366 (to reflect the one-half year period). |
The Funds 11
COMPARING YOUR FUND’S EXPENSES WITH THOSE OF OTHER FUNDS (Unaudited)
Using the SEC’s method to compare expenses
The Securities and Exchange Commission (SEC) has established guidelines to help investores assess fund expenses. Per these guidelines, the table below shows your fund’s expenses based on a $1,000 investment, assuming a hypothetical 5% annualized return.You can use this information to compare the ongoing expenses (but not transaction expenses or total cost) of investing in the fund with those of other funds.All mutual fund shareholder reports will provide this information to help you make this comparison. Please note that you cannot use this information to estimate your actual ending account balance and expenses paid during the period.
| Expenses and Value of a $1,000 Investment | ||||||
| assuming actual returns for the six months ended February 29, 2008 | ||||||
| Dreyfus | ||||||
| Class M Shares | Investor Shares | Premier Shares | ||||
| BNY Mellon National Intermediate | ||||||
| Municipal Bond Fund | ||||||
| Expenses paid per $1,000 † | $ 2.51 | $ 3.77 | $ 6.27 | |||
| Ending value (after expenses) | $1,022.38 | $1,021.13 | $1,018.65 | |||
| BNY Mellon National Short-Term | ||||||
| Municipal Bond Fund | ||||||
| Expenses paid per $1,000 † | $ 2.72 | $ 4.02 | — | |||
| Ending value (after expenses) | $1,022.18 | $1,020.89 | — | |||
| BNY Mellon Pennsylvania | ||||||
| Intermediate Municipal Bond Fund | ||||||
| Expenses paid per $1,000 † | $ 3.27 | $ 4.57 | — | |||
| Ending value (after expenses) | $1,021.63 | $1,020.34 | — | |||
| BNY Mellon Massachusetts | ||||||
| Intermediate Municipal Bond Fund | ||||||
| Expenses paid per $1,000 † | $ 2.61 | $ 3.87 | $ 6.37 | |||
| Ending value (after expenses) | $1,022.28 | $1,021.03 | $1,018.55 | |||
| † Expenses are equal to the BNY Mellon National Intermediate Municipal Bond Fund annualized expense ratio of .50% for Class M, .75% for Investor shares and 1.25% for |
| Dreyfus Premier shares, BNY Mellon National Short-Term Municipal Bond Fund .54% for Class M and .80% for Investor shares, BNY Mellon Pennsylvania Intermediate |
| Municipal Bond Fund .65% for Class M and .91% for Investor shares and BNY Mellon Massachusetts Intermediate Municipal Bond Fund .52% for Class M, .77% for Investor |
| shares and 1.27% for Dreyfus Premier shares, multiplied by the respective fund's average account value over the period, multiplied by 182/366 (to reflect the one-half year period). |
12
| STATEMENT OF INVESTMENTS |
| February 29, 2008 (Unaudited) |
| BNY Mellon National Intermediate Municipal Bond Fund | ||||||||
| Long-Term Municipal | Coupon | Maturity | Principal | |||||
| Investments—91.0% | Rate (%) | Date | Amount ($) | Value ($) | ||||
| Alabama—2.6% | ||||||||
| Alabama Public School and College Authority, | ||||||||
| Capital Improvement Bonds | 5.63 | 7/1/13 | 3,000,000 | 3,136,770 | ||||
| Birmingham Special Care Facilities Financing Authority- | ||||||||
| Baptist Medical Centers, Revenue (Baptist Health System Inc.) | 5.00 | 11/15/15 | 5,260,000 | 5,121,820 | ||||
| Jefferson County, Limited Obligation School Warrants | 5.00 | 1/1/24 | 13,500,000 | 13,210,155 | ||||
| Montgomery BMC Special Care Facilities Financing | ||||||||
| Authority, Revenue (Baptist Health) (Insured; MBIA) | 5.00 | 11/15/13 | 1,365,000 | 1,474,350 | ||||
| Montgomery BMC Special Care Facilities Financing | ||||||||
| Authority, Revenue (Baptist Health) (Insured; MBIA) | 5.00 | 11/15/14 | 2,500,000 | 2,698,075 | ||||
| Alaska—.1% | ||||||||
| Anchorage, Electric Utility Revenue (Insured; MBIA) | 8.00 | 12/1/10 | 1,000,000 | 1,132,160 | ||||
| Arizona—3.2% | ||||||||
| Maricopa County Unified School District | ||||||||
| (Paradise Valley) (Insured; MBIA) | 6.35 | 7/1/10 | 550,000 | 590,453 | ||||
| Maricopa County Unified School District | ||||||||
| (Paradise Valley) (Insured; MBIA) | 7.00 | 7/1/11 | 1,905,000 | 2,130,152 | ||||
| Maricopa County Unified School District (Scottsdale School) | 6.60 | 7/1/12 | 1,250,000 | 1,419,200 | ||||
| Phoenix | 6.25 | 7/1/16 | 1,250,000 | 1,460,238 | ||||
| Phoenix Civic Improvement Corporation, Transit Excise | ||||||||
| Tax Revenue (Light Rail Project) (Insured; AMBAC) | 5.00 | 7/1/16 | 6,000,000 | 6,301,860 | ||||
| Salt River Project Agricultural Improvement | ||||||||
| and Power District, Electric System Revenue | 5.00 | 1/1/10 | 1,000,000 | 1,039,860 | ||||
| Salt River Project Agricultural Improvement | ||||||||
| and Power District, Electric System Revenue | 5.00 | 1/1/17 | 1,000,000 | 1,056,310 | ||||
| Salt Verde Financial Corporation, Senior Gas Revenue | 5.25 | 12/1/28 | 5,000,000 | 4,417,200 | ||||
| Salt Verde Financial Corporation, Senior Gas Revenue | 5.50 | 12/1/29 | 4,000,000 | 3,632,160 | ||||
| Salt Verde Financial Corporation, Senior Gas Revenue | 5.00 | 12/1/32 | 5,500,000 | 4,590,905 | ||||
| Scottsdale Industrial Development | ||||||||
| Authority, HR (Scottsdale Healthcare) | 5.70 | 12/1/11 | 1,000,000 a | 1,094,210 | ||||
| Tucson | 5.00 | 7/1/12 | 1,265,000 | 1,356,510 | ||||
| University Medical Center Corporation, HR | 5.25 | 7/1/16 | 2,310,000 | 2,309,838 | ||||
| California—14.4% | ||||||||
| Agua Caliente Band, Cahuilla Indians Revenue | 5.60 | 7/1/13 | 1,815,000 | 1,764,289 | ||||
| Alameda Corridor Transportation Authority, | ||||||||
| Revenue (Insured; AMBAC) | 0/5.25 | 10/1/21 | 5,000,000 b | 3,967,150 | ||||
| California | 5.75 | 3/1/08 | 190,000 | 190,030 | ||||
| California | 6.60 | 2/1/09 | 510,000 | 529,487 | ||||
| California | 5.00 | 11/1/11 | 655,000 a | 697,503 | ||||
| California | 5.00 | 11/1/12 | 345,000 | 361,784 | ||||
| California | 5.50 | 6/1/20 | 270,000 | 277,395 | ||||
| California | 5.25 | 11/1/26 | 10,500,000 | 10,363,920 | ||||
| California | 5.50 | 11/1/33 | 3,900,000 | 3,914,742 | ||||
| California (Insured; FGIC) | 5.75 | 3/1/09 | 80,000 | 81,266 | ||||
The Funds 13
STATEMENT OF INVESTMENTS (Unaudited) (continued)
| BNY Mellon National Intermediate Municipal Bond Fund (continued) | ||||||||
| Long-Term Municipal | Coupon | Maturity | Principal | |||||
| Investments (continued) | Rate (%) | Date | Amount ($) | Value ($) | ||||
| California (continued) | ||||||||
| California, Economic Recovery Bonds | 5.00 | 7/1/16 | 15,400,000 | 16,047,262 | ||||
| California, GO (Various Purpose) | 5.00 | 2/1/14 | 1,825,000 a | 1,960,324 | ||||
| California, GO (Various Purpose) | 5.00 | 2/1/33 | 5,000,000 | 4,695,050 | ||||
| California County Tobacco Securitization Agency, | ||||||||
| Tobacco Settlement Asset-Backed Bonds | ||||||||
| (Los Angeles County Securitization Corporation) | 0/5.25 | 6/1/21 | 1,250,000 b | 929,875 | ||||
| California Department of Water Resources, | ||||||||
| Power Supply Revenue (Insured; AMBAC) | 5.38 | 5/1/12 | 5,000,000 a | 5,464,750 | ||||
| California Infrastructure and Economic Development | ||||||||
| Bank, Revenue (Clean Water State Revolving Fund) | 5.00 | 10/1/17 | 2,500,000 | 2,630,850 | ||||
| California Municipal Finance Authority, SWDR | ||||||||
| (Waste Management, Inc. Project) | 4.10 | 9/1/09 | 1,000,000 | 998,580 | ||||
| California State Public Works Board, LR (Department | ||||||||
| of General Services) (Capitol East End Complex— | ||||||||
| Blocks 171-174 and 225) (Insured; AMBAC) | 5.25 | 12/1/19 | 5,000,000 | 5,112,400 | ||||
| California Statewide Communities Development Authority, | ||||||||
| MFHR (Equity Residential/Parkview Terrace Club Apartments) | 5.20 | 6/15/09 | 3,000,000 | 3,063,150 | ||||
| California Statewide Communities Development | ||||||||
| Authority, Revenue (Daughters of Charity Health System) | 5.25 | 7/1/24 | 3,470,000 | 3,214,677 | ||||
| California Statewide Communities Development | ||||||||
| Authority, Revenue (Daughters of Charity Health System) | 5.25 | 7/1/35 | 8,000,000 | 6,985,520 | ||||
| Foothill/Eastern Transportation Corridor Agency, | ||||||||
| Toll Road Revenue (Insured; MBIA) | 0/5.80 | 1/15/20 | 1,505,000 b | 1,505,060 | ||||
| Foothill/Eastern Transportation Corridor Agency, | ||||||||
| Toll Road Revenue (Insured; MBIA) | 0/5.88 | 1/15/26 | 8,000,000 b | 7,851,760 | ||||
| Golden State Tobacco Securitization Corporation, | ||||||||
| Enhanced Tobacco Settlement Asset-Backed Bonds | 5.00 | 6/1/18 | 1,000,000 | 1,000,640 | ||||
| Golden State Tobacco Securitization Corporation, | ||||||||
| Tobacco Settlement Asset-Backed Bonds | 4.50 | 6/1/27 | 13,380,000 | 11,605,544 | ||||
| Hesperia Public Financing Authority, Revenue | ||||||||
| (Redevelopment and Housing Projects) (Insured; XLCA) | 5.00 | 9/1/37 | 5,000,000 | 4,522,650 | ||||
| Kern High School District, GO (Insured; MBIA) | 6.40 | 2/1/12 | 2,750,000 | 2,979,928 | ||||
| Long Beach Bond Finance Authority, Revenue (Redevelopment, | ||||||||
| Housing and Gas Utility Financings) (Insured; AMBAC) | 5.00 | 8/1/35 | 10,320,000 | 9,552,089 | ||||
| Los Angeles Department of Water and Power, | ||||||||
| Power System Revenue (Insured; MBIA) | 5.25 | 7/1/11 | 2,250,000 | 2,404,440 | ||||
| Los Angeles Unified School District, GO (Insured; MBIA) | 5.75 | 7/1/16 | 2,000,000 | 2,246,740 | ||||
| Oakland Joint Powers Financing Authority, LR | ||||||||
| (Oakland Convention Centers) (Insured; AMBAC) | 5.50 | 10/1/13 | 1,500,000 | 1,584,330 | ||||
| Sacramento Municipal Utility District, Electric Revenue | 5.30 | 7/1/12 | 870,000 | 908,358 | ||||
| Sacramento Municipal Utility District, Electric Revenue (Insured; FGIC) | 5.25 | 5/15/13 | 3,530,000 | 3,765,063 | ||||
| San Francisco City and County, GO (Insured; FGIC) | 4.00 | 6/15/20 | 1,800,000 | 1,666,224 | ||||
| San Jose Redevelopment Agency, Tax Allocation Revenue | ||||||||
| (Merged Area Redevelopment Project) (Insured; MBIA) | 6.00 | 8/1/09 | 205,000 | 214,239 | ||||
14
| BNY Mellon National Intermediate Municipal Bond Fund (continued) | ||||||||||
| Long-Term Municipal | Coupon | Maturity | Principal | |||||||
| Investments (continued) | Rate (%) | Date | Amount ($) | Value ($) | ||||||
| California (continued) | ||||||||||
| San Jose Redevelopment Agency, Tax Allocation Revenue | ||||||||||
| (Merged Area Redevelopment Project) (Insured; MBIA) | 6.00 | 8/1/09 | 420,000 | 436,246 | ||||||
| Southern California Public Power Authority, | ||||||||||
| Gas Project Revenue (Project Number One) | 5.00 | 11/1/28 | 2,600,000 | 2,330,978 | ||||||
| Southern California Public Power Authority, | ||||||||||
| Gas Project Revenue (Project Number One) | 5.00 | 11/1/29 | 6,500,000 | 5,796,440 | ||||||
| Southern California Public Power Authority, | ||||||||||
| Gas Project Revenue (Project Number One) | 5.00 | 11/1/33 | 4,000,000 | 3,521,840 | ||||||
| Southern California Public Power Authority, | ||||||||||
| Power Project Revenue (San Juan Unit 3) (Insured; FSA) | 5.50 | 1/1/13 | 3,010,000 | 3,298,147 | ||||||
| Southern California Public Power Authority, | ||||||||||
| Power Project Revenue (San Juan Unit 3) (Insured; FSA) | 5.50 | 1/1/14 | 2,000,000 | 2,208,380 | ||||||
| Westside Unified School District, GO (Insured; AMBAC) | 6.00 | 8/1/14 | 385,000 | 439,943 | ||||||
| Colorado—4.8% | ||||||||||
| Adams County, FHA Insured Mortgage Revenue | ||||||||||
| (Platte Valley Medical Center Project) (Insured; MBIA) | 5.00 | 2/1/31 | 5,000,000 | 4,719,800 | ||||||
| Colorado Department of Transportation, | ||||||||||
| Transportation RAN (Insured; MBIA) | 5.25 | 6/15/10 | 1,000,000 | 1,053,690 | ||||||
| Colorado Educational and Cultural Facilities Authority, | ||||||||||
| Revenue (Regis University Project) (Insured; Radian) | 5.00 | 6/1/22 | 1,825,000 | 1,730,301 | ||||||
| Colorado Health Facilities Authority, Health Facilities Revenue | ||||||||||
| (The Evangelical Lutheran Good Samaritan Society Project) | 5.25 | 6/1/31 | 1,000,000 | 908,840 | ||||||
| Colorado Health Facilities Authority, | ||||||||||
| Revenue (Vail Valley Medical Center Project) | 5.00 | 1/15/20 | 1,250,000 | 1,187,575 | ||||||
| Colorado Housing Finance Authority (Single Family Program) | 6.75 | 4/1/15 | 85,000 | 86,204 | ||||||
| Colorado Housing Finance Authority (Single Family Program) | 6.05 | 10/1/16 | 120,000 | 124,145 | ||||||
| Colorado Housing Finance Authority (Single Family Program) | 6.70 | 10/1/16 | 45,000 | 46,390 | ||||||
| Colorado Housing Finance Authority (Single Family Program) | 7.55 | 11/1/27 | 5,000 | 5,093 | ||||||
| Colorado Housing Finance Authority (Single Family Program) | 6.80 | 11/1/28 | 15,000 | 15,268 | ||||||
| Colorado Housing Finance Authority | ||||||||||
| (Single Family Program) (Collateralized; FHA) | 6.75 | 10/1/21 | 240,000 | 255,238 | ||||||
| Colorado Housing Finance Authority | ||||||||||
| (Single Family Program) (Collateralized; FHA) | 7.15 | 10/1/30 | 50,000 | 50,897 | ||||||
| E-470 Public Highway Authority, Revenue (Insured; MBIA) | 0/5.00 | 9/1/16 | 3,565,000 b | 2,991,819 | ||||||
| E-470 Public Highway Authority, Revenue (Insured; MBIA) | 0/5.00 | 9/1/17 | 3,500,000 b | 2,895,305 | ||||||
| Jefferson County School District, GO (Insured; MBIA) | 6.50 | 12/15/10 | 1,500,000 | 1,643,955 | ||||||
| Northwest Parkway Public Highway Authority, | ||||||||||
| Revenue (Insured; AMBAC) | 0/5.45 | 6/15/16 | 7,690,000 a,b | 7,059,651 | ||||||
| Northwest Parkway Public Highway Authority, | ||||||||||
| Revenue (Insured; AMBAC) | 0/5.70 | 6/15/16 | 7,345,000 a,b | 6,814,250 | ||||||
| Northwest Parkway Public Highway Authority, | ||||||||||
| Revenue (Insured; FSA) | 0/5.55 | 6/15/16 | 10,960,000 a,b | 10,104,243 | ||||||
| University of Colorado, Enterprise System Revenue | 5.50 | 6/1/10 | 500,000 | 529,060 | ||||||
The Funds 15
STATEMENT OF INVESTMENTS (Unaudited) (continued)
| BNY Mellon National Intermediate Municipal Bond Fund (continued) | ||||||||||
| Long-Term Municipal | Coupon | Maturity | Principal | |||||||
| Investments (continued) | Rate (%) | Date | Amount ($) | Value ($) | ||||||
| Colorado (continued) | ||||||||||
| University of Colorado Regents, Participation Interest | ||||||||||
| (Sempra Energy Colorado, Inc., Lease, Development | ||||||||||
| and Operating Agreement) (Insured; MBIA) | 6.00 | 12/1/22 | 5,000,000 | 5,246,000 | ||||||
| Connecticut—.2% | ||||||||||
| Connecticut (Insured; AMBAC) | 5.25 | 6/1/18 | 1,500,000 | 1,607,805 | ||||||
| Connecticut Health and Educational Facilities | ||||||||||
| Authority, Revenue (Yale University Issue) | 5.13 | 7/1/27 | 300,000 | 297,978 | ||||||
| District of Columbia—.5% | ||||||||||
| District of Columbia, GO (Insured; FSA) | 4.14 | 6/1/16 | 5,000,000 | 5,022,200 | ||||||
| Florida—6.9% | ||||||||||
| Florida Department of Transportation, | ||||||||||
| State Infrastructure Bank Revenue | 5.00 | 7/1/19 | 4,220,000 | 4,378,503 | ||||||
| Florida Department of Transportation, | ||||||||||
| State Infrastructure Bank Revenue | 5.00 | 7/1/20 | 2,500,000 | 2,561,725 | ||||||
| Florida Municipal Loan Council, Revenue (Insured; MBIA) | 5.75 | 11/1/15 | 520,000 | 553,212 | ||||||
| Hillsborough County Aviation Authority, Revenue | ||||||||||
| (Tampa International Airport) (Insured; AMBAC) | 5.13 | 10/1/20 | 3,540,000 | 3,586,445 | ||||||
| Hillsborough County Aviation Authority, Revenue | ||||||||||
| (Tampa International Airport) (Insured; AMBAC) | 5.13 | 10/1/21 | 3,675,000 | 3,693,191 | ||||||
| Hillsborough County Educational Facilities Authority, | ||||||||||
| Revenue (University of Tampa Project) (Insured; Radian) | 5.75 | 4/1/18 | 2,910,000 | 2,974,282 | ||||||
| JEA, Saint Johns River Power Park System, Revenue | 5.00 | 10/1/15 | 2,750,000 | 2,889,810 | ||||||
| Lee County, Airport Revenue (Insured; FSA) | 5.88 | 10/1/19 | 3,000,000 | 3,085,320 | ||||||
| Miami-Dade County, Aviation Revenue, Miami | ||||||||||
| International Airport (Hub of the Americas) | 5.00 | 10/1/10 | 3,000,000 | 3,105,480 | ||||||
| Miami-Dade County, Subordinate Special Obligation | 0/5.00 | 10/1/22 | 2,000,000 b | 1,448,640 | ||||||
| Miami-Dade County, Subordinate Special Obligation | 0/5.00 | 10/1/35 | 1,500,000 b | 1,249,935 | ||||||
| Orlando and Orange County Expressway Authority, | ||||||||||
| Expressway Revenue (Insured; AMBAC) | 5.00 | 7/1/13 | 4,710,000 | 4,987,560 | ||||||
| Orlando Utilities Commission, Utility System Revenue | 3.16 | 10/1/16 | 12,400,000 c | 11,710,808 | ||||||
| Orlando Utilities Commission, Water and Electric Revenue | 5.25 | 10/1/20 | 2,260,000 | 2,320,907 | ||||||
| Sarasota County, Limited Ad Valorem Tax Bonds | ||||||||||
| (Environmentally Sensitive Lands and Parkland Program) | 5.25 | 10/1/25 | 6,895,000 d | 6,780,474 | ||||||
| Seminole Tribe, Special Obligation Revenue | 5.75 | 10/1/22 | 5,000,000 | 4,797,250 | ||||||
| Seminole Tribe, Special Obligation Revenue | 5.50 | 10/1/24 | 2,000,000 | 1,856,660 | ||||||
| Seminole Tribe, Special Obligation Revenue | 5.25 | 10/1/27 | 7,500,000 | 6,616,575 | ||||||
| Georgia—.5% | ||||||||||
| Chatham County Hospital Authority, HR Improvement | ||||||||||
| (Memorial Health University Medical Center, Inc.) | 6.13 | 1/1/24 | 2,480,000 | 2,375,617 | ||||||
| Crisp County Development Authority, EIR | ||||||||||
| (International Paper Company Project) | 5.55 | 2/1/15 | 1,000,000 | 1,022,360 | ||||||
| Georgia | 5.40 | 11/1/10 | 1,000,000 | 1,067,520 | ||||||
16
| BNY Mellon National Intermediate Municipal Bond Fund (continued) | ||||||||||
| Long-Term Municipal | Coupon | Maturity | Principal | |||||||
| Investments (continued) | Rate (%) | Date | Amount ($) | Value ($) | ||||||
| Illinois—5.8% | ||||||||||
| Chicago, Gas Supply Revenue (The Peoples | ||||||||||
| Gas Light and Coke Company Project) | 4.75 | 6/30/14 | 1,000,000 | 1,018,630 | ||||||
| Chicago, GO, Project and Refunding (Insured; FGIC) | 5.00 | 1/1/29 | 10,000,000 | 9,502,600 | ||||||
| Chicago, SFMR (Collateralized: FNMA and GNMA) | 4.70 | 10/1/17 | 115,000 | 116,164 | ||||||
| Chicago Metropolitan Water Reclamation District, | ||||||||||
| GO (Capital Improvement) | 7.25 | 12/1/12 | 8,500,000 | 9,936,160 | ||||||
| Cook County, GO Capital Improvement (Insured; AMBAC) | 5.00 | 11/15/25 | 5,000,000 | 4,941,750 | ||||||
| DuPage, Cook and Will Counties Community | ||||||||||
| College District Number 502, GO | 5.25 | 6/1/16 | 5,980,000 | 6,438,786 | ||||||
| Illinois, GO | 5.00 | 1/1/17 | 7,500,000 | 7,938,825 | ||||||
| Illinois Finance Authority, Gas Supply Revenue (The Peoples | ||||||||||
| Gas Light and Coke Company Project) (Insured; AMBAC) | 4.30 | 6/1/16 | 2,500,000 | 2,459,775 | ||||||
| Illinois Health Facilities Authority, Revenue | ||||||||||
| (Loyola University Health System) | 5.75 | 7/1/11 | 1,985,000 | 2,048,500 | ||||||
| Lake County Community Unitary School | ||||||||||
| District Number 60, GO (Insured; FSA) | 5.63 | 12/1/11 | 3,150,000 | 3,279,938 | ||||||
| Metropolitan Pier and Exposition Authority, | ||||||||||
| Dedicated State Tax Revenue (Insured; AMBAC) | 5.38 | 6/1/14 | 5,000,000 | 5,058,300 | ||||||
| Regional Transportation Authority, GO (Insured; FGIC) | 7.75 | 6/1/09 | 1,000,000 | 1,062,060 | ||||||
| Regional Transportation Authority, GO (Insured; FGIC) | 7.75 | 6/1/10 | 1,620,000 | 1,788,448 | ||||||
| Regional Transportation Authority, GO (Insured; FGIC) | 7.75 | 6/1/12 | 1,890,000 | 2,211,565 | ||||||
| Indiana—.6% | ||||||||||
| Indiana Health Facility Financing Authority, | ||||||||||
| HR (The Methodist Hospitals, Inc.) | 5.25 | 9/15/10 | 650,000 | 655,675 | ||||||
| Indiana Health Facility Financing Authority, | ||||||||||
| HR (The Methodist Hospitals, Inc.) | 5.25 | 9/15/11 | 750,000 | 754,065 | ||||||
| Indiana Municipal Power Agency, Power | ||||||||||
| Supply System Revenue (Insured; AMBAC) | 5.13 | 1/1/20 | 4,045,000 | 4,079,747 | ||||||
| Iowa—.3% | ||||||||||
| Muscatine, Electric Revenue (Insured; AMBAC) | 5.50 | 1/1/11 | 3,000,000 | 3,173,130 | ||||||
| Kansas—.5% | ||||||||||
| Wyandotte County/Kansas City Unified Government, | ||||||||||
| Utility System Revenue (Insured; AMBAC) | 5.65 | 9/1/22 | 5,000,000 | 5,209,250 | ||||||
| Kentucky—1.4% | ||||||||||
| Kentucky Property and Buildings Commission, Revenue (Insured; FSA) | 6.00 | 2/1/10 | 2,000,000 a | 2,115,740 | ||||||
| Kentucky Turnpike Authority, EDR | ||||||||||
| (Revitalization’s Projects) (Insured; AMBAC) | 5.50 | 7/1/12 | 1,250,000 | 1,358,162 | ||||||
| Louisville and Jefferson County Metropolitan Sewer District, | ||||||||||
| Sewer and Drainage System Revenue (Insured; MBIA) | 5.50 | 5/15/34 | 10,000,000 | 10,003,900 | ||||||
| Louisiana—.5% | ||||||||||
| Louisiana Citizens Property Insurance Corporation, | ||||||||||
| Assessment Revenue (Insured; AMBAC) | 5.25 | 6/1/13 | 5,000,000 | 5,143,950 | ||||||
The Funds 17
STATEMENT OF INVESTMENTS (Unaudited) (continued)
| BNY Mellon National Intermediate Municipal Bond Fund (continued) | ||||||||
| Long-Term Municipal | Coupon | Maturity | Principal | |||||
| Investments (continued) | Rate (%) | Date | Amount ($) | Value ($) | ||||
| Maine—.2% | ||||||||
| Maine Municipal Bond Bank (Insured; FSA) | 5.88 | 11/1/09 | 1,660,000 a | 1,759,301 | ||||
| Maryland—.5% | ||||||||
| Maryland Health and Higher Educational Facilities Authority, | ||||||||
| Revenue (LifeBridge Health Issue) (Insured; Assured Guaranty) | 5.00 | 7/1/28 | 5,000,000 | 4,838,450 | ||||
| Massachusetts—4.9% | ||||||||
| Boston | 5.00 | 3/1/21 | 10,000,000 | 10,268,400 | ||||
| Massachusetts, Consolidated Loan | 5.25 | 11/1/12 | 3,000,000 a | 3,217,380 | ||||
| Massachusetts, Consolidated Loan | 5.00 | 8/1/14 | 3,000,000 a | 3,208,650 | ||||
| Massachusetts, Consolidated Loan (Insured; FSA) | 5.25 | 8/1/22 | 10,000,000 | 10,291,600 | ||||
| Massachusetts Development Finance | ||||||||
| Agency, Revenue (Combined Jewish | ||||||||
| Philanthropies of Greater Boston, Inc. Project) | 4.75 | 2/1/15 | 4,135,000 | 4,276,045 | ||||
| Massachusetts Housing Finance Agency, Housing Revenue | 5.13 | 12/1/34 | 350,000 | 317,443 | ||||
| Massachusetts Municipal Wholesale Electric | ||||||||
| Company, Power Supply Project Revenue | ||||||||
| (Nuclear Project Number 4 Issue) (Insured; MBIA) | 5.25 | 7/1/12 | 2,000,000 | 2,127,240 | ||||
| Massachusetts Port Authority, Revenue | 6.00 | 1/1/10 | 2,035,000 a | 2,167,336 | ||||
| Massachusetts Port Authority, Revenue | 5.75 | 7/1/10 | 1,325,000 | 1,407,269 | ||||
| Massachusetts School Building Authority, | ||||||||
| Dedicated Sales Tax Revenue (Insured; AMBAC) | 5.00 | 8/15/20 | 10,000,000 | 10,245,200 | ||||
| Massachusetts Water Pollution Abatement | ||||||||
| Trust (Pooled Loan Program) | 5.25 | 8/1/17 | 275,000 | 296,535 | ||||
| Weston | 5.63 | 3/1/10 | 650,000 a | 690,690 | ||||
| Michigan—1.1% | ||||||||
| Michigan Municipal Bond Authority, | ||||||||
| Clean Water Revolving Fund Revenue | 5.00 | 10/1/21 | 5,000,000 | 5,054,550 | ||||
| Michigan Municipal Bond Authority, | ||||||||
| Drinking Water Revolving Fund Revenue | 5.50 | 10/1/15 | 1,000,000 | 1,113,570 | ||||
| Michigan Tobacco Settlement Finance Authority, | ||||||||
| Tobacco Settlement Asset-Backed Bonds | 5.13 | 6/1/22 | 5,000,000 | 4,666,000 | ||||
| Minnesota—.9% | ||||||||
| Minneapolis (Special School | ||||||||
| District Number 1) (Insured; FSA) | 5.00 | 2/1/14 | 2,350,000 | 2,394,744 | ||||
| University of Minnesota Regents, Special Purpose | ||||||||
| Revenue (State Supported Stadium Debt) | 5.00 | 8/1/19 | 6,300,000 | 6,517,665 | ||||
| Mississippi—.0% | ||||||||
| Mississippi State University Educational Building | ||||||||
| Corporation, Revenue (Insured; MBIA) | 5.25 | 8/1/16 | 400,000 | 432,616 | ||||
| Missouri—.6% | ||||||||
| Missouri Environmental Improvement | ||||||||
| and Energy Resource Authority, Water Pollution | ||||||||
| Control Revenue (Revolving Fund Program) | 5.50 | 7/1/14 | 1,250,000 | 1,387,213 | ||||
| Missouri Highways and Transportation | ||||||||
| Commission, State Road Revenue | 5.50 | 2/1/10 | 2,000,000 | 2,101,600 | ||||
18
| BNY Mellon National Intermediate Municipal Bond Fund (continued) | ||||||||
| Long-Term Municipal | Coupon | Maturity | Principal | |||||
| Investments (continued) | Rate (%) | Date | Amount ($) | Value ($) | ||||
| Missouri (continued) | ||||||||
| Missouri Highways and Transportation | ||||||||
| Commission, State Road Revenue | 5.50 | 2/1/11 | 2,000,000 | 2,138,080 | ||||
| Nevada—1.0% | ||||||||
| Clark County School District, GO (Insured; FGIC) | 5.00 | 6/15/20 | 10,000,000 | 10,234,800 | ||||
| New Hampshire—.2% | ||||||||
| Nashua, Capital Improvement | 5.50 | 7/15/12 | 560,000 a | 608,720 | ||||
| New Hampshire Business Finance Authority, | ||||||||
| PCR (Central Maine Power Company) | 5.38 | 5/1/14 | 1,000,000 | 1,037,900 | ||||
| New Jersey—5.4% | ||||||||
| Garden State Preservation Trust, Open Space and | ||||||||
| Farmland Preservation Revenue (Insured; FSA) | 5.80 | 11/1/17 | 2,500,000 | 2,795,850 | ||||
| Garden State Preservation Trust, Open Space and | ||||||||
| Farmland Preservation Revenue (Insured; FSA) | 5.80 | 11/1/18 | 5,000,000 | 5,498,050 | ||||
| Garden State Preservation Trust, Open Space and | ||||||||
| Farmland Preservation Revenue (Insured; FSA) | 5.80 | 11/1/19 | 5,000,000 | 5,452,650 | ||||
| Garden State Preservation Trust, Open Space and | ||||||||
| Farmland Preservation Revenue (Insured; FSA) | 5.80 | 11/1/23 | 5,000,000 | 5,295,350 | ||||
| Gloucester County Improvement Authority, | ||||||||
| Solid Waste Resource Recovery Revenue | 6.85 | 12/1/09 | 4,000,000 | 4,192,840 | ||||
| Gloucester County Improvement Authority, | ||||||||
| Solid Waste Resource Recovery Revenue | 7.00 | 12/1/09 | 1,000,000 | 1,046,390 | ||||
| New Jersey | 6.00 | 2/15/11 | 1,000,000 | 1,081,580 | ||||
| New Jersey Economic Development | ||||||||
| Authority, Cigarette Tax Revenue | 5.38 | 6/15/15 | 4,400,000 | 4,432,604 | ||||
| New Jersey Economic Development | ||||||||
| Authority, Cigarette Tax Revenue | 5.50 | 6/15/24 | 4,000,000 | 3,746,120 | ||||
| New Jersey Economic Development | ||||||||
| Authority, Cigarette Tax Revenue | 5.50 | 6/15/31 | 1,000,000 | 899,480 | ||||
| New Jersey Economic Development Authority, | ||||||||
| School Facilities Construction Revenue | 5.00 | 3/1/17 | 2,000,000 | 2,090,300 | ||||
| New Jersey Economic Development Authority, | ||||||||
| School Facilities Construction Revenue | 5.00 | 3/1/18 | 1,000,000 | 1,037,910 | ||||
| New Jersey Economic Development Authority, School | ||||||||
| Facilities Construction Revenue (Insured; AMBAC) | 5.25 | 6/15/11 | 5,375,000 a | 5,728,621 | ||||
| New Jersey Economic Development Authority, Transportation | ||||||||
| Project Sublease Revenue (New Jersey Transit | ||||||||
| Corporation Light Rail Transit System Project) (Insured; FSA) | 5.88 | 5/1/09 | 1,000,000 a | 1,035,430 | ||||
| New Jersey Highway Authority, Senior Parkway Revenue | ||||||||
| (Garden State Parkway) (Insured; FGIC) | 5.00 | 1/1/09 | 1,060,000 | 1,080,098 | ||||
| New Jersey Highway Authority, Senior Parkway Revenue | ||||||||
| (Garden State Parkway) (Insured; FGIC) | 5.00 | 1/1/10 | 1,110,000 | 1,152,724 | ||||
| New Jersey Transit Corporation, COP (Federal Transit | ||||||||
| Administration Grants) (Insured; AMBAC) | 6.00 | 9/15/10 | 2,000,000 a | 2,149,360 | ||||
| Tobacco Settlement Financing Corporation of New Jersey, | ||||||||
| Tobacco Settlement Asset-Backed Bonds | 4.50 | 6/1/23 | 4,960,000 | 4,404,877 | ||||
The Funds 19
| STATEMENT OF INVESTMENTS (Unaudited) (continued) |
| BNY Mellon National Intermediate Municipal Bond Fund (continued) | ||||||||||
| Long-Term Municipal | Coupon | Maturity | Principal | |||||||
| Investments (continued) | Rate (%) | Date | Amount ($) | Value ($) | ||||||
| New Mexico—.3% | ||||||||||
| New Mexico Finance Authority, Revenue | ||||||||||
| (Public Project Revolving Fund) (Insured; AMBAC) | 5.25 | 6/1/17 | 1,000,000 | 1,055,710 | ||||||
| New Mexico Highway Commission, Tax Revenue | 6.00 | 6/15/10 | 2,000,000 a | 2,135,640 | ||||||
| New York—9.8% | ||||||||||
| Albany Industrial Development Agency, Civic Facility Revenue | ||||||||||
| (Saint Peter’s Hospital of the City of Albany Project) | 5.25 | 11/15/27 | 2,550,000 | 2,352,553 | ||||||
| Albany Industrial Development Agency, Civic Facility Revenue | ||||||||||
| (Saint Peter’s Hospital of the City of Albany Project) | 5.25 | 11/15/32 | 3,500,000 | 3,130,610 | ||||||
| Greece Central School District (Insured; FGIC) | 6.00 | 6/15/10 | 225,000 | 240,259 | ||||||
| Greece Central School District (Insured; FGIC) | 6.00 | 6/15/11 | 950,000 | 1,034,008 | ||||||
| Greece Central School District (Insured; FGIC) | 6.00 | 6/15/12 | 950,000 | 1,050,139 | ||||||
| Greece Central School District (Insured; FGIC) | 6.00 | 6/15/13 | 950,000 | 1,068,113 | ||||||
| Greece Central School District (Insured; FGIC) | 6.00 | 6/15/14 | 950,000 | 1,076,587 | ||||||
| Greece Central School District (Insured; FGIC) | 6.00 | 6/15/15 | 950,000 | 1,086,287 | ||||||
| Long Island Power Authority, Electric | ||||||||||
| System General Revenue (Insured; FGIC) | 5.25 | 12/1/20 | 10,000,000 | 10,208,600 | ||||||
| Long Island Power Authority, Electric | ||||||||||
| System General Revenue (Insured; FGIC) | 5.00 | 12/1/23 | 7,500,000 | 7,270,425 | ||||||
| Metropolitan Transportation Authority, | ||||||||||
| Commuter Facilities Revenue | 5.50 | 7/1/11 | 1,000,000 | 1,018,510 | ||||||
| Metropolitan Transportation Authority, | ||||||||||
| State Service Contract Revenue | 5.50 | 7/1/16 | 5,000,000 | 5,442,000 | ||||||
| Metropolitan Transportation Authority, | ||||||||||
| State Service Contract Revenue | 5.75 | 1/1/18 | 1,500,000 | 1,656,420 | ||||||
| New York City | 5.75 | 8/1/10 | 820,000 a | 881,270 | ||||||
| New York City | 5.75 | 8/1/12 | 280,000 | 283,413 | ||||||
| New York City | 5.75 | 8/1/13 | 830,000 | 881,410 | ||||||
| New York City | 5.13 | 12/1/22 | 6,000,000 | 5,984,160 | ||||||
| New York City | 5.13 | 12/1/27 | 5,000,000 | 4,869,350 | ||||||
| New York City (Insured; XLCA) | 5.50 | 8/1/10 | 2,000,000 | 2,115,100 | ||||||
| New York City Transitional Finance Authority, | ||||||||||
| Future Tax Secured Revenue | 6.13 | 5/15/10 | 2,000,000 a | 2,155,400 | ||||||
| New York City Transitional Finance Authority, | ||||||||||
| Future Tax Secured Revenue | 6.13 | 5/15/10 | 175,000 a | 188,636 | ||||||
| New York City Transitional Finance Authority, | ||||||||||
| Future Tax Secured Revenue | 5.50/14.00 | 11/1/26 | 3,000,000 e | 3,194,280 | ||||||
| New York State Dormitory Authority, Revenue | ||||||||||
| (Consolidated City University System) (Insured; FSA) | 5.75 | 7/1/18 | 200,000 | 221,188 | ||||||
| New York State Power Authority, General Purpose Revenue | 7.00 | 1/1/10 | 350,000 a | 374,553 | ||||||
| New York State Thruway Authority (Highway | ||||||||||
| and Bridge Trust Fund) (Insured; FSA) | 6.00 | 4/1/10 | 1,000,000 a | 1,071,890 | ||||||
| New York State Thruway Authority, Second | ||||||||||
| General Highway and Bridge Trust Fund Bonds | 5.00 | 4/1/15 | 5,000,000 | 5,372,850 | ||||||
20
| BNY Mellon National Intermediate Municipal Bond Fund (continued) | ||||||||
| Long-Term Municipal | Coupon | Maturity | Principal | |||||
| Investments (continued) | Rate (%) | Date | Amount ($) | Value ($) | ||||
| New York (continued) | ||||||||
| New York State Thruway Authority, Second | ||||||||
| General Highway and Bridge Trust Fund Bonds | 5.00 | 4/1/16 | 5,000,000 | 5,358,550 | ||||
| New York State Thruway Authority, Second | ||||||||
| General Highway and Bridge Trust Fund Bonds | 5.00 | 4/1/21 | 5,000,000 | 5,094,400 | ||||
| New York State Thruway Authority, Second | ||||||||
| General Highway and Bridge Trust Fund Bonds | 5.00 | 4/1/24 | 10,000,000 | 9,966,800 | ||||
| New York State Urban Development Corporation, | ||||||||
| Correctional and Youth Facilities Service Contract Revenue | 5.00 | 1/1/11 | 5,000,000 | 5,205,600 | ||||
| Tobacco Settlement Financing Corporation of | ||||||||
| New York, Asset-Backed Revenue Bonds (State | ||||||||
| Contingency Contract Secured) | 5.50 | 6/1/19 | 5,000,000 | 5,219,450 | ||||
| Tobacco Settlement Financing Corporation of | ||||||||
| New York, Asset-Backed Revenue Bonds (State | ||||||||
| Contingency Contract Secured) (Insured; MBIA) | 5.50 | 6/1/18 | 2,000,000 | 2,079,660 | ||||
| North Carolina—1.4% | ||||||||
| Charlotte, GO | 5.00 | 4/1/13 | 1,000,000 | 1,078,520 | ||||
| Concord, COP (Insured; MBIA) | 5.50 | 6/1/11 | 1,000,000 | 1,062,650 | ||||
| Durham County, GO | 5.50 | 4/1/10 | 1,000,000 | 1,056,470 | ||||
| Guilford County, Public Improvement | 5.10 | 10/1/10 | 1,500,000 a | 1,608,960 | ||||
| North Carolina Eastern Municipal Power | ||||||||
| Agency, Power System Revenue | 5.38 | 1/1/16 | 1,500,000 | 1,543,920 | ||||
| North Carolina Eastern Municipal Power | ||||||||
| Agency, Power System Revenue (Insured; FGIC) | 6.00 | 1/1/25 | 4,075,000 | 4,188,041 | ||||
| Raleigh Durham Airport Authority, Revenue (Insured; FGIC) | 5.25 | 11/1/13 | 2,465,000 | 2,577,922 | ||||
| Wake County Industrial Facilities and Pollution Control Financing | ||||||||
| Authority, PCR (Carolina Power and Light Company Project) | 5.38 | 2/1/17 | 1,000,000 | 1,027,870 | ||||
| Ohio—4.2% | ||||||||
| Akron, Sanitary Sewer System Special Revenue (Insured; AMBAC) | 6.00 | 12/1/14 | 500,000 | 526,740 | ||||
| American Municipal Power—Ohio, Inc., Electricity | ||||||||
| Purpose Revenue (Prepayment Issue) | 5.00 | 2/1/10 | 5,000,000 | 5,119,400 | ||||
| Buckeye Tobacco Settlement Financing Authority, | ||||||||
| Tobacco Settlement Asset-Backed Bonds | 5.13 | 6/1/24 | 12,000,000 | 11,153,640 | ||||
| Buckeye Tobacco Settlement Financing Authority, | ||||||||
| Tobacco Settlement Asset-Backed Bonds | 6.50 | 6/1/47 | 15,000,000 | 14,830,050 | ||||
| Cuyahoga County, Revenue (Cleveland Clinic Health System) | 6.00 | 1/1/15 | 2,265,000 | 2,511,115 | ||||
| Cuyahoga County, Revenue (Cleveland Clinic Health System) | 6.00 | 1/1/17 | 3,900,000 | 4,315,818 | ||||
| Ohio, GO Infrastructure Improvements | 5.63 | 2/1/09 | 1,000,000 | 1,030,150 | ||||
| Ohio Housing Finance Agency, MFHR (Uptown Towers | ||||||||
| Apartments Project) (Collateralized; GNMA) | 4.75 | 10/20/15 | 1,000,000 | 1,007,980 | ||||
| Toledo-Lucas County Port Authority, Port | ||||||||
| Facilities Revenue (Cargill Inc. Project) | 4.50 | 12/1/15 | 900,000 | 906,984 | ||||
| Oklahoma—.0% | ||||||||
| Oklahoma Housing Finance Agency, SFMR (Collateralized; FNMA) | 6.80 | 9/1/16 | 30,000 | 30,892 | ||||
The Funds 21
STATEMENT OF INVESTMENTS (Unaudited) (continued)
| BNY Mellon National Intermediate Municipal Bond Fund (continued) | ||||||||
| Long-Term Municipal | Coupon | Maturity | Principal | |||||
| Investments (continued) | Rate (%) | Date | Amount ($) | Value ($) | ||||
| Oregon—.5% | ||||||||
| Eagle Point School District Number 9, GO | 5.63 | 6/15/11 | 1,500,000 a | 1,615,680 | ||||
| Jackson County School District Number 6, GO | ||||||||
| (Central Point) (Insured; FGIC) | �� | 5.75 | 6/15/10 | 2,265,000 a | 2,406,653 | |||
| Portland, Convention Center Urban Renewal and | ||||||||
| Redevelopment Bonds (Insured; AMBAC) | 5.75 | 6/15/18 | 1,150,000 | 1,210,732 | ||||
| Pennsylvania—.7% | ||||||||
| Allegheny County Hospital Development Authority, | ||||||||
| Revenue (University of Pittsburgh Medical Center) | 5.25 | 6/15/15 | 1,620,000 | 1,709,570 | ||||
| Philadelphia School District, GO (Insured; AMBAC) | 5.00 | 4/1/17 | 2,165,000 | 2,239,952 | ||||
| State Public School Building Authority, College Revenue | ||||||||
| (Harrisburg Community College) (Insured; MBIA) | 6.25 | 4/1/08 | 795,000 | 797,663 | ||||
| Swarthmore Borough Authority, | ||||||||
| Revenue (Swarthmore College) | 5.00 | 9/15/11 | 1,000,000 | 1,064,060 | ||||
| Swarthmore Borough Authority, | ||||||||
| Revenue (Swarthmore College) | 5.00 | 9/15/12 | 1,400,000 | 1,499,526 | ||||
| Rhode Island—.1% | ||||||||
| Rhode Island Health and Educational Building | ||||||||
| Corporation, Higher Educational Facility Revenue | ||||||||
| (Providence College Issue) (Insured; XLCA) | 4.50 | 11/1/17 | 795,000 | 772,653 | ||||
| Rhode Island Health and Educational Building | ||||||||
| Corporation, Higher Educational Facility Revenue | ||||||||
| (Providence College Issue) (Insured; XLCA) | 5.00 | 11/1/22 | 250,000 | 235,178 | ||||
| South Carolina—3.2% | ||||||||
| Greenville County School District, Installment Purchase | ||||||||
| Revenue (Building Equity Sooner for Tomorrow) | 5.25 | 12/1/10 | 10,000,000 | 10,580,300 | ||||
| Greenville County School District, Installment Purchase | ||||||||
| Revenue (Building Equity Sooner for Tomorrow) | 5.25 | 12/1/11 | 5,650,000 | 6,028,267 | ||||
| Greenville County School District, Installment Purchase | ||||||||
| Revenue (Building Equity Sooner for Tomorrow) | 5.88 | 12/1/12 | 3,000,000 a | 3,348,450 | ||||
| Greenville County School District, Installment Purchase | ||||||||
| Revenue (Building Equity Sooner for Tomorrow) | 5.50 | 12/1/18 | 3,000,000 | 3,201,090 | ||||
| Greenville County School District, Installment Purchase | ||||||||
| Revenue (Building Equity Sooner for Tomorrow) | 5.00 | 12/1/24 | 1,000,000 | 958,300 | ||||
| Horry County School District, GO (Insured; | ||||||||
| South Carolina State Department of Education) | 5.38 | 3/1/17 | 5,030,000 | 5,355,441 | ||||
| Newberry Investing in Children’s Education, | ||||||||
| Installment Purchase Revenue (School District | ||||||||
| of Newberry County, South Carolina Project) | 5.25 | 12/1/20 | 1,000,000 | 963,450 | ||||
| South Carolina Jobs and Economic Development | ||||||||
| Authority, Hospital Facilities Revenue | ||||||||
| (Georgetown Memorial Hospital) (Insured; Radian) | 5.25 | 2/1/21 | 1,250,000 | 1,221,313 | ||||
| Tennessee—.0% | ||||||||
| Shelby County Health Educational and Housing Facilities | ||||||||
| Board, Revenue (Saint Jude Children’s Research Hospital) | 5.00 | 7/1/09 | 100,000 | 101,602 | ||||
22
| BNY Mellon National Intermediate Municipal Bond Fund (continued) | ||||||||
| Long-Term Municipal | Coupon | Maturity | Principal | |||||
| Investments (continued) | Rate (%) | Date | Amount ($) | Value ($) | ||||
| Texas—3.3% | ||||||||
| Cities of Dallas and Fort Worth, Dallas/Fort Worth | ||||||||
| International Airport, Joint Revenue Bonds (Insured; XLCA) | 5.00 | 11/1/14 | 5,000,000 | 5,038,950 | ||||
| Cities of Dallas and Fort Worth, Dallas/Fort Worth International | ||||||||
| Airport, Joint Revenue Improvement Bonds (Insured; FGIC) | 5.50 | 11/1/31 | 1,000,000 | 948,010 | ||||
| Cypress-Fairbanks Independent School District, Unlimited Tax | ||||||||
| Schoolhouse Bonds (Permanent School Fund Guarantee Program) | 5.25 | 2/15/14 | 10,000,000 a | 10,878,000 | ||||
| Cypress-Fairbanks Independent School District, Unlimited Tax | ||||||||
| Schoolhouse Bonds (Permanent School Fund Guarantee Program) | 5.00 | 2/15/26 | 6,750,000 | 6,624,382 | ||||
| Lower Colorado River Authority, Transmission Contract Revenue | ||||||||
| (LCRA Transmission Services Corporation Project) (Insured; FGIC) | 5.00 | 5/15/20 | 2,500,000 | 2,500,775 | ||||
| Lower Colorado River Authority, Transmission Contract Revenue | ||||||||
| (LCRA Transmission Services Corporation Project) (Insured; FGIC) | 5.00 | 5/15/21 | 2,500,000 | 2,471,975 | ||||
| San Antonio, General Improvement Bonds | 5.90 | 2/1/10 | 500,000 a | 528,010 | ||||
| Tarrant County, Limited Tax Bonds | 5.00 | 7/15/27 | 1,220,000 | 1,206,507 | ||||
| Texas Municipal Power Agency, Revenue (Insured; FGIC) | 4.40 | 9/1/11 | 2,750,000 | 2,752,310 | ||||
| Utah—.1% | ||||||||
| Intermountain Power Agency, Power | ||||||||
| Supply Revenue (Insured; FSA) | 6.25 | 7/1/09 | 750,000 | 784,642 | ||||
| Vermont—.5% | ||||||||
| Burlington, Electric Revenue (Insured; MBIA) | 6.25 | 7/1/11 | 2,000,000 | 2,158,360 | ||||
| Burlington, Electric Revenue (Insured; MBIA) | 6.25 | 7/1/12 | 2,500,000 | 2,737,500 | ||||
| Virginia—.7% | ||||||||
| Chesterfield County Industrial Development Authority, | ||||||||
| PCR (Virginia Electric and Power Company Project) | 5.88 | 6/1/17 | 3,000,000 | 3,126,960 | ||||
| Louisa Industrial Development Authority, PCR | ||||||||
| (Virginia Electric and Power Company) | 5.25 | 12/1/08 | 3,000,000 | 3,021,030 | ||||
| Newport News Industrial Development Authority, IDR | ||||||||
| (Virginia Advanced Shipbuilding and Carrier Integration Center) | 5.50 | 9/1/10 | 1,000,000 | 1,059,340 | ||||
| Washington—2.4% | ||||||||
| Port of Longview Industrial Development Corporation, | ||||||||
| SWDR (Weyerhaeuser Company Project) | 6.88 | 10/1/08 | 2,500,000 | 2,537,700 | ||||
| Seattle, Municipal Light and Power Revenue | 5.50 | 12/1/10 | 1,000,000 | 1,064,860 | ||||
| Washington, GO (Various Purpose) | 5.00 | 7/1/23 | 19,550,000 | 19,507,186 | ||||
| Washington Public Power Supply System, | ||||||||
| Revenue (Nuclear Project Number 1) | 7.00 | 7/1/08 | 380,000 | 385,768 | ||||
| Washington Public Power Supply System, | ||||||||
| Revenue (Nuclear Project Number 1) | 7.00 | 7/1/08 | 620,000 | 629,294 | ||||
| West Virginia—.4% | ||||||||
| Monongalia County Building Commission, HR | ||||||||
| (Monongalia General Hospital) | 5.25 | 7/1/20 | 4,240,000 | 4,119,754 | ||||
| Wisconsin—1.3% | ||||||||
| Kenosha, Waterworks Revenue (Insured; FGIC) | 5.00 | 12/1/12 | 750,000 | 773,632 | ||||
| Wisconsin, Transportation Revenue (Insured; FGIC) | 5.00 | 7/1/18 | 11,825,000 | 12,235,209 | ||||
The Funds 23
STATEMENT OF INVESTMENTS (Unaudited) (continued)
| BNY Mellon National Intermediate Municipal Bond Fund (continued) | ||||||||||
| Long-Term Municipal | Coupon | Maturity | Principal | |||||||
| Investments (continued) | Rate (%) | Date | Amount ($) | Value ($) | ||||||
| U.S. Related—5.0% | ||||||||||
| Puerto Rico Commonwealth | 5.00 | 7/1/12 | 2,000,000 | 2,044,040 | ||||||
| Puerto Rico Commonwealth (Insured; MBIA) | 6.25 | 7/1/11 | 950,000 | 1,030,665 | ||||||
| Puerto Rico Commonwealth (Insured; MBIA) | 6.25 | 7/1/13 | 1,380,000 | 1,531,345 | ||||||
| Puerto Rico Commonwealth, Public Improvement | 6.00 | 7/1/08 | 1,500,000 | 1,513,590 | ||||||
| Puerto Rico Commonwealth, Public Improvement (Insured; MBIA) | 5.50 | 7/1/20 | 5,000,000 | 5,141,850 | ||||||
| Puerto Rico Commonwealth, Public Improvement (Insured; MBIA) | 5.50 | 7/1/20 | 5,500,000 | 5,656,035 | ||||||
| Puerto Rico Electric Power Authority, Power Revenue (Insured; MBIA) | 5.25 | 7/1/15 | 2,000,000 | 2,122,260 | ||||||
| Puerto Rico Electric Power Authority, Power Revenue (Insured; MBIA) | 5.00 | 7/1/17 | 3,940,000 | 4,036,491 | ||||||
| Puerto Rico Government Development Bank, Senior Notes | 5.00 | 12/1/12 | 10,000,000 | 10,357,100 | ||||||
| Puerto Rico Government Development Bank, Senior Notes | 5.00 | 12/1/13 | 4,000,000 | 4,130,240 | ||||||
| Puerto Rico Highways and Transportation Authority, | ||||||||||
| Highway Revenue (Insured; MBIA) | 6.25 | 7/1/09 | 85,000 | 88,886 | ||||||
| Puerto Rico Highways and Transportation Authority, | ||||||||||
| Highway Revenue (Insured; MBIA) | 6.25 | 7/1/09 | 65,000 | 67,845 | ||||||
| Puerto Rico Highways and Transportation Authority, | ||||||||||
| Transportation Revenue (Insured; MBIA) | 5.88 | 7/1/10 | 1,405,000 a | 1,511,106 | ||||||
| Puerto Rico Highways and Transportation Authority, | ||||||||||
| Transportation Revenue (Insured; MBIA) | 5.88 | 7/1/10 | 2,595,000 a | 2,786,693 | ||||||
| Puerto Rico Public Buildings Authority, Government Facility Revenue | 5.50 | 7/1/14 | 1,000,000 | 1,053,710 | ||||||
| Puerto Rico Public Buildings Authority, Government Facility Revenue | 5.50 | 7/1/15 | 5,000 | 5,538 | ||||||
| Puerto Rico Public Buildings Authority, Government Facility Revenue | 5.50 | 7/1/15 | 995,000 | 1,042,919 | ||||||
| Puerto Rico Public Buildings Authority, Government Facility Revenue | 5.50 | 7/1/16 | 1,995,000 | 2,085,014 | ||||||
| Puerto Rico Public Buildings Authority, Government Facility Revenue | 5.50 | 7/1/16 | 5,000 | 5,540 | ||||||
| Puerto Rico Public Buildings Authority, Government Facility Revenue | 5.75 | 7/1/17 | 1,940,000 | 2,046,622 | ||||||
| Puerto Rico Public Buildings Authority, Government Facility Revenue | 5.75 | 7/1/17 | 5,000 | 5,626 | ||||||
| Puerto Rico Public Buildings Authority, | ||||||||||
| Government Facility Revenue (Insured; AMBAC) | 6.25 | 7/1/10 | 750,000 | 798,848 | ||||||
| University of Puerto Rico, University System | ||||||||||
| Revenue, Refunding (Insured; MBIA) | 6.25 | 6/1/08 | 750,000 | 756,915 | ||||||
| Total Long-Term Municipal Investments (cost $916,238,821) | 903,073,456 | |||||||||
| Short-Term Municipal Investments—9.6% | ||||||||||
| Florida—.9% | ||||||||||
| Pinellas County Health Facilities Authority, Hospital Facilities Revenue, | ||||||||||
| Refunding (Bayfront Hospital Projects) (LOC; SunTrust Bank) | 3.16 | 3/1/08 | 8,500,000 f | 8,500,000 | ||||||
| Illinois—1.1% | ||||||||||
| Illinois Finance Authority, Revenue (Advocate | ||||||||||
| Health Care Network) (Insured; AMBAC) | 7.37 | 3/7/08 | 8,400,000 f | 8,400,000 | ||||||
| Illinois Finance Authority, Revenue (Resurrection | ||||||||||
| Health Care) (LOC; JPMorgan Chase Bank) | 3.26 | 3/1/08 | 2,745,000 f | 2,745,000 | ||||||
| Massachusetts—.8% | ||||||||||
| Massachusetts Health and Educational Facilities Authority, | ||||||||||
| Revenue (Northeastern University Issue) (Insured; MBIA) | 3.31 | 4/4/08 | 6,000,000 f | 6,000,000 | ||||||
24
| BNY Mellon National Intermediate Municipal Bond Fund (continued) | ||||||||||
| Short-Term Municipal | Coupon | Maturity | Principal | |||||||
| Investments (continued) | Rate (%) | Date | Amount ($) | Value ($) | ||||||
| Massachusetts (continued) | ||||||||||
| Massachusetts Health and Educational Facilities Authority, | ||||||||||
| Revenue (Northeastern University Issue) (Insured; MBIA) | 3.43 | 4/4/08 | 2,000,000 f | 2,000,000 | ||||||
| Nevada—.1% | ||||||||||
| Las Vegas, GO (LOC; Lloyds Bank PLC) | 3.05 | 3/1/08 | 1,400,000 f | 1,400,000 | ||||||
| Ohio—1.6% | ||||||||||
| Cuyahoga County, Hospital Improvement Revenue (University | ||||||||||
| Hospitals of Cleveland Project) (LOC; JPMorgan Chase Bank) | 3.15 | 3/1/08 | 5,600,000 f | 5,600,000 | ||||||
| Ohio Higher Educational Facility Commission, Revenue | ||||||||||
| (Case Western Reserve University Project) (Insured; AMBAC) | 5.46 | 4/4/08 | 10,000,000 f | 10,000,000 | ||||||
| Pennsylvania—3.0% | ||||||||||
| Berks County Municipal Authority, HR (The Reading | ||||||||||
| Hospital and Medical Center Project) (Insured; AMBAC) | 5.75 | 4/4/08 | 5,000,000 f | 5,000,000 | ||||||
| Berks County Municipal Authority, Revenue (The Reading | ||||||||||
| Hospital and Medical Center Project) (Insured; AMBAC) | 5.38 | 4/4/08 | 7,100,000 f | 7,100,000 | ||||||
| Berks County Municipal Authority, Revenue (The Reading | ||||||||||
| Hospital and Medical Center Project) (Insured; AMBAC) | 6.87 | 4/4/08 | 10,000,000 f | 10,000,000 | ||||||
| Delaware County Industrial Development Authority, | ||||||||||
| Airport Facilities Revenue (United Parcel Service Project) | 3.07 | 3/1/08 | 5,500,000 f | 5,500,000 | ||||||
| Delaware County Industrial Development Authority, PCR | ||||||||||
| (PECO Energy Company Project) (LOC; Wachovia Bank) | 3.20 | 3/1/08 | 985,000 f | 985,000 | ||||||
| Schuylkill County Industrial Development Authority, RRR, Refunding | ||||||||||
| (Northeastern Power Company Project) (LOC; Dexia Credit Locale) | 3.10 | 3/1/08 | 970,000 f | 970,000 | ||||||
| Vermont—2.0% | ||||||||||
| Vermont Educational and Health Buildings Financing Agency, | ||||||||||
| HR (Fletcher Allen Health Care Project) (Insured; FSA) | 10.00 | 4/4/08 | 20,000,000 f | 20,000,000 | ||||||
| Wyoming—.1% | ||||||||||
| Sweetwater County, PCR, Refunding | ||||||||||
| (Pacificorp Projects) (LOC; Barclays Bank PLC) | 3.20 | 3/1/08 | 800,000 f | 800,000 | ||||||
| Total Short-Term Municipal Investments (cost $94,997,624) | 95,000,000 | |||||||||
| Total Investments (cost $1,011,236,445) | 100.6% | 998,073,456 | ||||||||
| Liabilities, Less Cash and Receivables | (.6%) | (5,837,646) | ||||||||
| Net Assets | 100.0% | 992,235,810 | ||||||||
| a These securities are prerefunded; the date shown represents the prerefunded date. Bonds which are prerefunded are collateralized by U.S. Government securities which are held in |
| escrow and are used to pay principal and interest on the municipal issue and to retire the bonds in full at the earliest refunding date. |
| b Zero coupon until a specified date at which time the stated coupon rate becomes effective until maturity. |
| c Variable rate security—interest rate subject to periodic change. |
| d Purchased on a delayed delivery basis. |
| e Subject to interest rate change on November 1, 2011. |
| f Securities payable on demand.Variable interest rate—subject to periodic change. |
The Funds 25
STATEMENT OF INVESTMENTS (Unaudited) (continued)
| Summary of Abbreviations | ||||||
| ACA | American Capital Access | AGC | ACE Guaranty Corporation | |||
| AGIC | Asset Guaranty Insurance Company | AMBAC | American Municipal Bond Assurance Corporation | |||
| ARRN | Adjustable Rate Receipt Notes | BAN | Bond Anticipation Notes | |||
| BIGI | Bond Investors Guaranty Insurance | BPA | Bond Purchase Agreement | |||
| CGIC | Capital Guaranty Insurance Company | CIC | Continental Insurance Company | |||
| CIFG | CDC Ixis Financial Guaranty | CMAC | Capital Market Assurance Corporation | |||
| COP | Certificate of Participation | CP | Commercial Paper | |||
| EDR | Economic Development Revenue | EIR | Environmental Improvement Revenue | |||
| FGIC | Financial Guaranty Insurance Company | FHA | Federal Housing Administration | |||
| FHLB | Federal Home Loan Bank | FHLMC | Federal Home Loan Mortgage Corporation | |||
| FNMA | Federal National Mortgage Association | FSA | Financial Security Assurance | |||
| GAN | Grant Anticipation Notes | GIC | Guaranteed Investment Contract | |||
| GNMA | Government National Mortgage Association | GO | General Obligation | |||
| HR | Hospital Revenue | IDB | Industrial Development Board | |||
| IDC | Industrial Development Corporation | IDR | Industrial Development Revenue | |||
| LOC | Letter of Credit | LOR | Limited Obligation Revenue | |||
| LR | Lease Revenue | MBIA | Municipal Bond Investors | |||
| Assurance Insurance Corporation | ||||||
| MFHR | Multi-Family Housing Revenue | MFMR | Multi-Family Mortgage Revenue | |||
| PCR | Pollution Control Revenue | PILOT | Payment in Lieu of Taxes | |||
| RAC | Revenue Anticipation Certificates | RAN | Revenue Anticipation Notes | |||
| RAW | Revenue Anticipation Warrants | RRR | Resources Recovery Revenue | |||
| SAAN | State Aid Anticipation Notes | SBPA | Standby Bond Purchase Agreement | |||
| SFHR | Single Family Housing Revenue | SFMR | Single Family Mortgage Revenue | |||
| SONYMA | State of New York Mortgage Agency | SWDR | Solid Waste Disposal Revenue | |||
| TAN | Tax Anticipation Notes | TAW | Tax Anticipation Warrants | |||
| TRAN | Tax and Revenue Anticipation Notes | XLCA | XL Capital Assurance | |||
| Summary of Combined Ratings (Unaudited) | ||||||||||
| Fitch | or | Moody’s | or | Standard & Poor’s | Value (%)† | |||||
| AAA | Aaa | AAA | 50.8 | |||||||
| AA | Aa | AA | 25.4 | |||||||
| A | A | A | 6.4 | |||||||
| BBB | Baa | BBB | 14.7 | |||||||
| F1 | MIG1/P1 | SP1/A1 | 2.7 | |||||||
| 100.0 | ||||||||||
| † |
| † Based on total investments. See notes to financial statements. |
26
| STATEMENT OF FINANCIAL FUTURES |
| February 29, 2008 (Unaudited) |
| Unrealized | ||||||||
| Market Value | Appreciation | |||||||
| BNY Mellon National | Notional Amount/ | Covered by | (Depreciation) | |||||
| Intermediate Municipal Bond Fund | Contracts | Contracts ($) | Expiration | at 2/29/2008 ($) | ||||
| Financial Futures Short | ||||||||
| 30 Year MMD Index | 10,000,000 | (9,334,201) | May 2008 | 665,799 | ||||
| 30 Year MMD Index | 10,000,000 | (9,334,645) | May 2008 | 665,355 | ||||
| U.S. Treasury 30 Year Bond | 275 | (32,914,063) | March 2008 | (713,281) | ||||
| 617,873 |
See notes to financial statements.
The Funds 27
| STATEMENT OF INVESTMENTS |
| February 29, 2008 (Unaudited) |
| BNY Mellon National Short-Term Municipal Bond Fund | ||||||||
| Long-Term Municipal | Coupon | Maturity | Principal | |||||
| Investments—90.2% | Rate (%) | Date | Amount ($) | Value ($) | ||||
| Alabama—2.5% | ||||||||
| Alabama Public School and College Authority, | ||||||||
| Capital Improvement Bonds | 5.63 | 7/1/13 | 1,000,000 | 1,045,590 | ||||
| Jefferson County, Sewer Revenue Warrants (Insured; FSA) | 5.25 | 2/1/13 | 3,000,000 | 3,051,840 | ||||
| Arizona—3.3% | ||||||||
| Chandler Industrial Development Authority, | ||||||||
| IDR (Intel Corporation Project) | 4.38 | 12/1/10 | 5,200,000 | 5,358,184 | ||||
| California—8.0% | ||||||||
| Agua Caliente Band, Cahuilla Indians Revenue | 4.60 | 7/1/08 | 400,000 | 401,020 | ||||
| California Department of Water Resources, Power Supply Revenue | 5.50 | 5/1/11 | 2,000,000 | 2,149,320 | ||||
| California Infrastructure and Economic Development | ||||||||
| Bank, Revenue (The J. Paul Getty Trust) | 3.90 | 12/1/11 | 2,000,000 | 2,037,720 | ||||
| California Statewide Communities Development Authority, | ||||||||
| MFHR (Clara Park / Cypress Sunrise / | ||||||||
| Wysong Plaza Apartments) (Collateralized; GNMA) | 4.55 | 1/20/16 | 1,335,000 | 1,338,284 | ||||
| California Statewide Communities Development | ||||||||
| Authority, Revenue (Kaiser Permanente) | 2.63 | 5/1/08 | 2,000,000 | 1,999,740 | ||||
| Del Mar Race Track Authority, Revenue | 5.00 | 8/15/09 | 1,080,000 | 1,095,541 | ||||
| Golden State Tobacco Securitization Corporation, | ||||||||
| Tobacco Settlement Asset-Backed Bonds | 5.00 | 6/1/11 | 1,005,000 | 1,020,598 | ||||
| San Bernardino County Housing Authority, MFHR | ||||||||
| (Equity Residential/Redlands Lawn and Tennis Apartments) | 5.20 | 6/15/09 | 3,000,000 | 3,063,150 | ||||
| Colorado—1.6% | ||||||||
| Black Hawk, Device Tax Revenue | 5.00 | 12/1/11 | 600,000 | 614,700 | ||||
| Colorado Health Facilities Authority, Health Facilities Revenue | ||||||||
| (The Evangelical Lutheran Good Samaritan Society Project) | 3.75 | 6/1/09 | 1,000,000 | 1,011,080 | ||||
| Colorado Health Facilities Authority, Health Facilities Revenue | ||||||||
| (The Evangelical Lutheran Good Samaritan Society Project) | 5.00 | 6/1/10 | 1,000,000 | 1,023,690 | ||||
| Connecticut—1.9% | ||||||||
| Connecticut Development Authority, PCR (Connecticut | ||||||||
| Light and Power Company Project) | 5.85 | 9/1/28 | 3,000,000 | 3,021,600 | ||||
| Florida—9.0% | ||||||||
| Florida Department of Environmental Protection, | ||||||||
| Preservation 2000 Revenue (Insured; FSA) | 5.25 | 7/1/13 | 5,000,000 | 5,087,500 | ||||
| Florida Hurricane Catastrophe Fund | ||||||||
| Finance Corporation, Revenue | 5.00 | 7/1/10 | 3,000,000 | 3,118,560 | ||||
| Florida Rural Utility Financing Commission, | ||||||||
| Revenue Notes (Public Projects Construction) | 4.00 | 2/1/11 | 1,250,000 | 1,257,812 | ||||
| Highlands County Health Facilities Authority, HR | ||||||||
| (Adventist Health System/Sunbelt Obligated Group) | 5.00 | 11/15/08 | 500,000 | 506,380 | ||||
| Miami-Dade County Health Facilities Authority, HR | ||||||||
| (Miami Children’s Hospital Project) (Insured; AMBAC) | 5.50 | 8/15/11 | 2,450,000 | 2,634,461 | ||||
| Palm Beach County School Board, COP (Master | ||||||||
| Lease Purchase Agreement) (Insured; FGIC) | 5.00 | 8/1/11 | 2,000,000 a | 2,047,880 | ||||
28
| BNY Mellon National Short-Term Municipal Bond Fund (continued) | ||||||||||
| Long-Term Municipal | Coupon | Maturity | Principal | |||||||
| Investments (continued) | Rate (%) | Date | Amount ($) | Value ($) | ||||||
| Idaho—1.6% | ||||||||||
| University of Idaho Regents, General Revenue (Insured; FSA) | 4.38 | 4/1/11 | 2,500,000 | 2,571,575 | ||||||
| Illinois—8.3% | ||||||||||
| Chicago, Senior Lien Water Revenue (Insured; AMBAC) | 5.50 | 11/1/11 | 1,750,000 b | 1,889,895 | ||||||
| Chicago, Senior Lien Water Revenue (Insured; AMBAC) | 5.50 | 11/1/11 | 1,000,000 b | 1,079,940 | ||||||
| Illinois, GO (Illinois Fund for Infrastructure, | ||||||||||
| Roads, Schools and Transit) (Insured; FGIC) | 6.00 | 1/1/17 | 5,575,000 | 5,830,948 | ||||||
| Illinois, Sales Tax Revenue (Illinois Fund for | ||||||||||
| Infrastructure, Roads, Schools and Transit) | 5.50 | 6/15/13 | 1,100,000 | 1,171,082 | ||||||
| Illinois Educational Facilities Authority, Revenue (University of Chicago) | 4.05 | 7/1/09 | 1,000,000 | 1,018,070 | ||||||
| Metropolitan Pier and Exposition Authority, | ||||||||||
| Dedicated State Tax Revenue (Insured; AMBAC) | 5.38 | 6/1/14 | 2,500,000 | 2,529,150 | ||||||
| Indiana—2.1% | ||||||||||
| Indiana Health and Educational Facility Financing | ||||||||||
| Authority, HR (Clarian Health Obligated Group) | 5.00 | 2/15/11 | 1,000,000 | 1,026,240 | ||||||
| Indiana Health Facility Financing Authority, | ||||||||||
| HR (The Methodist Hospitals, Inc.) | 5.25 | 9/15/09 | 2,415,000 | 2,437,846 | ||||||
| Iowa—.7% | ||||||||||
| Coralville, Annual Appropriation GO Urban | ||||||||||
| Renewal Bond Anticipation Project Notes | 4.25 | 6/1/09 | 1,085,000 | 1,087,984 | ||||||
| Kansas—1.6% | ||||||||||
| The Unified Government of Wyandotte County/Kansas City, | ||||||||||
| Tax Exempt Sales Tax Special Obligation Revenue | ||||||||||
| (Redevelopment Project Area B) (LOC; Citibank NA) | 3.75 | 12/1/12 | 2,565,000 | 2,562,794 | ||||||
| Kentucky—2.6% | ||||||||||
| Kentucky Economic Development Finance Authority, | ||||||||||
| Health System Revenue (Norton Healthcare, Inc.) | 6.25 | 10/1/10 | 335,000 b | 364,885 | ||||||
| Kentucky Economic Development Finance Authority, | ||||||||||
| Health System Revenue (Norton Healthcare, Inc.) | 6.25 | 10/1/12 | 665,000 | 700,870 | ||||||
| Kentucky Property and Buildings Commission, | ||||||||||
| Revenue (Project Number 69) (Insured; FSA) | 5.25 | 8/1/14 | 1,450,000 | 1,534,346 | ||||||
| Kentucky Property and Buildings Commission, | ||||||||||
| Revenue (Project Number 72) (Insured; MBIA) | 5.38 | 10/1/11 | 1,550,000 b | 1,664,762 | ||||||
| Louisiana—1.1% | ||||||||||
| Louisiana Public Facilities Authority, Revenue | ||||||||||
| (Department of Public Safety Project) (Insured; FSA) | 5.00 | 8/1/10 | 1,765,000 | 1,853,303 | ||||||
| Massachusetts—2.2% | ||||||||||
| Massachusetts, Federal Highway, GAN (Insured; FSA) | 5.75 | 6/15/12 | 2,000,000 | 2,130,780 | ||||||
| Massachusetts Health and Educational Facilities Authority, | ||||||||||
| Revenue (Milford Regional Medical Center Issue) | 5.00 | 7/15/09 | 340,000 | 343,801 | ||||||
| Massachusetts Health and Educational Facilities Authority, | ||||||||||
| Revenue (Milford Regional Medical Center Issue) | 5.00 | 7/15/10 | 200,000 | 202,492 | ||||||
| Massachusetts Housing Finance Agency, Housing Revenue | 4.20 | 12/1/10 | 925,000 | 948,930 | ||||||
The Funds 29
STATEMENT OF INVESTMENTS (Unaudited) (continued)
| BNY Mellon National Short-Term Municipal Bond Fund (continued) | ||||||||
| Long-Term Municipal | Coupon | Maturity | Principal | |||||
| Investments (continued) | Rate (%) | Date | Amount ($) | Value ($) | ||||
| Mississippi—1.3% | ||||||||
| Mississippi Business Finance Corporation, SWDR | ||||||||
| (Waste Management, Inc. Project) | 4.40 | 3/1/11 | 1,000,000 | 989,610 | ||||
| Mississippi Hospital Equipment and Facilities Authority, | ||||||||
| Hospital Refunding and Improvement Revenue | ||||||||
| (South Central Regional Medical Center) | 5.00 | 12/1/09 | 1,085,000 | 1,096,360 | ||||
| Missouri—1.2% | ||||||||
| Bi-State Development Agency of the Missouri-Illinois | ||||||||
| Metropolitan District, Subordinate Mass Transit Sales Tax | ||||||||
| Appropriation Revenue (Metrolink Cross County Extension Project) | 3.95 | 10/1/09 | 1,000,000 | 1,021,650 | ||||
| Blue Springs Neighborhood Improvement District, Limited GO | ||||||||
| Temporary Notes (South Area Sewer Improvement Project) | 4.13 | 3/1/09 | 1,000,000 | 1,006,710 | ||||
| Montana—2.7% | ||||||||
| Montana Board of Regents of Higher Education, University of | ||||||||
| Montana Facilities Improvement Revenue (Insured; MBIA) | 5.75 | 5/15/10 | 350,000 b | 377,689 | ||||
| Montana Board of Regents of Higher Education, University of | ||||||||
| Montana Facilities Improvement Revenue (Insured; MBIA) | 5.75 | 5/15/24 | 3,900,000 | 4,007,874 | ||||
| Nevada—1.9% | ||||||||
| Clark County, PCR (Southern California Edison Company) | 3.25 | 3/2/09 | 2,000,000 | 2,010,500 | ||||
| Truckee Meadows Water Authority, Water Revenue (Insured; FSA) | 5.50 | 7/1/15 | 1,000,000 | 1,066,680 | ||||
| New Hampshire—1.5% | ||||||||
| New Hampshire Health and Education Facilities Authority, Revenue | ||||||||
| (Center for Life Management Issue) (LOC; Ocean National Bank) | 4.05 | 7/1/11 | 2,505,000 | 2,510,311 | ||||
| New Jersey—1.0% | ||||||||
| New Jersey Economic Development Authority, Cigarette Tax Revenue | 5.63 | 6/15/17 | 1,105,000 | 1,105,044 | ||||
| University of Medicine and Dentistry of New Jersey, COP (Insured; MBIA) | 6.75 | 12/1/09 | 465,000 | 471,110 | ||||
| New York—3.5% | ||||||||
| Buffalo and Fort Erie Public Bridge Authority, Toll Bridge | ||||||||
| System Revenue (Liquidity Facility; Bank of Nova Scotia) | 4.00 | 7/1/10 | 1,000,000 | 1,024,560 | ||||
| New York City Transitional Finance Authority, | ||||||||
| Future Tax Secured Revenue 5.50/14.00 | 11/1/26 | 1,500,000 c | 1,597,140 | |||||
| Troy Industrial Development Authority, Civic Facility | ||||||||
| Revenue (Rensselaer Polytechnic Institute Project) | 5.00 | 9/1/10 | 3,000,000 | 3,130,260 | ||||
| North Carolina—1.6% | ||||||||
| Charlotte, GO | 5.25 | 2/1/12 | 2,500,000 | 2,554,775 | ||||
| Ohio—5.0% | ||||||||
| American Municipal Power—Ohio, Inc., Electricity | ||||||||
| Purpose Revenue (Prepayment Issue) | 5.00 | 2/1/11 | 3,000,000 | 3,077,790 | ||||
| Buckeye Tobacco Settlement Financing Authority, | ||||||||
| Tobacco Settlement Asset-Backed Bonds | 5.13 | 6/1/24 | 2,500,000 | 2,323,675 | ||||
30
| BNY Mellon National Short-Term Municipal Bond Fund (continued) | ||||||||
| Long-Term Municipal | Coupon | Maturity | Principal | |||||
| Investments (continued) | Rate (%) | Date | Amount ($) | Value ($) | ||||
| Ohio (continued) | ||||||||
| Lorain County, Hospital Facilities Improvement | ||||||||
| Revenue (Catholic Healthcare Partners) | 5.63 | 10/1/12 | 2,500,000 | 2,675,650 | ||||
| Pennsylvania—1.0% | ||||||||
| Lehigh County Industrial Development Authority, PCR (PPL | ||||||||
| Electric Utilities Corporation Project) (Insured; AMBAC) | 3.13 | 11/1/08 | 1,250,000 | 1,248,600 | ||||
| Sayre Health Care Facilities Authority, Revenue (Guthrie Health Issue) | 5.50 | 12/1/09 | 400,000 | 413,656 | ||||
| Tennessee—3.4% | ||||||||
| Tennessee Energy Acquisition Corporation, Gas Project Revenue | 5.00 | 9/1/09 | 2,500,000 | 2,559,075 | ||||
| The Health, Educational and Housing Facility Board of | ||||||||
| Shelby County, Revenue (Baptist Memorial Health Care) | 5.00 | 10/1/08 | 3,000,000 | 3,004,920 | ||||
| Texas—3.8% | ||||||||
| Austin, Hotel Occupancy Tax Revenue (Convention Center/ | ||||||||
| Waller Creek Venue Project) (Insured; AMBAC) | 5.25 | 11/15/19 | 3,000,000 | 3,071,490 | ||||
| Montgomery County, Unlimited Tax Adjustable | ||||||||
| Rate Road Bonds (Insured; FSA) | 5.00 | 9/1/10 | 1,050,000 | 1,100,117 | ||||
| Port Arthur Independent School District, Unlimited Tax | ||||||||
| School Building Bonds (Insured; AMBAC) | 5.25 | 2/15/18 | 1,000,000 | 1,013,590 | ||||
| Texas Municipal Gas Acquisition and Supply | ||||||||
| Corporation I, Gas Supply Revenue | 5.00 | 12/15/13 | 1,000,000 | 988,700 | ||||
| Virginia—7.7% | ||||||||
| Louisa Industrial Development Authority, PCR | ||||||||
| (Virginia Electric and Power Company) | 5.25 | 12/1/08 | 2,000,000 | 2,014,020 | ||||
| Peninsula Ports Authority, Coal Terminal Revenue | ||||||||
| (Dominion Terminal Associates Project—DETC Issue) | 3.30 | 10/1/08 | 1,400,000 | 1,404,326 | ||||
| Rappahannock Regional Jail Authority, Regional Jail Facility GAN | 4.25 | 12/1/09 | 3,000,000 | 3,040,470 | ||||
| Riverside Regional Jail Authority, Jail Facility Senior RAN | 4.25 | 7/1/10 | 3,000,000 | 3,046,590 | ||||
| Western Virginia Regional Jail Authority, Regional Jail Facility RAN | 4.13 | 12/1/09 | 3,000,000 | 3,031,710 | ||||
| Washington—2.5% | ||||||||
| Port of Longview Industrial Development Corporation, | ||||||||
| SWDR (Weyerhaeuser Company Project) | 6.88 | 10/1/08 | 1,500,000 | 1,522,620 | ||||
| Washington Higher Education Facilities Authority, Revenue | ||||||||
| (University of Puget Sound Project) (LOC; Bank of America) | 5.00 | 4/1/08 | 2,500,000 | 2,505,725 | ||||
| U.S. Related—5.6% | ||||||||
| Puerto Rico Electric Authority, Power Revenue | 4.00 | 7/1/08 | 500,000 | 502,155 | ||||
| Puerto Rico Highways and Transportation | ||||||||
| Authority, Highway Revenue (Insured; MBIA) | 6.00 | 7/1/11 | 2,000,000 | 2,112,460 | ||||
| Puerto Rico Infrastructure Financing Authority, Special Tax Revenue | 4.50 | 7/1/10 | 4,105,000 | 4,202,740 | ||||
| University of Puerto Rico, University System Revenue | 5.00 | 6/1/13 | 2,315,000 | 2,389,589 | ||||
| Total Long-Term Municipal Investments (cost $146,653,689) | 147,054,284 | |||||||
The Funds 31
STATEMENT OF INVESTMENTS (Unaudited) (continued)
| BNY Mellon National Short-Term Municipal Bond Fund (continued) | ||||||||||
| Short-Term Municipal | Coupon | Maturity | Principal | |||||||
| Investments—10.1% | Rate (%) | Date | Amount ($) | Value ($) | ||||||
| California—.9% | ||||||||||
| Los Angeles Department of Water and Power, | ||||||||||
| Power System Revenue (Insured; XCLA) | 4.00 | 3/7/08 | 1,500,000 d | 1,500,000 | ||||||
| Illinois—.7% | ||||||||||
| Illinois Finance Authority, Revenue (Resurrection | ||||||||||
| Health Care) (LOC; JPMorgan Chase Bank) | 4.01 | 3/1/08 | 1,200,000 d | 1,200,000 | ||||||
| Massachusetts—5.3% | ||||||||||
| Chelsea, LR (Massachusetts Information | ||||||||||
| Technolgy Center Project) (Insured; FSA) | 3.32 | 4/4/08 | 5,000,000 d | 5,000,000 | ||||||
| Massachusetts GO (Central Artery/Ted Williams Tunnel Infrastructure | ||||||||||
| Loan Act of 2000) (Liquidity Facility; State Street Bank and Trust Co.) | 3.00 | 3/1/08 | 100,000 d | 100,000 | ||||||
| Massachusetts Health and Educational Facilities | ||||||||||
| Authority, Revenue (Boston College Issue) | 5.00 | 4/4/08 | 3,000,000 d | 3,000,000 | ||||||
| Massachusetts Health and Educational Facilities Authority, | ||||||||||
| Revenue (Capital Asset Program Issue) (LOC; Bank of America) | 2.70 | 3/1/08 | 500,000 d | 500,000 | ||||||
| Michigan—.4% | ||||||||||
| Michigan Strategic Fund, LOR (Henry Ford Museum | ||||||||||
| and Greenfield Village Project) (LOC; Comerica Bank) | 3.15 | 3/1/08 | 700,000 d | 700,000 | ||||||
| Pennsylvania—1.4% | ||||||||||
| Delaware County Industrial Development Authority, Airport | ||||||||||
| Facilities Revenue (United Parcel Service Project) | 3.07 | 3/1/08 | 2,300,000 d | 2,300,000 | ||||||
| Texas—.8% | ||||||||||
| Harris County Health Facilities Development Corporation, | ||||||||||
| Revenue (Texas Children’s Hospital Project) (Insured; | ||||||||||
| MBIA and Liquidity Facility; JPMorgan Chase Bank) | 5.00 | 3/1/08 | 1,300,000 d | 1,300,000 | ||||||
| Virginia—.6% | ||||||||||
| Washington Economic Development Finance Authority, EDR | ||||||||||
| (Pioneer Human Services Project) (LOC; U.S. Bank NA) | 3.01 | 3/1/08 | 900,000 d | 900,000 | ||||||
| Total Short-Term Municipal Investments (cost $16,500,000) | 16,500,000 | |||||||||
| Total Investments (cost $163,153,689) | 100.3% | 163,554,284 | ||||||||
| Liabilities, Less Cash and Receivables | (.3%) | (475,822) | ||||||||
| Net Assets | 100.0% | 163,078,462 | ||||||||
| a Purchased on a delayed delivery basis. |
| b These securities are prerefunded; the date shown represents the prerefunded date. Bonds which are prerefunded are collateralized by U.S. Government securities which are held in |
| escrow and are used to pay principal and interest on the municipal issue and to retire the bonds in full at the earliest refunding date. |
| c Subject to interest rate change on November 1, 2011. |
| d Securities payable on demand.Variable interest rate—subject to periodic change. |
32
| Summary of Abbreviations | ||||||
| ACA | American Capital Access | AGC | ACE Guaranty Corporation | |||
| AGIC | Asset Guaranty Insurance Company | AMBAC | American Municipal Bond Assurance Corporation | |||
| ARRN | Adjustable Rate Receipt Notes | BAN | Bond Anticipation Notes | |||
| BIGI | Bond Investors Guaranty Insurance | BPA | Bond Purchase Agreement | |||
| CGIC | Capital Guaranty Insurance Company | CIC | Continental Insurance Company | |||
| CIFG | CDC Ixis Financial Guaranty | CMAC | Capital Market Assurance Corporation | |||
| COP | Certificate of Participation | CP | Commercial Paper | |||
| EDR | Economic Development Revenue | EIR | Environmental Improvement Revenue | |||
| FGIC | Financial Guaranty Insurance Company | FHA | Federal Housing Administration | |||
| FHLB | Federal Home Loan Bank | FHLMC | Federal Home Loan Mortgage Corporation | |||
| FNMA | Federal National Mortgage Association | FSA | Financial Security Assurance | |||
| GAN | Grant Anticipation Notes | GIC | Guaranteed Investment Contract | |||
| GNMA | Government National Mortgage Association | GO | General Obligation | |||
| HR | Hospital Revenue | IDB | Industrial Development Board | |||
| IDC | Industrial Development Corporation | IDR | Industrial Development Revenue | |||
| LOC | Letter of Credit | LOR | Limited Obligation Revenue | |||
| LR | Lease Revenue | MBIA | Municipal Bond Investors | |||
| Assurance Insurance Corporation | ||||||
| MFHR | Multi-Family Housing Revenue | MFMR | Multi-Family Mortgage Revenue | |||
| PCR | Pollution Control Revenue | PILOT | Payment in Lieu of Taxes | |||
| RAC | Revenue Anticipation Certificates | RAN | Revenue Anticipation Notes | |||
| RAW | Revenue Anticipation Warrants | RRR | Resources Recovery Revenue | |||
| SAAN | State Aid Anticipation Notes | SBPA | Standby Bond Purchase Agreement | |||
| SFHR | Single Family Housing Revenue | SFMR | Single Family Mortgage Revenue | |||
| SONYMA | State of New York Mortgage Agency | SWDR | Solid Waste Disposal Revenue | |||
| TAN | Tax Anticipation Notes | TAW | Tax Anticipation Warrants | |||
| TRAN | Tax and Revenue Anticipation Notes | XLCA | XL Capital Assurance | |||
| Summary of Combined Ratings (Unaudited) | ||||||||||
| Fitch | or | Moody’s | or | Standard & Poor’s | Value (%)† | |||||
| AAA | Aaa | AAA | 42.3 | |||||||
| AA | Aa | AA | 15.4 | |||||||
| A | A | A | 15.5 | |||||||
| BBB | Baa | BBB | 16.4 | |||||||
| F1 | MIG1/P1 | SP1/A1 | 8.2 | |||||||
| Not Rated e | Not Rated e | Not Rated e | 2.2 | |||||||
| 100.0 | ||||||||||
| † Based on total investments. e Securities which, while not rated by Fitch, Moody’s and Standard & Poor’s, have been determined by the Manager to be of comparable quality to those rated securities in which the fund may invest. See notes to financial statements. |
The Funds 33
| STATEMENT OF INVESTMENTS |
| February 29, 2008 (Unaudited) |
| BNY Mellon Pennsylvania Intermediate Municipal Bond Fund | ||||||||
| Long-Term Municipal | Coupon | Maturity | Principal | |||||
| Investments—98.4% | Rate (%) | Date | Amount ($) | Value ($) | ||||
| Alabama—.6% | ||||||||
| Jefferson County, Limited Obligation School Warrants | 5.50 | 1/1/21 | 3,500,000 | 3,608,850 | ||||
| Arizona—.2% | ||||||||
| University Medical Center Corporation, HR | 5.25 | 7/1/15 | 1,160,000 | 1,170,486 | ||||
| California—4.9% | ||||||||
| Agua Caliente Band, Cahuilla Indians Revenue | 6.00 | 7/1/18 | 1,500,000 | 1,466,595 | ||||
| Alameda Corridor Transportation Authority, | ||||||||
| Revenue (Insured; AMBAC) | 0/5.25 | 10/1/21 | 2,000,000 a | 1,586,860 | ||||
| California | 5.25 | 11/1/17 | 2,500,000 | 2,585,200 | ||||
| California | 5.50 | 6/1/20 | 110,000 | 113,013 | ||||
| California | 5.50 | 11/1/33 | 6,300,000 | 6,323,814 | ||||
| California County Tobacco Securitization Agency, | ||||||||
| Tobacco Settlement Asset-Backed Bonds | ||||||||
| (Los Angeles County Securitization Corporation) | 0/5.25 | 6/1/21 | 1,250,000 a | 929,875 | ||||
| Foothill/Eastern Transportation Corridor Agency, | ||||||||
| Toll Road Revenue | 5.75 | 1/15/40 | 2,000,000 | 1,887,560 | ||||
| Foothill/Eastern Transportation Corridor Agency, | ||||||||
| Toll Road Revenue (Insured; MBIA) | 0/5.88 | 1/15/27 | 6,000,000 a | 5,895,060 | ||||
| Foothill/Eastern Transportation Corridor Agency, | ||||||||
| Toll Road Revenue (Insured; MBIA) | 0/5.88 | 1/15/29 | 2,000,000 a | 1,950,560 | ||||
| Golden State Tobacco Securitization Corporation, Enhanced | ||||||||
| Tobacco Settlement Asset-Backed Bonds (Insured; AMBAC) | 5.00 | 6/1/21 | 1,910,000 | 1,908,014 | ||||
| Golden State Tobacco Securitization Corporation, | ||||||||
| Tobacco Settlement Asset-Backed Bonds | 4.50 | 6/1/27 | 4,460,000 | 3,868,515 | ||||
| Colorado—.8% | ||||||||
| Northwest Parkway Public Highway Authority, | ||||||||
| Revenue (Insured; AMBAC) | 0/5.70 | 6/15/16 | 5,000,000 a,b | 4,638,700 | ||||
| Florida—.7% | ||||||||
| Miami-Dade County, Subordinate Special Obligation | 0/5.00 | 10/1/35 | 1,500,000 a | 1,249,935 | ||||
| Seminole Tribe, Special Obligation Revenue | 5.50 | 10/1/24 | 3,000,000 | 2,784,990 | ||||
| Illinois—.3% | ||||||||
| Illinois Finance Authority, Gas Supply Revenue (The Peoples | ||||||||
| Gas Light and Coke Company Project) (Insured; AMBAC) | 4.30 | 6/1/16 | 2,000,000 | 1,967,820 | ||||
| Massachusetts—.5% | ||||||||
| Massachusetts Housing Finance Agency, Housing Revenue | 5.13 | 12/1/34 | 350,000 | 317,443 | ||||
| Massachusetts Water Pollution Abatement Trust (Pooled Loan Program) | 5.00 | 8/1/32 | 3,000,000 | 2,897,310 | ||||
| Michigan—1.2% | ||||||||
| Detroit City School District, School Buildings | ||||||||
| and Site Improvement Bonds (Insured; FGIC) | 5.25 | 5/1/17 | 2,000,000 | 2,137,000 | ||||
| Michigan Tobacco Settlement Finance Authority, | ||||||||
| Tobacco Settlement Asset-Backed Bonds | 5.13 | 6/1/22 | 5,225,000 | 4,875,970 | ||||
| Missouri—.1% | ||||||||
| Missouri Housing Development Commission, | ||||||||
| SFMR (Homeownership Loan Program) | ||||||||
| (Collateralized: FNMA and GNMA) | 6.40 | 9/1/29 | 400,000 | 412,636 | ||||
34
| BNY Mellon Pennsylvania Intermediate Municipal Bond Fund (continued) | ||||||||||
| Long-Term Municipal | Coupon | Maturity | Principal | |||||||
| Investments (continued) | Rate (%) | Date | Amount ($) | Value ($) | ||||||
| New Hampshire—.2% | ||||||||||
| New Hampshire Business Finance Authority, | ||||||||||
| PCR (Central Maine Power Company) | 5.38 | 5/1/14 | 1,015,000 | 1,053,468 | ||||||
| New Jersey—2.5% | ||||||||||
| Garden State Preservation Trust, Open Space and | ||||||||||
| Farmland Preservation Revenue (Insured; FSA) | 5.80 | 11/1/19 | 4,805,000 | 5,239,997 | ||||||
| Garden State Preservation Trust, Open Space and | ||||||||||
| Farmland Preservation Revenue (Insured; FSA) | 5.80 | 11/1/21 | 2,000,000 | 2,150,720 | ||||||
| Garden State Preservation Trust, Open Space and | ||||||||||
| Farmland Preservation Revenue (Insured; FSA) | 5.80 | 11/1/23 | 2,000,000 | 2,118,140 | ||||||
| New Jersey Economic Development | ||||||||||
| Authority, Cigarette Tax Revenue | 5.75 | 6/15/29 | 4,000,000 | 3,752,480 | ||||||
| Tobacco Settlement Financing Corporation of New Jersey, | ||||||||||
| Tobacco Settlement Asset-Backed Bonds | 4.50 | 6/1/23 | 1,845,000 | 1,638,508 | ||||||
| New York—1.1% | ||||||||||
| Long Island Power Authority, Electric System | ||||||||||
| General Revenue (Insured; FGIC) | 5.25 | 12/1/20 | 2,000,000 | 2,041,720 | ||||||
| New York City Transitional Finance Authority, | ||||||||||
| Future Tax Secured Revenue | 5.50/14.00 | 11/1/26 | 4,000,000 c | 4,259,040 | ||||||
| North Carolina—.5% | ||||||||||
| North Carolina Eastern Municipal Power | ||||||||||
| Agency, Power System Revenue | 5.30 | 1/1/15 | 1,500,000 | �� | 1,545,645 | |||||
| North Carolina Eastern Municipal Power | ||||||||||
| Agency, Power System Revenue | 5.13 | 1/1/23 | 1,500,000 | 1,446,285 | ||||||
| Ohio—2.1% | ||||||||||
| Buckeye Tobacco Settlement Financing Authority, | ||||||||||
| Tobacco Settlement Asset-Backed Bonds | 5.75 | 6/1/34 | 7,500,000 | 6,803,850 | ||||||
| Cuyahoga County, Revenue (Cleveland Clinic Health System) | 6.00 | 1/1/16 | 5,000,000 | 5,545,850 | ||||||
| Pennsylvania—67.3% | ||||||||||
| Allegheny County Hospital Development Authority, Revenue | ||||||||||
| (University of Pittsburgh Medical Center) | 5.00 | 6/15/14 | 5,000,000 | 5,234,150 | ||||||
| Allegheny County Port Authority, Special | ||||||||||
| Transportation Revenue (Insured; FGIC) | 5.38 | 3/1/11 | 2,500,000 | 2,639,575 | ||||||
| Allegheny County Port Authority, Special | ||||||||||
| Transportation Revenue (Insured; FGIC) | 5.50 | 3/1/14 | 2,500,000 | 2,651,050 | ||||||
| Allegheny County Port Authority, Special | ||||||||||
| Transportation Revenue (Insured; FGIC) | 5.50 | 3/1/16 | 1,360,000 | 1,442,566 | ||||||
| Allegheny County Sanitary Authority, Sewer Revenue (Insured; MBIA) | 5.00 | 12/1/18 | 2,560,000 | 2,666,675 | ||||||
| Beaver County Industrial Development Authority, PCR | ||||||||||
| (Duquesne Light Company Project) (Insured; AMBAC) | 4.50 | 11/1/29 | 6,500,000 | 5,667,480 | ||||||
| Blair County (Insured; AMBAC) | 5.38 | 8/1/15 | 1,880,000 | 2,060,330 | ||||||
| Blair County (Insured; AMBAC) | 5.38 | 8/1/16 | 1,980,000 | 2,164,833 | ||||||
| Central Dauphin School District, GO (Insured; MBIA) | 6.75 | 2/1/16 | 5,000,000 b | 5,952,850 | ||||||
| Central Dauphin School District, GO (Insured; MBIA) | 7.00 | 2/1/16 | 1,630,000 b | 1,966,905 | ||||||
| Central Dauphin School District, GO (Insured; MBIA) | 7.50 | 2/1/16 | 3,100,000 b | 3,840,559 | ||||||
The Funds 35
STATEMENT OF INVESTMENTS (Unaudited) (continued)
| BNY Mellon Pennsylvania Intermediate Municipal Bond Fund (continued) | ||||||||||
| Long-Term Municipal | Coupon | Maturity | Principal | |||||||
| Investments (continued) | Rate (%) | Date | Amount ($) | Value ($) | ||||||
| Pennsylvania (continued) | ||||||||||
| Central York School District, GO (Insured; FGIC) | 5.00 | 6/1/12 | 2,305,000 | 2,452,013 | ||||||
| Central York School District, GO (Insured; FGIC) | 5.50 | 6/1/12 | 80,000 b | 86,626 | ||||||
| Central York School District, GO (Insured; FGIC) | 5.50 | 6/1/14 | 920,000 | 984,142 | ||||||
| Chester County | 5.00 | 8/15/18 | 4,545,000 | 4,749,116 | ||||||
| Chichester School District, GO (Insured; FSA) | 5.25 | 3/15/24 | 1,355,000 | 1,371,802 | ||||||
| Coatesville Area School District, GO (Insured; FSA) | 5.25 | 8/15/14 | 1,485,000 b | 1,620,640 | ||||||
| Coatesville Area School District, GO (Insured; FSA) | 5.25 | 8/15/14 | 6,515,000 b | 7,110,080 | ||||||
| Delaware County Authority, College Revenue (Haverford College) | 5.88 | 11/15/21 | 1,500,000 | 1,585,350 | ||||||
| Delaware County Authority, College Revenue (Haverford College) | 5.75 | 11/15/25 | 3,000,000 | 3,141,810 | ||||||
| Delaware County Authority, University Revenue | ||||||||||
| (Villanova University) (Insured; AMBAC) | 5.00 | 8/1/20 | 2,095,000 | 2,107,507 | ||||||
| Delaware County Regional Water Quality | ||||||||||
| Control Authority, Sewer Revenue (Insured; FGIC) | 4.75 | 5/1/10 | 1,945,000 | 2,017,237 | ||||||
| Delaware River Joint Toll Bridge Commission, | ||||||||||
| Bridge Revenue (Insured; MBIA) | 5.25 | 7/1/17 | 1,485,000 | 1,568,205 | ||||||
| East Stroudsburg Area School District, GO (Insured; FSA) | 7.50 | 9/1/16 | 2,500,000 b | 3,136,275 | ||||||
| Easton Area School District, GO (Insured; FSA) | 7.50 | 4/1/18 | 1,000,000 | 1,209,020 | ||||||
| Easton Area School District, GO (Insured; FSA) | 7.50 | 4/1/21 | 3,000,000 | 3,552,540 | ||||||
| Easton Area School District, GO (Insured; FSA) | 7.50 | 4/1/22 | 3,000,000 | 3,528,720 | ||||||
| Erie County (Insured; FGIC) | 5.50 | 9/1/22 | 1,640,000 | 1,696,449 | ||||||
| Fleetwood Area School District, GO (Insured; FGIC) | 5.00 | 4/1/11 | 1,500,000 | 1,581,480 | ||||||
| Kennett Consolidated School District, GO (Insured; FGIC) | 5.50 | 2/15/12 | 1,310,000 b | 1,412,141 | ||||||
| Lancaster County Solid Waste Management Authority, | ||||||||||
| Resource Recovery System Revenue (Insured; AMBAC) | 5.25 | 12/15/08 | 3,940,000 | 3,994,569 | ||||||
| Lancaster County Solid Waste Management Authority, | ||||||||||
| Resource Recovery System Revenue (Insured; AMBAC) | 5.25 | 12/15/09 | 4,230,000 | 4,348,905 | ||||||
| Lancaster County Solid Waste Management Authority, | ||||||||||
| Resource Recovery System Revenue (Insured; AMBAC) | 5.25 | 12/15/10 | 2,000,000 | 2,086,340 | ||||||
| Lancaster County Vocational Technical | ||||||||||
| School Authority, LR (Insured; FGIC) | 5.25 | 2/15/10 | 1,500,000 | 1,555,050 | ||||||
| Lancaster Higher Education Authority, College | ||||||||||
| Revenue (Franklin and Marshall College Project) | 5.25 | 4/15/16 | 1,815,000 | 1,894,606 | ||||||
| Lancaster Parking Authority, Guaranteed | ||||||||||
| Parking Revenue (Insured; AMBAC) | 5.00 | 12/1/32 | 2,300,000 | 2,166,025 | ||||||
| Lancaster Parking Authority, Guaranteed | ||||||||||
| Parking Revenue (Insured; AMBAC) | 5.00 | 12/1/35 | 1,500,000 | 1,403,865 | ||||||
| Lehigh County General Purpose Authority, | ||||||||||
| Revenue (Good Shepherd Group) | 5.25 | 11/1/14 | 3,255,000 | 3,371,366 | ||||||
| Lehigh County Industrial Development Authority, PCR | ||||||||||
| (People Electric Utilities Corporation Project) (Insured; FGIC) | 4.75 | 2/15/27 | 2,000,000 | 1,813,760 | ||||||
| Lower Merion School District, GO | 5.00 | 9/1/22 | 2,980,000 | 3,034,176 | ||||||
| Lower Merion School District, GO | 5.00 | 5/15/29 | 11,975,000 | 11,819,924 | ||||||
| Montgomery County | 5.00 | 9/15/10 | 1,165,000 | 1,228,539 | ||||||
| Montgomery County | 5.00 | 9/15/11 | 2,155,000 | 2,298,351 | ||||||
36
| BNY Mellon Pennsylvania Intermediate Municipal Bond Fund (continued) | ||||||||||
| Long-Term Municipal | Coupon | Maturity | Principal | |||||||
| Investments (continued) | Rate (%) | Date | Amount ($) | Value ($) | ||||||
| Pennsylvania (continued) | ||||||||||
| Muhlenberg School District, GO (Insured; FGIC) | 5.38 | 4/1/15 | 1,000,000 | 1,061,930 | ||||||
| Neshaminy School District, GO (Insured; AMBAC) | 5.00 | 5/1/18 | 2,000,000 | 2,082,480 | ||||||
| Neshaminy School District, GO (Insured; AMBAC) | 5.00 | 5/1/24 | 1,500,000 | 1,480,260 | ||||||
| Northampton County Higher Education | ||||||||||
| Authority, Revenue (Lehigh University) | 5.50 | 11/15/11 | 2,500,000 | 2,710,050 | ||||||
| Northwestern Lehigh School District, GO (Insured; FSA) | 5.00 | 3/15/10 | 1,245,000 | 1,299,444 | ||||||
| Owen J. Roberts School District, GO (Insured; FSA) | 5.50 | 8/15/12 | 1,440,000 b | 1,564,358 | ||||||
| Parkland School District, GO (Insured; FGIC) | 5.25 | 9/1/11 | 2,220,000 | 2,372,292 | ||||||
| Parkland School District, GO (Insured; FGIC) | 5.38 | 9/1/14 | 3,110,000 | 3,401,220 | ||||||
| Parkland School District, GO (Insured; FGIC) | 5.38 | 9/1/16 | 1,490,000 | 1,623,027 | ||||||
| Pennsylvania | 6.00 | 1/15/10 | 2,500,000 b | 2,665,275 | ||||||
| Pennsylvania | 5.25 | 2/1/11 | 7,850,000 | 8,337,485 | ||||||
| Pennsylvania Economic Development Financing Authority, | ||||||||||
| SWDR (Waste Management Inc. Project) | 4.70 | 11/1/14 | 5,000,000 | 4,897,400 | ||||||
| Pennsylvania Higher Educational Facilities Authority, | ||||||||||
| College Revenue (Lafayette College Project) | 6.00 | 5/1/30 | 5,000,000 | 5,189,900 | ||||||
| Pennsylvania Higher Educational Facilities Authority, | ||||||||||
| Health Services Revenue (Allegheny Delaware | ||||||||||
| Valley Obligated Group Project) (Insured; MBIA) | 5.60 | 11/15/10 | 2,000,000 | 2,001,200 | ||||||
| Pennsylvania Higher Educational Facilities Authority, | ||||||||||
| Revenue (Bryn Mawr College) (Insured; AMBAC) | 5.25 | 12/1/12 | 3,000,000 | 3,246,450 | ||||||
| Pennsylvania Higher Educational Facilities Authority, | ||||||||||
| Revenue (Drexel University) (Insured; MBIA) | 5.30 | 5/1/10 | 3,035,000 | 3,100,890 | ||||||
| Pennsylvania Higher Educational Facilities Authority, | ||||||||||
| Revenue (La Salle University) | 5.50 | 5/1/34 | 2,250,000 | 2,085,457 | ||||||
| Pennsylvania Higher Educational Facilities Authority, | ||||||||||
| Revenue (State System of Higher Education) (Insured; AMBAC) | 5.00 | 6/15/10 | 2,785,000 | 2,907,178 | ||||||
| Pennsylvania Higher Educational Facilities Authority, | ||||||||||
| Revenue (State System of Higher Education) (Insured; AMBAC) | 5.75 | 6/15/10 | 3,045,000 | 3,228,126 | ||||||
| Pennsylvania Higher Educational Facilities Authority, | ||||||||||
| Revenue (State System of Higher Education) (Insured; AMBAC) | 5.00 | 6/15/11 | 2,935,000 | 3,094,488 | ||||||
| Pennsylvania Higher Educational Facilities Authority, | ||||||||||
| Revenue (Temple University) (Insured; MBIA) | 5.25 | 4/1/14 | 960,000 | 971,146 | ||||||
| Pennsylvania Higher Educational Facilities Authority, | ||||||||||
| Revenue (Thomas Jefferson University) (Insured; AMBAC) | 5.25 | 9/1/17 | 1,700,000 | 1,819,034 | ||||||
| Pennsylvania Higher Educational Facilities Authority, | ||||||||||
| Revenue (Thomas Jefferson University) (Insured; AMBAC) | 5.25 | 9/1/18 | 1,485,000 | 1,590,272 | ||||||
| Pennsylvania Higher Educational Facilities Authority, | ||||||||||
| Revenue (University of Scranton) (Insured; AMBAC) | 5.75 | 5/1/11 | 1,690,000 b | 1,822,006 | ||||||
| Pennsylvania Higher Educational Facilities Authority, | ||||||||||
| Revenue (UPMC Health System) | 5.00 | 1/15/10 | 1,630,000 | 1,683,545 | ||||||
| Pennsylvania Higher Educational Facilities Authority, | ||||||||||
| Revenue (UPMC Health System) | 5.13 | 1/15/11 | 1,550,000 | 1,619,920 | ||||||
| Pennsylvania Higher Educational Facilities Authority, | ||||||||||
| Revenue (UPMC Health System) | 6.00 | 1/15/22 | 2,500,000 | 2,642,825 | ||||||
The Funds 37
STATEMENT OF INVESTMENTS (Unaudited) (continued)
| BNY Mellon Pennsylvania Intermediate Municipal Bond Fund (continued) | ||||||||||
| Long-Term Municipal | Coupon | Maturity | Principal | |||||||
| Investments (continued) | Rate (%) | Date | Amount ($) | Value ($) | ||||||
| Pennsylvania (continued) | ||||||||||
| Pennsylvania Higher Educational Facilities Authority, | ||||||||||
| Revenue (UPMC Health System) (Insured; FSA) | 5.25 | 8/1/12 | 3,000,000 | 3,096,150 | ||||||
| Pennsylvania Housing Finance Agency, SFMR | 5.35 | 10/1/09 | 1,165,000 | 1,186,075 | ||||||
| Pennsylvania Housing Finance Agency, SFMR | 5.45 | 10/1/10 | 3,025,000 | 3,082,777 | ||||||
| Pennsylvania Housing Finance Agency, SFMR | 5.50 | 10/1/11 | 1,325,000 | 1,347,830 | ||||||
| Pennsylvania Housing Finance Agency, SFMR | 5.55 | 10/1/12 | 325,000 | 327,889 | ||||||
| Pennsylvania Industrial Development | ||||||||||
| Authority, EDR (Insured; AMBAC) | 5.80 | 1/1/09 | 5,000,000 | 5,133,400 | ||||||
| Pennsylvania Industrial Development | ||||||||||
| Authority, EDR (Insured; AMBAC) | 5.50 | 7/1/12 | 5,335,000 | 5,696,553 | ||||||
| Pennsylvania Turnpike Commission, Oil Franchise | ||||||||||
| Tax Subordinated Revenue (Insured; MBIA) | 5.25 | 12/1/13 | 2,500,000 b | 2,729,825 | ||||||
| Pennsylvania Turnpike Commission, | ||||||||||
| Registration Fee Revenue (Insured; FSA) | 5.25 | 7/15/24 | 5,000,000 | 5,132,700 | ||||||
| Pennsylvania Turnpike Commission, | ||||||||||
| Registration Fee Revenue (Insured; FSA) | 5.25 | 7/15/25 | 5,000,000 | 5,137,850 | ||||||
| Pennsylvania Turnpike Commission, Turnpike Revenue | 5.50 | 6/1/15 | 1,500,000 | 1,609,320 | ||||||
| Pennsylvania Turnpike Commission, | ||||||||||
| Turnpike Revenue (Insured; AMBAC) | 5.00 | 12/1/23 | 3,700,000 | 3,667,884 | ||||||
| Pennsylvania Turnpike Commission, | ||||||||||
| Turnpike Revenue (Insured; AMBAC) | 5.00 | 12/1/29 | 5,000,000 | 4,776,200 | ||||||
| Pennsylvania Turnpike Commission, | ||||||||||
| Turnpike Revenue (Insured; FGIC) | 5.00 | 6/1/11 | 3,000,000 | 3,162,420 | ||||||
| Pennsylvania Turnpike Commission, | ||||||||||
| Turnpike Revenue (Insured; FGIC) | 5.50 | 12/1/11 | 2,510,000 | 2,707,361 | ||||||
| Pennsylvania Turnpike Commission, | ||||||||||
| Turnpike Revenue (Insured; FGIC) | 5.50 | 12/1/12 | 2,000,000 | 2,175,100 | ||||||
| Perkiomen Valley School District, GO (Insured; FSA) | 5.25 | 3/1/11 | 690,000 b | 732,035 | ||||||
| Perkiomen Valley School District, GO (Insured; FSA) | 5.25 | 3/1/11 | 720,000 b | 763,862 | ||||||
| Perkiomen Valley School District, GO (Insured; FSA) | 5.25 | 3/1/13 | 540,000 | 568,058 | ||||||
| Perkiomen Valley School District, GO (Insured; FSA) | 5.25 | 3/1/14 | 570,000 | 599,617 | ||||||
| Philadelphia (Insured; FSA) | 5.25 | 3/15/09 | 3,500,000 b | 3,623,970 | ||||||
| Philadelphia (Insured; FSA) | 5.25 | 3/15/09 | 235,000 b | 243,324 | ||||||
| Philadelphia (Insured; FSA) | 5.25 | 3/15/09 | 2,000,000 b | 2,070,840 | ||||||
| Philadelphia (Insured; FSA) | 5.25 | 3/15/09 | 1,000,000 b | 1,035,420 | ||||||
| Philadelphia (Insured; FSA) | 5.25 | 8/1/17 | 12,500,000 | 13,452,750 | ||||||
| Philadelphia, Water and Wastewater Revenue (Insured; AMBAC) | 5.63 | 6/15/09 | 5,000,000 | 5,187,750 | ||||||
| Philadelphia, Water and Wastewater Revenue (Insured; AMBAC) | 5.25 | 12/15/12 | 10,000,000 | 10,630,000 | ||||||
| Philadelphia, Water and Wastewater Revenue (Insured; FSA) | 5.25 | 7/1/18 | 5,000,000 | 5,254,200 | ||||||
| Philadelphia, Water and Wastewater Revenue (Insured; FSA) | 5.00 | 7/1/23 | 1,690,000 | 1,675,601 | ||||||
| Philadelphia Authority for Industrial Development, Industrial and | ||||||||||
| Commercial Revenue (Girard Estates Facilities Leasing Project) | 5.00 | 5/15/19 | 2,400,000 | 2,403,144 | ||||||
38
| BNY Mellon Pennsylvania Intermediate Municipal Bond Fund (continued) | ||||||||||
| Long-Term Municipal | Coupon | Maturity | Principal | |||||||
| Investments (continued) | Rate (%) | Date | Amount ($) | Value ($) | ||||||
| Pennsylvania (continued) | ||||||||||
| Philadelphia Authority for Industrial Development, Revenue | ||||||||||
| (Cultural and Commercial Corridors Program) (Insured; FGIC) | 5.00 | 12/1/20 | 3,380,000 | 3,311,724 | ||||||
| Philadelphia Authority for Industrial Development, Revenue | ||||||||||
| (Cultural and Commercial Corridors Program) (Insured; FGIC) | 5.00 | 12/1/22 | 3,150,000 | 3,001,761 | ||||||
| Philadelphia Hospital and Higher Education Facilities | ||||||||||
| Authority, Revenue (Jefferson Health System) | 5.50 | 5/15/08 | 1,000,000 | 1,005,380 | ||||||
| Philadelphia Parking Authority, Airport | ||||||||||
| Parking Revenue (Insured; AMBAC) | 5.75 | 9/1/09 | 2,255,000 | 2,328,333 | ||||||
| Philadelphia School District, GO (Insured; AMBAC) | 5.00 | 4/1/17 | 5,000,000 | 5,173,100 | ||||||
| Philadelphia School District, GO (Insured; FSA) | 5.75 | 2/1/11 | 4,000,000 | 4,301,160 | ||||||
| Philadelphia School District, GO (Insured; FSA) | 5.75 | 2/1/11 | 3,000,000 b | 3,221,340 | ||||||
| Philadelphia School District, GO (Insured; FSA) | 5.50 | 2/1/12 | 1,310,000 b | 1,411,276 | ||||||
| Philadelphia School District, GO (Insured; FSA) | 5.50 | 2/1/12 | 1,770,000 b | 1,906,839 | ||||||
| Philadelphia School District, GO (Insured; MBIA) | 5.25 | 4/1/09 | 2,500,000 b | 2,566,675 | ||||||
| Pittsburgh School District, GO (Insured; FSA) | 5.50 | 9/1/16 | 4,000,000 | 4,422,920 | ||||||
| Pittsburgh School District, GO (Insured; FSA) | 5.50 | 9/1/18 | 1,000,000 | 1,097,920 | ||||||
| Pocono Mountain School District, GO (Insured; FSA) | 5.00 | 9/1/22 | 5,270,000 | 5,285,125 | ||||||
| Saint Mary Hospital Authority, Health System | ||||||||||
| Revenue (Catholic Health East Issue) | 5.00 | 11/15/21 | 1,000,000 | 965,750 | ||||||
| Scranton-Lackawanna Health and Welfare Authority, | ||||||||||
| Revenue (Community Medical Center Project) (Insured; MBIA) | 5.50 | 7/1/10 | 3,035,000 | 3,087,505 | ||||||
| Scranton-Lackawanna Health and Welfare Authority, | ||||||||||
| Revenue (Community Medical Center Project) (Insured; MBIA) | 5.50 | 7/1/11 | 3,195,000 | 3,248,868 | ||||||
| Springfield School District, GO (Insured; FSA) | 4.75 | 3/15/12 | 1,085,000 | 1,145,445 | ||||||
| State Public School Building Authority, School LR | ||||||||||
| (Richland School District Project) (Insured; FGIC) | 5.00 | 11/15/14 | 1,265,000 b | 1,364,986 | ||||||
| State Public School Building Authority, School LR | ||||||||||
| (The School District of Philadelphia Project) (Insured; FSA) | 5.00 | 6/1/13 | 5,000,000 b | 5,351,950 | ||||||
| State Public School Building Authority, School Revenue | ||||||||||
| (Tuscarora School District Project) (Insured; FSA) | 5.25 | 4/1/13 | 195,000 b | 210,680 | ||||||
| State Public School Building Authority, School Revenue | ||||||||||
| (Tuscarora School District Project) (Insured; FSA) | 5.25 | 4/1/17 | 840,000 | 899,984 | ||||||
| Susquehanna Area Regional Airport Authority, | ||||||||||
| Airport System Revenue | 5.38 | 1/1/18 | 6,000,000 | 5,621,700 | ||||||
| Susquehanna Area Regional Airport Authority, | ||||||||||
| Airport System Revenue (Insured; AMBAC) | 5.50 | 1/1/20 | 4,370,000 | 4,386,213 | ||||||
| Susquehanna Area Regional Airport Authority, | ||||||||||
| Airport System Revenue (Insured; AMBAC) | 5.00 | 1/1/33 | 2,400,000 | 2,226,096 | ||||||
| Swarthmore Borough Authority, College Revenue | 5.50 | 9/15/11 | 17,500,000 | 18,843,125 | ||||||
| Swarthmore Borough Authority, College Revenue | 5.25 | 9/15/17 | 1,000,000 | 1,068,970 | ||||||
| Twin Valley School District, GO (Insured; FSA) | 5.25 | 10/1/15 | 1,000,000 b | 1,098,930 | ||||||
| University Area Joint Authority, Sewer Revenue (Insured; MBIA) | 5.00 | 11/1/11 | 1,430,000 | 1,524,938 | ||||||
The Funds 39
STATEMENT OF INVESTMENTS (Unaudited) (continued)
| BNY Mellon Pennsylvania Intermediate Municipal Bond Fund (continued) | ||||||||||
| Long-Term Municipal | Coupon | Maturity | Principal | |||||||
| Investments (continued) | Rate (%) | Date | Amount ($) | Value ($) | ||||||
| Pennsylvania (continued) | ||||||||||
| Upper Darby School District, GO (Insured; FGIC) | 5.00 | 5/1/18 | 2,870,000 | 2,985,518 | ||||||
| Upper Merion Area School District, GO (Insured; MBIA) | 5.00 | 2/15/19 | 1,165,000 | 1,197,981 | ||||||
| Warwick School District, GO (Insured; FGIC) | 5.25 | 2/15/11 | 1,000,000 | 1,060,370 | ||||||
| Wilson Area School District, GO (Insured; FGIC) | 5.00 | 2/15/11 | 1,910,000 | 2,010,237 | ||||||
| Wilson School District, GO (Insured; FSA) | 5.38 | 5/15/12 | 1,785,000 b | 1,911,931 | ||||||
| Wilson School District, GO (Insured; FSA) | 5.38 | 5/15/12 | 1,500,000 b | 1,604,235 | ||||||
| York County (Insured; AMBAC) | 5.00 | 6/1/17 | 1,100,000 | 1,149,698 | ||||||
| York County Solid Waste and Refuse Authority, | ||||||||||
| Solid Waste System Revenue (Insured; FGIC) | 5.50 | 12/1/14 | 1,000,000 | 1,095,710 | ||||||
| South Carolina—.4% | ||||||||||
| Greenville County School District, Installment Purchase | ||||||||||
| Revenue (Building Equity Sooner for Tomorrow) | 5.50 | 12/1/18 | 2,000,000 | 2,134,060 | ||||||
| Texas—.3% | ||||||||||
| Cities of Dallas and Fort Worth, Dallas/Fort Worth International | ||||||||||
| Airport, Joint Revenue Improvement Bonds (Insured; FGIC) | 5.50 | 11/1/31 | 2,000,000 | 1,896,020 | ||||||
| Virginia—2.0% | ||||||||||
| Industrial Development Authority of the | ||||||||||
| County of Charles City, Solid Waste Disposal | ||||||||||
| Facility Revenue (USA Waste of Virginia, Inc. Project) | 4.88 | 2/1/09 | 6,600,000 | 6,650,688 | ||||||
| Louisa Industrial Development Authority, | ||||||||||
| PCR (Virginia Electric and Power Company) | 5.25 | 12/1/08 | 5,000,000 | 5,035,050 | ||||||
| U.S. Related—12.7% | ||||||||||
| Puerto Rico Commonwealth, Public Improvement | 5.25 | 7/1/23 | 4,090,000 | 3,887,095 | ||||||
| Puerto Rico Commonwealth, Public Improvement (Insured; FGIC) | 5.50 | 7/1/18 | 9,545,000 | 10,000,583 | ||||||
| Puerto Rico Commonwealth, Public Improvement (Insured; MBIA) | 5.50 | 7/1/14 | 7,500,000 | 7,989,975 | ||||||
| Puerto Rico Commonwealth, Public Improvement (Insured; MBIA) | 5.50 | 7/1/20 | 4,000,000 | 4,113,480 | ||||||
| Puerto Rico Electric Power Authority, Power Revenue (Insured; FSA) | 5.25 | 7/1/10 | 5,000,000 b | 5,307,450 | ||||||
| Puerto Rico Electric Power Authority, Power Revenue (Insured; MBIA) | 5.25 | 7/1/14 | 7,875,000 | 8,366,557 | ||||||
| Puerto Rico Electric Power Authority, Power Revenue (Insured; MBIA) | 5.50 | 7/1/17 | 6,000,000 | 6,441,180 | ||||||
| Puerto Rico Electric Power Authority, Power Revenue (Insured; MBIA) | 5.50 | 7/1/19 | 2,290,000 | 2,443,224 | ||||||
| Puerto Rico Government Development Bank, Senior Notes | 5.00 | 12/1/12 | 3,000,000 | 3,107,130 | ||||||
| Puerto Rico Government Development Bank, Senior Notes | 5.00 | 12/1/13 | 3,000,000 | 3,097,680 | ||||||
| Puerto Rico Highways and Transportation | ||||||||||
| Authority, Highway Revenue (Insured; FSA) | 5.50 | 7/1/13 | 1,500,000 | 1,590,615 | ||||||
| Puerto Rico Highways and Transportation | ||||||||||
| Authority, Highway Revenue (Insured; MBIA) | 5.50 | 7/1/13 | 4,000,000 | 4,222,080 | ||||||
| Puerto Rico Highways and Transportation | ||||||||||
| Authority, Transportation Revenue | 5.25 | 7/1/10 | 4,000,000 | 4,162,080 | ||||||
| Puerto Rico Infrastructure Financing Authority, Special Tax Revenue | 5.00 | 7/1/21 | 5,000,000 | 4,783,750 | ||||||
| Puerto Rico Municipal Finance Agency (Insured; FSA) | 5.50 | 8/1/09 | 5,000,000 | 5,188,650 | ||||||
| Total Long-Term Municipal Investments (cost $577,897,662) | 577,604,794 | |||||||||
40
| BNY Mellon Pennsylvania Intermediate Municipal Bond Fund (continued) | ||||||||||
| Short-Term Municipal | Coupon | Maturity | Principal | |||||||
| Investments—.5% | Rate (%) | Date | Amount ($) | Value ($) | ||||||
| Pennsylvania; | ||||||||||
| Berks County Municipal Authority, Revenue (The Reading | ||||||||||
| Hospital and Medical Center Project) (Insured; AMBAC) | 6.87 | 4/4/08 | 1,600,000 d | 1,600,000 | ||||||
| Pennsylvania Intergovernmental Cooperation | ||||||||||
| Authority, Special Tax Revenue, Refunding | ||||||||||
| (City of Philadelphia Funding Program) (Insured; AMBAC) | 6.47 | 3/7/08 | 1,600,000 d | 1,600,000 | ||||||
| Total Short-Term Municipal Investments (cost $3,200,000) | 3,200,000 | |||||||||
| Total Investments (cost $581,097,662) | 98.9% | 580,804,794 | ||||||||
| Cash and Receivables (Net) | 1.1% | 6,405,461 | ||||||||
| Net Assets | 100.0% | 587,210,255 | ||||||||
| a Zero coupon until a specified date at which time the stated coupon rate becomes effective until maturity. |
| b These securities are prerefunded; the date shown represents the prerefunded date. Bonds which are prerefunded are collateralized by U.S. Government securities which are held in |
| escrow and are used to pay principal and interest on the municipal issue and to retire the bonds in full at the earliest refunding date. |
| c Subject to interest rate change on November 1, 2011. |
| d Securities payable on demand.Variable interest rate—subject to periodic change. |
The Funds 41
STATEMENT OF INVESTMENTS (Unaudited) (continued)
| Summary of Abbreviations | ||||||
| ACA | American Capital Access | AGC | ACE Guaranty Corporation | |||
| AGIC | Asset Guaranty Insurance Company | AMBAC | American Municipal Bond Assurance Corporation | |||
| ARRN | Adjustable Rate Receipt Notes | BAN | Bond Anticipation Notes | |||
| BIGI | Bond Investors Guaranty Insurance | BPA | Bond Purchase Agreement | |||
| CGIC | Capital Guaranty Insurance Company | CIC | Continental Insurance Company | |||
| CIFG | CDC Ixis Financial Guaranty | CMAC | Capital Market Assurance Corporation | |||
| COP | Certificate of Participation | CP | Commercial Paper | |||
| EDR | Economic Development Revenue | EIR | Environmental Improvement Revenue | |||
| FGIC | Financial Guaranty Insurance Company | FHA | Federal Housing Administration | |||
| FHLB | Federal Home Loan Bank | FHLMC | Federal Home Loan Mortgage Corporation | |||
| FNMA | Federal National Mortgage Association | FSA | Financial Security Assurance | |||
| GAN | Grant Anticipation Notes | GIC | Guaranteed Investment Contract | |||
| GNMA | Government National Mortgage Association | GO | General Obligation | |||
| HR | Hospital Revenue | IDB | Industrial Development Board | |||
| IDC | Industrial Development Corporation | IDR | Industrial Development Revenue | |||
| LOC | Letter of Credit | LOR | Limited Obligation Revenue | |||
| LR | Lease Revenue | MBIA | Municipal Bond Investors | |||
| Assurance Insurance Corporation | ||||||
| MFHR | Multi-Family Housing Revenue | MFMR | Multi-Family Mortgage Revenue | |||
| PCR | Pollution Control Revenue | PILOT | Payment in Lieu of Taxes | |||
| RAC | Revenue Anticipation Certificates | RAN | Revenue Anticipation Notes | |||
| RAW | Revenue Anticipation Warrants | RRR | Resources Recovery Revenue | |||
| SAAN | State Aid Anticipation Notes | SBPA | Standby Bond Purchase Agreement | |||
| SFHR | Single Family Housing Revenue | SFMR | Single Family Mortgage Revenue | |||
| SONYMA | State of New York Mortgage Agency | SWDR | Solid Waste Disposal Revenue | |||
| TAN | Tax Anticipation Notes | TAW | Tax Anticipation Warrants | |||
| TRAN | Tax and Revenue Anticipation Notes | XLCA | XL Capital Assurance | |||
| Summary of Combined Ratings (Unaudited) | ||||||||||
| Fitch | or | Moody’s | or | Standard & Poor’s | Value (%)† | |||||
| AAA | Aaa | AAA | 68.6 | |||||||
| AA | Aa | AA | 10.1 | |||||||
| A | A | A | 8.6 | |||||||
| BBB | Baa | BBB | 12.7 | |||||||
| 100.0 | ||||||||||
| † Based on total investments. See notes to financial statements. |
42
| STATEMENT OF FINANCIAL FUTURES |
| February 29, 2008 (Unaudited) |
| Unrealized | ||||||||
| Market Value | Appreciation | |||||||
| BNY Mellon Pennsylvania | Notional Amount/ | Covered by | (Depreciation) | |||||
| Intermediate Municipal Bond Fund | Contracts | Contracts ($) | Expiration | at 2/29/2008 ($) | ||||
| Financial Futures Short | ||||||||
| 30 Year MMD Index | 6,000,000 | (5,600,521) | May 2008 | 399,479 | ||||
| 30 Year MMD Index | 6,000,000 | (5,600,787) | May 2008 | 399,213 | ||||
| U.S. Treasury 30 Year Bond | 125 | (14,960,937) | March 2008 | (324,218) | ||||
| 474,474 |
See notes to financial statements.
The Funds 43
| STATEMENT OF INVESTMENTS |
| February 29, 2008 (Unaudited) |
| BNY Mellon Massachusetts Intermediate Municipal Bond Fund | ||||||||
| Long-Term Municipal | Coupon | Maturity | Principal | |||||
| Investments—92.5% | Rate (%) | Date | Amount ($) | Value ($) | ||||
| Massachusetts—82.1% | ||||||||
| Ashland, GO (Insured; AMBAC) | 5.25 | 5/15/21 | 1,305,000 | 1,347,569 | ||||
| Auburn, GO (Insured; AMBAC) | 5.13 | 6/1/20 | 1,225,000 | 1,259,533 | ||||
| Bellingham, GO (Insured; AMBAC) | 5.38 | 3/1/14 | 1,685,000 | 1,785,308 | ||||
| Boston | 5.75 | 2/1/10 | 2,000,000 | 2,113,980 | ||||
| Boston | 5.00 | 3/1/20 | 2,500,000 | 2,591,325 | ||||
| Boston | 5.00 | 3/1/21 | 3,605,000 | 3,701,758 | ||||
| Boston Economic Development and Industrial | ||||||||
| Corporation, Public Parking Facility Bonds | 4.50 | 6/1/10 | 3,000,000 | 3,103,830 | ||||
| Boston Water and Sewer Commission, Revenue | 9.25 | 1/1/11 | 100,000 | 113,628 | ||||
| Boston Water and Sewer Commission, Revenue | 5.00 | 11/1/19 | 2,170,000 | 2,233,060 | ||||
| Boston Water and Sewer Commission, Revenue | 5.00 | 11/1/23 | 3,920,000 | 3,939,600 | ||||
| Brockton (Municipal Purpose Loan) (Insured; AMBAC) | 5.00 | 6/1/19 | 1,430,000 | 1,463,962 | ||||
| Burlington, GO | 5.25 | 2/1/12 | 200,000 | 215,232 | ||||
| Burlington, GO | 5.25 | 2/1/13 | 250,000 | 271,702 | ||||
| Cambridge, GO (Municipal Purpose Loan) | 5.00 | 12/15/11 | 510,000 | 546,399 | ||||
| Cohasset, GO | 5.00 | 6/15/22 | 895,000 | 901,659 | ||||
| Cohasset, GO | 5.00 | 6/15/23 | 895,000 | 899,735 | ||||
| Everett, GO (Insured; FGIC) | 5.38 | 12/15/17 | 1,250,000 | 1,339,700 | ||||
| Haverhill (State Qualified Municipal Purpose Loan) (Insured; FGIC) | 5.00 | 6/1/16 | 1,580,000 | 1,698,927 | ||||
| Haverhill (State Qualified Municipal Purpose Loan) (Insured; FGIC) | 5.00 | 6/1/18 | 505,000 | 530,856 | ||||
| Hingham, GO (Municipal Purpose Loan) | 5.38 | 4/1/17 | 1,645,000 | 1,759,755 | ||||
| Holden (Municipal Purpose Loan) (Insured; FGIC) | 6.00 | 3/1/10 | 1,000,000 a | 1,069,660 | ||||
| Hopedale, GO (Insured; AMBAC) | 5.00 | 11/15/19 | 650,000 | 673,504 | ||||
| Ipswich, GO (Insured; FGIC) | 5.00 | 11/15/14 | 500,000 | 541,780 | ||||
| Lynnfield, GO (Municipal Purpose Loan) | 5.00 | 7/1/20 | 505,000 | 515,969 | ||||
| Lynnfield, GO (Municipal Purpose Loan) | 5.00 | 7/1/21 | 525,000 | 533,227 | ||||
| Lynnfield, GO (Municipal Purpose Loan) | 5.00 | 7/1/22 | 585,000 | 590,973 | ||||
| Lynnfield, GO (Municipal Purpose Loan) | 5.00 | 7/1/23 | 585,000 | 589,382 | ||||
| Malden, GO (Insured; FGIC) | 5.00 | 8/1/18 | 2,260,000 | 2,339,394 | ||||
| Mansfield, GO (Insured; AMBAC) | 5.00 | 8/15/17 | 1,395,000 | 1,460,007 | ||||
| Marblehead, GO | 5.00 | 8/15/18 | 1,340,000 | 1,396,548 | ||||
| Marblehead, GO | 5.00 | 8/15/22 | 1,750,000 | 1,768,235 | ||||
| Mashpee, GO (Insured; FGIC) | 5.63 | 11/15/10 | 500,000 a | 539,740 | ||||
| Massachusetts | 6.50 | 8/1/08 | 590,000 | 599,328 | ||||
| Massachusetts (Insured; AMBAC) | 5.50 | 10/1/18 | 5,225,000 | 5,725,659 | ||||
| Massachusetts (Insured; FSA) | 5.25 | 9/1/22 | 2,275,000 | 2,361,768 | ||||
| Massachusetts (Insured; XLCA) | 4.41 | 12/1/12 | 2,470,000 b | 2,581,274 | ||||
| Massachusetts, Consolidated Loan | 5.75 | 6/1/10 | 5,000,000 a | 5,278,950 | ||||
| Massachusetts, Consolidated Loan | 5.25 | 11/1/12 | 2,000,000 a | 2,144,920 | ||||
| Massachusetts, Consolidated Loan | 5.25 | 10/1/13 | 2,600,000 a | 2,814,656 | ||||
| Massachusetts, Consolidated Loan | 5.25 | 10/1/13 | 2,500,000 a | 2,706,400 | ||||
| Massachusetts, Consolidated Loan | 5.00 | 3/1/15 | 1,500,000 a | 1,618,890 | ||||
44
| BNY Mellon Massachusetts Intermediate Municipal Bond Fund (continued) | ||||||||||
| Long-Term Municipal | Coupon | Maturity | Principal | |||||||
| Investments (continued) | Rate (%) | Date | Amount ($) | Value ($) | ||||||
| Massachusetts (continued) | ||||||||||
| Massachusetts, Consolidated Loan | 5.00 | 3/1/15 | 1,800,000 a | 1,942,668 | ||||||
| Massachusetts, Consolidated Loan | 5.00 | 8/1/16 | 1,000,000 a | 1,079,260 | ||||||
| Massachusetts, Consolidated Loan | 5.50 | 11/1/16 | 1,000,000 | 1,102,010 | ||||||
| Massachusetts, Consolidated Loan | 5.00 | 9/1/18 | 5,000,000 | 5,168,350 | ||||||
| Massachusetts, Consolidated Loan (Insured; FGIC) | 5.50 | 11/1/13 | 2,500,000 | 2,756,025 | ||||||
| Massachusetts, Consolidated Loan (Insured; FGIC) | 5.50 | 8/1/18 | 1,035,000 | 1,132,673 | ||||||
| Massachusetts, Consolidated Loan (Insured; FSA) | 5.25 | 1/1/13 | 5,000,000 a | 5,368,850 | ||||||
| Massachusetts, Consolidated Loan (Insured; FSA) | 5.25 | 8/1/22 | 5,825,000 | 5,994,857 | ||||||
| Massachusetts, Consolidated Loan (Insured; MBIA) | 5.50 | 1/1/12 | 1,500,000 | 1,620,255 | ||||||
| Massachusetts, Consolidated Loan (Insured; MBIA) | 5.00 | 8/1/12 | 420,000 a | 444,763 | ||||||
| Massachusetts, Consolidated Loan (Insured; MBIA) | 5.00 | 8/1/12 | 1,580,000 a | 1,673,157 | ||||||
| Massachusetts, Consolidated Loan (Insured; MBIA) | 5.50 | 11/1/12 | 3,000,000 | 3,284,400 | ||||||
| Massachusetts, Federal Highway, GAN | 5.50 | 6/15/14 | 4,335,000 | 4,473,763 | ||||||
| Massachusetts, Federal Highway, GAN (Insured; FSA) | 5.75 | 6/15/12 | 2,500,000 | 2,663,475 | ||||||
| Massachusetts, Federal Highway, GAN (Insured; FSA) | 5.13 | 12/15/12 | 1,500,000 | 1,539,060 | ||||||
| Massachusetts, Federal Highway, GAN (Insured; MBIA) | 5.13 | 6/15/15 | 500,000 | 514,540 | ||||||
| Massachusetts, Special Obligation Dedicated | ||||||||||
| Tax Revenue (Insured; FGIC) | 5.25 | 1/1/14 | 2,500,000 a | 2,711,925 | ||||||
| Massachusetts, Special Obligation | ||||||||||
| Dedicated Tax Revenue (Insured; FGIC) | 3.81 | 1/1/16 | 3,540,000 b | 3,632,996 | ||||||
| Massachusetts, Special Obligation Revenue | 5.38 | 6/1/11 | 6,350,000 | 6,799,262 | ||||||
| Massachusetts, Special Obligation Revenue | 5.50 | 6/1/13 | 1,000,000 | 1,098,370 | ||||||
| Massachusetts, Special Obligation Revenue (Insured; FGIC) | 5.38 | 6/1/12 | 5,000,000 a | 5,389,550 | ||||||
| Massachusetts Bay Transportation Authority, Assessment Revenue | 5.75 | 7/1/10 | 2,835,000 a | 3,014,654 | ||||||
| Massachusetts Bay Transportation Authority, Assessment Revenue | 5.75 | 7/1/11 | 165,000 | 174,516 | ||||||
| Massachusetts Bay Transportation Authority, Assessment Revenue | 5.25 | 7/1/14 | 1,045,000 a | 1,144,066 | ||||||
| Massachusetts Bay Transportation Authority, Assessment Revenue | 5.25 | 7/1/14 | 1,000,000 a | 1,094,800 | ||||||
| Massachusetts Bay Transportation Authority, Assessment Revenue | 5.00 | 7/1/15 | 5,000,000 a | 5,405,800 | ||||||
| Massachusetts Bay Transportation Authority, | ||||||||||
| General Transportation System (Insured; FGIC) | 5.25 | 3/1/15 | 1,000,000 | 1,079,960 | ||||||
| Massachusetts Bay Transportation Authority, | ||||||||||
| Senior Sales Tax Revenue | 5.00 | 7/1/15 | 3,500,000 | 3,755,010 | ||||||
| Massachusetts Bay Transportation Authority, | ||||||||||
| Senior Sales Tax Revenue | 5.50 | 7/1/16 | 2,500,000 | 2,757,950 | ||||||
| Massachusetts Bay Transportation Authority, | ||||||||||
| Senior Sales Tax Revenue | 5.25 | 7/1/21 | 2,000,000 | 2,102,900 | ||||||
| Massachusetts Bay Transportation Authority, | ||||||||||
| Senior Sales Tax Revenue | 5.25 | 7/1/22 | 2,430,000 | 2,529,436 | ||||||
| Massachusetts Development Finance Agency, | ||||||||||
| Education Revenue (Belmont Hill School Issue) | 5.00 | 9/1/11 | 500,000 a | 530,840 | ||||||
| Massachusetts Development Finance Agency, | ||||||||||
| Education Revenue (Dexter School Project) | 5.00 | 5/1/23 | 1,400,000 | 1,338,204 | ||||||
The Funds 45
STATEMENT OF INVESTMENTS (Unaudited) (continued)
| BNY Mellon Massachusetts Intermediate Municipal Bond Fund (continued) | ||||||||
| Long-Term Municipal | Coupon | Maturity | Principal | |||||
| Investments (continued) | Rate (%) | Date | Amount ($) | Value ($) | ||||
| Massachusetts (continued) | ||||||||
| Massachusetts Development Finance Agency, | ||||||||
| Education Revenue (Dexter School Project) | 5.00 | 5/1/24 | 1,465,000 | 1,382,594 | ||||
| Massachusetts Development Finance Agency, | ||||||||
| Higher Education Revenue (Emerson College Issue) | 5.00 | 1/1/16 | 1,000,000 | 1,028,670 | ||||
| Massachusetts Development Finance Agency, | ||||||||
| Higher Education Revenue (Emerson College Issue) | 5.00 | 1/1/22 | 2,000,000 | 1,960,740 | ||||
| Massachusetts Development Finance Agency, Higher | ||||||||
| Education Revenue (Smith College Issue) | 5.75 | 7/1/10 | 1,000,000 a | 1,072,720 | ||||
| Massachusetts Development Finance Agency, | ||||||||
| Revenue (Belmont Hill School Issue) | 4.50 | 9/1/36 | 1,380,000 | 1,146,145 | ||||
| Massachusetts Development Finance Agency, | ||||||||
| Revenue (Boston College Issue) | 5.00 | 7/1/20 | 1,000,000 | 1,012,220 | ||||
| Massachusetts Development Finance Agency, Revenue | ||||||||
| (Combined Jewish Philanthropies of Greater Boston, Inc. Project) | 5.25 | 2/1/22 | 1,000,000 | 1,018,600 | ||||
| Massachusetts Development Finance Agency, | ||||||||
| Revenue (Curry College Issue) (Insured; ACA) | 4.75 | 3/1/20 | 530,000 | 481,277 | ||||
| Massachusetts Development Finance Agency, | ||||||||
| Revenue (Curry College Issue) (Insured; ACA) | 5.25 | 3/1/26 | 1,000,000 | 909,410 | ||||
| Massachusetts Development Finance Agency, | ||||||||
| Revenue (Curry College Issue) (Insured; ACA) | 5.00 | 3/1/36 | 1,000,000 | 822,630 | ||||
| Massachusetts Development Finance Agency, | ||||||||
| Revenue (Massachusetts College of | ||||||||
| Pharmacy and Allied Health Sciences Issue) | 6.00 | 7/1/08 | 310,000 | 312,719 | ||||
| Massachusetts Development Finance Agency, | ||||||||
| Revenue (Massachusetts College of Pharmacy | ||||||||
| and Allied Health Sciences Issue) | 6.40 | 1/1/10 | 370,000 a | 396,485 | ||||
| Massachusetts Development Finance Agency, | ||||||||
| Revenue (Massachusetts College of Pharmacy | ||||||||
| and Allied Health Sciences Issue) | 6.50 | 1/1/10 | 395,000 a | 423,973 | ||||
| Massachusetts Development Finance Agency, | ||||||||
| Revenue (Massachusetts College of Pharmacy | ||||||||
| and Allied Health Sciences Issue) | 6.30 | 7/1/10 | 350,000 | 374,430 | ||||
| Massachusetts Development Finance Agency, | ||||||||
| Revenue (Massachusetts College of Pharmacy | ||||||||
| and Allied Health Sciences Issue) | 6.38 | 7/1/13 | 1,000,000 a | 1,150,580 | ||||
| Massachusetts Development Finance Agency, Revenue | ||||||||
| (Massachusetts College of Pharmacy and Allied | ||||||||
| Health Sciences Issue) (Insured; Assured Guaranty) | 5.00 | 7/1/24 | 2,750,000 | 2,680,892 | ||||
| Massachusetts Development Finance Agency, Revenue | ||||||||
| (Massachusetts College of Pharmacy and Allied | ||||||||
| Health Sciences Issue) (Insured; Assured Guaranty) | 5.00 | 7/1/27 | 1,000,000 | 962,740 | ||||
| Massachusetts Development Finance Agency, Revenue | ||||||||
| (Massachusetts College of Pharmacy and Allied | ||||||||
| Health Sciences Issue) (Insured; Assured Guaranty) | 5.00 | 7/1/35 | 2,000,000 | 1,875,380 | ||||
| Massachusetts Development Finance Agency, | ||||||||
| Revenue (Milton Academy Issue) | 5.00 | 9/1/19 | 1,000,000 | 1,037,860 | ||||
46
| BNY Mellon Massachusetts Intermediate Municipal Bond Fund (continued) | ||||||||
| Long-Term Municipal | Coupon | Maturity | Principal | |||||
| Investments (continued) | Rate (%) | Date | Amount ($) | Value ($) | ||||
| Massachusetts (continued) | ||||||||
| Massachusetts Development Finance Agency, | ||||||||
| Revenue (Suffolk University Issue) | 5.85 | 7/1/09 | 1,000,000 a | 1,048,520 | ||||
| Massachusetts Development Finance Agency, | ||||||||
| Revenue (The Park School Issue) | 4.50 | 9/1/31 | 1,000,000 | 856,260 | ||||
| Massachusetts Development Finance Agency, | ||||||||
| RRR (Waste Management Inc. Project) | 6.90 | 12/1/09 | 1,000,000 | 1,044,720 | ||||
| Massachusetts Development Finance Agency, | ||||||||
| SWDR (Waste Management Inc. Project) | 5.45 | 6/1/14 | 1,000,000 | 1,020,340 | ||||
| Massachusetts Educational Financing Authority, | ||||||||
| Education Loan Revenue (Insured; AMBAC) | 4.70 | 1/1/10 | 715,000 | 724,903 | ||||
| Massachusetts Educational Financing Authority, | ||||||||
| Education Loan Revenue (Insured; AMBAC) | 6.20 | 7/1/13 | 90,000 | 90,346 | ||||
| Massachusetts Health and Educational Facilities | ||||||||
| Authority, Revenue (Berklee College of Music Issue) | 5.00 | 10/1/22 | 1,080,000 | 1,033,560 | ||||
| Massachusetts Health and Educational Facilities | ||||||||
| Authority, Revenue (Berklee College of Music Issue) | 5.00 | 10/1/37 | 3,250,000 | 2,892,500 | ||||
| Massachusetts Health and Educational Facilities | ||||||||
| Authority, Revenue (Boston College Issue) | 5.13 | 6/1/37 | 2,000,000 | 1,927,940 | ||||
| Massachusetts Health and Educational Facilities | ||||||||
| Authority, Revenue (Dartmouth-Hitchcock | ||||||||
| Obligated Group Issue) (Insured; FSA) | 5.13 | 8/1/22 | 2,000,000 | 2,014,460 | ||||
| Massachusetts Health and Educational Facilities | ||||||||
| Authority, Revenue (Harvard University Issue) | 5.00 | 7/15/36 | 1,000,000 | 976,240 | ||||
| Massachusetts Health and Educational Facilities | ||||||||
| Authority, Revenue (Jordan Hospital Issue) | 5.00 | 10/1/10 | 500,000 | 502,205 | ||||
| Massachusetts Health and Educational Facilities Authority, | ||||||||
| Revenue (Massachusetts Institute of Technology Issue) | 5.00 | 7/1/23 | 5,335,000 | 5,403,235 | ||||
| Massachusetts Health and Educational Facilities | ||||||||
| Authority, Revenue (Milford Regional Medical Center Issue) | 5.00 | 7/15/11 | 500,000 | 505,855 | ||||
| Massachusetts Health and Educational Facilities | ||||||||
| Authority, Revenue (Milford Regional Medical Center Issue) | 5.00 | 7/15/22 | 500,000 | 446,485 | ||||
| Massachusetts Health and Educational Facilities Authority, | ||||||||
| Revenue (Northeastern University Issue) (Insured; MBIA) | 5.50 | 10/1/09 | 420,000 | 438,358 | ||||
| Massachusetts Health and Educational Facilities | ||||||||
| Authority, Revenue (Partners HealthCare System Issue) | 5.25 | 7/1/13 | 1,595,000 | 1,636,837 | ||||
| Massachusetts Health and Educational Facilities | ||||||||
| Authority, Revenue (Partners HealthCare System Issue) | 5.00 | 7/1/16 | 1,045,000 | 1,067,499 | ||||
| Massachusetts Health and Educational Facilities | ||||||||
| Authority, Revenue (Partners HealthCare System Issue) | 5.00 | 7/1/18 | 1,500,000 | 1,520,580 | ||||
| Massachusetts Health and Educational Facilities | ||||||||
| Authority, Revenue (Partners HealthCare System Issue) | 5.13 | 7/1/19 | 1,000,000 | 1,002,210 | ||||
| Massachusetts Health and Educational Facilities | ||||||||
| Authority, Revenue (Partners HealthCare System Issue) | 5.00 | 7/1/21 | 1,235,000 | 1,204,409 | ||||
| Massachusetts Health and Educational Facilities | ||||||||
| Authority, Revenue (Partners HealthCare System Issue) | 5.00 | 7/1/22 | 250,000 | 240,330 | ||||
The Funds 47
STATEMENT OF INVESTMENTS (Unaudited) (continued)
| BNY Mellon Massachusetts Intermediate Municipal Bond Fund (continued) | ||||||||||
| Long-Term Municipal | Coupon | Maturity | Principal | |||||||
| Investments (continued) | Rate (%) | Date | Amount ($) | Value ($) | ||||||
| Massachusetts (continued) | ||||||||||
| Massachusetts Health and Educational Facilities | ||||||||||
| Authority, Revenue (Tufts University Issue) | 5.50 | 8/15/14 | 1,000,000 | 1,108,220 | ||||||
| Massachusetts Health and Educational Facilities | ||||||||||
| Authority, Revenue (Tufts University Issue) | 5.50 | 2/15/36 | 1,000,000 | 1,007,020 | ||||||
| Massachusetts Health and Educational Facilities | ||||||||||
| Authority, Revenue (UMass Memorial Issue) | 5.25 | 7/1/25 | 2,000,000 | 1,817,460 | ||||||
| Massachusetts Health and Educational Facilities | ||||||||||
| Authority, Revenue (UMass Memorial Issue) | 5.00 | 7/1/33 | 1,000,000 | 828,750 | ||||||
| Massachusetts Health and Educational Facilities | ||||||||||
| Authority, Revenue (Wellesley College Issue) | 5.00 | 7/1/24 | 1,000,000 | 997,720 | ||||||
| Massachusetts Health and Educational Facilities | ||||||||||
| Authority, Revenue (Winchester Hospital Issue) | 6.75 | 7/1/10 | 1,570,000 a | 1,698,457 | ||||||
| Massachusetts Housing Finance Agency, Housing Revenue | 4.20 | 12/1/10 | 1,790,000 | 1,836,307 | ||||||
| Massachusetts Housing Finance Agency, Housing Revenue | 5.00 | 12/1/26 | 1,165,000 | 1,095,974 | ||||||
| Massachusetts Housing Finance Agency, Housing Revenue | 5.13 | 12/1/34 | 200,000 | 181,396 | ||||||
| Massachusetts Industrial Finance Agency, Education Revenue | ||||||||||
| (Saint John’s High School of Worcester County, Inc. Issue) | 5.70 | 6/1/18 | 1,700,000 | 1,722,355 | ||||||
| Massachusetts Industrial Finance Agency, | ||||||||||
| Education Revenue (The Tabor Academy Issue) | 5.40 | 12/1/08 | 775,000 a | 806,434 | ||||||
| Massachusetts Industrial Finance Agency, | ||||||||||
| Education Revenue (The Tabor Academy Issue) | 5.40 | 12/1/08 | 785,000 a | 816,840 | ||||||
| Massachusetts Industrial Finance Agency, | ||||||||||
| Revenue (Concord Academy Issue) | 5.45 | 9/1/17 | 500,000 | 507,845 | ||||||
| Massachusetts Industrial Finance Agency, | ||||||||||
| Revenue (Concord Academy Issue) | 5.50 | 9/1/27 | 1,250,000 | 1,250,350 | ||||||
| Massachusetts Industrial Finance Agency, | ||||||||||
| Revenue (Tufts University Issue) (Insured; MBIA) | 5.50 | 2/15/11 | 500,000 | 534,865 | ||||||
| Massachusetts Industrial Finance Agency, Revenue | ||||||||||
| (Wentworth Institute of Technology Inc. Issue) | 5.55 | 10/1/08 | 500,000 a | 518,625 | ||||||
| Massachusetts Municipal Wholesale Electric | ||||||||||
| Company, Power Supply Project Revenue | ||||||||||
| (Nuclear Project Number 4 Issue) (Insured; MBIA) | 5.25 | 7/1/12 | 2,000,000 | 2,127,240 | ||||||
| Massachusetts Municipal Wholesale Electric | ||||||||||
| Company, Power Supply Project Revenue | ||||||||||
| (Nuclear Project Number 5 Issue) (Insured; MBIA) | 5.00 | 7/1/11 | 120,000 | 126,026 | ||||||
| Massachusetts Municipal Wholesale Electric | ||||||||||
| Company, Power Supply Project Revenue | ||||||||||
| (Project Number 6 Issue) (Insured; MBIA) | 5.00 | 7/1/10 | 1,635,000 | 1,687,500 | ||||||
| Massachusetts Port Authority, Revenue | 6.00 | 1/1/10 | 2,500,000 a | 2,662,575 | ||||||
| Massachusetts Port Authority, Revenue | 5.75 | 7/1/11 | 3,500,000 | 3,778,040 | ||||||
| Massachusetts Port Authority, Revenue (Insured; FSA) | 5.50 | 7/1/14 | 1,265,000 | 1,307,972 | ||||||
| Massachusetts Port Authority, Revenue (Insured; MBIA) | 5.00 | 7/1/09 | 1,830,000 | 1,885,156 | ||||||
| Massachusetts School Building Authority, | ||||||||||
| Dedicated Sales Tax Revenue (Insured; AMBAC) | 5.00 | 8/15/16 | 2,720,000 | 2,910,155 | ||||||
48
| BNY Mellon Massachusetts Intermediate Municipal Bond Fund (continued) | ||||||||
| Long-Term Municipal | Coupon | Maturity | Principal | |||||
| Investments (continued) | Rate (%) | Date | Amount ($) | Value ($) | ||||
| Massachusetts (continued) | ||||||||
| Massachusetts School Building Authority, | ||||||||
| Dedicated Sales Tax Revenue (Insured; AMBAC) | 5.00 | 8/15/20 | 4,000,000 | 4,098,080 | ||||
| Massachusetts School Building Authority, | ||||||||
| Dedicated Sales Tax Revenue (Insured; AMBAC) | 5.00 | 8/15/22 | 3,500,000 | 3,515,645 | ||||
| Massachusetts School Building Authority, | ||||||||
| Dedicated Sales Tax Revenue (Insured; FSA) | 5.00 | 8/15/15 | 1,900,000 | 2,043,431 | ||||
| Massachusetts School Building Authority, | ||||||||
| Dedicated Sales Tax Revenue (Insured; FSA) | 5.00 | 8/15/21 | 2,000,000 | 2,029,800 | ||||
| Massachusetts Water Pollution Abatement Trust (Pool Program) | 5.50 | 8/1/11 | 4,000,000 | 4,317,040 | ||||
| Massachusetts Water Pollution Abatement Trust (Pool Program) | 5.00 | 8/1/21 | 2,625,000 | 2,679,075 | ||||
| Massachusetts Water Pollution Abatement | ||||||||
| Trust (Pooled Loan Program) | 5.63 | 8/1/10 | 975,000 a | 1,045,024 | ||||
| Massachusetts Water Pollution Abatement | ||||||||
| Trust (Pooled Loan Program) | 5.25 | 8/1/11 | 335,000 a | 356,839 | ||||
| Massachusetts Water Pollution Abatement | ||||||||
| Trust (Pooled Loan Program) | 5.00 | 8/1/12 | 3,910,000 a | 4,165,245 | ||||
| Massachusetts Water Pollution Abatement | ||||||||
| Trust (Pooled Loan Program) | 5.63 | 8/1/13 | 25,000 | 26,603 | ||||
| Massachusetts Water Pollution Abatement | ||||||||
| Trust (Pooled Loan Program) | 5.25 | 2/1/14 | 1,105,000 | 1,171,112 | ||||
| Massachusetts Water Pollution Abatement | ||||||||
| Trust (Pooled Loan Program) | 5.25 | 8/1/14 | 1,330,000 a | 1,457,188 | ||||
| Massachusetts Water Pollution Abatement | ||||||||
| Trust (Pooled Loan Program) | 5.50 | 8/1/14 | 30,000 | 31,222 | ||||
| Massachusetts Water Pollution Abatement | ||||||||
| Trust (Pooled Loan Program) | 5.25 | 8/1/17 | 170,000 | 183,313 | ||||
| Massachusetts Water Pollution Abatement | ||||||||
| Trust (Pooled Loan Program) | 5.00 | 8/1/18 | 75,000 | 78,763 | ||||
| Massachusetts Water Pollution Abatement | ||||||||
| Trust (Pooled Loan Program) | 5.00 | 8/1/32 | 2,000,000 | 1,931,540 | ||||
| Massachusetts Water Pollution Abatement | ||||||||
| Trust, Water Pollution Abatement Revenue | ||||||||
| (New Bedford Loan Program) | 5.25 | 2/1/12 | 500,000 | 535,905 | ||||
| Massachusetts Water Pollution Abatement | ||||||||
| Trust, Water Pollution Abatement Revenue | ||||||||
| (South Essex Sewer District Loan Program) | 6.38 | 2/1/15 | 195,000 | 195,589 | ||||
| Massachusetts Water Resources Authority, | ||||||||
| General Revenue (Insured; FSA) | 5.50 | 8/1/11 | 100,000 | 107,892 | ||||
| Massachusetts Water Resources Authority, | ||||||||
| General Revenue (Insured; FSA) | 5.25 | 8/1/18 | 500,000 | 535,335 | ||||
| Massachusetts Water Resources Authority, | ||||||||
| General Revenue (Insured; MBIA) | 6.00 | 8/1/14 | 1,000,000 | 1,133,240 | ||||
| Massachusetts Water Resources Authority, | ||||||||
| General Revenue (Insured; MBIA) | 5.25 | 8/1/19 | 1,500,000 | 1,584,150 | ||||
The Funds 49
STATEMENT OF INVESTMENTS (Unaudited) (continued)
| BNY Mellon Massachusetts Intermediate Municipal Bond Fund (continued) | ||||||||
| Long-Term Municipal | Coupon | Maturity | Principal | |||||
| Investments (continued) | Rate (%) | Date | Amount ($) | Value ($) | ||||
| Massachusetts (continued) | ||||||||
| Massachusetts Water Resources Authority, | ||||||||
| General Revenue (Insured; MBIA) | 5.25 | 8/1/21 | 1,000,000 | 1,034,820 | ||||
| Massachusetts Water Resources Authority, | ||||||||
| General Revenue (Insured; MBIA) | 5.25 | 8/1/24 | 2,500,000 | 2,537,025 | ||||
| Massachusetts Water Resources Authority, | ||||||||
| Subordinated General Revenue (Insured; MBIA) | 5.50 | 8/1/11 | 1,000,000 | 1,075,240 | ||||
| Middleborough, GO (Insured; MBIA) | 5.00 | 12/15/16 | 1,000,000 | 1,079,010 | ||||
| Middleborough, GO (Insured; MBIA) | 5.00 | 12/15/18 | 1,275,000 | 1,343,710 | ||||
| Milton School, GO | 5.00 | 3/1/23 | 500,000 | 500,000 | ||||
| Milton School, GO | 5.00 | 3/1/24 | 500,000 | 496,735 | ||||
| Milton School, GO | 5.00 | 3/1/25 | 500,000 | 494,360 | ||||
| Northampton, GO (Insured; MBIA) | 5.13 | 10/15/16 | 1,985,000 | 2,140,842 | ||||
| Northbridge, GO (Insured; AMBAC) | 5.25 | 2/15/17 | 1,000,000 | 1,063,890 | ||||
| Pembroke, GO (Insured; MBIA) | 4.50 | 8/1/13 | 695,000 | 732,092 | ||||
| Pembroke, GO (Insured; MBIA) | 5.00 | 8/1/20 | 960,000 | 991,536 | ||||
| Pittsfield, GO (Insured; MBIA) | 5.00 | 4/15/12 | 1,000,000 | 1,067,770 | ||||
| Pittsfield, GO (Insured; MBIA) | 5.50 | 4/15/14 | 500,000 | 538,455 | ||||
| Quabbin Regional School District (Insured; AMBAC) | 6.00 | 6/15/08 | 780,000 | 788,424 | ||||
| Randolph, GO (Insured; AMBAC) | 5.00 | 9/1/17 | 1,045,000 | 1,093,749 | ||||
| Randolph, GO (Insured; AMBAC) | 5.00 | 9/1/24 | 490,000 | 474,849 | ||||
| Sandwich, GO (Insured; MBIA) | 5.75 | 8/15/10 | 1,050,000 a | 1,129,443 | ||||
| Springfield (Municipal Purpose Loan) (Insured; FGIC) | 5.50 | 8/1/11 | 1,500,000 a | 1,626,345 | ||||
| Springfield Water and Sewer Commission, | ||||||||
| General Revenue (Insured; AMBAC) | 5.00 | 7/15/22 | 1,175,000 | 1,139,656 | ||||
| Springfield Water and Sewer Commission, | ||||||||
| General Revenue (Insured; AMBAC) | 5.00 | 7/15/23 | 1,235,000 | 1,183,636 | ||||
| University of Massachusetts Building Authority, | ||||||||
| Project Revenue (Insured; AMBAC) | 5.50 | 11/1/10 | 1,000,000 a | 1,065,070 | ||||
| Westfield (Insured; FGIC) | 6.50 | 5/1/10 | 735,000 a | 797,100 | ||||
| Worcester (Insured; FGIC) | 5.63 | 8/15/10 | 1,000,000 a | 1,072,720 | ||||
| Worcester, GO (Insured; FGIC) | 5.00 | 4/1/18 | 625,000 | 642,238 | ||||
| Worcester, GO (Insured; MBIA) | 5.25 | 8/15/16 | 1,000,000 | 1,065,800 | ||||
| Worcester, GO (Insured; MBIA) | 5.25 | 8/15/17 | 1,000,000 | 1,061,050 | ||||
| Worcester, GO (Municipal Purpose Loan) (Insured; MBIA) | 6.25 | 7/1/10 | 755,000 | 806,718 | ||||
| U.S. Related—10.4% | ||||||||
| Guam Economic Development Authority, | ||||||||
| Tobacco Settlement Asset-Backed Bonds | 5.15 | 5/15/11 | 250,000 | 264,712 | ||||
| Guam Economic Development Authority, | ||||||||
| Tobacco Settlement Asset-Backed Bonds | 5.20 | 5/15/12 | 300,000 | 321,126 | ||||
| Guam Economic Development Authority, | ||||||||
| Tobacco Settlement Asset-Backed Bonds | 5.20 | 5/15/13 | 1,175,000 | 1,270,668 | ||||
50
| BNY Mellon Massachusetts Intermediate Municipal Bond Fund (continued) | ||||||||
| Long-Term Municipal | Coupon | Maturity | Principal | |||||
| Investments (continued) | Rate (%) | Date | Amount ($) | Value ($) | ||||
| U.S. Related (continued) | ||||||||
| Puerto Rico Commonwealth (Insured; MBIA) | 6.25 | 7/1/11 | 1,050,000 | 1,139,155 | ||||
| Puerto Rico Commonwealth, Public Improvement | 5.00 | 7/1/14 | 2,500,000 | 2,566,050 | ||||
| Puerto Rico Commonwealth, Public Improvement | 5.25 | 7/1/22 | 1,500,000 | 1,442,880 | ||||
| Puerto Rico Commonwealth, Public Improvement (Insured; FSA) | 5.50 | 7/1/15 | 1,350,000 | 1,478,506 | ||||
| Puerto Rico Commonwealth, Public Improvement (Insured; MBIA) | 5.50 | 7/1/14 | 500,000 | 532,665 | ||||
| Puerto Rico Commonwealth, Public Improvement (Insured; MBIA) | 5.50 | 7/1/15 | 1,135,000 | 1,209,581 | ||||
| Puerto Rico Electric Power Authority, Power Revenue (Insured; MBIA) | 5.00 | 7/1/17 | 1,000,000 | 1,024,490 | ||||
| Puerto Rico Government Development Bank, Senior Notes | 5.00 | 12/1/12 | 3,205,000 | 3,319,451 | ||||
| Puerto Rico Government Development Bank, Senior Notes | 5.00 | 12/1/13 | 3,000,000 | 3,097,680 | ||||
| Puerto Rico Government Development Bank, Senior Notes | 5.25 | 1/1/15 | 2,000,000 | 2,047,120 | ||||
| Puerto Rico Highways and Transportation | ||||||||
| Authority, Highway Revenue | 5.00 | 7/1/16 | 1,000,000 | 1,024,250 | ||||
| Puerto Rico Highways and Transportation | ||||||||
| Authority, Highway Revenue (Insured; FGIC) | 5.50 | 7/1/16 | 3,265,000 | 3,464,067 | ||||
| Puerto Rico Highways and Transportation | ||||||||
| Authority, Highway Revenue (Insured; MBIA) | 6.25 | 7/1/09 | 540,000 | 564,689 | ||||
| Puerto Rico Highways and Transportation | ||||||||
| Authority, Highway Revenue (Insured; MBIA) | 6.25 | 7/1/09 | 460,000 | 480,134 | ||||
| Puerto Rico Highways and Transportation | ||||||||
| Authority, Highway Revenue (Insured; MBIA) | 6.00 | 7/1/11 | 4,000,000 | 4,224,920 | ||||
| Puerto Rico Highways and Transportation | ||||||||
| Authority, Transportation Revenue (Insured; FGIC) | 5.25 | 7/1/15 | 1,905,000 | 1,990,687 | ||||
| Puerto Rico Highways and Transportation | ||||||||
| Authority, Transportation Revenue (Insured; FGIC) | 5.25 | 7/1/16 | 1,550,000 | 1,610,714 | ||||
| Puerto Rico Highways and Transportation | ||||||||
| Authority, Transportation Revenue (Insured; FGIC) | 5.25 | 7/1/18 | 2,500,000 | 2,555,800 | ||||
| Puerto Rico Infrastructure Financing Authority, Special Tax Revenue | 5.00 | 7/1/20 | 2,260,000 | 2,188,064 | ||||
| Total Long-Term Municipal Investments (cost $338,283,233) | 335,928,989 | |||||||
| Short-Term Municipal Investments—6.3% | ||||||||
| Massachusetts; | ||||||||
| Chelsea, LR (Massachusetts Information | ||||||||
| Technology Center Project) (Insured; FSA) | 3.32 | 4/4/08 | 5,000,000 c | 5,000,000 | ||||
| Massachusetts, Consolidated Loan | ||||||||
| (Liquidity Facility; Dexia Credit Locale) | 3.22 | 3/1/08 | 650,000 c | 650,000 | ||||
| Massachusetts, GO (Central Artery/Ted Williams | ||||||||
| Tunnel Infrastructure Loan Act of 2000) | ||||||||
| (Liquidity Facility; Landesbank Baden-Wurttemberg) | 3.00 | 3/1/08 | 800,000 c | 800,000 | ||||
| Massachusetts, GO (Central Artery/Ted Williams | ||||||||
| Tunnel Infrastructure Loan Act of 2000) | ||||||||
| (Liquidity Facility; State Street Bank and Trust Co.) | 3.55 | 3/1/08 | 1,200,000 c | 1,200,000 | ||||
The Funds 51
STATEMENT OF INVESTMENTS (Unaudited) (continued)
| BNY Mellon Massachusetts Intermediate Municipal Bond Fund (continued) | ||||||||
| Short-Term Municipal | Coupon | Maturity | Principal | |||||
| Investments (continued) | Rate (%) | Date | Amount ($) | Value ($) | ||||
| Massachusetts (continued) | ||||||||
| Massachusetts Development Finance Agency, | ||||||||
| Revenue (Harvard University Issue) | 2.40 | 3/1/08 | 4,700,000 c | 4,700,000 | ||||
| Massachusetts Health and Educational Facilities | ||||||||
| Authority, Revenue (Amherst College Issue) | 3.07 | 3/1/08 | 200,000 c | 200,000 | ||||
| Massachusetts Health and Educational Facilities | ||||||||
| Authority, Revenue (Capital Asset Program | ||||||||
| Issue) (LOC; Bank of America) | 3.90 | 3/1/08 | 2,000,000 c | 2,000,000 | ||||
| Massachusetts Health and Educational Facilities Authority, | ||||||||
| Revenue (Children’s Hospital Issue) (Insured; AMBAC | ||||||||
| and Liquidity Facility; Bank of America) | 7.00 | 3/1/08 | 1,000,000 c | 1,000,000 | ||||
| Massachusetts Health and Educational Facilities Authority, | ||||||||
| Revenue (Partners HealthCare System Issue) | 6.50 | 4/4/08 | 5,000,000 c | 5,000,000 | ||||
| Massachusetts Water Resources Authority, Multi-Modal | ||||||||
| Subordinated General Revenue, Refunding | ||||||||
| (LOC; Landesbank Hessen-Thuringen Girozentrale) | 3.22 | 3/1/08 | 2,200,000 c | 2,200,000 | ||||
| Total Short-Term Municipal Investments (cost $22,750,000) | 22,750,000 | |||||||
| Total Investments (cost $361,033,233) | 98.8% | 358,678,989 | ||||||
| Cash and Receivables (Net) | 1.2% | 4,259,420 | ||||||
| Net Assets | 100.0% | 362,938,409 | ||||||
| a These securities are prerefunded; the date shown represents the prerefunded date. Bonds which are prerefunded are collateralized by U.S. Government securities which are held in |
| escrow and are used to pay principal and interest on the municipal issue and to retire the bonds in full at the earliest refunding date. |
| b Variable rate security—interest rate subject to periodic change. |
| c Securities payable on demand.Variable interest rate—subject to periodic change. |
52
| Summary of Abbreviations | ||||||
| ACA | American Capital Access | AGC | ACE Guaranty Corporation | |||
| AGIC | Asset Guaranty Insurance Company | AMBAC | American Municipal Bond Assurance Corporation | |||
| ARRN | Adjustable Rate Receipt Notes | BAN | Bond Anticipation Notes | |||
| BIGI | Bond Investors Guaranty Insurance | BPA | Bond Purchase Agreement | |||
| CGIC | Capital Guaranty Insurance Company | CIC | Continental Insurance Company | |||
| CIFG | CDC Ixis Financial Guaranty | CMAC | Capital Market Assurance Corporation | |||
| COP | Certificate of Participation | CP | Commercial Paper | |||
| EDR | Economic Development Revenue | EIR | Environmental Improvement Revenue | |||
| FGIC | Financial Guaranty Insurance Company | FHA | Federal Housing Administration | |||
| FHLB | Federal Home Loan Bank | FHLMC | Federal Home Loan Mortgage Corporation | |||
| FNMA | Federal National Mortgage Association | FSA | Financial Security Assurance | |||
| GAN | Grant Anticipation Notes | GIC | Guaranteed Investment Contract | |||
| GNMA | Government National Mortgage Association | GO | General Obligation | |||
| HR | Hospital Revenue | IDB | Industrial Development Board | |||
| IDC | Industrial Development Corporation | IDR | Industrial Development Revenue | |||
| LOC | Letter of Credit | LOR | Limited Obligation Revenue | |||
| LR | Lease Revenue | MBIA | Municipal Bond Investors | |||
| Assurance Insurance Corporation | ||||||
| MFHR | Multi-Family Housing Revenue | MFMR | Multi-Family Mortgage Revenue | |||
| PCR | Pollution Control Revenue | PILOT | Payment in Lieu of Taxes | |||
| RAC | Revenue Anticipation Certificates | RAN | Revenue Anticipation Notes | |||
| RAW | Revenue Anticipation Warrants | RRR | Resources Recovery Revenue | |||
| SAAN | State Aid Anticipation Notes | SBPA | Standby Bond Purchase Agreement | |||
| SFHR | Single Family Housing Revenue | SFMR | Single Family Mortgage Revenue | |||
| SONYMA | State of New York Mortgage Agency | SWDR | Solid Waste Disposal Revenue | |||
| TAN | Tax Anticipation Notes | TAW | Tax Anticipation Warrants | |||
| TRAN | Tax and Revenue Anticipation Notes | XLCA | XL Capital Assurance | |||
| Summary of Combined Ratings (Unaudited) | ||||||||||
| Fitch | or | Moody’s | or | Standard & Poor’s | Value (%)† | |||||
| AAA | Aaa | AAA | 55.7 | |||||||
| AA | Aa | AA | 24.7 | |||||||
| A | A | A | 7.3 | |||||||
| BBB | Baa | BBB | 8.6 | |||||||
| BB | Ba | BB | .1 | |||||||
| F1 | MIG1/P1 | SP1/A1 | 3.6 | |||||||
| 100.0 | ||||||||||
| † Based on total investments. See notes to financial statements. |
The Funds 53
| STATEMENT OF FINANCIAL FUTURES |
| February 29, 2008 (Unaudited) |
| Unrealized | ||||||||
| Market Value | Appreciation | |||||||
| BNY Mellon Massachusetts | Covered by | (Depreciation) | ||||||
| Intermediate Municipal Bond Fund | Contracts | Contracts ($) | Expiration | at 2/29/2008 ($) | ||||
| Financial Futures Short | ||||||||
| 30 Year MMD Index | 4,000,000 | (3,733,680) | May 2008 | 266,320 | ||||
| 30 Year MMD Index | 4,000,000 | (3,733,858) | May 2008 | 266,142 | ||||
| U.S. Treasury 30 Year Bond | 100 | (11,968,750) | March 2008 | (259,375) | ||||
| 273,087 |
See notes to financial statements.
54
| STATEMENT OF ASSETS AND LIABILITIES |
| February 29, 2008 (Unaudited) |
| BNY Mellon | BNY Mellon | BNY Mellon | BNY Mellon | |||||
| National | National | Pennsylvania | Massachusetts | |||||
| Intermediate | Short-Term | Intermediate | Intermediate | |||||
| Municipal Bond Fund | Municipal Bond Fund | Municipal Bond Fund | Municipal Bond Fund | |||||
| Assets ($): | ||||||||
| Investments in securities— | ||||||||
| See Statement of Investments+ | 998,073,456 | 163,554,284 | 580,804,794 | 358,678,989 | ||||
| Cash on Initial Margin—Note 5 | 467,500 | — | 212,500 | 170,000 | ||||
| Interest receivable | 10,812,151 | 1,803,595 | 7,254,747 | 3,722,339 | ||||
| Receivable for investment securites sold | — | 85,000 | 50,667 | — | ||||
| Receivable for futures variation margin—Note 5 | 789,748 | — | 552,599 | 335,586 | ||||
| Receivable for shares of Beneficial Interest subscribed | 376,177 | — | — | 789,000 | ||||
| Prepaid expenses and other receivables | 21,720 | 10,087 | 14,573 | 14,961 | ||||
| 1,010,540,752 | 165,452,966 | 588,889,880 | 363,710,875 | |||||
| Liabilities ($): | ||||||||
| Due to The Dreyfus Corporation and affiliates—Note 4(c) | 326,066 | 54,984 | 256,695 | 118,261 | ||||
| Due to Administrator—Note 4(a) | 104,392 | 16,776 | 61,800 | 37,742 | ||||
| Cash overdraft due to Custodian | 438,345 | 165,965 | 1,022,621 | 557,170 | ||||
| Payable for investment securities purchased | 17,231,223 | 2,062,660 | — | — | ||||
| Payable for shares of Beneficial Interest redeemed | 148,814 | 53,189 | 301,692 | 18,468 | ||||
| Accrued expenses and other liabilities | 56,102 | 20,930 | 36,817 | 40,825 | ||||
| 18,304,942 | 2,374,504 | 1,679,625 | 772,466 | |||||
| Net Assets ($) | 992,235,810 | 163,078,462 | 587,210,255 | 362,938,409 | ||||
| Composition of Net Assets ($): | ||||||||
| Paid—in capital | 1,001,681,564 | 163,704,039 | 586,169,737 | 365,097,245 | ||||
| Accumulated undistributed investment income—net | 43,816 | — | 18,145 | 826 | ||||
| Accumulated net realized gain (loss) on investments | 3,055,546 | (1,026,172) | 840,767 | (78,505) | ||||
| Accumulated net unrealized appreciation (depreciation) | ||||||||
| on investments (including $617,873, $474,474 and | ||||||||
| $273,087 net unrealized appreciation on financial futures | ||||||||
| for BNY Mellon National Intermediate Municipal Bond | ||||||||
| Fund, BNY Mellon Pennsylvania Intermediate Municipal | ||||||||
| Bond Fund and BNY Mellon Massachusetts Intermediate | ||||||||
| Municipal Bond Fund, respectively) | (12,545,116) | 400,595 | 181,606 | (2,081,157) | ||||
| Net Assets ($) | 992,235,810 | 163,078,462 | 587,210,255 | 362,938,409 | ||||
| Net Asset Value Per Share | ||||||||
| Class M Shares | ||||||||
| Net Assets ($) | 969,865,084 | 162,512,338 | 585,836,427 | 353,990,658 | ||||
| Shares Outstanding | 77,187,095 | 12,844,547 | 48,003,997 | 28,805,368 | ||||
| Net Asset Value Per Share ($) | 12.57 | 12.65 | 12.20 | 12.29 | ||||
| Investor Shares | ||||||||
| Net Assets ($) | 22,192,261 | 566,124 | 1,373,828 | 8,930,644 | ||||
| Shares Outstanding | 1,768,225 | 44,797 | 112,727 | 726,799 | ||||
| Net Asset Value Per Share ($) | 12.55 | 12.64 | 12.19 | 12.29 | ||||
| Dreyfus Premier Shares | ||||||||
| Net Assets ($) | 178,465 | — | — | 17,107 | ||||
| Shares Outstanding | 14,211 | — | — | 1,389 | ||||
| Net Asset Value Per Share ($) | 12.56 | — | — | 12.32 | ||||
| † Investments at cost ($) | 1,011,236,445 | 163,153,689 | 581,097,662 | 361,033,233 | ||||
See notes to financial statements.
The Funds 55
| STATEMENT OF OPERATIONS |
| Six Months Ended February 29, 2008 (Unaudited) |
| BNY Mellon | BNY Mellon | BNY Mellon | BNY Mellon | |||||
| National | National | Pennsylvania | Massachusetts | |||||
| Intermediate | Short-Term | Intermediate | Intermediate | |||||
| Municipal Bond Fund | Municipal Bond Fund | Municipal Bond Fund | Municipal Bond Fund | |||||
| Investment Income ($): | ||||||||
| Interest Income | 22,611,183 | 3,031,191 | 13,777,052 | 7,690,802 | ||||
| Expenses: | ||||||||
| Investment advisory fee—Note 4(a) | 1,753,077 | 278,561 | 1,526,441 | 637,418 | ||||
| Administration fee—Note 4(a) | 637,684 | 101,327 | 388,645 | 231,860 | ||||
| Custodian fees—Note 4(c) | 39,862 | 6,155 | 22,159 | 13,897 | ||||
| Shareholder servicing costs—Note 4(c) | 33,776 | 1,043 | 2,423 | 13,489 | ||||
| Registration fees | 19,650 | 12,122 | 12,472 | 17,818 | ||||
| Trustees’ fees and expenses—Note 4(d) | 15,889 | 2,655 | 9,442 | 5,921 | ||||
| Auditing fees | 14,234 | 13,320 | 5,657 | 15,187 | ||||
| Prospectus and shareholders’ reports | 2,141 | 2,421 | 1,805 | 2,908 | ||||
| Legal fees | 152 | 720 | 2,172 | 1,506 | ||||
| Distribution fees—Note 4(b) | 657 | — | — | 43 | ||||
| Miscellaneous | 41,384 | 14,476 | 29,016 | 28,730 | ||||
| Total Expenses | 2,558,506 | 432,800 | 2,000,232 | 968,777 | ||||
| Less—reduction in investment advisory fee | ||||||||
| due to undertaking—Note 4(a) | — | — | — | (8,306) | ||||
| Less—reduction in fees | ||||||||
| due to earnings credits—Note 2(b) | (1,629) | (37) | (1,681) | (1,743) | ||||
| Net Expenses | 2,556,877 | 432,763 | 1,998,551 | 958,728 | ||||
| Investment Income—Net | 20,054,306 | 2,598,428 | 11,778,501 | 6,732,074 | ||||
| Realized and Unrealized Gain (Loss) | ||||||||
| on Investments—Note 5 ($): | ||||||||
| Net realized gain (loss) on investments | 3,892,641 | 27,501 | 987,677 | 555,537 | ||||
| Net realized gain (loss) on financial futures | 409,893 | — | 186,315 | 149,052 | ||||
| Net Realized Gain (Loss) | 4,302,534 | 27,501 | 1,173,992 | 704,589 | ||||
| Net unrealized appreciation (depreciation) on investments | ||||||||
| (including $617,873, $474,474 and $273,087 | ||||||||
| appreciation on financial futures for BNY Mellon | ||||||||
| National Intermediate Municipal Bond Fund, BNY Mellon | ||||||||
| Pennsylvania Intermediate Municipal Bond Fund and | ||||||||
| BNY Mellon Massachusetts Intermediate Municipal | ||||||||
| Bond Fund, respectively) | (24,602,888) | 700,728 | (10,701,558) | (4,586,369) | ||||
| Net Realized and Unrealized | ||||||||
| Gain (Loss) on Investments | (20,300,354) | 728,229 | (9,527,566) | (3,881,780) | ||||
| Net Increase (Decrease) in Net Assets | ||||||||
| Resulting from Operations | (246,048) | 3,326,657 | 2,250,935 | 2,850,294 | ||||
See notes to financial statements.
56
STATEMENT OF CHANGES IN NET ASSETS
| BNY Mellon National Intermediate | BNY Mellon National Short-Term | |||||||
| Municipal Bond Fund | Municipal Bond Fund | |||||||
| Six Months Ended | Six Months Ended | |||||||
| February 29, 2008 | Year Ended | February 29, 2008 | Year Ended | |||||
| (Unaudited) | August 31, 2007 | (Unaudited) | August 31, 2007 | |||||
| Operations ($): | ||||||||
| Investment income—net | 20,054,306 | 35,012,568 | 2,598,428 | 4,738,360 | ||||
| Net realized gain (loss) on investments | 4,302,534 | (1,505,123) | 27,501 | (167,807) | ||||
| Net unrealized appreciation (depreciation) on investments | (24,602,888) | (13,239,501) | 700,728 | 179,724 | ||||
| Net Increase (Decrease) in Net Assets | ||||||||
| Resulting from Operations | (246,048) | 20,267,944 | 3,326,657 | 4,750,277 | ||||
| Dividends to Shareholders from ($): | ||||||||
| Investment income—net: | ||||||||
| Class M Shares | (19,558,643) | (34,000,332) | (2,588,935) | (4,720,147) | ||||
| Investor Shares | (447,575) | (896,185) | (9,493) | (11,132) | ||||
| Dreyfus Premier Shares | (4,272) | (36,057) | — | — | ||||
| Net realized gain on investments: | ||||||||
| Class M Shares | — | — | — | (33,181) | ||||
| Investor Shares | — | — | — | (80) | ||||
| Dreyfus Premier Shares | — | — | — | — | ||||
| Total Dividends | (20,010,490) | (34,932,574) | (2,598,428) | (4,764,540) | ||||
| Beneficial Interest Transactions ($): | ||||||||
| Net proceeds from shares sold: | ||||||||
| Class M Shares | 117,882,563 | 273,486,950 | 42,211,310 | 41,447,785 | ||||
| Investor Shares | 1,847,129 | 4,696,649 | 611,146 | 870,799 | ||||
| Dreyfus Premier Shares | 140 | 10 | — | — | ||||
| Dividends reinvested: | ||||||||
| Class M Shares | 2,630,164 | 4,139,829 | 391,819 | 495,028 | ||||
| Investor Shares | 329,949 | 633,977 | 6,879 | 9,505 | ||||
| Dreyfus Premier Shares | 1,417 | 19,116 | — | — | ||||
| Cost of shares redeemed: | ||||||||
| Class M Shares | (75,712,421) | (126,058,742) | (26,209,737) | (57,084,093) | ||||
| Investor Shares | (4,836,370) | (6,786,661) | (691,030) | (522,240) | ||||
| Dreyfus Premier Shares | (148,092) | (2,160,797) | — | — | ||||
| Increase (Decrease) in Net Assets from | ||||||||
| Beneficial Interest Transactions | 41,994,479 | 147,970,331 | 16,320,387 | (14,783,216) | ||||
| Total Increase (Decrease) in Net Assets | 21,737,941 | 133,305,701 | 17,048,616 | (14,797,479) | ||||
| Net Assets ($): | ||||||||
| Beginning of Period | 970,497,869 | 837,192,168 | 146,029,846 | 160,827,325 | ||||
| End of Period | 992,235,810 | 970,497,869 | 163,078,462 | 146,029,846 | ||||
The Funds 57
STATEMENT OF CHANGES IN NET ASSETS (continued)
| BNY Mellon National Intermediate | BNY Mellon National Short-Term | |||||||
| Municipal Bond Fund | Municipal Bond Fund | |||||||
| Six Months Ended | Six Months Ended | |||||||
| February 29, 2008 | Year Ended | February 29, 2008 | Year Ended | |||||
| (Unaudited) | August 31, 2007 | (Unaudited) | August 31, 2007 | |||||
| Capital Share Transactions: | ||||||||
| Class M Shares | ||||||||
| Shares sold | 9,087,969 | 21,096,258 | 3,333,697 | 3,291,249 | ||||
| Shares issued for dividends reinvested | 203,682 | 319,364 | 30,919 | 39,309 | ||||
| Shares redeemed | (5,844,374) | (9,731,631) | (2,065,538) | (4,533,591) | ||||
| Net Increase (Decrease) in Shares Outstanding | 3,447,277 | 11,683,991 | 1,299,078 | (1,203,033) | ||||
| Investor Shares a | ||||||||
| Shares sold | 142,371 | 364,741 | 48,366 | 69,222 | ||||
| Shares issued for dividends reinvested | 25,574 | 48,914 | 543 | 755 | ||||
| Shares redeemed | (373,451) | (523,350) | (54,589) | (41,489) | ||||
| Net Increase (Decrease) in Shares Outstanding | (205,506) | (109,695) | (5,680) | 28,488 | ||||
| Dreyfus Premier Shares a | ||||||||
| Shares sold | 11 | 1 | — | — | ||||
| Shares issued for dividends reinvested | 110 | 1,468 | — | — | ||||
| Shares redeemed | (11,413) | (166,217) | — | — | ||||
| Net Increase (Decrease) in Shares Outstanding | (11,292) | (164,748) | — | — | ||||
| a During the period ended February 29, 2008, 8,430 Dreyfus Premier shares of BNY Mellon National Intermediate Municipal Bond Fund representing $109,477 were |
| automatically converted to 8,430 Investor shares and during the year ended August 31, 2007 110,837 Dreyfus Premier shares of BNY Mellon National Intermediate Municipal |
| Bond Fund representing $1,442,058 were automatically converted to 110,895 Investor shares. |
See notes to financial statements.
58
| BNY Mellon Pennsylvania | ||||
| Intermediate Municipal Bond Fund | ||||
| Six Months Ended | ||||
| February 29, 2008 | Year Ended | |||
| (Unaudited) | August 31, 2007 | |||
| Operations ($): | ||||
| Investment income—net | 11,778,501 | 23,950,605 | ||
| Net realized gain (loss) on investments | 1,173,992 | 8,560 | ||
| Net unrealized appreciation (depreciation) on investments | (10,701,558) | (10,129,094) | ||
| Net Increase (Decrease) in Net Assets | ||||
| Resulting from Operations | 2,250,935 | 13,830,071 | ||
| Dividends to Shareholders from ($): | ||||
| Investment income—net: | ||||
| Class M Shares | (11,731,456) | (23,807,347) | ||
| Investor Shares | (28,900) | (107,626) | ||
| Net realized gain on investments: | ||||
| Class M Shares | (1,001,485) | (1,342,041) | ||
| Investor Shares | (2,591) | (10,403) | ||
| Total Dividends | (12,764,432) | (25,267,417) | ||
| Beneficial Interest Transactions ($): | ||||
| Net proceeds from shares sold: | ||||
| Class M Shares | 24,717,598 | 74,399,765 | ||
| Investor Shares | 865,998 | 4,155,623 | ||
| Dividends reinvested: | ||||
| Class M Shares | 951,993 | 1,424,071 | ||
| Investor Shares | 23,444 | 59,929 | ||
| Cost of shares redeemed: | ||||
| Class M Shares | (39,959,368) | (100,411,233) | ||
| Investor Shares | (788,542) | (6,473,353) | ||
| Increase (Decrease) in Net Assets from | ||||
| Beneficial Interest Transactions | (14,188,877) | (26,845,198) | ||
| Total Increase (Decrease) in Net Assets | (24,702,374) | (38,282,544) | ||
| Net Assets ($): | ||||
| Beginning of Period | 611,912,629 | 650,195,173 | ||
| End of Period | 587,210,255 | 611,912,629 | ||
| Capital Share Transactions (shares): | ||||
| Class M Shares | ||||
| Shares sold | 1,966,867 | 5,925,170 | ||
| Shares issued for dividends reinvested | 76,065 | 112,629 | ||
| Shares redeemed | (3,178,931) | (7,973,075) | ||
| Net Increase (Decrease) in Shares Outstanding | (1,135,999) | (1,935,276) | ||
| Investor Shares | ||||
| Shares sold | 69,375 | 328,071 | ||
| Shares issued for dividends reinvested | 1,877 | 4,755 | ||
| Shares redeemed | (62,874) | (511,838) | ||
| Net Increase (Decrease) in Shares Outstanding | 8,378 | (179,012) | ||
The Funds 59
STATEMENT OF CHANGES IN NET ASSETS (continued)
| BNY Mellon Massachusetts | ||||
| Intermediate Municipal Bond Fund | ||||
| Six Months Ended | ||||
| February 29, 2008 | Year Ended | |||
| (Unaudited) | August 31, 2007 | |||
| Operations ($): | ||||
| Investment income—net | 6,732,074 | 12,342,093 | ||
| Net realized gain (loss) on investments | 704,589 | (914,678) | ||
| Net unrealized appreciation (depreciation) on investments | (4,586,369) | (3,725,019) | ||
| Net Increase (Decrease) in Net Assets | ||||
| Resulting from Operations | 2,850,294 | 7,702,396 | ||
| Dividends to Shareholders from ($): | ||||
| Investment income—net: | ||||
| Class M Shares | (6,573,466) | (12,004,690) | ||
| Investor Shares | (157,524) | (333,605) | ||
| Dreyfus Premier Shares | (258) | (2,219) | ||
| Net realized gain on investments: | ||||
| Class M Shares | — | — | ||
| Investor Shares | — | — | ||
| Dreyfus Premier Shares | — | — | ||
| Total Dividends | (6,731,248) | (12,340,514) | ||
| Beneficial Interest Transactions ($): | ||||
| Net proceeds from shares sold: | ||||
| Class M Shares | 46,827,290 | 102,031,565 | ||
| Investor Shares | 1,176,372 | 164,103 | ||
| Dreyfus Premier Shares | — | — | ||
| Dividends reinvested: | ||||
| Class M Shares | 1,498,301 | 2,591,243 | ||
| Investor Shares | 80,568 | 174,802 | ||
| Dreyfus Premier Shares | 257 | 1,830 | ||
| Cost of shares redeemed: | ||||
| Class M Shares | (33,137,341) | (56,791,685) | ||
| Investor Shares | (1,250,384) | (1,042,303) | ||
| Dreyfus Premier Shares | — | (149,632) | ||
| Increase (Decrease) in Net Assets from | ||||
| Beneficial Interest Transactions | 15,195,063 | 46,979,923 | ||
| Total Increase (Decrease) in Net Assets | 11,314,109 | 42,341,805 | ||
| Net Assets ($): | ||||
| Beginning of Period | 351,624,300 | 309,282,495 | ||
| End of Period | 362,938,409 | 351,624,300 | ||
60
| BNY Mellon Massachusetts | ||||
| Intermediate Municipal Bond Fund | ||||
| Six Months Ended | ||||
| February 29, 2008 | Year Ended | |||
| (Unaudited) | August 31, 2007 | |||
| Capital Share Transactions: | ||||
| Class M Shares | ||||
| Shares sold | 3,719,132 | 8,130,189 | ||
| Shares issued for dividends reinvested | 119,237 | 206,519 | ||
| Shares redeemed | (2,622,548) | (4,526,581) | ||
| Net Increase (Decrease) in Shares Outstanding | 1,215,821 | 3,810,127 | ||
| Investor Shares a | ||||
| Shares sold | 92,948 | 13,027 | ||
| Shares issued for dividends reinvested | 6,414 | 13,920 | ||
| Shares redeemed | (99,372) | (83,241) | ||
| Net Increase (Decrease) in Shares Outstanding | (10) | (56,294) | ||
| Dreyfus Premier Shares a | ||||
| Shares sold | — | — | ||
| Shares issued for dividends reinvested | 21 | 145 | ||
| Shares redeemed | — | (11,860) | ||
| Net Increase (Decrease) in Shares Outstanding | 21 | (11,715) | ||
| a During the period ended August 31, 2007, 9,671 Dreyfus Premier shares of BNY Mellon Massachusetts Intermediate Municipal Bond Fund representing $122,161 were automatically converted to 9,692 Investor shares. See notes to financial statements. |
The Funds 61
FINANCIAL HIGHLIGHTS
The following tables describe the performance for each share class of each fund for the fiscal periods indicated. All information (except portfolio turnover rate) reflects financial results for a single fund share.Total return shows how much your investment in each fund would have increased (or decreased) during each period, assuming you had reinvested all dividends and distributions. These figures have been derived from each fund’s financial statements.
| Class M Shares | ||||||||||||
| Six Months Ended | ||||||||||||
| BNY Mellon National | February 29, 2008 | Year Ended August 31, | ||||||||||
| Intermediate Municipal Bond Fund | (Unaudited) | 2007 | 2006 | 2005 | 2004 | 2003 a | ||||||
| Per Share Data ($): | ||||||||||||
| Net asset value, beginning of period | 12.81 | 13.01 | 13.25 | 13.34 | 13.09 | 13.25 | ||||||
| Investment Operations: | ||||||||||||
| Investment income—net b | .26 | .50 | .50 | .50 | .51 | .50 | ||||||
| Net realized and unrealized | ||||||||||||
| gain (loss) on investments | (.24) | (.20) | (.16) | (.03) | .29 | (.14) | ||||||
| Total from Investment Operations | .02 | .30 | .34 | .47 | .80 | .36 | ||||||
| Distributions: | ||||||||||||
| Dividends from investment income—net | (.26) | (.50) | (.50) | (.50) | (.51) | (.50) | ||||||
| Dividends from net realized gain on investments | — | — | (.08) | (.06) | (.04) | (.02) | ||||||
| Total Distributions | (.26) | (.50) | (.58) | (.56) | (.55) | (.52) | ||||||
| Net asset value, end of period | 12.57 | 12.81 | 13.01 | 13.25 | 13.34 | 13.09 | ||||||
| Total Return (%) | .11c | 2.36 | 2.64 | 3.62 | 6.22 | 2.77 | ||||||
| Ratios/Supplemental Data (%): | ||||||||||||
| Ratio of total expenses to average net assets | .50d | .51 | .51 | .52 | .52 | .53 | ||||||
| Ratio of net expenses to average net assets | .50d,e | .51e | .51 | .52 | .52e | .52 | ||||||
| Ratio of net investment income | ||||||||||||
| to average net assets | 4.01d | 3.90 | 3.87 | 3.80 | 3.84 | 3.77 | ||||||
| Portfolio Turnover Rate | 29.39c | 27.18 | 28.19 | 42.72 | 53.26 | 50.68 | ||||||
| Net Assets, end of period ($ x 1,000) | 969,865 | 944,909 | 807,634 | 732,711 | 646,793 | 625,558 | ||||||
| a Effective December 16, 2002, MPAM shares were redesignated as Class M shares. b Based on average shares outstanding at each month end. c Not annualized. d Annualized. e The difference for the period represents less than .01%. See notes to financial statements. |
62
| Investor Shares | ||||||||||||
| Six Months Ended | ||||||||||||
| BNY Mellon National | February 29, 2008 | Year Ended August 31, | ||||||||||
| Intermediate Municipal Bond Fund | (Unaudited) | 2007 | 2006 | 2005 | 2004 | 2003 | ||||||
| Per Share Data ($): | ||||||||||||
| Net asset value, beginning of period | 12.80 | 13.00 | 13.23 | 13.33 | 13.08 | 13.24 | ||||||
| Investment Operations: | ||||||||||||
| Investment income—net a | .24 | .47 | .47 | .47 | .48 | .50 | ||||||
| Net realized and unrealized | ||||||||||||
| gain (loss) on investments | (.25) | (.20) | (.15) | (.04) | .29 | (.18) | ||||||
| Total from Investment Operations | (.01) | .27 | .32 | .43 | .77 | .32 | ||||||
| Distributions: | ||||||||||||
| Dividends from investment income—net | (.24) | (.47) | (.47) | (.47) | (.48) | (.46) | ||||||
| Dividends from net realized gain on investments | — | — | (.08) | (.06) | (.04) | (.02) | ||||||
| Total Distributions | (.24) | (.47) | (.55) | (.53) | (.52) | (.48) | ||||||
| Net asset value, end of period | 12.55 | 12.80 | 13.00 | 13.23 | 13.33 | 13.08 | ||||||
| Total Return (%) | (.10)b | 2.11 | 2.47 | 3.28 | 6.04 | 2.36 | ||||||
| Ratios/Supplemental Data (%): | ||||||||||||
| Ratio of total expenses to average net assets | .75c | .76 | .76 | .77 | .77 | .79 | ||||||
| Ratio of net expenses to average net assets | .75c,d | .76d | .76 | .77 | .77d | .77 | ||||||
| Ratio of net investment income | ||||||||||||
| to average net assets | 3.76c | 3.65 | 3.62 | 3.56 | 3.60 | 3.52 | ||||||
| Portfolio Turnover Rate | 29.39b | 27.18 | 28.19 | 42.72 | 53.26 | 50.68 | ||||||
| Net Assets, end of period ($ x 1,000) | 22,192 | 25,262 | 27,084 | 27,409 | 30,164 | 34,673 | ||||||
| a Based on average shares outstanding at each month end. b Not annualized. c Annualized. d The difference for the period represents less than .01%. See notes to financial statements. |
The Funds 63
FINANCIAL HIGHLIGHTS (continued)
| Dreyfus Premier Shares | ||||||||||||
| Six Months Ended | ||||||||||||
| BNY Mellon National | February 29, 2008 | Year Ended August 31, | ||||||||||
| Intermediate Municipal Bond Fund | (Unaudited) | 2007 | 2006 | 2005 | 2004 | 2003 a | ||||||
| Per Share Data ($): | ||||||||||||
| Net asset value, beginning of period | 12.81 | 13.00 | 13.24 | 13.33 | 13.08 | 13.37 | ||||||
| Investment Operations: | ||||||||||||
| Investment income—net b | .21 | .39 | .40 | .40 | .41 | .36 | ||||||
| Net realized and unrealized | ||||||||||||
| gain (loss) on investments | (.25) | (.17) | (.16) | (.03) | .29 | (.28) | ||||||
| Total from Investment Operations | (.04) | .22 | .24 | .37 | .70 | .08 | ||||||
| Distributions: | ||||||||||||
| Dividends from investment income—net | (.21) | (.41) | (.40) | (.40) | (.41) | (.35) | ||||||
| Dividends from net realized gain on investments | — | — | (.08) | (.06) | (.04) | (.02) | ||||||
| Total Distributions | (.21) | (.41) | (.48) | (.46) | (.45) | (.37) | ||||||
| Net asset value, end of period | 12.56 | 12.81 | 13.00 | 13.24 | 13.33 | 13.08 | ||||||
| Total Return (%) | (.35)c | 1.68 | 1.88 | 2.85 | 5.43 | .58c | ||||||
| Ratios/Supplemental Data (%): | ||||||||||||
| Ratio of total expenses to average net assets | 1.25d | 1.26 | 1.26 | 1.27 | 1.27 | 1.29d | ||||||
| Ratio of net expenses to average net assets | 1.25d,e | 1.26e | 1.26 | 1.27 | 1.27e | 1.27d | ||||||
| Ratio of net investment income | ||||||||||||
| to average net assets | 3.26d | 3.13 | 3.12 | 3.06 | 3.09 | 3.03d | ||||||
| Portfolio Turnover Rate | 29.39c | 27.18 | 28.19 | 42.72 | 53.26 | 50.68c | ||||||
| Net Assets, end of period ($ x 1,000) | 178 | 327 | 2,474 | 4,656 | 5,945 | 7,856 | ||||||
| a From close of business on October 11, 2002 (date the fund began offering Dreyfus Premier shares) to August 31, 2003. b Based on average shares outstanding at each month end. c Not annualized. d Annualized. e The difference for the period represents less than .01%. See notes to financial statements. |
64
| Class M Shares | ||||||||||||
| Six Months Ended | ||||||||||||
| BNY Mellon National Short-Term | February 29, 2008 | Year Ended August 31, | ||||||||||
| Municipal Bond Fund | (Unaudited) | 2007 | 2006 | 2005 | 2004 | 2003 a | ||||||
| Per Share Data ($): | ||||||||||||
| Net asset value, beginning of period | 12.59 | 12.59 | 12.63 | 12.81 | 12.86 | 12.91 | ||||||
| Investment Operations: | ||||||||||||
| Investment income—net b | .21 | .40 | .33 | .29 | .29 | .34 | ||||||
| Net realized and unrealized | ||||||||||||
| gain (loss) on investments | .06 | — | (.04) | (.18) | (.05) | (.03) | ||||||
| Total from Investment Operations | .27 | .40 | .29 | .11 | .24 | .31 | ||||||
| Distributions: | ||||||||||||
| Dividends from investment income—net | (.21) | (.40) | (.33) | (.29) | (.29) | (.35) | ||||||
| Dividends from net realized gain on investments | — | — | — | — | — | (.01) | ||||||
| Total Distributions | (.21) | (.40) | (.33) | (.29) | (.29) | (.36) | ||||||
| Net asset value, end of period | 12.65 | 12.59 | 12.59 | 12.63 | 12.81 | 12.86 | ||||||
| Total Return (%) | 2.12c | 3.21 | 2.36 | .91 | 2.00 | 2.35 | ||||||
| Ratios/Supplemental Data (%): | ||||||||||||
| Ratio of total expenses to average net assets | .54d | .55 | .53 | .54 | .53 | .55 | ||||||
| Ratio of net expenses to average net assets | .54d | .54 | .53 | .53 | .53 | .52 | ||||||
| Ratio of net investment income | ||||||||||||
| to average net assets | 3.27d | 3.14 | 2.65 | 2.31 | 2.28 | 2.66 | ||||||
| Portfolio Turnover Rate | 15.60c | 33.74 | 49.94 | 40.92 | 28.12 | 22.15 | ||||||
| Net Assets, end of period ($ x 1,000) | 162,512 | 145,395 | 160,551 | 207,063 | 221,600 | 210,574 | ||||||
| a | Effective December 16, 2002, MPAM shares were redesignated as Class M shares. | |
| b | Based on average shares outstanding at each month end. | |
| c | Not annualized. | |
| d | Annualized. |
See notes to financial statements.
The Funds 65
FINANCIAL HIGHLIGHTS (continued)
| Investor Shares | ||||||||||||
| Six Months Ended | ||||||||||||
| BNY Mellon National Short-Term | February 29, 2008 | Year Ended August 31, | ||||||||||
| Municipal Bond Fund | (Unaudited) | 2007 | 2006 | 2005 | 2004 | 2003 | ||||||
| Per Share Data ($): | ||||||||||||
| Net asset value, beginning of period | 12.58 | 12.58 | 12.62 | 12.79 | 12.84 | 12.91 | ||||||
| Investment Operations: | ||||||||||||
| Investment income—net a | .19 | .37 | .31 | .27 | .29 | .29 | ||||||
| Net realized and unrealized | ||||||||||||
| gain (loss) on investments | .06 | (.01) | (.05) | (.18) | (.07) | (.04) | ||||||
| Total from Investment Operations | .25 | .36 | .26 | .09 | .22 | .25 | ||||||
| Distributions: | ||||||||||||
| Dividends from investment income—net | (.19) | (.36) | (.30) | (.26) | (.27) | (.31) | ||||||
| Dividends from net realized gain on investments | — | — | — | — | — | (.01) | ||||||
| Total Distributions | (.19) | (.36) | (.30) | (.26) | (.27) | (.32) | ||||||
| Net asset value, end of period | 12.64 | 12.58 | 12.58 | 12.62 | 12.79 | 12.84 | ||||||
| Total Return (%) | 2.00b | 2.95 | 2.10 | .73 | 1.72 | 2.01 | ||||||
| Ratios/Supplemental Data (%): | ||||||||||||
| Ratio of total expenses to average net assets | .80c | .80 | .79 | .79 | .79 | .81 | ||||||
| Ratio of net expenses to average net assets | .80c | .80 | .79 | .78 | .79 | .76 | ||||||
| Ratio of net investment income | ||||||||||||
| to average net assets | 3.05c | 2.94 | 2.47 | 2.06 | 2.08 | 2.44 | ||||||
| Portfolio Turnover Rate | 15.60b | 33.74 | 49.94 | 40.92 | 28.12 | 22.15 | ||||||
| Net Assets, end of period ($ x 1,000) | 566 | 635 | 277 | 150 | 94 | 33 | ||||||
| a Based on average shares outstanding at each month end. b Not annualized. c Annualized. See notes to financial statements. |
66
| Class M Shares | ||||||||||||
| Six Months Ended | ||||||||||||
| BNY Mellon Pennsylvania | February 29, 2008 | Year Ended August 31, | ||||||||||
| Intermediate Municipal Bond Fund | (Unaudited) | 2007 | 2006 | 2005 | 2004 | 2003 a | ||||||
| Per Share Data ($): | ||||||||||||
| Net asset value, beginning of period | 12.43 | 12.66 | 12.92 | 13.13 | 12.95 | 13.15 | ||||||
| Investment Operations: | ||||||||||||
| Investment income—net b | .24 | .48 | .48 | .49 | .50 | .51 | ||||||
| Net realized and unrealized | ||||||||||||
| gain (loss) on investments | (.21) | (.20) | (.18) | (.13) | .21 | (.20) | ||||||
| Total from Investment Operations | .03 | .28 | .30 | .36 | .71 | .31 | ||||||
| Distributions: | ||||||||||||
| Dividends from investment income—net | (.24) | (.48) | (.48) | (.49) | (.50) | (.51) | ||||||
| Dividends from net realized gain on investments | (.02) | (.03) | (.08) | (.08) | (.03) | — | ||||||
| Total Distributions | (.26) | (.51) | (.56) | (.57) | (.53) | (.51) | ||||||
| Net asset value, end of period | 12.20 | 12.43 | 12.66 | 12.92 | 13.13 | 12.95 | ||||||
| Total Return (%) | .22c | 2.23 | 2.41 | 2.84 | 5.60 | 2.35 | ||||||
| Ratios/Supplemental Data (%): | ||||||||||||
| Ratio of total expenses to average net assets | .65d | .66 | .66 | .66 | .66 | .67 | ||||||
| Ratio of net expenses to average net assets | .65d,e | .66 | .66 | .66 | .66 | .67 | ||||||
| Ratio of net investment income | ||||||||||||
| to average net assets | 3.86d | 3.83 | 3.81 | 3.78 | 3.82 | 3.88 | ||||||
| Portfolio Turnover Rate | 4.84c | 20.18 | 13.80 | 23.88 | 18.87 | 17.58 | ||||||
| Net Assets, end of period ($ x 1,000) | 585,836 | 610,618 | 646,610 | 656,901 | 681,295 | 740,587 | ||||||
| a Effective December 16, 2002, MPAM shares were redesignated as Class M shares. b Based on average shares outstanding at each month end. c Not annualized. d Annualized. e The difference for the period represents less than .01%. See notes to financial statements. |
The Funds 67
FINANCIAL HIGHLIGHTS (continued)
| Investor Shares | ||||||||||||
| Six Months Ended | ||||||||||||
| BNY Mellon Pennsylvania | February 29, 2008 | Year Ended August 31, | ||||||||||
| Intermediate Municipal Bond Fund | (Unaudited) | 2007 | 2006 | 2005 | 2004 | 2003 | ||||||
| Per Share Data ($): | ||||||||||||
| Net asset value, beginning of period | 12.41 | 12.65 | 12.91 | 13.13 | 12.95 | 13.14 | ||||||
| Investment Operations: | ||||||||||||
| Investment income—net a | .23 | .45 | .46 | .45 | .47 | .48 | ||||||
| Net realized and unrealized | ||||||||||||
| gain (loss) on investments | (.21) | (.21) | (.19) | (.13) | .21 | (.20) | ||||||
| Total from Investment Operations | .02 | .24 | .27 | .32 | .68 | .28 | ||||||
| Distributions: | ||||||||||||
| Dividends from investment income—net | (.22) | (.45) | (.45) | (.46) | (.47) | (.47) | ||||||
| Dividends from net realized gain on investments | (.02) | (.03) | (.08) | (.08) | (.03) | — | ||||||
| Total Distributions | (.24) | (.48) | (.53) | (.54) | (.50) | (.47) | ||||||
| Net asset value, end of period | 12.19 | 12.41 | 12.65 | 12.91 | 13.13 | 12.95 | ||||||
| Total Return (%) | .17b | 1.89 | 2.15 | 2.50 | 5.41 | 2.09 | ||||||
| Ratios/Supplemental Data (%): | ||||||||||||
| Ratio of total expenses to average net assets | .91c | .91 | .91 | .91 | .92 | .93 | ||||||
| Ratio of net expenses to average net assets | .91c,d | .91 | .91 | .91 | .92 | .92 | ||||||
| Ratio of net investment income | ||||||||||||
| to average net assets | 3.62c | 3.59 | 3.57 | 3.50 | 3.56 | 3.59 | ||||||
| Portfolio Turnover Rate | 4.84b | 20.18 | 13.80 | 23.88 | 18.87 | 17.58 | ||||||
| Net Assets, end of period ($ x 1,000) | 1,374 | 1,295 | 3,586 | 4,561 | 2,741 | 2,944 | ||||||
| a Based on average shares outstanding at each month end. b Not annualized. c Annualized. d The difference for the period represents less than .01%. See notes to financial statements. |
See notes to financial statements.
68
FINANCIAL HIGHLIGHTS
Please note that the financial highlights information in the following tables for the fund’s Investor shares, Class M shares and Dreyfus Premier shares represents the financial highlights of the Class A shares, Class R shares and Class B shares, respectively, of the fund’s predecessor, Dreyfus Premier Limited Term Massachusetts Municipal Fund (the Premier Massachusetts Fund) before the fund commenced operations as of the close of business on September 6, 2002, and represents the performance of the fund’s Investor shares, Class M shares and Dreyfus Premier shares thereafter. Before the fund commenced operations, substantially all of the assets of the Premier Massachusetts Fund were transferred to the fund in a tax-free reorganization. Total return for the periods before the fund commenced operations shows how much an investment in the Premier Massachusetts Fund’s Class A shares, Class R shares and Class B shares would have increased (or decreased) during those periods, assuming all dividends and distributions were reinvested.Total return for the period since the fund commenced operations also reflects how much an investment in the fund’s Investor shares, Class M shares and Dreyfus Premier shares would have increased (or decreased), assuming all dividends and distributions were reinvested.
| Class M Shares | ||||||||||||
| Six Months Ended | ||||||||||||
| BNY Mellon Massachusetts | February 29, 2008 | Year Ended August 31, | ||||||||||
| Intermediate Municipal Bond Fund | (Unaudited) | 2007 | 2006 | 2005 | 2004 | 2003 a | ||||||
| Per Share Data ($): | ||||||||||||
| Net asset value, beginning of period | 12.42 | 12.58 | 12.75 | 12.81 | 12.59 | 12.79 | ||||||
| Investment Operations: | ||||||||||||
| Investment income—net b | .23 | .47 | .47 | .47 | .48 | .50 | ||||||
| Net realized and unrealized | ||||||||||||
| gain (loss) on investments | (.13) | (.16) | (.14) | (.06) | .22 | (.21) | ||||||
| Total from Investment Operations | .10 | .31 | .33 | .41 | .70 | .29 | ||||||
| Distributions: | ||||||||||||
| Dividends from investment income—net | (.23) | (.47) | (.47) | (.47) | (.48) | (.49) | ||||||
| Dividends from net realized gain on investments | — | — | (.03) | — | — | — | ||||||
| Total Distributions | (.23) | (.47) | (.50) | (.47) | (.48) | (.49) | ||||||
| Net asset value, end of period | 12.29 | 12.42 | 12.58 | 12.75 | 12.81 | 12.59 | ||||||
| Total Return (%) | .80c | 2.47 | 2.65 | 3.25 | 5.72 | 2.23 | ||||||
| Ratios/Supplemental Data (%): | ||||||||||||
| Ratio of total expenses to average net assets | .53d | .53 | .54 | .54 | .55 | .58 | ||||||
| Ratio of net expenses to average net assets | .52d | .50 | .50 | .50 | .50 | .50 | ||||||
| Ratio of net investment income | ||||||||||||
| to average net assets | 3.70d | 3.72 | 3.73 | 3.67 | 3.74 | 3.93 | ||||||
| Portfolio Turnover Rate | 5.99c | 18.85 | 20.57 | 32.16 | 27.26 | 15.54 | ||||||
| Net Assets, end of period ($ x 1,000) | 353,991 | 342,583 | 299,263 | 228,239 | 197,140 | 173,311 | ||||||
| a Effective December 16, 2002, MPAM shares were redesignated as Class M shares. b Based on average shares outstanding at each month end. c Not annualized. d Annualized. See notes to financial statements. |
The Funds 69
FINANCIAL HIGHLIGHTS (continued)
| Investor Shares | ||||||||||||
| Six Months Ended | ||||||||||||
| BNY Mellon Massachusetts | February 29, 2008 | Year Ended August 31, | ||||||||||
| Intermediate Municipal Bond Fund | (Unaudited) | 2007 | 2006 | 2005 | 2004 | 2003 | ||||||
| Per Share Data ($): | ||||||||||||
| Net asset value, beginning of period | 12.42 | 12.58 | 12.75 | 12.80 | 12.59 | 12.79 | ||||||
| Investment Operations: | ||||||||||||
| Investment income—net a | .22 | .44 | .44 | .44 | .45 | .47 | ||||||
| Net realized and unrealized | ||||||||||||
| gain (loss) on investments | (.13) | (.16) | (.14) | (.05) | .21 | (.20) | ||||||
| Total from Investment Operations | .09 | .28 | .30 | .39 | .66 | .27 | ||||||
| Distributions: | ||||||||||||
| Dividends from investment income—net | (.22) | (.44) | (.44) | (.44) | (.45) | (.47) | ||||||
| Dividends from net realized gain on investments | — | — | (.03) | — | — | — | ||||||
| Total Distributions | (.22) | (.44) | (.47) | (.44) | (.45) | (.47) | ||||||
| Net asset value, end of period | 12.29 | 12.42 | 12.58 | 12.75 | 12.80 | 12.59 | ||||||
| Total Return (%) | .67b | 2.21 | 2.40 | 3.07 | 5.38 | 1.97 | ||||||
| Ratios/Supplemental Data (%): | ||||||||||||
| Ratio of total expenses to average net assets | .78c | .78 | .79 | .79 | .80 | .83 | ||||||
| Ratio of net expenses to average net assets | .77c | .75 | .75 | .75 | .75 | .75 | ||||||
| Ratio of net investment income | ||||||||||||
| to average net assets | 3.46c | 3.48 | 3.49 | 3.43 | 3.50 | 3.68 | ||||||
| Portfolio Turnover Rate | 5.99b | 18.85 | 20.57 | 32.16 | 27.26 | 15.54 | ||||||
| Net Assets, end of period ($ x 1,000) | 8,931 | 9,024 | 9,854 | 10,371 | 11,698 | 12,965 | ||||||
| a Based on average shares outstanding at each month end. b Not annualized. c Annualized. See notes to financial statements. |
70
| Dreyfus Premier Shares | ||||||||||||
| Six Months Ended | ||||||||||||
| BNY Mellon Massachusetts | February 29, 2008 | Year Ended August 31, | ||||||||||
| Intermediate Municipal Bond Fund | (Unaudited) | 2007 | 2006 | 2005 | 2004 | 2003 | ||||||
| Per Share Data ($): | ||||||||||||
| Net asset value, beginning of period | 12.45 | 12.61 | 12.78 | 12.83 | 12.61 | 12.81 | ||||||
| Investment Operations: | ||||||||||||
| Investment income—net a | .19 | .35 | .37 | .38 | .38 | .40 | ||||||
| Net realized and unrealized | ||||||||||||
| gain (loss) on investments | (.13) | (.14) | (.14) | (.05) | .22 | (.20) | ||||||
| Total from Investment Operations | .06 | .21 | .23 | .33 | .60 | .20 | ||||||
| Distributions: | ||||||||||||
| Dividends from investment income—net | (.19) | (.37) | (.37) | (.38) | (.38) | (.40) | ||||||
| Dividends from net realized gain on investments | — | — | (.03) | — | — | — | ||||||
| Total Distributions | (.19) | (.37) | (.40) | (.38) | (.38) | (.40) | ||||||
| Net asset value, end of period | 12.32 | 12.45 | 12.61 | 12.78 | 12.83 | 12.61 | ||||||
| Total Return (%) | .43b | 1.71 | 1.89 | 2.59 | 4.85 | 1.55 | ||||||
| Ratios/Supplemental Data (%): | ||||||||||||
| Ratio of total expenses to average net assets | 1.28c | 1.28 | 1.29 | 1.29 | 1.30 | 1.33 | ||||||
| Ratio of net expenses to average net assets | 1.27c | 1.25 | 1.25 | 1.25 | 1.25 | 1.25 | ||||||
| Ratio of net investment income | ||||||||||||
| to average net assets | 2.97c | 2.96 | 2.99 | 2.98 | 3.01 | 3.19 | ||||||
| Portfolio Turnover Rate | 5.99b | 18.85 | 20.57 | 32.16 | 27.26 | 15.54 | ||||||
| Net Assets, end of period ($ x 1,000) | 17 | 17 | 165 | 202 | 655 | 941 | ||||||
| a | Based on average shares outstanding at each month end. | |
| b | Not annualized. | |
| c | Annualized. |
See notes to financial statements.
The Funds 71
NOTES TO FINANCIAL STATEMENTS (Unaudited)
NOTE 1—General:
BNY Mellon Funds Trust (the “Trust”) was organized as a Massachusetts business trust which is registered under the Investment Company Act of 1940, as amended (the “Act”), as an open-end management investment company and operates as a series company currently comprised of seventeen series including the following non-diversified municipal bond funds: BNY Mellon National Intermediate Municipal Bond Fund, BNY Mellon National Short-Term Municipal Bond Fund, BNY Mellon Pennsylvania Intermediate Municipal Bond Fund and BNY Mellon Massachusetts Intermediate Municipal Bond Fund (each, a “fund” and collectively, the “funds”). Effective March 31,2008,the Trust changed its name from “Mellon Funds Trust” to “BNY Mellon Funds Trust” and each fund added “BNY” to the beginning of its name. BNY Mellon National Intermediate Municipal Bond Fund and BNY Mellon National Short-Term Municipal Bond Fund seek to maximize current income exempt from federal income tax to the extent consistent with the preservation of capital. BNY Mellon Pennsylvania Intermediate Municipal Bond Fund seeks as high a level of income exempt from federal and Pennsylvania state income taxes as is consistent with the preservation of capital. BNY Mellon Massachusetts Intermediate Municipal Bond Fund seeks as high a level of income exempt from federal and Massachusetts state income taxes as is consistent with the preservation of capital.
Mellon Fund Advisers, a division of the Dreyfus Corporation (the “Manager” or “Dreyfus”) serves as each fund’s investment adviser (“Investment Adviser”). Mellon Bank, N.A. (“Mellon Bank”), an affiliate of Dreyfus, serves as administrator for the funds pursuant to an Administration Agreement with the Trust (the “Administration Agreement”). Mellon Bank has entered into a Sub-Administration Agreement with Dreyfus pursuant to which Mellon Bank pays Dreyfus for performing certain administrative services. Dreyfus and Mellon
Bank are wholly-owned subsidiaries of The Bank of New York Mellon Corporation (“BNY Mellon”). MBSC Securities Corporation (the “Distributor”), a wholly-owned subsidiary of Dreyfus, is the distributor of each fund’s shares, which are sold without a sales charge.
The Trust is authorized to issue an unlimited number of shares of beneficial interest, par value $.001 per share, in each of the Class M and Investor class shares of each fund and in the Dreyfus Premier class shares of BNY Mellon National Intermediate Municipal Bond Fund and BNY Mellon Massachusetts Intermediate Municipal Bond Fund. Dreyfus Premier shares of BNY Mellon National Intermediate Municipal Bond Fund and BNY Mellon Massachusetts Intermediate Municipal Bond Fund are subject to a contingent deferred sales charge (“CDSC”) imposed on redemptions of Dreyfus Premier shares made within six years of purchase and automatically convert to Investor class shares after six years. Each class of shares has similar rights and privileges, except with respect to the expenses borne by and the shareholder services offered to each class, the shareholder services plan applicable to the Investor shares and Dreyfus Premier shares and the Rule 12b-1 plan applicable to the Dreyfus Premier shares and certain voting rights. Income, expenses (other than expenses attributable to a specific class), and realized and unrealized gains or losses on investments are allocated to each class of shares based on its relative net assets.
The Trust accounts separately for the assets, liabilities and operations of each series. Expenses directly attributable to each series are charged to that series’ operations; expenses that are applicable to all series are allocated among them on a pro rata basis.
BNY Mellon National Intermediate Municipal Bond Fund and BNY Mellon Massachusetts Intermediate Municipal Bond Fund no longer offer Dreyfus Premier shares, except in connection with dividend reinvestment and permitted exchanges of Dreyfus Premier shares.
72
The funds’ financial statements are prepared in accordance with U.S. generally accepted accounting principles, which may require the use of management estimates and assump-tions.Actual results could differ from those estimates.
NOTE 2—Significant Accounting Policies:
(a) Portfolio valuation: Investments in municipal securities (excluding options and financial futures on municipal, U.S. Treasury securities and swaps) are valued each business day by an independent pricing service (the “Service”) approved by the Board of Trustees. Investments for which quoted bid prices are readily available and are representative of the bid side of the market in the judgment of the Service are valued at the mean between the quoted bid prices (as obtained by the Service from dealers in such securities) and asked prices (as calculated by the Service based upon its evaluation of the market for such securities). Other investments are valued by the Service, based on methods which include consideration of: yields or prices of municipal securities of comparable quality, coupon, maturity and type; indications as to values from dealers; and general market conditions. Options and financial futures on municipal and U.S.Treasury securities are valued at the last sales price on the securities exchange on which such securities are primarily traded or at the last sales price on the national securities market on each business day. Swap transactions are valued based on future cash flows and other factors, such as interest rates and underlying securities.
Financial Accounting Standards Board (“FASB”) released Statement of Financial Accounting Standards No. 157 “Fair Value Measurements” (“FAS 157”). FAS 157 establishes an authoritative definition of fair value, sets out a framework for measuring fair value, and requires additional disclosures about fair-value measurements. The application of FAS 157 is required for fiscal years beginning after November 15, 2007 and interim periods within those fiscal years. Management does not believe
that the application of this standard will have a material impact on the financial statements of the fund.
(b) Securities transactions and investment income: Securities transactions are recorded on a trade date basis. Realized gain and loss from securities transactions are recorded on the identified cost basis. Interest income, adjusted for accretion of discount and amortization of premium on investments, is earned from settlement date and recognized on the accrual basis. Securities purchased or sold on a when-issued or delayed-delivery basis may be settled a month or more after the trade date.
The funds have arrangements with the custodian and cash management banks whereby the funds may receive earnings credits when positive cash balances are maintained, which are used to offset custody and cash management fees. For financial reporting purposes, the funds include net earnings credits as expense offsets in the Statements of Operations.
(c) Concentration of risk: BNY Mellon Pennsylvania Intermediate Municipal Bond Fund and BNY Mellon Massachusetts Intermediate Municipal Bond Fund follow an investment policy of investing primarily in municipal obligations of one state. Economic changes affecting the state and certain of its public bodies and municipalities may affect the ability of issuers within the state to pay interest on, or repay principal of, municipal obligations held by the fund.
(d) Dividends to shareholders: The funds declare dividends daily from investment income-net; such dividends are paid monthly. With respect to each series, dividends from net realized capital gain, if any, are normally declared and paid annually, but the funds may make distributions on a more frequent basis to comply with the distribution requirements of the Internal Revenue Code of 1986, as amended (the “Code”). To the extent that net realized capital gain can be offset by capital loss carryovers of that
The Funds 73
NOTES TO FINANCIAL STATEMENTS (Unaudited) (continued)
fund, it is the policy of the fund not to distribute such gain. Income and capital gain distributions are determined in accordance with income tax regulations, which may differ from U.S. generally accepted accounting principles.
(e) Federal income taxes: It is the policy of each fund to continue to qualify as a regulated investment company, which can distribute tax exempt dividends, by complying with the applicable provisions of the Code, and to make distributions of income and net realized capital gain sufficient to relieve it from substantially all federal income and excise taxes. For federal income tax purposes, each series is treated as a single entity for the purpose of determining such qualification.
During the current year, the funds adopted FASB Interpretation No. 48, “Accounting for Uncertainty in Income Taxes” (“FIN 48”). FIN 48 provides guidance for how uncertain tax positions should be recognized, measured, presented and disclosed in the financial statements. FIN 48 requires the evaluation of tax positions taken or expected to be taken in the course of preparing the portfolio’s tax returns to determine whether the tax positions
are “more-likely-than-not” of being sustained by the applicable tax authority. Tax positions not deemed to meet the more-likely-than-not threshold would be recorded as a tax benefit or expense in the current year. Adoption of FIN 48 is required for fiscal years beginning after December 15, 2006 and is to be applied to all open tax years as of the effective date.The adoption of FIN 48 had no impact on the operations of the funds for the period ended February 29, 2008.
Each of the tax years in the three-year period ended August 31, 2007, remains subject to examination by the Internal Revenue Service and state taxing authorities.
Table 1 summarizes BNY Mellon National Intermediate Municipal Bond Fund, BNY Mellon National Short-Term Municipal Bond Fund and BNY Mellon Massachusetts Intermediate Municipal Bond Fund’s unused capital loss carryover available to be applied against future net securities profits, if any, realized subsequent to August 31, 2007.
Table 2 summarizes each relevant fund’s tax character of distributions paid to shareholders during the fiscal year
| Table 1. | ||||
| Expiring in fiscal † | 2014 ($) | 2015 ($) | ||
| BNY Mellon National Intermediate Municipal Bond Fund | — | 550,494 | ||
| BNY Mellon National Short-Term Municipal Bond Fund | 439,406 | 501,053 | ||
| BNY Mellon Massachusetts Intermediate Municipal Bond Fund | — | 67,779 | ||
| † | If not applied, the carryover expires in fiscal 2014 and 2015. |
| Table 2. | ||||||
| Tax-Exempt | Ordinary | Long-Term | ||||
| Income ($) | Income ($) | Capital Gains ($) | ||||
| 2007 | 2007 | 2007 | ||||
| BNY Mellon National Intermediate | ||||||
| Municipal Bond Fund | 34,847,113 | 85,461 | — | |||
| BNY Mellon National Short-Term | ||||||
| Municipal Bond Fund | 4,730,899 | 33,641 | — | |||
| BNY Mellon Pennsylvania Intermediate | ||||||
| Municipal Bond Fund | 23,914,973 | 191,052 | 1,161,392 | |||
| BNY Mellon Massachusetts Intermediate | ||||||
| Municipal Bond Fund | 12,340,514 | — | — | |||
74
ended August 31, 2007.The tax character of current year distributions will be determined at the end of the current fiscal year.
NOTE 3—Bank Line of Credit:
The funds participate with other Dreyfus-managed funds in a $100 million unsecured line of credit primarily to be utilized for temporary or emergency purposes, including the financing of redemptions. Interest is charged to the funds based on prevailing market rates in effect at the time of borrowings. During the period ended February 29, 2008, the funds did not borrow under the line of credit.
NOTE 4—Investment Advisory Fee, Administration
Fee and Other Transactions With Affiliates:
(a) Fees payable by the funds pursuant to the provisions of an Investment Advisory Agreement with the Investment Adviser are payable monthly, computed on the average daily value of each fund’s net assets at the following annual rates: .35% of the BNY Mellon National Intermediate Municipal Bond Fund, .35% of the BNY Mellon National Short-Term Municipal Bond Fund, .50% of the BNY Mellon Pennsylvania Intermediate Municipal Bond Fund and .35% of the BNY Mellon Massachusetts Intermediate Municipal Bond Fund.
Pursuant to the Administration Agreement with Mellon Bank, Mellon Bank provides or arranges for fund accounting, transfer agency and other fund administration services and receives a fee based on the total net assets of the Trust based on the following rates:
| 0 up to $6 billion | .15% | |
| $6 billion up to $12 billion | .12% | |
| In excess of $12 billion | .10% |
Mellon Bank had entered into a Sub-Administration Agreement with Dreyfus pursuant to which Mellon pays Dreyfus for performing certain administrative services.
Mellon Bank agreed, until September 30, 2007, with respect to BNY Mellon Massachusetts Intermediate Municipal Bond Fund, to waive receipt of its fees and/or reimburse a portion of the fund’s expenses, exclusive of
taxes, interest, brokerage commissions, Rule 12b-1 fees, Shareholder Services Plan fees and extraordinary expenses, so that the fund’s expenses, in the aggregate, do not exceed an annual rate of .50% of the value of the fund’s average daily net assets. The expense reimbursement, pursuant to the undertaking, for BNY Mellon Massachusetts Intermediate Bond Fund, amounted to $8,306 during the period ended February 29, 2008.
During the period ended February 29, 2008, the Distributor retained $711 from contingent deferred sales charges on redemptions of the BNY Mellon National Intermediate Municipal Bond Fund’s Dreyfus Premier shares.
(b) BNY Mellon National Intermediate Municipal Bond Fund and BNY Mellon Massachusetts Intermediate Municipal Bond Fund have adopted a Distribution Plan (the “Plan”) pursuant to Rule 12b-1 under the Act for distributing its Dreyfus Premier shares.The funds each pay the Distributor a fee at an annual rate of .50% of the value of the fund’s average daily net assets attributable to its Dreyfus Premier shares. During the period ended February 29, 2008, BNY Mellon National Intermediate Municipal Bond Fund and BNY Mellon Massachusetts Intermediate Municipal Bond Fund, Dreyfus Premier shares were charged $657 and $43, respectively, pursuant to the Plan.
(c) The funds have adopted a Shareholder Services Plan with respect to its Investor shares, and BNY Mellon National Intermediate Municipal Bond Fund and BNY Mellon Massachusetts Intermediate Municipal Bond Fund have adopted a Shareholder Services Plan with respect to its Dreyfus Premier shares, pursuant to which each fund pays the Distributor for the provision of certain services to holders of Investor shares and Dreyfus Premier shares a fee at an annual rate of .25% of the value of the average daily net assets attributable to Investor shares and Dreyfus Premier shares, respectively.The services provided may include personal services relating to shareholder accounts, such as answering shareholder inquiries regarding a fund, and providing reports and other information,
The Funds 75
NOTES TO FINANCIAL STATEMENTS (Unaudited) (continued)
and services related to the maintenance of such shareholder accounts.The Shareholder Services Plan allows the Distributor to make payments from the shareholder services fees it collects from each fund to compensate service agents (certain banks, securities brokers or dealers and other financial institutions) in respect of these services. Table 3 summarizes the amounts Investor shares and Dreyfus Premier shares were charged during the period ended February 29, 2008, pursuant to the Shareholder Services Plan.Additional fees included in shareholder servicing costs in the Statement of Operations include fees paid to the transfer agent.
| Table 3. | ||
| BNY Mellon National Intermediate | ||
| Municipal Bond Fund (Investor Shares) | $ 29,804 | |
| BNY Mellon National Intermediate Municipal | ||
| Bond Fund (Dreyfus Premier Shares) | 329 | |
| BNY Mellon National Short-Term | ||
| Municipal Bond Fund (Investor Shares) | 779 | |
| BNY Mellon Pennsylvania Intermediate | ||
| Municipal Bond Fund (Investor Shares) | 1,999 | |
| BNY Mellon Massachusetts Intermediate | ||
| Municipal Bond Fund (Investor Shares) | 11,382 | |
| BNY Mellon Massachusetts Intermediate | ||
| Municipal Bond Fund | ||
| (Dreyfus Premier Shares) | 22 | |
The funds compensate The Bank of New York, a subsidiary of BNY Mellon and a Dreyfus affiliate, under a cash management agreement for performing cash management services related to fund subscriptions and redemptions. Table 4 summarizes the amounts the funds were charged during the period ended February 29, 2008 pursuant to the cash management agreement.
| Table 4. | ||
| BNY Mellon National Intermediate | ||
| Municipal Bond Fund | $374 | |
| BNY Mellon National Short-Term | ||
| Municipal Bond Fund | 8 | |
| BNY Mellon Pennsylvania Intermediate | ||
| Municipal Bond Fund | 13 | |
| BNY Mellon Massachusetts Intermediate | ||
| Municipal Bond Fund | 132 | |
The funds compensate Mellon Bank under a cash management agreement for performing cash management
services related to fund subscriptions and redemptions. Table 5 summarizes the amounts the funds were charged during the period ended February 29, 2008, pursuant to the cash management agreement.
| Table 5. | ||
| BNY Mellon National Intermediate | ||
| Municipal Bond Fund | $1,255 | |
| BNY Mellon National Short-Term | ||
| Municipal Bond Fund | 29 | |
| BNY Mellon Pennsylvania | ||
| Intermediate Municipal Bond Fund | 50 | |
| BNY Mellon Massachusetts | ||
| Intermediate Municipal Bond Fund | 438 |
The funds compensate Mellon Bank, under a Custody Agreement for providing custodial services for the funds. Table 6 summarizes the amounts the funds were charged during the period ended February 29, 2008 pursuant to the custody agreement.
| Table 6. | ||
| BNY Mellon National Intermediate | ||
| Municipal Bond Fund | $39,862 | |
| BNY Mellon National Short-Term | ||
| Municipal Bond Fund | 6,155 | |
| BNY Mellon Pennsylvania Intermediate | ||
| Municipal Bond Fund | 22,159 | |
| BNY Mellon Massachusetts Intermediate | ||
| Municipal Bond Fund | 13,897 | |
During the period ended February 29, 2008, each of the funds was charged $2,411 for services performed by the Chief Compliance Officer.
Table 7 summarizes the components of Due to the Dreyfus Corporation and affiliates in the Statements of Assets and Liabilities for each fund.
(d) Each trustee who is not an “affiliated person” as defined in the Act receives from the Trust an annual fee of $48,000 and an attendance fee of $5,000 for each in-person meeting attended and $500 for telephone meetings and is reimbursed for travel and out-of-pocket expenses. The Chairman of the Trust’s Board receives an additional annual fee of $10,000 and the Chairman of the Trust’s Audit Committee receives an additional fee of $8,000.
76
NOTE 5—Securities Transactions:
Table 8 summarizes each fund’s aggregate amount of purchases and sales of investment securities, excluding short-term securities and financial futures, during the period ended February 29, 2008.
The funds may invest in financial futures contracts in order to gain exposure to or protect against changes in the market. The funds are exposed to market risk as a result of changes in the value of the underlying financial instruments. Investments in financial futures require the funds to “mark to market” on a daily basis, which reflects the change in the market value of the contracts at the
close of each day’s trading. Typically, variation margin payments are received or made to reflect daily unrealized gains or losses.When the contracts are closed, the funds recognize a realized gain or loss. These investments require initial margin deposits with a broker, which consist of cash or cash equivalents. The amount of these deposits is determined by the exchange or Board of Trade on which the contract is traded and is subject to change. Contracts open at February 29, 2008 are set forth in the Statement of Financial Futures.
Table 9 summarizes accumulated net unrealized appreciation on investments for each fund at February 29, 2008.
| Table 7. | ||||||||||
| Investment | Rule 12b-1 | Shareholder | Chief | |||||||
| Advisory | Distribution | Services | Custodian | Compliance | ||||||
| Fees ($) | Plan Fees ($) | Plan Fees ($) | Fees ($) | Officer Fees ($) | ||||||
| BNY Mellon National Intermediate | ||||||||||
| Municipal Bond Fund | 285,161 | 73 | 4,586 | 31,827 | 4,419 | |||||
| BNY Mellon National Short-Term | ||||||||||
| Municipal Bond Fund | 45,781 | — | 125 | 4,659 | 4,419 | |||||
| BNY Mellon Pennsylvania Intermediate | ||||||||||
| Municipal Bond Fund | 241,263 | - | 314 | 10,699 | 4,419 | |||||
| BNY Mellon Massachusetts Intermediate | ||||||||||
| Municipal Bond Fund | 103,097 | 7 | 1,821 | 8,917 | 4,419 | |||||
| Table 8. | ||||
| Purchases ($) | Sales ($) | |||
| BNY Mellon National Intermediate Municipal Bond Fund | 280,138,957 | 328,426,497 | ||
| BNY Mellon National Short-Term Municipal Bond Fund | 34,357,329 | 22,632,080 | ||
| BNY Mellon Pennsylvania Intermediate Municipal Bond Fund | 29,022,960 | 46,038,824 | ||
| BNY Mellon Massachusetts Intermediate Municipal Bond Fund | 20,930,295 | 24,974,944 | ||
| Table 9. | ||||||||
| Cost of | Gross | Gross | ||||||
| Investments ($) | Appreciation ($) | (Depreciation) ($) | Net ($) | |||||
| BNY Mellon National Intermediate Municipal Bond Fund | 1,011,236,445 | 13,980,791 | 27,143,780 | (13,162,989) | ||||
| BNY Mellon National Short-Term Municipal Bond Fund | 163,153,689 | 939,263 | 538,668 | 400,595 | ||||
| BNY Mellon Pennsylvania Intermediate Municipal Bond Fund | 581,097,662 | 11,305,785 | 11,598,653 | (292,868) | ||||
| BNY Mellon Massachusetts Intermediate Municipal Bond Fund | 361,033,233 | 4,819,501 | 7,173,745 | (2,354,244) | ||||
The Funds 77
NOTES
For More Information
| BNY Mellon Funds Trust | Custodian | |
| c/o The Dreyfus Corporation | ||
| 200 Park Avenue | Mellon Bank, N.A. | |
| New York, NY 10166 | One Mellon Bank Center | |
| Pittsburgh, PA 15258 | ||
| Investment Adviser | ||
| Transfer Agent & | ||
| Mellon Fund Advisers, a division of | Dividend Disbursing Agent | |
| The Dreyfus Corporation | ||
| 200 Park Avenue | Dreyfus Transfer, Inc. | |
| New York, NY 10166 | 200 Park Avenue | |
| New York, NY 10166 | ||
| Administrator | ||
| Distributor | ||
| Mellon Bank, N.A. | ||
| One Mellon Bank Center | MBSC Securities Corporation | |
| Pittsburgh, PA 15258 | 200 Park Avenue | |
| New York, NY 10166 | ||
| Sub-Administrator | ||
| The Dreyfus Corporation | ||
| 200 Park Avenue | ||
| New York, NY 10166 | ||
| Ticker Symbols: | ||||||
| BNY Mellon National Intermediate Municipal Bond Fund | Class M: MPNIX | Investor: MINMX | Dreyfus Premier: MNMBX | |||
| BNY Mellon National Short-Term Municipal Bond Fund | Class M: MPSTX | Investor: MINSX | ||||
| BNY Mellon Pennsylvania Intermediate Municipal Bond Fund | Class M: MPPIX | Investor: MIPAX | ||||
| BNY Mellon Massachusetts Intermediate Municipal Bond Fund | Class M: MMBMX | Investor: MMBIX | Dreyfus Premier: MMBPX |
Telephone Wealth Management (WM) Clients, please contact your Account Officer or call 1-888-281-7350.
Brokerage Clients of BNY Mellon Wealth Advisors (BNYMWA), please contact your financial representative
or call 1-800-830-0549, Option 2. Individual Account holders, please call Dreyfus at 1-800-645-6561.
Mail WM Clients, write to your Account Officer, c/o Mellon Bank, N.A., One Mellon Bank Center, Pittsburgh, PA 15258
BNYMWA Brokerage Clients, write to your financial representative, P.O. Box 9012, Hicksville, NY 11802–9012
Individual Account Holders, write to: BNY Mellon Funds, P.O. Box 55268, Boston, MA 02205–8502
The fund files its complete schedule of portfolio holdings with the Securities and Exchange Commission (“SEC”) for the first and third quarters of each fiscal year on Form N-Q. The funds’ Forms N-Q are available on the SEC’s website at http://www.sec.gov and may be reviewed and copied at the SEC’s Public Reference Room in Washington, DC. Information on the operation of the Public Reference Room may be obtained by calling 1-202-551-8090.
Information regarding how the fund voted proxies relating to portfolio securities for the 12-month period ended June 30, 2007, is available on the SEC’s website at http://www.sec.gov and without charge, upon request, by calling 1-800-645-6561.
MFTSA0208-MB
©2008 MBSC Securities Corporation
| Contents | ||
| The Funds | ||
| Letter from the President | 2 | |
| Discussion of Funds’ Performance | ||
| BNY Mellon Money Market Fund | 3 | |
| BNY Mellon National Municipal | ||
| Money Market Fund | 5 | |
| Understanding Your Fund’s Expenses | 7 | |
| Comparing Your Fund’s Expenses | ||
| With Those of Other Funds | 7 | |
| Statements of Investments | 8 | |
| Statements of Assets and Liabilities | 17 | |
| Statements of Operations | 18 | |
| Statements of Changes in Net Assets | 19 | |
| Financial Highlights | 20 | |
| Notes to Financial Statements | 24 | |
For More Information
| Back cover |
The views expressed herein are current to the date of this report. These views and the composition of the funds’ portfolios are subject to change at any time based on market and other conditions.
- Not FDIC-Insured
- Not Bank-Guaranteed
- May Lose Value
The Funds

| LETTER FROM |
| THE PRESIDENT |
Dear Shareholder:
We are pleased to present this semiannual report for BNY Mellon Funds Trust, covering the six-month period from September 1, 2007, through February 29, 2008.
The past six months proved to be one of the more challenging periods for investors in recent memory.The U.S. economy sputtered under the weight of plunging housing values, and credit concerns that originated in the bond market’s sub-prime mortgage sector spread to other areas of the financial markets.These developments dampened investor sentiment and produced heightened volatility in the stock market and the higher-yielding segments of the bond market. Even some areas of the taxable money markets were affected when difficult liquidity conditions arose in the inter-bank lending and commercial paper markets.
Recently, the Fed and the U.S. government have adopted accommodative monetary and fiscal policies in an effort to stimulate the U.S. economy, boost market liquidity and forestall a potential recession.While it’s too early to know if their actions will be effective, we believe that the best defense against any economic volatility is to maintain a long-term perspective. To benefit from this focus, talk to your portfolio manager today about your specific portfolio to ensure that your investments are best suited to capture the potential opportunities and manage the risks that may continue to surface during this current economic cycle.
For information about how each fund performed during the reporting period, as well as market perspectives, we have provided a Discussion of Fund Performance.
Thank you for your continued confidence and support.

| Christopher E. Sheldon |
| President |
| BNY Mellon Funds Trust |
| March 31, 2008 |

| DISCUSSION OF |
| FUND PERFORMANCE |
For the period of September 1, 2007, through February 29,
2008, as provided by J. Christopher Nicholl and John F.
Flahive, Portfolio Managers
Fund and Market Performance Overview
For the six-month period ended February 29, 2008, BNY Mellon Money Market Fund produced annualized yields of 4.63% for its Class M shares and 4.38% for its Investor shares. Taking into account the effects of compounding, the fund also produced annualized effective yields of 4.73% for its Class M shares and 4.47% for its Investor shares.1
Yields of money market instruments generally declined along with short-term interest rates over the reporting period, as the Federal Reserve Board (the “Fed”) eased monetary policy to combat an economic slowdown and an intensifying credit crisis in U.S. fixed-income markets.
The Fund’s Investment Approach
The fund seeks as high a level of current income as is consistent with the preservation of capital and the maintenance of liquidity.To pursue its goal, the fund invests in a diversified portfolio of high-quality, short-term debt securities, including U.S. government securities; certificates of deposit, time deposits, bankers’ acceptances and other short-term domestic or foreign bank obligations; repurchase agreements; high-grade commercial paper and other short-term corporate obligations; and taxable municipal obligations. Normally, the fund invests at least 25% of its net assets in bank obligations.
Credit Crisis and Economic Concerns Prompted
Fed Action
The reporting period began in the midst of a credit crisis that originated in the sub-prime mortgage sector of the U.S. bond market. Over the summer of
2007, investors had reacted negatively to reports of a higher-than-expected number of defaults and delinquencies among homeowners with sub-prime mortgages. These borrowers apparently were unable to meet their loan obligations when their adjustable-rate mortgages reset at higher levels. Soaring energy and food prices put additional pressure on some consumers’ overstretched finances.
The credit crisis sent repercussions throughout the financial markets as investors reassessed their previously generous attitudes toward risk. Newly cautious investors engaged in a “flight to quality,” turning away from riskier asset classes and flocking to the relative safety of U.S. Treasury securities and money market funds.The effects of the sell-off and resulting difficult liquidity conditions were particularly severe for commercial and investment banks, which suffered massive sub-prime related losses. Market turmoil also contributed to fears that declining housing values and slower consumer spending would derail the U.S. economy at the same time that rising commodity prices were fueling inflation fears.
The Fed responded aggressively to the financial markets’ and economy’s woes. In September, in an effort to stimulate the economy and promote market liquidity, the Fed implemented its first reduction in the overnight federal funds rate in more than four years. Additional reductions followed in October and December, driving the federal funds rate from 5.25% at the start of the reporting period to 4.25% by year-end.
However, disappointing economic news continued to mount during January, including the first monthly contraction in the U.S. labor market in more than four years. The credit crisis also worsened, threatening the credit ratings of certain bond insurers and the solvency of some major banks.The Fed responded aggressively,
The Funds 3
DISCUSSION OF FUND PERFORMANCE (continued)
implementing two additional rate cuts in the second half of the month that reduced the federal funds rate by another 125 basis points to 3%.
A Long Weighted Average Maturity Supported
Fund Results
As short-term interest rates fell, so did yields of most money market instruments.The fund proved to be well positioned for this development. We had set the fund’s weighted average maturity in a range that was significantly longer than industry averages, which enabled it to capture higher prevailing yields for as long as we deemed practical. Over the course of the reporting period, as short-term interest rates declined and yield differences narrowed along the market’s maturity range, we gradually reduced the fund’s weighted average maturity toward a more neutral position.
Although liquidity and credit concerns hurt the market for asset-backed commercial paper, the fund held none of the affected securities in this area. Instead, we focused on segments of the money markets that had no material direct exposure to troubled sub-prime loans.
Positioned for Additional Interest Rate Reductions
As of the reporting period’s end, market conditions have remained volatile, and the U.S. economy has continued to show signs of weakness, including record numbers of home foreclosures and additional job losses.Yet, inflationary pressures have remained uncomfortably high as crude oil prices surged past $100 per barrel. Despite these inflationary pressures, various Fed members, including Chairman Ben Bernanke, have indicated publicly that the Fed is prepared to inject additional liquidity into the banking system and reduce short-term interest rates further in order to forestall a potential recession.Therefore, we have maintained the fund’s weighted average maturity in a range we consider slightly longer than industry averages. In our judgment, this is a prudent strategy in today’s unsettled economic and market environments.
March 17, 2008
| An investment in the fund is not insured or guaranteed by the FDIC or any other | ||
| government agency.Although the fund seeks to preserve the value of your invest- | ||
| ment at $1.00 per share, it is possible to lose money by investing in the fund. | ||
| 1 | Annualized effective yield is based upon dividends declared daily and reinvested | |
| monthly. Past performance is no guarantee of future results.Yields fluctuate. |
4

| DISCUSSION OF |
| FUND PERFORMANCE |
For the period of September 1, 2007, through February 29,
2008, as provided by J. Christopher Nicholl and John F.
Flahive, Portfolio Managers
Fund and Market Performance Overview
For the six-month period ended February 29, 2008, BNY Mellon National Municipal Money Market Fund produced annualized yields of 3.00% for its Class M shares and 2.75% for its Investor shares.Taking into account the effects of compounding, the fund also produced annualized effective yields of 3.04% for its Class M shares and 2.79% for its Investor shares.1
Yields of tax-exempt money market instruments generally declined along with short-term interest rates over the reporting period, as the Federal Reserve Board (the “Fed”) eased monetary policy to combat an economic slowdown and an intensifying credit crisis in U.S. fixed-income markets.
The Fund’s Investment Approach
The fund seeks as high a level of current income exempt from federal income tax as is consistent with the preservation of capital and maintenance of liquidity.To pursue its goal, the fund invests at least 80% of its assets in short-term municipal obligations that provide income exempt from federal income tax. Among these are municipal notes, short-term municipal bonds, tax-exempt commercial paper and municipal leases.The fund may invest up to 20% of its total assets in taxable money market securities, such as U.S. government obligations, bank and corporate obligations and commercial paper. The fund also may invest in custodial receipts.
Credit Crisis and Economic Concerns Prompted
Fed Action
The reporting period began in the midst of a credit crisis that originated in the sub-prime mortgage sector of the U.S. bond market. Over the summer of 2007, investors had reacted negatively to reports of a
higher-than-expected number of defaults and delinquencies among homeowners with sub-prime mortgages. These borrowers apparently were unable to meet their loan obligations when their adjustable-rate mortgages reset at higher levels. Soaring energy and food prices put additional pressure on some consumers’ overstretched finances.
The credit crisis sent repercussions throughout the financial markets as investors reassessed their previously generous attitudes toward risk. Newly cautious investors engaged in a “flight to quality,” turning away from riskier asset classes and flocking to the relative safety of U.S. Treasury securities and money market funds.The effects of the sell-off and resulting difficult liquidity conditions were particularly severe for commercial and investment banks, which suffered massive sub-prime related losses. Market turmoil also contributed to fears that declining housing values and slower consumer spending would derail the U.S. economy at the same time that rising commodity prices were fueling inflation fears.
The Fed responded aggressively to the financial markets’ and economy’s woes. In September, in an effort to stimulate the economy and promote greater market liquidity, the Fed implemented its first reduction in the overnight federal funds rate in more than four years. Additional reductions followed in October and December, driving the federal funds rate from 5.25% at the start of the reporting period to 4.25% by year-end.
However, disappointing economic news continued to mount during January, including the first monthly contraction in the labor market in more than four years. The credit crisis also worsened, threatening the credit ratings of many bond insurers and the solvency of some major banks.The Fed responded aggressively, implementing two additional rate cuts during the second half of the month that reduced the federal funds rate by another 125 basis points to 3%.
The Funds 5
DISCUSSION OF FUND PERFORMANCE (continued)
A Long Weighted Average Maturity Supported
Fund Results
As short-term interest rates fell, so did yields of most tax-exempt money market instruments. However, because of supply-and-demand factors, yields of variable-rate demand notes, which are reset daily or weekly, remained higher than those of longer-term fixed-rate municipal notes for much of the reporting period. Accordingly, we generally focused on variable-rate demand notes, and the fund’s weighted average maturity remained in a range that was shorter than industry averages.
When liquidity and credit concerns hurt the market for variable-rate demand notes and municipal securities carrying third-party insurance enhancements, we moved quickly to pare back much of our exposure to securities backed by the affected insurers and ensure that our remaining exposure was mostly comprised of higher-rated issuers with greater financial flexibility and market access.
Positioned for Additional Interest Rate Reductions
As of the reporting period’s end, market conditions have remained volatile, and the U.S. economy has con-
tinued to show signs of weakness, including record numbers of home foreclosures and additional job losses.Yet, inflationary pressures have remained uncomfortably high as crude oil prices surged past $100 per barrel. Despite these inflationary pressures, various Fed members, including Chairman Ben Bernanke, have indicated that the Fed is prepared to inject additional liquidity into the banking system and reduce short-term interest rates further to forestall a potential recession. However, due to relatively high yields on variable-rate demand notes, we have maintained the fund’s short weighted average maturity. In our judgment, this is a prudent strategy in today’s unsettled economic and market environments.
March 17, 2008
| An investment in the fund is not insured or guaranteed by the FDIC or any | ||
| other government agency. Although the fund seeks to preserve the value of | ||
| your investment at $1.00 per share, it is possible to lose money by investing | ||
| in the fund. | ||
| 1 | Annualized effective yield is based upon dividends declared daily and | |
| reinvested monthly. Past performance is no guarantee of future results.Yields | ||
| fluctuate. Income may be subject to state and local taxes, and some income may | ||
| be subject to the federal alternative minimum tax (AMT) for certain investors. |
| 6 |
UNDERSTANDING YOUR FUND’S EXPENSES ( U n a u d i t e d )
As a mutual fund investor, you pay ongoing expenses, such as management fees and other expenses. Using the information below, you can estimate how these expenses affect your investment and compare them with the expenses of the funds.You also may pay one-time transaction expenses, including sales charges (loads) and redemption fees, which are not shown in this section and would have resulted in higher total expenses. For more information, see your fund’s prospectus or talk to your financial advisor.
Review your fund’s expenses
The table below shows the expenses you would have paid on a $1,000 investment in each class of each fund from September 1, 2007 to February 29, 2008. It also shows how much a $1,000 investment would be worth at the close of the period, assuming actual returns and expenses.
| Expenses and Value of a $1,000 Investment | ||||
| assuming actual returns for the six months ended February 29, 2008 | ||||
| Class M Shares | Investor Shares | |||
| BNY Mellon Money Market Fund | ||||
| Expenses paid per $1,000 † | $ 1.51 | $ 2.77 | ||
| Ending value (after expenses) | $1,023.30 | $1,022.00 | ||
| BNY Mellon National Municipal Money Market Fund | ||||
| Expenses paid per $1,000 † | $ 1.35 | $ 2.60 | ||
| Ending value (after expenses) | $1,015.10 | $1,013.80 |
COMPARING YOUR FUND’S EXPENSES WITH THOSE OF OTHER FUNDS (Unaudited)
Using the SEC’s method to compare expenses
The Securities and Exchange Commission (SEC) has established guidelines to help investors assess fund expenses. Per these guidelines, the table below shows your fund’s expenses based on a $1,000 investment, assuming a hypothetical 5% annualized return.You can use this information to compare the ongoing expenses (but not transaction expenses or total costs) of investing in the fund with those of other funds. All mutual fund shareholder reports will provide this information to help you make this comparison. Please note that you cannot use this information to estimate your actual ending account balance and expenses paid during the period.
| Expenses and Value of a $1,000 Investment | ||||
| assuming a hypothetical 5% annualized return for the six months ended February 29, 2008 | ||||
| Class M Shares | Investor Shares | |||
| BNY Mellon Money Market Fund | ||||
| Expenses paid per $1,000 † | $ 1.51 | $ 2.77 | ||
| Ending value (after expenses) | $1,023.37 | $1,022.13 | ||
| BNY Mellon National Municipal Money Market Fund | ||||
| Expenses paid per $1,000 † | $ 1.36 | $ 2.61 | ||
| Ending value (after expenses) | $1,023.52 | $1,022.28 | ||
| † Expenses are equal to the BNY Mellon Money Market Fund annualized expense ratio of .30% for Class M and .55% for Investor Class and BNY Mellon National Municipal |
| Money Market Fund, .27% for Class M and .52% for Investor Class, multiplied by the average account value over the period, multiplied by 182/366 (to reflect the one-half year |
| period). |
The Funds 7
| STATEMENT OF INVESTMENTS |
| February 29, 2008 (Unaudited) |
| BNY Mellon Money Market Fund | ||||||||||
| Negotiable Bank | Principal | Principal | ||||||||
| Certificates of Deposit—19.7% | Amount ($) | Value ($) | Commercial Paper (continued) | Amount ($) | Value ($) | |||||
| Bank of Scotland PLC | Dexia Delaware LLC | |||||||||
| 4.97%, 3/20/08 | 10,000,000 | 10,000,000 | 4.34%, 3/4/08 | 50,000,000 | 49,981,917 | |||||
| Barclays Bank PLC | Fortis Banque Luxembourg S.A. | |||||||||
| 5.20%, 6/16/08 | 8,250,000 | 8,259,853 | 2.78%, 7/10/08 | 25,000,000 b | 24,747,097 | |||||
| BNP Paribas (Yankee) | General Electric Capital Corp. | |||||||||
| 4.75%—5.36%, 6/20/08—7/3/08 | 45,000,000 | 45,011,161 | 3.04%, 3/12/08 | 50,000,000 | 49,953,556 | |||||
| Canadian Imperial Bank of Commerce | ING America Insurance Holdings Inc. | |||||||||
| 4.46%, 11/28/08 | 27,000,000 | 27,001,952 | 3.70%—5.00%, 3/6/08—3/13/08 | 50,000,000 | 49,941,472 | |||||
| Credit Suisse Group | JPMorgan Chase & Co. | |||||||||
| 4.61%, 4/11/08 | 45,000,000 a | 45,044,923 | 2.96%, 4/8/08 | 50,000,000 | 49,843,778 | |||||
| Fortis Bank | Los Angeles Department of Airports | |||||||||
| 3.10%, 3/12/08 | 25,000,000 b | 25,000,076 | 3.12%, 3/11/08 | 37,965,000 | 37,932,097 | |||||
| Harris Trust and Savings Bank | Prudential Funding LLC | |||||||||
| 5.40%, 6/6/08 | 10,000,000 | 10,000,000 | 2.99%, 3/5/08 | 43,500,000 | 43,485,548 | |||||
| HBOS Treasury Services PLC (Yankee) | Royal Bank of Scotland PLC | |||||||||
| 5.33%, 5/30/08 | 10,000,000 | 9,998,857 | 3.03%, 4/24/08 | 40,000,000 | 39,818,200 | |||||
| Toronto-Dominion Bank (Yankee) | Salvation Army | |||||||||
| 4.88%, 5/13/08 | 25,000,000 | 25,000,497 | 3.13%, 3/13/08 | 38,850,000 | 38,850,000 | |||||
| UBS Finance Delaware LLC (Yankee) | Societe Generale | |||||||||
| 5.50%, 3/6/08 | 25,000,000 | 25,000,000 | 4.91%, 3/19/08 | 10,000,000 | 9,975,450 | |||||
| Total Negotiable Bank | Societe Generale N.A. Inc. | |||||||||
| Certificates of Deposit | 3.08%, 5/28/08 | 20,000,000 | 19,849,422 | |||||||
| (cost $230,317,319) | 230,317,319 | UBS Finance Delaware LLC | ||||||||
| 4.43%, 8/12/08 | 15,000,000 | 14,697,283 | ||||||||
| Commercial Paper—69.2% | Westpac Banking Corp. | |||||||||
| AIG Funding Inc. | 4.69%, 4/2/08 | 40,000,000 b | 40,000,000 | |||||||
| 3.05%—3.12%, 3/6/08—3/13/08 | 49,000,000 | 48,954,850 | Total Commercial Paper | |||||||
| Allied Irish Banks N.A. Inc. | (cost $808,882,451) | 808,882,451 | ||||||||
| 4.95%, 4/3/08 | 20,000,000 b | 19,909,250 | ||||||||
| American Express Company | Notes—11.3% | |||||||||
| 3.00%, 3/11/08 | 50,000,000 | 49,958,333 | BBVA U.S. Senior, S.A. | |||||||
| Australia and New Zealand | Unipersonal | |||||||||
| Banking Group Ltd. | 4.02%, 4/17/08 | 39,000,000 a,b | 39,002,195 | |||||||
| 3.28%, 3/25/08 | 50,000,000 b | 49,890,667 | Cleveland Ohio Airport System | |||||||
| Banco Santander Puerto Rico | 3.14%, 3/7/08 | 1,600,000 a | 1,600,000 | |||||||
| 4.30%, 3/10/08 | 50,000,000 | 49,946,250 | General Secretariat | |||||||
| Bank of America Corp. | of American States | |||||||||
| 2.96%—2.97%, 3/3/08—5/27/08 | 42,000,000 | 41,783,400 | 3.20%, 3/7/08 | 4,280,000 a | 4,280,000 | |||||
| Calyon | HSBC Finance Corporation | |||||||||
| 4.51%, 4/2/08 | 50,000,000 | 49,799,556 | 6.30%, 6/17/08 | 6,500,000 a | 6,523,001 | |||||
| DEPFA BANK PLC | Mullenix St. Charles Properties LP | |||||||||
| 4.71%, 6/20/08 | 30,000,000 b | 29,564,325 | 3.11%, 3/7/08 | 7,000,000 a | 7,000,000 | |||||
8
| BNY Mellon Money Market Fund (continued) | ||||||||||
| Principal | Principal | |||||||||
| Notes (continued) | Amount ($) | Value ($) | Notes (continued) | Amount ($) | Value ($) | |||||
| North Texas Higher | Utah Telecommunications | |||||||||
| Education Authority, Inc. | Open Infrastructure Agency | |||||||||
| 7.63%, 3/7/08 | 34,000,000 a | 34,000,000 | 3.20%, 3/7/08 | 24,800,000 a | 24,800,000 | |||||
| Pitney Road Partners LLC | Total Notes | |||||||||
| 3.20%, 3/7/08 | 5,725,000 a | 5,725,000 | (cost $132,330,196) | 132,330,196 | ||||||
| Sacramento County, CA | Total Investments | |||||||||
| 5.00%, 3/7/08 | 6,300,000 a | 6,300,000 | (cost $1,171,529,966) | 100.2% | 1,171,529,966 | |||||
| Tulsa Oklahoma Airports | ||||||||||
| Improvement Trust | Liabilities, Less Cash and Receivables | (.2%) | (2,153,302) | |||||||
| 3.25%, 3/7/08 | 3,100,000 a | 3,100,000 | Net Assets | 100.0% | 1,169,376,664 | |||||
| a Variable rate security—interest rate subject to periodic change. |
| b Securities exempt from registration under Rule 144A of the Securities Act of 1933.These securities may be resold in transactions exempt from registration, normally to qualified |
| institutional buyers. At February 29, 2008, these securities amounted to $228,113,610 or 19.5% of net assets. |
| Portfolio Summary (Unaudited) † | ||||||
| Value (%) | Value (%) | |||||
| Banking | 62.9 | Transportation | 3.4 | |||
| Finance | 8.5 | Other | 13.2 | |||
| Insurance | 8.0 | |||||
| Multi-Line Insurance | 4.2 | 100.2 | ||||
| † Based on net assets. |
| See notes to financial statements. |
The Funds 9
| STATEMENT OF INVESTMENTS |
| February 29, 2008 (Unaudited) |
| BNY Mellon National Municipal Money Market Fund | ||||||||||
| Coupon | Maturity | Principal | ||||||||
| Short-Term Investments—98.6% | Rate (%) | Date | Amount ($) | Value ($) | ||||||
| Alabama—5.5% | ||||||||||
| Birmingham Medical Clinic Board, Medical Clinic Revenue (University | ||||||||||
| of Alabama Health Services Foundation) (LOC; SunTrust Bank) | 3.25 | 3/7/08 | 48,500,000 a | 48,500,000 | ||||||
| Jefferson County, Sewer Revenue (Capital | ||||||||||
| Improvement Warrants) (Insured; FGIC) | 5.00 | 2/1/09 | 3,935,000 b | 4,111,429 | ||||||
| Mobile Infirmary Health System Special Care Facilities | ||||||||||
| Financing Authority, Revenue (Infirmary Health System, Inc.) | 3.00 | 3/7/08 | 25,000,000 a | 25,000,000 | ||||||
| Arizona—.4% | ||||||||||
| McAllister Academic Village LLC, Revenue (Arizona State | ||||||||||
| University McAllister Academic Village Project) (Insured; | ||||||||||
| AMBAC and Liquidity Facility; State Street Bank and Trust Co.) | 8.00 | 3/7/08 | 4,995,000 a | 4,995,000 | ||||||
| California—.5% | ||||||||||
| Irvine Ranch Water District (LOC; Landesbank | ||||||||||
| Hessen-Thueringen Girozentrale) | 3.60 | 3/1/08 | 1,000,000 a | 1,000,000 | ||||||
| Irvine Ranch Water District, COP (Irvine Ranch Water District Capital | ||||||||||
| Improvement Project) (LOC; Landesbank Baden-Wurttemberg) | 3.65 | 3/1/08 | 6,300,000 a | 6,300,000 | ||||||
| Colorado—5.7% | ||||||||||
| Central Platte Valley Metropolitan District, GO | ||||||||||
| (Liquidity Facility; BNP Paribas) | 3.50 | 12/1/08 | 9,200,000 | 9,200,000 | ||||||
| Central Platte Valley Metropolitan District, GO (LOC; U.S. Bank NA) | 3.50 | 12/1/08 | 1,490,000 | 1,490,000 | ||||||
| Colorado Educational and Cultural Facilities Authority, Revenue | ||||||||||
| (National Jewish Federation Bond Program) (LOC; Bank of America) | 3.50 | 3/1/08 | 5,500,000 a | 5,500,000 | ||||||
| Colorado Educational and Cultural Facilities Authority, | ||||||||||
| Student Housing Facilities Revenue (Campus | ||||||||||
| Village Apartments Project) (LOC; Citibank NA) | 2.42 | 3/7/08 | 22,865,000 a | 22,865,000 | ||||||
| Commerce City Northern Infrastructure General | ||||||||||
| Improvement District, GO (LOC; U.S. Bank NA) | 3.28 | 3/7/08 | 6,150,000 a | 6,150,000 | ||||||
| Commerce City Northern Infrastructure General | ||||||||||
| Improvement District, GO, Refunding (LOC; U.S. Bank NA) | 3.21 | 3/7/08 | 7,400,000 a | 7,400,000 | ||||||
| Pitkin County, IDR, Refunding (Aspen Skiing | ||||||||||
| Company Project) (LOC; JPMorgan Chase Bank) | 3.50 | 3/1/08 | 5,000,000 a | 5,000,000 | ||||||
| Westminster Economic Development Authority, | ||||||||||
| Tax Increment Revenue (North Huron Urban | ||||||||||
| Renewal Project) (LOC; DEPFA Bank PLC) | 3.00 | 3/7/08 | 22,650,000 a | 22,650,000 | ||||||
| Florida—5.8% | ||||||||||
| Eclipse Funding Trust (Golden Knights Corporation Master Lease | ||||||||||
| Program) (Insured; MBIA and Liquidity Facility; U.S. Bank NA) | 3.26 | 3/7/08 | 24,285,000 a,c | 24,285,000 | ||||||
| Orange County Industrial Development Authority, IDR | ||||||||||
| (Catholic Charities of Central Florida, Inc. and Diocese | ||||||||||
| of Orlando Projects) (LOC; SunTrust Bank) | 3.70 | 3/1/08 | 5,000,000 a | 5,000,000 | ||||||
| Orange County Industrial Development Authority, | ||||||||||
| Revenue, Refunding (Lake Highland Preparatory | ||||||||||
| School, Inc. Project) (LOC; Bank of America) | 3.00 | 3/7/08 | 17,000,000 a | 17,000,000 | ||||||
| Palm Beach County, Revenue, Refunding (Saint Andrew’s | ||||||||||
| School of Boca Raton, Inc. Project) (LOC; Bank of America) | 3.00 | 3/7/08 | 10,000,000 a | 10,000,000 | ||||||
10
| BNY Mellon National Municipal Money Market Fund (continued) | ||||||||||
| Coupon | Maturity | Principal | ||||||||
| Short-Term Investments (continued) | Rate (%) | Date | Amount ($) | Value ($) | ||||||
| Florida (continued) | ||||||||||
| Palm Beach County Health Facilities Authority, | ||||||||||
| Health Facilities Revenue (Bethesda Healthcare | ||||||||||
| System, Inc. Project) (LOC; SunTrust Bank) | 3.70 | 3/1/08 | 7,000,000 a | 7,000,000 | ||||||
| Polk County School District, Sales Tax Revenue (Insured; FSA) | 4.00 | 10/1/08 | 7,815,000 | 7,846,098 | ||||||
| UCF Health Facilities Corporation, Capital Improvement | ||||||||||
| Revenue (UCF Health Sciences Campus at | ||||||||||
| Lake Nona Project) (LOC; Fifth Third Bank) | 3.20 | 3/7/08 | 10,000,000 a | 10,000,000 | ||||||
| Georgia—8.2% | ||||||||||
| Atlanta, Tax Allocation Revenue | ||||||||||
| (Westside Project) (LOC; Wachovia Bank) | 3.35 | 3/7/08 | 25,770,000 a | 25,770,000 | ||||||
| Atlanta, Water and Wastewater Revenue (Insured; | ||||||||||
| FSA and Liquidity Facility; Dexia Credit Locale) | 3.25 | 3/1/08 | 4,300,000 a | 4,300,000 | ||||||
| Atlanta, Water and Wastewater Revenue, CP | ||||||||||
| (LOC: Bank of America, Dexia Credit Locale, | ||||||||||
| JPMorgan Chase Bank and Lloyds TSB Bank PLC) | 3.35 | 7/29/08 | 9,111,000 | 9,111,000 | ||||||
| Clayton County Housing Authority, MFHR, Refunding | ||||||||||
| (Chateau Forest Apartments Project) (Insured; | ||||||||||
| FSA and Liquidity Facility; Societe Generale) | 3.04 | 3/7/08 | 6,530,000 a | 6,530,000 | ||||||
| De Kalb County Housing Authority, MFHR, Refunding | ||||||||||
| (Wood Terrace Apartment Project) (LOC; Wachovia Bank) | 3.27 | 3/7/08 | 15,935,000 a | 15,935,000 | ||||||
| Fayette County Hospital Authority, RAC (Fayette | ||||||||||
| Community Hospital Project) (LOC; SunTrust Bank) | 3.25 | 3/7/08 | 21,000,000 a | 21,000,000 | ||||||
| Fulton County Development Authority, Revenue | ||||||||||
| (Piedmont Healthcare, Inc. Project) (LOC; SunTrust Bank) | 3.25 | 3/7/08 | 9,000,000 a | 9,000,000 | ||||||
| Fulton County Development Authority, Revenue | ||||||||||
| (Saint George Village Catholic Continuing Care | ||||||||||
| Retirement Communities, Inc. Project) (LOC; Bank of America) | 3.00 | 3/7/08 | 13,075,000 a | 13,075,000 | ||||||
| Gainesville and Hall County Hospital Authority, RAC (Northeast | ||||||||||
| Georgia Health System, Inc. Project) (Insured; MBIA | ||||||||||
| and Liquidity Facility; Landesbank Baden-Wurttemberg) | 3.55 | 3/7/08 | 12,000,000 a | 12,000,000 | ||||||
| Illinois—10.7% | ||||||||||
| Chicago, GO (Insured; MBIA and Liquidity Facility; Citigroup) | 3.49 | 3/7/08 | 9,995,000 a,c | 9,995,000 | ||||||
| Chicago, Second Lien Water Revenue (LOC; JPMorgan Chase Bank) | 3.15 | 3/7/08 | 34,455,000 a | 34,455,000 | ||||||
| Chicago Board of Education, GO (Insured; | ||||||||||
| FSA and Liquidity Facility; DEPFA Bank PLC) | 3.45 | 3/1/08 | 1,200,000 a | 1,200,000 | ||||||
| Illinois Educational Facilities Authority, Revenue | ||||||||||
| (Benedictine University Project) (LOC; National City Bank) | 3.12 | 3/7/08 | 11,700,000 a | 11,700,000 | ||||||
| Illinois Finance Authority, Revenue (Resurrection | ||||||||||
| Health Care) (LOC; JPMorgan Chase Bank) | 4.01 | 3/1/08 | 15,270,000 a | 15,270,000 | ||||||
| Illinois Health Facilities Authority, Revenue (Ingalls | ||||||||||
| Memorial Hospital) (LOC; Northern Trust Co.) | 2.70 | 3/7/08 | 13,300,000 a | 13,300,000 | ||||||
| Illinois Health Facilities Authority, Revenue (The University | ||||||||||
| of Chicago Hospitals and Health System) | ||||||||||
| (Insured; MBIA and Liquidity Facility; Bank One) | 5.90 | 3/1/08 | 20,930,000 a | 20,930,000 | ||||||
The Funds 11
STATEMENT OF INVESTMENTS (Unaudited) (continued)
| BNY Mellon National Municipal Money Market Fund (continued) | ||||||||||
| Coupon | Maturity | Principal | ||||||||
| Short-Term Investments (continued) | Rate (%) | Date | Amount ($) | Value ($) | ||||||
| Illinois (continued) | ||||||||||
| Illinois Toll Highway Authority, Toll Highway Revenue, | ||||||||||
| Refunding (Insured; FSA and Liquidity Facility; | ||||||||||
| Landesbank Hessen-Thuringen Girozentrale) | 3.05 | 3/7/08 | 9,000,000 a | 9,000,000 | ||||||
| Kane County Forest Preserve District, GO Notes | 4.50 | 12/15/08 | 2,490,000 | 2,512,013 | ||||||
| Regional Transportation Authority, GO, Refunding | ||||||||||
| (Liquidity Facility; DEPFA Bank PLC) | 2.90 | 3/7/08 | 26,440,000 a | 26,440,000 | ||||||
| Will County, Revenue (University of Saint | ||||||||||
| Francis Project) (LOC; Fifth Third Bank) | 3.20 | 3/7/08 | 6,000,000 a | 6,000,000 | ||||||
| Indiana—2.0% | ||||||||||
| Indiana Health and Educational Facility Financing | ||||||||||
| Authority, HR (Community Hospital of LaGrange | ||||||||||
| County, Inc. Project) (LOC; National City Bank) | 3.12 | 3/7/08 | 12,465,000 a | 12,465,000 | ||||||
| Indianapolis, MFHR, Refunding (Lakeside | ||||||||||
| Pointe and Fox Club) (LOC; FNMA) | 3.60 | 3/7/08 | 15,000,000 a | 15,000,000 | ||||||
| Kentucky—4.3% | ||||||||||
| Danville, Multi-City LR, CP (LOC; Fifth Third Bank) | 1.00 | 7/8/08 | 49,000,000 | 49,000,000 | ||||||
| Public Energy Authority of Kentucky, Inc., Gas Supply | ||||||||||
| Revenue (Liquidity Facility; Societe Generale) | 3.66 | 3/1/08 | 10,660,000 a | 10,660,000 | ||||||
| Louisiana—.4% | ||||||||||
| Louisiana Offshore Terminal Authority, Deepwater Port | ||||||||||
| Revenue, Refunding (LOOP Inc. LLC Project) (LOC; Bank One) | 3.25 | 3/1/08 | 5,235,000 a | 5,235,000 | ||||||
| Maryland—2.3% | ||||||||||
| Maryland Health and Higher Educational Facilities | ||||||||||
| Authority, Revenue (University of Maryland | ||||||||||
| Medical System Issue) (LOC; Bank of America) | 3.00 | 3/7/08 | 31,670,000 a | 31,670,000 | ||||||
| Massachusetts—1.3% | ||||||||||
| Massachusetts, Consolidated Loan (LOC; Bank of America) | 4.02 | 3/1/08 | 7,100,000 a | 7,100,000 | ||||||
| Massachusetts, GO (Central Artery/Ted Williams | ||||||||||
| Tunnel Infrastructure Loan Act of 2000) | ||||||||||
| (Liquidity Facility; Landesbank Baden-Wurttemberg) | 3.55 | 3/1/08 | 11,600,000 a | 11,600,000 | ||||||
| Michigan—4.7% | ||||||||||
| Detroit, Sewage Disposal System Second Lien Revenue, | ||||||||||
| (Insured; FGIC and Liquidity Facility; DEPFA Bank PLC) | 3.74 | 7/10/08 | 20,500,000 | 20,530,669 | ||||||
| Hancock Hospital Finance Authority, Revenue | ||||||||||
| (Portage Health, Inc.) (LOC; National City Bank) | 3.12 | 3/7/08 | 26,830,000 a | 26,830,000 | ||||||
| Michigan Building Authority, Multi-Modal Revenue | ||||||||||
| (Facilities Program) (LOC; JPMorgan Chase Bank) | 3.40 | 3/7/08 | 18,500,000 a | 18,500,000 | ||||||
| Minnesota—3.7% | ||||||||||
| Minneapolis, Health Care Revenue, Refunding | ||||||||||
| (Fairview Health Services) (Insured; AMBAC | ||||||||||
| and Liquidity Facility; Royal Bank of Canada) | 9.00 | 3/7/08 | 19,900,000 a | 19,900,000 | ||||||
| Saint Louis Park, Health Care Facilities Revenue | ||||||||||
| (Park Nicollet Health Services) (Insured; | ||||||||||
| AMBAC and Liquidity Facility; Wells Fargo Bank) | 9.00 | 3/7/08 | 11,800,000 a | 11,800,000 | ||||||
12
| BNY Mellon National Municipal Money Market Fund (continued) | ||||||||||
| Coupon | Maturity | Principal | ||||||||
| Short-Term Investments (continued) | Rate (%) | Date | Amount ($) | Value ($) | ||||||
| Minnesota (continued) | ||||||||||
| Saint Louis Park, Health Care Facilities Revenue, Refunding | ||||||||||
| (Park Nicollet Health Services) (Insured; AMBAC | ||||||||||
| and Liquidity Facility; Wells Fargo Bank) | 9.00 | 3/7/08 | 20,000,000 a | 20,000,000 | ||||||
| Mississippi—2.5% | ||||||||||
| Jackson County, PCR, Refunding (Chevron U.S.A. Inc. Project) | 3.25 | 3/1/08 | 5,400,000 a | 5,400,000 | ||||||
| Jackson County, Port Facility Revenue, | ||||||||||
| Refunding (Chevron U.S.A. Inc. Project) | 3.65 | 3/1/08 | 3,000,000 a | 3,000,000 | ||||||
| Mississippi Business Finance Corporation, Gulf | ||||||||||
| Opportunity Zone IDR (Chevron U.S.A. Inc. Project) | 3.25 | 3/7/08 | 7,000,000 a | 7,000,000 | ||||||
| Mississippi Business Finance Corporation, Health Care Facilities | ||||||||||
| Revenue (Rush Medical Foundation Project) (LOC; Regions Bank) | 3.20 | 3/7/08 | 19,400,000 a | 19,400,000 | ||||||
| Missouri—.3% | ||||||||||
| Missouri Health and Educational Facilities Authority, | ||||||||||
| Health Facilities Revenue (SSM Health Care) | ||||||||||
| (Insured; FSA and Liquidity Facility; UBS AG) | 3.25 | 3/1/08 | 4,160,000 a | 4,160,000 | ||||||
| Nebraska—1.2% | ||||||||||
| Lancaster County Hospital Authority Number 1, | ||||||||||
| Health Facilities Revenue (Immanuel Health | ||||||||||
| Systems-Williamsburg Project) (LOC; ABN-AMRO) | 3.50 | 3/1/08 | 16,145,000 a | 16,145,000 | ||||||
| Nevada—.2% | ||||||||||
| Clark County, Sales and Excise Tax Revenue, CP | ||||||||||
| (LOC: California State Teachers Retirement | ||||||||||
| System and State Street Bank and Trust Co.) | 2.30 | 5/8/08 | 2,500,000 | 2,500,000 | ||||||
| New Jersey—1.1% | ||||||||||
| New Jersey Transportation Trust Fund Authority (Transportation | ||||||||||
| System) (Insured; AMBAC and Liquidity Facility; Citibank NA) | 4.38 | 3/7/08 | 15,535,000 a,c | 15,535,000 | ||||||
| New Mexico—.5% | ||||||||||
| Farmington, PCR, Refunding (Arizona Public Service | ||||||||||
| Company Four Corners Project) (LOC; Barclays Bank PLC) | 3.25 | 3/1/08 | 6,700,000 a | 6,700,000 | ||||||
| New York—7.0% | ||||||||||
| Metropolitan Transportation Authority, | ||||||||||
| Dedicated Tax Fund Bonds (Insured; FSA and | ||||||||||
| Liquidity Facility; Dexia Credit Locale) | 3.10 | 3/7/08 | 32,200,000 a | 32,200,000 | ||||||
| Metropolitan Transportation Authority, | ||||||||||
| Transportation Revenue (LOC; BNP Paribas) | 3.95 | 3/1/08 | 4,400,000 a | 4,400,000 | ||||||
| New York City (LOC; Bayerische Landesbank) | 3.05 | 3/1/08 | 5,900,000 a | 5,900,000 | ||||||
| New York City (LOC; JPMorgan Chase Bank) | 3.75 | 3/1/08 | 2,100,000 a | 2,100,000 | ||||||
| New York City (LOC; KBC Bank) | 3.10 | 3/1/08 | 8,130,000 a | 8,130,000 | ||||||
| New York City Transitional Finance Authority, Future Tax | ||||||||||
| Secured Revenue (Liquidity Facility; Bayerische Landesbank) | 4.00 | 3/1/08 | 25,000,000 a | 25,000,000 | ||||||
| Triborough Bridge and Tunnel Authority, | ||||||||||
| General Revenue, Refunding (Liquidity Facility; | ||||||||||
| Landesbank Baden-Wurttemberg) | 2.85 | 3/7/08 | 19,900,000 a | 19,900,000 | ||||||
The Funds 13
STATEMENT OF INVESTMENTS (Unaudited) (continued)
| BNY Mellon National Municipal Money Market Fund (continued) | ||||||||||
| Coupon | Maturity | Principal | ||||||||
| Short-Term Investments (continued) | Rate (%) | Date | Amount ($) | Value ($) | ||||||
| North Carolina—1.4% | ||||||||||
| New Hanover County, HR, Refunding (New Hanover Regional | ||||||||||
| Medical Center) (Insured; FSA and Liquidity Facility; Wachovia Bank) | 3.05 | 3/7/08 | 19,100,000 a | 19,100,000 | ||||||
| Ohio—4.0% | ||||||||||
| Cleveland-Cuyahoga County Port Authority, | ||||||||||
| Cultural Facility Revenue (Cleveland Museum | ||||||||||
| of Art Project) (Liquidity Facility; JPMorgan Chase Bank) | 3.06 | 3/7/08 | 20,000,000 a | 20,000,000 | ||||||
| Cuyahoga County, Hospital Improvement Revenue, Refunding | ||||||||||
| (The Metrohealth System Project) (LOC; National City Bank) | 3.16 | 3/7/08 | 18,400,000a | 18,400,000 | ||||||
| Delaware County, Health Care Facilities Revenue (Willow Brook | ||||||||||
| Christian Communities Project) (LOC; Fifth Third Bank) | 3.20 | 3/7/08 | 7,250,000 a | 7,250,000 | ||||||
| Warren County, Health Care Facilities Improvement | ||||||||||
| Revenue (Otterbein Homes Project) (LOC; U.S. Bank NA) | 3.35 | 3/7/08 | 10,000,000 a | 10,000,000 | ||||||
| Pennsylvania—3.5% | ||||||||||
| Delaware County Industrial Development Authority, PCR | ||||||||||
| (PECO Energy Company Project) (LOC; Wachovia Bank) | 4.00 | 3/1/08 | 3,050,000 a | 3,050,000 | ||||||
| Delaware County Industrial Development Authority, | ||||||||||
| PCR, Refunding (BP Exploration and Oil Inc. Project) | 3.45 | 3/1/08 | 2,300,000 a | 2,300,000 | ||||||
| Lancaster County, GO Notes (Insured; FSA | ||||||||||
| and Liquidity Facility; Royal Bank of Canada) | 3.24 | 3/7/08 | 22,615,000 a | 22,615,000 | ||||||
| Northampton County General Purpose | ||||||||||
| Authority, Revenue (Lafayette College) | 3.35 | 12/1/08 | 6,430,000 | 6,430,000 | ||||||
| Westmoreland County Industrial Development Authority, Health | ||||||||||
| System Revenue (Excela Health Project) (LOC; Wachovia Bank) | 3.04 | 3/7/08 | 14,140,000 a | 14,140,000 | ||||||
| South Carolina—1.4% | ||||||||||
| Greenville County School District, GO Notes | 4.00 | 6/2/08 | 20,000,000 | 20,030,755 | ||||||
| Tennessee—5.3% | ||||||||||
| Chattanooga Health Educational and Housing Facility Board, | ||||||||||
| HR, Refunding (Siskin Hospital for Physical | ||||||||||
| Rehabilitation, Inc. Project) (LOC; Bank of America) | 3.65 | 3/1/08 | 4,800,000 a | 4,800,000 | ||||||
| Clarksville Public Building Authority, Financing Revenue | ||||||||||
| (City of Murfreesboro Loan) (LOC; SunTrust Bank) | 3.25 | 3/7/08 | 6,000,000 a | 6,000,000 | ||||||
| Clarksville Public Building Authority, Pooled Financing Revenue | ||||||||||
| (Tennessee Municipal Bond Fund) (LOC; Bank of America) | 3.65 | 3/1/08 | 15,000,000 a | 15,000,000 | ||||||
| Shelby County, GO Notes, Refunding | ||||||||||
| (Liquidity Facility; Dexia Credit Locale) | 3.16 | 3/7/08 | 48,800,000 a | 48,800,000 | ||||||
| Texas—8.0% | ||||||||||
| Brownsville, Utilities System Improvement Revenue, | ||||||||||
| Refunding (Insured; AMBAC and Liquidity Facility; Citigroup) | 3.72 | 3/7/08 | 17,250,000 a,c | 17,250,000 | ||||||
| Lower Colorado River Authority, Improvement Revenue, | ||||||||||
| Refunding (Insured; MBIA and Liquidity Facility; | ||||||||||
| Landesbank Hessen-Thuringen Girozentrale) | 3.21 | 3/7/08 | 18,645,000 a | 18,645,000 | ||||||
| Southwest Higher Education Authority, Inc., Higher Education | ||||||||||
| Revenue (Southern Methodist University Project) | ||||||||||
| (LOC; Landesbank Hessen-Thuringen Girozentrale) | 3.50 | 3/1/08 | 5,765,000 a | 5,765,000 | ||||||
14
| BNY Mellon National Municipal Money Market Fund (continued) | ||||||||||
| Coupon | Maturity | Principal | ||||||||
| Short-Term Investments (continued) | Rate (%) | Date | Amount ($) | Value ($) | ||||||
| Texas (continued) | ||||||||||
| Texas Department of Transportation, State Highway Fund Revenue, CP | 3.02 | 3/5/08 | 20,000,000 | 20,000,000 | ||||||
| Texas Turnpike Authority, Central Texas Turnpike | ||||||||||
| System, First Tier Revenue (Insured; AMBAC | ||||||||||
| and Liquidity Facility; Bayerische Landesbank) | 6.25 | 3/7/08 | 15,840,000 a,c | 15,840,000 | ||||||
| Travis County Health Facilities Development Corporation, Retirement | ||||||||||
| Facilities Revenue (Longhorn Village Project) (LOC; Bank of Scotland) | 3.35 | 3/7/08 | 34,600,000 a | 34,600,000 | ||||||
| Utah—.8% | ||||||||||
| Wasatch County School District Board of Education, | ||||||||||
| GO School Building Bonds (Putters Program) (Liquidity Facility; | ||||||||||
| JPMorgan Chase Bank and LOC; Utah School Guaranty Program) | 3.41 | 3/7/08 | 10,995,000 a,c | 10,995,000 | ||||||
| Vermont—1.1% | ||||||||||
| Vermont Educational and Health Buildings Financing Agency, | ||||||||||
| HR (Mount Ascutney Hospital Project) (LOC; TD Banknorth) | 3.50 | 3/1/08 | 3,100,000 a | 3,100,000 | ||||||
| Vermont Housing Finance Agency, Student Housing Facilities | ||||||||||
| Revenue (West Block University of Vermont | ||||||||||
| Apartments Project) (LOC; Bank of Nova Scotia) | 3.19 | 3/7/08 | 12,075,000 a | 12,075,000 | ||||||
| Washington—2.3% | ||||||||||
| Seattle Housing Authority, Low Income Housing Assistance | ||||||||||
| Revenue (Foss Home Project) (LOC; Wells Fargo Bank) | 3.04 | 3/7/08 | 3,805,000 a | 3,805,000 | ||||||
| Washington Housing Finance Commission, Nonprofit | ||||||||||
| Revenue (Seattle Art Museum Project) (LOC; Allied Irish Banks) | 3.15 | 3/1/08 | 7,300,000 a | 7,300,000 | ||||||
| Washington Public Power Supply System, Electric Revenue, | ||||||||||
| Refunding (Project Number 1 and 3) (LOC; Bank of America) | 2.98 | 3/7/08 | 20,680,000 a | 20,680,000 | ||||||
| Wyoming—2.5% | ||||||||||
| Uinta County, PCR, Refunding (Chevron U.S.A. Inc. Project) | 3.25 | 3/1/08 | 34,545,000 a | 34,545,000 | ||||||
| Total Investments (cost $1,379,091,964) | 98.6% | 1,379,091,964 | ||||||||
| Cash and Receivables (Net) | 1.4% | 20,135,163 | ||||||||
| Net Assets | 100.0% | 1,399,227,127 | ||||||||
| a Securities payable on demand.Variable interest rate—subject to periodic change. |
| b This security is prerefunded; the date shown represents the prerefunded date. Bonds which are prerefunded are collateralized by U.S. Government securities which are held in escrow |
| and are used to pay principal and interest on the municipal issue and to retire the bonds in full at the earliest refunding date. |
| c Securities exempt from registration under Rule 144A of the Securities Act of 1933.These securities may be resold in transactions exempt from registration, normally to qualified |
| institutional buyers. At February 29, 2008, these securities amounted to $93,900,000 or 6.7% of net assets. |
The Funds 15
STATEMENT OF INVESTMENTS (Unaudited) (continued)
| Summary of Abbreviations | ||||||
| ACA | American Capital Access | AGC | ACE Guaranty Corporation | |||
| AGIC | Asset Guaranty Insurance Company | AMBAC | American Municipal Bond Assurance Corporation | |||
| ARRN | Adjustable Rate Receipt Notes | BAN | Bond Anticipation Notes | |||
| BIGI | Bond Investors Guaranty Insurance | BPA | Bond Purchase Agreement | |||
| CGIC | Capital Guaranty Insurance Company | CIC | Continental Insurance Company | |||
| CIFG | CDC Ixis Financial Guaranty | CMAC | Capital Market Assurance Corporation | |||
| COP | Certificate of Participation | CP | Commercial Paper | |||
| EDR | Economic Development Revenue | EIR | Environmental Improvement Revenue | |||
| FGIC | Financial Guaranty Insurance Company | FHA | Federal Housing Administration | |||
| FHLB | Federal Home Loan Bank | FHLMC | Federal Home Loan Mortgage Corporation | |||
| FNMA | Federal National Mortgage Association | FSA | Financial Security Assurance | |||
| GAN | Grant Anticipation Notes | GIC | Guaranteed Investment Contract | |||
| GNMA | Government National Mortgage Association | GO | General Obligation | |||
| HR | Hospital Revenue | IDB | Industrial Development Board | |||
| IDC | Industrial Development Corporation | IDR | Industrial Development Revenue | |||
| LOC | Letter of Credit | LOR | Limited Obligation Revenue | |||
| LR | Lease Revenue | MBIA | Municipal Bond Investors | |||
| Assurance Insurance Corporation | ||||||
| MFHR | Multi-Family Housing Revenue | MFMR | Multi-Family Mortgage Revenue | |||
| PCR | Pollution Control Revenue | PILOT | Payment in Lieu of Taxes | |||
| RAC | Revenue Anticipation Certificates | RAN | Revenue Anticipation Notes | |||
| RAW | Revenue Anticipation Warrants | RRR | Resources Recovery Revenue | |||
| SAAN | State Aid Anticipation Notes | SBPA | Standby Bond Purchase Agreement | |||
| SFHR | Single Family Housing Revenue | SFMR | Single Family Mortgage Revenue | |||
| SONYMA | State of New York Mortgage Agency | SWDR | Solid Waste Disposal Revenue | |||
| TAN | Tax Anticipation Notes | TAW | Tax Anticipation Warrants | |||
| TRAN | Tax and Revenue Anticipation Notes | XLCA | XL Capital Assurance | |||
| Summary of Combined Ratings (Unaudited) | ||||||||||
| Fitch | or | Moody’s | or | Standard & Poor’s | Value (%)† | |||||
| F1+,F1 | VMIG1,MIG1,P1 | SP1+,SP1,A1+,A1 | 92.4 | |||||||
| AAA,AA,A d | Aaa,Aa,A d | AAA,AA,A d | 7.6 | |||||||
| 100.0 | ||||||||||
| † | Based on total investments. | |
| d | Notes which are not F, MIG and SP rated are represented by bond ratings of the issuers. | |
| See notes to financial statements. | ||
16
| STATEMENT OF ASSETS AND LIABILITIES |
| February 29, 2008 (Unaudited) |
| BNY Mellon | BNY Mellon | |||
| Money Market | National Municipal | |||
| Fund | Money Market Fund | |||
| Assets ($): | ||||
| Investments in securities—See Statement of Investments+ | 1,171,529,966 | 1,379,091,964 | ||
| Cash | — | 15,605,056 | ||
| Interest receivable | 4,427,849 | 4,734,879 | ||
| Prepaid expenses | 22,695 | 25,550 | ||
| 1,175,980,510 | 1,399,457,449 | |||
| Liabilities ($): | ||||
| Due to The Dreyfus Corporation and affiliates—Note 4(b) | 155,934 | 41,165 | ||
| Due to Administrator—Note 4(a) | 115,235 | 147,511 | ||
| Cash overdraft due to Custodian | 6,291,546 | — | ||
| Accrued expenses | 41,131 | 41,646 | ||
| 6,603,846 | 230,322 | |||
| Net Assets ($) | 1,169,376,664 | 1,399,227,127 | ||
| Composition of Net Assets ($): | ||||
| Paid-in capital | 1,169,361,811 | 1,399,207,394 | ||
| Accumulated net realized gain (loss) on investments | 14,853 | 19,733 | ||
| Net Assets ($) | 1,169,376,664 | 1,399,227,127 | ||
| Net Asset Value Per Share | ||||
| Class M Shares | ||||
| Net Assets ($) | 1,168,029,434 | 1,399,226,033 | ||
| Shares Outstanding | 1,168,014,600 | 1,399,207,214 | ||
| Net Asset Value Per Share ($) | 1.00 | 1.00 | ||
| Investor Shares | ||||
| Net Assets ($) | 1,347,230 | 1,094 | ||
| Shares Outstanding | 1,347,211 | 1,094 | ||
| Net Asset Value Per Share ($) | 1.00 | 1.00 | ||
| † Investments at cost ($) | 1,171,529,966 | 1,379,091,964 |
See notes to financial statements.
The Funds 17
| STATEMENT OF OPERATIONS |
| February 29, 2008 (Unaudited) |
| BNY Mellon | BNY Mellon | |||
| Money Market | National Municipal | |||
| Fund | Money Market Fund | |||
| Investment Income ($): | ||||
| Interest Income | 23,706,668 | 19,430,148 | ||
| Expenses: | ||||
| Investment advisory fee—Note 4(a) | 727,368 | 905,265 | ||
| Administration fee—Note 4(a) | 618,307 | 769,555 | ||
| Custodian fees—Note 4(b) | 29,091 | 46,249 | ||
| Registration fees | 22,824 | 32,448 | ||
| Professional fees | 20,442 | 12,765 | ||
| Trustees’ fees and expenses—Note 4(c) | 14,878 | 16,693 | ||
| Shareholder servicing costs—Note 4(b) | 1,804 | 133 | ||
| Prospectus and shareholders’ reports | 1,059 | 742 | ||
| Miscellaneous | 10,651 | 15,819 | ||
| Total Expenses | 1,446,424 | 1,799,669 | ||
| Less-expense reduction in fees | ||||
| due to earnings credits—Note 2(b) | (10,648) | (160,692) | ||
| Net Expenses | 1,435,776 | 1,638,977 | ||
| Investment Income —Net | 22,270,892 | 17,791,171 | ||
| Net realized Gain (Loss) on Investments—Note 2(b) ($) | 15,900 | 13,740 | ||
| Net Increase in Net Assets Resulting from Operations | 22,286,792 | 17,804,911 |
See notes to financial statements.
18
STATEMENT OF CHANGES IN NET ASSETS
| BNY Mellon National | ||||||||
| BNY Mellon Money Market Fund | Municipal Money Market Fund | |||||||
| Six Months Ended | Six Months Ended | |||||||
| February 29, 2008 | Year Ended | February 29, 2008 | Year Ended | |||||
| (Unaudited) | August 31, 2007 | (Unaudited) | August 31, 2007 | |||||
| Operations ($): | ||||||||
| Investment income—net | 22,270,892 | 40,669,866 | 17,791,171 | 31,063,584 | ||||
| Net realized gain (loss) from investments | 15,900 | — | 13,740 | 10,881 | ||||
| Net Increase (Decrease) in Net Assets | ||||||||
| Resulting from Operations | 22,286,792 | 40,669,886 | 17,804,911 | 31,074,465 | ||||
| Dividends to Shareholders from ($): | ||||||||
| Investment income—net: | ||||||||
| Class M Shares | (22,241,985) | (40,620,276) | (17,791,156) | (31,060,143) | ||||
| Investor Shares | (28,907) | (49,610) | (15) | (3,441) | ||||
| Total Dividends | (22,270,892) | (40,669,886) | (17,791,171) | (31,063,584) | ||||
| Beneficial Interest Transactions ($1.00 per share): | ||||||||
| Net proceeds from shares sold: | ||||||||
| Class M Shares | 1,069,971,130 | 1,629,857,060 | 1,444,019,333 | 2,013,809,020 | ||||
| Investor Shares | 170,719 | 768,283 | — | 802,269 | ||||
| Dividends reinvested: | ||||||||
| Class M Shares | 17 | 5 | — | 3 | ||||
| Investor Shares | 28,906 | 49,602 | 15 | 2,907 | ||||
| Cost of shares redeemed: | ||||||||
| Class M Shares | (745,199,587) | (1,541,341,988) | (985,064,155) | (1,808,087,468) | ||||
| Investor Shares | (206,430) | (353,581) | — | (805,143) | ||||
| Increase (Decrease) in Net Assets from | ||||||||
| Beneficial Interest Transactions | 324,764,755 | 88,979,381 | 458,955,193 | 205,721,588 | ||||
| Total Increase (Decrease) In Net Assets | 324,780,655 | 88,979,381 | 458,968,933 | 205,732,469 | ||||
| Net Assets ($): | ||||||||
| Beginning of Period | 844,596,009 | 755,616,628 | 940,258,194 | 734,525,725 | ||||
| End of Period | 1,169,376,664 | 844,596,009 | 1,399,227,127 | 940,258,194 | ||||
See notes to financial statements.
The Funds 19
FINANCIAL HIGHLIGHTS
The following tables describe the performance for each share class for the fiscal periods indicated.All information reflects financial results for a single fund share. Total return shows how much your investment in the fund would have increased (or decreased) during each period, assuming you had reinvested all dividends and distributions. These figures have been derived from the fund’s financial statements.
| Class M Shares | ||||||||||||
| Six Months Ended | ||||||||||||
| February 29, 2008 | Year Ended August 31, | |||||||||||
| BNY Mellon Money Market Fund | (Unaudited) | 2007 | 2006 | 2005 | 2004 | 2003 a | ||||||
| Per Share Data ($): | ||||||||||||
| Net asset value, beginning of period | 1.00 | 1.00 | 1.00 | 1.00 | 1.00 | 1.00 | ||||||
| Investment Operations: | ||||||||||||
| Investment income—net | .023 | .050 | .043 | .023 | .008 | .002 | ||||||
| Distributions: | ||||||||||||
| Dividends from investment income—net | (.023) | (.050) | (.043) | (.023) | (.008) | (.002) | ||||||
| Net asset value, end of period | 1.00 | 1.00 | 1.00 | 1.00 | 1.00 | 1.00 | ||||||
| Total Return (%) | 4.67b | 5.16 | 4.35 | 2.30 | .82 | .76b | ||||||
| Ratios/Supplemental Data (%): | ||||||||||||
| Ratio of total expenses to average net assets | .30b | .30 | .31 | .31 | .33 | .36b | ||||||
| Ratio of net expenses to average net assets | .30b,c | .30c | .31 | .31 | .33 | .36b | ||||||
| Ratio of net investment income | ||||||||||||
| to average net assets | 4.59b | 5.04 | 4.29 | 2.36 | .82 | .78b | ||||||
| Net Assets, end of period ($ x 1,000) | 1,168,029 | 843,242 | 754,727 | 678,569 | 471,723 | 388,979 | ||||||
| a | From June 2, 2003 (commencement of operations) to August 31, 2003. | |
| b | Annualized. | |
| c | The difference for the period represents less than .01%. | |
| See notes to financial statements. | ||
20
| Investor Shares | ||||||||||||
| Six Months Ended | ||||||||||||
| February 29, 2008 | Year Ended August 31, | |||||||||||
| BNY Mellon Money Market Fund | (Unaudited) | 2007 | 2006 | 2005 | 2004 | 2003 a | ||||||
| Per Share Data ($): | ||||||||||||
| Net asset value, beginning of period | 1.00 | 1.00 | 1.00 | 1.00 | 1.00 | 1.00 | ||||||
| Investment Operations: | ||||||||||||
| Investment income—net | .022 | .048 | .040 | .020 | .006 | .001 | ||||||
| Distributions: | ||||||||||||
| Dividends from investment income—net | (.022) | (.048) | (.040) | (.020) | (.006) | (.001) | ||||||
| Net asset value, end of period | 1.00 | 1.00 | 1.00 | 1.00 | 1.00 | 1.00 | ||||||
| Total Return (%) | 4.41b | 4.89 | 4.09 | 2.05 | .57 | .52b | ||||||
| Ratios/Supplemental Data (%): | ||||||||||||
| Ratio of total expenses to average net assets | .55b | .55 | .56 | .57 | .64 | .62b | ||||||
| Ratio of net expenses to average net assets | .55b,c | .55c | .56 | .57 | .64 | .62b | ||||||
| Ratio of net investment income | ||||||||||||
| to average net assets | 4.39b | 4.80 | 4.09 | 2.20 | .79 | .48b | ||||||
| Net Assets, end of period ($ x 1,000) | 1,347 | 1,354 | 890 | 640 | 213 | 11 | ||||||
| a | From June 2, 2003 (commencement of operations) to August 31, 2003. | |
| b | Annualized. | |
| c | The difference for the period represents less than .01%. | |
| See notes to financial statements. | ||
The Funds 21
FINANCIAL HIGHLIGHTS (continued)
| Class M Shares | ||||||||||||
| Six Months Ended | ||||||||||||
| February 29, 2008 | Year Ended August 31, | |||||||||||
| BNY Mellon National Municipal Money Market Fund | (Unaudited) | 2007 | 2006 | 2005 | 2004 | 2003 a | ||||||
| Per Share Data ($): | ||||||||||||
| Net asset value, beginning of period | 1.00 | 1.00 | 1.00 | 1.00 | 1.00 | 1.00 | ||||||
| Investment Operations: | ||||||||||||
| Investment income—net | .015 | .033 | .028 | .017 | .007 | .002 | ||||||
| Distributions: | ||||||||||||
| Dividends from investment income—net | (.015) | (.033) | (.028) | (.017) | (.007) | (.002) | ||||||
| Net asset value, end of period | 1.00 | 1.00 | 1.00 | 1.00 | 1.00 | 1.00 | ||||||
| Total Return (%) | 3.03b | 3.40 | 2.88 | 1.68 | .70 | .64b | ||||||
| Ratios/Supplemental Data (%): | ||||||||||||
| Ratio of total expenses to average net assets | .30b | .30 | .32 | .32 | .33 | .35b | ||||||
| Ratio of net expenses to average net assets | .27b | .30c | .31 | .32c | .33 | .35b | ||||||
| Ratio of net investment income | ||||||||||||
| to average net assets | 2.95b | 3.35 | 2.86 | 1.68 | .71 | .62b | ||||||
| Net Assets, end of period ($ x 1,000) | 1,399,226 | 940,257 | 734,525 | 613,375 | 488,926 | 265,068 | ||||||
| a | From June 2, 2003 (commencement of operations) to August 31, 2003. | |
| b | Annualized. | |
| c | The difference for the period represents less than .01%. | |
| See notes to financial statements. | ||
22
| Investor Shares | ||||||||||||
| Six Months Ended | ||||||||||||
| February 29, 2008 | Year Ended August 31, | |||||||||||
| BNY Mellon National Municipal Money Market Fund | (Unaudited) | 2007 | 2006 | 2005 | 2004 | 2003 a | ||||||
| Per Share Data ($): | ||||||||||||
| Net asset value, beginning of period | 1.00 | 1.00 | 1.00 | 1.00 | 1.00 | 1.00 | ||||||
| Investment Operations: | ||||||||||||
| Investment income—net | .014 | .031 | .026 | .014 | .005 | .001 | ||||||
| Distributions: | ||||||||||||
| Dividends from investment income—net | (.014) | (.031) | (.026) | (.014) | (.005) | (.001) | ||||||
| Net asset value, end of period | 1.00 | 1.00 | 1.00 | 1.00 | 1.00 | 1.00 | ||||||
| Total Return (%) | 2.77b | 3.15 | 2.62 | 1.43 | .45 | .36b | ||||||
| Ratios/Supplemental Data (%): | ||||||||||||
| Ratio of total expenses to average net assets | .55b | .56 | .57 | .58 | .60 | .57b | ||||||
| Ratio of net expenses to average net assets | .52b | .55 | .57 | .57 | .60 | .57b | ||||||
| Ratio of net investment income | ||||||||||||
| to average net assets | 2.71b | 3.16 | 2.60 | 1.38 | .58 | .48b | ||||||
| Net Assets, end of period ($ x 1,000) | 1 | 1 | 1 | 1 | 1 | 1 | ||||||
| a | From June 2, 2003 (commencement of operations) to August 31, 2003. | |
| b | Annualized. | |
| See notes to financial statements. | ||
The Funds 23
NOTES TO FINANCIAL STATEMENTS (Unaudited)
NOTE 1—General:
BNY Mellon Funds Trust (the “Trust”) was organized as a Massachusetts business trust which is registered under the Investment Company Act of 1940, as amended (the “Act”), as an open-end management investment company and operates as a series company currently comprised of seventeen series including the following diversified money market funds: BNY Mellon Money Market Fund and BNY Mellon National Municipal Money Market Fund (each, a “fund” and collectively, the “funds”). Effective March 31, 2008, the Trust changed its name from “Mellon Funds Trust” to “BNY Mellon Funds Trust” and each fund added “BNY” to the beginning of its name. BNY Mellon Money Market Fund’s investment objective is to provide investors with as high a level of current income as is consistent with the preservation of capital and the maintenance of liquidity. BNY Mellon National Municipal Money Market Fund’s investment objective is to provide investors with as high a level of current income exempt from federal income tax as is consistent with the preservation of capital and the maintenance of liquidity.
Mellon Fund Advisers, a division of the Dreyfus Corporation (the “Manager” or “Dreyfus) serves as each fund’s investment adviser (“Investment Adviser”). Mellon Bank, N.A. (“Mellon Bank”), an affiliate of Dreyfus, serves as administrator for the funds pursuant to an Administration Agreement with the Trust (the “Administration Agreement”). Mellon Bank has entered into a Sub-Administration Agreement with Dreyfus pursuant to which Mellon Bank pays Dreyfus for performing certain administrative services. Dreyfus and Mellon Bank are wholly-owned subsidiaries of The Bank of New York Mellon Corporation (“BNY Mellon”). MBSC Securities Corporation (the “Distributor”), a wholly-owned subsidiary of Dreyfus, is the distributor of each fund’s shares, which are sold without a sales charge.
The Trust is authorized to issue an unlimited number of shares of beneficial interest, par value $.001 per share, in
each of the Class M and Investor class shares of each fund. Each class of shares has similar rights and privileges, except with respect to the expenses borne by and the shareholder services offered to each class and the shareholder services plan applicable to the Investor shares, the allocation of certain transfer agency costs, and certain voting rights. Income, expenses (other than expenses attributable to a specific class), and realized gains or losses on investments are allocated to each Class of shares based on its relative net assets.
The Trust accounts separately for the assets, liabilities and operations of each series. Expenses directly attributable to each series are charged to that series’ operations; expenses that are applicable to all series are allocated among them on a pro rata basis.
The fund’s financial statements are prepared in accordance with U.S. generally accepted accounting principles, which may require the use of management estimates and assumptions. Actual results could differ from those estimates.
NOTE 2—Significant Accounting Policies:
(a) Portfolio valuation: Investments in securities are valued at amortized cost in accordance with Rule 2a-7 of the Act, which has been determined by the Trust’s Board to represent the fair value of the fund’s investments.
It is the funds’ policy to maintain a continuous net asset value per share of $1.00; the fund has adopted certain investment, portfolio valuation and dividend and distribution policies to enable it to do so. There is no assurance, however, that the fund will be able to maintain a stable net asset value per share of $1.00.
Financial Accounting Standards Board (“FASB”) released Statement of Financial Accounting Standards No. 157 “Fair Value Measurements” (“FAS 157”). FAS 157 establishes an authoritative definition of fair value, sets out a framework for measuring fair value, and requires additional disclosures about fair-value measure-ments.The application of FAS 157 is required for fiscal
24
years beginning after November 15, 2007 and interim periods within those fiscal years. Management does not believe that the application of this standard will have a material impact on the financial statements of the fund.
(b) Securities transactions and investment income:Securities transactions are recorded on a trade date basis. Interest income, adjusted for accretion of discount and amortization of premium on investments, is earned from settlement date and recognized on the accrual basis. Realized gains and losses from securities transactions are recorded on the identified cost basis. Cost of investments represents amortized cost.
The fund has arrangements with the custodian and cash management banks whereby the fund may receive earnings credit when positive cash balances are maintained, which are used to offset custody and cash management fees. For financial reporting purposes, the fund includes net earnings credits as an expense offset in the Statement of Operations.
(c) Repurchase agreements: The funds may engage in repurchase agreement transactions. Under the terms of a typical repurchase agreement, a fund, through its custodian and sub-custodian, takes possession of an underlying debt obligation subject to an obligation of the seller to repurchase, and the fund to resell, the obligation at an agreed-upon price and time, thereby determining the yield during the fund’s holding period.This arrangement results in a fixed rate of return that is not subject to market fluctuations during the fund’s holding period. The value of the collateral is at least equal, at all times, to the total amount of the repurchase obligation, including interest. In the event of a counterparty default, the fund has the right to use the collateral to offset losses incurred.There is potential loss to the fund in the event the fund is delayed or prevented from exercising its rights to dispose of the collateral securities, including the risk of a possible decline in the value of the underlying securities during the period while the fund seeks to
assert its rights. The Investment Adviser reviews the value of the collateral and the creditworthiness of those banks and dealers with which the fund enters into repurchase agreements to evaluate potential risks.
(d) Dividends to shareholders: Dividends payable to shareholders are recorded by the funds on the ex-dividend date.The funds declare dividends daily from investment income-net; such dividends are paid monthly.With respect to each series, dividends from net realized capital gains, if any, are normally declared and paid annually, but the funds may make distributions on a more frequent basis to comply with the distribution requirements of the Internal Revenue Code of 1986, as amended (the “Code”).To the extent that net realized capital gains can be offset by capital losses carryovers of that fund, if any, it is the policy of the fund not to distribute such gains.
(e) Federal income taxes: It is the policy of the BNY Mellon Money Market Fund to continue to qualify as a regulated investment company, if such qualification is in the best interests of its shareholders, by complying with the applicable provisions of the Code, and to make distributions of taxable income sufficient to relieve it from substantially all federal income and excise taxes. It is the policy of the BNY Mellon National Municipal Money Market Fund to continue to qualify as a regulated investment company, which can distribute tax exempt dividends, by complying with the applicable provisions of the Code, and to make distributions of income and net realized capital gain sufficient to relieve it from substantially all federal income and excise taxes. For federal income tax purposes, each series is treated as a single entity for the purpose of determining such qualification.
During the current year, the fund adopted FASB Interpretation No. 48 Accounting for Uncertainty in Income Taxes” (“FIN 48”). FIN 48 provides guidance for how uncertain tax positions should be recognized, measured, presented and disclosed in the financial statements. FIN 48 requires the evaluation of tax positions
The Funds 25
NOTES TO FINANCIAL STATEMENTS (Unaudited) (continued)
taken or expected to be taken in the course of preparing the fund’s tax returns to determine whether the tax positions are more-likely-than-not of being sustained by the applicable tax authority. Tax positions not deemed to meet the “more-likely-than-not” threshold would be recorded as a tax benefit or expense in the current year. Adoption of FIN 48 is required for fiscal years beginning after December 15, 2006 and is to be applied to all open tax years as of the effective date.The adoption of FIN 48 had no impact on the operations of the fund for the period ended February 29, 2008.
Each of the tax years in the three-year period ended August 31, 2007, remains subject to examination by the Internal Revenue Service and state taxing authorities.
BNY Mellon Money Market Fund has an unused capital loss carryover of $1,047 available for Federal income tax purposes to be applied against future net securities profits, if any, realized subsequent to August 31, 2007. If not applied, $540 of the carryover expires in fiscal 2012, $56 expires in fiscal 2013 and $451 expires in fiscal 2014.
The tax characters of distributions paid to shareholders during the fiscal year ended August 31, 2007 were all ordinary income for the BNY Mellon Money Market Fund and all tax exempt income for the BNY Mellon National Municipal Money Market Fund.The tax character of current year distributions will be determined at the end of the current fiscal year.
At February 29, 2008, the cost of investments for federal income tax purposes was substantially the same as the cost for financial reporting purposes (see the Statement of Investments).
NOTE 3—Bank Line of Credit
The funds participate with other Dreyfus-managed funds in a $100 million unsecured line of credit primarily to be utilized for temporary or emergency purposes, including the financing of redemptions. Interest is charged to the fund based on prevailing market rates in effect at the time of borrowings.
NOTE 4—Investment Advisory Fee, Administration
Fee and Other Transactions With Affiliates:
(a) Fees payable by the funds pursuant to the provisions of an Investment Advisory Agreement with the Investment Adviser are payable monthly, computed on the average daily value of each fund’s net assets at the following annual rates: .15% of the BNY Mellon Money Market Fund and .15% of the BNY Mellon National Municipal Money Market Fund.
Pursuant to the Administration Agreement with Mellon Bank, Mellon provides or arranges for fund accounting, transfer agency and other fund administration services and receives a fee based on the total net assets of the Trust based on the following rates:
| 0 up to $6 billion | .15% | |
| In excess of $6 billion up to $12 billion | .12% | |
| In excess of $12 billion | .10% |
Mellon Bank has entered into a Sub-Administration Agreement with Dreyfus pursuant to which Mellon Bank pays Dreyfus for performing certain administrative services.
(b) The funds have adopted a Shareholder Services Plan with respect to its Investor shares pursuant to which each fund pays the Distributor for the provision of certain services to holders of Investor shares a fee at an annual rate of .25% of the value of the average daily net assets attributable to Investor shares. The services provided may include personal services relating to shareholder accounts, such as answering shareholder inquiries regarding a fund, and providing reports and other information, and services related to the maintenance of such shareholder accounts. The Shareholder Services Plan allows the Distributor to make payments from the shareholder services fees it collects from each fund to compensate service agents (certain banks, securities brokers or dealers and other financial institutions) in respect of these services. Table 1 summarizes the amounts Investor shares were charged during the period ended February 29, 2008, pursuant to the Shareholder Services Plan.
| 26 |
| Table 1. | ||
| BNY Mellon Money Market Fund | $1,647 | |
| BNY Mellon National Municipal | ||
| Money Market Fund | $ 1 |
The funds compensate The Bank of New York, a subsidiary of BNY Mellon and a Dreyfus affiliate, under a cash management agreement for performing cash management services related to fund subscriptions and redemptions. Table 2 summarizes the amounts the funds were charged during the period ended February 29, 2008, pursuant to the cash management agreements.
| Table 2. | ||
| BNY Mellon Money Market Fund | $7 | |
| BNY Mellon National Municipal | ||
| Money Market Fund | $3 |
The funds compensate Mellon Bank, under a cash management agreement for performing cash management services related to fund subscriptions and redemptions. Table 3 summarizes the amounts the funds were charged during the period ended February 29, 2008 pursuant to the cash management agreement.
| Table 3. | ||
| BNY Mellon Money Market Fund | $23 | |
| BNY Mellon National Municipal | ||
| Money Market Fund | $11 |
During the period ended February 29, 2008 each fund was charged $2,411 for services performed by the Chief Compliance Officer.
The funds compensate Mellon Bank, under a Custody Agreement for providing custodial services for the funds. Table 4 summarizes the amounts the funds were charged during the period ended February 29, 2008 pursuant to the custody agreement.
| Table 4. | ||
| BNY Mellon Money Market Fund | $29,091 | |
| BNY Mellon National Municipal | ||
| Money Market Fund | $46,249 |
Table 5 summarizes the components of “Due to The Dreyfus Corporation and affiliates” in the Statement of Assets and Liabilities for each fund.
(c) Each trustee who is not an “affiliated person” as defined in the Act receives from the Trust an annual fee of $48,000 and an attendance fee of $5,000 for each in-person meeting attended and $500 for telephone meetings and is reimbursed for travel and out-of-pocket expenses.
The Chairman of the Trust’s Board receives an additional annual fee of $10,000 and the Chairman of the Trust’s Audit Committee receives an additional annual fee of $8,000.
| Table 5. | ||||||||
| Investment | Shareholder | Chief | ||||||
| Advisory | Services | Custody | Compliance | |||||
| Fees ($) | Plan Fees ($) | Fees ($) | Officer Fees ($) | |||||
| BNY Mellon Money Market Fund | 134,907 | 264 | 16,344 | 4,419 | ||||
| BNY Mellon National Municipal Money Market Fund | 36,746 | — | — | 4,419 | ||||
The Funds 27
For More Information
| BNY Mellon Funds Trust | Custodian | |
| c/o The Dreyfus Corporation | ||
| 200 Park Avenue | Mellon Bank, N.A. | |
| New York, NY 10166 | One Mellon Bank Center | |
| Pittsburgh, PA 15258 | ||
| Investment Adviser | ||
| Transfer Agent & | ||
| Mellon Fund Advisers, a division of | Dividend Disbursing Agent | |
| The Dreyfus Corporation | ||
| 200 Park Avenue | Dreyfus Transfer, Inc. | |
| New York, NY 10166 | 200 Park Avenue | |
| New York, NY 10166 | ||
| Administrator | ||
| Distributor | ||
| Mellon Bank, N.A. | ||
| One Mellon Bank Center | MBSC Securities Corporation | |
| Pittsburgh, PA 15258 | 200 Park Avenue | |
| New York, NY 10166 | ||
| Sub-Administrator | ||
| The Dreyfus Corporation | ||
| 200 Park Avenue | ||
| New York, NY 10166 | ||
| Ticker Symbols: | ||||
| BNY Mellon Money Market Fund | Class M: MLMXX | Investor: MLOXX | ||
| BNY Mellon National Municipal Money Market Fund | Class M: MOMXX | Investor: MNTXX |
Telephone Wealth Management (WM) Clients, please contact your Account Officer or call 1-888-281-7350.
Brokerage Clients of BNY Mellon Wealth Advisors (BNYMWA), please contact your financial representative
or call 1-800-830-0549, Option 2. Individual Account holders, please call Dreyfus at 1-800-645-6561.
Mail WM Clients, write to your Account Officer, c/o Mellon Bank, N.A., One Mellon Bank Center, Pittsburgh, PA 15258
BNYMWA Brokerage Clients, write to your financial representative, P.O. Box 9012, Hicksville, NY 11802–9012
Individual Account Holders, write to: BNY Mellon Funds, P.O. Box 55268, Boston, MA 02205–8502
The funds file their complete schedule of portfolio holdings with the Securities and Exchange Commission (“SEC”) for the first and third quarters of each fiscal year on Form N-Q. The funds’ Forms N-Q are available on the SEC’s website at http://www.sec.gov and may be reviewed and copied at the SEC’s Public Reference Room in Washington, DC. Information on the operation of the Public Reference Room may be obtained by calling 1-202-551-8090.
Information regarding how the funds voted proxies relating to portfolio securities for the 12-month period ended June 30, 2007, is available on the SEC’s website at http://www.sec.gov and without charge, upon request, by calling 1-800-645-6561.
MFTSA0208-MM
©2008 MBSC Securities Corporation
| Contents | ||
| The Funds | ||
| Letter from the President | 2 | |
| Discussion of Funds’ Performance | ||
| BNY Mellon Bond Fund | 3 | |
| BNY Mellon | ||
| Intermediate Bond Fund | 5 | |
| BNY Mellon Short-Term U.S. | ||
| Government Securities Fund | 7 | |
| Understanding Your Fund’s Expenses | 9 | |
| Comparing Your Fund’s Expenses | ||
| With Those of Other Funds | 9 | |
| Statements of Investments | 10 | |
| Statements of Assets and Liabilities | 22 | |
| Statements of Operations | 23 | |
| Statements of Changes in Net Assets | 24 | |
| Financial Highlights | 26 | |
| Notes to Financial Statements | 32 | |
For More Information
| Back cover |
The views expressed herein are current to the date of this report. These views and the composition of the funds’ portfolios are subject to change at any time based on market and other conditions.
| • Not FDIC-Insured |
| • Not Bank-Guaranteed |
| • May Lose Value |
The Funds

| LETTER FROM |
| THE PRESIDENT |
Dear Shareholder:
We are pleased to present this semiannual report for the BNY Mellon Funds Trust, covering the six-month period from September 1, 2007, through February 29, 2008.
The past six months proved to be one of the more challenging periods for fixed-income investors in recent memory.The U.S. economy sputtered under the weight of plunging housing values, and credit concerns that originated in the U.S. sub-prime mortgage sector spread to other areas of the global financial markets.These developments dampened investor sentiment and produced heightened volatility in many segments of the U.S. bond market. U.S.Treasuries rallied strongly in the continuing “flight to quality,” but some of the higher-yielding market sectors posted sharp price declines.
Recently, the Fed and the U.S. government have adopted accommodative monetary and fiscal policies in an effort to stimulate the U.S. economy, boost market liquidity and forestall a potential recession.While it’s too early to know if their actions will be effective, we believe that the best defense against any economic volatility is to maintain a long-term perspective. To benefit from this focus, talk to your portfolio manager today about your specific portfolio to ensure that your investments are best suited to capture the potential opportunities and manage the risks that may continue to surface during this current economic cycle.
For information about how each fund performed during the reporting period, as well as market perspectives, we have provided a Discussion of Fund Performance.
Thank you for your continued confidence and support.


| DISCUSSION OF |
| FUND PERFORMANCE |
For the period of September 1, 2007, through February 29,
2008, as provided by John F. Flahive, Portfolio Manager
Fund and Market Performance Overview
For the six-month period ended February 29, 2008, BNY Mellon Bond Fund achieved total returns of 5.94% for Class M shares and 5.82% for Investor shares.1 In comparison, the Lehman Brothers U.S. Aggregate Index (the “Index”), the fund’s benchmark, achieved a total return of 5.67% for the same period.2
Although higher yielding sectors of the U.S. bond market were hurt by an intensifying credit crisis during the reporting period, U.S.Treasury securities generally gained value in the resulting “flight to quality,” supporting the Index’s performance compared to other asset classes. The fund produced higher returns than its benchmark, which we attribute to a generally neutral sector allocation strategy, a focus on higher-quality securities and an emphasis on bonds with maturities in the five- to seven-year range.
The Fund’s Investment Approach
The fund seeks total return (consisting of capital appreciation and current income). To pursue its goal, the fund actively manages bond market and maturity exposure and invests at least 80% of its assets in bonds, such as U.S. Treasury and government agency bonds, corporate bonds, mortgage-related securities and foreign corporate and government bonds. The fund’s investments in bonds must be rated investment-grade quality at the time of purchase3 or, if unrated, deemed of comparable quality by the investment adviser. Generally, the average effective duration of the fund’s portfolio will not exceed eight years.
High-Quality Bonds Fared Relatively Well in the
Downturn
The reporting period began amid a credit crisis originating in the sub-prime mortgage market, where an unexpectedly high number of homeowners defaulted on their loans. This development sent shockwaves throughout the financial markets as investors reassessed their attitudes toward risk and began to turn away from all but the highest-quality bonds. The effects of deteriorating investor sentiment were exacerbated by selling pressure from highly leveraged hedge funds and other institutional investors, which were forced to raise cash for redemption requests and margin calls. Market liquidity became increasingly difficult as major banks and bond dealers struggled with massive write-offs.As a result, a broad range of fixed-income markets — from mortgage-backed securities to municipal bonds — suffered sharp price declines.
The riskier segments of the bond market also were adversely affected by a U.S. economic slowdown, as declining housing prices, soaring food and energy costs and a softer job market put pressure on consumer spending. Liquidity injections and aggressive reductions of short-term interest rates by the Federal Reserve Board, as well as a fiscal stimulus package from Congress, have so far helped prevent a market collapse, but have not yet forestalled further economic deterioration.
U.S. government securities proved to be one of the brighter spots in the financial markets during the reporting period. As investors grew more risk averse, they flocked to U.S.Treasury securities and, to a lesser extent, U.S. government agency securities. Prices of these relatively “safe havens”climbed along with investor demand.
The Funds 3
DISCUSSION OF FUND PERFORMANCE (continued)
Adding Value Through Interest Rate Strategies
In this challenging environment, we adopted a sector allocation strategy that was roughly in line with that of the benchmark, which enabled the fund to participate fully in the relative strength of U.S. Treasury securities. We also focused on higher-quality securities, including investment-grade corporate bonds and highly rated mortgage-backed “pass-through” securities that held up relatively well during the economic downturn.The fund held none of the troubled sub-prime or “Alt-A” mortgage-backed securities that were at the epicenter of the credit crisis.
We added a significant amount of value through our interest rate strategies. Because we expected yield differences to narrow as longer-term yields declined more than short-term interest rates, we moved toward a more “bulleted” focus on securities in the five- to seven-year maturity range, which ranked among the main beneficiaries of the U.S.Treasuries rally. On average, we maintained the fund’s average duration in a range we considered in line with to slightly shorter than that of the benchmark. However, we achieved this position through relatively short durations among corporate bonds and slightly long durations among U.S. Treasury securities. This strategy boosted the fund’s exposure to the stronger-performing segments of each market.
Maintaining Caution in a Volatile Market
As of the reporting period’s end, the U.S. economy has continued to deteriorate and the credit crisis has intensi-fied.Therefore, we have maintained a defensive investment posture, including a generally neutral sector allocation strategy, a focus on higher-quality securities and broad diversification among individual issuers. While we have begun to find value-oriented opportunities in higher yielding areas of the bond market, we have held off on taking advantage of them until we see more convincing evidence that the worst of the downturn is behind us. In our judgment, these are prudent strategies in today’s unsettled market environment.
March 17, 2008
| 1 | Total return includes reinvestment of dividends and any capital gains paid. | |
| Past performance is no guarantee of future results. Share price, yield and | ||
| investment return fluctuate such that upon redemption, fund shares may be | ||
| worth more or less than their original cost. | ||
| 2 | SOURCE: LIPPER INC. — Reflects reinvestment of dividends and, where | |
| applicable, capital gain distributions.The Lehman Brothers U.S. Aggregate | ||
| Index is a widely accepted, unmanaged total return index of corporate, U.S. | ||
| government and U.S. government agency debt instruments, mortgage-backed | ||
| securities and asset-backed securities with an average maturity of 1-10 years. | ||
| 3 | The fund may continue to own investment-grade bonds (at the time of | |
| purchase), which are subsequently downgraded to below investment grade. |
4

| DISCUSSION OF |
| FUND PERFORMANCE |
For the period of September 1, 2007, through February 29,
2008, as provided by John F. Flahive, Portfolio Manager
Fund and Market Performance Overview
For the six-month period ended February 29, 2008, BNY Mellon Intermediate Bond Fund achieved total returns of 6.57% for Class M shares and 6.41% for Investor shares.1 In comparison, the Lehman Brothers Intermediate Government/Credit Bond Index (the “Index”), the fund’s benchmark, produced a total return of 6.74% for the same period.2
Although higher yielding sectors of the U.S. bond market were hurt by a credit crisis during the reporting period, U.S.Treasury securities generally gained value in a “flight to quality,”supporting the Index’s performance. The fund produced slightly lower returns than its benchmark, which we attribute to an average duration that was modestly shorter than industry averages.
The Fund’s Investment Approach
The fund seeks total return (consisting of capital appreciation and current income).To pursue its goal, the fund actively manages bond market and maturity exposure and invests at least 80% of its assets in bonds, such as U.S. government and agency bonds, corporate bonds, mortgage-related securities, foreign corporate and government bonds and municipal bonds.The fund’s investments in bonds must be rated investment grade at the time of purchase3 or, if unrated, deemed of comparable quality by the investment adviser. Generally, the fund’s average effective portfolio maturity will be between three and 10 years, and the average effective duration of the fund’s portfolio will be between 2.5 and 5.5 years.
When managing the fund, we use a disciplined process to select securities and manage risk.We generally choose
bonds based on yield, credit quality, the level of interest rates and inflation,general economic and financial trends and our outlook for the securities markets.Our management process also includes computer modeling and scenario testing of possible changes in market conditions.
High-Quality Bonds Fared Relatively Well in the
Downturn
The reporting period began amid a credit crisis originating in the sub-prime mortgage market, which sent shock waves throughout the financial markets as investors reassessed their attitudes toward risk and began to turn away from all but the highest-quality bonds.The effects of deteriorating investor sentiment were exacerbated by selling pressure from highly leveraged hedge funds and other institutional investors. Market liquidity became increasingly difficult as major banks and bond dealers struggled with massive write-offs. As a result, a broad range of fixed-income markets suffered sharp price declines.
The riskier segments of the bond market also were undermined by a U.S. economic slowdown as declining housing prices, soaring energy costs and a softer job market put pressure on consumer spending. Liquidity injections and aggressive reductions of short-term interest rates by the Federal Reserve Board, as well as a fiscal stimulus package from Congress, have so far helped prevent a market collapse, but have not yet forestalled further economic deterioration.
U.S. government securities proved to be one of the brighter spots in the financial markets during the reporting period. As investors grew more risk averse, they flocked to U.S.Treasury securities and, to a lesser extent, U.S. government agency securities. Prices of these relatively “safe havens”climbed along with investor demand.
The Funds 5
DISCUSSION OF FUND PERFORMANCE (continued)
Adding Value Through Interest Rate Strategies
In this challenging environment, we adopted a sector allocation strategy that was roughly in line with that of the benchmark, which enabled the fund to participate fully in the relative strength of U.S. Treasury securities. We also focused on higher-quality securities, including investment-grade corporate bonds and highly rated mortgage-backed “pass-through” securities that held up relatively well during the economic downturn.The fund held none of the troubled sub-prime or “Alt-A” mortgage-backed securities that were at the epicenter of the credit crisis.
However, we maintained an average duration that was slightly shorter than that of the benchmark, which prevented the fund from participating more fully in the rally toward the longer end of the intermediate maturity range.We achieved this position through relatively short durations among corporate bonds and slightly longer durations among U.S. Treasury securities, which helped offset a portion of duration-related weakness. In addition, because we expected yield differences to narrow as longer-term yields declined more than short-term interest rates, we moved toward a more “bulleted” focus on securities in the intermediate maturity range, which contributed positively to the fund’s relative performance.
Maintaining Caution in a Volatile Market
As of the reporting period’s end, the U.S. economy has continued to deteriorate and the credit crisis has inten-sified.Therefore, we have maintained a defensive investment posture, including a generally neutral sector allocation strategy, a focus on higher-quality securities and broad diversification among individual issuers.While we have begun to find value-oriented opportunities in higher yielding areas of the bond market, we have held off on taking advantage of them until we see more convincing evidence that the worst of the downturn is behind us. In our judgment, these are prudent strategies in today’s unsettled market environment.
March 17, 2008
| 1 | Total return includes reinvestment of dividends and any capital gains paid. | |
| Past performance is no guarantee of future results. Share price, yield and | ||
| investment return fluctuate such that upon redemption, fund shares may be | ||
| worth more or less than their original cost. | ||
| 2 | SOURCE: LIPPER INC. – Reflects reinvestment of dividends and, where | |
| applicable, capital gain distributions.The Lehman Brothers Intermediate | ||
| Government/Credit Bond Index is a widely accepted, unmanaged index of | ||
| government and credit bond market performance composed of U.S. government, | ||
| Treasury and agency securities, fixed-income securities and nonconvertible | ||
| investment-grade credit debt, with an average maturity of 1-10 years. Index return | ||
| does not reflect the fees and expenses associated with operating a mutual fund. | ||
| 3 | The fund may continue to own investment-grade bonds (at the time of | |
| purchase), which are subsequently downgraded to below investment grade. |
6

| DISCUSSION OF |
| FUND PERFORMANCE |
For the period of September 1, 2007, through February 29,
2008, as provided by Lawrence R. Dunn, CFA, Portfolio
Manager
Fund and Market Performance Overview
For the six-month period ended February 29, 2008, BNY Mellon Short-Term U.S. Government Securities Fund achieved total returns of 5.40% for Class M shares and 5.26% for Investor shares.1 In comparison, the Lehman Brothers 1-3 Year U.S. Government Index (the “Index”), the fund’s benchmark, achieved a total return of 5.79% for the same period.2
While most asset classes suffered due to an intensifying credit crisis and slowing economic growth, U.S. government securities fared relatively well amid a “flight to quality” among investors. The fund’s returns slightly lagged its benchmark, primarily due to its relatively heavy emphasis on U.S. government agency securities.
The Fund’s Investment Approach
The fund seeks to provide as high a level of current income as is consistent with the preservation of capi-tal.To pursue this goal, the fund invests at least 80% of its assets in securities issued or guaranteed by the U.S. government or its agencies or instrumentalities and in repurchase agreements. The fund may invest up to 35% of its net assets in mortgage-related securities issued by U.S. government agencies or instrumentalities, such as mortgage pass-through securities issued by the Government National Mortgage Association (“Ginnie Mae”), the Federal National Mortgage Association (“Fannie Mae”) and the Federal Home Loan Mortgage Corporation (“Freddie Mac”). The fund may also invest in collateralized mortgage obligations (“CMOs”), including stripped mortgage-backed
securities. Generally, the fund’s average effective portfolio maturity and the average effective duration of the fund’s portfolio will be less than three years.
When choosing securities, we typically first examine U.S. and global economic conditions and other market factors to estimate long- and short-term interest rates. Using a research-driven investment process, we then seek to identify what we believe are potentially profitable sectors before they are widely perceived by the market. We also seek to identify underpriced or mispriced securities that appear likely to perform well over time.
Credit Concerns Intensified as the Economy
Slowed
Mounting credit and economic concerns led to heightened turmoil in most areas of the global fixed-income markets during the reporting period, when turmoil in the U.S. sub-prime mortgage market, faltering housing prices and soaring food and energy prices caused investors to reassess their previously tolerant attitudes toward risk.The Federal Reserve Board (the “Fed”) attempted to promote market liquidity and forestall further economic deterioration by reducing the federal funds rate from 5.25% to 4.75% at its September meeting, its first cut in the overnight rate in more than four years. Investors initially reacted positively to the move, but reports of heavy sub-prime related losses among commercial and investment banks derailed a potential market rebound. The Fed again cut the federal funds rate in October and December, each time by 25 basis points. Still, the fourth quarter of 2007 ended with an annualized economic growth rate of just 0.6%.
The Funds 7
DISCUSSION OF FUND PERFORMANCE (continued)
The opening months of 2008 saw more downbeat economic news, including further erosion of housing prices, additional sub-prime related write-downs by banks and bond insurers, and the first monthly job losses in more than four years.The Fed responded aggressively to the disappointing economic data, reducing the federal funds rate by 125 basis points to 3% in two separate moves during the latter part of January.
U.S. Government Securities Benefited in a Flight
to Quality
Newly cautious investors punished most of the riskier asset classes that previously had done well in the economic expansion, including higher yielding sectors of the bond market. Selling pressure in these areas was exacerbated as hedge funds and other institutional investors were compelled to de-leverage their portfolios. Investors instead flocked to the relative “safe haven” of U.S. government securities, whose prices rose as demand increased.
Within the U.S. government securities market, U.S. Treasury securities fared better than U.S. government agency securities, and yield differences widened along the market’s maturity spectrum when shorter-term bond yields declined more than longer-term interest rates (i.e., a “steepening” of the Treasury yield curve). The fund benefited from the latter development, as widening yield differences were particularly supportive of securities with maturities in the two- to four-year
range, where the fund’s yield curve strategy focused. However, an overweight position in U.S. government agency securities, including short-term, callable mortgage-backed securities, detracted from the fund’s relative performance.
Maintaining Caution in a Volatile Market
The U.S. economy continued to falter, and credit conditions worsened by the reporting period’s end.Therefore, we have generally maintained a defensive investment posture, including an effort to reduce the fund’s exposure to callable U.S. government agency securities that may be relatively sensitive to heightened market volatility.While we have begun to identify value-oriented opportunities among short-term mortgage-backed securities from U.S. government agencies, we have held off on taking advantage of them until we see more convincing evidence that the worst of the downturn is behind us.
March 17, 2008
| 1 | Total return includes reinvestment of dividends and any capital gains paid. | |
| Past performance is no guarantee of future results. Share price, yield and | ||
| investment return fluctuate such that upon redemption, fund shares may be | ||
| worth more or less than their original cost. | ||
| 2 | SOURCE: LIPPER, INC. – Reflects reinvestment of dividends and, where | |
| applicable, capital gain distributions.The Lehman Brothers 1-3 Year U.S. | ||
| Government Index is a widely accepted, unmanaged index of government | ||
| bond market performance composed of U.S.Treasury and agency securities | ||
| with maturities of 1-3 years. Index return does not reflect the fees and | ||
| expenses associated with operating a mutual fund. |
8
UNDERSTANDING YOUR FUND’S EXPENSES (Unaudited)
As a mutual fund investor, you pay ongoing expenses, such as management fees and other expenses. Using the information below, you can estimate how these expenses affect your investment and compare them with the expenses of other funds.You also may pay one-time transaction expenses, including sales charges (loads) and redemption fees, which are not shown in this section and would have resulted in higher total expenses. For more information, see your fund’s prospectus or talk to your financial advisor.
Review your fund’s expenses
The table below shows the expenses you would have paid on a $1,000 investment in each class of each BNY Mellon fixed income fund from September 1, 2007 to February 29, 2008. It also shows how much as $1,000 investment would be worth at the close of the period assuming actual returns and expenses.
| Expenses and Value of a $1,000 Investment | ||||
| assuming actual returns for the six months ended February 29, 2008 | ||||
| Class M Shares | Investor Shares | |||
| BNY Mellon Bond Fund | ||||
| Expenses paid per $1,000 † | $ 2.82 | $ 4.20 | ||
| Ending value (after expenses) | $1,059.40 | $1,058.20 | ||
| BNY Mellon Intermediate Bond Fund | ||||
| Expenses paid per $1,000 † | $ 2.82 | $ 4.11 | ||
| Ending value (after expenses) | $1,065.70 | $1,064.10 | ||
| BNY Mellon Short-Term U.S. Government Securities Fund | ||||
| Expenses paid per $1,000 † | $ 2.81 | $ 4.08 | ||
| Ending value (after expenses) | $1,054.00 | $1,052.60 | ||
COMPARING YOUR FUND’S EXPENSES WITH THOSE OF OTHER FUNDS (Unaudited)
Using the SEC’s method to compare expenses
The Securities and Exchange Commission (SEC) has established guidelines to help investors assess fund expenses. Per these guidelines, the table below shows your fund’s expenses based on a $1,000 investment, assuming a hypothetical 5% annualized return.You can use this information to compare the ongoing expenses (but not transaction expenses or total costs) of investing in the fund with those of other funds. All mutual fund shareholder reports will provide this information to help you make this comparison. Please note that you cannot use this information to estimate your actual ending account balance and expenses paid during the period.
| Expenses and Value of a $1,000 Investment | ||||
| assuming a hypothetical 5% annualized return for the six months ended February 29, 2008 | ||||
| Class M Shares | Investor Shares | |||
| BNY Mellon Bond Fund | ||||
| Expenses paid per $1,000 † | $ 2.77 | $ 4.12 | ||
| Ending value (after expenses) | $1,022.13 | $1,020.79 | ||
| BNY Mellon Intermediate Bond Fund | ||||
| Expenses paid per $1,000 † | $ 2.77 | $ 4.02 | ||
| Ending value (after expenses) | $1,022.13 | $1,020.89 | ||
| BNY Mellon Short-Term U.S. Government Securities Fund | ||||
| Expenses paid per $1,000 † | $ 2.77 | $ 4.02 | ||
| Ending value (after expenses) | $1,022.13 | $1,020.89 | ||
| † Expenses are equal to the BNY Mellon Bond Fund’s annualized expense ratio of .55% for Class M and .82% for Investor shares, BNY Mellon Intermediate Bond Fund ..55% |
| for Class M and .80% for Investor shares and BNY Mellon Short-Term U.S. Government Securities Fund .55% for Class M and .80% for Investor shares, multiplied by the |
| average account value over the period, multiplied by 182/366 (to reflect the one-half year period). |
The Funds 9
| STATEMENT OF INVESTMENTS |
| February 29, 2008 (Unaudited) |
| BNY Mellon Bond Fund | ||||||||||
| Coupon | Maturity | Principal | ||||||||
| Bonds and Notes—99.6% | Rate (%) | Date | Amount ($) | Value ($) | ||||||
| Asset-Backed Ctfs./Auto Receivables—3.6% | ||||||||||
| Franklin Auto Trust, Ser. 2007-1, Cl. A4 | 5.03 | 2/16/15 | 5,865,000 | 6,034,994 | ||||||
| Harley-Davidson Motorcycle Trust, Ser. 2005-3, Cl. A2 | 4.41 | 6/15/12 | 2,365,000 | 2,391,155 | ||||||
| Harley-Davidson Motorcycle Trust, Ser. 2007-1, Cl. A4 | 5.21 | 6/15/13 | 3,715,000 | 3,847,504 | ||||||
| Honda Auto Receivables Owner Trust, Ser. 2007-1, Cl. A4 | 5.09 | 7/18/13 | 1,470,000 | 1,519,575 | ||||||
| Honda Auto Receivables Owner Trust, Ser. 2006-3, Cl. A4 | 5.11 | 4/15/12 | 6,180,000 | 6,371,867 | ||||||
| Household Automotive Trust, Ser. 2007-1, Cl. A4 | 5.33 | 11/17/13 | 4,700,000 | 4,858,466 | ||||||
| Hyundai Auto Receivables Trust, Ser. 2006-B, Cl. A4 | 5.15 | 5/15/13 | 3,600,000 | 3,719,180 | ||||||
| Nissan Auto Lease Trust, Ser. 2006-A, Cl. A4 | 5.10 | 7/16/12 | 7,200,000 | 7,393,789 | ||||||
| 36,136,530 | ||||||||||
| Asset-Backed Ctfs./Home Equity Loans—1.1% | ||||||||||
| CWCapital Cobalt, Ser. 2007-C2, Cl. A2 | 5.33 | 4/15/47 | 4,780,000 | 4,659,492 | ||||||
| JP Morgan Chase Commercial Mortgage | ||||||||||
| Securities, Ser. 2007-CB19, Cl. A2 | 5.75 | 2/12/49 | 1,934,000 a | 1,905,813 | ||||||
| MP Environmental Funding, Ser. 2007-A, Cl. A1 | 4.98 | 7/15/16 | 4,724,236 | 4,615,381 | ||||||
| 11,180,686 | ||||||||||
| Asset-Backed Ctfs./Other—.5% | ||||||||||
| CIT Equipment Collateral, Ser. 2006-VT2, Cl. A4 | 5.05 | 4/20/14 | 2,535,000 | 2,579,041 | ||||||
| CNH Equipment Trust, Ser. 2005-A, Cl. A4B | 4.29 | 6/15/12 | 2,137,162 | 2,144,131 | ||||||
| 4,723,172 | ||||||||||
| Bank & Finance—9.7% | ||||||||||
| AEP Texas Central Transition Funding, Sr. Scd. Bonds, Ser. A-4 | 5.17 | 1/1/18 | 7,090,000 | 7,156,971 | ||||||
| Agua Caliente Band of Cahuilla Indians, Sr. Scd. Notes | 6.08 | 10/1/16 | 2,635,000 b | 2,784,299 | ||||||
| Agua Caliente Band of Cahuilla Indians, Scd. Notes | 6.35 | 10/1/15 | 1,135,000 b | 1,138,178 | ||||||
| Agua Caliente Band of Cahuilla Indians, Sr. Scd. Notes | 6.44 | 10/1/16 | 2,860,000 b | 2,954,094 | ||||||
| AXA Financial, Sr. Notes | 7.75 | 8/1/10 | 5,000,000 | 5,479,545 | ||||||
| Bank of America, Sub. Notes | 5.49 | 3/15/19 | 10,600,000 | 10,410,164 | ||||||
| BankAmerica Capital II, Bank Gtd. Secs., Ser. 2 | 8.00 | 12/15/26 | 6,775,000 | 7,034,381 | ||||||
| Bear Stearns, Notes | 4.50 | 10/28/10 | 2,000,000 | 1,973,644 | ||||||
| Blackrock, Sr. Unsub. Notes | 6.25 | 9/15/17 | 4,885,000 | 5,161,754 | ||||||
| Caterpillar Financial Services, Sr. Unscd. Notes | 5.05 | 12/1/10 | 4,540,000 | 4,761,120 | ||||||
| CIT Group, Sr. Notes | 5.40 | 3/7/13 | 4,100,000 | 3,752,546 | ||||||
| Citigroup, Sr. Unscd. Notes | 6.13 | 11/21/17 | 3,135,000 | 3,224,100 | ||||||
| Countrywide Home Loan, Gtd. Notes, Ser. K | 5.63 | 7/15/09 | 2,855,000 | 2,619,437 | ||||||
| Countrywide Home Loan, Gtd. Notes, Ser. H | 6.25 | 4/15/09 | 1,435,000 c | 1,338,040 | ||||||
| Diageo Finance, Gtd. Notes | 5.50 | 4/1/13 | 3,805,000 | 4,004,158 | ||||||
| Goldman Sachs Group, Sub. Notes | 6.75 | 10/1/37 | 3,980,000 | 3,727,206 | ||||||
| HSBC Finance, Notes | 5.00 | 6/30/15 | 2,410,000 | 2,329,373 | ||||||
| HSBC Holdings, Sub. Notes | 6.50 | 9/15/37 | 4,500,000 | 4,217,931 | ||||||
| International Lease Finance, Sr. Unscd. Notes | 5.75 | 6/15/11 | 5,645,000 | 5,830,359 | ||||||
| John Deere Capital, Sr. Unscd. Notes | 7.00 | 3/15/12 | 4,360,000 | 4,899,410 | ||||||
| JP Morgan Chase & Co., Sr. Unscd. Notes | 5.38 | 10/1/12 | 1,800,000 | 1,892,376 | ||||||
10
| BNY Mellon Bond Fund (continued) | ||||||||||
| Coupon | Maturity | Principal | ||||||||
| Bonds and Notes (continued) | Rate (%) | Date | Amount ($) | Value ($) | ||||||
| Bank & Finance (continued) | ||||||||||
| Morgan Stanley, Sub. Notes | 4.75 | 4/1/14 | 7,210,000 | 6,958,407 | ||||||
| PNC Funding, Bank Gtd. Notes | 4.50 | 3/10/10 | 2,825,000 | 2,885,639 | ||||||
| 96,533,132 | ||||||||||
| Building & Construction—.4% | ||||||||||
| CRH America, Gtd. Notes | 5.30 | 10/15/13 | 4,095,000 | 4,017,424 | ||||||
| Commercial & Professional Services—.9% | ||||||||||
| Seminole Tribe of Florida, Notes | 5.80 | 10/1/13 | 8,840,000 b | 9,362,966 | ||||||
| Commercial Mortgage Pass-Through Ctfs.—4.2% | ||||||||||
| Citigroup/Deutsche Bank Commercial | ||||||||||
| Mortgage Trust, Ser. 2007-CD4, Cl. A2B | 5.21 | 12/11/49 | 3,390,000 | 3,293,208 | ||||||
| Citigroup/Deutsche Bank Commercial | ||||||||||
| Mortgage Trust, Ser. 2006-CD2, Cl. A3 | 5.43 | 1/15/46 | 3,870,000 a | 3,756,647 | ||||||
| Credit Suisse Mortgage Capital Certificates, Ser. 2007-C2, Cl. A2 | 5.45 | 1/15/49 | 4,610,000 a | 4,514,748 | ||||||
| Four Times Square Trust, Ser. 2006-4TS, Cl. A | 5.40 | 12/13/28 | 13,000,000 b | 11,622,242 | ||||||
| LB-UBS Commercial Mortgage Trust, Ser. 2007-C2, Cl. A2 | 5.30 | 2/15/40 | 4,225,000 | 4,117,162 | ||||||
| Merrill Lynch/Countrywide Commercial | ||||||||||
| Mortgage, Ser. 2007-7, Cl. A2 | 5.69 | 6/12/50 | 5,598,000 a | 5,510,011 | ||||||
| Merrill Lynch/Countrywide Commericial | ||||||||||
| Mortgage Trust, Ser. 2007-6, Cl. A2 | 5.33 | 3/12/51 | 3,845,000 | 3,743,141 | ||||||
| WaMu Mortgage Pass Through Certificates, Ser. 2003-S4, Cl. 4A1 | 4.00 | 2/25/32 | 940,230 | 893,594 | ||||||
| WaMu Mortgage Pass Through Certificates, Ser. 2004-AR9, Cl. A6 | 4.14 | 8/25/34 | 4,510,000 a | 4,554,444 | ||||||
| 42,005,197 | ||||||||||
| Foreign/Governmental—1.1% | ||||||||||
| Hydro-Quebec, Gov’t. Gtd. Bonds, Ser. IF | 8.00 | 2/1/13 | 3,920,000 | 4,764,411 | ||||||
| United Mexican States, Notes | 5.63 | 1/15/17 | 4,705,000 c | 4,912,020 | ||||||
| United Mexican States, Notes | 6.63 | 3/3/15 | 1,480,000 | 1,643,540 | ||||||
| 11,319,971 | ||||||||||
| Health Care—.4% | ||||||||||
| Aetna, Sr. Unscd. Notes | 5.75 | 6/15/11 | 3,380,000 | 3,556,290 | ||||||
| Industrials—1.6% | ||||||||||
| Devon Financing, Gtd. Notes | 6.88 | 9/30/11 | 4,110,000 | 4,525,768 | ||||||
| Emerson Electric, Sr. Unscd. Notes | 5.00 | 12/15/14 | 3,500,000 | 3,618,608 | ||||||
| Johnson Controls, Sr. Unscd. Notes | 5.25 | 1/15/11 | 7,110,000 | 7,408,122 | ||||||
| 15,552,498 | ||||||||||
| Information Technology—1.9% | ||||||||||
| Cisco Systems, Sr. Unscd. Notes | 5.50 | 2/22/16 | 4,200,000 | 4,346,067 | ||||||
| International Business Machines, Sr. Unscd. Debs. | 7.00 | 10/30/25 | 2,000,000 c | 2,221,524 | ||||||
| Intuit, Sr. Unscd. Notes | 5.40 | 3/15/12 | 4,735,000 | 4,878,897 | ||||||
| Oracle, Sr. Unscd. Notes | 5.00 | 1/15/11 | 5,210,000 | 5,400,577 | ||||||
| Oracle, Sr. Unscd. Notes | 5.25 | 1/15/16 | 1,790,000 | 1,822,798 | ||||||
| 18,669,863 | ||||||||||
The Funds 11
STATEMENT OF INVESTMENTS (Unaudited) (continued)
| BNY Mellon Bond Fund (continued) | ||||||||
| Coupon | Maturity | Principal | ||||||
| Bonds and Notes (continued) | Rate (%) | Date | Amount ($) | Value ($) | ||||
| Media & Telecommunications—3.7% | ||||||||
| AT&T, Sr. Unscd. Notes | 6.50 | 9/1/37 | 5,105,000 | 5,181,799 | ||||
| British Sky Broadcasting, Gtd. Notes | 6.88 | 2/23/09 | 4,180,000 | 4,322,337 | ||||
| Comcast, Gtd. Notes | 5.90 | 3/15/16 | 6,400,000 | 6,438,464 | ||||
| News America Holdings, Gtd. Debs. | 7.60 | 10/11/15 | 3,750,000 | 4,260,664 | ||||
| News America, Gtd. Notes | 6.15 | 3/1/37 | 2,375,000 | 2,259,706 | ||||
| SBC Communications, Sr. Unscd. Notes | 5.88 | 8/15/12 | 4,320,000 | 4,616,430 | ||||
| Sprint Capital, Gtd. Notes | 6.90 | 5/1/19 | 4,750,000 | 3,497,344 | ||||
| Time Warner, Gtd. Debs. | 6.50 | 11/15/36 | 2,115,000 | 1,978,208 | ||||
| Verizon Communications, Sr. Unscd. Notes | 5.50 | 2/15/18 | 4,545,000 | 4,570,770 | ||||
| 37,125,722 | ||||||||
| Real Estate Investment Trusts—1.0% | ||||||||
| ERP Operating, Sr. Unscd. Notes | 6.95 | 3/2/11 | 4,000,000 | 4,164,944 | ||||
| Simon Property Group, Sr. Unscd. Notes | 5.75 | 5/1/12 | 5,265,000 | 5,325,521 | ||||
| 9,490,465 | ||||||||
| Retailing—.8% | ||||||||
| Wal-Mart Stores, Sr. Unscd. Notes | 6.50 | 8/15/37 | 7,250,000 | 7,763,619 | ||||
| U.S. Government Agencies—7.7% | ||||||||
| Federal Farm Credit Banks, Bonds | 5.25 | 9/13/10 | 3,915,000 | 4,164,601 | ||||
| Federal Home Loan Banks, Bonds | 5.20 | 9/10/10 | 9,580,000 | 9,701,618 | ||||
| Federal Home Loan Banks, Bonds | 5.65 | 4/20/22 | 8,000,000 | 8,385,048 | ||||
| Federal Home Loan Mortgage Corp., Notes | 5.38 | 1/9/14 | 4,405,000 | 4,474,718 | ||||
| Federal Home Loan Mortgage Corp., Notes | 5.40 | 2/2/12 | 4,830,000 | 4,948,876 | ||||
| Federal Home Loan Mortgage Corp., Notes | 5.40 | 3/2/12 | 5,165,000 | 5,240,032 | ||||
| Federal Home Loan Mortgage Corp., Notes | 5.50 | 3/22/22 | 4,440,000 | 4,610,234 | ||||
| Federal Home Loan Mortgage Corp., Notes | 5.90 | 6/15/22 | 6,485,000 | 6,845,806 | ||||
| Federal National Mortgage Association, Notes | 5.25 | 3/5/14 | 13,815,000 | 14,444,591 | ||||
| Federal National Mortgage Association, Notes | 5.38 | 4/11/22 | 6,855,000 | 7,053,226 | ||||
| Federal National Mortgage Association, Notes | 5.50 | 7/9/10 | 6,320,000 | 6,459,817 | ||||
| 76,328,567 | ||||||||
| U.S. Government Agencies/Mortgage-Backed—39.9% | ||||||||
| Federal Home Loan Mortgage Corp: | ||||||||
| 4.50%, 3/1/21 | 15,390,002 | 15,384,743 | ||||||
| 5.00%, 1/1/21 | 1,521,577 | 1,542,724 | ||||||
| 5.08%, 10/1/35 | 5,231,692 a | 5,332,478 | ||||||
| 5.50%, 3/1/35—12/1/37 | 35,533,112 | 35,770,838 | ||||||
| 5.76%, 4/1/37 | 9,569,927 a | 9,833,218 | ||||||
| 5.94%, 5/1/37 | 8,116,745 a | 8,333,071 | ||||||
| 6.00%, 5/1/37—12/1/37 | 27,674,306 | 28,284,275 | ||||||
| 7.00%, 4/1/32—8/1/36 | 3,614,282 | 3,807,231 | ||||||
| Ser. 1660, Cl. H, 6.50%, 1/15/09 | 295,090 | 294,737 | ||||||
12
| BNY Mellon Bond Fund (continued) | ||||
| Principal | ||||
| Bonds and Notes (continued) | Amount ($) | Value ($) | ||
| U.S. Government Agencies/Mortgage-Backed (continued) | ||||
| Federal National Mortgage Association: | ||||
| 4.00%, 3/1/35 | 6,005,051 a | 6,147,075 | ||
| 4.50%, 1/1/36 | 8,502,812 | 8,149,154 | ||
| 4.57%, 3/1/35 | 3,683,152 a | 3,740,515 | ||
| 4.93%, 9/1/35 | 6,167,819 a | 6,270,134 | ||
| 5.00%, 3/1/21 | 4,877,556 | 4,948,017 | ||
| 5.01%, 10/1/35 | 6,012,023 a | 6,134,593 | ||
| 5.50%, 7/1/35—3/1/38 | 71,072,680 d | 71,566,849 | ||
| 5.70%, 4/1/37 | 9,965,304 a | 10,240,558 | ||
| 5.73%, 5/1/37 | 8,543,441 a | 8,774,630 | ||
| 5.97%, 5/1/37 | 8,873,374 a | 9,222,764 | ||
| 6.00%, 4/1/33—10/1/37 | 31,652,662 | 32,400,014 | ||
| 6.03%, 8/1/37 | 9,682,655 a | 9,883,591 | ||
| 6.50%, 4/1/17—12/1/37 | 41,712,429 | 43,263,618 | ||
| 7.00%, 4/1/32—6/1/32 | 1,760,966 | 1,877,236 | ||
| 7.50%, 7/1/32 | 592,147 | 638,439 | ||
| 8.00%, 5/1/08 | 12 | 12 | ||
| Government National Mortgage Association I: | ||||
| 5.00%, 11/15/34—3/15/36 | 28,286,899 | 28,367,324 | ||
| 5.50%, 2/15/36 | 7,205,758 | 7,372,618 | ||
| 6.00%, 10/15/08—7/15/34 | 11,529,994 | 11,956,994 | ||
| 7.00%, 5/15/23—11/15/23 | 630,069 | 677,813 | ||
| 9.00%, 12/15/09 | 246,277 | 248,075 | ||
| 7.00%, 12/15/23 | 323,899 | 348,443 | ||
| Government National Mortgage Association II; | ||||
| 5.00%, 1/20/37 | 16,251,540 | 16,213,790 | ||
| 397,025,571 | ||||
| U.S. Government Securities—20.9% | ||||
| U.S. Treasury Bonds: | ||||
| 4.50%, 2/15/36 | 13,805,000 c | 13,985,114 | ||
| 6.25%, 8/15/23 | 7,620,000 c | 9,369,628 | ||
| U.S. Treasury Inflation Protected Securities: | ||||
| Bonds, 2.38%, 1/15/27 | 9,504,053 c,e | 10,481,193 | ||
| Notes, 2.38%, 1/15/17 | 9,524,883 c,e | 10,631,408 | ||
| U.S. Treasury Notes: | ||||
| 3.50%, 2/15/18 | 3,000,000 c | 2,993,439 | ||
| 4.00%, 11/15/12 | 34,420,000 c | 36,797,148 | ||
| 4.00%, 2/15/14 | 25,800,000 c | 27,565,700 | ||
| 4.50%, 5/15/17 | 22,615,000 c | 24,369,449 | ||
| 4.63%, 3/31/08 | 9,690,000 c | 9,711,958 | ||
| 4.63%, 8/31/11 | 11,250,000 c | 12,223,834 | ||
| 4.63%, 2/29/12 | 39,255,000 c | 42,861,592 | ||
| 4.63%, 11/15/16 | 955,000 c | 1,041,398 | ||
| 4.75%, 8/15/17 | 5,540,000 c | 6,074,959 | ||
| 208,106,820 | ||||
The Funds 13
STATEMENT OF INVESTMENTS (Unaudited) (continued)
| BNY Mellon Bond Fund (continued) | ||||||||
| Coupon | Maturity | Principal | ||||||
| Bonds and Notes (continued) | Rate (%) | Date | Amount ($) | Value ($) | ||||
| Utilities—.2% | ||||||||
| Southern California Edison, | ||||||||
| First Mortgage Bonds, Ser. 04-F | 4.65 | 4/1/15 | 2,200,000 | 2,180,981 | ||||
| Total Bonds and Notes | ||||||||
| (cost $964,695,253) | 991,079,474 | |||||||
| Other Investment—.6% | Shares | Value ($) | ||||||
| Registered Investment Company; | ||||||||
| Dreyfus Institutional Preferred | ||||||||
| Plus Money Market Fund | ||||||||
| (cost $6,397,000) | 6,397,000 f | 6,397,000 | ||||||
| Investment of Cash Collateral for Securities Loaned—20.6% | ||||||||
| Registered Investment Company; | ||||||||
| Dreyfus Institutional Cash Advantage Plus Fund | ||||||||
| (cost $205,108,565) | 205,108,565 f | 205,108,565 | ||||||
| Total Investments (cost $1,176,200,818) | 120.8% | 1,202,585,039 | ||||||
| Liabilities, Less Cash and Receivables | (20.8%) | (206,873,692) | ||||||
| Net Assets | 100.0% | 995,711,347 | ||||||
| a Variable rate security—interest rate subject to periodic change. |
| b Securities exempt from registration under Rule 144A of the Securities Act of 1933.These securities may be resold in transactions exempt from registration, normally to qualified |
| institutional buyers. At February 29, 2008, these securities amounted to $27,861,779 or 2.8% of net assets. |
| c All or a portion of these securities are on loan. At February 29, 2008, the total market value of the fund’s securities on loan is $212,649,636 and the total market value of the |
| collateral held by the fund is $215,378,919, consisting of cash collateral of $205,108,565, U.S. Government and Agency securities valued at $840,604, and Letters of Credit |
| valued at $9,429,750. |
| d Purchased on a delayed delivery basis. |
| e Principal amount for accrual purposes is periodically adjusted based on changes in the Consumer Price Index. |
| f Investment in affiliated money market mutual fund. |
| Portfolio Summary (Unaudited) † | ||||||
| Value (%) | Value (%) | |||||
| U.S. Government & Agencies | 68.5 | Asset/Mortgage-Backed | 9.4 | |||
| Money Market Investments | 21.2 | Foreign/Governmental | 1.1 | |||
| Corporate Bonds | 20.6 | 120.8 | ||||
| † Based on net assets. |
| See notes to financial statements. |
14
| STATEMENT OF INVESTMENTS |
| February 29, 2008 (Unaudited) |
| BNY Mellon Intermediate Bond Fund | ||||||||||
| Coupon | Maturity | Principal | ||||||||
| Bonds and Notes—98.0% | Rate (%) | Date | Amount ($) | Value ($) | ||||||
| Asset-Backed Ctfs./Auto Receivables—3.6% | ||||||||||
| Harley-Davidson Motorcycle Trust, Ser. 2005-3, Cl. A2 | 4.41 | 6/15/12 | 2,350,000 | 2,375,989 | ||||||
| Harley-Davidson Motorcycle Trust, Ser. 2007-1, Cl. A4 | 5.21 | 6/17/13 | 2,020,000 | 2,092,048 | ||||||
| Honda Auto Receivables Owner Trust, Ser. 2004-3, Cl. A4 | 3.28 | 2/18/10 | 3,548,618 | 3,549,972 | ||||||
| Honda Auto Receivables Owner Trust, Ser. 2007-1, Cl. A4 | 5.09 | 7/18/13 | 2,395,000 | 2,475,770 | ||||||
| Honda Auto Receivables Owner Trust, Ser. 2006-3, Cl. A4 | 5.11 | 4/15/12 | 4,670,000 | 4,814,987 | ||||||
| Household Automotive Trust, Ser. 2007-1, Cl. A4 | 5.33 | 11/17/13 | 2,125,000 | 2,196,647 | ||||||
| Hyundai Auto Receivables Trust, Ser. 2006-B, Cl. A4 | 5.15 | 5/15/13 | 2,680,000 | 2,768,723 | ||||||
| Nissan Auto Lease Trust, Ser. 2006-A, Cl. A4 | 5.10 | 7/16/12 | 6,575,000 | 6,751,967 | ||||||
| Onyx Acceptance Grantor Trust, Ser. 2005-A, Cl. A4 | 3.91 | 9/15/11 | 2,444,226 | 2,412,622 | ||||||
| 29,438,725 | ||||||||||
| Asset-Backed Ctfs./Other—.8% | ||||||||||
| Caterpillar Financial Asset Trust, Ser. 2005-A, Cl. A4 | 4.10 | 6/25/10 | 1,892,108 | 1,898,798 | ||||||
| CIT Equipment Collateral, Ser. 2006-VT2, Cl. A4 | 5.05 | 4/20/14 | 3,185,000 | 3,240,334 | ||||||
| CNH Equipment Trust, Ser. 2005-A, Cl. A4B | 4.29 | 6/15/12 | 1,539,127 | 1,544,147 | ||||||
| 6,683,279 | ||||||||||
| Automotive, Trucks & Parts—.7% | ||||||||||
| Johnson Controls, Sr. Unscd. Notes | 5.25 | 1/15/11 | 5,715,000 | 5,954,630 | ||||||
| Bank & Finance—13.0% | ||||||||||
| Agua Caliente Band of Cahuilla Indians, Sr. Scd. Notes | 6.08 | 10/1/16 | 1,965,000 a | 2,076,337 | ||||||
| Agua Caliente Band of Cahuilla Indians, Scd. Notes | 6.35 | 10/1/15 | 990,000 a | 992,772 | ||||||
| Agua Caliente Band of Cahuilla Indians, Sr. Scd. Notes | 6.44 | 10/1/16 | 2,185,000 a | 2,256,887 | ||||||
| AXA Financial, Sr. Notes | 6.50 | 4/1/08 | 1,200,000 | 1,203,023 | ||||||
| AXA Financial, Sr. Notes | 7.75 | 8/1/10 | 3,625,000 | 3,972,670 | ||||||
| Bank of America, Sub. Notes | 5.42 | 3/15/17 | 8,900,000 | 8,799,492 | ||||||
| BankAmerica Capital II, Bank Gtd. Secs., Ser. 2 | 8.00 | 12/15/26 | 4,975,000 | 5,165,468 | ||||||
| Bear Stearns, Notes | 4.50 | 10/28/10 | 2,100,000 | 2,072,326 | ||||||
| Caterpillar Financial Services, Sr. Unscd. Notes | 5.05 | 12/1/10 | 4,975,000 | 5,217,307 | ||||||
| CIT Group, Sr. Notes | 5.40 | 3/7/13 | 3,730,000 | 3,413,901 | ||||||
| Citigroup, Sub. Notes | 5.00 | 9/15/14 | 4,400,000 | 4,268,752 | ||||||
| Citigroup, Sr. Unscd. Notes | 6.13 | 11/21/17 | 2,840,000 | 2,920,715 | ||||||
| Countrywide Home Loan, Gtd. Notes, Ser. K | 5.63 | 7/15/09 | 2,380,000 b | 2,183,628 | ||||||
| Countrywide Home Loan, Gtd. Notes, Ser. H | 6.25 | 4/15/09 | 1,200,000 b | 1,118,918 | ||||||
| Daimler Finance North America, Gtd. Notes | 6.50 | 11/15/13 | 3,935,000 | 4,254,365 | ||||||
| General Electric Capital, Sr. Unscd. Notes, Ser. A | 5.88 | 2/15/12 | 5,265,000 | 5,622,457 | ||||||
| Goldman Sachs Group, Sr. Unscd. Notes | 4.75 | 7/15/13 | 5,400,000 | 5,460,890 | ||||||
| Household Finance, Sr. Unscd. Notes | 6.38 | 11/27/12 | 8,108,000 | 8,619,169 | ||||||
| International Lease Finance, Sr. Unscd. Notes | 5.75 | 6/15/11 | 7,205,000 | 7,441,583 | ||||||
| John Deere Capital, Sr. Unscd. Notes | 7.00 | 3/15/12 | 5,805,000 | 6,523,183 | ||||||
| JP Morgan Chase & Co., Sr. Unscd. Notes | 5.38 | 10/1/12 | 4,110,000 | 4,320,925 | ||||||
| Merrill Lynch & Co., Notes | 5.45 | 2/5/13 | 7,580,000 | 7,642,626 | ||||||
The Funds 15
STATEMENT OF INVESTMENTS (Unaudited) (continued)
| BNY Mellon Intermediate Bond Fund (continued) | ||||||||
| Coupon | Maturity | Principal | ||||||
| Bonds and Notes (continued) | Rate (%) | Date | Amount ($) | Value ($) | ||||
| Bank & Finance (continued) | ||||||||
| Morgan Stanley, Sr. Unscd. Notes | 6.75 | 4/15/11 | 5,895,000 | 6,312,083 | ||||
| Prudential Financial, Sr. Unscd. Notes | 6.00 | 12/1/17 | 1,925,000 | 1,976,153 | ||||
| Wachovia, Sub. Notes | 6.38 | 2/1/09 | 4,000,000 | 4,059,180 | ||||
| 107,894,810 | ||||||||
| Building & Construction—.6% | ||||||||
| CRH America, Gtd. Notes | 5.30 | 10/15/13 | 4,930,000 | 4,836,606 | ||||
| Commercial & Professional Services—.9% | ||||||||
| Seminole Tribe of Florida, Notes | 5.80 | 10/1/13 | 6,765,000 a | 7,165,211 | ||||
| Commercial Mortgage Pass-Through Ctfs.—2.7% | ||||||||
| Citigroup/Deutsche Bank Commercial | ||||||||
| Mortgage Trust, Ser. 2007-CD4, Cl. A2B | 5.21 | 12/11/49 | 5,325,000 | 5,172,959 | ||||
| Credit Suisse Mortgage Capital | ||||||||
| Certificates, Ser. 2007-C2, Cl. A2 | 5.45 | 1/15/49 | 3,470,000 c | 3,398,303 | ||||
| CWCapital Cobalt, Ser. 2007-C2, Cl. A2 | 5.33 | 4/15/47 | 3,625,000 | 3,533,611 | ||||
| LB-UBS Commercial Mortgage Trust, Ser. 2007-C2, Cl. A2 | 5.30 | 2/15/40 | 7,200,000 | 7,016,228 | ||||
| Merrill Lynch/Countrywide Commericial | ||||||||
| Mortgage Trust, Ser. 2007-6, Cl. A2 | 5.33 | 3/12/51 | 2,930,000 | 2,852,380 | ||||
| 21,973,481 | ||||||||
| Food & Beverages—1.8% | ||||||||
| Coca-Cola, Sr. Unscd. Notes | 5.35 | 11/15/17 | 3,210,000 | 3,400,176 | ||||
| Diageo Finance, Gtd. Notes | 5.50 | 4/1/13 | 4,275,000 | 4,498,758 | ||||
| McDonald’s, Sr. Unscd. Notes | 5.80 | 10/15/17 | 4,460,000 | 4,720,674 | ||||
| Pepsico, Sr. Unscd. Notes | 4.65 | 2/15/13 | 2,355,000 | 2,471,695 | ||||
| 15,091,303 | ||||||||
| Foreign/Governmental—3.0% | ||||||||
| Hydro-Quebec, Gov’t Gtd. Debs., Ser. IU | 7.50 | 4/1/16 | 4,345,000 | 5,326,231 | ||||
| Hydro-Quebec, Gov’t. Gtd. Bonds, Ser. IF | 8.00 | 2/1/13 | 3,200,000 | 3,889,315 | ||||
| Nova Scotia Province, Bonds | 5.13 | 1/26/17 | 5,430,000 | 5,847,279 | ||||
| Quebec Province, Bonds | 5.13 | 11/14/16 | 8,110,000 | 8,758,354 | ||||
| United Mexican States, Notes | 6.63 | 3/3/15 | 1,064,000 | 1,181,572 | ||||
| 25,002,751 | ||||||||
| Health Care—1.1% | ||||||||
| Aetna, Sr. Unscd. Notes | 5.75 | 6/15/11 | 4,245,000 | 4,466,406 | ||||
| Astrazeneca, Sr. Unsub. Notes | 5.40 | 9/15/12 | 4,700,000 | 5,028,817 | ||||
| 9,495,223 | ||||||||
| Industrials—2.3% | ||||||||
| Devon Financing, Gtd. Notes | 6.88 | 9/30/11 | 4,575,000 | 5,037,807 | ||||
| Emerson Electric, Sr. Unscd. Notes | 4.63 | 10/15/12 | 3,000,000 | 3,094,062 | ||||
| Progress Energy, Sr. Unscd. Notes | 6.85 | 4/15/12 | 4,398,000 | 4,821,954 | ||||
| Vulcan Materials, Sr. Unscd. Notes | 5.60 | 11/30/12 | 5,710,000 | 5,985,422 | ||||
| 18,939,245 | ||||||||
16
| BNY Mellon Intermediate Bond Fund (continued) | ||||||||||
| Coupon | Maturity | Principal | ||||||||
| Bonds and Notes (continued) | Rate (%) | Date | Amount ($) | Value ($) | ||||||
| Media & Telecommunications—6.3% | ||||||||||
| British Sky Broadcasting, Gtd. Notes | 6.88 | 2/23/09 | 4,280,000 | 4,425,742 | ||||||
| Cisco Systems, Sr. Unscd. Notes | 5.50 | 2/22/16 | 7,135,000 | 7,383,141 | ||||||
| Comcast, Gtd. Notes | 5.90 | 3/15/16 | 5,135,000 | 5,165,861 | ||||||
| News America, Gtd. Notes | 4.75 | 3/15/10 | 5,315,000 | 5,368,373 | ||||||
| Nextel Communications, Gtd. Notes, Ser. E | 6.88 | 10/31/13 | 6,390,000 | 5,019,939 | ||||||
| SBC Communications, Sr. Unscd. Notes | 5.88 | 8/15/12 | 5,045,000 | 5,391,178 | ||||||
| Time Warner, Gtd. Notes | 5.50 | 11/15/11 | 6,625,000 | 6,711,112 | ||||||
| Verizon Global Funding, Sr. Unscd. Notes | 7.25 | 12/1/10 | 5,525,000 | 6,028,571 | ||||||
| Vodafone Group, Sr. Unscd. Notes | 7.75 | 2/15/10 | 6,165,000 | 6,621,167 | ||||||
| 52,115,084 | ||||||||||
| Real Estate Investment Trusts—1.8% | ||||||||||
| ERP Operating, Sr. Unscd. Notes | 6.95 | 3/2/11 | 3,280,000 | 3,415,254 | ||||||
| Mack-Cali Realty, Sr. Unscd. Notes | 7.75 | 2/15/11 | 5,280,000 | 5,914,841 | ||||||
| Simon Property Group, Sr. Unscd. Notes | 5.75 | 5/1/12 | 5,680,000 | 5,745,292 | ||||||
| 15,075,387 | ||||||||||
| Retailing—1.3% | ||||||||||
| Wal-Mart Stores, Sr. Unscd. Notes | 4.55 | 5/1/13 | 4,675,000 | 4,876,923 | ||||||
| Xerox, Sr. Unscd. Notes | 5.50 | 5/15/12 | 6,090,000 | 6,248,127 | ||||||
| 11,125,050 | ||||||||||
| Software & Services—1.5% | ||||||||||
| Intuit, Sr. Unscd. Notes | 5.40 | 3/15/12 | 5,115,000 | 5,270,445 | ||||||
| Oracle, Sr. Unscd. Notes | 5.25 | 1/15/16 | 7,000,000 | 7,128,261 | ||||||
| 12,398,706 | ||||||||||
| Transportation—.3% | ||||||||||
| United Parcel Service, Sr. Unscd. Notes | 4.50 | 1/15/13 | 2,725,000 b | 2,841,401 | ||||||
| U.S. Government Agencies—21.1% | ||||||||||
| Federal Farm Credit Banks, Bonds | 4.50 | 10/17/12 | 15,525,000 | 16,349,719 | ||||||
| Federal Farm Credit Banks, Bonds | 4.75 | 5/7/10 | 10,375,000 | 10,888,646 | ||||||
| Federal Farm Credit Banks, Bonds | 5.00 | 10/23/09 | 11,780,000 | 12,299,321 | ||||||
| Federal Farm Credit Banks, Bonds | 5.25 | 8/3/09 | 10,150,000 | 10,576,209 | ||||||
| Federal Farm Credit Banks, Bonds | 5.25 | 9/13/10 | 6,770,000 | 7,201,621 | ||||||
| Federal Home Loan Banks, Bonds | 3.63 | 12/17/10 | 7,530,000 | 7,720,148 | ||||||
| Federal Home Loan Banks, Bonds | 5.00 | 12/11/09 | 6,460,000 | 6,762,457 | ||||||
| Federal Home Loan Banks, Bonds | 5.13 | 9/10/10 | 7,315,000 | 7,776,891 | ||||||
| Federal Home Loan Banks, Bonds | 5.25 | 11/3/09 | 7,500,000 | 7,639,785 | ||||||
| Federal Home Loan Mortgage Corp., Notes | 5.25 | 9/3/10 | 8,355,000 | 8,445,384 | ||||||
| Federal Home Loan Mortgage Corp., Notes | 5.38 | 1/9/14 | 7,655,000 | 7,776,156 | ||||||
| Federal Home Loan Mortgage Corp., Notes | 5.40 | 2/2/12 | 7,900,000 | 8,094,435 | ||||||
| Federal Home Loan Mortgage Corp., Notes | 5.40 | 3/2/12 | 6,635,000 | 6,731,387 | ||||||
| Federal Home Loan Mortgage Corp., Notes | 5.75 | 5/23/11 | 8,475,000 | 8,515,222 | ||||||
The Funds 17
STATEMENT OF INVESTMENTS (Unaudited) (continued)
| BNY Mellon Intermediate Bond Fund (continued) | ||||||||
| Coupon | Maturity | Principal | ||||||
| Bonds and Notes (continued) | Rate (%) | Date | Amount ($) | Value ($) | ||||
| U.S. Government Agencies (continued) | ||||||||
| Federal National Mortgage Association, Notes | 4.75 | 3/12/10 | 20,270,000 | 21,223,582 | ||||
| Federal National Mortgage Association, Notes | 5.10 | 9/10/09 | 8,065,000 | 8,166,603 | ||||
| Federal National Mortgage Association, Notes | 5.25 | 3/5/14 | 11,855,000 | 12,395,268 | ||||
| Federal National Mortgage Association, Notes | 5.75 | 6/9/11 | 6,175,000 | 6,219,034 | ||||
| 174,781,868 | ||||||||
| U.S. Government Agencies/Mortgage-Backed—.3% | ||||||||
| Federal Home Loan Mortgage Corp: | ||||||||
| 3.50%, 5/1/08 | 595,735 | 592,208 | ||||||
| 6.86%, 11/1/32 | 246,244 c | 251,131 | ||||||
| REMIC, Ser. 2134, Cl. PM, | ||||||||
| 5.50%, 3/15/14 | 1,243,154 | 1,289,055 | ||||||
| 2,132,394 | ||||||||
| U.S. Government Securities—34.9% | ||||||||
| U.S. Treasury Inflation Protected | ||||||||
| Securities, Notes, 2.38%, 1/15/17 | 14,477,406 b,d | 16,159,275 | ||||||
| U.S. Treasury Notes: | ||||||||
| 3.50%, 2/15/18 | 1,500,000 b | 1,496,720 | ||||||
| 4.00%, 2/15/14 | 30,275,000 b | 32,346,960 | ||||||
| 4.13%, 8/15/10 | 27,500,000 b | 29,079,105 | ||||||
| 4.25%, 1/15/11 | 32,750,000 b | 34,970,876 | ||||||
| 4.25%, 11/15/13 | 17,555,000 b | 19,010,152 | ||||||
| 4.50%, 5/15/10 | 4,000,000 b | 4,249,376 | ||||||
| 4.50%, 11/15/15 | 20,505,000 b | 22,304,006 | ||||||
| 4.50%, 5/15/17 | 1,625,000 b | 1,751,066 | ||||||
| 4.63%, 8/31/11 | 13,240,000 b | 14,386,094 | ||||||
| 4.63%, 2/29/12 | 19,860,000 b | 21,684,657 | ||||||
| 4.63%, 11/15/16 | 4,760,000 b | 5,190,632 | ||||||
| 4.75%, 2/15/10 | 9,470,000 b | 10,039,687 | ||||||
| 4.75%, 8/15/17 | 8,220,000 b | 9,013,748 | ||||||
| 4.88%, 8/15/16 | 19,085,000 b | 21,157,516 | ||||||
| 5.13%, 5/15/16 | 11,830,000 b | 13,329,086 | ||||||
| 6.00%, 8/15/09 | 30,290,000 b | 32,228,106 | ||||||
| 288,397,062 | ||||||||
| Total Bonds and Notes | ||||||||
| (cost $779,909,293) | 811,342,216 | |||||||
18
| BNY Mellon Intermediate Bond Fund (continued) | ||||
| Other Investment—1.0% | Shares | Value ($) | ||
| Registered Investment Company; | ||||
| Dreyfus Institutional Preferred Plus Money Market Fund | ||||
| (cost $8,373,000) | 8,373,000 e | 8,373,000 | ||
| Investment of Cash Collateral for Securities Loaned—34.9% | ||||
| Registered Investment Company; | ||||
| Dreyfus Institutional Cash Advantage Plus Fund | ||||
| (cost $288,543,304) | 288,543,304 e | 288,543,304 | ||
| Total Investments (cost $1,076,825,597) | 133.9% | 1,108,258,520 | ||
| Liabilities, Less Cash and Receivables | (33.9%) | (280,673,602) | ||
| Net Assets | 100.0% | 827,584,918 | ||
| a Securities exempt from registration under Rule 144A of the Securities Act of 1933.These securities may be resold in transactions exempt from registration, normally to qualified |
| institutional buyers. At February 29, 2008, these securities amounted to $12,491,207 or 1.5% of net assets. |
| b All or a portion of these securities are on loan. At February 29, 2008, the total market value of the fund’s securities on loan is $290,034,338 and the total market value of the |
| collateral held by the fund is $293,745,775, consisting of cash collateral of $288,543,304, U.S. Government and Agency securities valued at $4,927,323, and Letters of Credit |
| valued at $275,148. |
| c Variable rate security—interest rate subject to periodic change. |
| d Principal amount for accrual purposes is periodically adjusted based on changes in the Consumer Price Index. |
| e Investment in affiliated money market mutual fund. |
| Portfolio Summary (Unaudited) † | ||||||
| Value (%) | Value (%) | |||||
| U.S. Government & Agencies | 56.3 | Asset/Mortgage-Backed | 7.1 | |||
| Money Market Investments | 35.9 | Foreign/Governmental | 3.0 | |||
| Corporate Bonds | 31.6 | 133.9 | ||||
| † Based on net assets. |
| See notes to financial statements. |
The Funds 19
| STATEMENT OF INVESTMENTS |
| February 29, 2008 (Unaudited) |
| BNY Mellon Short-Term U.S. Government Securities Fund | ||||||||
| Coupon | Maturity | Principal | ||||||
| Bonds and Notes—97.9% | Rate (%) | Date | Amount ($) | Value ($) | ||||
| U.S. Government Agencies—45.2% | ||||||||
| Federal Farm Credit Banks, Bonds | 3.00 | 3/3/11 | 4,195,000 | 4,219,478 | ||||
| Federal Farm Credit Banks, Bonds | 3.75 | 12/6/10 | 3,525,000 | 3,623,104 | ||||
| Federal Farm Credit Banks, Bonds | 4.25 | 10/10/08 | 1,577,000 | 1,593,842 | ||||
| Federal Farm Credit Banks, Bonds | 4.63 | 11/19/10 | 1,325,000 | 1,341,869 | ||||
| Federal Farm Credit Banks, Bonds | 4.75 | 5/7/10 | 1,440,000 | 1,511,292 | ||||
| Federal Farm Credit Banks, Bonds | 5.25 | 8/3/09 | 1,995,000 | 2,078,772 | ||||
| Federal Farm Credit Banks, Bonds | 5.25 | 9/13/10 | 1,490,000 | 1,584,995 | ||||
| Federal Home Loan Bank, Unscd. Bonds | 2.38 | 4/30/10 | 1,885,000 | 1,880,589 | ||||
| Federal Home Loan Banks, Bonds | 4.38 | 10/22/10 | 4,060,000 | 4,243,516 | ||||
| Federal Home Loan Banks, Bonds | 5.00 | 10/16/09 | 1,300,000 | 1,318,305 | ||||
| Federal Home Loan Banks, Bonds | 5.20 | 9/10/10 | 1,550,000 | 1,569,677 | ||||
| Federal Home Loan Banks, Bonds | 5.25 | 11/3/09 | 1,250,000 | 1,273,298 | ||||
| Federal Home Loan Banks, Bonds | 5.45 | 6/12/09 | 2,500,000 | 2,521,327 | ||||
| Federal Home Loan Mortgage Corp., Notes | 4.13 | 11/30/09 | 3,560,000 | 3,671,353 | ||||
| Federal Home Loan Mortgage Corp., Notes | 5.00 | 10/1/10 | 4,030,000 | 4,080,536 | ||||
| Federal Home Loan Mortgage Corp., Notes | 5.40 | 7/16/09 | 2,270,000 | 2,295,569 | ||||
| Federal Home Loan Mortgage Corp., Notes | 5.55 | 6/25/10 | 2,010,000 | 2,027,690 | ||||
| Federal National Mortgage Association, Notes | 3.88 | 12/10/09 | 3,400,000 | 3,493,044 | ||||
| Federal National Mortgage Association, Notes | 5.00 | 10/15/10 | 4,265,000 | 4,322,138 | ||||
| Federal National Mortgage Association, Notes | 5.20 | 11/20/09 | 2,165,000 | 2,175,370 | ||||
| Federal National Mortgage Association, Notes | 5.33 | 1/29/10 | 3,360,000 | 3,396,127 | ||||
| Federal National Mortgage Association, Notes | 5.50 | 7/9/10 | 5,835,000 | 5,964,088 | ||||
| 60,185,979 | ||||||||
| U.S. Government Agencies/Mortgage-Backed—7.1% | ||||||||
| Federal Home Loan Mortgage Corp.: | ||||||||
| 3.50%, 5/1/08—9/1/08 | 2,551,007 | 2,536,827 | ||||||
| 4.00%, 7/1/08—3/1/10 | 1,736,791 | 1,733,204 | ||||||
| 4.50%, 5/1/08 | 40,049 | 39,948 | ||||||
| 5.00%, 3/1/08—4/1/09 | 105,252 | 106,079 | ||||||
| 6.87%, 11/1/32 | 61,561 a | 62,783 | ||||||
| REMIC, Ser. 2638, Cl. NC, 3.00%, 5/15/22 | 517,297 | 516,153 | ||||||
| REMIC, Ser. 2495, Cl. UC, 5.00%, 7/15/32 | 112,383 | 114,975 | ||||||
| REMIC, Ser. 1648, Cl. E, 6.00%, 9/15/23 | 1,704,831 | 1,740,506 | ||||||
| REMIC, Ser. 1961, Cl. H, 6.50%, 5/15/12 | 247,799 | 252,767 | ||||||
| Federal National Mortgage Association.: | ||||||||
| 4.50%, 1/1/10 | 206,083 | 207,283 | ||||||
| 5.50%, 6/1/09 | 44,701 | 45,402 | ||||||
| 6.89%, 5/1/32 | 35,255 a | 35,896 | ||||||
| 6.94%, 3/1/32 | 22,959 a | 23,266 | ||||||
| 7.09%, 3/1/32 | 16,515 a | 17,066 | ||||||
| 7.13%, 6/1/32 | 136,054 a | 139,023 | ||||||
| 7.29%, 6/1/32 | 205,083 a | 210,052 | ||||||
| 7.31%, 4/1/32 | 8,302 a | 8,486 | ||||||
| REMIC, Ser. 2003-128, Cl. NB, 4.00%, 11/25/11 | 68,040 | 67,884 | ||||||
| REMIC, Ser. 1994-86, Cl. PJ, 6.00%, 6/25/09 | 719,706 | 725,549 | ||||||
| Whole Loan, Ser. 2003-W19, Cl. 1A4, 4.78%, 11/25/33 | 618,012 | 621,112 | ||||||
20
| BNY Mellon Short-Term U.S. Government Securities Fund (continued) | ||||
| Principal | ||||
| Bonds and Notes (continued) | Amount ($) | Value ($) | ||
| U.S. Government Agencies/Mortgage-Backed (continued) | ||||
| Government National Mortgage Association I | ||||
| 6.00%, 12/15/08—4/15/09 | 221,488 | 225,196 | ||
| 9,429,457 | ||||
| U.S. Government Securities—45.6% | ||||
| U.S. Treasury Notes: | ||||
| 3.50%, 2/15/10 | 6,750,000 b | 6,992,581 | ||
| 3.63%, 1/15/10 | 3,500,000 b | 3,629,885 | ||
| 4.13%, 8/15/10 | 5,250,000 b | 5,551,465 | ||
| 4.25%, 1/15/11 | 4,500,000 b | 4,805,159 | ||
| 4.38%, 12/15/10 | 9,000,000 b | 9,627,192 | ||
| 4.50%, 5/15/10 | 3,160,000 b | 3,357,007 | ||
| 4.50%, 11/15/10 | 4,000,000 b | 4,286,876 | ||
| 4.63%, 8/31/11 | 3,975,000 b | 4,319,088 | ||
| 5.75%, 8/15/10 | 9,000,000 b | 9,870,471 | ||
| 6.50%, 2/15/10 | 7,620,000 b | 8,327,235 | ||
| 60,766,959 | ||||
| Total Bonds and Notes | ||||
| (cost $126,707,587) | 130,382,395 | |||
| Other Investment—1.2% | Shares | Value ($) | ||
| Registered Investment Company; | ||||
| Dreyfus Institutional Preferred | ||||
| Plus Money Market Fund (cost $1,544,000) | 1,544,000 c | 1,544,000 | ||
| Investment of Cash Collateral for Securities Loaned—42.4% | ||||
| Registered Investment Company; | ||||
| Dreyfus Institutional Cash Advantage Plus Fund | ||||
| (cost $56,452,200) | 56,452,200 c | 56,452,200 | ||
| Total Investments (cost $184,703,787) | 141.5% | 188,378,595 | ||
| Liabilities, Less Cash and Receivables | (41.5%) | (55,231,329) | ||
| Net Assets | 100.0% | 133,147,266 | ||
| a Variable rate security—interest rate subject to periodic change. |
| b All or a portion of these securities are on loan. At February 29, 2008, the total market value of the fund’s securities on loan is $55,978,338 and the total market value of the |
| collateral held by the fund is $56,851,151, consisting of cash collateral of $56,452,200 and U.S. Government and agency securities valued at $389,951. |
| c Investment in affiliated money market mutual fund. |
| Portfolio Summary (Unaudited) † | ||
| Value (%) | ||
| U.S. Government & Agencies | 97.9 | |
| Money Market Investments | 43.6 | |
| 141.5 | ||
| † Based on net assets. |
| See notes to financial statements. |
The Funds 21
| STATEMENT OF ASSETS AND LIABILITIES |
| February 29, 2008 (Unaudited) |
| BNY Mellon | ||||||
| BNY Mellon | BNY Mellon | Short-Term | ||||
| Bond | Intermediate | U.S. Government | ||||
| Fund | Bond Fund | Securities Fund | ||||
| Assets ($): | ||||||
| Investments in securities— | ||||||
| See Statement of Investments †—Note 2(c) | ||||||
| (including securities loaned) ††—Note 2(b): | ||||||
| Unaffiliated issuers | 991,079,474 | 811,342,216 | 130,382,395 | |||
| Affiliated issuers | 211,505,565 | 296,916,304 | 57,996,200 | |||
| Dividend and interest receivable | 8,903,746 | 9,007,954 | 1,040,826 | |||
| Receivable for investment securities sold | 4,734,520 | 7,220,617 | 5,712,071 | |||
| Receivable for shares of Beneficial Interest subscribed | 503,622 | 450,000 | 631,500 | |||
| Prepaid expenses | 18,108 | 20,840 | 10,785 | |||
| 1,216,745,035 | 1,124,957,931 | 195,773,777 | ||||
| Liabilities ($): | ||||||
| Due to The Dreyfus Corporation and affiliates—Note 4(b) | 348,279 | 277,577 | 46,955 | |||
| Due to Administrator—Note 4(a) | 100,783 | 83,641 | 13,413 | |||
| Cash overdraft due to Custodian | 1,402,289 | 1,017,357 | 19,684 | |||
| Liability for securities on loan—Note 2(b) | 205,108,565 | 288,543,304 | 56,452,200 | |||
| Payable for investment securities purchased | 13,611,186 | 7,054,740 | 6,064,011 | |||
| Payable for shares of Beneficial Interest redeemed | 433,827 | 362,804 | 10,779 | |||
| Accrued expenses | 28,759 | 33,590 | 19,469 | |||
| 221,033,688 | 297,373,013 | 62,626,511 | ||||
| Net Assets ($) | 995,711,347 | 827,584,918 | 133,147,266 | |||
| Composition of Net Assets ($): | ||||||
| Paid-in capital | 990,643,444 | 819,490,517 | 139,396,618 | |||
| Accumulated undistributed (distributions | ||||||
| in excess of) investment income—net | 238,036 | (431,918) | (227,785) | |||
| Accumulated net realized gain (loss) on investments | (21,554,354) | (22,906,604) | (9,696,375) | |||
| Accumulated net unrealized appreciation | ||||||
| (depreciation) on investments | 26,384,221 | 31,432,923 | 3,674,808 | |||
| Net Assets ($) | 995,711,347 | 827,584,918 | 133,147,266 | |||
| Net Asset Value Per Share | ||||||
| Class M Shares | ||||||
| Net Assets ($) | 991,664,191 | 826,229,542 | 132,966,140 | |||
| Shares Outstanding | 78,330,965 | 65,035,335 | 10,734,008 | |||
| Net Asset Value Per Share ($) | 12.66 | 12.70 | 12.39 | |||
| Investor Shares | ||||||
| Net Assets ($) | 4,047,156 | 1,355,376 | 181,126 | |||
| Shares Outstanding | 320,340 | 106,702 | 14,622 | |||
| Net Asset Value Per Share ($) | 12.63 | 12.70 | 12.39 | |||
| † Investments at cost ($): | ||||||
| Unaffiliated issuers | 964,695,253 | 779,909,293 | 126,707,587 | |||
| Affiliated issuers | 211,505,565 | 296,916,304 | 57,996,200 | |||
| †† Value of securities loaned ($) | 212,649,636 | 290,034,338 | 55,978,338 |
See notes to financial statements.
22
| STATEMENT OF OPERATIONS |
| Six Months Ended February 29, 2008 (Unaudited) |
| BNY Mellon | ||||||
| BNY Mellon | BNY Mellon | Short-Term | ||||
| Bond | Intermediate | U.S. Government | ||||
| Fund | Bond Fund | Securities Fund | ||||
| Investment Income ($): | ||||||
| Income: | ||||||
| Interest | 25,016,019 | 18,447,341 | 2,846,006 | |||
| Dividends; | ||||||
| Affiliated Issuers | 263,666 | 255,850 | 42,281 | |||
| Income from securities lending | 498,990 | 715,199 | 128,098 | |||
| Total Income | 25,778,675 | 19,418,390 | 3,016,385 | |||
| Expenses: | ||||||
| Investment advisory fee—Note 4(a) | 1,931,398 | 1,549,113 | 227,815 | |||
| Administration fee—Note 4(a) | 614,735 | 493,103 | 82,864 | |||
| Custodian fees—Note 4(b) | 37,453 | 24,741 | 5,806 | |||
| Trustees’ fees and expenses—Note 4(c) | 15,348 | 15,564 | 2,247 | |||
| Registration fees | 12,654 | 14,602 | 11,346 | |||
| Professional fees | 11,769 | 9,315 | 16,126 | |||
| Prospectus and shareholders’ reports | 5,067 | 9,013 | 4,052 | |||
| Shareholder servicing costs—Note 4(b) | 2,853 | 2,553 | 334 | |||
| Miscellaneous | 17,624 | 15,396 | 9,289 | |||
| Total Expenses | 2,648,901 | 2,133,400 | 359,879 | |||
| Less—reduction in fees due to earnings credit—Note 2(b) | (266) | (92) | (43) | |||
| Net Expenses | 2,648,635 | 2,133,308 | 359,836 | |||
| Investment Income—Net | 23,130,040 | 17,285,082 | 2,656,549 | |||
| Realized and Unrealized Gain (Loss) on Investments—Note 5 ($): | ||||||
| Net realized gain (loss) on investments | 5,118,010 | 3,100,052 | 867,253 | |||
| Net unrealized appreciation (depreciation) on investments | 27,875,925 | 29,735,867 | 3,313,745 | |||
| Net Realized and Unrealized Gain (Loss) on Investments | 32,993,935 | 32,835,919 | 4,180,998 | |||
| Net Increase in Net Assets Resulting from Operations | 56,123,975 | 50,121,001 | 6,837,547 | |||
See notes to financial statements.
The Funds 23
STATEMENT OF CHANGES IN NET ASSETS
| BNY Mellon Bond Fund | BNY Mellon Intermediate Bond Fund | |||||||
| Six Months Ended | Six Months Ended | |||||||
| February 29, 2008 | Year Ended | February 29, 2008 | Year Ended | |||||
| (Unaudited) | August 31, 2007 | (Unaudited) | August 31, 2007 | |||||
| Operations ($): | ||||||||
| Investment income—net | 23,130,040 | 42,539,452 | 17,285,082 | 30,017,411 | ||||
| Net realized gain (loss) on investments | 5,118,010 | (5,725,505) | 3,100,052 | (1,245,819) | ||||
| Net unrealized appreciation (depreciation) on investments | 27,875,925 | 8,185,985 | 29,735,867 | 6,587,764 | ||||
| Net Increase (Decrease) in Net Assets | ||||||||
| Resulting from Operations | 56,123,975 | 44,999,932 | 50,121,001 | 35,359,356 | ||||
| Dividends to Shareholders from ($): | ||||||||
| Investment income—net: | ||||||||
| Class M Shares | (23,235,442) | (44,179,220) | (17,740,235) | (32,341,234) | ||||
| Investor Shares | (100,275) | (167,461) | (33,461) | (47,297) | ||||
| Total Dividends | (23,335,717) | (44,346,681) | (17,773,696) | (32,388,531) | ||||
| Beneficial Interest Transactions ($): | ||||||||
| Net proceeds from shares sold: | ||||||||
| Class M Shares | 90,298,158 | 224,083,407 | 112,156,447 | 189,209,805 | ||||
| Investor Shares | 2,299,134 | 2,299,966 | 2,233,435 | 1,671,176 | ||||
| Dividends reinvested: | ||||||||
| Class M Shares | 2,997,658 | 5,188,901 | 3,189,951 | 4,878,898 | ||||
| Investor Shares | 74,625 | 122,579 | 32,571 | 38,542 | ||||
| Cost of shares redeemed: | ||||||||
| Class M Shares | (78,693,071) | (171,502,626) | (46,473,385) | (128,112,462) | ||||
| Investor Shares | (3,091,248) | (1,121,092) | (2,896,355) | (463,190) | ||||
| Increase (Decrease) in Net Assets from | ||||||||
| Beneficial Interest Transactions | 13,885,256 | 59,071,135 | 68,242,664 | 67,222,769 | ||||
| Total Increase (Decrease) in Net Assets | 46,673,514 | 59,724,386 | 100,589,969 | 70,193,594 | ||||
| Net Assets ($): | ||||||||
| Beginning of Period | 949,037,833 | 889,313,447 | 726,994,949 | 656,801,355 | ||||
| End of Period | 995,711,347 | 949,037,833 | 827,584,918 | 726,994,949 | ||||
| Undistributed (distributions in | ||||||||
| excess of) investment income—net | 238,036 | 443,713 | (431,918) | 56,696 | ||||
| Capital Share Transactions (Shares): | ||||||||
| Class M Shares | ||||||||
| Shares sold | 7,247,206 | 18,282,293 | 9,036,417 | 15,561,595 | ||||
| Shares issued for dividends reinvested | 240,366 | 423,129 | 256,222 | 401,273 | ||||
| Shares redeemed | (6,325,396) | (13,973,760) | (3,732,239) | (10,519,626) | ||||
| Net Increase (Decrease) in Shares Outstanding | 1,162,176 | 4,731,662 | 5,560,400 | 5,443,242 | ||||
| Investor Shares | ||||||||
| Shares sold | 185,948 | 188,124 | 180,195 | 137,241 | ||||
| Shares issued for dividends reinvested | 6,003 | 10,011 | 2,622 | 3,173 | ||||
| Shares redeemed | (249,951) | (91,617) | (234,564) | (38,058) | ||||
| Net Increase (Decrease) in Shares Outstanding | (58,000) | 106,518 | (51,747) | 102,356 | ||||
See notes to financial statements.
24
| BNY Mellon Short-Term | ||||
| U.S. Government Securities Fund | ||||
| Six Months Ended | ||||
| February 29, 2008 | Year Ended | |||
| (Unaudited) | August 31, 2007 | |||
| Operations ($): | ||||
| Investment income—net | 2,656,549 | 5,383,065 | ||
| Net realized gain (loss) on investments | 867,253 | (332,872) | ||
| Net unrealized appreciation (depreciation) on investments | 3,313,745 | 1,219,315 | ||
| Net Increase (Decrease) in Net Assets | ||||
| Resulting from Operations | 6,837,547 | 6,269,508 | ||
| Dividends to Shareholders from ($): | ||||
| Investment income—net: | ||||
| Class M Shares | (2,914,927) | (5,930,702) | ||
| Investor Shares | (4,595) | (4,699) | ||
| Total Dividends | (2,919,522) | (5,935,401) | ||
| Beneficial Interest Transactions ($): | ||||
| Net proceeds from shares sold: | ||||
| Class M Shares | 13,583,746 | 49,065,963 | ||
| Investor Shares | 306,549 | 104,867 | ||
| Dividends reinvested: | ||||
| Class M Shares | 549,033 | 868,612 | ||
| Investor Shares | 4,429 | 4,167 | ||
| Cost of shares redeemed: | ||||
| Class M Shares | (13,706,811) | (53,525,145) | ||
| Investor Shares | (275,283) | (250,641) | ||
| Increase (Decrease) in Net Assets from | ||||
| Beneficial Interest Transactions | 461,663 | (3,732,177) | ||
| Total Increase (Decrease) in Net Assets | 4,379,688 | (3,398,070) | ||
| Net Assets ($): | ||||
| Beginning of Period | 128,767,578 | 132,165,648 | ||
| End of Period | 133,147,266 | 128,767,578 | ||
| Undistributed (distributions in | ||||
| excess of) investment income—net | (227,785) | 35,188 | ||
| Capital Share Transactions (Shares): | ||||
| Class M Shares | ||||
| Shares sold | 1,115,626 | 4,089,237 | ||
| Shares issued for dividends reinvested | 45,056 | 72,506 | ||
| Shares redeemed | (1,124,875) | (4,461,016) | ||
| Net Increase (Decrease) in Shares Outstanding | 35,807 | (299,273) | ||
| Investor Shares | ||||
| Shares sold | 25,275 | 8,753 | ||
| Shares issued for dividends reinvested | 364 | 348 | ||
| Shares redeemed | (22,634) | (20,894) | ||
| Net Increase (Decrease) in Shares Outstanding | 3,005 | (11,793) | ||
See notes to financial statements.
The Funds 25
FINANCIAL HIGHLIGHTS
The following tables describe the performance for each share class of each BNY Mellon fixed income fund for the fiscal periods indicated.All information (except portfolio turnover rate) reflects financial results for a single fund share.Total return shows how much your investment in each fund would have increased (or decreased) during the period, assuming you had reinvested all dividends and distributions.These figures have been derived from each fund’s financial statements.
| Class M Shares | ||||||||||||
| Six Months Ended | ||||||||||||
| February 29, 2008 | Year Ended August 31, | |||||||||||
| BNY Mellon Bond Fund | (Unaudited) | 2007 | 2006 | 2005 | 2004 | 2003a | ||||||
| Per Share Data ($): | ||||||||||||
| Net asset value, beginning of period | 12.24 | 12.23 | 12.66 | 12.79 | 12.92 | 12.95 | ||||||
| Investment Operations: | ||||||||||||
| Investment income—net b | .30 | .57 | .52 | .48 | .49 | .56 | ||||||
| Net realized and unrealized | ||||||||||||
| gain (loss) on investments | .42 | .04 | (.38) | (.07) | .21 | .06 | ||||||
| Total from Investment Operations | .72 | .61 | .14 | .41 | .70 | .62 | ||||||
| Distributions: | ||||||||||||
| Dividends from investment income—net | (.30) | (.60) | (.57) | (.54) | (.56) | (.62) | ||||||
| Dividends from net realized gain on investments | — | — | — | — | (.27) | (.03) | ||||||
| Total Distributions | (.30) | (.60) | (.57) | (.54) | (.83) | (.65) | ||||||
| Net asset value, end of period | 12.66 | 12.24 | 12.23 | 12.66 | 12.79 | 12.92 | ||||||
| Total Return (%) | 5.94c | 5.06 | 1.20 | 3.30 | 5.63 | 4.73 | ||||||
| Ratios/Supplemental Data (%): | ||||||||||||
| Ratio of total expenses to average net assets | .55d | .56 | .56 | .56 | .56 | .57 | ||||||
| Ratio of net expenses to average net assets | .55d,e | .56e | .56e | .56 | .56e | .55 | ||||||
| Ratio of net investment income | ||||||||||||
| to average net assets | 4.79d | 4.67 | 4.27 | 3.81 | 3.79 | 4.30 | ||||||
| Portfolio Turnover Rate | 30.28c | 134.49 | 104.53f | 151.34f | 133.00f | 134.12 | ||||||
| Net Assets, end of period ($ x 1,000) | 991,664 | 944,416 | 885,994 | 839,804 | 819,664 | 846,464 | ||||||
| a Effective December 16, 2002, MPAM shares were redesignated as Class M shares. |
| b Based on average shares outstanding at each month end. |
| c Not annualized. |
| d Annualized. |
| e The difference for the period represents less than .01%. |
| f The portfolio turnover rates excluding mortgage dollar roll transactions for the periods ended August 31, 2006, 2005 and 2004, were 101.12%, 104.24% and 106.10%, |
| respectively. |
| See notes to financial statements. |
26
| Investor Shares | ||||||||||||
| Six Months Ended | ||||||||||||
| February 29, 2008 | Year Ended August 31, | |||||||||||
| BNY Mellon Bond Fund | (Unaudited) | 2007 | 2006 | 2005 | 2004 | 2003 | ||||||
| Per Share Data ($): | ||||||||||||
| Net asset value, beginning of period | 12.21 | 12.21 | 12.63 | 12.77 | 12.90 | 12.94 | ||||||
| Investment Operations: | ||||||||||||
| Investment income—net a | .28 | .53 | .49 | .45 | .50 | .54 | ||||||
| Net realized and unrealized | ||||||||||||
| gain (loss) on investments | .42 | .04 | (.37) | (.08) | .17 | .04 | ||||||
| Total from Investment Operations | .70 | .57 | .12 | .37 | .67 | .58 | ||||||
| Distributions: | ||||||||||||
| Dividends from investment income—net | (.28) | (.57) | (.54) | (.51) | (.53) | (.59) | ||||||
| Dividends from net realized gain on investments | — | — | — | — | (.27) | (.03) | ||||||
| Total Distributions | (.28) | (.57) | (.54) | (.51) | (.80) | (.62) | ||||||
| Net asset value, end of period | 12.63 | 12.21 | 12.21 | 12.63 | 12.77 | 12.90 | ||||||
| Total Return (%) | 5.82b | 4.82 | 1.01 | 2.98 | 5.29 | 4.48 | ||||||
| Ratios/Supplemental Data (%): | ||||||||||||
| Ratio of total expenses to average net assets | .82c | .81 | .80 | .81 | .81 | .82 | ||||||
| Ratio of net expenses to average net assets | .82c,d | .81d | .80d | .81 | .81d | .80 | ||||||
| Ratio of net investment income | ||||||||||||
| to average net assets | 4.51c | 4.42 | 4.02 | 3.56 | 3.52 | 4.11 | ||||||
| Portfolio Turnover Rate | 30.28b | 134.49 | 104.53e | 151.34e | 133.00e | 134.12 | ||||||
| Net Assets, end of period ($ x 1,000) | 4,047 | 4,621 | 3,319 | 2,704 | 3,068 | 3,861 | ||||||
| a Based on average shares outstanding at each month end. |
| b Not annualized. |
| c Annualized. |
| d The difference for the period represents less than .01%. |
| e The portfolio turnover rates excluding mortgage dollar roll transactions for the periods ended August 31, 2006, 2005 and 2004, were 101.12%, 104.24% and 106.10%, |
| respectively. |
| See notes to financial statements. |
The Funds 27
FINANCIAL HIGHLIGHTS (continued)
| Class M Shares | ||||||||||||
| Six Months Ended | ||||||||||||
| February 29, 2008 | Year Ended August 31, | |||||||||||
| BNY Mellon Intermediate Bond Fund | (Unaudited) | 2007 | 2006 | 2005 | 2004 | 2003a | ||||||
| Per Share Data ($): | ||||||||||||
| Net asset value, beginning of period | 12.19 | 12.14 | 12.47 | 12.77 | 12.97 | 13.04 | ||||||
| Investment Operations: | ||||||||||||
| Investment income—net b | .28 | .53 | .46 | .41 | .42 | .51 | ||||||
| Net realized and unrealized | ||||||||||||
| gain (loss) on investments | .51 | .09 | (.26) | (.22) | .14 | .11 | ||||||
| Total from Investment Operations | .79 | .62 | .20 | .19 | .56 | .62 | ||||||
| Distributions: | ||||||||||||
| Dividends from investment income—net | (.28) | (.57) | (.53) | (.49) | (.52) | (.59) | ||||||
| Dividends from net realized gain on investments | — | — | — | — | (.24) | (.10) | ||||||
| Total Distributions | (.28) | (.57) | (.53) | (.49) | (.76) | (.69) | ||||||
| Net asset value, end of period | 12.70 | 12.19 | 12.14 | 12.47 | 12.77 | 12.97 | ||||||
| Total Return (%) | 6.57c | 5.22 | 1.69 | 1.53 | 4.45 | 4.77 | ||||||
| Ratios/Supplemental Data (%): | ||||||||||||
| Ratio of total expenses to average net assets | .55d | .56 | .56 | .57 | .57 | .57 | ||||||
| Ratio of net expenses to average net assets | .55d,e | .56 | .56 | .57 | .57e | .56 | ||||||
| Ratio of net investment income | ||||||||||||
| to average net assets | 4.46d | 4.36 | 3.79 | 3.23 | 3.26 | 3.88 | ||||||
| Portfolio Turnover Rate | 24.97c | 84.24 | 86.50 | 112.51f | 109.19 | 104.98 | ||||||
| Net Assets, end of period ($ x 1,000) | 826,230 | 725,064 | 656,120 | 569,233 | 524,590 | 467,627 | ||||||
| a Effective December 16, 2002, MPAM shares were redesignated as Class M shares. |
| b Based on average shares outstanding at each month end. |
| c Not annualized. |
| d Annualized. |
| e The difference for the period represents less than .01%. |
| f The portfolio turnover rate excluding mortgage dollar roll transactions for the period ended August 31, 2005 was 111.52%. |
| See notes to financial statements. |
28
| Investor Shares | ||||||||||||
| Six Months Ended | ||||||||||||
| February 29, 2008 | Year Ended August 31, | |||||||||||
| BNY Mellon Intermediate Bond Fund | (Unaudited) | 2007 | 2006 | 2005 | 2004 | 2003 | ||||||
| Per Share Data ($): | ||||||||||||
| Net asset value, beginning of period | 12.19 | 12.14 | 12.47 | 12.77 | 13.02 | 13.08 | ||||||
| Investment Operations: | ||||||||||||
| Investment income—net a | .27 | .48 | .43 | .37 | .55 | .48 | ||||||
| Net realized and unrealized | ||||||||||||
| gain (loss) on investments | .50 | .11 | (.26) | (.21) | (.07)b | .12 | ||||||
| Total from Investment Operations | .77 | .59 | .17 | .16 | .48 | .60 | ||||||
| Distributions: | ||||||||||||
| Dividends from investment income—net | (.26) | (.54) | (.50) | (.46) | (.49) | (.56) | ||||||
| Dividends from net realized gain on investments | — | — | — | — | (.24) | (.10) | ||||||
| Total Distributions | (.26) | (.54) | (.50) | (.46) | (.73) | (.66) | ||||||
| Net asset value, end of period | 12.70 | 12.19 | 12.14 | 12.47 | 12.77 | 13.02 | ||||||
| Total Return (%) | 6.41c | 4.96 | 1.43 | 1.30 | 3.88 | 4.51 | ||||||
| Ratios/Supplemental Data (%): | ||||||||||||
| Ratio of total expenses to average net assets | .80d | .81 | .81 | .81 | .82 | .81 | ||||||
| Ratio of net expenses to average net assets | .80d,e | .81 | .81 | .81 | .82e | .81e | ||||||
| Ratio of net investment income | ||||||||||||
| to average net assets | 4.22d | 4.10 | 3.55 | 3.00 | 3.01 | 3.57 | ||||||
| Portfolio Turnover Rate | 24.97c | 84.24 | 86.50 | 112.51f | 109.19 | 104.98 | ||||||
| Net Assets, end of period ($ x 1,000) | 1,355 | 1,931 | 681 | 547 | 455 | 305 | ||||||
| a Based on average shares outstanding at each month end. |
| b In addition to the net realized and unrealized gain on investments as shown in the Statement of Operations, this amount includes a decrease in net asset value per share resulting |
| from the timing of issuances and redemptions of shares in relation to fluctuating market values for the fund’s investments. |
| c Not annualized. |
| d Annualized. |
| e The difference for the period represents less than .01%. |
| f The portfolio turnover rate excluding mortgage dollar roll transactions for the period ended August 31, 2005 was 111.52%. |
| See notes to financial statements. |
The Funds 29
FINANCIAL HIGHLIGHTS (continued)
| Class M Shares | ||||||||||||
| Six Months Ended | ||||||||||||
| BNY Mellon Short-Term | February 29, 2008 | Year Ended August 31, | ||||||||||
| U.S. Government Securities Fund | (Unaudited) | 2007 | 2006 | 2005 | 2004 | 2003a | ||||||
| Per Share Data ($): | ||||||||||||
| Net asset value, beginning of period | 12.02 | 11.99 | 12.14 | 12.47 | 12.70 | 12.94 | ||||||
| Investment Operations: | ||||||||||||
| Investment income—net b | .25 | .56 | .39 | .28 | .25 | .34 | ||||||
| Net realized and unrealized | ||||||||||||
| gain (loss) on investments | .39 | .03 | (.06) | (.16) | (.01) | (.11) | ||||||
| Total from Investment Operations | .64 | .59 | .33 | .12 | .24 | .23 | ||||||
| Distributions: | ||||||||||||
| Dividends from investment income—net | (.27) | (.56) | (.48) | (.45) | (.45) | (.44) | ||||||
| Dividends from net realized gain on investments | — | — | — | — | (.02) | (.03) | ||||||
| Total Distributions | (.27) | (.56) | (.48) | (.45) | (.47) | (.47) | ||||||
| Net asset value, end of period | 12.39 | 12.02 | 11.99 | 12.14 | 12.47 | 12.70 | ||||||
| Total Return (%) | 5.40c | 5.05 | 2.78 | 1.00 | 1.97 | 1.68 | ||||||
| Ratios/Supplemental Data (%): | ||||||||||||
| Ratio of total expenses to average net assets | .55d | .55 | .54 | .55 | .55 | .56 | ||||||
| Ratio of net expenses to average net assets | .55d,e | .55 | .54 | .55e | .55e | .55 | ||||||
| Ratio of net investment income | ||||||||||||
| to average net assets | 4.08d | 4.65 | 3.24 | 2.25 | 1.97 | 2.68 | ||||||
| Portfolio Turnover Rate | 61.28c | 127.30 | 85.97 | 69.11 | 44.76 | 88.05 | ||||||
| Net Assets, end of period ($ x 1,000) | 132,966 | 128,628 | 131,885 | 161,963 | 176,301 | 139,971 | ||||||
| a Effective December 16, 2002, MPAM shares were redesignated as Class M shares. b Based on average shares outstanding at each month end. c Not annualized. d Annualized. e The difference for the period represents less than .01%. See notes to financial statements. |
30
| Investor Shares | ||||||||||||
| Six Months Ended | ||||||||||||
| BNY Mellon Short-Term | February 29, 2008 | Year Ended August 31, | ||||||||||
| U.S. Government Securities Fund | (Unaudited) | 2007 | 2006 | 2005 | 2004 | 2003 | ||||||
| Per Share Data ($): | ||||||||||||
| Net asset value, beginning of period | 12.02 | 12.00 | 12.14 | 12.47 | 12.73 | 12.93 | ||||||
| Investment Operations: | ||||||||||||
| Investment income—net a | .24 | .49 | .41 | .23 | .37 | .30 | ||||||
| Net realized and unrealized | ||||||||||||
| gain (loss) on investments | .39 | .06 | (.10) | (.14) | (.19) | (.06) | ||||||
| Total from Investment Operations | .63 | .55 | .31 | .09 | .18 | .24 | ||||||
| Distributions: | ||||||||||||
| Dividends from investment income—net | (.26) | (.53) | (.45) | (.42) | (.42) | (.41) | ||||||
| Dividends from net realized gain on investments | — | — | — | — | (.02) | (.03) | ||||||
| Total Distributions | (.26) | (.53) | (.45) | (.42) | (.44) | (.44) | ||||||
| Net asset value, end of period | 12.39 | 12.02 | 12.00 | 12.14 | 12.47 | 12.73 | ||||||
| Total Return (%) | 5.26b | 4.67 | 2.62 | .78 | 1.46 | 1.78 | ||||||
| Ratios/Supplemental Data (%): | ||||||||||||
| Ratio of total expenses to average net assets | .80c | .80 | .77 | .81 | .78 | .83 | ||||||
| Ratio of net expenses to average net assets | .80c,d | .80 | .77 | .81d | .78d | .80 | ||||||
| Ratio of net investment income | ||||||||||||
| to average net assets | 3.85c | 4.51 | 3.25 | 1.99 | 1.74 | 2.38 | ||||||
| Portfolio Turnover Rate | 61.28b | 127.30 | 85.97 | 69.11 | 44.76 | 88.05 | ||||||
| Net Assets, end of period ($ x 1,000) | 181 | 140 | 281 | 20 | 11 | 1 | ||||||
| a | Based on average shares outstanding at each month end. | |
| b | Not annualized. | |
| c | Annualized. | |
| d | The difference for the period represents less than .01%. |
See notes to financial statements.
The Funds 31
NOTES TO FINANCIAL STATEMENTS (Unaudited)
NOTE 1—General:
BNY Mellon Funds Trust (the “Trust”) was organized as a Massachusetts business trust which is registered under the Investment Company Act of 1940, as amended (the “Act”), as an open-end management investment company and operates as a series company currently comprised of seventeen series including the following diversified fixed income funds: BNY Mellon Bond Fund, BNY Mellon Intermediate Bond Fund and BNY Mellon Short-Term U.S. Government Securities Fund (each, a “fund” and collectively, the “funds”). Effective March 31, 2008, the Trust changed its name from “Mellon Funds Trust” to its current name and each fund added “BNY” to the beginning of its name. BNY Mellon Bond Fund’s and BNY Mellon Intermediate Bond Fund’s investment objective is to seek total return (consisting of capital appreciation and current income). BNY Mellon Short-Term U.S. Government Securities Fund’s investment objective is to seek to provide as high a level of current income as is consistent with the preservation of capital.
Mellon Fund Advisers, a division of the Dreyfus Corporation (the “Manager” or “Dreyfus) serves as each fund’s investment adviser (“Investment Adviser”). Mellon Bank, N.A. (“Mellon Bank”), an affiliate of Dreyfus, serves as administrator for the funds pursuant to an Administration Agreement with the Trust (the “Administration Agreement”). Mellon Bank has entered into a Sub-Administration Agreement with Dreyfus pursuant to which Mellon Bank pays Dreyfus for performing certain administrative services. Dreyfus and Mellon Bank are wholly-owned subsidiaries of The Bank of New York Mellon Corporation (“BNY Mellon”). MBSC Securities Corporation (the Distributor”), a wholly-owned subsidiary of Dreyfus, is the Distributor of each fund’s shares, which are sold without a sales charge.
The Trust is authorized to issue an unlimited number of shares of beneficial interest, par value $.001 per share, in each of the Class M and Investor class shares of each fund. Each class of shares has similar rights and privileges, except with respect to the expenses borne by and
the shareholder services offered to each class and the shareholder services plan applicable to the Investor shares, the allocation of certain transfer agency costs and certain voting rights. Income, expenses (other than expenses attributable to a specific class), and realized and unrealized gains or losses on investments are allocated daily for each class of shares based upon relative proportion of net assets of each class.
The Trust accounts separately for the assets, liabilities and operations of each series. Expenses directly attributable to each series are charged to that series’ operations; expenses that are applicable to all series are allocated among them on a pro rata basis.
The funds’ financial statements are prepared in accordance with U.S. generally accepted accounting principles, which may require the use of management estimates and assumptions. Actual results could differ from those estimates.
NOTE 2—Significant Accounting Policies:
(a) Portfolio valuation: Investments in securities excluding short-term investments (other than U.S. Treasury Bills), are valued each business day by an independent pricing service (the “Service”) approved by the Trust’s Board. Investments for which quoted bid prices are readily available and are representative of the bid side of the market in the judgment of the Service are valued at the mean between the quoted bid prices (as obtained by the Service from dealers in such securities) and asked prices (as calculated by the Service based upon its evaluation of the market for such securities). Other investments (which constitute a majority of the portfolio securities) are valued as determined by the Service, based on methods which include consideration of: yields or prices of securities of comparable quality, coupon, maturity and type; indications as to values from dealers; and general market conditions. Restricted securities, as well as securities or other assets for which recent market quotations are not readily available, that are not valued by a pricing service approved by the Trust’s Board, or are
32
determined by the fund not to reflect accurately fair value, are valued at fair value as determined in good faith under the direction of the Trust’s Board.The factors that may be considered when fair valuing a security include fundamental analytical data, the nature and duration of restrictions on disposition, an evaluation of the forces that influence the market in which the securities are purchased and sold, and public trading in similar securities of the issuer or comparable issuers. Short-term investments, excluding U.S.Treasury Bills, are carried at amortized cost, which approximates value. Registered open-end investment companies that are not traded on an exchange are valued at their net asset value.
The Financial Accounting Standards Board (“FASB”) released Statement of Financial Accounting Standards No. 157 “Fair Value Measurements” (“FAS 157”). FAS 157 establishes an authoritative definition of fair value, sets out a framework for measuring fair value, and requires additional disclosures about fair-value measure-ments.The application of FAS 157 is required for fiscal years beginning after November 15, 2007 and interim periods within those fiscal years. Management does not believe that the application of this standard will have a material impact on the financial statements of the funds.
(b) Securities transactions and investment income:Securities transactions are recorded on a trade date basis. Realized gains and losses from securities transactions are recorded on the identified cost basis. Dividend income is recorded on the ex-dividend date and interest income, including where applicable, accretion of discount and amortization of premium on investments is recognized on the accrual basis.
The funds have an arrangement with the custodian and cash management banks whereby the funds may receive earnings credits when positive cash balances are maintained, which are used to offset custody and cash management fees. For financial reporting purposes, the funds include net earnings credits as an expense offset in the Statement of Operations.
Pursuant to a securities lending agreement with Mellon Bank, the funds may lend securities to certain qualified institutions. It is the funds’ policy, that at origination, all loans are secured by collateral of at least 102% of the value of U.S. securities loaned and 105% of the value of foreign securities loaned. Collateral equivalent to at least 100% of the market value of securities on loan is maintained at all times. Collateral is either in the form of cash, which can be invested in certain money market mutual funds managed by Dreyfus, U.S. Government and Agency securities or Letters of Credit.The funds are entitled to receive all income on securities loaned, in addition to income earned as a result of the lending transaction.Although each security loaned is fully collateralized, the funds bear the risk of delay in recovery of, or loss of rights in, the securities loaned should a borrower fail to return the securities in a timely manner.
Table 1 summarizes the amount Mellon Bank earned from each fund from lending fund portfolio securities, pursuant to the securities lending agreement during the period ended February 29, 2008.
| Table 1. | ||
| BNY Mellon Bond Fund | $268,687 | |
| BNY Mellon Intermediate Bond Fund | 385,107 | |
| BNY Mellon Short-Term U.S. | ||
| Government Securities Fund | 68,976 |
(c) Affiliated issuers: Investments in other investment companies advised by Dreyfus are defined as “affiliated” in the Act.
(d) Concentration of Risk: The funds invest primarily in debt securities. Failure of an issuer of the debt securities to make timely interest or principal payments, or a decline or the perception of a decline in the credit quality of a debt security, can cause the debt security’s price to fall, potentially lowering the fund’s share price. In addition, the value of the debt securities may decline due to general market conditions that are not specifically related to a particular company, such as real or perceived adverse economic conditions, changes in outlook for
The Funds 33
NOTES TO FINANCIAL STATEMENTS (Unaudited) (continued)
corporate earnings, changes in interest or currency rates or adverse investor sentiment. They may also decline because of factors that affect a particular industry.
(e) Dividends to shareholders: Dividends payable to shareholders are recorded by the funds on the ex-dividend date. The funds declare and pay dividends from investment income-net monthly. With respect to each series, dividends from net realized capital gains, if any, are normally declared and paid annually, but the funds may make distributions on a more frequent basis to comply with the distribution requirements of the Internal Revenue Code of 1986, as amended (the “Code”). To the extent that net realized capital gains can be offset by capital loss carryovers of that fund, it is the policy of the fund not to distribute such gains. Income and capital gain distributions are determined in accordance with income tax regulations, which may differ from generally accepted accounting principles.
(f) Federal income taxes: It is the policy of each fund to continue to qualify as a regulated investment company, if such qualification is in the best interests of its shareholders, by complying with the applicable provisions of the Code, and to make distributions of taxable income sufficient to relieve it from substantially all federal income and excise taxes. For federal income tax purposes, each series is treated as a single entity for the purpose of determining such qualification.
During the current year, the funds adopted FASB Interpretation No. 48 “Accounting for Uncertainty in Income Taxes” (“FIN 48”). FIN 48 provides guidance for how uncertain tax positions should be recognized, measured, presented and disclosed in the financial statements.
FIN 48 requires the evaluation of tax positions taken or expected to be taken in the course of preparing the funds tax returns to determine whether the tax positions are “more-likely-than-not” of being sustained by the applicable tax authority.Tax positions not deemed to meet the more-likely-than-not threshold would be recorded as a tax benefit or expense in the current year.The adoption of FIN 48 had no impact on the operations of the fund for the period ended February 29, 2008.
Each of the tax years in the three-year period ended August 31, 2007, remains subject to examination by the Internal Revenue Service and state taxing authorities.
Table 2 summarizes each fund’s unused capital loss carryover available for federal income tax purposes to be applied against future net securities profits, if any, realized subsequent to August 31, 2007.
Table 3 summarizes each fund’s tax characters of distributions paid to shareholders during the fiscal year ended August 31, 2007. The tax character of current year distributions will be determined at the end of the current fiscal year.
| Ordinary | ||
| Table 3. | Income | |
| BNY Mellon Bond Fund | $44,346,681 | |
| BNY Mellon Intermediate Bond Fund | 32,388,531 | |
| BNY Mellon Short-Term U.S. | ||
| Government Securities Fund | 5,935,401 |
NOTE 3—Bank Line of Credit:
The funds participate with other Dreyfus-managed funds in a $100 million unsecured line of credit primarily to be utilized for temporary or emergency purposes, including
| Table 2. | ||||||||||
| Expiring in fiscal | 2012 ($)† | 2013 ($)† | 2014 ($)† | 2015 ($)† | Total ($) | |||||
| BNY Mellon Bond Fund | 1,596,239 | 136,060 | 1,275,059 | 15,167,648 | 18,175,006 | |||||
| BNY Mellon Intermediate Bond Fund | 1,813,775 | 892,928 | 4,073,519 | 14,278,037 | 21,058,259 | |||||
| BNY Mellon Short-Term U.S. Government Securities Fund | 182,342 | 1,852,740 | 2,969,151 | 4,701,997 | 9,706,230 | |||||
† If not applied, the carryovers expire in the above years.
34
the financing of redemptions. Interest is charged to the funds based on prevailing market rates in effect at the time of borrowing. During the period ended February 29, 2008, the funds did not borrow under the line of credit.
NOTE 4—Investment Advisory Fee, Administration
Fee and Other Transactions With Affiliates:
(a) Fees payable by the funds pursuant to the provisions of an Investment Advisory Agreement with the Investment Adviser are payable monthly, computed on the average daily value of each fund’s net assets at the following annual rates: .40% of the BNY Mellon Bond Fund, .40% of the BNY Mellon Intermediate Bond Fund and .35% of the BNY Mellon Short-Term U.S. Government Securities Fund.
Pursuant to the Administration Agreement with Mellon, Mellon provides or arranges for fund accounting, transfer agency and other fund administration services and receives a fee based on the total net assets of the Trust based on the following rates:
| 0 up to $6 billion | .15% | |
| $6 billion up to $12 billion | .12% | |
| In excess of $12 billion | .10% |
Mellon Bank has entered into a Sub-Administration Agreement with Dreyfus pursuant to which Mellon Bank pays Dreyfus for performing certain administrative services.
(b) The funds have adopted a Shareholder Services Plan with respect to its Investor shares pursuant to which each fund pays the Distributor for the provision of certain services to holders of Investor shares a fee at an annual rate of .25% of the value of the average daily net assets attributable to Investor shares. The services provided may include personal services relating to shareholder accounts, such as answering shareholder inquiries regarding a fund, and providing reports and other information, and services related to the maintenance of such shareholder accounts. The Shareholder Services Plan allows the Distributor to make payments from the shareholder services fees it collects from each
fund to compensate service agents (certain banks, securities brokers or dealers and other financial institutions) in respect of these services.
Table 4 summarizes the amounts Investor shares of each fund were charged during the period ended February 29, 2008, pursuant to the Shareholder Services Plan. Additional fees included in shareholder servicing costs in the Statement of Operations includes fees paid to the transfer agent.
| Table 4. | ||
| BNY Mellon Bond Fund | $5,563 | |
| BNY Mellon Intermediate Bond Fund | 2,108 | |
| BNY Mellon Short-Term U.S. | ||
| Government Securities Fund | 262 |
The funds compensate The Bank of New York, a subsidiary of BNY Mellon and a Dreyfus affiliate,under a cash management agreement for performing cash management services related to fund subscriptions and redemptions.
Table 5 summarizes the amount each fund was charged during the period ended February 29, 2008, pursuant to the cash management agreement.
| Table 5. | ||
| BNY Mellon Bond Fund | $53 | |
| BNY Mellon Intermediate Bond Fund | 18 | |
| BNY Mellon Short-Term U.S. | ||
| Government Securities Fund | 9 |
The funds compensate Mellon Bank under a cash management agreement for performing cash management services related to fund subscriptions and redemptions.
Table 6 summarizes the amount each fund was charged during the period ended February 29, 2008, pursuant to the cash management agreement.
| Table 6. | ||
| BNY Mellon Bond Fund | $178 | |
| BNY Mellon Intermediate Bond Fund | 74 | |
| BNY Mellon Short-Term U.S. | ||
| Government Securities Fund | 34 |
The Funds 35
NOTES TO FINANCIAL STATEMENTS (Unaudited) (continued)
The funds compensate Mellon Bank under a custody agreement for providing custodial services for the funds.
Table 7 summarizes the amount each fund was charged during the period ended February 29, 2008, pursuant to the custody agreement.
| Table 7. | ||
| BNY Mellon Bond Fund | $37,453 | |
| BNY Mellon Intermediate Bond Fund | 24,741 | |
| BNY Mellon Short-Term U.S. | ||
| Government Securities Fund | 5,806 |
During the period ended February 29, 2008, each fund was charged $2,411 for services performed by the Chief Compliance Officer.
Table 8 summarizes the components of “Due to The Dreyfus Corporation and affiliates” in the Statement of Assets and Liabilities for each fund.
(c) Each trustee who is not an “affiliated person” as defined in the Act receives from the Trust an annual fee
of $48,000 and an attendance fee of $5,000 for each in-person meeting attended and $500 for telephone meetings and is reimbursed for travel and out-of-pocket expenses.The Chairman of the Trust’s Board receives an additional annual fee of $10,000 and the Chairman of the Trust’s Audit Committee receives an additional annual fee of $8,000.
NOTE 5—Securities Transactions:
Table 9 summarizes each fund’s aggregate amount of purchases and sales of investment securities (including paydowns) excluding short-term securities, during the period ended February 29, 2008.
Table 10 summarizes accumulated net unrealized appreciation on investments for each fund at February 29, 2008.
At February 29, 2008, the cost of investments for each fund for federal income tax purposes was substantially the same as the cost for financial reporting purposes (see the Statement of Investments).
| Table 8. | ||||||||
| Investment | Chief | Shareholder | ||||||
| Advisory | Compliance | Services | Custodian | |||||
| Fees ($) | Officer Fees ($) | Plan Fees ($) | Fees ($) | |||||
| BNY Mellon Bond Fund | 314,633 | 4,419 | 785 | 28,442 | ||||
| BNY Mellon Intermediate Bond Fund | 261,118 | 4,419 | 285 | 11,755 | ||||
| BNY Mellon Short-Term U.S. Government Securities Fund | 38,545 | 4,419 | 27 | 3,964 | ||||
| Table 9. | ||||
| Purchases ($) | Sales ($) | |||
| BNY Mellon Bond Fund | 315,115,017 | 289,495,929 | ||
| BNY Mellon Intermediate Bond Fund | 255,182,425 | 183,845,098 | ||
| BNY Mellon Short-Term U.S. Government Securities Fund | 79,879,925 | 78,483,767 | ||
| Table 10. | ||||||
| Gross | Gross | |||||
| Appreciation ($) | (Depreciation) ($) | Net ($) | ||||
| BNY Mellon Bond Fund | 32,074,201 | 5,689,980 | 26,384,221 | |||
| BNY Mellon Intermediate Bond Fund | 32,154,458 | 721,535 | 31,432,923 | |||
| BNY Mellon Short-Term U.S. | ||||||
| Government Securities Fund | 3,753,220 | 78,412 | 3,674,808 | |||
36
NOTES
For More Information
| BNY Mellon Funds Trust | Custodian | |
| c/o The Dreyfus Corporation | ||
| 200 Park Avenue | Mellon Bank, N.A. | |
| New York, NY 10166 | One Mellon Bank Center | |
| Pittsburgh, PA 15258 | ||
| Investment Adviser | ||
| Transfer Agent & | ||
| Mellon Fund Advisers, a division of | Dividend Disbursing Agent | |
| The Dreyfus Corporation | ||
| 200 Park Avenue | Dreyfus Transfer, Inc. | |
| New York, NY 10166 | 200 Park Avenue | |
| New York, NY 10166 | ||
| Administrator | ||
| Distributor | ||
| Mellon Bank, N.A. | ||
| One Mellon Bank Center | MBSC Securities Corporation | |
| Pittsburgh, PA 15258 | 200 Park Avenue | |
| New York, NY 10166 | ||
| Sub-Administrator | ||
| The Dreyfus Corporation | ||
| 200 Park Avenue | ||
| New York, NY 10166 | ||
| Ticker Symbols: | ||||
| BNY Mellon Bond Fund | Class M: MPBFX | Investor: MIBDX | ||
| BNY Mellon Intermediate Bond Fund | Class M: MPIBX | Investor: MIIDX | ||
| BNY Mellon Short-Term U.S. Government Securities Bond Fund | Class M: MPSUX | Investor: MISTX |
Telephone Wealth Management (WM) Clients, please contact your Account Officer or call 1-888-281-7350.
Brokerage Clients of BNY Mellon Wealth Advisors (BNYMWA), please contact your financial representative
or call 1-800-830-0549, Option 2. Individual Account holders, please call Dreyfus at 1-800-645-6561.
Mail WM Clients, write to your Account Officer, c/o Mellon Bank, N.A., One Mellon Bank Center, Pittsburgh, PA 15258
BNYMWA Brokerage Clients, write to your financial representative, P.O. Box 9012, Hicksville, NY 11802–9012
Individual Account Holders, write to: BNY Mellon Funds, P.O. Box 55268, Boston, MA 02205–8502
The fund files its complete schedule of portfolio holdings with the Securities and Exchange Commission (“SEC”) for the first and third quarters of each fiscal year on Form N-Q. The fund’s Forms N-Q are available on the SEC’s website at http://www.sec.gov and may be reviewed and copied at the SEC’s Public Reference Room in Washington, DC. Information on the operation of the Public Reference Room may be obtained by calling 1-202-551-8090.
A description of the policies and procedures that the fund uses to determine how to vote proxies relating to portfolio securities, and information regarding how the fund voted these proxies for the 12-month period ended June 30, 2007, is available at http://www.dreyfus.com and on the SEC’s website at http://www.sec.gov. The description of the policies and procedures is also available without charge, upon request, by calling 1-800-645-6561.
MFTSA0208-TB
©2008 MBSC Securities Corporation
| Item 2. | Code of Ethics. | |
| Not applicable. | ||
| Item 3. | Audit Committee Financial Expert. | |
| Not applicable. | ||
| Item 4. | Principal Accountant Fees and Services. | |
| Not applicable. | ||
| Item 5. | Audit Committee of Listed Registrants. | |
| Not applicable. | ||
| Item 6. | Schedule of Investments. | |
| Not applicable. | ||
| Item 7. | Disclosure of Proxy Voting Policies and Procedures for Closed-End Management | |
| Investment Companies. | ||
| Not applicable. | ||
| Item 8. | Portfolio Managers of Closed-End Management Investment Companies. | |
| Not applicable. | ||
| Item 9. | Purchases of Equity Securities by Closed-End Management Investment Companies and | |
| Affiliated Purchasers. | ||
| Not applicable. | ||
| Item 10. | Submission of Matters to a Vote of Security Holders. |
The Registrant has a Nominating Committee (the "Committee"), which is responsible for selecting and nominating persons for election or appointment by the Registrant's Board as Board members. The Committee has adopted a Nominating Committee Charter (the "Charter"). Pursuant to the Charter, the Committee will consider recommendations for nominees from shareholders submitted to the Secretary of the Registrant, c/o The Dreyfus Corporation Legal Department, 200 Park Avenue, 8th Floor East, New York, New York 10166. A nomination submission must include information regarding the recommended nominee as specified in the Charter. This information includes all information relating to a recommended nominee that is required to be disclosed in solicitations or proxy statements for the election of Board members, as well as information sufficient to evaluate the factors to be considered by the Committee, including character and integrity, business and professional experience, and whether the person has the ability to apply sound and independent business judgment and would act in the interests of the Registrant and its shareholders.
Nomination submissions are required to be accompanied by a written consent of the individual to stand for election if nominated by the Board and to serve if elected by the shareholders, and such additional information must be provided regarding the recommended nominee as reasonably requested by the Committee.
Item 11. Controls and Procedures.
(a) The Registrant's principal executive and principal financial officers have concluded, based on their evaluation of the Registrant's disclosure controls and procedures as of a date within 90 days of the filing date of this report, that the Registrant's disclosure controls and procedures are reasonably designed to ensure that information required to be disclosed by the Registrant on Form N-CSR is recorded, processed, summarized and reported within the required time periods and that information required to be disclosed by the Registrant in the reports that it files or submits on Form N-CSR is accumulated and communicated to the Registrant's management, including its principal executive and principal financial officers, as appropriate to allow timely decisions regarding required disclosure.
(b) There were no changes to the Registrant's internal control over financial reporting that occurred during the second fiscal quarter of the period covered by this report that have materially affected, or are reasonably likely to materially affect, the Registrant's internal control over financial reporting.
| Item 12. | Exhibits. |
| (a)(1) | Not applicable. | |
| (a)(2) | Certifications of principal executive and principal financial officers as required by Rule 30a-2(a) | |
| under the Investment Company Act of 1940. | ||
| (a)(3) | Not applicable. | |
| (b) | Certification of principal executive and principal financial officers as required by Rule 30a-2(b) | |
| under the Investment Company Act of 1940. | ||
SIGNATURES
Pursuant to the requirements of the Securities Exchange Act of 1934 and the Investment Company Act of 1940, the Registrant has duly caused this Report to be signed on its behalf by the undersigned, thereunto duly authorized.
| By: | /s/Christopher E. Sheldon | |
| Christopher E. Sheldon | ||
| President | ||
| Date: | April 25, 2008 | |
Pursuant to the requirements of the Securities Exchange Act of 1934 and the Investment Company Act of 1940, this Report has been signed below by the following persons on behalf of the Registrant and in the capacities and on the dates indicated.
| By: | /s/Christopher E. Sheldon | |
| Christopher E. Sheldon | ||
| President | ||
| Date: | April 25, 2008 | |
| By: | /s/James Windels | |
| James Windels | ||
| Treasurer | ||
| Date: | April 25, 2008 | |
EXHIBIT INDEX
(a)(2) Certifications of principal executive and principal financial officers as required by Rule 30a-2(a) under the Investment Company Act of 1940. (EX-99.CERT)
(b) Certification of principal executive and principal financial officers as required by Rule 30a-2(b) under the Investment Company Act of 1940. (EX-99.906CERT)