| UNITED STATES |
| SECURITIES AND EXCHANGE COMMISSION |
| Washington, D.C. 20549 |
| FORM N-CSR |
| CERTIFIED SHAREHOLDER REPORT OF REGISTERED MANAGEMENT |
| INVESTMENT COMPANIES |
| Investment Company Act file number 811-09903 |
| Mellon Funds Trust |
| (Exact name of Registrant as specified in charter) |
| c/o The Dreyfus Corporation |
| 200 Park Avenue |
| New York, New York 10166 |
| (Address of principal executive offices) (Zip code) |
| Mark N. Jacobs, Esq. |
| 200 Park Avenue |
| New York, New York 10166 |
| (Name and address of agent for service) |
| Registrant's telephone number, including area code: (212) 922-6000 |
| Date of fiscal year end: | 08/31 | |
| Date of reporting period: | 02/28/2007 |
FORM N-CSR
| Item 1. | Reports to Stockholders. |
The Mellon Funds
| Mellon Large Cap Stock Fund |
| Mellon Income Stock Fund |
| Mellon Mid Cap Stock Fund |
| Mellon Small Cap Stock Fund |
| Mellon International Fund |
| Mellon Emerging Markets Fund |
| Mellon Balanced Fund |
SEMIANNUAL REPORT February 28, 2007
| Contents | ||
| The Funds | ||
| Letter from the President | 2 | |
| Discussion of Funds’ Performance | ||
| Mellon Large Cap Stock Fund | 3 | |
| Mellon Income Stock Fund | 5 | |
| Mellon Mid Cap Stock Fund | 7 | |
| Mellon Small Cap Stock Fund | 9 | |
| Mellon International Fund | 11 | |
| Mellon Emerging Markets Fund | 13 | |
| Mellon Balanced Fund | 15 | |
| Understanding Your Fund’s Expenses | 17 | |
| Comparing Your Fund’s Expenses | ||
| With Those of Other Funds | 18 | |
| Statements of Investments | 19 | |
| Statements of Assets and Liabilities | 46 | |
| Statements of Operations | 48 | |
| Statements of Changes in Net Assets | 50 | |
| Financial Highlights | 55 | |
| Notes to Financial Statements | 70 | |
For More Information
Back cover
The views expressed herein are current to the date of this report. These views and the composition of the funds’ portfolios are subject to change at any time based on market and other conditions.
| • Not FDIC-Insured |
| • Not Bank-Guaranteed |
| • May Lose Value |
The Funds

| LETTER FROM |
| THE PRESIDENT |
Dear Shareholder:
We are pleased to present this semiannual report for the Mellon Funds Trust, covering the six-month period from September 1, 2006, through February 28, 2007.
Despite a sudden bout of market volatility near the end of February 2007, the U.S. stock market fared relatively well. Domestic stock prices generally were propelled higher by stabilized short-term rates, moderate inflationary pressures, and robust corporate earnings. In international markets, the European and Asian markets posted very strong returns as well, boosted by fiscal reforms in many emerging markets and a surge in mergers-and-acquisitions activity and corporate reorganizations. Although the U.S. and other developed economies have shown signs of decelerating, many economists currently feel the risk of a full-blown recession is extremely small.
We remain optimistic about the sustainability of the current economic expansion. Productivity has increased as modern technologies and efficient business practices helped to limit cyclical inflation pressures around the world. Over the more immediate term, a warm winter in the U.S. and rapidly declining energy prices have mitigated the risks that weakness in the U.S. housing sector might derail business and consumer confidence.The overall result has been to bolster investor sentiment and stock prices.
For information about how each fund performed during the reporting period, as well as market perspectives, we have provided a Discussion of Fund Performance.
As always, we encourage you to talk with your portfolio manager to help ensure that your portfolio remains aligned with your current financial needs and future investment goals.
Thank you for your continued confidence and support.

| Christopher E. Sheldon |
| President |
| Mellon Funds Trust | ||
| March 15, 2007 |

| DISCUSSION OF FUND PERFORMANCE |
Michael D. Weiner, Portfolio Manager
How did Mellon Large Cap Stock Fund perform relative to its benchmark?
For the six-month period ended February 28, 2007, the fund’s Class M shares produced a total return of 7.81% while its Investor shares produced a total return of 7.66% .1 In comparison, the total return of the Standard & Poor’s 500 Composite Stock Price Index (“S&P 500 Index”), the fund’s benchmark, was 8.93% for the same period.2
Stocks were driven higher during the reporting period by continued U.S. economic growth, stable short-term interest rates and rising corporate earnings. The fund participated in the market’s rise to a significant degree, producing particularly strong returns in the materials, telecommunications services, consumer discretionary, utilities and financial services sectors. However, relatively weak returns in the health care and technology areas undermined the fund’s performance compared to the benchmark.
In addition, on February 23, 2007, Sean P. Fitzgibbon became the fund’s primary portfolio manager. The fund will continue to seek capital appreciation as its investment objective.
What is the fund’s investment approach?
The fund seeks capital appreciation.To pursue its goal, the fund normally invests at least 80% of its assets in stocks of large-cap companies. We choose stocks through a disciplined investment process that uses computer modeling techniques to identify and rank companies based on value, growth and other financial characteristics. Next, we use fundamental analysis to select the most attractive of the higher ranked securities, drawing on a variety of internal and Wall Street research sources. We also attempt to manage risks by diversifying the fund’s investments across companies and industries, maintaining weightings and risk characteristics that generally are similar to those of the S&P 500 Index.
What other factors influenced the fund’s performance?
While the market’s advance was broadly based, high levels of volatility and short-term stock price fluctuations were a significant influence on fund performance. Price volatility proved to be detrimental during the final months of 2006, but it worked in the fund’s favor during January and February 2007, nearly making up for the fund’s earlier underperfor-mance relative to the benchmark.
The fund produced some of its greater gains in the basic materials sector, where top performers included raw materials producers, such as Freeport-McMoRan Copper & Gold, industrial gas producer Air Products and Chemical, Inc. and nickel mining company Inco, which merged with another of the fund’s holdings, iron producer Companhia Vale do Rio Doce. In the telecommunications services area, gains in stocks such as Sprint Nextel enabled the fund to roughly match the benchmark’s strong returns from the sector.
The fund also derived robust gains from consumer discretionary holdings such as motorcycle maker Harley-Davidson, residential homebuilder D. R. Horton and automobile products producer Harman International Industries. These winners largely compensated for weaker returns from other consumer discretionary holdings, such as Starbucks, and from the fund’s lack of exposure to strong-performing cable service providers. Among utilities stocks, the fund’s position in Dynegy Cl. A performed well, due to an increase in private equity investment in energy generation and transmission companies. Finally, in the finan-
The Funds 3
DISCUSSION OF FUND PERFORMANCE (continued)
cial services sector, the fund delivered relatively positive performance through its emphasis on brokerage firms, such as Goldman Sachs Group, Lehman Brothers Holdings and JPMorgan Chase & Co.
On the negative side, health care and technology holdings detracted from the fund’s relative performance. Biotechnology giant Amgen was hurt by concerns regarding competitive issues and government reimbursement rates. In the technology area, the fund’s performance was hurt by significant exposure to Motorola, which dropped sharply when the company lost ground in the cellular handset market.
What is the fund’s current strategy?
As of the end of the reporting period, we have allocated a slightly greater percentage of the fund’s assets to technology stocks than the benchmark in light of attractive valuations, favorable product cycles and a positive corporate spending environment. Similarly, in the health care sector, a slightly overweight position reflects our favorable view of the sector’s long-term prospects as the U.S. population ages. We also have placed modest emphasis on energy stocks, where we see strong business fundamentals for drillers and oilfield services companies.
On the other hand, we have slightly reduced the fund’s consumer discretionary exposure in response to the potential for weakening consumer spending given current turmoil in the mortgage lending market.The fund also holds underweight exposure to the telecommunications services sector, where the competitive landscape appears uncertain and many companies face the need to make significant capital expenditures. It should be noted, however, that these over- and underweight positions were mild. In general, the fund remained true to its disciplined, sector-neutral investment approach.
More broadly, we believe current market valuations and economic trends toward slowing, but reasonable, growth are likely to favor the kinds of large-cap, high-quality, financially sound companies in which the fund invests.
March 15, 2007
| 1 | Total return includes reinvestment of dividends and any capital gains paid. | |
| Past performance is no guarantee of future results. Share price and investment | ||
| return fluctuate such that upon redemption, fund shares may be worth more or | ||
| less than their original cost. | ||
| 2 | SOURCE: LIPPER INC. — Reflects the monthly reinvestment of | |
| dividends and, where applicable, capital gain distributions.The Standard & | ||
| Poor’s 500 Composite Stock Price Index is a widely accepted, unmanaged | ||
| index of U.S. stock market performance. Index return does not reflect fees and | ||
| expenses associated with operating a mutual fund. |
| 4 |

| DISCUSSION OF |
| FUND PERFORMANCE |
Brian Ferguson, Portfolio Manager
Note to Shareholders: On February 23, 2007, D. Gary Richardson was replaced as the fund’s primary portfolio manager.
How did Mellon Income Stock Fund perform relative to its benchmark?
For the six-month period ended February 28, 2007, the fund’s Class M shares produced a total return of 7.33%, and its Investor shares produced a total return of 7.17% .1 In comparison, the Russell 1000 Value Index, the fund’s benchmark, provided a total return of 9.82% .2
Continued economic growth and strong corporate earnings drove stocks higher over the reporting period. The market’s performance proved to be broadly based, with most industry groups generating gains. The fund participated in the stock market’s advance to a significant degree, achieving notably good returns in the consumer staples sector and roughly matching the benchmark in several other key areas. However, relatively weak stock selection within the health care, financials and industrials sectors caused the fund’s returns to lag the benchmark.
What is the fund’s investment approach?
The fund seeks total return consisting of capital appreciation and income.To pursue its goal, the fund normally invests at least 80% of its assets in stocks. The fund seeks to focus on dividend-paying stocks and other investment techniques that produce income.We choose stocks through a disciplined investment process that combines computer modeling techniques, fundamental analysis and risk management. While we attempt to manage risks by diversifying broadly across companies and industries, the fund may at times overweight certain sectors in an attempt to earn higher yields.The fund may also use derivatives as a substitute for taking a position in an underlying asset, to increase returns or income, or as part of a hedging strategy.
What other factors influenced the fund’s performance?
In an environment characterized by moderate economic growth, subdued inflation and stable interest rates, market sentiment tended to favor relatively speculative issues rather than the income-producing, value-oriented stocks on which the fund focused. Even within the fund’s benchmark, lower-yielding, more volatile stocks produced stronger returns during the reporting period.
The impact of this trend was most evident in three sectors. In the health care sector, where the fund maintained mildly overweight exposure, dividend-paying pharmaceutical companies, such as Eli Lilly and GlaxoSmithKline, suffered declines due to concerns regarding the companies’ new product pipelines.While the fund invested in some of the sector’s better performers, such as Bristol-Myers Squibb, these stocks failed to make up for other, more disappointing stock selections. Among financial stocks, the fund invested in relatively few brokerage firms due to what we believed were the group’s high valuations and poor record of dividend growth; however, brokerage firms proved to be among the sector’s best performers during the reporting period. Finally, in the industrials sector, the fund emphasized major dividend-paying stocks, such as 3M, General Electric and United Technologies, at a time when smaller, more speculative stocks produced greater gains.
The fund matched or exceeded the benchmark’s performance in several sectors. Strong individual stock selections in the consumer discretionary sector enabled the fund to match the benchmark’s returns despite an underweight position in the high-flying cable industry. Top holdings included media giant News Corp. and casino and resort operator Harrah’s Entertainment. In the telecommunications services sector, strong stock selection and an overweight position in the sector helped produce competitive returns
The Funds 5
DISCUSSION OF FUND PERFORMANCE (continued)
among holdings such as AT&T, which benefited from rising earnings forecasts, and Verizon, which generated excitement over its deployment of fiber optic services to its customers’ homes.
Among basic materials stocks, the fund roughly matched the benchmark’s robust returns with holdings such as Monsanto and DuPont, which prospered as a result of greater emphasis in the United States on ethanol as a petroleum substitute; and Temple-Inland, which announced plans to divest its financial holdings to focus more intently on its core containerboard business. In the utilities sector, strong industrial demand and limited energy supplies broadly bolstered returns. Finally, in the consumer staples sector, the fund outperformed the benchmark primarily on the strength of Avon Products, which generated higher revenues from existing operations as well as expanding its presence in China.
What is the fund’s current strategy?
We continue to focus on what we believe are attractively valued, large-cap stocks with strong growth rates that are generating consistent cash flows. In addition, we have emphasized companies that either pay dividends or offer prospects for paying dividends in the near future.
As of the reporting period’s end, we have found a relatively large number of what we believe are attractively valued investments meeting our criteria in the technology sector, where we see opportunities for potential growth.The fund also holds relatively sizeable exposure to health care stocks, with an emphasis on pharmaceutical companies that are cutting costs to improve earnings in the face of competition from generic drugs. On the other hand, the fund holds a mildly underweight position in the energy sector, where growth opportunities currently appear to us limited.The fund’s financial sector exposure is somewhat light as well, particularly among, in our view, richly valued real estate investment trusts and regional banks, which appear vulnerable to credit problems.
March 15, 2007
| 1 | Total return includes reinvestment of dividends and any capital gains paid. | |
| Past performance is no guarantee of future results. Share price and investment | ||
| return fluctuate such that upon redemption, fund shares may be worth more or | ||
| less than their original cost. | ||
| 2 | SOURCE: LIPPER INC. — Reflects the reinvestment of dividends and, | |
| where applicable, capital gain distributions.The Russell 1000 Value Index is | ||
| an unmanaged index that measures the performance of those Russell 1000 | ||
| companies with lower price-to-book ratios and lower forecasted growth values. | ||
| Index return does not reflect fees and expenses associated with operating a | ||
| mutual fund. |
| 6 |

| DISCUSSION OF |
| FUND PERFORMANCE |
James C. Wadsworth, Portfolio Manager
How did Mellon Mid Cap Stock Fund perform relative to its benchmark?
For the six-month period ended February 28, 2007, the fund produced total returns of 11.16% for its Class M shares, 10.98% for its Investor shares and 10.62% for its Dreyfus Premier shares.1 In comparison, the Standard & Poor’s MidCap 400 Index (“S&P 400 Index”), the fund’s benchmark, produced a total return of 12.44% for the same period.2
Midcap stocks generally gained value over the reporting period as investors responded favorably to moderating economic growth, diminishing inflationary pressures, stable interest rates and rising corporate earnings.While the fund participated in the market’s rally to a significant degree, individual disappointments in the information technology, health care, consumer staples and energy sectors caused the fund’s returns to lag the benchmark.
What is the fund’s investment approach?
The fund seeks capital appreciation by normally investing at least 80% of its assets in stocks of domestic companies with market capitalizations between $1 billion and $10 billion at the time of purchase.When selecting securities, we begin with quantitative analysis to screen and rank stocks within each industry and sector based on valuation, earnings growth and financial health.We then use fundamental analysis to evaluate and select individual stocks, drawing on research by internal analysts and external Wall Street sources. Finally, we use portfolio construction techniques to manage sector and industry risks. Our goal is to keep those risks at levels that are similar to those of the S&P 400 Index.
What other factors influenced the fund’s performance?
Early in the reporting period, investors’ concerns regarding robust economic growth and higher inflation began to subside as housing markets cooled and energy prices fell.The Federal Reserve Board lent credence to a more benign inflation outlook when it refrained from raising short-term interest rates after more than two years of rate hikes. These factors, together with expectations of an economic “soft landing” and strong corporate earnings, helped fuel a stock market rally through the end of February, when turbulence in Chinese equity markets triggered a sharp U.S. market correction.
In this generally favorable market environment, investors apparently felt comfortable assuming the risks that midcap companies typically entail. As a result, midcap stocks generally produced higher returns than their large-cap counterparts, extending a cycle of smaller-stock dominance that has persisted for the better part of six years.
The fund received especially strong contributions to its relative performance from the industrials sector, where specialty metals producer Precision Castparts benefited from better-than-expected earnings and new orders from industrial giant General Electric. In the materials area, metals producer Allegheny Technologies saw its stock price advance strongly due to robust earnings stemming from rising stainless steel and titanium sales. In addition, a number of construction aggregate providers prospered in a consolidating industry amid greater federal highway spending and ongoing recovery efforts in areas affected by Hurricane Katrina in 2005.
Among financial stocks, investments in securities exchanges enabled the fund to benefit from intensifying mergers-and-acquisitions (“M&A”) activity, including the acquisition of New York Board of Trade by electronic futures exchange Intercontinental Exchange. Utilities holdings Dynegy, Cl A. and Northeast Utilities were rewarded with higher valuations for achieving improved revenues and earnings. In the consumer discretionary sector, the fund received positive contributions to relative performance from lodging chain Hilton Hotels, apparel retailer Urban Outfitters and superstore Dick’s Sporting Goods.
The Funds 7
DISCUSSION OF FUND PERFORMANCE (continued)
Gains in these market sectors were offset by lagging returns in other areas. In the information technology sector, strong results from outsourcer Cognizant Technology Solutions, Cl. A, and communications equipment maker Polycom were more than offset by weakness in Linux software developer Red Hat, which encountered greater competitive pressures, and semiconductor manufacturer Microsemi, which made an acquisition that many analysts considered expensive. Consequently, we sold our Red Hat and Microsemi positions early in the reporting period. In the health care sector, contract research organization Pharmaceutical Product Development and medical services provider Omnicare were hurt by the loss of major contracts and lower-than-expected earnings. Pepsi Bottling Group undermined results in the consumer staples sector when earnings came in lower than anticipated. Finally, declining commodity prices and unusually warm winter weather in many parts of the United States hurt returns of stocks comprising the energy sector.
What is the fund’s current strategy?
Although we have maintained the fund’s sector-neutral allocation strategy, we have identified a number of trends
within certain industry groups that we believe may send stock prices of individual companies higher. These trends include the impending retirement of the baby boom generation, the need for construction materials to build and maintain the nation’s infrastructure, strong federal spending on aerospace and defense, the need for new power plants and transmission lines, and growth in the delivery of broadband-intensive applications on the Internet. In our judgment, long-term secular trends such as these may fuel the growth of midcap companies. In addition, midcap businesses rank among the main candidates for purchase by larger enterprises in an environment that we expect to be characterized by additional M&A activity.
March 15, 2007
| 1 | Total return includes reinvestment of dividends and any capital gains paid. | |
| Past performance is no guarantee of future results. Share price and investment | ||
| return fluctuate such that upon redemption, fund shares may be worth more or | ||
| less than their original cost. | ||
| 2 | SOURCE: LIPPER INC. — Reflects reinvestment of dividends and, where | |
| applicable, capital gain distributions.The Standard & Poor’s MidCap 400 Index | ||
| is a widely accepted, unmanaged total return index measuring the performance of | ||
| the midsize company segment of the U.S. stock market. Index return does not | ||
| reflect the fees and expenses associated with operating a mutual fund. |
| 8 |

| DISCUSSION OF |
| FUND PERFORMANCE |
Dwight E. Cowden, Portfolio Manager
How did Mellon Small Cap Stock Fund perform relative to its benchmark?
For the six-month period ended February 28, 2007, the fund’s Class M shares produced a total return of 8.50%, and its Investor shares produced a total return of 8.38%.1 In comparison, the fund’s benchmark, the Standard & Poor’s SmallCap 600 Index (the “Index”), produced a total return of 10.46% for the same period.2
As they have for some time, small-cap stocks continued to produce generally higher returns than their large-cap counterparts during the reporting period. Investors responded positively to moderate economic growth, subdued inflation, steady interest rates and rising corporate earnings.The fund achieved lower returns than the Index, primarily due to disappointing returns from consumer-oriented stocks early in the reporting period.
What is the fund’s investment approach?
The fund seeks capital appreciation.To pursue its goal, the fund normally invests at least 80% of its assets in stocks of small capitalization companies whose market capitalizations generally range between $100 million and $3 billion at the time of purchase. We choose growth and value stocks using a disciplined process that combines computer modeling, fundamental analysis and risk management. We use a computer model to rank stocks within an industry or sector based on valuation, earnings growth and the company’s financial profile.We examine the fundamentals of the higher-ranked securities, and we select those we believe to be the most attractive.We use portfolio construction techniques to manage sector and industry risks, and we attempt to keep those risks at levels that are similar to those of the Index.
What other factors influenced the fund’s performance?
Small-cap stocks posted relatively strong returns over the reporting period, achieving gains in every market sector of the Index.As previous concerns over higher inflation and volatile energy prices began to ease, investors looked forward to more moderate economic growth and stable interest rates. In addition, small-cap stocks benefited from ample global liquidity as risk-tolerant investors sought high returns. Other positive factors included rising mergers-and-acquisitions (“M&A”) activity, including several large leveraged buyouts, and persistently low yields on 10-year U.S. Treasury securities, which helped keep borrowing costs affordable.
Small-cap stocks achieved some of their stronger gains in the materials and industrials sectors, as robust global demand and lower raw materials costs boosted earnings. Particularly strong contributions to the fund’s performance came from chemical producers Terra Industries and Nalco Holding. Terra Industries, a fertilizer producer, benefited from strong sales and profit growth arising from above-average corn planting, price increases and falling natural gas costs. Nalco’s stock price appreciated as investors gained greater confidence in management’s ability to cut costs while realigning the sales force to improve organic growth. Among steel producers, global industry consolidation and price increases helped boost returns from RTI International and AK Steel.
The fund also derived competitive results from the utilities sector. Electricity generator Dynegy Cl A. benefited from M&A activity within its industry as well as the sale of non-strategic assets. Management continued to rationalize the company’s portfolio of power plants, alleviating investor concerns regarding the company’s balance sheet.
The Funds 9
DISCUSSION OF FUND PERFORMANCE (continued)
On the other hand, the fund’s relative returns fell short of the Index in the health care sector, where disappointing stock selections in the biotechnology industry weighed on performance. Foxhollow Technologies reported a slowdown in sales of its leading product for arterial plaque removal. Panacos Pharmaceuticals announced delays in the launch of a key drug. Finally, Advanced Medical Optics was hurt by lower-than-expected laser vision sales and subdued forward earnings guidance.As a result, we sold our positions of these companies throughout the reporting period.
In the consumer discretionary sector, retailers encountered difficulties due to weather-related issues and slower holiday spending. Coldwater Creek, one of the fund’s larger holdings, suffered from disappointing same-store sales and increased inventories as warm weather held back shopping for winter-related merchandise. Bebe Stores suffered from similar problems, resulting in weaker-than-expected sales and increased markdowns. Nutrisystems announced higher marketing costs and a disappointing outlook for Internet sales of its products.
Finally, results from the financials sector were hurt by the fund’s relatively light exposure to real estate investment trusts (REITs). Surprisingly strong gains in the office and entertainment areas of the REIT sub-sector outpaced the fund’s overweight positions in lodging-related companies.
What is the fund’s current strategy?
We have continued to employ our longstanding investment approach, which combines quantitative screens with fundamental analysis to find what we believe are opportunities for growth. While our sector-neutral risk management strategy has remained intact, our “bottom-up” process has identified a greater number of opportunities in the consumer discretionary sector, where lagging performance over the reporting period has, in our view, created more attractive risk/reward profiles for many companies. Conversely, we have found fewer stocks meeting our criteria in the materials sector due to strong recent performance and typical seasonal weak-ness.We also have continued to focus on several investment themes — healthy living, consolidating industries, internet growth beneficiaries and global growth — that we believe will help propel the growth of certain companies and industries.
March 15, 2007
| 1 | Total return includes reinvestment of dividends and any capital gains paid. | |
| Past performance is no guarantee of future results. Share price and investment | ||
| return fluctuate such that upon redemption, fund shares may be worth more or | ||
| less than their original cost. | ||
| 2 | SOURCE: LIPPER INC. — Reflects the reinvestment of dividends and, | |
| where applicable, capital gain distributions.The Standard & Poor’s SmallCap | ||
| 600 Index is a broad-based index and a widely accepted, unmanaged index of | ||
| overall small-cap stock market performance.The Index does not take into | ||
| account fees and expenses to which the fund is subject. |
10
| DISCUSSION OF |
| FUND PERFORMANCE |
D. Kirk Henry and Remi J. Browne, Portfolio Managers
How did Mellon International Fund perform relative to its benchmark?
For the six-month period ended February 28, 2007, the fund’s Class M shares produced a total return of 10.16%, and its Investor shares produced a total return of 10.02% .1 The fund’s benchmark, the Morgan Stanley Capital International Europe, Australasia, Far East Index (“MSCI EAFE Index”), produced a total return of 12.17% for the same period.2
In an environment of strong global economic growth and favorable business dynamics, international stock markets continued to gain value throughout the reporting period. Although the fund was able to participate in the global markets’ rise to a degree, its returns lagged the benchmark, primarily due to an overweight position in Japanese financial and consumer-related stocks, which suffered during the reporting period due to the region’s slower-than-expected economic recovery.
What is the fund’s investment approach?
The fund seeks long-term capital growth. To pursue this goal, the fund normally invests at least 65% of its total assets in equity securities of foreign issuers.
Since June 30, 2005, the fund generally invests most of its cash inflows (purchases of fund shares and reinvested distributions) in accordance with a core investment style under the direction of the fund’s co-primary portfolio manager, Remi J. Browne.The fund’s portfolio as of June 30, 2005, will continue to be managed in accordance with the value-oriented investment style under the direction of the fund’s other co-primary portfolio manager, D. Kirk Henry. The allocation of cash inflows and outflows will be at the discretion of the investment adviser depending on the circumstances; however, under normal circumstances, generally between 90% and 100% of cash inflows will be allocated to the core investment style.We believe that by implementing a core investment style with respect to such assets, the fund may take advantage of investment opportunities in international markets that may not fall within the value-oriented investment style previously employed for the fund’s entire portfolio.
Pursuant to the core investment style, under normal circumstances, at least 80% of the fund’s cash inflows allocated to this style is invested in equity securities of companies located in the foreign countries represented in the Index and Canada.
The fund will continue to invest in stocks that appear to be undervalued (as measured by their price/earnings ratios), but stocks purchased pursuant to the core investment style may have value and/or growth char-acteristics.The core investment style portfolio manager employs a “bottom-up” investment approach, which emphasizes individual stock selection.The core investment style stock selection process is designed to produce a diversified portfolio that, relative to the Index, has a below-average price/earnings ratio and an above-average earnings growth trend.
The fund’s investment approach for the portion of the fund using the value-oriented investment style is research-driven and risk-averse. When selecting stocks, we identify potential investments through extensive quantitative and fundamental research. Emphasizing individual stock selection over economic or industry trends, the fund focuses on three key factors: value, business health and business momentum.
What other factors influenced the fund’s performance?
During the reporting period, international equity markets posted generally strong gains fueled by corporate restructuring and mergers-and-acquisitions activities throughout much of Europe. High levels of busi-
The Funds 11
DISCUSSION OF FUND PERFORMANCE (continued)
ness confidence, positive earnings announcements and favorable economic growth forecasts in most countries also supported stock prices. Even a modest global stock market correction during the summer had little effect as international stocks quickly recovered and generally continued to gain value through the balance of the reporting period.
While the fund also benefited from these conditions, its lagging relative performance can be attributed primarily to its overweight position in Japan, where we emphasized companies that were closely tied to the domestic economy, which has not yet accelerated. In addition, two Japanese consumer lenders, Takefuji and Aiful, fell sharply following the adoption of new government regulations designed to lower the debt burden of lower income borrowers. Japan’s domestic economy remains in a recovery phase, but it has been slow to gain momentum. Financial and consumer-related stocks also fell in this environment, including shares of Dentsu Corporation, a large advertising firm. In addition, the fund’s limited exposure to a number of Japanese auto and technology exporters that performed well also hurt its relative performance.
The fund enjoyed better results in Europe, where aggressive corporate restructuring efforts, strong export activities and improving domestic economic conditions bolstered a number of the fund’s German holdings. Notable performers included E.On AG., one of the country’s top electricity suppliers; Siemens AG, the electronics and electrical engineering giant; and Deutsche Post, whose
DHL arm has expanded to become well positioned in Asia and Russia. In the United Kingdom, the fund benefited from its overweight positions in Centrica, the private gas supplier and distributor, and Smiths Group, the industrial giant whose stock price rose sharply on news of a buyout of its aerospace division from General Electric. Also in the U.K., wireless carrier Vodafone Group flourished during the fourth quarter of 2006 as part of an industry-wide rebound in the telecommunications services sector.
What is the fund’s current strategy?
As of the end of the reporting period, we have found a number of investment opportunities in the health care, energy and consumer discretionary areas,where we believe stock prices have fallen to more attractive valuations. On the other hand, we are seeing fewer opportunities in the utilities industry, where valuations appear too high to meet our investment criteria. In our judgment, the fund remains well positioned to potentially capture value-oriented opportunities in international markets.
March 15, 2007
| 1 | Total return includes reinvestment of dividends and any capital gains paid. | |
| Past performance is no guarantee of future results. Share price and investment | ||
| return fluctuate such that upon redemption, fund shares may be worth more or | ||
| less than their original cost. | ||
| 2 | SOURCE: LIPPER INC.— Reflects reinvestment of net dividends and, | |
| where applicable, capital gain distributions.The Morgan Stanley Capital | ||
| International Europe, Australasia, Far East (MSCI EAFE) Index is an | ||
| unmanaged index composed of a sample of companies representative of the | ||
| market structure of European and Pacific Basin countries. Index return does | ||
| not reflect fees and expenses associated with operating a mutual fund. |
12

| DISCUSSION OF |
| FUND PERFORMANCE |
D. Kirk Henry and Daniel B. LeVan, Portfolio Managers
How did Mellon Emerging Markets Fund perform relative to its benchmark?
For the six-month period ended February 28, 2007, the fund’s Class M shares produced a total return of 14.67%, and the fund’s Investor shares produced a total return of 14.52% .1 In comparison, the Morgan Stanley Capital International Emerging Markets (Free) Index (the “Index”), the fund’s benchmark, provided a total return of 16.61% for the same period.2
We attribute the emerging markets’ strong performance to growing global demand for the natural resources produced by many developing nations. The fund’s returns fell short of the benchmark, primarily due to its lack of exposure to better-performing companies in China, India and Brazil.
What is the fund’s investment approach?
The fund seeks long-term capital growth.To pursue its goal, the fund invests at least 80% of its assets in equity securities of companies organized, or with a majority of assets or operations, in countries considered to be emerging markets.
The fund invests most of its cash inflows received since June 30, 2005, in accordance with a core investment style. The fund’s portfolio as of June 30, 2005, was invested in companies the investment adviser considered to be “value” companies. Pursuant to the core investment style, under normal circumstances, at least 80% of the fund’s cash inflows allocated to this style are invested in equity securities of companies located in the foreign countries represented in the Index.
The allocation of cash inflows and outflows will be at the discretion of the investment adviser depending on the circumstances; however, under normal circumstances, generally between 90% and 100% of cash inflows will be allocated to the core investment style.
We believe that by implementing a core investment style with respect to such assets, the fund may take advantage of investment opportunities in emerging markets that may not fall within the value-oriented investment style previously employed for the fund’s entire portfolio.
The fund will continue to invest in stocks that appear to be undervalued (as measured by their price/earnings ratios), but stocks purchased pursuant to the core investment style may have value and/or growth characteristics. The core investment style portfolio manager employs a “bottom-up” investment approach, which emphasizes individual stock selection. The core investment style stock selection process is designed to produce a diversified portfolio that, relative to the Index, has a below-average price/earnings ratio and an above-average earnings growth trend.
When choosing stocks for the portion of the fund using the value-oriented investment style, we use a research-driven and risk-averse approach. We identify potential investments through extensive quantitative and fundamental research. Emphasizing individual stock selection rather than economic and industry trends, we focus on three key factors: value, business health and business momentum.
What other factors influenced the fund’s performance?
The emerging markets continued to post strong gains during the reporting period in a decidedly upbeat global economic environment. Rich in iron ore, oil, copper and other natural resources, many emerging markets’ countries continued to benefit from rising global demand for the commodities and construction materials needed to build the world’s industrial infrastructures.
While the fund participated in the market’s gains to a substantial degree, it modestly underperformed its benchmark due to its limited exposure to stocks in China, India and Brazil that we deemed too richly
The Funds 13
DISCUSSION OF FUND PERFORMANCE (continued)
valued. For example, in China, the fund’s relatively light exposure to financial services companies hindered returns during a period of increased consumer lending. In India, a lack of exposure to industrial firms and software developers detracted from performance. In Brazil, an underweight position in Companhia Vale do Rio Doce (CVRD), the world’s largest iron ore miner, held back returns, as did relatively heavy exposure to integrated oil and gas producer Petrobras, which fell sharply when oil prices retreated.
The fund achieved better success with its holdings in the Philippines, Malaysia and Russia.The Philippines benefited from strong intra-Asian trade as well as lower prices for imported oil. In addition, utility Manila Electric advanced during the reporting period on the heels of governmental reforms that could allow it to pass higher costs along to consumers. In Malaysia, the recent passage of the “Ninth Malaysian Plan,” a comprehensive expansion of government investment in various infrastructure projects and public works, helped fuel gains in Sime Darby, an industrial conglomerate, and Gamuda, a large construction firm. Significantly underweight exposure
to stocks in Russia also benefited the fund, including relatively light holdings of oil and gas companies hurt by falling commodity prices.
What is the fund’s current strategy?
As of the end of the reporting period, we have found what we believe to be attractive investment opportunities in Taiwan and South Korea. Conversely, we have identified fewer opportunities in Russia and China. On a sector basis, we have favored stocks of consumer discretionary companies and utilities over shares of companies in the materials and energy sectors.
March 15, 2007
| 1 | Total return includes reinvestment of dividends and any capital gains paid. | |
| Past performance is no guarantee of future results. Share price and investment | ||
| return fluctuate such that upon redemption, fund shares may be worth more or | ||
| less than their original cost. | ||
| 2 | SOURCE: LIPPER INC. — Reflects reinvestment of gross dividends and, | |
| where applicable, capital gain distributions.The Morgan Stanley Capital | ||
| International Emerging Markets (Free) Index is a market capitalization- | ||
| weighted index composed of companies representative of the market structure of | ||
| 26 emerging market countries in Europe, Latin America and the Pacific Basin. | ||
| Index return does not reflect fees and expenses associated with operating a | ||
| mutual fund. |
| 14 |

| DISCUSSION OF |
| FUND PERFORMANCE |
Sean P. Fitzgibbon and John F. Flahive, Portfolio Managers
Note to Shareholders: On February 23, 2007, Sean Fitzgibbon replaced Michael Wiener as the primary portfolio manager of the fund’s equity portfolio.
How did Mellon Balanced Fund perform relative to its benchmark?
For the six-month period ended February 28, 2007, the fund’s Class M shares produced a total return of 6.83%, while its Investor shares produced a total return of 6.76% .1 In comparison, the fund’s benchmark, a blended index composed of 60% Standard & Poor’s 500 Composite Stock Price Index (“S&P 500 Index”) and 40% Lehman Brothers U.S.Aggregate Index, produced a 6.82% total return for the same period.2 Separately, the S&P 500 Index and the Lehman Brothers U.S. Aggregate Index produced total returns of 8.93% and 3.66%, respectively, for the same period.
Stocks and bonds were driven higher during the reporting period by moderating U.S. economic growth, diminishing inflationary pressures, stable short-term interest rates and robust corporate earnings. As a result, the fund produced returns that were in line with the blended benchmark index.
What is the fund’s investment approach?
The fund seeks long-term growth of principal in conjunction with current income. To pursue its goal, the fund may invest in equity securities, income producing bonds, Mellon Small Cap Stock Fund, Mellon Mid Cap Stock Fund, Mellon International Fund and Mellon Emerging Markets Fund (collectively, the “Mellon Funds”).The fund has established target allocations of 60% to equity securities and 40% to bonds and money market instruments.The fund may deviate from these targets within ranges of 15% above or below the target amount. The fund’s investments in
each of the Mellon Funds are subject to a separate limit of 20% of the fund’s total assets, as is the fund’s investment in money market instruments.
In the fund’s equity portfolio, individual stocks are chosen using a computer model, fundamental analysis and risk management techniques. Our computer model identifies and ranks stocks within each industry or sector based on value, earnings growth and the financial health of the company.
In the fund’s fixed-income portfolio, investments in debt securities must be of investment-grade quality at the time of purchase3 or, if unrated, deemed of comparable quality by the investment adviser. Generally, the fund’s average effective portfolio duration of bonds will not exceed eight years.We choose debt securities based on their yields, credit quality, the level of interest rates and inflation, general economic and financial trends and our outlook for the securities markets.
What other factors influenced the fund’s performance?
Investors’ concerns regarding robust economic growth, intensifying inflationary pressures and rising interest rates began to subside early in the reporting period as housing markets cooled and energy prices fell. The Federal Reserve Board (the “Fed”) lent credence to a more benign inflation outlook when it refrained from raising short-term interest rates after more than two years of rate hikes. These factors, together with expectations of an economic “soft landing” and strong corporate earnings, helped fuel rallies in U.S. stock and bond markets through the end of February, when turbulence in the Chinese equity markets triggered a global market correction.
Among equities, the fund produced some of its greater gains during the reporting period in the basic materials sector, where top performers included Freeport-
The Funds 15
DISCUSSION OF FUND PERFORMANCE (continued)
McMoRan Copper & Gold, industrial gas producer Air Products and Chemical, Inc. and nickel mining company Inco. In the telecommunications services sector, gains in Sprint Nextel enabled the fund to roughly match the benchmark’s strong returns from the sector.The fund also derived robust gains from consumer discretionary holdings Harley-Davidson, residential homebuilder D. R. Horton and automobile products producer Harman International Industries. Some of the fund’s utilities stocks, such as Dynegy Cl A., benefited from an increase in private equity investment in the sector.The fund delivered positive relative performance in the financial services area through holdings such as Goldman Sachs Group, Lehman Brothers Holdings and JPMorgan Chase & Co.
On the negative side, health care and technology holdings detracted from the fund’s relative performance. Biotechnology giant Amgen was hurt by concerns regarding competitive issues and government reimbursement rates. In the technology area, the fund’s performance was hurt by significant exposure to Motorola, which dropped sharply when the company lost ground in the cellular handset market.
The fund’s fixed-income component benefited from a relatively short average duration during temporary market weakness early in the reporting period.We subsequently shifted to a more neutral posture as inflation concerns eased, enabling the fund to participate more fully in the ensuing rally.The fund also benefited from its holdings of investment-grade corporate bonds, where we focused primarily on credits with short maturities that tend to be less sensitive to adverse developments. Because we regarded most bond market sectors as neither over- nor undervalued, we generally maintained a sector allocation strategy that was similar to that of the benchmark.
What is the fund’s current strategy?
In the fund’s equity portfolio, we have maintained slightly heavier-than-average exposure to technology companies in light of what we believe are attractive valuations, favorable product cycles and rising corporate spending. A slightly overweight position in the health care sector reflects our positive view of the area’s prospects as the U.S. population ages.We also see strong business fundamentals for drillers and oilfield services companies in the energy area. We have slightly reduced the fund’s consumer discretionary exposure due to the potential for weaker consumer spending amid rising mortgage defaults. The fund also holds mildly underweight exposure to the telecommunications services sector, where the competitive landscape appears uncertain.
Among bonds, we have emphasized broad diversification, and we have maintained the fund’s average duration and sector allocations in the neutral range. We believe these are prudent strategies until we see clearer signs of the economy’s health and the direction of Fed policy.
March 15, 2007
| 1 | Total return includes reinvestment of dividends and any capital gains paid. | |
| Past performance is no guarantee of future results. Share price and investment | ||
| return fluctuate such that upon redemption, fund shares may be worth more or | ||
| less than their original cost. | ||
| 2 | SOURCE: LIPPER INC. — Reflects reinvestment of dividends and, where | |
| applicable, capital gain distributions.The Standard & Poor’s 500 Composite | ||
| Stock Price Index is a widely accepted, unmanaged index of U.S. stock market | ||
| performance.The Lehman Brothers U.S. Aggregate Index is a widely accepted, | ||
| unmanaged total return index of corporate, U.S. government and U.S. | ||
| government agency debt instruments, mortgage-backed securities and asset- | ||
| backed securities with an average maturity of 1-10 years.The indices returns | ||
| do not reflect the fees and expenses associated with operating a mutual fund. | ||
| 3 | The fund may continue to own investment grade bonds (at the time of | |
| purchase), which are subsequently downgraded to below investment grade. |
| 16 |
UNDERSTANDING YOUR FUND’S EXPENSES ( U n a u d i t e d )
As a mutual fund investor, you pay ongoing expenses, such as management fees and other expenses. Using the information below, you can estimate how these expenses affect your investment and compare them with the expenses of other funds.You also may pay one-time transaction expenses, including sales charges (loads) and redemptions fees, which are not shown in this section and would have resulted in higher total expenses. For more information, see your fund’s prospectus or talk to your financial adviser.
Review your fund’s expenses
The table below shows the expenses you would have paid on a $1,000 investment in each class of each Mellon equity fund from September 1, 2006 to February 28, 2007. It also shows how much a $1,000 investment would be worth at the close of the period, assuming actual returns and expenses.

† Expenses are equal to the Mellon Large Cap Stock Fund’s annualized expense ratio of .80% for Class M and 1.05% for Investor Shares, Mellon Income Stock Fund ..81% for Class M and 1.06% for Investor Shares, Mellon Mid Cap Stock Fund .90% for Class M, 1.15% for Investor Shares and 1.90% for Dreyfus Premier Shares, Mellon Small Cap Stock Fund 1.01% for Class M and 1.26% for Investor Shares, Mellon International Fund 1.08% for Class M and 1.33% for Investor Shares, Mellon Emerging Markets Fund 1.50% for Class M and 1.75% for Investor Shares and Mellon Balanced Fund .58% for Class M and .83% for Investor Shares, multiplied by the respective fund's average account value over the period, multiplied by 181/365 (to reflect the one-half year period).
The Funds 17
COMPARING YOUR FUND’S EXPENSES WITH THOSE OF OTHER FUNDS (Unaudited)
Using the SEC’s method to compare expenses
The Securities and Exchange Commission (SEC) has established guidelines to help investores assess fund expenses. Per these guidelines, the table below shows your fund’s expenses based on a $1,000 investment, assuming a hypothetical 5% annualized return.You can use this information to compare the ongoing expenses (but not transaction expenses or total cost) of investing in the fund with those of other funds.All mutual fund shareholder reports will provide this information to help you make this comparison. Please note that you cannot use this information to estimate your actual ending account balance and expenses paid during the period.
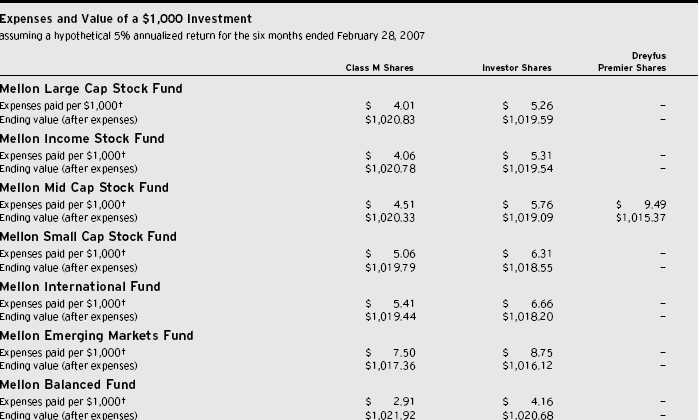
† Expenses are equal to the Mellon Large Cap Stock Fund’s annualized expense ratio of .80% for Class M and 1.05% for Investor Shares, Mellon Income Stock Fund ..81% for Class M and 1.06% for Investor Shares, Mellon Mid Cap Stock Fund .90% for Class M, 1.15% for Investor Shares and 1.90% for Dreyfus Premier Shares, Mellon Small Cap Stock Fund 1.01% for Class M and 1.26% for Investor Shares, Mellon International Fund 1.08% for Class M and 1.33% for Investor Shares, Mellon Emerging Markets Fund 1.50% for Class M and 1.75% for Investor Shares and Mellon Balanced Fund .58% for Class M and .83% for Investor Shares, multiplied by the respective fund's average account value over the period, multiplied by 181/365 (to reflect the one-half year period).
| 18 |
| STATEMENT OF INVESTMENTS |
| February 28, 2007 (Unaudited) |

The Funds 19
STATEMENT OF INVESTMENTS (Unaudited) (continued)
| Portfolio Summary | (Unaudited) † | |||||||
| Value (%) | Value (%) | |||||||
| Financial | 21.0 | Capital Goods | 2.9 | |||||
| Consumer Discretionary | 19.4 | Money Market Investment | 1.5 | |||||
| Information Technology | 15.9 | Telecommunication Services | 1.5 | |||||
| Energy | 13.0 | Technology | 1.5 | |||||
| Health Care | 12.0 | Utilities | 1.1 | |||||
| Industrial | 10.3 | 100.1 | ||||||
| † Based on net assets. | ||||||||
| See notes to financial statements. | ||||||||
| 20 |
| STATEMENT OF INVESTMENTS |
| February 28, 2007 (Unaudited) |
| Mellon Income Stock Fund | ||||||||||
| Common Stocks—99.5% | Shares | Value ($) | Shares | Value ($) | ||||||
| Banks—8.3% | Financial (continued) | |||||||||
| Freddie Mac | 114,100 | 7,322,938 | Capital One Financial | 66,197 | 5,102,465 | |||||
| SunTrust Banks | 40,500 | 3,414,555 | Chubb | 44,580 | 2,275,809 | |||||
| U.S. Bancorp | 97,006 | 3,459,234 | Citigroup | 393,775 | 19,846,260 | |||||
| Wachovia | 151,190 | 8,371,390 | Fidelity National Financial, Cl. A | 89,870 | 2,156,880 | |||||
| Washington Mutual | 117,200 a | 5,048,976 | Goldman Sachs Group | 11,030 | 2,223,648 | |||||
| Wells Fargo & Co. | 234,200 | 8,126,740 | JPMorgan Chase & Co. | 279,599 | 13,812,191 | |||||
| 35,743,833 | Lincoln National | 94,310 | 6,427,226 | |||||||
| Consumer Discretionary—7.8% | Merrill Lynch & Co. | 39,760 | 3,327,117 | |||||||
| Cadbury Schweppes, ADR | 76,740 | 3,302,122 | Morgan Stanley | 64,420 | 4,826,346 | |||||
| CBS, Cl. B | 86,300 | 2,619,205 | PNC Financial Services Group | 30,280 | 2,219,827 | |||||
| Federated Department Stores | 79,200 | 3,537,072 | ProLogis | 89,600 | 5,925,248 | |||||
| Home Depot | 79,400 | 3,144,240 | Prudential Financial | 24,610 | 2,238,033 | |||||
| McDonald’s | 90,100 | 3,939,172 | Simon Property Group | 25,860 | 2,915,456 | |||||
| News, Cl. A | 374,900 | 8,446,497 | Travelers Cos. | 86,451 | 4,388,253 | |||||
| Omnicom Group | 41,730 | 4,323,645 | 100,152,280 | |||||||
| PMI Group | 47,280 | 2,216,014 | Health Care—9.5% | |||||||
| TJX Cos. | 80,860 | 2,223,650 | Abbott Laboratories | 186,420 | 10,182,260 | |||||
| 33,751,617 | Baxter International | 66,230 | 3,312,162 | |||||||
| Consumer Staples—9.4% | Bristol-Myers Squibb | 184,800 | 4,876,872 | |||||||
| Altria Group | 157,090 | 13,239,545 | Eli Lilly & Co. | 102,570 | 5,399,285 | |||||
| Merck & Co. | 102,840 | 4,541,414 | ||||||||
| Clorox | 67,830 | 4,297,709 | ||||||||
| Pfizer | 343,458 | 8,572,712 | ||||||||
| Coca-Cola | 70,440 | 3,288,139 | ||||||||
| Wyeth | 87,789 | 4,294,638 | ||||||||
| Colgate-Palmolive | 64,990 | 4,377,726 | ||||||||
| 41,179,343 | ||||||||||
| Procter & Gamble | 169,720 | 10,775,523 | Industrial—9.0% | |||||||
| SUPERVALU | 117,840 | 4,355,366 | 3M | 56,000 | 4,148,480 | |||||
| 40,334,008 | Eaton | 26,650 | 2,158,916 | |||||||
| Energy—11.8% | Emerson Electric | 55,000 | 2,369,950 | |||||||
| Chevron | 157,166 | 10,783,159 | General Electric | 248,692 | 8,684,325 | |||||
| ConocoPhillips | 99,640 | 6,518,449 | Honeywell International | 80,200 | 3,724,488 | |||||
| EOG Resources | 32,800 | 2,221,872 | Johnson Controls | 33,580 | 3,149,804 | |||||
| Exxon Mobil | 266,276 | 19,086,664 | Lockheed Martin | 32,810 | 3,191,757 | |||||
| Marathon Oil | 24,110 | 2,187,741 | Raytheon (warrants 6/16/2011) | 299 b | 5,346 | |||||
| NRG Energy | 89,070 b | 5,899,997 | Textron | 27,100 | 2,501,059 | |||||
| Occidental Petroleum | 86,220 | 3,981,640 | United Technologies | 67,696 | 4,442,888 | |||||
| 50,679,522 | Waste Management | 126,100 | 4,293,705 | |||||||
| Financial—23.2% | 38,670,718 | |||||||||
| Accenture, Cl. A | 87,000 | 3,105,900 | Information Technology—6.0% | |||||||
| American International Group | 64,070 | 4,299,097 | Automatic Data Processing | 87,260 | 4,344,675 | |||||
| Bank of America | 248,188 | 12,625,324 | Cisco Systems | 162,140 b | 4,205,912 | |||||
| Bank of New York | 60,000 | 2,437,200 | Hewlett-Packard | 136,170 | 5,362,375 | |||||
The Funds 21
STATEMENT OF INVESTMENTS (Unaudited) (continued)
| Mellon Income Stock Fund (continued) | ||||||||||
| Common Stocks (continued) | Shares | Value ($) | Shares | Value ($) | ||||||
| Information Technology (continued) | Utilities (continued) | |||||||||
| International Business Machines | 22,550 | 2,097,376 | FPL Group | 82,200 | 4,855,554 | |||||
| Lucent Technologies | PPL | 115,040 | 4,373,821 | |||||||
| (warrants 12/10/2007) | 2,788 b | 488 | 22,054,848 | |||||||
| Microchip Technology | 96,100 a | 3,421,160 | Total Common Stocks | |||||||
| Microsoft | 151,160 | 4,258,177 | (cost $343,625,477) | 429,059,456 | ||||||
| QUALCOMM | 57,000 | 2,295,960 | ||||||||
| 25,986,123 | Other Investment—1.3% | |||||||||
| Materials—2.3% | Registered Investment Company; | |||||||||
| Air Products & Chemicals | 33,360 | 2,495,995 | Dreyfus Institutional Preferred | |||||||
| E.I. du Pont de Nemours & Co. | 43,530 | 2,209,148 | Plus Money Market Fund | |||||||
| Monsanto | 28,500 | 1,501,665 | (cost $5,575,000) | 5,575,000 c | 5,575,000 | |||||
| Temple-Inland | 61,820 | 3,696,836 | Investment of Cash Collateral | |||||||
| 9,903,644 | for Securities Loaned—.7% | |||||||||
| Telecommunication Services—7.1% | ||||||||||
| Registered Investment Company; | ||||||||||
| Alltel | 30,450 | 1,844,966 | ||||||||
| Dreyfus Institutional Cash | ||||||||||
| AT & T | 539,595 | 19,857,096 | Advantage Plus Fund | |||||||
| Verizon Communications | 202,251 | 7,570,255 | (cost $3,138,000) | 3,138,000 c | 3,138,000 | |||||
| Windstream | 88,452 | 1,331,203 | ||||||||
| 30,603,520 | Total Investments | |||||||||
| (cost $352,338,477) | 101.5% | 437,772,456 | ||||||||
| Utilities—5.1% | ||||||||||
| Dominion Resources/VA | 41,200 | 3,523,836 | Liabilities, Less Cash | |||||||
| Entergy | 44,450 | 4,387,215 | and Receivables | (1.5%) | (6,362,667) | |||||
| Exelon | 74,540 | 4,914,422 | Net Assets | 100.0% | 431,409,789 | |||||
| ADR—American Depository Receipts |
| a All or a portion of these securities are on loan. At February 28,2007, the total market value of the fund’s securities on loan is $3,062,616 and the total market value of the |
| collateral held by the fund is $3,138,000. |
| b Non-income producing security. |
| c Investment in affiliated money market mutual fund. |
| Portfolio Summary | (Unaudited) † | |||||||
| Value (%) | Value (%) | |||||||
| Financial | 23.2 | Telecommunication Services | 7.1 | |||||
| Energy | 11.8 | Information Technology | 6.0 | |||||
| Health Care | 9.5 | Utilities | 5.1 | |||||
| Consumer Staples | 9.4 | Materials | 2.3 | |||||
| Industrial | 9.0 | Money Market Investments | 2.0 | |||||
| Banks | 8.3 | |||||||
| Consumer Discretionary | 7.8 | 101.5 | ||||||
| † Based on net assets. | ||||||||
| See notes to financial statements. | ||||||||
22
| STATEMENT OF INVESTMENTS |
| February 28, 2007 (Unaudited) |
| Mellon Mid Cap Stock Fund | ||||||||||
| Common Stocks—98.9% | Shares | Value ($) | Shares | Value ($) | ||||||
| Consumer Discretionary—16.8% | Energy (continued) | |||||||||
| Abercrombie & Fitch, Cl. A | 237,400 | 18,557,558 | Southwestern Energy | 343,500 a | 13,396,500 | |||||
| Advance Auto Parts | 372,400 | 14,020,860 | Superior Energy Services | 261,500 a | 8,014,975 | |||||
| bebe Stores | 410,400 | 7,543,152 | Tesoro | 98,300 | 8,959,062 | |||||
| Children’s Place Retail Stores | 467,600 a | 25,465,496 | 129,169,967 | |||||||
| Coldwater Creek | 481,850 a | 8,866,040 | Financial—16.4% | |||||||
| D.R. Horton | 562,740 | 14,276,714 | AllianceBernstein Holding, LP | 112,100 | 9,618,180 | |||||
| Dick’s Sporting Goods | 227,140 a | 11,888,508 | Allied World Assurance Holdings | 232,800 | 9,705,432 | |||||
| Dollar Tree Stores | 237,500 a | 8,101,125 | AMB Property | 227,900 | 13,395,962 | |||||
| Domino’s Pizza | 40,400 | 1,246,744 | AmeriCredit | 346,500 a | 8,461,530 | |||||
| Focus Media Holding, ADR | 110,800 a | 8,875,080 | Arthur J. Gallagher & Co. | 315,500 | 9,032,765 | |||||
| Gentex | 674,500 | 11,270,895 | Axis Capital Holdings | 147,000 | 4,970,070 | |||||
| Hansen Natural | 214,100 a | 7,493,500 | City National/Beverly Hills, CA | 174,700 | 12,609,846 | |||||
| Harman International Industries | 109,000 | 10,808,440 | Compass Bancshares | 96,300 | 6,645,663 | |||||
| Hilton Hotels | 448,440 | 15,829,932 | Cullen/Frost Bankers | 172,100 | 9,307,168 | |||||
| ITT Educational Services | 184,800 a | 14,780,304 | Developers Diversified Realty | 195,740 | 12,832,714 | |||||
| Life Time Fitness | 154,000 a | 7,361,200 | Eaton Vance | 384,200 | 13,327,898 | |||||
| NutriSystem | 164,800 a,b | 7,440,720 | FelCor Lodging Trust | 386,700 | 9,118,386 | |||||
| Penn National Gaming | 187,200 a | 8,729,136 | Huntington Bancshares/OH | 373,300 | 8,641,895 | |||||
| Regis | 218,700 | 9,202,896 | IntercontinentalExchange | 104,600 a | 15,778,910 | |||||
| Ruby Tuesday | 247,300 | 7,245,890 | Jefferies Group | 281,600 | 7,617,280 | |||||
| Scientific Games, Cl. A | 370,700 a | 12,121,890 | Lazard, Cl. A | 262,800 | 13,531,572 | |||||
| Sotheby’s, Cl. A | 356,800 | 12,973,248 | Nasdaq Stock Market | 179,000 a | 5,357,470 | |||||
| Thor Industries | 243,090 | 10,170,886 | People’s Bank | 214,300 | 9,512,777 | |||||
| Urban Outfitters | 564,570 a | 14,012,627 | Radian Group | 114,346 | 6,569,178 | |||||
| Virgin Media | 298,400 | 7,821,064 | Rayonier | 303,986 | 13,576,015 | |||||
| VistaPrint | 158,200 a | 5,888,204 | SL Green Realty | 69,400 | 10,122,684 | |||||
| 281,992,109 | Sunstone Hotel Investors | 301,460 | 8,543,376 | |||||||
| Consumer Staples—1.4% | Taubman Centers | 172,470 | 10,256,791 | |||||||
| Performance Food Group | 320,500 a | 9,445,135 | TCF Financial | 438,100 | 11,583,364 | |||||
| Smithfield Foods | 456,400 a | 13,331,444 | TD Ameritrade Holding | 291,700 | 4,667,200 | |||||
| 22,776,579 | W.R. Berkley | 551,050 | 17,964,230 | |||||||
| Energy—7.7% | Webster Financial | 243,500 | 12,026,465 | |||||||
| Cameron International | 338,800 a | 19,206,572 | 274,774,821 | |||||||
| Consol Energy | 219,100 b | 7,815,297 | Health Care—10.7% | |||||||
| Denbury Resources | 462,600 a | 13,341,384 | Barr Pharmaceuticals | 153,800 a | 8,151,400 | |||||
| FMC Technologies | 215,800 a | 14,195,324 | C.R. Bard | 98,570 | 7,865,886 | |||||
| Grant Prideco | 193,900 a | 8,417,199 | Cephalon | 203,800 a | 14,486,104 | |||||
| Newfield Exploration | 355,860 a | 15,380,269 | Community Health Systems | 320,400 a | 11,934,900 | |||||
| Quicksilver Resources | 89,400 a | 3,448,158 | Cytyc | 434,900 a | 13,177,470 | |||||
| Range Resources | 265,900 | 8,490,187 | Dentsply International | 229,600 | 7,241,584 | |||||
| Smith International | 207,440 | 8,505,040 | Health Management Associates, Cl. A | 411,700 | 8,217,532 | |||||
| The Funds | 23 |
STATEMENT OF INVESTMENTS (Unaudited) (continued)
| Mellon Mid Cap Stock Fund (continued) | ||||||||||
| Common Stocks (continued) | Shares | Value ($) | Shares | Value ($) | ||||||
| Health Care (continued) | Information Technology (continued) | |||||||||
| Health Net | 354,200 a | 18,939,074 | Amphenol, Cl. A | 276,060 | 17,816,912 | |||||
| Henry Schein | 272,100 a | 14,195,457 | Avnet | 185,900 a | 6,798,363 | |||||
| Hologic | 156,400 a | 8,609,820 | CheckFree | 66,000 a | 2,502,720 | |||||
| MGI Pharma | 191,700 a | 4,067,874 | Citrix Systems | 130,700 a | 4,208,540 | |||||
| Omnicare | 526,800 | 21,883,272 | Cognizant Technology Solutions, | |||||||
| Pharmaceutical Product Development | 393,000 | 12,493,470 | Cl. A | 104,200 a | 9,398,840 | |||||
| Varian Medical Systems | 370,310 a | 17,015,745 | Comtech Telecommunications | 212,120 a | 7,286,322 | |||||
| Vertex Pharmaceuticals | 378,771 a | 11,624,482 | Digital River | 164,600 a | 9,117,194 | |||||
| 179,904,070 | F5 Networks | 143,200 a | 10,399,184 | |||||||
| Industrial—16.7% | FactSet Research Systems | 97,920 | 5,959,411 | |||||||
| Aircastle | 220,000 | 7,574,600 | Fairchild Semiconductor | |||||||
| AMETEK | 404,450 | 13,832,190 | International | 380,900 a | 7,126,639 | |||||
| Canadian Pacific Railway | 146,200 | 7,808,542 | Fortress Investment Group | 5,000 | 151,000 | |||||
| Chicago Bridge & Iron (NY Shares) | 264,200 | 7,854,666 | Harris | 155,800 | 7,646,664 | |||||
| Cintas | 156,900 | 6,335,622 | Integrated Device Technology | 690,200 a | 11,195,044 | |||||
| Corrections Corp. of America | 177,500 a | 9,293,900 | Intersil, Cl. A | 529,800 | 14,013,210 | |||||
| DRS Technologies | 233,600 | 12,378,464 | Lam Research | 226,500 a | 10,115,490 | |||||
| Dun & Bradstreet | 135,200 | 11,935,456 | Macrovision | 236,500 a | 5,834,455 | |||||
| Equifax | 205,300 | 7,949,216 | ManTech International, Cl. A | 237,100 a | 8,168,095 | |||||
| Expeditors International | McAfee | 549,800 a | 16,559,976 | |||||||
| Washington | 513,000 | 23,008,050 | MEMC Electronic Materials | 312,700 a | 16,125,939 | |||||
| Goodrich | 234,600 | 11,507,130 | Microchip Technology | 563,800 | 20,071,280 | |||||
| Jacobs Engineering Group | 188,700 a | 17,047,158 | Polycom | 343,600 a | 10,960,840 | |||||
| Joy Global | 185,275 | 8,215,094 | Synopsys | 456,000 a | 11,664,480 | |||||
| Kansas City Southern | 269,900 a | 8,647,596 | 252,184,885 | |||||||
| L-3 Communications Holdings | 100,600 | 8,762,260 | Materials—5.7% | |||||||
| Manpower | 221,300 | 16,442,590 | Albemarle | 155,100 | 12,694,935 | |||||
| NCI Building Systems | 149,000 a | 8,320,160 | Allegheny Technologies | 124,300 | 12,734,535 | |||||
| Oshkosh Truck | 236,300 | 12,677,495 | Ashland | 116,800 | 7,659,744 | |||||
| Precision Castparts | 326,000 | 29,656,220 | Florida Rock Industries | 88,100 | 5,936,178 | |||||
| Republic Services | 431,320 | 18,145,632 | Freeport-McMoRan | |||||||
| Robert Half International | 194,600 | 7,603,022 | Copper & Gold, Cl. B | 91,500 | 5,253,015 | |||||
| Shaw Group | 215,800 a | 6,642,324 | IPSCO | 81,400 | 8,877,484 | |||||
| Textron | 97,100 | 8,961,359 | Martin Marietta Materials | 144,300 | 18,083,676 | |||||
| WESCO International | 123,900 a | 8,267,847 | RPM International | 509,300 | 11,917,620 | |||||
| 278,866,593 | Vulcan Materials | 111,000 | 12,930,390 | |||||||
| Information Technology—15.1% | 96,087,577 | |||||||||
| Activision | 681,700 a | 11,398,024 | Telecommunication Services—1.1% | |||||||
| Akamai Technologies | 169,600 a | 8,746,272 | NII Holdings | 154,000 a | 10,909,360 | |||||
| Alliance Data Systems | 204,800 a | 12,236,800 | SBA Communications, Cl. A | 272,300 a | 7,343,931 | |||||
| Amdocs | 193,100 a | 6,683,191 | 18,253,291 | |||||||
| 24 |
| Mellon Mid Cap Stock Fund (continued) | ||||||||||
| Common Stocks (continued) | Shares | Value ($) | Other Investment—1.0% | Shares | Value ($) | |||||
| Utilities—7.3% | Registered Investment Company; | |||||||||
| Allegheny Energy | 171,300 a | 8,092,212 | Dreyfus Institutional Preferred | |||||||
| Alliant Energy | 425,500 | 17,794,410 | Plus Money Market Fund | |||||||
| (cost $16,677,000) | 16,677,000 c | 16,677,000 | ||||||||
| Aqua America | 566,600 | 12,912,814 | ||||||||
| DPL | 459,800 | 13,872,166 | Investment of Cash Collateral | |||||||
| Dynegy, Cl. A | 1,117,300 a | 9,173,033 | for Securities Loaned—.5% | |||||||
| Energen | 181,900 | 8,818,512 | Registered Investment Company; | |||||||
| Northeast Utilities | 554,600 | 16,116,676 | Dreyfus Institutional Cash | |||||||
| Advantage Plus Fund | ||||||||||
| (cost $8,946,720) | 8,946,720c | |||||||||
| OGE Energy | 347,800 | 13,428,558 | > | 8,946,720 | ||||||
| PPL | 224,200 | 8,524,084 | ||||||||
| Questar | 152,600 | 12,839,764 | Total Investments | |||||||
| (cost $1,405,376,590) | 100.4% 1,681,205,841 | |||||||||
| 121,572,229 | ||||||||||
| Total Common Stocks | Liabilities, Less Cash and Receivables | (.4%) | (6,668,636) | |||||||
| (cost $1,379,752,870) | 1,655,582,121 | Net Assets | 100.0% 1,674,537,205 | |||||||
| ADR—American Depository Receipts |
| a Non-income producing security. |
| b All or a portion of these securities are on loan. At February 28, 2007, the total market value of the fund’s securities on loan is $8,801,178 and the total market value of the |
| collateral held by the fund is $8,946,720. |
| c Investment in affiliated money market mutual fund. |
| Portfolio Summary | (Unaudited) † | |||||||
| Value (%) | Value (%) | |||||||
| Consumer Discretionary | 16.8 | Utilities | 7.3 | |||||
| 25 | ||||||||
| Industrial | 16.7 | Materials | 5.7 | |||||
| Financial | 16.4 | Money Market Investments | 1.5 | |||||
| Information Technology | 15.1 | Consumer Staples | 1.4 | |||||
| Health Care | 10.7 | Telecommunication Services | 1.1 | |||||
| Energy | 7.7 | 100.4 | ||||||
| † Based on net assets. | ||||||||
| See notes to financial statements. | ||||||||
The Funds 25
| STATEMENT OF INVESTMENTS |
| February 28, 2007 (Unaudited) |
| Mellon Small Cap Stock Fund | ||||||||||
| Common Stocks—95.9% | Shares | Value ($) | Shares | Value ($) | ||||||
| Consumer Discretionary—15.0% | Financial—18.0% | |||||||||
| Charter Communications, Cl. A | 1,541,400 a,b | 4,639,614 | Annaly Capital Management | 326,200 | 4,573,324 | |||||
| Children’s Place Retail Stores | 144,800 b | 7,885,808 | Apollo Investment | 282,043 a | 6,396,735 | |||||
| Coldwater Creek | 517,325 a,b | 9,518,780 | Aspen Insurance Holdings | 116,500 | 3,087,250 | |||||
| Life Time Fitness | 159,100 b | 7,604,980 | Asta Funding | 92,800 | 3,069,824 | |||||
| Live Nation | 223,500 b | 5,171,790 | Boston Private | |||||||
| Meritage Homes | 100,900 b | 3,909,875 | Financial Holdings | 220,100 | 6,349,885 | |||||
| NutriSystem | 99,000 a,b | 4,469,850 | Christopher & Banks | 337,200 | 6,261,804 | |||||
| Penn National Gaming | 103,200 b | 4,812,216 | Downey Financial | 85,300 a | 5,590,562 | |||||
| PEP Boys-Manny Moe & Jack | 260,600 a | 3,948,090 | East West Bancorp | 65,100 | 2,426,277 | |||||
| Phillips-Van Heusen | 59,800 a | 3,279,432 | Essex Property Trust | 27,100 | 3,763,919 | |||||
| Regis | 117,400 | 4,940,192 | FelCor Lodging Trust | 279,520 a | 6,591,082 | |||||
| Smith & Wesson Holding | 426,100 a,b | 5,292,162 | First Midwest Bancorp/IL | 81,140 a | 3,052,487 | |||||
| Sonic Automotive, Cl. A | 183,700 a | 5,400,780 | FirstFed Financial | 87,700 a,b | 5,016,440 | |||||
| Sotheby’s, Cl. A | 202,900 a | 7,377,444 | Innkeepers USA Trust | 369,000 | 6,162,300 | |||||
| Standard-Pacific | 132,300 a | 3,377,619 | International Securities | |||||||
| TiVo | 883,700 a,b | 5,187,319 | Exchange Holdings, Cl. A | 80,100 a | 3,704,625 | |||||
| Tractor Supply | 95,200 b | 4,871,384 | Investment Technology Group | 53,500 b | 2,189,755 | |||||
| Vail Resorts | 101,300 a,b | 5,263,548 | Kilroy Realty | 38,400 | 3,162,240 | |||||
| 96,950,883 | Knight Capital Group, Cl. A | 163,100 a,b | 2,578,611 | |||||||
| Consumer Staples—3.2% | National Financial Partners | 96,700 | 4,463,672 | |||||||
| Briggs & Stratton | 159,400 a | 4,660,856 | Ohio Casualty | 105,000 | 3,131,100 | |||||
| Chiquita Brands International | 198,900 a | 2,884,050 | Philadelphia | |||||||
| Consolidated Holding | 151,200 b | 6,941,592 | ||||||||
| Flowers Foods | 57,600 a | 1,692,864 | ||||||||
| Prosperity Bancshares | 174,700 | 6,074,319 | ||||||||
| Hain Celestial Group | 41,500 a,b | 1,203,915 | ||||||||
| SVB Financial Group | 101,500 b | 4,902,450 | ||||||||
| Jones Soda | 322,800 a,b | 3,973,668 | ||||||||
| Umpqua Holdings | 207,900 a | 5,615,379 | ||||||||
| Performance Food Group | 97,640 a,b | 2,877,451 | ||||||||
| Webster Financial | 93,400 | 4,613,026 | ||||||||
| Sanderson Farms | 99,000 a | 3,202,650 | ||||||||
| Whitney Holding | 67,400 | 2,137,928 | ||||||||
| 20,495,454 | ||||||||||
| Zenith National Insurance | 108,200 | 5,209,830 | ||||||||
| Energy—5.8% | ||||||||||
| 117,066,416 | ||||||||||
| Cabot Oil & Gas | 62,500 | 4,222,500 | ||||||||
| Health Care—13.2% | ||||||||||
| Forest Oil | 88,900 b | 2,835,910 | ||||||||
| Alpharma, Cl. A | 70,800 | 1,866,288 | ||||||||
| Helix Energy Solutions Group | 87,500 a,b | 2,937,375 | ||||||||
| American Medical | ||||||||||
| Input/Output | 356,100 a,b | 4,832,277 | Systems Holdings | 154,700 a,b | 3,146,598 | |||||
| Lone Star Technologies | 61,100 b | 2,904,083 | AMERIGROUP | 60,800 b | 2,011,264 | |||||
| Massey Energy | 113,900 | 2,763,214 | AMN Healthcare Services | 247,400 a,b | 6,877,720 | |||||
| Oceaneering International | 158,300 b | 6,243,352 | ARIAD Pharmaceuticals | 605,700 a,b | 2,925,531 | |||||
| St. Mary Land & Exploration | 142,890 a | 5,145,469 | Cooper Cos. | 53,400 | 2,450,526 | |||||
| Tetra Technologies | 75,600 a,b | 1,680,588 | Digene | 63,900 b | 3,021,192 | |||||
| Unit | 53,830 b | 2,634,978 | Five Star Quality Care | 466,900 a,b | 5,336,667 | |||||
| W-H Energy Services | 37,700 b | 1,583,400 | Hologic | 153,800 b | 8,466,690 | |||||
| 37,783,146 | ||||||||||
| 26 |
| Mellon Small Cap Stock Fund (continued) | ||||||||||
| Common Stocks (continued) | Shares | Value ($) | Shares | Value ($) | ||||||
| Health Care (continued) | Industrial (continued) | |||||||||
| IDEXX Laboratories | 32,640 b | 2,812,915 | Watson Wyatt | |||||||
| Immucor | 75,300 b | 2,239,422 | Worldwide, Cl. A | 46,200 | 2,220,834 | |||||
| Merit Medical Systems | 1 b | 14 | 96,226,255 | |||||||
| MGI Pharma | 148,300 b | 3,146,926 | Information Technology—15.0% | |||||||
| Par Pharmaceutical Cos. | 294,700 b | 7,155,316 | ANSYS | 82,280 b | 4,197,926 | |||||
| PDL BioPharma | 218,700 a,b | 4,174,983 | Avocent | 127,700 a,b | 4,064,691 | |||||
| Pediatrix Medical Group | 52,140 b | 2,820,774 | BearingPoint | 561,500 a,b | 4,492,000 | |||||
| Psychiatric Solutions | 180,020 a,b | 7,193,599 | Benchmark Electronics | 80,100 b | 1,720,548 | |||||
| Regeneron Pharmaceuticals | 67,100 b | 1,331,264 | CommScope | 101,010 a,b | 3,885,855 | |||||
| Respironics | 80,290 b | 3,289,481 | ECI Telecommunications | 533,500 b | 4,278,670 | |||||
| Sierra Health Services | 84,100 b | 3,125,156 | Esterline Technologies | 53,260 b | 2,179,399 | |||||
| Sirona Dental Systems | 128,900 | 4,797,658 | FactSet Research Systems | 40,650 | 2,473,959 | |||||
| Syneron Medical | 158,440 a,b | 4,231,932 | FLIR Systems | 71,200 a,b | 2,474,912 | |||||
| Thoratec | 163,800 b | 3,218,671 | Hyperion Solutions | 60,200 b | 2,578,968 | |||||
| 85,640,587 | Informatica | 354,800 a,b | 4,598,208 | |||||||
| Industrial—14.8% | Itron | 87,200 a,b | 5,634,864 | |||||||
| Acuity Brands | 43,100 | 2,387,740 | j2 Global Communications | 117,600 a,b | 2,827,104 | |||||
| AGCO | 171,000 a,b | 6,198,750 | JDA Software Group | 321,600 b | 4,778,976 | |||||
| American Axle & | L-1 Identity Solutions | 182,900 a,b | 2,906,281 | |||||||
| Manufacturing Holdings | 136,200 a | 3,340,986 | Micros Systems | 38,000 b | 2,118,880 | |||||
| Armor Holdings | 101,630 a,b | 6,472,815 | Microsemi | 72,430 a,b | 1,467,432 | |||||
| Baldor Electric | 87,900 | 3,199,560 | Napster | 1,408,200 b | 5,477,898 | |||||
| Corrections Corp. | Powerwave Technologies | 551,200 b | 2,932,384 | |||||||
| of America | 263,250 b | 13,783,770 | Quality Systems | 112,100 a | 4,588,253 | |||||
| DRS Technologies | 58,800 a | 3,115,812 | Rackable Systems | 172,100 b | 2,996,261 | |||||
| General Cable | 70,800 b | 3,536,460 | S1 | 742,900 a,b | 3,848,222 | |||||
| Genlyte Group | 56,000 a,b | 3,885,840 | Sonus Networks | 620,700 a,b | 4,773,183 | |||||
| Hexcel | 147,900 a,b | 2,671,074 | Trimble Navigation | 133,000 b | 3,519,180 | |||||
| IDEX | 56,220 | 2,924,002 | ValueClick | 180,800 a,b | 4,791,200 | |||||
| Kansas City Southern | 87,470 a,b | 2,802,539 | Varian Semiconductor | |||||||
| Landstar System | 66,400 | 2,967,416 | Equipment Associates | 59,070 a,b | 2,822,955 | |||||
| Manitowoc | 90,780 | 5,328,786 | VASCO Data Security | |||||||
| Quanta Services | 253,400 a,b | 5,876,346 | International | 264,800 a,b | 4,657,832 | |||||
| Shaw Group | 41,590 b | 1,280,140 | 97,086,041 | |||||||
| Superior Industries | Materials—4.6% | |||||||||
| International | 153,900 a | 3,301,155 | AK Steel Holding | 126,600 a,b | 2,928,258 | |||||
| Teledyne Technologies | 168,920 b | 6,427,406 | Carpenter Technology | 28,300 | 3,354,965 | |||||
| URS | 113,670 b | 4,725,262 | Cleveland-Cliffs | 42,040 a | 2,371,056 | |||||
| Wabtec | 163,800 a | 5,274,360 | Nalco Holding | 232,900 | 5,566,310 | |||||
| Waste Connections | 43,800 a,b | 1,936,836 | RTI International Metals | 55,200 a,b | 4,762,656 | |||||
| Watsco | 50,990 a | 2,568,366 | Terra Industries | 342,800 a,b | 5,981,860 | |||||
The Funds 27
STATEMENT OF INVESTMENTS (Unaudited) (continued)

| a All or a portion of these securities are on loan. At February 28, 2007, the total market value of the fund’s securities on loan is $140,398,193 and the total market value of the |
| collateral held by the fund is $147,071,194 consisting of cash collateral of $146,271,983 and U.S. Government and agency securities valued at $799,211. |
| b Non-income producing security. |
| c Investment in affiliated money market mutual fund. |
| Portfolio Summary (Unaudited) † | ||||||
| Value (%) | Value (%) | |||||
| Money Market Investments | 25.7 | Energy | 5.8 | |||
| Financial | 18.0 | Materials | 4.6 | |||
| Consumer Discretionary | 15.0 | Utilities | 4.4 | |||
| Information Technology | 15.0 | Consumer Staples | 3.2 | |||
| Industrial | 14.8 | Telecommunication Services | 1.9 | |||
| Health Care | 13.2 | 121.6 | ||||
| † Based on net assets. | ||||||
| See notes to financial statements. | ||||||
| 28 |
| STATEMENT OF INVESTMENTS |
| February 28, 2007 (Unaudited) |
| Mellon International Fund | ||||||||||
| Common Stocks—96.2% | Shares | Value ($) | Shares | Value ($) | ||||||
| Australia—3.9% | Finland (continued) | |||||||||
| Amcor | 3,097,187 | 17,789,595 | Rautaruukki | 73,700 | 3,373,931 | |||||
| BHP Billiton | 195,600 | 4,181,092 | UPM-Kymmene | 485,336 | 12,650,317 | |||||
| BlueScope Steel | 458,800 | 3,372,688 | 51,865,532 | |||||||
| Coca-Cola Amatil | 623,510 | 4,062,749 | France—10.0% | |||||||
| Commonwealth Bank of Australia | 79,200 | 3,117,588 | Air France-KLM | 26,500 | 1,150,039 | |||||
| Insurance Australia Group | 1,356,543 | 6,391,545 | BNP Paribas | 274,319 | 28,651,389 | |||||
| National Australia Bank | 624,712 | 19,865,619 | Bouygues | 46,430 | 3,237,442 | |||||
| Pacific Brands | 940,500 | 2,171,188 | Cap Gemini | 50,400 | 3,524,262 | |||||
| QBE Insurance Group | 283,800 | 7,155,393 | Carrefour | 154,210 | 10,299,700 | |||||
| Suncorp-Metway | 63,180 | 1,083,700 | Compagnie Generale | |||||||
| Tabcorp Holdings | 1,265,973 | 16,108,981 | de Geophysique-Veritas | 10,220 a | 2,109,445 | |||||
| Telstra | 4,764,100 | 15,990,483 | Compagnie Generale des | |||||||
| Woolworths | 144,000 | 3,086,047 | Etablissements Michelin, Cl. B | 870 | 90,499 | |||||
| Zinifex | 162,700 | 2,143,359 | Credit Agricole | 542,901 | 21,664,299 | |||||
| 106,520,027 | France Telecom | 1,137,575 | 30,900,226 | |||||||
| Austria—.2% | Lagardere | 172,127 | 13,229,488 | |||||||
| Boehler-Uddeholm | 64,200 | 4,727,079 | Peugeot | 106,671 | 7,196,545 | |||||
| Belgium—1.3% | Rhodia | 45,748 a | 160,402 | |||||||
| AGFA-Gevaert | 2,750 | 61,273 | Sanofi-Aventis | 574,355 | 48,833,044 | |||||
| Delhaize Group | 21,430 | 1,785,170 | Societe Generale | 69,000 | 11,625,365 | |||||
| Fortis | 468,838 | 20,172,792 | Suez | 60,100 | 2,911,961 | |||||
| InBev | 124,700 | 8,267,678 | Thomson | 789,805 | 14,859,772 | |||||
| KBC Groep | 53,000 | 6,448,631 | Total | 577,022 | 38,951,617 | |||||
| 36,735,544 | Total, ADR | 139,022 | 9,358,961 | |||||||
| Denmark—.4% | Valeo | 243,726 | 11,999,253 | |||||||
| Carlsberg, Cl. B | 40,180 | 4,151,829 | Vinci | 38,350 | 5,311,048 | |||||
| Danske Bank | 119,100 | 5,508,407 | Vivendi | 217,100 | 8,574,264 | |||||
| 9,660,236 | 274,639,021 | |||||||||
| Finland—1.9% | Germany—7.4% | |||||||||
| KCI Konecranes | 90,300 | 2,818,437 | Adidas | 402,132 | 19,707,534 | |||||
| Kesko, Cl. B | 26,900 | 1,418,673 | Allianz | 81,851 | 17,609,102 | |||||
| M-real, Cl. B | 723,030 | 4,917,135 | Bayerische Motoren Werke | 53,380 | 3,088,522 | |||||
| Metso | 56,900 | 2,823,917 | Beiersdorf | 32,800 | 2,117,373 | |||||
| Neste Oil | 58,600 | 1,882,517 | Deutsche Bank | 115,002 | 15,135,270 | |||||
| Nokia | 833,020 | 18,174,763 | Deutsche Post | 1,052,210 | 33,788,186 | |||||
| Nokia, ADR | 174,340 | 3,805,842 | Deutsche Telekom | 1,333,070 | 23,899,286 | |||||
The Funds 29
STATEMENT OF INVESTMENTS (Unaudited) (continued)
| Mellon International Fund (continued) | ||||||||||
| Common Stocks (continued) | Shares | Value ($) | Shares | Value ($) | ||||||
| Germany (continued) | Italy—4.1% | |||||||||
| E.ON | 117,692 | 15,447,254 | Banca Popolare di Milano | 210,000 | 3,259,192 | |||||
| Hannover Rueckversicherung | 357,081 a | 15,260,260 | Enel | 1,422,450 | 14,858,734 | |||||
| Heidelberger Druckmaschinen | 20,000 | 857,369 | ENI | 737,744 | 22,596,925 | |||||
| Infineon Technologies | 8,210 a | 126,007 | Mediaset | 1,907,053 | 22,153,888 | |||||
| MAN | 38,000 | 4,084,066 | Saras | 2,256,519 a | 12,427,561 | |||||
| Medion | 173,510 | 1,988,086 | UniCredito Italiano | 2,417,120 | 22,386,640 | |||||
| Merck | 25,043 | 3,131,200 | Unipol | 4,098,252 | 15,833,400 | |||||
| Metro | 2,730 | 188,694 | 113,516,340 | |||||||
| MTU Aero Engines Holding | 39,600 | 2,082,692 | Japan—24.9% | |||||||
| Muenchener Rueckversicherungs | 29,210 | 4,654,349 | 77 Bank | 1,679,500 | 11,908,730 | |||||
| Siemens | 324,415 | 34,192,740 | Aeon | 1,381,300 | 28,834,236 | |||||
| ThyssenKrupp | 105,100 | 5,152,092 | Aiful | 285,133 | 7,759,377 | |||||
| 202,510,082 | Astellas Pharma | 351,200 | 15,404,420 | |||||||
| Greece—.9% | Canon | 293,001 | 16,021,267 | |||||||
| Alpha Bank | 93,100 | 2,870,108 | Daiichi Sankyo | 68,700 | 2,212,102 | |||||
| Coca-Cola Hellenic Bottling | 60,500 | 2,340,590 | Dainippon Sumitomo Pharma | 120,800 | 1,339,443 | |||||
| Public Power | 752,614 | 19,457,611 | Dentsu | 8,760 | 24,431,016 | |||||
| 24,668,309 | Diamond Lease | 44,130 | 2,178,062 | |||||||
| Hong Kong—1.3% | FUJIFILM Holdings | 430,200 | 18,505,962 | |||||||
| BOC Hong Kong Holdings | 3,963,000 | 9,586,431 | Funai Electric | 136,140 | 13,150,900 | |||||
| China Mobile | 720,500 | 6,694,863 | Hino Motors | 3,169,900 | 17,600,881 | |||||
| CITIC Pacific | 1,486,400 | 4,965,320 | Honda Motor | 239,600 | 8,950,197 | |||||
| Hutchison Whampoa | 1,429,500 | 13,557,307 | Ibiden | 41,100 | 2,059,776 | |||||
| Johnson Electric Holdings | 362,500 | 263,064 | JS Group | 479,800 | 10,786,123 | |||||
| Wharf Holdings | 339,500 | 1,203,623 | Kao | 405,300 | 11,851,578 | |||||
| 36,270,608 | Kenedix | 389 | 2,051,435 | |||||||
| Ireland—.7% | Komatsu | 290,300 | 6,464,741 | |||||||
| Allied Irish Banks | 123,000 | 3,620,994 | Kubota | 270,000 | 2,685,738 | |||||
| Bank of Ireland | 365,990 | 8,343,479 | Kuraray | 755,600 | 8,263,228 | |||||
| C & C Group | 156,600 | 2,175,573 | Lawson | 302,100 | 11,591,244 | |||||
| CRH | 113,100 | 4,716,735 | Mabuchi Motor | 47,300 | 2,946,131 | |||||
| 18,856,781 | Makita | 109,300 | 4,018,213 | |||||||
| 30 |
The Funds 31
STATEMENT OF INVESTMENTS (Unaudited) (continued)
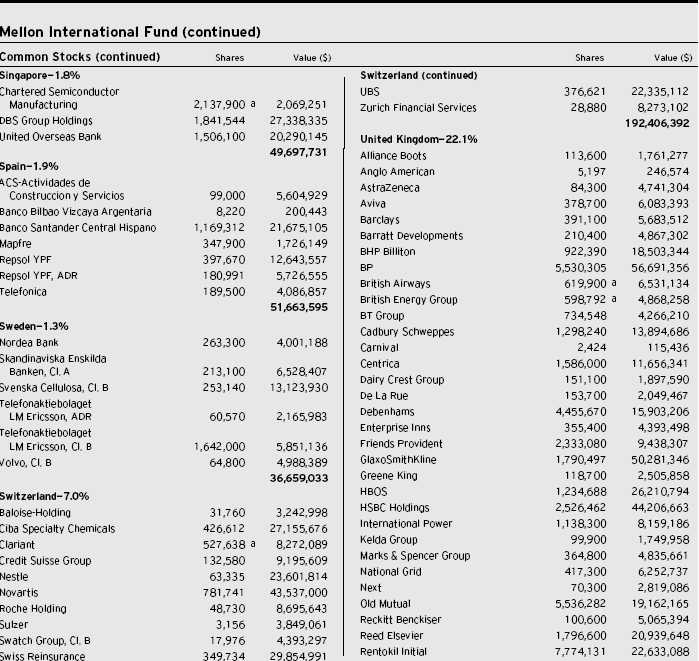
| 32 |
| Mellon International Fund (continued) | ||||||||||
| Common Stocks (continued) | Shares | Value ($) | Preferred Stocks—.5% | Shares | Value ($) | |||||
| United Kingdom (continued) | Germany | |||||||||
| Rexam | 980,500 | 9,704,550 | Fresenius | 90,240 | 6,668,297 | |||||
| Royal Bank of Scotland Group | 1,336,618 | 52,733,245 | Henkel | 19,940 | 2,812,123 | |||||
| Royal Dutch Shell, Cl. A | 236,295 | 7,665,877 | Porsche | 2,731 | 3,604,353 | |||||
| Royal Dutch Shell, Cl. B | 275,700 | 8,917,182 | Total Preferred Stocks | |||||||
| SABMiller | 895,813 | 19,843,749 | (cost $11,092,023) | 13,084,773 | ||||||
| Smiths Group | 691,485 | 13,986,764 | ||||||||
| Tesco | 261,500 | 2,218,466 | Other Investment—2.1% | |||||||
| Trinity Mirror | 1,725,690 | 16,622,604 | Registered Investment Company; | |||||||
| Unilever | 1,554,492 | 41,547,402 | Dreyfus Institutional Preferred | |||||||
| Vodafone Group | 13,538,435 | 37,620,292 | Plus Money Market Fund | |||||||
| Xstrata | 159,500 | 7,501,765 | (cost $57,300,000) | 57,300,000 | b 57,300,000 | |||||
| 606,775,675 | Total Investments | |||||||||
| United States—.5% | (cost $2,357,337,991) | 98.8% | 2,711,839,201 | |||||||
| iShares MSCI EAFE Index Fund | 207,400 | 15,378,710 | ||||||||
| Cash and Receivables (Net) | 1.2% | 34,125,302 | ||||||||
| Total Common Stocks | ||||||||||
| (cost $2,288,945,968) | 2,641,454,428 | Net Assets | 100.0% | 2,745,964,503 | ||||||
| ADR—American Depository Receipts | ||||||||||
| a Non-income producing security. | ||||||||||
| b Investment in affiliated money market mutual fund. | ||||||||||
| Portfolio Summary | (Unaudited) † | |||||||
| Value (%) | Value (%) | |||||||
| Financial | 22.9 | Insurance | 5.8 | |||||
| 33 | ||||||||
| Consumer Discretionary | 12.3 | Information Technology | 5.2 | |||||
| Industrial | 10.7 | Telecommunication Services | 5.0 | |||||
| Consumer Staples | 8.5 | Utilities | 3.2 | |||||
| Energy | 7.8 | Other | 2.1 | |||||
| Materials | 7.7 | Index | .6 | |||||
| Health Care | 7.0 | 98.8 | ||||||
| † Based on net assets. | ||||||||
| See notes to financial statements. | ||||||||
The Funds 33
| STATEMENT OF INVESTMENTS |
| February 28, 2007 (Unaudited) |
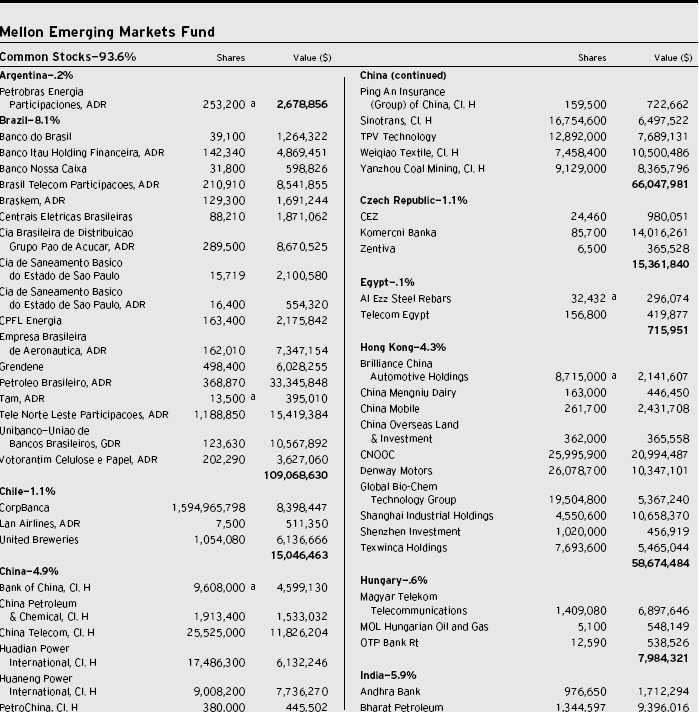
| 34 |
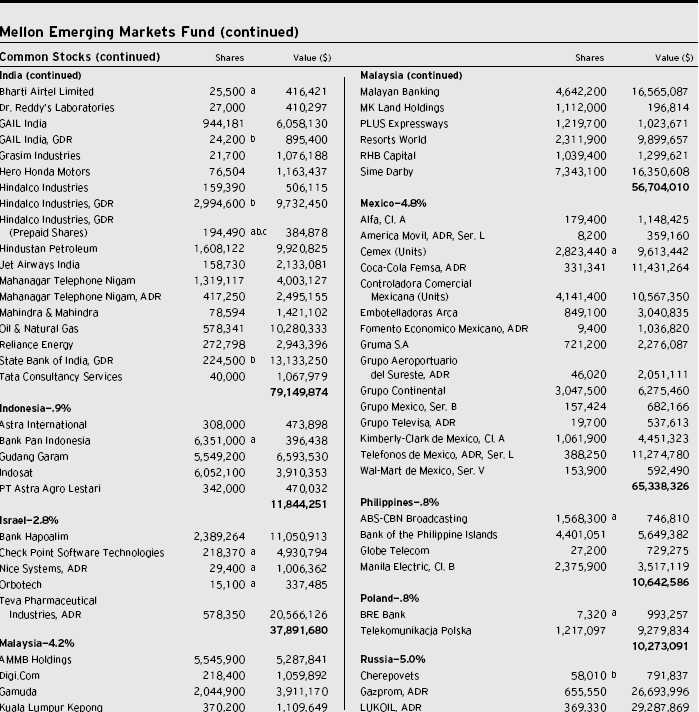
The Funds 35
STATEMENT OF INVESTMENTS (Unaudited) (continued)

| 36 |

The Funds 37
STATEMENT OF INVESTMENTS (Unaudited) (continued)
| Mellon Emerging Markets Fund (continued) | ||||||||||
| Investment of Cash Collateral | ||||||||||
| Preferred Stocks (continued) | Shares | Value ($) | for Securities Loaned—.1% | Shares | Value ($) | |||||
| Brazil (continued) | Registered Investment Company; | |||||||||
| Usinas Siderurgicas de Minas Gerais, Cl. A 31,800 | 1,325,212 | Dreyfus Institutional Cash | ||||||||
| Total Preferred Stocks | Advantage Plus Fund | |||||||||
| (cost $31,383,022) | 49,302,599 | (cost $1,638,360) | 1,638,360 | e 1,638,360 | ||||||
| Other Investment—2.0% | Total Investments | |||||||||
| (cost $1,066,873,058) | 99.4% | 1,341,450,517 | ||||||||
| Registered Investment Company; | ||||||||||
| Dreyfus Institutional Preferred | Cash and Receivables (Net) | .6% | 8,412,821 | |||||||
| Plus Money Market Fund | Net Assets | 100.0% | 1,349,863,338 | |||||||
| (cost $26,500,000) | 26,500,000 e | 26,500,000 | ||||||||
| ADR—American Depository Receipts |
| GDR—Global Depository Receipts |
| a Non-income producing security. |
| b Securities exempt from registration under Rule 144A of the Securities Act of 1933.These securities may be resold in transactions exempt from registration, normally to qualified |
| institutional buyers. At February 28, 2007, these securities amounted to $28,240,752 or 2.1% of net assets. |
| c The value of this security has been determined in good faith under the direction of the Trust’s Board. |
| d All or a portion of this security is on loan. At February 28, 2007, the total market value of the fund’s security on loan is $1,629,504 and the total market value of the collateral |
| held by the fund is $1,638,360. |
| e Investment in affiliated money market mutual fund. |
| Portfolio Summary (Unaudited) † | ||||||||
| Value (%) | Value (%) | |||||||
| Financial | 21.1 | Industrial | 5.5 | |||||
| 38 | The Funds | 38 | ||||||
| Information Technology | 13.4 | Utilities | 5.5 | |||||
| Energy | 13.3 | Health Care | 2.4 | |||||
| Consumer Discretionary | 11.5 | Other | 2.1 | |||||
| Telecommunication Services | 10.7 | Index | .4 | |||||
| Materials | 7.9 | |||||||
| Consumer Staples | 5.6 | 99.4 | ||||||
| † Based on net assets. | ||||||||
| See notes to financial statements. | ||||||||
| 38 |
| STATEMENT OF INVESTMENTS |
| February 28, 2007 (Unaudited) |
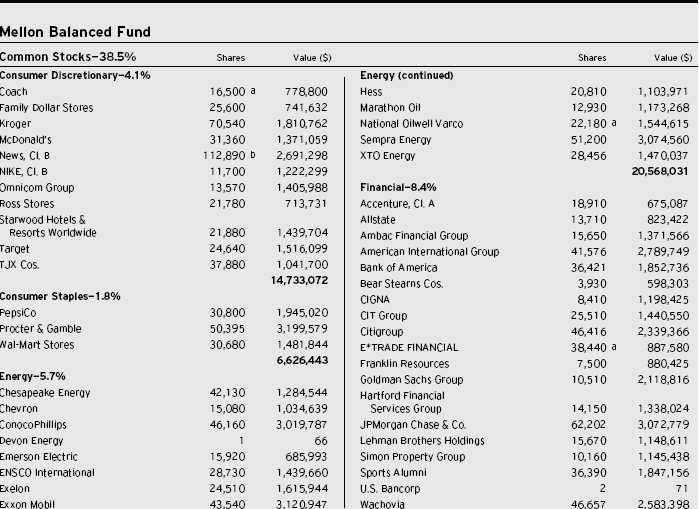
The Funds 39
STATEMENT OF INVESTMENTS (Unaudited) (continued)

| 40 |
The Funds 41
STATEMENT OF INVESTMENTS (Unaudited) (continued)
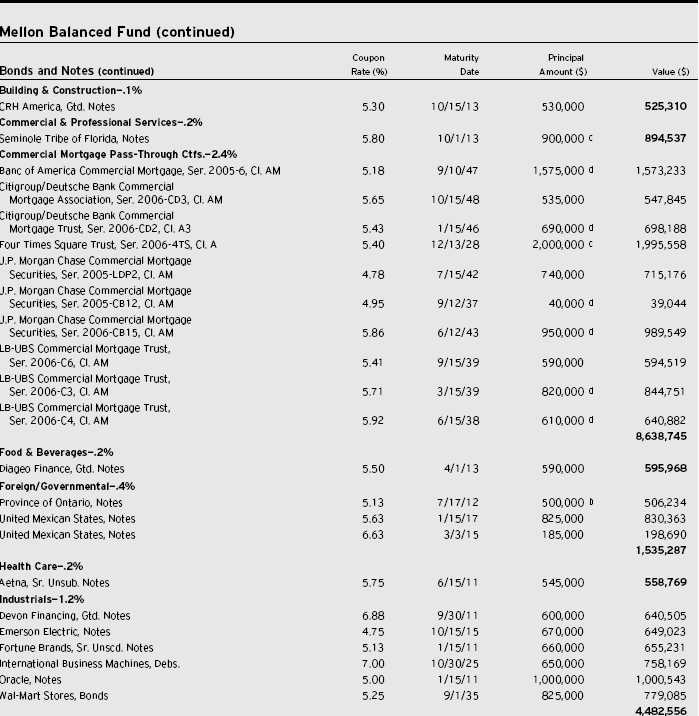
| 42 |
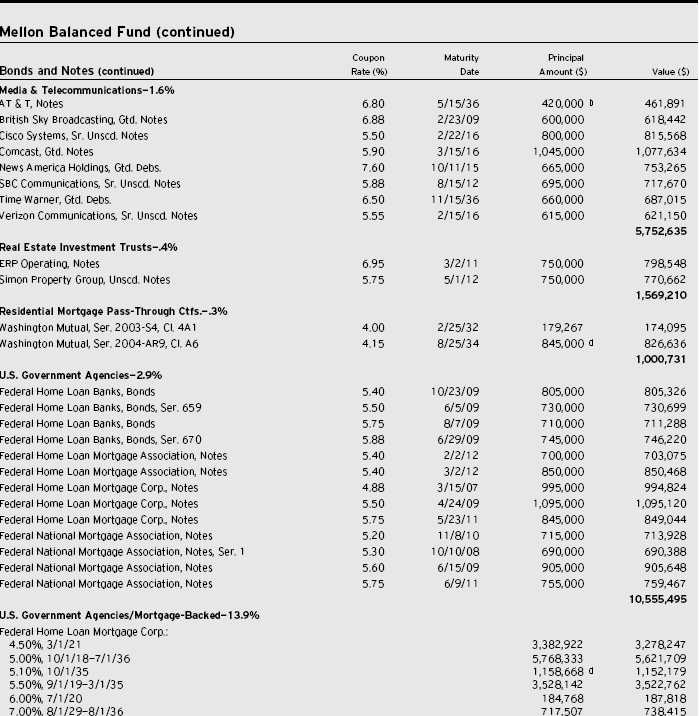
The Funds 43
STATEMENT OF INVESTMENTS (Unaudited) (continued)
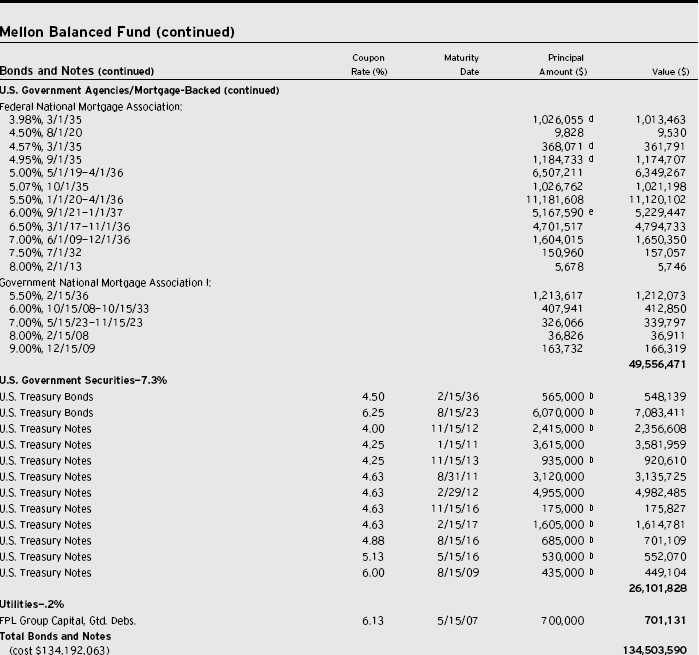
| 44 |
| Mellon Balanced Fund (continued) | ||||||||||
| Investment of Cash Collateral | ||||||||||
| Other Investments—24.1% | Shares | Value ($) | for Securities Loaned—3.2% | Shares | Value ($) | |||||
| Registered Investment Companies: | Registered Investment Company; | |||||||||
| Dreyfus Institutional Preferred | Dreyfus Institutional Cash | |||||||||
| Plus Money Market Fund | 3,207,000 f | 3,207,000 | Advantage Plus Fund | |||||||
| Mellon Emerging Markets Fund, | (cost $11,442,840) | 11,442,840 f | 11,442,840 | |||||||
| Class M Shares | 695,302 g | 14,330,180 | ||||||||
| Mellon International Fund, | Total Investments | |||||||||
| Class M Shares | 2,011,237 g | 34,452,493 | (cost $331,042,627) | 103.3% | 370,910,655 | |||||
| Mellon Mid Cap Stock Fund, | ||||||||||
| Class M Shares | 1,704,381 g | 23,026,185 | Liabilities, Less Cash | |||||||
| Mellon Small Cap Stock Fund, | and Receivables | (3.3%) | (11,905,846) | |||||||
| Class M Shares | 793,787 g | 11,343,220 | Net Assets | 100.0% | 359,004,809 | |||||
| Total Other Investments | ||||||||||
| (cost $76,495,123) | 86,359,078 | |||||||||
| ADR—American Depository Receipts | ||||||||||
| a Non-income producing security. | ||||||||||
| b All or a portion of these securities are on loan. At February 28, 2007, the total market value of the fund’s securities on loan is $13,298,505 and the total market value of the |
| collateral held by the fund is $13,656,127, consisting of cash collateral of $11,442,840 and Letters of Credit valued at $2,213,287. |
| c Securities exempt from registration under Rule 144A of the Securities Act of 1933.These securities may be resold in transactions exempt from registration, normally to qualified |
| institutional buyers. At February 28, 2007, these securities amounted to $4,298,261 or 1.2% of net assets. |
| d Variable rate security—interest rate subject to periodic change. |
| e Purchased on a delayed delivery basis. |
| f Investment in affiliated money market mutual fund. |
| g Investment in affiliated mutual fund. |
| Portfolio Summary (Unaudited) † | ||||||
| Value (%) | Value (%) | |||||
| U.S. Government & Agencies | 24.1 | Industrial | 4.1 | |||
| Affiliated Mutual Funds | 23.2 | Money Market Investments | 4.1 | |||
| Corporate Bonds | 8.4 | Consumer Staples | 1.8 | |||
| Financial | 8.4 | Tobacco | 1.3 | |||
| Information Technology | 6.6 | Materials | 1.2 | |||
| Energy | 5.7 | Telecommunication Services | .6 | |||
| Health Care | 4.7 | Foreign/Governmental | .4 | |||
| Asset/Mortgage-Backed | 4.6 | |||||
| Consumer Discretionary | 4.1 | 103.3 | ||||
| † Based on net assets. | ||||||
| See notes to financial statements. | ||||||
The Funds 45
| STATEMENTS OF ASSETS AND LIABILITIES |
| February 28, 2007 (Unaudited) |
| Mellon | Mellon | Mellon | Mellon | |||||
| Large Cap | Income | Mid Cap | Small Cap | |||||
| Stock Fund | Stock Fund | Stock Fund | Stock Fund | |||||
| Assets ($): | ||||||||
| Investments in securities— | ||||||||
| See Statement of Investments † | ||||||||
| (including securities on loan)++—Note 2(b): | ||||||||
| Unaffiliated issuers | 1,868,907,110 | 429,059,456 | 1,655,582,121 | 622,175,915 | ||||
| Affiliated issuers | 27,781,000 | 8,713,000 | 25,623,720 | 166,529,983 | ||||
| Cash | — | — | 1,364,364 | 2,687,922 | ||||
| Receivable for investment securities sold | 879,295,615 | 18,429,871 | 34,143,469 | 8,416,483 | ||||
| Dividends and interest receivable | 2,985,934 | 1,293,310 | 1,200,667 | 261,835 | ||||
| Receivable for shares of Beneficial Interest subscribed | 2,188,057 | 204,600 | 2,883,293 | 1,397,789 | ||||
| Prepaid expenses | 32,402 | 15,293 | 45,970 | 18,594 | ||||
| 2,781,190,118 | 457,715,530 | 1,720,843,604 | 801,488,521 | |||||
| Liabilities ($): | ||||||||
| Due to The Dreyfus Corporation and affiliates—Note 4(c) | 1,007,839 | 232,447 | 1,014,959 | 453,642 | ||||
| Due to Administrator—Note 4(a) | 190,777 | 43,731 | 166,993 | 64,843 | ||||
| Cash overdraft due to Custodian | 4,843 | 490,404 | — | — | ||||
| Liability for securities on loan—Note 2(b) | — | 3,138,000 | 8,946,720 | 146,271,983 | ||||
| Payable for investment securities purchased | 883,994,564 | 22,174,224 | 34,805,068 | 6,165,199 | ||||
| Payable for shares of Beneficial Interest redeemed | 812,333 | 195,908 | 1,314,590 | 109,759 | ||||
| Accrued expenses | 45,687 | 31,027 | 58,069 | 35,463 | ||||
| 886,056,043 | 26,305,741 | 46,306,399 | 153,100,889 | |||||
| Net Assets ($) | 1,895,134,075 | 431,409,789 | 1,674,537,205 | 648,387,632 | ||||
| Composition of Net Assets ($): | ||||||||
| Paid-in capital | 1,301,068,363 | 307,518,650 | 1,277,625,736 | 520,866,761 | ||||
| Accumulated undistributed | ||||||||
| investment income (loss)—net | 515,622 | 522,122 | 2,597,402 | (38,748) | ||||
| Accumulated net realized gain | ||||||||
| (loss) on investments | 194,796,832 | 37,935,038 | 118,484,816 | 50,491,456 | ||||
| Accumulated net unrealized appreciation | ||||||||
| (depreciation) on investments | 398,753,258 | 85,433,979 | 275,829,251 | 77,068,163 | ||||
| Net Assets ($) | 1,895,134,075 | 431,409,789 | 1,674,537,205 | 648,387,632 | ||||
| Net Asset Value Per Share | ||||||||
| Class M Shares | ||||||||
| Net Assets ($) | 1,885,013,158 | 429,768,482 | 1,639,070,105 | 643,005,989 | ||||
| Shares Outstanding | 174,189,615 | 41,960,277 | 121,330,063 | 45,003,968 | ||||
| Net Asset Value Per Share ($) | 10.82 | 10.24 | 13.51 | 14.29 | ||||
| Investor Shares | ||||||||
| Net Assets ($) | 10,120,917 | 1,641,307 | 30,390,542 | 5,381,643 | ||||
| Shares Outstanding | 933,221 | 159,288 | 2,266,270 | 384,605 | ||||
| Net Asset Value Per Share ($) | 10.85 | 10.30 | 13.41 | 13.99 | ||||
| Dreyfus Premier Shares | ||||||||
| Net Assets ($) | — | — | 5,076,558 | — | ||||
| Shares Outstanding | — | — | 392,439 | — | ||||
| Net Asset Value Per Share ($) | — | — | 12.94 | — | ||||
| † Investments at cost ($): | ||||||||
| Unaffiliated issuers | 1,470,153,852 | 343,625,477 | 1,379,752,870 | 545,107,752 | ||||
| Affiliated issuers | 27,781,000 | 8,713,000 | 25,623,720 | 166,529,983 | ||||
| †† Value of securities on loan ($) | — | 3,062,616 | 8,801,178 | 140,398,193 |
See notes to financial statements.
| 46 |
| Mellon | Mellon | Mellon | ||||||
| International | Emerging | Balanced | ||||||
| Fund | Markets Fund | Fund | ||||||
| Assets ($): | ||||||||
| Investments in securities—See Statement of Investments † | ||||||||
| (including securities on loan)††—Note 2(b): | ||||||||
| Unaffiliated issuers | 2,654,539,201 | 1,313,312,157 | 273,108,737 | |||||
| Affiliated issuers | 57,300,000 | 28,138,360 | 97,801,918 | |||||
| Cash | 5,184,783 | 1,708,624 | — | |||||
| Cash denominated in foreign currencies††† | 36,054,858 | 17,899,331 | — | |||||
| Receivable for investment securities sold | 27,312,953 | 3,470,070 | 73,587,006 | |||||
| Dividends and interest receivable | 4,382,347 | 2,798,608 | 1,209,911 | |||||
| Receivable for shares of Beneficial Interest subscribed | 3,626,267 | 1,924,746 | 208,120 | |||||
| Paydowns receivable | — | — | 932 | |||||
| Unrealized appreciation on foreign currency exchange contracts—Note 2(e) | 35,434 | 1,967 | — | |||||
| Prepaid expenses | 36,739 | 26,295 | 13,440 | |||||
| 2,788,472,582 | 1,369,280,158 | 445,930,064 | ||||||
| Liabilities ($): | ||||||||
| Due to The Dreyfus Corporation and affiliates—Note 4(c) | 2,382,027 | 1,848,749 | 134,054 | |||||
| Due to Administrator—Note 4(a) | 273,094 | 137,606 | 27,068 | |||||
| Cash overdraft due to Custodian | — | — | 333,279 | |||||
| Payable for investment securities purchased | 39,275,668 | 11,645,082 | 74,914,234 | |||||
| Liability for securities on loan—Note 2(b) | — | 1,638,360 | 11,442,840 | |||||
| Payable for shares of Beneficial Interest redeemed | 506,980 | 4,104,440 | 23,441 | |||||
| Unrealized depreciation on foreign currency exchange contracts—Note 2(e) | 1,737 | 5,096 | — | |||||
| Accrued expenses | 68,573 | 37,487 | 50,339 | |||||
| 42,508,079 | 19,416,820 | 86,925,255 | ||||||
| Net Assets ($) | 2,745,964,503 | 1,349,863,338 | 359,004,809 | |||||
| Composition of Net Assets ($): | ||||||||
| Paid-in capital | 2,241,968,714 | 948,614,762 | 292,299,532 | |||||
| Accumulated undistributed investment income (loss)—net | 619,893 | (1,548,305) | — | |||||
| Accumulated distributions in excess of investment income—net | — | — | (145) | |||||
| Accumulated net realized gain (loss) on investments | 148,679,313 | 128,191,363 | 26,837,394 | |||||
| Accumulated net unrealized appreciation (depreciation) on investments | — | — | 39,868,028 | |||||
| Accumulated net unrealized appreciation (depreciation) | ||||||||
| on investments and foreign currency transactions | 354,696,583 | 274,605,518 | — | |||||
| Net Assets ($) | 2,745,964,503 | 1,349,863,338 | 359,004,809 | |||||
| Net Asset Value Per Share | ||||||||
| Class M Shares | ||||||||
| Net Assets ($) | 2,736,411,466 | 1,340,967,177 | 354,654,471 | |||||
| Shares Outstanding | 159,771,556 | 65,055,526 | 28,521,896 | |||||
| Net Asset Value Per Share ($) | 17.13 | 20.61 | 12.43 | |||||
| Investor Shares | ||||||||
| Net Assets ($) | 9,553,037 | 8,896,161 | 4,350,338 | |||||
| Shares Outstanding | 535,057 | 428,032 | 348,576 | |||||
| Net Asset Value Per Share ($) | 17.85 | 20.78 | 12.48 | |||||
| † | Investments at cost ($): | |||||||
| Unaffiliated issuers | 2,300,037,991 | 1,038,734,698 | 243,104,664 | |||||
| Affiliated issuers | 57,300,000 | 28,138,360 | 87,937,963 | |||||
| †† | Value of securities on loan ($) | — | 1,629,504 | 13,298,505 | ||||
| ††† | Cash denominated in foreign currencies (cost) ($) | 35,889,197 | 17,891,421 | — | ||||
The Funds 47
| STATEMENTS OF OPERATIONS |
| Six Months Ended February 28, 2007 (Unaudited) |
| Mellon | Mellon | Mellon | Mellon | |||||
| Large Cap | Income | Mid Cap | Small Cap | |||||
| Stock Fund | Stock Fund | Stock Fund | Stock Fund | |||||
| Investment Income ($): | ||||||||
| Income: | ||||||||
| Cash dividends (net of $41,355, $12,918 and $3,288 | ||||||||
| foreign taxes withheld at source for the Mellon Large | ||||||||
| Cap Stock Fund, the Mellon Mid Cap Stock Fund | ||||||||
| and the Mellon Small Cap Stock Fund, respectively): | ||||||||
| Unaffiliated issuers | 14,678,584 | 6,158,553 | 9,708,137 | 2,382,119 | ||||
| Affiliated issuers | 182,866 | 302,894 | 648,715 | 511,007 | ||||
| Income from securities lending | 20,135 | 9,118 | 51,280 | 336,439 | ||||
| Total Income | 14,881,585 | 6,470,565 | 10,408,132 | 3,229,565 | ||||
| Expenses: | ||||||||
| Investment advisory fee—Note 4(a) | 6,023,276 | 1,421,284 | 6,066,372 | 2,790,095 | ||||
| Administration fee—Note 4(a) | 1,199,533 | 283,065 | 1,047,076 | 424,985 | ||||
| Custodian fees—Note 4(c) | 66,313 | 15,682 | 54,518 | 33,339 | ||||
| Trustees’ fees and expenses—Note 4(d) | 28,626 | 7,241 | 37,196 | 12,176 | ||||
| Interest expense—Note 3 | 27,269 | — | — | 5,066 | ||||
| Shareholder servicing costs—Note 4(c) | 11,778 | 2,102 | 52,618 | 8,517 | ||||
| Registration fees | 11,582 | 13,439 | 23,367 | 13,592 | ||||
| Auditing fees | 8,436 | 15,729 | 12,061 | 13,333 | ||||
| Prospectus and shareholders’ reports | 4,563 | 3,239 | 22,556 | 4,415 | ||||
| Legal fees | 4,119 | 1,211 | 5,536 | 3,089 | ||||
| Distribution fees—Note 4(b) | — | — | 20,543 | — | ||||
| Miscellaneous | 20,812 | 9,066 | 20,984 | 11,698 | ||||
| Total Expenses | 7,406,307 | 1,772,058 | 7,362,827 | 3,320,305 | ||||
| Less—reduction in custody fees due to | ||||||||
| earnings credits—Note 2(b) | — | (489) | (2,580) | — | ||||
| Net Expenses | 7,406,307 | 1,771,569 | 7,360,247 | 3,320,305 | ||||
| Investment Income (Loss)—Net | 7,475,278 | 4,698,996 | 3,047,885 | (90,740) | ||||
| Realized and Unrealized Gain (Loss) | ||||||||
| on Investments—Note 5 ($): | ||||||||
| Net realized gain (loss) on investments | 215,862,011 | 42,303,864 | 140,847,025 | 77,993,696 | ||||
| Net unrealized appreciation | ||||||||
| (depreciation) on investments | (84,402,974) | (15,561,083) | 31,137,794 | (22,410,264) | ||||
| Net Realized and Unrealized Gain | ||||||||
| (Loss) on Investments | 131,459,037 | 26,742,781 | 171,984,819 | 55,583,432 | ||||
| Net Increase in Net Assets | ||||||||
| Resulting from Operations | 138,934,315 | 31,441,777 | 175,032,704 | 55,492,692 | ||||
See notes to financial statements.
| 48 |
| Mellon | Mellon | Mellon | ||||
| International | Emerging | Balanced | ||||
| Fund | Markets Fund | Fund | ||||
| Investment Income ($): | ||||||
| Income: | ||||||
| Cash dividends (net of $921,160, $1,247,000 and $3,148 | ||||||
| foreign taxes withheld at source, respectively): | ||||||
| Unaffiliated issuers | 17,275,592 | 8,741,740 | 1,861,237 | |||
| Affiliated issuers | 1,134,033 | 720,317 | 89,089 | |||
| Interest | 313,434 | 17,467 | 3,490,170 | |||
| Income from securities lending | — | 593 | 5,684 | |||
| Total Income | 18,723,059 | 9,480,117 | 5,446,180 | |||
| Expenses: | ||||||
| Investment advisory fee—Note 4(a) | 11,163,951 | 7,851,884 | 780,437 | |||
| Administration fee—Note 4(a) | 1,700,137 | 883,886 | 176,141 | |||
| Custodian fees—Note 4(c) | 1,177,053 | 1,414,134 | 17,946 | |||
| Trustees’ fees and expenses—Note 4(d) | 42,654 | 30,599 | 6,634 | |||
| Registration fees | 25,457 | 16,649 | 13,412 | |||
| Auditing fees | 16,869 | 16,761 | 16,440 | |||
| Shareholder servicing costs—Note 4(c) | 12,445 | 13,694 | 4,093 | |||
| Legal fees | 8,154 | 4,152 | 2,705 | |||
| Prospectus and shareholders’ reports | 4,844 | 3,927 | 2,743 | |||
| Miscellaneous | 43,395 | 28,148 | 12,546 | |||
| Total Expenses | 14,194,959 | 10,263,834 | 1,033,097 | |||
| Less—reduction in custody fees due to | ||||||
| earnings credits—Note 2(b) | (40,213) | (27,578) | (1,566) | |||
| Net Expenses | 14,154,746 | 10,236,256 | 1,031,531 | |||
| Investment Income (Loss)—Net | 4,568,313 | (756,139) | 4,414,649 | |||
| Realized and Unrealized Gain (Loss) on Investments—Note 5 ($): | ||||||
| Net realized gain (loss) on investments | — | — | 28,521,425 | |||
| Net realized gain (loss) on investments and foreign currency transactions | 213,125,056 | 162,440,332 | — | |||
| Net realized gain (loss) on foreign currency exchange contracts | 1,160,837 | (91,639) | — | |||
| Net Realized Gain (Loss) | 214,285,893 | 162,348,693 | 28,521,425 | |||
| Net unrealized appreciation (depreciation) on investments | — | — | (9,168,521) | |||
| Net unrealized appreciation (depreciation) on investments | ||||||
| and foreign currency transactions | 37,573,350 | 29,888,330 | — | |||
| Net Realized and Unrealized Gain (Loss) on Investments | 251,859,243 | 192,237,023 | 19,352,904 | |||
| Net Increase in Net Assets Resulting from Operations | 256,427,556 | 191,480,884 | 23,767,553 | |||
See notes to financial statements.
The Funds 49
STATEMENTS OF CHANGES IN NET ASSETS
| Mellon Large Cap Stock Fund | Mellon Income Stock Fund | |||||||
| Six Months Ended | Six Months Ended | |||||||
| February 28, 2007 | Year Ended | February 28, 2007 | Year Ended | |||||
| (Unaudited) | August 31, 2006 | (Unaudited) | August 31, 2006 | |||||
| Operations ($): | ||||||||
| Investment income—net | 7,475,278 | 17,183,072 | 4,698,996 | 8,751,797 | ||||
| Net realized gain (loss) on investments | 215,862,011 | 84,329,469 | 42,303,864 | 34,438,855 | ||||
| Net unrealized appreciation (depreciation) on investments | (84,402,974) | 5,117,502 | (15,561,083) | (4,004,283) | ||||
| Net Increase (Decrease) in Net Assets | ||||||||
| Resulting from Operations | 138,934,315 | 106,630,043 | 31,441,777 | 39,186,369 | ||||
| Dividends to Shareholders from ($): | ||||||||
| Investment income—net: | ||||||||
| Class M Shares | (7,319,705) | (17,152,472) | (4,199,053) | (8,749,583) | ||||
| Investor Shares | (24,225) | (42,030) | (13,578) | (24,022) | ||||
| Net realized gain on investments: | ||||||||
| Class M Shares | (42,915,907) | — | (35,419,719) | (9,670,958) | ||||
| Investor Shares | (216,079) | — | (127,542) | (28,099) | ||||
| Total Dividends | (50,475,916) | (17,194,502) | (39,759,892) | (18,472,662) | ||||
| Beneficial Interest Transactions ($): | ||||||||
| Net proceeds from shares sold: | ||||||||
| Class M Shares | 112,622,839 | 227,413,998 | 55,156,580 | 78,557,547 | ||||
| Investor Shares | 3,117,773 | 4,226,744 | 154,701 | 656,596 | ||||
| Dividends reinvested: | ||||||||
| Class M Shares | 32,876,856 | 1,206,136 | 23,487,749 | 7,494,364 | ||||
| Investor Shares | 216,795 | 32,810 | 125,155 | 45,116 | ||||
| Cost of shares redeemed: | ||||||||
| Class M Shares | (114,684,366) | (285,249,914) | (61,854,641) | (80,409,607) | ||||
| Investor Shares | (1,208,458) | (847,400) | (75,706) | (393,552) | ||||
| Increase (Decrease) in Net Assets from | ||||||||
| Beneficial Interest Transactions | 32,941,439 | (53,217,626) | 16,993,838 | 5,950,464 | ||||
| Total Increase (Decrease) in Net Assets | 121,399,838 | 36,217,915 | 8,675,723 | 26,664,171 | ||||
| Net Assets ($): | ||||||||
| Beginning of Period | 1,773,734,237 | 1,737,516,322 | 422,734,066 | 396,069,895 | ||||
| End of Period | 1,895,134,075 | 1,773,734,237 | 431,409,789 | 422,734,066 | ||||
| Undistributed investment income—net | 515,622 | 384,274 | 522,122 | 35,757 | ||||
| Capital Share Transactions (Shares): | ||||||||
| Class M Shares | ||||||||
| Shares sold | 10,364,309 | 22,366,604 | 5,186,721 | 7,761,439 | ||||
| Shares issued for dividends reinvested | 3,010,852 | 118,321 | 2,272,051 | 748,557 | ||||
| Shares redeemed | (10,555,759) | (28,107,503) | (5,892,876) | (7,940,178) | ||||
| Net Increase (Decrease) in Shares Outstanding | 2,819,402 | (5,622,578) | 1,565,896 | 569,818 | ||||
| Investor Shares | ||||||||
| Shares sold | 284,843 | 413,292 | 14,572 | 65,043 | ||||
| Shares issued for dividends reinvested | 19,831 | 3,219 | 12,006 | 4,454 | ||||
| Shares redeemed | (110,243) | (83,751) | (7,254) | (39,039) | ||||
| Net Increase (Decrease) in Shares Outstanding | 194,431 | 332,760 | 19,324 | 30,458 | ||||
See notes to financial statements.
| 50 |
| Mellon Mid Cap Stock Fund | Mellon Small Cap Stock Fund | |||||||
| Six Months Ended | Six Months Ended | |||||||
| February 28, 2007 | Year Ended | February 28, 2007 | Year Ended | |||||
| (Unaudited) | August 31, 2006 | (Unaudited) | August 31, 2006 | |||||
| Operations ($): | ||||||||
| Investment income (loss)—net | 3,047,885 | 8,084,607 | (90,740) | (591,158) | ||||
| Net realized gain (loss) on investments | 140,847,025 | 228,981,377 | 77,993,696 | 71,023,155 | ||||
| Net unrealized appreciation (depreciation) on investments | 31,137,794 | (100,460,056) | (22,410,264) | (33,113,943) | ||||
| Net Increase (Decrease) in Net Assets | ||||||||
| Resulting from Operations | 175,032,704 | 136,605,928 | 55,492,692 | 37,318,054 | ||||
| Dividends to Shareholders from ($): | ||||||||
| Investment income—net: | ||||||||
| Class M Shares | (7,932,371) | (585,388) | — | — | ||||
| Investor Shares | (86,011) | — | — | — | ||||
| Net realized gain on investments: | ||||||||
| Class M Shares | (234,597,218) | (183,047,381) | (95,370,568) | (112,398,890) | ||||
| Investor Shares | (4,769,554) | (3,294,507) | (978,502) | (769,072) | ||||
| Dreyfus Premier Shares | (828,723) | (913,807) | — | — | ||||
| Total Dividends | (248,213,877) | (187,841,083) | (96,349,070) | (113,167,962) | ||||
| Beneficial Interest Transactions ($): | ||||||||
| Net proceeds from shares sold: | ||||||||
| Class M Shares | 162,578,792 | 322,007,128 | 74,931,508 | 101,252,534 | ||||
| Investor Shares | 3,174,559 | 8,472,498 | 710,515 | 2,946,956 | ||||
| Dreyfus Premier Shares | 18,519 | 147,986 | — | — | ||||
| Dividends reinvested: | ||||||||
| Class M Shares | 150,145,574 | 107,706,446 | 61,106,520 | 67,324,425 | ||||
| Investor Shares | 4,570,406 | 2,983,174 | 810,943 | 596,667 | ||||
| Dreyfus Premier Shares | 715,679 | 777,852 | — | — | ||||
| Cost of shares redeemed: | ||||||||
| Class M Shares | (162,888,705) | (278,084,760) | (119,880,709) | (223,780,728) | ||||
| Investor Shares | (6,218,972) | (6,511,212) | (2,294,415) | (1,129,701) | ||||
| Dreyfus Premier Shares | (1,555,248) | (2,595,296) | — | — | ||||
| Increase (Decrease) in Net Assets from | ||||||||
| Beneficial Interest Transactions | 150,540,604 | 154,903,816 | 15,384,362 | (52,789,847) | ||||
| Total Increase (Decrease) in Net Assets | 77,359,431 | 103,668,661 | (25,472,016) | (128,639,755) | ||||
| Net Assets ($): | ||||||||
| Beginning of Period | 1,597,177,774 | 1,493,509,113 | 673,859,648 | 802,499,403 | ||||
| End of Period | 1,674,537,205 | 1,597,177,774 | 648,387,632 | 673,859,648 | ||||
| Undistributed investment income (loss)—net | 2,597,402 | 7,567,899 | (38,748) | 51,992 | ||||
The Funds 51
STATEMENTS OF CHANGES IN NET ASSETS (continued)
| Mellon Mid Cap Stock Fund | Mellon Small Cap Stock Fund | |||||||
| Six Months Ended | Six Months Ended | |||||||
| February 28, 2007 | Year Ended | February 28, 2007 | Year Ended | |||||
| (Unaudited) | August 31, 2006 | (Unaudited) | August 31, 2006 | |||||
| Capital Share Transactions: | ||||||||
| Class M Shares | ||||||||
| Shares sold | 12,025,421 | 22,066,592 | 5,188,582 | 6,380,370 | ||||
| Shares issued for dividends reinvested | 11,348,872 | 7,821,451 | 4,297,223 | 4,506,320 | ||||
| Shares redeemed | (11,483,571) | (19,058,661) | (7,832,115) | (13,970,075) | ||||
| Net Increase (Decrease) in Shares Outstanding | 11,890,722 | 10,829,382 | 1,653,690 | (3,083,385) | ||||
| Investor Shares a | ||||||||
| Shares sold | 223,567 | 591,786 | 46,850 | 192,832 | ||||
| Shares issued for dividends reinvested | 347,891 | 217,911 | 57,630 | 40,562 | ||||
| Shares redeemed | (455,115) | (454,932) | (157,194) | (72,487) | ||||
| Net Increase (Decrease) in Shares Outstanding | 116,343 | 354,765 | (52,714) | 160,907 | ||||
| Dreyfus Premier Shares a | ||||||||
| Shares sold | 1,430 | 10,363 | — | — | ||||
| Shares issued for dividends reinvested | 56,352 | 58,271 | — | — | ||||
| Shares redeemed | (114,417) | (181,194) | — | — | ||||
| Net Increase (Decrease) in Shares Outstanding | (56,635) | (112,560) | — | — | ||||
a During the period ended February 28, 2007, 65,843 Dreyfus Premier shares of Mellon Mid Cap Stock Fund representing $901,832 were automatically converted to 63,768 Investor shares and during the period ended August 31, 2006, 108,175 Dreyfus Premier shares of Mellon Mid Cap Stock Fund representing $1,561,197 were automatically converted to 105,560 Investor shares.
See notes to financial statements.
| 52 |
| Mellon International Fund | Mellon Emerging Markets Fund | |||||||
| Six Months Ended | Six Months Ended | |||||||
| February 28, 2007 | Year Ended | February 28, 2007 | Year Ended | |||||
| (Unaudited) | August 31, 2006 | (Unaudited) | August 31, 2006 | |||||
| Operations ($): | ||||||||
| Investment income (loss)—net | 4,568,313 | 36,507,576 | (756,139) | 17,026,075 | ||||
| Net realized gain (loss) on investments | 214,285,893 | 306,648,753 | 162,348,693 | 376,972,112 | ||||
| Net unrealized appreciation (depreciation) on investments | 37,573,350 | 72,503,118 | 29,888,330 | (68,009,693) | ||||
| Net Increase (Decrease) in Net Assets | ||||||||
| Resulting from Operations | 256,427,556 | 415,659,447 | 191,480,884 | 325,988,494 | ||||
| Dividends to Shareholders from ($): | ||||||||
| Investment income—net: | ||||||||
| Class M Shares | (42,865,752) | (27,155,610) | (11,143,002) | (25,892,407) | ||||
| Investor Shares | (135,397) | (45,673) | (55,920) | (106,816) | ||||
| Net realized gain on investments: | ||||||||
| Class M Shares | (297,965,798) | (176,523,230) | (373,891,351) | (174,327,322) | ||||
| Investor Shares | (1,072,533) | (348,562) | (2,695,847) | (817,032) | ||||
| Total Dividends | (342,039,480) | (204,073,075) | (387,786,120) | (201,143,577) | ||||
| Beneficial Interest Transactions ($): | ||||||||
| Net proceeds from shares sold: | ||||||||
| Class M Shares | 275,654,340 | 582,805,627 | 140,967,746 | 199,962,686 | ||||
| Investor Shares | 2,690,212 | 6,503,433 | 2,621,389 | 10,192,455 | ||||
| Dividends reinvested: | ||||||||
| Class M Shares | 194,224,145 | 109,449,364 | 241,635,492 | 109,209,202 | ||||
| Investor Shares | 915,648 | 206,346 | 2,299,129 | 440,610 | ||||
| Cost of shares redeemed: | ||||||||
| Class M Shares | (182,896,901) | (225,815,006) | (158,752,508) | (459,201,910) | ||||
| Investor Shares | (3,020,135) | (1,591,384) | (6,418,282) | (3,990,490) | ||||
| Increase (Decrease) in Net Assets from | ||||||||
| Beneficial Interest Transactions | 287,567,309 | 471,558,380 | 222,352,966 | (143,387,447) | ||||
| Total Increase (Decrease) in Net Assets | 201,955,385 | 683,144,752 | 26,047,730 | (18,542,530) | ||||
| Net Assets ($): | ||||||||
| Beginning of Period | 2,544,009,118 | 1,860,864,366 | 1,323,815,608 | 1,342,358,138 | ||||
| End of Period | 2,745,964,503 | 2,544,009,118 | 1,349,863,338 | 1,323,815,608 | ||||
| Undistributed investment income (loss)—net | 619,893 | 39,052,729 | (1,548,305) | 10,406,756 | ||||
| Capital Share Transactions (Shares): | ||||||||
| Class M Shares | ||||||||
| Shares sold | 15,875,627 | 34,440,251 | 6,385,665 | 8,262,933 | ||||
| Shares issued for dividends reinvested | 11,512,990 | 6,993,570 | 11,695,813 | 4,884,132 | ||||
| Shares redeemed | (10,285,220) | (13,428,309) | (6,514,646) | (18,620,208) | ||||
| Net Increase (Decrease) in Shares Outstanding | 17,103,397 | 28,005,512 | 11,566,832 | (5,473,143) | ||||
| Investor Shares | ||||||||
| Shares sold | 143,350 | 373,162 | 107,150 | 422,462 | ||||
| Shares issued for dividends reinvested | 52,025 | 12,698 | 110,323 | 19,583 | ||||
| Shares redeemed | (163,024) | (90,283) | (266,614) | (164,864) | ||||
| Net Increase (Decrease) in Shares Outstanding | 32,351 | 295,577 | (49,141) | 277,181 | ||||
See notes to financial statements.
The Funds 53
STATEMENTS OF CHANGES IN NET ASSETS (continued)
| Mellon Balanced Fund | ||||
| Six Months Ended | ||||
| February 28, 2007 | Year Ended | |||
| (Unaudited) | August 31, 2006 | |||
| Operations ($): | ||||
| Investment income—net | 4,414,649 | 7,418,245 | ||
| Net realized gain (loss) on investments | 28,521,425 | 37,961,981 | ||
| Net unrealized appreciation (depreciation) on investments | (9,168,521) | (20,507,005) | ||
| Net Increase (Decrease) in Net Assets | ||||
| Resulting from Operations | 23,767,553 | 24,873,221 | ||
| Dividends to Shareholders from ($): | ||||
| Investment income—net: | ||||
| Class M Shares | (4,939,990) | (7,961,970) | ||
| Investor Shares | (50,928) | (58,159) | ||
| Net realized gain on investments: | ||||
| Class M Shares | (37,309,689) | (6,270,562) | ||
| Investor Shares | (410,941) | (45,032) | ||
| Total Dividends | (42,711,548) | (14,335,723) | ||
| Beneficial Interest Transactions ($): | ||||
| Net proceeds from shares sold: | ||||
| Class M Shares | 11,727,378 | 21,172,287 | ||
| Investor Shares | 1,942,712 | 2,513,568 | ||
| Dividends reinvested: | ||||
| Class M Shares | 32,208,994 | 5,584,354 | ||
| Investor Shares | 415,584 | 92,706 | ||
| Cost of shares redeemed: | ||||
| Class M Shares | (12,657,109) | (46,635,878) | ||
| Investor Shares | (1,525,382) | (801,560) | ||
| Increase (Decrease) in Net Assets from | ||||
| Beneficial Interest Transactions | 32,112,177 | (18,074,523) | ||
| Total Increase (Decrease) in Net Assets | 13,168,182 | (7,537,025) | ||
| Net Assets ($): | ||||
| Beginning of Period | 345,836,627 | 353,373,652 | ||
| End of Period | 359,004,809 | 345,836,627 | ||
| Undistributed (distributions in excess of) investment income—net | (145) | 576,124 | ||
| Capital Share Transactions (Shares): | ||||
| Class M Shares | ||||
| Shares sold | 910,927 | 1,624,227 | ||
| Shares issued for dividends reinvested | 2,597,010 | 432,096 | ||
| Shares redeemed | (963,358) | (3,573,242) | ||
| Net Increase (Decrease) in Shares Outstanding | 2,544,579 | (1,516,919) | ||
| Investor Shares | ||||
| Shares sold | 147,684 | 193,250 | ||
| Shares issued for dividends reinvested | 33,280 | 7,117 | ||
| Shares redeemed | (114,450) | (62,403) | ||
| Net Increase (Decrease) in Shares Outstanding | 66,514 | 137,964 | ||
See notes to financial statements.
| 54 |
FINANCIAL HIGHLIGHTS
The following tables describe the performance for each share class of each Mellon equity fund for the fiscal periods indicated. All information (except portfolio turnover rate) reflects financial results for a single fund share.Total return shows how much your investment in each fund would have increased (or decreased) during the period, assuming you had reinvested all dividends and distributions.These figures have been derived from each fund’s financial statements.
| Class M Shares | ||||||||||||
| Six Months Ended | ||||||||||||
| February 28, 2007 | Year Ended August 31, | |||||||||||
| Mellon Large Cap Stock Fund | (Unaudited) | 2006 | 2005 | 2004 | 2003 a | 2002 | ||||||
| Per Share Data ($): | ||||||||||||
| Net asset value, beginning of period | 10.31 | 9.79 | 8.74 | 8.16 | 7.77 | 9.52 | ||||||
| Investment Operations: | ||||||||||||
| Investment income—net b | .04 | .10 | .11 | .07 | .06 | .05 | ||||||
| Net realized and unrealized | ||||||||||||
| gain (loss) on investments | .76 | .52 | 1.05 | .58 | .39 | (1.59) | ||||||
| Total from Investment Operations | .80 | .62 | 1.16 | .65 | .45 | (1.54) | ||||||
| Distributions: | ||||||||||||
| Dividends from investment income—net | (.04) | (.10) | (.11) | (.07) | (.06) | (.05) | ||||||
| Dividends from net realized gain on investments | (.25) | — | — | — | — | (.16) | ||||||
| Total Distributions | (.29) | (.10) | (.11) | (.07) | (.06) | (.21) | ||||||
| Net asset value, end of period | 10.82 | 10.31 | 9.79 | 8.74 | 8.16 | 7.77 | ||||||
| Total Return (%) | 7.81c | 6.32 | 13.27 | 7.95 | 5.76 | (16.47) | ||||||
| Ratios/Supplemental Data (%): | ||||||||||||
| Ratio of total expenses to average net assets | .40c | .80 | .80 | .81 | .81 | .81 | ||||||
| Ratio of net expenses to average net assets | .40c | .80 | .80 | .81 | .81 | .81 | ||||||
| Ratio of net investment income | ||||||||||||
| to average net assets | .40c | .96 | 1.13 | .77 | .83 | .56 | ||||||
| Portfolio Turnover Rate | 60.14c | 19.08 | 23.49 | 43.52 | 56.96 | 44.26 | ||||||
| Net Assets, end of period ($ x 1,000) | 1,885,013 | 1,766,105 | 1,733,531 | 1,545,002 | 1,479,855 | 1,389,045 | ||||||
| a Effective December 16, 2002, MPAM shares were redesignated as Class M shares. |
| b Based on average shares outstanding at each month end. |
| c Not annualized. |
| See notes to financial statements. |
The Funds 55
FINANCIAL HIGHLIGHTS (continued)
| Investor Shares | ||||||||||||
| Six Months Ended | ||||||||||||
| February 28, 2007 | Year Ended August 31, | |||||||||||
| Mellon Large Cap Stock Fund | (Unaudited) | 2006 | 2005 | 2004 | 2003 | 2002 | ||||||
| Per Share Data ($): | ||||||||||||
| Net asset value, beginning of period | 10.33 | 9.82 | 8.76 | 8.16 | 7.77 | 9.52 | ||||||
| Investment Operations: | ||||||||||||
| Investment income—net a | .03 | .07 | .08 | .06 | .04 | .03 | ||||||
| Net realized and unrealized | ||||||||||||
| gain (loss) on investments | .77 | .51 | 1.06 | .58 | .39 | (1.59) | ||||||
| Total from Investment Operations | .80 | .58 | 1.14 | .64 | .43 | (1.56) | ||||||
| Distributions: | ||||||||||||
| Dividends from investment income—net | (.03) | (.07) | (.08) | (.04) | (.04) | (.03) | ||||||
| Dividends from net realized gain on investments | (.25) | — | — | — | — | (.16) | ||||||
| Total Distributions | (.28) | (.07) | (.08) | (.04) | (.04) | (.19) | ||||||
| Net asset value, end of period | 10.85 | 10.33 | 9.82 | 8.76 | 8.16 | 7.77 | ||||||
| Total Return (%) | 7.66b | 5.95 | 13.08 | 7.88 | 5.50 | (16.65) | ||||||
| Ratios/Supplemental Data (%): | ||||||||||||
| Ratio of total expenses to average net assets | .52b | 1.06 | 1.05 | 1.06 | 1.07 | 1.07 | ||||||
| Ratio of net expenses to average net assets | .52b | 1.06 | 1.05 | 1.06 | 1.07 | 1.07 | ||||||
| Ratio of net investment income | ||||||||||||
| to average net assets | .28b | .72 | .87 | .59 | .56 | .31 | ||||||
| Portfolio Turnover Rate | 60.14b | 19.08 | 23.49 | 43.52 | 56.96 | 44.26 | ||||||
| Net Assets, end of period ($ x 1,000) | 10,121 | 7,629 | 3,985 | 3,356 | 2,121 | 803 | ||||||
| a Based on average shares outstanding at each month end. | ||||||||||||
| b Not annualized. | ||||||||||||
| See notes to financial statements. | ||||||||||||
| 56 |
| Class M Shares | ||||||||||||
| Six Months Ended | ||||||||||||
| February 28, 2007 | Year Ended August 31, | |||||||||||
| Mellon Income Stock Fund | (Unaudited) | 2006 | 2005 | 2004 | 2003 a | 2002 | ||||||
| Per Share Data ($): | ||||||||||||
| Net asset value, beginning of period | 10.43 | 9.92 | 9.50 | 8.56 | 8.24 | 10.39 | ||||||
| Investment Operations: | ||||||||||||
| Investment income—net b | .11 | .22 | .21 | .16 | .12 | .11 | ||||||
| Net realized and unrealized | ||||||||||||
| gain (loss) on investments | .66 | .75 | 1.27 | 1.09 | .37 | (1.56) | ||||||
| Total from Investment Operations | .77 | .97 | 1.48 | 1.25 | .49 | (1.45) | ||||||
| Distributions: | ||||||||||||
| Dividends from investment income—net | (.10) | (.22) | (.20) | (.17) | (.12) | (.11) | ||||||
| Dividends from net realized gain on investments | (.86) | (.24) | (.86) | (.14) | (.05) | (.59) | ||||||
| Total Distributions | (.96) | (.46) | (1.06) | (.31) | (.17) | (.70) | ||||||
| Net asset value, end of period | 10.24 | 10.43 | 9.92 | 9.50 | 8.56 | 8.24 | ||||||
| Total Return (%) | 7.33c | 10.00 | 16.23 | 14.68 | 6.19 | (14.94) | ||||||
| Ratios/Supplemental Data (%): | ||||||||||||
| Ratio of total expenses to average net assets | .40c | .81 | .82 | .83 | .83 | .82 | ||||||
| Ratio of net expenses to average net assets | .40c | .81 | .82 | .83 | .83 | .82 | ||||||
| Ratio of net investment income | ||||||||||||
| to average net assets | 1.07c | 2.14 | 2.12 | 1.75 | 1.48 | 1.19 | ||||||
| Portfolio Turnover Rate | 44.48c | 40.75 | 34.61 | 52.47 | 12.82 | 30.35 | ||||||
| Net Assets, end of period ($ x 1,000) | 429,768 | 421,266 | 394,977 | 274,881 | 271,085 | 406,875 | ||||||
| a Effective December 16, 2002, MPAM shares were redesignated as Class M shares. | ||||||||||||
| b Based on average shares outstanding at each month end. | ||||||||||||
| c Not annualized. | ||||||||||||
| See notes to financial statements. | ||||||||||||
The Funds 57
FINANCIAL HIGHLIGHTS (continued)
| Investor Shares | ||||||||||||
| Six Months Ended | ||||||||||||
| February 28, 2007 | Year Ended August 31, | |||||||||||
| Mellon Income Stock Fund | (Unaudited) | 2006 | 2005 | 2004 | 2003 | 2002 | ||||||
| Per Share Data ($): | ||||||||||||
| Net asset value, beginning of period | 10.49 | 9.98 | 9.53 | 8.58 | 8.25 | 10.40 | ||||||
| Investment Operations: | ||||||||||||
| Investment income—net a | .10 | .19 | .18 | .14 | .10 | .10 | ||||||
| Net realized and unrealized | ||||||||||||
| gain (loss) on investments | .66 | .75 | 1.29 | 1.08 | .38 | (1.57) | ||||||
| Total from Investment Operations | .76 | .94 | 1.47 | 1.22 | .48 | (1.47) | ||||||
| Distributions: | ||||||||||||
| Dividends from investment income—net | (.09) | (.19) | (.16) | (.13) | (.10) | (.09) | ||||||
| Dividends from net realized gain on investments | (.86) | (.24) | (.86) | (.14) | (.05) | (.59) | ||||||
| Total Distributions | (.95) | (.43) | (1.02) | (.27) | (.15) | (.68) | ||||||
| Net asset value, end of period | 10.30 | 10.49 | 9.98 | 9.53 | 8.58 | 8.25 | ||||||
| Total Return (%) | 7.17b | 9.68 | 16.00 | 14.26 | 6.03 | (15.15) | ||||||
| Ratios/Supplemental Data (%): | ||||||||||||
| Ratio of total expenses to average net assets | .53b | 1.06 | 1.07 | 1.08 | 1.09 | 1.09 | ||||||
| Ratio of net expenses to average net assets | .53b | 1.06 | 1.07 | 1.08 | 1.09 | 1.09 | ||||||
| Ratio of net investment income | ||||||||||||
| to average net assets | .95b | 1.92 | 1.88 | 1.49 | 1.21 | 1.08 | ||||||
| Portfolio Turnover Rate | 44.48b | 40.75 | 34.61 | 52.47 | 12.82 | 30.35 | ||||||
| Net Assets, end of period ($ x 1,000) | 1,641 | 1,468 | 1,092 | 756 | 1,080 | 586 | ||||||
| a Based on average shares outstanding at each month end. | ||||||||||||
| b Not annualized. | ||||||||||||
| See notes to financial statements. | ||||||||||||
| 58 |
| Class M Shares | ||||||||||||
| Six Months Ended | ||||||||||||
| February 28, 2007 | Year Ended August 31, | |||||||||||
| Mellon Mid Cap Stock Fund | (Unaudited) | 2006 | 2005 | 2004 | 2003 a | 2002 | ||||||
| Per Share Data ($): | ||||||||||||
| Net asset value, beginning of period | 14.26 | 14.80 | 12.29 | 11.07 | 9.92 | 11.20 | ||||||
| Investment Operations: | ||||||||||||
| Investment income—net b | .03 | .08 | .04 | .04 | .05 | .04 | ||||||
| Net realized and unrealized | ||||||||||||
| gain (loss) on investments | 1.52 | 1.21 | 3.33 | 1.21 | 1.13 | (1.29) | ||||||
| Total from Investment Operations | 1.55 | 1.29 | 3.37 | 1.25 | 1.18 | (1.25) | ||||||
| Distributions: | ||||||||||||
| Dividends from investment income—net | (.08) | (.01) | (.04) | (.03) | (.03) | (.03) | ||||||
| Dividends from net realized gain on investments | (2.22) | (1.82) | (.82) | — | — | — | ||||||
| Total Distributions | (2.30) | (1.83) | (.86) | (.03) | (.03) | (.03) | ||||||
| Net asset value, end of period | 13.51 | 14.26 | 14.80 | 12.29 | 11.07 | 9.92 | ||||||
| Total Return (%) | 11.16c | 9.14 | 28.41 | 11.33 | 11.94 | (11.21) | ||||||
| Ratios/Supplemental Data (%): | ||||||||||||
| Ratio of total expenses to average net assets | .45c | .91 | .91 | .91 | .92 | .93 | ||||||
| Ratio of net expenses to average net assets | .45c | .91 | .91 | .91 | .92 | .93 | ||||||
| Ratio of net investment income | ||||||||||||
| to average net assets | .19c | .51 | .26 | .34 | .47 | .33 | ||||||
| Portfolio Turnover Rate | 56.29c | 93.33 | 83.57 | 69.03 | 67.97 | 61.20 | ||||||
| Net Assets, end of period ($ x 1,000) | 1,639,070 | 1,560,575 | 1,458,952 | 1,159,657 | 1,073,837 | 839,075 | ||||||
| a Effective December 16, 2002, MPAM shares were redesignated as Class M shares. | ||||||||||||
| b Based on average shares outstanding at each month end. | ||||||||||||
| c Not annualized. | ||||||||||||
| See notes to financial statements. | ||||||||||||
The Funds 59
FINANCIAL HIGHLIGHTS (continued
| Investor Shares | ||||||||||||
| Six Months Ended | ||||||||||||
| February 28, 2007 | Year Ended August 31, | |||||||||||
| Mellon Mid Cap Stock Fund | (Unaudited) | 2006 | 2005 | 2004 | 2003 | 2002 | ||||||
| Per Share Data ($): | ||||||||||||
| Net asset value, beginning of period | 14.16 | 14.73 | 12.24 | 11.03 | 9.90 | 11.19 | ||||||
| Investment Operations: | ||||||||||||
| Investment income (loss)—net a | .01 | .04 | .00b | .01 | .02 | (.00)b | ||||||
| Net realized and unrealized | ||||||||||||
| gain (loss) on investments | 1.50 | 1.21 | 3.32 | 1.21 | 1.13 | (1.28) | ||||||
| Total from Investment Operations | 1.51 | 1.25 | 3.32 | 1.22 | 1.15 | (1.28) | ||||||
| Distributions: | ||||||||||||
| Dividends from investment income—net | (.04) | — | (.01) | (.01) | (.02) | (.01) | ||||||
| Dividends from net realized gain on investments | (2.22) | (1.82) | (.82) | — | — | — | ||||||
| Total Distributions | (2.26) | (1.82) | (.83) | (.01) | (.02) | (.01) | ||||||
| Net asset value, end of period | 13.41 | 14.16 | 14.73 | 12.24 | 11.03 | 9.90 | ||||||
| Total Return (%) | 10.98c | 8.93 | 28.05 | 11.02 | 11.66 | (11.44) | ||||||
| Ratios/Supplemental Data (%): | ||||||||||||
| Ratio of total expenses to average net assets | .57c | 1.15 | 1.15 | 1.16 | 1.20 | 1.25 | ||||||
| Ratio of net expenses to average net assets | .57c | 1.15 | 1.15 | 1.16 | 1.20 | 1.25 | ||||||
| Ratio of net investment income | ||||||||||||
| (loss) to average net assets | .06c | .26 | .02 | .10 | .19 | (.00)d | ||||||
| Portfolio Turnover Rate | 56.29c | 93.33 | 83.57 | 69.03 | 67.97 | 61.20 | ||||||
| Net Assets, end of period ($ x 1,000) | 30,391 | 30,433 | 26,445 | 21,810 | 18,117 | 736 | ||||||
| a Based on average shares outstanding at each month end. | ||||||||||||
| b Amount represents less than $.01 per share. | ||||||||||||
| c Not annualized. | ||||||||||||
| d Amount represents less than .01%. | ||||||||||||
| See notes to financial statements. | ||||||||||||
| 60 |
| Dreyfus Premier Shares | ||||||||||
| Six Months Ended | ||||||||||
| February 28, 2007 | Year Ended August 31, | |||||||||
| Mellon Mid Cap Stock Fund | (Unaudited) | 2006 | 2005 | 2004 | 2003a | |||||
| Per Share Data ($): | ||||||||||
| Net asset value, beginning of period | 13.74 | 14.44 | 12.09 | 10.96 | 9.81 | |||||
| Investment Operations: | ||||||||||
| Investment (loss)—net b | (.04) | (.07) | (.09) | (.08) | (.06) | |||||
| Net realized and unrealized | ||||||||||
| gain (loss) on investments | 1.46 | 1.19 | 3.26 | 1.21 | 1.21 | |||||
| Total from Investment Operations | 1.42 | 1.12 | 3.17 | 1.13 | 1.15 | |||||
| Distributions: | ||||||||||
| Dividends from net realized gain on investments | (2.22) | (1.82) | (.82) | — | — | |||||
| Net asset value, end of period | 12.94 | 13.74 | 14.44 | 12.09 | 10.96 | |||||
| Total Return (%) | 10.62c | 8.13 | 27.11 | 10.31 | 11.72c | |||||
| Ratios/Supplemental Data (%): | ||||||||||
| Ratio of total expenses to average net assets | .94c | 1.90 | 1.88 | 1.91 | 1.95c | |||||
| Ratio of net expenses to average net assets | .94c | 1.90 | 1.88 | 1.91 | 1.95c | |||||
| Ratio of net investment (loss) | ||||||||||
| to average net assets | (.30)c | (.48) | (.71) | (.65) | (.58)c | |||||
| Portfolio Turnover Rate | 56.29c | 93.33 | 83.57 | 69.03 | 67.97 | |||||
| Net Assets, end of period ($ x 1,000) | 5,077 | 6,170 | 8,113 | 9,682 | 14,996 | |||||
| a From the close of business on September 6, 2002 (date the fund began offering Dreyfus Premier shares) to August 31, 2003. | ||||||||||
| b Based on average shares outstanding at each month end. | ||||||||||
| c Not annualized. | ||||||||||
| See notes to financial statements. | ||||||||||
The Funds 61
FINANCIAL HIGHLIGHTS (continued)
| Class M Shares | ||||||||||||
| Six Months Ended | ||||||||||||
| February 28, 2007 | Year Ended August 31, | |||||||||||
| Mellon Small Cap Stock Fund | (Unaudited) | 2006 | 2005 | 2004 | 2003 a | 2002 | ||||||
| Per Share Data ($): | ||||||||||||
| Net asset value, beginning of period | 15.39 | 17.18 | 14.92 | 13.17 | 10.95 | 11.99 | ||||||
| Investment Operations: | ||||||||||||
| Investment (loss)—net b | (.00)c | (.01) | (.01) | (.02) | (.00)c | (.03) | ||||||
| Net realized and unrealized | ||||||||||||
| gain (loss) on investments | 1.30 | .80 | 2.66 | 1.77 | 2.22 | (1.01) | ||||||
| Total from Investment Operations | 1.30 | .79 | 2.65 | 1.75 | 2.22 | (1.04) | ||||||
| Distributions: | ||||||||||||
| Dividends from net realized gain on investments | (2.40) | (2.58) | (.39) | — | — | — | ||||||
| Net asset value, end of period | 14.29 | 15.39 | 17.18 | 14.92 | 13.17 | 10.95 | ||||||
| Total Return (%) | 8.50d | 5.04 | 17.86 | 13.29 | 20.27 | (8.67) | ||||||
| Ratios/Supplemental Data (%): | ||||||||||||
| Ratio of total expenses to average net assets | .50d | 1.01 | 1.01 | 1.02 | 1.04 | 1.07 | ||||||
| Ratio of net expenses to average net assets | .50d | 1.01 | 1.01 | 1.02 | 1.03 | 1.05 | ||||||
| Ratio of net investment (loss) | ||||||||||||
| to average net assets | (.01)d | (.08) | (.07) | (.11) | (.02) | (.27) | ||||||
| Portfolio Turnover Rate | 93.29d | 108.79 | 148.54 | 91.71 | 91.99 | 76.66 | ||||||
| Net Assets, end of period ($ x 1,000) | 643,006 | 667,241 | 797,808 | 747,637 | 558,172 | 350,873 | ||||||
| a Effective December 16, 2002, MPAM shares were redesignated as Class M shares. | ||||||||||||
| b Based on average shares outstanding at each month end. | ||||||||||||
| c Amount represents less than $.01 per share. | ||||||||||||
| d Not annualized. | ||||||||||||
| See notes to financial statements. | ||||||||||||
| 62 |
| Investor Shares | ||||||||||||
| Six Months Ended | ||||||||||||
| February 28, 2007 | Year Ended August 31, | |||||||||||
| Mellon Small Cap Stock Fund | (Unaudited) | 2006 | 2005 | 2004 | 2003 | 2002 | ||||||
| Per Share Data ($): | ||||||||||||
| Net asset value, beginning of period | 15.13 | 16.97 | 14.78 | 13.08 | 10.90 | 11.98 | ||||||
| Investment Operations: | ||||||||||||
| Investment (loss)—net a | (.02) | (.05) | (.05) | (.05) | (.03) | (.06) | ||||||
| Net realized and unrealized | ||||||||||||
| gain (loss) on investments | 1.28 | .79 | 2.63 | 1.75 | 2.21 | (1.02) | ||||||
| Total from Investment Operations | 1.26 | .74 | 2.58 | 1.70 | 2.18 | (1.08) | ||||||
| Distributions: | ||||||||||||
| Dividends from net realized gain on investments | (2.40) | (2.58) | (.39) | — | — | — | ||||||
| Net asset value, end of period | 13.99 | 15.13 | 16.97 | 14.78 | 13.08 | 10.90 | ||||||
| Total Return (%) | 8.38b | 4.78 | 17.55 | 13.00 | 20.00 | (9.02) | ||||||
| Ratios/Supplemental Data (%): | ||||||||||||
| Ratio of total expenses to average net assets | .62b | 1.26 | 1.26 | 1.26 | 1.29 | 1.32 | ||||||
| Ratio of net expenses to average net assets | .62b | 1.26 | 1.26 | 1.26 | 1.28 | 1.30 | ||||||
| Ratio of net investment (loss) | ||||||||||||
| to average net assets | (.13)b | (.35) | (.33) | (.35) | (.27) | (.51) | ||||||
| Portfolio Turnover Rate | 93.29b | 108.79 | 148.54 | 91.71 | 91.99 | 76.66 | ||||||
| Net Assets, end of period ($ x 1,000) | 5,382 | 6,618 | 4,692 | 3,310 | 3,578 | 3,857 | ||||||
| a Based on average shares outstanding at each month end. | ||||||||||||
| b Not annualized. | ||||||||||||
| See notes to financial statements. | ||||||||||||
The Funds 63
FINANCIAL HIGHLIGHTS (continued)
| Class M Shares | ||||||||||||
| Six Months Ended | ||||||||||||
| February 28, 2007 | Year Ended August 31, | |||||||||||
| Mellon International Fund | (Unaudited) | 2006 | 2005 | 2004 | 2003 a | 2002 | ||||||
| Per Share Data ($): | ||||||||||||
| Net asset value, beginning of period | 17.77 | 16.20 | 14.29 | 11.77 | 11.03 | 12.08 | ||||||
| Investment Operations: | ||||||||||||
| Investment income—net b | .03 | .28 | .22 | .20 | .20 | .18 | ||||||
| Net realized and unrealized | ||||||||||||
| gain (loss) on investments | 1.74 | 3.02 | 2.52 | 2.51 | .68 | (1.07) | ||||||
| Total from Investment Operations | 1.77 | 3.30 | 2.74 | 2.71 | .88 | (.89) | ||||||
| Distributions: | ||||||||||||
| Dividends from investment income—net | (.30) | (.23) | (.20) | (.19) | (.14) | (.15) | ||||||
| Dividends from net realized gain on investments | (2.11) | (1.50) | (.63) | — | — | (.01) | ||||||
| Total Distributions | (2.41) | (1.73) | (.83) | (.19) | (.14) | (.16) | ||||||
| Net asset value, end of period | 17.13 | 17.77 | 16.20 | 14.29 | 11.77 | 11.03 | ||||||
| Total Return (%) | 10.16c | 21.86 | 19.51 | 23.15 | 8.19 | (7.39) | ||||||
| Ratios/Supplemental Data (%): | ||||||||||||
| Ratio of total expenses to average net assets | .54c | 1.10 | 1.09 | 1.11 | 1.12 | 1.12 | ||||||
| Ratio of net expenses to average net assets | .53c | 1.10 | 1.09 | 1.10 | 1.05 | 1.05 | ||||||
| Ratio of net investment income | ||||||||||||
| to average net assets | .17c | 1.68 | 1.40 | 1.46 | 1.99 | 1.59 | ||||||
| Portfolio Turnover Rate | 38.01c | 70.02 | 44.92 | 45.60 | 36.52 | 24.63 | ||||||
| Net Assets, end of period ($ x 1,000) | 2,736,411 | 2,534,753 | 1,857,398 | 1,265,004 | 820,568 | 543,566 | ||||||
| a Effective December 16, 2002, MPAM shares were as redesignated as Class M shares. | ||||||||||||
| b Based on average shares outstanding at each month end. | ||||||||||||
| c Not annualized. | ||||||||||||
| See notes to financial statements. | ||||||||||||
| 64 |
| Investor Shares | ||||||||||||
| Six Months Ended | ||||||||||||
| February 28, 2007 | Year Ended August 31, | |||||||||||
| Mellon International Fund | (Unaudited) | 2006 | 2005 | 2004 | 2003 | 2002 | ||||||
| Per Share Data ($): | ||||||||||||
| Net asset value, beginning of period | 18.41 | 16.74 | 14.74 | 12.13 | 11.34 | 12.08 | ||||||
| Investment Operations: | ||||||||||||
| Investment income—net a | .01 | .26 | .24 | .49 | .13 | .24 | ||||||
| Net realized and unrealized | ||||||||||||
| gain (loss) on investments | 1.81 | 3.11 | 2.55 | 2.20 | .78 | (.97) | ||||||
| Total from Investment Operations | 1.82 | 3.37 | 2.79 | 2.69 | .91 | (.73) | ||||||
| Distributions: | ||||||||||||
| Dividends from investment income—net | (.27) | (.20) | (.16) | (.08) | (.12) | — | ||||||
| Dividends from net realized gain on investments | (2.11) | (1.50) | (.63) | — | — | (.01) | ||||||
| Total Distributions | (2.38) | (1.70) | (.79) | (.08) | (.12) | (.01) | ||||||
| Net asset value, end of period | 17.85 | 18.41 | 16.74 | 14.74 | 12.13 | 11.34 | ||||||
| Total Return (%) | 10.02b | 21.49 | 19.24 | 22.28 | 8.24 | (5.95) | ||||||
| Ratios/Supplemental Data (%): | ||||||||||||
| Ratio of total expenses to average net assets | .66b | 1.36 | 1.34 | 1.35 | 1.36 | 1.38 | ||||||
| Ratio of net expenses to average net assets | .66b | 1.36 | 1.34 | 1.35 | 1.30 | 1.30 | ||||||
| Ratio of net investment income | ||||||||||||
| to average net assets | .04b | 1.50 | 1.50 | 2.63 | 1.10 | 2.16 | ||||||
| Portfolio Turnover Rate | 38.01b | 70.02 | 44.92 | 45.60 | 36.52 | 24.63 | ||||||
| Net Assets, end of period ($ x 1,000) | 9,553 | 9,256 | 3,466 | 900 | 308 | 2,588 | ||||||
| a Based on average shares outstanding at each month end. | ||||||||||||
| b Not annualized. | ||||||||||||
| See notes to financial statements. | ||||||||||||
The Funds 65
FINANCIAL HIGHLIGHTS (continued)
| Class M Shares | ||||||||||||
| Six Months Ended | ||||||||||||
| February 28, 2007 | Year Ended August 31, | |||||||||||
| Mellon Emerging Markets Fund | (Unaudited) | 2006 | 2005 | 2004 | 2003 a | 2002 | ||||||
| Per Share Data ($): | ||||||||||||
| Net asset value, beginning of period | 24.53 | 22.69 | 17.98 | 14.92 | 12.33 | 11.86 | ||||||
| Investment Operations: | ||||||||||||
| Investment income (loss)—net b | (.01) | .29 | .32 | .25 | .22 | .24 | ||||||
| Net realized and unrealized | ||||||||||||
| gain (loss) on investments | 3.63 | 4.96 | 6.09 | 3.16 | 2.77 | .75 | ||||||
| Total from Investment Operations | 3.62 | 5.25 | 6.41 | 3.41 | 2.99 | .99 | ||||||
| Distributions: | ||||||||||||
| Dividends from investment income—net | (.22) | (.44) | (.12) | (.12) | (.12) | (.19) | ||||||
| Dividends from net realized gain on investments | (7.32) | (2.97) | (1.58) | (.23) | (.28) | (.33) | ||||||
| Total Distributions | (7.54) | (3.41) | (1.70) | (.35) | (.40) | (.52) | ||||||
| Net asset value, end of period | 20.61 | 24.53 | 22.69 | 17.98 | 14.92 | 12.33 | ||||||
| Total Return (%) | 14.67c | 24.59 | 36.62 | 22.93 | 25.18 | 8.48 | ||||||
| Ratios/Supplemental Data (%): | ||||||||||||
| Ratio of total expenses to average net assets | .74c | 1.52 | 1.51 | 1.51 | 1.61 | 1.68 | ||||||
| Ratio of net expenses to average net assets | .74c | 1.52 | 1.51 | 1.50 | 1.35 | 1.35 | ||||||
| Ratio of net investment income (loss) | ||||||||||||
| to average net assets | (.05)c | 1.18 | 1.52 | 1.39 | 1.77 | 1.86 | ||||||
| Portfolio Turnover Rate | 31.01c | 49.06 | 42.97 | 46.36 | 26.43 | 55.00 | ||||||
| Net Assets, end of period ($ x 1,000) | 1,340,967 | 1,312,055 | 1,337,801 | 1,001,344 | 526,049 | 145,144 | ||||||
| a Effective December 16, 2002, MPAM shares were redesignated as Class M shares. | ||||||||||||
| b Based on average shares outstanding at each month end. | ||||||||||||
| c Not annualized. | ||||||||||||
| See notes to financial statements. | ||||||||||||
| 66 |
| Investor Shares | ||||||||||||
| Six Months Ended | ||||||||||||
| February 28, 2007 | Year Ended August 31, | |||||||||||
| Mellon Emerging Markets Fund | (Unaudited) | 2006 | 2005 | 2004 | 2003 | 2002 | ||||||
| Per Share Data ($): | ||||||||||||
| Net asset value, beginning of period | 24.65 | 22.79 | 18.08 | 15.00 | 12.38 | 11.92 | ||||||
| Investment Operations: | ||||||||||||
| Investment income (loss)—net a | (.04) | .26 | .30 | .17 | .17 | .11 | ||||||
| Net realized and unrealized | ||||||||||||
| gain (loss) on investments | 3.64 | 4.96 | 6.09 | 3.22 | 2.82 | .86 | ||||||
| Total from Investment Operations | 3.60 | 5.22 | 6.39 | 3.39 | 2.99 | .97 | ||||||
| Distributions: | ||||||||||||
| Dividends from investment income—net | (.15) | (.39) | (.10) | (.08) | (.09) | (.18) | ||||||
| Dividends from net realized gain on investments | (7.32) | (2.97) | (1.58) | (.23) | (.28) | (.33) | ||||||
| Total Distributions | (7.47) | (3.36) | (1.68) | (.31) | (.37) | (.51) | ||||||
| Net asset value, end of period | 20.78 | 24.65 | 22.79 | 18.08 | 15.00 | 12.38 | ||||||
| Total Return (%) | 14.52b | 24.29 | 36.26 | 22.68 | 24.99 | 8.26 | ||||||
| Ratios/Supplemental Data (%): | ||||||||||||
| Ratio of total expenses to average net assets | .87b | 1.78 | 1.72 | 1.84 | 1.85 | 1.90 | ||||||
| Ratio of net expenses to average net assets | .87b | 1.78 | 1.72 | 1.83 | 1.60 | 1.60 | ||||||
| Ratio of net investment income (loss) | ||||||||||||
| to average net assets | (.18)b | 1.07 | 1.48 | 1.14 | 1.12 | .88 | ||||||
| Portfolio Turnover Rate | 31.01b | 49.06 | 42.97 | 46.36 | 26.43 | 55.00 | ||||||
| Net Assets, end of period ($ x 1,000) | 8,896 | 11,761 | 4,557 | 3,424 | 313 | 684 | ||||||
| a Based on average shares outstanding at each month end. | ||||||||||||
| b Not annualized. | ||||||||||||
| See notes to financial statements. | ||||||||||||
The Funds 67
FINANCIAL HIGHLIGHTS (continued)
| Class M Shares | ||||||||||||
| Six Months Ended | ||||||||||||
| February 28, 2007 | Year Ended August 31, | |||||||||||
| Mellon Balanced Fund | (Unaudited) | 2006 | 2005 | 2004 | 2003 a | 2002 | ||||||
| Per Share Data ($): | ||||||||||||
| Net asset value, beginning of period | 13.17 | 12.79 | 11.56 | 10.79 | 10.28 | 11.39 | ||||||
| Investment Operations: | ||||||||||||
| Investment income—net b | .16 | .27 | .22 | .20 | .25 | .31 | ||||||
| Net realized and unrealized | ||||||||||||
| gain (loss) on investments | .73 | .64 | 1.25 | .78 | .51 | (.92) | ||||||
| Total from Investment Operations | .89 | .91 | 1.47 | .98 | .76 | (.61) | ||||||
| Distributions: | ||||||||||||
| Dividends from investment income—net | (.19) | (.30) | (.24) | (.21) | (.25) | (.30) | ||||||
| Dividends from net realized gain on investments | (1.44) | (.23) | — | — | — | (.20) | ||||||
| Total Distributions | (1.63) | (.53) | (.24) | (.21) | (.25) | (.50) | ||||||
| Net asset value, end of period | 12.43 | 13.17 | 12.79 | 11.56 | 10.79 | 10.28 | ||||||
| Total Return (%) | 6.83c | 7.22 | 12.78 | 9.13 | 7.68 | (5.70) | ||||||
| Ratios/Supplemental Data (%): | ||||||||||||
| Ratio of total expenses to average net assets | .29c | .60 | .58 | .59 | .62 | .63 | ||||||
| Ratio of net expenses to average net assets | .29c | .60 | .58 | .59 | .62 | .63 | ||||||
| Ratio of net investment income | ||||||||||||
| to average net assets | 1.23c | 2.10 | 1.81 | 1.77 | 2.41 | 2.81 | ||||||
| Portfolio Turnover Rate | 41.48c,d | 64.43d | 62.64d | 61.77d | 83.22 | 90.36 | ||||||
| Net Assets, end of period ($ x 1,000) | 354,654 | 342,110 | 351,525 | 342,326 | 348,402 | 372,089 | ||||||
| a Effective December 16, 2002, MPAM shares were redesignated as Class M shares. |
| b Based on average shares outstanding at each month end. |
| c Not annualized. |
| d The portfolio turnover rates excluding mortgage dollar roll transactions for the periods ended February 28, 2007, August 31, 2006, August 31, 2005 and August 31, 2004, were |
| 38.96%, 61.53%, 45.79% and 55.45%, respectively. |
| See notes to financial statements. |
| 68 |
| Investor Shares | ||||||||||||
| Six Months Ended | ||||||||||||
| February 28, 2007 | Year Ended August 31, | |||||||||||
| Mellon Balanced Fund | (Unaudited) | 2006 | 2005 | 2004 | 2003 | 2002 | ||||||
| Per Share Data ($): | ||||||||||||
| Net asset value, beginning of period | 13.21 | 12.83 | 11.57 | 10.79 | 10.27 | 11.39 | ||||||
| Investment Operations: | ||||||||||||
| Investment income—net a | .15 | .24 | .18 | .17 | .23 | .27 | ||||||
| Net realized and unrealized | ||||||||||||
| gain (loss) on investments | .73 | .63 | 1.26 | .77 | .51 | (.91) | ||||||
| Total from Investment Operations | .88 | .87 | 1.44 | .94 | .74 | (.64) | ||||||
| Distributions: | ||||||||||||
| Dividends from investment income—net | (.17) | (.26) | (.18) | (.16) | (.22) | (.28) | ||||||
| Dividends from net realized gain on investments | (1.44) | (.23) | — | — | — | (.20) | ||||||
| Total Distributions | (1.61) | (.49) | (.18) | (.16) | (.22) | (.48) | ||||||
| Net asset value, end of period | 12.48 | 13.21 | 12.83 | 11.57 | 10.79 | 10.27 | ||||||
| Total Return (%) | 6.76b | 6.93 | 12.55 | 8.76 | 7.52 | (5.91) | ||||||
| Ratios/Supplemental Data (%): | ||||||||||||
| Ratio of total expenses to average net assets | .41b | .85 | .85 | .85 | .87 | .89 | ||||||
| Ratio of net expenses to average net assets | .41b | .85 | .85 | .85 | .87 | .89 | ||||||
| Ratio of net investment income | ||||||||||||
| to average net assets | 1.12b | 1.86 | 1.45 | 1.45 | 2.13 | 2.45 | ||||||
| Portfolio Turnover Rate | 41.48b,c | 64.43c | 62.64c | 61.77c | 83.22 | 90.36 | ||||||
| Net Assets, end of period ($ x 1,000) | 4,350 | 3,727 | 1,848 | 665 | 431 | 165 | ||||||
| a Based on average shares outstanding at each month end. |
| b Not annualized. |
| c The portfolio turnover rates excluding mortgage dollar roll transactions for the periods ended February 28, 2007, August 31, 2006, August 31, 2005 and August 31, 2004, were |
| 38.96%, 61.53%, 45.79% and 55.45%, respectively. |
| See notes to financial statements. |
The Funds 69
NOTES TO FINANCIAL STATEMENTS (Unaudited)
NOTE 1—General:
Mellon Funds Trust (the “Trust”) was organized as a Massachusetts business trust which is registered under the Investment Company Act of 1940, as amended (the “Act”), as an open-end management investment company and operates as a series company currently comprised of sixteen series including the following diversified equity funds and balanced fund: Mellon Large Cap Stock Fund, Mellon Income Stock Fund, Mellon Mid Cap Stock Fund, Mellon Small Cap Stock Fund, Mellon International Fund, Mellon Emerging Markets Fund and Mellon Balanced Fund (each, a “fund” and collectively, the “funds”). Mellon Large Cap Stock Fund, Mellon Mid Cap Stock Fund and Mellon Small Cap Stock Fund seek capital appreciation and Mellon Income Stock Fund seeks total return (consisting of capital appreciation and income). Mellon International Fund and Mellon Emerging Markets Fund seek long-term capital growth. Mellon Balanced Fund seeks long-term growth of principal in conjunction with current income.
Mellon Fund Advisers, a division of The Dreyfus Corporation (the “Manager” or “Dreyfus”), serves as each fund’s investment adviser (“Investment Adviser”). Mellon Bank, N.A. (“Mellon Bank”), which is a wholly-owned subsidiary of Mellon Financial Corporation (“Mellon Financial”), serves as administrator for the funds pursuant to an Administration Agreement with the Trust (the “Administration Agreement”). Mellon Bank has entered into a Sub-Administration Agreement with Dreyfus pursuant to which Mellon Bank pays Dreyfus for performing certain administrative services. Dreyfus is a wholly-owned subsidiary of Mellon Financial. Dreyfus Service Corporation (the “Distributor”), a wholly-owned subsidiary of Dreyfus, is the Distributor of each fund’s shares, which are sold without a sales charge.
On December 4, 2006, Mellon Financial and The Bank of New York Company, Inc. announced that they had entered into a definitive agreement to merge. The new company will be called The Bank of New York Mellon Corporation. As part of this transaction, Dreyfus would become a wholly-owned subsidiary of The Bank of New York Mellon Corporation.The transaction is subject to certain regulatory approvals and the approval of The Bank of New York Company, Inc.’s and Mellon Financial’s shareholders, as well as other customary conditions to closing. Subject to such approvals and the satisfaction of the other conditions, Mellon Financial and The Bank of New York Company, Inc. expect the transaction to be completed in the third quarter of 2007.
The Trust is authorized to issue an unlimited number of shares of beneficial interest, par value $.001 per share, in each of the Class M and Investor class shares of each fund and in the Dreyfus Premier class shares of Mellon Mid Cap Stock Fund. Dreyfus Premier shares of Mellon Mid Cap Stock Fund are subject to a contingent deferred sales charge (“CDSC”) imposed on redemptions of Dreyfus Premier shares made within six years of purchase and automatically convert to Investor class shares after six years. Mellon Mid Cap Stock Fund no longer offers Dreyfus Premier shares, except in connection with dividend reinvestment and permitted exchanges of Dreyfus Premier shares. Each class of shares has similar rights and privileges, except with respect to the expenses borne by and the shareholder services offered to each class, the shareholder services plan applicable to the Investor shares and Dreyfus Premier shares and the Rule 12b-1 plan applicable to the Dreyfus Premier shares and certain voting rights. Income, expenses (other than expenses attributable to a specific class), and realized and unrealized gains or losses on investments are allocated to each class of shares based on its relative net assets.
The Trust accounts separately for the assets, liabilities and operations of each series. Expenses directly attributable to each series are charged to that series’ operations; expenses that are applicable to all series are allocated among them on a pro rata basis.
The funds’ financial statements are prepared in accordance with U.S. generally accepted accounting principles, which may require the use of management estimates and assump-tions.Actual results could differ from those estimates.
| 70 |
NOTE 2—Significant Accounting Policies:
(a) Portfolio valuation: Investments in equity securities are valued at the last sales price on the securities exchange or national securities market on which such securities are primarily traded. Securities listed on the National Market System for which market quotations are available are valued at the official closing price or, if there is no official closing price that day, at the last sales price. Securities not listed on an exchange or the national securities market, or securities for which there were no transactions, are valued at the average of the most recent bid and asked prices, except for open short positions, where the asked price is used for valuation purposes. Bid price is used when no asked price is available. Registered open-end investment companies that are not traded on an exchange are valued at their net asset value. When market quotations or official closing prices are not readily available, or are determined not to reflect accurately fair value, such as when the value of the security has been significantly affected by events after the close of the exchange or market on which the security is principally traded (for example, a foreign exchange or market), but before the funds calculate their net asset values, the funds may value these investments at fair value as determined in accordance with the procedures approved by the Trust’s Board. Fair valuing of securities may be determined with the assistance of a pricing service using calculations based on indices of domestic securities and other appropriate indicators, such as prices of relevant ADR’s and futures contracts. For other securities that are fair valued by the Trust’s Board, certain factors may be considered such as: fundamental analytical data, the nature and duration of restrictions on disposition, an evaluation of the forces that influence the market in which securities are purchased and sold and public trading in similar securities of the issuer or comparable issuers. Investments denominated in foreign currencies are translated to U.S. dollars at the prevailing rates of exchange. Forward currency exchange contracts are valued at the forward rate.
Mellon Balanced Fund
Most debt securities are valued each business day by an independent pricing service (the “Service”) approved by the Trust’s Board. Securities listed on the National Market System for which market quotations are available are valued at the official closing price or, if there is no official closing price that day, at the last sales price. Debt securities for which quoted bid prices are readily available and are representative of the bid side of the market in the judgment of the Service are valued at the mean between the quoted bid prices (as obtained by the Service from dealers in such securities) and asked prices (as calculated by the Service based upon its evaluation of the market for such securities). Other debt securities (which constitute a majority of the portfolio securities) are valued as determined by the Service, based on methods which include consideration of: yields or prices of securities of comparable quality, coupon, maturity and type; indications as to values from dealers; and general market conditions. Restricted securities,as well as securities or other assets for which recent market quotations are not readily available, that are not valued by a pricing service approved by the Trust’s Board, or are determined by the fund not to reflect accurately fair value, are valued at fair value as determined in good faith under the direction of the Trust’s Board.The factors that may be considered when fair valuing a security include fundamental analytical data, the nature and duration of restrictions on disposition,an evaluation of the forces that influence the market in which the securities are purchased and sold and public trading in similar securities of the issuer or comparable issuers.
On September 20, 2006, the Financial Accounting Standards Board (FASB) released Statement of Financial Accounting Standards No. 157 “Fair Value Measurements” (“FAS 157”). FAS 157 establishes an authoritative definition of fair value, sets out a framework for measuring fair value, and requires additional disclosures about fair-value measurements. The application of FAS 157 is required for fiscal years beginning
The Funds 71
NOTES TO FINANCIAL STATEMENTS (Unaudited) (continued)
after November 15, 2007 and interim periods within those fiscal years. Management does not believe that the application of this standard will have a material impact on the financial statements of the funds.
(b) Securities transactions and investment income:
Securities transactions are recorded on a trade date basis. Realized gain and loss from securities transactions are recorded on the identified cost basis. Dividend income is recorded on the ex-dividend date and interest income, including accretion of discount and amortization of premium on investments, is recognized on the accrual basis.
The funds have an arrangement with the custodian banks whereby the funds receive earnings credits from the custodian when positive cash balances are maintained, which are used to offset custody fees. For financial reporting purposes, the funds include net earnings credits as expense offsets in the Statements of Operations.
Pursuant to a securities lending agreement with Mellon Bank, an affiliate of Dreyfus, the funds may lend securities to certain qualified institutions. It is the funds’ policy, that at origination, all loans are secured by collateral of at least 102% of the value of U.S. securities loaned and 105% of the value of foreign securities loaned. Collateral equivalent to at least 100% of the market value of securities on loan is maintained at all times. Cash collateral is invested in certain money market mutual funds managed by Dreyfus.The funds are entitled to receive all income on securities loaned, in addition to income earned as a result of the lending transaction.Although each security loaned is fully collateralized, the funds bear the risk of delay in recovery of, or loss of rights in, the securities loaned should a borrower fail to return the securities in a timely manner.
(c) Affiliated issuers: Investments in other investment companies advised by Dreyfus are defined as “affiliated” in the Act.
(d) Foreign currency transactions: Mellon Emerging Markets Fund and Mellon International Fund do not isolate that portion of the results of operations resulting from
changes in foreign exchange rates on investments from the fluctuations arising from changes in the market prices of securities held. Such fluctuations are included with the net realized and unrealized gain or loss from investments.
Net realized foreign exchange gains or losses arise from sales and maturities of short-term securities, sales of foreign currencies, currency gains or losses realized on securities transactions and the difference between the amounts of dividends, interest, and foreign withholding taxes recorded on the fund’s books and the U.S. dollar equivalent of the amounts actually received or paid. Net unrealized foreign exchange gains and losses arise from changes in the value of assets and liabilities other than investments in securities, resulting from changes in exchange rates. Such gains and losses are included with net realized and unrealized gain or loss on investments.
(e) Foreign currency exchange contracts: Certain funds may enter into forward currency exchange contracts to hedge their exposure to changes in foreign currency exchange rates on their foreign portfolio holdings and to settle foreign currency transactions.When executing forward currency exchange contracts, a fund is obligated to buy or sell a foreign currency at a specified rate on a certain date in the future. With respect to sales of forward currency exchange contracts, a fund would incur a loss if the value of the contract increases between the date the forward contract is opened and the date the forward contract is closed. The fund realizes a gain if the value of the contract decreases between those dates.With respect to purchases of forward currency exchange contracts, a fund would incur a loss if the value of the contract decreases between the date the forward contract is opened and the date the forward contract is closed. A fund realizes a gain if the value of the contract increases between those dates. The fund is also exposed to credit risk associated with counterparty nonperformance on these forward currency exchange contracts, which is typically limited to the unrealized gain on each open con-tract.As of February 28, 2007, there were no open forward currency exchange contracts. Funds may also enter into
| 72 |
foreign exchange contracts at the prevailing spot rate in order to facilitate the settlement of purchases and sales of foreign securities. Table 1 summarizes open foreign exchange contracts for Mellon International Fund and Mellon Emerging Markets Fund at February 28, 2007.
(f) Concentration of risk: Mellon Emerging Markets Fund invests in equity securities traded on the stock markets of emerging market countries, which can be extremely volatile due to political, social and economic factors. Risks include changes in currency exchange
rates, a lack of comprehensive company information, political instability, differing auditing and legal standards, less diverse, less mature economic structures and less liquidity. Mellon Balanced Fund invests in debt securities. Failure of an issuer of the debt securities to make timely interest or principal payments, or a decline or the perception of a decline in the credit quality of a debt security, can cause the debt security’s price to fall, potentially lowering the fund’s share price. In addition, the value of debt securities may decline due to general market con-
| Table 1. | ||||||||
| Mellon International Fund | ||||||||
| Foreign | Unrealized | |||||||
| Currency | Appreciation | |||||||
| Foreign Currency Exchange Contracts | Amounts | Cost ($) | Value ($) | (Depreciation) ($) | ||||
| Purchases: | ||||||||
| British Pound, expiring 3/2/2007 | 2,655,710 | 5,202,270 | 5,215,283 | 13,013 | ||||
| Euro, expiring 3/2/2007 | 89,960 | 119,134 | 119,026 | (108) | ||||
| Japanese Yen, expiring 3/2/2007 | 8,000,000 | 67,573 | 67,610 | 37 | ||||
| Swedish Krona, expiring 3/2/2007 | 16,779,267 | 2,390,433 | 2,396,456 | 6,023 | ||||
| Swiss Franc, expiring 3/2/2007 | 3,409,243 | 2,792,151 | 2,798,361 | 6,210 | ||||
| Sales: | Proceeds ($) | |||||||
| Australian Dollar, expiring 3/1/2007 | 1,117,777 | 884,944 | 880,696 | 4,248 | ||||
| Australian Dollar, expiring 3/2/2007 | 755,583 | 595,248 | 595,324 | (76) | ||||
| British Pound, expiring 3/1/2007 | 60,597 | 119,134 | 119,000 | 134 | ||||
| Euro, expiring 3/1/2007 | 3,440,580 | 4,557,392 | 4,552,231 | 5,161 | ||||
| Euro, expiring 3/2/2007 | 129,719 | 172,239 | 171,631 | 608 | ||||
| Swiss Franc, expiring 3/1/2007 | 608,380 | 497,815 | 499,368 | (1,553) | ||||
| Total | 33,697 | |||||||
| Mellon Emerging Markets Fund | ||||||||
| Foreign | Unrealized | |||||||
| Currency | Appreciation | |||||||
| Foreign Currency Exchange Contracts | Amounts | Cost ($) | Value ($) | (Depreciation) ($) | ||||
| Purchases: | ||||||||
| British Pound, expiring 3/2/2007 | 336,448 | 659,068 | 660,717 | 1,649 | ||||
| Hong Kong Dollar, expiring 3/1/2007 | 1,871,638 | 239,597 | 239,548 | (49) | ||||
| Israeli Shekel, expiring 3/1/2007 | 5,569,443 | 1,324,471 | 1,321,025 | (3,446) | ||||
| Mexican Peso, expiring 3/1/2007 | 2,321,824 | 208,054 | 207,875 | (179) | ||||
| South Korean Won, expiring 3/2/2007 | 383,000,565 | 407,491 | 406,690 | (801) | ||||
| Thai Bhat, expiring 3/1/2007 | 425,799 | 12,015 | 12,233 | 218 | ||||
| Thai Bhat, expiring 3/2/2007 | 162,479 | 4,585 | 4,668 | 83 | ||||
| Sales: | Proceeds ($) | |||||||
| South Korean Won, expiring 3/2/2007 | 10,454,696 | 11,118 | 11,101 | 17 | ||||
| Turkish Lira, expiring 3/2/2007 | 414,556 | 292,766 | 293,387 | (621) | ||||
| Total | (3,129) | |||||||
The Funds 73
NOTES TO FINANCIAL STATEMENTS (Unaudited) (continued)
ditions that are not specifically related to a particular company, such as real or perceived adverse economic conditions, changes in outlook for corporate earnings, changes in interest or currency rates or adverse investor sentiment.They may also decline because of factors that affect a particular industry.
(g) Dividends to shareholders: Dividends payable to shareholders are recorded by the funds on the ex-dividend date. Mellon Large Cap Stock Fund, Mellon Income Stock Fund and Mellon Balanced Fund declare and pay dividends from investment income-net monthly. Mellon Mid Cap Stock Fund, Mellon Small Cap Stock Fund, Mellon International Fund and Mellon Emerging Markets Fund declare and pay dividends from investment income-net annually. With respect to each series, dividends from net realized capital gain, if any, are normally declared and paid annually, but the funds may make distributions on a more frequent basis to comply with the distribution requirements of the Internal Revenue Code of 1986, as amended (the “Code”). To the extent that net realized capital gain can be offset by capital loss carryovers of that fund, if any, it is the policy of the fund not to distribute such gain. Income and capital gain distributions are determined in accordance with income tax regulations, which may differ from U.S. generally accepted accounting principles.
(h) Federal income taxes: It is the policy of each fund to continue to qualify as a regulated investment company, if such qualification is in the best interests of its shareholders, by complying with the applicable provisions of the Code, and to make distributions of taxable income sufficient to relieve it from substantially all federal income and excise taxes. For federal income tax purposes, each series is treated as a single entity for the purpose of determining such qualification.
On July 13, 2006, the FASB released FASB Interpretation No. 48 “Accounting for Uncertainty in Income Taxes” (FIN 48). FIN 48 provides guidance for how uncertain tax positions should be recognized, measured, presented and disclosed in the financial statements. FIN 48 requires the evaluation of tax positions taken or expected to be taken in the course of preparing the funds’ tax returns to determine whether the tax positions are “more-likely-than-not” of being sustained by the applicable tax authority. Tax positions not deemed to meet the more-likely-than-not threshold would be recorded as a tax benefit or expense in the current year. Adoption of FIN 48 is required for fiscal years beginning after December 15, 2006 and is to be applied to all open tax years as of the effective date. Management does not believe that the application of this standard will have a material impact on the financial statements of the funds.
Table 2 summarizes each fund’s tax character of distributions paid to shareholders during the fiscal year ended August 31, 2006. The tax character of current year distributions will be determined at the end of the current fiscal year.
| Table 2. | ||||
| Ordinary | Long-Term | |||
| Income ($) | Capital Gains ($) | |||
| Mellon Large Cap Stock Fund | 17,194,502 | - | ||
| Mellon Income Stock Fund | 8,505,042 | 9,967,620 | ||
| Mellon Mid Cap Stock Fund | 20,235,607 | 167,605,476 | ||
| Mellon Small Cap Stock Fund | 3,248,365 | 109,919,597 | ||
| Mellon International Fund | 68,050,406 | 136,022,669 | ||
| Mellon Emerging Markets Fund | 57,206,290 | 143,937,287 | ||
| Mellon Balanced Fund | 8,020,129 | 6,315,594 | ||
| 74 |
NOTE 3—Bank Line of Credit:
The funds participate with other Dreyfus-managed funds in a $100 million unsecured line of credit primarily to be utilized for temporary or emergency purposes, including the financing of redemptions. Interest is charged to the funds based on prevailing market rates in effect at the time of borrowing. During the period ended February 28, 2007, Mellon Income Stock Fund, Mellon Mid Cap Stock Fund, Mellon International Fund, Mellon Emerging Markets Fund and Mellon Balanced Fund did not borrow under the line of credit.
The average daily amount of borrowings outstanding under the line of credit during the period ended February 28, 2007 for the Mellon Large Cap Stock Fund was approximately $945,300, with a related weighted average annualized interest rate of 5.82%.
The average daily amount of borrowings outstanding under the line of credit during the period ended February 28, 2007 for the Mellon Small Cap Stock Fund was approximately $176,400, with a related weighted average annualized interest rate of 5.79%.
NOTE 4-Investment Advisory Fee, Administration Fee and Other Transactions With Affiliates:
(a) Fees payable by the funds pursuant to the provisions of an Investment Advisory Agreement with the Investment Adviser are payable monthly, computed on the average daily value of each fund’s net assets at the following annual rates: .65% of the Mellon Large Cap Stock Fund, .65% of the Mellon Income Stock Fund, .75% of the Mellon Mid Cap Stock Fund, .85% of the Mellon Small Cap Stock Fund, .85% of the Mellon International Fund, 1.15% of the Mellon Emerging Markets Fund and .65% (equity investments), .40% (debt securities) and .15% (money market investments and other underlying Mellon funds) of the Mellon Balanced Fund.
Pursuant to the Administration Agreement with Mellon Bank, Mellon Bank provides or arranges for fund accounting, transfer agency and other fund administration services and receives a fee based on the total net assets of the Trust based on the following rates:
| 0 up to $6 billion | .15% | |
| $6 billion up to $12 billion | .12% | |
| In excess of $12 billion | .10% |
No administration fee is applied to assets held by the Mellon Balanced Fund, which are invested in cash or money market instruments or shares of certain other series of the Trust.
Mellon Bank has entered into a Sub-Administration Agreement with Dreyfus pursuant to which Mellon Bank pays Dreyfus for performing certain administrative services.
During the period ended February 28, 2007, the Distributor retained $3,150 from CDSC on redemptions of the Mellon Mid Cap Stock Fund’s Dreyfus Premier shares.
(b) Mellon Mid Cap Stock Fund has adopted a Distribution Plan (the “Plan”) pursuant to Rule 12b-1 under the Act for distributing its Dreyfus Premier shares. Mellon Mid Cap Stock Fund pays the Distributor a fee at an annual rate of .75% of the value of the fund’s average daily net assets attributable to its Dreyfus Premier shares. During the period ended February 28, 2007, Mellon Mid Cap Stock Fund’s Dreyfus Premier shares were charged $20,543 pursuant to the Plan.
(c) The funds have adopted a Shareholder Services Plan with respect to their Investor shares and Mellon Mid Cap Stock Fund has adopted a Shareholder Services Plan with respect to its Dreyfus Premier shares. Each fund pays the Distributor for the provision of certain services to holders of Investor shares and Dreyfus Premier shares a fee at an annual rate of .25% of the value of the average daily net assets attributable to Investor shares and Dreyfus Premier shares, respectively. The services provided may include personal services relating to shareholder accounts, such as answering shareholder inquiries regarding a fund, and providing
The Funds 75
NOTES TO FINANCIAL STATEMENTS (Unaudited) (continued)
reports and other information, and services related to the maintenance of such shareholder accounts. The Shareholder Services Plan allows the Distributor to make payments from the shareholder services fees it collects from each fund to compensate service agents (certain banks, securities brokers or dealers and other financial institutions) in respect of these services. Table 3 summarizes the amounts Investor shares and Dreyfus Premier shares were charged during the period ended February 28, 2007, pursuant to the Shareholder Services Plan. Additional fees included in shareholder servicing costs in the Statements of Operations include fees paid to the transfer agent.
| Table 3. | ||
| Mellon Large Cap Stock Fund | $11,271 | |
| Mellon Income Stock Fund | 1,995 | |
| Mellon Mid Cap Stock Fund, | ||
| Investor shares | 38,907 | |
| Mellon Mid Cap Stock Fund, | ||
| Dreyfus Premier shares | 6,847 | |
| Mellon Small Cap Stock Fund | 7,750 | |
| Mellon International Fund | 11,835 | |
| Mellon Emerging Markets Fund | 12,651 | |
| Mellon Balanced Fund | 4,093 |
All funds except Mellon International Fund and Mellon Emerging Markets Fund compensate Mellon Bank, an affiliate of Dreyfus, under a Custody Agreement with
Mellon Bank and Mellon International Fund and Mellon Emerging Markets Fund compensate Mellon Trust of New England, N.A. under a Custody Agreement with Mellon Trust of New England, N.A. for providing custodial services for the relevant funds. Table 4 summarizes the amounts the funds were charged during the period ended February 28, 2007, pursuant to the custody agreements.
| Table 4. | ||
| Mellon Large Cap Stock Fund | $66,313 | |
| Mellon Income Stock Fund | 15,682 | |
| Mellon Mid Cap Stock Fund | 54,518 | |
| Mellon Small Cap Stock Fund | 33,339 | |
| Mellon International Fund | 1,177,053 | |
| Mellon Emerging Markets Fund | 1,414,134 | |
| Mellon Balanced Fund | 17,946 |
During the period ended February 28, 2007, each fund was charged $2,044 for services performed by the Chief Compliance Officer.
Table 5 summarizes the components of Due to the Dreyfus Corporation and affiliates in the Statements of Assets and Liabilities for each fund.
(d) Each trustee who is not an “affiliated person” as defined in the Act receives from the Trust an annual fee of $48,000 and an attendance fee of $5,000 for each in-person meeting attended and $500 for telephone meetings and is reimbursed for travel and out-of-pocket
| Table 5. | ||||||||||
| Investment | Rule 12b-1 | Shareholder | Chief | |||||||
| Advisory | Distribution | Services | Custodian | Compliance | ||||||
| Fees ($) | Plan Fees ($) | Plan Fees ($) | Fees ($) | Officer Fees ($) | ||||||
| Mellon Large Cap Stock Fund | 966,747 | - | 1,958 | 36,408 | 2,726 | |||||
| Mellon Income Stock Fund | 221,606 | - | 324 | 7,791 | 2,726 | |||||
| Mellon Mid Cap Stock Fund | 976,412 | 2,985 | 6,970 | 25,866 | 2,726 | |||||
| Mellon Small Cap Stock Fund | 429,693 | - | 1,052 | 20,171 | 2,726 | |||||
| Mellon International Fund | 1,809,693 | - | 1,924 | 567,684 | 2,726 | |||||
| Mellon Emerging Markets Fund | 1,233,703 | - | 1,924 | 610,396 | 2,726 | |||||
| Mellon Balanced Fund | 122,104 | - | 849 | 8,375 | 2,726 | |||||
| 76 |
expenses.The Chairman of the Trust’s Board receives an additional annual fee of $10,000 and the Chairman of the Trust’s Audit Committee receives an additional annual fee of $8,000.
(e) The Trust and Dreyfus have received an exemptive order from the SEC which, among other things, permits each fund to use cash collateral received in connection with lending the funds’ securities and other uninvested cash to purchase shares of one or more registered money market mutual funds advised by Dreyfus in excess of the limitations imposed by the Act.
NOTE 5—Securities Transactions:
Table 6 summarizes each fund’s aggregate amount of purchases and sales (including paydowns) of investment securities, excluding short-term securities and foreign currency exchange contracts, during the period ended February 28, 2007, of which $8,341,495 in purchases
and $8,885,354 in sales were from mortgage dollar roll transactions in the Mellon Balanced Fund.
A mortgage dollar roll transaction involves a sale by the fund of mortgage related securities that it holds with an agreement by the fund to repurchase similar securities at an agreed upon price and date.The securities purchased will bear the same interest rate as those sold, but generally will be collateralized by pools of mortgages with different prepayment histories than those securities sold.
Table 7 summarizes accumulated net unrealized appreciation on investments for each fund at February 28, 2007.
At February 28, 2007, the cost of investments for each fund for federal income tax purposes was substantially the same as the cost for financial reporting purposes (see the Statements of Investments).
| Table 6. | ||||||
| Purchases ($) | Sales ($) | |||||
| Mellon Large Cap Stock Fund | 1,114,072,512 | 1,129,365,725 | ||||
| Mellon Income Stock Fund | 189,651,464 | 195,647,128 | ||||
| Mellon Mid Cap Stock Fund | 906,672,083 | 1,000,269,336 | ||||
| Mellon Small Cap Stock Fund | 601,612,382 | 698,355,015 | ||||
| Mellon International Fund | 974,562,006 | 1,033,447,340 | ||||
| Mellon Emerging Markets Fund | 424,458,524 | 410,816,322 | ||||
| Mellon Balanced Fund | 154,387,375 | 146,419,065 | ||||
| Table 7. | ||||||
| Gross | Gross | |||||
| Appreciation ($) | Depreciation ($) | Net ($) | ||||
| Mellon Large Cap Stock Fund | 404,322,942 | 5,569,684 | 398,753,258 | |||
| Mellon Income Stock Fund | 88,521,092 | 3,087,113 | 85,433,979 | |||
| Mellon Mid Cap Stock Fund | 302,088,966 | 26,259,715 | 275,829,251 | |||
| Mellon Small Cap Stock Fund | 94,677,202 | 17,609,039 | 77,068,163 | |||
| Mellon International Fund | 393,637,726 | 39,136,516 | 354,501,210 | |||
| Mellon Emerging Markets Fund | 308,208,339 | 33,630,880 | 274,577,459 | |||
| Mellon Balanced Fund | 41,156,365 | 1,288,337 | 39,868,028 | |||
The Funds 77
NOTES

Telephone Private Wealth Management (PWM) Clients, please contact your Account Officer or call 1-888-281-7350. Brokerage Clients of Mellon Private Wealth Advisors (MPWA), please contact your financial representative or call 1-800-830-0549-Option 2. Individual Account holders, please call Dreyfus at 1-800-896-8167.
Mail PWM Clients, write to your Account Officer, c/o Mellon Bank, N.A., One Mellon Bank Center, Pittsburgh, PA 15258
MPWA Brokerage Clients, write to your financial representative, P.O. Box 9012, Hicksville, NY 11802–9012
Individual Account Holders, write to: Mellon Funds, P.O. Box 55268, Boston, MA 02205–8502
The fund files its complete schedule of portfolio holdings with the Securities and Exchange Commission (“SEC”) for the first and third quarters of each fiscal year on Form N-Q. The fund’s Forms N-Q are available on the SEC’s website at http://www.sec.gov and may be reviewed and copied at the SEC’s Public Reference Room in Washington, DC. Information on the operation of the Public Reference Room may be obtained by calling 1-202-551-8090.
A description of the policies and procedures that the fund uses to determine how to vote proxies relating to portfolio securities, and information regarding how the fund voted these proxies for the 12-month period ended June 30, 2006, is available at http://www.dreyfus.com and on the SEC’s website at http://www.sec.gov. The description of the policies and procedures is also available without charge, upon request, by calling 1-800-645-6561.
©2007 Dreyfus Service Corporation
MFTSA0207-EQ
The Mellon Funds
| Mellon Bond Fund |
| Mellon Intermediate Bond Fund |
| Mellon Short-Term U.S. Government Securities Fund |
SEMIANNUAL REPORT February 28, 2007
| Contents | ||
| The Funds | ||
| Letter from the President | 2 | |
| Discussion of Funds’ Performance | ||
| Mellon Bond Fund | 3 | |
| Mellon Intermediate Bond Fund | 5 | |
| Mellon Short-Term U.S. | ||
| Government Securities Fund | 7 | |
| Understanding Your Fund’s Expenses | 9 | |
| Comparing Your Fund’s Expenses | ||
| With Those of Other Funds | 9 | |
| Statements of Investments | 10 | |
| Statements of Assets and Liabilities | 21 | |
| Statements of Operations | 22 | |
| Statements of Changes in Net Assets | 23 | |
| Financial Highlights | 25 | |
| Notes to Financial Statements | 31 | |
For More Information
| Back cover |
The views expressed herein are current to the date of this report. These views and the composition of the funds’ portfolios are subject to change at any time based on market and other conditions.
| • Not FDIC-Insured |
| • Not Bank-Guaranteed |
| • May Lose Value |
The Funds

| LETTER FROM |
| THE PRESIDENT |
Dear Shareholder:
We are pleased to present this semiannual report for the Mellon Funds Trust, covering the six-month period from September 1, 2006, through February 28, 2007.
The reporting period proved to be a time of relatively low volatility in the U.S. bond market, as short-term interest rates stabilized and yields of 10-year Treasury securities remained within a relatively narrow range. Fixed income investors ignored some of the bond markets’ more negative influences, including bouts of economic uncertainty, softening real estate markets, an inverted yield curve and ongoing geopolitical turmoil.
Investors disregarded these near-term concerns in favor of a longer view, looking to broader trends that showed moderately slower economic growth with subdued inflation risk and relatively strong credit fundamentals.
Municipal bonds also fared well despite a bout of weakness in January 2007 as prices generally were propelled higher by stabilized short-term rates, moderating inflationary pressures, and robust demand for tax-exempt securities from non-traditional investors, such as leveraged structured trading accounts and hedge funds.
We believe that investors reacting to near-term market influences with extreme shifts in investment strategy rarely is the best decision. Instead, a better course is to set a portfolio mix designed to meet long-term financial goals while attempting to manage short-term market volatility.As always, we encourage you to talk with your portfolio manager to help ensure that your portfolio remains aligned with your current financial needs and future investment goals.
For information about how each fund performed during the reporting period, as well as market perspectives, we have provided a Discussion of Fund Performance.
Thank you for your continued confidence and support.

| Christopher E. Sheldon |
| President |
| Mellon Funds Trust | ||
| March 15, 2007 |

| DISCUSSION OF FUND PERFORMANCE |
John F. Flahive, Portfolio Manager
How did Mellon Bond Fund perform relative to its benchmark?
For the six-month period ended February 28, 2007, the fund’s Class M shares achieved a total return of 3.70%, and its Investor shares achieved a total return of 3.51% .1 In comparison, the Lehman Brothers U.S. Aggregate Index (the “Index”), the fund’s benchmark, achieved a total return of 3.66% for the same period.2
Fixed-income securities generally rallied during the reporting period as investors responded favorably to stabilizing interest rates, diminishing inflationary pressures and moderating economic growth. The fund produced returns that were in line with the benchmark, primarily due to the success of our duration management strategy.
What is the fund’s investment approach?
The fund seeks total return (consisting of capital appreciation and current income). To pursue its goal, the fund actively manages bond market and maturity exposure and invests at least 80% of its assets in bonds, such as U.S. Treasury and government agency bonds, corporate bonds, mortgage-related securities and foreign corporate and government bonds. The fund’s investments in bonds must be rated investment grade quality at the time of purchase3 or, if unrated, deemed of comparable quality by the investment adviser. Generally, the average effective duration of the fund’s portfolio will not exceed eight years.
What other factors influenced the fund’s performance?
The economic characteristics of the current reporting period stood in stark contrast to those of the six months that preceded it. In the months before the reporting period began, interest rates climbed, inflationary pressures intensified and economic growth remained robust, sparking concerns that an overheated economy might derail the bond market. However, investor sentiment subsequently improved when U.S. economic growth moderated amid cooling housing markets. Inflationary pressures also appeared to diminish, as evidenced by a sharp decline in energy prices. As a result, after 17 increases in short-term interest rates since June 2004, the Federal Reserve Board (the “Fed”) held the overnight federal funds rate steady at 5.25% at each of five meetings between July 2006 and February 2007. Investors reacted favorably to the Fed’s shift in policy, and the bond market generally rallied.
Despite the apparent economic slowdown, business fundamentals remained healthy in most industries, supporting prices of corporate bonds across the credit-rating spectrum. In the U.S. government securities market, low levels of volatility helped mortgage-backed securities, asset-backed securities and other high-quality “yield advantaged” instruments outperform U.S.Treasury securities.
The fund benefited in this environment from its relatively short average duration early in the reporting period,when investors’economic and inflation concerns led to temporary weakness among longer-term bonds. We subsequently shifted to a more neutral duration posture as those concerns eased, enabling the fund to participate more fully in the market’s rally.We achieved a longer duration posture by selling positions with maturities of one year or less and purchasing securities with maturities in the two- to five-year range. Whenever possible, we acquired longer-term bonds at prices we considered attractive during moments of market weakness,and the fund benefited when prices of these newly purchased bonds bounced back.
The Funds 3
DISCUSSION OF FUND PERFORMANCE (continued)
The fund also received positive contributions to performance from its holdings of investment-grade corporate bonds. We focused primarily on corporate credits with relatively short maturities, which we regarded as less likely to be affected by unexpected adverse develop-ments.We also avoided issuers that we believed might be vulnerable to activities that tend to be unfriendly to bondholders, such as leveraged buyouts. Instead, we favored regulated industries where such activities are less common, such as banks, insurance companies and real estate investment trusts.
Mortgage-backed securities fared relatively well in an environment of low market volatility, and the fund participated fully in the mortgage sector’s performance. However, because we regarded most bond market sectors as neutrally valued, we generally maintained a sector allocation strategy that was similar to that of the benchmark. This strategy enabled us to focus more intently on adding value through our duration management, yield curve and security selection strategies.
What is the fund’s current strategy?
Heightened market volatility near the end of the reporting period suggested to us that fixed-income investors might be becoming more sensitive to risk. More specifically, the U.S. stock and bond markets reacted negatively to reports of a surge in the default rate among holders of sub-prime mortgages. As a result, we have maintained a generally defensive investment posture, emphasizing broad diversification across market sectors and seeking to manage unexpected weakness in any individual security or sector from having a disproportionate effect on the fund.
In addition, recent economic data have been mixed, indicating to us that the Fed is likely to remain on the sidelines over the foreseeable future. Accordingly, we have maintained the fund’s average duration in the neutral range. We believe this is a prudent strategy until we see clearer signs of the economy’s health and the direction of future Fed policy.
March 15, 2007
| 1 | Total return includes reinvestment of dividends and any capital gains paid. | |
| Past performance is no guarantee of future results. Share price, yield and | ||
| investment return fluctuate such that upon redemption, fund shares may be | ||
| worth more or less than their original cost. | ||
| 2 | SOURCE: LIPPER INC. — Reflects reinvestment of dividends and, where | |
| applicable, capital gain distributions.The Lehman Brothers U.S. Aggregate | ||
| Index is a widely accepted, unmanaged total return index of corporate, U.S. | ||
| government and U.S. government agency debt instruments, mortgage-backed | ||
| securities and asset-backed securities with an average maturity of 1-10 years. | ||
| 3 | The fund may continue to own investment grade bonds (at the time of | |
| purchase), which are subsequently downgraded to below investment grade. |
| 4 |

| DISCUSSION OF |
| FUND PERFORMANCE |
John F. Flahive, Portfolio Manager
How did Mellon Intermediate Bond Fund perform relative to its benchmark?
For the six-month period ended February 28, 2007, the fund’s Class M shares achieved a total return of 3.20%, and its Investor shares achieved a total return of 2.99% .1 In comparison, the Lehman Brothers Intermediate Government/Credit Bond Index (the “Index”), the fund’s benchmark, achieved a 3.27% total return for the same period.2
Fixed-income securities generally rallied during the reporting period as investors responded favorably to stabilizing interest rates, diminishing inflationary pressures and moderating economic growth.
What is the fund’s investment approach?
The fund seeks total return (consisting of capital appreciation and current income). To pursue its goal, the fund actively manages bond market and maturity exposure and invests at least 80% of its assets in bonds, such as U.S. government and agency bonds, corporate bonds, mortgage-related securities, foreign corporate and government bonds and municipal bonds. The fund’s investments in bonds must be rated investment grade at the time of purchase3 or, if unrated, deemed of comparable quality by the investment adviser. Generally, the fund’s average effective portfolio maturity will be between three and 10 years, and the average effective duration of the fund’s portfolio will be between 2.5 and 5.5 years.
When managing the fund, we use a disciplined process to select securities and manage risk. We generally choose bonds based on yield, credit quality, the level of interest rates and inflation, general economic and financial trends and our outlook for the securities markets. Our management process also includes computer modeling and scenario testing of possible changes in market conditions.
What other factors influenced the fund’s performance?
The economic characteristics of the current reporting period stood in stark contrast to those of the six months that preceded it. In the months before the reporting period began, interest rates climbed, inflationary pressures intensified and economic growth remained robust, sparking concerns that an overheated economy might derail the bond market. However, investor sentiment subsequently improved when U.S. economic growth moderated amid cooling housing markets. Inflationary pressures also appeared to diminish, as evidenced by a sharp decline in energy prices. As a result, after 17 increases in short-term interest rates since June 2004, the Federal Reserve Board (the “Fed”) held the overnight federal funds rate steady at 5.25% at each of five meetings between July 2006 and February 2007. Investors reacted favorably to the Fed’s shift in policy, and the bond market generally rallied.
Despite the apparent economic slowdown, business fundamentals remained healthy in most industries, supporting prices of corporate bonds across the credit-rating spectrum. In the U.S. government securities market, low levels of volatility helped mortgage-backed securities, asset-backed securities and other high-quality “yield advantaged” instruments outperform U.S.Treasury securities.
The fund benefited in this environment from its relatively short average duration early in the reporting period,when investors’economic and inflation concerns
The Funds 5
DISCUSSION OF FUND PERFORMANCE (continued)
led to temporary weakness among longer-term bonds. We subsequently shifted to a more neutral duration posture as those concerns eased, enabling the fund to participate more fully in the market’s rally. We achieved a longer duration posture by selling positions with maturities of one year or less and purchasing securities with maturities in the two- to four-year range. Whenever possible, we acquired intermediate-term bonds at prices we considered attractive during moments of market weakness, and the fund benefited when prices of these newly purchased bonds bounced back.
The fund also received positive contributions to performance from its holdings of investment-grade corporate bonds. We focused primarily on corporate credits with relatively short maturities, which we regarded as less likely to be affected by unexpected adverse developments. We also avoided issuers that we believed might be vulnerable to activities that tend to be unfriendly to bondholders, such as leveraged buyouts. High-quality mortgage-backed and asset-backed securities fared relatively well in an environment of low market volatility, and the fund benefited from its allocation in these sectors returns.
What is the fund’s current strategy?
Heightened market volatility near the end of the reporting period suggested to us that fixed-income investors may be becoming more sensitive to risk. More specifically,
the U.S. stock and bond markets reacted negatively to reports of a surge in the default rate among holders of sub-prime mortgages. As a result, we have maintained a generally defensive investment posture, emphasizing broad diversification across market sectors and seeking to manage unexpected weakness in any individual sector from having a disproportionate effect on the fund.
In addition, recent economic data have been mixed, indicating to us that the Fed is likely to remain on the sidelines over the foreseeable future. Accordingly, we have maintained the fund’s average duration in the neutral range.We believe this is a prudent strategy until we see clearer signs of the economy’s health and the direction of future Fed policy.
March 15, 2007
| 1 | Total return includes reinvestment of dividends and any capital gains paid. | |
| Past performance is no guarantee of future results. Share price, yield and | ||
| investment return fluctuate such that upon redemption, fund shares may be | ||
| worth more or less than their original cost. | ||
| 2 | SOURCE: LIPPER INC. – Reflects reinvestment of dividends and, where | |
| applicable, capital gain distributions.The Lehman Brothers Intermediate | ||
| Government/Credit Bond Index is a widely accepted, unmanaged index of | ||
| government and credit bond market performance composed of U.S. | ||
| government,Treasury and agency securities, fixed-income securities and | ||
| nonconvertible investment-grade credit debt, with an average maturity of | ||
| 1-10 years. Index return does not reflect the fees and expenses associated with | ||
| operating a mutual fund. | ||
| 3 | The fund may continue to own investment grade bonds (at the time of | |
| purchase), which are subsequently downgraded to below investment grade. |
| 6 |

| DISCUSSION OF |
| FUND PERFORMANCE |
Lawrence R. Dunn, CFA, Portfolio Manager
How did Mellon Short-Term U.S. Government Securities Fund perform relative to its benchmark?
For the six-month period ended February 28, 2007, the fund’s Class M shares achieved a total return of 2.41%, and its Investor shares achieved a total return of 2.17% .1 In comparison, the Lehman Brothers 1-3 Year U.S. Government Index (the “Index”), the fund’s benchmark, achieved a total return of 2.53% for the same period.2
Short-term U.S. government securities traded within a relatively narrow range as the Federal Reserve Board (the “Fed”) held short-term interest rates steady over the reporting period. While short-term bond yields stabilized, longer-term yields generally fell, causing yield differences to narrow across the market’s maturity spectrum. The fund’s returns were lower than its benchmark, due in part to our duration strategy, which hindered the fund’s performance during periods of heightened market volatility.
What is the fund’s investment approach?
The fund seeks to provide as high a level of current income as is consistent with the preservation of capital. To pursue this goal, the fund invests at least 80% of its assets in securities issued or guaranteed by the U.S. government or its agencies or instrumentalities and in repurchase agreements.The fund may invest up to 35% of its net assets in mortgage-related securities issued by U.S. government agencies or instrumentalities, such as mortgage pass-through securities issued by the Government National Mortgage Association (“Ginnie Mae”), the Federal National Mortgage Association (“Fannie Mae”) and the Federal Home Loan Mortgage Corporation (“Freddie Mac”). The fund may also invest in collateralized mortgage obligations (“CMOs”), including stripped mortgage-backed securities. Generally, the fund’s average effective portfolio maturity and the average effective duration of the fund’s portfolio will be less than three years.
When choosing securities,we typically first examine U.S. and global economic conditions and other market factors to estimate long- and short-term interest rates. Using a research-driven investment process, we then seek to identify what we believe are potentially profitable sectors before they are widely perceived by the market.We also seek to identify underpriced or mispriced securities that appear likely to perform well over time.
What other factors influenced the fund’s performance?
Investor sentiment generally improved during the reporting period as U.S. economic growth moderated and inflation concerns eased amid cooling housing markets. After 17 consecutive increases in short-term interest rates since June 2004, the Fed decided at its meeting in August 2006—just weeks before the reporting period began—to hold the overnight federal funds rate steady at 5.25% . The Fed cited in its decision the likelihood that slower economic growth would relieve prevailing inflationary pressures. The Fed continued to hold interest rates steady between September 2006 and February 2007.
Investors reacted favorably to the shift in Fed policy, causing longer-term bonds to rally and yield differences along the market’s maturity spectrum to narrow well beyond historical norms. At times, yields of intermediate-term U.S. Treasury securities were lower than
The Funds 7
DISCUSSION OF FUND PERFORMANCE (continued)
shorter-term yields, a phenomenon known as an “inverted yield curve.” Although an inverted yield curve sometimes has been considered a harbinger of economic weakness, some analysts believe the yield curve’s inversion was due primarily to supply-and-demand dynamics.
In this market environment, we maintained the fund’s average duration in a range that was slightly shorter than the benchmark.We achieved this position by employing a mildly “barbelled” yield curve strategy that balanced instruments with maturities of less than one year with securities in the three- to four-year range.This positioning helped the fund capture incrementally higher yields when the yield curve inverted. We increased the fund’s average duration to the neutral range by the end of February,when mixed economic signals pushed back expectations of a potential reduction in short-term interest rates.
In addition, the fund benefited from our emphasis on higher-yielding segments of the U.S. government securities market, including U.S. government agency debentures and mortgage-backed securities backed by U.S. government agencies. More specifically, we focused on high-quality mortgage-backed securities backed by seasoned balloon mortgages or hybrid adjustable-rate mortgages. Low levels of market volatility helped these “yield advantaged” securities outperform nominal U.S.Treasury securities.
What is the fund’s current strategy?
As of the reporting period’s end, we have maintained the fund’s generally neutral average duration amid greater uncertainty regarding Fed policy. Mixed signals, including stronger-than-expected economic data and subdued inflation, have delayed expectations of a possible easing of monetary policy later this year. We may look for additional opportunities to extend the fund’s duration further as opportunities to do so arise. In addition, we have maintained the fund’s mild emphasis on high-quality mortgage-backed securities and agency debentures. Although turmoil among sub-prime mortgages has roiled that segment of the market, higher-quality mortgage-backed securities have so far been relatively insulated from heightened volatility.
March 15, 2007
| 1 | Total return includes reinvestment of dividends and any capital gains paid. | |
| Past performance is no guarantee of future results. Share price, yield and | ||
| investment return fluctuate such that upon redemption, fund shares may be | ||
| worth more or less than their original cost. | ||
| 2 | SOURCE: LIPPER, INC. – Reflects reinvestment of dividends and, where | |
| applicable, capital gain distributions.The Lehman Brothers 1-3 Year U.S. | ||
| Government Index is a widely accepted, unmanaged index of government | ||
| bond market performance composed of U.S.Treasury and agency securities | ||
| with maturities of 1-3 years. Index return does not reflect the fees and | ||
| expenses associated with operating a mutual fund. |
| 8 |
UNDERSTANDING YOUR FUND’S EXPENSES (Unaudited)
As a mutual fund investor, you pay ongoing expenses, such as management fees and other expenses. Using the information below, you can estimate how these expenses affect your investment and compare them with the expenses of other funds.You also may pay one-time transaction expenses, including sales charges (loads) and redemption fees, which are not shown in this section and would have resulted in higher total expenses. For more information, see your fund’s prospectus or talk to your financial advisor.
Review your fund’s expenses
The table below shows the expenses you would have paid on a $1,000 investment in each class of each fund from September 1, 2006 to February 28, 2007. It also shows how much a $1,000 investment would be worth at the close of the period, assuming actual returns and expenses.
| Expenses and Value of a $1,000 Investment | ||||
| assuming actual returns for the six months ended February 28, 2007 | ||||
| Class M Shares | Investor Shares | |||
| Mellon Bond Fund | ||||
| Expenses paid per $1,000 † | $ 2.83 | $ 4.09 | ||
| Ending value (after expenses) | $1,037.00 | $1,035.10 | ||
| Mellon Intermediate Bond Fund | ||||
| Expenses paid per $1,000 † | $ 2.82 | $ 4.13 | ||
| Ending value (after expenses) | $1,032.00 | $1,029.90 | ||
| Mellon Short-Term U.S. Government Securities Fund | ||||
| Expenses paid per $1,000 † | $ 2.86 | $ 4.26 | ||
| Ending value (after expenses) | $1,024.10 | $1,021.70 | ||
COMPARING YOUR FUND’S EXPENSES WITH THOSE OF OTHER FUNDS (Unaudited)
Using the SEC’s method to compare expenses
The Securities and Exchange Commission (SEC) has established guidelines to help investors assess fund expenses. Per these guidelines, the table below shows your fund’s expenses based on a $1,000 investment, assuming a hypothetical 5% annualized return.You can use this information to compare the ongoing expenses (but not transaction expenses or total costs) of investing in the fund with those of other funds. All mutual fund shareholder reports will provide this information to help you make this comparison. Please note that you cannot use this information to estimate your actual ending account balance and expenses paid during the period.
| Expenses and Value of a $1,000 Investment | ||||
| assuming a hypothetical 5% annualized return for the six months ended February 28, 2007 | ||||
| Class M Shares | Investor Shares | |||
| Mellon Bond Fund | ||||
| Expenses paid per $1,000 † | $ 2.81 | $ 4.06 | ||
| Ending value (after expenses) | $1,022.02 | $1,020.78 | ||
| Mellon Intermediate Bond Fund | ||||
| Expenses paid per $1,000 † | $ 2.81 | $ 4.11 | ||
| Ending value (after expenses) | $1,022.02 | $1,020.73 | ||
| Mellon Short-Term U.S. Government Securities Fund | ||||
| Expenses paid per $1,000 † | $ 2.86 | $ 4.26 | ||
| Ending value (after expenses) | $1,021.97 | $1,020.58 | ||
† Expenses are equal to the Mellon Bond Fund annualized expense ratio of .56% for Class M and .81% for Investor shares, Mellon Intermediate Bond Fund .56% for Class M and .82% for Investor shares and Mellon Short-Term U.S. Government Securities Fund .57% for Class M and .85% for Investor shares, multiplied by the average account value over the period, multiplied by 181/365 (to reflect the one-half year period).
The Funds 9
| STATEMENT OF INVESTMENTS |
| February 28, 2007 (Unaudited) |
| Mellon Bond Fund | ||||||||
| Coupon | Maturity | Principal | ||||||
| Bonds and Notes—98.8% | Rate (%) | Date | Amount ($) | Value ($) | ||||
| Asset-Backed Ctfs./Auto Receivables—4.4% | ||||||||
| Harley-Davidson Motorcycle Trust, Ser. 2005-3, Cl. A2 | 4.41 | 6/15/12 | 2,365,000 | 2,346,947 | ||||
| Harley-Davidson Motorcycle Trust, Ser. 2007-1, Cl. A4 | 5.21 | 6/17/13 | 3,715,000 | 3,743,534 | ||||
| Honda Auto Receivables Owner Trust, Ser. 2004-3, Cl. A4 | 3.28 | 2/18/10 | 6,940,000 | 6,813,301 | ||||
| Honda Auto Receivables Owner Trust, Ser. 2006-3, Cl. A4 | 5.11 | 4/15/12 | 6,180,000 | 6,208,675 | ||||
| Honda Automobile Receivables Owner Trust, Ser. 2007-1, Cl. A4 | 5.09 | 7/18/13 | 1,470,000 | 1,475,483 | ||||
| Household Automotive Trust, Ser. 2007-1, Cl. A4 | 5.33 | 11/17/13 | 3,960,000 | 3,994,060 | ||||
| Hyundai Auto Receivables Trust, Ser. 2006-B, Cl. A4 | 5.15 | 5/15/13 | 3,600,000 | 3,614,616 | ||||
| Nissan Auto Lease Trust, Ser. 2006-A, Cl. A4 | 5.10 | 7/16/12 | 6,780,000 | 6,795,067 | ||||
| Onyx Acceptance Grantor Trust, Ser. 2005-A, Cl. A4 | 3.91 | 9/15/11 | 4,910,000 | 4,842,742 | ||||
| 39,834,425 | ||||||||
| Asset-Backed Ctfs./Equipment—.5% | ||||||||
| CIT Equipment Collateral, Ser. 2006-VT2, Cl. A4 | 5.05 | 4/20/14 | 2,535,000 | 2,538,720 | ||||
| CNH Equipment Trust, Ser. 2005-A, Cl. A4B | 4.29 | 6/15/12 | 2,305,000 | 2,280,956 | ||||
| 4,819,676 | ||||||||
| Automotive, Trucks & Parts—.8% | ||||||||
| Johnson Controls, Sr. Notes | 5.25 | 1/15/11 | 7,110,000 | 7,133,499 | ||||
| Bank & Finance—9.6% | ||||||||
| AEP Texas Central Transition Funding, Scd. Bonds, Ser. A-4 | 5.17 | 1/1/18 | 7,090,000 | 7,104,873 | ||||
| Agua Caliente Band of Cahuilla Indians, Scd. Notes | 6.08 | 10/1/16 | 2,635,000 a | 2,653,840 | ||||
| AXA Financial, Sr. Notes | 7.75 | 8/1/10 | 5,000,000 | 5,413,870 | ||||
| Bank of America, Sub. Notes | 5.42 | 3/15/17 | 10,600,000 a | 10,656,244 | ||||
| BankAmerica Capital II, Gtd. Cap. Secs., Ser. 2 | 8.00 | 12/15/26 | 6,775,000 | 7,051,285 | ||||
| Bear Stearns Cos., Notes | 4.50 | 10/28/10 | 2,000,000 | 1,965,314 | ||||
| Caterpillar Financial Services, Notes | 5.05 | 12/1/10 | 4,540,000 | 4,558,700 | ||||
| CIT Group, Sr. Notes | 7.75 | 4/2/12 | 4,365,000 | 4,850,912 | ||||
| Citigroup, Sub. Notes | 5.00 | 9/15/14 | 4,000,000 | 3,932,980 | ||||
| Goldman Sachs Group, Gtd. Cap. Secs. | 6.35 | 2/15/34 | 6,455,000 | 6,615,045 | ||||
| HSBC Holdings, Sub. Notes | 6.50 | 5/2/36 | 4,500,000 | 4,950,279 | ||||
| International Lease Finance, Notes | 5.75 | 6/15/11 | 3,635,000 b | 3,728,947 | ||||
| J.P. Morgan & Co., Sub. Notes | 6.25 | 1/15/09 | 1,800,000 | 1,835,645 | ||||
| John Deere Capital, Notes | 7.00 | 3/15/12 | 4,360,000 | 4,723,724 | ||||
| Lehman Brothers Holdings, Sub. Notes | 5.75 | 1/3/17 | 7,180,000 | 7,293,042 | ||||
| Morgan Stanley, Sub. Notes | 4.75 | 4/1/14 | 7,210,000 | 6,924,477 | ||||
| PNC Funding, Bank Gtd. Notes | 4.50 | 3/10/10 | 2,825,000 | 2,782,173 | ||||
| 87,041,350 | ||||||||
| Building & Construction—.4% | ||||||||
| CRH America, Gtd. Notes | 5.30 | 10/15/13 | 3,495,000 | 3,464,073 | ||||
| Commercial & Professional Services—.8% | ||||||||
| Seminole Tribe of Florida, Notes | 5.80 | 10/1/13 | 7,400,000 a | 7,355,082 |
| 10 |
| Mellon Bond Fund (continued) | ||||||||||
| Coupon | Maturity | Principal | ||||||||
| Bonds and Notes (continued) | Rate (%) | Date | Amount ($) | Value ($) | ||||||
| Commercial Mortgage Pass-Through Ctfs.—6.3% | ||||||||||
| Banc of America Commercial Mortgage, Ser. 2005-6, Cl. AM | 5.18 | 9/10/47 | 10,820,000 | c | 10,807,860 | |||||
| Citigroup/Deutsche Bank Commercial | ||||||||||
| Mortgage Association, Ser. 2006-CD3, Cl. AM | 5.65 | 10/15/48 | 3,280,000 | 3,358,749 | ||||||
| Citigroup/Deutsche Bank Commercial | ||||||||||
| Mortgage Trust, Ser. 2006-CD2, Cl. A3 | 5.43 | 1/15/46 | 3,870,000 | c | 3,915,922 | |||||
| Four Times Square Trust, Ser. 2006-4TS, Cl. A | 5.40 | 12/13/28 | 13,000,000 | a | 12,971,130 | |||||
| J.P. Morgan Chase Commercial Mortgage | ||||||||||
| Securities, Ser. 2005-LDP2, Cl. AM | 4.78 | 7/15/42 | 3,720,000 | 3,595,211 | ||||||
| J.P. Morgan Chase Commercial Mortgage | ||||||||||
| Securities, Ser. 2005-CB12, Cl. AM | 4.95 | 9/12/37 | 3,075,000 | c | 3,001,515 | |||||
| J.P. Morgan Chase Commercial Mortgage | ||||||||||
| Securities, Ser. 2006-CB15, Cl. AM | 5.86 | 6/12/43 | 6,080,000 | c | 6,333,116 | |||||
| LB-UBS Commercial Mortgage Trust, Ser. 2006-C6, Cl. AM | 5.41 | 9/15/39 | 3,890,000 | 3,919,794 | ||||||
| LB-UBS Commercial Mortgage Trust, Ser. 2006-C3, Cl. AM | 5.71 | 3/15/39 | 5,055,000 | c | 5,207,583 | |||||
| LB-UBS Commercial Mortgage Trust, Ser. 2006-C4, Cl. AM | 5.92 | 6/15/38 | 4,000,000 | c | 4,202,503 | |||||
| 57,313,383 | ||||||||||
| Financial Services—.5% | ||||||||||
| Verizon Communications, Sr. Unscd. Notes | 5.55 | 2/15/16 | 4,340,000 | 4,383,400 | ||||||
| Food & Beverages—.4% | ||||||||||
| Diageo Finance, Gtd. Notes | 5.50 | 4/1/13 | 3,805,000 | 3,843,488 | ||||||
| Foreign/Governmental—1.1% | ||||||||||
| Province of Ontario, Notes | 5.13 | 7/17/12 | 3,500,000 | 3,543,638 | ||||||
| United Mexican States, Notes | 5.63 | 1/15/17 | 4,705,000 | 4,735,583 | ||||||
| United Mexican States, Notes | 6.63 | 3/3/15 | 1,480,000 | 1,589,520 | ||||||
| 9,868,741 | ||||||||||
| Health Care—.4% | ||||||||||
| Aetna, Sr. Unsub. Notes | 5.75 | 6/15/11 | 3,380,000 | 3,465,392 | ||||||
| Industrials—2.8% | ||||||||||
| Devon Financing, Gtd. Notes | 6.88 | 9/30/11 | 3,000,000 | 3,202,524 | ||||||
| Emerson Electric, Notes | 5.00 | 12/15/14 | 3,500,000 | 3,456,961 | ||||||
| Fortune Brands, Sr. Unscd. Notes | 5.13 | 1/15/11 | 4,150,000 | b | 4,120,012 | |||||
| International Business Machines, Debs. | 7.00 | 10/30/25 | 2,000,000 | 2,332,828 | ||||||
| Oracle, Notes | 5.00 | 1/15/11 | 7,000,000 | 7,003,801 | ||||||
| Wal-Mart Stores, Bonds | 5.25 | 9/1/35 | 5,310,000 | 5,014,477 | ||||||
| 25,130,603 | ||||||||||
| Media & Telecommunications—4.2% | ||||||||||
| AT & T, Notes | 6.80 | 5/15/36 | 2,500,000 | 2,749,353 | ||||||
| British Sky Broadcasting, Gtd. Notes | 6.88 | 2/23/09 | 4,180,000 | 4,308,476 | ||||||
| Cisco Systems, Sr. Unscd. Notes | 5.50 | 2/22/16 | 4,200,000 | 4,281,732 | ||||||
| Comcast, Gtd. Notes | 5.90 | 3/15/16 | 6,400,000 | 6,599,866 | ||||||
The Funds 11
STATEMENT OF INVESTMENTS (Unaudited) (continued)
| Mellon Bond Fund (continued) | ||||||||||
| Coupon | Maturity | Principal | ||||||||
| Bonds and Notes (continued) | Rate (%) | Date | Amount ($) | Value ($) | ||||||
| Media & Telecommunications (continued) | ||||||||||
| News America Holdings, Gtd. Debs. | 7.60 | 10/11/15 | 3,750,000 | 4,247,738 | ||||||
| SBC Communications, Sr. Unscd. Notes | 5.88 | 8/15/12 | 4,320,000 | 4,460,910 | ||||||
| Time Warner, Gtd. Debs. | 6.50 | 11/15/36 | 4,480,000 | b | 4,663,375 | |||||
| Univision Communications, Gtd. Notes | 3.50 | 10/15/07 | 6,825,000 | 6,731,156 | ||||||
| 38,042,606 | ||||||||||
| Real Estate Investment Trusts—1.1% | ||||||||||
| ERP Operating, Notes | 6.95 | 3/2/11 | 4,000,000 | 4,258,924 | ||||||
| Simon Property Group, Unscd. Notes | 5.75 | 5/1/12 | 5,265,000 | 5,410,045 | ||||||
| 9,668,969 | ||||||||||
| Residential Mortgage Pass-Through Ctfs.—.6% | ||||||||||
| Washington Mutual, Ser. 2003-S4, Cl. 4A1 | 4.00 | 2/25/32 | 1,259,752 | 1,223,407 | ||||||
| Washington Mutual, Ser. 2004-AR9, Cl. A6 | 4.15 | 8/25/34 | 4,510,000 | c | 4,411,989 | |||||
| 5,635,396 | ||||||||||
| U.S. Government Agencies—8.1% | ||||||||||
| Federal Home Loan Banks, Bonds | 5.25 | 11/3/09 | 6,195,000 | 6,217,952 | ||||||
| Federal Home Loan Banks, Bonds | 5.40 | 10/23/09 | 5,210,000 | 5,212,110 | ||||||
| Federal Home Loan Banks, Bonds, Ser. 659 | 5.50 | 6/5/09 | 4,470,000 | 4,474,282 | ||||||
| Federal Home Loan Banks, Bonds | 5.75 | 8/7/09 | 4,590,000 | 4,598,326 | ||||||
| Federal Home Loan Banks, Bonds, Ser. 670 | 5.88 | 6/29/09 | 4,510,000 | 4,517,387 | ||||||
| Federal Home Loan Mortgage Association, Notes | 5.40 | 2/2/12 | 4,830,000 | 4,851,218 | ||||||
| Federal Home Loan Mortgage Association, Notes | 5.40 | 3/2/12 | 5,165,000 | d | 5,167,846 | |||||
| Federal Home Loan Mortgage Corp., Notes | 4.88 | 3/15/07 | 6,665,000 | 6,663,820 | ||||||
| Federal Home Loan Mortgage Corp., Notes | 5.50 | 4/24/09 | 6,685,000 | 6,685,735 | ||||||
| Federal Home Loan Mortgage Corp., Notes | 5.75 | 5/23/11 | 5,345,000 | 5,370,581 | ||||||
| Federal National Mortgage Association, Notes | 5.20 | 11/8/10 | 4,625,000 | 4,618,063 | ||||||
| Federal National Mortgage Association, Notes, Ser. 1 | 5.30 | 10/10/08 | 4,635,000 | 4,637,605 | ||||||
| Federal National Mortgage Association, Notes | 5.60 | 6/15/09 | 6,355,000 | 6,359,550 | ||||||
| Federal National Mortgage Association, Notes | 5.75 | 6/9/11 | 4,710,000 | 4,737,869 | ||||||
| 74,112,344 | ||||||||||
| U.S. Government Agencies/Mortgage-Backed—35.6% | ||||||||||
| Federal Home Loan Mortgage Corp.: | ||||||||||
| 4.50%, 9/1/18—3/1/21 | 22,018,518 | 21,337,476 | ||||||||
| 5.00%, 10/1/18—7/1/36 | 31,027,089 | 30,176,025 | ||||||||
| 5.11%, 10/1/35 | 6,144,867 | c | 6,110,453 | |||||||
| 5.50%, 9/1/19—3/1/35 | 31,266,035 | 31,193,560 | ||||||||
| 6.00%, 7/1/17—7/1/20 | 4,323,591 | 4,397,057 | ||||||||
| 7.00%, 4/1/32—8/1/36 | 4,624,951 | 4,758,308 | ||||||||
| Ser. 1660, Cl. H, 6.50%, 1/15/09 | 951,552 | 951,143 | ||||||||
| 12 |
| Mellon Bond Fund (continued) | ||||||||
| Principal | ||||||||
| Bonds and Notes (continued) | Amount ($) | Value ($) | ||||||
| U.S. Government Agencies/ | ||||||||
| Mortgage-Backed (continued) | ||||||||
| Federal National Mortgage Association: | ||||||||
| 3.98%, 3/1/35 | 7,650,907 c | 7,557,007 | ||||||
| 4.57%, 3/1/35 | 3,656,900 c | 3,594,508 | ||||||
| 4.95%, 9/1/35 | 7,112,483 c | 7,052,292 | ||||||
| 5.00%, 5/1/19—4/1/36 | 44,038,473 | 43,028,831 | ||||||
| 5.07%, 10/1/35 | 7,183,273 c | 7,144,353 | ||||||
| 5.50%, 1/1/20—4/1/36 | 67,605,206 | 67,248,853 | ||||||
| 6.00%, 9/1/21—1/1/37 | 30,069,892 d | 30,420,694 | ||||||
| 6.50%, 4/1/17—11/1/36 | 31,923,143 | 32,559,394 | ||||||
| 7.00%, 4/1/32—12/1/36 | 12,823,931 | 13,197,792 | ||||||
| 7.50%, 7/1/32 | 773,970 | 805,231 | ||||||
| 8.00%, 7/1/07—5/1/08 | 58,995 | 59,207 | ||||||
| Government National Mortgage Association I: | ||||||||
| 5.50%, 2/15/36 | 8,122,261 d | 8,111,930 | ||||||
| 6.00%, 10/15/08—10/15/33 | 2,853,733 | 2,896,933 | ||||||
| 7.00%, 5/15/23—12/15/23 | 750,170 | 781,760 | ||||||
| 8.00%, 5/15/07—2/15/08 | 104,156 | 104,372 | ||||||
| 9.00%, 12/15/09 | 708,698 | 719,896 | ||||||
| 7.00%, 12/15/23 | 391,948 | 408,452 | ||||||
| 324,615,527 | ||||||||
| U.S. Government Securities—20.3% | ||||||||
| U.S. Treasury Bonds: | ||||||||
| 4.50%, 2/15/36 | 8,510,000 b | 8,256,036 | ||||||
| 6.25%, 8/15/23 | 37,870,000 b | 44,192,548 | ||||||
| U.S. Treasury Notes: | ||||||||
| 4.00%, 11/15/12 | 43,860,000 b | 42,799,509 | ||||||
| 4.25%, 1/15/11 | 12,740,000 b | 12,623,556 | ||||||
| 4.25%, 11/15/13 | 7,675,000 b | 7,556,882 | ||||||
| 4.63%, 8/31/11 | 14,585,000 | 14,658,508 | ||||||
| 4.63%, 2/29/12 | 36,650,000 | 36,853,297 | ||||||
| 4.63%, 11/15/16 | 3,635,000 b | 3,652,183 | ||||||
| 4.63%, 2/15/17 | 10,710,000 b | 10,775,267 | ||||||
| 4.88%, 8/15/16 | 3,685,000 b | 3,771,656 | ||||||
| 185,139,442 | ||||||||
| Utilities—.9% | ||||||||
| FPL Group Capital, Gtd. Debs. | 6.13 | 5/15/07 | 6,000,000 | 6,009,690 | ||||
| Southern California Edison, First Mortgage Bonds | 4.65 | 4/1/15 | 2,200,000 | 2,117,188 | ||||
| 8,126,878 | ||||||||
| Total Bonds and Notes | ||||||||
| (cost $897,344,103) | 898,994,274 | |||||||
The Funds 13
STATEMENT OF INVESTMENTS (Unaudited) (continued)
| Mellon Bond Fund (continued) | ||||
| Other Investment—2.1% | Shares | Value ($) | ||
| Registered Investment Company; | ||||
| Dreyfus Institutional Preferred Plus Money Market Fund | ||||
| (cost $19,364,000) | 19,364,000 e | 19,364,000 | ||
| Investment of Cash Collateral for Securities Loaned—10.7% | ||||
| Registered Investment Company; | ||||
| Dreyfus Institutional Cash Advantage Plus Fund | ||||
| (cost $97,154,264) | 97,154,264 e | 97,154,264 | ||
| Total Investments (cost $1,013,862,367) | 111.6% | 1,015,512,538 | ||
| Liabilities, Less Cash and Receivables | (11.6%) | (105,154,031) | ||
| Net Assets | 100.0% | 910,358,507 | ||
| a Securities exempt from registration under Rule 144A of the Securities Act of 1933.These securities may be resold in transactions exempt from registration, normally to qualified |
| institutional buyers. At February 28, 2007, these securities amounted to $33,636,296 or 3.7% of net assets. |
| b All or a portion of these securities are on loan. At February 28, 2007, the total market value of the fund’s securities on loan is $125,547,818 and the total market value of the |
| collateral held by the fund is $135,350,332, consisting of cash collateral of $97,154,264 and Letters of Credit valued at $38,196,068. |
| c Variable rate security—interest rate subject to periodic change. |
| d Purchased on a delayed delivery basis. |
| e Investment in affiliated money market mutual fund. |
| Portfolio Summary (Unaudited) † | ||||||
| Value (%) | Value (%) | |||||
| U.S. Government & Agencies | 64.0 | Asset/Mortgage-Backed | 11.8 | |||
| Corporate Bonds | 21.9 | Foreign/Governmental | 1.1 | |||
| Money Market Investments | 12.8 | 111.6 | ||||
| † Based on net assets. | ||||||
| See notes to financial statements. | ||||||
| 14 |
| STATEMENT OF INVESTMENTS |
| February 28, 2007 (Unaudited) |
| Mellon Intermediate Bond Fund | ||||||||
| Coupon | Maturity | Principal | ||||||
| Bonds and Notes—98.0% | Rate (%) | Date | Amount ($) | Value ($) | ||||
| Asset-Backed Ctfs./Auto Receivables—4.4% | ||||||||
| Harley-Davidson Motorcycle Trust, Ser. 2005-3, Cl. A2 | 4.41 | 6/15/12 | 2,350,000 | 2,332,061 | ||||
| Harley-Davidson Motorcycle Trust, Ser. 2007-1, Cl. A4 | 5.21 | 6/15/13 | 2,020,000 | 2,035,515 | ||||
| Honda Auto Receivables Owner Trust, Ser. 2004-3, Cl. A4 | 3.28 | 2/18/10 | 4,660,000 | 4,574,926 | ||||
| Honda Auto Receivables Owner Trust, Ser. 2006-3, Cl. A4 | 5.11 | 4/15/12 | 4,670,000 | 4,691,669 | ||||
| Honda Automobile Receivables Owner Trust, Ser. 2007-1, Cl. A4 | 5.09 | 7/18/13 | 2,395,000 | 2,403,933 | ||||
| Household Automotive Trust, Ser. 2007-1, Cl. A4 | 5.33 | 11/17/13 | 2,125,000 | 2,143,277 | ||||
| Hyundai Auto Receivables Trust, Ser. 2006-B, Cl. A4 | 5.15 | 5/15/13 | 2,680,000 | 2,690,881 | ||||
| Nissan Auto Lease Trust, Ser. 2006-A, Cl. A4 | 5.10 | 7/16/12 | 6,575,000 | 6,589,612 | ||||
| Onyx Acceptance Grantor Trust, Ser. 2005-A, Cl. A4 | 3.91 | 9/15/11 | 3,150,000 | 3,106,851 | ||||
| 30,568,725 | ||||||||
| Asset-Backed Ctfs./Equipment—1.1% | ||||||||
| Caterpillar Financial Asset Trust, Ser. 2005-A, Cl. A4 | 4.10 | 6/25/10 | 2,700,000 | 2,669,400 | ||||
| CIT Equipment Collateral, Ser. 2006-VT2, Cl. A4 | 5.05 | 4/20/14 | 3,185,000 | 3,189,673 | ||||
| CNH Equipment Trust, Ser. 2005-A, Cl. A4B | 4.29 | 6/15/12 | 1,660,000 | 1,642,685 | ||||
| 7,501,758 | ||||||||
| Automotive, Trucks & Parts—.8% | ||||||||
| Johnson Controls, Sr. Notes | 5.25 | 1/15/11 | 5,715,000 | 5,733,888 | ||||
| Bank & Finance—13.5% | ||||||||
| Agua Caliente Band of Cahuilla Indians, Scd. Notes | 6.08 | 10/1/16 | 1,965,000 a | 1,979,049 | ||||
| AXA Financial, Sr. Notes | 7.75 | 8/1/10 | 3,625,000 | 3,925,056 | ||||
| Bank of America, Sub. Notes | 5.42 | 3/15/17 | 8,900,000 a | 8,947,223 | ||||
| Bank of New York, Sr. Notes, Ser. E | 3.63 | 1/15/09 | 4,000,000 | 3,902,880 | ||||
| BankAmerica Capital II, Gtd. Cap. Secs., Ser. 2 | 8.00 | 12/15/26 | 4,975,000 | 5,177,880 | ||||
| Bear Stearns Cos., Notes | 4.50 | 10/28/10 | 2,100,000 | 2,063,580 | ||||
| Caterpillar Financial Services, Notes | 5.05 | 12/1/10 | 4,975,000 | 4,995,492 | ||||
| CIT Group, Sr. Notes | 7.75 | 4/2/12 | 3,665,000 | 4,072,988 | ||||
| Citigroup, Sub. Notes | 5.00 | 9/15/14 | 4,400,000 | 4,326,278 | ||||
| Equitable Cos., Sr. Notes | 6.50 | 4/1/08 | 1,200,000 | 1,212,744 | ||||
| General Electric Capital, Notes | 5.50 | 4/28/11 | 5,265,000 | 5,361,392 | ||||
| Goldman Sachs Group, Notes | 4.75 | 7/15/13 | 5,400,000 | 5,257,705 | ||||
| Household Finance, Notes | 4.75 | 7/15/13 | 5,400,000 | 5,296,293 | ||||
| International Lease Finance, Notes | 5.75 | 6/15/11 | 4,645,000 b | 4,765,050 | ||||
| John Deere Capital, Notes | 7.00 | 3/15/12 | 3,660,000 | 3,965,328 | ||||
| KFW, Gov’t Gtd. Notes | 4.88 | 1/17/17 | 6,185,000 | 6,202,918 | ||||
| Landwirtschaftliche Rentenbank, Gov’t Gtd. Notes | 3.25 | 10/12/07 | 8,320,000 b | 8,225,951 | ||||
| Lehman Brothers Holdings, Sub. Notes | 5.75 | 1/3/17 | 3,760,000 | 3,819,197 | ||||
| Morgan Stanley, Unsub. Bonds | 6.75 | 4/15/11 | 5,895,000 | 6,261,575 | ||||
| Wachovia, Sub. Notes | 6.38 | 2/1/09 | 4,000,000 | 4,095,776 | ||||
| 93,854,355 | ||||||||
| Building & Construction—.7% | ||||||||
| CRH America, Gtd. Notes | 5.30 | 10/15/13 | 4,930,000 | 4,886,374 |
The Funds 15
STATEMENT OF INVESTMENTS (Unaudited) (continued)
| Mellon Intermediate Bond Fund (continued) | ||||||||
| Coupon | Maturity | Principal | ||||||
| Bonds and Notes (continued) | Rate (%) | Date | Amount ($) | Value ($) | ||||
| Commercial & Professional Services—.7% | ||||||||
| Seminole Tribe of Florida, Notes | 5.80 | 10/1/13 | 5,100,000 a | 5,069,043 | ||||
| Commercial Mortgage Pass-Through Ctfs.—2.6% | ||||||||
| Citigroup/Deutsche Bank Commercial Mortgage | ||||||||
| Association, Ser. 2006-CD3, Cl. AM | 5.65 | 10/15/48 | 4,485,000 | 4,592,680 | ||||
| Citigroup/Deutsche Bank Commercial Mortgage | ||||||||
| Trust, Ser. 2006-CD2, Cl. A3 | 5.43 | 1/15/46 | 3,735,000 c | 3,779,320 | ||||
| GS Mortgage Securities II, Ser. 2005-GG4, Cl. A4 | 4.76 | 7/10/39 | 2,800,000 | 2,709,452 | ||||
| J.P. Morgan Chase Commercial Mortgage | ||||||||
| Securities, Ser. 2005-LDP2, Cl. AM | 4.78 | 7/15/42 | 2,405,000 | 2,324,323 | ||||
| J.P. Morgan Chase Commercial Mortgage | ||||||||
| Securities, Ser. 2005-CB12, Cl. AM | 4.95 | 9/12/37 | 1,985,000 c | 1,937,563 | ||||
| LB-UBS Commercial Mortgage Trust, Ser. 2006-C4, Cl. AM | 5.92 | 6/15/38 | 2,800,000 c | 2,941,752 | ||||
| 18,285,090 | ||||||||
| Food & Beverages—.4% | ||||||||
| Diageo Finance, Gtd. Notes | 5.50 | 4/1/13 | 2,670,000 | 2,697,007 | ||||
| Foreign/Governmental—2.0% | ||||||||
| Province of Ontario, Notes | 5.13 | 7/17/12 | 2,200,000 | 2,227,430 | ||||
| Quebec Province, Sr. Unsub. Debs. | 5.75 | 2/15/09 | 10,560,000 | 10,747,905 | ||||
| United Mexican States, Notes | 6.63 | 3/3/15 | 1,064,000 | 1,142,736 | ||||
| 14,118,071 | ||||||||
| Health Care—.6% | ||||||||
| Aetna, Sr. Unsub. Notes | 5.75 | 6/15/11 | 3,850,000 | 3,947,266 | ||||
| Industrials—2.6% | ||||||||
| Devon Financing, Gtd. Notes | 6.88 | 9/30/11 | 4,000,000 | 4,270,032 | ||||
| Emerson Electric, Notes | 4.63 | 10/15/12 | 3,000,000 | 2,941,275 | ||||
| Fortune Brands, Sr. Unscd. Notes | 5.13 | 1/15/11 | 4,140,000 b | 4,110,084 | ||||
| Oracle, Notes | 5.00 | 1/15/11 | 7,000,000 | 7,003,801 | ||||
| 18,325,192 | ||||||||
| Media & Telecommunications—5.5% | ||||||||
| British Sky Broadcasting, Gtd. Notes | 6.88 | 2/23/09 | 3,965,000 | 4,086,868 | ||||
| Cisco Systems, Sr. Unscd. Notes | 5.25 | 2/22/11 | 7,135,000 | 7,202,183 | ||||
| Comcast, Gtd. Notes | 5.90 | 3/15/16 | 4,555,000 | 4,697,248 | ||||
| News America, Gtd. Notes | 4.75 | 3/15/10 | 5,315,000 | 5,268,712 | ||||
| SBC Communications, Sr. Unscd. Notes | 5.88 | 8/15/12 | 3,045,000 | 3,144,322 | ||||
| Sprint Capital, Gtd. Notes | 8.38 | 3/15/12 | 5,250,000 | 5,893,067 | ||||
| Time Warner, Gtd. Notes | 5.50 | 11/15/11 | 3,090,000 | 3,128,044 | ||||
| Univision Communications, Gtd. Notes | 3.50 | 10/15/07 | 2,595,000 | 2,559,319 | ||||
| Verizon Global Funding, Notes | 7.25 | 12/1/10 | 2,400,000 | 2,571,773 | ||||
| 38,551,536 | ||||||||
| Real Estate Investment Trusts—1.8% | ||||||||
| ERP Operating, Notes | 6.95 | 3/2/11 | 1,875,000 | 1,996,371 | ||||
| Mack-Cali Realty, Sr. Unscd. Notes | 7.75 | 2/15/11 | 5,280,000 | 5,726,144 | ||||
| Simon Property Group, Unscd. Notes | 5.75 | 5/1/12 | 4,350,000 | 4,469,838 | ||||
| 12,192,353 | ||||||||
16
| Mellon Intermediate Bond Fund (continued) | ||||||||
| Coupon | Maturity | Principal | ||||||
| Bonds and Notes (continued) | Rate (%) | Date | Amount ($) | Value ($) | ||||
| Retailing—.9% | ||||||||
| Home Depot, Sr. Unscd. Notes | 5.25 | 12/16/13 | 1,750,000 | 1,761,078 | ||||
| Wal-Mart Stores, Sr. Unscd. Notes | 4.55 | 5/1/13 | 4,675,000 | 4,547,092 | ||||
| 6,308,170 | ||||||||
| U.S. Government Agencies—16.9% | ||||||||
| Federal Home Loan Banks, Bonds | 5.25 | 11/3/09 | 7,500,000 | 7,527,788 | ||||
| Federal Home Loan Banks, Bonds | 5.40 | 9/18/08 | 6,410,000 | 6,420,006 | ||||
| Federal Home Loan Banks, Bonds | 5.40 | 10/23/09 | 6,800,000 | 6,802,754 | ||||
| Federal Home Loan Banks, Bonds, Ser. 661 | 5.50 | 6/13/08 | 6,090,000 | 6,098,197 | ||||
| Federal Home Loan Banks, Bonds, Ser. 659 | 5.50 | 6/5/09 | 4,745,000 | 4,749,546 | ||||
| Federal Home Loan Banks, Bonds | 5.75 | 8/7/09 | 7,015,000 | 7,027,725 | ||||
| Federal Home Loan Banks, Bonds, Ser. 670 | 5.88 | 6/29/09 | 7,060,000 | 7,071,564 | ||||
| Federal Home Loan Mortgage Association, Notes | 5.40 | 2/2/12 | 7,900,000 | 7,934,705 | ||||
| Federal Home Loan Mortgage Association, Notes | 5.40 | 3/2/12 | 6,635,000 | 6,638,655 | ||||
| Federal Home Loan Mortgage Corp., Notes | 5.50 | 4/24/09 | 4,935,000 | 4,935,543 | ||||
| Federal Home Loan Mortgage Corp., Notes | 5.75 | 5/23/11 | 8,475,000 | 8,515,561 | ||||
| Federal National Mortgage Association, Notes | 5.20 | 11/8/10 | 8,760,000 | 8,746,860 | ||||
| Federal National Mortgage Association, Notes | 5.25 | 4/4/08 | 7,135,000 | 7,136,249 | ||||
| Federal National Mortgage Association, Notes, Ser. 1 | 5.30 | 10/10/08 | 7,165,000 | 7,169,027 | ||||
| Federal National Mortgage Association, Notes | 5.60 | 6/15/09 | 7,695,000 | 7,700,510 | ||||
| Federal National Mortgage Association, Notes | 5.70 | 7/17/08 | 6,870,000 | 6,886,145 | ||||
| Federal National Mortgage Association, Notes | 5.75 | 6/9/11 | 6,175,000 | 6,211,537 | ||||
| 117,572,372 | ||||||||
| U.S. Government Agencies/Mortgage-Backed—1.2% | ||||||||
| Federal Home Loan Mortgage Corp.: | ||||||||
| 3.50%, 5/1/08 | 831,297 | 808,319 | ||||||
| 4.50%, 11/1/07 | 747,013 | 742,090 | ||||||
| 4.92%, 11/1/32 | 641,336 c | 648,397 | ||||||
| REMIC, Ser. 2134, Cl. PM, 5.50%, 3/15/14 | 1,686,997 | 1,699,852 | ||||||
| Federal National Mortgage Association | ||||||||
| 5.00%, 10/1/18 | 3,728,169 | 3,688,986 | ||||||
| Government National Mortgage Association I: | ||||||||
| 6.50%, 9/15/13 | 434,824 | 445,865 | ||||||
| 8.00%, 2/15/08 | 62,067 | 62,209 | ||||||
| 8,095,718 | ||||||||
| U.S. Government Securities—41.3% | ||||||||
| U.S. Treasury Notes: | ||||||||
| 4.00%, 11/15/12 | 37,320,000 b | 36,417,640 | ||||||
| 4.13%, 8/15/10 | 7,920,000 b | 7,824,405 | ||||||
| 4.25%, 1/15/11 | 40,170,000 b | 39,802,846 | ||||||
| 4.25%, 11/15/13 | 13,700,000 b | 13,489,157 | ||||||
| 4.38%, 8/15/12 | 4,560,000 b | 4,539,516 | ||||||
| 4.50%, 11/15/15 | 27,000,000 b | 26,898,777 | ||||||
| 4.50%, 2/15/16 | 5,360,000 b | 5,341,369 | ||||||
| 4.63%, 8/31/11 | 30,520,000 b | 30,673,821 | ||||||
| 4.63%, 11/15/16 | 11,755,000 b | 11,810,566 | ||||||
The Funds 17
STATEMENT OF INVESTMENTS (Unaudited) (continued)
| Mellon Intermediate Bond Fund (continued) | ||||||||
| Coupon | Maturity | Principal | ||||||
| Bonds and Notes (continued) | Rate (%) | Date | Amount ($) | Value ($) | ||||
| U.S. Government Securities (continued) | ||||||||
| U.S. Treasury Notes (continued): | ||||||||
| 4.88%, 8/15/16 | 20,870,000 b | 21,360,779 | ||||||
| 5.13%, 5/15/16 | 20,755,000 b | 21,619,259 | ||||||
| 6.00%, 8/15/09 | 65,005,000 b | 67,112,592 | ||||||
| 286,890,727 | ||||||||
| Utilities—1.0% | ||||||||
| Alabama Power, Sr. Notes, Ser. CC | 3.50 | 11/15/07 | 3,675,000 | 3,633,733 | ||||
| FPL Group Capital, Gtd. Debs. | 6.13 | 5/15/07 | 3,250,000 | 3,255,249 | ||||
| 6,888,982 | ||||||||
| Total Bonds and Notes | ||||||||
| (cost $679,382,078) | 681,486,627 | |||||||
| Other Investment—2.1% | Shares | Value ($) | ||||||
| Registered Investment Company; | ||||||||
| Dreyfus Institutional Preferred Plus Money Market Fund | ||||||||
| (cost $14,522,000) | 14,522,000 d | 14,522,000 | ||||||
| Investment of Cash Collateral for Securities Loaned—32.7% | ||||||||
| Registered Investment Company; | ||||||||
| Dreyfus Institutional Cash Advantage Plus Fund | ||||||||
| (cost $227,479,046) | 227,479,046 d | 227,479,046 | ||||||
| Total Investments (cost $921,383,124) | 132.8% | 923,487,673 | ||||||
| Liabilities, Less Cash and Receivables | (32.8%) | (228,006,001) | ||||||
| Net Assets | 100.0% | 695,481,672 | ||||||
| a Securities exempt from registration under Rule 144A of the Securities Act of 1933.These securities may be resold in transactions exempt from registration, normally to qualified |
| institutional buyers. At February 28, 2007, these securities amounted to $15,995,315 or 2.3% of net assets. |
| b All or a portion of these securities are on loan. At February 28, 2007, the total market value of the fund’s securities on loan is $222,798,984 and the total market value of the |
| collateral held by the fund is $228,562,594, consisting of cash collateral of $227,479,046, U.S. Government and agency securities valued at $2,298 and Letters of Credit valued |
| at $1,081,250. |
| c Variable rate security—interest rate subject to periodic change. |
| d Investment in affiliated money market mutual fund. |
| Portfolio Summary (Unaudited) † | ||||||
| Value (%) | Value (%) | |||||
| U.S. Government & Agencies | 59.4 | Asset/Mortgage-Backed | 8.1 | |||
| Money Market Investments | 34.8 | Foreign/Governmental | 2.0 | |||
| Corporate Bonds | 28.5 | 132.8 | ||||
| † Based on net assets. | ||||||
| See notes to financial statements. | ||||||
18
| STATEMENT OF INVESTMENTS |
| February 28, 2007 (Unaudited) |
| Mellon Short-Term U.S. Government Securities Fund | ||||||||
| Coupon | Maturity | Principal | ||||||
| Bonds and Notes—98.8% | Rate (%) | Date | Amount ($) | Value ($) | ||||
| U.S. Government Agencies—39.8% | ||||||||
| Federal Home Loan Banks, Bonds | 4.75 | 6/11/08 | 2,895,000 | 2,890,695 | ||||
| Federal Home Loan Banks, Bonds | 5.25 | 11/3/09 | 1,250,000 | 1,254,631 | ||||
| Federal Home Loan Banks, Bonds | 5.30 | 1/16/09 | 3,245,000 | 3,245,461 | ||||
| Federal Home Loan Banks, Bonds | 5.30 | 1/22/10 | 2,195,000 | 2,194,107 | ||||
| Federal Home Loan Banks, Bonds | 5.40 | 9/18/08 | 1,675,000 | 1,677,614 | ||||
| Federal Home Loan Banks, Bonds | 5.40 | 10/23/09 | 1,195,000 | 1,195,484 | ||||
| Federal Home Loan Banks, Bonds, Ser. 661 | 5.50 | 6/13/08 | 1,775,000 | 1,777,389 | ||||
| Federal Home Loan Banks, Bonds, Ser. 663 | 5.50 | 6/27/08 | 2,000,000 | 2,002,826 | ||||
| Federal Home Loan Banks, Bonds | 5.50 | 3/2/09 | 1,105,000 a | 1,105,274 | ||||
| Federal Home Loan Banks, Bonds, Ser. 659 | 5.50 | 6/5/09 | 1,225,000 | 1,226,173 | ||||
| Federal Home Loan Banks, Bonds, Ser. 1 | 5.50 | 11/3/09 | 2,500,000 | 2,500,190 | ||||
| Federal Home Loan Banks, Bonds | 5.75 | 8/7/09 | 1,755,000 | 1,758,183 | ||||
| Federal Home Loan Banks, Bonds, Ser. 670 | 5.88 | 6/29/09 | 1,810,000 | 1,812,965 | ||||
| Federal Home Loan Banks, Bonds, Ser. 4 | 6.00 | 6/29/11 | 1,300,000 | 1,302,526 | ||||
| Federal Home Loan Mortgage Association, Notes | 5.30 | 2/27/09 | 3,310,000 | 3,310,142 | ||||
| Federal Home Loan Mortgage Corp., Notes | 4.63 | 12/19/08 | 1,240,000 | 1,235,853 | ||||
| Federal Home Loan Mortgage Corp., REMIC, Ser. 2495, Cl. UC | 5.00 | 7/15/32 | 140,386 | 139,581 | ||||
| Federal Home Loan Mortgage Corp., Notes | 5.50 | 4/24/09 | 3,000,000 | 3,000,330 | ||||
| Federal National Mortgage Association, | ||||||||
| Whole Loan, Ser. 2003-W19, Cl. 1A4 | 4.78 | 11/25/33 | 1,325,300 | 1,314,883 | ||||
| Federal National Mortgage Association, Notes, Ser. 1 | 5.10 | 2/22/08 | 3,000,000 | 3,002,064 | ||||
| Federal National Mortgage Association, Notes | 5.25 | 4/4/08 | 1,975,000 | 1,975,345 | ||||
| Federal National Mortgage Association, Notes | 5.25 | 6/15/08 | 2,300,000 | 2,310,012 | ||||
| Federal National Mortgage Association, Notes, Ser. 1 | 5.30 | 10/10/08 | 1,675,000 | 1,675,941 | ||||
| Federal National Mortgage Association, Notes | 5.33 | 1/29/10 | 3,360,000 | 3,367,647 | ||||
| Federal National Mortgage Association, Notes | 5.60 | 6/15/09 | 1,215,000 | 1,215,870 | ||||
| Federal National Mortgage Association, Notes | 5.70 | 7/17/08 | 1,800,000 | 1,804,230 | ||||
| 50,295,416 | ||||||||
| U.S. Government Agencies/Mortgage-Backed—7.6% | ||||||||
| Federal Home Loan Mortgage Corp.: | ||||||||
| 3.50%, 5/1/08—9/1/08 | 3,331,199 | 3,244,226 | ||||||
| 4.00%, 2/1/08—3/1/10 | 2,936,588 | 2,890,817 | ||||||
| 4.50%, 11/1/07—5/1/08 | 1,299,518 | 1,290,512 | ||||||
| 4.92%, 11/1/32 | 160,334 b | 162,099 | ||||||
| 5.00%, 3/1/08—4/1/09 | 224,351 | 223,629 | ||||||
| Federal National Mortgage Association: | ||||||||
| 4.50%, 1/1/10 | 252,931 | 248,308 | ||||||
| 4.74%, 6/1/32 | 377,146 b | 384,323 | ||||||
| 4.84%, 3/1/32 | 61,937 b | 62,348 | ||||||
| 5.50%, 6/1/09 | 62,909 | 63,194 | ||||||
| 5.86%, 6/1/32 | 253,717 b | 258,982 | ||||||
| 6.71%, 4/1/32 | 38,281 b | 38,983 | ||||||
| 6.79%, 5/1/32 | 75,399 b | 76,738 | ||||||
| 7.09%, 3/1/32 | 31,181 b | 31,613 | ||||||
| 7.20%, 6/1/32 | 79,717 b | 80,642 | ||||||
The Funds 19
STATEMENT OF INVESTMENTS (Unaudited) (continued)
| Mellon Short-Term U.S. Government Securities Fund (continued) | ||||
| Principal | ||||
| Bonds and Notes (continued) | Amount ($) | Value ($) | ||
| U.S. Government Agencies/Mortgage-Backed (continued) | ||||
| Government National Mortgage Association I | ||||
| 6.00%, 12/15/08—4/15/09 | 581,636 | 585,532 | ||
| 9,641,946 | ||||
| U.S. Government Securities—51.4% | ||||
| U.S. Treasury Notes: | ||||
| 3.50%, 12/15/09 | 10,605,000 | 10,314,200 | ||
| 4.13%, 8/15/10 | 9,000,000 c | 8,891,370 | ||
| 4.75%, 11/15/08 | 10,250,000 c | 10,262,413 | ||
| 5.75%, 8/15/10 | 3,250,000 c | 3,378,606 | ||
| 6.00%, 8/15/09 | 15,455,000 c | 15,956,082 | ||
| 6.50%, 2/15/10 | 15,165,000 | 15,975,979 | ||
| 64,778,650 | ||||
| Total Bonds and Notes | ||||
| (cost $124,882,884) | 124,716,012 | |||
| Other Investment—1.5% | Shares | Value ($) | ||
| Registered Investment Company; | ||||
| Dreyfus Institutional Preferred | ||||
| Plus Money Market Fund (cost $1,935,000) | 1,935,000 d | 1,935,000 | ||
| Investment of Cash Collateral for Securities Loaned—27.4% | ||||
| Registered Investment Company; | ||||
| Dreyfus Institutional Cash Advantage Plus Fund | ||||
| (cost $34,600,344) | 34,600,344 d | 34,600,344 | ||
| Total Investments (cost $161,418,228) | 127.7% | 161,251,356 | ||
| Liabilities, Less Cash and Receivables | (27.7%) | (35,020,572) | ||
| Net Assets | 100.0% | 126,230,784 | ||
| a Purchased on a delayed delivery basis. |
| b Variable rate security—interest rate subject to periodic change. |
| c All or a portion of these securities are on loan. At February 28, 2007, the total market value of the fund’s securities on loan is $37,857,708 and the total market value of the |
| collateral held by the fund is $38,652,745, consisting of cash collateral of $34,600,344 and Letters of Credit valued at $4,052,401. |
| d Investment in affiliated money market mutual fund. |
| Portfolio Summary (Unaudited) † | ||
| Value (%) | ||
| U.S. Government & Agencies | 98.8 | |
| Money Market Investments | 28.9 | |
| 127.7 | ||
| † Based on net assets. | ||
| See notes to financial statements. | ||
20
| STATEMENT OF ASSETS AND LIABILITIES |
| February 28, 2007 (Unaudited) |
| Mellon | ||||||||
| Mellon | Mellon | Short-Term | ||||||
| Bond | Intermediate | U.S. Government | ||||||
| Fund | Bond Fund | Securities Fund | ||||||
| Assets ($): | ||||||||
| Investments in securities— | ||||||||
| See Statement of Investments+—Note 2(c) | ||||||||
| (including securities loaned)++—Note 2(b): | ||||||||
| Unaffiliated issuers | 898,994,274 | 681,486,627 | 124,716,012 | |||||
| Affiliated issuers | 116,518,264 | 242,001,046 | 36,535,344 | |||||
| Receivable for investment securities sold | 54,470,411 | 4,714,386 | — | |||||
| Receivable for shares of Beneficial Interest subscribed | 676,698 | 1,325,027 | 186,099 | |||||
| Dividend and interest receivable | 6,926,496 | 6,535,625 | 866,245 | |||||
| Paydowns receivable | 293 | 25,564 | 6,391 | |||||
| Prepaid expenses | 20,585 | 33,043 | 11,113 | |||||
| 1,077,607,021 | 936,121,318 | 162,321,204 | ||||||
| Liabilities ($): | ||||||||
| Due to The Dreyfus Corporation and affiliates—Note 4(b) | 297,390 | 225,604 | 40,122 | |||||
| Due to Administrator—Note 4(a) | 88,808 | 67,852 | 12,490 | |||||
| Cash overdraft due to Custodian | 1,848,331 | 1,189,571 | 274,175 | |||||
| Liability for securities loaned—Note 2(b) | 97,154,264 | 227,479,046 | 34,600,344 | |||||
| Payable for investment securities purchased | 67,436,395 | 11,251,717 | 1,105,000 | |||||
| Payable for shares of Beneficial Interest redeemed | 384,859 | 384,764 | 26,329 | |||||
| Accrued expenses | 38,467 | 41,092 | 31,960 | |||||
| 167,248,514 | 240,639,646 | 36,090,420 | ||||||
| Net Assets ($) | 910,358,507 | 695,481,672 | 126,230,784 | |||||
| Composition of Net Assets ($): | ||||||||
| Paid-in capital | 928,058,322 | 717,592,620 | 136,639,522 | |||||
| Accumulated distributions in | ||||||||
| excess of investment income—net | (657,082) | (1,375,449) | (293,778) | |||||
| Accumulated net realized gain (loss) on investments | (18,692,904) | (22,840,048) | (9,948,088) | |||||
| Accumulated net unrealized appreciation | ||||||||
| (depreciation) on investments | 1,650,171 | 2,104,549 | (166,872) | |||||
| Net Assets ($) | 910,358,507 | 695,481,672 | 126,230,784 | |||||
| Net Asset Value Per Share | ||||||||
| Class M Shares | ||||||||
| Net Assets ($) | 906,732,531 | 694,418,618 | 126,152,741 | |||||
| Shares Outstanding | 73,265,009 | 56,757,422 | 10,513,018 | |||||
| Net Asset Value Per Share ($) | 12.38 | 12.23 | 12.00 | |||||
| Investor Shares | ||||||||
| Net Assets ($) | 3,625,976 | 1,063,054 | 78,043 | |||||
| Shares Outstanding | 293,527 | 86,927 | 6,503 | |||||
| Net Asset Value Per Share ($) | 12.35 | 12.23 | 12.00 | |||||
| † | Investments at cost ($): | |||||||
| Unaffiliated issuers | 897,344,103 | 679,382,078 | 124,882,884 | |||||
| Affiliated issuers | 116,518,264 | 242,001,046 | 36,535,344 | |||||
| †† | Value of securities loaned ($) | 125,547,818 | 222,798,984 | 37,857,708 | ||||
| See notes to financial statements. |
The Funds 21
| STATEMENT OF OPERATIONS |
| Six Months Ended February 28, 2007 (Unaudited) |
| Mellon | ||||||
| Mellon | Mellon | Short-Term | ||||
| Bond | Intermediate | U.S. Government | ||||
| Fund | Bond Fund | Securities Fund | ||||
| Investment Income ($): | ||||||
| Income: | ||||||
| Dividends; | ||||||
| Affiliated Issuers | 310,817 | 236,774 | 38,103 | |||
| Interest | 22,785,303 | 15,911,735 | 3,004,992 | |||
| Income from securities lending | 54,242 | 91,138 | 6,081 | |||
| Total Income | 23,150,362 | 16,239,647 | 3,049,176 | |||
| Expenses: | ||||||
| Investment advisory fee—Note 4(a) | 1,780,155 | 1,338,448 | 226,558 | |||
| Administration fee—Note 4(a) | 576,152 | 433,165 | 83,807 | |||
| Custodian fees—Note 4(b) | 39,829 | 24,786 | 8,142 | |||
| Auditing fees | 14,344 | 15,611 | 15,473 | |||
| Registration fees | 14,150 | 17,126 | 16,954 | |||
| Trustees’ fees and expenses—Note 4(c) | 21,931 | 11,092 | 3,683 | |||
| Prospectus and shareholders’ reports | 3,999 | 5,414 | 3,234 | |||
| Legal fees | 3,163 | 3,771 | 674 | |||
| Shareholder servicing costs—Note 4(b) | 4,543 | 1,108 | 192 | |||
| Miscellaneous | 25,665 | 27,786 | 10,170 | |||
| Total Expenses | 2,483,931 | 1,878,307 | 368,887 | |||
| Investment Income—Net | 20,666,431 | 14,361,340 | 2,680,289 | |||
| Realized and Unrealized Gain (Loss) on Investments—Note 5 ($): | ||||||
| Net realized gain (loss) on investments | 412,567 | (465,480) | (291,827) | |||
| Net unrealized appreciation (depreciation) on investments | 11,327,860 | 6,995,257 | 691,380 | |||
| Net Realized and Unrealized Gain (Loss) on Investments | 11,740,427 | 6,529,777 | 399,553 | |||
| Net Increase (Decrease) in Net Assets Resulting from Operations | 32,406,858 | 20,891,117 | 3,079,842 | |||
See notes to financial statements.
| 22 |
STATEMENT OF CHANGES IN NET ASSETS
| Mellon Bond Fund | Mellon Intermediate Bond Fund | |||||||
| Six Months Ended | Six Months Ended | |||||||
| February 28, 2007 | Year Ended | February 28, 2007 | Year Ended | |||||
| (Unaudited) | August 31, 2006 | (Unaudited) | August 31, 2006 | |||||
| Operations ($): | ||||||||
| Investment income—net | 20,666,431 | 36,276,724 | 14,361,340 | 22,689,681 | ||||
| Net realized gain (loss) on investments | 412,567 | (11,613,132) | (465,480) | (8,012,157) | ||||
| Net unrealized appreciation (depreciation) on investments | 11,327,860 | (13,454,048) | 6,995,257 | (3,585,628) | ||||
| Net Increase (Decrease) in Net Assets | ||||||||
| Resulting from Operations | 32,406,858 | 11,209,544 | 20,891,117 | 11,091,896 | ||||
| Dividends to Shareholders from ($): | ||||||||
| Investment income—net: | ||||||||
| Class M Shares | (21,651,836) | (39,545,101) | (15,759,838) | (26,221,806) | ||||
| Investor Shares | (81,231) | (123,625) | (18,498) | (24,753) | ||||
| Total Dividends | (21,733,067) | (39,668,726) | (15,778,336) | (26,246,559) | ||||
| Beneficial Interest Transactions ($): | ||||||||
| Net proceeds from shares sold: | ||||||||
| Class M Shares | 95,228,018 | 240,428,852 | 95,621,427 | 236,514,039 | ||||
| Investor Shares | 669,111 | 1,431,673 | 462,269 | 259,594 | ||||
| Dividends reinvested: | ||||||||
| Class M Shares | 2,469,229 | 4,040,661 | 2,284,360 | 3,223,669 | ||||
| Investor Shares | 57,874 | 67,704 | 17,866 | 21,290 | ||||
| Cost of shares redeemed: | ||||||||
| Class M Shares | (87,592,669) | (169,904,457) | (64,713,856) | (137,710,274) | ||||
| Investor Shares | (460,294) | (799,794) | (104,530) | (132,332) | ||||
| Increase (Decrease) in Net Assets from | ||||||||
| Beneficial Interest Transactions | 10,371,269 | 75,264,639 | 33,567,536 | 102,175,986 | ||||
| Total Increase (Decrease) in Net Assets | 21,045,060 | 46,805,457 | 38,680,317 | 87,021,323 | ||||
| Net Assets ($): | ||||||||
| Beginning of Period | 889,313,447 | 842,507,990 | 656,801,355 | 569,780,032 | ||||
| End of Period | 910,358,507 | 889,313,447 | 695,481,672 | 656,801,355 | ||||
| Undistributed (distributions in excess of) | ||||||||
| investment income—net | (657,082) | 409,554 | (1,375,449) | 41,547 | ||||
| Capital Share Transactions (Shares): | ||||||||
| Class M Shares | ||||||||
| Shares sold | 7,736,933 | 19,602,576 | 7,846,002 | 19,436,432 | ||||
| Shares issued for dividends reinvested | 200,490 | 329,679 | 187,428 | 265,729 | ||||
| Shares redeemed | (7,109,541) | (13,845,343) | (5,307,701) | (11,302,357) | ||||
| Net Increase (Decrease) in Shares Outstanding | 827,882 | 6,086,912 | 2,725,729 | 8,399,804 | ||||
| Investor Shares | ||||||||
| Shares sold | 54,434 | 117,170 | 37,940 | 21,330 | ||||
| Shares issued for dividends reinvested | 4,707 | 5,557 | 1,466 | 1,757 | ||||
| Shares redeemed | (37,436) | (64,952) | (8,572) | (10,826) | ||||
| Net Increase (Decrease) in Shares Outstanding | 21,705 | 57,775 | 30,834 | 12,261 | ||||
| See notes to financial statements. |
The Funds 23
STATEMENT OF CHANGES IN NET ASSETS (continued)
| Mellon Short-Term | ||||
| U.S. Government Securities Fund | ||||
| Six Months Ended | ||||
| February 28, 2007 | Year Ended | |||
| (Unaudited) | August 31, 2006 | |||
| Operations ($): | ||||
| Investment income—net | �� | 2,680,289 | 4,761,722 | |
| Net realized gain (loss) on investments | (291,827) | (1,733,150) | ||
| Net unrealized appreciation (depreciation) on investments | 691,380 | 801,832 | ||
| Net Increase (Decrease) in Net Assets | ||||
| Resulting from Operations | 3,079,842 | 3,830,404 | ||
| Dividends to Shareholders from ($): | ||||
| Investment income—net: | ||||
| Class M Shares | (2,984,735) | (5,791,722) | ||
| Investor Shares | (2,361) | (5,612) | ||
| Total Dividends | (2,987,096) | (5,797,334) | ||
| Beneficial Interest Transactions ($): | ||||
| Net proceeds from shares sold: | ||||
| Class M Shares | 21,775,683 | 60,091,529 | ||
| Investor Shares | 1 | 462,711 | ||
| Dividends reinvested: | ||||
| Class M Shares | 446,137 | 795,437 | ||
| Investor Shares | 2,361 | 5,612 | ||
| Cost of shares redeemed: | ||||
| Class M Shares | (28,046,378) | (88,997,843) | ||
| Investor Shares | (205,414) | (207,365) | ||
| Increase (Decrease) in Net Assets from | ||||
| Beneficial Interest Transactions | (6,027,610) | (27,849,919) | ||
| Total Increase (Decrease) in Net Assets | (5,934,864) | (29,816,849) | ||
| Net Assets ($): | ||||
| Beginning of Period | 132,165,648 | 161,982,497 | ||
| End of Period | 126,230,784 | 132,165,648 | ||
| Undistributed (distributions in excess of) | ||||
| investment income—net | (293,778) | 13,029 | ||
| Capital Share Transactions (Shares): | ||||
| Class M Shares | ||||
| Shares sold | 1,813,507 | 4,995,237 | ||
| Shares issued for dividends reinvested | 37,192 | 66,332 | ||
| Shares redeemed | (2,335,155) | (7,401,788) | ||
| Net Increase (Decrease) in Shares Outstanding | (484,456) | (2,340,219) | ||
| Investor Shares | ||||
| Shares sold | — | 38,573 | ||
| Shares issued for dividends reinvested | 197 | 469 | ||
| Shares redeemed | (17,104) | (17,279) | ||
| Net Increase (Decrease) in Shares Outstanding | (16,907) | 21,763 | ||
See notes to financial statements.
| 24 |
FINANCIAL HIGHLIGHTS
The following tables describe the performance for each share class of each fund for the fiscal periods indicated.All information (except portfolio turnover rate) reflects financial results for a single fund share.Total return shows how much your investment in each fund would have increased (or decreased) during the period, assuming you had reinvested all dividends and distributions. These figures have been derived from each fund’s financial statements.
| Class M Shares | ||||||||||||
| Six Months Ended | ||||||||||||
| February 28, 2007 | Year Ended August 31, | |||||||||||
| Mellon Bond Fund | (Unaudited) | 2006 | 2005 | 2004 | 2003a | 2002 | ||||||
| Per Share Data ($): | ||||||||||||
| Net asset value, beginning of period | 12.23 | 12.66 | 12.79 | 12.92 | 12.95 | 13.15 | ||||||
| Investment Operations: | ||||||||||||
| Investment income—net b | .28 | .52 | .48 | .49 | .56 | .67 | ||||||
| Net realized and unrealized | ||||||||||||
| gain (loss) on investments | .17 | (.38) | (.07) | .21 | .06 | (.02) | ||||||
| Total from Investment Operations | .45 | .14 | .41 | .70 | .62 | .65 | ||||||
| Distributions: | ||||||||||||
| Dividends from investment income—net | (.30) | (.57) | (.54) | (.56) | (.62) | (.69) | ||||||
| Dividends from net realized gain on investments | — | — | — | (.27) | (.03) | (.16) | ||||||
| Total Distributions | (.30) | (.57) | (.54) | (.83) | (.65) | (.85) | ||||||
| Net asset value, end of period | 12.38 | 12.23 | 12.66 | 12.79 | 12.92 | 12.95 | ||||||
| Total Return (%) | 3.70c | 1.20 | 3.30 | 5.63 | 4.73 | 5.11 | ||||||
| Ratios/Supplemental Data (%): | ||||||||||||
| Ratio of total expenses to average net assets | .56d | .56 | .56 | .56 | .57 | .57 | ||||||
| Ratio of net expenses to average net assets | .56d | .56 | .56 | .56 | .55 | .55 | ||||||
| Ratio of net investment income | ||||||||||||
| to average net assets | 4.64d | 4.27 | 3.81 | 3.79 | 4.30 | 5.19 | ||||||
| Portfolio Turnover Rate | 42.81c | 104.53e | 151.34e | 133.00e | 134.12 | 163.78 | ||||||
| Net Assets, end of period ($ x 1,000) | 906,733 | 885,994 | 839,804 | 819,664 | 846,464 | 966,170 | ||||||
| a Effective December 16, 2002, MPAM shares were redesignated as Class M shares. |
| b Based on average shares outstanding at each month end. |
| c Not annualized. |
| d Annualized. |
| e The portfolio turnover rate excluding mortgage dollar roll transactions for the periods ended August 31, 2006, August 31, 2005 and August 31, 2004, were 101.12%, 104.24% |
| and 106.10%, respectively. |
| See notes to financial statements. |
The Funds 25
FINANCIAL HIGHLIGHTS (continued)
| Investor Shares | ||||||||||||
| Six Months Ended | ||||||||||||
| February 28, 2007 | Year Ended August 31, | |||||||||||
| Mellon Bond Fund | (Unaudited) | 2006 | 2005 | 2004 | 2003 | 2002 | ||||||
| Per Share Data ($): | ||||||||||||
| Net asset value, beginning of period | 12.21 | 12.63 | 12.77 | 12.90 | 12.94 | 13.15 | ||||||
| Investment Operations: | ||||||||||||
| Investment income—net a | .27 | .49 | .45 | .50 | .54 | .63 | ||||||
| Net realized and unrealized | ||||||||||||
| gain (loss) on investments | .15 | (.37) | (.08) | .17 | .04 | (.02) | ||||||
| Total from Investment Operations | .42 | .12 | .37 | .67 | .58 | .61 | ||||||
| Distributions: | ||||||||||||
| Dividends from investment income—net | (.28) | (.54) | (.51) | (.53) | (.59) | (.66) | ||||||
| Dividends from net realized gain on investments | — | — | — | (.27) | (.03) | (.16) | ||||||
| Total Distributions | (.28) | (.54) | (.51) | (.80) | (.62) | (.82) | ||||||
| Net asset value, end of period | 12.35 | 12.21 | 12.63 | 12.77 | 12.90 | 12.94 | ||||||
| Total Return (%) | 3.51b | 1.01 | 2.98 | 5.29 | 4.48 | 4.73 | ||||||
| Ratios/Supplemental Data (%): | ||||||||||||
| Ratio of total expenses to average net assets | .81c | .80 | .81 | .81 | .82 | .82 | ||||||
| Ratio of net expenses to average net assets | .81c | .80 | .81 | .81 | .80 | .80 | ||||||
| Ratio of net investment income | ||||||||||||
| to average net assets | 4.40c | 4.02 | 3.56 | 3.52 | 4.11 | 4.96 | ||||||
| Portfolio Turnover Rate | 42.81b | 104.53d | 151.34d | 133.00d | 134.12 | 163.78 | ||||||
| Net Assets, end of period ($ x 1,000) | 3,626 | 3,319 | 2,704 | 3,068 | 3,861 | 3,693 | ||||||
| a Based on average shares outstanding at each month end. |
| b Not annualized. |
| c Annualized. |
| d The portfolio turnover rate excluding mortgage dollar roll transactions for the periods ended August 31, 2006, August 31, 2005 and August 31, 2004, were 101.12%, 104.24% |
| and 106.10%, respectively. |
| See notes to financial statements. |
| 26 |
| Class M Shares | ||||||||||||
| Six Months Ended | ||||||||||||
| February 28, 2007 | Year Ended August 31, | |||||||||||
| Mellon Intermediate Bond Fund | (Unaudited) | 2006 | 2005 | 2004 | 2003a | 2002 | ||||||
| Per Share Data ($): | ||||||||||||
| Net asset value, beginning of period | 12.14 | 12.47 | 12.77 | 12.97 | 13.04 | 13.08 | ||||||
| Investment Operations: | ||||||||||||
| Investment income—net b | .26 | .46 | .41 | .42 | .51 | .62 | ||||||
| Net realized and unrealized | ||||||||||||
| gain (loss) on investments | .11 | (.26) | (.22) | .14 | .11 | .15 | ||||||
| Total from Investment Operations | .37 | .20 | .19 | .56 | .62 | .77 | ||||||
| Distributions: | ||||||||||||
| Dividends from investment income—net | (.28) | (.53) | (.49) | (.52) | (.59) | (.67) | ||||||
| Dividends from net realized gain on investments | — | — | — | (.24) | (.10) | (.14) | ||||||
| Total Distributions | (.28) | (.53) | (.49) | (.76) | (.69) | (.81) | ||||||
| Net asset value, end of period | 12.23 | 12.14 | 12.47 | 12.77 | 12.97 | 13.04 | ||||||
| Total Return (%) | 3.20c | 1.69 | 1.53 | 4.45 | 4.77 | 6.09 | ||||||
| Ratios/Supplemental Data (%): | ||||||||||||
| Ratio of total expenses to average net assets | .56d | .56 | .57 | .57 | .57 | .58 | ||||||
| Ratio of net expenses to average net assets | .56d | .56 | .57 | .57 | .56 | .56 | ||||||
| Ratio of net investment income | ||||||||||||
| to average net assets | 4.35d | 3.79 | 3.23 | 3.26 | 3.88 | 4.81 | ||||||
| Portfolio Turnover Rate | 44.23c | 86.50 | 112.51e | 109.19 | 104.98 | 106.09 | ||||||
| Net Assets, end of period ($ x 1,000) | 694,419 | 656,120 | 569,233 | 524,590 | 467,627 | 437,119 | ||||||
| a Effective December 16, 2002, MPAM shares were redesignated as Class M shares. |
| b Based on average shares outstanding at each month end. |
| c Not annualized. |
| d Annualized. |
| e The portfolio turnover rate excluding mortgage dollar roll transactions for the periods ended August 31, 2005, was 111.52%. |
| See notes to financial statements. |
The Funds 27
FINANCIAL HIGHLIGHTS (continued)
| Investor Shares | ||||||||||||
| Six Months Ended | ||||||||||||
| February 28, 2007 | Year Ended August 31, | |||||||||||
| Mellon Intermediate Bond Fund | (Unaudited) | 2006 | 2005 | 2004 | 2003 | 2002 | ||||||
| Per Share Data ($): | ||||||||||||
| Net asset value, beginning of period | 12.14 | 12.47 | 12.77 | 13.02 | 13.08 | 13.09 | ||||||
| Investment Operations: | ||||||||||||
| Investment income—net a | .23 | .43 | .37 | .55 | .48 | .56 | ||||||
| Net realized and unrealized | ||||||||||||
| gain (loss) on investments | .13 | (.26) | (.21) | (.07)b | .12 | .20 | ||||||
| Total from Investment Operations | .36 | .17 | .16 | .48 | .60 | .76 | ||||||
| Distributions: | ||||||||||||
| Dividends from investment income—net | (.27) | (.50) | (.46) | (.49) | (.56) | (.63) | ||||||
| Dividends from net realized gain on investments | — | — | — | (.24) | (.10) | (.14) | ||||||
| Total Distributions | (.27) | (.50) | (.46) | (.73) | (.66) | (.77) | ||||||
| Net asset value, end of period | 12.23 | 12.14 | 12.47 | 12.77 | 13.02 | 13.08 | ||||||
| Total Return (%) | 2.99c | 1.43 | 1.30 | 3.88 | 4.51 | 6.05 | ||||||
| Ratios/Supplemental Data (%): | ||||||||||||
| Ratio of total expenses to average net assets | .82d | .81 | .81 | .82 | .81 | .83 | ||||||
| Ratio of net expenses to average net assets | .82d | .81 | .81 | .82 | .81 | .81 | ||||||
| Ratio of net investment income | ||||||||||||
| to average net assets | 4.11d | 3.55 | 3.00 | 3.01 | 3.57 | 4.51 | ||||||
| Portfolio Turnover Rate | 44.23c | 86.50 | 112.51e | 109.19 | 104.98 | 106.09 | ||||||
| Net Assets, end of period ($ x 1,000) | 1,063 | 681 | 547 | 455 | 305 | 121 | ||||||
| a Based on average shares outstanding at each month end. |
| b In addition to the net realized and unrealized gain on investments as shown in the Statement of Operations, this amount includes a decrease in net asset value per share resulting |
| from the timing of issuances and redemptions of shares in relation to fluctuating market values for the fund’s investments. |
| c Not annualized. |
| d Annualized. |
| e The portfolio turnover rate excluding mortgage dollar roll transactions for the periods ended August 31, 2005, was 111.52%. |
| See notes to financial statements. |
| 28 |
| Class M Shares | ||||||||||||
| Six Months Ended | ||||||||||||
| Mellon Short-Term | February 28, 2007 | Year Ended August 31, | ||||||||||
| U.S. Government Securities Fund | (Unaudited) | 2006 | 2005 | 2004 | 2003a | 2002 | ||||||
| Per Share Data ($): | ||||||||||||
| Net asset value, beginning of period | 11.99 | 12.14 | 12.47 | 12.70 | 12.94 | 12.87 | ||||||
| Investment Operations: | ||||||||||||
| Investment income—net b | .25 | .39 | .28 | .25 | .34 | .52 | ||||||
| Net realized and unrealized | ||||||||||||
| gain (loss) on investments | .04 | (.06) | (.16) | (.01) | (.11) | .22 | ||||||
| Total from Investment Operations | .29 | .33 | .12 | .24 | .23 | .74 | ||||||
| Distributions: | ||||||||||||
| Dividends from investment income—net | (.28) | (.48) | (.45) | (.45) | (.44) | (.58) | ||||||
| Dividends from net realized gain on investments | — | — | — | (.02) | (.03) | (.09) | ||||||
| Total Distributions | (.28) | (.48) | (.45) | (.47) | (.47) | (.67) | ||||||
| Net asset value, end of period | 12.00 | 11.99 | 12.14 | 12.47 | 12.70 | 12.94 | ||||||
| Total Return (%) | 2.41c | 2.78 | 1.00 | 1.97 | 1.68 | 5.87 | ||||||
| Ratios/Supplemental Data (%): | ||||||||||||
| Ratio of total expenses to average net assets | .57d | .54 | .55 | .55 | .56 | .59 | ||||||
| Ratio of net expenses to average net assets | .57d | .54 | .55 | .55 | .55 | .55 | ||||||
| Ratio of net investment income | ||||||||||||
| to average net assets | 4.14d | 3.24 | 2.25 | 1.97 | 2.68 | 4.07 | ||||||
| Portfolio Turnover Rate | 57.06c | 85.97 | 69.11 | 44.76 | 88.05 | 97.19 | ||||||
| Net Assets, end of period ($ x 1,000) | 126,153 | 131,885 | 161,963 | 176,301 | 139,971 | 108,605 | ||||||
| a Effective December 16, 2002, MPAM shares were redesignated as Class M shares. | ||||||||||||
| b Based on average shares outstanding at each month end. | ||||||||||||
| c Not annualized. | ||||||||||||
| d Annualized. | ||||||||||||
| See notes to financial statements. | ||||||||||||
The Funds 29
FINANCIAL HIGHLIGHTS (continued)
| Investor Shares | ||||||||||||
| Six Months Ended | ||||||||||||
| Mellon Short-Term | February 28, 2007 | Year Ended August 31, | ||||||||||
| U.S. Government Securities Fund | (Unaudited) | 2006 | 2005 | 2004 | 2003a | 2002 | ||||||
| Per Share Data ($): | ||||||||||||
| Net asset value, beginning of period | 12.00 | 12.14 | 12.47 | 12.73 | 12.93 | 12.88 | ||||||
| Investment Operations: | ||||||||||||
| Investment income—net a | .21 | .41 | .23 | .37 | .30 | .46 | ||||||
| Net realized and unrealized | ||||||||||||
| gain (loss) on investments | .05 | (.10) | (.14) | (.19) | (.06) | .21 | ||||||
| Total from Investment Operations | .26 | .31 | .09 | .18 | .24 | .67 | ||||||
| Distributions: | ||||||||||||
| Dividends from investment income—net | (.26) | (.45) | (.42) | (.42) | (.41) | (.53) | ||||||
| Dividends from net realized gain on investments | — | — | — | (.02) | (.03) | (.09) | ||||||
| Total Distributions | (.26) | (.45) | (.42) | (.44) | (.44) | (.62) | ||||||
| Net asset value, end of period | 12.00 | 12.00 | 12.14 | 12.47 | 12.73 | 12.93 | ||||||
| Total Return (%) | 2.17b | 2.62 | .78 | 1.46 | 1.78 | 5.28 | ||||||
| Ratios/Supplemental Data (%): | ||||||||||||
| Ratio of total expenses to average net assets | .85c | .77 | .81 | .78 | .83 | .90 | ||||||
| Ratio of net expenses to average net assets | .85c | .77 | .81 | .78 | .80 | .80 | ||||||
| Ratio of net investment income | ||||||||||||
| to average net assets | 3.84c | 3.25 | 1.99 | 1.74 | 2.38 | 3.54 | ||||||
| Portfolio Turnover Rate | 57.06b | 85.97 | 69.11 | 44.76 | 88.05 | 97.19 | ||||||
| Net Assets, end of period ($ x 1,000) | 78 | 281 | 20 | 11 | 1 | 1 | ||||||
| a Based on average shares outstanding at each month end. | ||||||||||||
| b Not annualized. | ||||||||||||
| c Annualized. | ||||||||||||
| See notes to financial statements. | ||||||||||||
| 30 |
NOTES TO FINANCIAL STATEMENTS (Unaudited)
NOTE 1—General:
Mellon Funds Trust (the “Trust”) was organized as a Massachusetts business trust which is registered under the Investment Company Act of 1940, as amended (the “Act”), as an open-end management investment company and operates as a series company currently comprised of sixteen series including the following diversified fixed income funds: Mellon Bond Fund, Mellon Intermediate Bond Fund and Mellon Short-Term U.S. Government Securities Fund (each, a “fund” and collectively, the “funds”). Mellon Bond Fund’s and Mellon Intermediate Bond Fund’s investment objective is to seek total return (consisting of capital appreciation and current income). Mellon Short-Term U.S. Government Securities Fund’s investment objective is to seek to provide as high a level of current income as is consistent with the preservation of capital. Mellon Fund Advisers, a division of The Dreyfus Corporation (the “Manager” or “Dreyfus”), serves as each fund’s investment adviser (“Investment Adviser”). Mellon Bank, N.A. (“Mellon Bank”), which is a wholly-owned subsidiary of Mellon Financial Corporation, (“Mellon Financial”) serves as administrator for the funds pursuant to an Administration Agreement with the Trust (the “Administration Agreement”). Mellon Bank has entered into a Sub-Administration Agreement with Dreyfus pursuant to which Mellon Bank pays Dreyfus for performing certain administrative services. Dreyfus is a wholly-owned subsidiary of Mellon Financial. Dreyfus Service Corporation (the “Distributor”), a wholly-owned subsidiary of Dreyfus, is the Distributor of each fund’s shares, which are sold without a sales charge.
On December 4, 2006, Mellon Financial and The Bank of New York Company, Inc. announced that they had entered into a definitive agreement to merge. The new company will be called The Bank of New York Mellon Corporation. As part of this transaction, Dreyfus would become a wholly-owned subsidiary of The Bank of New York Mellon Corporation.The transaction is subject to certain regulatory approvals and the approval of The Bank of New York Company, Inc.’s and Mellon Financial’s shareholders, as well as other customary conditions to closing. Subject to such approvals and the satisfaction of the other conditions, Mellon Financial and The Bank of New York Company, Inc. expect the transaction to be completed in the third quarter of 2007.
The Trust is authorized to issue an unlimited number of shares of beneficial interest, par value $.001 per share, in each of the Class M and Investor class shares of each fund. Each class of shares has similar rights and privileges, except with respect to the expenses borne by and the shareholder services offered to each class and the shareholder services plan applicable to the Investor shares and certain voting rights. Income, expenses (other than expenses attributable to a specific class), and realized and unrealized gains or losses on investments are allocated daily for each class of shares based upon relative proportion of net assets of each class.
The Trust accounts separately for the assets, liabilities and operations of each series. Expenses directly attributable to each series are charged to that series’ operations; expenses that are applicable to all series are allocated among them on a pro rata basis.
The funds’ financial statements are prepared in accordance with U.S. generally accepted accounting principles, which may require the use of management estimates and assump-tions.Actual results could differ from those estimates.
NOTE 2—Significant Accounting Policies:
(a) Portfolio valuation: Investments in securities (excluding short-term investments (other than U.S.Treasury Bills), are valued each business day by an independent pricing service (the “Service”) approved by the Board of Trustees. Investments for which quoted bid prices are readily available and are representative of the bid side of the market in the judgment of the Service are valued at the mean between the quoted bid prices (as obtained by the Service
The Funds 31
NOTES TO FINANCIAL STATEMENTS (Unaudited) (continued)
from dealers in such securities) and asked prices (as calculated by the Service based upon its evaluation of the market for such securities). Other investments (which constitute a majority of the portfolio securities) are valued as determined by the Service, based on methods which include consideration of: yields or prices of securities of comparable quality, coupon, maturity and type; indications as to values from dealers; and general market conditions. Restricted securities, as well as securities or other assets for which recent market quotations are not readily available, that are not valued by a pricing service approved by the fund’s Board of Trustees,or are determined by the fund not to reflect accurately fair value are valued at fair value as determined in good faith under the direction of the Board of Trustees.The factors that may be considered when fair valuing a security include fundamental analytical data, the nature and duration of restrictions on disposition, an evaluation of the forces that influence the market in which the securities are purchased and sold, and public trading in similar securities of the issuer or comparable issuers. Registered open-end investment companies that are not traded on an exchange are valued at their net asset value.
On September 20, 2006, the Financial Accounting Standards Board (FASB) released Statement of Financial Accounting Standards No. 157 “Fair Value Measurements” (“FAS 157”). FAS 157 establishes an authoritative definition of fair value, sets out a framework for measuring fair value, and requires additional disclosures about fair-value measurements. The application of FAS 157 is required for fiscal years beginning after November 15, 2007 and interim periods within those fiscal years. Management does not believe that the application of this standard will have a material impact on the financial statements of the funds.
(b) Securities transactions and investment income:
Securities transactions are recorded on a trade date basis. Realized gain and loss from securities transactions are recorded on the identified cost basis. Dividend income is recorded on the ex-dividend date and interest income, including where applicable, accretion of discount and amortization of premium on investments is recognized on the accrual basis.
The funds have an arrangement with the custodian bank whereby the funds receive earnings credits from the custodian when positive cash balances are maintained, which are used to offset custody fees. For financial reporting purposes, the funds include net earnings credits as an expense offset in the Statement of Operations.
Pursuant to a securities lending agreement with Mellon Bank, N.A., an affiliate of Dreyfus, the fund may lend securities to certain qualified institutions. It is the fund’s policy, that at origination, all loans are secured by collateral of at least 102% of the value of U.S. securities loaned and 105% of the value of foreign securities loaned. Collateral equivalent to at least 100% of the market value of securities on loan is maintained at all times. Cash collateral is invested in certain money market mutual funds managed by Dreyfus. The funds are entitled to receive all income on securities loaned, in addition to income earned as a result of the lending transaction. Although each security loaned is fully collateralized, the funds bear the risk of delay in recovery of, or loss of rights in, the securities loaned should a borrower fail to return the securities in a timely manner.
(c) Affiliated issuers: Investments in other investment companies advised by the Manager are defined as “affiliated” in the Act.
(d) Concentration of Risk: The funds invest primarily in debt securities. Failure of an issuer of the debt securities to make timely interest or principal payments, or a decline or the perception of a decline in the credit quality of a debt security, can cause the debt security’s price to fall, potentially lowering the fund’s share price. In addition, the value of the debt securities may decline due to general market conditions that are not specifically related to a particular company, such as real or perceived adverse economic conditions, changes in outlook for
| 32 |
corporate earnings, changes in interest or currency rates or adverse investor sentiment. They may also decline because of factors that affect a particular industry.
(e) Dividends to shareholders: Dividends payable to shareholders are recorded by the funds on the ex-dividend date.The funds declare and pay dividends from investment income-net monthly. With respect to each series, dividends from net realized capital gain, if any, are normally declared and paid annually, but the funds may make distributions on a more frequent basis to comply with the distribution requirements of the Internal Revenue Code of 1986, as amended (the “Code”).To the extent that net realized capital gain can be offset by capital loss carryovers of that fund, it is the policy of the fund not to distribute such gain. Income and capital gain distributions are determined in accordance with income tax regulations, which may differ from generally accepted accounting principles.
(f) Federal income taxes: It is the policy of each fund to continue to qualify as a regulated investment company, if such qualification is in the best interests of its shareholders, by complying with the applicable provisions of the Code, and to make distributions of taxable income sufficient to relieve it from substantially all federal income and excise taxes. For federal income tax purposes, each series is treated as a single entity for the purpose of determining such qualification.
On July 13, 2006, the Financial Accounting Standards Board (FASB) released FASB Interpretation No. 48 “Accounting for Uncertainty in Income Taxes” (FIN 48). FIN 48 provides guidance for how uncertain tax positions should be recognized,measured,presented and disclosed in the financial statements. FIN 48 requires the evaluation of tax positions taken or expected to be taken in the course of preparing the fund’s tax returns to determine whether the tax positions are “more-likely-than-not” of being sustained by the applicable tax authority. Tax positions not deemed to meet the more-likely-than-not threshold would be recorded as a tax benefit or expense in the current year. Adoption of FIN 48 is required for fiscal years beginning after December 15, 2006 and is to be applied to all open tax years as of the effective date.Management does not believe that the application of this standard will have a material impact on the financial statements of the funds.
Table 1 summarizes each relevant fund’s accumulated capital loss carryover available to be applied against future net securities profits, if any, realized subsequent to August 31, 2006.
Table 2 summarizes each fund’s tax character of distributions paid to shareholders during the fiscal years ended August 31, 2006. The tax character of current year distributions will be determined at the end of the current fiscal year.
| Ordinary | ||
| Table 2. | Income | |
| Mellon Bond Fund | $39,668,726 | |
| Mellon Intermediate Bond Fund | 26,246,559 | |
| Mellon Short-Term U.S. | ||
| Government Securities Fund | 5,797,334 |
NOTE 3—Bank Line of Credit:
The funds participate with other Dreyfus-managed funds in a $100 million unsecured line of credit primarily to be utilized for temporary or emergency purposes, including the financing of redemptions. Interest is charged to the funds based on prevailing market rates in effect at the time of borrowings. During the period ended February 28, 2007, the funds did not borrow under the line of credit.
Table 1.
| Expiring in fiscal | 2012 ($)† | 2013 ($)† | 2014 ($)† | Total ($) | ||||
| Mellon Bond Fund | 1,596,239 | 136,060 | 1,275,059 | 3,007,358 | ||||
| Mellon Intermediate Bond Fund | 1,813,775 | 892,928 | 4,073,519 | 6,780,222 | ||||
| Mellon Short-Term U.S. Government Securities Fund | 182,342 | 1,852,740 | 2,969,151 | 5,004,233 |
† If not applied, the carryover expire in the above years.
The Funds 33
NOTES TO FINANCIAL STATEMENTS (Unaudited) (continued)
NOTE 4—Investment Advisory Fee, Administration Fee and Other Transactions With Affiliates:
(a) Fees payable by the funds pursuant to the provisions of an Investment Advisory Agreement with the Investment Adviser are payable monthly, computed on the average daily value of each fund’s net assets at the following annual rates: .40% of the Mellon Bond Fund, .40% of the Mellon Intermediate Bond Fund and .35% of the Mellon Short-Term U.S. Government Securities Fund.
Pursuant to the Administration Agreement with Mellon, Mellon provides or arranges for fund accounting, transfer agency and other fund administration services and receives a fee based on the total net assets of the Trust based on the following rates:
| 0 up to $6 billion | .15% | |
| $6 billion up to $12 billion | .12% | |
| In excess of $12 billion | .10% |
Mellon Bank has entered into a Sub-Administration Agreement with Dreyfus pursuant to which Mellon Bank pays Dreyfus for performing certain administrative services.
(b) The funds have adopted a Shareholder Services Plan with respect to its Investor shares pursuant to which each fund pays the Distributor for the provision of certain services to holders of Investor shares a fee at an annual rate of .25% of the value of the average daily net assets attributable to Investor shares. The services provided may include personal services relating to shareholder accounts, such as answering shareholder inquiries regarding a fund, and providing reports and other information, and services related to the maintenance of such shareholder accounts. The Shareholder Services Plan allows the Distributor to make payments from the shareholder services fees it collects from each fund to compensate service agents (certain banks, securities brokers or dealers and other financial institutions) in respect of these services. Table 3 summarizes the amounts Investor shares were charged during the period ended February 28, 2007, pursuant to the Shareholder Services Plan. Additional fees included in shareholder servicing costs in the Statement of Operations includes fees paid to the transfer agent.
| Table 3. | ||
| Mellon Bond Fund | $4,300 | |
| Mellon Intermediate Bond Fund | 975 | |
| Mellon Short-Term U.S. | ||
| Government Securities Fund | 154 |
The funds compensate Mellon Bank, N.A., an affiliate of Dreyfus, under a Custody Agreement for providing custodial services for the funds. Table 4 summarizes the amounts the funds were charged during the period ended February 28, 2007, pursuant to the custody agreements.
| Table 4. | ||
| Mellon Bond Fund | $39,829 | |
| Mellon Intermediate Bond Fund | 24,786 | |
| Mellon Short-Term U.S. | ||
| Government Securities Fund | 8,142 |
During the period ended February 28, 2007, each fund was charged $2,044 for services performed by the Chief Compliance Officer.
Table 5 summarizes the components of Due to The Dreyfus Corporation and affiliates in the Statement of Assets and Liabilities for each fund.
| Table 5. | ||||||||
| Investment | Chief | Shareholder | ||||||
| Advisory | Compliance | Services | Custodian | |||||
| Fees ($) | Officer Fees ($) | Plan Fees ($) | Fees ($) | |||||
| Mellon Bond Fund | 276,940 | 2,726 | 669 | 17,055 | ||||
| Mellon Intermediate Bond Fund | 211,591 | 2,726 | 175 | 11,112 | ||||
| Mellon Short-Term U.S. Government Securities Fund | 34,080 | 2,726 | 15 | 3,301 | ||||
| 34 |
(c) Each trustee who is not an “affiliated person” as defined in the Act receives from the Trust an annual fee of $48,000 and an attendance fee of $5,000 for each in-person meeting attended and $500 for telephone meetings and is reimbursed for travel and out-of-pocket expenses. The Chairman of the Trust’s Board receives an additional annual fee of $10,000 and the Chairman of the Trust’s Audit Committee receives an additional annual fee of $8,000.
(d) The Trust and Dreyfus have received an exemptive order from the SEC which, among other things, permits each fund to use cash collateral received in connection with lending the fund’s securities and other uninvested cash to purchase shares of one or more registered money market funds advised by Dreyfus in excess of the limitations imposed by the Act.
NOTE 5—Securities Transactions:
Table 6 summarizes each fund’s aggregate amount of purchases and sales of investment securities (including paydowns) excluding short-term securities, during the period ended February 28, 2007.
Table 7 summarizes the accumulated net unrealized appreciation (depreciation) on investments for each fund at February 28, 2007.
At February 28, 2007, the cost of investments for each fund for federal income tax purposes was substantially the same as the cost for financial reporting purposes (see the Statement of Investments).
| Table 6. | ||||||
| Purchases ($) | Sales ($) | |||||
| Mellon Bond Fund | 386,309,029 | 379,360,498 | ||||
| Mellon Intermediate Bond Fund | 323,819,657 | 292,137,123 | ||||
| Mellon Short-Term U.S. | ||||||
| Government Securities Fund | 73,068,409 | 79,190,113 | ||||
| Table 7. | ||||||
| Gross | Gross | |||||
| Appreciation ($) (Depreciation) ($) | Net ($) | |||||
| Mellon Bond Fund | 6,869,106 | 5,218,935 | 1,650,171 | |||
| Mellon Intermediate Bond Fund | 4,263,367 | 2,158,818 | 2,104,549 | |||
| Mellon Short-Term U.S. | ||||||
| Government Securities Fund | 181,922 | 348,794 | (166,872) | |||
The Funds 35
Telephone Private Wealth Management (PWM) Clients, please contact your Account Officer or call 1-888-281-7350. Brokerage Clients of Mellon Private Wealth Advisors (MPWA), please contact your financial representative or call 1-800-830-0549-Option 2. Individual Account Holders, please call Dreyfus at 1-800-896-8167.
Mail PWM Clients, write to your Account Officer, c/o Mellon Bank, N.A., One Mellon Bank Center, Pittsburgh, PA 15258
MPWA Brokerage Clients, write to your financial representative, P.O. Box 9012, Hicksville, NY 11802–9012
Individual Account Holders, write to: Mellon Funds, P.O. Box 55268, Boston, MA 02205–8502
The funds file their complete schedules of portfolio holdings with the Securities and Exchange Commission (“SEC”) for the first and third quarters of each fiscal year on Form N-Q. The funds’ Forms N-Q are available on the SEC’s website at http://www.sec.gov and may be reviewed and copied at the SEC’s Public Reference Room in Washington, DC. Information on the operation of the Public Reference Room may be obtained by calling 1-202-551-8090.
A description of the policies and procedures that the funds use to determine how to vote proxies relating to portfolio securities, and information regarding how the funds voted these proxies for the 12-month period ended June 30, 2006, is available at http://www.dreyfus.com and on the SEC’s website at http://www.sec.gov. The description of the policies and procedures is also available without charge, upon request, by calling 1-800-645-6561.
©2007 Dreyfus Service Corporation
MFTSA0207-TB
The Mellon Funds
| Mellon National Intermediate Municipal Bond Fund |
| Mellon National Short-Term Municipal Bond Fund |
| Mellon Pennsylvania Intermediate Municipal Bond Fund |
| Mellon Massachusetts Intermediate Municipal Bond Fund |
SEMIANNUAL REPORT February 28, 2007
| Contents | ||
| The Funds | ||
| Letter from the President | 2 | |
| Discussion of Funds’ Performance | ||
| Mellon National Intermediate | ||
| Municipal Bond Fund | 3 | |
| Mellon National Short-Term | ||
| Municipal Bond Fund | 5 | |
| Mellon Pennsylvania Intermediate | ||
| Municipal Bond Fund | 7 | |
| Mellon Massachusetts Intermediate | ||
| Municipal Bond Fund | 9 | |
| Understanding Your Fund’s Expenses | 11 | |
| Comparing Your Fund’s Expenses | ||
| With Those of Other Funds | 12 | |
| Statements of Investments | 13 | |
| Statements of Assets and Liabilities | 51 | |
| Statements of Operations | 52 | |
| Statements of Changes in Net Assets | 53 | |
| Financial Highlights | 58 | |
| Notes to Financial Statements | 68 | |
For More Information
Back cover
The views expressed herein are current to the date of this report. These views and the composition of the funds’ portfolios are subject to change at any time based on market and other conditions.
| • Not FDIC-Insured |
| • Not Bank-Guaranteed |
| • May Lose Value |
The Funds

| LETTER FROM |
| THE PRESIDENT |
Dear Shareholder:
We are pleased to present this semiannual report for the Mellon Funds Trust, covering the six-month period from September 1, 2006, through February 28, 2007.
The reporting period proved to be a time of relatively low volatility in the U.S. bond market, as short-term interest rates stabilized and yields of 10-year Treasury securities remained within a relatively narrow range. Fixed income investors ignored some of the bond markets’ more negative influences, including bouts of economic uncertainty, softening real estate markets, an inverted yield curve and ongoing geopolitical turmoil.
Investors disregarded these near-term concerns in favor of a longer view, looking to broader trends that showed moderately slower economic growth with subdued inflation risk and relatively strong credit fundamentals.
Municipal bonds also fared well despite a bout of weakness in January 2007 as prices generally were propelled higher by stabilized short-term rates, moderating inflationary pressures, and robust demand for tax-exempt securities from non-traditional investors, such as leveraged structured trading accounts and hedge funds.
We believe that investors reacting to near-term market influences with extreme shifts in investment strategy rarely is the best decision. Instead, a better course is to set a portfolio mix designed to meet long-term financial goals while attempting to manage short-term market volatility.As always, we encourage you to talk with your portfolio manager to help ensure that your portfolio remains aligned with your current financial needs and future investment goals.
For information about how each fund performed during the reporting period, as well as market perspectives, we have provided a Discussion of Fund Performance.
Thank you for your continued confidence and support.


| DISCUSSION OF |
| FUND PERFORMANCE |
John F. Flahive and Mary Collette O’Brien, Portfolio Managers
How did Mellon National Intermediate Municipal Bond Fund perform relative to its benchmark?
For the six-month period ended February 28, 2007, the fund achieved total returns of 2.32% for Class M shares, 2.12% for Investor shares and 1.94% for Dreyfus Premier shares.1 In comparison, the Lehman Brothers 7-Year Municipal Bond Index (the “Index”), the fund’s benchmark, achieved a total return of 2.17% for the same period.2
Municipal bonds fared relatively well during the reporting period as investors responded favorably to stabilizing interest rates, diminishing inflationary pressures and moderating economic growth. The fund’s Class M shares produced a higher return than that of the benchmark, due primarily to the success of our yield curve and security selection strategies.
What is the fund’s investment approach?
The fund seeks to maximize current income exempt from federal income tax to the extent consistent with the preservation of capital.To pursue its goal, the fund normally invests at least 80% of its assets in municipal bonds that provide income exempt from federal income tax. The fund may occasionally, including for temporary defensive purposes, invest in taxable bonds. The fund’s investments in municipal and taxable bonds must be rated investment grade at the time of purchase or, if unrated, deemed of comparable quality by the investment adviser.3 Generally, the fund’s average effective portfolio maturity will be between three and 10 years, and the average effective duration of the fund’s portfolio will not exceed eight years.
Rather than focusing on economic or market trends, we search for securities that, in our opinion, will help us enhance the fund’s yield without sacrificing quality. We use a more tactical approach with respect to the fund’s average duration. If we expect the supply of securities to increase temporarily, we may reduce the fund’s average duration to make cash available for the purchase of higher yielding securities. This is due to the fact that yields generally tend to rise if issuers are competing for investor interest. If we expect demand to surge at a time when we anticipate little issuance and therefore lower yields, we may increase the fund’s average duration to maintain current yields for as long as practical. At other times, we typically try to maintain a neutral average duration.
What other factors influenced the fund’s performance?
The economic characteristics of the current reporting period stood in stark contrast to those of the six months that preceded it. Before the start of the reporting period, the U.S. economy was growing robustly, inflationary pressures were intensifying and the Federal Reserve Board (the “Fed”) continued to raise short-term interest rates in a tightening campaign that began in June 2004. These conditions changed significantly during the reporting period, when weakness in the housing and automotive sectors caused the rate of economic growth to moderate. At the same time, energy prices fell sharply, helping to relieve inflationary pressures. The Fed responded by holding interest rates steady throughout the reporting period.
The municipal bond market also was supported by supply-and-demand influences, including robust demand for long-term securities from non-traditional investors such as hedge funds and highly leveraged institutional accounts. High levels of investor demand readily absorbed the available supply of newly issued bonds, including a surge of new issuance toward the end of 2006.
As short-term interest rates stabilized and inflation concerns diminished, longer-term municipal bond yields began to fall. The fund benefited in this environ-
The Funds 3
DISCUSSION OF FUND PERFORMANCE (continued)
ment from its focus on bonds with maturities in the 15-to 20-year range, which gained more value than shorter-term securities. We balanced longer-term holdings with bonds in the five-year maturity range in order to maintain an average duration that was somewhat shorter than industry averages over most of the reporting period.
In addition, the fund had slightly heavier exposure than the benchmark to BBB-rated municipal bonds. This positioning contributed positively to the fund’s relative performance as risk-tolerant investors were attracted to the relatively robust income streams that securities at the lower end of the investment-grade spectrum typically provide. Finally, the fund benefited from our use of futures contracts early in the reporting period. These instruments effectively insulated the fund from the full brunt of market declines.
What is the fund’s current strategy?
Heightened market volatility near the end of the reporting period suggested to us that fixed-income investors may be growing more sensitive to risk, as the U.S. stock and bond markets reacted negatively to reports of turmoil in the market for sub-prime mortgages. As a result, we have continued to emphasize broad diversification across issuers and market sectors, and we have maintained the fund’s high-quality credit profile.
In addition, recent economic data have been mixed, indicating to us that the Fed is likely to remain on the sidelines over the foreseeable future.Yet, currently narrow yield differences among municipal bonds of different maturities may widen if investors detect evidence that the Fed may ease monetary policy later this year. Accordingly, we have adopted a more “bulleted” yield curve strategy that emphasizes securities in the 10-year maturity range.
March 15, 2007
| 1 | Total return includes reinvestment of dividends and any capital gains paid. | |
| Past performance is no guarantee of future results. Share price, yield and | ||
| investment return fluctuate such that upon redemption, fund shares may be | ||
| worth more or less than their original cost. Income may be subject to state and | ||
| local taxes, and some income may be subject to the federal alternative minimum | ||
| tax (AMT) for certain investors. Capital gains, if any, are fully taxable. | ||
| 2 | SOURCE: LIPPER INC. — Reflects reinvestment of dividends and, where | |
| applicable, capital gain distributions.The Lehman Brothers 7-Year Municipal | ||
| Bond Index is an unmanaged total return performance benchmark for the | ||
| investment-grade, geographically unrestricted 7-year tax-exempt bond market, | ||
| consisting of municipal bonds with maturities of 6-8 years. Index return does | ||
| not reflect the fees and expenses associated with operating a mutual fund. | ||
| 3 | The fund may continue to own investment grade bonds (at the time of | |
| purchase), which are subsequently downgraded to below investment grade. |
| 4 |

| DISCUSSION OF |
| FUND PERFORMANCE |
Timothy J. Sanville and Jeremy Baker, Portfolio Managers
How did Mellon National Short-Term Municipal Bond Fund perform relative to its benchmark?
For the six-month period ended February 28, 2007, the fund achieved total returns of 1.70% for Class M shares and 1.49% for Investor shares.1 In comparison, the Lehman Brothers 3-Year Municipal Bond Index (the “Index”), the fund’s benchmark, achieved a total return of 1.78% for the same period.2
Municipal bonds fared relatively well during the reporting period as investors responded favorably to stabilizing interest rates, diminishing inflationary pressures and moderating economic growth.The fund’s Class M shares produced a return that was in line with the benchmark, which we attribute to our yield curve strategy.
What is the fund’s investment approach?
The fund seeks to maximize current income exempt from federal income tax to the extent consistent with the preservation of capital.To pursue its goal, the fund normally invests at least 80% of its assets in municipal bonds that provide income exempt from federal income tax. The fund occasionally, including for temporary defensive purposes, may invest in taxable bonds. The fund’s investments in municipal and taxable bonds must be rated investment grade at the time of purchase or, if unrated, deemed of comparable quality by the investment adviser.3 Generally, the average effective portfolio maturity and the average effective portfolio duration of the fund’s portfolio will be less than three years.
Rather than focusing on economic or market trends, we search for securities that, in our opinion, will help us enhance the fund’s yield without sacrificing quality. We use a more tactical approach with respect to the
fund’s average duration. If we expect the supply of securities to increase temporarily, we may reduce the fund’s average duration to make cash available for the purchase of higher yielding securities. This is due to the fact that yields generally tend to rise if issuers are competing for investor interest. If we expect demand to surge at a time when we anticipate little issuance and therefore lower yields, we may increase the fund’s average duration to maintain current yields for as long as practical. At other times, we typically try to maintain a neutral average duration.
What other factors influenced the fund’s performance?
The economic characteristics of the current reporting period stood in stark contrast to those of the six months that preceded it. Before the start of the reporting period, the U.S. economy was growing robustly, inflationary pressures were intensifying and the Federal Reserve Board (the “Fed”) continued to raise short-term interest rates in a tightening campaign that began in June 2004. These conditions changed significantly during the reporting period, when weakness in the housing and automotive sectors caused the rate of economic growth to moderate. At the same time, energy prices fell sharply, helping to relieve inflationary pressures. The Fed responded by holding interest rates steady throughout the reporting period.
The municipal bond market also was supported by supply-and-demand influences, including robust demand for long-term securities from non-traditional investors such as hedge funds and highly leveraged institutional accounts. High levels of investor demand readily absorbed the available supply of newly issued bonds, including a surge of new issuance toward the end of 2006.
The Funds 5
DISCUSSION OF FUND PERFORMANCE (continued)
As short-term interest rates stabilized and inflation concerns diminished, longer-term municipal bond yields began to fall. The fund benefited in this environment from a “barbelled” yield curve strategy, in which we balanced holdings with maturities of one year or less with bonds in the 10-year maturity range. This strategy enabled the fund to participate in strength among longer-term bonds while maintaining an average duration that generally was in line with industry averages.
In addition, the fund had slightly heavier exposure than the benchmark to BBB-rated municipal bonds. This positioning contributed positively to the fund’s relative performance, as risk-tolerant investors were attracted to the relatively robust income streams that securities at the lower end of the investment-grade spectrum typically provide. Finally, the fund benefited from our use of futures contracts early in the reporting period. These instruments effectively insulated the fund from the full brunt of market declines.
What is the fund’s current strategy?
Heightened market volatility near the end of the reporting period suggested to us that fixed-income investors may be growing more sensitive to risk, as the U.S. stock and bond markets reacted negatively to reports of turmoil in the market for sub-prime mortgages.As a result, >we have continued to emphasize broad diversification across issuers and market sectors, and we have maintained the fund’s high-quality credit profile.
In addition, recent economic data have been mixed, indicating to us that the Fed is likely to remain on the sidelines over the foreseeable future. Yet, currently narrow yield differences among municipal bonds of different maturities may widen if investors detect evidence that the Fed may ease monetary policy later this year. Accordingly, we have moved toward a more “bulleted” yield curve strategy that emphasizes securities in the three-year maturity range.
March 15, 2007
| 1 | Total return includes reinvestment of dividends and any capital gains paid. | |
| Past performance is no guarantee of future results. Share price, yield and | ||
| investment return fluctuate such that upon redemption, fund shares may be | ||
| worth more or less than their original cost. Income may be subject to state and | ||
| local taxes, and some income may be subject to the federal alternative | ||
| minimum tax (AMT) for certain investors. Capital gains, if any, are fully | ||
| taxable. | ||
| 2 | SOURCE: LIPPER INC. — Reflects reinvestment of dividends and, where | |
| applicable, capital gain distributions.The Lehman Brothers 3-Year Municipal | ||
| Bond Index is an unmanaged total return performance benchmark for the | ||
| investment-grade, geographically unrestricted 3-year tax-exempt bond market, | ||
| consisting of municipal bonds with maturities of 2-4 years. Index return does | ||
| not reflect the fees and expenses associated with operating a mutual fund. | ||
| 3 | The fund may continue to own investment grade bonds (at the time of | |
| purchase), which are subsequently downgraded to below investment grade. |
| 6 |

| DISCUSSION OF |
| FUND PERFORMANCE |
Mary Collette O’Brien and Jeremy N. Baker, Portfolio Managers
How did Mellon Pennsylvania Intermediate Municipal Bond Fund perform relative to its benchmark?
For the six-month period ended February 28, 2007, the fund achieved total returns of 2.20% for Class M shares and 2.15% for Investor shares.1 In comparison, the Lehman Brothers 7-Year Municipal Bond Index (the “Index”), the fund’s benchmark, achieved a total return of 2.17% for the same period.2
Municipal bonds fared relatively well during the reporting period as investors responded favorably to stabilizing interest rates, diminishing inflationary pressures and moderating economic growth. The fund’s two share classes produced returns that were in line with the benchmark, due primarily to the success of our yield curve and security selection strategies.
What is the fund’s investment approach?
The fund seeks as high a level of income exempt from federal and Pennsylvania state income taxes as is consistent with the preservation of capital. To pursue its goal, the fund normally invests at least 80% of its assets in municipal bonds, the interest from which is exempt from federal and Pennsylvania state personal income taxes. The fund may also invest in municipal bonds that are exempt from federal income taxes, but not Pennsylvania personal income taxes, and in taxable bonds. The fund’s investments in municipal and taxable bonds must be rated investment grade at the time of purchase or, if unrated, deemed of comparable quality by the investment adviser.3 Generally, the fund’s average effective portfolio maturity will be between three and 10 years, and the average effective duration of the fund’s portfolio will not exceed eight years.
Rather than focusing on economic or market trends, we search for securities that, in our opinion, will help us enhance the fund’s yield without sacrificing quality.
We use a more tactical approach with respect to the fund’s average duration. If we expect the supply of securities to increase temporarily, we may reduce the fund’s average duration to make cash available for the purchase of higher yielding securities. This is due to the fact that yields generally tend to rise if issuers are competing for investor interest. If we expect demand to surge at a time when we anticipate little issuance and therefore lower yields, we may increase the fund’s average duration to maintain current yields for as long as practical. At other times, we typically try to maintain a neutral average duration.
What other factors influenced the fund’s performance?
Before the start of the reporting period, the U.S. economy was growing robustly, inflationary pressures were intensifying and the Federal Reserve Board (the “Fed”) continued to raise short-term interest rates in a tightening campaign that began in June 2004.These conditions changed significantly during the reporting period, when weakness in the housing and automotive sectors caused the rate of economic growth to moderate.At the same time, energy prices fell sharply, helping to relieve inflationary pressures. The Fed responded by holding interest rates steady throughout the reporting period.
The municipal bond market also was supported by supply-and-demand influences, including robust demand for long-term securities from non-traditional investors such as hedge funds and highly leveraged institutional accounts. High levels of investor demand readily absorbed the available supply of newly issued municipal bonds, including an ample volume of new securities from Pennsylvania issuers.
As short-term interest rates stabilized and inflation concerns diminished, longer-term municipal bond yields began to fall.The fund benefited from its focus on non-callable bonds with maturities in the 15- to 20-year range, which gained more value than short-term securities. We balanced longer-term holdings
The Funds 7
DISCUSSION OF FUND PERFORMANCE (continued)
with bonds in the five-year maturity range in order to maintain an average duration that was somewhat shorter than industry averages over most of the reporting period.
In addition, the fund had slightly heavier exposure than the benchmark to BBB-rated securities.This positioning contributed positively to the fund’s relative performance, as risk-tolerant investors were attracted to the relatively robust income streams that bonds at the lower end of the investment-grade spectrum typically provide. Finally, the fund benefited from our use of futures contracts early in the reporting period.These instruments effectively insulated the fund from the full brunt of market declines.
What is the fund’s current strategy?
Heightened market volatility near the end of the reporting period suggested to us that fixed-income investors might be growing more sensitive to risk. As a result, we have continued to emphasize broad diversification across issuers and market sectors, and we have maintained the fund’s high-quality credit profile. In addition, recent economic data have been mixed, indicating to us that the Fed is likely to remain on the sidelines over the foreseeable future. Yet, currently narrow yield differences among municipal bonds of different maturities may widen if investors detect evidence that the Fed may ease monetary policy later this year. Accordingly, we have adopted a more “bulleted” yield curve strategy that emphasizes securities in the 10-year maturity range.
March 15, 2007
| 1 | Total return includes reinvestment of dividends and any capital gains paid. | |
| Past performance is no guarantee of future results. Share price, yield and | ||
| investment return fluctuate such that upon redemption, fund shares may be | ||
| worth more or less than their original cost. Income may be subject to state and | ||
| local taxes for non-Pennsylvania residents, and some income may be subject to | ||
| the federal alternative minimum tax (AMT) for certain investors. Capital | ||
| gains, if any, are fully taxable. | ||
| 2 | SOURCE: LIPPER INC. — Reflects reinvestment of dividends and, where | |
| applicable, capital gain distributions.The Lehman Brothers 7-Year Municipal | ||
| Bond Index is an unmanaged total return performance benchmark for the | ||
| investment-grade, geographically unrestricted 7-year tax-exempt bond market, | ||
| consisting of municipal bonds with maturities of 6-8 years. Index return does | ||
| not reflect the fees and expenses associated with operating a mutual fund. | ||
| 3 | The fund may continue to own investment grade bonds (at the time of | |
| purchase), which are subsequently downgraded to below investment grade. |
| 8 |

| DISCUSSION OF |
| FUND PERFORMANCE |
John F. Flahive and Mary Collette O’Brien, Portfolio Managers
How did Mellon Massachusetts Intermediate Municipal Bond Fund perform relative to its benchmark?
For the six-month period ended February 28, 2007, the fund achieved total returns of 2.40% for Class M shares, 2.28% for Investor shares and 2.02% for Dreyfus Premier shares.1 In comparison, the Lehman Brothers 7-Year Municipal Bond Index (the “Index”), the fund’s benchmark, achieved a total return of 2.17% for the same period.2
Municipal bonds fared relatively well during the reporting period as investors responded favorably to stabilizing interest rates, diminishing inflationary pressures and moderating economic growth. The fund’s Class M shares and its Investor shares produced higher returns than the benchmark, due primarily to the success of our yield curve and security selection strategies.
What is the fund’s investment approach?
The fund seeks as high a level of income exempt from federal and Massachusetts state income taxes as is consistent with the preservation of capital. To pursue its goal, the fund normally invests at least 80% of its assets in municipal bonds, the interest from which is exempt from federal and Massachusetts state personal income taxes. The fund may also invest in municipal bonds that are exempt from federal income taxes, but not Massachusetts personal income taxes, and in taxable bonds. The fund’s investments in municipal and taxable bonds must be rated investment grade at the time of purchase or, if unrated, deemed of comparable quality by the investment adviser.3 Generally, the fund’s average effective portfolio maturity will be between three and 10 years, and the average effective duration of the fund’s portfolio will not exceed eight years.
Rather than focusing on economic or market trends, we search for securities that, in our opinion, will help us enhance the fund’s yield without sacrificing quality.We use a more tactical approach with respect to the fund’s average duration. If we expect the supply of securities to increase temporarily, we may reduce the fund’s average duration to make cash available for the purchase of higher yielding securities.This is because yields generally tend to rise if issuers are competing for investor interest. If we expect demand to surge at a time when we anticipate little issuance and therefore lower yields, we may increase the fund’s average duration to maintain current yields for as long as practical.At other times, we typically try to maintain a neutral average duration.
What other factors influenced the fund’s performance?
Before the start of the reporting period, the U.S. economy was growing robustly, inflationary pressures were intensifying and the Federal Reserve Board (the “Fed”) continued to raise short-term interest rates in a tightening campaign that began in June 2004.These conditions changed significantly during the reporting period, when weakness in the housing and automotive sectors caused the rate of economic growth to mod-erate.At the same time, energy prices fell sharply, helping to relieve inflationary pressures. The Fed responded by holding interest rates steady throughout the reporting period.
The municipal bond market also was supported by supply-and-demand influences, including robust demand for long-term securities from non-traditional investors such as hedge funds and highly leveraged institutional accounts. High levels of investor demand readily absorbed the available supply of newly issued municipal bonds, including an ample volume of new securities from Massachusetts issuers.
The Funds 9
DISCUSSION OF FUND PERFORMANCE (continued)
As short-term interest rates stabilized and inflation concerns diminished, longer-term municipal bond yields began to fall.The fund benefited from its focus on non-callable bonds with maturities in the 15- to 20-year range, which gained more value than short-term securities. We balanced longer-term holdings with bonds in the five-year maturity range in order to maintain an average duration that was somewhat shorter than industry averages over most of the reporting period.
In addition, the fund had slightly heavier exposure than the benchmark to BBB-rated securities.This positioning contributed positively to the fund’s relative performance, as risk-tolerant investors were attracted to the relatively robust income streams that bonds at the lower end of the investment-grade spectrum typically provide. Finally, the fund benefited from our use of futures contracts early in the reporting period.These instruments effectively insulated the fund from the full brunt of market declines.
What is the fund’s current strategy?
Heightened market volatility near the end of the reporting period suggested to us that fixed-income investors might be growing more sensitive to risk. As a result, we have continued to emphasize broad diversification across issuers and market sectors, and we have maintained the fund’s high-quality credit profile. In addition, recent economic data have been mixed, indicating to us that the Fed is likely to remain on the sidelines over the foreseeable future. Yet, currently narrow yield differences among municipal bonds of different maturities may widen if investors detect evidence that the Fed may ease monetary policy later this year. Accordingly, we have adopted a more “bulleted” yield curve strategy that emphasizes securities in the 10-year maturity range.
March 15, 2007
| 1 | Total return includes reinvestment of dividends and any capital gains paid. | |
| Past performance is no guarantee of future results. Share price, yield and | ||
| investment return fluctuate such that upon redemption, fund shares may be | ||
| worth more or less than their original cost. Income may be subject to state and | ||
| local taxes for non-Massachusetts residents, and some income may be subject to | ||
| the federal alternative minimum tax (AMT) for certain investors. Capital | ||
| gains, if any, are fully taxable. Return figures provided reflect the absorption of | ||
| certain fund expenses by Mellon Bank, N.A. pursuant to an agreement in | ||
| effect through September 30, 2007, at which time it may be extended, | ||
| terminated or modified. Had these expenses not been absorbed, the fund’s | ||
| returns would have been lower. | ||
| 2 | SOURCE: LIPPER INC. — Reflects reinvestment of dividends and, where | |
| applicable, capital gain distributions.The Lehman Brothers 7-Year Municipal | ||
| Bond Index is an unmanaged total return performance benchmark for the | ||
| investment-grade, geographically unrestricted 7-year tax-exempt bond market, | ||
| consisting of municipal bonds with maturities of 6-8 years. Index return does | ||
| not reflect the fees and expenses associated with operating a mutual fund. | ||
| 3 | The fund may continue to own investment grade bonds (at the time of | |
| purchase), which are subsequently downgraded to below investment grade. |
| 10 |
UNDERSTANDING YOUR FUND’S EXPENSES ( U n a u d i t e d )
As a mutual fund investor, you pay ongoing expenses, such as management fees and other expenses. Using the information below, you can estimate how these expenses affect your investment and compare them with the expenses of other funds.You also may pay one-time transaction expenses, including sales charges (loads) and redemptions fees, which are not shown in this section and would have resulted in higher total expenses. For more information, see your fund’s prospectus or talk to your financial adviser.
Review your fund’s expenses
The table below shows the expenses you would have paid on a $1,000 investment in each class of each Mellon municipal bond fund from September 1, 2006 to February 28, 2007. It also shows how much a $1,000 investment would be worth at the close of the period, assuming actual returns and expenses.
| Expenses and Value of a $1,000 Investment | ||||||
| assuming actual returns for the six months ended February 28, 2007 | ||||||
| Dreyfus | ||||||
| Class M Shares | Investor Shares | Premier Shares | ||||
| Mellon National Intermediate | ||||||
| Municipal Bond Fund | ||||||
| Expenses paid per $1,000 † | $ 2.56 | $ 3.81 | $ 6.31 | |||
| Ending value (after expenses) | $1,023.20 | $1,021.20 | $1,019.40 | |||
| Mellon National Short-Term | ||||||
| Municipal Bond Fund | ||||||
| Expenses paid per $1,000 † | $ 2.75 | $ 4.00 | — | |||
| Ending value (after expenses) | $1,017.00 | $1,014.90 | — | |||
| Mellon Pennsylvania | ||||||
| Intermediate Municipal Bond Fund | ||||||
| Expenses paid per $1,000 † | $ 3.31 | $ 4.61 | — | |||
| Ending value (after expenses) | $1,022.00 | $1,021.50 | — | |||
| Mellon Massachusetts | ||||||
| Intermediate Municipal Bond Fund | ||||||
| Expenses paid per $1,000 † | $ 2.51 | $ 3.76 | $ 6.26 | |||
| Ending value (after expenses) | $1,024.00 | $1,022.80 | $1,020.20 | |||
The Funds 11
| † Expenses are equal to the Mellon National Intermediate Municipal Bond Fund annualized expense ratio of .51% for Class M, .76% for Investor shares and 1.26% for Dreyfus |
| Premier shares, Mellon National Short-Term Municipal Bond Fund .55% for Class M and .80% for Investor shares, Mellon Pennsylvania Intermediate Municipal Bond Fund |
| .66% for Class M and .92% for Investor shares and Mellon Massachusetts Intermediate Municipal Bond Fund .50% for Class M, .75% for Investor shares and 1.25% for |
| Dreyfus Premier shares, multiplied by the respective fund's average account value over the period, multiplied by 181/365 (to reflect the one-half year period). |
COMPARING YOUR FUND’S EXPENSES WITH THOSE OF OTHER FUNDS (Unaudited)
Using the SEC’s method to compare expenses
The Securities and Exchange Commission (SEC) has established guidelines to help investores assess fund expenses. Per these guidelines, the table below shows your fund’s expenses based on a $1,000 investment, assuming a hypothetical 5% annualized return.You can use this information to compare the ongoing expenses (but not transaction expenses or total cost) of investing in the fund with those of other funds.All mutual fund shareholder reports will provide this information to help you make this comparison. Please note that you cannot use this information to estimate your actual ending account balance and expenses paid during the period.
| Expenses and Value of a $1,000 Investment | ||||||
| assuming actual returns for the six months ended February 28, 2007 | ||||||
| Dreyfus | ||||||
| Class M Shares | Investor Shares | Premier Shares | ||||
| Mellon National Intermediate | ||||||
| Municipal Bond Fund | ||||||
| Expenses paid per $1,000 † | $ 2.56 | $ 3.81 | $ 6.31 | |||
| Ending value (after expenses) | $1,022.27 | $1,021.03 | $1,018.55 | |||
| Mellon National Short-Term | ||||||
| Municipal Bond Fund | ||||||
| Expenses paid per $1,000 † | $ 2.76 | $ 4.01 | — | |||
| Ending value (after expenses) | $1,022.07 | $1,020.83 | — | |||
| Mellon Pennsylvania | ||||||
| Intermediate Municipal Bond Fund | ||||||
| Expenses paid per $1,000 † | $ 3.31 | $ 4.61 | — | |||
| Ending value (after expenses) | $1,021.52 | $1,020.23 | — | |||
| Mellon Massachusetts | ||||||
| Intermediate Municipal Bond Fund | ||||||
| Expenses paid per $1,000 † | $ 2.51 | $ 3.76 | $ 6.26 | |||
| Ending value (after expenses) | $1,022.32 | $1,021.08 | $1,018.60 | |||
| † Expenses are equal to the Mellon National Intermediate Municipal Bond Fund annualized expense ratio of .51% for Class M, .76% for Investor shares and 1.26% for Dreyfus |
| Premier shares, Mellon National Short-Term Municipal Bond Fund .55% for Class M and .80% for Investor shares, Mellon Pennsylvania Intermediate Municipal Bond Fund |
| .66% for Class M and .92% for Investor shares and Mellon Massachusetts Intermediate Municipal Bond Fund .50% for Class M, .75% for Investor shares and 1.25% for |
| Dreyfus Premier shares, multiplied by the respective fund's average account value over the period, multiplied by 181/365 (to reflect the one-half year period). |
| 12 |
| STATEMENT OF INVESTMENTS |
| February 28, 2007 (Unaudited) |
| Mellon National Intermediate Municipal Bond Fund | ||||||||||
| Long-Term Municipal | Coupon | Maturity | Principal | |||||||
| Investments—94.3% | Rate (%) | Date | Amount ($) | Value ($) | ||||||
| Alabama—3.2% | ||||||||||
| Alabama | 5.00 | 6/1/09 | 2,295,000 | 2,364,217 | ||||||
| Alabama Public School and College Authority, Capital Improvement | 5.63 | 7/1/13 | 3,000,000 | 3,168,150 | ||||||
| Birmingham Special Care Facilities Financing Authority-Baptist | ||||||||||
| Medical Centers, Revenue (Baptist Health System Inc.) | 5.00 | 11/15/15 | 5,260,000 | 5,531,942 | ||||||
| Jefferson County, Limited Obligation School Warrants | 5.00 | 1/1/24 | 13,500,000 | 14,254,920 | ||||||
| Montgomery BMC Special Care Facilities Financing | ||||||||||
| Authority, Revenue (Baptist Health) (Insured; MBIA) | 0/5.00 | 11/15/13 | 1,365,000 a | 1,403,698 | ||||||
| Montgomery BMC Special Care Facilities Financing | ||||||||||
| Authority, Revenue (Baptist Health) (Insured; MBIA) | 0/5.00 | 11/15/14 | 2,500,000 a | 2,591,075 | ||||||
| Alaska—.1% | ||||||||||
| Anchorage, Electric Utility Revenue (Insured; MBIA) | 8.00 | 12/1/10 | 1,000,000 | 1,147,420 | ||||||
| Arizona—2.7% | ||||||||||
| Arizona School Facilities Board, | ||||||||||
| State School Improvement Revenue | 5.00 | 7/1/08 | 1,625,000 | 1,653,714 | ||||||
| Arizona School Facilities Board, | ||||||||||
| State School Trust Revenue (Insured; AMBAC) | 5.75 | 7/1/17 | 3,000,000 | 3,387,960 | ||||||
| Maricopa County Unified School District | ||||||||||
| (Paradise Valley) (Insured; MBIA) | 6.35 | 7/1/10 | 550,000 | 596,486 | ||||||
| Maricopa County Unified School District | ||||||||||
| (Paradise Valley) (Insured; MBIA) | 7.00 | 7/1/11 | 1,905,000 | 2,154,479 | ||||||
| Maricopa County Unified School District (Scottsdale School) | 6.60 | 7/1/12 | 1,250,000 | 1,425,788 | ||||||
| Phoenix | 6.25 | 7/1/16 | 1,250,000 | 1,500,300 | ||||||
| Phoenix Civic Improvement Corp., Transit Excise | ||||||||||
| Tax Revenue (Light Rail Project) (Insured; AMBAC) | 5.00 | 7/1/16 | 6,000,000 | 6,479,160 | ||||||
| Phoenix Industrial Development Authority, SFMR | ||||||||||
| (Collateralized: FHLMC, FNMA and GNMA) | 6.60 | 12/1/29 | 260,000 | 266,157 | ||||||
| Salt River Project Agricultural Improvement | ||||||||||
| and Power District, Electric System Revenue | 5.00 | 1/1/10 | 1,000,000 | 1,037,310 | ||||||
| Salt River Project Agricultural Improvement | ||||||||||
| and Power District, Electric System Revenue | 5.00 | 1/1/17 | 1,000,000 | 1,075,700 | ||||||
| Scottsdale Industrial Development Authority, | ||||||||||
| HR (Scottsdale Healthcare) | 5.70 | 12/1/11 | 1,000,000 b | 1,094,180 | ||||||
| Tucson | 5.00 | 7/1/12 | 1,265,000 | 1,348,085 | ||||||
| University Medical Center Corp., HR | 5.25 | 7/1/16 | 2,310,000 | 2,451,996 | ||||||
| California—18.1% | ||||||||||
| Agua Caliente Band, Cahuilla Indians Revenue | 5.60 | 7/1/13 | 1,815,000 | 1,898,490 | ||||||
| Alameda Corridor Transportation Authority, | ||||||||||
| Revenue (Insured; AMBAC) | 0/5.25 | 10/1/21 | 5,000,000 a | 4,153,100 | ||||||
| California | 5.75 | 3/1/08 | 190,000 | 191,913 | ||||||
| California | 6.60 | 2/1/09 | 510,000 | 537,713 | ||||||
| California | 5.50 | 6/1/10 | 3,685,000 b | 3,904,626 | ||||||
| California | 5.00 | 11/1/11 | 655,000 b | 696,272 | ||||||
| California | 5.00 | 11/1/12 | 345,000 | 364,303 | ||||||
| California | 5.50 | 6/1/20 | 270,000 | 282,998 | ||||||
The Funds 13
STATEMENT OF INVESTMENTS (Unaudited) (continued)
| Mellon National Intermediate Municipal Bond Fund (continued) | ||||||||
| Long-Term Municipal | Coupon | Maturity | Principal | |||||
| Investments (continued) | Rate (%) | Date | Amount ($) | Value ($) | ||||
| California (continued) | ||||||||
| California | 5.25 | 11/1/26 | 10,500,000 | 11,322,255 | ||||
| California | 5.50 | 11/1/33 | 3,900,000 | 4,265,781 | ||||
| California (Insured; FGIC) | 5.75 | 3/1/09 | 80,000 | 80,858 | ||||
| California, Economic Recovery Bonds | 5.00 | 7/1/16 | 15,400,000 | 16,246,076 | ||||
| California, GO (Various Purpose) | 5.00 | 2/1/33 | 1,825,000 | 1,919,170 | ||||
| California County Tobacco Securitization Agency, | ||||||||
| Tobacco Settlement Asset-Backed Bonds | ||||||||
| (Los Angeles County Securitization Corp.) | 0/5.25 | 6/1/21 | 1,250,000 a | 1,104,625 | ||||
| California Department of Water Resources, | ||||||||
| Power Supply Revenue | 5.50 | 5/1/08 | 4,000,000 | 4,085,760 | ||||
| California Department of Water Resources, | ||||||||
| Power Supply Revenue (Insured; AMBAC) | 5.38 | 5/1/12 | 5,000,000 b | 5,470,600 | ||||
| California Educational Facilities Authority, | ||||||||
| Revenue (Pepperdine University) | 5.75 | 9/15/08 | 3,250,000 b | 3,387,182 | ||||
| California Educational Facilities Authority, | ||||||||
| Revenue (Stanford University) | 5.00 | 11/1/11 | 3,000,000 | 3,189,450 | ||||
| California Infrastructure and Economic Development | ||||||||
| Bank, Revenue (Clean Water State Revolving Fund) | 5.00 | 10/1/17 | 2,500,000 | 2,653,650 | ||||
| California Municipal Finance Authority, | ||||||||
| SWDR (Waste Management Inc. Project) | 4.10 | 9/1/09 | 1,000,000 | 996,250 | ||||
| California State Public Works Board, LR | ||||||||
| (Department of General Services) (Capitol East End | ||||||||
| Complex—Blocks 171-174 and 225) (Insured; AMBAC) | 5.25 | 12/1/19 | 5,000,000 | 5,394,300 | ||||
| California Statewide Communities Development | ||||||||
| Authority, MFHR (Archstone/Seascape Village Apartments) | 5.25 | 6/1/08 | 4,000,000 | 4,069,360 | ||||
| California Statewide Communities Development | ||||||||
| Authority, MFHR (Equity Residential/ | ||||||||
| Parkview Terrace Club Apartments) | 5.20 | 6/15/09 | 3,000,000 | 3,089,040 | ||||
| California Statewide Communities Development Authority, | ||||||||
| Revenue (Daughters of Charity Health System) | 5.25 | 7/1/24 | 3,470,000 | 3,692,566 | ||||
| California Statewide Communities Development Authority, | ||||||||
| Revenue (Daughters of Charity Health System) | 5.25 | 7/1/35 | 7,000,000 | 7,393,750 | ||||
| Foothill/Eastern Transportation Corridor Agency, | ||||||||
| Toll Road Revenue (Insured; MBIA) | 0/5.80 | 1/15/20 | 1,505,000 a | 1,492,915 | ||||
| Foothill/Eastern Transportation Corridor Agency, | ||||||||
| Toll Road Revenue (Insured; MBIA) | 0/5.88 | 1/15/26 | 8,000,000 a | 7,893,200 | ||||
| Golden State Tobacco Securitization Corp., | ||||||||
| Enhanced Tobacco Settlement Asset-Backed Bonds | 5.75 | 6/1/08 | 6,755,000 b | 6,932,116 | ||||
| Golden State Tobacco Securitization Corp., | ||||||||
| Enhanced Tobacco Settlement Asset-Backed Bonds | 5.75 | 6/1/08 | 8,240,000 b | 8,456,053 | ||||
| Golden State Tobacco Securitization Corp., | ||||||||
| Enhanced Tobacco Settlement Asset-Backed Bonds | 5.00 | 6/1/18 | 1,000,000 | 1,016,340 | ||||
| Kern High School District (Insured; MBIA) | 6.40 | 2/1/12 | 2,750,000 | 3,035,368 | ||||
| Los Angeles Department of Water and Power, | ||||||||
| Power Systems Revenue (Insured; MBIA) | 5.25 | 7/1/11 | 2,250,000 | 2,403,000 | ||||
14
| Mellon National Intermediate Municipal Bond Fund (continued) | ||||||||||
| Long-Term Municipal | Coupon | Maturity | Principal | |||||||
| Investments (continued) | Rate (%) | Date | Amount ($) | Value ($) | ||||||
| California (continued) | ||||||||||
| Los Angeles Unified School District, GO (Insured; MBIA) | 5.13 | 7/1/12 | 20,000,000 b | 21,524,600 | ||||||
| Los Angeles Unified School District, GO (Insured; MBIA) | 5.75 | 7/1/16 | 2,000,000 | 2,326,380 | ||||||
| Modesto Wastewater Treatment Facility, Revenue (Insured; MBIA) | 6.00 | 11/1/09 | 500,000 | 531,955 | ||||||
| Oakland Joint Powers Financing Authority, LR | ||||||||||
| (Oakland Convention Centers) (Insured; AMBAC) | 5.50 | 10/1/13 | 1,500,000 | 1,662,615 | ||||||
| Sacramento Municipal Utility District, Electric Revenue | 5.30 | 7/1/12 | 1,010,000 | 1,049,188 | ||||||
| Sacramento Municipal Utility District, Electric Revenue (Insured; FGIC) | 5.25 | 5/15/13 | 3,530,000 | 3,854,619 | ||||||
| San Francisco City and County, GO (Insured; FGIC) | 4.00 | 6/15/20 | 5,000,000 | 5,004,200 | ||||||
| San Jose Redevelopment Agency, Tax Allocation Revenue | ||||||||||
| (Merged Area Redevelopment Project) (Insured; MBIA) | 6.00 | 8/1/09 | 205,000 | 216,870 | ||||||
| San Jose Redevelopment Agency, Tax Allocation Revenue | ||||||||||
| (Merged Area Redevelopment Project) (Insured; MBIA) | 6.00 | 8/1/09 | 420,000 | 443,474 | ||||||
| Santa Margarita-Dana Point Authority, Revenue (Insured; MBIA) | 7.25 | 8/1/07 | 500,000 | 507,665 | ||||||
| Southern California Public Power Authority, Power Project | ||||||||||
| Revenue (San Juan Unit 3) (Insured; FSA) | 5.50 | 1/1/13 | 3,010,000 | 3,311,211 | ||||||
| Southern California Public Power Authority, Power Project | ||||||||||
| Revenue (San Juan Unit 3) (Insured; FSA) | 5.50 | 1/1/14 | 2,000,000 | 2,229,160 | ||||||
| Westside Unified School District (Insured; AMBAC) | 6.00 | 8/1/14 | 385,000 | 446,981 | ||||||
| Colorado—4.2% | ||||||||||
| Colorado Department of Transportation, | ||||||||||
| Transportation RAN (Insured; MBIA) | 5.25 | 6/15/10 | 1,000,000 | 1,050,970 | ||||||
| Colorado Educational and Cultural Facilities Authority, | ||||||||||
| Revenue (Regis University Project) (Insured; Radian) | 5.00 | 6/1/22 | 1,825,000 | 1,919,498 | ||||||
| Colorado Health Facilities Authority, Health Facilities Revenue | ||||||||||
| (The Evangelical Lutheran Good Samaritan Society Project) | 5.25 | 6/1/31 | 1,000,000 | 1,063,610 | ||||||
| Colorado Health Facilities Authority, Revenue | ||||||||||
| (Vail Valley Medical Center Project) | 5.00 | 1/15/20 | 1,250,000 | 1,310,037 | ||||||
| Colorado Housing Finance Authority (Single Family Program) | 6.75 | 4/1/15 | 100,000 | 101,170 | ||||||
| Colorado Housing Finance Authority (Single Family Program) | 7.10 | 5/1/15 | 5,000 | 5,028 | ||||||
| Colorado Housing Finance Authority (Single Family Program) | 6.05 | 10/1/16 | 155,000 | 159,163 | ||||||
| Colorado Housing Finance Authority (Single Family Program) | 6.70 | 10/1/16 | 60,000 | 60,846 | ||||||
| Colorado Housing Finance Authority (Single Family Program) | 7.55 | 11/1/27 | 15,000 | 15,086 | ||||||
| Colorado Housing Finance Authority (Single Family Program) | 6.80 | 11/1/28 | 30,000 | 30,183 | ||||||
| Colorado Housing Finance Authority | ||||||||||
| (Single Family Program) (Collateralized; FHA) | 6.75 | 10/1/21 | 265,000 | 275,682 | ||||||
| Colorado Housing Finance Authority | ||||||||||
| (Single Family Program) (Collateralized; FHA) | 7.15 | 10/1/30 | 70,000 | 71,088 | ||||||
| E-470 Public Highway Authority, Revenue (Insured; MBIA) | 0/5.00 | 9/1/16 | 3,565,000 a | 3,104,117 | ||||||
| E-470 Public Highway Authority, Revenue (Insured; MBIA) | 0/5.00 | 9/1/17 | 3,500,000 a | 3,061,380 | ||||||
| Jefferson County School District (Insured; MBIA) | 6.50 | 12/15/10 | 1,500,000 | 1,650,480 | ||||||
| Northwest Parkway Public Highway Authority, | ||||||||||
| Revenue (Insured; AMBAC) | 0/5.45 | 6/15/17 | 7,690,000 a | 6,955,682 | ||||||
| Northwest Parkway Public Highway Authority, | ||||||||||
| Revenue (Insured; AMBAC) | 0/5.70 | 6/15/21 | 7,345,000 a | 6,725,963 | ||||||
The Funds 15
STATEMENT OF INVESTMENTS (Unaudited) (continued)
| Mellon National Intermediate Municipal Bond Fund (continued) | ||||||||
| Long-Term Municipal | Coupon | Maturity | Principal | |||||
| Investments (continued) | Rate (%) | Date | Amount ($) | Value ($) | ||||
| Colorado (continued) | ||||||||
| Northwest Parkway Public Highway Authority, | ||||||||
| Revenue (Insured; FSA) | 0/5.55 | 6/15/18 | 5,000,000 a | 4,529,900 | ||||
| University of Colorado, Enterprise System Revenue | 5.00 | 6/1/09 | 500,000 | 515,080 | ||||
| University of Colorado, Enterprise System Revenue | 5.50 | 6/1/10 | 500,000 | 529,010 | ||||
| University of Colorado Regents, Participation Interest | ||||||||
| (Sempra Energy Colorado, Inc., Lease, Development | ||||||||
| and Operating Agreement) (Insured; MBIA) | 6.00 | 12/1/22 | 5,000,000 | 5,407,950 | ||||
| Connecticut—.2% | ||||||||
| Connecticut (Insured; AMBAC) | 5.25 | 6/1/18 | 1,500,000 | 1,705,740 | ||||
| Connecticut Health and Educational Facilities | ||||||||
| Authority, Revenue (Yale University Issue) | 5.13 | 7/1/27 | 300,000 | 308,199 | ||||
| Florida—5.1% | ||||||||
| Florida Board of Education, Public Education | ||||||||
| Capital Outlay (Insured; FSA) | 5.20 | 6/1/23 | 10,000,000 | 10,259,500 | ||||
| Florida Municipal Loan Council, Revenue (Insured; MBIA) | 5.75 | 11/1/15 | 520,000 | 559,343 | ||||
| Halifax Hospital Medical Center, HR and Improvement | 5.00 | 6/1/38 | 2,000,000 | 2,060,380 | ||||
| Hillsborough County Aviation Authority, Revenue | ||||||||
| (Tampa International Airport) (Insured; AMBAC) | 5.13 | 10/1/20 | 3,540,000 | 3,836,404 | ||||
| Hillsborough County Aviation Authority, Revenue | ||||||||
| (Tampa International Airport) (Insured; AMBAC) | 5.13 | 10/1/21 | 3,675,000 | 3,977,158 | ||||
| Hillsborough County Educational Facilities Authority, | ||||||||
| Revenue (University of Tampa Project) (Insured; Radian) | 5.75 | 4/1/18 | 3,095,000 | 3,215,334 | ||||
| JEA, Saint Johns River Power Park System, Revenue | 5.00 | 10/1/15 | 2,750,000 | 2,881,835 | ||||
| Lee County, Airport Revenue (Insured; FSA) | 5.88 | 10/1/19 | 3,000,000 | 3,220,170 | ||||
| Miami-Dade County, Aviation Revenue, Miami | ||||||||
| International Airport (Hub of the Americas) | 5.00 | 10/1/10 | 3,000,000 | 3,090,720 | ||||
| Miami-Dade County, Subordinate Special Obligation | 0/5.00 | 10/1/22 | 2,000,000 a | 1,560,340 | ||||
| Miami-Dade County, Subordinate Special Obligation | 0/5.00 | 10/1/35 | 1,500,000 a | 1,426,260 | ||||
| Orlando and Orange County Expressway Authority, | ||||||||
| Expressway Revenue (Insured; AMBAC) | 5.00 | 7/1/13 | 4,710,000 | 5,059,953 | ||||
| Orlando Utilities Commission, Water and Electric Revenue | 5.25 | 10/1/11 | 3,145,000 b | 3,383,171 | ||||
| Orlando Utilities Commission, Water and Electric Revenue | 5.25 | 10/1/20 | 1,855,000 | 1,985,722 | ||||
| Georgia—.9% | ||||||||
| Chatham County Hospital Authority, HR Improvement | ||||||||
| (Memorial Health University Medical Center, Inc.) | 6.13 | 1/1/24 | 2,480,000 | 2,711,979 | ||||
| Crisp County Development Authority, EIR | ||||||||
| (International Paper Co. Project) | 5.55 | 2/1/15 | 1,000,000 | 1,071,300 | ||||
| Georgia | 5.40 | 11/1/10 | 1,000,000 | 1,061,920 | ||||
| Georgia | 5.75 | 9/1/11 | 3,460,000 | 3,767,767 | ||||
| Illinois—5.5% | ||||||||
| Chicago, Gas Supply Revenue | ||||||||
| (Peoples Gas Light and Coke Co. Project) | 4.75 | 6/30/14 | 1,000,000 | 1,027,360 | ||||
| Chicago, SFMR (Collateralized: FNMA and GNMA) | 4.70 | 10/1/17 | 140,000 | 141,145 | ||||
16
| Mellon National Intermediate Municipal Bond Fund (continued) | ||||||||
| Long-Term Municipal | Coupon | Maturity | Principal | |||||
| Investments (continued) | Rate (%) | Date | Amount ($) | Value ($) | ||||
| Illinois (continued) | ||||||||
| Chicago Metropolitan Water Reclamation | ||||||||
| District, GO (Capital Improvement) | 7.25 | 12/1/12 | 8,500,000 | 10,063,490 | ||||
| Cook County, GO Capital Improvement (Insured; AMBAC) | 5.00 | 11/15/25 | 5,000,000 | 5,255,450 | ||||
| DuPage, Cook and Will Counties Community | ||||||||
| College District Number 502, GO | 5.25 | 6/1/16 | 5,980,000 | 6,475,862 | ||||
| Illinois, GO | 5.00 | 1/1/17 | 7,500,000 | 8,242,575 | ||||
| Illinois Finance Authority, Gas Supply Revenue | ||||||||
| (Peoples Gas Light and Coke Co. Project) (Insured; AMBAC) | 4.30 | 6/1/16 | 2,500,000 | 2,571,275 | ||||
| Illinois Health Facilities Authority, Revenue | ||||||||
| (Loyola University Health System) | 5.75 | 7/1/11 | 2,500,000 | 2,600,750 | ||||
| Lake County Community Unitary School | ||||||||
| District (Waukegan) (Insured; FSA) | 5.63 | 12/1/11 | 3,150,000 | 3,308,256 | ||||
| Metropolitan Pier and Exposition Authority, | ||||||||
| Dedicated State Tax Revenue (Insured; AMBAC) | 5.38 | 6/1/14 | 5,000,000 | 5,068,900 | ||||
| Regional Transportation Authority (Insured; FGIC) | 7.75 | 6/1/09 | 1,000,000 | 1,086,430 | ||||
| Regional Transportation Authority (Insured; FGIC) | 7.75 | 6/1/10 | 1,620,000 | 1,817,559 | ||||
| Regional Transportation Authority (Insured; FGIC) | 7.75 | 6/1/12 | 1,890,000 | 2,247,097 | ||||
| Indiana—.6% | ||||||||
| Indiana Health Facility Financing Authority, | ||||||||
| HR (The Methodist Hospitals, Inc.) | 5.25 | 9/15/10 | 650,000 | 657,098 | ||||
| Indiana Health Facility Financing Authority, | ||||||||
| HR (The Methodist Hospitals, Inc.) | 5.25 | 9/15/11 | 750,000 | 760,260 | ||||
| Indiana Municipal Power Agency, Power | ||||||||
| Supply System Revenue (Insured; AMBAC) | 5.13 | 1/1/20 | 4,045,000 | 4,277,021 | ||||
| Iowa—.3% | ||||||||
| Muscatine, Electric Revenue (Insured; AMBAC) | 5.50 | 1/1/11 | 3,000,000 | 3,195,450 | ||||
| Kentucky—1.7% | ||||||||
| Kentucky Property and Buildings | ||||||||
| Commission, Revenue (Insured; FSA) | 6.00 | 2/1/10 | 2,000,000 b | 2,127,780 | ||||
| Kentucky Turnpike Authority, EDR | ||||||||
| (Revitalization’s Projects) (Insured; AMBAC) | 6.50 | 7/1/07 | 1,000,000 | 1,009,510 | ||||
| Kentucky Turnpike Authority, EDR | ||||||||
| (Revitalization’s Projects) (Insured; AMBAC) | 5.50 | 7/1/12 | 1,250,000 | 1,360,925 | ||||
| Louisville and Jefferson County Metropolitan Sewer District, | ||||||||
| Sewer and Drainage System Revenue (Insured; MBIA) | 5.50 | 5/15/34 | 10,000,000 | 10,779,100 | ||||
| Louisiana—.6% | ||||||||
| Louisiana Citizens Property Insurance Corp., | ||||||||
| Assessment Revenue (Insured; AMBAC) | 5.25 | 6/1/13 | 5,000,000 | 5,416,050 | ||||
| Maine—.2% | ||||||||
| Maine Municipal Bond Bank (Insured; FSA) | 5.88 | 11/1/09 | 1,660,000 b | 1,769,394 | ||||
| Massachusetts—3.9% | ||||||||
| Massachusetts, Consolidated Loan | 5.75 | 9/1/09 | 500,000 b | 529,205 | ||||
| Massachusetts, Consolidated Loan | 5.25 | 11/1/12 | 3,000,000 b | 3,233,520 | ||||
The Funds 17
STATEMENT OF INVESTMENTS (Unaudited) (continued)
| Mellon National Intermediate Municipal Bond Fund (continued) | ||||||||
| Long-Term Municipal | Coupon | Maturity | Principal | |||||
| Investments (continued) | Rate (%) | Date | Amount ($) | Value ($) | ||||
| Massachusetts (continued) | ||||||||
| Massachusetts, Consolidated Loan | 5.00 | 8/1/14 | 3,000,000 b | 3,239,580 | ||||
| Massachusetts Bay Transportation Authority, | ||||||||
| Senior Sales Tax Revenue | 5.50 | 7/1/16 | 5,000,000 | 5,694,550 | ||||
| Massachusetts Development Finance Agency, Revenue | ||||||||
| (Combined Jewish Philanthropies of Greater Boston, Inc. Project) | 4.75 | 2/1/15 | 4,135,000 | 4,272,199 | ||||
| Massachusetts Health and Educational Facilities Authority, | ||||||||
| Revenue (Massachusetts Institute of Technology Issue) | 5.00 | 7/1/23 | 7,500,000 | 8,514,075 | ||||
| Massachusetts Housing Finance Agency, Housing Revenue | 5.13 | 12/1/34 | 350,000 | 361,491 | ||||
| Massachusetts Municipal Wholesale Electric Co., | ||||||||
| Power Supply Project Revenue | ||||||||
| (Nuclear Project Number 4 Issue) (Insured; MBIA) | 5.25 | 7/1/12 | 2,000,000 | 2,145,400 | ||||
| Massachusetts Port Authority, Revenue | 6.00 | 1/1/10 | 2,035,000 b | 2,183,229 | ||||
| Massachusetts Port Authority, Revenue | 5.75 | 7/1/10 | 1,325,000 | 1,408,926 | ||||
| Massachusetts Water Pollution Abatement Trust | ||||||||
| (Pooled Loan Program) | 5.25 | 8/1/14 | 2,225,000 b | 2,453,597 | ||||
| Massachusetts Water Pollution Abatement Trust | ||||||||
| (Pooled Loan Program) | 5.25 | 8/1/17 | 275,000 | 301,510 | ||||
| Weston | 5.63 | 3/1/10 | 650,000 b | 693,147 | ||||
| Weston | 5.63 | 3/1/10 | 665,000 b | 709,143 | ||||
| Michigan—.9% | ||||||||
| Michigan Hospital Finance Authority, HR | ||||||||
| (Genesys Regional Medical Center Obligated Group) | 5.50 | 10/1/08 | 1,505,000 | 1,547,742 | ||||
| Michigan Municipal Bond Authority, | ||||||||
| Clean Water Revolving Fund Revenue | 5.00 | 10/1/21 | 5,000,000 | 5,249,400 | ||||
| Michigan Municipal Bond Authority, | ||||||||
| Drinking Water Revolving Fund Revenue | 5.50 | 10/1/15 | 1,000,000 | 1,132,200 | ||||
| Minnesota—.6% | ||||||||
| Minneapolis (Special School District Number 1) (Insured; FSA) | 5.00 | 2/1/14 | 2,350,000 | 2,405,977 | ||||
| Minnesota, GO | 5.00 | 8/1/13 | 2,500,000 | 2,693,900 | ||||
| Mississippi—.7% | ||||||||
| Mississippi Higher Education Assistance Corp., Student Loan Revenue | 6.05 | 9/1/07 | 5,000 | 5,007 | ||||
| Mississippi Hospital Equipment and Facilities | ||||||||
| Authority, Revenue (Baptist Memorial Health Care) | 5.00 | 9/1/24 | 5,845,000 | 6,070,968 | ||||
| Mississippi University Educational Building Corp., Revenue (Insured; MBIA) | 5.25 | 8/1/16 | 400,000 | 445,676 | ||||
| Missouri—.6% | ||||||||
| Missouri Environmental Improvement and Energy Resource Authority, | ||||||||
| Water Pollution Control Revenue (Revolving Fund Program) | 5.50 | 7/1/14 | 1,250,000 | 1,393,863 | ||||
| Missouri Highways and Transportation | ||||||||
| Commission, State Road Revenue | 5.50 | 2/1/10 | 2,000,000 | 2,104,260 | ||||
| Missouri Highways and Transportation | ||||||||
| Commission, State Road Revenue | 5.50 | 2/1/11 | 2,000,000 | 2,135,980 | ||||
| Montana—.6% | ||||||||
| Montana Facility Finance Authority, Revenue | ||||||||
| (Providence Health and Services) | 5.00 | 10/1/23 | 5,080,000 | 5,453,990 | ||||
18
| Mellon National Intermediate Municipal Bond Fund (continued) | ||||||||||
| Long-Term Municipal | Coupon | Maturity | Principal | |||||||
| Investments (continued) | Rate (%) | Date | Amount ($) | Value ($) | ||||||
| Nevada—2.4% | ||||||||||
| Clark County School District, GO (Insured; FGIC) | 5.00 | 6/15/20 | 20,000,000 c | 22,244,000 | ||||||
| New Hampshire—.2% | ||||||||||
| Nashua, Capital Improvement | 5.50 | 7/15/12 | 560,000 b | 610,030 | ||||||
| New Hampshire Business Finance Authority, | ||||||||||
| PCR (Central Maine Power Co.) | 5.38 | 5/1/14 | 1,000,000 | 1,066,970 | ||||||
| New Jersey—8.7% | ||||||||||
| Garden State Preservation Trust (Open Space | ||||||||||
| and Farmland Preservation) (Insured; FSA) | 5.80 | 11/1/18 | 5,000,000 | 5,777,600 | ||||||
| Garden State Preservation Trust (Open Space | ||||||||||
| and Farmland Preservation) (Insured; FSA) | 5.80 | 11/1/19 | 5,000,000 | 5,782,850 | ||||||
| Garden State Preservation Trust (Open Space | ||||||||||
| and Farmland Preservation) (Insured; FSA) | 5.80 | 11/1/23 | 5,000,000 | 5,788,500 | ||||||
| Gloucester County Improvement Authority, | ||||||||||
| Solid Waste Resource Recovery Revenue | 6.85 | 12/1/09 | 4,000,000 | 4,270,120 | ||||||
| Gloucester County Improvement Authority, | ||||||||||
| Solid Waste Resource Recovery Revenue | 7.00 | 12/1/09 | 1,000,000 | 1,068,570 | ||||||
| New Jersey | 6.00 | 2/15/11 | 1,000,000 | 1,086,170 | ||||||
| New Jersey Economic Development Authority, | ||||||||||
| Cigarette Tax Revenue | 5.38 | 6/15/15 | 4,400,000 | 4,747,908 | ||||||
| New Jersey Economic Development Authority, | ||||||||||
| Cigarette Tax Revenue | 5.50 | 6/15/24 | 4,000,000 | 4,228,440 | ||||||
| New Jersey Economic Development Authority, | ||||||||||
| Cigarette Tax Revenue | 5.50 | 6/15/31 | 1,000,000 | 1,063,970 | ||||||
| New Jersey Economic Development Authority, | ||||||||||
| School Facilities Construction Revenue | 5.00 | 3/1/17 | 2,000,000 | 2,158,920 | ||||||
| New Jersey Economic Development Authority, | ||||||||||
| School Facilities Construction Revenue | 5.00 | 3/1/18 | 1,000,000 | 1,077,390 | ||||||
| New Jersey Economic Development Authority, | ||||||||||
| School Facilities Construction Revenue (Insured; AMBAC) | 5.25 | 6/15/11 | 5,375,000 b | 5,721,580 | ||||||
| New Jersey Economic Development Authority, | ||||||||||
| Transportation Sublease Revenue (New Jersey | ||||||||||
| Transit Corp. Light Rail Transit System) (Insured; FSA) | 5.88 | 5/1/09 | 1,000,000 b | 1,047,230 | ||||||
| New Jersey Highway Authority, Senior Parkway | ||||||||||
| Revenue (Garden State Parkway) (Insured; FGIC) | 5.00 | 1/1/09 | 1,060,000 | 1,086,256 | ||||||
| New Jersey Highway Authority, Senior Parkway | ||||||||||
| Revenue (Garden State Parkway) (Insured; FGIC) | 5.00 | 1/1/10 | 1,110,000 | 1,151,725 | ||||||
| New Jersey Transit Corp., COP (Insured; AMBAC) | 5.50 | 9/15/09 | 5,000,000 | 5,222,600 | ||||||
| New Jersey Transit Corp., COP (Insured; AMBAC) | 6.00 | 9/15/10 | 2,000,000 b | 2,155,360 | ||||||
| New Jersey Transportation Trust Fund Authority | ||||||||||
| (Transportation System) | 5.25 | 12/15/20 | 10,000,000 | 11,332,000 | ||||||
| Tobacco Settlement Financing Corporation of New Jersey, | ||||||||||
| Tobacco Settlement Asset-Backed Bonds | 4.50 | 6/1/23 | 2,500,000 | 2,464,400 | ||||||
| Tobacco Settlement Financing Corporation of New Jersey, | ||||||||||
| Tobacco Settlement Asset-Backed Bonds | 5.00 | 6/1/29 | 12,500,000 | 12,457,500 | ||||||
The Funds 19
STATEMENT OF INVESTMENTS (Unaudited) (continued)
| Mellon National Intermediate Municipal Bond Fund (continued) | ||||||||||
| Long-Term Municipal | Coupon | Maturity | Principal | |||||||
| Investments (continued) | Rate (%) | Date | Amount ($) | Value ($) | ||||||
| New Mexico—.4% | ||||||||||
| New Mexico Finance Authority, Revenue (Public | ||||||||||
| Project Revolving Fund) (Insured; AMBAC) | 5.25 | 6/1/17 | 1,000,000 | 1,093,820 | ||||||
| New Mexico Highway Commission, Tax Revenue | 6.00 | 6/15/10 | 2,000,000 b | 2,146,240 | ||||||
| New York—8.6% | ||||||||||
| Greece Central School District (Insured; FGIC) | 6.00 | 6/15/10 | 225,000 | 241,960 | ||||||
| Greece Central School District (Insured; FGIC) | 6.00 | 6/15/11 | 950,000 | 1,040,953 | ||||||
| Greece Central School District (Insured; FGIC) | 6.00 | 6/15/12 | 950,000 | 1,059,734 | ||||||
| Greece Central School District (Insured; FGIC) | 6.00 | 6/15/13 | 950,000 | 1,077,100 | ||||||
| Greece Central School District (Insured; FGIC) | 6.00 | 6/15/14 | 950,000 | 1,094,134 | ||||||
| Greece Central School District (Insured; FGIC) | 6.00 | 6/15/15 | 950,000 | 1,107,481 | ||||||
| Long Island Power Authority, Electric | ||||||||||
| System General Revenue (Insured; FGIC) | 5.25 | 12/1/20 | 10,000,000 | 11,126,400 | ||||||
| Metropolitan Transportation Authority, | ||||||||||
| Commuter Facilities Revenue | 5.50 | 7/1/11 | 1,000,000 | 1,033,620 | ||||||
| Metropolitan Transportation Authority, | ||||||||||
| State Service Contract Revenue | 5.50 | 7/1/16 | 5,000,000 | 5,671,300 | ||||||
| Metropolitan Transportation Authority, | ||||||||||
| State Service Contract Revenue | 5.75 | 1/1/18 | 1,500,000 | 1,741,185 | ||||||
| New York City | 5.75 | 8/1/07 | 265,000 b | 269,985 | ||||||
| New York City | 5.75 | 8/1/10 | 820,000 b | 884,526 | ||||||
| New York City | 5.00 | 8/1/12 | 5,105,000 | 5,403,898 | ||||||
| New York City | 5.75 | 8/1/12 | 280,000 | 284,973 | ||||||
| New York City | 5.75 | 8/1/13 | 830,000 | 886,855 | ||||||
| New York City (Insured; XLCA) | 5.50 | 8/1/10 | 2,000,000 | 2,118,920 | ||||||
| New York City Industrial Development Agency, PILOT | ||||||||||
| Revenue (Queens Baseball Stadium Project) (Insured; AMBAC) | 5.00 | 1/1/24 | 3,445,000 | 3,750,606 | ||||||
| New York City Industrial Development Agency, PILOT | ||||||||||
| Revenue (Yankee Stadium Project) (Insured; MBIA) | 5.00 | 3/1/14 | 4,100,000 | 4,432,961 | ||||||
| New York City Transitional Finance Authority, | ||||||||||
| Future Tax Secured Revenue | 6.13 | 5/15/10 | 2,000,000 b | 2,171,900 | ||||||
| New York City Transitional Finance Authority, | ||||||||||
| Future Tax Secured Revenue | 6.13 | 5/15/10 | 825,000 b | 896,437 | ||||||
| New York City Transitional Finance Authority, | ||||||||||
| Future Tax Secured Revenue | 6.13 | 5/15/10 | 175,000 b | 190,153 | ||||||
| New York City Transitional Finance Authority, | ||||||||||
| Future Tax Secured Revenue | 5.50/14.00 | 11/1/26 | 3,000,000 d | 3,223,710 | ||||||
| New York State, GO | 5.00 | 4/15/14 | 10,000,000 | 10,824,100 | ||||||
| New York State Dormitory Authority, Revenue | ||||||||||
| (Consolidated City University System) (Insured; FSA) | 5.75 | 7/1/18 | 200,000 | 229,680 | ||||||
| New York State Power Authority, General Purpose Revenue | 7.00 | 1/1/10 | 300,000 b | 327,003 | ||||||
| New York State Thruway Authority (Highway | ||||||||||
| and Bridge Trust Fund) (Insured; FGIC) | 5.50 | 4/1/11 | 1,000,000 b | 1,081,290 | ||||||
| New York State Thruway Authority | ||||||||||
| (Highway and Bridge Trust Fund) (Insured; FSA) | 6.00 | 4/1/10 | 2,000,000 b | 2,159,840 | ||||||
20
| Mellon National Intermediate Municipal Bond Fund (continued) | ||||||||||
| Long-Term Municipal | Coupon | Maturity | Principal | |||||||
| Investments (continued) | Rate (%) | Date | Amount ($) | Value ($) | ||||||
| New York (continued) | ||||||||||
| New York State Thruway Authority | ||||||||||
| (Highway and Bridge Trust Fund) (Insured; FSA) | 6.00 | 4/1/10 | 1,000,000 b | 1,079,920 | ||||||
| New York State Urban Development Corp., Correctional | ||||||||||
| and Youth Facilities Service Contract Revenue | 5.00 | 1/1/11 | 5,000,000 | 5,216,900 | ||||||
| Orange County | 5.50 | 11/15/07 | 250,000 | 253,490 | ||||||
| Tobacco Settlement Financing Corp. of New York, Asset-Backed | ||||||||||
| Revenue (State Contingency Contract Secured) | 5.50 | 6/1/19 | 5,000,000 | 5,456,100 | ||||||
| Tobacco Settlement Financing Corp. of New York, Asset-Backed | ||||||||||
| Revenue (State Contingency Contract Secured) (Insured; MBIA) | 5.50 | 6/1/18 | 2,000,000 | 2,166,100 | ||||||
| North Carolina—2.8% | ||||||||||
| Charlotte | 5.00 | 4/1/13 | 1,000,000 | 1,075,650 | ||||||
| Concord, COP (Insured; MBIA) | 5.50 | 6/1/11 | 1,000,000 | 1,070,050 | ||||||
| Durham County | 5.50 | 4/1/10 | 1,000,000 | 1,055,840 | ||||||
| Guilford County, Public Improvement | 5.10 | 10/1/10 | 1,500,000 b | 1,602,300 | ||||||
| Mecklenburg County | 5.50 | 4/1/11 | 1,195,000 | 1,281,327 | ||||||
| Mecklenburg County, Public Improvement | 4.75 | 4/1/08 | 1,000,000 | 1,012,330 | ||||||
| North Carolina Eastern Municipal Power Agency, | ||||||||||
| Power System Revenue | 5.38 | 1/1/16 | 1,500,000 | 1,603,995 | ||||||
| North Carolina Infrastructure Finance Corporation, COP | ||||||||||
| (State of North Carolina Capital Improvements) (Insured; FSA) | 5.00 | 2/1/20 | 10,000,000 | 10,902,100 | ||||||
| Raleigh Durham Airport Authority, Revenue (Insured; FGIC) | 5.25 | 11/1/13 | 2,465,000 | 2,620,763 | ||||||
| Wake County | 5.75 | 2/1/10 | 2,000,000 b | 2,154,060 | ||||||
| Wake County Industrial Facilities and Pollution Control Financing | ||||||||||
| Authority, PCR (Carolina Power and Light Co. Project) | 5.38 | 2/1/17 | 1,000,000 | 1,067,210 | ||||||
| Ohio—2.8% | ||||||||||
| Akron, Sanitary Sewer System Special Revenue (Insured; AMBAC) | 6.00 | 12/1/14 | 500,000 | 534,485 | ||||||
| Butler County Transportation Improvement District (Insured; FSA) | 6.00 | 4/1/08 | 1,000,000 b | 1,044,500 | ||||||
| Columbus | 6.00 | 6/15/08 | 3,000,000 | 3,089,310 | ||||||
| Cuyahoga County, Revenue (Cleveland Clinic Health System) | 6.00 | 1/1/15 | 2,265,000 | 2,533,878 | ||||||
| Cuyahoga County, Revenue (Cleveland Clinic Health System) | 6.00 | 1/1/17 | 3,900,000 | 4,355,988 | ||||||
| Ohio, GO Infrastructure Improvements | 5.63 | 2/1/09 | 1,000,000 | 1,037,020 | ||||||
| Ohio, GO Infrastructure Improvements | 5.00 | 3/1/24 | 5,000,000 | 5,412,450 | ||||||
| Ohio Building Authority, State Facilities Receipts | ||||||||||
| (Juvenile Correctional Building Fund Projects) | 5.50 | 4/1/14 | 3,295,000 | 3,516,885 | ||||||
| Ohio Building Authority, State Facilities Receipts | ||||||||||
| (Sports Facilities Building Fund Projects) | 5.50 | 4/1/11 | 1,945,000 b | 2,083,990 | ||||||
| Ohio Housing Finance Agency, MFHR (Uptown Towers | ||||||||||
| Apartments Project) (Collateralized; GNMA) | 4.75 | 10/20/15 | 1,000,000 | 1,027,570 | ||||||
| Toledo-Lucas County Port Authority, Port Facilities | ||||||||||
| Revenue (Cargill Inc. Project) | 4.50 | 12/1/15 | 900,000 | 932,382 | ||||||
| Oklahoma—.0% | ||||||||||
| Oklahoma Housing Finance Agency, SFMR | ||||||||||
| (Collateralized; FNMA) | 6.80 | 9/1/16 | 60,000 | 61,625 | ||||||
The Funds 21
STATEMENT OF INVESTMENTS (Unaudited) (continued)
| Mellon National Intermediate Municipal Bond Fund (continued) | ||||||||
| Long-Term Municipal | Coupon | Maturity | Principal | |||||
| Investments (continued) | Rate (%) | Date | Amount ($) | Value ($) | ||||
| Oregon—.6% | ||||||||
| Eagle Point School District Number 9, GO | 5.63 | 6/15/11 | 1,500,000 b | 1,617,675 | ||||
| Jackson County School District Number 6, GO | ||||||||
| (Central Point) (Insured; FGIC) | 5.75 | 6/15/10 | 2,265,000 b | 2,415,351 | ||||
| Portland, Urban Renewal and Redevelopment | ||||||||
| (Convention Center) (Insured; AMBAC) | 5.75 | 6/15/18 | 1,150,000 | 1,233,594 | ||||
| Pennsylvania—1.2% | ||||||||
| Allegheny County Hospital Development Authority, | ||||||||
| Revenue (University of Pittsburgh Medical Center) | 5.25 | 6/15/15 | 1,620,000 | 1,766,594 | ||||
| Chester County | 5.00 | 11/15/10 | 3,420,000 | 3,581,834 | ||||
| Philadelphia School District (Insured; AMBAC) | 5.00 | 4/1/17 | 2,165,000 | 2,341,318 | ||||
| State Public School Building Authority, College Revenue | ||||||||
| (Harrisburg Community College) (Insured; MBIA) | 6.25 | 4/1/08 | 795,000 | 816,934 | ||||
| Swarthmore Borough Authority, Revenue (Swarthmore College) | 5.00 | 9/15/11 | 1,000,000 | 1,056,290 | ||||
| Swarthmore Borough Authority, Revenue (Swarthmore College) | 5.00 | 9/15/12 | 1,400,000 | 1,493,744 | ||||
| Rhode Island—.1% | ||||||||
| Rhode Island Health and Educational Building Corp., Higher | ||||||||
| Educational Revenue (Providence College) (Insured; XLCA) | 4.50 | 11/1/17 | 795,000 | 821,720 | ||||
| Rhode Island Health and Educational Building Corp., Higher | ||||||||
| Educational Revenue (Providence College) (Insured; XLCA) | 5.00 | 11/1/22 | 250,000 | 264,280 | ||||
| South Carolina—3.6% | ||||||||
| Greenville County School District, Installment Purchase | ||||||||
| Revenue (Building Equity Sooner for Tomorrow) | 5.25 | 12/1/10 | 10,000,000 | 10,532,200 | ||||
| Greenville County School District, Installment Purchase | ||||||||
| Revenue (Building Equity Sooner for Tomorrow) | 5.25 | 12/1/11 | 5,650,000 | 6,014,594 | ||||
| Greenville County School District, Installment Purchase | ||||||||
| Revenue (Building Equity Sooner for Tomorrow) | 5.88 | 12/1/12 | 3,000,000 b | 3,360,540 | ||||
| Greenville County School District, Installment Purchase | ||||||||
| Revenue (Building Equity Sooner for Tomorrow) | 5.50 | 12/1/18 | 3,000,000 | 3,408,060 | ||||
| Greenville County School District, Installment Purchase Revenue | ||||||||
| (Building Equity Sooner for Tomorrow) | 5.00 | 12/1/24 | 1,000,000 | 1,051,690 | ||||
| Horry County School District, GO (Insured; | ||||||||
| South Carolina State Department of Education) | 5.38 | 3/1/17 | 5,030,000 | 5,378,730 | ||||
| Newberry Investing in Children’s Education, | ||||||||
| Installment Purchase Revenue (School District | ||||||||
| of Newberry County, South Carolina Project) | 5.25 | 12/1/20 | 1,000,000 | 1,067,900 | ||||
| South Carolina Jobs and Economic Development Authority, | ||||||||
| EDR (Waste Management of South Carolina Inc. Project) | 3.30 | 11/1/07 | 1,000,000 | 993,510 | ||||
| South Carolina Jobs and Economic Development Authority, | ||||||||
| Hospital Facilities Revenue | ||||||||
| (Georgetown Memorial Hospital) (Insured; Radian) | 5.25 | 2/1/21 | 1,250,000 | 1,311,975 | ||||
| Tennessee—.0% | ||||||||
| Shelby County Health Educational and Housing Facilities Board, | ||||||||
| Revenue (Saint Judes Children’s Research Hospital) | 5.00 | 7/1/09 | 200,000 | 203,188 | ||||
| 22 |
| Mellon National Intermediate Municipal Bond Fund (continued) | ||||||||
| Long-Term Municipal | Coupon | Maturity | Principal | |||||
| Investments (continued) | Rate (%) | Date | Amount ($) | Value ($) | ||||
| Texas—3.2% | ||||||||
| Cypress-Fairbanks Independent School District, | ||||||||
| Tax Schoolhouse (Permanent School Fund Guaranteed) | 5.25 | 2/15/14 | 10,000,000 b | 10,966,300 | ||||
| Dallas/Fort Worth, International Airport, | ||||||||
| Joint Revenue (Insured; XLCA) | 5.00 | 11/1/14 | 5,000,000 | 5,130,500 | ||||
| Dallas/Fort Worth, International Airport, | ||||||||
| Joint Revenue Improvement (Insured; FGIC) | 5.50 | 11/1/31 | 1,000,000 | 1,060,480 | ||||
| Harris County, Toll Road Revenue (Insured; FGIC) | 6.00 | 8/1/09 | 5,150,000 | 5,425,216 | ||||
| Laredo Independent School District | ||||||||
| (Permanent School Fund Guaranteed) | 6.00 | 8/1/09 | 1,000,000 b | 1,054,630 | ||||
| Lewisville Independent School District, | ||||||||
| Unlimited Tax School Building Bonds | ||||||||
| (Permanent School Fund Guaranteed) | 7.50 | 8/15/07 | 600,000 | 610,638 | ||||
| Mission Consolidated Independent School District | ||||||||
| (Permanent School Fund Guaranteed) | 5.88 | 2/15/08 | 1,690,000 b | 1,725,828 | ||||
| San Antonio, General Improvement Bonds | 5.90 | 2/1/10 | 500,000 b | 531,140 | ||||
| Texas Municipal Power Agency, Revenue (Insured; FGIC) | 4.40 | 9/1/11 | 2,750,000 | 2,758,910 | ||||
| Utah—.6% | ||||||||
| Intermountain Power Agency, Power Supply Revenue (Insured; FSA) | 6.25 | 7/1/09 | 750,000 | 793,080 | ||||
| Intermountain Power Agency, Power Supply Revenue (Insured; MBIA) | 6.00 | 7/1/08 | 4,200,000 | 4,328,142 | ||||
| Vermont—.5% | ||||||||
| Burlington, Electric Revenue (Insured; MBIA) | 6.25 | 7/1/11 | 2,000,000 | 2,205,660 | ||||
| Burlington, Electric Revenue (Insured; MBIA) | 6.25 | 7/1/12 | 2,500,000 | 2,809,500 | ||||
| Virginia—1.0% | ||||||||
| Chesterfield County Industrial Development Authority, | ||||||||
| PCR (Virginia Electric and Power Company Project) | 5.88 | 6/1/17 | 3,000,000 | 3,228,510 | ||||
| Louisa Industrial Development Authority, PCR | ||||||||
| (Virginia Electric and Power Company) | 5.25 | 12/1/08 | 3,000,000 | 3,033,240 | ||||
| Newport News Industrial Development Authority, IDR | ||||||||
| (Virginia Advanced Shipbuilding and Carrier Integration Center) | 5.50 | 9/1/10 | 1,000,000 | 1,061,590 | ||||
| Virginia Commonwealth Transportation Board | ||||||||
| (Federal Highway Reimbursement Notes) | 5.00 | 9/27/12 | 2,000,000 | 2,136,720 | ||||
| Washington—.2% | ||||||||
| Seattle, Municipal Light and Power Revenue | 5.50 | 12/1/10 | 1,000,000 | 1,059,850 | ||||
| Washington Public Power Supply System, | ||||||||
| Revenue (Nuclear Project Number 1) | 7.00 | 7/1/08 | 380,000 | 396,621 | ||||
| Washington Public Power Supply System, | ||||||||
| Revenue (Nuclear Project Number 1) | 7.00 | 7/1/08 | 620,000 | 646,294 | ||||
| West Virginia—.5% | ||||||||
| Monongalia County Building Commission, | ||||||||
| HR (Monongalia General Hospital) | 5.25 | 7/1/20 | 4,415,000 | 4,690,231 | ||||
| Wisconsin—.1% | ||||||||
| Kenosha, Waterworks Revenue (Insured; FGIC) | 5.00 | 12/1/12 | 750,000 | 780,472 | ||||
The Funds 23
STATEMENT OF INVESTMENTS (Unaudited) (continued)
| Mellon National Intermediate Municipal Bond Fund (continued) | ||||||||||
| Long-Term Municipal | Coupon | Maturity | Principal | |||||||
| Investments (continued) | Rate (%) | Date | Amount ($) | Value ($) | ||||||
| Wisconsin (continued) | ||||||||||
| Wisconsin Health and Educational Facilities Authority, | ||||||||||
| Revenue (Aurora Medical Group Inc.) (Insured; FSA) | 5.75 | 11/15/07 | 500,000 | 507,175 | ||||||
| U.S. Related—6.1% | ||||||||||
| Puerto Rico Commonwealth | 6.00 | 7/1/08 | 1,500,000 | 1,540,590 | ||||||
| Puerto Rico Commonwealth | 5.00 | 7/1/12 | 2,000,000 | 2,089,840 | ||||||
| Puerto Rico Commonwealth (Insured; MBIA) | 6.25 | 7/1/11 | 950,000 | 1,049,294 | ||||||
| Puerto Rico Commonwealth (Insured; MBIA) | 6.25 | 7/1/13 | 1,380,000 | 1,582,667 | ||||||
| Puerto Rico Electric Power Authority, Power Revenue (Insured; FSA) | 5.25 | 7/1/29 | 4,605,000 | 4,850,078 | ||||||
| Puerto Rico Electric Power Authority, Power Revenue (Insured; MBIA) | 5.25 | 7/1/15 | 2,000,000 | 2,225,960 | ||||||
| Puerto Rico Electric Power Authority, Power Revenue (Insured; MBIA) | 5.00 | 7/1/17 | 3,940,000 | 4,298,658 | ||||||
| Puerto Rico Government Development Bank, Senior Notes | 5.00 | 12/1/12 | 10,000,000 | 10,565,500 | ||||||
| Puerto Rico Government Development Bank, Senior Notes | 5.00 | 12/1/13 | 4,000,000 | 4,260,200 | ||||||
| Puerto Rico Highway and Transportation Authority, | ||||||||||
| Highway Revenue (Insured; MBIA) | 6.25 | 7/1/09 | 150,000 | 158,859 | ||||||
| Puerto Rico Highway and Transportation Authority, | ||||||||||
| Transportation Revenue (Insured; MBIA) | 5.88 | 7/1/10 | 1,405,000 b | 1,519,269 | ||||||
| Puerto Rico Highway and Transportation Authority, | ||||||||||
| Transportation Revenue (Insured; MBIA) | 5.88 | 7/1/10 | 2,595,000 b | 2,806,051 | ||||||
| Puerto Rico Public Buildings Authority, Government Facility Revenue | 5.50 | 7/1/14 | 1,000,000 | 1,101,570 | ||||||
| Puerto Rico Public Buildings Authority, Government Facility Revenue | 5.50 | 7/1/15 | 1,000,000 | 1,111,820 | ||||||
| Puerto Rico Public Buildings Authority, Government Facility Revenue | 5.50 | 7/1/16 | 2,000,000 | 2,242,580 | ||||||
| Puerto Rico Public Buildings Authority, Government Facility Revenue | 5.75 | 7/1/17 | 1,945,000 | 2,228,192 | ||||||
| Puerto Rico Public Buildings Authority, | ||||||||||
| Government Facility Revenue (Insured; AMBAC) | 6.25 | 7/1/10 | 750,000 | 811,635 | ||||||
| University of Puerto Rico, University System Revenue | 5.00 | 6/1/22 | 10,000,000 | 10,698,900 | ||||||
| University of Puerto Rico, University System Revenue (Insured; MBIA) | 6.25 | 6/1/08 | 750,000 | 774,233 | ||||||
| Total Long-Term Municipal Investments | ||||||||||
| (cost $834,887,698) | 863,000,540 | |||||||||
| Short-Term Municipal Investments—7.2% | ||||||||||
| Florida—1.2% | ||||||||||
| Sunshine State Governmental Financing Commission, | ||||||||||
| Revenue (Governmental Financing Program) | ||||||||||
| (Insured; AMBAC and Liquidity Facility; Dexia Credit Locale) | 3.64 | 3/1/07 | 10,800,000 e | 10,800,000 | ||||||
| Georgia—.1% | ||||||||||
| Gainesville and Hall County Development Authority, | ||||||||||
| Senior Living Facility Revenue (Lanier Village Estates, Inc. | ||||||||||
| Project) (LOC; Allied Irish Bank PLC) | 3.64 | 3/1/07 | 500,000 e | 500,000 | ||||||
| Illinois—2.0% | ||||||||||
| Illinois Finance Authority, Revenue (Resurrection | ||||||||||
| Health Care) (LOC; JPMorgan Chase Bank) | 3.64 | 3/1/07 | 19,305,000 e | 19,305,000 | ||||||
| Indiana—.1% | ||||||||||
| Indiana Health and Educational Facility Financing | ||||||||||
| Authority, HR (Jackson County Schneck | ||||||||||
| Memorial Hospital Project) (LOC; Fifth Third Bank) | 3.63 | 3/1/07 | 1,095,000 e | 1,095,000 | ||||||
24
| Mellon National Intermediate Municipal Bond Fund (continued) | ||||||||||
| Short-Term Municipal | Coupon | Maturity | Principal | |||||||
| Investments (continued) | Rate (%) | Date | Amount ($) | Value ($) | ||||||
| Massachusetts—.3% | ||||||||||
| Massachusetts, GO (Central Artery/Ted Williams | ||||||||||
| Tunnel Infrastructure Loan Act of 2000) | ||||||||||
| (Liquidity Facility; Landesbank Baden-Wurttemberg) | 3.60 | 3/1/07 | 1,200,000 e | 1,200,000 | ||||||
| Massachusetts, GO (Central Artery/Ted Williams | ||||||||||
| Tunnel Infrastructure Loan Act of 2000) | ||||||||||
| (Liquidity Facility; State Street Bank and Trust Co.) | 3.60 | 3/1/07 | 1,200,000 e | 1,200,000 | ||||||
| Michigan—.1% | ||||||||||
| Royal Oak Hospital Finance Authority, HR, | ||||||||||
| Refunding (William Beaumont Hospital Obligated Group) | ||||||||||
| (Insured; AMBAC and Liquidity Facility; Morgan Stanley Bank) | 3.63 | 3/1/07 | 900,000 | e | 900,000 | |||||
| Missouri—.8% | ||||||||||
| Missouri Health and Educational Facilities Authority, | ||||||||||
| Health Facilities Revenue (Cox Health System) | ||||||||||
| (Insured; AMBAC and Liquidity Facility; Bank of Nova Scotia) | 3.64 | 3/1/07 | 7,100,000 e | 7,100,000 | ||||||
| Nebraska—.1% | ||||||||||
| Lancaster County Hospital Authority Number 1, | ||||||||||
| Health Facilities Revenue (Immanuel Health | ||||||||||
| Systems-Williamsburg Project) (LOC; ABN-AMRO) | 3.64 | 3/1/07 | 1,000,000 e | 1,000,000 | ||||||
| Pennsylvania—.1% | ||||||||||
| Schuylkill County Industrial Development Authority, RRR, Refunding | ||||||||||
| (Northeastern Power Co. Project) (LOC; Dexia Credit Locale) | 3.70 | 3/1/07 | 700,000 e | 700,000 | ||||||
| Texas—1.4% | ||||||||||
| Harris County Health Facilities Development | ||||||||||
| Corporation, Revenue (Texas Children’s Hospital Project) | ||||||||||
| (Insured; MBIA and Liquidity Facility; JPMorgan Chase Bank) | 3.63 | 3/1/07 | 12,400,000 e | 12,400,000 | ||||||
| Washington—.3% | ||||||||||
| Washington Housing Finance Commission, Nonprofit | ||||||||||
| Revenue (Local 82—J.A.T.C. Educational | ||||||||||
| Development Trust Project) (LOC; US Bank NA) | 3.63 | 3/1/07 | 3,065,000 e | 3,065,000 | ||||||
| Wisconsin—.7% | ||||||||||
| Wisconsin Health and Educational Facilities Authority, | ||||||||||
| Revenue (ProHealth Care, Inc. Obligated Group) | ||||||||||
| (Insured; AMBAC and LOC; Bank One) | 3.63 | 3/1/07 | 6,350,000 e | 6,350,000 | ||||||
| Total Short-Term Municipal Investments | ||||||||||
| (cost $65,615,000) | 65,615,000 | |||||||||
| Total Investments (cost $900,502,698) | 101.5% | 928,615,540 | ||||||||
| Liabilities, Less Cash and Receivables | (1.5%) | (13,491,910) | ||||||||
| Net Assets | 100.0% | 915,123,630 | ||||||||
| a Zero coupon until a specified date at which time the stated coupon rate becomes effective until maturity. |
| b These securities are prerefunded; the date shown represents the prerefunded date. Bonds which are prerefunded are collateralized by U.S. Government securities which are held in |
| escrow and are used to pay principal and interest on the municipal issue and to retire the bonds in full at the earliest refunding date. |
| c Purchased on a delayed delivery basis. |
| d Subject to interest rate change on November 1, 2011. |
| e Securities payable on demand.Variable interest rate—subject to periodic change. |
The Funds 25
STATEMENT OF INVESTMENTS (Unaudited) (continued)
| Summary of Abbreviations | ||||||
| ACA | American Capital Access | AGC | ACE Guaranty Corporation | |||
| AGIC | Asset Guaranty Insurance Company | AMBAC | American Municipal Bond Assurance Corporation | |||
| ARRN | Adjustable Rate Receipt Notes | BAN | Bond Anticipation Notes | |||
| BIGI | Bond Investors Guaranty Insurance | BPA | Bond Purchase Agreement | |||
| CGIC | Capital Guaranty Insurance Company | CIC | Continental Insurance Company | |||
| CIFG | CDC Ixis Financial Guaranty | CMAC | Capital Market Assurance Corporation | |||
| COP | Certificate of Participation | CP | Commercial Paper | |||
| EDR | Economic Development Revenue | EIR | Environmental Improvement Revenue | |||
| FGIC | Financial Guaranty Insurance Company | FHA | Federal Housing Administration | |||
| FHLB | Federal Home Loan Bank | FHLMC | Federal Home Loan Mortgage Corporation | |||
| FNMA | Federal National Mortgage Association | FSA | Financial Security Assurance | |||
| GAN | Grant Anticipation Notes | GIC | Guaranteed Investment Contract | |||
| GNMA | Government National Mortgage Association | GO | General Obligation | |||
| HR | Hospital Revenue | IDB | Industrial Development Board | |||
| IDC | Industrial Development Corporation | IDR | Industrial Development Revenue | |||
| LOC | Letter of Credit | LOR | Limited Obligation Revenue | |||
| LR | Lease Revenue | MBIA | Municipal Bond Investors | |||
| Assurance Insurance Corporation | ||||||
| MFHR | Multi-Family Housing Revenue | MFMR | Multi-Family Mortgage Revenue | |||
| PCR | Pollution Control Revenue | PILOT | Payment in Lieu of Taxes | |||
| RAC | Revenue Anticipation Certificates | RAN | Revenue Anticipation Notes | |||
| RAW | Revenue Anticipation Warrants | RRR | Resources Recovery Revenue | |||
| SAAN | State Aid Anticipation Notes | SBPA | Standby Bond Purchase Agreement | |||
| SFHR | Single Family Housing Revenue | SFMR | Single Family Mortgage Revenue | |||
| SONYMA | State of New York Mortgage Agency | SWDR | Solid Waste Disposal Revenue | |||
| TAN | Tax Anticipation Notes | TAW | Tax Anticipation Warrants | |||
| TRAN | Tax and Revenue Anticipation Notes | XLCA | XL Capital Assurance | |||
| Summary of Combined Ratings (Unaudited) | ||||||||||
| Fitch or | Moody’s | or | Standard & Poor’s | Value (%)† | ||||||
| AAA | Aaa | AAA | 54.2 | |||||||
| AA | Aa | AA | 19.3 | |||||||
| A | A | A | 7.0 | |||||||
| BBB | Baa | BBB | 11.7 | |||||||
| F1 | MIG1/P1 | SP1/A1 | 7.1 | |||||||
| Not Rated f | Not Rated f | Not Rated f | .7 | |||||||
| 100.0 | ||||||||||
| † | Based on total investments. | |||||||||
| f | Securities which, while not rated by Fitch, Moody’s and Standard & Poor’s, have been determined by the Manager to be of comparable quality to those rated securities in which the | |||||||||
| fund may invest. | ||||||||||
| See notes to financial statements. | ||||||||||
| 26 |
| STATEMENT OF INVESTMENTS |
| February 28, 2007 (Unaudited) |
| Mellon National Short-Term Municipal Bond Fund | ||||||||
| Long-Term Municipal | Coupon | Maturity | Principal | |||||
| Investments—97.6% | Rate (%) | Date | Amount ($) | Value ($) | ||||
| Alabama—2.1% | ||||||||
| Jefferson County, Sewer Revenue Capital | ||||||||
| Improvement Warrants (Insured; FGIC) | 5.13 | 2/1/09 | 3,000,000 a | 3,108,570 | ||||
| Arizona—3.5% | ||||||||
| Chandler Industrial Development Authority, IDR (Intel Corp. Project) | 4.38 | 12/1/10 | 5,200,000 | 5,280,756 | ||||
| California—4.9% | ||||||||
| Agua Caliente Band, Cahuilla Indians Revenue | 4.60 | 7/1/08 | 800,000 | 804,984 | ||||
| California Infrastructure and Economic Development | ||||||||
| Bank, Revenue (The J. Paul Getty Trust) | 3.90 | 12/1/11 | 2,000,000 | 2,022,880 | ||||
| California Statewide Communities Development | ||||||||
| Authority, MFHR (Clara Park/Cypress Sunrise/ | ||||||||
| Wysong Plaza Apartments) (Collateralized; GNMA) | 4.55 | 1/20/16 | 1,335,000 | 1,370,124 | ||||
| California Statewide Communities Development | ||||||||
| Authority, Revenue (Kaiser Permanente) | 2.63 | 5/1/08 | 2,000,000 | 1,966,060 | ||||
| Del Mar Race Track Authority, Revenue | 5.00 | 8/15/09 | 1,080,000 | 1,106,741 | ||||
| Colorado—1.8% | ||||||||
| Black Hawk, Device Tax Revenue | 5.00 | 12/1/11 | 600,000 | 618,252 | ||||
| Colorado Health Facilities Authority, Health Facilities Revenue | ||||||||
| (The Evangelical Lutheran Good Samaritan Society Project) | 3.75 | 6/1/09 | 1,000,000 | 991,310 | ||||
| Colorado Health Facilities Authority, Health Facilities Revenue | ||||||||
| (The Evangelical Lutheran Good Samaritan Society Project) | 5.00 | 6/1/10 | 1,000,000 | 1,031,280 | ||||
| Connecticut—2.2% | ||||||||
| Connecticut Development Authority, PCR | ||||||||
| (Connecticut Light and Power Co. Project) | 5.85 | 9/1/28 | 3,000,000 | 3,151,470 | ||||
| Mohegan Tribe of Indians of Connecticut Gaming Authority, | ||||||||
| Priority Distribution Payment Public Improvement Revenue | 5.00 | 1/1/08 | 200,000 | 201,884 | ||||
| Florida—4.4% | ||||||||
| Escambia County Health Facilities Authority, | ||||||||
| Revenue (Ascension Health Credit Group) | 5.00 | 11/15/07 | 400,000 | 403,764 | ||||
| Florida Department of Environmental Protection, | ||||||||
| Preservation 2000 Revenue (Insured; FSA) | 5.25 | 7/1/13 | 5,000,000 | 5,148,550 | ||||
| Highlands County Health Facilities Authority, HR | ||||||||
| (Adventist Health System/Sunbelt Obligated Group) | 5.00 | 11/15/07 | 500,000 | 504,125 | ||||
| Highlands County Health Facilities Authority, HR | ||||||||
| (Adventist Health System/Sunbelt Obligated Group) | 5.00 | 11/15/08 | 500,000 | 509,380 | ||||
| Illinois—7.3% | ||||||||
| Illinois, GO (Illinois Fund for Infrastructure, | ||||||||
| Roads, Schools and Transit) (Insured; FGIC) | 6.00 | 1/1/17 | 5,575,000 | 5,905,207 | ||||
| Illinois, Sales Tax Revenue (Illinois Fund for | ||||||||
| Infrastructure, Roads, Schools and Transit) | 5.50 | 6/15/13 | 1,100,000 | 1,177,033 | ||||
| Illinois Finance Authority, Educational Advancement | ||||||||
| Fund Inc., Student Housing Revenue (University Center) | 4.50 | 5/1/07 | 1,235,000 | 1,236,050 | ||||
The Funds 27
STATEMENT OF INVESTMENTS (Unaudited) (continued)
| Mellon National Short-Term Municipal Bond Fund (continued) | ||||||||
| Long-Term Municipal | Coupon | Maturity | Principal | |||||
| Investments (continued) | Rate (%) | Date | Amount ($) | Value ($) | ||||
| Illinois (continued) | ||||||||
| Metropolitan Pier and Exposition Authority, | ||||||||
| Dedicated State Tax Revenue (Insured; AMBAC) | 5.38 | 6/1/14 | 2,500,000 | 2,534,450 | ||||
| Indiana—2.3% | ||||||||
| Indiana Health and Educational Facility Financing | ||||||||
| Authority, HR (Clarian Health Obligated Group) | 5.00 | 2/15/11 | 1,000,000 | 1,036,490 | ||||
| Indiana Health Facility Financing Authority, HR | ||||||||
| (The Methodist Hospitals, Inc.) | 5.25 | 9/15/09 | 2,415,000 | 2,434,948 | ||||
| Kansas—4.0% | ||||||||
| The Unified Government of Wyandotte County/Kansas City, | ||||||||
| Tax Exempt Sales Tax Special Obligation Revenue | ||||||||
| (Redevelopment Project Area B) (LOC; Citibank NA) | 3.75 | 12/1/12 | 6,000,000 | 6,001,560 | ||||
| Kentucky—1.8% | ||||||||
| Kentucky Economic Development Finance Authority, | ||||||||
| Health System Revenue (Norton Healthcare, Inc.) | 6.25 | 10/1/10 | 335,000 a | 366,466 | ||||
| Kentucky Economic Development Finance Authority, | ||||||||
| Health System Revenue (Norton Healthcare, Inc.) | 6.25 | 10/1/12 | 665,000 | 710,772 | ||||
| Kentucky Property and Buildings Commission, | ||||||||
| Revenue (Project 69) (Insured; FSA) | 5.25 | 8/1/14 | 1,450,000 | 1,539,102 | ||||
| Massachusetts—3.8% | ||||||||
| Massachusetts, Federal Highway, GAN (Insured; FSA) | 5.75 | 6/15/12 | 2,000,000 | 2,143,880 | ||||
| Massachusetts Development Finance Agency, Revenue | ||||||||
| (Combined Jewish Philanthropies of Greater Boston, Inc. Project) | 3.50 | 2/1/08 | 495,000 | 492,253 | ||||
| Massachusetts Health and Educational Facilities Authority, | ||||||||
| Revenue (Milford Regional Medical Center Issue) | 5.00 | 7/15/09 | 340,000 | 346,895 | ||||
| Massachusetts Health and Educational Facilities Authority, | ||||||||
| Revenue (Milford Regional Medical Center Issue) | 5.00 | 7/15/10 | 200,000 | 205,206 | ||||
| Massachusetts Health and Educational Facilities Authority, | ||||||||
| Revenue (Partners HealthCare System Issue) (Insured; MBIA) | 5.38 | 7/1/17 | 1,000,000 | 1,015,210 | ||||
| Massachusetts Housing Finance Agency, Housing Revenue | 4.20 | 12/1/10 | 1,520,000 | 1,531,643 | ||||
| Michigan—.7% | ||||||||
| Michigan Hospital Finance Authority, HR (Oakwood Obligated Group) | 5.00 | 11/1/07 | 1,000,000 | 1,007,550 | ||||
| Mississippi—3.6% | ||||||||
| Mississippi Business Finance Corp., SWDR | ||||||||
| (Waste Management, Inc. Project) | 4.40 | 3/1/11 | 1,000,000 | 999,810 | ||||
| Mississippi Hospital Equipment and Facilities Authority, | ||||||||
| Hospital Refunding and Improvement | ||||||||
| Revenue (South Central Regional Medical Center) | 5.00 | 12/1/09 | 1,085,000 | 1,110,161 | ||||
| Mississippi Hospital Equipment and Facilities Authority, | ||||||||
| Revenue (Baptist Memorial Health Care) | 3.70 | 10/1/07 | 3,290,000 | 3,287,039 | ||||
| Missouri—1.3% | ||||||||
| Bi-State Development Agency of the Missouri-Illinois | ||||||||
| Metropolitan District, Subordinate Mass Transit Sales Tax | ||||||||
| Appropriation Revenue (Metrolink Cross County Extension Project) | 3.95 | 10/1/09 | 1,000,000 | 1,004,750 | ||||
| 28 |
| Mellon National Short-Term Municipal Bond Fund (continued) | ||||||||||
| Long-Term Municipal | Coupon | Maturity | Principal | |||||||
| Investments (continued) | Rate (%) | Date | Amount ($) | Value ($) | ||||||
| Missouri (continued) | ||||||||||
| Blue Springs Neighborhood Improvement District, Limited GO | ||||||||||
| Temporary Notes (South Area Sewer Improvement Project) | 4.13 | 3/1/09 | 1,000,000 | 1,001,290 | ||||||
| Montana—3.1% | ||||||||||
| Montana Board of Regents of Higher Education, University | ||||||||||
| of Montana Facilities Improvement Revenue (Insured; MBIA) | 5.75 | 5/15/10 | 350,000 a | 378,588 | ||||||
| Montana Board of Regents of Higher Education, University | ||||||||||
| of Montana Facilities Improvement Revenue (Insured; MBIA) | 5.75 | 5/15/24 | 3,900,000 | 4,203,069 | ||||||
| Nevada—1.3% | ||||||||||
| Clark County, PCR (Southern California Edison Co.) | 3.25 | 3/2/09 | 2,000,000 | 1,966,540 | ||||||
| New Hampshire—1.7% | ||||||||||
| New Hampshire Health and Education Facilities Authority, Revenue | ||||||||||
| (Center for Life Management Issue) (LOC; Ocean National Bank) | 4.05 | 7/1/11 | 2,505,000 | 2,504,900 | ||||||
| New Jersey—1.8% | ||||||||||
| New Jersey Economic Development Authority, Cigarette Tax Revenue | 5.63 | 6/15/17 | 2,000,000 | 2,010,140 | ||||||
| University of Medicine and Dentistry, COP (Insured; MBIA) | 6.75 | 12/1/09 | 675,000 | 682,486 | ||||||
| New Mexico—.7% | ||||||||||
| Gallup, PCR (Tri-State Generation and Transmission | ||||||||||
| Association, Inc. Project) (Insured; AMBAC) | 5.00 | 8/15/07 | 1,000,000 | 1,005,880 | ||||||
| New York—2.8% | ||||||||||
| New York City, GO (Insured; XLCA) | 5.20 | 8/1/09 | 2,000,000 | 2,032,200 | ||||||
| New York City Transitional Finance Authority, | ||||||||||
| Future Tax Secured Revenue | 5.00 | 11/1/10 | 2,000,000 | 2,094,640 | ||||||
| North Carolina—3.2% | ||||||||||
| Charlotte, GO | 5.25 | 2/1/12 | 2,500,000 | 2,584,575 | ||||||
| Charlotte, Water and Sewer System Revenue | 5.75 | 6/1/10 | 2,000,000 a | 2,148,460 | ||||||
| Ohio—2.9% | ||||||||||
| Cleveland, Waterworks Revenue (Insured; FSA) | 5.00 | 1/1/08 | 1,565,000 a | 1,597,928 | ||||||
| Lorain County, Hospital Facilities Improvement | ||||||||||
| Revenue (Catholic Healthcare Partners) | 5.63 | 10/1/12 | 2,500,000 b | 2,700,550 | ||||||
| Pennsylvania—3.5% | ||||||||||
| Lehigh County Industrial Development Authority, PCR | ||||||||||
| (PPL Electric Utilities Corporation Project) (Insured; AMBAC) | 3.13 | 11/1/08 | 1,250,000 | 1,237,187 | ||||||
| Pennsylvania Higher Educational Facilities Authority, | ||||||||||
| Health System Revenue (University of Pennsylvania) | 5.00 | 8/15/07 | 1,000,000 | 1,005,900 | ||||||
| Pennsylvania Industrial Development Authority, EDR (Insured; AMBAC) | 7.00 | 7/1/07 | 440,000 | 444,862 | ||||||
| Philadelphia, Gas Works Revenue (Insured; FSA) | 5.00 | 8/1/07 | 640,000 | 643,482 | ||||||
| Philadelphia Hospital and Higher Educational Facilities | ||||||||||
| Authority, Revenue (Jefferson Health System) | 5.50 | 5/15/07 | 1,495,000 | 1,500,412 | ||||||
| Sayre Health Care Facilities Authority, Revenue (Guthrie Health Issue) | 5.50 | 12/1/09 | 400,000 | 415,284 | ||||||
| South Carolina—3.3% | ||||||||||
| Greenville County School District, Installment Purchase | ||||||||||
| Revenue (Building Equity Sooner for Tomorrow) | 5.00 | 12/1/07 | 1,000,000 | 1,009,990 | ||||||
The Funds 29
STATEMENT OF INVESTMENTS (Unaudited) (continued)
| Mellon National Short-Term Municipal Bond Fund (continued) | ||||||||
| Long-Term Municipal | Coupon | Maturity | Principal | |||||
| Investments (continued) | Rate (%) | Date | Amount ($) | Value ($) | ||||
| South Carolina (continued) | ||||||||
| South Carolina Jobs and Economic Development Authority, | ||||||||
| EDR (Waste Management of South Carolina Inc. Project) | 3.30 | 11/1/07 | 4,000,000 | 3,974,040 | ||||
| Tennessee—1.7% | ||||||||
| Tennessee Energy Acquisition Corporation, Gas Project Revenue | 5.00 | 9/1/09 | 2,500,000 | 2,576,450 | ||||
| Texas—11.3% | ||||||||
| Austin, Hotel Occupancy Tax Revenue (Convention Center/ | ||||||||
| Waller Creek Venue Project) (Insured; AMBAC) | 5.25 | 11/15/19 | 3,000,000 | 3,109,020 | ||||
| Conroe Independent School District, Schoolhouse | 5.13 | 2/15/09 | 2,830,000 a | 2,909,721 | ||||
| Grand Prairie Independent School District, Tax | ||||||||
| School Building (Permanent School Fund Guaranteed) | 3.05 | 7/31/07 | 2,900,000 | 2,889,763 | ||||
| Hays Consolidated Independent School District | ||||||||
| (Permanent School Fund Guaranteed) | 5.38 | 8/15/08 | 2,000,000 a | 2,050,300 | ||||
| Montgomery County, Unlimited Tax | ||||||||
| Adjustable Rate Road Bonds (Insured; FSA) | 5.00 | 9/1/08 | 2,000,000 | 2,038,180 | ||||
| Port Arthur Independent School District, | ||||||||
| Unlimited Tax School Building (Insured; AMBAC) | 5.25 | 2/15/18 | 1,000,000 | 1,026,890 | ||||
| San Antonio, Electric and Gas Systems | ||||||||
| Junior Lien Revenue (SBPA; BNP Paribas) | 3.55 | 12/1/07 | 2,000,000 | 1,999,100 | ||||
| Texas Municipal Gas Acquisition and Supply | ||||||||
| Corporation I, Gas Supply Revenue | 5.00 | 12/15/13 | 1,000,000 | 1,069,070 | ||||
| Virginia—5.7% | ||||||||
| Louisa Industrial Development Authority, PCR | ||||||||
| (Virginia Electric and Power Company) | 5.25 | 12/1/08 | 2,000,000 | 2,022,160 | ||||
| Peninsula Ports Authority, Coal Terminal Revenue | ||||||||
| (Dominion Terminal Associates Project—DETC Issue) | 3.30 | 10/1/08 | 1,400,000 | 1,383,494 | ||||
| Rappahannock Regional Jail Authority, Regional Jail Facility GAN | 4.25 | 12/1/09 | 3,000,000 | 3,027,960 | ||||
| Western Virginia Regional Jail Authority, Regional Jail Facility RAN | 4.13 | 12/1/09 | 2,000,000 | 2,017,820 | ||||
| Washington—3.1% | ||||||||
| Washington Higher Education Facilities Authority, Revenue | ||||||||
| (University of Puget Sound Project) (LOC; Bank of America) | 5.00 | 4/1/08 | 2,500,000 | 2,533,025 | ||||
| Washington Public Power Supply System, Revenue | ||||||||
| (Nuclear Project Number 3) (Insured; AMBAC) | 6.00 | 7/1/07 | 2,050,000 | 2,066,113 | ||||
| Wyoming—1.3% | ||||||||
| Uinta County, PCR (Amoco Project) | 2.25 | 7/1/07 | 2,000,000 | 1,986,000 | ||||
| 30 |
| Mellon National Short-Term Municipal Bond Fund (continued) | ||||||||||
| Long-Term Municipal | Coupon | Maturity | Principal | |||||||
| Investments (continued) | Rate (%) | Date | Amount ($) | Value ($) | ||||||
| U.S. Related—6.5% | ||||||||||
| Puerto Rico Electric Authority, Power Revenue | 4.00 | 7/1/08 | 500,000 | 501,570 | ||||||
| Puerto Rico Infrastructure Financing | ||||||||||
| Authority, Special Tax Revenue | 4.50 | 7/1/10 | 4,105,000 | 4,190,959 | ||||||
| Puerto Rico Public Buildings Authority, | ||||||||||
| Government Facilities Revenue | 4.50 | 7/1/07 | 2,500,000 | 2,505,875 | ||||||
| University of Puerto Rico, University System Revenue | 5.00 | 6/1/13 | 2,315,000 | 2,455,983 | ||||||
| Total Long-Term Municipal Investments (cost $146,044,700) | 145,808,461 | |||||||||
| Short-Term Municipal Investments—1.2% | ||||||||||
| Indiana—1.1% | ||||||||||
| Indiana Health and Educational Facility Financing | ||||||||||
| Authority, HR (Jackson County Schneck | ||||||||||
| Memorial Hospital Project) (LOC; Fifth Third Bank) | 3.63 | 3/1/07 | 600,000 c | 600,000 | ||||||
| Indiana Health Facility Financing Authority, | ||||||||||
| Revenue (Ascension Health Credit Group) | 3.45 | 3/1/07 | 1,000,000 | 999,980 | ||||||
| Pennsylvania—.1% | ||||||||||
| Schuylkill County Industrial Development | ||||||||||
| Authority, RRR, Refunding (Northeastern | ||||||||||
| Power Co. Project) (LOC; Dexia Credit Locale) | 3.70 | 3/1/07 | 195,000 c | 195,000 | ||||||
| Total Short-Term Municipal Investments (cost $1,794,999) | 1,794,980 | |||||||||
| Total Investments (cost $147,839,699) | 98.8% | 147,603,441 | ||||||||
| Cash and Receivables (Net) | 1.2% | 1,798,964 | ||||||||
| Net Assets | 100.0% | 149,402,405 | ||||||||
| a These securities are prerefunded; the date shown represents the prerefunded date. Bonds which are prerefunded are collateralized by U.S. Government securities which are held in |
| escrow and are used to pay principal and interest on the municipal issue and to retire the bonds in full at the earliest refunding date. |
| b Purchased on a delayed delivery basis. |
| c Securities payable on demand.Variable interest rate—subject to periodic change. |
The Funds 31
STATEMENT OF INVESTMENTS (Unaudited) (continued)
| Summary of Abbreviations | ||||||
| ACA | American Capital Access | AGC | ACE Guaranty Corporation | |||
| AGIC | Asset Guaranty Insurance Company | AMBAC | American Municipal Bond Assurance Corporation | |||
| ARRN | Adjustable Rate Receipt Notes | BAN | Bond Anticipation Notes | |||
| BIGI | Bond Investors Guaranty Insurance | BPA | Bond Purchase Agreement | |||
| CGIC | Capital Guaranty Insurance Company | CIC | Continental Insurance Company | |||
| CIFG | CDC Ixis Financial Guaranty | CMAC | Capital Market Assurance Corporation | |||
| COP | Certificate of Participation | CP | Commercial Paper | |||
| EDR | Economic Development Revenue | EIR | Environmental Improvement Revenue | |||
| FGIC | Financial Guaranty Insurance Company | FHA | Federal Housing Administration | |||
| FHLB | Federal Home Loan Bank | FHLMC | Federal Home Loan Mortgage Corporation | |||
| FNMA | Federal National Mortgage Association | FSA | Financial Security Assurance | |||
| GAN | Grant Anticipation Notes | GIC | Guaranteed Investment Contract | |||
| GNMA | Government National Mortgage Association | GO | General Obligation | |||
| HR | Hospital Revenue | IDB | Industrial Development Board | |||
| IDC | Industrial Development Corporation | IDR | Industrial Development Revenue | |||
| LOC | Letter of Credit | LOR | Limited Obligation Revenue | |||
| LR | Lease Revenue | MBIA | Municipal Bond Investors | |||
| Assurance Insurance Corporation | ||||||
| MFHR | Multi-Family Housing Revenue | MFMR | Multi-Family Mortgage Revenue | |||
| PCR | Pollution Control Revenue | PILOT | Payment in Lieu of Taxes | |||
| RAC | Revenue Anticipation Certificates | RAN | Revenue Anticipation Notes | |||
| RAW | Revenue Anticipation Warrants | RRR | Resources Recovery Revenue | |||
| SAAN | State Aid Anticipation Notes | SBPA | Standby Bond Purchase Agreement | |||
| SFHR | Single Family Housing Revenue | SFMR | Single Family Mortgage Revenue | |||
| SONYMA | State of New York Mortgage Agency | SWDR | Solid Waste Disposal Revenue | |||
| TAN | Tax Anticipation Notes | TAW | Tax Anticipation Warrants | |||
| TRAN | Tax and Revenue Anticipation Notes | XLCA | XL Capital Assurance | |||
| Summary of Combined Ratings (Unaudited) | ||||||||||
| Fitch | or | Moody’s | or | Standard & Poor’s | Value (%)† | |||||
| AAA | Aaa | AAA | 43.1 | |||||||
| AA | Aa | AA | 13.8 | |||||||
| A | A | A | 14.9 | |||||||
| BBB | Baa | BBB | 20.2 | |||||||
| BB | Ba | BB | .1 | |||||||
| F1 | MIG1/P1 | SP1/A1 | 3.9 | |||||||
| Not Rated d | Not Rated d | Not Rated d | 4.0 | |||||||
| 100.0 | ||||||||||
| † Based on total investments. |
| d Securities which, while not rated by Fitch, Moody’s and Standard & Poor’s, have been determined by the Manager to be of comparable quality to those rated securities in which the |
| fund may invest. |
| See notes to financial statements. |
| 32 |
| STATEMENT OF INVESTMENTS |
| February 28, 2007 (Unaudited) |
| Mellon Pennsylvania Intermediate Municipal Bond Fund | ||||||||
| Long-Term Municipal | Coupon | Maturity | Principal | |||||
| Investments—98.0% | Rate (%) | Date | Amount ($) | Value ($) | ||||
| Alabama—.6% | ||||||||
| Jefferson County, Limited Obligation School Warrants | 5.50 | 1/1/21 | 3,500,000 | 3,836,560 | ||||
| Arizona—.2% | ||||||||
| University Medical Center Corp., HR | 5.25 | 7/1/15 | 1,160,000 | 1,232,813 | ||||
| California—4.2% | ||||||||
| Agua Caliente Band, Cahuilla Indians Revenue | 6.00 | 7/1/18 | 1,500,000 | 1,634,220 | ||||
| Alameda Corridor Transportation Authority, | ||||||||
| Revenue (Insured; AMBAC) | 0/5.25 | 10/1/21 | 2,000,000 a | 1,661,240 | ||||
| California | 5.25 | 11/1/17 | 2,500,000 | 2,705,700 | ||||
| California | 5.50 | 6/1/20 | 110,000 | 115,295 | ||||
| California | 5.50 | 11/1/33 | 6,300,000 | 6,890,877 | ||||
| California County Tobacco Securitization Agency, | ||||||||
| Tobacco Settlement Asset-Backed Bonds | ||||||||
| (Los Angeles County Securitization Corp.) | 0/5.25 | 6/1/21 | 1,250,000 a | 1,104,625 | ||||
| Foothill/Eastern Transportation Corridor Agency, | ||||||||
| Toll Road Revenue | 5.75 | 1/15/40 | 2,000,000 | 2,103,980 | ||||
| Foothill/Eastern Transportation Corridor Agency, | ||||||||
| Toll Road Revenue (Insured; MBIA) | 0/5.88 | 1/15/27 | 6,000,000 a | 5,912,460 | ||||
| Foothill/Eastern Transportation Corridor Agency, | ||||||||
| Toll Road Revenue (Insured; MBIA) | 0/5.88 | 1/15/29 | 2,000,000 a | 1,964,640 | ||||
| Golden State Tobacco Securitization Corp., Enhanced | ||||||||
| Tobacco Settlement Asset-Backed Bonds (Insured; AMBAC) | 5.00 | 6/1/21 | 1,910,000 | 2,005,729 | ||||
| Colorado—.7% | ||||||||
| Northwest Parkway Public Highway Authority, | ||||||||
| Revenue (Insured; AMBAC) | 0/5.70 | 6/15/21 | 5,000,000 a | 4,578,600 | ||||
| Florida—.2% | ||||||||
| Miami-Dade County, Subordinate Special Obligation | 0/5.00 | 10/1/35 | 1,500,000 a | 1,426,260 | ||||
| Illinois—.3% | ||||||||
| Illinois Finance Authority, Gas Supply Revenue | ||||||||
| (Peoples Gas Light and Coke Co. Project) (Insured; AMBAC) | 4.30 | 6/1/16 | 2,000,000 | 2,057,020 | ||||
| Massachusetts—.6% | ||||||||
| Massachusetts Housing Finance Agency, Housing Revenue | 5.13 | 12/1/34 | 350,000 | 361,491 | ||||
| Massachusetts Water Pollution Abatement Trust | ||||||||
| (Pooled Loan Program) | 5.00 | 8/1/32 | 3,000,000 | 3,147,900 | ||||
| Michigan—.4% | ||||||||
| Detroit City School District (Insured; FGIC) | 5.25 | 5/1/17 | 2,000,000 | 2,233,420 | ||||
| Missouri—.1% | ||||||||
| Missouri Housing Development Commission, SFMR | ||||||||
| (Homeownership Loan Program) (Collateralized: FNMA and GNMA) | 6.40 | 9/1/29 | 520,000 | 537,290 | ||||
| New Hampshire—.2% | ||||||||
| New Hampshire Business Finance Authority, PCR | ||||||||
| (Central Maine Power Co.) | 5.38 | 5/1/14 | 1,015,000 | 1,082,975 | ||||
The Funds 33
STATEMENT OF INVESTMENTS (Unaudited) (continued)
| Mellon Pennsylvania Intermediate Municipal Bond Fund (continued) | ||||||||||
| Long-Term Municipal | Coupon | Maturity | Principal | |||||||
| Investments (continued) | Rate (%) | Date | Amount ($) | Value ($) | ||||||
| New Jersey—4.5% | ||||||||||
| Garden State Preservation Trust (Open Space | ||||||||||
| and Farmland Preservation) (Insured; FSA) | 5.80 | 11/1/19 | 4,805,000 | 5,557,319 | ||||||
| Garden State Preservation Trust (Open Space | ||||||||||
| and Farmland Preservation) (Insured; FSA) | 5.80 | 11/1/21 | 2,000,000 | 2,313,140 | ||||||
| Garden State Preservation Trust (Open Space | ||||||||||
| and Farmland Preservation) (Insured; FSA) | 5.80 | 11/1/23 | 2,000,000 | 2,315,400 | ||||||
| New Jersey Economic Development Authority, Cigarette Tax Revenue | 5.75 | 6/15/29 | 4,000,000 | 4,343,520 | ||||||
| New Jersey Transportation Trust Fund Authority | ||||||||||
| (Transportation System) | 5.25 | 12/15/19 | 4,000,000 | 4,511,760 | ||||||
| Tobacco Settlement Financing Corporation of New Jersey, | ||||||||||
| Tobacco Settlement Asset-Backed Bonds | 4.50 | 6/1/23 | 2,000,000 | 1,971,520 | ||||||
| Tobacco Settlement Financing Corporation of New Jersey, | ||||||||||
| Tobacco Settlement Asset-Backed Bonds | 5.00 | 6/1/29 | 7,500,000 | 7,474,500 | ||||||
| New York—1.6% | ||||||||||
| Long Island Power Authority, Electric System | ||||||||||
| General Revenue (Insured; FGIC) | 5.25 | 12/1/20 | 2,000,000 | 2,225,280 | ||||||
| New York City Industrial Development Agency, PILOT | ||||||||||
| Revenue (Queens Baseball Stadium Project) (Insured; AMBAC) | 5.00 | 1/1/26 | 2,040,000 | 2,215,766 | ||||||
| New York City Transitional Finance Authority, | ||||||||||
| Future Tax Secured Revenue | 5.50/14.00 | 11/1/26 | 4,000,000 | b | 4,298,280 | |||||
| New York State Dormitory Authority, Revenue (Schools Program) | 5.25 | 7/1/11 | 1,200,000 | 1,252,716 | ||||||
| North Carolina—.5% | ||||||||||
| North Carolina Eastern Municipal Power Agency, | ||||||||||
| Power System Revenue | 5.30 | 1/1/15 | 1,500,000 | 1,601,415 | ||||||
| North Carolina Eastern Municipal Power Agency, | ||||||||||
| Power System Revenue | 5.13 | 1/1/23 | 1,500,000 | 1,573,515 | ||||||
| Ohio—.9% | ||||||||||
| Cuyahoga County, Revenue (Cleveland Clinic Health System) | 6.00 | 1/1/16 | 5,000,000 | 5,596,500 | ||||||
| Pennsylvania—66.0% | ||||||||||
| Allegheny County Hospital Development Authority, Revenue | ||||||||||
| (University of Pittsburgh Medical Center) | 5.00 | 6/15/14 | 5,000,000 | 5,339,550 | ||||||
| Allegheny County Port Authority, | ||||||||||
| Special Transportation Revenue (Insured; FGIC) | 5.38 | 3/1/11 | 2,500,000 | 2,660,225 | ||||||
| Allegheny County Port Authority, | ||||||||||
| Special Transportation Revenue (Insured; FGIC) | 5.50 | 3/1/14 | 2,500,000 | 2,685,850 | ||||||
| Allegheny County Port Authority, | ||||||||||
| Special Transportation Revenue (Insured; FGIC) | 5.50 | 3/1/16 | 1,360,000 | 1,462,163 | ||||||
| Allegheny County Sanitary Authority, Sewer Revenue (Insured; MBIA) | 5.00 | 12/1/18 | 2,560,000 | 2,786,099 | ||||||
| Beaver County Industrial Development Authority, | ||||||||||
| PCR (Duquesne Light Company Project) (Insured; AMBAC) | 4.50 | 11/1/29 | 7,500,000 | 7,587,075 | ||||||
| Blair County (Insured; AMBAC) | 5.38 | 8/1/15 | 1,880,000 | 2,103,645 | ||||||
| Blair County (Insured; AMBAC) | 5.38 | 8/1/16 | 1,980,000 | 2,233,915 | ||||||
| Central Dauphin School District, GO (Insured; MBIA) | 6.75 | 2/1/16 | 5,000,000 | c | 6,126,550 | |||||
| Central Dauphin School District, GO (Insured; MBIA) | 7.00 | 2/1/16 | 1,630,000 | c | 2,026,514 | |||||
34
| Mellon Pennsylvania Intermediate Municipal Bond Fund (continued) | ||||||||||
| Long-Term Municipal | Coupon | Maturity | Principal | |||||||
| Investments (continued) | Rate (%) | Date | Amount ($) | Value ($) | ||||||
| Pennsylvania (continued) | ||||||||||
| Central Dauphin School District, GO (Insured; MBIA) | 7.50 | 2/1/16 | 3,100,000 | c | 3,965,241 | |||||
| Central York School District, GO (Insured; FGIC) | 5.00 | 6/1/12 | 2,305,000 | 2,451,967 | ||||||
| Central York School District, GO (Insured; FGIC) | 5.50 | 6/1/12 | 80,000 | c | 86,998 | |||||
| Central York School District, GO (Insured; FGIC) | 5.50 | 6/1/14 | 920,000 | 997,501 | ||||||
| Chester County | 5.00 | 8/15/18 | 4,545,000 | 4,939,597 | ||||||
| Chichester School District, GO (Insured; FSA) | 5.25 | 3/15/24 | 1,355,000 | 1,494,931 | ||||||
| Coatesville Area School District (Insured; FSA) | 5.25 | 8/15/14 | 1,485,000 | c | 1,637,257 | |||||
| Coatesville Area School District (Insured; FSA) | 5.25 | 8/15/14 | 6,515,000 | c | 7,182,983 | |||||
| Cumberland County Municipal Authority, Revenue | ||||||||||
| (Dickerson College) (Insured; AMBAC) | 5.25 | 11/1/09 | 1,170,000 | 1,218,298 | ||||||
| Delaware County Authority, Revenue (Haverford College) | 5.88 | 11/15/21 | 1,500,000 | 1,621,440 | ||||||
| Delaware County Authority, Revenue (Haverford College) | 5.75 | 11/15/25 | 3,000,000 | 3,228,900 | ||||||
| Delaware County Authority, University Revenue | ||||||||||
| (Villanova University) (Insured; AMBAC) | 5.00 | 8/1/20 | 2,095,000 | 2,283,005 | ||||||
| Delaware County Regional Water Quality Control | ||||||||||
| Authority, Sewer Revenue (Insured; FGIC) | 4.75 | 5/1/10 | 1,945,000 | 2,009,982 | ||||||
| Delaware River Joint Toll Bridge Commission, | ||||||||||
| Bridge Revenue (Insured; MBIA) | 5.25 | 7/1/17 | 1,485,000 | 1,644,905 | ||||||
| Downingtown Area School District | 5.25 | 2/1/08 | 300,000 | 304,470 | ||||||
| Downingtown Area School District | 5.38 | 2/1/09 | 5,020,000 | 5,184,606 | ||||||
| East Stroudsburg Area School District, GO (Insured; FSA) | 7.50 | 9/1/22 | 2,500,000 | 3,226,600 | ||||||
| Easton Area School District, GO (Insured; FSA) | 7.50 | 4/1/18 | 1,000,000 | 1,279,300 | ||||||
| Easton Area School District, GO (Insured; FSA) | 7.50 | 4/1/21 | 3,000,000 | 3,847,770 | ||||||
| Easton Area School District, GO (Insured; FSA) | 7.50 | 4/1/22 | 3,000,000 | 3,850,440 | ||||||
| Erie County (Insured; FGIC) | 5.50 | 9/1/22 | 1,640,000 | 1,944,253 | ||||||
| Fleetwood Area School District (Insured; FGIC) | 5.00 | 4/1/11 | 1,500,000 | 1,576,560 | ||||||
| Harrisburg Authority, School Revenue | ||||||||||
| (Harrisburg Project) (Insured; FGIC) | 5.00 | 4/1/10 | 2,500,000 | 2,599,600 | ||||||
| Kennett Consolidated School District (Insured; FGIC) | 5.50 | 2/15/12 | 1,310,000 | c | 1,418,795 | |||||
| Lancaster County Solid Waste Management Authority, | ||||||||||
| Resource Recovery System Revenue (Insured; AMBAC) | 5.25 | 12/15/08 | 3,940,000 | 4,029,162 | ||||||
| Lancaster County Solid Waste Management Authority, | ||||||||||
| Resource Recovery System Revenue (Insured; AMBAC) | 5.25 | 12/15/09 | 4,230,000 | 4,372,001 | ||||||
| Lancaster County Solid Waste Management Authority, | ||||||||||
| Resource Recovery System Revenue (Insured; AMBAC) | 5.25 | 12/15/10 | 2,000,000 | 2,087,220 | ||||||
| Lancaster County Vocational Technical | ||||||||||
| School Authority, LR (Insured; FGIC) | 5.25 | 2/15/10 | 1,500,000 | 1,567,890 | ||||||
| Lancaster Higher Education Authority, College Revenue | ||||||||||
| (Franklin and Marshall College Project) | 5.25 | 4/15/16 | 1,815,000 | 1,948,294 | ||||||
| Lehigh County General Purpose Authority, HR | ||||||||||
| (Saint Luke’s Hospital of Bethlehem, Pennsylvania Project) | 4.51 | 8/15/33 | 5,000,000 | d | 5,000,000 | |||||
| Lehigh County General Purpose Authority, | ||||||||||
| Revenue (Good Shepherd Group) | 5.25 | 11/1/14 | 3,255,000 | 3,364,759 | ||||||
The Funds 35
STATEMENT OF INVESTMENTS (Unaudited) (continued)
| Mellon Pennsylvania Intermediate Municipal Bond Fund (continued) | ||||||||||
| Long-Term Municipal | Coupon | Maturity | Principal | |||||||
| Investments (continued) | Rate (%) | Date | Amount ($) | Value ($) | ||||||
| Pennsylvania (continued) | ||||||||||
| Lehigh County Industrial Development Authority, | ||||||||||
| PCR (People Electric Utilities Corp. Project) (Insured; FGIC) | 4.75 | 2/15/27 | 2,000,000 | 2,070,340 | ||||||
| Lower Merion School District | 5.00 | 5/15/29 | 11,975,000 | 12,650,989 | ||||||
| Montgomery County | 5.00 | 9/15/10 | 1,165,000 | 1,218,637 | ||||||
| Montgomery County | 5.00 | 9/15/11 | 2,155,000 | 2,278,158 | ||||||
| Muhlenberg School District (Insured; FGIC) | 5.38 | 4/1/15 | 1,000,000 | 1,075,610 | ||||||
| Neshaminy School District, GO (Insured; AMBAC) | 5.00 | 5/1/18 | 2,000,000 | 2,184,660 | ||||||
| Neshaminy School District, GO (Insured; AMBAC) | 5.00 | 5/1/24 | 1,500,000 | 1,623,150 | ||||||
| North Penn School District Authority, School Revenue | 6.20 | 3/1/07 | 305,000 | 305,061 | ||||||
| Northampton County Higher Education Authority, | ||||||||||
| Revenue (Lehigh University) | 5.50 | 11/15/11 | 2,500,000 | 2,699,050 | ||||||
| Northwestern Lehigh School District (Insured; FSA) | 5.00 | 3/15/10 | 1,245,000 | 1,293,941 | ||||||
| Owen J. Roberts School District (Insured; FSA) | 5.50 | 8/15/12 | 1,440,000 | c | 1,570,493 | |||||
| Parkland School District (Insured; FGIC) | 5.25 | 9/1/11 | 2,220,000 | 2,366,897 | ||||||
| Parkland School District (Insured; FGIC) | 5.38 | 9/1/14 | 3,110,000 | 3,453,500 | ||||||
| Parkland School District (Insured; FGIC) | 5.38 | 9/1/16 | 1,490,000 | 1,682,404 | ||||||
| Pennsylvania | 6.00 | 1/15/10 | 2,500,000 | c | 2,683,450 | |||||
| Pennsylvania | 5.25 | 10/15/10 | 10,000,000 | 10,547,700 | ||||||
| Pennsylvania | 5.25 | 2/1/11 | 7,850,000 | 8,306,713 | ||||||
| Pennsylvania Economic Development Financing Authority, | ||||||||||
| SWDR (Waste Management Inc. Project) | 4.70 | 11/1/14 | 5,000,000 | 5,111,550 | ||||||
| Pennsylvania Higher Educational Facilities Authority, | ||||||||||
| College Revenue (Allegheny College Project) (Insured; MBIA) | 6.10 | 11/1/08 | 845,000 | 846,732 | ||||||
| Pennsylvania Higher Educational Facilities Authority, | ||||||||||
| College Revenue (Lafayette College Project) | 6.00 | 5/1/30 | 5,000,000 | 5,328,850 | ||||||
| Pennsylvania Higher Educational Facilities Authority, | ||||||||||
| Health Services Revenue (Allegheny Delaware Valley | ||||||||||
| Obligated Group Project) (Insured; MBIA) | 5.60 | 11/15/10 | 2,000,000 | 2,120,280 | ||||||
| Pennsylvania Higher Educational Facilities Authority, | ||||||||||
| Revenue (Bryn Mawr College) (Insured; AMBAC) | 5.25 | 12/1/12 | 3,000,000 | 3,246,270 | ||||||
| Pennsylvania Higher Educational Facilities Authority, | ||||||||||
| Revenue (Drexel University) (Insured; MBIA) | 5.30 | 5/1/07 | 875,000 | c | 894,889 | |||||
| Pennsylvania Higher Educational Facilities Authority, | ||||||||||
| Revenue (Drexel University) (Insured; MBIA) | 5.30 | 5/1/10 | 3,035,000 | 3,103,470 | ||||||
| Pennsylvania Higher Educational Facilities Authority, | ||||||||||
| Revenue (La Salle University) | 5.50 | 5/1/34 | 2,250,000 | 2,387,407 | ||||||
| Pennsylvania Higher Educational Facilities Authority, | ||||||||||
| Revenue (State System of Higher Education) (Insured; AMBAC) | 5.00 | 6/15/10 | 2,785,000 | 2,901,970 | ||||||
| Pennsylvania Higher Educational Facilities Authority, | ||||||||||
| Revenue (State System of Higher Education) (Insured; AMBAC) | 5.75 | 6/15/10 | 3,045,000 | 3,238,357 | ||||||
| Pennsylvania Higher Educational Facilities Authority, | ||||||||||
| Revenue (State System of Higher Education) (Insured; AMBAC) | 5.00 | 6/15/11 | 2,935,000 | 3,089,322 | ||||||
| Pennsylvania Higher Educational Facilities Authority, | ||||||||||
| Revenue (Temple University) (Insured; MBIA) | 5.25 | 4/1/14 | 960,000 | 984,653 | ||||||
36
| Mellon Pennsylvania Intermediate Municipal Bond Fund (continued) | ||||||||||
| Long-Term Municipal | Coupon | Maturity | Principal | |||||||
| Investments (continued) | Rate (%) | Date | Amount ($) | Value ($) | ||||||
| Pennsylvania (continued) | ||||||||||
| Pennsylvania Higher Educational Facilities Authority, | ||||||||||
| Revenue (Thomas Jefferson University) (Insured; AMBAC) | 5.25 | 9/1/17 | 1,700,000 | 1,912,228 | ||||||
| Pennsylvania Higher Educational Facilities Authority, | ||||||||||
| Revenue (Thomas Jefferson University) (Insured; AMBAC) | 5.25 | 9/1/18 | 1,485,000 | 1,676,075 | ||||||
| Pennsylvania Higher Educational Facilities Authority, | ||||||||||
| Revenue (University of Scranton) (Insured; AMBAC) | 5.75 | 5/1/11 | 1,690,000 | c | 1,826,518 | |||||
| Pennsylvania Higher Educational Facilities Authority, | ||||||||||
| Revenue (UPMC Health System) | 5.00 | 1/15/10 | 1,630,000 | 1,680,579 | ||||||
| Pennsylvania Higher Educational Facilities Authority, | ||||||||||
| Revenue (UPMC Health System) | 5.13 | 1/15/11 | 1,550,000 | 1,618,154 | ||||||
| Pennsylvania Higher Educational Facilities Authority, | ||||||||||
| Revenue (UPMC Health System) | 6.00 | 1/15/22 | 2,500,000 | 2,714,400 | ||||||
| Pennsylvania Higher Educational Facilities Authority, | ||||||||||
| Revenue (UPMC Health System) (Insured; FSA) | 5.25 | 8/1/12 | 3,000,000 | 3,126,450 | ||||||
| Pennsylvania Housing Finance Agency, SFMR | 5.35 | 10/1/09 | 1,165,000 | 1,189,919 | ||||||
| Pennsylvania Housing Finance Agency, SFMR | 5.45 | 10/1/10 | 3,025,000 | 3,093,274 | ||||||
| Pennsylvania Housing Finance Agency, SFMR | 5.50 | 10/1/11 | 1,325,000 | 1,355,488 | ||||||
| Pennsylvania Housing Finance Agency, SFMR | 5.55 | 10/1/12 | 325,000 | 327,132 | ||||||
| Pennsylvania Industrial Development | ||||||||||
| Authority, EDR (Insured; AMBAC) | 5.80 | 1/1/09 | 5,000,000 | 5,189,050 | ||||||
| Pennsylvania Industrial Development | ||||||||||
| Authority, EDR (Insured; AMBAC) | 5.50 | 7/1/12 | 5,335,000 | 5,794,984 | ||||||
| Pennsylvania Turnpike Commission, Oil Franchise | ||||||||||
| Tax Subordinated Revenue (Insured; MBIA) | 5.25 | 12/1/13 | 2,500,000 | c | 2,735,175 | |||||
| Pennsylvania Turnpike Commission, | ||||||||||
| Registration Fee Revenue (Insured; FSA) | 5.25 | 7/15/24 | 5,000,000 | 5,821,850 | ||||||
| Pennsylvania Turnpike Commission, | ||||||||||
| Registration Fee Revenue (Insured; FSA) | 5.25 | 7/15/25 | 5,000,000 | 5,854,300 | ||||||
| Pennsylvania Turnpike Commission, Turnpike Revenue | 5.50 | 6/1/15 | 1,500,000 | 1,616,985 | ||||||
| Pennsylvania Turnpike Commission, | ||||||||||
| Turnpike Revenue (Insured; AMBAC) | 5.00 | 12/1/29 | 5,000,000 | 5,368,300 | ||||||
| Pennsylvania Turnpike Commission, | ||||||||||
| Turnpike Revenue (Insured; FGIC) | 5.00 | 6/1/11 | 3,000,000 | 3,161,250 | ||||||
| Pennsylvania Turnpike Commission, | ||||||||||
| Turnpike Revenue (Insured; FGIC) | 5.50 | 12/1/11 | 2,510,000 | 2,713,837 | ||||||
| Pennsylvania Turnpike Commission, | ||||||||||
| Turnpike Revenue (Insured; FGIC) | 5.50 | 12/1/12 | 2,000,000 | 2,192,100 | ||||||
| Perkiomen Valley School District (Insured; FSA) | 5.25 | 3/1/11 | 690,000 | c | 730,951 | |||||
| Perkiomen Valley School District (Insured; FSA) | 5.25 | 3/1/11 | 720,000 | c | 762,732 | |||||
| Perkiomen Valley School District (Insured; FSA) | 5.25 | 3/1/13 | 540,000 | 570,499 | ||||||
| Perkiomen Valley School District (Insured; FSA) | 5.25 | 3/1/14 | 570,000 | 601,977 | ||||||
| Philadelphia (Insured; FSA) | 5.25 | 3/15/11 | 3,500,000 | 3,634,890 | ||||||
| Philadelphia (Insured; FSA) | 5.25 | 3/15/12 | 235,000 | 244,057 | ||||||
| Philadelphia (Insured; FSA) | 5.25 | 3/15/13 | 2,000,000 | 2,076,280 | ||||||
The Funds 37
STATEMENT OF INVESTMENTS (Unaudited) (continued)
| Mellon Pennsylvania Intermediate Municipal Bond Fund (continued) | ||||||||||
| Long-Term Municipal | Coupon | Maturity | Principal | |||||||
| Investments (continued) | Rate (%) | Date | Amount ($) | Value ($) | ||||||
| Pennsylvania (continued) | ||||||||||
| Philadelphia (Insured; FSA) | 5.25 | 3/15/14 | 1,000,000 | 1,037,940 | ||||||
| Philadelphia, Water and Wastewater Revenue (Insured; AMBAC) | 5.63 | 6/15/09 | 5,000,000 | 5,218,200 | ||||||
| Philadelphia, Water and Wastewater Revenue (Insured; AMBAC) | 5.25 | 12/15/12 | 10,000,000 | 10,815,100 | ||||||
| Philadelphia, Water and Wastewater Revenue (Insured; FSA) | 5.25 | 7/1/18 | 5,000,000 | 5,498,900 | ||||||
| Philadelphia, Water and Wastewater Revenue (Insured; FSA) | 5.00 | 7/1/23 | 1,690,000 | 1,814,350 | ||||||
| Philadelphia Authority for Industrial Development, Industrial and | ||||||||||
| Commercial Revenue (Girard Estates Facilities Leasing Project) | 5.00 | 5/15/19 | 2,400,000 | 2,406,528 | ||||||
| Philadelphia Hospital and Higher Education Facilities | ||||||||||
| Authority, Revenue (Jefferson Health System) | 5.50 | 5/15/08 | 1,000,000 | 1,020,700 | ||||||
| Philadelphia Parking Authority, | ||||||||||
| Airport Parking Revenue (Insured; AMBAC) | 5.75 | 9/1/09 | 2,255,000 | 2,364,097 | ||||||
| Philadelphia Parking Authority, Parking Revenue (Insured; AMBAC) | 5.25 | 2/1/13 | 1,935,000 | 2,005,647 | ||||||
| Philadelphia Parking Authority, Parking Revenue (Insured; AMBAC) | 5.25 | 2/1/14 | 2,040,000 | 2,114,093 | ||||||
| Philadelphia School District (Insured; AMBAC) | 5.00 | 4/1/17 | 5,000,000 | 5,407,200 | ||||||
| Philadelphia School District (Insured; FSA) | 5.75 | 2/1/11 | 4,000,000 | 4,295,680 | ||||||
| Philadelphia School District (Insured; FSA) | 5.75 | 2/1/11 | 3,000,000 | c | 3,228,900 | |||||
| Philadelphia School District (Insured; FSA) | 5.50 | 2/1/12 | 1,310,000 | c | 1,417,996 | |||||
| Philadelphia School District (Insured; FSA) | 5.50 | 2/1/12 | 1,770,000 | c | 1,915,919 | |||||
| Philadelphia School District (Insured; MBIA) | 5.00 | 10/1/08 | 5,000,000 | 5,102,900 | ||||||
| Philadelphia School District (Insured; MBIA) | 5.25 | 4/1/09 | 2,500,000 | c | 2,581,050 | |||||
| Pittsburgh School District (Insured; FSA) | 5.50 | 9/1/16 | 4,000,000 | 4,539,080 | ||||||
| Pittsburgh School District (Insured; FSA) | 5.50 | 9/1/18 | 1,000,000 | 1,152,740 | ||||||
| Saint Mary Hospital Authority, Health | ||||||||||
| System Revenue (Catholic Health East Issue) | 5.00 | 11/15/21 | 1,000,000 | 1,047,150 | ||||||
| Scranton-Lackawanna Health and Welfare Authority, | ||||||||||
| Revenue (Community Medical Center Project) (Insured; MBIA) | 5.50 | 7/1/10 | 3,035,000 | 3,126,930 | ||||||
| Scranton-Lackawanna Health and Welfare Authority, | ||||||||||
| Revenue (Community Medical Center Project) (Insured; MBIA) | 5.50 | 7/1/11 | 3,195,000 | 3,291,361 | ||||||
| Springfield School District (Delaware County) (Insured; FSA) | 4.75 | 3/15/12 | 1,085,000 | 1,139,293 | ||||||
| State Public School Building Authority, School LR | ||||||||||
| (Richland School District Project) (Insured; FGIC) | 5.00 | 11/15/14 | 1,265,000 | c | 1,376,889 | |||||
| State Public School Building Authority, School Revenue | ||||||||||
| (Lease-Philadelphia School District Project) (Insured; FSA) | 5.00 | 6/1/13 | 5,000,000 | c | 5,370,000 | |||||
| State Public School Building Authority, School Revenue | ||||||||||
| (Tuscarora School District Project) (Insured; FSA) | 5.25 | 4/1/13 | 195,000 | c | 211,731 | |||||
| State Public School Building Authority, School Revenue | ||||||||||
| (Tuscarora School District Project) (Insured; FSA) | 5.25 | 4/1/17 | 840,000 | 906,125 | ||||||
| Susquehanna Area Regional Airport Authority | ||||||||||
| Airport System Revenue | 5.38 | 1/1/18 | 6,000,000 | 6,196,380 | ||||||
| Susquehanna Area Regional Airport Authority, | ||||||||||
| Airport System Revenue (Insured; AMBAC) | 5.50 | 1/1/20 | 4,370,000 | 4,687,044 | ||||||
| 38 |
| Mellon Pennsylvania Intermediate Municipal Bond Fund (continued) | ||||||||||
| Long-Term Municipal | Coupon | Maturity | Principal | |||||||
| Investments (continued) | Rate (%) | Date | Amount ($) | Value ($) | ||||||
| Pennsylvania (continued) | ||||||||||
| Susquehanna Area Regional Airport Authority, | ||||||||||
| Airport System Revenue (Insured; AMBAC) | 5.00 | 1/1/33 | 2,400,000 | 2,509,176 | ||||||
| Swarthmore Borough Authority, College Revenue | 5.50 | 9/15/11 | 17,500,000 | 18,818,275 | ||||||
| Swarthmore Borough Authority, College Revenue | 5.25 | 9/15/17 | 1,000,000 | 1,072,920 | ||||||
| Twin Valley School District, GO (Insured; FSA) | 5.25 | 4/1/21 | 1,000,000 | 1,105,020 | ||||||
| University Area Joint Authority, Sewer Revenue (Insured; MBIA) | 5.00 | 11/1/11 | 1,430,000 | 1,512,525 | ||||||
| Upper Darby School District, GO (Insured; FGIC) | 5.00 | 5/1/18 | 2,870,000 | 3,110,334 | ||||||
| Upper Merion Area School District (Insured; MBIA) | 5.00 | 2/15/19 | 1,165,000 | 1,254,623 | ||||||
| Upper Saint Clair Township School District | 5.20 | 7/15/07 | 6,000,000 | c | 6,035,400 | |||||
| Warwick School District (Insured; FGIC) | 5.25 | 2/15/11 | 1,000,000 | 1,058,730 | ||||||
| Wilson Area School District (Insured; FGIC) | 5.00 | 2/15/11 | 1,910,000 | 2,005,061 | ||||||
| Wilson School District (Insured; FSA) | 5.38 | 5/15/15 | 1,785,000 | 1,918,482 | ||||||
| Wilson School District (Insured; FSA) | 5.38 | 5/15/16 | 1,500,000 | 1,612,170 | ||||||
| York County (Insured; AMBAC) | 5.00 | 6/1/17 | 1,100,000 | 1,173,480 | ||||||
| York County Solid Waste and Refuse Authority, | ||||||||||
| Solid Waste System Revenue (Insured; FGIC) | 5.50 | 12/1/14 | 1,000,000 | 1,119,440 | ||||||
| South Carolina—.7% | ||||||||||
| Greenville County School District, Installment | ||||||||||
| Purchase Revenue (Building Equity Sooner for Tomorrow) | 5.88 | 12/1/12 | 2,000,000 | c | 2,240,360 | |||||
| Greenville County School District, Installment | ||||||||||
| Purchase Revenue (Building Equity Sooner for Tomorrow) | 5.50 | 12/1/18 | 2,000,000 | 2,272,040 | ||||||
| Texas—.3% | ||||||||||
| Dallas/Fort Worth, International Airport, | ||||||||||
| Joint Revenue Improvement (Insured; FGIC) | 5.50 | 11/1/31 | 2,000,000 | 2,120,960 | ||||||
| Virginia—1.9% | ||||||||||
| Industrial Development Authority of the County | ||||||||||
| of Charles City, Solid Waste Disposal Facility | ||||||||||
| Revenue (USA Waste of Virginia, Inc. Project) | 4.88 | 2/1/09 | 6,600,000 | 6,687,450 | ||||||
| Louisa Industrial Development Authority, PCR | ||||||||||
| (Virginia Electric and Power Company) | 5.25 | 12/1/08 | 5,000,000 | 5,055,400 | ||||||
| U.S. Related—14.1% | ||||||||||
| Puerto Rico Commonwealth, Public Improvement | 5.25 | 7/1/23 | 4,090,000 | 4,470,002 | ||||||
| Puerto Rico Commonwealth, Public Improvement (Insured; FGIC) | 5.50 | 7/1/18 | 9,545,000 | 11,052,156 | ||||||
| Puerto Rico Commonwealth, Public Improvement (Insured; MBIA) | 5.50 | 7/1/14 | 7,500,000 | 8,393,850 | ||||||
| Puerto Rico Electric Power Authority, Power Revenue (Insured; FSA) | 5.25 | 7/1/29 | 5,000,000 | 5,266,100 | ||||||
| Puerto Rico Electric Power Authority, Power Revenue (Insured; MBIA) | 5.25 | 7/1/14 | 7,875,000 | 8,687,700 | ||||||
| Puerto Rico Electric Power Authority, Power Revenue (Insured; MBIA) | 5.50 | 7/1/17 | 6,000,000 | 6,915,180 | ||||||
| Puerto Rico Electric Power Authority, Power Revenue (Insured; MBIA) | 5.50 | 7/1/19 | 2,290,000 | 2,669,339 | ||||||
| Puerto Rico Government Development Bank, Senior Notes | 5.00 | 12/1/12 | 3,000,000 | 3,169,650 | ||||||
| Puerto Rico Government Development Bank, Senior Notes | 5.00 | 12/1/13 | 3,000,000 | 3,195,150 | ||||||
The Funds 39
STATEMENT OF INVESTMENTS (Unaudited) (continued)
| Mellon Pennsylvania Intermediate Municipal Bond Fund (continued) | ||||||||||
| Long-Term Municipal | Coupon | Maturity | Principal | |||||||
| Investments (continued) | Rate (%) | Date | Amount ($) | Value ($) | ||||||
| U.S. Related (continued) | ||||||||||
| Puerto Rico Highway and Transportation Authority, | ||||||||||
| Highway Revenue (Insured; FSA) | 5.50 | 7/1/13 | 1,500,000 | 1,618,830 | ||||||
| Puerto Rico Highway and Transportation Authority, | ||||||||||
| Highway Revenue (Insured; MBIA) | 5.50 | 7/1/13 | 4,000,000 | 4,316,880 | ||||||
| Puerto Rico Highway and Transportation Authority, | ||||||||||
| Highway Revenue, Series Y (Insured; MBIA) | 6.25 | 7/1/08 | 1,295,000 | 1,341,115 | ||||||
| Puerto Rico Highway and Transportation Authority, | ||||||||||
| Highway Revenue, Series Z (Insured; MBIA) | 6.25 | 7/1/08 | 1,000,000 | 1,034,410 | ||||||
| Puerto Rico Highway and Transportation Authority, | ||||||||||
| Transportation Revenue | 5.25 | 7/1/10 | 4,000,000 | 4,177,000 | ||||||
| Puerto Rico Infrastructure Financing Authority, Special Tax Revenue | 5.00 | 7/1/21 | 5,000,000 | 5,364,100 | ||||||
| Puerto Rico Municipal Finance Agency (Insured; FSA) | 5.50 | 8/1/09 | 7,090,000 | 7,394,090 | ||||||
| University of Puerto Rico, University System Revenue | 5.00 | 6/1/22 | 8,510,000 | 9,104,764 | ||||||
| Total Long-Term Municipal Investments (cost $591,634,825) | 614,216,059 | |||||||||
| Short-Term Municipal Investments—1.1% | ||||||||||
| Pennsylvania; | ||||||||||
| Delaware County Authority, Revenue (White Horse | ||||||||||
| Village Project) (LOC; Citizens Bank of Pennsylvania) | 3.63 | 3/1/07 | 2,900,000 | e | 2,900,000 | |||||
| Philadelphia Authority for Industrial Development, Revenue | ||||||||||
| (The Fox Chase Cancer Center Project) (LOC; JPMorgan Chase Bank) | 3.64 | 3/1/07 | 400,000 | e | 400,000 | |||||
| South Fork Municipal Authority, HR (Conemaugh Health System | ||||||||||
| Project) (Insured; MBIA and Liquidity Facility; Credit Suisse Group) | 3.60 | 3/1/07 | 3,500,000 | e | 3,500,000 | |||||
| Total Short-Term Municipal Investments (cost $6,800,000) | 6,800,000 | |||||||||
| Total Investments (cost $598,434,825) | 99.1% | 621,016,059 | ||||||||
| Cash and Receivables (Net) | .9% | 5,353,568 | ||||||||
| Net Assets | 100.0% | 626,369,627 | ||||||||
| a Zero coupon until a specified date at which time the stated coupon rate becomes effective until maturity. |
| b Subject to interest rate change on November 1, 2011. |
| c These securities are prerefunded; the date shown represents the prerefunded date. Bonds which are prerefunded are collateralized by U.S. Government securities which are held in |
| escrow and are used to pay principal and interest on the municipal issue and to retire the bonds in full at the earliest refunding date. |
| d Variable rate security—interest rate subject to periodic change. |
| e Securities payable on demand.Variable interest rate—subject to periodic change. |
| 40 |
| Summary of Abbreviations | ||||||
| ACA | American Capital Access | AGC | ACE Guaranty Corporation | |||
| AGIC | Asset Guaranty Insurance Company | AMBAC | American Municipal Bond Assurance Corporation | |||
| ARRN | Adjustable Rate Receipt Notes | BAN | Bond Anticipation Notes | |||
| BIGI | Bond Investors Guaranty Insurance | BPA | Bond Purchase Agreement | |||
| CGIC | Capital Guaranty Insurance Company | CIC | Continental Insurance Company | |||
| CIFG | CDC Ixis Financial Guaranty | CMAC | Capital Market Assurance Corporation | |||
| COP | Certificate of Participation | CP | Commercial Paper | |||
| EDR | Economic Development Revenue | EIR | Environmental Improvement Revenue | |||
| FGIC | Financial Guaranty Insurance Company | FHA | Federal Housing Administration | |||
| FHLB | Federal Home Loan Bank | FHLMC | Federal Home Loan Mortgage Corporation | |||
| FNMA | Federal National Mortgage Association | FSA | Financial Security Assurance | |||
| GAN | Grant Anticipation Notes | GIC | Guaranteed Investment Contract | |||
| GNMA | Government National Mortgage Association | GO | General Obligation | |||
| HR | Hospital Revenue | IDB | Industrial Development Board | |||
| IDC | Industrial Development Corporation | IDR | Industrial Development Revenue | |||
| LOC | Letter of Credit | LOR | Limited Obligation Revenue | |||
| LR | Lease Revenue | MBIA | Municipal Bond Investors | |||
| Assurance Insurance Corporation | ||||||
| MFHR | Multi-Family Housing Revenue | MFMR | Multi-Family Mortgage Revenue | |||
| PCR | Pollution Control Revenue | PILOT | Payment in Lieu of Taxes | |||
| RAC | Revenue Anticipation Certificates | RAN | Revenue Anticipation Notes | |||
| RAW | Revenue Anticipation Warrants | RRR | Resources Recovery Revenue | |||
| SAAN | State Aid Anticipation Notes | SBPA | Standby Bond Purchase Agreement | |||
| SFHR | Single Family Housing Revenue | SFMR | Single Family Mortgage Revenue | |||
| SONYMA | State of New York Mortgage Agency | SWDR | Solid Waste Disposal Revenue | |||
| TAN | Tax Anticipation Notes | TAW | Tax Anticipation Warrants | |||
| TRAN | Tax and Revenue Anticipation Notes | XLCA | XL Capital Assurance | |||
| Summary of Combined Ratings (Unaudited) | ||||||||||
| Fitch | or | Moody’s | or | Standard & Poor’s | Value (%)† | |||||
| AAA | Aaa | AAA | 69.0 | |||||||
| AA | Aa | AA | 13.2 | |||||||
| A | A | A | 3.6 | |||||||
| BBB | Baa | BBB | 13.1 | |||||||
| F1 | MIG1/P1 | SP1/A1 | 1.1 | |||||||
| 100.0 | ||||||||||
| † Based on total investments. | ||||||||||
| See notes to financial statements. | ||||||||||
The Funds 41
| STATEMENT OF INVESTMENTS |
| February 28, 2007 (Unaudited) |
| Mellon Massachusetts Intermediate Municipal Bond Fund | ||||||||
| Long-Term Municipal | Coupon | Maturity | Principal | |||||
| Investments—92.2% | Rate (%) | Date | Amount ($) | Value ($) | ||||
| Massachusetts—79.8% | ||||||||
| Ashland, GO (Insured; AMBAC) | 5.25 | 5/15/21 | 1,305,000 | 1,442,691 | ||||
| Auburn (Insured; AMBAC) | 5.13 | 6/1/20 | 1,225,000 | 1,328,341 | ||||
| Bellingham (Insured; AMBAC) | 5.38 | 3/1/14 | 1,685,000 | 1,806,387 | ||||
| Boston | 5.75 | 2/1/10 | 2,000,000 | 2,117,460 | ||||
| Boston Economic Development and | ||||||||
| Industrial Corp., Public Parking Facility | 4.50 | 6/1/10 | 3,000,000 | 3,059,490 | ||||
| Boston Water and Sewer Commission, Revenue | 9.25 | 1/1/11 | 100,000 | 117,173 | ||||
| Boston Water and Sewer Commission, Revenue | 5.00 | 11/1/19 | 2,170,000 | 2,344,381 | ||||
| Boston Water and Sewer Commission, Revenue | 5.00 | 11/1/23 | 3,920,000 | 4,212,863 | ||||
| Brockton (Municipal Purpose Loan) (Insured; AMBAC) | 5.00 | 6/1/19 | 1,430,000 | 1,547,517 | ||||
| Burlington | 5.25 | 2/1/12 | 200,000 | 214,440 | ||||
| Burlington | 5.25 | 2/1/13 | 250,000 | 271,340 | ||||
| Cambridge (Municipal Purpose Loan) | 5.00 | 12/15/11 | 510,000 | 541,288 | ||||
| Cohasset | 5.00 | 6/15/22 | 895,000 | 961,946 | ||||
| Cohasset | 5.00 | 6/15/23 | 895,000 | 960,183 | ||||
| Everett (Insured; FGIC) | 5.38 | 12/15/17 | 1,250,000 | 1,381,712 | ||||
| Everett (Insured; MBIA) | 6.13 | 12/15/09 | 1,000,000 a | 1,075,190 | ||||
| Falmouth, GO Notes, BAN | 4.50 | 7/20/07 | 2,500,000 | 2,508,250 | ||||
| Haverhill (State Qualified Municipal Purpose Loan) (Insured; FGIC) | 4.00 | 6/1/15 | 1,530,000 | 1,564,195 | ||||
| Haverhill (State Qualified Municipal Purpose Loan) (Insured; FGIC) | 5.00 | 6/1/16 | 1,580,000 | 1,739,296 | ||||
| Haverhill (State Qualified Municipal Purpose Loan) (Insured; FGIC) | 5.00 | 6/1/18 | 505,000 | 553,591 | ||||
| Hingham (Municipal Purpose Loan) | 5.38 | 4/1/17 | 1,645,000 | 1,770,168 | ||||
| Holden (Municipal Purpose Loan) (Insured; FGIC) | 6.00 | 3/1/10 | 1,000,000 a | 1,076,380 | ||||
| Hopedale (Insured; AMBAC) | 5.00 | 11/15/19 | 650,000 | 706,374 | ||||
| Ipswich, GO (Insured; FGIC) | 5.00 | 11/15/14 | 500,000 | 545,630 | ||||
| Lawrence, GO (Insured; FSA) | 5.00 | 2/1/21 | 2,640,000 | 2,880,425 | ||||
| Lynn (Insured; MBIA) | 5.25 | 2/15/08 | 1,500,000 | 1,523,715 | ||||
| Lynnfield (Municipal Purpose Loan) | 5.00 | 7/1/20 | 505,000 | 543,648 | ||||
| Lynnfield (Municipal Purpose Loan) | 5.00 | 7/1/21 | 525,000 | 564,832 | ||||
| Lynnfield (Municipal Purpose Loan) | 5.00 | 7/1/22 | 585,000 | 628,606 | ||||
| Lynnfield (Municipal Purpose Loan) | 5.00 | 7/1/23 | 585,000 | 627,834 | ||||
| Mansfield (Insured; AMBAC) | 5.00 | 8/15/17 | 1,395,000 | 1,520,759 | ||||
| Marblehead | 5.00 | 8/15/18 | 1,340,000 | 1,447,160 | ||||
| Marblehead | 5.00 | 8/15/22 | 1,750,000 | 1,882,387 | ||||
| Mashpee (Insured; FGIC) | 5.63 | 11/15/10 | 500,000 a | 540,070 | ||||
| Massachusetts | 6.50 | 8/1/08 | 595,000 | 617,646 | ||||
| Massachusetts (Insured; FSA) | 5.25 | 9/1/22 | 7,500,000 | 8,646,225 | ||||
| Massachusetts (Insured; XLCA) | 1.92 | 12/1/12 | 1,770,000 b | 1,854,075 | ||||
| Massachusetts, Consolidated Loan | 5.75 | 6/1/10 | 5,000,000 a | 5,313,950 | ||||
| Massachusetts, Consolidated Loan | 5.25 | 11/1/12 | 2,000,000 a | 2,155,680 | ||||
| Massachusetts, Consolidated Loan | 5.25 | 10/1/13 | 2,600,000 a | 2,831,348 | ||||
| Massachusetts, Consolidated Loan | 5.25 | 10/1/13 | 2,500,000 a | 2,722,450 | ||||
42
| Mellon Massachusetts Intermediate Municipal Bond Fund (continued) | ||||||||||
| Long-Term Municipal | Coupon | Maturity | Principal | |||||||
| Investments (continued) | Rate (%) | Date | Amount ($) | Value ($) | ||||||
| Massachusetts (continued) | ||||||||||
| Massachusetts, Consolidated Loan | 5.00 | 3/1/15 | 1,500,000 | a | 1,635,390 | |||||
| Massachusetts, Consolidated Loan | 5.00 | 3/1/15 | 1,800,000 | a | 1,962,468 | |||||
| Massachusetts, Consolidated Loan | 5.50 | 11/1/16 | 1,000,000 | 1,138,930 | ||||||
| Massachusetts, Consolidated Loan | 5.00 | 9/1/18 | 5,000,000 | 5,424,400 | ||||||
| Massachusetts, Consolidated Loan | 5.00 | 8/1/21 | 1,000,000 | 1,087,270 | ||||||
| Massachusetts, Consolidated Loan (Insured; FGIC) | 5.50 | 11/1/13 | 2,500,000 | 2,766,200 | ||||||
| Massachusetts, Consolidated Loan (Insured; FGIC) | 5.50 | 8/1/18 | 1,035,000 | 1,194,214 | ||||||
| Massachusetts, Consolidated Loan (Insured; FSA) | 5.25 | 1/1/13 | 5,000,000 | a | 5,399,450 | |||||
| Massachusetts, Consolidated Loan (Insured; MBIA) | 5.00 | 8/1/12 | 1,580,000 | a | 1,678,876 | |||||
| Massachusetts, Consolidated Loan (Insured; MBIA) | 5.00 | 8/1/12 | 420,000 | a | 446,284 | |||||
| Massachusetts, Federal Highway, GAN (Insured; FSA) | 5.75 | 6/15/12 | 2,500,000 | 2,679,850 | ||||||
| Massachusetts, Federal Highway, GAN (Insured; FSA) | 5.13 | 12/15/12 | 1,500,000 | 1,550,790 | ||||||
| Massachusetts, Federal Highway, GAN (Insured; MBIA) | 5.13 | 6/15/15 | 1,500,000 | 1,549,875 | ||||||
| Massachusetts, Special Obligation Revenue | 5.38 | 6/1/11 | 6,350,000 | 6,774,117 | ||||||
| Massachusetts, Special Obligation Revenue | 5.50 | 6/1/13 | 1,000,000 | 1,100,560 | ||||||
| Massachusetts, Special Obligation Revenue (Insured; FGIC) | 5.38 | 6/1/12 | 5,000,000 | a | 5,400,300 | |||||
| Massachusetts Bay Transportation Authority, Assessment Revenue | 5.75 | 7/1/10 | 1,835,000 | a | 1,957,174 | |||||
| Massachusetts Bay Transportation Authority, Assessment Revenue | 5.75 | 7/1/11 | 165,000 | 175,585 | ||||||
| Massachusetts Bay Transportation Authority, Assessment Revenue | 5.25 | 7/1/14 | 1,045,000 | a | 1,151,423 | |||||
| Massachusetts Bay Transportation Authority, Assessment Revenue | 5.25 | 7/1/14 | 1,000,000 | a | 1,101,840 | |||||
| Massachusetts Bay Transportation Authority, Assessment Revenue | 5.00 | 7/1/15 | 5,000,000 | a | 5,464,500 | |||||
| Massachusetts Bay Transportation Authority, | ||||||||||
| General Transportation System (Insured; FGIC) | 5.50 | 3/1/09 | 2,000,000 | 2,072,780 | ||||||
| Massachusetts Bay Transportation Authority, | ||||||||||
| General Transportation System (Insured; FGIC) | 5.25 | 3/1/15 | 1,000,000 | 1,105,270 | ||||||
| Massachusetts Bay Transportation Authority, | ||||||||||
| Senior Sales Tax Revenue | 5.00 | 7/1/12 | 6,000,000 | a | 6,391,080 | |||||
| Massachusetts Bay Transportation Authority, | ||||||||||
| Senior Sales Tax Revenue | 5.00 | 7/1/15 | 3,500,000 | 3,825,150 | ||||||
| Massachusetts Bay Transportation Authority, | ||||||||||
| Senior Sales Tax Revenue | 5.50 | 7/1/16 | 2,500,000 | 2,847,275 | ||||||
| Massachusetts Bay Transportation Authority, | ||||||||||
| Senior Sales Tax Revenue | 5.25 | 7/1/21 | 2,000,000 | 2,293,160 | ||||||
| Massachusetts Bay Transportation Authority, | ||||||||||
| Senior Sales Tax Revenue | 5.25 | 7/1/22 | 2,430,000 | 2,798,339 | ||||||
| Massachusetts Development Finance Agency, | ||||||||||
| Education Revenue (Belmont Hill School Issue) | 5.00 | 9/1/15 | 500,000 | 527,205 | ||||||
| Massachusetts Development Finance Agency, | ||||||||||
| Higher Education Revenue (Emerson College Issue) | 5.00 | 1/1/16 | 1,000,000 | 1,081,930 | ||||||
| Massachusetts Development Finance Agency, | ||||||||||
| Higher Education Revenue (Emerson College Issue) | 5.00 | 1/1/22 | 2,000,000 | 2,148,660 | ||||||
| Massachusetts Development Finance Agency, | ||||||||||
| Higher Education Revenue (Smith College Issue) | 5.75 | 7/1/10 | 1,000,000 | a | 1,075,450 | |||||
The Funds 43
STATEMENT OF INVESTMENTS (Unaudited) (continued)
| Mellon Massachusetts Intermediate Municipal Bond Fund (continued) | ||||||||||
| Long-Term Municipal | Coupon | Maturity | Principal | |||||||
| Investments (continued) | Rate (%) | Date | Amount ($) | Value ($) | ||||||
| Massachusetts (continued) | ||||||||||
| Massachusetts Development Finance Agency, Revenue | ||||||||||
| (Combined Jewish Philanthropies of Greater Boston, Inc. Project) | 5.25 | 2/1/22 | 1,000,000 | 1,071,920 | ||||||
| Massachusetts Development Finance Agency, | ||||||||||
| Revenue (Curry College Issue) (Insured; ACA) | 4.75 | 3/1/20 | 530,000 | 548,455 | ||||||
| Massachusetts Development Finance Agency, | ||||||||||
| Revenue (Curry College Issue) (Insured; ACA) | 5.25 | 3/1/26 | 1,000,000 | 1,078,080 | ||||||
| Massachusetts Development Finance Agency, | ||||||||||
| Revenue (Curry College Issue) (Insured; ACA) | 5.00 | 3/1/36 | 1,000,000 | 1,043,470 | ||||||
| Massachusetts Development Finance Agency, | ||||||||||
| Revenue (Massachusetts College of | ||||||||||
| Pharmacy and Allied Health Sciences Issue) | 6.00 | 7/1/08 | 310,000 | 318,001 | ||||||
| Massachusetts Development Finance Agency, | ||||||||||
| Revenue (Massachusetts College of | ||||||||||
| Pharmacy and Allied Health Sciences Issue) | 6.30 | 1/1/10 | 350,000 | 378,305 | ||||||
| Massachusetts Development Finance Agency, | ||||||||||
| Revenue (Massachusetts College of | ||||||||||
| Pharmacy and Allied Health Sciences Issue) | 6.40 | 1/1/10 | 370,000 | a | 400,910 | |||||
| Massachusetts Development Finance Agency, | ||||||||||
| Revenue (Massachusetts College of | ||||||||||
| Pharmacy and Allied Health Sciences Issue) | 6.50 | 1/1/10 | 395,000 | a | 429,057 | |||||
| Massachusetts Development Finance Agency, | ||||||||||
| Revenue (Massachusetts College of | ||||||||||
| Pharmacy and Allied Health Sciences Issue) | 6.38 | 7/1/23 | 1,000,000 | 1,138,680 | ||||||
| Massachusetts Development Finance Agency, Revenue | ||||||||||
| (Massachusetts College of Pharmacy and Allied | ||||||||||
| Health Sciences Issue) (Insured; Assured Guaranty) | 5.00 | 7/1/24 | 2,750,000 | 2,914,257 | ||||||
| Massachusetts Development Finance Agency, Revenue | ||||||||||
| (Massachusetts College of Pharmacy and Allied | ||||||||||
| Health Sciences Issue) (Insured; Assured Guaranty) | 5.00 | 7/1/27 | 1,000,000 | 1,055,390 | ||||||
| Massachusetts Development Finance Agency, Revenue | ||||||||||
| (Massachusetts College of Pharmacy and Allied | ||||||||||
| Health Sciences Issue) (Insured; Assured Guaranty) | 5.00 | 7/1/35 | 2,000,000 | 2,103,600 | ||||||
| Massachusetts Development Finance Agency, | ||||||||||
| Revenue (Milton Academy Issue) | 5.00 | 9/1/19 | 1,000,000 | 1,083,360 | ||||||
| Massachusetts Development Finance Agency, | ||||||||||
| Revenue (Suffolk University Issue) | 5.85 | 7/1/09 | 1,000,000 | a | 1,056,580 | |||||
| Massachusetts Development Finance Agency, | ||||||||||
| Revenue (The Park School Issue) | 4.50 | 9/1/31 | 1,000,000 | 1,000,240 | ||||||
| Massachusetts Development Finance Agency, | ||||||||||
| RRR (Waste Management Inc. Project) | 6.90 | 12/1/09 | 1,000,000 | 1,065,470 | ||||||
| Massachusetts Development Finance Agency, | ||||||||||
| SWDR (Waste Management Inc. Project) | 5.45 | 6/1/14 | 1,000,000 | 1,071,750 | ||||||
| Massachusetts Educational Financing Authority, | ||||||||||
| Education Loan Revenue (Insured; AMBAC) | 4.70 | 1/1/10 | 715,000 | 723,144 | ||||||
| Massachusetts Educational Financing Authority, | ||||||||||
| Education Loan Revenue (Insured; AMBAC) | 6.20 | 7/1/13 | 180,000 | 180,218 | ||||||
44
| Mellon Massachusetts Intermediate Municipal Bond Fund (continued) | ||||||||
| Long-Term Municipal | Coupon | Maturity | Principal | |||||
| Investments (continued) | Rate (%) | Date | Amount ($) | Value ($) | ||||
| Massachusetts (continued) | ||||||||
| Massachusetts Health and Educational Facilities | ||||||||
| Authority, Revenue (Boston College Issue) | 5.13 | 6/1/37 | 2,000,000 | 2,111,800 | ||||
| Massachusetts Health and Educational Facilities | ||||||||
| Authority, Revenue (Dartmouth-Hitchcock | ||||||||
| Obligated Group Issue) (Insured; FSA) | 5.13 | 8/1/22 | 2,000,000 | 2,117,700 | ||||
| Massachusetts Health and Educational Facilities | ||||||||
| Authority, Revenue (Harvard University Issue) | 5.00 | 7/15/36 | 1,000,000 | 1,070,940 | ||||
| Massachusetts Health and Educational Facilities | ||||||||
| Authority, Revenue (Jordan Hospital Issue) | 5.00 | 10/1/10 | 500,000 | 506,120 | ||||
| Massachusetts Health and Educational Facilities | ||||||||
| Authority, Revenue (Massachusetts Institute of Technology Issue) | 5.00 | 7/1/23 | 5,335,000 | 6,056,345 | ||||
| Massachusetts Health and Educational Facilities | ||||||||
| Authority, Revenue (Milford Regional Medical Center Issue) | 5.00 | 7/15/11 | 500,000 | 515,125 | ||||
| Massachusetts Health and Educational Facilities | ||||||||
| Authority, Revenue (Milford Regional Medical Center Issue) | 5.00 | 7/15/22 | 500,000 | 523,700 | ||||
| Massachusetts Health and Educational Facilities | ||||||||
| Authority, Revenue (Northeastern University Issue) (Insured; MBIA) | 5.50 | 10/1/09 | 420,000 | 439,723 | ||||
| Massachusetts Health and Educational Facilities | ||||||||
| Authority, Revenue (Partners HealthCare System Issue) | 5.25 | 7/1/13 | 1,595,000 | 1,659,231 | ||||
| Massachusetts Health and Educational Facilities | ||||||||
| Authority, Revenue (Partners HealthCare System Issue) | 5.00 | 7/1/16 | 1,045,000 | 1,106,874 | ||||
| Massachusetts Health and Educational Facilities | ||||||||
| Authority, Revenue (Partners HealthCare System Issue) | 5.13 | 7/1/19 | 1,000,000 | 1,032,840 | ||||
| Massachusetts Health and Educational Facilities Authority, | ||||||||
| Revenue (Partners HealthCare System Issue) (Insured; MBIA) | 5.38 | 7/1/17 | 2,000,000 | 2,030,420 | ||||
| Massachusetts Health and Educational Facilities | ||||||||
| Authority, Revenue (Tufts University Issue) | 5.50 | 8/15/14 | 1,000,000 | 1,119,420 | ||||
| Massachusetts Health and Educational Facilities | ||||||||
| Authority, Revenue (Tufts University Issue) | 5.50 | 2/15/36 | 1,000,000 | 1,059,350 | ||||
| Massachusetts Health and Educational Facilities | ||||||||
| Authority, Revenue (UMass Memorial Issue) | 5.25 | 7/1/25 | 2,000,000 | 2,118,940 | ||||
| Massachusetts Health and Educational Facilities | ||||||||
| Authority, Revenue (UMass Memorial Issue) | 5.00 | 7/1/33 | 1,000,000 | 1,025,650 | ||||
| Massachusetts Health and Educational Facilities | ||||||||
| Authority, Revenue (Wellesley College Issue) | 5.00 | 7/1/24 | 1,000,000 | 1,057,190 | ||||
| Massachusetts Health and Educational Facilities | ||||||||
| Authority, Revenue (Winchester Hospital Issue) | 6.75 | 7/1/10 | 1,600,000 a | 1,748,112 | ||||
| Massachusetts Housing Finance Agency, Housing Revenue | 4.20 | 12/1/10 | 2,945,000 | 2,967,559 | ||||
| Massachusetts Housing Finance Agency, Housing Revenue | 5.00 | 12/1/26 | 1,165,000 | 1,198,832 | ||||
| Massachusetts Housing Finance Agency, Housing Revenue | 5.13 | 12/1/34 | 200,000 | 206,566 | ||||
| Massachusetts Housing Finance Agency, SFHR (Insured; MBIA) | 6.00 | 6/1/14 | 370,000 | 373,171 | ||||
| Massachusetts Industrial Finance Agency, Education Revenue | ||||||||
| (Saint John’s High School of Worcester County, Inc. Issue) | 5.70 | 6/1/18 | 1,700,000 | 1,751,068 | ||||
| Massachusetts Industrial Finance Agency, | ||||||||
| Education Revenue (The Tabor Academy Issue) | 5.40 | 12/1/08 | 775,000 a | 809,209 | ||||
The Funds 45
STATEMENT OF INVESTMENTS (Unaudited) (continued)
| Mellon Massachusetts Intermediate Municipal Bond Fund (continued) | ||||||||||
| Long-Term Municipal | Coupon | Maturity | Principal | |||||||
| Investments (continued) | Rate (%) | Date | Amount ($) | Value ($) | ||||||
| Massachusetts (continued) | ||||||||||
| Massachusetts Industrial Finance Agency, | ||||||||||
| Education Revenue (The Tabor Academy Issue) | 5.40 | 12/1/08 | 785,000 | a | 818,253 | |||||
| Massachusetts Industrial Finance Agency, | ||||||||||
| Revenue (Babson College Issue) (Insured; MBIA) | 5.75 | 10/1/07 | 555,000 | 561,888 | ||||||
| Massachusetts Industrial Finance Agency, | ||||||||||
| Revenue (Concord Academy Issue) | 5.45 | 9/1/17 | 500,000 | 513,680 | ||||||
| Massachusetts Industrial Finance Agency, | ||||||||||
| Revenue (Concord Academy Issue) | 5.50 | 9/1/27 | 1,250,000 | 1,284,387 | ||||||
| Massachusetts Industrial Finance Agency, | ||||||||||
| Revenue (Tufts University Issue) (Insured; MBIA) | 5.50 | 2/15/11 | 500,000 | 534,415 | ||||||
| Massachusetts Industrial Finance Agency, Revenue | ||||||||||
| (Wentworth Institute of Technology Inc. Issue) | 5.55 | 10/1/08 | 500,000 | a | 523,150 | |||||
| Massachusetts Municipal Wholesale Electric Co., Power Supply | ||||||||||
| Project Revenue (Nuclear Project Number 4 Issue) (Insured; MBIA) | 5.25 | 7/1/12 | 2,000,000 | 2,145,400 | ||||||
| Massachusetts Municipal Wholesale Electric Co., Power Supply | ||||||||||
| Project Revenue (Nuclear Project Number 5 Issue) (Insured; MBIA) | 5.00 | 7/1/11 | 120,000 | 126,125 | ||||||
| Massachusetts Port Authority, Revenue | 6.00 | 1/1/10 | 2,500,000 | a | 2,682,100 | |||||
| Massachusetts Port Authority, Revenue | 5.75 | 7/1/11 | 3,500,000 | 3,778,600 | ||||||
| Massachusetts Port Authority, Revenue (Insured; FSA) | 5.50 | 7/1/14 | 1,265,000 | 1,316,448 | ||||||
| Massachusetts School Building Authority, | ||||||||||
| Dedicated Sales Tax (Insured; FSA) | 5.00 | 8/15/15 | 1,900,000 | 2,075,598 | ||||||
| Massachusetts School Building Authority, | ||||||||||
| Dedicated Sales Tax (Insured; FSA) | 5.00 | 8/15/21 | 2,000,000 | 2,162,520 | ||||||
| Massachusetts Water Pollution Abatement | ||||||||||
| Trust (Pooled Loan Program) | 5.25 | 2/1/09 | 500,000 | 515,245 | ||||||
| Massachusetts Water Pollution Abatement | ||||||||||
| Trust (Pooled Loan Program) | 5.63 | 8/1/10 | 975,000 | a | 1,046,195 | |||||
| Massachusetts Water Pollution Abatement | ||||||||||
| Trust (Pooled Loan Program) | 5.25 | 8/1/11 | 335,000 | a | 356,356 | |||||
| Massachusetts Water Pollution Abatement | ||||||||||
| Trust (Pooled Loan Program) | 5.00 | 8/1/12 | 3,910,000 | a | 4,160,631 | |||||
| Massachusetts Water Pollution Abatement | ||||||||||
| Trust (Pooled Loan Program) | 5.63 | 8/1/13 | 25,000 | 26,738 | ||||||
| Massachusetts Water Pollution Abatement | ||||||||||
| Trust (Pooled Loan Program) | 5.25 | 2/1/14 | 1,105,000 | 1,173,366 | ||||||
| Massachusetts Water Pollution Abatement | ||||||||||
| Trust (Pooled Loan Program) | 5.25 | 8/1/14 | 1,330,000 | a | 1,466,644 | |||||
| Massachusetts Water Pollution Abatement | ||||||||||
| Trust (Pooled Loan Program) | 5.50 | 8/1/14 | 30,000 | 31,515 | ||||||
| Massachusetts Water Pollution Abatement | ||||||||||
| Trust (Pooled Loan Program) | 5.25 | 8/1/17 | 170,000 | 186,388 | ||||||
| Massachusetts Water Pollution Abatement | ||||||||||
| Trust (Pooled Loan Program) | 5.00 | 8/1/18 | 75,000 | 79,467 | ||||||
| Massachusetts Water Pollution Abatement | ||||||||||
| Trust (Pooled Loan Program) | 5.00 | 8/1/32 | 2,000,000 | 2,098,600 | ||||||
46
| Mellon Massachusetts Intermediate Municipal Bond Fund (continued) | ||||||||
| Long-Term Municipal | Coupon | Maturity | Principal | |||||
| Investments (continued) | Rate (%) | Date | Amount ($) | Value ($) | ||||
| Massachusetts (continued) | ||||||||
| Massachusetts Water Pollution Abatement Trust, Water | ||||||||
| Pollution Abatement Revenue (New Bedford Loan Program) | 5.25 | 2/1/12 | 500,000 | 535,170 | ||||
| Massachusetts Water Pollution Abatement Trust, Water Pollution | ||||||||
| Abatement Revenue (South Essex Sewer District Loan Program) | 6.38 | 2/1/15 | 195,000 | 195,429 | ||||
| Massachusetts Water Resource Authority, | ||||||||
| General Revenue (Insured; FSA) | 5.50 | 8/1/11 | 1,100,000 | 1,182,665 | ||||
| Massachusetts Water Resource Authority, | ||||||||
| General Revenue (Insured; FSA) | 5.25 | 8/1/18 | 500,000 | 564,445 | ||||
| Massachusetts Water Resource Authority, | ||||||||
| General Revenue (Insured; MBIA) | 6.00 | 8/1/14 | 1,000,000 | 1,149,710 | ||||
| Massachusetts Water Resource Authority, | ||||||||
| General Revenue (Insured; MBIA) | 5.25 | 8/1/19 | 1,500,000 | 1,685,595 | ||||
| Massachusetts Water Resources Authority, | ||||||||
| General Revenue (Insured; MBIA) | 5.25 | 8/1/21 | 1,000,000 | 1,123,370 | ||||
| Massachusetts Water Resource Authority, | ||||||||
| General Revenue (Insured; MBIA) | 5.25 | 8/1/24 | 2,500,000 | 2,787,900 | ||||
| Massachusetts Water Resources Authority, | ||||||||
| Subordinated General Revenue (Insured; MBIA) | 5.50 | 8/1/11 | 1,000,000 | 1,075,570 | ||||
| Mendon-Upton Regional School District, GO Notes (Insured; FGIC) | 6.00 | 6/1/07 | 600,000 | 603,582 | ||||
| Middleborough, GO | 5.00 | 12/15/16 | 1,000,000 | 1,104,750 | ||||
| Middleborough, GO | 5.00 | 12/15/18 | 1,275,000 | 1,402,946 | ||||
| Milton School | 5.00 | 3/1/23 | 500,000 | 536,630 | ||||
| Milton School | 5.00 | 3/1/24 | 500,000 | 535,565 | ||||
| Milton School | 5.00 | 3/1/25 | 500,000 | 534,855 | ||||
| Northampton (Insured; MBIA) | 5.13 | 10/15/16 | 1,985,000 | 2,187,728 | ||||
| Northbridge (Insured; AMBAC) | 5.25 | 2/15/17 | 1,000,000 | 1,077,080 | ||||
| Pembroke, GO (Insured; MBIA) | 4.50 | 8/1/13 | 695,000 | 728,339 | ||||
| Pembroke, GO (Insured; MBIA) | 5.00 | 8/1/20 | 960,000 | 1,050,912 | ||||
| Pittsfield (Insured; MBIA) | 5.00 | 4/15/12 | 1,000,000 | 1,064,290 | ||||
| Pittsfield (Insured; MBIA) | 5.50 | 4/15/14 | 500,000 | 547,055 | ||||
| Quabbin Regional School District (Insured; AMBAC) | 6.00 | 6/15/08 | 780,000 | 803,221 | ||||
| Randolph (Insured; AMBAC) | 5.00 | 9/1/17 | 1,045,000 | 1,138,987 | ||||
| Randolph (Insured; AMBAC) | 5.00 | 9/1/24 | 490,000 | 529,621 | ||||
| Sandwich, GO (Insured; MBIA) | 5.75 | 8/15/10 | 1,050,000 a | 1,131,627 | ||||
| Springfield (Insured; FGIC) | 5.50 | 8/1/11 | 1,500,000 a | 1,626,135 | ||||
| Springfield Water and Sewer Commission, | ||||||||
| General Revenue (Insured; AMBAC) | 5.00 | 7/15/22 | 1,175,000 | 1,277,119 | ||||
| Springfield Water and Sewer Commission, | ||||||||
| General Revenue (Insured; AMBAC) | 5.00 | 7/15/23 | 1,235,000 | 1,339,308 | ||||
| University of Massachusetts Building Authority, | ||||||||
| Project Revenue (Insured; AMBAC) | 5.50 | 11/1/10 | 1,000,000 a | 1,064,270 | ||||
| Uxbridge (Municipal Purpose Loan) (Insured; MBIA) | 6.13 | 11/15/07 | 525,000 | 534,172 | ||||
| Westfield (Insured; FGIC) | 6.50 | 5/1/10 | 735,000 a | 804,582 | ||||
The Funds 47
STATEMENT OF INVESTMENTS (Unaudited) (continued)
| Mellon Massachusetts Intermediate Municipal Bond Fund (continued) | ||||||||
| Long-Term Municipal | Coupon | Maturity | Principal | |||||
| Investments (continued) | Rate (%) | Date | Amount ($) | Value ($) | ||||
| Massachusetts (continued) | ||||||||
| Worcester (Insured; FGIC) | 5.63 | 8/15/10 | 1,000,000 a | 1,073,710 | ||||
| Worcester (Insured; FGIC) | 5.00 | 4/1/18 | 625,000 | 676,938 | ||||
| Worcester (Insured; MBIA) | 5.25 | 8/15/16 | 1,000,000 | 1,107,390 | ||||
| Worcester (Insured; MBIA) | 5.25 | 8/15/17 | 1,000,000 | 1,101,000 | ||||
| Worcester (Municipal Purpose Loan) (Insured; MBIA) | 6.25 | 7/1/10 | 755,000 | 816,555 | ||||
| U.S. Related—12.4% | ||||||||
| Guam Economic Development Authority, | ||||||||
| Tobacco Settlement Asset-Backed Bonds | 0/5.15 | 5/15/11 | 250,000 c | 246,480 | ||||
| Guam Economic Development Authority, | ||||||||
| Tobacco Settlement Asset-Backed Bonds | 0/5.20 | 5/15/12 | 300,000 c | 297,615 | ||||
| Guam Economic Development Authority, | ||||||||
| Tobacco Settlement Asset-Backed Bonds | 0/5.20 | 5/15/13 | 1,175,000 c | 1,159,748 | ||||
| Puerto Rico Commonwealth (Insured; MBIA) | 6.25 | 7/1/11 | 1,050,000 | 1,159,746 | ||||
| Puerto Rico Commonwealth, Public Improvement | 5.00 | 7/1/14 | 2,500,000 d | 2,674,800 | ||||
| Puerto Rico Commonwealth, Public Improvement | 5.25 | 7/1/22 | 1,500,000 | 1,640,595 | ||||
| Puerto Rico Commonwealth, Public Improvement (Insured; FSA) | 5.50 | 7/1/15 | 1,350,000 | 1,526,594 | ||||
| Puerto Rico Commonwealth, Public Improvement (Insured; MBIA) | 5.50 | 7/1/14 | 500,000 | 559,590 | ||||
| Puerto Rico Commonwealth, Public Improvement (Insured; MBIA) | 5.50 | 7/1/15 | 1,135,000 | 1,283,469 | ||||
| Puerto Rico Electric Power Authority, Power Revenue (Insured; MBIA) | 5.00 | 7/1/17 | 1,000,000 | 1,091,030 | ||||
| Puerto Rico Government Development Bank, Senior Notes | 5.00 | 12/1/12 | 3,205,000 | 3,386,243 | ||||
| Puerto Rico Government Development Bank, Senior Notes | 5.00 | 12/1/13 | 3,000,000 | 3,195,150 | ||||
| Puerto Rico Government Development Bank, Senior Notes | 5.25 | 1/1/15 | 2,000,000 | 2,159,060 | ||||
| Puerto Rico Highway and Transportation Authority, Highway Revenue | 5.00 | 7/1/16 | 1,000,000 d | 1,082,530 | ||||
| Puerto Rico Highway and Transportation Authority, | ||||||||
| Highway Revenue (Insured; FGIC) | 5.50 | 7/1/16 | 3,265,000 | 3,726,834 | ||||
| Puerto Rico Highway and Transportation Authority, | ||||||||
| Highway Revenue (Insured; MBIA) | 6.25 | 7/1/09 | 1,000,000 | 1,059,060 | ||||
| Puerto Rico Highway and Transportation Authority, | ||||||||
| Transportation Revenue (Insured; FGIC) | 5.25 | 7/1/15 | 1,905,000 | 2,072,697 | ||||
| Puerto Rico Highway and Transportation Authority, | ||||||||
| Transportation Revenue (Insured; FGIC) | 5.25 | 7/1/16 | 1,550,000 | 1,682,789 | ||||
| Puerto Rico Highway and Transportation Authority, | ||||||||
| Transportation Revenue (Insured; FGIC) | 5.25 | 7/1/18 | 2,500,000 | 2,713,450 | ||||
| Puerto Rico Infrastructure Financing Authority, Special Tax Revenue | 5.00 | 7/1/20 | 2,260,000 | 2,424,573 | ||||
| Puerto Rico Public Buildings Authority, Revenue | ||||||||
| (Guaranteed Government Facilities) (Insured; MBIA) | 4.00 | 7/1/07 | 1,050,000 | 1,051,071 | ||||
| University of Puerto Rico, University System Revenue | 5.00 | 6/1/23 | 5,000,000 | 5,341,500 | ||||
| Total Long-Term Municipal Investments (cost $301,077,372) | 309,116,217 | |||||||
| 48 |
| Mellon Massachusetts Intermediate Municipal Bond Fund (continued) | ||||||||||
| Short-Term Municipal | Coupon | Maturity | Principal | |||||||
| Investments—8.2% | Rate (%) | Date | Amount ($) | Value ($) | ||||||
| Massachusetts; | ||||||||||
| Massachusetts, Consolidated Loan | ||||||||||
| (Liquidity Facility; Dexia Credit Locale) | 3.62 | 3/1/07 | 5,100,000 | e | 5,100,000 | |||||
| Massachusetts, GO (Central Artery/Ted Williams | ||||||||||
| Tunnel Infrastructure Loan Act of 2000) | ||||||||||
| (Liquidity Facility; Landesbank Baden-Wurttemberg) | 3.60 | 3/1/07 | 1,600,000 | e | 1,600,000 | |||||
| Massachusetts, GO (Central Artery/Ted Williams | ||||||||||
| Tunnel Infrastructure Loan Act of 2000) | ||||||||||
| (Liquidity Facility; State Street Bank and Trust Co.) | 3.60 | 3/1/07 | 5,100,000 | e | 5,100,000 | |||||
| Massachusetts Health and Educational Facilities Authority, | ||||||||||
| Revenue (Capital Asset Program Issue) (Insured; | ||||||||||
| MBIA and Liquidity Facility; State Street Bank and Trust Co.) | 3.57 | 3/1/07 | 1,500,000 | e | 1,500,000 | |||||
| Massachusetts Health and Educational Facilities Authority, | ||||||||||
| Revenue (Childrens Hospital Issue) (Insured; | ||||||||||
| AMBAC and Liquidity Facility; Bank of America) | 3.61 | 3/1/07 | 9,950,000 | e | 9,950,000 | |||||
| Massachusetts Water Resources Authority, | ||||||||||
| Multi-Modal Subordinated General Revenue, | ||||||||||
| Refunding (LOC; Landesbank Hessen-Thuringen Girozentrale) | 3.66 | 3/1/07 | 4,095,000 | e | 4,095,000 | |||||
| Total Short-Term Municipal Investments (cost $27,345,000) | 27,345,000 | |||||||||
| Total Investments (cost $328,422,372) | 100.4% | 336,461,217 | ||||||||
| Liabilities, Less Cash and Receivables | (.4%) | (1,483,999) | ||||||||
| Net Assets | 100.0% | 334,977,218 | ||||||||
| a These securities are prerefunded; the date shown represents the prerefunded date. Bonds which are prerefunded are collateralized by U.S. Government securities which are held in |
| escrow and are used to pay principal and interest on the municipal issue and to retire the bonds in full at the earliest refunding date. |
| b Variable rate security—interest rate subject to periodic change. |
| c Zero coupon until a specified date at which time the stated coupon rate becomes effective until maturity. |
| d Purchased on a delayed delivery basis. |
| e Securities payable on demand.Variable interest rate—subject to periodic change. |
The Funds 49
STATEMENT OF INVESTMENTS (Unaudited) (continued)
| Summary of Abbreviations | ||||||
| ACA | American Capital Access | AGC | ACE Guaranty Corporation | |||
| AGIC | Asset Guaranty Insurance Company | AMBAC | American Municipal Bond Assurance Corporation | |||
| ARRN | Adjustable Rate Receipt Notes | BAN | Bond Anticipation Notes | |||
| BIGI | Bond Investors Guaranty Insurance | BPA | Bond Purchase Agreement | |||
| CGIC | Capital Guaranty Insurance Company | CIC | Continental Insurance Company | |||
| CIFG | CDC Ixis Financial Guaranty | CMAC | Capital Market Assurance Corporation | |||
| COP | Certificate of Participation | CP | Commercial Paper | |||
| EDR | Economic Development Revenue | EIR | Environmental Improvement Revenue | |||
| FGIC | Financial Guaranty Insurance Company | FHA | Federal Housing Administration | |||
| FHLB | Federal Home Loan Bank | FHLMC | Federal Home Loan Mortgage Corporation | |||
| FNMA | Federal National Mortgage Association | FSA | Financial Security Assurance | |||
| GAN | Grant Anticipation Notes | GIC | Guaranteed Investment Contract | |||
| GNMA | Government National Mortgage Association | GO | General Obligation | |||
| HR | Hospital Revenue | IDB | Industrial Development Board | |||
| IDC | Industrial Development Corporation | IDR | Industrial Development Revenue | |||
| LOC | Letter of Credit | LOR | Limited Obligation Revenue | |||
| LR | Lease Revenue | MBIA | Municipal Bond Investors | |||
| Assurance Insurance Corporation | ||||||
| MFHR | Multi-Family Housing Revenue | MFMR | Multi-Family Mortgage Revenue | |||
| PCR | Pollution Control Revenue | PILOT | Payment in Lieu of Taxes | |||
| RAC | Revenue Anticipation Certificates | RAN | Revenue Anticipation Notes | |||
| RAW | Revenue Anticipation Warrants | RRR | Resources Recovery Revenue | |||
| SAAN | State Aid Anticipation Notes | SBPA | Standby Bond Purchase Agreement | |||
| SFHR | Single Family Housing Revenue | SFMR | Single Family Mortgage Revenue | |||
| SONYMA | State of New York Mortgage Agency | SWDR | Solid Waste Disposal Revenue | |||
| TAN | Tax Anticipation Notes | TAW | Tax Anticipation Warrants | |||
| TRAN | Tax and Revenue Anticipation Notes | XLCA | XL Capital Assurance | |||
| 50 |
| Summary of Combined Ratings (Unaudited) | ||||||||||
| Fitch | or | Moody’s | or | Standard & Poor’s | Value (%)† | |||||
| AAA | Aaa | AAA | 56.4 | |||||||
| AA | Aa | AA | 20.5 | |||||||
| A | A | A | 3.9 | |||||||
| BBB | Baa | BBB | 10.3 | |||||||
| F1 | MIG1/P1 | SP1/A1 | 8.9 | |||||||
| 100.0 | ||||||||||
| † Based on total investments. | ||||||||||
| See notes to financial statements. | ||||||||||
| STATEMENT OF ASSETS AND LIABILITIES |
| February 28, 2007 (Unaudited) |
| Mellon | Mellon | Mellon | Mellon | |||||
| National | National | Pennsylvania | Massachusetts | |||||
| Intermediate | Short-Term | Intermediate | Intermediate | |||||
| Municipal Bond Fund | Municipal Bond Fund | Municipal Bond Fund | Municipal Bond Fund | |||||
| Assets ($): | ||||||||
| Investments in securities— | ||||||||
| See Statement of Investments † | 928,615,540 | 147,603,441 | 621,016,059 | 336,461,217 | ||||
| Cash | 318,274 | 173,428 | — | — | ||||
| Interest receivable | 9,698,972 | 1,677,557 | 7,015,702 | 3,313,745 | ||||
| Receivable for investment securites sold | 3,937,522 | 2,800,445 | 1,012,835 | — | ||||
| Receivable for shares of Beneficial Interest subscribed | 742,241 | 40,000 | 281,205 | 78,649 | ||||
| Prepaid expenses and other receivables | 25,506 | 11,969 | 17,513 | 16,383 | ||||
| 943,338,055 | 152,306,840 | 629,343,314 | 339,869,994 | |||||
| Liabilities ($): | ||||||||
| Due to The Dreyfus Corporation and affiliates—Note 4(c) | 261,741 | 44,479 | 253,119 | 93,354 | ||||
| Due to Administrator—Note 4(a) | 87,721 | 14,765 | 61,656 | 32,626 | ||||
| Cash overdraft due to Custodian | — | — | 1,692,642 | 518,137 | ||||
| Payable for investment securities purchased | 27,399,333 | 2,747,919 | — | 3,756,228 | ||||
| Payable for shares of Beneficial Interest redeemed | 396,028 | 50,726 | 919,832 | 462,800 | ||||
| Accrued expenses and other liabilities | 69,602 | 46,546 | 46,438 | 29,631 | ||||
| 28,214,425 | 2,904,435 | 2,973,687 | 4,892,776 | |||||
| Net Assets ($) | 915,123,630 | 149,402,405 | 626,369,627 | 334,977,218 | ||||
| Composition of Net Assets ($): | ||||||||
| Paid—in capital | 886,884,035 | 150,579,860 | 602,693,228 | 326,943,349 | ||||
| Accumulated undistributed investment income—net | 48,294 | 7,081 | 17,419 | 778 | ||||
| Accumulated net realized gain (loss) on investments | 78,459 | (948,278) | 1,077,746 | (5,754) | ||||
| Accumulated net unrealized appreciation | ||||||||
| (depreciation) on investments | 28,112,842 | (236,258) | 22,581,234 | 8,038,845 | ||||
| Net Assets ($) | 915,123,630 | 149,402,405 | 626,369,627 | 334,977,218 | ||||
| Net Asset Value Per Share | ||||||||
| Class M Shares | ||||||||
| Net Assets ($) | 889,737,116 | 149,107,231 | 621,736,102 | 325,225,840 | ||||
| Shares Outstanding | 68,129,810 | 11,828,818 | 49,054,572 | 25,707,796 | ||||
| Net Asset Value Per Share ($) | 13.06 | 12.61 | 12.67 | 12.65 | ||||
| Investor Shares | ||||||||
| Net Assets ($) | 24,232,849 | 295,174 | 4,633,525 | 9,670,027 | ||||
| Shares Outstanding | 1,857,734 | 23,445 | 365,665 | 764,456 | ||||
| Net Asset Value Per Share ($) | 13.04 | 12.59 | 12.67 | 12.65 | ||||
| Dreyfus Premier Shares | ||||||||
| Net Assets ($) | 1,153,665 | — | — | 81,351 | ||||
| Shares Outstanding | 88,409 | — | — | 6,415 | ||||
| Net Asset Value Per Share ($) | 13.05 | — | — | 12.68 | ||||
| + Investments at cost ($) | 900,502,698 | 147,839,699 | 598,434,825 | 328,422,372 |
See notes to financial statements.
The Funds 51
| STATEMENT OF OPERATIONS |
| Six Months Ended February 28, 2007 (Unaudited) |
| Mellon | Mellon | Mellon | Mellon | |||||
| National | National | Pennsylvania | Massachusetts | |||||
| Intermediate | Short-Term | Intermediate | Intermediate | |||||
| Municipal Bond Fund | Municipal Bond Fund | Municipal Bond Fund | Municipal Bond Fund | |||||
| Investment Income ($): | ||||||||
| Interest Income | 18,622,093 | 2,758,668 | 14,144,993 | 6,653,986 | ||||
| Expenses: | ||||||||
| Investment advisory fee—Note 4(a) | 1,487,811 | 268,704 | 1,583,238 | 558,231 | ||||
| Administration fee—Note 4(a) | 550,280 | 99,401 | 409,960 | 206,464 | ||||
| Shareholder servicing costs—Note 4(c) | 34,313 | 439 | 5,437 | 12,994 | ||||
| Custodian fees—Note 4(c) | 32,629 | 6,794 | 22,043 | 12,264 | ||||
| Registration fees | 20,921 | 13,222 | 13,525 | 20,247 | ||||
| Trustees’ fees and expenses—Note 4(d) | 12,874 | 2,766 | 11,365 | 5,327 | ||||
| Auditing fees | 11,772 | 12,937 | 20,312 | 10,800 | ||||
| Prospectus and shareholders’ reports | 10,465 | 2,935 | 2,786 | 5,075 | ||||
| Legal fees | 4,955 | 649 | 5,006 | 561 | ||||
| Distribution fees—Note 4(b) | 4,218 | — | — | 258 | ||||
| Loan commitment fees—Note 5 | ||||||||
| Miscellaneous | 37,435 | 14,005 | 27,636 | 24,975 | ||||
| Total Expenses | 2,207,673 | 421,852 | 2,101,308 | 857,196 | ||||
| Less—reduction in investment advisory fee due to | ||||||||
| undertaking—Note 4(a) | — | — | — | (47,175) | ||||
| Less—reduction in custody fees | ||||||||
| due to earnings credits—Note 2(b) | (1,841) | (1,420) | (42) | (2,124) | ||||
| Net Expenses | 2,205,832 | 420,432 | 2,101,266 | 807,897 | ||||
| Investment Income—Net | 16,416,261 | 2,338,236 | 12,043,727 | 5,846,089 | ||||
| Realized and Unrealized Gain (Loss) | ||||||||
| on Investments—Note 5 ($): | ||||||||
| Net realized gain (loss) on investments | 824,387 | (76,310) | 977,979 | 53,692 | ||||
| Net realized gain (loss) on financial futures | (599,748) | — | (526,894) | (180,661) | ||||
| Net Realized Gain (Loss) | 224,639 | (76,310) | 451,085 | (126,969) | ||||
| Net unrealized appreciation (depreciation) on investments | ||||||||
| [including $630,359, $552,609 and $190,195 | ||||||||
| appreciation on financial futures for Mellon National | ||||||||
| Intermediate Municipal Bond Fund, Mellon | ||||||||
| Pennsylvania Intermediate Municipal Bond Fund | ||||||||
| and Mellon Massachusetts Intermediate Municipal | ||||||||
| Bond Fund, respectively] | 2,815,569 | 243,599 | 1,568,977 | 1,808,614 | ||||
| Net Realized and Unrealized Gain (Loss) on Investments | 3,040,208 | 167,289 | 2,020,062 | 1,681,645 | ||||
| Net Increase in Net Assets Resulting from Operations | 19,456,469 | 2,505,525 | 14,063,789 | 7,527,734 | ||||
See notes to financial statements.
| 52 |
STATEMENT OF CHANGES IN NET ASSETS
| Mellon National Intermediate | Mellon National Short-Term | |||||||
| Municipal Bond Fund | Municipal Bond Fund | |||||||
| Six Months Ended | Six Months Ended | |||||||
| February 28, 2007 | Year Ended | February 28, 2007 | Year Ended | |||||
| (Unaudited) | August 31, 2006 | (Unaudited) | August 31, 2006 | |||||
| Operations ($): | ||||||||
| Investment income—net | 16,416,261 | 30,397,740 | 2,338,236 | 4,881,603 | ||||
| Net realized gain (loss) on investments | 224,639 | 1,687,825 | (76,310) | (577,270) | ||||
| Net unrealized appreciation (depreciation) on investments | 2,815,569 | (10,915,472) | 243,599 | (163,129) | ||||
| Net Increase (Decrease) in Net Assets | ||||||||
| Resulting from Operations | 19,456,469 | 21,170,093 | 2,505,525 | 4,141,204 | ||||
| Dividends to Shareholders from ($): | ||||||||
| Investment income—net: | ||||||||
| Class M Shares | (15,891,151) | (29,193,086) | (2,326,721) | (4,843,663) | ||||
| Investor Shares | (450,632) | (969,918) | (4,434) | (5,384) | ||||
| Dreyfus Premier Shares | (26,184) | (111,677) | — | — | ||||
| Net realized gain on investments: | ||||||||
| Class M Shares | — | (4,125,830) | (33,181) | — | ||||
| Investor Shares | — | (156,620) | (80) | — | ||||
| Dreyfus Premier Shares | — | (24,763) | — | — | ||||
| Total Dividends | (16,367,967) | (34,581,894) | (2,364,416) | (4,849,047) | ||||
| Beneficial Interest Transactions ($): | ||||||||
| Net proceeds from shares sold: | ||||||||
| Class M Shares | 135,946,849 | 253,612,779 | 14,958,955 | 70,999,600 | ||||
| Investor Shares | 1,370,996 | 4,013,414 | 98,611 | 276,545 | ||||
| Dreyfus Premier Shares | — | 15,100 | — | — | ||||
| Dividends reinvested: | ||||||||
| Class M Shares | 1,784,307 | 4,736,447 | 183,256 | 456,461 | ||||
| Investor Shares | 313,947 | 763,970 | 4,293 | 4,053 | ||||
| Dreyfus Premier Shares | 14,530 | 78,305 | — | — | ||||
| Cost of shares redeemed: | ||||||||
| Class M Shares | (58,625,901) | (170,610,911) | (26,726,823) | (117,260,641) | ||||
| Investor Shares | (4,619,758) | (4,601,716) | (84,321) | (153,908) | ||||
| Dreyfus Premier Shares | (1,342,010) | (2,180,122) | — | — | ||||
| Increase (Decrease) in Net Assets from | ||||||||
| Beneficial Interest Transactions | 74,842,960 | 85,827,266 | (11,566,029) | (45,677,890) | ||||
| Total Increase (Decrease) in Net Assets | 77,931,462 | 72,415,465 | (11,424,920) | (46,385,733) | ||||
| Net Assets ($): | ||||||||
| Beginning of Period | 837,192,168 | 764,776,703 | 160,827,325 | 207,213,058 | ||||
| End of Period | 915,123,630 | 837,192,168 | 149,402,405 | 160,827,325 | ||||
The Funds 53
STATEMENT OF CHANGES IN NET ASSETS (continued)
| Mellon National Intermediate | Mellon National Short-Term | |||||||
| Municipal Bond Fund | Municipal Bond Fund | |||||||
| Six Months Ended | Six Months Ended | |||||||
| February 28, 2007 | Year Ended | February 28, 2007 | Year Ended | |||||
| (Unaudited) | August 31, 2006 | (Unaudited) | August 31, 2006 | |||||
| Capital Share Transactions: | ||||||||
| Class M Shares | ||||||||
| Shares sold | 10,432,075 | 19,566,754 | 1,186,716 | 5,642,030 | ||||
| Shares issued for dividends reinvested | 136,730 | 365,740 | 14,536 | 36,272 | ||||
| Shares redeemed | (4,494,822) | (13,177,915) | (2,120,936) | (9,320,074) | ||||
| Net Increase (Decrease) in Shares Outstanding | 6,073,983 | 6,754,579 | (919,684) | (3,641,772) | ||||
| Investor Shares a | ||||||||
| Shares sold | 105,149 | 309,430 | 7,814 | 22,072 | ||||
| Shares issued for dividends reinvested | 24,077 | 59,090 | 341 | 323 | ||||
| Shares redeemed | (354,918) | (356,184) | (6,699) | (12,266) | ||||
| Net Increase (Decrease) in Shares Outstanding | (225,692) | 12,336 | 1,456 | 10,129 | ||||
| Dreyfus Premier Shares a | ||||||||
| Shares sold | — | 1,157 | — | — | ||||
| Shares issued for dividends reinvested | 1,113 | 6,048 | — | — | ||||
| Shares redeemed | (102,955) | (168,678) | — | — | ||||
| Net Increase (Decrease) in Shares Outstanding | (101,842) | (161,473) | — | — | ||||
| a During the period ended February 28, 2007, 74,197 Dreyfus Premier shares of Mellon National Intermediate Municipal Bond Fund representing $967,315 were automatically |
| converted to 74,248 Investor shares and during the year ended August 31, 2006 92,784 Dreyfus Premier shares of Mellon National Intermediate Municipal Bond Fund |
| representing $1,204,073 were automatically converted to 92,790 Investor shares. |
| See notes to financial statements. |
| 54 |
| Mellon Pennsylvania Intermediate Municipal Bond Fund | ||||
| Six Months Ended | ||||
| February 28, 2007 | Year Ended | |||
| (Unaudited) | August 31, 2006 | |||
| Operations ($): | ||||
| Investment income—net | 12,043,727 | 24,234,012 | ||
| Net realized gain (loss) on investments | 451,085 | 3,684,916 | ||
| Net unrealized appreciation (depreciation) on investments | 1,568,977 | (12,734,195) | ||
| Net Increase (Decrease) in Net Assets | ||||
| Resulting from Operations | 14,063,789 | 15,184,733 | ||
| Dividends to Shareholders from ($): | ||||
| Investment income—net: | ||||
| Class M Shares | (11,951,113) | (24,062,515) | ||
| Investor Shares | (75,195) | (137,117) | ||
| Net realized gain on investments: | ||||
| Class M Shares | (1,342,041) | (3,859,415) | ||
| Investor Shares | (10,402) | (24,946) | ||
| Total Dividends | (13,378,751) | (28,083,993) | ||
| Beneficial Interest Transactions ($): | ||||
| Net proceeds from shares sold: | ||||
| Class M Shares | 26,409,345 | 89,637,673 | ||
| Investor Shares | 3,594,850 | 3,333,794 | ||
| Dividends reinvested: | ||||
| Class M Shares | 1,077,435 | 2,554,279 | ||
| Investor Shares | 39,065 | 82,443 | ||
| Cost of shares redeemed: | ||||
| Class M Shares | (53,048,689) | (89,704,159) | ||
| Investor Shares | (2,582,590) | (4,271,962) | ||
| Increase (Decrease) in Net Assets from | ||||
| Beneficial Interest Transactions | (24,510,584) | 1,632,068 | ||
| Total Increase (Decrease) in Net Assets | (23,825,546) | (11,267,192) | ||
| Net Assets ($): | ||||
| Beginning of Period | 650,195,173 | 661,462,365 | ||
| End of Period | 626,369,627 | 650,195,173 | ||
| Capital Share Transactions: | ||||
| Class M Shares | ||||
| Shares sold | 2,086,046 | 7,109,004 | ||
| Shares issued for dividends reinvested | 84,911 | 202,020 | ||
| Shares redeemed | (4,191,657) | (7,095,924) | ||
| Net Increase (Decrease) in Shares Outstanding | (2,020,700) | 215,100 | ||
| Investor Shares | ||||
| Shares sold | 283,424 | 263,887 | ||
| Shares issued for dividends reinvested | 3,086 | 6,543 | ||
| Shares redeemed | (204,206) | (340,339) | ||
| Net Increase (Decrease) in Shares Outstanding | 82,304 | (69,909) | ||
The Funds 55
STATEMENT OF CHANGES IN NET ASSETS (continued)
| Mellon Massachusetts Intermediate Municipal Bond Fund | ||||
| Six Months Ended | ||||
| February 28, 2007 | Year Ended | |||
| (Unaudited) | August 31, 2006 | |||
| Operations ($): | ||||
| Investment income—net | 5,846,089 | 9,949,644 | ||
| Net realized gain (loss) on investments | (126,969) | 611,840 | ||
| Net unrealized appreciation (depreciation) on investments | 1,808,614 | (2,761,304) | ||
| Net Increase (Decrease) in Net Assets | ||||
| Resulting from Operations | 7,527,734 | 7,800,180 | ||
| Dividends to Shareholders from ($): | ||||
| Investment income—net: | ||||
| Class M Shares | (5,677,074) | (9,591,937) | ||
| Investor Shares | (166,722) | (350,640) | ||
| Dreyfus Premier Shares | (1,515) | (5,578) | ||
| Net realized gain on investments: | ||||
| Class M Shares | — | (520,934) | ||
| Investor Shares | — | (22,961) | ||
| Dreyfus Premier Shares | — | (438) | ||
| Total Dividends | (5,845,311) | (10,492,488) | ||
| Beneficial Interest Transactions ($): | ||||
| Net proceeds from shares sold: | ||||
| Class M Shares | 51,801,752 | 141,468,644 | ||
| Investor Shares | 114,141 | 487,809 | ||
| Dreyfus Premier Shares | — | 200 | ||
| Dividends reinvested: | ||||
| Class M Shares | 1,144,410 | 2,036,396 | ||
| Investor Shares | 87,736 | 206,244 | ||
| Dreyfus Premier Shares | 1,192 | 4,264 | ||
| Cost of shares redeemed: | ||||
| Class M Shares | (28,614,381) | (69,932,774) | ||
| Investor Shares | (436,877) | (1,069,567) | ||
| Dreyfus Premier Shares | (85,673) | (38,357) | ||
| Increase (Decrease) in Net Assets from | ||||
| Beneficial Interest Transactions | 24,012,300 | 73,162,859 | ||
| Total Increase (Decrease) in Net Assets | 25,694,723 | 70,470,551 | ||
| Net Assets ($): | ||||
| Beginning of Period | 309,282,495 | 238,811,944 | ||
| End of Period | 334,977,218 | 309,282,495 | ||
| 56 |
| Mellon Massachusetts Intermediate Municipal Bond Fund | ||||
| Six Months Ended | ||||
| February 28, 2007 | Year Ended | |||
| (Unaudited) | August 31, 2006 | |||
| Capital Share Transactions: | ||||
| Class M Shares | �� | |||
| Shares sold | 4,106,960 | 11,309,173 | ||
| Shares issued for dividends reinvested | 90,621 | 162,754 | ||
| Shares redeemed | (2,269,205) | (5,587,614) | ||
| Net Increase (Decrease) in Shares Outstanding | 1,928,376 | 5,884,313 | ||
| Investor Shares a | ||||
| Shares sold | 9,031 | 38,972 | ||
| Shares issued for dividends reinvested | 6,946 | 16,462 | ||
| Shares redeemed | (34,624) | (85,555) | ||
| Net Increase (Decrease) in Shares Outstanding | (18,647) | (30,121) | ||
| Dreyfus Premier Shares a | ||||
| Shares sold | — | 16 | ||
| Shares issued for dividends reinvested | 94 | 340 | ||
| Shares redeemed | (6,762) | (3,080) | ||
| Net Increase (Decrease) in Shares Outstanding | (6,668) | (2,724) | ||
| a During the period ended February 28, 2007, 6,464 Dreyfus Premier shares of Mellon Massachusetts Intermediate Municipal Bond Fund representing $81,906 were automatically |
| converted to 6,477 Investor shares and during the period ended August 31, 2006, 1,947 Dreyfus Premier shares of Mellon Massachusetts Intermediate Municipal Bond Fund |
| representing $24,171 were automatically converted to 1,952 Investor shares. |
| See notes to financial statements. |
The Funds 57
FINANCIAL HIGHLIGHTS
The following tables describe the performance for each share class of each fund for the fiscal periods indicated. All information (except portfolio turnover rate) reflects financial results for a single fund share.Total return shows how much your investment in each fund would have increased (or decreased) during each period, assuming you had reinvested all dividends and distributions. These figures have been derived from each fund’s financial statements.
| Class M Shares | ||||||||||||
| Six Months Ended | ||||||||||||
| Mellon National Intermediate | February 28, 2007 | Year Ended August 31, | ||||||||||
| Municipal Bond Fund | (Unaudited) | 2006 | 2005 | 2004 | 2003 a | 2002 | ||||||
| Per Share Data ($): | ||||||||||||
| Net asset value, beginning of period | 13.01 | 13.25 | 13.34 | 13.09 | 13.25 | 13.24 | ||||||
| Investment Operations: | ||||||||||||
| Investment income—net b | .25 | .50 | .50 | .51 | .50 | .52 | ||||||
| Net realized and unrealized | ||||||||||||
| gain (loss) on investments | .05 | (.16) | (.03) | .29 | (.14) | .14 | ||||||
| Total from Investment Operations | .30 | .34 | .47 | .80 | .36 | .66 | ||||||
| Distributions: | ||||||||||||
| Dividends from investment income—net | (.25) | (.50) | (.50) | (.51) | (.50) | (.52) | ||||||
| Dividends from net realized gain on investments | — | (.08) | (.06) | (.04) | (.02) | (.13) | ||||||
| Total Distributions | (.25) | (.58) | (.56) | (.55) | (.52) | (.65) | ||||||
| Net asset value, end of period | 13.06 | 13.01 | 13.25 | 13.34 | 13.09 | 13.25 | ||||||
| Total Return (%) | 2.32c | 2.64 | 3.62 | 6.22 | 2.77 | 5.16 | ||||||
| Ratios/Supplemental Data (%): | ||||||||||||
| Ratio of total expenses to average net assets | .51d | .51 | .52 | .52 | .53 | .53 | ||||||
| Ratio of net expenses to average net assets | .51d | .51 | .52 | .52 | .52 | .52 | ||||||
| Ratio of net investment income | ||||||||||||
| to average net assets | 3.87d | 3.87 | 3.80 | 3.84 | 3.77 | 4.04 | ||||||
| Portfolio Turnover Rate | 11.27c | 28.19 | 42.72 | 53.26 | 50.68 | 60.12 | ||||||
| Net Assets, end of period ($ x 1,000) | 889,737 | 807,634 | 732,711 | 646,793 | 625,558 | 555,158 | ||||||
| a Effective December 16, 2002, MPAM shares were redesignated as Class M shares. | ||||||||||||
| b Based on average shares outstanding at each month end. | ||||||||||||
| c Not annualized. | ||||||||||||
| d Annualized. | ||||||||||||
| See notes to financial statements. | ||||||||||||
| 58 |
| Investor Shares | ||||||||||||
| Six Months Ended | ||||||||||||
| Mellon National Intermediate | February 28, 2007 | Year Ended August 31, | ||||||||||
| Municipal Bond Fund | (Unaudited) | 2006 | 2005 | 2004 | 2003 | 2002 | ||||||
| Per Share Data ($): | ||||||||||||
| Net asset value, beginning of period | 13.00 | 13.23 | 13.33 | 13.08 | 13.24 | 13.23 | ||||||
| Investment Operations: | ||||||||||||
| Investment income—net a | .23 | .47 | .47 | .48 | .50 | .50 | ||||||
| Net realized and unrealized | ||||||||||||
| gain (loss) on investments | .04 | (.15) | (.04) | .29 | (.18) | .13 | ||||||
| Total from Investment Operations | .27 | .32 | .43 | .77 | .32 | .63 | ||||||
| Distributions: | ||||||||||||
| Dividends from investment income—net | (.23) | (.47) | (.47) | (.48) | (.46) | (.49) | ||||||
| Dividends from net realized gain on investments | — | (.08) | (.06) | (.04) | (.02) | (.13) | ||||||
| Total Distributions | (.23) | (.55) | (.53) | (.52) | (.48) | (.62) | ||||||
| Net asset value, end of period | 13.04 | 13.00 | 13.23 | 13.33 | 13.08 | 13.24 | ||||||
| Total Return (%) | 2.12b | 2.47 | 3.28 | 6.04 | 2.36 | 4.98 | ||||||
| Ratios/Supplemental Data (%): | ||||||||||||
| Ratio of total expenses to average net assets | .76c | .76 | .77 | .77 | .79 | .84 | ||||||
| Ratio of net expenses to average net assets | .76c | .76 | .77 | .77 | .77 | .77 | ||||||
| Ratio of net investment income | ||||||||||||
| to average net assets | 3.63c | 3.62 | 3.56 | 3.60 | 3.52 | 3.74 | ||||||
| Portfolio Turnover Rate | 11.27b | 28.19 | 42.72 | 53.26 | 50.68 | 60.12 | ||||||
| Net Assets, end of period ($ x 1,000) | 24,233 | 27,084 | 27,409 | 30,164 | 34,673 | 909 | ||||||
| a Based on average shares outstanding at each month end. | ||||||||||||
| b Not annualized. | ||||||||||||
| c Annualized. | ||||||||||||
| See notes to financial statements. | ||||||||||||
The Funds 59
FINANCIAL HIGHLIGHTS (continued)
| Dreyfus Premier Shares | ||||||||||
| Six Months Ended | ||||||||||
| Mellon National Intermediate | February 28, 2007 | Year Ended August 31, | ||||||||
| Municipal Bond Fund | (Unaudited) | 2006 | 2005 | 2004 | 2003a | |||||
| Per Share Data ($): | ||||||||||
| Net asset value, beginning of period | 13.00 | 13.24 | 13.33 | 13.08 | 13.37 | |||||
| Investment Operations: | ||||||||||
| Investment income—net b | .19 | .40 | .40 | .41 | .36 | |||||
| Net realized and unrealized | ||||||||||
| gain (loss) on investments | .06 | (.16) | (.03) | .29 | (.28) | |||||
| Total from Investment Operations | .25 | .24 | .37 | .70 | .08 | |||||
| Distributions: | ||||||||||
| Dividends from investment income—net | (.20) | (.40) | (.40) | (.41) | (.35) | |||||
| Dividends from net realized gain on investments | — | (.08) | (.06) | (.04) | (.02) | |||||
| Total Distributions | (.20) | (.48) | (.46) | (.45) | (.37) | |||||
| Net asset value, end of period | 13.05 | 13.00 | 13.24 | 13.33 | 13.08 | |||||
| Total Return (%) | 1.94c | 1.88 | 2.85 | 5.43 | .58c | |||||
| Ratios/Supplemental Data (%): | ||||||||||
| Ratio of total expenses to average net assets | 1.26d | 1.26 | 1.27 | 1.27 | 1.29d | |||||
| Ratio of net expenses to average net assets | 1.26d | 1.26 | 1.27 | 1.27 | 1.27d | |||||
| Ratio of net investment income | ||||||||||
| to average net assets | 3.12d | 3.12 | 3.06 | 3.09 | 3.03d | |||||
| Portfolio Turnover Rate | 11.27c | 28.19 | 42.72 | 53.26 | 50.68c | |||||
| Net Assets, end of period ($ x 1,000) | 1,154 | 2,474 | 4,656 | 5,945 | 7,856 | |||||
| a From close of business on October 11, 2002 (date the fund began offering Dreyfus Premier shares) to August 31, 2003. | ||||||||||
| b Based on average shares outstanding at each month end. | ||||||||||
| c Not annualized. | ||||||||||
| d Annualized. | ||||||||||
| See notes to financial statements. | ||||||||||
| 60 |
| Class M Shares | ||||||||||||
| Six Months Ended | ||||||||||||
| Mellon National Short-Term | February 28, 2007 | Year Ended August 31, | ||||||||||
| Municipal Bond Fund | (Unaudited) | 2006 | 2005 | 2004 | 2003 a | 2002 | ||||||
| Per Share Data ($): | ||||||||||||
| Net asset value, beginning of period | 12.59 | 12.63 | 12.81 | 12.86 | 12.91 | 12.90 | ||||||
| Investment Operations: | ||||||||||||
| Investment income—net b | .19 | .33 | .29 | .29 | .34 | .46 | ||||||
| Net realized and unrealized | ||||||||||||
| gain (loss) on investments | .02 | (.04) | (.18) | (.05) | (.03) | .10 | ||||||
| Total from Investment Operations | .21 | .29 | .11 | .24 | .31 | .56 | ||||||
| Distributions: | ||||||||||||
| Dividends from investment income—net | (.19) | (.33) | (.29) | (.29) | (.35) | (.46) | ||||||
| Dividends from net realized gain on investments | (.00)c | — | — | — | (.01) | (.09) | ||||||
| Total Distributions | (.19) | (.33) | (.29) | (.29) | (.36) | (.55) | ||||||
| Net asset value, end of period | 12.61 | 12.59 | 12.63 | 12.81 | 12.86 | 12.91 | ||||||
| Total Return (%) | 1.70d | 2.36 | .91 | 2.00 | 2.35 | 4.43 | ||||||
| Ratios/Supplemental Data (%): | ||||||||||||
| Ratio of total expenses to average net assets | .55e | .53 | .54 | .53 | .55 | .57 | ||||||
| Ratio of net expenses to average net assets | .55e | .53 | .53 | .53 | .52 | .52 | ||||||
| Ratio of net investment income | ||||||||||||
| to average net assets | 3.05e | 2.65 | 2.31 | 2.28 | 2.66 | 3.56 | ||||||
| Portfolio Turnover Rate | 17.88d | 49.94 | 40.92 | 28.12 | 22.15 | 50.86 | ||||||
| Net Assets, end of period ($ x 1,000) | 149,107 | 160,551 | 207,063 | 221,600 | 210,574 | 138,670 | ||||||
| a Effective December 16, 2002, MPAM shares were redesignated as Class M shares. | ||||||||||||
| b Based on average shares outstanding at each month end. | ||||||||||||
| c Amount represents less than $.01 per share. | ||||||||||||
| d Not annualized. | ||||||||||||
| e Annualized. | ||||||||||||
| See notes to financial statements. | ||||||||||||
The Funds 61
FINANCIAL HIGHLIGHTS (continued)
| Investor Shares | ||||||||||||
| Six Months Ended | ||||||||||||
| Mellon National Short-Term | February 28, 2007 | Year Ended August 31, | ||||||||||
| Municipal Bond Fund | (Unaudited) | 2006 | 2005 | 2004 | 2003 | 2002 | ||||||
| Per Share Data ($): | ||||||||||||
| Net asset value, beginning of period | 12.58 | 12.62 | 12.79 | 12.84 | 12.91 | 12.90 | ||||||
| Investment Operations: | ||||||||||||
| Investment income—net a | .18 | .31 | .27 | .29 | .29 | .42 | ||||||
| Net realized and unrealized | ||||||||||||
| gain (loss) on investments | — | (.05) | (.18) | (.07) | (.04) | .10 | ||||||
| Total from Investment Operations | .18 | .26 | .09 | .22 | .25 | .52 | ||||||
| Distributions: | ||||||||||||
| Dividends from investment income—net | (.17) | (.30) | (.26) | (.27) | (.31) | (.42) | ||||||
| Dividends from net realized gain on investments | (.00)b | — | — | — | (.01) | (.09) | ||||||
| Total Distributions | (.17) | (.30) | (.26) | (.27) | (.32) | (.51) | ||||||
| Net asset value, end of period | 12.59 | 12.58 | 12.62 | 12.79 | 12.84 | 12.91 | ||||||
| Total Return (%) | 1.49c | 2.10 | .73 | 1.72 | 2.01 | 4.16 | ||||||
| Ratios/Supplemental Data (%): | ||||||||||||
| Ratio of total expenses to average net assets | .80d | .79 | .79 | .79 | .81 | .72 | ||||||
| Ratio of net expenses to average net assets | .80d | .79 | .78 | .79 | .76 | .67 | ||||||
| Ratio of net investment income | ||||||||||||
| to average net assets | 2.82d | 2.47 | 2.06 | 2.08 | 2.44 | 4.15 | ||||||
| Portfolio Turnover Rate | 17.88c | 49.94 | 40.92 | 28.12 | 22.15 | 50.86 | ||||||
| Net Assets, end of period ($ x 1,000) | 295 | 277 | 150 | 94 | 33 | 1 | ||||||
| a Based on average shares outstanding at each month end. | ||||||||||||
| b Amount represents less than $.01 per share. | ||||||||||||
| c Not annualized. | ||||||||||||
| d Annualized. | ||||||||||||
| See notes to financial statements. | ||||||||||||
| 62 |
| Class M Shares | ||||||||||||
| Six Months Ended | ||||||||||||
| Mellon Pennsylvania Intermediate | February 28, 2007 | Year Ended August 31, | ||||||||||
| Municipal Bond Fund | (Unaudited) | 2006 | 2005 | 2004 | 2003 a | 2002 | ||||||
| Per Share Data ($): | ||||||||||||
| Net asset value, beginning of period | 12.66 | 12.92 | 13.13 | 12.95 | 13.15 | 13.16 | ||||||
| Investment Operations: | ||||||||||||
| Investment income—net b | .24 | .48 | .49 | .50 | .51 | .53 | ||||||
| Net realized and unrealized | ||||||||||||
| gain (loss) on investments | .04 | (.18) | (.13) | .21 | (.20) | .11 | ||||||
| Total from Investment Operations | .28 | .30 | .36 | .71 | .31 | .64 | ||||||
| Distributions: | ||||||||||||
| Dividends from investment income—net | (.24) | (.48) | (.49) | (.50) | (.51) | (.53) | ||||||
| Dividends from net realized gain on investments | (.03) | (.08) | (.08) | (.03) | — | (.12) | ||||||
| Total Distributions | (.27) | (.56) | (.57) | (.53) | (.51) | (.65) | ||||||
| Net asset value, end of period | 12.67 | 12.66 | 12.92 | 13.13 | 12.95 | 13.15 | ||||||
| Total Return (%) | 2.20c | 2.41 | 2.84 | 5.60 | 2.35 | 5.03 | ||||||
| Ratios/Supplemental Data (%): | ||||||||||||
| Ratio of total expenses to average net assets | .66d | .66 | .66 | .66 | .67 | .68 | ||||||
| Ratio of net expenses to average net assets | .66d | .66 | .66 | .66 | .67 | .67 | ||||||
| Ratio of net investment income | ||||||||||||
| to average net assets | 3.81d | 3.81 | 3.78 | 3.82 | 3.88 | 4.09 | ||||||
| Portfolio Turnover Rate | 9.42c | 13.80 | 23.88 | 18.87 | 17.58 | 34.50 | ||||||
| Net Assets, end of period ($ x 1,000) | 621,736 | 646,610 | 656,901 | 681,295 | 740,587 | 837,441 | ||||||
| a Effective December 16, 2002, MPAM shares were redesignated as Class M shares. | ||||||||||||
| b Based on average shares outstanding at each month end. | ||||||||||||
| c Not annualized. | ||||||||||||
| d Annualized. | ||||||||||||
| See notes to financial statements. | ||||||||||||
The Funds 63
FINANCIAL HIGHLIGHTS (continued)
| Investor Shares | ||||||||||||
| Six Months Ended | ||||||||||||
| Mellon Pennsylvania Intermediate | February 28, 2007 | Year Ended August 31, | ||||||||||
| Municipal Bond Fund | (Unaudited) | 2006 | 2005 | 2004 | 2003 | 2002 a | ||||||
| Per Share Data ($): | ||||||||||||
| Net asset value, beginning of period | 12.65 | 12.91 | 13.13 | 12.95 | 13.14 | 13.16 | ||||||
| Investment Operations: | ||||||||||||
| Investment income—net a | .22 | .46 | .45 | .47 | .48 | .54 | ||||||
| Net realized and unrealized | ||||||||||||
| gain (loss) on investments | .05 | (.19) | (.13) | .21 | (.20) | .06 | ||||||
| Total from Investment Operations | .27 | .27 | .32 | .68 | .28 | .60 | ||||||
| Distributions: | ||||||||||||
| Dividends from investment income—net | (.22) | (.45) | (.46) | (.47) | (.47) | (.50) | ||||||
| Dividends from net realized gain on investments | (.03) | (.08) | (.08) | (.03) | — | (.12) | ||||||
| Total Distributions | (.25) | (.53) | (.54) | (.50) | (.47) | (.62) | ||||||
| Net asset value, end of period | 12.67 | 12.65 | 12.91 | 13.13 | 12.95 | 13.14 | ||||||
| Total Return (%) | 2.15b | 2.15 | 2.50 | 5.41 | 2.09 | 4.69 | ||||||
| Ratios/Supplemental Data (%): | ||||||||||||
| Ratio of total expenses to average net assets | .92c | .91 | .91 | .92 | .93 | .94 | ||||||
| Ratio of net expenses to average net assets | .92c | .91 | .91 | .92 | .92 | .92 | ||||||
| Ratio of net investment income | ||||||||||||
| to average net assets | 3.58c | 3.57 | 3.50 | 3.56 | 3.59 | 3.84 | ||||||
| Portfolio Turnover Rate | 9.42b | 13.80 | 23.88 | 18.87 | 17.58 | 34.50 | ||||||
| Net Assets, end of period ($ x 1,000) | 4,634 | 3,586 | 4,561 | 2,741 | 2,944 | 963 | ||||||
| a Based on average shares outstanding at each month end. | ||||||||||||
| b Not annualized. | ||||||||||||
| c Annualized. | ||||||||||||
| See notes to financial statements. | ||||||||||||
| 64 |
FINANCIAL HIGHLIGHTS
Please note that the financial highlights information in the following tables for the fund’s Investor shares, Class M shares and Dreyfus Premier shares represents the financial highlights of the Class A shares, Class R shares and Class B shares, respectively, of the fund’s predecessor, Dreyfus Premier Limited Term Massachusetts Municipal Fund (the Premier Massachusetts Fund) before the fund commenced operations as of the close of business on September 6, 2002, and represents the performance of the fund’s Investor shares, Class M shares and Dreyfus Premier shares thereafter. Before the fund commenced operations, substantially all of the assets of the Premier Massachusetts Fund were transferred to the fund in a tax-free reorganization. Total return for the periods before the fund commenced operations shows how much an investment in the Premier Massachusetts Fund’s Class A shares, Class R shares and Class B shares would have increased (or decreased) during those periods, assuming all dividends and distributions were reinvested.Total return for the period since the fund commenced operations also reflects how much an investment in the fund’s Investor shares, Class M shares and Dreyfus Premier shares would have increased (or decreased), assuming all dividends and distributions were reinvested.
| Class M Shares | ||||||||||||||
| Six Months Ended | Year Ended | |||||||||||||
| Mellon Massachusetts Intermediate February 28, 2007 | Year Ended August 31, | Two Months Ended | June 30, | |||||||||||
| Municipal Bond Fund | (Unaudited) | 2006 | 2005 | 2004 | 2003 a | August 31, 2002 b | 2002 | |||||||
| Per Share Data ($): | ||||||||||||||
| Net asset value, beginning of period | 12.58 | 12.75 | 12.81 | 12.59 | 12.79 | 12.62 | 12.38 | |||||||
| Investment Operations: | ||||||||||||||
| Investment income—net c | .23 | .47 | .47 | .48 | .50 | .09 | .52 | |||||||
| Net realized and unrealized gain | ||||||||||||||
| (loss) on investments | .07 | (.14) | (.06) | .22 | (.21) | .17 | .24 | |||||||
| Total from Investment Operations | .30 | .33 | .41 | .70 | .29 | .26 | .76 | |||||||
| Distributions: | ||||||||||||||
| Dividends from investment income—net | (.23) | (.47) | (.47) | (.48) | (.49) | (.09) | (.52) | |||||||
| Dividends from net realized | ||||||||||||||
| gain on investments | — | (.03) | — | — | — | — | — | |||||||
| Total Distributions | (.23) | (.50) | (.47) | (.48) | (.49) | (.09) | (.52) | |||||||
| Net asset value, end of period | 12.65 | 12.58 | 12.75 | 12.81 | 12.59 | 12.79 | 12.62 | |||||||
| Total Return (%) | 2.40d | 2.65 | 3.25 | 5.72 | 2.23 | 2.10d | 6.19 | |||||||
| Ratios/Supplemental Data (%): | ||||||||||||||
| Ratio of total expenses to average net assets | .53e | .54 | .54 | .55 | .58 | .50e | .50 | |||||||
| Ratio of net expenses to average net assets | .50e | .50 | .50 | .50 | .50 | .50e | .50 | |||||||
| Ratio of net investment income | ||||||||||||||
| to average net assets | 3.67e | 3.73 | 3.67 | 3.74 | 3.93 | 3.94e | 4.18 | |||||||
| Portfolio Turnover Rate | 9.77d | 20.57 | 32.16 | 27.26 | 15.54 | 4.48d | 11.45 | |||||||
| Net Assets, end of period ($ x 1,000) | 325,226 | 299,263 | 228,239 | 197,140 | 173,311 | 170,030 | 162,413 | |||||||
| a Effective December 16, 2002, MPAM shares were redesignated as Class M shares. | ||||||||||||||
| b The Premier Massachusetts Fund has changed its fiscal year end from June 30 to August 31. | ||||||||||||||
| c Based on average shares outstanding at each month end. | ||||||||||||||
| d Not annualized. | ||||||||||||||
| e Annualized. | ||||||||||||||
| See notes to financial statements. | ||||||||||||||
The Funds 65
FINANCIAL HIGHLIGHTS (continued)
| Investor Shares | ||||||||||||||||
| Six Months Ended | Year Ended | |||||||||||||||
| Mellon Massachusetts Intermediate | February 28, 2007 | Year Ended August 31, | Two Months Ended | June 30, | ||||||||||||
| Municipal Bond Fund | (Unaudited) | 2006 | 2005 | 2004 | 2003 a | August 31, 2002 b | 2002 | |||||||||
| Per Share Data ($): | ||||||||||||||||
| Net asset value, beginning of period | 12.58 | 12.75 | 12.80 | 12.59 | 12.79 | 12.61 | 12.38 | |||||||||
| Investment Operations: | ||||||||||||||||
| Investment income—net b | .21 | .44 | .44 | .45 | .47 | .08 | .49 | |||||||||
| Net realized and unrealized | ||||||||||||||||
| gain (loss) on investments | .07 | (.14) | (.05) | .21 | (.20) | .18 | .23 | |||||||||
| Total from Investment Operations | .28 | .30 | .39 | .66 | .27 | .26 | .72 | |||||||||
| Distributions: | ||||||||||||||||
| Dividends from investment income—net | (.21) | (.44) | (.44) | (.45) | (.47) | (.08) | (.49) | |||||||||
| Dividends from net realized | ||||||||||||||||
| gain on investments | — | (.03) | — | — | — | — | — | |||||||||
| Total Distributions | (.21) | (.47) | (.44) | (.45) | (.47) | (.08) | (.49) | |||||||||
| Net asset value, end of period | 12.65 | 12.58 | 12.75 | 12.80 | 12.59 | 12.79 | 12.61 | |||||||||
| Total Return (%) | 2.28c | 2.40 | 3.07 | 5.38 | 1.97 | 2.06c,d | 5.92 d | |||||||||
| Ratios/Supplemental Data (%): | ||||||||||||||||
| Ratio of total expenses to average net assets | .78e | .79 | .79 | .80 | .83 | .75e | .75 | |||||||||
| Ratio of net expenses to average net assets | .75e | .75 | .75 | .75 | .75 | .75e | .75 | |||||||||
| Ratio of net investment income | ||||||||||||||||
| to average net assets | 3.43e | 3.49 | 3.43 | 3.50 | 3.68 | 3.69e | 3.93 | |||||||||
| Portfolio Turnover Rate | 9.77c | 20.57 | 32.16 | 27.26 | 15.54 | 4.48c | 11.45 | |||||||||
| Net Assets, end of period ($ x 1,000) | 9,670 | 9,854 | 10,371 | 11,698 | 12,965 | 13,866 | 13,553 | |||||||||
| a The Premier Massachusetts Fund has changed its fiscal year end from June 30 to August 31. |
| b Based on average shares outstanding at each month end. |
| c Not annualized. |
| d Exclusive of sales charge which was applicable to Class A shares of the Premier Massachusetts Fund. |
| e Annualized. |
| See notes to financial statements. |
| 66 |
| Dreyfus Premier Shares | ||||||||||||||||
| Six Months Ended | Year Ended | |||||||||||||||
| Mellon Massachusetts Intermediate | February 28, 2007 | Year Ended August 31, | Two Months Ended | June 30, | ||||||||||||
| Municipal Bond Fund | (Unaudited) | 2006 | 2005 | 2004 | 2003 a | August 31, 2002 b | 2002 | |||||||||
| Per Share Data ($): | ||||||||||||||||
| Net asset value, beginning of period | 12.61 | 12.78 | 12.83 | 12.61 | 12.81 | 12.64 | 12.40 | |||||||||
| Investment Operations: | ||||||||||||||||
| Investment income—net b | .17 | .37 | .38 | .38 | .40 | .07 | .43 | |||||||||
| Net realized and unrealized | ||||||||||||||||
| gain (loss) on investments | .08 | (.14) | (.05) | .22 | (.20) | .17 | .24 | |||||||||
| Total from Investment Operations | .25 | .23 | .33 | .60 | .20 | .24 | .67 | |||||||||
| Distributions: | ||||||||||||||||
| Dividends from investment income—net | (.18) | (.37) | (.38) | (.38) | (.40) | (.07) | (.43) | |||||||||
| Dividends from net realized | ||||||||||||||||
| gain on investments | — | (.03) | — | — | — | — | — | |||||||||
| Total Distributions | (.18) | (.40) | (.38) | (.38) | (.40) | (.07) | (.43) | |||||||||
| Net asset value, end of period | 12.68 | 12.61 | 12.78 | 12.83 | 12.61 | 12.81 | 12.64 | |||||||||
| Total Return (%) | 2.02c | 1.89 | 2.59 | 4.85 | 1.55 | 1.98c,d | 5.40d | |||||||||
| Ratios/Supplemental Data (%): | ||||||||||||||||
| Ratio of total expenses to average net assets | 1.28e | 1.29 | 1.29 | 1.30 | 1.33 | 1.25e | 1.25 | |||||||||
| Ratio of net expenses to average net assets | 1.25e | 1.25 | 1.25 | 1.25 | 1.25 | 1.25e | 1.25 | |||||||||
| Ratio of net investment income | ||||||||||||||||
| to average net assets | 2.94e | 2.99 | 2.98 | 3.01 | 3.19 | 3.17e | 3.41 | |||||||||
| Portfolio Turnover Rate | 9.77c | 20.57 | 32.16 | 27.26 | 15.54 | 4.48c | 11.45 | |||||||||
| Net Assets, end of period ($ x 1,000) | 81 | 165 | 202 | 655 | 941 | 1,484 | 1,251 | |||||||||
| a The Premier Massachusetts Fund has changed its fiscal year end from June 30 to August 31. |
| b Based on average shares outstanding at each month end. |
| c Not annualized. |
| d Exclusive of sales charge which was applicable to Class A shares of the Premier Massachusetts Fund. |
| e Annualized. |
| See notes to financial statements. |
The Funds 67
NOTES TO FINANCIAL STATEMENTS (Unaudited)
NOTE 1—General:
Mellon Funds Trust (the “Trust”) was organized as a Massachusetts business trust which is registered under the Investment Company Act of 1940, as amended (the “Act”), as an open-end management investment company and operates as a series company currently comprised of sixteen series including the following non-diversified municipal bond funds: Mellon National Intermediate Municipal Bond Fund, Mellon National Short-Term Municipal Bond Fund, Mellon Pennsylvania Intermediate Municipal Bond Fund and Mellon Massachusetts Intermediate Municipal Bond Fund (each, a “fund” and collectively, the “funds”). Mellon National Intermediate Municipal Bond Fund and Mellon National Short-Term Municipal Bond Fund seek to maximize current income exempt from federal income tax to the extent consistent with the preservation of capital. Mellon Pennsylvania Intermediate Municipal Bond Fund seeks as high a level of income exempt from federal and Pennsylvania state income taxes as is consistent with the preservation of capital. Mellon Massachusetts Intermediate Municipal Bond Fund seeks as high a level of income exempt from federal and Massachusetts state income taxes as is consistent with the preservation of capital. Mellon Fund Advisers, a division of The Dreyfus Corporation (“Dreyfus”), serves as each fund’s investment adviser (“Investment Adviser”). Mellon Bank, N.A. (“Mellon Bank”), which is a wholly-owned subsidiary of Mellon Financial Corporation (“Mellon Financial”), serves as administrator for the funds pursuant to an Administration Agreement with the Trust (the “Administration Agreement”). Mellon Bank has entered into a Sub-Administration Agreement with Dreyfus pursuant to which Mellon Bank pays Dreyfus for performing certain administrative services. Dreyfus is a wholly-owned subsidiary of Mellon Financial. Dreyfus Service Corporation (the “Distributor”), a wholly-owned subsidiary of Dreyfus, is the Distributor of each fund’s shares, which are sold without a front-end sales charge.
On December 4, 2006, Mellon Financial and The Bank of New York Company, Inc. announced that they had entered into a definitive agreement to merge. The new company will be called The Bank of New York Mellon Corporation. As part of this transaction, Dreyfus would become a wholly-owned subsidiary of The Bank of New York Mellon Corporation.The transaction is subject to certain regulatory approvals and the approval of The Bank of New York Company, Inc.’s and Mellon Financial’s shareholders, as well as other customary conditions to closing. Subject to such approvals and the satisfaction of the other conditions, Mellon Financial and The Bank of New York Company, Inc. expect the transaction to be completed in the third quarter of 2007.
The Trust is authorized to issue an unlimited number of shares of beneficial interest, par value $.001 per share, in each of the Class M and Investor class shares of each fund and in the Dreyfus Premier class shares of Mellon National Intermediate Municipal Bond Fund and Mellon Massachusetts Intermediate Municipal Bond Fund. Dreyfus Premier shares of Mellon National Intermediate Municipal Bond Fund and Mellon Massachusetts Intermediate Municipal Bond Fund are subject to a contingent deferred sales charge (“CDSC”) imposed on redemptions of Dreyfus Premier shares made within six years of purchase and automatically convert to Investor class shares after six years. Each class of shares has similar rights and privileges, except with respect to the expenses borne by and the shareholder services offered to each class, the shareholder services plan applicable to the Investor shares and Dreyfus Premier shares and the Rule 12b-1 plan applicable to the Dreyfus Premier shares and certain voting rights. Income, expenses (other than expenses attributable to a specific class), and realized and unrealized gains or losses on investments are allocated to each class of shares based on its relative net assets.
The Trust accounts separately for the assets, liabilities and operations of each series. Expenses directly attributable
| 68 |
to each series are charged to that series’ operations; expenses that are applicable to all series are allocated among them on a pro rata basis.
Mellon National Intermediate Municipal Bond Fund and Mellon Massachusetts Intermediate Municipal Bond Fund no longer offer Dreyfus Premier shares, except in connection with dividend reinvestment and permitted exchanges of Dreyfus Premier shares.
The funds’ financial statements are prepared in accordance with U.S. generally accepted accounting principles, which may require the use of management estimates and assumptions. Actual results could differ from those estimates.
NOTE 2—Significant Accounting Policies:
(a) Portfolio valuation: Investments in municipal securities (excluding options and financial futures on municipal, U.S.Treasury securities and swaps) are valued each business day by an independent pricing service (the “Service”) approved by the Board of Trustees. Investments for which quoted bid prices are readily available and are representative of the bid side of the market in the judgment of the Service are valued at the mean between the quoted bid prices (as obtained by the Service from dealers in such securities) and asked prices (as calculated by the Service based upon its evaluation of the market for such securities). Other investments are valued by the Service, based on methods which include consideration of:yields or prices of municipal securities of comparable quality, coupon, maturity and type; indications as to values from dealers; and general market conditions. Options and financial futures on municipal and U.S.Treasury securities are valued at the last sales price on the securities exchange on which such securities are primarily traded or at the last sales price on the national securities market on each business day. Swap transactions are valued based on future cash flows and other factors, such as interest rates and underlying securities.
On September 20, 2006, the Financial Accounting Standards Board (FASB) released Statement of Financial Accounting Standards No. 157 “Fair Value Measurements” (“FAS 157”). FAS 157 establishes an authoritative definition of fair value, sets out a framework for measuring fair value, and requires additional disclosures about fair-value measurements. The application of FAS 157 is required for fiscal years beginning after November 15, 2007 and interim periods within those fiscal years. Management does not believe that the application of this standard will have a material impact on the financial statements of the fund.
(b) Securities transactions and investment income:
Securities transactions are recorded on a trade date basis. Realized gain and loss from securities transactions are recorded on the identified cost basis. Interest income, adjusted for accretion of discount and amortization of premium on investments, is earned from settlement date and recognized on the accrual basis. Securities purchased or sold on a when-issued or delayed-delivery basis may be settled a month or more after the trade date.
The funds have an arrangement with the custodian banks whereby the funds receive earnings credits from the custodian when positive cash balances are maintained, which are used to offset custody fees. For financial reporting purposes, the funds include net earnings credits as expense offsets in the Statements of Operations.
(c) Concentration of risk: Mellon Pennsylvania Intermediate Municipal Bond Fund and Mellon Massachusetts Intermediate Municipal Bond Fund follow an investment policy of investing primarily in municipal obligations of one state. Economic changes affecting the state and certain of its public bodies and municipalities may affect the ability of issuers within the state to pay interest on, or repay principal of, municipal obligations held by the fund.
The Funds 69
NOTES TO FINANCIAL STATEMENTS (Unaudited) (continued)
(d) Dividends to shareholders: The funds declare dividends daily from investment income-net; such dividends are paid monthly.With respect to each series, dividends from net realized capital gain, if any, are normally declared and paid annually, but the funds may make distributions on a more frequent basis to comply with the distribution requirements of the Internal Revenue Code of 1986, as amended (the “Code”).To the extent that net realized capital gain can be offset by capital loss carryovers of that fund, it is the policy of the fund not to distribute such gain. Income and capital gain distributions are determined in accordance with income tax regulations, which may differ from U.S. generally accepted accounting principles.
(e) Federal income taxes: It is the policy of each fund to continue to qualify as a regulated investment company, which can distribute tax exempt dividends, by complying with the applicable provisions of the Code, and to make distributions of income and net realized capital gain sufficient to relieve it from substantially all federal income and excise taxes. For federal income tax purposes, each series is treated as a single entity for the purpose of determining such qualification.
On July 13, 2006, the FASB released FASB Interpretation No. 48, “Accounting for Uncertainty in Income Taxes”
(FIN 48). FIN 48 provides guidance for how uncertain tax positions should be recognized, measured, presented and disclosed in the financial statements. FIN 48 requires the evaluation of tax positions taken or expected to be taken in the course of preparing the portfolio’s tax returns to determine whether the tax positions are “more-likely-than-not” of being sustained by the applicable tax authority.Tax positions not deemed to meet the more-likely-than-not threshold would be recorded as a tax benefit or expense in the current year. Adoption of FIN 48 is required for fiscal years beginning after December 15, 2006 and is to be applied to all open tax years as of the effective date. Management does not believe that the application of this standard will have a material impact on the financial statements of the funds.
Table 1 summarizes Mellon National Short-Term Municipal Bond Fund’s unused capital loss carryover available to be applied against future net securities profits, if any, realized subsequent to August 31, 2006.
| Table 1. | ||
| Expiring in fiscal † | 2014 ($) | |
| Mellon National Short-Term | ||
| Municipal Bond Fund | 439,406 | |
| † If not applied, the carryover expires in fiscal 2014. | ||
| Table 2. | ||||||
| Tax-Exempt | Ordinary | Long-Term | ||||
| Income ($) | Income ($) | Capital Gains ($) | ||||
| 2006 | 2006 | 2006 | ||||
| Mellon National Intermediate | ||||||
| Municipal Bond Fund | 30,274,681 | 346,623 | 3,960,590 | |||
| Mellon National Short-Term | ||||||
| Municipal Bond Fund | 4,849,047 | — | — | |||
| Mellon Pennsylvania Intermediate | ||||||
| Municipal Bond Fund | 24,199,632 | 762,820 | 3,121,541 | |||
| Mellon Massachusetts Intermediate | ||||||
| Municipal Bond Fund | 9,948,155 | 241,765 | 302,568 | |||
| 70 |
Table 2 summarizes each relevant fund’s tax character of distributions paid to shareholders during the fiscal year ended August 31, 2006.The tax character of current year distributions will be determined at the end of the current fiscal year.
NOTE 3—Bank Line of Credit:
The funds participate with other Dreyfus-managed funds in a $100 million unsecured line of credit primarily to be utilized for temporary or emergency purposes, including the financing of redemptions. Interest is charged to the funds based on prevailing market rates in effect at the time of borrowings. During the period ended February 28, 2007, the funds did not borrow under the line of credit.
NOTE 4-Investment Advisory Fee, Administration Fee and Other Transactions With Affiliates:
(a) Fees payable by the funds pursuant to the provisions of an Investment Advisory Agreement with the Investment Adviser are payable monthly, computed on the average daily value of each fund’s net assets at the following annual rates: .35% of the Mellon National Intermediate Municipal Bond Fund, .35% of the Mellon National Short-Term Municipal Bond Fund, .50% of the Mellon Pennsylvania Intermediate Municipal Bond Fund and ..35% of the Mellon Massachusetts Intermediate Municipal Bond Fund.
Pursuant to the Administration Agreement with Mellon Bank, Mellon Bank provides or arranges for fund accounting, transfer agency and other fund administration services and receives a fee based on the total net assets of the Trust based on the following rates:
| 0 up to $6 billion | .15% | |
| $6 billion up to $12 billion | .12% | |
| In excess of $12 billion | .10% |
Mellon Bank has entered into a Sub-Administration Agreement with Dreyfus pursuant to which Mellon pays Dreyfus for performing certain administrative services.
Mellon Bank has agreed, until September 30, 2007, with respect to Mellon Massachusetts Intermediate Municipal Bond Fund, to waive receipt of its fees and/or reimburse a portion of the fund’s expenses, exclusive of taxes, interest, brokerage commissions, Rule 12b-1 fees, Shareholder Services Plan fees and extraordinary expenses, so that the fund’s expenses, in the aggregate, do not exceed an annual rate of .50% of the value of the fund’s average daily net assets. The expense reimbursement, pursuant to the undertaking, for Mellon Massachusetts Intermediate Bond Fund, amounted to $47,175 during the period ended February 28, 2007.
During the period ended February 28, 2007, the Distributor retained $2,992 from contingent deferred sales charges on redemptions of the Mellon National Intermediate Municipal Bond Fund’s Dreyfus Premier shares, and $13 from contingent deferred sales charges on redemptions of the Mellon Massachusetts Intermediate Municipal Bond Fund’s Dreyfus Premier shares.
(b) Mellon National Intermediate Municipal Bond Fund and Mellon Massachusetts Intermediate Municipal Bond Fund have adopted a Distribution Plan (the “Plan”) pursuant to Rule 12b-1 under the Act for distributing its Dreyfus Premier shares.The funds each pay the Distributor a fee at an annual rate of .50% of the value of the fund’s average daily net assets attributable to its Dreyfus Premier shares. During the period ended February 28, 2007, Mellon National Intermediate Municipal Bond Fund and Mellon Massachusetts Intermediate Municipal Bond Fund, Dreyfus Premier shares were charged $4,217 and $258, respectively, pursuant to the Plan.
The Funds 71
NOTES TO FINANCIAL STATEMENTS (Unaudited) (continued)
(c) The funds have adopted a Shareholder Services Plan with respect to its Investor shares, and Mellon National Intermediate Municipal Bond Fund and Mellon Massachusetts Intermediate Municipal Bond Fund have adopted a Shareholder Services Plan with respect to its Dreyfus Premier shares, pursuant to which each fund pays the Distributor for the provision of certain services to holders of Investor shares and Dreyfus Premier shares a fee at an annual rate of .25% of the value of the average daily net assets attributable to Investor shares and Dreyfus Premier shares, respectively. The services provided may include personal services relating to shareholder accounts, such as answering shareholder inquiries regarding a fund, and providing reports and other information, and services related to the maintenance of such shareholder accounts. The Shareholder Services Plan allows the Distributor to make payments from the shareholder services fees it collects from each fund to compensate service agents (certain banks, securities brokers or dealers and other financial institutions) in respect of these services. Table 3 summarizes the amounts Investor shares and Dreyfus Premier shares were charged during the period ended February 28, 2007, pursuant to the Shareholder Services Plan. Additional fees included in shareholder servicing costs in the Statement of Operations include fees paid to the transfer agent.
| Table 3. | ||
| Mellon National Intermediate | ||
| Municipal Bond Fund (Investor Shares) | $ 31,148 | |
| Mellon National Intermediate Municipal | ||
| Bond Fund (Dreyfus Premier Shares) | 2,109 | |
| Mellon National Short-Term | ||
| Municipal Bond Fund (Investor Shares) | 394 | |
| Mellon Pennsylvania Intermediate | ||
| Municipal Bond Fund (Investor Shares) | 5,263 | |
| Mellon Massachusetts Intermediate | ||
| Municipal Bond Fund (Investor Shares) | 12,161 | |
| Mellon Massachusetts Intermediate | ||
| Municipal Bond Fund | ||
| (Dreyfus Premier Shares) | 129 |
The funds compensate Mellon Bank, an affiliate of Dreyfus, under a Custody Agreement for providing custodial services for the funds. Table 4 summarizes the amounts the funds were charged during the period ended February 28, 2007 pursuant to the custody agreement.
| Table 4. | ||
| Mellon National Intermediate | ||
| Municipal Bond Fund | $32,629 | |
| Mellon National Short-Term | ||
| Municipal Bond Fund | 6,794 | |
| Mellon Pennsylvania Intermediate | ||
| Municipal Bond Fund | 22,043 | |
| Mellon Massachusetts Intermediate | ||
| Municipal Bond Fund | 12,264 |
| Table 5. | ||||||||||||
| Investment | Rule 12b-1 | Shareholder | Chief | |||||||||
| Advisory | Distribution | Services | Custodian | Compliance | Expense | |||||||
| Fees ($) | Plan Fees ($) | Plan Fees ($) | Fees ($) | Officer Fees ($) | Reimbursement($) | |||||||
| Mellon National Intermediate | ||||||||||||
| Municipal Bond Fund | 239,356 | 453 | 4,846 | 14,360 | 2,726 | — | ||||||
| Mellon National Short-Term | ||||||||||||
| Municipal Bond Fund | 40,239 | — | 67 | 1,447 | 2,726 | — | ||||||
| Mellon Pennsylvania Intermediate | ||||||||||||
| Municipal Bond Fund | 240,431 | — | 908 | 9,054 | 2,726 | — | ||||||
| Mellon Massachusetts Intermediate | ||||||||||||
| Municipal Bond Fund | 89,024 | 31 | 1,880 | 5,135 | 2,726 | (5,442) | ||||||
| 72 |
During the period ended February 28, 2007, each of the funds was charged $2,044 for services performed by the Chief Compliance Officer.
Table 5 summarizes the components of Due to the Dreyfus Corporation and affiliates in the Statements of Assets and Liabilities for each fund.
(d) Each trustee who is not an “affiliated person” as defined in the Act receives from the Trust an annual fee of $48,000 and an attendance fee of $5,000 for each in-person meeting attended and $500 for telephone meetings and is reimbursed for travel and out-of-pocket expenses. The Chairman of the Trust’s Board receives an additional annual fee of $10,000 and the Chairman of the Trust’s Audit Committee receives an additional fee of $8,000.
NOTE 5—Securities Transactions:
Table 6 summarizes each fund’s aggregate amount of purchases and sales of investment securities, excluding short-term securities and financial futures, during the period ended February 28, 2007.
The funds may invest in financial futures contracts in order to gain exposure to or protect against changes in the market. The funds are exposed to market risk as a result of changes in the value of the underlying financial instruments. Investments in financial futures require the funds to “mark to market” on a daily basis, which reflects the change in the market value of the contracts at the close of each day’s trading. Typically, variation margin payments are received or made to reflect daily unrealized gains or losses. When the contracts are closed, the funds recognize a realized gain or loss. These investments require initial margin deposits with a broker, which consist of cash or cash equivalents. The amount of these deposits is determined by the exchange or Board of Trade on which the contract is traded and is subject to change. Contracts open at February 28, 2007 are set forth in the Statement of Financial Futures.
Table 7 summarizes accumulated net unrealized appreciation on investments for each fund at February 28, 2007.
| Table 6. | ||||
| Purchases ($) | Sales ($) | |||
| Mellon National Intermediate Municipal Bond Fund | 140,854,308 | 94,284,756 | ||
| Mellon National Short-Term Municipal Bond Fund | 27,280,653 | 47,859,151 | ||
| Mellon Pennsylvania Intermediate Municipal Bond Fund | 59,236,852 | 82,964,961 | ||
| Mellon Massachusetts Intermediate Municipal Bond Fund | 38,677,804 | 29,953,718 | ||
| Table 7. | ||||||
| Gross | Gross | |||||
| Appreciation ($) | (Depreciation) ($) | Net ($) | ||||
| Mellon National Intermediate Municipal Bond Fund | 28,809,053 | 696,211 | 28,112,842 | |||
| Mellon National Short-Term Municipal Bond Fund | 205,760 | 442,018 | (236,258) | |||
| Mellon Pennsylvania Intermediate Municipal Bond Fund | 22,670,214 | 88,980 | 22,581,234 | |||
| Mellon Massachusetts Intermediate Municipal Bond Fund | 8,228,557 | 189,712 | 8,038,845 | |||
The Funds 73
NOTES

Telephone Private Wealth Management (PWM) Clients, please contact your Account Officer or call 1-888-281-7350. Brokerage Clients of Mellon Private Wealth Advisors (MPWA), please contact your financial representative or call 1-800-830-0549-Option 2. Individual Account holders, please call Dreyfus at 1-800-896-8167.
Mail PWM Clients, write to your Account Officer, c/o Mellon Bank, N.A., One Mellon Bank Center, Pittsburgh, PA 15258
MPWA Brokerage Clients, write to your financial representative, P.O. Box 9012, Hicksville, NY 11802–9012
Individual Account Holders, write to: Mellon Funds, P.O. Box 55268, Boston, MA 02205–8502
The fund files its complete schedule of portfolio holdings with the Securities and Exchange Commission (“SEC”) for the first and third quarters of each fiscal year on Form N-Q. The funds’ Forms N-Q are available on the SEC’s website at http://www.sec.gov and may be reviewed and copied at the SEC’s Public Reference Room in Washington, DC. Information on the operation of the Public Reference Room may be obtained by calling 1-202-551-8090.
Information regarding how the fund voted proxies relating to portfolio securities for the 12-month period ended June 30, 2006, is available on the SEC’s website at http://www.sec.gov and without charge, upon request, by calling 1-800-645-6561.
©2007 Dreyfus Service Corporation
MFTSA0207-MB
The Mellon Funds
| Mellon Money Market Fund |
| Mellon National Municipal Money Market Fund |
SEMIANNUAL REPORT February 28, 2007
| Contents | ||
| The Funds | ||
| Letter from the President | 2 | |
| Discussion of Funds’ Performance | ||
| Mellon Money Market Fund | 3 | |
| Mellon National Municipal | ||
| Money Market Fund | 5 | |
| Understanding Your Fund’s Expenses | 7 | |
| Comparing Your Fund’s Expenses | ||
| With Those of Other Funds | 7 | |
| Statements of Investments | 8 | |
| Statements of Assets and Liabilities | 15 | |
| Statements of Operations | 16 | |
| Statements of Changes in Net Assets | 17 | |
| Financial Highlights | 18 | |
| Notes to Financial Statements | 22 | |
For More Information
| Back cover |
The views expressed herein are current to the date of this report. These views and the composition of the funds’ portfolios are subject to change at any time based on market and other conditions.
| • Not FDIC-Insured |
| • Not Bank-Guaranteed |
| • May Lose Value |
The Funds

| LETTER FROM |
| THE PRESIDENT |
Dear Shareholder:
We are pleased to present this semiannual report for the Mellon Funds Trust, covering the six-month period from September 1, 2006, through February 28, 2007.
This was a strong period for the financial markets, with rallies in the second half of last year helping stocks and bonds achieve positive absolute returns. A number of factors contributed to the markets’ gains, including a more moderate economic expansion, strong business conditions, subdued inflation, stabilizing interest rates, and robust investor demand for most asset classes. Although short-term interest rates remained stable over the course of the reporting period, money market instruments generally continued to provide attractive yields in the wake of the Federal Reserve’s numerous rate hikes.
In our analysis, the reporting period provided an excellent reminder of the need for a long-term investment perspective. Adopting a short time frame has proved costly for some investors recently, as reducing allocations to stocks and bonds generally meant missing rallies. Indeed, history shows that investors reacting to near-term developments with extreme shifts in strategy rarely is the best decision.We believe that a better course is to maintain a portfolio mix designed to meet future goals, while attempting to manage short-term market volatility. Money market funds have continued to play an important role in that mix, as they seek preservation of capital and have benefited recently from relatively high yields.
For information about how each fund performed during the reporting period, as well as market perspectives, we have provided a Discussion of Fund Performance.
As always, we encourage you to talk with your portfolio manager to help ensure that your portfolio remains aligned with your current financial needs and future investment goals.
Thank you for your continued confidence and support.


| DISCUSSION OF |
| FUND PERFORMANCE |
J. Christopher Nicholl and John F. Flahive, Portfolio Managers
How did Mellon Money Market Fund perform during the reporting period?
For the six-month period ended February 28, 2007, the fund produced annualized yields of 5.04% for its Class M shares and 4.78% for its Investor shares.Taking into account the effects of compounding, the fund also produced annualized effective yields of 5.15% and 4.89% for its Class M shares and Investor shares, respectively.1
Yields of money market instruments remained relatively stable over the reporting period as the Federal Reserve Board (the “Fed”) held the overnight federal funds rate steady at 5.25% in an environment of moderate economic growth and subdued inflation.
What is the fund’s investment approach?
The fund seeks as high a level of current income as is consistent with the preservation of capital and the maintenance of liquidity. To pursue its goal, the fund invests in a diversified portfolio of high-quality, short-term debt securities, including U.S. government securities; certificates of deposit, time deposits, bankers’ acceptances and other short-term domestic or foreign bank obligations; repurchase agreements; asset-backed securities; high-grade commercial paper and other short-term corporate obligations; and taxable municipal obligations. Normally, the fund invests at least 25% of its net assets in bank obligations.
What other factors influenced the fund’s performance?
In the months leading up to the start of the reporting period, the U.S. economy was growing robustly, inflationary pressures were intensifying and the Fed continued to raise short-term interest rates. However, these conditions changed significantly when a slowdown in economic growth helped to relieve investors’ inflation concerns. The Fed lent credence to a more moderate inflation outlook when it refrained from raising short-term interest rates during the reporting period, citing the likelihood that cooling economic growth would reduce inflationary pressures. In addition, tumbling oil prices put a lid on one of the main drivers of investors’ inflation fears, while a decline in the unemployment rate helped reassure investors that the economy was headed for a soft landing.
As the rate of economic growth slowed, some investors began to anticipate that the Fed might reduce short-term interest rates sometime in 2007. However, the economy appeared to gain new momentum in January, when the U.S. Department of Labor reported that weekly wages rose by an inflation-adjusted 2.1% in 2006. The government also announced that the U.S. economy overall grew at a 2.2% annualized rate in the fourth quarter compared to 2.0% in the third quarter. Inflation drove consumer prices higher at a relatively tame 2.5% rate in 2006, the lowest annual increase since 2003.
The combination of moderate economic growth and subdued inflation led many investors to conclude that the Fed would remain on the sidelines for much of 2007. The Fed did just that at its meeting in late January, when it left the federal funds rate unchanged for the fifth consecutive time. In February, sharp declines in global equity markets near month-end contributed to general uncertainty regarding the likely direction of Fed policy later in the year.
Although yields of money market securities stabilized along with interest rates in this environment, yields of longer-dated instruments declined, causing yield differences along the market’s maturity range to fall well below historical norms. At times, yields of longer-dated instruments were lower than shorter-dated ones, a phenomenon known as an “inverted yield curve.” While inverted yield curves sometimes have been considered harbingers of economic weakness, some analysts attributed the reporting period’s inversion to supply-and-demand factors.
The Funds 3
DISCUSSION OF FUND PERFORMANCE (continued)
With the yield curve flat to inverted, investors continued to focus on instruments maturing in six months or less. Over the first half of the reporting period, we generally maintained the fund’s weighted average maturity in a range that was 10 to 15 days longer than industry averages in an attempt to capture incrementally higher yields.We later scaled back the fund’s weighted average maturity toward the neutral range when mixed economic data suggested that the Fed was unlikely to ease monetary policy in the foreseeable future. As we gradually shortened the fund’s weighted average maturity, we increased the fund’s holdings of commercial paper and reduced its position in certificates of deposit.
What is the fund’s current strategy?
Recent economic data have remained mixed, reinforcing an uncertain outlook for Fed policy. On one hand, a surge in defaults among holders of sub-prime mortgages has sparked concerns regarding its potentially adverse influence on overall economic growth. On the other
hand, persistently low unemployment rates and signs that the housing downturn may be moderating have continued to point to the likelihood of a soft landing for the U.S. economy. Meanwhile, inflationary pressures have remained relatively benign.
As of the reporting period’s end, we have maintained the fund’s weighted average maturity in the neutral range. We believe this is a prudent strategy until we see clearer signs of the economy’s health and the direction of future Fed policy.
March 15, 2007
An investment in the fund is not insured or guaranteed by the FDIC or any other government agency. Although the fund seeks to preserve the value of your investment at $1.00 per share, it is possible to lose money by investing in the fund.
1 Annualized effective yield is based upon dividends declared daily and reinvested monthly. Past performance is no guarantee of future results.Yields fluctuate.
| 4 |

| DISCUSSION OF |
| FUND PERFORMANCE |
J. Christopher Nicholl and John F. Flahive, Portfolio Managers
How did Mellon National Municipal Money Market Fund perform during the reporting period?
For the six-month period ended February 28, 2007, the fund produced annualized yields of 3.28% for its Class M shares and 3.03% for its Investor shares.Taking into account the effects of compounding, the fund also produced annualized effective yields of 3.33% and 3.07% for its Class M shares and Investor shares, respectively.1
Yields of tax-exempt money market instruments remained relatively stable over the reporting period as the Federal Reserve Board (the “Fed”) held the overnight federal funds rate steady at 5.25% in an environment of moderate economic growth and subdued inflation.
What is the fund’s investment approach?
The fund seeks as high a level of current income exempt from federal income tax as is consistent with the preservation of capital and maintenance of liquidity. To pursue its goal, the fund invests at least 80% of its assets in short-term municipal obligations that provide income exempt from federal income tax. Among these are municipal notes, short-term municipal bonds, tax-exempt commercial paper and municipal leases. The fund may invest up to 20% of its total assets in taxable money market securities, such as U.S.government obligations, bank and corporate obligations and commercial paper.The fund also may invest in custodial receipts.
What other factors influenced the fund’s performance?
In the months leading up to the start of the reporting period, the U.S. economy was growing robustly, inflationary pressures were intensifying and the Fed continued to raise short-term interest rates. However, these conditions changed significantly when a slowdown in economic growth helped to relieve investors’ inflation concerns. The Fed lent credence to a more moderate inflation outlook when it refrained from raising short-term interest rates during the reporting period, citing the likelihood that cooling economic growth would reduce inflationary pressures. In addition, tumbling oil prices put a lid on one of the main drivers of investors’ inflation fears, while a decline in the unemployment rate helped reassure investors that the economy was headed for a soft landing.
As the rate of economic growth slowed, some investors began to anticipate that the Fed might reduce short-term interest rates sometime in 2007. However, the economy appeared to gain new momentum in January, when the U.S. Department of Labor reported that weekly wages rose by an inflation-adjusted 2.1% in 2006. The government also announced that the U.S. economy overall grew at a 2.2% annualized rate in the fourth quarter compared to 2.0% in the third quarter.Inflation drove consumer prices higher at a relatively tame 2.5% rate in 2006, the lowest annual increase since 2003.
The combination of moderate economic growth and subdued inflation led many investors to conclude that the Fed would remain on the sidelines for much of 2007.The Fed did just that at its meeting in late January, when it left the federal funds rate unchanged for the fifth consecutive time. Sharp declines in global equity markets near the end of February also contributed to general uncertainty regarding the likely direction of Fed policy later in the year.
In addition, supply-and-demand factors influenced tax-exempt money market yields.The growing economy reduced the borrowing needs of several states and municipalities, and some revised their borrowing programs to rely more heavily on variable-rate demand notes, on which yields are reset daily or weekly. Yet, investor demand remained strong, as evidenced by an increase in money market fund assets to record levels. These changes generally put downward pressure on tax-exempt money market yields.
The Funds 5
DISCUSSION OF FUND PERFORMANCE (continued)
As yields of longer-dated instruments declined, yield differences along the market’s maturity range narrowed well below historical norms. At times, yields of municipal notes were lower than yields of variable-rate demand notes, a phenomenon known as an “inverted yield curve.” As a result, investors focused mainly on shorter-term instruments.
Early in the reporting period, as it became evident to us that the Fed would remain on the sidelines, we reduced the fund’s weighted average maturity from a relatively long position to one in a range between neutral and slightly shorter than industry averages. As we did so, we increased the fund’s holdings of variable-rate demand notes and reduced its positions in seasoned municipal bonds, tax-exempt commercial paper and municipal notes.
What is the fund’s current strategy?
Recent economic data have remained mixed, reinforcing an uncertain outlook for Fed policy. On one hand, a surge in defaults among holders of sub-prime mortgages has sparked economic concerns. On the other hand, persistently low unemployment rates and signs that the housing downturn may be moderating have continued to point to the likelihood of a soft landing for the U.S. economy. Meanwhile, inflationary pressures have remained relatively benign.
As of the reporting period’s end, we have maintained the fund’s weighted average maturity in the short-to-neutral range.We believe this is a prudent strategy until we see clearer signs of the economy’s health and the direction of future Fed policy.
March 15, 2007
An investment in the fund is not insured or guaranteed by the FDIC or any other government agency. Although the fund seeks to preserve the value of your investment at $1.00 per share, it is possible to lose money by investing in the fund.
1 Annualized effective yield is based upon dividends declared daily and reinvested monthly. Past performance is no guarantee of future results. Yields fluctuate. Income may be subject to state and local taxes, and some income may be subject to the federal alternative minimum tax (AMT) for certain investors.
| 6 |
UNDERSTANDING YOUR FUND’S EXPENSES ( U n a u d i t e d )
As a mutual fund investor, you pay ongoing expenses, such as management fees and other expenses. Using the information below, you can estimate how these expenses affect your investment and compare them with the expenses of the funds.You also may pay one-time transaction expenses, including sales charges (loads) and redemption fees, which are not shown in this section and would have resulted in higher total expenses. For more information, see your fund’s prospectus or talk to your financial advisor.
Review your fund’s expenses
The table below shows the expenses you would have paid on a $1,000 investment in each class of each fund from September 1, 2006 to February 28, 2007. It also shows how much a $1,000 investment would be worth at the close of the period, assuming actual returns and expenses.
| Expenses and Value of a $1,000 Investment | ||||
| assuming actual returns for the six months ended February 28, 2007 | ||||
| Class M Shares | Investor Shares | |||
| Mellon Money Market Fund | ||||
| Expenses paid per $1,000 † | $ 1.51 | $ 2.76 | ||
| Ending value (after expenses) | $1,025.20 | $1,024.00 | ||
| Mellon National Municipal Money Market Fund | ||||
| Expenses paid per $1,000 † | $ 1.55 | $ 2.85 | ||
| Ending value (after expenses) | $1,016.40 | $1,015.10 | ||

Using the SEC’s method to compare expenses
The Securities and Exchange Commission (SEC) has established guidelines to help investors assess fund expenses. Per these guidelines, the table below shows your fund’s expenses based on a $1,000 investment, assuming a hypothetical 5% annualized return.You can use this information to compare the ongoing expenses (but not transaction expenses or total costs) of investing in the fund with those of other funds. All mutual fund shareholder reports will provide this information to help you make this comparison. Please note that you cannot use this information to estimate your actual ending account balance and expenses paid during the period.

† Expenses are equal to the Mellon Money Market Fund annualized expense ratio of .30% for Class M and .55% for Investor Class and Mellon National Municipal Money Market Fund, .31% for Class M and .57% for Investor Class, multiplied by the respective fund’s average account value over the period, multiplied by 181/365 (to reflect the one-half year period).
The Funds 7
| STATEMENT OF INVESTMENTS |
| February 28, 2007 (Unaudited) |

| 8 |

| Portfolio Summary (Unaudited) † | ||||||
| Value (%) | Value (%) | |||||
| Banking | 43.6 | Transportation | 4.5 | |||
| Finance | 11.8 | Commercial & Professional Services | 3.6 | |||
| Insurance | 4.7 | Other | 27.1 | |||
| Multi-Line Insurance | 4.7 | 100.0 | ||||
| † Based on net assets. | ||||||
| See notes to financial statements. | ||||||
The Funds 9
| STATEMENT OF INVESTMENTS |
| February 28, 2007 (Unaudited) |
| Mellon National Municipal Money Market Fund | ||||||||||
| Coupon | Maturity | Principal | ||||||||
| Short-Term Investments—96.0% | Rate (%) | Date | Amount ($) | Value ($) | ||||||
| Alabama—10.7% | ||||||||||
| Birmingham Medical Clinic Board, Medical Clinic Revenue (University | ||||||||||
| of Alabama Health Services Foundation) (LOC; SunTrust Bank) | 3.52 | 3/7/07 | 48,500,000 | a | 48,500,000 | |||||
| Eclipse Funding Trust (University of South Alabama) | ||||||||||
| (Insured; AMBAC and Liquidity Facility; U.S. Bank NA) | 3.69 | 3/7/07 | 26,140,000 | a | 26,140,000 | |||||
| Pell City Special Care Facilities Financing Authority, Revenue | ||||||||||
| (Noland Health Services, Inc.) (LOC; Allied Irish Bank) | 3.68 | 3/7/07 | 39,000,000 | a | 39,000,000 | |||||
| Port City Medical Clinic Board, Health Care Facilities | ||||||||||
| Revenue (Infirmary Health Systems) (Insured; | ||||||||||
| AMBAC and Liquidity Facility: Bank of Nova Scotia and KBC Bank) | 3.65 | 3/7/07 | 10,000,000 | a | 10,000,000 | |||||
| Colorado—8.8% | ||||||||||
| Central Platte Valley Metropolitan District, GO | ||||||||||
| (Liquidity Facility; BNP Paribas) | 3.70 | 12/1/07 | 9,200,000 | 9,200,000 | ||||||
| Colorado Educational and Cultural Facilities Authority, | ||||||||||
| Student Housing Facilities Revenue (Campus Village | ||||||||||
| Apartments Project) (LOC; Citibank NA) | 3.67 | 3/7/07 | 22,865,000 | a | 22,865,000 | |||||
| Colorado Springs, Utilities System Subordinate Lien Revenue | ||||||||||
| (Insured; MBIA and Liquidity Facility; Bayerische Landesbank) | 3.65 | 3/7/07 | 25,800,000 | a | 25,800,000 | |||||
| Commerce City Northern Infrastructure | ||||||||||
| General Improvement District, GO (LOC; U.S. Bank NA) | 3.70 | 3/7/07 | 6,150,000 | a | 6,150,000 | |||||
| Commerce City Northern Infrastructure | ||||||||||
| General Improvement District, GO, Refunding (LOC; U.S. Bank NA) | 3.70 | 3/7/07 | 7,400,000 | a | 7,400,000 | |||||
| Pinery West Metropolitan District Number 2, | ||||||||||
| GO Notes (LOC; U.S. Bank NA) | 3.70 | 11/1/07 | 8,705,000 | 8,705,000 | ||||||
| Westminster Economic Development Authority, Tax Increment Revenue | ||||||||||
| (North Huron Urban Renewal Project) (LOC; DEPFA Bank PLC) | 3.66 | 3/7/07 | 22,650,000 | a | 22,650,000 | |||||
| Florida—4.2% | ||||||||||
| Eclipse Funding Trust (Golden Knights Corporation Master Lease | ||||||||||
| Program) (Insured; MBIA and Liquidity Facility; U.S. Bank NA) | 3.69 | 3/7/07 | 24,370,000 | a | 24,370,000 | |||||
| Florida, State Board of Education, Public Education Capital Outlay | ||||||||||
| (Insured; FSA and Liquidity Facility; Morgan Stanley Bank) | 3.69 | 3/7/07 | 24,990,000 | a | 24,990,000 | |||||
| Georgia—6.0% | ||||||||||
| Atlanta, Tax Allocation Revenue | ||||||||||
| (Westside Project) (LOC; Wachovia Bank) | 3.67 | 3/7/07 | 26,390,000 | a | 26,390,000 | |||||
| Burke County Development Authority, PCR, CP (Vogtle Project) | ||||||||||
| (Insured; AMBAC and Liquidity Facility; Rabobank Nederland) | 3.56 | 3/2/07 | 21,000,000 | 21,000,000 | ||||||
| Clayton County Housing Authority, MFHR, | ||||||||||
| Refunding (Chateau Forest Apartments Project) | ||||||||||
| (Insured; FSA and Liquidity Facility; Societe Generale) | 3.57 | 3/7/07 | 6,530,000 | a | 6,530,000 | |||||
| De Kalb County Housing Authority, MFHR, Refunding | ||||||||||
| (Wood Terrace Apartment Project) (Insured; FNMA) | 3.83 | 3/7/07 | 15,935,000 | a | 15,935,000 | |||||
| Idaho—1.0% | ||||||||||
| Idaho, GO Notes, TAN | 4.50 | 6/29/07 | 12,000,000 | 12,030,445 | ||||||
| 10 |
| Mellon National Municipal Money Market Fund (continued) | ||||||||||
| Coupon | Maturity | Principal | ||||||||
| Short-Term Investments (continued) | Rate (%) | Date | Amount ($) | Value ($) | ||||||
| Illinois—8.8% | ||||||||||
| Chicago, Second Lien Water Revenue (LOC; JPMorgan Chase Bank) | 3.52 | 3/7/07 | 34,455,000 | a | 34,455,000 | |||||
| Illinois Educational Facilities Authority, Revenue | ||||||||||
| (Benedictine University Project) (LOC; National City Bank) | 3.67 | 3/7/07 | 12,400,000 | a | 12,400,000 | |||||
| Illinois Finance Authority, Revenue (Resurrection | ||||||||||
| Health Care) (LOC; JPMorgan Chase Bank) | 3.67 | 3/1/07 | 14,000,000 | a | 14,000,000 | |||||
| Illinois Health Facilities Authority, Revenue (Ingalls | ||||||||||
| Memorial Hospital) (LOC; Northern Trust Co.) | 3.52 | 3/7/07 | 14,800,000 | a | 14,800,000 | |||||
| Regional Transportation Authority, GO, Refunding | ||||||||||
| (Liquidity Facility; DEPFA Bank PLC) | 3.55 | 3/7/07 | 26,985,000 | a | 26,985,000 | |||||
| Kentucky—1.3% | ||||||||||
| Breckinridge County, Lease Program Revenue (Kentucky | ||||||||||
| Association of Counties Leasing Trust) (LOC; U.S. Bank NA) | 3.52 | 3/7/07 | 300,000 | a | 300,000 | |||||
| Public Energy Authority of Kentucky, Inc., Gas Supply | ||||||||||
| Revenue (Liquidity Facility; Societe Generale) | 3.66 | 3/1/07 | 14,900,000 | a | 14,900,000 | |||||
| Louisiana—2.3% | ||||||||||
| Louisiana, Gasoline and Fuels Tax Revenue (Insured; FGIC | ||||||||||
| and Liquidity Facillity; Morgan Stanley Bank) | 3.69 | 3/7/07 | 26,260,000 | a | 26,260,000 | |||||
| Massachusetts—1.1% | ||||||||||
| Massachusetts, Consolidated Loan (LOC; Bank of America) | 3.66 | 3/1/07 | 13,000,000 | a | 13,000,000 | |||||
| Michigan—7.9% | ||||||||||
| Detroit, Sewage Disposal System Second Lien Revenue, CP | ||||||||||
| (Insured; FGIC and Liquidity Facility; DEPFA Bank PLC) | 3.78 | 7/12/07 | 10,000,000 | 10,000,000 | ||||||
| Detroit School District, School Building and Site | ||||||||||
| Improvement GO (Putters Program) (Insured; | ||||||||||
| FSA and Liquidity Facility; JPMorgan Chase Bank) | 3.70 | 3/7/07 | 8,500,000 | a | 8,500,000 | |||||
| Hancock Hospital Finance Authority, Revenue, Refunding | ||||||||||
| (Portage Health, Inc.) (LOC; National City Bank) | 3.67 | 3/7/07 | 27,920,000 | a | 27,920,000 | |||||
| RBC Municipal Products Incorporated Trust | ||||||||||
| (Detroit, Water Supply System Revenue) (Insured; | ||||||||||
| FSA and Liquidity Facility; Royal Bank of Canada) | 3.70 | 3/7/07 | 20,000,000 | a | 20,000,000 | |||||
| University of Michigan Regents, HR | 3.52 | 3/7/07 | 25,060,000 | a | 25,060,000 | |||||
| Mississippi—5.1% | ||||||||||
| Jackson County, Port Facility Revenue, Refunding | ||||||||||
| (Chevron U.S.A. Inc. Project) | 3.64 | 3/1/07 | 26,200,000 | a | 26,200,000 | |||||
| Mississippi Business Finance Corporation, Health Care Facilities | ||||||||||
| Revenue (Rush Medical Foundation Project) (LOC; Regions Bank) | 3.69 | 3/7/07 | 20,000,000 | a | 20,000,000 | |||||
| Mississippi Development Bank, CP (LOC; BNP Paribas) | 3.80 | 3/19/07 | 13,100,000 | 13,100,000 | ||||||
| Montana—1.1% | ||||||||||
| RBC Municipal Products Incorporated Trust (Forsyth, | ||||||||||
| PCR (NorthWestern Corporation Colstrip Project)) | ||||||||||
| (Insured; AMBAC and Liquidity Facility; Royal Bank of Canada) | 3.69 | 3/7/07 | 13,000,000 | a | 13,000,000 | |||||
The Funds 11
STATEMENT OF INVESTMENTS (Unaudited) (continued)
| Mellon National Municipal Money Market Fund (continued) | ||||||||||
| Coupon | Maturity | Principal | ||||||||
| Short-Term Investments (continued) | Rate (%) | Date | Amount ($) | Value ($) | ||||||
| Nebraska—3.3% | ||||||||||
| Eclipse Funding Trust (Omaha Metropolitan Utilities District) | ||||||||||
| (Insured; MBIA and Liquidity Facility; U.S. Bancorp) | 3.69 | 3/7/07 | 19,070,000 | a | 19,070,000 | |||||
| Lancaster County Hospital Authority Number 1, | ||||||||||
| Health Facilities Revenue (Immanuel Health | ||||||||||
| Systems-Williamsburg Project) (LOC; ABN-AMRO) | 3.64 | 3/1/07 | 19,300,000 | a | 19,300,000 | |||||
| Nevada—3.9% | ||||||||||
| Director of Nevada Department of Business and Industry, | ||||||||||
| Revenue (Nevada Cancer Institute Project) (LOC; Bank of America) | 3.67 | 3/7/07 | 45,000,000 | a | 45,000,000 | |||||
| New York—5.4% | ||||||||||
| New York City, GO Notes (Liquidity Facility; Dexia Credit Locale) | 3.60 | 3/1/07 | 6,500,000 | a | 6,500,000 | |||||
| New York City, GO Notes (LOC; Westdeutsche Landesbank) | 3.50 | 3/7/07 | 20,800,000 | a | 20,800,000 | |||||
| New York City Transitional Finance Authority, Future Tax Secured | ||||||||||
| Revenue (Liquidity Facility; Landesbank Baden-Wurttemberg) | 3.60 | 3/1/07 | 35,000,000 | a | 35,000,000 | |||||
| North Carolina—1.7% | ||||||||||
| New Hanover County, HR, Refunding (New Hanover Regional | ||||||||||
| Medical Center) (Insured; FSA and Liquidity Facility; Wachovia Bank) | 3.51 | 3/7/07 | 19,700,000 | a | 19,700,000 | |||||
| Ohio—4.5% | ||||||||||
| Cleveland-Cuyahoga County Port Authority, Cultural | ||||||||||
| Facility Revenue (Cleveland Museum of Art Project) | ||||||||||
| (Liquidity Facility; JPMorgan Chase Bank) | 3.65 | 3/7/07 | 20,000,000 | a | 20,000,000 | |||||
| Cuyahoga County, Hospital Improvement Revenue, Refunding | ||||||||||
| (The Metrohealth System Project) (LOC; National City Bank) | 3.67 | 3/7/07 | 18,400,000 | a | 18,400,000 | |||||
| RBC Municipal Products Incorporated Trust (Cleveland, | ||||||||||
| Airport System Revenue) (Insured; AMBAC | ||||||||||
| and Liquidity Facility; Royal Bank of Canada) | 3.69 | 3/7/07 | 13,500,000 | a | 13,500,000 | |||||
| Pennsylvania—3.7% | ||||||||||
| Emmaus General Authority (Pennsylvania Variable Rate | ||||||||||
| Loan Program) (Insured; FSA and LOC; Wachovia Bank) | 3.52 | 3/7/07 | 25,000,000 | a | 25,000,000 | |||||
| Philadelphia Hospitals and Higher Education Facilities | ||||||||||
| Authority, HR (Temple University) (LOC; PNC Bank) | 3.71 | 3/7/07 | 3,400,000 | a | 3,400,000 | |||||
| Westmoreland County Industrial Development Authority, Health | ||||||||||
| System Revenue (Excela Health Project) (LOC; Wachovia Bank) | 3.64 | 3/7/07 | 14,910,000 | a | 14,910,000 | |||||
| Tennessee—10.4% | ||||||||||
| Clarksville Public Building Authority, Pooled Financing Revenue | ||||||||||
| (Tennessee Municipal Bond Fund) (LOC; Bank of America) | 3.65 | 3/1/07 | 21,100,000 | a | 21,100,000 | |||||
| Clarksville Public Building Authority, Pooled Financing Revenue | ||||||||||
| (Tennessee Municipal Bond Fund) (LOC; Bank of America) | 3.65 | 3/1/07 | 11,000,000 | a | 11,000,000 | |||||
| Montgomery County Public Building Authority, Pooled Financing | ||||||||||
| Revenue (Tennessee County Loan Pool) (LOC; Bank of America) | 3.65 | 3/1/07 | 24,650,000 | a | 24,650,000 | |||||
| Shelby County, GO Notes, Refunding | ||||||||||
| (Liquidity Facility; Dexia Credit Locale) | 3.66 | 3/7/07 | 50,000,000 | a | 50,000,000 | |||||
| Tennessee State School Bond Authority, CP | 3.60 | 3/8/07 | 13,000,000 | 13,000,000 | ||||||
| 12 |
| Mellon National Municipal Money Market Fund (continued) | ||||||||||
| Coupon | Maturity | Principal | ||||||||
| Short-Term Investments (continued) | Rate (%) | Date | Amount ($) | Value ($) | ||||||
| Texas—3.2% | ||||||||||
| RBC Municipal Products Incorporated Trust (Waco Health Facilities | ||||||||||
| Development Corporation—Hillcrest Health System Project) | ||||||||||
| (Insured; MBIA and Liquidity Facility; Royal Bank of Canada) | 3.69 | 3/7/07 | 7,000,000 | a | 7,000,000 | |||||
| San Antonio, Hotel Occupancy Tax Subordinate | ||||||||||
| Lien Revenue, Refunding (Putters Program) (Insured; | ||||||||||
| FSA and Liquidity Facility; JPMorgan Chase Bank) | 3.70 | 3/7/07 | 8,100,000 | a | 8,100,000 | |||||
| Texas, TRAN | 4.50 | 8/31/07 | 22,300,000 | 22,401,021 | ||||||
| Utah—.9% | ||||||||||
| Wasatch County School District Board of Education, GO | ||||||||||
| School Building Bonds (Putters Program) (Liquidity Facility; | ||||||||||
| JPMorgan Chase Bank and LOC; Utah School Guaranty Program) | 3.70 | 3/7/07 | 10,995,000 | a | 10,995,000 | |||||
| Vermont—.4% | ||||||||||
| Winooski, Special Obligation, Refunding (LOC; TD Banknorth, N.A.) | 3.65 | 3/1/07 | 5,000,000 | a | 5,000,000 | |||||
| Washington—.3% | ||||||||||
| Washington Health Care Facilities Authority, | ||||||||||
| Revenue (MultiCare Health System) (Insured; | ||||||||||
| FSA and Liquidity Facility; U.S. Bank NA) | 3.64 | 3/1/07 | 3,300,000 | a | 3,300,000 | |||||
| Total Investments (cost $1,115,661,466) | 96.0% | 1,115,661,466 | ||||||||
| Cash and Receivables (Net) | 4.0% | 46,963,289 | ||||||||
| Net Assets | 100.0% | 1,162,624,755 | ||||||||
a Securities payable on demand.Variable interest rate—subject to periodic change.
The Funds 13
STATEMENT OF INVESTMENTS (Unaudited) (continued)
| Summary of Abbreviations | ||||||||||
| ACA | American Capital Access | AGC | ACE Guaranty Corporation | |||||||
| AGIC | Asset Guaranty Insurance Company | AMBAC | American Municipal Bond Assurance Corporation | |||||||
| ARRN | Adjustable Rate Receipt Notes | BAN | Bond Anticipation Notes | |||||||
| BIGI | Bond Investors Guaranty Insurance | BPA | Bond Purchase Agreement | |||||||
| CGIC | Capital Guaranty Insurance Company | CIC | Continental Insurance Company | |||||||
| CIFG | CDC Ixis Financial Guaranty | CMAC | Capital Market Assurance Corporation | |||||||
| COP | Certificate of Participation | CP | Commercial Paper | |||||||
| EDR | Economic Development Revenue | EIR | Environmental Improvement Revenue | |||||||
| FGIC | Financial Guaranty Insurance Company | FHA | Federal Housing Administration | |||||||
| FHLB | Federal Home Loan Bank | FHLMC | Federal Home Loan Mortgage Corporation | |||||||
| FNMA | Federal National Mortgage Association | FSA | Financial Security Assurance | |||||||
| GAN | Grant Anticipation Notes | GIC | Guaranteed Investment Contract | |||||||
| GNMA | Government National Mortgage Association | GO | General Obligation | |||||||
| HR | Hospital Revenue | IDB | Industrial Development Board | |||||||
| IDC | Industrial Development Corporation | IDR | Industrial Development Revenue | |||||||
| LOC | Letter of Credit | LOR | Limited Obligation Revenue | |||||||
| LR | Lease Revenue | MBIA | Municipal Bond Investors | |||||||
| Assurance Insurance Corporation | ||||||||||
| MFHR | Multi-Family Housing Revenue | MFMR | Multi-Family Mortgage Revenue | |||||||
| PCR | Pollution Control Revenue | PILOT | Payment in Lieu of Taxes | |||||||
| RAC | Revenue Anticipation Certificates | RAN | Revenue Anticipation Notes | |||||||
| RAW | Revenue Anticipation Warrants | RRR | Resources Recovery Revenue | |||||||
| SAAN | State Aid Anticipation Notes | SBPA | Standby Bond Purchase Agreement | |||||||
| SFHR | Single Family Housing Revenue | SFMR | Single Family Mortgage Revenue | |||||||
| SONYMA | State of New York Mortgage Agency | SWDR | Solid Waste Disposal Revenue | |||||||
| TAN | Tax Anticipation Notes | TAW | Tax Anticipation Warrants | |||||||
| TRAN | Tax and Revenue Anticipation Notes | XLCA | XL Capital Assurance | |||||||
| Summary of Combined Ratings (Unaudited) | ||||||||||
| Fitch | or Moody’s | or | Standard & Poor’s | Value (%)† | ||||||
| F1+,F1 | VMIG1,MIG1,P1 | SP1+,SP1,A1+,A1 | 100.0 | |||||||
| † Based on total investments. | ||||||||||
| See notes to financial statements. | ||||||||||
| 14 |
| STATEMENT OF ASSETS AND LIABILITIES |
| February 28, 2007 (Unaudited) |
| Mellon | Mellon | |||
| Money Market | National Municipal | |||
| Fund | Money Market Fund | |||
| Assets ($): | ||||
| Investments in securities—See Statement of Investments+ | 844,971,764 | 1,115,661,466 | ||
| Receivable for investment securities sold | — | 43,021,559 | ||
| Interest receivable | 3,296,358 | 5,602,489 | ||
| Prepaid expenses | 24,564 | 26,953 | ||
| 848,292,686 | 1,164,312,467 | |||
| Liabilities ($): | ||||
| Due to The Dreyfus Corporation and affiliates—Note 4(b) | 100,691 | 131,692 | ||
| Due to Administrator—Note 4(a) | 82,045 | 109,790 | ||
| Cash overdraft due to Custodian | 2,852,145 | 1,357,578 | ||
| Interest payable—Note 3 | 1,391 | 3,989 | ||
| Accrued expenses | 60,092 | 84,663 | ||
| 3,096,364 | 1,687,712 | |||
| Net Assets ($) | 845,196,322 | 1,162,624,755 | ||
| Composition of Net Assets ($): | ||||
| Paid-in capital | 845,197,369 | 1,162,629,643 | ||
| Accumulated net realized gain (loss) on investments | (1,047) | (4,888) | ||
| Net Assets ($) | 845,196,322 | 1,162,624,755 | ||
| Net Asset Value Per Share | ||||
| Class M Shares | ||||
| Net Assets ($) | 844,295,642 | 1,162,623,693 | ||
| Shares Outstanding | 844,296,688 | 1,162,629,495 | ||
| Net Asset Value Per Share ($) | 1.00 | 1.00 | ||
| Investor Shares | ||||
| Net Assets ($) | 900,680 | 1,062 | ||
| Shares Outstanding | 900,680 | 1,062 | ||
| Net Asset Value Per Share ($) | 1.00 | 1.00 | ||
| † Investments at cost ($) | 844,971,764 | 1,115,661,466 |
See notes to financial statements.
The Funds 15
| STATEMENT OF OPERATIONS |
| February 28, 2007 (Unaudited) |
| Mellon | Mellon | |||
| Money Market | National Municipal | |||
| Fund | Money Market Fund | |||
| Investment Income ($): | ||||
| Interest Income | 21,301,945 | 15,629,489 | ||
| Expenses: | ||||
| Investment advisory fee—Note 4(a) | 599,189 | 654,220 | ||
| Administration fee—Note 4(a) | 517,084 | 564,243 | ||
| Professional fees | 21,557 | 18,856 | ||
| Registration fees | 15,964 | 22,934 | ||
| Trustees’ fees and expenses—Note 4(c) | 15,380 | 11,699 | ||
| Custodian fees—Note 4(b) | 11,028 | 26,908 | ||
| Prospectus and shareholders’ reports | 7,790 | 1,172 | ||
| Interest expense—Note 3 | 3,237 | 19,956 | ||
| Shareholder servicing costs—Note 4(b) | 1,140 | 273 | ||
| Miscellaneous | 12,955 | 16,327 | ||
| Total Expenses | 1,205,324 | 1,336,588 | ||
| Less—expense reduction in custody fees | ||||
| due to earnings credits—Note 2(b) | (17,116) | (20,988) | ||
| Net Expenses | 1,188,208 | 1,315,600 | ||
| Investment Income—Net, representing net increase | ||||
| in net assets resulting from operations | 20,113,737 | 14,313,889 | ||
| See notes to financial statements. |
| 16 |
STATEMENT OF CHANGES IN NET ASSETS
| Mellon Money Market Fund | Mellon National Municipal Money Market Fund | |||||||
| Six Months Ended | Six Months Ended | |||||||
| February 28, 2007 | Year Ended | February 28, 2007 | Year Ended | |||||
| (Unaudited) | August 31, 2006 | (Unaudited) | August 31, 2006 | |||||
| Operations ($): | ||||||||
| Investment income—net | 20,113,737 | 30,587,460 | 14,313,889 | 20,496,728 | ||||
| Net realized gain (loss) from investments | — | (451) | — | (4,888) | ||||
| Net Increase (Decrease) in Net Assets | ||||||||
| Resulting from Operations | 20,113,737 | 30,587,009 | 14,313,889 | 20,491,840 | ||||
| Dividends to Shareholders from ($): | ||||||||
| Investment income—net: | ||||||||
| Class M Shares | (20,092,166) | (30,559,662) | (14,310,465) | (20,497,989) | ||||
| Investor Shares | (21,571) | (27,798) | (3,424) | (27) | ||||
| Total Dividends | (20,113,737) | (30,587,460) | (14,313,889) | (20,498,016) | ||||
| Beneficial Interest Transactions ($1.00 per share): | ||||||||
| Net proceeds from shares sold: | ||||||||
| Class M Shares | 869,530,692 | 1,493,637,578 | 1,193,772,661 | 1,462,312,267 | ||||
| Investor Shares | 106,299 | 537,609 | 802,269 | — | ||||
| Dividends reinvested: | ||||||||
| Class M Shares | 5 | 45 | 3 | 30 | ||||
| Investor Shares | 21,561 | 27,901 | 2,890 | 27 | ||||
| Cost of shares redeemed: | ||||||||
| Class M Shares | (779,961,971) | (1,417,479,737) | (765,673,650) | (1,341,156,187) | ||||
| Investor Shares | (116,892) | (315,714) | (805,143) | — | ||||
| Increase (Decrease) in Net Assets from | ||||||||
| Beneficial Interest Transactions | 89,579,694 | 76,407,682 | 428,099,030 | 121,156,137 | ||||
| Total Increase (Decrease) In Net Assets | 89,579,694 | 76,407,231 | 428,099,030 | 121,149,961 | ||||
| Net Assets ($): | ||||||||
| Beginning of Period | 755,616,628 | 679,209,397 | 734,525,725 | 613,375,764 | ||||
| End of Period | 845,196,322 | 755,616,628 | 1,162,624,755 | 734,525,725 | ||||
See notes to financial statements.
The Funds 17
FINANCIAL HIGHLIGHTS
The following tables describe the performance for each share class for the fiscal periods indicated. All information reflects financial results for a single fund share. Total return shows how much your investment in the fund would have increased (or decreased) during each period, assuming you had reinvested all dividends and distributions. These figures have been derived from the fund’s financial statements.
| Class M Shares | ||||||||||
| Six Months Ended | ||||||||||
| February 28, 2007 | Year Ended August 31, | |||||||||
| Mellon Money Market Fund | (Unaudited) | 2006 | 2005 | 2004 | 2003 a | |||||
| Per Share Data ($): | ||||||||||
| Net asset value, beginning of period | 1.00 | 1.00 | 1.00 | 1.00 | 1.00 | |||||
| Investment Operations: | ||||||||||
| Investment income—net | .025 | .043 | .023 | .008 | .002 | |||||
| Distributions: | ||||||||||
| Dividends from investment income—net | (.025) | (.043) | (.023) | (.008) | (.002) | |||||
| Net asset value, end of period | 1.00 | 1.00 | 1.00 | 1.00 | 1.00 | |||||
| Total Return (%) | 5.08b | 4.35 | 2.30 | .82 | .76b | |||||
| Ratios/Supplemental Data (%): | ||||||||||
| Ratio of total expenses to average net assets | .30b | .31 | .31 | .33 | .36b | |||||
| Ratio of net expenses to average net assets | .30b | .31 | .31 | .33 | .36b | |||||
| Ratio of net investment income | ||||||||||
| to average net assets | 5.04b | 4.29 | 2.36 | .82 | .78b | |||||
| Net Assets, end of period ($ x 1,000) | 844,296 | 754,727 | 678,569 | 471,723 | 388,979 | |||||
| a | From June 2, 2003 (commencement of operations) to August 31, 2003. | |
| b | Annualized. | |
| See notes to financial statements. | ||
| 18 |
| Investor Shares | ||||||||||
| Six Months Ended | ||||||||||
| February 28, 2007 | Year Ended August 31, | |||||||||
| Mellon Money Market Fund | (Unaudited) | 2006 | 2005 | 2004 | 2003 a | |||||
| Per Share Data ($): | ||||||||||
| Net asset value, beginning of period | 1.00 | 1.00 | 1.00 | 1.00 | 1.00 | |||||
| Investment Operations: | ||||||||||
| Investment income—net | .024 | .040 | .020 | .006 | .001 | |||||
| Distributions: | ||||||||||
| Dividends from investment income—net | (.024) | (.040) | (.020) | (.006) | (.001) | |||||
| Net asset value, end of period | 1.00 | 1.00 | 1.00 | 1.00 | 1.00 | |||||
| Total Return (%) | 4.84b | 4.09 | 2.05 | .57 | .52b | |||||
| Ratios/Supplemental Data (%): | ||||||||||
| Ratio of total expenses to average net assets | .55b | .56 | .57 | .64 | .62b | |||||
| Ratio of net expenses to average net assets | .55b | .56 | .57 | .64 | .62b | |||||
| Ratio of net investment income | ||||||||||
| to average net assets | 4.78b | 4.09 | 2.20 | .79 | .48b | |||||
| Net Assets, end of period ($ x 1,000) | 901 | 890 | 640 | 213 | 11 | |||||
| a | From June 2, 2003 (commencement of operations) to August 31, 2003. | |
| b | Annualized. | |
| See notes to financial statements. | ||
The Funds 19
FINANCIAL HIGHLIGHTS (continued)
| Class M Shares | ||||||||||
| Six Months Ended | ||||||||||
| February 28, 2007 | Year Ended August 31, | |||||||||
| Mellon National Municipal Money Market Fund | (Unaudited) | 2006 | 2005 | 2004 | 2003 a | |||||
| Per Share Data ($): | ||||||||||
| Net asset value, beginning of period | 1.00 | 1.00 | 1.00 | 1.00 | 1.00 | |||||
| Investment Operations: | ||||||||||
| Investment income—net | .016 | .028 | .017 | .007 | .002 | |||||
| Distributions: | ||||||||||
| Dividends from investment income—net | (.016) | (.028) | (.017) | (.007) | (.002) | |||||
| Net asset value, end of period | 1.00 | 1.00 | 1.00 | 1.00 | 1.00 | |||||
| Total Return (%) | 3.31b | 2.88 | 1.68 | .70 | .64b | |||||
| Ratios/Supplemental Data (%): | ||||||||||
| Ratio of total expenses to average net assets | .31b | .32 | .32 | .33 | .35b | |||||
| Ratio of net expenses to average net assets | .30b | .31 | .32 | .33 | .35b | |||||
| Ratio of net investment income | ||||||||||
| to average net assets | 3.28b | 2.86 | 1.68 | .71 | .62b | |||||
| Net Assets, end of period ($ x 1,000) | 1,162,624 | 734,525 | 613,375 | 488,926 | 265,068 | |||||
| a | From June 2, 2003 (commencement of operations) to August 31, 2003. | |
| b | Annualized. | |
| See notes to financial statements. | ||
| 20 |
| Investor Shares | ||||||||||
| Six Months Ended | ||||||||||
| February 28, 2007 | Year Ended August 31, | |||||||||
| Mellon National Municipal Money Market Fund | (Unaudited) | 2006 | 2005 | 2004 | 2003 a | |||||
| Per Share Data ($): | ||||||||||
| Net asset value, beginning of period | 1.00 | 1.00 | 1.00 | 1.00 | 1.00 | |||||
| Investment Operations: | ||||||||||
| Investment income—net | .015 | .026 | .014 | .005 | .001 | |||||
| Distributions: | ||||||||||
| Dividends from investment income—net | (.015) | (.026) | (.014) | (.005) | (.001) | |||||
| Net asset value, end of period | 1.00 | 1.00 | 1.00 | 1.00 | 1.00 | |||||
| Total Return (%) | 3.05b | 2.62 | 1.43 | .45 | .36b | |||||
| Ratios/Supplemental Data (%): | ||||||||||
| Ratio of total expenses to average net assets | .57b | .57 | .58 | .60 | .57b | |||||
| Ratio of net expenses to average net assets | .55b | .57 | .57 | .60 | .57b | |||||
| Ratio of net investment income | ||||||||||
| to average net assets | 3.16b | 2.60 | 1.38 | .58 | .48b | |||||
| Net Assets, end of period ($ x 1,000) | 1 | 1 | 1 | 1 | 1 | |||||
| a | From June 2, 2003 (commencement of operations) to August 31, 2003. | |
| b | Annualized. | |
| See notes to financial statements. | ||
The Funds 21
NOTES TO FINANCIAL STATEMENTS (Unaudited)
NOTE 1—General:
Mellon Funds Trust (the “Trust”) was organized as a Massachusetts business trust which is registered under the Investment Company Act of 1940, as amended (the “Act”), as an open-end management investment company and operates as a series company currently comprised of sixteen series including the following diversified money market funds: Mellon Money Market Fund and Mellon National Municipal Money Market Fund (each, a “fund” and collectively, the “funds”). Mellon Money Market Fund investment objective is to provide investors with as high a level of current income as is consistent with the preservation of capital and the maintenance of liquidity. Mellon National Municipal Money Market Fund investment objective is to provide investors with as high a level of current income exempt from federal income tax as is consistent with the preservation of capital and the maintenance of liquidity. Mellon Fund Advisers, a division of The Dreyfus Corporation (“ the “Manager” or “Dreyfus”), serves as each fund’s investment adviser (“Investment Adviser”). Mellon Bank, N.A. (“Mellon Bank”), which is a wholly-owned subsidiary of Mellon Financial Corporation, (“Mellon Financial”), serves as administrator for the funds pursuant to an Administration Agreement with the Trust (the “Administration Agreement”). Mellon Bank has entered into a Sub-Administration Agreement with Dreyfus pursuant to which Mellon Bank pays Dreyfus for performing certain administrative services. Dreyfus is a wholly-owned subsidiary of Mellon Financial. Dreyfus Service Corporation (the “Distributor”), a wholly-owned subsidiary of Dreyfus, is the Distributor of each fund’s shares, which are sold without a sales charge.
On December 4, 2006, Mellon Financial and The Bank of New York Company, Inc. announced that they had entered into a definitive agreement to merge. The new company will be called The Bank of New York Mellon Corporation. As part of this transaction, Dreyfus would become a wholly-owned subsidiary of The Bank of New York Mellon Corporation. The transaction is sub-
ject to certain regulatory approvals and the approval of The Bank of New York Company, Inc.’s and Mellon Financial’s shareholders, as well as other customary conditions to closing. Subject to such approvals and the satisfaction of the other conditions, Mellon Financial and The Bank of New York Company, Inc. expect the transaction to be completed in the third quarter of 2007.
The Trust is authorized to issue an unlimited number of shares of beneficial interest, par value $.001 per share, in each of the Class M and Investor class shares of each fund. Each class of shares has similar rights and privileges, except with respect to the expenses borne by and the shareholder services offered to each class and the shareholder services plan applicable to the Investor shares and certain voting rights. Income, expenses (other than expenses attributable to a specific class), and realized gains or losses on investments are allocated to each Class of shares based on its relative net assets.
The Trust accounts separately for the assets, liabilities and operations of each series. Expenses directly attributable to each series are charged to that series’ operations; expenses that are applicable to all series are allocated among them on a pro rata basis.
The fund’s financial statements are prepared in accordance with U.S. generally accepted accounting principles, which may require the use of management estimates and assump-tions.Actual results could differ from those estimates.
NOTE 2—Significant Accounting Policies:
(a) Portfolio valuation: Investments in securities are valued at amortized cost in accordance with Rule 2a-7 of the Act, which has been determined by the Trust’s Board to represent the fair value of the fund’s investments.
It is the funds’ policy to maintain a continuous net asset value per share of $1.00; the fund has adopted certain investment, portfolio valuation and dividend and distribution policies to enable it to do so.There is no assurance, however, that the fund will be able to maintain a stable net asset value per share of $1.00.
| 22 |
On September 20, 2006, the Financial Accounting Standards Board (FASB) released Statement of Financial Accounting Standards No. 157 “Fair Value Measurements” (“FAS 157”). FAS 157 establishes an authoritative definition of fair value, sets out a framework for measuring fair value, and requires additional disclosures about fair-value measurements. The application of FAS 157 is required for fiscal years beginning after November 15, 2007 and interim periods within those fiscal years. Management does not believe that the application of this standard will have a material impact on the financial statements of the fund.
(b) Securities transactions and investment income:
Securities transactions are recorded on a trade date basis. Interest income, adjusted for accretion of discount and amortization of premium on investments, is earned from settlement date and recognized on the accrual basis. Cost of investments represents amortized cost.
The fund has an arrangement with the custodian bank whereby the fund receives earnings credit from the custodian when positive cash balances are maintained, which are used to offset custody fees. For financial reporting purposes, the fund includes net earnings credits as an expense offset in the Statement of Operations.
(c) Repurchase agreements: The funds may engage in repurchase agreement transactions. Under the terms of a typical repurchase agreement, a fund, through its custodian and sub-custodian, takes possession of an underlying debt obligation subject to an obligation of the seller to repurchase, and the fund to resell, the obligation at an agreed-upon price and time, thereby determining the yield during the fund’s holding period.This arrangement results in a fixed rate of return that is not subject to market fluctuations during the fund’s holding period. The value of the collateral is at least equal, at all times, to the total amount of the repurchase obligation, including interest. In the event of a counterparty default, the fund has the right to use the collateral to offset losses incurred. There is potential loss to the fund in the event the fund
is delayed or prevented from exercising its rights to dispose of the collateral securities, including the risk of a possible decline in the value of the underlying securities during the period while the fund seeks to assert its rights. The Investment Adviser reviews the value of the collateral and the creditworthiness of those banks and dealers with which the fund enters into repurchase agreements to evaluate potential risks.
(d) Dividends to shareholders: Dividends payable to shareholders are recorded by the funds on the ex-dividend date.The funds declare dividends daily from investment income-net; such dividends are paid monthly.With respect to each series, dividends from net realized capital gain, if any, are normally declared and paid annually, but the funds may make distributions on a more frequent basis to comply with the distribution requirements of the Internal Revenue Code of 1986, as amended (the “Code”).To the extent that net realized capital gain can be offset by capital loss carryovers of that fund, if any, it is the policy of the fund not to distribute such gain.
(e) Federal income taxes: It is the policy of the Mellon Money Market Fund to continue to qualify as a regulated investment company, if such qualification is in the best interests of its shareholders, by complying with the applicable provisions of the Code, and to make distributions of taxable income sufficient to relieve it from substantially all federal income and excise taxes. It is the policy of the Mellon National Municipal Money Market Fund to continue to qualify as a regulated investment company, which can distribute tax exempt dividends, by complying with the applicable provisions of the Code, and to make distributions of income and net realized capital gain sufficient to relieve it from substantially all federal income and excise taxes. For federal income tax purposes, each series is treated as a single entity for the purpose of determining such qualification.
On July 13, 2006, the FASB released FASB Interpretation No. 48 Accounting for Uncertainty in Income Taxes” (FIN 48). FIN 48 provides guidance for
The Funds 23
NOTES TO FINANCIAL STATEMENTS (Unaudited) (continued)
how uncertain tax positions should be recognized, measured, presented and disclosed in the financial statements. FIN 48 requires the evaluation of tax positions taken or expected to be taken in the course of preparing the fund’s tax returns to determine whether the tax positions are more-likely-than-not of being sustained by the applicable tax authority. Tax positions not deemed to meet the “more-likely-than-not” threshold would be recorded as a tax benefit or expense in the current year. Adoption of FIN 48 is required for fiscal years beginning after December 15, 2006 and is to be applied to all open tax years as of the effective date. Management does not believe that the application of this standard will have a material impact on the financial statements of the funds.
The Mellon Money Market Fund has an unused capital loss carryover of $1,047 available for Federal income tax purposes to be applied against future net securities profits, if any, realized subsequent to August 31, 2006. If not applied, $540 of the carryover expires in fiscal 2012, $56 expires in fiscal 2013 and $451 expires in fiscal 2014.
Mellon National Municipal Money Market Fund has an unused capital loss carryover of $4,888 available for Federal income tax purposes to be applied against future net securities profits, if any, realized subsequent to August 31, 2006. If not applied the carryover expires in fiscal 2014.
The tax character of distributions paid to shareholders during the fiscal year ended August 31, 2006 were all ordinary income for the Mellon Money Market Fund and all tax exempt income for the Mellon National Municipal Money Market Fund.The tax character of current year distributions will be determined at the end of the current fiscal year.
At February 28, 2007, the cost of investments for federal income tax purposes was substantially the same as the cost for financial reporting purposes (see the Statement of Investments).
NOTE 3—Bank Line of Credit
The funds participate with other Dreyfus-managed funds in a $100 million unsecured line of credit primarily to be utilized for temporary or emergency purposes, including the financing of redemptions. Interest is charged to the fund based on prevailing market rates in effect at the time of borrowings.
The average daily amount of borrowings outstanding for Mellon Money Market Fund during the period ended February 28, 2007 was approximately $111,500 with a related weighted average annualized interest rate of 5.85% ..
The average daily amount of borrowings outstanding for Mellon National Municipal Money Market Fund during the period ended February 28, 2007 was approximately $691,200 with a related weighted average annualized interest rate of 5.82% .
NOTE 4—Investment Advisory Fee, Administration Fee and Other Transactions With Affiliates:
(a) Fees payable by the funds pursuant to the provisions of an Investment Advisory Agreement with the Investment Adviser are payable monthly, computed on the average daily value of each fund’s net assets at the following annual rates: .15% of the Mellon Money Market Fund and .15% of the Mellon National Municipal Money Market Fund.
Pursuant to the Administration Agreement with Mellon Bank, Mellon provides or arranges for fund accounting, transfer agency and other fund administration services and receives a fee based on the total net assets of the Trust based on the following rates:
| 0 up to $6 billion | .15% | |
| In excess of $6 billion up to $12 billion | .12% | |
| In excess of $12 billion | .10% |
| 24 |
Mellon Bank has entered into a Sub-Administration Agreement with Dreyfus pursuant to which Mellon Bank pays Dreyfus for performing certain administrative services.
(b) The funds have adopted a Shareholder Services Plan with respect to its Investor shares pursuant to which each fund pays the Distributor for the provision of certain services to holders of Investor shares a fee at an annual rate of .25% of the value of the average daily net assets attributable to Investor shares. The services provided may include personal services relating to shareholder accounts, such as answering shareholder inquiries regarding a fund, and providing reports and other information, and services related to the maintenance of such shareholder accounts. The Shareholder Services Plan allows the Distributor to make payments from the shareholder services fees it collects from each fund to compensate service agents (certain banks, securities brokers or dealers and other financial institutions) in respect of these services. Table 1 summarizes the amounts Investor shares were charged during the period ended February 28, 2007, pursuant to the Shareholder Services Plan.
| Table 1. | ||
| Mellon Money Market Fund | $1,127 | |
| Mellon National Municipal | ||
| Money Market Fund | $ 271 |
The funds compensate Mellon Bank under a Custody Agreement for providing custodial services for the funds. Table 2 summarizes the amounts the funds were charged during the period ended February 28, 2007, pursuant to the custody agreements.
| Table 2. | ||
| Mellon Money Market Fund | $11,028 | |
| Mellon National Municipal | ||
| Money Market Fund | $26,908 |
During the period ended February 28, 2007 the funds were charged $2,044 for services performed by the Chief Compliance Officer.
Table 3 summarizes the components of Due to The Dreyfus Corporation and affiliates in the Statement of Assets and Liabilities for each fund.
(c) Each trustee who is not an “affiliated person” as defined in the Act receives from the Trust an annual fee of $48,000 and an attendance fee of $5,000 for each in-person meeting attended and $500 for telephone meetings and is reimbursed for travel and out-of-pocket expenses.
The Chairman of the Trust’s Board receives an additional annual fee of $10,000 and the Chairman of the Trust’s Audit Committee receives an additional annual fee of $8,000.
| Table 3. | ||||||||
| Investment | Shareholder | Chief | ||||||
| Advisory | Services | Custody | Compliance | |||||
| Fees ($) | Plan Fees ($) | Fees ($) | Officer Fees ($) | |||||
| Mellon Money Market Fund | 95,944 | 171 | 1,850 | 2,726 | ||||
| Mellon National Municipal Money Market Fund | 128,855 | 111 | — | 2,726 | ||||
The Funds 25
NOTES
For More Information

Telephone Private Wealth Management (PWM) Clients, please contact your Account Officer or call 1-888-281-7350. Brokerage Clients of Mellon Private Wealth Advisors (MPWA), please contact your financial representative or call 1-800-830-0549-Option 2. Individual Account holders, please call Dreyfus at 1-800-896-8167.
Mail PWM Clients, write to your Account Officer, c/o Mellon Bank, N.A., One Mellon Bank Center, Pittsburgh, PA 15258
MPWA Brokerage Clients, write to your financial representative, P.O. Box 9012, Hicksville, NY 11802–9012
Individual Account Holders, write to: Mellon Funds, P.O. Box 55268, Boston, MA 02205–8502
The funds file their complete schedule of portfolio holdings with the Securities and Exchange Commission (“SEC”) for the first and third quarters of each fiscal year on Form N-Q. The funds’ Forms N-Q are available on the SEC’s website at http://www.sec.gov and may be reviewed and copied at the SEC’s Public Reference Room in Washington, DC. Information on the operation of the Public Reference Room may be obtained by calling 1-202-551-8090.
Information regarding how the funds voted proxies relating to portfolio securities for the 12-month period ended June 30, 2006, is available on the SEC’s website at http://www.sec.gov and without charge, upon request, by calling 1-800-645-6561.
©2007 Dreyfus Service Corporation
MFTSA0207-MM
| Item 2. | Code of Ethics. | |
| Not applicable. | ||
| Item 3. | Audit Committee Financial Expert. | |
| Not applicable. | ||
| Item 4. | Principal Accountant Fees and Services. | |
| Not applicable. | ||
| Item 5. | Audit Committee of Listed Registrants. | |
| Not applicable. | ||
| Item 6. | Schedule of Investments. | |
| Not applicable. | ||
| Item 7. | Disclosure of Proxy Voting Policies and Procedures for Closed-End Management | |
| Investment Companies. | ||
| Not applicable. | ||
| Item 8. | Portfolio Managers of Closed-End Management Investment Companies. | |
| Not applicable. | ||
| Item 9. | Purchases of Equity Securities by Closed-End Management Investment Companies and | |
| Affiliated Purchasers. | ||
| Not applicable. | ||
| Item 10. | Submission of Matters to a Vote of Security Holders. |
The Registrant has a Nominating Committee (the "Committee"), which is responsible for selecting and nominating persons for election or appointment by the Registrant's Board as Board members. The Committee has adopted a Nominating Committee Charter (the "Charter"). Pursuant to the Charter, the Committee will consider recommendations for nominees from shareholders submitted to the Secretary of the Registrant, c/o The Dreyfus Corporation Legal Department, 200 Park Avenue, 8th Floor East, New York, New York 10166. A nomination submission must include information regarding the recommended nominee as specified in the Charter. This information includes all information relating to a recommended nominee that is required to be disclosed in solicitations or proxy statements for the election of Board members, as well as information sufficient to evaluate the factors to be considered by the Committee, including character and integrity, business and professional experience, and whether the person has the ability to apply sound and independent business judgment and would act in the interests of the Registrant and its shareholders.
Nomination submissions are required to be accompanied by a written consent of the individual to stand for election if nominated by the Board and to serve if elected by the shareholders, and such additional information must be provided regarding the recommended nominee as reasonably requested by the Committee.
(a) The Registrant's principal executive and principal financial officers have concluded, based on their evaluation of the Registrant's disclosure controls and procedures as of a date within 90 days of the filing date of this report, that the Registrant's disclosure controls and procedures are reasonably designed to ensure that information required to be disclosed by the Registrant on Form N-CSR is recorded, processed, summarized and reported within the required time periods and that information required to be disclosed by the Registrant in the reports that it files or submits on Form N-CSR is accumulated and communicated to the Registrant's management, including its principal executive and principal financial officers, as appropriate to allow timely decisions regarding required disclosure.
(b) There were no changes to the Registrant's internal control over financial reporting that occurred during the second fiscal quarter of the period covered by this report that have materially affected, or are reasonably likely to materially affect, the Registrant's internal control over financial reporting.
Item 12. Exhibits.
| (a)(1) | Not applicable. | |
| (a)(2) | Certifications of principal executive and principal financial officers as required by Rule 30a-2(a) | |
| under the Investment Company Act of 1940. | ||
| (a)(3) | Not applicable. | |
| (b) | Certification of principal executive and principal financial officers as required by Rule 30a-2(b) | |
| under the Investment Company Act of 1940. | ||
SIGNATURES
Pursuant to the requirements of the Securities Exchange Act of 1934 and the Investment Company Act of 1940, the Registrant has duly caused this Report to be signed on its behalf by the undersigned, thereunto duly authorized.
| By: | /s/ Christopher E. Sheldon | |
| Christopher E. Sheldon | ||
| President | ||
| Date: | April 25, 2007 | |
Pursuant to the requirements of the Securities Exchange Act of 1934 and the Investment Company Act of 1940, this Report has been signed below by the following persons on behalf of the Registrant and in the capacities and on the dates indicated.
Item 11. Controls and Procedures.
| By: | /s/ Christopher E. Sheldon | |
| Christopher E. Sheldon | ||
| President | ||
| Date: | April 25, 2007 | |
| By: | /s/ James Windels | |
| James Windels | ||
| Treasurer | ||
| Date: | April 25, 2007 | |
| EXHIBIT INDEX | ||
| (a)(2) Certifications of principal executive and principal financial officers as required by Rule 30a- | ||
| 2(a) under the Investment Company Act of 1940. (EX-99.CERT) | ||
| (b) Certification of principal executive and principal financial officers as required by Rule 30a- | ||
| 2(b) under the Investment Company Act of 1940. (EX-99.906CERT) | ||