| UNITED STATES |
| SECURITIES AND EXCHANGE COMMISSION |
| Washington, D.C. 20549 |
| FORM N-CSR |
| CERTIFIED SHAREHOLDER REPORT OF REGISTERED MANAGEMENT |
| INVESTMENT COMPANIES |
| Investment Company Act file number 811-09903 |
| Mellon Funds Trust |
| (Exact name of Registrant as specified in charter) |
| c/o The Dreyfus Corporation |
| 200 Park Avenue |
| New York, New York 10166 |
| (Address of principal executive offices) (Zip code) |
| Mark N. Jacobs, Esq. |
| 200 Park Avenue |
| New York, New York 10166 |
| (Name and address of agent for service) |
| Registrant's telephone number, including area code: (212) 922-6000 |
| Date of fiscal year end: | 08/31 | |
| Date of reporting period: | 08/31/05 |
FORM N-CSR
Item 1. Reports to Stockholders.
The Mellon Funds
| Mellon Large Cap Stock Fund |
| Mellon Income Stock Fund |
| Mellon Mid Cap Stock Fund |
| Mellon Small Cap Stock Fund |
| Mellon International Fund |
| Mellon Emerging Markets Fund |
| Mellon Balanced Fund |
ANNUAL REPORT August 31, 2005
| Contents | ||
| The Funds | ||
| Letter from the President | 2 | |
| Discussion of Funds’ Performance | ||
| Mellon Large Cap Stock Fund | 3 | |
| Mellon Income Stock Fund | 6 | |
| Mellon Mid Cap Stock Fund | 9 | |
| Mellon Small Cap Stock Fund | 12 | |
| Mellon International Fund | 15 | |
| Mellon Emerging Markets Fund | 18 | |
| Mellon Balanced Fund | 21 | |
| Understanding Your Fund’s Expenses | 24 | |
| Comparing Your Fund’s Expenses | ||
| With Those of Other Funds | 25 | |
| Statements of Investments | 26 | |
| Statements of Assets and Liabilities | 52 | |
| Statements of Operations | 54 | |
| Statements of Changes in Net Assets | 56 | |
| Financial Highlights | 61 | |
| Notes to Financial Statements | 76 | |
| Report of Independent Registered | ||
| Public Accounting Firm | 86 | |
| Important Tax Information | 87 | |
| Information About the Review | ||
| and Approval of Each Fund’s | ||
| Investment Advisory Agreement | 89 | |
| Board Members Information | 98 | |
| Officers of the Trust | 100 | |
For More Information
| Back cover |
The views expressed herein are current to the date of this report. These views and the composition of the funds’ portfolios are subject to change at any time based on market and other conditions.
- Not FDIC-Insured
- Not Bank-Guaranteed
- May Lose Value
The Funds

This annual report for The Mellon Funds covers the period from September 1, 2004, through August 31, 2005. Inside, you’ll find valuable information about how the funds were managed during the reporting period, including discussions with each fund’s portfolio manager.
On average, U.S. stock prices ended the reporting period higher than where they began. However, most of the equity markets’ gains occurred during the closing months of 2004. So far in 2005, positive factors, including steady economic growth and higher corporate profits, were largely offset by headwinds, such as sharply higher energy prices and rising short-term interest rates.Against the same backdrop and, contrary to historical norms, bonds generally rallied as inflation appeared to remain low and demand for U.S. fixed-income securities was robust, particularly from overseas investors. In global markets, international stocks generally rose more than U.S. stocks over the past year, with gains achieved in the industrialized markets of Europe and Asia, as well as many of the emerging markets.
Recent shocks to the U.S. economy — including sharply higher gasoline prices and other consequences of Hurricane Katrina — have added a degree of uncertainty to the outlook for stocks and bonds. However, our economists currently believe that the economy should continue to grow without either entering a recession or triggering a significant acceleration of inflation.As always, we encourage you to discuss the potential implications of these and other matters with your portfolio manager.
Thank you for your continued confidence and support.


| DISCUSSION OF |
| FUND PERFORMANCE |
| Michael D. Weiner, Portfolio Manager |
| How did Mellon Large Cap Stock Fund perform |
| relative to its benchmark? |
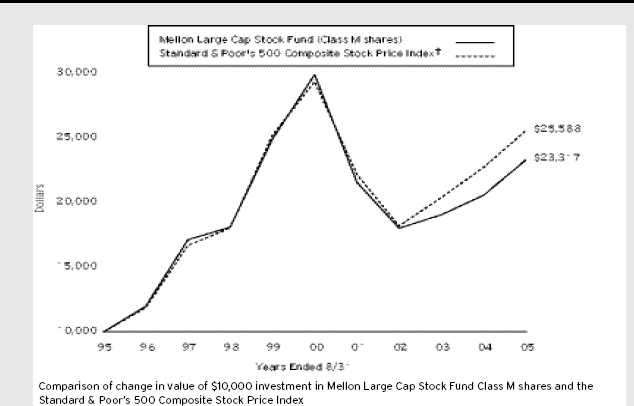
For the 12-month reporting period ended August 31, 2005, the fund’s Class M shares produced a total return of 13.27% while its Investor shares produced a total return of 13.08% .1 In comparison, the total return of the Standard & Poor’s 500 Composite Stock Price Index (“S&P 500 Index”), the fund’s benchmark, was 12.55% for the same period.2
We attribute these results to an expanding economy and growing corporate earnings, which offset the negative impact of rising interest rates and higher oil and gas prices.The fund had mildly stronger performance than its benchmark, primarily due to the success of our stock selection strategy in the energy, consumer discretionary and industrial sectors.
On a separate note, Michael D. Weiner became the fund’s portfolio manager on December 31, 2004.
What is the fund’s investment approach?
Effective December 31, 2004, the fund changed the way it describes its investment objective, which is to seek capital appreciation.To pursue its goal, the fund normally invests at least 80% of its assets in stocks of large-cap companies. Stocks are chosen through a disciplined investment process that combines computer modeling techniques, fundamental analysis and risk management.
When selecting securities, we use a computer model to identify and rank stocks within an industry or sector, based on:
- Value, or how a stock is priced relative to its per- ceived intrinsic worth;
- Growth, in this case the sustainability or growth of earnings; and
- Financial profile, which measures the financial health of the company.
Next, a team of experienced analysts examines the fundamentals of the higher-ranked securities.The portfolio manager then decides which stocks to purchase and whether any current holdings should be sold.
We also attempt to manage the risks by diversifying across companies and industries.The fund is structured so that its sector weightings and risk characteristics are generally similar to those of the S&P 500 Index.
What other factors influenced the fund’s performance?
Although we choose the fund’s investments based on our “bottom-up” stock selection process and not according to broad economic or market trends, it is worth noting that stocks generally overcame concerns related to surging energy prices and rising interest rates, and were driven higher by improving investor sentiment amid higher corporate earnings in a moderately expanding U.S. economy. However, most of the market’s gains were achieved in the final weeks of 2004. Despite periodic rallies and declines, the market gained relatively little ground overall during the first eight months of 2005.
Energy stocks represented a notable exception to the broader market’s trends, as they were driven higher throughout the reporting period by sharply higher oil and gas prices amid robust industrial demand for energy and constrained U.S. refinery capacity. The fund’s energy holdings outperformed the benchmark’s energy component, fueled by especially strong returns from integrated oil and gas companies, such as ConocoPhillips, Exxon Mobil and Occidental Petroleum. Independent oil and gas exploration and production companies, such as Devon Energy and XTO Energy, further contributed to the fund’s relatively strong energy returns.
Consumer discretionary and industrial holdings also produced relatively attractive returns. In the consumer discretionary sector, returns proved to be particularly strong among media holdings, such as The Walt Disney
| The Funds 3 |
DISCUSSION OF FUND PERFORMANCE (continued)
Company; specialty retailers, such as Chico’s FAS; and multiline retailers, such as Nordstrom and Target. Top industrial holdings included construction machinery maker Caterpillar; climate control and industrial machinery company Ingersoll-Rand; and electrical component manufacturer ITT Industries.
Other notably good performers included electric utility Exelon, food and tobacco giant Altria Group, and several health care stocks, such as insurers UnitedHealth Group and Aetna, and biotechnology concern Amgen. On the whole, however, the fund’s health care holdings produced mixed results compared to the benchmark. The strong gains cited above were balanced by relatively weak returns from pharmaceutical giants Pfizer and Merck, medical device maker Boston Scientific and insurer AIG.
In addition, the fund’s results in the technology and financials sectors trailed the benchmark slightly. While most holdings performed reasonably well, the fund did not invest in several of the companies that produced the greatest gains in the benchmark.
What is the fund’s current strategy?
We believe the current economic environment of moderate growth, low inflation and gradual interest-
rate increases remains generally positive for large-cap stocks. At the same time, we are concerned about the impact of soaring energy prices, which could slow future economic growth. Accordingly, we have focused on what we believe are high-quality companies with sound business fundamentals, strong cash flows and good prospects for meeting analysts’ earnings expectations. As part of our risk management discipline, the fund’s sector allocations roughly match those of the benchmark. However, the fund currently maintains slightly greater exposure than the S&P 500 Index to energy stocks, where commodity prices appear likely to remain high, and slightly less exposure to the financials sector, especially companies that tend to be sensitive to rising interest rates.
| September 15, 2005 |
| 1 | Total return includes reinvestment of dividends and any capital gains paid. | |
| Past performance is no guarantee of future results. Share price and investment | ||
| return fluctuate such that upon redemption, fund shares may be worth more or | ||
| less than their original cost. | ||
| 2 | SOURCE: LIPPER INC. — Reflects the monthly reinvestment of | |
| dividends and, where applicable, capital gain distributions.The Standard & | ||
| Poor’s 500 Composite Stock Price Index is a widely accepted, unmanaged | ||
| index of U.S. stock market performance. |
| 4 |
| FUND PERFORMANCE |
| Average Annual Total Returns as of 8/31/05 | ||||||||||
| Inception | From | |||||||||
| Date | 1 Year | 5 Years | 10 Years | Inception | ||||||
| Class M shares | 13.27% | (4.87)% | 8.83% | |||||||
| Investor shares | 7/11/01 | 13.08% | — | — | 0.54% |
| † Source: Lipper Inc. |
| Past performance is not predictive of future performance.The fund’s performance shown in the graph and table does not reflect the deduction of taxes that a shareholder |
| would pay on fund distributions or the redemption of fund shares. |
| The above graph compares a $10,000 investment made in Class M shares of Mellon Large Cap Stock Fund on 8/31/95 to a $10,000 investment made in the |
| Standard & Poor’s 500 Composite Stock Price Index (the “Index”) on that date. All dividends and capital gain distributions are reinvested. |
| Before the fund commenced operations, substantially all of the assets of a predecessor common trust fund (CTF) that, in all material respects, had the same investment |
| objective, policies, guidelines and restrictions as the fund (and those of another CTF) were transferred to the fund. Please note that the performance of the fund’s Class |
| M shares represents the performance of the predecessor CTF through October 1, 2000, adjusted to reflect the fund’s fees and expenses, by subtracting from the actual |
| performance of the CTF the expenses of the fund’s Class M shares as they were estimated prior to the conversion of the CTF into the fund, and the performance of |
| the fund’s Class M shares thereafter.The predecessor CTF was not registered under the Investment Company Act of 1940, as amended, and therefore was not subject |
| to certain investment restrictions that might have adversely affected performance. In addition, the expenses of the fund’s Class M shares may be higher than those |
| estimated prior to the conversion of the CTF into the fund, which would lower the performance shown in the above line graph. |
| Effective July 11, 2001, existing fund shares were designated as Class M shares and the fund began offering a second class of shares designated as Investor shares, |
| which are subject to a Shareholder Services Plan. Performance for Investor shares will vary from the performance of Class M shares shown above because of the |
| differences in charges and expenses. |
| The fund’s performance shown in the line graph takes into account all applicable fees and expenses for Class M shares only.The Index is a widely accepted, |
| unmanaged index of U.S. stock market performance.The Index does not take into account charges, fees and other expenses. Further information relating to fund |
| performance, including expense reimbursements, if applicable, is contained in the Financial Highlights section of the prospectus and elsewhere in this report. |
The Funds 5

DISCUSSION OF FUND PERFORMANCE
D. Gary Richardson, Portfolio Manager
How did Mellon Income Stock Fund perform relative to its benchmark?
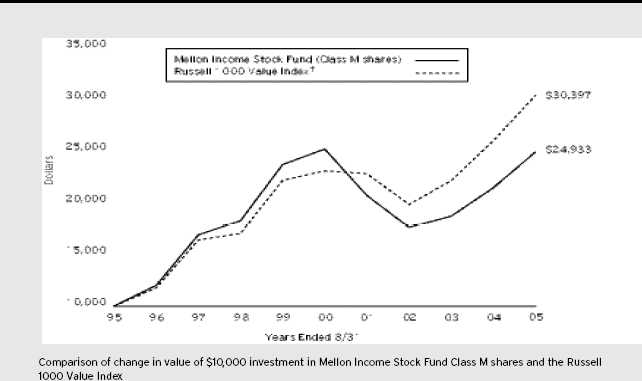
For the 12-month period ended August 31, 2005, the fund’s Class M shares produced a total return of 16.23%, and its Investor shares produced a total return of 16.00% .1 In comparison, the Russell 1000 Value Index, the fund’s benchmark,provided a total return of 16.86% .2
We attribute these results primarily to the positive effects of sustained economic growth and improving business fundamentals for many companies. Returns were particularly impressive from energy stocks, which were driven higher by surging commodity prices amid rising global demand for a limited supply of oil and gas. The fund achieved particularly strong results in the energy, utilities, consumer staples and materials and processing sectors. However, relatively weak returns in the health care and financials sectors caused the fund’s total return to lag slightly behind its benchmark.
What is the fund’s investment approach?
Effective December 31, 2004, the fund changed the way it describes its investment objective, which is to seek total return (consisting of capital appreciation and income).To pursue its goal, the fund normally invests at least 80% of its assets in stocks.The fund seeks to invest primarily in dividend-paying stocks. Stocks are chosen through a disciplined investment process that combines computer modeling techniques, fundamental analysis and risk management. Because the fund seeks to invest primarily in dividend-paying stocks, it generally emphasizes stocks with value characteristics, although it may also purchase growth stocks.
When selecting securities, we use a computer model to identify and rank stocks within an industry or sector, based on:
- Value, or how a stock is priced relative to its per- ceived intrinsic worth;
- Growth, in this case the sustainability or growth of earnings; and
- Financial profile, which measures the financial health of the company.
Next, based on fundamental analysis, we generally select the most attractive of the higher-ranked securities.The portfolio manager then decides which stocks to purchase and whether any current holdings should be sold. We also attempt to manage the risks by diversifying broadly across companies and industries, limiting the potential adverse impact of any one stock or industry on the overall portfolio. In an attempt to earn higher yields, the fund may at times invest a higher percentage of assets than its benchmark in certain industry sectors.
What other factors influenced the fund’s performance?
The fund outperformed its benchmark in the energy sector due to the fund’s slightly overweighted exposure to energy companies and to good individual stock selections within the sector. The fund’s performance benefited from longstanding holdings, such as refinery specialist Sunoco and integrated oil and gas company ConocoPhillips, as well as more recent additions to the fund, such as oil services provider Halliburton and diversified producer Marathon Oil.
Our stock selection strategy generated relatively strong returns in several other sectors as well.Among the fund’s
| 6 |
holdings in the utilities sector, electricity generating companies such as Exelon, PPL and Constellation Energy Group benefited from high levels of industrial demand and recent legislation that opened the sector to new mergers-and-acquisitions opportunities. In the consumer staples sector, the fund established a position in natural food retailer Whole Foods Market, which experienced significant growth as consumers became more health-conscious, enhancing the fund’s returns. Altria Group and other tobacco holdings also contributed positively to the fund’s performance, as litigation concerns eased and business prospects improved.Timely sales of other consumer staples holdings, such as Sara Lee and ConAgra Foods, further bolstered the fund’s relative performance. In the materials and processing area, specialty chemical company Monsanto contributed to the fund’s performance, as did Eastman Chemical. Finally, in the consumer discretionary sector, a buyout of May Department Stores increased the value of the fund’s position.
On the other hand, the fund’s health care holdings were hurt by a variety of regulatory issues and patent expirations among large pharmaceutical companies. In the financials sector, the fund’s investments in large banks, such as JP Morgan Chase & Co. and Citigroup, suffered due to rising interest rates.The fund’s underweighted exposure to real estate investment trusts
(REITs) and life insurance providers — two areas that produced surprisingly good returns during the reporting period — further detracted from the fund’s performance relative to the benchmark.
What is the fund’s current strategy?
As of the end of the reporting period, we have continued to maintain the fund’s slightly overweighted exposure to the energy sector, where the impact of Hurricane Katrina on refinery operations along the Gulf Coast appears likely to intensify the current imbalance between energy supply and demand.We also have increased the fund’s holdings of utility stocks in light of recent legislation enhancing the sector’s mergers-and-acquisitions potential. Conversely, the fund holds slightly less exposure than the benchmark to the financials and consumer discretionary sectors, which we believe may be vulnerable to rising interest rates.
| September 15, 2005 |
| 1 | Total return includes reinvestment of dividends and any capital gains paid. | |
| Past performance is no guarantee of future results. Share price and | ||
| investment return fluctuate such that upon redemption, fund shares may be | ||
| worth more or less than their original cost. | ||
| 2 | SOURCE: LIPPER INC. — Reflects the reinvestment of dividends | |
| and, where applicable, capital gain distributions.The Russell 1000 Value | ||
| Index is an unmanaged index that measures the performance of those | ||
| Russell 1000 companies with lower price-to-book ratios and lower | ||
| forecasted growth values. |
| The Funds 7 |
| FUND PERFORMANCE |
| Average Annual Total Returns as of 8/31/05 | ||||||||||
| Inception | From | |||||||||
| Date | 1 Year | 5 Years | 10 Years | Inception | ||||||
| Class M shares | 16.23% | (0.21)% | 9.57% | |||||||
| Investor shares | 7/11/01 | 16.00% | — | — | 3.75% |
| † Source: Lipper Inc. |
| Past performance is not predictive of future performance.The fund’s performance shown in the graph and table does not reflect the deduction of taxes that a shareholder |
| would pay on fund distributions or the redemption of fund shares. |
| The above graph compares a $10,000 investment made in Class M shares of Mellon Income Stock Fund on 8/31/95 to a $10,000 investment made in the Russell |
| 1000 Value Index (the “Index”) on that date. All dividends and capital gain distributions are reinvested. |
| Before the fund commenced operations, substantially all of the assets of a predecessor common trust fund (CTF) that, in all material respects, had the same investment |
| objective, policies, guidelines and restrictions as the fund (and those of another CTF) were transferred to the fund. Please note that the performance of the fund’s Class M |
| shares represents the performance of the predecessor CTF through October 1, 2000, adjusted to reflect the fund’s fees and expenses, by subtracting from the actual |
| performance of the CTF the expenses of the fund’s Class M shares as they were estimated prior to the conversion of the CTF into the fund, and the performance of the |
| fund’s Class M shares thereafter.The predecessor CTF was not registered under the Investment Company Act of 1940, as amended, and therefore was not subject to |
| certain investment restrictions that might have adversely affected performance. In addition, the expenses of the fund’s Class M shares may be higher than those estimated |
| prior to the conversion of the CTF into the fund, which would lower the performance shown in the above line graph. |
| Effective July 11, 2001, existing fund shares were designated as Class M shares and the fund began offering a second class of shares designated as Investor shares, which |
| are subject to a Shareholder Services Plan. Performance for Investor shares will vary from the performance of Class M shares shown above because of the differences in |
| charges and expenses. |
| The fund’s performance shown in the line graph takes into account all applicable fees and expenses for Class M shares only.The Index does not take into account |
| charges, fees and other expenses. Further information relating to fund performance, including expense reimbursements, if applicable, is contained in the Financial |
| Highlights section of the prospectus and elsewhere in this report. |
| 8 |

DISCUSSION OF FUND PERFORMANCE
James C. Wadsworth, Portfolio Manager
How did the Mellon Mid Cap Stock Fund perform relative to its benchmark?
For the 12-month period ended August 31, 2005, the fund produced total returns of 28.41% for its Class M shares, 28.05% for its Investor shares and 27.11% for its Dreyfus Premier shares.1 In comparison, the Standard & Poor’s MidCap 400 Index (“S&P 400 Index”), the fund’s benchmark, produced a total return of 24.82% for the same period.2
Midcap stock prices moved higher during the reporting period as steady economic growth and rising corporate profits outweighed negative influences, such as soaring energy prices and rising interest rates. The fund produced higher returns than its benchmark, primarily due to the success of our stock selection strategy across a variety of market sectors.
What is the fund’s investment approach?
Effective December 31, 2004, the fund changed the way it describes its investment objective, which is to seek capital appreciation. To pursue its goal, the fund normally invests at least 80% of its assets in stocks of midcap domestic companies, whose market capitalizations generally range between $1 billion and $10 billion at the time of purchase. Stocks are chosen through a disciplined investment process that combines computer modeling techniques, fundamental analysis and risk management.
When selecting securities, we use a computer model to identify and rank stocks within each industry or sector, based on:
- Value, or how a stock is priced relative to its per- ceived intrinsic worth;
- Growth, in this case the sustainability or growth of earnings; and
- Financial profile, which measures the financial health of the company.
Next, based on fundamental analysis, we generally select the most attractive of the higher-ranked securities, drawing on a variety of sources, including internal analysts and external Wall Street research. Finally, we use portfolio construction techniques to manage sector and industry risks. Our goal is to keep those risks at levels that are similar to those of the S&P 400 Index. For example, if the S&P 400 Index has a 10% weighting in a particular sector, about 10% of the fund’s assets will also normally be invested in that sector.
What other factors influenced the fund’s performance?
Stocks generally were hindered when the reporting period began by investors’ concerns regarding the sustainability of economic growth and the uncertainty of a contentious political environment.These issues largely were resolved by early November, when new signs of economic strength appeared and the presidential election ended. Stocks rallied sharply in the closing weeks of 2004, accounting for a substantial portion of the market’s gains for the reporting period.Although 2005 so far has proved to be a less favorable environment for many stocks, midcap stocks generally fared better than their large- and small-cap counterparts. Many midcap companies posted better financial results than analysts forecasted, helping them overcome adverse influences such as surging energy prices and higher interest rates.
The fund achieved above-average results in eight of the 10 market sectors that comprise its benchmark, with particularly strong results in the energy sector and materials sector. Many energy stocks benefited from higher oil and gas prices, including natural gas producer Southwestern Energy and refiner Premcor, which was the subject of an acquisition offer from Valero Energy. In the materials sector, the fund enjoyed especially
| The Funds 9 |
DISCUSSION OF FUND PERFORMANCE (continued)
strong returns from coal miner Peabody Energy. In a related development, mining equipment manufacturer Joy Global benefited from rising customer demand.
Other holdings that benefited the fund’s performance for the reporting period included apparel retailers Chico’s FAS and Nordstrom, whose affluent customers continued to spend despite higher gasoline prices. In the financial sector, asset manager Legg Mason, commodities exchange Chicago Mercantile Exchange and online broker Ameritrade Holding posted attractive gains due to favorable trends in their niche markets. Finally, homebuilder Toll Brothers continued to benefit from higher prices for single family homes in affluent residential communities.
Although some of the fund’s technology holdings proved to be disappointing, a modest underweighting to the technology sector helped cushion the effect. Nonetheless, technology outsourcing provider Sirva was hurt by accounting restatements, and the purchase of outsourcer Cognizant Technology Solutions undermined the fund’s relative performance. In the industrials sector, Dycom Industries underperformed when reported and prospective earnings per share were revised downward.
What is the fund’s current strategy?
We have continued to emphasize energy stocks positioned to benefit from higher prices for natural gas. In the industrials sector, we have focused on engineering and construction companies that we believe should benefit from the repair of facilities along the Gulf Coast in the wake of Hurricanes Katrina and Rita. In the materials sector, we added a position in a producer of highway construction materials. In addition, we have reduced the number of holdings in the fund to 151 as of the end of the reporting period. In our view, the fund is well-positioned to participate in the potential of midcap companies that retain the opportunity for further growth.
| September 15, 2005 |
| 1 | Total return includes reinvestment of dividends and any capital gains paid. | |
| Past performance is no guarantee of future results. Share price and investment | ||
| return fluctuate such that upon redemption, fund shares may be worth more or | ||
| less than their original cost. | ||
| 2 | SOURCE: LIPPER INC. — Reflects reinvestment of dividends and, where | |
| applicable, capital gain distributions.The Standard & Poor’s MidCap 400 | ||
| Index is a widely accepted, unmanaged total return index measuring the | ||
| performance of the midsize company segment of the U.S. stock market. |
| 10 |
| FUND PERFORMANCE |
| Average Annual Total Returns as of 8/31/05 | ||||||||||
| Inception | From | |||||||||
| Date | 1 Year | 5 Years | 10 Years | Inception | ||||||
| Class M shares | 28.41% | 4.59% | 9.01% | |||||||
| Investor shares | 7/11/01 | 28.05% | — | — | 8.27% | |||||
| Dreyfus Premier shares | ||||||||||
| with applicable redemption †† | 9/6/02 | 23.11% | — | — | 15.50% | |||||
| without redemption | 9/6/02 | 27.11% | — | — | 16.25% |
| † Source: Lipper Inc. |
| Past performance is not predictive of future performance.The fund’s performance shown in the graph and table does not reflect the deduction of taxes that a shareholder |
| would pay on fund distributions or the redemption of fund shares. |
| The above graph compares a $10,000 investment made in Class M shares of Mellon Mid Cap Stock Fund on 8/31/95 to a $10,000 investment made in the |
| Standard & Poor’s MidCap 400 Index (the “Index”) on that date. All dividends and capital gain distributions are reinvested. |
| Before the fund commenced operations, substantially all of the assets of a predecessor common trust fund (CTF) that, in all material respects, had the same investment |
| objective, policies, guidelines and restrictions as the fund were transferred to the fund. Please note that the performance of the fund’s Class M shares represents the |
| performance of the predecessor CTF through October 1, 2000, adjusted to reflect the fund’s fees and expenses, by subtracting from the actual performance of the CTF |
| the expenses of the fund’s Class M shares as they were estimated prior to the conversion of the CTF into the fund, and the performance of the fund’s Class M shares |
| thereafter.The predecessor CTF was not registered under the Investment Company Act of 1940, as amended, and therefore was not subject to certain investment |
| restrictions that might have adversely affected performance. In addition, the expenses of the fund’s Class M shares may be higher than those estimated prior to the |
| conversion of the CTF into the fund, which would lower the performance shown in the above line graph. |
| Effective July 11, 2001, existing fund shares were designated as Class M shares and the fund began offering a second class of shares designated as Investor shares, |
| which are subject to a Shareholder Services Plan. Performance for Investor shares will vary from the performance of Class M shares shown above because of the |
| differences in charges and expenses. |
| The fund’s performance shown in the line graph takes into account all applicable fees and expenses for Class M shares only.The Index is a widely accepted, |
| unmanaged total return index measuring the performance of the midsize company segment of the U.S. stock market.The Index does not take into account charges, fees |
| and other expenses. Further information relating to fund performance, including expense reimbursements, if applicable, is contained in the Financial Highlights section of |
| the prospectus and elsewhere in this report. |
| †† The maximum contingent deferred sales charge for Dreyfus Premier shares is 4%. After six years Dreyfus Premier shares convert to Investor shares. |
The Funds 11

DISCUSSION OF FUND PERFORMANCE
Dwight Cowden, Portfolio Manager
How did Mellon Small Cap Stock Fund perform relative to its benchmark?
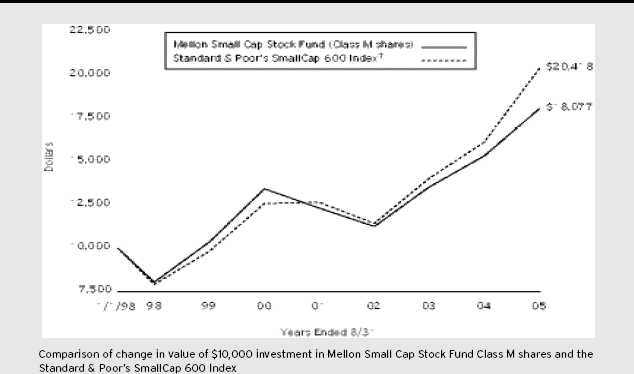
For the 12-month period ended August 31, 2005, the fund’s Class M shares produced a total return of 17.86%, and its Investor shares produced a total return of 17.55% .1 In comparison, the fund’s benchmark, the Standard & Poor’s SmallCap 600 Index (“S&P 600 Index”), produced a total return of 26.49% for the same period.2
Faster-than-anticipated economic growth offset concerns regarding rising interest rates and higher energy prices, allowing for a robust market environment for small-cap stocks during the reporting period.All of the economic sectors in the S&P 600 Index produced positive returns, led by the energy and utilities areas, where surging oil and gas prices led to sharply higher earnings. While the fund participated to a significant degree in the market’s good performance, its results underper-formed its benchmark, mainly because micro-cap stocks within the S&P 600 Index fared better than stocks toward the upper end of the small-cap range, where the fund primarily focused.
What is the fund’s investment approach?
Effective December 31, 2004, the fund changed the way it describes its investment objective, which is to seek capital appreciation. To pursue its goal, the fund normally invests at least 80% of its assets in stocks of small capitalization companies whose market capitalizations generally range between $100 million and $3 billion at the time of purchase. The fund invests in growth and value stocks, which are chosen through a disciplined investment process that combines computer modeling techniques, fundamental analysis and risk management.
When selecting securities, we use a computer model to identify and rank stocks within an industry or sector, based on:
- Value, or how a stock is priced relative to its perceived intrinsic worth;
- Growth, which measures the sustainability and rate of growth of earnings; and
- Financial profile, which measures the financial health of the company.
Next, we examine the fundamentals of the higher-ranked securities. Using these insights, we select what we believe are the most attractive securities identified by the model. Finally, we use portfolio construction techniques to manage sector and industry risks. We attempt to keep those risks at levels that are similar to those of the S&P 600 Index. For example, if the S&P 600 Index has a 10% weighting in a particular sector, about 10% of the fund’s assets will also normally be invested in that sector.
What other factors influenced the fund’s performance?
Although we choose stocks through our bottom-up security selection process, and not in response to broader economic or market trends, it is worth noting that small-cap stocks produced substantially higher returns than large-cap stocks during the reporting period. A growing economy and sound business conditions apparently made investors more comfortable with the risks of smaller companies. In addition, small-cap stocks generally were not affected by the regulatory concerns that hurt several large health care and financial services companies.
Energy and utilities stocks provided the fund with especially strong contributions to its relative performance over the reporting period, as sharply higher oil and gas prices benefited both groups. Holdings in the energy sector that helped the fund’s performance included petroleum refiner Frontier Oil, as well as exploration and production companies, such as Energy Partners. In the utilities sector, our stock selection strategy identified Energen Corporation, UGI Corporation and CMS Energy which also benefited the fund’s performance.
On the other hand, disappointing stock selection and sector allocation decisions undermined results from the
| 12 |
fund’s technology and health care holdings. In the technology area, oversupply issues and low factory utilization rates continued to adversely affect the semiconductor and semiconductor equipment industries. As a result, holdings such as MIPS Technologies, Axcelis Technologies, and ChipMOS Technologies posted negative earnings reports. In the health care sector, medical products manufacturer Merit Medical Systems announced disappointing earnings due to competitive pressures that eroded demand for its products. Pediatric services provider Pediatrix Medical Group fell on concerns that future margins could decline due to a change in revenue sources.
What is the fund’s current strategy?
We have continued to manage the fund utilizing our proprietary quantitative model and fundamental analysis, an approach that tends to give the fund a bias toward higher-quality companies. In our view, quality companies tend to outperform over the long term.
We also have continued to maintain a generally sector-neutral position in most market sectors. However,
because we believe energy prices and rising interest rates are likely to have negative implications for consumer spending and economic growth, we recently reduced the fund’s exposure to the consumer discretionary sector.We also remain cautious with regard to the financials sector, where higher interest rates may put pressure on profit margins. Conversely, we have modestly increased the fund’s exposure to the health care and technology sectors, where we believe market forces may benefit companies that have defendable product niches and attractive valuations.
| September 15, 2005 |
1 Total return includes reinvestment of dividends and any capital gains paid. Past performance is no guarantee of future results. Share price and investment return fluctuate such that upon redemption, fund shares may be worth more or less than their original cost.
Part of the fund’s recent performance is attributable to positive returns from its initial public offering (IPO) investments. There can be no guarantee that IPOs will have or continue to have a positive effect on the fund’s performance.
2 SOURCE: LIPPER INC. — Reflects the reinvestment of dividends and, where applicable, capital gain distributions.The Standard & Poor’s SmallCap 600 Index is a broad-based index and a widely accepted, unmanaged index of overall small-cap stock market performance.
| The Funds 13 |
| FUND PERFORMANCE |
| Average Annual Total Returns as of 8/31/05 | ||||||||
| Inception | From | |||||||
| Date | 1 Year | 5 Years | Inception | |||||
| Class M shares | 1/1/98 | 17.86% | 6.09% | 8.04% | ||||
| Investor shares | 7/11/01 | 17.55% | — | 9.46% |
| † Source: Lipper Inc. |
| Past performance is not predictive of future performance.The fund’s performance shown in the graph and table does not reflect the deduction of taxes that a shareholder |
| would pay on fund distributions or the redemption of fund shares. |
| Part of the fund’s recent performance is attributable to positive returns from its initial public offering (IPO) investments.There can be no guarantee that IPOs will have |
| or continue to have a positive effect on the fund’s performance. |
| The above graph compares a $10,000 investment made in Class M shares of Mellon Small Cap Stock Fund on 1/1/98 (inception date) to a $10,000 investment |
| made in the Standard & Poor’s SmallCap 600 Index (the “Index”) on that date. All dividends and capital gain distributions are reinvested. |
| Before the fund commenced operations, substantially all of the assets of a predecessor common trust fund (CTF) that, in all material respects, had the same investment |
| objective, policies, guidelines and restrictions as the fund were transferred to the fund. Please note that the performance of the fund’s Class M shares represents the |
| performance of the predecessor CTF through October 1, 2000, adjusted to reflect the fund’s fees and expenses, by subtracting from the actual performance of the CTF |
| the expenses of the fund’s Class M shares as they were estimated prior to the conversion of the CTF into the fund, and the performance of the fund’s Class M shares |
| thereafter.The predecessor CTF was not registered under the Investment Company Act of 1940, as amended, and therefore was not subject to certain investment |
| restrictions that might have adversely affected performance. In addition, the expenses of the fund’s Class M shares may be higher than those estimated prior to the |
| conversion of the CTF into the fund, which would lower the performance shown in the above line graph. |
| Effective July 11, 2001, existing fund shares were designated as Class M shares and the fund began offering a second class of shares designated as Investor shares, |
| which are subject to a Shareholder Services Plan. Performance for Investor shares will vary from the performance of Class M shares shown above because of the |
| differences in charges and expenses. |
| The fund’s performance shown in the line graph takes into account all applicable fees and expenses for Class M shares only.The Index is a widely accepted, |
| unmanaged index of overall small-cap stock market performance which does not take into account charges, fees and other expenses. Further information relating to fund |
| performance, including expense reimbursements, if applicable, is contained in the Financial Highlights section of the prospectus and elsewhere in this report. |
| 14 |

| DISCUSSION OF |
| FUND PERFORMANCE |
| D. Kirk Henry and Remi J. Browne, |
| Portfolio Managers |
| How did Mellon International Fund perform |
| relative to its benchmark? |
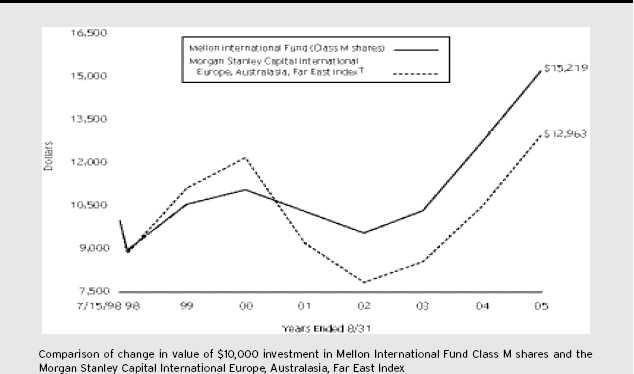
For the 12-month period ended August 31, 2005, the fund’s Class M shares produced a total return of 19.51%, and its Investor shares produced a total return of 19.24% .1 The fund’s benchmark, the Morgan Stanley Capital International Europe, Australasia, Far East Index (“MSCI EAFE Index”), produced a total return of 23.58% for the same period.2
We attribute the market’s returns to steady global economic growth and improved corporate earnings, which helped bolster investor sentiment in many regions of the world. The fund’s returns trailed the benchmark, chiefly due to its exposure in the materials sector, higher weight in Japan, and our stock selection in the technology sector.
On a separate note, effective June 30, 2005, Remi J. Browne, CFA, became a co-primary portfolio manager of the fund and is responsible for the portion of the fund’s portfolio that is managed in accordance with the core investment style.
What is the fund’s investment approach?
The fund seeks long-term capital growth. To pursue this goal, the fund normally invests at least 65% of its total assets in equity securities of foreign issuers.
Since June 30, 2005, the fund generally invests most of its cash inflows (purchases of fund shares and reinvested distributions) in accordance with a core investment style under the direction of the fund’s co-primary portfolio manager, Remi J. Browne.The fund’s portfolio as of June 30, 2005, will continue to be managed in accordance with the value-oriented investment style under the direction of the fund’s other co-primary portfolio manager D. Kirk Henry. The allocation of cash inflows and outflows will be at the discretion of
the investment adviser depending on the circumstances; however, under normal circumstances, generally between 90% to 100% of cash inflows will be allocated to the core investment style. We believe that by implementing a core investment style with respect to such assets, the fund may take advantage of investment opportunities in international markets that may not fall within the value-oriented investment style previously employed for the fund’s entire portfolio.
Pursuant to the core investment style, under normal circumstances, at least 80% of the fund’s cash inflows allocated to this style is invested in equity securities of companies located in the foreign countries represented in the MSCI EAFE Index and Canada.
The fund will continue to invest in stocks that appear to be undervalued (as measured by their price/earnings ratios), but stocks purchased pursuant to the core investment style may have value and/or growth characteristics. The core investment style portfolio manager employs a bottom-up investment approach which emphasizes individual stock selection. The core investment style stock selection process is designed to produce a diversified portfolio that,relative to the MSCI EAFE Index,has a below-average price/earnings ratio and an above-average earnings growth trend.
The fund’s investment approach for the portion of the fund using the value-oriented investment style is research-driven and risk-averse.When selecting stocks, we identify potential investments through extensive quantitative and fundamental research. Emphasizing individual stock selection over economic or industry trends, the fund focuses on three key factors: value, business health and business momentum.
What other factors influenced the fund’s performance?
Steady global economic growth, rising commodity prices and higher corporate earnings helped international stock markets post generally strong returns over
| The Funds 15 |
DISCUSSION OF FUND PERFORMANCE (continued)
the reporting period’s first half. Europe’s economic recovery gained some momentum, the result of corporate restructuring efforts, which helped boost returns in Germany, France and Italy.The United Kingdom posted more modest gains due to lackluster consumer spending and market volatility following the London terrorist attacks. During the second half of the reporting period, international stock market returns moderated as investors became concerned that corporate earnings and global economic growth might already have peaked.
Not surprisingly, energy stocks provided the greatest contributions to the fund’s returns, as they continued to benefit from surging oil and gas prices.The fund’s performance was helped by returns from integrated oil producers such as France’s Total, Italy’s ENI and Spanish refiner Repsol YPF. Conversely, Ciba Specialty Chemicals declined due to profit pressure from rising fuel costs.
Widespread corporate restructuring in Germany helped boost profits for several holdings in the fund’s portfolio, including automobile manufacturer Volkswagen and insurance firm Allianz. In France, information technology firm Thomson, which specializes in the film industry, benefited from the release of new editing software.
In the United Kingdom, solid commodity prices benefited the fund’s longstanding metals and mining holding, Rio Tinto, while defense contractor BAE Systems and drug producer GlaxoSmithKline fared well due to a shift in market leadership toward companies with records of consistent earnings growth in a variety of economic conditions.
On the other hand, the fund’s performance was hindered by its overweighted position in Japan, which lagged most other markets during the reporting period. Our stock selection strategy in Japan, which focused on information technology and domestic stocks, also undermined the fund’s relative performance. To a lesser degree, the fund’s limited exposure to metals stocks in Australia, which we regarded as fully valued, also detracted from the fund’s relative performance.
What is the fund’s current strategy?
As of the end of the reporting period, we have trimmed positions that have reached our price targets, locking in their gains. In our view, many international stocks have become more fully valued in today’s market environment. In markets such as these, patience and discipline are central to our strategy of seeking high-quality companies that may have been overlooked by the market. However, our longer-term outlook for the international stock markets remains positive, and we expect our quantitative and fundamental analyses to help us identify new opportunities as they arise.
| September 15, 2005 |
| 1 | Total return includes reinvestment of dividends and any capital gains paid. | |
| Past performance is no guarantee of future results. Share price and investment | ||
| return fluctuate such that upon redemption, fund shares may be worth more or | ||
| less than their original cost. | ||
| 2 | SOURCE: LIPPER INC. — Reflects reinvestment of net dividends and, | |
| where applicable, capital gain distributions.The Morgan Stanley Capital | ||
| International Europe,Australasia, Far East (MSCI EAFE) Index is an | ||
| unmanaged index composed of a sample of companies representative of the | ||
| market structure of European and Pacific Basin countries. |
| 16 |
| FUND PERFORMANCE |
| Average Annual Total Returns as of 8/31/05 | ||||||||
| Inception | From | |||||||
| Date | 1 Year | 5 Years | Inception | |||||
| Class M shares | 7/15/98 | 19.51% | 6.58% | 6.07% | ||||
| Investor shares | 7/11/01 | 19.24% | — | 10.21% |
| † Source: Lipper Inc. |
| Past performance is not predictive of future performance.The fund’s performance shown in the graph and table does not reflect the deduction of taxes that a shareholder |
| would pay on fund distributions or the redemption of fund shares. |
| The above graph compares a $10,000 investment made in Class M shares of Mellon International Fund on 7/15/98 (inception date) to a $10,000 investment |
| made in the Morgan Stanley Capital International Europe,Australasia, Far East Index (the “Index”) on that date. For comparative purposes, the value of the Index |
| on 6/30/98 is used as the beginning value on 7/15/98. All dividends and capital gain distributions are reinvested. |
| Before the fund commenced operations, substantially all of the assets of a predecessor common trust fund (CTF) that, in all material respects, had the same investment |
| objective, policies, guidelines and restrictions as the fund (and those of another CTF) were transferred to the fund. Please note that the performance of the fund’s Class |
| M shares represents the performance of the predecessor CTF through October 1, 2000, adjusted to reflect the fund’s fees and expenses, by subtracting from the actual |
| performance of the CTF the expenses of the fund’s Class M shares as they were estimated prior to the conversion of the CTF into the fund, and the performance of |
| the fund’s Class M shares thereafter.The predecessor CTF was not registered under the Investment Company Act of 1940, as amended, and therefore was not subject |
| to certain investment restrictions that might have adversely affected performance. In addition, the expenses of the fund’s Class M shares may be higher than those |
| estimated prior to the conversion of the CTF into the fund, which would lower the performance shown in the above line graph. |
| Effective July 11, 2001, existing fund shares were designated as Class M shares and the fund began offering a second class of shares designated as Investor shares, |
| which are subject to a Shareholder Services Plan. Performance for Investor shares will vary from the performance of Class M shares shown above because of the |
| differences in charges and expenses. |
| The fund’s performance shown in the line graph takes into account all applicable fees and expenses for Class M shares only.The Index is a free float-adjusted market |
| capitalization index that is designed to measure developed market equity performance, excluding the U.S. and Canada.The Index consists of 21 MSCI developed |
| market country indices.The Index does not take into account charges, fees and other expenses. Further information relating to fund performance, including expense |
| reimbursements, if applicable, is contained in the Financial Highlights section of the prospectus and elsewhere in this report. |
The Funds 17

| DISCUSSION OF |
| FUND PERFORMANCE |
| D. Kirk Henry and Remi J. Browne, |
| Portfolio Managers |
| How did Mellon Emerging Markets Fund perform |
| relative to its benchmark? |
For the 12-month period ended August 31, 2005, the fund’s Class M shares produced a total return of 36.62%, and the fund’s Investor shares produced a total return of 36.26% .1 In comparison, the Morgan Stanley Capital International Emerging Markets Index (“MSCI EM Index”), the fund’s benchmark, provided a total return of 42.40% for the same period.2
Companies in the emerging markets benefited during the reporting period from ongoing global economic growth and higher prices for many exports, especially natural resources.The fund’s returns trailed the benchmark, mostly due to its limited exposure to Mexican stocks trading at what we believed were relatively high valuations. In addition, the fund’s stock selection in information technology and telecommunications services also detracted from its relative performance.
On a separate note, effective June 30, 2005, Remi J. Browne, CFA, became a co-primary portfolio manager of the fund and is responsible for the portion of the fund’s portfolio that is managed in accordance with the core investment style.
What is the fund’s investment approach?
The fund seeks long-term capital growth.To pursue its goal, the fund invests at least 80% of its assets in equity securities of companies organized, or with a majority of assets or operations, in countries considered to be emerging markets.
Since June 30, 2005, the fund generally invests most of its cash inflows (purchases of fund shares and reinvested distributions) in accordance with a core investment style under the direction of the fund’s co-primary portfolio manager, Remi J. Browne.The fund’s portfolio as of June 30, 2005, will continue to be managed in accordance with the value-oriented investment style under the
direction of the fund’s other co-primary portfolio manager, D. Kirk Henry. The allocation of cash inflows and outflows will be at the discretion of the investment adviser depending on the circumstances; however, under normal circumstances, generally between 90% to 100% of cash inflows will be allocated to the core investment style.We believe that by implementing a core investment style with respect to such assets,the fund may take advantage of investment opportunities in emerging markets that may not fall within the value-oriented investment style previously employed for the fund’s entire portfolio.
Pursuant to the core investment style, under normal circumstances, at least 80% of the fund’s cash inflows allocated to this style are invested in equity securities of companies located in the foreign countries represented in the MSCI EM Index.
The fund will continue to invest in stocks that appear to be undervalued (as measured by their price/earnings ratios), but stocks purchased pursuant to the core investment style may have value and/or growth characteristics. The core investment style portfolio manager employs a bottom-up investment approach which emphasizes individual stock selection.The core investment style stock selection process is designed to produce a diversified portfolio that, relative to the MSCI EM Index, has a below-average price/earnings ratio and an above-average earnings growth trend.
When choosing stocks for the portion of the fund using value-oriented investment style, we use a research-driven and risk-adverse approach.We identify potential investments through extensive quantitative and fundamental research. Emphasizing individual stock selection rather than economic and industry trends, we focus on three key factors: value, business health and business momentum.
What other factors influenced the fund’s performance?
We attribute the emerging markets’ strong performance during the reporting period primarily to the
| 18 |
effects of a strengthening global economy. The emerging markets — which are rich in oil, iron and other natural resources — benefited from rising global demand for industrial and construction materials. In addition, many companies in the emerging markets benefited from stronger domestic economies. Finally, with interest rates at low levels in the United States, Japan and most of Europe, international investors were attracted by the higher potential returns offered by the emerging markets.
The fund achieved good results from its holdings in Russia, where oil exporter LUKOIL posted especially strong gains.While the company performed well due to rising oil and gas prices, it also cut costs, boosting earnings further. A number of holdings in South Africa contributed positively to the fund’s performance. A strong local currency and low inflation enabled the country’s central bank to reduce interest rates. At the same time, the South African government implemented programs to boost employment and consumer spending. These factors helped fuel gains in bank holding company Nedbank Group (formerly Nedcor),furniture producer Steinhoff International Holdings, energy producer Sasol, metals and mining firm Impala Platinum and diversified industrial conglomerate Bidvest Group.
The fund also achieved attractive returns from its holdings in South Korea, one of the fund’s largest areas of investment and a market that has been out of favor with investors for some time now. Korea Electric Power benefited from solid electricity demand and a strong local currency, which helped offset the effects of higher prices for raw materials.
On the other hand, the fund’s relative performance was hindered by its lack of exposure to two Mexican firms that are part of the MSCI EM Index but which we believed were too richly valued to meet our investment criteria. Certain textile exporters in Brazil also undermined the fund’s returns, as did South African paper companies, where earnings growth has been slow. Finally, returns from the fund’s holdings in semiconductor and contract manufacturers in Taiwan proved to be disappointing.
What is the fund’s current strategy?
As of the end of the reporting period, we have trimmed positions that have reached our price targets, locking in their gains. In our view, many stocks in today’s emerging markets have become more fully valued. In investment environments such as these, patience and discipline are central to our strategy of seeking high-quality companies that may have been overlooked by the market. However, our longer-term outlook for stocks in the emerging markets remains positive, and we expect our quantitative and fundamental analyses to help us identify new opportunities as they arise.
| September 15, 2005 |
| 1 | Total return includes reinvestment of dividends and any capital gains paid. | |
| Past performance is no guarantee of future results. Share price and | ||
| investment return fluctuate such that upon redemption, fund shares may be | ||
| worth more or less than their original cost. | ||
| 2 | SOURCE: LIPPER INC. — Reflects reinvestment of gross dividends | |
| and, where applicable, capital gain distributions.The Morgan Stanley | ||
| Capital International Emerging Markets (MSCI EM) Index is a market | ||
| capitalization-weighted index composed of companies representative of the | ||
| market structure of 26 emerging market countries in Europe, Latin America | ||
| and the Pacific Basin. |
| The Funds 19 |
| FUND PERFORMANCE |

| Average Annual Total Returns as of 8/31/05 | ||||||||
| Inception | From | |||||||
| Date | 1 Year | Inception | ||||||
| Class M shares | 10/2/00 | 36.62% | 17.13% | |||||
| Investor shares | 7/11/01 | 36.26% | 21.19% |
| † Source: Lipper Inc. |
| Past performance is not predictive of future performance.The fund’s performance shown in the graph and table does not reflect the deduction of taxes that a shareholder |
| would pay on fund distributions or the redemption of fund shares. |
| The above graph compares a $10,000 investment made in Class M shares of Mellon Emerging Markets Fund on 10/2/00 (inception date) to a $10,000 |
| investment made in the Morgan Stanley Capital International Emerging Markets Index (the “Index”) on that date. For comparative purposes, the value of the Index |
| on 9/30/00 is used as the beginning value on 10/2/00. All dividends and capital gain distributions are reinvested. |
| Effective July 11, 2001, existing fund shares were designated as Class M shares and the fund began offering a second class of shares designated as Investor shares, |
| which are subject to a Shareholder Services Plan. Performance for Investor shares will vary from the performance of Class M shares shown above because of the |
| differences in charges and expenses. |
| The fund’s performance shown in the line graph takes into account all applicable fees and expenses for Class M shares only.The Index is a market capitalization- |
| weighted index composed of companies representative of the market structure of 26 emerging market countries in Europe, Latin America and the Pacific Basin.The |
| Index excludes closed markets and those shares in otherwise free markets, which are not purchasable by foreigners.The Index includes gross dividends reinvested and |
| does not take into account charges, fees and other expenses.These factors can contribute to the Index potentially outperforming the fund. Further information relating to |
| fund performance, including expense reimbursements, if applicable, is contained in the Financial Highlights section of the prospectus and elsewhere in this report. |
| 20 |
| DISCUSSION OF |
| FUND PERFORMANCE |
| Michael D. Weiner and Lawrence R. Dunn, |
| Portfolio Managers |
| How did Mellon Balanced Fund perform relative |
| to its benchmark? |
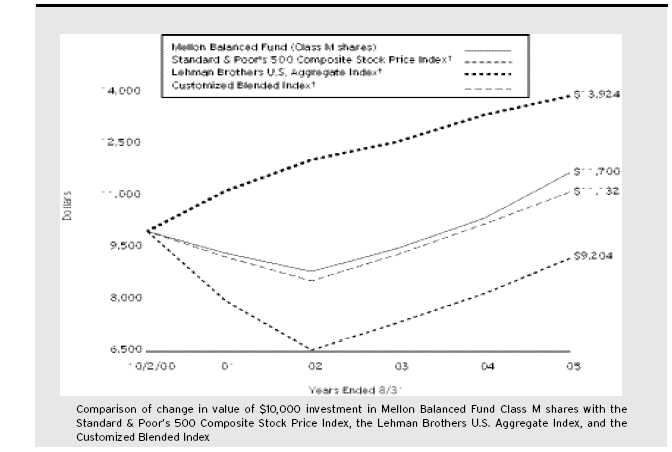
For the 12-month period ended August 31, 2005, the fund’s Class M shares produced a total return of 12.78% while its Investor shares produced a total return of 12.56% .1 In comparison, the fund’s benchmark, a blended index composed of 60% Standard & Poor’s 500 Composite Stock Price Index (“S&P 500 Index”) and 40% Lehman Brothers U.S. Aggregate Index, produced a 9.19% total return for the same period.2 Separately, the S&P 500 Index and the Lehman Brothers U.S. Aggregate Index produced total returns of 12.55% and 4.15%, respectively, for the same period.
We attribute these results to the effects of a growing economy and rising corporate earnings on the stock market, and to support provided by low inflation and robust overseas demand in the bond market.The fund produced higher returns than its benchmark, primarily due to the success of our stock selection strategy in the energy, consumer discretionary and industrial sectors.
On a separate note, Michael D. Weiner became the fund’s co-portfolio manager on December 31, 2004, with respect to its equity investments.
What is the fund’s investment approach?
The fund seeks long-term growth of principal in conjunction with current income.To pursue its goal, the fund may invest in equity securities, income-producing bonds, Mellon Small Cap Stock Fund, Mellon Mid Cap Stock Fund, Mellon International Fund and Mellon Emerging Markets Fund.The fund has established target allocations for its assets of 60% in the aggregate to equity securities and 40% to bonds and money market instruments. The fund may deviate from these targets within ranges of 15% above or below the target amount. The fund’s investments in each of Mellon Small Cap Stock Fund, Mellon Mid Cap Stock Fund, Mellon International Fund and
Mellon Emerging Markets Fund are subject to a separate limit of 20% of the fund’s total assets, as is the fund’s investment in money market instruments.
With respect to the equity portion of the fund’s portfolio, individual stocks are chosen through a computer model, fundamental analysis and risk management. Our computer model identifies and ranks stocks within each industry or sector, based on a variety of criteria.A team of experienced analysts then examines the fundamentals of the higher-ranked candidates. Finally, the portfolio managers decide which stocks to purchase or sell.The equity portion of the fund’s portfolio is structured so that its allocations of assets to economic sectors are similar to those of the S&P 500 Index.
With respect to the fixed-income portion of the fund’s portfolio, the fund’s investments in debt securities must be of investment-grade quality at the time of purchase or, if unrated, deemed of comparable quality by the investment adviser. Generally, the fund’s average effective portfolio duration of bonds will not exceed eight years. We choose debt securities based on their yields, credit quality, the level of interest rates and inflation, general economic and financial trends and our outlook for the securities markets.
What other factors influenced the fund’s performance?
Stocks and longer-term bonds fared relatively well during the reporting period. Stocks prices were driven higher by improving investor sentiment in a moderately expanding economy. Contrary to historical norms, bonds maintained most of their value despite the potentially eroding effects of rising short-term interest rates.
Energy stocks represented a significant driver of the fund’s relative performance, with strong returns from integrated oil and gas companies and independent exploration and production companies. In the consumer discretionary sector, returns proved particularly strong among media holdings, such as The Walt Disney Company; specialty retailers, such as Chico’s FAS; and
| The Funds 21 |
DISCUSSION OF FUND PERFORMANCE (continued)
multiline retailers, such as Nordstrom and Target. The fund’s holdings in construction machinery maker Caterpillar, climate control and industrial machinery company Ingersoll-Rand and electrical component manufacturer ITT Industries also helped the fund’s performance.
On the other hand, health care stocks produced mixed results as gains among certain insurers and biotechnology firms were offset by relatively weak returns from pharmaceutical giants Pfizer and Merck, medical device maker Boston Scientific and insurer AIG.The fund’s results in the technology and financials sectors also trailed the benchmark slightly, as the fund did not invest in several of the companies that produced the greatest gains in the benchmark.
In the fund’s bond portfolio, a relatively defensive duration posture constrained results when longer-term bond yields remained surprisingly stable while shorter-term yields climbed. The fund’s mix of fixed-income securities roughly matched that of the benchmark.Within the fund’s corporate bond portfolio, however, our sector allocation strategy helped boost relative performance. We focused primarily on bonds from the media, finance, basic materials and telecommunications industries, and we maintained relatively light exposure to the troubled automotive sector.
What is the fund’s current strategy?
Among stocks, we have focused on what we believe are high-quality companies with sound business fundamentals, strong cash flows and good earnings prospects.The fund currently maintains slightly greater exposure than the benchmark to energy stocks, where commodity prices appear likely to remain high, and slightly less exposure to financial companies that tend to be sensitive to rising interest rates. With further interest-rate hikes expected, we have continued to maintain a relatively cautious fixed-income investment posture, including a short average duration and a sector-neutral asset mix.
| September 15, 2005 |
| 1 | Total return includes reinvestment of dividends and any capital gains paid. | |
| Past performance is no guarantee of future results. Share price and investment | ||
| return fluctuate such that upon redemption, fund shares may be worth more or | ||
| less than their original cost. | ||
| 2 | SOURCE: LIPPER INC. — Reflects reinvestment of dividends and, where | |
| applicable, capital gain distributions.The Standard & Poor’s 500 Composite | ||
| Stock Price Index is a widely accepted, unmanaged index of U.S. stock market | ||
| performance.The Lehman Brothers U.S. Aggregate Index is a widely accepted, | ||
| unmanaged total return index of corporate, U.S. government and U.S. | ||
| government agency debt instruments, mortgage-backed securities and asset- | ||
| backed securities with an average maturity of 1-10 years. |
| 22 |
| FUND PERFORMANCE |
| Average Annual Total Returns as of 8/31/05 | ||||||||
| Inception | From | |||||||
| Date | 1 Year | Inception | ||||||
| Class M shares | 10/2/00 | 12.78% | 3.25% | |||||
| Investor shares | 7/11/01 | 12.55% | 5.08% |
† Source: Lipper Inc.
Past performance is not predictive of future performance.The fund’s performance shown in the graph and table does not reflect the deduction of taxes that a shareholder would pay on fund distributions or the redemption of fund shares.
The above graph compares a $10,000 investment made in Class M shares of Mellon Balanced Fund on 10/2/00 (inception date) to a $10,000 investment made in three different indices: (1) the Standard & Poor’s 500 Composite Stock Price Index (the “S&P 500 Index”), (2) the Lehman Brothers U.S.Aggregate Index (the “Lehman Index”) and (3) the Customized Blended Index on that date.The Customized Blended Index is calculated on a year-to-year basis. For comparative purposes, the value of each index on 9/30/00 is used as the beginning value on 10/2/00.All dividends and capital gain distributions are reinvested.
Effective July 11, 2001, existing fund shares were designated as Class M shares and the fund began offering a second class of shares designated as Investor shares, which are subject to a Shareholder Services Plan. Performance for Investor shares will vary from the performance of Class M shares shown above because of the differences in charges and expenses.
The fund’s performance shown in the line graph takes into account all applicable fees and expenses for Class M shares only.The S&P 500 Index is a widely accepted, unmanaged index of U.S. stock market performance.The Lehman Index is a widely accepted, unmanaged index of corporate, government and government agency debt instruments, mortgage-backed securities and asset-backed securities with an average maturity of 1-10 years.The indices do not take into account charges, fees and other expenses.The Customized Blended Index is composed of the S&P 500 Index, 60%, and the Lehman Index, 40%. Further information relating to fund performance, including expense reimbursements, if applicable, is contained in the Financial Highlights section of the prospectus and elsewhere in this report.
The Funds 23
UNDERSTANDING YOUR FUND’ S EXPENSES (Unaudited)
As a mutual fund investor, you pay ongoing expenses, such as management fees and other expenses. Using the information below, you can estimate how these expenses affect your investment and compare them with the expenses of other funds.You also may pay one-time transaction expenses, including sales charges (loads) and redemptions fees, which are not shown in this section and would have resulted in higher total expenses. For more information, see your fund’s prospectus or talk to your financial adviser.
Review your fund’s expenses
The table below shows the expenses you would have paid on a $1,000 investment in each class of each Mellon equity fund from March 1, 2005 to August 31, 2005. It also shows how much a $1,000 investment would be worth at the close of the period, assuming actual returns and expenses.
| Expenses and Value of a $1,000 Investment | ||||||||
| assuming actual returns for the six months ended August 31, 2005 | ||||||||
| Dreyfus | ||||||||
| Class M Shares | Investor Shares | Premier Shares | ||||||
| Mellon Large Cap Stock Fund | ||||||||
| Expenses paid per $1,000 † | $ 4.09 | $ 5.37 | — | |||||
| Ending value (after expenses) | $1,028.30 | $1,028.00 | — | |||||
| Mellon Income Stock Fund | ||||||||
| Expenses paid per $1,000 † | $ 4.19 | $ 5.46 | — | |||||
| Ending value (after expenses) | $1,026.40 | $1,025.00 | — | |||||
| Mellon Mid Cap Stock Fund | ||||||||
| Expenses paid per $1,000 † | $ 4.74 | $ 6.11 | $ 10.04 | |||||
| Ending value (after expenses) | $1,091.40 | $1,089.50 | $1,084.90 | |||||
| Mellon Small Cap Stock Fund | ||||||||
| Expenses paid per $1,000 † | $ 5.11 | $ 6.37 | — | |||||
| Ending value (after expenses) | $1,007.60 | $1,005.90 | — | |||||
| Mellon International Fund | ||||||||
| Expenses paid per $1,000 † | $ 5.51 | $ 6.77 | — | |||||
| Ending value (after expenses) | $1,004.30 | $1,003.00 | — | |||||
| Mellon Emerging Markets Fund | ||||||||
| Expenses paid per $1,000 † | $ 7.73 | $ 8.96 | — | |||||
| Ending value (after expenses) | $1,044.20 | $1,043.00 | — | |||||
| Mellon Balanced Fund | ||||||||
| Expenses paid per $1,000 † | $ 3.02 | $ 4.34 | — | |||||
| Ending value (after expenses) | $1,028.90 | $1,027.60 | — | |||||
† Expenses are equal to the Mellon Large Cap Stock Fund’s annualized expense ratio of .80% for Class M and 1.05% for Investor Shares, Mellon Income Stock Fund ..82% for Class M and 1.07% for Investor Shares, Mellon Mid Cap Stock Fund .90% for Class M, 1.16% for Investor Shares and 1.91% for Dreyfus Premier Shares, Mellon Small Cap Stock Fund 1.01% for Class M and 1.26% for Investor Shares, Mellon International Fund 1.09% for Class M and 1.34% for Investor Shares, Mellon Emerging Markets Fund 1.50% for Class M and 1.74% for Investor Shares and Mellon Balanced Fund .59% for Class M and .85% for Investor Shares, multiplied by the respective fund's average account value over the period, multiplied by 184/365 (to reflect the one-half year period).
| 24 |
COMPARING YOUR FUND’ S EXPENSES WITH THOSE OF OTHER FUNDS (Unaudited)
| Using the SEC’s method to compare expenses |
The Securities and Exchange Commission (SEC) has established guidelines to help investores assess fund expenses. Per these guidelines, the table below shows your fund’s expenses based on a $1,000 investment, assuming a hypothetical 5% annualized return.You can use this information to compare the ongoing expenses (but not transaction expenses or total cost) of investing in the fund with those of other funds.All mutual fund shareholder reports will provide this information to help you make this comparison. Please note that you cannot use this information to estimate your actual ending account balance and expenses paid during the period.
| Expenses and Value of a $1,000 Investment | ||||||||||||
| assuming a hypothetical 5% annualized return for the six months ended August 31, 2005 | ||||||||||||
| Dreyfus | ||||||||||||
| Class M Shares | Investor Shares | Premier Shares | ||||||||||
| Mellon Large Cap Stock Fund | ||||||||||||
| Expenses paid per $1,000 † | $ 4.08 | $ 5.35 | — | |||||||||
| Ending value (after expenses) | $1,021.17 | $1,019.91 | — | |||||||||
| Mellon Income Stock Fund | ||||||||||||
| Expenses paid per $1,000 † | $ 4.18 | $ 5.45 | — | |||||||||
| Ending value (after expenses) | $1,021.07 | $1,019.81 | — | |||||||||
| Mellon Mid Cap Stock Fund | ||||||||||||
| Expenses paid per $1,000 † | $4.58 | $ 5.90 | $ 9.70 | |||||||||
| Ending value (after expenses) | $1,020.67 | $1,019.36 | $1,015.58 | |||||||||
| Mellon Small Cap Stock Fund | ||||||||||||
| Expenses paid per $1,000 † | $ 5.14 | $ 6.41 | — | |||||||||
| Ending value (after expenses) | $1,020.11 | $1,018.85 | — | |||||||||
| Mellon International Fund | ||||||||||||
| Expenses paid per $1,000 † | $ 5.55 | $ 6.82 | — | |||||||||
| Ending value (after expenses) | $1,019.71 | $1,018.45 | — | |||||||||
| Mellon Emerging Markets Fund | ||||||||||||
| Expenses paid per $1,000 † | $ 7.63 | $ 8.84 | — | |||||||||
| Ending value (after expenses) | $1,017.64 | $1,016.43 | — | |||||||||
| Mellon Balanced Fund | ||||||||||||
| Expenses paid per $1,000 † | $ 3.01 | $ 4.33 | — | |||||||||
| Ending value (after expenses) | $1,022.23 | $1,020.92 | — | |||||||||
† Expenses are equal to the Mellon Large Cap Stock Fund’s annualized expense ratio of .80% for Class M and 1.05% for Investor Shares, Mellon Income Stock Fund ..82% for Class M and 1.07% for Investor Shares, Mellon Mid Cap Stock Fund .90% for Class M, 1.16% for Investor Shares and 1.91% for Dreyfus Premier Shares, Mellon Small Cap Stock Fund 1.01% for Class M and 1.26% for Investor Shares, Mellon International Fund 1.09% for Class M and 1.34% for Investor Shares, Mellon Emerging Markets Fund 1.50% for Class M and 1.74% for Investor Shares and Mellon Balanced Fund .59% for Class M and .85% for Investor Shares, multiplied by the respective fund's average account value over the period, multiplied by 184/365 (to reflect the one-half year period).
| The Funds 25 |
| STATEMENT OF INVESTMENTS | ||||||||||
| August 31, 2005 | ||||||||||
| Mellon Large Cap Stock Fund | ||||||||||
| Common Stocks—96.9% | Shares | Value ($) | Shares | Value ($) | ||||||
| Capital Goods—.1% | Energy (continued) | |||||||||
| Goodrich | 54,650 | 2,504,063 | Devon Energy | 232,712 | 14,141,908 | |||||
| Consumer Cyclical—9.1% | Exxon Mobil | 868,780 | 52,039,922 | |||||||
| Aeropostale | 191,400 a | 4,888,356 | Occidental Petroleum | 276,110 | 22,925,413 | |||||
| Bed Bath & Beyond | 246,800 a | 10,007,740 | Suncor Energy | 198,980 b | 11,791,555 | |||||
| Chico’s FAS | 278,530 a | 9,667,776 | XTO Energy | 400,920 | 15,956,616 | |||||
| Coach | 152,600 a | 5,064,794 | 176,634,990 | |||||||
| Coldwater Creek | 154,940 a | 4,748,911 | Health Care—13.2% | |||||||
| Harrah’s Entertainment | 116,100 | 8,075,916 | Abbott Laboratories | 378,880 | 17,098,854 | |||||
| Home Depot | 172,740 | 6,964,877 | Aetna | 155,380 | 12,379,124 | |||||
| McDonald’s | 310,060 | 10,061,447 | Amgen | 343,710 a | 27,462,429 | |||||
| Nordstrom | 432,800 | 14,533,424 | Boston Scientific | 618,320 a | 16,620,442 | |||||
| Starbucks | 302,730 a | 14,845,879 | Fisher Scientific International | 105,400 a | 6,796,192 | |||||
| Starwood Hotels & Resorts Worldwide | 221,200 | 12,895,960 | Johnson & Johnson | 364,690 | 23,117,699 | |||||
| Target | 234,950 | 12,628,563 | Kinetic Concepts | 103,700 a | 5,682,760 | |||||
| Wal-Mart Stores | 495,884 | 22,294,945 | Medtronic | 291,900 | 16,638,300 | |||||
| Walgreen | 391,300 | 18,128,929 | Novartis, ADR | 238,400 | 11,622,000 | |||||
| Yum! Brands | 66,480 | 3,149,822 | Pfizer | 1,442,146 | 36,731,459 | |||||
| 157,957,339 | Sanofi-Synthelabo, ADR | 197,600 | 8,449,376 | |||||||
| Consumer Staples—7.3% | UnitedHealth Group | 598,640 | 30,829,960 | |||||||
| ACCO Brands | 24,702 a | 644,722 | Wyeth | 345,138 | 15,803,869 | |||||
| Altria Group | 306,510 | 21,670,257 | 229,232,464 | |||||||
| Archer-Daniels-Midland | 324,580 | 7,306,296 | Interest Sensitive—20.2% | |||||||
| Coca-Cola | 163,140 | 7,178,160 | Allstate | 186,640 | 10,491,034 | |||||
| Fortune Brands | 105,110 | 9,142,468 | American Express | 268,590 | 14,836,912 | |||||
| General Mills | 134,840 | 6,218,821 | American International Group | 484,920 | 28,707,264 | |||||
| Gillette | 217,880 | 11,737,195 | Bear Stearns Cos. | 79,960 | 8,035,980 | |||||
| Kimberly-Clark | 141,020 | 8,788,366 | Capital One Financial | 142,370 | 11,708,509 | |||||
| PepsiCo | 418,817 | 22,972,112 | Citigroup | 591,239 | 25,878,531 | |||||
| Procter & Gamble | 472,510 | 26,214,855 | Commerce Bancorp | 138,800 b | 4,680,336 | |||||
| Sysco | 138,220 | 4,613,784 | Fannie Mae | 193,240 | 9,862,970 | |||||
| 126,487,036 | Freddie Mac | 251,630 | 15,193,419 | |||||||
| Energy—10.2% | General Electric | 1,281,266 | 43,063,350 | |||||||
| Amerada Hess | 129,030 b | 16,399,713 | Goldman Sachs Group | 167,010 | 18,568,172 | |||||
| Apache | 214,290 b | 15,347,450 | JPMorgan Chase & Co. | 958,536 | 32,484,785 | |||||
| ConocoPhillips | 425,120 | 28,032,413 | Lehman Brothers Holdings | 124,730 | 13,178,972 | |||||
| 26 |
| Mellon Large Cap Stock Fund (continued) | ||||||||||||
| Common Stocks (continued) | Shares | Value ($) | Shares | Value ($) | ||||||||
| Interest Sensitive (continued) | Services (continued) | |||||||||||
| MBNA | 389,650 | 9,819,180 | McGraw-Hill Cos. | 347,720 | 16,767,058 | |||||||
| Morgan Stanley | 156,900 | 7,981,503 | News, Cl. B | 917,240 b | 15,675,632 | |||||||
| PNC Financial Services Group | 184,500 | 10,374,435 | Sprint Nextel | 903,006 | 23,414,945 | |||||||
| Radian Group | 78,250 | 4,004,835 | Time Warner | 902,580 | 16,174,234 | |||||||
| RenaissanceRe Holdings | 103,100 | 4,671,461 | 89,548,122 | |||||||||
| Simon Property Group | 138,100 | b | 10,505,267 | Technology—16.4% | ||||||||
| St. Paul Travelers Cos. | 495,150 | 21,296,401 | Amdocs | 324,090 a | 9,512,042 | |||||||
| US Bancorp | 449,269 | 13,127,640 | Apple Computer | 146,000 a | 6,851,780 | |||||||
| Wachovia | 176,380 | 8,751,976 | Cisco Systems | 1,599,934 a | 28,190,837 | |||||||
| Wells Fargo & Co. | 389,240 | 23,206,489 | Corning | 427,600 a | 8,534,896 | |||||||
| 350,429,421 | Danaher | 232,400 | 12,447,344 | |||||||||
| Producer Goods—10.5% | Dell | 693,522 a | 24,689,383 | |||||||||
| Air Products & Chemicals | 184,120 | 10,200,248 | eBay | 516,020 a | 20,893,650 | |||||||
| Caterpillar | 262,200 | 14,549,478 | Electronic Arts | 120,600 a | 6,907,968 | |||||||
| Companhia Vale do Rio Doce, ADR | 261,990 | 9,009,836 | EMC | 814,840 a | 10,478,842 | |||||||
| Cooper Industries, Cl. A | 105,700 | 7,022,708 | Google, Cl. A | 32,000 | 9,152,000 | |||||||
| DR Horton | 243,400 | 8,986,328 | Intel | 1,101,078 | 28,319,726 | |||||||
| Freeport-McMoRan Copper & Gold, Cl. B | 336,980 | 14,210,447 | International Business Machines | 90,470 | 7,293,691 | |||||||
| General Dynamics | 79,550 | 9,115,634 | Linear Technology | 286,190 | 10,855,187 | |||||||
| Honeywell International | 298,510 | 11,426,963 | Marvell Technology Group | 144,200 a | 6,804,798 | |||||||
| Inco | 322,990 | 13,672,167 | Microsoft | 2,153,446 | 59,004,420 | |||||||
| Ingersoll-Rand, Cl. A | 115,600 | 9,204,072 | QUALCOMM | 525,260 | 20,858,075 | |||||||
| ITT Industries | 82,120 | 8,960,934 | Symantec | 687,660 a,b | 14,427,107 | |||||||
| L-3 Communications Holdings | 91,200 | 7,467,456 | 285,221,746 | |||||||||
| Pentair | 208,560 | 8,233,949 | Utilities—4.4% | |||||||||
| PPG Industries | 147,560 | 9,293,329 | Ameren | 101,700 | 5,586,381 | |||||||
| 3M | 140,170 | 9,973,095 | Constellation Energy Group | 204,710 | 12,026,713 | |||||||
| Tyco International | 506,330 | 14,091,164 | Entergy | 136,640 | 10,235,702 | |||||||
| United Technologies | 333,940 | 16,697,000 | Exelon | 333,840 | 17,990,638 | |||||||
| 182,114,808 | PPL | 334,940 | 10,704,682 | |||||||||
| Retail—.4% | SBC Communications | 377,409 b | 9,088,009 | |||||||||
| Best Buy | 162,400 | 7,739,984 | Telefonos de Mexico, ADR | 549,820 | 10,556,544 | |||||||
| Services—5.1% | 76,188,669 | |||||||||||
| Allied Waste Industries | 526,400 | a | 4,200,672 | Total Common Stocks | ||||||||
| Cendant | 654,650 | 13,315,581 | (cost $1,206,019,912) | 1,684,058,642 | ||||||||
| The Funds 27 |
| STATEMENT OF INVESTMENTS (continued) |
| Mellon Large Cap Stock Fund (continued) | ||||||||||
| Principal | Investment of Cash Collateral | |||||||||
| Short-Term Investment—2.9% | Amount ($) | Value ($) | for Securities Loaned—2.3% | Shares | Value ($) | |||||
| Repurchase Agreement; | Registered Investment Company; | |||||||||
| Salomon Smith Barney, | Dreyfus Institutional Cash | |||||||||
| 3.60%, dated 8/31/2005, | Advantage Plus Fund | |||||||||
| due 9/1/2005, in the amount | (cost $39,543,268) | 39,543,268c | 39,543,268 | |||||||
| of $50,715,071 (fully | ||||||||||
| collateralized by $51,556,000 | Total Investments | |||||||||
| Federal Home Loan Mortgage Corp., | (cost $1,296,273,180) | 102.1% | 1,774,311,910 | |||||||
| Notes, 4.75%, 8/9/2010, | Liabilities, Less Cash and Receivables | (2.1%) | (36,795,588) | |||||||
| value $51,724,731) | ||||||||||
| (cost $50,710,000) | 50,710,000 | 50,710,000 | Net Assets | 100.0% | 1,737,516,322 | |||||
| ADR—American Depository Receipts. |
| a Non-income producing. |
| b All or a portion of these securities are on loan. At August 31, 2005, the total market value of the fund’s securities on loan is $44,570,928 and the total market value of the |
| collateral held by the fund is $45,408,768, consisting of cash collateral of $39,543,268 and U.S. Government and agency securities valued at $5,865,500. |
| c Investment in affiliated money market mutual fund. |
| Portfolio Summary (Unaudited) † | ||||||
| Value (%) | Value (%) | |||||
| Interest Sensitive | 20.2 | Consumer Cyclical | 9.1 | |||
| Technology | 16.4 | Consumer Staples | 7.3 | |||
| Health Care | 13.2 | Short-Term/Money Market Investments | 5.2 | |||
| Producer Goods | 10.5 | Other | 10.0 | |||
| Energy | 10.2 | 102.1 | ||||
| † Based on net assets. | ||||||
| See notes to financial statements. | ||||||
| 28 |
| STATEMENT OF INVESTMENTS | ||||||||||
| August 31, 2005 | ||||||||||
| Mellon Income Stock Fund | ||||||||||
| Common Stocks—98.9% | Shares | Value ($) | Shares | Value ($) | ||||||
| Banking—10.1% | Energy (continued) | |||||||||
| AmSouth Bancorporation | 52,500 | 1,381,800 | Marathon Oil | 95,200 | 6,122,312 | |||||
| Bank of America | 276,140 | 11,882,304 | Occidental Petroleum | 64,110 | 5,323,053 | |||||
| Compass Bancshares | 49,200 | 2,303,052 | Sunoco | 90,580 | 6,585,166 | |||||
| JPMorgan Chase & Co. | 95,849 | 3,248,323 | 63,847,042 | |||||||
| North Fork Bancorporation | 80,400 | 2,210,196 | Entertainment—.5% | |||||||
| US Bancorp | 200,406 | 5,855,863 | Regal Entertainment Group, Cl. A | 103,200 a | 2,017,560 | |||||
| Wachovia | 125,820 | 6,243,188 | Health Care—6.5% | |||||||
| Wells Fargo & Co. | 117,100 | 6,981,502 | Abbott Laboratories | 117,900 | 5,320,827 | |||||
| 40,106,228 | Aetna | 49,040 | 3,907,017 | |||||||
| Consumer Cyclical—4.0% | Bristol-Myers Squibb | 91,600 | 2,241,452 | |||||||
| Dana | 108,530 | 1,460,814 | Eli Lilly & Co. | 69,760 | 3,838,195 | |||||
| Harrah’s Entertainment | 66,200 | 4,604,872 | Novartis, ADR | 28,270 | 1,378,163 | |||||
| JC Penney (Holding) | 34,600 | 1,682,598 | Pfizer | 200,168 | 5,098,279 | |||||
| Johnson Controls | 48,790 a | 2,926,424 | Wyeth | 87,789 | 4,019,858 | |||||
| Starwood Hotels & Resorts Worldwide | 50,000 | 2,915,000 | 25,803,791 | |||||||
| VF | 16,400 | 972,684 | Interest Sensitive—18.3% | |||||||
| Whole Foods Market | 10,700 | 1,383,082 | Allstate | 67,100 | 3,771,691 | |||||
| 15,945,474 | American International Group | 74,300 | 4,398,560 | |||||||
| Consumer Staples—7.7% | Arthur J. Gallagher & Co. | 83,300 | 2,379,048 | |||||||
| Altria Group | 136,690 | 9,663,983 | Block (H&R) | 142,940 | 3,852,233 | |||||
| Coca-Cola | 85,100 | 3,744,400 | Chubb | 22,290 | 1,938,339 | |||||
| Diageo, ADR | 34,800 | 2,008,308 | Citigroup | 296,055 | 12,958,327 | |||||
| Newell Rubbermaid | 81,000 | 1,897,830 | General Electric | 370,592 | 12,455,597 | |||||
| PepsiCo | 27,472 | 1,506,839 | Hartford Financial | |||||||
| Procter & Gamble | 55,820 | 3,096,894 | Services Group | 60,640 | 4,429,752 | |||||
| Reynolds American | 45,670 a | 3,833,540 | Mack-Cali Realty | 18,700 | 823,735 | |||||
| SUPERVALU | 50,100 | 1,743,480 | MBNA | 142,300 | 3,585,960 | |||||
| Tupperware | 132,300 | 2,900,016 | Mercury General | 29,600 a | 1,738,408 | |||||
| 30,395,290 | New York Community Bancorp | 115,600 a | 2,032,248 | |||||||
| Energy—16.1% | Plum Creek Timber | 148,970 | 5,474,648 | |||||||
| Chevron | 122,606 | 7,528,009 | Simon Property Group | 25,860 | 1,967,170 | |||||
| ConocoPhillips | 211,060 | 13,917,297 | St. Paul Travelers Cos. | 76,501 | 3,290,308 | |||||
| Exxon Mobil | 300,906 | 18,024,269 | Washington Mutual | 117,200 | 4,873,176 | |||||
| Halliburton | 58,600 | 3,631,442 | XL Capital, Cl. A | 38,400 | 2,668,800 | |||||
| Helmerich & Payne | 45,700 | 2,715,494 | 72,638,000 | |||||||
| The Funds 29 |
| STATEMENT OF INVESTMENTS (continued) |
| Mellon Income Stock Fund (continued) | ||||||||||
| Common Stocks (continued) | Shares | Value ($) | Shares | Value ($) | ||||||
| Producer Goods—7.8% | Services (continued) | |||||||||
| Air Products & Chemicals | 33,360 | 1,848,144 | Walt Disney | 63,470 | 1,598,809 | |||||
| Burlington Northern Santa Fe | 37,600 | 1,993,552 | 31,559,206 | |||||||
| General Dynamics | 27,300 | 3,128,307 | Technology—5.7% | |||||||
| Goodrich | 23,500 | 1,076,770 | Danaher | 32,940 | 1,764,266 | |||||
| Honeywell International | 80,200 | 3,070,056 | Hewlett-Packard | 208,430 | 5,786,017 | |||||
| Lincoln Electric Holdings | 33,300 | 1,254,744 | Intel | 62,726 | 1,613,313 | |||||
| Masco | 76,410 | 2,344,259 | International Business Machines | 47,336 | 3,816,228 | |||||
| Monsanto | 63,140 | 4,030,857 | Intersil, Cl. A | 100,000 | 2,100,000 | |||||
| Olin | 83,700 | 1,563,516 | Lucent Technologies (Warrants) | 2,788 b | 2,314 | |||||
| Raytheon | 38,200 | 1,498,204 | Microsoft | 112,300 | 3,077,020 | |||||
| Rockwell Automation | 80,700 | 4,199,628 | Nokia, ADR | 109,600 | 1,728,392 | |||||
| Sherwin-Williams | 30,710 | 1,423,716 | Pitney Bowes | 36,600 | 1,582,950 | |||||
| United Technologies | 67,696 | 3,384,800 | QUALCOMM | 24,200 | 960,982 | |||||
| 30,816,553 | 22,431,482 | |||||||||
| Securities & Asset | Utilities—11.5% | |||||||||
| Management—2.7% | Cinergy | 49,400 | 2,175,576 | |||||||
| Bear Stearns Cos. | 15,880 | 1,595,940 | Citizens Communications | 224,700 | 3,064,908 | |||||
| Lehman Brothers Holdings | 30,606 | 3,233,830 | Constellation Energy Group | 71,400 | 4,194,750 | |||||
| Merrill Lynch & Co. | 59,770 | 3,416,453 | Dominion Resources | 21,700 a | 1,659,616 | |||||
| T Rowe Price Group | 35,200 | 2,217,600 | Exelon | 108,640 | 5,854,609 | |||||
| 10,463,823 | NSTAR | 80,500 | 2,379,580 | |||||||
| Services—8.0% | PG&E | 140,000 | 5,252,800 | |||||||
| ALLTEL | 85,550 | 5,303,245 | PPL | 158,880 | 5,077,805 | |||||
| Automatic Data Processing | 98,700 | 4,219,425 | SBC Communications | 317,315 | 7,640,945 | |||||
| EW Scripps, Cl. A | 60,500 | 3,025,000 | Southern | 48,200 | 1,658,080 | |||||
| McGraw-Hill Cos. | 97,634 | 4,707,911 | Verizon Communications | 206,391 | 6,751,050 | |||||
| RR Donnelley & Sons | 115,280 | 4,306,861 | 45,709,719 | |||||||
| Sprint Nextel | 68,500 | 1,776,205 | Total Common Stocks | |||||||
| Vodafone Group, ADR | 243,000 | 6,621,750 | (cost $286,734,823) | 391,734,168 | ||||||
| 30 |
| Mellon Income Stock Fund (continued) | ||||||||||
| Principal | Investment of Cash Collateral | |||||||||
| Short-Term Investment—1.0% | Amount ($) | Value ($) | for Securities Loaned—1.9% | Shares | Value ($) | |||||
| Repurchase Agreement; | Registered Investment Company; | |||||||||
| Salomon Smith Barney, | Dreyfus Institutional Cash | |||||||||
| 3.60%, dated 8/31/2005, | Advantage Plus Fund | |||||||||
| due 9/1/2005 in the | (cost $7,600,890) | 7,600,890 c | 7,600,890 | |||||||
| amount of $3,930,393 | ||||||||||
| (fully collateralized by | Total Investments | |||||||||
| $3,996,000 Federal Home Loan | (cost $298,265,713) | 101.8% | 403,265,058 | |||||||
| Mortgage Corp., Notes, due | Liabilities, Less Cash and Receivables | (1.8%) | (7,195,163) | |||||||
| 8/9/2010 value, $4,009,078) | ||||||||||
| (cost $3,930,000) | 3,930,000 | 3,930,000 | Net Assets | 100.0% | 396,069,895 | |||||
| ADR—American Depository Receipts. | ||||||||||
| a All or a portion of these securities are on loan. At August 31, 2005, the total market value of the fund’s securities on loan is $9,432,269 and the total market value of the | ||||||||||
| collateral held by the fund is $9,607,890, consisting of cash collateral of $7,600,890 and U.S. Government and agency securities valued at $2,007,000. | ||||||||||
| b Non-income producing. | ||||||||||
| c Investment in affiliated money market mutual fund. | ||||||||||
| Portfolio Summary (Unaudited) † | ||||||
| Value (%) | Value (%) | |||||
| Interest Sensitive | 18.3 | Health Care | 6.5 | |||
| Energy | 16.1 | Technology | 5.7 | |||
| Utilities | 11.5 | Consumer Cyclical | 4.0 | |||
| Banking | 10.1 | Short-Term/Money Market Investments | 2.9 | |||
| Services | 8.0 | Other | 3.2 | |||
| Producer Goods | 7.8 | |||||
| Consumer Staples | 7.7 | 101.8 | ||||
| † Based on net assets. | ||||||
| See notes to financial statements. | ||||||
| The Funds 31 |
| STATEMENT OF INVESTMENTS | ||||||||||
| August 31, 2005 | ||||||||||
| Mellon Mid Cap Stock Fund | ||||||||||
| Common Stocks—99.2% | Shares | Value ($) | Shares | Value ($) | ||||||
| Building and Construction—.2% | Energy (continued) | |||||||||
| Chicago Bridge & Iron | Premcor | 116,500 c | 10,868,285 | |||||||
| (New York Shares) | 111,400 | 3,455,628 | Questar | 274,800 | 21,439,896 | |||||
| Consumer Cyclical—11.6% | Southwestern Energy | 224,400 a | 12,992,760 | |||||||
| Advance Auto Parts | 183,700 a | 11,192,841 | Ultra Petroleum | 178,800 a | 7,910,112 | |||||
| Aeropostale | 464,700 a | 11,868,438 | Weatherford International | 117,900 a | 7,983,009 | |||||
| ARAMARK, Cl. B | 284,300 b | 7,767,076 | Western Gas Resources | 280,600 | 13,468,800 | |||||
| BorgWarner | 142,240 | 8,315,351 | 161,667,690 | |||||||
| Chico’s FAS | 645,100 a | 22,391,421 | Finance—.4% | |||||||
| Coldwater Creek | 283,500 a | 8,689,275 | Refco | 219,800 a | 6,143,410 | |||||
| Dick’s Sporting Goods | 241,400 a | 7,637,896 | Health Care—12.5% | |||||||
| Genuine Parts | 181,800 | 8,330,076 | Coventry Health Care | 234,450 a | 18,756,000 | |||||
| Harman International Industries | 119,300 | 12,335,620 | DaVita | 127,100 a | 5,835,161 | |||||
| Hilton Hotels | 620,200 | 14,370,034 | DENTSPLY International | 169,600 | 8,983,712 | |||||
| Marvel Enterprises | 323,600 a | 6,229,300 | Fisher Scientific International | 151,400 a | 9,762,272 | |||||
| Nordstrom | 291,800 | 9,798,644 | Henry Schein | 238,800 a | 9,955,572 | |||||
| O’Reilly Automotive | 244,800 a | 6,749,136 | Invitrogen | 111,400 a,b | 9,438,922 | |||||
| Oshkosh Truck | 164,000 b | 6,578,040 | Kinetic Concepts | 172,500 a | 9,453,000 | |||||
| Outback Steakhouse | 249,300 | 10,373,373 | LifePoint Hospitals | 221,800 a | 10,087,464 | |||||
| PETCO Animal Supplies | 164,600 a | 3,640,952 | Omnicare | 303,800 | 15,964,690 | |||||
| PetSmart | 191,900 | 4,945,263 | PacifiCare Health Systems | 184,500 a | 13,907,610 | |||||
| Urban Outfitters | 209,200 a | 11,644,072 | PerkinElmer | 251,600 | 5,208,120 | |||||
| 172,856,808 | Perrigo | 426,000 | 6,104,580 | |||||||
| Consumer Staples—3.4% | Protein Design Labs | 349,700 a | 9,350,978 | |||||||
| Constellation Brands, Cl. A | 328,800 a | 9,048,576 | Sepracor | 203,800 a,b | 10,230,760 | |||||
| Loews—Carolina Group | 271,000 | 10,463,310 | Shire Pharmaceuticals Group, ADR | 277,400 | 10,574,488 | |||||
| McCormick & Co. | 211,500 | 7,171,965 | Sierra Health Services | 133,100 a,b | 8,957,630 | |||||
| Pepsi Bottling Group | 270,500 | 7,974,340 | Sybron Dental Specialties | 198,500 a | 7,695,845 | |||||
| Performance Food Group | 245,400 a,b | 7,600,038 | Vertex Pharmaceuticals | 291,600 a | 5,365,440 | |||||
| SUPERVALU | 1 | 35 | WellChoice | 153,300 a,b | 10,899,630 | |||||
| Tupperware | 374,900 | 8,217,808 | 186,531,874 | |||||||
| 50,476,072 | Insurance—.5% | |||||||||
| Energy—10.8% | Mercury General | 124,100 | 7,288,393 | |||||||
| Denbury Resources | 199,300 a | 9,014,339 | Interest Sensitive—16.2% | |||||||
| Diamond Offshore Drilling | 165,100 | 9,750,806 | AMB Property | 211,900 | 9,393,527 | |||||
| Energen | 200,100 | 7,667,832 | Ameritrade Holding | 601,400 a | 11,967,860 | |||||
| Grant Prideco | 484,300 a | 17,851,298 | Associated Banc-Corp | 377,558 | 12,285,737 | |||||
| National Oilwell Varco | 208,200 a | 13,368,522 | Bank of Hawaii | 209,500 | 10,632,125 | |||||
| Newfield Exploration | 278,960 a | 13,172,491 | Chicago Mercantile Exchange | 48,300 | 13,408,080 | |||||
| Noble Energy | 119,000 | 10,488,660 | Colonial BancGroup | 347,500 | 8,082,850 | |||||
| Plains Exploration & Production | 153,600 a | 5,690,880 | Comerica | 145,500 | 8,801,295 | |||||
| 32 |
| Mellon Mid Cap Stock Fund (continued) | ||||||||||
| Common Stocks (continued) | Shares | Value ($) | Shares | Value ($) | ||||||
| Interest Sensitive (continued) | Producer Goods (continued) | |||||||||
| Compass Bancshares | 259,700 | 12,156,557 | Precision Castparts | 157,700 | 15,246,436 | |||||
| Cullen/Frost Bankers | 182,200 | 8,904,114 | Sherwin-Williams | 127,700 | 5,920,172 | |||||
| Developers Diversified Realty | 207,240 b | 9,945,448 | Stanley Works | 144,700 | 6,620,025 | |||||
| Edwards (A.G.) | 258,600 | 11,691,306 | Toll Brothers | 292,600 a | 14,059,430 | |||||
| General Growth Properties | 204,900 | 9,238,941 | 233,582,711 | |||||||
| Jefferies Group | 229,900 b | 9,076,452 | Services—10.5% | |||||||
| La Quinta | 782,100 a | 6,608,745 | Allied Waste Industries | 905,800 a | 7,228,284 | |||||
| LaBranche & Co. | 247,900 a,b | 2,126,982 | CACI International, Cl. A | 134,000 a | 8,393,760 | |||||
| Lazard, Cl. A | 220,200 | 5,597,484 | ChoicePoint | 187,500 a | 8,049,375 | |||||
| Legg Mason | 203,495 | 21,271,332 | Cognizant Technology | |||||||
| MGIC Investment | 117,600 | 7,341,768 | Solutions, Cl. A | 368,500 a | 16,777,805 | |||||
| Nationwide Financial Services, Cl. A | 175,500 | 6,767,280 | Dun & Bradstreet | 143,300 a | 9,123,911 | |||||
| New York Community Bancorp | 549,600 b | 9,661,968 | Equifax | 155,700 | 5,144,328 | |||||
| Platinum Underwriters Holdings | 246,800 | 8,016,064 | EW Scripps, Cl. A | 166,000 | 8,300,000 | |||||
| Protective Life | 156,300 | 6,412,989 | FactSet Research Systems | 210,150 | 7,355,250 | |||||
| Radian Group | 276,346 | 14,143,388 | Fair Isaac | 242,550 | 9,913,018 | |||||
| Rayonier | 184,524 | 10,010,427 | Getty Images | 105,800 a,b | 9,055,422 | |||||
| Sunstone Hotel Investors | 306,160 | 7,745,848 | ITT Educational Services | 195,700 a,b | 9,949,388 | |||||
| 241,288,567 | Labor Ready | 287,000 a | 6,520,640 | |||||||
| Producer Goods—15.6% | Monster Worldwide | 241,700 a | 7,550,708 | |||||||
| Ashland | 148,400 | 9,021,236 | Nextel Partners, Cl. A | 495,100 a,b | 12,991,424 | |||||
| Bemis | 258,300 | 6,754,545 | Radio One, Cl. D | 560,600 a | 7,837,188 | |||||
| CH Robinson Worldwide | 230,900 | 14,258,075 | Republic Services | 359,120 | 13,010,918 | |||||
| Cooper Industries, Cl. A | 123,300 | 8,192,052 | Shaw Group | 489,000 a | 10,317,900 | |||||
| Cytec Industries | 224,000 | 10,662,400 | 157,519,319 | |||||||
| Dycom Industries | 120,000 a | 2,126,400 | Technology—12.2% | |||||||
| Freeport-McMoRan | Activision | 652,133 a | 14,575,172 | |||||||
| Copper & Gold, Cl. B | 288,400 | 12,161,828 | Amdocs | 261,000 a | 7,660,350 | |||||
| Goodrich | 206,600 | 9,466,412 | AMETEK | 190,500 | 7,675,245 | |||||
| Inco | 230,600 | 9,761,298 | Amphenol, Cl. A | 199,400 | 8,456,554 | |||||
| Joy Global | 203,050 | 9,705,790 | ATI Technologies | 550,600 a | 6,706,308 | |||||
| Kennametal | 148,500 | 6,926,040 | CheckFree | 348,900 a | 12,836,031 | |||||
| Lafarge North America | 62,300 | 4,295,585 | Harris | 440,000 | 16,988,400 | |||||
| Landstar System | 103,200 | 3,748,224 | Hyperion Solutions | 172,300 a | 7,472,651 | |||||
| Lennar, Cl. A | 252,300 b | 15,667,830 | International Rectifier | 211,300 a | 10,163,530 | |||||
| Lyondell Chemical | 547,800 | 14,133,240 | Lam Research | 270,700 a | 8,581,190 | |||||
| MDC Holdings | 84,300 | 6,438,834 | McAfee | 456,900 a | 14,003,985 | |||||
| Overseas Shipholding Group | 161,500 | 9,875,725 | Microchip Technology | 642,200 | 19,985,264 | |||||
| Peabody Energy | 373,900 | 26,797,413 | Polycom | 347,100 a | 6,181,851 | |||||
| Pentair | 297,460 | 11,743,721 | ||||||||
| The Funds 33 |
| STATEMENT OF INVESTMENTS (continued) |
| Mellon Mid Cap Stock Fund (continued) | ||||||||||||
| Principal | ||||||||||||
| Common Stocks (continued) | Shares | Value ($) | Short-Term Investment—.7% | Amount ($) | Value ($) | |||||||
| Technology (continued) | Repurchase Agreement; | |||||||||||
| SanDisk | 449,500 | a | 17,454,085 | Salomon Smith Barney, 3.60%, | ||||||||
| Sybase | 352,790 | a | 7,877,801 | dated 8/31/2005, due 9/1/2005 | ||||||||
| Symbol Technologies | 8,259 | 75,818 | in the amount of $10,151,015 | |||||||||
| (fully collateralized by $10,320,000 | ||||||||||||
| TIBCO Software | 876,400 | a | 6,695,696 | of Federal Home Loan Mortgage | ||||||||
| Zebra Technologies, Cl. A | 222,200 | a | 8,301,392 | Corp., Notes, 4.75%, 8/9/2010, | ||||||||
| 181,691,323 | value $10,353,775) | |||||||||||
| Transportation—.6% | (cost $10,150,000) | 10,150,000 | 10,150,000 | |||||||||
| JB Hunt Transport Services | 479,500 | 8,664,565 | Investment of Cash Collateral | |||||||||
| Utilities—4.7% | for Securities Loaned—1.1% | Shares | Value ($) | |||||||||
| CenturyTel | 212,100 | 7,614,390 | Registered Investment Company; | |||||||||
| DPL | 516,400 | 13,937,636 | Dreyfus Institutional Cash | |||||||||
| OGE Energy | 368,300 | 10,691,749 | Advantage Plus Fund | |||||||||
| PPL | 467,800 | 14,950,888 | (cost $16,892,046) | 16,892,046 | d 16,892,046 | |||||||
| SCANA | 319,200 | 13,530,888 | ||||||||||
| Total Investments | ||||||||||||
| Westar Energy | 423,800 | 10,179,676 | (cost $1,163,962,120) | 101.0% | 1,509,113,633 | |||||||
| 70,905,227 | ||||||||||||
| Total Common Stocks | Liabilities, Less Cash and Receivables | (1.0%) | (15,604,520) | |||||||||
| (cost $1,136,920,074) | 1,482,071,587 | Net Assets | 100.0% | 1,493,509,113 | ||||||||
| ADR—American Depository Receipts. | ||||||||||||
| a Non-income producing. | ||||||||||||
| b All or a portion of these securities are on loan. At August 31, 2005, the total market value of the fund’s securities on loan is $34,949,101 and the total market value of the | ||||||||||||
| collateral held by the fund is $35,619,406, consisting of cash collateral of $16,892,046 and U.S. Government and agency securities valued at $18,727,360. | ||||||||||||
| c The valuation of this security has been determined in good faith under the direction of the Trust’s Board. | ||||||||||||
| d Investment in affiliated money market mutual fund. | ||||||||||||
| Portfolio Summary (Unaudited) † | ||||||
| Value (%) | Value (%) | |||||
| Interest Sensitive | 16.2 | Services | 10.5 | |||
| Producer Goods | 15.6 | Utilities | 4.7 | |||
| Health Care | 12.5 | Consumer Staples | 3.4 | |||
| Technology | 12.2 | Short-Term/Money Market Investments | 1.8 | |||
| Consumer Cyclical | 11.6 | Other | 1.7 | |||
| Energy | 10.8 | 101.0 | ||||
| † Based on net assets. | ||||||
| See notes to financial statements. | ||||||
| 34 |
| STATEMENT OF INVESTMENTS | ||||||||||
| August 31, 2005 | ||||||||||
| Mellon Small Cap Stock Fund | ||||||||||
| Common Stocks—99.7% | Shares | Value ($) | Shares | Value ($) | ||||||
| Consumer Cyclical—15.1% | Energy (continued) | |||||||||
| Aeropostale | 390,200 a | 9,965,708 | Unit | 245,530 a | 12,782,292 | |||||
| Alaska Air Group | 124,230 a | 4,189,036 | Veritas DGC | 105,140 a | 3,381,302 | |||||
| AnnTaylor Stores | 293,520 a | 7,514,112 | 76,863,285 | |||||||
| Choice Hotels International | 85,010 | 5,218,764 | Health Care—10.5% | |||||||
| Coldwater Creek | 320,350 a | 9,818,728 | Abgenix | 328,660 a | 3,611,973 | |||||
| Dick’s Sporting Goods | 243,100 a,b | 7,691,684 | American Healthways | 52,660 a,b | 2,301,242 | |||||
| Guitar Center | 47,420 a | 2,721,908 | Cooper Cos. | 49,400 | 3,387,358 | |||||
| Gymboree | 532,720 a | 8,187,906 | Encysive Pharmaceuticals | 364,200 a | 4,508,796 | |||||
| Marvel Enterprises | 197,400 a | 3,799,950 | IDEXX Laboratories | 109,840 a | 7,034,154 | |||||
| Men’s Wearhouse | 113,495 a | 3,459,328 | Immucor | 65,800 a | 1,557,486 | |||||
| Oshkosh Truck | 107,500 | 4,311,825 | Kindred Healthcare | 107,430 a,b | 3,287,358 | |||||
| Panera Bread, Cl. A | 47,760 a | 2,662,142 | Merit Medical Systems | 1 a | 17 | |||||
| Pinnacle Airlines | 447,100 a,b | 4,318,986 | MGI Pharma | 103,350 a | 2,786,316 | |||||
| Polaris Industries | 62,680 b | 3,301,982 | Molina Healthcare | 80,050 a | 2,179,762 | |||||
| Quiksilver | 670,390 a | 10,223,448 | Owens & Minor | 62,060 | 1,778,640 | |||||
| Red Robin Gourmet Burgers | 83,100 a | 3,995,448 | Pediatrix Medical Group | 32,870 a | 2,436,653 | |||||
| SCP Pool | 104,370 | 3,819,942 | Pharmaceutical Product Development | 107,630 a | 6,056,340 | |||||
| Shuffle Master | 326,638 a,b | 7,986,299 | Psychiatric Solutions | 166,810 a | 7,973,518 | |||||
| Sonic | 250,570 a | 7,664,936 | ResMed | 101,050 a,b | 7,309,957 | |||||
| Talbots | 90,060 | 2,764,842 | Respironics | 101,790 a | 3,986,096 | |||||
| Wild Oats Markets | 622,470 a,b | 7,525,662 | Sierra Health Services | 88,070 a,b | 5,927,111 | |||||
| 121,142,636 | Sybron Dental Specialties | 134,910 a | 5,230,461 | |||||||
| Consumer Products—2.2% | Symbion | 166,510 a | 4,457,473 | |||||||
| Cott | 359,200 a | 9,109,312 | Syneron Medical | 230,660 b | 8,515,967 | |||||
| Performance Food Group | 261,440 a,b | 8,096,797 | 84,326,678 | |||||||
| 17,206,109 | Interest Sensitive—12.6% | |||||||||
| E-Commerce—1.0% | AmerUs Group | 57,630 b | 3,188,092 | |||||||
| Monster Worldwide | 266,400 a | 8,322,336 | Apollo Investment | 162,625 | 3,127,279 | |||||
| Electronics—.5% | BankUnited Financial, Cl. A | 148,650 | 3,508,140 | |||||||
| Integrated Device Technology | 389,900 a,b | 4,171,930 | Capital Automotive REIT | 92,260 | 3,309,366 | |||||
| Energy—9.6% | Centene | 174,030 a | 5,304,434 | |||||||
| Cal Dive International | 118,500 a | 7,401,510 | Cullen/Frost Bankers | 79,200 | 3,870,504 | |||||
| Cimarex Energy | 138,250 a | 5,908,805 | Downey Financial | 61,260 b | 3,882,659 | |||||
| Dynegy, Cl. A | 769,900 a | 3,356,764 | East West Bancorp | 73,090 | 2,480,674 | |||||
| Energen | 187,380 | 7,180,402 | Endurance Specialty Holdings | 68,410 | 2,510,647 | |||||
| Goodrich Petroleum | 409,400 a | 8,920,826 | Equity Inns | 611,990 | 7,864,072 | |||||
| Hydril | 32,990 a | 2,259,815 | Equity One | 181,090 | 4,215,775 | |||||
| Piedmont Natural Gas | 113,150 b | 2,778,964 | First Midwest Bancorp | 103,140 b | 3,913,132 | |||||
| Remington Oil & Gas | 142,140 a | 5,476,654 | Fremont General | 220,970 | 5,042,535 | |||||
| Southwestern Energy | 108,580 a | 6,286,782 | Horace Mann Educators | 159,050 | 3,114,199 | |||||
| St. Mary Land & Exploration | 104,890 b | 3,615,558 | La Quinta | 658,620 a | 5,565,339 | |||||
| UGI | 271,740 | 7,513,611 | Max Re Capital | 108,490 | 2,494,185 | |||||
| The Funds 35 |
| STATEMENT OF INVESTMENTS (continued) |
| Mellon Small Cap Stock Fund (continued) | ||||||||||
| Common Stocks (continued) | Shares | Value ($) | Shares | Value ($ | ||||||
| Interest Sensitive (continued) | Producer Goods (continued) | |||||||||
| Nelnet, Cl. A | 99,710 a | 3,569,618 | Steel Dynamics | 237,600 | 7,491,528 | |||||
| New Century Financial | 37,870 b | 1,628,031 | Teledyne Technologies | 172,220 a | 6,652,859 | |||||
| Ohio Casualty | 126,420 | 3,193,369 | Timken | 138,940 | 4,080,668 | |||||
| Philadelphia Consolidated Holding | 41,700 a | 3,239,673 | United Stationers | 50,360 a | 2,361,884 | |||||
| Phoenix Cos. | 224,410 b | 2,690,676 | URS | 63,170 a | 2,380,246 | |||||
| South Financial Group | 89,500 | 2,606,240 | Walter Industries | 195,610 | 8,581,411 | |||||
| SVB Financial Group | 78,700 a | 3,702,048 | Watsco | 106,480 | 5,191,965 | |||||
| UCBH Holdings | 386,550 | 7,371,509 | WCI Communities | 245,600 a,b | 7,409,752 | |||||
| UICI | 64,680 | 1,996,025 | 167,940,230 | |||||||
| Umpqua Holdings | 181,380 | 4,416,603 | Real Estate Investment Trusts—1.5% | |||||||
| Wintrust Financial | 65,450 b | 3,373,293 | Spirit Finance | 358,700 | 3,823,742 | |||||
| 101,178,117 | Sunstone Hotel Investors | 337,700 | 8,543,810 | |||||||
| Producer Goods—20.9% | 12,367,552 | |||||||||
| Actuant, Cl. A | 119,670 b | 5,074,008 | Services—11.4% | |||||||
| AptarGroup | 71,650 | 3,563,154 | Alamosa Holdings | 281,930 a | 4,877,389 | |||||
| Armor Holdings | 45,130 a | 1,913,963 | Allied Waste Industries | 980,730 a,b | 7,826,225 | |||||
| Briggs & Stratton | 80,290 | 2,962,701 | Allscripts Healthcare Solutions | 346,790 a,b | 6,165,926 | |||||
| CLARCOR | 169,160 | 4,787,228 | CACI International, Cl. A | 169,570 a | 10,621,865 | |||||
| Cleveland-Cliffs | 32,070 b | 2,279,536 | Cerner | 60,030 a,b | 4,727,963 | |||||
| Commercial Metals | 102,600 | 3,070,818 | FactSet Research Systems | 51,650 | 1,807,750 | |||||
| Engineered Support Systems | 107,060 | 3,650,746 | Global Payments | 124,720 | 8,204,082 | |||||
| EnPro Industries | 117,830 a | 4,053,352 | Healthcare Services Group | 183,320 b | 3,382,254 | |||||
| Florida Rock Industries | 96,125 | 5,440,675 | Kronos | 64,970 a | 2,815,150 | |||||
| FMC | 87,020 a | 4,956,659 | Labor Ready | 273,260 a | 6,208,467 | |||||
| GATX | 87,230 b | 3,535,432 | Navigant Consulting | 440,530 a | 8,519,850 | |||||
| Georgia Gulf | 52,060 | 1,452,474 | Radio One, Cl. D | 627,900 a | 8,778,042 | |||||
| HB Fuller | 116,220 | 3,813,178 | Regal Entertainment Group, Cl. A | 402,800 | 7,874,740 | |||||
| Headwaters | 60,680 a | 2,336,180 | Ventiv Health | 417,100 a | 9,468,170 | |||||
| IDEX | 71,420 | 3,106,770 | 91,277,873 | |||||||
| JB Hunt Transport Services | 418,700 | 7,565,909 | Technology—13.0% | |||||||
| Kansas City Southern | 111,070 a | 2,233,618 | Advanced Energy Industries | 357,800 a | 4,264,976 | |||||
| MDC Holdings | 54,904 | 4,193,567 | Agile Software | 1,260,800 a | 8,371,712 | |||||
| Manitowoc | 57,640 | 2,686,024 | Anixter International | 99,070 a | 3,782,493 | |||||
| Massey Energy | 189,680 | 9,635,744 | ANSYS | 104,280 a | 3,936,570 | |||||
| Maverick Tube | 128,770 a | 4,101,324 | ATI Technologies | 455,300 a | 5,545,554 | |||||
| Meritage Homes | 35,790 a | 2,801,999 | Benchmark Electronics | 217,280 a | 6,325,021 | |||||
| NVR | 8,130 a | 7,195,050 | Cypress Semiconductor | 127,950 a | 1,999,858 | |||||
| Olin | 340,150 | 6,354,002 | Esterline Technologies | 68,520 a | 2,990,898 | |||||
| Overseas Shipholding Group | 73,660 | 4,504,309 | FLIR Systems | 115,760 a | 3,737,890 | |||||
| Pacer International | 218,530 a | 5,734,227 | Hyperion Solutions | 63,180 a | 2,740,117 | |||||
| Quanta Services | 517,700 a | 6,212,400 | Internet Security Systems | 66,030 a | 1,500,202 | |||||
| Standard-Pacific | 104,140 | 4,574,870 | Manhattan Associates | 192,500 a,b | 4,069,450 | |||||
36
| Mellon Small Cap Stock Fund (continued) | ||||||||||||
| Principal | ||||||||||||
| Common Stocks (continued) | Shares | Value ($) | Short-Term Investment—.4% | Amount ($) | Value ($) | |||||||
| Technology (continued) | Repurchase Agreement; | |||||||||||
| Micrel | 165,020 | a | 2,079,252 | Salomon Smith Barney, | ||||||||
| MICROS Systems | 228,400 | a | 10,184,356 | 3.60%, dated 8/31/2005, | ||||||||
| Microsemi | 91,830 | a | 2,212,185 | due 9/1/2005 in the amount | ||||||||
| of $3,450,345 (fully collateralized | ||||||||||||
| MIPS Technologies | 1,139,200 | a | 7,142,784 | by $3,508,000 of Federal Home | ||||||||
| Progress Software | 59,650 | a | 1,828,869 | Loan Mortgage Corp., Notes, | ||||||||
| Roper Industries | 124,040 | 4,778,021 | 4.75%, 8/9/2010, | |||||||||
| Silicon Laboratories | 247,000 | a | 7,664,410 | value $3,519,481) | ||||||||
| Take-Two Interactive Software | 103,270 | a,b | 2,457,826 | (cost $3,450,000) | 3,450,000 | 3,450,000 | ||||||
| THQ | 64,430 | a | 2,165,492 | Investment of Cash Collateral | ||||||||
| Trimble Navigation | 102,280 | a | 3,735,265 | for Securities Loaned—12.1% | Shares | Value ($) | ||||||
| Varian Semiconductor | Registered Investment Company; | |||||||||||
| Equipment Associates | 139,480 | a | 6,319,839 | |||||||||
| Dreyfus Institutional Cash | ||||||||||||
| WebSideStory | 283,300 | 4,714,112 | Advantage Plus Fund | |||||||||
| 104,547,152 | (cost $96,933,352) | 96,933,352 c | 96,933,352 | |||||||||
| Utilities—1.4% | ||||||||||||
| Alaska Communications | Total Investments | |||||||||||
| Systems Group | 381,720 | b | 4,134,028 | (cost $768,066,972) | 112.2% | 900,659,342 | ||||||
| CMS Energy | 422,240 | a | 6,798,064 | Liabilities, Less Cash | ||||||||
| 10,932,092 | and Receivables | (12.2%) | (98,159,939) | |||||||||
| Total Common Stocks | Net Assets | 100.0% | 802,499,403 | |||||||||
| (cost $667,683,620) | 800,275,990 | |||||||||||
| a Non-income producing. | ||||||||||||
| b All or a portion of these securities are on loan. At August 31, 2005, the total market value of the fund’s securities on loan is $94,286,727 and the total market value of the | ||||||||||||
| collateral held by the fund is $97,027,784, consisting of cash collateral of $96,933,352 and U.S. Government and agency securities valued at $94,432. | ||||||||||||
| c Investment in affiliated money market mutual fund. | ||||||||||||
| Portfolio Summary (Unaudited) † | ||||||
| Value (%) | Value (%) | |||||
| Producer Goods | 20.9 | Services | 11.4 | |||
| Consumer Cyclical | 15.1 | Health Care | 10.5 | |||
| Technology | 13.0 | Other | 16.2 | |||
| Interest Sensitive | 12.6 | |||||
| Short-Term/Money Market Investments | 12.5 | 112.2 | ||||
| † Based on net assets. | ||||||
| See notes to financial statements. | ||||||
| The Funds 37 |
| STATEMENT OF INVESTMENTS | ||||||||||
| August 31, 2005 | ||||||||||
| Mellon International Fund | ||||||||||
| Common Stocks—97.0% | Shares | Value ($) | Shares | Value ($) | ||||||
| Australia—1.8% | France (continued) | |||||||||
| Amcor | 2,458,525 | 12,342,515 | Remy Cointreau | 6,500 | 300,551 | |||||
| Caltex Australia | 46,000 | 604,487 | Renault | 6,900 | 610,279 | |||||
| Commonwealth | Sanofi-Aventis | 205,648 | 17,542,358 | |||||||
| Bank of Australia | 17,000 | 481,219 | Schneider Electric | 120,090 | 9,437,228 | |||||
| CSL | 9,400 | 244,243 | Societe Generale | 14,100 | 1,521,713 | |||||
| Macquarie Bank | 16,800 | 803,080 | Suez | 8,400 | 244,785 | |||||
| National Australia Bank | 730,131 | 17,279,801 | Total | 91,228 | 23,964,535 | |||||
| Oil Search | 178,500 | 495,890 | Total, ADR | 75,511 | 9,955,370 | |||||
| Qantas Airways | 141,400 | 344,116 | Valeo | 444,002 | 18,214,852 | |||||
| QBE Insurance Group | 19,800 | 256,500 | Vinci | 5,600 | 497,025 | |||||
| Rinker Group | 82,200 | 898,860 | Vivendi Universal | 29,100 | 913,649 | |||||
| 33,750,711 | 173,614,863 | |||||||||
| Austria—.1% | Germany—8.8% | |||||||||
| Boehler-Uddeholm | 3,800 | 586,891 | Allianz | 116,971 | 15,118,337 | |||||
| OMV | 24,300 | 1,322,496 | Bayerische Motoren Werke | 9,100 | 408,320 | |||||
| 1,909,387 | Continental | 16,000 | 1,263,863 | |||||||
| Belgium—1.1% | Deutsche Bank | 243,342 | 21,063,731 | |||||||
| Fortis | 692,897 | 19,739,040 | Deutsche Lufthansa | 939,897 | 12,501,413 | |||||
| KBC Groep | 9,700 | 803,523 | Deutsche Post | 927,165 | 23,395,497 | |||||
| 20,542,563 | Deutsche Postbank | 215,723 | 11,825,540 | |||||||
| Denmark—.0% | Deutsche Telekom | 838,870 | 15,893,734 | |||||||
| Novo Nordisk, Cl. B | 12,200 | 628,138 | E.ON | 176,160 | 16,807,598 | |||||
| Finland—1.7% | Hannover Rueckversicherung | 32,600 | 1,170,619 | |||||||
| Fortum | 21,700 | 422,376 | Heidelberger Druckmaschinen | 238,741 | 8,513,984 | |||||
| Kesko, Cl. B | 19,200 | 547,911 | Infineon Technologies | 1,276,344 a | 11,910,254 | |||||
| M-real, Cl. B | 2,077,775 | 11,346,440 | KarstadtQuelle | 99,752 b | 1,328,014 | |||||
| Nokia | 262,700 | 4,106,168 | Medion | 176,162 | 2,799,127 | |||||
| Nokia, ADR | 245,340 | 3,869,012 | Merck | 4,100 | 351,460 | |||||
| Rautaruukki | 21,700 | 435,751 | SAP | 2,300 | 390,125 | |||||
| UPM-Kymmene | 516,616 | 10,316,687 | Schering | 5,400 | 341,150 | |||||
| 31,044,345 | ThyssenKrupp | 24,800 | 474,156 | |||||||
| France—9.3% | Volkswagen | 329,187 | 17,306,893 | |||||||
| BNP Paribas | 299,088 | 21,734,027 | 162,863,815 | |||||||
| Bouygues | 13,900 | 619,413 | Greece—.0% | |||||||
| Carrefour | 542,390 | 25,186,318 | Coca-Cola Hellenic Bottling | 15,300 | 471,508 | |||||
| Credit Agricole | 654,390 | 17,423,998 | Hong Kong—1.0% | |||||||
| Elior | 25,700 | 339,297 | Bank of East Asia | 4,808,151 | 14,034,371 | |||||
| France Telecom | 834,473 | 25,109,465 | Cheung Kong Holdings | 25,000 | 271,176 | |||||
| 38 |
| Mellon International Fund (continued) | ||||||||||
| Common Stocks (continued) | Shares | Value ($) | Shares | Value ($) | ||||||
| Hong Kong (continued) | Japan (continued) | |||||||||
| China Mobile (Hong Kong) | 224,000 | 973,958 | Hisamitsu Pharmaceutical | 14,100 | 373,087 | |||||
| China Resources Power Holdings | 579,000 | 330,540 | Honda Motor | 17,700 | 951,191 | |||||
| Citic Pacific | 743,500 | 2,084,335 | Hoya | 6,700 | 876,480 | |||||
| Kerry Properties | 115,000 | 311,682 | Japan Tobacco | 33 | 476,943 | |||||
| Orient Overseas International | 68,000 | 271,570 | JS Group | 666,600 | 11,281,934 | |||||
| Wharf Holdings | 63,000 | 231,722 | Kao | 655,200 | 15,625,697 | |||||
| 18,509,354 | Kawasaki Kisen Kaisha | 63,000 | 416,058 | |||||||
| Ireland—1.5% | KDDI | 3,235 | 17,133,931 | |||||||
| Anglo Irish Bank | 39,300 | 529,505 | Kirin Beverage | 300 | 6,573 | |||||
| Bank of Ireland | 1,708,860 | 27,068,676 | Kobe Steel | 371,000 | 882,247 | |||||
| CRH | 18,200 | 494,022 | Komatsu | 73,000 | 816,893 | |||||
| 28,092,203 | Kubota | 101,000 | 630,173 | |||||||
| Italy—4.5% | Kuraray | 1,152,500 | 10,201,375 | |||||||
| Banca Intesa | 163,600 | 787,520 | Kyushu Electric Power | 10,800 | 245,376 | |||||
| Banche Popolari Unite Scrl | 223,941 | 4,563,141 | Mabuchi Motor | 265,800 | 13,739,279 | |||||
| Banco Popolare di Verona | Matsumotokiyoshi | 213,150 | 6,367,769 | |||||||
| e Novara Scrl | 376,250 | 6,757,615 | Mazda Motor | 97,000 | 385,031 | |||||
| Benetton Group | 905,598 | 8,908,319 | Minebea | 2,606,600 | 10,870,608 | |||||
| Capitalia | 74,700 | 418,976 | Mitsubishi | 51,900 | 859,276 | |||||
| ENI | 845,044 | 25,000,458 | Mitsubishi Tokyo Financial Group | 1,252 | 12,779,549 | |||||
| Finmeccanica | 626,171 | 11,732,591 | Mitsui OSK Lines | 85,000 | 627,304 | |||||
| Mediaset | 58,000 | 716,396 | Mitsui Sumitomo Insurance | 26,000 | 265,938 | |||||
| UniCredito Italiano | 4,478,830 | 25,493,466 | Mizuho Financial Group | 102 | 570,063 | |||||
| 84,378,482 | Murata Manufacturing | 202,900 | 10,674,646 | |||||||
| Japan—26.3% | Nippon Express | 5,066,600 | 22,634,384 | |||||||
| Aeon | 991,800 | 18,587,660 | Nippon Steel | 249,000 | 730,399 | |||||
| Alps Electric | 499,900 | 8,148,646 | Nippon Telegraph & Telephone | 2,902 | 12,626,895 | |||||
| Asahi Breweries | 39,200 | 483,705 | Nisshin Seifun Group | 30,000 | 325,659 | |||||
| Bridgestone | 22,000 | 436,160 | Ono Pharmaceutical | 9,500 | 473,054 | |||||
| Canon | 384,800 | 19,478,501 | ORIX | 76,200 | 12,577,102 | |||||
| Credit Saison | 281,800 | 11,089,355 | Promise | 4,000 | 272,122 | |||||
| Dentsu | 4,058 | 10,711,381 | Rinnai | 518,700 | 12,108,138 | |||||
| Diamond Lease | 5,500 | 221,870 | Rohm | 179,700 | 16,436,429 | |||||
| Eisai | 13,500 | 513,955 | Sankyo | 7,200 | 355,282 | |||||
| Fuji Heavy Industries | 2,645,400 | 11,568,612 | Santen Pharmaceutical | 11,400 | 291,686 | |||||
| Fuji Photo Film | 385,100 | 12,478,269 | Sanyo Shinpan Finance | 9,100 | 645,172 | |||||
| Fujitsu | 58,000 | 347,154 | Sekisui House | 1,389,500 | 15,317,798 | |||||
| Funai Electric | 131,600 | 12,355,932 | 77 Bank | 1,992,500 | 13,621,840 | |||||
| The Funds 39 |
| STATEMENT OF INVESTMENTS (continued) |
| Mellon International Fund (continued) | ||||||||||
| Common Stocks (continued) | Shares | Value ($) | Shares | Value ($) | ||||||
| Japan (continued) | New Zealand—.0% | |||||||||
| Shin-Etsu Chemical | 432,300 | 17,553,870 | Fletcher Building | 54,400 | 277,225 | |||||
| Skylark | 731,200 | 11,073,323 | Norway—.1% | |||||||
| Sohgo Security Services | 398,355 | 5,362,653 | DNB NOR | 53,200 | 560,224 | |||||
| Sumitomo Bakelite | 1,207,800 | 8,080,086 | Norsk Hydro | 4,400 | 467,132 | |||||
| Sumitomo Chemical | 2,039,000 | 11,398,188 | Orkla | 12,400 | 497,072 | |||||
| Sumitomo Electric Industries | 41,600 | 514,166 | Tandberg | 21,800 | 266,262 | |||||
| Sumitomo Mitsui Financial Group | 3,727 | 30,589,608 | Yara International | 20,200 | 335,285 | |||||
| Sumitomo Rubber Industries | 49,000 | 520,197 | 2,125,975 | |||||||
| Sumitomo Trust & Banking | 75,000 | 523,413 | Portugal—.9% | |||||||
| Takeda Pharmaceutical | 323,900 | 17,548,560 | Energias de Portugal | 5,658,060 | 15,902,294 | |||||
| Takefuji | 283,830 | 19,907,653 | Singapore—2.0% | |||||||
| TDK | 80,400 | 6,001,178 | DBS Group Holdings | 2,340,644 | 21,801,844 | |||||
| Fraser & Neave | 41,400 | 411,919 | ||||||||
| Toyo Suisan Kaisha | 15,800 | 278,658 | ||||||||
| Keppel | 35,000 | 242,099 | ||||||||
| Toyoda Gosei | 636,000 | 10,628,946 | ||||||||
| United Overseas Bank | 1,633,300 | 13,820,427 | ||||||||
| Toyota Motor | 391,800 | 16,038,453 | 36,276,289 | |||||||
| Yamaha Motor | 62,200 | 1,170,597 | Spain—3.1% | |||||||
| 489,084,130 | ACS | 21,200 | 636,083 | |||||||
| Luxembourg—.0% | Banco Sabadell | 325,008 | 8,461,461 | |||||||
| Arcelor | 20,400 | 447,618 | Corp Mapfre | 30,500 | 502,301 | |||||
| Netherlands—6.6% | Endesa | 1,039,801 | 23,456,257 | |||||||
| ABN AMRO Holding | 566,812 | 13,536,767 | Repsol YPF | 176,300 | 5,211,454 | |||||
| Aegon | 1,228,359 | 17,216,433 | Repsol YPF, ADR | 634,451 | 18,754,372 | |||||
| Buhrmann | 46,500 | 565,754 | Union Fenosa | 8,900 | 258,916 | |||||
| CSM | 8,900 | 248,713 | 57,280,844 | |||||||
| Heineken | 676,357 | 21,835,789 | Sweden—1.1% | |||||||
| ING Groep | 53,100 | 1,540,843 | Lindex | 5,300 | 278,863 | |||||
| Koninklijke Philips Electronics | 566,090 | 14,891,461 | Skandinaviska Enskilda | |||||||
| Koninklijke Philips Electronics | Banken, Cl. A | 28,300 | 514,423 | |||||||
| (New York Shares) | 242,880 | 6,448,464 | Svenska Cellulosa, Cl. B | 531,960 | 18,917,446 | |||||
| Royal Dutch Shell, Cl. A | 667,200 | 21,745,775 | Telefonaktiebolaget | |||||||
| LM Ericsson, Cl. B | 200,300 | 693,767 | ||||||||
| VNU | 351,341 | 10,784,141 | ||||||||
| Volvo, Cl. B | 17,500 | 749,574 | ||||||||
| Wolters Kluwer | 780,183 | 14,618,320 | 21,154,073 | |||||||
| 123,432,460 | ||||||||||
| 40 |
| Mellon International Fund (continued) | ||||||||||
| Common Stocks (continued) | Shares | Value ($) | Shares | Value ($) | ||||||
| Switzerland—7.5% | United Kingdom (continued) | |||||||||
| Baloise Holding | 4,000 | 211,918 | Dairy Crest Group | 26,900 | 235,189 | |||||
| Ciba Specialty Chemicals | 330,417 | 20,098,262 | Diageo | 1,275,336 | 18,208,462 | |||||
| Clariant | 524,848 | 7,505,594 | Enterprise Inns | 41,900 | 623,904 | |||||
| Compagnie Financiere | Filtrona | 7,289 | 32,061 | |||||||
| Richemont (Units), Cl. A | 12,700 | 481,107 | Friends Provident | 220,600 | 690,961 | |||||
| Credit Suisse Group | 31,200 | 1,350,956 | GKN | 2,547,382 | 13,202,476 | |||||
| Logitech International | 13,700 a | 507,529 | GlaxoSmithKline | 1,325,379 | 31,992,201 | |||||
| Lonza Group | 110,913 | 6,322,359 | Greene King | 10,600 | 252,616 | |||||
| Nestle | 91,150 | 25,561,504 | HBOS | 53,700 | 841,719 | |||||
| Novartis | 567,140 | 27,471,409 | HSBC Holdings | 842,530 | 13,563,141 | |||||
| Sulzer | 1,400 | 664,197 | Inchcape | 20,839 | 777,626 | |||||
| Swiss Reinsurance | 378,890 | 24,389,987 | International Power | 63,900 | 268,111 | |||||
| Swisscom | 320 | 107,584 | Kelda Group | 52,000 | 635,091 | |||||
| UBS | 284,239 | 23,233,685 | Legal & General Group | 117,200 | 235,045 | |||||
| Zurich Financial Services | 4,600 | 812,476 | Lloyds TSB Group | 7,100 | 58,364 | |||||
| 138,718,567 | Marks & Spencer Group | 1,646,172 | 10,586,750 | |||||||
| United Kingdom—19.5% | O2 | 105,800 | 292,287 | |||||||
| Alliance Unichem | 31,300 | 465,502 | Old Mutual | 363,700 | 926,094 | |||||
| Anglo American | 819,210 | 20,704,594 | Rexam | 820,992 | 7,448,111 | |||||
| AstraZeneca | 20,800 | 948,653 | Rio Tinto | 2,000 | 70,630 | |||||
| Aviva | 77,400 | 854,615 | Royal Bank of Scotland Group | 1,005,596 | 29,385,292 | |||||
| BAA | 1,263,334 | 13,926,376 | Royal Dutch Shell, Cl. A | 1,400 | 45,680 | |||||
| BAE Systems | 1,297,934 | 7,656,948 | Royal Dutch Shell, Cl. B | 3,800 | 128,853 | |||||
| Barclays | 2,044,597 | 20,382,446 | SABMiller | 13,900 | 245,188 | |||||
| Barratt Developments | 43,000 | 548,039 | Sage Group | 99,100 | 408,210 | |||||
| BHP Billiton | 40,600 | 603,082 | Sainsbury (J) | 2,090,927 | 10,676,582 | |||||
| BOC Group | 585,874 | 11,057,943 | Scottish Power | 63,900 | 577,691 | |||||
| Boots Group | 1,623,161 | 18,053,866 | Shire Pharmaceuticals | 24,400 | 304,822 | |||||
| BP | 2,457,500 | 27,998,455 | Stagecoach Group | 148,700 | 289,506 | |||||
| British Airways | 82,700 a | 413,333 | Standard Chartered | 32,800 | 700,673 | |||||
| British American Tobacco | 13,500 | 271,595 | Tesco | 94,200 | 554,019 | |||||
| BT Group | 3,885,383 | 15,094,008 | Tullow Oil | 102,500 | 398,194 | |||||
| Bunzl | 95,143 | 935,610 | Unilever | 2,056,560 | 20,668,536 | |||||
| Centrica | 4,452,770 | 20,047,454 | Vodafone Group | 13,585,070 | 37,163,280 | |||||
| The Funds 41 |
| STATEMENT OF INVESTMENTS (continued) |
| Mellon International Fund (continued) | ||||||||||
| Principal | ||||||||||
| Common Stocks (continued) | Shares | Value ($) | Short-Term Investment—1.5% | Amount ($) | Value ($) | |||||
| United Kingdom (continued) | Repurchase Agreement; | |||||||||
| Wolseley | 23,000 | 467,692 | J.P. Morgan Chase & Co., | |||||||
| Xstrata | 32,600 | 764,572 | 3.48%, dated 8/31/2005, | |||||||
| 363,682,148 | due 9/1/2005 in the amount | |||||||||
| United States—.1% | of $28,002,707 (fully | |||||||||
| iShares MSCI EAFE Index Fund | 23,900 | 1,338,400 | collateralized by $28,277,000 | |||||||
| U.S. Treasury Notes, | ||||||||||
| Total Common Stocks | 4.125%, 8/15/2008, | |||||||||
| (cost $1,560,950,358) | 1,805,525,392 | value $28,559,770) | ||||||||
| (cost $28,000,000) | 28,000,000 | 28,000,000 | ||||||||
| Preferred Stocks—.1% | ||||||||||
| Germany: | Total Investments | |||||||||
| Fresenius | 2,500 | 321,118 | (cost $1,589,617,005) | 98.6% | 1,834,241,033 | |||||
| Henkel KGaA | 4,170 | 394,523 | Cash and Receivables (Net) | 1.4% | 26,623,333 | |||||
| Total Preferred Stocks | Net Assets | 100.0% | 1,860,864,366 | |||||||
| (cost $666,647) | 715,641 | |||||||||
| ADR—American Depository Receipts. | ||||||||||
| a Non-income producing. | ||||||||||
| b A portion of this security is on loan. At August 31, 2005, the total market value of the fund’s security on loan is $444,162 and the total market value of the collateral held by the | ||||||||||
| fund is $467,082, consisting of U.S. Government and agency securities. | ||||||||||
| Portfolio Summary (Unaudited) † | ||||||
| Value (%) | Value (%) | |||||
| Banking | 16.7 | Beverages & Tobacco | 2.3 | |||
| Financial Services | 7.4 | Merchandising | 2.3 | |||
| Energy | 7.2 | Miscellaneous | 2.2 | |||
| Food & Household Products | 5.9 | Consumer Services | 1.6 | |||
| Telecommunications | 5.8 | Machinery & Engineering | 1.6 | |||
| Healthcare | 4.4 | Textiles & Apparel | 1.6 | |||
| Chemicals | 4.3 | Appliances & Household Durables | 1.5 | |||
| Utilities | 4.2 | Miscellaneous Materials | 1.5 | |||
| Automobiles | 3.4 | Short-Term Investments | 1.5 | |||
| Transportation | 3.3 | Other | 14.2 | |||
| Electronic Components | 2.9 | |||||
| Forest Products & Paper | 2.8 | 98.6 | ||||
| † Based on net assets. | ||||||
| See notes to financial statements. | ||||||
| 42 |
| STATEMENT OF INVESTMENTS | ||||||||||||
| August 31, 2005 | ||||||||||||
| Mellon Emerging Markets Fund | ||||||||||||
| Common Stocks—93.8% | Shares | Value ($) | Shares | Value ($) | ||||||||
| Brazil—7.0% | Hong Kong—3.9% | |||||||||||
| Banco Itau Holding Financeira, ADR | 48,700 | 5,102,786 | Beijing Enterprises Holdings | 1,497,000 | 2,107,325 | |||||||
| Brasil Telecom Participacoes, ADR | 234,540 | 8,548,983 | Brilliance China Automotive Holdings | 9,683,000 | 1,649,775 | |||||||
| Centrais Electricas Brasileiras | 90,574 | 1,253,218 | China Mobile (Hong Kong) | 3,996,600 | 17,377,321 | |||||||
| Cia de Saneamento Basico | China Resources Enterprise | 4,585,300 | 7,387,335 | |||||||||
| do Estado de Sao Paulo | 123,584 | 7,762,494 | CNOOC | 6,883,000 | 4,951,265 | |||||||
| Cia de Saneamento Basico | Denway Motors | 23,869,500 | 8,852,934 | |||||||||
| do Estado de Sao Paulo, ADR | 210,100 | 3,298,570 | c | 1,365,966 | ||||||||
| Panva Gas Holdings | 2,987,000 | |||||||||||
| Contax Participacoes, ADR | 272,800 a | 178,308 | Shanghai Industrial Holdings | 4,666,600 | 8,898,486 | |||||||
| Empresa Brasileira | 52,590,407 | |||||||||||
| de Aeronautica, ADR | 358,950 | 12,871,947 | Hungary—1.7% | |||||||||
| Grendene | 670,100 | 4,721,217 | Egis | 2,526 | 233,534 | |||||||
| Petroleo Brasileiro, ADR | 559,980 | 35,032,349 | Gedeon Richter | 53,657 | 8,566,036 | |||||||
| Telecomunicacoes Brasileiras, ADR | 272,800 | 7,818,448 | Magyar Telekom | 2,644,000 | 13,357,583 | |||||||
| Unibanco, GDR | 158,810 | 7,101,983 | Mol Magyar Olaj-es Gazipari | 4,519 | 496,099 | |||||||
| 93,690,303 | 22,653,252 | |||||||||||
| Chile—.4% | India—9.0% | |||||||||||
| Banco Santander Chile, ADR | 128,500 | 4,874,005 | Bharat Petroleum | 1,235,348 | 9,939,349 | |||||||
| China—4.2% | Dr. Reddy’s Laboratories | 139,300 | 2,513,246 | |||||||||
| Beijing Capital International | Dr. Reddy’s Laboratories, ADR | 584,400 | 10,618,548 | |||||||||
| Airport, Cl. H | 4,165,000 | 1,714,690 | GAIL India | 946,181 | 5,002,400 | |||||||
| Byd, Cl. H | 421,000 | 750,383 | GAIL India, GDR | 170,200 | b | 5,408,956 | ||||||
| China Petroleum & Chemical, ADR | 36,300 | 1,625,877 | Hindalco Industries, GDR | 460,300 | b | 14,637,540 | ||||||
| China Petroleum & Chemical, Cl. H | 13,746,700 | 6,120,388 | Hindustan Petroleum | 1,669,722 | 11,085,957 | |||||||
| China Shenhua Energy, Cl. H | 5,102,000 | 5,672,188 | Mahanagar Telephone Nigam | 4,347,957 | 12,656,766 | |||||||
| China Shipping | Mahanagar Telephone Nigam, ADR | 340,450 | 2,383,150 | |||||||||
| Container Lines, Cl. H | 617,000 | 248,470 | Mahindra & Mahindra | 16,700 | 273,907 | |||||||
| China Telecom, Cl. H | 23,113,400 | 8,625,739 | Oil & Natural Gas | 386,536 | 8,588,633 | |||||||
| Datang International | Reliance Industries | 1,325,608 | 21,494,139 | |||||||||
| Power Generation, Cl. H | 250,000 | 187,234 | Satyam Computer Services | 30,148 | 362,251 | |||||||
| Huadian Power International, Cl. H | 29,094,300 | 8,043,859 | b | 15,196,500 | ||||||||
| State Bank of India, GDR | 337,700 | |||||||||||
| Huaneng Power International, Cl. H | 5,923,600 | 4,231,651 | Tata TEA | 24,840 | 449,569 | |||||||
| PetroChina, Cl. H | 10,492,000 | 8,157,017 | 120,610,911 | |||||||||
| Sinopec Yizheng | Indonesia—1.8% | |||||||||||
| Chemical Fibre, Cl. H | 19,060,000 | 3,031,332 | Astra International | 250,000 | 246,551 | |||||||
| Sinotrans, Cl. H | 15,027,600 | 5,277,723 | Bank Mandiri Persero | 25,324,500 | 3,380,396 | |||||||
| Weiqiao Textile, Cl. H | 2,028,500 | 2,663,224 | Bank Rakyat Indonesia | 681,500 | 171,172 | |||||||
| 56,349,775 | Gudang Garam | 5,317,700 | 5,689,496 | |||||||||
| Croatia—.4% | Indofood Sukses Makmur | 54,366,500 | 4,171,547 | |||||||||
| Pliva, GDR | 457,400 b | 5,799,832 | Telekomunikasi Indonesia | 19,481,500 | 9,593,801 | |||||||
| Egypt—.3% | United Tractors | 791,000 | 299,043 | |||||||||
| Commercial International Bank, GDR | 489,300 b | 3,982,902 | 23,552,006 | |||||||||
| The Funds 43 |
| STATEMENT OF INVESTMENTS (continued) |
| Mellon Emerging Markets Fund (continued) | ||||||||||
| Common Stocks (continued) | Shares | Value ($) | Shares | Value ($) | ||||||
| Israel—.8% | Poland (continued) | |||||||||
| Bank Hapoalim | 915,782 | 3,380,403 | Telekomunikacja Polska | 929,267 | 6,422,715 | |||||
| Bank Leumi Le-Israel | 1,151,000 | 3,405,025 | 11,958,702 | |||||||
| Check Point Software Technologies | 12,400 c | 279,744 | Russia—3.8% | |||||||
| Nice Systems, ADR | 6,500 c | 281,060 | Gazprom, ADR | 315,900 | 15,573,870 | |||||
| Super-Sol | 1,565,094 | 3,904,442 | LUKOIL, ADR | 682,000 | 33,142,710 | |||||
| 11,250,674 | NovaTek, GDR | 115,200 b,c | 2,534,400 | |||||||
| Malaysia—4.4% | Rostelecom, ADR | 22,900 | 309,150 | |||||||
| AMMB Holdings | 1,569,800 | 1,065,897 | 51,560,130 | |||||||
| Commerce Asset Holdings | 6,404,300 | 9,422,922 | South Africa—11.1% | |||||||
| Gamuda | 7,233,300 | 8,212,889 | Alexander Forbes | 2,300,119 | 4,968,835 | |||||
| Genting | 2,575,000 | 13,037,835 | Aveng | 3,006,641 | 6,258,915 | |||||
| Kuala Lumpur Kepong | 2,206,400 | 4,214,271 | Bidvest Group | 873,380 | 11,992,681 | |||||
| MK Land Holdings | 1,545,000 | 401,718 | Edgars Consolidated Stores | 64,320 | 321,347 | |||||
| Resorts World | 2,745,900 | 7,493,224 | Illovo Sugar | 833,876 | 1,159,435 | |||||
| Sime Darby | 9,099,200 | 14,590,102 | Impala Platinum Holdings | 114,690 | 12,054,613 | |||||
| 58,438,858 | Investec | 9,644 | 307,593 | |||||||
| Mexico—6.9% | JD Group | 30,268 | 351,898 | |||||||
| Alfa, Cl. A | 46,000 | 278,882 | Mittal Steel South Africa | 41,227 | 311,874 | |||||
| Cemex | 1,271,142 | 6,053,170 | Nampak | 4,196,510 | 10,153,378 | |||||
| Cemex, ADR | 7,200 | 343,224 | Nedbank Group | 1,881,063 | 25,974,333 | |||||
| Coca-Cola Femsa, ADR | 770,300 | 20,798,100 | Network Healthcare Holdings | 4,034,171 | 3,878,889 | |||||
| Controladora Comercial | Old Mutual | 4,638,886 | 11,812,059 | |||||||
| Mexicana (Units) | 9,497,100 | 13,244,375 | ||||||||
| Sanlam | 6,983,700 | 14,559,890 | ||||||||
| Desc, Ser. B | 6,871,166 c | 1,782,312 | ||||||||
| Sappi | 1,655,781 | 17,728,433 | ||||||||
| Embotelladoras Arca | 183,000 | 394,719 | ||||||||
| Sasol | 501,361 | 16,935,211 | ||||||||
| Grupo Continental | 2,047,500 | 3,464,531 | ||||||||
| Grupo Financiero Banorte, Cl. O | 42,945 | 352,551 | Shoprite Holdings | 1,364,836 | 3,441,574 | |||||
| Grupo Mexico, Ser. B | 183,029 | 321,781 | Steinhoff International Holdings | 2,598,369 | 6,735,756 | |||||
| Kimberly-Clark de Mexico, Cl. A | 3,522,100 | 11,582,064 | Telkom SA | 23,402 | 468,775 | |||||
| Organizacion Soriana, Cl. B | 59,400 | 233,049 | Tiger Brands | 16,802 | 342,243 | |||||
| Telefonos de Mexico, ADR | 1,729,200 | 33,200,640 | 149,757,732 | |||||||
| 92,049,398 | South Korea—21.1% | |||||||||
| Philippines—.6% | CJ | 90,860 | 5,800,947 | |||||||
| ABS-CBN Broadcasting | 1,568,300 c | 376,888 | Daeduck Electronics | 27,710 | 252,446 | |||||
| Bank of Philippine Islands | 6,436,576 | 6,120,213 | Daegu Bank | 28,130 | 295,879 | |||||
| Manila Electric, Cl. B | 2,878,000 c | 1,162,904 | Daelim Industrial | 111,660 | 6,628,458 | |||||
| 7,660,005 | Dongbu Insurance | 26,910 | 325,454 | |||||||
| Poland—.9% | Honam Petrochemical | 4,600 | 241,063 | |||||||
| KGHM Polska Miedz | 240,533 | 2,948,107 | Hyundai Department Store | 77,900 | 5,140,814 | |||||
| Polski Koncern Naftowy Orlen | 15,999 | 276,201 | Hyundai Development | 115,870 | 3,110,387 | |||||
| Powszechna Kasa | Hyundai Motor | 178,090 | 12,298,528 | |||||||
| Oszczednosci Bank Polski | 261,300 b | 2,311,679 | Industrial Bank of Korea | 664,650 | 6,953,480 | |||||
44
| Mellon Emerging Markets Fund (continued) | ||||||||||
| Common Stocks (continued) | Shares | Value ($) | Shares | Value ($) | ||||||
| South Korea (continued) | Taiwan (continued) | |||||||||
| INI Steel | 121,730 | 2,478,992 | Elan Microelectronics | 2,204,726 | 980,458 | |||||
| Kangwon Land | 702,317 | 11,088,064 | Evergreen Marine | 284,900 | 195,708 | |||||
| KCC | 1,200 | 258,567 | Far EasTone Telecommunications | 168,000 | 211,804 | |||||
| Kia Motors | 354,840 | 5,294,186 | First Financial Holding | 15,273,300 | 11,243,988 | |||||
| Kookmin Bank | 469,114 | 23,603,266 | High Tech Computer | 35,600 | 393,188 | |||||
| Kookmin Bank, ADR | 53,340 | 2,703,271 | Nien Hsing Textile | 2,056,000 | 1,562,912 | |||||
| Korea Electric Power | 756,180 | 23,793,824 | Novatek Microelectronics | 85,909 | 364,237 | |||||
| Korea Fine Chemical | 11,140 | 91,944 | Optimax Technology | 3,822,283 | 6,697,188 | |||||
| Korean Air Lines | 493,220 | 8,465,766 | Phoenix Precision Technology | 253,358 | 242,985 | |||||
| KT, ADR | 905,350 | 18,423,873 | Quanta Computer | 9,543,433 | 15,230,442 | |||||
| KT Freetel | 15,150 | 368,544 | Siliconware Precision Industries | 280,084 | 252,818 | |||||
| Kumho Tire, GDR | 308,200 b | 2,326,910 | SinoPac Financial Holdings | 28,723,225 | 13,807,460 | |||||
| LG Chem | 308,440 | 12,654,458 | Sunplus Technology | 2,773,000 | 2,799,637 | |||||
| LG Electronics | 274,480 | 16,549,278 | Taishin Financial Holdings | 2,183,440 | 1,402,568 | |||||
| LG Telecom | 56,300 c | 305,516 | Taiwan Mobile | 8,737,806 | 8,147,333 | |||||
| POSCO | 67,000 | 13,894,136 | Taiwan Semiconductor | |||||||
| POSCO, ADR | 71,350 | 3,728,038 | Manufacturing, ADR | 32,900 | 270,767 | |||||
| Pusan Bank | 27,560 | 266,696 | United Microelectronics | 48,199,928 | 29,085,996 | |||||
| Samsung | 212,090 | 3,129,330 | Yageo | 33,239,960 c | 10,532,171 | |||||
| Samsung Electro-Mechanics | 536,100 | 12,967,001 | 166,201,476 | |||||||
| Samsung Electronics | 60,050 | 31,732,103 | Thailand—2.2% | |||||||
| Samsung Fire & Marine Insurance | 145,350 | 13,983,571 | Bank of Ayudhya | 621,300 | 191,461 | |||||
| Samsung SDI | 86,840 | 8,192,735 | Charoen Pokphand Foods | 20,310,700 | 2,432,587 | |||||
| SK | 132,600 | 6,602,553 | Delta Electronics Thai | 956,700 | 359,799 | |||||
| SK Telecom | 45,100 | 8,252,892 | Kasikornbank | 6,009,700 | 8,847,678 | |||||
| SK Telecom, ADR | 550,000 | 11,693,000 | Krung Thai Bank | 38,766,800 | 8,973,591 | |||||
| 283,895,970 | PTT | 48,000 | 282,907 | |||||||
| Taiwan—12.4% | Siam Commercial Bank | 6,922,500 | 7,998,012 | |||||||
| Accton Technology | 3,368,225 c | 1,262,874 | Siam Makro | 547,400 | 752,407 | |||||
| Acer | 150,520 | 286,529 | Thai Olefins | 136,200 | 195,134 | |||||
| Advanced Semiconductor | 30,033,576 | |||||||||
| Engineering | 9,511,000 | 6,558,051 | Turkey—.7% | |||||||
| Asia Cement | 612,360 | 338,004 | Tupras Turkiye Petrol Rafine | 601,456 | 9,208,468 | |||||
| Asustek Computer | 3,322,128 | 8,093,465 | United States—.2% | |||||||
| Benq | 8,465,100 | 7,938,193 | iShares MSCI Emerging Markets Index | 38,000 | 2,968,560 | |||||
| Catcher Technology | 64,190 | 424,763 | Total Common Stocks | |||||||
| China Development | (cost $959,194,279) | 1,259,086,942 | ||||||||
| Financial Holding | 664,000 c | 243,125 | ||||||||
| China Motor | 6,665,220 | 6,129,616 | Preferred Stocks—2.7% | |||||||
| Chunghwa Telecom, ADR | 166,400 | 3,203,200 | Brazil: | |||||||
| Compal Electronics | 23,518,572 | 23,525,824 | Banco Bradesco | 9,700 | 411,697 | |||||
| Delta Electronics | 2,931,287 | 4,776,172 | Banco Itau Holding Financeira | 1,900 | 397,564 | |||||
The Funds 45
| STATEMENT OF INVESTMENTS (continued) |
| Mellon Emerging Markets Fund (continued) | ||||||||||
| Principal | ||||||||||
| Preferred Stocks (continued) | Shares | Value ($) | Short-Term Investment—1.4% | Amount ($) | Value ($) | |||||
| Brazil (continued): | Repurchase Agreement; | |||||||||
| Centrais Electricas Brasileiras | 163,381 | 2,177,395 | JP Morgan Chase & Co., | |||||||
| Cia de Tecidos Norte de Minas | 53,122 | 3,832,919 | 3.48%, dated 8/31/2005, | |||||||
| Cia Energetica de Minas Gerais | 217,434 | 7,599,732 | due 9/1/2005 in the | |||||||
| amount of $18,801,817 | ||||||||||
| Cia Paranaense de Energia | 1,332,700 | 7,653,083 | (collateralized by $18,986,000 | |||||||
| Duratex | 189,500 | 1,785,535 | U.S. Treasury Notes, | |||||||
| Perdigao | 8,100 | 215,555 | 4.125%, 8/15/2008, | |||||||
| Petroleo Brasileiro | 8,400 | 463,478 | value $19,175,860) | |||||||
| Telecomunicacoes de Sao Paulo | 201,427 | 3,706,065 | (cost $18,800,000) | 18,800,000 | 18,800,000 | |||||
| Telemar Norte Leste, Cl. A | 150,904 | 3,330,507 | Total Investments | |||||||
| Telemig Celular Participacoes | 2,811,118 | 4,438,419 | (cost $1,001,211,354) | 97.9% | 1,314,162,787 | |||||
| Tim Participacoes | 168,500 | 263,896 | Cash and Receivables (Net) | 2.1% | 28,195,351 | |||||
| Total Preferred Stocks | ||||||||||
| (cost $23,217,075) | 36,275,845 | Net Assets | 100.0% | 1,342,358,138 | ||||||
| ADR—American Depository Receipts. |
| GDR—Global Depository Receipts. |
| a The valuation of this security has been determined in good faith under the direction of the Trust’s Board. |
| b Securities exempt from registration under Rule 144A of the Securities Act of 1933.These securities may be resold in transactions exempt from registration, normally to qualified |
| institutional buyers. At August 31, 2005, these securities amounted to $52,198,719 or 3.9% of net assets. |
| c Non-income producing. |

| Telecommunications | 11.1 | Multi-Industry | 2.8 | |||
| Banking | 9.2 | Electrical & Electronics | 2.5 | |||
| Electronic Components & Instruments | 8.2 | Utilities | 2.5 | |||
| Energy | 6.5 | Leisure & Tourism | 2.4 | |||
| Energy Equipment & Services | 5.8 | Building Materials | 2.3 | |||
| Financial Services | 4.6 | Insurance | 1.9 | |||
| Utilities | 4.5 | Data Processing & Reproduction | 1.8 | |||
| Healthcare | 4.3 | Consumer Durables | 1.6 | |||
| Metals | 3.8 | Forest Products & Paper | 1.6 | |||
| Automobiles | 3.2 | Short-Term Investments | 1.4 | |||
| Beverages & Tobacco | 3.1 | Other | 9.8 | |||
| Chemicals | 3.0 | 97.9 | ||||
| † Based on net assets. | ||||||
| See notes to financial statements. | ||||||
| 46 |
| STATEMENT OF INVESTMENTS | ||||||||||
| August 31, 2005 | ||||||||||
| Mellon Balanced Fund | ||||||||||
| Common Stocks—43.0% | Shares | Value ($) | Shares | Value ($) | ||||||
| Consumer Cyclical—4.1% | Health Care—5.7% | |||||||||
| Aeropostale | 17,500 a | 446,950 | Abbott Laboratories | 34,130 | 1,540,287 | |||||
| Bed Bath & Beyond | 22,760 a | 922,918 | Aetna | 13,980 | 1,113,786 | |||||
| Chico’s FAS | 26,420 a | 917,038 | Amgen | 31,310 a | 2,501,669 | |||||
| Coach | 13,800 a | 458,022 | Boston Scientific | 56,290 a | 1,513,075 | |||||
| Coldwater Creek | 13,990 a | 428,794 | Johnson & Johnson | 33,030 | 2,093,772 | |||||
| Harrah’s Entertainment | 10,850 | 754,726 | Kinetic Concepts | 9,300 a | 509,640 | |||||
| Home Depot | 15,840 | 638,669 | Medtronic | 26,320 | 1,500,240 | |||||
| McDonald’s | 28,130 | 912,818 | Novartis, ADR | 21,550 | 1,050,562 | |||||
| Nordstrom | 41,880 | 1,406,330 | Pfizer | 130,323 | 3,319,327 | |||||
| Starbucks | 27,650 a | 1,355,956 | Sanofi-Synthelabo, ADR | 17,800 | 761,128 | |||||
| Starwood Hotels | UnitedHealth Group | 53,800 | 2,770,700 | |||||||
| & Resorts Worldwide | 20,180 | 1,176,494 | Wyeth | 31,140 | 1,425,901 | |||||
| Target | 21,640 | 1,163,150 | 20,100,087 | |||||||
| Wal-Mart Stores | 44,760 | 2,012,410 | Interest Sensitive—8.9% | |||||||
| Walgreen | 35,370 | 1,638,692 | Allstate | 16,910 | 950,511 | |||||
| Yum! Brands | 5,990 | 283,806 | American Express | 23,920 | 1,321,341 | |||||
| 14,516,773 | American International Group | 43,356 | 2,566,675 | |||||||
| Consumer Staples—3.2% | Bear Stearns Cos. | 7,330 | 736,665 | |||||||
| ACCO Brands | 2,218 a | 57,890 | Capital One Financial | 12,650 | 1,040,336 | |||||
| Altria Group | 27,400 | 1,937,180 | Citigroup | 53,106 | 2,324,450 | |||||
| Archer-Daniels-Midland | 29,660 | 667,647 | Commerce Bancorp | 12,500 | 421,500 | |||||
| Coca-Cola | 14,760 | 649,440 | Fannie Mae | 17,120 | 873,805 | |||||
| Fortune Brands | 9,440 | 821,091 | Freddie Mac | 22,770 | 1,374,853 | |||||
| General Mills | 12,160 | 560,819 | General Electric | 115,460 | 3,880,611 | |||||
| Gillette | 19,770 | 1,065,010 | Goldman Sachs Group | 15,210 | 1,691,048 | |||||
| Kimberly-Clark | 12,730 | 793,334 | JPMorgan Chase & Co. | 86,172 | 2,920,369 | |||||
| PepsiCo | 37,500 | 2,056,875 | Lehman Brothers Holdings | 11,330 | 1,197,128 | |||||
| Procter & Gamble | 43,020 | 2,386,749 | MBNA | 34,920 | 879,984 | |||||
| Sysco | 12,570 | 419,586 | Morgan Stanley | 14,280 | 726,423 | |||||
| 11,415,621 | PNC Financial Services Group | 16,710 | 939,603 | |||||||
| Electronics-Semiconductors/ | ||||||||||
| Components—.2% | Radian Group | 7,070 | 361,842 | |||||||
| Marvell Technology Group | 13,000 a | 613,470 | RenaissanceRe Holdings | 9,250 | 419,117 | |||||
| Energy—4.5% | Simon Property Group | 12,560 | 955,439 | |||||||
| Amerada Hess | 11,470 | 1,457,837 | St. Paul Travelers Cos. | 44,290 | 1,904,913 | |||||
| Apache | 19,150 | 1,371,523 | US Bancorp | 40,586 | 1,185,923 | |||||
| ConocoPhillips | 37,920 | 2,500,445 | Wachovia | 15,867 | 787,321 | |||||
| Devon Energy | 20,838 | 1,266,325 | Wells Fargo & Co. | 35,080 | 2,091,470 | |||||
| Exxon Mobil | 78,450 | 4,699,155 | 31,551,327 | |||||||
| Occidental Petroleum | 24,860 | 2,064,126 | Producer Goods—4.7% | |||||||
| Suncor Energy | 16,930 | 1,003,272 | Air Products & Chemicals | 16,680 | 924,072 | |||||
| XTO Energy | 35,756 | 1,423,088 | Caterpillar | 23,680 | 1,314,003 | |||||
| 15,785,771 | Companhia Vale do Rio Doce, ADR | 23,720 | 815,731 | |||||||
The Funds 47
| STATEMENT OF INVESTMENTS (continued) |
| Mellon Balanced Fund (continued) | ||||||||||||
| Common Stocks (continued) | Shares | Value ($) | Shares | Value ($) | ||||||||
| Producer Goods (continued) | Technology (continued) | |||||||||||
| Cooper Industries, Cl. A | 9,390 | 623,871 | Microsoft | 192,420 | 5,272,308 | |||||||
| DR Horton | 22,000 | 812,240 | QUALCOMM | 47,450 | 1,884,239 | |||||||
| Freeport-McMoRan Copper & Gold, Cl. B | 30,190 | 1,273,112 | Symantec | 62,340 a | 1,307,893 | |||||||
| General Dynamics | 7,190 | 823,902 | 25,165,782 | |||||||||
| Goodrich | 7,900 | 216,729 | Utilities—1.9% | |||||||||
| Honeywell International | 26,970 | 1,032,412 | Ameren | 9,120 | 500,962 | |||||||
| Inco | 29,510 | 1,249,158 | Constellation Energy Group | 18,670 | 1,096,862 | |||||||
| Ingersoll-Rand, Cl. A | 10,400 | 828,048 | Entergy | 12,330 | 923,640 | |||||||
| ITT Industries | 7,330 | 799,850 | Exelon | 30,110 | 1,622,628 | |||||||
| L-3 Communications Holdings | 8,160 | 668,141 | PPL | 30,300 | 968,388 | |||||||
| Pentair | 18,720 | 739,066 | SBC Communications | 34,097 | 821,056 | |||||||
| PPG Industries | 13,530 | 852,119 | Telefonos de Mexico, ADR | 49,600 | 952,320 | |||||||
| 3M | 12,650 | 900,048 | 6,885,856 | |||||||||
| Tyco International | 45,670 | 1,270,996 | Total Common Stocks | |||||||||
| United Technologies | 30,220 | 1,511,000 | (cost $107,282,428) | 152,063,662 | ||||||||
| 16,654,498 | Principal | |||||||||||
| Retail-Computers | Bonds and Notes—32.2% | Amount ($) | Value ($) | |||||||||
| & Electronics—.2% | ||||||||||||
| Asset-Backed Certificates/ | ||||||||||||
| Best Buy | 14,700 | 700,602 | Automobile—.6% | |||||||||
| Scientific Instruments—.2% | Harley-Davidson Motorcycle Trust: | |||||||||||
| Fisher Scientific International | 10,100 | a | 651,248 | Ser. 2003-4, Cl. A2, | ||||||||
| Services—2.3% | 2.69%, 4/15/2011 | 670,000 | 655,631 | |||||||||
| Allied Waste Industries | 47,900 | a | 382,242 | Ser. 2005-3, Cl. A2, | ||||||||
| Cendant | 60,220 | 1,224,875 | 4.41%, 6/15/2012 | 275,000 | 274,957 | |||||||
| McGraw-Hill Cos. | 31,080 | 1,498,677 | Honda Auto Receivables Owner Trust, | |||||||||
| Ser. 2004-3, Cl. A4, | ||||||||||||
| News, Cl. B | 82,690 | 1,413,172 | 3.28%, 2/18/2010 | 580,000 | 566,227 | |||||||
| Sprint Nextel Corp | 80,116 | 2,077,408 | Onyx Acceptance Owner Trust, | |||||||||
| Time Warner | 79,590 | 1,426,253 | Ser. 2005-A, Cl. A4, | |||||||||
| 8,022,627 | 3.91%, 9/15/2011 | 590,000 | 585,156 | |||||||||
| Technology—7.1% | 2,081,971 | |||||||||||
| Amdocs | 29,110 | a | 854,378 | Asset-Backed Certificates/ | ||||||||
| Apple Computer | 13,200 | a | 619,476 | Credit Card—.5% | ||||||||
| Cisco Systems | 144,080 | a | 2,538,690 | Bank One Issuance Trust, | ||||||||
| Corning | 38,600 | a | 770,456 | Ser. 2003-C3, Cl. C3, | ||||||||
| Danaher | 20,910 | 1,119,940 | 4.77%, 2/16/2016 | 1,800,000 | 1,806,727 | |||||||
| Dell | 63,180 | a | 2,249,208 | Asset-Backed | ||||||||
| eBay | 46,940 | a | 1,900,601 | Certificates/Other—.3% | ||||||||
| Caterpillar Financial Asset Trust, | ||||||||||||
| Electronic Arts | 10,910 | a | 624,925 | Ser. 2005-A, Cl. A4, | ||||||||
| EMC | 73,900 | a | 950,354 | 4.10%, 6/25/2010 | 755,000 | 752,685 | ||||||
| Google, Cl. A | 2,900 | a | 829,400 | CNH Equipment Trust, | ||||||||
| Intel | 100,940 | 2,596,177 | Ser. 2005-A, Cl. A4B, | |||||||||
| International Business Machines | 8,140 | 656,247 | 4.29%, 6/15/2012 | 275,000 | 275,384 | |||||||
| Linear Technology | 26,140 | 991,490 | 1,028,069 | |||||||||
48
| Mellon Balanced Fund (continued) | ||||||||||||||
| Principal | Principal | |||||||||||||
| Bonds and Notes (continued) | Amount ($) | Value ($) | Amount ($) | Value ($) | ||||||||||
| Banking/Finance—4.1% | Commercial Mortgage Pass- | |||||||||||||
| American Express, | Through Certificates (continued) | |||||||||||||
| Notes, 4.75%, 6/17/2009 | 1,235,000 | b | 1,253,610 | GS Mortgage Securities II (continued): | ||||||||||
| AXA Financial, | Ser. 2005-GG4, Cl. A4, | |||||||||||||
| Sr. Notes, 7.75%, 8/1/2010 | 500,000 | 570,356 | 4.761%, 7/10/2039 | 350,000 | 352,976 | |||||||||
| Bank of America, | JP Morgan Chase Commercial | |||||||||||||
| Sr. Notes, 5.875%, 2/15/2009 | 750,000 | 788,256 | Mortgage Securities: | |||||||||||
| Bear Stearns Cos., | Ser. 2005-CB11, Cl. A2, | |||||||||||||
| Notes, 4.50%, 10/28/2010 | 980,000 | 979,725 | 5.016%, 8/12/2037 | 520,000 | 531,258 | |||||||||
| Ser. 2005-LDP2, Cl. AM, | ||||||||||||||
| Caterpillar Financial Services, | 4.78%, 7/15/2042 | 430,000 | 432,878 | |||||||||||
| Notes, Ser. F, 3.625%, 11/15/2007 | 810,000 | 800,725 | 3,903,795 | |||||||||||
| CIT Group, | Foreign/Governmental—.9% | |||||||||||||
| Debs., 5.875%, 10/15/2008 | 1,200,000 | 1,252,339 | Financement Quebec, | |||||||||||
| Countrywide Home Loan, | Govt. Gtd. Notes, 5%, 10/25/2012 | 605,000 | 627,669 | |||||||||||
| Notes, 3.25%, 5/21/2008 | 600,000 | 582,399 | Province of Manitoba, | |||||||||||
| ERP Operating, | Notes, 4.45%, 4/12/2010 | 405,000 | 410,212 | |||||||||||
| Notes, 6.95%, 3/2/2011 | 750,000 | 829,660 | Province of Ontario: | |||||||||||
| General Electric Capital, | Notes, 5.125%, 7/17/2012 | 500,000 | b | 530,920 | ||||||||||
| Notes, 3.125%, 4/1/2009 | 220,000 | b | 211,632 | Sr. Unsub. Bonds, 5.50%, 10/1/2008 | 465,000 | 485,095 | ||||||||
| Goldman Sachs Group, | Republic of Italy, | |||||||||||||
| Notes, 4.75%, 7/15/2013 | 1,000,000 | 995,501 | Bonds, 4%, 6/16/2008 | 710,000 | 708,579 | |||||||||
| KFW, | United Mexican States, | |||||||||||||
| Gov’t Gtd. Notes, | Notes, 6.625%, 3/3/2015 | 500,000 | b | 553,250 | ||||||||||
| 3.75%, 1/24/2008 | 975,000 | 967,386 | 3,315,725 | |||||||||||
| Landwirtschaftliche Rentenbank, | Industrial—1.1% | |||||||||||||
| Gov’t Gtd. Notes, | Alcoa, Notes, 4.25%, 8/15/2007 | 885,000 | 886,191 | |||||||||||
| 3.25%, 10/12/2007 | 895,000 | 878,548 | ||||||||||||
| Canadian National Railways, | ||||||||||||||
| Lehman Brothers Holdings, | Notes, 4.25%, 8/1/2009 | 1,000,000 | 995,028 | |||||||||||
| Notes, 7%, 2/1/2008 | 875,000 | 927,741 | Conoco Funding, | |||||||||||
| Merrill Lynch & Co., | Gtd. Notes, 6.35%, 10/15/2011 | 490,000 | 541,942 | |||||||||||
| Notes, Ser. C, 4.125%, 9/10/2009 | 900,000 | 890,707 | International Business Machines, | |||||||||||
| Morgan Stanley, | Debs., 7%, 10/30/2025 | 650,000 | 801,965 | |||||||||||
| Unsub. Notes, 6.75%, 4/15/2011 | 775,000 | 857,364 | Wal-Mart Stores, | |||||||||||
| PNC Funding, | Bonds, 5.25%, 9/1/2035 | 690,000 | 698,888 | |||||||||||
| Sr. Notes, 4.50%, 3/10/2010 | 900,000 | 901,999 | 3,924,014 | |||||||||||
| Wells Fargo Financial, | Media/Telecommunications—1.6% | |||||||||||||
| Notes, 5.50%, 8/1/2012 | 795,000 | 842,729 | Comcast, | |||||||||||
| 14,530,677 | Bonds, 5.65%, 6/15/2035 | 515,000 | 507,360 | |||||||||||
| Commercial Mortgage | British Sky Broadcasting, | |||||||||||||
| Pass-Through Certificates—1.1% | Gtd. Notes, 6.875%, 2/23/2009 | 330,000 | 353,790 | |||||||||||
| Asset Securitization, | Sprint Capital, | |||||||||||||
| Ser. 1995-MD4, Cl. A1, | Notes, 8.375%, 3/15/2012 | 950,000 | 1,135,850 | |||||||||||
| 7.10%, 8/13/2029 | 89,907 | 92,458 | Time Warner Cos., | |||||||||||
| GS Mortgage Securities II: | Gtd. Notes, 6.95%, 1/15/2028 | 650,000 | 735,491 | |||||||||||
| Ser. 1998-GLII, Cl. A2, | Univision Communications, | |||||||||||||
| 6.562%, 4/13/2031 | 2,375,000 | 2,494,225 | Sr. Notes, 3.50%, 10/15/2007 | 1,150,000 | 1,123,243 | |||||||||
The Funds 49
| STATEMENT OF INVESTMENTS (continued) |
| Mellon Balanced Fund (continued) | ||||||||||
| Principal | Principal | |||||||||
| Bonds and Notes (continued) | Amount ($) | Value ($) | Amount ($) | Value ($) | ||||||
| Media/Telecommunications (continued) | U.S. Government | |||||||||
| Verizon New York, | Agencies (continued) | |||||||||
| Debs., 7.375%, 4/1/2032 | 500,000 | 588,188 | Federal Home Loan | |||||||
| Viacom, | Mortgage Corp., Notes: | |||||||||
| Gtd. Notes, 7.875%, 7/30/2030 | 850,000 | 1,048,835 | 3.75%, 8/3/2007 | 885,000 | 880,545 | |||||
| 5,492,757 | 4.50%, 8/22/2007 | 655,000 | 657,364 | |||||||
| 3.30%, 9/14/2007 | 1,125,000 | 1,110,420 | ||||||||
| Real Estate Investment Trusts—.2% | 3.25%, 11/2/2007 | 155,000 | 152,425 | |||||||
| Liberty Property, | 4.375%, 1/25/2010 | 840,000 | 838,848 | |||||||
| Sr. Notes, 7.25%, 3/15/2011 | 250,000 | 278,735 | 4.75%, 12/8/2010 | 715,000 | 716,380 | |||||
| Mack-Cali Realty, | Federal National Mortgage | |||||||||
| Notes, 7.75%, 2/15/2011 | 475,000 | 540,085 | Association, Notes: | |||||||
| 818,820 | 4%, 5/9/2007 | 585,000 | 583,750 | |||||||
| Residential Mortgage | 4.125%, 6/16/2008 | 590,000 | 587,133 | |||||||
| Pass-Through Certificates—.1% | 4.75%, 8/25/2008 | 425,000 | 426,938 | |||||||
| ABN Ambro Mortgage Corp., | 9,370,812 | |||||||||
| Ser. 2002-1A, Cl. M, | U.S. Government Agencies/ | |||||||||
| 5.627%, 6/25/2032 | 207,875 c | 208,597 | Mortgage-Backed—10.8% | |||||||
| Washington Mutual, | Federal Home Loan Mortgage Corp.: | |||||||||
| Ser. 2003-S4, Cl. 4A1, | 8.50%, 6/1/2018 | 658,180 | 712,479 | |||||||
| 4%, 2/25/2032 | 291,710 | 290,168 | 5%, 10/1/2018 | 1,287,418 | 1,298,683 | |||||
| 498,765 | 7%, 8/1/2029 | 153,732 | 160,985 | |||||||
| U.S. Government—7.8% | 5.625%, 7/1/2031 | 172,344 | 177,109 | |||||||
| U.S. Treasury Bonds: | 6.50%, 8/1/2032 | 926,899 | 959,915 | |||||||
| 6.25%, 8/15/2023 | 2,540,000 | 3,148,203 | 5.50%, 9/1/2006-3/1/2035 | 4,059,261 | 4,129,474 | |||||
| 6%, 2/15/2026 | 50,000 | 61,332 | Federal National | |||||||
| 5.375%, 2/15/2031 | 1,195,000 | 1,401,412 | Mortgage Association: | |||||||
| U.S. Treasury Inflation | 8%, 2/1/2013 | 235,915 | 246,161 | |||||||
| Protection Securities, | 4.50%, 5/1/2020-7/1/2020 | 2,855,815 | 2,834,712 | |||||||
| 1.625%, 1/15/2015 | 1,201,943 b,d | 1,201,592 | 7%, 6/1/2009-6/1/2032 | 609,867 | 636,054 | |||||
| U.S Treasury Notes: | 7.50%, 7/1/2032 | 267,806 | 284,041 | |||||||
| 5.50%, 2/15/2008 | 155,000 b | 161,163 | 6%, 9/1/2019-3/1/2035 | 3,455,813 | 3,549,577 | |||||
| 6%, 8/15/2009 | 7,210,000 b | 7,775,192 | 6.50%, 3/1/2017-6/1/2035 | 2,364,751 | 2,449,485 | |||||
| 4.375%, 5/15/2007-8/15/20012 | 8,090,000 b | 8,181,117 | 5%, 10/1/2018-7/1/2035 | 10,860,930 | 10,855,619 | |||||
| 4%, 11/15/2012 | 400,000 b | 401,920 | 5.50%, 1/1/2020-7/1/2035 | 7,204,479 | 7,300,805 | |||||
| 4.125%, 5/15/2015 | 5,200,000 b | 5,235,100 | Ser. 333, Cl. 2, 5.50%, | |||||||
| 27,567,031 | 3/1/2033 (Interest | |||||||||
| Only Obligation) | 1,190,989 | 226,863 | ||||||||
| U.S. Government Agencies—2.7% | ||||||||||
| Federal Farm Credit Bank, Bonds, | Government National | |||||||||
| 4.125%, 4/15/2009 | 855,000 | 855,043 | Mortgage Association I: | |||||||
| 8%, 2/15/2008 | 170,810 | 175,026 | ||||||||
| Federal Home Loan Bank, Bonds: | 9%, 12/15/2009 | 389,920 | 407,829 | |||||||
| 3.75%, 3/7/2007 | 130,000 | 129,326 | 7%, 5/15/2023-11/15/2023 | 418,205 | 442,252 | |||||
| 4%, 4/25/2007 | 85,000 | 84,850 | 6.50%, 2/15/2024 | 245,267 | 256,763 | |||||
| 3.875%, 2/15/2008 | 760,000 | 755,689 | 7.50%, 3/15/2027 | 165,996 | 177,096 | |||||
| 3.90%, 2/25/2008 | 560,000 | 557,846 | 6%, 10/15/2008-10/15/2033 | 858,352 | 882,442 | |||||
| 4.25%, 5/16/2008 | 610,000 | 607,395 | ||||||||
| 4.65%, 8/22/2008 | 425,000 | 426,860 | 38,163,370 | |||||||
50
| Mellon Balanced Fund (continued) | ||||||||||
| Principal | ||||||||||
| Bonds and Notes (continued) | Amount ($) | Value ($) | Other Investments (continued) | Shares | Value ($) | |||||
| Utilities—.4% | Registered Investment | |||||||||
| Dominion Resources | Companies (continued): | |||||||||
| Sr. Unscd. Notes, | Mellon Small Cap Stock Fund, | |||||||||
| 5.15%, 7/15/2015 | 500,000 | 506,838 | Class M Shares | 634,438 e | 10,899,641 | |||||
| FPL Group Capital, | Total Other Investments | |||||||||
| Gtd. Debs., 6.125%, 5/15/2007 | 700,000 | 721,628 | (cost $65,913,724) | 90,040,116 | ||||||
| 1,228,466 | ||||||||||
| Total Bonds and Notes | Investment of Cash Collateral | |||||||||
| (cost $113,095,071) | 113,730,999 | for Securities Loaned—6.1% | ||||||||
| Registered Investment Company; | ||||||||||
| Other Investments—25.5% | Shares | Value ($) | Dreyfus Institutional Cash | |||||||
| Registered Investment Companies: | Advantage Plus Fund | |||||||||
| (cost $21,441,190) | 21,441,190 f | 21,441,190 | ||||||||
| Mellon Emerging Markets Fund, | ||||||||||
| Class M Shares | 899,547 e | 20,410,713 | Total Investments | |||||||
| Mellon International Fund, | (cost $307,732,413) | 106.8% | 377,275,967 | |||||||
| Class M Shares | 2,103,737 e | 34,080,543 | Liabilities, Less Cash and Receivables | (6.8%) | (23,902,315) | |||||
| Mellon Mid Cap Stock Fund, | ||||||||||
| Class M Shares | 1,665,488 e | 24,649,219 | Net Assets | 100.0% | 353,373,652 | |||||
| ADR—American Depository Receipts. | ||||||||||
| a Non-income producing. | ||||||||||
| b All or a portion of these securities are on loan. At August 31, 2005, the total market value of the fund’s securities on loan is $24,945,632 and the total market value of the | ||||||||||
| collateral held by the fund is $25,478,199, consisting of cash collateral of $21,441,190 and U.S. Government and agency securities valued at $4,037,009. | ||||||||||
| c Variable rate security—interest rate subject to periodic change. | ||||||||||
| d Principal amount for accrual purposes is periodically adjusted based on changes in the Consumer Price Index. | ||||||||||
| e Investments in affiliated mutual funds. | ||||||||||
| f Investment in affiliated money market mutual fund. | ||||||||||
| Portfolio Summary (Unaudited) † | ||||||
| Value (%) | Value (%) | |||||
| Registered Investment Companies | 25.5 | Health Care | 5.7 | |||
| U.S. Government Agencies/Mortgage-Backed | 10.8 | Producer Goods | 4.7 | |||
| Interest Sensitive | 8.9 | Energy | 4.5 | |||
| U.S Government | 7.8 | Other | 25.7 | |||
| Technology | 7.1 | |||||
| Money Market Investments | 6.1 | 106.8 | ||||
| † Based on net assets. | ||||||
| See notes to financial statements. | ||||||
| The Funds 51 |
| STATEMENTS OF ASSETS AND LIABILITIES | ||||||||||
| August 31, 2005 | ||||||||||
| Mellon | Mellon | Mellon | Mellon | |||||||
| Large Cap | Income | Mid Cap | Small Cap | |||||||
| Stock Fund | Stock Fund | Stock Fund | Stock Fund | |||||||
| Assets ($): | ||||||||||
| Investments in securities— | ||||||||||
| See Statement of Investments† | ||||||||||
| (including securities on loan)††—Note 2(b): | ||||||||||
| Unaffiliated isuers | 1,734,768,642 | 395,664,168 | 1,492,221,587 | 803,725,990 | ||||||
| Affiliated issuers | 39,543,268 | 7,600,890 | 16,892,046 | 96,933,352 | ||||||
| Cash | — | — | 1,414,161 | 1,392,678 | ||||||
| Receivable for investment securities sold | 28,037,824 | — | 11,109,585 | 2,920,697 | ||||||
| Dividends and interest receivable | 2,617,556 | 944,674 | 1,164,131 | 279,103 | ||||||
| Receivable for shares of Beneficial Interest subscribed | 1,083,190 | 280,000 | 613,977 | 255,626 | ||||||
| Prepaid expenses | 25,974 | 16,736 | 35,592 | 15,801 | ||||||
| 1,806,076,454 | 404,506,468 | 1,523,451,079 | 905,523,247 | |||||||
| Liabilities ($): | ||||||||||
| Due to The Dreyfus Corporation and affiliates—Note 4(c) | 990,846 | 226,319 | 977,591 | 612,143 | ||||||
| Due to Administrator—Note 4(a) | 197,441 | 44,744 | 167,060 | 91,533 | ||||||
| Cash overdraft due to Custodian | 291,298 | 383,091 | — | — | ||||||
| Liability for securities on loan—Note 2(b) | 39,543,268 | 7,600,890 | 16,892,046 | 96,933,352 | ||||||
| Payable for investment securities purchased | 27,107,360 | 151,867 | 11,388,220 | 4,832,723 | ||||||
| Payable for shares of Beneficial Interest redeemed | 379,157 | — | 474,921 | 518,869 | ||||||
| Accrued expenses | 50,762 | 29,662 | 42,128 | 35,224 | ||||||
| 68,560,132 | 8,436,573 | 29,941,966 | 103,023,844 | |||||||
| Net Assets ($) | 1,737,516,322 | 396,069,895 | 1,493,509,113 | 802,499,403 | ||||||
| Composition of Net Assets ($): | ||||||||||
| Paid-in capital | 1,321,344,550 | 284,574,348 | 972,181,316 | 558,272,246 | ||||||
| Accumulated undistributed investment income—net | 534,727 | 56,371 | 1,036,313 | 174,382 | ||||||
| Accumulated net realized gain (loss) on investments | (62,401,685) | 6,439,831 | 175,139,971 | 111,460,405 | ||||||
| Accumulated net unrealized appreciation | ||||||||||
| (depreciation) on investments | 478,038,730 | 104,999,345 | 345,151,513 | 132,592,370 | ||||||
| Net Assets ($) | 1,737,516,322 | 396,069,895 | 1,493,509,113 | 802,499,403 | ||||||
| Net Asset Value Per Share | ||||||||||
| Class M Shares | ||||||||||
| Net Assets ($) | 1,733,531,012 | 394,977,477 | 1,458,951,536 | 797,807,512 | ||||||
| Shares Outstanding | 176,992,791 | 39,824,563 | 98,609,959 | 46,433,663 | ||||||
| Net Asset Value Per Share ($) | 9.79 | 9.92 | 14.80 | 17.18 | ||||||
| Investor Shares | ||||||||||
| Net Assets ($) | 3,985,310 | 1,092,418 | 26,444,991 | 4,691,891 | ||||||
| Shares Outstanding | 406,030 | 109,506 | 1,795,162 | 276,412 | ||||||
| Net Asset Value Per Share ($) | 9.82 | 9.98 | 14.73 | 16.97 | ||||||
| Dreyfus Premier Shares | ||||||||||
| Net Assets ($) | — | — | 8,112,586 | — | ||||||
| Shares Outstanding | — | — | 561,634 | — | ||||||
| Net Asset Value Per Share ($) | — | — | 14.44 | — | ||||||
| † | Investments at cost ($): | |||||||||
| Unaffiliated issuers | 1,256,729,912 | 290,664,823 | 1,147,070,074 | 671,133,620 | ||||||
| Affiliated issuers | 39,543,268 | 7,600,890 | 16,892,046 | 96,933,352 | ||||||
| †† | Value of securities on loan ($) | 44,570,928 | 9,432,269 | 34,949,101 | 94,286,727 | |||||
| See notes to financial statements. |
| 52 |
| Mellon | Mellon | Mellon | ||||||
| International | Emerging | Balanced | ||||||
| Fund | Markets Fund | Fund | ||||||
| Assets ($): | ||||||||
| Investments in securities—See Statement of Investments † | ||||||||
| (including securities on loan) ††—Note 2(b): | ||||||||
| Unaffiliated isuers | 1,834,241,033 | 1,314,162,787 | 265,794,661 | |||||
| Affiliated issuers | — | — | 111,481,306 | |||||
| Cash | 6,372,622 | 1,169,341 | — | |||||
| Cash denominated in foreign currencies††† | 21,321,712 | 17,317,061 | — | |||||
| Receivable for investment securites sold | 8,225,719 | 16,545,367 | 3,388,501 | |||||
| Dividends and interest receivable | 4,926,274 | 3,565,779 | 1,094,940 | |||||
| Receivable for shares of Beneficial Interest subscribed | 1,097,347 | 1,960,640 | — | |||||
| Paydowns receivable | — | — | 11,438 | |||||
| Unrealized appreciation on foreign currency exchange contracts—Note 2(e) | 28,078 | 12,634 | — | |||||
| Prepaid expenses | 18,278 | 25,794 | 14,866 | |||||
| 1,876,231,063 | 1,354,759,403 | 381,785,712 | ||||||
| Liabilities ($): | ||||||||
| Due to The Dreyfus Corporation and affiliates—Note 4(c) | 1,694,271 | 1,901,417 | 150,930 | |||||
| Due to Administrator—Note 4(a) | 208,155 | 152,824 | 30,029 | |||||
| Cash overdraft due to Custodian | — | — | 2,027,841 | |||||
| Payable for investment securities purchased | 12,791,355 | 9,432,917 | 3,290,599 | |||||
| Liability for securities on loan—Note 2(b) | — | — | 21,441,190 | |||||
| Payable for shares of Beneficial Interest redeemed | 583,646 | 845,686 | 21,006 | |||||
| Bank loan payable—Note 3 | — | — | 1,400,000 | |||||
| Unrealized depreciation on foreign currency exchange contracts—Note 2(e) | 425 | 29,799 | — | |||||
| Interest expense—Note 3 | — | — | 8,068 | |||||
| Accrued expenses | 88,845 | 38,622 | 42,397 | |||||
| 15,366,697 | 12,401,265 | 28,412,060 | ||||||
| Net Assets ($) | 1,860,864,366 | 1,342,358,138 | 353,373,652 | |||||
| Composition of Net Assets ($): | ||||||||
| Paid-in capital | 1,482,843,025 | 869,649,243 | 278,261,878 | |||||
| Accumulated undistributed investment income—net | 21,539,696 | 20,147,828 | 668,597 | |||||
| Accumulated net realized gain (loss) on investments | 111,861,530 | 139,834,186 | 4,899,623 | |||||
| Accumulated net unrealized appreciation (depreciation) on investments | — | — | 69,543,554 | |||||
| Accumulated net unrealized appreciation (depreciation) | ||||||||
| on investments and foreign currency transactions | 244,620,115 | 312,726,881 | — | |||||
| Net Assets ($) | 1,860,864,366 | 1,342,358,138 | 353,373,652 | |||||
| Net Asset Value Per Share | ||||||||
| Class M Shares | ||||||||
| Net Assets ($) | 1,857,397,916 | 1,337,800,722 | 351,525,348 | |||||
| Shares Outstanding | 114,662,647 | 58,961,837 | 27,494,236 | |||||
| Net Asset Value Per Share ($) | 16.20 | 22.69 | 12.79 | |||||
| Investor Shares | ||||||||
| Net Assets ($) | 3,466,450 | 4,557,416 | 1,848,304 | |||||
| Shares Outstanding | 207,129 | 199,992 | 144,098 | |||||
| Net Asset Value Per Share ($) | 16.74 | 22.79 | 12.83 | |||||
| † | Investments at cost ($): | |||||||
| Unaffiliated issuers | 1,589,617,005 | 1,001,211,354 | 220,377,499 | |||||
| Affiliated issuers | — | — | 87,354,914 | |||||
| †† | Value of securities on loan ($) | 444,162 | — | 24,945,632 | ||||
| ††† | Cash denominated in foreign currencies (cost) ($) | 21,392,868 | 17,651,540 | — | ||||
See notes to financial statements.
The Funds 53
| STATEMENTS OF OPERATIONS | ||||||||||
| Year Ended August 31, 2005 | ||||||||||
| Mellon | Mellon | Mellon | Mellon | |||||||
| Large Cap | Income | Mid Cap | Small Cap | |||||||
| Stock Fund | Stock Fund | Stock Fund | Stock Fund | |||||||
| Investment Income ($): | ||||||||||
| Income: | ||||||||||
| Cash dividends (net of $74,686, $10,952, $6,918 and | ||||||||||
| $11,003 foreign taxes withheld at source, respectively) | 31,092,567 | 9,758,465 | 15,316,562 | 7,124,022 | ||||||
| Interest | 597,024 | 329,648 | 340,791 | 189,637 | ||||||
| Income from securities lending | 38,270 | 8,328 | 143,034 | 476,664 | ||||||
| Total Income | 31,727,861 | 10,096,441 | 15,800,387 | 7,790,323 | ||||||
| Expenses: | ||||||||||
| Investment advisory fee—Note 4(a) | 10,673,410 | 2,230,567 | 10,109,587 | 7,048,135 | ||||||
| Administration fee—Note 4(a) | 2,215,136 | 462,685 | 1,818,117 | 1,118,908 | ||||||
| Custodian fees—Note 4(c) | 107,795 | 26,300 | 98,873 | 85,387 | ||||||
| Trustees’ fees and expenses—Note 4(d) | 62,739 | 13,197 | 49,961 | 33,607 | ||||||
| Auditing fees | 29,635 | 23,243 | 25,082 | 24,087 | ||||||
| Legal fees | 29,482 | 5,228 | 6,891 | 14,521 | ||||||
| Registration fees | 27,960 | 27,540 | 35,855 | 28,011 | ||||||
| Shareholder servicing costs—Note 4(c) | 10,872 | 2,750 | 97,997 | 12,737 | ||||||
| Prospectus and shareholders’ reports | 7,824 | 6,987 | 42,052 | 6,861 | ||||||
| Distribution fees—Note 4(b) | — | — | 65,730 | — | ||||||
| Interest expense—Note 3 | — | — | 9,654 | 2,892 | ||||||
| Miscellaneous | 36,367 | 9,946 | 27,997 | 11,322 | ||||||
| Total Expenses | 13,201,220 | 2,808,443 | 12,387,796 | 8,386,468 | ||||||
| Less—reduction in custody fees due to | ||||||||||
| earnings credits—Note 2(b) | (1,801) | (1,345) | — | (3,113) | ||||||
| Net Expenses | 13,199,419 | 2,807,098 | 12,387,796 | 8,383,355 | ||||||
| Investment Income (Loss)—Net | 18,528,442 | 7,289,343 | 3,412,591 | (593,032) | ||||||
| Realized and Unrealized Gain (Loss) | ||||||||||
| on Investments—Note 5 ($): | ||||||||||
| Net realized gain (loss) on investments | 49,992,372 | 6,443,507 | 199,130,337 | 124,554,417 | ||||||
| Net unrealized appreciation | ||||||||||
| (depreciation) on investments | 134,534,665 | 36,248,833 | 131,825,896 | 7,285,347 | ||||||
| Net Realized and Unrealized | ||||||||||
| Gain (Loss) on Investments | 184,527,037 | 42,692,340 | 330,956,233 | 131,839,764 | ||||||
| Net Increase in Net Assets | ||||||||||
| Resulting from Operations | 203,055,479 | 49,981,683 | 334,368,824 | 131,246,732 | ||||||
| See notes to financial statements. |
| 54 |
| Mellon | Mellon | Mellon | ||||
| International | Emerging | Balanced | ||||
| Fund | Markets Fund | Fund | ||||
| Investment Income ($): | ||||||
| Income: | ||||||
| Cash dividends (net of $3,676,777, $4,608,393 and $6,916 foreign | ||||||
| taxes withheld at source, respectively) | 37,655,638 | 36,946,077 | 3,492,985 | |||
| Interest | 1,256,359 | 481,619 | 4,919,829 | |||
| Income from securities lending | 81,724 | — | 26,225 | |||
| Total Income | 38,993,721 | 37,427,696 | 8,439,039 | |||
| Expenses: | ||||||
| Investment advisory fee—Note 4(a) | 13,341,337 | 14,233,018 | 1,552,710 | |||
| Administration fee—Note 4(a) | 2,116,403 | 1,669,408 | 349,162 | |||
| Custodian fees—Note 4(c) | 1,375,485 | 2,561,561 | 31,528 | |||
| Registration fees | 74,602 | 32,716 | 25,068 | |||
| Trustees’ fees and expenses—Note 4(d) | 59,953 | 45,820 | 14,434 | |||
| Auditing fees | 28,570 | 26,850 | 35,645 | |||
| Legal fees | 22,123 | 20,803 | 4,136 | |||
| Shareholder servicing costs—Note 4(c) | 7,456 | 14,005 | 3,205 | |||
| Prospectus and shareholders’ reports | 3,841 | 5,516 | 13,117 | |||
| Interest expense—Note 3 | 2,377 | — | 8,306 | |||
| Miscellaneous | 56,945 | 49,564 | 20,725 | |||
| Total Expenses | 17,089,092 | 18,659,261 | 2,058,036 | |||
| Less—reduction in custody fees due to earnings credits—Note 2(b) | — | (12,917) | — | |||
| Net Expenses | 17,089,092 | 18,646,344 | 2,058,036 | |||
| Investment Income—Net | 21,904,629 | 18,781,352 | 6,381,003 | |||
| Realized and Unrealized Gain (Loss) on Investments—Note 5 ($): | ||||||
| Net realized gain (loss) on investments | — | — | 16,266,463 | |||
| Net realized gain (loss) on investments and foreign currency transactions | 142,332,726 | 163,176,508 | — | |||
| Net realized gain (loss) on foreign currency exchange contracts | (1,471,761) | (387,715) | — | |||
| Net Realized Gain (Loss) | 140,860,965 | 162,788,793 | 16,266,463 | |||
| Net unrealized appreciation (depreciation) on investments | — | — | 19,693,002 | |||
| Net unrealized appreciation (depreciation) | ||||||
| on investments and foreign currency transactions | 100,934,933 | 192,279,052 | — | |||
| Net Realized and Unrealized Gain (Loss) on Investments | 241,795,898 | 355,067,845 | 35,959,465 | |||
| Net Increase in Net Assets Resulting from Operations | 263,700,527 | 373,849,197 | 42,340,468 | |||
| See notes to financial statements. |
| The Funds 55 |
STATEMENTS OF CHANGES IN NET ASSETS
| Mellon Large Cap Stock Fund | Mellon Income Stock Fund | |||||||
| Year Ended August 31, | Year Ended August 31, | |||||||
| 2005 | 2004 | 2005 | 2004 | |||||
| Operations ($): | ||||||||
| Investment income—net | 18,528,442 | 12,308,880 | 7,289,343 | 4,711,642 | ||||
| Net realized gain (loss) on investments | 49,992,372 | 68,780,791 | 6,443,507 | 34,939,890 | ||||
| Net unrealized appreciation (depreciation) on investments | 134,534,665 | 38,241,235 | 36,248,833 | (2,981,630) | ||||
| Net Increase (Decrease) in Net Assets Resulting from Operations | 203,055,479 | 119,330,906 | 49,981,683 | 36,669,902 | ||||
| Dividends to Shareholders from ($): | ||||||||
| Investment income—net: | ||||||||
| Class M Shares | (18,372,314) | (12,496,818) | (7,052,698) | (4,805,224) | ||||
| Investor Shares | (31,103) | (21,293) | (15,954) | (12,371) | ||||
| Net realized gain on investments: | ||||||||
| Class M Shares | — | — | (27,270,508) | (3,983,636) | ||||
| Investor Shares | — | — | (75,936) | (14,224) | ||||
| Total Dividends | (18,403,417) | (12,518,111) | (34,415,096) | (8,815,455) | ||||
| Beneficial Interest Transactions ($): | ||||||||
| Net proceeds from shares sold: | ||||||||
| Class M Shares | 207,306,006 | 186,854,023 | 139,980,677 | 45,592,369 | ||||
| Investor Shares | 1,519,222 | 14,101,149 | 276,218 | 88,373 | ||||
| Dividends reinvested: | ||||||||
| Class M Shares | 921,282 | 726,047 | 18,406,441 | 2,737,835 | ||||
| Investor Shares | 21,575 | 10,984 | 89,750 | 26,489 | ||||
| Cost of shares redeemed: | ||||||||
| Class M Shares | (203,961,213) | (228,844,318) | (53,808,276) | (72,272,051) | ||||
| Investor Shares | (1,299,792) | (13,279,261) | (78,671) | (555,022) | ||||
| Increase (Decrease) in Net Assets from | ||||||||
| Beneficial Interest Transactions | 4,507,080 | (40,431,376) | 104,866,139 | (24,382,007) | ||||
| Total Increase (Decrease) in Net Assets | 189,159,142 | 66,381,419 | 120,432,726 | 3,472,440 | ||||
| Net Assets ($): | ||||||||
| Beginning of Period | 1,548,357,180 | 1,481,975,761 | 275,637,169 | 272,164,729 | ||||
| End of Period | 1,737,516,322 | 1,548,357,180 | 396,069,895 | 275,637,169 | ||||
| Undistributed investment income—net | 534,727 | 437,108 | 56,371 | 63,830 | ||||
| Capital Share Transactions (Shares): | ||||||||
| Class M Shares | ||||||||
| Shares sold | 22,038,590 | 21,219,504 | 14,483,294 | 4,864,972 | ||||
| Shares issued for dividends reinvested | 98,190 | 82,445 | 1,931,894 | 292,117 | ||||
| Shares redeemed | (21,865,930) | (25,953,732) | (5,530,554) | (7,871,834) | ||||
| Net Increase (Decrease) in Shares Outstanding | 270,850 | (4,651,783) | 10,884,634 | (2,714,745) | ||||
| Investor Shares | ||||||||
| Shares sold | 160,554 | 1,589,881 | 28,956 | 9,545 | ||||
| Shares issued for dividends reinvested | 2,301 | 1,249 | 9,336 | 2,829 | ||||
| Shares redeemed | (139,866) | (1,468,062) | (8,150) | (58,918) | ||||
| Net Increase (Decrease) in Shares Outstanding | 22,989 | 123,068 | 30,142 | (46,544) | ||||
| See notes to financial statements. |
| 56 |
| Mellon Mid Cap Stock Fund | Mellon Small Cap Stock Fund | |||||||
| Year Ended August 31, | Year Ended August 31, | |||||||
| 2005 | 2004 | 2005 | 2004 | |||||
| Operations ($): | ||||||||
| Investment income (loss)—net | 3,412,591 | 3,917,981 | (593,032) | (765,197) | ||||
| Net realized gain (loss) on investments | 199,130,337 | 107,373,012 | 124,554,417 | 43,686,983 | ||||
| Net unrealized appreciation (depreciation) on investments | 131,825,896 | 11,137,361 | 7,285,347 | 35,068,269 | ||||
| Net Increase (Decrease) in Net Assets Resulting from Operations | 334,368,824 | 122,428,354 | 131,246,732 | 77,990,055 | ||||
| Dividends to Shareholders from ($): | ||||||||
| Investment income—net: | ||||||||
| Class M Shares | (3,984,308) | (3,197,923) | — | — | ||||
| Investor Shares | (17,531) | (10,284) | — | — | ||||
| Net realized gain on investments: | ||||||||
| Class M Shares | (77,822,375) | — | (19,844,248) | — | ||||
| Investor Shares | (1,434,735) | — | (84,779) | — | ||||
| Dreyfus Premier Shares | (570,464) | — | — | — | ||||
| Total Dividends | (83,829,413) | (3,208,207) | (19,929,027) | — | ||||
| Beneficial Interest Transactions ($): | ||||||||
| Net proceeds from shares sold: | ||||||||
| Class M Shares | 215,658,261 | 159,457,396 | 124,390,649 | 206,754,973 | ||||
| Investor Shares | 4,329,614 | 11,860,398 | 1,679,037 | 666,905 | ||||
| Dreyfus Premier Shares | 163,180 | 246,977 | — | — | ||||
| Dividends reinvested: | ||||||||
| Class M Shares | 46,621,454 | 668,015 | 11,761,061 | — | ||||
| Investor Shares | 1,344,492 | 9,349 | 79,795 | — | ||||
| Dreyfus Premier Shares | 488,518 | — | — | — | ||||
| Cost of shares redeemed: | ||||||||
| Class M Shares | (207,406,100) | (189,805,996) | (196,753,928) | (94,900,610) | ||||
| Investor Shares | (5,592,823) | (10,367,338) | (921,111) | (1,315,084) | ||||
| Dreyfus Premier Shares | (3,785,773) | (7,089,773) | — | — | ||||
| Increase (Decrease) in Net Assets from | ||||||||
| Beneficial Interest Transactions | 51,820,823 | (35,020,972) | (59,764,497) | 111,206,184 | ||||
| Total Increase (Decrease) in Net Assets | 302,360,234 | 84,199,175 | 51,553,208 | 189,196,239 | ||||
| Net Assets ($): | ||||||||
| Beginning of Period | 1,191,148,879 | 1,106,949,704 | 750,946,195 | 561,749,956 | ||||
| End of Period | 1,493,509,113 | 1,191,148,879 | 802,499,403 | 750,946,195 | ||||
| Undistributed investment income—net | 1,036,313 | 2,419,500 | 174,382 | 76,408 | ||||
| The Funds 57 |
| STATEMENTS OF CHANGES IN NET ASSETS (continued) |
| Mellon Mid Cap Stock Fund | Mellon Small Cap Stock Fund | |||||||
| Year Ended August 31, | Year Ended August 31, | |||||||
| 2005 | 2004 | 2005 | 2004 | |||||
| Capital Share Transactions: | ||||||||
| Class M Shares | ||||||||
| Shares sold | 16,035,142 | 13,025,718 | 7,529,761 | 14,075,756 | ||||
| Shares issued for dividends reinvested | 3,594,561 | 55,575 | 707,645 | — | ||||
| Shares redeemed | (15,380,226) | (15,743,025) | (11,908,708) | (6,347,665) | ||||
| Net Increase (Decrease) in Shares Outstanding | 4,249,477 | (2,661,732) | (3,671,302) | 7,728,091 | ||||
| Investor Shares a | ||||||||
| Shares sold | 326,579 | 967,869 | 104,401 | 44,983 | ||||
| Shares issued for dividends reinvested | 103,982 | 781 | 4,851 | — | ||||
| Shares redeemed | (417,144) | (829,700) | (56,733) | (94,651) | ||||
| Net Increase (Decrease) in Shares Outstanding | 13,417 | 138,950 | 52,519 | (49,668) | ||||
| Dreyfus Premier Shares a | ||||||||
| Shares sold | 12,634 | 19,462 | — | — | ||||
| Shares issued for dividends reinvested | 38,315 | — | — | — | ||||
| Shares redeemed | (290,042) | (586,382) | — | — | ||||
| Net Increase (Decrease) in Shares Outstanding | (239,093) | (566,920) | — | — | ||||
a During the period ended August 31, 2005, 177,382 Dreyfus Premier shares of Mellon Mid Cap Stock Fund representing $2,306,284 were automatically converted to 174,748 Investor shares and during the period ended August 31, 2004, 408,718 Dreyfus Premier shares of Mellon Mid Cap Stock Fund representing $4,969,465 were automatically converted to 405,061 Investor shares.
See notes to financial statements.
| 58 |
| Mellon International Fund | Mellon Emerging Markets Fund | |||||||
| Year Ended August 31, | Year Ended August 31, | |||||||
| 2005 | 2004 | 2005 | 2004 | |||||
| Operations ($): | ||||||||
| Investment income—net | 21,904,629 | 16,404,935 | 18,781,352 | 11,759,859 | ||||
| Net realized gain (loss) on investments | 140,860,965 | 88,031,934 | 162,788,793 | 80,463,564 | ||||
| Net unrealized appreciation (depreciation) on investments | 100,934,933 | 96,766,316 | 192,279,052 | 47,288,199 | ||||
| Net Increase (Decrease) in Net Assets Resulting from Operations | 263,700,527 | 201,203,185 | 373,849,197 | 139,511,622 | ||||
| Dividends to Shareholders from ($): | ||||||||
| Investment income—net: | ||||||||
| Class M Shares | (18,606,194) | (13,996,941) | (7,111,602) | (5,321,756) | ||||
| Investor Shares | (11,955) | (1,305) | (21,031) | (2,047) | ||||
| Net realized gain on investments: | ||||||||
| Class M Shares | (58,460,661) | — | (93,399,039) | (10,285,747) | ||||
| Investor Shares | (46,662) | — | (338,211) | (5,743) | ||||
| Total Dividends | (77,125,472) | (13,998,246) | (100,869,883) | (15,615,293) | ||||
| Beneficial Interest Transactions ($): | ||||||||
| Net proceeds from shares sold: | ||||||||
| Class M Shares | 532,302,524 | 352,182,586 | 276,540,708 | 412,560,640 | ||||
| Investor Shares | 3,052,884 | 4,308,413 | 3,641,107 | 3,575,511 | ||||
| Dividends reinvested: | ||||||||
| Class M Shares | 16,624,186 | 3,040,359 | 57,373,886 | 7,970,340 | ||||
| Investor Shares | 49,927 | 1,240 | 348,588 | 6,955 | ||||
| Cost of shares redeemed: | ||||||||
| Class M Shares | (142,862,209) | (97,834,871) | (269,519,059) | (69,024,287) | ||||
| Investor Shares | (781,894) | (3,874,911) | (3,774,228) | (578,993) | ||||
| Increase (Decrease) in Net Assets from | ||||||||
| Beneficial Interest Transactions | 408,385,418 | 257,822,816 | 64,611,002 | 354,510,166 | ||||
| Total Increase (Decrease) in Net Assets | 594,960,473 | 445,027,755 | 337,590,316 | 478,406,495 | ||||
| Net Assets ($): | ||||||||
| Beginning of Period | 1,265,903,893 | 820,876,138 | 1,004,767,822 | 526,361,327 | ||||
| End of Period | 1,860,864,366 | 1,265,903,893 | 1,342,358,138 | 1,004,767,822 | ||||
| Undistributed investment income—net | 21,539,696 | 16,352,003 | 20,147,828 | 7,087,091 | ||||
| Capital Share Transactions (Shares): | ||||||||
| Class M Shares | ||||||||
| Shares sold | 34,292,129 | 25,536,689 | 13,502,727 | 23,872,309 | ||||
| Shares issued for dividends reinvested | 1,088,683 | 233,335 | 2,793,276 | 457,802 | ||||
| Shares redeemed | (9,252,652) | (6,932,933) | (13,020,978) | (3,908,665) | ||||
| Net Increase (Decrease) in Shares Outstanding | 26,128,160 | 18,837,091 | 3,275,025 | 20,421,446 | ||||
| Investor Shares | ||||||||
| Shares sold | 191,177 | 292,232 | 176,814 | 200,762 | ||||
| Shares issued for dividends reinvested | 3,160 | 91 | 16,872 | 397 | ||||
| Shares redeemed | (48,259) | (256,688) | (183,120) | (32,580) | ||||
| Net Increase (Decrease) in Shares Outstanding | 146,078 | 35,635 | 10,566 | 168,579 | ||||
| See notes to financial statements. |
| The Funds 59 |
| STATEMENTS OF CHANGES IN NET ASSETS (continued) |
| Mellon Balanced Fund | ||||
| Year Ended August 31, | ||||
| 2005 | 2004 | |||
| Operations ($): | ||||
| Investment income—net | 6,381,003 | 6,358,677 | ||
| Net realized gain (loss) on investments | 16,266,463 | 7,905,951 | ||
| Net unrealized appreciation (depreciation) on investments | 19,693,002 | 17,010,291 | ||
| Net Increase (Decrease) in Net Assets Resulting from Operations | 42,340,468 | 31,274,919 | ||
| Dividends to Shareholders from ($): | ||||
| Investment income—net: | ||||
| Class M Shares | (6,757,641) | (6,621,136) | ||
| Investor Shares | (17,186) | (8,017) | ||
| Total Dividends | (6,774,827) | (6,629,153) | ||
| Beneficial Interest Transactions ($): | ||||
| Net proceeds from shares sold: | ||||
| Class M Shares | 15,452,501 | 14,543,502 | ||
| Investor Shares | 1,371,782 | 201,741 | ||
| Dividends reinvested: | ||||
| Class M Shares | 119,933 | 105,144 | ||
| Investor Shares | 12,030 | 3,972 | ||
| Cost of shares redeemed: | ||||
| Class M Shares | (41,826,634) | (45,340,881) | ||
| Investor Shares | (312,570) | (1,612) | ||
| Increase (Decrease) in Net Assets from | ||||
| Beneficial Interest Transactions | (25,182,958) | (30,488,134) | ||
| Total Increase (Decrease) in Net Assets | 10,382,683 | (5,842,368) | ||
| Net Assets ($): | ||||
| Beginning of Period | 342,990,969 | 348,833,337 | ||
| End of Period | 353,373,652 | 342,990,969 | ||
| Undistributed investment income—net | 668,597 | 627,471 | ||
| Capital Share Transactions (Shares:) | ||||
| Class M Shares | ||||
| Shares sold | 1,254,690 | 1,257,979 | ||
| Shares issued for dividends reinvested | 9,722 | 9,111 | ||
| Shares redeemed | (3,393,828) | (3,930,836) | ||
| Net Increase (Decrease) in Shares Outstanding | (2,129,416) | (2,663,746) | ||
| Investor Shares | ||||
| Shares sold | 111,038 | 17,335 | ||
| Shares issued for dividends reinvested | 967 | 344 | ||
| Shares redeemed | (25,405) | (139) | ||
| Net Increase (Decrease) in Shares Outstanding | 86,600 | 17,540 |
| See notes to financial statements. |
| 60 |
| FINANCIAL HIGHLIGHTS |
The following tables describe the performance for each share class of each Mellon equity fund for the fiscal periods indicated. All information (except portfolio turnover rate) reflects financial results for a single fund share.Total return shows how much your investment in each fund would have increased (or decreased) during the period, assuming you had reinvested all dividends and distributions.These figures have been derived from each fund’s financial statements.
| Class M Shares | ||||||||||
| Year Ended August 31, | ||||||||||
| Mellon Large Cap Stock Fund | 2005 | 2004 | 2003 a | 2002 | 2001 b | |||||
| Per Share Data ($): | ||||||||||
| Net asset value, beginning of period | 8.74 | 8.16 | 7.77 | 9.52 | 12.50 | |||||
| Investment Operations: | ||||||||||
| Investment income—netc | .11 | .07 | .06 | .05 | .03 | |||||
| Net realized and unrealized gain (loss) on investments | 1.05 | .58 | .39 | (1.59) | (2.97) | |||||
| Total from Investment Operations | 1.16 | .65 | .45 | (1.54) | (2.94) | |||||
| Distributions: | ||||||||||
| Dividends from investment income—net | (.11) | (.07) | (.06) | (.05) | (.03) | |||||
| Dividends from net realized gain on investments | — | — | — | (.16) | (.01) | |||||
| Total Distributions | (.11) | (.07) | (.06) | (.21) | (.04) | |||||
| Net asset value, end of period | 9.79 | 8.74 | 8.16 | 7.77 | 9.52 | |||||
| Total Return (%) | 13.27 | 7.95 | 5.76 | (16.47) | (23.55)d | |||||
| Ratios/Supplemental Data (%): | ||||||||||
| Ratio of total expenses to average net assets | .80 | .81 | .81 | .81 | .75d | |||||
| Ratio of net expenses to average net assets | .80 | .81 | .81 | .81 | .75d | |||||
| Ratio of net investment income to average net assets | 1.13 | .77 | .83 | .56 | .27d | |||||
| Portfolio Turnover Rate | 23.49 | 43.52 | 56.96 | 44.26 | 45.08d | |||||
| Net Assets, end of period ($ x 1,000) | 1,733,531 | 1,545,002 | 1,479,855 | 1,389,045 | 1,857,167 | |||||
| a Effective December 16, 2002, MPAM shares were redesignated as Class M shares. | ||||||||||
| b From October 2, 2000 (commencement of operations) to August 31, 2001. | ||||||||||
| c Based on average shares outstanding at each month end. | ||||||||||
| d Not annualized. | ||||||||||
| See notes to financial statements. | ||||||||||
| The Funds 61 |
| FINANCIAL HIGHLIGHTS (continued) |
| Investor Shares | ||||||||||
| Year Ended August 31, | ||||||||||
| Mellon Large Cap Stock Fund | 2005 | 2004 | 2003 | 2002 | 2001 a | |||||
| Per Share Data ($): | ||||||||||
| Net asset value, beginning of period | 8.76 | 8.16 | 7.77 | 9.52 | 9.99 | |||||
| Investment Operations: | ||||||||||
| Investment income (loss)—net b | .08 | .06 | .04 | .03 | (.00)c | |||||
| Net realized and unrealized gain (loss) on investments | 1.06 | .58 | .39 | (1.59) | (.47) | |||||
| Total from Investment Operations | 1.14 | .64 | .43 | (1.56) | (.47) | |||||
| Distributions: | ||||||||||
| Dividends from investment income—net | (.08) | (.04) | (.04) | (.03) | (.00)c | |||||
| Dividends from net realized gain on investments | — | — | — | (.16) | — | |||||
| Total Distributions | (.08) | (.04) | (.04) | (.19) | (.00)c | |||||
| Net asset value, end of period | 9.82 | 8.76 | 8.16 | 7.77 | 9.52 | |||||
| Total Return (%) | 13.08 | 7.88 | 5.50 | (16.65) | (4.69)d | |||||
| Ratios/Supplemental Data (%): | ||||||||||
| Ratio of total expenses to average net assets | 1.05 | 1.06 | 1.07 | 1.07 | .23d | |||||
| Ratio of net expenses to average net assets | 1.05 | 1.06 | 1.07 | 1.07 | .23d | |||||
| Ratio of net investment income (loss) to average net assets | .87 | .59 | .56 | .31 | (.05)d | |||||
| Portfolio Turnover Rate | 23.49 | 43.52 | 56.96 | 44.26 | 45.08d | |||||
| Net Assets, end of period ($ x 1,000) | 3,985 | 3,356 | 2,121 | 803 | 1,496 | |||||
| a From July 11, 2001 (date the fund began offering Investor shares) to August 31, 2001. | ||||||||||
| b Based on average shares outstanding at each month end. | ||||||||||
| c Amount represents less than $.01 per share. | ||||||||||
| d Not annualized. | ||||||||||
| See notes to financial statements. | ||||||||||
| 62 |
| Class M Shares | ||||||||||
| Year Ended August 31, | ||||||||||
| Mellon Income Stock Fund | 2005 | 2004 | 2003 a | 2002 b | 2001 c | |||||
| Per Share Data ($): | ||||||||||
| Net asset value, beginning of period | 9.50 | 8.56 | 8.24 | 10.39 | 12.50 | |||||
| Investment Operations: | ||||||||||
| Investment income—net d | .21 | .16 | .12 | .11 | .09 | |||||
| Net realized and unrealized gain (loss) on investments | 1.27 | 1.09 | .37 | (1.56) | (1.96) | |||||
| Total from Investment Operations | 1.48 | 1.25 | .49 | (1.45) | (1.87) | |||||
| Distributions: | ||||||||||
| Dividends from investment income—net | (.20) | (.17) | (.12) | (.11) | (.09) | |||||
| Dividends from net realized gain on investments | (.86) | (.14) | (.05) | (.59) | (.15) | |||||
| Total Distributions | (1.06) | (.31) | (.17) | (.70) | (.24) | |||||
| Net asset value, end of period | 9.92 | 9.50 | 8.56 | 8.24 | 10.39 | |||||
| Total Return (%) | 16.23 | 14.68 | 6.19 | (14.94) | (15.12)e | |||||
| Ratios/Supplemental Data (%): | ||||||||||
| Ratio of total expenses to average net assets | .82 | .83 | .83 | .82 | .77e | |||||
| Ratio of net expenses to average net assets | .82 | .83 | .83 | .82 | .77e | |||||
| Ratio of net investment income to average net assets | 2.12 | 1.75 | 1.48 | 1.19 | .78e | |||||
| Portfolio Turnover Rate | 34.61 | 52.47 | 12.82 | 30.35 | 30.28e | |||||
| Net Assets, end of period ($ x 1,000) | 394,977 | 274,881 | 271,085 | 406,875 | 631,743 | |||||
| a Effective December 16, 2002, MPAM shares were redesignated as Class M shares. |
| b As required, effective September 1, 2001, the fund has adopted the provisions of the AICPA Audit and Accounting Guide for Investment Companies and began accreting discount |
| or amortizing premium on fixed income securities on a scientific basis and including paydown gains and losses in interest income.There were no effect of these changes for the period |
| ended August 31, 2002 and the ratios were not affected by these changes. Per share data and ratios/supplemental data for periods prior to September 1, 2001 have not been restated |
| to reflect these changes in presentation. |
| c From October 2, 2000 (commencement of operations) to August 31, 2001. |
| d Based on average shares outstanding at each month end. |
| e Not annualized. |
| See notes to financial statements. |
| The Funds 63 |
| FINANCIAL HIGHLIGHTS (continued) |
| Investor Shares | ||||||||||
| Year Ended August 31, | ||||||||||
| Mellon Income Stock Fund | 2005 | 2004 | 2003 | 2002 a | 2001 b | |||||
| Per Share Data ($): | ||||||||||
| Net asset value, beginning of period | 9.53 | 8.58 | 8.25 | 10.40 | 10.66 | |||||
| Investment Operations: | ||||||||||
| Investment income—net c | .18 | .14 | .10 | .10 | .02 | |||||
| Net realized and unrealized gain (loss) on investments | 1.29 | 1.08 | .38 | (1.57) | (.27) | |||||
| Total from Investment Operations | 1.47 | 1.22 | .48 | (1.47) | (.25) | |||||
| Distributions: | ||||||||||
| Dividends from investment income—net | (.16) | (.13) | (.10) | (.09) | (.01) | |||||
| Dividends from net realized gain on investments | (.86) | (.14) | (.05) | (.59) | — | |||||
| Total Distributions | (1.02) | (.27) | (.15) | (.68) | (.01) | |||||
| Net asset value, end of period | 9.98 | 9.53 | 8.58 | 8.25 | 10.40 | |||||
| Total Return (%) | 16.00 | 14.26 | 6.03 | (15.15) | (2.32)d | |||||
| Ratios/Supplemental Data (%): | ||||||||||
| Ratio of total expenses to average net assets | 1.07 | 1.08 | 1.09 | 1.09 | .20d | |||||
| Ratio of net expenses to average net assets | 1.07 | 1.08 | 1.09 | 1.09 | .20d | |||||
| Ratio of net investment income to average net assets | 1.88 | 1.49 | 1.21 | 1.08 | .16d | |||||
| Portfolio Turnover Rate | 34.61 | 52.47 | 12.82 | 30.35 | 30.28d | |||||
| Net Assets, end of period ($ x 1,000) | 1,092 | 756 | 1,080 | 586 | 163 | |||||
| a As required, effective September 1, 2001, the fund has adopted the provisions of the AICPA Audit and Accounting Guide for Investment Companies and began accreting discount |
| or amortizing premium on fixed income securities on a scientific basis and including paydown gains and losses in interest income.There were no effect of these changes for the period |
| ended August 31, 2002 and the ratios were not affected by these changes. Per share data and ratios/supplemental data for periods prior to September 1, 2001 have not been restated |
| to reflect these changes in presentation. |
| b From July 11, 2001 (date the fund began offering Investor shares) to August 31, 2001. |
| c Based on average shares outstanding at each month end. |
| d Not annualized. |
| See notes to financial statements. |
| 64 |
| Class M Shares | ||||||||||
| Year Ended August 31, | ||||||||||
| Mellon Mid Cap Stock Fund | 2005 | 2004 | 2003 a | 2002 | 2001 b | |||||
| Per Share Data ($): | ||||||||||
| Net asset value, beginning of period | 12.29 | 11.07 | 9.92 | 11.20 | 12.50 | |||||
| Investment Operations: | ||||||||||
| Investment income—net c | .04 | .04 | .05 | .04 | .02 | |||||
| Net realized and unrealized gain (loss) on investments | 3.33 | 1.21 | 1.13 | (1.29) | (1.32) | |||||
| Total from Investment Operations | 3.37 | 1.25 | 1.18 | (1.25) | (1.30) | |||||
| Distributions: | ||||||||||
| Dividends from investment income—net | (.04) | (.03) | (.03) | (.03) | (.00)d | |||||
| Dividends from net realized gain on investments | (.82) | — | — | — | — | |||||
| Total Distributions | (.86) | (.03) | (.03) | (.03) | (.00)d | |||||
| Net asset value, end of period | 14.80 | 12.29 | 11.07 | 9.92 | 11.20 | |||||
| Total Return (%) | 28.41 | 11.33 | 11.94 | (11.21) | (10.39)e | |||||
| Ratios/Supplemental Data (%): | ||||||||||
| Ratio of total expenses to average net assets | .91 | .91 | .92 | .93 | .85e | |||||
| Ratio of net investment income to average net assets | .26 | .34 | .47 | .33 | .14e | |||||
| Portfolio Turnover Rate | 83.57 | 69.03 | 67.97 | 61.20 | 59.63e | |||||
| Net Assets, end of period ($ x 1,000) | 1,458,952 | 1,159,657 | 1,073,837 | 839,075 | 850,110 | |||||
| a Effective December 16, 2002, MPAM shares were redesignated as Class M shares. | ||||||||||
| b From October 2, 2000 (commencement of operations) to August 31, 2001. | ||||||||||
| c Based on average shares outstanding at each month end. | ||||||||||
| d Amount represents less than $.01 per share. | ||||||||||
| e Not annualized. | ||||||||||
| See notes to financial statements. | ||||||||||
| The Funds 65 |
| FINANCIAL HIGHLIGHTS (continued) |
| Investor Shares | ||||||||||
| Year Ended August 31, | ||||||||||
| Mellon Mid Cap Stock Fund | 2005 | 2004 | 2003 | 2002 | 2001 a | |||||
| Per Share Data ($): | ||||||||||
| Net asset value, beginning of period | 12.24 | 11.03 | 9.90 | 11.19 | 11.32 | |||||
| Investment Operations: | ||||||||||
| Investment income (loss)—net b | .00c | .01 | .02 | (.00)c | (.00)c | |||||
| Net realized and unrealized | ||||||||||
| gain (loss) on investments | 3.32 | 1.21 | 1.13 | (1.28) | (.13) | |||||
| Total from Investment Operations | 3.32 | 1.22 | 1.15 | (1.28) | (.13) | |||||
| Distributions: | ||||||||||
| Dividends from investment income—net | (.01) | (.01) | (.02) | (.01) | — | |||||
| Dividends from net realized gain on investments | (.82) | — | — | — | — | |||||
| Total Distributions | (.83) | (.01) | (.02) | (.01) | — | |||||
| Net asset value, end of period | 14.73 | 12.24 | 11.03 | 9.90 | 11.19 | |||||
| Total Return (%) | 28.05 | 11.02 | 11.66 | (11.44) | (1.15)d | |||||
| Ratios/Supplemental Data (%): | ||||||||||
| Ratio of total expenses to average net assets | 1.15 | 1.16 | 1.20 | 1.25 | .20d | |||||
| Ratio of net investment income (loss) to average net assets | .02 | .10 | .19 | (.00)e | (.03)d | |||||
| Portfolio Turnover Rate | 83.57 | 69.03 | 67.97 | 61.20 | 59.63d | |||||
| Net Assets, end of period ($ x 1,000) | 26,445 | 21,810 | 18,117 | 736 | 140 | |||||
| a From July 11, 2001 (date the fund began offering Investor shares) to August 31, 2001. | ||||||||||
| b Based on average shares outstanding at each month end. | ||||||||||
| c Amount represents less than $.01 per share. | ||||||||||
| d Not annualized. | ||||||||||
| e Amount represents less than .01%. | ||||||||||
| See notes to financial statements. | ||||||||||
| 66 |
| Dreyfus Premier Shares | ||||||
| Year Ended August 31, | ||||||
| Mellon Mid Cap Stock Fund | 2005 | 2004 | 2003 a | |||
| Per Share Data ($): | ||||||
| Net asset value, beginning of period | 12.09 | 10.96 | 9.81 | |||
| Investment Operations: | ||||||
| Investment (loss)—net b | (.09) | (.08) | (.06) | |||
| Net realized and unrealized gain (loss) on investments | 3.26 | 1.21 | 1.21 | |||
| Total from Investment Operations | 3.17 | 1.13 | 1.15 | |||
| Distributions: | ||||||
| Dividends from net realized gain on investments | (.82) | — | — | |||
| Net asset value, end of period | 14.44 | 12.09 | 10.96 | |||
| Total Return (%) | 27.11 | 10.31 | 11.72c | |||
| Ratios/Supplemental Data (%): | ||||||
| Ratio of total expenses to average net assets | 1.88 | 1.91 | 1.95c | |||
| Ratio of net investment (loss) to average net assets | (.71) | (.65) | (.58)c | |||
| Portfolio Turnover Rate | 83.57 | 69.03 | 67.97 | |||
| Net Assets, end of period ($ x 1,000) | 8,113 | 9,682 | 14,996 | |||
| a From the close of business on September 6, 2002 (date the fund began offering Dreyfus Premier shares) to August 31, 2003. | ||||||
| b Based on average shares outstanding at each month end. | ||||||
| c Not annualized. | ||||||
| See notes to financial statements. | ||||||
| The Funds 67 |
| FINANCIAL HIGHLIGHTS (continued) |
| Class M Shares | ||||||||||
| �� | Year Ended August 31, | |||||||||
| Mellon Small Cap Stock Fund | 2005 | 2004 | 2003 a | 2002 | 2001 b | |||||
| Per Share Data ($): | ||||||||||
| Net asset value, beginning of period | 14.92 | 13.17 | 10.95 | 11.99 | 12.50 | |||||
| Investment Operations: | ||||||||||
| Investment (loss)—net c | (.01) | (.02) | (.00)d | (.03) | (.01) | |||||
| Net realized and unrealized gain (loss) on investments | 2.66 | 1.77 | 2.22 | (1.01) | (.50) | |||||
| Total from Investment Operations | 2.65 | 1.75 | 2.22 | (1.04) | (.51) | |||||
| Distributions: | ||||||||||
| Dividends from net realized gain on investments | (.39) | — | — | — | — | |||||
| Net asset value, end of period | 17.18 | 14.92 | 13.17 | 10.95 | 11.99 | |||||
| Total Return (%) | 17.86 | 13.29 | 20.27 | (8.67) | (4.08)e | |||||
| Ratios/Supplemental Data (%): | ||||||||||
| Ratio of total expenses to average net assets | 1.01 | 1.02 | 1.04 | 1.07 | 1.00e | |||||
| Ratio of net expenses to average net assets | 1.01 | 1.02 | 1.03 | 1.05 | .96e | |||||
| Ratio of net investment (loss) to average net assets | (.07) | (.11) | (.02) | (.27) | (.09)e | |||||
| Portfolio Turnover Rate | 148.54 | 91.71 | 91.99 | 76.66 | 101.57e | |||||
| Net Assets, end of period ($ x 1,000) | 797,808 | 747,637 | 558,172 | 350,873 | 151,440 | |||||
| a Effective December 16, 2002, MPAM shares were redesignated as Class M shares. | ||||||||||
| b From October 2, 2000 (commencement of operations) to August 31, 2001. | ||||||||||
| c Based on average shares outstanding at each month end. | ||||||||||
| d Amount represents less than $.01 per share. | ||||||||||
| e Not annualized. | ||||||||||
| See notes to financial statements. | ||||||||||
| 68 |
| Investor Shares | ||||||||||
| Year Ended August 31, | ||||||||||
| Mellon Small Cap Stock Fund | 2005 | 2004 | 2003 | 2002 | 2001 a | |||||
| Per Share Data ($): | ||||||||||
| Net asset value, beginning of period | 14.78 | 13.08 | 10.90 | 11.98 | 11.95 | |||||
| Investment Operations: | ||||||||||
| Investment (loss)—net b | (.05) | (.05) | (.03) | (.06) | (.01) | |||||
| Net realized and unrealized gain (loss) on investments | 2.63 | 1.75 | 2.21 | (1.02) | .04 | |||||
| Total from Investment Operations | 2.58 | 1.70 | 2.18 | (1.08) | .03 | |||||
| Distributions: | ||||||||||
| Dividends from net realized gain on investments | (.39) | — | — | — | — | |||||
| Net asset value, end of period | 16.97 | 14.78 | 13.08 | 10.90 | 11.98 | |||||
| Total Return (%) | 17.55 | 13.00 | 20.00 | (9.02) | .25c | |||||
| Ratios/Supplemental Data (%): | ||||||||||
| Ratio of total expenses to average net assets | 1.26 | 1.26 | 1.29 | 1.32 | .20c | |||||
| Ratio of net expenses to average net assets | 1.26 | 1.26 | 1.28 | 1.30 | .19c | |||||
| Ratio of net investment (loss) to average net assets | (.33) | (.35) | (.27) | (.51) | (.06)c | |||||
| Portfolio Turnover Rate | 148.54 | 91.71 | 91.99 | 76.66 | 101.57c | |||||
| Net Assets, end of period ($ x 1,000) | 4,692 | 3,310 | 3,578 | 3,857 | 1 | |||||
| a From July 11, 2001 (date the fund began offering Investor shares) to August 31, 2001. | ||||||||||
| b Based on average shares outstanding at each month end. | ||||||||||
| c Not annualized. | ||||||||||
| See notes to financial statements. | ||||||||||
| The Funds 69 |
| FINANCIAL HIGHLIGHTS (continued) |
| Class M Shares | ||||||||||
| Year Ended August 31, | ||||||||||
| Mellon International Fund | 2005 | 2004 | 2003 a | 2002 | 2001 b | |||||
| Per Share Data ($): | ||||||||||
| Net asset value, beginning of period | 14.29 | 11.77 | 11.03 | 12.08 | 12.50 | |||||
| Investment Operations: | ||||||||||
| Investment income—net c | .22 | .20 | .20 | .18 | .16 | |||||
| Net realized and unrealized gain (loss) on investments | 2.52 | 2.51 | .68 | (1.07) | (.58) | |||||
| Total from Investment Operations | 2.74 | 2.71 | .88 | (.89) | (.42) | |||||
| Distributions: | ||||||||||
| Dividends from investment income—net | (.20) | (.19) | (.14) | (.15) | (.00)d | |||||
| Dividends from net realized gain on investments | (.63) | — | — | (.01) | — | |||||
| Total Distributions | (.83) | (.19) | (.14) | (.16) | (.00)d | |||||
| Net asset value, end of period | 16.20 | 14.29 | 11.77 | 11.03 | 12.08 | |||||
| Total Return (%) | 19.51 | 23.15 | 8.19 | (7.39) | (3.33)e | |||||
| Ratios/Supplemental Data (%): | ||||||||||
| Ratio of total expenses to average net assets | 1.09 | 1.11 | 1.12 | 1.12 | 1.04e | |||||
| Ratio of net expenses to average net assets | 1.09 | 1.10 | 1.05 | 1.05 | .96e | |||||
| Ratio of net investment income to average net assets | 1.40 | 1.46 | 1.99 | 1.59 | 1.31e | |||||
| Portfolio Turnover Rate | 44.92 | 45.60 | 36.52 | 24.63 | 34.27e | |||||
| Net Assets, end of period ($ x 1,000) | 1,857,398 | 1,265,004 | 820,568 | 543,566 | 398,759 | |||||
| a Effective December 16, 2002, MPAM shares were as redesignated as Class M shares. | ||||||||||
| b From October 2, 2000 (commencement of operations) to August 31, 2001. | ||||||||||
| c Based on average shares outstanding at each month end. | ||||||||||
| d Amount represents less than $.01 per share. | ||||||||||
| e Not annualized. | ||||||||||
| See notes to financial statements. | ||||||||||
| 70 |
| Investor Shares | ||||||||||
| Year Ended August 31, | ||||||||||
| Mellon International Fund | 2005 | 2004 | 2003 | 2002 | 2001 a | |||||
| Per Share Data ($): | ||||||||||
| Net asset value, beginning of period | 14.74 | 12.13 | 11.34 | 12.08 | 11.98 | |||||
| Investment Operations: | ||||||||||
| Investment income (loss)—net b | .24 | .49 | .13 | .24 | (.00)c | |||||
| Net realized and unrealized gain (loss) on investments | 2.55 | 2.20 | .78 | (.97) | .10 | |||||
| Total from Investment Operations | 2.79 | 2.69 | .91 | (.73) | .10 | |||||
| Distributions: | ||||||||||
| Dividends from investment income—net | (.16) | (.08) | (.12) | — | — | |||||
| Dividends from net realized gain on investments | (.63) | — | — | (.01) | — | |||||
| Total Distributions | (.79) | (.08) | (.12) | (.01) | — | |||||
| Net asset value, end of period | 16.74 | 14.74 | 12.13 | 11.34 | 12.08 | |||||
| Total Return (%) | 19.24 | 22.28 | 8.24 | (5.95) | .75d | |||||
| Ratios/Supplemental Data (%): | ||||||||||
| Ratio of total expenses to average net assets | 1.34 | 1.35 | 1.36 | 1.38 | .23d | |||||
| Ratio of net expenses to average net assets | 1.34 | 1.35 | 1.30 | 1.30 | .22d | |||||
| Ratio of net investment income (loss) to average net assets | 1.50 | 2.63 | 1.10 | 2.16 | (.01)d | |||||
| Portfolio Turnover Rate | 44.92 | 45.60 | 36.52 | 24.63 | 34.27d | |||||
| Net Assets, end of period ($ x 1,000) | 3,466 | 900 | 308 | 2,588 | 28 | |||||
| a From July 11, 2001 (date the fund began offering Investor shares) to August 31, 2001. | ||||||||||
| b Based on average shares outstanding at each month end. | ||||||||||
| c Amount represents less than $.01 per share. | ||||||||||
| d Not annualized. | ||||||||||
| See notes to financial statements. | ||||||||||
| The Funds 71 |
| FINANCIAL HIGHLIGHTS (continued) |
| Class M Shares | ||||||||||
| Year Ended August 31, | ||||||||||
| Mellon Emerging Markets Fund | 2005 | 2004 | 2003 a | 2002 | 2001 b | |||||
| Per Share Data ($): | ||||||||||
| Net asset value, beginning of period | 17.98 | 14.92 | 12.33 | 11.86 | 12.50 | |||||
| Investment Operations: | ||||||||||
| Investment income—net c | .32 | .25 | .22 | .24 | .28 | |||||
| Net realized and unrealized gain (loss) on investments | 6.09 | 3.16 | 2.77 | .75 | (.87) | |||||
| Total from Investment Operations | 6.41 | 3.41 | 2.99 | .99 | (.59) | |||||
| Distributions: | ||||||||||
| Dividends from investment income—net | (.12) | (.12) | (.12) | (.19) | (.05) | |||||
| Dividends from net realized gain on investments | (1.58) | (.23) | (.28) | (.33) | (.00)d | |||||
| Total Distributions | (1.70) | (.35) | (.40) | (.52) | (.05) | |||||
| Net asset value, end of period | 22.69 | 17.98 | 14.92 | 12.33 | 11.86 | |||||
| Total Return (%) | 36.62 | 22.93 | 25.18 | 8.48 | (4.68)e | |||||
| Ratios/Supplemental Data (%): | ||||||||||
| Ratio of total expenses to average net assets | 1.51 | 1.51 | 1.61 | 1.68 | 1.66e | |||||
| Ratio of net expenses to average net assets | 1.51 | 1.50 | 1.35 | 1.35 | 1.24e | |||||
| Ratio of net investment income to average net assets | 1.52 | 1.39 | 1.77 | 1.86 | 2.24e | |||||
| Portfolio Turnover Rate | 42.97 | 46.36 | 26.43 | 55.00 | 44.74e | |||||
| Net Assets, end of period ($ x 1,000) | 1,337,801 | 1,001,344 | 526,049 | 145,144 | 54,863 | |||||
| a Effective December 16, 2002, MPAM shares were redesignated as Class M shares. | ||||||||||
| b From October 2, 2000 (commencement of operations) to August 31, 2001. | ||||||||||
| c Based on average shares outstanding at each month end. | ||||||||||
| d Amount represents less than $.01 per share. | ||||||||||
| e Not annualized. | ||||||||||
| See notes to financial statements. | ||||||||||
| 72 |
| Investor Shares | ||||||||||
| Year Ended August 31, | ||||||||||
| Mellon Emerging Markets Fund | 2005 | 2004 | 2003 | 2002 | 2001 a | |||||
| Per Share Data ($): | ||||||||||
| Net asset value, beginning of period | 18.08 | 15.00 | 12.38 | 11.92 | 12.17 | |||||
| Investment Operations: | ||||||||||
| Investment income—net b | .30 | .17 | .17 | .11 | .03 | |||||
| Net realized and unrealized gain (loss) on investments | 6.09 | 3.22 | 2.82 | .86 | (.28) | |||||
| Total from Investment Operations | 6.39 | 3.39 | 2.99 | .97 | (.25) | |||||
| Distributions: | ||||||||||
| Dividends from investment income—net | (.10) | (.08) | (.09) | (.18) | — | |||||
| Dividends from net realized gain on investments | (1.58) | (.23) | (.28) | (.33) | — | |||||
| Total Distributions | (1.68) | (.31) | (.37) | (.51) | — | |||||
| Net asset value, end of period | 22.79 | 18.08 | 15.00 | 12.38 | 11.92 | |||||
| Total Return (%) | 36.26 | 22.68 | 24.99 | 8.26 | (2.06)c | |||||
| Ratios/Supplemental Data (%): | ||||||||||
| Ratio of total expenses to average net assets | 1.72 | 1.84 | 1.85 | 1.90 | .27c | |||||
| Ratio of net expenses to average net assets | 1.72 | 1.83 | 1.60 | 1.60 | .23c | |||||
| Ratio of net investment income to average net assets | 1.48 | 1.14 | 1.12 | .88 | .03c | |||||
| Portfolio Turnover Rate | 42.97 | 46.36 | 26.43 | 55.00 | 44.74c | |||||
| Net Assets, end of period ($ x 1,000) | 4,557 | 3,424 | 313 | 684 | 1 | |||||
| a From July 11, 2001 (date the fund began offering Investor shares) to August 31, 2001. | ||||||||||
| b Based on average shares outstanding at each month end. | ||||||||||
| c Not annualized. | ||||||||||
| See notes to financial statements. | ||||||||||
| The Funds 73 |
| FINANCIAL HIGHLIGHTS (continued) |
| Class M Shares | ||||||||||
| Year Ended August 31, | ||||||||||
| Mellon Balanced Fund | 2005 | 2004 | 2003 a | 2002 b | 2001 c | |||||
| Per Share Data ($): | ||||||||||
| Net asset value, beginning of period | 11.56 | 10.79 | 10.28 | 11.39 | 12.50 | |||||
| Investment Operations: | ||||||||||
| Investment income—net d | .22 | .20 | .25 | .31 | .32 | |||||
| Net realized and unrealized gain (loss) on investments | 1.25 | .78 | .51 | (.92) | (1.11) | |||||
| Total from Investment Operations | 1.47 | .98 | .76 | (.61) | (.79) | |||||
| Distributions: | ||||||||||
| Dividends from investment income—net | (.24) | (.21) | (.25) | (.30) | (.32) | |||||
| Dividends from net realized gain on investments | — | — | — | (.20) | — | |||||
| Total Distributions | (.24) | (.21) | (.25) | (.50) | (.32) | |||||
| Net asset value, end of period | 12.79 | 11.56 | 10.79 | 10.28 | 11.39 | |||||
| Total Return (%) | 12.78 | 9.13 | 7.68 | (5.70) | (6.38)e | |||||
| Ratios/Supplemental Data (%): | ||||||||||
| Ratio of total expenses to average net assets | .58 | .59 | .62 | .63 | .59e | |||||
| Ratio of net expenses to average net assets | .58 | .59 | .62 | .63 | .59e | |||||
| Ratio of net investment income to average net assets | 1.81 | 1.77 | 2.41 | 2.81 | 2.70e | |||||
| Portfolio Turnover Rate | 62.64f | 61.77f | 83.22 | 90.36 | 75.62e | |||||
| Net Assets, end of period ($ x 1,000) | 351,525 | 342,326 | 348,402 | 372,089 | 412,801 | |||||
| a Effective December 16, 2002, MPAM shares were redesignated as Class M shares. |
| b As required, effective September 1, 2001, the fund has adopted the provisions of the AICPA Audit and Accounting Guide for Investment Companies and began accreting discount |
| or amortizing premium on fixed income securities on a scientific basis and including paydown gains and losses in interest income.The effect of these changes for the period ended |
| August 31, 2002 was to increase net investment income per share by less than $.01, decrease net realized and unrealized gain (loss) on investments per share by less than $.01 and |
| increase the ratio of net investment income to average net assets from 2.79% to 2.81%. Per share data and ratios/supplemental data for periods prior to September 1, 2001 have |
| not been restated to reflect these changes in presentation. |
| c From October 2, 2000 (commencement of operations) to August 31, 2001. |
| d Based on average shares outstanding at each month end. |
| e Not annualized. |
| f The portfolio turnover rates excluding mortgage dollar roll transactions for the periods ended August 31, 2005 and August 31, 2004, were 45.79% and 55.45%, respectively. |
| See notes to financial statements. |
| 74 |
| Investor Shares | ||||||||||
| Year Ended August 31, | ||||||||||
| Mellon Balanced Fund | 2005 | 2004 | 2003 | 2002 a | 2001 b | |||||
| Per Share Data ($): | ||||||||||
| Net asset value, beginning of period | 11.57 | 10.79 | 10.27 | 11.39 | 11.53 | |||||
| Investment Operations: | ||||||||||
| Investment income—net c | .18 | .17 | .23 | .27 | .04 | |||||
| Net realized and unrealized gain (loss) on investments | 1.26 | .77 | .51 | (.91) | (.13) | |||||
| Total from Investment Operations | 1.44 | .94 | .74 | (.64) | (.09) | |||||
| Distributions: | ||||||||||
| Dividends from investment income—net | (.18) | (.16) | (.22) | (.28) | (.05) | |||||
| Dividends from net realized gain on investments | — | — | — | (.20) | — | |||||
| Total Distributions | (.18) | (.16) | (.22) | (.48) | (.05) | |||||
| Net asset value, end of period | 12.83 | 11.57 | 10.79 | 10.27 | 11.39 | |||||
| Total Return (%) | 12.55 | 8.76 | 7.52 | (5.91) | (.88)d | |||||
| Ratios/Supplemental Data (%): | ||||||||||
| Ratio of total expenses to average net assets | .85 | .85 | .87 | .89 | .16d | |||||
| Ratio of net expenses to average net assets | .85 | .85 | .87 | .89 | .16d | |||||
| Ratio of net investment income to average net assets | 1.45 | 1.45 | 2.13 | 2.45 | .32d | |||||
| Portfolio Turnover Rate | 62.64e | 61.77e | 83.22 | 90.36 | 75.62d | |||||
| Net Assets, end of period ($ x 1,000) | 1,848 | 665 | 431 | 165 | 1 | |||||
| a As required, effective September 1, 2001, the fund has adopted the provisions of the AICPA Audit and Accounting Guide for Investment Companies and began accreting discount |
| or amortizing premium on fixed income securities on a scientific basis and including paydown gains and losses in interest income.The effect of these changes for the period ended |
| August 31, 2002 was to increase net investment income per share by $.01, decrease net realized and unrealized gain (loss) on investments per share by $.01 and increase the ratio |
| of net investment income to average net assets from 2.43% to 2.45%. Per share data and ratios/supplemental data for periods prior to September 1, 2001 have not been restated to |
| reflect these changes in presentation. |
| b From July 11, 2001 (date the fund began offering Investor shares) to August 31, 2001. |
| c Based on average shares outstanding at each month end. |
| d Not annualized. |
| e The portfolio turnover rates excluding mortgage dollar roll transactions for the periods ended August 31, 2005 and August 31, 2004, were 45.79% and 55.45%, respectively. |
| See notes to financial statements. |
| The Funds 75 |
NOTES TO FINANCIAL STATEMENTS
| NOTE 1—General: |
Mellon Funds Trust (the “Trust”) was organized as a Massachusetts business trust which is registered under the Investment Company Act of 1940, as amended (the “Act”), as an open-end management investment company and operates as a series company currently comprised of sixteen series including the following diversified equity funds and balanced fund: Mellon Large Cap Stock Fund, Mellon Income Stock Fund, Mellon Mid Cap Stock Fund, Mellon Small Cap Stock Fund, Mellon International Fund, Mellon Emerging Markets Fund and Mellon Balanced Fund (each, a “fund” and collectively, the “funds”). With respect to Mellon Large Cap Stock Fund, Mellon Income Stock Fund, Mellon Mid Cap Stock Fund and Mellon Small Cap Stock Fund, effective December 31, 2004, each fund changed the manner in which its respective investment objective is articulated. Mellon Large Cap Stock Fund, Mellon Mid Cap Stock Fund and Mellon Small Cap Stock Fund seek capital appreciation and Mellon Income Stock Fund seeks total return (consisting of capital appreciation and income). Mellon International Fund and Mellon Emerging Markets Fund seek long-term capital growth. Mellon Balanced Fund seeks long-term growth of principal in conjunction with current income. Mellon Fund Advisers, a division of The Dreyfus Corporation (“Dreyfus”), serves as each fund’s investment adviser (“Investment Adviser”). Mellon Bank, N.A. (“Mellon Bank”), which is a wholly-owned subsidiary of Mellon Financial Corporation (“Mellon Financial”), serves as administrator for the funds pursuant to an Administration Agreement with the Trust (the “Administration Agreement”). Mellon Bank has entered into a Sub-Administration Agreement with Dreyfus pursuant to which Mellon Bank pays Dreyfus for performing certain administrative services. Dreyfus is a wholly-owned subsidiary of Mellon Financial. Dreyfus Service Corporation (the “Distributor”), a wholly-owned subsidiary of Dreyfus, is the Distributor of each fund’s shares, which are sold without a sales charge.
The Trust is authorized to issue an unlimited number of shares of beneficial interest, par value $.001 per share, in
each of the Class M and Investor class shares of each fund and in the Dreyfus Premier class shares of Mellon Mid Cap Stock Fund. Dreyfus Premier shares of Mellon Mid Cap Stock Fund are subject to a contingent deferred sales charge (“CDSC”) imposed on redemptions of Dreyfus Premier shares made within six years of purchase and automatically convert to Investor class shares after six years. Each class of shares has similar rights and privileges, except with respect to the expenses borne by and the shareholder services offered to each class, the shareholder services plan applicable to the Investor shares and Dreyfus Premier shares and the Rule 12b-1 plan applicable to the Dreyfus Premier shares and certain voting rights. Income, expenses (other than expenses attributable to a specific class), and realized and unrealized gains or losses on investments are allocated to each class of shares based on its relative net assets.
The Trust accounts separately for the assets, liabilities and operations of each series. Expenses directly attributable to each series are charged to that series’ operations; expenses that are applicable to all series are allocated among them on a pro rata basis.
The funds’ financial statements are prepared in accordance with U.S. generally accepted accounting principles, which may require the use of management estimates and assump-tions.Actual results could differ from those estimates.
NOTE 2—Significant Accounting Policies:
(a) Portfolio valuation: Investments in equity securities are valued at the last sales price on the securities exchange or national securities market on which such securities are primarily traded. Securities listed on the National Market System for which market quotations are available are valued at the official closing price or, if there is no official closing price that day, at the last sales price. Securities not listed on an exchange or the national securities market, or securities for which there were no transactions, are valued at the average of the most recent bid and asked prices, except for open short positions, where the asked price is used for valuation purposes. Bid price is used when no asked price is avail-
| 76 |
able. Investments in registered investment companies are valued at their net asst value.When market quotations or official closing prices are not readily available, or are determined not to reflect accurately fair value, such as when the value of the security has been significantly affected by events after the close of the exchange or market on which the security is principally traded (for example, a foreign exchange or market), but before the funds calculate their net asset values, the funds may value these investments at fair value as determined in accordance with the procedures approved by the Trust’s Board. Fair valuing of securities may be determined with the assistance of a pricing service using calculations based on indices of domestic securities and other appropriate indicators, such as prices of relevant ADR’s and futures contracts. For other securities that are fair valued by the Trust’s Board, certain factors may be considered such as: fundamental analytical data, the nature and duration of restrictions on disposition, an evaluation of the forces that influence the market in which securities are purchased and sold and public trading in similar securities of the issuer or comparable issuers. Investments denominated in foreign currencies are translated to U.S. dollars at the prevailing rates of exchange. Forward currency exchange contracts are valued at the forward rate.
| Mellon Balanced Fund |
Most debt securities are valued each business day by an independent pricing service (the “Service”) approved by the Trust’s Board. Securities listed on the National Market System for which market quotations are available are valued at the official closing price or, if there is no official closing price that day, at the last sales price. Debt securities for which quoted bid prices are readily available and are representative of the bid side of the market in the judgment of the Service are valued at the mean between the quoted bid prices (as obtained by the Service from dealers in such securities) and asked prices (as calculated by the Service based upon its evaluation of the market for such securities). Other debt securities (which constitute a majority of the portfolio securities) are valued as determined by the Service, based on meth-
ods which include consideration of: yields or prices of securities of comparable quality, coupon, maturity and type; indications as to values from dealers; and general market conditions. Securities for which there are no such valuations are valued at fair value as determined in good faith under the direction of the Trust’s Board. Restricted securities, as well as securities or other assets for which recent market quotations are not readily available, that are not valued by a pricing service approved by the Trust’s Board, or are determined by the fund not to reflect accurately fair value (such as when an event occurs after the close of the exchange on which the security is principally traded and that is determined by the fund to have changed the value of the security), are valued at fair value as determined in good faith under the direction of the Trust’s Board. The factors that may be considered when fair valuing a security include fundamental analytical data, the nature and duration of restrictions on disposition, an evaluation of the forces that influence the market in which the securities are purchased and sold and public trading in similar securities of the issuer or comparable issuers.
(b) Securities transactions and investment income:
Securities transactions are recorded on a trade date basis. Realized gain and loss from securities transactions are recorded on the identified cost basis. Dividend income is recorded on the ex-dividend date and interest income, including accretion of discount and amortization of premium on investments, is recognized on the accrual basis.
The funds have an arrangement with the custodian banks whereby the funds receive earnings credits from the custodian when positive cash balances are maintained, which are used to offset custody fees. For financial reporting purposes, the funds include net earnings credits as expense offsets in the Statements of Operations.
Pursuant to a securities lending agreement with Mellon Bank, an affiliate of Dreyfus, the funds may lend securities to certain qualified institutions.At origination,all loans are secured by collateral of at least 102% of the value of U.S. securities loaned and 105% of the value of foreign securi-
| The Funds 77 |
NOTES TO FINANCIAL STATEMENTS (continued)
ties loaned. Collateral equivalent to at least 100% of the market value of securities on loan will be maintained at all times. Cash collateral is invested in certain money market mutual funds managed by Dreyfus.The funds are entitled to receive all income on securities loaned, in addition to income earned as a result of the lending transaction. Although each security loaned is fully collateralized, the funds would bear the risk of delay in recovery of, or loss of rights in, the securities loaned should a borrower fail to return the securities in a timely manner.
The funds may engage in repurchase agreement transactions. Under the terms of a typical repurchase agreement, a fund, through its custodian and sub-custodian, takes possession of an underlying debt obligation subject to an obligation of the seller to repurchase, and the fund to resell, the obligation at an agreed-upon price and time, thereby determining the yield during the fund’s holding period.This arrangement results in a fixed rate of return that is not subject to market fluctuations during the fund’s holding period.The value of the collateral is at least equal, at all times, to the total amount of the repurchase obligation, including interest. In the event of a counterparty default, the fund has the right to use the collateral to offset losses incurred. There is potential loss to the fund in the event the fund is delayed or prevented from exercising its rights to dispose of the collateral securities, including the risk of a possible decline in the value of the underlying securities during the period while the fund seeks to assert its rights.The Investment Adviser reviews the value of the collateral and the creditworthiness of those banks and dealers with which the fund enters into repurchase agreements to evaluate potential risks.
(c) Affiliated issuers: Investments in other investment companies advised by Dreyfus are defined as “affiliated” in the Act.
(d) Foreign currency transactions: Mellon Emerging Markets Fund and Mellon International Fund do not isolate that portion of the results of operations resulting from changes in foreign exchange rates on investments from the fluctuations arising from changes in the market prices
of securities held. Such fluctuations are included with the net realized and unrealized gain or loss from investments.
Net realized foreign exchange gains or losses arise from sales and maturities of short-term securities, sales of foreign currencies, currency gains or losses realized on securities transactions and the difference between the amounts of dividends, interest, and foreign withholding taxes recorded on the fund’s books and the U.S. dollar equivalent of the amounts actually received or paid. Net unrealized foreign exchange gains and losses arise from changes in the value of assets and liabilities other than investments in securities, resulting from changes in exchange rates. Such gains and losses are included with net realized and unrealized gain or loss on investments.
(e) Foreign currency exchange contracts: Certain funds may enter into forward currency exchange contracts to hedge their exposure to changes in foreign currency exchange rates on their foreign portfolio holdings and to settle foreign currency transactions. When executing forward currency exchange contracts, a fund is obligated to buy or sell a foreign currency at a specified rate on a certain date in the future.With respect to sales of forward currency exchange contracts, a fund would incur a loss if the value of the contract increases between the date the forward contract is opened and the date the forward contract is closed. The fund realizes a gain if the value of the contract decreases between those dates. With respect to purchases of forward currency exchange contracts, a fund would incur a loss if the value of the contract decreases between the date the forward contract is opened and the date the forward contract is closed. A fund realizes a gain if the value of the contract increases between those dates.The fund is also exposed to credit risk associated with counterparty nonperformance on these forward currency exchange contracts, which is typically limited to the unrealized gain on each open contract.As of August 31, 2005, there were no open forward currency exchange contracts. Funds may also enter into foreign exchange contracts at the prevailing spot rate in order to facilitate the settle-
| 78 |
ment of purchases and sales of foreign securities. Table 1 summarizes open foreign exchange contracts for Mellon International Fund and Mellon Emerging Markets Fund at August 31, 2005.
(f) Concentration of risk: Mellon Emerging Markets Fund invests in equity securities traded on the stock markets of emerging market countries, which can be extremely volatile due to political, social and economic factors. Risks include changes in currency exchange rates, a lack of comprehensive company information, political instability, differing auditing and legal standards, less diverse, less mature economic structures and less liquidity.
(g) Dividends to shareholders: Dividends payable to shareholders are recorded by the funds on the ex-dividend date.Mellon Large Cap Stock Fund,Mellon Income Stock Fund and Mellon Balanced Fund declare and pay dividends from investment income-net monthly. Mellon Mid Cap Stock Fund, Mellon Small Cap Stock Fund, Mellon International Fund and Mellon Emerging Markets Fund declare and pay dividends from investment income-net annually. With respect to each series, dividends from net realized capital gain, if any, are normally declared and paid annually, but the funds may make distributions on a more frequent basis to comply with the distribution require-
| Table 1. | ||||||||
| Mellon International Fund | ||||||||
| Foreign | Unrealized | |||||||
| Currency | Appreciation | |||||||
| Foreign Currency Exchange Contracts | Amounts | Cost ($) | Value ($) | (Depreciation) ($) | ||||
| Purchases: | ||||||||
| British Pounds, expiring 9/1/2005 | 6,605 | 11,861 | 11,907 | 46 | ||||
| Euro, expiring 9/2/2005 | 39,542 | 48,320 | 48,743 | 423 | ||||
| Japanese Yen, expiring 9/1/2005 | 528,027,500 | 4,744,363 | 4,769,681 | 25,318 | ||||
| Japanese Yen, expiring 9/2/2005 | 86,658,709 | 780,498 | 782,789 | 2,291 | ||||
| Sales: | Proceeds ($) | |||||||
| British Pounds, expiring 9/1/2005 | 26,999 | 48,320 | 48,671 | (351) | ||||
| Euro, expiring 9/1/2005 | 9,682 | 11,861 | 11,935 | (74) | ||||
| Total | 27,653 | |||||||
| Mellon Emerging Markets Fund | ||||||||
| Foreign | Unrealized | |||||||
| Currency | Appreciation | |||||||
| Foreign Currency Exchange Contracts | Amounts | Cost ($) | Value ($) | (Depreciation) ($) | ||||
| Purchases: | ||||||||
| Indonesian Rupiah, expiring 9/1/2005 | 2,777,782,284 | 273,673 | 269,688 | (3,985) | ||||
| Malaysian Ringgit, expiring 9/2/2005 | 447,967 | 119,573 | 118,761 | (812) | ||||
| South Korean Won, expiring 9/1/2005 | 474,119,945 | 458,707 | 456,543 | (2,164) | ||||
| Sales: | Proceeds ($) | |||||||
| Hungary Forint, expiring 9/2/2005 | 40,409,350 | 202,909 | 204,149 | (1,240) | ||||
| Poland Zloty, expiring 9/2/2005 | 2,180,770 | 664,565 | 669,893 | (5,328) | ||||
| South African Rand, expiring 9/1/2005 | 3,511,175 | 537,206 | 551,638 | (14,432) | ||||
| South African Rand, expiring 9/2/2005 | 819,110 | 126,994 | 128,690 | (1,696) | ||||
| South Korean Won, expiring 9/1/2005 | 771,432,778 | 746,067 | 742,834 | 3,233 | ||||
| South Korean Won, expiring 9/2/2005 | 2,243,101,907 | 2,169,345 | 2,159,944 | 9,401 | ||||
| Turkish Lira, expiring 9/1/2005 | 14,851 | 10,896 | 11,038 | (142) | ||||
| Turkish Lira, expiring 9/2/2005 | 14,851 | 11,038 | 11,038 | 0 | ||||
| Total | (17,165) | |||||||
The Funds 79
| NOTES TO FINANCIAL STATEMENTS (continued) |
ments of the Internal Revenue Code of 1986, as amended (the “Code”). To the extent that net realized capital gain can be offset by capital loss carryovers of that fund, it is the policy of the fund not to distribute such gain. Income and capital gain distributions are determined in accordance with income tax regulations, which may differ from U.S. generally accepted accounting principles.
(h) Federal income taxes: It is the policy of each fund to continue to qualify as a regulated investment company, if such qualification is in the best interests of its shareholders, by complying with the applicable provisions of the Code, and to make distributions of taxable income sufficient to relieve it from substantially all fed-
eral income and excise taxes. For federal income tax purposes, each series is treated as a single entity for the purpose of determining such qualification.
Table 2 summarizes each fund’s components of accumulated earnings on a tax basis at August 31, 2005.
Table 3 summarizes Mellon Large Cap Stock Fund’s accumulated capital loss carryover available to be applied against future net securities profits, if any, realized subsequent to August 31, 2005.
Table 4 summarizes each fund’s tax character of distributions paid to shareholders during the fiscal periods ended August 31, 2005 and August 31, 2004, respectively.
| Table 2. | ||||||||
| Undistributed | Accumulated | Undistributed | ||||||
| Ordinary | Capital | Capital | Unrealized | |||||
| Income ($) | Losses ($) | Gains ($) | Appreciation ($) | |||||
| Mellon Large Cap Stock Fund | 506,555 | 60,482,970 | — | 476,148,187 | ||||
| Mellon Income Stock Fund | — | — | 6,610,359 | 104,885,188 | ||||
| Mellon Mid Cap Stock Fund | 20,363,291 | — | 155,960,349 | 345,004,157 | ||||
| Mellon Small Cap Stock Fund | 3,280,247 | — | 109,811,864 | 131,135,046 | ||||
| Mellon International Fund | 60,210,453 | — | 82,132,366 | 235,678,522 | ||||
| Mellon Emerging Markets Fund | 47,744,270 | — | 115,606,897 | 309,357,728 | ||||
| Mellon Balanced Fund | 688,120 | — | 6,309,952 | 68,113,702 | ||||
| Table 3. | ||||||||
| Expiring in fiscal | 2011 ($)† | |||||||
| Mellon Large Cap Stock Fund | 60,482,970 | |||||||
| † If not applied, the carryover expires in fiscal 2011. | ||||||||
| Table 4. | ||||||||
| Long-Term | ||||||||
| Ordinary Income ($) | Capital Gains ($) | |||||||
| 2005 | 2004 | 2005 | 2004 | |||||
| Mellon Large Cap Stock Fund | 18,403,417 | 12,518,111 | - | — | ||||
| Mellon Income Stock Fund | 7,068,652 | 4,817,595 | 27,346,444 | 3,997,860 | ||||
| Mellon Mid Cap Stock Fund | 8,137,578 | 3,208,207 | 75,691,835 | — | ||||
| Mellon Small Cap Stock Fund | — | — | 19,929,027 | — | ||||
| Mellon International Fund | 37,686,099 | 13,998,246 | 39,439,373 | — | ||||
| Mellon Emerging Markets Fund | 56,279,263 | 13,199,030 | 44,590,620 | 2,416,263 | ||||
| Mellon Balanced Fund | 6,774,827 | 6,629,153 | — | — | ||||
| 80 |
During the period ended August 31, 2005, as a result of permanent book to tax differences, the funds increased (decreased) accumulated undistributed investment income-net, increased (decreased) accumulated net realized gain (loss) on investments and increased (decreased) paid-in capital as summarized in Table 5. These permanent book to tax differences are primarily due to the tax treatment for real estate investment trusts for the Mellon Large Cap Stock Fund, the Mellon Income Stock Fund and the Mellon Mid Cap Stock Fund, real estate investment trusts and net operating losses for the Mellon Small Cap Stock Fund, foreign exchange gains and losses and passive foreign investment companies for the Mellon International Fund, foreign exchange gains and losses for the Mellon Emerging Markets Fund and amortization adjustments, treasury protected securities and real estate investment trusts for the Mellon Balanced Fund. Net assets were not affected by this reclassification.
NOTE 3—Bank Line of Credit:
The funds participate with other Dreyfus-managed funds in a $100 million unsecured line of credit primarily to be utilized for temporary or emergency purposes, including the financing of redemptions. Interest is charged to the funds based on prevailing market rates in effect at the time of borrowings. During the period ended August 31, 2005, the funds did not borrow under the line of credit with the exception of Mellon Mid Cap Stock Fund, Mellon Small Cap Stock Fund, Mellon International Fund and Mellon Balanced Fund.
The average daily amount of borrowings outstanding under the line of credit during the period ended August 31, 2005 for the Mellon Mid Cap Stock Fund was approximately $412,900, with a related weighted average annualized interest rate of 2.34%.
The average daily amount of borrowings outstanding under the line of credit during the period ended August 31, 2005 for the Mellon Small Cap Stock Fund was approximately $82,100, with a related weighted average annualized interest rate of 3.48%.
The average daily amount of borrowings outstanding under the line of credit during the period ended August 31, 2005 for the Mellon International Fund was approximately $86,100, with a related weighted average annualized interest rate of 2.76%.
The average daily amount of borrowings outstanding under the line of credit during the period ended August 31, 2005 for the Mellon Balanced Fund was approximately $206,600, with a related weighted average annualized interest rate of 4.02%.
NOTE 4—Investment Advisory Fee, Administration Fee and Other Transactions With Affiliates:
(a) Fees payable by the funds pursuant to the provisions of an Investment Advisory Agreement with the Investment Adviser are payable monthly, computed on the average daily value of each fund’s net assets at the following annual rates: .65% of the Mellon Large Cap Stock
| Table 5. | ||||||
| Accumulated | Accumulated | |||||
| Undistributed | Net Realized | Paid-in | ||||
| Investment Income—Net ($) | Gain (Loss) ($) | Capital ($) | ||||
| Mellon Large Cap Stock Fund | (27,406) | 27,406 | — | |||
| Mellon Income Stock Fund | (228,150) | 228,150 | — | |||
| Mellon Mid Cap Stock Fund | (793,939) | 793,939 | — | |||
| Mellon Small Cap Stock Fund | 691,006 | (674,279) | (16,727) | |||
| Mellon International Fund | 1,901,213 | (1,901,213) | — | |||
| Mellon Emerging Markets Fund | 1,412,018 | (1,412,018) | — | |||
| Mellon Balanced Fund | 434,950 | (646,774) | 211,824 | |||
| The Funds 81 |
NOTES TO FINANCIAL STATEMENTS (continued)
Fund, .65% of the Mellon Income Stock Fund, .75% of the Mellon Mid Cap Stock Fund, .85% of the Mellon Small Cap Stock Fund, .85% of the Mellon International Fund, 1.15% of the Mellon Emerging Markets Fund and .65% (equity investments), .40% (debt securities) and .15% (money market investments and other underlying Mellon funds) of the Mellon Balanced Fund.
Pursuant to the Administration Agreement with Mellon Bank, Mellon Bank provides or arranges for fund accounting, transfer agency and other fund administration services and receives a fee based on the total net assets of the Trust based on the following rates:
| 0 up to $6 billion | 15% | |
| $6 billion up to $12 billion | 12% | |
| In excess of $12 billion | 10% |
No administration fee is applied to assets held by the Mellon Balanced Fund, which are invested in cash or money market instruments or shares of certain other series of the Trust.
Mellon Bank has entered into a Sub-Administration Agreement with Dreyfus pursuant to which Mellon Bank pays Dreyfus for performing certain administrative services.
During the period ended August 31, 2005, the Distributor retained $18,356 from the contingent deferred sales charge on redemptions of the Mellon Mid Cap Stock Fund’s Dreyfus Premier shares.
(b) Mellon Mid Cap Stock Fund has adopted a Distribution Plan (the “Plan”) pursuant to Rule 12b-1 under the Act for distributing its Dreyfus Premier shares. Mellon Mid Cap Stock Fund pays the Distributor a fee at an annual rate of .75% of the value of the fund’s average daily net assets attributable to its Dreyfus Premier shares. During the period ended August 31, 2005, Mellon Mid Cap Stock Fund’s Dreyfus Premier shares were charged $65,730 pursuant to the Plan.
(c) The funds have adopted a Shareholder Services Plan with respect to their Investor shares and Mellon Mid Cap Stock Fund has adopted a Shareholder Services
Plan with respect to its Dreyfus Premier shares, pursuant to which each fund pays the Distributor for the provision of certain services to holders of Investor shares and Dreyfus Premier shares a fee at an annual rate of ..25% of the value of the average daily net assets attributable to Investor shares and Dreyfus Premier shares, respectively. The services provided may include personal services relating to shareholder accounts, such as answering shareholder inquiries regarding a fund, and providing reports and other information, and services related to the maintenance of such shareholder accounts. The Shareholder Services Plan allows the Distributor to make payments from the shareholder services fees it collects from each fund to compensate service agents (certain banks, securities brokers or dealers and other financial institutions) in respect of these services. Table 6 summarizes the amounts Investor shares and Dreyfus Premier shares were charged during the period ended August 31, 2005, pursuant to the Shareholder Services Plan. Additional fees included in shareholder servicing costs in the Statements of Operations include fees paid to the transfer agent.
| Table 6. | ||
| Mellon Large Cap Stock Fund | $8,847 | |
| Mellon Income Stock Fund | 2,442 | |
| Mellon Mid Cap Stock Fund, | ||
| Investor shares | 61,084 | |
| Mellon Mid Cap Stock Fund, | ||
| Dreyfus Premier shares | 21,910 | |
| Mellon Small Cap Stock Fund | 10,204 | |
| Mellon International Fund | 5,696 | |
| Mellon Emerging Markets Fund | 12,246 | |
| Mellon Balanced Fund | 2,838 |
All funds except Mellon International Fund and Mellon Emerging Markets Fund compensate Mellon Bank, an affiliate of Dreyfus, under a Custody Agreement with Mellon Bank and Mellon International Fund and Mellon Emerging Markets Fund compensate Mellon Trust of New England, N.A. under a Custody Agreement with Mellon Trust of New England, N.A. for providing custo-
| 82 |
dial services for the relevant funds.Table 7 summarizes the amounts the funds were charged during the period ended August 31, 2005, pursuant to the custody agreements.
| Table 7. | ||
| Mellon Large Cap Stock Fund | $107,795 | |
| Mellon Income Stock Fund | 26,300 | |
| Mellon Mid Cap Stock Fund | 98,873 | |
| Mellon Small Cap Stock Fund | 85,387 | |
| Mellon International Fund | 1,375,485 | |
| Mellon Emerging Markets Fund | 2,561,561 | |
| Mellon Balanced Fund | 31,528 |
During the period ended August 31, 2005, each of the funds were charged $2,520 for services performed by the Chief Compliance Officer.
Table 8 summarizes the components of Due to the Dreyfus Corporation and affiliates in the Statements of Assets and Liabilities for each fund.
(d) Each trustee who is not an “affiliated person” as defined in the Act receives from the Trust an annual fee
of $44,000 and an attendance fee of $4,000 for each in-person meeting attended and $500 for telephone meetings and is reimbursed for travel and out-of-pocket expenses. Prior to September 14, 2004, the attendance fee payable to each trustee was $3,000 for each in-person meeting attended.
(e) The Trust and Dreyfus have received an exemptive order from the SEC which, among other things, permits each fund to use collateral received in connection with lending the funds’ securities and other uninvested cash to purchase shares of one or more registered mutual funds advised by Dreyfus in excess of the limitations imposed by the Act.
NOTE 5—Securities Transactions:
Table 9 summarizes each fund’s aggregate amount of purchases and sales (including paydowns) of investment securities, excluding short-term securities and foreign currency exchange contracts, during the period ended August 31, 2005, of which $58,907,505 in purchases and
| Table 8. | ||||||||||
| Investment | Rule 12b-1 | Shareholder | Chief | |||||||
| Advisory | Distribution | Services | Custody | Compliance | ||||||
| Fees ($) | Plan Fees ($) | Plan Fees ($) | Fees ($) | Officer Fees ($) | ||||||
| Mellon Large Cap Stock Fund | 961,138 | — | 833 | 27,342 | 1,533 | |||||
| Mellon Income Stock Fund | 218,046 | — | 231 | 6,509 | 1,533 | |||||
| Mellon Mid Cap Stock Fund | 939,371 | 5,150 | 7,290 | 24,247 | 1,533 | |||||
| Mellon Small Cap Stock Fund | 583,309 | — | 996 | 26,305 | 1,533 | |||||
| Mellon International Fund | 1,326,507 | — | 744 | 365,487 | 1,533 | |||||
| Mellon Emerging Markets Fund | 1,317,623 | — | 934 | 581,327 | 1,533 | |||||
| Mellon Balanced Fund | 133,859 | — | 375 | 15,163 | 1,533 | |||||
| Table 9. | ||||
| Purchases ($) | Sales ($) | |||
| Mellon Large Cap Stock Fund | 378,776,591 | 402,311,581 | ||
| Mellon Income Stock Fund | 193,507,828 | 114,122,479 | ||
| Mellon Mid Cap Stock Fund | 1,113,811,856 | 1,133,358,009 | ||
| Mellon Small Cap Stock Fund | 1,211,660,652 | 1,275,686,513 | ||
| Mellon International Fund | 1,045,312,709 | 673,326,917 | ||
| Mellon Emerging Markets Fund | 510,196,948 | 522,895,655 | ||
| Mellon Balanced Fund | 219,275,232 | 235,090,722 | ||
The Funds 83
NOTES TO FINANCIAL STATEMENTS (continued)
$59,121,454 in sales were from mortgage dollar roll transactions in the Mellon Balanced Fund.
A mortgage dollar roll transaction involves a sale by the fund of mortgage related securities that it holds with an agreement by the fund to repurchase similar securities at an agreed upon price and date.The securities purchased will bear the same interest rate as those sold, but generally will be collateralized by pools of mortgages with different prepayment histories than those securities sold.
Table 10 summarizes the cost of investments for federal income tax purposes and accumulated net unrealized appreciation on investments for each fund at August 31, 2005.
| NOTE 6—Legal Matters: |
In early 2004, two purported class and derivative actions were filed against Mellon Financial, Mellon Bank, N.A., Dreyfus, Founders Asset Management LLC, and certain directors of the Dreyfus Funds and the Dreyfus Founders Funds (together, the “Funds”) in the United States District Court for the Western District of Pennsylvania. In September 2004, plaintiffs served a Consolidated Amended Complaint (the “Amended Complaint”) on behalf of a purported class of all persons who acquired interests in any of the Funds between January 30, 1999 and November 17, 2003, and derivatively on behalf of the
Funds.The Amended Complaint in the newly styled In re Dreyfus Mutual Funds Fee Litigation also named the Distributor, Premier Mutual Fund Services, Inc. and two additional Fund directors as defendants and alleges violations of the Investment Company Act of 1940, the Investment Advisers Act of 1940, the Pennsylvania Unfair Trade Practices and Consumer Protection Law and common-law claims. Plaintiffs seek to recover allegedly improper and excessive Rule 12b-1 and advisory fees allegedly charged to the Funds for marketing and distribution services. More specifically, plaintiffs claim, among other things, that 12b-1 fees and directed brokerage were improperly used to pay brokers to recommend the Funds over other funds, and that such payments were not disclosed to investors. In addition, plaintiffs assert that economies of scale and soft-dollar benefits were not passed on to the Funds. Plaintiffs further allege that 12b-1 fees were improperly charged to certain of the Funds that were closed to new investors. The Amended Complaint seeks compensatory and punitive damages, rescission of the advisory contracts, and an accounting and restitution of any unlawful fees, as well as an award of attorneys’ fees and litigation expenses. As noted, some of the claims in this litigation are asserted derivatively on behalf of the Funds that have been named as nominal defendants. With respect to such derivative claims, no
| Table 10. | ||||||||
| Cost of | Gross | Gross | ||||||
| Investments ($) | Appreciation ($) | (Depreciation) ($) | Net ($) | |||||
| Mellon Large Cap Stock Fund | 1,298,163,723 | 483,575,643 | 7,427,456 | 476,148,187 | ||||
| Mellon Income Stock Fund | 298,379,870 | 106,954,971 | 2,069,783 | 104,885,188 | ||||
| Mellon Mid Cap Stock Fund | 1,164,109,476 | 368,196,847 | 23,192,690 | 345,004,157 | ||||
| Mellon Small Cap Stock Fund | 769,524,296 | 145,217,390 | 14,082,344 | 131,135,046 | ||||
| Mellon International Fund | 1,598,558,598 | 274,644,370 | 38,961,935 | 235,682,435 | ||||
| Mellon Emerging Markets Fund | 1,004,580,507 | 340,688,878 | 31,106,598 | 309,582,280 | ||||
| Mellon Balanced Fund | 309,162,265 | 70,369,304 | 2,255,602 | 68,113,702 | ||||
| 84 |
relief is sought against the Funds. Dreyfus believes the allegations to be totally without merit and intends to defend the action vigorously. None of the trustees of the Trust, nor the funds, were named in the actions. In November 2004, all named defendants moved to dismiss the Amended Complaint in whole or substantial part. Briefing was completed in May 2005.
Additional lawsuits arising out of these circumstances and presenting similar allegations and requests for relief may be filed against the defendants in the future. Neither Dreyfus nor the Funds believe that any of the pending actions will have a material adverse effect on the Funds or Dreyfus’ ability to perform its contract with the Funds.
| The Funds 85 |
REPORT OF INDEPENDENT REGISTERED PUBLIC ACCOUNTING FIRM
The Board of Trustees and Shareholders of Mellon Funds Trust:
We have audited the accompanying statements of assets and liabilities of the Mellon Large Cap Stock Fund, the Mellon Income Stock Fund, the Mellon Mid Cap Stock Fund, the Mellon Small Cap Stock Fund, the Mellon International Fund, the Mellon Emerging Markets Fund and the Mellon Balanced Fund of Mellon Funds Trust (collectively “the Funds”), including the statements of investments, as of August 31, 2005, and the related statements of operations for the year then ended, the statements of changes in net assets for each of the years in the two-year period then ended, and the financial highlights for each of the periods indicated herein.These financial statements and financial highlights are the responsibility of the Funds’ management. Our responsibility is to express an opinion on these financial statements and financial highlights based on our audits.
We conducted our audits in accordance with the standards of the Public Company Accounting Oversight Board (United States).Those standards require that we plan and perform the audit to obtain reasonable assurance about whether the financial statements and financial highlights are free of material misstatement.An audit includes exam-
ining, on a test basis, evidence supporting the amounts and disclosures in the financial statements and financial highlights. Our procedures included confirmation of securities owned as of August 31, 2005, by correspondence with the custodian and brokers or by other appropriate auditing procedures where replies from brokers were not received. An audit also includes assessing the accounting principles used and significant estimates made by management, as well as evaluating the overall financial statement presenta-tion.We believe that our audits provide a reasonable basis for our opinion.
In our opinion, the financial statements and financial highlights referred to above present fairly, in all material respects,the financial position of the Funds as of August 31, 2005, and the results of their operations for the year then ended, the changes in their net assets for each of the years in the two-year period then ended and the financial highlights for each of the periods indicated herein, in conformity with U.S. generally accepted accounting principles.

| 86 |
IMPORTANT TAX INFORMATION (Unaudited)
| Mellon Large Cap Stock Fund |
For federal tax purposes the fund hereby designates 100% of the ordinary dividends paid during the fiscal year ended August 31, 2005 as qualifying for the corporate dividends received deduction.Also certain dividends paid by the fund may be subject to a maximum tax rate of 15%, as provided for by the Jobs and Growth Tax Relief Reconciliation Act of 2003. Of the distributions paid during the fiscal year, $18,403,417 represents the maximum amount that may be considered qualified dividend income. Shareholders will receive notification in January 2006 of the percentage applicable to the preparation of their 2005 income tax returns.
| Mellon Income Stock Fund |
For federal tax purposes the fund hereby designates 100% of the ordinary dividends paid during the fiscal year ended August 31, 2005 as qualifying for the corporate dividends received deduction.Also certain dividends paid by the fund may be subject to a maximum tax rate of 15%, as provided for by the Jobs and Growth Tax Relief Reconciliation Act of 2003. Of the distributions paid during the fiscal year, $7,033,062 represents the maximum amount that may be considered qualified dividend income. Shareholders will receive notification in January 2006 of the percentage applicable to the preparation of their 2005 income tax returns. Also, the fund designates $.8574 per share as a long-term capital gain distribution paid on December 31, 2004 and also designates $.0051 per share as a long-term capital gain distribution paid on March 31, 2005.
| Mellon Mid Cap Stock Fund |
For federal tax purposes the fund hereby designates 60.62% of the ordinary dividends paid during the fiscal year ended August 31, 2005 as qualifying for the corporate dividends received deduction.Also certain dividends paid by the fund may be subject to a maximum tax rate of 15%, as provided for by the Jobs and Growth Tax Relief Reconciliation Act of 2003. Of the distributions paid during the fiscal year, $8,137,578 represents the
maximum amount that may be considered qualified dividend income. Shareholders will receive notification in January 2006 of the percentage applicable to the preparation of their 2005 income tax returns. Also, the fund designates $.7760 per share as a long-term capital gain distribution paid on December 10, 2004.
Mellon Small Cap Stock Fund
The fund designates $.3915 per share as a long-term capital gain distribution paid on December 8, 2004.
Mellon International Fund
In accordance with federal tax law, the fund elects to provide each shareholder with their portion of the fund’s foreign taxes paid and the income sourced from foreign countries. Accordingly, the fund hereby makes the following designations regarding its fiscal year ended August 31, 2005:
- the total amount of taxes paid to foreign coun- tries was $3,435,265.
- the total amount of income sourced from foreign countries was $33,179,597.
As required by federal tax law rules, shareholders will receive notification of their proportionate share of foreign taxes paid and foreign sourced income for the 2005 calendar year with Form 1099-DIV which will be mailed by January 31, 2006.
Also certain dividends paid by the fund may be subject to a maximum tax rate of 15%, as provided for by the Jobs and Growth Tax Relief Reconciliation Act of 2003. Of the distributions paid during the fiscal year, $22,069,776 represents the maximum amount that may be considered qualified dividend income. Also, the fund designates $.4236 per share as a long-term capital gain distribution paid on December 15, 2004.
Mellon Emerging Markets Fund
In accordance with federal tax law, the fund elects to provide each shareholder with their portion of the fund’s foreign taxes paid and the income sourced from foreign
| The Funds 87 |
IMPORTANT TAX INFORMATION (Unaudited) (continued)
countries. Accordingly, the fund hereby makes the following designations regarding its fiscal year ended August 31, 2005:
- the total amount of taxes paid to foreign coun- tries was $4,892,118.
- the total amount of income sourced from foreign countries was $31,414,640.
As required by federal tax law rules, shareholders will receive notification of their proportionate share of foreign taxes paid and foreign sourced income for the 2005 calendar year with Form 1099-DIV which will be mailed by January 31, 2006.
Also certain dividends paid by the fund may be subject to a maximum tax rate of 15%, as provided for by the Jobs and Growth Tax Relief Reconciliation Act of 2003. Of the distributions paid during the fiscal year, $13,902,666 represents the maximum amount that may
be considered qualified dividend income. Also, the fund designates $.7497 per share as a long-term capital gain distribution paid on December 31, 2004.
| Mellon Balanced Fund |
For federal tax purposes the fund hereby designates 47.73% of the ordinary dividends paid during the fiscal year ended August 31, 2005 as qualifying for the corporate dividends received deduction.Also certain dividends paid by the fund may be subject to a maximum tax rate of 15%, as provided for by the Jobs and Growth Tax Relief Reconciliation Act of 2003. Of the distributions paid during the fiscal year, $3,383,685 represents the maximum amount that may be considered qualified dividend income. Shareholders will receive notification in January 2006 of the percentage applicable to the preparation of their 2005 income tax returns.
| 88 |
INFORMATION ABOUT THE REVIEW AND APPROVAL OF EACH FUND’ S INVESTMENT ADVISORY AGREEMENT (Unaudited)
MELLON FUNDS TRUST (Mellon Large Cap Stock Fund, Mellon Income Stock Fund, Mellon Mid Cap Stock Fund, Mellon Small Cap Stock Fund, Mellon International Fund, Mellon Emerging Markets Funds and Mellon Balanced Fund)
At a meeting of the Board of Trustees held on March 15-16, 2005, the Board considered the re-approval of the Trust’s Investment Advisory Agreement for another one year term, pursuant to which the Investment Adviser, a division of Dreyfus, provides the funds with investment advisory services. The Board members also considered the re-approval of the Trust’s Administration Agreement with Mellon Bank for another one year term, pursuant to which Mellon Bank provides the funds with administrative services. Mellon Bank has entered into a Sub-Administration Agreement with Dreyfus pursuant to which Mellon Bank pays Dreyfus for performing certain of these administrative services. The Board members who are not “interested persons” (as defined in the Act) of the Trust were assisted in their review by independent legal counsel and met with counsel in executive session separate from representatives of Dreyfus.
Analysis of Nature, Extent and Quality of Services Provided to the Funds. The Board members received a presentation from representatives of Dreyfus regarding services provided to the funds, and discussed the nature, extent and quality of the services provided to the funds pursuant to the Investment Advisory Agreement. Dreyfus’ representatives reviewed the funds’ distribution of accounts, and noted the diversity of distribution of the funds and Dreyfus’ corresponding need for broad, deep and diverse resources to be able to provide ongoing shareholder services to each of the funds’ distribution channels. The Board also reviewed the number of shareholder accounts in each fund, as well as each fund’s asset size.
The Board members also considered Dreyfus’ research and portfolio management capabilities and that Dreyfus also provides oversight of day-to-day fund operations, including fund accounting and administration and assis-
tance in meeting legal and regulatory requirements.The Board members also considered Dreyfus’ extensive administrative, accounting and compliance infrastructure.
Comparative Analysis of the Funds’ Performance, Management Fees and Expense Ratios.
Mellon Large Cap Stock Fund. The Board members reviewed the fund’s performance and expense ratios and placed significant emphasis on comparisons to a group of comparable funds and Lipper averages. The Board reviewed the fund’s performance, management fee and total expense ratio within this comparison group and against the fund’s Lipper category average.The group of comparable funds was previously approved by the Board for this purpose,and was prepared using a Board-approved selection methodology that was based, in part, on selecting non-affiliated funds reported in the same Lipper category as the fund. The Board members noted that although the fund’s performance for the 1-, 3- and 5-year periods ended December 31, 2004 was below that of the Lipper and comparison group averages, it was showing a trend of improvement. Management also presented the Board with the quartile, percentile and rank of the fund for the 1-month, 3-month, 1-year and 3-year periods ended January 31, 2005 and February 28, 2005 within its Lipper category, and noted that the fund’s rankings in its Lipper category as of February 28th had improved versus those of January 31st for each period. Management also noted that, over the past year, management had discussed and implemented several significant enhancements to its equity processes and that as part of the enhancements, management had redefined the roles and responsibilities of certain personnel and had hired several people for its equity group. The Board members then discussed the fund’s advisory fee and expense ratio and reviewed the range of advisory fees in the comparison group and noted that the fund’s expense ratio was lower than the average expense ratio of the comparison group and that of its Lipper category and that the fund’s expense ratio ranked first (was the lowest) in the comparison group.
| The Funds 89 |
| INFORMATION ABOUT THE REVIEW AND APPROVAL OF EACH FUND ’S |
| INVESTMENT ADVISORY AGREEMENT (Unaudited) (continued) |
Representatives of Dreyfus reviewed with the Board members a comparison of the fees paid to Dreyfus or its affiliates by mutual funds with similar investment objectives, policies and strategies as the fund (the “Similar Funds”). These comparison groups also compared the management fee and total expense ratios of Similar Funds. The Similar Funds’ comparison group was composed exclusively of investment companies managed by Dreyfus or its affiliates that were reported in the same Lipper category as the fund. Dreyfus’ representatives explained the nature of each Similar Fund and the differences, from Dreyfus’ perspective, in management of these Similar Funds compared to managing and providing other services to the fund. Dreyfus’ representatives also reviewed the costs associated with distribution through intermediaries. The Board analyzed differences in fees paid to Dreyfus and discussed the relationship of the management fees paid in light of Dreyfus’ performance and the services provided. The Similar Funds had management fees that were both higher and lower than the fund’s management fee, and management noted that the management fees of the Similar Funds (that were lower than the fund’s management fee) reflected historical pricing, pricing of a “unitary fee” fund and pricing of funds offered only to separate accounts established by insurance companies to fund variable annuity contracts and variable life insurance poli-cies.The Board members considered the relevance of the fee information provided for the Similar Funds to evaluate the appropriateness and reasonableness of the fund’s management fee. The Board acknowledged that differences in fees paid by the Similar Funds seemed to be consistent with the services provided.
Representatives of Dreyfus also reviewed with the Board members a comparison of the fees paid to Dreyfus or its affiliates by separate accounts with similar investment objectives, policies and strategies as the fund (the “Similar Accounts”).The Similar Accounts’ comparison group was composed exclusively of separate accounts
and “wrap” accounts managed by Dreyfus or its affiliates. Dreyfus’ representatives explained the nature of each Similar Account and the differences, from Dreyfus’ perspective, in management of these Separate Accounts as compared to managing and providing other services to the fund. Dreyfus’ representatives also reviewed the costs associated with distribution through intermediaries.The Board analyzed differences in fees paid to Dreyfus and discussed the relationship of the management fees paid in light of Dreyfus’ performance and the services pro-vided.The Board members considered the relevance of the fee information provided for the Similar Accounts to evaluate the appropriateness and reasonableness of the fund’s management fee. The Board acknowledged that differences in fees paid by the Similar Accounts seemed to be consistent with the services provided.
Mellon Income Stock Fund. The Board members reviewed the fund’s performance and expense ratios and placed significant emphasis on comparisons to a group of comparable funds and Lipper averages. The Board reviewed the fund’s performance, management fee and total expense ratio within this comparison group and against the fund’s Lipper category average.The group of comparable funds was previously approved by the Board for this purpose, and was prepared using a Board-approved selection methodology that was based, in part, on selecting non-affiliated funds reported in the same Lipper category as the fund.The Board members noted that the fund’s performance as of December 31, 2004 was below the averages of the comparison group for the 1-, 3- and 5-year periods, was comparable to its Lipper category average for the 1-year period and was below its Lipper category averages for the 3- and 5-year periods. Management also presented the Board with the quartile, percentile and rank of the fund for the 1-month, 3-month, 1-year and 3-year periods ended January 31, 2005 and February 28, 2005 within its Lipper category, and noted that the fund’s rankings in its Lipper category
| 90 |
as of February 28th had improved versus those of January 31st for each period, except the 1-month period ended February 28th. The Board members noted that the fund’s performance was showing a trend of improvement. Management also noted that, over the past year, management had discussed and implemented several significant enhancements to its equity processes.The Board members then discussed the fund’s advisory fee and expense ratio and reviewed the range of advisory fees in the comparison group and noted that the fund’s expense ratio was lower than the average expense ratio of the comparison group and that of its Lipper category and that the fund’s expense ratio ranked in the first quartile (was among the lowest) in the comparison group.
Representatives of Dreyfus stated that there were no other mutual funds managed by Dreyfus or its affiliates with similar investment objectives, policies and strategies as the fund, which were reported in the same Lipper category as the fund, and that there were no separate accounts managed by Dreyfus or its affiliates with similar investment objectives, policies and strategies as the fund.
Mellon Mid Cap Stock Fund. The Board members reviewed the fund’s performance and expense ratios and placed significant emphasis on comparisons to a group of comparable funds and Lipper averages. The Board reviewed the fund’s performance, management fee and total expense ratio within this comparison group and against the fund’s Lipper category average.The group of comparable funds was previously approved by the Board for this purpose, and was prepared using a Board-approved selection methodology that was based, in part, on selecting non-affiliated funds reported in the same Lipper category as the fund.The Board members noted that the fund’s performance as of December 31, 2004 was above the averages of the comparison group for the 1- and 3-year periods, was below the average of the
comparison group for the 5-year period, was above its Lipper category average for the 1-year period and was below its Lipper category averages for the 3- and 5-year periods. Management also presented the Board with the quartile, percentile and rank of the fund for the 1-month, 3-month, 1-year and 3-year periods ended January 31, 2005 and February 28, 2005 within its Lipper category, and noted that the fund’s ranking in its Lipper category as of February 28th had improved versus that of January 31st for each period, except the 3-year period ended February 28th. The Board members noted that the Fund’s performance was showing a trend of improvement. Management also noted that, over the past year, management had discussed and implemented several significant enhancements to its equity processes and that as part of the enhancements, management had redefined the roles and responsibilities of certain personnel and had hired several people for its equity group.The Board members then discussed the fund’s advisory fee and expense ratio and reviewed the range of advisory fees in the comparison group and noted that the fund’s expense ratio was lower than the average expense ratio of the comparison group and that of its Lipper category and that the fund’s expense ratio ranked first (was the lowest) in the comparison group.
Representatives of Dreyfus reviewed with the Board members a comparison of the fees paid to Dreyfus or its affiliates by mutual funds with similar investment objectives, policies and strategies as the fund (the “Similar Funds”). These comparison groups also compared the management fee and total expense ratios of Similar Funds.The Similar Funds’ comparison group was composed exclusively of investment companies managed by Dreyfus or its affiliates that were reported in the same Lipper category as the fund. Dreyfus’ representatives explained the nature of each Similar Fund and the dif-
| The Funds 91 |
INFORMATION ABOUT THE REVIEW AND APPROVAL OF EACH FUND’S INVESTMENT ADVISORY AGREEMENT (Unaudited) (continued)
ferences, from Dreyfus’ perspective, in management of these Similar Funds compared to managing and providing other services to the fund. Dreyfus’ representatives also reviewed the costs associated with distribution through intermediaries. The Board analyzed differences in fees paid to Dreyfus and discussed the relationship of the management fees paid in light of Dreyfus’ performance and the services provided. Management noted that the management fees of the Similar Funds were substantially comparable to those of the fund or reflected the pricing of a “unitary fee” fund and a fund offered only to separate accounts established by insurance companies to fund variable annuity contracts and variable life insurance policies. The Board members considered the relevance of the fee information provided for the Similar Funds to evaluate the appropriateness and reasonableness of the fund’s management fee.The Board acknowledged that differences in fees paid by the Similar Funds seemed to be consistent with the services provided.
Representatives of Dreyfus stated that there were no separate accounts managed by Dreyfus or its affiliates with similar investment objectives, policies and strategies as the fund.
Mellon Small Cap Stock Fund. The Board members reviewed the fund’s performance and expense ratios and placed significant emphasis on comparisons to a group of comparable funds and Lipper averages. The Board reviewed the fund’s performance, management fee and total expense ratio within this comparison group and against the fund’s Lipper category average.The group of comparable funds was previously approved by the Board for this purpose, and was prepared using a Board-approved selection methodology that was based, in part, on selecting non-affiliated funds reported in the same Lipper category as the fund.The Board members noted that the fund’s performance as of December 31, 2004 was below the averages of the comparison group for the 1-, 3- and 5-year periods, was comparable to its Lipper category average for the 1- and 3-year periods and was below its Lipper category average for the 5-year period.
Management also presented the Board with the quartile, percentile and rank of the fund for the 1-month, 3-month, 1-year and 3-year periods ended January 31, 2005 and February 28, 2005 within its Lipper category, and noted that the fund’s ranking in its Lipper category as of February 28th had improved versus that of January 31st for the 1-month and 3-month periods and was generally comparable to that of January 31st for the 1-year and 3-year periods.The Board members noted that the fund’s performance was showing a trend of improvement. Management also noted that, over the past year, management had discussed and implemented several significant enhancements to its equity processes and that as part of the enhancements, management was seeking a candidate to serve as a co-primary portfolio manager of the fund.The Board members then discussed the fund’s advisory fee and expense ratio and reviewed the range of advisory fees in the comparison group and noted that the fund’s expense ratio was lower than the average expense ratio of the comparison group and that of its Lipper category and that the fund’s expense ratio ranked in the second quartile (was among the lowest) in the comparison group.
Representatives of Dreyfus reviewed with the Board members a comparison of the fees paid to Dreyfus or its affiliates by mutual funds with similar investment objectives, policies and strategies as the fund (the “Similar Funds”). These comparison groups also compared the management fee and total expense ratios of Similar Funds. The Similar Funds’ comparison group was composed exclusively of investment companies managed by Dreyfus or its affiliates that were reported in the same Lipper category as the fund. Dreyfus’ representatives explained the nature of each Similar Fund and the differences, from Dreyfus’ perspective, in management of these Similar Funds compared to managing and providing other services to the fund. Dreyfus’ representatives also reviewed the costs associated with distribution through intermediaries. The Board analyzed differences in fees paid to Dreyfus and discussed the relationship of the management
| 92 |
fees paid in light of Dreyfus’ performance and the services provided. The Similar Funds had management fees that were both higher and lower than the fund’s management fee, and management noted that the management fees of the Similar Funds reflected historical pricing and pricing of an index fund and a fund offered only to separate accounts established by insurance companies to fund variable annuity contracts and variable life insurance policies. The Board members considered the relevance of the fee information provided for the Similar Funds to evaluate the appropriateness and reasonableness of the fund’s management fee.The Board acknowledged that differences in fees paid by the Similar Funds seemed to be consistent with the services provided.
Representatives of Dreyfus stated that there were no separate accounts managed by Dreyfus or its affiliates with similar investment objectives, policies and strategies as the fund.
Mellon International Fund. The Board members reviewed the fund’s performance and expense ratios and placed significant emphasis on comparisons to a group of comparable funds and Lipper averages. The Board reviewed the fund’s performance, management fee and total expense ratio within this comparison group and against the fund’s Lipper category average.The group of comparable funds was previously approved by the Board for this purpose, and was prepared using a Board-approved selection methodology that was based, in part, on selecting non-affiliated funds reported in the same Lipper category as the fund.The Board members noted that the fund’s performance as of December 31, 2004 was comparable to the averages of the comparison group for the 1- and 3-year periods, was below the average of the comparison group for the 5-year period, was below its Lipper category averages for the 1- and 3-year periods and was above its Lipper category average for the 5-year period. Management also presented the Board with the quartile, percentile and rank of the fund for the 1-month, 3-month, 1-year and 3-year periods ended
January 31, 2005 and February 28, 2005 within its Lipper category, and noted that the fund’s ranking in its Lipper category as of February 28th had improved versus that for the 3-month period. The Board Members also noted management’s efforts to improve performance in connection with its proposal, which was effective June 30, 2005, to invest most of the fund’s cash inflows in accordance with a core investment style and to add a co-primary portfolio manager of the fund to manage the fund’s core investment style. The Board members then discussed the fund’s advisory fee and expense ratio and reviewed the range of advisory fees in the comparison group and noted that the fund’s expense ratio was lower than the average expense ratio of the comparison group and that of its Lipper category and that the fund’s expense ratio ranked in the second quartile (was among the lowest) in the comparison group.
Representatives of Dreyfus reviewed with the Board members a comparison of the fees paid to Dreyfus or its affiliates by mutual funds with similar investment objectives, policies and strategies as the fund (the “Similar Funds”). These comparison groups also compared the management fee and total expense ratios of Similar Funds.The Similar Funds’ comparison group was composed exclusively of investment companies managed by Dreyfus or its affiliates that were reported in the same Lipper category as the fund. Dreyfus’ representatives explained the nature of each Similar Fund and the differences, from Dreyfus’ perspective, in management of these Similar Funds compared to managing and providing other services to the fund. Dreyfus’ representatives also reviewed the costs associated with distribution through intermediaries. The Board analyzed differences in fees paid to Dreyfus and discussed the relationship of the management fees paid in light of Dreyfus’ performance and the services provided. Management noted that the management fees of the Similar Funds were comparable to those of the fund or reflected the pricing of a “master/feeder” fund structure and of funds offered
| The Funds 93 |
INFORMATION ABOUT THE REVIEW AND APPROVAL OF EACH FUND’S INVESTMENT ADVISORY AGREEMENT (Unaudited) (conti nued)
only to institutional investors or to separate accounts established by insurance companies to fund variable annuity contracts and variable life insurance policies.The Board members considered the relevance of the fee information provided for the Similar Funds to evaluate the appropriateness and reasonableness of the fund’s management fee. The Board acknowledged that differences in fees paid by the Similar Funds seemed to be consistent with the services provided.
Representatives of Dreyfus also reviewed with the Board members a comparison of the fees paid to Dreyfus or its affiliates by separate accounts with similar investment objectives, policies and strategies as the fund (the “Similar Accounts”).The Similar Accounts’ comparison group was composed exclusively of separate accounts and “wrap” accounts managed by Dreyfus or its affiliates. Dreyfus’ representatives explained the nature of each Similar Account and the differences, from Dreyfus’ perspective, in management of these Separate Accounts as compared to managing and providing other services to the fund. Dreyfus’ representatives also reviewed the costs associated with distribution through intermediaries.The Board analyzed differences in fees paid to Dreyfus and discussed the relationship of the management fees paid in light of Dreyfus’ performance and the services pro-vided.The Board members considered the relevance of the fee information provided for the Similar Accounts to evaluate the appropriateness and reasonableness of the fund’s management fee. The Board acknowledged that differences in fees paid by the Similar Accounts seemed to be consistent with the services provided.
Mellon Emerging Markets Fund. The Board members reviewed the fund’s performance and expense ratios and placed significant emphasis on comparisons to a group of comparable funds and Lipper averages. The Board reviewed the fund’s performance, management fee and total expense ratio within this comparison group and against the fund’s Lipper category average.The group of comparable funds was previously approved by the Board for this purpose, and was prepared using a Board-
approved selection methodology that was based, in part, on selecting non-affiliated funds reported in the same Lipper category as the fund.The Board members noted that the fund’s performance as of December 31, 2004 was above the averages of the comparison group and its Lipper category averages for the 1- and 3-year periods. Management also presented the Board with the quartile, percentile and rank of the fund for the 1-month, 3-month, 1-year and 3-year periods ended January 31, 2005 and February 28, 2005 within its Lipper category, and noted that the fund’s ranking in its Lipper category as of February 28th had improved versus that of January 31st for the 1-month period. The Board Members also noted management’s efforts to improve performance in connection with its proposal, which was effective June 30, 2005, to invest most of the fund’s cash inflows in accordance with a core investment style and to add a co-primary portfolio manager of the fund to manage the fund’s core investment style. The Board members then discussed the fund’s advisory fee and expense ratio and reviewed the range of advisory fees in the comparison group and noted that the fund’s expense ratio was lower than the average expense ratio of the comparison group and that of its Lipper category and that the fund’s expense ratio ranked in the second quartile (was among the lowest) in the comparison group.
Representatives of Dreyfus reviewed with the Board members a comparison of the fee paid to Dreyfus or its affiliates by a mutual fund with a similar investment objective and similar policies and strategies as the fund (the “Similar Fund”).This comparison group also compared the management fee and total expense ratio of the Similar Fund.The Similar Fund’s comparison group was composed exclusively of an investment company managed by Dreyfus or its affiliates that was reported in the same Lipper category as the fund. Dreyfus’ representatives explained the nature of the Similar Fund and the differences, from Dreyfus’ perspective, in management of the Similar Fund compared to managing and providing other services to the fund. Dreyfus’ representatives also
| 94 |
reviewed the costs associated with distribution through intermediaries. The Board analyzed differences in fees paid to Dreyfus and discussed the relationship of the management fees paid in light of Dreyfus’ performance and the services provided. Management noted that the management fee of the Similar Fund was comparable to that of the fund.The Board members considered the relevance of the fee information provided for the Similar Fund to evaluate the appropriateness and reasonableness of the fund’s management fee.The Board acknowledged that the fee paid by the Similar Fund seemed to be consistent with the services provided.
Representatives of Dreyfus also reviewed with the Board members a comparison of the fees paid to Dreyfus or its affiliates by separate accounts with similar investment objectives, policies and strategies as the fund (the “Similar Accounts”).The Similar Accounts’ comparison group was composed exclusively of separate accounts and “wrap” accounts managed by Dreyfus or its affiliates. Dreyfus’ representatives explained the nature of each Similar Account and the differences, from Dreyfus’ perspective, in management of these Separate Accounts as compared to managing and providing other services to the fund. Dreyfus’ representatives also reviewed the costs associated with distribution through intermediaries.The Board analyzed differences in fees paid to Dreyfus and discussed the relationship of the management fees paid in light of Dreyfus’ performance and the services pro-vided.The Board members considered the relevance of the fee information provided for the Similar Accounts to evaluate the appropriateness and reasonableness of the fund’s management fee. The Board acknowledged that differences in fees paid by the Similar Accounts seemed to be consistent with the services provided.
Mellon Balanced Fund. The Board members reviewed the fund’s performance and expense ratios and placed significant emphasis on comparisons to a group of comparable funds and Lipper averages. The Board reviewed the fund’s performance, management fee and total expense ratio within this comparison group and against
the fund’s Lipper category average. The group of comparable funds was previously approved by the Board for this purpose, and was prepared using a Board-approved selection methodology that was based, in part, on selecting non-affiliated funds reported in the same Lipper category as the fund. The Board members noted that the fund’s performance as of December 31, 2004 was above the averages of the comparison group and its Lipper category averages for the 1- and 3-year periods. Management also presented the Board with the quartile, percentile and rank of the fund for the 1-month, 3-month, 1-year and 3-year periods ended January 31, 2005 and February 28, 2005 within its Lipper category, and noted that the fund’s ranking in its Lipper category as of February 28th had improved versus that of January 31st for each period.The Board Members also noted the trend of good performance of the fund. The Board members then discussed the fund’s advisory fee and expense ratio and reviewed the range of advisory fees in the comparison group and noted that the fund’s expense ratio was lower than the average expense ratio of the comparison group and that of its Lipper category and that the fund’s expense ratio ranked in the first quartile (was among the lowest) in the comparison group.
Representatives of Dreyfus reviewed with the Board members a comparison of the fees paid to Dreyfus or its affiliates by mutual funds with similar investment objectives, policies and strategies as the fund (the “Similar Funds”). These comparison groups also compared the management fee and total expense ratios of Similar Funds. The Similar Funds’ comparison group was composed exclusively of investment companies managed by Dreyfus or its affiliates that were reported in the same Lipper category as the fund. Dreyfus’ representatives explained the nature of each Similar Fund and the differences, from Dreyfus’ perspective, in management of these Similar Funds compared to managing and providing other services to the fund. Dreyfus’ representatives also reviewed the costs associated with distribution through intermediaries. The Board analyzed differences in fees paid to
| The Funds 95 |
| INFORMATION ABOUT THE REVIEW AND APPROVAL OF EACH FUND’S |
| INVESTMENT ADVISORY AGREEMENT (Unaudited) (continued) |
Dreyfus and discussed the relationship of the management fees paid in light of Dreyfus’ performance and the services provided. The Similar Funds had management fees that were both higher and lower than the fund’s management fee, and management noted that the management fees of the Similar Funds (that were lower than the fund’s management fee) reflected historical pricing, pricing of a “unitary fee” fund and pricing of a fund offered only to separate accounts established by insurance companies to fund variable annuity contracts and variable life insurance poli-cies.The Board members considered the relevance of the fee information provided for the Similar Funds to evaluate the appropriateness and reasonableness of the fund’s management fee. The Board acknowledged that differences in fees paid by the Similar Funds seemed to be consistent with the services provided.
Representatives of Dreyfus stated that there were no separate accounts managed by Dreyfus or its affiliates with similar investment objectives, policies and strategies as the fund.
Analysis of Profitability and Economies of Scale. Dreyfus’ representatives reviewed the dollar amount of expenses allocated and profit received by Dreyfus and its affiliates with respect to each fund and the method used to determine such expenses and profit. The Board received and considered information prepared by an independent consulting firm regarding Dreyfus’ approach to allocating costs to, and determining the profitability of, individual funds and the entire Dreyfus mutual fund complex.The Dreyfus representatives stated that the methodology had also been reviewed by an independent registered public accounting firm which, like the consultant, found the methodology to be reasonable. The consulting firm also analyzed where any
economies of scale might emerge in connection with the management of the funds.The Board members evaluated the analysis in light of the relevant circumstances for each fund, and the extent to which economies of scale would be realized as the fund grows and whether fee levels reflect these economies of scale for the benefit of fund investors.The Board noted that it appeared that the benefits of any economies of scale also would be appropriately shared with shareholders through increased investment in fund management and administration resources. The Board members also considered potential benefits to Dreyfus and its affiliates, including Mellon Fund Advisers, from acting as investment adviser, including soft dollar arrangements with respect to trading each fund’s portfolio.
It was noted that the Board members should consider Dreyfus’ profitability with respect to each fund as part of their evaluation of whether the fees under the Investment Advisory Agreement bear a reasonable relationship to the mix of services provided by Dreyfus, including the nature, extent and quality of such services and that a discussion of economies of scale are predicated on increasing assets and that, if a fund’s assets had been decreasing, the possibility that Dreyfus may have realized any economies of scale would be less.The Board members also discussed the profitability percentage ranges determined by appropriate court cases to be reasonable given the services rendered to investment companies. It was noted that the profitability percentage for managing each fund was not unreasonable given the fund’s overall performance and generally superior service levels provided.
At the conclusion of these discussions, each of the Board Members expressed the opinion that he or she had been
| 96 |
furnished with sufficient information to make an informed business decision with respect to the continuation of the Trust’s Investment Advisory Agreement. Based on their discussions and considerations as described above, the Board made the following conclusions and determinations.
- The Board concluded that the nature, extent and qual- ity of the services provided by Dreyfus are adequate and appropriate.
- The Board was generally satisfied with the each fund’s performance, noting in particular, with respect to Mellon Large Cap Stock Fund, Mellon Income Stock Fund, Mellon Mid Cap Stock Fund and Mellon Small Cap Stock Fund, that each fund’s short-term perfor- mance was showing a trend of improvement, with respect to Mellon International Fund and Mellon Emerging Markets Fund, that management had made efforts to improve the funds’ performance in connection with its proposal, effective on June 30, 2005, to invest most of the funds’ cash inflows in accordance with a core investment style and to add a co-primary portfolio manager of each fund to manage the fund’s core invest- ment style and, with respect to Mellon Balanced Fund, that management’s change, effective December 31, 2004, to the fund’s primary portfolio manager for the
- equity portion of its portfolio was a positive step aimed at seeking to maintain the fund’s good performance.
- The Board concluded that the fee paid by each fund to Mellon Fund Advisers was reasonable in light of comparative performance and expense and advisory fee information, costs of the services provided and profits to be realized and benefits derived or to be derived by Dreyfus and its affiliates from its relation- ship with the funds.
- The Board determined that the economies of scale which may accrue to Dreyfus and its affiliates in con- nection with the management of the funds had been adequately considered by Dreyfus in connection with the management fee rate charged to each fund, and that, to the extent in the future it were to be determined that material economies of scale had not been shared with the funds, the Board would seek to have those economies of scale shared with fund shareholders.
The Board members considered these conclusions and determinations and, without any one factor being dispositive, the Board determined that re-approval of the Trust’s Investment Advisory Agreement and Administration Agreement with respect to the funds was in the best interests of each fund and its respective shareholders.
| The Funds 97 |
BOARD MEMBERS INFORMATION (Unaudited)
| Patrick J. O’Connor (62) |
| Chairman of the Board (2000) |
| Principal Occupation During Past 5 Years: |
| • Attorney, Cozen and O’Connor, P.C. since 1973, including Vice |
| Chairman since 1980 and Chief Executive Officer and President |
| since 2002 |
| Other Board Memberships and Affiliations: |
| • Board of Consultors of Villanova University School of Law, |
| Board Member |
| • Temple University,Trustee |
| • Philadelphia Police Foundation, Board Member |
| • Philadelphia Children’s First Fund, Board Member |
| • Committee on Rules of Evidence of Pennsylvania Supreme |
| Court,Vice Chair |
| • American College of Trial Lawyers, Fellow |
| • Historical Society of the United States District Court for the |
| Eastern District of Pennsylvania, Director |
| No. of Portfolios for which Board Member Serves: 16 |
| ——————— |
| Ronald R. Davenport (69) |
| Board Member (2000) |
| Principal Occupation During Past 5 Years: |
| • Chairman of Sheridan Broadcasting Corporation since July 1972 |
| Other Board Memberships and Affiliations: |
| • American Urban Radio Networks, Co-Chairman |
| • Aramark Corporation, Board Member |
| • Momentum Equity Group LLC, Director |
| No. of Portfolios for which Board Member Serves: 16 |
| ——————— |
| John L. Diederich (68) |
| Board Member (2000) |
| Principal Occupation During Past 5 Years: |
| • Chairman of Digital Site Systems, Inc., a privately held software |
| company providing internet service to the construction materials |
| industry, since July 1998 |
| Other Board Memberships and Affiliations: |
| • Continental Mills, a dry baking products company, Board Member |
| • Pittsburgh Parks Conservancy, Board Member |
| No. of Portfolios for which Board Member Serves: 16 |
| Maureen D. McFalls (60) |
| Board Member (2000) |
| Principal Occupation During Past 5 Years: |
| • Director of the Office of Government Relations at Carnegie |
| Mellon University since January 2000 |
| • Manager, Government Communications, of the Software |
| Engineering Institute at Carnegie Mellon University from |
| March 1994 to December 1999 |
| Other Board Memberships and Affiliations: |
| • Maglev, Inc., a company seeking a partnership between industry |
| and government in Pennsylvania to create a magnetically levitated |
| high-speed transportation system, Board Member representing |
| Carnegie Mellon University |
| • Coro Center For Civic Leadership, Board Member |
| • Pennsylvania Association for Individuals with Disabilities, |
| Board Member |
| No. of Portfolios for which Board Member Serves: 16 |
| ——————— |
| Kevin C. Phelan (61) |
| Board Member (2000) |
| Principal Occupation During Past 5 Years: |
| • Mortgage Banker, Meredith & Grew, Inc. since March 1978, |
| including Executive Vice President and Director |
| since March 1998 |
| Other Board Memberships and Affiliations: |
| • Greater Boston Chamber of Commerce, Director |
| • Fiduciary Trust, Director |
| • St. Elizabeth’s Medical Center of Boston, Board Member |
| • Providence College,Trustee |
| • Simmons College,Trustee |
| • Newton Country Day School, Chairman of the Board |
| • Board of Visitors of Babson College, Board Member |
| • Board of Visitors of Boston University School of Public Health, |
| Board Member |
| • Boston Public Library Foundation, Director |
| • Boston Foundation, Director |
| • Boston Municipal Research Bureau, Board Member |
| • Boys and Girls Club of Boston, Board Member |
| • Greater Boston Real Estate Board, Director |
| No. of Portfolios for which Board Member Serves: 16 |
| 98 |
| Patrick J. Purcell (57) |
| Board Member (2000) |
| Principal Occupation During Past 5 Years: |
| • Owner, President and Publisher of The Boston Herald since |
| February 1994 |
| • President and Founder, jobfind.com, an employment search site |
| on the world wide web, since July 1996 |
| • President and Chief Executive Officer, Herald Media since 2001 |
| Other Board Memberships and Affiliations: |
| • The American Ireland Fund, an organization that raises funds for |
| philanthropic projects in Ireland, Director |
| • The Genesis Fund, an organization that raises funds for the spe- |
| cialized care and treatment of New England area children born |
| with birth defects, mental retardation and genetic diseases, |
| Board Member |
| • United Way of Massachusetts Bay, Board Member |
| • Greater Boston Chamber of Commerce, Board Member |
| • St. John’s University,Trustee |
| No. of Portfolios for which Board Member Serves: 16 |
| Thomas F. Ryan, Jr. (64) |
| Board Member (2000) |
| Principal Occupation During Past 5 Years: |
| • Retired since April 1999 |
| • President and Chief Operating Officer of the American Stock |
| Exchange from October 1995 to April 1999 |
| Other Board Memberships and Affiliations: |
| • Boston College,Trustee |
| • Brigham & Women’s Hospital,Trustee |
| • New York State Independent System Operator, a non-profit |
| organization which administers a competitive wholesale market |
| for electricity in New York State, Director |
| • RepliGen Corporation, a biopharmaceutical company, Director |
| No. of Portfolios for which Board Member Serves: 16 |
Once elected all Board Members serve for an indefinite term.The address of the Board Members and Officers is in c/o The Dreyfus Corporation, 200 Park Avenue, New York, New York 10166. Additional information about the Board Members is available in the fund’s Statement of Additional Information which can be obtained from Dreyfus free of charge by calling this toll free number: 1-800-645-6561. For individual account holders for Private Wealth Management clients, please contact your account officer or call 1-888-281-7350.
| The Funds 99 |
OFFICERS OF THE TRUST (Unaudited)
LAWRENCE P. KEBLUSEK, President since June 2003.
As Chief Investment Officer of Mellon’s Private Wealth Management group, Mr. Keblusek is responsible for investment strategy, policy and implementation for Mellon’s Private Wealth Management group. Prior to joining Mellon, Mr. Keblusek was a Managing Director at Citigroup since 1995. He was previously a Vice President of the Trust. He is 55 years old and has been employed by Mellon since August 2002.
MARK N. JACOBS, Vice President since June 2000.
Executive Vice President, Secretary and General Counsel of Dreyfus, and an officer of 91 investment companies (comprised of 200 portfolios) managed by Dreyfus. He is 59 years old and has been an employee of Dreyfus since June 1977.
CHRISTOPHER SHELDON, Vice President since June 2003.
As director of Investment Strategy for Mellon’s Private Wealth Management group since April 2003, Mr. Sheldon manages the analysis and development of investment and asset allocation strategies and investment product research. Prior to assuming his current position, Mr. Sheldon was the West Coast managing director of Mellon’s Private Wealth Management group from 2001-2003 and its regional manager from 1998-2001. He is 38 years old has been employed by Mellon since January 1995.
MICHAEL A. ROSENBERG, Vice President and Secretary since August 2005.
Associate General Counsel of Dreyfus, and an officer of 91investment companies (comprised of 200 portfolios) managed by Dreyfus. He is 45 years old and has been an employee of Dreyfus since October 1991.
JAMES BITETTO, Vice President and Assistant Secretary since August 2005.
Assistant General Counsel and Assistant Secretary of Dreyfus, and an officer of 91 investment companies (comprised of 200 portfolios) managed by Dreyfus. He is 39 years old and has been an employee of Dreyfus since December 1996.
JONI LACKS CHARATAN, Vice President and Assistant Secretary since August 2005.
Assistant General Counsel and Assistant Secretary of Dreyfus, and an officer of 91 investment companies (comprised of 200 portfolios) managed by Dreyfus. She is 49 years old and has been an employee of Dreyfus since October 1998.
JOSEPH M. CHIOFFI, Vice President and Assistant Secretary since August 2005.
Assistant General Counsel and Assistant Secretary of Dreyfus, and an officer of 91 investment companies (comprised of 200 portfolios) managed by Dreyfus. He is 43 years old and has been an employee of Dreyfus since June 2000.
JANETTE E. FARRAGHER, Vice President and Assistant Secretary since August 2005.
Associate General Counsel of Dreyfus, and an officer of 91 investment companies (comprised of 200 portfolios) managed by Dreyfus. She is 42 years old and has been an employee of Dreyfus since February 1984.
JOHN B. HAMMALIAN, Vice President and Assistant Secretary since August 2005.
Associate General Counsel of Dreyfus, and an officer of 91 investment companies (comprised of 200 portfolios) managed by Dreyfus. He is 42 years old and has been an employee of Dreyfus since February 1991.
ROBERT R. MULLERY, Vice President and Assistant Secretary since August 2005.
Associate General Counsel of Dreyfus, and an officer of 91 investment companies (comprised of 200 portfolios) managed by Dreyfus. He is 53 years old and has been an employee of Dreyfus since May 1986.
JEFF PRUSNOFSKY, Vice President and Assistant Secretary since August 2005.
Associate General Counsel of Dreyfus, and an officer of 91 investment companies (comprised of 200 portfolios) managed by Dreyfus. He is 40 years old and has been an employee of Dreyfus since October 1990.
JAMES WINDELS, Treasurer since November 2001.
Director – Mutual Fund Accounting of Dreyfus, and an officer of 91 investment companies (comprised of 200 portfolios) managed by Dreyfus. He is 46 years old and has been an employee of Dreyfus since April 1985.
| 100 |
GREGORY S. GRUBER, Assistant Treasurer since March 2000.
Senior Accounting Manager – Municipal Bond Funds of Dreyfus, and an officer of 91 investment companies (comprised of 200 portfolios) managed by Dreyfus. He is 46 years old and has been an employee of Dreyfus since August 1981.
ERIK D. NAVILOFF, Assistant Treasurer since December 2002.
Senior Accounting Manager – Taxable Fixed Income Funds of Dreyfus, and an officer of 91 investment companies (comprised of 200 portfolios) managed by Dreyfus. He is 37 years old and has been an employee of Dreyfus since November 1992.
ROBERT ROBOL, Assistant Treasurer since December 2002.
Senior Accounting Manager – Money Market Funds of Dreyfus, and an officer of 91 investment companies (comprised of 200 portfolios) managed by Dreyfus. He is 41 years old and has been an employee of Dreyfus since October 1988.
ROBERT SVAGNA, Assistant Treasurer since December 2002.
Senior Accounting Manager – Equity Funds of Dreyfus, and an officer of 91 investment companies (comprised of 200 portfolios) managed by Dreyfus. He is 38 years old and has been an employee of Dreyfus since November 1990.
KENNETH J. SANDGREN, Assistant Treasurer since November 2001.
Mutual Funds Tax Director of Dreyfus, and an officer of 91 investment companies (comprised of 200 portfolios) managed by Dreyfus. He is 51 years old and has been an employee of Dreyfus since June 1993.
JOSEPH W. CONNOLLY, Chief Compliance Officer since October 2004.
Chief Compliance Officer of the Manager and The Dreyfus Family of Funds (91 investment companies, comprising 200 portfolios). From November 2001 through March 2004, Mr. Connolly was first Vice-President, Mutual Fund Servicing for Mellon Global Securities Services. In that capacity, Mr. Connolly was responsible for managing Mellon’s Custody, Fund Accounting and Fund Administration services to third-party mutual fund clients. He is 48 years old and has served in various capacities with the Manager since 1980, including manager of the firm’s Fund Accounting Department from 1997 through October 2001.
WILLIAM GERMENIS, Anti-Money Laundering Compliance Officer since September 2002.
Vice President and Anti-Money Laundering Compliance Officer of the Distributor, and the Anti-Money Laundering Compliance Officer of 87 investment companies (comprised of 196 portfolios) managed by Dreyfus. He is 35 years old and has been an employee of the Distributor since October 1998.
| The Funds 101 |
N O T E S
For More Information
| Mellon Funds Trust c/o The Dreyfus Corporation 200 Park Avenue New York, NY 10166 |
Investment Adviser
Mellon Fund Advisers, a division of The Dreyfus Corporation 200 Park Avenue New York, NY 10166
| Administrator |
| Mellon Bank, N.A. One Mellon Bank Center Pittsburgh, PA 15258 |
| Sub-Administrator |
| The Dreyfus Corporation 200 Park Avenue New York, NY 10166 |
Custodian
Domestic Equity Funds: Mellon Bank, N.A. One Mellon Bank Center Pittsburgh, PA 15258
International and Emerging Markets Funds: Mellon Trust of New England, N.A. One Boston Place Boston, MA 02108
| Transfer Agent & Dividend Disbursing Agent |
| Dreyfus Transfer, Inc. 200 Park Avenue New York, NY 10166 |
| Distributor |
| Dreyfus Service Corporation 200 Park Avenue New York, NY 10166 |
Telephone Private Wealth Management (PWM) Clients, please contact your Account Officer or call 1-888-281-7350. Brokerage Clients of Mellon Private Wealth Advisors (MPWA), please contact your financial representative or call 1-800-830-0549-Option 2. Individual Account holders, please call Dreyfus at 1-800-896-8167.
Mail PWM Clients, write to your Account Officer, c/o Mellon Bank, N.A., One Mellon Bank Center, Pittsburgh, PA 15258
MPWA Brokerage Clients, write to your financial representative, P.O. Box 9012, Hicksville, NY 11802–9012
Individual Account Holders, write to: Mellon Funds, P.O. Box 55268, Boston, MA 02205–8502
The fund files its complete schedule of portfolio holdings with the Securities and Exchange Commission (“SEC”) for the first and third quarters of each fiscal year on Form N-Q. The fund’s Forms N-Q are available on the SEC’s website at http://www.sec.gov and may be reviewed and copied at the SEC’s Public Reference Room in Washington, DC. Information on the operation of the Public Reference Room may be obtained by calling 1-800-SEC-0330.
A description of the policies and procedures that the fund uses to determine how to vote proxies relating to portfolio securities, and information regarding how the fund voted these proxies for the 12-month period ended June 30, 2005, is available at http://www.dreyfus.com and on the SEC’s website at http://www.sec.gov. The description of the policies and procedures is also available without charge, upon request, by calling 1-800-645-6561.
| ©2005 Dreyfus Service Corporation |
| MFTAR0805-EQ |
The Mellon Funds
| Mellon Bond Fund |
| Mellon Intermediate Bond Fund |
| Mellon Short-Term U.S. Government Securities Fund |
| ANNUAL REPORT | August 31, 2005 |
| Contents | ||
| The Funds | ||
| Letter from the President | 2 | |
| Discussion of Funds’ Performance | ||
| Mellon Bond Fund | 3 | |
| Mellon Intermediate Bond Fund | 6 | |
| Mellon Short-Term U.S. | ||
| Government Securities Fund | 9 | |
| Understanding Your Fund’s Expenses | 12 | |
| Comparing Your Fund’s Expenses | ||
| With Those of Other Funds | 12 | |
| Statements of Investments | 13 | |
| Statements of Assets and Liabilities | 23 | |
| Statements of Operations | 24 | |
| Statements of Changes in Net Assets | 25 | |
| Financial Highlights | 27 | |
| Notes to Financial Statements | 33 | |
| Report of Independent Registered | ||
| Public Accounting Firm | 39 | |
| Important Tax Information | 40 | |
| Information About the Review | ||
| and Approval of Each Fund’s | ||
| Investment Advisory Agreement | 41 | |
| Board Members Information | 45 | |
| Officers of the Trust | 47 | |
For More Information
| Back cover |
The views expressed herein are current to the date of this report. These views and the composition of the funds’ portfolios are subject to change at any time based on market and other conditions.
| • Not FDIC-Insured |
| • Not Bank-Guaranteed |
| • May Lose Value |
The Funds

This annual report for The Mellon Funds covers the period from September 1, 2004, through August 31, 2005. Inside, you’ll find valuable information about how the funds were managed during the reporting period, including discussions with each fund’s portfolio manager.
On average, U.S. stock prices ended the reporting period higher than where they began. However, most of the equity markets’ gains occurred during the closing months of 2004. So far in 2005, positive factors, including steady economic growth and higher corporate profits, were largely offset by headwinds, such as sharply higher energy prices and rising short-term interest rates.Against the same backdrop and, contrary to historical norms, bonds generally rallied as inflation appeared to remain low and demand for U.S. fixed-income securities was robust, particularly from overseas investors. In global markets, international stocks generally rose more than U.S. stocks over the past year, with gains achieved in the industrialized markets of Europe and Asia, as well as many of the emerging markets.
Recent shocks to the U.S. economy — including sharply higher gasoline prices and other consequences of Hurricane Katrina — have added a degree of uncertainty to the outlook for stocks and bonds. However, our economists currently believe that the economy should continue to grow without either entering a recession or triggering a significant acceleration of inflation.As always, we encourage you to discuss the potential implications of these and other matters with your portfolio manager.
Thank you for your continued confidence and support.

| Lawrence P. Keblusek |
| President |
| Mellon Funds Trust |
| September 15, 2005 |

| DISCUSSION OF |
| FUND PERFORMANCE |
John F. Flahive, Portfolio Manager
How did Mellon Bond Fund perform relative to its benchmark?
For the 12-month period ended August 31, 2005, the fund’s Class M shares achieved a total return of 3.30%, and its Investor shares achieved a total return of 2.98% .1 In comparison, the Lehman Brothers U.S. Aggregate Index, the fund’s benchmark, achieved a total return of 4.15% for the same period.2
Despite steadily rising short-term interest rates, longer-term bonds remained surprisingly resilient, ending the reporting period at prices that were relatively unchanged compared to the reporting period’s beginning. We attribute the market’s strength to robust demand from overseas investors and low domestic inflation expectations. The fund produced lower returns than its benchmark, primarily due to a relatively defensive investment posture that was designed to help preserve capital in a rising interest-rate environment.
Note to shareholders: John F. Flahive became the fund’s portfolio manager on August 1, 2005.
What is the fund’s investment approach?
Effective December 31, 2004, the fund changed the way it describes its investment objective, which is to seek total return (consisting of capital appreciation and current income). To pursue its goal, the fund actively manages bond market and maturity exposure and invests at least 80% of its assets in bonds, such as U.S. Treasury and government agency bonds, corporate bonds, mortgage-related securities and foreign corporate and government bonds.The fund’s investments in bonds must be rated investment grade quality at the time of purchase or, if unrated, deemed of comparable quality by the investment adviser. Generally, the fund’s average effective duration will not exceed eight years.
What other factors influenced the fund’s performance?
The fund’s performance was influenced by rising short-term interest rates throughout the reporting period.The Federal Reserve Board (the “Fed”) continued to move away from its accommodative monetary policy of the past several years, implementing eight consecutive increases in the overnight federal funds rate, which climbed from 1.5% at the start of the reporting period to 3.5% at the reporting period’s end. The Fed’s credit-tightening campaign was intended to achieve a monetary policy that neither stimulates nor restricts economic growth.
Unlike most previous credit-tightening cycles, longer-term bond yields failed to rise along with short-term interest rates. In fact, longer-term bond yields fell during much of the reporting period before rising modestly during the summer of 2005. As a result, longer-term bond prices and yields ended the reporting period virtually unchanged from where they began, a situation Fed Chairman Alan Greenspan called “a conundrum.” We believe that bond prices have been supported by robust demand from overseas investors, including Asian central banks, and low inflation expectations among U.S. investors.
Early in 2005, we had positioned the fund for a rising interest-rate environment, which we believed might erode longer-term bond prices.Accordingly, we set the fund’s average duration — a measure of sensitivity to changing interest rates — in a range we considered shorter than industry averages. This positioning was designed to maintain the liquidity required to capture higher yields as they became available. However, this relatively defensive posture held back the fund’s returns when longer-term bond prices did not fall, and yields did not rise.We offset some, but not all, of the adverse
| T h e F u n d s 3 |
DISCUSSION OF FUND PERFORMANCE (continued)
effects of the fund’s short average duration through a “barbell” strategy in which longer- and shorter-term securities were balanced to achieve our duration target.
The fund’s mix of fixed-income securities roughly matched that of the benchmark.Within the fund’s corporate bond portfolio, however, our sector allocation strategy helped boost relative performance.We focused primarily on bonds issued by companies in the media, finance, basic materials and telecommunications industries, and the fund maintained relatively light exposure to bonds from issuers in the automotive sector. Indeed, bonds from the major U.S. automobile manufacturers experienced sharp declines during the spring of 2005, when disappointing financial results led the credit-rating agencies to downgrade automakers’ bonds to the high-yield category.
The fund also maintained a position in mortgage-backed securities, which tend to offer higher yields than U.S. Treasury securities with comparable maturities. As part of our generally defensive investment posture, we focused primarily on mortgage-backed securities with maturities in the three- to five-year range.
What is the fund’s current strategy?
Recent statements from the Fed have given no indication that it has reached the end of its credit-tightening campaign, and many analysts believe that further rate hikes are likely. While the aftermath of Hurricane Katrina may reduce the rate of economic growth, the economic expansion currently appears to remain intact. Accordingly, we have continued to maintain the fund’s relatively cautious investment posture, including a short average duration and a neutral asset mix. However, as yield differences along the maturity spectrum have narrowed, we have reduced the fund’s “barbell” structure. In our judgment, these are prudent strategies in today’s changing economic and market environments.
| September 15, 2005 |
| 1 | Total return includes reinvestment of dividends and any capital gains paid. | |
| Past performance is no guarantee of future results. Share price, yield and | ||
| investment return fluctuate such that upon redemption, fund shares may be | ||
| worth more or less than their original cost. | ||
| 2 | SOURCE: LIPPER INC. — Reflects reinvestment of dividends and, where | |
| applicable, capital gain distributions.The Lehman Brothers U.S. Aggregate | ||
| Index is a widely accepted, unmanaged total return index of corporate, U.S. | ||
| government and U.S. government agency debt instruments, mortgage-backed | ||
| securities and asset-backed securities with an average maturity of 1-10 years. |
| 4 |
| F U N D P E R F O R M A N C E |
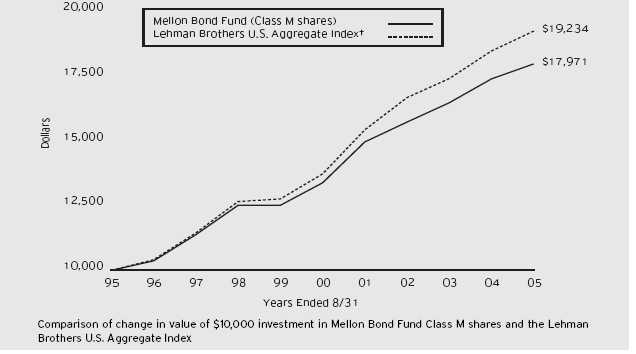
| Average Annual Total Returns | as of 8/31/05 | |||||||||
| Inception | From | |||||||||
| Date | 1 Year | 5 Years | 10 Years | Inception | ||||||
| Class M shares | 3.30% | 6.07% | 6.04% | |||||||
| Investor shares | 7/11/01 | 2.98% | — | — | 4.85% |
| † Source: Lipper Inc. |
| Past performance is not predictive of future performance.The fund’s performance shown in the graph and table does not reflect the deduction of taxes that a shareholder |
| would pay on fund distributions or the redemption of fund shares. |
| The above graph compares a $10,000 investment made in Class M shares of Mellon Bond Fund on 8/31/95 to a $10,000 investment made in the Lehman |
| Brothers U.S. Aggregate Index (the “Index”) on that date. All dividends and capital gain distributions are reinvested. |
| Before the fund commenced operations, substantially all of the assets of a predecessor common trust fund (CTF) that, in all material respects, had the same investment |
| objective, policies, guidelines and restrictions as the fund (and those of two other CTFs) were transferred to the fund. Please note that the performance of the fund’s |
| Class M shares represents the performance of the predecessor CTF through October 1, 2000, adjusted to reflect the fund’s fees and expenses, by subtracting from the |
| actual performance of the CTF the expenses of the fund’s Class M shares as they were estimated prior to the conversion of the CTF into the fund, and the |
| performance of the fund’s Class M shares thereafter.The predecessor CTF was not registered under the Investment Company Act of 1940, as amended, and therefore |
| was not subject to certain investment restrictions that might have adversely affected performance. In addition, the expenses of the fund’s Class M shares may be higher |
| than those estimated prior to the conversion of the CTF into the fund, which would lower the performance shown in the above line graph. |
| Effective July 11, 2001, existing fund shares were designated as Class M shares and the fund began offering a second class of shares designated as Investor shares, |
| which are subject to a Shareholder Services Plan. Performance for Investor shares will vary from the performance of Class M shares shown above because of the |
| differences in charges and expenses. |
| The fund’s performance shown in the line graph takes into account all applicable fees and expenses for Class M shares only.The Index is a widely accepted, |
| unmanaged index of corporate, government and government agency debt instruments, mortgage-backed securities, and asset-backed securities with an average maturity |
| of 1-10 years.The Index does not take into account charges, fees and other expenses. Further information relating to fund performance, including expense |
| reimbursements, if applicable, is contained in the Financial Highlights section of the prospectus and elsewhere in this report. |
| T h e F u n d s 5 |

| DISCUSSION OF |
| FUND PERFORMANCE |
Lawrence R. Dunn, CFA, Portfolio Manager
How did Mellon Intermediate Bond Fund perform relative to its benchmark?
For the 12-month period ended August 31, 2005, the fund’s Class M shares achieved a total return of 1.53%, and its Investor shares achieved a total return of 1.30% .1 In comparison, the Lehman Brothers Intermediate Government/Credit Bond Index (the “Index”), the fund’s benchmark, achieved a 2.55% total return for the same period.2
Despite steadily rising short-term interest rates, yields of intermediate- and long-term bonds were little changed over the reporting period, as robust foreign demand and low inflation helped support prices.The fund produced lower returns than its benchmark, primarily due to a defensive duration management strategy that was designed to help preserve capital in a rising interest-rate environment.
What is the fund’s investment approach?
Effective December 31, 2004, the fund changed the way it describes its investment objective, which is to seek total return (consisting of capital appreciation and current income). To pursue its goal, the fund actively manages bond market and maturity exposure and invests at least 80% of its assets in bonds, such as U.S. government and agency bonds, corporate bonds, mortgage-related securities, foreign corporate and government bonds and municipal bonds.The fund’s investments in bonds must be rated investment grade at the time of purchase or, if unrated, deemed of comparable quality by the investment adviser. Generally, the fund’s average effective portfolio maturity will be between three and 10 years, and its average effective portfolio duration will be between 2.5 and 5.5 years.
When managing the fund, we use a disciplined process to select securities and manage risk. We generally choose bonds based on yield, credit quality, the level of interest rates and inflation, general economic and financial trends and our outlook for the securities markets. Our management process also includes computer modeling and scenario testing of possible changes in market conditions.
What other factors influenced the fund’s performance?
The bond market was influenced to a significant degree by investors’ economic and inflation expectations. Early in the reporting period, economic growth appeared to be hindered by rising energy prices and heightened political uncertainty in advance of the U.S. presidential elections.As a result, investors’ inflation outlook was relatively benign, supporting bond prices. After the election, rallying equity markets and signs of more robust economic growth led many analysts to anticipate a potential acceleration of inflation. However, the economy continued to expand at a moderate pace when energy prices renewed their surge, manufacturing activity failed to meet expectations and labor markets achieved only modest improvement.
In this economic environment, the Federal Reserve Board (the “Fed”) continued to move away from its accommodative monetary policy of the past several years.The Fed increased the overnight federal funds rate eight times during the reporting period, driving it from 1.5% to 3.5% . Largely because of strong demand from foreign investors and persistently low inflation expectations, however, intermediate-term bond yields remained roughly unchanged, causing yield differences to narrow across the short-intermediate maturity spectrum.
| 6 |
Because the Fed was clear in its intentions to raise short-term interest rates until it achieved a level that neither stimulated nor restricted economic growth, we set the fund’s average duration — a measure of sensitivity to changing interest rates — in a range that was modestly shorter than industry averages, including an emphasis on securities in the one- to three-year maturity range.This position, which was designed to protect the fund from the potentially eroding effects of higher interest rates,detracted from performance when longer-term bond yields failed to rise along with short-term rates. While better results from the fund’s longer-term holdings helped boost returns,it was not enough to fully offset the fund’s short duration position.
In addition, because of concerns regarding the age of the current business cycle, we tended to focus on higher-quality securities within the fund’s corporate bond portfolio. However, lower-rated credits that are part of the Index fared better, further undermining the fund’s relative performance. Among mortgage-backed securities, which are not part of the Index, we focused primarily on 15-year fixed-rate securities and adjustable-rate mortgages with shorter maturities.We also invested a portion of the fund’s assets in high-quality asset-backed securities, which contributed positively to the fund’s performance.
What is the fund’s current strategy?
We currently expect the Fed to continue to raise short-term interest rates at upcoming meetings of its Federal Open Market Committee. However, the economic damage caused by Hurricane Katrina may cause the Fed to pause in its credit-tightening campaign sooner than many analysts previously expected. The Fed may need time to assess the impact of the storm and previous rate hikes on economic growth and inflation. Accordingly, while we have maintained the fund’s relatively short average duration, we have tempered that position with a more intent focus on securities with maturities in the five- to 10-year range.
| September 15, 2005 |
| 1 | Total return includes reinvestment of dividends and any capital gains paid. | |
| Past performance is no guarantee of future results. Share price, yield and | ||
| investment return fluctuate such that upon redemption, fund shares may be | ||
| worth more or less than their original cost. | ||
| 2 | SOURCE: LIPPER INC. – Reflects reinvestment of dividends and, | |
| where applicable, capital gain distributions.The Lehman Brothers | ||
| Intermediate Government/Credit Bond Index is a widely accepted, | ||
| unmanaged index of government and corporate bond market performance | ||
| composed of U.S. government,Treasury and agency securities, fixed-income | ||
| securities and nonconvertible investment-grade corporate debt, with an | ||
| average maturity of 1-10 years. |
| T h e F u n d s 7 |
| F U N D P E R F O R M A N C E |

| Average Annual Total Returns | as of 8/31/05 | |||||||||
| Inception | From | |||||||||
| Date | 1 Year | 5 Years | 10 Years | Inception | ||||||
| Class M shares | 1.53% | 5.59% | 5.44% | |||||||
| Investor shares | 7/11/01 | 1.30% | — | — | 4.36% |
| † Source: Lipper Inc. |
| Past performance is not predictive of future performance.The fund’s performance shown in the graph and table does not reflect the deduction of taxes that a shareholder |
| would pay on fund distributions or the redemption of fund shares. |
| The above graph compares a $10,000 investment made in Class M shares of Mellon Intermediate Bond Fund on 8/31/95 to a $10,000 investment made in the |
| Lehman Brothers Intermediate Government/Credit Bond Index (the “Index”) on that date. All dividends and capital gain distributions are reinvested. |
| Before the fund commenced operations, substantially all of the assets of a predecessor common trust fund (CTF) that, in all material respects, had the same investment |
| objective, policies, guidelines and restrictions as the fund were transferred to the fund. Please note that the performance of the fund’s Class M shares represents the |
| performance of the predecessor CTF through October 1, 2000, adjusted to reflect the fund’s fees and expenses, by subtracting from the actual performance of the CTF |
| the expenses of the fund’s Class M shares as they were estimated prior to the conversion of the CTF into the fund, and the performance of the fund’s Class M shares |
| thereafter.The predecessor CTF was not registered under the Investment Company Act of 1940, as amended, and therefore was not subject to certain investment |
| restrictions that might have adversely affected performance. In addition, the expenses of the fund’s Class M shares may be higher than those estimated prior to the |
| conversion of the CTF into the fund, which would lower the performance shown in the above line graph. |
| Effective July 11, 2001, existing fund shares were designated as Class M shares and the fund began offering a second class of shares designated as Investor shares, |
| which are subject to a Shareholder Services Plan. Performance for Investor shares will vary from the performance of Class M shares shown above because of the |
| differences in charges and expenses. |
| The fund’s performance shown in the line graph takes into account all applicable fees and expenses for Class M shares only.The Index is a widely accepted, |
| unmanaged index of U.S. government and credit bond market performance composed of U.S. government,Treasury and agency securities, fixed-income securities and |
| nonconvertible investment-grade corporate debt, with an average maturity of 1-10 years.The Index does not take into account charges, fees and other expenses. Further |
| information relating to fund performance, including expense reimbursements, if applicable, is contained in the Financial Highlights section of the prospectus and |
| elsewhere in this report. |
| 8 |

| DISCUSSION OF |
| FUND PERFORMANCE |
Lawrence R. Dunn, CFA, Portfolio Manager
How did Mellon Short-Term U.S. Government Securities Fund perform relative to its benchmark?
For the 12-month period ended August 31, 2005, the fund’s Class M shares achieved a total return of 1.00%, and its Investor shares achieved a total return of 0.78% .1 In comparison, the Lehman Brothers 1-3 Year U.S. Government Index (the “Index”), the fund’s benchmark, achieved a total return of 1.27% for the same period.2
Despite steadily rising short-term interest rates, yields of longer-term U.S. government securities were little changed over the reporting period, as robust foreign demand and low inflation helped support prices. The fund produced lower returns than its benchmark, primarily due to a defensive duration management strategy that was designed to help preserve capital in a rising interest-rate environment.
What is the fund’s investment approach?
The fund seeks to provide as high a level of current income as is consistent with the preservation of capi-tal.To pursue this goal, the fund invests at least 80% of its assets in securities issued or guaranteed by the U.S. government or its agencies or instrumentalities and in repurchase agreements. The fund may invest up to 35% of its net assets in mortgage-related securities issued by U.S. government agencies or instrumentalities, such as mortgage pass-through securities issued by the Government National Mortgage Association (“Ginnie Mae”), the Federal National Mortgage Association (“Fannie Mae”) and the Federal Home Loan Mortgage Corporation (“Freddie Mac”).The fund may also invest in collateralized mortgage obligations (“CMOs”), including stripped mortgage-backed securities. Generally, the fund’s average effective portfolio maturity and its average effective portfolio duration will be less than three years.
When choosing securities,we typically first examine U.S. and global economic conditions and other market factors to estimate long- and short-term interest rates. Using a research-driven investment process, we then seek to identify what we believe are potentially profitable sectors before they are widely perceived by the market. We also seek to identify underpriced or mispriced securities that appear likely to perform well over time.
What other factors influenced the fund’s performance?
The U.S.government securities market was influenced to a significant degree by investors’ economic and inflation expectations. Early in the reporting period, economic growth appeared to be hindered by rising energy prices and heightened political uncertainty in advance of the presidential elections.As a result, investors’ inflation outlook was relatively benign, supporting prices of U.S. Treasury securities. After the election, rallying equity markets and signs of more robust economic growth led many analysts to anticipate a potential acceleration of inflation.However,the economy continued to expand at a moderate pace when energy prices renewed their surge, manufacturing activity failed to meet expectations and labor markets achieved only modest improvement.
In this environment, the Federal Reserve Board (the “Fed”) continued to move away from its accommodative monetary policy of the past several years.The Fed increased the overnight federal funds rate eight times during the reporting period, driving it from 1.5% to 3.5% . Largely because of strong demand from foreign investors and persistently low inflation expectations, however, intermediate-term bond yields remained roughly unchanged, causing yield differences to narrow across the short-intermediate maturity spectrum.
Because the Fed was clear in its intentions to raise short-term interest rates until it achieved a level that neither stimulated nor restricted economic growth, we set the fund’s average duration — a measure of sensi-
| T h e F u n d s 9 |
DISCUSSION OF FUND PERFORMANCE (continued)
tivity to changing interest rates — in a range that was modestly shorter than industry averages, including an emphasis on U.S.Treasury securities with maturities of one year or less. This position, which was designed to protect the fund from the potentially eroding effects of higher interest rates, detracted from performance when longer-term bond yields failed to rise along with short-term rates.While better results from the fund’s longer-term holdings helped boost returns, it was not enough to fully offset the fund’s short duration position.
In addition to the fund’s core position in U.S.Treasury securities, we allocated approximately 10% of the fund’s assets to mortgage-backed securities backed by U.S. government agencies. We focused primarily on short-term balloon mortgages, hybrids and 15-year fixed-rate securities that offered a yield advantage over U.S. Treasuries with comparable maturities.
What is the fund’s current strategy?
We currently expect the Fed to continue to raise short-term interest rates at upcoming meetings of its Federal
Open Market Committee. However, the economic damage caused by Hurricane Katrina may cause the Fed to pause in its credit-tightening campaign sooner than many analysts previously expected. The Fed may need time to assess the impact of the storm, the federal government’s fiscal response and previous rate hikes on economic growth and inflation. Accordingly, while we have maintained the fund’s relatively short average duration, we are prepared to temper that position with a more intent focus on securities with maturities in the two- to three-year range.
| September 15, 2005 |
| 1 | Total return includes reinvestment of dividends and any capital gains paid. | |
| Past performance is no guarantee of future results. Share price, yield and | ||
| investment return fluctuate such that upon redemption, fund shares may be | ||
| worth more or less than their original cost. | ||
| 2 | SOURCE: LIPPER INC. – Reflects reinvestment of dividends and, where | |
| applicable, capital gain distributions.The Lehman Brothers 1-3 Year U.S. | ||
| Government Index is a widely accepted, unmanaged index of government | ||
| bond market performance composed of U.S.Treasury and agency securities | ||
| with maturities of 1-3 years. |
| 10 |
| F U N D P E R F O R M A N C E |
![]()
| Average Annual Total Returns | as of 8/31/05 | |||||||||
| Inception | From | |||||||||
| Date | 1 Year | 5 Years | 10 Years | Inception | ||||||
| Class M shares | 1.00% | 3.87% | 4.54% | |||||||
| Investor shares | 7/11/01 | 0.78% | — | — | 2.55% |
| † Source: Lipper Inc. |
| Past performance is not predictive of future performance.The fund’s performance shown in the graph and table does not reflect the deduction of taxes that a shareholder |
| would pay on fund distributions or the redemption of fund shares. |
| The above graph compares a $10,000 investment made in Class M shares of Mellon Short-Term U.S. Government Securities Fund on 8/31/95 to a $10,000 |
| investment made in the Lehman Brothers 1-3 Year U.S. Government Index (the “Index”) on that date. All dividends and capital gain distributions are reinvested. |
| Before the fund commenced operations, substantially all of the assets of a predecessor common trust fund (CTF) that, in all material respects, had the same investment |
| objective, policies, guidelines and restrictions as the fund were transferred to the fund. Please note that the performance of the fund’s Class M shares represents the |
| performance of the predecessor CTF through October 1, 2000, adjusted to reflect the fund’s fees and expenses, by subtracting from the actual performance of the CTF |
| the expenses of the fund’s Class M shares as they were estimated prior to the conversion of the CTF into the fund, and the performance of the fund’s Class M shares |
| thereafter.The predecessor CTF was not registered under the Investment Company Act of 1940, as amended, and therefore was not subject to certain investment |
| restrictions that might have adversely affected performance. In addition, the expenses of the fund’s Class M shares may be higher than those estimated prior to the |
| conversion of the CTF into the fund, which would lower the performance shown in the above line graph. |
| Effective July 11, 2001, existing fund shares were designated as Class M shares and the fund began offering a second class of shares designated as Investor shares, |
| which are subject to a Shareholder Services Plan. Performance for Investor shares will vary from the performance of Class M shares shown above because of the |
| differences in charges and expenses. |
| The fund’s performance shown in the line graph takes into account all applicable fees and expenses for Class M shares only.The Index is a widely accepted, |
| unmanaged index of government bond market performance composed of U.S.Treasury and agency securities with maturities of 1-3 years.The Index does not take into |
| account charges, fees and other expenses. Further information relating to fund performance, including expense reimbursements, if applicable, is contained in the Financial |
| Highlights section of the prospectus and elsewhere in this report. |
| T h e F u n d s 11 |
UNDERSTANDING YOUR FUND ’S EXPENSES ( Unaudited )
As a mutual fund investor, you pay ongoing expenses, such as management fees and other expenses. Using the information below, you can estimate how these expenses affect your investment and compare them with the expenses of other funds.You also may pay one-time transaction expenses, including sales charges (loads) and redemption fees, which are not shown in this section and would have resulted in higher total expenses. For more information, see your fund’s prospectus or talk to your financial advisor.
Review your fund’s expenses
The table below shows the expenses you would have paid on a $1,000 investment in each class of each fund from March 1, 2005 to August 31, 2005. It also shows how much a $1,000 investment would be worth at the close of the period, assuming actual returns and expenses.
| Expenses and Value of a $1,000 Investment | ||||
| assuming actual returns for the six months ended August 31, 2005 | ||||
| Class M Shares | Investor Shares | |||
| Mellon Bond Fund | ||||
| Expenses paid per $1,000 † | $ 2.86 | $ 4.13 | ||
| Ending value (after expenses) | $1,023.20 | $1,021.90 | ||
| Mellon Intermediate Bond Fund | ||||
| Expenses paid per $1,000 † | $ 2.90 | $ 4.16 | ||
| Ending value (after expenses) | $1,015.40 | $1,015.00 | ||
| Mellon Short-Term U.S. Government Securities Fund | ||||
| Expenses paid per $1,000 † | $ 2.84 | $ 4.31 | ||
| Ending value (after expenses) | $1,012.00 | $1,010.70 | ||
COMPARING YOUR FUND ’S EXPENSES WITH THOSE OF OTHER FUNDS ( Unaudited)
Using the SEC’s method to compare expenses
The Securities and Exchange Commission (SEC) has established guidelines to help investors assess fund expenses. Per these guidelines, the table below shows your fund’s expenses based on a $1,000 investment, assuming a hypothetical 5% annualized return.You can use this information to compare the ongoing expenses (but not transaction expenses or total costs) of investing in the fund with those of other funds. All mutual fund shareholder reports will provide this information to help you make this comparison. Please note that you cannot use this information to estimate your actual ending account balance and expenses paid during the period.
| Expenses and Value of a $1,000 Investment | ||||
| assuming a hypothetical 5% annualized return for the six months ended August 31, 2005 | ||||
| Class M Shares | Investor Shares | |||
| Mellon Bond Fund | ||||
| Expenses paid per $1,000 † | $ 2.85 | $ 4.13 | ||
| Ending value (after expenses) | $1,022.38 | $1,021.12 | ||
| Mellon Intermediate Bond Fund | ||||
| Expenses paid per $1,000 † | $ 2.91 | $ 4.18 | ||
| Ending value (after expenses) | $1,022.33 | $1,021.07 | ||
| Mellon Short-Term U.S. Government Securities Fund | ||||
| Expenses paid per $1,000 † | $ 2.85 | $ 4.33 | ||
| Ending value (after expenses) | $1,022.38 | $1,020.92 | ||
† Expenses are equal to the Mellon Bond Fund annualized expense ratio of .56% for Class M and .81% for Investor shares, Mellon Intermediate Bond Fund .57% for Class M and .82% for Investor shares and Mellon Short-Term U.S. Government Securities Fund .56% for Class M and .85% for Investor shares, multiplied by the average account value over the period, multiplied by 184/365 (to reflect the one-half year period).
| 12 |
| STATEMENT OF INVESTMENTS | ||||||||||
| August 31 , 2005 | ||||||||||
| Mellon Bond Fund | ||||||||||
| Principal | Principal | |||||||||
| Bonds and Notes—98.6% | Amount ($) | Value ($) | Amount ($) | Value ($) | ||||||
| Aerospace & Defense—.2% | Bank & Finance (continued) | |||||||||
| United Technologies, | Countrywide Home Loans, | |||||||||
| Notes, 6.5%, 2009 | 1,250,000 | 1,347,676 | Notes, 3.25%, 2008 | 6,165,000 | 5,984,150 | |||||
| Asset-Backed-Ctfs— | Credit Suisse First Boston, | |||||||||
| Automobile Receivables—1.8% | Notes, 4.875%, 2010 | 2,100,000 | 2,132,920 | |||||||
| Harley-Davidson Motorcycle Trust: | Fifth Third Bancorp, | |||||||||
| Ser. 2003-4, Cl. A2, | Notes, 3.375%, 2008 | 3,000,000 | 2,929,497 | |||||||
| 2.69%, 2011 | 4,650,000 | 4,550,273 | Ford Motor Credit, | |||||||
| Ser. 2005-3, Cl. A2, | Notes, 7%, 2013 | 3,000,000 a | 2,880,192 | |||||||
| 4.41%, 2012 | 2,365,000 | 2,364,631 | Goldman Sachs, | |||||||
| Honda Auto Receivables Owner | Notes, 4.75%, 2013 | 6,500,000 | 6,470,756 | |||||||
| Trust, Ser. 2004-3, Cl. A4, | KfW, | |||||||||
| 3.28%, 2010 | 3,820,000 | 3,729,291 | Gtd. Global Notes, (Gtd. By | |||||||
| Onyx Acceptance Grantor Trust, | Fedal Rep. of Gemany), | |||||||||
| Ser. 2005-A, Cl. A4, | 3.75%, 2008 | 7,530,000 | 7,471,198 | |||||||
| 3.91%, 2011 | 4,910,000 | 4,869,690 | Landwirtschaftliche Rentenbank, | |||||||
| 15,513,885 | Gtd. Global Notes, | |||||||||
| Asset-Backed Ctfs.— | (Gtd. By Bundes Republik | |||||||||
| Credit Cards—1.3% | Deutschland), 3.25%, 2007 | 6,555,000 | 6,434,506 | |||||||
| Bank One Issuance Trust, | Lehman Brothers: | |||||||||
| Ser. 2003-03, Cl. C3, | Notes, 4.25%, 2010 | 5,200,000 | 5,158,878 | |||||||
| 4.77%, 2016 | 11,000,000 | 11,041,108 | Notes, 7%, 2008 | 2,000,000 a | 2,120,552 | |||||
| Asset-Backed Ctfs.— | Merrill Lynch & Co., | |||||||||
| Others—.3% | Notes, 4.125%, 2009 | 3,250,000 | 3,216,441 | |||||||
| CNH Equipment Trust, | Morgan (J.P.), | |||||||||
| Ser. 2005-A, Cl. A4B, | Sub. Notes, 6.25%, 2009 | 1,800,000 | 1,901,065 | |||||||
| 4.29%, 2012 | 2,305,000 | 2,308,219 | Morgan Stanley Dean Witter & Co., | |||||||
| Bank & Finance—10.3% | Bonds, 6.75%, 2011 | 3,200,000 | 3,540,083 | |||||||
| AXA Financial, | PNC Funding, | |||||||||
| Sr. Notes, 7.75%, 2010 | 5,650,000 | 6,445,028 | Notes, 4.5%, 2010 | 2,825,000 | 2,831,274 | |||||
| American Express, | Wells Fargo & Co., | |||||||||
| Notes, 4.75%, 2009 | 3,000,000 a | 3,045,207 | Notes, 3.12%, 2008 | 2,425,000 | 2,355,160 | |||||
| Bank of America, | 86,542,840 | |||||||||
| Sr. Notes, 5.875%, 2009 | 6,585,000 | 6,920,888 | Collateralized Mortgage | |||||||
| Bear Stearns & Cos., | Obligations—.9% | |||||||||
| Notes, 4.5%, 2010 | 2,000,000 | 1,999,438 | ABN Amro Mortgage, | |||||||
| CIT Group, | Ser. 2002-1A, Cl. M, | |||||||||
| Sr. Debs., 5.875%, 2008 | 4,800,000 | 5,009,357 | 5.619%, 2032 | 1,270,851 b | 1,275,265 | |||||
| Caterpillar Financial Services, | Federal Home Loan Mortgage Corp.: | |||||||||
| Notes, 3.625%, 2007 | 5,825,000 | 5,758,304 | REMIC, Muiltclass Mortgage | |||||||
| Citigroup, | Participation Ctfs., Ser. 1660, | |||||||||
| Sr. Notes, 6.2%, 2009 | 1,825,000 | 1,937,946 | Cl. H, 6.50%, 1/15/2009 | 2,555,417 | 2,606,781 | |||||
| T h e F u n d s 13 |
| STATEMENT OF INVESTMENTS (continued) |
| Mellon Bond Fund (continued) | ||||||||||
| Principal | Principal | |||||||||
| Bonds and Notes (continued) | Amount ($) | Value ($) | Amount ($) | Value ($) | ||||||
| Collateralized Mortgage | Industrials—2.7% | |||||||||
| Obligations (continued) | Canadian National Railway, | |||||||||
| Federal National | Notes, 4.25%, 2009 | 7,600,000 | 7,562,213 | |||||||
| Mortgage Association: | Emerson Electric, | |||||||||
| (Interest Only Obligation) | Notes, 5%, 2014 | 4,290,000 | 4,436,096 | |||||||
| Ser. 333, Cl. 2, | IBM: | |||||||||
| 5.5%, 3/1/2033 | 7,838,368 c | 1,493,073 | Debs., 7%, 2025 | 2,000,000 | 2,467,586 | |||||
| REMIC Trust, Pass-Through | Notes, 4.375%, 2009 | 3,000,000 | 3,017,802 | |||||||
| Ctfs., Ser. 1992-18, Cl. HC, | Pemex Project Funding Master Trust, | |||||||||
| 7.5%, 3/25/2007 | 296,184 | 301,012 | Notes, 5.75%, 2015 | 5,000,000 d | 5,018,750 | |||||
| Washington Mutual, | 22,502,447 | |||||||||
| Ser. 2003-S4, Cl. 4A1, | ||||||||||
| 4%, 2032 | 2,049,914 | 2,039,079 | Media & Telecommunications—7.0% | |||||||
| 7,715,210 | British Sky Broadcasting, | |||||||||
| Notes, 6.875%, 2009 | 4,180,000 | 4,481,340 | ||||||||
| Commercial Mortgage | ||||||||||
| Pass-Through Ctfs.—2.7% | Comcast Cable Communications: | |||||||||
| Bonds, 5.65%, 2035 | 3,000,000 | 2,955,495 | ||||||||
| Asset Securitization, | Sr. Notes, 5.85%, 2010 | 1,000,000 | 1,049,235 | |||||||
| Ser.1995-MD IV, Cl. A-1, | ||||||||||
| 7.10%, 2029 | 392,425 | 403,561 | Grupo Televisa, | |||||||
| Sr. Notes, 6.625%, 2025 | 3,000,000 d | 3,060,000 | ||||||||
| GS Mortgage Securities II: | Sprint Capital, | |||||||||
| Ser. 1998-GLII, Cl. A-2, | Notes, 8.375%, 2012 | 4,800,000 | 5,739,034 | |||||||
| 6.562%, 2031 | 8,750,000 | 9,189,250 | ||||||||
| Ser. 2005-GG4, Cl. A4, | Time Warner: | |||||||||
| 4.761%, 2039 | 1,850,000 | 1,865,733 | Debs., 6.95%, 2028 | 4,430,000 | 5,012,651 | |||||
| Sr. Debs., 7.7%, 2032 | 3,000,000 | 3,709,278 | ||||||||
| JP Morgan Chase Commercial | ||||||||||
| Mortgage Securities: | Tribune, | |||||||||
| Ser. 2005-CB11, Cl. A2, | Notes, 5.25%, 2015 | 5,000,000 | 5,142,215 | |||||||
| 5.016%, 2037 | 4,145,000 | 4,234,738 | Univision Communications, | |||||||
| Ser. 2005-CB12, Cl. AM, | Sr. Notes, 3.5%, 2007 | 9,400,000 | 9,181,290 | |||||||
| 4.948%, 2037 | 3,075,000 | 3,131,643 | Verizon Global Funding, | |||||||
| Ser. 2005-LDP2, Cl. AM, | Notes, 7.6%, 2007 | 750,000 | 785,345 | |||||||
| 4.78%, 2042 | 3,720,000 | 3,744,900 | Verizon New York: | |||||||
| 22,569,825 | Debs., Ser. A, 6.875%, 2012 | 1,125,000 | 1,242,359 | |||||||
| Foreign Government—3.1% | Debs., Ser. B, 7.375%, 2032 | 4,500,000 | 5,293,692 | |||||||
| Financement-Quebec, | Viacom, | |||||||||
| Notes, 5%, 2012 | 4,875,000 | 5,057,661 | Debs., 7.875%, 2030 | 5,400,000 | 6,663,184 | |||||
| Province of Manitoba Canada, | Vodafone, | |||||||||
| Notes, 4.45%, 2010 | 3,220,000 | 3,261,438 | Sr. Notes, 7.75%, 2010 | 4,430,000 | 5,013,334 | |||||
| Province of Ontario: | 59,328,452 | |||||||||
| Notes, 5.125%, 2012 | 3,500,000 a | 3,716,437 | Real Estate Investment | |||||||
| Sr. Notes, 5.5%, 2008 | 4,000,000 | 4,172,864 | Trust—1.8% | |||||||
| Republic of Italy, | ERP Operating, | |||||||||
| Bonds, 4%, 2008 | 5,730,000 | 5,718,534 | Notes, 6.95%, 2011 | 4,000,000 | 4,424,856 | |||||
| United Mexican States, | Liberty Property, | |||||||||
| Notes, 6.625%, 2015 | 4,000,000 a | 4,426,000 | Sr. Notes, 7.25%, 2011 | 2,025,000 | 2,257,750 | |||||
| 26,352,934 | ||||||||||
| 14 |
| Mellon Bond Fund (continued) | ||||||||||
| Principal | Principal | |||||||||
| Bonds and Notes (continued) | Amount ($) | Value ($) | Amount ($) | Value ($) | ||||||
| Real Estate Investment Trust (continued) | U.S. Government Agencies (continued) | |||||||||
| Mack-Cali Realty, | Federal Home Loan | |||||||||
| Notes, 7.75%, 2011 | 4,775,000 | 5,429,275 | Mortgage Corp. (continued): | |||||||
| Simon Property, | Notes, 4.75%, 12/8/2010 | 4,375,000 | 4,383,444 | |||||||
| Notes, 5.1%, 2015 | 3,000,000 a,d | 3,002,943 | Federal National Mortgage Association: | |||||||
| 15,114,824 | Notes, 4%, 5/9/2007 | 4,845,000 | 4,834,646 | |||||||
| Retail—.6% | Notes, 4.125%, 6/16/2008 | 4,925,000 | 4,901,065 | |||||||
| Wal-Mart Stores, | Notes, 4.75%, 8/25/2008 | 3,125,000 | 3,139,250 | |||||||
| Bonds, 5.25%, 2035 | 5,310,000 | 5,378,398 | 77,569,205 | |||||||
| U.S. Government—21.0% | U.S. Government Agencies/ | |||||||||
| Mortgage-Backed—34.3% | ||||||||||
| U.S. Treasury Bonds: | Federal Home Loan Mortgage Corp.: | |||||||||
| 5.375%, 2/15/2031 | 8,875,000 | 10,407,979 | 5%, 10/1/2018 | 9,733,363 | 9,818,530 | |||||
| 6%, 2/15/2026 | 4,000,000 | 4,906,560 | 5.5%, 9/1/2006-3/1/2035 | 36,559,489 | 37,158,318 | |||||
| 6.25%, 8/15/2023 | 16,620,000 | 20,599,659 | 5.625%, 7/1/2031 | 840,176 b | 863,407 | |||||
| U.S. Treasury Inflation | 6%, 7/1/2017 | 4,784,833 | 4,938,809 | |||||||
| Protected Securities, | 6.5%, 8/1/2031-7/1/2032 | 2,768,389 | 2,868,212 | |||||||
| 1.625%, 1/15/2015 | 14,713,677 a,e | 14,709,409 | 7%, 4/1/2032 | 894,890 | 936,833 | |||||
| U.S. Treasury Note: | 8.5%, 6/1/2018 | 3,554,665 | 3,847,925 | |||||||
| 3.375%, 10/15/2009 | 4,545,000 a | 4,463,690 | Federal National Mortgage Association: | |||||||
| 4%, 4/15/2010 | 9,630,000 a | 9,686,056 | 4.5%, 5/1/2020-7/1/2020 | 23,454,974 | 23,281,653 | |||||
| 4%, 11/15/2012 | 6,300,000 a | 6,330,240 | 5%, 5/1/2019-7/1/2035 | 90,664,982 | 90,620,597 | |||||
| 4.125%, 5/15/2015 | 19,310,000 a | 19,440,342 | 5.5%, 1/1/2020-7/1/2035 | 48,117,075 | 48,787,881 | |||||
| 4.375%, 5/15/2007 | 39,615,000 a | 39,989,362 | 6%, 9/1/2019-9/1/2034 | 22,220,268 | 22,812,333 | |||||
| 4.375%, 8/15/2012 | 5,325,000 | 5,483,046 | 6.5%, 3/1/2017-6/1/2035 | 13,777,686 | 14,273,308 | |||||
| 5.5%, 2/15/2008 | 18,000,000 a | 18,715,680 | 7%, 6/1/2009-6/1/2032 | 5,076,159 | 5,313,831 | |||||
| 6%, 8/15/2009 | 20,200,000 a | 21,783,478 | 7.5%, 7/1/2032 | 1,373,038 | 1,456,272 | |||||
| 176,515,501 | 8%, 7/1/2007-2/1/2013 | 1,267,886 | 1,315,190 | |||||||
| U.S. Government Agencies—9.2% | Government National | |||||||||
| Federal Farm Credit Banks, | Mortgage Association I: | |||||||||
| Bonds, 4.125%, 4/15/2009 | 6,740,000 | 6,740,337 | 6%, 10/15/2008-10/15/2033 | 5,733,820 | 5,908,843 | |||||
| 6.5%, 2/15/2024-8/15/2034 | 8,195,488 | 8,558,596 | ||||||||
| Federal Home Loan Banks: | 7%, 5/15/2023-12/15/2023 | 1,691,453 | 1,788,712 | |||||||
| Bonds, 3.625%, 5/15/2008 | 365,000 | 360,210 | 7.5%, 3/15/2027 | 893,082 | 952,802 | |||||
| Bonds, 3.75%, 3/7/2007 | 2,500,000 | 2,487,037 | 8%, 5/15/2007-9/15/2008 | 1,800,926 | 1,836,385 | |||||
| Bonds, 3.875%, 2/15/2008 | 6,040,000 | 6,005,735 | 9%, 12/15/2009 | 1,687,730 | 1,765,248 | |||||
| Bonds, 3.9%, 2/25/2008 | 4,415,000 | 4,398,016 | ||||||||
| Bonds, 4%, 4/25/2007 | 5,000,000 | 4,991,185 | 289,103,685 | |||||||
| Bonds, 4.25%, 5/16/2008 | 4,910,000 | 4,889,034 | Utilities—1.4% | |||||||
| Bonds, 4.65%, 8/22/2008 | 3,125,000 | 3,138,675 | Dominion Resources, | |||||||
| Bonds, Ser. S107, | Sr. Notes, 5.15%, 2015 | 1,000,000 | 1,013,676 | |||||||
| 3.75%, 8/15/2007 | 1,005,000 | 998,243 | FPL Group Capital, | |||||||
| Federal Home Loan Mortgage Corp.: | Debs., 6.125%, 2007 | 6,800,000 | 7,010,100 | |||||||
| Notes, 3.25%, 11/2/2007 | 3,445,000 | 3,387,772 | Southern California Edison, | |||||||
| Notes, 3.3%, 9/14/2007 | 6,375,000 | 6,292,380 | First Mortgage, 4.65%, 2015 | 4,200,000 | 4,196,010 | |||||
| Notes, 3.75%, 8/3/2007 | 5,225,000 | 5,198,697 | 12,219,786 | |||||||
| Notes, 4.375%, 1/25/2010 | 6,570,000 | 6,560,993 | Total Bonds and Notes | |||||||
| Notes, 4.5%, 8/22/2007 | 4,845,000 | 4,862,486 | (cost $827,347,636) | 831,123,995 | ||||||
| T h e F u n d s 15 |
| STATEMENT OF INVESTMENTS (continued) |
| Mellon Bond Fund (continued) | ||||||||||
| Principal | Investment of Cash Collateral | |||||||||
| Short-Term Investment—1.6% | Amount ($) | Value ($) | for Securities Loaned—16.9% | Shares | Value ($) | |||||
| Repurchase Agreement; | Registered Investment Company; | |||||||||
| JP Morgan Chase & Co., | Dreyfus Institutional Cash | |||||||||
| 3.48%, dated 8/31/2005 | Advantage Plus Fund | |||||||||
| due 9/1/2005 | (cost $142,491,618) 142,491,618 f | 142,491,618 | ||||||||
| in the amount of $13,245,280 | ||||||||||
| (fully collateralized by $13,375,000, | Total Investments | |||||||||
| U.S. Treasury Notes, 4.125%, | (cost $983,083,254) | 117.1% | 986,859,613 | |||||||
| 8/15/2008, | Liabilities, Less Cash and Receivables | (17.1%) | (144,351,623) | |||||||
| value $13,532,935) | ||||||||||
| (cost $13,244,000) | 13,244,000 | 13,244,000 | Net Assets | 100.0% | 842,507,990 | |||||
| a All or a portion of these securities are on loan. At August 31, 2005 the total market value of the fund's securities on loan is $148,168,332 and the total market value of the | ||||||||||
| collateral held by the fund is $151,431,661, consisting of cash collateral of $142,491,618 and U.S Government debt valued at $8,940,043. | ||||||||||
| b Variable rate security—interest rate subject to periodic change. | ||||||||||
| c Notional face amount shown. | ||||||||||
| d These securities are exempt from registration under Rule 144A of the Securities Act of 1933.These securities may be resold in transactions exempt from registration, normally to | ||||||||||
| qualified institutional buyers. At August 31, 2005, these securities amounted to $11,081,693 or 1.2% of net assets. | ||||||||||
| e Principal amount for accrual purposes is periodically adjusted based on changes in the Consumer Price Index. | ||||||||||
| f Investments in affiliated money market mutual funds. | ||||||||||
| Portfolio Summary (Unaudited) † | ||||||
| Value (%) | Value (%) | |||||
| U.S. Agency Mortgage-Backed Securities | 34.3 | Mortgage/Asset-Backed Securities | 7.0 | |||
| U.S. Government/Agencies Securities | 30.2 | Foreign Government Securities | 3.1 | |||
| Corporate Bonds/Notes | 24.0 | |||||
| Short-Term/Money Market Instruments | 18.5 | 117.1 | ||||
| † Based on net assets. | ||||||
| See notes to financial statements. | ||||||
| 16 |
| STATEMENT OF INVESTMENTS | ||||||||||||
| August 31 , 2005 | ||||||||||||
| Mellon Intermediate Bond Fund | ||||||||||||
| Principal | Principal | |||||||||||
| Bonds and Notes—98.4% | Amount ($) | Value ($) | Amount ($) | Value ($) | ||||||||
| Asset-Backed Ctfs— | Bank & Finance (continued) | |||||||||||
| Automobile Receivables—1.7% | Fifth Third Bancorp, | |||||||||||
| Harley-Davidson Motorcycle Trust: | Notes, 3.375%, 2008 | 3,680,000 | 3,593,516 | |||||||||
| Ser. 2003-4, Cl. A2, 2.69%, 2011 | 2,470,000 | 2,417,027 | Ford Motor Credit, | |||||||||
| Ser. 2005-3, Cl. A2, 4.41%, 2012 | 2,350,000 | 2,349,632 | Notes, 7%, 2013 | 2,000,000 | a | 1,920,128 | ||||||
| Honda Auto Receivables Owner Trust, | General Electric Capital, | |||||||||||
| Ser. 2004-3, Cl. A4, | Notes, Ser. A, 3.125%, 2009 | 5,885,000 | a | 5,661,164 | ||||||||
| 3.28%, 2/18/10 | 2,030,000 | 1,981,796 | Goldman Sachs, | |||||||||
| Onyx Acceptance Grantor Trust, | Notes, 4.75%, 2013 | 5,400,000 | 5,375,705 | |||||||||
| Ser. 2005-A, Cl. A4, 3.91%, 2011 | 3,150,000 | 3,124,139 | Household Finance, | |||||||||
| 9,872,594 | Notes, 4.75%, 2013 | 5,400,000 | 5,405,659 | |||||||||
| Asset-Backed Ctfs.— | International Lease Finance, | |||||||||||
| Credit Cards—.8% | Notes, 4.35%, 2008 | 3,500,000 | a | 3,485,430 | ||||||||
| Bank One Issuance Trust, | KfW, | |||||||||||
| Ser. 2003-03, Cl. C3, 4.77%, 2016 | 4,275,000 | 4,290,976 | Gtd. Global Notes, (Gtd. by | |||||||||
| Asset-Backed Ctfs.—Other—1.1% | Federal Rep. of Germany), | |||||||||||
| CNH Equipment Trust, | 3.75%, 2008 | 9,470,000 | 9,396,049 | |||||||||
| Ser. 2005-A, Cl. A4B, 4.29%, 2012 | 1,385,000 | 1,386,934 | Landwirtschaftliche Rentenbank, | |||||||||
| Caterpillar Financial Asset Trust, | Gtd. Global Notes, (Gtd. By | |||||||||||
| Ser. 2005-A, Cl. A4, 4.1%, 2010 | 2,700,000 | 2,691,722 | Bundes Republik Deutschland), | |||||||||
| 3.25%, 2007 | 8,320,000 | 8,167,062 | ||||||||||
| John Deere Owner Trust, | ||||||||||||
| Ser. 2004-A, Cl. A4, 3.02%, 2011 | 2,245,000 | 2,196,633 | Lehman Brothers: | |||||||||
| Notes, 4.25%, 2010 | 2,400,000 | 2,381,021 | ||||||||||
| 6,275,289 | Notes, 7%, 2008 | 1,680,000 | 1,781,264 | |||||||||
| Bank & Finance—19.3% | Merrill Lynch & Co, | |||||||||||
| AXA Financial: | Notes, 4.125%, 2009 | 6,700,000 | 6,630,816 | |||||||||
| Sr. Notes, 6.5%, 2008 | 1,200,000 | 1,263,713 | Morgan Stanley | |||||||||
| Sr. Notes, 7.75%, 2010 | 3,625,000 | 4,135,085 | Bonds, 5.8%, 2007 | 5,000,000 | 5,116,925 | |||||||
| American Express, | US Bank, | |||||||||||
| Notes, 4.75%, 2009 | 2,000,000 a | 2,030,138 | Sr. Notes, 4.125%, 2008 | 4,000,000 | 3,992,424 | |||||||
| Bank of America, | Wachovia, | |||||||||||
| Sr. Notes, 5.875%, 2009 | 3,500,000 | 3,678,528 | Sub. Notes, 6.375%, 2009 | 4,000,000 | 4,247,988 | |||||||
| Bank of New York, | Wells Fargo & Co., | |||||||||||
| Sr. Notes, 3.625%, 2009 | 4,575,000 | 4,480,947 | Notes, 3.12%, 2008 | 5,000,000 | 4,856,000 | |||||||
| Bear Stearns & Cos., | 109,819,879 | |||||||||||
| Notes, 4.5%, 2010 | 2,100,000 | 2,099,410 | Collateralized Mortgage | |||||||||
| CIT Group, | Obligations—.6% | |||||||||||
| Debs., 5.875%, 2008 | 2,275,000 | 2,374,226 | ABN Amro Mortgage, | |||||||||
| Caterpillar Financial Services, | Ser. 2002-1A, Cl. M, | |||||||||||
| Notes, 3.625%, 2007 | 5,700,000 | 5,634,735 | 5.627113%, 2032 | 529,521 | b | 531,360 | ||||||
| Citigroup, | Federal Home Loan Mortgage Corp., | |||||||||||
| Sr. Notes, 6.2%, 2009 | 4,400,000 | 4,672,307 | Mulitclass Mortgage | |||||||||
| Countrywide Home Loans, | Participation Ctfs., REMIC, | |||||||||||
| Notes, 3.25%, 2008 | 4,630,000 | 4,494,179 | Ser. 2134, Cl. PM, | |||||||||
| Credit Suisse First Boston, | 5.5%, 3/15/2014 | 2,628,203 | 2,689,756 | |||||||||
| Notes, 4.875%, 2010 | 2,900,000 | 2,945,460 | 3,221,116 | |||||||||
T h e F u n d s 17
| STATEMENT OF INVESTMENTS (continued) |
| Mellon Intermediate Bond Fund (continued) | ||||||||||||
| Principal | Principal | |||||||||||
| Bonds and Notes (continued) | Amount ($) | Value ($) | Amount ($) | Value ($) | ||||||||
| Commercial Mortgage | Media & | |||||||||||
| Pass-Through Ctfs.—2.5% | Telecommunications—8.5% | |||||||||||
| GS Mortgage Securities II: | AOL Time Warner, | |||||||||||
| Ser. 1998-GLII, Cl. A-2, | Notes, 6.875%, 2012 | 2,750,000 | a | 3,062,870 | ||||||||
| 6.562%, 2031 | 4,250,000 | 4,463,350 | British Sky Broadcasting, | |||||||||
| Ser. 2005-GG4, Cl. A4, | Notes, 6.875%, 2009 | 3,500,000 | 3,752,319 | |||||||||
| 4.761%, 2039 | 2,800,000 | 2,823,812 | ||||||||||
| Comcast Cable Communications: | ||||||||||||
| JP Morgan Chase Commercial | Notes, 5.3%, 2014 | 2,000,000 | 2,042,918 | |||||||||
| Mortgage Securities: | Sr. Notes, 5.85%, 2010 | 2,400,000 | 2,518,164 | |||||||||
| Ser. 2005-CB11, Cl. A2, | ||||||||||||
| 5.016%, 2037 | 2,645,000 | 2,702,264 | Grupo Televisa, | |||||||||
| Ser. 2005-CB12, Cl. AM, | Sr. Notes, 6.625%, 2025 | 2,000,000 | c | 2,040,000 | ||||||||
| 4.948%, 2037 | 1,985,000 | 2,021,565 | News America, | |||||||||
| Ser. 2005-LDP2, Cl. AM, | Sr. Notes, 4.75%, 2010 | 4,115,000 | 4,142,455 | |||||||||
| 4.78%, 2042 | 2,405,000 | 2,421,097 | Sprint Capital, | |||||||||
| 14,432,088 | Notes, 8.375%, 2012 | 5,250,000 | a | 6,277,068 | ||||||||
| Foreign Government—4.1% | Tribune, | |||||||||||
| Financement-Quebec, | Notes, 5.25%, 2015 | 3,000,000 | 3,085,329 | |||||||||
| Notes, 5%, 2012 | 6,330,000 | 6,567,179 | Univision Communications: | |||||||||
| Mexico Government, | Sr. Notes, | |||||||||||
| Notes, 6.625%, 2015 | 2,875,000 a | 3,181,187 | 3.5%, 2007 | 4,965,000 | 4,849,479 | |||||||
| Province of Manitoba Canada, | Sr. Notes, | |||||||||||
| Notes, 4.45%, 2010 | 4,190,000 a | 4,243,921 | 3.875%, 2008 | 1,850,000 | 1,800,415 | |||||||
| Province of Ontario, | Verizon New York, | |||||||||||
| Notes, 5.125%, 2012 | 2,200,000 a | 2,336,046 | Debs., Ser. A, | |||||||||
| Republic of Italy, | 6.875%, 2012 | 4,925,000 | 5,438,771 | |||||||||
| Bonds, 4%, 2008 | 7,315,000 a | 7,300,363 | Viacom, | |||||||||
| 23,628,696 | Sr. Notes, 6.625%, 2011 | 5,850,000 | 6,364,665 | |||||||||
| Industrials—2.4% | Vodafone, | |||||||||||
| Canadian National Railway, | Notes, 7.75%, 2010 | 2,675,000 | 3,027,239 | |||||||||
| Notes, 4.25%, 2009 | 3,875,000 | 3,855,734 | 48,401,692 | |||||||||
| Conoco Funding, | Real Estate Investment | |||||||||||
| Notes, 6.35%, 2011 | 1,825,000 | 2,018,459 | Trust—1.8% | |||||||||
| Dominion Resources, | ERP Operating, | |||||||||||
| Sr. Notes, 5.15%, 2015 | 1,225,000 | 1,241,753 | Notes, 6.95%, 2011 | 1,875,000 | 2,074,151 | |||||||
| Emerson Electric, | Liberty Property, | |||||||||||
| Notes, 4.625%, 2012 | 3,625,000 | 3,680,564 | Sr. Notes, 7.25%, 2011 | 1,480,000 | 1,650,108 | |||||||
| Pemex Project Funding | Mack-Cali Realty: | |||||||||||
| Master Trust,Notes, 5.75%, 2015 | 3,000,000 c | 3,011,250 | Notes, 7.25%, 2009 | 2,525,000 | 2,721,988 | |||||||
| 13,807,760 | Notes, 7.75%, 2011 | 1,500,000 | 1,705,532 | |||||||||
| 18 |
| Mellon Intermediate Bond Fund (continued) | ||||||||||
| Principal | Principal | |||||||||
| Bonds and Notes (continued) | Amount ($) | Value ($) | Amount ($) | Value ($) | ||||||
| Real Estate Investment | U.S. Government Agencies (continued) | |||||||||
| Trust (continued) | Federal Home Loan Banks (continued): | |||||||||
| Simon Property, | Bonds, Ser. S107, | |||||||||
| Notes, 5.1%, 2015 | 2,000,000 a,c | 2,001,962 | 3.75%, 8/15/2007 | 6,990,000 | 6,943,006 | |||||
| 10,153,741 | Federal Home Loan Mortgage Corp.: | |||||||||
| Retail—.9% | Notes, 3.25%, 11/2/2007 | 1,545,000 | 1,519,334 | |||||||
| Notes, 3.3%, 9/14/2007 | 7,700,000 | 7,600,208 | ||||||||
| Wal-Mart Stores, | Notes, 3.75%, 8/3/2007 | 2,410,000 | 2,397,868 | |||||||
| Sr. Notes, 6.875%, 2009 | 4,500,000 | 4,916,318 | Notes, 4.5%, 8/22/2007 | 6,460,000 | 6,483,314 | |||||
| Technology—1.0% | Federal National Mortgage Association: | |||||||||
| IBM, | Notes, 2.71%, 1/30/2007 | 3,685,000 | 3,621,703 | |||||||
| Notes, 4.375%, 2009 | 5,000,000 | 5,029,670 | Notes, 3.55%, 2/16/2007 | 9,665,000 | 9,603,927 | |||||
| U.S. Government— 31.7% | Notes, 4%, 5/9/2007 | 6,405,000 | 6,391,313 | |||||||
| Notes, 4.125%, 6/16/2008 | 5,625,000 | 5,597,663 | ||||||||
| U.S. Treasury Inflation | Notes, 4.75%, 8/25/2008 | 3,045,000 | 3,058,885 | |||||||
| Protected Bonds, | ||||||||||
| 1.625%, 1/15/2015 | 8,535,868 a,d | 8,533,368 | 108,502,668 | |||||||
| U.S. Government Agencies/ | ||||||||||
| U.S. Treasury Notes: | Mortgage-Backed—1.8% | |||||||||
| 3.5%, 11/15/2009 | 12,660,000 a | 12,493,774 | Federal Home Loan Mortgage Corp.: | |||||||
| 4%, 4/15/2010 | 6,725,000 a | 6,764,146 | 3.5%, 5/1/2008 | 1,166,947 | 1,134,857 | |||||
| 4%, 11/15/2012 | 8,390,000 a | 8,430,272 | 4.5%, 11/1/2007 | 1,278,710 | 1,280,705 | |||||
| 4.125%, 5/15/2015 | 1,375,000 a | 1,384,281 | 4.919%, 11/1/2032 | 1,061,374 b | 1,069,834 | |||||
| 4.375%, 5/15/2007 | 41,370,000 a | 41,760,947 | ||||||||
| 4.375%, 8/15/2012 | 6,315,000 a | 6,502,429 | Federal National Mortgage Association: | |||||||
| 5%, 10/1/2018 | 4,988,878 | 5,029,388 | ||||||||
| 5.5%, 2/15/2008 | 59,140,000 a | 61,491,406 | 5.5%, 6/1/2006 | 196,329 | 198,169 | |||||
| 6.5%, 10/15/2006 | 32,480,000 a | 33,440,434 | 7%, 6/1/2009 | 353,526 | 364,683 | |||||
| 180,801,057 | Government National | |||||||||
| U.S. Government Agencies—19.0% | Mortgage Association I: | |||||||||
| Federal Farm Credit Bank: | 6.5%, 9/15/2013 | 685,357 | 714,909 | |||||||
| Bonds, 2.125%, 7/17/2006 | 4,500,000 | 4,430,875 | 8%, 2/15/2008 | 287,887 | 294,992 | |||||
| Bonds, 4.125%, 4/15/2009 | 6,730,000 | 6,730,336 | 10,087,537 | |||||||
| Federal Home Loan Banks: | Utilities—1.2% | |||||||||
| Bonds, 3.75%, 3/7/2007 | 6,865,000 | 6,829,405 | Alabama Power, | |||||||
| Bonds, 3.875%, 2/15/2008 | 7,485,000 | 7,442,538 | Sr. Notes, Cl. CC, 3.5%, 2007 | 3,675,000 | 3,618,567 | |||||
| Bonds, 3.9%, 2/25/2008 | 5,560,000 | 5,538,611 | FPL Group Capital, | |||||||
| Bonds, 4%, 4/25/2007 | 6,805,000 | 6,793,003 | Debs., 6.125%, 2007 | 3,250,000 | 3,350,415 | |||||
| Bonds, 4.25%, 5/16/2008 | 6,495,000 | 6,467,266 | 6,968,982 | |||||||
| Bonds, 4.65%, 8/22/2008 | 3,155,000 | 3,168,806 | Total Bonds and Notes | |||||||
| Bonds, Ser. QP06, | (cost $561,515,143) | 560,210,063 | ||||||||
| 4.125%, 11/15/2006 | 7,870,000 | 7,884,607 | ||||||||
| T h e F u n d s 19 |
| STATEMENT OF INVESTMENTS (continued) |
| Mellon Intermediate Bond Fund (continued) | ||||||||||
| Principal | Investment of Cash Collateral | |||||||||
| Short-Term Investment—1.4% | Amount ($) | Value ($) | for Securities Loaned—34.3% | Shares | Value ($) | |||||
| Repurchase Agreement; | Registered Investment Company; | |||||||||
| JP Morgan Chase & Co., | Dreyfus Institutional Cash | |||||||||
| 3.48%, dated 8/31/2005 | Advantage Plus Fund | |||||||||
| due 9/1/2005 | (cost $195,681,804) 195,681,804 e | 195,681,804 | ||||||||
| in the amount of $7,958,769 | ||||||||||
| (fully collateralized by $8,037,000 | Total Investments (cost $765,154,947) | 134.1% | 763,849,867 | |||||||
| U.S. Treasury Notes, 4.125%, | Liabilities, Less Cash and Receivables | (34.1%) | (194,069,835) | |||||||
| 8/15/2008, value $8,131,903) | ||||||||||
| (cost $7,958,000) | 7,958,000 | 7,958,000 | Net Assets | 100.0% | 569,780,032 | |||||
| a All or a portion of these securities are on loan. At August 31, 2005, the total market value of the fund's securities on loan is $207,529,846 and the total market value of the |
| collateral held by the fund is $212,766,902, consisting of cash collateral of $195,681,804, U.S. Government debt valued at $17,085,098. |
| b Variable rate security—interest rate subject to periodic change. |
| c These securities are exempt from registration under Rule 144A of the Securities Act of 1933.These securities may be resold in transactions exempt from registration, normally to |
| qualified institutional buyers. At August 31, 2005, these securities amounted to $7,053,212 or 1.2% of net assets. |
| d Principal amount for accrual purposes is periodically adjusted based on changes in the Consumer Price Index. |
| e Investment in affiliated money market mutual funds. |
| Portfolio Summary (Unaudited) † | ||||||
| Value (%) | Value (%) | |||||
| U.S. Governments/Agencies Securities | 50.7 | Foreign Government Securities | 4.1 | |||
| Short-Term/Money Market Investments | 35.7 | U.S. Agency Mortgage-Backed Securities | 1.8 | |||
| Corporate Bonds/ Notes | 35.1 | |||||
| Mortgages/Asset-Backed Securities | 6.7 | 134.1 | ||||
| † Based on net assets. | ||||||
| See notes to financial statements. | ||||||
| 20 |
| STATEMENT OF INVESTMENTS | ||||||||||
| August 31 , 2005 | ||||||||||
| Mellon Short-Term U.S. Government Securities Fund | ||||||||||
| Principal | Principal | |||||||||
| Bonds and Notes—98.1% | Amount ($) | Value ($) | Amount ($) | Value ($) | ||||||
| Collateralized Mortgage | U.S. Government Agencies (continued) | |||||||||
| Obligations—.2% | Federal National Mortgage Association: | |||||||||
| Federal Home Loan | Notes, 2.35%, 4/29/2006 | 1,335,000 | 1,321,675 | |||||||
| Mortgage Corp., | Notes, 2.5%, 5/12/2006 | 1,009,000 | 999,426 | |||||||
| Multiclass Mortgage Participation | Notes, 2.71%, 1/30/2007 | 745,000 | 732,203 | |||||||
| Ctfs., REMIC, Ser. 2495, | Notes, 3%, 3/2/2007 | 550,000 | 542,248 | |||||||
| Cl. UC, 5%, 7/15/2032 | 244,034 | 246,363 | Notes, 3%, 10/19/2006 | 1,275,000 | 1,261,562 | |||||
| U.S. Government—48.4% | Notes, 3%, 12/15/2006 | 1,000,000 | 987,987 | |||||||
| U.S. Treasury Notes: | Notes, 3.01%, 6/2/2006 | 2,000,000 | 1,985,448 | |||||||
| 3%, 11/15/2007 | 16,000,000 a | 15,727,360 | Notes, 3.05%, 12/28/2006 | 2,000,000 | 1,981,688 | |||||
| 4.375%, 5/15/2007 | 18,025,000 a | 18,195,336 | Notes, 3.05%, 4/20/2007 | 510,000 | 502,498 | |||||
| 5.5%, 2/15/2008 | 9,000,000 a | 9,357,840 | Notes, 3.55%, 1/12/2007 | 3,545,000 | 3,524,723 | |||||
| 5.625%, 2/15/2006 | 17,500,000 a | 17,655,750 | Notes, 3.55%, 2/16/2007 | 3,425,000 | 3,403,357 | |||||
| 6.5%, 10/15/2006 | 17,000,000 a | 17,502,690 | Notes, 4%, 5/9/2007 | 1,850,000 | 1,846,047 | |||||
| Notes, 4.1%, 4/18/2007 | 1,375,000 | 1,373,554 | ||||||||
| 78,438,976 | Notes, 4.125%, 6/16/2008 | 1,870,000 | 1,860,912 | |||||||
| U.S. Government Agencies—39.9% | Notes, 4.75%, 8/25/2008 | 1,205,000 | 1,210,495 | |||||||
| Federal Farm Credit Banks: | 64,613,074 | |||||||||
| Bonds, 1.875%, 1/16/2007 | 2,000,000 | 1,944,298 | U.S. Government Agencies/ | |||||||
| Bonds, 2.125%, 7/17/2006 | 2,470,000 | 2,432,058 | Mortgage-Backed—9.6% | |||||||
| Bonds, 2.25%, 9/1/2006 | 835,000 | 821,253 | ||||||||
| Bonds, 2.375%, 10/2/2006 | 1,425,000 | 1,401,314 | Federal Home Loan Mortgage Corp.: | |||||||
| 3.5%, 5/1/2008-9/1/2008 | 4,730,951 | 4,600,850 | ||||||||
| Federal Home Loan Banks: | 4%, 2/1/2008-3/1/2010 | 4,204,105 | 4,153,122 | |||||||
| Bonds, 2.75%, 5/15/2006 | 895,000 | 887,941 | 4.5%, 11/1/2007-5/1/2008 | 2,261,002 | 2,265,042 | |||||
| Bonds, 2.95%, 9/14/2006 | 2,150,000 | 2,128,403 | 4.91%, 11/1/2032 | 265,343 b | 267,458 | |||||
| Bonds, 3.875%, 2/15/2008 | 2,270,000 | 2,257,122 | 5%, 3/1/2008-4/1/2009 | 375,380 | 378,873 | |||||
| Bonds, 4%, 4/5/2007 | 1,315,000 | 1,315,062 | 5.625%, 7/1/2031 | 86,171 b | 88,555 | |||||
| Bonds, 4%, 4/25/2007 | 2,015,000 | 2,011,448 | ||||||||
| Bonds, 4.25%, 5/16/2008 | 1,900,000 | 1,891,887 | Federal National Mortgage Association: | |||||||
| Bonds, Ser. 571, | 4.5%, 1/1/2010 | 373,942 | 372,656 | |||||||
| 4.65%, 8/22/2008 | 1,205,000 | 1,210,273 | 4.699%, 6/1/2032 | 531,145 b | 538,778 | |||||
| Bonds, Ser. QP06, | 4.944%, 3/1/2032 | 109,417 b | 110,438 | |||||||
| 4.125%, 11/15/2006 | 3,385,000 | 3,391,283 | 5.193%, 4/1/2032 | 122,153 b | 125,796 | |||||
| Bonds, Ser. S706, | 5.23%, 5/1/2032 | 329,533 b | 332,374 | |||||||
| 5.375%, 5/15/2006 | 1,605,000 | 1,620,890 | 5.375%, 5/1/2032 | 93,441 b | 95,431 | |||||
| 5.5%, 6/1/2009 | 109,145 | 110,850 | ||||||||
| Federal Home Loan Mortgage Corp.: | 5.718%, 6/1/2032 | 142,888 b | 148,359 | |||||||
| Notes, 2.14%, 2/24/2006 | 1,000,000 | 992,039 | 5.773%, 3/1/2032 | 64,206 b | 65,356 | |||||
| Notes, 2.2%, 12/30/2005 | 1,220,000 | 1,213,989 | 5.825%, 6/1/2032 | 457,537 b | 472,430 | |||||
| Notes, 2.25%, 2/17/2006 | 2,765,000 | 2,745,678 | ||||||||
| Notes, 3%, 4/25/2007 | 2,000,000 | 1,969,624 | Government National | |||||||
| Notes, 3.25%, 11/2/2007 | 1,490,000 | 1,465,248 | Mortgage Association I, | |||||||
| Notes, 3.3%, 9/14/2007 | 2,470,000 | 2,437,989 | 6%, 12/15/2008-4/15/2009 | 1,451,199 | 1,490,160 | |||||
| Notes, 3.75%, 8/3/2007 | 2,295,000 | 2,283,447 | 15,616,528 | |||||||
| Notes, 4.375%, 1/25/2010 | 2,770,000 | 2,766,202 | Total Bonds and Notes | |||||||
| Notes, 4.5%, 8/22/2007 | 1,885,000 | 1,891,803 | (cost $160,575,025) | 158,914,941 | ||||||
| T h e F u n d s 21 |
| STATEMENT OF INVESTMENTS (continued) |
| Mellon Short-Term U.S. Government Securities Fund (continued) | ||||||||||
| Principal | Investment of Cash Collateral | |||||||||
| Short-Term Investment—2.6% | Amount ($) | Value ($) | for Securities Loaned—42.0% | Shares | Value ($) | |||||
| Repurchase Agreement; | Registered Investment Company; | |||||||||
| JP Morgan Chase & Co., | Dreyfus Institutional Cash | |||||||||
| 3.48%, dated 8/31/2005, | Advantage Plus Fund | |||||||||
| due 9/1/2005 | (cost $68,091,473) | 68,091,473 | 68,091,473 | |||||||
| in the amount of $4,188,405 | ||||||||||
| (fully collateralized | Total Investments | |||||||||
| by $4,229,000 | (cost $232,854,498) | 142.7% | 231,194,414 | |||||||
| U.S. Treasury Note, 4.125%, | Liabilities, Less Cash and Receivables | (42.7%) | (69,211,917) | |||||||
| 8/15/2008 value $4,278,937) | ||||||||||
| (cost $4,188,000) | 4,188,000 c | 4,188,000 | Net Assets | 100.0% | 161,982,497 | |||||
| a All or a portion of these securities are on loan. At August 31, 2005, the total market value of the fund's securities on loan is $71,211,785 and the total market value of the |
| collateral held by the fund is $72,996,824, consisting of cash collateral of $68,091,473 and U.S. Government debt valued at $4,905,351. |
| b Variable rate security—interest rate subject to periodic change. |
| c Investment in affiliated money market mutual funds. |

| U.S. Government/Agencies Securities | 88.3 | U.S. Agency Mortgage-Backed Securities | 9.8 | |||
| Short-Term/Money Market Investments | 44.6 | 142.7 | ||||
| † Based on net assets. | ||||||
| See notes to financial statements. | ||||||
| 22 |
STATEMENTS OF ASSETS AND LIABILITIES
August 31 , 2005
| Mellon | ||||||
| Mellon | Mellon | Short-Term | ||||
| Bond | Intermediate | U.S. Government | ||||
| Fund | Bond Fund | Securities Fund | ||||
| Assets ($): | ||||||
| Investments in securities— | ||||||
| See Statement of Investments+—Note 2(c) | ||||||
| (including securities loaned)++—Note 2(b): | ||||||
| Unaffiliated issuers | 844,367,995 | 568,168,063 | 163,102,941 | |||
| Affiliated issuers | 142,491,618 | 195,681,804 | 68,091,473 | |||
| Dividends and interest receivable | 6,387,610 | 5,885,514 | 1,412,947 | |||
| Receivable for investment securites sold | 4,573,979 | 9,619,631 | — | |||
| Receivable for shares of Beneficial Interest subscribed | 357,995 | 705,949 | 209,150 | |||
| Paydowns receivable | 61,612 | 62,972 | 15,895 | |||
| Prepaid expenses | 14,608 | 15,298 | 17,076 | |||
| 998,255,417 | 780,139,231 | 232,849,482 | ||||
| Liabilities ($): | ||||||
| Due to The Dreyfus Corporation and affiliates—Note 3(b) | 292,512 | 208,779 | 54,036 | |||
| Due to Administrator—Note 3(a) | 91,647 | 64,076 | 18,252 | |||
| Liability for securities loaned—Note 2(b) | 142,491,618 | 195,681,804 | 68,091,473 | |||
| Cash overdraft due to Custodian | 2,480,065 | 7,954,220 | 244,695 | |||
| Payable for investment securities purchased | 10,227,497 | 6,227,721 | 2,420,814 | |||
| Payable for shares of Beneficial Interest redeemed | 129,008 | 183,987 | 9,167 | |||
| Accrued expenses | 35,080 | 38,612 | 28,548 | |||
| 155,747,427 | 210,359,199 | 70,866,985 | ||||
| Net Assets ($) | 842,507,990 | 569,780,032 | 161,982,497 | |||
| Composition of Net Assets ($): | ||||||
| Paid-in capital | 842,422,414 | 581,849,098 | 170,517,051 | |||
| Accumulated undistributed investment income—net | 438,115 | 181,224 | 35,694 | |||
| Accumulated net realized gain (loss) on investments | (4,128,898) | (10,945,210) | (6,910,164) | |||
| Accumulated net unrealized appreciation | ||||||
| (depreciation) on investments | 3,776,359 | (1,305,080) | (1,660,084) | |||
| Net Assets ($) | 842,507,990 | 569,780,032 | 161,982,497 | |||
| Net Asset Value Per Share | ||||||
| Class M Shares | ||||||
| Net Assets ($) | 839,803,988 | 569,233,483 | 161,962,509 | |||
| Shares Outstanding | 66,350,215 | 45,631,889 | 13,337,693 | |||
| Net Asset Value Per Share ($) | 12.66 | 12.47 | 12.14 | |||
| Investor Shares | ||||||
| Net Assets ($) | 2,704,002 | 546,549 | 19,988 | |||
| Shares Outstanding | 214,047 | 43,832 | 1,647 | |||
| Net Asset Value Per Share ($) | 12.63 | 12.47 | 12.14 | |||
| † Investments at cost ($): | ||||||
| Unaffiliated issuers | 840,591,636 | 569,473,143 | 164,763,025 | |||
| Affiliated issuers | 142,491,618 | 195,681,804 | 68,091,473 | |||
| ††Value of securities loaned ($) | 148,168,332 | 207,529,846 | 71,211,785 |
| See notes to financial statements. |
| T h e F u n d s 23 |
| STATEMENTS | OF OPERATIONS | |
| Year Ended August 31 , | 2005 |
| Mellon | ||||||
| Mellon | Mellon | Short-Term | ||||
| Bond | Intermediate | U.S. Government | ||||
| Fund | Bond Fund | Securities Fund | ||||
| Investment Income ($): | ||||||
| Income: | ||||||
| Interest | 36,303,365 | 20,382,903 | 4,656,843 | |||
| Income from securites lending | 145,879 | 118,308 | 31,620 | |||
| Total Income | 36,449,244 | 20,501,211 | 4,688,463 | |||
| Expenses: | ||||||
| Investment advisory fee—Note 3(a) | 3,334,649 | 2,158,931 | 586,506 | |||
| Administration fee—Note 3(a) | 1,124,849 | 728,105 | 226,171 | |||
| Custodian fees—Note 3(b) | 64,925 | 44,671 | 22,155 | |||
| Registration fees | 30,036 | 33,077 | 23,911 | |||
| Auditing fees | 25,882 | 24,677 | 22,021 | |||
| Trustees' fees and expenses—Note 3(c) | 23,262 | 20,752 | 7,549 | |||
| Legal fees | 14,015 | 8,765 | 3,766 | |||
| Prospectus and shareholders' reports | 11,216 | 6,024 | 6,122 | |||
| Shareholder servicing costs—Note 3(b) | 8,311 | 5,812 | 202 | |||
| Miscellaneous | 46,987 | 23,748 | 17,320 | |||
| Total Expenses | 4,684,132 | 3,054,562 | 915,723 | |||
| Less—expense reduction in custody fees | ||||||
| due to earnings credits—Note 1(b) | — | — | (1,629) | |||
| Net expenses | 4,684,132 | 3,054,562 | 914,094 | |||
| Investment Income—Net | 31,765,112 | 17,446,649 | 3,774,369 | |||
| Realized and Unrealized Gain (Loss) on Investments—Note 4 ($): | ||||||
| Net realized gain (loss) on investments | 5,843,843 | (1,907,257) | (1,015,599) | |||
| Net unrealized appreciation (depreciation) on investments | (10,671,423) | (6,826,688) | (1,151,379) | |||
| Net Realized and Unrealized Gain (Loss) on Investments | (4,827,580) | (8,733,945) | (2,166,978) | |||
| Net Increase in Net Assets Resulting from Operations | 26,937,532 | 8,712,704 | 1,607,391 | |||
| See notes to financial statements. |
| 24 |
STATEMENTS OF CHANGES IN NET ASSETS
| Mellon Bond Fund | Mellon Intermediate Bond Fund | |||||||
| Year Ended August 31, | Year Ended August 31, | |||||||
| 2005 | 2004 | 2005 | 2004 | |||||
| Operations ($): | ||||||||
| Investment income—net | 31,765,112 | 31,494,946 | 17,446,649 | 16,432,387 | ||||
| Net realized gain (loss) on investments | 5,843,843 | (133,402) | (1,907,257) | 939,931 | ||||
| Net unrealized appreciation (depreciation) on investments | (10,671,423) | 13,882,009 | (6,826,688) | 3,822,793 | ||||
| Net Increase (Decrease) in Net Assets | ||||||||
| Resulting from Operations | 26,937,532 | 45,243,553 | 8,712,704 | 21,195,111 | ||||
| Dividends to Shareholders from ($): | ||||||||
| Investment income—net: | ||||||||
| Class M Shares | (35,555,587) | (36,121,179) | (21,074,940) | (20,375,125) | ||||
| Investor Shares | (116,007) | (157,181) | (17,253) | (34,773) | ||||
| Net realized gain on investments: | ||||||||
| Class M Shares | — | (17,018,671) | — | (9,166,862) | ||||
| Investor Shares | — | (61,689) | — | (8,352) | ||||
| Total Dividends | (35,671,594) | (53,358,720) | (21,092,193) | (29,585,112) | ||||
| Beneficial Interest Transactions ($): | ||||||||
| Net proceeds from shares sold: | ||||||||
| Class M Shares | 168,833,816 | 103,772,972 | 158,006,759 | 140,283,197 | ||||
| Investor Shares | 293,755 | 7,537,232 | 314,490 | 6,057,622 | ||||
| Dividends reinvested: | ||||||||
| Class M Shares | 3,433,836 | 14,963,476 | 1,847,547 | 8,032,347 | ||||
| Investor Shares | 51,515 | 93,985 | 13,673 | 14,821 | ||||
| Cost of shares redeemed: | ||||||||
| Class M Shares | (143,427,019) | (137,503,943) | (102,841,225) | (83,021,807) | ||||
| Investor Shares | (675,720) | (8,341,659) | (226,406) | (5,859,825) | ||||
| Increase (Decrease) in Net Assets from | ||||||||
| Beneficial Interest Transactions | 28,510,183 | (19,477,937) | 57,114,838 | 65,506,355 | ||||
| Total Increase (Decrease) in Net Assets | 19,776,121 | (27,593,104) | 44,735,349 | 57,116,354 | ||||
| Net Assets ($): | ||||||||
| Beginning of Period | 822,731,869 | 850,324,973 | 525,044,683 | 467,928,329 | ||||
| End of Period | 842,507,990 | 822,731,869 | 569,780,032 | 525,044,683 | ||||
| Undistributed investment income—net | 438,115 | 698,208 | 181,224 | 115,608 | ||||
| Capital Share Transactions (Shares): | ||||||||
| Class M Shares | ||||||||
| Shares sold | 13,306,299 | 8,082,403 | 12,573,035 | 10,880,644 | ||||
| Shares issued for dividends reinvested | 270,952 | 1,166,839 | 147,205 | 624,731 | ||||
| Shares redeemed | (11,312,031) | (10,693,762) | (8,167,590) | (6,483,796) | ||||
| Net Increase (Decrease) in Shares Outstanding | 2,265,220 | (1,444,520) | 4,552,650 | 5,021,579 | ||||
| Investor Shares | ||||||||
| Shares sold | 23,103 | 596,511 | 24,951 | 475,368 | ||||
| Shares issued for dividends reinvested | 4,071 | 7,335 | 1,088 | 1,151 | ||||
| Shares redeemed | (53,408) | (662,727) | (17,847) | (464,298) | ||||
| Net Increase (Decrease) in Shares Outstanding | (26,234) | (58,881) | 8,192 | 12,221 | ||||
| See notes to financial statements. |
| T h e F u n d s 25 |
| STATEMENTS OF CHANGES IN NET ASSETS (continued) |
| Mellon Short-Term U.S. Government Securities Fund | ||||
| Year Ended August 31, | ||||
| 2005 | 2004 | |||
| Operations ($): | ||||
| Investment income—net | 3,774,369 | 3,244,676 | ||
| Net realized gain (loss) on investments | (1,015,599) | (296,064) | ||
| Net unrealized appreciation (depreciation) on investments | (1,151,379) | (247,165) | ||
| Net Increase (Decrease) in Net Assets Resulting from Operations | 1,607,391 | 2,701,447 | ||
| Dividends to Shareholders from ($): | ||||
| Investment income—net: | ||||
| Class M Shares | (6,154,146) | (5,914,214) | ||
| Investor Shares | (376) | (4,708) | ||
| Net realized gain on investments: | ||||
| Class M Shares | — | (198,147) | ||
| Investor Shares | — | (1) | ||
| Total Dividends | (6,154,522) | (6,117,070) | ||
| Beneficial Interest Transactions ($): | ||||
| Net proceeds from shares sold: | ||||
| Class M Shares | 80,903,887 | 104,633,452 | ||
| Investor Shares | 20,152 | 1,639,534 | ||
| Dividends reinvested: | ||||
| Class M Shares | 808,058 | 1,064,461 | ||
| Investor Shares | 356 | 279 | ||
| Cost of shares redeemed: | ||||
| Class M Shares | (91,504,077) | (65,962,515) | ||
| Investor Shares | (11,510) | (1,619,458) | ||
| Increase (Decrease) in Net Assets from Beneficial Interest Transactions | (9,783,134) | 39,755,753 | ||
| Total Increase (Decrease) in Net Assets | (14,330,265) | 36,340,130 | ||
| Net Assets ($): | ||||
| Beginning of Period | 176,312,762 | 139,972,632 | ||
| End of Period | 161,982,497 | 176,312,762 | ||
| Undistributed investment income—net | 35,694 | 76,627 | ||
| Capital Share Transactions (Shares): | ||||
| Class M Shares | ||||
| Shares sold | 6,586,447 | 8,281,381 | ||
| Shares issued for dividends reinvested | 65,932 | 84,550 | ||
| Shares redeemed | (7,449,019) | (5,255,350) | ||
| Net Increase (Decrease) in Shares Outstanding | (796,640) | 3,110,581 | ||
| Investor Shares | ||||
| Shares sold | 1,660 | 130,906 | ||
| Shares issued for dividends reinvested | 29 | 22 | ||
| Shares redeemed | (946) | (130,114) | ||
| Net Increase (Decrease) in Shares Outstanding | 743 | 814 | ||
| See notes to financial statements. |
| 26 |
| FINANCIAL HIGHLIGHTS |
The following tables describe the performance for each share class of each fund for the fiscal periods indicated.All information (except portfolio turnover rate) reflects financial results for a single fund share.Total return shows how much your investment in each fund would have increased (or decreased) during the period, assuming you had reinvested all dividends and distributions. These figures have been derived from each fund’s financial statements.
| Class M Shares | ||||||||||
| Year Ended August 31, | ||||||||||
| Mellon Bond Fund | 2005 | 2004 | 2003 a | 2002 b | 2001 c | |||||
| Per Share Data ($): | ||||||||||
| Net asset value, beginning of period | 12.79 | 12.92 | 12.95 | 13.15 | 12.50 | |||||
| Investment Operations: | ||||||||||
| Investment income—net | .48d | .49d | .56d | .67d | .70 | |||||
| Net realized and unrealized | ||||||||||
| gain (loss) on investments | (.07) | .21 | .06 | (.02) | .65 | |||||
| Total from Investment Operations | .41 | .70 | .62 | .65 | 1.35 | |||||
| Distributions: | ||||||||||
| Dividends from investment income—net | (.54) | (.56) | (.62) | (.69) | (.70) | |||||
| Dividends from net realized gain on investments | — | (.27) | (.03) | (.16) | — | |||||
| Total Distributions | (.54) | (.83) | (.65) | (.85) | (.70) | |||||
| Net asset value, end of period | 12.66 | 12.79 | 12.92 | 12.95 | 13.15 | |||||
| Total Return (%) | 3.30 | 5.63 | 4.73 | 5.11 | 11.05e | |||||
| Ratios/Supplemental Data (%): | ||||||||||
| Ratio of total expenses to average net assets | .56 | .56 | .57 | .57 | .58f | |||||
| Ratio of net expenses to average net assets | .56 | .56 | .55 | .55 | .56f | |||||
| Ratio of net investment income | ||||||||||
| to average net assets | 3.81 | 3.79 | 4.30 | 5.19 | 5.96f | |||||
| Portfolio Turnover Rate | 151.34g | 133.00g | 134.12 | 163.78 | 120.55e | |||||
| Net Assets, end of period ($ x 1,000) | 839,804 | 819,664 | 846,464 | 966,170 | 675,666 | |||||
| a Effective December 16, 2002, MPAM shares were redesignated as Class M shares. |
| b As required, effective September 1, 2001, the fund has adopted the provisions of the AICPA Audit and Accounting Guide for Investment Companies and began accreting discount |
| or amortizing premium on fixed income securities on a scientific basis and including paydown gains and losses in interest income.The effect of this change for the period ended |
| August 31, 2002 was to decrease net investment income per share by $.02, increase net realized and unrealizd gain (loss) on investments per share by $.02 and decrease the ratio |
| of net investment income to average net assets from 5.32% to 5.19%. Per share data and ratios/supplemental data for periods prior to September 1, 2001 have not been restated to |
| reflect this change in presentation. |
| c From October 2, 2000 (commencement of operations) to August 31, 2001. Effective July 11, 2001, shares of the fund were redesignated as MPAM shares and the fund |
| commenced selling Investor shares. |
| d Based on average shares outstanding at each month end. |
| e Not annualized. |
| f Annualized. |
| g The portfolio turnover rate excluding mortgage dollar roll transactions for the periods ended August 31, 2005 and August 31, 2004, were 104.24% and 106.10%, respectively. |
| See notes to financial statements. |
| T h e F u n d s 27 |
| FINANCIAL HIGHLIGHTS (continued) |
| Investor Shares | ||||||||||
| Year Ended August 31, | ||||||||||
| Mellon Bond Fund | 2005 | 2004 | 2003 | 2002 a | 2001 b | |||||
| Per Share Data ($): | ||||||||||
| Net asset value, beginning of period | 12.77 | 12.90 | 12.94 | 13.15 | 12.94 | |||||
| Investment Operations: | ||||||||||
| Investment income—net | .45c | .50c | .54c | .63c | .10 | |||||
| Net realized and unrealized | ||||||||||
| gain (loss) on investments | (.08) | .17 | .04 | (.02) | .23 | |||||
| Total from Investment Operations | .37 | .67 | .58 | .61 | .33 | |||||
| Distributions: | ||||||||||
| Dividends from investment income—net | (.51) | (.53) | (.59) | (.66) | (.12) | |||||
| Dividends from net realized gain on investments | — | (.27) | (.03) | (.16) | — | |||||
| Total Distributions | (.51) | (.80) | (.62) | (.82) | (.12) | |||||
| Net asset value, end of period | 12.63 | 12.77 | 12.90 | 12.94 | 13.15 | |||||
| Total Return (%) | 2.98 | 5.29 | 4.48 | 4.73 | 2.54d | |||||
| Ratios/Supplemental Data (%): | ||||||||||
| Ratio of total expenses to average net assets | .81 | .81 | .82 | .82 | 1.34e | |||||
| Ratio of net expenses to average net assets | .81 | .81 | .80 | .80 | .81e | |||||
| Ratio of net investment income | ||||||||||
| to average net assets | 3.56 | 3.52 | 4.11 | 4.96 | 6.03e | |||||
| Portfolio Turnover Rate | 151.34f | 133.00f | 134.12 | 163.78 | 120.55d | |||||
| Net Assets, end of period ($ x 1,000) | 2,704 | 3,068 | 3,861 | 3,693 | 957 | |||||
| a As required, effective September 1, 2001, the fund has adopted the provisions of the AICPA Audit and Accounting Guide for Investment Companies and began accreting discount |
| or amortizing premium on fixed income securities on a scientific basis and including paydown gains and losses in interest income.The effect of this change for the period ended |
| August 31, 2002 was to decrease net investment income per share by $.02, increase net realized and unrealizd gain (loss) on investments per share by $.02 and decrease the ratio |
| of net investment income to average net assets from 5.08% to 4.96%. Per share data and ratios/supplemental data for periods prior to September 1, 2001 have not been restated to |
| reflect this change in presentation. |
| b From July 11, 2001 (date the fund began offering Investor shares) to August 31, 2001. |
| c Based on average shares outstanding at each month end. |
| d Not annualized. |
| e Annualized. |
| f The portfolio turnover rate excluding mortgage dollar roll transactions for the periods ended August 31, 2005 and August 31, 2004, were 104.24% and 106.10%, respectively. |
| See notes to financial statements. |
| 28 |
| Class M Shares | ||||||||||
| Year Ended August 31, | ||||||||||
| Mellon Intermediate Bond Fund | 2005 | 2004 | 2003 a | 2002 b | 2001 c | |||||
| Per Share Data ($): | ||||||||||
| Net asset value, beginning of period | 12.77 | 12.97 | 13.04 | 13.08 | 12.50 | |||||
| Investment Operations: | ||||||||||
| Investment income—net | .41d | .42d | .51 | .62d | .68 | |||||
| Net realized and unrealized | ||||||||||
| gain (loss) on investments | (.22) | .14 | .11 | .15 | .58 | |||||
| Total from Investment Operations | .19 | .56 | .62 | .77 | 1.26 | |||||
| Distributions: | ||||||||||
| Dividends from investment income—net | (.49) | (.52) | (.59) | (.67) | (.68) | |||||
| Dividends from net realized gain on investments | — | (.24) | (.10) | (.14) | — | |||||
| Total Distributions | (.49) | (.76) | (.69) | (.81) | (.68) | |||||
| Net asset value, end of period | 12.47 | 12.77 | 12.97 | 13.04 | 13.08 | |||||
| Total Return (%) | 1.53 | 4.45 | 4.77 | 6.09 | 10.29e | |||||
| Ratios/Supplemental Data (%): | ||||||||||
| Ratio of total expenses to average net assets | .57 | .57 | .57 | .58 | .59f | |||||
| Ratio of net expenses to average net assets | .57 | .57 | .56 | .56 | .56f | |||||
| Ratio of net investment income | ||||||||||
| to average net assets | 3.23 | 3.26 | 3.88 | 4.81 | 5.77f | |||||
| Portfolio Turnover Rate | 112.51g | 109.19 | 104.98 | 106.09 | 134.69e | |||||
| Net Assets, end of period ($ x 1,000) | 569,233 | 524,590 | 467,627 | 437,119 | 398,959 | |||||
| a Effective December 16, 2002, MPAM shares were redesignated as Class M shares. |
| b As required, effective September 1, 2001, the fund has adopted the provisions of the AICPA Audit and Accounting Guide for Investment Companies and began accreting discount |
| or amortizing premium on fixed income securities on a scientific basis and including paydown gains and losses in interest income.The effect of this change for the period ended |
| August 31, 2002 was to decrease net investment income per share by $.04, increase net realized and unrealizd gain (loss) on investments per share by $.04 and decrease the ratio |
| of net investment income to average net assets from 5.15% to 4.81%. Per share data and ratios/supplemental data for periods prior to September 1, 2001 have not been restated to |
| reflect this change in presentation. |
| c From October 2, 2000 (commencement of operations) to August 31, 2001. |
| d Based on average shares outstanding at each month end. |
| e Not annualized. |
| f Annualized. |
| g The portfolio turnover rate excluding mortgage dollar roll transactions for the period ended August 31, 2005, was 111.52%. |
| See notes to financial statements. |
| T h e F u n d s 29 |
| FINANCIAL HIGHLIGHTS (continued) |
| Investor Shares | ||||||||||
| Year Ended August 31, | ||||||||||
| Mellon Intermediate Bond Fund | 2005 | 2004 | 2003 | 2002 a | 2001 b | |||||
| Per Share Data ($): | ||||||||||
| Net asset value, beginning of period | 12.77 | 13.02 | 13.08 | 13.09 | 12.90 | |||||
| Investment Operations: | ||||||||||
| Investment income—net | .37c | .55c | .48c | .56c | .20 | |||||
| Net realized and unrealized | ||||||||||
| gain (loss) on investments | (.21) | (.07)d | .12 | .20 | .10 | |||||
| Total from Investment Operations | .16 | .48 | .60 | .76 | .30 | |||||
| Distributions: | ||||||||||
| Dividends from investment income—net | (.46) | (.49) | (.56) | (.63) | (.11) | |||||
| Dividends from net realized gain on investments | — | (.24) | (.10) | (.14) | — | |||||
| Total Distributions | (.46) | (.73) | (.66) | (.77) | (.11) | |||||
| Net asset value, end of period | 12.47 | 12.77 | 13.02 | 13.08 | 13.09 | |||||
| Total Return (%) | 1.30 | 3.88 | 4.51 | 6.05 | 2.31e | |||||
| Ratios/Supplemental Data (%): | ||||||||||
| Ratio of total expenses to average net assets | .81 | .82 | .81 | .83 | .93f | |||||
| Ratio of net expenses to average net assets | .81 | .82 | .81 | .81 | .81f | |||||
| Ratio of net investment income | ||||||||||
| to average net assets | 3.00 | 3.01 | 3.57 | 4.51 | 5.14f | |||||
| Portfolio Turnover Rate | 112.51g | 109.19 | 104.98 | 106.09 | 134.69e | |||||
| Net Assets, end of period ($ x 1,000) | 547 | 455 | 305 | 121 | 148 | |||||
| a As required, effective September 1, 2001, the fund has adopted the provisions of the AICPA Audit and Accounting Guide for Investment Companies and began accreting discount |
| or amortizing premium on fixed income securities on a scientific basis and including paydown gains and losses in interest income.The effect of this change for the period ended |
| August 31, 2002 was to decrease net investment income per share by $.04, increase net realized and unrealizd gain (loss) on investments per share by $.04 and decrease the ratio |
| of net investment income to average net assets from 4.90% to 4.51%. Per share data and ratios/supplemental data for periods prior to September 1, 2001 have not been restated to |
| reflect this change in presentation. |
| b From July 11, 2001 (date the fund began offering Investor shares) to August 31, 2001. |
| c Based on average shares outstanding at each month end. |
| d In addition to the net realized and unrealized gain on investments as shown in the Statement of Operations, this amount includes a decrease in net asset value per share resulting |
| from the timing of issuances and redemptions of shares in relation to fluctuating market values for the fund's investments. |
| e Not annualized. |
| f Annualized. |
| g The portfolio turnover rate excluding mortgage dollar roll transactions for the period ended August 31, 2005, was 111.52%. |
| See notes to financial statements. |
| 30 |
| Class M Shares | ||||||||||
| Year Ended August 31, | ||||||||||
| Mellon Short-Term U.S. Government Securities Fund | 2005 | 2004 | 2003 a | 2002 b | 2001 c | |||||
| Per Share Data ($): | ||||||||||
| Net asset value, beginning of period | 12.47 | 12.70 | 12.94 | 12.87 | 12.50 | |||||
| Investment Operations: | ||||||||||
| Investment income—net | .28d | .25d | .34d | .52d | .63 | |||||
| Net realized and unrealized | ||||||||||
| gain (loss) on investments | (.16) | (.01) | (.11) | .22 | .37 | |||||
| Total from Investment Operations | .12 | .24 | .23 | .74 | 1.00 | |||||
| Distributions: | ||||||||||
| Dividends from investment income—net | (.45) | (.45) | (.44) | (.58) | (.63) | |||||
| Dividends from net realized gain on investments | — | (.02) | (.03) | (.09) | (.00)e | |||||
| Total Distributions | (.45) | (.47) | (.47) | (.67) | (.63) | |||||
| Net asset value, end of period | 12.14 | 12.47 | 12.70 | 12.94 | 12.87 | |||||
| Total Return (%) | 1.00 | 1.97 | 1.68 | 5.87 | 8.20f | |||||
| Ratios/Supplemental Data (%): | ||||||||||
| Ratio of total expenses to average net assets | .55 | .55 | .56 | .59 | .59g | |||||
| Ratio of net expenses to average net assets | .55 | .55 | .55 | .55 | .55g | |||||
| Ratio of net investment income | ||||||||||
| to average net assets | 2.25 | 1.97 | 2.68 | 4.07 | 5.41g | |||||
| Portfolio Turnover Rate | 69.11 | 44.76 | 88.05 | 97.19 | 89.21f | |||||
| Net Assets, end of period ($ x 1,000) | 161,963 | 176,301 | 139,971 | 108,605 | 88,732 | |||||
| a Effective December 16, 2002, MPAM shares were redesignated as Class M shares. |
| b As required, effective September 1, 2001, the fund has adopted the provisions of the AICPA Audit and Accounting Guide for Investment Companies and began accreting discount |
| or amortizing premium on fixed income securities on a scientific basis and including paydown gains and losses in interest income.The effect of this change for the period ended |
| August 31, 2002 was to decrease net investment income per share by $.05, increase net realized and unrealizd gain (loss) on investments per share by $.05 and decrease the ratio |
| of net investment income to average net assets from 4.47% to 4.07%. Per share data and ratios/supplemental data for periods prior to September 1, 2001 have not been restated to |
| reflect this change in presentation. |
| c From October 2, 2000 (commencement of operations) to August 31, 2001. Effective July 11, 2001, shares of the fund were redesignated as MPAM shares and the fund |
| commenced selling Investor shares. |
| d Based on average shares outstanding at each month end. |
| e Amount represents less than $.01 per share. |
| f Not annualized. |
| g Annualized. |
| See notes to financial statements. |
| T h e F u n d s 31 |
| FINANCIAL HIGHLIGHTS (continued) |
| Investor Shares | ||||||||||
| Year Ended August 31, | ||||||||||
| Mellon Short-Term U.S. Government Securities Fund | 2005 | 2004 | 2003 | 2002 a | 2001 b | |||||
| Per Share Data ($): | ||||||||||
| Net asset value, beginning of period | 12.47 | 12.73 | 12.93 | 12.88 | 12.82 | |||||
| Investment Operations: | ||||||||||
| Investment income—net | .23c | .37c | .30c | .46c | .09 | |||||
| Net realized and unrealized | ||||||||||
| gain (loss) on investments | (.14) | (.19) | (.06) | .21 | .08 | |||||
| Total from Investment Operations | .09 | .18 | .24 | .67 | .17 | |||||
| Distributions: | ||||||||||
| Dividends from investment income—net | (.42) | (.42) | (.41) | (.53) | (.11) | |||||
| Dividends from net realized gain on investments | — | (.02) | (.03) | (.09) | — | |||||
| Total Distributions | (.42) | (.44) | (.44) | (.62) | (.11) | |||||
| Net asset value, end of period | 12.14 | 12.47 | 12.73 | 12.93 | 12.88 | |||||
| Total Return (%) | .78 | 1.46 | 1.78 | 5.28 | 1.29d | |||||
| Ratios/Supplemental Data (%): | ||||||||||
| Ratio of total expenses to average net assets | .81 | .78 | .83 | .90 | 1.00e | |||||
| Ratio of net expenses to average net assets | .81 | .78 | .80 | .80 | .80e | |||||
| Ratio of net investment income | ||||||||||
| to average net assets | 1.99 | 1.74 | 2.38 | 3.54 | 4.86e | |||||
| Portfolio Turnover Rate | 69.11 | 44.76 | 88.05 | 97.19 | 89.21d | |||||
| Net Assets, end of period ($ x 1,000) | 20 | 11 | 1 | 1 | 1 | |||||
a As required, effective September 1, 2001, the fund has adopted the provisions of the AICPA Audit and Accounting Guide for Investment Companies and began accreting discount or amortizing premium on fixed income securities on a scientific basis and including paydown gains and losses in interest income.The effect of this change for the period ended August 31, 2002 was to decrease net investment income per share by $.05, increase net realized and unrealizd gain (loss) on investments per share by $.05 and decrease the ratio of net investment income to average net assets from and 3.94% to 3.54% for the Investor shares. Per share data and ratios/supplemental data for periods prior to September 1, 2001 have not been restated to reflect this change in presentation. b From July 11, 2001 (date the fund began offering Investor shares) to August 31, 2001. c Based on average shares outstanding at each month end. d Not annualized. e Annualized.
See notes to financial statements.
| 32 |
NOTES TO FINANCIAL STATEMENTS
| NOTE 1—General: |
Mellon Funds Trust (the “Trust”) was organized as a Massachusetts business trust which is registered under the Investment Company Act of 1940, as amended (the “Act”), as an open-end management investment company and operates as a series company currently comprised of sixteen series including the following diversified fixed income funds: Mellon Bond Fund, Mellon Intermediate Bond Fund and Mellon Short-Term U.S. Government Securities Fund (each, a “fund” and collectively, the “funds”).With respect to Mellon Bond Fund and Mellon Intermediate Bond Fund, effective December 31, 2004, each fund changed the manner in which its respective investment objective is articulated. Mellon Bond Fund’s and Mellon Intermediate Bond Fund’s investment objective seeks total return (consisting of capital appreciation and current income). Mellon Short-Term U.S. Government Securities Fund investment objective is to seek to provide as high a level of current income as is consistent with the preservation of capital. Mellon Fund Advisers, a division of The Dreyfus Corporation (“Dreyfus”), serves as each fund’s investment adviser (“Investment Adviser”). Mellon Bank, N.A. (“Mellon Bank”), which is a wholly-owned subsidiary of Mellon Financial Corporation, (“Mellon Financial”) serves as administrator for the funds pursuant to an Administration Agreement with the Trust (the “Administration Agreement”). Mellon Bank has entered into a Sub-Administration Agreement with Dreyfus pursuant to which Mellon Bank pays Dreyfus for performing certain administrative services. Dreyfus is a wholly-owned subsidiary of Mellon Financial. Dreyfus Service Corporation (the “Distributor”), a wholly-owned subsidiary of Dreyfus, is the Distributor of each fund’s shares, which are sold without a sales charge.
The Trust is authorized to issue an unlimited number of shares of beneficial interest, par value $.001 per share, in each of the Class M and Investor class shares of each fund. Each class of shares has similar rights and privileges, except with respect to the expenses borne by and the shareholder services offered to each class and the
shareholder services plan applicable to the Investor shares and certain voting rights. Income, expenses (other than expenses attributable to a specific class), and realized and unrealized gains or losses on investments are allocated daily for each class of shares based upon relative proportion of net assets of each class.
The Trust accounts separately for the assets, liabilities and operations of each series. Expenses directly attributable to each series are charged to that series’ operations; expenses that are applicable to all series are allocated among them on a pro rata basis.
The funds’ financial statements are prepared in accordance with U.S. generally accepted accounting principles, which may require the use of management estimates and assumptions. Actual results could differ from those estimates.
NOTE 2—Significant Accounting Policies:
(a) Portfolio valuation: Investments in securities (excluding short-term investments (other than U.S. Treasury Bills), are valued each business day by an independent pricing service (the “Service”) approved by the Board of Trustees. Investments for which quoted bid prices are readily available and are representative of the bid side of the market in the judgment of the Service are valued at the mean between the quoted bid prices (as obtained by the Service from dealers in such securities) and asked prices (as calculated by the Service based upon its evaluation of the market for such securities). Other investments (which constitute a majority of the portfolio securities) are valued as determined by the Service,based on methods which include consideration of: yields or prices of securities of comparable quality,coupon,maturity and type; indications as to values from dealers;and general market conditions. Securities for which there are no such valuations are valued at fair value as determined in good faith under the direction of the fund’s Board of Trustees.Restricted securities, as well as securities or other assets for which recent market quotations are not readily available, that are not valued by a pricing service approved by the fund’s Board of Trustees,or are determined by the fund not to reflect accurately fair value (such as when an event occurs after the close of the exchange
| T h e F u n d s 33 |
NOTES TO FINANCIAL STATEMENTS (continued)
| 34 |
on which the security is principally traded and that is determined by the fund to have changed the value of the security), are valued at fair value as determined in good faith under the direction of the Board of Trustees.The factors that may be considered when fair valuing a security include fundamental analytical data, the nature and duration of restrictions on disposition, an evaluation of the forces that influence the market in which the securities are purchased and sold, and public trading in similar securities of the issuer or comparable issuers. Investments in registered investment companies are valued at their net asset value.
(b) Securities transactions and investment income:
Securities transactions are recorded on a trade date basis. Realized gain and loss from securities transactions are recorded on the identified cost basis. Dividend income is recorded on the ex-dividend date and interest income, including where applicable, accretion of discount and amortization of premium on investments is recognized on the accrual basis.
The funds have an arrangement with the custodian bank whereby the funds receive earnings credits from the custodian when positive cash balances are maintained, which are used to offset custody fees. For financial reporting purposes, the funds include net earnings credits as an expense offset in the Statement of Operations.
Pursuant to a securities lending agreement with Mellon Bank,N.A.,an affiliate of Dreyfus,the fund may lend securities to certain qualified institutions. At origination, all loans are secured by collateral of at least 102% of the value of U.S. securities loaned and 105% of the value of foreign securities loaned. Collateral equivalent to at least 100% of the market value of securities on loan will be maintained at all times. Cash collateral is invested in certain money market mutual funds managed by Dreyfus.The funds will be entitled to receive all income on securities loaned, in addition to income earned as a result of the lending transaction. Although each security loaned is fully collateralized, the funds would bear the risk of delay in recovery of,
or loss of rights in, the securities loaned should a borrower fail to return the securities in a timely manner.
The funds may engage in repurchase agreement transactions. Under the terms of a typical repurchase agreement, a fund, through its custodian and sub-custodian, takes possession of an underlying debt obligation subject to an obligation of the seller to repurchase, and the fund to resell, the obligation at an agreed-upon price and time, thereby determining the yield during the fund’s holding period.This arrangement results in a fixed rate of return that is not subject to market fluctuations during the fund’s holding period.The value of the collateral is at least equal, at all times, to the total amount of the repurchase obligation, including interest. In the event of a counter party default, the fund has the right to use the collateral to offset losses incurred. There is potential loss to the fund in the event the fund is delayed or prevented from exercising its rights to dispose of the collateral securities, including the risk of a possible decline in the value of the underlying securities during the period while the fund seeks to assert its rights.The Investment Adviser reviews the value of the collateral and the creditworthiness of those banks and dealers with which the fund enters into repurchase agreements to evaluate potential risks.
(c) Affiliated issuers: Investments in other investment companies advised by the Manager are defined as “affiliated” in the Act.
(d) Dividends to shareholders: Dividends payable to shareholders are recorded by the funds on the ex-dividend date. The funds declare and pay dividends from investment income-net monthly.With respect to each series, dividends from net realized capital gain, if any, are normally declared and paid annually,but the funds may make distributions on a more frequent basis to comply with the distribution requirements of the Internal Revenue Code of 1986, as amended (the “Code”).To the extent that net realized capital gain can be offset by capital loss carryovers of that fund, it is the policy of the fund not to distribute such gain. Income and cap-
ital gain distributions are determined in accordance with income tax regulations, which may differ from generally accepted accounting principles.
(e) Federal income taxes: It is the policy of each fund to continue to qualify as a regulated investment company, if such qualification is in the best interests of its shareholders, by complying with the applicable provisions of the Code, and to make distributions of taxable income sufficient to relieve it from substantially all federal income and excise taxes. For federal income tax purposes, each series is treated as a single entity for the purpose of determining such qualification.
Table 1 summarizes each fund’s components of accumulated earnings on a tax basis at August 31, 2005.
Table 2 summarizes each relevant fund’s accumulated capital loss carryover available to be applied against future net securities profits, if any, realized subsequent to August 31, 2005.
Table 3 summarizes each fund’s tax character of distributions paid to shareholders during the fiscal years ended August 31, 2005 and August 31, 2004, respectively.
During the period ended August 31, 2005, as a result of permanent book to tax differences, primarily due to
| Table 1. | ||||||||
| Undistributed | Accumulated | Unrealized | ||||||
| Ordinary | Capital Gains/ | Appreciation/ | Post 10/31 | |||||
| Income ($) | Losses ($)† | (Depreciation) ($) | Losses †† | |||||
| Mellon Bond Fund | 688,351 | (1,732,299) | 1,129,524 | — | ||||
| Mellon Intermediate Bond Fund | 332,388 | (2,706,703) | (6,386,893) | (3,307,858) | ||||
| Mellon Short-Term U.S. Government Securities Fund | 35,694 | (2,035,082) | (3,972,644) | (2,562,522) | ||||
† In addition, the funds had capital losses realized after October 31, 2004, which were deferred for tax purposes to the first day of the following year.
Table 2.
| Expiring in fiscal | 2012 ($)† | 2013 ($)† | Total ($) | |||||
| Mellon Bond Fund | 1,596,239 | 136,060 | 1,732,299 | |||||
| Mellon Intermediate Bond Fund | 1,813,775 | 892,928 | 2,706,703 | |||||
| Mellon Short-Term U.S. Government Securities Fund | 182,342 | 1,852,740 | 2,035,082 | |||||
| † If not applied, the carryover expire in the above years. | ||||||||
| Table 3. | ||||||||
| Long-Term | ||||||||
| Ordinary Income ($) | Capital Gains ($) | |||||||
| 2005 | 2004 | 2005 | 2004 | |||||
| Mellon Bond Fund | 35,671,594 | 41,173,145 | — | 12,185,575 | ||||
| Mellon Intermediate Bond Fund | 21,092,193 | 23,660,869 | — | 5,924,243 | ||||
| Mellon Short-Term U.S. | ||||||||
| Government Securities Fund | 6,154,522 | 5,918,922 | — | 198,148 | ||||
| T h e F u n d s 35 |
NOTES TO FINANCIAL STATEMENTS (continued)
amortization of premiums and paydown gains and losses on mortgage backed securities, the fund increased (decreased) accumulated undistributed investment income-net, increased (decreased) accumulated net realized gain (loss) on investments and increased (decreased) paid-in capital as summarized in Table 4. Net assets were not affected by this reclassification.
NOTE 3—Investment Advisory Fee, Administration Fee and Other Transactions With Affiliates:
(a) Fees payable by the funds pursuant to the provisions of an Investment Advisory Agreement with the Investment Adviser are payable monthly, computed on the average daily value of each fund’s net assets at the following annual rates: .40% of the Mellon Bond Fund, .40% of the Mellon Intermediate Bond Fund and .35% of the Mellon Short-Term U.S. Government Securities Fund.
Pursuant to the Administration Agreement with Mellon, Mellon provides or arranges for fund accounting, transfer agency and other fund administration services and receives a fee based on the total net assets of the Trust based on the following rates:
| 0 up to $6 billion | .15% | |
| $6 billion up to $12 billion | .12% |
Mellon Bank has entered into a Sub-Administration Agreement with Dreyfus pursuant to which Mellon Bank pays Dreyfus for performing certain administrative services.
(b) The funds have adopted a Shareholder Services Plan with respect to its Investor shares pursuant to which each fund pays the Distributor for the provision of certain services to holders of Investor shares a fee at an annual rate
of .25% of the value of the average daily net assets attributable to Investor shares. The services provided may include personal services relating to shareholder accounts, such as answering shareholder inquiries regarding a fund, and providing reports and other information, and services related to the maintenance of such shareholder accounts. The Shareholder Services Plan allows the Distributor to make payments from the shareholder services fees it collects from each fund to compensate service agents (certain banks, securities brokers or dealers and other financial institutions) in respect of these services. Table 5 summarizes the amounts Investor shares were charged during the period ended August 31, 2005, pursuant to the Shareholder Services Plan. Additional fees included in shareholder servicing costs in the Statement of Operations includes fees paid to the transfer agent.
| Table 5. | ||
| Mellon Bond Fund | $7,231 | |
| Mellon Intermediate Bond Fund | 1,163 | |
| Mellon Short-Term | ||
| U.S. Government Securities Fund | 25 |
The funds compensate Mellon Bank, N.A., an affiliate of Dreyfus, under a Custody Agreement for providing custodial services for the funds. Table 6 summarizes the amounts the funds were charged during the period ended August 31, 2005, pursuant to the custody agreements.
| Table 6. | ||
| Mellon Bond Fund | $64,925 | |
| Mellon Intermediate Bond Fund | 44,671 | |
| Mellon Short-Term | ||
| U.S. Government Securities Fund | 22,155 |
| Table 4. | ||||||
| Accumulated | Accumulated | |||||
| Undistributed | Net Realized | Paid-in | ||||
| Investment Income—Net ($) | Gain (Loss) ($) | Capital ($) | ||||
| Mellon Bond Fund | 3,646,389 | (5,158,284) | 1,511,895 | |||
| Mellon Intermediate Bond Fund | 3,711,160 | (6,220,382) | 2,509,222 | |||
| Mellon Short-Term U.S. Government Securities Fund | 2,339,220 | (4,727,014) | 2,387,794 | |||
| 36 |
During the period ended August 31, 2005, each fund was charged $2,520 for services performed by the Chief Compliance Officer.
Table 7 summarizes the components of Due to The Dreyfus Corporation and affiliates in the Statement of Assets and Liabilities for each fund.
(c) Each Trustee who is not “affiliated person” as defined in the Act receives from the Trust an annual fee of $44,000 and an attendance fee of $4,000 for each in-person meeting attended and $500 for telephone meetings and is reimbursed for travel and out-of-pocket expenses. Prior to September 14, 2004, the attendance fee payable to each Trustee was $3,000 for each in-person meeting.
(d) The Trust and Dreyfus have received an exemptive order from the SEC which, among other things, permits each fund to use cash collateral received in connection with lending the fund’s securities and other uninvested cash to purchase shares of one or more registered money market funds advised by Dreyfus in excess of the limitations imposed by the Act.
NOTE 4—Securities Transactions:
Table 8 summarizes each fund’s aggregate amount of purchases and sales (including paydowns) of investments securities, excluding short-term securities, during the period ended August 31, 2005 of which $381,524,399 in purchases and $382,541,309 in sales were from mortgage dollar roll transactions in the Mellon Bond Fund, and $5,226,525 in purchases and $5,237,536 in sales in Mellon Intermediate Bond Fund.
A mortgage dollar roll transactions involves a sale by the fund of mortgage related securities that it holds with an agreement by the fund to repurchase similar securities at an agreed upon price and date.The securities purchased will bear the same interest rate as those sold, but generally will be collateralized by pools of mortgages with different prepayment histories than those securities sold. Proceeds from the sale will be reinvested and additional income from the sale is included in realized gain loss. Losses may arise due to changes in the value of the securities.
Table 9 on the next page summarizes the cost of investments for federal income tax purposes and accumulated
Table 7.
| Investment | Chief | Shareholder | ||||||
| Advisory | Compliance | Services | Custodian | |||||
| Fees ($) | Officer Fees ($) | Plan Fees ($) | Fees ($) | |||||
| Mellon Bond Fund | 283,064 | 1,533 | 566 | 7,349 | ||||
| Mellon Intermediate Bond Fund | 192,158 | 1,533 | 112 | 14,976 | ||||
| Mellon Short-Term U.S.Government Securities Fund | 47,894 | 1,533 | 2 | 4,607 |
Table 8.
| Purchases ($) | Sales ($) | |||
| Mellon Bond Fund | 1,275,926,860 | 1,229,054,811 | ||
| Mellon Intermediate Bond Fund | 646,577,746 | 593,923,206 | ||
| Mellon Short-Term U.S. Government Securities Fund | 112,503,486 | 121,980,879 |
| T h e F u n d s 37 |
| 38 |
net unrealized appreciation (depreciation) on investments for each fund at August 31, 2005:
| NOTE 5—Bank Line of Credit: |
The funds participate with other Dreyfus-managed funds in a $100 million unsecured line of credit primarily to be utilized for temporary or emergency purposes, including the financing of redemptions. Interest is charged to the funds based on prevailing market rates in effect at the time of borrowings. During the period ended August 31, 2005, the funds did not borrow under the line of credit.
| NOTE 6—Legal Matters: |
In early 2004, two purported class and derivative actions were filed against Mellon Financial, Mellon Bank, N.A., Dreyfus, Founders Asset Management LLC, and certain directors of the Dreyfus Funds and the Dreyfus Founders Funds (together, the “Funds”) in the United States District Court for the Western District of Pennsylvania. In September 2004, plaintiffs served a Consolidated Amended Complaint (the “Amended Complaint”) on behalf of a purported class of all persons who acquired interests in any of the Funds between January 30, 1999 and November 17, 2003, and derivatively on behalf of the Funds.The Amended Complaint in the newly styled In re Dreyfus Mutual Funds Fee Litigation also named the Distributor, Premier Mutual Fund Services, Inc. and two additional Fund directors as defendants and alleges violations of the Investment Company Act of 1940, the Investment Advisers Act of 1940, the Pennsylvania Unfair Trade Practices and
Consumer Protection Law and common-law claims. Plaintiffs seek to recover allegedly improper and excessive Rule 12b-1 and advisory fees allegedly charged to the Funds for marketing and distribution services. More specifically, plaintiffs claim, among other things, that 12b-1 fees and directed brokerage were improperly used to pay brokers to recommend the Funds over other funds, and that such payments were not disclosed to investors. In addition, plaintiffs assert that economies of scale and soft-dollar benefits were not passed on to the Funds. Plaintiffs further allege that 12b-1 fees were improperly charged to certain of the Funds that were closed to new investors.The Amended Complaint seeks compensatory and punitive damages, rescission of the advisory contracts, and an accounting and restitution of any unlawful fees, as well as an award of attorneys’ fees and litigation expenses. As noted, some of the claims in this litigation are asserted derivatively on behalf of the Funds that have been named as nominal defendants. With respect to such derivative claims, no relief is sought against the Funds. Dreyfus believes the allegations to be totally without merit and intends to defend the action vigorously. In November 2004, all named defendants moved to dismiss the Amended Complaint in the whole or substantial part. Briefing was completed in May 2005.
Additional lawsuits arising out of these circumstances and presenting similar allegations and requests for relief may be filed against the defendants in the future. Neither Dreyfus nor the Funds believe that any of the pending actions will have a material adverse effect on the Funds or Dreyfus’ ability to perform its contract with the Funds.
| Table 9. | ||||||||
| Cost of | Gross | Gross | ||||||
| Investments ($) | Appreciation ($) | (Depreciation) ($) | Net ($) | |||||
| Mellon Bond Fund | 985,730,090 | 7,311,003 | 6,181,480 | 1,129,523 | ||||
| Mellon Intermediate Bond Fund | 770,236,760 | 2,308,918 | 8,695,811 | (6,386,893) | ||||
| Mellon Short-Term U.S. Government Securities Fund | 235,167,058 | 20,665 | 3,993,309 | (3,792,644) | ||||
REPORT OF INDEPENDENT REGISTERED PUBLIC ACCOUNTING FIRM
The Board of Trustees and Shareholders of Mellon Funds Trust:
We have audited the accompanying statements of assets and liabilities of Mellon Bond Fund, Mellon Intermediate Bond Fund and Mellon Short-Term U.S. Government Securities Fund of Mellon Funds Trust (collectively “the Funds”), including the statements of investments, as of August 31, 2005, and the related statements of operations for the year then ended, the statements of changes in net assets for each of the years in the two-year period then ended, and the financial highlights for each of the periods indicated herein. These financial statements and financial highlights are the responsibility of the Funds’management. Our responsibility is to express an opinion on these financial statements and financial highlights based on our audits.
We conducted our audits in accordance with the standards of the Public Company Accounting Oversight Board (United States). Those standards require that we plan and perform the audit to obtain reasonable assurance about whether the financial statements and financial highlights are free of material misstatement.An audit includes examining, on a test basis, evidence supporting the
amounts and disclosures in the financial statements. Our procedures included confirmation of securities owned as of August 31,2005,by correspondence with the custodian and brokers or by other appropriate auditing procedures where replies from brokers were not received. An audit also includes assessing the accounting principles used and significant estimates made by management, as well as evaluating the overall financial statement presentation. We believe that our audits provide a reasonable basis for our opinion.
In our opinion, the financial statements and financial highlights referred to above present fairly, in all material respects, the financial position of the Funds as of August 31, 2005, and the results of their operations for the year then ended, the changes in their net assets for each of the years in the two-year period then ended and the financial highlights for each of the periods indicated herein, in conformity with U.S. generally accepted accounting principles.
| New York, New York October 20, 2005 |
| T h e F u n d s 39 |
IMPORTANT TAX INFORMATION (Unaudited)
| 40 |
Mellon Short-Term U.S. Government Securities Fund
For state individual income tax purposes, the fund hereby designates 65.56% of the ordinary income dividends paid during its fiscal year ended August 31, 2005 as attributable to interest income from direct obligations of the United States. Such dividends are currently exempt from taxation for individual income tax purposes in most states, including New York, California and the District of Columbia.
INFORMATION ABOUT THE REVIEW AND APPROVAL OF EACH FUND ’S INVESTMENT ADVISORY AGREEMENT (Unaudited)
MELLON FUNDS TRUST (Mellon Bond Fund, Mellon Intermediate Bond Fund and Mellon Short-Term U.S. Government Securities Fund)
At a meeting of the Board of Trustees held on March 15-16, 2005, the Board considered the re-approval of the Trust’s Investment Advisory Agreement for another one year term, pursuant to which the Investment Adviser, a division of Dreyfus, provides the funds with investment advisory services. The Board members also considered the re-approval of the Trust’s Administration Agreement with Mellon Bank for another one year term, pursuant to which Mellon Bank provides the funds with administrative services. Mellon Bank has entered into a Sub-Administration Agreement with Dreyfus pursuant to which Mellon Bank pays Dreyfus for performing certain of these administrative services. The Board members who are not “interested persons” (as defined in the Act) of the Trust were assisted in their review by independent legal counsel and met with counsel in executive session separate from representatives of Dreyfus.
Analysis of Nature, Extent and Quality of Services Provided to the Funds. The Board members received a presentation from representatives of Dreyfus regarding services provided to the funds, and discussed the nature, extent and quality of the services provided to the funds pursuant to the Investment Advisory Agreement. Dreyfus’ representatives reviewed the funds’ distribution of accounts, and noted the diversity of distribution of the funds and Dreyfus’ corresponding need for broad, deep and diverse resources to be able to provide ongoing shareholder services to each of the funds’ distribution channels. The Board also reviewed the number of shareholder accounts in each fund, as well as each fund’s asset size.
The Board members also considered Dreyfus’ research and portfolio management capabilities and that Dreyfus also provides oversight of day-to-day fund operations, including fund accounting and administration and assistance in meeting legal and regulatory requirements.The Board members also considered Dreyfus’ extensive administrative, accounting and compliance infrastructure.
Comparative Analysis of the Funds’ Performance and Management Fees and Expense Ratios.
Mellon Bond Fund. The Board members reviewed the fund’s performance and expense ratios and placed significant emphasis on comparisons to a group of comparable funds and Lipper averages. The Board reviewed the fund’s performance, management fee and total expense ratio within this comparison group and against the fund’s Lipper category average. The group of comparable funds was previously approved by the Board for this purpose, and was prepared using a Board-approved selection methodology that was based, in part, on selecting non-affiliated funds reported in the same Lipper category as the fund.The Board members noted that, as of December 31, 2004, the fund’s total return performance was below the averages of the comparison group and its Lipper category for the 1-, 3- and 5-year periods and that the fund’s income performance was above the averages of the comparison group and its Lipper category for the 1- and 3-year periods.The Board members then discussed the fund’s advisory fee and expense ratio and reviewed the range of advisory fees in the comparison group and noted that the fund’s expense ratio was lower than the average expense ratio of the comparison group and that of its Lipper category and that the fund’s expense ratio ranked in the second quartile (was among the lowest) in the comparison group.
Representatives of Dreyfus reviewed with the Board members a comparison of the fees paid to Dreyfus or its affiliates by mutual funds with similar investment objectives, policies and strategies as the fund (the “Similar Funds”). These comparison groups also compared the management fee and total expense ratios of Similar Funds.The Similar Funds’ comparison group was composed exclusively of investment companies managed by Dreyfus or its affiliates that were reported in the same Lipper category as the fund. Dreyfus’ representatives explained the nature of each Similar Fund and the differences, from Dreyfus’ perspective, in management of these Similar Funds compared to managing and
| T h e F u n d s 41 |
INFORMATION ABOUT THE REVIEW AND APPROVAL OF EACH FUND ’S INVESTMENT ADVISORY AGREEMENT (Unaudited) ( c o n t i n u e d )
providing other services to the fund. Dreyfus’ representatives also reviewed the costs associated with distribution through intermediaries.The Board analyzed differences in fees paid to Dreyfus and discussed the relationship of the management fees paid in light of Dreyfus’ performance and the services provided. The Similar Funds had management fees that were both higher and lower than the fund’s management fee, and management noted that the management fees of the Similar Funds (that were lower than the fund’s management fee) reflected historical pricing, pricing of institutional funds and pricing of funds offered only to separate accounts established by insurance companies to fund variable annuity contracts and variable life insurance policies.The Board members considered the relevance of the fee information provided for the Similar Funds to evaluate the appropriateness and reasonableness of the fund’s management fee. The Board acknowledged that differences in fees paid by the Similar Funds seemed to be consistent with the services provided.
Representatives of Dreyfus stated that there were no separate accounts managed by Dreyfus or its affiliates with similar investment objectives, policies and strategies as the fund.
Mellon Intermediate Bond Fund. The Board members reviewed the fund’s performance and expense ratios and placed significant emphasis on comparisons to two groups of comparable funds and Lipper averages. Management advised the Board members that Lipper had reviewed the fund and that, based on the fund’s holdings, Lipper intended to reclassify the fund from the “Intermediate Investment Grade Debt Funds” category (the funds selected from this Lipper category, “Comparison Group I”) to the “Short-Intermediate Investment Grade Debt Funds” category (the funds selected from the second Lipper category, “Comparison Group II”).The Board reviewed the fund’s performance, management fee and total expense ratio within each comparison group and against the fund’s Lipper average for each category. Each group of comparable funds was
previously approved by the Board for this purpose, and was prepared using a Board-approved selection methodology that was based, in part, on selecting non-affiliated funds reported in the same Lipper category as the fund. The Board members noted that, as of December 31, 2004, the fund’s total return performance versus Comparison Group I was below the averages of the comparison group and its Lipper category, and that versus Comparison Group II was above the averages of the comparison group and its Lipper category, for the 1-, 3-and 5-year periods.They also noted the improvement in the fund’s relative total return performance versus that of the funds in Comparison Group II.The Board members then noted that, as of December 31, 2004, the fund’s income performance was above the averages of Comparison Group I and Comparison Group II and their corresponding Lipper categories for the 1- and 3-year periods. The Board members then discussed the fund’s advisory fee and expense ratio and reviewed the range of advisory fees in each comparison group and noted that, with respect to each comparison group, the fund’s expense ratio was lower than the average expense ratio of the respective comparison group and that of its corresponding Lipper category and that the fund’s expense ratio ranked in the second quartile (was among the lowest) in each comparison group.
Representatives of Dreyfus stated that there were no other mutual funds managed by Dreyfus or its affiliates with similar investment objectives, policies and strategies as the fund, which were reported in the same Lipper category as the fund, and that there were no separate accounts managed by Dreyfus or its affiliates with similar investment objectives, policies and strategies as the fund.
Mellon Short-Term U.S. Government Securities Fund. The Board members reviewed the fund’s performance and expense ratios and placed significant emphasis on comparisons to a group of comparable funds and Lipper averages. The Board reviewed the fund’s performance, management fee and total expense ratio within this comparison group and against the fund’s Lipper cat-
| 42 |
egory average.The group of comparable funds was previously approved by the Board for this purpose, and was prepared using a Board-approved selection methodology that was based, in part, on selecting non-affiliated funds reported in the same Lipper category as the fund. The Board members noted that, as of December 31, 2004, the fund’s total return performance was below the average of the comparison group, and above the average of its Lipper category, for the 1-year period, was below the average of the comparison group, and was comparable to the average of its Lipper category, for the 3-year period, was comparable to the average of the comparison group, and was above the average of its Lipper category, for the 5-year period and that the fund’s income performance was above the averages of the comparison group and its Lipper category for the 1- and 3-year periods.The Board members then discussed the fund’s advisory fee and expense ratio and reviewed the range of advisory fees in the comparison group and noted that the fund’s expense ratio was lower than the average expense ratio of the comparison group and that of its Lipper category and that the fund’s expense ratio ranked in the second quartile (was among the lowest) in the comparison group.
Representatives of Dreyfus reviewed with the Board members a comparison of the fee paid to Dreyfus or its affiliates by a mutual fund with a similar investment objective and similar policies and strategies as the fund (the “Similar Fund”).This comparison group also compared the management fee and total expense ratio of the Similar Fund.The Similar Fund’s comparison group was composed exclusively of an investment company managed by Dreyfus or its affiliates that was reported in the same Lipper category as the fund. Dreyfus’ representatives explained the nature of the Similar Fund and the differences, from Dreyfus’ perspective, in management of the Similar Fund compared to managing and providing other services to the fund. Dreyfus’ representatives also reviewed the costs associated with distribution through intermediaries.The Board analyzed differences in fees paid to Dreyfus and discussed the relationship of the management fees paid in light of Dreyfus’ perfor-
mance and the services provided. Management noted that the management fee of the Similar Fund was comparable to that of the fund.The Board members considered the relevance of the fee information provided for the Similar Fund to evaluate the appropriateness and reasonableness of the fund’s management fee.The Board acknowledged that the fee paid by the Similar Fund seemed to be consistent with the services provided.
Representatives of Dreyfus stated that there were no separate accounts managed by Dreyfus or its affiliates with similar investment objectives, policies and strategies as the fund.
Analysis of Profitability and Economies of Scale. Dreyfus’ representatives reviewed the dollar amount of expenses allocated and profit received by Dreyfus and its affiliates with respect to each fund and the method used to determine such expenses and profit. The Board received and considered information prepared by an independent consulting firm regarding Dreyfus’ approach to allocating costs to, and determining the profitability of, individual funds and the entire Dreyfus mutual fund complex.The Dreyfus representatives stated that the methodology had also been reviewed by an independent registered public accounting firm which, like the consultant, found the methodology to be reasonable. The consulting firm also analyzed where any economies of scale might emerge in connection with the management of the funds.The Board members evaluated the analysis in light of the relevant circumstances for each fund, and the extent to which economies of scale would be realized as the fund grows and whether fee levels reflect these economies of scale for the benefit of fund investors.The Board noted that it appeared that the benefits of any economies of scale also would be appropriately shared with shareholders through increased investment in fund management and administration resources. The Board members also considered potential benefits to Dreyfus and its affiliates, including Mellon Fund Advisers, from acting as investment adviser with respect to each fund.
| T h e F u n d s 43 |
INFORMATION ABOUT THE REVIEW AND APPROVAL OF EACH FUND ’S INVESTMENT ADVISORY AGREEMENT (Unaudited) ( c o n t i n u e d )
It was noted that the Board members should consider Dreyfus’ profitability with respect to each fund as part of their evaluation of whether the fees under the Investment Advisory Agreement bear a reasonable relationship to the mix of services provided by Dreyfus, including the nature, extent and quality of such services and that a discussion of economies of scale are predicated on increasing assets and that, if a fund’s assets had been decreasing, the possibility that Dreyfus may have realized any economies of scale would be less.The Board members also discussed the profitability percentage ranges determined by appropriate court cases to be reasonable given the services rendered to investment companies. It was noted that the profitability percentage for managing each fund was not unreasonable given the fund’s overall performance and generally superior service levels provided.
At the conclusion of these discussions, each of the Board Members expressed the opinion that he or she had been furnished with sufficient information to make an informed business decision with respect to the continuation of the Trust’s Investment Advisory Agreement. Based on their discussions and considerations as described above, the Board made the following conclusions and determinations.
- The Board concluded that the nature, extent and quality of the services provided by Dreyfus are ade- quate and appropriate.
- The Board was generally satisfied with the each fund’s performance, noting in particular, with respect to
- Mellon Bond Fund, that the underperformance of the fund’s total return versus its comparison group may be attributable, in part, to the lower-quality holdings of some funds in the comparison group and, with respect to Mellon Intermediate Bond Fund, that the fund’s ranking in its Lipper category had improved following Lipper’s reclassification of the fund.
- The Board concluded that the fee paid by each fund to Mellon Fund Advisers was reasonable in light of comparative performance and expense and advisory fee information, costs of the services provided and profits to be realized and benefits derived or to be derived by Dreyfus and its affiliates from its relation- ship with the funds.
- The Board determined that the economies of scale which may accrue to Dreyfus and its affiliates in con- nection with the management of the funds had been adequately considered by Dreyfus in connection with the management fee rate charged to each fund, and that, to the extent in the future it were to be determined that material economies of scale had not been shared with the funds, the Board would seek to have those economies of scale shared with fund shareholders.
The Board members considered these conclusions and determinations and, without any one factor being dispositive, the Board determined that re-approval of the Trust’s Investment Advisory Agreement and Administration Agreement with respect to the funds was in the best interests of each fund and its respective shareholders.
| 44 |
BOARD MEMBERS INFORMATION (Unaudited)
| Patrick J. O’Connor (62) |
| Chairman of the Board (2000) |
| Principal Occupation During Past 5 Years: |
| • Attorney, Cozen and O’Connor, P.C. since 1973, including Vice |
| Chairman since 1980 and Chief Executive Officer and President |
| since 2002 |
| Other Board Memberships and Affiliations: |
| • Board of Consultors of Villanova University School of Law, |
| Board Member |
| • Temple University,Trustee |
| • Philadelphia Police Foundation, Board Member |
| • Philadelphia Children’s First Fund, Board Member |
| • Committee on Rules of Evidence of Pennsylvania Supreme |
| Court,Vice Chair |
| • American College of Trial Lawyers, Fellow |
| • Historical Society of the United States District Court for the |
| Eastern District of Pennsylvania, Director |
| No. of Portfolios for which Board Member Serves: 16 |
| ——————— |
| Ronald R. Davenport (69) |
| Board Member (2000) |
| Principal Occupation During Past 5 Years: |
| • Chairman of Sheridan Broadcasting Corporation since July 1972 |
| Other Board Memberships and Affiliations: |
| • American Urban Radio Networks, Co-Chairman |
| • Aramark Corporation, Board Member |
| • Momentum Equity Group LLC, Director |
| No. of Portfolios for which Board Member Serves: 16 |
| ——————— |
| John L. Diederich (68) |
| Board Member (2000) |
| Principal Occupation During Past 5 Years: |
| • Chairman of Digital Site Systems, Inc., a privately held software |
| company providing internet service to the construction materials |
| industry, since July 1998 |
| Other Board Memberships and Affiliations: |
| • Continental Mills, a dry baking products company, Board Member |
| • Pittsburgh Parks Conservancy, Board Member |
| No. of Portfolios for which Board Member Serves: 16 |
| Maureen D. McFalls (60) |
| Board Member (2000) |
| Principal Occupation During Past 5 Years: |
| • Director of the Office of Government Relations at Carnegie |
| Mellon University since January 2000 |
| • Manager, Government Communications, of the Software |
| Engineering Institute at Carnegie Mellon University from |
| March 1994 to December 1999 |
| Other Board Memberships and Affiliations: |
| • Maglev, Inc., a company seeking a partnership between industry |
| and government in Pennsylvania to create a magnetically levitated |
| high-speed transportation system, Board Member representing |
| Carnegie Mellon University |
| • Coro Center For Civic Leadership, Board Member |
| • Pennsylvania Association for Individuals with Disabilities, |
| Board Member |
| No. of Portfolios for which Board Member Serves: 16 |
| ——————— |
| Kevin C. Phelan (61) |
| Board Member (2000) |
| Principal Occupation During Past 5 Years: |
| • Mortgage Banker, Meredith & Grew, Inc. since March 1978, |
| including Executive Vice President and Director |
| since March 1998 |
| Other Board Memberships and Affiliations: |
| • Greater Boston Chamber of Commerce, Director |
| • Fiduciary Trust, Director |
| • St. Elizabeth’s Medical Center of Boston, Board Member |
| • Providence College,Trustee |
| • Simmons College,Trustee |
| • Newton Country Day School, Chairman of the Board |
| • Board of Visitors of Babson College, Board Member |
| • Board of Visitors of Boston University School of Public Health, |
| Board Member |
| • Boston Public Library Foundation, Director |
| • Boston Foundation, Director |
| • Boston Municipal Research Bureau, Board Member |
| • Boys and Girls Club of Boston, Board Member |
| • Greater Boston Real Estate Board, Director |
| No. of Portfolios for which Board Member Serves: 16 |
T h e F u n d s 45
BOARD MEMBERS INFORMATION (Unaudited) (continued)
| Patrick J. Purcell (57) |
| Board Member (2000) |
| Principal Occupation During Past 5 Years: |
| • Owner, President and Publisher of The Boston Herald since |
| February 1994 |
| • President and Founder, jobfind.com, an employment search site |
| on the world wide web, since July 1996 |
| • President and Chief Executive Officer, Herald Media since 2001 |
| Other Board Memberships and Affiliations: |
| • The American Ireland Fund, an organization that raises funds for |
| philanthropic projects in Ireland, Director |
| • The Genesis Fund, an organization that raises funds for the spe- |
| cialized care and treatment of New England area children born |
| with birth defects, mental retardation and genetic diseases, |
| Board Member |
| • United Way of Massachusetts Bay, Board Member |
| • Greater Boston Chamber of Commerce, Board Member |
| • St. John’s University,Trustee |
| No. of Portfolios for which Board Member Serves: 16 |
| Thomas F. Ryan, Jr. (64) |
| Board Member (2000) |
| Principal Occupation During Past 5 Years: |
| • Retired since April 1999 |
| • President and Chief Operating Officer of the American Stock |
| Exchange from October 1995 to April 1999 |
| Other Board Memberships and Affiliations: |
| • Boston College,Trustee |
| • Brigham & Women’s Hospital,Trustee |
| • New York State Independent System Operator, a non-profit |
| organization which administers a competitive wholesale market |
| for electricity in New York State, Director |
| • RepliGen Corporation, a biopharmaceutical company, Director |
| No. of Portfolios for which Board Member Serves: 16 |
Once elected all Board Members serve for an indefinite term.The address of the Board Members and Officers is in c/o The Dreyfus Corporation, 200 Park Avenue, New York, New York 10166. Additional information about the Board Members is available in the fund’s Statement of Additional Information which can be obtained from Dreyfus free of charge by calling this toll free number: 1-800-645-6561. For individual account holders for Private Wealth Management clients, please contact your account officer or call 1-888-281-7350.
46
| OFFICERS OF THE TRUST (Unaudited ) |
LAWRENCE P. KEBLUSEK, President since June 2003.
As Chief Investment Officer of Mellon’s Private Wealth Management group, Mr. Keblusek is responsible for investment strategy, policy and implementation for Mellon’s Private Wealth Management group. Prior to joining Mellon, Mr. Keblusek was a Managing Director at Citigroup since 1995. He was previously a Vice President of the Trust. He is 55 years old and has been employed by Mellon since August 2002.
MARK N. JACOBS, Vice President since June 2000.
Executive Vice President, Secretary and General Counsel of Dreyfus, and an officer of 91 investment companies (comprised of 200 portfolios) managed by Dreyfus. He is 59 years old and has been an employee of Dreyfus since June 1977.
CHRISTOPHER SHELDON, Vice President since June 2003.
As director of Investment Strategy for Mellon’s Private Wealth Management group since April 2003, Mr. Sheldon manages the analysis and development of investment and asset allocation strategies and investment product research. Prior to assuming his current position, Mr. Sheldon was the West Coast managing director of Mellon’s Private Wealth Management group from 2001-2003 and its regional manager from 1998-2001. He is 38 years old has been employed by Mellon since January 1995.
MICHAEL A. ROSENBERG, Vice President and Secretary since August 2005.
Associate General Counsel of Dreyfus, and an officer of 91investment companies (comprised of 200 portfolios) managed by Dreyfus. He is 45 years old and has been an employee of Dreyfus since October 1991.
JAMES BITETTO, Vice President and Assistant Secretary since August 2005.
Assistant General Counsel and Assistant Secretary of Dreyfus, and an officer of 91 investment companies (comprised of 200 portfolios) managed by Dreyfus. He is 39 years old and has been an employee of Dreyfus since December 1996.
JONI LACKS CHARATAN, Vice President and Assistant Secretary since August 2005.
Assistant General Counsel and Assistant Secretary of Dreyfus, and an officer of 91investment companies (comprised of 200 portfolios) managed by Dreyfus. She is 49 years old and has been an employee of Dreyfus since October 1998.
JOSEPH M. CHIOFFI, Vice President and Assistant Secretary since August 2005.
Assistant General Counsel and Assistant Secretary of Dreyfus, and an officer of 91 investment companies (comprised of 200 portfolios) managed by Dreyfus. He is 43 years old and has been an employee of Dreyfus since June 2000.
JANETTE E. FARRAGHER, Vice President and Assistant Secretary since August 2005.
Associate General Counsel of Dreyfus, and an officer of 91 investment companies (comprised of 200 portfolios) managed by Dreyfus. She is 42 years old and has been an employee of Dreyfus since February 1984.
JOHN B. HAMMALIAN, Vice President and Assistant Secretary since August 2005.
Associate General Counsel of Dreyfus, and an officer of 91 investment companies (comprised of 200 portfolios) managed by Dreyfus. He is 42 years old and has been an employee of Dreyfus since February 1991.
ROBERT R. MULLERY, Vice President and Assistant Secretary since August 2005.
Associate General Counsel of Dreyfus, and an officer of 91 investment companies (comprised of 200 portfolios) managed by Dreyfus. He is 53 years old and has been an employee of Dreyfus since May 1986.
JEFF PRUSNOFSKY, Vice President and Assistant Secretary since August 2005.
Associate General Counsel of Dreyfus, and an officer of 91 investment companies (comprised of 200 portfolios) managed by Dreyfus. He is 40 years old and has been an employee of Dreyfus since October 1990.
JAMES WINDELS, Treasurer since November 2001.
Director – Mutual Fund Accounting of Dreyfus, and an officer of 91 investment companies (comprised of 200 portfolios) managed by Dreyfus. He is 46 years old and has been an employee of Dreyfus since April 1985.
| T h e F u n d s 47 |
OFFICERS OF THE TRUST (Unaudited ) (continued)
| 48 |
GREGORY S. GRUBER, Assistant Treasurer since March 2000.
Senior Accounting Manager – Municipal Bond Funds of Dreyfus, and an officer of 91 investment companies (comprised of 200 portfolios) managed by Dreyfus. He is 46 years old and has been an employee of Dreyfus since August 1981.
ERIK D. NAVILOFF, Assistant Treasurer since December 2002.
Senior Accounting Manager – Taxable Fixed Income Funds of Dreyfus, and an officer of 91 investment companies (comprised of 200 portfolios) managed by Dreyfus. He is 37 years old and has been an employee of Dreyfus since November 1992.
ROBERT ROBOL, Assistant Treasurer since December 2002.
Senior Accounting Manager – Money Market Funds of Dreyfus, and an officer of 91 investment companies (comprised of 200 portfolios) managed by Dreyfus. He is 41 years old and has been an employee of Dreyfus since October 1988.
ROBERT SVAGNA, Assistant Treasurer since December 2002.
Senior Accounting Manager – Equity Funds of Dreyfus, and an officer of 91 investment companies (comprised of 200 portfolios) managed by Dreyfus. He is 38 years old and has been an employee of Dreyfus since November 1990.
KENNETH J. SANDGREN, Assistant Treasurer since November 2001.
Mutual Funds Tax Director of Dreyfus, and an officer of 91 investment companies (comprised of 200 portfolios) managed by Dreyfus. He is 51 years old and has been an employee of Dreyfus since June 1993.
JOSEPH W. CONNOLLY, Chief Compliance Officer since October 2004.
Chief Compliance Officer of the Manager and The Dreyfus Family of Funds (91 investment companies, comprising 200 portfolios). From November 2001 through March 2004, Mr. Connolly was first Vice-President, Mutual Fund Servicing for Mellon Global Securities Services. In that capacity, Mr. Connolly was responsible for managing Mellon’s Custody, Fund Accounting and Fund Administration services to third-party mutual fund clients. He is 48 years old and has served in various capacities with the Manager since 1980, including manager of the firm’s Fund Accounting Department from 1997 through October 2001.
WILLIAM GERMENIS, Anti-Money Laundering Compliance Officer since September 2002.
Vice President and Anti-Money Laundering Compliance Officer of the Distributor, and the Anti-Money Laundering Compliance Officer of 87 investment companies (comprised of 196 portfolios) managed by Dreyfus. He is 35 years old and has been an employee of the Distributor since October 1998.
N O T E S
For More Information
| Mellon Funds Trust |
| c/o The Dreyfus Corporation |
| 200 Park Avenue |
| New York, NY 10166 |
| Investment Adviser |
| Mellon Fund Advisers, a division of |
| The Dreyfus Corporation |
| 200 Park Avenue |
| New York, NY 10166 |
| Administrator |
| Mellon Bank, N.A. |
| One Mellon Bank Center |
| Pittsburgh, PA 15258 |
| Sub-Administrator |
| The Dreyfus Corporation |
| 200 Park Avenue |
| New York, NY 10166 |
| Custodian |
| Mellon Bank, N.A. |
| One Mellon Bank Center |
| Pittsburgh, PA 15258 |
| Transfer Agent & |
| Dividend Disbursing Agent |
| Dreyfus Transfer, Inc. |
| 200 Park Avenue |
| New York, NY 10166 |
| Distributor |
| Dreyfus Service Corporation |
| 200 Park Avenue |
| New York, NY 10166 |
Telephone Private Wealth Management (PWM) Clients, please contact your Account Officer or call 1-888-281-7350. Brokerage Clients of Mellon Private Wealth Advisors (MPWA), please contact your financial representative or call 1-800-830-0549-Option 2. Individual Account holders, please call Dreyfus at 1-800-896-8167.
Mail PWM Clients, write to your Account Officer, c/o Mellon Bank, N.A., One Mellon Bank Center, Pittsburgh, PA 15258
MPWA Brokerage Clients, write to your financial representative, P.O. Box 9012, Hicksville, NY 11802–9012
Individual Account Holders, write to: Mellon Funds, P.O. Box 55268, Boston, MA 02205–8502
The fund files its complete schedule of portfolio holdings with the Securities and Exchange Commission (“SEC”) for the first and third quarters of each fiscal year on Form N-Q. The fund’s Forms N-Q are available on the SEC’s website at http://www.sec.gov and may be reviewed and copied at the SEC’s Public Reference Room in Washington, DC. Information on the operation of the Public Reference Room may be obtained by calling 1-800-SEC-0330.
A description of the policies and procedures that the fund uses to determine how to vote proxies relating to portfolio securities, and information regarding how the fund voted these proxies for the 12-month period ended June 30, 2005, is available at http://www.dreyfus.com and on the SEC’s website at http://www.sec.gov. The description of the policies and procedures is also available without charge, upon request, by calling 1-800-645-6561.
| ©2005 Dreyfus Service Corporation |
| MFTAR0805-TB |
The Mellon Funds
| Mellon National Intermediate Municipal Bond Fund |
| Mellon National Short-Term Municipal Bond Fund |
| Mellon Pennsylvania Intermediate Municipal Bond Fund |
| Mellon Massachusetts Intermediate Municipal Bond Fund |
ANNUAL REPORT August 31, 2005
| Contents | ||
| The Funds | ||
| Letter from the President | 2 | |
| Discussion of Funds’ Performance | ||
| Mellon National Intermediate | ||
| Municipal Bond Fund | 3 | |
| Mellon National Short-Term | ||
| Municipal Bond Fund | 6 | |
| Mellon Pennsylvania Intermediate | ||
| Municipal Bond Fund | 9 | |
| Mellon Massachusetts Intermediate | ||
| Municipal Bond Fund | 12 | |
| Understanding Your Fund’s Expenses | 15 | |
| Comparing Your Fund’s Expenses | ||
| With Those of Other Funds | 16 | |
| Statements of Investments | 17 | |
| Statements of | ||
| Financial Futures 28, 43, 49 | ||
| Statements of Assets and Liabilities | 50 | |
| Statements of Operations | 51 | |
| Statements of Changes in Net Assets | 52 | |
| Financial Highlights | 57 | |
| Notes to Financial Statements | 67 | |
| Report of Independent Registered | ||
| Public Accounting Firm | 73 | |
| Important Tax Information | 74 | |
| Information About the Review | ||
| and Approval of Each Fund’s | ||
| Investment Advisory Agreement | 75 | |
| Board Members Information | 80 | |
| Officers of the Trust | 82 | |
For More Information
| Back cover |
For More Information
| Back cover |
The views expressed herein are current to the date of this report. These views and the composition of the funds’ portfolios are subject to change at any time based on market and other conditions.
- Not FDIC-Insured
- Not Bank-Guaranteed
- May Lose Value
The Funds

This annual report for The Mellon Funds covers the period from September 1, 2004, through August 31, 2005. Inside, you’ll find valuable information about how the funds were managed during the reporting period, including discussions with each fund’s portfolio manager.
On average, U.S. stock prices ended the reporting period higher than where they began. However, most of the equity markets’ gains occurred during the closing months of 2004. So far in 2005, positive factors, including steady economic growth and higher corporate profits, were largely offset by headwinds, such as sharply higher energy prices and rising short-term interest rates.Against the same backdrop and, contrary to historical norms, bonds generally rallied as inflation appeared to remain low and demand for U.S. fixed-income securities was robust, particularly from overseas investors. In global markets, international stocks generally rose more than U.S. stocks over the past year, with gains achieved in the industrialized markets of Europe and Asia, as well as many of the emerging markets.
Recent shocks to the U.S. economy — including sharply higher gasoline prices and other consequences of Hurricane Katrina — have added a degree of uncertainty to the outlook for stocks and bonds. However, our economists currently believe that the economy should continue to grow without either entering a recession or triggering a significant acceleration of inflation.As always, we encourage you to discuss the potential implications of these and other matters with your portfolio manager.
Thank you for your continued confidence and support.


DISCUSSION OF FUND PERFORMANCE
John F. Flahive, Portfolio Manager
How did Mellon National Intermediate Municipal Bond Fund perform relative to its benchmark?
For the 12-month period ended August 31, 2005, the fund achieved total returns of 3.62% for Class M shares, 3.28% for Investor shares and 2.85% for Dreyfus Premier shares.1 In comparison, the Lehman Brothers 7-Year Municipal Bond Index, the fund’s benchmark, achieved a total return of 2.90% for the same period.2 In addition, the average total return for all funds reported in the Lipper Intermediate Municipal Debt Funds category was 2.60% for the same period.3
Despite rising interest rates, municipal bond prices remained relatively stable over the reporting period. The fund produced higher returns than its benchmark and Lipper category average, primarily due to its focus on securities in the 15- to 20-year maturity range.
What is the fund’s investment approach?
The fund seeks to maximize current income exempt from federal income tax to the extent consistent with the preservation of capital.To pursue its goal, the fund normally invests at least 80% of its assets in municipal bonds that provide income exempt from federal income tax. The fund may occasionally, including for temporary defensive purposes, invest in taxable bonds. The fund’s investments in municipal and taxable bonds must be rated investment grade at the time of purchase or, if unrated, deemed of comparable quality by the investment adviser. Generally, the fund’s average effective portfolio maturity will be between three and ten years, and its average effective portfolio duration will not exceed eight years.
Rather than focusing on economic or market trends, we search for securities that, in our opinion, will help us enhance the fund’s yield without sacrificing quality.
We use a more tactical approach with respect to the fund’s average duration. If we expect the supply of securities to increase temporarily, we may reduce the fund’s average duration to make cash available for the purchase of higher-yielding securities. This is due to the fact that yields generally tend to rise if issuers are competing for investor interest. If we expect demand to surge at a time when we anticipate little issuance and therefore lower yields, we may increase the fund’s average duration to maintain current yields for as long as practical. At other times, we typically try to maintain a neutral average duration.
What other factors influenced the fund’s performance?
Like most U.S. fixed-income securities, municipal bonds were affected during the reporting period by rising short-term interest rates in a moderately growing economy. Interest rates escalated gradually as the Federal Reserve Board (the “Fed”) continued to move away from its accommodative monetary policy of the past several years.The Fed implemented eight consecutive rate hikes, driving the overnight federal funds rate from 1.5% at the start of the reporting period to 3.5% at the reporting period’s end.
Contrary to historical norms, however, longer-term bond yields remained surprisingly resilient. Instead of rising along with short-term interest rates, longer-term bond yields fell over much of the reporting period before rebounding modestly during the summer. As a result, intermediate-term municipal bond yields ended the reporting period little changed from where they began, enabling the fund to achieve positive absolute returns that were derived primarily from tax-exempt interest income.
Municipal bonds also were influenced by changing supply-and-demand dynamics. The volume of newly
| The Funds 3 |
DISCUSSION OF FUND PERFORMANCE (continued)
issued municipal bonds hit record highs during the reporting period as states and municipalities continued to refinance older debt at lower rates. However, the ample supply of new securities was absorbed by robust investor demand, including buying by hedge funds, insurance companies and other investors that typically did not invest in municipal securities, helping to keep yields low.
In this economic environment, we positioned the fund to benefit from narrower yield differences between short-and long-term bonds. By focusing primarily on securities in the 15- to 20-year range at the longer end of the intermediate-term maturity spectrum, the fund avoided most of the eroding effects of rising short-term interest rates and participated more fully in the strength of longer-term bonds. The fund also benefited from refunding activity among some of its holdings, which helped support their prices, as well as strong contributions to performance from bonds backed by revenues from health care facilities and industrial development projects.
What is the fund’s current strategy?
We have continued to maintain a somewhat cautious investment posture, which we believe remains prudent in an investment environment characterized by rising
interest rates and economic uncertainty in the wake of Hurricane Katrina. Accordingly, we have set the fund’s average duration — a measure of sensitivity to changing interest rates — in a range that is modestly shorter than industry averages, and we have continued to emphasize higher-quality securities. In addition, we have maintained our focus on securities at the longer end of the intermediate-term maturity range, which we believe may benefit the portfolio further should yield differences continue to narrow along the maturity spectrum.
| September 15, 2005 |
1 Total return includes reinvestment of dividends and any capital gains paid. Past performance is no guarantee of future results. Share price, yield and investment return fluctuate such that upon redemption, fund shares may be worth more or less than their original cost. Income may be subject to state and local taxes, and some income may be subject to the federal alternative minimum tax (AMT) for certain investors. Capital gains, if any, are fully taxable.
2 SOURCE: LIPPER INC. — Reflects reinvestment of dividends and, where applicable, capital gain distributions.The Lehman Brothers 7-Year Municipal Bond Index is an unmanaged total return performance benchmark for the investment-grade, geographically unrestricted 7-year tax-exempt bond market, consisting of municipal bonds with maturities of 6-8 years. Index returns do not reflect the fees and expenses associated with operating a mutual fund.
3 Source: Lipper Inc.
| 4 |
| FUND PERFORMANCE |

| Average Annual Total Returns | as of 8/31/05 | |||||||||
| Inception | From | |||||||||
| Date | 1 Year | 5 Years | 10 Years | Inception | ||||||
| Class M shares | 3.62% | 5.53% | 5.37% | |||||||
| Investor shares | 7/11/01 | 3.28% | — | — | 4.77% | |||||
| Dreyfus Premier shares | ||||||||||
| with applicable redemption †† | 10/11/02 | (0.13)% | — | — | 2.40% | |||||
| without redemption | 10/11/02 | 2.85% | — | — | 3.05% |
| † Source: Lipper Inc. |
| Past performance is not predictive of future performance.The fund’s performance shown in the graph and table does not reflect the deduction of taxes that a shareholder |
| would pay on fund distributions or the redemption of fund shares. |
| The above graph compares a $10,000 investment made in Class M shares of Mellon National Intermediate Municipal Bond Fund on 8/31/95 to a $10,000 |
| investment made in the Lehman Brothers 7-Year Municipal Bond Index (the “Index”) on that date.All dividends and capital gain distributions are reinvested. |
| Before the fund commenced operations, substantially all of the assets of a predecessor common trust fund (CTF) that, in all material respects, had the same investment |
| objective, policies, guidelines and restrictions as the fund were transferred to the fund. Please note that the performance of the fund’s Class M shares represents the |
| performance of the predecessor CTF through October 1, 2000, adjusted to reflect the fund’s fees and expenses, by subtracting from the actual performance of the CTF |
| the expenses of the fund’s Class M shares as they were estimated prior to the conversion of the CTF into the fund, and the performance of the fund’s Class M shares |
| thereafter.The predecessor CTF was not registered under the Investment Company Act of 1940, as amended, and therefore was not subject to certain investment |
| restrictions that might have adversely affected performance. In addition, the expenses of the fund’s Class M shares may be higher than those estimated prior to the |
| conversion of the CTF into the fund, which would lower the performance shown in the above line graph. |
| Effective July 11, 2001, existing fund shares were designated as Class M shares and the fund began offering a second class of shares designated as Investor shares, |
| which are subject to a Shareholder Services Plan. Performance for Investor shares will vary from the performance of Class M shares shown above because of the |
| differences in charges and expenses. |
| The fund’s performance shown in the line graph takes into account all applicable fees and expenses for Class M shares only.The Index is an unmanaged total return |
| performance benchmark for the investment-grade, geographically unrestricted, 7-year tax-exempt bond market, consisting of municipal bonds with maturities of 6-8 |
| years.The Index does not take into account charges, fees and other expenses. Further information relating to fund performance, including expense reimbursements, if |
| applicable, is contained in the Financial Highlights section of the prospectus and elsewhere in this report. |
| †† The maximum contingent deferred sales charge for Dreyfus Premier shares is 3%.After six years Dreyfus Premier shares convert to Investor shares. |
The Funds 5

| DISCUSSION OF |
| FUND PERFORMANCE |
| M. Collette O’Brien and Timothy J. Sanville, |
| Portfolio Managers |
How did Mellon National Short-Term Municipal Bond Fund perform relative to its benchmark?
For the 12-month period ended August 31, 2005, the fund achieved total returns of 0.91% for Class M shares and 0.73% for Investor shares.1 In comparison, the Lehman Brothers 3-Year Municipal Bond Index (the “Index”), the fund’s benchmark, achieved a total return of 0.84% for the same period.2
Rising interest rates in a moderately growing economy eroded the value of most short-term fixed-income securities, including municipal bonds, during the reporting period.The fund’s returns were roughly in line with its benchmark, as good results from holdings in the one- to two-year maturity range were offset by the fund’s relatively light exposure to the better-performing, lower-quality bonds that are contained in the Index.
What is the fund’s investment approach?
The fund seeks to maximize current income exempt from federal income tax to the extent consistent with the preservation of capital.To pursue its goal, the fund normally invests at least 80% of its assets in municipal bonds that provide income exempt from federal income tax. The fund occasionally, including for temporary defensive purposes, may invest in taxable bonds. The fund’s investments in municipal and taxable bonds must be rated investment grade at the time of purchase or, if unrated, deemed of comparable quality by the investment adviser. Generally, the fund’s average effective portfolio maturity and its average effective portfolio duration will be less than three years.
Rather than focusing on economic or market trends, we search for securities that, in our opinion, will help us enhance the fund’s yield without sacrificing quality.We use a more tactical approach with respect to the fund’s average duration. If we expect the supply of securities to increase temporarily, we may reduce the fund’s average duration to make cash available for the purchase of higher-yielding securities.This is due to the fact that yields generally tend to rise if issuers are competing for investor interest. If we expect demand to surge at a time when we anticipate little issuance and therefore lower yields, we may increase the fund’s average duration to maintain current yields for as long as practical. At other times, we typically try to maintain a neutral average duration.
What other factors influenced the fund’s performance?
Like most U.S. fixed-income securities, municipal bonds were affected during the reporting period by rising short-term interest rates in a moderately growing economy. Interest rates escalated gradually as the Federal Reserve Board (the “Fed”) continued to move away from its accommodative monetary policy of the past several years. The Fed implemented eight consecutive rate hikes, driving the overnight federal funds rate from 1.5% at the start of the reporting period to 3.5% at the reporting period’s end.
Contrary to historical norms,longer-term bond yields fell over much of the reporting period before rebounding modestly during the summer. However, shorter-term bonds lost a relatively modest amount of value in the rising interest-rate environment. The fund nonetheless achieved mildly positive absolute returns as tax-exempt interest income more than offset price depreciation.
| 6 |
Municipal bonds also were influenced by changing supply-and-demand dynamics. The volume of newly issued short-term municipal bonds fell during the reporting period as states and municipalities enjoyed higher tax revenues in the recovering economy and had less need to borrow to finance budget deficits.The reduced supply of new securities was easily absorbed by robust investor demand, putting further upward pressure on short-term bond yields.
In this economic environment, we positioned the fund relatively defensively, emphasizing securities in the one- to two-year range and setting its average duration — a measure of sensitivity to changing interest rates —in a range we considered shorter than industry aver-ages.This positioning enabled the fund to avoid the full brunt of weakness among bonds with two- to three-year maturities, which comprised a more substantial portion of the Index. However, the benefits of this strategy were offset to a degree by our focus on higher-quality securities. Because the economic recovery helped to improve the credit profiles of many issuers, investors grew more comfortable owning lower-rated securities, enabling them to produce higher returns than higher-quality municipal securities over the reporting period.
What is the fund’s current strategy?
We have continued to maintain a somewhat cautious investment posture, which we believe remains appropriate in an investment environment characterized by rising interest rates and heightened economic uncertainty in the wake of Hurricane Katrina. Accordingly, we have maintained the fund’s relatively short average duration, and we have continued to emphasize higher-quality securities.In our view,these are prudent strategies that may help the fund withstand renewed market volatility while enabling it to capture potentially higher yields as economic and market conditions evolve.
| September 15, 2005 |
| 1 | Total return includes reinvestment of dividends and any capital gains | |
| paid. Past performance is no guarantee of future results. Share price, yield | ||
| and investment return fluctuate such that upon redemption, fund shares | ||
| may be worth more or less than their original cost. Income may be subject | ||
| to state and local taxes, and some income may be subject to the federal | ||
| alternative minimum tax (AMT) for certain investors. Capital gains, if | ||
| any, are fully taxable. | ||
| 2 | SOURCE: LIPPER INC. — Reflects reinvestment of dividends and, | |
| where applicable, capital gain distributions.The Lehman Brothers 3-Year | ||
| Municipal Bond Index is an unmanaged total return performance | ||
| benchmark for the investment-grade, geographically unrestricted 3-year tax- | ||
| exempt bond market, consisting of municipal bonds with maturities of 2-4 | ||
| years. Index returns do not reflect the fees and expenses associated with | ||
| operating a mutual fund. |
| The Funds 7 |
| FUND PERFORMANCE |

| Average Annual Total Returns | as of 8/31/05 | |||||
| Inception | From | |||||
| Date | 1 Year | Inception | ||||
| Class M shares | 10/2/00 | 0.91% | 3.41% | |||
| Investor shares | 7/11/01 | 0.73% | 2.44% |
| † Source: Lipper Inc. |
| Past performance is not predictive of future performance.The fund’s performance shown in the graph and table does not reflect the deduction of taxes that a shareholder |
| would pay on fund distributions or the redemption of fund shares. |
| The above graph compares a $10,000 investment made in Class M shares of Mellon National Short-Term Municipal Bond Fund on 10/2/00 (inception date) to a |
| $10,000 investment made in the Lehman Brothers 3-Year Municipal Bond Index (the “Index”) on that date. For comparative purposes, the value of the Index on |
| 9/30/00 is used as the beginning value on 10/2/00.All dividends and capital gain distributions are reinvested. |
| Effective July 11, 2001, existing fund shares were designated as Class M shares and the fund began offering a second class of shares designated as Investor shares, |
| which are subject to a Shareholder Services Plan. Performance for Investor shares will vary from the performance of Class M shares shown above because of the |
| differences in charges and expenses. |
| The fund’s performance shown in the line graph takes into account all applicable fees and expenses for Class M shares only.The Index is an unmanaged total return |
| performance benchmark for the investment-grade, geographically unrestricted, 3-year tax-exempt bond market, consisting of municipal bonds with maturities of 2-4 |
| years.The Index does not take into account charges, fees and other expenses. Further information relating to fund performance, including expense reimbursements, if |
| applicable, is contained in the Financial Highlights section of the prospectus and elsewhere in this report. |
| 8 |

| DISCUSSION OF |
| FUND PERFORMANCE |
| John F. Flahive and M. Collette O’Brien, |
| Portfolio Managers |
| How did Mellon Pennsylvania Intermediate |
| Municipal Bond Fund perform relative to its |
| benchmark? |
For the 12-month period ended August 31, 2005, the fund achieved total returns of 2.84% for Class M shares and 2.50% for Investor shares.1 In comparison, the Lehman Brothers 7-Year Municipal Bond Index, the fund’s benchmark, achieved a total return of 2.90% for the same period.2 In addition, the average total return for all funds reported in the Lipper Pennsylvania Intermediate Municipal Debt Funds category was 2.23% for the same period.3
Despite rising interest rates, municipal bond prices remained relatively stable over the reporting period. The fund produced returns that were roughly in line with its benchmark and higher than its Lipper category average, primarily due to its focus on securities in the 15- to 20-year maturity range.
What is the fund’s investment approach?
The fund seeks as high a level of income exempt from federal and Pennsylvania state income taxes as is consistent with the preservation of capital.To pursue its goal, the fund normally invests at least 80% of its assets in municipal bonds, the interest from which is exempt from federal and Pennsylvania state personal income taxes.The fund may also invest in municipal bonds that are exempt from federal income taxes, but not Pennsylvania personal income taxes, and in taxable bonds. The fund’s investments in municipal and taxable bonds must be rated investment grade at the time of purchase or, if unrated, deemed of comparable quality by the investment adviser. Generally, the fund’s average effective portfolio maturity will be between three and ten years,and its average effective portfolio duration will not exceed eight years.
Rather than focusing on economic or market trends, we search for securities that, in our opinion, will help us enhance the fund’s yield without sacrificing quality. We use a more tactical approach with respect to the fund’s average duration. If we expect the supply of securities to increase temporarily, we may reduce the fund’s average duration to make cash available for the purchase of higher-yielding securities. This is due to the fact that yields generally tend to rise if issuers are competing for investor interest. If we expect demand to surge at a time when we anticipate little issuance and therefore lower yields, we may increase the fund’s average duration to maintain current yields for as long as practical.At other times, we typically try to maintain a neutral average duration.
What other factors influenced the fund’s performance?
Like most U.S. fixed-income securities, municipal bonds were affected during the reporting period by rising short-term interest rates in a moderately growing economy. Interest rates escalated gradually as the Federal Reserve Board (the “Fed”) continued to move away from its accommodative monetary policy of the past several years.The Fed implemented eight consecutive rate hikes, driving the overnight federal funds rate from 1.5% at the start of the reporting period to 3.5% at the reporting period’s end.
Contrary to historical norms, however, longer-term bond yields remained surprisingly resilient. Instead of rising along with short-term interest rates, longer-term bond yields fell over much of the reporting period before rebounding modestly during the summer. As a result, intermediate-term municipal bond yields ended the reporting period little changed from where they began, enabling the fund to achieve positive absolute returns that were derived primarily from tax-exempt interest income.
| The Funds 9 |
DISCUSSION OF FUND PERFORMANCE (continued)
Municipal bonds from Pennsylvania also were influenced by the state’s improving fiscal condition. Higher tax revenues helped Pennsylvania maintain a healthy credit profile, and the supply of newly issued securities remained relatively sparse.These factors helped to keep yields relatively low.
In this economic environment, we positioned the fund to benefit from narrower yield differences between short-and long-term bonds. By focusing primarily on securities in the 15- to 20-year range at the longer end of the intermediate-term maturity spectrum, the fund avoided most of the eroding effects of rising short-term interest rates and participated more fully in the strength of longer-term bonds. The fund also benefited from refunding activity among some of its holdings, which helped support their prices, as well as strong contributions to performance from bonds backed by revenues from health care facilities and industrial development projects.
What is the fund’s current strategy?
We have continued to maintain a somewhat cautious investment posture, which we believe remains prudent in an investment environment characterized by rising
interest rates and economic uncertainty in the wake of Hurricane Katrina. Accordingly, we have set the fund’s average duration — a measure of sensitivity to changing interest rates — in a range that is modestly shorter than industry averages, and we have continued to emphasize higher-quality securities. In addition, we have maintained our focus on securities at the longer end of the intermediate-term maturity range, which we believe may benefit the portfolio further should yield differences continue to narrow along the maturity spectrum.
| September 15, 2005 |
| 1 | Total return includes reinvestment of dividends and any capital gains paid. | |
| Past performance is no guarantee of future results. Share price, yield and | ||
| investment return fluctuate such that upon redemption, fund shares may be | ||
| worth more or less than their original cost. Income may be subject to state and | ||
| local taxes for non-Pennsylvania residents, and some income may be subject to | ||
| the federal alternative minimum tax (AMT) for certain investors. Capital | ||
| gains, if any, are fully taxable. | ||
| 2 | SOURCE: LIPPER INC. — Reflects reinvestment of dividends and, where | |
| applicable, capital gain distributions.The Lehman Brothers 7-Year Municipal | ||
| Bond Index is an unmanaged total return performance benchmark for the | ||
| investment-grade, geographically unrestricted 7-year tax-exempt bond market, | ||
| consisting of municipal bonds with maturities of 6-8 years. Index returns do | ||
| not reflect the fees and expenses associated with operating a mutual fund. | ||
| 3 | Source: Lipper Inc. |
| 10 |
| FUND PERFORMANCE |
![]()
| Average Annual Total Returns | as of 8/31/05 | |||||||||
| Inception | From | |||||||||
| Date | 1 Year | 5 Years | 10 Years | Inception | ||||||
| Class M shares | 2.84% | 4.99% | 4.83% | |||||||
| Investor shares | 7/11/01 | 2.50% | — | — | 4.18% |
| † Source: Lipper Inc. |
| Past performance is not predictive of future performance.The fund’s performance shown in the graph and table does not reflect the deduction of taxes that a shareholder |
| would pay on fund distributions or the redemption of fund shares. |
| The above graph compares a $10,000 investment made in Class M shares of Mellon Pennsylvania Intermediate Municipal Bond Fund on 8/31/95 to a $10,000 |
| investment made in the Lehman Brothers 7-Year Municipal Bond Index (the “Index”) on that date.All dividends and capital gain distributions are reinvested. |
| Before the fund commenced operations, substantially all of the assets of a predecessor common trust fund (CTF) that, in all material respects, had the same investment |
| objective, policies, guidelines and restrictions as the fund were transferred to the fund. Please note that the performance of the fund’s Class M shares represents the |
| performance of the predecessor CTF through October 1, 2000, adjusted to reflect the fund’s fees and expenses, by subtracting from the actual performance of the CTF |
| the expenses of the fund’s Class M shares as they were estimated prior to the conversion of the CTF into the fund, and the performance of the fund’s Class M shares |
| thereafter.The predecessor CTF was not registered under the Investment Company Act of 1940, as amended, and therefore was not subject to certain investment |
| restrictions that might have adversely affected performance. In addition, the expenses of the fund’s Class M shares may be higher than those estimated prior to the |
| conversion of the CTF into the fund, which would lower the performance shown in the above line graph. |
| Effective July 11, 2001, existing fund shares were designated as Class M shares and the fund began offering a second class of shares designated as Investor shares, |
| which are subject to a Shareholder Services Plan. Performance for Investor shares will vary from the performance of Class M shares shown above because of the |
| differences in charges and expenses. |
| The fund invests primarily in Pennsylvania investment-grade municipal bonds.The fund’s performance shown in the line graph takes into account all applicable fees |
| and expenses for Class M shares only.The Index is not limited to investments principally in Pennsylvania municipal obligations.The Index is an unmanaged total |
| return performance benchmark for the investment-grade, geographically unrestricted, 7-year tax-exempt, bond market, consisting of municipal bonds with maturities of |
| 6-8 years.The Index does not take into account charges, fees and other expenses.These factors can contribute to the Index potentially outperforming the fund. Further |
| information relating to fund performance, including expense reimbursements, if applicable, is contained in the Financial Highlights section of the prospectus and |
| elsewhere in this report. |
The Funds 11

| DISCUSSION OF |
| FUND PERFORMANCE |
John F. Flahive, Portfolio Manager
How did Mellon Massachusetts Intermediate Municipal Bond Fund perform relative to its benchmark?
For the 12-month period ended August 31, 2005, the fund achieved total returns of 3.25% for Class M shares, 3.07% for Investor shares and 2.59% for Dreyfus Premier shares.1 In comparison, the Lehman Brothers 7-Year Municipal Bond Index, the fund’s benchmark, achieved a total return of 2.90% for the same period.2 In addition, the average total return for all funds reported in the Lipper Massachusetts Intermediate Municipal Debt Funds category was 2.48% for the same period.3
Despite rising interest rates, municipal bond prices remained relatively stable over the reporting period.The fund produced higher returns than its benchmark and Lipper category average, primarily due to its focus on securities in the 15- to 20-year maturity range.
What is the fund’s investment approach?
The fund seeks as high a level of income exempt from federal and Massachusetts state income taxes as is consistent with the preservation of capital.To pursue its goal,the fund normally invests at least 80% of its assets in municipal bonds, the interest from which is exempt from federal and Massachusetts state personal income taxes.The fund may also invest in municipal bonds that are exempt from federal income taxes, but not Massachusetts personal income taxes,and in taxable bonds.The fund’s investments in municipal and taxable bonds must be rated investment grade at the time of purchase or, if unrated, deemed of comparable quality by the investment adviser. Generally, the fund’s average effective portfolio maturity will be between three and ten years,and its average effective portfolio duration will not exceed eight years.
Rather than focusing on economic or market trends, we search for securities that, in our opinion, will help us enhance the fund’s yield without sacrificing quality.We use a more tactical approach with respect to the fund’s average duration. If we expect the supply of securities to increase temporarily, we may reduce the fund’s average duration to make cash available for the purchase of higher-yielding securities.This is because yields generally tend to rise if issuers are competing for investor interest. If we expect demand to surge at a time when we anticipate little issuance and therefore lower yields, we may increase the fund’s average duration to maintain current yields for as long as practical.At other times, we typically try to maintain a neutral average duration.
What other factors influenced the fund’s performance?
Like most U.S. fixed-income securities, municipal bonds were affected during the reporting period by rising short-term interest rates in a moderately growing economy. Interest rates escalated gradually as the Federal Reserve Board (the “Fed”) continued to move away from its accommodative monetary policy of the past several years.The Fed implemented eight consecutive rate hikes, driving the overnight federal funds rate from 1.5% at the start of the reporting period to 3.5% at the reporting period’s end.
Contrary to historical norms, however, longer-term bond yields remained surprisingly resilient. Instead of rising along with short-term interest rates, longer-term bond yields fell over much of the reporting period before rebounding modestly during the summer. As a result, intermediate-term municipal bond yields ended the reporting period little changed from where they began, enabling the fund to achieve positive absolute returns that were derived primarily from tax-exempt interest income.
| 12 |
Municipal bonds from Massachusetts also were influenced by the state’s improving fiscal condition.The state ended its most recent fiscal year with a budget surplus that approached record levels, and one of the major bond rating agencies recently upgraded the state’s credit rating.These factors helped to keep yields relatively low.
In this environment, we positioned the fund to benefit from narrower yield differences between short- and long-term bonds. By focusing primarily on securities in the 15- to 20-year range at the longer end of the intermediate-term maturity spectrum, the fund avoided most of the eroding effects of rising short-term interest rates and participated more fully in the strength of longer-term bonds. The fund also benefited from refunding activity among some of its holdings, which helped support their prices, as well as strong contributions to performance from bonds backed by revenues from health care facilities, educational institutions and the state’s settlement with U.S. tobacco companies.
What is the fund’s current strategy?
We have continued to maintain a somewhat cautious investment posture, which we believe remains prudent in an investment environment characterized by rising interest rates and economic uncertainty in the wake of
Hurricane Katrina. Accordingly, we have set the fund’s average duration — a measure of sensitivity to changing interest rates — in a range that is modestly shorter than industry averages, and we have continued to emphasize higher-quality securities. In addition, we have maintained our focus on securities at the longer end of the intermediate-term maturity range, which we believe may benefit the portfolio further should yield differences continue to narrow along the maturity spectrum.
| September 15, 2005 |
| 1 | Total return includes reinvestment of dividends and any capital gains paid. | |
| Past performance is no guarantee of future results. Share price, yield and | ||
| investment return fluctuate such that upon redemption, fund shares may be | ||
| worth more or less than their original cost. Income may be subject to state | ||
| and local taxes for non-Massachusetts residents, and some income may be | ||
| subject to the federal alternative minimum tax (AMT) for certain investors. | ||
| Capital gains, if any, are fully taxable. Return figures provided reflect the | ||
| absorption of fund expenses by Mellon Bank, N.A. pursuant to an | ||
| agreement in effect through September 30, 2007, at which time it may be | ||
| extended, terminated or modified. Had these expenses not been absorbed, | ||
| the fund’s returns would have been lower. | ||
| 2 | SOURCE: LIPPER INC. — Reflects reinvestment of dividends and, | |
| where applicable, capital gain distributions.The Lehman Brothers 7-Year | ||
| Municipal Bond Index is an unmanaged total return performance | ||
| benchmark for the investment-grade, geographically unrestricted 7-year tax- | ||
| exempt bond market, consisting of municipal bonds with maturities of 6-8 | ||
| years. Index returns do not reflect the fees and expenses associated with | ||
| operating a mutual fund. | ||
| 3 | Source: Lipper Inc. |
| The Funds 13 |
| FUND PERFORMANCE |

| Investor shares | 3.07% | 4.90% | 4.74% | |||
| Class M shares | 3.25% | 5.16% | 5.00% | |||
| Dreyfus Premier shares | ||||||
| with applicable redemption †† | (0.40)% | 4.23% | 4.43% | |||
| without redemption | 2.59% | 4.40% | 4.43% | |||
| † Source: Lipper Inc. | ||||||
| Past performance is not predictive of future performance. |
| The above graph compares a $10,000 investment made in Class M shares, Investor shares and Dreyfus Premier shares of Mellon Massachusetts Intermediate |
| Municipal Bond Fund on 8/31/95 to a $10,000 investment made in the Lehman Brothers 7-Year Municipal Bond Index (the “Index”) on that date.All |
| dividends and capital gain distributions are reinvested. |
| As of the close of business on September 6, 2002, substantially all of the assets of another investment company managed by Dreyfus, Dreyfus Premier Limited Term |
| Massachusetts Municipal Fund (the “Premier Massachusetts Fund”), were transferred to the Mellon Massachusetts Fund in a tax-free reorganization and the fund |
| commenced operations.The performance shown in the line graph for Class M shares represents the performance of the Premier Massachusetts Fund’s Class R shares |
| prior to the commencement of operations of the Mellon Massachusetts Fund and the performance of the Mellon Massachusetts Fund’s Class M shares thereafter.The |
| performance shown in the line graph for Investor shares represents the performance of the Premier Massachusetts Fund’s Class A shares prior to the commencement of |
| operations of the Mellon Massachusetts Fund, and the performance of the Mellon Massachusetts Fund’s Investor shares thereafter. |
| The fund’s performance shown in the line graph takes into account all applicable fees and expenses for all share classes.The Index, unlike the fund, is an unmanaged |
| total return performance benchmark for the investment-grade, geographically unrestricted 7-year tax-exempt bond market consisting of municipal bonds with maturities |
| of 6-8 years.The Index does not take into account charges, fees and other expenses and is not limited to investments principally in Massachusetts municipal obligations. |
| These factors can contribute to the Index outperforming or underperforming the fund. Further information relating to fund performance, including expense |
| reimbursements, if applicable, is contained in the Financial Highlights section of the prospectus and elsewhere in this report. Performance for Dreyfus Premier shares |
| assumes the conversion of Dreyfus Premier shares to Investor shares at the end of the sixth year following the date of purchase. |
| †† The maximum contingent deferred sales charge for Dreyfus Premier shares is 3%.After six years Dreyfus Premier shares convert to Investor shares. |
| 14 |
UNDERSTANDING YOUR FUND’S EXPENSES (Unaudited)
As a mutual fund investor, you pay ongoing expenses, such as management fees and other expenses. Using the information below, you can estimate how these expenses affect your investment and compare them with the expenses of other funds.You also may pay one-time transaction expenses, including sales charges (loads) and redemptions fees, which are not shown in this section and would have resulted in higher total expenses. For more information, see your fund’s prospectus or talk to your financial adviser.
Review your fund’s expenses
The table below shows the expenses you would have paid on a $1,000 investment in each class of each Mellon municipal bond fund from March 1, 2005 to August 31, 2005. It also shows how much a $1,000 investment would be worth at the close of the period, assuming actual returns and expenses.
| Expenses and Value of a $1,000 Investment | ||||||
| assuming actual returns for the six months ended August 31, 2005 | ||||||
| Dreyfus | ||||||
| Class M Shares | Investor Shares | Premier Shares | ||||
| Mellon National Intermediate | ||||||
| Municipal Bond Fund | ||||||
| Expenses paid per $1,000 † | $ 2.65 | $ 3.92 | $ 6.45 | |||
| Ending value (after expenses) | $1,019.80 | $1,017.80 | $1,016.00 | |||
| Mellon National Short-Term | ||||||
| Municipal Bond Fund | ||||||
| Expenses paid per $1,000 † | $ 2.68 | $ 3.95 | — | |||
| Ending value (after expenses) | $1,009.50 | $1,008.20 | — | |||
| Mellon Pennsylvania Intermediate | ||||||
| Municipal Bond Fund | ||||||
| Expenses paid per $1,000 † | $ 3.36 | $ 4.67 | — | |||
| Ending value (after expenses) | $1,016.80 | $1,015.40 | — | |||
| Mellon Massachusetts Intermediate | ||||||
| Municipal Bond Fund | ||||||
| Expenses paid per $1,000 † | $ 2.54 | $ 3.81 | $ 6.35 | |||
| Ending value (after expenses) | $1,018.70 | $1,017.50 | $1,015.10 | |||
† Expenses are equal to the Mellon National Intermediate Municipal Bond Fund annualized expense ratio of .52% for Class M, .77% for Investor shares and 1.27% for Dreyfus Premier shares, Mellon National Short-Term Municipal Bond Fund .53% for Class M and .78% for Investor shares, Mellon Pennsylvania Intermediate Municipal Bond Fund .66% for Class M and .92% for Investor shares and Mellon Massachusetts Intermediate Municipal Bond Fund .50% for Class M, .75% for Investor shares and 1.25% for Dreyfus Premier shares, multiplied by the respective fund’s average account value over the period, multiplied by 184/365 (to reflect the one-half year period).
| The Funds 15 |
COMPARING YOUR FUND’S EXPENSES WITH THOSE OF OTHER FUNDS (Unaudited)
| Using the SEC’s method to compare expenses |
The Securities and Exchange Commission (SEC) has established guidelines to help investores assess fund expenses. Per these guidelines, the table below shows your fund’s expenses based on a $1,000 investment, assuming a hypothetical 5% annualized return.You can use this information to compare the ongoing expenses (but not transaction expenses or total cost) of investing in the fund with those of other funds.All mutual fund shareholder reports will provide this information to help you make this comparison. Please note that you cannot use this information to estimate your actual ending account balance and expenses paid during the period.
| Expenses and Value of a $1,000 Investment | ||||||
| assuming a hypothetical 5% annualized return for the six months ended August 31, 2005 | ||||||
| Dreyfus | ||||||
| Class M Shares | Investor Shares | Premier Shares | ||||
| Mellon National Intermediate | ||||||
| Municipal Bond Fund | ||||||
| Expenses paid per $1,000 † | $ 2.65 | $ 3.92 | $ 6.46 | |||
| Ending value (after expenses) | $1,022.58 | $1,021.32 | $1,018.80 | |||
| Mellon National Short-Term | ||||||
| Municipal Bond Fund | ||||||
| Expenses paid per $1,000 † | $ 2.70 | $ 3.97 | — | |||
| Ending value (after expenses) | $1,022.53 | $1,021.27 | — | |||
| Mellon Pennsylvania Intermediate | ||||||
| Municipal Bond Fund | ||||||
| Expenses paid per $1,000 † | $ 3.36 | $ 4.69 | — | |||
| Ending value (after expenses) | $1,021.88 | $1,020.57 | — | |||
| Mellon Massachusetts Intermediate | ||||||
| Municipal Bond Fund | ||||||
| Expenses paid per $1,000 † | $ 2.55 | $ 3.82 | $ 6.36 | |||
| Ending value (after expenses) | $1,022.68 | $1,021.42 | $1,018.90 | |||
† Expenses are equal to the Mellon National Intermediate Municipal Bond Fund annualized expense ratio of .52% for Class M, .77% for Investor shares and 1.27% for Dreyfus Premier shares, Mellon National Short-Term Municipal Bond Fund .53% for Class M and .78% for Investor shares, Mellon Pennsylvania Intermediate Municipal Bond Fund .66% for Class M and .92% for Investor shares and Mellon Massachusetts Intermediate Municipal Bond Fund .50% for Class M, .75% for Investor shares and 1.25% for Dreyfus Premier shares, multiplied by the respective fund’s average account value over the period, multiplied by 184/365 (to reflect the one-half year period).
| 16 |
| STATEMENT OF INVESTMENTS | ||||||||||
| August 31, 2005 | ||||||||||
| Mellon National Intermediate Municipal Bond Fund | ||||||||||
| Long-Term Municipal | Principal | Principal | ||||||||
| Investments—98.4% | Amount ($) | Value ($) | Amount ($) | Value ($) | ||||||
| Alabama—1.7% | Arizona (continued) | |||||||||
| Alabama 5%, 6/1/2009 | 2,295,000 | 2,452,506 | Tucson 5%, 7/1/2012 | 1,265,000 | 1,389,451 | |||||
| Alabama Public School and College | University Medical Center Corp., HR | |||||||||
| Authority, Capital Improvement | 5.25%, 7/1/2016 | 2,310,000 | 2,488,216 | |||||||
| 5.625%, 7/1/2013 | 3,000,000 | 3,298,470 | California—22.2% | |||||||
| Jefferson County, Limited | Agua Caliente Band, | |||||||||
| Obligation School | Cahuilla Indians Revenue: | |||||||||
| Warrants 5%, 1/1/2024 | 3,500,000 | 3,702,545 | 4%, 7/1/2006 | 300,000 | 301,920 | |||||
| Montgomery BMC Special Care | 5.60%, 7/1/2013 | 1,815,000 | 1,854,640 | |||||||
| Facilities Financing Authority, | Alameda Corridor Transportation | |||||||||
| Revenue (Baptist Health): | Authority, Revenue | |||||||||
| 0/5%, 11/15/2013 | (Subordinated Lien) 0/5.25%, | |||||||||
| (Insured; MBIA) | 1,365,000 a | 1,318,289 | 10/1/2021 (Insured; AMBAC) | 5,000,000 a | 3,820,950 | |||||
| 0/5%, 11/15/2014 | California: | |||||||||
| (Insured; MBIA) | 2,500,000 a | 2,418,550 | 6.80%, 10/1/2005 | 700,000 | 702,275 | |||||
| Alaska—.2% | 4%, 2/1/2008 | 2,385,000 | 2,436,683 | |||||||
| Anchorage, Electric Utility Revenue | 5.75%, 3/1/2008 | 190,000 | 193,549 | |||||||
| 8%, 12/1/2010 (Insured; MBIA) | 1,000,000 | 1,219,930 | 6.60%, 2/1/2009 | 510,000 | 565,891 | |||||
| Arizona—2.4% | 5.75%, 3/1/2009 | |||||||||
| Arizona School Facilities Board, | (Insured; FGIC) | 80,000 | 81,547 | |||||||
| State School Improvement | 5%, 11/1/2011 | 655,000 b | 721,057 | |||||||
| Revenue 5%, 7/1/2008 | 1,625,000 | 1,712,815 | 5%, 11/1/2012 | 345,000 | 373,563 | |||||
| 5%, 5/1/2018 | 30,000,000 | 32,697,900 | ||||||||
| Maricopa County Unified | 5.50%, 6/1/2020 | 5,000,000 | 5,416,750 | |||||||
| School District: | 5.25%, 11/1/2026 | 10,500,000 | 11,597,775 | |||||||
| (Paradise Valley): | 5%, 2/1/2033 | 1,825,000 | 1,915,009 | |||||||
| 6.35%, 7/1/2010 | 5.50%, 11/1/2033 | 3,900,000 | 4,395,066 | |||||||
| (Insured; MBIA) | 550,000 | 627,011 | ||||||||
| 7%, 7/1/2011 | California Department of Water | |||||||||
| (Insured; MBIA) | 1,905,000 | 2,269,998 | Resources, Power Supply Revenue: | |||||||
| (Scottsdale School) | 5.50%, 5/1/2008 | 4,000,000 | 4,237,160 | |||||||
| 6.60%, 7/1/2012 | 1,250,000 | 1,495,787 | 5.375%, 5/1/2018 | |||||||
| (Insured; AMBAC) | 5,000,000 | 5,543,750 | ||||||||
| Phoenix: | ||||||||||
| 5.40%, 7/1/2007 | 1,000,000 | 1,044,190 | California Economic Recovery | |||||||
| 6.25%, 7/1/2016 | 1,250,000 | 1,543,012 | 5%, 7/1/2016 | 10,400,000 | 11,224,720 | |||||
| Phoenix Industrial Development | California Educational | |||||||||
| Authority, SFMR 6.60%, | Facilities Authority: | |||||||||
| 12/1/2029 (Collateralized: | (Pepperdine University) | |||||||||
| FHLMC, FNMA and GNMA) | 585,000 | 589,159 | 5.75%, 9/15/2008 | 3,250,000 b | 3,547,017 | |||||
| (Stanford University) | ||||||||||
| Salt River Project Agricultural | 5%, 11/1/2011 | 3,000,000 | 3,300,780 | |||||||
| Improvement and Power District, | ||||||||||
| Electric System Revenue: | California Housing Finance Agency, | |||||||||
| 5%, 1/1/2010 | 1,000,000 | 1,074,980 | Home Mortgage Revenue | |||||||
| 5%, 1/1/2016 | 1,475,000 | 1,615,228 | 5.65%, 8/1/2006 (Insured; MBIA) | 655,000 | 665,585 | |||||
| 5%, 1/1/2017 | 1,000,000 | 1,092,070 | California Infrastructure and Economic | |||||||
| Scottsdale Industrial Development | Development Bank, Revenue | |||||||||
| Authority, HR (Scottsdale | (Clean Water State Revolving | |||||||||
| Healthcare) 5.70%, 12/1/2021 | 1,000,000 | 1,089,750 | Fund) 5%, 10/1/2017 | 2,500,000 | 2,724,225 | |||||
| The Funds 17 |
| STATEMENT OF INVESTMENTS (continued) |
| Mellon National Intermediate Municipal Bond Fund (continued) | ||||||||||
| Long-Term Municipal | Principal | Principal | ||||||||
| Investments (continued) | Amount ($) | Value ($) | Amount ($) | Value ($) | ||||||
| California (continued) | California (continued) | |||||||||
| California Municipal Finance Authority, | San Francisco City and County Airports | |||||||||
| SWDR (Waste Management Inc. | Commission, International Airport | |||||||||
| Project) 4.10%, 9/1/2009 | 1,000,000 | 1,010,180 | Revenue 5.625%, 5/1/2006 | |||||||
| California Statewide Community | (Insured; FGIC) | 500,000 | 508,715 | |||||||
| Development Authority, Revenue: | San Jose Redevelopment Agency, | |||||||||
| (Daughters of Charity Health) | Tax Allocation (Merged | |||||||||
| 5.25%, 7/1/2024 | 3,000,000 | 3,180,690 | Area Redevelopment): | |||||||
| (Kaiser-Permanente) | 6%, 8/1/2009 (Insured; MBIA) | 205,000 | 227,761 | |||||||
| 3.85%, 8/1/2006 | 1,250,000 | 1,259,000 | 6%, 8/1/2009 (Insured; MBIA) | 420,000 | 464,764 | |||||
| Multi Family Housing: | Santa Margarita-Dana Point | |||||||||
| (Archstone/Seascape) | Authority, Revenue 7.25%, | |||||||||
| 5.25%, 6/1/2008 | 4,000,000 | 4,174,840 | 8/1/2007 (Insured; MBIA) | 500,000 | 539,985 | |||||
| (Equity Residential) | Southern California Public Power | |||||||||
| 5.20%, 6/15/2009 | 3,000,000 | 3,167,880 | Authority, Power Project | |||||||
| Foothill/Eastern Transportation | Revenue (San Juan Unit 3): | |||||||||
| Corridor Agency, | 5.50%, 1/1/2013 | |||||||||
| Toll Road Revenue: | (Insured; FSA) | 3,010,000 | 3,413,942 | |||||||
| 0/5.80%, 1/15/2020 | 5.50%, 1/1/2014 | |||||||||
| (Insured; MBIA) | 1,505,000 a | 1,376,217 | (Insured; FSA) | 2,000,000 | 2,286,080 | |||||
| 0/5.875%, 1/15/2026 | Westside Unified School District | |||||||||
| (Insured; MBIA) | 8,000,000 a | 7,201,120 | 6%, 8/1/2014 (Insured; AMBAC) | 385,000 | 458,262 | |||||
| Golden State Tobacco Securitization | Colorado—4.1% | |||||||||
| Corp., Tobacco Settlement Revenue | ||||||||||
| (Enhanced-Asset Backed): | Colorado Department of Transportation, | |||||||||
| 5.75%, 6/1/2008 | 6,755,000 b | 7,243,724 | Transportation Revenue, RAN | |||||||
| 5.75%, 6/1/2008 | 8,240,000 b | 8,836,164 | 5.25%, 6/15/2010 | |||||||
| 5%, 6/1/2045 | 10,000,000 | 10,434,600 | (Insured; MBIA) | 1,000,000 | 1,091,140 | |||||
| Kern High School District | Colorado Educational and Cultural | |||||||||
| 6.40%, 2/1/2012 (Insured; MBIA) | 2,750,000 | 3,192,447 | Facilities Authority, Revenue | |||||||
| (Regis University Project) | ||||||||||
| Los Angeles Department of Water and | 5%, 6/1/2022 (Insured; Radian) | 1,825,000 | 1,913,147 | |||||||
| Power, Power Systems Revenue | ||||||||||
| 5.25%, 7/1/2011 (Insured; MBIA) | 2,250,000 | 2,489,152 | Colorado Health Facilities Authority, | |||||||
| Revenue (Vail Valley Medical | ||||||||||
| Los Angeles Unified School District | Center Project) 5%, 1/15/2020 | 1,250,000 | 1,308,500 | |||||||
| 5.75%, 7/1/2016 (Insured; MBIA) | 2,000,000 | 2,369,980 | ||||||||
| Colorado Housing Finance Authority: | ||||||||||
| Modesto Wastewater Treatment | 6.75%, 4/1/2015 | 145,000 | 147,917 | |||||||
| Facility, Revenue 6%, 11/1/2009 | 6.70%, 10/1/2016 | 90,000 | 90,405 | |||||||
| (Insured; MBIA) | 500,000 | 558,360 | 7.15%, 10/1/2030 | |||||||
| Oakland Joint Powers Financing | (Insured; FHA) | 130,000 | 135,087 | |||||||
| Authority, LR (Oakland Convention | (Single Family Program): | |||||||||
| Centers) 5.50%, 10/1/2013 | 7.10%, 5/1/2015 | 30,000 | 30,190 | |||||||
| (Insured; AMBAC) | 1,500,000 | 1,709,010 | 6.05%, 10/1/2016 | 275,000 | 282,004 | |||||
| Sacramento Municipal Utility | 6.75%, 10/1/2021 | |||||||||
| District, Electric Revenue: | (Insured; FHA) | 405,000 | 413,404 | |||||||
| 5.30%, 7/1/2012 | 1,145,000 | 1,224,555 | 7.55%, 11/1/2027 | 50,000 | 50,348 | |||||
| 5.25%, 5/15/2013 | 6.80%, 11/1/2028 | 65,000 | 65,436 | |||||||
| (Insured; FGIC) | 3,530,000 | 3,964,931 | ||||||||
| 18 |
| Mellon National Intermediate Municipal Bond Fund (continued) | ||||||||||
| Long-Term Municipal | Principal | Principal | ||||||||
| Investments (continued) | Amount ($) | Value ($) | Amount ($) | Value ($) | ||||||
| Colorado (continued) | Florida (continued) | |||||||||
| E-470 Public Highway | JEA, Saint Johns River Power | �� | ||||||||
| Authority, Revenue: | Park System, Revenue | |||||||||
| 0/5%, 9/1/2016 (Insured; MBIA) | 3,565,000 a | 2,898,274 | 5%, 10/1/2015 | 2,750,000 | 2,974,180 | |||||
| 0/5%, 9/1/2017 (Insured; MBIA) | 3,500,000 a | 2,850,715 | Key West Utility Board, Electric | |||||||
| Jefferson County School District | Revenue 5.75%, 10/1/2006 | |||||||||
| 6.50%, 12/15/2010 | (Insured; AMBAC) | 1,000,000 | 1,030,860 | |||||||
| (Insured; MBIA) | 1,500,000 | 1,734,885 | Lee County, Airport Revenue | |||||||
| Northwest Parkway Public | 5.875%, 10/1/2019 | |||||||||
| Highway Authority: | (Insured; FSA) | 2,500,000 | 2,756,475 | |||||||
| 0/5.45%, 6/15/2017 | Miami-Dade County, Subordinate | |||||||||
| (Insured; AMBAC) | 7,690,000 a | 6,565,184 | Special Obligation: | |||||||
| 0/5.55%, 6/15/2018 | 0/5%, 10/1/2022 | 2,000,000 a | 1,445,780 | |||||||
| (Insured; FSA) | 5,000,000 a | 4,265,150 | 0/5%, 10/1/2035 | 1,500,000 a | 1,315,785 | |||||
| 0/5.70%, 6/15/2021 | Orlando and Orange County | |||||||||
| (Insured; AMBAC) | 7,345,000 a | 6,279,681 | Expressway Authority, Expressway | |||||||
| University of Colorado, | Revenue 5%, 7/1/2013 | |||||||||
| Enterprise System Revenue: | (Insured; AMBAC) | 4,710,000 | 5,205,445 | |||||||
| 5%, 6/1/2009 | 500,000 | 533,400 | Georgia—1.7% | |||||||
| 5.50%, 6/1/2010 | 500,000 | 550,510 | ||||||||
| Atlanta, Water and Wastewater | ||||||||||
| Connecticut—.3% | Revenue 5%, 5/1/2009 | |||||||||
| Connecticut 5.25%, 6/1/2018 | (Insured; FGIC) | 1,435,000 b | 1,543,386 | |||||||
| (Insured; AMBAC) | 1,500,000 | 1,723,830 | Burke County Development | |||||||
| Connecticut Health and Educational | Authority, PCR (Georgia Power Co. | |||||||||
| Facilities Authority, | Plant Vogtle Project) | |||||||||
| Revenue (Yale University) | 4.75%, 5/1/2034 (Insured; FGIC) | 1,595,000 | 1,619,244 | |||||||
| 5.125%, 7/1/2027 | 300,000 | 316,560 | Chatham County Hospital Authority | |||||||
| Stamford 6.60%, 1/15/2007 | 500,000 | 524,870 | (Memorial Health Medical Center) | |||||||
| Florida—3.8% | 6.125%, 1/1/2024 | 2,480,000 | 2,727,132 | |||||||
| Florida Board of Education (Capital | Crisp County Development | |||||||||
| Outlay—Public Education) | Authority, EIR (International | |||||||||
| 5.50%, 6/1/2010 | 1,750,000 b | 1,943,305 | Paper Co. Project) | |||||||
| Florida Municipal Loan Council, | 5.55%, 2/1/2015 | 1,000,000 | 1,069,930 | |||||||
| Revenue 5.75%, 11/1/2015 | Georgia: | |||||||||
| (Insured; MBIA) | 520,000 | 585,088 | 5.40%, 11/1/2010 | 1,000,000 | 1,107,720 | |||||
| Hillsborough County Aviation | 5.75%, 9/1/2011 | 3,460,000 | 3,937,203 | |||||||
| Authority, Revenue (Tampa | Georgia Municipal Electric Authority | |||||||||
| International Airport): | (Project One) 6%, 1/1/2006 | 1,275,000 | 1,287,877 | |||||||
| 5.125%, 10/1/2020 | Illinois—3.5% | |||||||||
| (Insured; AMBAC) | 3,540,000 | 3,884,619 | Chicago: | |||||||
| 5.125%, 10/1/2021 | Gas Supply Revenue | |||||||||
| (Insured; AMBAC) | 3,675,000 | 4,023,169 | (Peoples Gas, Light and Coke) | |||||||
| Hillsborough County Educational | 4.75%, 6/30/2014 | 1,000,000 | 1,042,330 | |||||||
| Facilities Authority (University of | SFMR 4.70%, 10/1/2017 | |||||||||
| Tampa Project) 5.75%, 4/1/2018 | (Collateralized: FNMA and GNMA) | 195,000 | 195,392 | |||||||
| (Insured; Radian) | 3,270,000 | 3,596,117 | ||||||||
| T h e F u n d s 19 |
| STATEMENT OF INVESTMENTS (continued) |
| Mellon National Intermediate Municipal Bond Fund (continued) | ||||||||||
| Long-Term Municipal | Principal | Principal | ||||||||
| Investments (continued) | Amount ($) | Value ($) | Amount ($) | Value ($) | ||||||
| Illinois (continued) | Massachusetts—4.9% | |||||||||
| Chicago Metropolitan Water | Massachusetts, Consolidated Loan: | |||||||||
| Reclamation District | 5.75%, 9/1/2009 | 500,000 b | 554,405 | |||||||
| (Chicago Capital Improvement) | 5.25%, 11/1/2012 | 3,000,000 b | 3,332,490 | |||||||
| 7.25%, 12/1/2012 | 8,500,000 | 10,560,570 | 5%, 8/1/2014 | 3,000,000 b | 3,304,590 | |||||
| Du Page County Community High | Massachusetts Bay Transportation | |||||||||
| School District (Downers Grove) | Authority, Sales Tax Revenue | |||||||||
| 5.50%, 12/1/2009 (Insured; FSA) | 1,000,000 b | 1,084,780 | 5.50%, 7/1/2016 | 7,750,000 | 9,011,700 | |||||
| Illinois Finance Authority, Gas Supply | Massachusetts Development | |||||||||
| Revenue (People’s Gas, Light and | Finance Agency, Revenue: | |||||||||
| Coke Co.) 4.30%, 6/1/2016 | (Boston University Issue) | |||||||||
| (Insured; AMBAC) | 2,500,000 | 2,538,850 | 5%, 10/1/2035 | |||||||
| Illinois Health Facilities Authority, | (Insured; AMBAC) | 2,000,000 | 2,132,900 | |||||||
| Revenue (Loyola University | (Combined Jewish Philanthropies) | |||||||||
| Health System) 5.75%, 7/1/2011 | 2,500,000 | 2,721,400 | 4.75%, 2/1/2015 | 4,135,000 | 4,390,915 | |||||
| Lake County Community Unitary | Massachusetts Housing | |||||||||
| School District (Waukegan) | Finance Agency, HR | |||||||||
| 5.625%, 12/1/2011 (Insured; FSA) | 3,150,000 | 3,442,981 | 5.125%, 12/1/2034 | 350,000 | 359,786 | |||||
| Regional Transportation Authority: | Massachusetts Municipal Wholesale | |||||||||
| 7.75%, 6/1/2009 (Insured; FGIC) | 1,000,000 | 1,158,900 | Electric Co. Power Supply System | |||||||
| 7.75%, 6/1/2010 (Insured; FGIC) | 1,620,000 | 1,934,021 | Revenue (Project Number 6) | |||||||
| 7.75%, 6/1/2012 (Insured; FGIC) | 1,890,000 | 2,373,953 | 5.25%, 7/1/2012 (Insured; MBIA) | 2,000,000 | 2,216,760 | |||||
| Iowa—.4% | Massachusetts Port Authority, | |||||||||
| Muscatine, Electric Revenue | Revenue: | |||||||||
| 5.50%, 1/1/2011 | 6%, 1/1/2010 | 2,035,000 b | 2,290,738 | |||||||
| (Insured; AMBAC) | 3,000,000 | 3,322,530 | 5.75%, 7/1/2010 | 1,325,000 | 1,462,323 | |||||
| Kentucky—.6% | Massachusetts School Building | |||||||||
| Authority, Dedicated Sales Tax | ||||||||||
| Kentucky Property and Buildings | 5%, 8/15/2017 (Insured; FSA) | 4,000,000 | 4,413,920 | |||||||
| Commission, Revenue | ||||||||||
| 6%, 2/1/2010 (Insured; FSA) | 2,000,000 b | 2,233,080 | Massachusetts Water Pollution | |||||||
| Abatement Trust (Pool Program | ||||||||||
| Kentucky Turnpike Authority, EDR | Bonds) 5.25%, 8/1/2017 | 2,500,000 | 2,796,975 | |||||||
| (Revitalization’s Projects): | ||||||||||
| 6.50%, 7/1/2007 | Weston: | |||||||||
| (Insured; AMBAC) | 1,000,000 | 1,062,760 | 5.625%, 3/1/2010 | 650,000 b | 718,757 | |||||
| 5.50%, 7/1/2012 | 5.625%, 3/1/2010 | 665,000 b | 734,759 | |||||||
| (Insured; AMBAC) | 1,250,000 | 1,410,837 | Michigan—1.2% | |||||||
| Maine—.2% | Fowlerville Community School District | |||||||||
| Maine Municipal Bond Bank | 6.50%, 5/1/2006 (Insured; MBIA) | 555,000 | 568,287 | |||||||
| 5.875%, 11/1/2009 | Michigan Hospital Finance | |||||||||
| (Insured; FSA) | 1,660,000 b | 1,852,045 | Authority, Revenue | |||||||
| Maryland—1.6% | (Genesys Regional Medical | |||||||||
| Hospital) 5.50%, 10/1/2008 | 1,505,000 | 1,610,621 | ||||||||
| Maryland Health and Higher | ||||||||||
| Educational Facilities Authority, | Michigan Municipal Bond Authority, | |||||||||
| Revenue (Johns Hopkins | State Revolving Fund Revenue: | |||||||||
| University) 5%, 7/1/2024 | 1,000,000 | 1,073,360 | (Clean Water) | |||||||
| 5%, 10/1/2021 | 5,000,000 | 5,367,950 | ||||||||
| Maryland State and Local Facilities | (Drinking Water) | |||||||||
| Loan (Second Series) | 5.50%, 10/1/2015 | 1,000,000 | 1,158,980 | |||||||
| 5%, 8/1/2015 | 10,000,000 | 11,072,800 | ||||||||
20
| Mellon National Intermediate Municipal Bond Fund (continued) | ||||||||||||
| Long-Term Municipal | Principal | Principal | ||||||||||
| Investments (continued) | Amount ($) | Value ($) | Amount ($) | Value ($) | ||||||||
| Michigan (continued) | New Hampshire (continued) | |||||||||||
| Saint Johns Public Schools (School | New Hampshire Business Finance | |||||||||||
| Bond Loan Fund) 6.50%, | Authority, PCR (Central Maine | |||||||||||
| 5/1/2006 (Insured; FGIC) | 525,000 | 537,568 | Power Co.) 5.375%, 5/1/2014 | 1,000,000 | 1,079,890 | |||||||
| Minnesota—2.5% | New Jersey—7.2% | |||||||||||
| Minneapolis (Special School | Garden State Preservation Trust: | |||||||||||
| District Number 1) | (Open Space and | |||||||||||
| 5%, 2/1/2014 (Insured; FSA) | 2,350,000 | 2,489,566 | Farmland Preservation): | |||||||||
| Minnesota Housing Finance Agency | 5.80%, 11/1/2018 | |||||||||||
| (Residential Housing) | (Insured; FSA) | 5,000,000 | c | 5,908,600 | ||||||||
| 2.35%, 12/11/2006 | 5,000,000 | 4,937,850 | 5.80%, 11/1/2019 | |||||||||
| Minnesota Public Facilities Authority, | (Insured; FSA) | 5,000,000 | c | 5,889,850 | ||||||||
| Water Pollution Control Revenue | 5.80%, 11/1/2023 | |||||||||||
| 5.25%, 3/1/2016 | 10,000,000 | 11,446,200 | (Insured; FSA) | 5,000,000 | c | 5,806,250 | ||||||
| Mississippi—1.1% | Gloucester County Improvement | |||||||||||
| Authority, Solid Waste Resource | ||||||||||||
| Mississippi 5.50%, 12/1/2017 | 1,250,000 | 1,467,912 | Recovery Revenue: | |||||||||
| Mississippi Higher Education | 6.85%, 12/1/2009 | 4,000,000 | 4,473,160 | |||||||||
| Assistance Corp., Student Loan | 7%, 12/1/2009 | 1,000,000 | 1,119,540 | |||||||||
| Revenue 6.05%, 9/1/2007 | 85,000 | 85,139 | New Jersey 6%, 2/15/2011 | 1,000,000 | 1,131,010 | |||||||
| Mississippi Hospital Equipment and | New Jersey Economic | |||||||||||
| Facilities Authority, Revenue | Development Authority: | |||||||||||
| (Baptist Memorial Health Care) | Cigarette Tax Revenue: | |||||||||||
| 5%, 9/1/2024 | 5,845,000 | 6,004,861 | 5%, 6/15/2013 | |||||||||
| Mississippi University Educational | (Insured; FGIC) | 3,000,000 | 3,276,090 | |||||||||
| Building Corp., Revenue | 5.375%, 6/15/2015 | 4,400,000 | 4,853,904 | |||||||||
| 5.25%, 8/1/2016 (Insured; MBIA) | 400,000 | 455,064 | 5.50%, 6/15/2024 | 4,000,000 | 4,251,920 | |||||||
| Missouri—.8% | 5.50%, 6/15/2031 | 1,000,000 | 1,058,090 | |||||||||
| Missouri Environmental Improvement | School Facilities Construction | |||||||||||
| and Energy Resource Authority, | Revenue 5.25%, 6/15/2011 | 5,375,000 | b | 5,946,524 | ||||||||
| Water Pollution Control Revenue | Trasportation Sublease Revenue | |||||||||||
| (Revolving Fund Program) | (New Jersey Transit Corp. Light | |||||||||||
| 5.50%, 7/1/2014 | 1,250,000 | 1,433,887 | Rail Transit System) 5.875%, | |||||||||
| Missouri Highways and Transportation | 5/1/2009 (Insured; FSA) | 1,000,000 | b | 1,097,430 | ||||||||
| Commission, State Road Revenue: | New Jersey Highway Authority, | |||||||||||
| 5.50%, 2/1/2010 | 2,000,000 | 2,193,180 | General Revenue | |||||||||
| 5.50%, 2/1/2011 | 2,000,000 | 2,223,900 | (Garden State Parkway): | |||||||||
| 5%, 1/1/2009 (Insured; FGIC) | 1,060,000 | 1,126,208 | ||||||||||
| Nebraska—.3% | 5%, 1/1/2010 (Insured; FGIC) | 1,110,000 | 1,193,694 | |||||||||
| Municipal Energy Agency of Nebraska, | New Jersey Transit Corp., COP: | |||||||||||
| Power Supply System | 5.50%, 9/15/2009 | |||||||||||
| 5%, 4/1/2025 (Insured; FSA) | 2,000,000 | 2,140,040 | (Insured; AMBAC) | 5,000,000 | 5,422,550 | |||||||
| Nevada—.3% | 6%, 9/15/2010 | |||||||||||
| Humboldt County, PCR | (Insured; AMBAC) | 2,000,000 | b | 2,263,140 | ||||||||
| (Sierra Pacific) 6.55%, | New Mexico—.4% | |||||||||||
| 10/1/2013 (Insured; AMBAC) | 2,000,000 | 2,086,640 | New Mexico Finance Authority, | |||||||||
| New Hampshire—.2% | Revenue (Public Project Revolving | |||||||||||
| Nashua, Capital Improvement | Fund) 5.25%, 6/1/2017 | |||||||||||
| 5.50%, 7/15/2018 | 560,000 | 627,318 | (Insured; AMBAC) | 1,000,000 | 1,113,720 | |||||||
The Funds 21
| STATEMENT OF INVESTMENTS (continued) |
| Mellon National Intermediate Municipal Bond Fund (continued) | ||||||||||
| Long-Term Municipal | Principal | Principal | ||||||||
| Investments (continued) | Amount ($) | Value ($) | Amount ($) | Value ($) | ||||||
| New Mexico (continued) | New York (continued) | |||||||||
| New Mexico Highway Commission, | New York Counties Tobacco Trust IV, | |||||||||
| Tax Revenue 6%, 6/15/2010 | 2,000,000 b | 2,249,260 | Tobacco Settlement Pass-Through: | |||||||
| New York—10.8% | 5%, 6/1/2042 | 1,000,000 | 987,490 | |||||||
| Greece Central School District: | 5%, 6/1/2045 | 2,000,000 | 1,974,320 | |||||||
| 6%, 6/15/2010 (Insured; FGIC) | 225,000 | 253,786 | New York State Dormitory Authority, | |||||||
| 6%, 6/15/2011 (Insured; FGIC) | 950,000 | 1,091,066 | Revenue: | |||||||
| 6%, 6/15/2012 (Insured; FGIC) | 950,000 | 1,105,249 | (Consolidated City University | |||||||
| 6%, 6/15/2013 (Insured; FGIC) | 950,000 | 1,118,929 | System) 5.75%, 7/1/2018 | |||||||
| 6%, 6/15/2014 (Insured; FGIC) | 950,000 | 1,128,059 | (Insured; FSA) | 200,000 | 237,402 | |||||
| 6%, 6/15/2015 (Insured; FGIC) | 950,000 | 1,137,939 | (FIT Student Housing) 5.75%, | |||||||
| Long Island Power Authority, | 7/1/2006 (Insured; AMBAC) | 130,000 | 133,082 | |||||||
| Electric System Revenue: | New York State Power Authority, | |||||||||
| 5%, 6/1/2009 | 2,000,000 | 2,123,620 | General Purpose Revenue | |||||||
| 5%, 4/1/2010 | 7%, 1/1/2010 | 300,000 b | 347,283 | |||||||
| (Insured; AMBAC) | 2,500,000 | 2,688,150 | New York State Thruway Authority: | |||||||
| Metropolitan Transportation Authority: | (Highway and Bridge Trust Fund): | |||||||||
| Commuter Facilities Revenue: | 5.50%, 4/1/2007 (Insured; FGIC) | 500,000 | 520,795 | |||||||
| 5.50%, 7/1/2007 | 6%, 4/1/2010 (Insured; FSA) | 2,000,000 b | 2,263,800 | |||||||
| (Insured; AMBAC) | 1,000,000 | 1,047,610 | 6%, 4/1/2010 (Insured; FSA) | 1,000,000 b | 1,131,900 | |||||
| 5.50%, 7/1/2011 | 1,000,000 | 1,078,100 | 5.50%, 4/1/2011 | |||||||
| Service Contract Revenue: | (Insured; FGIC) | 1,000,000 b | 1,127,550 | |||||||
| 5.50%, 7/1/2016 | 5,000,000 | 5,751,200 | (Second General Highway and | |||||||
| 5.75%, 1/1/2018 | 1,500,000 | 1,752,705 | Bridge Trust Fund): | |||||||
| Nassau County, General | 5.25%, 4/1/2012 | |||||||||
| Improvement 5.10%, | (Insured; AMBAC) | 5,000,000 | 5,555,400 | |||||||
| 11/1/2013 (Insured; AMBAC) | 3,000,000 b | 3,195,990 | 5%, 4/1/2019 | |||||||
| (Insured; AMBAC) | 5,000,000 c | 5,496,350 | ||||||||
| New York City: | ||||||||||
| 7%, 8/1/2006 | 300,000 | 311,058 | New York State Urban Development | |||||||
| 6%, 4/15/2007 | 4,000,000 b | 4,239,840 | Corp., Revenue (Correctional | |||||||
| 5.75%, 8/1/2007 | 265,000 b | 281,902 | Capital Facilities) 5%, 1/1/2011 | 5,000,000 | 5,353,000 | |||||
| 5.50%, 8/1/2010 (Insured; XLCA) | 2,000,000 | 2,204,820 | Orange County 5.50%, 11/15/2007 | 250,000 | 264,108 | |||||
| 5%, 8/1/2012 | 5,105,000 | 5,542,907 | Port Authority of New York and | |||||||
| 5.75%, 8/1/2012 | 280,000 | 295,571 | New Jersey 5.50%, 10/15/2006 | |||||||
| 5.75%, 8/1/2013 | 1,650,000 | 1,813,961 | (Insured; MBIA) | 3,045,000 | 3,131,113 | |||||
| New York City Municipal Water | Tobacco Settlement Financing | |||||||||
| Finance Authority, Water and | Corp. of New York, Asset-Backed | |||||||||
| Sewer Systems Revenue: | Revenue (State Contingency | |||||||||
| 5.75%, 6/15/2006 | Contract Secured): | |||||||||
| (Insured; MBIA) | 440,000 b | 454,595 | 5.50%, 6/1/2018 | |||||||
| 5.75%, 6/15/2026 | (Insured; MBIA) | 2,000,000 | 2,223,900 | |||||||
| (Insured; MBIA) | 815,000 | 840,567 | 5.50%, 6/1/2019 | 5,000,000 | 5,578,100 | |||||
| New York City Transitional Finance | North Carolina—4.1% | |||||||||
| Authority, Revenue: | Charlotte 5%, 4/1/2013 | 1,000,000 | 1,111,080 | |||||||
| 6.125%, 5/15/2010 | 825,000 b | 941,754 | Charlotte-Mecklenberg Hospital | |||||||
| 6.125%, 5/15/2010 | 175,000 b | 199,766 | Authority, Health Care System | |||||||
| 6.125%, 5/15/2010 | 2,000,000 b | 2,283,040 | Revenue 5.60%, 1/15/2011 | 1,000,000 | 1,029,090 | |||||
| 5.50%, 11/1/2011 | 3,000,000 | 3,322,050 | ||||||||
22
| Mellon National Intermediate Municipal Bond Fund (continued) | ||||||||||||
| Long-Term Municipal | Principal | Principal | ||||||||||
| Investments (continued) | Amount ($) | Value ($) | Amount ($) | Value ($) | ||||||||
| North Carolina (continued) | Ohio (continued) | |||||||||||
| Concord, COP 5.50%, | Ohio Infrastructure Improvements | |||||||||||
| 6/1/2011 (Insured; MBIA) | 1,000,000 | 1,113,200 | 5.625%, 2/1/2009 | 1,000,000 | 1,081,980 | |||||||
| Durham County 5.50%, 4/1/2010 | 1,000,000 | 1,103,130 | Toledo—Lucas County Port | |||||||||
| Guilford County, Public Improvement | Authority, Port Facilities | |||||||||||
| 5.10%, 10/1/2010 | 1,500,000 | b | 1,660,830 | Revenue (Cargill Inc. Project) | ||||||||
| Mecklenburg County: | 4.50%, 12/1/2015 | 900,000 | 936,486 | |||||||||
| 5.50%, 4/1/2011 | 1,195,000 | 1,337,074 | Oklahoma—.2% | |||||||||
| Public Improvement | Oklahoma Capital Improvement | |||||||||||
| 4.75%, 4/1/2008 | 1,000,000 | 1,045,580 | Authority, State Highway Capital | |||||||||
| North Carolina: | Improvement Revenue | |||||||||||
| 5%, 2/1/2012 | 9,000,000 | 9,911,970 | 5%, 6/1/2006 (Insured; MBIA) | 1,200,000 | 1,219,296 | |||||||
| Public Improvement | Oklahoma Housing Finance Agency, | |||||||||||
| 5%, 3/1/2012 | 5,000,000 | 5,511,450 | SFMR 6.80%, 9/1/2016 | |||||||||
| North Carolina Eastern Municipal | (Collateralized; FNMA) | 120,000 | 121,302 | |||||||||
| Power Agency, Power System | Oregon—.7% | |||||||||||
| Revenue 5.375%, 1/1/2016 | 1,500,000 | 1,610,655 | Jackson County School District: | |||||||||
| Raleigh Durham Airport Authority, | (Central Point) 5.75%, | |||||||||||
| Revenue 5.25%, 11/1/2013 | 6/15/2010 (Insured; FGIC) | 2,265,000 b | 2,522,304 | |||||||||
| (Insured; FGIC) | 2,465,000 | 2,704,450 | (Eagle Point) 5.625%, 6/15/2011 | 1,500,000 b | 1,685,610 | |||||||
| Wake County 5.75%, 2/1/2010 | 2,000,000 | b | 2,249,220 | Portland Urban Renewal and | ||||||||
| Wake County Industrial Facilities | Redevelopment (Convention | |||||||||||
| and Pollution Control Financing | Center) 5.75%, 6/15/2018 | |||||||||||
| Authority, Revenue (Carolina Power | (Insured; AMBAC) | 1,150,000 | 1,284,987 | |||||||||
| and Light Co.) 5.375%, 2/1/2017 | 1,000,000 | 1,079,260 | Pennsylvania—2.0% | |||||||||
| Ohio—3.0% | Allegheny County Hospital | |||||||||||
| Akron, Sewer Systems Revenue | Development Authority, Revenue | |||||||||||
| 6%, 12/1/2014 (Insured; AMBAC) | 500,000 | 559,245 | (University of Pittsburgh Medical | |||||||||
| Butler County Transportation | Center) 5.25%, 6/15/2015 | 1,620,000 | 1,780,672 | |||||||||
| Improvement District | Chester County 5%, 11/15/2010 | 3,420,000 | 3,711,692 | |||||||||
| 6%, 4/1/2011 (Insured; FSA) | 1,000,000 | 1,088,730 | Pennsylvania Higher Educational | |||||||||
| Columbus 6%, 6/15/2008 | 3,000,000 | 3,239,670 | Facilities Authority, | |||||||||
| Cuyahoga County, Revenue | Health Services Revenue | |||||||||||
| (Cleveland Clinic Health System): | (University of Pennsylvania) | |||||||||||
| 6%, 1/1/2015 | 2,265,000 | 2,589,008 | 5.35%, 1/1/2006 | 3,750,000 b | 3,818,363 | |||||||
| 6%, 1/1/2017 | 3,900,000 | 4,429,698 | Philadelphia School District | |||||||||
| Erie County, Hospital Facilities | 5%, 4/1/2017 (Insured; AMBAC) | 2,165,000 | 2,376,542 | |||||||||
| Revenue (Firelands Regional Medical | Scranton-Lackawanna Health and | |||||||||||
| Center) 4.50%, 8/15/2006 | 1,200,000 | 1,213,788 | Welfare Authority, Catholic | |||||||||
| Ohio Building Authority: | Healthcare Revenue | |||||||||||
| (Adult Correction Building) | (Mercy Health) 5.10%, | |||||||||||
| 5.25%, 4/1/2008 | 2,000,000 | b | 2,130,300 | 1/1/2007 (Insured; MBIA) | 100,000 | 102,734 | ||||||
| (Juvenile Correction Facilities) | State Public School Building Authority, | |||||||||||
| 5.50%, 4/1/2014 | 3,295,000 | 3,645,852 | College Revenue (Harrisburg | |||||||||
| (Sports Building Fund) | Community College) 6.25%, | |||||||||||
| 5.50%, 4/1/2014 | 1,945,000 | 2,152,104 | 4/1/2008 (Insured; MBIA) | 795,000 | 858,433 | |||||||
| The Funds 23 |
| STATEMENT OF INVESTMENTS (continued) |
| Mellon National Intermediate Municipal Bond Fund (continued) | ||||||||||
| Long-Term Municipal | Principal | Principal | ||||||||
| Investments (continued) | Amount ($) | Value ($) | Amount ($) | Value ($) | ||||||
| Pennsylvania (continued) | Texas (continued) | |||||||||
| Swarthmore Borough Authority, | Laredo Independent School District | |||||||||
| College Revenue: | (Permanent School Fund | |||||||||
| 5%, 9/15/2011 | 1,000,000 | 1,092,550 | Guaranteed) 6%, 8/1/2009 | 1,000,000 b | 1,106,350 | |||||
| 5%, 9/15/2012 | 1,400,000 | 1,540,350 | Lewisville Independent School | |||||||
| Rhode Island—.1% | District Building Bonds (Permanent | |||||||||
| Rhode Island Health and Educational | School Fund Guaranteed): | |||||||||
| Building Corp., Higher Educational | 7.50%, 8/15/2006 | 650,000 | 678,626 | |||||||
| Revenue (Providence College): | 7.50%, 8/15/2007 | 600,000 | 651,972 | |||||||
| 4.50%, 11/1/2017 | Mission Consolidated Independent | |||||||||
| (Insured; XLCA) | 795,000 | 824,948 | School District (Permanent | |||||||
| 5%, 11/1/2022 (Insured; XLCA) | 250,000 | 266,093 | School Fund Guaranteed) | |||||||
| South Carolina—4.4% | 5.875%, 2/15/2008 | 1,690,000 b | 1,806,035 | |||||||
| Georgetown County School District, GO | Red River Education Finance | |||||||||
| 5%, 3/1/2015 (Insured; FSA) | 5,000,000 | 5,501,700 | Corp., Education Revenue | |||||||
| Greenville County School District, | (The Hockaday School | |||||||||
| Installment Purchase Revenue: | Project) 5%, 5/15/2004 | 1,980,000 | 2,111,591 | |||||||
| (Building Equity Sooner | San Antonio Electric and Gas | |||||||||
| Tomorrow): | Revenue General Improvement | |||||||||
| 5.25%, 12/1/2010 | 10,000,000 | 10,869,600 | 5.90%, 2/1/2010 | 500,000 b | 556,220 | |||||
| 5.25%, 12/1/2011 | 5,650,000 | 6,198,785 | Texas Municipal Power Agency, | |||||||
| 5.875%, 12/1/2012 | 3,000,000 b | 3,496,440 | Revenue 4.40%, 9/1/2011 | |||||||
| 5.50%, 12/1/2018 | 3,000,000 | 3,424,230 | (Insured; FGIC) | 2,750,000 | 2,803,268 | |||||
| 5%, 12/1/2024 | 1,000,000 | 1,055,940 | Utah—.7% | |||||||
| South Carolina Jobs-Economic | Intermountain Power Agency, | |||||||||
| Development Authority, Revenue: | Power Supply Revenue: | |||||||||
| Economic Development (Waste | 6%, 7/1/2008 (Insured; MBIA) | 4,200,000 | 4,531,884 | |||||||
| Management of South Carolina | 6.25%, 7/1/2009 (Insured; FSA) | 750,000 | 832,868 | |||||||
| Inc.) 3.30%, 11/1/2007 | 1,000,000 | 996,540 | Vermont—.7% | |||||||
| Hospital Facilities (Georgetown | ||||||||||
| Memorial Hospital) 5.25%, | Burlington, Electric Revenue: | |||||||||
| 2/1/2021 (Insured; Radian) | 1,250,000 | 1,316,075 | 6.25%, 7/1/2011 (Insured; MBIA) | 2,000,000 | 2,310,060 | |||||
| 6.25%, 7/1/2012 (Insured; MBIA) | 2,500,000 | 2,931,900 | ||||||||
| South Carolina School Facilities | ||||||||||
| 5%, 1/1/2009 | 1,000,000 | 1,063,120 | Virginia—1.3% | |||||||
| Tennessee—.0% | Chesterfield County Industrial | |||||||||
| Development Authority, PCR | ||||||||||
| Shelby County Health Educational and | 5.875%, 6/1/2017 | 3,000,000 | 3,303,060 | |||||||
| Housing Facilities Board, Revenue | ||||||||||
| (Saint Judes Children’s Research) | Louisa Industrial Development | |||||||||
| 5%, 7/1/2009 | 200,000 | 209,524 | Authority, PCR (Virginia Electric and | |||||||
| Power Co.) 5.25%, 12/1/2008 | 3,000,000 | 3,101,430 | ||||||||
| Texas—2.4% | ||||||||||
| Newport News Industrial | ||||||||||
| Austin Independent School District | Development Authority, Revenue | |||||||||
| (Permanent School Fund | (Advanced Shipbuilding Carrier) | |||||||||
| Guaranteed) 5.70%, 8/1/2011 | 1,530,000 | 1,567,516 | 5.50%, 9/1/2010 | 1,000,000 | 1,105,250 | |||||
| Dallas Fort Worth, International | Virginia Commonwealth | |||||||||
| Airport Revenue 5.50%, | Transportation Board (Federal | |||||||||
| 11/1/2031 (Insured; FGIC) | 1,000,000 | 1,068,520 | Highway Reimbursement | |||||||
| Harris County, Toll Road Revenue | Notes) 5%, 9/27/2012 | 2,000,000 | 2,205,020 | |||||||
| 6%, 8/1/2009 (Insured; FGIC) | 5,150,000 | 5,687,712 | ||||||||
24
| Mellon National Intermediate Municipal Bond Fund (continued) | ||||||||||||
| Long-Term Municipal | Principal | Principal | ||||||||||
| Investments (continued) | Amount ($) | Value ($) | Amount ($) | Value ($) | ||||||||
| Washington—.4% | U.S. Related (continued) | |||||||||||
| Seattle Municipal Light and Power, | Puerto Rico Public Buildings Authority, | |||||||||||
| Revenue 5.50%, 12/1/2010 | 1,000,000 | 1,100,140 | Government Facility Revenue: | |||||||||
| Washington Public Power | 6.25%, 7/1/2010 | |||||||||||
| Supply System, Revenue | (Insured; AMBAC) | 750,000 | 854,348 | |||||||||
| (Nuclear Project Number 1): | 5.50%, 7/1/2014 | 1,000,000 | 1,129,700 | |||||||||
| 6%, 7/1/2006 (Insured; MBIA) | 500,000 | 512,835 | 5.50%, 7/1/2015 | 1,000,000 | 1,134,830 | |||||||
| 7%, 7/1/2008 | 380,000 | 420,918 | 5.50%, 7/1/2016 | 2,000,000 | 2,279,480 | |||||||
| 7%, 7/1/2008 | 620,000 | 683,562 | 5.75%, 7/1/2017 | 1,945,000 | 2,270,263 | |||||||
| West Virginia—.6% | University of Puerto Rico, University | |||||||||||
| Monongalia County Building Commission, | Revenue 6.25%, 6/1/2008 | |||||||||||
| HR (Monongalia General Hospital) | (Insured; MBIA) | 750,000 | 814,710 | |||||||||
| 5.25%, 7/1/2020 | 4,415,000 | 4,709,878 | Total Long-Term | |||||||||
| Wisconsin—.9% | Municipal Investments | |||||||||||
| (cost $715,824,755) | 752,405,572 | |||||||||||
| Kenosha, Waterworks Revenue | ||||||||||||
| 5%, 12/1/2012 (Insured; FGIC) | 750,000 | 804,075 | Short-Term Municipal | |||||||||
| Wisconsin 5%, 5/1/2016 | Investments—5.4% | |||||||||||
| (Insured; MBIA) | 5,000,000 | 5,479,900 | ||||||||||
| Arizona—.4% | ||||||||||||
| Wisconsin Health and Educational | ||||||||||||
| Facilities Authority, Revenue | Phoenix Industrial Development | |||||||||||
| (Aurora Medical Group Inc.) 5.75%, | Authority, Revenue | |||||||||||
| 11/15/2007 (Insured; FSA) | 500,000 | 528,395 | (Valley of The Sun YMCA Project) | |||||||||
| 2.35% (LOC; Bank of America) | 2,900,000 | d | 2,900,000 | |||||||||
| U.S. Related—4.5% | ||||||||||||
| Colorado—.2% | ||||||||||||
| Puerto Rico Commonwealth: | ||||||||||||
| 6%, 7/1/2008 | 1,500,000 | 1,604,205 | Colorado Educational and Cultural | |||||||||
| 6.25%, 7/1/2011 (Insured; MBIA) | 950,000 | 1,102,200 | Facilities Authority, Revenue | |||||||||
| 5%, 7/1/2012 | 2,000,000 | 2,143,760 | (National Jewish Federation | |||||||||
| 6.25%, 7/1/2013 (Insured; MBIA) | 1,380,000 | 1,648,934 | Bond Program) 2.35% | |||||||||
| Public Improvement | (LOC; Bank of America) | 1,800,000 | d | 1,800,000 | ||||||||
| 5%, 7/1/2012 | 5,000,000 b | 5,507,950 | Florida—.3% | |||||||||
| Puerto Rico Commonwealth | Alachua County Health Facilities | |||||||||||
| Highway and Transportation | Authority, Continuing Care | |||||||||||
| Authority, Transportation Revenue: | Retirement Community, Revenue | |||||||||||
| 6.25%, 7/1/2009 (Insured; MBIA) | 150,000 | 167,262 | (Oak Hammock at the University | |||||||||
| 5.875%, 7/1/2010 | of Florida Project) | |||||||||||
| (Insured; MBIA) | 1,405,000 b | 1,591,134 | 2.35% (LOC; BNP Paribas) | 1,700,000 | d | 1,700,000 | ||||||
| 5.875%, 7/1/2035 | Jacksonville Health Facilities Authority, | |||||||||||
| (Insured; MBIA) | 2,595,000 | 2,902,196 | HR, (Genesis Rehabilitation | |||||||||
| Puerto Rico Electric Power | Hospital Project) 2.35% | |||||||||||
| Authority, Power Revenue: | (LOC; Bank of America) | 900,000 | d | 900,000 | ||||||||
| 6.50%, 7/1/2006 | Georgia—.2% | |||||||||||
| (Insured; MBIA) | 625,000 | 643,806 | Gainesville and Hall County | |||||||||
| 5.25%, 7/1/2015 | Development Authority, | |||||||||||
| (Insured; MBIA) | 2,000,000 | 2,284,500 | Senoir Living Facility | |||||||||
| 5%, 7/1/2017 | Revenue (Lanier Village | |||||||||||
| (Insured; MBIA) | 3,940,000 | 4,381,122 | Estates, Inc. Project) | |||||||||
| 5.25%, 7/1/2029 | 2.38% (LOC; Bank of America) | 1,200,000 | d | 1,200,000 | ||||||||
| (Insured; FSA) | 2,000,000 | 2,171,200 | ||||||||||
The Funds 25
| STATEMENT OF INVESTMENTS (continued) |
| Mellon National Intermediate Municipal Bond Fund (continued) | ||||||||||||
| Short-Term Municipal | Principal | Principal | ||||||||||
| Investments (continued) | Amount ($) | Value ($) | Amount ($) | Value ($) | ||||||||
| Indiana—.5% | Tennessee (continued) | |||||||||||
| Indiana Educational Facilities Authority, | Montgomery County Public Building | |||||||||||
| Educational Facilities Revenue | Authority, Pooled Financing | |||||||||||
| (Depauw University Project) | Revenue (Tennessee County | |||||||||||
| 2.32% (LOC; Northern Trust Bank) | 3,400,000 | d | 3,400,000 | Loan Pool) 2.35% (LOC; | ||||||||
| Minnesota—.3% | Bank of America) | 6,800,000 d | 6,800,000 | |||||||||
| Arden Hills, Health Care and Housing | Texas—1.6% | |||||||||||
| Revenue (Presbyterian Homes of | Harris County Health Facilites, | |||||||||||
| Arden Hills, Inc. Project) | Development Corp. HR | |||||||||||
| 2.40% (LOC; U.S. Bancorp) | 2,100,000 | d | 2,100,000 | (Texas Children’s Hospital Project) | ||||||||
| Nebraska—.4% | 2.36% (Insured; MBIA and LOC; | |||||||||||
| Lancaster County Hospital | JPMorgan Chase Bank) | 2,400,000 d | 2,400,000 | |||||||||
| Authority, HR (BryanLGH Medical | Texas, TRAN 4.50%, 8/31/2006 | 10,000,000 | 10,152,800 | |||||||||
| Center Project) 2.35% (Insured; | Total Short-Term | |||||||||||
| AMBAC and LOC; U.S. Bancorp) | 3,000,000 | d | 3,000,000 | Municipal Investments | ||||||||
| Tennessee—1.5% | (cost $41,050,100) | 41,052,800 | ||||||||||
| Clarksville Public Building Authority, | Total Investments | |||||||||||
| Pooled Financing Revenue | (cost $756,874,855) | 103.8% | 793,458,372 | |||||||||
| (Tennessee Municipal Bond Fund): | ||||||||||||
| 2.35% (LOC; | Liabilities, Less Cash | |||||||||||
| Bank of America) | 2,100,000 | d | 2,100,000 | and Receivables | (3.8%) | (28,681,669) | ||||||
| 2.35% (LOC; | Net Assets | 100.0% | 764,776,703 | |||||||||
| Bank of America) | 2,600,000 | d | 2,600,000 | |||||||||
| 26 |
| Summary of Abbreviations | ||||||
| ACA | American Capital Access | IDB | Industrial Development Board | |||
| AGIC | Asset Guaranty Insurance Company | IDC | Industrial Development Corporation | |||
| AMBAC | American Municipal Bond Assurance Corporation | IDR | Industrial Development Revenue | |||
| ARRN | Adjustable Rate Receipt Notes | LOC | Letter of Credit | |||
| BAN | Bond Anticipation Notes | LOR | Limited Obligation Revenue | |||
| BIGI | Bond Investors Guaranty Insurance | LR | Lease Revenue | |||
| BPA | Bond Purchase Agreement | MBIA | Municipal Bond Investors | |||
| CGIC | Capital Guaranty Insurance Company | Assurance Insurance Corporation | ||||
| CIC | Continental Insurance Company | MFHR | Multi-Family Housing Revenue | |||
| CIFG | CDC Ixis Financial Guaranty | MFMR | Multi-Family Mortgage Revenue | |||
| CMAC | Capital Market Assurance Corporation | PCR | Pollution Control Revenue | |||
| COP | Certificate of Participation | RAC | Revenue Anticipation Certificates | |||
| CP | Commercial Paper | RAN | Revenue Anticipation Notes | |||
| EDR | Economic Development Revenue | RAW | Revenue Anticipation Warrants | |||
| EIR | Environmental Improvement Revenue | RRR | Resources Recovery Revenue | |||
| FGIC | Financial Guaranty Insurance Company | SAAN | State Aid Anticipation Notes | |||
| FHA | Federal Housing Administration | SBPA | Standby Bond Purchase Agreement | |||
| FHLB | Federal Home Loan Bank | SFHR | Single Family Housing Revenue | |||
| FHLMC | Federal Home Loan Mortgage Corporation | SFMR | Single Family Mortgage Revenue | |||
| FNMA | Federal National Mortgage Association | SONYMA | State of New York Mortgage Agency | |||
| FSA | Financial Security Assurance | SWDR | Solid Waste Disposal Revenue | |||
| GAN | Grant Anticipation Notes | TAN | Tax Anticipation Notes | |||
| GIC | Guaranteed Investment Contract | TAW | Tax Anticipation Warrants | |||
| GNMA | Government National Mortgage Association | TRAN | Tax and Revenue Anticipation Notes | |||
| GO | General Obligation | XLCA | XL Capital Assurance | |||
| HR | Hospital Revenue | |||||
| Summary of Combined Ratings (Unaudited) | ||||||
| Fitch | or Moody’s or | Standard & Poor’s Value (%) † | ||||
| AAA | Aaa | AAA | 55.3 | |||
| AA | Aa | AA | 17.2 | |||
| A | A | A | 16.2 | |||
| BBB | Baa | BBB | 6.5 | |||
| F1 | MIG1/P1 | SP1/A1 | 4.0 | |||
| Not Rated e | Not Rated e | Not Rated e | .8 | |||
| 100.0 | ||||||
| † Based on total investments. |
| a Zero Coupon until a specified date, at which time the stated coupon rate becomes effective until maturity. |
| b These securities are prerefunded; the date shown represents the prerefunded date. Bonds which are prerefunded are collateralized by U.S. Government securities which are held in |
| escrow and are used to pay principal and interest on the municipal issue and to retire the bonds in full at the earliest refunding date. |
| c Purchased on a delayed delivery basis. |
| d Securities payable on demand.Variable interest rate—subject to periodic change. |
| e Securities which, while not rated by Fitch, Moody’s and Standard & Poor’s, have been determined by the Investment Adviser to be of comparable quality to those rated securities in |
| which the fund may invest. |
| See notes to financial statements. |
| The Funds 27 |
| STATEMENT OF FINANCIAL FUTURES | ||||||||
| August 31, 2005 | ||||||||
| Market Value | Unrealized | |||||||
| Covered by | (Depreciation) | |||||||
| Contracts | Contracts ($) | Expiration | at 8/31/2005 ($) | |||||
| Financial Futures Sold Short | ||||||||
| U.S. Treasury Futures 5 Year Note | 55 | 5,969,219 | September 2005 | (11,172) | ||||
| U.S. Treasury Futures 10 Year Note | 295 | 33,311,953 | September 2005 | (5,598) | ||||
| U.S. Treasury Futures 30 Year Bond | 205 | 24,266,875 | September 2005 | (354,002) | ||||
| (370,772) | ||||||||
| See notes to financial statements. |
| 28 |
| STATEMENT OF INVESTMENTS | ||||||||||||
| August 31, 2005 | ||||||||||||
| Mellon National Short-Term Municipal Bond Fund | ||||||||||||
| Long-Term Municipal | Principal | Principal | ||||||||||
| Investments—97.1% | Amount ($) | Value ($) | Amount ($) | Value ($) | ||||||||
| Alabama—3.4% | Connecticut—2.2% | |||||||||||
| Alabama 5.25%, 6/1/2007 | 1,205,000 | 1,253,598 | Connecticut | |||||||||
| Alabama Water Pollution Control | 4%, 12/15/2005 | 1,000,000 | 1,003,570 | |||||||||
| Authority, Revolving Fund Loan: | Mashantucket Western Pequot Tribe | |||||||||||
| 5%, 8/15/2007 | 6.50%, 9/1/2006 | 2,970,000 c | 3,077,276 | |||||||||
| (Insured; AMBAC) | 1,000,000 | 1,038,860 | Mohegan Tribe of Indians, Gaming | |||||||||
| 5.50%, 8/15/2007 | Authority, Priority Distribution | |||||||||||
| (Insured; AMBAC) | 2,000,000 | 2,096,580 | Payment Public Improvement | |||||||||
| Jefferson County, Limited | 5%, 1/1/2008 | 500,000 | 517,300 | |||||||||
| Obligation School Warrant | Florida—4.9% | |||||||||||
| 5%, 1/1/2007 | 2,500,000 | 2,561,475 | Escambia County Health Facilities | |||||||||
| Arizona—1.5% | Authority, Revenue | |||||||||||
| Maricopa County Community College | (Ascension Health Credit): | |||||||||||
| District 6.50%, 7/1/2006 | 1,510,000 | a | 1,570,581 | 5%, 11/15/2006 | 1,000,000 | 1,023,520 | ||||||
| Tucson, Water System Revenue | 5%, 11/15/2007 | 400,000 | 415,628 | |||||||||
| 6%, 7/1/2006 (Insured; MBIA) | 1,500,000 | a | 1,554,045 | Florida Board of Education, Public | ||||||||
| California—9.7% | Education 5.375%, 6/1/2008 | 1,000,000 | 1,049,670 | |||||||||
| Agua Caliente Band of Cahuilla | Orlando Utilities Commission, | |||||||||||
| Indians, Revenue: | Water and Electric | |||||||||||
| 4%, 7/1/2006 | 200,000 | 201,280 | Revenue 5%, 10/1/2006 | 2,500,000 | 2,557,275 | |||||||
| 4.60%, 7/1/2008 | 800,000 | 804,072 | Pinellas County, Capital | |||||||||
| California, Economic Recovery | Improvement Revenue | |||||||||||
| 5%, 7/1/2008 | 2,500,000 | 2,629,525 | 4.50%, 1/1/2006 | 4,000,000 | 4,023,040 | |||||||
| California Department of Water | Saint Johns County Industrial | |||||||||||
| Resources, Power Supply Revenue: | Development Authority, IDR | |||||||||||
| 5%, 2/1/2008 | 1,000,000 | 1,044,790 | (Professional Golf Hall of Fame | |||||||||
| 5.50%, 5/1/2008 | 3,500,000 | 3,707,515 | Project) 5.875%, 9/1/2006 | |||||||||
| California Infrastructure and | (Insured; MBIA) | 1,085,000 a | 1,129,051 | |||||||||
| Economic Development Bank, | Georgia—1.0% | |||||||||||
| Workers Compensation Relief | Cobb County Development Authority, | |||||||||||
| Revenue 5%, 10/1/2009 | SWDR (Georgia Waste Management | |||||||||||
| (Insured; AMBAC) | 2,500,000 | 2,687,275 | Project) 3.65%, 4/1/2006 | 1,000,000 | 1,000,720 | |||||||
| California Pollution Control Financing | College Park Business and Industrial | |||||||||||
| Authority, PCR (Southern California | Development Authority, | |||||||||||
| Edison Co.) 2%, 3/1/2006 | 2,000,000 | 1,984,720 | Revenue (Civic Center Project) | |||||||||
| California Statewide Communities | 5.80%, 9/1/2005 (Insured; FSA) | 1,165,000 | 1,165,000 | |||||||||
| Development Authority, Revenue | Illinois—2.1% | |||||||||||
| (Kaiser Permanente): | Chicago Transit Authority, Capital | |||||||||||
| 3.85%, 8/1/2006 | 1,000,000 | 1,007,200 | Grant Receipt Revenue | |||||||||
| 2.625%, 5/1/2008 | 2,000,000 | 1,959,600 | (Douglas Branch Reconstruction) | |||||||||
| Del Mar Race Track Authority, | 5%, 6/1/2007 (Insured; AMBAC) | 3,400,000 | 3,405,916 | |||||||||
| Revenue 5%, 8/15/2009 | 1,080,000 | b | 1,135,674 | Illinois (Sales Tax Revenue) | ||||||||
| Santa Clara Transitional Authority, | 3.50%, 6/15/2006 | 1,000,000 | 1,005,230 | |||||||||
| Sales Tax Revenue 4%, 10/2/2006 | 3,000,000 | 3,033,990 | Kansas—2.8% | |||||||||
| Colorado—.5% | Burlington, PCR (Kansas Gas and | |||||||||||
| Colorado Health Facilities Authority, | Electric Co. Project) | |||||||||||
| Revenue (Evangelical Lutheran | 2.65%, 6/1/2006 | 2,500,000 | 2,494,225 | |||||||||
| Hospital) 3.75%, 3/1/2009 | 1,000,000 | 997,530 | ||||||||||
The Funds 29
| STATEMENT OF INVESTMENTS (continued) |
| Mellon National Short-Term Municipal Bond Fund (continued) | ||||||||||
| Long-Term Municipal | Principal | Principal | ||||||||
| Investments (continued) | Amount ($) | Value ($) | Amount ($) | Value ($) | ||||||
| Kansas (continued) | Massachusetts (continued) | |||||||||
| The Unified Government of Wyandotte | Massachusetts Housing Finance Agency, | |||||||||
| County/ Kansas City Tax Exempt | Housing Revenue | |||||||||
| Sales Tax Special Obligation Revenue | 4.20%, 12/1/2010 | 2,075,000 | 2,096,435 | |||||||
| (Redevelopment Project Area B) | Michigan—3.1% | |||||||||
| 3.75%, 12/1/2012 | 3,250,000 | 3,301,903 | Michigan, Environmental Program | |||||||
| Kentucky—1.5% | 5%, 5/1/2009 | 2,000,000 | 2,131,240 | |||||||
| Kentucky Asset and Liability | Michigan Building Authority, | |||||||||
| Commission, General Fund Tax | Revenue (Facilities Program) | |||||||||
| and RAN 4%, 6/28/2006 | 2,000,000 | 2,019,380 | 5.50%, 10/15/2006 | 1,250,000 | 1,286,562 | |||||
| Kentucky Economic Development | Michigan Hospital Finance Authority, | |||||||||
| Finance Authority, Health System | Revenue (Oakwood Obligated | |||||||||
| Revenue (Norton Healthcare Inc.) | Group) 5%, 11/1/2007 | 1,000,000 | 1,032,570 | |||||||
| 6.25%, 10/1/2012 | 1,000,000 | 1,096,680 | Michigan Municipal Bond Authority, | |||||||
| Louisiana—1.0% | Revenue (Clean Water State | |||||||||
| Jefferson Sales Tax District, | Revolving Fund): | |||||||||
| Special Sales Tax Revenue | 4.50%, 10/1/2006 | 1,000,000 | 1,017,730 | |||||||
| 5%, 12/1/2005 (Insured; AMBAC) | 900,000 | 904,878 | 5%, 10/1/2006 | 1,000,000 | 1,023,020 | |||||
| Louisiana Local Government | Minnesota—2.1% | |||||||||
| Environment Facilities Community | Minnesota 5%, 10/1/2006 | 2,000,000 | 2,046,040 | |||||||
| Development Authority, Revenue | Minnesota Housing Finance | |||||||||
| (Kenner Road Project) | Authority, Residential Housing | |||||||||
| 5%, 3/1/2006 (Insured; AMBAC) | 1,050,000 | 1,061,119 | 2.35%, 12/11/2006 | 2,000,000 | 1,975,140 | |||||
| Maryland—1.7% | Willmar Independent School District | |||||||||
| Washington Suburban Sanitary | Number 347 5.15%, 2/1/2009 | 400,000 | 403,732 | |||||||
| District, Sewage Disposal | Mississippi—1.5% | |||||||||
| 5%, 6/1/2006 | 3,500,000 | 3,557,330 | ||||||||
| Mississippi, Highway Revenue, Four | ||||||||||
| Massachusetts—4.8% | Lane Highway Program | |||||||||
| Lowell, GO | 5.25%, 6/1/2006 | 3,000,000 | 3,053,100 | |||||||
| 5.50%, 12/15/2006 | Nevada—.9% | |||||||||
| (Insured; AMBAC) | 1,000,000 a | 1,052,540 | ||||||||
| Clark County, PCR (Southern California | ||||||||||
| Marlborough, GO | Edison Co.) 3.25%, 3/2/2009 | 2,000,000 | 1,968,240 | |||||||
| 4%, 6/15/2006 | 1,307,000 | 1,318,972 | ||||||||
| New Hampshire—1.9% | ||||||||||
| Massachusetts, Federal Highway | ||||||||||
| Grant Anticipation Notes | Coos County, TAN | |||||||||
| 5.75%, 6/15/2012 (Insured; FSA) | 2,000,000 | 2,233,640 | 3.50%, 12/30/2005 | 1,850,000 | 1,852,849 | |||||
| Massachusetts College Building | New Hampshire Business Finance | |||||||||
| Authority, Project | Authority, SWDR (Waste | |||||||||
| Revenue 4%, 5/1/2006 | 535,000 | 538,938 | Management Inc. Project) | |||||||
| 3.625%, 5/1/2006 | 2,000,000 | 2,001,480 | ||||||||
| Massachusetts Development | ||||||||||
| Finance Agency, Revenue | New Jersey—2.5% | |||||||||
| (Combined Jewish Philanthropies) | New Jersey Economic Development | |||||||||
| 3.50%, 2/1/2008 | 1,435,000 | 1,439,434 | Authority, Revenue: | |||||||
| Massachusetts Health and | Cigarette Tax | |||||||||
| Educational Facilities Authority, | 5.625%, 6/15/2017 | 2,000,000 | 2,074,900 | |||||||
| Revenue (Springfield College) | School Facilities Construction | |||||||||
| 4%, 10/15/2007 | 1,220,000 | 1,239,032 | 5%, 9/1/2007 | 1,000,000 | 1,037,620 | |||||
30
| Mellon National Short-Term Municipal Bond Fund (continued) | ||||||||||
| Long-Term Municipal | Principal | Principal | ||||||||
| Investments (continued) | Amount ($) | Value ($) | Amount ($) | Value ($) | ||||||
| New Jersey (continued) | Ohio—1.0% | |||||||||
| New Jersey Transportation Trust Fund | Ohio Higher Education Capital | |||||||||
| Authority 5%, 12/15/2006 | 1,000,000 | 1,025,040 | Facilities, GO: | |||||||
| University of Medicine and | 5.25%, 5/1/2006 | 1,000,000 | 1,015,980 | |||||||
| Dentistry, COP 6.75%, | 5.25%, 2/1/2008 | 1,025,000 | 1,078,546 | |||||||
| 12/1/2009 (Insured; MBIA) | 1,050,000 | 1,053,350 | Pennsylvania—8.5% | |||||||
| New Mexico—.5% | Berks County 5.50%, 11/15/2005 | |||||||||
| Gallup, PCR (Tri-State Generation | (Insured; AMBAC) | 1,835,000 | 1,845,258 | |||||||
| and Transmission Association, Inc. | Dauphin County General | |||||||||
| Project) 5%, 8/15/2007 | Authority, School Revenue | |||||||||
| (Insured; AMBAC) | 1,000,000 | 1,037,310 | 3.25%, 6/1/2006 | 2,000,000 | 2,000,380 | |||||
| New York—6.5% | Lehigh County Industrial | |||||||||
| Long Island Power Authority, | Development Center, PCR | |||||||||
| Electric System General Revenue | (Peoples Electric Utility Corp.) | |||||||||
| 5%, 12/1/2005 | 2,000,000 | 2,010,980 | 3.125%, 11/1/2008 | |||||||
| (Insured; AMBAC) | 1,250,000 | 1,253,225 | ||||||||
| Metropolitan Transportation | ||||||||||
| Authority, Service Contract | Pennsylvania: | |||||||||
| 5%, 1/1/2006 | 1,425,000 | 1,434,790 | 5.125%, 9/15/2006 | |||||||
| (Insured; AMBAC) | 1,175,000 | 1,202,671 | ||||||||
| Municipal Assistance Corp. for the City | 5%, 10/1/2007 (Insured; FGIC) | 1,000,000 | 1,042,240 | |||||||
| of New York 5.25%, 7/1/2006 | 1,415,000 | 1,444,064 | ||||||||
| Pennsylvania Higher Educational | ||||||||||
| New York City: | Facilities Authority, Revenue | |||||||||
| 5.25%, 11/15/2007 | 2,095,000 | 2,196,063 | (University of Pennsylvania | |||||||
| 5.20%, 8/1/2009 (Insured; XLCA) | 2,000,000 | 2,097,680 | Health System): | |||||||
| New York City Educational | 4%, 8/15/2006 | 1,000,000 | 1,007,460 | |||||||
| Construction Fund, Revenue | 5%, 8/15/2007 | 1,000,000 | 1,031,350 | |||||||
| 5%, 4/1/2007 (Insured; MBIA) | 1,000,000 | 1,032,170 | Pennsylvania Industrial | |||||||
| New York City Transitional Finance | Development Authority, EDR | |||||||||
| Authority, Revenue (New York City | 7%, 7/1/2007 (Insured; AMBAC) | 440,000 | 470,941 | |||||||
| Recovery) 5%, 11/1/2006 | 1,250,000 | 1,281,037 | Philadelphia, Gas Works Revenue | |||||||
| New York State Dormitory Authority, | 5%, 8/1/2007 (Insured; FSA) | 1,555,000 | 1,613,701 | |||||||
| Revenue (Lutheran Medical Center) | Philadelphia Hospital and | |||||||||
| 4%, 8/1/2007 (Insured; MBIA) | 1,000,000 | 1,018,320 | Higher Educational Facilities | |||||||
| New York State Thruway Authority, | Authority, Revenue | |||||||||
| Service Contract Revenue, | (Jefferson Health System) | |||||||||
| Local Highway and Bridge | 5.50%, 5/15/2007 | 1,495,000 | 1,553,320 | |||||||
| 5%, 4/1/2006 | 1,000,000 | 1,012,470 | Pittsburgh: | |||||||
| North Carolina—3.3% | 5%, 9/1/2005 (Insured; FGIC) | 2,000,000 a | 2,000,000 | |||||||
| Guilford County 4%, 10/1/2007 | 2,000,000 | 2,037,100 | 5%, 9/1/2006 (Insured; MBIA) | 2,500,000 | 2,549,025 | |||||
| North Carolina: | Rhode Island—2.0% | |||||||||
| 5.10%, 6/1/2006 | 1,000,000 a | 1,032,320 | Rhode Island, EDR, | |||||||
| Public Improvement 5%, 3/1/2006 | 1,000,000 | 1,011,090 | Department of Transportation | |||||||
| North Carolina Eastern Municipal | 5%, 6/15/2006 | 2,000,000 | 2,032,620 | |||||||
| Power Agency, Power System | Rhode Island Depositors | |||||||||
| Revenue 5%, 1/1/2007 | 655,000 | 668,821 | Economic Protection Corp. | |||||||
| Wake County, Public Improvement | Special Obligation 6.40%, | |||||||||
| 5%, 4/1/2006 | 2,000,000 | 2,025,640 | 8/1/2006 (Insured; FSA) | 2,000,000 | 2,064,680 | |||||
| The Funds 31 |
| STATEMENT OF INVESTMENTS (continued) |
| Mellon National Short-Term Municipal Bond Fund (continued) | ||||||||||
| Long-Term Municipal | Principal | Principal | ||||||||
| Investments (continued) | Amount ($) | Value ($) | Amount ($) | Value ($) | ||||||
| South Carolina—2.4% | Texas (continued) | |||||||||
| Greenville County School District, | Texas Public Finance Authority | |||||||||
| Installment Purchase Revenue | 5.75%, 10/1/2006 | 4,000,000 a | 4,124,720 | |||||||
| (Building Equity Sooner for | Texas Turnpike Authority, | |||||||||
| Tomorrow) 5%, 12/1/2007 | 1,000,000 | 1,040,340 | Central Texas Turnpike System | |||||||
| South Carolina Jobs and Economic | Revenue 5%, 6/1/2007 | 2,500,000 | 2,585,900 | |||||||
| Development Authority, EDR | Utah—1.5% | |||||||||
| (Waste Management of | Jordan School District (Local | |||||||||
| South Carolina Inc. Project) | School Board Program) | |||||||||
| 3.30%, 11/1/2007 | 4,000,000 | 3,986,160 | 5.25%, 6/15/2007 | 3,000,000 | 3,120,780 | |||||
| Tennessee—2.5% | Virginia—1.7% | |||||||||
| Humphreys Industrial Development | Louisa Industrial Development | |||||||||
| Board, SWDR (E.I. Dupont | Authority, PCR (Virginia | |||||||||
| Denemours and Co. Project) | Electric and Power Co.) | |||||||||
| 6.70%, 5/1/2024 | 2,000,000 | 2,055,060 | 5.25%, 12/1/2008 | 2,000,000 | 2,067,620 | |||||
| Shelby County Health, Educational | Peninsula Ports Authority, Coal | |||||||||
| and Housing Facilities Board, | Terminal Revenue (Dominion | |||||||||
| Revenue (Baptist Memorial | Terminal Association Project) | |||||||||
| Healthcare) 4%, 9/1/2006 | 3,000,000 | 3,021,600 | 3.30%, 10/1/2008 | 1,400,000 | 1,395,296 | |||||
| Texas—11.7% | Washington—1.0% | |||||||||
| Dallas, Waterworks and Sewage | Washington Public Power Supply | |||||||||
| System Revenue 5%, 10/1/2007 | 1,000,000 | 1,040,380 | System, Revenue (Nuclear Project | |||||||
| Dallas Civic Center, | Number 3) 6%, 7/1/2007 | |||||||||
| Improvement 4.80%, | (Insured; AMBAC) | 2,050,000 | 2,159,757 | |||||||
| 8/15/2011 (Insured; MBIA) | 3,050,000 | 3,208,386 | Wyoming—1.0% | |||||||
| Grand Prairie Independent School | Uinta County, PCR (Amoco Project) | |||||||||
| District, Tax School Building | 2.25%, 7/1/2007 | 2,000,000 | 1,965,440 | |||||||
| (Permanent School Fund | ||||||||||
| Guaranteed) 3.05%, 7/31/2007 | 3,000,000 | 3,000,000 | U.S. Related—4.4% | |||||||
| Hays Consolidated Independent | Commonwealth of Puerto Rico, | |||||||||
| School District | Public Improvement: | |||||||||
| 5.375%, 8/15/2008 | 2,000,000 a | 2,133,940 | 5%, 7/1/2006 | 1,000,000 | 1,016,300 | |||||
| 5.375%, 7/1/2007 | ||||||||||
| Killeen Independent School | (Insured; FSA) | 1,000,000 a | 1,045,210 | |||||||
| District (Permanent School Fund | ||||||||||
| Guaranteed) 4.50%, 2/15/2007 | 500,000 | 510,990 | Puerto Rico Electric Authority, | |||||||
| Power Revenue 4%, 7/1/2008 | 500,000 | 510,190 | ||||||||
| North Texas Thruway Authority, | ||||||||||
| Dallas North Thruway System | Puerto Rico Highway and | |||||||||
| Revenue 5%, 7/1/2008 | Transportation Authority, Highway | |||||||||
| (Insured; AMBAC) | 2,000,000 | 2,095,860 | Revenue 5%, 7/1/2006 | 2,500,000 | 2,541,150 | |||||
| Spring Independent School District, | Puerto Rico Municipal Finance | |||||||||
| Schoolhouse 5%, 8/15/2006 | Agency 4%, 8/1/2006 | |||||||||
| (Insured; FSA and SBPA; Dexia Bank) | 2,000,000 | 2,036,820 | (Insured; FSA) | 1,355,000 | 1,369,688 | |||||
| Tarrant Regional Water District, | Puerto Rico Public Buildings | |||||||||
| Water Revenue 4.50%, | Authority (Government | |||||||||
| 3/1/2006 (Insured; FSA) | 1,000,000 | 1,008,280 | Facilities) 4.50%, 7/1/2007 | 2,500,000 | 2,554,550 | |||||
| Texas A & M University, Financing | Total Long-Term | |||||||||
| System Revenue 5.625%, | Municipal Investments | |||||||||
| 5/15/2006 (Insured; AMBAC) | 2,500,000 a | 2,549,525 | (cost $201,542,177) | 201,223,819 | ||||||
32
| Mellon National Short-Term Municipal Bond Fund (continued) | ||||||||||
| Short-Term Municipal | Principal | Principal | ||||||||
| Investments—4.0% | Amount ($) | Value ($) | Amount ($) | Value ($) | ||||||
| Florida—.2% | Pennsylvania (continued) | |||||||||
| Capital Projects Finance Authority, | The Hospitals and Higher Education | |||||||||
| Continuing Care Retirement | Facilities Authority of Philadelphia, | |||||||||
| Community Revenue (Capital | HR (The Children’s Hospital of | |||||||||
| Projects Loan Program-The Glenridge | Philadelphia Project) 2.36% | |||||||||
| on Palmer Ranch Project) | (Insured; MBIA and LOC; | |||||||||
| 2.35% (LOC; Bank of Scotland) | 300,000 d | 300,000 | Westdeutsche Landesbank) | 2,000,000 d | 2,000,000 | |||||
| Missouri—.0% | Texas—1.7% | |||||||||
| Missouri Development Finance Board, | Harris County Health Facilities, | |||||||||
| LR (Missouri Association of Municipal | Development Corp. HR | |||||||||
| Utilities Lease Financing Program) | (Texas Children’s Hospital Project) | |||||||||
| 2.40% (LOC; U.S. Bank NA) | 100,000 d | 100,000 | 2.36% (LOC; MBIA and LOC; | |||||||
| Nebraska—.5% | JPMorgan Chase Bank) | 500,000 d | 500,000 | |||||||
| Hospital Authority Number 1 of | Texas, TRAN 4.50%, 8/31/2006 | 3,000,000 b | 3,045,390 | |||||||
| Lancaster County, Health Facilities | Total Short-Term | |||||||||
| Revenue (Immanuel Health | Municipal Investments | |||||||||
| Systems-Williamsburg Project) | (cost $8,378,760) | 8,380,390 | ||||||||
| 2.36% (LOC; ABN-AMRO) | 1,100,000 d | 1,100,000 | ||||||||
| Pennsylvania—1.6% | Total Investments | |||||||||
| (cost $209,920,937) | 101.1% | 209,604,209 | ||||||||
| Allegheny County Hospital | ||||||||||
| Development Authority, Revenue | Liabilities, Less Cash and Receivables | (1.1%) | (2,391,151) | |||||||
| (Presbyterian University Hospital) | Net Assets | 100.0% | 207,213,058 | |||||||
| 2.50% (LOC; Bank One NA) | 1,335,000 d | 1,335,000 | ||||||||
| The Funds 33 |
| STATEMENT OF INVESTMENTS (continued) |
| Summary of Abbreviations | ||||||
| ACA | American Capital Access | IDB | Industrial Development Board | |||
| AGIC | Asset Guaranty Insurance Company | IDC | Industrial Development Corporation | |||
| AMBAC | American Municipal Bond Assurance Corporation | IDR | Industrial Development Revenue | |||
| ARRN | Adjustable Rate Receipt Notes | LOC | Letter of Credit | |||
| BAN | Bond Anticipation Notes | LOR | Limited Obligation Revenue | |||
| BIGI | Bond Investors Guaranty Insurance | LR | Lease Revenue | |||
| BPA | Bond Purchase Agreement | MBIA | Municipal Bond Investors | |||
| CGIC | Capital Guaranty Insurance Company | Assurance Insurance Corporation | ||||
| CIC | Continental Insurance Company | MFHR | Multi-Family Housing Revenue | |||
| CIFG | CDC Ixis Financial Guaranty | MFMR | Multi-Family Mortgage Revenue | |||
| CMAC | Capital Market Assurance Corporation | PCR | Pollution Control Revenue | |||
| COP | Certificate of Participation | RAC | Revenue Anticipation Certificates | |||
| CP | Commercial Paper | RAN | Revenue Anticipation Notes | |||
| EDR | Economic Development Revenue | RAW | Revenue Anticipation Warrants | |||
| EIR | Environmental Improvement Revenue | RRR | Resources Recovery Revenue | |||
| FGIC | Financial Guaranty Insurance Company | SAAN | State Aid Anticipation Notes | |||
| FHA | Federal Housing Administration | SBPA | Standby Bond Purchase Agreement | |||
| FHLB | Federal Home Loan Bank | SFHR | Single Family Housing Revenue | |||
| FHLMC | Federal Home Loan Mortgage Corporation | SFMR | Single Family Mortgage Revenue | |||
| FNMA | Federal National Mortgage Association | SONYMA | State of New York Mortgage Agency | |||
| FSA | Financial Security Assurance | SWDR | Solid Waste Disposal Revenue | |||
| GAN | Grant Anticipation Notes | TAN | Tax Anticipation Notes | |||
| GIC | Guaranteed Investment Contract | TAW | Tax Anticipation Warrants | |||
| GNMA | Government National Mortgage Association | TRAN | Tax and Revenue Anticipation Notes | |||
| GO | General Obligation | XLCA | XL Capital Assurance | |||
| HR | Hospital Revenue | |||||
| Summary of Combined Ratings (Unaudited) | ||||||
| Fitch | or Moody’s or | Standard & Poor’s Value (%) † | ||||
| AAA | Aaa | AAA | 46.9 | |||
| AA | Aa | AA | 23.1 | |||
| A | A | A | 13.4 | |||
| BBB | Baa | BBB | 9.0 | |||
| BB | Ba | BB | .3 | |||
| F1 | MIG1/P1 | SP1/A1 | 4.0 | |||
| Not Rated e | Not Rated e | Not Rated e | 3.3 | |||
| 100.0 | ||||||
| † Based on total investments. |
| a These securities are prerefunded; the date shown represents the prerefunded date. Bonds which are prerefunded are collateralized by U.S. Government securities which are held in |
| escrow and are used to pay principal and interest on the municipal issue and to retire the bonds in full at the earliest refunding date. |
| b Purchased on a delayed delivery basis. |
| c Security exempt from registration under Rule 144A of the Securities Act of 1933.This security may be resold in transactions exempt from registration, normally to qualified |
| institutional buyers.At August 31, 2005, this security amounted to $3,077,276 or 1.5% of net assets. |
| d Securities payable on demand.Variable interest rate—subject to periodic change. |
| e Securities which, while not rated by Fitch, Moody’s and Standard & Poor’s, have been determined by the Investment Adviser to be of comparable quality to those rated securities in |
| which the fund may invest. |
| See notes to financial statements. |
| 34 |
| STATEMENT OF INVESTMENTS | ||||||||||||
| August 31, 2005 | ||||||||||||
| Mellon Pennsylvania Intermediate Municipal Bond Fund | ||||||||||||
| Long-Term Municipal | Principal | Principal | ||||||||||
| Investments—99.9% | Amount ($) | Value ($) | Amount ($) | Value ($) | ||||||||
| Alabama—.6% | Kentucky—.3% | |||||||||||
| Jefferson County, Limited Obligation | Kentucky Property and Buildings | |||||||||||
| School Warrant 5.50%, 1/1/2021 | 3,500,000 | 3,863,510 | Commission, Revenue | |||||||||
| Arizona—.2% | (Project Number 68) | |||||||||||
| University Medical Center Corp., | 5.75%, 10/1/2010 | 1,500,000 | 1,675,110 | |||||||||
| HR 5.25%, 7/1/2015 | 1,160,000 | 1,254,830 | Massachusetts—.5% | |||||||||
| California—7.0% | Massachusetts Housing Finance | |||||||||||
| Agua Caliente Band Cahuilla Indians, | Agency, Housing Revenue | |||||||||||
| Revenue 6%, 7/1/2018 | 1,500,000 | 1,606,950 | 5.125%, 12/1/2034 | 350,000 | 359,786 | |||||||
| Alameda Corridor Transportation | Massachusetts Water Pollution | |||||||||||
| Authority, Revenue 0/5.25%, | Abatement Trust (Pool Program | |||||||||||
| 10/1/2021 (Insured; AMBAC) | 2,000,000 a | 1,528,380 | Bonds) 5%, 8/1/2032 | 3,000,000 | 3,156,450 | |||||||
| California: | Michigan—.3% | |||||||||||
| 5.25%, 11/1/2017 | 2,500,000 | 2,756,575 | Detroit City School District | |||||||||
| 5%, 5/1/2019 | 20,000,000 | 21,748,200 | 5.25%, 5/1/2017 (Insured; FGIC) | 2,000,000 | 2,270,120 | |||||||
| 5.50%, 6/1/2020 | 2,000,000 | 2,166,700 | Mississippi—.8% | |||||||||
| 5.50%, 11/1/2033 | 6,300,000 | 7,099,722 | Mississippi Hospital Equipment and | |||||||||
| Foothill/Eastern Transportation | Facilities Authority, Revenue | |||||||||||
| Corridor Agency, Toll Road Revenue: | (Baptist Memorial Health) | |||||||||||
| 0/5.875%, 1/15/2027 | 5%, 10/1/2008 | 5,000,000 | 5,194,250 | |||||||||
| (Insured; MBIA) | 6,000,000 a | 5,388,300 | Missouri—.1% | |||||||||
| 0/5.875%, 1/15/2029 | Missouri Housing Development | |||||||||||
| (Insured; MBIA) | 2,000,000 a | 1,786,400 | Commission, SFMR | |||||||||
| 5.75%, 1/15/2040 | 2,000,000 | 2,062,720 | 6.40%, 9/1/2029 | 765,000 | 769,215 | |||||||
| Colorado—.6% | New Hampshire—.2% | |||||||||||
| Northwest Parkway Public Highway | New Hampshire Business Finance | |||||||||||
| Authority, Senior Revenue | Authority, PCR (Central Maine | |||||||||||
| 0/5.70%, 6/15/2021 | Power Co.) 5.375%, 5/1/2014 | 1,015,000 | 1,096,088 | |||||||||
| (Insured; AMBAC) | 5,000,000 a | 4,274,800 | ||||||||||
| New Jersey—2.2% | ||||||||||||
| Florida—.2% | ||||||||||||
| Garden State Preservation Trust | ||||||||||||
| Miami-Dade County, | (Open Space and Farmland): | |||||||||||
| Subordinate Special | 5.80%, 11/1/2019 | |||||||||||
| Obligation 0/5%, 10/1/2035 | 1,500,000 a | 1,315,785 | (Insured; FSA) | 4,805,000 | b | 5,660,146 | ||||||
| Georgia—.2% | 5.80%, 11/1/2021 | |||||||||||
| Burke County Development | (Insured; FSA) | 2,000,000 | b | 2,341,000 | ||||||||
| Authority, PCR (Georgia Power Co. | 5.80%, 11/1/2023 | |||||||||||
| Plant Vogtle Project) 4.75%, | (Insured; FSA) | 2,000,000 | b | 2,322,500 | ||||||||
| 5/1/2034 (Insured; FGIC) | 1,525,000 | 1,548,180 | New Jersey Economic Development | |||||||||
| Illinois—.6% | Authority, Cigarette Tax Revenue | |||||||||||
| Illinois Educational Facilities | 5.75%, 6/15/2029 | 4,000,000 | 4,324,680 | |||||||||
| Authority (University of Chicago) | New York—1.4% | |||||||||||
| 5.25%, 7/1/2011 | 1,960,000 | 2,087,753 | New York City Transitional | |||||||||
| Illinois Finance Authority, | Finance Authority, Revenue | |||||||||||
| Revenue (Peoples Gas Light | (Future Tax Secured) | |||||||||||
| and Coke Co.) 4.30%, | 5.50%/14%, 11/1/2026 | 4,000,000 | c | 4,429,400 | ||||||||
| 6/1/2016 (Insured; AMBAC) | 2,000,000 | 2,031,080 | ||||||||||
T h e F u n d s 35
| STATEMENT OF INVESTMENTS(continued) |
| Mellon Pennsylvania Intermediate Municipal Bond Fund (continued) | ||||||||||
| Long-Term Municipal | Principal | Principal | ||||||||
| Investments (continued) | Amount ($) | Value ($) | Amount ($) | Value ($) | ||||||
| New York (continued) | Pennsylvania (continued) | |||||||||
| New York Counties Tobacco Trust IV, | Athens Area School District | |||||||||
| Tobacco Settlement Pass-Through | 4.75%, 4/15/2011 (Insured; FGIC) | 1,740,000 | 1,871,039 | |||||||
| 5%, 6/1/2045 | 1,000,000 | 987,160 | Blair County: | |||||||
| New York State Dormitory | 5.375%, 8/1/2015 | |||||||||
| Authority, Revenue: | (Insured; AMBAC) | 1,880,000 | 2,151,434 | |||||||
| (Mental Health Services Facilities): | 5.375%, 8/1/2016 | |||||||||
| 6%, 8/15/2007 | 20,000 d | 21,283 | (Insured; AMBAC) | 1,980,000 | 2,282,306 | |||||
| 6%, 8/15/2007 | 2,480,000 | 2,616,846 | Bucks County Technical School | |||||||
| (School Program) | Authority, School Revenue: | |||||||||
| 5.25%, 7/1/2011 | 1,200,000 | 1,285,836 | 5.10%, 8/15/2008 | |||||||
| North Carolina—.5% | (Insured; AMBAC) | 1,000,000 | 1,009,860 | |||||||
| North Carolina Eastern Municipal | 5.40%, 8/15/2011 | |||||||||
| Power Agency, | (Insured; AMBAC) | 1,500,000 | 1,516,815 | |||||||
| Power System Revenue: | Carlisle Area School District | |||||||||
| 5.30%, 1/1/2015 | 1,500,000 | 1,610,475 | 5%, 3/1/2012 (Insured; MBIA) | 1,295,000 | 1,417,144 | |||||
| 5.125%, 1/1/2023 | 1,500,000 | 1,558,395 | Central York School District: | |||||||
| Ohio—.9% | 5%, 6/1/2012 (Insured; FGIC) | 2,305,000 | 2,529,738 | |||||||
| Cuyahoga County, Revenue | 5.50%, 6/1/2014 (Insured; FGIC) | 1,000,000 | 1,125,910 | |||||||
| (Cleveland Clinic Health System) | Chester County 5%, 8/15/2018 | 4,545,000 | 4,999,455 | |||||||
| 6%, 1/1/2016 | 5,000,000 | 5,689,900 | Chichester School District | |||||||
| Pennsylvania—69.5% | 5%, 3/15/2009 (Insured; FSA) | 1,000,000 | 1,064,140 | |||||||
| Allegheny County Hospital | Coatesville Area School District | |||||||||
| Development Authority, Revenue: | 5.25%, 8/15/2019 (Insured; FSA) | 8,000,000 | 8,915,200 | |||||||
| (Pittsburgh Mercy Health System) | Conestoga Valley School District: | |||||||||
| 5.60%, 8/15/2006 | 5%, 5/1/2010 (Insured; FGIC) | 2,070,000 | 2,232,578 | |||||||
| (Insured; AMBAC) | 2,135,000 | 2,189,955 | 5%, 5/1/2011 (Insured; FGIC) | 1,500,000 | 1,632,765 | |||||
| (University of Pittsburgh | Conrad Weiser Area School District: | |||||||||
| Medical Center): | 5.20%, 12/15/2010 | |||||||||
| 4.95%, 12/1/2007 | (Insured; MBIA) | 1,000,000 | 1,017,510 | |||||||
| (Insured; MBIA) | 690,000 | 706,891 | 5.25%, 12/15/2014 | |||||||
| 5.15%, 12/1/2009 | (Insured; MBIA) | 3,890,000 | 3,959,592 | |||||||
| (Insured; MBIA) | 750,000 | 768,285 | ||||||||
| 5%, 6/15/2014 | 9,720,000 | 10,469,606 | Cumberland County Municipal | |||||||
| Authority, College Revenue | ||||||||||
| Allegheny County Port Authority, | (Dickerson College): | |||||||||
| Special Transportation Revenue: | 5.25%, 11/1/2008 | |||||||||
| 5.50%, 6/1/2008 | (Insured; AMBAC) | 1,000,000 | 1,066,570 | |||||||
| (Insured; MBIA) | 4,000,000 | 4,261,000 | 5.25%, 11/1/2009 | |||||||
| 5.375%, 3/1/2011 | (Insured; AMBAC) | 1,170,000 | 1,266,232 | |||||||
| (Insured; FGIC) | 2,500,000 | 2,763,600 | ||||||||
| 5.50%, 3/1/2014 | Delaware County 5.50%, 10/1/2015 | 280,000 | 280,588 | |||||||
| (Insured; FGIC) | 2,500,000 | 2,784,100 | Delaware County Authority, | |||||||
| 5.50%, 3/1/2016 | College Revenue | |||||||||
| (Insured; FGIC) | 1,360,000 | 1,514,550 | (Haverford College): | |||||||
| Allegheny County Sanitary Authority, | 5.875%, 11/15/2021 | 1,500,000 | 1,686,720 | |||||||
| Sewer Revenue 5%, 12/1/2018 | 5.75%, 11/15/2025 | 3,000,000 | 3,345,060 | |||||||
| (Insured; MBIA) | 2,560,000 | 2,812,928 | ||||||||
| 36 |
| Mellon Pennsylvania Intermediate Municipal Bond Fund (continued) | ||||||||||
| Long-Term Municipal | Principal | Principal | ||||||||
| Investments (continued) | Amount ($) | Value ($) | Amount ($) | Value ($) | ||||||
| Pennsylvania (continued) | Pennsylvania (continued) | |||||||||
| Delaware County Regional | Lehigh County General Purpose | |||||||||
| Water Quality Control | Authority, Revenues (Good Shepherd | |||||||||
| Authority, Sewer Revenue | Group) 5.25%, 11/1/2014 | 3,255,000 | 3,454,857 | |||||||
| 4.75%, 5/1/2010 (Insured; FGIC) | 1,945,000 | 2,076,813 | Lehigh County Industrial | |||||||
| Delaware River Joint Toll Bridge | Development Authority, PCR | |||||||||
| Commission, Bridge Revenue | (Peoples Electric Utilities Corp. | |||||||||
| 5.25%, 7/1/2017 (Insured; MBIA) | 1,485,000 | 1,673,862 | Project) 4.75%, 2/15/2027 | |||||||
| Downingtown Area School District: | (Insured; FGIC) | 2,000,000 | 2,071,640 | |||||||
| 5.25%, 2/1/2008 | 300,000 | 315,888 | Lower Merion School District | |||||||
| 5.375%, 2/1/2009 | 5,020,000 | 5,396,199 | 5%, 5/15/2029 | 11,975,000 | 12,716,731 | |||||
| Erie County 5.375%, 9/1/2016 | Montgomery County: | |||||||||
| (Insured; MBIA) | 2,445,000 | 2,751,579 | 5%, 9/15/2010 | 1,165,000 | 1,265,411 | |||||
| Exeter Township School District | 5%, 9/15/2011 | 2,155,000 | 2,363,087 | |||||||
| 5.15%, 5/15/2010 | 1,990,000 | 2,020,546 | Montgomery County Higher Education | |||||||
| Fleetwood Area School District | and Health Authority, HR | |||||||||
| 5%, 4/1/2011 (Insured; FGIC) | 1,500,000 | 1,631,415 | (Abington Memorial Hospital) | |||||||
| Harrisburg Authority, Resource | 5%, 6/1/2007 (Insured; AMBAC) | 2,940,000 | 3,038,225 | |||||||
| Recovery Facility Revenue | Muhlenberg School District | |||||||||
| 5%, 12/1/2013 (Insured; FSA) | 4,000,000 | 4,343,480 | 5.375%, 4/1/2015 (Insured; FGIC) | 1,000,000 | 1,107,820 | |||||
| Harrisburg Authority, School | North Pennsylvania School District | |||||||||
| Revenue (Harrisburg Project) | Authority, School Revenue | |||||||||
| 5%, 4/1/2010 (Insured; FGIC) | 2,500,000 | 2,693,675 | (Montgomery and Bucks County) | |||||||
| Hazleton Area School District | 6.20%, 3/1/2007 | 860,000 | 880,416 | |||||||
| 6.50%, 3/1/2008 (Insured; FSA) | 1,300,000 | 1,408,212 | North Wales Water Authority, | |||||||
| Kennett Consolidated School | Water Revenue 5.40%, | |||||||||
| District 5.50%, | 11/1/2010 (Insured; FGIC) | 1,000,000 | 1,004,150 | |||||||
| 2/15/2015 (Insured; FGIC) | 1,310,000 | 1,462,196 | Northampton County Higher | |||||||
| Lancaster County Solid Waste | Education Authority, | |||||||||
| Management Authority, RRR: | Revenue (Lehigh University) | |||||||||
| 5.25%, 12/15/2008 | 5.50%, 11/15/2011 | 2,500,000 | 2,805,175 | |||||||
| (Insured; AMBAC) | 3,940,000 | 4,160,640 | Northeastern Hospital and | |||||||
| 5.25%, 12/15/2009 | Education Authority, College | |||||||||
| (Insured; AMBAC) | 4,230,000 | 4,518,571 | Revenue (Luzerne County | |||||||
| 5.25%, 12/15/2010 | Community College) 5.25%, | |||||||||
| (Insured; AMBAC) | 2,000,000 | 2,155,420 | 8/15/2007 (Insured; MBIA) | 1,170,000 | 1,221,433 | |||||
| Lancaster County Vocational- | Northwestern Lehigh School District: | |||||||||
| Technical School Authority, LR: | 5%, 3/15/2009 (Insured; FSA) | 1,190,000 | 1,266,327 | |||||||
| 5.25%, 2/15/2009 | 5%, 3/15/2010 (Insured; FSA) | 1,245,000 | 1,340,765 | |||||||
| (Insured; FGIC) | 1,000,000 | 1,070,940 | Owen J. Roberts School District | |||||||
| 5.25%, 2/15/2010 | 5.50%, 8/15/2018 (Insured; FSA) | 1,440,000 | 1,615,003 | |||||||
| (Insured; FGIC) | 1,500,000 | 1,629,195 | Parkland School District: | |||||||
| Lancaster Higher Education | 5.25%, 9/1/2011 (Insured; FGIC) | 2,220,000 | 2,454,543 | |||||||
| Authority, College Revenue | 5.375%, 9/1/2014 (Insured; FGIC) | 3,110,000 | 3,543,472 | |||||||
| (Franklin and Marshall College) | 5.375%, 9/1/2016 (Insured; FGIC) | 1,490,000 | 1,718,953 | |||||||
| 5.25%, 4/15/2016 | 1,815,000 | 1,987,661 | ||||||||
| The Funds 37 |
| STATEMENT OF INVESTMENTS(continued) |
| Mellon Pennsylvania Intermediate Municipal Bond Fund (continued) | ||||||||||
| Long-Term Municipal | Principal | Principal | ||||||||
| Investments (continued) | Amount ($) | Value ($) | Amount ($) | Value ($) | ||||||
| Pennsylvania (continued) | Pennsylvania (continued) | |||||||||
| Penn Manor School District: | Pennsylvania Higher Educational | |||||||||
| 5.20%, 6/1/2006 (Insured; FGIC) | 355,000 d | 361,312 | Facilities Authority (continued): | |||||||
| 5.20%, 6/1/2012 (Insured; FGIC) | 395,000 | 401,581 | (UPMC Health System): | |||||||
| Pennsylvania: | 5%, 1/15/2010 | 1,630,000 | 1,722,307 | |||||||
| 5.25%, 10/15/2009 | 10,000,000 | 10,818,800 | 5.125%, 1/15/2011 | 1,550,000 | 1,656,191 | |||||
| 6%, 1/15/2010 | 2,500,000 d | 2,810,825 | 5.25%, 8/1/2012 | |||||||
| 5.25%, 10/15/2010 | 10,000,000 | 10,965,000 | (Insured; FSA) | 3,000,000 | 3,236,370 | |||||
| 5.25%, 2/1/2011 | 7,850,000 | 8,627,857 | 6%, 1/15/2022 | 2,500,000 | 2,762,825 | |||||
| 5.25%, 2/1/2012 (Insured; FGIC) | 1,000,000 | 1,111,420 | Health Services | |||||||
| Pennsylvania Economic Development | (University of Pennsylvania): | |||||||||
| Financing Authority, SWDR | 5.875%, 1/1/2006 | 2,000,000 d | 2,039,920 | |||||||
| (Waste Management Inc. Project) | 5.60%, 11/15/2010 | |||||||||
| 4.70%, 11/1/2014 | 5,000,000 | 5,113,000 | (Insured; MBIA) | 2,000,000 | 2,193,000 | |||||
| Pennsylvania Higher Educational | Pennsylvania Housing | |||||||||
| Facilities Authority: | Finance Agency: | |||||||||
| College and University Revenue: | (Single Family Mortgage): | |||||||||
| (Allegheny College Project) | 5.35%, 10/1/2009 | 1,165,000 | 1,199,135 | |||||||
| 6.10%, 11/1/2008 | 5.45%, 10/1/2010 | 3,025,000 | 3,171,410 | |||||||
| (Insured; MBIA) | 1,750,000 | 1,759,310 | 5.50%, 10/1/2011 | 1,325,000 | 1,386,957 | |||||
| (Bryn Mawr College) | 5.55%, 10/1/2012 | 325,000 | 325,767 | |||||||
| 5.25%, 12/1/2012 | 5.75%, 10/1/2013 | 975,000 | 1,009,145 | |||||||
| (Insured; AMBAC) | 3,000,000 | 3,353,820 | Pennsylvania Industrial | |||||||
| (Drexel University): | Development Authority, EDR: | |||||||||
| 5.30%, 5/1/2007 | 6%, 7/1/2008 | |||||||||
| (Insured; MBIA) | 875,000 d | 925,540 | (Insured; AMBAC) | 5,600,000 | 6,042,512 | |||||
| 5.50%, 5/1/2007 | 5.80%, 1/1/2009 | |||||||||
| (Insured; MBIA) | 1,275,000 | 1,328,461 | (Insured; AMBAC) | 5,000,000 | 5,422,700 | |||||
| 5.30%, 5/1/2010 | 5.50%, 7/1/2012 | |||||||||
| (Insured; MBIA) | 3,035,000 | 3,202,623 | (Insured; AMBAC) | 5,335,000 | 6,007,583 | |||||
| (La Salle University) | Pennsylvania State University | |||||||||
| 5.50%, 5/1/2034 | 2,250,000 | 2,375,573 | 5%, 3/1/2009 | 3,000,000 | 3,190,560 | |||||
| (Lafayette College Project) | Pennsylvania Turnpike | |||||||||
| 6%, 5/1/2030 | 5,000,000 | 5,554,050 | Commission, Turnpike Revenue: | |||||||
| (State Systems) | 5%, 6/1/2009 (Insured; FGIC) | 3,275,000 | 3,497,373 | |||||||
| 5.75%, 6/15/2010 | 5%, 6/1/2011 | |||||||||
| (Insured; AMBAC) | 3,045,000 | 3,381,046 | (Insured; FGIC) | 3,000,000 | 3,271,530 | |||||
| (State Systems Higher Education): | 5.50%, 12/1/2011 | |||||||||
| 5%, 6/15/2010 | (Insured; FGIC) | 2,510,000 | 2,820,939 | |||||||
| (Insured; AMBAC) | 2,785,000 | 3,005,544 | 5.50%, 12/1/2012 | |||||||
| 5%, 6/15/2011 | (Insured; FGIC) | 2,000,000 | 2,270,500 | |||||||
| (Insured; AMBAC) | 2,935,000 | 3,193,896 | 5.50%, 6/1/2015 | 1,500,000 | 1,677,615 | |||||
| (Temple University) | 5%, 12/1/2029 | |||||||||
| 5.25%, 4/1/2014 | (Insured; AMBAC) | 5,000,000 | 5,349,200 | |||||||
| (Insured; MBIA) | 2,500,000 | 2,652,600 | Perkiomen Valley School District: | |||||||
| (University of Scranton) | 5.25%, 3/1/2013 (Insured; FSA) | 1,230,000 | 1,342,951 | |||||||
| 5.75%, 11/1/2016 | 5.25%, 3/1/2014 (Insured; FSA) | 1,290,000 | 1,408,461 | |||||||
| (Insured; AMBAC) | 1,690,000 | 1,895,352 | ||||||||
| 38 |
| Mellon Pennsylvania Intermediate Municipal Bond Fund (continued) | ||||||||||
| Long-Term Municipal | Principal | Principal | ||||||||
| Investments (continued) | Amount ($) | Value ($) | Amount ($) | Value ($) | ||||||
| Pennsylvania (continued) | Pennsylvania (continued) | |||||||||
| Philadelphia: | Saint Mary Hospital Authority, | |||||||||
| 5.25%, 3/15/2011 | Health System Revenue | |||||||||
| (Insured; FSA) | 3,500,000 | 3,762,080 | (Catholic Health East) | |||||||
| 5.25%, 3/15/2012 | 5%, 11/15/2021 | 1,000,000 | 1,053,860 | |||||||
| (Insured; FSA) | 235,000 | 252,597 | Scranton-Lackawanna Health | |||||||
| 5.25%, 3/15/2013 | and Welfare Authority, Revenue: | |||||||||
| (Insured; FSA) | 2,000,000 | 2,149,760 | (Community Medical | |||||||
| 5.25%, 3/15/2014 | Center Project): | |||||||||
| (Insured; FSA) | 1,000,000 | 1,074,880 | 5.50%, 7/1/2010 | |||||||
| Water and Wastewater Revenue: | (Insured; MBIA) | 3,035,000 | 3,239,589 | |||||||
| 5.625%, 6/15/2009 | 5.50%, 7/1/2011 | |||||||||
| (Insured; AMBAC) | 5,000,000 | 5,447,600 | (Insured; MBIA) | 3,195,000 | 3,410,375 | |||||
| 5.25%, 12/15/2012 | (University of Scranton Project) | |||||||||
| (Insured; AMBAC) | 10,000,000 | 11,163,100 | 5.50%, 11/1/2007 | |||||||
| 5.25%, 7/1/2018 | (Insured; AMBAC) | 3,040,000 | 3,202,853 | |||||||
| (Insured; FSA) | 5,000,000 | 5,609,600 | Springfield School District | |||||||
| 5%, 7/1/2023 (Insured; FSA) | 1,690,000 | 1,828,343 | (Delaware County): | |||||||
| Philadelphia Authority for Industrial | 4.75%, 3/15/2010 | |||||||||
| Development, Industrial and | (Insured; FSA) | 1,145,000 | 1,221,051 | |||||||
| Commercial Revenue | 4.75%, 3/15/2011 | |||||||||
| (Girard Estates Facilities Leasing | (Insured; FSA) | 780,000 | 838,165 | |||||||
| Project) 5%, 5/15/2019 | 2,400,000 | 2,462,208 | 4.75%, 3/15/2012 | |||||||
| Philadelphia Hospital and Higher | (Insured; FSA) | 1,085,000 | 1,172,657 | |||||||
| Education Facilities Authority, | State Public School Building Authority, | |||||||||
| Revenue (Jefferson Health | School Revenue: | |||||||||
| System) 5.50%, 5/15/2008 | 1,000,000 | 1,058,170 | (Lease-Philadelphia School | |||||||
| Philadelphia Parking Authority, | District Project) 5%, | |||||||||
| Parking Revenue: | 6/1/2029 (Insured; FSA) | 5,000,000 | 5,280,600 | |||||||
| 5.25%, 2/1/2013 | (Tuscarora School District | |||||||||
| (Insured; AMBAC) | 1,935,000 | 2,076,332 | Project) 5.25%, | |||||||
| 5.25%, 2/1/2014 | 4/1/2017 (Insured; FSA) | 1,035,000 | 1,148,871 | |||||||
| (Insured; AMBAC) | 2,040,000 | 2,189,002 | Susquehanna Area Regional Airport | |||||||
| Airport | Authority, Airport System, Revenue: | |||||||||
| 5.75%, 9/1/2009 | 5.375%, 1/1/2018 | 6,000,000 | 6,199,500 | |||||||
| (Insured; AMBAC) | 2,255,000 | 2,469,744 | 5.50%, 1/1/2020 | |||||||
| Philadelphia School District: | (Insured; AMBAC) | 4,370,000 | 4,778,464 | |||||||
| 5%, 10/1/2008 (Insured; MBIA) | 10,000,000 | 10,561,900 | 5%, 1/1/2033 | |||||||
| 5.25%, 4/1/2009 (Insured; MBIA) | 2,500,000 d | 2,684,850 | (Insured; AMBAC) | 2,400,000 | 2,519,208 | |||||
| 5.75%, 2/1/2011 (Insured; FSA) | 4,000,000 | 4,478,120 | Swarthmore Borough Authority, | |||||||
| 5.75%, 2/1/2011 (Insured; FSA) | 3,000,000 d | 3,372,510 | College Revenue: | |||||||
| 5.50%, 2/1/2012 (Insured; FSA) | 1,770,000 d | 1,986,082 | 5.50%, 9/15/2011 | 17,500,000 | 19,564,650 | |||||
| 5.50%, 2/1/2012 (Insured; FSA) | 1,310,000 d | 1,469,925 | 5.25%, 9/15/2017 | 1,000,000 | 1,104,060 | |||||
| 5%, 4/1/2017 (Insured; AMBAC) | 5,000,000 | 5,488,550 | University Area Joint Authority, | |||||||
| Pittsburgh School District: | Sewer Revenue 5%, | |||||||||
| 5.50%, 9/1/2016 (Insured; FSA) | 4,000,000 | 4,643,840 | 11/1/2011 (Insured; MBIA) | 1,430,000 | 1,564,163 | |||||
| 5.50%, 9/1/2018 (Insured; FSA) | 1,000,000 | 1,171,440 | ||||||||
| The Funds 39 |
| STATEMENT OF INVESTMENTS(continued) |
| Mellon Pennsylvania Intermediate Municipal Bond Fund (continued) | ||||||||||
| Long-Term Municipal | Principal | Principal | ||||||||
| Investments (continued) | Amount ($) | Value ($) | Amount ($) | Value ($) | ||||||
| Pennsylvania (continued) | South Carolina—.7% | |||||||||
| Upper Darby School District, GO: | Greenville County School District, | |||||||||
| 5%, 2/15/2010 (Insured; AMBAC) | 1,100,000 | 1,183,391 | Installment Purchase Revenue | |||||||
| 5%, 5/1/2018 (Insured; FGIC) | 2,870,000 | 3,149,968 | (Building Equity Sooner | |||||||
| 5%, 5/1/2019 (Insured; FGIC) | 3,000,000 | 3,285,000 | for Tomorrow): | |||||||
| Upper Merion Area School District | 5.875%, 12/1/2012 | 2,000,000 d | 2,330,960 | |||||||
| 5%, 2/15/2019 (Insured; MBIA) | 1,165,000 | 1,270,724 | 5.50%, 12/1/2018 | 2,000,000 | 2,282,820 | |||||
| Upper Saint Clair Township School | Texas—.3% | |||||||||
| District 5.20%, 7/15/2007 | 7,000,000 d | 7,288,890 | Cities of Dallas and Fort Worth, | |||||||
| Wallenpaupack Area School District | Dallas/Fort Worth International | |||||||||
| 5.50%, 3/1/2008 (Insured; FGIC) | 2,090,000 | 2,215,567 | Airport Revenue, | |||||||
| Warwick School District, Lancaster | Improvement 5.50%, | |||||||||
| County 5.25%, 2/15/2011 | 11/1/2031 (Insured; FGIC) | 2,000,000 | 2,137,040 | |||||||
| (Insured; FGIC) | 1,000,000 | 1,100,020 | Virginia—1.8% | |||||||
| Wilson Area School District | Industrial Development Authority of | |||||||||
| 5%, 2/15/2011 (Insured; FGIC) | 1,910,000 | 2,074,642 | the County of Charles City, | |||||||
| Wilson School District: | Solid Waste Disposal | |||||||||
| 5.375%, 5/15/2015 | Facility Revenue (USA Waste | |||||||||
| (Insured; FSA) | 1,785,000 | 1,980,582 | of Virginia, Inc. Project) | |||||||
| 5.375%, 5/15/2016 | 4.875%, 2/1/2009 | 6,600,000 | 6,800,178 | |||||||
| (Insured; FSA) | 1,500,000 | 1,663,410 | Louisa Industrial Development | |||||||
| Woodland Hills School District, GO | Authority, PCR (Virginia | |||||||||
| 5%, 9/1/2014 (Insured; FSA) | 1,400,000 | 1,554,994 | Electric and Power Co.) | |||||||
| 5.25%, 12/1/2008 | 5,000,000 | 5,169,050 | ||||||||
| Wyoming Valley Sanitary Authority, | ||||||||||
| Sewer Revenue | U.S. Related—11.0% | |||||||||
| 5%,11/15/2007 (Insured; MBIA) | 1,960,000 | 2,045,966 | Commonwealth of Puerto Rico, | |||||||
| York County 5%, 6/1/2017 | Public Improvement: | |||||||||
| (Insured; AMBAC) | 1,100,000 | 1,201,728 | 5%, 7/1/2012 | 5,000,000 d | 5,507,950 | |||||
| 5.50%, 7/1/2014 | ||||||||||
| York County Solid Waste and | (Insured; MBIA) | 7,500,000 | 8,664,825 | |||||||
| Refuse Authority, Solid Waste | 5.50%, 7/1/2018 | |||||||||
| System Revenue 5.50%, | (Insured; FGIC) | 9,545,000 | 11,260,427 | |||||||
| 12/1/2014 (Insured; FGIC) | 1,000,000 | 1,148,980 | ||||||||
| 40 |
| Mellon Pennsylvania Intermediate Municipal Bond Fund (continued) | ||||||||||
| Long-Term Municipal | Principal | Short-Term Municipal | Principal | |||||||
| Investments (continued) | Amount ($) | Value ($) | Investments—.8% | Amount ($) | Value ($) | |||||
| U.S. Related (continued) | Indiana—.3% | |||||||||
| Puerto Rico Electric Power | Indiana Educational Facilities | |||||||||
| Authority, Power Revenue: | Authority, Educational Facilities | |||||||||
| 5.25%, 7/1/2014 | Revenue (Depauw University | |||||||||
| (Insured; MBIA) | 7,875,000 | 8,949,229 | Project) 2.32% (LOC; | |||||||
| 5.50%, 7/1/2017 | Northern Trust Bank) | 1,800,000 e | 1,800,000 | |||||||
| (Insured; MBIA) | 6,000,000 | 7,049,100 | Oklahoma—.3% | |||||||
| 5.25%, 7/1/2029 | ||||||||||
| (Insured; FSA) | 5,000,000 | 5,428,000 | Tulsa County Industial Authority, | |||||||
| First Mortgage Revenue | ||||||||||
| Puerto Rico Highway and | (Montereau in Warren | |||||||||
| Transportation Authority: | Woods Project) 2.33% | |||||||||
| Highway Revenue: | (LOC; BNP Paribas) | 1,800,000 e | 1,800,000 | |||||||
| Series Y, 6.25%, | ||||||||||
| 7/1/2008 (Insured; MBIA) | 1,295,000 | 1,409,724 | Pennsylvania—.2% | |||||||
| Series Z, 6.25%, | Pennsylvania Higher Educational | |||||||||
| 7/1/2008 (Insured; MBIA) | 1,000,000 | 1,088,590 | Facilities Authority, Temple | |||||||
| 5.50%, 7/1/2013 | University Revenue | |||||||||
| (Insured; FSA) | 1,500,000 | 1,695,690 | 2.31% (LOC; Landesbank | |||||||
| 5.50%, 7/1/2013 | Hessen-Thurigen Girozentrale) | 1,600,000 e | 1,600,000 | |||||||
| (Insured; MBIA) | 4,000,000 | 4,521,840 | Total Short-Term | |||||||
| Transportation Revenue | Municipal Investments | |||||||||
| 5.25%, 7/1/2010 | 4,000,000 | 4,328,920 | (cost $5,200,000) | 5,200,000 | ||||||
| Puerto Rico Municipal | ||||||||||
| Finance Agency: | Total Investments | |||||||||
| 5.50%, 8/1/2007 | 5,000,000 | 5,243,600 | (cost $632,113,574) | 100.7% | 666,198,113 | |||||
| 5.50%, 8/1/2009 (Insured; FSA) | 7,090,000 | 7,730,652 | Liabilities, Less Cash | |||||||
| Total Long-Term | and Receivables | (.7%) | (4,735,748) | |||||||
| Municipal Investments | Net Assets | 100.0% | 661,462,365 | |||||||
| (cost $626,913,574) | 660,998,113 | |||||||||
| The Funds 41 |
| STATEMENT OF INVESTMENTS(continued) |
| Summary of Abbreviations | ||||||
| ACA | American Capital Access | IDB | Industrial Development Board | |||
| AGIC | Asset Guaranty Insurance Company | IDC | Industrial Development Corporation | |||
| AMBAC | American Municipal Bond Assurance Corporation | IDR | Industrial Development Revenue | |||
| ARRN | Adjustable Rate Receipt Notes | LOC | Letter of Credit | |||
| BAN | Bond Anticipation Notes | LOR | Limited Obligation Revenue | |||
| BIGI | Bond Investors Guaranty Insurance | LR | Lease Revenue | |||
| BPA | Bond Purchase Agreement | MBIA | Municipal Bond Investors | |||
| CGIC | Capital Guaranty Insurance Company | Assurance Insurance Corporation | ||||
| CIC | Continental Insurance Company | MFHR | Multi-Family Housing Revenue | |||
| CIFG | CDC Ixis Financial Guaranty | MFMR | Multi-Family Mortgage Revenue | |||
| CMAC | Capital Market Assurance Corporation | PCR | Pollution Control Revenue | |||
| COP | Certificate of Participation | RAC | Revenue Anticipation Certificates | |||
| CP | Commercial Paper | RAN | Revenue Anticipation Notes | |||
| EDR | Economic Development Revenue | RAW | Revenue Anticipation Warrants | |||
| EIR | Environmental Improvement Revenue | RRR | Resources Recovery Revenue | |||
| FGIC | Financial Guaranty Insurance Company | SAAN | State Aid Anticipation Notes | |||
| FHA | Federal Housing Administration | SBPA | Standby Bond Purchase Agreement | |||
| FHLB | Federal Home Loan Bank | SFHR | Single Family Housing Revenue | |||
| FHLMC | Federal Home Loan Mortgage Corporation | SFMR | Single Family Mortgage Revenue | |||
| FNMA | Federal National Mortgage Association | SONYMA | State of New York Mortgage Agency | |||
| FSA | Financial Security Assurance | SWDR | Solid Waste Disposal Revenue | |||
| GAN | Grant Anticipation Notes | TAN | Tax Anticipation Notes | |||
| GIC | Guaranteed Investment Contract | TAW | Tax Anticipation Warrants | |||
| GNMA | Government National Mortgage Association | TRAN | Tax and Revenue Anticipation Notes | |||
| GO | General Obligation | XLCA | XL Capital Assurance | |||
| HR | Hospital Revenue | |||||
| Summary of Combined Ratings (Unaudited) | ||||||
| Fitch | or Moody’s or | Standard & Poor’s Value (%) † | ||||
| AAA | Aaa | AAA | 64.8 | |||
| AA | Aa | AA | 18.3 | |||
| A | A | A | 11.3 | |||
| BBB | Baa | BBB | 4.8 | |||
| F1 | MIG1/P1 | SP1/A1 | .8 | |||
| 100.0 | ||||||
| † Based on total investments. |
| a Zero coupon until a specified date, at which time, the stated coupon rate becomes effective until maturity. |
| b Purchased on a delayed delivery basis. |
| c Subject to interest rate change on November 1, 2011. |
| d These securities are prerefunded;the date shown represents the prerefunded date. Bonds which are prerefunded are collateralized by U.S. Government securities which are held in |
| escrow and are used to pay principal and interest on the municipal issue and to retire the bonds in full at the earliest refunding date. |
| e Securities payable on demand.Variable interest rate—subject to periodic change. |
| See notes to financial statements. |
| 42 |
| STATEMENT OF FINANCIAL FUTURES | ||||||||
| August 31, 2005 | ||||||||
| Market Value | Unrealized | |||||||
| Covered by | (Depreciation) | |||||||
| Contracts | Contracts ($) | Expiration | at 8/31/2005 ($) | |||||
| Financial Futures Sold Short | ||||||||
| U.S. Treasury Futures 5 Year Note | 50 | 5,426,563 | September 2005 | (10,156) | ||||
| U.S. Treasury Futures 10 Year Note | 265 | 29,924,297 | September 2005 | (8,466) | ||||
| U.S. Treasury Futures 30 Year Bond | 185 | 21,899,375 | September 2005 | (319,465) | ||||
| (338,087) | ||||||||
| See notes to financial statements. |
| The Funds 43 |
| STATEMENT OF INVESTMENTS | ||||||||||||
| August 31, 2005 | ||||||||||||
| Mellon Massachusetts Intermediate Municipal Bond Fund | ||||||||||||
| Long-Term Municipal | Principal | Principal | ||||||||||
| Investments—97.2% | Amount ($) | Value ($) | Amount ($) | Value ($) | ||||||||
| Massachusetts—88.2% | Massachusetts (continued) | |||||||||||
| Amesbury, GO 5%, | Mansfield 5%, 8/15/2017 | |||||||||||
| 9/15/2013 (Insured; MBIA) | 1,420,000 | 1,576,825 | (Insured; AMBAC) | 1,395,000 | b | 1,541,796 | ||||||
| Auburn 5.125%, 6/1/2020 | Marblehead: | |||||||||||
| (Insured; AMBAC) | 1,225,000 | 1,346,422 | 5%, 8/15/2018 | 1,440,000 | 1,579,853 | |||||||
| Bellingham 5.375%, | 5%, 8/15/2022 | 1,750,000 | 1,899,118 | |||||||||
| 3/1/2014 (Insured; AMBAC) | 1,685,000 | 1,872,271 | Mashpee 5.625%, | |||||||||
| Boston 5.75%, 2/1/2010 | 2,000,000 | 2,216,260 | 11/15/2010 (Insured; FGIC) | 500,000 | a | 564,370 | ||||||
| Boston Economic Development | Massachusetts: | |||||||||||
| and Industrial Corp., Public Parking | 6.50%, 8/1/2008 | 600,000 | 654,072 | |||||||||
| Facility 4.50%, 6/1/2010 | 3,000,000 | 3,140,790 | Zero Coupon, 12/1/2012 | |||||||||
| Boston Water and Sewer | (Insured; XLCA) | 1,770,000 | 1,905,600 | |||||||||
| Commission, Revenue: | Consolidated Loan: | |||||||||||
| 9.25%, 1/1/2011 | 100,000 | 126,653 | 5.75%, 6/1/2010 | 5,000,000 | a | 5,575,650 | ||||||
| 5%, 11/1/2019 | 2,170,000 | 2,372,504 | 5.50%, 3/1/2012 (Insured; FSA) | 2,000,000 | a | 2,235,440 | ||||||
| 5%, 11/1/2023 | 3,920,000 | 4,241,597 | 5%, 8/1/2012 (Insured; MBIA) | 420,000 | a | 458,984 | ||||||
| 5.25%, 11/1/2012 | 2,000,000 | a | 2,221,660 | |||||||||
| Brockton (Municipal Purpose Loan) | 5.25%, 1/1/2013 (Insured; FSA) | 1,300,000 | a | 1,442,857 | ||||||||
| 5%, 6/1/2019 (Insured; AMBAC) | 1,430,000 | 1,565,593 | 5.25%, 10/1/2013 | 2,500,000 | a | 2,793,500 | ||||||
| Burlington: | 5%, 3/1/2022 | 1,800,000 | 1,947,762 | |||||||||
| 5.25%, 2/1/2012 | 200,000 | 222,650 | 5%, 3/1/2025 | 1,500,000 | 1,620,660 | |||||||
| 5.25%, 2/1/2013 | 250,000 | 280,785 | 5%, 8/1/2027 (Insured; MBIA) | 1,580,000 | 1,735,835 | |||||||
| Cambridge (Municipal Purpose Loan): | Federal Highway: | |||||||||||
| 5%, 12/15/2011 | 510,000 | 562,443 | 5.50%, 12/15/2009 | 5,000,000 | 5,462,850 | |||||||
| 4%, 1/1/2014 | 1,000,000 | 1,045,030 | 5.75%, 6/15/2010 | 2,000,000 | 2,222,600 | |||||||
| Cohasset: | 5.75%, 6/15/2012 | |||||||||||
| 5%, 6/15/2022 | 895,000 | 969,339 | (Insured; FSA) | 2,500,000 | 2,792,050 | |||||||
| 5%, 6/15/2023 | 895,000 | 967,262 | (Grant Anticipation Notes) | |||||||||
| Easton 6%, 9/15/2006 | 105,000 | 106,742 | 5.125%, 6/15/2015 | |||||||||
| (Insured; MBIA) | 1,500,000 | 1,598,385 | ||||||||||
| Everett: | Special Obligation Revenue: | |||||||||||
| 6.125%, 12/15/2009 | 5.375%, 6/1/2011 | 6,350,000 | 7,027,609 | |||||||||
| (Insured; MBIA) | 1,000,000 a | 1,129,620 | 5.50%, 6/1/2013 | 1,000,000 | 1,135,400 | |||||||
| 5.375%, 12/15/2017 | 5.25%, 1/1/2014 (Insured; FGIC) | 2,405,000 | a | 2,689,295 | ||||||||
| (Insured; FGIC) | 1,250,000 | 1,421,150 | ||||||||||
| Massachusetts Bay | ||||||||||||
| Hingham (Municipal Purpose | Transportation Authority: | |||||||||||
| Loan) 5.375%, 4/1/2017 | 1,645,000 | 1,827,463 | Assessment Revenue: | |||||||||
| Holden (Municipal Purpose Loan) | 5.75%, 7/1/2010 | 1,835,000 | a | 2,049,438 | ||||||||
| 6%, 3/1/2014 (Insured; FGIC) | 1,000,000 | 1,124,440 | 5.75%, 7/1/2011 | 165,000 | 182,993 | |||||||
| Hopedale: | 5.25%, 7/1/2014 | 1,045,000 | a | 1,179,063 | ||||||||
| 4%, 11/15/2013 (Insured; AMBAC) | 250,000 | 260,160 | 5.25%, 7/1/2014 | 1,000,000 | a | 1,128,290 | ||||||
| 5%, 11/15/2019 (Insured; AMBAC) | 650,000 | 717,074 | General Transportation System: | |||||||||
| Lynn 5.25%, 2/15/2008 | 5.50%, 3/1/2009 | |||||||||||
| (Insured; MBIA) | 1,500,000 | 1,581,300 | (Insured; FGIC) | 2,000,000 | 2,158,600 | |||||||
| Lynnfield (Municipal Purpose Loan): | 5.25%, 3/1/2015 | |||||||||||
| 5%, 7/1/2020 | 505,000 | 550,283 | (Insured; FGIC) | 1,000,000 | 1,129,020 | |||||||
| 5%, 7/1/2021 | 525,000 | 570,843 | Sales Tax Revenue: | |||||||||
| 5%, 7/1/2022 | 585,000 | 634,257 | 5.50%, 7/1/2016 | 2,500,000 | 2,907,000 | |||||||
| 5%, 7/1/2023 | 585,000 | 632,894 | 5.25%, 7/1/2021 | 2,000,000 | 2,323,060 | |||||||
44
| Mellon Massachusetts Intermediate Municipal Bond Fund (continued) | ||||||||||
| Long-Term Municipal | Principal | Principal | ||||||||
| Investments (continued) | Amount ($) | Value ($) | Amount ($) | Value ($) | ||||||
| Massachusetts (continued) | Massachusetts (continued) | |||||||||
| Massachusetts Development | Massachusetts Health and | |||||||||
| Finance Agency, Revenue: | Educational Facilities Authority, | |||||||||
| (Boston University Issue) 5%, | Revenue (continued): | |||||||||
| 10/1/2035 (Insured; AMBAC) | 2,000,000 | 2,132,900 | (Northeastern University) 5.50%, | |||||||
| (College of Pharmacy and | 10/1/2009 (Insured; MBIA) | 420,000 | 457,951 | |||||||
| Allied Health): | (Partners Healthcare Systems): | |||||||||
| 5%, 7/1/2024 (Insured; | 5.25%, 7/1/2013 | 1,595,000 | 1,700,509 | |||||||
| Assured Guaranty) | 2,750,000 | 2,916,485 | 5%, 7/1/2014 | 1,300,000 | 1,429,376 | |||||
| 5%, 7/1/2027 (Insured; | 5%, 7/1/2016 | 1,045,000 | 1,126,280 | |||||||
| Assured Guaranty) | 1,000,000 | 1,053,540 | 5.125%, 7/1/2019 | 1,000,000 | 1,049,610 | |||||
| 5%, 7/1/2035 (Insured; | (Tufts University): | |||||||||
| Assured Guaranty) | 2,000,000 | 2,093,200 | 5.50%, 8/15/2014 | 1,000,000 | 1,147,630 | |||||
| (Combined Jewish Philanthropies) | 5.50%, 2/15/2036 | 1,000,000 | 1,093,330 | |||||||
| 5.25%, 2/1/2022 | 1,000,000 | 1,094,790 | (UMass Memorial Issue): | |||||||
| Education (Belmont Hill | 5.25%, 7/1/2025 | 2,000,000 | 2,100,960 | |||||||
| School) 5%, 9/1/2015 | 500,000 | 534,885 | 5%, 7/1/2033 | 1,000,000 | 1,013,510 | |||||
| Higher Education (Smith College) | (Wellesley College) | |||||||||
| 5.75%, 7/1/2010 | 1,000,000 a | 1,125,470 | 5%, 7/1/2024 | 1,000,000 | 1,079,610 | |||||
| (Massachusetts College | (Winchester Hospital) | |||||||||
| of Pharmacy): | 6.75%, 7/1/2010 | 1,600,000 a | 1,840,960 | |||||||
| 6%, 7/1/2008 | 310,000 | 329,251 | Massachusetts Housing Finance Agency: | |||||||
| 6.30%, 1/1/2010 | 350,000 a | 398,209 | Housing: | |||||||
| 6.40%, 1/1/2010 | 370,000 a | 422,455 | 4.20%, 12/1/2010 | 4,000,000 | 4,041,320 | |||||
| 6.50%, 1/1/2010 | 395,000 a | 452,587 | 5%, 12/1/2026 | 1,165,000 | 1,199,449 | |||||
| 6.375%, 7/1/2023 | 1,000,000 | 1,128,200 | 5.125%, 12/1/2034 | 200,000 | 205,592 | |||||
| (Milton Academy) 5%, 9/1/2019 | 1,000,000 | 1,090,250 | SFHR 6%, 6/1/2014 (Insured; MBIA) | 370,000 | 372,020 | |||||
| Resource Recovery | Massachusetts Industrial | |||||||||
| (Waste Management, Inc.) | Finance Agency, Revenue: | |||||||||
| 6.90%, 12/1/2009 | 1,000,000 | 1,111,120 | (Babson College) 5.75%, | |||||||
| Solid Waste Disposal (Waste | 10/1/2007 (Insured; MBIA) | 555,000 | 586,219 | |||||||
| Management, Inc.) | (College of The Holy Cross) | |||||||||
| 5.45%, 6/1/2014 | 1,000,000 | 1,083,210 | 5.50%, 3/1/2007 | |||||||
| (Suffolk University) | (Insured; MBIA) | 1,145,000 | 1,182,201 | |||||||
| 5.85%, 7/1/2009 | 1,000,000 a | 1,103,500 | (Concord Academy): | |||||||
| Massachusetts Education Loan | 5.45%, 9/1/2017 | 500,000 | 526,040 | |||||||
| Authority, Education Loan | 5.50%, 9/1/2027 | 1,250,000 | 1,315,350 | |||||||
| Revenue 6.20%, 7/1/2013 | Electric Utility (Nantucket | |||||||||
| (Insured; AMBAC) | 295,000 | 297,832 | Electric Co.) 6.75%, | |||||||
| Massachusetts Educational Financing | 7/1/2006 (Insured; AMBAC) | 1,400,000 | 1,442,994 | |||||||
| Authority, Education Loan Revenue | (Saint John’s School, Inc.) | |||||||||
| 4.70%, 1/1/2010 (Insured; AMBAC) | 715,000 | 723,001 | 5.70%, 6/1/2018 | 1,000,000 | 1,045,190 | |||||
| Massachusetts Health and Educational | (The Tabor Academy) | |||||||||
| Facilities Authority, Revenue: | 5.40%, 12/1/2028 | 500,000 | 519,920 | |||||||
| (Boston College) | (Tufts University): | |||||||||
| 5.125%, 6/1/2037 | 2,000,000 | 2,119,680 | 5.50%, 2/15/2007 | |||||||
| (Dartmouth-Hitchcock) 5.125%, | (Insured; MBIA) | 710,000 | 736,164 | |||||||
| 8/1/2022 (Insured; FSA) | 2,000,000 | 2,169,920 | 5.50%, 2/15/2011 | |||||||
| (Jordan Hospital) 5%, 10/1/2010 | 500,000 | 511,340 | (Insured; MBIA) | 500,000 | 555,765 | |||||
| The Funds 45 |
| STATEMENT OF INVESTMENTS(continued) |
| Mellon Massachusetts Intermediate Municipal Bond Fund (continued) | ||||||||||
| Long-Term Municipal | Principal | Principal | ||||||||
| Investments (continued) | Amount ($) | Value ($) | Amount ($) | Value ($) | ||||||
| Massachusetts (continued) | Massachusetts (continued) | |||||||||
| Massachusetts Industrial | Massachusetts Water | |||||||||
| Finance Agency, Revenue (continued): | Resource Authority: | |||||||||
| (Wentworth Institute of | 5.30%, 11/1/2006 | |||||||||
| Technology) 5.55%, 10/1/2013 | 500,000 | 531,030 | (Insured; FGIC) | 1,000,000 a | 1,036,910 | |||||
| (Worcester Polytechnic) 5.35%, | Series B, 5.50%, 8/1/2011 | |||||||||
| 9/1/2006 (Insured; MBIA) | 850,000 | 870,936 | (Insured; FSA) | 1,100,000 | 1,229,074 | |||||
| Massachusetts Municipal | Series D, 5.50%, 8/1/2011 | |||||||||
| Wholesale Electric Co., Power | (Insured; MBIA) | 1,000,000 | 1,117,340 | |||||||
| Supply System Revenue: | 6%, 8/1/2014 | |||||||||
| (Nuclear Project Number 5) | (Insured; MBIA) | 1,000,000 | 1,187,680 | |||||||
| 5%, 7/1/2011 (Insured; MBIA) | 120,000 | 130,308 | 5.25%, 8/1/2018 | |||||||
| (Nuclear Project Number 4) | (Insured; FSA) | 500,000 | 573,725 | |||||||
| 5.25%, 7/1/2012 | 5.25%, 8/1/2019 | |||||||||
| (Insured; MBIA) | 2,000,000 | 2,216,760 | (Insured; MBIA) | 1,500,000 | 1,712,250 | |||||
| Massachusetts Port Authority, | 5.25%, 8/1/2021 | |||||||||
| Revenue: | (Insured; MBIA) | 1,000,000 | 1,135,320 | |||||||
| 6%, 1/1/2010 | 2,500,000 a | 2,814,175 | Mendon Upton Regional School District | |||||||
| 5.75%, 7/1/2011 | 3,500,000 | 3,913,070 | 6%, 6/1/2007 (Insured; FGIC) | 600,000 | 631,608 | |||||
| 5.50%, 7/1/2014 (Insured; FSA) | 1,265,000 | 1,361,545 | Milton School: | |||||||
| Massachusetts School Building | 5%, 3/1/2023 | 500,000 | 540,220 | |||||||
| Authority, Dedicated Sales Tax: | 5%, 3/1/2024 | 500,000 | 539,400 | |||||||
| 5%, 8/15/2017 (Insured; FSA) | 4,000,000 | 4,413,920 | 5%, 3/1/2025 | 500,000 | 538,990 | |||||
| 5%, 8/15/2018 (Insured; FSA) | 1,100,000 | 1,209,032 | Northampton 5.125%, | |||||||
| Massachusetts Turnpike Authority, | 10/15/2016 (Insured; MBIA) | 1,985,000 | 2,232,033 | |||||||
| Turnpike Revenue | Northbridge 5.25%, 2/15/2017 | |||||||||
| 5%, 1/1/2020 (Insured; MBIA) | 2,440,000 | 2,701,568 | (Insured; AMBAC) | 1,000,000 | 1,108,620 | |||||
| Massachusetts Water Pollution | Pittsfield: | |||||||||
| Abatement Trust: | 5%, 4/15/2012 (Insured; MBIA) | 1,000,000 | 1,098,660 | |||||||
| (Pooled Loan Program): | 5.50%, 4/15/2014 (Insured; MBIA) | 500,000 | 567,395 | |||||||
| 5.25%, 2/1/2009 | 500,000 | 535,455 | Quabbin Regional School District | |||||||
| 5.50%, 8/1/2009 | 1,055,000 a | 1,158,464 | 6%, 6/15/2008 (Insured; AMBAC) | 780,000 | 842,743 | |||||
| 5.625%, 8/1/2010 | 975,000 a | 1,093,492 | Randolph: | |||||||
| 5.25%, 8/1/2011 | 335,000 a | 370,828 | 5%, 9/1/2017 (Insured; AMBAC) | 1,045,000 | 1,157,818 | |||||
| 5%, 8/1/2012 | 3,910,000 a | 4,295,643 | 5%, 9/1/2024 (Insured; AMBAC) | 490,000 | 533,071 | |||||
| 5.625%, 8/1/2013 | 25,000 | 27,823 | ||||||||
| 5.25%, 2/1/2014 | 965,000 | 1,058,296 | Sandwich, GO: | |||||||
| 5.50%, 8/1/2014 | 30,000 | 32,822 | 5.75%, 8/15/2010 (Insured; MBIA) | 1,050,000 a | 1,184,358 | |||||
| 5.25%, 8/1/2017 | 1,500,000 | 1,678,185 | 5%, 7/15/2015 (Insured; MBIA) | 1,060,000 | 1,185,419 | |||||
| 5%, 8/1/2018 | 75,000 | 81,448 | Somerville 6%, | |||||||
| 5%, 8/1/2032 | 2,000,000 | 2,104,300 | 2/15/2007 (Insured; FSA) | 775,000 | 809,387 | |||||
| Water Pollution | Springfield 5.50%, | |||||||||
| Abatement Revenue: | 8/1/2014 (Insured; FGIC) | 1,500,000 | 1,686,645 | |||||||
| (New Bedford Loan Program) | University of Massachusetts | |||||||||
| 5.25%, 2/1/2012 | 500,000 | 553,275 | Building Authority, Project | |||||||
| (South Essex Sewer District | Revenue 5.50%, 11/1/2010 | |||||||||
| Loan Program) | (Insured; AMBAC) | 1,000,000 a | 1,111,600 | |||||||
| 6.375%, 2/1/2015 | 195,000 | 197,498 | ||||||||
46
| Mellon Massachusetts Intermediate Municipal Bond Fund (continued) | ||||||||||
| Long-Term Municipal | Principal | Short-Term Municipal | Principal | |||||||
| Investments (continued) | Amount ($) | Value ($) | Investments—3.3% | Amount ($) | Value ($) | |||||
| Massachusetts (continued) | Massachusetts; | |||||||||
| Uxbridge (Municipal Purpose Loan) | Massachusetts, GO (Central Artery/ | |||||||||
| 6.125%, 11/15/2007 | Ted Williams Tunnel | |||||||||
| (Insured; MBIA) | 525,000 | 560,663 | Infrastructure Loan Act): | |||||||
| Westfield 6.50%, | 2.35% | 2,650,000 d | 2,650,000 | |||||||
| 5/1/2010 (Insured; FGIC) | 735,000 a | 848,506 | 2.35% | 200,000 d | 200,000 | |||||
| Worcester: | Massachusetts Health | |||||||||
| 5.625%, 8/15/2010 (Insured; FGIC) | 1,000,000 a | 1,122,260 | and Educational | |||||||
| 5.25%, 8/15/2017 (Insured; MBIA) | 1,000,000 | 1,130,550 | Facilities Authority: | |||||||
| (Municipal Purpose Loan) | (Capital Asset Program | |||||||||
| 6.25%, 7/1/2010 (Insured; MBIA) | 755,000 | 856,782 | Issue) 2.35% (LOC; | |||||||
| U.S. Related—9.0% | Bank Of America) | 1,200,000 d | 1,200,000 | |||||||
| Guam Economic | (Peabody Essex Museum Issue) | |||||||||
| Development Authority: | 2.47% (LOC; Royal | |||||||||
| 0/5.15%, 5/15/2011 | 250,000 c | 229,308 | Bank of Scotland) | 1,500,000 d | 1,500,000 | |||||
| 0/5.20%, 5/15/2012 | 300,000 c | 275,436 | Massachusetts Industrial | |||||||
| 0/5.20%, 5/15/2013 | 1,175,000 c | 1,069,708 | Finance Agency, Higher | |||||||
| Puerto Rico Commonwealth: | Education Revenue | |||||||||
| 5%, 7/1/2008 | 5,000,000 | 5,213,450 | (Southern New England School | |||||||
| 6%, 7/1/2008 | 2,500,000 | 2,673,675 | of Law Issue) 2.47% (LOC; | |||||||
| 6.25%, 7/1/2011 (Insured; MBIA) | 1,050,000 | 1,218,221 | Bank of America) | 400,000 d | 400,000 | |||||
| Public Improvement: | Massachusetts Water Resources | |||||||||
| 5.50%, 7/1/2014 (Insured; MBIA) | 500,000 | 577,655 | Authority, Multi-Modal Subordinated | |||||||
| 5.50%, 7/1/2015 (Insured; FSA) | 1,350,000 | 1,569,874 | General Revenue: | |||||||
| Puerto Rico Commonwealth Highway | 2.35% (LOC; Landesbank | |||||||||
| and Transportation Authority: | Baden-Wurttemberg) | 700,000 d | 700,000 | |||||||
| Highway Revenue 6.25%, | 2.37% (LOC; Landesbank | |||||||||
| 7/1/2009 (Insured; MBIA) | 1,000,000 | 1,115,080 | Hessen-Thurigen Girozentrale) | 500,000 d | 500,000 | |||||
| Transportation Revenue: | Route 3 North Transportation | |||||||||
| 5.25%, 7/1/2015 | Improvements Association, LR | |||||||||
| (Insured; FGIC) | 1,905,000 | 2,134,362 | 2.50% (Insured; AMBAC and | |||||||
| 5.25%, 7/1/2018 | LOC; Dexia Credit Locale) | 800,000 d | 800,000 | |||||||
| (Insured; FGIC) | 2,500,000 | 2,790,100 | Total Short-Term | |||||||
| Puerto Rico Electric Power | Municipal Investments | |||||||||
| Authority, Power Revenue: | (cost $7,950,000) | 7,950,000 | ||||||||
| 5%, 7/1/2009 | 500,000 | 530,165 | ||||||||
| 5%, 7/1/2017 (Insured; MBIA) | 1,000,000 | 1,111,960 | Total Investments | |||||||
| Puerto Rico Public Buildings Authority, | (cost $230,941,375) | 100.5% | 240,043,908 | |||||||
| Revenue (Guaranteed Government | ||||||||||
| Facilities) 4%, 7/1/2007 | Liabilities, Less Cash | |||||||||
| (Insured; MBIA) | 1,050,000 | 1,070,779 | and Receivables | (.5%) | (1,231,964) | |||||
| Total Long-Term | Net Assets | 100.0% | 238,811,944 | |||||||
| Municipal Investments | ||||||||||
| (cost $222,991,375) | 232,093,908 | |||||||||
| The Funds 47 |
| STATEMENT OF INVESTMENTS (continued) |
| Summary of Abbreviations | ||||||
| ACA | American Capital Access | IDB | Industrial Development Board | |||
| AGIC | Asset Guaranty Insurance Company | IDC | Industrial Development Corporation | |||
| AMBAC | American Municipal Bond Assurance Corporation | IDR | Industrial Development Revenue | |||
| ARRN | Adjustable Rate Receipt Notes | LOC | Letter of Credit | |||
| BAN | Bond Anticipation Notes | LOR | Limited Obligation Revenue | |||
| BIGI | Bond Investors Guaranty Insurance | LR | Lease Revenue | |||
| BPA | Bond Purchase Agreement | MBIA | Municipal Bond Investors | |||
| CGIC | Capital Guaranty Insurance Company | Assurance Insurance Corporation | ||||
| CIC | Continental Insurance Company | MFHR | Multi-Family Housing Revenue | |||
| CIFG | CDC Ixis Financial Guaranty | MFMR | Multi-Family Mortgage Revenue | |||
| CMAC | Capital Market Assurance Corporation | PCR | Pollution Control Revenue | |||
| COP | Certificate of Participation | RAC | Revenue Anticipation Certificates | |||
| CP | Commercial Paper | RAN | Revenue Anticipation Notes | |||
| EDR | Economic Development Revenue | RAW | Revenue Anticipation Warrants | |||
| EIR | Environmental Improvement Revenue | RRR | Resources Recovery Revenue | |||
| FGIC | Financial Guaranty Insurance Company | SAAN | State Aid Anticipation Notes | |||
| FHA | Federal Housing Administration | SBPA | Standby Bond Purchase Agreement | |||
| FHLB | Federal Home Loan Bank | SFHR | Single Family Housing Revenue | |||
| FHLMC | Federal Home Loan Mortgage Corporation | SFMR | Single Family Mortgage Revenue | |||
| FNMA | Federal National Mortgage Association | SONYMA | State of New York Mortgage Agency | |||
| FSA | Financial Security Assurance | SWDR | Solid Waste Disposal Revenue | |||
| GAN | Grant Anticipation Notes | TAN | Tax Anticipation Notes | |||
| GIC | Guaranteed Investment Contract | TAW | Tax Anticipation Warrants | |||
| GNMA | Government National Mortgage Association | TRAN | Tax and Revenue Anticipation Notes | |||
| GO | General Obligation | XLCA | XL Capital Assurance | |||
| HR | Hospital Revenue | |||||
| Summary of Combined Ratings (Unaudited) | ||||||
| Fitch | or Moody’s or | Standard & Poor’s Value (%) † | ||||
| AAA | Aaa | AAA | 55.9 | |||
| AA | Aa | AA | 30.7 | |||
| A | A | A | 1.0 | |||
| BBB | Baa | BBB | 9.1 | |||
| F1 | MIG1/ P1 | SP1/A1 | 3.3 | |||
| 100.0 | ||||||
| † Based on total investments. |
| a These securities are prerefunded; the date shown represents the prerefunded date. Bonds which are prerefunded are collateralized by U.S. Government securities which are held in |
| escrow and are used to pay principal and interest on the municipal issue and to retire the bonds in full at the earliest refunding date. |
| b Purchased on a delayed delivery basis. |
| c Zero coupon until a specified date at which time the stated coupon rate becomes effective until maturity. |
| d Securities payable on demand.Variable interest rate—subject to periodic change. |
| See notes to financial statements. |
| 48 |
| STATEMENT OF FINANCIAL FUTURES | ||||||||
| August 31, 2005 | ||||||||
| Market Value | Unrealized | |||||||
| Covered by | (Depreciation) | |||||||
| Contracts | Contracts ($) | Expiration | at 8/31/2005 ($) | |||||
| Financial Futures Sold Short | ||||||||
| U.S. Treasury Futures 5 Year Note | 20 | 2,170,625 | September 2005 | (4,062) | ||||
| U.S. Treasury Futures 10 Year Note | 90 | 10,162,969 | September 2005 | (3,326) | ||||
| U.S. Treasury Futures 30 Year Bond | 60 | 7,102,500 | September 2005 | (103,610) | ||||
| (110,998) | ||||||||
| See notes to financial statements. |
| The Funds 49 |
| STATEMENTS OF ASSETS AND LIABILITIES | ||||||||
| August 31, 2005 | ||||||||
| Mellon | Mellon | Mellon | Mellon | |||||
| National | National | Pennsylvania | Massachusetts | |||||
| Intermediate | Short-Term | Intermediate | Intermediate | |||||
| Municipal Bond Fund | Municipal Bond Fund | Municipal Bond Fund | Municipal Bond Fund | |||||
| Assets ($): | ||||||||
| Investments in securities— | ||||||||
| See Statement of Investments † | 793,458,372 | 209,604,209 | 666,198,113 | 240,043,908 | ||||
| Cash on Initial Margin—Note 5 | 484,500 | — | 436,500 | 146,500 | ||||
| Interest receivable | 8,658,518 | 2,480,795 | 8,075,352 | 2,385,287 | ||||
| Receivable for investment securites sold | 2,493,500 | — | 489,672 | — | ||||
| Receivable for shares of Beneficial Interest subscribed | 162,500 | 320,570 | 263,785 | 25,000 | ||||
| Prepaid expenses | 29,578 | 14,244 | 22,886 | 24,257 | ||||
| 805,286,968 | 212,419,818 | 675,486,308 | 242,624,952 | |||||
| Liabilities ($): | ||||||||
| Due to The Dreyfus Corporation and affiliates—Note 4(c) | 248,616 | 67,865 | 294,001 | 72,771 | ||||
| Due to Administrator—Note 4(a) | 85,797 | 23,634 | 74,627 | 26,503 | ||||
| Cash overdraft due to Custodian | 3,760,712 | 186,623 | 2,542,959 | 558,385 | ||||
| Payable for investment securities purchased | 35,834,722 | 4,174,509 | 10,129,675 | 2,976,516 | ||||
| Payable for futures variation margin—Note 5 | 303,281 | — | 273,281 | 92,188 | ||||
| Payable for shares of Beneficial Interest redeemed | 203,246 | 713,815 | 659,354 | 48,000 | ||||
| Accrued expenses and other liabilities | 73,891 | 40,314 | 50,046 | 38,645 | ||||
| 40,510,265 | 5,206,760 | 14,023,943 | 3,813,008 | |||||
| Net Assets ($) | 764,776,703 | 207,213,058 | 661,462,365 | 238,811,944 | ||||
| Composition of Net Assets ($): | ||||||||
| Paid—in capital | 725,799,705 | 207,823,779 | 625,571,744 | 229,759,400 | ||||
| Accumulated net realized gain (loss) on investments | 2,764,253 | (293,993) | 2,144,169 | 61,009 | ||||
| Accumulated net unrealized appreciation (depreciation) | ||||||||
| [including ($370,772), ($338,087) and ($110,998) | ||||||||
| net unrealized (depreciation) on financial futures | ||||||||
| for Mellon National Intermediate Municipal Bond | ||||||||
| Fund, Mellon Pennsylvania Intermediate Municipal | ||||||||
| Bond Fund and Mellon Massachusetts Intermediate | ||||||||
| Municipal Bond Fund, respectively] | 36,212,745 | (316,728) | 33,746,452 | 8,991,535 | ||||
| Net Assets ($) | 764,776,703 | 207,213,058 | 661,462,365 | 238,811,944 | ||||
| Net Asset Value Per Share | ||||||||
| Class M Shares | ||||||||
| Net Assets ($) | 732,711,365 | 207,063,417 | 656,901,334 | 228,239,237 | ||||
| Shares Outstanding | 55,301,248 | 16,390,274 | 50,860,172 | 17,895,107 | ||||
| Net Asset Value Per Share ($) | 13.25 | 12.63 | 12.92 | 12.75 | ||||
| Investor Shares | ||||||||
| Net Assets ($) | 27,409,463 | 149,641 | 4,561,031 | 10,370,659 | ||||
| Shares Outstanding | 2,071,090 | 11,860 | 353,270 | 813,224 | ||||
| Net Asset Value Per Share ($) | 13.23 | 12.62 | 12.91 | 12.75 | ||||
| Dreyfus Premier Shares | ||||||||
| Net Assets ($) | 4,655,875 | — | — | 202,048 | ||||
| Shares Outstanding | 351,724 | — | — | 15,807 | ||||
| Net Asset Value Per Share ($) | 13.24 | — | — | 12.78 | ||||
| † Investments at cost ($) | 756,874,855 | 209,920,937 | 632,113,574 | 230,941,375 | ||||
| See notes to financial statements. |
| 50 |
| STATEMENTS OF OPERATIONS | ||||||||||
| Year Ended August 31, 2005 | ||||||||||
| Mellon | Mellon | Mellon | Mellon | |||||||
| National | National | Pennsylvania | Massachusetts | |||||||
| Intermediate | Short-Term | Intermediate | Intermediate | |||||||
| Municipal Bond Fund | Municipal Bond Fund | Municipal Bond Fund | Municipal Bond Fund | |||||||
| Investment Income ($): | ||||||||||
| Interest Income | 31,101,193 | 6,001,685 | 29,828,662 | 9,203,436 | ||||||
| Expenses: | ||||||||||
| Investment advisory fee—Note 4(a) | 2,519,179 | 739,360 | 3,355,471 | 772,315 | ||||||
| Administration fee—Note 4(a) | 970,968 | 285,075 | 905,581 | 297,672 | ||||||
| Shareholder servicing costs—Note 4(c) | 88,097 | 617 | 9,527 | 29,695 | ||||||
| Custodian fees—Note 4(c) | 56,360 | 22,226 | 49,993 | 17,819 | ||||||
| Registration fees | 47,159 | 24,216 | 26,555 | 32,834 | ||||||
| Auditing fees | 35,031 | 26,276 | 32,516 | 31,847 | ||||||
| Trustees’ fees and expenses—Note 4(d) | 27,515 | 8,686 | 26,477 | 9,096 | ||||||
| Distribution fees—Note 4(b) | 26,400 | — | — | 1,518 | ||||||
| Prospectus and shareholders’ reports | 22,517 | — | — | 3,060 | ||||||
| Legal fees | 14,338 | 4,031 | 15,543 | 1,690 | ||||||
| Miscellaneous | 69,201 | 21,841 | 21,558 | 32,567 | ||||||
| Total Expenses | 3,876,765 | 1,132,328 | 4,443,221 | 1,230,113 | ||||||
| Less—reduction in investment advisory fee | ||||||||||
| due to undertaking—Note 4(a) | — | — | — | (97,124) | ||||||
| Less—reduction in custody fees | ||||||||||
| due to earnings credits—Note 2(b) | — | (5,843) | — | — | ||||||
| Net Expenses | 3,876,765 | 1,126,485 | 4,443,221 | 1,132,989 | ||||||
| Investment Income—Net | 27,224,428 | 4,875,200 | 25,385,441 | 8,070,447 | ||||||
| Realized and Unrealized Gain (Loss) | ||||||||||
| on Investments—Note 5 ($): | ||||||||||
| Net realized gain (loss) on investments | 4,929,594 | (306,685) | 4,096,846 | 1,112,026 | ||||||
| Net realized gain (loss) on financial futures | (3,630,388) | — | (3,879,685) | (989,875) | ||||||
| Net Realized Gain (Loss) | 1,299,206 | (306,685) | 217,161 | 122,151 | ||||||
| Net unrealized (depreciation) on investments | ||||||||||
| (including $1,137,822, $1,472,226 and $341,580 | ||||||||||
| appreciation on financial futures for Mellon National | ||||||||||
| Intermediate Municipal Bond Fund, Mellon Pennsylvania | ||||||||||
| Intermediate Municipal Bond Fund and Mellon | ||||||||||
| Massachusetts Intermediate Municipal | ||||||||||
| Bond Fund, respectively) | (3,147,194) | (2,585,470) | (6,966,166) | (929,112) | ||||||
| Net Realized and Unrealized Gain (Loss) on Investments | (1,847,988) | (2,892,155) | (6,749,005) | (806,961) | ||||||
| Net Increase in Net Assets Resulting from Operations | 25,376,440 | 1,983,045 | 18,636,436 | 7,263,486 | ||||||
| See notes to financial statements. |
| The Funds 51 |
STATEMENTS OF CHANGES IN NET ASSETS
| Mellon National Intermediate | Mellon National Short-Term | |||||||
| Municipal Bond Fund | Municipal Bond Fund | |||||||
| Year Ended August 31, | Year Ended August 31, | |||||||
| 2005 | 2004 | 2005 | 2004 | |||||
| Operations ($): | ||||||||
| Investment income—net | 27,224,428 | 25,732,162 | 4,875,200 | 5,102,377 | ||||
| Net realized gain (loss) on investments | 1,299,206 | 6,932,040 | (306,685) | 132,115 | ||||
| Net unrealized appreciation (depreciation) on investments | (3,147,194) | 7,949,583 | (2,585,470) | (1,163,845) | ||||
| Net Increase (Decrease) in Net Assets | ||||||||
| Resulting from Operations | 25,376,440 | 40,613,785 | 1,983,045 | 4,070,647 | ||||
| Dividends to Shareholders from ($): | ||||||||
| Investment income—net: | ||||||||
| Class M Shares | (25,973,923) | (24,381,081) | (4,857,538) | (5,123,165) | ||||
| Investor Shares | (1,015,149) | (1,140,332) | (3,058) | (2,209) | ||||
| Dreyfus Premier Shares | (160,871) | (214,978) | — | — | ||||
| Net realized gain on investments: | ||||||||
| Class M Shares | (2,952,454) | (1,938,957) | (33,941) | — | ||||
| Investor Shares | (130,078) | (101,785) | (25) | — | ||||
| Dreyfus Premier Shares | (24,499) | (22,614) | — | — | ||||
| Total Dividends | (30,256,974) | (27,799,747) | (4,894,562) | (5,125,374) | ||||
| Beneficial Interest Transactions ($): | ||||||||
| Net proceeds from shares sold: | ||||||||
| Class M Shares | 168,322,003 | 92,725,243 | 80,462,689 | 107,345,169 | ||||
| Investor Shares | 997,977 | 1,795,226 | 81,778 | 189,212 | ||||
| Dreyfus Premier Shares | 35,306 | 93,493 | — | — | ||||
| Dividends reinvested: | ||||||||
| Class M Shares | 3,261,425 | 2,709,006 | 497,679 | 476,987 | ||||
| Investor Shares | 746,936 | 789,805 | 2,181 | 2,102 | ||||
| Dreyfus Premier Shares | 97,238 | 115,490 | — | — | ||||
| Cost of shares redeemed: | ||||||||
| Class M Shares | (81,034,937) | (86,237,556) | (92,587,933) | (95,741,349) | ||||
| Investor Shares | (4,288,210) | (7,739,754) | (26,291) | (130,394) | ||||
| Dreyfus Premier Shares | (1,381,659) | (2,251,287) | — | — | ||||
| Increase (Decrease) in Net Assets from | ||||||||
| Beneficial Interest Transactions | 86,756,079 | 1,999,666 | (11,569,897) | 12,141,727 | ||||
| Total Increase (Decrease) in Net Assets | 81,875,545 | 14,813,704 | (14,481,414) | 11,087,000 | ||||
| Net Assets ($): | ||||||||
| Beginning of Period | 682,901,158 | 668,087,454 | 221,694,472 | 210,607,472 | ||||
| End of Period | 764,776,703 | 682,901,158 | 207,213,058 | 221,694,472 | ||||
| 52 |
| Mellon National Intermediate | Mellon National Short-Term | |||||||
| Municipal Bond Fund | Municipal Bond Fund | |||||||
| Year Ended August 31, | Year Ended August 31, | |||||||
| 2005 | 2004 | 2005 | 2004 | |||||
| Capital Share Transactions: | ||||||||
| Class M Shares | ||||||||
| Shares sold | 12,696,418 | 6,985,297 | 6,343,090 | 8,362,321 | ||||
| Shares issued for dividends reinvested | 245,554 | 203,894 | 39,257 | 37,189 | ||||
| Shares redeemed | (6,108,084) | (6,501,591) | (7,297,105) | (7,474,588) | ||||
| Net Increase (Decrease) in Shares Outstanding | 6,833,888 | 687,600 | (914,758) | 924,922 | ||||
| Investor Shares a | ||||||||
| Shares sold | 75,443 | 135,711 | 6,417 | 14,726 | ||||
| Shares issued for dividends reinvested | 56,350 | 59,490 | 172 | 164 | ||||
| Shares redeemed | (323,572) | (583,659) | (2,078) | (10,145) | ||||
| Net Increase (Decrease) in Shares Outstanding | (191,779) | (388,458) | 4,511 | 4,745 | ||||
| Dreyfus Premier Shares a | ||||||||
| Shares sold | 2,666 | 6,920 | — | — | ||||
| Shares issued for dividends reinvested | 7,333 | 8,697 | — | — | ||||
| Shares redeemed | (104,164) | (170,369) | — | — | ||||
| Net Increase (Decrease) in Shares Outstanding | (94,165) | (154,752) | — | — | ||||
a During the period ended August 31, 2005, 38,734 Dreyfus Premier shares of Mellon National Intermediate Municipal Bond Fund representing $512,908 were automatically converted to 38,734 Investor shares and during the year ended August 31, 2004, 65,825 Dreyfus Premier shares of Mellon National Intermediate Municipal Bond Fund representing $868,322 were automatically converted to 65,833 Investor shares.
See notes to financial statements.
| The Funds 53 |
| STATEMENTS OF CHANGES IN NET ASSETS(continued) |
| Mellon Pennsylvania Intermediate Municipal Bond Fund | ||||
| Year Ended August 31, | ||||
| 2005 | 2004 | |||
| Operations ($): | ||||
| Investment income—net | 25,385,441 | 27,375,623 | ||
| Net realized gain (loss) on investments | 217,161 | 8,628,398 | ||
| Net unrealized appreciation (depreciation) on investments | (6,966,166) | 2,964,408 | ||
| Net Increase (Decrease) in Net Assets Resulting from Operations | 18,636,436 | 38,968,429 | ||
| Dividends to Shareholders from ($): | ||||
| Investment income—net: | ||||
| Class M Shares | (25,226,961) | (27,371,553) | ||
| Investor Shares | (124,901) | (107,403) | ||
| Net realized gain on investments: | ||||
| Class M Shares | (4,276,843) | (1,786,516) | ||
| Investor Shares | (19,443) | (8,199) | ||
| Total Dividends | (29,648,148) | (29,273,671) | ||
| Beneficial Interest Transactions ($): | ||||
| Net proceeds from shares sold: | ||||
| Class M Shares | 65,423,035 | 44,955,224 | ||
| Investor Shares | 2,366,668 | 426,469 | ||
| Dividends reinvested: | ||||
| Class M Shares | 2,624,841 | 1,156,977 | ||
| Investor Shares | 39,408 | 24,195 | ||
| Cost of shares redeemed: | ||||
| Class M Shares | (81,478,309) | (115,052,210) | ||
| Investor Shares | (538,227) | (700,100) | ||
| Increase (Decrease) in Net Assets from | ||||
| Beneficial Interest Transactions | (11,562,584) | (69,189,445) | ||
| Total Increase (Decrease) in Net Assets | (22,574,296) | (59,494,687) | ||
| Net Assets ($): | ||||
| Beginning of Period | 684,036,661 | 743,531,348 | ||
| End of Period | 661,462,365 | 684,036,661 | ||
| Capital Share Transactions: | ||||
| Class M Shares | ||||
| Shares sold | 5,044,489 | 3,434,644 | ||
| Shares issued for dividends reinvested | 201,687 | 88,092 | ||
| Shares redeemed | (6,277,254) | (8,799,386) | ||
| Net Increase (Decrease) in Shares Outstanding | (1,031,078) | (5,276,650) | ||
| Investor Shares | ||||
| Shares sold | 183,045 | 32,810 | ||
| Shares issued for dividends reinvested | 3,043 | 1,845 | ||
| Shares redeemed | (41,670) | (53,183) | ||
| Net Increase (Decrease) in Shares Outstanding | 144,418 | (18,528) | ||
| See notes to financial statements. |
| 54 |
| Mellon Massachusetts Intermediate Municipal Bond Fund | ||||
| Year Ended August 31, | ||||
| 2005 | 2004 | |||
| Operations ($): | ||||
| Investment income—net | 8,070,447 | 7,288,002 | ||
| Net realized gain (loss) on investments | 122,151 | 1,467,739 | ||
| Net unrealized appreciation (depreciation) on investments | (929,112) | 1,828,686 | ||
| Net Increase (Decrease) in Net Assets Resulting from Operations | 7,263,486 | 10,584,427 | ||
| Dividends to Shareholders from ($): | ||||
| Investment income—net: | ||||
| Class M Shares | (7,684,432) | (6,855,459) | ||
| Investor Shares | (375,565) | (434,236) | ||
| Dreyfus Premier Shares | (9,056) | (27,069) | ||
| Total Dividends | (8,069,053) | (7,316,764) | ||
| Beneficial Interest Transactions ($): | ||||
| Net proceeds from shares sold: | ||||
| Class M Shares | 70,762,479 | 43,023,674 | ||
| Investor Shares | 268,171 | 475,539 | ||
| Dreyfus Premier Shares | 1,201 | — | ||
| Dividends reinvested: | ||||
| Class M Shares | 1,658,306 | 1,562,472 | ||
| Investor Shares | 201,526 | 238,712 | ||
| Dreyfus Premier Shares | 4,311 | 7,098 | ||
| Cost of shares redeemed: | ||||
| Class M Shares | (40,564,487) | (23,788,847) | ||
| Investor Shares | (1,750,485) | (2,204,270) | ||
| Dreyfus Premier Shares | (456,127) | (307,248) | ||
| Increase (Decrease) in Net Assets from | ||||
| Beneficial Interest Transactions | 30,124,895 | 19,007,130 | ||
| Total Increase (Decrease) in Net Assets | 29,319,328 | 22,274,793 | ||
| Net Assets ($): | ||||
| Beginning of Period | 209,492,616 | 187,217,823 | ||
| End of Period | 238,811,944 | 209,492,616 | ||
| T h e F u n d s 55 |
| STATEMENTS OF CHANGES IN NET ASSETS(continued) |
| Mellon Massachusetts Intermediate Municipal Bond Fund | ||||
| Year Ended August 31, | ||||
| 2005 | 2004 | |||
| Capital Share Transactions: | ||||
| Class M Shares | ||||
| Shares sold | 5,549,494 | 3,374,954 | ||
| Shares issued for dividends reinvested | 130,029 | 122,397 | ||
| Shares redeemed | (3,179,864) | (1,871,173) | ||
| Net Increase (Decrease) in Shares Outstanding | 2,499,659 | 1,626,178 | ||
| Investor Shares a | ||||
| Shares sold | 20,985 | 37,334 | ||
| Shares issued for dividends reinvested | 15,802 | 18,690 | ||
| Shares redeemed | (137,234) | (172,545) | ||
| Net Increase (Decrease) in Shares Outstanding | (100,447) | (116,521) | ||
| Dreyfus Premier Shares a | ||||
| Shares sold | 95 | — | ||
| Shares issued for dividends reinvested | 337 | 555 | ||
| Shares redeemed | (35,661) | (24,198) | ||
| Net Increase (Decrease) in Shares Outstanding | (35,229) | (23,643) | ||
a During the period ended August 31, 2005, 6,911 Dreyfus Premier shares of Mellon Massachusetts Intermediate Municipal Bond Fund representing $88,499 were automatically converted to 6,927 Investor shares and during the period ended August 31, 2004, 552 Dreyfus Premier shares of Mellon Massachusetts Intermediate Municipal Bond Fund representing $6,996 were automatically converted to 553 Investor shares.
See notes to financial statements.
| 56 |
| FINANCIAL HIGHLIGHTS |
The following tables describe the performance for each share class of each fund for the fiscal periods indicated.All information (except portfolio turnover rate) reflects financial results for a single fund share.Total return shows how much your investment in each fund would have increased (or decreased) during the period, assuming you had reinvested all dividends and distributions. These figures have been derived from each fund’s financial statements.
| Class M Shares | ||||||||||
| Year Ended August 31, | ||||||||||
| Mellon National Intermediate Municipal Bond Fund | 2005 | 2004 | 2003 a | 2002 b | 2001 c | |||||
| Per Share Data ($): | ||||||||||
| Net asset value, beginning of period | 13.34 | 13.09 | 13.25 | 13.24 | 12.50 | |||||
| Investment Operations: | ||||||||||
| Investment income—net | .50d | .51d | .50d | .52d | .51 | |||||
| Net realized and unrealized | ||||||||||
| gain (loss) on investments | (.03) | .29 | (.14) | .14 | .74 | |||||
| Total from Investment Operations | .47 | .80 | .36 | .66 | 1.25 | |||||
| Distributions: | ||||||||||
| Dividends from investment income—net | (.50) | (.51) | (.50) | (.52) | (.51) | |||||
| Dividends from net realized gain on investments | (.06) | (.04) | (.02) | (.13) | (.00)e | |||||
| Total Distributions | (.56) | (.55) | (.52) | (.65) | (.51) | |||||
| Net asset value, end of period | 13.25 | 13.34 | 13.09 | 13.25 | 13.24 | |||||
| Total Return (%) | 3.62 | 6.22 | 2.77 | 5.16 | 10.21f | |||||
| Ratios/Supplemental Data (%): | ||||||||||
| Ratio of total expenses to average net assets | .52 | .52 | .53 | .53 | .53g | |||||
| Ratio of net expenses to average net assets | .52 | .52 | .52 | .52 | .52g | |||||
| Ratio of net investment income | ||||||||||
| to average net assets | 3.80 | 3.84 | 3.77 | 4.04 | 4.33g | |||||
| Portfolio Turnover Rate | 42.72 | 53.26 | 50.68 | 60.12 | 47.78f | |||||
| Net Assets, end of period ($ x 1,000) | 732,711 | 646,793 | 625,558 | 555,158 | 477,595 | |||||
| a Effective December 16, 2002, MPAM shares were redesignated as Class M shares. |
| b As required, effective September 1, 2001, the fund has adopted the provisions of the AICPA Audit and Accounting Guide for Investment Companies and began accreting |
| discount or amortizing premium on a scientific basis for debt securities.The effect of this change for the period ended August 31, 2002 was to increase net investment income per |
| share by less than $.01, decrease net realized and unrealized gain (loss) on investments per share by less than $.01 and increase the ratio of net investment income to average |
| net assets from 4.02% to 4.04% for Class M shares. Per share data and ratios/supplemental data for periods prior to September 1, 2001 have not been restated to reflect this |
| change in presentation. |
| c From October 2, 2000 (commencement of operations) to August 31, 2001. Effective July 11, 2001, shares of the fund were redesignated as MPAM shares and the fund |
| commenced selling Investor shares. |
| d Based on average shares outstanding at each month end. |
| e Amount represents less than $.01 per share. |
| f Not annualized. |
| g Annualized. |
| See notes to financial statements. |
| The Funds 57 |
| FINANCIAL HIGHLIGHTS(continued) |
| Investor Shares | ||||||||||
| Year Ended August 31, | ||||||||||
| Mellon National Intermediate Municipal Bond Fund | 2005 | 2004 | 2003 | 2002 a | 2001 b | |||||
| Per Share Data ($): | ||||||||||
| Net asset value, beginning of period | 13.33 | 13.08 | 13.24 | 13.23 | 12.91 | |||||
| Investment Operations: | ||||||||||
| Investment income—net | .47c | .48c | .50c | .50c | .07 | |||||
| Net realized and unrealized | ||||||||||
| gain (loss) on investments | (.04) | .29 | (.18) | .13 | .32 | |||||
| Total from Investment Operations | .43 | .77 | .32 | .63 | .39 | |||||
| Distributions: | ||||||||||
| Dividends from investment income—net | (.47) | (.48) | (.46) | (.49) | (.07) | |||||
| Dividends from net realized gain on investments | (.06) | (.04) | (.02) | (.13) | — | |||||
| Total Distributions | (.53) | (.52) | (.48) | (.62) | (.07) | |||||
| Net asset value, end of period | 13.23 | 13.33 | 13.08 | 13.24 | 13.23 | |||||
| Total Return (%) | 3.28 | 6.04 | 2.36 | 4.98 | 3.05d | |||||
| Ratios/Supplemental Data (%): | ||||||||||
| Ratio of total expenses to average net assets | .77 | .77 | .79 | .84 | .85e | |||||
| Ratio of net expenses to average net assets | .77 | .77 | .77 | .77 | .77e | |||||
| Ratio of net investment income | ||||||||||
| to average net assets | 3.56 | 3.60 | 3.52 | 3.74 | 3.91e | |||||
| Portfolio Turnover Rate | 42.72 | 53.26 | 50.68 | 60.12 | 47.78d | |||||
| Net Assets, end of period ($ x 1,000) | 27,409 | 30,164 | 34,673 | 909 | 1 | |||||
| a As required, effective September 1, 2001, the fund has adopted the provisions of the AICPA Audit and Accounting Guide for Investment Companies and began accreting discount |
| or amortizing premium on a scientific basis for debt securities.The effect of this change for the period ended August 31, 2002 was to increase net investment income per share by less |
| than $.01, decrease net realized and unrealized gain (loss) on investments per share by less than $.01 and increase the ratio of net investment income to average net assets from |
| 3.73% to 3.74% for Class M shares and Investor shares, respectively. Per share data and ratios/supplemental data for periods prior to September 1, 2001 have not been restated to |
| reflect this change in presentation. |
| b From July 11, 2001 (date the fund began offering Investor shares) to August 31, 2001. |
| c Based on average shares outstanding at each month end. |
| d Not annualized. |
| e Annualized. |
| See notes to financial statements. |
| 58 |
| Dreyfus Premier Shares | ||||||
| Year Ended August 31, | ||||||
| Mellon National Intermediate Municpal Bond Fund | 2005 | 2004 | 2003 a | |||
| Per Share Data ($): | ||||||
| Net asset value, beginning of period | 13.33 | 13.08 | 13.37 | |||
| Investment Operations: | ||||||
| Investment income—net b | .40 | .41 | .36 | |||
| Net realized and unrealized gain (loss) on investments | (.03) | .29 | (.28) | |||
| Total from Investment Operations | .37 | .70 | .08 | |||
| Distributions: | ||||||
| Dividends from investment income—net | (.40) | (.41) | (.35) | |||
| Dividends from net realized gain on investments | (.06) | (.04) | (.02) | |||
| Total Distributions | (.46) | (.45) | (.37) | |||
| Net asset value, end of period | 13.24 | 13.33 | 13.08 | |||
| Total Return (%) | 2.85 | 5.43 | .58c | |||
| Ratios/Supplemental Data (%): | ||||||
| Ratio of total expenses to average net assets | 1.27 | 1.27 | 1.29d | |||
| Ratio of net expenses to average net assets | 1.27 | 1.27 | 1.27d | |||
| Ratio of net investment income | ||||||
| to average net assets | 3.06 | 3.09 | 3.03d | |||
| Portfolio Turnover Rate | 42.72 | 53.26 | 50.68c | |||
| Net Assets, end of period ($ x 1,000) | 4,656 | 5,945 | 7,856 | |||
| a From close of business on October 11, 2002 (date the fund began offering Dreyfus Premier shares) to August 31, 2003. | ||||||
| b Based on average shares outstanding at each month end. | ||||||
| c Not annualized. | ||||||
| d Annualized. | ||||||
| See notes to financial statements. | ||||||
| The Funds 59 |
| FINANCIAL HIGHLIGHTS (continued) |
| Class M Shares | ||||||||||
| Year Ended August 31, | ||||||||||
| Mellon National Short-Term Municipal Bond Fund | 2005 | 2004 | 2003 a | 2002 b | 2001 c | |||||
| Per Share Data ($): | ||||||||||
| Net asset value, beginning of period | 12.81 | 12.86 | 12.91 | 12.90 | 12.50 | |||||
| Investment Operations: | ||||||||||
| Investment income—net | .29d | .29d | .34d | .46d | .48 | |||||
| Net realized and unrealized | ||||||||||
| gain (loss) on investments | (.18) | (.05) | (.03) | .10 | .40 | |||||
| Total from Investment Operations | .11 | .24 | .31 | .56 | .88 | |||||
| Distributions: | ||||||||||
| Dividends from investment income—net | (.29) | (.29) | (.35) | (.46) | (.48) | |||||
| Dividends from net realized gain on investments | — | — | (.01) | (.09) | — | |||||
| Total Distributions | (.29) | (.29) | (.36) | (.55) | (.48) | |||||
| Net asset value, end of period | 12.63 | 12.81 | 12.86 | 12.91 | 12.90 | |||||
| Total Return (%) | .91 | 2.00 | 2.35 | 4.43 | 7.15e | |||||
| Ratios/Supplemental Data (%): | ||||||||||
| Ratio of total expenses to average net assets | .54 | .53 | .55 | .57 | .58f | |||||
| Ratio of net expenses to average net assets | .53 | .53 | .52 | .52 | .52f | |||||
| Ratio of net investment income | ||||||||||
| to average net assets | 2.31 | 2.28 | 2.66 | 3.56 | 4.11f | |||||
| Portfolio Turnover Rate | 40.92 | 28.12 | 22.15 | 50.86 | 44.18e | |||||
| Net Assets, end of period ($ x 1,000) | 207,063 | 221,600 | 210,574 | 138,670 | 119,026 | |||||
| a Effective December 16, 2002, MPAM shares were redesignated as Class M shares. |
| b As required, effective September 1, 2001, the fund has adopted the provisions of the AICPA Audit and Accounting Guide for Investment Companies and began accreting discount |
| or amortizing premium on a scientific basis for debt securities.The effect of this change for the period ended August 31, 2002 was to increase net investment income per share and |
| decrease net realized and unrealizd gain (loss) on investments per share by less than $.01 and increase the ratio of net investment income to average net assets by less than .01% for |
| Class M shares. Per share data and ratios/supplemental data for periods prior to September 1, 2001 have not been restated to reflect this change in presentation. |
| c From October 2, 2000 (commencement of operations) to August 31, 2001. Effective July 11, 2001, shares of the fund were redesignated as MPAM shares and the fund |
| commenced selling Investor shares. |
| d Based on average shares outstanding at each month end. |
| e Not annualized. |
| f Annualized. |
| See notes to financial statements. |
| 60 |
| Investor Shares | ||||||||||
| Year Ended August 31, | ||||||||||
| Mellon National Short-Term Municipal Bond Fund | 2005 | 2004 | 2003 | 2002 a | 2001 b | |||||
| Per Share Data ($): | ||||||||||
| Net asset value, beginning of period | 12.79 | 12.84 | 12.91 | 12.90 | 12.78 | |||||
| Investment Operations: | ||||||||||
| Investment income—net | .27c | .29c | .29c | .42c | .07 | |||||
| Net realized and unrealized | ||||||||||
| gain (loss) on investments | (.18) | (.07) | (.04) | .10 | .12 | |||||
| Total from Investment Operations | .09 | .22 | .25 | .52 | .19 | |||||
| Distributions: | ||||||||||
| Dividends from investment income—net | (.26) | (.27) | (.31) | (.42) | (.07) | |||||
| Dividends from net realized gain on investments | — | — | (.01) | (.09) | — | |||||
| Total Distributions | (.26) | (.27) | (.32) | (.51) | (.07) | |||||
| Net asset value, end of period | 12.62 | 12.79 | 12.84 | 12.91 | 12.90 | |||||
| Total Return (%) | .73 | 1.72 | 2.01 | 4.16 | 1.48d | |||||
| Ratios/Supplemental Data (%): | ||||||||||
| Ratio of total expenses to average net assets | .79 | .79 | .81 | .72 | .96e | |||||
| Ratio of net expenses to average net assets | .78 | .79 | .76 | .67 | .77e | |||||
| Ratio of net investment income | ||||||||||
| to average net assets | 2.06 | 2.08 | 2.44 | 4.15 | 3.76e | |||||
| Portfolio Turnover Rate | 40.92 | 28.12 | 22.15 | 50.86 | 44.18d | |||||
| Net Assets, end of period ($ x 1,000) | 150 | 94 | 33 | 1 | 1 | |||||
| a As required, effective September 1, 2001, the fund has adopted the provisions of the AICPA Audit and Accounting Guide for Investment Companies and began accreting discount |
| or amortizing premium on a scientific basis for debt securities.The effect of this change for the period ended August 31, 2002 was to increase net investment income per share and |
| decrease net realized and unrealizd gain (loss) on investments per share by less than $.01 and increase the ratio of net investment income to average net assets by less than .01% for |
| Investor shares. Per share data and ratios/supplemental data for periods prior to September 1, 2001 have not been restated to reflect this change in presentation. |
| b From July 11, 2001 (date the fund began offering Investor shares) to August 31, 2001. |
| c Based on average shares outstanding at each month end. |
| d Not annualized. |
| e Annualized. |
| See notes to financial statements. |
| T h e F u n d s 61 |
| FINANCIAL HIGHLIGHTS(continued) |
| Class M Shares | ||||||||||
| Year Ended August 31, | ||||||||||
| Mellon Pennsylvania Intermediate Municipal Bond Fund | 2005 | 2004 | 2003 a | 2002 b | 2001 c | |||||
| Per Share Data ($): | ||||||||||
| Net asset value, beginning of period | 13.13 | 12.95 | 13.15 | 13.16 | 12.50 | |||||
| Investment Operations: | ||||||||||
| Investment income—net | .49d | .50d | .51d | .53d | .50 | |||||
| Net realized and unrealized | ||||||||||
| gain (loss) on investments | (.13) | .21 | (.20) | .11 | .66 | |||||
| Total from Investment Operations | .36 | .71 | .31 | .64 | 1.16 | |||||
| Distributions: | ||||||||||
| Dividends from investment income—net | (.49) | (.50) | (.51) | (.53) | (.50) | |||||
| Dividends from net realized gain on investments | (.08) | (.03) | — | (.12) | (.00)e | |||||
| Total Distributions | (.57) | (.53) | (.51) | (.65) | (.50) | |||||
| Net asset value, end of period | 12.92 | 13.13 | 12.95 | 13.15 | 13.16 | |||||
| Total Return (%) | 2.84 | 5.60 | 2.35 | 5.03 | 9.50f | |||||
| Ratios/Supplemental Data (%): | ||||||||||
| Ratio of total expenses to average net assets | .66 | .66 | .67 | .68 | .68g | |||||
| Ratio of net expenses to average net assets | .66 | .66 | .67 | .67 | .67g | |||||
| Ratio of net investment income | ||||||||||
| to average net assets | 3.78 | 3.82 | 3.88 | 4.09 | 4.25g | |||||
| Portfolio Turnover Rate | 23.88 | 18.87 | 17.58 | 34.50 | 39.32f | |||||
| Net Assets, end of period ($ x 1,000) | 656,901 | 681,295 | 740,587 | 837,441 | 879,711 | |||||
| a Effective December 16, 2002, MPAM shares were redesignated as Class M shares. |
| b As required, effective September 1, 2001, the fund has adopted the provisions of the AICPA Audit and Accounting Guide for Investment Companies and began accreting discount |
| or amortizing premium on a scientific basis for debt securities.The effect of this change for the period ended August 31, 2002 was to increase net investment income per share and |
| decrease net realized and unrealized gain (loss) on investments per share by less than $.01 and increase the ratio of net investment income to average net assets from 4.08% to |
| 4.09% for Class M shares. Per share data and ratios/supplemental data for periods prior to September 1, 2001 have not been restated to reflect this change in presentation. |
| c From October 2, 2000 (commencement of operations) to August 31, 2001. Effective July 11, 2001, shares of the fund were redesignated as MPAM shares and the fund |
| commenced selling Investor shares. |
| d Based on average shares outstanding at each month end. |
| e Amount represents less than $.01 per share. |
| f Not annualized. |
| g Annualized. |
| See notes to financial statements. |
| 62 |
| Investor Shares | ||||||||||
| Year Ended August 31, | ||||||||||
| Mellon Pennsylvania Intermediate Municipal Bond Fund | 2005 | 2004 | 2003 | 2002 a | 2001 b | |||||
| Per Share Data ($): | ||||||||||
| Net asset value, beginning of period | 13.13 | 12.95 | 13.14 | 13.16 | 12.90 | |||||
| Investment Operations: | ||||||||||
| Investment income—net | .45c | .47c | .48c | .54c | .07 | |||||
| Net realized and unrealized | ||||||||||
| gain (loss) on investments | (.13) | .21 | (.20) | .06 | .26 | |||||
| Total from Investment Operations | .32 | .68 | .28 | .60 | .33 | |||||
| Distributions: | ||||||||||
| Dividends from investment income—net | (.46) | (.47) | (.47) | (.50) | (.07) | |||||
| Dividends from net realized gain on investments | (.08) | (.03) | — | (.12) | — | |||||
| Total Distributions | (.54) | (.50) | (.47) | (.62) | (.07) | |||||
| Net asset value, end of period | 12.91 | 13.13 | 12.95 | 13.14 | 13.16 | |||||
| Total Return (%) | 2.50 | 5.41 | 2.09 | 4.69 | 2.58d | |||||
| Ratios/Supplemental Data (%): | ||||||||||
| Ratio of total expenses to average net assets | .91 | .92 | .93 | .94 | 1.14e | |||||
| Ratio of net expenses to average net assets | .91 | .92 | .92 | .92 | .92e | |||||
| Ratio of net investment income | ||||||||||
| to average net assets | 3.50 | 3.56 | 3.59 | 3.84 | 3.86e | |||||
| Portfolio Turnover Rate | 23.88 | 18.87 | 17.58 | 34.50 | 39.32d | |||||
| Net Assets, end of period ($ x 1,000) | 4,561 | 2,741 | 2,944 | 963 | 230 | |||||
| a As required, effective September 1, 2001, the fund has adopted the provisions of the AICPA Audit and Accounting Guide for Investment Companies and began accreting discount |
| or amortizing premium on a scientific basis for debt securities.The effect of this change for the period ended August 31, 2002 was to increase net investment income per share and |
| decrease net realized and unrealized gain (loss) on investments per share by less than $.01 and increase the ratio of net investment income to average net assets from 3.83% to |
| 3.84% for Investor shares. Per share data and ratios/supplemental data for periods prior to September 1, 2001 have not been restated to reflect this change in presentation. |
| b From July 11, 2001 (date the fund began offering Investor shares) to August 31, 2001. |
| c Based on average shares outstanding at each month end. |
| d Not annualized. |
| e Annualized. |
| See notes to financial statements. |
| The Funds 63 |
| FINANCIAL HIGHLIGHTS |
Please note that the financial highlights information in the following tables for the fund’s Investor shares, Class M shares and Dreyfus Premier shares represents the financial highlights of the Class A shares, Class R shares and Class B shares, respectively, of the fund’s predecessor, Dreyfus Premier Limited Term Massachusetts Municipal Fund (the Premier Massachusetts Fund) before the fund commenced operations as of the close of business on September 6, 2002, and represents the performance of the fund’s Investor shares, Class M shares and Dreyfus Premier shares thereafter. Before the fund commenced operations, substantially all of the assets of the Premier Massachusetts Fund were transferred to the fund in a tax-free reorganization. Total return for the periods before the fund commenced operations shows how much an investment in the Premier Massachusetts Fund’s Class A shares, Class R shares and Class B shares would have increased (or decreased) during those periods, assuming all dividends and distributions were reinvested.Total return for the period since the fund commenced operations also reflects how much an investment in the fund’s Investor shares, Class M shares and Dreyfus Premier shares would have increased (or decreased), assuming all dividends and distributions were reinvested.
| Class M Shares | ||||||||||||
| Two Months | ||||||||||||
| Mellon Massachusetts | Year Ended August 31, | Ended | Year Ended June 30, | |||||||||
| Intermediate Municipal Bond Fund | 2005 | 2004 | 2003 a | August 31, 2002 b | 2002 c | 2001 | ||||||
| Per Share Data ($): | ||||||||||||
| Net asset value, beginning of period | 12.81 | 12.59 | 12.79 | 12.62 | 12.38 | 11.89 | ||||||
| Investment Operations: | ||||||||||||
| Investment income—net | .47d | .48d | .50d | .09d | .52d | .55 | ||||||
| Net realized and unrealized | ||||||||||||
| gain (loss) on investments | (.06) | .22 | (.21) | .17 | .24 | .49 | ||||||
| Total from Investment Operations | .41 | .70 | .29 | .26 | .76 | 1.04 | ||||||
| Distributions: | ||||||||||||
| Dividends from investment income—net | (.47) | (.48) | (.49) | (.09) | (.52) | (.55) | ||||||
| Net asset value, end of period | 12.75 | 12.81 | 12.59 | 12.79 | 12.62 | 12.38 | ||||||
| Total Return (%) | 3.25 | 5.72 | 2.23 | 2.10e | 6.19 | 8.90 | ||||||
| Ratios/Supplemental Data (%): | ||||||||||||
| Ratio of total expenses to average net assets | .54 | .55 | .58 | .50f | .50 | .50 | ||||||
| Ratio of net expenses to average net assets | .50 | .50 | .50 | .50f | .50 | .50 | ||||||
| Ratio of net investment income | ||||||||||||
| to average net assets | 3.67 | 3.74 | 3.93 | 3.94f | 4.18 | 4.49 | ||||||
| Portfolio Turnover Rate | 32.16 | 27.26 | 15.54 | 4.48e | 11.45 | 14.88 | ||||||
| Net Assets, end of period ($ x 1,000) | 228,239 | 197,140 | 173,311 | 170,030 | 162,413 | 126,264 | ||||||
| a Effective December 16, 2002, MPAM shares were redesignated as Class M shares. |
| b The Premier Massachusetts Fund has changed its fiscal year end from June 30 to August 31. |
| c As required, effective July 1, 2001, the fund has adopted the provisions of the AICPA Audit and Accounting Guide for Investment Companies and began accreting discount or |
| amortizing premium on a scientific basis for debt securities on a daily basis.The effect of this change for the period ended June 30, 2002 was to increase net investment income per |
| share and decrease net realized and unrealized gain (loss) on investments per share by less than $.01 and increase the ratio of net investment income to average net assets by less |
| than .01%. Per share data and ratios/supplemental data for periods prior to July 1, 2001 have not been restated to reflect this change in presentation. |
| d Based on average shares outstanding at each month end. |
| e Not annualized. |
| f Annualized. |
| See notes to financial statements. |
| 64 |
| Investor Shares | ||||||||||||
| Two Months | ||||||||||||
| Mellon Massachusetts | Year Ended August 31, | Ended | Year Ended June 30, | |||||||||
| Intermediate Municipal Bond Fund | 2005 | 2004 | 2003 | August 31, 2002 a | 2002 b | 2001 | ||||||
| Per Share Data ($): | ||||||||||||
| Net asset value, beginning of period | 12.80 | 12.59 | 12.79 | 12.61 | 12.38 | 11.89 | ||||||
| Investment Operations: | ||||||||||||
| Investment income—net | .44c | .45c | .47c | .08c | .49c | .52 | ||||||
| Net realized and unrealized | ||||||||||||
| gain (loss) on investments | (.05) | .21 | (.20) | .18 | .23 | .49 | ||||||
| Total from Investment Operations | .39 | .66 | .27 | .26 | .72 | 1.01 | ||||||
| Distributions: | ||||||||||||
| Dividends from investment income—net | (.44) | (.45) | (.47) | (.08) | (.49) | (.52) | ||||||
| Net asset value, end of period | 12.75 | 12.80 | 12.59 | 12.79 | 12.61 | 12.38 | ||||||
| Total Return (%) | 3.07 | 5.38 | 1.97 | 2.06d,e | 5.92e | 8.63e | ||||||
| Ratios/Supplemental Data (%): | ||||||||||||
| Ratio of total expenses to average net assets | .79 | .80 | .83 | .75f | .75 | .75 | ||||||
| Ratio of net expenses to average net assets | .75 | .75 | .75 | .75f | .75 | .75 | ||||||
| Ratio of net investment income | ||||||||||||
| to average net assets | 3.43 | 3.50 | 3.68 | 3.69f | 3.93 | 4.24 | ||||||
| Portfolio Turnover Rate | 32.16 | 27.26 | 15.54 | 4.48e | 11.45 | 14.88 | ||||||
| Net Assets, end of period ($ x 1,000) | 10,371 | 11,698 | 12,965 | 13,866 | 13,553 | 12,850 | ||||||
| a The Premier Massachusetts Fund has changed its fiscal year end from June 30 to August 31. |
| b As required, effective July 1, 2001, the fund has adopted the provisions of the AICPA Audit and Accounting Guide for Investment Companies and began accreting discount or |
| amortizing premium on a scientific basis for debt securities.The effect of this change for the period ended June 30, 2002 was to increase net investment income per share and decrease |
| net realized and unrealized gain (loss) on investments per share by less than $.01 and increase the ratio of net investment income to average net assets by less than .01%. Per share |
| data and ratios/supplemental data for periods prior to July 1, 2001 have not been restated to reflect this change in presentation. |
| c Based on average shares outstanding at each month end. |
| d Not annualized. |
| e Exclusive of sales charge which was applicable to Class A shares of the Premier Massachusetts Fund. |
| f Annualized. |
| See notes to financial statements. |
| The Funds 65 |
| FINANCIAL HIGHLIGHTS(continued) |
| Dreyfus Premier Shares | ||||||||||||
| Two Months | ||||||||||||
| Mellon Massachusetts | Year Ended August 31, | Ended | Year Ended June 30, | |||||||||
| Intermediate Municipal Bond Fund | 2005 | 2004 | 2003 | August 31, 2002 a | 2002 b | 2001 | ||||||
| Per Share Data ($): | ||||||||||||
| Net asset value, beginning of period | 12.83 | 12.61 | 12.81 | 12.64 | 12.40 | 11.92 | ||||||
| Investment Operations: | ||||||||||||
| Investment income—net | 38c | .38c | .40c | .07c | .43c | .46 | ||||||
| Net realized and unrealized | ||||||||||||
| gain (loss) on investments | (.05) | .22 | (.20) | .17 | .24 | .48 | ||||||
| Total from Investment Operations | .33 | .60 | .20 | .24 | .67 | .94 | ||||||
| Distributions: | ||||||||||||
| Dividends from investment income—net | (.38) | (.38) | (.40) | (.07) | (.43) | (.46) | ||||||
| Net asset value, end of period | 12.78 | 12.83 | 12.61 | 12.81 | 12.64 | 12.40 | ||||||
| Total Return (%) | 2.59 | 4.85 | 1.55 | 1.98d,e | 5.40d | 8.00d | ||||||
| Ratios/Supplemental Data (%): | ||||||||||||
| Ratio of total expenses to average net assets | 1.29 | 1.30 | 1.33 | 1.25f | 1.25 | 1.25 | ||||||
| Ratio of net expenses to average net assets | 1.25 | 1.25 | 1.25 | 1.25f | 1.25 | 1.25 | ||||||
| Ratio of net investment income | ||||||||||||
| to average net assets | 2.98 | 3.01 | 3.19 | 3.17f | 3.41 | 3.74 | ||||||
| Portfolio Turnover Rate | 32.16 | 27.26 | 15.54 | 4.48e | 11.45 | 14.88 | ||||||
| Net Assets, end of period ($ x 1,000) | 202 | 655 | 941 | 1,484 | 1,251 | 862 | ||||||
| a The Premier Massachusetts Fund has changed its fiscal year end from June 30 to August 31. |
| b As required, effective July 1, 2001, the fund has adopted the provisions of the AICPA Audit and Accounting Guide for Investment Companies and began accreting discount or |
| amortizing premium on a scientific basis for debt securities on a daily basis.The effect of this change for the period ended June 30, 2002 was to increase net investment income per |
| share and decrease net realized and unrealized gain (loss) on investments per share by less than $.01 and increase the ratio of net investment income to average net assets from |
| 3.40% to 3.41%. Per share data and ratios/supplemental data for periods prior to July 1, 2001 have not been restated to reflect this change in presentation. |
| c Based on average shares outstanding at each month end. |
| d Exclusive of sales charge which was applicable to Class B shares of the Premier Massachusetts Fund. |
| e Not annualized. |
| f Annualized. |
| See notes to financial statements. |
| 66 |
NOTES TO FINANCIAL STATEMENTS
NOTE 1—General:
Mellon Funds Trust (the “Trust”) was organized as a Massachusetts business trust which is registered under the Investment Company Act of 1940, as amended (the “Act”), as an open-end management investment company and operates as a series company currently comprised of sixteen series including the following non-diversified municipal bond funds: Mellon National Intermediate Municipal Bond Fund, Mellon National Short-Term Municipal Bond Fund, Mellon Pennsylvania Intermediate Municipal Bond Fund and Mellon Massachusetts Intermediate Municipal Bond Fund (each, a “fund” and collectively, the “funds”). Mellon National Intermediate Municipal Bond Fund and Mellon National Short-Term Municipal Bond Fund seek to maximize current income exempt from federal income tax to the extent consistent with the preservation of capital. Mellon Pennsylvania Intermediate Municipal Bond Fund seeks as high a level of income exempt from federal and Pennsylvania state income taxes as is consistent with the preservation of capital. Mellon Massachusetts Intermediate Municipal Bond Fund seeks as high a level of income exempt from federal and Massachusetts state income taxes as is consistent with the preservation of capital. Mellon Fund Advisers, a division of The Dreyfus Corporation (“Dreyfus”), serves as each fund’s investment adviser (“Investment Adviser”). Mellon Bank, N.A. (“Mellon Bank”), which is a wholly-owned subsidiary of Mellon Financial Corporation (“Mellon Financial”), serves as administrator for the funds pursuant to an Administration Agreement with the Trust (the “Administration Agreement”). Mellon Bank has entered into a Sub-Administration Agreement with Dreyfus pursuant to which Mellon Bank pays Dreyfus for performing certain administrative services. Dreyfus is a wholly-owned subsidiary of Mellon Financial. Dreyfus Service Corporation (the “Distributor”), a wholly-owned subsidiary of Dreyfus, is the Distributor of each fund’s shares, which are sold without a front-end sales charge.
The Trust is authorized to issue an unlimited number of shares of beneficial interest, par value $.001 per share, in each of the Class M and Investor class shares of each fund
and in the Dreyfus Premier class shares of Mellon National Intermediate Municipal Bond Fund and Mellon Massachusetts Intermediate Municipal Bond Fund. Dreyfus Premier shares of Mellon National Intermediate Municipal Bond Fund and Mellon Massachusetts Intermediate Municipal Bond Fund are subject to a contingent deferred sales charge (“CDSC”) imposed on redemptions of Dreyfus Premier shares made within six years of purchase and automatically convert to Investor class shares after six years. Each class of shares has similar rights and privileges, except with respect to the expenses borne by and the shareholder services offered to each class, the shareholder services plan applicable to the Investor shares and Dreyfus Premier shares and the Rule 12b-1 plan applicable to the Dreyfus Premier shares and certain voting rights. Income, expenses (other than expenses attributable to a specific class), and realized and unrealized gains or losses on investments are allocated to each class of shares based on its relative net assets.
The Trust accounts separately for the assets, liabilities and operations of each series. Expenses directly attributable to each series are charged to that series’ operations; expenses that are applicable to all series are allocated among them on a pro rata basis.
The funds’ financial statements are prepared in accordance with U.S. generally accepted accounting principles, which may require the use of management estimates and assump-tions.Actual results could differ from those estimates.
NOTE 2—Significant Accounting Policies:
(a) Portfolio valuation: Investments in municipal securities (excluding options and financial futures on municipal, U.S. Treasury securities and swaps) are valued each business day by an independent pricing service (the “Service”) approved by the Board of Trustees. Investments for which quoted bid prices are readily available and are representative of the bid side of the market in the judgment of the Service are valued at the mean between the quoted bid prices (as obtained by the Service from dealers in such securities) and asked prices (as calculated by the Service based upon its evaluation of
| The Funds 67 |
NOTES TO FINANCIAL STATEMENTS(continued)
the market for such securities). Other investments (which constitute a majority of each fund’s securities) are valued by the Service, based on methods which include consideration of: yields or prices of municipal securities of comparable quality, coupon, maturity and type; indications as to values from dealers; and general market conditions. Options and financial futures on municipal and U.S. Treasury securities are valued at the last sales price on the securities exchange on which such securities are primarily traded or at the last sales price on the national securities market on each business day. Swap transactions are valued based on future cash flows and other factors, such as interest rates and underlying securities.
(b) Securities transactions and investment income:
Securities transactions are recorded on a trade date basis. Realized gain and loss from securities transactions are recorded on the identified cost basis. Interest income, adjusted for accretion of discount and amortization of premium on investments, is earned from settlement date and recognized on the accrual basis. Securities purchased or sold on a when-issued or delayed-delivery basis may be settled a month or more after the trade date.
The funds have an arrangement with the custodian banks whereby the funds receive earnings credits from the custodian when positive cash balances are maintained, which are used to offset custody fees. For financial reporting purposes, the funds include net earnings credits as expense offsets in the Statements of Operations.
(c) Concentration of risk: Mellon Pennsylvania Intermediate Municipal Bond Fund and Mellon Massachusetts Intermediate Municipal Bond Fund follow an investment policy of investing primarily in municipal obligations of one state. Economic changes affecting the state and certain of its public bodies and municipalities may affect the ability of issuers within the state to pay interest on, or repay principal of, municipal obligations held by the fund.
(d) Dividends to shareholders: The funds declare dividends daily from investment income-net; such dividends are paid monthly. With respect to each series, dividends from net realized capital gain, if any, are normally
declared and paid annually, but the funds may make distributions on a more frequent basis to comply with the distribution requirements of the Internal Revenue Code of 1986, as amended (the “Code”).To the extent that net realized capital gain can be offset by capital loss carryovers of that fund, it is the policy of the fund not to distribute such gain. Income and capital gain distributions are determined in accordance with income tax regulations, which may differ from U.S. generally accepted accounting principles.
(e) Federal income taxes: It is the policy of each fund to continue to qualify as a regulated investment company, which can distribute tax exempt dividends, by complying with the applicable provisions of the Code, and to make distributions of income and net realized capital gain sufficient to relieve it from substantially all federal income and excise taxes. For federal income tax purposes, each series is treated as a single entity for the purpose of determining such qualification.
Table 1 on the next page summarizes each fund’s components of accumulated earnings on a tax basis at August 31, 2005.
Table 2 on the next page summarizes Mellon Massachusetts Intermediate Municipal Bond Fund’s unused capital loss carryover available to be applied against future net securities profits, if any, realized subsequent to August 31, 2005.
Table 3 on the next page summarizes each relevant fund’s tax character of distributions paid to shareholders during the fiscal years ended August 31, 2005 and August 31, 2004, respectively.
During the period ended August 31, 2005, as a result of permanent book to tax differences, primarily due to the tax treatment for amortization of premiums, the funds increased (decreased) accumulated undistributed investment income-net, increased (decreased) accumulated net realized gain (loss) on investments and increased (decreased) paid-in capital as summarized in Table 4 on the next page. Net assets were not affected by this reclassification.
| 68 |
NOTE 3—Bank Line of Credit:
The funds participate with other Dreyfus-managed funds in a $100 million unsecured line of credit primarily to be utilized for temporary or emergency purposes, including the financing of redemptions. Interest is charged to the funds based on prevailing market rates in effect at the time of borrowings. During the period ended August 31, 2005, the funds did not borrow under the line of credit.
NOTE 4—Investment Advisory Fee, Administration Fee and Other Transactions With Affiliates:
(a) Fees payable by the funds pursuant to the provisions of an Investment Advisory Agreement with the Investment Adviser are payable monthly, computed on the average daily value of each fund’s net assets at the following annual rates: .35% of the Mellon National Intermediate Municipal Bond Fund, .35% of the Mellon National
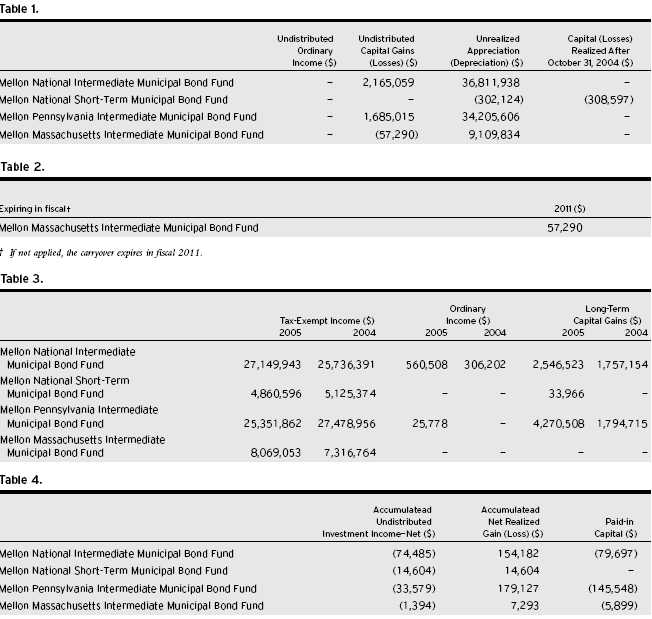
The Funds 69
NOTES TO FINANCIAL STATEMENTS(continued)
Short-Term Municipal Bond Fund, .50% of the Mellon Pennsylvania Intermediate Municipal Bond Fund and .35% of the Mellon Massachusetts Intermediate Municipal Bond Fund.
Pursuant to the Administration Agreement with Mellon Bank, Mellon Bank provides or arranges for fund accounting, transfer agency and other fund administration services and receives a fee based on the total net assets of the Trust based on the following rates:
| 0 up to $6 billion | .15% | |
| $6 billion up to $12 billion | .12% | |
| In excess of $12 billion | .10% |
Mellon Bank has entered into a Sub-Administration Agreement with Dreyfus pursuant to which Mellon pays Dreyfus for performing certain administrative services.
Mellon Bank has agreed, until September 30, 2007, with respect to Mellon Massachusetts Intermediate Municipal Bond Fund, to waive receipt of its fees and/or reimburse a portion of the fund’s expenses, exclusive of taxes, interest, brokerage commissions, Rule 12b-1 fees, Shareholder Services Plan fees and extraordinary expenses, so that the fund’s expenses, in the aggregate, do not exceed an annual rate of .50% of the value of the fund’s average daily net assets.The expense reimbursement, pursuant to the undertaking, for Mellon Massachusetts Intermediate Municipal Bond Fund, amounted to $97,124 during the period ended August 31, 2005.
During the period ended August 31,2005,the Distributor retained $13,206 from contingent deferred sales charges on redemptions of the Mellon National Intermediate Municipal Bond Fund’s Dreyfus Premier shares, and $16,517 from contingent deferred sales charges on redemptions of the Mellon Massachusetts Intermediate Municipal Bond Fund’s Dreyfus Premier shares.
(b) Mellon National Intermediate Municipal Bond Fund and Mellon Massachusetts Intermediate Municipal Bond Fund have adopted a Distribution Plan (the “Plan”) pursuant to Rule 12b-1 under the Act for distributing its Dreyfus Premier shares.The funds each pay the Distributor a fee at an annual rate of .50% of the value of the fund’s average daily net assets attributable to its Dreyfus Premier
shares. During the period ended August 31, 2005, Mellon National Intermediate Municipal Bond Fund and Mellon Massachusetts Intermediate Municipal Bond Fund, Dreyfus Premier shares were charged $26,400 and $1,518, respectively, pursuant to the Plan.
(c) The funds have adopted a Shareholder Services Plan with respect to its Investor shares, and Mellon National Intermediate Municipal Bond Fund and Mellon Massachusetts Intermediate Municipal Bond Fund have adopted a Shareholder Services Plan with respect to its Dreyfus Premier shares, pursuant to which each fund pays the Distributor for the provision of certain services to holders of Investor shares and Dreyfus Premier shares a fee at an annual rate of .25% of the value of the average daily net assets attributable to Investor shares and Dreyfus Premier shares, respectively. The services provided may include personal services relating to shareholder accounts, such as answering shareholder inquiries regarding a fund, and providing reports and other information, and services related to the maintenance of such shareholder accounts. The Shareholder Services Plan allows the Distributor to make payments from the shareholder services fees it collects from each fund to compensate service agents (certain banks,securities brokers or dealers and other financial institutions) in respect of these services. Table 5 summarizes the amounts Investor shares and Dreyfus Premier shares were charged during the period ended August 31, 2005, pursuant to the Shareholder Services Plan.Additional fees included in shareholder servicing costs in the Statement of Operations include fees paid to the transfer agent.
| Table 5. | ||
| Mellon National Intermediate | ||
| Municipal Bond Fund (Investor Shares) | $71,564 | |
| Mellon National Intermediate Municipal | ||
| Bond Fund (Dreyfus Premier Shares) | 13,200 | |
| Mellon National Short-Term | ||
| Municipal Bond Fund | 373 | |
| Mellon Pennsylvania Intermediate | ||
| Municipal Bond Fund | 8,938 | |
| Mellon Massachusetts Intermediate | ||
| Municipal Bond Fund (Investor Shares) | 27,406 | |
| Mellon Massachusetts Intermediate | ||
| Municipal Bond Fund | ||
| (Dreyfus Premier Shares) | 759 |
| 70 |
The funds compensate Mellon Bank, an affiliate of Dreyfus, under a Custody Agreement for providing custodial services for the funds. Table 6 summarizes the amounts the funds were charged during the period ended August 31, 2005 pursuant to the custody agreement.
| Table 6. | ||
| Mellon National Intermediate | ||
| Municipal Bond Fund | $56,360 | |
| Mellon National Short-Term | ||
| Municipal Bond Fund | 22,226 | |
| Mellon Pennsylvania Intermediate | ||
| Municipal Bond Fund | 49,993 | |
| Mellon Massachusetts Intermediate | ||
| Municipal Bond Fund | 17,819 |
During the period ended August 31, 2005, each of the funds were charged $2,520 for services performed by the Chief Compliance Officer.
Table 7 summarizes the components of Due to the Dreyfus Corporation and affiliates in the Statements of Assets and Liabilities for each fund.
(d) Each trustee who is not an “affiliated person” as defined in the Act receives from the Trust an annual fee of $44,000 and an attendance fee of $4,000 for each in-
person meeting attended and $500 for telephone meetings and is reimbursed for travel and out-of-pocket expenses. Prior to September 14, 2004, the attendance fee payable to each trustee was $3,000 for each in-person meeting attended.
NOTE 5—Securities Transactions:
Table 8 summarizes each fund’s aggregate amount of purchases and sales of investment securities, excluding short-term securities and financial futures, during the period ended August 31, 2005.
The funds may invest in financial futures contracts in order to gain exposure to or protect against changes in the market. The funds are exposed to market risk as a result of changes in the value of the underlying financial instruments. Investments in financial futures require the funds to “mark to market” on a daily basis, which reflects the change in the market value of the contracts at the close of each day’s trading. Typically, variation margin payments are received or made to reflect daily unrealized gains or losses.When the contracts are closed, the funds recognize a realized gain or loss. These investments require initial margin deposits with a broker, which con-
| Table 7. | ||||||||||||
| Investment | Rule 12b-1 | Shareholder | Chief | |||||||||
| Advisory | Distribution | Services | Custodian | Compliance | Expense | |||||||
| Fees ($) | Plan Fees ($) | Plan Fees ($) | Fees ($) | Officer Fees ($) | Reimbursement($) | |||||||
| Mellon National Intermediate | ||||||||||||
| Municipal Bond Fund | 225,136 | 1,999 | 6,800 | 13,148 | 1,533 | — | ||||||
| Mellon National Short-Term | ||||||||||||
| Municipal Bond Fund | 61,970 | — | 32 | 4,330 | 1,533 | — | ||||||
| Mellon Pennsylvania Intermediate | ||||||||||||
| Municipal Bond Fund | 279,844 | — | 958 | 11,666 | 1,533 | — | ||||||
| Mellon Massachusetts Intermediate | ||||||||||||
| Municipal Bond Fund | 69,545 | 85 | 2,233 | 4,848 | 1,533 | (5,473) | ||||||
| Table 8. | ||||
| Purchases ($) | Sales ($) | |||
| Mellon National Intermediate Municipal Bond Fund | 390,778,324 | 301,518,468 | ||
| Mellon National Short-Term Municipal Bond Fund | 83,053,984 | 86,978,980 | ||
| Mellon Pennsylvania Intermediate Municipal Bond Fund | 158,907,272 | 161,116,425 | ||
| Mellon Massachusetts Intermediate Municipal Bond Fund | 95,851,726 | 68,840,165 | ||
The Funds 71
NOTES TO FINANCIAL STATEMENTS(continued)
sist of cash or cash equivalents. The amount of these deposits is determined by the exchange or Board of Trade on which the contract is traded and is subject to change. Contracts open at August 31, 2005 are set forth in the Statement of Financial Futures.
Table 9 summarizes accumulated net unrealized appreciation on investments for each fund at August 31, 2005.
NOTE 6—Legal Matters:
In early 2004, two purported class and derivative actions were filed against Mellon Financial, Mellon Bank, N.A., Dreyfus, Founders Asset Management LLC, and certain directors of the Dreyfus Funds and the Dreyfus Founders Funds (together, the “Funds”) in the United States District Court for the Western District of Pennsylvania. In September 2004, plaintiffs served a Consolidated Amended Complaint (the “Amended Complaint”) on behalf of a purported class of all persons who acquired interests in any of the Funds between January 30, 1999 and November 17, 2003, and derivatively on behalf of the Funds.The Amended Complaint in the newly styled In re Dreyfus Mutual Funds Fee Litigation also named the Distributor, Premier Mutual Fund Services, Inc. and two additional Fund directors as defendants and alleges violations of the Investment Company Act of 1940, the Investment Advisers Act of 1940, the Pennsylvania Unfair Trade Practices and Consumer Protection Law and common-law claims. Plaintiffs seek to recover allegedly improper and excessive Rule 12b-1 and advisory fees allegedly charged to the Funds for marketing and distribution services. More
specifically, plaintiffs claim, among other things, that 12b-1 fees and directed brokerage were improperly used to pay brokers to recommend the Funds over other funds, and that such payments were not disclosed to investors. In addition, plaintiffs assert that economies of scale and soft-dollar benefits were not passed on to the Funds. Plaintiffs further allege that 12b-1 fees were improperly charged to certain of the Funds that were closed to new investors.The Amended Complaint seeks compensatory and punitive damages, rescission of the advisory contracts, and an accounting and restitution of any unlawful fees, as well as an award of attorneys’ fees and litigation expenses. As noted, some of the claims in this litigation are asserted derivatively on behalf of the Funds that have been named as nominal defendants. With respect to such derivative claims, no relief is sought against the Funds. Dreyfus believes the allegations to be totally without merit and intends to defend the action vigorously. None of the trustees of the Trust, nor the funds, were named in the actions. In November 2004, all named defendants moved to dismiss the Amended Complaint in whole or substantial part. Briefing was completed in May 2005.
Additional lawsuits arising out of these circumstances and presenting similar allegations and requests for relief may be filed against the defendants in the future. Neither Dreyfus nor the Funds believe that any of the pending actions will have a material adverse effect on the Funds or Dreyfus’ ability to perform its contract with the Funds.
| Table 9. | ||||||||
| Cost of | Gross | Gross | ||||||
| Investments ($) | Appreciation ($) | (Depreciation) ($) | Net ($) | |||||
| Mellon National Intermediate Municipal Bond Fund | 756,646,434 | 37,053,354 | 241,416 | 36,811,938 | ||||
| Mellon National Short-Term Municipal Bond Fund | 209,906,333 | 570,472 | 872,596 | (302,124) | ||||
| Mellon Pennsylvania Intermediate Municipal Bond Fund | 631,992,507 | 34,361,379 | 155,773 | 34,205,606 | ||||
| Mellon Massachusetts Intermediate Municipal Bond Fund | 230,934,074 | 9,305,145 | 195,311 | 9,109,834 | ||||
| 72 |
REPORT OF INDEPENDENT REGISTERED PUBLIC ACCOUNTING FIRM
The Board of Trustees and Shareholders of Mellon Funds Trust:
We have audited the accompanying statements of assets and liabilities of Mellon National Intermediate Municipal Bond Fund, Mellon National Short-Term Municipal Bond Fund, Mellon Pennsylvania Intermediate Municipal Bond Fund and Mellon Massachusetts Intermediate Municipal Bond Fund of Mellon Funds Trust (collectively “the Funds”), including the statements of investments and statements of financial futures, as of August 31, 2005, and the related statements of operations for the year then ended, the statements of changes in net assets for each of the years in the two-year period then ended, and the financial highlights for each of the periods indicated herein.These financial statements and financial highlights are the responsibility of the Funds’ management. Our responsibility is to express an opinion on these financial statements and financial highlights based on our audits.
We conducted our audits in accordance with standards of the Public Company Accounting Oversight Board (United States).Those standards require that we plan and perform the audit to obtain reasonable assurance about whether the financial statements and financial highlights are free of material misstatement.An audit includes exam-
ining, on a test basis, evidence supporting the amounts and disclosures in the financial statements. Our procedures included confirmation of securities owned as of August 31, 2005, by correspondence with the custodian and brokers or by other appropriate auditing procedures where replies from brokers were not received. An audit also includes assessing the accounting principles used and significant estimates made by management, as well as evaluating the overall financial statement presentation.We believe that our audits provide a reasonable basis for our opinion.
In our opinion, the financial statements and financial highlights referred to above present fairly, in all material respects, the financial position of the Funds as of August 31, 2005, the results of their operations for the year then ended, the changes in their net assets for each of the years in the two-year period then ended and the financial highlights for each of the periods indicated herein, in conformity with U.S. generally accepted accounting principles.

| The Funds 73 |
IMPORTANT TAX INFORMATION(Unaudited)
Mellon National Intermediate Municipal Bond Fund
In accordance with federal tax law, the fund hereby makes the following designations regarding its fiscal year ended August 31, 2005:
- all the dividends paid from investment income- net are “exempt-interest dividends” (not generally subject to regular federal income tax), and
- the fund hereby designates $.0486 per share as a long-term capital gain distribution of the $.0593 per share paid on December 9, 2004.
As required by federal tax law rules, shareholders will receive notification of their portion of the fund’s taxable ordinary dividends (if any) and capital gains distributions (if any) paid for the 2005 calendar year on Form 1099-DIV which will be mailed by January 31, 2006.
Mellon National Short-Term Municipal Bond Fund
In accordance with federal tax law, the fund hereby makes the following designations regarding its fiscal year ended August 31, 2005:
- all the dividends paid from investment income- net are “exempt-interest dividends” (not generally subject to regular federal income tax), and
- the fund hereby designates $.0020 per share as a long-term capital gain distribution paid on December 9, 2004.
As required by federal tax law rules, shareholders will receive notification of their portion of the fund’s taxable ordinary dividends (if any) and capital gains distributions (if any) paid for the 2005 calendar year on Form 1099-DIV which will be mailed by January 31, 2006.
Mellon Pennsylvania Intermediate Municipal Bond Fund
In accordance with federal tax law, the fund hereby makes the following designations regarding its fiscal year ended August 31, 2005:
- all the dividends paid from investment income- net are “exempt-interest dividends” (not generally subject to regular federal income tax), and
- the fund hereby designates $.0829 per share as a long-term capital gain distribution of the $.0834 per share paid on December 9, 2004.
As required by federal tax law rules, shareholders will receive notification of their portion of the fund’s taxable ordinary dividends (if any) and capital gain distributions (if any) paid for the 2005 calendar year on Form 1099-DIV which will be mailed by January 31, 2006.
Mellon Massachusetts Intermediate Municipal Bond Fund
In accordance with federal tax law, the fund hereby designates all the dividends paid from investment income-net during its fiscal year ended August 31, 2005 as “exempt-interest dividends” (not generally subject to regular federal income tax).
As required by federal tax law rules, shareholders will receive notification of their portion of the fund’s taxable ordinary dividends (if any) and capital gains distributions (if any) paid for the 2005 calendar year on Form 1099-DIV which will be mailed by January 31, 2006.
| 74 |
INFORMATION ABOUT THE REVIEW AND APPROVAL
OF EACH FUND’ S INVESTMENT ADVISORY AGREEMENT (Unaudited)
MELLON FUNDS TRUST (Mellon National Intermediate Municipal Bond Fund, Mellon National Short-Term Municipal Bond Fund, Mellon Pennsylvania Intermediate Municipal Bond Fund and Mellon Massachusetts Intermediate Municipal Bond Fund)
At a meeting of the Board of Trustees held on March 15-16, 2005, the Board considered the re-approval of the Trust’s Investment Advisory Agreement for another one year term, pursuant to which the Investment Adviser, a division of Dreyfus, provides the funds with investment advisory services. The Board members also considered the re-approval of the Trust’s Administration Agreement with Mellon Bank for another one year term, pursuant to which Mellon Bank provides the funds with administrative services. Mellon Bank has entered into a Sub-Administration Agreement with Dreyfus pursuant to which Mellon Bank pays Dreyfus for performing certain of these administrative services. The Board members who are not “interested persons” (as defined in the Act) of the Trust were assisted in their review by independent legal counsel and met with counsel in executive session separate from representatives of Dreyfus.
Analysis of Nature, Extent and Quality of Services Provided to the Funds. The Board members received a presentation from representatives of Dreyfus regarding services provided to the funds, and discussed the nature, extent and quality of the services provided to the funds pursuant to the Investment Advisory Agreement. Dreyfus’ representatives reviewed the funds’ distribution of accounts, and noted the diversity of distribution of the funds and Dreyfus’ corresponding need for broad, deep and diverse resources to be able to provide ongoing shareholder services to each of the funds’ distribution channels. The Board also reviewed the number of shareholder accounts in each fund, as well as each fund’s asset size.
The Board members also considered Dreyfus’ research and portfolio management capabilities and that Dreyfus also provides oversight of day-to-day fund operations, including fund accounting and administration and assis-
tance in meeting legal and regulatory requirements.The Board members also considered Dreyfus’ extensive administrative, accounting and compliance infrastructure.
Comparative Analysis of the Funds’ Performance and Management Fees and Expense Ratios.
Mellon National Intermediate Municipal Bond Fund.
The Board members reviewed the fund’s performance and expense ratios and placed significant emphasis on comparisons to a group of comparable funds and Lipper averages. The Board reviewed the fund’s performance, management fee and total expense ratio within this comparison group and against the fund’s Lipper category average. The group of comparable funds was previously approved by the Board for this purpose, and was prepared using a Board-approved selection methodology that was based, in part, on selecting non-affiliated funds reported in the same Lipper category as the fund. The Board members noted that, as of December 31, 2004, the fund’s total return performance was above the averages of the comparison group and its Lipper category for the 1-, 3-and 5-year periods and that the fund’s income performance was above the averages of the comparison group and its Lipper category for the 1- and 3-year periods.The Board members also noted the fund’s number one ranking versus the comparison group for the 1-, 3-, 5- and 10-year periods ended December 31, 2004. The Board members then discussed the fund’s advisory fee and expense ratio and reviewed the range of advisory fees in the comparison group and noted that the fund’s expense ratio was lower than the average expense ratio of the comparison group and that of its Lipper category and that the fund’s expense ratio ranked in the second quartile (was among the lowest) in the comparison group.
Representatives of Dreyfus reviewed with the Board members a comparison of the fees paid to Dreyfus or its affiliates by mutual funds with similar investment objectives, policies and strategies as the fund (the “Similar Funds”). These comparison groups also compared the management fee and total expense ratios of Similar Funds.
| The Funds 75 |
| INFORMATION ABOUT THE REVIEW AND APPROVAL OF EACH FUND’ S | ||
| INVESTMENT ADVISORY AGREEMENT(Unaudited)(continued) |
The Similar Funds’ comparison group was composed exclusively of investment companies managed by Dreyfus or its affiliates that were reported in the same Lipper category as the fund. Dreyfus’ representatives explained the nature of each Similar Fund and the differences, from Dreyfus’ perspective, in management of these Similar Funds compared to managing and providing other services to the fund. Dreyfus’ representatives also reviewed the costs associated with distribution through intermediaries. The Board analyzed differences in fees paid to Dreyfus and discussed the relationship of the management fees paid in light of Dreyfus’ performance and the services provided. The Similar Funds had management fees that were both higher and lower than the fund’s management fee, and management noted that the management fee of the Similar Fund (that was lower than the fund’s management fee) reflected the pricing and characteristics of an institutional fund.The Board members considered the relevance of the fee information provided for the Similar Funds to evaluate the appropriateness and reasonableness of the fund’s management fee.The Board acknowledged that differences in fees paid by the Similar Funds seemed to be consistent with the services provided.
Representatives of Dreyfus stated that there were no separate accounts managed by Dreyfus or its affiliates with similar investment objectives, policies and strategies as the fund.
Mellon National Short-Term Municipal Bond Fund.
The Board members reviewed the fund’s performance and expense ratios and placed significant emphasis on comparisons to a group of comparable funds and Lipper averages. The Board reviewed the fund’s performance, management fee and total expense ratio within this comparison group and against the fund’s Lipper category average. The group of comparable funds was previously approved by the Board for this purpose, and was prepared using a Board-approved selection methodology that was based, in part, on selecting non-affiliated funds reported in the same Lipper category as the fund. The Board members noted that, as of December 31, 2004, the fund’s total return performance was below the average of the
comparison group for the 1-year period, was above the average of the comparison group for the 3-year period and was above its Lipper category average for the 1- and 3-year periods, and that the fund’s income performance was above the averages of the comparison group and its Lipper category for the 1- and 3-year periods.The Board members then discussed the fund’s advisory fee and expense ratio and reviewed the range of advisory fees in the comparison group and noted that the fund’s expense ratio was lower than the average expense ratio of the comparison group and that of its Lipper category and that the fund’s expense ratio ranked in the second quartile (was among the lowest) in the comparison group.
Representatives of Dreyfus reviewed with the Board members a comparison of the fee paid to Dreyfus or its affiliates by a mutual fund with a similar investment objective and similar policies and strategies as the fund (the “Similar Fund”).This comparison group also compared the management fee and total expense ratio of the Similar Fund.The Similar Fund’s comparison group was composed exclusively of an investment company managed by Dreyfus or its affiliates that was reported in the same Lipper category as the fund. Dreyfus’ representatives explained the nature of the Similar Fund and the differences, from Dreyfus’ perspective, in management of the Similar Fund compared to managing and providing other services to the fund. Dreyfus’ representatives also reviewed the costs associated with distribution through intermediaries. Management noted that the management fee of the Similar Fund was comparable to that of the fund.The Board members considered the relevance of the fee information provided for the Similar Fund to evaluate the appropriateness and reasonableness of the fund’s management fee. The Board acknowledged that the fee paid by the Similar Fund seemed to be consistent with the services provided.
Representatives of Dreyfus stated that there were no separate accounts managed by Dreyfus or its affiliates with similar investment objectives, policies and strategies as the fund.
| 76 |
Mellon Pennsylvania Intermediate Municipal Bond Fund. The Board members reviewed the fund’s performance and expense ratios and placed significant emphasis on comparisons to a group of comparable funds and Lipper averages. The Board reviewed the fund’s performance, management fee and total expense ratio within this comparison group and against the fund’s Lipper category average. The group of comparable funds was previously approved by the Board for this purpose, and was prepared using a Board-approved selection methodology that was based, in part, on selecting non-affiliated funds reported in the same Lipper category as the fund.The Board members noted that the fund’s comparison group consisted of only one other fund.The Board members also noted that, as of December 31, 2004, the fund’s total return performance was higher than that of the other fund in the comparison group for the 1-year period, was comparable to that of the other fund for the 3- and 5-year periods and was above its Lipper category average for the 1-, 3- and 5-year periods and that the fund’s income performance was comparable to that of the other fund for the 1-year period and was below that of the other fund for the 3-year period. The Board members then discussed the fund’s advisory fee and expense ratio and reviewed the range of advisory fees in the comparison group and noted that the fund’s expense ratio was lower than the average expense ratio of the other fund in the comparison group and was lower than the average of the fund’s Lipper category.
Representatives of Dreyfus reviewed with the Board members a comparison of the fee paid to Dreyfus or its affiliates by a mutual fund with a similar investment objective and similar policies and strategies as the fund (the “Similar Fund”).This comparison group also compared the management fee and total expense ratio of the Similar Fund.The Similar Fund’s comparison group was composed exclusively of an investment company managed by Dreyfus or its affiliates that was reported in the same Lipper category as the fund. Dreyfus’ representatives explained the nature of the Similar Fund and the differences, from Dreyfus’ perspective, in management of the Similar Fund compared to managing and providing
other services to the fund. Dreyfus’ representatives also reviewed the costs associated with distribution through intermediaries. The Board analyzed differences in fees paid to Dreyfus and discussed the relationship of the management fees paid in light of Dreyfus’ performance and the services provided. Management noted that the management fee of the Similar Fund was comparable to that of the fund.The Board members considered the relevance of the fee information provided for the Similar Fund to evaluate the appropriateness and reasonableness of the fund’s management fee.The Board acknowledged that the fee paid by the Similar Fund seemed to be consistent with the services provided.
Representatives of Dreyfus stated that there were no separate accounts managed by Dreyfus or its affiliates with similar investment objectives, policies and strategies as the fund.
Mellon Massachusetts Intermediate Municipal Bond Fund. The Board members reviewed the fund’s performance and expense ratios and placed significant emphasis on comparisons to a group of comparable funds and Lipper averages. The Board reviewed the fund’s performance, management fee and total expense ratio within this comparison group and against the fund’s Lipper category average.The group of comparable funds was previously approved by the Board for this purpose, and was prepared using a Board-approved selection methodology that was based, in part, on selecting non-affiliated funds reported in the same Lipper category as the fund. The Board members noted that the fund’s comparison group consisted of only two other funds for the 1-year period, and only one other fund for the 3- and 5-year periods, ended December 31, 2004 The Board members also noted that, as of December 31, 2004, the fund’s total return performance was higher than that of the other two funds in the comparison group for the 1-year period and was higher than that of the other fund for the 3- and 5-year periods and that the fund’s income performance was higher than that of the other funds in the comparison group for the 1-year period and was comparable to
| The Funds 77 |
| INFORMATION ABOUT THE REVIEW AND APPROVAL OF EACH FUND’ S | ||
| INVESTMENT ADVISORY AGREEMENT(Unaudited)(continued) |
that of the other fund for the 3- and 5-year periods.The Board members then discussed the fund’s advisory fee and expense ratio and reviewed the range of advisory fees in the comparison group and noted that the fund’s expense ratio was lower than the average expense ratio of the comparison group and that of its Lipper category and that the fund’s expense ratio ranked first (was the lowest) in the comparison group.The Board members also considered Mellon Bank’s contractual undertaking for the fund in effect through September 30, 2007.
Representatives of Dreyfus reviewed with the Board members a comparison of the fees paid to Dreyfus or its affiliates by mutual funds with similar investment objectives, policies and strategies as the fund (the “Similar Funds”). These comparison groups also compared the management fee and total expense ratios of Similar Funds. The Similar Funds’ comparison group was composed exclusively of investment companies managed by Dreyfus or its affiliates that were reported in the same Lipper category as the fund. Dreyfus’ representatives explained the nature of each Similar Fund and the differences, from Dreyfus’ perspective, in management of these Similar Funds compared to managing and providing other services to the fund. Dreyfus’ representatives also reviewed the costs associated with distribution through intermediaries. The Board analyzed differences in fees paid to Dreyfus and discussed the relationship of the management fees paid in light of Dreyfus’ performance and the services provided. The Similar Funds had management fees that were both higher and lower than the fund’s management fee, and management noted that the management fee of the Similar Fund (that was lower than the fund’s management fee) reflected the pricing of an institutional fund. The Board members considered the relevance of the fee information provided for the Similar Funds to evaluate the appropriateness and reasonableness of the fund’s management fee.The Board acknowledged that differences in fees paid by the Similar Funds seemed to be consistent with the services provided.
Representatives of Dreyfus stated that there were no separate accounts managed by Dreyfus or its affiliates with similar investment objectives, policies and strategies as the fund.
Analysis of Profitability and Economies of Scale. Dreyfus’ representatives reviewed the dollar amount of expenses allocated and profit received by Dreyfus and its affiliates with respect to each fund and the method used to determine such expenses and profit. The Board received and considered information prepared by an independent consulting firm regarding Dreyfus’ approach to allocating costs to, and determining the profitability of, individual funds and the entire Dreyfus mutual fund complex.The Dreyfus representatives stated that the methodology had also been reviewed by an independent registered public accounting firm which, like the consultant, found the methodology to be reasonable. The consulting firm also analyzed where any economies of scale might emerge in connection with the management of the funds.The Board members evaluated the analysis in light of the relevant circumstances for each fund, and the extent to which economies of scale would be realized as the fund grows and whether fee levels reflect these economies of scale for the benefit of fund investors.The Board noted that it appeared that the benefits of any economies of scale also would be appropriately shared with shareholders through increased investment in fund management and administration resources. The Board members also considered potential benefits to Dreyfus and its affiliates, including Mellon Fund Advisers, from acting as investment adviser with respect to each fund.
It was noted that the Board members should consider Dreyfus’ profitability with respect to each fund as part of their evaluation of whether the fees under the Investment Advisory Agreement bear a reasonable relationship to the mix of services provided by Dreyfus, including the nature, extent and quality of such services and that a dis-
| 78 |
cussion of economies of scale are predicated on increasing assets and that, if a fund’s assets had been decreasing, the possibility that Dreyfus may have realized any economies of scale would be less. The Board members also discussed the profitability percentage ranges determined by appropriate court cases to be reasonable given the services rendered to investment companies. It was noted that the profitability percentage for managing each fund was not unreasonable given the fund’s overall performance and generally superior service levels provided.
At the conclusion of these discussions, each of the Board Members expressed the opinion that he or she had been furnished with sufficient information to make an informed business decision with respect to the continuation of the Trust’s Investment Advisory Agreement. Based on their discussions and considerations as described above, the Board made the following conclusions and determinations.
- The Board concluded that the nature, extent and qual- ity of the services provided by Dreyfus are adequate and appropriate.
- The Board was generally satisfied with the each fund’s performance, noting in particular, with respect to Mellon National Intermediate Municipal Bond Fund, the fund’s strong total return performance over a 10-year period ended December 31, 2004.
- The Board concluded that the fee paid by each fund to Mellon Fund Advisers was reasonable in light of comparative performance and expense and advisory fee information, costs of the services provided and profits to be realized and benefits derived or to be derived by Dreyfus and its affiliates from its relation- ship with the funds.
- The Board determined that the economies of scale which may accrue to Dreyfus and its affiliates in con- nection with the management of the funds had been adequately considered by Dreyfus in connection with the management fee rate charged to each fund, and that, to the extent in the future it were to be determined that material economies of scale had not been shared with the funds, the Board would seek to have those economies of scale shared with fund shareholders.
The Board members considered these conclusions and determinations and, without any one factor being dispositive, the Board determined that re-approval of the Trust’s Investment Advisory Agreement and Administration Agreement with respect to the funds was in the best interests of each fund and its respective shareholders.
| The Funds 79 |
BOARD MEMBERS INFORMATION(Unaudited)
| Patrick J. O’Connor (62) |
| Chairman of the Board (2000) |
| Principal Occupation During Past 5 Years: |
| • Attorney, Cozen and O’Connor, P.C. since 1973, including Vice |
| Chairman since 1980 and Chief Executive Officer and President |
| since 2002 |
| Other Board Memberships and Affiliations: |
| • Board of Consultors of Villanova University School of Law, |
| Board Member |
| • Temple University,Trustee |
| • Philadelphia Police Foundation, Board Member |
| • Philadelphia Children’s First Fund, Board Member |
| • Committee on Rules of Evidence of Pennsylvania Supreme |
| Court,Vice Chair |
| • American College of Trial Lawyers, Fellow |
| • Historical Society of the United States District Court for the |
| Eastern District of Pennsylvania, Director |
| No. of Portfolios for which Board Member Serves: 16 |
| ——————— |
| Ronald R. Davenport (69) |
| Board Member (2000) |
| Principal Occupation During Past 5 Years: |
| • Chairman of Sheridan Broadcasting Corporation since July 1972 |
| Other Board Memberships and Affiliations: |
| • American Urban Radio Networks, Co-Chairman |
| • Aramark Corporation, Board Member |
| • Momentum Equity Group LLC, Director |
| No. of Portfolios for which Board Member Serves: 16 |
| ——————— |
| John L. Diederich (68) |
| Board Member (2000) |
| Principal Occupation During Past 5 Years: |
| • Chairman of Digital Site Systems, Inc., a privately held software |
| company providing internet service to the construction materials |
| industry, since July 1998 |
| Other Board Memberships and Affiliations: |
| • Continental Mills, a dry baking products company, Board Member |
| • Pittsburgh Parks Conservancy, Board Member |
| No. of Portfolios for which Board Member Serves: 16 |
| Maureen D. McFalls (60) |
| Board Member (2000) |
| Principal Occupation During Past 5 Years: |
| • Director of the Office of Government Relations at Carnegie |
| Mellon University since January 2000 |
| • Manager, Government Communications, of the Software |
| Engineering Institute at Carnegie Mellon University from |
| March 1994 to December 1999 |
| Other Board Memberships and Affiliations: |
| • Maglev, Inc., a company seeking a partnership between industry |
| and government in Pennsylvania to create a magnetically levitated |
| high-speed transportation system, Board Member representing |
| Carnegie Mellon University |
| • Coro Center For Civic Leadership, Board Member |
| • Pennsylvania Association for Individuals with Disabilities, |
| Board Member |
| No. of Portfolios for which Board Member Serves: 16 |
| ——————— |
| Kevin C. Phelan (61) |
| Board Member (2000) |
| Principal Occupation During Past 5 Years: |
| • Mortgage Banker, Meredith & Grew, Inc. since March 1978, |
| including Executive Vice President and Director |
| since March 1998 |
| Other Board Memberships and Affiliations: |
| • Greater Boston Chamber of Commerce, Director |
| • Fiduciary Trust, Director |
| • St. Elizabeth’s Medical Center of Boston, Board Member |
| • Providence College,Trustee |
| • Simmons College,Trustee |
| • Newton Country Day School, Chairman of the Board |
| • Board of Visitors of Babson College, Board Member |
| • Board of Visitors of Boston University School of Public Health, |
| Board Member |
| • Boston Public Library Foundation, Director |
| • Boston Foundation, Director |
| • Boston Municipal Research Bureau, Board Member |
| • Boys and Girls Club of Boston, Board Member |
| • Greater Boston Real Estate Board, Director |
| No. of Portfolios for which Board Member Serves: 16 |
| 80 |
| Patrick J. Purcell (57) |
| Board Member (2000) |
| Principal Occupation During Past 5 Years: |
| • Owner, President and Publisher of The Boston Herald since |
| February 1994 |
| • President and Founder, jobfind.com, an employment search site |
| on the world wide web, since July 1996 |
| • President and Chief Executive Officer, Herald Media since 2001 |
| Other Board Memberships and Affiliations: |
| • The American Ireland Fund, an organization that raises funds for |
| philanthropic projects in Ireland, Director |
| • The Genesis Fund, an organization that raises funds for the spe- |
| cialized care and treatment of New England area children born |
| with birth defects, mental retardation and genetic diseases, |
| Board Member |
| • United Way of Massachusetts Bay, Board Member |
| • Greater Boston Chamber of Commerce, Board Member |
| • St. John’s University,Trustee |
| No. of Portfolios for which Board Member Serves: 16 |
| Thomas F. Ryan, Jr. (64) |
| Board Member (2000) |
| Principal Occupation During Past 5 Years: |
| • Retired since April 1999 |
| • President and Chief Operating Officer of the American Stock |
| Exchange from October 1995 to April 1999 |
| Other Board Memberships and Affiliations: |
| • Boston College,Trustee |
| • Brigham & Women’s Hospital,Trustee |
| • New York State Independent System Operator, a non-profit |
| organization which administers a competitive wholesale market |
| for electricity in New York State, Director |
| • RepliGen Corporation, a biopharmaceutical company, Director |
| No. of Portfolios for which Board Member Serves: 16 |
Once elected all Board Members serve for an indefinite term.The address of the Board Members and Officers is in c/o The Dreyfus Corporation, 200 Park Avenue, New York, New York 10166. Additional information about the Board Members is available in the fund’s Statement of Additional Information which can be obtained from Dreyfus free of charge by calling this toll free number: 1-800-645-6561. For individual account holders for Private Wealth Management clients, please contact your account officer or call 1-888-281-7350.
| The Funds 81 |
OFFICERS OF THE TRUST (Unaudited)
LAWRENCE P. KEBLUSEK, President since June 2003.
As Chief Investment Officer of Mellon’s Private Wealth Management group, Mr. Keblusek is responsible for investment strategy, policy and implementation for Mellon’s Private Wealth Management group. Prior to joining Mellon, Mr. Keblusek was a Managing Director at Citigroup since 1995. He was previously a Vice President of the Trust. He is 55 years old and has been employed by Mellon since August 2002.
MARK N. JACOBS, Vice President since June 2000.
Executive Vice President, Secretary and General Counsel of Dreyfus, and an officer of 91 investment companies (comprised of 200 portfolios) managed by Dreyfus. He is 59 years old and has been an employee of Dreyfus since June 1977.
CHRISTOPHER SHELDON, Vice President since June 2003.
As director of Investment Strategy for Mellon’s Private Wealth Management group since April 2003, Mr. Sheldon manages the analysis and development of investment and asset allocation strategies and investment product research. Prior to assuming his current position, Mr. Sheldon was the West Coast managing director of Mellon’s Private Wealth Management group from 2001-2003 and its regional manager from 1998-2001. He is 38 years old has been employed by Mellon since January 1995.
MICHAEL A. ROSENBERG, Vice President and Secretary since August 2005.
Associate General Counsel of Dreyfus, and an officer of 91 investment companies (comprised of 200 portfolios) managed by Dreyfus. He is 45 years old and has been an employee of Dreyfus since October 1991.
JAMES BITETTO, Vice President and Assistant Secretary since August 2005.
Assistant General Counsel and Assistant Secretary of Dreyfus, and an officer of 91 investment companies (comprised of 200 portfolios) managed by Dreyfus. He is 39 years old and has been an employee of Dreyfus since December 1996.
JONI LACKS CHARATAN, Vice President and Assistant Secretary since August 2005.
Assistant General Counsel and Assistant Secretary of Dreyfus, and an officer of 91 investment companies (comprised of 200 portfolios) managed by Dreyfus. She is 49 years old and has been an employee of Dreyfus since October 1998.
JOSEPH M. CHIOFFI, Vice President and Assistant Secretary since August 2005.
Assistant General Counsel and Assistant Secretary of Dreyfus, and an officer of 91 investment companies (comprised of 200 portfolios) managed by Dreyfus. He is 43 years old and has been an employee of Dreyfus since June 2000.
JANETTE E. FARRAGHER, Vice President and Assistant Secretary since August 2005.
Associate General Counsel of Dreyfus, and an officer of 91 investment companies (comprised of 200 portfolios) managed by Dreyfus. She is 42 years old and has been an employee of Dreyfus since February 1984.
JOHN B. HAMMALIAN, Vice President and Assistant Secretary since August 2005.
Associate General Counsel of Dreyfus, and an officer of 91 investment companies (comprised of 200 portfolios) managed by Dreyfus. He is 42 years old and has been an employee of Dreyfus since February 1991.
ROBERT R. MULLERY, Vice President and Assistant Secretary since August 2005.
Associate General Counsel of Dreyfus, and an officer of 91 investment companies (comprised of 200 portfolios) managed by Dreyfus. He is 53 years old and has been an employee of Dreyfus since May 1986.
JEFF PRUSNOFSKY, Vice President and Assistant Secretary since August 2005.
Associate General Counsel of Dreyfus, and an officer of 91 investment companies (comprised of 200 portfolios) managed by Dreyfus. He is 40 years old and has been an employee of Dreyfus since October 1990.
JAMES WINDELS, Treasurer since November 2001.
Director – Mutual Fund Accounting of Dreyfus, and an officer of 91 investment companies (comprised of 200 portfolios) managed by Dreyfus. He is 46 years old and has been an employee of Dreyfus since April 1985.
| 82 |
GREGORY S. GRUBER, Assistant Treasurer since March 2000.
Senior Accounting Manager – Municipal Bond Funds of Dreyfus, and an officer of 91 investment companies (comprised of 200 portfolios) managed by Dreyfus. He is 46 years old and has been an employee of Dreyfus since August 1981.
ERIK D. NAVILOFF, Assistant Treasurer since December 2002.
Senior Accounting Manager – Taxable Fixed Income Funds of Dreyfus, and an officer of 91 investment companies (comprised of 200 portfolios) managed by Dreyfus. He is 37 years old and has been an employee of Dreyfus since November 1992.
ROBERT ROBOL, Assistant Treasurer since December 2002.
Senior Accounting Manager – Money Market Funds of Dreyfus, and an officer of 91 investment companies (comprised of 200 portfolios) managed by Dreyfus. He is 41 years old and has been an employee of Dreyfus since October 1988.
ROBERT SVAGNA, Assistant Treasurer since December 2002.
Senior Accounting Manager – Equity Funds of Dreyfus, and an officer of 91 investment companies (comprised of 200 portfolios) managed by Dreyfus. He is 38 years old and has been an employee of Dreyfus since November 1990.
KENNETH J. SANDGREN, Assistant Treasurer since November 2001.
Mutual Funds Tax Director of Dreyfus, and an officer of 91 investment companies (comprised of 200portfolios) managed by Dreyfus. He is 51 years old and has been an employee of Dreyfus since June 1993.
JOSEPH W. CONNOLLY, Chief Compliance Officer since October 2004.
Chief Compliance Officer of the Manager and The Dreyfus Family of Funds (91 investment companies, comprising 200 portfolios). From November 2001 through March 2004, Mr. Connolly was first Vice-President, Mutual Fund Servicing for Mellon Global Securities Services. In that capacity, Mr. Connolly was responsible for managing Mellon’s Custody, Fund Accounting and Fund Administration services to third-party mutual fund clients. He is 48 years old and has served in various capacities with the Manager since 1980, including manager of the firm’s Fund Accounting Department from 1997 through October 2001.
WILLIAM GERMENIS, Anti-Money Laundering Compliance Officer since September 2002.
Vice President and Anti-Money Laundering Compliance Officer of the Distributor, and the Anti-Money Laundering Compliance Officer of 87 investment companies (comprised of 196 portfolios) managed by Dreyfus. He is 35 years old and has been an employee of the Distributor since October 1998.
| The Funds 83 |
For More Information
| Mellon Funds Trust |
| c/o The Dreyfus Corporation 200 Park Avenue New York, NY 10166 |
| Investment Adviser Mellon Fund Advisers, a division of The Dreyfus Corporation 200 Park Avenue New York, NY 10166 |
| Administrator |
| Mellon Bank, N.A. One Mellon Bank Center Pittsburgh, PA 15258 |
| Sub-Administrator |
| The Dreyfus Corporation 200 Park Avenue New York, NY 10166 |
| Custodian |
| Mellon Bank, N.A. One Mellon Bank Center Pittsburgh, PA 15258 |
| Transfer Agent & Dividend Disbursing Agent |
| Dreyfus Transfer, Inc. 200 Park Avenue New York, NY 10166 |
| Distributor Dreyfus Service Corporation 200 Park Avenue New York, NY 10166 |
Telephone Private Wealth Management (PWM) Clients, please contact your Account Officer or call 1-888-281-7350. Brokerage Clients of Mellon Private Wealth Advisors (MPWA), please contact your financial representative or call 1-800-830-0549-Option 2. Individual Account holders, please call Dreyfus at 1-800-896-8167.
Mail PWM Clients, write to your Account Officer, c/o Mellon Bank, N.A., One Mellon Bank Center, Pittsburgh, PA 15258
MPWA Brokerage Clients, write to your financial representative, P.O. Box 9012, Hicksville, NY 11802–9012
Individual Account Holders, write to: Mellon Funds, P.O. Box 55268, Boston, MA 02205–8502
The fund files its complete schedule of portfolio holdings with the Securities and Exchange Commission (“SEC”) for the first and third quarters of each fiscal year on Form N-Q. The funds’ Forms N-Q are available on the SEC’s website at http://www.sec.gov and may be reviewed and copied at the SEC’s Public Reference Room in Washington, DC. Information on the operation of the Public Reference Room may be obtained by calling 1-800-SEC-0330.
Information regarding how the fund voted proxies relating to portfolio securities for the 12-month period ended June 30, 2005, is available on the SEC’s website at http://www.sec.gov and without charge, upon request, by calling 1-800-645-6561.
| ©2005 Dreyfus Service Corporation |
| MFTAR0805-MB |
The Mellon Funds
Mellon Money Market Fund
Mellon National Municipal Money Market Fund
ANNUAL REPORT August 31, 2005
| Contents | ||
| The Funds | ||
| Letter from the President | 2 | |
| Discussion of Funds’ Performance | ||
| Mellon Money Market Fund | 3 | |
| Mellon National Municipal | ||
| Money Market Fund | 5 | |
| Understanding Your Fund’s Expenses | 7 | |
| Comparing Your Fund’s Expenses | ||
| With Those of Other Funds | 7 | |
| Statements of Investments | 8 | |
| Statements of Assets and Liabilities | 15 | |
| Statements of Operations | 16 | |
| Statements of Changes in Net Assets | 17 | |
| Financial Highlights | 18 | |
| Notes to Financial Statements | 22 | |
| Report of Independent Registered | ||
| Public Accounting Firm | 26 | |
| Important Tax Information | 27 | |
| Information About the Review | ||
| and Approval of Each Fund’s | ||
| Investment Advisory Agreement | 28 | |
| Board Members Information | 31 | |
| Officers of the Fund | 33 | |
For More Information
| Back cover |
The views expressed herein are current to the date of this report. These views and the composition of the funds’ portfolios are subject to change at any time based on market and other conditions.
- Not FDIC-Insured
- Not Bank-Guaranteed
- May Lose Value
The Funds

This annual report for The Mellon Funds covers the period from September 1, 2004, through August 31, 2005. Inside, you’ll find valuable information about how the funds were managed during the reporting period, including discussions with each fund’s portfolio manager.
On average, U.S. stock prices ended the reporting period higher than where they began. However, most of the equity markets’ gains occurred during the closing months of 2004. So far in 2005, positive factors, including steady economic growth and higher corporate profits, were largely offset by headwinds, such as sharply higher energy prices and rising short-term interest rates.Against the same backdrop and, contrary to historical norms, bonds generally rallied as inflation appeared to remain low and demand for U.S. fixed-income securities was robust, particularly from overseas investors. In global markets, international stocks generally rose more than U.S. stocks over the past year, with gains achieved in the industrialized markets of Europe and Asia, as well as many of the emerging markets.
Recent shocks to the U.S. economy — including sharply higher gasoline prices and other consequences of Hurricane Katrina — have added a degree of uncertainty to the outlook for stocks and bonds. However, our economists currently believe that the economy should continue to grow without either entering a recession or triggering a significant acceleration of inflation.As always, we encourage you to discuss the potential implications of these and other matters with your portfolio manager.


| DISCUSSION OF |
| FUND PERFORMANCE |
| J. Christopher Nicholl, Portfolio Manager |
| How did Mellon Money Market Fund perform |
| during the period? |
For the 12-month period ended August 31, 2005, the fund produced yields of 2.27% for its Class M shares and 2.03% for its Investor shares.Taking into account the effects of compounding, the fund also produced effective yields of 2.30% and 2.05% for its Class M shares and Investor shares, respectively. 1
Yields of money market securities rose steadily over the reporting period, primarily in response to higher short-term interest rates from the Federal Reserve Board (the “Fed”).
What is the fund’s investment approach?
The fund seeks as high a level of current income as is consistent with the preservation of capital and the maintenance of liquidity. To pursue its goal, the fund invests in a diversified portfolio of high-quality, short-term debt securities, including U.S. government securities; certificates of deposit, time deposits, bankers’ acceptances and other short-term domestic or foreign bank obligations; repurchase agreements; asset-backed securities; high-grade commercial paper and other short-term corporate obligations; and taxable municipal obligations. Normally, the fund invests at least 25% of its net assets in bank obligations.
What other factors influenced the fund’s performance?
The fund’s performance was mainly influenced by the Fed’s ongoing efforts to move away from its accommodative monetary policy of the past several years. The Fed raised short-term interest rates by 25 basis points at each of eight meetings of its Federal Open Market Committee (FOMC) during the reporting period, driving the overnight federal funds rate from 1.5% at the start of the reporting period to 3.5% by the reporting period’s end.
The Fed’s credit tightening campaign occurred in an environment of moderate economic growth. Despite occasional concerns among analysts that the economy might be growing too robustly, potentially igniting inflationary pressures, or too weakly, increasing the risk of recession, U.S. gross domestic product continued to expand steadily throughout the reporting period. More specifically, U.S. GDP rose at annualized rates of 3.1% in the fourth quarter of 2004, 3.5% during the first quarter of 2005 and 3.3% for the second quarter of 2005. Inflation remained at relatively low levels, as discounts from automobile manufacturers and apparel retailers offset soaring energy prices during the spring and summer of 2005.
Unlike some previous cycles of rising interest rates, this time the Fed’s policy intentions were made clear to investors by Chairman Alan Greenspan and other Fed governors, which helped the market respond to rate hikes in an orderly fashion. The Fed’s “transparency” helped keep market volatility unusually low while yields rose gradually and steadily among money market securities with maturities between one day and one year. Indeed, yields of longer-term fixed-income securities ended the reporting period little changed from where they began, a situation that Fed Chairman Greenspan called “a conundrum.”
For much of the reporting period, we maintained the fund’s weighted average maturity in a range we considered modestly shorter than industry averages.This positioning was designed to maintain the liquidity the fund needed to capture higher yields as interest rates rose.At times, however, when yield differences between short-and longer-term money market instruments widened due to shifts in economic expectations and investor sentiment, we extended the fund’s weighted average maturity temporarily to participate in the higher yields offered by securities in the two- to six-month range.
We adjusted this strategy during the final months of the reporting period, when we believed longer-term yields
| The Funds 3 |
DISCUSSION OF FUND PERFORMANCE (continued)
became more attractive and the risks between the Fed continuing to tighten and the Fed pausing to assess economic growth became a bit more balanced. Accordingly, we extended the fund’s weighted average maturity toward a range that was in line with to slightly longer than industry averages, including occasional purchases of money market instruments with one-year maturities.
Over the course of the reporting period, we generally increased the fund’s holdings of bank certificates of deposit and decreased its exposure to commercial paper. We continue to find the taxable municipals attractive, and have sought to increase our exposure to that sector.
What is the fund’s current strategy?
Although we expect the Fed to continue to raise short-term interest rates at upcoming FOMC meetings, we believe that the effects of Hurricane Katrina, in tandem
with the Fed’s previous rate hikes, have made it far more difficult to plot the Fed’s likely path. If these factors have constrained the rate of economic growth and inflation remains benign, the Fed may have relatively few rate-hikes left in store. On the other hand, rising inflationary pressures and robust economic growth could lead to more interest-rate increases than most analysts currently anticipate. Consequently, we have continued to maintain the fund’s weighted average maturity in the neutral range.
| September 15, 2005 |
An investment in the fund is not insured or guaranteed by the FDIC or any other government agency. Although the fund seeks to preserve the value of your investment at $1.00 per share, it is possible to lose money by investing in the fund.
1 Effective yield is based upon dividends declared daily and reinvested monthly. Past performance is no guarantee of future results.Yields fluctuate.
| 4 |

| DISCUSSION OF |
| FUND PERFORMANCE |
J. Christopher Nicholl, Portfolio Manager
How did Mellon National Municipal Money Market Fund perform during the period?
For the 12-month period ended August 31, 2005, the fund produced yields of 1.67% for its Class M shares and 1.42% for its Investor shares.Taking into account the effects of compounding, the fund also produced effective yields of 1.68% and 1.43% for its Class M shares and Investor shares, respectively. 1
Yields of tax-exempt money market securities rose steadily over the reporting period, primarily in response to higher short-term interest rates from the Federal Reserve Board (the “Fed”).
What is the fund’s investment approach?
The fund seeks as high a level of current income exempt from federal income tax as is consistent with the preservation of capital and maintenance of liquidity.To pursue its goal, the fund invests at least 80% of its assets in short-term municipal obligations that provide income exempt from federal income tax. Among these are municipal notes, short-term municipal bonds, tax-exempt commercial paper and municipal leases.The fund may invest up to 20% of its total assets in taxable money market securities, such as U.S. government obligations, bank and corporate obligations and commercial paper.
What other factors influenced the fund’s performance?
The fund’s performance was mainly influenced by the Fed’s ongoing efforts to move away from its accommodative monetary policy of the past several years. The Fed raised short-term interest rates by 25 basis points at each of eight meetings of its Federal Open Market Committee (FOMC) during the reporting period, driving the overnight federal funds rate from 1.5% at the start of the reporting period to 3.5% by the reporting period’s end. Unlike some previous cycles of rising interest rates, this time the Fed’s policy
intentions were made clear to investors by Chairman Alan Greenspan and other Fed governors, which helped keep market volatility relatively low.
The Fed’s credit tightening campaign occurred in an environment of moderate economic growth. Despite occasional concerns among analysts that the economy might be growing too robustly, potentially igniting inflationary pressures, or too weakly, increasing the risk of recession, U.S. gross domestic product continued to expand steadily throughout the reporting period. More specifically, U.S. GDP rose at annualized rates of 3.1% in the fourth quarter of 2004, 3.5% during the first quarter of 2005 and 3.3% for the second quarter of 2005. Inflation remained at relatively low levels, as discounts from automobile manufacturers and apparel retailers offset soaring energy prices during the spring and summer of 2005.
Better economic conditions helped improve the fiscal conditions of many states and municipalities. As a result, issuers had less need to borrow to cover budget shortfalls, and the supply of newly issued tax-exempt money market instruments fell compared to the same period one year earlier. Moderating supply amid robust investor demand, including participation of non-traditional investors such as hedge funds and insurance companies, generally put downward pressure on tax-exempt money market yields.
For much of the reporting period, we maintained the fund’s weighted average maturity in a range we considered very short.This positioning was designed to maintain the liquidity the fund needed to capture higher yields quickly as interest rates rose. However, most other money market funds adopted a similar strategy, so the fund’s weighted average maturity generally remained in line with industry averages. In fact, the industry’s weighted average maturity in May 2005 fell to the shortest point on record.At times,when yield differences between short- and longer-term money market instruments widened due to investor sentiment and technical
| The Funds 5 |
DISCUSSION OF FUND PERFORMANCE (continued)
factors, we extended the fund’s weighted average maturity temporarily to participate in the higher yields offered by securities in the two- to six-month range.
We adjusted this strategy during the final months of the reporting period, when we believed longer-term yields became more attractive and the risks between the Fed continuing to tighten and the Fed pausing to assess economic growth became a bit more balanced. Accordingly, we extended the fund’s weighted average maturity modestly, including occasional purchases of municipal money market instruments with maturities of six months. As part of this strategy, we increased the fund’s holdings of tax-exempt commercial paper and reduced its exposure to variable-rate demand notes on which yields are reset daily or weekly.
What is the fund’s current strategy?
Although we expect the Fed to continue to raise short-term interest rates at upcoming FOMC meetings, we
believe that the effects of Hurricane Katrina, in tandem with the Fed’s previous rate hikes, have made it far more difficult to plot the Fed’s likely path. If these factors have constrained the rate of economic growth and inflation remains benign,the Fed may have relatively few rate-hikes left in store. On the other hand, rising inflationary pressures and robust economic growth could lead to more interest-rate increases than most analysts currently anticipate. Consequently, we have continued to maintain the fund’s weighted average maturity in the neutral range.
| September 15, 2005 |
An investment in the fund is not insured or guaranteed by the FDIC or any other government agency. Although the fund seeks to preserve the value of your investment at $1.00 per share, it is possible to lose money by investing in the fund.
1 Effective yield is based upon dividends declared daily and reinvested monthly. Past performance is no guarantee of future results.Yields fluctuate. Income may be subject to state and local taxes, and some income may be subject to the federal alternative minimum tax (AMT) for certain investors.
| 6 |
UNDERSTANDING YOUR FUND’S EXPENSES (Unaudited)
As a mutual fund investor, you pay ongoing expenses, such as management fees and other expenses. Using the information below, you can estimate how these expenses affect your investment and compare them with the expenses of the funds.You also may pay one-time transaction expenses, including sales charges (loads) and redemption fees, which are not shown in this section and would have resulted in higher total expenses. For more information, see your fund’s prospectus or talk to your financial advisor.
Review your fund’s expenses
The table below shows the expenses you would have paid on a $1,000 investment in each class of each fund from March 1, 2005 to August 31, 2005. It also shows how much a $1,000 investment would be worth at the close of the period, assuming actual returns and expenses.
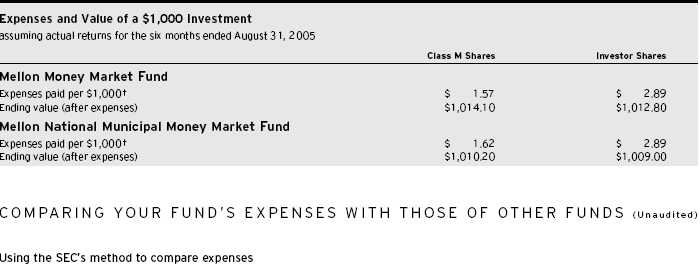
The Securities and Exchange Commission (SEC) has established guidelines to help investors assess fund expenses. Per these guidelines, the table below shows your fund’s expenses based on a $1,000 investment, assuming a hypothetical 5% annualized return.You can use this information to compare the ongoing expenses (but not transaction expenses or total costs) of investing in the fund with those of other funds. All mutual fund shareholder reports will provide this information to help you make this comparison. Please note that you cannot use this information to estimate your actual ending account balance and expenses paid during the period.
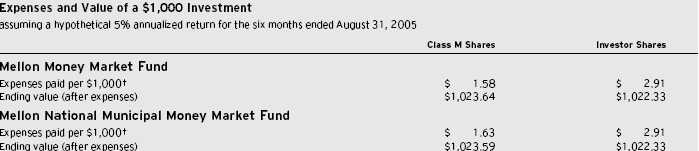
† Expenses are equal to the Mellon Money Market Fund annualized expense ratio of .31% for Class M and .57% for Investor Class and Mellon National Municipal Money Market Fund, .32% for Class M and .57% for Investor Class, multiplied by the average account value over the period, multiplied by 184/365 (to reflect the one-half year period).
| The Funds 7 |
| STATEMENT OF INVESTMENTS | ||||||||||
| August 31, 2005 | ||||||||||
| Mellon Money Market Fund | ||||||||||
| Principal | Principal | |||||||||
| Bond Anticipation Notes—1.4% | Amount ($) | Value ($) | Commercial Paper (continued) | Amount ($) | Value ($) | |||||
| Camden County Improvement | DEPFA Bank PLC, Discount Notes | |||||||||
| Authority 4.22%, 8/3/2006 | 3.55%, 9/26/2005 | 30,000,000 a | 29,926,250 | |||||||
| (cost $9,300,000) | 9,300,000 | 9,300,000 | General Electic Capital Corp., | |||||||
| Discount Notes | ||||||||||
| Negotiable Bank | 3.52%, 9/2/2005 | 33,000,000 | 32,996,773 | |||||||
| Certificates of Deposit—22.1% | Lloyds TSB Bank PLC, | |||||||||
| Barclays Bank PLC NY (Yankee) | Discount Notes | |||||||||
| 3.70%, 11/8/2005 | 15,000,000 | 15,000,000 | 3.38%, 10/19/2005 | 20,000,000 | 19,998,756 | |||||
| BNP Paribas NY (Yankee) | Michigan State, General Obligation | |||||||||
| 3.77%-3.80%, | 3.60%, 10/4/2005 | 19,030,000 | 19,030,000 | |||||||
| 11/23/2005-12/28/2005 | 30,000,000 | 29,998,654 | Oakland-Alameda County | |||||||
| Credit Suisse First | Coliseum Authority | |||||||||
| Boston (Yankee) | 3.68%, 10/7/2005 | 15,200,000 | 15,200,000 | |||||||
| 3.27%, 9/2/2005 | 30,000,000 | 30,000,008 | Prudential Funding LLC | |||||||
| Rabobank Nederland (Yankee) | 3.46%, 9/1/2005 | 30,000,000 | 30,000,000 | |||||||
| 3.58%, 12/28/2005 | 15,000,000 | 14,998,065 | Rabobank USA Finance Corp., | |||||||
| Toronto Dominion Bank | Discount Notes | |||||||||
| NY (Yankee) | 3.53%, 9/23/2005 | 15,000,000 | 14,967,733 | |||||||
| 3.50%, 12/29/2005 | 30,000,000 | 30,000,921 | Salvation Army | |||||||
| Wells Fargo Bank N.A. | 3.47%-3.95%, | |||||||||
| 3.50%, 9/20/2005 | 30,000,000 | 29,999,979 | 10/31/2005-12/13/2005 | 27,145,000 | 27,145,000 | |||||
| Total Negotiable | Texas State Public Finance | |||||||||
| Bank Certificates of Deposit | Authority, Discount Notes | |||||||||
| (cost $149,997,627) | 149,997,627 | 3.63%, 10/11/2005 | 29,500,000 | 29,498,876 | ||||||
| Transmission Authority of | ||||||||||
| Commercial Paper—52.4% | Northern California | |||||||||
| 3.75%, 12/1/2005 | 3,725,000 | 3,725,000 | ||||||||
| AIG Funding Inc., Discount Notes | UBS Finance Delaware LLC, | |||||||||
| 3.38%, 9/8/2005 | 34,000,000 | 33,977,787 | Discount Notes | |||||||
| Alaska Housing Finance Corp., | 3.59%, 10/3/2005 | 30,000,000 | 29,904,800 | |||||||
| Discount Notes | ||||||||||
| 3.47%-3.60%, | Total Commercial Paper | |||||||||
| 9/7/2005-10/4/2005 | 30,100,000 | 30,041,822 | (cost $356,343,836) | 356,343,836 | ||||||
| American Express Co., | ||||||||||
| Discount Notes | Mandatory Demand Note—1.0% | |||||||||
| 3.52%, 9/22/2005 | 30,000,000 | 29,938,750 | Grand Prairie Texas Sports Facility | |||||||
| ChevronTexaco Corp., | Development Corp., Inc. | |||||||||
| Discount Notes | 2.53%, 9/15/2005 | |||||||||
| 3.48%, 9/9/2005 | 10,000,000 | 9,992,289 | (cost $6,535,000) | 6,535,000 | 6,535,000 | |||||
| 8 |
| Mellon Money Market Fund (continued) | ||||||||||
| Variable Rate | Principal | Principal | ||||||||
| Demand Notes—18.5% | Amount ($) | Value ($) | Amount ($) | Value ($) | ||||||
| Bochasanwasi Shree | Tulsa Oklahoma Airport | |||||||||
| Akshar Purushottam | Improvement Trust | |||||||||
| Swaminaryan Sanstha | 3.61%, 9/7/2005 | 17,150,000 b | 17,150,000 | |||||||
| 3.80%, 9/7/2005 | 6,100,000 b | 6,100,000 | Washington State Housing | |||||||
| Cleveland Ohio Airport Systems | Finance Commission | |||||||||
| 3.60%, 9/7/2005 | 15,200,000 b | 15,200,000 | 3.58%-3.65%, | |||||||
| Cuyahoga County | 9/1/2005 | 9,985,000 b | 9,985,000 | |||||||
| 3.62%, 9/7/2005 | 1,500,000 b | 1,500,000 | Total Variable Rate | |||||||
| Eskaton Lodge Granite | Demand Notes | |||||||||
| 3.61%, 9/1/2005 | 7,000,000 b | 7,000,000 | (cost $125,415,000) | 125,415,000 | ||||||
| General Secretariate OAS | ||||||||||
| 3.50%, 9/7/2005 | 4,370,000 b | 4,370,000 | Repurchase Agreement—4.7% | |||||||
| Mullenix-St. Charles | JPMorgan Securities, | |||||||||
| 3.65%, 9/7/2005 | 7,000,000 b | 7,000,000 | 3.48%, dated 8/31/2005, | |||||||
| New Jersey Economic | due 9/1/2005 in the amount | |||||||||
| Development Authority | of $32,003,093 (fully collateralized | |||||||||
| 3.51%, 9/7/2005-9/30/2005 | 19,400,000 b | 19,400,000 | by $32,317,000 U.S. Treasury | |||||||
| New York State | Notes, 4.125%, due 8/15/2008, | |||||||||
| Dormitory Authority | value $32,640,170) | |||||||||
| 3.64%, 9/7/2005 | 10,300,000 b | 10,300,000 | (cost $32,000,000) | 32,000,000 | 32,000,000 | |||||
| New York State Housing | ||||||||||
| Finance Agency | Total Investments | |||||||||
| 3.56%, 9/7/2005 | 8,000,000 b | 8,000,000 | (cost $679,591,463) | 100.1% | 679,591,463 | |||||
| Pitney Road Partners | Liabilities, Less Cash | |||||||||
| 3.61%, 9/7/2005 | 5,010,000 b | 5,010,000 | and Receivables | (.1%) | (382,066) | |||||
| Sacramento County | Net Assets | 100.0% | 679,209,397 | |||||||
| 3.55%, 9/7/2005 | 14,400,000 b | 14,400,000 | ||||||||
a Securities exempt from registration under Rule 144A of the Securities Act of 1933.These securities may be resold in transactions exempt from registration, normally to qualified institutional buyers. At August 31, 2005, these securities amounted to $29,926,250 or 4.4% of net assets.
b Variable interest rate—subject to periodic change.
| Portfolio Summary | (Unaudited) † | |||||||
| Value (%) | Value (%) | |||||||
| Banking | 36.0 | Brokerage | 4.7 | |||||
| Insurance | 9.4 | Financial Services | 4.4 | |||||
| Housing | 8.1 | Other | 27.0 | |||||
| Industrial Revenue | 5.6 | |||||||
| Finance | 4.9 | 100.1 | ||||||
| † Based on net assets. | ||||||||
| See notes to financial statements. | ||||||||
| The Funds 9 |
| STATEMENT OF INVESTMENTS | ||||||||||||||
| August 31, 2005 | ||||||||||||||
| Mellon National Municipal Money Market Fund | ||||||||||||||
| Tax Exempt | Principal | Principal | ||||||||||||
| Investments—99.7% | Amount ($) | Value ($) | Amount ($) | Value ($) | ||||||||||
| Alabama—4.8% | Colorado (continued) | |||||||||||||
| Birmingham-Carraway Special Care | Colorado Health Facilities Authority, | |||||||||||||
| Facilities Financing Authority, | Health Care Facilities Revenue | |||||||||||||
| Health Care Facilities Revenue | (Exempla Inc.) 2.40% | |||||||||||||
| (Carraway Methodist Hospitals) | (LOC; U.S. Bank NA) | 9,755,000 | a | 9,755,000 | ||||||||||
| 2.36% (LOC; Amsouth Bank) | 15,000,000 | a | 15,000,000 | Dove Valley Metropolitan District, | ||||||||||
| Daphne-Villa Mercy Special Care | GO Notes 1.95%, 11/1/2005 | |||||||||||||
| Facilities Financing Authority, | (LOC; BNP Paribas) | 3,590,000 | 3,590,000 | |||||||||||
| Health Care Facilities Revenue | Pinery West Metropolitan District | |||||||||||||
| (Mercy Medical Project) | Number 2, GO Notes 1.95%, | |||||||||||||
| 2.34% (LOC; Amsouth Bank) | 4,200,000 | a | 4,200,000 | 11/1/2005 (LOC; U.S. Bank NA) | 7,015,000 | 7,015,000 | ||||||||
| Port City Medical Clinic Board, | Westminster Economic Development | |||||||||||||
| Health Care Facilities Revenue | Authority, Tax Increment Revenue | |||||||||||||
| (Infirmary Health Systems): | (North Huron Urban Renewal) | |||||||||||||
| 2.48% (Insured; AMBAC and | 2.52% (LOC; DEPFA Bank PLC) | 22,650,000 | a | 22,650,000 | ||||||||||
| Liquidity Facility: Bank of | Connecticut—1.2% | |||||||||||||
| Nova Scotia and KBC Bank) | 200,000 | a | 200,000 | |||||||||||
| 2.51% (Insured; AMBAC and | Connecticut Health and Educational | |||||||||||||
| Liquidity Facility: Bank of | Facility Authority, College and | |||||||||||||
| Nova Scotia and KBC Bank) | 10,000,000 | a | 10,000,000 | University Revenue | ||||||||||
| (Yale University) 2.25% | 7,250,000 | a | 7,250,000 | |||||||||||
| Arizona—.6% | ||||||||||||||
| Florida—2.4% | ||||||||||||||
| Maricopa County Industrial | ||||||||||||||
| Development Authority, | Broward County Housing Finance | |||||||||||||
| MFHR (Gran Victoria Housing | Authority MFHR, Refunding | |||||||||||||
| LLC Project) 2.49% | (Waters Edge Project) | |||||||||||||
| (Insured; FNMA) | 4,000,000 | a | 4,000,000 | 2.50% (Insured; FNMA) | 6,740,000 | a | 6,740,000 | |||||||
| Arkansas—.7% | Sunshine State Governmental | |||||||||||||
| Financing Commission, | ||||||||||||||
| Arkansas Development Finance | Revenue 2.36% (Insured; | |||||||||||||
| Authority, Revenue (Higher | AMBAC and Liquidity Facility; | |||||||||||||
| Education Capital Asset | Dexia Credit Locale) | 8,000,000 | a | 8,000,000 | ||||||||||
| Program) 2.53% (Insured; FGIC | ||||||||||||||
| and Liquidity Facility; Citibank) | 4,500,000 | a | 4,500,000 | Georgia—7.9% | ||||||||||
| California—1.8% | Burke County Development Authority, | |||||||||||||
| PCR (Oglethorpe Power Corp.) | ||||||||||||||
| Los Angeles Community | 2.35% (Insured; FGIC and Liquidity | |||||||||||||
| Facility; Bayerische Landesbank) | 12,595,000 | |||||||||||||
| Redevelopment Agency, | a | 12,595,000 | ||||||||||||
| COP (Baldwin Hills Public Park) | ||||||||||||||
| 2.25% (LOC; Wells Fargo Bank) | 7,000,000 | a | 7,000,000 | Clayton County Housing Authority, | ||||||||||
| MFHR, Refunding (Chateau | ||||||||||||||
| Ventura County Public Finance | Forest Apartments) 2.44% | |||||||||||||
| Authority, LR, CP 2.50%, | (Insured; FSA and Liquidity | |||||||||||||
| Facility; Societe Generale) | 6,530,000 | |||||||||||||
| 9/8/2005 (LOC; Scotiabank) | 4,200,000 | 4,200,000 | a | 6,530,000 | ||||||||||
| Colorado—8.0% | Conyers-Rockdale-Big Haynes | |||||||||||||
| Castlewood Ranch Metropolitan | Impoundment Authority, | |||||||||||||
| District, GO Notes 2.30%, | Revenue 2.37% (Insured; FSA and | |||||||||||||
| 12/1/2005 (LOC; U.S. Bank NA) | 6,050,000 | 6,050,000 | Liquidity Facility; Wachovia Bank) | 7,200,000 | a | 7,200,000 | ||||||||
| 10 |
| Mellon National Municipal Money Market Fund (continued) | ||||||||||||||
| Tax Exempt | Principal | Principal | ||||||||||||
| Investments (continued) | Amount ($) | Value ($) | Amount ($) | Value ($) | ||||||||||
| Georgia (continued) | Illinois (continued) | |||||||||||||
| Marietta Housing Authority, | Illinois Health Facilities | |||||||||||||
| MFHR, Refunding | Authority, Revenue (continued): | |||||||||||||
| (Summit) 2.50% (Insured; FNMA) | 4,900,000 | a | 4,900,000 | (Ingalls Memorial Hospital) | ||||||||||
| Municipal Electric Authority of | 2.35% (LOC; | |||||||||||||
| Georgia, CP 2.50%, 9/9/2005 | Northern Trust Co.) | 14,800,000 | a | 14,800,000 | ||||||||||
| (LOC; Westdeutsche Landesbank, | (Revolving Fund Pooled Program) | |||||||||||||
| Bayerische Landesbank | 2.38% (LOC; Bank One) | 5,800,000 | a | 5,800,000 | ||||||||||
| and Wachovia Bank) | 17,227,000 | 17,227,000 | (Rush Presbyterian Saint Luke’s | |||||||||||
| Hawaii—4.3% | Medical Center) 2.37% | |||||||||||||
| (LOC; Northern Trust Co.) | 3,000,000 | a | 3,000,000 | |||||||||||
| Honolulu City and County, | (Swedish Covenant Hospital) | |||||||||||||
| Revenue, CP 2.65%, 12/8/2005 | 2.34% (Insured; AMBAC | |||||||||||||
| (LOC; Landesbank Hessen- | and Liquidity Facility | |||||||||||||
| Thuringen Girozentrale) | 26,400,000 | 26,400,000 | Northern Trust Co.) | 4,900,000 | a | 4,900,000 | ||||||||
| Idaho—1.0% | Regional Transportation | |||||||||||||
| Idaho Health Facilities Authority, | Authority, Sales Tax Revenue, | |||||||||||||
| Health Care Facilities Revenue | Refunding 2.37% (Liquidity | |||||||||||||
| (Aces-Pooled Financing Program) | Facility; DEPFA Bank PLC) | 27,500,000 | a | 27,500,000 | ||||||||||
| 2.58% (LOC; U.S. Bank NA) | 6,000,000 | a | 6,000,000 | Indiana—.2% | ||||||||||
| Illinois—16.7% | Indiana Educational Facilities Authority, | |||||||||||||
| Chicago, GO Notes: | College and University Revenue | |||||||||||||
| 2.20%, 12/8/2005 (LOC; State | (Depauw University Project) 2.32% | |||||||||||||
| Street Bank and Trust Co.) | 11,500,000 | 11,500,000 | (LOC; Northern Trust Co.) | 1,400,000 | a | 1,400,000 | ||||||||
| 2.30%, 12/8/2005 (LOC; | Kansas—1.5% | |||||||||||||
| Bank of America) | 2,700,000 | 2,700,000 | Olathe, Health Care Facilities Revenue | |||||||||||
| Illinois Development Finance Authority: | 2.32% (Insured; AMBAC and | |||||||||||||
| Health Care Facilities Revenue | Liquidity Facility; Bank of America) | 9,000,000 | a | 9,000,000 | ||||||||||
| (Provena Health) 2.34% (Insured; | Kentucky—1.7% | |||||||||||||
| MBIA and Liquidity Facility; | ||||||||||||||
| JPMorgan Chase Bank) | 5,000,000 | a | 5,000,000 | Breckinridge County, LR (Kentucky | ||||||||||
| MFHR, Refunding (Orleans-Illinois | Association Counties Leasing Trust) | |||||||||||||
| Project) 2.50% (Insured; FSA | 2.35% (LOC U.S. Bank NA) | 4,600,000 | a | 4,600,000 | ||||||||||
| and Liquidity Facility; | Kentucky Economic Development | |||||||||||||
| The Bank of New York) | 12,000,000 | a | 12,000,000 | Finance Authority, Hospital | ||||||||||
| Illinois Educational Facilities | Facilities Revenue (Baptist | |||||||||||||
| Authority, College and University | Healthcare System) 2.33% | |||||||||||||
| Revenue (Columbia College) | (Insured; MBIA and Liquidity | |||||||||||||
| 2.36% (LOC; Bank of Montreal) | 9,705,000 | a | 9,705,000 | Facility; National City Bank) | 6,000,000 | a | 6,000,000 | |||||||
| Illinois Health Facilities | Louisiana—.9% | |||||||||||||
| Authority, Revenue: | Plaquemines Port Harbor and | |||||||||||||
| (Decatur Memorial Hospital | Terminal District, Port Facilities | |||||||||||||
| Project) 2.34% (Insured; MBIA | Revenue (International Marine | |||||||||||||
| and Liquidity Facility; | Term Project) 2.60%, | |||||||||||||
| Northern Trust Co.) | 5,400,000 | a | 5,400,000 | 3/15/2006 (LOC; KBC Bank) | 5,750,000 | 5,750,000 | ||||||||
| The Funds 11 |
| STATEMENT OF INVESTMENTS (continued) |
| Mellon National Municipal Money Market Fund (continued) | ||||||||||||
| Tax Exempt | Principal | Principal | ||||||||||
| Investments (continued) | Amount ($) | Value ($) | Amount ($) | Value ($) | ||||||||
| Maine—.8% | Minnesota—.7% | |||||||||||
| Finance Authority of Maine, Private | Saint Paul Housing Redevelopement | |||||||||||
| Schools Revenue (Foxcroft Academy) | Authority, Revenue (Minnesota | |||||||||||
| 2.52% (LOC; Allied Irish Bank) | 4,800,000 a | 4,800,000 | Public Radio Project) 2.32% | |||||||||
| Massachusetts—6.3% | (LOC; Allied Irish Bank PLC) | 4,000,000 | a | 4,000,000 | ||||||||
| Massachusetts, GO Notes (Central | Mississippi—1.2% | |||||||||||
| Artery) 2.33% (Liquidity Facility | Jackson County, Port Facility Revenue | |||||||||||
| Landesbank Baden-Wuerttemburg) | 3,400,000 a | 3,400,000 | (Chevron USA. Inc. Project) 2.38% | 7,300,000 | a | 7,300,000 | ||||||
| Massachusetts Health and | Nebraska—2.3% | |||||||||||
| Educational Facilities Authority: | Lancaster County Hospital Authority, | |||||||||||
| College and University Revenue | Health Care Facilities Revenue | |||||||||||
| (Massachusetts Institute | (Immanuel Health System) | |||||||||||
| of Technology) 2.36% | 2,700,000 a | 2,700,000 | 2.34% (LOC; ABN-AMRO) | 14,115,000 | a | 14,115,000 | ||||||
| Revenue | New Hampshire—1.2% | |||||||||||
| (Capital Asset Program): | ||||||||||||
| 2.32% (Insured; MBIA and | New Hampshire Business Finance | |||||||||||
| Liquidity Facility; State | Authority, RRR, Refunding | |||||||||||
| Street Bank and Trust Co.) | 2,500,000 a | 2,500,000 | (Wheelabrator Concord) | |||||||||
| 2.43% (LOC; | 2.38% (LOC; Wachovia Bank) | 7,600,000 | a | 7,600,000 | ||||||||
| Bank of America) | 10,050,000 a | 10,050,000 | New Jersey—1.6% | |||||||||
| 2.43% (LOC; | New Jersey, TRAN | |||||||||||
| Bank of Scotland) | 14,300,000 a | 14,300,000 | 4%, 6/23/2006 | 10,000,000 | 10,094,691 | |||||||
| Massachusetts Water Resources | New York—1.3% | |||||||||||
| Authority, Water Revenue, | New York State Enviromental | |||||||||||
| Refunding 2.35% (Insured; | Quality, CP 2.55%, 10/17/2005 | |||||||||||
| FGIC and Liquidity Facility; | (LOC: Landesbank Hessen- | |||||||||||
| Dexia Credit Locale) | 5,550,000 a | 5,550,000 | Thuringern Girozentrale | |||||||||
| Michigan—6.5% | and Bayerische Landesbank) | 8,000,000 | 8,000,000 | |||||||||
| Detroit, Sewer Disposal Revenue | Ohio—2.4% | |||||||||||
| 2.55%, 10/5/2005 (Insured; | Cuyahoga County, HR | |||||||||||
| 2.54% (LOC; National City Bank) | 15,000,000 | |||||||||||
| FGIC and Liquidity Facility; FGIC) | 10,000,000 | 10,000,000 | a | 15,000,000 | ||||||||
| Michigan Building Authority, Revenue | Oklahoma—.3% | |||||||||||
| 2.68%, 10/13/2005 (LOC: Bank | ||||||||||||
| of New York and State Street | Tulsa County Industrial Authority, | |||||||||||
| Bank and Trust Co.) | 20,000,000 | 20,000,000 | First Mortage Revenue | |||||||||
| (Montercau in Warren Woods | ||||||||||||
| Michigan Hospital Finance Authority, | Project) 2.33% (LOC; BNP Paribas) | 1,600,000 | a | 1,600,000 | ||||||||
| Health Care Facilities Revenue | ||||||||||||
| (Hospital Equipment Loan Program) | Pennsylvania—4.4% | |||||||||||
| 2.39% (LOC; National City Bank) | 4,700,000 a | 4,700,000 | Lehigh County Industrial Development | |||||||||
| Michigan Municipal Bond Authority, | Authority, PCR (Allegheny Electric | |||||||||||
| Revenue 4%, 8/18/2006 | 5,000,000 | 5,050,433 | Cooperative) 2.60% (LOC; Rabobank) | 300,000 | a | 300,000 | ||||||
| 12 |
| Mellon National Municipal Money Market Fund (continued) | ||||||||||||||
| Tax Exempt | Principal | Principal | ||||||||||||
| Investments (continued) | Amount ($) | Value ($) | Amount ($) | Value ($) | ||||||||||
| Pennsylvania (continued) | Texas (continued) | |||||||||||||
| Luzerne County Convention Center | Northside Independent School | |||||||||||||
| Authority, Hotel Room | District (Permanent School | |||||||||||||
| Rent Tax Revenue 2.49% | Funding Guaranteed) 2.85% | |||||||||||||
| (LOC; Wachovia Bank) | 7,340,000 | a | 7,340,000 | (LOC; DEPFA Bank PLC) | 10,000,000 | a | 10,000,000 | |||||||
| Philadelphia Hospitals and | Port of Port Arthur Texas Navigation | |||||||||||||
| Higher Education Facilities | District of Jefferson County, PCR | |||||||||||||
| Authority, HR | (Texaco Inc. Project) 2.34% | 5,300,000 | a | 5,300,000 | ||||||||||
| (Temple University) | Texas, TRAN 4.50%, 8/31/2006 | 10,000,000 | b | 10,145,200 | ||||||||||
| 2.53% (LOC; PNC Bank) | 3,400,000 | a | 3,400,000 | Washington—4.8% | ||||||||||
| Westmoreland County Industrial | Seattle, Water System Revenue | |||||||||||||
| Development Authority, | 2.22% (LOC; Bayerische | |||||||||||||
| Health System Revenue (Excela | Landesbank) | 10,800,000 | a | 10,800,000 | ||||||||||
| Health Project) 2.49% | ||||||||||||||
| (LOC; Wachovia Bank) | 15,655,000 | a | 15,655,000 | Snohomish County Public Utility | ||||||||||
| District Number 1, Generation | ||||||||||||||
| Tennessee—3.6% | System Revenue, Refunding | |||||||||||||
| Clarksville Public Building | 2.35% (Insured; FSA and Liquidity | |||||||||||||
| Authority, Pooled Financing | Facility; Dexia Credit Locale) | 15,100,000 | a | 15,100,000 | ||||||||||
| Revenue (Tennessee | Washington Public Power Supply | |||||||||||||
| Municipal Bond Fund): | System, Electric Power and | |||||||||||||
| 2.33% (LOC; | Light Revenue, Refunding | |||||||||||||
| Bank of America) | 6,200,000 | a | 6,200,000 | (Nuclear Project Number 1) | ||||||||||
| 2.33% (LOC; | 2.35% (LOC; Bank of America) | 3,600,000 | a | 3,600,000 | ||||||||||
| Bank of America) | 10,000,000 | a | 10,000,000 | |||||||||||
| West Virginia—1.2% | ||||||||||||||
| Montogomery County Public | ||||||||||||||
| Building Authority, Pooled | Marshall County, PCR | |||||||||||||
| Financing Revenue | (Ohio Power Co. Project) | |||||||||||||
| (Tenessee County | 2.33% (LOC; Bank of Scotland) | 7,100,000 | a | 7,100,000 | ||||||||||
| Loan Pool) 2.33% | Wisconsin—1.3% | |||||||||||||
| (LOC; Bank of America) | 5,700,000 | a | 5,700,000 | Wisconsin Health and Educational | ||||||||||
| Texas—6.1% | Facilities Authority, Health Care | |||||||||||||
| Brownsville Utility Authority, CP | Facilities Revenue (University of | |||||||||||||
| 2.64%, 10/4/2005 (LOC; State | Wisconsin Medical Foundation) | |||||||||||||
| Street Bank and Trust Co.) | 9,250,000 | 9,250,000 | 2.34% (LOC; ABN-AMRO) | 7,900,000 | a | 7,900,000 | ||||||||
| Grand Prairie Sports Facilities | Total Investments | |||||||||||||
| Development Corp. Inc., | (cost $611,607,324) | 99.7% | 611,607,324 | |||||||||||
| Sales Tax Revenue, Refunding | ||||||||||||||
| 1.75%, 9/15/2005 (Insured; | Cash and Receivables (Net) | .3% | 1,768,440 | |||||||||||
| FSA and Liquidity Facility; | Net Assets | 100.0% | 613,375,764 | |||||||||||
| Dexia Credit Locale) | 3,000,000 | 3,000,000 | ||||||||||||
| The Funds 13 |
| STATEMENT OF INVESTMENTS (continued) |
| Summary of Abbreviations | ||||||||
| ACA | American Capital Access | IDB | Industrial Development Board | |||||
| AGIC | Asset Guaranty Insurance Company | IDC | Industrial Development Corporation | |||||
| AMBAC | American Municipal Bond Assurance Corporation | IDR | Industrial Development Revenue | |||||
| ARRN | Adjustable Rate Receipt Notes | LOC | Letter of Credit | |||||
| BAN | Bond Anticipation Notes | LOR | Limited Obligation Revenue | |||||
| BIGI | Bond Investors Guaranty Insurance | LR | Lease Revenue | |||||
| BPA | Bond Purchase Agreement | MBIA | Municipal Bond Investors | |||||
| CGIC | Capital Guaranty Insurance Company | Assurance Insurance Corporation | ||||||
| CIC | Continental Insurance Company | MFHR | Multi-Family Housing Revenue | |||||
| CIFG | CDC Ixis Financial Guaranty | MFMR | Multi-Family Mortgage Revenue | |||||
| CMAC | Capital Market Assurance Corporation | PCR | Pollution Control Revenue | |||||
| COP | Certificate of Participation | RAC | Revenue Anticipation Certificates | |||||
| CP | Commercial Paper | RAN | Revenue Anticipation Notes | |||||
| EDR | Economic Development Revenue | RAW | Revenue Anticipation Warrants | |||||
| EIR | Environmental Improvement Revenue | RRR | Resources Recovery Revenue | |||||
| FGIC | Financial Guaranty Insurance Company | SAAN | State Aid Anticipation Notes | |||||
| FHA | Federal Housing Administration | SBPA | Standby Bond Purchase Agreement | |||||
| FHLB | Federal Home Loan Bank | SFHR | Single Family Housing Revenue | |||||
| FHLMC | Federal Home Loan Mortgage Corporation | SFMR | Single Family Mortgage Revenue | |||||
| FNMA | Federal National Mortgage Association | SONYMA | State of New York Mortgage Agency | |||||
| FSA | Financial Security Assurance | SWDR | Solid Waste Disposal Revenue | |||||
| GAN | Grant Anticipation Notes | TAN | Tax Anticipation Notes | |||||
| GIC | Guaranteed Investment Contract | TAW | Tax Anticipation Warrants | |||||
| GNMA | Government National Mortgage Association | TRAN | Tax and Revenue Anticipation Notes | |||||
| GO | General Obligation | XLCA | XL Capital Assurance | |||||
| HR | Hospital Revenue | |||||||
| Summary of Combined Ratings (Unaudited) | ||||||||
| Fitch | or Moody’s or | Standard & Poor’s | Value (%) | |||||
| F1+, F1 | VMIG1, MIG1, P1 | SP1+, SP1, A1+, A1 | 94.6 | |||||
| AAA, AA, A c | Aaa, Aa, A c | AAA, AA, A c | 5.4 | |||||
| 100.0 | ||||||||
| † Based on total investments. | ||||||||
| a Securities payable on demand.Variable interest rate—subject to periodic change. | ||||||||
| b Purchased on a delayed delivery basis. | ||||||||
| c Notes which are not F, MIG and SP rated are represented by bond ratings of the issuers. | ||||||||
| See notes to financial statements. | ||||||||
| 14 |
| STATEMENTS OF ASSETS AND LIABILITIES | ||||||
| August 31, 2005 | ||||||
| Mellon | Mellon | |||||
| Money Market | National Municipal | |||||
| Fund | Money Market Fund | |||||
| Assets ($): | ||||||
| Investments in securities—See Statement of Investments† | 679,591,463 | 611,607,324 | ||||
| Cash | — | 10,572,992 | ||||
| Interest receivable | 1,739,820 | 1,555,458 | ||||
| Prepaid expenses | 12,100 | 12,474 | ||||
| 681,343,383 | 623,748,248 | |||||
| Liabilities ($): | ||||||
| Due to The Dreyfus Corporation and affiliates—Note 4(b) | 95,621 | 92,787 | ||||
| Due to Administrator—Note 4(a) | 75,919 | 70,309 | ||||
| Cash overdraft due to Custodian | 1,887,798 | — | ||||
| Payable for investment securities purchased | — | 10,145,200 | ||||
| Interest payable—Note 3 | — | 11,012 | ||||
| Accrued expenses | 74,648 | 53,176 | ||||
| 2,133,986 | 10,372,484 | |||||
| Net Assets ($) | 679,209,397 | 613,375,764 | ||||
| Composition of Net Assets ($): | ||||||
| Paid-in capital | 679,209,993 | 613,374,476 | ||||
| Accumulated undistributed investment income—net | — | 1,288 | ||||
| Accumulated net realized gain (loss) on investments | (596) | — | ||||
| Net Assets ($) | 679,209,397 | 613,375,764 | ||||
| Net Asset Value Per Share | ||||||
| Class M Shares | ||||||
| Net Assets ($) | 678,569,481 | 613,374,745 | ||||
| Shares Outstanding | 678,570,077 | 613,374,371 | ||||
| Net Asset Value Per Share ($) | 1.00 | 1.00 | ||||
| Investor Shares | ||||||
| Net Assets ($) | 639,916 | 1,019 | ||||
| Shares Outstanding | 639,916 | 1,019 | ||||
| Net Asset Value Per Share ($) | 1.00 | 1.00 | ||||
| † Investments at cost ($) | 679,591,463 | 611,607,324 | ||||
| See notes to financial statements. |
| The Funds 15 |
| STATEMENTS OF OPERATIONS | ||||||
| Year Ended August 31, 2005 | ||||||
| Mellon | Mellon | |||||
| Money Market | National Municipal | |||||
| Fund | Money Market Fund | |||||
| Investment Income ($): | ||||||
| Interest Income | 15,423,770 | 11,544,991 | ||||
| Expenses: | ||||||
| Investment advisory fee—Note 4(a) | 863,928 | 864,074 | ||||
| Administration fee—Note 4(a) | 776,268 | 776,922 | ||||
| Registration fees | 52,684 | 43,027 | ||||
| Custodian fees—Note 4(b) | 46,436 | 46,061 | ||||
| Trustees’ fees and expenses—Note 4(c) | 21,398 | 23,348 | ||||
| Professional fees | 20,966 | 33,368 | ||||
| Prospectus and shareholders’ reports | 12,475 | 3,462 | ||||
| Interest expense—Note 3 | — | 47,989 | ||||
| Shareholder servicing costs—Note 4(b) | 896 | 995 | ||||
| Miscellaneous | 11,041 | 16,919 | ||||
| Total Expenses | 1,806,092 | 1,856,165 | ||||
| Less—expense reduction in custody fees | ||||||
| due to earnings credits—Note 2(b) | — | (3,963) | ||||
| Net Expenses | 1,806,092 | 1,852,202 | ||||
| Investment Income—Net | 13,617,678 | 9,692,789 | ||||
| Realized and Unrealized Gain (Loss) on Investments—Note 2(b) ($): | ||||||
| Net realized gain (loss) on investments | (56) | 1,288 | ||||
| Net unrealized appreciation (depreciation) on investments | — | (786) | ||||
| Net Realized and Unrealized Gain (Loss) on Investments | (56) | 502 | ||||
| Net Increase in Net Assets Resulting from Operations | 13,617,622 | 9,693,291 | ||||
| See notes to financial statements. |
| 16 |
STATEMENTS OF CHANGES IN NET ASSETS
| Mellon National Municipal | ||||||||
| Mellon Money Market Fund | Money Market Fund | |||||||
| Year Ended August 31, | Year Ended August 31, | |||||||
| 2005 | 2004 | 2005 | 2004 | |||||
| Operations ($): | ||||||||
| Investment income—net | 13,617,678 | 3,402,144 | 9,692,789 | 2,763,190 | ||||
| Net realized gain (loss) on investments | (56) | (540) | 1,288 | — | ||||
| Net unrealized appreciation (depreciation) on investments | — | — | (786) | 786 | ||||
| Net Increase (Decrease) in Net Assets | ||||||||
| Resulting from Operations | 13,617,622 | 3,401,604 | 9,693,291 | 2,763,976 | ||||
| Dividends to Shareholders from ($): | ||||||||
| Investment income—net: | ||||||||
| Class M Shares | (13,610,468) | (3,401,824) | (9,692,775) | (2,763,184) | ||||
| Investor Shares | (7,210) | (320) | (14) | (6) | ||||
| Total Dividends | (13,617,678) | (3,402,144) | (9,692,789) | (2,763,190) | ||||
| Beneficial Interest Transactions ($1.00 per share): | ||||||||
| Net proceeds from shares sold: | ||||||||
| Class M Shares | 1,325,177,521 | 893,105,183 | 1,152,528,623 | 867,387,196 | ||||
| Investor Shares | 466,825 | 309,407 | — | — | ||||
| Dividends reinvested: | ||||||||
| Class M Shares | 24 | 8 | 143,750 | 7 | ||||
| Investor Shares | 7,255 | 319 | 14 | 4 | ||||
| Cost of shares redeemed: | ||||||||
| Class M Shares | (1,118,330,648) | (810,361,313) | (1,028,224,224) | (643,530,026) | ||||
| Investor Shares | (46,696) | (107,759) | — | — | ||||
| Increase (Decrease) in Net Assets from | ||||||||
| Beneficial Interest Transactions | 207,274,281 | 82,945,845 | 124,448,163 | 223,857,181 | ||||
| Total Increase (Decrease) In Net Assets | 207,274,225 | 82,945,305 | 124,448,665 | 223,857,967 | ||||
| Net Assets ($): | ||||||||
| Beginning of Period | 471,935,172 | 388,989,867 | 488,927,099 | 265,069,132 | ||||
| End of Period | 679,209,397 | 471,935,172 | 613,375,764 | 488,927,099 | ||||
| See notes to financial statements. |
| The Funds 17 |
FINANCIAL HIGHLIGHTS
The following tables describe the performance for each share class for the fiscal periods indicated. All information reflects financial results for a single fund share.Total return shows how much your investment in the fund would have increased (or decreased) during each period, assuming you had reinvested all dividends and distributions.These figures have been derived from the fund’s financial statements.
| Class M Shares | ||||||
| Year Ended August 31, | ||||||
| Mellon Money Market Fund | 2005 | 2004 | 2003 a | |||
| Per Share Data ($): | ||||||
| Net asset value, beginning of period | 1.00 | 1.00 | 1.00 | |||
| Investment Operations: | ||||||
| Investment income—net | .023 | .008 | .002 | |||
| Distributions: | ||||||
| Dividends from investment income—net | (.023) | (.008) | (.002) | |||
| Net asset value, end of period | 1.00 | 1.00 | 1.00 | |||
| Total Return (%) | 2.30 | .82 | .76b | |||
| Ratios/Supplemental Data (%): | ||||||
| Ratio of total expenses to average net assets | .31 | .33 | .36b | |||
| Ratio of net expenses to average net assets | .31 | .33 | .36b | |||
| Ratio of net investment income to average net assets | 2.36 | .82 | .78b | |||
| Net Assets, end of period ($ x 1,000) | 678,569 | 471,723 | 388,979 | |||
| a From June 2, 2003 (commencement of operations) to August 31, 2003. | ||||||
| b Annualized. | ||||||
| See notes to financial statements. | ||||||
| 18 |
| Investor Shares | ||||||
| Year Ended August 31, | ||||||
| Mellon Money Market Fund | 2005 | 2004 | 2003 a | |||
| Per Share Data ($): | ||||||
| Net asset value, beginning of period | 1.00 | 1.00 | 1.00 | |||
| Investment Operations: | ||||||
| Investment income—net | .020 | .006 | .001 | |||
| Distributions: | ||||||
| Dividends from investment income—net | (.020) | (.006) | (.001) | |||
| Net asset value, end of period | 1.00 | 1.00 | 1.00 | |||
| Total Return (%) | 2.05 | .57 | .52b | |||
| Ratios/Supplemental Data (%): | ||||||
| Ratio of total expenses to average net assets | .57 | .64 | .62b | |||
| Ratio of net expenses to average net assets | .57 | .64 | .62b | |||
| Ratio of net investment income to average net assets | 2.20 | .79 | .48b | |||
| Net Assets, end of period ($ x 1,000) | 640 | 213 | 11 | |||
| a From June 2, 2003 (commencement of operations) to August 31, 2003. | ||||||
| b Annualized. | ||||||
| See notes to financial statements. | ||||||
| The Funds 19 |
| FINANCIAL HIGHLIGHTS (continued) |
| Class M Shares | ||||||
| Year Ended August 31, | ||||||
| Mellon National Municipal Money Market Fund | 2005 | 2004 | 2003 a | |||
| Per Share Data ($): | ||||||
| Net asset value, beginning of period | 1.00 | 1.00 | 1.00 | |||
| Investment Operations: | ||||||
| Investment income—net | .017 | .007 | .002 | |||
| Distributions: | ||||||
| Dividends from investment income—net | (.017) | (.007) | (.002) | |||
| Net asset value, end of period | 1.00 | 1.00 | 1.00 | |||
| Total Return (%) | 1.68 | .70 | .64b | |||
| Ratios/Supplemental Data (%): | ||||||
| Ratio of total expenses to average net assets | .32 | .33 | .35b | |||
| Ratio of net expenses to average net assets | .32 | .33 | .35b | |||
| Ratio of net investment income to average net assets | 1.68 | .71 | .62b | |||
| Net Assets, end of period ($ x 1,000) | 613,375 | 488,926 | 265,068 | |||
| a From June 2, 2003 (commencement of operations) to August 31, 2003. | ||||||
| b Annualized. | ||||||
| See notes to financial statements. | ||||||
| 20 |
| Investor Shares | ||||||
| Year Ended August 31, | ||||||
| Mellon National Municipal Money Market Fund | 2005 | 2004 | 2003 a | |||
| Per Share Data ($): | ||||||
| Net asset value, beginning of period | 1.00 | 1.00 | 1.00 | |||
| Investment Operations: | ||||||
| Investment income—net | .014 | .005 | .001 | |||
| Distributions: | ||||||
| Dividends from investment income—net | (.014) | (.005) | (.001) | |||
| Net asset value, end of period | 1.00 | 1.00 | 1.00 | |||
| Total Return (%) | 1.43 | .45 | .36b | |||
| Ratios/Supplemental Data (%): | ||||||
| Ratio of total expenses to average net assets | .58 | .60 | .57b | |||
| Ratio of net expenses to average net assets | .57 | .60 | .57b | |||
| Ratio of net investment income to average net assets | 1.38 | .58 | .48b | |||
| Net Assets, end of period ($ x 1,000) | 1 | 1 | 1 | |||
| a From June 2, 2003 (commencement of operations) to August 31, 2003. | ||||||
| b Annualized. | ||||||
| See notes to financial statements. | ||||||
| The Funds 21 |
NOTES TO FINANCIAL STATEMENTS
| NOTE 1—General: |
Mellon Funds Trust (the “Trust”) was organized as a Massachusetts business trust which is registered under the Investment Company Act of 1940, as amended (the “Act”), as an open-end management investment company and operates as a series company currently comprised of sixteen series including the following diversified money market funds: Mellon Money Market Fund and Mellon National Municipal Money Market Fund (each, a “fund” and collectively, the “funds”). Mellon Money Market Fund investment objective is to provide investors with as high a level of current income as is consistent with the preservation of capital and the maintenance of liquidity. Mellon National Municipal Money Market Fund investment objective is to provide investors with as high a level of current income exempt from federal income tax as is consistent with the preservation of capital and the maintenance of liquidity. Mellon Fund Advisers, a division of The Dreyfus Corporation (“Dreyfus”), serves as each fund’s investment adviser (“Investment Adviser”). Mellon Bank, N.A. (“Mellon Bank”), which is a wholly-owned subsidiary of Mellon Financial Corporation, (“Mellon Financial”), serves as administrator for the funds pursuant to an Administration Agreement with the Trust (the “Administration Agreement”). Mellon Bank has entered into a Sub-Administration Agreement with Dreyfus pursuant to which Mellon Bank pays Dreyfus for performing certain administrative services. Dreyfus is a wholly-owned subsidiary of Mellon Financial. Dreyfus Service Corporation (the “Distributor”), a wholly-owned subsidiary of Dreyfus, is the Distributor of each fund’s shares, which are sold without a sales charge.
The Trust is authorized to issue an unlimited number of shares of beneficial interest, par value $.001 per share, in each of the Class M and Investor class shares of each fund. Each class of shares has similar rights and privileges, except with respect to the expenses borne by and the shareholder services offered to each class and the shareholder services plan applicable to the Investor
shares and certain voting rights. Income, expenses (other than expenses attributable to a specific class), and realized gains or losses on investments are allocated to each Class of shares based on its relative net assets.
The Trust accounts separately for the assets, liabilities and operations of each series. Expenses directly attributable to each series are charged to that series’ operations; expenses that are applicable to all series are allocated among them on a pro rata basis.
The fund’s financial statements are prepared in accordance with U.S. generally accepted accounting principles, which may require the use of management estimates and assumptions. Actual results could differ from those estimates.
NOTE 2—Significant Accounting Policies:
(a) Portfolio valuation: Investments in securities are valued at amortized cost in accordance with Rule 2a-7 of the Act, which has been determined by the Trust’s Board to represent the fair value of the fund’s investments.
It is the funds’ policy to maintain a continuous net asset value per share of $1.00; the fund has adopted certain investment, portfolio valuation and dividend and distribution policies to enable it to do so. There is no assurance, however, that the fund will be able to maintain a stable net asset value per share of $1.00.
(b) Securities transactions and investment income:
Securities transactions are recorded on a trade date basis. Interest income, adjusted for accretion of discount and amortization of premium on investments, is earned from settlement date and recognized on the accrual basis. Cost of investments represents amortized cost.
The funds have an arrangement with the custodian bank whereby the funds receive earnings credits from the custodian when positive cash balances are maintained, which are used to offset custody fees. For financial reporting purposes, the funds include net earnings credits as expense offsets in the Statement of Operations.
| 22 |
(c) Repurchase agreements: The funds may engage in repurchase agreement transactions. Under the terms of a typical repurchase agreement, a fund, through its custodian and sub-custodian, takes possession of an underlying debt obligation subject to an obligation of the seller to repurchase, and the fund to resell, the obligation at an agreed-upon price and time, thereby determining the yield during the fund’s holding period.This arrangement results in a fixed rate of return that is not subject to market fluctuations during the fund’s holding period. The value of the collateral is at least equal, at all times, to the total amount of the repurchase obligation, including interest. In the event of a counterparty default, the fund has the right to use the collateral to offset losses incurred.There is potential loss to the fund in the event the fund is delayed or prevented from exercising its rights to dispose of the collateral securities, including the risk of a possible decline in the value of the underlying securities during the period while the fund seeks to assert its rights. The Investment Adviser reviews the value of the collateral and the creditworthiness of those banks and dealers with which the fund enters into repurchase agreements to evaluate potential risks.
(d) Dividends to shareholders: Dividends payable to shareholders are recorded by the funds on the ex-dividend date.The funds declare dividends daily from investment income-net; such dividends are paid monthly.With respect to each series, dividends from net realized capital gain, if any, are normally declared and paid annually, but the funds may make distributions on a more frequent basis to comply with the distribution requirements of the Internal Revenue Code of 1986, as amended (the “Code”).To the extent that net realized capital gain can be offset by capital loss carryovers of that fund, it is the policy of the fund not to distribute such gain.
(e) Federal income taxes: It is the policy of the Mellon Money Market Fund to continue to qualify as a regulated investment company, if such qualification is in the best interests of its shareholders, by complying with the applic-
able provisions of the Code, and to make distributions of taxable income sufficient to relieve it from substantially all federal income and excise taxes. It is the policy of the Mellon National Municipal Money Market Fund to continue to qualify as a regulated investment company, which can distribute tax exempt dividends, by complying with the applicable provisions of the Code, and to make distributions of income and net realized capital gain sufficient to relieve it from substantially all federal income and excise taxes. For federal income tax purposes, each series is treated as a single entity for the purpose of determining such qualification.
At August 31, 2005, the components of accumulated earnings on a tax basis were substantially the same as for financial reporting purposes.
The Mellon Money Market Fund has an unused capital loss carryover of $596 available for Federal income tax purposes to be applied against future net securities profits if any, realized subsequent to August 31, 2005. If not applied, $540 of the carryover expires in fiscal 2012 and $56 expires in fiscal 2013.
The tax character of distributions paid to shareholders during the fiscal periods ended August 31, 2005 and August 31, 2004 was all ordinary income for the Mellon Money Market Fund and all tax exempt income for the Mellon National Municipal Money Market Fund.
During the period ended August 31, 2005, as a result of permanent book to tax differences, Mellon National Municipal Money Market Fund decreased net realized gain (loss) on investments by $1,288 and increased accumulated undistributed investment income net by the same amount. Net assets were not affected by this reclassification.
At August 31, 2005, the cost of investments for federal income tax purposes was substantially the same as the cost for financial reporting purposes (see the Statement of Investments).
| The Funds 23 |
NOTES TO FINANCIAL STATEMENTS (continued)
| NOTE 3—Bank Line of Credit |
The funds participate with other Dreyfus-managed funds in a $100 million unsecured line of credit primarily to be utilized for temporary or emergency purposes, including the financing of redemptions. Interest is charged to the fund based on prevailing market rates in effect at the time of borrowings. During the period ended August 31, 2005, the Mellon Money Market Fund did not borrow under the line of credit.
The average daily amount of borrowings outstanding for Mellon National Municipal Money Market Fund during the year ended August 31, 2005 was approximately $1,376,900 with a related weighted average annualized interest rate of 3.49% .
NOTE 4—Investment Advisory Fee, Administration Fee and Other Transactions With Affiliates:
(a) Fees payable by the funds pursuant to the provisions of an Investment Advisory Agreement with the Investment Adviser are payable monthly, computed on the average daily value of each fund’s net assets at the following annual rates: .15% of the Mellon Money Market Fund and .15% of the Mellon National Municipal Money Market Fund.
Pursuant to the Administration Agreement with Mellon Bank, Mellon Bank provides or arranges for fund accounting, transfer agency and other fund administration services and receives a fee based on the total net assets of the Trust based on the following rates:
| 0 up to $6 billion | .15 of 1% | |
| $6 billion up to $12 billion | .12 of 1% | |
| In excess of $12 billion | .10 of 1% |
Mellon Bank has entered into a Sub-Administration Agreement with Dreyfus pursuant to which Mellon Bank pays Dreyfus for performing certain administrative services.
(b) The funds have adopted a Shareholder Services Plan with respect to its Investor shares pursuant to which each fund pays the Distributor for the provision of certain ser-
vices to holders of Investor shares a fee at an annual rate of .25% of the value of the average daily net assets attributable to Investor shares. The services provided may include personal services relating to shareholder accounts, such as answering shareholder inquiries regarding a fund, and providing reports and other information, and services related to the maintenance of such shareholder accounts. The Shareholder Services Plan allows the Distributor to make payments from the shareholder services fees it collects from each fund to compensate service agents (certain banks, securities brokers or dealers and other financial institutions) in respect of these services. Table 1 summarizes the amounts Investor shares were charged during the year ended August 31, 2005, pursuant to the Shareholder Services Plan.
| Table 1. | ||
| Mellon Money Market Fund | $819 | |
| Mellon National Municipal | ||
| Money Market Fund | $924 |
The funds compensate Mellon Bank under a Custody Agreement for providing custodial services for the funds. Table 2 summarizes the amounts the funds were charged during the year ended August 31, 2005, pursuant to the custody agreements.
| Table 2. | ||
| Mellon Money Market Fund | $46,436 | |
| Mellon National Municipal Money Market Fund | $46,061 | |
During the year ended August 31, 2005, the funds were charged $2,520 for services performed by the Chief Compliance Officer.
Table 3 on the next page summarizes the components of Due to The Dreyfus Corporation and affiliates in the Statement of Assets and Liabilities for each fund.
(c) Each trustee who is not an “affiliated person” as defined in the Act receives from the Trust an annual fee of $44,000 and an attendance fee of $4,000 for each in-person meeting attended and $500 for telephone meetings and is reimbursed for travel and out-of-pocket
| 24 |
expenses. Prior to September 14, 2004, the attendance fee payable to each trustee was $3,000 for each in-person meeting attended.
NOTE 5—Legal Matters:
In early 2004, two purported class and derivative actions were filed against Mellon Financial, Mellon Bank, N.A., Dreyfus, Founders Asset Management LLC, and certain directors of the Dreyfus Funds and the Dreyfus Founders Funds (together, the “Funds”) in the United States District Court for the Western District of Pennsylvania. In September 2004,plaintiffs served a Consolidated Amended Complaint (the “Amended Complaint”) on behalf of a purported class of all persons who acquired interests in any of the Funds between January 30, 1999 and November 17, 2003, and derivatively on behalf of the Funds. The Amended Complaint in the newly styled In re Dreyfus Mutual Funds Fee Litigation also named the Distributor, Premier Mutual Fund Services, Inc. and two additional Fund directors as defendants and alleges violations of the Investment Company Act of 1940,the Investment Advisers Act of 1940, the Pennsylvania Unfair Trade Practices and Consumer Protection Law and common-law claims. Plaintiffs seek to recover allegedly improper and excessive Rule 12b-1 and advisory fees allegedly charged to the Funds for marketing and distribution services. More specifically, plaintiffs claim, among other things, that 12b-1 fees and directed brokerage were improperly used to pay
brokers to recommend the Funds over other funds, and that such payments were not disclosed to investors. In addition, plaintiffs assert that economies of scale and soft-dollar benefits were not passed on to the Funds. Plaintiffs further allege that 12b-1 fees were improperly charged to certain of the Funds that were closed to new investors.The Amended Complaint seeks compensatory and punitive damages, rescission of the advisory contracts, and an accounting and restitution of any unlawful fees, as well as an award of attorneys’ fees and litigation expenses. As noted, some of the claims in this litigation are asserted derivatively on behalf of the Funds that have been named as nominal defendants. With respect to such derivative claims, no relief is sought against the Funds. Dreyfus believes the allegations to be totally without merit and intends to defend the action vigorously. None of the trustees of the Trust, nor the funds, were named in the actions. In November 2004, all named defendants moved to dismiss the Amended Complaint in whole or substantial part. Briefing was completed in May 2005.
Additional lawsuits arising out of these circumstances and presenting similar allegations and requests for relief may be filed against the defendants in the future. Neither Dreyfus nor the Funds believe that any of the pending actions will have a material adverse effect on the Funds or Dreyfus’ ability to perform its contract with the Funds.
| Table 3. | ||||||||
| Investment | Shareholder | Chief | ||||||
| Advisory | Services | Custody | Compliance | |||||
| Fees ($) | Plan Fees ($) | Fees ($) | Officer Fees ($) | |||||
| Mellon Money Market Fund | 85,378 | 125 | 8,585 | 1,533 | ||||
| Mellon National Municipal Money Market Fund | 85,121 | - | 6,133 | 1,533 | ||||
| The Funds 25 |
REPORT OF INDEPENDENT REGISTERED PUBLIC ACCOUNTING FIRM
The Board of Trustees and Shareholders of Mellon Funds Trust
We have audited the accompanying statements of assets and liabilities of Mellon Funds Trust comprised of Mellon Money Market Fund and Mellon National Municipal Money Market Fund (collectively “the Funds”), including the statements of investments as of August 31, 2005, and the related statements of operations for the year then ended, the statements of changes in net assets for each of the years in the two-year period then ended, and the financial highlights for each of the periods indicated herein.These financial statements and financial highlights are the responsibility of the Funds’ management. Our responsibility is to express an opinion on these financial statements and financial highlights based on our audits.
We conducted our audits in accordance with the standards of the Public Company Accounting Oversight Board (United States).Those standards require that we plan and perform the audit to obtain reasonable assurance about whether the financial statements and financial highlights are free of material misstatement.An audit includes examining, on a test basis, evidence supporting the amounts and
disclosures in the financial statements and financial highlights. Our procedures included confirmation of securities owned as of August 31, 2005, by correspondence with the custodian and brokers or by other appropriate auditing procedures where replies from brokers were not received. An audit also includes assessing the accounting principles used and significant estimates made by management, as well as evaluating the overall financial statement presenta-tion.We believe that our audits provide a reasonable basis for our opinion.
In our opinion, the financial statements and financial highlights referred to above present fairly, in all material respects,the financial position of the Funds as of August 31, 2005 and the results of their operations for the year then ended, the changes in their net assets for each of the years in the two-year period then ended, and the financial highlights for each of the periods indicated herein, in conformity with U.S. generally accepted accounting principles.

| 26 |
IMPORTANT TAX INFORMATION (Unaudited)
Mellon National Municipal Money Market Fund
In accordance with federal tax law, the fund hereby designates all the dividends paid from investment income-net during its fiscal year ended August 31, 2005 as “exempt-interest dividends” (not generally subject to regular federal income tax).
As required by federal tax law rules, shareholders will receive notification of their portion of the fund’s taxable ordinary dividends (if any) and capital gains distributions (if any) paid for the 2005 calendar year on Form 1099-DIV which will be mailed by January 31, 2006.
| The Funds 27 |
| INFORMATION ABOUT THE REVIEW AND APPROVAL | ||
| OF EACH FUND’S INVESTMENT ADVISORY AGREEMENT | (Unaudited) |
MELLON FUNDS TRUST (Mellon Money Market Fund and Mellon National Municipal Money Market Fund)
At a meeting of the Board of Trustees held on March 15-16, 2005, the Board considered the re-approval of the Trust’s Investment Advisory Agreement for another one year term, pursuant to which the Investment Adviser, a division of Dreyfus, provides the funds with investment advisory services. The Board members also considered the re-approval of the Trust’s Administration Agreement with Mellon Bank for another one year term, pursuant to which Mellon Bank provides the funds with administrative services. Mellon Bank has entered into a Sub-Administration Agreement with Dreyfus pursuant to which Mellon Bank pays Dreyfus for performing certain of these administrative services. The Board members who are not “interested persons” (as defined in the Act) of the Trust were assisted in their review by independent legal counsel and met with counsel in executive session separate from representatives of Dreyfus.
Analysis of Nature, Extent and Quality of Services Provided to the Funds. The Board members received a presentation from representatives of Dreyfus regarding services provided to the funds, and discussed the nature, extent and quality of the services provided to the funds pursuant to the Investment Advisory Agreement. Dreyfus’ representatives reviewed the funds’ distribution of accounts, and noted the diversity of distribution of the funds and Dreyfus’ corresponding need for broad, deep and diverse resources to be able to provide ongoing shareholder services to each of the funds’ distribution channels. The Board also reviewed the number of shareholder accounts in each fund, as well as each fund’s asset size.
The Board members also considered Dreyfus’ research and portfolio management capabilities and that Dreyfus also provides oversight of day-to-day fund operations, including fund accounting and administration and assistance in meeting legal and regulatory requirements.The Board members also considered Dreyfus’ extensive administrative, accounting and compliance infrastructure.
Comparative Analysis of the Funds’ Performance and Management Fees and Expense Ratios.
Mellon Money Market Fund. The Board members reviewed the fund’s performance and expense ratios and placed significant emphasis on comparisons to a group of comparable funds and iMoneyNet and Lipper aver-ages.The Board reviewed the fund’s performance, management fee and total expense ratio within this comparison group and against the fund’s iMoneyNet category average (with respect to performance) and Lipper category average (with respect to expense ratios).The group of comparable funds was previously approved by the Board for this purpose, and was prepared using a Board-approved selection methodology that was based, in part, on selecting non-affiliated funds reported in the same iMoneyNet category as the fund. The Board members noted that, as of December 31, 2004, the fund’s one-year total return performance was the highest of the comparison group and was above the average of its iMoneyNet category.The Board members then discussed the fund’s advisory fee and expense ratio and reviewed the range of advisory fees in the comparison group and noted that the fund’s expense ratio was lower than the average expense ratio of the comparison group and that of its Lipper category and that the fund’s expense ratio ranked first (was the lowest) in the comparison group.
Representatives of Dreyfus reviewed with the Board members a comparison of the fees paid to Dreyfus or its affiliates by mutual funds with similar investment objectives, policies and strategies as the fund (the “Similar Funds”). These comparison groups also compared the management fee and total expense ratios of Similar Funds. The Similar Funds’ comparison group was composed exclusively of investment companies managed by Dreyfus or its affiliates that were reported in the same Lipper category as the fund. Dreyfus’ representatives explained the nature of each Similar Fund and the differences, from Dreyfus’ perspective, in management of these Similar Funds compared to managing and providing other services to the fund. Dreyfus’ representatives also
| 28 |
reviewed the costs associated with distribution through intermediaries. The Board analyzed differences in fees paid to Dreyfus and discussed the relationship of the management fees paid in light of Dreyfus’ performance and the services provided. The Similar Funds’ management fees were higher than the fund’s management fee, and included a “unitary fee” fund and a fund offered only to separate accounts established by insurance companies to fund variable annuity contracts and variable life insurance policies. The Board members considered the relevance of the fee information provided for the Similar Funds to evaluate the appropriateness and reasonableness of the fund’s management fee.The Board acknowledged that differences in fees paid by the Similar Funds seemed to be consistent with the services provided.
Representatives of Dreyfus stated that there were no separate accounts managed by Dreyfus or its affiliates with similar investment objectives, policies and strategies as the fund.
Mellon National Municipal Money Market Fund.
The Board members reviewed the fund’s performance and expense ratios and placed significant emphasis on comparisons to a group of comparable funds and iMoneyNet and Lipper averages. The Board reviewed the fund’s performance, management fee and total expense ratio within this comparison group and against the fund’s iMoneyNet category average(with respect to performance) and Lipper category average (with respect to expense ratios). The group of comparable funds was previously approved by the Board for this purpose, and was prepared using a Board-approved selection methodology that was based, in part, on selecting non-affiliated funds reported in the same iMoneyNet category as the fund. The Board members noted that, as of December 31, 2004, the fund’s one-year total return performance was the highest of the comparison group and was above the average of its iMoneyNet category.The Board members then discussed the fund’s advisory fee and expense ratio and reviewed the range of advisory fees in the
comparison group and noted that the fund’s expense ratio was lower than the average expense ratio of the comparison group and that of its Lipper category and that the fund’s expense ratio ranked first (was the lowest) in the comparison group.
Representatives of Dreyfus reviewed with the Board members a comparison of the fees paid to Dreyfus or its affiliates by mutual funds with similar investment objectives, policies and strategies as the fund (the “Similar Funds”). These comparison groups also compared the management fee and total expense ratios of Similar Funds. The Similar Funds’ comparison group was composed exclusively of investment companies managed by Dreyfus or its affiliates that were reported in the same Lipper category as the fund. Dreyfus’ representatives explained the nature of each Similar Fund and the differences, from Dreyfus’ perspective, in management of these Similar Funds compared to managing and providing other services to the fund. Dreyfus’ representatives also reviewed the costs associated with distribution through intermediaries. The Board analyzed differences in fees paid to Dreyfus and discussed the relationship of the management fees paid in light of Dreyfus’ performance and the services provided. The Similar Funds’ management fees were higher than the fund’s management fee, and included a “unitary fee” fund. The Board members considered the relevance of the fee information provided for the Similar Funds to evaluate the appropriateness and reasonableness of the fund’s management fee.The Board acknowledged that differences in fees paid by the Similar Funds seemed to be consistent with the services provided.
Representatives of Dreyfus stated that there were no separate accounts managed by Dreyfus or its affiliates with similar investment objectives, policies and strategies as the fund.
Analysis of Profitability and Economies of Scale. Dreyfus’ representatives reviewed the dollar amount of expenses allocated and profit received by Dreyfus and its affiliates
| The Funds 29 |
| INFORMATION ABOUT THE REVIEW AND APPROVAL OF EAC H FUND’S |
| INVESTMENT ADVISORY AGREEMENT (Unaudited) (continued) |
with respect to each fund and the method used to determine such expenses and profit. The Board received and considered information prepared by an independent consulting firm regarding Dreyfus’ approach to allocating costs to, and determining the profitability of, individual funds and the entire Dreyfus mutual fund complex.The Dreyfus representatives stated that the methodology had also been reviewed by an independent registered public accounting firm which, like the consultant, found the methodology to be reasonable.The consulting firm also analyzed where any economies of scale might emerge in connection with the management of the funds. The Board members evaluated the analysis in light of the relevant circumstances for each fund, and the extent to which economies of scale would be realized as the fund grows and whether fee levels reflect these economies of scale for the benefit of fund investors. The Board noted that it appeared that the benefits of any economies of scale also would be appropriately shared with shareholders through increased investment in fund management and administration resources. The Board members also considered potential benefits to Dreyfus and its affiliates, including Mellon Fund Advisers, from acting as investment adviser with respect to each fund.
It was noted that the Board members should consider Dreyfus’ profitability with respect to each fund as part of their evaluation of whether the fees under the Investment Advisory Agreement bear a reasonable relationship to the mix of services provided by Dreyfus, including the nature, extent and quality of such services and that a discussion of economies of scale are predicated on increasing assets and that, if a fund’s assets had been decreasing, the possibility that Dreyfus may have realized any economies of scale would be less. The Board members also discussed the profitability percentage ranges determined by appropriate court cases to be reasonable given the services rendered to investment companies. It was noted that the profitability percentage for managing each
fund was not unreasonable given the fund’s overall performance and generally superior service levels provided.
At the conclusion of these discussions, each of the Board Members expressed the opinion that he or she had been furnished with sufficient information to make an informed business decision with respect to the continuation of the Trust’s Investment Advisory Agreement. Based on their discussions and considerations as described above, the Board made the following conclusions and determinations.
- The Board concluded that the nature, extent and quality of the services provided by Dreyfus are ade- quate and appropriate.
- The Board was generally satisfied with the each fund’s performance.
- The Board concluded that the fee paid by each fund to Mellon Fund Advisers was reasonable in light of comparative performance and expense and advisory fee information, costs of the services provided and profits to be realized and benefits derived or to be derived by Dreyfus and its affiliates from its relation- ship with the funds.
- The Board determined that the economies of scale which may accrue to Dreyfus and its affiliates in con- nection with the management of the funds had been adequately considered by Dreyfus in connection with the management fee rate charged to each fund, and that, to the extent in the future it were to be determined that material economies of scale had not been shared with the funds, the Board would seek to have those economies of scale shared with fund shareholders.
The Board members considered these conclusions and determinations and, without any one factor being dispositive, the Board determined that re-approval of the Trust’s Investment Advisory Agreement and Administration Agreement with respect to the funds was in the best interests of each fund and its respective shareholders.
| 30 |
BOARD MEMBERS INFORMATION (Unaudited)
| Patrick J. O’Connor (62) |
| Chairman of the Board (2000) |
| Principal Occupation During Past 5 Years: |
| • Attorney, Cozen and O’Connor, P.C. since 1973, including Vice |
| Chairman since 1980 and Chief Executive Officer and President |
| since 2002 |
| Other Board Memberships and Affiliations: |
| • Board of Consultors of Villanova University School of Law, |
| Board Member |
| • Temple University,Trustee |
| • Philadelphia Police Foundation, Board Member |
| • Philadelphia Children’s First Fund, Board Member |
| • Committee on Rules of Evidence of Pennsylvania Supreme |
| Court,Vice Chair |
| • American College of Trial Lawyers, Fellow |
| • Historical Society of the United States District Court for the |
| Eastern District of Pennsylvania, Director |
| No. of Portfolios for which Board Member Serves: 16 |
| ——————— |
| Ronald R. Davenport (69) |
| Board Member (2000) |
| Principal Occupation During Past 5 Years: |
| • Chairman of Sheridan Broadcasting Corporation since July 1972 |
| Other Board Memberships and Affiliations: |
| • American Urban Radio Networks, Co-Chairman |
| • Aramark Corporation, Board Member |
| • Momentum Equity Group LLC, Director |
| No. of Portfolios for which Board Member Serves: 16 |
| ——————— |
| John L. Diederich (68) |
| Board Member (2000) |
| Principal Occupation During Past 5 Years: |
| • Chairman of Digital Site Systems, Inc., a privately held software |
| company providing internet service to the construction materials |
| industry, since July 1998 |
| Other Board Memberships and Affiliations: |
| • Continental Mills, a dry baking products company, Board Member |
| • Pittsburgh Parks Conservancy, Board Member |
| No. of Portfolios for which Board Member Serves: 16 |
| Maureen D. McFalls (60) |
| Board Member (2000) |
| Principal Occupation During Past 5 Years: |
| • Director of the Office of Government Relations at Carnegie |
| Mellon University since January 2000 |
| • Manager, Government Communications, of the Software |
| Engineering Institute at Carnegie Mellon University from |
| March 1994 to December 1999 |
| Other Board Memberships and Affiliations: |
| • Maglev, Inc., a company seeking a partnership between industry |
| and government in Pennsylvania to create a magnetically levitated |
| high-speed transportation system, Board Member representing |
| Carnegie Mellon University |
| • Coro Center For Civic Leadership, Board Member |
| • Pennsylvania Association for Individuals with Disabilities, |
| Board Member |
| No. of Portfolios for which Board Member Serves: 16 |
| ——————— |
| Kevin C. Phelan (61) |
| Board Member (2000) |
| Principal Occupation During Past 5 Years: |
| • Mortgage Banker, Meredith & Grew, Inc. since March 1978, |
| including Executive Vice President and Director |
| since March 1998 |
| Other Board Memberships and Affiliations: |
| • Greater Boston Chamber of Commerce, Director |
| • Fiduciary Trust, Director |
| • St. Elizabeth’s Medical Center of Boston, Board Member |
| • Providence College,Trustee |
| • Simmons College,Trustee |
| • Newton Country Day School, Chairman of the Board |
| • Board of Visitors of Babson College, Board Member |
| • Board of Visitors of Boston University School of Public Health, |
| Board Member |
| • Boston Public Library Foundation, Director |
| • Boston Foundation, Director |
| • Boston Municipal Research Bureau, Board Member |
| • Boys and Girls Club of Boston, Board Member |
| • Greater Boston Real Estate Board, Director |
| No. of Portfolios for which Board Member Serves: 16 |
BOARD MEMBERS INFORMATION (Unaudited) (continued)
| Patrick J. Purcell (57) |
| Board Member (2000) |
| Principal Occupation During Past 5 Years: |
| • Owner, President and Publisher of The Boston Herald since |
| February 1994 |
| • President and Founder, jobfind.com, an employment search site |
| on the world wide web, since July 1996 |
| • President and Chief Executive Officer, Herald Media since 2001 |
| Other Board Memberships and Affiliations: |
| • The American Ireland Fund, an organization that raises funds for |
| philanthropic projects in Ireland, Director |
| • The Genesis Fund, an organization that raises funds for the spe- |
| cialized care and treatment of New England area children born |
| with birth defects, mental retardation and genetic diseases, |
| Board Member |
| • United Way of Massachusetts Bay, Board Member |
| • Greater Boston Chamber of Commerce, Board Member |
| • St. John’s University,Trustee |
| No. of Portfolios for which Board Member Serves: 16 |
| Thomas F. Ryan, Jr. (64) |
| Board Member (2000) |
| Principal Occupation During Past 5 Years: |
| • Retired since April 1999 |
| • President and Chief Operating Officer of the American Stock |
| Exchange from October 1995 to April 1999 |
| Other Board Memberships and Affiliations: |
| • Boston College,Trustee |
| • Brigham & Women’s Hospital,Trustee |
| • New York State Independent System Operator, a non-profit |
| organization which administers a competitive wholesale market |
| for electricity in New York State, Director |
| • RepliGen Corporation, a biopharmaceutical company, Director |
| No. of Portfolios for which Board Member Serves: 16 |
Once elected all Board Members serve for an indefinite term.The address of the Board Members and Officers is in c/o The Dreyfus Corporation, 200 Park Avenue, New York, New York 10166. Additional information about the Board Members is available in the fund’s Statement of Additional Information which can be obtained from Dreyfus free of charge by calling this toll free number: 1-800-645-6561. For individual account holders for Private Wealth Management clients, please contact your account officer or call 1-888-281-7350.
32
OFFICERS OF THE FUND (Unaudited)
LAWRENCE P. KEBLUSEK, President since June 2003.
As Chief Investment Officer of Mellon’s Private Wealth Management group, Mr. Keblusek is responsible for investment strategy, policy and implementation for Mellon’s Private Wealth Management group. Prior to joining Mellon, Mr. Keblusek was a Managing Director at Citigroup since 1995. He was previously a Vice President of the Trust. He is 55 years old and has been employed by Mellon since August 2002.
MARK N. JACOBS, Vice President since June 2000.
Executive Vice President, Secretary and General Counsel of Dreyfus, and an officer of 91 investment companies (comprised of 200 portfolios) managed by Dreyfus. He is 59 years old and has been an employee of Dreyfus since June 1977.
CHRISTOPHER SHELDON, Vice President since June 2003.
As director of Investment Strategy for Mellon’s Private Wealth Management group since April 2003, Mr. Sheldon manages the analysis and development of investment and asset allocation strategies and investment product research. Prior to assuming his current position, Mr. Sheldon was the West Coast managing director of Mellon’s Private Wealth Management group from 2001-2003 and its regional manager from 1998-2001. He is 38 years old has been employed by Mellon since January 1995.
MICHAEL A. ROSENBERG, Vice President and Secretary since August 2005.
Associate General Counsel of Dreyfus, and an officer of 91 investment companies (comprised of 200 portfolios) managed by Dreyfus. He is 45 years old and has been an employee of Dreyfus since October 1991.
JAMES BITETTO, Vice President and Assistant Secretary since August 2005.
Assistant General Counsel and Assistant Secretary of Dreyfus, and an officer of 91 investment companies (comprised of 200 portfolios) managed by Dreyfus. He is 39 years old and has been an employee of Dreyfus since December 1996.
JONI LACKS CHARATAN, Vice President and Assistant Secretary since August 2005.
Assistant General Counsel and Assistant Secretary of Dreyfus, and an officer of 91 investment companies (comprised of 200 portfolios) managed by Dreyfus. She is 49 years old and has been an employee of Dreyfus since October 1998.
JOSEPH M. CHIOFFI, Vice President and Assistant Secretary since August 2005.
Assistant General Counsel and Assistant Secretary of Dreyfus, and an officer of 91 investment companies (comprised of 200 portfolios) managed by Dreyfus. He is 43 years old and has been an employee of Dreyfus since June 2000.
JANETTE E. FARRAGHER, Vice President and Assistant Secretary since August 2005.
Associate General Counsel of Dreyfus, and an officer of 91 investment companies (comprised of 200 portfolios) managed by Dreyfus. She is 42 years old and has been an employee of Dreyfus since February 1984.
JOHN B. HAMMALIAN, Vice President and Assistant Secretary since August 2005.
Associate General Counsel of Dreyfus, and an officer of 91 investment companies (comprised of 200 portfolios) managed by Dreyfus. He is 42 years old and has been an employee of Dreyfus since February 1991.
ROBERT R. MULLERY, Vice President and Assistant Secretary since August 2005.
Associate General Counsel of Dreyfus, and an officer of 91 investment companies (comprised of 200 portfolios) managed by Dreyfus. He is 53 years old and has been an employee of Dreyfus since May 1986.
JEFF PRUSNOFSKY, Vice President and Assistant Secretary since August 2005.
Associate General Counsel of Dreyfus, and an officer of 91 investment companies (comprised of 200 portfolios) managed by Dreyfus. He is 40 years old and has been an employee of Dreyfus since October 1990.
JAMES WINDELS, Treasurer since November 2001.
Director – Mutual Fund Accounting of Dreyfus, and an officer of 91 investment companies (comprised of 200 portfolios) managed by Dreyfus. He is 46 years old and has been an employee of Dreyfus since April 1985.
| The Funds 33 |
OFFICERS OF THE FUND (Unaudited) (continued)
GREGORY S. GRUBER, Assistant Treasurer since March 2000.
Senior Accounting Manager – Municipal Bond Funds of Dreyfus, and an officer of 91 investment companies (comprised of 200 portfolios) managed by Dreyfus. He is 46 years old and has been an employee of Dreyfus since August 1981.
ERIK D. NAVILOFF, Assistant Treasurer since December 2002.
Senior Accounting Manager – Taxable Fixed Income Funds of Dreyfus, and an officer of 91 investment companies (comprised of 200 portfolios) managed by Dreyfus. He is 37 years old and has been an employee of Dreyfus since November 1992.
ROBERT ROBOL, Assistant Treasurer since December 2002.
Senior Accounting Manager – Money Market Funds of Dreyfus, and an officer of 91 investment companies (comprised of 200 portfolios) managed by Dreyfus. He is 41 years old and has been an employee of Dreyfus since October 1988.
ROBERT SVAGNA, Assistant Treasurer since December 2002.
Senior Accounting Manager – Equity Funds of Dreyfus, and an officer of 91 investment companies (comprised of 200 portfolios) managed by Dreyfus. He is 38 years old and has been an employee of Dreyfus since November 1990.
KENNETH J. SANDGREN, Assistant Treasurer since November 2001.
Mutual Funds Tax Director of Dreyfus, and an officer of 91 investment companies (comprised of 200portfolios) managed by Dreyfus. He is 51 years old and has been an employee of Dreyfus since June 1993.
JOSEPH W. CONNOLLY, Chief Compliance Officer since October 2004.
Chief Compliance Officer of the Manager and The Dreyfus Family of Funds (91 investment companies, comprising 200 portfolios). From November 2001 through March 2004, Mr. Connolly was first Vice-President, Mutual Fund Servicing for Mellon Global Securities Services. In that capacity, Mr. Connolly was responsible for managing Mellon’s Custody, Fund Accounting and Fund Administration services to third-party mutual fund clients. He is 48 years old and has served in various capacities with the Manager since 1980, including manager of the firm’s Fund Accounting Department from 1997 through October 2001.
WILLIAM GERMENIS, Anti-Money Laundering Compliance Officer since September 2002.
Vice President and Anti-Money Laundering Compliance Officer of the Distributor, and the Anti-Money Laundering Compliance Officer of 87 investment companies (comprised of 196 portfolios) managed by Dreyfus. He is 35 years old and has been an employee of the Distributor since October 1998.
| 34 |
For More Information
| Mellon Funds Trust |
| c/o The Dreyfus Corporation 200 Park Avenue New York, NY 10166 |
| Investment Adviser Mellon Fund Advisers, a division of The Dreyfus Corporation 200 Park Avenue New York, NY 10166 |
| Administrator |
| Mellon Bank, N.A. One Mellon Bank Center Pittsburgh, PA 15258 |
| Sub-Administrator |
| The Dreyfus Corporation 200 Park Avenue New York, NY 10166 |
| Custodian |
| Mellon Bank, N.A. One Mellon Bank Center Pittsburgh, PA 15258 |
| Transfer Agent & Dividend Disbursing Agent |
| Dreyfus Transfer, Inc. 200 Park Avenue New York, NY 10166 |
| Distributor Dreyfus Service Corporation 200 Park Avenue New York, NY 10166 |
Telephone Private Wealth Management (PWM) Clients, please contact your Account Officer or call 1-888-281-7350. Brokerage Clients of Mellon Private Wealth Advisors (MPWA), please contact your financial representative or call 1-800-830-0549-Option 2. Individual Account holders, please call Dreyfus at 1-800-896-8167.
Mail PWM Clients, write to your Account Officer, c/o Mellon Bank, N.A., One Mellon Bank Center, Pittsburgh, PA 15258
MPWA Brokerage Clients, write to your financial representative, P.O. Box 9012, Hicksville, NY 11802–9012
Individual Account Holders, write to: Mellon Funds, P.O. Box 55268, Boston, MA 02205–8502
The funds file their complete schedule of portfolio holdings with the Securities and Exchange Commission (“SEC”) for the first and third quarters of each fiscal year on Form N-Q. The funds’ Forms N-Q are available on the SEC’s website at http://www.sec.gov and may be reviewed and copied at the SEC’s Public Reference Room in Washington, DC. Information on the operation of the Public Reference Room may be obtained by calling 1-800-SEC-0330.
Information regarding how the funds voted proxies relating to portfolio securities for the 12-month period ended June 30, 2005, is available on the SEC’s website at http://www.sec.gov and without charge, upon request, by calling 1-800-645-6561.
| ©2005 Dreyfus Service Corporation |
| MFTAR0805-MM |
Item 2. Code of Ethics.
The Registrant has adopted a code of ethics that applies to the Registrant's principal executive officer, principal financial officer, principal accounting officer or controller, or persons performing similar functions There have been no amendments to, or waivers in connection with, the Code of Ethics during the period covered by this Report.
Item 3. Audit Committee Financial Expert.
The Registrant's Board has determined that Thomas F. Ryan, Jr., a member of the Audit Committee of the Board, is an audit committee financial expert as defined by the Securities and Exchange Commission (the "SEC"). Thomas F. Ryan, Jr., is "independent" as defined by the SEC for purposes of audit committee financial expert determinations.
Item 4. Principal Accountant Fees and Services
(a) Audit Fees. The aggregate fees billed for each of the last two fiscal years (the "Reporting Periods") for professional services rendered by the Registrant's principal accountant (the "Auditor") for the audit of the Registrant's annual financial statements, or services that are normally provided by the Auditor in connection with the statutory and regulatory filings or engagements for the Reporting Periods, were $289,025 in 2004 and $313,100 in 2005.
(b) Audit-Related Fees. The aggregate fees billed in the Reporting Periods for assurance and related services by the Auditor that are reasonably related to the performance of the audit of the Registrant's financial statements and are not reported under paragraph (a) of this Item 4 were $55,000 in 2004 and $51,500 in 2005. These services consisted of security counts required by Rule 17f-2 under the Investment Company Act of 1940, as amended.
The aggregate fees billed in the Reporting Periods for non-audit assurance and related services by the Auditor to the Registrant's investment adviser (not including any sub-investment adviser whose role is primarily portfolio management and is subcontracted with or overseen by another investment adviser), and any entity controlling, controlled by or under common control with the investment adviser that provides ongoing services to the Registrant ("Service Affiliates"), that were reasonably related to the performance of the annual audit of the Service Affiliate, which required pre-approval by the Audit Committee were $-0- in 2004 and $-0- in 2005.
Note: For the second paragraph in each of (b) through (d) of this Item 4, certain of such services were not pre-approved prior to May 6, 2003, when such services were required to be pre-approved. On and after May 6, 2003, 100% of all services provided by the Auditor were pre-approved as required. For comparative purposes, the fees shown assume that all such services were pre-approved, including services that were not pre-approved prior to the compliance date of the pre-approval requirement.
(c) Tax Fees. The aggregate fees billed in the Reporting Periods for professional services rendered by the Auditor for tax compliance, tax advice and tax planning ("Tax Services") were $30,152 in 2004 and $32,000 in 2005. These services consisted of (i) review or preparation of U.S. federal, state, local and excise tax returns; (ii) U.S. federal, state and local tax planning, advice and assistance regarding statutory, regulatory or
administrative developments, (iii) tax advice regarding tax qualification matters and/or treatment of various financial instruments held or proposed to be acquired or held, and (iv) determination of Passive Foreign Investment Companies (as applicable).
The aggregate fees billed in the Reporting Periods for Tax Services by the Auditor to Service Affiliates which required pre-approval by the Audit Committee were $-0- in 2004 and $-0- in 2005.
(d) All Other Fees. The aggregate fees billed in the Reporting Periods for products and services provided by the Auditor, other than the services reported in paragraphs (a) through (c) of this Item, were $-0- in 2004 and $-0- in 2005.
The aggregate fees billed in the Reporting Periods for Non-Audit Services by the Auditor to Service Affiliates, other than the services reported in paragraphs (b) through (c) of this Item, which required pre-approval by the Audit Committee were $-0- in 2004 and $-0- in 2005.
Audit Committee Pre-Approval Policies and Procedures. The Registrant's Audit Committee has established policies and procedures (the "Policy") for pre-approval (within specified fee limits) of the Auditor's engagements for non-audit services to the Registrant and Service Affiliates without specific case-by-case consideration. Pre-approval considerations include whether the proposed services are compatible with maintaining the Auditor's independence. Pre-approvals pursuant to the Policy are considered annually.
Non-Audit Fees. The aggregate non-audit fees billed by the Auditor for services rendered to the Registrant, and rendered to Service Affiliates, for the Reporting Periods were $2,776,719 in 2004 and $1,476,000 in 2005.
Auditor Independence. The Registrant's Audit Committee has considered whether the provision of non-audit services that were rendered to Service Affiliates which were not pre-approved (not requiring pre-approval) is compatible with maintaining the Auditor's independence.
| Item 5. | Audit Committee of Listed Registrants. | |
| Not applicable. | ||
| Item 6. | Schedule of Investments. | |
| Not applicable. | ||
| Item 7. | Disclosure of Proxy Voting Policies and Procedures for Closed-End Management | |
| Investment Companies. | ||
| Not applicable. | ||
| Item 8. | Portfolio Managers of Closed-End Management Investment Companies. | |
| Not applicable. | ||
| Item 9. | Purchases of Equity Securities by Closed-End Management Investment Companies and | |
| Affiliated Purchasers. | ||
| Not applicable. | ||
| Item 10. | Submission of Matters to a Vote of Security Holders. |
The Registrant has a Nominating Committee (the "Committee"), which is responsible for selecting and nominating persons for election or appointment by the Registrant's Board as Board members. The Committee has adopted a Nominating Committee Charter (the "Charter"). Pursuant to the Charter, the Committee will consider recommendations for nominees from shareholders submitted to the Secretary of the Registrant, c/o The Dreyfus Corporation Legal Department, 200 Park Avenue, 8th Floor East, New York, New York 10166. A nomination submission must include information regarding the recommended nominee as specified in the Charter. This information includes all information relating to a recommended nominee that is required to be disclosed in solicitations or proxy statements for the election of Board members, as well as information sufficient to evaluate the factors to be considered by the Committee, including character and integrity, business and professional experience, and whether the person has the ability to apply sound and independent business judgment and would act in the interests of the Registrant and its shareholders. Nomination submissions are required to be accompanied by a written consent of the individual to stand for election if nominated by the Board and to serve if elected by the shareholders, and such additional information must be provided regarding the recommended nominee as reasonably requested by the Committee.
Item 11. Controls and Procedures.
(a) The Registrant's principal executive and principal financial officers have concluded, based on their evaluation of the Registrant's disclosure controls and procedures as of a date within 90 days of the filing date of this report, that the Registrant's disclosure controls and procedures are reasonably designed to ensure that information required to be disclosed by the Registrant on Form N-CSR is recorded, processed, summarized and reported within the required time periods and that information required to be disclosed by the Registrant in the reports that it files or submits on Form N-CSR is accumulated and communicated to the Registrant's management, including its principal executive and principal financial officers, as appropriate to allow timely decisions regarding required disclosure.
(b) There were no changes to the Registrant's internal control over financial reporting that occurred during the second fiscal quarter of the period covered by this report that have materially affected, or are reasonably likely to materially affect, the Registrant's internal control over financial reporting.
Item 12. Exhibits.
| (a)(1) | Code of ethics referred to in Item 2. | |
| (a)(2) | Certifications of principal executive and principal financial officers as required by Rule 30a-2(a) | |
| under the Investment Company Act of 1940. | ||
| (a)(3) | Not applicable. | |
| (b) | Certification of principal executive and principal financial officers as required by Rule 30a-2(b) | |
| under the Investment Company Act of 1940. | ||
| SIGNATURES |
Pursuant to the requirements of the Securities Exchange Act of 1934 and the Investment Company Act of 1940, the Registrant has duly caused this Report to be signed on its behalf by the undersigned, thereunto duly authorized.
Mellon Funds Trust
| By: | /s/Lawrence P. Keblusek | |
| Lawrence P. Keblusek | ||
| President | ||
| Date: | October 27, 2005 | |
Pursuant to the requirements of the Securities Exchange Act of 1934 and the Investment Company Act of 1940, this Report has been signed below by the following persons on behalf of the Registrant and in the capacities and on the dates indicated.
| By: | /s/Lawrence P. Keblusek | |||
| Lawrence P. Keblusek | ||||
| Chief Executive Officer | ||||
| Date: | October 27, 2005 | |||
| By: | /s/James Windels | |||
| James Windels | ||||
| Chief Financial Officer | ||||
| Date: | October 27, 2005 | |||
| EXHIBIT INDEX | ||||
| (a)(1) | Code of ethics referred to in Item 2. | |||
| (a)(2) | Certifications of principal executive and principal financial officers as required by Rule 30a- | |||
| 2(a) under the Investment Company Act of 1940. (EX-99.CERT) | ||||
| (b) | Certification of principal executive and principal financial officers as required by Rule 30a- | |||
| 2(b) under the Investment Company Act of 1940. (EX-99.906CERT) | ||||
Exhibit (a)(1)