UNITED STATES
SECURITIES AND EXCHANGE COMMISSION
Washington, D.C. 20549
FORM N-CSR
CERTIFIED SHAREHOLDER REPORT OF REGISTERED MANAGEMENT
INVESTMENT COMPANIES
Investment Company Act file number | 811-09903 |
| |
| BNY Mellon Funds Trust | |
| (Exact name of Registrant as specified in charter) | |
| | |
| c/o The Dreyfus Corporation 200 Park Avenue New York, New York 10166 | |
| (Address of principal executive offices) (Zip code) | |
| | |
| Michael A. Rosenberg, Esq. 200 Park Avenue New York, New York 10166 | |
| (Name and address of agent for service) | |
|
Registrant's telephone number, including area code: | (212) 922-6000 |
| |
Date of fiscal year end: | 8/31 | |
Date of reporting period: | 2/28/2011 | |
| | | | | | | |
FORM N-CSR
Item 1. Reports to Stockholders.
|
| BNY Mellon Large Cap Stock Fund |
| BNY Mellon Large Cap Market Opportunities Fund |
| BNY Mellon Tax-Sensitive Large Cap Multi-Strategy Fund |
| BNY Mellon Income Stock Fund |
| BNY Mellon Mid Cap Stock Fund |
| BNY Mellon Small Cap Stock Fund |
| BNY Mellon U.S. Core Equity 130/30 Fund |
| BNY Mellon Focused Equity Opportunities Fund |
| BNY Mellon Small/Mid Cap Fund |
| BNY Mellon International Fund |
| BNY Mellon Emerging Markets Fund |
| BNY Mellon InternationalAppreciation Fund |
| BNY Mellon Balanced Fund |
The BNY Mellon Funds
| |
| SEMIANNUAL REPORT | February 28, 2011 |

Contents
| |
| The Funds | |
| |
| Letter from the President | 2 |
| Discussion of Funds’ Performance | |
| BNY Mellon Large Cap Stock Fund | 3 |
| BNY Mellon Large Cap | |
| Market Opportunities Fund | 5 |
| BNY Mellon Tax-Sensitive | |
| Large Cap Multi-Strategy Fund | 7 |
| BNY Mellon Income Stock Fund | 9 |
| BNY Mellon Mid Cap Stock Fund | 11 |
| BNY Mellon Small Cap Stock Fund | 13 |
| BNY Mellon U.S. Core | |
| Equity 130/30 Fund | 15 |
| BNY Mellon Focused Equity | |
| Opportunities Fund | 17 |
| BNY Mellon Small/Mid Cap Fund | 19 |
| BNY Mellon International Fund | 21 |
| BNY Mellon Emerging Markets Fund | 23 |
| BNY Mellon International | |
| Appreciation Fund | 25 |
| BNY Mellon Balanced Fund | 27 |
| Understanding Your Fund’s Expenses | 29 |
| Comparing Your Fund’s Expenses | |
| With Those of Other Funds | 31 |
| Statements of Investments | 33 |
| Statement of Options Written | 44,56 |
| Statement of Securities Sold Short | 53 |
| Statement of Financial Futures | 74 |
| Statements of Assets and Liabilities | 81 |
| Statements of Operations | 87 |
| Statement of Cash Flows | 91 |
| Statements of Changes in Net Assets | 92 |
| Financial Highlights | 100 |
| Notes to Financial Statements | 127 |
| |
| |
| |
| For More Information | |
| |
| Back cover | |
The views expressed herein are current to the date of this report. These views and the composition of the funds’ portfolios are subject to change at any time based on market and other conditions.

The Funds

LETTER FROM
THE PRESIDENT
Dear Shareholder:
We are pleased to present to you this semiannual report for the BNY Mellon Funds Trust, covering the reporting period ended February 28, 2011.
Equities throughout the world fared quite well over the past six months. International stock markets have rallied broadly since the fall, when new rounds of monetary stimulus from U.S. and foreign central banks gave investors confidence that the global economy was unlikely to slip back into recession. As a result, developed markets in Europe and Japan rebounded strongly from relatively depressed levels, while emerging markets added more moderately to their previous gains. Market sectors that tend to be sensitive to macroeconomic changes performed particularly well as commodity prices climbed and investors looked forward to better business conditions.
We currently expect the U.S. economy to gain a moderate degree of momentum over the remainder of 2011 as the latest unemployment figures and benign inflationary pressures appear favorable to equities over the near term. However, in the wake of recent gains, we believe that selectivity will become a more important determinant of investment success. We favor companies with higher growth potential, and we also are optimistic about the prospects of high-quality companies with ample cash reserves capable of generating dividend increases and share buybacks.As always, your portfolio manager can help you align your investment portfolio with the opportunities and challenges that 2011 has in store.
For information about how each fund performed during the reporting period, as well as market perspectives, we have provided a Discussion of Fund Performance for each fund.
Thank you for your continued confidence and support.

|
| Christopher E. Sheldon |
| President |
| BNY Mellon Funds Trust |
| March 15, 2011 |

DISCUSSION OF
FUND PERFORMANCE
For the period of September 1, 2010, through February 28, 2011, as provided by Sean P. Fitzgibbon and Jeffrey D. McGrew, Portfolio Managers
Fund and Market Performance Overview
For the six-month period ended February 28, 2011, BNY Mellon Large Cap Stock Fund’s Class M shares produced a total return of 28.45%, and Investor shares returned 28.46%.1 In comparison, the total return of the Standard & Poor’s 500 Composite Stock Price Index (“S&P 500 Index”), the fund’s benchmark, was 27.73%.2
U.S. stocks rallied during the reporting period as the economic recovery gathered momentum. The fund produced higher returns than its benchmark, primarily due to the success of our stock selection strategy in the information technology and industrials sectors.
The Fund’s Investment Approach
The fund seeks capital appreciation.To pursue its goal, the fund normally invests at least 80% of its assets in stocks of large-cap companies.We choose stocks through a disciplined investment process that uses computer modeling techniques to identify and rank companies based on value, growth and other financial characteristics. Also, we use fundamental analysis, conducting independent research to select the most attractive of the higher-ranked securities. We also attempt to manage risks by diversifying the fund’s investments across companies and industries, maintaining weightings and risk characteristics that generally are similar to those of the S&P 500 Index.
Greater Economic Confidence Fueled a Market Rally
Despite a subpar U.S. economic recovery and a sovereign debt crisis in Europe, investor sentiment improved dramatically soon after the start of the reporting period when the Federal Reserve Board announced a new round of quantitative easing of U.S. monetary policy. This stimulative measure helped convince investors that the economy was unlikely to slip back into recession.A more optimistic investment outlook was reinforced by subsequent improvements in employment and consumer spending, as well as better-than-expected corporate earnings across a number of industry groups.
Later in the fall, the end of uncertainty surrounding U.S. midterm elections and the passage of fiscally stimulative tax legislation lent further support to the stock market rally. However, the rally was interrupted in February when a wave of political unrest in the Middle East led to sharply higher crude oil prices.
Cyclical Sectors Bolstered Relative Performance
The fund participated fully in the market rally over the reporting period, as our stock selection strategy proved especially effective in some of the market’s more economically sensitive industry groups, including the information technology, industrials and energy sectors. Among technology companies, we focused on businesses that we believed were poised to benefit from the trend toward “cloud computing,” in which enterprises access data and applications over
DISCUSSION OF FUND PERFORMANCE (continued)
the Internet.This trend helped lift the stocks of software developers Oracle and Informatica. In addition, communications equipment maker QUALCOMM benefited from the increased adoption of smartphones, while Apple enjoyed continued market leadership in both phones and tablets. Internet retailer Amazon.com also saw a strong holiday sales season fueled by the popularity of its Kindle e-reader.
In the industrials sector, we focused mainly on companies that traditionally have benefited from the later stages of the economic cycle. Heavy equipment maker Caterpillar encountered robust demand from the energy and materials end markets it serves, and new management at industrial conglomerate Dover raised investor confidence, as they implemented new operating efficiencies and made strategic acquisitions. Construction engineer Ingersoll-Rand saw increased demand for HVAC systems from new construction as well as upgrades in existing buildings that had been postponed during the downturn. In the energy sector, exploration-and-production companies advanced as oil and gas prices climbed, enabling longtime holdings Hess and Newfield Exploration to deliver better-than-expected earnings along with the more recent addition, Anadarko Petroleum.
Disappointments during the reporting period were most pronounced in the consumer discretionary sector. Strong results from retailers Nordstrom and Limited Brands were offset by unfortunate timing in the purchase of shares of Ford Motor, causing the fund to miss much of the automaker’s initial gains during the rally. In the telecommunications services sector, industry giant AT&T was undermined by concerns over the loss of its position as the exclusive carrier for the wildly popular iPhone. The fund’s results in the financials sector were hindered to a
degree by American Express, which lagged sector averages after reporting mixed financial results. Finally, the fund suffered shortfalls from diabetes drug specialist Amylin Pharmaceuticals, biotechnology firm Human Genome Sciences and beverage producer PepsiCo.
New Opportunities in a Recovering Economy
We expect the U.S. and global economic rebounds to persist, but going forward revenue improvement will be accompanied by rising expenses as companies resume spending and investment. In this environment, our stock selection process has identified potential opportunities in the consumer discretionary, energy and health care sectors, but has identified fewer opportunities in the consumer staples, materials, financials and telecommunications services sectors. While we believe that these modest tilts position the fund to benefit from further economic growth, we remain cautious regarding valuations and near-term volatility, and we have attempted to keep the fund’s risks roughly in line with those of the broader market.
March 15, 2011
| |
| | Please note, the position in any security highlighted with italicized typeface |
| | was sold during the reporting period. |
| | Equity funds are subject generally to market, market sector, market liquidity, |
| | issuer and investment style risks, among other factors, to varying degrees, all of |
| | which are more fully described in the fund’s prospectus. |
| 1 | Total return includes reinvestment of dividends and any capital gains paid. |
| | Past performance is no guarantee of future results. Share price and investment |
| | return fluctuate such that upon redemption, fund shares may be worth more or |
| | less than their original cost. |
| 2 | SOURCE: LIPPER INC. — Reflects the monthly reinvestment of |
| | dividends and, where applicable, capital gain distributions.The Standard & |
| | Poor’s 500 Composite Stock Price Index is a widely accepted, unmanaged |
| | index of U.S. stock market performance. Index return does not reflect fees and |
| | expenses associated with operating a mutual fund. Investors cannot invest |
| | directly in any index. |
4

DISCUSSION OF
FUND PERFORMANCE
For the period of September 1, 2010, through February 28, 2011, as provided by Christopher E. Sheldon, CFA, Portfolio Manager
Fund and Market Performance Overview
For the six-month period ended February 28, 2011, BNY Mellon Large Cap Market Opportunities Fund’s Class M shares produced a total return of 26.33%, and Investor shares returned 26.21%.1 In comparison, the total return of the Standard & Poor’s 500 Composite Stock Price Index (“S&P 500 Index”), the fund’s benchmark, was 27.73% for the same period.2
Large-cap stocks rallied strongly as the U.S. and global economic recoveries gained momentum. Although the fund participated to a substantial degree in the market’s gains, it produced lower returns than its benchmark due to mild shortfalls in two of the three underlying strategies in which it invested.
The Fund’s Investment Approach
The fund seeks long-term capital appreciation. To pursue its goal, the fund normally invests at least 80% of its assets in equity securities of large cap companies, currently defined to be those companies with total market capitalizations of $5 billion or more at the time of the purchase.The fund normally allocates its assets among multiple investment strategies, each employed by the fund’s investment adviser or its affiliates that invest primarily in equity securities issued by large-cap companies.The fund is designed to provide exposure to various large-cap equity portfolio managers and investment strategies and styles, including some or all of the following: the Focused Equity Strategy, U.S. Large Cap Equity Strategy, U.S. Core Equity 130/30 Strategy, Dynamic Large Cap Value Strategy, Large Cap Growth Strategy and U.S. Large Cap Growth Strategy, all as more particularly described in the fund’s prospectus.The fund invests directly in securities or in other mutual funds advised by the fund’s investment adviser or its affiliates.
The fund’s investment adviser determines the investment strategies, sets the target allocations, monitors portfolio trading activity within the investment strategies and executes all purchases and sales of portfolio securities of the fund.
Greater Economic Confidence Fueled a Market Rally
The reporting period began in the wake of a period of choppy stock market performance stemming from a subpar U.S. economic recovery and a sovereign debt crisis in Europe. However, investor sentiment soon improved dramatically when the Federal Reserve Board announced a new round of quantitative easing of U.S. monetary policy. This stimulative measure helped convince many investors that the U.S. economy was unlikely to slip back into recession, and they began to look forward to better business conditions for U.S. and multinational companies. A more optimistic investment outlook was reinforced by subsequent releases of economic data, which showed improvements in employment and consumer spending, as well as better-than-expected corporate earnings across a number of industry groups.
Later in the fall, the end of uncertainty surrounding U.S. midterm elections and the passage of fiscally stimulative tax legislation lent further support to the stock market rally. However, the rally was interrupted in February when a wave of political unrest in the Middle East led to sharply higher energy prices.
Focused Equities Strategy Bolstered Relative Results
Although the fund captured much of the broad-based market rally during the reporting period, its U.S. Core Equity 130/30 Strategy caused it to lag modestly behind the S&P 500 Index. In the U.S. Core Equity 130/30 Strategy, strong relative results in the health care and consumer discretionary sectors were not enough to offset the adverse effects of relative performance in the
DISCUSSION OF FUND PERFORMANCE (continued)
financials sector and underweighted exposure to the materials sector. In the U.S. Large Cap Equity Strategy, an underweighted position in the financials sector compared to the benchmark undermined the fund’s performance. Above-average returns stemming from overweighted exposure to the energy sector and underweighted positions in the traditionally defensive telecommunications services and utilities sectors helped offset the shortfall.
The Focused Equity Strategy produced better relative results, outperforming the S&P 500 Index on the strength of successful stock selections in the health care, industrials, materials and technology sectors. Relative performance in the health care sector was bolstered by its lack of exposure to large pharmaceutical companies, while industrial companies Caterpillar and Honeywell International, iron ore producer Cliffs Natural Resources and information technology firms Cognizant Technology Solutions, Baidu and Apple also helped drive the fund’s returns.
A Cyclical Bias in a Recovering Economy
Despite headwinds from resurgent oil prices and a moribund housing market, we believe the current economic recovery is likely to persist. Consequently, we have maintained the fund’s tilt toward more cyclical investments. For example, our allocation strategy has
maintained relatively heavy exposure to the energy and information technology sectors, and we have placed less emphasis on the traditionally defensive consumer staples, utilities and telecommunications services sectors. Of course, we are prepared to change the fund’s allocations among its underlying strategies as economic and market conditions evolve.
March 15, 2011
| |
| | Equity funds are subject generally to market, market sector, market liquidity, |
| | issuer and investment style risks, among other factors, to varying degrees, all of |
| | which are more fully described in the fund’s prospectus. |
| | The fund may use derivative instruments, such as options, futures and options |
| | on futures and swaps.A small investment in derivatives could have a |
| | potentially large impact on the fund’s performance.The use of derivatives |
| | involves risks different from, or possibly greater than, the risks associated with |
| | investing directly in the underlying assets. |
| 1 | Total return includes reinvestment of dividends and any capital gains paid. |
| | Past performance is no guarantee of future results. Share price and investment |
| | return fluctuate such that upon redemption, fund shares may be worth more or |
| | less than their original cost. Return figures provided reflect the absorption of |
| | certain fund expenses by BNY Mellon Fund Advisors pursuant to an |
| | agreement in effect until January 1, 2012, at which time it may be extended, |
| | terminated or modified. Had these expenses not been absorbed, the fund’s |
| | returns would have been lower. |
| 2 | SOURCE: LIPPER INC. — Reflects monthly reinvestment of dividends |
| | and, where applicable, capital gain distributions.The Standard & Poor’s 500 |
| | Composite Stock Price Index is a widely accepted, unmanaged index of U.S. |
| | stock market performance. Investors cannot invest directly in any index. |
6

DISCUSSION OF
FUND PERFORMANCE
For the period of September 1, 2010, through February 28, 2011, as provided by Christopher E. Sheldon, CFA, Portfolio Manager
Fund and Market Performance Overview
For the six-month period ended February 28, 2011, BNY Mellon Tax-Sensitive Large Cap Multi-Strategy Fund’s Class M shares produced a total return of 27.56%, and Investor shares returned 27.38%.1 In comparison, the total return of the Standard & Poor’s 500 Composite Stock Price Index (“S&P 500 Index”), the fund’s benchmark, was 27.73% for the same period.2
Large-cap stocks rallied strongly as the U.S. and global economic recoveries gained momentum. The fund produced returns that were roughly in line with its benchmark, as strong relative results from its Large Cap Core Strategy and Focused Equity Strategy offset shortfalls in the U.S. Large Cap Equity Strategy and U.S. Core Equity 130/30 Strategy.
The Fund’s Investment Approach
The fund seeks long-term capital appreciation.To pursue its goal, the fund normally invests at least 80% of its assets in equity securities of large cap companies, currently defined to be those companies with total market capitalizations of $5 billion or more at the time of purchase. The fund normally allocates its assets among multiple investment strategies, each employed by the fund’s investment adviser or its affiliates, that invest primarily in equity securities issued by large-cap companies.The fund is designed to provide exposure to various large-cap equity portfolio managers and investment strategies and styles, and uses tax-sensitive strategies to reduce the impact of federal and state income taxes on its after-tax returns.The fund apportions its assets among some or all of the following: the Large Cap Core Strategy, Large Cap Tax-Sensitive Strategy, Focused Equity Strategy, U.S. Large Cap Equity Strategy, U.S. Core Equity 130/30 Strategy,
Dynamic Large CapValue Strategy, Large Cap Growth Strategy and U.S. Large Cap Growth Strategy, all as more particularly described in the fund’s prospectus. The fund invests directly in securities or in other mutual funds advised by the fund’s investment adviser or its affiliates.
The fund’s investment adviser determines the investment strategies, sets the target allocations, monitors portfolio trading activity within the investment strategies and executes all purchases and sales of portfolio securities of the fund.
Greater Economic Confidence Fueled a Market Rally
Shortly after the start of the reporting period, investor sentiment improved dramatically when the Federal Reserve Board announced a new round of quantitative easing of U.S. monetary policy.A more optimistic outlook was reinforced by subsequent improvements in employment and consumer spending, as well as better-than-expected corporate earnings across most industry groups. Later in the fall, the end of uncertainty surrounding U.S. midterm elections and the passage of fiscally stimulative tax legislation lent further support to a rising stock market. However, the rally was interrupted in February when a wave of political unrest in the Middle East led to sharply higher energy prices.
Focused Equities and Large Cap Core Strategies Boosted Relative Results
In the fund’s Focused Equity Strategy, the health care sector benefited from lack of exposure to large pharmaceutical companies, while industrial companies Caterpillar and Honeywell International, iron ore producer Cliffs Natural Resources and information technology firms Cognizant Technology Solutions, Baidu and Apple also helped fuel the fund’s relative returns. Gains in the Large Cap Core Strategy were primarily driven by the information technology sec-
DISCUSSION OF FUND PERFORMANCE (continued)
tor, where a number of companies benefited from emerging trends such as “cloud computing” and the shift from personal computers to smartphones and tablet computers. The strategy also scored successes in industrial companies leveraged to the recovering global economy, including Caterpillar, Eaton and Honeywell.
On the other hand, the U.S. Core Equity 130/30 Strategy trailed the S&P 500 Index modestly. In the U.S. Core Equity 130/30 Strategy, strong results in the energy, materials and industrial sectors were reduced by lower returns in the utilities, telecom and staples sectors. The U.S. Large Cap Equity Strategy performed in line with the market. An underweighted position in the financials sector dampened the fund’s relative performance. Better returns stemming from overweighted exposure to the energy sector, more than offset lesser returns from underweighted positions in the traditionally defensive telecommunications services and utilities sectors.
The Large Cap Tax-Sensitive Strategy produced returns that were in line with market averages, as strong performance in the energy sector was balanced by lagging results among telecommunications services companies and utilities.
A Cyclical Bias in a Recovering Economy
Despite headwinds from resurgent oil prices and a moribund housing market, we believe the economic recovery is likely to persist. Consequently, we have maintained the
fund’s exposure to cyclical investments. For example, our allocation strategy has maintained relatively heavy exposure to the energy and information technology sectors, and we have placed less emphasis on the traditionally defensive consumer staples, utilities and telecommunications services sectors. Of course, we are prepared to change the fund’s allocations among its underlying strategies as economic and market conditions evolve.
March 15, 2011
| |
| | Equity funds are subject generally to market, market sector, market liquidity, |
| | issuer and investment style risks, among other factors, to varying degrees, all of |
| | which are more fully described in the fund’s prospectus. |
| | The fund may use derivative instruments, such as options, futures and options |
| | on futures and swaps.A small investment in derivatives could have a |
| | potentially large impact on the fund’s performance.The use of derivatives |
| | involves risks different from, or possibly greater than, the risks associated with |
| | investing directly in the underlying assets. |
| 1 | Total return includes reinvestment of dividends and any capital gains paid. |
| | Past performance is no guarantee of future results. Share price and investment |
| | return fluctuate such that upon redemption, fund shares may be worth more or |
| | less than their original cost. Return figures provided reflect the absorption of |
| | certain fund expenses by BNY Mellon Fund Advisors pursuant to an |
| | agreement in effect until January 1, 2012, at which time it may be extended, |
| | terminated or modified. Had these expenses not been absorbed, the fund’s |
| | returns would have been lower. |
| 2 | SOURCE: LIPPER INC. — Reflects monthly reinvestment of dividends |
| | and, where applicable, capital gain distributions.The Standard & Poor’s 500 |
| | Composite Stock Price Index is a widely accepted, unmanaged index of U.S. |
| | stock market performance. Investors cannot invest directly in any index. |
8

DISCUSSION OF
FUND PERFORMANCE
For the period of September 1, 2010, through February 28, 2011, as provided by Brian C. Ferguson, Portfolio Manager
Fund and Market Performance Overview
For the six-month period ended February 28, 2011, BNY Mellon Income Stock Fund’s Class M shares produced a total return of 27.27%, and its Investor shares returned 27.06%.1 The fund’s benchmark, the Russell 1000 Value Index, produced a total return of 26.30% for the same period.2
Stocks rallied strongly over the reporting period as the U.S. and global economic recoveries gained momentum. The fund produced higher returns than its benchmark, due to the success of our stock selection strategy in seven of the 10 industry groups represented in the Russell 1000Value Index.
The Fund’s Investment Approach
The fund seeks total return consisting of capital appreciation and income.To pursue its goal, the fund normally invests at least 80% of its assets in stocks.The fund seeks to focus on dividend-paying stocks and other investment techniques that produce income. We choose stocks through a disciplined investment process that combines quantitative modeling techniques, fundamental analysis and risk management.While we attempt to manage risks by diversifying broadly across companies and industries, the fund may at times overweight certain sectors in an attempt to earn higher yields. The fund may also use derivatives as a substitute for taking a position in an underlying asset, to increase returns or income, or as part of a hedging strategy.
Greater Economic Confidence Fueled a Market Rally
Despite a subpar U.S. economic recovery and a sovereign debt crisis in Europe, investor sentiment improved dramatically soon after the start of the reporting period when the Federal Reserve Board announced a new round of quantitative easing of U.S. monetary policy. This stimulative measure helped convince many investors that the U.S. economy was unlikely to slip back into recession, and they began to look forward to better business conditions for domestic and multinational companies. A more optimistic investment outlook was reinforced by subsequent improvements in employment and consumer spending, as well as better-than-expected corporate earnings across a number of industry groups.
Later in the fall, the end of uncertainty surrounding U.S. midterm elections and the passage of fiscally stimulative tax legislation lent further support to the stock market rally. However, the rally was interrupted in February when a wave of political unrest in the Middle East led to sharply higher crude oil prices.
Stock Selection Strategy Boosted Fund Results
The fund participated fully in the stock market’s gains over the reporting period. Returns were especially robust in the industrials sector. Capital goods producers encountered better business conditions in an improving global economy, supporting higher stock prices for heavy equipment maker Caterpillar and industrial conglomerates Dover and General Electric.
DISCUSSION OF FUND PERFORMANCE (continued)
In the consumer discretionary sector, overweighted exposure to media stocks lifted the fund’s relative performance, led by advertising agency holding company Omnicom Group. Automotive parts supplier Johnson Controls also advanced as car and truck sales continued to rebound from previously depressed levels.
The fund benefited from underweighted exposure to the utilities sector, the only segment of the benchmark that fell short of double-digit returns for the reporting period. Utilities generally did not meet our investment criteria due to their high valuations and low rates of earnings growth. Among individual stocks in other market sectors, energy services provider Schlumberger advanced due to rising demand for a limited supply of oil, and technology firm QUALCOMM benefited from the ongoing shift from personal computers to mobile and tablet devices. Lack of exposure to insurance holding company Berkshire Hathaway supported the fund’s relative performance in the financials sector.
Although the energy sector provided the fund’s highest absolute returns during the reporting period, the sector’s performance compared to the benchmark suffered as the fund did not own many of the large, integrated energy producers that benefited most from higher commodity prices. Conversely, the fund held overweighted positions in the telecommunications services sector due to its high dividend yields, but the sector generally lagged market averages as investors turned toward more economically sensitive investments. In the information technology sector, networking giant Cisco Systems did not participate as strongly as other companies in the growing trend toward “cloud computing,” in which businesses store and access data and applications over the Internet.
Positioned for a More Selective Market Environment
We expect the U.S. economic recovery to persist in 2011. Greater economic and political clarity may help convince business leaders to deploy some of their massive cash reserves for mergers-and-acquisitions, stock buybacks and other productive uses. However, a number of economic headwinds remain, including geopolitical turmoil, rising commodity prices and troubled U.S. housing markets.
We expect investors to become more selective in this environment, favoring companies that can grow consistently in a moderately expanding economy. Therefore, we have maintained overweighted positions among companies we believe tend to do well in cyclical recoveries.
March 15, 2011
| |
| | Please note, the position in any security highlighted with italicized typeface |
| | was sold during the reporting period. |
| | Equity funds are subject generally to market, market sector, market liquidity, |
| | issuer and investment style risks, among other factors, to varying degrees, all of |
| | which are more fully described in the fund’s prospectus. |
| 1 | Total return includes reinvestment of dividends and any capital gains paid. |
| | Past performance is no guarantee of future results. Share price and investment |
| | return fluctuate such that upon redemption, fund shares may be worth more or |
| | less than their original cost. |
| 2 | SOURCE: LIPPER INC. — Reflects the reinvestment of dividends and, |
| | where applicable, capital gain distributions.The Russell 1000 Value Index is |
| | an unmanaged index which measures the performance of those Russell 1000 |
| | companies with lower price-to-book ratios and lower forecasted growth values. |
| | Investors cannot invest directly in any index. |
10

DISCUSSION OF
FUND PERFORMANCE
For the period from September 1, 2010, through February 28, 2011, as provided by Stephen A. Mozur, Portfolio Manager
Fund and Market Performance Overview
For the six-month period ended February 28, 2011, BNY Mellon Mid Cap Stock Fund’s Class M shares produced a total return of 40.10%, Investor shares returned 39.83% and Dreyfus Premier shares returned 39.40%.1 In comparison, the Standard & Poor’s MidCap 400 Index (“S&P 400 Index”), the fund’s benchmark, produced a total return of 34.86% for the same period.2
Midcap stocks rallied over the reporting period as the economic recovery gained momentum.The fund produced returns that were higher than its benchmark, due primarily to an emphasis on companies with growth-oriented business models.
The Fund’s Investment Approach
The fund seeks capital appreciation by normally investing at least 80% of its assets in stocks of domestic companies with market capitalizations generally in the range of companies included in the S&P 400 Index at the time of purchase. The fund invests in growth and value stocks, which are chosen through a disciplined investment process that combines computer modeling techniques, fundamental analysis and risk management. Based on fundamental analysis, the investment adviser generally selects the most attractive securities, drawing on a variety of sources, including internal as well as Wall Street research, and company management. Finally, we manage risk by diversifying across companies and industries. Our goal is to keep those risks at levels that are similar to those of the S&P 400 Index.
Improved Economic Confidence Fueled a Market Rally
Despite a subpar U.S. economic recovery and a sovereign debt crisis in Europe, investor sentiment improved dramatically soon after the start of the reporting period when the Federal Reserve Board announced a new round of quantitative easing of U.S. monetary policy. A more optimistic investment outlook was reinforced by subsequent improvements in employment and consumer spending, as well as increased mergers-and-acquisitions activity and better-than-expected corporate earnings across a number of industry groups. Later in the fall, the end of uncertainty surrounding U.S. midterm elections and the passage of fiscally stimulative tax legislation lent further support to the stock market. However, the rally was interrupted in February when a wave of political unrest in the Middle East led to sharply higher crude oil prices.
In this generally favorable environment, midcap stocks produced substantially higher returns than large-cap stocks.
A Cyclical Bias Boosted Fund Results
The fund achieved above-average results in eight of the 10 economic sectors represented in the S&P 400 Index, scoring particularly strong returns from overweighted positions in economically sensitive industry groups. In the information technology sector, successful stock selections and an emphasis on high-growth communications equipment companies boosted relative performance. RiverbedTechnology more than doubled
DISCUSSION OF FUND PERFORMANCE (continued)
in value and Rackspace Hosting advanced strongly amid increasing demand for data center infrastructure and network optimization as companies transitioned to “cloud computing” for their data management needs. JDS Uniphase and Acme Packet produced higher earnings due to increased spending by telecommunications companies on optical components. Employee training software developer SuccessFactors gained value after reporting strong bookings and revenue growth.
In the financials sector, insurance holding company CNO Financial Group climbed after successfully restructuring its debt, which resulted in upgrades from major credit-rating agencies. Insurance provider Hartford Financial Services Group gained substantial value as credit losses eased and the company’s capital position and earnings outlook improved. Real estate investment trust Host Hotels & Resorts advanced amid improved occupancy rates and the announcement of several acquisitions. Rising commodity prices helped boost the energy sector, benefiting exploration-and-production companies Brigham Exploration and SandRidge Energy. In addition, coal producers International Coal Group and Massey Energy benefited from rising commodity prices and takeover speculation.
Disappointments proved relatively mild during the reporting period. In the health care sector, biopharmaceu-tical firm Inspire Pharmaceuticals fell sharply on the first trading day of 2011 due to negative trial data for a cystic fibrosis drug under development. Salix Pharmaceuticals fell when regulators delayed approval of a new drug treating irritable bowel syndrome. Thoratec slid due to competitive concerns regarding its heart pump products, and the company reported disappointing quarterly earnings in early 2011.
Positioned for More Economic Recovery
Despite headwinds from resurgent oil prices and a moribund housing market, we believe the economic recovery is likely to persist. Consequently, we have maintained the fund’s tilt toward cyclical companies with the potential for higher-than-average revenues and earnings growth. We have found a number of opportunities in the energy, industrials and information technology sectors, but we have found fewer opportunities in the traditionally defensive utilities and consumer staples sectors. We also have invested in midcap stocks that we believe will benefit from other investment themes, including a rebound in auto and truck sales, improving conditions in the airline industry, rising mergers-and-acquisitions activity, rising demand for wireless communications and higher commodity prices.
March 15, 2011
| |
| | Please note, the position in any security highlighted in italicized typeface was |
| | sold during the reporting period. |
| | Equity funds are subject generally to market, market sector, market liquidity, |
| | issuer and investment style risks, among other factors, to varying degrees, all of |
| | which are more fully described in the fund’s prospectus. |
| | Stocks of small- and/or midcap companies often experience sharper price |
| | fluctuations than stocks of large-cap companies. |
| 1 | Total return includes reinvestment of dividends and any capital gains paid, and |
| | does not take into consideration the contingent deferred sales charges imposed |
| | on redemptions in the case of Dreyfus Premier shares. Had these charges been |
| | reflected, returns would have been lower. Past performance is no guarantee of |
| | future results. Share price and investment return fluctuate such that upon |
| | redemption, fund shares may be worth more or less than their original cost. |
| 2 | SOURCE: LIPPER INC. — Reflects reinvestment of dividends and, where |
| | applicable, capital gain distributions.The Standard & Poor’s MidCap 400 |
| | Index is a widely accepted, unmanaged total return index measuring the |
| | performance of the midsize company segment of the U.S. stock market. Index |
| | return does not reflect the fees and expenses associated with operating a mutual |
| | fund. Investors cannot invest directly in any index. |
12

DISCUSSION OF
FUND PERFORMANCE
For the period from September 1, 2010, through February 28, 2011, as provided by Stephen A. Mozur, Portfolio Manager
Fund and Market Performance Overview
For the six-month period ended February 28, 2011, BNY Mellon Small Cap Stock Fund’s Class M shares produced a total return of 37.81%, and its Investor shares produced a total return of 37.50%.1 In comparison, the fund’s benchmark, the Standard & Poor’s SmallCap 600 Index (the “Index”), produced a total return of 35.41% for the same period.2
Small-cap stocks rallied over the reporting period as the economic recovery gained momentum. The fund produced returns that were higher than its benchmark, due primarily to an emphasis on companies with growth-oriented business models.
The Fund’s Investment Approach
The fund seeks capital appreciation.To pursue its goal, the fund normally invests at least 80% of its assets in stocks of small-cap companies. We choose stocks through a disciplined investment process that uses computer modeling techniques to identify and rank companies based on value, growth and other financial characteristics. Also, we use fundamental analysis, conducting independent research to select the most attractive of the higher-ranked securities. We also attempt to manage risks by diversifying the fund’s investments across companies and industries, maintaining weightings and risk characteristics that generally are similar to those of the S&P 600 Index.
Improved Economic Confidence Fueled a Market Rally
The reporting period began in the wake of a period of choppy stock market performance stemming from a subpar U.S. economic recovery and a sovereign debt crisis in Europe. However, investor sentiment soon improved dramatically when the Federal Reserve Board
announced a new round of quantitative easing of U.S. monetary policy, and investors began to look forward to better business conditions. A more optimistic investment outlook was reinforced by subsequent releases of economic data, which showed improvements in employment and consumer spending, as well as better-than-expected corporate earnings across a number of industry groups.
Later in the fall, the end of uncertainty surrounding U.S. midterm elections and the passage of fiscally stimulative tax legislation lent further support to the stock market rally. However, the rally was interrupted in February when a wave of political unrest in the Middle East led to sharply higher crude oil prices.
In this generally favorable environment, small-cap stocks produced higher returns, on average, than their mid- and large-cap counterparts.
A Cyclical Bias Boosted Fund Results
The fund achieved above-average results in eight of the 10 economic sectors represented in the S&P 600 Index, scoring particularly strong returns from overweighted positions in economically sensitive industry groups. In the information technology sector, successful stock selections and an emphasis on high-growth communications equipment companies boosted relative performance. Riverbed Technology more than doubled in value amid increasing demand for data center infrastructure and network optimization as companies transitioned to “cloud computing” for their data management needs. Finisar and Acme Packet produced higher earnings due to increased spending by telecommunications companies on optical components. Storage solutions provider Compellent Technologies rose after receiving an acquisition offer from a major computer equipment manufacturer. Employee training software developer SuccessFactors gained value after reporting strong bookings and revenue growth.
DISCUSSION OF FUND PERFORMANCE (continued)
In the health care sector, Amarin Corp. climbed amid takeover speculation after receiving positive test results from a new drug under development, and medical products producer Cooper Companies gained market share in a strong overall market. Among industrial companies, Titan International benefited from strong demand for agriculture equipment, and Navistar International and WABCO Holdings encountered continuing strength in heavy duty truck orders. Baldor Electric advanced after receiving a takeover offer. Finally, in the energy sector, rising commodity prices helped boost Brigham Exploration and International Coal Group.
Disappointments proved relatively mild during the reporting period.The fund’s investments in the consumer discretionary sector produced positive absolute returns but lagged their respective benchmark components. We attribute most of the sector’s relative underperformance to gains in companies held by the benchmark but not the fund. In addition, Maidenform Brands declined when inventories grew much faster than sales, retailers Tuesday Morning and Talbots fell due to weaker-than-expected earnings, and footwear seller Skechers USA slid on concerns regarding increased competition.
Positioned for More Economic Recovery
Despite headwinds from resurgent oil prices and a moribund housing market, we believe the economic recovery is likely to persist. Consequently, we have maintained the fund’s tilt toward cyclical companies with the potential for
higher-than-average revenues and earnings growth. We have found a number of opportunities in the energy, materials, industrials and information technology sectors. We have found fewer opportunities in the traditionally defensive utilities and consumer staples sectors. We also have invested in small-cap stocks that we believe will benefit from other investment themes, including a rebound in auto and truck sales, improving conditions in the airline industry, an increase in mergers-and-acquisitions activity, rising demand for wireless communications and higher commodity prices.
March 15, 2011
| |
| | Please note, the position in any security highlighted in italicized typeface was |
| | sold during the reporting period. |
| | Equity funds are subject generally to market, market sector, market liquidity, |
| | issuer and investment style risks, among other factors, to varying degrees, all of |
| | which are more fully described in the fund’s prospectus. |
| 1 | Total return includes reinvestment of dividends and any capital gains paid. |
| | Past performance is no guarantee of future results. Share price and investment |
| | return fluctuate such that upon redemption, fund shares may be worth more or |
| | less than their original cost. Return figures provided reflect the absorption of |
| | certain fund expenses by BNY Mellon Fund Advisors pursuant to an |
| | agreement in effect through September 30, 2010, at which time it was |
| | terminated. Had these expenses not been absorbed, the fund’s returns would |
| | have been lower. |
| 2 | SOURCE: LIPPER INC. — Reflects the reinvestment of dividends and, |
| | where applicable, capital gain distributions.The Standard & Poor’s SmallCap |
| | 600 Index is a broad-based index and a widely accepted, unmanaged index of |
| | overall small-cap stock market performance.The index does not take into |
| | account fees and expenses to which the fund is subject. Investors cannot invest |
| | directly in any index. |
14

DISCUSSION OF
FUND PERFORMANCE
For the period of September 1, 2010, through February 28, 2011, as provided by Sean P. Fitzgibbon and Jeffrey D. McGrew, Portfolio Managers
Fund and Market Performance Overview
For the six-month period ended February 28, 2011, BNY Mellon U.S. Core Equity 130/30 Fund’s Class M shares produced a total return of 25.39%, and Investor shares returned 25.15%.1 In comparison, the total return of the Standard & Poor’s 500 Composite Stock Price Index (“S&P 500 Index”), the fund’s benchmark, was 27.73%.2
U.S. stocks rallied during the reporting period as the economic recovery gathered momentum. The fund produced lower returns than its benchmark, primarily due to our short-selling strategy.
The Fund’s Investment Approach
The fund seeks capital appreciation, normally investing at least 80% of its assets in stocks of large-cap companies. We choose stocks through a disciplined investment process that uses computer modeling techniques to identify and rank companies based on value, growth and other financial characteristics. The portfolio managers supplement and confirm this information using fundamental analysis, and generally buy “long” the most attractive of the higher-ranked securities and sell “short” those stocks identified by the computer model and fundamental analysis as being likely to underperform. Normally, up to 130% of the fund’s assets will be in long positions, and approximately 30% of the fund’s assets will be in short positions. However, the fund’s short positions may range in value from approximately 25% to 35% of the fund’s assets.We also attempt to mitigate risks by diversifying the fund’s investments across companies
and industries, maintaining weightings and risk characteristics that generally are similar to those of the S&P 500 Index.
Greater Economic Confidence Fueled a Market Rally
Despite a subpar U.S. economic recovery and a sovereign debt crisis in Europe, investor sentiment improved dramatically soon after the start of the reporting period when the Federal Reserve Board announced a new round of quantitative easing of U.S. monetary policy. This stimulative measure helped convince investors that the economy was unlikely to slip back into recession. A more optimistic investment outlook was reinforced by subsequent improvements in employment and consumer spending, as well as better-than-expected corporate earnings across a number of industry groups.
Later in the fall, the end of uncertainty surrounding U.S. midterm elections and the passage of fiscally stimulative tax legislation lent further support to the stock market rally. However, the rally was interrupted in February when a wave of political unrest in the Middle East led to sharply higher crude oil prices.
Market Momentum Undermined Short Sales
Although the fund’s long positions generally produced strong returns, the fund’s relative performance was hindered by some of its short positions. In the consumer discretionary sector, a short position in retailer J. Crew Group proved counterproductive when the company was acquired. In addition, strong returns from Nordstrom and Limited Brands were offset by unfortunate timing in the purchase of shares of Ford Motor. Results in the financials sector were hindered by a short position in commodities exchange CBOE Holdings, which gained
DISCUSSION OF FUND PERFORMANCE (continued)
value amid takeover speculation. A long position in American Express also lagged sector averages after the company reported mixed financial results. Finally, the fund’s selection among electricity producers and exclusion of natural gas producers hurt its relative performance in that sector.
The fund achieved better results in the industrials sector, where heavy equipment maker Caterpillar encountered robust demand from the energy and materials end markets it serves, industrial conglomerate Dover showed positive results from management initiatives, and construction engineer Ingersoll-Rand saw increased demand for HVAC systems. Among technology companies, Internet retailer Amazon.com enjoyed a strong holiday season fueled by sales of its Kindle e-reader.We also focused on businesses that we believed would benefit from the trend toward “cloud computing,” in which enterprises access data and applications over the Internet.This trend helped lift software developers Oracle and Informatica. Communications equipment maker QUALCOMM benefited from the increased adoption of smartphones, while a short position in handset maker Nokia added value to the portfolio as Nokia continued to lose share in that market. In the health care sector, longstanding holding King Pharmaceuticals was acquired by Pfizer during the reporting period, and the fund benefited from underweighted exposure to industry giant Merck & Co. Finally, medical devices producer Covidien rebounded from earlier weakness, and the stock was further supported by its addition to the S&P 500 Index.
New Opportunities in a Recovering Economy
We expect the U.S. and global economic rebounds to persist, but corporate earnings may come under pressure as companies resume spending and investment. In this environment, our stock selection process has identified a number of potential opportunities in the consumer
discretionary, energy and health care sectors, but has identified fewer opportunities in the consumer staples, materials, financials and telecommunications services sectors.While we believe that these modest tilts position the fund to benefit from further economic growth, we remain cautious regarding valuations and near-term volatility, and we have attempted to keep the fund’s risks roughly in line with those of the broader market.
March 15, 2011
| |
| | Please note, the position in any security highlighted with italicized typeface |
| | was sold during the reporting period. |
| | Equity funds are subject generally to market, market sector, market liquidity, |
| | issuer and investment style risks, among other factors, to varying degrees, all of |
| | which are more fully described in the fund’s prospectus. |
| | The use of leverage may magnify the fund’s gains or losses. For derivatives |
| | with a leveraging component, adverse changes in the value or level of the |
| | underlying asset can result in a loss that is much greater than the original |
| | investment in the derivative. |
| | Short sales involve selling a security the fund does not own in anticipation that |
| | the security’s price will decline. Short sales may involve substantial risk and |
| | leverage, and expose the fund to the risk that it will be required to buy the |
| | security sold short at a time when the security has appreciated in value, thus |
| | resulting in a loss to the fund. Short positions in stocks involve more risk than |
| | long positions in stocks because the maximum sustainable loss on a stock |
| | purchased is limited to the amount paid for the stock plus the transaction costs, |
| | whereas there is no maximum attainable price on the shorted stock. In theory, |
| | stocks sold short have unlimited risk. It is possible that the market value of |
| | securities the fund holds in long positions will decline at the same time that |
| | the market value of the securities in the fund has sold short increases, thereby |
| | increasing the fund’s potential volatility. Leveraging occurs when the fund |
| | increases its assets available for investment using borrowing or similar |
| | transactions. Short sales effectively leverage the fund’s assets.The use of leverage |
| | may magnify the fund’s gains or losses. |
| 1 | Total return includes reinvestment of dividends and any capital gains paid. |
| | Past performance is no guarantee of future results. Share price and investment |
| | return fluctuate such that upon redemption, fund shares may be worth more or |
| | less than their original cost. |
| 2 | SOURCE: LIPPER INC. — Reflects the monthly reinvestment of |
| | dividends and, where applicable, capital gain distributions.The Standard & |
| | Poor’s 500 Composite Stock Price Index is a widely accepted, unmanaged |
| | index of U.S. stock market performance. Index return does not reflect fees and |
| | expenses associated with operating a mutual fund. Investors cannot invest |
| | directly in any index. |
16

DISCUSSION OF
FUND PERFORMANCE
For the period from September 1, 2010, through February 28, 2011, as provided by Irene D. O’Neill, Portfolio Manager
Fund and Market Performance Overview
For the six-month period ended February 28, 2011, BNY Mellon Focused Equity Opportunities Fund’s Class M shares produced a total return of 31.36%, and Investor shares returned 31.24%.1 In comparison, the total return of the Russell 1000 Index (the “Index”), the fund’s benchmark, was 28.65% for the same period.2
U.S. stocks rallied over the reporting period as the economic recovery gained momentum.The fund produced returns that were higher than its benchmark, due primarily to successful stock selections in the health care, industrials, materials and technology sectors.
The Fund’s Investment Approach
The fund seeks capital appreciation.To pursue its goal, the fund normally invests at least 80% of its assets in equity securities. We begin with a top-down assessment of broad economic, political and social trends. We strive to determine those sectors and industries most likely to benefit from identified trends, focusing on areas we believe present the most attractive growth outlook.Within those sectors and industries, we then employ a bottom-up, fundamental approach to find individual companies with:
Unrecognized or underestimated earnings power
Sustainable revenues and cash flow
Positive operational or financial catalysts
Attractive valuations based on growth prospects
Strong or improving financial conditions
Finally, we select for investment the 25 to 30 best opportunities from the companies meeting these criteria.
Greater Economic Confidence Fueled a Market Rally
The reporting period began in the wake of a period of choppy stock market performance stemming from a subpar U.S. economic recovery and a sovereign debt crisis in Europe. However, investor sentiment soon improved markedly when the Federal Reserve Board announced a new round of quantitative easing of U.S. monetary policy. This stimulative measure helped convince many investors that the U.S. economy was unlikely to slip back into recession, and they began to look forward to better business conditions for U.S. and multinational companies. A more optimistic investment outlook was reinforced by subsequent releases of economic data, which showed improvements in employment and consumer spending, as well as better-than-expected corporate earnings across a number of industry groups.
Later in the fall, the end of uncertainty surrounding U.S. midterm elections and the passage of fiscally stimulative tax legislation lent further support to the stock market rally. However, the rally was interrupted in February when a wave of political unrest in the Middle East led to sharply higher crude oil prices.
Focused Stock Selection Strategy Boosted Fund Results
Our research-intensive approach to security selection enabled the fund to achieve particularly strong results in the health care sector, an area of the benchmark that
DISCUSSION OF FUND PERFORMANCE (continued)
generally lagged market averages during the reporting period.The fund’s relative performance in the sector was bolstered by its lack of exposure to large pharmaceutical companies, which suffered amid concerns regarding patent expirations on key products. Instead, the fund scored success with medical devices and supplies producer Covidien, which gained value after a successful restructuring in which the company shed slower-growing businesses and acquired faster-growing ones. Generic drug makerWatson Pharmaceuticals also fared well in anticipation of strong sales of the generic versions of cholesterol medicine Lipitor and ADHD drug Concerta.
The fund held only two stocks in the industrials sector, both of which produced above-average returns. Heavy equipment manufacturer Caterpillar advanced due to strong demand for construction and mining equipment in the emerging markets, and industrial conglomerate Honeywell International encountered rising capital spending on the process controls used in factory automation. Among materials stocks, iron ore producer Cliffs Natural Resources benefited from rising commodity prices. In the technology sector, the fund favored companies driving new technological trends, such as cloud computing. The reporting period’s winners in the technology sector included CognizantTechnology Solutions, which provides consulting and outsourcing services; Baidu, the dominant Chinese search engine; and electronics innovator Apple, maker of the wildly popular iPad tablet computer and iPhone smartphone.
Disappointments during the reporting period proved relatively mild. Consumer discretionary stock International Game Technology was hurt by delayed upgrades of slot machines by hotels and casinos, and an expected turnaround for consumer staples company Avon Products had not yet materialized. Both stocks were sold during the reporting period.
A Cyclical Bias in a Recovering Economy
Despite headwinds from resurgent oil prices and a moribund housing market, we believe the current economic recovery is likely to persist. Consequently, we have maintained the fund’s tilt toward more cyclical investments, and we have focused on companies that we believe are likely to benefit from higher revenues rather than those that have boosted earnings by cutting costs.We have found a number of growth opportunities in the energy sector, where demand continues to recover, and among technology companies at the cutting edge of new trends. We have found fewer opportunities meeting our criteria in the traditionally defensive consumer staples, utilities and telecommunications services sectors.
March 15, 2011
| |
| | Please note, the position in any security highlighted in italicized typeface was |
| | sold during the reporting period. |
| | Equity funds are subject generally to market, market sector, market liquidity, |
| | issuer and investment style risks, among other factors, to varying degrees, all of |
| | which are more fully described in the fund’s prospectus. |
| | The fund is non-diversified, which means that a relatively high percentage of |
| | the fund’s assets may be invested in a limited number of issuers.Therefore, the |
| | fund’s performance may be more vulnerable to changes in the market value of |
| | a single issuer or group of issuers and more susceptible to risks associated with |
| | a single economic, political or regulatory occurrence than a diversified fund. |
| 1 | Total return includes reinvestment of dividends and any capital gains paid. |
| | Past performance is no guarantee of future results. Share price and investment |
| | return fluctuate such that upon redemption, fund shares may be worth more or |
| | less than their original cost.The fund’s returns reflect the absorption of certain |
| | fund expenses by BNY Mellon Fund Advisors pursuant to an agreement in |
| | effect until January 1, 2011, at which point it was terminated. Had these |
| | expenses not been absorbed, the fund’s returns would have been lower. |
| 2 | SOURCE: LIPPER INC. — Reflects the monthly reinvestment of |
| | dividends and, where applicable, capital gain distributions.The Russell 1000 |
| | Index is a widely accepted, unmanaged index of U.S. stock market |
| | performance. Index return does not reflect fees and expenses associated with |
| | operating a mutual fund. Investors cannot invest directly in any index. |
18

DISCUSSION OF
FUND PERFORMANCE
For the period from September 1, 2010, through February 28, 2011, as provided by John M. Chambers, Portfolio Manager
Fund and Market Performance Overview
For the six-month period ended February 28, 2011, BNY Mellon Small/Mid Cap Stock Fund’s Class M shares produced a total return of 38.69%, and Investor shares returned 38.52%.1 In comparison, the Russell 2500 Index (the “Index”), the fund’s benchmark, produced a total return of 36.04% for the same period.2
Small- and midcap stocks rallied over the reporting period as the economic recovery gained momentum. The fund produced returns that were higher than its benchmark, due primarily to an emphasis on companies with growth-oriented business models.
The Fund’s Investment Approach
The fund seeks capital appreciation.To pursue its goal, the fund normally invests at least 80% of its assets in equity securities of small-cap and midcap companies with total market capitalizations of between $200 million and $7 billion at the time of investment.The fund invests in growth and value stocks, which are chosen through a disciplined investment process that combines computer modeling techniques, fundamental analysis and risk management to identify and rank stocks within an industry or sector based on several characteristics, including value, growth and the company’s financial health. Using fundamental analysis, the investment adviser generally selects the most attractive securities. Finally, we seek to manage risk by diversifying across companies and industries.The fund is structured so that its sector weightings and risk characteristics are generally similar to those of the Russell 2500 Index.
Improved Economic Confidence Fueled a Market Rally
Despite a subpar U.S. economic recovery and a sovereign debt crisis in Europe, investor sentiment improved dramatically soon after the start of the reporting period when the Federal Reserve Board announced a new round of quantitative easing of U.S. monetary policy. A more optimistic investment outlook was reinforced by subsequent improvements in employment and consumer spending, as well as better-than-expected corporate earnings across a number of industry groups. Later in the fall, the end of uncertainty surrounding U.S. midterm elections and the passage of fiscally stimulative tax legislation lent further support to the stock market. However, the rally was interrupted in February when a wave of political unrest in the Middle East led to sharply higher crude oil prices.
In this generally favorable environment, small-cap stocks produced modestly higher returns than midcap stocks, and midcap stocks produced substantially higher returns than large-cap stocks.
A Cyclical Bias Boosted Fund Results
The fund achieved above-average results in eight of the 10 economic sectors represented in the Russell 2500 Index, achieving particularly strong returns from overweighted positions in economically sensitive industry groups. In the information technology sector, successful stock selections and an emphasis on high-growth communications equipment companies boosted the fund’s relative performance. Riverbed Technology more than doubled in value amid increasing demand for data center infrastructure and network optimization
DISCUSSION OF FUND PERFORMANCE (continued)
as companies transitioned to “cloud computing” for their data management needs. Finisar and Acme Packet produced higher earnings due to increased spending by telecommunications companies on optical components. Audio software developer Sonic Solutions and data storage solutions providers Compellent Technologies, Isilon Systems and Netezza rose after receiving acquisition offers from larger technology companies. Employee training software developer SuccessFactors gained value after reporting strong bookings and revenue growth.
In the health care sector, Amarin Corp. climbed amid takeover speculation after receiving positive test results from a new drug under development, and Savient Pharmaceuticals gained value after receiving regulatory approval for a new gout medicine. Among industrial companies, Titan International benefited from strong demand for agriculture equipment, and Navistar International and WABCO Holdings encountered continuing strength in heavy duty truck orders. Railroad Kansas City Southern moved higher along with rail freight demand. Rising commodity prices helped boost the energy sector, benefiting Brigham Exploration, SandRidge Energy, Energy XXI and International Coal.
Disappointments proved relatively mild during the reporting period.The fund’s investments in the consumer discretionary sector produced positive absolute returns but lagged their respective benchmark components. We attribute most of the sector’s relative underperformance to gains in companies held by the benchmark but not the fund. In addition, apparel retailer Talbots fell due to disappointing earnings amid delays in their turnaround strategy.
Positioned for More Economic Recovery
Despite headwinds from resurgent oil prices and a moribund housing market, we believe the economic recovery is likely to persist. Consequently, we have maintained the
fund’s tilt toward cyclical companies with the potential for higher-than-average revenues and earnings growth. We have found a number of opportunities in the information technology, industrials, energy and materials sectors. We have found fewer opportunities in the traditionally defensive utilities and consumer staples sectors. We also have invested in small- and midcap stocks that we believe will benefit from other investment themes, including a rebound in auto and truck sales, improving conditions in the airline industry, turnarounds in the lodging and advertising industries, rising demand for wireless communications and higher commodity prices.
March 15, 2011
| |
| | Please note, the position in any security highlighted in italicized typeface was |
| | sold during the reporting period. |
| | Equity funds are subject generally to market, market sector, market liquidity, |
| | issuer and investment style risks, among other factors, to varying degrees, all of |
| | which are more fully described in the fund’s prospectus. |
| | Stocks of small- and/or midcap companies often experience sharper price |
| | fluctuations than stocks of large-cap companies. |
| 1 | Total return includes reinvestment of dividends and any capital gains paid. Past |
| | performance is no guarantee of future results. Share price and investment return |
| | fluctuate such that upon redemption, fund shares may be worth more or less |
| | than their original cost. Return figures provided reflect the absorption of certain |
| | fund expenses by BNY Mellon Fund Advisors pursuant to an agreement in |
| | effect until January 1, 2011, at which point it was terminated. Had these |
| | expenses not been absorbed, the fund’s returns would have been lower. |
| | Part of the fund’s recent performance is attributable to positive returns from its |
| | initial public offering (IPO) investments.There can be no guarantee that IPOs |
| | will have or continue to have a positive effect on fund performance. Currently, |
| | the fund is relatively small in asset size. IPOs tend to have a reduced effect on |
| | performance as a fund’s asset base grows. |
| 2 | SOURCE: LIPPER INC. — Reflects the reinvestment of dividends and, |
| | where applicable, capital gain distributions.The Russell 2500 Index is a |
| | widely accepted, unmanaged index, which measures the performance of those |
| | Russell 2500 companies with lower price-to-book ratios and lower forecasted |
| | growth value. Investors cannot invest directly in any index. |
20

DISCUSSION OF
FUND PERFORMANCE
For the period of September 1, 2010, through February 28, 2011, as provided by D. Kirk Henry, Sean P. Fitzgibbon and Mark A. Bogar, Portfolio Managers
Portfolio and Market Performance Overview
For the six-month period ended February 28, 2011, BNY Mellon International Fund’s Class M shares produced a total return of 25.34%, and Investor shares produced a total return of 25.08%.1 In comparison, the fund’s benchmark, the Morgan Stanley Capital International Europe, Australasia, Far East Index (the “MSCI EAFE Index”), produced a total return of 23.77% for the same period.2
International stocks rallied strongly as the global economic recovery gathered momentum. The fund’s returns were higher than its benchmark, primarily due to the success of our core investment style in Japan and Germany.
The Fund’s Investment Approach
The fund seeks long-term capital growth. To pursue this goal, the fund normally invests at least 65% of its total assets in equity securities of foreign issuers.
The fund allocates its assets between a core investment style and a value investment style at the discretion of the investment adviser.The fund is not managed to a specific target duration between these investment styles. However, under normal conditions, at least 30% of the fund’s assets will be invested in each of the core and value investment styles. Pursuant to the core investment style, under normal circumstances, at least 80% of the fund’s cash inflows allocated to this style are invested in equity securities of companies located in the foreign countries represented in the MSCI EAFE Index and Canada.
The fund will continue to invest in stocks that appear to be undervalued (as measured by their price/earnings ratios), but stocks purchased pursuant to the core investment style may have value and/or growth char-acteristics.The core investment style portfolio manager employs a “bottom-up” investment approach, which emphasizes individual stock selection. The core investment style stock selection process is designed to produce a diversified portfolio that, relative to the MSCI EAFE Index, has a below-average price/earnings ratio and an above-average earnings growth trend.
The fund’s investment approach for the portion of the fund using the value-oriented investment style is research-driven and risk-averse.When selecting stocks, we identify potential investments through valuation screening and extensive fundamental research. Emphasizing individual stock selection over economic or industry trends, the fund focuses on three key factors: value, business health and business momentum.
Greater Economic Confidence Supported Rallying Markets
The reporting period began in the wake of heightened volatility in international markets, as a sovereign debt crisis in Europe threatened an already sluggish regional rebound and Japan struggled with longstanding deflation-ary forces. However, it became apparent in September that these economic concerns probably were overblown. By the fall, most European banks had passed a series of “stress tests,” corporate earnings climbed, mergers-and-acquisitions activity intensified, commodity prices rose and major central banks implemented new programs to ease monetary policy. Greater clarity regarding fiscal and tax policies in the United States after the national midterm elections also supported global investor sentiment. The
DISCUSSION OF FUND PERFORMANCE (continued)
resulting rally in global equity markets persisted until February when political uprisings in the Middle East sparked a sharp increase in oil and gas prices.
Stock Selections Produced Mixed Results
The fund’s core investment style fared particularly well in the reporting period’s market rally, scoring successes in Japan including industrial conglomerate Mitsubishi and technology firm Hitachi.The fund’s investments in automobile manufacturers in Germany also fared well in the recovering economy, as robust sales of the luxury-oriented Audi and Porche brands drove shares of Volkswagen higher. German grocery chain Metro also rebounded from what we believed were previously oversold conditions.
The industrial sector provided the greatest contribution to the fund’s relative performance, as U.K.-based materials science company Cookson Group and Swedish construction-related firms Atlas Copco and Sandvik benefited from the global economic recovery and higher commodity prices.The energy sector rebounded strongly from earlier weakness as oil and gas prices climbed, boosting the stocks of exploration and production companies, such as offshore driller Transocean.
The fund’s value style achieved strong results from underweighted exposure to Spain, which was at the epicenter of Europe’s sovereign debt crisis. In addition, Spanish wind turbine maker Gamesa Corp Tecnologica and power utility Iberdrola rebounded sharply from previously depressed levels. However, these gains were offset by lagging results from several Spanish banks. The fund’s holdings in the Netherlands also disappointed, mainly due to weakness stemming from the restructuring of Koninklijke Philips
Electronics. From a sector perspective, health care companies in the United Kingdom were hurt by concerns regarding upcoming patent expirations.
Finding Value Among Companies with Catalysts for Growth
We have been encouraged by the rallies in the world’s developed markets, but a number of economic head-winds remain.Therefore, we intend to continue to focus primarily on what we believe are attractively valued, growing companies with the ability to reduce costs, employ proprietary technologies or provide significant exposure to faster-growing emerging markets.
March 15, 2011
| |
| | Please note, the position in any security highlighted with italicized typeface |
| | was sold during the reporting period. |
| | Equity funds are subject generally to market, market sector, market liquidity, |
| | issuer and investment style risks, among other factors, to varying degrees, all of |
| | which are more fully described in the fund’s prospectus. |
| | The fund’s performance will be influenced by political, social and economic |
| | factors affecting investments in foreign companies. Special risks associated with |
| | investments in foreign companies include exposure to currency fluctuations, less |
| | liquidity, less developed or less efficient trading markets, lack of comprehensive |
| | company information, political instability and differing auditing and legal |
| | standards.These risks are enhanced in emerging market countries. |
| 1 | Total return includes reinvestment of dividends and any capital gains paid. |
| | Past performance is no guarantee of future results. Share price and investment |
| | return fluctuate such that upon redemption, fund shares may be worth more or |
| | less than their original cost. |
| 2 | SOURCE: LIPPER INC. — Reflects reinvestment of net dividends and, |
| | where applicable, capital gain distributions.The Morgan Stanley Capital |
| | International Europe,Australasia, Far East (MSCI EAFE) Index is an |
| | unmanaged index composed of a sample of companies representative of the |
| | market structure of European and Pacific Basin countries. Index return does |
| | not reflect fees and expenses associated with operating a mutual fund. Investors |
| | cannot invest directly in any index. |
22

DISCUSSION OF
FUND PERFORMANCE
For the period of September 1, 2010, through February 28, 2011, as provided by D. Kirk Henry, Sean P. Fitzgibbon and Jay Malikowski, Portfolio Managers
Fund and Market Performance Overview
For the six-month period ended February 28, 2011, BNY Mellon Emerging Markets Fund’s Class M shares produced a total return of 13.99%, and Investor shares returned 14.02%.1 This compares with a 15.03% total return produced by the Morgan Stanley Capital International Emerging Markets Index (“MSCI EM Index”), the fund’s benchmark, for the same period.2
Emerging market stocks generally advanced during the reporting period as the global economic recovery gathered momentum. The fund’s returns were lower than its benchmark, primarily due to shortfalls in South Korea and Mexico.
The Fund’s Investment Approach
The fund seeks long-term capital growth.To pursue its goal, the fund invests at least 80% of its assets in equity securities of companies organized, or with a majority of assets or operations, in countries considered to be emerging markets.
The fund allocates its assets between a core investment style and a value investment style at the discretion of the investment adviser.The fund is not managed to a specific target duration between these investment styles. However, under normal conditions at least 30% of the fund’s assets will be invested in each of the core and value investment styles. Pursuant to the core investment style, under normal circumstances at least 80% of the fund’s cash inflows allocated to this style are invested in equity securities of companies located in the foreign countries represented in the MSCI EM Index.
The fund will continue to invest in stocks that appear to be undervalued (as measured by their price/earnings
ratios), but stocks purchased pursuant to the core investment style may have value and/or growth char-acteristics.The core investment style portfolio manager employs a “bottom-up” investment approach, which emphasizes individual stock selection. The core investment style stock selection process is designed to produce a diversified portfolio that, relative to the MSCI EM Index, has a below-average price/earnings ratio and an above-average earnings growth trend.
When choosing stocks for the portion of the fund using the value-oriented investment style, we use a research-driven and risk-averse approach. We identify potential investments through valuation screening and extensive fundamental research. Emphasizing individual stock selection rather than economic and industry trends, we focus on three key factors: value, business health and business momentum.
Greater Economic Confidence Supported Rallying Markets
The reporting period began in the wake of heightened volatility in international markets, as robust economic growth in emerging markets was balanced by a sluggish rebound in developed markets. However, it became apparent in September that economic concerns in the United States and Europe probably were overblown. By the fall, most European banks had passed “stress tests,” corporate earnings climbed, commodity prices rose and major central banks implemented new programs to ease monetary policy.
Although emerging market stocks gained value during the reporting period, they generally lagged those of developed markets.The emerging markets’ gains were tempered by recently higher valuations and concerns that measures designed to forestall an acceleration of inflation in China might derail a major engine of global growth.
DISCUSSION OF FUND PERFORMANCE (continued)
Stock Selections Produced Mixed Results
Although the fund participated in the emerging markets’ gains to a significant degree, its relative performance was constrained by investments in South Korea, where steelmaker POSCO was hurt by rising input costs and casino operator Grand Korea Leisure declined amid concerns regarding the impact of recent military tensions on tourism. The fund held no exposure to automakers Hyundai Motors or Kia Motors, which benefited from a global rebound in car and truck sales.The fund’s holdings in Mexico lagged global averages, due to underweighted exposure to metals-and-mining companies as well as telecommunications company America Movil. Finally, in the consumer staples sector, disappointments included agricultural producers in India and China and a South Korean brewery.
The fund achieved better results inTaiwan, where technology companies Quanta Computer, Catcher Technology, HTC and United Microelectronics participated in the global economic recovery and the emergence of new technological trends. Taiwanese financial institutions First Financial Holdings and Chinatrust Financial Holdings also fared well. In China, auto seller Great Wall Motor benefited from burgeoning car and truck sales, while Weichai Power, SinoPac Financial Holdings, CNOOC, Weiqiao Textile and Asia Cement China Holdings advanced along with industrial demand. The fund’s investments in Brazil moved higher due to gains in oil giant Petroleo Brasileiro, materials producerValé and footwear maker Grendene.
Adjusting to the Middle Stages of the Economic Cycle
We have been encouraged by the continued robust growth in the world’s emerging markets, but we believe markets have reached the middle stages of the economic cycle. Therefore, we expect to see heightened market
volatility over the near term, but we remain confident in the longer-term potential of emerging market companies.
After lagging developed market equities over the past two quarters, valuations in emerging markets are once again trading at a modest discount versus history on Price/Earnings and Price/Book, which is encouraging. The recent spike in inflation trends caused by higher commodity prices has driven monetary tightening in several EM countries, which should help alleviate such pressures.We have more recently found what we believe are interesting opportunities in China, India and Brazil, as mid-cycle conditions have triggered concerns over a growth slowdown.We also believe the portfolio is nicely balanced in terms of offensive and defensive elements, and has the potential to benefit from an environment more conducive to active stock selection over the next twelve months.
March 15, 2011
| |
| | Please note, the position in any security highlighted with italicized typeface |
| | was sold during the reporting period. |
| | Equity funds are subject generally to market, market sector, market liquidity, |
| | issuer and investment style risks, among other factors, to varying degrees, all of |
| | which are more fully described in the fund’s prospectus. |
| | The fund’s performance will be influenced by political, social and economic |
| | factors affecting investments in foreign companies. Special risks associated with |
| | investments in foreign companies include exposure to currency fluctuations, less |
| | liquidity, less developed or less efficient trading markets, lack of comprehensive |
| | company information, political instability and differing auditing and legal |
| | standards.These risks are enhanced in emerging markets countries. |
| 1 | Total return includes reinvestment of dividends and any capital gains paid. |
| | Past performance is no guarantee of future results. Share price and investment |
| | return fluctuate such that upon redemption, fund shares may be worth more or |
| | less than their original cost. |
| 2 | SOURCE: LIPPER INC. — Reflects reinvestment of gross dividends and, |
| | where applicable, capital gain distributions.The Morgan Stanley Capital |
| | International Emerging Markets Index is a market capitalization-weighted |
| | index composed of companies representative of the market structure of select |
| | designated emerging market countries in Europe, Latin America and the Pacific |
| | Basin. Index return does not reflect fees and expenses associated with operating |
| | a mutual fund. Investors cannot invest directly in any index. |
24

DISCUSSION OF
FUND PERFORMANCE
For the period of September 1, 2010, through February 28, 2011, as provided byThomas J. Durante, Richard A. Brown and Karen Q.Wong, Portfolio Managers
Fund and Market Performance Overview
For the six-month period ended February 28, 2011, BNY Mellon International Appreciation Fund’s Class M shares produced a total return of 25.67%, and Investor shares returned 25.55%.1 In comparison, the fund’s benchmark, the Morgan Stanley Capital International Europe, Australasia, Far East Index (“MSCI EAFE Index”), produced a total return of 23.77% for the same period.2
International stock markets rallied strongly as the global economic recovery gained momentum. Differences between the fund’s and the benchmark’s returns were primarily the result of expenses and pricing disparities between the common stocks of the companies comprising the MSCI EAFE Index and the related Depository Receipts (DRs) in which the fund invests.
The Fund’s Investment Approach
The fund seeks long-term capital appreciation.To pursue its goal, the fund normally invests at least 80% of its assets in equity securities, including DRs, common stocks, preferred stocks, convertible securities, equity securities in foreign investment funds or trusts and other equity investments.
The fund invests primarily in DRs representing the local shares of non-U.S. companies, in particular, American Depositary Receipts (ADRs). In selecting
securities, we screen the MSCI EAFE Index universe of approximately 1,000 issuers for the availability of issuers with a DR facility.The investment adviser then uses a proprietary mathematical algorithm to reflect the characteristics of the developed markets that takes into consideration risk characteristics, including country weights and sector weights within each country. As a result of this process, we expect to hold ADRs representing 200 to 300 foreign issuers. The fund’s country allocation is expected to be within 5% of that of the MSCI EAFE Index, and under normal circumstances, the fund will invest in at least 10 different countries.The fund generally will not invest in securities from developing countries because they are not included in the MSCI EAFE Index.
Global Markets Rebounded Amid Renewed Economic Optimism
The reporting period began in the midst of a sovereign debt crisis in Europe and a subpar economic recovery in most of the world’s developed markets. However, investor sentiment improved dramatically in September when the Federal Reserve Board announced a new round of quantitative easing of monetary policy, signaling that major central banks were committed to forestalling a double-dip recession. At the same time, infrastructure construction in the emerging markets continued to support increased global industrial activity, driving commodity prices higher, and better-than-expected economic data in Europe suggested that fears surrounding the region’s sovereign debt crisis may have been overblown.
DISCUSSION OF FUND PERFORMANCE (continued)
As a result of these developments, international stock markets rallied broadly, with all 10 market sectors within the MSCI EAFE Index posting positive absolute returns during the reporting period. In a reversal of recent trends, developed markets generally gained more value than emerging markets.
Financials and Industrials Led the Markets’ Advance
The financials sector achieved especially impressive results as banks rebounded from the 2008–2009 global financial meltdown. Financial institutions in Asia and Australia, which had not been burdened with troubled loans, fared particularly well. Banks in Spain, Greece and other peripheral European nations, which had been at the epicenter of the region’s debt crisis, also began to recover during the reporting period.
Industrial stocks continued to benefit from robust infrastructure construction activity in Asian emerging markets. In addition, European industrial producers advanced when the full extent of damage from the sovereign debt crisis failed to materialize. Many European manufacturers that had cut costs during the downturn boosted their earnings significantly in the improving business climate. Similarly, materials stocks climbed amid robust demand for construction materials, and major metals-and-mining companies gained value along with commodity prices. In the energy sector, rising oil prices lifted the stocks of oil-and-gas producers, led by U.K.-based BP as litigation concerns surrounding the 2010 Gulf of Mexico oil spill eased.
During a reporting period with relatively few disappointments, the traditionally defensive consumer staples sector generally trailed other industry groups but still achieved a double-digit gain. The health care and utilities sectors lagged market averages to a lesser degree.
Diversification Benefits of Index Investing
We remain encouraged by the global economic recovery, but we are aware that a number of headwinds could dampen the market rally. Most notably, oil prices have surged due to a wave of political unrest in the Middle East, which could fuel inflationary pressures in faster-growing markets, such as China.
Nonetheless, it is important to note that the fund does not attempt to take active positions in markets or industry groups. Instead, we strive to replicate the returns of the MSCI EAFE Index by closely approximating its composition. In our experience, this passive investment approach can help investors manage risks through broad diversification, effectively limiting the impact on the overall portfolio of unexpected losses in any single industry group or holding.
March 15, 2011
| |
| | Equity funds are subject generally to market, market sector, market liquidity, |
| | issuer and investment style risks, among other factors, to varying degrees, all of |
| | which are more fully described in the fund’s prospectus. |
| | The fund’s performance will be influenced by political, social and economic |
| | factors affecting investments in foreign companies. Special risks associated with |
| | investments in foreign companies include exposure to currency fluctuations, less |
| | liquidity, less developed or less efficient trading markets, lack of comprehensive |
| | company information, political instability and differing auditing and legal |
| | standards.These risks are enhanced in emerging market countries. |
| 1 | Total return includes reinvestment of dividends and any capital gains paid. |
| | Past performance is no guarantee of future results. Share price and investment |
| | return fluctuate such that upon redemption, fund shares may be worth more or |
| | less than their original cost.The fund’s returns reflect the absorption of certain |
| | fund expenses by BNY Mellon Fund Advisors pursuant to an agreement in |
| | effect until September 30, 2010, at which point it was terminated. Had these |
| | expenses not been absorbed, the fund’s returns would have been lower. |
| 2 | SOURCE: LIPPER INC. — Reflects reinvestment of net dividends and, |
| | where applicable, capital gain distributions.The Morgan Stanley Capital |
| | International Europe,Australasia, Far East (MSCI EAFE) Index is an |
| | unmanaged index composed of a sample of companies representative of the |
| | market structure of European and Pacific Basin countries. Index return does |
| | not reflect fees and expenses associated with operating a mutual fund. Investors |
| | cannot invest directly in any index. |
26

DISCUSSION OF
FUND PERFORMANCE
For the period of September 1, 2010, through February 28, 2011, as provided by Sean P. Fitzgibbon, Jeffrey D. McGrew and John F. Flahive, Portfolio Managers
Fund and Market Performance Overview
For the six-month period ended February 28, 2011, BNY Mellon Balanced Fund’s Class M shares produced a total return of 16.30%, and Investor shares returned 16.16%.1 In comparison, the fund’s benchmark, a blended index composed of 60% Standard & Poor’s 500 Composite Stock Price Index (“S&P 500 Index”) and 40% Barclays Capital U.S.Aggregate Index, produced a 16.30% total return for the same period.2 Separately, the S&P 500 Index and the Barclays Capital U.S.Aggregate Index produced total returns of 27.73% and –0.83%, respectively, for the same period.
U.S. stocks rallied and bonds generally declined during the reporting period as the economic recovery gathered momentum. The fund produced returns that were in line with its benchmark.
The Fund’s Investment Approach
The fund seeks long-term growth of principal in conjunction with current income. To pursue its goal, the fund may invest in equity securities, income producing bonds, BNY Mellon Small Cap Stock Fund, BNY Mellon Mid Cap Stock Fund, BNY Mellon International Fund and BNY Mellon Emerging Markets Fund (collectively, the “BNY Mellon Funds”). The fund has established target allocations of 60% to equity securities and 40% to bonds and money market instruments. The fund may deviate from these targets within ranges of 15% above or below the target amount. The fund’s investments in each of the BNY Mellon Funds are subject to a separate limit of 20% of the fund’s total assets, as is the fund’s investment in money market instruments.
In the fund’s equity portfolio, individual stocks are chosen using a computer model, fundamental analysis and risk management techniques. Our computer
model identifies and ranks stocks within each industry or sector based on value, earnings growth and the financial health of the company.
In the fund’s fixed-income portfolio, investments in debt securities must be of investment-grade quality at the time of purchase3 or, if unrated, deemed of comparable quality by the investment adviser. Generally, the fund’s average effective portfolio duration of bonds will not exceed eight years.We choose debt securities based on their yields, credit quality, the level of interest rates and inflation, general economic and financial trends and our outlook for the securities markets.
Stocks Rallied While Bonds Swooned
Sentiment in equity markets improved dramatically soon after the start of the reporting period, when a new round of quantitative easing of U.S. monetary policy helped convince investors that a double-dip recession was unlikely.A more optimistic outlook was reinforced by subsequent improvements in employment, consumer spending and corporate earnings. However, these same factors undermined the bond market, as investors turned away from traditional safe havens in favor of more aggressive investments.
Later in the fall, the end of uncertainty surrounding midterm elections and the passage of fiscally stimulative tax legislation lent further support to the trends in both markets. However, in February political unrest in the Middle East led to sharply higher crude oil prices and renewed market volatility.
Cyclical Sectors Bolstered Performance
Our stock selection strategy proved especially effective in the more economically sensitive industry groups. Among technology companies, the trend toward “cloud computing” helped lift the stocks of software developers Oracle and Informatica. Communications equipment maker QUALCOMM prospered amid greater adoption of smartphones, while Apple enjoyed continued market leadership in both phones and
DISCUSSION OF FUND PERFORMANCE (continued)
tablets. Internet retailer Amazon.com also enjoyed strong holiday sales. In the industrials sector, heavy equipment maker Caterpillar encountered robust demand from the energy and materials end markets it serves, industrial conglomerate Dover showed positive results from new management’s initiatives, and construction engineer Ingersoll-Rand saw increased demand for HVAC systems. In the energy sector, rising oil and gas prices boosted results for Hess, Anadarko Petroleum and Newfield Exploration.
The fund’s bond portfolio benefited from a shorter average duration than its benchmark, which helped cushion market volatility.After longer-term interest rates had risen, we adopted a market-neutral position, enabling the fund to capture incrementally higher yields. In addition, corporate bonds from financial institutions and industrial companies ranked among the fund’s top fixed-income performers.
Disappointments during the reporting period included the stock market’s consumer discretionary sector, where unfortunate timing in the purchase of Ford Motor caused the fund to miss much of the automaker’s initial gains. Telecommunications giant AT&T was undermined by concerns over its loss of exclusivity for sales of the wildly popular iPhone. Financial services provider American Express lagged sector averages after reporting mixed financial results, and the fund also suffered shortfalls from diabetes specialist Amylin Pharmaceuticals, biotechnology firm Human Genome Sciences and beverage producer PepsiCo. Among bonds, underweighted exposure to commercial mortgage-backed securities undermined relative results.
Positioned for Further Economic Recovery
We have identified what we believe are a number of equity opportunities in the consumer discretionary, energy and health care sectors, but have identified fewer opportunities in the consumer staples, materials, financials and telecommunications services sectors. In the bond portfolio, we have maintained a relatively defensive investment posture, including a shorter-than-average duration stance.
March 15, 2011
| |
| | Equities are subject generally to market, market sector, market liquidity, issuer |
| | and investment style risks, among other factors, to varying degrees, all of which |
| | are more fully described in the fund’s prospectus. |
| | Bonds are subject generally to interest rate, credit, liquidity and market risks, to |
| | varying degrees, all of which are more fully described in the fund’s prospectus. |
| | Generally, all other factors being equal, bond prices are inversely related to |
| | interest-rate changes, and rate increases can cause price declines. |
| 1 | Total return includes reinvestment of dividends and any capital gains paid. |
| | Past performance is no guarantee of future results. Share price and investment |
| | return fluctuate such that upon redemption, fund shares may be worth more or |
| | less than their original cost. |
| 2 | SOURCE: LIPPER INC. — Reflects reinvestment of dividends and, where |
| | applicable, capital gain distributions.The Standard & Poor’s 500 Composite |
| | Stock Price Index is a widely accepted, unmanaged index of U.S. stock market |
| | performance.The Barclays Capital U.S.Aggregate Index is a widely accepted, |
| | unmanaged total return index of corporate, U.S. government and U.S. |
| | government agency debt instruments, mortgage-backed securities and asset- |
| | backed securities with an average maturity of 1-10 years.The indices’ returns |
| | do not reflect the fees and expenses associated with operating a mutual fund. |
| | Investors cannot invest directly in any index. |
| 3 | The fund may continue to own investment-grade bonds (at the time of |
| | purchase), which are subsequently downgraded to below investment grade. |
28
UNDERSTANDING YOUR FUND’S EXPENSES (Unaudited)
As a mutual fund investor, you pay ongoing expenses, such as management fees and other expenses. Using the information below, you can estimate how these expenses affect your investment and compare them with the expenses of other funds.You also may pay one-time transaction expenses, including sales charges (loads) and redemptions fees, which are not shown in this section and would have resulted in higher total expenses. For more information, see your fund’s prospectus or talk to your financial adviser.
Review your fund’s expenses
The table below shows the expenses you would have paid on a $1,000 investment in each class of each BNY Mellon equity fund from September 1, 2010 to February 28, 2011. It also shows how much a $1,000 investment would be worth at the close of the period, assuming actual returns and expenses.
| | | | | | |
| Expenses and Value of a $1,000 Investment | | | | | | |
| assuming actual returns for the six months ended February 28, 2011 | | | | | | |
| | | | | | | Dreyfus |
| | | Class M Shares | | Investor Shares | | Premier Shares |
| BNY Mellon Large Cap Stock Fund | | | | | | |
| Expenses paid per $1,000† | $ | 4.53 | $ | 6.06 | | — |
| Ending value (after expenses) | $ | 1,284.50 | $ | 1,284.60 | | — |
| Annualized expense ratio (%) | | .80 | | 1.07 | | — |
| BNY Mellon Large Cap Market | | | | | | |
| Opportunities Fund | | | | | | |
| Expenses paid per $1,000† | $ | 4.77 | $ | 6.17 | | — |
| Ending value (after expenses) | $ | 1,263.30 | $ | 1,262.10 | | — |
| Annualized expense ratio (%) | | .85 | | 1.10 | | — |
| BNY Mellon Tax-Sensitive | | | | | | |
| Large Cap Multi-Strategy Fund | | | | | | |
| Expenses paid per $1,000† | $ | 5.25 | $ | 6.65 | | — |
| Ending value (after expenses) | $ | 1,275.60 | $ | 1,273.80 | | — |
| Annualized expense ratio (%) | | .93 | | 1.18 | | — |
| BNY Mellon Income Stock Fund | | | | | | |
| Expenses paid per $1,000† | $ | 4.96 | $ | 6.36 | | — |
| Ending value (after expenses) | $ | 1,272.70 | $ | 1,270.60 | | — |
| Annualized expense ratio (%) | | .88 | | 1.13 | | — |
| BNY Mellon Mid Cap Stock Fund | | | | | | |
| Expenses paid per $1,000† | $ | 5.36 | $ | 6.84 | $ | 11.28 |
| Ending value (after expenses) | $ | 1,401.00 | $ | 1,398.30 | $ | 1,394.00 |
| Annualized expense ratio (%) | | .90 | | 1.15 | | 1.90 |
| BNY Mellon Small Cap Stock Fund | | | | | | |
| Expenses paid per $1,000† | $ | 5.96 | $ | 7.42 | | — |
| Ending value (after expenses) | $ | 1,378.10 | $ | 1,375.00 | | — |
| Annualized expense ratio (%) | | 1.01 | | 1.26 | | — |
| BNY Mellon U.S. Core Equity 130/30 Fund | | | | | | |
| Expenses paid per $1,000† | $ | 9.17 | $ | 10.89 | | — |
| Ending value (after expenses) | $ | 1,253.90 | $ | 1,251.50 | | — |
| Annualized expense ratio (%) | | 1.64 | | 1.95 | | — |
UNDERSTANDING YOUR FUND’S EXPENSES (Unaudited) (continued)
| | | | | |
| Expenses and Value of a $1,000 Investment (continued) | | | | | |
| assuming actual returns for the six months ended February 28, 2011 | | | | | |
| | | | | | Dreyfus |
| | | Class M Shares | | Investor Shares | Premier Shares |
| BNY Mellon Focused | | | | | |
| Equity Opportunities Fund | | | | | |
| Expenses paid per $1,000† | $ | 4.99 | $ | 6.36 | — |
| Ending value (after expenses) | $ | 1,313.60 | $ | 1,312.40 | — |
| Annualized expense ratio (%) | | .87 | | 1.11 | — |
| BNY Mellon Small/Mid Cap Fund | | | | | |
| Expenses paid per $1,000† | $ | 5.50 | $ | 6.86 | — |
| Ending value (after expenses) | $ | 1,386.90 | $ | 1.385.20 | — |
| Annualized expense ratio (%) | | .93 | | 1.16 | — |
| BNY Mellon International Fund | | | | | |
| Expenses paid per $1,000† | $ | 5.64 | $ | 7.03 | — |
| Ending value (after expenses) | $ | 1,253.40 | $ | 1,250.80 | — |
| Annualized expense ratio (%) | | 1.01 | | 1.26 | — |
| BNY Mellon Emerging Markets Fund | | | | | |
| Expenses paid per $1,000† | $ | 7.53 | $ | 8.81 | — |
| Ending value (after expenses) | $ | 1,139.90 | $ | 1,140.20 | — |
| Annualized expense ratio (%) | | 1.42 | | 1.66 | — |
| BNY Mellon International Appreciation Fund | | | | | |
| Expenses paid per $1,000† | $ | 3.75 | $ | 5.20 | — |
| Ending value (after expenses) | $ | 1,256.70 | $ | 1,255.50 | — |
| Annualized expense ratio (%) | | .67 | | .93 | — |
| BNY Mellon Balanced Fund | | | | | |
| Expenses paid per $1,000† | $ | 2.95 | $ | 4.29 | — |
| Ending value (after expenses) | $ | 1,163.00 | $ | 1,161.60 | — |
| Annualized expense ratio (%) | | .55 | | .80 | — |
|
| † Expenses are equal to each fund’s annualized expense ratios as shown above, multiplied by the average account value over the period, multiplied by 181/365 (to reflect the |
| one-half year period). |
30
COMPARING YOUR FUND’S EXPENSES WITH THOSE OF OTHER FUNDS (Unaudited)
Using the SEC’s method to compare expenses
The Securities and Exchange Commission (SEC) has established guidelines to help investors assess fund expenses. Per these guidelines, the table below shows your fund’s expenses based on a $1,000 investment, assuming a hypothetical 5% annualized return.You can use this information to compare the ongoing expenses (but not transaction expenses or total cost) of investing in each fund with those of other funds. All mutual fund shareholder reports will provide this information to help you make this comparison. Please note that you cannot use this information to estimate your actual ending account balance and expenses paid during the period.
| | | | | | | |
| Expenses and Value of a $1,000 Investment | | | | | | | |
| assuming a hypothetical 5% annualized return for the six months ended February 28, 2011 | | | | |
| | | | | | | | Dreyfus |
| | | Class M Shares | | Investor Shares | | Premier Shares |
| BNY Mellon Large Cap Stock Fund | | | | | | | |
| Expenses paid per $1,000† | | | $4.01 | | $ 5.36 | | — |
| Ending value (after expenses) | | $1,020.83 | | $ 1,019.49 | | — |
| Annualized expense ratio (%) | | | .80 | | 1.07 | | — |
| BNY Mellon Large Cap Market | | | | | | | |
| Opportunities Fund | | | | | | | |
| Expenses paid per $1,000† | | | $ 4.26 | | $ 5.51 | | — |
| Ending value (after expenses) | | $1,020.58 | | $1,019.34 | | — |
| Annualized expense ratio (%) | | | .85 | | 1.10 | | — |
| BNY Mellon Tax-Sensitive | | | | | | | |
| Large Cap Multi-Strategy Fund | | | | | | | |
| Expenses paid per $1,000† | | | $4.66 | | $ 5.91 | | — |
| Ending value (after expenses) | | $1,020.18 | | $1,018.94 | | — |
| Annualized expense ratio (%) | | | .93 | | 1.18 | | — |
| BNY Mellon Income Stock Fund | | | | | | | |
| Expenses paid per $1,000† | | | $ 4.41 | | $ 5.66 | | — |
| Ending value (after expenses) | | $1,020.43 | | $ 1,019.19 | | — |
| Annualized expense ratio (%) | | | .88 | | 1.13 | | — |
| BNY Mellon Mid Cap Stock Fund | | | | | | | |
| Expenses paid per $1,000† | | | $ 4.51 | | $ 5.76 | | $ 9.49 |
| Ending value (after expenses) | | $1,020.33 | | $ 1,019.09 | | $1,015.37 |
| Annualized expense ratio (%) | | | .90 | | 1.15 | | 1.90 |
| BNY Mellon Small Cap Stock Fund | | | | | | | |
| Expenses paid per $1,000† | | | $5.06 | | $ 6.31 | | — |
| Ending value (after expenses) | | $1,019.79 | | $1,018.55 | | — |
| Annualized expense ratio (%) | | | 1.01 | | 1.26 | | — |
| BNY Mellon U.S. Core Equity 130/30 Fund | | | | | | | |
| Expenses paid per $1,000† | | | $8.20 | | $9.74 | | — |
| Ending value (after expenses) | | $1,016.66 | | $1,015.12 | | — |
| Annualized expense ratio (%) | | | 1.64 | | 1.95 | | — |
COMPARING YOUR FUND’S EXPENSES WITH THOSE OF OTHER FUNDS (Unaudited) (continued)
| | | | | | |
| Expenses and Value of a $1,000 Investment (continued) | | | | | | |
| assuming a hypothetical 5% annualized return for the six months ended February 28, 2011 | | | |
| | | | | | | Dreyfus |
| | | Class M Shares | | Investor Shares | Premier Shares |
| BNY Mellon Focused | | | | | | |
| Equity Opportunities Fund | | | | | | |
| Expenses paid per $1,000† | | | $ 4.36 | | $5.56 | — |
| Ending value (after expenses) | | $1,020.48 | | $ 1,019.29 | — |
| Annualized expense ratio (%) | | | .87 | | 1.11 | — |
| BNY Mellon Small/Mid Cap Fund | | | | | | |
| Expenses paid per $1,000† | | | $4.66 | | $ 5.81 | — |
| Ending value (after expenses) | | $1,020.18 | | $1,019.04 | — |
| Annualized expense ratio (%) | | | .93 | | 1.16 | — |
| BNY Mellon International Fund | | | | | | |
| Expenses paid per $1,000† | | | $5.06 | | $6.31 | — |
| Ending value (after expenses) | | $1,019.79 | | $1,018.55 | — |
| Annualized expense ratio (%) | | | 1.01 | | 1.26 | — |
| BNY Mellon Emerging Markets Fund | | | | | | |
| Expenses paid per $1,000† | | | $7.10 | | $8.30 | — |
| Ending value (after expenses) | | $1,017.75 | | $1,016.56 | — |
| Annualized expense ratio (%) | | | 1.42 | | 1.66 | — |
| BNY Mellon International Appreciation Fund | | | | | | |
| Expenses paid per $1,000† | | | $ 3.36 | | $4.66 | — |
| Ending value (after expenses) | | $1,021.47 | | $1,020.18 | — |
| Annualized expense ratio (%) | | | .67 | | .93 | — |
| BNY Mellon Balanced Fund | | | | | | |
| Expenses paid per $1,000† | | | $2.76 | | $4.01 | — |
| Ending value (after expenses) | | $1,022.07 | | $1,020.83 | — |
| Annualized expense ratio (%) | | | .55 | | .80 | — |
|
| † Expenses are equal to each fund’s annualized expense ratios as shown above, multiplied by the average account value over the period, multiplied by 181/365 (to reflect the |
| one-half year period). |
32
|
| STATEMENT OF INVESTMENTS |
| February 28, 2011 (Unaudited) |
| | | | | | | |
| BNY Mellon Large Cap Stock Fund | | | | |
| Common Stocks—99.8% | Shares | Value ($) | | Shares | Value ($) |
| Consumer Discretionary—13.2% | | | Financial (continued) | | |
| Amazon.com | 44,580a | 7,725,268 | Capital One Financial | 519,580 | 25,859,497 |
| Autoliv | 123,980 | 9,284,862 | Citigroup | 6,752,980a | 31,603,946 |
| Carnival | 286,750 | 12,235,623 | Comerica | 268,050 | 10,427,145 |
| DIRECTV, Cl. A | 380,900a | 17,509,973 | JPMorgan Chase & Co. | 298,396 | 13,932,109 |
| Ford Motor | 1,605,240a | 24,158,862 | Lincoln National | 620,710 | 19,688,921 |
| General Motors | 191,943 | 6,435,849 | MetLife | 321,970 | 15,248,499 |
| Limited Brands | 334,370 | 10,706,527 | Wells Fargo & Co. | 1,211,310 | 39,076,861 |
| Mattel | 622,620 | 15,602,857 | | | 209,081,772 |
| Newell Rubbermaid | 1,456,430 | 28,167,356 | Health Care—11.8% | | |
| News, Cl. B | 538,360 | 9,905,824 | Allscripts Healthcare Solutions | 500,280a | 10,680,978 |
| Omnicom Group | 523,330 | 26,637,497 | Amylin Pharmaceuticals | 708,980a | 10,847,394 |
| Stanley Black & Decker | 107,810 | 8,175,232 | CIGNA | 384,660 | 16,182,646 |
| Time Warner | 218,783 | 8,357,511 | Covidien | 349,450 | 17,979,202 |
| | | 184,903,241 | Dendreon | 158,840a | 5,335,436 |
| Consumer Staples—8.3% | | | Gilead Sciences | 135,050a | 5,264,249 |
| Energizer Holdings | 212,710a | 14,215,409 | Human Genome Sciences | 558,100a,b | 13,969,243 |
| Nestle, ADR | 234,980 | 13,304,568 | McKesson | 261,010 | 20,692,873 |
| PepsiCo | 466,617 | 29,592,850 | Pfizer | 2,444,930 | 47,040,453 |
| Philip Morris International | 313,899 | 19,706,579 | St. Jude Medical | 160,390 | 7,679,473 |
| Unilever, ADR | 1,076,180 | 31,962,546 | Zimmer Holdings | 158,800a | 9,899,592 |
| Walgreen | 167,470 | 7,258,150 | | | 165,571,539 |
| | | 116,040,102 | Industrial—11.6% | | |
| Energy—14.6% | | | Caterpillar | 269,310 | 27,720,078 |
| Alpha Natural Resources | 154,150a,b | 8,358,013 | Cummins | 152,190 | 15,389,453 |
| Anadarko Petroleum | 223,780 | 18,311,917 | Dover | 320,460 | 20,589,555 |
| Apache | 117,510 | 14,644,096 | General Electric | 1,733,606 | 36,267,038 |
| Cameron International | 132,610a | 7,841,229 | Ingersoll-Rand | 411,740 | 18,651,822 |
| Chevron | 317,930 | 32,985,238 | Norfolk Southern | 189,930 | 12,455,609 |
| ENSCO, ADR | 262,730b | 14,739,153 | Textron | 508,530b | 13,776,078 |
| Halliburton | 346,220 | 16,251,567 | Thomas & Betts | 149,310a | 8,270,281 |
| Hess | 323,320 | 28,138,540 | Tyco International | 194,710 | 8,828,151 |
| Newfield Exploration | 230,050a | 16,745,340 | | | 161,948,065 |
| Occidental Petroleum | 334,880 | 34,147,714 | Information Technology—18.7% | | |
| Valero Energy | 416,280 | 11,730,770 | Alcatel-Lucent, ADR | 2,137,670a | 10,474,583 |
| | | 203,893,577 | Apple | 156,880a | 55,411,585 |
| Financial—15.0% | | | BMC Software | 382,950a | 18,956,025 |
| American Express | 502,350 | 21,887,390 | EMC | 531,690a | 14,467,285 |
| Bank of America | 2,194,360 | 31,357,404 | Google, Cl. A | 41,270a | 25,315,018 |
STATEMENT OF INVESTMENTS (Unaudited) (continued)
| | | | | | | | |
| BNY Mellon Large Cap Stock Fund (continued) | | | | | |
| |
| Common Stocks (continued) | Shares | Value ($) | | Shares | | Value ($) | |
| Information Technology (continued) | | | Utilities (continued) | | | | |
| Informatica | 225,400a | 10,596,054 | Entergy | 161,850 | | 11,523,720 | |
| International Business Machines | 264,840 | 42,872,299 | Public Service Enterprise Group | 476,330 | | 15,575,991 | |
| Motorola Mobility Holdings | 110,923a | 3,349,875 | | | | 35,324,817 | |
| Motorola Solutions | 126,784a | 4,898,934 | Total Common Stocks | | | | |
| NetApp | 134,190a | 6,932,255 | (cost $1,069,072,901) | | | 1,395,377,397 | |
| |
| Oracle | 1,003,010 | 32,999,029 | Investment of Cash Collateral | | | | |
| QUALCOMM | 452,160 | 26,939,693 | for Securities Loaned—2.4% | | | | |
| Teradata | 188,904a | 9,033,389 | | | | | |
| | | | Registered Investment Company; | | | | |
| | | 262,246,024 | | | | | |
| | | | Dreyfus Institutional Cash | | | | |
| Materials—1.7% | | | Advantage Plus Fund | | | | |
| CF Industries Holdings | 48,510 | 6,853,493 | (cost $33,593,151) | 33,593,151 c 33,593,151 | |
| E.I. du Pont de Nemours & Co. | 303,360 | 16,645,363 | | | | | |
| | | | Total Investments | | | | |
| | | 23,498,856 | | | | | |
| | | | (cost $1,102,666,052) | 102.2 | % | 1,428,970,548 | |
| Telecommunication Services—2.4% | | | | | | | |
| | | | Liabilities, Less Cash | | | | |
| AT&T | 1,158,189 | 32,869,404 | | | | | |
| | | | and Receivables | (2.2 | %) | (31,395,021 | ) |
| Utilities—2.5% | | | | | | | |
| American Electric Power | 229,880 | 8,225,106 | Net Assets | 100.0 | % | 1,397,575,527 | |
ADR—American Depository Receipts
|
| a Non-income producing security. |
| b Security, or portion thereof, on loan.At February 28, 2011, the value of the fund’s securities on loan was $29,269,732 and |
| the value of the collateral held by the fund was $33,593,151. |
| c Investment in affiliated money market mutual fund. |
| | | |
| Portfolio Summary (Unaudited) † | | | |
| |
| | Value (%) | | Value (%) |
| Information Technology | 18.7 | Consumer Staples | 8.3 |
| Financial | 15.0 | Utilities | 2.5 |
| Energy | 14.6 | Money Market Investment | 2.4 |
| Consumer Discretionary | 13.2 | Telecommunication Services | 2.4 |
| Health Care | 11.8 | Materials | 1.7 |
| Industrial | 11.6 | | 102.2 |
| |
| † Based on net assets. | | | |
| See notes to financial statements. | | | |
34
|
| STATEMENT OF INVESTMENTS |
| February 28, 2011 (Unaudited) |
| | | | | | | |
| BNY Mellon Large Cap Market Opportunities Fund | | | |
| Common Stocks—66.0% | Shares | Value ($) | | Shares | Value ($) |
| Consumer Discretionary—9.3% | | | Financial (continued) | | |
| Carnival | 15,260 | 651,144 | Invesco | 29,953 | 803,938 |
| Family Dollar Stores | 12,071 | 604,516 | Morgan Stanley | 29,392 | 872,355 |
| Johnson Controls | 24,869 | 1,014,655 | | | 3,766,191 |
| Lowe’s | 28,822 | 754,272 | Health Care—10.9% | | |
| McDonald’s | 7,719 | 584,174 | Abbott Laboratories | 10,883 | 523,472 |
| NIKE, Cl. B | 7,319 | 651,611 | Agilent Technologies | 20,344a | 856,075 |
| Panera Bread, Cl. A | 5,741a | 670,262 | Baxter International | 14,131 | 751,063 |
| Starbucks | 21,591 | 712,071 | C.R. Bard | 6,888 | 673,371 |
| TJX | 13,133 | 654,943 | Celgene | 9,988a | 530,363 |
| Tractor Supply | 12,226 | 636,608 | Covidien | 16,953 | 872,232 |
| Walt Disney | 25,154 | 1,100,236 | Gilead Sciences | 16,029a | 624,810 |
| | | 8,034,492 | Johnson & Johnson | 9,250 | 568,320 |
| Consumer Staples—3.8% | | | Medtronic | 14,852 | 592,892 |
| Coca-Cola | 13,570 | 867,394 | Meridian Bioscience | 27,645 | 596,303 |
| Colgate-Palmolive | 6,843 | 537,312 | Resmed | 16,805a | 531,038 |
| Kraft Foods, Cl. A | 25,154 | 800,903 | Stryker | 11,622 | 735,208 |
| PepsiCo | 8,289 | 525,688 | Varian Medical Systems | 9,806a | 679,360 |
| Wal-Mart Stores | 10,476 | 544,542 | Watson Pharmaceuticals | 14,976a | 838,506 |
| | | 3,275,839 | | | 9,373,013 |
| Energy—9.6% | | | Industrial—7.8% | | |
| Apache | 5,619 | 700,240 | Boeing | 7,962 | 573,344 |
| Cameron International | 14,130a | 835,507 | C.H. Robinson Worldwide | 8,288 | 599,968 |
| CARBO Ceramics | 6,602 | 818,450 | Caterpillar | 11,591 | 1,193,062 |
| EOG Resources | 6,178 | 693,851 | Donaldson | 11,407 | 642,214 |
| Exxon Mobil | 13,000 | 1,111,890 | Dover | 12,150 | 780,638 |
| Halliburton | 19,501 | 915,377 | Honeywell International | 16,106 | 932,698 |
| Occidental Petroleum | 15,387 | 1,569,012 | MSC Industrial Direct, Cl. A | 10,406 | 657,555 |
| Schlumberger | 8,955 | 836,576 | Precision Castparts | 5,078 | 719,807 |
| Southwestern Energy | 21,476a | 847,872 | Rockwell Collins | 9,408 | 606,252 |
| | | 8,328,775 | | | 6,705,538 |
| Financial—4.4% | | | Information Technology—16.3% | | |
| Allstate | 24,310 | 772,572 | Adobe Systems | 18,677a | 644,357 |
| Citigroup | 281,480a | 1,317,326 | Amphenol, Cl. A | 11,944 | 686,541 |
STATEMENT OF INVESTMENTS (Unaudited) (continued)
| | | | | | | |
| BNY Mellon Large Cap Market Opportunities Fund (continued) | | | |
| Common Stocks (continued) | Shares | Value ($) | | Shares | | Value ($) |
| Information Technology (continued) | | | Materials (continued) | | | |
| Apple | 4,328a | 1,528,693 | Ecolab | 12,786 | | 621,911 |
| Automatic Data Processing | 12,925 | 646,250 | Monsanto | 9,268 | | 666,277 |
| Baidu, ADR | 6,785a | 822,071 | Praxair | 5,965 | | 592,802 |
| Cisco Systems | 23,053a | 427,864 | | | | 3,351,733 |
| Cognizant Technology Solutions, Cl. A | 11,309a | 869,323 | Total Common Stocks | | | |
| Dolby Laboratories, Cl. A | 8,104a | 409,819 | (cost $52,139,854) | | | 56,868,982 |
| FLIR Systems | 18,119 | 585,244 | | | | |
| Google, Cl. A | 2,867a | 1,758,618 | Other Investment—33.4% | | | |
| Intel | 25,642 | 550,534 | Registered Investment Companies: | | | |
| MasterCard, Cl. A | 2,585 | 621,848 | BNY Mellon U.S. Core | | | |
| Microsoft | 20,609 | 547,787 | Equity 130/30 Fund, Cl. M | 2,186,016 | b | 26,778,697 |
| Oracle | 22,626 | 744,395 | Dreyfus Institutional Preferred | | | |
| Paychex | 20,546 | 690,962 | Plus Money Market Fund | 1,958,000 | c | 1,958,000 |
| QUALCOMM | 13,892 | 827,685 | Total Other Investment | | | |
| | | | (cost $27,019,286) | | | 28,736,697 |
| Rovi | 13,846a | 767,345 | | | | |
| Salesforce.com | 6,835a | 904,065 | Total Investments | | | |
| | | 14,033,401 | (cost $79,159,140) | 99.4 | % | 85,605,679 |
| Materials—3.9% | | | Cash and Receivables (Net) | .6 | % | 511,571 |
| Celanese, Ser. A | 20,916 | 866,968 | | | | |
| | | | Net Assets | 100.0 | % | 86,117,250 |
| Cliffs Natural Resources | 6,220 | 603,775 | | | | |
ADR—American Depository Receipts
| |
| a | Non-income producing security. |
| b | Investment in affiliated mutual fund. |
| c | Investment in affiliated money market mutual fund. |
| | | |
| Portfolio Summary (Unaudited) † | | | |
| |
| | Value (%) | | Value (%) |
| Mutual Funds: Domestic | 31.1 | Financial | 4.4 |
| Information Technology | 16.3 | Materials | 3.9 |
| Health Care | 10.9 | Consumer Staples | 3.8 |
| Energy | 9.6 | Money Market Investment | 2.3 |
| Consumer Discretionary | 9.3 | | |
| Industrial | 7.8 | | 99.4 |
| |
| † Based on net assets. | | | |
| See notes to financial statements. | | | |
36
|
| STATEMENT OF INVESTMENTS |
| February 28, 2011 (Unaudited) |
| | | | | | | |
| BNY Mellon Tax-Sensitive Large Cap Multi-Strategy Fund | | |
| Common Stocks—79.9% | Shares | Value ($) | | Shares | Value ($) |
| Consumer Discretionary—9.6% | | | Consumer Discretionary (continued) | | |
| Amazon.com | 292a | 50,601 | Tractor Supply | 4,313 | 224,578 |
| Bed Bath & Beyond | 208a | 10,015 | Viacom, Cl. B | 548 | 24,474 |
| Carnival | 9,508 | 405,706 | Walt Disney | 15,563 | 680,726 |
| CBS, Cl. B | 959 | 22,882 | Whirlpool | 110 | 9,075 |
| Coach | 301 | 16,531 | Wyndham Worldwide | 370 | 11,574 |
| Comcast, Cl. A | 3,066 | 78,980 | Yum! Brands | 3,153 | 158,690 |
| DIRECTV, Cl. A | 252a | 11,584 | | | 5,163,670 |
| Discovery Communications, Cl. A | 124a | 5,346 | Consumer Staples—6.4% | | |
| Expedia | 550 | 10,923 | Altria Group | 979 | 24,837 |
| Family Dollar Stores | 4,253 | 212,990 | Archer-Daniels-Midland | 237 | 8,812 |
| Ford Motor | 3,863a | 58,138 | Avon Products | 4,704 | 130,818 |
| Fortune Brands | 329 | 20,352 | Coca-Cola | 9,513 | 608,071 |
| Genuine Parts | 414 | 21,814 | Colgate-Palmolive | 3,274 | 257,074 |
| Harley-Davidson | 294 | 12,001 | ConAgra Foods | 910 | 21,076 |
| Home Depot | 6,013 | 225,307 | Costco Wholesale | 2,065 | 154,441 |
| International Game Technology | 5,481 | 90,217 | CVS Caremark | 1,260 | 41,656 |
| Johnson Controls | 14,276 | 582,461 | Dean Foods | 830a | 8,765 |
| Kohl’s | 225 | 12,125 | Dr. Pepper Snapple Group | 520 | 18,751 |
| Leggett & Platt | 510 | 11,761 | H.J. Heinz | 173 | 8,688 |
| Limited Brands | 289 | 9,254 | Hershey | 171 | 8,947 |
| Lowe’s | 11,860 | 310,376 | J.M. Smucker | 119 | 8,192 |
| Macy’s | 429 | 10,253 | Kraft Foods, Cl. A | 16,045 | 510,873 |
| Marriott International, Cl. A | 371 | 14,547 | Kroger | 326 | 7,465 |
| Mattel | 488 | 12,229 | Lorillard | 30 | 2,303 |
| McDonald’s | 3,976 | 300,904 | McCormick & Co. | 412 | 19,632 |
| McGraw-Hill | 348 | 13,461 | Mead Johnson Nutrition | 137 | 8,199 |
| Netflix | 50a | 10,333 | PepsiCo | 7,170 | 454,721 |
| News, Cl. A | 2,996 | 52,041 | Philip Morris International | 4,828 | 303,102 |
| NIKE, Cl. B | 3,222 | 286,855 | Procter & Gamble | 4,506 | 284,103 |
| O’Reilly Automotive | 164a | 9,115 | Reynolds American | 490 | 16,817 |
| Omnicom Group | 350 | 17,815 | Safeway | 296 | 6,459 |
| Panera Bread, Cl. A | 2,026a | 236,536 | Sara Lee | 848 | 14,518 |
| Priceline.com | 58a | 26,325 | SUPERVALU | 1,580 | 13,635 |
| Ross Stores | 577 | 41,567 | SYSCO | 517 | 14,367 |
| Stanley Black & Decker | 193 | 14,635 | Wal-Mart Stores | 6,159 | 320,145 |
| Staples | 611 | 13,014 | Walgreen | 3,787 | 164,129 |
| Starbucks | 8,534 | 281,451 | | | 3,440,596 |
| Starwood Hotels & Resorts Worldwide | 366b | 22,363 | Energy—11.3% | | |
| Target | 3,534 | 185,712 | Anadarko Petroleum | 451 | 36,905 |
| Time Warner | 932 | 35,602 | Apache | 2,544 | 317,033 |
| Time Warner Cable | 413 | 29,810 | Baker Hughes | 320 | 22,736 |
| TJX | 5,226 | 260,621 | Cameron International | 7,446a | 440,282 |
STATEMENT OF INVESTMENTS (Unaudited) (continued)
| | | | | | | |
| BNY Mellon Tax-Sensitive Large Cap Multi-Strategy Fund (continued) | | |
| Common Stocks (continued) | Shares | Value ($) | | Shares | Value ($) |
| Energy (continued) | | | Financial (continued) | | |
| CARBO Ceramics | 2,325 | 288,230 | Citigroup | 168,986a | 790,854 |
| Chesapeake Energy | 540 | 19,229 | CME Group | 45 | 14,008 |
| Chevron | 3,504 | 363,540 | Comerica | 318 | 12,370 |
| ConocoPhillips | 1,456 | 113,379 | Discover Financial Services | 817 | 17,770 |
| Consol Energy | 266 | 13,489 | Equity Residential | 377b | 20,776 |
| Devon Energy | 599 | 54,773 | Fifth Third Bancorp | 1,374 | 20,060 |
| El Paso | 2,205 | 41,013 | Franklin Resources | 147 | 18,466 |
| EOG Resources | 2,501 | 280,887 | Genworth Financial, Cl. A | 572a | 7,568 |
| Exxon Mobil | 14,580 | 1,247,027 | Goldman Sachs Group | 314 | 51,427 |
| FMC Technologies | 125a | 11,756 | Hartford Financial Services Group | 706 | 20,898 |
| Halliburton | 10,326 | 484,702 | Host Hotels & Resorts | 1,053b | 19,375 |
| Hess | 323 | 28,111 | IntercontinentalExchange | 109a | 13,974 |
| Marathon Oil | 757 | 37,547 | Invesco | 17,454 | 468,465 |
| Murphy Oil | 139 | 10,221 | Janus Capital Group | 470 | 6,312 |
| National Oilwell Varco | 430 | 34,215 | JPMorgan Chase & Co. | 10,124 | 472,690 |
| Noble | 370 | 16,543 | KeyCorp | 1,550 | 14,167 |
| Noble Energy | 113 | 10,471 | Kimco Realty | 940b | 18,217 |
| Occidental Petroleum | 7,337 | 748,154 | Leucadia National | 340 | 11,264 |
| Peabody Energy | 193 | 12,640 | Lincoln National | 936 | 29,690 |
| Plains Exploration & Production | 2,531a | 99,139 | Loews | 227 | 9,818 |
| QEP Resources | 2,648 | 104,728 | Marsh & McLennan | 896 | 27,274 |
| Schlumberger | 5,920 | 553,046 | MetLife | 782 | 37,036 |
| Southwestern Energy | 11,164a | 440,755 | Morgan Stanley | 16,631 | 493,608 |
| Spectra Energy | 537 | 14,365 | Nasdaq OMX Group | 430a | 12,302 |
| Tesoro | 1,140a | 27,109 | Northern Trust | 159 | 8,200 |
| Valero Energy | 6,813 | 191,990 | NYSE Euronext | 453 | 16,761 |
| Williams | 759 | 23,043 | People’s United Financial | 1,973 | 26,004 |
| | | 6,087,058 | Plum Creek Timber | 501b | 21,022 |
| Financial—9.3% | | | PNC Financial Services Group | 2,350 | 144,995 |
| ACE | 649 | 41,049 | Principal Financial Group | 369 | 12,642 |
| Aflac | 2,839 | 167,104 | ProLogis | 1,220b | 19,837 |
| Allstate | 14,495 | 460,651 | Prudential Financial | 606 | 39,893 |
| American Express | 4,429 | 192,972 | Regions Financial | 1,700 | 12,988 |
| Ameriprise Financial | 152 | 9,625 | Simon Property Group | 262b | 28,830 |
| AON | 471 | 24,793 | State Street | 3,135 | 140,197 |
| AvalonBay Communities | 199b | 24,085 | SunTrust Banks | 779 | 23,502 |
| Bank of America | 9,474 | 135,383 | T. Rowe Price Group | 281 | 18,821 |
| BB&T | 969 | 26,744 | Travelers | 491 | 29,426 |
| Berkshire Hathaway, Cl. B | 1,632a | 142,441 | U.S. Bancorp | 6,700 | 185,791 |
| Capital One Financial | 473 | 23,541 | Wells Fargo & Co. | 10,553 | 340,440 |
| Charles Schwab | 1,381 | 26,198 | Weyerhaeuser | 1,360b | 33,198 |
| Chubb | 201 | 12,197 | | | 4,997,719 |
38
| | | | | | | |
| BNY Mellon Tax-Sensitive Large Cap Multi-Strategy Fund (continued) | | |
| Common Stocks (continued) | Shares | Value ($) | | Shares | Value ($) |
| Health Care—10.7% | | | Health Care (continued) | | |
| Abbott Laboratories | 5,475 | 263,347 | WellPoint | 254 | 16,883 |
| Aetna | 488 | 18,232 | Zimmer Holdings | 2,215a | 138,083 |
| Agilent Technologies | 10,480a | 440,998 | | | 5,779,053 |
| Allergan | 279 | 20,693 | Industrial—9.2% | | |
| AmerisourceBergen | 846 | 32,072 | 3M | 504 | 46,484 |
| Amgen | 2,722a | 139,720 | Boeing | 3,821 | 275,150 |
| Baxter International | 8,274 | 439,763 | C.H. Robinson Worldwide | 3,145 | 227,667 |
| Becton Dickinson & Co. | 137 | 10,960 | Caterpillar | 6,607 | 680,059 |
| Biogen Idec | 212a | 14,501 | CSX | 446 | 33,298 |
| Boston Scientific | 2,149a | 15,387 | Cummins | 136 | 13,752 |
| Bristol-Myers Squibb | 692 | 17,861 | Danaher | 512 | 25,907 |
| C.R. Bard | 3,019 | 295,137 | Deere & Co. | 2,137 | 192,651 |
| Cardinal Health | 2,962 | 123,338 | Donaldson | 4,025 | 226,607 |
| Celgene | 4,373a | 232,206 | Dover | 4,379 | 281,351 |
| CIGNA | 468 | 19,689 | Eaton | 1,521 | 168,496 |
| Coventry Health Care | 370a | 11,174 | Emerson Electric | 3,618 | 215,850 |
| Covidien | 8,406 | 432,489 | Expeditors International of | | |
| DaVita | 180a | 14,287 | Washington | 356 | 17,017 |
| Eli Lilly & Co. | 606 | 20,943 | FedEx | 338 | 30,427 |
| Express Scripts | 626a | 35,194 | Fluor | 567 | 40,121 |
| Forest Laboratories | 310a | 10,044 | General Dynamics | 341 | 25,957 |
| Genzyme | 191a | 14,411 | General Electric | 17,927 | 375,033 |
| Gilead Sciences | 6,900a | 268,962 | Goodrich | 201 | 17,332 |
| Hospira | 2,357a | 124,567 | Honeywell International | 9,157 | 530,282 |
| Humana | 151a | 9,817 | Illinois Tool Works | 443 | 23,966 |
| Intuitive Surgical | 20a | 6,559 | ITT | 448 | 25,953 |
| Johnson & Johnson | 6,101 | 374,845 | MSC Industrial Direct, Cl. A | 3,669 | 231,844 |
| Laboratory Corp. of America Holdings | 241a | 21,721 | Norfolk Southern | 282 | 18,494 |
| McKesson | 359 | 28,462 | Northrop Grumman | 156 | 10,402 |
| Medco Health Solutions | 373a | 22,992 | Paccar | 317 | 15,891 |
| Medtronic | 6,724 | 268,422 | Parker Hannifin | 122 | 10,880 |
| Merck & Co. | 2,221 | 72,338 | Precision Castparts | 2,045 | 289,879 |
| Meridian Bioscience | 9,747 | 210,243 | R.R. Donnelley & Sons | 730 | 13,593 |
| Mylan | 880a | 20,126 | Rockwell Automation | 298 | 26,144 |
| Pfizer | 18,787 | 361,462 | Rockwell Collins | 3,930 | 253,249 |
| Resmed | 5,922a | 187,135 | Southwest Airlines | 1,585 | 18,751 |
| St. Jude Medical | 236 | 11,300 | Tyco International | 434 | 19,678 |
| Stryker | 4,591 | 290,427 | Union Pacific | 2,221 | 211,906 |
| Thermo Fisher Scientific | 390a | 21,770 | United Parcel Service, Cl. B | 823 | 60,737 |
| UnitedHealth Group | 952 | 40,536 | United Technologies | 3,147 | 262,900 |
| Varian Medical Systems | 3,459a | 239,640 | Waste Management | 604 | 22,384 |
| Watson Pharmaceuticals | 7,507a | 420,317 | | | 4,940,092 |
STATEMENT OF INVESTMENTS (Unaudited) (continued)
| | | | | | | |
| BNY Mellon Tax-Sensitive Large Cap Multi-Strategy Fund (continued) | | |
| Common Stocks (continued) | Shares | Value ($) | | Shares | Value ($) |
| Information Technology—17.6% | | | Information Technology (continued) | | |
| Accenture, Cl. A | 2,213 | 113,925 | Riverbed Technology | 2,780a | 114,786 |
| Adobe Systems | 7,602a | 262,269 | Rovi | 6,873a | 380,902 |
| Akamai Technologies | 270a | 10,133 | Salesforce.com | 3,694a | 488,605 |
| Altera | 278 | 11,637 | SanDisk | 220a | 10,912 |
| Amphenol, Cl. A | 4,817 | 276,881 | Symantec | 1,094a | 19,725 |
| Analog Devices | 623 | 24,845 | Taiwan Semiconductor | | |
| Apple | 3,597a | 1,270,496 | Manufacturing, ADR | 9,645 | 118,537 |
| Applied Materials | 1,278 | 20,998 | Teradata | 3,778a | 180,664 |
| Autodesk | 824a | 34,649 | Texas Instruments | 1,349 | 48,038 |
| Automatic Data Processing | 5,187 | 259,350 | Visa, Cl. A | 360 | 26,298 |
| Baidu, ADR | 2,317a | 280,728 | Western Digital | 450a | 13,761 |
| Broadcom, Cl. A | 502 | 20,692 | Western Union | 1,042 | 22,914 |
| Cisco Systems | 14,422a | 267,672 | Xerox | 880 | 9,460 |
| Citrix Systems | 184a | 12,909 | Xilinx | 1,164 | 38,703 |
| Cognizant Technology Solutions, Cl. A | 4,188a | 321,932 | Yahoo! | 992a | 16,269 |
| Computer Sciences | 370 | 17,808 | | | 9,472,065 |
| Compuware | 2,308a | 25,988 | Materials—3.8% | | |
| Corning | 1,431 | 32,999 | Air Products & Chemicals | 1,979 | 182,068 |
| Dell | 1,002a | 15,862 | Alcoa | 840 | 14,154 |
| Dolby Laboratories, Cl. A | 2,855a | 144,377 | Bemis | 761 | 24,999 |
| eBay | 942a | 31,562 | Celanese, Ser. A | 9,854 | 408,448 |
| EMC | 2,180a | 59,318 | CF Industries Holdings | 80 | 11,302 |
| F5 Networks | 110a | 12,981 | Cliffs Natural Resources | 2,407 | 233,647 |
| Fiserv | 346a | 21,891 | Dow Chemical | 1,086 | 40,356 |
| FLIR Systems | 6,386 | 206,268 | E.I. du Pont de Nemours & Co. | 901 | 49,438 |
| Google, Cl. A | 1,637a | 1,004,136 | Ecolab | 5,118 | 248,940 |
| Hewlett-Packard | 5,638 | 245,986 | Freeport-McMoRan Copper & Gold | 3,444 | 182,360 |
| Intel | 20,987 | 450,591 | International Paper | 734 | 20,391 |
| International Business Machines | 2,797 | 452,778 | Monsanto | 3,881 | 279,005 |
| Intuit | 207a | 10,884 | Newmont Mining | 387 | 21,389 |
| Juniper Networks | 3,594a | 158,136 | Nucor | 261 | 12,518 |
| Linear Technology | 255 | 8,813 | PPG Industries | 158 | 13,964 |
| MasterCard, Cl. A | 1,080 | 259,805 | Praxair | 2,507 | 249,146 |
| Micron Technology | 1,010a | 11,241 | Sigma-Aldrich | 296 | 18,911 |
| Microsoft | 18,280 | 485,882 | United States Steel | 462 | 26,560 |
| Molex | 1,024 | 28,600 | Vulcan Materials | 259 | 11,875 |
| Monster Worldwide | 320a | 5,488 | | | 2,049,471 |
| Motorola Mobility Holdings | 208a | 6,282 | Telecommunication Services—1.0% | | |
| Motorola Solutions | 238a | 9,196 | American Tower, Cl. A | 365a | 19,695 |
| NetApp | 503a | 25,985 | AT&T | 10,060 | 285,503 |
| Oracle | 12,115 | 398,584 | Frontier Communications | 2,198 | 18,661 |
| Paychex | 7,944 | 267,157 | Metropcs Communications | 850a | 12,240 |
| QUALCOMM | 6,626 | 394,777 | Sprint Nextel | 1,444a | 6,310 |
40
| | | | | | | | |
| BNY Mellon Tax-Sensitive Large Cap Multi-Strategy Fund (continued) | | | | |
| Common Stocks (continued) | Shares | | Value ($) | | Shares | | Value ($) | |
| Telecommunication Services (continued) | | | | Utilities (continued) | | | | |
| Verizon Communications | 5,100 | | 188,292 | Sempra Energy | 3,063 | | 163,043 | |
| Windstream | 2,050 | | 25,707 | Southern | 453 | | 17,264 | |
| | | | 556,408 | TECO Energy | 1,040 | | 18,834 | |
| Utilities—1.0% | | | | Wisconsin Energy | 354 | | 20,957 | |
| AES | 1,833 | a | 22,674 | | | | 512,058 | |
| Ameren | 312 | | 8,724 | Total Common Stocks | | | | |
| CenterPoint Energy | 1,210 | | 19,191 | (cost $37,483,710) | | | 42,998,190 | |
| CMS Energy | 1,056 | | 20,339 | | | | | |
| Constellation Energy Group | 700 | | 21,749 | Other Investment—21.2% | | | | |
| Dominion Resources | 333 | | 15,195 | Registered Investment Companies: | | | | |
| DTE Energy | 540 | | 25,423 | BNY Mellon U.S. Core | | | | |
| Duke Energy | 593 | | 10,668 | Equity 130/30 Fund | 757,919 | c | 9,284,505 | |
| Exelon | 189 | | 7,893 | Dreyfus Institutional Preferred | | | | |
| NiSource | 1,010 | | 19,352 | Plus Money Market Fund | 2,145,000 | d | 2,145,000 | |
| Northeast Utilities | 673 | | 22,909 | Total Other Investment | | | | |
| | | | | (cost $10,497,110) | | | 11,429,505 | |
| NRG Energy | 1,050 | a | 20,989 | | | | | |
| Pepco Holdings | 285 | | 5,338 | Total Investments (cost $47,980,820) | 101.1 | % | 54,427,695 | |
| PG&E | 758 | | 34,913 | Liabilities, Less Cash and Receivables | (1.1 | %) | (588,850 | ) |
| Pinnacle West Capital | 445 | | 18,792 | | | | | |
| | | | | Net Assets | 100.0 | % | 53,838,845 | |
| SCANA | 440 | | 17,811 | | | | | |
| |
| ADR—American Depository Receipts | | | | | | | | |
| a Non-income producing security. | | | | | | | | |
| b Investment in real estate investment trust. | | | | | | | | |
| c Investment in affiliated mutual fund. | | | | | | | | |
| d Investment in affiliated money market mutual fund. | | | | | | | | |
| |
| |
| |
| Portfolio Summary (Unaudited) † | | | | | | | | |
| | | | Value (%) | | | | Value (%) | |
| Information Technology | | | 17.6 | Consumer Staples | | | 6.4 | |
| Mutual Funds: Domestic | | | 17.2 | Money Market Investment | | | 4.0 | |
| Energy | | | 11.3 | Materials | | | 3.8 | |
| Health Care | | | 10.7 | Telecommunication Services | | | 1.0 | |
| Consumer Discretionary | | | 9.6 | Utilities | | | 1.0 | |
| Financial | | | 9.3 | | | | | |
| Industrial | | | 9.2 | | | | 101.1 | |
| |
| † Based on net assets. | | | | | | | | |
| See notes to financial statements. | | | | | | | | |
|
| STATEMENT OF INVESTMENTS |
| February 28, 2011 (Unaudited) |
| | | | | | |
| BNY Mellon Income Stock Fund | | | | |
| Common Stocks—97.4% | Shares | Value ($) | | Shares | Value ($) |
| Consumer Discretionary—14.3% | | | Industrial—14.4% | | |
| Carnival | 25,410 | 1,084,245 | Caterpillar | 9,840a | 1,012,831 |
| Home Depot | 13,960 | 523,081 | Dover | 15,850 | 1,018,362 |
| Johnson Controls | 39,840 | 1,625,472 | Eaton | 10,350 | 1,146,573 |
| Omnicom Group | 87,610 | 4,459,349 | General Electric | 256,802 | 5,372,298 |
| Regal Entertainment Group, Cl. A | 161,070 | 2,406,386 | Hubbell, Cl. B | 24,770 | 1,672,223 |
| Stanley Black & Decker | 7,360 | 558,109 | Pitney Bowes | 175,040b | 4,407,507 |
| Target | 13,460 | 707,323 | United Technologies | 19,800 | 1,654,092 |
| Time Warner | 124,650 | 4,761,630 | | | 16,283,886 |
| | | 16,125,595 | Information Technology—3.2% | | |
| Consumer Staples—9.6% | | | Paychex | 33,470 | 1,125,596 |
| Dr. Pepper Snapple Group | 31,530 | 1,136,972 | QUALCOMM | 42,570 | 2,536,321 |
| Kraft Foods, Cl. A | 51,980 | 1,655,043 | | | 3,661,917 |
| Lorillard | 31,880 | 2,447,428 | Materials—3.2% | | |
| PepsiCo | 49,490 | 3,138,656 | Air Products & Chemicals | 11,150 | 1,025,800 |
| Philip Morris International | 39,530 | 2,481,693 | Dow Chemical | 28,310 | 1,052,000 |
| | | 10,859,792 | Freeport-McMoRan | | |
| Energy—8.3% | | | Copper & Gold | 19,000a | 1,006,050 |
| ConocoPhillips | 22,020 | 1,714,697 | Packaging Corp. of America | 18,750 | 539,813 |
| Exxon Mobil | 57,130 | 4,886,329 | | | 3,623,663 |
| Occidental Petroleum | 16,200 | 1,651,914 | Telecommunication | | |
| Schlumberger | 11,380 | 1,063,120 | Services—10.3% | | |
| | | 9,316,060 | AT&T | 87,265 | 2,476,581 |
| Financial—17.2% | | | Vodafone Group, ADR | 166,270 | 4,758,647 |
| American Express | 25,320 | 1,103,192 | Windstream | 345,792 | 4,336,232 |
| Ameriprise Financial | 16,170 | 1,023,884 | | | 11,571,460 |
| Arthur J. Gallagher & Co. | 35,960 | 1,129,144 | Utilities—9.2% | | |
| Comerica | 29,040 | 1,129,656 | Dominion Resources | 24,550 | 1,120,216 |
| JPMorgan Chase & Co. | 109,359 | 5,105,972 | DTE Energy | 35,490 | 1,670,869 |
| Marsh & McLennan | 36,010 | 1,096,144 | Entergy | 27,160 | 1,933,792 |
| MetLife | 33,420 | 1,582,771 | National Grid, ADR | 47,850b | 2,235,552 |
| New York Community Bancorp | 119,260 | 2,225,392 | NextEra Energy | 51,710 | 2,868,354 |
| People’s United Financial | 27,530 | 362,845 | Questar | 27,940 | 499,288 |
| U.S. Bancorp | 126,680 | 3,512,836 | | | 10,328,071 |
| Wells Fargo & Co. | 33,270 | 1,073,290 | Total Common Stocks | | |
| | | | (cost $91,120,055) | | 109,772,951 |
| | | 19,345,126 | | | |
| Health Care—7.7% | | | | | |
| | | | Preferred Stocks—1.7% | | |
| Cardinal Health | 26,970 | 1,123,031 | | | |
| Merck & Co. | 68,560 | 2,232,999 | Consumer Discretionary—.7% | | |
| Pfizer | 275,538 | 5,301,351 | General Motors, | | |
| | | | Ser. B, Conv., Cum. $.647 | 15,870 | 807,466 |
| | | 8,657,381 | | | |
42
| | | | | | | | |
| BNY Mellon Income Stock Fund (continued) | | | | | |
| |
| | | | | Investment of Cash Collateral | | | | |
| Preferred Stocks (continued) | Shares | | Value ($) | for Securities Loaned—2.2% | Shares | | Value ($) | |
| |
| Financial—1.0% | | | | Registered Investment Company; | | | | |
| Citigroup, | | | | Dreyfus | | | | |
| Conv., Cum. $7.354 | 8,050 | | 1,082,725 | Institutional Cash | | | | |
| Total Preferred Stocks | | | | Advantage Plus Fund | | | | |
| (cost $1,956,210) | | | 1,890,191 | (cost $2,451,522) | 2,451,522 | c | 2,451,522 | |
| |
| | | | | Total Investments | | | | |
| Other Investment—.5% | | | | (cost $96,099,787) | 101.8 | % | 114,686,664 | |
| |
| Registered Investment Company; | | | | Liabilities, Less Cash | | | | |
| Dreyfus Institutional Preferred | | | | and Receivables | (1.8 | %) | (1,967,033 | ) |
| Plus Money Market Fund | | | | | | | | |
| | | | | Net Assets | 100.0 | % | 112,719,631 | |
| (cost $572,000) | 572,000 | c | 572,000 | | | | | |
ADR—American Depository Receipts
|
| a Held by a broker as collateral for open options written. |
| b Security, or portion thereof, on loan.At February 28, 2011, the value of the fund’s securities on loan was $2,417,058 and the value of the collateral held by the fund was $2,451,522. |
| c Investment in affiliated money market mutual fund. |
| | | |
| Portfolio Summary (Unaudited) † | | | |
| |
| | Value (%) | | Value (%) |
| Financial | 18.2 | Energy | 8.3 |
| Consumer Discretionary | 15.0 | Health Care | 7.7 |
| Industrial | 14.4 | Information Technology | 3.2 |
| Telecommunication Services | 10.3 | Materials | 3.2 |
| Consumer Staples | 9.6 | Money Market Investments | 2.7 |
| Utilities | 9.2 | | 101.8 |
| |
| † Based on net assets. | | | |
| See notes to financial statements. | | | |
|
| STATEMENT OF OPTIONS WRITTEN |
| February 28, 2011 (Unaudited) |
| | | | |
| BNY Mellon | Number of | | | |
| Income Stock Fund | Contracts | | Value ($) | |
| Call Options: | | | | |
| Caterpillar, | | | | |
| May 2011 @ $110 | 49 | a | (11,809 | ) |
| Freeport-Mcmoran, | | | | |
| May 2011 @ $59.5 | 95 | a | (14,440 | ) |
| (Premiums received $29,827) | | | (26,249 | ) |
| |
| a Non-income producing security. | | | | |
| See notes to financial statements. | | | | |
44
|
| STATEMENT OF INVESTMENTS |
| February 28, 2011 (Unaudited) |
| | | | | | | |
| BNY Mellon Mid Cap Stock Fund | | | | |
| Common Stocks—99.3% | Shares | Value ($) | | Shares | Value ($) |
| Consumer Discretionary—13.9% | | | Financial—20.1% | | |
| Abercrombie & Fitch, Cl. A | 275,100 | 15,782,487 | Affiliated Managers Group | 137,600a | 14,688,800 |
| Cablevision Systems (NY Group), Cl. A | 289,500 | 10,668,075 | Alexandria Real Estate Equities | 162,700c | 13,048,540 |
| Chipotle Mexican Grill | 32,600a | 7,987,000 | Camden Property Trust | 261,900c | 15,496,623 |
| Cracker Barrel Old Country Store | 197,800 | 9,858,352 | CB Richard Ellis Group, Cl. A | 649,000a | 16,250,960 |
| Darden Restaurants | 199,600 | 9,407,148 | CNO Financial Group | 1,929,800a | 13,971,752 |
| DeVry | 125,800 | 6,824,650 | East West Bancorp | 661,600 | 15,362,352 |
| Dollar Tree | 95,200a | 4,790,464 | Fifth Third Bancorp | 656,100 | 9,579,060 |
| Foot Locker | 735,700 | 14,618,359 | Genworth Financial, Cl. A | 580,700a | 7,682,661 |
| Harman International Industries | 154,100 | 7,495,424 | Hartford Financial Services Group | 296,000 | 8,761,600 |
| Interpublic Group of Cos. | 863,600 | 11,399,520 | Home Properties | 234,400c | 13,810,848 |
| Lear | 141,700 | 14,991,860 | Host Hotels & Resorts | 833,559c | 15,337,486 |
| Lennar, Cl. A | 356,800b | 7,193,088 | Huntington Bancshares | 2,128,000 | 14,555,520 |
| Macy’s | 426,600 | 10,195,740 | Lazard, Cl. A | 229,800 | 10,111,200 |
| Men’s Wearhouse | 398,400 | 10,637,280 | Macerich | 306,100c | 15,500,904 |
| Phillips-Van Heusen | 291,900 | 17,516,919 | MGIC Investment | 1,374,600a,b | 11,807,814 |
| Pier 1 Imports | 916,900a | 9,242,352 | New York Community Bancorp | 530,900 | 9,906,594 |
| Royal Caribbean Cruises | 311,000a | 13,618,690 | Raymond James Financial | 346,000 | 13,258,720 |
| Toll Brothers | 529,400a | 11,255,044 | Rayonier | 235,686c | 14,454,622 |
| Visteon | 108,600a,b | 8,030,970 | Reinsurance Group of America | 201,100 | 12,144,429 |
| Vitamin Shoppe | 411,900a | 14,330,001 | SL Green Realty | 98,800c | 7,482,124 |
| | | 215,843,423 | SunTrust Banks | 275,300 | 8,305,801 |
| Consumer Staples—2.8% | | | Synovus Financial | 802,600b | 2,046,630 |
| Energizer Holdings | 226,100a | 15,110,263 | Waddell & Reed Financial, Cl. A | 310,000 | 12,517,800 |
| Green Mountain Coffee Roasters | 146,300a,b | 5,966,114 | Webster Financial | 571,300 | 13,242,734 |
| Herbalife | 133,600 | 10,475,576 | Weingarten Realty Investors | 510,900c | 13,216,983 |
| Ralcorp Holdings | 190,600a | 12,360,410 | Willis Group Holdings | 284,100 | 11,048,649 |
| | | 43,912,363 | | | 313,591,206 |
| Energy—7.8% | | | Health Care—11.5% | | |
| Atwood Oceanics | 253,000a | 11,516,560 | Allscripts Healthcare Solutions | 593,200a | 12,664,820 |
| Brigham Exploration | 528,600a | 19,336,188 | Amarin, ADR | 853,100a | 6,594,463 |
| Cabot Oil & Gas | 185,100 | 8,451,666 | AMERIGROUP | 213,400a | 12,238,490 |
| Cimarex Energy | 107,000 | 12,425,910 | Edwards Lifesciences | 180,300a | 15,332,712 |
| Complete Production Services | 329,300a | 9,487,133 | Health Management | | |
| Forest Oil | 397,000a | 14,089,530 | Associates, Cl. A | 1,108,500a | 11,085,000 |
| International Coal Group | 1,940,700a | 19,154,709 | LifePoint Hospitals | 258,300a | 10,068,534 |
| Oceaneering International | 159,700a | 13,355,711 | MAP Pharmaceuticals | 458,700a | 7,398,831 |
| SandRidge Energy | 1,313,700a | 14,201,097 | Mednax | 169,200a | 10,986,156 |
| | | 122,018,504 | Resmed | 188,400a | 5,953,440 |
STATEMENT OF INVESTMENTS (Unaudited) (continued)
| | | | | | | |
| BNY Mellon Mid Cap Stock Fund (continued) | | | |
| Common Stocks (continued) | Shares | Value ($) | | Shares | Value ($) |
| Health Care (continued) | | | Information Technology (continued) | | |
| Salix Pharmaceuticals | 170,800a | 5,694,472 | Atmel | 1,088,500a | 15,979,180 |
| St. Jude Medical | 175,400 | 8,398,152 | Check Point | | |
| SXC Health Solutions | 147,800a | 7,293,930 | Software Technologies | 154,200a,b | 7,685,328 |
| Thoratec | 317,800a | 8,860,264 | Ciena | 227,800a | 6,280,446 |
| United Therapeutics | 163,700a | 11,038,291 | Cypress Semiconductor | 644,500a | 13,508,720 |
| Universal Health Services, Cl. B | 347,900 | 15,902,509 | F5 Networks | 72,800a | 8,591,128 |
| VCA Antech | 391,100a | 9,793,144 | Informatica | 197,500a | 9,284,475 |
| Vertex Pharmaceuticals | 254,000a | 11,854,180 | Novellus Systems | 266,400a | 10,645,344 |
| Volcano | 303,800a | 7,971,712 | Polycom | 189,000a | 9,034,200 |
| | | 179,129,100 | Quest Software | 351,000a | 9,403,290 |
| Industrial—15.9% | | | Rackspace Hosting | 362,500a,b | 13,379,875 |
| AMETEK | 426,275 | 17,882,236 | Riverbed Technology | 398,300a | 16,445,807 |
| BE Aerospace | 347,000a | 11,700,840 | Rovi | 237,900a | 13,184,418 |
| Cummins | 81,800 | 8,271,616 | SAVVIS | 272,400a | 8,850,276 |
| Donaldson | 225,400 | 12,690,020 | Skyworks Solutions | 531,700a | 19,109,298 |
| Eaton | 94,000 | 10,413,320 | SuccessFactors | 300,500a | 10,790,955 |
| Flowserve | 54,700 | 6,835,859 | TIBCO Software | 632,700a | 15,577,074 |
| Gardner Denver | 174,200 | 12,740,988 | Trimble Navigation | 381,300a | 18,740,895 |
| Hubbell, Cl. B | 135,500 | 9,147,605 | Vishay Intertechnology | 699,400a | 12,204,530 |
| IDEX | 290,100 | 11,963,724 | | | 263,126,208 |
| Joy Global | 238,900 | 23,264,082 | Materials—6.5% | | |
| Kansas City Southern | 321,900a | 17,331,096 | Celanese, Ser. A | 245,300 | 10,167,685 |
| KBR | 485,000 | 15,908,000 | CF Industries Holdings | 51,100 | 7,219,408 |
| Manpower | 227,000 | 14,414,500 | Cliffs Natural Resources | 209,800 | 20,365,286 |
| Navistar International | 131,700a | 8,162,766 | Cytec Industries | 210,200 | 11,945,666 |
| Roper Industries | 111,500 | 9,380,495 | Eastman Chemical | 119,300 | 11,143,813 |
| Terex | 470,275a | 15,871,781 | Molycorp | 161,900 | 7,769,581 |
| Triumph Group | 121,100 | 10,486,049 | Steel Dynamics | 807,600 | 14,908,296 |
| United Rentals | 317,700a | 9,842,346 | Stillwater Mining | 313,800a | 7,490,406 |
| WABCO Holdings | 154,400a | 9,021,592 | Temple-Inland | 445,700 | 10,424,923 |
| Waste Connections | 424,300 | 12,300,457 | | | 101,435,064 |
| | | 247,629,372 | Telecommunication Services—.7% | | |
| Information Technology—16.9% | | | SBA Communications, Cl. A | 269,900a,b | 11,360,091 |
| Acme Packet | 142,500a | 10,721,700 | Utilities—3.2% | | |
| Alliance Data Systems | 162,400a,b | 12,787,376 | ITC Holdings | 196,800 | 13,490,640 |
| ANSYS | 243,400a | 13,708,288 | National Fuel Gas | 230,000 | 16,767,000 |
| Aruba Networks | 236,900a | 7,213,605 | Northeast Utilities | 231,700 | 7,887,068 |
46
| | | | | | | | |
| BNY Mellon Mid Cap Stock Fund (continued) | | | |
| | | | | Investment of Cash Collateral | | |
| Common Stocks (continued) | Shares | | Value ($) | for Securities Loaned—1.8% | Shares | Value ($) |
| Utilities (continued) | | | | Registered | | |
| Wisconsin Energy | 190,700 | | 11,289,440 | Investment Company; | | |
| | | | 49,434,148 | Dreyfus Institutional Cash | | |
| Total Common Stocks | | | | Advantage Plus Fund | | |
| (cost $1,213,056,600) | 1,547,479,479 | (cost $27,727,078) | 27,727,078 d 27,727,078 |
| | | | | Total Investments | | |
| Other Investment—.6% | | | | (cost $1,250,253,678) | 101.7% | 1,584,676,557 |
| Registered Investment Company; | | | | Liabilities, Less Cash | | |
| Dreyfus Institutional Preferred | | | | and Receivables | (1.7%) | (27,010,664) |
| Plus Money Market Fund | | | | Net Assets | 100.0% | 1,557,665,893 |
| (cost $9,470,000) | 9,470,000 | d | 9,470,000 | | | |
ADR—American Depository Receipts
|
| a Non-income producing security. |
| b Security, or portion thereof, on loan.At February 28, 2011, the value of the fund’s securities on loan was $41,636,421 and the value of the collateral held by the fund was |
| $42,720,067, consisting of cash collateral of $27,727,078 and U.S. Government and agency securities valued at $14,992,989. |
| c Investment in real estate investment trust. |
| d Investment in affiliated money market mutual fund. |
| | | |
| Portfolio Summary (Unaudited) † | | | |
| |
| | Value (%) | | Value (%) |
| Financial | 20.1 | Materials | 6.5 |
| Information Technology | 16.9 | Utilities | 3.2 |
| Industrial | 15.9 | Consumer Staples | 2.8 |
| Consumer Discretionary | 13.9 | Money Market Investments | 2.4 |
| Health Care | 11.5 | Telecommunication Services | .7 |
| Energy | 7.8 | | 101.7 |
| |
| † Based on net assets. | | | |
| See notes to financial statements. | | | |
|
| STATEMENT OF INVESTMENTS |
| February 28, 2011 (Unaudited) |
| | | | | | | |
| BNY Mellon Small Cap Stock Fund | | | | |
| |
| Common Stocks—97.0% | Shares | Value ($) | | Shares | Value ($) |
| Consumer Discretionary—13.0% | | | Financial (continued) | | |
| Callaway Golf | 440,800 | 3,411,792 | East West Bancorp | 229,800 | 5,335,956 |
| Cracker Barrel Old Country Store | 96,900 | 4,829,496 | Entertainment Properties Trust | 84,370b,c | 4,021,918 |
| CROCS | 241,500a | 4,262,475 | EZCORP, Cl. A | 111,200a,b | 3,189,216 |
| Deckers Outdoor | 35,900a | 3,167,098 | Financial Engines | 122,400 | 2,987,784 |
| Express | 183,800b | 3,304,724 | Hersha Hospitality Trust | 540,700c | 3,552,399 |
| Finish Line, Cl. A | 270,800 | 4,728,168 | Home Properties | 93,000c | 5,479,560 |
| KB Home | 215,100b | 2,850,075 | Huntington Bancshares | 481,900 | 3,296,196 |
| Lear | 27,800 | 2,941,240 | Inland Real Estate | 113,990c | 1,073,786 |
| MDC Partners, Cl. A | 211,600 | 3,671,260 | Kilroy Realty | 48,200c | 1,867,750 |
| Men’s Wearhouse | 178,200 | 4,757,940 | Kite Realty Group Trust | 505,184c | 2,849,238 |
| Royal Caribbean Cruises | 67,800a,b | 2,968,962 | Lexington Realty Trust | 425,300b,c | 4,027,591 |
| Ruby Tuesday | 353,200a | 4,718,752 | MGIC Investment | 269,000a,b | 2,310,710 |
| Ruth’s Hospitality Group | 696,400a,b | 3,488,964 | National Financial Partners | 267,600a,b | 3,783,864 |
| Shuffle Master | 346,500a | 3,260,565 | National Penn Bancshares | 390,700 | 3,102,158 |
| Sonic Automotive, Cl. A | 254,100b | 3,653,958 | Pinnacle Financial Partners | 256,400a | 4,089,580 |
| Vitamin Shoppe | 123,400a | 4,293,086 | Signature Bank | 88,440a | 4,589,151 |
| | | 60,308,555 | Stifel Financial | 68,200a | 4,892,668 |
| Consumer Staples—1.3% | | | U-Store-It Trust | 243,300c | 2,493,825 |
| Energizer Holdings | 41,900a | 2,800,177 | Webster Financial | 155,700 | 3,609,126 |
| Ralcorp Holdings | 47,700a | 3,093,345 | | | 85,296,736 |
| | | 5,893,522 | Health Care—11.9% | | |
| Energy—7.1% | | | Amarin, ADR | 707,700a | 5,470,521 |
| Brigham Exploration | 154,300a | 5,644,294 | AMERIGROUP | 96,900a | 5,557,215 |
| CARBO Ceramics | 33,700 | 4,177,789 | Cardiome Pharma | 410,100a | 2,366,277 |
| International Coal Group | 481,100a | 4,748,457 | Chemed | 48,500 | 3,173,840 |
| ION Geophysical | 300,100a | 3,847,282 | Cooper | 86,900 | 5,372,158 |
| Oil States International | 79,000a | 5,750,410 | Cyberonics | 95,100a | 3,141,153 |
| Petroleum Development | 69,000a | 3,238,170 | Emergent BioSolutions | 111,100a | 2,337,544 |
| SandRidge Energy | 522,800a | 5,651,468 | Health Net | 64,700a | 1,903,474 |
| | | 33,057,870 | MAP Pharmaceuticals | 201,100a | 3,243,743 |
| Financial—18.4% | | | Omnicare | 96,900b | 2,774,247 |
| Arthur J. Gallagher & Co. | 66,900 | 2,100,660 | Regeneron Pharmaceuticals | 65,800a | 2,386,566 |
| BioMed Realty Trust | 119,240c | 2,164,206 | Salix Pharmaceuticals | 92,800a | 3,093,952 |
| Cathay General Bancorp | 202,000 | 3,579,440 | SXC Health Solutions | 54,300a | 2,679,705 |
| CNO Financial Group | 450,800a | 3,263,792 | Thoratec | 100,600a | 2,804,728 |
| DiamondRock Hospitality | 442,800a,c | 5,207,328 | VCA Antech | 115,100a | 2,882,104 |
| Dollar Financial | 113,550a | 2,428,834 | Volcano | 74,700a | 1,960,128 |
48
| | | | | | | |
| BNY Mellon Small Cap Stock Fund (continued) | | | |
| Common Stocks (continued) | Shares | Value ($) | | Shares | Value ($) |
| Health Care (continued) | | | Information | | |
| Zoll Medical | 80,600a | 3,730,168 | Technology (continued) | | |
| | | 54,877,523 | Commvault Systems | 102,800a | 3,755,284 |
| Industrial—16.8% | | | Cypress Semiconductor | 352,300a | 7,384,208 |
| AAR | 109,400a | 2,985,526 | Finisar | 124,300a | 5,098,786 |
| Actuant, Cl. A | 142,500 | 4,032,750 | Fortinet | 90,500a | 3,696,020 |
| AMETEK | 59,650 | 2,502,317 | GT Solar International | 293,500a,b | 3,137,515 |
| BE Aerospace | 72,400a | 2,441,328 | IPG Photonics | 44,700a | 2,544,324 |
| Belden | 15,363 | 562,747 | Ixia | 118,700a | 2,083,185 |
| Casella Waste Systems, Cl.A | 300,524a | 2,202,841 | Logmein | 72,200a | 2,591,258 |
| CLARCOR | 110,000 | 4,525,400 | Microsemi | 181,720a | 4,003,292 |
| EMCOR Group | 134,100a | 4,272,426 | Motricity | 156,300b | 2,419,524 |
| Esterline Technologies | 51,700a | 3,700,169 | NetScout Systems | 121,300a | 3,031,287 |
| Gardner Denver | 31,700 | 2,318,538 | OmniVision Technologies | 109,700a | 3,359,014 |
| Healthcare Services Group | 260,800 | 4,634,416 | Quality Systems | 15,300 | 1,222,470 |
| Interface, Cl. A | 205,400 | 3,424,018 | Riverbed Technology | 109,300a | 4,512,997 |
| Kansas City Southern | 57,100a | 3,074,264 | SAVVIS | 99,400a | 3,229,506 |
| Lindsay | 47,200b | 3,332,792 | Skyworks Solutions | 193,090a | 6,939,654 |
| Manpower | 34,100 | 2,165,350 | Sourcefire | 123,300a | 3,341,430 |
| Navistar International | 50,500a | 3,129,990 | SuccessFactors | 65,900a | 2,366,469 |
| Nielson Holdings | 128,300 | 3,411,497 | Taleo, Cl. A | 104,900a | 3,387,221 |
| Robbins & Myers | 62,674 | 2,671,793 | Universal Display | 30,200a | 1,271,118 |
| SYKES Enterprises | 153,700a | 2,858,820 | Varian Semiconductor | | |
| Terex | 105,105a | 3,547,294 | Equipment Associates | 145,600a | 6,946,576 |
| Titan International | 110,900b | 2,663,818 | Vishay Intertechnology | 137,000a | 2,390,650 |
| Towers Watson & Co., Cl. A | 41,300 | 2,428,440 | Wright Express | 89,400a | 4,559,400 |
| TransDigm Group | 37,000a | 2,974,060 | | | 104,007,639 |
| Triumph Group | 52,900 | 4,580,611 | Materials—5.1% | | |
| WABCO Holdings | 53,700a | 3,137,691 | Celanese, Ser. A | 75,900 | 3,146,055 |
| | | 77,578,896 | Century Aluminum | 203,600a | 3,451,020 |
| Information | | | Cliffs Natural Resources | 27,800 | 2,698,546 |
| Technology—22.5% | | | Coeur d’Alene Mines | 90,500a | 2,851,655 |
| Acme Packet | 56,200a | 4,228,488 | Cytec Industries | 56,000 | 3,182,480 |
| Aruba Networks | 137,700a | 4,192,965 | Ferro | 219,600a | 3,496,032 |
| Blue Coat Systems | 109,000a | 3,067,260 | Globe Specialty Metals | 115,900 | 2,699,311 |
| Brightpoint | 250,200a | 3,152,520 | Temple-Inland | 90,000 | 2,105,100 |
| Cognex | 99,800 | 2,785,418 | | | 23,630,199 |
| Coherent | 53,600a | 3,309,800 | | | |
STATEMENT OF INVESTMENTS (Unaudited) (continued)
| | | | | | | | |
| BNY Mellon Small Cap Stock Fund (continued) | | | | | |
| |
| | | | | Investment of Cash Collateral | | | | |
| Common Stocks (continued) | Shares | | Value ($) | for Securities Loaned—6.3% | Shares | | Value ($) | |
| |
| Utilities—.9% | | | | Registered Investment Company; | | | | |
| Cleco | 125,400 | b | 4,056,690 | Dreyfus Institutional Cash | | | | |
| Total Common Stocks | | | | Advantage Plus Fund | | | | |
| (cost $367,248,817) | | | 448,707,630 | (cost $29,103,032) | 29,103,032 | d | 29,103,032 | |
| |
| | | | | Total Investments | | | | |
| Other Investment—1.1% | | | | (cost $401,383,849) | 104.4 | % | 482,842,662 | |
| |
| Registered Investment Company; | | | | Liabilities, Less Cash | | | | |
| Dreyfus Institutional Preferred | | | | and Receivables | (4.4 | %) | (20,406,596 | ) |
| Plus Money Market Fund | | | | | | | | |
| | | | | Net Assets | 100.0 | % | 462,436,066 | |
| (cost $5,032,000) | 5,032,000 | d | 5,032,000 | | | | | |
ADR—American Depository Receipts
|
| a Non-income producing security. |
| b Security, or portion thereof, on loan.At February 28, 2011, the value of the fund’s securities on loan was $28,149,670 and |
| the value of the collateral held by the fund was $29,103,032. |
| c Investment in real estate investment trust. |
| d Investment in affiliated money market mutual fund. |
| | | |
| Portfolio Summary (Unaudited) † | | | |
| |
| | Value (%) | | Value (%) |
| Information Technology | 22.5 | Energy | 7.1 |
| Financial | 18.4 | Materials | 5.1 |
| Industrial | 16.8 | Consumer Staples | 1.3 |
| Consumer Discretionary | 13.0 | Utilities | .9 |
| Health Care | 11.9 | | |
| Money Market Investments | 7.4 | | 104.4 |
| |
| † Based on net assets. | | | |
| See notes to financial statements. | | | |
50
|
| STATEMENT OF INVESTMENTS |
| February 28, 2011 (Unaudited) |
| | | | | | | |
| BNY Mellon U.S. Core Equity 130/30 Fund | | | |
| |
| Common Stocks—126.2% | Shares | Value ($) | | Shares | Value ($) |
| Consumer Discretionary—17.9% | | | Energy (continued) | | |
| Amazon.com | 9,150a | 1,585,604 | Occidental Petroleum | 53,640b | 5,469,671 |
| Autoliv | 36,060 | 2,700,533 | Schlumberger | 22,330b | 2,086,069 |
| Carnival | 59,200b | 2,526,064 | Valero Energy | 84,570b | 2,383,183 |
| DIRECTV, Cl. A | 80,400a,b | 3,695,988 | | | 44,869,619 |
| Ford Motor | 411,050a,b | 6,186,302 | Financial—16.2% | | |
| General Motors | 38,896 | 1,304,183 | American Express | 107,880b | 4,700,332 |
| Guess? | 43,630b | 1,976,003 | Ameriprise Financial | 19,570 | 1,239,172 |
| Johnson Controls | 32,230b | 1,314,984 | Bank of America | 447,290b | 6,391,774 |
| Limited Brands | 30,570b | 978,851 | Capital One Financial | 113,140b | 5,630,978 |
| Macy’s | 62,840 | 1,501,876 | Charles Schwab | 96,862b | 1,837,472 |
| Mattel | 128,930b | 3,230,986 | Citigroup | 1,460,710a | 6,836,123 |
| Newell Rubbermaid | 361,900b | 6,999,146 | Comerica | 53,570 | 2,083,873 |
| News, Cl. A | 116,670b | 2,026,558 | Hartford Financial Services Group | 63,580 | 1,881,968 |
| Omnicom Group | 109,310b | 5,563,879 | JPMorgan Chase & Co. | 60,100b | 2,806,069 |
| Stanley Black & Decker | 69,190b | 5,246,678 | Lincoln National | 126,680b | 4,018,290 |
| Staples | 162,500b | 3,461,250 | MetLife | 61,290b | 2,902,694 |
| Time Warner | 84,690b | 3,235,158 | Wells Fargo & Co. | 250,380b | 8,077,259 |
| | | 53,534,043 | | | 48,406,004 |
| Consumer Staples—16.4% | | | Health Care—19.8% | | |
| ConAgra Foods | 51,270 | 1,187,413 | Allergan | 19,200b | 1,424,064 |
| Dr. Pepper Snapple Group | 35,730 | 1,288,424 | Allscripts Healthcare Solutions | 159,890a,b | 3,413,651 |
| Energizer Holdings | 65,150a | 4,353,975 | Amylin Pharmaceuticals | 214,130a | 3,276,189 |
| Kraft Foods, Cl. A | 64,380 | 2,049,859 | ArthroCare | 26,110a | 900,534 |
| Molson Coors Brewing, Cl. B | 35,550 | 1,625,702 | Celgene | 11,050a,b | 586,755 |
| Nestle, ADR | 59,820b | 3,387,008 | CIGNA | 83,480b | 3,512,004 |
| PepsiCo | 152,010b | 9,640,474 | Covidien | 139,160b | 7,159,782 |
| Philip Morris International | 121,494b | 7,627,393 | Dendreon | 101,480a,b | 3,408,713 |
| Procter & Gamble | 70,190b | 4,425,480 | Express Scripts | 10,290a,b | 578,504 |
| Unilever, ADR | 268,150b | 7,964,055 | Gilead Sciences | 52,370a,b | 2,041,383 |
| Walgreen | 93,750 | 4,063,125 | Human Genome Sciences | 131,250a,b | 3,285,188 |
| Whole Foods Market | 25,940b | 1,519,046 | McKesson | 68,300 | 5,414,824 |
| | | 49,131,954 | Mylan | 39,160a | 895,589 |
| Energy—15.0% | | | PerkinElmer | 33,510 | 888,015 |
| Alpha Natural Resources | 29,960a,b | 1,624,431 | Pfizer | 547,510b | 10,534,092 |
| Anadarko Petroleum | 55,860 | 4,571,024 | Sanofi-Aventis, ADR | 41,670b | 1,440,949 |
| Apache | 23,810 | 2,967,202 | St. Jude Medical | 73,890b | 3,537,853 |
| Cameron International | 27,610a,b | 1,632,579 | Thermo Fisher Scientific | 10,620a,b | 592,808 |
| Chevron | 76,690b | 7,956,588 | UnitedHealth Group | 20,860 | 888,219 |
| ENSCO, ADR | 51,600b | 2,894,760 | Universal Health Services, Cl. B | 25,840b | 1,181,146 |
| Halliburton | 87,360b | 4,100,678 | Warner Chilcott, Cl. A | 64,640b | 1,530,675 |
| Hess | 66,520b | 5,789,236 | Zimmer Holdings | 42,690a,b | 2,661,295 |
| Newfield Exploration | 46,630a | 3,394,198 | | | 59,152,232 |
STATEMENT OF INVESTMENTS (Unaudited) (continued)
| | | | | | | | |
| BNY Mellon U.S. Core Equity 130/30 Fund (continued) | | | |
| |
| Common Stocks (continued) | Shares | Value ($) | | Shares | | Value ($) |
| Industrial—11.4% | | | Materials—2.7% | | | |
| Caterpillar | 55,290b | 5,691,000 | Alcoa | 88,040 | | 1,483,474 |
| Cummins | 26,520b | 2,681,702 | CF Industries Holdings | 9,480 | b | 1,339,334 |
| Dover | 61,880b | 3,975,790 | E.I. du Pont de Nemours & Co. | 66,600 | b | 3,654,342 |
| General Electric | 357,720 | 7,483,502 | United States Steel | 25,090 | b | 1,442,424 |
| Ingersoll-Rand | 86,900b | 3,936,570 | | | | 7,919,574 |
| Norfolk Southern | 40,190b | 2,635,660 | Telecommunication | | | |
| Textron | 98,290b | 2,662,676 | Services—2.3% | | | |
| Thomas & Betts | 30,910a | 1,712,105 | AT&T | 239,320 | b | 6,791,902 |
| Tyco International | 40,260b | 1,825,388 | Utilities—3.1% | | | |
| United Technologies | 17,260b | 1,441,900 | American Electric Power | 44,230 | b | 1,582,549 |
| | | 34,046,293 | Entergy | 32,820 | b | 2,336,784 |
| Information Technology—21.4% | | | NextEra Energy | 38,800 | | 2,152,236 |
| Agilent Technologies | 21,160a | 890,413 | Public Service Enterprise Group | 94,470 | | 3,089,169 |
| Alcatel-Lucent, ADR | 770,110a | 3,773,539 | | | | 9,160,738 |
| Apple | 31,490a,b | 11,122,583 | Total Common Stocks | | | |
| BMC Software | 97,330a,b | 4,817,835 | (cost $326,543,100) | | | 377,037,646 |
| Corning | 90,920 | 2,096,615 | | | | |
| EMC | 108,980a | 2,965,346 | Other Investment—1.5% | | | |
| Google, Cl. A | 8,550a | 5,244,570 | Registered Investment Company; | | | |
| Informatica | 44,950a | 2,113,100 | Dreyfus Institutional Preferred | | | |
| International Business Machines | 53,780b | 8,705,906 | Plus Money Market Fund | | | |
| | | | (cost $4,579,000) | 4,579,000 | c | 4,579,000 |
| Motorola Mobility Holdings | 30,221a | 912,674 | | | | |
| Motorola Solutions | 34,544a | 1,334,780 | Total Investments | | | |
| NetApp | 52,270a,b | 2,700,268 | (cost $331,122,100) | 127.7 | % | 381,616,646 |
| Oracle | 203,670b | 6,700,743 | Liabilities, Less Cash | | | |
| QUALCOMM | 117,060b | 6,974,435 | and Receivables | (27.7 | %) | (82,929,671) |
| Teradata | 76,798a,b | 3,672,480 | Net Assets | 100.0 | % | 298,686,975 |
| | | 64,025,287 | | | | |
ADR—American Depository Receipts
| |
| a | Non-income producing security. |
| b | Held by a broker as collateral for open short positions. |
| c | Investment in affiliated money market mutual fund. |
| | | |
| Portfolio Summary (Unaudited) † | | | |
| |
| | Value (%) | | Value (%) |
| Information Technology | 21.4 | Industrial | 11.4 |
| Health Care | 19.8 | Utilities | 3.1 |
| Consumer Discretionary | 17.9 | Materials | 2.7 |
| Consumer Staples | 16.4 | Telecommunication Services | 2.3 |
| Financial | 16.2 | Money Market Investment | 1.5 |
| Energy | 15.0 | | 127.7 |
| |
| † Based on net assets. | | | |
| See notes to financial statements. | | | |
52
STATEMENT OF SECURITIES SOLD SHORT
February 28, 2011 (Unaudited)
| | | | | | | |
| BNY Mellon U.S. Core Equity 130/30 Fund | | | |
| |
| Common Stocks—27.2% | Shares | Value ($) | | Shares | Value ($) |
| Consumer Discretionary—5.6% | | | Health Care (continued) | | |
| Advanced Auto Parts | 22,620 | 1,417,822 | CareFusion | 62,030a | 1,694,660 |
| Chipotle Mexican Grill | 3,390a | 830,550 | Charles River Laboratories | | |
| Darden Restaurants | 29,730 | 1,401,175 | International | 23,730a | 864,721 |
| Dollar General | 71,830a | 2,029,197 | Covance | 34,730a | 1,959,814 |
| Gap | 57,760 | 1,301,333 | C.R. Bard | 12,050 | 1,178,008 |
| Genuine Parts | 43,080 | 2,269,885 | Dentsply International | 63,600 | 2,376,732 |
| J.C. Penney | 26,060 | 911,058 | Eli Lilly & Co. | 37,050 | 1,280,448 |
| Polo Ralph Lauren | 16,990 | 2,152,803 | Gen-Probe | 4,540a | 285,475 |
| Tiffany & Co. | 23,910 | 1,471,660 | Haemonetics | 18,070a | 1,114,015 |
| Urban Outfitters | 32,650a | 1,253,107 | IDEXX Laboratories | 15,070a | 1,170,939 |
| Warnaco Group | 26,600a | 1,561,686 | Intuitive Surgical | 3,770a | 1,236,371 |
| | | 16,600,276 | Life Technologies | 16,530a | 882,206 |
| Consumer Staples—6.5% | | | Masimo | 44,430 | 1,339,120 |
| Altria Group | 85,870 | 2,178,522 | Owens & Minor | 34,870 | 1,087,944 |
| Coca-Cola | 54,240 | 3,467,021 | | | 22,318,712 |
| Constellation Brands, Cl. A | 72,090a | 1,464,869 | Industrials—1.0% | | |
| Flowers Foods | 159,510 | 4,242,966 | Lockheed Martin | 18,660 | 1,477,126 |
| General Mills | 43,030 | 1,598,134 | Stericycle | 16,360a | 1,413,831 |
| H.J. Heinz | 52,940 | 2,658,647 | | | 2,890,957 |
| Hormel Foods | 139,340 | 3,817,916 | Information | | |
| | | 19,428,075 | Technology—2.8% | | |
| Energy—1.1% | | | Altera | 32,050 | 1,341,613 |
| Nabors Industries | 68,110a | 1,939,092 | Finisar | 45,010a | 1,846,310 |
| Southwestern Energy | 37,510a | 1,480,895 | Intel | 69,130 | 1,484,221 |
| | | 3,419,987 | Nokia, ADR | 266,440 | 2,299,377 |
| Financial—1.3% | | | Research In Motion | 8,400a | 555,576 |
| Legg Mason | 43,760 | 1,586,300 | Vishay Intertechnology | 52,400a | 914,380 |
| Northern Trust | 20,520 | 1,058,216 | | | 8,441,477 |
| Waddell & Reed Financial, Cl. A | 31,570 | 1,274,797 | Materials—1.4% | | |
| | | 3,919,313 | Greif, Cl. A | 45,380 | 2,934,271 |
| Health Care—7.5% | | | Sigma-Aldrich | 18,670 | 1,192,826 |
| Amgen | 17,060a | 875,690 | | | 4,127,097 |
| AstraZeneca, ADR | 62,110 | 3,053,949 | Total Securities Sold Short | | |
| | | | (proceeds $74,867,906) | 27.2% | 81,145,894 |
| Biogen Idec | 28,050a | 1,918,620 | | | |
|
| ADR—American Depository Receipts |
| a Non-income producing security. |
| | | |
| Portfolio Summary (Unaudited) † | | | |
| |
| | Value (%) | | Value (%) |
| Health Care | 7.5 | Financial | 1.3 |
| Consumer Staples | 6.5 | Energy | 1.1 |
| Consumer Discretionary | 5.6 | Industrial | 1.0 |
| Information Technology | 2.8 | | |
| Materials | 1.4 | | 27.2 |
See notes to financial statements.
|
| STATEMENT OF INVESTMENTS |
| February 28, 2011 (Unaudited) |
| | | | | | | |
| BNY Mellon Focused Equity Opportunities Fund | | | |
| Common Stocks—97.8% | Shares | Value ($) | | Shares | Value ($) |
| Consumer Discretionary—12.5% | | | Health Care—12.1% | | |
| Carnival | 230,900 | 9,852,503 | Agilent Technologies | 314,430a | 13,231,214 |
| Johnson Controls | 353,455 | 14,420,964 | Baxter International | 210,000 | 11,161,500 |
| Lowe’s | 427,170 | 11,179,039 | Covidien | 245,875 | 12,650,269 |
| Walt Disney | 370,185 | 16,191,892 | Watson Pharmaceuticals | 234,400a,c | 13,124,056 |
| | | 51,644,398 | | | 50,167,039 |
| Consumer Staples—6.0% | | | Industrial—10.4% | | |
| Coca-Cola | 202,750 | 12,959,780 | Caterpillar | 165,885 | 17,074,543 |
| Kraft Foods, Cl. A | 373,845 | 11,903,225 | Dover | 188,900 | 12,136,825 |
| | | 24,863,005 | Honeywell International | 243,405 | 14,095,584 |
| Energy—16.7% | | | | | 43,306,952 |
| Cameron International | 225,600a | 13,339,728 | Information | | |
| Exxon Mobil | 193,700 | 16,567,161 | Technology—21.3% | | |
| Halliburton | 286,455b | 13,446,198 | Apple | 61,426a | 21,696,277 |
| Occidental Petroleum | 124,155 | 12,660,085 | Baidu, ADR | 102,300a | 12,394,668 |
| Southwestern Energy | 330,745a,c | 13,057,813 | Cognizant | | |
| | | 69,070,985 | Technology Solutions, Cl. A | 168,800a | 12,975,656 |
| Financial—13.4% | | | Google, Cl. A | 26,215a | 16,080,281 |
| Allstate | 381,200 | 12,114,536 | Rovi | 205,350a,c | 11,380,497 |
| Citigroup | 3,918,100a | 18,336,708 | Salesforce.com | 103,600a | 13,703,172 |
| Invesco | 447,360 | 12,007,142 | | | 88,230,551 |
| Morgan Stanley | 447,600 | 13,284,768 | Materials—5.4% | | |
| | | 55,743,154 | Celanese, Ser. A | 319,100 | 13,226,695 |
54
| | | | | | | | |
| BNY Mellon Focused Equity Opportunities Fund (continued) | | |
| | | | | Investment of Cash Collateral | | |
| Common Stocks (continued) | Shares | | Value ($) | for Securities Loaned—.5% | Shares | Value ($) |
| Materials (continued) | | | | Registered | | |
| Cliffs Natural Resources | 93,485 | | 9,074,589 | Investment Company; | | |
| | | | 22,301,284 | Dreyfus Institutional Cash | | |
| Total Common Stocks | | | | Advantage Fund | | |
| (cost $342,868,085) | | | 405,327,368 | (cost $2,118,146) | 2,118,146d | 2,118,146 |
| | | | | Total Investments | | |
| Other Investment—2.9% | | | | (cost $356,801,231) | 101.2% | 419,260,514 |
| Registered Investment Company; | | | | Liabilities, Less Cash | | |
| Dreyfus Institutional Preferred | | | | and Receivables | (1.2%) | (4,795,297) |
| Plus Money Market Fund | | | | Net Assets | 100.0% | 414,465,217 |
| (cost $11,815,000) | 11,815,000 | d | 11,815,000 | | | |
ADR—American Depository Receipts
|
| a Non-income producing security. |
| b Held by a broker as collateral for open options written positions. |
| c Security, or portion thereof, on loan.At February 28, 2011, the value of the fund’s securities on loan was $2,039,681 and the value of the collateral held by the fund was $2,118,146. |
| d Investment in affiliated money market mutual fund. |
| | | |
| Portfolio Summary (Unaudited) † | | | |
| |
| | Value (%) | | Value (%) |
| Information Technology | 21.3 | Industrial | 10.4 |
| Energy | 16.7 | Consumer Staples | 6.0 |
| Financial | 13.4 | Materials | 5.4 |
| Consumer Discretionary | 12.5 | Money Market Investments | 3.4 |
| Health Care | 12.1 | | 101.2 |
| |
| † Based on net assets. | | | |
| See notes to financial statements. | | | |
STATEMENT OF OPTIONS WRITTEN
February 28, 2011 (Unaudited)
| | | | |
| BNY Mellon Focused | Number of | | | |
| Equity Opportunities Fund | Contracts | | Value ($) | |
| Call Options; | | | | |
| Halliburton, | | | | |
| March 2011 @ $45 | | | | |
| (premiums received $98,732) | 689 | a | (186,030 | ) |
| |
| a Non-income producing security. | | | | |
| See notes to financial statements. | | | | |
56
|
| STATEMENT OF INVESTMENTS |
| February 28, 2011 (Unaudited) |
| | | | | | | |
| BNY Mellon Small/Mid Cap Fund | | | | |
| |
| Common Stocks—95.8% | Shares | Value ($) | | Shares | Value ($) |
| Consumer Discretionary—18.1% | | | Energy (continued) | | |
| 7 Days Group Holdings, ADR | 140,000a,b | 2,647,400 | Noble Energy | 19,000 | 1,760,540 |
| Abercrombie & Fitch, Cl. A | 73,655 | 4,225,587 | Petroleum Development | 63,000b | 2,956,590 |
| Bravo Brio Restaurant Group | 160,000 | 2,756,800 | RPC | 120,000a | 2,349,600 |
| Cablevision Systems (NY Group), Cl. A | 80,000 | 2,948,000 | SandRidge Energy | 425,000b | 4,594,250 |
| Cenveo | 672,575a,b | 3,759,694 | Walter Energy | 24,000 | 2,904,240 |
| Chico’s FAS | 200,000 | 2,748,000 | | | 39,134,626 |
| Express | 100,000 | 1,798,000 | Financial—13.7% | | |
| Hertz Global Holdings | 210,000a,b | 3,194,100 | Affiliated Managers Group | 18,060b | 1,927,905 |
| Interface, Cl. A | 105,890 | 1,765,186 | Annaly Capital Management | 100,000c | 1,793,000 |
| Interpublic Group of Cos | 253,020 | 3,339,864 | Associated Banc-Corp | 120,000 | 1,736,400 |
| Liberty Media-Starz, Ser. A | 32,000b | 2,246,400 | Camden Property Trust | 27,000a,c | 1,597,590 |
| Macy’s | 80,800 | 1,931,120 | Cathay General Bancorp | 110,000a | 1,949,200 |
| MDC Holdings | 100,000a | 2,625,000 | City National | 25,440 | 1,498,670 |
| MDC Partners, Cl. A | 472,304 | 8,194,474 | CNO Financial Group | 364,930b | 2,642,093 |
| Men’s Wearhouse | 80,000a | 2,136,000 | Dollar Financial | 444,000b | 9,497,160 |
| Morgans Hotel Group | 643,995b | 5,725,115 | Douglas Emmett | 82,015c | 1,537,781 |
| Navistar International | 53,910b | 3,341,342 | East West Bancorp | 80,000 | 1,857,600 |
| Phillips-Van Heusen | 36,000 | 2,160,360 | Enstar Group | 20,454b | 1,715,272 |
| Standard-Pacific | 464,155a,b | 1,856,620 | Financial Engines | 100,000 | 2,441,000 |
| Starwood Hotels & Resorts Worldwide | 50,000c | 3,055,000 | First Financial Bancorp | 84,000 | 1,422,120 |
| Titan International | 100,410a | 2,411,848 | Forestar Group | 235,185b | 4,529,663 |
| TiVo | 210,875a,b | 2,167,795 | Host Hotels & Resorts | 152,030a,c | 2,797,352 |
| Universal Display | 60,000a,b | 2,525,400 | Huntington Bancshares | 396,700 | 2,713,428 |
| ValueVision Media, Cl. A | 400,000b | 2,676,000 | Inland Real Estate | 84,400c | 795,048 |
| Vitamin Shoppe | 352,026b | 12,246,985 | KKR & Co. | 110,000c | 1,832,600 |
| WABCO Holdings | 53,515b | 3,126,881 | MGIC Investment | 331,250a,b | 2,845,437 |
| Warnaco Group | 35,000b | 2,054,850 | National Financial Partners | 198,600b | 2,808,204 |
| | | 89,663,821 | National Penn Bancshares | 170,000 | 1,349,800 |
| Consumer Staples—1.0% | | | Och-Ziff Capital Management | | |
| Fresh Market | 70,750a | 2,886,600 | Group, Cl. A | 120,625 | 1,943,269 |
| Green Mountain Coffee Roasters | 55,300a,b | 2,255,134 | Regions Financial | 248,000 | 1,894,720 |
| | | 5,141,734 | Signature Bank | 40,000b | 2,075,600 |
| Energy—7.9% | | | SunTrust Banks | 99,710 | 3,008,251 |
| Brigham Exploration | 148,360b | 5,427,009 | Webster Financial | 139,320 | 3,229,438 |
| Cabot Oil & Gas | 95,000 | 4,337,700 | Willis Group Holdings | 45,000 | 1,750,050 |
| Complete Production Services | 65,800b | 1,895,698 | Zions Bancorporation | 102,000a | 2,382,720 |
| Energy XXI | 94,000b | 3,241,120 | | | 67,571,371 |
| Forest Oil | 93,610b | 3,322,219 | Health Care—12.2% | | |
| GT Solar International | 300,000a,b | 3,207,000 | Amarin, ADR | 1,000,000a,b | 7,730,000 |
| International Coal Group | 318,000a,b | 3,138,660 | AMERIGROUP | 40,000a,b | 2,294,000 |
STATEMENT OF INVESTMENTS (Unaudited) (continued)
| | | | | | | |
| BNY Mellon Small/Mid Cap Fund (continued) | | | |
| |
| Common Stocks (continued) | Shares | Value ($) | | Shares | Value ($) |
| Health Care (continued) | | | Information Technology (continued) | | |
| Cardiome Pharma | 730,000b | 4,212,100 | China Digital TV Holding, ADR | 450,100a | 3,218,215 |
| Cephalon | 78,000a,b | 4,392,180 | Ctrip.com International, ADR | 62,000b | 2,403,740 |
| Emergent BioSolutions | 82,530b | 1,736,431 | Cypress Semiconductor | 123,500b | 2,588,560 |
| Health Management Associates, Cl. A | 200,000b | 2,000,000 | Entropic Communications | 400,000a,b | 3,704,000 |
| Healthcare Services Group | 107,145 | 1,903,967 | F5 Networks | 19,240b | 2,270,512 |
| LifePoint Hospitals | 58,000b | 2,260,840 | Fortinet | 102,470a,b | 4,184,875 |
| MAP Pharmaceuticals | 247,990b | 4,000,079 | Internap Network Services | 23,025b | 156,570 |
| Mednax | 29,000b | 1,882,970 | KIT Digital | 170,000a,b | 2,211,700 |
| NuPathe | 494,000b | 3,868,020 | LivePerson | 120,000b | 1,203,600 |
| Pharmacyclics | 348,300a,b | 1,797,228 | MakeMyTrip | 115,000a | 3,041,750 |
| Salix Pharmaceuticals | 101,270b | 3,376,342 | NeoPhotonics | 104,000b | 1,908,400 |
| St. Jude Medical | 80,000 | 3,830,400 | OmniVision Technologies | 100,000b | 3,062,000 |
| SXC Health Solutions | 92,100b | 4,545,135 | ON Semiconductor | 272,725b | 3,040,884 |
| Targacept | 120,000b | 3,440,400 | Opnet Technologies | 120,285 | 4,099,313 |
| Universal Health Services, Cl. B | 48,000 | 2,194,080 | Rackspace Hosting | 74,140a,b | 2,736,507 |
| Volcano | 71,195b | 1,868,157 | Red Hat | 70,000b | 2,889,600 |
| Zoll Medical | 60,000a,b | 2,776,800 | Renesola, ADR | 325,000a,b | 3,591,250 |
| | | 60,109,129 | Riverbed Technology | 121,730b | 5,026,232 |
| Industrial—11.6% | | | Rovi | 50,680b | 2,808,686 |
| AMETEK | 67,417 | 2,828,143 | Sourcefire | 134,000b | 3,631,400 |
| American Superconductor | 71,790a,b | 1,903,871 | STEC | 100,000b | 2,043,000 |
| Atlas Air Worldwide Holdings | 54,000b | 3,687,120 | SuccessFactors | 55,000b | 1,975,050 |
| BE Aerospace | 96,810b | 3,264,433 | Synchronoss Technologies | 100,000b | 3,426,000 |
| Casella Waste Systems, Cl. A | 40,914b | 299,900 | Varian Semiconductor | | |
| Cummins | 26,395 | 2,669,062 | Equipment Associates | 60,560b | 2,889,318 |
| Donaldson | 46,000 | 2,589,800 | Vishay Intertechnology | 111,060b | 1,937,997 |
| Eaton | 24,900 | 2,758,422 | Zagg | 270,000a,b | 2,438,100 |
| Gardner Denver | 37,000 | 2,706,180 | | | 75,116,059 |
| Goodrich | 25,055 | 2,160,493 | Materials—6.0% | | |
| Harbin Electric | 184,000a,b | 3,492,320 | Celanese, Ser. A | 57,400 | 2,379,230 |
| Joy Global | 31,500 | 3,067,470 | CF Industries Holdings | 25,000 | 3,532,000 |
| Kansas City Southern | 65,455b | 3,524,097 | Cliffs Natural Resources | 40,440 | 3,925,511 |
| KBR | 54,635 | 1,792,028 | Coeur d’Alene Mines | 65,000a,b | 2,048,150 |
| Lindsay | 72,000a | 5,083,920 | Eastman Chemical | 42,900 | 4,007,289 |
| Manpower | 17,090 | 1,085,215 | Ferro | 141,745b | 2,256,580 |
| Roper Industries | 35,265 | 2,966,844 | Globe Specialty Metals | 104,585a | 2,435,785 |
| Terex | 111,300a,b | 3,756,375 | Steel Dynamics | 256,000 | 4,725,760 |
| Toll Brothers | 58,970b | 1,253,702 | Stillwater Mining | 100,000b | 2,387,000 |
| TransDigm Group | 48,000a,b | 3,858,240 | Vulcan Materials | 48,000a | 2,200,800 |
| Triumph Group | 30,000a | 2,597,700 | | | 29,898,105 |
| | | 57,345,335 | Telecommunications—9.0% | | |
| Information Technology—15.1% | | | Acme Packet | 63,740b | 4,795,798 |
| Ancestry.com | 80,000b | 2,628,800 | ADTRAN | 70,000 | 3,183,600 |
58
| | | | | | | | |
| BNY Mellon Small/Mid Cap Fund (continued) | | | | | |
| |
| Common Stocks (continued) | Shares | Value ($) | Other Investment—4.2% | Shares | | Value ($) | |
| Telecommunications (continued) | | | Registered | | | | |
| Aruba Networks | 181,360a,b | 5,522,412 | Investment Company; | | | | |
| Ciena | 150,000a,b | 4,135,500 | Dreyfus Institutional | | | | |
| Finisar | 134,000a,b | 5,496,680 | Preferred Plus | | | | |
| | | | Money Market Fund | | | | |
| IPG Photonics | 50,000b | 2,846,000 | (cost $21,004,000) | 21,004,000 | d | 21,004,000 | |
| Ixia | 124,000a,b | 2,176,200 | | | | | |
| Logmein | 74,500a,b | 2,673,805 | Investment of Cash Collateral | | | | |
| Motricity | 620,000a | 9,597,600 | for Securities Loaned—17.8% | | | | |
| SAVVIS | 78,800b | 2,560,212 | Registered | | | | |
| SBA Communications, Cl. A | 34,340a,b | 1,445,371 | Investment Company; | | | | |
| | | 44,433,178 | Dreyfus Institutional | | | | |
| | | | Cash Advantage Fund | | | | |
| Utilities—1.2% | | | | | | | |
| | | | (cost $87,956,559) | 87,956,559 | d | 87,956,559 | |
| Cleco | 50,600a | 1,636,910 | | | | | |
| DPL | 49,190a | 1,279,924 | Total Investments | | | | |
| ITC Holdings | 26,460 | 1,813,833 | (cost $504,061,389) | 117.8 | % | 583,170,184 | |
| Wisconsin Energy | 18,000 | 1,065,600 | Liabilities, Less Cash | | | | |
| | | 5,796,267 | and Receivables | (17.8 | %) | (88,289,759 | ) |
| Total Common Stocks | | | Net Assets | 100.0 | % | 494,880,425 | |
| (cost $395,100,830) | | 474,209,625 | | | | | |
ADR—American Depository Receipts
|
| a Security, or portion thereof, on loan.At February 28, 2011, the total value of the fund’s securities on loan is $85,111,397 and the total value of the collateral held by the fund is |
| $88,069,358, consisting of cash collateral of $87,956,559 and U.S. Government and agency securities valued at $112,799. |
| b Non-income producing security. |
| c Investment in real estate investment trust. |
| d Investment in affiliated money market mutual fund. |
| | | |
| Portfolio Summary (Unaudited) † | | | |
| |
| | Value (%) | | Value (%) |
| Money Market Investments | 22.0 | Telecommunications | 9.0 |
| Consumer Discretionary | 18.1 | Energy | 7.9 |
| Information Technology | 15.1 | Materials | 6.0 |
| Financial | 13.7 | Utilities | 1.2 |
| Health Care | 12.2 | Consumer Staples | 1.0 |
| Industrial | 11.6 | | 117.8 |
| |
| † Based on net assets. | | | |
| See notes to financial statements. | | | |
STATEMENT OF INVESTMENTS
February 28, 2011 (Unaudited)
| | | | | | | |
| BNY Mellon International Fund | | | | |
| Common Stocks—96.9% | Shares | Value ($) | | Shares | Value ($) |
| Australia—6.5% | | | France (continued) | | |
| Atlas Iron | 904,140a | 3,544,131 | GDF Suez | 126,798 | 5,139,916 |
| Australia & New Zealand | | | Lagardere | 39,030 | 1,756,366 |
| Banking Group | 104,950 | 2,578,417 | Legrand | 40,720 | 1,707,952 |
| BHP Billiton | 77,400 | 3,633,703 | Rhodia | 123,880 | 3,565,144 |
| BlueScope Steel | 911,338 | 1,929,995 | Sanofi-Aventis | 304,692 | 21,023,100 |
| Coca-Cola Amatil | 551,210 | 6,650,415 | Societe Generale | 234,772 | 16,506,546 |
| Commonwealth Bank of Australia | 91,720 | 4,959,680 | Total | 431,652 | 26,453,323 |
| Commonwealth Property | | | Vivendi | 205,490 | 5,858,504 |
| Office Fund | 2,449,510 | 2,132,351 | | | 139,456,401 |
| Dexus Property Group | 4,013,440 | 3,493,785 | Germany—5.4% | | |
| Foster’s Group | 987,364 | 5,750,249 | Allianz | 48,535 | 6,992,319 |
| National Australia Bank | 381,349 | 10,017,415 | BASF | 54,740 | 4,551,973 |
| Nufarm | 816,267a | 4,363,198 | Celesio | 106,550 | 2,948,041 |
| Primary Health Care | 1,252,113 | 4,130,493 | Daimler | 48,391 | 3,408,993 |
| Qantas Airways | 839,170a | 1,999,305 | Deutsche Bank | 97,710 | 6,280,644 |
| QBE Insurance Group | 514,980 | 9,511,324 | Deutsche Telekom | 376,010 | 5,056,464 |
| Stockland | 776,330 | 3,003,608 | E.ON | 305,540 | 10,024,306 |
| Toll Holdings | 532,960 | 3,255,811 | Gerresheimer | 28,110 | 1,246,536 |
| Westfield Group | 289,552 | 2,874,382 | Metro | 103,130 | 7,542,696 |
| | | 73,828,262 | Muenchener Rueckversicherungs | 31,590 | 5,272,556 |
| China—.3% | | | RWE | 52,551 | 3,546,863 |
| Foxconn International Holdings | 4,094,000a | 2,896,500 | SAP | 79,090 | 4,771,638 |
| Denmark—.7% | | | | | 61,643,029 |
| Carlsberg, Cl. B | 34,950 | 3,719,461 | Hong Kong—2.1% | | |
| Pandora | 64,398 | 3,754,464 | AIA Group | 480,600 | 1,400,824 |
| | | 7,473,925 | Esprit Holdings | 2,010,082 | 9,859,416 |
| Finland—1.5% | | | Hang Seng Bank | 528,700 | 8,431,502 |
| Nokia | 1,450,839 | 12,573,164 | Hongkong Land Holdings | 313,000 | 2,144,050 |
| Sampo, Cl. A | 139,850 | 4,328,700 | Pacific Basin Shipping | 3,576,000 | 2,080,031 |
| | | 16,901,864 | | | 23,915,823 |
| France—12.3% | | | Ireland—.7% | | |
| Alcatel-Lucent | 425,970a | 2,108,512 | CRH | 94,105 | 2,169,976 |
| Alstom | 126,216 | 7,526,874 | Dragon Oil | 308,220a | 2,988,803 |
| Arkema | 41,190 | 3,009,133 | Smurfit Kappa Group | 182,130a | 2,261,985 |
| BNP Paribas | 91,000 | 7,105,098 | | | 7,420,764 |
| Carrefour | 172,110 | 8,450,410 | Israel—.9% | | |
| Credit Agricole | 292,214 | 5,129,250 | Mizrahi Tefahot Bank | 200,990 | 2,043,590 |
| Danone | 52,721 | 3,305,157 | Teva Pharmaceutical Industries, ADR | 153,210 | 7,675,821 |
| EDF | 156,180 | 6,964,586 | | | 9,719,411 |
| France Telecom | 625,953 | 13,846,530 | | | |
60
| | | | | | | |
| BNY Mellon International Fund (continued) | | | |
| Common Stocks (continued) | Shares | Value ($) | | Shares | Value ($) |
| Italy—3.4% | | | Japan (continued) | | |
| Banco Popolare | 340,580 | 1,189,064 | Nintendo | 9,320 | 2,730,889 |
| Buzzi Unicem | 148,450 | 2,099,761 | Nippon Express | 828,000 | 3,562,814 |
| Enel | 1,224,870 | 7,298,580 | Nomura Holdings | 589,600 | 3,733,425 |
| ENI | 158,954 | 3,875,910 | NTN | 409,000 | 2,189,866 |
| Finmeccanica | 586,551 | 7,341,398 | Panasonic | 426,800 | 5,744,231 |
| Parmalat | 400,943 | 1,228,291 | Rengo | 414,000 | 2,707,536 |
| Saras | 4,480,253a | 11,524,289 | Ricoh | 433,800 | 5,716,477 |
| Unipol Gruppo Finanziario | 5,002,697 | 3,479,369 | Ryohin Keikaku | 66,500 | 3,162,215 |
| | | 38,036,662 | Secom | 104,500 | 5,256,616 |
| Japan—23.6% | | | Sekisui House | 366,000 | 3,780,576 |
| Asahi Kasei | 415,000 | 2,861,194 | Seven & I Holdings | 257,900 | 7,178,514 |
| Astellas Pharma | 86,900 | 3,404,615 | Shimachu | 133,000 | 3,053,285 |
| Bridgestone | 135,400 | 2,770,730 | Shimizu | 1,047,000 | 4,479,555 |
| Canon | 107,900 | 5,196,822 | Shin-Etsu Chemical | 129,700 | 7,443,818 |
| Central Japan Railway | 757 | 6,764,464 | SMC | 14,100 | 2,404,437 |
| Chuo Mitsui Trust Holdings | 1,174,860 | 4,997,876 | Softbank | 101,300 | 4,154,532 |
| Coca-Cola West | 107,400 | 1,977,195 | Sumitomo Mitsui Financial Group | 374,800 | 14,134,320 |
| Dainippon Screen Manufacturing | 205,000 | 1,979,708 | Sumitomo Trust & Banking | 214,000 | 1,357,692 |
| Daito Trust Construction | 53,900 | 4,394,756 | Taiyo Nippon Sanso | 476,000 | 4,236,025 |
| East Japan Railway | 107,800 | 7,498,099 | Tokyo Electron | 45,800 | 2,989,695 |
| Fuji Heavy Industries | 240,000 | 2,056,598 | Tokyo Gas | 1,322,000 | 5,898,539 |
| Fujitsu | 656,000 | 4,426,527 | Tokyo Steel Manufacturing | 696,600 | 7,748,988 |
| Hitachi | 1,274,000 | 7,708,942 | Toyo Suisan Kaisha | 146,000 | 3,299,969 |
| Honda Motor | 136,200 | 5,902,194 | Toyoda Gosei | 207,200 | 4,852,945 |
| INPEX | 611 | 4,264,788 | Toyota Motor | 244,100 | 11,398,594 |
| JFE Holdings | 36,200 | 1,139,478 | Ushio | 47,100 | 966,124 |
| Kaneka | 304,000 | 2,229,693 | Yahoo! Japan | 4,492 | 1,688,515 |
| Kao | 131,700 | 3,541,837 | Yamada Denki | 116,240 | 8,852,457 |
| KDDI | 882 | 5,714,321 | Yamato Holdings | 180,000 | 2,882,465 |
| Keihin | 186,900 | 4,128,456 | | | 267,238,472 |
| Makita | 78,200 | 3,293,185 | Luxembourg—.4% | | |
| Matsumotokiyoshi Holdings | 185,000 | 4,143,023 | ArcelorMittal | 54,200 | 1,991,382 |
| Medipal Holdings | 589,400 | 5,591,032 | L’Occitane International | 637,750 | 1,526,407 |
| Miraca Holdings | 77,600 | 2,997,567 | Subsea 7 | 58,313 | 1,498,382 |
| Mitsubishi | 236,000 | 6,522,780 | | | 5,016,171 |
| Mitsubishi Gas Chemical | 302,000 | 2,329,466 | Netherlands—3.5% | | |
| Mitsubishi Tanabe Pharma | 229,600 | 3,887,244 | Aegon | 597,132a | 4,588,950 |
| Mitsubishi UFJ Financial Group | 2,801,800 | 15,515,132 | European Aeronautic | | |
| NEC | 871,000 | 2,395,636 | Defence and Space | 114,135a | 3,301,230 |
STATEMENT OF INVESTMENTS (Unaudited) (continued)
| | | | | | | |
| BNY Mellon International Fund (continued) | | | |
| Common Stocks (continued) | Shares | Value ($) | | Shares | Value ($) |
| Netherlands (continued) | | | Switzerland (continued) | | |
| Heineken | 73,125 | 3,769,975 | Transocean | 56,540a | 4,643,205 |
| ING Groep | 471,250a | 5,909,321 | UBS | 551,499a | 10,951,627 |
| Koninklijke Ahold | 138,710 | 1,862,075 | Zurich Financial Services | 18,400 | 5,341,169 |
| Koninklijke Philips Electronics | 337,949 | 11,033,965 | | | 71,158,383 |
| Nutreco | 29,030 | 2,147,225 | United Kingdom—20.8% | | |
| Royal Dutch Shell, Cl. A | 143,935 | 5,177,139 | Aberdeen Asset Management | 475,700 | 1,622,425 |
| Unilever | 62,290 | 1,878,602 | Anglo American | 150,601 | 8,161,206 |
| | | 39,668,482 | BAE Systems | 896,973 | 4,795,891 |
| Norway—1.1% | | | Barclays | 1,295,730 | 6,737,316 |
| Norsk Hydro | 379,729 | 3,119,091 | BP | 1,715,102 | 13,792,973 |
| Telenor | 304,200 | 5,043,565 | British American Tobacco | 176,230 | 7,053,325 |
| TGS Nopec Geophysical | 170,800 | 4,410,143 | British Land | 461,330 | 4,376,013 |
| | | 12,572,799 | BT Group | 579,070 | 1,715,163 |
| Singapore—1.6% | | | Burberry Group | 139,080 | 2,710,878 |
| DBS Group Holdings | 1,084,680 | 12,093,696 | Compass Group | 310,960 | 2,798,003 |
| United Overseas Bank | 408,457 | 5,800,231 | Drax Group | 555,490 | 3,565,163 |
| | | 17,893,927 | easyJet | 453,642a | 2,636,424 |
| Spain—2.4% | | | Eurasian Natural Resources | 223,750 | 3,508,256 |
| Banco Bilbao | | | GlaxoSmithKline | 1,157,434 | 22,221,438 |
| Vizcaya Argentaria | 636,330 | 7,855,557 | Home Retail Group | 2,033,202 | 7,288,114 |
| Banco Santander | 718,400 | 8,857,815 | HSBC Holdings | 2,284,693 | 25,181,615 |
| Gamesa Corp Tecnologica | 644,666a | 5,683,729 | IMI | 220,370 | 3,184,786 |
| Iberdrola | 601,496 | 5,248,336 | Kingfisher | 945,550 | 3,910,458 |
| | | 27,645,437 | Legal & General Group | 1,120,120 | 2,163,252 |
| Sweden—3.0% | | | Lonmin | 116,898 | 3,489,039 |
| Atlas Copco, Cl. A | 120,290 | 3,021,684 | Man Group | 589,520 | 2,753,342 |
| Electrolux, Ser. B | 134,100 | 3,362,239 | Old Mutual | 1,212,420 | 2,591,820 |
| Husqvarna, Cl. B | 380,737 | 3,065,806 | QinetiQ Group | 990,325a | 2,034,936 |
| Investor, Cl. B | 232,230 | 5,342,287 | Reed Elsevier | 329,000 | 2,938,933 |
| Securitas, Cl. B | 397,000 | 4,638,436 | Resolution | 1,903,475 | 8,948,938 |
| Telefonaktiebolaget LM | | | Rexam | 736,290 | 4,368,857 |
| Ericsson, Cl. B | 675,190 | 8,688,263 | Rio Tinto | 137,740 | 9,649,682 |
| Volvo, Cl. B | 315,560 | 5,460,619 | Royal Dutch Shell, Cl. A | 321,354 | 11,553,051 |
| | | 33,579,334 | Royal Dutch Shell, Cl. B | 447,390 | 15,989,643 |
| Switzerland—6.3% | | | Smith & Nephew | 251,230 | 2,905,845 |
| ABB | 164,940a | 4,033,405 | Tesco | 1,316,871 | 8,652,977 |
| Adecco | 59,930 | 4,034,680 | Thomas Cook Group | 1,163,240 | 3,575,913 |
| Lonza Group | 34,550 | 2,922,861 | Unilever | 628,057 | 18,623,012 |
| Nestle | 104,655 | 5,924,931 | Vodafone Group | 2,322,756 | 6,581,532 |
| Novartis | 261,836 | 14,682,656 | WPP | 251,340 | 3,458,714 |
| Partners Group Holding | 12,140 | 2,175,557 | | | 235,538,933 |
| Roche Holding | 109,080 | 16,448,292 | | | |
62
| | | | | | |
| BNY Mellon International Fund (continued) | | | |
| |
| Common Stocks (continued) | Shares | Value ($) | Other Investment—1.8% | Shares | Value ($) |
| United States—.4% | | | Registered | | |
| iShares MSCI EAFE Index Fund | 79,770 | 4,909,844 | Investment Company; | | |
| Total Common Stocks | | | Dreyfus | | |
| (cost $979,142,577) | | 1,096,514,423 | Institutional Preferred | | |
| | | | Plus Money Market Fund | | |
| | | | (cost $20,600,000) | 20,600,000 b 20,600,000 |
| Preferred Stocks—.9% | | | | | |
| Germany | | | Total Investments | | |
| | | | (cost $1,006,547,238) | 99.6% | 1,127,640,108 |
| ProSieben Sat.1 Media | 114,670 | 3,709,930 | | | |
| Volkswagen | 40,188 | 6,815,755 | Cash and Receivables (Net) | .4% | 4,225,935 |
| Total Preferred Stocks | | | Net Assets | 100.0% | 1,131,866,043 |
| (cost $6,804,661) | | 10,525,685 | | | |
ADR—American Depository Receipts
| |
| a | Non-income producing security. |
| b | Investment in affiliated money market mutual fund. |
| | | |
| Portfolio Summary (Unaudited) † | | | |
| |
| | Value (%) | | Value (%) |
| Financial | 24.1 | Information Technology | 5.7 |
| Consumer Discretionary | 12.7 | Utilities | 4.2 |
| Health Care | 9.9 | Telecommunication Services | 3.8 |
| Energy | 9.7 | Money Market Investment | 1.8 |
| Industrial | 9.7 | Exchange Traded Funds | .4 |
| Consumer Staples | 9.4 | | |
| Materials | 8.2 | | 99.6 |
| |
| † Based on net assets. | | | |
| See notes to financial statements. | | | |
STATEMENT OF INVESTMENTS
February 28, 2011 (Unaudited)
| | | | | | | |
| BNY Mellon Emerging Markets Fund | | | | |
| Common Stocks—90.6% | Shares | Value ($) | | Shares | Value ($) |
| Brazil—9.5% | | | China (continued) | | |
| Banco do Brasil | 797,700 | 14,263,478 | China Vanadium | | |
| Banco Santander Brasil, ADS | 1,093,240 | 13,315,663 | Titano-Magnetite Mining | 18,159,000a | 7,041,626 |
| Brasil Telecom, ADR | 106,230 | 2,448,601 | Evergrande Real Estate Group | 13,728,000 | 6,451,525 |
| Centrais Eletricas Brasileiras | 262,103 | 3,702,020 | Great Wall Motor, Cl. H | 7,480,500 | 11,622,246 |
| Cia de Saneamento de Minas Gerais | 434,400 | 7,571,583 | Guangzhou Automobile Group, Cl. H | 6,387,254 | 8,201,405 |
| Cia Energetica de Minas Gerais, ADR | 108,842 | 1,835,076 | Huaneng Power International, ADR | 96,150 | 2,162,413 |
| Cielo | 1,025,700 | 8,094,387 | Huaneng Power International, Cl. H | 11,460,200 | 6,401,113 |
| Fibria Celulose, ADR | 463,600a | 6,680,476 | Industrial & Commercial | | |
| Fleury | 774,600 | 10,265,615 | Bank of China, Cl. H | 43,926,475 | 33,728,855 |
| Gafisa | 1,158,000 | 7,127,010 | Maanshan Iron & Steel, Cl. H | 5,128,000 | 2,620,627 |
| Gerdau, ADR | 425,480 | 5,743,980 | Perfect World, ADR | 309,420a | 6,565,892 |
| Grendene | 627,010 | 3,542,429 | PetroChina, ADR | 51,850 | 7,068,710 |
| Itau Unibanco Holding, ADR | 647,734 | 14,392,649 | PetroChina, Cl. H | 9,584,000 | 13,044,479 |
| JBS | 2,314,400 | 8,680,043 | Renhe Commercial Holdings | 69,400,000 | 10,426,040 |
| Magnesita Refratarios | 1,100,100a | 5,481,325 | Shanda Games, ADR | 272,860a | 1,664,446 |
| Obrascon Huarte Lain Brasil | 162,500 | 5,417,643 | Sinotrans, Cl. H | 17,585,600 | 4,809,621 |
| Petroleo Brasileiro, ADR | 1,360,000 | 51,753,010 | TPV Technology | 3,871,680 | 2,276,874 |
| Porto Seguro | 581,840 | 9,267,196 | Weichai Power, Cl. H | 998,000 | 6,637,956 |
| Redecard | 965,300 | 12,473,825 | Weiqiao Textile, Cl. H | 6,205,400 | 5,633,305 |
| Rossi Residencial | 1,203,300 | 9,329,589 | Zhejiang Expressway, Cl. H | 4,784,000 | 4,287,663 |
| Tele Norte Leste | | | | | 234,863,312 |
| Participacoes, ADR | 448,508 | 7,081,941 | Hong Kong—6.6% | | |
| Vale, ADR | 422,220 | 14,452,591 | BYD Electronic International | 11,894,500 | 7,560,064 |
| | | 222,920,130 | China Agri-Industries Holdings | 14,893,519 | 15,126,828 |
| China—10.1% | | | China Dongxiang Group | 26,547,000 | 10,055,682 |
| Asia Cement China Holdings | 8,934,000 | 4,645,955 | China Minsheng Bank, Cl. H | 15,663,500 | 13,656,287 |
| Beijing Capital International | | | China Mobile | 3,970,400 | 37,241,618 |
| Airport, Cl. H | 15,558,000 | 7,751,032 | China Mobile, ADR | 225,840 | 10,675,457 |
| Changyou.com, ADR | 266,330a | 9,968,732 | China Power International | | |
| China Coal Energy, Cl. H | 4,587,000 | 6,537,712 | Development | 25,880,920 | 5,117,696 |
| China Construction Bank, Cl. H | 36,601,229 | 32,004,927 | CNOOC | 10,085,000 | 22,894,556 |
| China Pacific Insurance Group, Cl. H | 615,600 | 2,489,908 | Country Garden Holdings | 15,811,000 | 6,273,240 |
| China Petroleum & Chemical, ADR | 34,178 | 3,506,663 | Global Bio-Chem Technology Group | 39,485,920a | 5,627,808 |
| China Petroleum & Chemical, Cl. H | 10,980,000 | 11,194,299 | Guangdong Investment | 10,694,000 | 5,410,164 |
| China Railway Construction, Cl. H | 5,121,500 | 5,727,820 | Hutchison Whampoa | 577,000 | 6,793,901 |
| China Railway Group, Cl. H | 8,147,000 | 5,178,178 | NWS Holdings | 4,225,398 | 6,575,735 |
| China Shenhua Energy, Cl. H | 1,257,000 | 5,213,290 | | | 153,009,036 |
64
| | | | | | | |
| BNY Mellon Emerging Markets Fund (continued) | | | |
| Common Stocks (continued) | Shares | Value ($) | | Shares | Value ($) |
| Hungary—1.0% | | | Indonesia (continued) | | |
| MOL Hungarian Oil and Gas | 124,920a | 15,132,223 | Indofood Sukses Makmur | 15,570,000 | 8,383,778 |
| OTP Bank | 299,430a | 8,961,206 | Indosat | 6,967,000 | 3,988,364 |
| | | 24,093,429 | International Nickel Indonesia | 890,000 | 509,494 |
| India—9.1% | | | Medco Energi Internasional | 11,256,496 | 3,732,387 |
| Apollo Tyres | 5,785,710 | 6,672,132 | Telekomunikasi Indonesia | 7,442,900 | 6,285,734 |
| Bank of India | 824,240 | 7,858,995 | | | 42,079,947 |
| Bharti Airtel | 1,317,870 | 9,449,995 | Israel—.1% | | |
| Chambal Fertilizers & Chemicals | 5,039,790 | 7,493,310 | Teva Pharmaceutical Industries, ADR | 44,150 | 2,211,915 |
| Glenmark Pharmaceuticals | 808,270 | 4,493,490 | Malaysia—2.8% | | |
| Hexaware Technologies | 5,302,680 | 6,207,374 | AMMB Holdings | 4,594,700 | 9,353,577 |
| Hindustan Petroleum | 855,110 | 6,040,630 | Axiata Group | 5,937,700a | 9,498,763 |
| India Cements | 5,352,845 | 10,158,166 | Genting Malaysia | 9,944,560 | 10,790,524 |
| Jubilant Industries | 13,534a | 53,369 | KNM Group | 8,155,100a | 6,817,081 |
| Jubilant Life Sciences | 1,388,840 | 5,031,918 | Malayan Banking | 3,302,859 | 9,333,108 |
| Mahanagar Telephone Nigam | 2,034,617a | 1,820,435 | Petronas Chemicals Group | 1,738,300 | 3,589,998 |
| Mahanagar Telephone Nigam, ADR | 274,750a | 505,540 | Tenaga Nasional | 7,336,512 | 15,151,623 |
| NMDC | 1,270,046 | 7,378,401 | | | 64,534,674 |
| Oil & Natural Gas | 1,161,802 | 6,944,785 | Mexico—2.1% | | |
| Patni Computer Systems | 419,920 | 4,151,424 | America Movil, ADR, Ser. L | 271,460 | 15,587,233 |
| Reliance Industries | 1,125,812 | 23,975,241 | Consorcio ARA | 4,750,700 | 2,802,727 |
| Rolta India | 2,095,190 | 6,468,355 | Desarrolladora Homex, ADR | 233,750a | 6,365,012 |
| Shree Renuka Sugars | 9,806,920 | 15,425,885 | Fomento Economico Mexicano, ADR | 232,430 | 13,069,539 |
| Sintex Industries | 6,722,560 | 21,772,391 | Grupo Continental | 1,187,290 | 4,085,985 |
| State Bank of India | 154,820 | 8,989,579 | Grupo Financiero Banorte, Cl. O | 1,257,900 | 5,706,152 |
| State Bank of India, GDR | 76,760b | 9,065,356 | Industrias CH, Ser. B | 446,700a | 1,771,667 |
| Sterlite Industries India | 1,023,440 | 3,694,684 | | | 49,388,315 |
| Sterlite Industries India, ADR | 810 | 11,939 | Mongolia—.4% | | |
| Tata Consultancy Services | 660,890 | 16,096,653 | Mongolian Mining | 7,611,500 | 9,656,089 |
| Tata Motors | 614,870 | 14,126,863 | Philippines—.2% | | |
| Welspun | 1,911,850 | 7,954,492 | Bank of the Philippine Islands | 3,601,408 | 4,597,806 |
| | | 211,841,402 | Poland—1.2% | | |
| Indonesia—1.8% | | | Asseco Poland | 482,063 | 8,613,520 |
| Astra International | 1,476,500 | 8,711,877 | Bank Pekao | 49,280 | 2,824,591 |
| Bank Mandiri | 9,347,500 | 6,145,837 | KGHM Polska Miedz | 159,100 | 9,734,873 |
| Bank Pembangunan Daerah | | | Telekomunikacja Polska | 1,012,170 | 6,101,427 |
| Jawa Barat dan Banten | 33,448,000 | 4,322,476 | | | 27,274,411 |
STATEMENT OF INVESTMENTS (Unaudited) (continued)
| | | | | | | |
| BNY Mellon Emerging Markets Fund (continued) | | | |
| Common Stocks (continued) | Shares | Value ($) | | Shares | Value ($) |
| Russia—6.8% | | | South Korea (continued) | | |
| Gazprom, ADR | 2,346,610 | 69,037,266 | Hyundai Mipo Dockyard | 66,708 | 10,225,033 |
| LUKOIL, ADR | 664,330 | 47,001,347 | Hyundai Mobis | 96,468 | 22,436,406 |
| Magnitogorsk | | | Jinro | 97,640 | 2,686,149 |
| Iron & Steel Works, GDR | 376,280b,c | 5,437,246 | KB Financial Group | 248,568 | 12,156,961 |
| MMC Norilsk Nickel, ADR | 461,629 | 11,148,340 | KB Financial Group, ADR | 73,390 | 3,577,762 |
| Rosneft Oil, GDR | 526,820b | 4,973,181 | Korea Electric Power | 464,805a | 11,366,339 |
| Sberbank of Russian, GDR | 25,590 | 9,887,671 | Korea Electric Power, ADR | 58,910 | 718,702 |
| VimpelCom, ADR | 850,520 | 12,009,342 | Korea Exchange Bank | 1,299,540 | 10,512,382 |
| | | 159,494,393 | Korean Reinsurance | 423,106 | 4,292,353 |
| South Africa—7.1% | | | KT | 198,034 | 6,860,523 |
| Anglo Platinum | 155,021a | 15,073,496 | KT, ADR | 195,470 | 3,868,351 |
| AngloGold Ashanti, ADR | 27,937 | 1,364,443 | KT&G | 176,713 | 8,971,475 |
| ArcelorMittal South Africa | 392,658 | 5,085,238 | Kukdo Chemical | 79,030 | 3,487,081 |
| Aveng | 1,977,351 | 10,388,725 | LG Electronics | 26,509 | 2,607,096 |
| Exxaro Resources | 513,020 | 11,233,020 | Lotte Chilsung Beverage | 1,061a | 863,916 |
| FirstRand | 3,551,850 | 9,993,643 | Nong Shim | 51,201 | 9,413,199 |
| JD Group | 835,318 | 6,262,635 | POSCO | 41,615 | 16,960,882 |
| MTN Group | 1,648,959 | 29,106,939 | POSCO, ADR | 21,520 | 2,218,282 |
| Murray & Roberts Holdings | 2,047,350 | 7,351,347 | Samsung Electronics | 82,284 | 67,291,128 |
| Nedbank Group | 530,440 | 9,736,479 | Samsung Fire & Marine Insurance | 33,982 | 6,729,258 |
| Sappi | 980,787a | 5,206,447 | Shinhan Financial Group | 100,193 | 4,181,181 |
| Sasol | 452,723 | 24,771,832 | Shinsegae | 13,386 | 2,959,117 |
| Sasol, ADR | 36,790 | 2,018,667 | SK Chemicals | 58,867 | 3,066,832 |
| Standard Bank Group | 1,687,874 | 24,205,992 | SK Holdings | 61,512 | 7,221,318 |
| Telkom | 791,230 | 4,028,597 | SK Innovation | 52,613 | 8,157,777 |
| | | 165,827,500 | SK Telecom | 39,489 | 5,703,014 |
| South Korea—14.1% | | | SK Telecom, ADR | 376,730 | 6,626,681 |
| Busan Bank | 870,620 | 10,452,223 | Tong Yang Life Insurance | 742,290 | 8,319,646 |
| Chong Kun Dang Pharmaceutical | 150,430 | 3,065,512 | Woori Finance Holdings | 353,140a | 4,270,909 |
| CJ Cheiljedang | 42,951 | 7,592,012 | Youngone | 384,018 | 4,082,945 |
| Daegu Bank | 649,200 | 8,771,807 | Youngone Holdings | 118,492 | 3,202,061 |
| Daehan Steel | 237,030 | 2,009,814 | Yuhan | 65,958 | 8,882,839 |
| Grand Korea Leisure | 523,770 | 8,770,879 | | | 330,332,926 |
| Hana Financial Group | 160,960 | 6,417,579 | Taiwan—10.5% | | |
| Hite Brewery | 55,864a | 5,023,875 | Advanced Semiconductor | | |
| Hyundai Development | 159,030a | 4,311,627 | Engineering | 5,654,618 | 6,330,009 |
66
| | | | | | | |
| BNY Mellon Emerging Markets Fund (continued) | | | |
| Common Stocks (continued) | Shares | Value ($) | | Shares | Value ($) |
| Taiwan (continued) | | | Thailand (continued) | | |
| Asia Cement | 8,399,727 | 8,428,811 | Krung Thai Bank | 8,379,000d | 4,494,378 |
| Asustek Computer | 683,974 | 6,185,128 | Krung Thai Bank | 9,535,100 | 5,114,494 |
| AU Optronics | 2,881,000a | 2,605,268 | PTT Exploration & Production | 811,000 | 4,780,859 |
| AU Optronics, ADR | 1,004,070a | 9,016,548 | | | 49,284,551 |
| Chinatrust Financial Holding | 9,609,599 | 7,494,628 | Turkey—2.7% | | |
| Chroma Ate | 1,533,000 | 4,545,352 | Arcelik | 1,321,780 | 6,134,547 |
| Chunghwa Telecom | 1,577,600 | 4,672,288 | Asya Katilim Bankasi | 3,086,720 | 4,981,228 |
| CTCI | 7,988,000 | 8,861,532 | Haci Omer Sabanci Holding | 1,506,694 | 6,050,337 |
| First Financial Holding | 3,523,161 | 2,860,266 | KOC Holding | 1,804,580 | 7,562,587 |
| Fubon Financial Holding | 8,232,978 | 10,392,588 | Turk Telekomunikasyon | 3,327,760 | 14,820,110 |
| HON HAI Precision Industry | 6,938,568 | 25,424,544 | Turkcell Iletisim Hizmet | 768,730 | 4,308,254 |
| HTC | 641,100 | 22,952,617 | Turkcell Iletisim Hizmet, ADR | 22,010 | 309,681 |
| KGI Securities | 6,639,000 | 3,180,346 | Turkiye Halk Bankasi | 973,020 | 7,059,911 |
| Nan Ya Printed Circuit Board | 3,151,440 | 11,229,793 | Turkiye Is Bankasi, Cl. C | 3,835,811 | 11,948,296 |
| Powertech Technology | 4,296,250 | 14,948,125 | | | 63,174,951 |
| Quanta Computer | 6,823,000 | 13,326,261 | United Kingdom—.6% | | |
| Siliconware Precision | | | African Barrick Gold | 1,178,500 | 11,092,621 |
| Industries | 2,238,000 | 3,077,090 | JKX Oil & Gas | 567,251 | 2,801,490 |
| SinoPac Financial Holdings | 24,813,225 | 10,218,241 | | | 13,894,111 |
| Taishin Financial Holdings | 16,939,164a | 8,740,921 | United States—1.8% | | |
| Taiwan Semiconductor | | | iShares MSCI Emerging | | |
| Manufacturing | 3,227,517 | 7,649,173 | Markets Index Fund | 929,831 | 42,576,961 |
| Taiwan Semiconductor | | | Total Common Stocks | | |
| Manufacturing, ADR | 1,903,157 | 23,389,799 | (cost $1,858,414,069) | 2,117,164,837 |
| Tatung | 20,833,000a | 4,839,346 | | | |
| Transcend Information | 2,623,040 | 6,877,908 | Preferred Stocks—7.1% | | |
| United Microelectronics | 19,269,397 | 9,975,753 | | | |
| | | | Brazil | | |
| United Microelectronics, ADR | 504,000 | 1,411,200 | | | |
| | | | Banco Bradesco | 1,200,756 | 23,094,237 |
| Young Fast Optoelectronics | 852,000 | 7,475,443 | | | |
| | | | Banco do Estado do | | |
| | | 246,108,978 | Rio Grande do Sul | 1,071,200 | 11,717,658 |
| Thailand—2.1% | | | Bradespar | 409,200 | 10,619,820 |
| Asian Property Development | 25,403,400 | 5,016,910 | Cia de Bebidas das Americas | 214,200 | 5,690,371 |
| Bangchak Petroleum | 6,766,800 | 3,897,530 | Cia de Tecidos do Norte de | | |
| Bangkok Bank | 928,300 | 4,687,212 | Minas—Coteminas | 721,960 | 2,126,220 |
| Banpu | 275,600 | 6,139,956 | Cia Energetica de | | |
| Kasikornbank | 4,014,500 | 15,153,212 | Minas Gerais | 544,358 | 9,046,459 |
STATEMENT OF INVESTMENTS (Unaudited) (continued)
| | | | | | |
| BNY Mellon Emerging Markets Fund (continued) | | | |
| Preferred Stocks (continued) | Shares | Value ($) | Other Investment—1.6% | Shares | Value ($) |
| Brazil (continued) | | | Registered Investment Company; | | |
| Cia Paranaense de Energia, Cl. B | 715,100 | 17,965,609 | Dreyfus Institutional | | |
| Gerdau | 81,600 | 1,078,485 | Preferred Plus | | |
| Itau Unibanco Holding | 855,135 | 19,016,706 | Money Market Fund | | |
| | | | (cost $36,800,000) | 36,800,000 e 36,800,000 |
| Petroleo Brasileiro | 1,087,800 | 18,685,734 | | | |
| Usinas Siderurgicas de | | | Total Investments | | |
| Minas Gerais, Cl. A | 280,200 | 3,199,784 | (cost $2,017,983,399) | 99.3% | 2,320,878,116 |
| Vale, Cl. A | 1,498,500 | 44,672,196 | Cash and Receivables (Net) | .7% | 16,482,809 |
| Total Preferred Stocks | | | | | |
| (cost $122,769,330) | | 166,913,279 | Net Assets | 100.0% | 2,337,360,925 |
ADR—American Depository Receipts
ADS—American Depository Shares
GDR—Global Depository Receipts
|
| a Non-income producing security. |
| b Securities exempt from registration under Rule 144A of the Securities Act of 1933.These securities may be resold in transactions exempt from registration, normally to qualified |
| institutional buyers.At February 28, 2011, these securities had a value of $19,475,783 or .8% of net assets. |
| c The valuation of this security has been determined in good faith by management under the direction of the Board of Directors.At February 28, 2011, the value of this security |
| amounted to $5,437,246 or .2% of net assets. |
| d Foreign ownership limit is 25% of total shares outstanding. |
| e Investment in affiliated money market mutual fund. |
| | | |
| Portfolio Summary (Unaudited) † | | | |
| |
| | Value (%) | | Value (%) |
| Financial | 23.4 | Consumer Staples | 4.6 |
| Energy | 16.4 | Utilities | 3.7 |
| Information Technology | 14.3 | Exchange Traded Funds | 1.8 |
| Materials | 11.8 | Money Market Investment | 1.6 |
| Telecommunication Services | 8.9 | Health Care | 1.5 |
| Consumer Discretionary | 6.3 | | |
| Industrial | 5.0 | | 99.3 |
| |
| † Based on net assets. | | | |
| See notes to financial statements. | | | |
68
STATEMENT OF INVESTMENTS
February 28, 2011 (Unaudited)
| | | | | | | |
| BNY Mellon International Appreciation Fund | | | |
| Common Stocks—100.2% | Shares | Value ($) | | Shares | Value ($) |
| Consumer Discretionary—10.5% | | | Consumer Staples (continued) | | |
| Adidas, ADR | 11,075 | 355,397 | Coca Cola Hellenic Bottling, ADR | 11,185 | 304,456 |
| Bridgestone, ADR | 14,362 | 590,278 | Coca-Cola Amatil, ADR | 65,681 | 1,610,498 |
| British Sky Broadcasting Group, ADR | 13,695 | 703,101 | Danone, ADR | 76,602 | 960,589 |
| Casio Computer, ADR | 4,290 | 378,052 | Delhaize Group, ADR | 16,273 | 1,260,995 |
| Compass Group, ADR | 42,121 | 379,931 | Diageo, ADR | 11,998 | 938,963 |
| Daimler | 31,607a | 2,230,190 | Foster’s Group, ADR | 120,506 | 698,935 |
| Denso, ADR | 46,288 | 866,974 | Heineken, ADR | 18,509 | 476,237 |
| Electrolux, Cl. B, ADR | 12,867 | 644,508 | Henkel & Co., ADR | 14,272 | 863,313 |
| Fiat, ADR | 39,395 | 368,343 | Imperial Tobacco Group, ADR | 13,287 | 850,501 |
| Hennes & Mauritz, ADR | 170,906 | 1,114,307 | J. Sainsbury, ADR | 14,245 | 349,430 |
| Honda Motor, ADR | 52,848 | 2,308,929 | Kao, ADR | 22,970 | 618,352 |
| Intercontinental Hotels Group, ADR | 25,633 | 573,154 | Kirin Holdings, ADR | 35,382 | 505,255 |
| Kingfisher, ADR | 66,928 | 552,825 | Koninklijke Ahold, ADR | 35,754 | 478,746 |
| LVMH Moet Hennessy | | | L’Oreal, ADR | 44,914 | 1,043,352 |
| Louis Vuitton, ADR | 38,319 | 1,208,198 | Nestle, ADR | 93,755 | 5,308,408 |
| Marks & Spencer Group, ADR | 33,455 | 376,369 | Sabmiller, ADR | 24,142 | 813,827 |
| Marui Group, ADR | 32,401 | 582,570 | Shiseido, ADR | 22,862 | 466,842 |
| Mediaset, ADR | 21,720 | 419,196 | Tesco, ADR | 77,821 | 1,558,755 |
| Nissan Motor, ADR | 52,962 | 1,080,425 | Unilever (NY Shares) | 26,103 | 789,355 |
| Panasonic, ADR | 43,520 | 586,214 | Unilever, ADR | 15,990 | 474,903 |
| Pearson, ADR | 21,712 | 372,795 | Yamazaki Baking, ADR | 5,023 | 609,406 |
| Peugeot, ADR | 12,756a | 512,536 | | | 24,616,443 |
| Publicis Groupe, ADR | 42,032 | 1,197,492 | Energy—8.7% | | |
| Reed Elsevier, ADR | 10,831 | 387,100 | BG Group, ADR | 20,587 | 2,506,261 |
| Sega Sammy Holdings, ADR | 109,384 | 613,644 | BP, ADR | 83,895 | 4,066,391 |
| Sharp, ADR | 40,118 | 433,274 | ENI, ADR | 41,275 | 2,016,284 |
| Sodexo, ADR | 26,462 | 1,826,143 | Repsol, ADR | 29,557 | 994,593 |
| Sony, ADR | 29,922 | 1,102,326 | Royal Dutch Shell, Cl. A, ADR | 46,998 | 3,395,605 |
| Sumitomo Electric Industries, ADR | 3,702 | 539,960 | Royal Dutch Shell, Cl. B, ADR | 39,993 | 2,884,295 |
| Toyota Motor, ADR | 36,048 | 3,363,278 | Statoil, ADR | 32,955 | 869,682 |
| Volkswagen, ADR | 14,318 | 434,551 | Technip, ADR | 8,428 | 830,579 |
| Wolters Kluwer, ADR | 11,972 | 282,060 | Total, ADR | 62,169 | 3,810,960 |
| WPP, ADR | 8,629 | 593,503 | Woodside Petroleum, ADR | 21,015 | 924,660 |
| | | 26,977,623 | | | 22,299,310 |
| Consumer Staples—9.6% | | | Financial—24.5% | | |
| Aeon, ADR | 79,968 | 1,002,799 | Aegon (NY Shares) | 99,300a | 763,617 |
| Ajinomoto, ADR | 4,423 | 506,920 | Ageas, ADR | 140,757 | 449,015 |
| British American Tobacco, ADR | 26,200 | 2,125,606 | | | |
STATEMENT OF INVESTMENTS (Unaudited) (continued)
| | | | | | | |
| BNY Mellon International Appreciation Fund (continued) | | |
| Common Stocks (continued) | Shares | Value ($) | | Shares | Value ($) |
| Financial (continued) | | | Financial (continued) | | |
| Allianz, ADR | 159,470 | 2,302,747 | National Australia Bank, ADR | 67,129 | 1,769,520 |
| Alpha Bank, ADR | 55,424a | 92,558 | National Bank of Greece, ADR | 136,731 | 257,054 |
| Australian & New Zealand | | | Nomura Holdings, ADR | 119,257 | 752,512 |
| Banking Group, ADR | 84,598 | 2,089,571 | ORIX, ADR | 10,179 | 571,245 |
| AXA, ADR | 72,000 | 1,507,680 | Prudential, ADR | 60,650 | 1,400,409 |
| Banco Bilbao Vizcaya Argentaria, ADR | 116,298 | 1,430,465 | Shinsei Bank, ADR | 57,546a | 149,044 |
| Banco Santander, ADR | 217,127 | 2,670,662 | Shizuoka Bank, ADR | 3,560 | 334,144 |
| Bank of Yokohama, ADR | 8,083 | 434,461 | Sino Land, ADR | 37,855 | 343,114 |
| Barclays, ADR | 69,444 | 1,442,352 | Social Generale, ADR | 109,645 | 1,539,416 |
| BNP Paribas, ADR | 49,361 | 1,930,509 | Sumitomo Mitsui Financial Group, ADR | 129,196 | 979,306 |
| British Land, ADR | 47,476 | 455,770 | Sumitomo Trust & Banking, ADR | 75,933 | 487,490 |
| Capitaland, ADR | 45,596 | 230,260 | Sun Hung Kai Properties, ADR | 49,737 | 805,739 |
| Cheung Kong Holdings, ADR | 50,143 | 780,225 | Swiss Reinsurance, ADR | 15,329 | 935,376 |
| City Developments, ADR | 87,591 | 772,553 | Tokio Marine Holdings, ADR | 33,355 | 1,094,711 |
| Commerzbank, ADR | 37,925a | 329,568 | Tokyu Land, ADR | 10,001 | 571,276 |
| Commonwealth Bank of Australia, ADR | 15,823b | 2,567,212 | UBS | 106,851a | 2,120,992 |
| Credit Agricole, ADR | 22,091 | 192,634 | United Overseas Bank, ADR | 24,700 | 705,185 |
| Credit Suisse Group, ADR | 34,774 | 1,607,602 | Westfield Group, ADR | 28,114 | 563,686 |
| Daiwa House Industry, ADR | 4,061 | 522,813 | Westpac Banking, ADR | 19,023 | 2,300,261 |
| Daiwa Securities Group, ADR | 89,390 | 486,282 | Zurich Financial Services, ADR | 49,197 | 1,424,745 |
| Danske Bank, ADR | 27,008a | 313,293 | | | 62,705,863 |
| Deutsche Bank | 29,483 | 1,892,219 | Health Care—8.0% | | |
| Erste Group Bank, ADR | 4,433 | 116,854 | AstraZeneca, ADR | 31,412 | 1,544,528 |
| Hachijuni Bank, ADR | 2,799 | 178,828 | Bayer, ADR | 24,830 | 1,930,036 |
| Hang Seng Bank, ADR | 32,669 | 524,664 | Cie Generale d’Opitique Essilor | | |
| HSBC Holdings, ADR | 88,078 | 4,852,217 | International, ADR | 15,084 | 538,197 |
| Hysan Development, ADR | 89,301 | 811,746 | Eisai, ADR | 28,923 | 1,086,926 |
| ING Groep, ADR | 146,569a | 1,839,441 | Elan, ADR | 9,218a | 58,534 |
| Intesa Sanpaolo, ADR | 146,334 | 2,973,507 | Fresenius Medical Care & Co., ADR | 7,675 | 509,467 |
| Legal & General Group, ADR | 92,800 | 903,872 | GlaxoSmithKline, ADR | 53,399 | 2,061,735 |
| Lend Lease Group, ADR | 184,716 | 1,732,636 | Novartis, ADR | 37,887 | 2,131,901 |
| Lloyds Banking Group, ADR | 191,480a | 773,579 | Novo Nordisk, ADR | 23,115 | 2,927,746 |
| Mitsubishi Estate, ADR | 5,695 | 1,162,293 | Olympus, ADR | 62,140 | 1,825,673 |
| Mitsubishi UFJ Financial Group, ADR | 257,292 | 1,422,825 | Roche Holding, ADR | 78,216 | 2,937,793 |
| Mizuho Financial Group, ADR | 109,542 | 456,790 | Sanofi-Aventis, ADR | 48,739 | 1,685,395 |
| MS&AD Insurance Group Holdings, ADR | 44,902 | 587,318 | Smith & Nephew, ADR | 6,393 | 370,474 |
70
| | | | | | | |
| BNY Mellon International Appreciation Fund (continued) | | |
| |
| Common Stocks (continued) | Shares | Value ($) | | Shares | Value ($) |
| Health Care (continued) | | | Industrial (continued) | | |
| Teva Pharmaceutical Industries, ADR | 17,900 | 896,790 | Orkla, ADR | 26,607 | 244,784 |
| | | 20,505,195 | Rolls-Royce Group, ADR | 14,497 | 732,099 |
| Industrial—11.7% | | | Ryanair Holdings, ADR | 160 | 4,563 |
| ABB, ADR | 60,572 | 1,484,620 | Sandvik, ADR | 50,376 | 964,197 |
| Air France, ADR | 40,458a | 661,488 | Secom, ADR | 37,120 | 471,424 |
| All Nippon Airways, ADR | 79,722a | 581,971 | Siemens, ADR | 21,311 | 2,865,051 |
| Asahi Glass, ADR | 66,076 | 931,672 | SKF, ADR | 38,690 | 1,079,838 |
| Atlas Copco, Cl. A, ADR | 47,447 | 1,195,190 | Sumitomo, ADR | 28,536 | 419,479 |
| Atlas Copco, Cl. B, ADR | 47,220 | 1,068,116 | Swire Pacific, Cl. A, ADR | 43,906 | 616,879 |
| Bae Systems, ADR | 121 | 2,589 | TNT, ADR | 18,567 | 489,240 |
| Dai Nippon Printing, ADR | 30,828 | 418,336 | Toppan Printing, ADR | 7,981 | 362,417 |
| Deutsche Lufthansa, ADR | 34,416a | 700,710 | TOTO, ADR | 4,089 | 342,127 |
| European Aeronautic Defence | | | Vestas Wind Systems, ADR | 4,708a | 54,142 |
| and Space, ADR | 19,043a | 552,057 | Volvo, ADR | 65,152a | 1,125,175 |
| Experian, ADR | 32,340 | 410,395 | | | 30,125,750 |
| Hutchison Whampoa, ADR | 9,330 | 537,128 | Information Technology—5.2% | | |
| International Consolidated | | | Advantest, ADR | 17,445 | 362,682 |
| Airlines Group, ADR | 22,962a | 411,020 | Alcatel-Lucent, ADR | 87,481a | 428,657 |
| Invensys, ADR | 88,290 | 511,199 | Canon, ADR | 37,897 | 1,829,667 |
| ITOCHU, ADR | 29,705 | 621,726 | Computershare, ADR | 47,642 | 468,797 |
| Kajima, ADR | 12,417 | 330,393 | Dassault Systemes, ADR | 6,885 | 527,253 |
| Kawasaki Heavy Industries, ADR | 38,754 | 627,040 | Fujifilm Holdings, ADR | 19,819 | 693,269 |
| Keppel, ADR | 37,443 | 666,485 | Fujitsu, ADR | 13,602 | 460,564 |
| Komatsu, ADR | 35,588 | 1,087,569 | Hitachi, ADR | 11,435 | 694,791 |
| Koninklijke Philips Electronics | | | Kyocera, ADR | 7,112 | 742,706 |
| (NY Shares) | 11,842 | 387,233 | | | |
| | | | Mitsubishi Electric, ADR | 45,775 | 1,073,424 |
| Kubota, ADR | 16,871 | 864,470 | | | |
| | | | NICE Systems, ADR | 4,300 | 148,974 |
| Marubeni, ADR | 5,423 | 412,961 | | | |
| | | | Nintendo, ADR | 24,953 | 914,527 |
| Metso, ADR | 18,812 | 972,392 | | | |
| | | | Nokia, ADR | 93,814 | 809,615 |
| Mitsubishi, ADR | 21,557 | 1,198,138 | | | |
| | | | Omron, ADR | 21,660 | 602,581 |
| Mitsui & Co., ADR | 2,811 | 1,026,549 | | | |
| | | | Ricoh, ADR | 4,031 | 268,263 |
| MTR, ADR | 9,562 | 353,794 | | | |
| | | | Sage Group, ADR | 16,187 | 299,460 |
| Neptune Orient Lines, ADR | 77,900a | 498,560 | | | |
| | | | SAP, ADR | 20,862 | 1,260,065 |
| Nidec, ADR | 25,281 | 588,289 | | | |
| | | | TDK, ADR | 8,571 | 576,143 |
| Nippon Yusen, ADR | 63,873 | 562,082 | | | |
| | | | Telefonaktiebolaget LM Ericsson, ADR | 69,804a | 896,283 |
| NSK, ADR | 36,210 | 690,163 | | | |
STATEMENT OF INVESTMENTS (Unaudited) (continued)
| | | | | | |
| BNY Mellon International Appreciation Fund (continued) | | |
| Common Stocks (continued) | Shares | Value ($) | | Shares | Value ($) |
| Information Technology (continued) | | | Telecommunications—5.2% | | |
| Trend Micro, ADR | 12,337 | 381,213 | BT Group, ADR | 23,103 | 690,780 |
| | | 13,438,934 | Deutsche Telekom, ADR | 65,534 | 879,466 |
| Materials—11.6% | | | France Telecom, ADR | 42,002 | 932,864 |
| Air Liquide, ADR | 36,988 | 956,510 | Hellenic Telecommunications | | |
| Akzo Nobel, ADR | 5,605 | 381,813 | Organization, ADR | 7,159 | 35,580 |
| Alumina, ADR | 49,520 | 485,296 | Koninklijke KPN, ADR | 40,229 | 652,917 |
| Amcor, ADR | 26,296 | 754,432 | Nippon Telegraph & | | |
| Anglo American, ADR | 82,394 | 2,227,110 | Telephone, ADR | 21,882 | 535,671 |
| ArcelorMittal (NY Shares) | 16,205 | 594,237 | NTT DOCOMO, ADR | 46,365 | 870,735 |
| Asahi Kasei, ADR | 44,485 | 616,117 | Portugal Telecom, ADR | 17,340 | 202,878 |
| BASF, ADR | 31,896 | 2,651,196 | Singapore | | |
| | | | Telecommunications, ADR | 23,960 | 558,028 |
| BHP Billiton, ADR | 78,638 | 6,952,413 | | | |
| | | | Swisscom, ADR | 7,236 | 320,048 |
| Boral, ADR | 29,021 | 658,777 | | | |
| | | | Telecom Corp of | | |
| CRH, ADR | 4,053 | 93,503 | New Zealand, ADR | 13,228 | 104,633 |
| James Hardie Industries, ADR | 15,724a | 525,653 | Telecom Italia, ADR | 50,766 | 735,158 |
| Johnson Matthey, ADR | 6,130 | 370,926 | Telefonica, ADR | 100,128 | 2,560,273 |
| Kobe Steel, ADR | 52,450 | 719,614 | Telenor, ADR | 6,496 | 323,891 |
| Koninklijke DSM, ADR | 9,446 | 138,667 | Telstra, ADR | 30,948 | 441,628 |
| Lafarge, ADR | 20,620 | 310,125 | Vodafone Group, ADR | 120,224 | 3,440,811 |
| Newcrest Mining, ADR | 17,239 | 671,287 | | | 13,285,361 |
| Nippon Steel, ADR | 21,965 | 799,746 | Utilities—5.2% | | |
| Nisshin Steel, ADR | 6,880 | 307,345 | Centrica, ADR | 44,440 | 991,012 |
| Nitto Denko, ADR | 15,310 | 921,356 | CLP Holdings, ADR | 80,013 | 654,506 |
| Norsk Hydro, ADR | 40,233 | 331,118 | E.ON, ADR | 56,894 | 1,868,968 |
| OJI Paper, ADR | 848 | 42,022 | Enel, ADR | 168,807 | 1,007,778 |
| Rexam, ADR | 13,836 | 413,005 | Energias de Portugal, ADR | 11,130 | 422,717 |
| Rio Tinto, ADR | 38,400 | 2,729,472 | GDF Suez, ADR | 36,436 | 1,481,488 |
| Stora Enso, ADR | 52,234 | 588,155 | Hong Kong & China Gas, ADR | 255,054 | 561,119 |
| Sumitomo Metal Industries, ADR | 22,929 | 584,460 | Iberdrola, ADR | 49,223 | 1,711,484 |
| Svenska Cellulosa, ADR | 38,119 | 633,157 | International Power, ADR | 11,394 | 620,403 |
| Syngenta, ADR | 17,795 | 1,197,959 | National Grid, ADR | 15,108 | 705,846 |
| Teijin, ADR | 14,424 | 695,408 | RWE, ADR | 21,130 | 1,425,219 |
| Toray Industries, ADR | 8,528 | 647,957 | Scottish & Southern Energy, ADR | 35,782 | 729,237 |
| UPM-Kymmene, ADR | 39,622 | 786,893 | United Utilities Group, ADR | 14,047 | 270,826 |
| | | 29,785,729 | | | |
72
| | | | | | | | | |
| | BNY Mellon International Appreciation Fund (continued) | | | | |
| |
| | Common Stocks (continued) | Shares | | Value ($) | Other Investment—.2% | Shares | | Value ($) | |
| | Utilities (continued) | | | | Registered Investment Company; | | | | |
| | Veolia Enviroment, ADR | 26,277 | | 863,988 | Dreyfus Institutional | | | | |
| | | | | 13,314,591 | Preferred Plus | | | | |
| | Total Common Stocks | | | | Money Market Fund | | | | |
| | (cost $264,825,787) | | | 257,054,799 | (cost $408,000) | 408,000 | d | 408,000 | |
| | | | | | Total Investments | | | | |
| | | Principal | | | (cost $265,478,766) | 100.5 | % | 257,707,782 | |
| Short-Term Investments—.1% | Amount ($) | | Value ($) | | | | | |
| | | | | | Liabilities, Less Cash | | | | |
| | U.S. Treasury Bills; | | | | and Receivables | (.5 | %) | (1,183,897 | ) |
| | 0.13%, 3/24/11 | | | | | | | | |
| | (cost $244,979) | 245,000 | c | 244,983 | Net Assets | 100.0 | % | 256,523,885 | |
ADR—American Depository Receipts
|
| a Non-income producing security. |
| b Securities exempt from registration under Rule 144A of the Securities Act of 1933.These securities may be resold in transactions exempt from registration, normally to qualified |
| institutional buyers.At February 28, 2011, these securities had a value of $2,567,212 or 1.0% of net assets. |
| c Held by a broker as collateral for open financial futures positions. |
| d Investment in affiliated money market mutual fund. |
| | | |
| Portfolio Summary (Unaudited) † | | | |
| |
| | Value (%) | | Value (%) |
| Financial | 24.5 | Health Care | 8.0 |
| Industrial | 11.7 | Information Technology | 5.2 |
| Materials | 11.6 | Telecommunications | 5.2 |
| Consumer Discretionary | 10.5 | Utilities | 5.2 |
| Consumer Staples | 9.6 | Short-Term/Money Market Investments | .3 |
| Energy | 8.7 | | 100.5 |
| |
| † Based on net assets. | | | |
| See notes to financial statements. | | | |
STATEMENT OF FINANCIAL FUTURES
February 28, 2011 (Unaudited)
| | | | |
| | | Market Value | | |
| BNY Mellon | Number of | Covered by | | Unrealized |
| International Appreciation Fund | Contracts | Contracts ($) | Expiration | Appreciation ($) |
| Financial Futures Long | | | | |
| DJ Euro STOXX 50 | 12 | 498,937 | March 2011 | 4,937 |
| FTSE 100 | 5 | 485,540 | March 2011 | 5,830 |
| SPI 200 Futures | 3 | 368,521 | March 2011 | 1,186 |
| TOPIX | 9 | 1,046,269 | March 2011 | 21,244 |
| | | | | 33,197 |
| |
| See notes to financial statements. | | | | |
74
STATEMENT OF INVESTMENTS
February 28, 2011 (Unaudited)
| | | | | |
| BNY Mellon Balanced Fund | | | | |
| | Coupon | Maturity | Principal | |
| Bonds and Notes—34.5% | Rate (%) | Date | Amount ($) | Value ($) |
| Asset-Backed Ctfs./Auto Receivables—1.0% | | | | |
| Ally Auto Receivables Trust, Ser. 2010-3, Cl. A4 | 1.55 | 8/17/15 | 300,000 | 297,628 |
| Americredit Automobile Receivables Trust, Ser. 2010-3, Cl. A3 | 1.14 | 4/8/15 | 650,000 | 649,177 |
| Franklin Auto Trust, Ser. 2007-1, Cl. A4 | 5.03 | 2/16/15 | 374,468 | 375,033 |
| Harley-Davidson Motorcycle Trust, Ser. 2009-2, Cl. A3 | 2.62 | 3/15/14 | 1,895,014 | 1,914,944 |
| Harley-Davidson Motorcycle Trust, Ser. 2007-1, Cl. A4 | 5.21 | 6/17/13 | 194,222 | 197,887 |
| Household Automotive Trust, Ser. 2007-1, Cl. A4 | 5.33 | 11/17/13 | 288,878 | 290,682 |
| Nissan Auto Receivables Owner Trust, Ser. 2010-A, Cl. A4 | 1.31 | 9/15/16 | 360,000 | 357,499 |
| | | | | 4,082,850 |
| Automotive, Trucks & Parts—.2% | | | | |
| Johnson Controls, Sr. Unscd. Notes | 5.50 | 1/15/16 | 750,000 | 833,388 |
| Banks—2.3% | | | | |
| Bank of America, Sub. Notes | 5.49 | 3/15/19 | 2,520,000 | 2,579,212 |
| Barclays Bank, Sr. Unscd. Notes, Ser. 1 | 5.00 | 9/22/16 | 1,415,000 | 1,503,643 |
| Citigroup, Sub. Notes | 5.00 | 9/15/14 | 500,000 | 526,176 |
| Citigroup, Sr. Unscd. Notes | 6.13 | 11/21/17 | 470,000 | 519,212 |
| Goldman Sachs Group, Sub. Notes | 6.75 | 10/1/37 | 600,000 | 616,892 |
| JPMorgan Chase & Co., Sub. Notes | 5.13 | 9/15/14 | 760,000 | 822,588 |
| Lloyds TSB Bank, Bank Gtd. Notes | 6.38 | 1/21/21 | 900,000 | 933,030 |
| Morgan Stanley, Sub. Notes | 4.75 | 4/1/14 | 1,090,000 | 1,140,451 |
| Royal Bank of Scotland, Bank Gtd. Notes | 4.88 | 3/16/15 | 585,000 | 606,965 |
| | | | | 9,248,169 |
| Commercial & Professional Services—.2% | | | | |
| Seminole Tribe of Florida, Sr. Scd. Notes | 5.80 | 10/1/13 | 870,000a | 873,814 |
| Seminole Tribe of Florida, Notes | 7.75 | 10/1/17 | 105,000a,b | 111,956 |
| | | | | 985,770 |
| Commercial Mortgage Pass-Through Ctfs.—1.2% | | | | |
| Banc of America Commercial Mortgage, Ser. 2005-6, Cl. A2 | 5.17 | 9/10/47 | 24,496c | 24,494 |
| Bear Stearns Commercial Mortgage Securities, | | | | |
| Ser. 2004-PWR5, Cl. A3 | 4.57 | 7/11/42 | 695,000 | 701,501 |
| GE Capital Commercial Mortgage, Ser. 2004-C3, Cl. A3 | 4.87 | 7/10/39 | 825,517c | 839,324 |
| GMAC Commercial Mortgage Securities, Ser. 2001-C2, Cl. B | 6.79 | 4/15/34 | 380,000 | 383,467 |
| GMAC Commercial Mortgage Securities, Ser. 2001-C1, Cl. D | 7.03 | 4/15/34 | 635,000c | 634,268 |
| JP Morgan Chase Commercial Mortgage Securities, | | | | |
| Ser. 2004-C1, Cl. A2 | 4.30 | 1/15/38 | 26,803 | 27,296 |
| JP Morgan Chase Commercial Mortgage Securities, | | | | |
| Ser. 2001-CIB2, Cl. A3 | 6.43 | 4/15/35 | 736,053 | 742,578 |
| LB-UBS Commercial Mortgage Trust, Ser. 2003-C7, Cl. A2 | 4.06 | 9/15/27 | 51,172c | 51,206 |
| Merrill Lynch Mortgage Trust, Ser. 2005-CKI1, Cl. A2FL | 0.39 | 11/12/37 | 302,613c | 299,563 |
| Morgan Stanley Capital I, Ser. 2007-IQ14, Cl. A1 | 5.38 | 4/15/49 | 240,889 | 245,364 |
| Prudential Mortgage Capital Funding, Ser. 2001-ROCK, Cl. A2 | 6.61 | 5/10/34 | 177,351 | 177,330 |
STATEMENT OF INVESTMENTS (Unaudited) (continued)
| | | | | |
| BNY Mellon Balanced Fund (continued) | | | | |
| | Coupon | Maturity | Principal | |
| Bonds and Notes (continued) | Rate (%) | Date | Amount ($) | Value ($) |
| Commercial Mortgage Pass-Through Ctfs. (continued) | | | | |
| Wachovia Bank Commercial Mortgage Trust, Ser. 2003-C3, Cl. A1 | 4.04 | 2/15/35 | 57,452 | 57,718 |
| Wachovia Bank Commercial Mortgage Trust, Ser. 2005-C20, Cl. A4 | 5.24 | 7/15/42 | 27,115c | 27,323 |
| Wachovia Bank Commercial Mortgage Trust, Ser. 2007-C32, Cl. A1 | 5.69 | 6/15/49 | 396,598 | 402,242 |
| | | | | 4,613,674 |
| Diversified Financial Services—1.1% | | | | |
| Blackrock, Sr. Unscd. Notes | 6.25 | 9/15/17 | 710,000 | 812,446 |
| General Electric Capital, Sub. Notes | 5.30 | 2/11/21 | 280,000 | 288,205 |
| General Electric Capital, Notes | 5.63 | 9/15/17 | 795,000 | 871,847 |
| HSBC Finance, Sr. Sub. Notes | 6.68 | 1/15/21 | 1,042,000a | 1,092,102 |
| NYSE Euronext, Sr. Unscd. Notes | 4.80 | 6/28/13 | 840,000 | 902,082 |
| TD Ameritrade Holding, Gtd. Notes | 4.15 | 12/1/14 | 545,000 | 568,674 |
| | | | | 4,535,356 |
| Electric Utilities—.1% | | | | |
| Xcel Energy, Sr. Unscd. Notes | 4.70 | 5/15/20 | 510,000 | 528,515 |
| Entertainment—.2% | | | | |
| Agua Caliente Band of Cahuilla Indians, Sr. Scd. Notes | 6.08 | 10/1/16 | 289,000a | 279,584 |
| Agua Caliente Band of Cahuilla Indians, Sr. Scd. Notes | 6.44 | 10/1/16 | 362,000a | 350,206 |
| | | | | 629,790 |
| Food & Beverages—.6% | | | | |
| Diageo Finance, Gtd. Notes | 5.50 | 4/1/13 | 655,000 | 711,289 |
| General Mills, Sr. Unscd. Notes | 5.65 | 2/15/19 | 195,000 | 217,057 |
| Kraft Foods, Sr. Unscd. Notes | 5.38 | 2/10/20 | 1,020,000 | 1,086,974 |
| Pepsico, Sr. Unscd. Notes | 4.50 | 1/15/20 | 570,000 | 597,498 |
| | | | | 2,612,818 |
| Foreign/Governmental—.6% | | | | |
| Province of Ontario Canada, Sr. Unscd. Bonds | 4.00 | 10/7/19 | 1,155,000 | 1,182,074 |
| United Mexican States, Sr. Unscd. Notes | 5.63 | 1/15/17 | 825,000 | 913,687 |
| United Mexican States, Sr. Unscd. Notes | 6.63 | 3/3/15 | 185,000 | 212,287 |
| | | | | 2,308,048 |
| Industrials—.2% | | | | |
| CRH America, Gtd. Notes | 5.30 | 10/15/13 | 605,000 | 647,323 |
| Manufacturing—.2% | | | | |
| Tyco International Finance, Gtd. Notes | 3.38 | 10/15/15 | 900,000 | 922,601 |
| Media & Telecommunications—1.9% | | | | |
| AT&T, Sr. Unscd. Notes | 5.80 | 2/15/19 | 670,000 | 750,017 |
| AT&T, Sr. Unscd. Notes | 5.88 | 8/15/12 | 695,000 | 745,082 |
| Cisco Systems, Sr. Unscd. Notes | 5.50 | 2/22/16 | 640,000 | 723,285 |
| Comcast, Gtd. Notes | 5.90 | 3/15/16 | 1,015,000 | 1,129,929 |
| News America, Gtd. Notes | 6.15 | 3/1/37 | 250,000 | 254,077 |
| Rogers Communications, Gtd. Notes | 6.38 | 3/1/14 | 530,000 | 597,581 |
76
| | | | | |
| BNY Mellon Balanced Fund (continued) | | | | |
| | Coupon | Maturity | Principal | |
| Bonds and Notes (continued) | Rate (%) | Date | Amount ($) | Value ($) |
| Media & Telecommunications (continued) | | | | |
| Telefonica Emisiones, Gtd. Notes | 4.95 | 1/15/15 | 1,080,000 | 1,137,650 |
| Time Warner Cable, Gtd. Notes | 4.13 | 2/15/21 | 950,000 | 892,615 |
| Time Warner, Gtd. Notes | 3.15 | 7/15/15 | 435,000 | 442,087 |
| Verizon Communications, Sr. Unscd. Notes | 5.50 | 2/15/18 | 1,050,000 | 1,146,783 |
| | | | | 7,819,106 |
| Municipal Bonds—1.3% | | | | |
| California, GO (Build America Bonds) | 7.30 | 10/1/39 | 1,350,000 | 1,425,641 |
| Illinois, GO | 4.42 | 1/1/15 | 440,000 | 440,607 |
| Los Angeles Community College District, GO (Build America Bonds) | 6.75 | 8/1/49 | 1,275,000 | 1,366,150 |
| Massachusetts, GO (Build America Bonds) | 4.20 | 12/1/21 | 525,000 | 519,152 |
| New Jersey Turnpike Authority, | | | | |
| Turnpike Revenue (Build America Bonds) | 7.10 | 1/1/41 | 750,000 | 814,320 |
| New York City Municipal Water Finance Authority, | | | | |
| Water and Sewer System Second General | | | | |
| Resolution Revenue (Build America Bonds) | 6.28 | 6/15/42 | 495,000 | 499,698 |
| University of California Regents, | | | | |
| General Revenue (Build America Bonds) | 1.99 | 5/1/13 | 365,000 | 367,811 |
| | | | | 5,433,379 |
| Oil & Gas—.4% | | | | |
| BP Capital Markets, Gtd. Notes | 3.88 | 3/10/15 | 700,000 | 734,081 |
| Petrobras International Finance, Gtd. Notes | 5.38 | 1/27/21 | 675,000 | 680,960 |
| Shell International Finance, Gtd. Notes | 3.10 | 6/28/15 | 250,000 | 257,124 |
| | | | | 1,672,165 |
| Property & Casualty Insurance—.4% | | | | |
| MetLife, Sr. Unscd. Notes | 7.72 | 2/15/19 | 535,000 | 659,558 |
| Prudential Financial, Sr. Unscd. Notes | 4.75 | 9/17/15 | 805,000 | 862,658 |
| | | | | 1,522,216 |
| Real Estate—.2% | | | | |
| Simon Property Group, Sr. Unscd. Notes | 5.65 | 2/1/20 | 685,000 | 747,793 |
| Software—.3% | | | | |
| Microsoft, Sr. Unscd. Notes | 5.30 | 2/8/41 | 85,000 | 85,956 |
| Oracle, Sr. Unscd. Notes | 5.75 | 4/15/18 | 1,060,000 | 1,193,968 |
| | | | | 1,279,924 |
| Transportation—.1% | | | | |
| GATX, Sr. Unscd. Notes | 4.75 | 5/15/15 | 250,000 | 261,946 |
| U.S. Government Agencies—.5% | | | | |
| Federal Home Loan Banks, Bonds | 3.63 | 10/18/13 | 470,000 | 500,125 |
| Federal National Mortgage Association, Notes | 3.00 | 9/16/14 | 530,000d | 554,849 |
| Federal National Mortgage Association, Notes | 4.38 | 7/17/13 | 775,000d | 835,550 |
| | | | | 1,890,524 |
STATEMENT OF INVESTMENTS (Unaudited) (continued)
| | | | | | | | |
| BNY Mellon Balanced Fund (continued) | | | |
| |
| | Principal | | | Principal | |
| Bonds and Notes (continued) | Amount ($) | Value ($) | | Amount ($) | Value ($) |
| |
| U.S. Government Agencies/ | | | U.S. Government | | |
| Mortgage-Backed—11.0% | | | Securities (continued) | | |
| Federal Home Loan Mortgage Corp.: | | | U.S. Treasury Notes (continued): | | |
| 4.50%, 3/1/21—12/1/40 | 3,153,227d | 3,224,519 | 2.63%, 11/15/20 | 4,390,000b | 4,108,079 |
| 5.00%, 4/1/22—7/1/40 | 4,581,679d | 4,810,982 | 4.00%, 11/15/12 | 3,500,000 | 3,706,035 |
| 5.50%, 12/1/37—12/1/38 | 3,062,578d | 3,280,394 | 4.25%, 8/15/13 | 2,655,000 | 2,873,623 |
| 6.00%, 12/1/37—6/1/39 | 2,168,261d | 2,358,805 | 4.25%, 11/15/13 | 1,065,000 | 1,158,936 |
| 6.50%, 4/1/39 | 1,288,462d | 1,440,000 | 4.50%, 11/15/15 | 1,325,000 | 1,476,030 |
| Federal National Mortgage Association: | | | 5.13%, 5/15/16 | 1,365,000 | 1,563,352 |
| 4.00% | 5,430,000d,e | 5,355,338 | | | 42,207,455 |
| 4.50% | 1,490,000d,e | 1,519,101 | Total Bonds and Notes | | |
| 3.50%, 1/1/26 | 1,377,188d | 1,383,414 | (cost $134,813,128) | | 138,857,122 |
| 4.00%, 9/1/24—3/1/25 | 2,295,717d | 2,368,556 | | | |
| 4.50%, 3/1/23—5/1/40 | 5,771,240d | 5,948,068 | | | |
| 5.00%, 4/1/23 | 747,309d | 794,513 | Common Stocks—30.7% | Shares | Value ($) |
| 5.50%, 4/1/36—6/1/38 | 3,243,328d | 3,487,747 | Consumer Discretionary—4.0% | | |
| 6.00%, 4/1/33—10/1/38 | 3,143,122d | 3,438,605 | Amazon.com | 4,010g | 694,893 |
| 6.50%, 10/1/36—1/1/39 | 1,485,492d | 1,664,309 | | | |
| | | | Autoliv | 11,160 | 835,772 |
| Ser. 2003-64, Cl. BC, | | | | | |
| 5.50%, 3/25/30 | 836,869d | 867,755 | Carnival | 25,810 | 1,101,313 |
| Government National | | | DIRECTV, Cl. A | 32,990g | 1,516,550 |
| Mortgage Association I; | | | Ford Motor | 141,820g | 2,134,391 |
| 5.00%, 11/15/34—3/15/36 | 1,996,048 | 2,132,206 | General Motors | 16,987 | 569,574 |
| | | 44,074,312 | Limited Brands | 28,920 | 926,018 |
| U.S. Government Securities—10.5% | | | Mattel | 54,640 | 1,369,278 |
| U.S. Treasury Bonds; | | | Newell Rubbermaid | 126,530 | 2,447,090 |
| 3.88%, 8/15/40 | 450,000 | 404,086 | News, Cl. B | 48,280b | 888,352 |
| U.S. Treasury Inflation | | | Omnicom Group | 46,410 | 2,362,269 |
| Protected Securities: | | | | | |
| | | | Stanley Black & Decker | 9,040 | 685,503 |
| Bonds, 2.38%, 1/15/27 | 1,407,380f | 1,557,904 | | | |
| Notes, 0.50%, 4/15/15 | 662,415f | 687,928 | Time Warner | 18,883 | 721,331 |
| Notes, 0.63%, 4/15/13 | 585,848f | 611,434 | | | 16,252,334 |
| Notes, 1.38%, 7/15/18 | 1,112,903f | 1,185,329 | Consumer Staples—2.6% | | |
| Notes, 1.38%, 1/15/20 | 937,488f | 981,872 | Energizer Holdings | 18,800g | 1,256,404 |
| Notes, 2.38%, 1/15/17 | 1,407,380f | 1,587,481 | | | |
| | | | Nestle, ADR | 19,070 | 1,079,743 |
| U.S. Treasury Notes: | | | | | |
| | | | PepsiCo | 41,960 | 2,661,103 |
| 0.38%, 9/30/12 | 110,000 | 109,815 | | | |
| 0.50%, 11/30/12 | 555,000 | 554,371 | Philip Morris International | 27,690 | 1,738,378 |
| 0.50%, 10/15/13 | 1,650,000 | 1,629,632 | Unilever, ADR | 96,440 | 2,864,268 |
| 0.75%, 8/15/13 | 3,000,000 | 2,990,157 | Walgreen | 14,990 | 649,667 |
| 0.75%, 9/15/13 | 1,550,000 | 1,542,977 | | | 10,249,563 |
| 0.75%, 12/15/13 | 470,000b | 465,961 | | | |
| | | | Energy—4.4% | | |
| 1.00%, 3/31/12 | 120,000 | 120,900 | | | |
| 1.00%, 1/15/14 | 1,000,000b | 996,953 | Alpha Natural Resources | 13,260b,g | 718,957 |
| 1.13%, 12/15/12 | 6,555,000 | 6,616,197 | Anadarko Petroleum | 19,350 | 1,583,410 |
| 1.25%, 2/15/14 | 1,240,000b | 1,243,293 | Apache | 10,390 | 1,294,802 |
| 1.38%, 5/15/13 | 150,000 | 151,981 | Cameron International | 11,820g | 698,917 |
| 1.75%, 7/31/15 | 3,160,000 | 3,145,199 | | | |
| | | | Chevron | 28,130 | 2,918,488 |
| 2.38%, 7/31/17 | 750,000 | 737,930 | | | |
78
| | | | | | | | |
| BNY Mellon Balanced Fund (continued) | | | | |
| Common Stocks (continued) | Shares | Value ($) | | | Shares | Value ($) |
| Energy (continued) | | | | Industrial (continued) | | |
| ENSCO, ADR | 23,220 | 1,302,642 | | Thomas & Betts | 13,100g | 725,609 |
| Halliburton | 30,620 | 1,437,303 | | Tyco International | 16,862 | 764,523 |
| Hess | 27,940 | 2,431,618 | | | | 14,181,806 |
| Newfield Exploration | 20,350g | 1,481,277 | | Information Technology—5.8% | | |
| Occidental Petroleum | 29,270 | 2,984,662 | | Alcatel-Lucent, ADR | 211,070g | 1,034,243 |
| Valero Energy | 36,480 | 1,028,006 | | Apple | 13,680g | 4,831,913 |
| | | 17,880,082 | | BMC Software | 34,060g | 1,685,970 |
| Exchange Traded Funds—.2% | | | | EMC | 45,830g | 1,247,034 |
| Standard & Poor’s Depository | | | | Google, Cl. A | 3,630g | 2,226,642 |
| Receipts S&P 500 ETF Trust | 6,340b | 844,171 | | Informatica | 20,160g | 947,722 |
| Financial—4.6% | | | | International Business Machines | 23,550 | 3,812,274 |
| American Express | 43,640 | 1,901,395 | | Motorola Mobility Holdings | 9,748g | 294,390 |
| Bank of America | 195,930 | 2,799,840 | | Motorola Solutions | 11,144g | 430,604 |
| Capital One Financial | 46,450 | 2,311,817 | | NetApp | 12,000g | 619,920 |
| Citigroup | 603,630g | 2,824,988 | | Oracle | 89,220 | 2,935,338 |
| Comerica | 23,190 | 902,091 | | QUALCOMM | 40,070 | 2,387,371 |
| JPMorgan Chase & Co. | 26,572 | 1,240,647 | | Teradata | 16,403g | 784,391 |
| Lincoln National | 55,480 | 1,759,826 | | | | 23,237,812 |
| MetLife | 27,360 | 1,295,770 | | Materials—.5% | | |
| Wells Fargo & Co. | 107,010 | 3,452,143 | | CF Industries Holdings | 4,290 | 606,091 |
| | | 18,488,517 | | E.I. du Pont de Nemours & Co. | 27,330 | 1,499,597 |
| Health Care—3.6% | | | | | | 2,105,688 |
| Allscripts Healthcare Solutions | 43,300g | 924,455 | | Telecommunication Services—.7% | | |
| Amylin Pharmaceuticals | 62,190g | 951,507 | | AT&T | 100,277 | 2,845,861 |
| CIGNA | 33,410 | 1,405,559 | | Utilities—.8% | | |
| Covidien | 31,312 | 1,611,002 | | American Electric Power | 19,540 | 699,141 |
| Dendreon | 13,770g | 462,534 | | Entergy | 14,310 | 1,018,872 |
| Gilead Sciences | 11,610g | 452,558 | | Public Service Enterprise Group | 41,720 | 1,364,244 |
| Human Genome Sciences | 47,030g | 1,177,161 | | | | 3,082,257 |
| McKesson | 23,550 | 1,867,044 | | Total Common Stocks | | |
| Pfizer | 217,910 | 4,192,588 | | (cost $95,419,742) | | 123,725,810 |
| St. Jude Medical | 13,860 | 663,617 | | | | |
| Zimmer Holdings | 13,630g | 849,694 | | | Principal | |
| | | 14,557,719 | Short | -Term Investments—1.4% | Amount ($) | Value ($) |
| Industrial—3.5% | | | | U.S. Treasury Bills; | | |
| Caterpillar | 23,880 | 2,457,968 | | 0.07%, 3/10/11 | | |
| Cummins | 13,380 | 1,352,986 | | (cost $5,802,898) | 5,803,000 | 5,802,872 |
| Dover | 27,810 | 1,786,793 | | | | |
| General Electric | 152,990 | 3,200,551 | | Other Investment—34.6% | Shares | Value ($) |
| Ingersoll-Rand | 35,700 | 1,617,210 | | Registered Investment Companies: | | |
| Norfolk Southern | 16,830 | 1,103,711 | | BNY Mellon Emerging | | |
| Textron | 43,280b | 1,172,455 | | Markets Fund, Cl. M | 3,249,707h | 36,949,165 |
STATEMENT OF INVESTMENTS (Unaudited) (continued)
| | | | | | | | |
| BNY Mellon Balanced Fund (continued) | | | | | |
| |
| | | | | Investment of Cash Collateral | | | | |
| Other Investment (continued) | Shares | | Value ($) | for Securities Loaned—.8% | Shares | | Value ($) | |
| |
| Registered Investment | | | | Registered | | | | |
| Companies (continued): | | | | Investment Company; | | | | |
| BNY Mellon International | | | | Dreyfus Institutional Cash | | | | |
| Fund, Cl. M | 3,082,439 | h | 35,540,526 | Advantage Plus Fund | | | | |
| BNY Mellon Mid Cap Stock | | | | (cost $3,031,427) | 3,031,427 | i | 3,031,427 | |
| Fund, Cl. M | 2,213,561 | h | 28,864,831 | | | | | |
| | | | | Total Investments | | | | |
| BNY Mellon Small Cap | | | | (cost $372,201,666) | 102.0 | % | 410,883,653 | |
| Stock Fund, Cl. M | 1,314,359 | g,h | 16,192,900 | | | | | |
| Dreyfus Institutional Preferred | | | | Liabilities, Less Cash | | | | |
| Plus Money Market Fund | 21,919,000 | i | 21,919,000 | and Receivables | (2.0 | %) | (8,071,949 | ) |
| Total Other Investment | | | | Net Assets | 100.0 | % | 402,811,704 | |
| (cost $133,134,471) | | | 139,466,422 | | | | | |
ADR—American Depository Receipts GO—General Obligations
|
| a Securities exempt from registration under Rule 144A of the Securities Act of 1933.These securities may be resold in transactions exempt from registration, normally to qualified |
| institutional buyers.At February 28, 2011, these securities had a value of $2,707,662 or .7% of net assets. |
| b Security, or portion thereof, on loan.At February 28, 2011, the value of the fund’s securities on loan was $9,772,422 and the value of the collateral held by the fund was |
| $11,332,316, consisting of cash collateral of $3,031,427 and U.S. Government and Agency securities valued at $8,300,889. |
| c Variable rate security—interest rate subject to periodic change. |
| d The Federal Housing Finance Agency (“FHFA”) placed Federal Home Loan Mortgage Corporation and Federal National Mortgage Association into conservatorship with FHFA |
| as the conservator.As such, the FHFA oversees the continuing affairs of these companies. |
| e Purchased on a forward commitment basis. |
| f Principal amount for accrual purposes is periodically adjusted based on changes in the Consumer Price Index. |
| g Non-income producing security. |
| h Investment in affiliated mutual fund. |
| i Investment in affiliated money market mutual fund. |
| | | |
| Portfolio Summary (Unaudited) † | | | |
| |
| | Value (%) | | Value (%) |
| Common Stocks | 30.7 | Short-Term/Money Market Investments | 7.6 |
| U.S. Government & Agencies | 22.0 | Asset/Mortgage-Backed | 2.2 |
| Mutual Funds: Foreign | 18.0 | Municipal Bonds | 1.3 |
| Mutual Funds: Domestic | 11.2 | Foreign/Governmental | .6 |
| Corporate Bonds | 8.4 | | 102.0 |
| |
| † Based on net assets. | | | |
| See notes to financial statements. | | | |
80
STATEMENTS OF ASSETS AND LIABILITIES
February 28, 2011 (Unaudited)
| | | | | |
| | BNY Mellon | BNY Mellon | BNY Mellon | BNY Mellon | BNY Mellon |
| | Large Cap | Large Cap Market | Tax-Sensitive Large Cap | Income | Mid Cap |
| | Stock Fund | Opportunities Fund | Multi-Strategy Fund | Stock Fund | Stock Fund |
| Assets ($): | | | | | |
| Investments in securities— | | | | | |
| See Statement of Investments† | | | | | |
| (including securities on loan)††—Note 2(b): | | | | | |
| Unaffiliated issuers | 1,395,377,397 | 56,868,982 | 42,998,190 | 111,663,142 | 1,547,479,479 |
| Affiliated issuers | 33,593,151 | 28,736,697 | 11,429,505 | 3,023,522 | 37,197,078 |
| Cash | �� | 726,589 | 304,985 | — | 1,268,201 |
| Receivable for investment securities sold | 5,591,074 | — | — | 8,637,594 | — |
| Dividends and interest receivable | 2,865,035 | 55,346 | 60,722 | 341,941 | 923,178 |
| Receivable for shares of | | | | | |
| Beneficial Interest subscribed | 260,860 | 467,000 | 103,200 | 231,130 | 550,609 |
| Prepaid expenses | 12,339 | 53,518 | 59,034 | 9,711 | 26,805 |
| | 1,437,699,856 | 86,908,132 | 54,955,636 | 123,907,040 | 1,587,445,350 |
| Liabilities ($): | | | | | |
| Due to The Dreyfus Corporation | | | | | |
| and affiliates—Note 4(c) | 757,872 | 81,065 | 133,146 | 61,925 | 939,359 |
| Due to Administrator—Note 4(a) | 133,090 | 5,270 | 4,016 | 10,225 | 146,275 |
| Cash overdraft due to Custodian | 1,296,500 | — | — | 140,536 | — |
| Liability for securities on loan—Note 2(b) | 33,593,151 | — | — | 2,451,522 | 27,727,078 |
| Bank loan payable—Note 3 | 3,500,000 | — | — | — | — |
| Payable for shares of | | | | | |
| Beneficial Interest redeemed | 751,968 | 8,700 | 15,320 | 10,050 | 869,689 |
| Interest payable—Note 3 | 4,749 | — | — | — | 1,004 |
| Payable for investment securities purchased | — | 624,239 | 897,492 | 8,456,102 | — |
| Outstanding options written, at value (premiums | | | | | |
| received $29,827)—See Statement of | | | | | |
| Options Written—Note 5 | — | — | — | 26,249 | — |
| Accrued expenses | 86,999 | 71,608 | 66,817 | 30,800 | 96,052 |
| | 40,124,329 | 790,882 | 1,116,791 | 11,187,409 | 29,779,457 |
| Net Assets ($) | 1,397,575,527 | 86,117,250 | 53,838,845 | 112,719,631 | 1,557,665,893 |
STATEMENTS OF ASSETS AND LIABILITIES (continued)
| | | | | | | | | |
| | BNY Mellon | BNY Mellon | BNY Mellon | BNY Mellon | BNY Mellon |
| | Large Cap | Large Cap Market | Tax-Sensitive Large Cap | Income | Mid Cap |
| | Stock Fund | Opportunities Fund | Multi-Strategy Fund | Stock Fund | Stock Fund |
| Composition of Net Assets ($): | | | | | |
| Paid-in capital | 1,136,825,080 | 79,613,876 | 47,366,648 | 112,493,447 | 1,257,102,976 |
| Accumulated undistributed (distributions | | | | | |
| in excess of) investment income—net | 15,451 | (3,759) | 16,413 | 12,525 | 628,458 |
| Accumulated net realized | | | | | |
| gain (loss) on investments | (65,569,500) | 60,594 | 8,909 | (18,376,796) | (34,488,420) |
| Accumulated net unrealized appreciation | | | | | |
| (depreciation) on investments | 326,304,496 | 6,446,539 | 6,446,875 | — | 334,422,879 |
| Accumulated net unrealized appreciation | | | | | |
| (depreciation) on investments | | | | | |
| and options transactions | — | — | — | 18,590,455 | — |
| Net Assets ($) | 1,397,575,527 | 86,117,250 | 53,838,845 | 112,719,631 | 1,557,665,893 |
| Net Asset Value Per Share | | | | | |
| Class M Shares | | | | | |
| Net Assets ($) | 1,356,618,864 | 86,105,326 | 53,654,765 | 111,739,212 | 1,530,291,614 |
| Shares Outstanding | 148,255,646 | 7,218,761 | 4,437,821 | 16,191,896 | 117,317,988 |
| Net Asset Value Per Share ($) | 9.15 | 11.93 | 12.09 | 6.90 | 13.04 |
| Investor Shares | | | | | |
| Net Assets ($) | 40,956,663 | 11,924 | 184,080 | 980,419 | 26,734,366 |
| Shares Outstanding | 4,472,534 | 1,000 | 15,244 | 140,889 | 2,068,752 |
| Net Asset Value Per Share ($) | 9.16 | 11.92 | 12.08 | 6.96 | 12.92 |
| Dreyfus Premier Shares | | | | | |
| Net Assets ($) | — | — | — | — | 639,913 |
| Shares Outstanding | — | — | — | — | 52,866 |
| Net Asset Value Per Share ($) | — | — | — | — | 12.10 |
| † Investments at cost ($): | | | | | |
| Unaffiliated issuers | 1,069,072,901 | 52,139,854 | 37,483,710 | 93,076,265 | 1,213,056,600 |
| Affiliated issuers | 33,593,151 | 27,019,286 | 10,497,110 | 3,023,522 | 37,197,078 |
| ††Value of securities on loan ($) | 29,269,732 | — | — | 2,417,058 | 41,636,421 |
| |
| See notes to financial statements. | | | | | |
82
| | | | | |
| | BNY Mellon | BNY Mellon | BNY Mellon | |
| | Small Cap | U.S. Core Equity | Focused Equity | BNY Mellon |
| | Stock Fund | 130/30Fund | Opportunities Fund | Small/Mid Cap Fund |
| Assets ($): | | | | |
| Investments in securities— | | | | |
| See Statement of Investments† | | | | |
| (including securities on loan)††—Note 2(b): | | | | |
| Unaffiliated issuers | 448,707,630 | 377,037,646 | 405,327,368 | 474,209,625 |
| Affiliated issuers | 34,135,032 | 4,579,000 | 13,933,146 | 108,960,559 |
| Cash | 148,718 | — | 1,328,806 | 1,203,169 |
| Receivable for shares of | | | | |
| Beneficial Interest subscribed | 33,604,397 | 440,359 | 801,874 | 1,400,507 |
| Dividends and interest receivable | 207,056 | 672,111 | 372,847 | 664,209 |
| Receivable for investment securities sold | 32,802 | 3,156,086 | — | 14,274,599 |
| Receivable to brokers for | | | | |
| proceeds on securities sold short | — | 11,645,256 | — | — |
| Prepaid expenses | 11,544 | 8,701 | 21,662 | 24,754 |
| | 516,847,179 | 397,539,159 | 421,785,703 | 600,737,422 |
| Liabilities ($): | | | | |
| Due to The Dreyfus Corporation | | | | |
| and affiliates—Note 4(c) | 331,067 | 190,916 | 230,702 | 289,933 |
| Due to Administrator—Note 4(a) | 43,845 | 27,581 | 38,073 | 45,634 |
| Cash overdraft due to Custodian | — | 411,619 | — | — |
| Liability for securities on loan—Note 2(b) | 29,103,032 | — | 2,118,146 | 87,956,559 |
| Payable for investment securities purchased | 24,179,982 | 16,532,971 | 4,485,897 | 17,420,038 |
| Payable for shares of Beneficial Interest redeemed | 683,719 | 310,008 | 224,191 | 95,581 |
| Securities sold short, at value (proceeds $74,867,906) | | | | |
| —See Statement of Securities Sold Short | — | 81,145,894 | — | — |
| Dividends payable on securities sold short | — | 148,691 | — | — |
| Due to Broker | — | 45,693 | — | — |
| Outstanding options written, at value | | | | |
| (premiums received $98,732)— | | | | |
| See Statement of Options Written—Note 5 | — | — | 186,030 | — |
| Accrued expenses | 69,468 | 38,811 | 37,447 | 49,252 |
| | 54,411,113 | 98,852,184 | 7,320,486 | 105,856,997 |
| Net Assets ($) | 462,436,066 | 298,686,975 | 414,465,217 | 494,880,425 |
STATEMENTS OF ASSETS AND LIABILITIES (continued)
| | | | | | | | |
| | BNY Mellon | BNY Mellon | BNY Mellon | |
| | Small Cap | U.S. Core Equity | Focused Equity | BNY Mellon |
| | Stock Fund | 130/30Fund | Opportunities Fund | Small/Mid Cap Fund |
| Composition of Net Assets ($): | | | | |
| Paid-in capital | 490,326,873 | 303,324,330 | 349,666,055 | 403,809,806 |
| Accumulated undistributed (distributions in | | | | |
| excess of) investment income (loss)—net | (340,716) | 153,504 | (40,347) | (155,314) |
| Accumulated net realized gain (loss) on investments | (109,008,904) | (49,007,417) | 2,467,524 | 12,117,138 |
| Accumulated net unrealized appreciation | | | | |
| (depreciation) on investments | 81,458,813 | — | — | 79,108,795 |
| Accumulated net unrealized appreciation | | | | |
| (depreciation) on investments | | | | |
| and options transactions | — | — | 62,371,985 | |
| Accumulated net unrealized appreciation | | | | |
| (depreciation) on investments | | | | |
| and securities sold short | — | 44,216,558 | — | — |
| Net Assets ($) | 462,436,066 | 298,686,975 | 414,465,217 | 494,880,425 |
| Net Asset Value Per Share | | | | |
| Class M Shares | | | | |
| Net Assets ($) | 454,845,314 | 298,597,178 | 414,448,571 | 494,812,928 |
| Shares Outstanding | 36,934,029 | 24,373,297 | 31,390,020 | 32,960,089 |
| Net Asset Value Per Share ($) | 12.32 | 12.25 | 13.20 | 15.01 |
| Investor Shares | | | | |
| Net Assets ($) | 7,590,752 | 89,797 | 16,646 | 67,497 |
| Shares Outstanding | 632,875 | 7,379 | 1,262 | 4,503 |
| Net Asset Value Per Share ($) | 11.99 | 12.17 | 13.19 | 14.99 |
| † Investments at cost ($): | | | | |
| Unaffiliated issuers | 367,248,817 | 326,543,100 | 342,868,085 | 395,100,830 |
| Affiliated issuers | 34,135,032 | 4,579,000 | 13,933,146 | 108,960,559 |
| ††Value of securities on loan ($) | 28,149,670 | — | 2,039,681 | 85,111,397 |
| |
| See notes to financial statements. | | | | |
84
| | | | |
| | BNY Mellon | BNY Mellon | BNY Mellon | BNY Mellon |
| | International | Emerging | International | Balanced |
| | Fund | Markets Fund | Appreciation Fund | Fund |
| Assets ($): | | | | |
| Investments in securities—See Statement of Investments† | | | | |
| (including securities on loan)††—Note 2(b): | | | | |
| Unaffiliated issuers | 1,107,040,108 | 2,284,078,116 | 257,299,782 | 268,385,804 |
| Affiliated issuers | 20,600,000 | 36,800,000 | 408,000 | 142,497,849 |
| Cash | 1,004,654 | 6,656,897 | 285,241 | — |
| Cash denominated in foreign currencies††† | 1,924,131 | 13,672,420 | — | — |
| Dividends and interest receivable | 5,132,592 | 1,568,914 | 731,380 | 1,248,342 |
| Receivable for investment securities sold | 3,846,140 | 12,228,600 | 30,665 | 5,068,148 |
| Receivable for shares of Beneficial Interest subscribed | 369,756 | 2,771,564 | 27,605 | 89,750 |
| Receivable for futures variation margin—Note 5 | — | — | 23,168 | — |
| Unrealized appreciation on forward foreign | | | | |
| currency exchange contracts—Note 5 | 29,605 | 9,423 | 98,909 | — |
| Prepaid expenses and other assets | 6,911 | 14,240 | 442,848 | 480 |
| | 1,139,953,897 | 2,357,800,174 | 259,347,598 | 417,290,373 |
| Liabilities ($): | | | | |
| Due to The Dreyfus Corporation and affiliates—Note 4(c) | 897,918 | 2,757,543 | 111,743 | 141,789 |
| Due to Administrator—Note 4(a) | 106,335 | 219,535 | 24,458 | 25,774 |
| Cash overdraft due to Custodian | — | — | — | 462,053 |
| Payable for investment securities purchased | 6,176,664 | 16,774,196 | 105,756 | 10,550,984 |
| Payable for shares of Beneficial Interest redeemed | 808,161 | 555,738 | 2,510,011 | 220,783 |
| Interest payable—Note 3 | 314 | — | — | — |
| Unrealized depreciation on forward foreign | | | | |
| currency exchange contracts—Note 5 | — | 4,622 | 39 | — |
| Liability for securities on loan—Note 2(b) | — | — | — | 3,031,427 |
| Accrued expenses | 98,462 | 127,615 | 71,706 | 45,859 |
| | 8,087,854 | 20,439,249 | 2,823,713 | 14,478,669 |
| Net Assets ($) | 1,131,866,043 | 2,337,360,925 | 256,523,885 | 402,811,704 |
STATEMENTS OF ASSETS AND LIABILITIES (continued)
| | | | | | | | |
| | | BNY Mellon | BNY Mellon | BNY Mellon | BNY Mellon |
| | | International | Emerging | International | Balanced |
| | | Fund | Markets Fund | Appreciation Fund | Fund |
| Composition of Net Assets ($): | | | | |
| Paid-in capital | 1,663,565,985 | 2,112,357,571 | 298,922,262 | 356,485,665 |
| Accumulated undistributed investment income (loss)—net | 1,960,357 | (4,836,130) | 356,280 | 2,253,463 |
| Accumulated net realized gain (loss) on investments | (655,116,647) | (73,095,844) | (35,115,740) | 5,390,589 |
| Accumulated net unrealized appreciation (depreciation) | | | | |
| | on investments and foreign currency transactions | | | | |
| | (including $33,197 net unrealized appreciation on | | | | |
| | financial futures for the BNY Mellon International | | | | |
| | Appreciation Fund) | 121,456,348 | 302,935,328 | (7,638,917) | — |
| Accumulated net unrealized appreciation | | | | |
| | (depreciation) on investments | — | — | — | 38,681,987 |
| Net Assets ($) | 1,131,866,043 | 2,337,360,925 | 256,523,885 | 402,811,704 |
| Net Asset Value Per Share | | | | |
| Class M Shares | | | | |
| | Net Assets ($) | 1,126,353,287 | 2,324,440,931 | 252,282,978 | 397,977,458 |
| | Shares Outstanding | 97,715,027 | 204,352,375 | 19,479,185 | 35,094,280 |
| | Net Asset Value Per Share ($) | 11.53 | 11.37 | 12.95 | 11.34 |
| Investor Shares | | | | |
| | Net Assets ($) | 5,512,756 | 12,919,994 | 4,240,907 | 4,834,246 |
| | Shares Outstanding | 451,562 | 1,107,560 | 330,591 | 423,912 |
| | Net Asset Value Per Share ($) | 12.21 | 11.67 | 12.83 | 11.40 |
| † | Investments at cost ($): | | | | |
| | Unaffiliated issuers | 985,947,238 | 1,981,183,399 | 265,070,766 | 236,035,768 |
| | Affiliated issuers | 20,600,000 | 36,800,000 | 408,000 | 136,165,898 |
| †† | Value of securities on loan ($) | — | — | — | 9,772,422 |
| ††† Cash denominated in foreign currencies (cost) ($) | 1,905,696 | 13,780,325 | — | — |
See notes to financial statements.
86
STATEMENTS OF OPERATIONS
Six Months Ended February 28, 2011 (Unaudited)
| | | | | | | | | | |
| | BNY Mellon | BNY Mellon | BNY Mellon | BNY Mellon | BNY Mellon |
| | Large Cap | Large Cap Market | Tax-Sensitive Large Cap | Income | Mid Cap |
| | Stock Fund | Opportunities Fund | Multi-Strategy Fund | Stock Fund | Stock Fund |
| Investment Income ($): | | | | | |
| Income: | | | | | |
| Cash dividends (net of $1,247 and $4,038 | | | | | |
| foreign taxes withheld at source for | | | | | |
| BNY Mellon Income Stock Fund and | | | | | |
| BNY Mellon Mid Cap Stock Fund, respectively): | | | | | |
| Unaffiliated issuers | 11,996,849 | 186,918 | 237,541 | 1,496,981 | 6,681,925 |
| Affiliated issuers | 2,586 | 56,503 | 29,850 | 349 | 10,432 |
| Income from securities lending—Note 2(b) | 8,422 | — | — | 692 | 106,919 |
| Total Income | 12,007,857 | 243,421 | 267,391 | 1,498,022 | 6,799,276 |
| Expenses: | | | | | |
| Investment advisory fees—Note 4(a) | 4,402,902 | 112,136 | 109,600 | 313,443 | 5,277,157 |
| Administration fees—Note 4(a) | 813,473 | 18,316 | 18,556 | 59,668 | 870,502 |
| Custodian fees—Note 4(c) | 54,152 | 41,246 | 175,725 | 6,149 | 47,301 |
| Shareholder servicing costs—Note 4(c) | 45,646 | 527 | 338 | 1,374 | 34,586 |
| Trustees’ fees and expenses—Note 4(d) | 39,888 | 307 | 307 | 3,012 | 34,272 |
| Legal fees | 16,564 | 40,823 | 39,963 | 1,876 | 11,874 |
| Loan commitment fees—Note 3 | 16,438 | 49 | 39 | 460 | 9,626 |
| Auditing fees | 16,026 | 13,250 | 13,250 | 13,355 | 13,522 |
| Registration fees | 15,921 | 29,164 | 24,796 | 13,484 | 16,433 |
| Interest expense—Note 3 | 14,598 | — | — | 2,094 | 2,099 |
| Prospectus and shareholders’ reports | 3,635 | 3,915 | 3,936 | 4,107 | 15,572 |
| Distribution fees—Note 4(b) | — | — | — | — | 2,251 |
| Miscellaneous | 17,627 | 5,784 | 5,641 | 8,551 | 12,713 |
| Total Expenses | 5,456,870 | 265,517 | 392,151 | 427,573 | 6,347,908 |
| Less—reduction in investment advisory fee | | | | | |
| due to undertakings—Note 4(a) | — | (92,334) | — | — | — |
| Less—expense reimbursement | | | | | |
| due to undertakings—Note 4(a) | — | — | (227,078) | — | — |
| Less—reduction in fees due to | | | | | |
| earnings credits—Note 4(c) | (7) | (1) | (1) | (2) | (169) |
| Net Expenses | 5,456,863 | 173,182 | 165,072 | 427,571 | 6,347,739 |
| Investment Income—Net | 6,550,994 | 70,239 | 102,319 | 1,070,451 | 451,537 |
| Realized and Unrealized Gain (Loss) | | | | | |
| on Investments—Note 5 ($): | | | | | |
| Net realized gain (loss) on investments | 126,210,226 | 169,054 | 106,444 | 8,820,615 | 180,937,392 |
| Net realized gain (loss) on options transactions | — | — | — | 22,295 | — |
| Net Realized Gain (Loss) | 126,210,226 | 169,054 | 106,444 | 8,842,910 | 180,937,392 |
| Net unrealized appreciation | | | | | |
| (depreciation) on investments: | | | | | |
| Unaffiliated issuers | 200,013,562 | 4,867,825 | 5,777,920 | 13,450,572 | 279,497,525 |
| Affiliated issuers | — | 1,746,051 | 954,175 | — | — |
| Net unrealized appreciation (depreciation) | | | | | |
| on options transactions | — | — | — | 3,578 | — |
| Net Unrealized Appreciation (Depreciation) | 200,013,562 | 6,613,876 | 6,732,095 | 13,454,150 | 279,497,525 |
| Net Realized and Unrealized | | | | | |
| Gain (Loss) on Investments | 326,223,788 | 6,782,930 | 6,838,539 | 22,297,060 | 460,434,917 |
| Net Increase in Net Assets | | | | | |
| Resulting from Operations | 332,774,782 | 6,853,169 | 6,940,858 | 23,367,511 | 460,886,454 |
See notes to financial statements.
STATEMENTS OF OPERATIONS (Unaudited) (continued)
| | | | | | | | |
| | BNY Mellon | BNY Mellon | BNY Mellon | |
| | Small Cap | U.S. Core Equity | Focused Equity | BNY Mellon |
| | Stock Fund | 130/30Fund | Opportunities Fund | Small/Mid Cap Fund |
| Investment Income ($): | | | | |
| Income: | | | | |
| Cash dividends (net of $3,803 and $12,307 foreign taxes | | | | |
| withheld at source for BNY Mellon Small Cap Stock Fund | | | | |
| and BNY Mellon Small/Mid Cap Fund, respectively): | | | | |
| Unaffiliated issuers | 1,597,342 | 2,726,640 | 2,008,878 | 2,161,592 |
| Affiliated issuers | 5,043 | 3,009 | 3,982 | 14,694 |
| Income from securities lending—Note 2(b) | 171,161 | — | 885 | 207,963 |
| Total Income | 1,773,546 | 2,729,649 | 2,013,745 | 2,384,249 |
| Expenses: | | | | |
| Investment advisory fees—Note 4(a) | 1,937,741 | 955,148 | 1,108,346 | 1,299,476 |
| Administration fees—Note 4(a) | 282,102 | 147,673 | 195,815 | 214,204 |
| Custodian fees—Note 4(c) | 26,412 | 16,461 | 16,420 | 21,203 |
| Registration fees | 14,316 | 17,175 | 26,047 | 38,337 |
| Auditing fees | 13,660 | 14,150 | 14,156 | 12,768 |
| Trustees’ fees and expenses—Note 4(d) | 13,344 | 5,723 | 3,910 | 5,380 |
| Shareholder servicing costs—Note 4(c) | 9,543 | 186 | 112 | 107 |
| Legal fees | 8,373 | 2,642 | 1,203 | 796 |
| Prospectus and shareholders’ reports | 4,465 | 4,284 | 2,394 | 4,632 |
| Loan commitment fees—Note 3 | 1,992 | 1,658 | 1,717 | 1,767 |
| Interest expense—Note 3 | 715 | — | — | — |
| Dividends on securities sold short | — | 533,377 | — | — |
| Interest on securities sold short | — | 257,886 | — | — |
| Miscellaneous | 13,231 | 7,206 | 7,787 | 7,955 |
| Total Expenses | 2,325,894 | 1,963,569 | 1,377,907 | 1,606,625 |
| Less—reduction in investment advisory fee | | | | |
| due to undertakings—Note 4(a) | (5,069) | — | (5,365) | (3,558) |
| Less—reduction in fees due to | | | | |
| earnings credits—Note 4(c) | (44) | (1) | (1) | (1) |
| Net Expenses | 2,320,781 | 1,963,568 | 1,372,541 | 1,603,066 |
| Investment Income (Loss)—Net | (547,235) | 766,081 | 641,204 | 781,183 |
| Realized and Unrealized Gain (Loss) | | | | |
| on Investments—Note 5 ($): | | | | |
| Net realized gain (loss) on investments | 60,980,473 | 19,640,384 | 6,927,922 | 14,462,943 |
| Net realized gain (loss) on short sale transactions | — | (8,779,756) | — | — |
| Net Realized Gain (Loss) | 60,980,473 | 10,860,628 | 6,927,922 | 14,462,943 |
| Net unrealized appreciation | | | | |
| (depreciation) on investments | 84,631,519 | 49,231,698 | 73,579,778 | 84,464,728 |
| Net unrealized appreciation | | | | |
| (depreciation) on securities sold short | — | (10,076,088) | — | — |
| Net unrealized appreciation | | | | |
| (depreciation) on options transactions | — | — | (116,469) | — |
| Net Unrealized Appreciation (Depreciation) | 84,631,519 | 39,155,610 | 73,463,309 | 84,464,728 |
| Net Realized and Unrealized | | | | |
| Gain (Loss) on Investments | 145,611,992 | 50,016,238 | 80,391,231 | 98,927,671 |
| Net Increase in Net Assets | | | | |
| Resulting from Operations | 145,064,757 | 50,782,319 | 81,032,435 | 99,708,854 |
| |
| See notes to financial statements. | | | | |
88
| | | | | | | | |
| | | BNY Mellon | BNY Mellon | BNY Mellon |
| | BNY Mellon | Emerging | International | Balanced |
| | International Fund | Markets Fund | Appreciation Fund | Fund |
| Investment Income ($): | | | | |
| Income: | | | | |
| Cash dividends (net of $577,163, $1,391,677 and | | | | |
| $274,797 foreign taxes withheld at source for | | | | |
| BNY Mellon International Fund, BNY Mellon Emerging | | | | |
| Markets Fund and BNY Mellon International | | | | |
| Appreciation Fund, respectively): | | | | |
| Unaffiliated issuers | 9,847,691 | 12,377,648 | 3,112,205 | 1,180,300 |
| Affiliated issuers | 7,276 | 37,240 | 2,271 | 757,612 |
| Interest | 989 | — | 12,405 | 2,275,230 |
| Income from securities lending—Note 2(b) | — | 7,077 | — | 3,046 |
| Total Income | 9,855,956 | 12,421,965 | 3,126,881 | 4,216,188 |
| Expenses: | | | | |
| Investment advisory fees—Note 4(a) | 4,617,630 | 12,220,512 | 620,816 | 781,128 |
| Administration fees—Note 4(a) | 672,233 | 1,314,682 | 153,640 | 165,228 |
| Custodian fees—Note 4(c) | 46,396 | 1,292,853 | 17,397 | 18,373 |
| Trustees’ fees and expenses—Note 4(d) | 33,300 | 48,110 | 6,932 | 9,264 |
| Legal fees | 17,474 | 16,717 | 1,906 | 2,133 |
| Registration fees | 14,998 | 43,583 | 10,894 | 5,511 |
| Loan commitment fees—Note 3 | 13,572 | 31,077 | 97 | 4,077 |
| Auditing fees | 9,491 | 42,524 | 14,791 | 14,780 |
| Shareholder servicing costs—Note 4(c) | 7,010 | 14,067 | 5,285 | 5,942 |
| Interest expense—Note 3 | 1,810 | — | 47 | — |
| Prospectus and shareholders’ reports | 159 | 3,859 | 4,909 | 4,349 |
| Miscellaneous | 44,786 | 41,841 | 8,991 | 20,347 |
| Total Expenses | 5,478,859 | 15,069,825 | 845,705 | 1,031,132 |
| Less—reduction in investment advisory fee | | | | |
| due to undertakings—Note 4(a) | — | — | (4,069) | — |
| Less—reduction in fees due to earnings credits—Note 4(c) | (10) | (12) | (18) | (2) |
| Net Expenses | 5,478,849 | 15,069,813 | 841,618 | 1,031,130 |
| Investment Income (Loss)—Net | 4,377,107 | (2,647,848) | 2,285,263 | 3,185,058 |
STATEMENTS OF OPERATIONS (Unaudited) (continued)
| | | | | | | |
| | | BNY Mellon | BNY Mellon | BNY Mellon |
| | BNY Mellon | Emerging | International | Balanced |
| | International Fund | Markets Fund | Appreciation Fund | Fund |
| Realized and Unrealized Gain (Loss) | | | | |
| on Investments—Note 5 ($): | | | | |
| Net realized gain (loss) on investments | | | | |
| and foreign currency transactions | 42,283,702 | 115,715,130 | (1,096,431) | — |
| Net realized gain (loss) on forward | | | | |
| foreign currency exchange contracts | (269,305) | (1,128,691) | 211,951 | — |
| Net realized gain (loss) on financial futures | — | — | 292,940 | — |
| Net realized gain (loss) on investments | — | — | — | 15,581,639 |
| Net Realized Gain (Loss) | 42,014,397 | 114,586,439 | (591,540) | 15,581,639 |
| Net unrealized appreciation (depreciation) on | | | | |
| investments and foreign currency transactions | 196,273,293 | 136,525,761 | 53,821,366 | — |
| Net unrealized appreciation (depreciation) on | | | | |
| forward foreign currency exchange contracts | 55,059 | 12,821 | (30,734) | — |
| Net unrealized appreciation | | | | |
| (depreciation) on financial futures | — | — | 91,122 | — |
| Net unrealized appreciation (depreciation) on investments: | | | | |
| Unaffiliated issuers | — | — | — | 14,889,041 |
| Affiliated issuers | — | — | — | 21,969,877 |
| Net Unrealized Appreciation (Depreciation) | 196,328,352 | 136,538,582 | 53,881,754 | 36,858,918 |
| Net Realized and Unrealized | | | | |
| Gain (Loss) on Investments | 238,342,749 | 251,125,021 | 53,290,214 | 52,440,557 |
| Net Increase in Net Assets | | | | |
| Resulting from Operations | 242,719,856 | 248,477,173 | 55,575,477 | 55,625,615 |
| |
| See notes to financial statements. | | | | |
90
STATEMENT OF CASH FLOWS
Six Months Ended February 28, 2011 (Unaudited)
| | | | |
| BNY Mellon U.S. Core Equity 130/30 Fund | | | |
| Cash Flows from Operating Activities ($): | | | |
| Purchases of portfolio securities | (276,278,531 | ) | |
| Proceeds from sales of portfolio securities | 222,944,393 | | |
| Purchases from securities sold short | (11,706,111 | ) | |
| Net purchase of short—term portfolio securities | (1,630,000 | ) | |
| Dividends received | 2,523,768 | | |
| Interest and dividends paid | (701,181 | ) | |
| Operating expenses paid | (205,725 | ) | |
| Paid to The Dreyfus Corporation | (897,084 | ) | (65,950,471) |
| Cash Flows from Financing Activites ($): | | | |
| Net Beneficial Interest transactions | | | 65,812,837 |
| Dividends paid | | | (1,000,686) |
| Cash at beginning of period | | | 726,701 |
| Cash Overdraft at end of period | | | (411,619) |
| Reconciliation of Net Increase in Net Assets Resulting from | | | |
| Operations to Net Cash Used by Operating Activities ($): | | | |
| Net Increase in Net Assets Resulting from Operations | | | 50,782,319 |
| Adjustments to reconcile net increase in net assets resulting | | | |
| from operations to net cash used by operating activities ($): | | | |
| Purchases of portfolio securities | | | (276,278,531) |
| Proceeds from sales of portfolio securities | | | 222,944,393 |
| Purchases from securities sold short | | | (11,706,111) |
| Net sale of short—term portfolio securities | | | (1,630,000) |
| Increase in interest and dividends payable on | | | |
| securities sold short and loan commitment fees | | | 91,740 |
| Increase in accrued operating expenses | | | 774 |
| Increase in prepaid expenses | | | 9,000 |
| Increase in Due from The Dreyfus Corporation | | | 58,064 |
| Net realized gains on investments | | | (10,860,628) |
| Net unrealized appreciation on investments | | | (39,155,610) |
| Decrease in dividends and income receivable | | | (205,881) |
| Net Cash Used by Operating Activities | | | (65,950,471) |
| |
| See notes to financial statements. | | | |
STATEMENTS OF CHANGES IN NET ASSETS
| | | | | | | | |
| | | | BNY Mellon Large Cap |
| | BNY Mellon Large Cap Stock Fund | Market Opportunities Fund |
| | Six Months Ended | | Six Months Ended | |
| | February 28, 2011 | Year Ended | February 28, 2011 | Year Ended |
| | (Unaudited) | August 31, 2010 | (Unaudited) | August 31, 2010a |
| Operations ($): | | | | |
| Investment income—net | 6,550,994 | 11,371,345 | 70,239 | 1,014 |
| Net realized gain (loss) on investments | 126,210,226 | 186,677,267 | 169,054 | (602) |
| Net unrealized appreciation (depreciation) on investments | 200,013,562 | (90,064,732) | 6,613,876 | (167,337) |
| Net Increase (Decrease) in Net Assets | | | | |
| Resulting from Operations | 332,774,782 | 107,983,880 | 6,853,169 | (166,925) |
| Dividends to Shareholders from ($): | | | | |
| Investment income—net: | | | | |
| Class M Shares | (6,862,333) | (11,021,302) | (75,193) | — |
| Investor Shares | (168,163) | (44,449) | (7) | — |
| Net realized gain on investments: | | | | |
| Class M Shares | — | — | (107,832) | — |
| Investor Shares | — | — | (26) | — |
| Total Dividends | (7,030,496) | (11,065,751) | (183,058) | — |
| Beneficial Interest Transactions ($): | | | | |
| Net proceeds from shares sold: | | | | |
| Class M Shares | 61,780,423 | 208,779,258 | 82,201,996 | 5,337,671 |
| Investor Shares | 33,935,477 | 2,684,994 | — | 10,000 |
| Dividends reinvested: | | | | |
| Class M Shares | 916,986 | 1,341,554 | 88,903 | — |
| Investor Shares | 162,492 | 39,778 | — | — |
| Cost of shares redeemed: | | | | |
| Class M Shares | (203,308,207) | (577,935,600) | (7,927,436) | (97,070) |
| Investor Shares | (7,363,821) | (3,958,994) | — | — |
| Increase (Decrease) in Net Assets from | | | | |
| Beneficial Interest Transactions | (113,876,650) | (369,049,010) | 74,363,463 | 5,250,601 |
| Total Increase (Decrease) in Net Assets | 211,867,636 | (272,130,881) | 81,033,574 | 5,083,676 |
| Net Assets ($): | | | | |
| Beginning of Period | 1,185,707,891 | 1,457,838,772 | 5,083,676 | — |
| End of Period | 1,397,575,527 | 1,185,707,891 | 86,117,250 | 5,083,676 |
| Undistributed (distributions in excess of) | | | | |
| investment income—net | 15,451 | 494,953 | (3,759) | 1,202 |
| Capital Share Transactions (Shares): | | | | |
| Class M Shares | | | | |
| Shares sold | 7,449,861 | 28,089,959 | 7,367,360 | 545,214 |
| Shares issued for dividends reinvested | 107,907 | 182,062 | 7,792 | — |
| Shares redeemed | (23,952,762) | (77,703,853) | (691,840) | (9,765) |
| Net Increase (Decrease) in Shares Outstanding | (16,394,994) | (49,431,832) | 6,683,312 | 535,449 |
| Investor Shares | | | | |
| Shares sold | 4,250,906 | 359,559 | — | 1,000 |
| Shares issued for dividends reinvested | 19,037 | 5,397 | — | — |
| Shares redeemed | (840,865) | (541,583) | — | — |
| Net Increase (Decrease) in Shares Outstanding | 3,429,078 | (176,627) | — | 1,000 |
| |
| a From July 30, 2010 (commencement of operations) to August 31, 2010. | | | | |
| See notes to financial statements. | | | | |
92
| | | | | | | | |
| | BNY Mellon Tax- Sensitive | | |
| | Large Cap Multi-Strategy Fund | BNY Mellon Income Stock Fund |
| | Six Months Ended | | Six Months Ended | |
| | February 28, 2011 | Year Ended | February 28, 2011 | Year Ended |
| | (Unaudited) | August 31, 2010a | (Unaudited) | August 31, 2010 |
| Operations ($): | | | | |
| Investment income—net | 102,319 | 3,610 | 1,070,451 | 1,759,613 |
| Net realized gain (loss) on investments | 106,444 | (1,044) | 8,842,910 | 8,116,861 |
| Net unrealized appreciation (depreciation) on investments | 6,732,095 | (285,220) | 13,454,150 | (3,722,472) |
| Net Increase (Decrease) in Net Assets | | | | |
| Resulting from Operations | 6,940,858 | (282,654) | 23,367,511 | 6,154,002 |
| Dividends to Shareholders from ($): | | | | |
| Investment income—net: | | | | |
| Class M Shares | (89,598) | — | (1,172,490) | (1,709,209) |
| Investor Shares | (265) | — | (11,936) | (14,414) |
| Net realized gain on investments: | | | | |
| Class M Shares | (96,101) | — | — | — |
| Investor Shares | (406) | — | — | — |
| Total Dividends | (186,370) | — | (1,184,426) | (1,723,623) |
| Beneficial Interest Transactions ($): | | | | |
| Net proceeds from shares sold: | | | | |
| Class M Shares | 43,004,869 | 10,618,723 | 25,772,581 | 6,266,202 |
| Investor Shares | 145,000 | 10,000 | 14,629 | 172,180 |
| Dividends reinvested: | | | | |
| Class M Shares | 75,037 | — | 134,854 | 160,533 |
| Investor Shares | — | — | 10,193 | 12,512 |
| Cost of shares redeemed: | | | | |
| Class M Shares | (6,486,618) | — | (26,751,787) | (46,945,226) |
| Investor Shares | — | — | (276,653) | (271,337) |
| Increase (Decrease) in Net Assets from | | | | |
| Beneficial Interest Transactions | 36,738,288 | 10,628,723 | (1,096,183) | (40,605,136) |
| Total Increase (Decrease) in Net Assets | 43,492,776 | 10,346,069 | 21,086,902 | (36,174,757) |
| Net Assets ($): | | | | |
| Beginning of Period | 10,346,069 | — | 91,632,729 | 127,807,486 |
| End of Period | 53,838,845 | 10,346,069 | 112,719,631 | 91,632,729 |
| Undistributed investment income—net | 16,413 | 3,957 | 12,525 | 126,500 |
| Capital Share Transactions (Shares): | | | | |
| Class M Shares | | | | |
| Shares sold | 3,922,542 | 1,085,576 | 3,884,357 | 1,086,244 |
| Shares issued for dividends reinvested | 6,519 | — | 21,367 | 28,378 |
| Shares redeemed | (576,816) | — | (4,225,823) | (8,114,105) |
| Net Increase (Decrease) in Shares Outstanding | 3,352,245 | 1,085,576 | (320,099) | (6,999,483) |
| Investor Shares | | | | |
| Shares sold | 14,244 | 1,000 | 2,198 | 29,558 |
| Shares issued for dividends reinvested | — | — | 1,608 | 2,194 |
| Shares redeemed | — | — | (41,316) | (45,435) |
| Net Increase (Decrease) in Shares Outstanding | 14,244 | 1,000 | (37,510) | (13,683) |
| |
| a From July 30, 2010 (commencement of operations) to August 31, 2010. | | | | |
| See notes to financial statements. | | | | |
STATEMENTS OF CHANGES IN NET ASSETS (continued)
| | | | | | | | |
| | BNY Mellon Mid Cap Stock Fund | BNY Mellon Small Cap Stock Fund |
| | Six Months Ended | | Six Months Ended | |
| | February 28, 2011 | Year Ended | February 28, 2011 | Year Ended |
| | (Unaudited) | August 31, 2010 | (Unaudited) | August 31, 2010 |
| Operations ($): | | | | |
| Investment income (loss)—net | 451,537 | 6,748,867 | (547,235) | 66,349 |
| Net realized gain (loss) on investments | 180,937,392 | 127,211,257 | 60,980,473 | 44,616,451 |
| Net unrealized appreciation (depreciation) on investments | 279,497,525 | (26,653,307) | 84,631,519 | (2,612,330) |
| Net Increase (Decrease) in Net Assets | | | | |
| Resulting from Operations | 460,886,454 | 107,306,817 | 145,064,757 | 42,070,470 |
| Dividends to Shareholders from ($): | | | | |
| Investment income—net: | | | | |
| Class M Shares | (358,451) | (8,420,413) | — | (754,676) |
| Investor Shares | — | (92,947) | — | — |
| Total Dividends | (358,451) | (8,513,360) | — | (754,676) |
| Beneficial Interest Transactions ($): | | | | |
| Net proceeds from shares sold: | | | | |
| Class M Shares | 90,294,563 | 204,861,905 | 17,918,900 | 57,811,400 |
| Investor Shares | 5,841,685 | 6,321,719 | 1,518,782 | 3,207,091 |
| Dreyfus Premier Shares | — | 9 | — | — |
| Dividends reinvested: | | | | |
| Class M Shares | 77,865 | 1,904,825 | — | 151,608 |
| Investor Shares | — | 84,880 | — | — |
| Cost of shares redeemed: | | | | |
| Class M Shares | (175,459,738) | (326,317,292) | (118,845,178) | (296,691,618) |
| Investor Shares | (7,699,716) | (7,108,008) | (2,066,999) | (3,791,821) |
| Dreyfus Premier Shares | (82,084) | (246,586) | — | — |
| Increase (Decrease) in Net Assets from | | | | |
| Beneficial Interest Transactions | (87,027,425) | (120,498,548) | (101,474,495) | (239,313,340) |
| Total Increase (Decrease) in Net Assets | 373,500,578 | (21,705,091) | 43,590,262 | (197,997,546) |
| Net Assets ($): | | | | |
| Beginning of Period | 1,184,165,315 | 1,205,870,406 | 418,845,804 | 616,843,350 |
| End of Period | 1,557,665,893 | 1,184,165,315 | 462,436,066 | 418,845,804 |
| Undistributed investment income (loss)—net | 628,458 | 535,372 | (340,716) | 206,519 |
94
| | | | | | | | |
| | BNY Mellon Mid Cap Stock Fund | BNY Mellon Small Cap Stock Fund |
| | Six Months Ended | | Six Months Ended | |
| | February 28, 2011 | Year Ended | February 28, 2011 | Year Ended |
| | (Unaudited) | August 31, 2010 | (Unaudited) | August 31, 2010 |
| Capital Share Transactions: | | | | |
| Class M Shares | | | | |
| Shares sold | 7,627,241 | 21,189,689 | 1,588,164 | 6,192,288 |
| Shares issued for dividends reinvested | 6,510 | 208,405 | — | 16,977 |
| Shares redeemed | (15,164,481) | (33,694,346) | (10,837,244) | (31,292,076) |
| Net Increase (Decrease) in Shares Outstanding | (7,530,730) | (12,296,252) | (9,249,080) | (25,082,811) |
| Investor Sharesa | | | | |
| Shares sold | 505,662 | 661,836 | 141,951 | 351,180 |
| Shares issued for dividends reinvested | — | 9,348 | — | — |
| Shares redeemed | (681,435) | (734,495) | (199,929) | (410,745) |
| Net Increase (Decrease) in Shares Outstanding | (175,773) | (63,311) | (57,978) | (59,565) |
| Dreyfus Premier Sharesa | | | | |
| Shares sold | — | 1 | — | — |
| Shares redeemed | (7,739) | (27,146) | — | — |
| Net Increase (Decrease) in Shares Outstanding | (7,739) | (27,145) | — | — |
|
| a During the period ended February 28, 2011, 3,905 Dreyfus Premier shares of BNY Mellon Mid Cap Stock Fund representing $41,199 were automatically converted to 3,667 |
| Investor shares and during the period ended August 31, 2010, 14,199 Dreyfus Premier shares of BNY Mellon Mid Cap Stock Fund representing $138,528 were automatically |
| converted to 15,060 Investor shares. |
See notes to financial statements.
STATEMENTS OF CHANGES IN NET ASSETS (continued)
| | | | | | | | |
| | | | BNY Mellon Focused |
| | BNY Mellon U.S. Core Equity 130/30 Fund | Equity Opportunities Fund |
| | Six Months Ended | | Six Months Ended | |
| | February 28, 2011 | Year Ended | February 28, 2011 | Year Ended |
| | (Unaudited) | August 31, 2010 | (Unaudited) | August 31, 2010a |
| Operations ($): | | | | |
| Investment income—net | 766,081 | 371,824 | 641,204 | 641,504 |
| Net realized gain (loss) on investments | 10,860,628 | 8,006,974 | 6,927,922 | (4,460,111) |
| Net unrealized appreciation (depreciation) on investments | 39,155,610 | (3,208,945) | 73,463,309 | (11,091,324) |
| Net Increase (Decrease) in Net Assets | | | | |
| Resulting from Operations | 50,782,319 | 5,169,853 | 81,032,435 | (14,909,931) |
| Dividends to Shareholders from ($): | | | | |
| Investment income—net: | | | | |
| Class M Shares | (1,000,193) | (307,480) | (1,301,815) | (23,592) |
| Investor Shares | (493) | — | (30) | (5) |
| Net realized gain on investments: | | | | |
| Class M Shares | — | — | — | (403) |
| Investor Shares | — | — | — | —b |
| Total Dividends | (1,000,686) | (307,480) | (1,301,845) | (24,000) |
| Beneficial Interest Transactions ($): | | | | |
| Net proceeds from shares sold: | | | | |
| Class M Shares | 86,379,224 | 148,604,687 | 126,844,658 | 262,921,709 |
| Investor Shares | 209,970 | 3,158 | 30 | 16,190 |
| Dividends reinvested: | | | | |
| Class M Shares | — | 120,318 | 204,553 | 6,026 |
| Investor Shares | — | — | — | 5 |
| Cost of shares redeemed: | | | | |
| Class M Shares | (23,684,924) | (48,400,711) | (30,658,852) | (9,662,634) |
| Investor Shares | (143,985) | (10,269) | — | (3,127) |
| Increase (Decrease) in Net Assets from | | | | |
| Beneficial Interest Transactions | 62,760,285 | 100,317,183 | 96,390,389 | 253,278,169 |
| Total Increase (Decrease) in Net Assets | 112,541,918 | 105,179,556 | 176,120,979 | 238,344,238 |
| Net Assets ($): | | | | |
| Beginning of Period | 186,145,057 | 80,965,501 | 238,344,238 | — |
| End of Period | 298,686,975 | 186,145,057 | 414,465,217 | 238,344,238 |
| Undistributed (distributions in excess of) | | | | |
| investment income—net | 153,504 | 388,109 | (40,347) | 620,294 |
| Capital Share Transactions (Shares): | | | | |
| Class M Shares | | | | |
| Shares sold | 7,481,164 | 14,900,619 | 10,288,053 | 24,529,894 |
| Shares issued for dividends reinvested | — | 12,202 | 16,658 | 552 |
| Shares redeemed | (2,088,314) | (4,858,891) | (2,527,566) | (917,571) |
| Net Increase (Decrease) in Shares Outstanding | 5,392,850 | 10,053,930 | 7,777,145 | 23,612,875 |
| Investor Shares | | | | |
| Shares sold | 18,271 | 288 | 2 | 1,525 |
| Shares issued for dividends reinvested | — | — | — | 1 |
| Shares redeemed | (11,692) | (1,040) | — | (266) |
| Net Increase (Decrease) in Shares Outstanding | 6,579 | (752) | 2 | 1,260 |
| |
| a | From September 30, 2009 (commencement of operations) to August 31, 2010. |
| b | Amount represents less than $ 1. |
See notes to financial statements.
96
| | | | | | | | |
| | BNY Mellon Small/Mid Cap Fund | BNY Mellon International Fund |
| | Six Months Ended | | Six Months Ended | |
| | February 28, 2011 | Year Ended | February 28, 2011 | Year Ended |
| | (Unaudited) | August 31, 2010a | (Unaudited) | August 31, 2010 |
| Operations ($): | | | | |
| Investment income—net | 781,183 | 59,283 | 4,377,107 | 20,938,942 |
| Net realized gain (loss) on investments | 14,462,943 | (41,857) | 42,014,397 | 17,897,604 |
| Net unrealized appreciation (depreciation) on investments | 84,464,728 | (5,355,933) | 196,328,352 | (88,400,400) |
| Net Increase (Decrease) in Net Assets | | | | |
| Resulting from Operations | 99,708,854 | (5,338,507) | 242,719,856 | (49,563,854) |
| Dividends to Shareholders from ($): | | | | |
| Investment income—net: | | | | |
| Class M Shares | (946,111) | (46,121) | (21,098,723) | (29,900,390) |
| Investor Shares | — | (500) | (85,465) | (109,581) |
| Net realized gain on investments: | | | | |
| Class M Shares | (2,188,505) | (128,453) | — | — |
| Investor Shares | (548) | (1,533) | — | — |
| Total Dividends | (3,135,164) | (176,607) | (21,184,188) | (30,009,971) |
| Beneficial Interest Transactions ($): | | | | |
| Net proceeds from shares sold: | | | | |
| Class M Shares | 192,249,001 | 240,567,850 | 65,255,754 | 175,302,528 |
| Investor Shares | 98,139 | 538,931 | 3,916,401 | 4,187,465 |
| Dividends reinvested: | | | | |
| Class M Shares | 1,483,925 | 102,901 | 4,224,852 | 5,828,151 |
| Investor Shares | 130 | 1,742 | 71,118 | 96,704 |
| Cost of shares redeemed: | | | | |
| Class M Shares | (17,510,354) | (13,099,812) | (160,252,350) | (352,584,183) |
| Investor Shares | (64,618) | (545,986) | (3,850,769) | (4,832,167) |
| Increase (Decrease) in Net Assets from | | | | |
| Beneficial Interest Transactions | 176,256,223 | 227,565,626 | (90,634,994) | (172,001,502) |
| Total Increase (Decrease) in Net Assets | 272,829,913 | 222,050,512 | 130,900,674 | (251,575,327) |
| Net Assets ($): | | | | |
| Beginning of Period | 222,050,512 | — | 1,000,965,369 | 1,252,540,696 |
| End of Period | 494,880,425 | 222,050,512 | 1,131,866,043 | 1,000,965,369 |
| Undistributed (distributions in excess of) | | | | |
| investment income—net | (155,314) | 9,614 | 1,960,357 | 18,767,438 |
| Capital Share Transactions (Shares): | | | | |
| Class M Shares | | | | |
| Shares sold | 13,806,610 | 21,480,182 | 6,033,830 | 17,152,076 |
| Shares issued for dividends reinvested | 106,222 | 9,254 | 397,446 | 557,184 |
| Shares redeemed | (1,279,549) | (1,162,630) | (14,921,714) | (34,733,321) |
| Net Increase (Decrease) in Shares Outstanding | 12,633,283 | 20,326,806 | (8,490,438) | (17,024,061) |
| Investor Shares | | | | |
| Shares sold | 7,517 | 49,168 | 346,388 | 394,948 |
| Shares issued for dividends reinvested | 9 | 157 | 6,316 | 8,735 |
| Shares redeemed | (4,504) | (47,844) | (336,546) | (445,265) |
| Net Increase (Decrease) in Shares Outstanding | 3,022 | 1,481 | 16,158 | (41,582) |
|
| a From September 30, 2009 (commencement of operations) to August 31, 2010. |
| See notes to financial statements. |
STATEMENTS OF CHANGES IN NET ASSETS (continued)
| | | | | | | | |
| | | | BNY Mellon |
| | BNY Mellon Emerging Markets Fund | International Appreciation Fund |
| | Six Months Ended | | Six Months Ended | |
| | February 28, 2011 | Year Ended | February 28, 2011 | Year Ended |
| | (Unaudited) | August 31, 2010 | (Unaudited) | August 31, 2010 |
| Operations ($): | | | | |
| Investment income (loss)—net | (2,647,848) | 13,341,492 | 2,285,263 | 5,693,232 |
| Net realized gain (loss) on investments | 114,586,439 | 144,710,956 | (591,540) | (6,443,823) |
| Net unrealized appreciation (depreciation) on investments | 136,538,582 | 24,777,402 | 53,881,754 | (8,229,860) |
| Net Increase (Decrease) in Net Assets | | | | |
| Resulting from Operations | 248,477,173 | 182,829,850 | 55,575,477 | (8,980,451) |
| Dividends to Shareholders from ($): | | | | |
| Investment income—net: | | | | |
| Class M Shares | (9,688,664) | (11,020,148) | (5,520,095) | (7,535,695) |
| Investor Shares | (44,586) | (35,030) | (79,745) | (113,186) |
| Total Dividends | (9,733,250) | (11,055,178) | (5,599,840) | (7,648,881) |
| Beneficial Interest Transactions ($): | | | | |
| Net proceeds from shares sold: | | | | |
| Class M Shares | 417,369,453 | 712,314,185 | 10,614,275 | 31,858,519 |
| Investor Shares | 9,996,330 | 11,306,226 | 50,419 | 583,760 |
| Dividends reinvested: | | | | |
| Class M Shares | 2,266,421 | 2,790,469 | 230,727 | 327,197 |
| Investor Shares | 31,912 | 29,682 | 74,815 | 105,666 |
| Cost of shares redeemed: | | | | |
| Class M Shares | (129,143,985) | (187,116,932) | (25,815,771) | (53,896,689) |
| Investor Shares | (5,267,439) | (9,505,611) | (135,279) | (1,130,199) |
| Increase (Decrease) in Net Assets from | | | | |
| Beneficial Interest Transactions | 295,252,692 | 529,818,019 | (14,980,814) | (22,151,746) |
| Total Increase (Decrease) in Net Assets | 533,996,615 | 701,592,691 | 34,994,823 | (38,781,078) |
| Net Assets ($): | | | | |
| Beginning of Period | 1,803,364,310 | 1,101,771,619 | 221,529,062 | 260,310,140 |
| End of Period | 2,337,360,925 | 1,803,364,310 | 256,523,885 | 221,529,062 |
| Undistributed investment income (loss)—net | (4,836,130) | 7,544,968 | 356,280 | 3,670,857 |
| Capital Share Transactions (Shares): | | | | |
| Class M Shares | | | | |
| Shares sold | 36,163,983 | 71,964,613 | 885,186 | 2,798,262 |
| Shares issued for dividends reinvested | 196,227 | 282,722 | 19,308 | 28,576 |
| Shares redeemed | (11,335,922) | (18,909,854) | (2,110,355) | (4,702,781) |
| Net Increase (Decrease) in Shares Outstanding | 25,024,288 | 53,337,481 | (1,205,861) | (1,875,943) |
| Investor Shares | | | | |
| Shares sold | 855,798 | 1,123,587 | 4,237 | 52,060 |
| Shares issued for dividends reinvested | 2,693 | 2,930 | 6,319 | 9,310 |
| Shares redeemed | (441,135) | (937,083) | (11,811) | (100,485) |
| Net Increase (Decrease) in Shares Outstanding | 417,356 | 189,434 | (1,255) | (39,115) |
| |
| See notes to financial statements. | | | | |
98
| | | | |
| | BNY Mellon Balanced Fund |
| | Six Months Ended | |
| | February 28, 2011 | Year Ended |
| | (Unaudited) | August 31, 2010 |
| Operations ($): | | |
| Investment income—net | 3,185,058 | 5,992,687 |
| Net realized gain (loss) on investments | 15,581,639 | 14,897,600 |
| Net unrealized appreciation (depreciation) on investments | 36,858,918 | 52,840 |
| Net Increase (Decrease) in Net Assets Resulting from Operations | 55,625,615 | 20,943,127 |
| Dividends to Shareholders from ($): | | |
| Investment income—net: | | |
| Class M Shares | (3,803,576) | (7,815,981) |
| Investor Shares | (40,682) | (91,647) |
| Total Dividends | (3,844,258) | (7,907,628) |
| Beneficial Interest Transactions ($): | | |
| Net proceeds from shares sold: | | |
| Class M Shares | 28,430,185 | 60,552,191 |
| Investor Shares | 673,707 | 327,865 |
| Dividends reinvested: | | |
| Class M Shares | 194,252 | 388,019 |
| Investor Shares | 36,165 | 84,534 |
| Cost of shares redeemed: | | |
| Class M Shares | (16,946,807) | (40,292,941) |
| Investor Shares | (509,748) | (996,979) |
| Increase (Decrease) in Net Assets from | | |
| Beneficial Interest Transactions | 11,877,754 | 20,062,689 |
| Total Increase (Decrease) in Net Assets | 63,659,111 | 33,098,188 |
| Net Assets ($): | | |
| Beginning of Period | 339,152,593 | 306,054,405 |
| End of Period | 402,811,704 | 339,152,593 |
| Undistributed investment income—net | 2,253,463 | 2,912,663 |
| Capital Share Transactions (Shares): | | |
| Class M Shares | | |
| Shares sold | 2,610,541 | 6,064,420 |
| Shares issued for dividends reinvested | 17,840 | 39,027 |
| Shares redeemed | (1,555,951) | (4,025,443) |
| Net Increase (Decrease) in Shares Outstanding | 1,072,430 | 2,078,004 |
| Investor Shares | | |
| Shares sold | 60,565 | 32,318 |
| Shares issued for dividends reinvested | 3,303 | 8,457 |
| Shares redeemed | (45,316) | (99,995) |
| Net Increase (Decrease) in Shares Outstanding | 18,552 | (59,220) |
| |
| See notes to financial statements. | | |
FINANCIAL HIGHLIGHTS
The following tables describe the performance for each share class of each BNY Mellon equity fund for the fiscal periods indicated. All information (except portfolio turnover rate) reflects financial results for a single fund share.Total return shows how much your investment in each fund would have increased (or decreased) during each period, assuming you had reinvested all dividends and distributions.These figures have been derived from each fund’s financial statements.
| | | | | | | | | | | | |
| | | | Class M Shares | | |
| | Six Months Ended | | | | | |
| | February 28, 2011 | | Year Ended August 31, | |
| BNY Mellon Large Cap Stock Fund | (Unaudited) | 2010 | 2009 | 2008 | 2007 | 2006 |
| Per Share Data ($): | | | | | | |
| Net asset value, beginning of period | 7.16 | 6.77 | 8.77 | 11.56 | 10.31 | 9.79 |
| Investment Operations: | | | | | | |
| Investment income—neta | .04 | .06�� | .09 | .11 | .09 | .10 |
| Net realized and unrealized | | | | | | |
| gain (loss) on investments | 1.99 | .39 | (1.91) | (1.05) | 1.49 | .52 |
| Total from Investment Operations | 2.03 | .45 | (1.82) | (.94) | 1.58 | .62 |
| Distributions: | | | | | | |
| Dividends from investment income—net | (.04) | (.06) | (.09) | (.12) | (.08) | (.10) |
| Dividends from net realized gain on investments | — | — | (.09) | (1.73) | (.25) | — |
| Total Distributions | (.04) | (.06) | (.18) | (1.85) | (.33) | (.10) |
| Net asset value, end of period | 9.15 | 7.16 | 6.77 | 8.77 | 11.56 | 10.31 |
| Total Return (%) | 28.45b | 6.62 | (20.39) | (9.95) | 15.60 | 6.32 |
| Ratios/Supplemental Data (%): | | | | | | |
| Ratio of total expenses to average net assets | .80c | .80 | .81 | .80 | .80 | .80 |
| Ratio of net expenses to average net assets | .80c | .80 | .81 | .80 | .79 | .80 |
| Ratio of net investment income | | | | | | |
| to average net assets | .97c | .81 | 1.51 | 1.15 | .76 | .96 |
| Portfolio Turnover Rate | 41.37b | 71.61 | 109.39 | 56.13 | 77.46 | 19.08 |
| Net Assets, end of period ($ x 1,000) | 1,356,619 | 1,178,235 | 1,449,565 | 1,750,688 | 1,970,482 | 1,766,105 |
| |
| a | Based on average shares outstanding at each month end. |
| b | Not annualized. |
| c | Annualized. |
See notes to financial statements.
100
| | | | | | | | | | | | |
| | | | Investor Shares | | | |
| | Six Months Ended | | | | | |
| | February 28, 2011 | | Year Ended August 31, | |
| BNY Mellon Large Cap Stock Fund | (Unaudited) | 2010 | 2009 | 2008 | 2007 | 2006 |
| Per Share Data ($): | | | | | | |
| Net asset value, beginning of period | 7.16 | 6.78 | 8.78 | 11.58 | 10.33 | 9.82 |
| Investment Operations: | | | | | | |
| Investment income—neta | .03 | .04 | .08 | .09 | .06 | .07 |
| Net realized and unrealized | | | | | | |
| gain (loss) on investments | 2.01 | .38 | (1.91) | (1.07) | 1.50 | .51 |
| Total from Investment Operations | 2.04 | .42 | (1.83) | (.98) | 1.56 | .58 |
| Distributions: | | | | | | |
| Dividends from investment income—net | (.04) | (.04) | (.08) | (.09) | (.06) | (.07) |
| Dividends from net realized gain on investments | — | — | (.09) | (1.73) | (.25) | — |
| Total Distributions | (.04) | (.04) | (.17) | (1.82) | (.31) | (.07) |
| Net asset value, end of period | 9.16 | 7.16 | 6.78 | 8.78 | 11.58 | 10.33 |
| Total Return (%) | 28.46b | 6.21 | (20.56) | (10.26) | 15.29 | 5.95 |
| Ratios/Supplemental Data (%): | | | | | | |
| Ratio of total expenses to average net assets | 1.07c | 1.05 | 1.06 | 1.05 | 1.05 | 1.06 |
| Ratio of net expenses to average net assets | 1.07c | 1.05 | 1.06 | 1.05 | 1.04 | 1.06 |
| Ratio of net investment income | | | | | | |
| to average net assets | .72c | .56 | 1.25 | .89 | .51 | .72 |
| Portfolio Turnover Rate | 41.37b | 71.61 | 109.39 | 56.13 | 77.46 | 19.08 |
| Net Assets, end of period ($ x 1,000) | 40,957 | 7,473 | 8,274 | 9,829 | 11,704 | 7,629 |
| |
| a | Based on average shares outstanding at each month end. |
| b | Not annualized. |
| c | Annualized. |
See notes to financial statements.
FINANCIAL HIGHLIGHTS (continued)
| | | | |
| | Class M Shares |
| | Six Months Ended | |
| | February 28, 2011 | Period Ended |
| BNY Mellon Large Cap Market Opportunities Fund | (Unaudited) | August 31, 2010a |
| Per Share Data ($): | | |
| Net asset value, beginning of period | 9.48 | 10.00 |
| Investment Operations: | | |
| Investment income—netb | .02 | .00c |
| Net realized and unrealized | | |
| gain (loss) on investments | 2.48 | (.52) |
| Total from Investment Operations | 2.50 | (.52) |
| Distributions: | | |
| Dividends from investment income—net | (.02) | — |
| Dividends from net realized gain on investments | (.03) | — |
| Total Distributions | (.05) | — |
| Net asset value, end of period | 11.93 | 9.48 |
| Total Return (%)d | 26.33 | (5.20) |
| Ratios/Supplemental Data (%): | | |
| Ratio of total expenses to average net assetse,f | 1.30 | 15.54 |
| Ratio of net expenses to average net assetse,f | .85 | .98 |
| Ratio of net investment income to average net assetse,f | .34 | .48 |
| Portfolio Turnover Rated | 12.97 | 2.12 |
| Net Assets, end of period ($ x 1,000) | 86,105 | 5,074 |
| |
| a | From July 30, 2010 (commencement of operations) to August 31, 2010. |
| b | Based on average shares outstanding at each month end. |
| c | Amount represents less than $.01 per share. |
| d | Not annualized. |
| e | Annualized. |
| f | Amount does not include the activity of the underlying funds. |
See notes to financial statements.
102
| | | | |
| | Investor Shares |
| | Six Months Ended | |
| | February 28, 2011 | Period Ended |
| BNY Mellon Large Cap Market Opportunities Fund | (Unaudited) | August 31, 2010a |
| Per Share Data ($): | | |
| Net asset value, beginning of period | 9.48 | 10.00 |
| Investment Operations: | | |
| Investment income—netb | .01 | .00c |
| Net realized and unrealized | | |
| gain (loss) on investments | 2.47 | (.52) |
| Total from Investment Operations | 2.48 | (.52) |
| Distributions: | | |
| Dividends from investment income—net | (.01) | — |
| Dividends from net realized gain on investments | (.03) | — |
| Total Distributions | (.04) | — |
| Net asset value, end of period | 11.92 | 9.48 |
| Total Return (%)d | 26.21 | (5.20) |
| Ratios/Supplemental Data (%): | | |
| Ratio of total expenses to average net assetse,f | 1.79 | 9.38 |
| Ratio of net expenses to average net assetse,f | 1.10 | 1.23 |
| Ratio of net investment income to average net assetse,f | .12 | .16 |
| Portfolio Turnover Rated | 12.97 | 2.12 |
| Net Assets, end of period ($ x 1,000) | 12 | 9 |
| |
| a | From July 30, 2010 (commencement of operations) to August 31, 2010. |
| b | Based on average shares outstanding at each month end. |
| c | Amount represents less than $.01 per share. |
| d | Not annualized. |
| e | Annualized. |
| f | Amount does not include the activity of the underlying funds. |
See notes to financial statements.
FINANCIAL HIGHLIGHTS (continued)
| | | | |
| | Class M Shares |
| | Six Months Ended | |
| | February 28, 2011 | Period Ended |
| BNY Mellon Tax-Sensitive Large Cap Multi-Strategy Fund | (Unaudited) | August 31, 2010a |
| Per Share Data ($): | | |
| Net asset value, beginning of period | 9.52 | 10.00 |
| Investment Operations: | | |
| Investment income—netb | .03 | .01 |
| Net realized and unrealized | | |
| gain (loss) on investments | 2.59 | (.49) |
| Total from Investment Operations | 2.62 | (.48) |
| Distributions: | | |
| Dividends from investment income—net | (.02) | — |
| Dividends from net realized gain on investments | (.03) | — |
| Total Distributions | (.05) | — |
| Net asset value, end of period | 12.09 | 9.52 |
| Total Return (%)c | 27.56 | (4.80) |
| Ratios/Supplemental Data (%): | | |
| Ratio of total expenses to average net assetsd,e | 2.21 | 8.12 |
| Ratio of net expenses to average net assetsd,e | .93 | .99 |
| Ratio of net investment income to average net assetsd,e | .58 | .91 |
| Portfolio Turnover Ratec | 12.01 | 1.53 |
| Net Assets, end of period ($ x 1,000) | 53,655 | 10,337 |
| |
| a | From July 30, 2010 (commencement of operations) to August 31, 2010. |
| b | Based on average shares outstanding at each month end. |
| c | Not annualized. |
| d Annualized. |
| e | Amount does not include the activity of the underlying funds. |
See notes to financial statements.
104
| | | | |
| | Investor Shares |
| | Six Months Ended | |
| | February 28, 2011 | Period Ended |
| BNY Mellon Tax-Sensitive Large Cap Multi-Strategy Fund | (Unaudited) | August 31, 2010a |
| Per Share Data ($): | | |
| Net asset value, beginning of period | 9.52 | 10.00 |
| Investment Operations: | | |
| Investment income—netb | .02 | .01 |
| Net realized and unrealized | | |
| gain (loss) on investments | 2.59 | (.49) |
| Total from Investment Operations | 2.61 | (.48) |
| Distributions: | | |
| Dividends from investment income—net | (.02) | — |
| Dividends from net realized gain on investments | (.03) | — |
| Total Distributions | (.05) | — |
| Net asset value, end of period | 12.08 | 9.52 |
| Total Return (%)c | 27.38 | (4.80) |
| Ratios/Supplemental Data (%): | | |
| Ratio of total expenses to average net assetsd,e | 2.68 | 5.88 |
| Ratio of net expenses to average net assetd,e | 1.18 | 1.24 |
| Ratio of net investment income to average net assetsd,e | .32 | .65 |
| Portfolio Turnover Ratec | 12.01 | 1.53 |
| Net Assets, end of period ($ x 1,000) | 184 | 10 |
| |
| a | From July 30, 2010 (commencement of operations) to August 31, 2010. |
| b | Based on average shares outstanding at each month end. |
| c | Not annualized. |
| d | Annualized. |
| e | Amount does not include the activity of the underlying funds. |
See notes to financial statements.
FINANCIAL HIGHLIGHTS (continued)
| | | | | | | | | | | | |
| | | | Class M Shares | | | |
| | Six Months Ended | | | | | |
| | February 28, 2011 | | Year Ended August 31, | |
| BNY Mellon Income Stock Fund | (Unaudited) | 2010 | 2009 | 2008 | 2007 | 2006 |
| Per Share Data ($): | | | | | | |
| Net asset value, beginning of period | 5.49 | 5.39 | 7.22 | 10.61 | 10.43 | 9.92 |
| Investment Operations: | | | | | | |
| Investment income—neta | .07 | .09 | .12 | .16 | .19 | .22 |
| Net realized and unrealized | | | | | | |
| gain (loss) on investments | 1.42 | .10 | (1.35) | (1.35) | 1.04 | .75 |
| Total from Investment Operations | 1.49 | .19 | (1.23) | (1.19) | 1.23 | .97 |
| Distributions: | | | | | | |
| Dividends from investment income—net | (.08) | (.09) | (.13) | (.16) | (.19) | (.22) |
| Dividends from net realized gain on investments | — | — | (.47) | (2.04) | (.86) | (.24) |
| Total Distributions | (.08) | (.09) | (.60) | (2.20) | (1.05) | (.46) |
| Net asset value, end of period | 6.90 | 5.49 | 5.39 | 7.22 | 10.61 | 10.43 |
| Total Return (%) | 27.27b | 3.44 | (15.73) | (13.79) | 12.11 | 10.00 |
| Ratios/Supplemental Data (%): | | | | | | |
| Ratio of total expenses to average net assets | .88c | .86 | .87 | .84 | .81 | .81 |
| Ratio of net expenses to average net assets | .88c | .86 | .87 | .84 | .81 | .81 |
| Ratio of net investment income | | | | | | |
| to average net assets | 2.22c | 1.55 | 2.47 | 1.87 | 1.81 | 2.14 |
| Portfolio Turnover Rate | 56.09b | 66.78 | 65.88 | 33.02 | 62.06 | 40.75 |
| Net Assets, end of period ($ x 1,000) | 111,739 | 90,645 | 126,763 | 199,367 | 414,866 | 421,266 |
| |
| a | Based on average shares outstanding at each month end. |
| b | Not annualized. |
| c | Annualized. |
See notes to financial statements.
106
| | | | | | | | | | | | |
| | | | Investor Shares | | | |
| | Six Months Ended | | | | | |
| | February 28, 2011 | | Year Ended August 31, | |
| BNY Mellon Income Stock Fund | (Unaudited) | 2010 | 2009 | 2008 | 2007 | 2006 |
| Per Share Data ($): | | | | | | |
| Net asset value, beginning of period | 5.54 | 5.44 | 7.27 | 10.67 | 10.49 | 9.98 |
| Investment Operations: | | | | | | |
| Investment income—neta | .06 | .08 | .11 | .14 | .17 | .19 |
| Net realized and unrealized | | | | | | |
| gain (loss) on investments | 1.43 | .10 | (1.35) | (1.36) | 1.04 | .75 |
| Total from Investment Operations | 1.49 | .18 | (1.24) | (1.22) | 1.21 | .94 |
| Distributions: | | | | | | |
| Dividends from investment income—net | (.07) | (.08) | (.12) | (.14) | (.17) | (.19) |
| Dividends from net realized gain on investments | — | — | (.47) | (2.04) | (.86) | (.24) |
| Total Distributions | (.07) | (.08) | (.59) | (2.18) | (1.03) | (.43) |
| Net asset value, end of period | 6.96 | 5.54 | 5.44 | 7.27 | 10.67 | 10.49 |
| Total Return (%) | 27.06b | 3.19 | (15.84) | (14.03) | 11.78 | 9.68 |
| Ratios/Supplemental Data (%): | | | | | | |
| Ratio of total expenses to average net assets | 1.13c | 1.11 | 1.12 | 1.09 | 1.06 | 1.06 |
| Ratio of net expenses to average net assets | 1.13c | 1.11 | 1.12 | 1.09 | 1.06 | 1.06 |
| Ratio of net investment income | | | | | | |
| to average net assets | 1.96c | 1.29 | 2.19 | 1.62 | 1.55 | 1.92 |
| Portfolio Turnover Rate | 56.09b | 66.78 | 65.88 | 33.02 | 62.06 | 40.75 |
| Net Assets, end of period ($ x 1,000) | 980 | 988 | 1,045 | 1,407 | 1,719 | 1,468 |
| |
| a | Based on average shares outstanding at each month end. |
| b | Not annualized. |
| c | Annualized. |
See notes to financial statements.
FINANCIAL HIGHLIGHTS (continued)
| | | | | | | | | | | | |
| | | | Class M Shares | | |
| | Six Months Ended | | | | | |
| | February 28, 2011 | | Year Ended August 31, | |
| BNY Mellon Mid Cap Stock Fund | (Unaudited) | 2010 | 2009 | 2008 | 2007 | 2006 |
| Per Share Data ($): | | | | | | |
| Net asset value, beginning of period | 9.31 | 8.64 | 11.11 | 14.19 | 14.26 | 14.80 |
| Investment Operations: | | | | | | |
| Investment income—neta | .00b | .05 | .07 | .03 | .06 | .08 |
| Net realized and unrealized | | | | | | |
| gain (loss) on investments | 3.73 | .68 | (2.46) | (.53) | 2.17 | 1.21 |
| Total from Investment Operations | 3.73 | .73 | (2.39) | (.50) | 2.23 | 1.29 |
| Distributions: | | | | | | |
| Dividends from investment income—net | (.00)b | (.06) | (.06) | (.04) | (.08) | (.01) |
| Dividends from net realized gain on investments | — | — | (.02) | (2.54) | (2.22) | (1.82) |
| Total Distributions | (.00)b | (.06) | (.08) | (2.58) | (2.30) | (1.83) |
| Net asset value, end of period | 13.04 | 9.31 | 8.64 | 11.11 | 14.19 | 14.26 |
| Total Return (%) | 40.10c | 8.49 | (21.33) | (5.67) | 16.76 | 9.14 |
| Ratios/Supplemental Data (%): | | | | | | |
| Ratio of total expenses to average net assets | .90d | .90 | .92 | .90 | .90 | .91 |
| Ratio of net expenses to average net assets | .90d | .90 | .92 | .90 | .90 | .91 |
| Ratio of net investment income | | | | | | |
| to average net assets | .07d | .53 | .86 | .28 | .42 | .51 |
| Portfolio Turnover Rate | 66.41c | 123.41 | 147.50 | 121.12 | 112.31 | 93.33 |
| Net Assets, end of period ($ x 1,000) | 1,530,292 | 1,162,906 | 1,185,376 | 1,540,821 | 1,708,747 | 1,560,575 |
| |
| a | Based on average shares outstanding at each month end. |
| b | Amount represents less than $.01 per share. |
| c | Not annualized. |
| d | Annualized. |
See notes to financial statements.
108
| | | | | | | | | | | | |
| | | | Investor Shares | | | |
| | Six Months Ended | | | | | |
| | February 28, 2011 | | Year Ended August 31, | |
| BNY Mellon Mid Cap Stock Fund | (Unaudited) | 2010 | 2009 | 2008 | 2007 | 2006 |
| Per Share Data ($): | | | | | | |
| Net asset value, beginning of period | 9.24 | 8.57 | 11.00 | 14.07 | 14.16 | 14.73 |
| Investment Operations: | | | | | | |
| Investment income (loss)—neta | (.01) | .03 | .05 | .00b | .02 | .04 |
| Net realized and unrealized | | | | | | |
| gain (loss) on investments | 3.69 | .68 | (2.43) | (.53) | 2.15 | 1.21 |
| Total from Investment Operations | 3.68 | .71 | (2.38) | (.53) | 2.17 | 1.25 |
| Distributions: | | | | | | |
| Dividends from investment income—net | — | (.04) | (.03) | — | (.04) | — |
| Dividends from net realized gain on investments | — | — | (.02) | (2.54) | (2.22) | (1.82) |
| Total Distributions | — | (.04) | (.05) | (2.54) | (2.26) | (1.82) |
| Net asset value, end of period | 12.92 | 9.24 | 8.57 | 11.00 | 14.07 | 14.16 |
| Total Return (%) | 39.83c | 8.30 | (21.51) | (5.94) | 16.44 | 8.93 |
| Ratios/Supplemental Data (%): | | | | | | |
| Ratio of total expenses to average net assets | 1.15d | 1.15 | 1.17 | 1.15 | 1.15 | 1.15 |
| Ratio of net expenses to average net assets | 1.15d | 1.15 | 1.17 | 1.15 | 1.15 | 1.15 |
| Ratio of net investment income | | | | | | |
| (loss) to average net assets | (.18)d | .27 | .63 | .03 | .16 | .26 |
| Portfolio Turnover Rate | 66.41c | 123.41 | 147.50 | 121.12 | 112.31 | 93.33 |
| Net Assets, end of period ($ x 1,000) | 26,734 | 20,733 | 19,785 | 28,520 | 35,139 | 30,433 |
| |
| a | Based on average shares outstanding at each month end. |
| b | Amount represents less than $.01 per share. |
| c | Not annualized. |
| d | Annualized. |
See notes to financial statements.
FINANCIAL HIGHLIGHTS (continued)
| | | | | | | | | | | | |
| | | | Dreyfus Premier Shares | | |
| | Six Months Ended | | | | | |
| | February 28, 2011 | | Year Ended August 31, | |
| BNY Mellon Mid Cap Stock Fund | (Unaudited) | 2010 | 2009 | 2008 | 2007 | 2006 |
| Per Share Data ($): | | | | | | |
| Net asset value, beginning of period | 8.68 | 8.08 | 10.40 | 13.52 | 13.74 | 14.44 |
| Investment Operations: | | | | | | |
| Investment (loss)—neta | (.05) | (.04) | (.01) | (.09) | (.07) | (.07) |
| Net realized and unrealized | | | | | | |
| gain (loss) on investments | 3.47 | .64 | (2.29) | (.49) | 2.07 | 1.19 |
| Total from Investment Operations | 3.42 | .60 | (2.30) | (.58) | 2.00 | 1.12 |
| Distributions: | | | | | | |
| Dividends from net realized gain on investments | — | — | (.02) | (2.54) | (2.22) | (1.82) |
| Net asset value, end of period | 12.10 | 8.68 | 8.08 | 10.40 | 13.52 | 13.74 |
| Total Return (%) | 39.40b | 7.43 | (22.09) | (6.63) | 15.58 | 8.13 |
| Ratios/Supplemental Data (%): | | | | | | |
| Ratio of total expenses to average net assets | 1.90c | 1.90 | 1.92 | 1.90 | 1.90 | 1.90 |
| Ratio of net expenses to average net assets | 1.90c | 1.90 | 1.92 | 1.90 | 1.90 | 1.90 |
| Ratio of net investment (loss) | | | | | | |
| to average net assets | (.93)c | (.45) | (.11) | (.73) | (.53) | (.48) |
| Portfolio Turnover Rate | 66.41b | 123.41 | 147.50 | 121.12 | 112.31 | 93.33 |
| Net Assets, end of period ($ x 1,000) | 640 | 526 | 709 | 1,669 | 3,635 | 6,170 |
| |
| a | Based on average shares outstanding at each month end. |
| b | Not annualized. |
| c | Annualized. |
See notes to financial statements.
110
| | | | | | | | | | | | |
| | | | Class M Shares | | | |
| | Six Months Ended | | | | | |
| | February 28, 2011 | | Year Ended August 31, | |
| BNY Mellon Small Cap Stock Fund | (Unaudited) | 2010 | 2009 | 2008 | 2007 | 2006 |
| Per Share Data ($): | | | | | | |
| Net asset value, beginning of period | 8.94 | 8.57 | 11.44 | 14.82 | 15.39 | 17.18 |
| Investment Operations: | | | | | | |
| Investment income (loss)—neta | (.01) | .00b | .07 | .03 | .00b | (.01) |
| Net realized and unrealized | | | | | | |
| gain (loss) on investments | 3.39 | .38 | (2.85) | (1.15) | 1.83 | .80 |
| Total from Investment Operations | 3.38 | .38 | (2.78) | (1.12) | 1.83 | .79 |
| Distributions: | | | | | | |
| Dividends from investment income—net | — | (.01) | (.08) | — | — | — |
| Dividends from net realized gain on investments | — | — | (.01) | (2.26) | (2.40) | (2.58) |
| Total Distributions | — | (.01) | (.09) | (2.26) | (2.40) | (2.58) |
| Net asset value, end of period | 12.32 | 8.94 | 8.57 | 11.44 | 14.82 | 15.39 |
| Total Return (%) | 37.81c | 4.45 | (24.11) | (9.07) | 12.53 | 5.04 |
| Ratios/Supplemental Data (%): | | | | | | |
| Ratio of total expenses to average net assets | 1.02d | 1.00 | 1.03 | 1.01 | 1.01 | 1.01 |
| Ratio of net expenses to average net assets | 1.01d | .98 | .99 | 1.01 | 1.00 | 1.01 |
| Ratio of net investment income | | | | | | |
| (loss) to average net assets | (.24)d | .01 | .88 | .28 | .02 | (.08) |
| Portfolio Turnover Rate | 84.76c | 183.41 | 159.78 | 132.19 | 167.04 | 108.79 |
| Net Assets, end of period ($ x 1,000) | 454,845 | 412,824 | 610,567 | 633,118 | 670,238 | 667,241 |
| |
| a | Based on average shares outstanding at each month end. |
| b | Amount represents less than $.01 per share. |
| c | Not annualized. |
| d | Annualized. |
See notes to financial statements.
FINANCIAL HIGHLIGHTS (continued)
| | | | | | | | | | | | |
| | | | Investor Shares | | | |
| | Six Months Ended | | | | | |
| | February 28, 2011 | | Year Ended August 31, | |
| BNY Mellon Small Cap Stock Fund | (Unaudited) | 2010 | 2009 | 2008 | 2007 | 2006 |
| Per Share Data ($): | | | | | | |
| Net asset value, beginning of period | 8.72 | 8.36 | 11.11 | 14.50 | 15.13 | 16.97 |
| Investment Operations: | | | | | | |
| Investment income (loss)—neta | (.03) | (.02) | .05 | .00b | (.03) | (.05) |
| Net realized and unrealized | | | | | | |
| gain (loss) on investments | 3.30 | .38 | (2.72) | (1.13) | 1.80 | .79 |
| Total from Investment Operations | 3.27 | .36 | (2.67) | (1.13) | 1.77 | .74 |
| Distributions: | | | | | | |
| Dividends from investment income—net | — | — | (.07) | — | — | — |
| Dividends from net realized gain on investments | — | — | (.01) | (2.26) | (2.40) | (2.58) |
| Total Distributions | — | — | (.08) | (2.26) | (2.40) | (2.58) |
| Net asset value, end of period | 11.99 | 8.72 | 8.36 | 11.11 | 14.50 | 15.13 |
| Total Return (%) | 37.50c | 4.31 | (23.92) | (9.36) | 12.33 | 4.78 |
| Ratios/Supplemental Data (%): | | | | | | |
| Ratio of total expenses to average net assets | 1.27d | 1.25 | 1.28 | 1.26 | 1.26 | 1.26 |
| Ratio of net expenses to average net assets | 1.26d | 1.23 | 1.23 | 1.26 | 1.25 | 1.26 |
| Ratio of net investment income | | | | | | |
| (loss) to average net assets | (.49)d | (.24) | .61 | .02 | (.23) | (.35) |
| Portfolio Turnover Rate | 84.76c | 183.41 | 159.78 | 132.19 | 167.04 | 108.79 |
| Net Assets, end of period ($ x 1,000) | 7,591 | 6,022 | 6,277 | 3,795 | 5,341 | 6,618 |
| |
| a | Based on average shares outstanding at each month end. |
| b | Amount represents less than $.01 per share. |
| c | Not annualized. |
| d | Annualized. |
See notes to financial statements.
112
| | | | | | | | | | |
| | | Class M Shares | | |
| | Six Months Ended | | | | |
| | February 28, 2011 | | Year Ended August 31, | |
| BNY Mellon U.S. Core Equity 130/30 Fund | (Unaudited) | 2010 | 2009 | 2008 | 2007a |
| Per Share Data ($): | | | | | |
| Net asset value, beginning of period | 9.81 | 9.07 | 11.39 | 12.64 | 12.50 |
| Investment Operations: | | | | | |
| Investment income (loss)—netb | .04 | .03 | .07 | .07 | (.00)c |
| Net realized and unrealized | | | | | |
| gain (loss) on investments | 2.45 | .74 | (2.28) | (1.32) | .14 |
| Total from Investment Operations | 2.49 | .77 | (2.21) | (1.25) | .14 |
| Distributions: | | | | | |
| Dividends from investment income—net | (.05) | (.03) | (.11) | — | — |
| Net asset value, end of period | 12.25 | 9.81 | 9.07 | 11.39 | 12.64 |
| Total Return (%) | 25.39d | 8.53 | (19.19) | (9.89) | 1.12d |
| Ratios/Supplemental Data (%): | | | | | |
| Ratio of total expenses to average net assets | 1.64e | 1.79 | 2.02 | 2.39f | .50d |
| Ratio of net expenses to average net assets | 1.64e | 1.79 | 2.02 | 2.28f | .28d |
| Ratio of net investment income | | | | | |
| (loss) to average net assets | .64e | .26 | .87 | .58 | (.03)d |
| Portfolio Turnover Rate | 74.95d | 117.53 | 138.97 | 163.66 | 11.94d |
| Net Assets, end of period ($ x 1,000) | 298,597 | 186,137 | 80,952 | 180,803 | 26,064 |
| |
| a | From August 1, 2007 (commencement of operations) to August 31, 2007. |
| b | Based on average shares outstanding at each month end. |
| c | Amount represents less than $.01 per share. |
| d | Not annualized. |
| e | Annualized. |
| f | Higher costs are due to borrowing costs associated with the 130/30 fund structure. |
See notes to financial statements.
FINANCIAL HIGHLIGHTS (continued)
| | | | | | | | | | |
| | | Investor Shares | | |
| | Six Months Ended | | | | |
| | February 28, 2011 | | Year Ended August 31, | |
| BNY Mellon U.S. Core Equity 130/30 Fund | (Unaudited) | 2010 | 2009 | 2008 | 2007a |
| Per Share Data ($): | | | | | |
| Net asset value, beginning of period | 9.76 | 9.02 | 11.36 | 12.63 | 12.50 |
| Investment Operations: | | | | | |
| Investment income (loss)—netb | .02 | (.01) | .04 | .02 | (.00)c |
| Net realized and unrealized | | | | | |
| gain (loss) on investments | 2.43 | .75 | (2.27) | (1.29) | .13 |
| Total from Investment Operations | 2.45 | .74 | (2.23) | (1.27) | .13 |
| Distributions: | | | | | |
| Dividends from investment income—net | (.04) | — | (.11) | — | — |
| Net asset value, end of period | 12.17 | 9.76 | 9.02 | 11.36 | 12.63 |
| Total Return (%) | 25.15d | 8.20 | (19.47) | (10.06) | 1.04d |
| Ratios/Supplemental Data (%): | | | | | |
| Ratio of total expenses to average net assets | 1.95e | 2.09 | 2.25 | 2.81f | .50d |
| Ratio of net expenses to average net assets | 1.95e | 2.09 | 2.25 | 2.71f | .28d |
| Ratio of net investment income | | | | | |
| (loss) to average net assets | .37e | (.08) | .56 | .16 | (.03)d |
| Portfolio Turnover Rate | 74.95d | 117.53 | 138.97 | 163.66 | 11.94d |
| Net Assets, end of period ($ x 1,000) | 90 | 8 | 14 | 13 | 10 |
| |
| a | From August 1, 2007 (commencement of operations) to August 31, 2007. |
| b | Based on average shares outstanding at each month end. |
| c | Amount represents less than $.01 per share. |
| d | Not annualized. |
| e | Annualized. |
| f | Higher costs are due to borrowing costs associated with the 130/30 fund structure. |
See notes to financial statements.
114
| | | | |
| | Class M Shares |
| | Six Months Ended | |
| | February 28, 2011 | Period Ended |
| BNY Mellon Focused Equity Opportunities Fund | (Unaudited) | August 31, 2010a |
| Per Share Data ($): | | |
| Net asset value, beginning of period | 10.09 | 10.00 |
| Investment Operations: | | |
| Investment income—netb | .02 | .06 |
| Net realized and unrealized | | |
| gain (loss) on investments | 3.14 | .04 |
| Total from Investment Operations | 3.16 | .10 |
| Distributions: | | |
| Dividends from investment income—net | (.05) | (.01) |
| Dividends from net realized gain on investments | — | (.00)c |
| Total Distributions | (.05) | (.01) |
| Net asset value, end of period | 13.20 | 10.09 |
| Total Return (%)d | 31.36 | 1.01 |
| Ratios/Supplemental Data (%): | | |
| Ratio of total expenses to average net assetse | .87 | .98 |
| Ratio of net expenses to average net assetse | .87 | .89 |
| Ratio of net investment income to average net assetse | .40 | .59 |
| Portfolio Turnover Rated | 38.65 | 64.75 |
| Net Assets, end of period ($ x 1,000) | 414,449 | 238,332 |
| |
| a | From September 30, 2009 (commencement of operations) to August 31, 2010. |
| b | Based on average shares outstanding at each month end. |
| c | Amount represents less than $.01 per share. |
| d | Not annualized. |
| e | Annualized. |
See notes to financial statements.
FINANCIAL HIGHLIGHTS (continued)
| | | | |
| | Investor Shares |
| | Six Months Ended | |
| | February 28, 2011 | Period Ended |
| BNY Mellon Focused Equity Opportunities Fund | (Unaudited) | August 31, 2010a |
| Per Share Data ($): | | |
| Net asset value, beginning of period | 10.07 | 10.00 |
| Investment Operations: | | |
| Investment income—netb | .01 | .02 |
| Net realized and unrealized | | |
| gain (loss) on investments | 3.13 | .06 |
| Total from Investment Operations | 3.14 | .08 |
| Distributions: | | |
| Dividends from investment income—net | (.02) | (.01) |
| Dividends from net realized gain on investments | — | (.00)c |
| Total Distributions | (.02) | (.01) |
| Net asset value, end of period | 13.19 | 10.07 |
| Total Return (%)d | 31.24 | .75 |
| Ratios/Supplemental Data (%): | | |
| Ratio of total expenses to average net assetse | 1.11 | 1.53 |
| Ratio of net expenses to average net assetse | 1.11 | 1.14 |
| Ratio of net investment income to average net assetse | .18 | .23 |
| Portfolio Turnover Rated | 38.65 | 64.75 |
| Net Assets, end of period ($ x 1,000) | 17 | 13 |
| |
| a | From September 30, 2009 (commencement of operations) to August 31, 2010. |
| b | Based on average shares outstanding at each month end. |
| c | Amount represents less than $.01 per share. |
| d | Not annualized. |
| e | Annualized. |
See notes to financial statements.
116
| | | | |
| | Class M Shares |
| | Six Months Ended | |
| | February 28, 2011 | Period Ended |
| BNY Mellon Small/Mid Cap Fund | (Unaudited) | August 31, 2010a |
| Per Share Data ($): | | |
| Net asset value, beginning of period | 10.92 | 10.00 |
| Investment Operations: | | |
| Investment income—netb | .03 | .01 |
| Net realized and unrealized | | |
| gain (loss) on investments | 4.19 | .95 |
| Total from Investment Operations | 4.22 | .96 |
| Distributions: | | |
| Dividends from investment income—net | (.04) | (.01) |
| Dividends from net realized gain on investments | (.09) | (.03) |
| Total Distributions | (.13) | (.04) |
| Net asset value, end of period | 15.01 | 10.92 |
| Total Return (%)c | 38.69 | 9.65 |
| Ratios/Supplemental Data (%): | | |
| Ratio of total expenses to average net assetsd | .93 | 1.07 |
| Ratio of net expenses to average net assetsd | .93 | .92 |
| Ratio of net investment income to average net assetsd | .45 | .06 |
| Portfolio Turnover Ratec | 55.50 | 109.25 |
| Net Assets, end of period ($ x 1,000) | 494,813 | 222,034 |
| |
| a | From September 30, 2009 (commencement of operations) to August 31, 2010. |
| b | Based on average shares outstanding at each month end. |
| c | Not annualized. |
| d | Annualized. |
See notes to financial statements.
FINANCIAL HIGHLIGHTS (continued)
| | | | |
| | Investor Shares |
| | Six Months Ended | |
| | February 28, 2011 | Period Ended |
| BNY Mellon Small/Mid Cap Fund | (Unaudited) | August 31, 2010a |
| Per Share Data ($): | | |
| Net asset value, beginning of period | 10.89 | 10.00 |
| Investment Operations: | | |
| Investment income—netb | .03 | .01 |
| Net realized and unrealized | | |
| gain (loss) on investments | 4.16 | .92 |
| Total from Investment Operations | 4.19 | .93 |
| Distributions: | | |
| Dividends from investment income—net | — | (.01) |
| Dividends from net realized gain on investments | (.09) | (.03) |
| Total Distributions | (.09) | (.04) |
| Net asset value, end of period | 14.99 | 10.89 |
| Total Return (%)c | 38.52 | 9.34 |
| Ratios/Supplemental Data (%): | | |
| Ratio of total expenses to average net assetsd | 1.18 | 2.35 |
| Ratio of net expenses to average net assetsd | 1.16 | 1.20 |
| Ratio of net investment income to average net assetsd | .45 | .08 |
| Portfolio Turnover Ratec | 55.50 | 109.25 |
| Net Assets, end of period ($ x 1,000) | 67 | 16 |
| |
| a | From September 30, 2009 (commencement of operations) to August 31, 2010. |
| b | Based on average shares outstanding at each month end. |
| c | Not annualized. |
| d | Annualized. |
See notes to financial statements.
118
| | | | | | | | | | | | |
| | | | Class M Shares | | |
| | Six Months Ended | | | | | |
| | February 28, 2011 | | Year Ended August 31, | |
| BNY Mellon International Fund | (Unaudited) | 2010 | 2009 | 2008 | 2007 | 2006 |
| Per Share Data ($): | | | | | | |
| Net asset value, beginning of period | 9.38 | 10.12 | 12.11 | 17.56 | 17.77 | 16.20 |
| Investment Operations: | | | | | | |
| Investment income—neta | .04 | .18 | .22 | .33 | .28 | .28 |
| Net realized and unrealized | | | | | | |
| gain (loss) on investments | 2.32 | (.67) | (1.54) | (3.14) | 1.92 | 3.02 |
| Total from Investment Operations | 2.36 | (.49) | (1.32) | (2.81) | 2.20 | 3.30 |
| Distributions: | | | | | | |
| Dividends from investment income—net | (.21) | (.25) | (.41) | (.29) | (.30) | (.23) |
| Dividends from net realized gain on investments | — | — | (.26) | (2.35) | (2.11) | (1.50) |
| Total Distributions | (.21) | (.25) | (.67) | (2.64) | (2.41) | (1.73) |
| Net asset value, end of period | 11.53 | 9.38 | 10.12 | 12.11 | 17.56 | 17.77 |
| Total Return (%) | 25.34b | (5.07) | (9.95) | (18.61) | 12.93 | 21.86 |
| Ratios/Supplemental Data (%): | | | | | | |
| Ratio of total expenses to average net assets | 1.01c | 1.09 | 1.14 | 1.10 | 1.08 | 1.10 |
| Ratio of net expenses to average net assets | 1.01c | 1.09 | 1.03 | 1.06 | 1.08 | 1.10 |
| Ratio of net investment income | | | | | | |
| to average net assets | .81c | 1.79 | 2.52 | 2.22 | 1.59 | 1.68 |
| Portfolio Turnover Rate | 30.31b | 67.16 | 102.83 | 78.35 | 72.83 | 70.02 |
| Net Assets, end of period ($ x 1,000) | 1,126,353 | 996,647 | 1,247,441 | 2,002,307 | 2,836,968 | 2,534,753 |
| |
| a | Based on average shares outstanding at each month end. |
| b | Not annualized. |
| c | Annualized. |
See notes to financial statements.
FINANCIAL HIGHLIGHTS (continued)
| | | | | | | | | | | | |
| | | | Investor Shares | | | |
| | Six Months Ended | | | | | |
| | February 28, 2011 | | Year Ended August 31, | |
| BNY Mellon International Fund | (Unaudited) | 2010 | 2009 | 2008 | 2007 | 2006 |
| Per Share Data ($): | | | | | | |
| Net asset value, beginning of period | 9.92 | 10.69 | 12.70 | 18.29 | 18.41 | 16.74 |
| Investment Operations: | | | | | | |
| Investment income—neta | .03 | .16 | .20 | .28 | .23 | .26 |
| Net realized and unrealized | | | | | | |
| gain (loss) on investments | 2.44 | (.70) | (1.60) | (3.26) | 2.03 | 3.11 |
| Total from Investment Operations | 2.47 | (.54) | (1.40) | (2.98) | 2.26 | 3.37 |
| Distributions: | | | | | | |
| Dividends from investment income—net | (.18) | (.23) | (.35) | (.26) | (.27) | (.20) |
| Dividends from net realized gain on investments | — | — | (.26) | (2.35) | (2.11) | (1.50) |
| Total Distributions | (.18) | (.23) | (.61) | (2.61) | (2.38) | (1.70) |
| Net asset value, end of period | 12.21 | 9.92 | 10.69 | 12.70 | 18.29 | 18.41 |
| Total Return (%) | 25.08b | (5.26) | (10.11) | (18.87) | 12.73 | 21.49 |
| Ratios/Supplemental Data (%): | | | | | | |
| Ratio of total expenses to average net assets | 1.26c | 1.34 | 1.38 | 1.35 | 1.33 | 1.36 |
| Ratio of net expenses to average net assets | 1.26c | 1.34 | 1.28 | 1.32 | 1.32 | 1.36 |
| Ratio of net investment income | | | | | | |
| to average net assets | .55c | 1.46 | 2.27 | 1.82 | 1.26 | 1.50 |
| Portfolio Turnover Rate | 30.31b | 67.16 | 102.83 | 78.35 | 72.83 | 70.02 |
| Net Assets, end of period ($ x 1,000) | 5,513 | 4,319 | 5,099 | 6,627 | 13,634 | 9,256 |
| |
| a | Based on average shares outstanding at each month end. |
| b | Not annualized. |
| c | Annualized. |
See notes to financial statements.
120
| | | | | | | | | | | | |
| | | | Class M Shares | | |
| | Six Months Ended | | | | | |
| | February 28, 2011 | | Year Ended August 31, | |
| BNY Mellon Emerging Markets Fund | (Unaudited) | 2010 | 2009 | 2008 | 2007 | 2006 |
| Per Share Data ($): | | | | | | |
| Net asset value, beginning of period | 10.02 | 8.71 | 16.89 | 24.42 | 24.53 | 22.69 |
| Investment Operations: | | | | | | |
| Investment income (loss)—neta | (.01) | .08 | .14 | .23 | .25 | .29 |
| Net realized and unrealized | | | | | | |
| gain (loss) on investments | 1.41 | 1.31 | (3.58) | (1.45) | 7.18 | 4.96 |
| Total from Investment Operations | 1.40 | 1.39 | (3.44) | (1.22) | 7.43 | 5.25 |
| Distributions: | | | | | | |
| Dividends from investment income—net | (.05) | (.08) | (.42) | (.21) | (.22) | (.44) |
| Dividends from net realized gain on investments | — | — | (4.32) | (6.10) | (7.32) | (2.97) |
| Total Distributions | (.05) | (.08) | (4.74) | (6.31) | (7.54) | (3.41) |
| Net asset value, end of period | 11.37 | 10.02 | 8.71 | 16.89 | 24.42 | 24.53 |
| Total Return (%) | 13.99b | 15.92 | (6.07) | (9.11) | 35.81 | 24.59 |
| Ratios/Supplemental Data (%): | | | | | | |
| Ratio of total expenses to average net assets | 1.42c | 1.54 | 1.64 | 1.53 | 1.50 | 1.52 |
| Ratio of net expenses to average net assets | 1.42c | 1.54 | 1.64 | 1.52 | 1.50 | 1.52 |
| Ratio of net investment income | | | | | | |
| (loss) to average net assets | (.25)c | .85 | 1.76 | 1.11 | 1.05 | 1.18 |
| Portfolio Turnover Rate | 39.19b | 76.34 | 119.72 | 63.60 | 60.72 | 49.06 |
| Net Assets, end of period ($ x 1,000) | 2,324,441 | 1,796,274 | 1,097,296 | 1,141,146 | 1,521,024 | 1,312,055 |
| |
| a | Based on average shares outstanding at each month end. |
| b | Not annualized. |
| c | Annualized. |
See notes to financial statements.
FINANCIAL HIGHLIGHTS (continued)
| | | | | | | | | | | | |
| | | | Investor Shares | | | |
| | Six Months Ended | | | | | |
| | February 28, 2011 | | Year Ended August 31, | |
| BNY Mellon Emerging Markets Fund | (Unaudited) | 2010 | 2009 | 2008 | 2007 | 2006 |
| Per Share Data ($): | | | | | | |
| Net asset value, beginning of period | 10.27 | 8.94 | 17.05 | 24.60 | 24.65 | 22.79 |
| Investment Operations: | | | | | | |
| Investment income (loss)—neta | (.03) | .06 | .11 | .20 | .15 | .26 |
| Net realized and unrealized | | | | | | |
| gain (loss) on investments | 1.47 | 1.33 | (3.55) | (1.50) | 7.27 | 4.96 |
| Total from Investment Operations | 1.44 | 1.39 | (3.44) | (1.30) | 7.42 | 5.22 |
| Distributions: | | | | | | |
| Dividends from investment income—net | (.04) | (.06) | (.35) | (.15) | (.15) | (.39) |
| Dividends from net realized gain on investments | — | — | (4.32) | (6.10) | (7.32) | (2.97) |
| Total Distributions | (.04) | (.06) | (4.67) | (6.25) | (7.47) | (3.36) |
| Net asset value, end of period | 11.67 | 10.27 | 8.94 | 17.05 | 24.60 | 24.65 |
| Total Return (%) | 14.02b | 15.56 | (6.32) | (9.29) | 35.52 | 24.29 |
| Ratios/Supplemental Data (%): | | | | | | |
| Ratio of total expenses to average net assets | 1.66c | 1.77 | 1.91 | 1.78 | 1.75 | 1.78 |
| Ratio of net expenses to average net assets | 1.66c | 1.77 | 1.91 | 1.78 | 1.74 | 1.78 |
| Ratio of net investment income | | | | | | |
| (loss) to average net assets | (.52)c | .54 | 1.32 | .96 | .65 | 1.07 |
| Portfolio Turnover Rate | 39.19b | 76.34 | 119.72 | 63.60 | 60.72 | 49.06 |
| Net Assets, end of period ($ x 1,000) | 12,920 | 7,091 | 4,476 | 7,187 | 10,846 | 11,761 |
| |
| a | Based on average shares outstanding at each month end. |
| b | Not annualized. |
| c | Annualized. |
See notes to financial statements.
122
| | | | | | | | | | | | | | |
| | | | Class M Shares | | | | |
| | Six Months Ended | | | | | | |
| BNY Mellon International | February 28, 2011 | Year Ended | Eight Months Ended | | Year Ended December 31, | |
| Appreciation Fund† | (Unaudited) | August 31, 2010 | August 31, 2009a | 2008 | 2007 | 2006 | 2005 |
| Per Share Data ($): | | | | | | | |
| Net asset value, beginning of period | 10.54 | 11.35 | 9.40 | 16.58 | 15.46 | 12.62 | 11.32 |
| Investment Operations: | | | | | | | |
| Investment income—netb | .11 | .26 | .23 | .45 | .41 | .30 | .20 |
| Net realized and unrealized | | | | | | | |
| gain (loss) on investments | 2.57 | (.73) | 1.73 | (7.17) | 1.10 | 2.81 | 1.29 |
| Total from Investment Operations | 2.68 | (.47) | 1.96 | (6.72) | 1.51 | 3.11 | 1.49 |
| Distributions: | | | | | | | |
| Dividends from investment income—net | (.27) | (.34) | (.01) | (.46) | (.39) | (.27) | (.19) |
| Net asset value, end of period | 12.95 | 10.54 | 11.35 | 9.40 | 16.58 | 15.46 | 12.62 |
| Total Return (%) | 25.67c | (4.35) | 20.93c | (41.12) | 9.79 | 24.68 | 13.14 |
| Ratios/Supplemental Data (%): | | | | | | | |
| Ratio of total expenses | | | | | | | |
| to average net assets | .68d | .68 | .70d | .70 | .69 | .68 | .84 |
| Ratio of net expenses | | | | | | | |
| to average net assets | .67d | .66 | .66d | .67 | .69 | .68 | .84 |
| Ratio of net investment income | | | | | | | |
| to average net assets | 1.85d | 2.29 | 3.80d | 3.32 | 2.45 | 2.14 | 1.71 |
| Portfolio Turnover Rate | .76c | 2.71 | 2.63c | 10.62 | 11 | 15 | 11 |
| Net Assets, end of period ($ x 1,000) | 252,283 | 218,067 | 256,140 | 267,393 | 545,392 | 456,316 | 308,769 |
|
| † Represents information for Institutional shares of the fund’s predecessor, BNY Hamilton International Equity Fund, through September 12, 2008. |
| a The fund has changed its fiscal year end from December 31 to August 31. |
| b Based on average shares outstanding at each month end. |
| c Not annualized. |
| d Annualized. |
See notes to financial statements.
FINANCIAL HIGHLIGHTS (continued)
| | | | | | | | | | | | | | |
| | | | Investor Shares | | | | |
| | Six Months Ended | | | | | | |
| BNY Mellon International | February 28, 2011 | Year Ended | Eight Months Ended | | Year Ended December 31, | |
| Appreciation Fund† | (Unaudited) | August 31, 2010 | August 31, 2009a | 2008 | 2007 | 2006 | 2005 |
| Per Share Data ($): | | | | | | | |
| Net asset value, beginning of period | 10.43 | 11.24 | 9.31 | 16.37 | 15.27 | 12.47 | 11.19 |
| Investment Operations: | | | | | | | |
| Investment income—netb | .10 | .23 | .22 | .40 | .36 | .27 | .17 |
| Net realized and unrealized | | | | | | | |
| gain (loss) on investments | 2.54 | (.72) | 1.71 | (7.06) | 1.09 | 2.77 | 1.26 |
| Total from Investment Operations | 2.64 | (.49) | 1.93 | (6.66) | 1.45 | 3.04 | 1.43 |
| Distributions: | | | | | | | |
| Dividends from investment income—net | (.24) | (.32) | — | (.40) | (.35) | (.24) | (.15) |
| Net asset value, end of period | 12.83 | 10.43 | 11.24 | 9.31 | 16.37 | 15.27 | 12.47 |
| Total Return (%) | 25.55c | (4.60) | 20.73c | (41.21) | 9.50 | 24.38 | 12.81 |
| Ratios/Supplemental Data (%): | | | | | | | |
| Ratio of total expenses | | | | | | | |
| to average net assets | .93d | .93 | .95d | .95 | .94 | .93 | 1.10 |
| Ratio of net expenses | | | | | | | |
| to average net assets | .93d | .90 | .91d | .92 | .94 | .93 | 1.10 |
| Ratio of net investment income | | | | | | | |
| to average net assets | 1.60d | 2.08 | 3.56d | 3.02 | 2.20 | 1.92 | 1.49 |
| Portfolio Turnover Rate | .76c | 2.71 | 2.63c | 10.62 | 11 | 15 | 11 |
| Net Assets, end of period ($ x 1,000) | 4,241 | 3,462 | 4,171 | 3,179 | 5,623 | 5,366 | 4,431 |
|
| † Represents information for Class A shares of the fund’s predecessor, BNY Hamilton International Equity Fund, through September 12, 2008. |
| a The fund has changed its fiscal year end from December 31 to August 31. |
| b Based on average shares outstanding at each month end. |
| c Not annualized. |
| d Annualized. |
See notes to financial statements.
124
| | | | | | | | | | | | |
| | | | Class M Shares | | | |
| | Six Months Ended | | | | | |
| | February 28, 2011 | | Year Ended August 31, | |
| BNY Mellon Balanced Fund | (Unaudited) | 2010 | 2009 | 2008 | 2007 | 2006 |
| Per Share Data ($): | | | | | | |
| Net asset value, beginning of period | 9.85 | 9.44 | 10.93 | 12.91 | 13.17 | 12.79 |
| Investment Operations: | | | | | | |
| Investment income—neta | .09 | .19 | .24 | .30 | .29 | .27 |
| Net realized and unrealized | | | | | | |
| gain (loss) on investments | 1.51 | .46 | (1.01) | (.73) | 1.21 | .64 |
| Total from Investment Operations | 1.60 | .65 | (.77) | (.43) | 1.50 | .91 |
| Distributions: | | | | | | |
| Dividends from investment income—net | (.11) | (.24) | (.27) | (.36) | (.32) | (.30) |
| Dividends from net realized gain on investments | — | — | (.45) | (1.19) | (1.44) | (.23) |
| Total Distributions | (.11) | (.24) | (.72) | (1.55) | (1.76) | (.53) |
| Net asset value, end of period | 11.34 | 9.85 | 9.44 | 10.93 | 12.91 | 13.17 |
| Total Return (%) | 16.30b | 6.84 | (6.08) | (3.99) | 12.09 | 7.22 |
| Ratios/Supplemental Data (%): | | | | | | |
| Ratio of total expenses to average net assetsc | .55d | .57 | .60 | .58 | .58 | .60 |
| Ratio of net expenses to average net assetsc | .55d | .57 | .60 | .58 | .58 | .60 |
| Ratio of net investment income | | | | | | |
| to average net assetsc | 1.70d | 1.78 | 2.81 | 2.51 | 2.26 | 2.10 |
| Portfolio Turnover Rate | 39.75b | 69.81 | 78.44e | 51.92e | 89.78e | 64.43e |
| Net Assets, end of period ($ x 1,000) | 397,977 | 335,138 | 301,643 | 317,545 | 358,068 | 342,110 |
|
| a Based on average shares outstanding at each month end. |
| b Not annualized. |
| c Amount does not include the activity of the underlying funds. |
| d Annualized. |
| e The portfolio turnover rates excluding mortgage dollar roll transactions for the periods ended August 31, 2009, 2008, 2007 and 2006 were 77.77%, 51.44%, 75.75% and |
| 61.53%, respectively. |
See notes to financial statements.
FINANCIAL HIGHLIGHTS (continued)
| | | | | | | | | | | | |
| | | | Investor Shares | | | |
| | Six Months Ended | | | | | |
| | February 28, 2011 | | Year Ended August 31, | |
| BNY Mellon Balanced Fund | (Unaudited) | 2010 | 2009 | 2008 | 2007 | 2006 |
| Per Share Data ($): | | | | | | |
| Net asset value, beginning of period | 9.90 | 9.50 | 10.98 | 12.96 | 13.21 | 12.83 |
| Investment Operations: | | | | | | |
| Investment income—neta | .08 | .17 | .23 | .27 | .26 | .24 |
| Net realized and unrealized | | | | | | |
| gain (loss) on investments | 1.52 | .44 | (1.01) | (.74) | 1.21 | .63 |
| Total from Investment Operations | 1.60 | .61 | (.78) | (.47) | 1.47 | .87 |
| Distributions: | | | | | | |
| Dividends from investment income—net | (.10) | (.21) | (.25) | (.32) | (.28) | (.26) |
| Dividends from net realized gain on investments | — | — | (.45) | (1.19) | (1.44) | (.23) |
| Total Distributions | (.10) | (.21) | (.70) | (1.51) | (1.72) | (.49) |
| Net asset value, end of period | 11.40 | 9.90 | 9.50 | 10.98 | 12.96 | 13.21 |
| Total Return (%) | 16.16b | 6.44 | (6.11) | (4.29) | 11.73 | 6.93 |
| Ratios/Supplemental Data (%): | | | | | | |
| Ratio of total expenses to average net assetsc | .80d | .82 | .85 | .81 | .86 | .85 |
| Ratio of net expenses to average net assetsc | .80d | .82 | .85 | .81 | .86 | .85 |
| Ratio of net investment income | | | | | | |
| to average net assetsc | 1.43d | 1.54 | 2.57 | 2.28 | 1.98 | 1.86 |
| Portfolio Turnover Rate | 39.75b | 69.81 | 78.44c | 51.92c | 89.78c | 64.43c |
| Net Assets, end of period ($ x 1,000) | 4,834 | 4,015 | 4,412 | 4,812 | 4,274 | 3,727 |
|
| a Based on average shares outstanding at each month end. |
| b Not annualized. |
| c Amount does not include the activity of the underlying funds. |
| d Annualized. |
| e The portfolio turnover rates excluding mortgage dollar roll transactions for the periods ended August 31, 2009, 2008, 2007 and 2006 were 77.77%, 51.44%, 75.75% and |
| 61.53%, respectively. |
See notes to financial statements.
126
NOTES TO FINANCIAL STATEMENTS (Unaudited)
NOTE 1—General:
BNY Mellon FundsTrust (the “Trust”) was organized as a Massachusetts business trust which is registered under the Investment Company Act of 1940, as amended (the “Act”), as an open-end management investment company and operates as a series company currently consisting of twenty-five series including the following diversified equity funds and balanced fund: BNY Mellon Large Cap Stock Fund, BNY Mellon Large Cap Market Opportunities Fund, BNY Mellon Tax-Sensitive Large Cap Multi-Strategy Fund, BNY Mellon Income Stock Fund, BNY Mellon Mid Cap Stock Fund, BNY Mellon Small Cap Stock Fund, BNY Mellon U.S. Core Equity 130/30 Fund, BNY Mellon Small/Mid Cap Fund, BNY Mellon International Fund, BNY Mellon Emerging Markets Fund, BNY Mellon International Appreciation Fund and BNY Mellon Balanced Fund and the following non-diversified equity fund: BNY Mellon Focused Equity Opportunities Fund (each, a “fund” and collectively, the “funds”). BNY Mellon Large Cap Stock Fund, BNY Mellon Large Cap Market Opportunities Fund, BNY Mellon Tax-Sensitive Large Cap Multi-Strategy Fund, BNY Mellon Mid Cap Stock Fund, BNY Mellon Small Cap Stock Fund, BNY Mellon U.S. Core Equity 130/30 Fund, BNY Mellon Focused Equity Opportunities Fund and BNY Mellon Small/Mid Cap Fund seek capital appreciation and BNY Mellon Income Stock Fund seeks total return (consisting of capital appreciation and income). BNY Mellon International Fund and BNY Mellon Emerging Markets Fund seek long-term capital growth. BNY Mellon International Appreciation Fund seeks long-term capital appreciation. BNY Mellon Balanced Fund seeks long-term growth of principal in conjunction with current income.
BNY Mellon Fund Advisers, a division of The Dreyfus Corporation (the “Manager” or “Dreyfus”), a wholly-owned subsidiary of The Bank of New York Mellon
Corporation (“BNY Mellon”), serves as each fund’s investment adviser (“Investment Adviser”).The Bank of New York Mellon, a subsidiary of BNY Mellon and an affiliate of Dreyfus, serves as administrator for the funds pursuant to an Administration Agreement with the Trust (the “Administration Agreement”). The Bank of New York Mellon has entered into a Sub-Administration Agreement with Dreyfus pursuant to which The Bank of New York Mellon pays Dreyfus for performing certain administrative services. Walter Scott & Partners Limited (“Walter Scott”), also a subsidiary of BNY Mellon and an affiliate of Dreyfus, serves as the BNY Mellon Large Cap Market Opportunities Fund’s and BNY Mellon Tax-Sensitive Large Cap Multi-Strategy Fund’s sub-investment adviser. MBSC Securities Corporation (the “Distributor”), a wholly-owned subsidiary of Dreyfus, is the distributor of each fund’s shares.
The Trust is authorized to issue an unlimited number of shares of Beneficial Interest, par value $.001 per share, in each of the Class M and Investor class shares of each fund and in the Dreyfus Premier class shares of BNY Mellon Mid Cap Stock Fund. Dreyfus Premier shares of BNY Mellon Mid Cap Stock Fund are subject to a contingent deferred sales charge (“CDSC”) imposed on redemptions of Dreyfus Premier shares made within six years of purchase and automatically convert to Investor class shares after six years. BNY Mellon Mid Cap Stock Fund does not offer Dreyfus Premier shares, except in connection with dividend reinvestment and permitted exchanges of Dreyfus Premier shares. Other differences between the classes include the services offered to and the expenses borne by each class, the allocation of certain transfer agency costs and certain voting rights. Income, expenses (other than expenses attributable to a specific class), and realized and unrealized gains or losses on investments are allocated to each class of shares based on its relative net assets.
NOTES TO FINANCIAL STATEMENTS (Unaudited) (continued)
As of February 28, 2011, MBC Investments Corp., an indirect subsidiary of BNY Mellon, held the following shares:
| |
| BNY Mellon Large Cap Market | |
| Opportunities Fund, Investor shares | 1,000 |
| BNY Mellon U.S. Core Equity | |
| 130/30 Fund, Investor shares | 800 |
| BNY Mellon Focused Equity | |
| Opportunities Fund, Investor shares | 1,002 |
| BNY Mellon Small/Mid Cap Fund, | |
| Investor shares | 1,010 |
TheTrust accounts separately for the assets, liabilities and operations of each series. Expenses directly attributable to each series are charged to that series’ operations; expenses which are applicable to all series are allocated among them on a pro rata basis.
The Financial Accounting Standards Board (“FASB”) Accounting Standards Codification (“ASC”) is the exclusive reference of authoritative U.S. generally accepted accounting principles (“GAAP”) recognized by the FASB to be applied by nongovernmental entities. Rules and interpretive releases of the Securities and Exchange Commission (“SEC”) under authority of federal laws are also sources of authoritative GAAP for SEC registrants. Each fund’s financial statements are prepared in accordance with GAAP, which may require the use of management estimates and assumptions. Actual results could differ from those estimates.
NOTE 2—Significant Accounting Policies:
(a) Portfolio valuation: Investments in equity securities are valued at the last sales price on the securities exchange or national securities market on which such securities are primarily traded. Securities listed on the National Market System for which market quotations are available are valued at the official closing price or, if there is no official closing price that day, at the last sales price. Securities not listed on an exchange or the national securities market, or securities for which there were no transactions, are valued at the average of the most recent bid and asked prices, except for open short positions, where the asked price is
used for valuation purposes. Bid price is used when no asked price is available. Registered investment companies that are not traded on an exchange are valued at their net asset value. When market quotations or official closing prices are not readily available, or are determined not to reflect accurately fair value, such as when the value of the security has been significantly affected by events after the close of the exchange or market on which the security is principally traded (for example, a foreign exchange or market), but before the funds calculate their net asset values, the funds may value these investments at fair value as determined in accordance with the procedures approved by the Trust’s Board. Fair valuing of securities may be determined with the assistance of a pricing service using calculations based on indices of domestic securities and other appropriate indicators, such as prices of relevant ADRs and futures contracts. For other securities that are fair valued by the Trust’s Board, certain factors may be considered such as: fundamental analytical data, the nature and duration of restrictions on disposition, an evaluation of the forces that influence the market in which securities are purchased and sold, and public trading in similar securities of the issuer or comparable issuers. Financial futures and options, which are traded on an exchange, are valued at the last sales price on the securities exchange on which such securities are primarily traded or at the last sales price on the national securities market on each business day. Options traded over-the-counter are valued at the mean between the bid and asked price. Investments denominated in foreign currencies are translated to U.S. dollars at the prevailing rates of exchange. Forward foreign currency exchange contracts (“forward contracts”) are valued at the forward rate.
BNY Mellon Balanced Fund
Most debt securities are valued each business day by an independent pricing service (the “Service”) approved by theTrust’s Board. Securities listed on the National Market System for which market quotations are available are valued at the official closing price or, if there is no official closing price that day, at the last sales price. Debt securities
128
for which quoted bid prices are readily available and are representative of the bid side of the market in the judgment of the Service are valued at the mean between the quoted bid prices (as obtained by the Service from dealers in such securities) and asked prices (as calculated by the Service based upon its evaluation of the market for such securities). Other debt securities (which constitute a majority of the portfolio securities) are valued as determined by the Service, based on methods which include consideration of: yields or prices of securities of comparable quality, coupon, maturity and type; indications as to values from dealers; and general market conditions. Restricted securities, as well as securities or other assets for which recent market quotations are not readily available and are not valued by a pricing service approved by the Trust’s Board, or are determined by the fund not to reflect accurately fair value, are valued at fair value as determined in good faith under the direction of theTrust’s Board.The factors that may be considered when fair valuing a security include fundamental analytical data, the nature and duration of restrictions on disposition, an evaluation of the forces that influence the market in which the securities are purchased and sold, and public trading in similar securities of the issuer or comparable issuers.
The fair value of a financial instrument is the amount that would be received to sell an asset or paid to transfer a liability in an orderly transaction between market participants at the measurement date (i.e. the exit price). GAAP establishes a fair value hierarchy that prioritizes the inputs of valuation techniques used to measure fair value.This hierarchy gives the highest priority to unadjusted quoted prices in active markets for identical assets or liabilities (Level 1 measurements) and the lowest priority to unobservable inputs (Level 3 measurements).
Additionally, GAAP provides guidance on determining whether the volume and activity in a market has decreased significantly and whether such a decrease in activity results in transactions that are not orderly. GAAP requires enhanced disclosures around valuation inputs and techniques used during annual and interim periods.
Various inputs are used in determining the value of each fund’s investments relating to fair value measurements. These inputs are summarized in the three broad levels listed below:
Level 1—unadjusted quoted prices in active markets for identical investments.
Level 2—other significant observable inputs (including quoted prices for similar investments, interest rates, prepayment speeds, credit risk, etc.).
Level 3—significant unobservable inputs (including the funds’ own assumptions in determining the fair value of investments).
The inputs or methodology used for valuing securities are not necessarily an indication of the risk associated with investing in those securities.
Table 1 summarizes the inputs used as of February 28, 2011 in valuing each fund’s investments.
In January 2010, FASB issued Accounting Standards Update (“ASU”) No. 2010-06 “Improving Disclosures about Fair Value Measurements”. The portions of ASU No. 2010-06 which require reporting entities to prepare new disclosures surrounding amounts and reasons for significant transfers in and out of Level 1 and Level 2 fair value measurements as well as inputs and valuation techniques used to measure fair value for both recurring and nonrecurring fair value measurements that fall in either Level 2 or Level 3 have been adopted by each fund. No significant transfers between Level 1 or Level 2 fair value measurements occurred at February 28, 2011. The remaining portion of ASU No. 2010-06 requires reporting entities to make new disclosures about information on purchases, sales, issuances and settlements on a gross basis in the reconciliation of activity in Level 3 fair value measurements. These new and revised disclosures are required to be implemented for fiscal years beginning after December 15, 2010. Management is currently evaluating the impact that the adoption of this remaining portion of ASU No. 2010-06 may have on the funds’ financial statement disclosures.
NOTES TO FINANCIAL STATEMENTS (Unaudited) (continued)
| | | | | | | | | |
| Table 1—Fair Value Measurements | | | | | | | | |
| |
| | | | | Investments in Securities | | | |
| | | | | | Level 2—Other | Level 3—Significant | | |
| | Level 1—Unadjusted | | | Significant | | Unobservable | | |
| | | Quoted Prices | | Observable Inputs | | Inputs | | |
| | Assets ($) | Liabilities ($) | | Assets ($) | Liabilities ($) | Assets ($) | Liabilities ($) | Total ($) | |
| BNY Mellon Large Cap | | | | | | | | | |
| Stock Fund | | | | | | | | | |
| Equity Securities— | | | | | | | | | |
| Domestic† | 1,315,611,685 | — | | — | — | — | — | 1,315,611,685 | |
| Equity Securities— | | | | | | | | | |
| Foreign† | 79,765,712 | — | | — | — | — | — | 79,765,712 | |
| Mutual Funds | 33,593,151 | — | | — | — | — | — | 33,593,151 | |
| BNY Mellon Large | | | | | | | | | |
| Cap Market | | | | | | | | | |
| Opportunities Fund | | | | | | | | | |
| Equity Securities— | | | | | | | | | |
| Domestic† | 56,046,911 | — | | — | — | — | — | 56,046,911 | |
| Equity Securities— | | | | | | | | | |
| Foreign† | 822,071 | — | | — | — | — | — | 822,071 | |
| Mutual Funds | 28,736,697 | — | | — | — | — | — | 28,736,697 | |
| BNY Mellon | | | | | | | | | |
| Tax-Sensitive | | | | | | | | | |
| Large Cap | | | | | | | | | |
| Multi-Strategy Fund | | | | | | | | | |
| Equity Securities— | | | | | | | | | |
| Domestic† | 42,598,925 | — | | — | — | — | — | 42,598,925 | |
| Equity Securities— | | | | | | | | | |
| Foreign† | 399,265 | — | | — | — | — | — | 399,265 | |
| Mutual Funds | 11,429,505 | — | | — | — | — | — | 11,429,505 | |
| BNY Mellon Income | | | | | | | | | |
| Stock Fund | | | | | | | | | |
| Equity Securities— | | | | | | | | | |
| Domestic† | 104,668,943 | — | | — | — | — | — | 104,668,943 | |
| Equity Securities— | | | | | | | | | |
| Foreign† | 6,994,199 | — | | — | — | — | — | 6,994,199 | |
| Mutual Funds | 3,023,522 | — | | — | — | — | — | 3,023,522 | |
| Other Financial | | | | | | | | | |
| Instruments: | | | | | | | | | |
| Options Written | — | (26,249 | ) | — | — | — | — | (26,249 | ) |
| BNY Mellon Mid Cap | | | | | | | | | |
| Stock Fund | | | | | | | | | |
| Equity Securities— | | | | | | | | | |
| Domestic† | 1,522,151,039 | — | | — | — | — | — | 1,522,151,039 | |
| Equity Securities— | | | | | | | | | |
| Foreign† | 25,328,440 | — | | — | — | — | — | 25,328,440 | |
| Mutual Funds | 37,197,078 | — | | — | — | — | — | 37,197,078 | |
| BNY Mellon Small Cap | | | | | | | | | |
| Stock Fund | | | | | | | | | |
| Equity Securities— | | | | | | | | | |
| Domestic† | 437,199,572 | — | | — | — | — | — | 437,199,572 | |
| Equity Securities— | | | | | | | | | |
| Foreign† | 11,508,058 | — | | — | — | — | — | 11,508,058 | |
| Mutual Funds | 34,135,032 | — | | — | — | — | — | 34,135,032 | |
130
| | | | | | | | | | |
| Table 1—Fair Value Measurements (continued) | | | | | | | | |
| |
| | | | | Investments in Securities | | | |
| | | | | | Level 2—Other | | Level 3—Significant | | |
| | Level 1—Unadjusted | | | Significant | | | Unobservable | | |
| | | Quoted Prices | | Observable Inputs | | | Inputs | | |
| | Assets ($) | Liabilities ($) | | Assets ($) | Liabilities ($) | | Assets ($) | Liabilities ($) | Total ($) | |
| BNY Mellon U.S. Core | | | | | | | | | | |
| Equity 130/30 Fund | | | | | | | | | | |
| Equity Securities— | | | | | | | | | | |
| Domestic† | 354,876,802 | — | | — | — | | — | — | 354,876,802 | |
| Equity Securities— | | | | | | | | | | |
| Foreign† | 22,160,844 | — | | — | — | | — | — | 22,160,844 | |
| Mutual Funds | 4,579,000 | — | | — | — | | — | — | 4,579,000 | |
| Securities Sold Short: | | | | | | | | | | |
| Equity Securities— | | | | | | | | | | |
| Domestic†† | — | (75,236,992 | ) | — | — | | — | — | (75,236,992 | ) |
| Equity Securities— | | | | | | | | | | |
| Foreign†† | — | (5,908,902 | ) | — | — | | — | — | (5,908,902 | ) |
| BNY Mellon Focused Equity | | | | | | | | | |
| Opportunities Fund | | | | | | | | | | |
| Equity Securities— | | | | | | | | | | |
| Domestic† | 392,932,700 | — | | — | — | | — | — | 392,932,700 | |
| Equity Securities— | | | | | | | | | | |
| Foreign† | 12,394,668 | — | | — | — | | — | — | 12,394,668 | |
| Mutual Funds | 13,933,146 | — | | — | — | | — | — | 13,933,146 | |
| Other Financial Instruments: | | | | | | | | | |
| Options Written | — | (186,030 | ) | — | — | | — | — | (186,030 | ) |
| BNY Mellon | | | | | | | | | | |
| Small/Mid Cap Fund | | | | | | | | | | |
| Equity Securities— | | | | | | | | | | |
| Domestic† | 433,928,326 | — | | — | — | | — | — | 433,928,326 | |
| Equity Securities— | | | | | | | | | | |
| Foreign† | 40,281,299 | — | | — | — | | — | — | 40,281,299 | |
| Mutual Funds | 108,960,559 | — | | — | — | | — | — | 108,960,559 | |
| BNY Mellon | | | | | | | | | | |
| International Fund | | | | | | | | | | |
| Equity Securities— | | | | | | | | | | |
| Foreign† | 1,102,130,264 | — | | — | — | | — | — | 1,102,130,264 | |
| Mutual Funds/Exchange | | | | | | | | | | |
| Traded Funds | 25,509,844 | — | | — | — | | — | — | 25,509,844 | |
| Other Financial Instruments: | | | | | | | | | |
| Forward Foreign | | | | | | | | | | |
| Currency Exchange | | | | | | | | | | |
| Contracts††† | — | — | | 29,605 | — | | — | — | 29,605 | |
| BNY Mellon Emerging | | | | | | | | | | |
| Markets Fund | | | | | | | | | | |
| Equity Securities— | | | | | | | | | | |
| Foreign† | 2,241,501,155 | — | | — | — | | — | — | 2,241,501,155 | |
| Mutual Funds/Exchange | | | | | | | | | | |
| Traded Funds | 79,376,961 | — | | — | — | | — | — | 79,376,961 | |
| Other Financial Instruments: | | | | | | | | | |
| Forward Foreign | | | | | | | | | | |
| Currency Exchange | | | | | | | | | | |
| Contracts††† | — | — | | 9,423 | (4,622 | ) | — | — | 4,801 | |
NOTES TO FINANCIAL STATEMENTS (Unaudited) (continued)
| | | | | | | | |
| Table 1—Fair Value Measurements (continued) | | | | | |
| |
| | | | Investments in Securities | | |
| | | | | Level 2—Other | Level 3—Significant | |
| | Level 1—Unadjusted | | Significant | | Unobservable | |
| | | Quoted Prices | Observable Inputs | | Inputs | |
| | Assets ($) | Liabilities ($) | Assets ($) | Liabilities ($) | Assets ($) | Liabilities ($) | Total ($) |
| BNY Mellon International | | | | | | | |
| Appreciation Fund | | | | | | | |
| Equity Securities— | | | | | | | |
| Foreign† | 257,054,799 | — | — | — | — | — | 257,054,799 |
| U.S. Treasury | — | — | 244,983 | — | — | — | 244,983 |
| Mutual Funds | 408,000 | — | — | — | — | — | 408,000 |
| Other Financial Instruments: | | | | | | |
| Forward Foreign | | | | | | | |
| Currency Exchange | | | | | | | |
| Contracts††† | — | — | 98,909 | (39) | — | — | 98,870 |
| Futures††† | 33,197 | — | — | — | — | — | 33,197 |
| BNY Mellon Balanced Fund | | | | | | | |
| Asset—Backed | — | — | 4,082,850 | — | — | — | 4,082,850 |
| Commercial | | | | | | | |
| Mortgage—Backed | — | — | 4,613,674 | — | — | — | 4,613,674 |
| Corporate Bonds† | — | — | 34,246,880 | — | — | — | 34,246,880 |
| Equity Securities— | | | | | | | |
| Domestic† | 115,764,971 | — | — | — | — | — | 115,764,971 |
| Equity Securities— | | | | | | | |
| Foreign† | 7,116,668 | — | — | — | — | — | 7,116,668 |
| Foreign Government | — | — | 2,308,048 | — | — | — | 2,308,048 |
| Municipal Bonds | — | — | 5,433,379 | — | — | — | 5,433,379 |
| Mutual Funds/Exchange | | | | | | | |
| Traded Funds | 143,342,020 | — | — | — | — | — | 143,342,020 |
| U.S. Government | | | | | | | |
| Agencies/ | | | | | | | |
| Mortgage—Backed | — | — | 45,964,836 | — | — | — | 45,964,836 |
| U.S. Treasury | — | — | 48,010,327 | — | — | — | 48,010,327 |
| |
| † | See Statement of Investments for additional detailed categorizations. |
| †† | See Statement of Securities Sold Short for additional detailed categorizations. |
| ††† Amount shown represents unrealized appreciation (depreciation) at period end. |
(b) Securities transactions and investment income:
Securities transactions are recorded on a trade date basis. Realized gains and losses from securities transactions are recorded on the identified cost basis. Dividend income is recognized on the ex-dividend date and interest income, including, where applicable, accretion of discount and amortization of premium on investments, is recognized on the accrual basis.
BNY Mellon International Fund, BNY Mellon Emerging Markets Fund and BNY Mellon International Appreciation Fund
Investing in foreign markets may involve special risks and considerations not typically associated with investing in the U.S. These risks include revaluation of currencies, high rates of inflation, repatriation restrictions on income and capital, and adverse political and economic develop-
132
ments. Moreover, securities issued in these markets may be less liquid, subject to government ownership controls and delayed settlements, and their prices may be more volatile than those of comparable securities in the U.S.
Pursuant to a securities lending agreement withThe Bank of New York Mellon, the funds may lend securities to qualified institutions. It is the funds’ policy that, at origination, all loans are secured by collateral of at least 102% of the value of U.S. securities loaned and 105% of the value of foreign securities loaned. Collateral equivalent to at least 100% of the market value of securities on loan is maintained at all times. Collateral is either in the form of cash, which can be invested in certain money market mutual funds managed by Dreyfus, U.S. Government and Agency securities or letters of credit.The funds are entitled to receive all income on securities loaned, in addition to income earned as a result of the lending transaction. Although each security loaned is fully collateralized, the funds bear the risk of delay in recovery of, or loss of rights in, the securities loaned should a borrower fail to return the securities in a timely manner. Table 2 summarizes the amounts The Bank of New York Mellon earned from each relevant fund from lending portfolio securities, pursuant to the securities lending agreement during the period ended February 28, 2011.
| | |
| Table 2—Securities Lending Agreement | | |
| BNY Mellon Large Cap Stock Fund | $ | 3,609 |
| BNY Mellon Income Stock Fund | | 297 |
| BNY Mellon Mid Cap Stock Fund | | 35,640 |
| BNY Mellon Small Cap Stock Fund | | 57,054 |
| BNY Mellon Focused Equity | | |
| Opportunities Fund | | 379 |
| BNY Mellon Small/Mid Cap Fund | | 69,321 |
| BNY Mellon Emerging Markets Fund | | 3,811 |
| BNY Mellon Balanced Fund | | 1,305 |
(c) Affiliated issuers: Investments in other investment companies advised by Dreyfus are defined as “affiliated” in the Act.
The funds may invest in shares of certain affiliated investment companies also advised or managed by Dreyfus. Table 3 summarizes each fund’s investments in affiliated investment companies for the period ended February 28, 2011.
(d) Foreign currency transactions: BNY Mellon Emerging Markets Fund, BNY Mellon International Fund and BNY Mellon International Appreciation Fund do not isolate that portion of the results of operations resulting from changes in foreign exchange rates on investments from the fluctuations arising from changes in the market prices of securities held. Such fluctuations are included with the net realized and unrealized gain or loss on investments.
Net realized foreign exchange gains or losses arise from sales of foreign currencies, currency gains or losses realized on securities transactions between trade and settlement date, and the difference between the amounts of dividends, interest and foreign withholding taxes recorded on the funds’ books and the U.S. dollar equivalent of the amounts actually received or paid. Net unrealized foreign exchange gains and losses arise from changes in the value of assets and liabilities other than investments resulting from changes in exchange rates. Foreign currency gains and losses on investments are included with net realized and unrealized gain or loss on investments.
(e) Concentration of risk: BNY Mellon U. S. Core Equity 130/30 Fund enters into short sales. Short sales involve selling a security the fund does not own in anticipation that the security’s price will decline. Short sales may involve substantial risk and “leverage.” The fund may be required to buy the security sold short at a time when the security has appreciated in value, thus resulting in a loss to the fund. Short positions in stocks involve more risk than long positions in stocks. In theory, stocks sold short have unlimited risk. BNY Mellon Balanced Fund invests in debt securities. Failure of an issuer of the debt securities to make timely interest or principal pay-
NOTES TO FINANCIAL STATEMENTS (Unaudited) (continued)
| | | | | | | | | |
| Table 3—Affiliated Investment Companies | | | | | | | | |
| |
| Affiliated | Value | | | | | Net Unrealized | Value | | Net |
| Investment Company | 8/31/2010 | ($) | Purchases ($) | Sales ($) | Dividends ($) | Appreciation ($) | 2/28/2011 | ($) | Assets (%) |
| BNY Mellon Large Cap | | | | | | | | | |
| Stock Fund | | | | | | | | | |
| Dreyfus Institutional Preferred | | | | | | | | | |
| Plus Money Market Fund | 92,000 | | 114,793,000 | 114,885,000 | — | — | — | | — |
| Dreyfus Institutional Cash | | | | | | | | | |
| Advantage Plus Fund | 48,126,233 | | 276,291,549 | 290,824,631 | — | — | 33,593,151 | | 2.4 |
| Total | 48,218,233 | | 391,084,549 | 405,709,631 | — | — | 33,593,151 | | 2.4 |
| BNY Mellon Large Cap Market | | | | | | | | | |
| Opportunities Fund | | | | | | | | | |
| BNY Mellon U.S. Core Equity | | | | | | | | | |
| 130/30 Fund, CI. M | 969,360 | | 24,063,286 | — | 54,286 | 1,746,051 | 26,778,697 | | 31.1 |
| Dreyfus Institutional Preferred | | | | | | | | | |
| Plus Money Market Fund | 1,349,000 | | 42,747,000 | 42,138,000 | — | — | 1,958,000 | | 2.3 |
| Total | 2,318,360 | | 66,810,286 | 42,138,000 | 54,286 | 1,746,051 | 28,736,697 | | 33.4 |
| BNY Mellon Tax-Sensitive | | | | | | | | | |
| Large Cap Multi-Strategy Fund | | | | | | | | | |
| BNY Mellon U.S. Core Equity | | | | | | | | | |
| 130/30 Fund, CI. M | 968,220 | | 7,362,110 | — | 28,110 | 954,175 | 9,284,505 | | 17.2 |
| Dreyfus Institutional Preferred | | | | | | | | | |
| Plus Money Market Fund | 486,000 | | 33,245,000 | 31,586,000 | — | — | 2,145,000 | | 4.0 |
| Total | 1,454,220 | | 40,607,110 | 31,586,000 | 28,110 | 954,175 | 11,429,505 | | 21.2 |
| BNY Mellon Income Stock Fund | | | | | | | | | |
| Dreyfus Institutional Preferred | | | | | | | | | |
| Plus Money Market Fund | — | | 15,294,000 | 14,722,000 | — | — | 572,000 | | .5 |
| Dreyfus Institutional Cash | | | | | | | | | |
| Advantage Plus Fund | 226,325 | | 14,754,140 | 12,528,943 | — | — | 2,451,522 | | 2.2 |
| Total | 226,325 | | 30,048,140 | 27,250,943 | — | — | 3,023,522 | | 2.7 |
| BNY Mellon Mid Cap Stock Fund | | | | | | | | | |
| Dreyfus Institutional Preferred | | | | | | | | | |
| Plus Money Market Fund | 7,623,000 | | 312,932,000 | 311,085,000 | — | — | 9,470,000 | | .6 |
| Dreyfus Institutional Cash | | | | | | | | | |
| Advantage Plus Fund | 106,687,288 | | 220,769,245 | 299,729,455 | — | — | 27,727,078 | | 1.8 |
| Total | 114,310,288 | | 533,701,245 | 610,814,455 | — | — | 37,197,078 | | 2.4 |
| BNY Mellon Small Cap Stock Fund | | | | | | | | | |
| Dreyfus Institutional Preferred | | | | | | | | | |
| Plus Money Market Fund | 3,332,000 | | 163,601,000 | 161,901,000 | — | — | 5,032,000 | | 1.1 |
| Dreyfus Institutional Cash | | | | | | | | | |
| Advantage Plus Fund | 70,173,617 | | 141,281,311 | 182,351,896 | — | — | 29,103,032 | | 6.3 |
| Total | 73,505,617 | | 304,882,311 | 344,252,896 | — | — | 34,135,032 | | 7.4 |
| BNY Mellon U.S. Core | | | | | | | | | |
| Equity 130/30 Fund | | | | | | | | | |
| Dreyfus Institutional Preferred | | | | | | | | | |
| Plus Money Market Fund | 2,949,000 | | 63,461,000 | 61,831,000 | — | — | 4,579,000 | | 1.5 |
| BNY Mellon Focused Equity | | | | | | | | | |
| Opportunities Fund | | | | | | | | | |
| Dreyfus Institutional Preferred | | | | | | | | | |
| Plus Money Market Fund | 1,644,000 | | 80,454,000 | 70,283,000 | — | — | 11,815,000 | | 2.9 |
| Dreyfus Institutional Cash | | | | | | | | | |
| Advantage Fund | — | | 43,420,550 | 41,302,404 | — | — | 2,118,146 | | .5 |
| Total | 1,644,000 | | 123,874,550 | 111,585,404 | — | — | 13,933,146 | | 3.4 |
134
| | | | | | | | | |
| Table 3—Affiliated Investment Companies (continued) | | | | | | |
| |
| Affiliated | Value | | | | | Net Unrealized | Value | | Net |
| Investment Company | 8/31/2010 | ($) | Purchases ($) | Sales ($) | Dividends ($) | Appreciation ($) | 2/28/2011 | ($) | Assets (%) |
| BNY Mellon Small/Mid Cap Fund | | | | | | | | | |
| Dreyfus Institutional Preferred | | | | | | | | | |
| Plus Money Market Fund | 7,326,000 | | 139,637,000 | 125,959,000 | — | — | 21,004,000 | | 4.2 |
| Dreyfus Institutional Cash | | | | | | | | | |
| Advantage Fund | 18,044,546 | | 182,691,437 | 112,779,424 | — | — | 87,956,559 | | 17.8 |
| Total | 25,370,546 | | 322,328,437 | 238,738,424 | — | — | 108,960,559 | | 22.0 |
| BNY Mellon International Fund | | | | | | | | | |
| Dreyfus Institutional Preferred | | | | | | | | | |
| Plus Money Market Fund | 2,800,000 | | 120,750,000 | 102,950,000 | — | — | 20,600,000 | | 1.8 |
| BNY Mellon Emerging Markets Fund | | | | | | | | | |
| Dreyfus Institutional Preferred | | | | | | | | | |
| Plus Money Market Fund | 27,100,000 | | 427,900,000 | 418,200,000 | — | — | 36,800,000 | | 1.6 |
| BNY Mellon International | | | | | | | | | |
| Appreciation Fund | | | | | | | | | |
| Dreyfus Institutional Preferred | | | | | | | | | |
| Plus Money Market Fund | 1,978,000 | | 19,233,000 | 20,803,000 | — | — | 408,000 | | .2 |
| BNY Mellon Balanced Fund | | | | | | | | | |
| BNY Mellon Emerging | | | | | | | | | |
| Markets Fund, CI. M | 28,114,308 | | 5,147,586 | — | 147,586 | 3,687,271 | 36,949,165 | | 9.2 |
| BNY Mellon | | | | | | | | | |
| International Fund, CI. M | 26,854,293 | | 2,348,066 | — | 598,066 | 6,338,167 | 35,540,526 | | 8.8 |
| BNY Mellon Mid Cap | | | | | | | | | |
| Stock Fund, CI. M | 20,046,439 | | 741,460 | — | 6,460 | 8,076,932 | 28,864,831 | | 7.2 |
| BNY Mellon Small Cap | | | | | | | | | |
| Stock Fund, CI. M | 9,965,393 | | 2,360,000 | — | — | 3,867,507 | 16,192,900 | | 4.0 |
| Dreyfus Institutional Preferred | | | | | | | | | |
| Plus Money Market Fund | 2,020,000 | | 76,765,000 | 56,866,000 | — | — | 21,919,000 | | 5.4 |
| Dreyfus Institutional Cash | | | | | | | | | |
| Advantage Plus Fund | 3,312,094 | | 42,460,200 | 42,740,867 | — | — | 3,031,427 | | .8 |
| Total | 90,312,527 | | 129,822,312 | 99,606,867 | 752,112 | 21,969,877 | 142,497,849 | | 35.4 |
ments, or a decline or the perception of a decline in the credit quality of a debt security, can cause the debt security’s price to fall, potentially lowering the fund’s share price. In addition, the value of debt securities may decline due to general market conditions that are not specifically related to a particular company, such as real or perceived adverse economic conditions, changes in outlook for corporate earnings, changes in interest or currency rates or adverse investor sentiment. They may also decline because of factors that affect a particular industry.
BNY Mellon Focused Equity Opportunities Fund is non-diversified, which means that a relatively high percentage of the fund’s assets may be invested in a limited number of issuers.Therefore, the fund’s performance may
be more vulnerable to changes in market value of a single issuer or group of issuers and more susceptible to risks associated with a single economic, political or regulatory occurrence than a diversified fund.
(f) Dividends to shareholders: Dividends payable to shareholders are recorded by the funds on the ex-dividend date. BNY Mellon Large Cap Stock Fund, BNY Mellon Income Stock Fund and BNY Mellon Balanced Fund declare and pay dividends from investment income-net monthly. BNY Mellon Large Cap Market Opportunities Fund, BNY Mellon Tax-Sensitive Large Cap Multi-Strategy Fund, BNY Mellon Mid Cap Stock Fund, BNY Mellon Small Cap Stock Fund, BNY Mellon U.S. Core Equity 130/30 Fund, BNY Mellon Focused Equity
NOTES TO FINANCIAL STATEMENTS (Unaudited) (continued)
Opportunities Fund, BNY Mellon Small/Mid Cap Fund, BNY Mellon International Fund, BNY Mellon Emerging Markets Fund and BNY Mellon International Appreciation Fund declare and pay dividends from investment income-net annually. With respect to each series, dividends from net realized capital gains, if any, are normally declared and paid annually, but the funds may make distributions on a more frequent basis to comply with the distribution requirements of the Internal Revenue Code of 1986, as amended (the “Code”).To the extent that net realized capital gains can be offset by capital loss carryovers of that fund, it is the policy of the funds not to distribute such gains. Income and capital gain distributions are determined in accordance with income tax regulations, which may differ from GAAP.
(g) Federal income taxes: It is the policy of each fund to continue to qualify as a regulated investment company, if such qualification is in the best interests of its shareholders, by complying with the applicable provisions of the Code, and to make distributions of taxable income sufficient to relieve it from substantially all federal income and excise taxes. For federal income tax purposes, each series is treated as a single entity for the purpose of determining such qualification.
As of and during the period ended February 28, 2011, the funds did not have any liabilities for any uncertain tax positions.The funds recognize interest and penalties,
if any, related to uncertain tax positions as income tax expense in the Statements of Operations. During the period, the funds did not incur any interest or penalties.
Except for BNY Mellon Large Cap Market Opportunities Fund, BNY Mellon Tax-Sensitive Large Cap Multi-Strategy Fund, BNY Mellon Focused Equity Opportunities Fund and BNY Mellon Small/Mid Cap Fund, each of the tax years in the three-year period ended August 31, 2010 remains subject to examination by the Internal Revenue Service and state taxing authorities. For the BNY Mellon Large Cap Market Opportunities Fund, BNY Mellon Tax-Sensitive Large Cap Multi-Strategy Fund, BNY Mellon Focused Equity Opportunities Fund and BNY Mellon Small/Mid Cap Fund, the period ended August 31, 2010 remains subject to examination by the Internal Revenue Service and state taxing authorities.
Table 4 summarizes each relevant fund’s unused capital loss carryover available for federal income tax purposes to be applied against future net securities profits, if any, realized subsequent to August 31, 2010.
Under the recently enacted Regulated Investment Company Modernization Act of 2010, each relevant fund will be permitted to carry forward capital losses incurred in taxable years beginning after December 22, 2010 for an unlimited period. However, any losses incurred during those future taxable years will be required to be utilized
| | | | | | | | | |
| Table 4—Capital Loss Carryover | | | | | |
| |
| Expiring in fiscal | 2011($)† | 2016($)† | 2017($)† | 2018($)† | Total ($) |
| BNY Mellon Large Cap Stock Fund | — | — | 104,532,089 | 83,560,108 | 188,092,197 |
| BNY Mellon Income Stock Fund | — | — | 8,161,053 | 16,370,250 | 24,531,303 |
| BNY Mellon Mid Cap Stock Fund | — | — | 83,544,677 | 130,609,314 | 214,153,991 |
| BNY Mellon Small Cap Stock Fund | — | 4,923,837 | 66,384,085 | 97,486,290 | 168,794,212 |
| BNY Mellon U.S. Core Equity 130/30 Fund | — | 114,430 | 23,308,714 | 32,853,812 | 56,276,956 |
| BNY Mellon International Fund | — | — | 160,678,992 | 462,294,170 | 622,973,162 |
| BNY Mellon Emerging Markets Fund | — | — | 43,341,501 | 107,445,362 | 150,786,863 |
| BNY Mellon International Appreciation Fund | 10,488,108 | — | 17,216,911 | — | 27,705,019 |
| BNY Mellon Balanced Fund | — | — | 7,507,394 | 1,657,826 | 9,165,220 |
| |
| † | If not applied, the carryovers expire in the above years. |
136
prior to the losses incurred in pre-enactment taxable years.As a result of this ordering rule, pre-enactment capital loss carryovers may be more likely to expire unused.
Table 5 summarizes each relevant fund’s tax character of distributions paid to shareholders during the fiscal year ended August 31, 2010.The tax character of current year distributions will be determined at the end of the current fiscal year.
NOTE 3—Bank Lines of Credit:
The funds participate with other Dreyfus-managed funds in a $225 million unsecured credit facility led by Citibank, N.A. and a $300 million unsecured credit facility provided by The Bank of New York Mellon (each, a “Facility”), each to be utilized primarily for temporary or emergency purposes, including the financing of redemptions. In connection therewith, each fund has agreed to pay its pro rata portion of commitment fees for each Facility. Interest is charged to the funds based on rates determined pursuant to the terms of the respective Facility at the time of borrowing. During the period ended February 28, 2011, BNY Mellon Large Cap Market Opportunities Fund, BNY Mellon Tax-Sensitive Large Cap Multi-Strategy Fund, BNY Mellon U.S. Core Equity 130/30 Fund, BNY Mellon Focused Equity Opportunities Fund, BNY
Mellon Small/Mid Cap Fund, BNY Mellon Emerging Markets Fund and BNY Mellon Balanced Fund did not borrow under the Facilities.
The average amount of borrowings outstanding under the Facilities during the period ended February 28, 2011 for BNY Mellon Large Cap Stock Fund, was approximately $2,062,400 with a related weighted average annualized interest rate of 1.43%.
The average amount of borrowings outstanding under the Facilities during the period ended February 28, 2011 for BNY Mellon Income Stock Fund, was approximately $296,700 with a related weighted average annualized interest rate of 1.42%.
The average amount of borrowings outstanding under the Facilities during the period ended February 28, 2011 for BNY Mellon Mid Cap Stock Fund, was approximately $296,100 with a related weighted average annualized interest rate of 1.43%.
The average amount of borrowings outstanding under the Facilities during the period ended February 28, 2011 for BNY Mellon Small Cap Stock Fund, was approximately $101,100 with a related weighted average annualized interest rate of 1.43%.
| |
| Table 5—Tax Character of Distributions Paid | |
| |
| | Ordinary Income ($) |
| | August 31, 2010 |
| BNY Mellon Large Cap Stock Fund | 11,065,751 |
| BNY Mellon Income Stock Fund | 1,723,623 |
| BNY Mellon Mid Cap Stock Fund | 8,513,360 |
| BNY Mellon Small Cap Stock Fund | 754,676 |
| BNY Mellon U.S. Core Equity 130/30 Fund | 307,480 |
| BNY Mellon Focused Equity Opportunities Fund | 24,000 |
| BNY Mellon Small/Mid Cap Fund | 176,607 |
| BNY Mellon International Fund | 30,009,971 |
| BNY Mellon Emerging Markets Fund | 11,055,178 |
| BNY Mellon International Appreciation Fund | 7,648,881 |
| BNY Mellon Balanced Fund | 7,907,628 |
NOTES TO FINANCIAL STATEMENTS (Unaudited) (continued)
The average amount of borrowings outstanding under the Facilities during the period ended February 28, 2011 for BNY Mellon International Fund, was approximately $255,200 with a related weighted average annualized interest rate of 1.43%.
The average amount of borrowings outstanding under the Facilities during the period ended February 28, 2011 for BNY Mellon International Appreciation Fund, was approximately $6,600 with a related weighted average annualized interest rate of 1.43%.
NOTE 4—Investment Advisory Fee, Administration Fee, Sub-Investment Advisory Fee and Other Transactions With Affiliates:
(a) Fees payable by the funds pursuant to the provisions of an investment advisory agreement with the Investment Adviser are payable monthly, computed on the average daily value of each fund’s net assets at the following annual rates: .65% of BNY Mellon Large Cap Stock Fund, .70% (direct investment in securities) and .15% (other underlying BNY Mellon funds), of BNY Mellon Large Cap Market Opportunities Fund, .70% (direct investment in securities) and .15% (other underlying BNY Mellon funds), of BNY MellonTax-Sensitive Large Cap Multi-Strategy Fund, .65% of BNY Mellon Income Stock Fund, .75% of BNY Mellon Mid Cap Stock Fund, .85% of BNY Mellon Small Cap Stock Fund, .80% of BNY Mellon U.S. Core Equity 130/30 Fund, .70% of BNY Mellon Focused Equity Opportunities Fund, .75% of BNY Mellon Small/Mid Cap Fund, .85% of BNY Mellon International Fund, 1.15% of BNY Mellon Emerging Markets Fund, .50% of BNY Mellon International Appreciation Fund and .65% (equity investments), .40% (debt securities) and .15% (money market investments and other underlying BNY Mellon funds) of BNY Mellon Balanced Fund.
For BNY Mellon Large Cap Market Opportunities Fund, the Investment Adviser has contractually agreed, until January 1, 2012, to waive receipt of its fees and/or assume the expenses of the fund, so that the total annual
fund operating expenses of neither class, excluding shareholder services fees, taxes, interest, brokerage commissions and extraordinary expenses, do not exceed 1.25% of the value of the average daily net assets of their respective class. The reduction in investment advisory fee, amounted to $92,334 during the period ended February 28, 2011.
For BNY Mellon Tax-Sensitive Large Cap Multi-Strategy Fund, the Investment Adviser has contractually agreed, until January 1, 2012, to waive receipt of its fees and/or assume the expenses of the fund, so that the total annual fund operating expenses of neither class, excluding shareholder services fees, taxes, interest, brokerage commissions and extraordinary expenses, do not exceed 1.15% of the value of the average daily net assets of their respective class.The expense reimbursement, pursuant to the undertaking, amounted to $227,078 during the period ended February 28, 2011.
For BNY Mellon Small Cap Stock Fund, the Investment Adviser had contractually agreed until, September 30, 2010, to waive receipt of its fees and/or assume the expenses of the fund so that the direct expenses of Class M shares and Investor shares of the fund, exclusive of taxes, interest, brokerage commissions, commitment fees on borrowings and extraordinary expenses, did not exceed an annual rate of .99% and 1.24% of the value of the average daily net assets of their respective class. The reduction in investment advisory fee, pursuant to the undertaking, amounted to $5,069 during the period ended February 28, 2010.This undertaking is no longer in effect.
For BNY Focused Equity Opportunities Fund, the Investment Adviser had contractually agreed until, January 1, 2011, to waive receipt of its fees and/or assume the expenses of the fund so that the direct expenses of neither class, excluding shareholder services fees, taxes, interest, brokerage commissions, commitment fees on borrowings and extraordinary expenses, did not exceed .90% of the value of the average daily net assets of their respective class. The reduction in investment
138
advisory fee, pursuant to the undertaking, amounted to $5,365 during the period ended February 28, 2011.This undertaking is no longer in effect.
For BNY Small/Mid Cap Fund, the Investment Adviser had contractually agreed, until January 1, 2011, to waive receipt of its fees and/or assume the expenses of the fund so that the direct expenses of neither class, excluding shareholder services fees, taxes, interest, brokerage commissions, commitment fees on borrowings and extraordinary expenses, did not exceed .95% of the value of the average daily net assets of their respective class. The reduction in investment advisory fee, pursuant to the undertaking, amounted to $3,558 during the period ended February 28, 2011.This undertaking is no longer in effect.
For BNY Mellon International Appreciation Fund, the Investment Adviser had contractually agreed until, September 30, 2010, to waive receipt of its fees and/or assume the expenses of the fund so that the direct expenses of neither class, excluding shareholder services fees, taxes, interest, brokerage commissions, commitment fees on borrowings and extraordinary expenses, did not exceed .67% of the value of the average daily net assets of their respective class. The reduction in investment advisory fee, pursuant to the undertaking, amounted to $4,069 during the period ended February 28, 2011.This undertaking is no longer in effect.
Pursuant to the Administration Agreement,The Bank of New York Mellon provides or arranges for fund accounting, transfer agency and other fund administration services and receives a fee based on the total net assets of the Trust based on the following rates:
| | |
| 0 up to $6 billion | .15% |
| $6 billion up to $12 billion | .12% |
| In excess of $12 billion | .10% |
No administration fee is applied to assets held by BNY
Mellon Large Cap Market Opportunities Fund and
BNY Mellon Tax-Sensitive Large Cap Multi-Strategy Fund which are invested in shares of certain other series of the Trust.
No administration fee is applied to assets held by BNY Mellon Balanced Fund which are invested in cash or money market instruments or shares of certain other series of the Trust.
The Bank of New York Mellon has entered into a Sub-Administration Agreement with Dreyfus pursuant to which The Bank of New York Mellon pays Dreyfus for performing certain administrative services.
Pursuant to a Sub-Investment Advisory Agreement between Dreyfus and Walter Scott, Dreyfus pays Walter Scott a monthly fee at an annual rate of .41% of BNY Mellon Large Cap Market Opportunities Fund’s and BNY Mellon Tax-Sensitive Large Cap Multi-Strategy Fund’s average daily net assets.
During the period ended February 28, 2011, the Distributor retained $222 from CDSCs on redemptions of BNY Mellon Mid Cap Stock Fund’s Dreyfus Premier shares.
(b) BNY Mellon Mid Cap Stock Fund has adopted a Distribution Plan (the “Plan”) pursuant to Rule 12b-1 under the Act for distributing its Dreyfus Premier shares. BNY Mellon Mid Cap Stock Fund pays the Distributor a fee at an annual rate of .75% of the value of the fund’s average daily net assets attributable to its Dreyfus Premier shares. During the period ended February 28, 2011, BNY Mellon Mid Cap Stock Fund’s Dreyfus Premier shares were charged $2,251 pursuant to the Plan.
(c) The funds have adopted a Shareholder Services Plan with respect to their Investor shares and BNY Mellon Mid Cap Stock Fund has adopted a Shareholder Services Plan with respect to its Dreyfus Premier shares. Each fund pays the Distributor for the provision of certain
NOTES TO FINANCIAL STATEMENTS (Unaudited) (continued)
services to holders of Investor shares and Dreyfus Premier shares a fee at an annual rate of .25% of the value of the average daily net assets attributable to Investor shares and Dreyfus Premier shares.The services provided may include personal services relating to shareholder accounts, such as answering shareholder inquiries regarding a fund, and providing reports and other information and services related to the maintenance of such shareholder accounts. The Shareholder Services Plan allows the Distributor to make payments from the shareholder services fees it collects from each fund to compensate service agents (certain banks, securities brokers or dealers and other financial institutions) in respect of these services. Table 6 summarizes the amounts Investor shares and Dreyfus Premier shares were charged during the period ended February 28, 2011, pursuant to the Shareholder Services Plan. Additional fees included in shareholder servicing costs in the Statements of Operations include fees paid for cash management charges.
| | |
| Table 6—Shareholder Service Plan Fees | | |
| BNY Mellon Large Cap Stock Fund | $ | 45,513 |
| BNY Mellon Large Cap Market | | |
| Opportunities Fund | | 14 |
| BNY Mellon Tax-Sensitive | | |
| Large Cap Multi-Strategy Fund | | 195 |
| BNY Mellon Income Stock Fund | | 1,328 |
| BNY Mellon Mid Cap Stock Fund, | | |
| Investor shares | | 29,984 |
| BNY Mellon Mid Cap Stock Fund, | | |
| Dreyfus Premier shares | | 750 |
| BNY Mellon Small Cap Stock Fund | | 8,558 |
| BNY Mellon U.S. Core | | |
| Equity 130/30 Fund | | 122 |
| BNY Mellon Focused Equity | | |
| Opportunities Fund | | 19 |
| BNY Mellon Small/Mid Cap Fund | | 85 |
| BNY Mellon International Fund | | 6,513 |
| BNY Mellon Emerging Markets Fund | | 13,493 |
| BNY Mellon International | | |
| Appreciation Fund | | 4,872 |
| BNY Mellon Balanced Fund | | 5,647 |
The funds have arrangements with the custodian and cash management bank whereby the funds may receive earnings credits when positive cash balances are maintained, which are used to offset custody and cash management fees. For financial reporting purposes, the funds include net earnings credits as an expense offset in the Statement of Operations.
The funds compensate The Bank of New York Mellon under cash management agreements for performing cash management services related to fund subscriptions and redemptions. Table 7 summarizes the amount each fund was charged during the period ended February 28, 2011, pursuant to the cash management agreements, which is included in Shareholder servicing costs in the Statements of Operations.These fees were partially offset by earnings credits, also summarized in Table 7.
| | | |
| Table 7—Cash Management Agreement Fees | |
| Cash Management | Earnings |
| | Fees ($) | Credits ($) |
| BNY Mellon Large Cap | | |
| Stock Fund | 154 | (7) |
| BNY Mellon Large Cap Market | | |
| Opportunities Fund | 7 | (1) |
| BNY Mellon Tax-Sensitive | | |
| Large Cap Multi-Strategy Fund | 7 | (1) |
| BNY Mellon Income Stock Fund | 51 | (2) |
| BNY Mellon Mid Cap Stock Fund | 4,066 | (169) |
| BNY Mellon Small Cap | | |
| Stock Fund | 1,058 | (44) |
| BNY Mellon U.S. Core | | |
| Equity 130/30 Fund | 24 | (1) |
| BNY Mellon Focused | | |
| Equity Opportunities Fund | 17 | (1) |
| BNY Mellon Small/Mid Cap Fund | 18 | (1) |
| BNY Mellon International Fund | 238 | (10) |
| BNY Mellon Emerging | | |
| Markets Fund | 281 | (12) |
| BNY Mellon International | | |
| Appreciation Fund | 433 | (18) |
| BNY Mellon Balanced Fund | 36 | (2) |
140
The funds also compensate The Bank of New York Mellon under a custody agreement for providing custodial services for the funds. Table 8 summarizes the amount each fund was charged during the period ended February 28, 2011, pursuant to the custody agreement.
| | |
| Table 8—Custody Agreement Fees | | |
| BNY Mellon Large Cap Stock Fund | $ | 54,152 |
| BNY Mellon Large Cap Market | | |
| Opportunities Fund | | 41,246 |
| BNY Mellon Tax-Sensitive | | |
| Large Cap Multi-Strategy Fund | | 175,725 |
| BNY Mellon Income Stock Fund | | 6,149 |
| BNY Mellon Mid Cap Stock Fund | | 47,301 |
| BNY Mellon Small Cap Stock Fund | | 26,412 |
| BNY Mellon U.S. Core | | |
| Equity 130/30 Fund | | 16,461 |
| BNY Mellon Focused | | |
| Equity Opportunities Fund | | 16,420 |
| BNY Mellon Small/Mid Cap Fund | | 21,203 |
Table 8—Custody Agreement Fees (continued)
| |
| BNY Mellon International Fund | 46,396 |
| BNY Mellon Emerging Markets Fund | 1,292,853 |
| BNY Mellon International | |
| Appreciation Fund | 17,397 |
| BNY Mellon Balanced Fund | 18,373 |
During the period ended February 28, 2011, each fund was charged $3,197 for services performed by the Chief Compliance Officer.
Table 9 summarizes the components of “Due to The Dreyfus Corporation and affiliates” in the Statements of Assets and Liabilities for each fund.
(d) Each Trustee who is not an “affiliated person” as defined in the Act receives from the Trust an annual fee of $68,000 and an attendance fee of $7,500 for each in-person meeting attended and $500 for telephone meetings and is reimbursed for travel and out-of-pocket
| | | | | | | |
| Table 9—Due to The Dreyfus Corporation and Affiliates | | | | |
| |
| | Investment | Rule 12b-1 | Shareholder | | Chief | |
| | Advisory | Distribution | Services | Custodian | Compliance | Less Expense |
| | Fees ($) | Plan Fees ($) | Plan Fees ($) | Fees ($) | Officer Fees ($) | Reimbursement ($) |
| BNY Mellon Large Cap Stock Fund | 703,552 | — | 7,887 | 45,000 | 1,433 | — |
| BNY Mellon Large Cap Market | | | | | | |
| Opportunities Fund | 45,630 | — | 2 | 34,000 | 1,433 | — |
| BNY Mellon Tax-Sensitive | | | | | | |
| Large Cap Multi-Strategy Fund | 23,913 | — | 35 | 126,250 | 1,433 | (18,485) |
| BNY Mellon Income Stock Fund | 54,051 | — | 197 | 6,244 | 1,433 | — |
| BNY Mellon Mid Cap Stock Fund | 892,214 | 368 | 5,287 | 40,057 | 1,433 | — |
| BNY Mellon Small Cap Stock Fund | 303,090 | — | 1,475 | 25,069 | 1,433 | — |
| BNY Mellon U.S. Core Equity 130/30 Fund | 179,446 | — | 33 | 10,004 | 1,433 | — |
| BNY Mellon Focused | | | | | | |
| Equity Opportunities Fund | 216,744 | — | 3 | 12,522 | 1,433 | — |
| BNY Mellon Small/Mid Cap Fund | 278,346 | — | 13 | 10,141 | 1,433 | — |
| BNY Mellon International Fund | 735,077 | — | 1,056 | 160,352 | 1,433 | — |
| BNY Mellon Emerging Markets Fund | 2,053,231 | — | 2,415 | 700,464 | 1,433 | — |
| BNY Mellon International | | | | | | |
| Appreciation Fund | 99,456 | — | 806 | 10,048 | 1,433 | — |
| BNY Mellon Balanced Fund | 124,381 | — | 946 | 15,029 | 1,433 | — |
NOTES TO FINANCIAL STATEMENTS (Unaudited) (continued)
expenses.The Chairman of the Trust’s Board receives an additional annual fee of $15,000 and the Chairman of the Trust’s Audit Committee receives an additional annual fee of $10,000.
NOTE 5—Securities Transactions:
Table 10 summarizes each fund’s aggregate amount of purchases and sales (including paydowns) of investment securities and securities sold short, excluding short-term securities, financial futures, options transactions and forward contracts, during the period ended February 28, 2011.
Short Sales: BNY Mellon U.S. Core Equity 130/30 Fund is engaged in short-selling which obligates the fund to replace the security borrowed by purchasing the security at current market value.The fund incurs a loss if the price of the security increases between the date of the short sale and the date on which the fund replaces the borrowed security. The fund realizes a gain if the price of the security declines between those dates. Until the fund replaces the borrowed security, the fund will maintain daily a segregated account with a broker or
custodian of permissible liquid assets sufficient to cover its short position. Securities sold short at February 28, 2011, and their related market values and proceeds, are set forth in the Statement of Securities Sold Short.
The provisions of ASC Topic 815 “Derivatives and Hedging” require qualitative disclosures about objectives and strategies for using derivatives, quantitative disclosures about fair value amounts of gains and losses on derivative instruments and disclosures about credit-risk-related contingent features in derivative agreements. BNY Mellon Large Cap Stock Fund, BNY Mellon Large Cap Market Opportunities Fund, BNY Mellon Tax-Sensitive Large Cap Multi-Strategy Fund, BNY Mellon Mid Cap Stock Fund, BNY Mellon Small Cap Stock Fund, BNY Mellon U.S. Core Equity 130/30 Fund, BNY Mellon Small/Mid Cap Fund and BNY Mellon Balanced Fund held no derivatives during the period ended February 28, 2011.
During the period, BNY Mellon Income Stock Fund, BNY Mellon Focused Equity Opportunities Fund, BNY Mellon International Fund, BNY Mellon
| | |
| Table 10—Purchases and Sales | | |
| |
| | Purchases ($) | Sales ($) |
| BNY Mellon Large Cap Stock Fund | 552,444,004 | 667,099,329 |
| BNY Mellon Large Cap Market Opportunities Fund | 77,131,183 | 5,098,586 |
| BNY Mellon Tax-Sensitive Large Cap Multi-Strategy Fund | 40,139,301 | 3,983,805 |
| BNY Mellon Income Stock Fund | 54,337,602 | 56,951,577 |
| BNY Mellon Mid Cap Stock Fund | 921,400,415 | 1,022,128,151 |
| BNY Mellon Small Cap Stock Fund | 376,811,291 | 491,187,137 |
| BNY Mellon Focused Equity Opportunities Fund | 208,203,294 | 121,431,555 |
| BNY Mellon Small/Mid Cap Fund | 347,466,793 | 185,306,225 |
| BNY Mellon International Fund | 321,854,638 | 442,983,643 |
| BNY Mellon Emerging Markets Fund | 1,072,690,527 | 808,155,261 |
| BNY Mellon International Appreciation Fund | 1,841,861 | 15,670,136 |
| BNY Mellon Balanced Fund | 146,587,251 | 155,289,744 |
| BNY Mellon U.S. Core Equity 130/30 Fund | | |
| Long transactions | 288,040,580 | 225,020,809 |
| Short sale transactions | 97,258,152 | 98,027,412 |
| Total | 385,298,732 | 323,048,221 |
142
Emerging Markets Fund and BNY Mellon International Appreciation Fund held derivatives. These disclosure requirements distinguish between derivatives, which are accounted for as “hedges” and those that do not qualify for hedge accounting. Because investment companies value their derivatives at fair value and recognize changes in fair value through the Statements of Operations, they do not qualify for such accounting. Accordingly, even though a fund’s investments in derivatives may represent
economic hedges, they are considered to be non-hedge transactions for purposes of this disclosure.
BNY Mellon International Appreciation Fund held derivatives that subject the fund to multiple categories of risk exposure. Table 11 shows the fund’s exposure to different types of market risk as it relates to the Statement of Assets and Liabilities and the Statement of Operations, respectively.
Table 11—Derivatives and Hedging
Fair value of derivative instruments for BNY Mellon International Appreciation Fund as of February 28, 2011 is shown below:
| | | | |
| | Derivative | | Derivative |
| | Assets ($) | | Liabilities ($) |
| Equity risk1 | 33,197 | Equity risk1 | — |
| Foreign exchange risk2 | 98,909 | Foreign exchange risk3 | (39) |
| Gross fair value of derivatives contracts | 132,106 | | (39) |
Statement of Assets and Liabilities location:
|
| 1 Includes cumulative appreciation (depreciation) on futures contracts as reported in the Statement of Financial Futures, but only the unpaid variation margin is reported in |
| the Statement of Assets and Liabilities. |
| 2 Unrealized appreciation on forward foreign currency exchange contracts. |
| 3 Unrealized depreciation on forward foreign currency exchange contracts. |
The effect of derivative instruments in the Statement of Operations for BNY Mellon International Appreciation Fund during the period ended February 28, 2011 is shown below:
| | | | | |
| | Amount of realized gain or (loss) on derivatives recognized in income ($) |
| Underlying risk | Futures4 | Forward Contracts5 | Total |
| Equity | 292,940 | — | 292,940 |
| Foreign exchange | — | 211,951 | 211,951 |
| Total | 292,940 | 211,951 | 504,891 |
| |
| | Change in unrealized appreciation or (depreciation) on derivatives recognized in income ($) |
| Underlying risk | Futures6 | Forward Contracts7 | Total |
| Equity | 91,122 | — | 91,122 |
| Foreign exchange | — | (30,734) | (30,734) |
| Total | 91,122 | (30,734) | 60,388 |
Statement of Operations location:
| |
| 4 | Net realized gain (loss) on financial futures. |
| 5 | Net realized gain (loss) on forward foreign currency exchange contracts. |
| 6 | Net unrealized appreciation (depreciation) on financial futures. |
| 7 | Net unrealized appreciation (depreciation) on forward foreign currency exchange contracts. |
NOTES TO FINANCIAL STATEMENTS (Unaudited) (continued)
Futures Contracts: In the normal course of pursuing its investment objective, BNY Mellon International Appreciation Fund is exposed to market risk, including equity price risk as a result of changes in value of underlying financial instruments.The fund invests in financial futures contracts in order to manage its exposure to or protect against changes in the market.A futures contract represents a commitment for the future purchase or a sale of an asset at a specified date. Upon entering into such contracts, these investments require initial margin deposits with a broker, which consist of cash or cash equivalents.The amount of these deposits is determined by the exchange or Board of Trade on which the contract is traded and is subject to change.Accordingly, variation margin payments are received or made to reflect daily unrealized gains or losses which are recorded in the Statement of Operations. Futures contracts are valued daily at the last sales price established by the Board of Trade or exchange upon which they are traded. When the contracts are closed, the fund recognizes a realized gain or loss.There is minimal counterparty credit risk to the fund with futures since futures are exchange traded, and the exchange’s clearinghouse guarantees the futures against default. Contracts open at February 28, 2011 are set forth in the Statement of Financial Futures.
Options: BNY Mellon Income Stock Fund and BNY Mellon Focused Equity Opportunities Fund purchases and writes (sells) put and call options to hedge against changes in the values of equities, or as a substitute for an investment. Each fund is subject to market risk in the course of pursuing its investment objectives through its investments in options contracts. A call option gives the purchaser of the option the right (but not the obligation) to buy, and obligates the writer to sell, the underlying security or securities at the exercise price at any time during the option period, or at a specified date.
Conversely, a put option gives the purchaser of the option the right (but not the obligation) to sell, and obligates the writer to buy the underlying security or securities at the exercise price at any time during the option period, or at a specified date.
As a writer of call options, each fund receives a premium at the outset and then bears the market risk of unfavorable changes in the price of the financial instrument underlying the option. Generally, each fund realizes a gain, to the extent of the premium, if the price of the underlying financial instrument decreases between the date the option is written and the date on which the option is terminated. Generally, each fund incurs a loss, if the price of the financial instrument increases between those dates.
As a writer of put options, each fund receives a premium at the outset and then bears the market risk of unfavorable changes in the price of the financial instrument underlying the option. Generally, each fund realizes a gain, to the extent of the premium, if the price of the underlying financial instrument increases between the date the option is written and the date on which the option is terminated. Generally, each fund incurs a loss, if the price of the financial instrument decreases between those dates.
As a writer of an option, each fund has no control over whether the underlying securities may be sold (call) or purchased (put) and as a result bears the market risk of an unfavorable change in the price of the security underlying the written option. There is a risk of loss from a change in value of such options which may exceed the related premiums received. One risk of holding a put or a call option is that if the option is not sold or exercised prior to its expiration, it becomes worthless. However, this risk is limited to the premium paid by each fund. Upon the expiration or closing of the option transaction, a gain or loss is reported in the Statements of Operations.
144
Table 12 summarizes BNY Mellon Income Stock Fund’s and BNY Mellon Focused Equity Opportunities Fund’s call/put options written during the period ended February 28, 2011.
Forward Foreign Currency Exchange Contracts:
BNY Mellon International Fund, BNY Mellon Emerging Markets Fund and BNY Mellon International Appreciation Fund enter into forward contracts in order to hedge their exposure to changes in foreign currency exchange rates on its foreign portfolio holdings, to settle foreign currency transactions or as a part of their investment strategies.When executing forward contracts, each fund is obligated to buy or sell a foreign currency at a specified rate on a certain date in the future.With respect to sales of forward contracts, each fund incurs a loss if the
value of the contract increases between the date the forward contract is opened and the date the forward contract is closed. Each fund realizes a gain if the value of the contract decreases between those dates.With respect to purchases of forward contracts, each fund incurs a loss if the value of the contract decreases between the date the forward contract is opened and the date the forward contract is closed. Each fund realizes a gain if the value of the contract increases between those dates. Any realized gain or loss which occurred during the period is reflected in the Statements of Operations. Each fund is exposed to foreign currency risk as a result of changes in value of underlying financial instruments. Each fund is also exposed to credit risk associated with counterparty nonperformance on these forward contracts, which is
| | | | |
| Table 12—Options Written | | | | |
| |
| BNY Mellon Income Stock Fund | | | Options Terminated |
| | Number of | Premiums | | Net Realized |
| Options Written | Contracts | Received ($) | Cost ($) | Gain ($) |
| Contracts outstanding August 31, 2010 | — | — | | |
| Contracts written | 523 | 53,722 | | |
| Contracts terminated: | | | | |
| Contracts closed | 100 | 17,199 | 1,600 | 15,599 |
| Contracts expired | 279 | 6,696 | — | 6,696 |
| Total contracts terminated | 379 | 23,895 | 1,600 | 22,295 |
| Contracts outstanding February 28, 2011 | 144 | 29,827 | | |
| |
| |
| Table 12—Options Written (continued) | | | | |
| |
| BNY Mellon Focused Equity Opportunities Fund | | | | |
| | | Number of | | Premiums |
| Options Written | | Contracts | Received ($) |
| Contracts outstanding August 31, 2010 | | — | | — |
| Contracts written | | 689 | | 98,732 |
| Contracts outstanding February 28, 2011 | | 689 | | 98,732 |
NOTES TO FINANCIAL STATEMENTS (Unaudited) (continued)
typically limited to the unrealized gain on each open contract. Table 13 summarizes open forward contracts for each fund at February 28, 2011.
Table 14 summarizes each relevant fund’s average market value of derivatives outstanding during the period ended February 28, 2011.
| | | | | |
| Table 13—Forward Foreign Currency Exchange Contracts | | | |
| |
| BNY Mellon International Fund | | | | |
| | Foreign | | | |
| | Currency | | | Unrealized |
| Forward Foreign Currency Exchange Contracts | Amounts | Cost ($) | Value ($) | Appreciation ($) |
| Purchases: | | | | |
| Australian Dollar, Expiring 3/1/2011 | 676,237 | 687,205 | 688,513 | 1,308 |
| British Pound, Expiring 3/1/2011 | 1,317,744 | 2,118,234 | 2,142,186 | 23,952 |
| British Pound, Expiring 3/1/2011 | 205,883 | 330,951 | 334,693 | 3,742 |
| Euro, Expiring 3/1/2011 | 126,373 | 173,792 | 174,389 | 597 |
| Hong Kong Dollar, Expiring 3/1/2011 | 1,028,048 | 131,998 | 132,004 | 6 |
| | | | | 29,605 |
| |
| |
| Table 13—Forward Foreign Currency Exchange Contracts (continued) | | |
| |
| BNY Mellon Emerging Markets Fund | | | | |
| | Foreign | | | Unrealized |
| | Currency | | | Appreciation |
| Forward Foreign Currency Exchange Contracts | Amounts | Cost ($) | Value ($) | (Depreciation) ($) |
| Purchases: | | | | |
| Brazilian Real, Expiring 3/1/2011 | 855 | 515 | 514 | (1) |
| Indian Rupee, Expiring 3/1/2011 | 7,958,687 | 176,663 | 175,824 | (839) |
| Indian Rupee, Expiring 3/1/2011 | 22,538,356 | 500,296 | 497,920 | (2,376) |
| Indian Rupee, Expiring 3/1/2011 | 2,095,794 | 46,522 | 46,301 | (221) |
| Indian Rupee, Expiring 3/1/2011 | 7,336,505 | 162,853 | 162,079 | (774) |
| South African Rand, Expiring 3/1/2011 | 4,346,731 | 621,139 | 624,306 | 3,167 |
| South African Rand, Expiring 3/1/2011 | 4,716,094 | 673,920 | 677,356 | 3,436 |
| South Korean Won, Expiring 3/2/2011 | 38,765,271 | 34,293 | 34,346 | 53 |
| South Korean Won, Expiring 3/3/2011 | 154,567,821 | 137,125 | 136,949 | (176) |
| South Korean Won, Expiring 3/3/2011 | 27,279,645 | 24,201 | 24,170 | (31) |
| Sales: | | Proceeds ($) | | |
| Indian Rupee, Expiring 3/3/2011 | 36,756 | 817 | 812 | 5 |
| Indian Rupee, Expiring 3/3/2011 | 29,187 | 649 | 645 | 4 |
| South African Rand, Expiring 3/2/2011 | 1,321,086 | 189,866 | 189,743 | 123 |
| South African Rand, Expiring 3/2/2011 | 26,069,262 | 3,746,660 | 3,744,239 | 2,421 |
| South Korean Won, Expiring 3/2/2011 | 118,494,373 | 104,788 | 104,988 | (200) |
| South Korean Won, Expiring 3/2/2011 | 2,756,754 | 2,438 | 2,442 | (4) |
| South Korean Won, Expiring 3/3/2011 | 259,194,629 | 229,864 | 229,650 | 214 |
| Gross Unrealized Appreciation | | | | 9,423 |
| Gross Unrealized Depreciation | | | | (4,622) |
146
| | | | | |
| Table 13—Forward Foreign Currency Exchange Contracts (continued) | | | |
| |
| BNY Mellon International Appreciation Fund | | | | |
| | Foreign | | | Unrealized |
| | Currency | | | Appreciation |
| Forward Foreign Currency Exchange Contracts | Amounts | Cost ($) | Value ($) | (Depreciation) ($) |
| Purchases: | | | | |
| Australian Dollar, Expiring 3/16/2011 | 235,200 | 231,890 | 238,966 | 7,076 |
| Australian Dollar, Expiring 3/16/2011 | 119,600 | 121,296 | 121,515 | 219 |
| Australian Dollar, Expiring 3/16/2011 | 55,783 | 56,211 | 56,676 | 465 |
| British Pounds, Expiring 3/16/2011 | 355,800 | 558,657 | 578,329 | 19,672 |
| British Pounds, Expiring 3/16/2011 | 116,600 | 186,116 | 189,525 | 3,409 |
| British Pounds, Expiring 3/16/2011 | 117,000 | 186,708 | 190,176 | 3,468 |
| British Pounds, Expiring 3/16/2011 | 50,190 | 80,628 | 81,581 | 953 |
| Euro, Expiring 3/16/2011 | 612,100 | 799,299 | 844,499 | 45,200 |
| Euro, Expiring 3/16/2011 | 87,800 | 118,947 | 121,136 | 2,189 |
| Euro, Expiring 3/16/2011 | 59,400 | 80,978 | 81,953 | 975 |
| Euro, Expiring 3/16/2011 | 27,400 | 37,540 | 37,803 | 263 |
| Euro, Expiring 3/16/2011 | 85,063 | 115,310 | 117,360 | 2,050 |
| Euro, Expiring 3/16/2011 | 60,800 | 83,145 | 83,884 | 739 |
| Japanese Yen, Expiring 3/16/2011 | 7,425,342 | 88,542 | 90,778 | 2,236 |
| Japanese Yen, Expiring 3/16/2011 | 46,250,000 | 556,991 | 565,423 | 8,432 |
| Japanese Yen, Expiring 3/16/2011 | 9,285,000 | 112,265 | 113,513 | 1,248 |
| Japanese Yen, Expiring 3/16/2011 | 9,200,000 | 112,158 | 112,473 | 315 |
| Japanese Yen, Expiring 3/16/2011 | 9,285,000 | 113,552 | 113,513 | (39) |
| Gross Unrealized Appreciation | | | | 98,909 |
| Gross Unrealized Depreciation | | | | (39) |
| |
| |
| Table 14—Average Market Value of Derivatives | | | | |
| |
| | | | | Average |
| | | | | Market Value ($) |
| BNY Mellon Income Stock Fund | | | | |
| Equity options contracts | | | | 7,055 |
| BNY Mellon Focused Equity Opportunities Fund | | | | |
| Equity options contracts | | | | 119,655 |
| BNY Mellon International Fund | | | | |
| Forward contracts | | | | 5,723,409 |
| BNY Mellon Emerging Markets Fund | | | | |
| Forward contracts | | | | 13,429,216 |
| BNY Mellon International Appreciation Fund | | | | |
| Equity futures contracts | | | | 2,928,501 |
| Forward contracts | | | | 3,110,072 |
NOTES TO FINANCIAL STATEMENTS (Unaudited) (continued)
Table 15 summarizes accumulated net unrealized appreciation (depreciation) on investments for each fund at February 28, 2011.
At February 28, 2011, the cost of investments for federal income tax purposes was substantially the same as the cost for financial reporting purposes (see the Statements of Investments).
| | | | |
| Table 15—Accumulated Net Unrealized Appreciation (Depreciation) | | | |
| |
| | Gross | Gross | |
| | Appreciation ($) | Depreciation ($) | Net ($) |
| BNY Mellon Large Cap Stock Fund | 336,106,120 | 9,801,624 | 326,304,496 |
| BNY Mellon Large Cap Market Opportunities Fund | 6,855,118 | 408,579 | 6,446,539 |
| BNY Mellon Tax-Sensitive Large Cap Multi-Strategy Fund | 6,605,838 | 158,963 | 6,446,875 |
| BNY Mellon Income Stock Fund | 19,188,471 | 601,594 | 18,586,877 |
| BNY Mellon Mid Cap Stock Fund | 345,739,221 | 11,316,342 | 334,422,879 |
| BNY Mellon Small Cap Stock Fund | 85,837,472 | 4,378,659 | 81,458,813 |
| BNY Mellon U.S. Core Equity 130/30 Fund | 53,242,836 | 2,748,290 | 50,494,546 |
| BNY Mellon Focused Equity Opportunities Fund | 64,166,606 | 1,707,323 | 62,459,283 |
| BNY Mellon Small/Mid Cap Fund | 88,064,507 | 8,955,712 | 79,108,795 |
| BNY Mellon International Fund | 167,492,108 | 46,399,238 | 121,092,870 |
| BNY Mellon Emerging Markets Fund | 372,720,172 | 69,825,455 | 302,894,717 |
| BNY Mellon International Appreciation Fund | 43,654,738 | 51,425,722 | (7,770,984) |
| BNY Mellon Balanced Fund | 44,982,939 | 6,300,952 | 38,681,987 |
148

| | | |
| Ticker Symbols: | | | |
| BNY Mellon Large Cap Stock Fund | Class M: MPLCX | Investor: MILCX | |
| BNY Mellon Large Cap Market Opportunities Fund | Class M: MMOMX | Investor: MMOIX | |
| BNY Mellon Tax-Sensitive Large Cap Multi-Strategy Fund | Class M: MTSMX | Investor: MTSIX | |
| BNY Mellon Income Stock Fund | Class M: MPISX | Investor: MIISX | |
| BNY Mellon Mid Cap Stock Fund | Class M: MPMCX | Investor: MIMSX | Dreyfus Premier: MMSPX |
| BNY Mellon Small Cap Stock Fund | Class M: MPSSX | Investor: MISCX | |
| BNY Mellon U.S. Core Equity 130/30 Fund | Class M: MUCMX | Investor: MUCIX | |
| BNY Mellon Focused Equity Opportunities Fund | Class M: MFOMX | Investor: MFOIX | |
| BNY Mellon Small/Mid Cap Fund | Class M: MMCMX | Investor: MMCIX | |
| BNY Mellon International Fund | Class M: MPITX | Investor: MIINX | |
| BNY Mellon Emerging Markets Fund | Class M: MEMKX | Investor: MIEGX | |
| BNY Mellon International Appreciation Fund | Class M: MPPMX | Investor: MARIX | |
| BNY Mellon Balanced Fund | Class M: MPBLX | Investor: MIBLX | |
Telephone Wealth Management (WM) Clients, please contact your Account Officer or call 1-888-281-7350. Brokerage Clients of BNY Mellon Wealth Advisors (BNYMWA), please contact your financial representative or call 1-800-830-0549, Option 2. Individual Account holders, please call Dreyfus at 1-800-645-6561.
Mail WM Clients, write to your Account Officer, c/o The Bank of New York Mellon, One Mellon Bank Center, Pittsburgh, PA 15258 BNYMWA Brokerage Clients, write to your financial representative, P.O. Box 9012, Hicksville, NY 11802–9012 Individual Account Holders, write to: BNY Mellon Funds, P.O. Box 55268, Boston, MA 02205–8502
The funds file their complete schedule of portfolio holdings with the Securities and Exchange Commission (“SEC”) for the first and third quarters of each fiscal year on Form N-Q. The funds’ Forms N-Q are available on the SEC’s website at http://www.sec.gov and may be reviewed and copied at the SEC’s Public Reference Room in Washington, DC. Information on the operation of the Public Reference Room may be obtained by calling 1-800-SEC-0330.
A description of the policies and procedures that the funds use to determine how to vote proxies relating to portfolio securities, and information regarding how the funds voted these proxies for the most recent 12-month period ended June 30 is available at http://www.dreyfus.com and on the SEC’s website at http://www.sec.gov. The description of the policies and procedures is also available without charge, upon request, by calling 1-800-645-6561.
© 2011 MBSC Securities Corporation
MFTSA0211-EQ
The BNY Mellon Funds
|
| BNY Mellon Bond Fund |
| BNY Mellon Intermediate Bond Fund |
| BNY Mellon Intermediate U.S. Government Fund |
| BNY Mellon Short-Term U.S. Government Securities Fund |
| |
| SEMIANNUAL REPORT | February 28, 2011 |

| |
| Contents | |
| |
| The Funds | |
| Letter from the President | 2 |
| Discussion of Funds’ Performance | |
| BNY Mellon Bond Fund | 3 |
| BNY Mellon | |
| Intermediate Bond Fund | 5 |
| BNY Mellon Intermediate | |
| U.S. Government Fund | 7 |
| BNY Mellon Short-Term U.S. | |
| Government Securities Fund | 9 |
| UnderstandingYour Fund’s Expenses | 11 |
| ComparingYour Fund’s Expenses | |
| With Those of Other Funds | 12 |
| Statements of Investments | 13 |
| Statements of Assets and Liabilities | 28 |
| Statements of Operations | 29 |
| Statements of Changes in Net Assets | 30 |
| Financial Highlights | 32 |
| Notes to Financial Statements | 40 |
For More Information
Back cover
The views expressed herein are current to the date of this report. These views and the composition of the funds’ portfolios are subject to change at any time based on market and other conditions.
• Not FDIC-Insured
• Not Bank-Guaranteed
• May Lose Value
The Funds

LETTER FROM
THE PRESIDENT
Dear Shareholder:
We are pleased to present to you this semiannual report for the BNY Mellon FundsTrust, covering the reporting period ended February 28, 2011.
Fixed-income securities generally produced mixed results over the past six months. Higher-quality segments of the U.S. bond market — including U.S. government securities — encountered heightened volatility when a new round of monetary stimulus suggested that the economy was likely to gain strength. However, lower-quality market sectors, most notably high-yield bonds, continued to advance along with expectations for better business conditions in a recovering economy.
We currently believe that bonds are fairly valued in light of our expectation that the U.S. economy will gain a moderate degree of momentum over the remainder of 2011. New fiscal stimulus measures, improving unemployment figures and generally benign inflationary pressures should offset ongoing concerns regarding the federal budget deficit and a moribund housing market.Although the U.S. bond market does not appear poised for a sustained increase in yields under these conditions, we anticipate periodic bouts of market volatility as the Federal Reserve Board moves closer to an eventual increase in short-term interest rates.These swings could offer short-term opportunities to tactical investors. As always, your portfolio manager can help you align your investment portfolio with the opportunities and challenges that 2011 has in store.
For information about how each fund performed during the reporting period, as well as market perspectives, we have provided a Discussion of Fund Performance for each fund.
Thank you for your continued confidence and support.

Christopher E. Sheldon
President
BNY Mellon Funds Trust
March 15, 2011

DISCUSSION OF
FUND PERFORMANCE
For the period of September 1, 2010, through February 28, 2011, as provided by John F. Flahive, Portfolio Manager and Director of Fixed Income
Fund and Market Performance Overview
For the six-month period ended February 28, 2011, BNY Mellon Bond Fund’s Class M shares produced a total return of 0.01%, and Investor shares returned –0.12%.1 In comparison, the fund’s benchmark, the Barclays Capital U.S. Aggregate Index (the “Index”), produced a total return of –0.83%.2
The reporting period generally proved to be a favorable time for higher yielding sectors of the bond market, but declines in U.S. government securities weighed on market averages.The fund produced higher returns than its benchmark, as a relatively short average duration helped shelter the fund from the full brunt of the market’s weakness, and overweighted exposure to investment-grade corporate bonds bolstered participation in one of the market’s stronger areas.
The Fund’s Investment Approach
The fund seeks to maximize total return consisting of capital appreciation and current income. To pursue its goal, the fund actively manages bond market and maturity exposure and invests at least 80% of its assets in bonds, such as U.S. Treasury and government agency bonds, corporate bonds, mortgage-related securities and foreign corporate and government bonds. The fund’s investments in bonds must be rated investment-grade quality at the time of purchase3 or, if unrated, deemed of comparable quality by the investment adviser. Generally, the average effective duration of the fund’s portfolio will not exceed eight years.
U.S. Government Securities Declined as the Economy Gained Traction
Although the reporting period began in the midst of an economic recovery, recent developments had threatened
to derail the already choppy rebound. High unemployment and troubled housing markets continued to weigh on U.S. economic growth, and Europe had been roiled by a sovereign debt crisis.As a result, investors at the start of the reporting period generally favored high-quality investments, such as U.S. government securities.
In response to the sluggish economy, the Federal Reserve Board (the “Fed”) maintained its target for the federal funds rate in a range between 0% and 0.25%, a position it first established in December 2008. In addition, the Fed announced a new round of quantitative easing of monetary policy for the fall of 2010. The Fed’s September announcement led to a more optimistic economic outlook, and concerns regarding a double-dip recession eased. Investors began to turn away from traditionally defensive investments, such as U.S. government securities, and toward riskier assets, including stocks and high yield bonds. Investment-grade corporate bonds, commercial mortgage-backed securities and asset-backed securities also benefited from improved economic expectations, but U.S. Treasury securities and, to a lesser extent, U.S. government agency securities lost value, driving the Index into negative territory for the reporting period overall.
Defensive Posture Bolstered Relative Performance
At the start of the reporting period, we had adopted a relatively defensive interest-rate posture, setting the fund’s average duration in a range that was significantly shorter than industry averages.We achieved this position through an emphasis on bonds with shorter-term maturities, which helped protect the fund from heightened market volatility during the final months of 2010. After longer-term interest rates had risen, we adjusted the fund’s average duration to a market-neutral position for the reporting period’s second half, enabling the fund to capture incrementally higher yields.
DISCUSSION OF FUND PERFORMANCE (continued)
In addition, the fund benefited from overweighted exposure to investment-grade corporate bonds, which generally retained their value as the economic recovery gathered momentum. Corporate bonds issued by financial institutions and industrial companies were among the fund’s top performers for the reporting period.The fund also benefited from above-average returns from taxable municipal bonds issued under the federally subsidized Build America Bonds program.
On the other hand, the fund’s underweighted exposure to commercial mortgage-backed securities during the reporting period generally undermined its results compared to the benchmark, while an overweighted position in residential mortgage-backed securities produced returns that were roughly in line with market averages.
Finding Opportunities in a More Mature Recovery
Despite economic headwinds stemming from moribund U.S. housing markets and rising geopolitical tensions, we expect the U.S. economic recovery to persist as the remainder of 2011 unfolds.Although the Fed has signaled that it has no plans to raise short-term interest rates anytime soon, investors have begun to prepare for the end of the quantitative easing program that began last fall.
Consequently, we have maintained the fund’s relatively defensive investment posture, including a shorter-than-average duration stance.We have balanced this conservative interest-rate strategy with a more constructive sector
allocation strategy, including overweighted exposure to investment-grade corporate bonds, which we believe will continue to benefit from robust demand from investors seeking competitive yields in a low interest-rate environment. In our judgment, these are prudent strategies as the U.S. economy moves into the middle stages of its cycle.
March 15, 2011
| |
| | Bond funds are subject generally to interest rate, credit, liquidity and market |
| | risks, to varying degrees, all of which are more fully described in the fund’s |
| | prospectus. Generally, all other factors being equal, bond prices are inversely |
| | related to interest-rate changes, and rate increases can cause price declines. |
| | The fund may use derivative instruments, such as options, futures and options |
| | on futures, forward contracts and swaps.A small investment in derivatives could |
| | have a potentially large impact on the fund’s performance.The use of |
| | derivatives involves risks different from, or possibly greater than, the risks |
| | associated with investing directly in the underlying assets. |
| 1 | Total return includes reinvestment of dividends and any capital gains paid. |
| | Past performance is no guarantee of future results. Share price, yield and |
| | investment return fluctuate such that upon redemption, fund shares may be |
| | worth more or less than their original cost. Return figures provided reflect the |
| | absorption of certain fund expenses by BNY Mellon Fund Advisors pursuant |
| | to an agreement in effect through September 30, 2010, at which time it |
| | terminated. Had these expenses not been absorbed, the fund’s returns would |
| | have been lower. |
| 2 | SOURCE: LIPPER INC. — Reflects reinvestment of dividends and, where |
| | applicable, capital gain distributions.The Barclays Capital U.S.Aggregate |
| | Index is a widely accepted, unmanaged total return index of corporate, U.S. |
| | government and U.S. government agency debt instruments, mortgage-backed |
| | securities and asset-backed securities with an average maturity of 1-10 years. |
| | Investors cannot invest directly in any index. |
| 3 | The fund may continue to own investment-grade bonds (at the time of |
| | purchase), which are subsequently downgraded to below investment grade. |
4

DISCUSSION OF
FUND PERFORMANCE
For the period of September 1, 2010, through February 28, 2011, as provided by John F. Flahive, Portfolio Manager and Director of Fixed Income
Fund and Market Performance Overview
For the six-month period ended February 28, 2011, BNY Mellon Intermediate Bond Fund’s Class M shares produced a total return of –0.32%, and Investor shares returned –0.45%.1 In comparison, the fund’s benchmark, the Barclays Capital Intermediate Government/Credit Bond Index (the “Index”), produced a total return of –0.62%.2
The reporting period generally proved to be a favorable time for higher yielding sectors of the bond market, but declines in U.S. government securities weighed on market averages. The fund produced higher returns than its benchmark, as a relatively short average duration helped shelter the fund from the full brunt of the market’s weakness.
The Fund’s Investment Approach
The fund seeks total return (consisting of capital appreciation and current income).To pursue its goal, the fund actively manages bond market and maturity exposure and invests at least 80% of its assets in bonds, such as U.S. government and agency bonds, corporate bonds, mortgage-related securities, foreign corporate and government bonds and municipal bonds.The fund’s investments in bonds must be rated investment grade at the time of purchase3 or, if unrated, deemed of comparable quality by the investment adviser. Generally, the fund’s average effective portfolio maturity will be between three and 10 years, and the average effective duration of the fund’s portfolio will be between 2.5 and 5.5 years.
When managing the fund, we use a disciplined process to select securities and manage risk. We generally choose bonds based on yield, credit quality, the level of interest rates and inflation, general economic and financial trends and our outlook for the securities markets. Our management process also includes computer modeling and scenario testing of possible changes in market conditions.
U.S. Government Securities Declined as the Economy Gained Traction
Although the reporting period began in the midst of an economic recovery, recent developments had threatened to derail the already choppy rebound. High unemployment and troubled housing markets continued to weigh on U.S. economic growth, and Europe was roiled by a sovereign debt crisis. As a result, investors at the start of the reporting period generally favored high-quality investments, such as U.S. government securities.
In response to the sluggish economy, the Federal Reserve Board (the “Fed”) maintained its target for the federal funds rate in a range between 0% and 0.25%, a position it first established in December 2008. In addition, the Fed announced a new round of quantitative easing of monetary policy for the fall of 2010.The Fed’s September announcement led to a more optimistic economic outlook, and concerns regarding a double-dip recession eased. Investors began to turn away from traditionally defensive investments, such as U.S. government securities, and toward riskier assets, including stocks and high yield bonds. Investment-grade corporate bonds, commercial mortgage-backed securities and asset-backed securities also benefited from improved economic expectations, but U.S.
DISCUSSION OF FUND PERFORMANCE (continued)
Treasury securities and, to a lesser extent, U.S. government agency securities lost value, driving the Index into negative territory for the reporting period overall.
Defensive Posture Bolstered Relative Performance
At the start of the reporting period, we had adopted a relatively defensive interest-rate posture, setting the fund’s average duration in a range that was significantly shorter than industry averages.We achieved this position through an emphasis on bonds with shorter-term maturities, which helped protect the fund from heightened market volatility during the final months of 2010.We generally maintained this conservative interest-rate strategy through the end of the reporting period.
On the other hand, our focus on longer-duration corporate-backed securities detracted modestly from the fund’s relative performance. Although investment-grade corporate bonds generally retained their value as the economic recovery gathered momentum, longer-term securities lagged their short- and intermediate-term counterparts. Weakness was especially apparent among longer-duration holdings from industrial companies. Overweighted exposure to residential mortgage-backed securities produced returns that were roughly in line with market averages.
Finding Opportunities in a More Mature Recovery
Despite economic headwinds stemming from moribund U.S. housing markets and rising geopolitical tensions, we expect the U.S. economic recovery to persist as the remainder of 2011 unfolds.Although the Fed has signaled that it has no plans to raise short-term interest rates anytime soon, investors have begun to prepare for the end of the quantitative easing program that began last fall.
Consequently, we have maintained the fund’s relatively defensive investment posture, including a shorter-than-average duration stance.We have balanced this conservative interest-rate strategy with a more constructive sector allocation strategy, including overweighted exposure to investment-grade corporate bonds, which we believe will continue to benefit from robust demand from investors seeking competitive yields in a low interest-rate environment. In our judgment, these are prudent strategies as the U.S. economy moves into the middle stages of its cycle.
March 15, 2011
| |
| | Bond funds are subject generally to interest rate, credit, liquidity and market |
| | risks, to varying degrees, all of which are more fully described in the fund’s |
| | prospectus. Generally, all other factors being equal, bond prices are inversely |
| | related to interest-rate changes, and rate increases can cause price declines. |
| | The fund may use derivative instruments, such as options, futures and options |
| | on futures, forward contracts and swaps.A small investment in derivatives could |
| | have a potentially large impact on the fund’s performance.The use of |
| | derivatives involves risks different from, or possibly greater than, the risks |
| | associated with investing directly in the underlying assets. |
| 1 | Total return includes reinvestment of dividends and any capital gains paid. |
| | Past performance is no guarantee of future results. Share price, yield and |
| | investment return fluctuate such that upon redemption, fund shares may be |
| | worth more or less than their original cost. |
| 2 | SOURCE: LIPPER INC. – Reflects reinvestment of dividends and, where |
| | applicable, capital gain distributions.The Barclays Capital Intermediate |
| | Government/Credit Bond Index is a widely accepted, unmanaged index of |
| | government and credit bond market performance composed of U.S. government, |
| | Treasury and agency securities, fixed-income securities and nonconvertible |
| | investment-grade credit debt, with an average maturity of 1-10 years. Index |
| | return does not reflect the fees and expenses associated with operating a mutual |
| | fund. Investors cannot invest directly in any index. |
| 3 | The fund may continue to own investment-grade bonds (at the time of |
| | purchase), which are subsequently downgraded to below investment grade. |
6

DISCUSSION OF
FUND PERFORMANCE
For the period of September 1, 2010, through February 28, 2011, as provided by John F. Flahive, Portfolio Manager and Director of Fixed Income
Fund and Market Performance Overview
For the six-month period ended February 28, 2011, BNY Mellon Intermediate U.S. Government Fund’s Class M shares achieved a total return of –0.84%, and the fund’s Investor shares achieved a total return of –0.95%.1 In comparison, the fund’s benchmark, the Barclays Capital Intermediate Government Index (the “Index”), achieved a total return of -0.62%.2
U.S. government securities encountered heightened volatility in a strengthening economy, and investors shifted their focus from traditionally defensive U.S. government securities to riskier assets. The fund produced higher returns than its benchmark, as a relatively short average duration helped cushion the brunt of the market’s volatility.
The Fund’s Investment Approach
The fund seeks to provide as high a level of current income as is consistent with the preservation of capital. This objective may be changed without shareholder approval.To pursue its goal, the fund normally invests at least 80% of its assets in securities issued or guaranteed by the U.S. government or its agencies or instrumentalities.
The fund allocates broadly among U.S.Treasury obligations, direct U.S. government agency debt obligations and U.S. government agency mortgage-backed securities, including mortgage pass-through securities and collateralized mortgage obligations (CMOs).The securities in which the fund invests include those backed by the full faith and credit of the U.S. government and those that are neither insured nor guaranteed by the U.S. government. Under normal market conditions, the fund maintains an average effective portfolio maturity between three and 10 years.The fund attempts to manage interest rate risk by adjusting its duration.The fund may invest in individual bonds of any maturity or duration and does not expect to target any specific range of duration.
Defensive Investments Lagged as U.S. Economy Strengthened
The reporting period began in the wake of a long rally among U.S. government securities.A “flight to quality” in a subpar U.S. economic recovery had driven prices of U.S. government securities higher through September 2010.A sovereign debt crisis in Europe also contributed to investor’s concerns at the time.
However, economic sentiment improved dramatically after the Federal Reserve Board (the “Fed”) announced a new round of quantitative easing of U.S. monetary policy, convincing many investors that the economy was unlikely to slip back into recession. Economic expectations were further buoyed by subsequent releases of economic data showing improvements in employment and consumer spending. In addition, forecasts of renewed global economic weakness stemming from the European debt crisis failed to materialize. Later in the fall, the end of uncertainty surrounding U.S. midterm elections and the passage of fiscally stimulative tax legislation lent additional support to a more positive economic outlook.As a result, yields of U.S. government securities rose sharply from October through December, and they remained within a relatively narrow range during the first two months of 2011.
Investors responded to the improving U.S. economy by refocusing on riskier assets, such as stocks and high yield bonds. In contrast, traditionally defensive U.S. government securities fell out of favor with investors, causing their yields to rise and prices to fall. Meanwhile, yield differences between U.S. government agency securities and U.S.Treasury securities generally narrowed, but yield differences widened along the market’s maturity range.
DISCUSSION OF FUND PERFORMANCE (continued)
A Short Duration Posture Bolstered Relative Performance
The fund generally adopted a defensive investment posture as economic expectations improved in the early fall, including an average duration that was shorter than that of the benchmark.This strategy proved effective, helping to cushion the brunt of market volatility as yields climbed in the intermediate-term segment of the market’s maturity range.The fund also was helped by our emphasis on U.S. government agency securities and a correspondingly underweighted position in lower yielding U.S. Treasury securities.The fund achieved positive results from investments in short-duration mortgage-backed securities that are not represented in the benchmark, including project loans from Ginnie Mae.These securities provided higher yields than the residential mortgage-backed securities in the Index. Finally, an allocation to Treasury Inflation Protected Securities (“TIPS”) fared well when rising commodity prices sparked worries about a potential acceleration of inflation in the global economy.
Maintaining a Risk-Conscious Approach
Despite ongoing headwinds from rising commodity prices and a moribund housing market, we believe that the U.S. economic expansion is likely to persist.Although higher short-term interest rates from the Fed do not appear to be imminent, some investors have begun to prepare their portfolios for the end of the Fed’s quantitative easing program, as well as eventual rate hikes down the road. Consequently, we have maintained the fund’s average duration in a short position compared to that of the benchmark. However, in an attempt to boost yields, we have continued to favor higher-yielding U.S. government agency securities, short-duration mortgage-backed securities and TIPS over nominal U.S.Treasury securities.
March 15, 2011
| |
| | Bond funds are subject generally to interest rate, credit, liquidity and market |
| | risks, to varying degrees, all of which are more fully described in the fund’s |
| | prospectus. Generally, all other factors being equal, bond prices are inversely |
| | related to interest-rate changes, and rate increases can cause price declines. |
| | The fund may use derivative instruments, such as options, futures and options |
| | on futures and swaps.A small investment in derivatives could have a |
| | potentially large impact on the fund’s performance.The use of derivatives |
| | involves risks different from, or possibly greater than, the risks associated with |
| | investing directly in the underlying assets. |
| 1 | Total return includes reinvestment of dividends and any capital gains paid. |
| | Past performance is no guarantee of future results. Share price, yield and |
| | investment return fluctuate such that upon redemption, fund shares may be |
| | worth more or less than their original cost. Return figures provided reflect the |
| | absorption of certain fund expenses by BNY Mellon Fund Advisors pursuant |
| | to an agreement in effect through September 30, 2010, at which time it was |
| | terminated. Had these expenses not been absorbed, the fund’s returns would |
| | have been lower. |
| 2 | SOURCE: FactSet – Reflects reinvestment of dividends and, where applicable, |
| | capital gain distributions.The Barclays Capital Intermediate Government Index |
| | is a widely accepted, unmanaged index of government bond market performance |
| | composed of U.S.Treasury and agency securities with maturities of 1-10 years. |
| | Index return does not reflect the fees and expenses associated with operating a |
| | mutual fund. Investors cannot invest directly in any index. |
8

DISCUSSION OF
FUND PERFORMANCE
For the period of September 1, 2010, through February 28, 2011, as provided by Lawrence R. Dunn, CFA, Portfolio Manager
Fund and Market Performance Overview
For the six-month period ended February 28, 2011, BNY Mellon Short-Term U.S. Government Securities Fund’s Class M shares achieved a total return of –0.11%, and the fund’s Investor shares achieved a total return of –0.33%.1 In comparison, the Barclays Capital 1-3 Year U.S. Government Index (the “Index”), the fund’s benchmark, achieved a total return of 0.14%.2
U.S. government securities encountered heightened volatility in a strengthening economy as investors turned toward riskier assets and away from traditionally defensive U.S. government securities. The fund produced lower returns than its benchmark, primarily due to a “barbell” yield curve strategy as intermediate-term yields increased.
The Fund’s Investment Approach
The fund seeks to provide as high a level of current income as is consistent with the preservation of capital. To pursue this goal, the fund invests at least 80% of its assets in securities issued or guaranteed by the U.S. government or its agencies or instrumentalities and in repurchase agreements.The fund may invest up to 35% of its net assets in mortgage-related securities issued by U.S. government agencies or instrumentalities, such as mortgage pass-through securities issued by the Government National Mortgage Association (“Ginnie Mae”), the Federal National Mortgage Association (“Fannie Mae”) and the Federal Home Loan Mortgage Corporation (“Freddie Mac”). The fund may also invest in collateralized mortgage obligations (“CMOs”), including stripped mortgage-backed securities. Generally, the fund’s average effective portfolio maturity and the average effective duration of the fund’s portfolio will be less than three years.
When choosing securities, we typically first examine U.S. and global economic conditions and other market factors to estimate long- and short-term interest rates. Using a research-driven investment process, we then seek to identify what we believe are potentially profitable sectors before they are widely perceived by the market. We also seek to identify underpriced or mispriced securities that appear likely to perform well over time.
Defensive Investments Lagged as U.S. Economy Strengthened
A “flight to quality” in a subpar U.S. economic recovery caused prices of U.S. government securities to rise in the months prior to the start of the reporting period. However, economic sentiment improved dramatically in September, after the Federal Reserve Board (the “Fed”) announced a new round of quantitative easing of U.S. monetary policy, convincing many investors that the economy was unlikely to slip back into recession. Economic expectations were further buoyed by subsequent improvements in employment and consumer spending. Later in the fall, the end of uncertainty surrounding U.S. midterm elections and the passage of fiscally stimulative tax legislation lent additional support to a more positive economic outlook. As a result, yields of U.S. government securities rose sharply from October through December, and they remained within a relatively narrow range during the first two months of 2011.
Investors responded to the improving economy by refo-cusing on riskier assets, such as stocks and high yield bonds. In contrast, U.S. government securities fell out of favor, causing their yields to rise and prices to fall. Meanwhile, yield differences between U.S. government agency securities and U.S.Treasury securities generally narrowed, but yield differences along the short- to intermediate-term maturity spectrum widened as longer-term yields increased.
DISCUSSION OF FUND PERFORMANCE (continued)
“Barbell” Duration Strategy Dampened Relative Results
The fund generally adopted a defensive investment posture when economic expectations improved, including a relatively short average duration.We achieved a short duration posture through a barbell strategy in which an emphasis on securities maturing in one year or less was balanced by holdings with longer-term maturities. However, this strategy proved ineffective when yield differences steepened at the short end of the maturity spectrum.Although we later increased the fund’s average duration to a position just short of neutral, it was not enough to offset earlier weakness. The fund was hurt to a lesser degree by a reduced emphasis on U.S. government agency securities as their valuations reached levels we considered expensive. By the reporting period’s end, the mix of U.S.Treasury securities and U.S. government agency securities in the fund roughly matched that of the benchmark.
The fund achieved better relative results from its investments in short-duration mortgage-backed securities that are not represented in the benchmark, including project loans from Ginnie Mae.These securities provided higher yields than the residential mortgage-backed securities in the Index.
Maintaining a Risk-Conscious Approach
Despite ongoing headwinds from rising commodity prices and a moribund housing market, we believe that the U.S. economic expansion is likely to persist.
Although higher short-term interest rates from the Fed do not appear to be imminent, some investors have begun to prepare their portfolios for the end of the Fed’s quantitative easing program. Consequently, we have maintained the fund’s average duration in a slightly short position compared to that of the benchmark, but we have done so through a more bulleted strategy, emphasizing maturities in the one- to two-year range.
March 15, 2011
| |
| | Bond funds are subject generally to interest rate, credit, liquidity and market |
| | risks, to varying degrees, all of which are more fully described in the fund’s |
| | prospectus. Generally, all other factors being equal, bond prices are inversely |
| | related to interest-rate changes, and rate increases can cause price declines. |
| | The fund may use derivative instruments, such as options, futures and options |
| | on futures.A small investment in derivatives could have a potentially large |
| | impact on the fund’s performance.The use of derivatives involves risks different |
| | from, or possibly greater than, the risks associated with investing directly in the |
| | underlying assets. |
| 1 | Total return includes reinvestment of dividends and any capital gains paid. |
| | Past performance is no guarantee of future results. Share price, yield and |
| | investment return fluctuate such that upon redemption, fund shares may be |
| | worth more or less than their original cost. |
| 2 | SOURCE: LIPPER INC. – Reflects reinvestment of dividends and, where |
| | applicable, capital gain distributions. The Barclays Capital 1-3 Year U. S. |
| | Government Index is a widely accepted, unmanaged index of government |
| | bond market performance composed of U. S. Treasury and agency securities |
| | with maturities of 1-3 years. Index return does not reflect the fees and |
| | expenses associated with operating a mutual fund. Investors cannot invest |
| | directly in any index. |
10
UNDERSTANDING YOUR FUND’S EXPENSES (Unaudited)
As a mutual fund investor, you pay ongoing expenses, such as management fees and other expenses. Using the information below, you can estimate how these expenses affect your investment and compare them with the expenses of other funds.You also may pay one-time transaction expenses, including sales charges (loads) and redemption fees, which are not shown in this section and would have resulted in higher total expenses. For more information, see your fund’s prospectus or talk to your financial advisor.
Review your fund’s expenses
The table below shows the expenses you would have paid on a $1,000 investment in each class of each BNY Mellon fixed income fund from September 1, 2010 to February 28, 2011. It also shows how much as $1,000 investment would be worth at the close of the period assuming actual returns and expenses.
| | | | |
| Expenses and Value of a $1,000 Investment | | | | |
| assuming actual returns for the six months ended February 28, 2011 | | | | |
| | | Class M Shares | | Investor Shares |
| BNY Mellon Bond Fund | | | | |
| Expenses paid per $1,000† | | $2.73 | $ | 3.96 |
| Ending value (after expenses) | | $1,000.10 | $ | 998.80 |
| Annualized expense ratio (%) | | .55 | | .80 |
| BNY Mellon Intermediate Bond Fund | | | | |
| Expenses paid per $1,000† | | $2.72 | $ | 3.96 |
| Ending value (after expenses) | | $996.80 | $ | 995.50 |
| Annualized expense ratio (%) | | .55 | | .80 |
| BNY Mellon Intermediate U.S. Government Fund | | | | |
| Expenses paid per $1,000† | | $3.65 | $ | 4.89 |
| Ending value (after expenses) | | $991.60 | $ | 990.50 |
| Annualized expense ratio (%) | | .74 | | .99 |
| BNY Mellon Short-Term U.S. Government Securities Fund | | | | |
| Expenses paid per $1,000† | | $2.63 | $ | 3.81 |
| Ending value (after expenses) | | $998.90 | $ | 996.70 |
| Annualized expense ratio (%) | | .53 | | .77 |
|
| † Expenses are equal to each fund’s annualized expense ratio as shown above, multiplied by the average account value over the period, multiplied by 181/365 (to reflect the |
| one-half year period). |
COMPARING YOUR FUND’S EXPENSES WITH THOSE OF OTHER FUNDS (Unaudited)
Using the SEC’s method to compare expenses
The Securities and Exchange Commission (SEC) has established guidelines to help investors assess fund expenses. Per these guidelines, the table below shows your fund’s expenses based on a $1,000 investment, assuming a hypothetical 5% annualized return.You can use this information to compare the ongoing expenses (but not transaction expenses or total cost) of investing in each fund with those of other funds. All mutual fund shareholder reports will provide this information to help you make this comparison. Please note that you cannot use this information to estimate your actual ending account balance and expenses paid during the period.
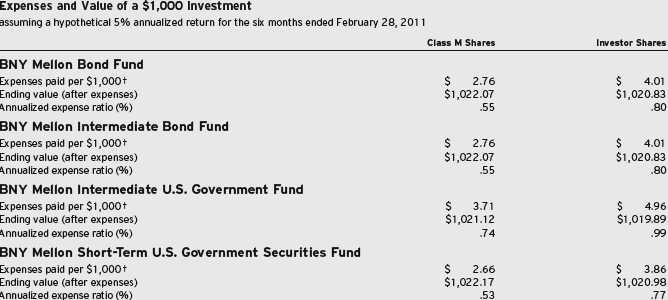
|
| † Expenses are equal to each fund’s annualized expense ratio as shown above, multiplied by the average account value over the period, multiplied by 181/365 (to reflect the |
| one-half year period). |
12
STATEMENT OF INVESTMENTS
February 28, 2011 (Unaudited)
| | | | | |
| BNY Mellon Bond Fund | | | | |
| | Coupon | Maturity | Principal | |
| Bonds and Notes—98.4% | Rate (%) | Date | Amount ($) | Value ($) |
| Asset-Backed Ctfs./Auto Receivables—3.2% | | | | |
| Ally Auto Receivables Trust, Ser. 2010-3, Cl. A4 | 1.55 | 8/17/15 | 3,545,000 | 3,516,973 |
| Americredit Automobile Receivables Trust, Ser. 2010-3, Cl. A3 | 1.14 | 4/8/15 | 6,905,000 | 6,896,261 |
| Ford Credit Auto Owner Trust, Ser. 2007-A, Cl. A4A | 5.47 | 6/15/12 | 369,710 | 375,565 |
| Franklin Auto Trust, Ser. 2007-1, Cl. A4 | 5.03 | 2/16/15 | 2,988,099 | 2,992,611 |
| Harley-Davidson Motorcycle Trust, Ser. 2009-2, Cl. A3 | 2.62 | 3/15/14 | 19,154,770 | 19,356,222 |
| Harley-Davidson Motorcycle Trust, Ser. 2007-1, Cl. A4 | 5.21 | 6/17/13 | 2,299,769 | 2,343,156 |
| Household Automotive Trust, Ser. 2007-1, Cl. A4 | 5.33 | 11/17/13 | 4,446,655 | 4,474,427 |
| Nissan Auto Receivables Owner Trust, Ser. 2010-A, Cl. A4 | 1.31 | 9/15/16 | 3,965,000 | 3,937,451 |
| | | | | 43,892,666 |
| Automotive, Trucks & Parts—.7% | | | | |
| Johnson Controls, Sr. Unscd. Notes | 5.50 | 1/15/16 | 8,414,000 | 9,349,502 |
| Banks—6.6% | | | | |
| Bank of America, Sub. Notes | 5.49 | 3/15/19 | 19,975,000 | 20,444,352 |
| BankAmerica Capital II, Gtd. Secs., Ser. 2 | 8.00 | 12/15/26 | 6,775,000 | 6,910,500 |
| Barclays Bank, Sr. Unscd. Notes, Ser. 1 | 5.00 | 9/22/16 | 12,610,000 | 13,399,953 |
| Citigroup, Sub. Notes | 5.00 | 9/15/14 | 6,815,000 | 7,171,779 |
| Citigroup, Sr. Unscd. Notes | 6.13 | 11/21/17 | 3,135,000 | 3,463,260 |
| Goldman Sachs Group, Sub. Notes | 6.75 | 10/1/37 | 7,130,000 | 7,330,731 |
| JPMorgan Chase & Co., Sub. Notes | 5.13 | 9/15/14 | 4,805,000 | 5,200,706 |
| Lloyds TSB Bank, Bank Gtd. Notes | 6.38 | 1/21/21 | 9,015,000 | 9,345,851 |
| Morgan Stanley, Sub. Notes | 4.75 | 4/1/14 | 9,590,000 | 10,033,873 |
| Royal Bank of Scotland, Bank Gtd. Notes | 4.88 | 3/16/15 | 9,115,000 | 9,457,241 |
| | | | | 92,758,246 |
| Building & Construction—.5% | | | | |
| CRH America, Gtd. Notes | 5.30 | 10/15/13 | 7,100,000 | 7,596,688 |
| Commercial & Professional Services—.7% | | | | |
| Seminole Tribe of Florida, Sr. Scd. Notes | 5.80 | 10/1/13 | 9,136,000a | 9,176,052 |
| Seminole Tribe of Florida, Notes | 7.75 | 10/1/17 | 1,130,000a,b | 1,204,863 |
| | | | | 10,380,915 |
| Commercial Mortgage Pass-Through Ctfs.—3.9% | | | | |
| Banc of America Commercial Mortgage, Ser. 2005-6, Cl. A2 | 5.17 | 9/10/47 | 416,899c | 416,875 |
| Bear Stearns Commercial Mortgage | | | | |
| Securities, Ser. 2004-PWR5, Cl. A3 | 4.57 | 7/11/42 | 7,922,000 | 7,996,105 |
| Commercial Mortgage Asset Trust, Ser. 1999-C1, Cl. D | 7.35 | 1/17/32 | 2,260,000c | 2,436,443 |
| GE Capital Commercial Mortgage, Ser. 2004-C3, Cl. A3 | 4.87 | 7/10/39 | 7,758,903c | 7,888,675 |
| GMAC Commercial Mortgage Securities, Ser. 2001-C2, Cl. B | 6.79 | 4/15/34 | 4,400,000 | 4,440,144 |
| GMAC Commercial Mortgage Securities, Ser. 2001-C1, Cl. D | 7.03 | 4/15/34 | 7,926,000c | 7,916,868 |
| Greenwich Capital Commercial Funding, Ser. 2005-GG3, Cl. A2 | 4.31 | 8/10/42 | 4,509,474 | 4,536,601 |
| JP Morgan Chase Commercial Mortgage | | | | |
| Securities, Ser. 2004-C1, Cl. A2 | 4.30 | 1/15/38 | 302,989 | 308,567 |
| JP Morgan Chase Commercial Mortgage | | | | |
| Securities, Ser. 2006-CB15, Cl. A1 | 4.75 | 6/12/43 | 235,180 | 235,516 |
STATEMENT OF INVESTMENTS (Unaudited) (continued)
| | | | | |
| BNY Mellon Bond Fund (continued) | | | | |
| | Coupon | Maturity | Principal | |
| Bonds and Notes (continued) | Rate (%) | Date | Amount ($) | Value ($) |
| Commercial Mortgage Pass-Through Ctfs. (continued) | | | | |
| JP Morgan Chase Commercial Mortgage | | | | |
| Securities, Ser. 2001-CIB2, Cl. A3 | 6.43 | 4/15/35 | 8,312,378 | 8,386,059 |
| LB-UBS Commercial Mortgage Trust, | | | | |
| Ser. 2003-C7, Cl. A2 | 4.06 | 9/15/27 | 474,575c | 474,895 |
| Merrill Lynch Mortgage Trust, Ser. 2005-CKI1, Cl. A2FL | 0.39 | 11/12/37 | 1,992,971c | 1,972,884 |
| Prudential Mortgage Capital Funding, Ser. 2001-ROCK, Cl. A2 | 6.61 | 5/10/34 | 1,741,598 | 1,741,392 |
| Wachovia Bank Commercial Mortgage Trust, Ser. 2003-C3, Cl. A1 | 4.04 | 2/15/35 | 618,537 | 621,403 |
| Wachovia Bank Commercial Mortgage Trust, Ser. 2005-C20, Cl. A4 | 5.24 | 7/15/42 | 323,298c | 325,781 |
| Wachovia Bank Commercial Mortgage Trust, Ser. 2007-C32, Cl. A1 | 5.69 | 6/15/49 | 4,708,887 | 4,775,901 |
| | | | | 54,474,109 |
| Diversified Financial Services—3.6% | | | | |
| Blackrock, Sr. Unscd. Notes | 6.25 | 9/15/17 | 7,860,000 | 8,994,127 |
| General Electric Capital, Sub. Notes | 5.30 | 2/11/21 | 2,765,000 | 2,846,023 |
| General Electric Capital, Notes | 5.63 | 9/15/17 | 10,070,000 | 11,043,396 |
| HSBC Finance, Sr. Sub. Notes | 6.68 | 1/15/21 | 10,510,000a | 11,015,352 |
| NYSE Euronext, Sr. Unscd. Notes | 4.80 | 6/28/13 | 8,451,000 | 9,075,588 |
| TD Ameritrade Holding, Gtd. Notes | 4.15 | 12/1/14 | 6,485,000 | 6,766,695 |
| | | | | 49,741,181 |
| Electric Utilities—.7% | | | | |
| Emerson Electric, Sr. Unscd. Notes | 5.00 | 12/15/14 | 3,500,000 | 3,880,821 |
| Xcel Energy, Sr. Unscd. Notes | 4.70 | 5/15/20 | 5,785,000 | 5,995,013 |
| | | | | 9,875,834 |
| Entertainment—.4% | | | | |
| Agua Caliente Band of Cahuilla Indians, Sr. Scd. Notes | 6.08 | 10/1/16 | 1,912,000a | 1,849,707 |
| Agua Caliente Band of Cahuilla Indians, Scd. Notes | 6.35 | 10/1/15 | 1,724,000a | 1,675,056 |
| Agua Caliente Band of Cahuilla Indians, Sr. Scd. Notes | 6.44 | 10/1/16 | 2,273,000a | 2,198,946 |
| | | | | 5,723,709 |
| Food & Beverages—1.9% | | | | |
| Diageo Finance, Gtd. Notes | 5.50 | 4/1/13 | 5,945,000 | 6,455,901 |
| General Mills, Sr. Unscd. Notes | 5.65 | 2/15/19 | 2,215,000 | 2,465,545 |
| Kraft Foods, Sr. Unscd. Notes | 5.38 | 2/10/20 | 9,265,000 | 9,873,349 |
| Pepsico, Sr. Unscd. Notes | 4.50 | 1/15/20 | 7,040,000 | 7,379,631 |
| | | | | 26,174,426 |
| Foreign/Governmental—1.4% | | | | |
| Province of Ontario Canada, Sr. Unscd. Bonds | 4.00 | 10/7/19 | 10,855,000 | 11,109,452 |
| United Mexican States, Sr. Unscd. Notes | 5.63 | 1/15/17 | 5,975,000 | 6,617,313 |
| United Mexican States, Sr. Unscd. Notes | 6.63 | 3/3/15 | 1,480,000b | 1,698,300 |
| | | | | 19,425,065 |
| Manufacturing—.8% | | | | |
| Tyco International Finance, Gtd. Notes | 3.38 | 10/15/15 | 10,415,000 | 10,676,541 |
| Media & Telecommunications—5.8% | | | | |
| America Movil Sab de CV, Gtd. Notes | 3.63 | 3/30/15 | 3,000,000 | 3,099,609 |
| AT&T, Sr. Unscd. Notes | 5.80 | 2/15/19 | 8,145,000 | 9,117,749 |
14
| | | | | |
| BNY Mellon Bond Fund (continued) | | | | |
| | Coupon | Maturity | Principal | |
| Bonds and Notes (continued) | Rate (%) | Date | Amount ($) | Value ($) |
| Media & Telecommunications (continued) | | | | |
| AT&T, Sr. Unscd. Notes | 5.88 | 8/15/12 | 5,995,000 | 6,427,006 |
| Cisco Systems, Sr. Unscd. Notes | 5.50 | 2/22/16 | 5,550,000 | 6,272,238 |
| Comcast, Gtd. Notes | 5.90 | 3/15/16 | 8,975,000 | 9,991,248 |
| News America, Gtd. Notes | 6.15 | 3/1/37 | 2,375,000 | 2,413,732 |
| Rogers Communications, Gtd. Notes | 6.38 | 3/1/14 | 6,810,000 | 7,678,350 |
| Telefonica Emisiones, Gtd. Notes | 4.95 | 1/15/15 | 9,295,000 | 9,791,167 |
| Time Warner Cable, Gtd. Notes | 4.13 | 2/15/21 | 10,550,000 | 9,912,727 |
| Time Warner, Gtd. Notes | 3.15 | 7/15/15 | 4,715,000 | 4,791,812 |
| Verizon Communications, Sr. Unscd. Notes | 5.50 | 2/15/18 | 10,755,000 | 11,746,331 |
| | | | | 81,241,969 |
| Municipal Bonds—3.9% | | | | |
| California, GO (Build America Bonds) | 7.30 | 10/1/39 | 11,215,000 | 11,843,376 |
| Illinois, GO | 4.42 | 1/1/15 | 4,935,000 | 4,941,810 |
| Los Angeles Community College District, GO (Build America Bonds) | 6.75 | 8/1/49 | 13,725,000 | 14,706,200 |
| Massachusetts, GO (Build America Bonds) | 4.20 | 12/1/21 | 5,340,000 | 5,280,512 |
| New Jersey Turnpike Authority, | | | | |
| Turnpike Revenue (Build America Bonds) | 7.10 | 1/1/41 | 8,145,000 | 8,843,515 |
| New York City Municipal Water Finance Authority, Water and Sewer | | | | |
| System Second General Resolution Revenue (Build America Bonds) | 6.28 | 6/15/42 | 5,430,000 | 5,481,531 |
| University of California Regents, | | | | |
| General Revenue (Build America Bonds) | 1.99 | 5/1/13 | 3,610,000 | 3,637,797 |
| | | | | 54,734,741 |
| Oil & Gas—1.1% | | | | |
| BP Capital Markets, Gtd. Notes | 3.88 | 3/10/15 | 7,540,000 | 7,907,100 |
| Petrobras International Finance, Gtd. Notes | 5.38 | 1/27/21 | 6,825,000 | 6,885,258 |
| | | | | 14,792,358 |
| Property & Casualty Insurance—1.2% | | | | |
| MetLife, Sr. Unscd. Notes | 7.72 | 2/15/19 | 6,865,000 | 8,463,302 |
| Prudential Financial, Sr. Unscd. Notes | 4.75 | 9/17/15 | 7,135,000 | 7,646,044 |
| | | | | 16,109,346 |
| Real Estate—.9% | | | | |
| Boston Properties, Sr. Unscd. Notes | 4.13 | 5/15/21 | 3,000,000 | 2,880,213 |
| Simon Property Group, Sr. Unscd. Notes | 5.65 | 2/1/20 | 8,285,000 | 9,044,478 |
| | | | | 11,924,691 |
| Residential Mortgage Pass-Through Ctfs.—.1% | | | | |
| GMAC Mortgage Corporation Loan Trust, Ser. 2004-JR1, Cl. A6 | 0.71 | 12/25/33 | 369,014c | 365,483 |
| GMAC Mortgage Corporation Loan Trust, Ser. 2004-J2, Cl. A2 | 0.76 | 6/25/34 | 428,932c | 425,237 |
| GMAC Mortgage Corporation Loan Trust, Ser. 2004-J5, Cl. A1 | 5.25 | 1/25/35 | 42,114 | 42,075 |
| | | | | 832,795 |
| Software—1.0% | | | | |
| Microsoft, Sr. Unscd. Notes | 5.30 | 2/8/41 | 2,795,000 | 2,826,438 |
| Oracle, Sr. Unscd. Notes | 5.75 | 4/15/18 | 10,410,000 | 11,725,668 |
| | | | | 14,552,106 |
STATEMENT OF INVESTMENTS (Unaudited) (continued)
| | | | | | |
| BNY Mellon Bond Fund (continued) | | | | |
| |
| | Coupon | Maturity | Principal | |
| Bonds and Notes (continued) | Rate (%) | Date | Amount ($) | Value ($) |
| Transportation—.2% | | | | |
| GATX, Sr. Unscd. Notes | 4.75 | 5/15/15 | 2,850,000 | 2,986,184 |
| U.S. Government Agencies—2.1% | | | | |
| Federal Home Loan Banks, Bonds | 3.63 | 10/18/13 | 11,670,000 | 12,418,000 |
| Federal National Mortgage Association, Notes | 3.00 | 9/16/14 | 6,610,000d | 6,919,910 |
| Federal National Mortgage Association, Notes | 4.38 | 7/17/13 | 9,520,000d | 10,263,788 |
| | | | | 29,601,698 |
| U.S. Government Agencies/Mortgage-Backed—33.3% | | | | |
| Federal Home Loan Mortgage Corp.: | | | | |
| 4.50%, 3/1/21—12/1/40 | | | 29,137,525d | 29,833,914 |
| 5.00%, 6/1/28—7/1/40 | | | 52,095,015d | 54,679,324 |
| 5.50%, 12/1/37—12/1/38 | | | 30,149,868d | 32,275,314 |
| 6.00%, 12/1/37—6/1/39 | | | 22,678,804d | 24,671,805 |
| 6.50%, 4/1/39 | | | 13,800,659d | 15,423,777 |
| Multiclass Mortgage Participation Ctfs., | | | | |
| Ser. 2587, Cl. WB, 5.00%, 11/15/16 | | | 425,652d | 431,401 |
| Federal National Mortgage Association: | | | | |
| 4.00% | | | 54,270,000d,e | 53,523,788 |
| 4.50% | | | 18,570,000d,e | 18,932,691 |
| 3.50%, 1/1/26 | | | 14,283,976d | 14,348,546 |
| 4.00%, 9/1/24—3/1/25 | | | 24,021,071d | 24,757,238 |
| 4.50%, 3/1/23—5/1/40 | | | 59,669,743d | 61,555,307 |
| 5.00%, 3/1/21—4/1/23 | | | 8,133,517d | 8,664,472 |
| 5.50%, 4/1/36—6/1/38 | | | 32,797,879d | 35,268,528 |
| 6.00%, 4/1/33—9/1/39 | | | 34,279,157d | 37,519,988 |
| 6.50%, 10/1/36—1/1/39 | | | 16,500,224d | 18,484,237 |
| Ser. 2003-64, Cl. BC, 5.50%, 3/25/30 | | | 9,267,582d | 9,609,611 |
| Government National Mortgage Association I; | | | | |
| 5.00%, 11/15/34—1/15/39 | | | 22,090,037 | 23,589,457 |
| | | | | 463,569,398 |
| U.S. Government Securities—24.4% | | | | |
| U.S. Treasury Bonds: | | | | |
| 3.88%, 8/15/40 | | | 4,500,000 | 4,040,861 |
| 4.38%, 5/15/40 | | | 2,275,000 | 2,230,562 |
| 7.13%, 2/15/23 | | | 1,734,000 | 2,311,909 |
| U.S. Treasury Inflation Protected Securities: | | | | |
| Bonds, 2.38%, 1/15/27 | | | 13,709,730f | 15,176,026 |
| Notes, 0.50%, 4/15/15 | | | 7,311,844f | 7,593,467 |
| Notes, 0.63%, 4/15/13 | | | 7,030,182b,f | 7,337,204 |
| Notes, 1.38%, 7/15/18 | | | 12,089,483f | 12,876,243 |
| Notes, 1.38%, 1/15/20 | | | 9,851,220f | 10,317,616 |
| Notes, 2.38%, 1/15/17 | | | 13,726,031f | 15,482,538 |
| U.S. Treasury Notes: | | | | |
| 0.38%, 8/31/12 | | | 8,940,000 | 8,931,623 |
| 0.38%, 9/30/12 | | | 1,340,000 | 1,337,750 |
| 0.50%, 11/30/12 | | | 4,500,000 | 4,494,902 |
| 0.50%, 10/15/13 | | | 25,775,000 | 25,456,833 |
| 0.50%, 11/15/13 | | | 50,000 | 49,313 |
| 0.75%, 8/15/13 | | | 38,750,000 | 38,622,861 |
16

GO—General Obligation
|
| a Securities exempt from registration under Rule 144A of the Securities Act of 1933.These securities may be resold in transactions exempt from registration, normally to qualified |
| institutional buyers.At February 28, 2011, these securities had a value of $27,119,976 or 1.9% of net assets. |
| b Security, or portion thereof, on loan.At February 28, 2011, the value of the fund’s securities on loan was $54,906,642 and the value of the collateral held by the fund was |
| $56,098,600, consisting of cash collateral of $1,517,227 and U.S. Government and Agency securities valued at $54,581,373. |
| c Variable rate security—interest rate subject to periodic change. |
| d The Federal Housing Finance Agency (“FHFA”) placed Federal Home Loan Mortgage Corporation and Federal National Mortgage Association into conservatorship with FHFA |
| as the conservator.As such, the FHFA oversees the continuing affairs of these companies. |
| e Purchased on a forward commitment basis. |
| f Principal amount for accrual purposes is periodically adjusted based on changes in the Consumer Price Index. |
| g Non-income producing security. |
| h Investment in affiliated money market mutual fund. |
| | | |
| Portfolio Summary (Unaudited)† | | | |
| |
| | Value (%) | | Value (%) |
| U.S. Government & Agencies | 59.8 | Municipal Bonds | 3.9 |
| Corporate Bonds | 26.1 | Foreign/Governmental | 1.4 |
| Asset/Mortgage-Backed | 7.2 | Common Stocks | .0 |
| Short-Term/Money Market Investments | 5.5 | | 103.9 |
† Based on net assets.
See notes to financial statements.
STATEMENT OF INVESTMENTS
February 28, 2011 (Unaudited)
| | | | | |
| BNY Mellon Intermediate Bond Fund | | | | |
| | Coupon | Maturity | Principal | |
| Bonds and Notes—98.6% | Rate (%) | Date | Amount ($) | Value ($) |
| Aerospace & Defense—.6% | | | | |
| General Dynamics, Gtd. Notes | 5.25 | 2/1/14 | 3,050,000 | 3,356,894 |
| United Technologies, Sr. Unscd. Notes | 6.13 | 2/1/19 | 1,860,000 | 2,171,777 |
| | | | | 5,528,671 |
| Asset-Backed Ctfs./Auto Receivables—.2% | | | | |
| Harley-Davidson Motorcycle Trust, Ser. 2007-1, Cl. A4 | 5.21 | 6/17/13 | 891,657 | 908,479 |
| Household Automotive Trust, Ser. 2007-1, Cl. A4 | 5.33 | 11/17/13 | 1,461,584 | 1,470,713 |
| | | | | 2,379,192 |
| Automotive, Trucks & Parts—1.3% | | | | |
| Daimler Finance North America, Gtd. Notes | 6.50 | 11/15/13 | 4,385,000 | 4,945,627 |
| GATX, Sr. Unscd. Notes | 4.75 | 5/15/15 | 1,900,000 | 1,990,790 |
| Johnson Controls, Sr. Unscd. Notes | 5.50 | 1/15/16 | 5,230,000 | 5,811,492 |
| | | | | 12,747,909 |
| Bank & Finance—14.9% | | | | |
| American Express Credit, Sr. Unscd. Notes | 2.75 | 9/15/15 | 3,325,000 | 3,273,798 |
| Bank of America, Sr. Unscd. Notes | 3.70 | 9/1/15 | 7,940,000a | 8,029,674 |
| Bank of America, Sub. Notes | 5.42 | 3/15/17 | 12,705,000 | 13,033,285 |
| BankAmerica Capital II, Gtd. Secs., Ser. 2 | 8.00 | 12/15/26 | 4,975,000 | 5,074,500 |
| Barclays Bank, Sr. Unscd. Notes, Ser. 1 | 5.00 | 9/22/16 | 8,250,000 | 8,766,821 |
| Caterpillar Financial Services, Sr. Unscd. Notes | 6.13 | 2/17/14 | 4,975,000 | 5,614,820 |
| Citigroup, Sub. Notes | 5.00 | 9/15/14 | 6,790,000 | 7,145,470 |
| Citigroup, Sr. Unscd. Notes | 6.13 | 11/21/17 | 2,840,000 | 3,137,371 |
| Comerica, Sr. Unscd. Notes | 3.00 | 9/16/15 | 4,000,000 | 3,987,480 |
| General Electric Capital, Sr. Unscd. Notes | 1.88 | 9/16/13 | 3,250,000 | 3,263,322 |
| General Electric Capital, Sr. Unscd. Notes | 2.80 | 1/8/13 | 5,000,000 | 5,131,020 |
| General Electric Capital, Sub. Notes | 5.30 | 2/11/21 | 1,955,000 | 2,012,287 |
| Goldman Sachs Group, Sr. Unscd. Notes | 4.75 | 7/15/13 | 7,780,000 | 8,286,354 |
| HSBC Finance, Sr. Unscd. Notes | 6.38 | 11/27/12 | 5,860,000 | 6,334,467 |
| HSBC Finance, Sr. Sub. Notes | 6.68 | 1/15/21 | 2,956,000b | 3,098,133 |
| John Deere Capital, Sr. Unscd. Notes | 7.00 | 3/15/12 | 1,888,000 | 2,013,748 |
| JPMorgan Chase & Co., Sub. Notes | 5.13 | 9/15/14 | 4,110,000 | 4,448,471 |
| Lloyds TSB Bank, Bank Gtd. Notes | 4.88 | 1/21/16 | 6,130,000 | 6,245,354 |
| Morgan Stanley, Sub. Notes | 4.75 | 4/1/14 | 5,985,000 | 6,262,016 |
| NYSE Euronext, Sr. Unscd. Notes | 4.80 | 6/28/13 | 3,630,000 | 3,898,282 |
| Private Export Funding, Gov’t Gtd. Notes | 4.38 | 3/15/19 | 15,935,000 | 16,982,376 |
| Rabobank Nederland, Gtd. Notes | 2.13 | 10/13/15 | 4,765,000 | 4,606,974 |
| Royal Bank of Scotland, Bank Gtd. Notes | 4.88 | 3/16/15 | 5,260,000 | 5,457,497 |
| TD Ameritrade Holding, Gtd. Notes | 4.15 | 12/1/14 | 3,195,000 | 3,333,784 |
| Wachovia, Sub. Notes | 5.25 | 8/1/14 | 5,710,000 | 6,162,660 |
| | | | | 145,599,964 |
18
| | | | | |
| BNY Mellon Intermediate Bond Fund (continued) | | | | |
| | Coupon | Maturity | Principal | |
| Bonds and Notes (continued) | Rate (%) | Date | Amount ($) | Value ($) |
| Building & Construction—.5% | | | | |
| CRH America, Gtd. Notes | 5.30 | 10/15/13 | 4,784,000 | 5,118,669 |
| Commercial & Professional Services—1.3% | | | | |
| Seminole Tribe of Florida, Sr. Scd. Notes | 5.80 | 10/1/13 | 6,380,000b | 6,407,970 |
| Seminole Tribe of Florida, Notes | 7.75 | 10/1/17 | 765,000a,b | 815,681 |
| Stanford University, Bonds | 4.75 | 5/1/19 | 5,000,000 | 5,390,450 |
| | | | | 12,614,101 |
| Entertainment—.4% | | | | |
| Agua Caliente Band of Cahuilla Indians, Sr. Scd. Notes | 6.08 | 10/1/16 | 1,425,000b | 1,378,573 |
| Agua Caliente Band of Cahuilla Indians, Scd. Notes | 6.35 | 10/1/15 | 849,000b | 824,897 |
| Agua Caliente Band of Cahuilla Indians, Sr. Scd. Notes | 6.44 | 10/1/16 | 1,735,000b | 1,678,474 |
| | | | | 3,881,944 |
| Food & Beverages—2.1% | | | | |
| Diageo Finance, Gtd. Notes | 5.50 | 4/1/13 | 4,415,000 | 4,794,416 |
| Dr Pepper Snapple Group, Sr. Notes | 2.90 | 1/15/16 | 3,250,000 | 3,238,953 |
| Kraft Foods, Sr. Unscd. Notes | 4.13 | 2/9/16 | 6,930,000 | 7,231,538 |
| McDonald’s, Sr. Unscd. Notes | 5.80 | 10/15/17 | 4,460,000 | 5,125,231 |
| | | | | 20,390,138 |
| Foreign/Governmental—1.4% | | | | |
| Province of Nova Scotia Canada, Sr. Unscd. Bonds | 5.13 | 1/26/17 | 5,430,000 | 6,064,506 |
| Province of Ontario Canada, Sr. Unscd. Bonds | 4.00 | 10/7/19 | 6,515,000 | 6,667,718 |
| United Mexican States, Sr. Unscd. Notes | 6.63 | 3/3/15 | 1,064,000a | 1,220,940 |
| | | | | 13,953,164 |
| Health Care—2.6% | | | | |
| Amgen, Sr. Notes | 5.70 | 2/1/19 | 2,905,000 | 3,265,083 |
| Astrazeneca, Sr. Unscd. Notes | 5.90 | 9/15/17 | 5,895,000 | 6,755,175 |
| GlaxoSmithKline Capital, Gtd. Bonds | 5.65 | 5/15/18 | 5,853,000 | 6,617,378 |
| Pfizer, Sr. Unscd. Notes | 6.20 | 3/15/19 | 4,050,000 | 4,697,672 |
| Thermo Fisher Scientific, Sr. Unscd. Notes | 3.20 | 3/1/16 | 3,675,000 | 3,729,166 |
| | | | | 25,064,474 |
| Industrials—2.4% | | | | |
| BP Capital Markets, Gtd. Notes | 3.88 | 3/10/15 | 5,045,000 | 5,290,626 |
| Emerson Electric, Sr. Unscd. Notes | 4.63 | 10/15/12 | 3,000,000 | 3,184,566 |
| Occidental Petroleum, Sr. Unscd. Notes | 4.13 | 6/1/16 | 3,005,000 | 3,227,045 |
| Petrobras International Finance, Gtd. Notes | 3.88 | 1/27/16 | 2,695,000 | 2,734,660 |
| Progress Energy, Sr. Unscd. Notes | 6.85 | 4/15/12 | 5,093,000 | 5,410,375 |
| Xcel Energy, Sr. Unscd. Notes | 4.70 | 5/15/20 | 3,705,000 | 3,839,503 |
| | | | | 23,686,775 |
| Media & Telecommunications—6.6% | | | | |
| AT&T, Sr. Unscd. Notes | 5.80 | 2/15/19 | 5,095,000 | 5,703,491 |
STATEMENT OF INVESTMENTS (Unaudited) (continued)
| | | | |
| BNY Mellon Intermediate Bond Fund (continued) | | | | |
| | Coupon | Maturity | Principal | |
| Bonds and Notes (continued) | Rate (%) | Date | Amount ($) | Value ($) |
| Media & Telecommunications (continued) | | | | |
| Cisco Systems, Sr. Unscd. Notes | 5.50 | 2/22/16 | 7,135,000 | 8,063,499 |
| Comcast, Gtd. Notes | 5.90 | 3/15/16 | 5,135,000 | 5,716,441 |
| News America, Gtd. Notes | 5.30 | 12/15/14 | 5,260,000 | 5,830,394 |
| Rogers Communications, Gtd. Notes | 6.38 | 3/1/14 | 4,934,000 | 5,563,139 |
| Telefonica Emisiones, Gtd. Notes | 4.95 | 1/15/15 | 6,270,000 | 6,604,693 |
| Time Warner Cable, Gtd. Notes | 4.13 | 2/15/21 | 7,225,000 | 6,788,574 |
| Time Warner, Gtd. Notes | 3.15 | 7/15/15 | 5,010,000 | 5,091,618 |
| Verizon Communications, Sr. Unscd. Notes | 8.75 | 11/1/18 | 6,530,000 | 8,439,196 |
| Vodafone Group, Sr. Unscd. Notes | 5.35 | 2/27/12 | 6,200,000 | 6,481,207 |
| | | | | 64,282,252 |
| Multi-Line Insurance—1.1% | | | | |
| MetLife, Sr. Unscd. Notes | 6.75 | 6/1/16 | 4,450,000 | 5,171,496 |
| Prudential Financial, Sr. Unscd. Notes | 4.75 | 9/17/15 | 4,735,000 | 5,074,144 |
| | | | | 10,245,640 |
| Municipal Bonds—2.9% | | | | |
| California, GO (Various Purpose) | 5.45 | 4/1/15 | 4,550,000 | 4,810,624 |
| California, GO (Various Purpose) | 5.95 | 4/1/16 | 3,255,000 | 3,501,176 |
| Illinois, GO | 4.42 | 1/1/15 | 3,225,000 | 3,229,450 |
| Massachusetts, GO (Build America Bonds) | 4.20 | 12/1/21 | 14,370,000 | 14,209,918 |
| University of California Regents, | | | | |
| General Revenue (Build America Bonds) | 1.99 | 5/1/13 | 2,590,000 | 2,609,943 |
| | | | | 28,361,111 |
| Real Estate—.6% | | | | |
| Simon Property Group, Sr. Unscd. Notes | 4.20 | 2/1/15 | 5,410,000 | 5,702,768 |
| Retailing—.5% | | | | |
| Wal-Mart Stores, Sr. Unscd. Notes | 4.55 | 5/1/13 | 4,675,000 | 5,026,135 |
| Software & Services—.8% | | | | |
| Oracle, Sr. Unscd. Notes | 5.75 | 4/15/18 | 7,000,000 | 7,884,695 |
| U.S. Government Agencies—11.5% | | | | |
| Federal Farm Credit Banks, Bonds | 2.13 | 6/18/12 | 9,065,000 | 9,253,987 |
| Federal Farm Credit Banks, Bonds | 2.25 | 4/24/12 | 12,935,000 | 13,199,133 |
| Federal Farm Credit Banks, Bonds | 3.40 | 2/7/13 | 15,800,000 | 16,615,533 |
| Federal Home Loan Banks, Bonds | 2.05 | 8/10/12 | 8,910,000 | 8,971,488 |
| Federal Home Loan Banks, Bonds | 3.63 | 10/18/13 | 6,850,000 | 7,289,058 |
20
| | | | | |
| BNY Mellon Intermediate Bond Fund (continued) | | | | |
| |
| | Coupon | Maturity | Principal | |
| Bonds and Notes (continued) | Rate (%) | Date | Amount ($) | Value ($) |
| U.S. Government Agencies (continued) | | | | |
| Federal Home Loan Banks, Bonds | 4.25 | 6/14/13 | 7,500,000 | 8,065,110 |
| Federal Home Loan Mortgage Corp., Notes | 1.50 | 7/12/13 | 9,820,000d | 9,846,740 |
| Federal Home Loan Mortgage Corp., Notes | 1.88 | 3/8/13 | 9,000,000d | 9,002,781 |
| Federal Home Loan Mortgage Corp., Notes | 2.00 | 4/27/12 | 7,830,000d | 7,847,892 |
| Federal National Mortgage Association, Notes | 3.00 | 9/16/14 | 8,550,000d | 8,950,867 |
| Federal National Mortgage Association, Notes | 4.38 | 7/17/13 | 12,055,000d | 12,996,845 |
| | | | | 112,039,434 |
| U.S. Government Agencies/Mortgage-Backed—.0% | | | | |
| Federal Home Loan Mortgage Corp. | | | | |
| REMIC, Ser. 2134, Cl. PM, 5.50%, 3/15/14 | | | 358,021d | 377,660 |
| U.S. Government Securities—46.9% | | | | |
| U.S. Treasury Inflation Protected Securities: | | | | |
| Notes, 0.50%, 4/15/15 | | | 9,339,540e | 9,699,262 |
| Notes, 0.63%, 4/15/13 | | | 4,064,648a,e | 4,242,159 |
| Notes, 1.38%, 7/15/18 | | | 7,907,203e | 8,421,788 |
| Notes, 2.38%, 1/15/17 | | | 15,106,242e | 17,039,373 |
| U.S. Treasury Notes: | | | | |
| 0.38%, 9/30/12 | | | 11,400,000 | 11,380,859 |
| 0.50%, 11/30/12 | | | 1,500,000 | 1,498,300 |
| 0.50%, 10/15/13 | | | 1,340,000 | 1,323,459 |
| 0.75%, 9/15/13 | | | 12,045,000a | 11,990,424 |
| 0.75%, 12/15/13 | | | 10,500,000a | 10,409,763 |
| 0.88%, 2/29/12 | | | 2,000,000 | 2,011,792 |
| 1.00%, 12/31/11 | | | 10,000,000 | 10,062,500 |
| 1.00%, 3/31/12 | | | 5,330,000 | 5,369,954 |
| 1.00%, 4/30/12 | | | 27,710,000 | 27,925,473 |
| 1.13%, 12/15/12 | | | 10,965,000 | 11,067,369 |
| 1.25%, 2/15/14 | | | 1,340,000a | 1,343,559 |
| 1.38%, 10/15/12 | | | 16,670,000 | 16,901,163 |
| 1.38%, 5/15/13 | | | 1,085,000 | 1,099,330 |
| 1.50%, 7/15/12 | | | 9,000,000 | 9,139,221 |
| 1.75%, 7/31/15 | | | 3,065,000 | 3,050,644 |
| 2.00%, 1/31/16 | | | 5,250,000a | 5,225,803 |
| 2.13%, 12/31/15 | | | 1,545,000a | 1,549,467 |
| 2.38%, 9/30/14 | | | 1,600,000 | 1,651,250 |
| 2.38%, 7/31/17 | | | 6,500,000 | 6,395,389 |
| 2.63%, 1/31/18 | | | 5,250,000a | 5,192,171 |
| 2.63%, 8/15/20 | | | 2,430,000 | 2,284,579 |
STATEMENT OF INVESTMENTS (Unaudited) (continued)
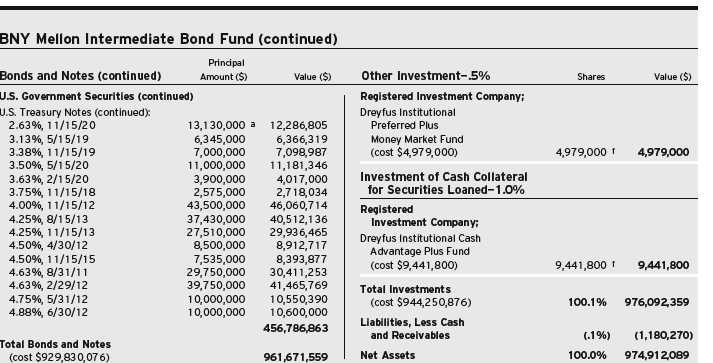
|
| a Security, or portion thereof, on loan.At February 28, 2011, the value of the fund’s securities on loan was $51,215,645 and the value of the collateral held by the fund was |
| $52,499,831, consisting of cash collateral of $9,441,800 and U.S. Government and Agency securities valued at $43,058,031. |
| b Securities exempt from registration under Rule 144A of the Securities Act of 1933.These securities may be resold in transactions exempt from registration, normally to qualified |
| institutional buyers.At February 28, 2011, these securities had a value of $14,203,728 or 1.5% of net assets. |
| c Variable rate security—interest rate subject to periodic change. |
| d The Federal Housing Finance Agency (“FHFA”) placed Federal Home Loan Mortgage Corporation and Federal National Mortgage Association into conservatorship with FHFA |
| as the conservator.As such, the FHFA oversees the continuing affairs of these companies. |
| e Principal amount for accrual purposes is periodically adjusted based on changes in the Consumer Price Index. |
| f Investment in affiliated money market mutual fund. |
| | | |
| Portfolio Summary (Unaudited)† | | | |
| |
| | Value (%) | | Value (%) |
| U.S. Government & Agencies | 58.4 | Foreign/Governmental | 1.4 |
| Corporate Bonds | 35.7 | Asset/Mortgage-Backed | .2 |
| Municipal Bonds | 2.9 | | |
| Money Market Investments | 1.5 | | 100.1 |
| |
| † Based on net assets. | | | |
| See notes to financial statements. | | | |
22
STATEMENT OF INVESTMENTS
February 28, 2011 (Unaudited)
| | | | | |
| BNY Mellon Intermediate U.S. Government Fund | | | | |
| |
| | Coupon | Maturity | Principal | |
| Bonds and Notes—98.8% | Rate (%) | Date | Amount ($) | Value ($) |
| Diversified Financial Services—2.7% | | | | |
| Private Export Funding, Gov’t Gtd. Notes | 4.38 | 3/15/19 | 1,635,000 | 1,742,465 |
| U.S. Government Agencies—33.8% | | | | |
| Federal Farm Credit Banks, Bonds | 1.02 | 3/1/13 | 1,250,000 | 1,253,856 |
| Federal Home Loan Banks, Bonds | 1.63 | 3/20/13 | 1,515,000 | 1,541,611 |
| Federal Home Loan Banks, Bonds | 3.63 | 10/18/13 | 1,280,000 | 1,362,043 |
| Federal Home Loan Banks, Bonds | 4.25 | 6/14/13 | 635,000 | 682,846 |
| Federal Home Loan Banks, Bonds | 4.88 | 12/13/13 | 3,750,000 | 4,121,393 |
| Federal Home Loan Mortgage Corp., Notes | 1.00 | 5/16/13 | 1,000,000a | 998,552 |
| Federal Home Loan Mortgage Corp., Notes, Ser. 1 | 1.63 | 6/28/13 | 2,525,000a | 2,535,516 |
| Federal Home Loan Mortgage Corp., Notes | 1.88 | 3/8/13 | 1,225,000a | 1,225,378 |
| Federal Home Loan Mortgage Corp., Notes | 5.50 | 8/20/12 | 1,345,000a | 1,442,183 |
| Federal National Mortgage Association, Notes | 1.50 | 12/30/13 | 915,000a | 913,847 |
| Federal National Mortgage Association, Notes | 1.50 | 1/27/14 | 1,000,000a | 997,359 |
| Federal National Mortgage Association, Notes | 2.00 | 6/24/13 | 1,200,000a | 1,204,986 |
| Federal National Mortgage Association, Notes | 2.05 | 4/26/13 | 925,000a | 927,195 |
| Federal National Mortgage Association, Notes | 4.38 | 7/17/13 | 1,270,000a | 1,369,224 |
| Federal National Mortgage Association, Bonds, Ser. 1 | 4.75 | 11/19/12 | 750,000a | 802,651 |
| Federal National Mortgage Association, Sub. Notes | 5.13 | 1/2/14 | 440,000a | 479,268 |
| | | | | 21,857,908 |
| U.S. Government Agencies/Mortgage-Backed—9.1% | | | | |
| Federal Home Loan Mortgage Corp.: | | | | |
| REMIC, Ser. 2999, Cl. NB, 4.50%, 7/15/17 | | | 207,011a | 211,001 |
| REMIC, Ser. 2619, Cl. YK, 5.00%, 5/15/16 | | | 111,609a | 111,904 |
| REMIC, Ser. 2587, Cl. WB, 5.00%, 11/15/16 | | | 110,354a | 111,845 |
| REMIC, Ser. 3137, Cl. PA, 5.13%, 12/15/13 | | | 182,334a | 186,044 |
| Government National Mortgage Association I: | | | | |
| Ser. 2008-45, Cl. A, 3.58%, 11/16/27 | | | 170,332 | 173,542 |
| Ser. 2004-23, Cl. AB, 3.63%, 9/16/27 | | | 216,775 | 224,764 |
| Ser. 2005-76, Cl. A, 3.96%, 5/16/30 | | | 552,506 | 574,735 |
| Ser. 2005-29, Cl. A, 4.02%, 7/16/27 | | | 101,845 | 105,348 |
| Ser. 2006-3, Cl. A, 4.21%, 1/16/28 | | | 122,296 | 124,636 |
| Ser. 2003-47, Cl. C, 4.23%, 10/16/27 | | | 107,116 | 108,285 |
| Ser. 2008-78, Cl. B, 4.52%, 6/16/32 | | | 1,400,000 | 1,484,034 |
| Ser. 2005-79, Cl. B, 4.65%, 8/16/39 | | | 120,000 | 125,051 |
| Ser. 2004-12, Cl. BA, 4.81%, 8/16/32 | | | 562,543 | 591,011 |
| Ser. 2006-32, Cl. A, 5.08%, 1/16/30 | | | 521,826 | 546,706 |
| Ser. 2004-60, Cl. C, 5.24%, 3/16/28 | | | 1,000,000b | 1,053,199 |
| Ser. 2004-50, Cl. C, 5.32%, 8/16/30 | | | 132,459b | 139,702 |
| | | | | 5,871,807 |
STATEMENT OF INVESTMENTS (Unaudited) (continued)
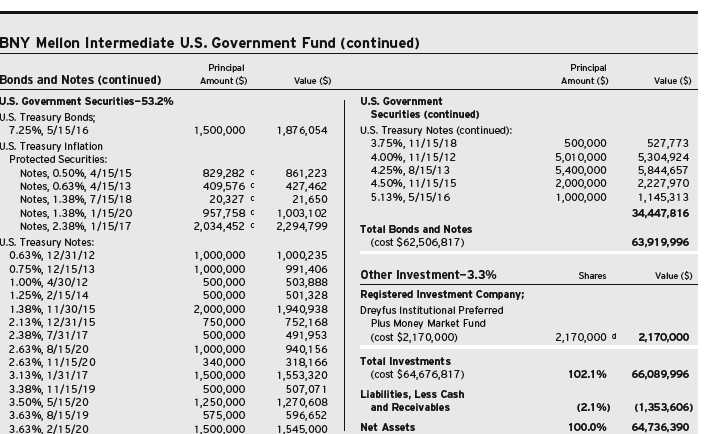
|
| a The Federal Housing Finance Agency (“FHFA”) placed Federal Home Loan Mortgage Corporation and Federal National Mortgage Association into conservatorship with FHFA |
| as the conservator.As such, the FHFA oversees the continuing affairs of these companies. |
| b Variable rate security—interest rate subject to periodic change. |
| c Principal amount for accrual purposes is periodically adjusted based on changes in the Consumer Price Index. |
| d Investment in affiliated money market mutual fund. |
| | | |
| Portfolio Summary (Unaudited)† | | | |
| | Value (%) | | Value (%) |
| U.S. Government & Agencies | 96.1 | Corporate Bonds | 2.7 |
| Money Market Investment | 3.3 | | 102.1 |
| † Based on net assets. | | | |
| See notes to financial statements. | | | |
24
STATEMENT OF INVESTMENTS
February 28, 2011 (Unaudited)
| | | | | |
| BNY Mellon Short-Term U.S. Government Securities Fund | | | |
| | Coupon | Maturity | Principal | |
| Bonds and Notes—98.4% | Rate (%) | Date | Amount ($) | Value ($) |
| Banks—2.8% | | | | |
| Bank of America, Gtd. Notes | 3.13 | 6/15/12 | 1,875,000 | 1,938,101 |
| Goldman Sachs Group, Gtd. Notes | 3.25 | 6/15/12 | 400,000 | 414,153 |
| JPMorgan Chase & Co., Gtd. Notes | 3.13 | 12/1/11 | 1,750,000 | 1,787,149 |
| Key Bank, Gtd. Notes | 3.20 | 6/15/12 | 2,000,000 | 2,070,796 |
| Regions Bank, Gtd. Notes | 3.25 | 12/9/11 | 1,875,000 | 1,917,883 |
| Wells Fargo & Co., Gtd. Notes | 3.00 | 12/9/11 | 1,000,000 | 1,020,880 |
| | | | | 9,148,962 |
| Diversified Financial Services—1.6% | | | | |
| General Electric Capital, Gtd. Notes | 2.00 | 9/28/12 | 3,655,000 | 3,737,632 |
| General Electric Capital, Gtd. Notes | 3.00 | 12/9/11 | 1,635,000 | 1,669,266 |
| | | | | 5,406,898 |
| Municipal Bonds—.6% | | | | |
| California, GO | 5.25 | 4/1/14 | 1,000,000 | 1,058,950 |
| University of California Regents, | | | | |
| General Revenue (Build America Bonds) | 1.99 | 5/15/50 | 840,000 | 846,468 |
| | | | | 1,905,418 |
| U.S. Government Agencies—23.8% | | | | |
| Federal Farm Credit Banks, Bonds | 1.02 | 3/1/13 | 6,250,000 | 6,269,281 |
| Federal Farm Credit Banks, Bonds | 2.25 | 4/24/12 | 2,795,000 | 2,852,074 |
| Federal Home Loan Banks, Bonds | 1.63 | 3/20/13 | 5,825,000 | 5,927,316 |
| Federal Home Loan Mortgage Corp., Notes | 1.00 | 5/16/13 | 5,250,000a | 5,242,398 |
| Federal Home Loan Mortgage Corp., Notes | 1.13 | 7/27/12 | 4,880,000a | 4,921,919 |
| Federal Home Loan Mortgage Corp., Notes, Ser. 1 | 1.63 | 6/28/13 | 5,915,000a | 5,939,636 |
| Federal Home Loan Mortgage Corp., Notes | 1.88 | 3/8/13 | 5,000,000a | 5,001,545 |
| Federal Home Loan Mortgage Corp., Notes | 2.13 | 3/23/12 | 3,910,000a | 3,980,517 |
| Federal National Mortgage Association, Notes | 0.88 | 11/8/13 | 2,700,000a | 2,665,556 |
| Federal National Mortgage Association, Notes, Ser. 1 | 1.13 | 7/30/12 | 5,000,000a | 5,042,160 |
| Federal National Mortgage Association, Notes | 1.50 | 12/30/13 | 4,695,000a | 4,689,084 |
| Federal National Mortgage Association, Notes | 1.50 | 1/27/14 | 5,000,000a | 4,986,795 |
| Federal National Mortgage Association, Notes | 2.00 | 6/24/13 | 4,880,000a | 4,900,276 |
| Federal National Mortgage Association, Notes | 2.05 | 4/26/13 | 4,180,000a | 4,189,919 |
| Federal National Mortgage Association, Unscd. Notes | 3.00 | 7/28/14 | 5,765,000a | 5,817,761 |
| Federal National Mortgage Association, Notes | 4.75 | 2/21/13 | 5,830,000a | 6,284,606 |
| | | | | 78,710,843 |
STATEMENT OF INVESTMENTS (Unaudited) (continued)
| | | | | | | |
| BNY Mellon Short-Term U.S. Government Securities Fund (continued) | | | |
| |
| | Principal | | | Principal | | |
| Bonds and Notes (continued) | Amount ($) | Value ($) | | Amount ($) | | Value ($) |
| U.S. Government Agencies/ | | | U.S. Government Agencies/ | | | |
| Mortgage-Backed—10.8% | | | Mortgage-Backed (continued) | | | |
| Federal Home Loan Mortgage Corp.: | | | Government National | | | |
| 4.00%, 6/1/11—11/1/11 | 2,284,061a | 2,313,632 | Mortgage Association I (continued): | | | |
| 5.00%, 6/1/11—7/1/12 | 2,633,461a | 2,703,749 | Ser. 2004-23, Cl. AB, | | | |
| REMIC, Ser. 2937, Cl. VC, | | | 3.63%, 9/16/27 | 476,429 | | 493,987 |
| 5.00%, 6/15/14 | 325,104a | 343,080 | Ser. 2006-68, Cl. A, 3.89%, | | | |
| REMIC, Ser. 2625, Cl. JD, | | | 7/16/26 | 1,209,211 | | 1,241,202 |
| 3.25%, 7/15/17 | 805,653a | 823,251 | Ser. 2006-67, Cl. A, 3.95%, | | | |
| REMIC, Ser. 2999, Cl. NB, | | | 11/16/30 | 1,398,355 | | 1,449,330 |
| 4.50%, 7/15/17 | 975,910a | 994,720 | Ser. 2005-76, Cl. A, 3.96%, | | | |
| REMIC, Ser. 2619, Cl. YK, | | | 5/16/30 | 865,996 | | 900,838 |
| 5.00%, 5/15/16 | 557,889a | 559,360 | Ser. 2005-29, Cl. A, 4.02%, | | | |
| REMIC, Ser. 2495, Cl. UC, | | | 7/16/27 | 407,382 | | 421,391 |
| 5.00%, 7/15/32 | 54,483a | 57,483 | Ser. 2006-3, Cl. A, 4.21%, | | | |
| REMIC, Ser. 3137, Cl. PA, | | | 1/16/28 | 313,580 | | 319,579 |
| 5.13%, 12/15/13 | 573,051a | 584,711 | Ser. 2009-19, Cl. AC, | | | |
| REMIC, Ser. 3196, Cl. CE, | | | 4.22%, 3/16/34 | 940,075 | | 990,654 |
| 5.25%, 8/15/11 | 263,214a | 267,678 | Ser. 2003-47, Cl. C, 4.23%, | | | |
| REMIC, Ser. 1961, Cl. H, | | | 10/16/27 | 428,463 | | 433,140 |
| 6.50%, 5/15/12 | 2,042a | 2,050 | Ser. 2008-78, Cl. B, 4.52%, | | | |
| Federal National Mortgage Association: | | | 6/16/32 | 5,500,000 | | 5,830,134 |
| 4.50%, 8/1/13 | 36,134a | 38,365 | Ser. 2005-79, Cl. B, 4.65%, | | | |
| 5.00%, 11/1/12—11/1/13 | 552,365a | 587,118 | 8/16/39 | 480,000 | | 500,202 |
| Ser. 2002-T11, Cl. A, | | | Ser. 2004-12, Cl. BA, | | | |
| 4.77%, 4/25/12 | 141,213a | 144,072 | 4.81%, 8/16/32 | 1,947,265 | | 2,045,807 |
| Ser. 2002-T3, Cl. A, 5.14%, | | | Ser. 2006-32, Cl. A, 5.08%, | | | |
| 12/25/11 | 197,494a | 198,226 | 1/16/30 | 1,934,132 | | 2,026,348 |
| Ser. 2001-T6, Cl. A, 5.70%, | | | Ser. 2006-31, Cl. C, 5.18%, | | | |
| 5/25/11 | 3,789a | 3,789 | 5/16/34 | 3,500,000b | | 3,792,747 |
| Ser. 2002-T3, Cl. B, 5.76%, | | | Ser. 2004-60, Cl. C, 5.24%, | | | |
| 12/25/11 | 270,000a | 280,510 | 3/16/28 | 4,000,000b | | 4,212,796 |
| Government National | | | Ser. 2004-50, Cl. C, 5.32%, | | | |
| Mortgage Association I: | | | 8/16/30 | 397,377b | | 419,107 |
| Ser. 2008-45, Cl. A, 3.58%, | | | | | | 35,673,225 |
| 11/16/27 | 681,328 | 694,169 | | | | |
26
| | | | | | | | |
| BNY Mellon Short-Term U.S. Government Securities Fund (continued) | | | | |
| |
| | Principal | | | Principal | | | |
| Bonds and Notes (continued) | Amount ($) | Value ($) | | Amount ($) | | Value ($) | |
| U.S. Government Securities—58.8% | | | U.S. Government Securities (continued) | | | |
| U.S. Treasury Notes: | | | U.S. Treasury Notes (continued): | | | | |
| 0.50%, 10/15/13 | 5,750,000 | 5,679,022 | 4.75%, 5/31/12 | 11,000,000 | | 11,605,429 | |
| 0.63%, 7/31/12 | 3,500,000 | 3,511,225 | 4.88%, 6/30/12 | 8,500,000 | | 9,010,000 | |
| 0.63%, 12/31/12 | 9,750,000 | 9,752,291 | | | | 194,208,693 | |
| 0.75%, 8/15/13 | 11,000,000 | 10,963,909 | Total Bonds and Notes | | | | |
| 0.75%, 9/15/13 | 13,250,000c | 13,189,964 | (cost $323,984,879) | | | 325,054,039 | |
| 1.00%, 3/31/12 | 11,000,000 | 11,082,456 | | | | | |
| 1.00%, 7/15/13 | 12,250,000 | 12,293,071 | | | | | |
| 1.13%, 12/15/12 | 12,000,000 | 12,112,032 | Other Investment—3.8% | Shares | | Value ($) | |
| 1.13%, 6/15/13 | 11,000,000 | 11,078,166 | Registered Investment Company; | | | | |
| 1.25%, 2/15/14 | 3,005,000c | 3,012,981 | | | | | |
| | | | Dreyfus Institutional Preferred | | | | |
| 1.38%, 5/15/12 | 11,000,000 | 11,137,071 | | | | | |
| | | | Plus Money Market Fund | | | | |
| 1.38%, 9/15/12 | 5,000,000 | 5,069,140 | | | | | |
| | | | (cost $12,561,000) | 12,561,000d | | 12,561,000 | |
| 1.38%, 10/15/12 | 5,000,000 | 5,069,335 | | | | | |
| 1.38%, 5/15/13 | 10,750,000 | 10,891,975 | Total Investments | | | | |
| 1.50%, 7/15/12 | 5,000,000 | 5,077,345 | (cost $336,545,879) | 102.2% | | 337,615,039 | |
| 1.75%, 8/15/12 | 5,000,000 | 5,096,290 | | | | | |
| 1.88%, 6/15/12 | 11,000,000 | 11,214,841 | Liabilities, Less Cash | | | | |
| 4.00%, 11/15/12 | 11,500,000 | 12,176,971 | and Receivables | (2.2%) | | (7,355,710) | |
| 4.50%, 4/30/12 | 11,000,000 | 11,534,105 | Net Assets | 100.0% | | 330,259,329 | |
| 4.63%, 2/29/12 | 3,500,000 | 3,651,074 | | | | | |
GO—General Obligations
|
| a The Federal Housing Finance Agency (“FHFA”) placed Federal Home Loan Mortgage Corporation and Federal National Mortgage Association into conservatorship with FHFA |
| as the conservator.As such, the FHFA oversees the continuing affairs of these companies. |
| b Variable rate security—interest rate subject to periodic change. |
| c Security, or portion thereof, on loan.At February 28, 2011, the value of the fund’s securities on loan was $13,194,978 and the value of the collateral held by the fund was |
| $13,488,366, consisting of U.S. Government and agency securities valued at $13,488,366. |
| d Investment in affiliated money market mutual fund. |
| | | |
| Portfolio Summary (Unaudited)† | | | |
| |
| | Value (%) | | Value (%) |
| U.S. Government & Agencies | 93.4 | Municipal Bonds | .6 |
| Corporate Bonds | 4.4 | | |
| Money Market Investment | 3.8 | | 102.2 |
| |
| † Based on net assets. | | | |
| See notes to financial statements. | | | |
The Funds 27
STATEMENT OF ASSETS AND LIABILITIES
February 28, 2011 (Unaudited)
| | | | | | | | |
| | | | BNY Mellon | BNY Mellon |
| | BNY Mellon | BNY Mellon | Intermediate | Short-Term |
| | Bond | Intermediate | U.S. Government | U.S. Government |
| | Fund | Bond Fund | Fund | Securities Fund |
| Assets ($): | | | | |
| Investments in securities—See Statement of Investments† | | | | |
| (including securities on loan)††—Note 2(b): | | | | |
| Unaffiliated issuers | 1,429,035,785 | 961,671,559 | 63,919,996 | 325,054,039 |
| Affiliated issuers | 18,105,227 | 14,420,800 | 2,170,000 | 12,561,000 |
| Cash | — | 1,414,425 | — | 57,674 |
| Receivable for investment securities sold | 13,747,792 | — | — | — |
| Dividends and interest receivable | 9,625,189 | 8,341,290 | 384,405 | 1,422,473 |
| Receivable for shares of Beneficial Interest subscribed | 1,145,980 | 278,378 | 50,000 | 1,126,490 |
| Prepaid expenses | 1,923 | 1,302 | 17,106 | 9,288 |
| | 1,471,661,896 | 986,127,754 | 66,541,507 | 340,230,964 |
| Liabilities ($): | | | | |
| Due to The Dreyfus Corporation and affiliates—Note 4(b) | 470,644 | 331,200 | 29,737 | 100,096 |
| Due to Administrator—Note 4(a) | 131,069 | 91,886 | 6,110 | 30,953 |
| Cash overdraft due to Custodian | 3,041,278 | — | 92,932 | — |
| Payable for investment securities purchased | 71,555,430 | 250,109 | 1,500,112 | 9,255,718 |
| Liability for securities on loan—Note 2(b) | 1,517,227 | 9,441,800 | — | — |
| Payable for shares of Beneficial Interest redeemed | 1,466,950 | 1,040,812 | 153,812 | 545,230 |
| Accrued expenses | 94,784 | 59,858 | 22,414 | 39,638 |
| | 78,277,382 | 11,215,665 | 1,805,117 | 9,971,635 |
| Net Assets ($) | 1,393,384,514 | 974,912,089 | 64,736,390 | 330,259,329 |
| Composition of Net Assets ($): | | | | |
| Paid-in capital | 1,358,662,671 | 954,638,107 | 64,376,512 | 339,283,467 |
| Accumulated distributions in excess of investment income—net | (4,257,682) | (3,010,574) | (213,363) | (1,430,578) |
| Accumulated net realized gain (loss) on investments | (3,697,803) | (8,556,927) | (839,938) | (8,662,720) |
| Accumulated net unrealized appreciation | | | | |
| (depreciation) on investments | 42,677,328 | 31,841,483 | 1,413,179 | 1,069,160 |
| Net Assets ($) | 1,393,384,514 | 974,912,089 | 64,736,390 | 330,259,329 |
| Net Asset Value Per Share | | | | |
| Class M Shares | | | | |
| Net Assets ($) | 1,386,656,427 | 971,026,650 | 59,429,197 | 329,799,070 |
| Shares Outstanding | 105,914,314 | 75,267,919 | 5,909,039 | 26,857,505 |
| Net Asset Value Per Share ($) | 13.09 | 12.90 | 10.06 | 12.28 |
| Investor Shares | | | | |
| Net Assets ($) | 6,728,087 | 3,885,439 | 5,307,193 | 460,259 |
| Shares Outstanding | 514,895 | 301,220 | 528,221 | 37,511 |
| Net Asset Value Per Share ($) | 13.07 | 12.90 | 10.05 | 12.27 |
| † Investments at cost ($): | | | | |
| Unaffiliated issuers | 1,386,358,457 | 929,830,076 | 62,506,817 | 323,984,879 |
| Affiliated issuers | 18,105,227 | 14,420,800 | 2,170,000 | 12,561,000 |
| ††Value of securities on loan ($) | 54,906,642 | 51,215,645 | — | 13,194,978 |
| |
| See notes to financial statements. | | | | |
28
STATEMENT OF OPERATIONS
Six Months Ended February 28, 2011 (Unaudited)
| | | | | | | | |
| | | | BNY Mellon | BNY Mellon |
| | BNY Mellon | BNY Mellon | Intermediate | Short-Term |
| | Bond | Intermediate | U.S. Government | U.S. Government |
| | Fund | Bond Fund | Fund | Securities Fund |
| Investment Income ($): | | | | |
| Income: | | | | |
| Interest | 24,624,177 | 14,327,583 | 735,059 | 1,934,767 |
| Dividends; | | | | |
| Affiliated issuers | 39,558 | 10,474 | 1,051 | 5,120 |
| Income from securities lending—Note 2(b) | 20,856 | 11,547 | — | 3,527 |
| Total Income | 24,684,591 | 14,349,604 | 736,110 | 1,943,414 |
| Expenses: | | | | |
| Investment advisory fee—Note 4(a) | 2,845,974 | 1,961,991 | 162,283 | 561,110 |
| Administration fee—Note 4(a) | 880,560 | 607,015 | 40,167 | 198,381 |
| Custodian fees—Note 4(b) | 51,013 | 36,172 | 2,745 | 12,671 |
| Trustees’ fees and expenses—Note 4(c) | 38,415 | 18,644 | 1,909 | 11,769 |
| Registration fees | 19,272 | 20,344 | 10,737 | 23,086 |
| Auditing fees | 18,600 | 13,225 | 14,087 | 14,780 |
| Loan commitment fees—Note 3 | 17,139 | 13,629 | 104 | 3,240 |
| Legal fees | 16,412 | 13,385 | 757 | 2,298 |
| Shareholder servicing costs—Note 4(b) | 12,399 | 6,483 | 8,426 | 1,161 |
| Prospectus and shareholders’ reports | 4,387 | 3,572 | 1,210 | 6,706 |
| Miscellaneous | 26,573 | 17,699 | 12,125 | 14,660 |
| Total Expenses | 3,930,744 | 2,712,159 | 254,550 | 849,862 |
| Less—reduction in investment advisory fee | | | | |
| due to undertaking—Note 4(a) | — | — | (6,758) | — |
| Less—reduction in fees due to earnings credits—Note 4(b) | (18) | (3) | (13) | (2) |
| Net Expenses | 3,930,726 | 2,712,156 | 247,779 | 849,860 |
| Investment Income—Net | 20,753,865 | 11,637,448 | 488,331 | 1,093,554 |
| Realized and Unrealized Gain (Loss) | | | | |
| on Investments—Note 5 ($): | | | | |
| Net realized gain (loss) on investments | 9,974,160 | 5,146,808 | 142,664 | 423,626 |
| Net unrealized appreciation (depreciation) on investments | (30,674,781) | (19,872,363) | (1,213,524) | (1,788,185) |
| Net Realized and Unrealized Gain (Loss) on Investments | (20,700,621) | (14,725,555) | (1,070,860) | (1,364,559) |
| Net Increase (Decrease) in Net Assets Resulting from Operations | 53,244 | (3,088,107) | (582,529) | (271,005) |
| |
| See notes to financial statements. | | | | |
STATEMENTS OF CHANGES IN NET ASSETS
| | | | | | | | |
| | BNY Mellon Bond Fund | BNY Mellon Intermediate Bond Fund |
| | Six Months Ended | | Six Months Ended | |
| | February 28, 2011 | Year Ended | February 28, 2011 | Year Ended |
| | (Unaudited) | August 31, 2010 | (Unaudited) | August 31, 2010 |
| Operations ($): | | | | |
| Investment income—net | 20,753,865 | 46,809,985 | 11,637,448 | 25,172,141 |
| Net realized gain (loss) on investments | 9,974,160 | 26,793,639 | 5,146,808 | 9,510,348 |
| Net unrealized appreciation (depreciation) on investments | (30,674,781) | 33,824,361 | (19,872,363) | 24,451,432 |
| Net Increase (Decrease) in Net Assets | | | | |
| Resulting from Operations | 53,244 | 107,427,985 | (3,088,107) | 59,133,921 |
| Dividends to Shareholders from ($): | | | | |
| Investment income—net: | | | | |
| Class M Shares | (27,227,614) | (57,273,181) | (15,699,242) | (34,238,003) |
| Investor Shares | (144,070) | (317,453) | (72,454) | (105,565) |
| Net realized gain on investments: | | | | |
| Class M Shares | (1,949,838) | — | — | — |
| Investor Shares | (10,235) | — | — | — |
| Total Dividends | (29,331,757) | (57,590,634) | (15,771,696) | (34,343,568) |
| Beneficial Interest Transactions ($): | | | | |
| Net proceeds from shares sold: | | | | |
| Class M Shares | 112,361,178 | 367,138,065 | 117,812,790 | 345,023,068 |
| Investor Shares | 3,116,207 | 9,726,748 | 4,210,950 | 6,082,988 |
| Dividends reinvested: | | | | |
| Class M Shares | 4,575,161 | 7,264,737 | 2,909,071 | 6,687,797 |
| Investor Shares | 119,031 | 230,353 | 67,755 | 94,585 |
| Cost of shares redeemed: | | | | |
| Class M Shares | (157,027,893) | (308,825,208) | (119,496,522) | (244,678,747) |
| Investor Shares | (9,364,238) | (4,008,682) | (5,055,094) | (4,224,495) |
| Increase (Decrease) in Net Assets from | | | | |
| Beneficial Interest Transactions | (46,220,554) | 71,526,013 | 448,950 | 108,985,196 |
| Total Increase (Decrease) in Net Assets | (75,499,067) | 121,363,364 | (18,410,853) | 133,775,549 |
| Net Assets ($): | | | | |
| Beginning of Period | 1,468,883,581 | 1,347,520,217 | 993,322,942 | 859,547,393 |
| End of Period | 1,393,384,514 | 1,468,883,581 | 974,912,089 | 993,322,942 |
| Undistributed (distributions in excess of) | | | | |
| investment income—net | (4,257,682) | 2,360,137 | (3,010,574) | 1,123,674 |
| Capital Share Transactions (Shares): | | | | |
| Class M Shares | | | | |
| Shares sold | 8,497,775 | 28,162,871 | 9,055,936 | 26,754,599 |
| Shares issued for dividends reinvested | 348,790 | 555,927 | 223,523 | 517,830 |
| Shares redeemed | (11,890,289) | (23,661,002) | (9,195,178) | (18,985,466) |
| Net Increase (Decrease) in Shares Outstanding | (3,043,724) | 5,057,796 | 84,281 | 8,286,963 |
| Investor Shares | | | | |
| Shares sold | 236,949 | 741,666 | 322,706 | 469,607 |
| Shares issued for dividends reinvested | 9,055 | 17,645 | 5,207 | 7,308 |
| Shares redeemed | (703,605) | (306,534) | (389,344) | (328,177) |
| Net Increase (Decrease) in Shares Outstanding | (457,601) | 452,777 | (61,431) | 148,738 |
| |
| See notes to financial statements. | | | | |
30
| | | | | | | | |
| | BNY Mellon Intermediate | BNY Mellon Short-Term |
| | U.S. Government Fund | U.S. Government Securities Fund |
| | Six Months Ended | | Six Months Ended | |
| | February 28, 2011 | Year Ended | February 28, 2011 | Year Ended |
| | (Unaudited) | August 31, 2010 | (Unaudited) | August 31, 2010 |
| Operations ($): | | | | |
| Investment income—net | 488,331 | 1,073,308 | 1,093,554 | 2,672,649 |
| Net realized gain (loss) on investments | 142,664 | 718,436 | 423,626 | 1,181,656 |
| Net unrealized appreciation (depreciation) on investments | (1,213,524) | 1,360,631 | (1,788,185) | 937,169 |
| Net Increase (Decrease) in Net Assets | | | | |
| Resulting from Operations | (582,529) | 3,152,375 | (271,005) | 4,791,474 |
| Dividends to Shareholders from ($): | | | | |
| Investment income—net: | | | | |
| Class M Shares | (866,172) | (1,804,997) | (2,778,968) | (4,677,556) |
| Investor Shares | (77,321) | (190,012) | (5,816) | (15,711) |
| Net realized gain on investments: | | | | |
| Class M Shares | (41,533) | (829,682) | — | — |
| Investor Shares | (3,710) | (95,399) | — | — |
| Total Dividends | (988,736) | (2,920,090) | (2,784,784) | (4,693,267) |
| Beneficial Interest Transactions ($): | | | | |
| Net proceeds from shares sold: | | | | |
| Class M Shares | 13,911,512 | 17,557,948 | 111,219,163 | 257,459,398 |
| Investor Shares | 98,302 | 287,498 | 1,652,720 | 903,260 |
| Dividends reinvested: | | | | |
| Class M Shares | 193,462 | 890,528 | 604,502 | 1,087,611 |
| Investor Shares | 72,508 | 262,075 | 4,085 | 3,820 |
| Cost of shares redeemed: | | | | |
| Class M Shares | (13,072,629) | (14,862,578) | (83,683,148) | (130,942,023) |
| Investor Shares | (1,410,053) | (477,536) | (2,176,317) | (757,806) |
| Increase (Decrease) in Net Assets from | | | | |
| Beneficial Interest Transactions | (206,898) | 3,657,935 | 27,621,005 | 127,754,260 |
| Total Increase (Decrease) in Net Assets | (1,778,163) | 3,890,220 | 24,565,216 | 127,852,467 |
| Net Assets ($): | | | | |
| Beginning of Period | 66,514,553 | 62,624,333 | 305,694,113 | 177,841,646 |
| End of Period | 64,736,390 | 66,514,553 | 330,259,329 | 305,694,113 |
| Undistributed (distributions in excess of) | | | | |
| investment income—net | (213,363) | 241,799 | (1,430,578) | 260,652 |
| Capital Share Transactions (Shares): | | | | |
| Class M Shares | | | | |
| Shares sold | 1,369,806 | 1,723,129 | 9,010,046 | 20,783,982 |
| Shares issued for dividends reinvested | 19,038 | 87,814 | 48,999 | 87,811 |
| Shares redeemed | (1,288,173) | (1,461,517) | (6,783,197) | (10,571,625) |
| Net Increase (Decrease) in Shares Outstanding | 100,671 | 349,426 | 2,275,848 | 10,300,168 |
| Investor Shares | | | | |
| Shares sold | 9,609 | 27,940 | 133,832 | 72,868 |
| Shares issued for dividends reinvested | 7,129 | 25,807 | 332 | 308 |
| Shares redeemed | (137,935) | (46,765) | (176,258) | (61,105) |
| Net Increase (Decrease) in Shares Outstanding | (121,197) | 6,982 | (42,094) | 12,071 |
See notes to financial statements.
FINANCIAL HIGHLIGHTS
The following tables describe the performance for each share class of each BNY Mellon fixed income fund for the fiscal periods indicated. All information (except portfolio turnover rate) reflects financial results for a single fund share. Total return shows how much your investment in each fund would have increased (or decreased) during the period, assuming you had reinvested all dividends and distributions.These figures have been derived from each fund’s financial statements.
| | | | | | | | | | | | |
| | | | Class M Shares | | | |
| | Six Months Ended | | | | | |
| | February 28, 2011 | | Year Ended August 31, | |
| BNY Mellon Bond Fund | (Unaudited) | 2010 | 2009 | 2008 | 2007 | 2006 |
| Per Share Data ($): | | | | | | |
| Net asset value, beginning of period | 13.36 | 12.90 | 12.38 | 12.24 | 12.23 | 12.66 |
| Investment Operations: | | | | | | |
| Investment income—neta | .19 | .43 | .52 | .60 | .57 | .52 |
| Net realized and unrealized | | | | | | |
| gain (loss) on investments | (.19) | .56 | .56 | .15 | .04 | (.38) |
| Total from Investment Operations | — | .99 | 1.08 | .75 | .61 | .14 |
| Distributions: | | | | | | |
| Dividends from investment income—net | (.25) | (.53) | (.56) | (.61) | (.60) | (.57) |
| Dividends from net realized gain on investments | (.02) | — | — | — | — | — |
| Total Distributions | (.27) | (.53) | (.56) | (.61) | (.60) | (.57) |
| Net asset value, end of period | 13.09 | 13.36 | 12.90 | 12.38 | 12.24 | 12.23 |
| Total Return (%) | .01b | 7.84 | 8.95 | 6.17 | 5.06 | 1.20 |
| Ratios/Supplemental Data (%): | | | | | | |
| Ratio of total expenses to average net assets | .55c | .55 | .56 | .55 | .56 | .56 |
| Ratio of net expenses to average net assets | .55c | .55 | .56 | .55 | .56 | .56 |
| Ratio of net investment income | | | | | | |
| to average net assets | 2.92c | 3.29 | 4.15 | 4.78 | 4.67 | 4.27 |
| Portfolio Turnover Rate | 56.65b | 99.66 | 62.19 | 60.76 | 134.49 | 104.53d |
| Net Assets, end of period ($ x 1,000) | 1,386,656 | 1,455,913 | 1,340,824 | 995,421 | 944,416 | 885,994 |
|
| a Based on average shares outstanding at each month end. |
| b Not annualized. |
| c Annualized. |
| d The portfolio turnover rate excluding mortgage dollar roll transactions for the period ended August 31, 2006 was 101.12%. |
See notes to financial statements.
32
| | | | | | | | | | | | |
| | | | Investor Shares | | | |
| | Six Months Ended | | | | | |
| | February 28, 2011 | | Year Ended August 31, | |
| BNY Mellon Bond Fund | (Unaudited) | 2010 | 2009 | 2008 | 2007 | 2006 |
| Per Share Data ($): | | | | | | |
| Net asset value, beginning of period | 13.34 | 12.88 | 12.36 | 12.21 | 12.21 | 12.63 |
| Investment Operations: | | | | | | |
| Investment income—neta | .17 | .39 | .50 | .56 | .53 | .49 |
| Net realized and unrealized | | | | | | |
| gain (loss) on investments | (.18) | .57 | .54 | .16 | .04 | (.37) |
| Total from Investment Operations | (.01) | .96 | 1.04 | .72 | .57 | .12 |
| Distributions: | | | | | | |
| Dividends from investment income—net | (.24) | (.50) | (.52) | (.57) | (.57) | (.54) |
| Dividends from net realized gain on investments | (.02) | — | — | — | — | — |
| Total Distributions | (.26) | (.50) | (.52) | (.57) | (.57) | (.54) |
| Net asset value, end of period | 13.07 | 13.34 | 12.88 | 12.36 | 12.21 | 12.21 |
| Total Return (%) | (.12)b | 7.60 | 8.74 | 5.81 | 4.82 | 1.01 |
| Ratios/Supplemental Data (%): | | | | | | |
| Ratio of total expenses to average net assets | .80c | .81 | .81 | .80 | .81 | .80 |
| Ratio of net expenses to average net assets | .80c | .81 | .81 | .80 | .81 | .80 |
| Ratio of net investment income | | | | | | |
| to average net assets | 2.69c | 3.03 | 3.88 | 4.52 | 4.42 | 4.02 |
| Portfolio Turnover Rate | 56.65b | 99.66 | 62.19 | 60.76 | 134.49 | 104.53d |
| Net Assets, end of period ($ x 1,000) | 6,728 | 12,971 | 6,696 | 3,472 | 4,621 | 3,319 |
|
| a Based on average shares outstanding at each month end. |
| b Not annualized. |
| c Annualized. |
| d The portfolio turnover rate excluding mortgage dollar roll transactions for the period ended August 31, 2006 was 101.12%. |
See notes to financial statements.
FINANCIAL HIGHLIGHTS (continued)
| | | | | | | | | | | | |
| | | | Class M Shares | | | |
| | Six Months Ended | | | | | |
| | February 28, 2011 | | Year Ended August 31, | |
| BNY Mellon Intermediate Bond Fund | (Unaudited) | 2010 | 2009 | 2008 | 2007 | 2006 |
| Per Share Data ($): | | | | | | |
| Net asset value, beginning of period | 13.15 | 12.81 | 12.37 | 12.19 | 12.14 | 12.47 |
| Investment Operations: | | | | | | |
| Investment income—neta | .15 | .35 | .46 | .55 | .53 | .46 |
| Net realized and unrealized | | | | | | |
| gain (loss) on investments | (.19) | .47 | .50 | .21 | .09 | (.26) |
| Total from Investment Operations | (.04) | .82 | .96 | .76 | .62 | .20 |
| Distributions: | | | | | | |
| Dividends from investment income—net | (.21) | (.48) | (.52) | (.58) | (.57) | (.53) |
| Net asset value, end of period | 12.90 | 13.15 | 12.81 | 12.37 | 12.19 | 12.14 |
| Total Return (%) | (.32)b | 6.52 | 8.07 | 6.19 | 5.22 | 1.69 |
| Ratios/Supplemental Data (%): | | | | | | |
| Ratio of total expenses to average net assets | .55c | .55 | .56 | .55 | .56 | .56 |
| Ratio of net expenses to average net assets | .55c | .55 | .56 | .55 | .56 | .56 |
| Ratio of net investment income | | | | | | |
| to average net assets | 2.37c | 2.72 | 3.75 | 4.43 | 4.36 | 3.79 |
| Portfolio Turnover Rate | 23.12b | 44.58 | 53.05 | 53.28 | 84.24 | 86.50 |
| Net Assets, end of period ($ x 1,000) | 971,027 | 988,555 | 856,808 | 785,841 | 725,064 | 656,120 |
| |
| a | Based on average shares outstanding at each month end. |
| b | Not annualized. |
| c | Annualized. |
See notes to financial statements.
34
| | | | | | | | | | | | |
| | | | Investor Shares | | | |
| | Six Months Ended | | | | | |
| | February 28, 2011 | | Year Ended August 31, | | |
| BNY Mellon Intermediate Bond Fund | (Unaudited) | 2010 | 2009 | 2008 | 2007 | 2006 |
| Per Share Data ($): | | | | | | |
| Net asset value, beginning of period | 13.15 | 12.81 | 12.36 | 12.19 | 12.14 | 12.47 |
| Investment Operations: | | | | | | |
| Investment income—neta | .14 | .31 | .43 | .53 | .48 | .43 |
| Net realized and unrealized | | | | | | |
| gain (loss) on investments | (.20) | .48 | .51 | .18 | .11 | (.26) |
| Total from Investment Operations | (.06) | .79 | .94 | .71 | .59 | .17 |
| Distributions: | | | | | | |
| Dividends from investment income—net | (.19) | (.45) | (.49) | (.54) | (.54) | (.50) |
| Net asset value, end of period | 12.90 | 13.15 | 12.81 | 12.36 | 12.19 | 12.14 |
| Total Return (%) | (.45)b | 6.26 | 7.78 | 5.91 | 4.96 | 1.43 |
| Ratios/Supplemental Data (%): | | | | | | |
| Ratio of total expenses to average net assets | .80c | .81 | .81 | .80 | .81 | .81 |
| Ratio of net expenses to average net assets | .80c | .81 | .81 | .80 | .81 | .81 |
| Ratio of net investment income | | | | | | |
| to average net assets | 2.12c | 2.44 | 3.48 | 4.19 | 4.10 | 3.55 |
| Portfolio Turnover Rate | 23.12b | 44.58 | 53.05 | 53.28 | 84.24 | 86.50 |
| Net Assets, end of period ($ x 1,000) | 3,885 | 4,768 | 2,740 | 1,616 | 1,931 | 681 |
| |
| a | Based on average shares outstanding at each month end. |
| b | Not annualized. |
| c | Annualized. |
See notes to financial statements.
FINANCIAL HIGHLIGHTS (continued)
| | | | | | | | | | | | | | | |
| | | | | Class M Shares† | | | |
| | Six Months Ended | | | | | | |
| BNY Mellon Intermediate | February 28, 2011 | Year Ended | Eight Months Ended | | Year Ended December 31, | |
| U.S. Government Fund | | (Unaudited) | August 31, 2010 | August 31, 2009a | 2008 | 2007 | 2006 | 2005 |
| Per Share Data ($): | | | | | | | | |
| Net asset value, beginning of period | | 10.30 | 10.27 | 10.43 | 9.99 | 9.81 | 9.94 | 10.15 |
| Investment Operations: | | | | | | | | |
| Investment income—netb | | .08 | .17 | .14 | .42 | .42 | .42 | .39 |
| Net realized and unrealized | | | | | | | | |
| gain (loss) on investments | | (.16) | .33 | (.10) | .39 | .23 | (.08) | (.14) |
| Total from Investment Operations | | (.08) | .50 | .04 | .81 | .65 | .34 | .25 |
| Distributions: | | | | | | | | |
| Dividends from investment income—net | (.15) | (.32) | (.20) | (.37) | (.47) | (.47) | (.46) |
| Dividends from net realized | | | | | | | | |
| gain on investments | | (.01) | (.15) | (.00)c | — | — | — | — |
| Total Distributions | | (.16) | (.47) | (.20) | (.37) | (.47) | (.47) | (.46) |
| Net asset value, end of period | | 10.06 | 10.30 | 10.27 | 10.43 | 9.99 | 9.81 | 9.94 |
| Total Return (%) | | (.84)d | 5.03 | .41d | 8.31 | 6.80 | 3.58 | 2.51 |
| Ratios/Supplemental Data (%): | | | | | | | | |
| Ratio of total expenses to average net assets | .76e | .74 | .78e | .76 | .77 | .78 | .78 |
| Ratio of net expenses to average net assets | .74e | .65 | .65e | .65 | .65 | .65 | .65 |
| Ratio of net investment income | | | | | | | | |
| to average net assets | | 1.53e | 1.71 | 2.08e | 4.12 | 4.31 | 4.27 | 3.88 |
| Portfolio Turnover Rate | | 23.89d | 60.52 | 56.74d | 85.47 | 57 | 21 | 29 |
| Net Assets, end of period ($ x 1,000) | 59,429 | 59,832 | 56,037 | 120,970 | 106,650 | 103,686 | 114,209 |
|
| † Represents information for Institutional shares of the fund’s predecessor, BNY Hamilton Intermediate Government Fund, through September 12, 2008. |
| a The fund has changed its fiscal year end from December 31 to August 31. |
| b Based on average shares outstanding at each month end. |
| c Amount represents less than $.01 per share. |
| d Not annualized. |
| e Annualized. |
See notes to financial statements.
36
| | | | | | | | | | | | | | | |
| | | | | Investor Shares† | | | | |
| | Six Months Ended | | | | | | |
| BNY Mellon Intermediate | February 28, 2011 | Year Ended | Eight Months Ended | | Year Ended December 31, | |
| U.S. Government Fund | | (Unaudited) | August 31, 2010 | August 31, 2009a | 2008 | 2007 | 2006 | 2005 |
| Per Share Data ($): | | | | | | | | |
| Net asset value, beginning of period | | 10.29 | 10.25 | 10.42 | 9.98 | 9.80 | 9.93 | 10.14 |
| Investment Operations: | | | | | | | | |
| Investment income—netb | | .06 | .15 | .13 | .39 | .40 | .39 | .36 |
| Net realized and unrealized | | | | | | | | |
| gain (loss) on investments | | (.15) | .34 | (.12) | .40 | .23 | (.07) | (.14) |
| Total from Investment Operations | | (.09) | .49 | .01 | .79 | .63 | .32 | .22 |
| Distributions: | | | | | | | | |
| Dividends from investment income—net | (.14) | (.30) | (.18) | (.35) | (.45) | (.45) | (.43) |
| Dividends from net realized | | | | | | | | |
| gain on investments | | (.01) | (.15) | (.00)c | — | — | — | — |
| Total Distributions | | (.15) | (.45) | (.18) | (.35) | (.45) | (.45) | (.43) |
| Net asset value, end of period | | 10.05 | 10.29 | 10.25 | 10.42 | 9.98 | 9.80 | 9.93 |
| Total Return (%) | | (.95)d | 4.87 | .14d | 8.06 | 6.53 | 3.32 | 2.25 |
| Ratios/Supplemental Data (%): | | | | | | | | |
| Ratio of total expenses to average net assets | 1.01e | .99 | 1.04e | 1.01 | 1.02 | 1.03 | 1.03 |
| Ratio of net expenses to average net assets | .99e | .90 | .90e | .90 | .90 | .90 | .90 |
| Ratio of net investment income | | | | | | | | |
| to average net assets | | 1.28e | 1.46 | 1.89e | 3.87 | 4.06 | 4.02 | 3.62 |
| Portfolio Turnover Rate | | 23.89d | 60.52 | 56.74d | 85.47 | 57 | 21 | 29 |
| Net Assets, end of period ($ x 1,000) | 5,307 | 6,682 | 6,588 | 6,292 | 6,015 | 6,319 | 7,161 |
|
| † Represents information for Class A shares of the fund’s predecessor, BNY Hamilton Intermediate Government Fund, through September 12, 2008. |
| a The fund has changed its fiscal year end from December 31 to August 31. |
| b Based on average shares outstanding at each month end. |
| c Amount represents less than $.01 per share. |
| d Not annualized. |
| e Annualized. |
See notes to financial statements.
FINANCIAL HIGHLIGHTS (continued)
| | | | | | | | | | | | |
| | | | Class M Shares | | | |
| | Six Months Ended | | | | | |
| BNY Mellon Short-Term | February 28, 2011 | | Year Ended August 31, | |
| U.S. Government Securities Fund | (Unaudited) | 2010 | 2009 | 2008 | 2007 | 2006 |
| Per Share Data ($): | | | | | | |
| Net asset value, beginning of period | 12.40 | 12.39 | 12.19 | 12.02 | 11.99 | 12.14 |
| Investment Operations: | | | | | | |
| Investment income—neta | .04 | .13 | .29 | .46 | .56 | .39 |
| Net realized and unrealized | | | | | | |
| gain (loss) on investments | (.05) | .11 | .30 | .23 | .03 | (.06) |
| Total from Investment Operations | (.01) | .24 | .59 | .69 | .59 | .33 |
| Distributions: | | | | | | |
| Dividends from investment income—net | (.11) | (.23) | (.39) | (.52) | (.56) | (.48) |
| Net asset value, end of period | 12.28 | 12.40 | 12.39 | 12.19 | 12.02 | 11.99 |
| Total Return (%) | (.11)b | 1.96 | 4.90 | 5.83 | 5.05 | 2.78 |
| Ratios/Supplemental Data (%): | | | | | | |
| Ratio of total expenses to average net assets | .53c | .53 | .56 | .55 | .55 | .54 |
| Ratio of net expenses to average net assets | .53c | .53 | .56 | .55 | .55 | .54 |
| Ratio of net investment income | | | | | | |
| to average net assets | .68c | 1.07 | 2.32 | 3.79 | 4.65 | 3.24 |
| Portfolio Turnover Rate | 44.09b | 59.58 | 117.43 | 84.77 | 127.30 | 85.97 |
| Net Assets, end of period ($ x 1,000) | 329,799 | 304,707 | 177,005 | 133,857 | 128,628 | 131,885 |
| |
| a | Based on average shares outstanding at each month end. |
| b | Not annualized. |
| c | Annualized. |
See notes to financial statements.
38
| | | | | | | | | | | | |
| | | | Investor Shares | | | |
| | Six Months Ended | | | | | |
| BNY Mellon Short-Term | February 28, 2011 | | Year Ended August 31, | |
| U.S. Government Securities Fund | (Unaudited) | 2010 | 2009 | 2008 | 2007 | 2006 |
| Per Share Data ($): | | | | | | |
| Net asset value, beginning of period | 12.40 | 12.39 | 12.20 | 12.02 | 12.00 | 12.14 |
| Investment Operations: | | | | | | |
| Investment income—neta | .03 | .11 | .23 | .45 | .49 | .41 |
| Net realized and unrealized | | | | | | |
| gain (loss) on investments | (.07) | .10 | .32 | .22 | .06 | (.10) |
| Total from Investment Operations | (.04) | .21 | .55 | .67 | .55 | .31 |
| Distributions: | | | | | | |
| Dividends from investment income—net | (.09) | (.20) | (.36) | (.49) | (.53) | (.45) |
| Net asset value, end of period | 12.27 | 12.40 | 12.39 | 12.20 | 12.02 | 12.00 |
| Total Return (%) | (.33)b | 1.73 | 4.63 | 5.55 | 4.67 | 2.62 |
| Ratios/Supplemental Data (%): | | | | | | |
| Ratio of total expenses to average net assets | .77c | .78 | .82 | .79 | .80 | .77 |
| Ratio of net expenses to average net assets | .77c | .78 | .82 | .79 | .80 | .77 |
| Ratio of net investment income | | | | | | |
| to average net assets | .42c | .84 | 1.93 | 3.61 | 4.51 | 3.25 |
| Portfolio Turnover Rate | 44.09b | 59.58 | 117.43 | 84.77 | 127.30 | 85.97 |
| Net Assets, end of period ($ x 1,000) | 460 | 987 | 837 | 94 | 140 | 281 |
| |
| a | Based on average shares outstanding at each month end. |
| b | Not annualized. |
| c | Annualized. |
See notes to financial statements.
NOTES TO FINANCIAL STATEMENTS (Unaudited)
NOTE 1—General:
BNY Mellon Funds Trust (the “Trust”) was organized as a Massachusetts business trust which is registered under the Investment Company Act of 1940, as amended (the “Act”), as an open-end management investment company and operates as a series company currently consisting of twenty-five series including the following diversified fixed income funds: BNY Mellon Bond Fund, BNY Mellon Intermediate Bond Fund, BNY Mellon Intermediate U.S. Government Fund and BNY Mellon Short-Term U.S. Government Securities Fund (each, a “fund” and collectively, the “funds”). BNY Mellon Bond Fund’s and BNY Mellon Intermediate Bond Fund’s investment objective seek total return (consisting of capital appreciation and current income). BNY Mellon Intermediate U.S. Government Fund’s and BNY Mellon Short-Term U.S. Government Securities Fund’s investment objective seek to provide as high a level of current income as is consistent with the preservation of capital.
BNY Mellon Fund Advisers, a division of The Dreyfus Corporation (the “Manager” or “Dreyfus”), a wholly-owned subsidiary of The Bank of New York Mellon Corporation (“BNY Mellon”), serves as each fund’s investment adviser (“Investment Adviser”).The Bank of New York Mellon, a subsidiary of BNY Mellon and an affiliate of Dreyfus, serves as administrator for the funds pursuant to an Administration Agreement with the Trust (the “Administration Agreement”). The Bank of New York Mellon has entered into a Sub-Administration Agreement with Dreyfus pursuant to whichThe Bank of New York Mellon pays Dreyfus for performing certain administrative services. MBSC Securities Corporation (the “Distributor”), a wholly-owned subsidiary of Dreyfus, is the distributor of each fund’s shares, which are sold without a sales charge.
The Trust is authorized to issue an unlimited number of shares of Beneficial Interest, par value $.001 per share, in each of the Class M and Investor shares of each fund.
Each class of shares has similar rights and privileges, except with respect to the expenses borne by and the shareholder services offered to each class and the shareholder services plan applicable to the Investor shares, the allocation of certain transfer agency costs and certain voting rights. Income, expenses (other than expenses attributable to a specific class), and realized and unrealized gains or losses on investments are allocated to each class of shares based on its relative net assets.
TheTrust accounts separately for the assets, liabilities and operations of each series. Expenses directly attributable to each series are charged to that series’ operations; expenses that are applicable to all series are allocated among them on a pro rata basis.
The Financial Accounting Standards Board (“FASB”) Accounting Standards Codification (“ASC”) is the exclusive reference of authoritative U.S. generally accepted accounting principles (“GAAP”) recognized by the FASB to be applied by nongovernmental entities. Rules and interpretive releases of the Securities and Exchange Commission (“SEC”) under authority of federal laws are also sources of authoritative GAAP for SEC registrants. Each fund’s financial statements are prepared in accordance with GAAP, which may require the use of management estimates and assumptions. Actual results could differ from those estimates.
NOTE 2—Significant Accounting Policies:
(a) Portfolio valuation: Investments in securities excluding short-term investments (other than U.S.Treasury Bills), are valued each business day by an independent pricing service (the “Service”) approved by the Trust’s Board. Investments for which quoted bid prices are readily available and are representative of the bid side of the market in the judgment of the Service are valued at the mean between the quoted bid prices (as obtained by the Service from dealers in such securities) and asked prices (as calculated by the Service based upon its evaluation of the
40
market for such securities). Other investments (which constitute a majority of the portfolio securities) are valued as determined by the Service, based on methods which include consideration of: yields or prices of securities of comparable quality, coupon, maturity and type; indications as to values from dealers; and general market conditions. Restricted securities, as well as securities or other assets for which recent market quotations are not readily available and are not valued by a pricing service approved by the Trust’s Board, or are determined by the funds not to reflect accurately fair value, are valued at fair value as determined in good faith under the direction of theTrust’s Board.The factors that may be considered when fair valuing a security include fundamental analytical data, the nature and duration of restrictions on disposition, an evaluation of the forces that influence the market in which the securities are purchased and sold and public trading in similar securities of the issuer or comparable issuers. Short-term investments, excluding U.S. Treasury Bills, are carried at amortized cost, which approximates value. Registered investment companies that are not traded on an exchange are valued at their net asset value.
The fair value of a financial instrument is the amount that would be received to sell an asset or paid to transfer a liability in an orderly transaction between market participants at the measurement date (i.e. the exit price). GAAP establishes a fair value hierarchy that prioritizes the inputs of valuation techniques used to measure fair value.This hierarchy gives the highest priority to unadjusted quoted prices in active markets for identical assets or liabilities (Level 1 measurements) and the lowest priority to unobservable inputs (Level 3 measurements).
Additionally, GAAP provides guidance on determining whether the volume and activity in a market has decreased significantly and whether such a decrease in activity results in transactions that are not orderly. GAAP requires enhanced disclosures around valuation inputs and techniques used during annual and interim periods.
Various inputs are used in determining the value of each fund’s investments relating to fair value measurements. These inputs are summarized in the three broad levels listed below:
Level 1—unadjusted quoted prices in active markets for identical investments.
Level 2—other significant observable inputs (including quoted prices for similar investments, interest rates, prepayment speeds, credit risk, etc.).
Level 3—significant unobservable inputs (including the funds’ own assumptions in determining the fair value of investments).
The inputs or methodology used for valuing securities are not necessarily an indication of the risk associated with investing in those securities.
Table 1 summarizes the inputs used as of February 28, 2011 in valuing each fund’s investments.
In January 2010, FASB issued Accounting Standards Update (“ASU”) No. 2010-06 “Improving Disclosures about Fair Value Measurements”. The portions of ASU No. 2010-06 which require reporting entities to prepare new disclosures surrounding amounts and reasons for significant transfers in and out of Level 1 and Level 2 fair value measurements as well as inputs and valuation techniques used to measure fair value for both recurring and nonrecurring fair value measurements that fall in either Level 2 or Level 3 have been adopted by the funds. No significant transfers between Level 1 or Level 2 fair value measurements occurred at February 28, 2011. The remaining portion of ASU No. 2010-06 requires reporting entities to make new disclosures about information on purchases, sales, issuances and settlements on a gross basis in the reconciliation of activity in Level 3 fair value measurements. These new and revised disclosures are required to be implemented for fiscal years beginning after December 15, 2010. Management is currently evaluating the impact that the adoption of this remaining
NOTES TO FINANCIAL STATEMENTS (Unaudited) (continued)
portion of ASU No. 2010-06 may have on the funds’ financial statement disclosures.
(b) Securities transactions and investment income:
Securities transactions are recorded on a trade date basis.
Realized gains and losses from securities transactions are
recorded on the identified cost basis. Dividend income is recorded on the ex-dividend date and interest income, including, where applicable, accretion of discount and amortization of premium on investments, is recognized on the accrual basis.
| | | | | | | | |
| Table 1—Fair Value Measurements | | | | | | |
| |
| |
| | | | | Investments in Securities | | |
| | | | | | Level 2—Other | | | |
| | | Level 1—Unadjusted | | Significant | Level 3—Significant | |
| | | | Quoted Prices | Observable Inputs | Unobservable Inputs | |
| | | Assets ($) | Liabilities ($) | Assets ($) | Liabilities ($) | Assets ($) | Liabilities ($) | Total |
| BNY Mellon Bond Fund | | | | | | | | |
| Asset-Backed | | — | — | 43,892,666 | — | — | — | 43,892,666 |
| Commercial Mortgage-Backed | — | — | 54,474,109 | — | — | — | 54,474,109 |
| Corporate Bonds† | | — | — | 363,883,696 | — | — | — | 363,883,696 |
| Equity Securities—Domestic† | | 82,640 | — | — | — | — | — | 82,640 |
| Foreign Government | | — | — | 19,425,065 | — | — | — | 19,425,065 |
| Municipal Bonds | | — | — | 54,734,741 | — | — | — | 54,734,741 |
| Mutual Funds | 18,105,227 | — | — | — | — | — | 18,105,227 |
| Residential | | | | | | | | |
| Mortgage-Backed | | — | — | 832,795 | — | — | — | 832,795 |
| U.S. Government Agencies/ | | | | | | | | |
| Mortgage-Backed | | — | — | 493,171,096 | — | — | — | 493,171,096 |
| U.S. Treasury | | — | — | 398,538,977 | — | — | — | 398,538,977 |
| BNY Mellon Intermediate | | | | | | | | |
| Bond Fund | | | | | | | | |
| Asset-Backed | | — | — | 2,379,192 | — | — | — | 2,379,192 |
| Corporate Bonds† | | — | — | 347,774,135 | — | — | — | 347,774,135 |
| Foreign Government | | — | — | 13,953,164 | — | — | — | 13,953,164 |
| Municipal Bonds | | — | — | 28,361,111 | — | — | — | 28,361,111 |
| Mutual Funds | 14,420,800 | — | — | — | — | — | 14,420,800 |
| U.S. Government | | | | | | | | |
| Agencies/ | | | | | | | | |
| Mortgage-Backed | | — | — | 112,417,094 | — | — | — | 112,417,094 |
| U.S. Treasury | | — | — | 456,786,863 | — | — | — | 456,786,863 |
| BNY Mellon Intermediate | | | | | | | | |
| U.S. Government Fund | | | | | | | | |
| Corporate Bonds† | | — | — | 1,742,465 | — | — | — | 1,742,465 |
| Mutual Funds | | 2,170,000 | — | — | — | — | — | 2,170,000 |
| U.S. Government | | | | | | | | |
| Agencies/ | | | | | | | | |
| Mortgage-Backed | | — | — | 27,729,715 | — | — | — | 27,729,715 |
| U.S. Treasury | | — | — | 34,447,816 | — | — | — | 34,447,816 |
| Bny Mellon Short-Term U.S. | | | | | | | | |
| Government Securities Fund | | | | | | | |
| Corporate Bonds† | | — | — | 14,555,860 | — | — | — | 14,555,860 |
| Municipal Bonds | | — | — | 1,905,418 | — | — | — | 1,905,418 |
| Mutual Funds | 12,561,000 | — | — | — | — | — | 12,561,000 |
| U.S. Government | | | | | | | | |
| Agencies/ | | | | | | | | |
| Mortgage-Backed | | — | — | 114,384,068 | — | — | — | 114,384,068 |
| U.S. Treasury | | — | — | 194,208,693 | — | — | — | 194,208,693 |
| |
| † | See Statements of Investments for additional detailed categorizations. |
42
Pursuant to a securities lending agreement withThe Bank of NewYork Mellon, the funds may lend securities to certain qualified institutions. It is the funds’ policy that, at origination, all loans are secured by collateral of at least 102% of the value of U.S. securities loaned and 105% of the value of foreign securities loaned. Collateral equivalent to at least 100% of the market value of securities on loan is maintained at all times. Collateral is either in the form of cash, which can be invested in certain money market mutual funds managed by Dreyfus, U.S. Government and Agency securities or letters of credit. The funds are entitled to receive all income on securities loaned, in addition to income earned as a result of the lending transaction.Although each security loaned is fully collateralized, the funds bear the risk of delay in recovery of, or loss of rights in, the securities loaned should a borrower fail to return the securities in a timely manner. Table 2 summarizes the amount The Bank of NewYork
Mellon earned from each relevant fund from lending portfolio securities pursuant to the securities lending agreement during the period ended February 28, 2011.
| | |
| Table 2—Securities Lending Agreement | | |
| BNY Mellon Bond Fund | | $11,230 |
| BNY Mellon Intermediate Bond Fund | | 6,218 |
| BNY Mellon Short-Term U.S. | | |
| Government Securities Fund | | 1,899 |
(c) Affiliated issuers: Investments in other investment companies advised by Dreyfus are defined as “affiliated” in the Act.
The funds may invest in shares of certain affiliated investment companies also advised or managed by Dreyfus. Table 3 summarizes each fund’s investments in affiliated investment companies for the period ended February 28, 2011.
| | | | | | | |
| Table 3—Affiliated Investment Companies | | | | | | | |
| |
| | Value | | | | Value | | Net |
| Affiliated Investment Company | 8/31/2010 | ($) | Purchases ($) | Sales ($) | 2/28/2011 | ($) | Assets (%) |
| BNY Mellon Bond Fund | | | | | | | |
| Dreyfus Institutional Preferred | | | | | | | |
| Plus Money Market Fund | 12,219,000 | | 369,567,000 | 365,198,000 | 16,588,000 | | 1.2 |
| Dreyfus Institutional Cash | | | | | | | |
| Advantage Plus Fund | 962,574 | | 280,092,680 | 279,538,027 | 1,517,227 | | .1 |
| Total | 13,181,574 | | 649,659,680 | 644,736,027 | 18,105,227 | | 1.3 |
| BNY Mellon Intermediate Bond Fund | | | | | | | |
| Dreyfus Institutional Preferred | | | | | | | |
| Plus Money Market Fund | 10,833,000 | | 84,084,000 | 89,938,000 | 4,979,000 | | .5 |
| Dreyfus Institutional Cash | | | | | | | |
| Advantage Plus Fund | 13,308,666 | | 124,189,777 | 128,056,643 | 9,441,800 | | 1.0 |
| Total | 24,141,666 | | 208,273,777 | 217,994,643 | 14,420,800 | | 1.5 |
| BNY Mellon Intermediate | | | | | | | |
| U.S. Government Fund | | | | | | | |
| Dreyfus Institutional Preferred | | | | | | | |
| Plus Money Market Fund | 935,000 | | 14,019,000 | 12,784,000 | 2,170,000 | | 3.3 |
| BNY Mellon Short-Term U.S. | | | | | | | |
| Government Securities Fund | | | | | | | |
| Dreyfus Institutional Preferred | | | | | | | |
| Plus Money Market Fund | 4,348,000 | | 97,669,000 | 89,456,000 | 12,561,000 | | 3.8 |
| Dreyfus Institutional Cash | | | | | | | |
| Advantage Plus Fund | 5,970,000 | | 97,580,887 | 103,550,887 | — | | — |
| Total | 10,318,000 | | 195,249,887 | 193,006,887 | 12,561,000 | | 3.8 |
NOTES TO FINANCIAL STATEMENTS (Unaudited) (continued)
(d) Concentration of risk: The funds invest primarily in debt securities. Failure of an issuer of the debt securities to make timely interest or principal payments, or a decline or the perception of a decline in the credit quality of a debt security, can cause the debt security’s price to fall, potentially lowering each fund’s share price. In addition, the value of the debt securities may decline due to general market conditions that are not specifically related to a particular company, such as real or perceived adverse economic conditions, changes in outlook for corporate earnings, changes in interest or currency rates or adverse investor sentiment. They may also decline because of factors that affect a particular industry.
(e) Dividends to shareholders: Dividends payable to shareholders are recorded by the funds on the ex-dividend date. The funds declare and pay dividends from investment income-net monthly. With respect to each series, dividends from net realized capital gains, if any, are normally declared and paid annually, but the funds may make distributions on a more frequent basis to comply with the distribution requirements of the Internal Revenue Code of 1986, as amended (the “Code”). To the extent that net realized capital gains can be offset by capital loss carryovers of that fund, it is the policy of the funds not to distribute such gains. Income and capital gain distributions are determined in accordance with income tax regulations, which may differ from GAAP.
(f) Federal income taxes: It is the policy of each fund to continue to qualify as a regulated investment company, if such qualification is in the best interests of its shareholders, by complying with the applicable provisions of the Code, and to make distributions of taxable income sufficient to relieve it from substantially all federal income
Table 4—Capital Loss Carryover
and excise taxes. For federal income tax purposes, each series is treated as a single entity for the purpose of determining such qualification.
As of and during the period ended February 28, 2011, the funds did not have any liabilities for any uncertain tax positions.The funds recognize interest and penalties, if any, related to uncertain tax positions as income tax expense in the Statements of Operations. During the period, the funds did not incur any interest or penalties.
Each of the tax years in the three-year period ended August 31, 2010 remains subject to examination by the Internal Revenue Service and state taxing authorities.
Table 4 summarizes each relevant fund’s unused capital loss carryover available for federal income tax purposes to be applied against future net securities profits, if any, realized subsequent to August 31, 2010.
Under the recently earned Regulated Investment Company Modernization Act of 2010, each relevant fund will be permitted to carry forward capital losses incurred in taxable years beginning after December 22, 2010 for an unlimited period. However, any losses incurred during those future taxable years will be required to be utilized prior to the losses incurred in pre-enactment taxable years. As a result of this ordering rule, pre-enactment capital loss carryovers may be more likely to expire unused.
Table 5 summarizes each fund’s tax character of distributions paid to shareholders during the fiscal year ended August 31, 2010. The tax character of current year distributions will be determined at the end of the current fiscal year.
| | | | | | | | | | | |
| Expiring in fiscal | 2014($)† | 2015($)† | 2016($)† | 2017($) | 2018($)† | Total ($) |
| BNY Mellon Bond Fund | — | — | 7,345,590 | — | — | 7,345,590 |
| BNY Mellon Intermediate Bond Fund | — | 3,867,963 | — | — | — | 3,867,963 |
| BNY Mellon Short-Term U.S. | | | | | | |
| Government Securities Fund | 2,822,720 | 4,701,996 | — | — | 28,529 | 7,553,245 |
| |
| † | If not applied, the carryovers expire in the above years. |
44
NOTE 3—Bank Lines of Credit:
The funds participates with other Dreyfus-managed funds in a $225 million unsecured credit facility led by Citibank, N.A. and a $300 million unsecured credit facility provided by The Bank of New York Mellon (each, a “Facility”), each to be utilized primarily for temporary or emergency purposes, including the financing of redemptions. In connection therewith, the funds have agreed to pay its pro rata portion of commitment fees for each Facility. Interest is charged to the funds based on rates determined pursuant to the terms of the respective Facility at the time of borrowing. During the period ended on February 28, 2011, the funds did not borrow under the Facilities.
NOTE 4—Investment Advisory Fee, Administration Fee and Other Transactions With Affiliates:
(a) Fees payable by the funds pursuant to the provisions of an investment advisory agreement with the Investment Adviser are payable monthly, computed on the average daily value of each fund’s net assets at the following annual rates: .40% of BNY Mellon Bond Fund, .40% of BNY Mellon Intermediate Bond Fund, .50% of BNY Mellon Intermediate U.S. Government Fund and .35% of BNY Mellon Short-Term U.S. Government Securities Fund.
The Investment Adviser had contractually agreed, from September 1, 2009 through September 30, 2010, to waive receipt of its fees and/or assume expenses of BNY Mellon Bond Fund so that the direct expenses of Class M shares and Investor shares of the fund (excluding taxes, interest, brokerage commissions, commitment fees
Table 5—Tax Character of Distributions Paid
on borrowings and extraordinary expenses) did not exceed .69% and .94% of the value of the average daily net assets of their respective class. During the period ended February 28, 2011, there was no expense reimbursement pursuant to the undertaking.This undertaking is no longer in effect.
The Investment Adviser had contractually agreed, from September 1, 2009 through September 30, 2010, to waive receipt of its fees and/or assume the expenses of BNY Mellon Intermediate U.S. Government Fund so that the direct expenses of neither class (excluding shareholder services fees, taxes, interest, brokerage commissions, commitment fees on borrowings, and extraordinary expenses) did not exceed .65% of the value of the average daily net assets of their respective class.The reduction in investment advisory fee, pursuant to the undertaking, amounted to $6,758 during the period ended February 28, 2011.This undertaking is no longer in effect.
Pursuant to the Administration Agreement,The Bank of New York Mellon provides or arranges for fund accounting, transfer agency and other fund administration services and receives a fee based on the total net assets of the Trust based on the following rates:
| | |
| 0 up to $6 billion | .15% |
| $6 billion up to $12 billion | .12% |
| In excess of $12 billion | .10% |
The Bank of New York Mellon has entered into a Sub-Administration Agreement with Dreyfus pursuant to which The Bank of New York Mellon pays Dreyfus for performing certain administrative services.
| | |
| | | Long Term |
| | Ordinary Income ($) | Capital Gains ($) |
| | August 31, 2010 | August 31, 2010 |
| BNY Mellon Bond Fund | 57,590,634 | — |
| BNY Mellon Intermediate Bond Fund | 34,343,568 | — |
| BNY Mellon Intermediate U.S. Government Fund | 2,309,590 | 610,500 |
| BNY Mellon Short-Term | | |
| U.S. Government Securities Fund | 4,693,267 | — |
NOTES TO FINANCIAL STATEMENTS (Unaudited) (continued)
(b) The funds have adopted a Shareholder Services Plan with respect to its Investor shares. Each fund pays the Distributor for the provision of certain services to holders of Investor shares a fee at an annual rate of .25% of the value of the average daily net assets attributable to Investor shares.The services provided may include personal services relating to shareholder accounts, such as answering shareholder inquiries regarding a fund and providing reports and other information and services related to the maintenance of such shareholder accounts. The Shareholder Services Plan allows the Distributor to make payments from the shareholder services fees it collects from each fund to compensate service agents (certain banks, securities brokers or dealers and other financial institutions) in respect of these services. Table 6 summarizes the amount Investor shares of each fund were charged during the period ended February 28, 2011, pursuant to the Shareholder Services Plan. Additional fees included in shareholder servicing costs in the Statements of Operations include fees paid for cash management charges.
| | |
| Table 6—Shareholder Service Plan Fees | | |
| BNY Mellon Bond Fund | | $10,737 |
| BNY Mellon Intermediate Bond Fund | | 6,227 |
| BNY Mellon Intermediate | | |
| U.S. Government Fund | | 7,469 |
| BNY Mellon Short-Term | | |
| U.S. Government Securities Fund | | 997 |
The funds have arrangements with the custodian and cash management bank whereby the funds may receive earnings credits when positive cash balances are maintained, which are used to offset custody and cash management fees. For financial reporting purposes, the funds include net earnings credits as an expense offset in the Statements of Operations.
The funds compensate The Bank of New York Mellon under cash management agreements for performing cash management services related to fund subscriptions and redemptions. Table 7 summarizes the amount each fund was charged during the period ended February 28, 2011, pursuant to the cash management agreements, which is included in Shareholder servicing costs in the Statements of Operations. These fees were offset by earnings credits pursuant to the cash management agreements, also summarized in Table 7.
The funds also compensate The Bank of New York Mellon under a custody agreement for providing custodial services for the funds. Table 8 summarizes the amount each fund was charged during the period ended February 28, 2011, pursuant to the custody agreement.
| | |
| Table 8—Custody Agreement Fees | | |
| BNY Mellon Bond Fund | | $51,013 |
| BNY Mellon Intermediate Bond Fund | | 36,172 |
| BNY Mellon Intermediate | | |
| U.S. Government Fund | | 2,745 |
| BNY Mellon Short-Term | | |
| U.S. Government Securities Fund | | 12,671 |
During the period ended February 28, 2011, each fund was charged $3,197 for services performed by the Chief Compliance Officer.
Table 9 summarizes the components of “Due to The Dreyfus Corporation and affiliates” in the Statement of Assets and Liabilities for each fund.
(c) Each trustee who is not an “affiliated person” as defined in the Act receives from theTrust an annual fee of $68,000 and an attendance fee of $7,500 for each in-person meeting attended and $500 for telephone meetings and is reimbursed for travel and out-of-pocket expenses.
| | | |
| Table 7—Cash Management Agreement Fees | | |
| |
| | Cash Management Fees ($) | Earnings Credits ($) |
| BNY Mellon Bond Fund | 426 | (18) |
| BNY Mellon Intermediate Bond Fund | 59 | (3) |
| BNY Mellon Intermediate U.S. Government Fund | 322 | (13) |
| BNY Mellon Short-Term U.S. Government Securities Fund | 52 | (2) |
46
The Chairman of the Trust’s Board receives an additional annual fee of $15,000 and the Chairman of the Trust’s Audit Committee receives an additional annual fee of $10,000.
NOTE 5—Securities Transactions:
Table 10 summarizes each fund’s aggregate amount of purchases and sales (including paydowns) of investment securities, excluding short-term securities, during the period ended February 28, 2011.
The provisions of ASC Topic 815 “Derivatives and Hedging” require qualitative disclosures about objectives and strategies for using derivatives, quantitative disclosures about fair value amounts of gains and losses on derivative instruments and disclosures about credit-risk-related contingent features in derivative agreements.The funds held no derivatives during the period ended February 28, 2011.These disclosures did not impact the notes to the financial statements.
Table 11 summarizes accumulated net unrealized appreciation on investments for each fund at February 28, 2011.
At February 28, 2011, the cost of investments for federal income tax purposes was substantially the same as the cost for financial reporting purposes (see Statements of Investments).
Table 9—Due to The Dreyfus Corporation and Affiliates
| | | | |
| | Investment | | Shareholder | Chief |
| | Advisory | Custodian | Services | Compliance |
| | Fees ($) | Fees ($) | Plan Fees ($) | Officer Fees ($) |
| BNY Mellon Bond Fund | 426,381 | 41,500 | 1,330 | 1,433 |
| BNY Mellon Intermediate Bond Fund | 298,912 | 30,000 | 855 | 1,433 |
| BNY Mellon Intermediate U.S. Government Fund | 24,846 | 2,444 | 1,014 | 1,433 |
| BNY Mellon Short-Term U.S. Government Securities Fund | 88,107 | 10,467 | 89 | 1,433 |
| |
| |
| Table 10—Purchases and Sales | | | | |
| |
| | | Purchases ($) | | Sales ($) |
| BNY Mellon Bond Fund | | 801,310,950 | 855,216,196 |
| BNY Mellon Intermediate Bond Fund | | 228,955,764 | 224,878,405 |
| BNY Mellon Intermediate U.S. Government Fund | | 15,391,441 | | 15,353,933 |
| BNY Mellon Short-Term U.S. Government Securities Fund | | 167,199,492 | 139,672,319 |
| |
| |
| Table 11—Accumulated Net Unrealized Appreciation | | | | |
| |
| | | Gross | Gross | |
| | | Appreciation ($) | Depreciation ($) | Net ($) |
| BNY Mellon Bond Fund | | 47,071,930 | 4,394,602 | 42,677,328 |
| BNY Mellon Intermediate Bond Fund | | 34,208,631 | 2,367,148 | 31,841,483 |
| BNY Mellon Intermediate | | | | |
| U.S. Government Fund | | 1,599,098 | 185,919 | 1,413,179 |
| BNY Mellon Short-Term | | | | |
| U.S. Government Securities Fund | | 1,509,712 | 440,552 | 1,069,160 |
For More Information
| |
| BNY Mellon Funds Trust | Custodian |
| c/o The Dreyfus Corporation | |
| 200 Park Avenue | The Bank of New York Mellon |
| New York, NY 10166 | One Wall Street |
| | New York, NY 10286 |
| Investment Adviser | |
| | Transfer Agent & |
| BNY Mellon Fund Advisers, a division of | Dividend Disbursing Agent |
| The Dreyfus Corporation | |
| 200 Park Avenue | Dreyfus Transfer, Inc. |
| New York, NY 10166 | 200 Park Avenue |
| | New York, NY 10166 |
| Administrator | |
| | Distributor |
| The Bank of New York Mellon | |
| One Wall Street | MBSC Securities Corporation |
| New York, NY 10286 | 200 Park Avenue |
| | New York, NY 10166 |
| Sub-Administrator | |
| |
| The Dreyfus Corporation | |
| 200 Park Avenue | |
| New York, NY 10166 | |
| | |
| Ticker Symbols: | | |
| BNY Mellon Bond Fund | Class M: MPBFX | Investor: MIBDX |
| BNY Mellon Intermediate Bond Fund | Class M: MPIBX | Investor: MIIDX |
| BNY Mellon Intermediate U.S. Government Fund | Class M: MGVMX | Investor: MOVIX |
| BNY Mellon Short-Term U.S. Government Securities Fund | Class M: MPSUX | Investor: MISTX |
Telephone Wealth Management (WM) Clients, please contact your Account Officer or call 1-888-281-7350. Brokerage Clients of BNY Mellon Wealth Advisors (BNYMWA), please contact your financial representative or call 1-800-830-0549, Option 2. Individual Account holders, please call Dreyfus at 1-800-645-6561.
Mail WM Clients, write to your Account Officer, c/o The Bank of New York Mellon, One Mellon Bank Center, Pittsburgh, PA 15258 BNYMWA Brokerage Clients, write to your financial representative, P.O. Box 9012, Hicksville, NY 11802–9012 Individual Account Holders, write to: BNY Mellon Funds, P.O. Box 55268, Boston, MA 02205–8502
The funds file their complete schedule of portfolio holdings with the Securities and Exchange Commission (“SEC”) for the first and third quarters of each fiscal year on Form N-Q. The funds’ Forms N-Q are available on the SEC’s website at http://www.sec.gov and may be reviewed and copied at the SEC’s Public Reference Room in Washington, DC. Information on the operation of the Public Reference Room may be obtained by calling 1-800-SEC-0330.
A description of the policies and procedures that the fund uses to determine how to vote proxies relating to portfolio securities, and information regarding how the fund voted these proxies for the most recent 12-month period ended June 30 is available at http://www.dreyfus.com and on the SEC’s website at http://www.sec.gov. The description of the policies and procedures is also available without charge, upon request, by calling 1-800-645-6561.
©2011 MBSC Securities Corporation
MFTSA0211-TB
The BNY Mellon Funds
|
| BNY Mellon National Intermediate Municipal Bond Fund |
| BNY Mellon National Short-Term Municipal Bond Fund |
| BNY Mellon Pennsylvania Intermediate Municipal Bond Fund |
| BNY Mellon Massachusetts Intermediate Municipal Bond Fund |
| BNY Mellon New York Intermediate Tax-Exempt Bond Fund |
| BNY Mellon Municipal Opportunities Fund |
SEMIANNUAL REPORT February 28, 2011

Contents
| |
| The Funds | |
| |
| Letter from the President | 2 |
| Discussion of Funds’ Performance | |
| BNY Mellon National Intermediate | |
| Municipal Bond Fund | 3 |
| BNY Mellon National Short-Term | |
| Municipal Bond Fund | 5 |
| BNY Mellon Pennsylvania | |
| Intermediate Municipal Bond Fund | 7 |
| BNY Mellon Massachusetts | |
| Intermediate Municipal Bond Fund | 9 |
| BNY Mellon NewYork | |
| Intermediate Tax-Exempt Bond Fund | 11 |
| BNY Mellon Municipal | |
| Opportunities Fund | 13 |
| UnderstandingYour Fund’s Expenses | 15 |
| ComparingYour Fund’s Expenses | |
| With Those of Other Funds | 16 |
| Statements of Investments | 17 |
| Statements of Assets and Liabilities | 84 |
| Statements of Operations | 86 |
| Statements of Changes in Net Assets | 88 |
| Financial Highlights | 95 |
| Notes to Financial Statements | 109 |
| |
| |
| For More Information | |
| |
| Back cover | |
The views expressed herein are current to the date of this report.These views and the composition of the funds’ portfolios are subject to change at any time based on market and other conditions.

The Funds

LETTER FROM
THE PRESIDENT
Dear Shareholder:
We are pleased to present to you this semiannual report for the BNY Mellon Funds Trust, covering the reporting period ended February 28, 2011.
The past six months proved to be an extraordinarily volatile period for municipal bonds. Fixed-income securi ties generally experienced price declines when municipal bonds responded negatively to reports of potential budget shortfalls affecting most state and local governments, the increased supply caused by the end of the Build America Bonds (BAB) subsidy program, as issuers sought to issue tax-exempt BAB bonds before the 2010 year-deadline. In addition, a new round of monetary stimulus suggested that the economy was likely to gain strength, kindling concerns regarding potentially higher interest rates down the road.
We believe that municipal bonds have become more attractively valued in the wake of recent market volatility Despite negative media coverage of the risks confronting the market, we believe that the vast majority of issuers continue to service their debt without interruption. In analysis, fundamental measures of quality – including liq uidity and revenue stabilization – support a stable outlook for tax-backed and revenue-backed municipal bonds. Over the longer term, we believe that higher tax rates in many states will provide additional support to the municipal bond market. As always, your portfolio manager can help you align your investments with the opportunities challenges that 2011 has in store.
For information about how each fund performed dur ing the reporting period, as well as market perspectives, we have provided a Discussion of Fund Performance each fund.
Thank you for your continued confidence and support
Sincerely,

Christopher E. Sheldon
President
BNY Mellon Funds Trust
March 15, 2011

DISCUSSION OF
FUND PERFORMANCE
For the period of September 1, 2010, through February 28, 2011, as provided by John F. Flahive and Mary Collette O’Brien, Portfolio Managers
Fund and Market Performance Overview
For the six-month period ended February 28, 2011, BNY Mellon National Intermediate Municipal Bond Fund’s Class M shares produced a total return of –3.11%, Investor shares returned –3.16% and Dreyfus Premier shares returned –3.47%.1 In comparison, the BofA Merrill Lynch 2-17 Year Municipal Bond Index, the fund’s benchmark, returned –2.40% for the same period.2
Municipal bonds encountered heightened volatility during the reporting period amid rising long-term interest rates, intensifying credit concerns and changing supply-and-demand dynamics. The fund produced lower returns than its benchmark, due primarily to overweighted exposure to longer-term municipal bonds.
The Fund’s Investment Approach
The fund seeks to maximize current income exempt from federal income tax to the extent consistent with the preservation of capital.To pursue its goal, the fund normally invests at least 80% of its assets in municipal bonds that provide income exempt from federal income tax. The fund may occasionally, including for temporary defensive purposes, invest in taxable bonds. The fund’s investments in municipal and taxable bonds must be rated investment grade at the time of purchase or, if unrated, deemed of comparable quality by the investment adviser.3 Generally, the fund’s average effective portfolio maturity will be between three and 10 years, and the average effective duration of the fund’s portfolio will not exceed eight years.
Rather than focusing on economic or market trends, we search for securities that, in our opinion, will help us enhance the fund’s yield without sacrificing quality. We use a more tactical approach with respect to the fund’s average duration. If we expect the supply of securities to increase temporarily, we may reduce the fund’s average duration to make cash available for the purchase of higher yielding securities. This is due to the fact that yields generally tend to rise if issuers are competing for investor interest. If we expect demand to surge at a time when we anticipate little issuance and therefore lower yields, we may increase the fund’s average duration to maintain current yields for as long as practical.At other times, we typically try to maintain a neutral average duration.
Changing Market Forces Derailed Municipal Bonds
The U.S. economic recovery gained traction in the fall after the Federal Reserve Board embarked on a new round of quantitative easing.This stimulative measure eased investors’ economic worries, and interest rates climbed at the longer end of the market’s maturity range, causing bond prices to fall.
In addition, municipal bonds encountered heightened volatility in anticipation of changes in supply-and-demand dynamics as it became clearer that the Build America Bonds program, which had shifted a substantial portion of new issuance to the taxable municipal bond market, would be allowed to expire at the end of 2010. Consequently, investors began to sell longer-maturity municipal bonds in anticipation of a more ample supply of traditional tax-exempt securities. Finally, most states and some local municipalities continued to struggle with fiscal pressures, which were highlighted by news reports about state budget cuts and other austerity measures.As a result of these various market forces, municipal bonds lost some of their value during the reporting period.
Longer-Term Holdings Dampened Relative Returns
The fund’s relative performance was undermined by overweighted exposure to municipal bonds with maturities of 15 years or more, which bore the brunt of rising long-term interest rates. As rates increased, we
DISCUSSION OF FUND PERFORMANCE (continued)
lengthened the fund’s average duration as we sought to capture higher yields.While this move positioned the fund for eventual market stabilization, it proved counterproductive at the time. In addition, the fund’s BBB-rated bonds were hurt by intensifying credit concerns.Although none of the fund’s holdings experienced credit problems, they suffered due to investor’s general concerns regarding credit quality.
These adverse influences were mitigated to a degree by a “barbell” yield curve strategy at the lower end of the investment-grade range, in which we balanced longer-term holdings with securities maturing in four years or less. In addition, the fund’s holdings of bonds issued on behalf of educational institutions fared relatively well. The fund also benefited from the use of futures contracts, which helped us manage interest-rate risks more effectively. Finally, we increased the fund’s cash position toward the end of 2010, which enabled us to cushion the impact of market volatility.
Weathering a Period of Transition
We were encouraged by signs of market stabilization in February, when long-term interest rates moderated and demand for municipal bonds bounced back. Although we expect additional bouts of volatility over the near term as the economic recovery progresses, we remain optimistic about the potential of the municipal bond market over the longer term. Once the transition to a more ample supply of tax-exempt securities is complete, we believe demand for municipal securities seems likely to stay robust as investors respond to higher state taxes and possible federal tax increases down the road. Consequently, we currently intend to maintain a relatively defensive investment posture, but we are prepared to adjust the fund’s positioning as market conditions evolve.
March 15, 2011
| |
| | Bond funds are subject generally to interest rate, credit, liquidity and market |
| | risks, to varying degrees, all of which are more fully described in the fund’s |
| | prospectus. Generally, all other factors being equal, bond prices are inversely |
| | related to interest-rate changes, and rate increases can cause price declines. |
| 1 | Total return includes reinvestment of dividends and any capital gains paid and |
| | does not take into consideration the applicable contingent deferred sales charges |
| | imposed on redemptions in the case of Dreyfus Premier shares. Past |
| | performance is no guarantee of future results. Share price, yield and investment |
| | return fluctuate such that upon redemption, fund shares may be worth more or |
| | less than their original cost. Income may be subject to state and local taxes, and |
| | some income may be subject to the federal alternative minimum tax (AMT) |
| | for certain investors. Capital gains, if any, are fully taxable. |
| 2 | SOURCE: FACTSET — Reflects reinvestment of dividends and, where |
| | applicable, capital gain distributions.The BofA Merrill Lynch 2-17Year |
| | Municipal Bond Index is a broad-based, unmanaged, market-weighted index |
| | of investment grade municipal bonds maturing in the 2-17 year range. Index |
| | returns do not reflect the fees and expenses associated with operating a mutual |
| | fund. Investors cannot invest directly in any index. |
| 3 | The fund may continue to own investment-grade bonds (at the time of |
| | purchase), which are subsequently downgraded to below investment grade. |
4

DISCUSSION OF
FUND PERFORMANCE
For the period of September 1, 2010, through February 28, 2011, as provided by Timothy J. Sanville and Jeremy N. Baker, Portfolio Managers
Fund and Market Performance Overview
For the six-month period ended February 28, 2011, BNY Mellon National Short-Term Municipal Bond Fund’s Class M shares produced a total return of –0.38%, and Investor shares produced a total return of –0.59%.1 In comparison, the BofA Merrill Lynch 1-5 Year Municipal Bond Index, the fund’s benchmark, produced a total return of –0.52% for the same period.2
Municipal bonds encountered heightened volatility during the reporting period amid rising long-term interest rates, intensifying credit concerns and changing supply-and-demand dynamics. The fund produced returns that were roughly in line with its benchmark, as the positive effects of a relatively short average duration were offset by shortfalls stemming from underweighted exposure to AAA- and BBB-rated securities.
The Fund’s Investment Approach
The fund seeks to maximize current income exempt from federal income tax to the extent consistent with the preservation of capital.To pursue its goal, the fund normally invests at least 80% of its assets in municipal bonds that provide income exempt from federal income tax.The fund occasionally may invest in taxable bonds, including for temporary defensive purposes.The fund’s investments in municipal and taxable bonds must be rated investment grade at the time of purchase or, if unrated, deemed of comparable quality by the investment adviser.3 Generally, the average effective portfolio maturity and the average effective portfolio duration of the fund’s portfolio will be less than three years.
Rather than focusing on economic or market trends, we search for securities that, in our opinion, will help us enhance the fund’s yield without sacrificing quality. We use a more tactical approach with respect to the fund’s average duration. If we expect the supply of securities to increase temporarily, we may reduce the fund’s average duration to make cash available for the purchase of higher yielding securities. This is due to the fact that yields generally tend to rise if issuers are competing for investor interest. If we expect demand to surge at a time when we anticipate little issuance and therefore lower yields, we may increase the fund’s average duration to maintain current yields for as long as practical.At other times, we typically try to maintain a neutral average duration.
Changing Market Forces Derailed Municipal Bonds
The U.S. economic recovery gained traction in the fall after the Federal Reserve Board embarked on a new round of quantitative easing.This stimulative measure eased investors’ economic worries, and interest rates climbed at the longer end of the market’s maturity range, causing bond prices to fall.
In addition, municipal bonds encountered heightened volatility in anticipation of changes in supply-and-demand dynamics, when it became clearer that the Build America Bonds program, which had shifted a substantial portion of new issuance to the taxable municipal bond market, would be allowed to expire at the end of 2010. Consequently, investors began to sell longer-maturity municipal bonds in anticipation of a more ample supply of traditional tax-exempt securities. Finally, most states and some local municipalities continued to struggle with fiscal pressures, which were
DISCUSSION OF FUND PERFORMANCE (continued)
highlighted by news reports about state budget cuts and other austerity measures. As a result of these various market forces, short-term municipal bonds lost some of their value during the reporting period, but they tended to fare better than longer-term municipal bonds.
Short Duration Bolstered Relative Returns
The fund’s relative performance was positively influenced by a short duration posture compared to the benchmark, which we had established in anticipation of stronger economic growth and potential increases in short-term interest rates. We achieved this defensive duration stance through a focus on securities with maturities in the three- to four-year range. In addition, we maintained a larger-than-usual cash position over much of the reporting period, which also contributed to the fund’s relatively short duration.
However, the beneficial effects of the fund’s duration position were balanced by less favorable results stemming from underweighted exposure to bonds at both ends of the investment-grade credit-rating spectrum. We generally favored bonds rated A or AA over those with AAA or BBB ratings, largely because we believed that securities in the middle of the range offered the best combination of safety, liquidity and yield. However, AAA and BBB securities modestly outperformed other investment-grade rating tiers during the reporting period, dampening the fund’s relative results.
Weathering a Period of Transition
We were encouraged by signs of market stabilization in February, when longer-term interest rates moderated and
overall demand for municipal bonds bounced back. Although we expect additional bouts of volatility over the near term as the economic recovery progresses, we remain optimistic about the potential of the municipal bond market over the longer term. Once the transition to a more ample supply of tax-exempt securities is complete, we believe demand for municipal securities seems likely to stay robust as investors respond to higher state taxes and possible federal tax increases down the road. Consequently, we currently intend to maintain a relatively defensive investment posture, but we are prepared to adjust the fund’s positioning as market conditions evolve.
March 15, 2011
| |
| | Bond funds are subject generally to interest rate, credit, liquidity and market |
| | risks, to varying degrees, all of which are more fully described in the fund’s |
| | prospectus. Generally, all other factors being equal, bond prices are inversely |
| | related to interest-rate changes, and rate increases can cause price declines. |
| 1 | Total return includes reinvestment of dividends and any capital gains paid. |
| | Past performance is no guarantee of future results. Share price, yield and |
| | investment return fluctuate such that upon redemption, fund shares may be |
| | worth more or less than their original cost. Income may be subject to state and |
| | local taxes, and some income may be subject to the federal alternative minimum |
| | tax (AMT) for certain investors. Capital gains, if any, are fully taxable. |
| 2 | SOURCE: FACTSET — Reflects reinvestment of dividends and, where |
| | applicable, capital gain distributions.The BofA Merrill Lynch 1-5Year |
| | Municipal Bond Index is a broad-based, unmanaged, market-weighted index |
| | of investment-grade municipal bonds maturing in the 1- to (but not including) |
| | 5-year range. Index returns do not reflect the fees and expenses associated with |
| | operating a mutual fund. Investors cannot invest directly in any index. |
| 3 | The fund may continue to own investment-grade bonds (at the time of |
| | purchase), which are subsequently downgraded to below investment grade. |
6

DISCUSSION OF
FUND PERFORMANCE
For the period of September 1, 2010, through February 28, 2011, as provided by Mary Collette O’Brien and Jeremy N. Baker, Portfolio Managers
Fund and Market Performance Overview
For the six-month period ended February 28, 2011, BNY Mellon Pennsylvania Intermediate Municipal Bond Fund’s Class M shares produced a total return of –2.96%, and Investor shares returned –3.01%.1 In comparison, the BofA Merrill Lynch 2-17 Year Municipal Bond Index, the fund’s benchmark, returned –2.40% for the same period.2
Municipal bonds encountered heightened volatility during the reporting period amid rising long-term interest rates, intensifying credit concerns and changing supply-and-demand dynamics. The fund produced lower returns than its benchmark, due primarily to overweighted exposure to longer-term municipal bonds.
The Fund’s Investment Approach
The fund seeks as high a level of income exempt from federal and Pennsylvania state income taxes as is consistent with the preservation of capital.To pursue its goal, the fund normally invests at least 80% of its assets in municipal bonds, the interest from which is exempt from federal and Pennsylvania state personal income taxes.The fund may also invest in municipal bonds that are exempt from federal income taxes, but not Pennsylvania personal income taxes, and in taxable bonds.The fund’s investments in municipal and taxable bonds must be rated investment grade at the time of purchase or, if unrated, deemed of comparable quality by the investment adviser.3 Generally, the fund’s average effective portfolio maturity will be between three and 10 years, and the average effective duration of the fund’s portfolio will not exceed eight years.
Rather than focusing on economic or market trends, we search for securities that, in our opinion, will help us enhance the fund’s yield without sacrificing quality. We use a more tactical approach with respect to the fund’s average duration. If we expect the supply of securities to increase temporarily, we may reduce the fund’s average duration to make cash available for the purchase of higher yielding securities. This is due to the fact that yields generally tend to rise if issuers are competing for investor interest. If we expect demand to surge at a time when we anticipate little issuance and therefore lower yields, we may increase the fund’s average duration to maintain current yields for as long as practical.At other times, we typically try to maintain a neutral average duration.
Changing Market Forces Derailed Municipal Bonds
The U.S. economic recovery gained traction in the fall after the Federal Reserve Board embarked on a new round of quantitative easing.This stimulative measure eased investors’ economic worries, and interest rates climbed at the longer end of the market’s maturity range, causing bond prices to fall.
In addition, municipal bonds encountered heightened volatility in anticipation of changes in supply-and-demand dynamics, when it became clearer that the Build America Bonds program, which had shifted a substantial portion of new issuance to the taxable municipal bond market, would be allowed to expire at the end of 2010. Consequently, investors began to sell longer-maturity municipal bonds in anticipation of a more ample supply of traditional tax-exempt securities. Like most states and some local municipalities, Pennsylvania continued to struggle with fiscal pressures, but credit conditions remained relatively stable
DISCUSSION OF FUND PERFORMANCE (continued)
due to the state’s history of prudent financial management. As a result, Pennsylvania municipal bonds generally lost slightly less value than national averages.
Longer-Term Holdings Dampened Relative Returns
The fund’s relative performance was undermined to a degree by overweighted exposure to municipal bonds with maturities of 15 years or more, which bore the brunt of rising long-term interest rates. As rates increased, we lengthened the fund’s average duration as we sought to capture higher yields.While this move positioned the fund for eventual market stabilization, it proved counterproductive at the time. In addition, the fund’s BBB-rated bonds, specifically Puerto Rico credits, were hurt by intensifying credit concerns. Weakness was particularly pronounced among bonds backed by the national tobacco settlement agreement between states and U.S. tobacco companies.
These adverse influences were mitigated to a degree by a “barbell” yield curve strategy, in which we balanced longer-term holdings with securities maturing in four years or less. In addition, the fund’s holdings of escrowed bonds, for which the funds for early redemption have been set aside, fared relatively well.The fund also benefited from the use of futures contracts, which helped us manage interest-rate risks more effectively. Finally, we increased the fund’s cash position toward the end of 2010, helping to cushion the impact of subsequent market volatility.
Weathering a Period of Transition
We were encouraged by signs of market stabilization in February, when long-term interest rates moderated and demand for municipal bonds bounced back. Although we expect additional bouts of volatility over the near term as the U.S. economic recovery progresses, we remain optimistic about the potential of the municipal bond market over the longer term. Once the transition to a more ample national supply of tax-exempt securities is complete, we believe demand for municipal securities seems likely to stay robust as investors respond to higher taxes in some states and possible federal tax increases down the road. Consequently, we currently intend to maintain a relatively defensive investment posture, but we are prepared to adjust the fund’s positioning as market conditions evolve.
March 15, 2011
| |
| | Bond funds are subject generally to interest rate, credit, liquidity and market |
| | risks, to varying degrees, all of which are more fully described in the fund’s |
| | prospectus. Generally, all other factors being equal, bond prices are inversely |
| | related to interest-rate changes, and rate increases can cause price declines. |
| 1 | Total return includes reinvestment of dividends and any capital gains paid. |
| | Past performance is no guarantee of future results. Share price, yield and |
| | investment return fluctuate such that upon redemption, fund shares may be |
| | worth more or less than their original cost. Income may be subject to state and |
| | local taxes for non-Pennsylvania residents, and some income may be subject to |
| | the federal alternative minimum tax (AMT) for certain investors. Capital |
| | gains, if any, are fully taxable. |
| 2 | SOURCE: FACTSET — Reflects reinvestment of dividends and, where |
| | applicable, capital gain distributions.The BofA Merrill Lynch 2-17Year |
| | Municipal Bond Index is a broad-based, unmanaged, market-weighted index |
| | of investment grade municipal bonds maturing in the 2-17 year range. Index |
| | returns do not reflect the fees and expenses associated with operating a mutual |
| | fund. Investors cannot invest directly in any index. |
| 3 | The fund may continue to own investment-grade bonds (at the time of |
| | purchase), which are subsequently downgraded to below investment grade. |
8

DISCUSSION OF
FUND PERFORMANCE
For the period of September 1, 2010, through February 28, 2011, as provided by John F. Flahive and Mary Collette O’Brien, Portfolio Managers
Fund and Market Performance Overview
For the six-month period ended February 28, 2011, BNY Mellon Massachusetts Intermediate Municipal Bond Fund’s Class M shares produced a total return of –2.75%, Investor shares returned –2.87% and Dreyfus Premier shares returned –3.10%.1 In comparison, the BofA Merrill Lynch 2-17 Year Municipal Bond Index, the fund’s benchmark, returned –2.40% for the same period.2
Municipal bonds encountered heightened volatility during the reporting period amid rising long-term interest rates, intensifying credit concerns and changing supply-and-demand dynamics. The fund produced modestly lower returns than its benchmark, due primarily to our duration management strategy as longer-term interest rates climbed.
The Fund’s Investment Approach
The fund seeks as high a level of income exempt from federal and Massachusetts state income taxes as is consistent with the preservation of capital. To pursue its goal, the fund normally invests at least 80% of its assets in municipal bonds, the interest from which is exempt from federal and Massachusetts state personal income taxes.The fund may also invest in municipal bonds that are exempt from federal income taxes, but not Massachusetts personal income taxes, and in taxable bonds.The fund’s investments in municipal and taxable bonds must be rated investment grade at the time of purchase or, if unrated, deemed of comparable quality by the investment adviser.3 Generally, the fund’s average effective portfolio maturity will be between three and 10 years, and the average effective duration of the fund’s portfolio will not exceed eight years.
Rather than focusing on economic or market trends, we search for securities that, in our opinion, will help us enhance the fund’s yield without sacrificing quality.We use a more tactical approach with respect to the fund’s average duration. If we expect the supply of securities to increase temporarily, we may reduce the fund’s average duration to make cash available for the purchase of higher yielding securities.This is because yields generally tend to rise if issuers are competing for investor interest. If we expect demand to surge at a time when we anticipate little issuance and therefore lower yields, we may increase the fund’s average duration to maintain current yields for as long as practical.At other times, we typically try to maintain a neutral average duration.
Changing Market Forces Derailed Municipal Bonds
The U.S. economic recovery gained traction in the fall, after the Federal Reserve Board embarked on a new round of quantitative easing. This stimulative measure eased investors’ worries of a double-dip recession, and interest rates climbed at the longer end of the market’s maturity range, causing bond prices to fall.
In addition, municipal bonds encountered heightened volatility in anticipation of changes in supply-and-demand dynamics, when it became clear in the fall that the Build America Bonds program, which had shifted a substantial portion of new issuance to the taxable municipal bond market, would be allowed to expire at the end of 2010. Consequently, investors began to sell longer-maturity municipal bonds in anticipation of a more ample supply of traditional tax-exempt securities, putting downward pressure on prices. Finally, although most states and some local municipalities continued to struggle with fiscal pressures, Massachusetts has fared relatively well due to its diversified economic base and history of prudent financial management. As a result, Massachusetts municipal bonds generally lost less value than national averages.
DISCUSSION OF FUND PERFORMANCE (continued)
Longer-Term Holdings Dampened Relative Returns
The fund’s relative performance was undermined by overweighted exposure to municipal bonds with maturities of 15 years or more, which bore the brunt of rising long-term interest rates.As rates increased, we lengthened the fund’s average duration as we sought to capture higher yields. While this move positioned the fund for eventual market stabilization, it proved counterproductive at the time.
On the other hand, overweighted exposure to municipal bonds with maturities of five years or less contributed positively to the fund’s performance compared to the benchmark. In addition, the fund’s holdings of escrowed bonds, for which the funds for early redemption have been set aside, fared relatively well, as did bonds issued on behalf of educational institutions.The fund also benefited from the use of futures contracts, which helped us manage interest-rate risks more effectively. Finally, we increased the fund’s cash position toward the end of 2010, which enabled us to cushion the impact of subsequent market volatility.
Weathering a Period of Transition
We were encouraged by signs of market stabilization in February, when long-term interest rates moderated and demand for municipal bonds recovered. Although we expect additional bouts of volatility over the near term as the U.S. economic recovery progresses, we remain optimistic about the potential of the municipal bond market over the longer term. Once the transition to a more ample national supply of tax-exempt securities is complete, we believe demand for municipal securities seems likely to stay robust as investors respond to higher taxes in some states and possible federal tax increases down the road. Consequently, we currently intend to maintain a relatively defensive investment posture, but we are prepared to adjust the fund’s positioning as market conditions evolve.
March 15, 2011
| |
| | Bond funds are subject generally to interest rate, credit, liquidity and market |
| | risks, to varying degrees, all of which are more fully described in the fund’s |
| | prospectus. Generally, all other factors being equal, bond prices are inversely |
| | related to interest-rate changes, and rate increases can cause price declines. |
| 1 | Total return includes reinvestment of dividends and any capital gains paid and |
| | does not take into consideration the applicable contingent deferred sales charges |
| | imposed on redemptions in the case of Dreyfus Premier shares. Past |
| | performance is no guarantee of future results. Share price, yield and investment |
| | return fluctuate such that upon redemption, fund shares may be worth more or |
| | less than their original cost. Income may be subject to state and local taxes for |
| | non-Massachusetts residents, and some income may be subject to the federal |
| | alternative minimum tax (AMT) for certain investors. Capital gains, if any, |
| | are fully taxable. |
| 2 | SOURCE: FACTSET — Reflects reinvestment of dividends and, where |
| | applicable, capital gain distributions.The BofA Merrill Lynch 2-17Year |
| | Municipal Bond Index is an unmanaged total return performance benchmark |
| | for the investment-grade, geographically unrestricted tax-exempt bond market, |
| | consisting of municipal bonds with maturities ranging from 2 to 17 years. |
| | Index return does not reflect the fees and expenses associated with operating a |
| | mutual fund. Investors cannot invest directly in any index. |
| 3 | The fund may continue to own investment-grade bonds (at the time of |
| | purchase), which are subsequently downgraded to below investment grade. |
10

DISCUSSION OF
FUND PERFORMANCE
For the period of September 1, 2010, through February 28, 2011, as provided by John F. Flahive, Portfolio Manager and Director of Fixed Income
Fund and Market Performance Overview
For the six-month period ended February 28, 2011, BNY Mellon New York Intermediate Tax-Exempt Bond Fund’s Class M shares produced a total return of –2.87%, and Investor shares returned –2.99%.1 In comparison, the BofA Merrill Lynch 2-17 Year Municipal Bond Index, the fund’s benchmark, returned –2.40% for the same period.2
Municipal bonds encountered heightened volatility during the reporting period amid rising long-term interest rates, intensifying credit concerns and changing supply-and-demand dynamics. The fund produced lower returns than its benchmark, due primarily to overweighted exposure to longer-term municipal bonds.
The Fund’s Investment Approach
The fund seeks as high a level of income exempt from federal, New York state and New York city income taxes as is consistent with the preservation of capital. This objective may be changed without shareholder approval.To pursue its goal, the fund normally invests at least 80% of its assets in municipal bonds that provide income exempt from federal, NewYork state and New York city personal income taxes. These municipal bonds include those issued by NewYork state and New York city as well as those issued by U.S. territories and possessions.3 Generally, the fund’s average effective portfolio maturity will be between three and 10 years.
Rather than focusing on economic or market trends, we search for securities that, in our opinion, will help us enhance the fund’s yield without sacrificing quality. We use a more tactical approach with respect to the fund’s average duration. If we expect the supply of securities to increase temporarily, we may reduce the fund’s average duration to make cash available for the purchase of higher yielding securities.This is because yields generally tend to rise if issuers are competing for investor interest. If we expect demand to surge at a time when we anticipate little issuance and therefore lower yields, we may increase the fund’s average duration to maintain current yields for as long as practical.At other times, we typically try to maintain a neutral average duration.
Changing Market Forces Derailed Municipal Bonds
The U.S. economic recovery gained traction in the fall after the Federal Reserve Board embarked on a new round of quantitative easing.This stimulative measure eased investors’ economic worries, and interest rates climbed at the longer end of the market’s maturity range, causing longer-term bond prices to fall.
In addition, municipal bonds encountered heightened volatility in anticipation of changes in supply-and-demand dynamics when it became clearer that the federally subsidized Build America Bonds program, which had shifted a substantial portion of new issuance to the taxable municipal bond market, would be allowed to expire at the end of 2010. Consequently, investors began to sell longer-maturity municipal bonds in anticipation of a more ample supply of traditional tax-exempt securities, putting downward pressure on prices. Like most states and some local municipalities, New York has continued to struggle with fiscal pressures, but credit concerns have eased somewhat as business conditions onWall Street, a major driver of the state’s economic activity, have improved.
DISCUSSION OF FUND PERFORMANCE (continued)
Longer-Term Holdings Dampened Relative Returns
The fund’s relative performance was undermined to a degree by overweighted exposure to municipal bonds with maturities of 15 years or more, which bore the brunt of rising long-term interest rates. As rates increased, we lengthened the fund’s average duration as we sought to capture higher yields. While this move positioned the fund for eventual market stabilization, it proved counterproductive at the time. In addition, the fund’s holdings of BBB-rated bonds were hurt by intensifying credit concerns. Weakness was particularly pronounced among longer-term bonds issued on behalf of educational institutions.
These adverse influences were mitigated to a degree by a “barbell” yield curve strategy, in which we balanced longer-term holdings with securities maturing in four years or less. In addition, the fund’s holdings of escrowed bonds, for which the funds for early redemption have been set aside, fared relatively well, as did bonds backed by revenues from transportation facilities.The fund also benefited from the use of futures contracts, which helped us manage interest-rate risks more effectively. Finally, we increased the fund’s cash position toward the end of 2010, helping to cushion the impact of subsequent market volatility.
Weathering a Period of Transition
We were encouraged by signs of market stabilization in February, when long-term interest rates moderated and demand for municipal bonds bounced back. Although we expect additional bouts of volatility over the near term as the U.S. economic recovery progresses, we remain optimistic about the potential of the municipal bond market over the longer term. Once the transition to a more ample national supply of tax-exempt securities is complete, we believe demand for municipal securities seems likely to stay robust as investors respond to higher taxes in some states and possible federal tax increases down the road. Consequently, we currently intend to maintain a relatively defensive investment posture, but we are prepared to adjust the fund’s positioning as market conditions evolve.
March 15, 2011
| |
| | Bond funds are subject generally to interest rate, credit, liquidity and market |
| | risks, to varying degrees, all of which are more fully described in the fund’s |
| | prospectus. Generally, all other factors being equal, bond prices are inversely |
| | related to interest-rate changes and rate increases can cause price declines. |
| 1 | Total return includes reinvestment of dividends and any capital gains paid. |
| | Past performance is no guarantee of future results. Share price, yield and |
| | investment return fluctuate such that upon redemption, fund shares may be |
| | worth more or less than their original cost. Income may be subject to state and |
| | local taxes for non-NewYork residents, and some income may be subject to the |
| | federal alternative minimum tax (AMT) for certain investors. Capital gains, if |
| | any, are fully taxable. Return figures provided reflect the absorption of certain |
| | fund expenses by BNY Mellon Fund Advisors pursuant to an agreement in |
| | effect through September 30, 2011, at which time it may be extended, |
| | modified or terminated. Had these expenses not been absorbed, the fund’s |
| | returns would have been lower. |
| 2 | SOURCE: FACTSET — Reflects reinvestment of dividends and, where |
| | applicable, capital gain distributions.The BofA Merrill Lynch 2-17Year |
| | Municipal Bond Index is an unmanaged total return performance benchmark |
| | for the investment-grade, geographically unrestricted tax-exempt bond market, |
| | consisting of municipal bonds with maturities ranging from 2 to 17 years. |
| | Index return does not reflect the fees and expenses associated with operating a |
| | mutual fund. Investors cannot invest directly in any index. |
| 3 | The fund may continue to own investment-grade bonds (at the time of |
| | purchase), which are subsequently downgraded to below investment grade. |
12

DISCUSSION OF
FUND PERFORMANCE
For the period of September 1, 2010, through February 28, 2011, as provided by John F. Flahive, Portfolio Manager and Director of Fixed Income
Fund and Market Performance Overview
For the six-month period ended February 28, 2011, BNY Mellon Municipal Opportunities Fund’s Class M shares produced a total return of –3.52%, and Investor shares returned –3.63%.1 In comparison, the Barclays Capital Municipal Bond Index (the “Index”), the fund’s benchmark, achieved a total return of –3.51% for the same period.2
Municipal bonds encountered heightened volatility during the reporting period amid rising long-term interest rates, intensifying credit concerns and changing supply-and-demand dynamics. The fund produced returns that were roughly in line with its benchmark, as above-average returns from tactical trading activity were balanced by shortfalls stemming mainly from the fund’s sensitivity to rising interest rates.
The Fund’s Investment Approach
The fund seeks to maximize total return consisting of high current income exempt from federal income tax and capital appreciation. This objective may be changed without shareholder approval. To pursue its goal, the fund normally invests at least 80% of its assets in U.S. dollar-denominated fixed-income securities that provide income exempt from federal income tax (municipal bonds).While the fund typically invests in a diversified portfolio of municipal bonds, it may invest up to 20% of its assets in taxable fixed-income securities, including taxable municipal bonds and non-U.S. dollar-denominated foreign debt securities, such as Brady bonds and sovereign debt obligations.
We will seek to deliver value-added excess returns (“alpha”) by applying an investment approach designed to identify and exploit relative value opportunities within the municipal bond market and other fixed-income markets. Although the fund seeks to be diversified by geography and sector, the fund may at times invest a significant portion of its assets in a particular state or region or in a particular sector due to market conditions.
Changing Market Forces Derailed Municipal Bonds
Although the U.S. economy had hit a rough patch in the months before the start of the reporting period, the recovery began to gain traction in September after the Federal Reserve Board embarked on a new round of quantitative easing. This stimulative measure eased investors’ worries regarding a potential double-dip recession, and interest rates climbed at the longer end of the market’s maturity range. As interest rates rose, bond prices fell.
In addition, municipal bonds encountered heightened volatility in anticipation of changes in supply-and-demand dynamics, when it became clearer that the Build America Bonds program, which had shifted a substantial portion of new issuance to the taxable municipal bond market, would be allowed to expire at the end of 2010. Consequently, investors began to sell longer-maturity municipal bonds in anticipation of a more ample supply of traditional tax-exempt securities, putting downward pressure on prices. Finally, most states and some local municipalities continued to struggle with fiscal pressures, which were highlighted by news reports about state budget cuts and other austerity measures. As a result of these various market
DISCUSSION OF FUND PERFORMANCE (continued)
forces, municipal bonds lost some of their value during the reporting period. Longer-term bonds generally declined more sharply than shorter-term securities.
Trading Opportunities Boosted Relative Returns
The fund’s relative performance was bolstered by market volatility during the reporting period, as we successfully captured tactical opportunities to put cash to work by purchasing municipal bonds at what we believed were relatively attractive prices during bouts of market weakness. The fund’s holdings of municipal bonds with maturities of 25 years or more fared particularly well over the reporting period, while those with maturities in the three- to seven-year range detracted modestly from its relative performance. The fund also benefited from the use of futures contracts, which helped us manage interest-rate risks more effectively. Finally, a larger-than-usual cash position helped shelter the fund from some of the market’s volatility.
The fund’s average duration fluctuated between five and nine years during the reporting period due to asset flows and the use of futures contracts, but the fund’s overall sensitivity to rising interest rates detracted from its returns, on average, compared to the benchmark. In addition, we employed derivative instruments, such as swaps, to leverage some of the fund’s holdings, and this strategy modestly dampened the fund’s returns in a generally weak market environment.
Weathering a Period of Transition
We were encouraged by signs of market stabilization in February, when long-term interest rates moderated and demand for municipal bonds bounced back. Although we expect additional bouts of volatility over the near term as the U.S. economic recovery gathers momentum, we remain optimistic about the potential of the municipal bond market over the longer term. Once the transition to a more ample supply of tax-exempt securities is complete later this year, we believe demand for municipal securities seems likely to stay robust as investors respond to higher state income taxes and possible federal tax increases down the road. Consequently, we currently intend to maintain a relatively defensive investment posture, but we are prepared to adjust the fund’s positioning as market conditions evolve.
March 15, 2011
| |
| | Bond funds are subject generally to interest rate, credit, liquidity and market |
| | risks, to varying degrees, all of which are more fully described in the fund’s |
| | prospectus. Generally, all other factors being equal, bond prices are inversely |
| | related to interest-rate changes, and rate increases can cause price declines. |
| 1 | Total return includes reinvestment of dividends and any capital gains paid. |
| | Past performance is no guarantee of future results. Share price, yield and |
| | investment return fluctuate such that upon redemption, fund shares may be |
| | worth more or less than their original cost. Income may be subject to state and |
| | local taxes, and some income may be subject to the federal alternative minimum |
| | tax (AMT) for certain investors. Capital gains, if any, are fully taxable. |
| 2 | SOURCE: LIPPER INC. — Reflects reinvestment of dividends and, where |
| | applicable, capital gain distributions.The Barclays Capital Municipal Bond |
| | Index is an unmanaged total return performance benchmark for the investment- |
| | grade, geographically unrestricted tax-exempt bond market. Index return does |
| | not reflect the fees and expenses associated with operating a mutual fund. |
| | Investors cannot invest directly in any index. |
14
UNDERSTANDING YOUR FUND’S EXPENSES (Unaudited)
As a mutual fund investor, you pay ongoing expenses, such as management fees and other expenses. Using the information below, you can estimate how these expenses affect your investment and compare them with the expenses of other funds.You also may pay one-time transaction expenses, including sales charges (loads) and redemptions fees, which are not shown in this section and would have resulted in higher total expenses. For more information, see your fund’s prospectus or talk to your financial adviser.
Review your fund’s expenses
The table below shows the expenses you would have paid on a $1,000 investment in each class of each BNY Mellon municipal bond fund from September 1, 2010 to February 28, 2011. It also shows how much a $1,000 investment would be worth at the close of the period, assuming actual returns and expenses.
| | | | | | |
| Expenses and Value of a $1,000 Investment | | | | | | |
| assuming actual returns for the six months ended February 28, 2011 | | | | | | |
| | | | | | | Dreyfus |
| | | Class M Shares | | Investor Shares | | Premier Shares |
| |
| BNY Mellon National Intermediate | | | | | | |
| Municipal Bond Fund | | | | | | |
| Expenses paid per $1,000† | | $2.44 | | $3.66 | | $6.09 |
| Ending value (after expenses) | | $968.90 | | $968.40 | | $965.30 |
| Annualized expense ratio (%) | | .50 | | .75 | | 1.25 |
| BNY Mellon National Short-Term | | | | | | |
| Municipal Bond Fund | | | | | | |
| Expenses paid per $1,000† | | $2.52 | | $3.81 | | — |
| Ending value (after expenses) | | $996.20 | | $994.10 | | — |
| Annualized expense ratio (%) | | .51 | | .77 | | — |
| BNY Mellon Pennsylvania | | | | | | |
| Intermediate Municipal Bond Fund | | | | | | |
| Expenses paid per $1,000† | | $3.22 | | $4.44 | | — |
| Ending value (after expenses) | | $970.40 | | $969.90 | | — |
| Annualized expense ratio (%) | | .66 | | .91 | | — |
| BNY Mellon Massachusetts | | | | | | |
| Intermediate Municipal Bond Fund | | | | | | |
| Expenses paid per $1,000† | | $2.59 | | $3.81 | | $6.30 |
| Ending value (after expenses) | | $972.50 | | $971.30 | | $969.00 |
| Annualized expense ratio (%) | | .53 | | .78 | | 1.29 |
| BNY Mellon New York | | | | | | |
| Intermediate Tax-Exempt Bond Fund | | | | | | |
| Expenses paid per $1,000† | | $2.88 | | $4.10 | | — |
| Ending value (after expenses) | | $971.30 | | $970.10 | | — |
| Annualized expense ratio (%) | | .59 | | .84 | | — |
| BNY Mellon Municipal | | | | | | |
| Opportunities Fund | | | | | | |
| Expenses paid per $1,000† | | $3.56 | $ | 4.67 | | — |
| Ending value (after expenses) | | $964.80 | $ | 963.70 | | — |
| Annualized expense ratio (%) | | .73 | | .96 | | — |
|
| † Expenses are equal to each fund’s annualized expense ratio as shown above, multiplied by the average account value over the period, multiplied by 181/365 (to reflect the |
| one-half year period). |
COMPARING YOUR FUND’S EXPENSES WITH THOSE OF OTHER FUNDS (Unaudited)
Using the SEC’s method to compare expenses
The Securities and Exchange Commission (SEC) has established guidelines to help investores assess fund expenses. Per these guidelines, the table below shows your fund’s expenses based on a $1,000 investment, assuming a hypothetical 5% annualized return.You can use this information to compare the ongoing expenses (but not transaction expenses or total cost) of investing in each fund with those of other funds. All mutual fund shareholder reports will provide this information to help you make this comparison. Please note that you cannot use this information to estimate your actual ending account balance and expenses paid during the period.
| | | | | | |
| Expenses and Value of a $1,000 Investment | | | | | | |
| assuming actual returns for the six months ended February 28, 2011 | | | | | | |
| | | | | | | Dreyfus |
| | | Class M Shares | | Investor Shares | | Premier Shares |
| |
| BNY Mellon National Intermediate | | | | | | |
| Municipal Bond Fund | | | | | | |
| Expenses paid per $1,000† | | $2.51 | | $3.76 | $ | 6.26 |
| Ending value (after expenses) | | $1,022.32 | | $1,021.08 | $ | 1,018.60 |
| Annualized expense ratio (%) | | .50 | | .75 | | 1.25 |
| BNY Mellon National Short-Term | | | | | | |
| Municipal Bond Fund | | | | | | |
| Expenses paid per $1,000† | | $2.56 | | $3.86 | | — |
| Ending value (after expenses) | | $1,022.27 | | $1,020.98 | | — |
| Annualized expense ratio (%) | | .51 | | .77 | | — |
| BNY Mellon Pennsylvania | | | | | | |
| Intermediate Municipal Bond Fund | | | | | | |
| Expenses paid per $1,000† | | $3.31 | | $4.56 | | — |
| Ending value (after expenses) | | $1,021.52 | | $1,020.28 | | — |
| Annualized expense ratio (%) | | .66 | | .91 | | — |
| BNY Mellon Massachusetts | | | | | | |
| Intermediate Municipal Bond Fund | | | | | | |
| Expenses paid per $1,000† | | $2.66 | | $3.91 | $ | 6.46 |
| Ending value (after expenses) | | $1,022.17 | | $1,020.93 | $ | 1,018.40 |
| Annualized expense ratio (%) | | .53 | | .78 | $ | 1.29 |
| BNY Mellon New York | | | | | | |
| Intermediate Tax-Exempt Bond Fund | | | | | | |
| Expenses paid per $1,000† | | $2.96 | | $4.21 | | — |
| Ending value (after expenses) | | $1,021.87 | | $1,020.63 | | — |
| Annualized expense ratio (%) | | .59 | | .84 | | — |
| BNY Mellon Municipal | | | | | | |
| Opportunities Fund | | | | | | |
| Expenses paid per $1,000† | | $3.66 | | $4.81 | | — |
| Ending value (after expenses) | | $1,021.17 | | $1,020.03 | | — |
| Annualized expense ratio (%) | | .73 | | .96 | | — |
|
| † Expenses are equal to each fund’s annualized expense ratio as shown above, multiplied by the average account value over the period, multiplied by 181/365 (to reflect the |
| one-half year period). |
16
|
| STATEMENT OF INVESTMENTS |
| February 28, 2011 (Unaudited) |
| | | | | |
| BNY Mellon National Intermediate Municipal Bond Fund | | | |
| Long-Term Municipal | Coupon | Maturity | Principal | |
| Investments—98.8% | Rate (%) | Date | Amount ($) | Value ($) |
| Alabama—1.9% | | | | |
| Birmingham Special Care Facilities Financing Authority-Baptist | | | | |
| Medical Centers, Revenue (Baptist Health System, Inc.) | 5.00 | 11/15/15 | 5,000,000 | 5,249,850 |
| Jefferson County, Limited Obligation School Warrants | 5.25 | 1/1/15 | 1,180,000 | 1,139,750 |
| Jefferson County, Limited Obligation School Warrants | 5.25 | 1/1/16 | 4,810,000 | 4,609,327 |
| Jefferson County, Limited Obligation School Warrants | | | | |
| (Insured; Assured Guaranty Municipal Corp.) | 5.00 | 1/1/24 | 13,325,000 | 12,575,469 |
| Montgomery BMC Special Care Facilities | | | | |
| Financing Authority, Revenue (Baptist Health) | | | | |
| (Insured; National Public Finance Guarantee Corp.) | 5.00 | 11/15/13 | 1,365,000 | 1,506,346 |
| Montgomery BMC Special Care Facilities | | | | |
| Financing Authority, Revenue (Baptist Health) | | | | |
| (Insured; National Public Finance Guarantee Corp.) | 5.00 | 11/15/14 | 2,500,000 | 2,818,250 |
| Arizona—2.6% | | | | |
| Arizona Board of Regents, Arizona State University | | | | |
| System Revenue (Polytechnic Campus Project) | 6.00 | 7/1/25 | 2,500,000 | 2,756,700 |
| Arizona Board of Regents, Arizona State University | | | | |
| System Revenue (Polytechnic Campus Project) | 6.00 | 7/1/26 | 1,000,000 | 1,094,790 |
| Arizona Board of Regents, Arizona State University | | | | |
| System Revenue (Polytechnic Campus Project) | 6.00 | 7/1/28 | 1,100,000 | 1,196,382 |
| Arizona Transportation Board, Highway Revenue | 5.00 | 7/1/26 | 5,000,000 | 5,232,500 |
| Paradise Valley Unified School District Number 69 of Maricopa | | | | |
| County, GO (Insured; National Public Finance Guarantee Corp.) | 7.00 | 7/1/11 | 1,905,000 | 1,945,881 |
| Phoenix, GO | 6.25 | 7/1/16 | 1,250,000 | 1,504,825 |
| Phoenix Civic Improvement Corporation, Transit Excise | | | | |
| Tax Revenue (Light Rail Project) (Insured; AMBAC) | 5.00 | 7/1/16 | 6,000,000 | 6,568,680 |
| Salt Verde Financial Corporation, Senior Gas Revenue | 5.50 | 12/1/29 | 3,060,000 | 2,882,245 |
| Scottsdale Industrial Development Authority, HR | | | | |
| (Scottsdale Healthcare) (Prerefunded) | 5.70 | 12/1/11 | 1,000,000a | 1,049,880 |
| Scottsdale Unified School District Number 48 of | | | | |
| Maricopa County, School Improvement Bonds | 6.60 | 7/1/12 | 1,250,000 | 1,344,212 |
| University Medical Center Corporation, HR | 5.25 | 7/1/16 | 2,310,000 | 2,400,090 |
| University of Arizona Board of Regents, System Revenue | 6.20 | 6/1/16 | 10,000,000 | 11,201,700 |
| California—14.5% | | | | |
| Agua Caliente Band, Cahuilla Indians Revenue | 5.60 | 7/1/13 | 1,220,000b | 1,189,951 |
| Alameda Corridor Transportation Authority, | | | | |
| Revenue (Insured; AMBAC) | 0/5.25 | 10/1/21 | 5,000,000c | 4,308,000 |
| California, Economic Recovery Bonds | 5.00 | 7/1/15 | 2,950,000 | 3,216,120 |
| California, Economic Recovery Bonds (Prerefunded) | 5.00 | 7/1/14 | 2,050,000a | 2,319,882 |
| California, GO | 5.00 | 11/1/12 | 345,000 | 353,625 |
| California, GO | 5.50 | 6/1/20 | 270,000 | 270,859 |
| California, GO | 5.25 | 11/1/26 | 10,500,000 | 10,615,290 |
| California, GO | 5.50 | 11/1/33 | 3,900,000 | 3,906,864 |
| California, GO (Various Purpose) | 6.00 | 3/1/33 | 8,000,000 | 8,411,600 |
STATEMENT OF INVESTMENTS (Unaudited) (continued)
| | | | | |
| BNY Mellon National Intermediate Municipal Bond Fund (continued) | | | |
| |
| Long-Term Municipal | Coupon | Maturity | Principal | | |
| Investments (continued) | Rate (%) | Date | Amount ($) | | Value ($) |
| California (continued) | | | | | |
| California, GO (Various Purpose) | 6.50 | 4/1/33 | 3,000,000 | | 3,263,010 |
| California, GO (Various Purpose) | 6.00 | 4/1/38 | 6,000,000 | | 6,203,340 |
| California, GO (Various Purpose) (Prerefunded) | 5.00 | 2/1/14 | 1,825,000 | a | 2,037,138 |
| California County Tobacco Securitization Agency, | | | | | |
| Tobacco Settlement Asset-Backed Bonds | | | | | |
| (Golden Gate Tobacco Funding Corporation) | 4.50 | 6/1/21 | 2,520,000 | | 2,116,498 |
| California County Tobacco Securitization Agency, | | | | | |
| Tobacco Settlement Asset-Backed Bonds | | | | | |
| (Los Angeles County Securitization Corporation) | 5.25 | 6/1/21 | 1,250,000 | | 1,105,387 |
| California Department of Water Resources, Power Supply Revenue | 5.00 | 5/1/22 | 5,000,000 | | 5,498,300 |
| California Department of Water Resources, Power Supply | | | | | |
| Revenue (Insured; Assured Guaranty Municipal Corp.) | 5.00 | 5/1/21 | 11,985,000 | | 13,044,234 |
| California Department of Water Resources, | | | | | |
| Water System Revenue (Central Valley Project) | 5.00 | 12/1/19 | 8,925,000 | d | 9,958,515 |
| California Educational Facilities Authority, | | | | | |
| Revenue (University of Southern California) | 5.25 | 10/1/38 | 5,000,000 | | 5,063,750 |
| California Health Facilities Financing Authority, | | | | | |
| Revenue (Providence Health and Services) | 6.25 | 10/1/24 | 8,500,000 | | 9,563,520 |
| California Health Facilities Financing Authority, | | | | | |
| Revenue (Providence Health and Services) | 6.25 | 10/1/28 | 4,000,000 | | 4,343,960 |
| California Health Facilities Financing Authority, | | | | | |
| Revenue (Providence Health and Services) | 6.50 | 10/1/38 | 3,440,000 | | 3,739,830 |
| California Health Facilities Financing Authority, Revenue | | | | | |
| (Providence Health and Services) (Prerefunded) | 6.50 | 10/1/18 | 60,000 | a | 76,049 |
| California Infrastructure and Economic Development Bank, | | | | | |
| Clean Water State Revolving Fund Revenue | 5.00 | 10/1/17 | 2,500,000 | | 2,645,625 |
| California Infrastructure and Economic Development Bank, Revenue | | | | | |
| (California Independent System Operator Corporation Project) | 6.00 | 2/1/30 | 8,000,000 | | 8,296,000 |
| California Infrastructure and Economic Development Bank, | | | | | |
| Revenue (The J. David Gladstone Institutes Project) | 5.50 | 10/1/22 | 3,990,000 | | 4,040,952 |
| California State Public Works Board, LR (Department of | | | | | |
| General Services) (Capitol East End Complex—Blocks | | | | | |
| 171-174 and 225) (Insured; AMBAC) | 5.25 | 12/1/19 | 5,000,000 | | 5,068,700 |
| California State Public Works Board, LR (Department of | | | | | |
| Mental Health-Coalinga State Hospital) | 5.00 | 6/1/24 | 1,500,000 | | 1,436,325 |
| California Statewide Communities Development Authority, | | | | | |
| Revenue (Saint Joseph Health System) | | | | | |
| (Insured; Assured Guaranty Municipal Corp.) | 4.50 | 7/1/18 | 3,940,000 | | 4,096,103 |
| California Statewide Communities Development Authority, | | | | | |
| Mortgage Revenue (Methodist Hospital of Southern | | | | | |
| California Project) (Collateralized; FHA) | 6.25 | 8/1/24 | 5,000,000 | | 5,648,850 |
| California Statewide Communities Development | | | | | |
| Authority, Revenue (The California Endowment) | 5.25 | 7/1/15 | 1,740,000 | | 1,888,961 |
| Golden State Tobacco Securitization Corporation, | | | | | |
| Enhanced Tobacco Settlement Asset-Backed Bonds | 5.00 | 6/1/18 | 590,000 | | 589,994 |
18
| | | | | |
| BNY Mellon National Intermediate Municipal Bond Fund (continued) | | |
| Long-Term Municipal | Coupon | Maturity | Principal | |
| Investments (continued) | Rate (%) | Date | Amount ($) | Value ($) |
| California (continued) | | | | |
| Golden State Tobacco Securitization Corporation, | | | | |
| Tobacco Settlement Asset-Backed Bonds | 4.50 | 6/1/27 | 10,280,000 | 7,401,394 |
| Hesperia Public Financing Authority, Revenue | | | | |
| (Redevelopment and Housing Projects) (Insured; XLCA) | 5.00 | 9/1/37 | 2,940,000 | 1,879,954 |
| Kern High School District, GO (Insured; | | | | |
| National Public Finance Guarantee Corp.) | 6.40 | 2/1/12 | 2,750,000 | 2,863,602 |
| Los Angeles Department of Airports, | | | | |
| Senior Revenue (Los Angeles International Airport) | 5.25 | 5/15/26 | 15,520,000 | 16,198,534 |
| Los Angeles Unified School District, GO | | | | |
| (Insured; Assured Guaranty Municipal Corp.) | 5.00 | 7/1/24 | 2,395,000 | 2,436,481 |
| Los Angeles Unified School District, GO | | | | |
| (Insured; National Public Finance Guarantee Corp.) | 5.75 | 7/1/16 | 2,000,000 | 2,319,260 |
| New Haven Unified School District, GO | | | | |
| (Insured; Assured Guaranty Municipal Corp.) | 0.00 | 8/1/33 | 4,000,000e | 875,680 |
| Newport Beach, Revenue (Hoag Memorial Hospital Presbyterian) | 5.00 | 2/7/13 | 5,000,000 | 5,345,850 |
| Novato Unified School District, GO | | | | |
| (Insured; National Public Finance Guarantee Corp.) | 5.00 | 8/1/26 | 6,285,000 | 6,289,022 |
| Oakland Joint Powers Financing Authority, LR | | | | |
| (Oakland Convention Centers) (Insured; AMBAC) | 5.50 | 10/1/13 | 1,500,000 | 1,564,950 |
| Oceanside Unified School District, GO | | | | |
| (Insured; Assured Guaranty Municipal Corp.) | 0.00 | 8/1/36 | 11,100,000e | 1,958,928 |
| Sacramento County, Airport System Subordinate | | | | |
| and Passenger Facility Charges Grant Revenue | 6.00 | 7/1/35 | 3,000,000 | 3,036,090 |
| Sacramento County Water Financing Authority, Revenue | | | | |
| (Sacramento County Water Agency Zones 40 and 41 Water | | | | |
| System Project) (Insured; National Public Finance Guarantee Corp.) | 0.75 | 6/1/34 | 8,000,000f | 5,334,240 |
| Sacramento Municipal Utility District, Electric Revenue | 5.30 | 7/1/12 | 390,000 | 402,804 |
| Sacramento Municipal Utility District, Electric Revenue | | | | |
| (Insured; National Public Finance Guarantee Corp.) | 5.25 | 5/15/13 | 3,530,000 | 3,807,776 |
| San Francisco City and County Public Utilities | | | | |
| Commission, San Francisco Water Revenue | 5.00 | 11/1/26 | 5,000,000 | 5,179,400 |
| Santa Barbara Financing Authority, Revenue (Airport Project) | 5.00 | 7/1/39 | 3,000,000 | 2,751,510 |
| Southern California Public Power Authority, | | | | |
| Gas Project Revenue (Project Number One) | 5.00 | 11/1/28 | 1,000,000 | 926,790 |
| Southern California Public Power Authority, Power Project Revenue | | | | |
| (San Juan Unit 3) (Insured; Assured Guaranty Municipal Corp.) | 5.50 | 1/1/13 | 3,010,000 | 3,251,041 |
| Southern California Public Power Authority, Power Project Revenue | | | | |
| (San Juan Unit 3) (Insured; Assured Guaranty Municipal Corp.) | 5.50 | 1/1/14 | 2,000,000 | 2,223,180 |
| Southern California Public Power Authority, | | | | |
| Revenue (Windy Point/Windy Flats Project) | 5.00 | 7/1/30 | 8,000,000 | 8,046,960 |
| Westside Unified School District, GO (Insured; AMBAC) | 6.00 | 8/1/14 | 385,000 | 424,432 |
| Colorado—5.0% | | | | |
| Colorado Health Facilities Authority, | | | | |
| Revenue (Catholic Health Initiatives) | 6.00 | 10/1/23 | 2,000,000 | 2,201,820 |
|
| STATEMENT OF INVESTMENTS (Unaudited) (continued) |
| | | | | |
| BNY Mellon National Intermediate Municipal Bond Fund (continued) | | |
| Long-Term Municipal | Coupon | Maturity | Principal | |
| Investments (continued) | Rate (%) | Date | Amount ($) | Value ($) |
| Colorado (continued) | | | | |
| Colorado Health Facilities Authority, | | | | |
| Revenue (Catholic Health Initiatives) | 6.25 | 10/1/33 | 1,600,000 | 1,679,632 |
| Colorado Health Facilities Authority, | | | | |
| Revenue (Vail Valley Medical Center Project) | 5.00 | 1/15/20 | 1,250,000 | 1,261,325 |
| Colorado Housing and Finance Authority, SFMR | 4.90 | 11/1/11 | 1,210,000 | 1,235,071 |
| Colorado Housing and Finance Authority, | | | | |
| Single Family Program Senior and Subordinate Bonds | 6.75 | 4/1/15 | 45,000 | 45,788 |
| Colorado Housing and Finance Authority, Single Family | | | | |
| Program Senior and Subordinate Bonds | 6.05 | 10/1/16 | 55,000 | 58,256 |
| Colorado Housing and Finance Authority, Single Family | | | | |
| Program Senior and Subordinate Bonds | 6.70 | 10/1/16 | 20,000 | 20,874 |
| Colorado Housing and Finance Authority, Single Family | | | | |
| Program Senior and Subordinate Bonds (Collateralized; FHA) | 6.75 | 10/1/21 | 125,000 | 135,532 |
| Colorado Housing and Finance Authority, Single Family | | | | |
| Program Senior and Subordinate Bonds (Collateralized; FHA) | 7.15 | 10/1/30 | 30,000 | 30,620 |
| Denver City and County, Airport System Revenue | | | | |
| (Insured: Assured Guaranty Municipal Corp. and | | | | |
| National Public Finance Guarantee Corp.) | 5.25 | 11/15/19 | 4,445,000 | 4,765,262 |
| E-470 Public Highway Authority, Senior Revenue | | | | |
| (Insured; National Public Finance Guarantee Corp.) | 0/5.00 | 9/1/16 | 3,565,000c | 3,818,971 |
| E-470 Public Highway Authority, Senior Revenue | | | | |
| (Insured; National Public Finance Guarantee Corp.) | 5.25 | 9/1/16 | 5,000,000 | 5,311,300 |
| E-470 Public Highway Authority, Senior Revenue | | | | |
| (Insured; National Public Finance Guarantee Corp.) | 0/5.00 | 9/1/17 | 3,500,000c | 3,745,175 |
| Northwest Parkway Public Highway Authority, | | | | |
| Revenue (Insured; AMBAC) (Prerefunded) | 0/5.45 | 6/15/16 | 7,690,000a,c | 8,711,693 |
| Northwest Parkway Public Highway Authority, | | | | |
| Revenue (Insured; AMBAC) (Prerefunded) | 0/5.70 | 6/15/16 | 7,345,000a,c | 8,406,132 |
| Northwest Parkway Public Highway Authority, Revenue | | | | |
| (Insured; Assured Guaranty Municipal Corp.) (Prerefunded) | 0/5.55 | 6/15/16 | 10,960,000a,c | 12,467,000 |
| Public Authority for Colorado Energy, Natural Gas Purchase Revenue | 5.75 | 11/15/18 | 2,965,000 | 3,140,647 |
| Public Authority for Colorado Energy, Natural Gas Purchase Revenue | 6.13 | 11/15/23 | 4,645,000 | 4,899,314 |
| Regional Transportation District, COP | 5.00 | 6/1/19 | 1,750,000 | 1,902,863 |
| Regional Transportation District, COP | 5.00 | 6/1/20 | 2,700,000 | 2,912,247 |
| Regional Transportation District, COP | 5.50 | 6/1/22 | 2,200,000 | 2,377,716 |
| University of Colorado Regents, Participation Interest (Sempra Energy | | | | |
| Colorado, Inc., Lease, Development and Operating Agreement) | | | | |
| (Insured; National Public Finance Guarantee Corp.) (Prerefunded) | 6.00 | 6/1/12 | 5,000,000a | 5,323,150 |
| Connecticut—.4% | | | | |
| Connecticut, GO (Insured; AMBAC) | 5.25 | 6/1/18 | 1,500,000 | 1,762,845 |
| Connecticut Health and Educational Facilities Authority, | | | | |
| Revenue (Connecticut State University System Issue) | | | | |
| (Insured; Assured Guaranty Municipal Corp.) | 5.00 | 11/1/14 | 1,260,000 | 1,409,121 |
| Connecticut Health and Educational Facilities Authority, | | | | |
| Revenue (Stamford Hospital Issue) | 5.00 | 7/1/30 | 3,150,000 | 3,084,795 |
20
| | | | | |
| BNY Mellon National Intermediate Municipal Bond Fund (continued) | | |
| Long-Term Municipal | Coupon | Maturity | Principal | |
| Investments (continued) | Rate (%) | Date | Amount ($) | Value ($) |
| District of Columbia—.3% | | | | |
| District of Columbia, GO | | | | |
| (Insured; Assured Guaranty Municipal Corp.) | 3.29 | 6/1/16 | 5,000,000f | 4,969,750 |
| Florida—6.1% | | | | |
| Citizens Property Insurance Corporation, High-Risk Account Senior | | | | |
| Secured Revenue (Insured; Assured Guaranty Municipal Corp.) | 5.00 | 6/1/15 | 15,000,000 | 15,826,200 |
| Florida Department of Transportation, | | | | |
| State Infrastructure Bank Revenue | 5.00 | 7/1/19 | 4,220,000 | 4,574,522 |
| Florida Department of Transportation, | | | | |
| State Infrastructure Bank Revenue | 5.00 | 7/1/20 | 2,500,000 | 2,679,175 |
| Florida Hurricane Catastrophe Fund Finance Corporation, Revenue | 5.00 | 7/1/11 | 5,000,000 | 5,057,850 |
| Florida Hurricane Catastrophe Fund Finance Corporation, Revenue | 5.00 | 7/1/15 | 10,000,000 | 10,692,400 |
| Florida Municipal Loan Council, Revenue | | | | |
| (Insured; National Public Finance Guarantee Corp.) | 5.75 | 11/1/15 | 520,000 | 524,774 |
| Hillsborough County Aviation Authority, Revenue | | | | |
| (Tampa International Airport) (Insured; AMBAC) | 5.13 | 10/1/20 | 3,540,000 | 3,726,204 |
| Hillsborough County Aviation Authority, Revenue | | | | |
| (Tampa International Airport) (Insured; AMBAC) | 5.13 | 10/1/21 | 3,675,000 | 3,845,152 |
| Hillsborough County Educational Facilities Authority, | | | | |
| Revenue (University of Tampa Project) (Insured; Radian) | 5.75 | 4/1/18 | 2,280,000 | 2,293,794 |
| Miami-Dade County, Aviation Revenue (Miami International Airport) | 5.50 | 10/1/41 | 5,000,000 | 4,741,600 |
| Miami-Dade County, Subordinate Special Obligation | | | | |
| Bonds (Insured; National Public Finance Guarantee Corp.) | 0/5.00 | 10/1/22 | 2,000,000c | 1,751,580 |
| Orlando Utilities Commission, Utility System Revenue | 2.55 | 10/1/16 | 13,400,000f | 12,923,764 |
| Orlando-Orange County Expressway Authority, | | | | |
| Revenue (Insured; AMBAC) | 5.00 | 7/1/13 | 4,710,000 | 5,031,646 |
| Sarasota County, Limited Ad Valorem Tax Bonds | | | | |
| (Environmentally Sensitive Lands and Parkland Program) | 5.25 | 10/1/25 | 6,895,000 | 7,233,200 |
| Seminole Tribe, Special Obligation Revenue | 5.75 | 10/1/22 | 5,000,000b | 4,724,000 |
| Tampa Bay Water, A Regional Water Supply | | | | |
| Authority, Utility System Revenue | 5.00 | 10/1/20 | 5,000,000d | 5,516,400 |
| Georgia—3.8% | | | | |
| Burke County Development Authority, PCR | | | | |
| (Oglethorpe Power Corporation Vogtle Project) | 7.00 | 1/1/23 | 6,000,000 | 6,935,580 |
| Burke County Development Authority, PCR | | | | |
| (Oglethorpe Power Corporation Vogtle Project) | | | | |
| (Insured; National Public Finance Guarantee Corp.) | 4.75 | 4/1/11 | 17,500,000 | 17,565,275 |
| Chatham County Hospital Authority, HR Improvement | | | | |
| (Memorial Health University Medical Center, Inc.) | 5.75 | 1/1/29 | 5,000,000 | 4,428,600 |
| Crisp County Development Authority, EIR | | | | |
| (International Paper Company Project) | 5.55 | 2/1/15 | 1,000,000 | 1,069,660 |
| Fulton County, Water and Sewerage Revenue | | | | |
| (Insured; National Public Finance Guarantee Corp.) | 5.00 | 1/1/35 | 10,000,000 | 9,754,500 |
| Fulton County Development Authority, Revenue (Spelman College) | 5.00 | 6/1/24 | 2,010,000 | 2,021,959 |
| Main Street Natural Gas Inc., Gas Project Revenue | 6.38 | 7/15/38 | 1,335,000g | 856,109 |
STATEMENT OF INVESTMENTS (Unaudited) (continued)
| | | | | |
| BNY Mellon National Intermediate Municipal Bond Fund (continued) | | |
| Long-Term Municipal | Coupon | Maturity | Principal | |
| Investments (continued) | Rate (%) | Date | Amount ($) | Value ($) |
| Georgia (continued) | | | | |
| Municipal Electric Authority of Georgia, GO | | | | |
| (Project One Subordinated Bonds) | 5.75 | 1/1/20 | 5,000,000 | 5,715,600 |
| Private Colleges and Universities Authority, | | | | |
| Revenue (Emory University) | 5.00 | 9/1/18 | 2,000,000 | 2,220,940 |
| Putnam County Development Authority, | | | | |
| PCR (Georgia Power Company) | 5.10 | 6/1/23 | 6,120,000 | 6,189,462 |
| Hawaii—.5% | | | | |
| Hawaii Department of Budget and Finance, Special Purpose | | | | |
| Revenue (Hawaiian Electric Company, Inc. and Subsidiary Projects) | 6.50 | 7/1/39 | 7,000,000 | 6,907,320 |
| Idaho—.8% | | | | |
| University of Idaho Regents, General Revenue | 5.25 | 4/1/21 | 10,515,000 | 11,397,209 |
| Illinois—5.5% | | | | |
| Chicago, GO (Insured; Assured Guaranty Municipal Corp.) | 5.00 | 1/1/14 | 5,000,000 | 5,314,500 |
| Chicago, GO (Modern Schools Across | | | | |
| Chicago Program) (Insured; AMBAC) | 5.00 | 12/1/17 | 1,110,000 | 1,155,854 |
| Chicago Metropolitan Water Reclamation District, | | | | |
| GO Capital Improvement | 7.25 | 12/1/12 | 8,500,000 | 9,483,110 |
| Cook County, GO Capital Improvement (Insured; AMBAC) | 5.00 | 11/15/25 | 5,000,000 | 5,014,250 |
| DuPage, Cook and Will Counties Community | | | | |
| College District Number 502, GO (Prerefunded) | 5.25 | 6/1/13 | 5,980,000a | 6,590,199 |
| Illinois, GO | 5.00 | 9/1/19 | 7,500,000 | 7,535,850 |
| Illinois, GO (Fund for Infrastructure, Roads, School and Transit) | 5.25 | 10/1/15 | 3,000,000 | 3,067,710 |
| Illinois, GO (Insured; Assured Guaranty Municipal Corp.) | 5.00 | 1/1/20 | 5,000,000 | 5,045,900 |
| Illinois, GO (Insured; Assured Guaranty Municipal Corp.) | 5.00 | 1/1/22 | 2,000,000 | 1,971,920 |
| Illinois, GO (Insured; Assured Guaranty Municipal Corp.) | 5.00 | 1/1/23 | 5,000,000 | 4,881,850 |
| Illinois Finance Authority, Gas Supply Revenue (The Peoples | | | | |
| Gas Light and Coke Company Project) (Insured; AMBAC) | 4.30 | 6/1/16 | 2,500,000 | 2,528,375 |
| Illinois Health Facilities Authority, Revenue | | | | |
| (Loyola University Health System) | 5.75 | 7/1/11 | 540,000 | 546,458 |
| Illinois Toll Highway Authority, Toll Highway Senior Priority | | | | |
| Revenue (Insured; Assured Guaranty Municipal Corp.) | 5.00 | 1/1/24 | 15,000,000 | 15,124,800 |
| Metropolitan Pier and Exposition Authority, | | | | |
| Revenue (McCormick Place Expansion Project) | 5.00 | 6/15/50 | 6,000,000 | 5,000,340 |
| Railsplitter Tobacco Settlement Authority, | | | | |
| Tobacco Settlement Revenue | 5.00 | 6/1/15 | 3,500,000 | 3,694,495 |
| Regional Transportation Authority, GO | | | | |
| (Insured; National Public Finance Guarantee Corp.) | 7.75 | 6/1/12 | 1,890,000 | 2,037,930 |
| Will County School District Number 161, GO | | | | |
| (Insured; National Public Finance Guarantee Corp.) | 5.00 | 1/1/23 | 4,355,000 | 4,438,485 |
| Indiana—.5% | | | | |
| Indiana Finance Authority, Acquisition Revenue | | | | |
| (National Collegiate Athletic Association Project) | 5.00 | 5/1/15 | 1,000,000 | 1,132,650 |
| Indiana Health Facility Financing Authority, | | | | |
| HR (The Methodist Hospitals, Inc.) | 5.25 | 9/15/11 | 750,000 | 756,630 |
22
| | | | | |
| BNY Mellon National Intermediate Municipal Bond Fund (continued) | | | |
| Long-Term Municipal | Coupon | Maturity | Principal | | |
| Investments (continued) | Rate (%) | Date | Amount ($) | | Value ($) |
| Indiana (continued) | | | | | |
| Indiana Municipal Power Agency, | | | | | |
| Power Supply System Revenue (Insured; AMBAC) | 5.13 | 1/1/20 | 4,045,000 | | 4,146,085 |
| Indiana University Trustees, Student Fee Revenue (Indiana | | | | | |
| University) (Insured; National Public Finance Guarantee Corp.) | 5.00 | 8/1/11 | 1,425,000 | | 1,453,600 |
| Kansas—.3% | | | | | |
| Wyandotte County/Kansas City Unified Government, | | | | | |
| Utility System Revenue (Insured; AMBAC) | 5.65 | 9/1/22 | 4,700,000 | | 5,167,180 |
| Kentucky—.5% | | | | | |
| Kentucky Housing Corporation, Housing Revenue | 4.80 | 7/1/20 | 3,000,000 | | 3,013,380 |
| Louisville and Jefferson County Metropolitan Sewer | | | | | |
| District, Sewer and Drainage System Revenue | | | | | |
| (Insured; National Public Finance Guarantee Corp.) | 5.50 | 5/15/34 | 4,000,000 | | 4,044,600 |
| Louisiana—2.8% | | | | | |
| Jefferson Sales Tax District, Special Sales Tax | | | | | |
| Revenue (Insured; AMBAC) | 5.25 | 12/1/21 | 4,375,000 | | 4,721,850 |
| Louisiana, Gasoline and Fuels Tax Second Lien Revenue | 1.01 | 6/1/13 | 5,000,000 | f | 4,990,850 |
| Louisiana Citizens Property Insurance Corporation, | | | | | |
| Assessment Revenue (Insured; AMBAC) | 5.25 | 6/1/13 | 4,000,000 | | 4,225,640 |
| Louisiana Citizens Property Insurance Corporation, | | | | | |
| Assessment Revenue (Insured; AMBAC) | 5.00 | 6/1/21 | 5,500,000 | | 5,525,795 |
| Louisiana Citizens Property Insurance Corporation, Assessment | | | | | |
| Revenue (Insured; Assured Guaranty Municipal Corp.) | 6.13 | 6/1/25 | 14,500,000 | | 15,905,485 |
| Louisiana Local Government Environmental Facilities and | | | | | |
| Community Development Authority, Revenue (Louisiana Community | | | | | |
| and Technical College System Facilities Corporation Project) | 5.00 | 10/1/22 | 5,000,000 | | 5,286,650 |
| Louisiana Public Facilities Authority, Revenue | | | | | |
| (CHRISTUS Health Obligated Group) | 6.00 | 7/1/29 | 2,000,000 | | 2,053,900 |
| Maine—.2% | | | | | |
| Maine Housing Authority, Mortgage Purchase Bonds | 4.75 | 11/15/21 | 2,450,000 | | 2,446,986 |
| Maine Housing Authority, Mortgage Purchase Bonds | 5.30 | 11/15/23 | 715,000 | | 717,674 |
| Maryland—.6% | | | | | |
| Howard County, Consolidated Public Improvement GO | 5.00 | 8/15/17 | 5,030,000 | | 5,902,705 |
| University System of Maryland, Auxiliary Facility | | | | | |
| and Tuition Revenue (Prerefunded) | 5.00 | 4/1/13 | 2,405,000 | a | 2,620,656 |
| Massachusetts—2.5% | | | | | |
| Boston Water and Sewer Commission, General Revenue | 5.00 | 11/1/26 | 2,155,000 | | 2,330,417 |
| Massachusetts, Consolidated Loan | | | | | |
| (Insured; National Public Finance Guarantee Corp.) | 5.50 | 10/1/20 | 3,285,000 | | 3,941,376 |
| Massachusetts Development Finance Agency, Revenue | | | | | |
| (Combined Jewish Philanthropies of Greater Boston, Inc. Project) | 4.75 | 2/1/15 | 2,525,000 | | 2,671,677 |
| Massachusetts Development Finance Agency, | | | | | |
| Revenue (Olin College Issue) (Insured; XLCA) | 5.25 | 7/1/33 | 5,000,000 | | 4,934,900 |
| Massachusetts Health and Educational Facilities Authority, | | | | | |
| Revenue (Partners HealthCare System Issue) | 5.25 | 7/1/29 | 3,500,000 | | 3,499,860 |
STATEMENT OF INVESTMENTS (Unaudited) (continued)
| | | | |
| BNY Mellon National Intermediate Municipal Bond Fund (continued) | | |
| Long-Term Municipal | Coupon | Maturity | Principal | |
| Investments (continued) | Rate (%) | Date | Amount ($) | Value ($) |
| Massachusetts (continued) | | | | |
| Massachusetts Health and Educational Facilities | | | | |
| Authority, Revenue (Simmons College Issue) | 7.50 | 10/1/22 | 2,000,000 | 2,367,300 |
| Massachusetts Health and Educational Facilities | | | | |
| Authority, Revenue (Simmons College Issue) | 8.00 | 10/1/29 | 5,000,000 | 5,588,750 |
| Massachusetts Health and Educational Facilities | | | | |
| Authority, Revenue (Simmons College Issue) | 8.00 | 10/1/39 | 1,500,000 | 1,659,195 |
| Massachusetts Housing Finance Agency, Housing Revenue | 5.13 | 12/1/34 | 350,000 | 319,287 |
| Massachusetts Municipal Wholesale Electric Company, Power | | | | |
| Supply Project Revenue (Nuclear Project Number 4 Issue) | | | | |
| (Insured; National Public Finance Guarantee Corp.) | 5.25 | 7/1/12 | 2,000,000 | 2,078,520 |
| Massachusetts School Building Authority, | | | | |
| Dedicated Sales Tax Revenue (Insured; AMBAC) | 5.00 | 8/15/20 | 6,000,000 | 6,701,040 |
| Massachusetts School Building Authority, Dedicated Sales | | | | |
| Tax Revenue (Insured; Assured Guaranty Municipal Corp.) | 5.00 | 8/15/30 | 1,500,000 | 1,521,225 |
| Massachusetts Water Pollution Abatement Trust (Pool Program) | 5.25 | 8/1/17 | 275,000 | 307,296 |
| Massachusetts Water Pollution Abatement Trust, | | | | |
| Water Pollution Abatement Revenue (MWRA Program) | 5.75 | 8/1/29 | 380,000 | 381,117 |
| Michigan—1.3% | | | | |
| Detroit, Water Supply System Second Lien Revenue (Insured; FGIC) | 5.75 | 7/1/22 | 7,000,000 | 7,564,130 |
| Michigan Municipal Bond Authority, | | | | |
| Clean Water Revolving Fund Revenue | 5.25 | 10/1/18 | 2,000,000 | 2,048,960 |
| Michigan Municipal Bond Authority, | | | | |
| Clean Water Revolving Fund Revenue | 5.00 | 10/1/21 | 5,000,000 | 5,107,250 |
| Michigan Municipal Bond Authority, | | | | |
| Drinking Water Revolving Fund Revenue | 5.50 | 10/1/15 | 1,000,000 | 1,157,080 |
| Michigan Tobacco Settlement Finance Authority, | | | | |
| Tobacco Settlement Asset-Backed Bonds | 5.13 | 6/1/22 | 4,945,000 | 3,930,286 |
| Minnesota—1.4% | | | | |
| Minneapolis, Health Care System Revenue (Fairview Health Services) | 6.63 | 11/15/28 | 12,000,000 | 12,955,440 |
| Minnesota Higher Education Facilities Authority, | | | | |
| Revenue (Macalester College) | 5.00 | 3/1/14 | 1,410,000 | 1,559,291 |
| University of Minnesota Regents, Special Purpose | | | | |
| Revenue (State Supported Stadium Debt) | 5.00 | 8/1/19 | 6,300,000 | 6,890,373 |
| Mississippi—.2% | | | | |
| Mississippi Home Corporation, SFMR | | | | |
| (Collateralized: FHLMC, FNMA and GNMA) | 4.38 | 12/1/18 | 1,920,000 | 1,923,782 |
| Mississippi State University Educational Building Corporation, | | | | |
| Revenue (Insured; National Public Finance Guarantee Corp.) | 5.25 | 8/1/16 | 400,000 | 460,072 |
| Missouri—.3% | | | | |
| Curators of the University of Missouri, System Facilities Revenue | 5.00 | 11/1/12 | 2,000,000 | 2,141,940 |
| Missouri Environmental Improvement and Energy Resource Authority, | | | | |
| Water PCR (State Revolving Fund Program—Master Trust) | 5.50 | 7/1/14 | 1,250,000 | 1,420,887 |
| Missouri Housing Development Commission, SFMR (Homeownership | | | | |
| Loan Program) (Collateralized: FNMA and GNMA) | 5.05 | 9/1/24 | 600,000 | 600,858 |
24
| | | | | |
| BNY Mellon National Intermediate Municipal Bond Fund (continued) | | |
| Long-Term Municipal | Coupon | Maturity | Principal | |
| Investments (continued) | Rate (%) | Date | Amount ($) | Value ($) |
| Nebraska—.2% | | | | |
| Nebraska Investment Finance Authority, | | | | |
| SFHR (Collateralized: FHLMC, FNMA and GNMA) | 4.70 | 9/1/21 | 1,000,000 | 997,860 |
| Nebraska Investment Finance Authority, SFHR | | | | |
| (Collateralized: FHLMC, FNMA and GNMA) | 5.25 | 9/1/22 | 590,000 | 590,201 |
| Omaha City, GO (City of Omaha Convention Center/Arena Project) | 6.50 | 12/1/16 | 1,000,000 | 1,245,730 |
| Nevada—1.9% | | | | |
| Clark County, Highway Revenue (Motor Vehicle Fuel Tax) | 5.00 | 7/1/28 | 15,000,000 | 15,039,600 |
| Clark County School District, GO (Insured; | | | | |
| National Public Finance Guarantee Corp.) | 5.00 | 6/15/20 | 12,930,000 | 14,106,242 |
| New Hampshire—.1% | | | | |
| Nashua, Capital Improvement Bonds (Prerefunded) | 5.50 | 7/15/12 | 560,000a | 598,388 |
| New Hampshire Business Finance Authority, | | | | |
| PCR (Central Maine Power Company) | 5.38 | 5/1/14 | 1,000,000 | 1,073,260 |
| New Jersey—5.5% | | | | |
| Essex County Improvement Authority, Project Consolidation | | | | |
| Revenue (County Guaranteed) (Refunding Project) | | | | |
| (Insured; National Public Finance Guarantee Corp.) | 5.50 | 10/1/24 | 12,725,000 | 14,021,423 |
| Essex County Improvement Authority, Project Consolidation | | | | |
| Revenue (County Guaranteed) (Refunding Project) | | | | |
| (Insured; National Public Finance Guarantee Corp.) | 5.50 | 10/1/25 | 5,630,000 | 6,151,451 |
| Garden State Preservation Trust, Open Space and Farmland | | | | |
| Preservation Revenue (Insured; Assured Guaranty Municipal Corp.) | 5.13 | 11/1/16 | 1,000,000 | 1,153,950 |
| Garden State Preservation Trust, Open Space and Farmland | | | | |
| Preservation Revenue (Insured; Assured Guaranty Municipal Corp.) | 5.80 | 11/1/17 | 2,500,000 | 2,922,500 |
| Garden State Preservation Trust, Open Space and Farmland | | | | |
| Preservation Revenue (Insured; Assured Guaranty Municipal Corp.) | 5.80 | 11/1/18 | 5,000,000 | 5,684,500 |
| Garden State Preservation Trust, Open Space and Farmland | | | | |
| Preservation Revenue (Insured; Assured Guaranty Municipal Corp.) | 5.80 | 11/1/19 | 5,000,000 | 5,712,850 |
| Garden State Preservation Trust, Open Space and Farmland | | | | |
| Preservation Revenue (Insured; Assured Guaranty Municipal Corp.) | 5.80 | 11/1/23 | 5,000,000 | 5,668,750 |
| New Jersey Economic Development Authority, Cigarette Tax Revenue | 5.38 | 6/15/15 | 4,400,000 | 4,557,300 |
| New Jersey Economic Development Authority, Cigarette Tax Revenue | 5.50 | 6/15/24 | 3,000,000 | 2,775,540 |
| New Jersey Economic Development Authority, | | | | |
| School Facilities Construction Revenue | 5.00 | 3/1/17 | 2,000,000 | 2,107,540 |
| New Jersey Economic Development Authority, | | | | |
| School Facilities Construction Revenue | 1.51 | 2/1/18 | 10,000,000f | 9,985,300 |
| New Jersey Economic Development Authority, | | | | |
| School Facilities Construction Revenue | 5.00 | 3/1/18 | 1,000,000 | 1,053,190 |
| New Jersey Educational Facilities Authority, Revenue | | | | |
| (Rowan University Issue) (Insured; FGIC) (Prerefunded) | 5.25 | 7/1/11 | 100,000a | 102,686 |
| New Jersey Educational Facilities Authority, Revenue (Rowan | | | | |
| University Issue) (Insured; National Public Finance Guarantee Corp.) | 5.25 | 6/30/13 | 900,000 | 921,330 |
| New Jersey Educational Facilities Authority, Revenue | | | | |
| (University of Medicine and Dentistry of New Jersey Issue) | 7.50 | 12/1/32 | 3,750,000 | 4,129,050 |
STATEMENT OF INVESTMENTS (Unaudited) (continued)
| | | | | |
| BNY Mellon National Intermediate Municipal Bond Fund (continued) | | |
| Long-Term Municipal | Coupon | Maturity | Principal | |
| Investments (continued) | Rate (%) | Date | Amount ($) | Value ($) |
| New Jersey (continued) | | | | |
| New Jersey Transportation Trust Fund | | | | |
| Authority (Transportation System) | 0.00 | 12/15/29 | 10,000,000e | 3,054,400 |
| New Jersey Transportation Trust Fund | | | | |
| Authority (Transportation System) | 0.00 | 12/15/30 | 15,000,000e | 4,227,900 |
| New Jersey Turnpike Authority, Turnpike Revenue | | | | |
| (Insured; National Public Finance Guarantee Corp.) | 5.00 | 1/1/19 | 1,000,000 | 1,061,420 |
| Tobacco Settlement Financing Corporation of New Jersey, | | | | |
| Tobacco Settlement Asset-Backed Bonds | 4.50 | 6/1/23 | 8,945,000 | 7,475,158 |
| New Mexico—1.6% | | | | |
| New Mexico Finance Authority, Revenue | | | | |
| (Public Project Revolving Fund) (Insured; AMBAC) | 5.25 | 6/1/17 | 1,000,000 | 1,114,560 |
| New Mexico Finance Authority, | | | | |
| State Transportation Senior Lien Revenue | 5.00 | 6/15/18 | 5,000,000 | 5,818,400 |
| New Mexico Finance Authority, | | | | |
| State Transportation Senior Lien Revenue | 5.00 | 6/15/21 | 15,000,000 | 17,371,950 |
| New York—6.9% | | | | |
| Albany Industrial Development Agency, Civic Facility | | | | |
| Revenue (Saint Peter's Hospital of the City of Albany Project) | 5.75 | 11/15/22 | 1,000,000 | 1,031,490 |
| Greece Central School District, GO (Insured; FGIC) | 6.00 | 6/15/11 | 950,000 | 966,064 |
| Greece Central School District, GO (Insured; FGIC) | 6.00 | 6/15/12 | 950,000 | 1,018,723 |
| Greece Central School District, GO (Insured; FGIC) | 6.00 | 6/15/13 | 950,000 | 1,067,249 |
| Greece Central School District, GO (Insured; FGIC) | 6.00 | 6/15/14 | 950,000 | 1,103,672 |
| Greece Central School District, GO (Insured; FGIC) | 6.00 | 6/15/15 | 950,000 | 1,135,079 |
| Long Island Power Authority, Electric System General Revenue | 5.25 | 12/1/12 | 4,000,000 | 4,289,400 |
| Metropolitan Transportation Authority, Commuter Facilities Revenue | 5.50 | 7/1/11 | 1,000,000 | 1,004,460 |
| Metropolitan Transportation Authority, Dedicated Tax Fund | | | | |
| Revenue (Insured; National Public Finance Guarantee Corp.) | 5.00 | 11/15/28 | 2,880,000 | 2,921,213 |
| Metropolitan Transportation Authority, | | | | |
| State Service Contract Revenue | 5.50 | 7/1/16 | 5,000,000 | 5,610,400 |
| Metropolitan Transportation Authority, | | | | |
| State Service Contract Revenue | 5.75 | 1/1/18 | 1,500,000 | 1,740,285 |
| Metropolitan Transportation Authority, | | | | |
| Transit Facilities Revenue (Insured; FGIC) | 0.00 | 7/1/11 | 1,000,000e | 998,770 |
| Metropolitan Transportation Authority, Transportation Revenue | 6.50 | 11/15/28 | 12,000,000 | 13,391,280 |
| Monroe County, Public Improvement GO | 6.00 | 6/1/11 | 115,000 | 116,553 |
| New York City, GO | 5.13 | 12/1/24 | 10,000,000 | 10,524,900 |
| New York City, GO | 5.13 | 12/1/25 | 10,000,000 | 10,440,000 |
| New York City Municipal Water Finance Authority, | | | | |
| Water and Sewer System Second General Resolution Revenue | 5.50 | 6/15/40 | 3,500,000 | 3,608,990 |
| New York City Transitional Finance Authority, | | | | |
| Future Tax Secured Revenue | 5.38 | 11/15/21 | 1,050,000 | 1,113,893 |
| New York City Transitional Finance Authority, | | | | |
| Future Tax Secured Revenue | 5.50/14.00 | 11/1/26 | 3,000,000h | 3,092,880 |
26
| | | | |
| BNY Mellon National Intermediate Municipal Bond Fund (continued) | | |
| Long-Term Municipal | Coupon | Maturity | Principal | |
| Investments (continued) | Rate (%) | Date | Amount ($) | Value ($) |
| New York (continued) | | | | |
| New York Liberty Development Corporation, | | | | |
| Revenue (Goldman Sachs Headquarters Issue) | 5.00 | 10/1/15 | 1,000,000 | 1,062,210 |
| New York Local Government Assistance Corporation, Revenue | 6.00 | 4/1/12 | 1,370,000 | 1,405,086 |
| New York State Dormitory Authority, Revenue (Consolidated City | | | | |
| University System) (Insured; Assured Guaranty Municipal Corp.) | 5.75 | 7/1/18 | 200,000 | 228,290 |
| New York State Mortgage Agency, Homeowner Mortgage Revenue | 5.00 | 10/1/18 | 1,500,000 | 1,505,220 |
| New York State Thruway Authority, Second General | | | | |
| Highway and Bridge Trust Fund Bonds | 5.00 | 4/1/15 | 5,000,000 | 5,550,000 |
| New York State Thruway Authority, Second General | | | | |
| Highway and Bridge Trust Fund Bonds | 5.00 | 4/1/16 | 5,000,000 | 5,600,350 |
| New York State Thruway Authority, Second General | | | | |
| Highway and Bridge Trust Fund Bonds | 5.00 | 4/1/21 | 5,000,000 | 5,387,600 |
| New York State Thruway Authority, Second General | | | | |
| Highway and Bridge Trust Fund Bonds (Insured; AMBAC) | 5.00 | 4/1/25 | 3,000,000 | 3,090,150 |
| New York State Thruway Authority, Second General | | | | |
| Highway and Bridge Trust Fund Bonds | | | | |
| (Insured; Assured Guaranty Municipal Corp.) | 5.00 | 4/1/24 | 4,500,000 | 4,698,450 |
| Port Authority of New York and New Jersey, Special Project | | | | |
| Revenue (JFK International Air Terminal LLC Project) | 6.00 | 12/1/36 | 2,000,000 | 1,966,320 |
| Tobacco Settlement Financing Corporation of New York, Asset-Backed | | | | |
| Revenue Bonds (State Contingency Contract Secured) | 5.50 | 6/1/19 | 5,000,000 | 5,364,250 |
| Tobacco Settlement Financing Corporation of New York, | | | | |
| Asset-Backed Revenue Bonds (State Contingency Contract | | | | |
| Secured) (Insured; National Public Finance Guarantee Corp.) | 5.50 | 6/1/18 | 2,000,000 | 2,090,940 |
| North Carolina—4.9% | | | | |
| Charlotte, GO | 5.00 | 4/1/13 | 1,000,000 | 1,088,030 |
| Concord, COP (Insured; National Public Finance Guarantee Corp.) | 5.50 | 6/1/11 | 1,000,000 | 1,012,610 |
| North Carolina, GO | 5.00 | 5/1/18 | 14,740,000 | 17,370,795 |
| North Carolina Eastern Municipal Power Agency, | | | | |
| Power System Revenue | 5.38 | 1/1/16 | 1,500,000 | 1,581,270 |
| North Carolina Eastern Municipal Power Agency, | | | | |
| Power System Revenue | 5.00 | 1/1/17 | 8,050,000 | 9,191,329 |
| North Carolina Eastern Municipal Power Agency, | | | | |
| Power System Revenue | 5.25 | 1/1/20 | 5,000,000 | 5,364,400 |
| North Carolina Eastern Municipal Power Agency, | | | | |
| Power System Revenue | 5.00 | 1/1/26 | 18,000,000 | 17,757,720 |
| North Carolina Eastern Municipal Power Agency, Power System | | | | |
| Revenue (Insured; National Public Finance Guarantee Corp.) | 6.00 | 1/1/25 | 4,075,000 | 4,543,177 |
| North Carolina Municipal Power Agency Number 1, | | | | |
| Catawba Electric Revenue | 5.50 | 1/1/13 | 2,770,000 | 2,932,821 |
| North Carolina Municipal Power Agency Number 1, | | | | |
| Catawba Electric Revenue | 5.00 | 1/1/24 | 5,500,000 | 5,749,920 |
| Wake County, LOR | 5.00 | 1/1/24 | 5,955,000 | 6,447,538 |
STATEMENT OF INVESTMENTS (Unaudited) (continued)
| | | | |
| BNY Mellon National Intermediate Municipal Bond Fund (continued) | | |
| Long-Term Municipal | Coupon | Maturity | Principal | |
| Investments (continued) | Rate (%) | Date | Amount ($) | Value ($) |
| Ohio—1.1% | | | | |
| Akron, Sanitary Sewer System Special Revenue (Insured; AMBAC) | 6.00 | 12/1/14 | 500,000 | 502,175 |
| Cuyahoga County, Revenue (Cleveland Clinic | | | | |
| Health System Obligated Group) | 6.00 | 1/1/15 | 2,265,000 | 2,463,890 |
| Cuyahoga County, Revenue (Cleveland Clinic | | | | |
| Health System Obligated Group) | 6.00 | 1/1/17 | 3,900,000 | 4,232,592 |
| Cuyahoga County, Revenue (Cleveland Clinic | | | | |
| Health System Obligated Group) | 5.75 | 1/1/24 | 4,000,000 | 4,195,200 |
| Montgomery County, Revenue (Catholic Health Initiatives) | 6.00 | 10/1/23 | 3,055,000 | 3,363,280 |
| Ohio Housing Finance Agency, MFHR (Uptown Towers | | | | |
| Apartments Project) (Collateralized; GNMA) | 4.75 | 10/20/15 | 855,000 | 892,877 |
| Toledo-Lucas County Port Authority, | | | | |
| Port Facilities Revenue (Cargill, Inc. Project) | 4.50 | 12/1/15 | 900,000 | 957,771 |
| Oregon—.1% | | | | |
| Portland, Convention Center Urban Renewal and | | | | |
| Redevelopment Bonds (Insured; AMBAC) | 5.75 | 6/15/18 | 1,150,000 | 1,159,729 |
| Pennsylvania—1.2% | | | | |
| Allegheny County Hospital Development Authority, | | | | |
| Revenue (University of Pittsburgh Medical Center) | 5.25 | 6/15/15 | 1,620,000 | 1,811,889 |
| Pennsylvania Turnpike Commission, Turnpike Subordinate Revenue | 5.00 | 6/1/18 | 5,000,000 | 5,378,200 |
| Philadelphia School District, GO | 5.00 | 9/1/13 | 5,000,000 | 5,324,200 |
| Philadelphia School District, GO (Insured; AMBAC) | 5.00 | 4/1/17 | 2,165,000 | 2,303,971 |
| Swarthmore Borough Authority, Revenue (Swarthmore College) | 5.00 | 9/15/11 | 1,000,000 | 1,025,270 |
| Swarthmore Borough Authority, Revenue (Swarthmore College) | 5.00 | 9/15/12 | 1,400,000 | 1,493,506 |
| Rhode Island—.1% | | | | |
| Rhode Island Health and Educational Building Corporation, | | | | |
| Higher Educational Facility Revenue | | | | |
| (Providence College Issue) (Insured; XLCA) | 4.50 | 11/1/17 | 795,000 | 822,396 |
| Rhode Island Health and Educational Building Corporation, | | | | |
| Higher Educational Facility Revenue | | | | |
| (Providence College Issue) (Insured; XLCA) | 5.00 | 11/1/22 | 250,000 | 255,155 |
| South Carolina—1.8% | | | | |
| Greenville County School District, Installment Purchase | | | | |
| Revenue (Building Equity Sooner for Tomorrow) | 5.50 | 12/1/18 | 3,000,000 | 3,447,690 |
| Greenville County School District, Installment Purchase | | | | |
| Revenue (Building Equity Sooner for Tomorrow) | 5.00 | 12/1/24 | 350,000 | 354,949 |
| Newberry Investing in Children's Education, | | | | |
| Installment Purchase Revenue (School District of | | | | |
| Newberry County, South Carolina Project) | 5.25 | 12/1/20 | 1,000,000 | 1,030,870 |
| Piedmont Municipal Power Agency, Electric Revenue | 5.00 | 1/1/18 | 15,080,000 | 16,473,694 |
| South Carolina Jobs and Economic Development Authority, | | | | |
| Hospital Facilities Revenue (Georgetown | | | | |
| Memorial Hospital) (Insured; Radian) | 5.25 | 2/1/21 | 1,250,000 | 1,230,975 |
| Spartanburg Sanitary Sewer District, Sewer System | | | | |
| Revenue (Insured; Assured Guaranty Municipal Corp.) | 4.13 | 3/1/26 | 950,000 | 955,691 |
28
| | | | | |
| BNY Mellon National Intermediate Municipal Bond Fund (continued) | | |
| Long-Term Municipal | Coupon | Maturity | Principal | |
| Investments (continued) | Rate (%) | Date | Amount ($) | Value ($) |
| South Carolina (continued) | | | | |
| Spartanburg Sanitary Sewer District, Sewer System | | | | |
| Revenue (Insured; Assured Guaranty Municipal Corp.) | 4.25 | 3/1/27 | 3,130,000 | 3,154,477 |
| Tennessee—.5% | | | | |
| Metropolitan Government of Nashville and Davidson County, GO | 5.00 | 7/1/22 | 7,000,000 | 7,886,690 |
| Texas—10.1% | | | | |
| Cities of Dallas and Fort Worth, Dallas/Fort Worth International | | | | |
| Airport, Joint Revenue Improvement Bonds (Insured; | | | | |
| National Public Finance Guarantee Corp.) | 5.50 | 11/1/31 | 1,000,000 | 999,950 |
| Dallas, GO | 5.00 | 2/15/27 | 2,500,000 | 2,612,725 |
| Forney Independent School District, Unlimited Tax School | | | | |
| Building Bonds (Permanent School Fund Guarantee Program) | 5.75 | 8/15/33 | 1,000,000 | 1,077,500 |
| Harris County, Toll Road Senior Lien Revenue | | | | |
| (Insured; Assured Guaranty Municipal Corp.) | 5.00 | 8/15/30 | 11,735,000 | 11,751,194 |
| Harris County, Toll Road Senior Lien Revenue | | | | |
| (Insured; National Public Finance Guarantee Corp.) | 5.00 | 8/15/25 | 4,000,000 | 4,132,960 |
| Harris County, Unlimited Tax Road Bonds | 5.00 | 10/1/21 | 13,705,000 | 15,585,737 |
| Harris County Health Facilities Development Corporation, HR | | | | |
| (Memorial Hermann Healthcare System) | 7.00 | 12/1/27 | 5,000,000 | 5,448,150 |
| Houston, Airport System Senior Lien Revenue | 5.50 | 7/1/39 | 6,000,000 | 6,013,860 |
| Houston, Public Improvement GO | 5.00 | 3/1/18 | 5,000,000 | 5,787,900 |
| Katy Independent School District, Unlimited Tax Refunding | | | | |
| Bonds (Permanent School Fund Guarantee Program) | 0.00 | 2/15/16 | 1,505,000e | 1,337,373 |
| Klein Independent School District, Unlimited Tax Schoolhouse | | | | |
| Bonds (Permanent School Fund Guarantee Program) (Prerefunded) | 5.00 | 8/1/12 | 1,575,000a | 1,675,327 |
| Love Field Airport Modernization Corporation, | | | | |
| Special Facilities Revenue (Southwest Airlines | | | | |
| Company—Love Field Modernization Program Project) | 5.25 | 11/1/40 | 15,500,000 | 13,876,685 |
| Lower Colorado River Authority, Junior Lien Revenue (Seventh | | | | |
| Supplemental Series) (Insured; Assured Guaranty Municipal Corp.) | 5.00 | 1/1/15 | 1,135,000 | 1,285,694 |
| Lower Colorado River Authority, Revenue | 5.00 | 5/15/16 | 14,000,000 | 15,856,400 |
| Royse City Independent School District, Unlimited Tax School | | | | |
| Building Bonds (Permanent School Fund Guarantee Program) | 0.00 | 8/15/14 | 3,260,000e | 3,069,681 |
| San Antonio, Electric and Gas Systems Revenue | 5.00 | 2/1/17 | 5,000,000 | 5,760,150 |
| San Antonio, Electric and Gas Systems Revenue | 5.00 | 2/1/25 | 10,000,000 | 10,622,700 |
| Socorro Independent School District, Unlimited Tax School | | | | |
| Building Bonds (Permanent School Fund Guarantee Program) | 5.38 | 8/15/19 | 90,000 | 91,803 |
| Socorro Independent School District, Unlimited | | | | |
| Tax School Building Bonds (Permanent School | | | | |
| Fund Guarantee Program) (Prerefunded) | 5.38 | 8/15/11 | 1,560,000a | 1,596,598 |
| Texas A&M University System Board of Regents, | | | | |
| Financing System Revenue (Prerefunded) | 5.38 | 5/11/11 | 810,000a | 818,780 |
| Texas Department of Housing and Community Affairs, SFMR | | | | |
| (Collateralized: FNMA and GNMA and Insured; | | | | |
| National Public Finance Guarantee Corp.) | 5.45 | 9/1/23 | 970,000 | 975,374 |
STATEMENT OF INVESTMENTS (Unaudited) (continued)
| | | | |
| BNY Mellon National Intermediate Municipal Bond Fund (continued) | | |
| Long-Term Municipal | Coupon | Maturity | Principal | |
| Investments (continued) | Rate (%) | Date | Amount ($) | Value ($) |
| Texas (continued) | | | | |
| Texas Public Finance Authority, Unemployment | | | | |
| Compensation Obligation Assessment Revenue | 5.00 | 7/1/17 | 7,500,000 | 8,424,750 |
| Texas Public Finance Authority, Unemployment | | | | |
| Compensation Obligation Assessment Revenue | 5.00 | 1/1/20 | 10,000,000 | 10,731,700 |
| Texas Tech University System Board of Regents, | | | | |
| Finance System and Improvement Revenue (Insured; AMBAC) | 5.00 | 2/15/12 | 2,000,000 | 2,087,040 |
| Texas Transportation Commission, | | | | |
| State Highway Fund First Tier Revenue | 5.00 | 4/1/20 | 15,000,000 | 16,762,950 |
| Texas Water Development Board, State Revolving | | | | |
| Fund Subordinate Lien Revenue | 5.00 | 7/15/24 | 4,500,000 | 4,795,110 |
| Utah—1.1% | | | | |
| Utah, GO | 5.00 | 7/1/18 | 13,995,000 | 16,508,922 |
| Vermont—.3% | | | | |
| Burlington, Electric Revenue (Insured; | | | | |
| National Public Finance Guarantee Corp.) | 6.25 | 7/1/11 | 2,000,000 | 2,037,500 |
| Burlington, Electric Revenue (Insured; | | | | |
| National Public Finance Guarantee Corp.) | 6.25 | 7/1/12 | 2,500,000 | 2,665,500 |
| Vermont Housing Finance Agency, SFHR | | | | |
| (Insured; Assured Guaranty Municipal Corp.) | 4.85 | 5/1/11 | 495,000 | 495,822 |
| Virginia—.5% | | | | |
| Chesterfield County Industrial Development Authority, | | | | |
| PCR (Virginia Electric and Power Company Project) | 5.88 | 6/1/17 | 2,500,000 | 2,555,700 |
| Virginia College Building Authority, Educational Facilities | | | | |
| Revenue (Public Higher Education Financing Program) | 5.00 | 9/1/16 | 4,070,000 | 4,692,588 |
| Washington—1.5% | | | | |
| Energy Northwest, Electric Revenue (Project Number 1) | | | | |
| (Insured; Assured Guaranty Municipal Corp.) | 5.50 | 7/1/13 | 1,000,000 | 1,063,420 |
| FYI Properties, LR (State of Washington | | | | |
| Department of Information Services Project) | 5.25 | 6/1/29 | 5,625,000 | 5,714,944 |
| Tumwater Office Properties, LR (Washington State Office Building) | 5.00 | 7/1/28 | 16,230,000 | 16,335,495 |
| West Virginia—.5% | | | | |
| Monongalia County Building Commission, HR | | | | |
| (Monongalia General Hospital) | 5.25 | 7/1/20 | 3,630,000 | 3,701,656 |
| West Virginia Economic Development Authority, PCR | | | | |
| (Appalachian Power Company—Amos Project) | 4.85 | 9/4/13 | 1,000,000 | 1,056,870 |
| West Virginia Economic Development Authority, PCR | | | | |
| (Appalachian Power Company—Amos Project) | 4.85 | 9/4/13 | 2,600,000 | 2,747,862 |
| Wisconsin—2.0% | | | | |
| Wisconsin, General Fund Annual Appropriation Bonds | 6.00 | 5/1/36 | 9,500,000 | 10,140,205 |
| Wisconsin, GO | 5.00 | 5/1/20 | 5,800,000 | 6,521,694 |
| Wisconsin, Transportation Revenue | | | | |
| (Insured; National Public Finance Guarantee Corp.) | 5.00 | 7/1/18 | 11,825,000 | 13,097,961 |
| U.S. Related—4.9% | | | | |
| Puerto Rico Commonwealth, Public Improvement GO | 5.00 | 7/1/12 | 2,000,000 | 2,059,480 |
30
| | | | | |
| BNY Mellon National Intermediate Municipal Bond Fund (continued) | | |
| Long-Term Municipal | Coupon | Maturity | Principal | |
| Investments (continued) | Rate (%) | Date | Amount ($) | Value ($) |
| U.S. Related (continued) | | | | |
| Puerto Rico Commonwealth, Public Improvement GO | | | | |
| (Insured; National Public Finance Guarantee Corp.) | 6.25 | 7/1/11 | 950,000 | 969,304 |
| Puerto Rico Commonwealth, Public Improvement GO | | | | |
| (Insured; National Public Finance Guarantee Corp.) | 6.25 | 7/1/13 | 1,380,000 | 1,490,414 |
| Puerto Rico Electric Power Authority, Power Revenue | 5.25 | 7/1/18 | 5,000,000 | 5,349,650 |
| Puerto Rico Electric Power Authority, Power Revenue | 5.25 | 7/1/23 | 5,000,000 | 5,053,000 |
| Puerto Rico Electric Power Authority, Power Revenue | | | | |
| (Insured; National Public Finance Guarantee Corp.) | 5.25 | 7/1/15 | 2,000,000 | 2,167,500 |
| Puerto Rico Electric Power Authority, Power Revenue | | | | |
| (Insured; National Public Finance Guarantee Corp.) | 5.00 | 7/1/17 | 3,940,000 | 4,126,598 |
| Puerto Rico Government Development Bank, Senior Notes | 5.00 | 12/1/12 | 10,000,000 | 10,437,400 |
| Puerto Rico Government Development Bank, Senior Notes | 5.00 | 12/1/13 | 4,000,000 | 4,221,600 |
| Puerto Rico Housing Finance Authority, Capital Fund Program | | | | |
| Revenue (Puerto Rico Public Housing Administration Projects) | 5.00 | 12/1/11 | 580,000 | 599,853 |
| Puerto Rico Housing Finance Authority, Capital Fund Program | | | | |
| Revenue (Puerto Rico Public Housing Administration Projects) | 5.00 | 12/1/11 | 420,000 | 432,617 |
| Puerto Rico Public Buildings Authority, Government Facility Revenue | 5.50 | 7/1/14 | 1,000,000 | 1,069,680 |
| Puerto Rico Public Buildings Authority, Government Facility Revenue | 5.50 | 7/1/15 | 995,000 | 1,049,466 |
| Puerto Rico Public Buildings Authority, Government Facility Revenue | 5.50 | 7/1/15 | 5,000 | 5,855 |
| Puerto Rico Public Buildings Authority, Government Facility Revenue | 5.50 | 7/1/16 | 5,000 | 5,970 |
| Puerto Rico Public Buildings Authority, Government Facility Revenue | 5.50 | 7/1/16 | 1,995,000 | 2,085,294 |
| Puerto Rico Public Buildings Authority, Government Facility Revenue | 5.75 | 7/1/17 | 1,940,000 | 2,048,815 |
| Puerto Rico Public Buildings Authority, Government Facility Revenue | 5.75 | 7/1/17 | 5,000 | 6,060 |
| Puerto Rico Sales Tax Financing Corporation, | | | | |
| Sales Tax Revenue (First Subordinate Series) | 0/6.75 | 8/1/32 | 11,000,000c | 8,907,140 |
| Puerto Rico Sales Tax Financing Corporation, | | | | |
| Sales Tax Revenue (First Subordinate Series) | 0/6.25 | 8/1/33 | 2,500,000c | 1,706,125 |
| Puerto Rico Sales Tax Financing Corporation, | | | | |
| Sales Tax Revenue (First Subordinate Series) | 6.00 | 8/1/42 | 17,500,000 | 17,498,950 |
| Puerto Rico Sales Tax Financing Corporation, | | | | |
| Sales Tax Revenue (First Subordinate Series) | 6.50 | 8/1/44 | 2,500,000 | 2,605,050 |
| Total Long-Term Municipal Investments | | | | |
| (cost $1,461,384,345) | | | | 1,485,413,406 |
| |
| Short-Term Municipal Investments—1.2% | | | | |
| Colorado—.3% | | | | |
| Colorado Educational and Cultural Facilities Authority, Revenue | | | | |
| (National Jewish Federation Bond Program) (LOC; Bank of America) | 0.26 | 3/1/11 | 2,420,000i | 2,420,000 |
| Colorado Health Facilities Authority, HR, Refunding (North Colorado | | | | |
| Medical Center, Inc. Project) (LOC; Wells Fargo Bank) | 0.21 | 3/1/11 | 2,200,000i | 2,200,000 |
| Connecticut—.0% | | | | |
| Connecticut Health and Educational Facilities Authority, | | | | |
| Revenue (Edgehill Issue) (LOC; JPMorgan Chase Bank) | 0.23 | 3/1/11 | 500,000i | 500,000 |
STATEMENT OF INVESTMENTS (Unaudited) (continued)
| | | | | |
| BNY Mellon National Intermediate Municipal Bond Fund (continued) | | | |
| Short-Term Municipal | Coupon | Maturity | Principal | | |
| Investments (continued) | Rate (%) | Date | Amount ($) | | Value ($) |
| Florida—.1% | | | | | |
| Orange County Health Facilities Authority, HR (Orlando Regional | | | | | |
| Healthcare System) (Insured; Assured Guaranty Municipal Corp. | | | | | |
| and Liquidity Facility; Dexia Credit Locale) | 0.33 | 3/1/11 | 1,700,000 | i | 1,700,000 |
| Iowa—.1% | | | | | |
| Iowa Higher Education Loan Authority, Private College Facility | | | | | |
| Revenue (Des Moines University Project) (LOC; U.S. Bank NA) | 0.23 | 3/1/11 | 1,420,000 | i | 1,420,000 |
| Kentucky—.1% | | | | | |
| Trimble County, Lease Program Revenue (Kentucky | | | | | |
| Association of Counties Leasing Trust) (LOC; U.S. Bank NA) | 0.19 | 3/1/11 | 1,400,000 | i | 1,400,000 |
| Massachusetts—.0% | | | | | |
| Massachusetts, Consolidated Loan | | | | | |
| (Liquidity Facility; Dexia Credit Locale) | 0.28 | 3/1/11 | 200,000 | i | 200,000 |
| New Hampshire—.1% | | | | | |
| New Hampshire Business Finance Authority, Revenue | | | | | |
| (Huggins Hospital Issue) (LOC; TD Bank) | 0.23 | 3/1/11 | 1,400,000 | i | 1,400,000 |
| Ohio—.1% | | | | | |
| Allen County, Hospital Facilities Revenue | | | | | |
| (Catholic Healthcare Partners) (LOC; Wells Fargo Bank) | 0.19 | 3/1/11 | 900,000 | i | 900,000 |
| Pennsylvania—.1% | | | | | |
| Lancaster County Hospital Authority, Health System | | | | | |
| Revenue (The Lancaster General Hospital | | | | | |
| Refunding Project) (LOC; Bank of America) | 0.24 | 3/1/11 | 900,000 | i | 900,000 |
| Tennessee—.3% | | | | | |
| Clarksville Public Building Authority, Pooled Financing Revenue | | | | | |
| (Tennessee Municipal Bond Fund) (LOC; Bank of America) | 0.27 | 3/1/11 | 2,200,000 | i | 2,200,000 |
| Montgomery County Public Building Authority, Pooled Financing | | | | | |
| Revenue (Tennessee County Loan Pool) (LOC; Bank of America) | 0.27 | 3/1/11 | 3,290,000 | i | 3,290,000 |
| Total Short-Term Municipal Investments | | | | | |
| (cost $18,530,000) | | | | | 18,530,000 |
| |
| Total Investments (cost $1,479,914,345) | | | 100.0 | % | 1,503,943,406 |
| Cash and Receivables (Net) | | | .0 | % | 40,779 |
| Net Assets | | | 100.0 | % | 1,503,984,185 |
|
| a These securities are prerefunded; the date shown represents the prerefunded date. Bonds which are prerefunded are collateralized by U.S. Government securities which are held in |
| escrow and are used to pay principal and interest on the municipal issue and to retire the bonds in full at the earliest refunding date. |
| b Securities exempt from registration under Rule 144A of the Securities Act of 1933.These securities may be resold in transactions exempt from registration, normally to qualified |
| institutional buyers.At February 28, 2011, these securities had a value of $5,913,951 or 0.4% of net assets. |
| c Zero coupon until a specified date at which time the stated coupon rate becomes effective until maturity. |
| d Purchased on a delayed delivery basis. |
| e Security issued with a zero coupon. Income is recognized through the accretion of discount. |
| f Variable rate security—interest rate subject to periodic change. |
| g Non-income producing—security in default. |
| h Subject to interest rate change on November 1, 2011. |
| i Variable rate demand note—rate shown is the interest rate in effect at February 28, 2011. Maturity date represents the next demand date, or the ultimate maturity date if earlier. |
32
| | | | | | |
| Summary of Abbreviations | | | | |
| |
| ABAG | Association of Bay Area Governments | | ACA | American Capital Access |
| AGC | ACE Guaranty Corporation | | AGIC | Asset Guaranty Insurance Company |
| AMBAC | American Municipal Bond Assurance Corporation | ARRN | Adjustable Rate Receipt Notes |
| BAN | Bond Anticipation Notes | | BPA | Bond Purchase Agreement |
| CIFG | CDC Ixis Financial Guaranty | | COP | Certificate of Participation |
| CP | Commercial Paper | | EDR | Economic Development Revenue |
| EIR | Environmental Improvement Revenue | | FGIC | Financial Guaranty Insurance Company |
| FHA | Federal Housing Administration | | FHLB | Federal Home Loan Bank |
| FHLMC | Federal Home Loan Mortgage Corporation | FNMA | Federal National Mortgage Association |
| GAN | Grant Anticipation Notes | | GIC | Guaranteed Investment Contract |
| GNMA | Government National Mortgage Association | GO | General Obligation | |
| HR | Hospital Revenue | | IDB | Industrial Development Board |
| IDC | Industrial Development Corporation | | IDR | Industrial Development Revenue |
| LOC | Letter of Credit | | | LOR | Limited Obligation Revenue |
| LR | Lease Revenue | | | MFHR | Multi-Family Housing Revenue |
| MFMR | Multi-Family Mortgage Revenue | | PCR | Pollution Control Revenue |
| PILOT | Payment in Lieu of Taxes | | PUTTERS | Puttable Tax-Exempt Receipts |
| RAC | Revenue Anticipation Certificates | | RAN | Revenue Anticipation Notes |
| RAW | Revenue Anticipation Warrants | | RRR | Resources Recovery Revenue |
| SAAN | State Aid Anticipation Notes | | SBPA | Standby Bond Purchase Agreement |
| SFHR | Single Family Housing Revenue | | SFMR | Single Family Mortgage Revenue |
| SONYMA | State of New York Mortgage Agency | | SWDR | Solid Waste Disposal Revenue |
| TAN | Tax Anticipation Notes | | TAW | Tax Anticipation Warrants |
| TRAN | Tax and Revenue Anticipation Notes | | XLCA | XL Capital Assurance |
| |
| |
| |
| Summary of Combined Ratings (Unaudited) | | | |
| |
| Fitch | or | Moody’s | or | Standard & Poor’s | Value (%)† |
| AAA | | Aaa | | AAA | | 27.0 |
| AA | | Aa | | AA | | 43.2 |
| A | | A | | A | | 20.0 |
| BBB | | Baa | | BBB | | 8.2 |
| BB | | Ba | | BB | | .1 |
| F1 | | MIG1/P1 | | SP1/A1 | | 1.2 |
| Not Ratedj | | Not Ratedj | | Not Ratedj | | .3 |
| | | | | | | 100.0 |
|
| † Based on total investments. |
| j Securities which, while not rated by Fitch, Moody's and Standard & Poor's, have been determined by the Manager to be of comparable quality to those rated securities in which the |
| fund may invest. |
See notes to financial statements.
|
| STATEMENT OF INVESTMENTS |
| February 28, 2011 (Unaudited) |
| | | | |
| BNY Mellon National Short-Term Municipal Bond Fund | | | |
| Long-Term Municipal | Coupon | Maturity | Principal | |
| Investments—92.4% | Rate (%) | Date | Amount ($) | Value ($) |
| Alabama—.4% | | | | |
| Jefferson County, Limited Obligation School Warrants | | | | |
| (Insured; Assured Guaranty Municipal Corp.) | 5.50 | 2/15/16 | 1,370,000 | 1,358,780 |
| Jefferson County, Sewer Revenue Warrants | | | | |
| (Insured; Assured Guaranty Municipal Corp.) | 5.25 | 2/1/13 | 3,000,000 | 2,884,740 |
| Alaska—.5% | | | | |
| Alaska Industrial Development and | | | | |
| Export Authority, Revolving Fund Revenue | 5.00 | 4/1/14 | 2,370,000 | 2,581,191 |
| Anchorage, Senior Lien Electric Revenue | | | | |
| (Insured; National Public Finance Guarantee Corp.) | 5.00 | 12/1/11 | 1,000,000 | 1,033,920 |
| North Slope Borough, GO | 5.00 | 6/30/12 | 1,000,000 | 1,057,280 |
| Arizona—3.3% | | | | |
| Arizona Health Facilities Authority, | | | | |
| Health Facility Revenue (Catholic Healthcare West) | 5.00 | 7/2/12 | 4,000,000 | 4,161,760 |
| Arizona School Facilities Board, COP (Lease-to-Own-Agreement) | 5.50 | 9/1/13 | 3,300,000 | 3,562,482 |
| Arizona School Facilities Board, COP (Lease-to-Own-Agreement) | | | | |
| (Insured; National Public Finance Guarantee Corp.) | 5.00 | 9/1/12 | 1,275,000 | 1,337,335 |
| Arizona School Facilities Board, COP (Lease-to-Own-Agreement) | | | | |
| (Insured; National Public Finance Guarantee Corp.) | 5.00 | 9/1/13 | 10,950,000 | 11,688,139 |
| Arizona Transportation Board, Subordinated Highway Revenue | 5.00 | 7/1/14 | 2,165,000 | 2,409,147 |
| Scottsdale, GO (Projects of 2000 and 2004) | 5.00 | 7/1/13 | 3,000,000 | 3,287,640 |
| University of Arizona Board of Regents, System Revenue | 6.20 | 6/1/16 | 5,000,000 | 5,600,850 |
| California—5.6% | | | | |
| California, Economic Recovery Bonds | 2.50 | 7/1/12 | 2,000,000 | 2,035,160 |
| California, GO (Various Purpose) | 5.00 | 9/1/12 | 3,220,000 | 3,401,544 |
| California Department of Water Resources, Power Supply Revenue | 5.00 | 5/1/13 | 5,000,000 | 5,418,550 |
| California Health Facilities Financing Authority, | | | | |
| Health Facility Revenue (Catholic Healthcare West) | 5.00 | 7/2/12 | 1,500,000 | 1,569,675 |
| California Health Facilities Financing Authority, | | | | |
| Health Facility Revenue (Catholic Healthcare West) | 5.00 | 7/2/12 | 3,000,000 | 3,143,040 |
| California Infrastructure and Economic Development Bank, | | | | |
| Revenue (The J. Paul Getty Trust) | 3.90 | 12/1/11 | 2,000,000 | 2,051,240 |
| California Infrastructure and Economic Development Bank, | | | | |
| Revenue (The J. Paul Getty Trust) | 2.25 | 4/2/12 | 2,500,000 | 2,545,575 |
| California Statewide Communities Development Authority, | | | | |
| MFHR (Clara Park/Cypress Sunrise/Wysong | | | | |
| Plaza Apartments) (Collateralized; GNMA) | 4.55 | 1/20/16 | 1,065,000 | 1,116,237 |
| California Statewide Communities Development Authority, PCR | | | | |
| (Southern California Edison Company) (Insured; XLCA) | 4.10 | 4/1/13 | 1,000,000 | 1,037,260 |
| California Statewide Communities Development | | | | |
| Authority, Revenue (Kaiser Permanente) | 5.00 | 4/1/13 | 5,000,000 | 5,329,600 |
| California Statewide Communities Development Authority, | | | | |
| Revenue (Proposition 1A Receivables Program) | 5.00 | 6/15/13 | 13,000,000 | 13,746,980 |
| Golden State Tobacco Securitization Corporation, | | | | |
| Tobacco Settlement Asset-Backed Bonds | 5.00 | 6/1/11 | 1,005,000 | 1,009,955 |
34
| | | | | |
| BNY Mellon National Short-Term Municipal Bond Fund (continued) | | |
| Long-Term Municipal | Coupon | Maturity | Principal | |
| Investments (continued) | Rate (%) | Date | Amount ($) | Value ($) |
| California (continued) | | | | |
| Los Angeles County Capital Asset Leasing | | | | |
| Corporation, LR (LAC-CAL Equipment Program) | 5.00 | 6/1/11 | 2,665,000 | 2,693,835 |
| Los Angeles County Capital Asset Leasing | | | | |
| Corporation, LR (LAC-CAL Equipment Program) | 5.00 | 12/1/11 | 3,105,000 | 3,201,938 |
| Mount San Antonio Community College District, GO | | | | |
| (Insured; National Public Finance Guarantee Corp.) | 5.00 | 8/1/15 | 2,000,000 | 2,099,380 |
| Sacramento County Sanitation Districts Financing Authority, | | | | |
| Revenue (Sacramento Regional County Sanitation | | | | |
| District) (Insured; AMBAC) (Prerefunded) | 5.00 | 12/1/14 | 1,000,000a | 1,140,330 |
| San Bernardino County Transportation Authority, | | | | |
| Sales Tax Revenue Notes | 5.00 | 5/1/12 | 1,500,000 | 1,569,330 |
| Tuolumne Wind Project Authority, | | | | |
| Revenue (Tuolumne Company Project) | 4.00 | 1/1/13 | 1,000,000 | 1,042,900 |
| Colorado—1.1% | | | | |
| Black Hawk, Device Tax Revenue | 5.00 | 12/1/11 | 600,000 | 608,634 |
| Colorado Health Facilities Authority, | | | | |
| Revenue (Catholic Health Initiatives) | 5.00 | 11/12/13 | 5,000,000 | 5,415,550 |
| Denver City and County, Airport System Revenue | | | | |
| (Insured; National Public Finance Guarantee Corp.) | 5.50 | 11/15/15 | 5,000,000 | 5,137,450 |
| Connecticut—2.5% | | | | |
| Connecticut, GO (Economic Recovery) | 5.00 | 1/1/13 | 10,000,000 | 10,761,400 |
| Connecticut, GO (Economic Recovery) | 5.00 | 1/1/14 | 10,010,000 | 11,059,048 |
| Connecticut Health and Educational Facilities Authority, | | | | |
| Revenue (Ascension Health Credit Group) | 3.50 | 2/1/12 | 1,395,000 | 1,430,391 |
| Connecticut Health and Educational Facilities Authority, | | | | |
| Revenue (Quinnipiac University Issue) | | | | |
| (Insured; National Public Finance Guarantee Corp.) | 5.00 | 7/1/12 | 1,190,000 | 1,241,539 |
| Delaware—.5% | | | | |
| Delaware, GO | 5.00 | 10/1/13 | 3,275,000 | 3,620,840 |
| University of Delaware, Revenue | 2.00 | 6/1/11 | 1,675,000 | 1,681,901 |
| Florida—6.2% | | | | |
| Citizens Property Insurance Corporation, | | | | |
| High-Risk Account Senior Secured Revenue | 5.00 | 6/1/13 | 10,000,000 | 10,478,200 |
| Clearwater, Water and Sewer Revenue | 5.00 | 12/1/11 | 1,000,000 | 1,033,610 |
| Escambia County, SWDR (Gulf Power Company Project) | 2.00 | 4/3/12 | 2,500,000 | 2,516,625 |
| Florida Department of Environmental Protection, Florida Forever | | | | |
| Revenue (Insured; National Public Finance Guarantee Corp.) | 5.00 | 7/1/12 | 1,100,000 | 1,161,688 |
| Florida Department of Environmental Protection, Florida Forever | | | | |
| Revenue (Insured; National Public Finance Guarantee Corp.) | 5.00 | 7/1/13 | 6,100,000 | 6,624,844 |
| Florida Department of Environmental Protection, Florida Forever | | | | |
| Revenue (Insured; National Public Finance Guarantee Corp.) | 5.25 | 7/1/16 | 3,250,000 | 3,425,597 |
| Florida Department of Management Services, Florida Facilities | | | | |
| Pool Revenue (Insured; Assured Guaranty Municipal Corp.) | 5.25 | 9/1/13 | 1,825,000 | 1,981,603 |
STATEMENT OF INVESTMENTS (Unaudited) (continued)
| | | | | |
| BNY Mellon National Short-Term Municipal Bond Fund (continued) | | |
| Long-Term Municipal | Coupon | Maturity | Principal | |
| Investments (continued) | Rate (%) | Date | Amount ($) | Value ($) |
| Florida (continued) | | | | |
| Florida Hurricane Catastrophe Fund Finance Corporation, Revenue | 5.00 | 7/1/13 | 4,060,000 | 4,282,285 |
| Florida Hurricane Catastrophe Fund Finance Corporation, Revenue | 5.00 | 7/1/15 | 10,000,000 | 10,692,400 |
| Florida State Board of Education, Lottery Revenue (Insured; AMBAC) | 5.25 | 7/1/14 | 5,000,000 | 5,542,450 |
| Florida State Board of Education, Public Education Capital | | | | |
| Outlay Bonds (Insured; National Public Finance Guarantee Corp.) | 5.25 | 6/1/13 | 3,000,000 | 3,279,930 |
| Miami-Dade County, Double-Barreled Aviation GO | 5.00 | 7/1/14 | 1,000,000 | 1,102,830 |
| Miami-Dade County Health Facilities Authority, HR | | | | |
| (Miami Children's Hospital Project) (Insured; AMBAC) | 5.50 | 8/15/11 | 2,450,000 | 2,508,898 |
| Orlando-Orange County Expressway Authority, | | | | |
| Revenue (Insured; AMBAC) | 5.00 | 7/1/12 | 2,000,000 | 2,095,360 |
| Palm Beach County School Board, COP | | | | |
| (Master Lease Purchase Agreement) (Insured; AMBAC) | 5.25 | 8/1/11 | 1,000,000 | 1,018,810 |
| Palm Beach County School Board, COP | | | | |
| (Master Lease Purchase Agreement) (Insured; FGIC) | 5.00 | 8/1/11 | 2,200,000 | 2,237,246 |
| Georgia—3.8% | | | | |
| Atlanta, Airport General Revenue | | | | |
| (Insured; National Public Finance Guarantee Corp.) | 5.88 | 1/1/17 | 1,000,000 | 1,008,640 |
| Burke County Development Authority, PCR | | | | |
| (Oglethorpe Power Corporation Vogtle Project) | 6.50 | 4/1/11 | 2,000,000 | 2,010,300 |
| Forsyth County, GO | 5.00 | 3/1/12 | 2,000,000 | 2,093,720 |
| Georgia, GO | 5.00 | 5/1/12 | 1,270,000 | 1,337,869 |
| Georgia, GO | 4.50 | 12/1/12 | 3,125,000 | 3,340,437 |
| Georgia, GO | 4.00 | 7/1/13 | 5,000,000 | 5,366,150 |
| Georgia, GO (Prerefunded) | 5.00 | 8/1/12 | 5,000,000a | 5,321,150 |
| Gwinnett County School District, GO | 5.00 | 2/1/13 | 3,000,000 | 3,246,570 |
| Main Street Natural Gas, Inc., Gas Project Revenue | 5.00 | 3/15/11 | 5,000,000 | 5,009,050 |
| Main Street Natural Gas, Inc., Gas Project Revenue | 5.00 | 3/15/12 | 5,790,000 | 5,975,106 |
| Metropolitan Atlanta Rapid Transit Authority, Sales Tax Revenue | | | | |
| (Insured; National Public Finance Guarantee Corp.) (Prerefunded) | 5.00 | 1/1/13 | 2,000,000a | 2,159,180 |
| Hawaii—1.4% | | | | |
| Hawaii, GO (Insured; Assured Guaranty | | | | |
| Municipal Corp.) (Prerefunded) | 5.25 | 7/1/12 | 10,850,000a | 11,522,374 |
| Hawaii, GO (Insured; National Public Finance Guarantee Corp.) | 5.50 | 8/1/11 | 1,000,000 | 1,022,040 |
| Hawaii, GO (Insured; National Public Finance Guarantee Corp.) | 5.00 | 10/1/12 | 1,000,000 | 1,068,850 |
| Idaho—.3% | | | | |
| University of Idaho Regents, General Revenue | | | | |
| (Insured; Assured Guaranty Municipal Corp.) (Prerefunded) | 4.38 | 4/1/11 | 2,500,000a | 2,509,300 |
| Illinois—3.5% | | | | |
| Chicago, GO (Project and Refunding Series) | | | | |
| (Insured; National Public Finance Guarantee Corp.) | 5.25 | 1/1/12 | 2,035,000 | 2,118,109 |
| Chicago, Senior Lien Water Revenue (Insured; AMBAC) (Prerefunded) | 5.50 | 11/1/11 | 1,000,000a | 1,034,530 |
| Chicago, Senior Lien Water Revenue (Insured; AMBAC) (Prerefunded) | 5.50 | 11/1/11 | 1,750,000a | 1,810,427 |
| Chicago Board of Education, Unlimited Tax GO (Dedicated | | | | |
| Revenues) (Insured; National Public Finance Guarantee Corp.) | 5.00 | 12/1/14 | 2,000,000 | 2,153,480 |
36
| | | | | |
| BNY Mellon National Short-Term Municipal Bond Fund (continued) | | | |
| Long-Term Municipal | Coupon | Maturity | Principal | | |
| Investments (continued) | Rate (%) | Date | Amount ($) | | Value ($) |
| Illinois (continued) | | | | | |
| Chicago O'Hare International Airport, Second Lien | | | | | |
| Passenger Facility Charge Revenue (Insured; AMBAC) | 5.50 | 1/1/14 | 1,000,000 | | 1,013,330 |
| Chicago Transit Authority, Capital Grant Receipts | | | | | |
| Revenue (Federal Transit Administration Section 5307 | | | | | |
| Formula Funds) (Insured; AMBAC) | 5.00 | 6/1/14 | 3,815,000 | | 4,029,823 |
| Cook County, GO Capital Equipment Bonds | 5.00 | 11/15/12 | 1,000,000 | | 1,056,200 |
| Illinois, GO | 5.00 | 1/1/12 | 1,000,000 | | 1,025,820 |
| Illinois, GO | 5.00 | 1/1/14 | 13,500,000 | | 14,124,510 |
| Illinois, GO (Fund for Infrastructure, Roads, Schools and Transit) | | | | | |
| (Insured; Assured Guaranty Municipal Corp.) | 5.25 | 10/1/11 | 2,000,000 | | 2,042,280 |
| Illinois, Sales Tax Revenue (Fund for Infrastructure, | | | | | |
| Roads, Schools and Transit) (Prerefunded) | 5.50 | 6/15/11 | 1,100,000 | a | 1,116,962 |
| Illinois Finance Authority, Revenue (Northwestern Memorial Hospital) | 5.00 | 8/15/11 | 1,000,000 | | 1,020,660 |
| Illinois Finance Authority, SWDR (Waste Management, Inc. Project) | 1.45 | 10/3/11 | 1,500,000 | | 1,493,235 |
| Indiana—1.0% | | | | | |
| Indiana Transportation Finance Authority, Highway | | | | | |
| Revenue (Insured; FGIC) (Prerefunded) | 5.25 | 6/1/14 | 1,000,000 | a | 1,135,030 |
| Purdue University Trustees, Purdue University | | | | | |
| Student Facilities System Revenue | 5.25 | 7/1/12 | 2,000,000 | | 2,124,220 |
| Whiting, Environmental Facilities Revenue | | | | | |
| (BP Products North America, Inc.) | 2.80 | 6/2/14 | 6,000,000 | | 5,977,440 |
| Iowa—.4% | | | | | |
| Iowa Higher Education Loan Authority, Private College | | | | | |
| Facility Revenue (Grinnell College Project) | 2.10 | 12/1/11 | 2,500,000 | | 2,531,700 |
| Iowa Higher Education Loan Authority, Private College | | | | | |
| Facility Revenue (Grinnell College Project) | 4.00 | 12/1/13 | 1,000,000 | | 1,079,500 |
| Kentucky—1.7% | | | | | |
| Kentucky Economic Development Finance Authority, | | | | | |
| Health System Revenue (Norton Healthcare, Inc.) | 6.25 | 10/1/12 | 665,000 | | 674,064 |
| Kentucky Property and Buildings Commission, Revenue | | | | | |
| (Project Number 69) (Insured; Assured Guaranty Municipal Corp.) | 5.25 | 8/1/14 | 1,450,000 | | 1,476,245 |
| Kentucky Property and Buildings Commission, Revenue | | | | | |
| (Project Number 72) (Insured; National Public | | | | | |
| Finance Guarantee Corp.) (Prerefunded) | 5.38 | 10/1/11 | 1,550,000 | a | 1,596,314 |
| Kentucky Property and Buildings Commission, | | | | | |
| Revenue (Project Number 82) (Insured; | | | | | |
| Assured Guaranty Municipal Corp.) | 5.25 | 10/1/13 | 8,480,000 | | 9,294,334 |
| Louisville/Jefferson County Metro Government, PCR | | | | | |
| (Louisville Gas and Electric Company Project) | 1.90 | 4/2/12 | 3,000,000 | | 3,011,790 |
| Louisiana—.2% | | | | | |
| Louisiana Offshore Terminal Authority, | | | | | |
| Deepwater Port Revenue (LOOP LLC Project) | 1.88 | 10/1/13 | 2,000,000 | | 1,986,700 |
| Maryland—1.4% | | | | | |
| Maryland, GO (State and Local Facilities | | | | | |
| Loan—Capital Improvement Bonds) | 5.00 | 8/1/12 | 1,195,000 | | 1,271,133 |
STATEMENT OF INVESTMENTS (Unaudited) (continued)
| | | | | |
| BNY Mellon National Short-Term Municipal Bond Fund (continued) | | |
| Long-Term Municipal | Coupon | Maturity | Principal | |
| Investments (continued) | Rate (%) | Date | Amount ($) | Value ($) |
| Maryland (continued) | | | | |
| Maryland, GO (State and Local Facilities | | | | |
| Loan—Capital Improvement Bonds) | 5.00 | 7/15/13 | 5,000,000 | 5,488,900 |
| Maryland Department of Transportation, | | | | |
| Consolidated Transportation Revenue | 5.00 | 3/1/13 | 4,950,000 | 5,362,335 |
| Maryland Health and Higher Educational Facilities Authority, | | | | |
| Revenue (The Johns Hopkins Health System Obligated Group Issue) | 5.00 | 11/15/11 | 1,000,000 | 1,032,020 |
| Massachusetts—3.7% | | | | |
| Massachusetts, Consolidated Loan | 5.25 | 8/1/13 | 1,500,000 | 1,650,825 |
| Massachusetts, Consolidated Loan | | | | |
| (Insured; Assured Guaranty Municipal Corp.) | 5.50 | 11/1/12 | 2,000,000 | 2,162,640 |
| Massachusetts, Consolidated Loan (Insured; FGIC) (Prerefunded) | 5.25 | 11/1/12 | 2,000,000a | 2,151,420 |
| Massachusetts, Consolidated Loan (Insured; XLCA) (Prerefunded) | 5.25 | 11/1/12 | 15,000,000a | 16,135,650 |
| Massachusetts Development Finance Agency, | | | | |
| Revenue (Brandeis University Issue) | 3.00 | 10/1/12 | 1,375,000 | 1,402,720 |
| Massachusetts Development Finance Agency, | | | | |
| Revenue (Brandeis University Issue) | 3.00 | 10/1/13 | 1,140,000 | 1,163,267 |
| Massachusetts Health and Educational Facilities Authority, | | | | |
| Revenue (Dana-Farber Cancer Institute Issue) | 4.00 | 12/1/11 | 1,725,000 | 1,758,517 |
| Massachusetts Health and Educational Facilities Authority, | | | | |
| Revenue (Northeastern University Issue) | 4.13 | 2/16/12 | 1,000,000 | 1,025,630 |
| Massachusetts Health and Educational Facilities Authority, | | | | |
| Revenue (Northeastern University Issue) | 4.10 | 4/19/12 | 1,000,000 | 1,031,830 |
| Massachusetts Health and Educational Facilities Authority, | | | | |
| Revenue (Partners HealthCare System Issue) | 5.00 | 7/1/13 | 1,350,000 | 1,461,550 |
| Massachusetts Health and Educational Facilities Authority, | | | | |
| Revenue (Partners HealthCare System Issue) | 5.00 | 7/1/14 | 1,600,000 | 1,768,576 |
| Massachusetts Health and Educational Facilities Authority, | | | | |
| Revenue (Simmons College Issue) | 6.13 | 10/1/14 | 1,000,000 | 1,123,020 |
| Massachusetts Water Pollution Abatement Trust | | | | |
| (Pool Program) (Prerefunded) | 5.00 | 8/1/12 | 3,000,000a | 3,181,920 |
| Michigan—.4% | | | | |
| Michigan, State Trunk Line Fund Revenue (Insured; Assured | | | | |
| Guaranty Municipal Corp.) (Prerefunded) | 5.50 | 11/1/11 | 4,145,000a | 4,287,091 |
| Minnesota—3.6% | | | | |
| Minnesota, GO (Prerefunded) | 5.25 | 11/1/12 | 13,175,000a | 14,207,130 |
| Minnesota, GO (State Trunk Highway Bonds) | 5.00 | 8/1/12 | 1,720,000 | 1,829,530 |
| Minnesota, GO (State Trunk Highway Bonds) | 4.00 | 8/1/13 | 1,310,000 | 1,408,171 |
| Minnesota, GO (Various Purpose) | 4.00 | 8/1/13 | 11,500,000 | 12,361,810 |
| Northern Municipal Power Agency, Electric System | | | | |
| Revenue (Insured; Assured Guaranty Municipal Corp.) | 5.00 | 1/1/12 | 2,000,000 | 2,068,060 |
| Osseo Independent School District Number 279, GO School Building | | | | |
| Bonds (Minnesota School District Credit Enhancement Program) | 3.00 | 2/1/12 | 3,325,000 | 3,404,368 |
38
| | | | | |
| BNY Mellon National Short-Term Municipal Bond Fund (continued) | | | |
| Long-Term Municipal | Coupon | Maturity | Principal | | |
| Investments (continued) | Rate (%) | Date | Amount ($) | | Value ($) |
| Mississippi—.3% | | | | | |
| Mississippi Business Finance Corporation, | | | | | |
| Revenue (Mississippi Power Company Project) | 2.25 | 1/15/13 | 1,150,000 | | 1,149,782 |
| Mississippi Business Finance Corporation, SWDR | | | | | |
| (Waste Management, Inc. Project) | 4.40 | 3/3/14 | 2,000,000 | | 2,003,500 |
| Missouri—.3% | | | | | |
| Rockwood R-6 School District, GO | 5.00 | 2/1/12 | 1,035,000 | | 1,079,609 |
| Saint Louis, Airport Revenue (Lambert-Saint Louis International | | | | | |
| Airport) (Insured; Assured Guaranty Municipal Corp.) | 5.00 | 7/1/13 | 1,800,000 | | 1,909,530 |
| Montana—.2% | | | | | |
| Montana Board of Regents of Higher Education of the | | | | | |
| University of Montana, Facilities Improvement Revenue | | | | | |
| (Insured; National Public Finance Guarantee Corp.) | 5.75 | 5/15/24 | 1,610,000 | | 1,647,175 |
| Nebraska—.7% | | | | | |
| Nebraska Public Power District, General Revenue | | | | | |
| (Insured; Assured Guaranty Municipal Corp.) | 5.00 | 1/1/13 | 1,300,000 | | 1,393,769 |
| University of Nebraska Facilities Corporation, | | | | | |
| Deferred Maintenance Bonds (Insured; AMBAC) | 5.00 | 7/15/13 | 5,125,000 | | 5,609,466 |
| Nevada—2.3% | | | | | |
| Clark County, Airport System Junior Subordinate Lien Revenue | 5.00 | 7/1/12 | 10,000,000 | | 10,463,700 |
| Clark County, Limited Tax GO Public Safety Bonds | | | | | |
| (Insured; Assured Guaranty Municipal Corp.) | 5.00 | 1/1/14 | 1,000,000 | | 1,089,980 |
| Clark County, Passenger Facility Charge Revenue | | | | | |
| (Las Vegas-McCarran International Airport) | 5.00 | 7/1/14 | 2,500,000 | | 2,692,100 |
| Clark County School District, Limited Tax GO | | | | | |
| (Insured; Assured Guaranty Municipal Corp.) | 5.50 | 6/15/13 | 5,625,000 | | 6,127,481 |
| Las Vegas Valley Water District, GO | | | | | |
| (Additionally Secured by Pledged Revenues) | 5.00 | 2/1/13 | 1,000,000 | | 1,069,830 |
| Las Vegas Valley Water District, GO (Additionally Secured by | | | | | |
| Southern Nevada Water Authority Pledged Revenues) | 5.00 | 6/1/14 | 450,000 | | 493,861 |
| New Hampshire—1.1% | | | | | |
| Manchester, School Facilities Revenue (Insured; National | | | | | |
| Public Finance Guarantee Corp.) (Prerefunded) | 5.50 | 6/1/13 | 4,465,000 | a | 4,907,749 |
| New Hampshire Health and Education Facilities | | | | | |
| Authority, Revenue (Center for Life Management | | | | | |
| Issue) (LOC; Ocean National Bank) | 4.05 | 7/1/11 | 2,425,000 | | 2,440,811 |
| New Hampshire Health and Education Facilities Authority, | | | | | |
| Revenue (Dartmouth-Hitchcock Obligated Group Issue) | 3.50 | 8/1/12 | 2,535,000 | | 2,601,164 |
| Portsmouth, GO | 5.00 | 9/15/13 | 1,000,000 | | 1,072,210 |
| New Jersey—3.0% | | | | | |
| New Jersey, COP (Equipment Lease Purchase Agreement) | 5.00 | 6/15/12 | 2,000,000 | | 2,092,360 |
| New Jersey, GO | 5.25 | 7/1/12 | 2,000,000 | | 2,119,200 |
| New Jersey, GO | 5.00 | 8/1/13 | 7,880,000 | | 8,589,358 |
STATEMENT OF INVESTMENTS (Unaudited) (continued)
| | | | | |
| BNY Mellon National Short-Term Municipal Bond Fund (continued) | | |
| Long-Term Municipal | Coupon | Maturity | Principal | |
| Investments (continued) | Rate (%) | Date | Amount ($) | Value ($) |
| New Jersey (continued) | | | | |
| New Jersey Economic Development Authority, | | | | |
| Cigarette Tax Revenue | 5.38 | 6/15/14 | 2,935,000 | 3,067,545 |
| New Jersey Economic Development Authority, | | | | |
| Cigarette Tax Revenue (Insured; FGIC) | 5.00 | 6/15/13 | 5,000,000 | 5,158,350 |
| New Jersey Economic Development Authority, Exempt Facilities | | | | |
| Revenue (Waste Management of New Jersey, Inc. Project) | 2.20 | 11/1/13 | 2,000,000 | 1,955,500 |
| New Jersey Economic Development Authority, School Facilities | | | | |
| Construction Revenue (Insured; Assured Guaranty Municipal Corp.) | 5.00 | 3/1/12 | 2,000,000 | 2,092,120 |
| New Jersey Economic Development Authority, School Facilities | | | | |
| Construction Revenue (Insured; Assured Guaranty Municipal Corp.) | 5.00 | 9/1/12 | 2,750,000 | 2,934,635 |
| Tobacco Settlement Financing Corporation of New Jersey, | | | | |
| Tobacco Settlement Asset-Backed Bonds | 5.50 | 6/1/11 | 1,000,000 | 1,013,200 |
| New Mexico—1.6% | | | | |
| Albuquerque Bernalillo County Water Utility Authority, | | | | |
| Joint Water and Sewer System Revenue | 5.00 | 7/1/12 | 3,700,000 | 3,922,592 |
| New Mexico Educational Assistance Foundation, | | | | |
| Education Loan Revenue | 0.99 | 12/1/20 | 5,000,000b | 4,958,550 |
| New Mexico Finance Authority, | | | | |
| State Transportation Senior Lien Revenue | 5.00 | 6/15/13 | 4,940,000 | 5,394,678 |
| New Mexico Finance Authority, State Transportation | | | | |
| Subordinate Lien Revenue (Insured; AMBAC) | 5.00 | 6/15/13 | 1,000,000 | 1,092,520 |
| New York—11.8% | | | | |
| Buffalo Fiscal Stability Authority, Sales Tax and State Aid Secured | | | | |
| Revenue (Insured; National Public Finance Guarantee Corp.) | 5.00 | 9/1/11 | 3,090,000 | 3,162,769 |
| Metropolitan Transportation Authority, Transportation Revenue | 5.00 | 11/15/13 | 11,125,000 | 12,052,046 |
| New York City, GO | 5.00 | 10/1/11 | 4,250,000 | 4,366,450 |
| New York City, GO | 5.00 | 8/15/13 | 5,000,000 | 5,454,550 |
| New York City, GO | 5.00 | 8/1/14 | 4,000,000 | 4,444,800 |
| New York City Transitional Finance Authority, | | | | |
| Future Tax Secured Revenue | 5.50/14.00 | 11/1/26 | 3,345,000c | 3,448,561 |
| New York City Transitional Finance Authority, | | | | |
| Future Tax Secured Revenue (Insured; | | | | |
| National Public Finance Guarantee Corp.) | 5.50 | 11/1/14 | 3,910,000 | 4,207,316 |
| New York City Transitional Finance Authority, | | | | |
| Future Tax Secured Subordinate Revenue | 4.00 | 11/1/11 | 5,000,000 | 5,123,200 |
| New York City Trust for Cultural Resources, | | | | |
| Revenue (The Juilliard School) | 2.75 | 7/1/12 | 3,500,000 | 3,591,595 |
| New York State, GO | 3.00 | 2/1/14 | 10,000,000 | 10,486,300 |
| New York State Dormitory Authority, LR (State University | | | | |
| Dormitory Facilities Issue) (Insured; XLCA) | 5.25 | 7/1/13 | 1,000,000 | 1,081,980 |
| New York State Dormitory Authority, Revenue (New York | | | | |
| State Association for Retarded Children, Inc.) | | | | |
| (Insured; Assured Guaranty Municipal Corp.) | 5.00 | 7/1/12 | 1,100,000 | 1,138,027 |
40
| | | | | |
| BNY Mellon National Short-Term Municipal Bond Fund (continued) | | |
| Long-Term Municipal | Coupon | Maturity | Principal | |
| Investments (continued) | Rate (%) | Date | Amount ($) | Value ($) |
| New York (continued) | | | | |
| New York State Dormitory Authority, Revenue | | | | |
| (School Districts Revenue Financing Program) | | | | |
| (Insured; National Public Finance Guarantee Corp.) | 5.75 | 10/1/17 | 2,500,000 | 2,644,675 |
| New York State Environmental Facilities Corporation, | | | | |
| State Clean Water and Drinking Water Revolving Funds Revenue | | | | |
| (New York City Municipal Water Finance Authority Project) | 5.38 | 6/15/16 | 5,000,000 | 5,287,650 |
| New York State Municipal Bond Bank Agency, | | | | |
| Special School Purpose Revenue (Prior Year Claims) | 5.50 | 6/1/13 | 5,000,000 | 5,456,600 |
| New York State Thruway Authority, | | | | |
| Local Highway and Bridge Service Contract Bonds | 5.50 | 4/1/15 | 2,675,000 | 2,802,036 |
| New York State Thruway Authority, Second General Highway | | | | |
| and Bridge Trust Fund Bonds (Insured; AMBAC) (Prerefunded) | 5.00 | 4/1/14 | 1,475,000a | 1,644,832 |
| New York State Urban Development Corporation, | | | | |
| Service Contract Revenue | 5.00 | 1/1/12 | 10,000,000 | 10,365,300 |
| New York State Urban Development Corporation, | | | | |
| Service Contract Revenue | 5.00 | 1/1/14 | 1,000,000 | 1,091,440 |
| Tobacco Settlement Financing Corporation of New York, | | | | |
| Asset-Backed Revenue Bonds (State Contingency Contract Secured) | 5.00 | 6/1/12 | 1,055,000 | 1,109,765 |
| Tobacco Settlement Financing Corporation of New York, | | | | |
| Asset-Backed Revenue Bonds (State Contingency Contract Secured) | 5.50 | 6/1/16 | 5,000,000 | 5,052,100 |
| Triborough Bridge and Tunnel Authority, General Purpose Revenue | | | | |
| (Insured; National Public Finance Guarantee Corp.) (Prerefunded) | 5.00 | 1/1/12 | 1,000,000a | 1,039,080 |
| Triborough Bridge and Tunnel Authority, | | | | |
| General Purpose Revenue (Prerefunded) | 5.13 | 1/1/12 | 2,055,000a | 2,138,371 |
| Triborough Bridge and Tunnel Authority, | | | | |
| General Revenue (MTA Bridges and Tunnels) | 4.00 | 11/15/12 | 12,325,000 | 12,984,757 |
| Troy Industrial Development Authority, Civic Facility | | | | |
| Revenue (Rensselaer Polytechnic Institute Project) | 4.05 | 9/1/11 | 3,500,000 | 3,549,070 |
| Westchester County, GO | 3.00 | 6/1/13 | 1,350,000 | 1,416,110 |
| North Carolina—2.9% | | | | |
| Brunswick County, GO | 5.00 | 5/1/13 | 2,445,000 | 2,662,165 |
| Forsyth County, GO | 3.00 | 7/1/13 | 1,495,000 | 1,569,885 |
| Mecklenburg County, Public Improvement GO | 5.00 | 3/1/12 | 5,000,000 | 5,232,550 |
| North Carolina, GO | 5.00 | 6/1/13 | 10,000,000 | 10,936,300 |
| North Carolina Eastern Municipal Power Agency, | | | | |
| Power System Revenue | 5.50 | 1/1/12 | 5,000,000 | 5,175,550 |
| North Carolina Eastern Municipal Power Agency, Power System | | | | |
| Revenue (Insured; Assured Guaranty Municipal Corp.) | 5.00 | 1/1/13 | 2,000,000 | 2,132,680 |
| Ohio—1.0% | | | | |
| Lorain County, Hospital Facilities Improvement | | | | |
| Revenue (Catholic Healthcare Partners) | 5.63 | 10/1/12 | 2,500,000 | 2,590,950 |
| Ohio, GO Highway Captial Improvements Bonds | | | | |
| (Full Faith and Credit/Highway User Receipts) | 5.25 | 5/1/12 | 525,000 | 554,589 |
STATEMENT OF INVESTMENTS (Unaudited) (continued)
| | | | | |
| BNY Mellon National Short-Term Municipal Bond Fund (continued) | | |
| Long-Term Municipal | Coupon | Maturity | Principal | |
| Investments (continued) | Rate (%) | Date | Amount ($) | Value ($) |
| Ohio (continued) | | | | |
| Ohio, Mental Health Capital Facilities Bonds | | | | |
| (Insured; Assured Guaranty Municipal Corp.) | 5.00 | 6/1/13 | 2,230,000 | 2,415,335 |
| Ohio Water Development Authority, Fresh Water Revenue | 5.00 | 12/1/12 | 1,905,000 | 2,047,742 |
| Ohio Water Development Authority, Water Development | | | | |
| Revenue (Fresh Water Improvement Series) | 5.00 | 6/1/13 | 2,060,000 | 2,244,638 |
| Oklahoma—.6% | | | | |
| Oklahoma Building Bonds Commission, GO | | | | |
| (Insured; National Public Finance Guarantee Corp.) (Prerefunded) | 5.00 | 7/15/13 | 5,460,000a | 6,072,339 |
| Pennsylvania—6.7% | | | | |
| Allegheny County Airport Authority, Airport Revenue | | | | |
| (Pittsburgh International Airport) | 5.00 | 1/1/13 | 1,400,000 | 1,449,364 |
| Allegheny County Hospital Development Authority, | | | | |
| Revenue (University of Pittsburgh Medical Center) | 5.00 | 6/15/13 | 1,000,000 | 1,077,780 |
| Allegheny County Hospital Development Authority, | | | | |
| Revenue (University of Pittsburgh Medical Center) | 5.00 | 5/15/14 | 2,875,000 | 3,153,961 |
| Berks County Municipal Authority, Revenue | | | | |
| (The Reading Hospital and Medical Center Project) | 5.00 | 11/1/13 | 3,035,000 | 3,298,499 |
| Delaware County Industrial Development Authority, | | | | |
| PCR (PECO Energy Company Project) | 4.00 | 12/1/12 | 8,490,000 | 8,824,846 |
| Delaware Valley Regional Finance Authority, | | | | |
| Local Government Revenue | 5.50 | 7/1/12 | 1,500,000 | 1,570,665 |
| Montgomery County, GO | 5.00 | 9/15/11 | 2,155,000 | 2,210,427 |
| Pennsylvania, GO | 5.50 | 2/1/13 | 1,100,000 | 1,198,692 |
| Pennsylvania, GO | 5.00 | 2/15/13 | 10,750,000 | 11,626,448 |
| Pennsylvania, GO | 5.00 | 7/15/14 | 6,740,000 | 7,558,236 |
| Pennsylvania, GO (Insured; National Public | | | | |
| Finance Guarantee Corp.) | 5.00 | 1/1/13 | 1,950,000 | 2,100,716 |
| Pennsylvania, GO (Insured; National Public | | | | |
| Finance Guarantee Corp.) (Prerefunded) | 4.00 | 2/1/14 | 5,000,000a | 5,433,550 |
| Pennsylvania Higher Educational Facilities Authority, Revenue | | | | |
| (The University of Pennsylvania Health System) (Insured; AMBAC) | 5.00 | 8/15/12 | 6,325,000 | 6,679,833 |
| Pennsylvania Intergovernmental Cooperation Authority, | | | | |
| Special Tax Revenue (City of Philadelphia Funding Program) | 5.00 | 6/15/12 | 1,500,000 | 1,583,610 |
| Philadelphia School District, GO | 5.00 | 9/1/12 | 5,000,000 | 5,266,350 |
| Swarthmore Borough Authority, Revenue (Swarthmore College) | 5.00 | 9/15/13 | 1,500,000 | 1,647,060 |
| South Carolina—.2% | | | | |
| Piedmont Municipal Power Agency, Electric Revenue | 5.00 | 1/1/15 | 2,000,000 | 2,169,760 |
| Texas—6.9% | | | | |
| Austin, Water and Wastewater System Revenue | 4.00 | 11/15/13 | 1,500,000 | 1,616,100 |
| Cities of Dallas and Fort Worth, Dallas/Fort Worth | | | | |
| International Airport, Joint Revenue | 4.00 | 11/1/11 | 1,775,000 | 1,812,683 |
| Cities of Dallas and Fort Worth, Dallas/Fort Worth | | | | |
| International Airport, Joint Revenue | 4.00 | 11/1/12 | 2,220,000 | 2,310,865 |
42
| | | | | |
| BNY Mellon National Short-Term Municipal Bond Fund (continued) | | |
| Long-Term Municipal | Coupon | Maturity | Principal | |
| Investments (continued) | Rate (%) | Date | Amount ($) | Value ($) |
| Texas (continued) | | | | |
| Cypress-Fairbanks Independent School District, Unlimited Tax | | | | |
| Schoolhouse Bonds (Permanent School Fund Guarantee Program) | 5.00 | 2/15/13 | 1,550,000 | 1,677,642 |
| Dallas Area Rapid Transit, Senior Lien | | | | |
| Sales Tax Revenue (Insured; AMBAC) (Prerefunded) | 5.38 | 12/1/11 | 2,135,000a | 2,216,194 |
| Frisco Independent School District, Unlimited Tax School Building | | | | |
| Bonds (Permanent School Fund Guarantee Program) (Prerefunded) | 6.25 | 8/15/12 | 1,905,000a | 2,064,277 |
| Gulf Coast Waste Disposal Authority, Environmental Facilities | | | | |
| Revenue (BP Products North America, Inc. Project) | 2.30 | 9/3/13 | 4,000,000 | 3,998,920 |
| Harris County, GO and Revenue (Prerefunded) | 5.00 | 8/15/12 | 15,000,000a | 15,981,000 |
| Harris County, Unlimited Tax Road Bonds | 5.00 | 10/1/12 | 1,000,000 | 1,068,850 |
| Harris County, Unlimited Tax Toll Road | | | | |
| and Subordinate Lien Revenue | 5.00 | 8/15/12 | 2,100,000 | 2,233,182 |
| Harris County Cultural Education Facilities Finance | | | | |
| Corporation, Revenue (The Methodist Hospital System) | 5.25 | 12/1/12 | 1,800,000 | 1,922,670 |
| Lower Colorado River Authority, Revenue | | | | |
| (Insured; Assured Guaranty Municipal Corp.) | 5.88 | 5/15/15 | 1,075,000 | 1,079,536 |
| North Texas Tollway Authority, First Tier System Revenue | 5.00 | 1/1/13 | 2,050,000 | 2,159,655 |
| Northside Independent School District, Unlimited Tax School | | | | |
| Building Bonds (Permanent School Fund Guarantee Program) | 1.50 | 8/1/12 | 10,000,000 | 10,028,100 |
| Pflugerville Independent School District, Unlimited Tax | | | | |
| Bonds (Permanent School Fund Guarantee Program) | 4.00 | 8/15/12 | 1,940,000 | 2,037,388 |
| Plano, GO | 5.25 | 9/1/14 | 1,225,000 | 1,392,862 |
| Texas, Water Financial Assistance GO | | | | |
| Bonds (Water Infrastructure Fund) | 4.00 | 8/1/11 | 500,000 | 507,875 |
| Texas A&M University System Board of Regents, | | | | |
| Financing System Revenue | 5.00 | 5/15/13 | 1,375,000 | 1,498,571 |
| Texas Municipal Gas Acquisition and | | | | |
| Supply Corporation I, Gas Supply Revenue | 5.00 | 12/15/13 | 720,000 | 755,150 |
| University of Texas System Board of Regents, | | | | |
| Financing System Revenue | 5.25 | 8/15/12 | 4,485,000 | 4,788,365 |
| University of Texas System Board of Regents, | | | | |
| Financing System Revenue | 5.00 | 8/15/13 | 6,485,000 | 7,125,264 |
| Utah—1.2% | | | | |
| Salt Lake County, Sales Tax Revenue | 5.00 | 8/1/12 | 1,000,000 | 1,063,190 |
| Timpanogos Special Service District, Sewer Revenue | | | | |
| (Insured; Assured Guaranty Municipal Corp.) | 5.00 | 6/1/14 | 1,775,000 | 1,960,452 |
| Utah, GO | 4.00 | 7/1/13 | 8,000,000 | 8,585,840 |
| Virginia—3.0% | | | | |
| Hampton, Public Improvement GO | 4.25 | 1/15/13 | 4,015,000 | 4,275,493 |
| Louisa Industrial Development Authority, PCR | | | | |
| (Virginia Electric and Power Company Project) | 5.00 | 12/1/11 | 1,500,000 | 1,543,050 |
| Newport News, GO General Improvement | | | | |
| Bonds and GO Water Bonds | 5.00 | 1/15/13 | 1,000,000 | 1,078,850 |
STATEMENT OF INVESTMENTS (Unaudited) (continued)
| | | | | |
| BNY Mellon National Short-Term Municipal Bond Fund (continued) | | |
| Long-Term Municipal | Coupon | Maturity | Principal | |
| Investments (continued) | Rate (%) | Date | Amount ($) | Value ($) |
| Virginia (continued) | | | | |
| Richmond, GO Public Improvement | | | | |
| (Insured; Assured Guaranty Municipal Corp.) | 5.25 | 7/15/16 | 6,040,000 | 6,593,928 |
| Virginia Beach, GO Public Improvement | 5.00 | 7/15/11 | 1,000,000 | 1,017,950 |
| Virginia College Building Authority, Educational Facilities | | | | |
| Revenue (21st Century College and Equipment Programs) | 5.00 | 2/1/13 | 2,000,000 | 2,159,160 |
| Virginia College Building Authority, Educational Facilities | | | | |
| Revenue (21st Century College and Equipment Programs) | 5.00 | 2/1/14 | 2,610,000 | 2,895,325 |
| Virginia College Building Authority, Educational Facilities Revenue | | | | |
| (21st Century College and Equipment Programs) (Prerefunded) | 5.00 | 2/1/12 | 1,200,000a | 1,250,892 |
| Virginia College Building Authority, Educational Facilities | | | | |
| Revenue (Public Higher Education Financing Program) | 5.00 | 9/1/12 | 1,555,000 | 1,658,330 |
| Virginia Commonwealth Transportation Board, Transportation | | | | |
| Revenue (U.S. Route 58 Corridor Development Program) | 5.25 | 5/15/12 | 5,000,000 | 5,287,600 |
| Virginia Resources Authority, Infrastructure | | | | |
| Revenue (Virginia Pooled Financing Program) | 5.00 | 5/1/12 | 1,430,000 | 1,506,291 |
| Washington—2.9% | | | | |
| Chelan County Public Utility District Number 1, | | | | |
| Chelan Hydro Consolidated System Revenue | | | | |
| (Insured; National Public Finance Guarantee Corp.) | 5.00 | 7/1/12 | 4,000,000 | 4,197,520 |
| Energy Northwest, Electric Revenue (Columbia Generating | | | | |
| Station) (Insured; Assured Guaranty Municipal Corp.) | 5.38 | 7/1/15 | 1,530,000 | 1,568,632 |
| Energy Northwest, Electric Revenue | | | | |
| (Project Number 3) (Insured; AMBAC) | 6.00 | 7/1/16 | 5,000,000 | 5,316,300 |
| King County, Limited Tax GO (Baseball Stadium) | 5.50 | 12/1/12 | 4,795,000 | 5,201,856 |
| King County, Limited Tax GO (Baseball Stadium) | 5.50 | 12/1/12 | 310,000 | 336,784 |
| King County, Limited Tax GO (Payable From Sewer Revenues) | 5.00 | 1/1/14 | 1,000,000 | 1,107,760 |
| Seattle, Municipal Light and Power Improvement Revenue | 5.00 | 4/1/12 | 1,145,000 | 1,201,540 |
| Snohomish County, Unlimited Tax GO (Edmonds School | | | | |
| District Number 15) (Insured; Assured Guaranty Municipal Corp.) | 5.00 | 12/1/12 | 1,500,000 | 1,611,495 |
| Washington, GO (Various Purpose) (Insured; AMBAC) | 5.00 | 7/1/12 | 3,000,000 | 3,177,990 |
| Washington, GO (Various Purpose) (Insured; AMBAC) | 5.00 | 1/1/14 | 3,810,000 | 4,219,461 |
| Wisconsin—1.2% | | | | |
| Wisconsin, GO | 5.00 | 5/1/13 | 6,130,000 | 6,661,961 |
| Wisconsin, GO (Insured; National Public Finance Guarantee Corp.) | 5.00 | 5/1/12 | 1,000,000 | 1,052,390 |
| Wisconsin, Petroleum Inspection Fee Revenue | 5.00 | 7/1/13 | 3,500,000 | 3,804,885 |
| U.S. Related—3.0% | | | | |
| Puerto Rico Commonwealth, Public Improvement GO | 5.00 | 7/1/13 | 2,140,000 | 2,247,706 |
| Puerto Rico Commonwealth, Public Improvement GO | 5.50 | 7/1/13 | 1,335,000 | 1,417,223 |
| Puerto Rico Commonwealth, Public Improvement GO | 5.50 | 7/1/13 | 5,000,000 | 5,307,950 |
| Puerto Rico Electric Power Authority, Power Revenue | 2.00 | 7/1/11 | 700,000 | 702,219 |
| Puerto Rico Government Development Bank, GO | | | | |
| (Insured; National Public Finance Guarantee Corp.) | 4.75 | 12/1/15 | 5,000,000 | 5,095,400 |
| Puerto Rico Government Development Bank, Senior Notes | 5.00 | 12/1/13 | 1,800,000 | 1,899,720 |
44
| | | | | |
| BNY Mellon National Short-Term Municipal Bond Fund (continued) | | | |
| Long-Term Municipal | Coupon | Maturity | Principal | | |
| Investments (continued) | Rate (%) | Date | Amount ($) | | Value ($) |
| U.S. Related (continued) | | | | | |
| Puerto Rico Highways and Transportation Authority, Highway | | | | | |
| Revenue (Insured; National Public Finance Guarantee Corp.) | 6.00 | 7/1/11 | 1,030,000 | | 1,047,417 |
| Puerto Rico Highways and Transportation Authority, | | | | | |
| Transportation Revenue (Insured; FGIC) | 5.25 | 7/1/14 | 2,250,000 | | 2,351,610 |
| Puerto Rico Highways and Transportation Authority, | | | | | |
| Transportation Revenue (Prerefunded) | 5.25 | 7/1/12 | 1,000,000 | a | 1,062,110 |
| Puerto Rico Public Buildings Authority, | | | | | |
| Government Facilities Revenue | 5.50 | 7/1/11 | 2,000,000 | | 2,028,280 |
| University of Puerto Rico, University System Revenue | 5.00 | 6/1/13 | 2,315,000 | | 2,419,129 |
| University of Puerto Rico, University System Revenue | 5.00 | 6/1/14 | 2,930,000 | | 3,087,165 |
| Total Long-Term Municipal Investments | | | | | |
| (cost $891,093,666) | | | | | 897,752,702 |
| |
| Short-Term Municipal Investments—6.3% | | | | | |
| California—1.0% | | | | | |
| California, RAN | 3.00 | 5/25/11 | 10,000,000 | | 10,049,200 |
| Colorado—.3% | | | | | |
| Colorado Educational and Cultural Facilities Authority, Revenue | | | | | |
| (National Jewish Federal Bond Program) (LOC; TD Bank) | 0.21 | 3/1/11 | 1,000,000 | d | 1,000,000 |
| Colorado Educational and Cultural Facilities Authority, Revenue | | | | | |
| (National Jewish Federation Bond Program) (LOC; U.S. Bank NA) | 0.21 | 3/1/11 | 2,100,000 | d | 2,100,000 |
| Florida—1.0% | | | | | |
| Lakeland, Energy System Revenue, Refunding | 1.01 | 3/7/11 | 8,500,000 | d | 8,499,235 |
| Orange County Health Facilities Authority, HR (Orlando Regional | | | | | |
| Healthcare System) (Insured; Assured Guaranty Municipal Corp. | | | | | |
| and Liquidity Facility; Dexia Credit Locale) | 0.33 | 3/1/11 | 900,000 | d | 900,000 |
| Georgia—.1% | | | | | |
| Gainesville and Hall County Hospital Authority, RAC (Northeast | | | | | |
| Georgia Health System, Inc. Project) (LOC; Wells Fargo Bank) | 0.21 | 3/1/11 | 700,000 | d | 700,000 |
| Illinois—.2% | | | | | |
| Quincy, Revenue, Refunding (Blessing Hospital) | | | | | |
| (LOC; JPMorgan Chase Bank) | 0.26 | 3/1/11 | 1,600,000 | d | 1,600,000 |
| Indiana—.1% | | | | | |
| Indiana Finance Authority, Environmental Revenue, Refunding | | | | | |
| (Duke Energy Indiana, Inc. Project) (LOC; Bank of America) | 0.21 | 3/1/11 | 500,000 | d | 500,000 |
| Kentucky—.0% | | | | | |
| Lexington-Fayette Urban County Airport Board, General Airport | | | | | |
| Revenue, Refunding (LOC; JPMorgan Chase Bank) | 0.19 | 3/1/11 | 300,000 | d | 300,000 |
| Massachusetts—.4% | | | | | |
| Massachusetts, Consolidated Loan | | | | | |
| (Liquidity Facility; Dexia Credit Locale) | 0.28 | 3/1/11 | 300,000 | d | 300,000 |
| Massachusetts, GO Notes, Refunding | 0.79 | 3/7/11 | 3,700,000 | d | 3,699,963 |
STATEMENT OF INVESTMENTS (Unaudited) (continued)
| | | | | |
| BNY Mellon National Short-Term Municipal Bond Fund (continued) | | | |
| Short-Term Municipal | Coupon | Maturity | Principal | | |
| Investments (continued) | Rate (%) | Date | Amount ($) | | Value ($) |
| New York—.2% | | | | | |
| Long Island Power Authority, Electric System Subordinated | | | | | |
| Revenue (LOC; Westdeutsche Landesbank) | 0.21 | 3/1/11 | 1,800,000 | d | 1,800,000 |
| North Carolina—.5% | | | | | |
| North Carolina Medical Care Commission, Health Care Facilities | | | | | |
| Revenue (Duke University Health System) | 0.56 | 12/1/11 | 5,000,000 | | 5,000,000 |
| Ohio—.1% | | | | | |
| Allen County, Hospital Facilities Revenue (Catholic Healthcare | | | | | |
| Partners) (LOC; JPMorgan Chase Bank) | 0.19 | 3/1/11 | 900,000 | d | 900,000 |
| Pennsylvania—1.0% | | | | | |
| Lancaster County Hospital Authority, Health System | | | | | |
| Revenue (The Lancaster General Hospital Refunding | | | | | |
| Project) (LOC; Bank of America) | 0.24 | 3/1/11 | 500,000 | d | 500,000 |
| Pennsylvania Turnpike Commission, Turnpike Revenue | 0.88 | 3/7/11 | 10,000,000 | d | 10,014,800 |
| Tennessee—.5% | | | | | |
| Clarksville Public Building Authority, Pooled Financing Revenue | | | | | |
| (Tennessee Municipal Bond Fund) (LOC; Bank of America) | 0.27 | 3/1/11 | 2,900,000 | d | 2,900,000 |
| Montgomery County Public Building Authority, Pooled Financing | | | | | |
| Revenue (Tennessee County Loan Pool) (LOC; Bank of America) | 0.27 | 3/1/11 | 1,500,000 | d | 1,500,000 |
| Texas—.9% | | | | | |
| Texas, TRAN | 2.00 | 8/31/11 | 9,000,000 | | 9,076,770 |
| Total Short-Term Municipal Investments | | | | | |
| (cost $61,309,735) | | | | | 61,339,968 |
| |
| Total Investments (cost $952,403,401) | | | 98.7 | % | 959,092,670 |
| Cash and Receivables (Net) | | | 1.3 | % | 12,374,749 |
| Net Assets | | | 100.0 | % | 971,467,419 |
|
| a These securities are prerefunded; the date shown represents the prerefunded date. Bonds which are prerefunded are collateralized by U.S. Government securities which are held in |
| escrow and are used to pay principal and interest on the municipal issue and to retire the bonds in full at the earliest refunding date. |
| b Variable rate security—interest rate subject to periodic change. |
| c Subject to interest rate change on November 1, 2011. |
| d Variable rate demand note—rate shown is the interest rate in effect at February 28, 2011. Maturity date represents the next demand date, or the ultimate maturity date if earlier. |
46
| | | | | | |
| Summary of Abbreviations | | | | |
| |
| ABAG | Association of Bay Area Governments | | ACA | American Capital Access |
| AGC | ACE Guaranty Corporation | | AGIC | Asset Guaranty Insurance Company |
| AMBAC | American Municipal Bond Assurance Corporation | ARRN | Adjustable Rate Receipt Notes |
| BAN | Bond Anticipation Notes | | BPA | Bond Purchase Agreement |
| CIFG | CDC Ixis Financial Guaranty | | COP | Certificate of Participation |
| CP | Commercial Paper | | EDR | Economic Development Revenue |
| EIR | Environmental Improvement Revenue | | FGIC | Financial Guaranty Insurance Company |
| FHA | Federal Housing Administration | | FHLB | Federal Home Loan Bank |
| FHLMC | Federal Home Loan Mortgage Corporation | FNMA | Federal National Mortgage Association |
| GAN | Grant Anticipation Notes | | GIC | Guaranteed Investment Contract |
| GNMA | Government National Mortgage Association | GO | General Obligation | |
| HR | Hospital Revenue | | IDB | Industrial Development Board |
| IDC | Industrial Development Corporation | | IDR | Industrial Development Revenue |
| LOC | Letter of Credit | | | LOR | Limited Obligation Revenue |
| LR | Lease Revenue | | | MFHR | Multi-Family Housing Revenue |
| MFMR | Multi-Family Mortgage Revenue | | PCR | Pollution Control Revenue |
| PILOT | Payment in Lieu of Taxes | | PUTTERS | Puttable Tax-Exempt Receipts |
| RAC | Revenue Anticipation Certificates | | RAN | Revenue Anticipation Notes |
| RAW | Revenue Anticipation Warrants | | RRR | Resources Recovery Revenue |
| SAAN | State Aid Anticipation Notes | | SBPA | Standby Bond Purchase Agreement |
| SFHR | Single Family Housing Revenue | | SFMR | Single Family Mortgage Revenue |
| SONYMA | State of New York Mortgage Agency | | SWDR | Solid Waste Disposal Revenue |
| TAN | Tax Anticipation Notes | | TAW | Tax Anticipation Warrants |
| TRAN | Tax and Revenue Anticipation Notes | | XLCA | XL Capital Assurance |
| |
| |
| |
| Summary of Combined Ratings (Unaudited) | | | |
| |
| Fitch | or | Moody’s | or | Standard & Poor’s | Value (%)† |
| AAA | | Aaa | | AAA | | 28.7 |
| AA | | Aa | | AA | | 42.7 |
| A | | A | | A | | 21.8 |
| BBB | | Baa | | BBB | | 2.4 |
| F1 | | MIG1/P1 | | SP1/A1 | | 4.2 |
| Not Ratede | | Not Ratede | | Not Ratede | | .2 |
| | | | | | | 100.0 |
|
| † Based on total investments. |
| e Securities which, while not rated by Fitch, Moody's and Standard & Poor's, have been determined by the Manager to be of comparable quality to those rated securities in which the |
| fund may invest. |
See notes to financial statements.
|
| STATEMENT OF INVESTMENTS |
| February 28, 2011 (Unaudited) |
| | | | | |
| BNY Mellon Pennsylvania Intermediate Municipal Bond Fund | | | |
| Long-Term Municipal | Coupon | Maturity | Principal | |
| Investments—98.4% | Rate (%) | Date | Amount ($) | Value ($) |
| Alabama—1.3% | | | | |
| Jefferson County, Limited Obligation School Warrants | 5.25 | 1/1/15 | 2,500,000 | 2,414,725 |
| Jefferson County, Limited Obligation School Warrants | | | | |
| (Insured; Assured Guaranty Municipal Corp.) | 5.50 | 1/1/21 | 3,500,000 | 3,440,570 |
| Arizona—.3% | | | | |
| University Medical Center Corporation, HR | 5.25 | 7/1/15 | 1,160,000 | 1,221,190 |
| California—6.7% | | | | |
| Agua Caliente Band, Cahuilla Indians Revenue | 6.00 | 7/1/18 | 1,500,000a | 1,423,500 |
| Alameda Corridor Transportation Authority, | | | | |
| Revenue (Insured; AMBAC) | 0/5.25 | 10/1/21 | 2,000,000b | 1,723,200 |
| California, GO | 5.50 | 6/1/20 | 110,000 | 110,350 |
| California, GO | 5.50 | 11/1/33 | 6,300,000 | 6,311,088 |
| California, GO (Various Purpose) | 6.50 | 4/1/33 | 1,000,000 | 1,087,670 |
| California, GO (Various Purpose) | 6.00 | 4/1/38 | 5,000,000 | 5,169,450 |
| California County Tobacco Securitization Agency, | | | | |
| Tobacco Settlement Asset-Backed Bonds | | | | |
| (Los Angeles County Securitization Corporation) | 5.25 | 6/1/21 | 1,250,000 | 1,105,387 |
| Foothill/Eastern Transportation Corridor Agency, Toll Road Revenue | 5.75 | 1/15/40 | 2,000,000 | 1,673,420 |
| Foothill/Eastern Transportation Corridor Agency, Toll Road | | | | |
| Revenue (Insured; National Public Finance Guarantee Corp.) | 5.88 | 1/15/27 | 6,000,000 | 5,366,460 |
| Foothill/Eastern Transportation Corridor Agency, Toll Road | | | | |
| Revenue (Insured; National Public Finance Guarantee Corp.) | 5.88 | 1/15/29 | 2,000,000 | 1,765,820 |
| Golden State Tobacco Securitization Corporation, Enhanced | | | | |
| Tobacco Settlement Asset-Backed Bonds (Insured; AMBAC) | 5.00 | 6/1/21 | 2,000,000 | 1,959,020 |
| Golden State Tobacco Securitization Corporation, | | | | |
| Tobacco Settlement Asset-Backed Bonds | 4.50 | 6/1/27 | 3,865,000 | 2,782,723 |
| Colorado—1.3% | | | | |
| Northwest Parkway Public Highway Authority, | | | | |
| Revenue (Insured; AMBAC) (Prerefunded) | 0/5.70 | 6/15/16 | 5,000,000b,c | 5,722,350 |
| Florida—1.6% | | | | |
| Miami-Dade County, Water and Sewer System Revenue | | | | |
| (Insured; Assured Guaranty Municipal Corp.) | 5.00 | 10/1/39 | 5,000,000 | 4,766,050 |
| Seminole Tribe, Special Obligation Revenue | 5.50 | 10/1/24 | 3,000,000a | 2,706,660 |
| Massachusetts—.1% | | | | |
| Massachusetts Housing Finance Agency, Housing Revenue | 5.13 | 12/1/34 | 350,000 | 319,287 |
| Michigan—1.4% | | | | |
| Detroit City School District, School Buildings and | | | | |
| Site Improvement Bonds (Insured; FGIC) | 5.25 | 5/1/17 | 2,000,000 | 2,119,320 |
| Michigan Tobacco Settlement Finance Authority, | | | | |
| Tobacco Settlement Asset-Backed Bonds | 5.13 | 6/1/22 | 5,170,000 | 4,109,116 |
| New Jersey—1.6% | | | | |
| Garden State Preservation Trust, Open Space and Farmland | | | | |
| Preservation Revenue (Insured; Assured Guaranty Municipal Corp.) | 5.80 | 11/1/21 | 2,000,000 | 2,290,840 |
| Garden State Preservation Trust, Open Space and Farmland | | | | |
| Preservation Revenue (Insured; Assured Guaranty Municipal Corp.) | 5.80 | 11/1/23 | 2,000,000 | 2,267,500 |
48
| | | | | |
| BNY Mellon Pennsylvania Intermediate Municipal Bond Fund (continued) | | |
| Long-Term Municipal | Coupon | Maturity | Principal | |
| Investments (continued) | Rate (%) | Date | Amount ($) | Value ($) |
| New Jersey (continued) | | | | |
| Tobacco Settlement Financing Corporation of New Jersey, | | | | |
| Tobacco Settlement Asset-Backed Bonds | 4.50 | 6/1/23 | 3,425,000 | 2,862,204 |
| North Carolina—.7% | | | | |
| North Carolina Eastern Municipal Power Agency, | | | | |
| Power System Revenue | 5.30 | 1/1/15 | 1,500,000 | 1,576,695 |
| North Carolina Eastern Municipal Power Agency, | | | | |
| Power System Revenue | 5.13 | 1/1/23 | 1,500,000 | 1,513,920 |
| Ohio—1.2% | | | | |
| Cuyahoga County, Revenue (Cleveland Clinic Health System) | 6.00 | 1/1/16 | 5,000,000 | 5,439,050 |
| Pennsylvania—69.3% | | | | |
| Allegheny County Airport Authority, Airport | | | | |
| Revenue (Pittsburgh International Airport) | | | | |
| (Insured; Assured Guaranty Municipal Corp.) | 5.00 | 1/1/17 | 1,000,000 | 1,044,960 |
| Allegheny County Hospital Development Authority, Revenue | | | | |
| (University of Pittsburgh Medical Center) | 5.00 | 6/15/14 | 5,000,000 | 5,494,500 |
| Allegheny County Port Authority, Special Transportation Revenue | 5.25 | 3/1/24 | 5,000,000 | 5,190,450 |
| Allegheny County Port Authority, Special Transportation | | | | |
| Revenue (Insured; National Public Finance Guarantee Corp.) | 5.38 | 3/1/11 | 2,500,000 | 2,501,025 |
| Allegheny County Port Authority, Special Transportation | | | | |
| Revenue (Insured; National Public Finance Guarantee Corp.) | 5.50 | 3/1/16 | 1,360,000 | 1,374,185 |
| Allegheny County Sanitary Authority, Sewer Revenue | | | | |
| (Insured; National Public Finance Guarantee Corp.) | 5.00 | 12/1/18 | 2,560,000 | 2,736,230 |
| Allegheny County Sanitary Authority, Sewer Revenue | | | | |
| (Insured; National Public Finance Guarantee Corp.) | 5.00 | 12/1/22 | 6,860,000 | 7,085,077 |
| Allentown School District, GO | 5.00 | 2/15/22 | 5,875,000 | 6,233,669 |
| Beaver County Industrial Development Authority, | | | | |
| PCR (Duquesne Light Company Project) (Insured; AMBAC) | 4.50 | 11/1/29 | 6,500,000 | 5,660,915 |
| Berks County Municipal Authority, Revenue | | | | |
| (The Reading Hospital and Medical Center Project) | 5.00 | 11/1/19 | 2,000,000 | 2,182,020 |
| Central Bucks School District, GO | 5.00 | 5/15/23 | 5,000,000 | 5,386,000 |
| Central Dauphin School District, GO (Insured; National | | | | |
| Public Finance Guarantee Corp.) (Prerefunded) | 6.75 | 2/1/16 | 5,000,000c | 6,198,150 |
| Central Dauphin School District, GO (Insured; National | | | | |
| Public Finance Guarantee Corp.) (Prerefunded) | 7.00 | 2/1/16 | 1,630,000c | 2,047,704 |
| Central Dauphin School District, GO (Insured; National | | | | |
| Public Finance Guarantee Corp.) (Prerefunded) | 7.50 | 2/1/16 | 3,100,000c | 3,947,292 |
| Central York School District, GO (Insured; FGIC) (Prerefunded) | 5.50 | 6/1/12 | 80,000c | 85,030 |
| Chester County, GO | 5.00 | 8/15/18 | 4,545,000 | 5,029,770 |
| Chester County, GO | 5.00 | 7/15/25 | 3,060,000 | 3,319,029 |
| Chester County, GO (Prerefunded) | 5.00 | 7/15/19 | 1,940,000c | 2,235,656 |
| Coatesville Area School District, GO | | | | |
| (Insured; Assured Guaranty Municipal Corp.) | 5.00 | 8/1/21 | 5,000,000 | 5,450,000 |
| Coatesville Area School District, GO (Insured; | | | | |
| Assured Guaranty Municipal Corp.) (Prerefunded) | 5.25 | 8/15/14 | 1,485,000c | 1,696,330 |
STATEMENT OF INVESTMENTS (Unaudited) (continued)
| | | | | |
| BNY Mellon Pennsylvania Intermediate Municipal Bond Fund (continued) | | |
| Long-Term Municipal | Coupon | Maturity | Principal | |
| Investments (continued) | Rate (%) | Date | Amount ($) | Value ($) |
| Pennsylvania (continued) | | | | |
| Coatesville Area School District, GO (Insured; | | | | |
| Assured Guaranty Municipal Corp.) (Prerefunded) | 5.25 | 8/15/14 | 6,515,000c | 7,442,150 |
| Commonwealth Financing Authority of Pennsylvania, Revenue | 5.00 | 6/1/24 | 5,000,000 | 5,246,350 |
| Delaware County Authority, University Revenue | | | | |
| (Villanova University) (Insured; AMBAC) | 5.00 | 8/1/20 | 2,095,000 | 2,239,597 |
| Delaware River Joint Toll Bridge Commission, Bridge Revenue | | | | |
| (Insured; National Public Finance Guarantee Corp.) | 5.25 | 7/1/17 | 1,485,000 | 1,662,042 |
| Downingtown Area School District, GO | 5.00 | 11/1/18 | 2,010,000 | 2,336,484 |
| East Stroudsburg Area School District, GO | | | | |
| (Insured; Assured Guaranty Municipal Corp.) (Prerefunded) | 7.50 | 9/1/16 | 2,500,000c | 3,250,350 |
| Easton Area School District, GO | | | | |
| (Insured; Assured Guaranty Municipal Corp.) | 7.50 | 4/1/18 | 1,000,000 | 1,216,040 |
| Easton Area School District, GO | | | | |
| (Insured; Assured Guaranty Municipal Corp.) | 7.50 | 4/1/21 | 3,000,000 | 3,559,710 |
| Easton Area School District, GO | | | | |
| (Insured; Assured Guaranty Municipal Corp.) | 7.50 | 4/1/22 | 3,000,000 | 3,527,550 |
| Easton Area School District, GO | | | | |
| (Insured; Assured Guaranty Municipal Corp.) | 5.50 | 4/1/23 | 2,260,000 | 2,470,361 |
| Erie County, GO (Insured; National Public Finance Guarantee Corp.) | 5.50 | 9/1/22 | 1,640,000 | 1,910,436 |
| Lancaster Higher Education Authority, College | | | | |
| Revenue (Franklin and Marshall College Project) | 5.25 | 4/15/16 | 1,815,000 | 1,937,549 |
| Lehigh County General Purpose Authority, | | | | |
| Revenue (Good Shepherd Group) | 5.25 | 11/1/14 | 2,670,000 | 2,811,777 |
| Lehigh County Industrial Development Authority, PCR | | | | |
| (People Electric Utilities Corporation Project) | | | | |
| (Insured; National Public Finance Guarantee Corp.) | 4.75 | 2/15/27 | 2,000,000 | 1,895,880 |
| Lower Merion School District, GO | 5.00 | 9/1/22 | 2,980,000 | 3,275,437 |
| Lower Merion School District, GO | 5.00 | 5/15/29 | 5,000,000 | 5,094,550 |
| Montgomery County, GO | 5.00 | 12/15/17 | 2,025,000 | 2,370,769 |
| Montgomery County Industrial Development Authority, FHA | | | | |
| Insured Mortgage Revenue (New Regional Medical Center Project) | 5.50 | 8/1/25 | 1,000,000 | 1,053,310 |
| Muhlenberg School District, GO (Insured; | | | | |
| National Public Finance Guarantee Corp.) | 5.38 | 4/1/15 | 1,000,000 | 1,043,350 |
| Parkland School District, GO (Insured; National | | | | |
| Public Finance Guarantee Corp.) | 5.38 | 9/1/14 | 3,110,000 | 3,515,109 |
| Parkland School District, GO (Insured; National | | | | |
| Public Finance Guarantee Corp.) | 5.38 | 9/1/16 | 1,490,000 | 1,731,216 |
| Pennsylvania, GO | 5.00 | 7/1/20 | 10,000,000 | 11,636,200 |
| Pennsylvania Economic Development Financing Authority, | | | | |
| SWDR (Waste Management, Inc. Project) | 4.70 | 11/1/14 | 5,000,000 | 5,118,100 |
| Pennsylvania Higher Educational Facilities Authority, | | | | |
| Revenue (Bryn Mawr College) (Insured; AMBAC) | 5.25 | 12/1/12 | 3,000,000 | 3,218,070 |
| Pennsylvania Higher Educational Facilities Authority, | | | | |
| Revenue (La Salle University) | 5.50 | 5/1/34 | 2,250,000 | 2,099,295 |
50
| | | | | |
| BNY Mellon Pennsylvania Intermediate Municipal Bond Fund (continued) | | |
| Long-Term Municipal | Coupon | Maturity | Principal | |
| Investments (continued) | Rate (%) | Date | Amount ($) | Value ($) |
| Pennsylvania (continued) | | | | |
| Pennsylvania Higher Educational Facilities Authority, | | | | |
| Revenue (Saint Joseph's University) | 5.00 | 11/1/25 | 2,010,000 | 2,064,190 |
| Pennsylvania Higher Educational Facilities Authority, | | | | |
| Revenue (The Trustees of the University of Pennsylvania) | 5.00 | 9/1/19 | 5,090,000 | 5,902,466 |
| Pennsylvania Higher Educational Facilities Authority, | | | | |
| Revenue (Thomas Jefferson University) (Insured; AMBAC) | 5.25 | 9/1/17 | 1,700,000 | 1,870,782 |
| Pennsylvania Higher Educational Facilities Authority, | | | | |
| Revenue (Thomas Jefferson University) (Insured; AMBAC) | 5.25 | 9/1/18 | 1,485,000 | 1,629,594 |
| Pennsylvania Industrial Development Authority, EDR (Insured; AMBAC) | 5.50 | 7/1/12 | 5,335,000 | 5,656,380 |
| Pennsylvania Intergovernmental Cooperation Authority, | | | | |
| Special Tax Revenue (City of Philadelphia Funding Program) | 5.00 | 6/15/19 | 2,000,000 | 2,282,480 |
| Pennsylvania Intergovernmental Cooperation Authority, | | | | |
| Special Tax Revenue (City of Philadelphia Funding Program) | 5.00 | 6/15/20 | 3,000,000 | 3,410,730 |
| Pennsylvania Intergovernmental Cooperation Authority, | | | | |
| Special Tax Revenue (City of Philadelphia Funding Program) | 5.00 | 6/15/22 | 3,395,000 | 3,738,778 |
| Pennsylvania Turnpike Commission, Oil Franchise Tax Subordinated | | | | |
| Revenue (Insured; National Public Finance Guarantee Corp.) | 5.00 | 12/1/21 | 5,000,000 | 5,176,100 |
| Pennsylvania Turnpike Commission, Oil Franchise Tax | | | | |
| Subordinated Revenue (Insured; National Public | | | | |
| Finance Guarantee Corp.) (Prerefunded) | 5.25 | 12/1/13 | 2,500,000c | 2,793,250 |
| Pennsylvania Turnpike Commission, Registration Fee | | | | |
| Revenue (Insured; Assured Guaranty Municipal Corp.) | 5.25 | 7/15/24 | 5,000,000 | 5,426,100 |
| Pennsylvania Turnpike Commission, Registration Fee | | | | |
| Revenue (Insured; Assured Guaranty Municipal Corp.) | 5.25 | 7/15/25 | 5,000,000 | 5,388,150 |
| Pennsylvania Turnpike Commission, | | | | |
| Turnpike Revenue (Insured; AMBAC) | 5.00 | 12/1/29 | 5,000,000 | 4,969,550 |
| Pennsylvania Turnpike Commission, Turnpike | | | | |
| Revenue (Insured; National Public Finance Guarantee Corp.) | 5.50 | 12/1/12 | 2,000,000 | 2,158,240 |
| Pennsylvania Turnpike Commission, Turnpike Subordinate Revenue | 5.00 | 6/1/26 | 5,000,000 | 4,952,250 |
| Pennsylvania Turnpike Commission, Turnpike Subordinate | | | | |
| Revenue (Insured; Assured Guaranty Municipal Corp.) | 6.00 | 6/1/28 | 1,500,000 | 1,604,355 |
| Philadelphia, GO (Insured; Assured Guaranty Municipal Corp.) | 5.25 | 8/1/17 | 12,500,000 | 14,023,500 |
| Philadelphia, Water and Wastewater Revenue (Insured; AMBAC) | 5.25 | 12/15/12 | 10,000,000 | 10,655,800 |
| Philadelphia, Water and Wastewater Revenue | | | | |
| (Insured; Assured Guaranty Municipal Corp.) | 5.25 | 7/1/18 | 5,000,000 | 5,419,800 |
| Philadelphia Authority for Industrial Development, Revenue | | | | |
| (Cultural and Commercial Corridors Program) | | | | |
| (Insured; National Public Finance Guarantee Corp.) | 5.00 | 12/1/20 | 3,380,000 | 3,423,095 |
| Philadelphia Authority for Industrial Development, Revenue | | | | |
| (Cultural and Commercial Corridors Program) | | | | |
| (Insured; National Public Finance Guarantee Corp.) | 5.00 | 12/1/22 | 3,150,000 | 3,108,451 |
| Philadelphia School District, GO (Insured; AMBAC) | 5.00 | 4/1/17 | 5,000,000 | 5,320,950 |
| Pittsburgh School District, GO | | | | |
| (Insured; Assured Guaranty Municipal Corp.) | 5.50 | 9/1/16 | 4,000,000 | 4,552,120 |
STATEMENT OF INVESTMENTS (Unaudited) (continued)
| | | | | |
| BNY Mellon Pennsylvania Intermediate Municipal Bond Fund (continued) | | | |
| |
| Long-Term Municipal | Coupon | Maturity | Principal | | |
| Investments (continued) | Rate (%) | Date | Amount ($) | | Value ($) |
| Pennsylvania (continued) | | | | | |
| Pittsburgh School District, GO | | | | | |
| (Insured; Assured Guaranty Municipal Corp.) | 5.50 | 9/1/18 | 1,000,000 | | 1,148,840 |
| Pocono Mountain School District, GO | | | | | |
| (Insured; Assured Guaranty Municipal Corp.) | 5.00 | 9/1/22 | 5,270,000 | | 5,582,195 |
| Saint Mary Hospital Authority, Health System | | | | | |
| Revenue (Catholic Health East Issue) | 5.00 | 11/15/21 | 1,000,000 | | 1,010,380 |
| Scranton-Lackawanna Health and Welfare Authority, | | | | | |
| Revenue (Community Medical Center Project) | | | | | |
| (Insured; National Public Finance Guarantee Corp.) | 5.50 | 7/1/11 | 3,195,000 | | 3,204,553 |
| Southeastern Pennsylvania Transportation Authority, Revenue | 5.00 | 3/1/26 | 3,000,000 | | 3,094,380 |
| State Public School Building Authority, School LR (Richland | | | | | |
| School District Project) (Insured; FGIC) (Prerefunded) | 5.00 | 11/15/14 | 1,265,000 | c | 1,444,276 |
| State Public School Building Authority, School LR | | | | | |
| (The School District of Philadelphia Project) | | | | | |
| (Insured; Assured Guaranty Municipal Corp.) (Prerefunded) | 5.00 | 6/1/13 | 5,000,000 | c | 5,468,750 |
| State Public School Building Authority, School Revenue | | | | | |
| (Tuscarora School District Project) (Insured; | | | | | |
| Assured Guaranty Municipal Corp.) | 5.25 | 4/1/17 | 840,000 | | 902,504 |
| State Public School Building Authority, School Revenue | | | | | |
| (Tuscarora School District Project) (Insured; Assured | | | | | |
| Guaranty Municipal Corp.) (Prerefunded) | 5.25 | 4/1/13 | 195,000 | c | 212,856 |
| Susquehanna Area Regional Airport Authority, | | | | | |
| Airport System Revenue | 5.38 | 1/1/18 | 6,000,000 | | 5,402,700 |
| Susquehanna Area Regional Airport Authority, | | | | | |
| Airport System Revenue (Insured; AMBAC) | 5.50 | 1/1/20 | 4,370,000 | | 4,407,276 |
| Susquehanna Area Regional Airport Authority, | | | | | |
| Airport System Revenue (Insured; AMBAC) | 5.00 | 1/1/33 | 2,290,000 | | 1,829,824 |
| Swarthmore Borough Authority, College Revenue | 5.25 | 9/15/17 | 1,000,000 | | 1,062,640 |
| Twin Valley School District, GO (Insured; Assured | | | | | |
| Guaranty Municipal Corp.) (Prerefunded) | 5.25 | 10/1/15 | 1,000,000 | c | 1,167,960 |
| University of Pittsburgh of the Commonwealth System of | | | | | |
| Higher Education, University Capital Project Bonds | 5.50 | 9/15/21 | 2,500,000 | | 2,895,650 |
| Upper Darby School District, GO | | | | | |
| (Insured; National Public Finance Guarantee Corp.) | 5.00 | 5/1/18 | 2,870,000 | | 3,127,812 |
| Upper Merion Area School District, GO | | | | | |
| (Insured; National Public Finance Guarantee Corp.) | 5.00 | 2/15/19 | 1,165,000 | | 1,269,955 |
| West Mifflin Area School District, GO | | | | | |
| (Insured; Assured Guaranty Municipal Corp.) | 5.50 | 4/1/24 | 1,060,000 | | 1,146,952 |
| Westmoreland County, GO (Insured; | | | | | |
| National Public Finance Guarantee Corp.) | 0.00 | 12/1/15 | 1,500,000 | d | 1,258,590 |
| Wilson School District, GO (Insured; | | | | | |
| Assured Guaranty Municipal Corp.) (Prerefunded) | 5.38 | 5/15/12 | 1,785,000 | c | 1,890,868 |
| Wilson School District, GO (Insured; | | | | | |
| Assured Guaranty Municipal Corp.) (Prerefunded) | 5.38 | 5/15/12 | 1,500,000 | c | 1,588,965 |
52
| | | | | |
| BNY Mellon Pennsylvania Intermediate Municipal Bond Fund (continued) | | | |
| Long-Term Municipal | Coupon | Maturity | Principal | | |
| Investments (continued) | Rate (%) | Date | Amount ($) | | Value ($) |
| Pennsylvania (continued) | | | | | |
| York County, GO (Insured; AMBAC) | 5.00 | 6/1/17 | 1,100,000 | | 1,184,260 |
| York County Solid Waste and Refuse Authority, | | | | | |
| Solid Waste System Revenue (Insured; | | | | | |
| National Public Finance Guarantee Corp.) | 5.50 | 12/1/14 | 1,000,000 | | 1,127,400 |
| South Carolina—.5% | | | | | |
| Greenville County School District, Installment Purchase | | | | | |
| Revenue (Building Equity Sooner for Tomorrow) | 5.50 | 12/1/18 | 2,000,000 | | 2,298,460 |
| Texas—.4% | | | | | |
| Cities of Dallas and Fort Worth, Dallas/Fort Worth | | | | | |
| International Airport, Joint Revenue Improvement | | | | | |
| Bonds (Insured; National Public Finance Guarantee Corp.) | 5.50 | 11/1/31 | 2,000,000 | | 1,999,900 |
| U.S. Related—12.0% | | | | | |
| Government of Guam, LOR (Section 30) | 5.63 | 12/1/29 | 1,000,000 | | 986,800 |
| Puerto Rico Commonwealth, Public Improvement GO | 5.25 | 7/1/23 | 4,090,000 | | 3,991,799 |
| Puerto Rico Commonwealth, | | | | | |
| Public Improvement GO (Insured; FGIC) | 5.50 | 7/1/18 | 5,000,000 | | 5,203,100 |
| Puerto Rico Commonwealth, Public Improvement GO | | | | | |
| (Insured; National Public Finance Guarantee Corp.) | 5.50 | 7/1/14 | 7,500,000 | | 8,059,500 |
| Puerto Rico Electric Power Authority, Power Revenue | | | | | |
| (Insured; National Public Finance Guarantee Corp.) | 5.25 | 7/1/14 | 7,875,000 | | 8,521,695 |
| Puerto Rico Electric Power Authority, Power Revenue | | | | | |
| (Insured; National Public Finance Guarantee Corp.) | 5.50 | 7/1/17 | 6,000,000 | | 6,567,960 |
| Puerto Rico Government Development Bank, Senior Notes | 5.00 | 12/1/12 | 3,000,000 | | 3,131,220 |
| Puerto Rico Government Development Bank, Senior Notes | 5.00 | 12/1/13 | 3,000,000 | | 3,166,200 |
| Puerto Rico Highways and Transportation Authority, | | | | | |
| Highway Revenue (Insured; Assured Guaranty Municipal Corp.) | 5.50 | 7/1/13 | 1,500,000 | | 1,577,865 |
| Puerto Rico Highways and Transportation Authority, | | | | | |
| Highway Revenue (Insured; National Public | | | | | |
| Finance Guarantee Corp.) | 5.50 | 7/1/13 | 4,000,000 | | 4,168,200 |
| Puerto Rico Infrastructure Financing Authority, | | | | | |
| Special Tax Revenue | 5.00 | 7/1/21 | 5,000,000 | | 4,920,450 |
| Puerto Rico Sales Tax Financing Corporation, | | | | | |
| Sales Tax Revenue (First Subordinate Series) | 0/6.75 | 8/1/32 | 1,000,000 | b | 809,740 |
| Puerto Rico Sales Tax Financing Corporation, | | | | | |
| Sales Tax Revenue (First Subordinate Series) | 0/6.25 | 8/1/33 | 500,000 | b | 341,225 |
| Puerto Rico Sales Tax Financing Corporation, | | | | | |
| Sales Tax Revenue (First Subordinate Series) | 0.00 | 8/1/36 | 3,750,000 | d | 705,487 |
| Puerto Rico Sales Tax Financing Corporation, | | | | | |
| Sales Tax Revenue (First Subordinate Series) | 5.38 | 8/1/39 | 1,000,000 | | 925,420 |
| Puerto Rico Sales Tax Financing Corporation, | | | | | |
| Sales Tax Revenue (First Subordinate Series) | 6.00 | 8/1/42 | 1,500,000 | | 1,499,910 |
| Total Long-Term Municipal Investments | | | | | |
| (cost $438,023,517) | | | | | 445,638,867 |
STATEMENT OF INVESTMENTS (Unaudited) (continued)
| | | | | |
| BNY Mellon Pennsylvania Intermediate Municipal Bond Fund (continued) | | | |
| Short-Term Municipal | Coupon | Maturity | Principal | | |
| Investments—1.4% | Rate (%) | Date | Amount ($) | | Value ($) |
| Colorado—.4% | | | | | |
| Colorado Educational and Cultural Facilities Authority, | | | | | |
| Revenue (National Jewish Federation Bond | | | | | |
| Program) (LOC; Bank of America) | 0.27 | 3/1/11 | 400,000 | e | 400,000 |
| Pitkin County, IDR, Refunding (Aspen Skiing Company | | | | | |
| Project) (LOC; JPMorgan Chase Bank) | 0.24 | 3/1/11 | 1,600,000 | e | 1,600,000 |
| Florida—.0% | | | | | |
| Orange County School Board, COP (Master Lease | | | | | |
| Purchase Agreement) (LOC; Wells Fargo Bank) | 0.20 | 3/1/11 | 200,000 | e | 200,000 |
| Iowa—.2% | | | | | |
| Iowa Finance Authority, Health Facilities Revenue | | | | | |
| (Great River Medical Center Project) (LOC; Allied Irish Banks) | 0.23 | 3/1/11 | 1,000,000 | e | 1,000,000 |
| Ohio—.2% | | | | | |
| Ohio Water Development Authority, PCR, Refunding (FirstEnergy | | | | | |
| Generation Corporation Project) (LOC; Barclays Bank) | 0.22 | 3/1/11 | 900,000 | e | 900,000 |
| Pennsylvania—.6% | | | | | |
| Lancaster County Hospital Authority, Health System | | | | | |
| Revenue (The Lancaster General Hospital | | | | | |
| Refunding Project) (LOC; Bank of America) | 0.24 | 3/1/11 | 2,300,000 | e | 2,300,000 |
| Lehigh County General Purpose Authority, HR | | | | | |
| (Lehigh Valley Health Network) (LOC; Bank of America) | 0.24 | 3/1/11 | 100,000 | e | 100,000 |
| Total Short-Term Municipal Investments | | | | | |
| (cost $6,500,000) | | | | | 6,500,000 |
| |
| Total Investments (cost $444,523,517) | | | 99.8 | % | 452,138,867 |
| Cash and Receivables (Net) | | | .2 | % | 868,446 |
| Net Assets | | | 100.0 | % | 453,007,313 |
|
| a Securities exempt from registration under Rule 144A of the Securities Act of 1933.These securities may be resold in transactions exempt from registration, normally to qualified |
| institutional buyers.At February 28, 2011, these securities had a value of $4,130,160 or 0.9% of net assets. |
| b Zero coupon until a specified date at which time the stated coupon rate becomes effective until maturity. |
| c These securities are prerefunded; the date shown represents the prerefunded date. Bonds which are prerefunded are collateralized by U.S. Government securities which are held in |
| escrow and are used to pay principal and interest on the municipal issue and to retire the bonds in full at the earliest refunding date. |
| d Security issued with a zero coupon. Income is recognized through the accretion of discount. |
| e Variable rate demand note—rate shown is the interest rate in effect at February 28, 2011. Maturity date represents the next demand date, or the ultimate maturity date if earlier. |
54
| | | | | | |
| Summary of Abbreviations | | | | |
| |
| ABAG | Association of Bay Area Governments | | ACA | American Capital Access |
| AGC | ACE Guaranty Corporation | | AGIC | Asset Guaranty Insurance Company |
| AMBAC | American Municipal Bond Assurance Corporation | ARRN | Adjustable Rate Receipt Notes |
| BAN | Bond Anticipation Notes | | BPA | Bond Purchase Agreement |
| CIFG | CDC Ixis Financial Guaranty | | COP | Certificate of Participation |
| CP | Commercial Paper | | EDR | Economic Development Revenue |
| EIR | Environmental Improvement Revenue | | FGIC | Financial Guaranty Insurance Company |
| FHA | Federal Housing Administration | | FHLB | Federal Home Loan Bank |
| FHLMC | Federal Home Loan Mortgage Corporation | FNMA | Federal National Mortgage Association |
| GAN | Grant Anticipation Notes | | GIC | Guaranteed Investment Contract |
| GNMA | Government National Mortgage Association | GO | General Obligation | |
| HR | Hospital Revenue | | IDB | Industrial Development Board |
| IDC | Industrial Development Corporation | | IDR | Industrial Development Revenue |
| LOC | Letter of Credit | | | LOR | Limited Obligation Revenue |
| LR | Lease Revenue | | | MFHR | Multi-Family Housing Revenue |
| MFMR | Multi-Family Mortgage Revenue | | PCR | Pollution Control Revenue |
| PILOT | Payment in Lieu of Taxes | | PUTTERS | Puttable Tax-Exempt Receipts |
| RAC | Revenue Anticipation Certificates | | RAN | Revenue Anticipation Notes |
| RAW | Revenue Anticipation Warrants | | RRR | Resources Recovery Revenue |
| SAAN | State Aid Anticipation Notes | | SBPA | Standby Bond Purchase Agreement |
| SFHR | Single Family Housing Revenue | | SFMR | Single Family Mortgage Revenue |
| SONYMA | State of New York Mortgage Agency | | SWDR | Solid Waste Disposal Revenue |
| TAN | Tax Anticipation Notes | | TAW | Tax Anticipation Warrants |
| TRAN | Tax and Revenue Anticipation Notes | | XLCA | XL Capital Assurance |
| |
| |
| |
| Summary of Combined Ratings (Unaudited) | | | |
| |
| Fitch | or | Moody’s | or | Standard & Poor’s | Value (%)† |
| AAA | | Aaa | | AAA | | 38.1 |
| AA | | Aa | | AA | | 31.1 |
| A | | A | | A | | 21.3 |
| BBB | | Baa | | BBB | | 6.3 |
| F1 | | MIG1/P1 | | SP1/A1 | | 1.4 |
| Not Ratedf | | Not Ratedf | | Not Ratedf | | 1.8 |
| | | | | | | 100.0 |
|
| † Based on total investments. |
| f Securities which, while not rated by Fitch, Moody's and Standard & Poor's, have been determined by the Manager to be of comparable quality to those rated securities in which the |
| fund may invest. |
See notes to financial statements.
|
| STATEMENT OF INVESTMENTS |
| February 28, 2011 (Unaudited) |
| | | | | |
| BNY Mellon Massachusetts Intermediate Municipal Bond Fund | | |
| Long-Term Municipal | Coupon | Maturity | Principal | |
| Investments—97.7% | Rate (%) | Date | Amount ($) | Value ($) |
| Massachusetts—87.4% | | | | |
| Ashland, GO (Insured; AMBAC) | 5.25 | 5/15/21 | 1,305,000 | 1,407,429 |
| Auburn, GO (Insured; AMBAC) | 5.13 | 6/1/20 | 1,225,000 | 1,333,400 |
| Boston, GO | 5.00 | 3/1/20 | 1,700,000 | 1,909,508 |
| Boston, GO | 5.00 | 3/1/21 | 2,000,000 | 2,220,620 |
| Boston Water and Sewer Commission, General Revenue | 5.00 | 11/1/17 | 2,000,000 | 2,339,740 |
| Boston Water and Sewer Commission, General Revenue | 5.00 | 11/1/18 | 1,500,000 | 1,762,770 |
| Boston Water and Sewer Commission, General Revenue | 5.00 | 11/1/19 | 2,170,000 | 2,376,063 |
| Boston Water and Sewer Commission, General Revenue | 5.00 | 11/1/23 | 3,920,000 | 4,121,331 |
| Boston Water and Sewer Commission, General Revenue | 5.00 | 11/1/25 | 2,500,000 | 2,725,025 |
| Brockton, GO (Municipal Purpose Loan) (Insured; AMBAC) | 5.00 | 6/1/19 | 1,430,000 | 1,542,999 |
| Burlington, GO | 5.25 | 2/1/12 | 200,000 | 209,050 |
| Burlington, GO | 5.25 | 2/1/13 | 250,000 | 271,590 |
| Cambridge, GO (Municipal Purpose Loan) | 5.00 | 12/15/11 | 10,000 | 10,374 |
| Cohasset, GO | 5.00 | 6/15/22 | 895,000 | 966,394 |
| Cohasset, GO | 5.00 | 6/15/23 | 895,000 | 935,051 |
| Everett, GO (Insured; National Public Finance Guarantee Corp.) | 5.38 | 12/15/17 | 1,250,000 | 1,399,987 |
| Haverhill, GO (State Qualified Municipal Purpose Loan) | | | | |
| (Insured; National Public Finance Guarantee Corp.) | 5.00 | 6/1/16 | 1,580,000 | 1,819,939 |
| Haverhill, GO (State Qualified Municipal Purpose Loan) | | | | |
| (Insured; National Public Finance Guarantee Corp.) | 5.00 | 6/1/18 | 505,000 | 567,726 |
| Hingham, GO (Municipal Purpose Loan) (Prerefunded) | 5.38 | 4/1/12 | 1,645,000a | 1,735,080 |
| Hopedale, GO (Insured; AMBAC) | 5.00 | 11/15/19 | 650,000 | 688,753 |
| Ipswich, GO (Insured; National Public Finance Guarantee Corp.) | 5.00 | 11/15/14 | 500,000 | 564,580 |
| Lynnfield, GO (Municipal Purpose Loan) | 5.00 | 7/1/20 | 505,000 | 549,041 |
| Lynnfield, GO (Municipal Purpose Loan) | 5.00 | 7/1/21 | 525,000 | 563,614 |
| Lynnfield, GO (Municipal Purpose Loan) | 5.00 | 7/1/22 | 585,000 | 631,823 |
| Lynnfield, GO (Municipal Purpose Loan) | 5.00 | 7/1/23 | 585,000 | 612,045 |
| Mansfield, GO (Insured; AMBAC) | 5.00 | 8/15/17 | 1,395,000 | 1,551,840 |
| Marblehead, GO | 5.00 | 8/15/18 | 1,340,000 | 1,463,066 |
| Marblehead, GO | 5.00 | 8/15/22 | 1,750,000 | 1,891,382 |
| Massachusetts, Consolidated Loan | 5.50 | 11/1/16 | 1,000,000 | 1,179,680 |
| Massachusetts, Consolidated Loan | 5.00 | 8/1/20 | 4,000,000 | 4,511,000 |
| Massachusetts, Consolidated Loan (Insured; | | | | |
| Assured Guaranty Municipal Corp.) | 5.25 | 8/1/22 | 5,825,000 | 6,428,004 |
| Massachusetts, Consolidated Loan (Insured; | | | | |
| Assured Guaranty Municipal Corp.) (Prerefunded) | 5.00 | 12/1/14 | 5,000,000a | 5,677,900 |
| Massachusetts, Consolidated Loan (Insured; FGIC) | 5.50 | 8/1/18 | 1,035,000 | 1,234,227 |
| Massachusetts, Consolidated Loan (Insured; | | | | |
| National Public Finance Guarantee Corp.) (Prerefunded) | 5.00 | 8/1/12 | 420,000a | 445,780 |
| Massachusetts, Consolidated Loan (Prerefunded) | 5.25 | 11/1/12 | 2,000,000a | 2,151,420 |
| Massachusetts, Consolidated Loan (Prerefunded) | 5.25 | 10/1/13 | 10,000,000a | 11,105,000 |
| Massachusetts, Consolidated Loan (Prerefunded) | 5.00 | 3/1/15 | 1,500,000a | 1,714,305 |
56
| | | | | |
| BNY Mellon Massachusetts Intermediate Municipal Bond Fund (continued) | | |
| |
| Long-Term Municipal | Coupon | Maturity | Principal | |
| Investments (continued) | Rate (%) | Date | Amount ($) | Value ($) |
| Massachusetts (continued) | | | | |
| Massachusetts, Consolidated Loan (Prerefunded) | 5.00 | 3/1/15 | 1,800,000a | 2,059,452 |
| Massachusetts, Consolidated Loan (Prerefunded) | 5.00 | 8/1/16 | 1,000,000a | 1,172,300 |
| Massachusetts, GO (Insured; AMBAC) | 5.50 | 10/1/18 | 225,000 | 268,540 |
| Massachusetts, GO (Insured; XLCA) | 3.56 | 12/1/12 | 2,470,000b | 2,490,748 |
| Massachusetts, Special Obligation Dedicated Tax | | | | |
| Revenue (Insured; FGIC) (Prerefunded) | 5.25 | 1/1/14 | 2,500,000a | 2,795,800 |
| Massachusetts, Special Obligation Dedicated Tax Revenue | | | | |
| (Insured; National Public Finance Guarantee Corp.) | 3.14 | 1/1/16 | 3,540,000b | 3,562,054 |
| Massachusetts, Special Obligation Revenue | 5.50 | 6/1/13 | 1,000,000 | 1,099,350 |
| Massachusetts Bay Transportation Authority, Assessment Revenue | 5.00 | 7/1/18 | 4,000,000 | 4,655,440 |
| Massachusetts Bay Transportation Authority, | | | | |
| Assessment Revenue (Prerefunded) | 5.25 | 7/1/14 | 1,045,000a | 1,187,810 |
| Massachusetts Bay Transportation Authority, | | | | |
| Assessment Revenue (Prerefunded) | 5.25 | 7/1/14 | 1,000,000a | 1,136,660 |
| Massachusetts Bay Transportation Authority, GO | | | | |
| (General Transportation System) (Insured; | | | | |
| National Public Finance Guarantee Corp.) | 5.25 | 3/1/15 | 1,000,000 | 1,131,560 |
| Massachusetts Bay Transportation Authority, | | | | |
| Senior Sales Tax Revenue | 5.00 | 7/1/15 | 3,500,000 | 3,977,435 |
| Massachusetts Bay Transportation Authority, | | | | |
| Senior Sales Tax Revenue | 5.50 | 7/1/16 | 2,500,000 | 2,941,825 |
| Massachusetts Bay Transportation Authority, | | | | |
| Senior Sales Tax Revenue | 5.25 | 7/1/21 | 2,000,000 | 2,358,480 |
| Massachusetts Bay Transportation Authority, | | | | |
| Senior Sales Tax Revenue | 5.25 | 7/1/22 | 2,430,000 | 2,853,792 |
| Massachusetts Bay Transportation Authority, | | | | |
| Senior Sales Tax Revenue | 5.25 | 7/1/22 | 3,415,000 | 4,010,576 |
| Massachusetts College Building Authority, Project Revenue | 5.00 | 5/1/23 | 1,000,000 | 1,081,330 |
| Massachusetts Development Finance Agency, | | | | |
| Education Revenue (Belmont Hill School Issue) (Prerefunded) | 5.00 | 9/1/11 | 500,000a | 515,135 |
| Massachusetts Development Finance Agency, | | | | |
| Education Revenue (Dexter School Project) | 5.00 | 5/1/23 | 1,400,000 | 1,461,754 |
| Massachusetts Development Finance Agency, | | | | |
| Education Revenue (Dexter School Project) | 5.00 | 5/1/24 | 1,465,000 | 1,513,433 |
| Massachusetts Development Finance Agency, | | | | |
| Higher Education Revenue (Emerson College Issue) | 5.00 | 1/1/16 | 1,000,000 | 1,079,630 |
| Massachusetts Development Finance Agency, | | | | |
| Higher Education Revenue (Emerson College Issue) | 5.00 | 1/1/22 | 2,000,000 | 2,043,540 |
| Massachusetts Development Finance Agency, | | | | |
| Revenue (Belmont Hill School Issue) | 4.50 | 9/1/36 | 1,130,000 | 979,077 |
| Massachusetts Development Finance Agency, | | | | |
| Revenue (Bentley University Issue) | 5.00 | 7/1/25 | 2,770,000 | 2,788,310 |
| Massachusetts Development Finance Agency, | | | | |
| Revenue (Boston College Issue) | 5.00 | 7/1/20 | 1,000,000 | 1,101,630 |
STATEMENT OF INVESTMENTS (Unaudited) (continued)
| | | | | |
| BNY Mellon Massachusetts Intermediate Municipal Bond Fund (continued) | | | |
| |
| Long-Term Municipal | Coupon | Maturity | Principal | | |
| Investments (continued) | Rate (%) | Date | Amount ($) | | Value ($) |
| Massachusetts (continued) | | | | | |
| Massachusetts Development Finance Agency, | | | | | |
| Revenue (College of the Holy Cross Issue) | 5.00 | 9/1/21 | 1,800,000 | | 1,974,186 |
| Massachusetts Development Finance Agency, Revenue | | | | | |
| (Combined Jewish Philanthropies of Greater Boston, Inc. Project) | 5.25 | 2/1/22 | 955,000 | | 993,582 |
| Massachusetts Development Finance Agency, | | | | | |
| Revenue (Curry College Issue) (Insured; ACA) | 4.75 | 3/1/20 | 530,000 | | 513,013 |
| Massachusetts Development Finance Agency, | | | | | |
| Revenue (Curry College Issue) (Insured; ACA) | 5.25 | 3/1/26 | 1,000,000 | | 942,500 |
| Massachusetts Development Finance Agency, | | | | | |
| Revenue (Curry College Issue) (Insured; ACA) | 5.00 | 3/1/36 | 1,000,000 | | 849,600 |
| Massachusetts Development Finance Agency, Revenue | | | | | |
| (Massachusetts College of Pharmacy and Allied Health | | | | | |
| Sciences Issue) (Insured; Assured Guaranty Municipal Corp.) | 5.00 | 7/1/24 | 2,750,000 | | 2,835,772 |
| Massachusetts Development Finance Agency, Revenue | | | | | |
| (Massachusetts College of Pharmacy and Allied Health | | | | | |
| Sciences Issue) (Insured; Assured Guaranty Municipal Corp.) | 5.00 | 7/1/27 | 1,000,000 | | 1,016,500 |
| Massachusetts Development Finance Agency, Revenue | | | | | |
| (Massachusetts College of Pharmacy and | | | | | |
| Allied Health Sciences Issue) (Prerefunded) | 6.38 | 7/1/13 | 1,000,000 | a | 1,142,290 |
| Massachusetts Development Finance Agency, | | | | | |
| Revenue (Milton Academy Issue) (Prerefunded) | 5.00 | 9/1/13 | 1,000,000 | a | 1,103,780 |
| Massachusetts Development Finance Agency, | | | | | |
| Revenue (Olin College Issue) (Insured; XLCA) | 5.25 | 7/1/33 | 5,000,000 | | 4,934,900 |
| Massachusetts Development Finance Agency, | | | | | |
| Revenue (Suffolk University Issue) | 5.13 | 7/1/40 | 2,000,000 | | 1,759,640 |
| Massachusetts Development Finance Agency, | | | | | |
| Revenue (The Park School Issue) | 4.50 | 9/1/31 | 1,000,000 | | 909,540 |
| Massachusetts Development Finance Agency, | | | | | |
| Revenue (Worcester Polytechnic Institute Issue) | 5.00 | 9/1/40 | 2,500,000 | | 2,308,300 |
| Massachusetts Development Finance Agency, | | | | | |
| RRR (Waste Management, Inc. Project) | 3.40 | 12/1/12 | 1,250,000 | | 1,254,325 |
| Massachusetts Development Finance Agency, | | | | | |
| SWDR (Dominion Energy Brayton Point Issue) | 5.75 | 5/1/19 | 2,000,000 | | 2,136,140 |
| Massachusetts Development Finance Agency, | | | | | |
| SWDR (Waste Management, Inc. Project) | 5.45 | 6/1/14 | 1,000,000 | | 1,055,080 |
| Massachusetts Health and Educational Facilities Authority, | | | | | |
| Revenue (Berklee College of Music Issue) | 5.00 | 10/1/32 | 2,000,000 | | 1,953,440 |
| Massachusetts Health and Educational Facilities Authority, | | | | | |
| Revenue (Berklee College of Music Issue) | 5.00 | 10/1/37 | 3,250,000 | | 3,111,647 |
| Massachusetts Health and Educational Facilities Authority, | | | | | |
| Revenue (Boston College Issue) | 5.13 | 6/1/37 | 2,000,000 | | 1,942,240 |
| Massachusetts Health and Educational Facilities Authority, | | | | | |
| Revenue (Cape Cod Healthcare Obligated Group Issue) | | | | | |
| (Insured; Assured Guaranty Municipal Corp.) | 5.13 | 11/15/35 | 1,000,000 | | 941,210 |
58
| | | | |
| BNY Mellon Massachusetts Intermediate Municipal Bond Fund (continued) | | |
| |
| Long-Term Municipal | Coupon | Maturity | Principal | |
| Investments (continued) | Rate (%) | Date | Amount ($) | Value ($) |
| Massachusetts (continued) | | | | |
| Massachusetts Health and Educational Facilities Authority, | | | | |
| Revenue (CareGroup Issue) (Insured; National | | | | |
| Public Finance Guarantee Corp.) | 5.25 | 7/1/20 | 1,000,000 | 1,028,120 |
| Massachusetts Health and Educational Facilities Authority, | | | | |
| Revenue (CareGroup Issue) (Insured; National | | | | |
| Public Finance Guarantee Corp.) | 5.25 | 7/1/23 | 1,000,000 | 993,650 |
| Massachusetts Health and Educational Facilities Authority, | | | | |
| Revenue (Dana-Farber Cancer Institute Issue) | 5.25 | 12/1/22 | 2,750,000 | 2,867,507 |
| Massachusetts Health and Educational Facilities Authority, | | | | |
| Revenue (Dana-Farber Cancer Institute Issue) | 5.25 | 12/1/27 | 2,000,000 | 1,993,220 |
| Massachusetts Health and Educational Facilities Authority, | | | | |
| Revenue (Dana-Farber Cancer Institute Issue) | 5.00 | 12/1/37 | 2,500,000 | 2,306,025 |
| Massachusetts Health and Educational Facilities Authority, | | | | |
| Revenue (Dartmouth-Hitchcock Obligated Group Issue) | | | | |
| (Insured; Assured Guaranty Municipal Corp.) | 5.13 | 8/1/22 | 2,000,000 | 2,025,100 |
| Massachusetts Health and Educational Facilities Authority, | | | | |
| Revenue (Harvard University Issue) | 5.00 | 12/15/25 | 2,500,000 | 2,743,000 |
| Massachusetts Health and Educational Facilities Authority, | | | | |
| Revenue (Harvard University Issue) | 5.00 | 12/15/27 | 3,230,000 | 3,491,016 |
| Massachusetts Health and Educational Facilities Authority, | | | | |
| Revenue (Harvard University Issue) | 5.00 | 7/15/36 | 1,000,000 | 1,014,670 |
| Massachusetts Health and Educational Facilities Authority, | | | | |
| Revenue (Isabella Stewart Gardner Museum Issue) | 5.00 | 5/1/26 | 2,525,000 | 2,582,646 |
| Massachusetts Health and Educational Facilities Authority, | | | | |
| Revenue (Isabella Stewart Gardner Museum Issue) | 5.00 | 5/1/27 | 1,000,000 | 1,017,390 |
| Massachusetts Health and Educational Facilities Authority, | | | | |
| Revenue (Massachusetts Eye and Ear Infirmary Issue) | 5.00 | 7/1/14 | 500,000 | 528,450 |
| Massachusetts Health and Educational Facilities Authority, | | | | |
| Revenue (Massachusetts Eye and Ear Infirmary Issue) | 5.00 | 7/1/15 | 500,000 | 529,325 |
| Massachusetts Health and Educational Facilities Authority, | | | | |
| Revenue (Massachusetts Eye and Ear Infirmary Issue) | 5.38 | 7/1/35 | 1,550,000 | 1,449,235 |
| Massachusetts Health and Educational Facilities Authority, | | | | |
| Revenue (Massachusetts Institute of Technology Issue) | 5.50 | 7/1/22 | 1,500,000 | 1,828,320 |
| Massachusetts Health and Educational Facilities Authority, | | | | |
| Revenue (Massachusetts Institute of Technology Issue) | 5.00 | 7/1/23 | 3,335,000 | 3,845,388 |
| Massachusetts Health and Educational Facilities Authority, | | | | |
| Revenue (Massachusetts Institute of Technology Issue) | 5.00 | 7/1/38 | 2,000,000 | 2,036,300 |
| Massachusetts Health and Educational Facilities Authority, | | | | |
| Revenue (Milford Regional Medical Center Issue) | 5.00 | 7/15/11 | 500,000 | 503,515 |
| Massachusetts Health and Educational Facilities Authority, | | | | |
| Revenue (Milford Regional Medical Center Issue) | 5.00 | 7/15/22 | 500,000 | 468,130 |
| Massachusetts Health and Educational Facilities Authority, | | | | |
| Revenue (Northeastern University Issue) | 4.13 | 2/16/12 | 1,500,000 | 1,538,445 |
STATEMENT OF INVESTMENTS (Unaudited) (continued)
| | | | | |
| BNY Mellon Massachusetts Intermediate Municipal Bond Fund (continued) | | |
| Long-Term Municipal | Coupon | Maturity | Principal | |
| Investments (continued) | Rate (%) | Date | Amount ($) | Value ($) |
| Massachusetts (continued) | | | | |
| Massachusetts Health and Educational Facilities Authority, | | | | |
| Revenue (Northeastern University Issue) | 5.00 | 10/1/12 | 975,000 | 1,032,593 |
| Massachusetts Health and Educational Facilities Authority, | | | | |
| Revenue (Northeastern University Issue) | 5.00 | 10/1/24 | 2,495,000 | 2,599,116 |
| Massachusetts Health and Educational Facilities Authority, | | | | |
| Revenue (Northeastern University Issue) | 5.63 | 10/1/29 | 3,000,000 | 3,110,430 |
| Massachusetts Health and Educational Facilities Authority, | | | | |
| Revenue (Northeastern University Issue) | 5.00 | 10/1/30 | 3,000,000 | 2,944,740 |
| Massachusetts Health and Educational Facilities Authority, | | | | |
| Revenue (Northeastern University Issue) | 5.00 | 10/1/35 | 2,500,000 | 2,400,775 |
| Massachusetts Health and Educational Facilities Authority, | | | | |
| Revenue (Partners HealthCare System Issue) | 6.00 | 7/1/14 | 60,000 | 61,488 |
| Massachusetts Health and Educational Facilities Authority, | | | | |
| Revenue (Partners HealthCare System Issue) | 5.00 | 7/1/16 | 1,045,000 | 1,105,004 |
| Massachusetts Health and Educational Facilities Authority, | | | | |
| Revenue (Partners HealthCare System Issue) | 5.00 | 7/1/18 | 1,500,000 | 1,651,995 |
| Massachusetts Health and Educational Facilities Authority, | | | | |
| Revenue (Partners HealthCare System Issue) | 5.00 | 7/1/21 | 1,235,000 | 1,307,766 |
| Massachusetts Health and Educational Facilities Authority, | | | | |
| Revenue (Partners HealthCare System Issue) | 5.75 | 7/1/21 | 85,000 | 86,935 |
| Massachusetts Health and Educational Facilities Authority, | | | | |
| Revenue (Partners HealthCare System Issue) | 5.00 | 7/1/22 | 250,000 | 262,867 |
| Massachusetts Health and Educational Facilities Authority, | | | | |
| Revenue (Partners HealthCare System Issue) | 5.25 | 7/1/29 | 2,350,000 | 2,349,906 |
| Massachusetts Health and Educational Facilities Authority, | | | | |
| Revenue (Partners HealthCare System Issue) (Prerefunded) | 5.75 | 7/1/11 | 2,240,000a | 2,303,594 |
| Massachusetts Health and Educational Facilities Authority, | | | | |
| Revenue (Partners HealthCare System Issue) (Prerefunded) | 6.00 | 7/1/11 | 1,400,000a | 1,440,936 |
| Massachusetts Health and Educational Facilities Authority, | | | | |
| Revenue (Simmons College Issue) | 7.50 | 10/1/22 | 1,000,000 | 1,183,650 |
| Massachusetts Health and Educational Facilities Authority, | | | | |
| Revenue (Simmons College Issue) | 8.00 | 10/1/29 | 1,800,000 | 2,011,950 |
| Massachusetts Health and Educational Facilities Authority, | | | | |
| Revenue (Simmons College Issue) | 8.00 | 10/1/39 | 1,500,000 | 1,659,195 |
| Massachusetts Health and Educational Facilities Authority, | | | | |
| Revenue (Southcoast Health System Obligated Group Issue) | 5.00 | 7/1/29 | 1,400,000 | 1,301,328 |
| Massachusetts Health and Educational Facilities Authority, | | | | |
| Revenue (Southcoast Health System Obligated Group Issue) | 5.00 | 7/1/39 | 1,500,000 | 1,313,235 |
| Massachusetts Health and Educational Facilities Authority, | | | | |
| Revenue (Tufts University Issue) | 5.50 | 8/15/14 | 1,000,000 | 1,135,170 |
| Massachusetts Health and Educational Facilities Authority, | | | | |
| Revenue (Tufts University Issue) | 5.25 | 8/15/23 | 1,000,000 | 1,091,680 |
| Massachusetts Health and Educational Facilities Authority, | | | | |
| Revenue (Tufts University Issue) | 5.38 | 8/15/38 | 2,000,000 | 2,058,120 |
60
| | | | | |
| BNY Mellon Massachusetts Intermediate Municipal Bond Fund (continued) | | |
| Long-Term Municipal | Coupon | Maturity | Principal | |
| Investments (continued) | Rate (%) | Date | Amount ($) | Value ($) |
| Massachusetts (continued) | | | | |
| Massachusetts Health and Educational Facilities Authority, | | | | |
| Revenue (UMass Memorial Issue) | 5.25 | 7/1/25 | 2,000,000 | 1,991,880 |
| Massachusetts Health and Educational Facilities Authority, | | | | |
| Revenue (UMass Memorial Issue) | 5.00 | 7/1/33 | 1,000,000 | 900,440 |
| Massachusetts Health and Educational Facilities Authority, | | | | |
| Revenue (Wellesley College Issue) | 5.00 | 7/1/24 | 1,000,000 | 1,053,470 |
| Massachusetts Housing Finance Agency, Housing Revenue | 4.00 | 6/1/19 | 3,500,000 | 3,502,030 |
| Massachusetts Housing Finance Agency, Housing Revenue | 5.13 | 12/1/34 | 200,000 | 182,450 |
| Massachusetts Industrial Finance Agency, Education Revenue | | | | |
| (Saint John's High School of Worcester County, Inc. Issue) | 5.70 | 6/1/18 | 1,435,000 | 1,436,607 |
| Massachusetts Municipal Wholesale Electric Company, | | | | |
| Power Supply Project Revenue (Nuclear Project Number 4 Issue) | | | | |
| (Insured; National Public Finance Guarantee Corp.) | 5.25 | 7/1/12 | 2,000,000 | 2,078,520 |
| Massachusetts Municipal Wholesale Electric Company, | | | | |
| Power Supply Project Revenue (Nuclear Project Number 4 Issue) | | | | |
| (Insured; National Public Finance Guarantee Corp.) | 5.25 | 7/1/14 | 5,000,000 | 5,167,700 |
| Massachusetts Municipal Wholesale Electric Company, | | | | |
| Power Supply Project Revenue (Nuclear Project Number 5 Issue) | | | | |
| (Insured; National Public Finance Guarantee Corp.) | 5.00 | 7/1/11 | 120,000 | 121,525 |
| Massachusetts Port Authority, Revenue | 5.00 | 7/1/28 | 2,500,000 | 2,574,125 |
| Massachusetts School Building Authority, | | | | |
| Dedicated Sales Tax Revenue (Insured; AMBAC) | 5.00 | 8/15/16 | 2,720,000 | 3,132,733 |
| Massachusetts School Building Authority, | | | | |
| Dedicated Sales Tax Revenue (Insured; AMBAC) | 5.00 | 8/15/20 | 4,000,000 | 4,467,360 |
| Massachusetts School Building Authority, Dedicated Sales Tax | | | | |
| Revenue (Insured; Assured Guaranty Municipal Corp.) | 5.00 | 8/15/15 | 1,900,000 | 2,161,231 |
| Massachusetts School Building Authority, Dedicated Sales Tax | | | | |
| Revenue (Insured; Assured Guaranty Municipal Corp.) | 5.00 | 8/15/18 | 5,000,000 | 5,562,150 |
| Massachusetts School Building Authority, Dedicated Sales Tax | | | | |
| Revenue (Insured; Assured Guaranty Municipal Corp.) | 5.00 | 8/15/21 | 2,000,000 | 2,168,100 |
| Massachusetts School Building Authority, Dedicated Sales Tax | | | | |
| Revenue (Insured; Assured Guaranty Municipal Corp.) | 5.00 | 8/15/24 | 1,750,000 | 1,845,235 |
| Massachusetts Turnpike Authority, Turnpike Revenue | | | | |
| (Insured; National Public Finance Guarantee Corp.) | 5.00 | 1/1/20 | 5,000,000 | 5,811,450 |
| Massachusetts Water Pollution Abatement Trust (Pool Program) | 5.63 | 8/1/13 | 25,000 | 25,362 |
| Massachusetts Water Pollution Abatement Trust (Pool Program) | 5.25 | 2/1/14 | 1,105,000 | 1,126,912 |
| Massachusetts Water Pollution Abatement Trust (Pool Program) | 5.50 | 8/1/14 | 30,000 | 30,130 |
| Massachusetts Water Pollution Abatement Trust (Pool Program) | 5.25 | 8/1/17 | 170,000 | 189,965 |
| Massachusetts Water Pollution Abatement Trust (Pool Program) | 5.00 | 8/1/18 | 75,000 | 79,000 |
| Massachusetts Water Pollution Abatement Trust (Pool Program) | 5.00 | 8/1/21 | 2,625,000 | 2,922,701 |
| Massachusetts Water Pollution Abatement Trust (Pool Program) | 5.00 | 8/1/32 | 2,000,000 | 2,014,000 |
| Massachusetts Water Pollution Abatement Trust | | | | |
| (Pool Program) (Prerefunded) | 5.25 | 8/1/11 | 335,000a | 341,794 |
STATEMENT OF INVESTMENTS (Unaudited) (continued)
| | | | | |
| BNY Mellon Massachusetts Intermediate Municipal Bond Fund (continued) | | |
| Long-Term Municipal | Coupon | Maturity | Principal | |
| Investments (continued) | Rate (%) | Date | Amount ($) | Value ($) |
| Massachusetts (continued) | | | | |
| Massachusetts Water Pollution Abatement Trust | | | | |
| (Pool Program) (Prerefunded) | 5.25 | 8/1/14 | 1,330,000a | 1,518,927 |
| Massachusetts Water Pollution Abatement Trust, | | | | |
| Water Pollution Abatement Revenue (MWRA Program) | 5.75 | 8/1/29 | 155,000 | 155,456 |
| Massachusetts Water Pollution Abatement Trust, Water Pollution | | | | |
| Abatement Revenue (New Bedford Loan Program) | 5.25 | 2/1/12 | 500,000 | 522,155 |
| Massachusetts Water Pollution Abatement Trust, Water Pollution | | | | |
| Abatement Revenue (South Essex Sewer District Loan Program) | 6.38 | 2/1/15 | 195,000 | 195,975 |
| Massachusetts Water Resources Authority, General Revenue | 5.00 | 8/1/19 | 2,475,000 | 2,880,479 |
| Massachusetts Water Resources Authority, General Revenue | 5.00 | 8/1/27 | 7,500,000 | 7,971,825 |
| Massachusetts Water Resources Authority, General Revenue | 5.00 | 8/1/39 | 1,000,000 | 1,003,710 |
| Massachusetts Water Resources Authority, General Revenue | | | | |
| (Insured; Assured Guaranty Municipal Corp.) | 5.25 | 8/1/18 | 500,000 | 590,450 |
| Massachusetts Water Resources Authority, General Revenue | | | | |
| (Insured; National Public Finance Guarantee Corp.) | 6.00 | 8/1/14 | 1,000,000 | 1,152,570 |
| Massachusetts Water Resources Authority, General Revenue | | | | |
| (Insured; National Public Finance Guarantee Corp.) | 5.25 | 8/1/19 | 1,500,000 | 1,714,410 |
| Massachusetts Water Resources Authority, General Revenue | | | | |
| (Insured; National Public Finance Guarantee Corp.) | 5.25 | 8/1/21 | 1,000,000 | 1,118,360 |
| Massachusetts Water Resources Authority, General Revenue | | | | |
| (Insured; National Public Finance Guarantee Corp.) | 5.25 | 8/1/24 | 2,500,000 | 2,708,875 |
| Middleborough, GO (Insured; National Public | | | | |
| Finance Guarantee Corp.) | 5.00 | 12/15/16 | 1,000,000 | 1,139,200 |
| Middleborough, GO (Insured; National Public | | | | |
| Finance Guarantee Corp.) | 5.00 | 12/15/18 | 1,275,000 | 1,411,068 |
| Milton, GO School Bonds | 5.00 | 3/1/23 | 500,000 | 528,320 |
| Milton, GO School Bonds | 5.00 | 3/1/24 | 500,000 | 524,480 |
| Milton, GO School Bonds | 5.00 | 3/1/25 | 500,000 | 518,420 |
| Northampton, GO (Insured; National Public | | | | |
| Finance Guarantee Corp.) | 5.13 | 10/15/16 | 1,985,000 | 2,191,460 |
| Northbridge, GO (Insured; AMBAC) | 5.25 | 2/15/17 | 1,000,000 | 1,047,780 |
| Pembroke, GO (Insured; National Public Finance Guarantee Corp.) | 4.50 | 8/1/13 | 695,000 | 747,896 |
| Pembroke, GO (Insured; National Public Finance Guarantee Corp.) | 5.00 | 8/1/20 | 960,000 | 1,034,602 |
| Pittsfield, GO (Insured; National Public Finance Guarantee Corp.) | 5.00 | 4/15/12 | 1,000,000 | 1,048,810 |
| Pittsfield, GO (Insured; National Public Finance | | | | |
| Guarantee Corp.) (Prerefunded) | 5.50 | 4/15/12 | 500,000a | 533,840 |
| Randolph, GO (Insured; AMBAC) | 5.00 | 9/1/17 | 1,045,000 | 1,127,147 |
| Randolph, GO (Insured; AMBAC) | 5.00 | 9/1/24 | 490,000 | 502,368 |
| Springfield Water and Sewer Commission, | | | | |
| General Revenue (Insured; AMBAC) | 5.00 | 7/15/22 | 1,175,000 | 1,231,212 |
| Springfield Water and Sewer Commission, | | | | |
| General Revenue (Insured; AMBAC) | 5.00 | 7/15/23 | 1,235,000 | 1,281,362 |
| University of Massachusetts Building Authority, Revenue | 6.88 | 5/1/14 | 1,500,000 | 1,669,680 |
62
| | | | | |
| BNY Mellon Massachusetts Intermediate Municipal Bond Fund (continued) | | |
| Long-Term Municipal | Coupon | Maturity | Principal | |
| Investments (continued) | Rate (%) | Date | Amount ($) | Value ($) |
| Massachusetts (continued) | | | | |
| Worcester, GO (Insured; National Public Finance Guarantee Corp.) | 5.25 | 8/15/16 | 1,000,000 | 1,092,120 |
| Worcester, GO (Insured; National Public Finance Guarantee Corp.) | 5.25 | 8/15/17 | 1,000,000 | 1,080,830 |
| Worcester, GO (Insured; National Public Finance Guarantee Corp.) | 5.00 | 4/1/18 | 625,000 | 667,263 |
| U.S. Related—10.3% | | | | |
| Government of Guam, LOR (Section 30) | 5.63 | 12/1/29 | 1,000,000 | 986,800 |
| Guam Economic Development Authority, | | | | |
| Tobacco Settlement Asset-Backed Bonds | 5.15 | 5/15/11 | 250,000 | 252,480 |
| Guam Economic Development Authority, | | | | |
| Tobacco Settlement Asset-Backed Bonds | 5.20 | 5/15/12 | 300,000 | 316,215 |
| Guam Economic Development Authority, | | | | |
| Tobacco Settlement Asset-Backed Bonds | 5.20 | 5/15/13 | 1,175,000 | 1,284,404 |
| Puerto Rico Commonwealth, Public Improvement GO | 5.00 | 7/1/14 | 2,500,000 | 2,639,000 |
| Puerto Rico Commonwealth, Public Improvement GO | 5.25 | 7/1/22 | 1,500,000 | 1,480,995 |
| Puerto Rico Commonwealth, Public Improvement GO | | | | |
| (Insured; National Public Finance Guarantee Corp.) | 6.25 | 7/1/11 | 1,050,000 | 1,071,336 |
| Puerto Rico Commonwealth, Public Improvement GO | | | | |
| (Insured; National Public Finance Guarantee Corp.) | 5.50 | 7/1/14 | 500,000 | 537,300 |
| Puerto Rico Commonwealth, Public Improvement GO | | | | |
| (Insured; National Public Finance Guarantee Corp.) | 5.50 | 7/1/15 | 1,135,000 | 1,206,403 |
| Puerto Rico Electric Power Authority, Power Revenue | 5.25 | 7/1/23 | 2,000,000 | 2,021,200 |
| Puerto Rico Electric Power Authority, Power Revenue | | | | |
| (Insured; National Public Finance Guarantee Corp.) | 5.00 | 7/1/17 | 1,000,000 | 1,047,360 |
| Puerto Rico Government Development Bank, Senior Notes | 5.00 | 12/1/12 | 3,205,000 | 3,345,187 |
| Puerto Rico Government Development Bank, Senior Notes | 5.00 | 12/1/13 | 3,000,000 | 3,166,200 |
| Puerto Rico Government Development Bank, Senior Notes | 5.25 | 1/1/15 | 2,000,000 | 2,070,440 |
| Puerto Rico Government Development Bank, Senior Notes | 5.00 | 12/1/15 | 1,090,000 | 1,131,475 |
| Puerto Rico Highways and Transportation | | | | |
| Authority, Highway Revenue | 5.00 | 7/1/16 | 1,000,000 | 1,024,400 |
| Puerto Rico Highways and Transportation Authority, | | | | |
| Highway Revenue (Insured; FGIC) | 5.50 | 7/1/16 | 3,265,000 | 3,421,459 |
| Puerto Rico Highways and Transportation Authority, | | | | |
| Transportation Revenue (Insured; FGIC) | 5.25 | 7/1/15 | 1,905,000 | 1,957,235 |
| Puerto Rico Highways and Transportation Authority, | | | | |
| Transportation Revenue (Insured; FGIC) | 5.25 | 7/1/16 | 1,550,000 | 1,576,164 |
| Puerto Rico Infrastructure Financing Authority, Special Tax Revenue | 5.00 | 7/1/20 | 2,260,000 | 2,258,169 |
| Puerto Rico Sales Tax Financing Corporation, | | | | |
| Sales Tax Revenue (First Subordinate Series) | 0/6.75 | 8/1/32 | 1,000,000c | 809,740 |
| Puerto Rico Sales Tax Financing Corporation, | | | | |
| Sales Tax Revenue (First Subordinate Series) | 0/6.25 | 8/1/33 | 750,000c | 511,838 |
| Puerto Rico Sales Tax Financing Corporation, | | | | |
| Sales Tax Revenue (First Subordinate Series) | 0.00 | 8/1/36 | 3,000,000d | 564,390 |
| Puerto Rico Sales Tax Financing Corporation, | | | | |
| Sales Tax Revenue (First Subordinate Series) | 5.38 | 8/1/39 | 1,500,000 | 1,388,130 |
STATEMENT OF INVESTMENTS (Unaudited) (continued)
| | | | | |
| BNY Mellon Massachusetts Intermediate Municipal Bond Fund (continued) | | | |
| Long-Term Municipal | Coupon | Maturity | Principal | | |
| Investments (continued) | Rate (%) | Date | Amount ($) | | Value ($) |
| U.S. Related (continued) | | | | | |
| Puerto Rico Sales Tax Financing Corporation, | | | | | |
| Sales Tax Revenue (First Subordinate Series) | 6.00 | 8/1/42 | 1,500,000 | | 1,499,910 |
| Total Long-Term Municipal Investments | | | | | |
| (cost $346,116,864) | | | | | 355,128,957 |
| |
| Short-Term Municipal Investments—1.7% | | | | | |
| Massachusetts; | | | | | |
| Massachusetts, Consolidated Loan | | | | | |
| (Liquidity Facility; Dexia Credit Locale) | 0.28 | 3/1/11 | 2,200,000 | e | 2,200,000 |
| Massachusetts, Consolidated Loan (LOC; Bank of America) | 0.23 | 3/1/11 | 100,000 | e | 100,000 |
| Massachusetts, GO Notes (Central Artery/Ted Williams | | | | | |
| Tunnel Infrastructure Loan Act of 2000) | | | | | |
| (Liquidity Facility; Landesbank Baden-Wurttemberg) | 0.25 | 3/1/11 | 1,200,000 | e | 1,200,000 |
| Massachusetts Development Finance Agency, Revenue | | | | | |
| (Boston University Issue) (LOC; JPMorgan Chase Bank) | 0.22 | 3/1/11 | 800,000 | e | 800,000 |
| Massachusetts Development Finance Agency, Revenue, Refunding | | | | | |
| (College of The Holy Cross Issue) (LOC; Bank of America) | 0.22 | 3/1/11 | 1,300,000 | e | 1,300,000 |
| Massachusetts Health and Educational Facilities Authority, Revenue | | | | | |
| (Baystate Medical Center Issue) (LOC; JPMorgan Chase Bank) | 0.22 | 3/1/11 | 400,000 | e | 400,000 |
| Total Short-Term Municipal Investments | | | | | |
| (cost $6,000,000) | | | | | 6,000,000 |
| |
| Total Investments (cost $352,116,864) | | | 99.4 | % | 361,128,957 |
| Cash and Receivables (Net) | | | .6 | % | 2,202,958 |
| Net Assets | | | 100.0 | % | 363,331,915 |
|
| a These securities are prerefunded; the date shown represents the prerefunded date. Bonds which are prerefunded are collateralized by U.S. Government securities which are held in |
| escrow and are used to pay principal and interest on the municipal issue and to retire the bonds in full at the earliest refunding date. |
| b Variable rate security—interest rate subject to periodic change. |
| c Zero coupon until a specified date at which time the stated coupon rate becomes effective until maturity. |
| d Security issued with a zero coupon. Income is recognized through the accretion of discount. |
| e Variable rate demand note—rate shown is the interest rate in effect at February 28, 2011. Maturity date represents the next demand date, or the ultimate maturity date if earlier. |
64
| | | | | | |
| Summary of Abbreviations | | | | |
| |
| ABAG | Association of Bay Area Governments | | ACA | American Capital Access |
| AGC | ACE Guaranty Corporation | | AGIC | Asset Guaranty Insurance Company |
| AMBAC | American Municipal Bond Assurance Corporation | ARRN | Adjustable Rate Receipt Notes |
| BAN | Bond Anticipation Notes | | BPA | Bond Purchase Agreement |
| CIFG | CDC Ixis Financial Guaranty | | COP | Certificate of Participation |
| CP | Commercial Paper | | EDR | Economic Development Revenue |
| EIR | Environmental Improvement Revenue | | FGIC | Financial Guaranty Insurance Company |
| FHA | Federal Housing Administration | | FHLB | Federal Home Loan Bank |
| FHLMC | Federal Home Loan Mortgage Corporation | FNMA | Federal National Mortgage Association |
| GAN | Grant Anticipation Notes | | GIC | Guaranteed Investment Contract |
| GNMA | Government National Mortgage Association | GO | General Obligation | |
| HR | Hospital Revenue | | IDB | Industrial Development Board |
| IDC | Industrial Development Corporation | | IDR | Industrial Development Revenue |
| LOC | Letter of Credit | | | LOR | Limited Obligation Revenue |
| LR | Lease Revenue | | | MFHR | Multi-Family Housing Revenue |
| MFMR | Multi-Family Mortgage Revenue | | PCR | Pollution Control Revenue |
| PILOT | Payment in Lieu of Taxes | | PUTTERS | Puttable Tax-Exempt Receipts |
| RAC | Revenue Anticipation Certificates | | RAN | Revenue Anticipation Notes |
| RAW | Revenue Anticipation Warrants | | RRR | Resources Recovery Revenue |
| SAAN | State Aid Anticipation Notes | | SBPA | Standby Bond Purchase Agreement |
| SFHR | Single Family Housing Revenue | | SFMR | Single Family Mortgage Revenue |
| SONYMA | State of New York Mortgage Agency | | SWDR | Solid Waste Disposal Revenue |
| TAN | Tax Anticipation Notes | | TAW | Tax Anticipation Warrants |
| TRAN | Tax and Revenue Anticipation Notes | | XLCA | XL Capital Assurance |
| |
| |
| |
| Summary of Combined Ratings (Unaudited) | | | |
| |
| Fitch | or | Moody’s | or | Standard & Poor’s | Value (%)† |
| AAA | | Aaa | | AAA | | 38.1 |
| AA | | Aa | | AA | | 30.0 |
| A | | A | | A | | 23.5 |
| BBB | | Baa | | BBB | | 5.2 |
| F1 | | MIG1/P1 | | SP1/A1 | | 1.3 |
| F2 | | VMIG2, MIG3/P2 | | SP2/A2 | | .3 |
| Not Ratedf | | Not Ratedf | | Not Ratedf | | 1.6 |
| | | | | | | 100.0 |
|
| † Based on total investments. |
| f Securities which, while not rated by Fitch, Moody's and Standard & Poor's, have been determined by the Manager to be of comparable quality to those rated securities in which the |
| fund may invest. |
See notes to financial statements.
The Funds 65
|
| STATEMENT OF INVESTMENTS |
| February 28, 2011 (Unaudited) |
| | | | | |
| BNY Mellon New York Intermediate Tax-Exempt Bond Fund | | | |
| Long-Term Municipal | Coupon | Maturity | Principal | |
| Investments—97.2% | Rate (%) | Date | Amount ($) | Value ($) |
| Arizona—.2% | | | | |
| Salt Verde Financial Corporation, Senior Gas Revenue | 5.00 | 12/1/32 | 500,000 | 434,180 |
| New York—89.0% | | | | |
| Albany County Airport Authority, Airport Revenue | | | | |
| (Insured; Assured Guaranty Municipal Corp.) | 5.00 | 12/15/23 | 1,500,000 | 1,550,955 |
| Albany Industrial Development Agency, Civic Facility Revenue | | | | |
| (Saint Peter's Hospital of the City of Albany Project) | 5.75 | 11/15/22 | 2,500,000 | 2,578,725 |
| Battery Park City Authority, Senior Revenue | 5.25 | 11/1/22 | 1,000,000 | 1,075,270 |
| Cold Spring Harbor Central School District, GO | 5.00 | 2/1/19 | 1,075,000 | 1,262,544 |
| Cold Spring Harbor Central School District, GO | 5.00 | 2/1/22 | 1,410,000 | 1,635,360 |
| Erie County Industrial Development Agency, | | | | |
| Revenue (City School District of the City of Buffalo Project) | 5.00 | 5/1/17 | 2,500,000 | 2,787,425 |
| Katonah-Lewisboro Union Free School District, GO | | | | |
| (Insured; National Public Finance Guarantee Corp.) | 5.00 | 9/15/15 | 1,000,000 | 1,146,310 |
| Long Island Power Authority, Electric System General Revenue | 5.25 | 6/1/14 | 2,000,000 | 2,214,000 |
| Long Island Power Authority, Electric System General | | | | |
| Revenue (Insured; National Public Finance Guarantee Corp.) | 4.00 | 5/1/12 | 850,000 | 881,475 |
| Long Island Power Authority, Electric System General Revenue | | | | |
| (Insured; National Public Finance Guarantee Corp.) | 5.00 | 12/1/18 | 1,000,000 | 1,091,020 |
| Metropolitan Transportation Authority, Dedicated Tax Fund | | | | |
| Revenue (Insured; National Public Finance Guarantee Corp.) | 5.25 | 11/15/15 | 2,000,000 | 2,056,380 |
| Metropolitan Transportation Authority, Dedicated Tax Fund | | | | |
| Revenue (Insured; National Public Finance Guarantee Corp.) | 5.00 | 11/15/28 | 5,000,000 | 5,071,550 |
| Metropolitan Transportation Authority, | | | | |
| Transit Facilities Revenue (Insured; FGIC) | 0.00 | 7/1/11 | 1,000,000a | 998,770 |
| Metropolitan Transportation Authority, Transportation Revenue | 5.00 | 11/15/17 | 1,000,000 | 1,089,180 |
| Nassau County, GO (General Improvement) | 4.00 | 10/1/16 | 1,545,000 | 1,629,249 |
| Nassau County, GO (Insured; Assured Guaranty Municipal Corp.) | 5.00 | 7/1/22 | 1,000,000 | 1,034,070 |
| Nassau County Interim Finance Authority, | | | | |
| Sales Tax Secured Revenue (Insured; AMBAC) | 5.00 | 11/15/16 | 1,500,000 | 1,618,215 |
| Nassau County Interim Finance Authority, | | | | |
| Sales Tax Secured Revenue (Insured; AMBAC) | 5.00 | 11/15/17 | 1,500,000 | 1,615,320 |
| Nassau County Interim Finance Authority, Sales Tax Secured | | | | |
| Revenue (Insured; National Public Finance Guarantee Corp.) | 5.00 | 11/15/16 | 1,000,000 | 1,130,920 |
| Nassau County Sewer and Storm Water Finance Authority, System | | | | |
| Revenue (Insured; Berkshire Hathaway Assurance Corporation) | 5.38 | 11/1/28 | 1,000,000 | 1,052,540 |
| New York City, GO | 5.00 | 8/1/17 | 2,835,000 | 3,215,230 |
| New York City, GO | 5.00 | 8/1/18 | 1,000,000 | 1,103,580 |
| New York City, GO | 5.25 | 9/1/20 | 1,000,000 | 1,123,440 |
| New York City, GO | 5.13 | 12/1/22 | 1,000,000 | 1,074,380 |
| New York City, GO | 5.25 | 9/1/23 | 1,000,000 | 1,078,030 |
| New York City, GO (Insured; Assured Guaranty Municipal Corp.) | 5.00 | 4/1/18 | 1,000,000 | 1,085,400 |
| New York City Industrial Development Agency, Civic Facility | | | | |
| Revenue (United Jewish Appeal—Federation of | | | | |
| Jewish Philanthropies of New York, Inc. Project) | 5.00 | 7/1/27 | 1,250,000 | 1,254,487 |
66
| | | | |
| BNY Mellon New York Intermediate Tax-Exempt Bond Fund (continued) | | |
| Long-Term Municipal | Coupon | Maturity | Principal | |
| Investments (continued) | Rate (%) | Date | Amount ($) | Value ($) |
| New York (continued) | | | | |
| New York City Industrial Development Agency, | | | | |
| PILOT Revenue (Queens Baseball Stadium Project) | | | | |
| (Insured; Assured Guaranty Municipal Corp.) | 6.50 | 1/1/46 | 500,000 | 520,955 |
| New York City Industrial Development Agency, PILOT | | | | |
| Revenue (Yankee Stadium Project) | | | | |
| (Insured; Assured Guaranty Municipal Corp.) | 7.00 | 3/1/49 | 1,000,000 | 1,091,980 |
| New York City Industrial Development Agency, Special Revenue | | | | |
| (New York City—New York Stock Exchange Project) | 5.00 | 5/1/21 | 1,000,000 | 1,087,550 |
| New York City Industrial Development Agency, Special Revenue | | | | |
| (New York City—New York Stock Exchange Project) | 5.00 | 5/1/29 | 1,000,000 | 1,009,280 |
| New York City Municipal Water Finance Authority, | | | | |
| Water and Sewer System Revenue | 5.75 | 6/15/40 | 1,275,000 | 1,347,522 |
| New York City Municipal Water Finance Authority, | | | | |
| Water and Sewer System Second General Resolution Revenue | 5.00 | 6/15/20 | 2,500,000 | 2,781,225 |
| New York City Transitional Finance Authority, Building Aid Revenue | 5.25 | 1/15/25 | 1,545,000 | 1,626,854 |
| New York City Transitional Finance Authority, Building Aid Revenue | 5.25 | 1/15/27 | 1,650,000 | 1,716,264 |
| New York City Transitional Finance Authority, | | | | |
| Future Tax Secured Revenue | 5.50 | 11/15/17 | 1,755,000 | 1,884,782 |
| New York City Transitional Finance Authority, | | | | |
| Future Tax Secured Revenue | 5.00 | 8/1/22 | 2,000,000 | 2,158,400 |
| New York City Transitional Finance Authority, | | | | |
| Future Tax Secured Subordinate Revenue | 5.00 | 11/1/18 | 1,750,000 | 2,013,515 |
| New York City Trust for Cultural Resources, | | | | |
| Revenue (Lincoln Center for the Performing Arts, Inc.) | 5.75 | 12/1/16 | 1,000,000 | 1,159,120 |
| New York City Trust for Cultural Resources, | | | | |
| Revenue (The Juilliard School) | 5.00 | 1/1/34 | 1,850,000 | 1,864,800 |
| New York City Trust for Cultural Resources, | | | | |
| Revenue (The Juilliard School) | 5.00 | 1/1/39 | 3,750,000 | 3,755,775 |
| New York City Trust for Cultural Resources, | | | | |
| Revenue (The Museum of Modern Art) | 5.00 | 4/1/25 | 1,150,000 | 1,209,616 |
| New York City Trust for Cultural Resources, | | | | |
| Revenue (The Museum of Modern Art) | 5.00 | 4/1/31 | 1,000,000 | 1,015,420 |
| New York Liberty Development Corporation, | | | | |
| Revenue (Goldman Sachs Headquarters Issue) | 5.00 | 10/1/15 | 1,850,000 | 1,965,088 |
| New York Local Government Assistance Corporation, Revenue | 5.00 | 4/1/18 | 2,500,000 | 2,849,550 |
| New York Local Government Assistance Corporation, | | | | |
| Subordinate Lien Revenue (Insured; | | | | |
| Assured Guaranty Municipal Corp.) | 5.00 | 4/1/13 | 2,000,000 | 2,170,180 |
| New York State, GO | 5.00 | 4/15/14 | 1,000,000 | 1,078,430 |
| New York State, GO | 5.25 | 3/15/15 | 2,750,000 | 2,787,648 |
| New York State, GO | 5.00 | 3/1/19 | 1,000,000 | 1,122,300 |
| New York State, GO | 5.00 | 2/15/26 | 2,600,000 | 2,763,930 |
| New York State Dormitory Authority, Consolidated Fifth | | | | |
| General Resolution Revenue (City University System) | 5.00 | 7/1/19 | 1,000,000 | 1,073,720 |
STATEMENT OF INVESTMENTS (Unaudited) (continued)
| | | | | |
| BNY Mellon New York Intermediate Tax-Exempt Bond Fund (continued) | | |
| Long-Term Municipal | Coupon | Maturity | Principal | |
| Investments (continued) | Rate (%) | Date | Amount ($) | Value ($) |
| New York (continued) | | | | |
| New York State Dormitory Authority, Consolidated | | | | |
| Revenue (City University System) (Insured; FGIC) | 5.75 | 7/1/18 | 2,370,000 | 2,670,469 |
| New York State Dormitory Authority, Court Facilities LR | | | | |
| (The City of New York Issue) (Prerefunded) | 5.38 | 5/15/13 | 1,000,000b | 1,104,450 |
| New York State Dormitory Authority, | | | | |
| LR (State University Dormitory Facilities Issue) | 5.00 | 7/1/18 | 1,000,000 | 1,075,150 |
| New York State Dormitory Authority, Revenue (Columbia University) | 5.00 | 7/1/12 | 1,000,000 | 1,060,160 |
| New York State Dormitory Authority, Revenue (Columbia University) | 5.00 | 7/1/18 | 1,500,000 | 1,700,505 |
| New York State Dormitory Authority, Revenue (Columbia University) | 5.00 | 7/1/38 | 500,000 | 508,105 |
| New York State Dormitory Authority, Revenue (Convent of the | | | | |
| Sacred Heart) (Insured; Assured Guaranty Municipal Corp.) | 5.63 | 11/1/35 | 1,000,000 | 1,007,230 |
| New York State Dormitory Authority, Revenue (Fordham | | | | |
| University) (Insured; National Public Finance Guarantee Corp.) | 5.00 | 7/1/18 | 405,000 | 414,837 |
| New York State Dormitory Authority, Revenue | | | | |
| (Memorial Sloan-Kettering Cancer Center) | | | | |
| (Insured; National Public Finance Guarantee Corp.) | 5.00 | 7/1/20 | 3,250,000 | 3,442,270 |
| New York State Dormitory Authority, Revenue | | | | |
| (Memorial Sloan-Kettering Cancer Center) | | | | |
| (Insured; National Public Finance Guarantee Corp.) | 5.50 | 7/1/23 | 2,000,000 | 2,211,280 |
| New York State Dormitory Authority, Revenue | | | | |
| (Mount Sinai Hospital Obligated Group) | 5.00 | 7/1/26 | 3,000,000 | 2,995,020 |
| New York State Dormitory Authority, Revenue | | | | |
| (Mount Sinai School of Medicine of New York University) | 5.13 | 7/1/39 | 5,000,000 | 4,607,650 |
| New York State Dormitory Authority, Revenue (New York University) | 5.25 | 7/1/34 | 2,500,000 | 2,534,375 |
| New York State Dormitory Authority, Revenue (New York University) | | | | |
| (Insured; National Public Finance Guarantee Corp.) | 5.00 | 7/1/21 | 1,500,000 | 1,576,785 |
| New York State Dormitory Authority, Revenue | | | | |
| (Rochester Institute of Technology) | 5.00 | 7/1/23 | 1,000,000 | 1,047,840 |
| New York State Dormitory Authority, Revenue | | | | |
| (State University Educational Facilities) | | | | |
| (Insured; National Public Finance Guarantee Corp.) | 5.88 | 5/15/11 | 1,500,000 | 1,517,355 |
| New York State Dormitory Authority, Revenue | | | | |
| (State University Educational Facilities) | | | | |
| (Insured; National Public Finance Guarantee Corp.) | 5.25 | 5/15/15 | 500,000 | 556,410 |
| New York State Dormitory Authority, | | | | |
| Revenue (The Rockefeller University) | 5.00 | 7/1/25 | 1,000,000 | 1,072,120 |
| New York State Dormitory Authority, | | | | |
| Revenue (The Rockefeller University) | 5.00 | 7/1/40 | 5,000,000 | 5,025,050 |
| New York State Dormitory Authority, Revenue (Vassar College) | 5.00 | 7/1/15 | 675,000 | 764,957 |
| New York State Dormitory Authority, Secured HR | | | | |
| (The Bronx-Lebanon Hospital Center) | 4.00 | 8/15/14 | 1,000,000 | 1,059,710 |
| New York State Dormitory Authority, | | | | |
| State Personal Income Tax Revenue (Education) | 5.00 | 3/15/16 | 1,000,000 | 1,086,210 |
| New York State Dormitory Authority, | | | | |
| State Personal Income Tax Revenue (Education) | 5.75 | 3/15/36 | 1,000,000 | 1,065,860 |
68
| | | | | |
| BNY Mellon New York Intermediate Tax-Exempt Bond Fund (continued) | | | |
| |
| Long-Term Municipal | Coupon | Maturity | Principal | | |
| Investments (continued) | Rate (%) | Date | Amount ($) | | Value ($) |
| New York (continued) | | | | | |
| New York State Dormitory Authority, Third General Resolution | | | | | |
| Revenue (State University Educational Facilities Issue) | 5.25 | 5/15/12 | 1,500,000 | | 1,572,030 |
| New York State Environmental Facilities Corporation, State Clean | | | | | |
| Water and Drinking Water Revolving Funds Revenue | | | | | |
| (New York City Municipal Water Finance Authority Projects) | 5.25 | 6/15/12 | 390,000 | | 391,677 |
| New York State Environmental Facilities Corporation, State Clean | | | | | |
| Water and Drinking Water Revolving Funds Revenue | | | | | |
| (New York City Municipal Water Finance Authority Projects) | 5.25 | 6/15/14 | 1,500,000 | | 1,695,420 |
| New York State Environmental Facilities Corporation, State Clean | | | | | |
| Water and Drinking Water Revolving Funds Revenue | | | | | |
| (New York City Municipal Water Finance Authority Projects) | 5.38 | 6/15/15 | 1,000,000 | | 1,053,650 |
| New York State Environmental Facilities Corporation, State Clean | | | | | |
| Water and Drinking Water Revolving Funds Revenue | | | | | |
| (New York City Municipal Water Finance Authority Projects) | 5.25 | 6/15/19 | 775,000 | | 812,045 |
| New York State Environmental Facilities Corporation, State Clean | | | | | |
| Water and Drinking Water Revolving Funds Revenue | | | | | |
| (New York City Municipal Water Finance Authority Projects) | 5.00 | 6/15/25 | 1,200,000 | | 1,255,248 |
| New York State Environmental Facilities Corporation, State Water | | | | | |
| Pollution Control Revolving Fund Revenue (New York City | | | | | |
| Municipal Water Finance Authority Project) | 7.00 | 6/15/12 | 150,000 | | 150,857 |
| New York State Medical Care Facilities Finance Agency, | | | | | |
| Secured Mortgage Revenue (Collateralized; SONYMA) | 6.38 | 11/15/20 | 245,000 | | 245,551 |
| New York State Mortgage Agency, Homeowner Mortgage Revenue | 5.10 | 10/1/17 | 1,000,000 | | 1,001,150 |
| New York State Mortgage Agency, Homeowner Mortgage Revenue | 5.38 | 10/1/17 | 875,000 | | 875,928 |
| New York State Municipal Bond Bank Agency, Recovery Act | | | | | |
| Revenue (Insured; Assured Guaranty Municipal Corp.) | 5.00 | 5/15/16 | 2,000,000 | | 2,199,040 |
| New York State Power Authority, Revenue (Insured; FGIC) | 5.00 | 11/15/20 | 1,000,000 | | 1,082,910 |
| New York State Power Authority, Revenue (Prerefunded) | 5.00 | 11/15/12 | 2,500,000 | b | 2,689,050 |
| New York State Thruway Authority, | | | | | |
| General Revenue (Insured; AMBAC) | 5.00 | 1/1/19 | 1,000,000 | | 1,059,530 |
| New York State Thruway Authority, | | | | | |
| Local Highway and Bridge Service Contract Bonds | 5.50 | 4/1/14 | 1,000,000 | | 1,047,490 |
| New York State Thruway Authority, Second General | | | | | |
| Highway and Bridge Trust Fund Bonds (Insured; AMBAC) | 5.00 | 4/1/25 | 2,000,000 | | 2,060,100 |
| New York State Thruway Authority, Second General | | | | | |
| Highway and Bridge Trust Fund Bonds (Insured; | | | | | |
| Assured Guaranty Municipal Corp.) (Prerefunded) | 4.75 | 4/1/13 | 1,000,000 | b | 1,074,290 |
| New York State Urban Development Corporation, | | | | | |
| Service Contract Revenue | 5.00 | 1/1/16 | 2,000,000 | | 2,230,480 |
| New York State Urban Development Corporation, | | | | | |
| Service Contract Revenue | 5.25 | 1/1/24 | 2,375,000 | | 2,509,496 |
| Onondaga County, GO | 5.00 | 5/1/17 | 1,150,000 | | 1,212,388 |
| Onondaga County, GO (Prerefunded) | 5.00 | 5/1/12 | 350,000 | b | 368,988 |
| Onondaga County Trust for Cultural Resources, | | | | | |
| Revenue (Syracuse University Project) | 5.00 | 12/1/19 | 2,500,000 | | 2,810,950 |
STATEMENT OF INVESTMENTS (Unaudited) (continued)
| | | | | |
| BNY Mellon New York Intermediate Tax-Exempt Bond Fund (continued) | | |
| Long-Term Municipal | Coupon | Maturity | Principal | |
| Investments (continued) | Rate (%) | Date | Amount ($) | Value ($) |
| New York (continued) | | | | |
| Orange County, GO | 5.00 | 7/15/19 | 1,000,000 | 1,096,430 |
| Orange County, GO | 5.00 | 7/15/20 | 1,000,000 | 1,087,660 |
| Port Authority of New York and New Jersey (Consolidated Bonds, | | | | |
| 125th Series) (Insured; Assured Guaranty Municipal Corp.) | 5.00 | 10/15/19 | 2,000,000 | 2,095,620 |
| Port Authority of New York and New Jersey (Consolidated Bonds, | | | | |
| 128th Series) (Insured; Assured Guaranty Municipal Corp.) | 5.00 | 11/1/18 | 1,000,000 | 1,065,100 |
| Port Authority of New York and New Jersey (Consolidated Bonds, | | | | |
| 140th Series) (Insured; Assured Guaranty Municipal Corp.) | 5.00 | 12/1/19 | 1,000,000 | 1,087,570 |
| Port Authority of New York and New Jersey | | | | |
| (Consolidated Bonds, 142nd Series) | 5.00 | 7/15/21 | 1,000,000 | 1,085,650 |
| Rockland County, GO (Various Purpose) | 5.00 | 10/1/15 | 500,000 | 513,835 |
| Sales Tax Asset Receivable Corporation, | | | | |
| Sales Tax Asset Revenue (Insured; AMBAC) | 5.00 | 10/15/29 | 2,500,000 | 2,535,875 |
| Sales Tax Asset Receivable Corporation, Sales Tax Asset Revenue | | | | |
| (Insured; National Public Finance Guarantee Corp.) | 5.00 | 10/15/25 | 1,450,000 | 1,522,181 |
| Suffolk County Industrial Development Agency, Civic Facility | | | | |
| Revenue (New York Institute of Technology Project) | 5.00 | 3/1/26 | 750,000 | 729,555 |
| Suffolk County Water Authority, Water System Revenue | | | | |
| (Insured; National Public Finance Guarantee Corp.) | 4.00 | 6/1/14 | 1,000,000 | 1,066,580 |
| Tobacco Settlement Financing Corporation, Asset-Backed | | | | |
| Revenue Bonds (State Contingency Contract Secured) | 5.00 | 6/1/12 | 2,000,000 | 2,103,820 |
| Triborough Bridge and Tunnel Authority, General Purpose Revenue | 6.00 | 1/1/12 | 305,000 | 319,616 |
| Triborough Bridge and Tunnel Authority, General Purpose Revenue | 5.25 | 1/1/16 | 1,000,000 | 1,034,490 |
| Triborough Bridge and Tunnel Authority, | | | | |
| General Purpose Revenue (Prerefunded) | 5.25 | 1/1/22 | 1,000,000b | 1,172,990 |
| Triborough Bridge and Tunnel Authority, General Revenue | 5.25 | 11/15/15 | 1,000,000 | 1,149,020 |
| Triborough Bridge and Tunnel Authority, General Revenue | 5.25 | 11/15/16 | 2,000,000 | 2,134,840 |
| Triborough Bridge and Tunnel Authority, General Revenue | 5.25 | 11/15/17 | 775,000 | 825,336 |
| Triborough Bridge and Tunnel Authority, General Revenue | 5.00 | 11/15/21 | 1,000,000 | 1,038,180 |
| Westchester County, GO | 4.00 | 11/15/15 | 1,000,000 | 1,085,430 |
| U.S. Related—8.0% | | | | |
| Puerto Rico Commonwealth, Public Improvement GO | 5.50 | 7/1/13 | 1,000,000 | 1,061,590 |
| Puerto Rico Electric Power Authority, Power Revenue | 5.25 | 7/1/26 | 2,000,000 | 1,942,440 |
| Puerto Rico Government Development Bank, Senior Notes | 5.00 | 12/1/15 | 3,500,000 | 3,633,175 |
| Puerto Rico Highways and Transportation Authority, Highway | | | | |
| Revenue (Insured; National Public Finance Guarantee Corp.) | 6.00 | 7/1/11 | 515,000 | 523,709 |
| Puerto Rico Highways and Transportation Authority, | | | | |
| Transportation Revenue (Prerefunded) | 5.25 | 7/1/12 | 1,000,000b | 1,062,110 |
| Puerto Rico Housing Finance Authority, Capital Fund Program | | | | |
| Revenue (Puerto Rico Housing Administration Projects) | 5.00 | 12/1/18 | 260,000 | 269,539 |
| Puerto Rico Housing Finance Authority, Capital Fund Program | | | | |
| Revenue (Puerto Rico Housing Administration Projects) | 5.00 | 12/1/19 | 270,000 | 278,578 |
70
| | | | | |
| BNY Mellon New York Intermediate Tax-Exempt Bond Fund (continued) | | | |
| Long-Term Municipal | Coupon | Maturity | Principal | | |
| Investments (continued) | Rate (%) | Date | Amount ($) | | Value ($) |
| U.S. Related (continued) | | | | | |
| Puerto Rico Housing Finance Authority, Capital Fund | | | | | |
| Program Revenue (Puerto Rico Housing | | | | | |
| Administration Projects) (Prerefunded) | 5.00 | 12/1/13 | 730,000 | b | 810,103 |
| Puerto Rico Housing Finance Authority, Capital Fund | | | | | |
| Program Revenue (Puerto Rico Housing | | | | | |
| Administration Projects) (Prerefunded) | 5.00 | 12/1/13 | 740,000 | b | 821,200 |
| Puerto Rico Sales Tax Financing Corporation, | | | | | |
| Sales Tax Revenue (First Subordinate Series) | 0/6.75 | 8/1/32 | 1,700,000 | c | 1,376,558 |
| Puerto Rico Sales Tax Financing Corporation, | | | | | |
| Sales Tax Revenue (First Subordinate Series) | 0/6.25 | 8/1/33 | 500,000 | c | 341,225 |
| Puerto Rico Sales Tax Financing Corporation, | | | | | |
| Sales Tax Revenue (First Subordinate Series) | 0.00 | 8/1/34 | 2,000,000 | a | 436,940 |
| Puerto Rico Sales Tax Financing Corporation, | | | | | |
| Sales Tax Revenue (First Subordinate Series) | 0.00 | 8/1/36 | 1,250,000 | a | 235,163 |
| Puerto Rico Sales Tax Financing Corporation, | | | | | |
| Sales Tax Revenue (First Subordinate Series) | 5.38 | 8/1/39 | 1,000,000 | | 925,420 |
| Puerto Rico Sales Tax Financing Corporation, | | | | | |
| Sales Tax Revenue (First Subordinate Series) | 6.00 | 8/1/42 | 2,500,000 | | 2,499,850 |
| Total Long-Term Municipal Investments | | | | | |
| (cost $191,247,920) | | | | | 196,411,353 |
| |
| Short-Term Municipal Investments—1.9% | | | | | |
| New York; | | | | | |
| Albany Industrial Development Agency, Civic Facility Revenue | | | | | |
| (The College of Saint Rose Project) (LOC; Bank of America) | 0.50 | 3/1/11 | 800,000 | d | 800,000 |
| Long Island Power Authority, Electric System Subordinated | | | | | |
| Revenue (LOC; State Street Bank and Trust Co.) | 0.17 | 3/1/11 | 700,000 | d | 700,000 |
| New York City, GO Notes (LOC; Bayerische Landesbank) | 0.25 | 3/1/11 | 100,000 | d | 100,000 |
| New York City, GO Notes (LOC; JPMorgan Chase Bank) | 0.17 | 3/1/11 | 500,000 | d | 500,000 |
| New York City Municipal Water Finance Authority, Water and | | | | | |
| Sewer System Revenue (Liquidity Facility; Dexia Credit Locale) | 0.25 | 3/1/11 | 800,000 | d | 800,000 |
| New York City Transitional Finance Authority, Future Tax Secured | | | | | |
| Revenue (Liquidity Facility; Bayerische Landesbank) | 0.23 | 3/1/11 | 900,000 | d | 900,000 |
| Total Short-Term Municipal Investments | | | | | |
| (cost $3,800,000) | | | | | 3,800,000 |
| |
| Total Investments (cost $195,047,920) | | | 99.1 | % | 200,211,353 |
| Cash and Receivables (Net) | | | .9 | % | 1,806,896 |
| Net Assets | | | 100.0 | % | 202,018,249 |
|
| a Security issued with a zero coupon. Income is recognized through the accretion of discount. |
| b These securities are prerefunded; the date shown represents the prerefunded date. Bonds which are prerefunded are collateralized by U.S. Government securities which are held in |
| escrow and are used to pay principal and interest on the municipal issue and to retire the bonds in full at the earliest refunding date. |
| c Zero coupon until a specified date at which time the stated coupon rate becomes effective until maturity. |
| d Variable rate demand note—rate shown is the interest rate in effect at February 28, 2011. Maturity date represents the next demand date, or the ultimate maturity date if earlier. |
STATEMENT OF INVESTMENTS (Unaudited) (continued)
| | | | | | |
| Summary of Abbreviations | | | | |
| |
| ABAG | Association of Bay Area Governments | | ACA | American Capital Access |
| AGC | ACE Guaranty Corporation | | AGIC | Asset Guaranty Insurance Company |
| AMBAC | American Municipal Bond Assurance Corporation | ARRN | Adjustable Rate Receipt Notes |
| BAN | Bond Anticipation Notes | | BPA | Bond Purchase Agreement |
| CIFG | CDC Ixis Financial Guaranty | | COP | Certificate of Participation |
| CP | Commercial Paper | | EDR | Economic Development Revenue |
| EIR | Environmental Improvement Revenue | | FGIC | Financial Guaranty Insurance Company |
| FHA | Federal Housing Administration | | FHLB | Federal Home Loan Bank |
| FHLMC | Federal Home Loan Mortgage Corporation | FNMA | Federal National Mortgage Association |
| GAN | Grant Anticipation Notes | | GIC | Guaranteed Investment Contract |
| GNMA | Government National Mortgage Association | GO | General Obligation | |
| HR | Hospital Revenue | | IDB | Industrial Development Board |
| IDC | Industrial Development Corporation | | IDR | Industrial Development Revenue |
| LOC | Letter of Credit | | | LOR | Limited Obligation Revenue |
| LR | Lease Revenue | | | MFHR | Multi-Family Housing Revenue |
| MFMR | Multi-Family Mortgage Revenue | | PCR | Pollution Control Revenue |
| PILOT | Payment in Lieu of Taxes | | PUTTERS | Puttable Tax-Exempt Receipts |
| RAC | Revenue Anticipation Certificates | | RAN | Revenue Anticipation Notes |
| RAW | Revenue Anticipation Warrants | | RRR | Resources Recovery Revenue |
| SAAN | State Aid Anticipation Notes | | SBPA | Standby Bond Purchase Agreement |
| SFHR | Single Family Housing Revenue | | SFMR | Single Family Mortgage Revenue |
| SONYMA | State of New York Mortgage Agency | | SWDR | Solid Waste Disposal Revenue |
| TAN | Tax Anticipation Notes | | TAW | Tax Anticipation Warrants |
| TRAN | Tax and Revenue Anticipation Notes | | XLCA | XL Capital Assurance |
| |
| |
| |
| Summary of Combined Ratings (Unaudited) | | | |
| |
| Fitch | or | Moody’s | or | Standard & Poor’s | Value (%)† |
| AAA | | Aaa | | AAA | | 31.0 |
| AA | | Aa | | AA | | 48.9 |
| A | | A | | A | | 16.4 |
| BBB | | Baa | | BBB | | 2.2 |
| F1 | | MIG1/P1 | | SP1/A1 | | 1.4 |
| Not Ratede | | Not Ratede | | Not Ratede | | .1 |
| | | | | | | 100.0 |
|
| † Based on total investments. |
| e Securities which, while not rated by Fitch, Moody's and Standard & Poor's, have been determined by the Manager to be of comparable quality to those rated securities in which the |
| fund may invest. |
See notes to financial statements.
72
STATEMENT OF INVESTMENTS
February 28, 2011 (Unaudited)
| | | | | |
| BNY Mellon Municipal Opportunities Fund | | | | | |
| | Coupon | Maturity | Principal | | |
| Bonds and Notes—.3% | Rate (%) | Date | Amount ($) | | Value ($) |
| U.S. Government Agencies: | | | | | |
| Federal Home Loan Mortgage Corp., Notes | 4.13 | 9/27/13 | 450,000 | a | 484,674 |
| Federal National Mortgage Association, Notes | 1.25 | 7/29/13 | 800,000 | a | 800,091 |
| Total Bonds and Notes | | | | | |
| (cost $1,284,842) | | | | | 1,284,765 |
| |
| Long-Term Municipal Investments—96.7% | | | | | |
| Alabama—1.2% | | | | | |
| Jefferson County, Limited Obligation School Warrants | | | | | |
| (Insured; Assured Guaranty Municipal Corp.) | 5.50 | 2/15/16 | 5,000,000 | | 4,959,050 |
| Tuscaloosa Public Educational Building Authority, | | | | | |
| Student Housing Revenue (Ridgecrest Student Housing, LLC | | | | | |
| University of Alabama Ridgecrest Residential Project) | | | | | |
| (Insured; Assured Guaranty Municipal Corp.) | 6.75 | 7/1/33 | 1,100,000 | | 1,212,728 |
| Arizona—.7% | | | | | |
| Arizona Board of Regents, Arizona State University | | | | | |
| System Revenue (Polytechnic Campus Project) | 6.00 | 7/1/27 | 750,000 | | 817,665 |
| Pima County Industrial Development Authority, IDR | | | | | |
| (Tucson Electric Power Company Project) | 5.25 | 10/1/40 | 3,250,000 | | 2,916,258 |
| California—16.4% | | | | | |
| California, GO | 4.50 | 8/1/30 | 5,000,000 | | 4,426,700 |
| California, GO (Various Purpose) | 6.50 | 4/1/33 | 1,000,000 | | 1,087,670 |
| California, GO (Various Purpose) | 6.00 | 4/1/38 | 2,250,000 | | 2,326,252 |
| California Department of Water Resources, | | | | | |
| Water System Revenue (Central Valley Project) | 5.00 | 12/1/20 | 9,570,000 | b | 10,657,631 |
| California Educational Facilities Authority, | | | | | |
| Revenue (University of Southern California) | 5.25 | 10/1/38 | 10,500,000 | | 10,633,875 |
| California Health Facilities Financing Authority, | | | | | |
| Revenue (Providence Health and Services) | 6.50 | 10/1/38 | 490,000 | | 532,708 |
| California Health Facilities Financing Authority, | | | | | |
| Revenue (Providence Health and Services) (Prerefunded) | 6.50 | 10/1/18 | 10,000 | c | 12,675 |
| California Infrastructure and Economic Development Bank, Revenue | | | | | |
| (California Independent System Operator Corporation Project) | 6.25 | 2/1/39 | 3,000,000 | | 3,103,950 |
| California Municipal Finance Authority, | | | | | |
| Revenue (Eisenhower Medical Center) | 5.75 | 7/1/40 | 7,000,000 | | 6,443,570 |
| California Statewide Communities Development Authority, | | | | | |
| Mortgage Revenue (Methodist Hospital of Southern | | | | | |
| California Project) (Collateralized; FHA) | 6.75 | 2/1/38 | 2,500,000 | | 2,718,850 |
| California Statewide Communities Development | | | | | |
| Authority, Revenue (Sutter Health) | 6.00 | 8/15/42 | 6,000,000 | | 5,982,960 |
| Golden State Tobacco Securitization Corporation, | | | | | |
| Tobacco Settlement Asset-Backed Bonds | 4.50 | 6/1/27 | 985,000 | | 709,180 |
| JPMorgan Chase Putters/Drivers Trust (Los Angeles Department | | | | | |
| of Airports, Senior Revenue (Los Angeles International Airport)) | 5.25 | 5/15/18 | 10,000,000 | d,e | 10,437,200 |
STATEMENT OF INVESTMENTS (Unaudited) (continued)
| | | | | |
| BNY Mellon Municipal Opportunities Fund (continued) | | | |
| Long-Term Municipal | Coupon | Maturity | Principal | |
| Investments (continued) | Rate (%) | Date | Amount ($) | Value ($) |
| California (continued) | | | | |
| Los Angeles Unified School District, GO | 5.00 | 1/1/34 | 1,000,000 | 957,270 |
| M-S-R Energy Authority, Gas Revenue | 7.00 | 11/1/34 | 3,730,000 | 4,112,288 |
| New Haven Unified School District, GO | | | | |
| (Insured; Assured Guaranty Municipal Corp.) | 0.00 | 8/1/32 | 6,500,000f | 1,522,690 |
| Newport Beach, Revenue (Hoag Memorial Hospital Presbyterian) | 6.00 | 12/1/40 | 4,630,000 | 4,710,284 |
| Northern California Gas Authority Number 1, Gas Project Revenue | 0.92 | 7/1/27 | 660,000g | 459,188 |
| Oceanside Unified School District, GO | | | | |
| (Insured; Assured Guaranty Municipal Corp.) | 0.00 | 8/1/35 | 8,000,000f | 1,518,640 |
| Sacramento County, Airport System Subordinate | | | | |
| and Passenger Facility Charges Grant Revenue | 6.00 | 7/1/35 | 3,000,000 | 3,036,090 |
| San Diego County Regional Airport Authority, | | | | |
| Subordinate Airport Revenue | 5.00 | 7/1/34 | 1,000,000 | 913,200 |
| San Diego County Regional Airport Authority, | | | | |
| Subordinate Airport Revenue | 5.00 | 7/1/40 | 2,000,000 | 1,769,120 |
| San Diego Regional Building Authority, LR (County | | | | |
| Operations Center and Annex Redevelopment Project) | 5.38 | 2/1/36 | 2,000,000 | 1,993,100 |
| San Diego Unified School District, GO | 0.00 | 7/1/25 | 4,000,000f | 1,692,000 |
| South Bayside Waste Management Authority, Solid Waste | | | | |
| Enterprise Revenue (Shoreway Environmental Center) | 6.00 | 9/1/36 | 1,000,000 | 983,960 |
| Torrance, Revenue (Torrance Memorial Medical Center) | 5.00 | 9/1/40 | 2,000,000 | 1,662,720 |
| Colorado—1.9% | | | | |
| Colorado Health Facilities Authority, | | | | |
| Revenue (Catholic Health Initiatives) | 6.00 | 10/1/23 | 500,000 | 550,455 |
| Denver City and County, Airport System Revenue | | | | |
| (Insured: Assured Guaranty Municipal Corp. and | | | | |
| National Public Finance Guarantee Corp.) | 5.25 | 11/15/19 | 1,000,000 | 1,072,050 |
| Northern Colorado Water Conservancy District Building | | | | |
| Corporation, COP (Lease Purchase Agreement) | | | | |
| (Insured; National Public Finance Guarantee Corp.) | 5.50 | 10/1/16 | 500,000 | 523,650 |
| Regional Transportation District, Revenue | | | | |
| (Denver Transit Partners Eagle P3 Project) | 6.00 | 1/15/41 | 8,500,000 | 7,847,880 |
| Delaware—.9% | | | | |
| Delaware Economic Development Authority, | | | | |
| Exempt Facility Revenue (Indian River Power LLC Project) | 5.38 | 10/1/45 | 5,200,000 | 4,549,740 |
| Florida—7.0% | | | | |
| Brevard County Health Facilities Authority, | | | | |
| Health Facilities Revenue (Health First, Inc. Project) | 7.00 | 4/1/39 | 1,500,000 | 1,606,830 |
| Florida Municipal Power Agency, | | | | |
| All-Requirements Power Supply Project Revenue | 6.25 | 10/1/31 | 1,000,000 | 1,096,630 |
| Miami-Dade County, Aviation Revenue (Miami International Airport) | 5.50 | 10/1/41 | 1,200,000 | 1,137,984 |
| Miami-Dade County Educational Facilities Authority, | | | | |
| Revenue (University of Miami Issue) (Insured; | | | | |
| Berkshire Hathaway Assurance Corporation) | 5.50 | 4/1/38 | 600,000 | 603,798 |
| Miami-Dade County Expressway Authority, Toll System Revenue | 5.00 | 7/1/40 | 2,000,000 | 1,819,940 |
74
| | | | | |
| BNY Mellon Municipal Opportunities Fund (continued) | | | | |
| Long-Term Municipal | Coupon | Maturity | Principal | | |
| Investments (continued) | Rate (%) | Date | Amount ($) | | Value ($) |
| Florida (continued) | | | | | |
| Miami-Dade County School Board, COP | | | | | |
| (Master Lease Purchase Agreement) (Insured; AMBAC) | 5.00 | 11/1/25 | 5,000,000 | | 4,910,450 |
| Mid-Bay Bridge Authority, Springing Lien Revenue | 7.25 | 10/1/34 | 5,000,000 | | 5,035,500 |
| Mid-Bay Bridge Authority, Springing Lien Revenue | 7.25 | 10/1/40 | 5,000,000 | | 4,997,100 |
| Palm Beach County School Board, COP | | | | | |
| (Master Lease Purchase Agreement) | | | | | |
| (Insured; National Public Finance Guarantee Corp.) | 5.00 | 8/1/12 | 500,000 | | 525,290 |
| Sarasota County Public Hospital District, HR | | | | | |
| (Sarasota Memorial Hospital Project) | 5.63 | 7/1/39 | 2,000,000 | | 1,998,420 |
| Seminole Tribe, Special Obligation Revenue | 5.50 | 10/1/24 | 1,000,000 | e | 902,220 |
| Seminole Tribe, Special Obligation Revenue | 5.25 | 10/1/27 | 2,500,000 | e | 2,088,400 |
| Seminole Tribe, Tribal Economic Development Bonds | 5.13 | 10/1/17 | 3,000,000 | e | 2,905,500 |
| Tampa Bay Water, A Regional Water Supply Authority, | | | | | |
| Utility System Revenue | 5.00 | 10/1/18 | 3,000,000 | b | 3,335,550 |
| Tampa Bay Water, A Regional Water Supply Authority, | | | | | |
| Utility System Revenue | 5.00 | 10/1/19 | 2,460,000 | b | 2,724,130 |
| Georgia—2.0% | | | | | |
| Burke County Development Authority, PCR | | | | | |
| (Oglethorpe Power Corporation Vogtle Project) | 7.00 | 1/1/23 | 1,000,000 | | 1,155,930 |
| Chatham County Hospital Authority, HR Improvement | | | | | |
| (Memorial Health University Medical Center, Inc.) | 5.75 | 1/1/29 | 2,140,000 | | 1,895,441 |
| Medical Center Hospital Authority, RAC (Columbus | | | | | |
| Regional Healthcare System, Inc. Project) | | | | | |
| (Insured; Assured Guaranty Municipal Corp.) | 5.00 | 8/1/45 | 7,000,000 | | 6,108,410 |
| Municipal Electric Authority of Georgia, | | | | | |
| GO (Project One Subordinated Bonds) | 5.75 | 1/1/20 | 1,000,000 | | 1,143,120 |
| Hawaii—1.4% | | | | | |
| Hawaii Department of Budget and Finance, Special Purpose | | | | | |
| Revenue (Hawai'i Pacific Health Obligated Group) | 5.63 | 7/1/30 | 1,350,000 | | 1,287,940 |
| Hawaii Department of Budget and Finance, | | | | | |
| Special Purpose Revenue (Hawaiian Electric | | | | | |
| Company, Inc. and Subsidiary Projects) | 6.50 | 7/1/39 | 6,000,000 | | 5,920,560 |
| Idaho—.9% | | | | | |
| University of Idaho Regents, General Revenue | 5.25 | 4/1/21 | 4,485,000 | | 4,861,292 |
| Illinois—5.1% | | | | | |
| Illinois Finance Authority, Revenue (The Art Institute of Chicago) | 6.00 | 3/1/38 | 1,000,000 | | 1,032,680 |
| JPMorgan Chase Putters/Drivers Trust (Metropolitan Pier and | | | | | |
| Exposition Authority, Revenue (McCormick Place Expansion | | | | | |
| Project)) (Insured; Assured Guaranty Muncipal Corp.) | 5.00 | 6/15/42 | 10,000,000 | d,e | 8,581,900 |
| Metropolitan Pier and Exposition Authority, | | | | | |
| Revenue (McCormick Place Expansion Project) | 5.50 | 6/15/42 | 12,500,000 | d,e | 11,497,750 |
| Metropolitan Pier and Exposition Authority, Revenue | | | | | |
| (McCormick Place Expansion Project) | | | | | |
| (Insured; Assured Guaranty Municipal Corp.) | 0.00 | 6/15/26 | 2,000,000 | f | 804,820 |
STATEMENT OF INVESTMENTS (Unaudited) (continued)
| | | | | |
| BNY Mellon Municipal Opportunities Fund (continued) | | | | |
| Long-Term Municipal | Coupon | Maturity | Principal | | |
| Investments (continued) | Rate (%) | Date | Amount ($) | | Value ($) |
| Illinois (continued) | | | | | |
| Metropolitan Pier and Exposition Authority, Revenue | | | | | |
| (McCormick Place Expansion Project) | | | | | |
| (Insured; Assured Guaranty Municipal Corp.) | 0.00 | 6/15/43 | 5,000,000 | f | 567,850 |
| Railsplitter Tobacco Settlement Authority, | | | | | |
| Tobacco Settlement Revenue | 5.25 | 6/1/20 | 555,000 | | 545,776 |
| Railsplitter Tobacco Settlement Authority, | | | | | |
| Tobacco Settlement Revenue | 6.00 | 6/1/28 | 3,000,000 | | 2,942,850 |
| Indiana—.3% | | | | | |
| Whiting, Environmental Facilities Revenue | | | | | |
| (BP Products North America, Inc.) | 2.80 | 6/2/14 | 1,570,000 | | 1,564,097 |
| Kentucky—.1% | | | | | |
| Kentucky Property and Buildings Commission, | | | | | |
| Revenue (Project Number 90) | 5.38 | 11/1/23 | 500,000 | | 541,070 |
| Louisiana—1.5% | | | | | |
| Louisiana Citizens Property Insurance Corporation, Assessment | | | | | |
| Revenue (Insured; Assured Guaranty Municipal Corp.) | 6.13 | 6/1/25 | 4,000,000 | | 4,387,720 |
| Louisiana Public Facilities Authority, | | | | | |
| Revenue (CHRISTUS Health Obligated Group) | 6.00 | 7/1/29 | 1,000,000 | | 1,026,950 |
| New Orleans Aviation Board, Revenue | | | | | |
| (Insured; Assured Guaranty Municipal Corp.) | 6.00 | 1/1/23 | 2,000,000 | | 2,213,640 |
| Maryland—4.1% | | | | | |
| Frederick County, Special Obligation Bonds | | | | | |
| (Urbana Community Development Authority) | 5.00 | 7/1/40 | 2,000,000 | | 1,817,280 |
| Maryland Economic Development Corporation, EDR (Terminal Project) | 5.75 | 6/1/35 | 6,000,000 | | 5,418,600 |
| Maryland Economic Development Corporation, Port Facilities | | | | | |
| Revenue (CNX Marine Terminals Inc. Port of Baltimore Facility) | 5.75 | 9/1/25 | 1,000,000 | | 940,320 |
| Maryland Health and Higher Educational Facilities | | | | | |
| Authority, Revenue (Anne Arundel Health System Issue) | 6.75 | 7/1/29 | 2,000,000 | | 2,221,760 |
| Maryland Health and Higher Educational Facilities Authority, | | | | | |
| Revenue (MedStar Health Issue) (Insured; Berkshire | | | | | |
| Hathaway Assurance Corporation) | 5.25 | 11/15/14 | 10,000,000 | d,e | 9,602,800 |
| Maryland Health and Higher Educational Facilities Authority, | | | | | |
| Revenue (University of Maryland Medical System Issue) | 5.00 | 7/1/34 | 1,000,000 | | 945,940 |
| Maryland Health and Higher Educational Facilities Authority, | | | | | |
| Revenue (University of Maryland Medical System Issue) | 5.13 | 7/1/39 | 250,000 | | 236,597 |
| Massachusetts—6.6% | | | | | |
| Massachusetts Development Finance Agency, | | | | | |
| Revenue (Harvard University Issue) | 5.00 | 10/15/40 | 12,000,000 | | 12,308,400 |
| Massachusetts Development Finance Agency, | | | | | |
| Revenue (Suffolk University Issue) | 5.13 | 7/1/40 | 1,000,000 | �� | 879,820 |
| Massachusetts Development Finance Agency, SWDR | | | | | |
| (Dominion Energy Brayton Point Issue) | 5.75 | 5/1/19 | 2,000,000 | | 2,136,140 |
| Massachusetts Development Finance Agency, SWDR | | | | | |
| (Waste Management, Inc. Project) | 5.50 | 5/1/14 | 1,000,000 | | 1,054,320 |
76
| | | | | |
| BNY Mellon Municipal Opportunities Fund (continued) | | | | |
| Long-Term Municipal | Coupon | Maturity | Principal | | |
| Investments (continued) | Rate (%) | Date | Amount ($) | | Value ($) |
| Massachusetts (continued) | | | | | |
| Massachusetts Health and Educational Facilities Authority, | | | | | |
| Revenue (Harvard University Issue) | 5.00 | 12/15/34 | 10,000,000 | | 10,355,600 |
| Massachusetts Health and Educational Facilities Authority, | | | | | |
| Revenue (Isabella Stewart Gardner Museum Issue) | 5.00 | 5/1/25 | 2,305,000 | | 2,376,593 |
| Massachusetts Health and Educational Facilities Authority, | | | | | |
| Revenue (Massachusetts Eye and Ear Infirmary Issue) | 5.38 | 7/1/35 | 2,000,000 | | 1,869,980 |
| Massachusetts Health and Educational Facilities Authority, | | | | | |
| Revenue (Simmons College Issue) | 7.50 | 10/1/22 | 500,000 | | 591,825 |
| Massachusetts Health and Educational Facilities Authority, | | | | | |
| Revenue (Simmons College Issue) | 8.00 | 10/1/39 | 2,000,000 | | 2,212,260 |
| Massachusetts Water Pollution Abatement Trust, | | | | | |
| Water Pollution Abatement Revenue (MWRA Program) | 5.75 | 8/1/29 | 50,000 | | 50,147 |
| Michigan—.2% | | | | | |
| Detroit, Water Supply System Second Lien Revenue | | | | | |
| (Insured; Assured Guaranty Municipal Corp.) | 5.00 | 7/1/22 | 950,000 | | 964,611 |
| Minnesota—6.3% | | | | | |
| JPMorgan Chase Putters/Drivers Trust | | | | | |
| (Minnesota, GO (Various Purpose)) | 5.00 | 8/1/18 | 17,125,000 | d,e | 19,282,866 |
| JPMorgan Chase Putters/Drivers Trust | | | | | |
| (Minnesota, GO (Various Purpose)) | 5.00 | 8/1/18 | 10,000,000 | d,e | 11,808,500 |
| Minneapolis, Health Care System | | | | | |
| Revenue (Fairview Health Services) | 6.63 | 11/15/28 | 1,000,000 | | 1,079,620 |
| Mississippi—.3% | | | | | |
| Warren County, Gulf Opportunity Zone Revenue | | | | | |
| (International Paper Company Projects) | 5.80 | 5/1/34 | 1,500,000 | | 1,454,535 |
| Missouri—.1% | | | | | |
| Cape Girardeau County Industrial Development Authority, | | | | | |
| Health Facilities Revenue (Saint Francis Medical Center) | 5.50 | 6/1/34 | 385,000 | | 372,222 |
| New Jersey—1.7% | | | | | |
| New Jersey, COP (Equipment Lease Purchase Agreement) | 5.25 | 6/15/28 | 1,000,000 | | 1,007,950 |
| New Jersey Educational Facilities Authority, Revenue | | | | | |
| (Montclair State University Issue) (Insured; AMBAC) | 5.00 | 7/1/31 | 2,605,000 | | 2,555,922 |
| New Jersey Educational Facilities Authority, Revenue | | | | | |
| (University of Medicine and Dentistry of New Jersey Issue) | 7.50 | 12/1/32 | 2,000,000 | | 2,202,160 |
| New Jersey Transportation Trust Fund | | | | | |
| Authority (Transportation System) | 0.00 | 12/15/29 | 5,000,000 | f | 1,527,200 |
| New Jersey Transportation Trust Fund | | | | | |
| Authority (Transportation System) | 0.00 | 12/15/30 | 5,000,000 | f | 1,409,300 |
| New York—8.6% | | | | | |
| Albany Industrial Development Agency, Civic Facility | | | | | |
| Revenue (Saint Peter's Hospital of the City of Albany Project) | 5.75 | 11/15/22 | 4,225,000 | | 4,358,045 |
| Brooklyn Arena Local Development Corporation, | | | | | |
| PILOT Revenue (Barclays Center Project) | 6.00 | 7/15/30 | 5,000,000 | | 4,871,200 |
STATEMENT OF INVESTMENTS (Unaudited) (continued)
| | | | |
| BNY Mellon Municipal Opportunities Fund (continued) | | | |
| Long-Term Municipal | Coupon | Maturity | Principal | |
| Investments (continued) | Rate (%) | Date | Amount ($) | Value ($) |
| New York (continued) | | | | |
| Metropolitan Transportation Authority, Transportation Revenue | 6.50 | 11/15/28 | 500,000 | 557,970 |
| New York City, GO | 6.00 | 10/15/23 | 500,000 | 564,510 |
| New York City Industrial Development Agency, PILOT | | | | |
| Revenue (Queens Baseball Stadium Project) | | | | |
| (Insured; Assured Guaranty Municipal Corp.) | 6.50 | 1/1/46 | 500,000 | 520,955 |
| New York City Industrial Development Agency, PILOT | | | | |
| Revenue (Yankee Stadium Project) (Insured; | | | | |
| Assured Guaranty Municipal Corp.) | 7.00 | 3/1/49 | 1,300,000 | 1,419,574 |
| New York City Municipal Water Finance Authority, | | | | |
| Water and Sewer System Revenue | 5.75 | 6/15/40 | 9,000,000 | 9,511,920 |
| New York City Municipal Water Finance Authority, | | | | |
| Water and Sewer System Second General Resolution Revenue | 5.50 | 6/15/40 | 1,500,000 | 1,546,710 |
| New York State Dormitory Authority, | | | | |
| Revenue (Columbia University) | 5.00 | 7/1/38 | 6,365,000 | 6,468,177 |
| New York State Dormitory Authority, | | | | |
| Revenue (The Rockefeller University) | 5.00 | 7/1/41 | 3,000,000 | 3,014,250 |
| New York State Dormitory Authority, | | | | |
| State Personal Income Tax Revenue (Education) | 5.75 | 3/15/36 | 1,000,000 | 1,065,860 |
| Port Authority of New York and New Jersey, Special Project | | | | |
| Revenue (JFK International Air Terminal LLC Project) | 6.00 | 12/1/42 | 10,510,000 | 10,244,097 |
| North Carolina—.6% | | | | |
| North Carolina Eastern Municipal Power Agency, | | | | |
| Power System Revenue | 5.00 | 1/1/26 | 2,500,000 | 2,466,350 |
| North Carolina Eastern Municipal Power Agency, Power System | | | | |
| Revenue (Insured; Assured Guaranty Municipal Corp.) | 6.00 | 1/1/19 | 250,000 | 276,320 |
| North Carolina Eastern Municipal Power Agency, | | | | |
| Power System Revenue (Insured; FGIC) | 5.50 | 1/1/17 | 150,000 | 150,283 |
| Ohio—.2% | | | | |
| Montgomery County, Revenue (Catholic Health Initiatives) | 6.25 | 10/1/33 | 1,000,000 | 1,060,610 |
| Oregon—.4% | | | | |
| Oregon Health and Science University, Revenue | 5.75 | 7/1/39 | 2,000,000 | 2,043,660 |
| Other State—4.1% | | | | |
| Metropolitan Water District of Southern California, | | | | |
| Water Revenue (Build America Bonds) | 6.95 | 7/1/40 | 7,500,000 | 7,902,825 |
| New York City, GO (Build America Bonds) | 6.65 | 12/1/31 | 12,500,000 | 13,032,125 |
| Pennsylvania—1.3% | | | | |
| Delaware County Authority, Revenue (Villanova University) | 5.25 | 12/1/31 | 1,940,000 | 1,994,689 |
| Pennsylvania Higher Educational Facilities Authority, | | | | |
| Revenue (University of Pennsylvania Health System) | 5.75 | 8/15/41 | 2,550,000 | 2,571,879 |
| Philadelphia, Gas Works Revenue | 5.25 | 8/1/40 | 2,500,000 | 2,285,575 |
| Texas—12.4% | | | | |
| Dallas, GO | 5.00 | 2/15/27 | 515,000 | 538,221 |
| Forney Independent School District, Unlimited Tax School | | | | |
| Building Bonds (Permanent School Fund Guarantee Program) | 5.75 | 8/15/33 | 1,000,000 | 1,077,500 |
78
| | | | | |
| BNY Mellon Municipal Opportunities Fund (continued) | | | |
| Long-Term Municipal | Coupon | Maturity | Principal | |
| Investments (continued) | Rate (%) | Date | Amount ($) | Value ($) |
| Texas (continued) | | | | |
| Harris County Health Facilities Development Corporation, | | | | |
| HR (Memorial Hermann Healthcare System) | 7.00 | 12/1/27 | 1,000,000 | 1,089,630 |
| Houston, Airport System Senior Lien Revenue | 5.50 | 7/1/39 | 1,000,000 | 1,002,310 |
| Liberty Hill Independent School District, Unlimited Tax School | | | | |
| Building Bonds (Permanent School Fund Guarantee Program) | 5.00 | 8/1/38 | 5,000,000 | 5,056,350 |
| Liberty Hill Independent School District, Unlimited Tax School | | | | |
| Building Bonds (Permanent School Fund Guarantee Program) | 5.00 | 8/1/40 | 2,000,000 | 2,019,780 |
| Love Field Airport Modernization Corporation, | | | | |
| Special Facilities Revenue (Southwest Airlines | | | | |
| Company—Love Field Modernization Program Project) | 5.25 | 11/1/40 | 18,535,000 | 16,593,829 |
| North Texas Tollway Authority, System First Tier Revenue | 6.00 | 1/1/38 | 7,000,000 | 6,980,820 |
| Texas Private Activity Bond Surface Transportation | | | | |
| Corporation, Senior Lien Revenue (LBJ Infrastructure | | | | |
| Group LLC IH-635 Managed Lanes Project) | 7.00 | 6/30/40 | 5,000,000 | 5,088,400 |
| Texas Private Activity Bond Surface Transportation | | | | |
| Corporation, Senior Lien Revenue (NTE Mobility | | | | |
| Partners LLC North Tarrant Express Managed Lanes Project) | 7.50 | 12/31/31 | 2,500,000 | 2,658,875 |
| Texas Public Finance Authority Charter School Finance | | | | |
| Corporation, Education Revenue (Cosmos Foundation, Inc.) | 6.20 | 2/15/40 | 5,900,000 | 5,596,740 |
| Texas Public Finance Authority, Unemployment | | | | |
| Compensation Obligation Assessment Revenue | 5.00 | 1/1/20 | 10,000,000 | 10,731,700 |
| Waxahachie Independent School District, Unlimited Tax School | | | | |
| Building Bonds (Permanent School Fund Guarantee Program) | 5.00 | 8/15/37 | 5,200,000 | 5,262,712 |
| Washington—.6% | | | | |
| Port of Seattle, Intermediate Lien Revenue | 5.00 | 6/1/40 | 3,000,000 | 2,858,130 |
| Wisconsin—1.4% | | | | |
| Oneida Tribe of Indians, Retail Sales Revenue | 6.50 | 2/1/31 | 1,325,000e | 1,367,427 |
| Southeast Wisconsin Professional Baseball Park District, | | | | |
| Sales Tax Revenue (Insured; National Public | | | | |
| Finance Guarantee Corp.) | 5.50 | 12/15/23 | 1,000,000 | 1,087,570 |
| Wisconsin, General Fund Annual Appropriation Bonds | 5.38 | 5/1/25 | 1,000,000 | 1,072,090 |
| Wisconsin, General Fund Annual Appropriation Bonds | 5.75 | 5/1/33 | 1,500,000 | 1,584,405 |
| Wisconsin, General Fund Annual Appropriation Bonds | 6.00 | 5/1/33 | 1,000,000 | 1,077,820 |
| Wisconsin, General Fund Annual Appropriation Bonds | 6.00 | 5/1/36 | 1,000,000 | 1,067,390 |
| U.S. Related—8.4% | | | | |
| Guam Government Department of Education, COP | | | | |
| (John F. Kennedy High School Project) | 6.63 | 12/1/30 | 1,000,000 | 937,940 |
| Guam Government Department of Education, COP | | | | |
| (John F. Kennedy High School Project) | 6.88 | 12/1/40 | 1,000,000 | 936,720 |
| Puerto Rico Aqueduct and Sewer Authority, Senior Lien Revenue | 6.00 | 7/1/38 | 9,105,000 | 8,536,484 |
| Puerto Rico Commonwealth, Public Improvement GO | 6.00 | 7/1/40 | 10,000,000 | 9,756,600 |
| Puerto Rico Electric Power Authority, Power Revenue | 5.75 | 7/1/36 | 5,000,000 | 4,769,050 |
| Puerto Rico Electric Power Authority, Power Revenue | | | | |
| (Insured; National Public Finance Guarantee Corp.) | 5.00 | 7/1/17 | 750,000 | 785,520 |
STATEMENT OF INVESTMENTS (Unaudited) (continued)
| | | | | |
| BNY Mellon Municipal Opportunities Fund (continued) | | | | |
| Long-Term Municipal | Coupon | Maturity | Principal | | |
| Investments (continued) | Rate (%) | Date | Amount ($) | | Value ($) |
| U.S. Related (continued) | | | | | |
| Puerto Rico Sales Tax Financing Corporation, | | | | | |
| Sales Tax Revenue (First Subordinate Series) | 0/6.75 | 8/1/32 | 6,000,000 | h | 4,858,440 |
| Puerto Rico Sales Tax Financing Corporation, | | | | | |
| Sales Tax Revenue (First Subordinate Series) | 0/6.25 | 8/1/33 | 750,000 | h | 511,838 |
| Puerto Rico Sales Tax Financing Corporation, | | | | | |
| Sales Tax Revenue (First Subordinate Series) | 5.38 | 8/1/39 | 1,500,000 | | 1,388,130 |
| Puerto Rico Sales Tax Financing Corporation, | | | | | |
| Sales Tax Revenue (First Subordinate Series) | 6.00 | 8/1/42 | 3,870,000 | | 3,869,768 |
| Virgin Islands Public Finance Authority, | | | | | |
| Revenue (Virgin Islands Matching Fund Loan Note) | 5.00 | 10/1/29 | 5,000,000 | | 4,710,950 |
| Virgin Islands Public Finance Authority, Subordinated Revenue | | | | | |
| (Virgin Islands Matching Fund Loan Note— Diageo Project) | 6.75 | 10/1/37 | 2,000,000 | | 2,021,360 |
| Total Long-Term Municipal Investments | | | | | |
| (cost $499,062,519) | | | | | 496,126,136 |
| |
| Short-Term Municipal Investments—13.0% | | | | | |
| Colorado—2.1% | | | | | |
| Colorado Educational and Cultural Facilities Authority, | | | | | |
| Revenue (National Jewish Federation Bond | | | | | |
| Program) (LOC; Bank of America) | 0.26 | 3/1/11 | 2,675,000 | i | 2,675,000 |
| Colorado Educational and Cultural Facilities Authority, | | | | | |
| Revenue (National Jewish Federation Bond | | | | | |
| Program) (LOC; Bank of America) | 0.26 | 3/1/11 | 2,100,000 | i | 2,100,000 |
| Colorado Educational and Cultural Facilities Authority, | | | | | |
| Revenue (National Jewish Federation Bond | | | | | |
| Program) (LOC; Bank of America) | 0.26 | 3/1/11 | 2,420,000 | i | 2,420,000 |
| Colorado Educational and Cultural Facilities Authority, | | | | | |
| Revenue (National Jewish Federation Bond | | | | | |
| Program) (LOC; Bank of America) | 0.26 | 3/1/11 | 2,000,000 | i | 2,000,000 |
| Colorado Educational and Cultural Facilities Authority, Revenue | | | | | |
| (National Jewish Federation Bond Program) (LOC; TD Bank) | 0.21 | 3/1/11 | 1,400,000 | i | 1,400,000 |
| Connecticut—.0% | | | | | |
| Connecticut Health and Educational Facilities Authority, | | | | | |
| Revenue (Promfret School Issue) (LOC; Bank of America) | 0.49 | 3/7/11 | 100,000 | i | 100,000 |
| Florida—1.3% | | | | | |
| Orange County Health Facilities Authority, HR (Orlando Regional | | | | | |
| Healthcare System) (Insured; Assured Guaranty | | | | | |
| Municipal Corp. and Liquidity Facility; Dexia Credit Locale) | 0.30 | 3/1/11 | 3,130,000 | i | 3,130,000 |
| Orange County School Board, COP | | | | | |
| (Master Lease Purchase Agreement) (LOC; Wells Fargo Bank) | 0.21 | 3/1/11 | 3,625,000 | i | 3,625,000 |
| Georgia—.0% | | | | | |
| Gainesville and Hall County Hospital Authority, RAC (Northeast | | | | | |
| Georgia Health System, Inc. Project) (LOC; Wells Fargo Bank) | 0.21 | 3/1/11 | 100,000 | i | 100,000 |
80
| | | | | |
| BNY Mellon Municipal Opportunities Fund (continued) | | | | |
| Short-Term Municipal | Coupon | Maturity | Principal | | |
| Investments (continued) | Rate (%) | Date | Amount ($) | | Value ($) |
| Kentucky—.0% | | | | | |
| Shelby County, Lease Program Revenue (Kentucky Association | | | | | |
| of Counties Leasing Trust) (LOC; U.S. Bank NA) | 0.19 | 3/1/11 | 100,000 | i | 100,000 |
| Massachusetts—2.7% | | | | | |
| Massachusetts, Consolidated Loan | | | | | |
| (Liquidity Facility; Dexia Credit Locale) | 0.28 | 3/1/11 | 4,400,000 | i | 4,400,000 |
| Massachusetts Health and Educational Facilities Authority, Revenue | | | | | |
| (Baystate Medical Center Issue) (LOC; JPMorgan Chase Bank) | 0.22 | 3/1/11 | 5,750,000 | i | 5,750,000 |
| Massachusetts Health and Educational Facilities Authority, Revenue | | | | | |
| (The Henry Heywood Memorial Hospital Issue) (LOC; TD Bank) | 0.22 | 3/1/11 | 2,575,000 | i | 2,575,000 |
| Massachusetts Water Resources Authority, Subordinated General | | | | | |
| Revenue, Refunding (LOC; Landesbank Baden-Wurttemberg) | 0.23 | 3/1/11 | 1,200,000 | i | 1,200,000 |
| Michigan—.4% | | | | | |
| Farmington Hills Hospital Finance Authority, HR, Refunding | | | | | |
| (Botsford Obligated Group) (LOC; U.S. Bank NA) | 0.23 | 3/1/11 | 1,800,000 | i | 1,800,000 |
| Nebraska—.3% | | | | | |
| Lancaster County Hospital Authority Number 1, HR, | | | | | |
| Refunding (BryanLGH Medical Center) (LOC; U.S. Bank NA) | 0.23 | 3/1/11 | 1,500,000 | i | 1,500,000 |
| New Hampshire—.9% | | | | | |
| New Hampshire Business Finance Authority, Revenue | | | | | |
| (Huggins Hospital Issue) (LOC; TD Bank) | 0.23 | 3/1/11 | 4,600,000 | i | 4,600,000 |
| New York—.1% | | | | | |
| New York State Dormitory Authority, Revenue | | | | | |
| (University of Rochester) (LOC; HSBC Bank USA) | 0.17 | 3/1/11 | 300,000 | i | 300,000 |
| Ohio—.3% | | | | | |
| Cleveland-Cuyahoga County Port Authority, Educational Facility | | | | | |
| Revenue (Laurel School Project) (LOC; JPMorgan Chase Bank) | 0.24 | 3/1/11 | 1,600,000 | i | 1,600,000 |
| Tennessee—1.8% | | | | | |
| Chattanooga Industrial Development Board, Revenue | | | | | |
| (Hunter Museum of American Art Project) (LOC; Bank of America) | 0.55 | 3/7/11 | 200,000 | i | 200,000 |
| Clarksville Public Building Authority, Financing Revenue | | | | | |
| (Metropolitan Government of Nashville and Davidson | | | | | |
| County Loan) (LOC; Bank of America) | 0.27 | 3/1/11 | 2,200,000 | i | 2,200,000 |
| Clarksville Public Building Authority, Pooled Financing Revenue | | | | | |
| (Tennessee Municipal Bond Fund) (LOC; Bank of America) | 0.27 | 3/1/11 | 1,085,000 | i | 1,085,000 |
| Sevier County Public Building Authority, Local Government | | | | | |
| Public Improvement Revenue (LOC; KBC Bank) | 0.25 | 3/1/11 | 5,505,000 | i | 5,505,000 |
| Texas—2.9% | | | | | |
| Texas, TRAN | 2.00 | 8/31/11 | 15,300,000 | | 15,430,509 |
| Vermont—.2% | | | | | |
| Vermont Educational and Health Buildings | | | | | |
| Financing Agency, Revenue (North Country | | | | | |
| Hospital Project) (LOC; TD Bank) | 0.21 | 3/1/11 | 500,000 | i | 500,000 |
STATEMENT OF INVESTMENTS (Unaudited) (continued)
| | | | | | |
| BNY Mellon Municipal Opportunities Fund (continued) | | | |
| Short-Term Municipal | Coupon | Maturity | Principal | |
| Investments (continued) | Rate (%) | Date | Amount ($) | Value ($) |
| Vermont (continued) | | | | |
| Vermont Educational and Health Buildings Financing | | | | |
| Agency, Revenue (Northeastern Vermont Regional | | | | |
| Hospital Project) (LOC; TD Bank) | 0.21 | 3/1/11 | 500,000i | 500,000 |
| Vermont Educational and Health Buildings Financing | | | | |
| Agency, Revenue (Southwestern Vermont Medical | | | | |
| Center Project) (LOC; TD Bank) | 0.21 | 3/1/11 | 100,000i | 100,000 |
| Total Short-Term Municipal Investments | | | | |
| (cost $66,889,556) | | | | 66,895,509 |
| |
| Total Investments (cost $567,236,917) | | | 110.0% | 564,306,410 |
| Liabilities, Less Cash and Receivables | | | (10.0%) | (51,306,916) |
| Net Assets | | | 100.0% | 512,999,494 |
|
| a The Federal Housing Finance Agency (“FHFA”) placed Federal Home Loan Mortgage Corporation and Federal National Mortgage Association into conservatorship with FHFA |
| as the conservator.As such, the FHFA oversees the continuing affairs of these companies. |
| b Purchased on a delayed delivery basis. |
| c This security is prerefunded; the date shown represents the prerefunded date. Bonds which are prerefunded are collateralized by U.S. Government securities which are held in escrow |
| and are used to pay principal and interest on the municipal issue and to retire the bonds in full at the earliest refunding date. |
| d Collateral for floating rate borrowings. |
| e Securities exempt from registration under Rule 144A of the Securities Act of 1933.These securities may be resold in transactions exempt from registration, normally to qualified |
| institutional buyers.At February 28, 2011, these securities had a value of $78,474,563 or 15.3% of net assets. |
| f Security issued with a zero coupon. Income is recognized through the accretion of discount. |
| g Variable rate security—interest rate subject to periodic change. |
| h Zero coupon until a specified date at which time the stated coupon rate becomes effective until maturity. |
| i Variable rate demand note—rate shown is the interest rate in effect at February 28, 2011. Maturity date represents the next demand date, or the ultimate maturity date if earlier. |
82
| | | | | | |
| Summary of Abbreviations | | | | |
| |
| ABAG | Association of Bay Area Governments | | ACA | American Capital Access |
| AGC | ACE Guaranty Corporation | | AGIC | Asset Guaranty Insurance Company |
| AMBAC | American Municipal Bond Assurance Corporation | ARRN | Adjustable Rate Receipt Notes |
| BAN | Bond Anticipation Notes | | BPA | Bond Purchase Agreement |
| CIFG | CDC Ixis Financial Guaranty | | COP | Certificate of Participation |
| CP | Commercial Paper | | EDR | Economic Development Revenue |
| EIR | Environmental Improvement Revenue | | FGIC | Financial Guaranty Insurance Company |
| FHA | Federal Housing Administration | | FHLB | Federal Home Loan Bank |
| FHLMC | Federal Home Loan Mortgage Corporation | FNMA | Federal National Mortgage Association |
| GAN | Grant Anticipation Notes | | GIC | Guaranteed Investment Contract |
| GNMA | Government National Mortgage Association | GO | General Obligation | |
| HR | Hospital Revenue | | IDB | Industrial Development Board |
| IDC | Industrial Development Corporation | | IDR | Industrial Development Revenue |
| LOC | Letter of Credit | | | LOR | Limited Obligation Revenue |
| LR | Lease Revenue | | | MFHR | Multi-Family Housing Revenue |
| MFMR | Multi-Family Mortgage Revenue | | PCR | Pollution Control Revenue |
| PILOT | Payment in Lieu of Taxes | | PUTTERS | Puttable Tax-Exempt Receipts |
| RAC | Revenue Anticipation Certificates | | RAN | Revenue Anticipation Notes |
| RAW | Revenue Anticipation Warrants | | RRR | Resources Recovery Revenue |
| SAAN | State Aid Anticipation Notes | | SBPA | Standby Bond Purchase Agreement |
| SFHR | Single Family Housing Revenue | | SFMR | Single Family Mortgage Revenue |
| SONYMA | State of New York Mortgage Agency | | SWDR | Solid Waste Disposal Revenue |
| TAN | Tax Anticipation Notes | | TAW | Tax Anticipation Warrants |
| TRAN | Tax and Revenue Anticipation Notes | | XLCA | XL Capital Assurance |
| |
| |
| |
| Summary of Combined Ratings (Unaudited) | | | |
| |
| Fitch | or | Moody’s | or | Standard & Poor’s | Value (%)† |
| AAA | | Aaa | | AAA | | 23.0 |
| AA | | Aa | | AA | | 21.4 |
| A | | A | | A | | 18.8 |
| BBB | | Baa | | BBB | | 22.5 |
| BB | | Ba | | BB | | .2 |
| B | | B | | B | | .4 |
| F1 | | MIG1/P1 | | SP1/A1 | | 12.8 |
| Not Ratedj | | Not Ratedj | | Not Ratedj | | .9 |
| | | | | | | 100.0 |
|
| † Based on total investments. |
| j Securities which, while not rated by Fitch, Moody's and Standard & Poor's, have been determined by the Manager to be of comparable quality to those rated securities in which the |
| fund may invest. |
See notes to financial statements.
|
| STATEMENT OF ASSETS AND LIABILITIES |
| February 28, 2011 (Unaudited) |
| | | | | | |
| | BNY Mellon | BNY Mellon | BNY Mellon | BNY Mellon |
| | National | National | Pennsylvania | Massachusetts |
| | Intermediate | Short-Term | Intermediate | Intermediate |
| | Municipal Bond Fund | Municipal Bond Fund | Municipal Bond Fund | Municipal Bond Fund |
| Assets ($): | | | | |
| Investments in securities— | | | | |
| See Statement of Investments† | 1,503,943,406 | 959,092,670 | 452,138,867 | 361,128,957 |
| Cash | — | 2,406,745 | — | — |
| Interest receivable | 17,427,523 | 9,591,724 | 5,240,270 | 3,697,038 |
| Receivable for shares of | | | | |
| Beneficial Interest subscribed | 1,115,894 | 2,348,791 | 1,920 | 51,368 |
| Receivable for investment securites sold | — | — | 5,565,272 | — |
| Prepaid expenses and other receivables | 17,694 | 12,119 | 11,250 | 13,711 |
| | 1,522,504,517 | 973,452,049 | 462,957,579 | 364,891,074 |
| Liabilities ($): | | | | |
| Due to The Dreyfus Corporation | | | | |
| and affiliates—Note 4(c) | 455,345 | 292,519 | 192,442 | 113,357 |
| Due to Administrator—Note 4(a) | 140,745 | 91,558 | 42,619 | 34,140 |
| Cash overdraft due to Custodian | 1,336,956 | — | 850,316 | 424,361 |
| Payable for investment securities purchased | 15,725,244 | — | 8,722,451 | — |
| Payable for shares of Beneficial Interest redeemed | 742,210 | 1,555,860 | 90,345 | 923,859 |
| Accrued expenses and other liabilities | 119,832 | 44,693 | 52,093 | 63,442 |
| | 18,520,332 | 1,984,630 | 9,950,266 | 1,559,159 |
| Net Assets ($) | 1,503,984,185 | 971,467,419 | 453,007,313 | 363,331,915 |
| Composition of Net Assets ($): | | | | |
| Paid—in capital | 1,478,101,366 | 966,155,693 | 446,772,800 | 353,429,914 |
| Accumulated undistributed investment income—net | 169,368 | 26,134 | 21,475 | 639 |
| Accumulated net realized gain (loss) on investments | 1,684,390 | (1,403,677) | (1,402,312) | 889,269 |
| Accumulated net unrealized appreciation | | | | |
| (depreciation) on investments | 24,029,061 | 6,689,269 | 7,615,350 | 9,012,093 |
| Net Assets ($) | 1,503,984,185 | 971,467,419 | 453,007,313 | 363,331,915 |
| Net Asset Value Per Share | | | | |
| Class M Shares | | | | |
| Net Assets ($) | 1,470,268,024 | 968,096,690 | 444,346,965 | 354,791,467 |
| Shares Outstanding | 113,078,704 | 75,274,951 | 35,972,599 | 27,871,369 |
| Net Asset Value Per Share ($) | 13.00 | 12.86 | 12.35 | 12.73 |
| Investor Shares | | | | |
| Net Assets ($) | 33,616,983 | 3,370,729 | 8,660,348 | 8,521,055 |
| Shares Outstanding | 2,588,468 | 262,431 | 701,897 | 669,457 |
| Net Asset Value Per Share ($) | 12.99 | 12.84 | 12.34 | 12.73 |
| Dreyfus Premier Shares | | | | |
| Net Assets ($) | 99,178 | — | — | 19,393 |
| Shares Outstanding | 7,633 | — | — | 1,520 |
| Net Asset Value Per Share ($) | 12.99 | — | — | 12.76 |
| † Investments at cost ($) | 1,479,914,345 | 952,403,401 | 444,523,517 | 352,116,864 |
| |
| See notes to financial statements. | | | | |
84
| | | |
| | BNY Mellon | |
| | New York | BNY Mellon |
| | Intermediate | Municipal |
| | Tax-Exempt Bond Fund | Opportunities Fund |
| Assets ($): | | |
| Investments in securities—See Statement of Investments+ | 200,211,353 | 564,306,410 |
| Cash | — | 10,790,306 |
| Interest receivable | 2,385,371 | 5,447,513 |
| Receivable for investment securites sold | — | 3,009,000 |
| Receivable for shares of Beneficial Interest subscribed | 72,000 | 1,256,320 |
| Receivable from broker for swap transactions—Note 5 | — | 898,062 |
| Prepaid expenses and other receivables | 14,853 | 14,189 |
| | 202,683,577 | 585,721,800 |
| Liabilities ($): | | |
| Due to The Dreyfus Corporation and affiliates—Note 4(c) | 71,336 | 207,348 |
| Due to Administrator—Note 4(a) | 18,840 | 47,032 |
| Cash overdraft due to Custodian | 464,526 | — |
| Payable for investment securities purchased | — | 31,041,959 |
| Payable for floating rate notes issued—Note 5 | — | 40,435,000 |
| Payable for shares of Beneficial Interest redeemed | 75,561 | 870,564 |
| Interest and expense payable related | | |
| to floating rate notes issued—Note 4 | — | 52,254 |
| Accrued expenses and other liabilities | 35,065 | 68,149 |
| | 665,328 | 72,722,306 |
| Net Assets ($) | 202,018,249 | 512,999,494 |
| Composition of Net Assets ($): | | |
| Paid—in capital | 196,691,554 | 511,824,441 |
| Accumulated undistributed investment income—net | 7,378 | 186,036 |
| Accumulated net realized gain (loss) on investments | 155,884 | 3,919,524 |
| Accumulated net unrealized appreciation | | |
| (depreciation) on investments | 5,163,433 | (2,930,507) |
| Net Assets ($) | 202,018,249 | 512,999,494 |
| Net Asset Value Per Share | | |
| Class M Shares | | |
| Net Assets ($) | 184,989,880 | 511,936,084 |
| Shares Outstanding | 16,712,050 | 42,937,589 |
| Net Asset Value Per Share ($) | 11.07 | 11.92 |
| Investor Shares | | |
| Net Assets ($) | 17,028,369 | 1,063,410 |
| Shares Outstanding | 1,537,440 | 89,163 |
| Net Asset Value Per Share ($) | 11.08 | 11.93 |
| † Investments at cost ($) | 195,047,920 | 567,236,917 |
| |
| See notes to financial statements. | | |
|
| STATEMENT OF OPERATIONS |
| Six Months Ended February 28, 2011 (Unaudited) |
| | | | | | | | |
| | BNY Mellon | BNY Mellon | BNY Mellon | BNY Mellon |
| | National | National | Pennsylvania | Massachusetts |
| | Intermediate | Short-Term | Intermediate | Intermediate |
| | Municipal Bond Fund | Municipal Bond Fund | Municipal Bond Fund | Municipal Bond Fund |
| Investment Income ($): | | | | |
| Interest Income | 32,868,150 | 9,859,271 | 10,306,247 | 7,714,908 |
| Expenses: | | | | |
| Investment advisory fee—Note 4(a) | 2,740,450 | 1,801,883 | 1,189,292 | 676,497 |
| Administration fee—Note 4(a) | 969,128 | 637,189 | 294,405 | 239,246 |
| Custodian fees—Note 4(c) | 56,119 | 46,260 | 18,773 | 15,539 |
| Trustees' fees and expenses—Note 4(d) | 42,849 | 18,463 | 9,157 | 10,134 |
| Shareholder servicing costs—Note 4(c) | 42,253 | 4,851 | 11,893 | 10,599 |
| Auditing fees | 25,146 | 2,342 | 4,142 | 27,158 |
| Loan commitment fees—Note 3 | 23,843 | 11,750 | 6,096 | 6,253 |
| Registration fees | 20,415 | 14,658 | 14,340 | 20,384 |
| Legal fees | 8,381 | 14,487 | 11,398 | — |
| Distribution fees—Note 4(b) | 276 | — | — | 48 |
| Prospectus and shareholders' reports | — | 2,454 | 2,035 | 4,191 |
| Miscellaneous | 51,985 | 54,844 | 24,978 | 31,805 |
| Total Expenses | 3,980,845 | 2,609,181 | 1,586,509 | 1,041,854 |
| Less—reduction in fees | | | | |
| due to earnings credits—Note 4(c) | (31) | (3) | (2) | (10) |
| Net Expenses | 3,980,814 | 2,609,178 | 1,586,507 | 1,041,844 |
| Investment Income—Net | 28,887,336 | 7,250,093 | 8,719,740 | 6,673,064 |
| Realized and Unrealized Gain (Loss) | | | | |
| on Investments—Note 5 ($): | | | | |
| Net realized gain (loss) on investments | 2,108,115 | 238,464 | 932,631 | 880,031 |
| Net realized gain (loss) on financial futures | 687,572 | — | 182,004 | 141,559 |
| Net Realized Gain (Loss) | 2,795,687 | 238,464 | 1,114,635 | 1,021,590 |
| Net unrealized appreciation | | | | |
| (depreciation) on investments | (83,586,991) | (12,019,810) | (24,579,573) | (19,374,157) |
| Net Realized and Unrealized | | | | |
| Gain (Loss) on Investments | (80,791,304) | (11,781,346) | (23,464,938) | (18,352,567) |
| Net (Decrease) in Net Assets | | | | |
| Resulting from Operations | (51,903,968) | (4,531,253) | (14,745,198) | (11,679,503) |
| |
| See notes to financial statements. | | | | |
86
| | | | |
| | BNY Mellon | BNY Mellon |
| | New York Intermediate | Municipal |
| | Tax-Exempt Bond Fund | Opportunities Fund |
| Investment Income ($): | | |
| Interest Income | 4,091,363 | 9,583,425 |
| Expenses: | | |
| Investment advisory fee—Note 4(a) | 516,674 | 1,037,424 |
| Administration fee—Note 4(a) | 127,894 | 256,653 |
| Interest and expense related to floating rate notes issued—Note 5 | — | 96,828 |
| Shareholder servicing costs—Note 4(c) | 23,758 | 1,456 |
| Registration fees | 14,985 | 32,560 |
| Custodian fees—Note 4(c) | 7,909 | 19,801 |
| Auditing fees | 7,874 | 29,403 |
| Trustees' fees and expenses—Note 4(d) | 4,417 | 4,800 |
| Legal fees | 2,317 | 899 |
| Prospectus and shareholders' reports | 2,065 | 2,759 |
| Loan commitment fees—Note 3 | 331 | 2,850 |
| Interest expense—Note 3 | — | 90 |
| Miscellaneous | 33,030 | 23,277 |
| Total Expenses | 741,254 | 1,508,800 |
| Less—reduction in investment advisory fee | | |
| due to undertaking—Note 4(a) | (109,868) | — |
| Less—reduction in fees | | |
| due to earnings credits—Note 4(c) | (35) | (1) |
| Net Expenses | 631,351 | 1,508,799 |
| Investment Income—Net | 3,460,012 | 8,074,626 |
| Realized and Unrealized Gain (Loss) on Investments—Note 5 ($): | | |
| Net realized gain (loss) on investments | 134,983 | 5,644,615 |
| Net realized gain (loss) on financial futures | — | 2,871,874 |
| Net realized gain (loss) on swap transactions | — | (463,465) |
| Net Realized Gain (Loss) | 134,983 | 8,053,024 |
| Net unrealized appreciation (depreciation) on investments | (10,014,368) | (29,361,027) |
| Net unrealized appreciation (depreciation) on financial futures | — | 1,245,078 |
| Net unrealized appreciation (depreciation) on swap transactions | — | 197,069 |
| Net Unrealized Appreciation (Depreciation) | (10,014,368) | (27,918,880) |
| Net Realized and Unrealized Gain (Loss) on Investments | (9,879,385) | (19,865,856) |
| Net (Decrease) in Net Assets Resulting from Operations | (6,419,373) | (11,791,230) |
| |
| See notes to financial statements. | | |
STATEMENT OF CHANGES IN NET ASSETS
| | | | | | | | |
| | BNY Mellon National Intermediate | BNY Mellon National Short-Term |
| | Municipal Bond Fund | Municipal Bond Fund |
| | Six Months Ended | | Six Months Ended | |
| | February 28, 2011 | Year Ended | February 28, 2011 | Year Ended |
| | (Unaudited) | August 31, 2010 | (Unaudited) | August 31, 2010 |
| Operations ($): | | | | |
| Investment income—net | 28,887,336 | 58,231,021 | 7,250,093 | 14,175,472 |
| Net realized gain (loss) on investments | 2,795,687 | 9,629,291 | 238,464 | (424,283) |
| Net unrealized appreciation (depreciation) on investments | (83,586,991) | 64,500,398 | (12,019,810) | 13,173,941 |
| Net Increase (Decrease) in Net Assets | | | | |
| Resulting from Operations | (51,903,968) | 132,360,710 | (4,531,253) | 26,925,130 |
| Dividends to Shareholders from ($): | | | | |
| Investment income—net: | | | | |
| Class M Shares | (28,144,791) | (56,871,848) | (7,203,534) | (14,102,984) |
| Investor Shares | (571,551) | (1,053,314) | (20,425) | (19,519) |
| Dreyfus Premier Shares | (1,626) | (4,354) | — | — |
| Net realized gain on investments: | | | | |
| Class M Shares | (9,584,383) | — | — | — |
| Investor Shares | (208,964) | — | — | — |
| Dreyfus Premier Shares | (715) | — | — | — |
| Total Dividends | (38,512,030) | (57,929,516) | (7,223,959) | (14,122,503) |
| Beneficial Interest Transactions ($): | | | | |
| Net proceeds from shares sold: | | | | |
| Class M Shares | 154,740,076 | 508,110,745 | 367,265,185 | 1,122,401,893 |
| Investor Shares | 10,470,531 | 12,382,325 | 4,546,919 | 5,081,076 |
| Dreyfus Premier Shares | 363 | 783 | — | — |
| Dividends reinvested: | | | | |
| Class M Shares | 8,696,553 | 6,841,545 | 1,857,957 | 3,498,579 |
| Investor Shares | 518,659 | 735,891 | 9,899 | 17,320 |
| Dreyfus Premier Shares | 243 | 1,064 | — | — |
| Cost of shares redeemed: | | | | |
| Class M Shares | (242,617,727) | (316,873,597) | (449,994,763) | (614,591,338) |
| Investor Shares | (9,448,793) | (7,014,088) | (3,503,233) | (4,186,369) |
| Dreyfus Premier Shares | (14,621) | (54,912) | — | — |
| Increase (Decrease) in Net Assets from | | | | |
| Beneficial Interest Transactions | (77,654,716) | 204,129,756 | (79,818,036) | 512,221,161 |
| Total Increase (Decrease) in Net Assets | (168,070,714) | 278,560,950 | (91,573,248) | 525,023,788 |
| Net Assets ($): | | | | |
| Beginning of Period | 1,672,054,899 | 1,393,493,949 | 1,063,040,667 | 538,016,879 |
| End of Period | 1,503,984,185 | 1,672,054,899 | 971,467,419 | 1,063,040,667 |
| Undistributed investment income—net | 169,368 | — | 26,134 | — |
88
| | | | | | | | |
| | BNY Mellon National Intermediate | BNY Mellon National Short-Term |
| | Municipal Bond Fund | Municipal Bond Fund |
| | Six Months Ended | | Six Months Ended | |
| | February 28, 2011 | Year Ended | February 28, 2011 | Year Ended |
| | (Unaudited) | August 31, 2010 | (Unaudited) | August 31, 2010 |
| Capital Share Transactions: | | | | |
| Class M Shares | | | | |
| Shares sold | 11,690,752 | 37,999,991 | 28,439,267 | 86,959,713 |
| Shares issued for dividends reinvested | 662,093 | 510,831 | 143,969 | 270,826 |
| Shares redeemed | (18,410,399) | (23,686,559) | (34,867,980) | (47,599,781) |
| Net Increase (Decrease) in Shares Outstanding | (6,057,554) | 14,824,263 | (6,284,744) | 39,630,758 |
| Investor Sharesa | | | | |
| Shares sold | 796,442 | 926,442 | 352,540 | 394,015 |
| Shares issued for dividends reinvested | 39,329 | 54,999 | 768 | 1,343 |
| Shares redeemed | (717,803) | (525,254) | (272,226) | (325,131) |
| Net Increase (Decrease) in Shares Outstanding | 117,968 | 456,187 | 81,082 | 70,227 |
| Dreyfus Premier Sharesa | | | | |
| Shares sold | 28 | 58 | — | — |
| Shares issued for dividends reinvested | 18 | 80 | — | — |
| Shares redeemed | (1,126) | (4,088) | — | — |
| Net Increase (Decrease) in Shares Outstanding | (1,080) | (3,950) | — | — |
|
| a During the year ended August 31, 2010, 2 Dreyfus Premier shares of BNY Mellon National Intermediate Municipal Bond Fund representing $24 were automatically converted |
| to 2 Investor shares. |
See notes to financial statements.
STATEMENT OF CHANGES IN NET ASSETS (continued)
| | | | |
| | BNY Mellon Pennsylvania |
| | Intermediate Municipal Bond Fund |
| | Six Months Ended | |
| | February 28, 2011 | Year Ended |
| | (Unaudited) | August 31, 2010 |
| Operations ($): | | |
| Investment income—net | 8,719,740 | 18,860,064 |
| Net realized gain (loss) on investments | 1,114,635 | (554,785) |
| Net unrealized appreciation (depreciation) on investments | (24,579,573) | 22,794,719 |
| Net Increase (Decrease) in Net Assets Resulting from Operations | (14,745,198) | 41,099,998 |
| Dividends to Shareholders from ($): | | |
| Investment income—net: | | |
| Class M Shares | (8,542,786) | (18,568,757) |
| Investor Shares | (155,479) | (229,463) |
| Net realized gain on investments: | | |
| Class M Shares | — | (113,887) |
| Investor Shares | — | (939) |
| Total Dividends | (8,698,265) | (18,913,046) |
| Beneficial Interest Transactions ($): | | |
| Net proceeds from shares sold: | | |
| Class M Shares | 15,978,895 | 77,631,357 |
| Investor Shares | 2,065,022 | 8,956,905 |
| Dividends reinvested: | | |
| Class M Shares | 378,981 | 834,142 |
| Investor Shares | 41,307 | 81,604 |
| Cost of shares redeemed: | | |
| Class M Shares | (49,905,239) | (101,436,721) |
| Investor Shares | (2,384,638) | (2,518,488) |
| Increase (Decrease) in Net Assets from | | |
| Beneficial Interest Transactions | (33,825,672) | (16,451,201) |
| Total Increase (Decrease) in Net Assets | (57,269,135) | 5,735,751 |
| Net Assets ($): | | |
| Beginning of Period | 510,276,448 | 504,540,697 |
| End of Period | 453,007,313 | 510,276,448 |
| Undistributed investment income—net | 21,475 | — |
| Capital Share Transactions (Shares): | | |
| Class M Shares | | |
| Shares sold | 1,274,024 | 6,152,736 |
| Shares issued for dividends reinvested | 30,265 | 66,009 |
| Shares redeemed | (3,993,952) | (8,031,887) |
| Net Increase (Decrease) in Shares Outstanding | (2,689,663) | (1,813,142) |
| Investor Shares | | |
| Shares sold | 164,658 | 706,411 |
| Shares issued for dividends reinvested | 3,300 | 5,835 |
| Shares redeemed | (191,273) | (200,092) |
| Net Increase (Decrease) in Shares Outstanding | (23,315) | 512,154 |
| |
| See notes to financial statements. | | |
90
| | | | |
| | BNY Mellon Massachusetts |
| | Intermediate Municipal Bond Fund |
| | Six Months Ended | |
| | February 28, 2011 | Year Ended |
| | (Unaudited) | August 31, 2010 |
| Operations ($): | | |
| Investment income—net | 6,673,064 | 13,939,034 |
| Net realized gain (loss) on investments | 1,021,590 | 2,973,105 |
| Net unrealized appreciation (depreciation) on investments | (19,374,157) | 13,425,742 |
| Net Increase (Decrease) in Net Assets Resulting from Operations | (11,679,503) | 30,337,881 |
| Dividends to Shareholders from ($): | | |
| Investment income—net: | | |
| Class M Shares | (6,540,795) | (13,669,090) |
| Investor Shares | (131,368) | (267,539) |
| Dreyfus Premier Shares | (262) | (516) |
| Net realized gain on investments: | | |
| Class M Shares | (2,090,359) | — |
| Investor Shares | (45,562) | — |
| Dreyfus Premier Shares | (105) | — |
| Total Dividends | (8,808,451) | (13,937,145) |
| Beneficial Interest Transactions ($): | | |
| Net proceeds from shares sold: | | |
| Class M Shares | 29,392,909 | 100,466,494 |
| Investor Shares | 1,237,755 | 1,526,575 |
| Dividends reinvested: | | |
| Class M Shares | 2,875,932 | 3,506,780 |
| Investor Shares | 130,955 | 167,469 |
| Dreyfus Premier Shares | 367 | 516 |
| Cost of shares redeemed: | | |
| Class M Shares | (65,074,521) | (93,496,329) |
| Investor Shares | (573,279) | (2,986,356) |
| Increase (Decrease) in Net Assets from | | |
| Beneficial Interest Transactions | (32,009,882) | 9,185,149 |
| Total Increase (Decrease) in Net Assets | (52,497,836) | 25,585,885 |
| Net Assets ($): | | |
| Beginning of Period | 415,829,751 | 390,243,866 |
| End of Period | 363,331,915 | 415,829,751 |
| Undistributed investment income—net | 639 | — |
STATEMENT OF CHANGES IN NET ASSETS (continued)
| | | | |
| | BNY Mellon Massachusetts |
| | Intermediate Municipal Bond Fund |
| | Six Months Ended | |
| | February 28, 2011 | Year Ended |
| | (Unaudited) | August 31, 2010 |
| Capital Share Transactions: | | |
| Class M Shares | | |
| Shares sold | 2,280,080 | 7,724,233 |
| Shares issued for dividends reinvested | 223,609 | 268,880 |
| Shares redeemed | (5,078,576) | (7,182,891) |
| Net Increase (Decrease) in Shares Outstanding | (2,574,887) | 810,222 |
| Investor Shares | | |
| Shares sold | 95,160 | 117,346 |
| Shares issued for dividends reinvested | 10,181 | 12,845 |
| Shares redeemed | (44,113) | (229,363) |
| Net Increase (Decrease) in Shares Outstanding | 61,228 | (99,172) |
| Dreyfus Premier Shares | | |
| Shares issued for dividends reinvested | 29 | 39 |
| |
| See notes to financial statements. | | |
92
| | | | |
| | BNY Mellon New York |
| | Intermediate Tax-Exempt Bond Fund |
| | Six Months Ended | |
| | February 28, 2011 | Year Ended |
| | (Unaudited) | August 31, 2010 |
| Operations ($): | | |
| Investment income—net | 3,460,012 | 6,364,090 |
| Net realized gain (loss) on investments | 134,983 | 180,657 |
| Net unrealized appreciation (depreciation) on investments | (10,014,368) | 7,406,706 |
| Net Increase (Decrease) in Net Assets | | |
| Resulting from Operations | (6,419,373) | 13,951,453 |
| Dividends to Shareholders from ($): | | |
| Investment income—net: | | |
| Class M Shares | (3,186,406) | (5,819,185) |
| Investor Shares | (266,228) | (527,436) |
| Net realized gain on investments: | | |
| Class M Shares | (169,336) | (1,490) |
| Investor Shares | (15,169) | (152) |
| Total Dividends | (3,637,139) | (6,348,263) |
| Beneficial Interest Transactions ($): | | |
| Net proceeds from shares sold: | | |
| Class M Shares | 22,796,088 | 65,072,584 |
| Investor Shares | 1,461,766 | 1,610,885 |
| Dividends reinvested: | | |
| Class M Shares | 479,144 | 779,460 |
| Investor Shares | 219,887 | 418,543 |
| Cost of shares redeemed: | | |
| Class M Shares | (25,845,432) | (29,785,020) |
| Investor Shares | (1,183,241) | (2,148,320) |
| Increase (Decrease) in Net Assets from | | |
| Beneficial Interest Transactions | (2,071,788) | 35,948,132 |
| Total Increase (Decrease) in Net Assets | (12,128,300) | 43,551,322 |
| Net Assets ($): | | |
| Beginning of Period | 214,146,549 | 170,595,227 |
| End of Period | 202,018,249 | 214,146,549 |
| Undistributed investment income—net | 7,378 | — |
| Capital Share Transactions (Shares): | | |
| Class M Shares | | |
| Shares sold | 2,017,882 | 5,743,485 |
| Shares issued for dividends reinvested | 42,805 | 68,768 |
| Shares redeemed | (2,308,902) | (2,628,307) |
| Net Increase (Decrease) in Shares Outstanding | (248,215) | 3,183,946 |
| Investor Shares | | |
| Shares sold | 129,384 | 142,185 |
| Shares issued for dividends reinvested | 19,604 | 36,891 |
| Shares redeemed | (106,112) | (189,528) |
| Net Increase (Decrease) in Shares Outstanding | 42,876 | (10,452) |
| |
| See notes to financial statements. | | |
STATEMENT OF CHANGES IN NET ASSETS (continued)
| | | | |
| | BNY Mellon |
| | Municipal Opportunities Fund |
| | Six Months Ended | |
| | February 28, 2011 | Year Ended |
| | (Unaudited) | August 31, 2010 |
| Operations ($): | | |
| Investment income—net | 8,074,626 | 7,638,142 |
| Net realized gain (loss) on investments | 8,053,024 | 2,595,299 |
| Net unrealized appreciation (depreciation) on investments | (27,918,880) | 14,993,700 |
| Net Increase (Decrease) in Net Assets Resulting from Operations | (11,791,230) | 25,227,141 |
| Dividends to Shareholders from ($): | | |
| Investment income—net: | | |
| Class M Shares | (7,868,148) | (7,435,840) |
| Investor Shares | (20,442) | (48,955) |
| Net realized gain on investments: | | |
| Class M Shares | (5,311,842) | (4,605,769) |
| Investor Shares | (14,700) | (48,090) |
| Total Dividends | (13,215,132) | (12,138,654) |
| Beneficial Interest Transactions ($): | | |
| Net proceeds from shares sold: | | |
| Class M Shares | 197,498,683 | 256,211,257 |
| Investor Shares | 984,415 | 688,290 |
| Dividends reinvested: | | |
| Class M Shares | 4,127,369 | 4,694,015 |
| Investor Shares | 30,899 | 87,415 |
| Cost of shares redeemed: | | |
| Class M Shares | (49,703,448) | (29,907,595) |
| Investor Shares | (1,022,036) | (866,650) |
| Increase (Decrease) in Net Assets from | | |
| Beneficial Interest Transactions | 151,915,882 | 230,906,732 |
| Total Increase (Decrease) in Net Assets | 126,909,520 | 243,995,219 |
| Net Assets ($): | | |
| Beginning of Period | 386,089,974 | 142,094,755 |
| End of Period | 512,999,494 | 386,089,974 |
| Undistributed investment income—net | 186,036 | — |
| Capital Share Transactions (Shares): | | |
| Class M Shares | | |
| Shares sold | 16,649,985 | 20,613,460 |
| Shares issued for dividends reinvested | 341,642 | 381,307 |
| Shares redeemed | (4,164,960) | (2,410,868) |
| Net Increase (Decrease) in Shares Outstanding | 12,826,667 | 18,583,899 |
| Investor Shares | | |
| Shares sold | 81,059 | 54,942 |
| Shares issued for dividends reinvested | 2,543 | 7,093 |
| Shares redeemed | (84,925) | (70,361) |
| Net Increase (Decrease) in Shares Outstanding | (1,323) | (8,326) |
| |
| See notes to financial statements. | | |
94
FINANCIAL HIGHLIGHTS
The following tables describe the performance for each share class of each BNY Mellon municipal bond fund for the fiscal periods indicated. All information (except portfolio turnover rate) reflects financial results for a single fund share.Total return shows how much your investment in each fund would have increased (or decreased) during the period, assuming you had reinvested all dividends and distributions.These figures have been derived from each fund’s financial statements.
| | | | | | | | | | | | |
| | | | Class M Shares | | |
| | Six Months Ended | | | | | |
| BNY Mellon National | February 28, 2011 | | Year Ended August 31, | |
| Intermediate Municipal Bond Fund | (Unaudited) | 2010 | 2009 | 2008 | 2007 | 2006 |
| Per Share Data ($): | | | | | | |
| Net asset value, beginning of period | 13.75 | 13.10 | 12.84 | 12.81 | 13.01 | 13.25 |
| Investment Operations: | | | | | | |
| Investment income—neta | .24 | .50 | .52 | .52 | .50 | .50 |
| Net realized and unrealized | | | | | | |
| gain (loss) on investments | (.67) | .65 | .27 | .02 | (.20) | (.16) |
| Total from Investment Operations | (.43) | 1.15 | .79 | .54 | .30 | .34 |
| Distributions: | | | | | | |
| Dividends from investment income—net | (.24) | (.50) | (.52) | (.51) | (.50) | (.50) |
| Dividends from net realized gain on investments | (.08) | — | (.01) | — | — | (.08) |
| Total Distributions | (.32) | (.50) | (.53) | (.51) | (.50) | (.58) |
| Net asset value, end of period | 13.00 | 13.75 | 13.10 | 12.84 | 12.81 | 13.01 |
| Total Return (%) | (3.11)b | 8.96 | 6.37 | 4.32 | 2.36 | 2.64 |
| Ratios/Supplemental Data (%): | | | | | | |
| Ratio of total expenses to average net assets | .50c | .50 | .51 | .51 | .51 | .51 |
| Ratio of net expenses to average net assets | .50c | .50 | .51 | .51 | .51 | .51 |
| Ratio of net investment income to average net assets | 3.69c | 3.76 | 4.11 | 4.01 | 3.90 | 3.87 |
| Portfolio Turnover Rate | 15.82b | 42.75 | 42.82 | 49.50 | 27.18 | 28.19 |
| Net Assets, end of period ($ x 1,000) | 1,470,268 | 1,638,004 | 1,366,960 | 1,045,019 | 944,909 | 807,634 |
| |
| a | Based on average shares outstanding at each month end. |
| b | Not annualized. |
| c | Annualized. |
See notes to financial statements.
FINANCIAL HIGHLIGHTS (continued)
| | | | | | | | | | | | |
| | | | Investor Shares | | | |
| | Six Months Ended | | | | | |
| BNY Mellon National | February 28, 2011 | | Year Ended August 31, | |
| Intermediate Municipal Bond Fund | (Unaudited) | 2010 | 2009 | 2008 | 2007 | 2006 |
| Per Share Data ($): | | | | | | |
| Net asset value, beginning of period | 13.73 | 13.09 | 12.83 | 12.80 | 13.00 | 13.23 |
| Investment Operations: | | | | | | |
| Investment income—neta | .23 | .47 | .49 | .48 | .47 | .47 |
| Net realized and unrealized | | | | | | |
| gain (loss) on investments | (.66) | .64 | .27 | .03 | (.20) | (.15) |
| Total from Investment Operations | (.43) | 1.11 | .76 | .51 | .27 | .32 |
| Distributions: | | | | | | |
| Dividends from investment income—net | (.23) | (.47) | (.49) | (.48) | (.47) | (.47) |
| Dividends from net realized gain on investments | (.08) | — | (.01) | — | — | (.08) |
| Total Distributions | (.31) | (.47) | (.50) | (.48) | (.47) | (.55) |
| Net asset value, end of period | 12.99 | 13.73 | 13.09 | 12.83 | 12.80 | 13.00 |
| Total Return (%) | (3.16)b | 8.61 | 6.11 | 4.06 | 2.11 | 2.47 |
| Ratios/Supplemental Data (%): | | | | | | |
| Ratio of total expenses to average net assets | .75c | .75 | .76 | .76 | .76 | .76 |
| Ratio of net expenses to average net assets | .75c | .75 | .76 | .76 | .76 | .76 |
| Ratio of net investment income to average net assets | 3.46c | 3.51 | 3.88 | 3.77 | 3.65 | 3.62 |
| Portfolio Turnover Rate | 15.82b | 42.75 | 42.82 | 49.50 | 27.18 | 28.19 |
| Net Assets, end of period ($ x 1,000) | 33,617 | 33,931 | 26,368 | 21,668 | 25,262 | 27,084 |
| |
| a | Based on average shares outstanding at each month end. |
| b | Not annualized. |
| c | Annualized. |
See notes to financial statements.
96
| | | | | | | | | | | | |
| | | | Dreyfus Premier Shares | | | |
| | Six Months Ended | | | | | |
| BNY Mellon National | February 28, 2011 | | Year Ended August 31, | |
| Intermediate Municipal Bond Fund | (Unaudited) | 2010 | 2009 | 2008 | 2007 | 2006 |
| Per Share Data ($): | | | | | | |
| Net asset value, beginning of period | 13.74 | 13.10 | 12.84 | 12.81 | 13.00 | 13.24 |
| Investment Operations: | | | | | | |
| Investment income—neta | .19 | .40 | .42 | .41 | .39 | .40 |
| Net realized and unrealized | | | | | | |
| gain (loss) on investments | (.67) | .64 | .27 | .04 | (.17) | (.16) |
| Total from Investment Operations | (.48) | 1.04 | .69 | .45 | .22 | .24 |
| Distributions: | | | | | | |
| Dividends from investment income—net | (.19) | (.40) | (.42) | (.42) | (.41) | (.40) |
| Dividends from net realized gain on investments | (.08) | — | (.01) | — | — | (.08) |
| Total Distributions | (.27) | (.40) | (.43) | (.42) | (.41) | (.48) |
| Net asset value, end of period | 12.99 | 13.74 | 13.10 | 12.84 | 12.81 | 13.00 |
| Total Return (%)b | (3.47)c | 8.06 | 5.66 | 3.46 | 1.68 | 1.88 |
| Ratios/Supplemental Data (%): | | | | | | |
| Ratio of total expenses to average net assets | 1.25d | 1.25 | 1.26 | 1.26 | 1.26 | 1.26 |
| Ratio of net expenses to average net assets | 1.25d | 1.25 | 1.26 | 1.26 | 1.26 | 1.26 |
| Ratio of net investment income to average net assets | 2.97d | 3.02 | 3.37 | 3.27 | 3.13 | 3.12 |
| Portfolio Turnover Rate | 15.82c | 42.75 | 42.82 | 49.50 | 27.18 | 28.19 |
| Net Assets, end of period ($ x 1,000) | 99 | 120 | 166 | 177 | 327 | 2,474 |
| |
| a | Based on average shares outstanding at each month end. |
| b | Exclusive of sales charge. |
| c | Not annualized. |
| d | Annualized. |
See notes to financial statements.
FINANCIAL HIGHLIGHTS (continued)
| | | | | | | | | | | | |
| | | | Class M Shares | | | |
| | Six Months Ended | | | | | |
| BNY Mellon National Short-Term | February 28, 2011 | | Year Ended August 31, | |
| Municipal Bond Fund | (Unaudited) | 2010 | 2009 | 2008 | 2007 | 2006 |
| Per Share Data ($): | | | | | | |
| Net asset value, beginning of period | 13.01 | 12.80 | 12.69 | 12.59 | 12.59 | 12.63 |
| Investment Operations: | | | | | | |
| Investment income—neta | .09 | .21 | .31 | .41 | .40 | .33 |
| Net realized and unrealized | | | | | | |
| gain (loss) on investments | (.15) | .21 | .14 | .10 | — | (.04) |
| Total from Investment Operations | .06 | .42 | .45 | .51 | .40 | .29 |
| Distributions: | | | | | | |
| Dividends from investment income—net | (.09) | (.21) | (.34) | (.41) | (.40) | (.33) |
| Net asset value, end of period | 12.86 | 13.01 | 12.80 | 12.69 | 12.59 | 12.59 |
| Total Return (%) | (.38)b | 3.22 | 3.61 | 4.09 | 3.21 | 2.36 |
| Ratios/Supplemental Data (%): | | | | | | |
| Ratio of total expenses to average net assets | .51c | .51 | .54 | .54 | .55 | .53 |
| Ratio of net expenses to average net assets | .51c | .51 | .54 | .54 | .54 | .53 |
| Ratio of net investment income to average net assets | 1.41c | 1.60 | 2.50 | 3.23 | 3.14 | 2.65 |
| Portfolio Turnover Rate | 6.75b | 16.46 | 12.61 | 22.93 | 33.74 | 49.94 |
| Net Assets, end of period ($ x 1,000) | 968,097 | 1,060,685 | 536,597 | 168,243 | 145,395 | 160,551 |
| |
| a | Based on average shares outstanding at each month end. |
| b | Not annualized. |
| c | Annualized. |
See notes to financial statements.
98
| | | | | | | | | | | | |
| | | | Investor Shares | | | |
| | Six Months Ended | | | | | |
| BNY Mellon National Short-Term | February 28, 2011 | | Year Ended August 31, | |
| Municipal Bond Fund | (Unaudited) | 2010 | 2009 | 2008 | 2007 | 2006 |
| Per Share Data ($): | | | | | | |
| Net asset value, beginning of period | 12.99 | 12.78 | 12.68 | 12.58 | 12.58 | 12.62 |
| Investment Operations: | | | | | | |
| Investment income—neta | .08 | .19 | .31 | .38 | .37 | .31 |
| Net realized and unrealized | | | | | | |
| gain (loss) on investments | (.16) | .20 | .10 | .10 | (.01) | (.05) |
| Total from Investment Operations | (.08) | .39 | .41 | .48 | .36 | .26 |
| Distributions: | | | | | | |
| Dividends from investment income—net | (.07) | (.18) | (.31) | (.38) | (.36) | (.30) |
| Net asset value, end of period | 12.84 | 12.99 | 12.78 | 12.68 | 12.58 | 12.58 |
| Total Return (%) | (.59)b | 3.05 | 3.28 | 3.83 | 2.95 | 2.10 |
| Ratios/Supplemental Data (%): | | | | | | |
| Ratio of total expenses to average net assets | .77c | .77 | .80 | .80 | .80 | .79 |
| Ratio of net expenses to average net assetsb | .77c | .77 | .80 | .80 | .80 | .79 |
| Ratio of net investment income to average net assets | 1.17c | 1.39 | 2.38 | 2.99 | 2.94 | 2.47 |
| Portfolio Turnover Rate | 6.75b | 16.46 | 12.61 | 22.93 | 33.74 | 49.94 |
| Net Assets, end of period ($ x 1,000) | 3,371 | 2,356 | 1,420 | 662 | 635 | 277 |
| |
| a | Based on average shares outstanding at each month end. |
| b | Not annualized. |
| c | Annualized. |
See notes to financial statements.
FINANCIAL HIGHLIGHTS (continued)
| | | | | | | | | | | | |
| | | | Class M Shares | | | |
| | Six Months Ended | | | | | |
| BNY Mellon Pennsylvania�� | February 28, 2011 | | Year Ended August 31, | |
| Intermediate Municipal Bond Fund | (Unaudited) | 2010 | 2009 | 2008 | 2007 | 2006 |
| Per Share Data ($): | | | | | | |
| Net asset value, beginning of period | 12.96 | 12.40 | 12.35 | 12.43 | 12.66 | 12.92 |
| Investment Operations: | | | | | | |
| Investment income—neta | .23 | .46 | .48 | .48 | .48 | .48 |
| Net realized and unrealized | | | | | | |
| gain (loss) on investments | (.61) | .56 | .09 | (.06) | (.20) | (.18) |
| Total from Investment Operations | (.38) | 1.02 | .57 | .42 | .28 | .30 |
| Distributions: | | | | | | |
| Dividends from investment income—net | (.23) | (.46) | (.48) | (.48) | (.48) | (.48) |
| Dividends from net realized gain on investments | — | (.00)b | (.04) | (.02) | (.03) | (.08) |
| Total Distributions | (.23) | (.46) | (.52) | (.50) | (.51) | (.56) |
| Net asset value, end of period | 12.35 | 12.96 | 12.40 | 12.35 | 12.43 | 12.66 |
| Total Return (%) | (2.96)c | 8.44 | 4.90 | 3.43 | 2.23 | 2.41 |
| Ratios/Supplemental Data (%): | | | | | | |
| Ratio of total expenses to average net assets | .66d | .66 | .67 | .66 | .66 | .66 |
| Ratio of net expenses to average net assets | .66d | .66 | .67 | .66 | .66 | .66 |
| Ratio of net investment income to average net assets | 3.67d | 3.68 | 4.02 | 3.87 | 3.83 | 3.81 |
| Portfolio Turnover Rate | 3.87c | 7.11 | 12.75 | 10.14 | 20.18 | 13.80 |
| Net Assets, end of period ($ x 1,000) | 444,347 | 500,892 | 501,978 | 566,767 | 610,618 | 646,610 |
| |
| a | Based on average shares outstanding at each month end. |
| b | Amount represents less than $.01 per share. |
| c | Not annualized. |
| d | Annualized. |
See notes to financial statements.
100
| | | | | | | | | | | | |
| | | | Investor Shares | | | |
| | Six Months Ended | | | | | |
| BNY Mellon Pennsylvania | February 28, 2011 | | Year Ended August 31, | |
| Intermediate Municipal Bond Fund | (Unaudited) | 2010 | 2009 | 2008 | 2007 | 2006 |
| Per Share Data ($): | | | | | | |
| Net asset value, beginning of period | 12.94 | 12.39 | 12.33 | 12.41 | 12.65 | 12.91 |
| Investment Operations: | | | | | | |
| Investment income—neta | .21 | .44 | .46 | .46 | .45 | .46 |
| Net realized and unrealized | | | | | | |
| gain (loss) on investments | (.60) | .54 | .09 | (.07) | (.21) | (.19) |
| Total from Investment Operations | (.39) | .98 | .55 | .39 | .24 | .27 |
| Distributions: | | | | | | |
| Dividends from investment income—net | (.21) | (.43) | (.45) | (.45) | (.45) | (.45) |
| Dividends from net realized gain on investments | — | (.00)b | (.04) | (.02) | (.03) | (.08) |
| Total Distributions | (.21) | (.43) | (.49) | (.47) | (.48) | (.53) |
| Net asset value, end of period | 12.34 | 12.94 | 12.39 | 12.33 | 12.41 | 12.65 |
| Total Return (%) | (3.01)c | 8.08 | 4.72 | 3.17 | 1.89 | 2.15 |
| Ratios/Supplemental Data (%): | | | | | | |
| Ratio of total expenses to average net assets | .91d | .92 | .92 | .91 | .91 | .91 |
| Ratio of net expenses to average net assets | .91d | .92 | .92 | .91 | .91 | .91 |
| Ratio of net investment income to average net assets | 3.42d | 3.42 | 3.76 | 3.63 | 3.59 | 3.57 |
| Portfolio Turnover Rate | 3.87c | 7.11 | 12.75 | 10.14 | 20.18 | 13.80 |
| Net Assets, end of period ($ x 1,000) | 8,660 | 9,385 | 2,563 | 1,442 | 1,295 | 3,586 |
| |
| a | Based on average shares outstanding at each month end. |
| b | Amount represents less than $.01 per share. |
| c | Not annualized. |
| d | Annualized. |
See notes to financial statements.
FINANCIAL HIGHLIGHTS (continued)
| | | | | | | | | | | | |
| | | | Class M Shares | | | |
| | Six Months Ended | | | | | |
| BNY Mellon Massachusetts | February 28, 2011 | | Year Ended August 31, | |
| Intermediate Municipal Bond Fund | (Unaudited) | 2010 | 2009 | 2008 | 2007 | 2006 |
| Per Share Data ($): | | | | | | |
| Net asset value, beginning of period | 13.39 | 12.86 | 12.57 | 12.42 | 12.58 | 12.75 |
| Investment Operations: | | | | | | |
| Investment income—neta | .22 | .45 | .46 | .47 | .47 | .47 |
| Net realized and unrealized | | | | | | |
| gain (loss) on investments | (.59) | .53 | .29 | .14 | (.16) | (.14) |
| Total from Investment Operations | (.37) | .98 | .75 | .61 | .31 | .33 |
| Distributions: | | | | | | |
| Dividends from investment income—net | (.22) | (.45) | (.46) | (.46) | (.47) | (.47) |
| Dividends from net realized gain on investments | (.07) | — | — | — | — | (.03) |
| Total Distributions | (.29) | (.45) | (.46) | (.46) | (.47) | (.50) |
| Net asset value, end of period | 12.73 | 13.39 | 12.86 | 12.57 | 12.42 | 12.58 |
| Total Return (%) | (2.75)b | 7.75 | 6.18 | 5.02 | 2.47 | 2.65 |
| Ratios/Supplemental Data (%): | | | | | | |
| Ratio of total expenses to average net assets | .53c | .52 | .54 | .52 | .53 | .54 |
| Ratio of net expenses to average net assets | .53c | .52 | .54 | .52 | .50 | .50 |
| Ratio of net investment income to average net assets | 3.46c | 3.44 | 3.70 | 3.71 | 3.72 | 3.73 |
| Portfolio Turnover Rate | 2.58b | 21.44 | 16.78 | 8.75 | 18.85 | 20.57 |
| Net Assets, end of period ($ x 1,000) | 354,791 | 407,667 | 381,129 | 374,115 | 342,583 | 299,263 |
| |
| a | Based on average shares outstanding at each month end. |
| b | Not annualized. |
| c | Annualized. |
See notes to financial statements.
102
| | | | | | | | | | | | |
| | | | Investor Shares | | | |
| | Six Months Ended | | | | | |
| BNY Mellon Massachusetts | February 28, 2011 | | Year Ended August 31, | |
| Intermediate Municipal Bond Fund | (Unaudited) | 2010 | 2009 | 2008 | 2007 | 2006 |
| Per Share Data ($): | | | | | | |
| Net asset value, beginning of period | 13.39 | 12.86 | 12.57 | 12.42 | 12.58 | 12.75 |
| Investment Operations: | | | | | | |
| Investment income—neta | .21 | .42 | .43 | .44 | .44 | .44 |
| Net realized and unrealized | | | | | | |
| gain (loss) on investments | (.59) | .53 | .29 | .14 | (.16) | (.14) |
| Total from Investment Operations | (.38) | .95 | .72 | .58 | .28 | .30 |
| Distributions: | | | | | | |
| Dividends from investment income—net | (.21) | (.42) | (.43) | (.43) | (.44) | (.44) |
| Dividends from net realized gain on investments | (.07) | — | — | — | — | (.03) |
| Total Distributions | (.28) | (.42) | (.43) | (.43) | (.44) | (.47) |
| Net asset value, end of period | 12.73 | 13.39 | 12.86 | 12.57 | 12.42 | 12.58 |
| Total Return (%) | (2.87)b | 7.49 | 5.92 | 4.76 | 2.21 | 2.40 |
| Ratios/Supplemental Data (%): | | | | | | |
| Ratio of total expenses to average net assets | .78c | .77 | .79 | .77 | .78 | .79 |
| Ratio of net expenses to average net assets | .78c | .77 | .79 | .77 | .75 | .75 |
| Ratio of net investment income to average net assets | 3.22c | 3.20 | 3.45 | 3.47 | 3.48 | 3.49 |
| Portfolio Turnover Rate | 2.58b | 21.44 | 16.78 | 8.75 | 18.85 | 20.57 |
| Net Assets, end of period ($ x 1,000) | 8,521 | 8,143 | 9,096 | 8,574 | 9,024 | 9,854 |
| |
| a | Based on average shares outstanding at each month end. |
| b | Not annualized. |
| c | Annualized. |
See notes to financial statements.
FINANCIAL HIGHLIGHTS (continued)
| | | | | | | | | | | | |
| | | | Dreyfus Premier Shares | | | |
| | Six Months Ended | | | | | |
| BNY Mellon Massachusetts | February 28, 2011 | | Year Ended August 31, | |
| Intermediate Municipal Bond Fund | (Unaudited) | 2010 | 2009 | 2008 | 2007 | 2006 |
| Per Share Data ($): | | | | | | |
| Net asset value, beginning of period | 13.42 | 12.89 | 12.60 | 12.45 | 12.61 | 12.78 |
| Investment Operations: | | | | | | |
| Investment income—neta | .17 | .35 | .37 | .38 | .35 | .37 |
| Net realized and unrealized | | | | | | |
| gain (loss) on investments | (.59) | .53 | .29 | .14 | (.14) | (.14) |
| Total from Investment Operations | (.42) | .88 | .66 | .52 | .21 | .23 |
| Distributions: | | | | | | |
| Dividends from investment income—net | (.17) | (.35) | (.37) | (.37) | (.37) | (.37) |
| Dividends from net realized gain on investments | (.07) | — | — | — | — | (.03) |
| Total Distributions | (.24) | (.35) | (.37) | (.37) | (.37) | (.40) |
| Net asset value, end of period | 12.76 | 13.42 | 12.89 | 12.60 | 12.45 | 12.61 |
| Total Return (%)b | (3.10)c | 6.94 | 5.38 | 4.25 | 1.71 | 1.89 |
| Ratios/Supplemental Data (%): | | | | | | |
| Ratio of total expenses to average net assets | 1.29d | 1.28 | 1.29 | 1.27 | 1.28 | 1.29 |
| Ratio of net expenses to average net assets | 1.29d | 1.27 | 1.29 | 1.27 | 1.25 | 1.25 |
| Ratio of net investment income to average net assets | 2.71d | 2.69 | 2.95 | 2.97 | 2.96 | 2.99 |
| Portfolio Turnover Rate | 2.58c | 21.44 | 16.78 | 8.75 | 18.85 | 20.57 |
| Net Assets, end of period ($ x 1,000) | 19 | 20 | 19 | 18 | 17 | 165 |
| |
| a | Based on average shares outstanding at each month end. |
| b | Exclusive of sales charge. |
| c | Not annualized. |
| d | Annualized. |
See notes to financial statements.
104
| | | | | | | | | | | | | | |
| | | | Class M Shares† | | | |
| Six Months Ended | | | | | | |
| BNY Mellon New York Intermediate February 28, 2011 | Year Ended | Eight Months Ended | | Year Ended December 31, | |
| Tax-Exempt Bond Fund | (Unaudited) | August 31, 2010 | August 31, 2009a | 2008 | 2007 | 2006 | 2005 |
| Per Share Data ($): | | | | | | | |
| Net asset value, beginning of period | 11.60 | 11.16 | 10.71 | 10.81 | 10.75 | 10.74 | 10.89 |
| Investment Operations: | | | | | | | |
| Investment income—netb | .19 | .38 | .25 | .37 | .38 | .37 | .35 |
| Net realized and unrealized | | | | | | | |
| gain (loss) on investments | (.52) | .44 | .45 | (.09) | .07 | .01 | (.14) |
| Total from Investment Operations | (.33) | .82 | .70 | .28 | .45 | .38 | .21 |
| Distributions: | | | | | | | |
| Dividends from investment income—net | (.19) | (.38) | (.25) | (.37) | (.38) | (.37) | (.35) |
| Dividends from net realized | | | | | | | |
| gain on investments | (.01) | (.00)c | (.00)c | (.01) | (.01) | (.00)c | (.01) |
| Total Distributions | (.20) | (.38) | (.25) | (.38) | (.39) | (.37) | (.36) |
| Net asset value, end of period | 11.07 | 11.60 | 11.16 | 10.71 | 10.81 | 10.75 | 10.74 |
| Total Return (%) | (2.87)d | 7.45 | 6.58d | 2.64 | 4.33 | 3.64 | 2.01 |
| Ratios/Supplemental Data (%): | | | | | | | |
| Ratio of total expenses to average net assets | .70e | .72 | .72e | .75 | .75 | .76 | .77 |
| Ratio of net expenses to average net assets | .59e | .59 | .59e | .59 | .59 | .59 | .59 |
| Ratio of net investment income | | | | | | | |
| to average net assets | 3.37e | 3.33 | 3.40e | 3.49 | 3.56 | 3.46 | 3.26 |
| Portfolio Turnover Rate | 5.09d | 4.80 | 1.47d | 6 | 17 | 13 | 16 |
| Net Assets, end of period ($ x 1,000) | 184,990 | 196,795 | 153,785 | 113,699 | 97,935 | 94,789 | 95,160 |
|
| † Represents information for Institutional shares of the fund's predecessor, BNY Hamilton Intermediate NewYork Tax-Exempt Fund, through September 12, 2008. |
| a The fund has changed its fiscal year end from December 31 to August 31. |
| b Based on average shares outstanding at each month end. |
| c Amount represents less than $.01 per share. |
| d Not annualized. |
| e Annualized. |
See notes to financial statements.
FINANCIAL HIGHLIGHTS (continued)
| | | | | | | | | | | | | | |
| | | | Investor Shares† | | | | |
| Six Months Ended | | | | | | |
| BNY Mellon New York Intermediate February 28, 2011 | Year Ended | Eight Months Ended | | Year Ended December 31, | |
| Tax-Exempt Bond Fund | (Unaudited) | August 31, 2010 | August 31, 2009a | 2008 | 2007 | 2006 | 2005 |
| Per Share Data ($): | | | | | | | |
| Net asset value, beginning of period | 11.61 | 11.17 | 10.72 | 10.82 | 10.76 | 10.75 | 10.90 |
| Investment Operations: | | | | | | | |
| Investment income—netb | .17 | .35 | .23 | .34 | .35 | .34 | .33 |
| Net realized and unrealized | | | | | | | |
| gain (loss) on investments | (.52) | .44 | .45 | (.08) | .08 | .01 | (.14) |
| Total from Investment Operations | (.35) | .79 | .68 | .26 | .43 | .35 | .19 |
| Distributions: | | | | | | | |
| Dividends from investment income—net | (.17) | (.35) | (.23) | (.35) | (.36) | (.34) | (.33) |
| Dividends from net realized | | | | | | | |
| gain on investments | (.01) | (.00)c | (.00)c | (.01) | (.01) | (.00)c | (.01) |
| Total Distributions | (.18) | (.35) | (.23) | (.36) | (.37) | (.34) | (.34) |
| Net asset value, end of period | 11.08 | 11.61 | 11.17 | 10.72 | 10.82 | 10.76 | 10.75 |
| Total Return (%) | (2.99)d | 7.17 | 6.40d | 2.39e | 4.07e | 3.38e | 1.76e |
| Ratios/Supplemental Data (%): | | | | | | | |
| Ratio of total expenses to average net assets | .95f | .97 | .96d | 1.00 | 1.00 | 1.01 | 1.02 |
| Ratio of net expenses to average net assets | .84f | .84 | .84d | .84 | .84 | .84 | .84 |
| Ratio of net investment income | | | | | | | |
| to average net assets | 3.13f | 3.08 | 3.15d | 3.24 | 3.31 | 3.21 | 3.00 |
| Portfolio Turnover Rate | 5.09d | 4.80 | 1.47d | 6 | 17 | 13 | 16 |
| Net Assets, end of period ($ x 1,000) | 17,028 | 17,352 | 16,810 | 16,198 | 17,153 | 18,131 | 20,164 |
|
| † Represents information for Class A shares of the fund's predecessor, BNY Hamilton Intermediate NewYork Tax-Exempt Fund, through September 12, 2008. |
| a The fund has changed its fiscal year end from December 31 to August 31. |
| b Based on average shares outstanding at each month end. |
| c Amount represents less than $.01 per share. |
| d Not annualized. |
| e Exclusive of sales charge. |
| f Annualized. |
See notes to financial statements.
106
| | | | | | |
| | | Class M Shares | |
| | Six Months Ended | | |
| | February 28, 2011 | Year Ended August 31, |
| BNY Mellon Municipal Opportunities Fund | (Unaudited) | 2010 | 2009a |
| Per Share Data ($): | | | |
| Net asset value, beginning of period | 12.78 | 12.22 | 10.00 |
| Investment Operations: | | | |
| Investment income—netb | .23 | .50 | .43 |
| Net realized and unrealized | | | |
| gain (loss) on investments | (.68) | .95 | 2.19 |
| Total from Investment Operations | (.45) | 1.45 | 2.62 |
| Distributions: | | | |
| Dividends from investment income—net | (.23) | (.52) | (.39) |
| Dividends from net realized gain on investments | (.18) | (.37) | (.01) |
| Total Distributions | (.41) | (.89) | (.40) |
| Net asset value, end of period | 11.92 | 12.78 | 12.22 |
| Total Return (%) | (3.52)c | 12.38 | 26.58c |
| Ratios/Supplemental Data (%): | | | |
| Ratio of total expenses to average net assets | .73d | .71 | .87d |
| Ratio of net expenses to average net assets | .73d | .71 | .75d |
| Ratio of interest and expense related to floating | | | |
| rate notes issued to average net assets | .05d | .01 | — |
| Ratio of net investment income to average net assets | 3.89d | 4.12 | 4.36d |
| Portfolio Turnover Rate | 90.33c | 145.57 | 161.70c |
| Net Assets, end of period ($ x 1,000) | 511,936 | 384,933 | 140,887 |
| |
| a | From October 15, 2008 (commencement of initial offering) to August 31, 2009. |
| b | Based on average shares outstanding at each month end. |
| c | Not annualized. |
| d | Annualized. |
See notes to financial statements.
FINANCIAL HIGHLIGHTS (continued)
| | | | | | |
| | | Investor Shares | |
| | Six Months Ended | | |
| | February 28, 2011 | Year Ended August 31, |
| BNY Mellon Municipal Opportunities Fund | (Unaudited) | 2010 | 2009a |
| Per Share Data ($): | | | |
| Net asset value, beginning of period | 12.79 | 12.22 | 10.00 |
| Investment Operations: | | | |
| Investment income—netb | .22 | .50 | .42 |
| Net realized and unrealized | | | |
| gain (loss) on investments | (.68) | .93 | 2.18 |
| Total from Investment Operations | (.46) | 1.43 | 2.60 |
| Distributions: | | | |
| Dividends from investment income—net | (.22) | (.49) | (.37) |
| Dividends from net realized gain on investments | (.18) | (.37) | (.01) |
| Total Distributions | (.40) | (.86) | (.38) |
| Net asset value, end of period | 11.93 | 12.79 | 12.22 |
| Total Return (%) | (3.63)c | 12.19 | 26.29c |
| Ratios/Supplemental Data (%): | | | |
| Ratio of total expenses to average net assets | .96d | .96 | 1.11d |
| Ratio of net expenses to average net assets | .96d | .95 | .99d |
| Ratio of interest and expense related to floating | | | |
| rate notes issued to average net assets | .05d | .00e | — |
| Ratio of net investment income to average net assets | 3.62d | 4.00 | 4.48d |
| Portfolio Turnover Rate | 90.33c | 145.57 | 161.70c |
| Net Assets, end of period ($ x 1,000) | 1,063 | 1,157 | 1,208 |
| |
| a | From October 15, 2008 (commencement of initial offering) to August 31, 2009. |
| b | Based on average shares outstanding at each month end. |
| c | Not annualized. |
| d Annualized. |
| e | Amount represents less than .01%. |
See notes to financial statements.
108
NOTES TO FINANCIAL STATEMENTS (Unaudited)
NOTE 1—General:
BNY Mellon Funds Trust (the “Trust”) was organized as a Massachusetts business trust which is registered under the Investment Company Act of 1940, as amended (the “Act”), as an open-end management investment company and operates as a series company currently comprised of twenty-five series, including the following non-diversified municipal bond funds: BNY Mellon National Intermediate Municipal Bond Fund, BNY Mellon National Short-Term Municipal Bond Fund, BNY Mellon Pennsylvania Intermediate Municipal Bond Fund, BNY Mellon Massachusetts Intermediate Municipal Bond Fund, BNY Mellon New York Intermediate Tax-Exempt Bond Fund and BNY Mellon Municipal Opportunities Fund, (each, a “fund” and collectively, the “funds”). BNY Mellon National Intermediate Municipal Bond Fund, BNY Mellon National Short-Term Municipal Bond Fund and BNY Mellon Municipal Opportunities Fund seek to maximize current income exempt from federal income tax to the extent consistent with the preservation of capital. BNY Mellon Pennsylvania Intermediate Municipal Bond Fund seeks as high a level of income exempt from federal and Pennsylvania state income taxes as is consistent with the preservation of capital. BNY Mellon Massachusetts Intermediate Municipal Bond Fund seeks as high a level of income exempt from federal and Massachusetts state income taxes as is consistent with the preservation of capital. BNY Mellon New York Intermediate Tax-Exempt Bond Fund seeks as high a level of current income exempt from federal, New York state and New York city personal income taxes as is consistent with the preservation of capital.
BNY Mellon Fund Advisers, a division of The Dreyfus Corporation (the “Manager” or “Dreyfus”), a wholly-owned subsidiary of The Bank of New York Mellon Corporation (“BNY Mellon”), serves as each fund’s investment adviser (“Investment Adviser”).The Bank of New York Mellon, a subsidiary of BNY Mellon and an affiliate of Dreyfus, serves as administrator for the funds pursuant to an Administration Agreement with the Trust
(the “Administration Agreement”). The Bank of New York Mellon has entered into a Sub-Administration Agreement with Dreyfus pursuant to whichThe Bank of New York Mellon pays Dreyfus for performing certain administrative services. MBSC Securities Corporation (the “Distributor”), a wholly-owned subsidiary of Dreyfus, is the distributor of each fund’s shares.
The Trust is authorized to issue an unlimited number of shares of Beneficial Interest, par value $.001 per share, in each of the Class M and Investor class shares of each fund and in the Dreyfus Premier class shares of BNY Mellon National Intermediate Municipal Bond Fund and BNY Mellon Massachusetts Intermediate Municipal Bond Fund. Dreyfus Premier shares of BNY Mellon National Intermediate Municipal Bond Fund and BNY Mellon Massachusetts Intermediate Municipal Bond Fund are subject to a contingent deferred sales charge (“CDSC”) imposed on redemptions of Dreyfus Premier shares made within six years of purchase and automatically convert to Investor class shares after six years. Other differences between the classes include the services offered to and the expenses borne by each class, the allocation of certain transfer agency costs and certain voting rights. Income, expenses (other than expenses attributable to a specific class), and realized and unrealized gains or losses on investments are allocated to each class of shares based on its relative net assets.
TheTrust accounts separately for the assets, liabilities and operations of each series. Expenses directly attributable to each series are charged to that series’ operations; expenses which are applicable to all series are allocated among them on a pro rata basis.
The Financial Accounting Standards Board (“FASB”) Accounting Standards Codification (“ASC”) is the exclusive reference of authoritative U.S. generally accepted accounting principles (“GAAP”) recognized by the FASB to be applied by nongovernmental entities. Rules and interpretive releases of the Securities and Exchange Commission (“SEC”) under authority of fed-
NOTES TO FINANCIAL STATEMENTS (Unaudited) (continued)
eral laws are also sources of authoritative GAAP for SEC registrants. The funds’ financial statements are prepared in accordance with GAAP, which may require the use of management estimates and assumptions. Actual results could differ from those estimates.
NOTE 2—Significant Accounting Policies:
(a) Portfolio valuation: Investments in municipal securities (excluding financial futures and swaps) are valued each business day by an independent pricing service (the “Service”) approved by theTrust’s Board. Investments for which quoted bid prices are readily available and are representative of the bid side of the market in the judgment of the Service are valued at the mean between the quoted bid prices (as obtained by the Service from dealers in such securities) and asked prices (as calculated by the Service based upon its evaluation of the market for such securities). Other investments are valued by the Service, based on methods which include consideration of: yields or prices of municipal securities of comparable quality, coupon, maturity and type; indications as to values from dealers; and general market conditions. Financial futures, which are traded on an exchange, are valued at the last sales price on the securities exchange on which such securities are primarily traded or at the last sales price on the national securities market on each business day. Investments in swap transactions are valued each business day by a pricing service approved by the Trust’s Board. Swaps are valued by the service by using a swap pricing model which incorporates among other factors, default probabilities, recovery rates, credit curves of the underlying issuer and swap spreads on interest rates.
The fair value of a financial instrument is the amount that would be received to sell an asset or paid to transfer a liability in an orderly transaction between market participants at the measurement date (i.e. the exit price). GAAP establishes a fair value hierarchy that prioritizes the inputs of valuation techniques used to measure fair value.This hierarchy gives the highest priority to unadjusted quoted prices in active markets for identical assets
or liabilities (Level 1 measurements) and the lowest priority to unobservable inputs (Level 3 measurements).
Additionally, GAAP provides guidance on determining whether the volume and activity in a market has decreased significantly and whether such a decrease in activity results in transactions that are not orderly. GAAP requires enhanced disclosures around valuation inputs and techniques used during annual and interim periods.
Various inputs are used in determining the value of each fund’s investments relating to fair value measurements. These inputs are summarized in the three broad levels listed below:
Level 1—unadjusted quoted prices in active markets for identical investments.
Level 2—other significant observable inputs (including quoted prices for similar investments, interest rates, prepayment speeds, credit risk, etc.).
Level 3—significant unobservable inputs (including the funds’ own assumptions in determining the fair value of investments).
The inputs or methodology used for valuing securities are not necessarily an indication of the risk associated with investing in those securities. Table 1 summarizes the inputs used as of February 28, 2011 in valuing each fund’s investments.
In January 2010, FASB issued Accounting Standards Update (“ASU”) No. 2010-06 “Improving Disclosures about Fair Value Measurements”. The portions of ASU No. 2010-06 which require reporting entities to prepare new disclosures surrounding amounts and reasons for significant transfers in and out of Level 1 and Level 2 fair value measurements as well as inputs and valuation techniques used to measure fair value for both recurring and nonrecurring fair value measurements that fall in either Level 2 or Level 3 have been adopted by the funds. No significant transfers between Level 1 or Level 2 fair value measurements occurred at February 28, 2011. The remaining portion of ASU No. 2010-06 requires report-
110
ing entities to make new disclosures about information on purchases, sales, issuances and settlements on a gross basis in the reconciliation of activity in Level 3 fair value measurements. These new and revised disclosures are required to be implemented for fiscal years beginning after December 15, 2010. Management is currently evaluating the impact that the adoption of this remaining portion of ASU No. 2010-06 may have on the fund’s financial statement disclosures.
(b) Securities transactions and investment income:
Securities transactions are recorded on a trade date basis. Realized gain and loss from securities transactions are recorded on the identified cost basis. Interest income, adjusted for accretion of discount and amortization of
premium on investments, is earned from settlement date and recognized on the accrual basis. Securities purchased or sold on a when issued or delayed-delivery basis may be settled a month or more after the trade date.
(c) Concentration of risk: BNY Mellon Pennsylvania Intermediate Municipal Bond Fund, BNY Mellon Massachusetts Intermediate Municipal Bond Fund and BNY Mellon New York Intermediate Tax-Exempt Bond Fund each follow an investment policy of investing primarily in municipal obligations of one state. Economic changes affecting the state and certain of its public bodies and municipalities may affect the ability of issuers within the state to pay interest on, or repay principal of, municipal obligations held by the fund.
| | | | | | | |
| Table 1—Fair Value Measurements | | | | | | |
| |
| | | | Investments in Securities | | |
| | | | | Level 2—Other | | | |
| | Level 1—Unadjusted | | Significant | Level 3—Significant | |
| | | Quoted Prices | Observable Inputs | Unobservable Inputs | |
| | Assets ($) | Liabilities ($) | Assets ($) | Liabilities ($) | Assets ($) | Liabilities ($) | Total |
| BNY Mellon National | | | | | | | |
| Intermediate Municipal | | | | | | | |
| Bond Fund | | | | | | | |
| Municipal Bonds | — | — | 1,503,943,406 | — | — | — | 1,503,943,406 |
| BNY Mellon National | | | | | | | |
| Short-Term Municipal | | | | | | | |
| Bond Fund | | | | | | | |
| Municipal Bonds | — | — | 959,092,670 | — | — | — | 959,092,670 |
| BNY Mellon Pennsylvania | | | | | | | |
| Intermediate Municipal | | | | | | | |
| Bond Fund | | | | | | | |
| Municipal Bonds | — | — | 452,138,867 | — | — | — | 452,138,867 |
| BNY Mellon Massachusetts | | | | | | | |
| Intermediate Municipal | | | | | | | |
| Bond Fund | | | | | | | |
| Municipal Bonds | — | — | 361,128,957 | — | — | — | 361,128,957 |
| BNY Mellon New York | | | | | | | |
| Intermediate Tax-Exempt | | | | | | | |
| Bond Fund | | | | | | | |
| Municipal Bonds | — | — | 200,211,353 | — | — | — | 200,211,353 |
| BNY Mellon Municipal | | | | | | | |
| Opportunities Fund | | | | | | | |
| Municipal Bonds | — | — | 563,021,645 | — | — | — | 563,021,645 |
| U.S. Government Agency | — | — | 1,284,765 | — | — | — | 1,284,765 |
NOTES TO FINANCIAL STATEMENTS (Unaudited) (continued)
(d) Dividends to shareholders: The funds declare dividends daily from investment income-net; such dividends are paid monthly. With respect to each series, dividends from net realized capital gain, if any, are normally declared and paid annually, but the funds may make distributions on a more frequent basis to comply with the distribution requirements of the Internal Revenue Code of 1986, as amended (the “Code”). To the extent that net realized capital gain can be offset by capital loss carryovers of that fund, it is the policy of each fund not to distribute such gain. Income and capital gain distributions are determined in accordance with income tax regulations, which may differ from GAAP.
(e) Federal income taxes: It is the policy of each fund to continue to qualify as a regulated investment company, which can distribute tax exempt dividends, by complying with the applicable provisions of the Code, and to make distributions of income and net realized capital gain sufficient to relieve it from substantially all federal income and excise taxes. For federal income tax purposes, each series is treated as a single entity for the purpose of determining such qualification.
As of and during the period ended February 28, 2011, the funds did not have any liabilities for any uncertain tax positions.The funds recognize interest and penalties, if any, related to uncertain tax positions as income tax expense in the Statements of Operations. During the period, the funds did not incur any interest or penalties.
Each of the tax years in the three-year period ended August 31, 2010, and December 31, 2008 as to BNY Mellon New York Intermediate Tax-Exempt Bond Fund, remain subject to examination by the Internal Revenue Service and state taxing authorities.
Table 2 summarizes each relevant fund’s unused capital loss carryover available to be applied against future net securities profits, if any, realized subsequent to August 31, 2010.
Under the recently enacted Regulated Investment Company Modernization Act of 2010, each relevant fund will be permitted to carry forward capital losses incurred in taxable years beginning after December 22, 2010 for an unlimited period. However, any losses incurred during those future taxable years will be required to be utilized prior to the losses incurred in pre-enactment taxable years. As a result of this ordering rule, pre-enactment capital loss carryovers may be more likely to expire unused.
Table 3 summarizes each fund’s tax character of distributions paid to shareholders during the fiscal year ended August 31, 2010.The tax character of current year distributions will be determined at the end of the current fiscal year.
NOTE 3—Bank Lines of Credit:
The funds participate with other Dreyfus-managed funds in a $225 million unsecured credit facility led by Citibank, N.A. and a $300 million unsecured credit
Table 2—Capital Loss Carryover
| | | | | | | | | | | |
| Expiring in fiscal† | 2014($)† | 2015($)† | 2016($)† | 2017($)† | 2018($)† | Total ($) |
| BNY Mellon National Short-Term | | | | | | |
| Municipal Bond Fund | 439,406 | 501,053 | 99,584 | 62,757 | 172,218 | 1,275,018 |
| BNY Mellon Pennsylvania Intermediate | | | | | | |
| Municipal Bond Fund | — | — | — | — | 2,277,946 | 2,277,946 |
| |
| † | If not applied, the carryovers expire in the above years. |
112
facility provided by The Bank of New York Mellon, (each, a “Facility”), each to be utilized primarily for temporary or emergency purposes, including the financing of redemptions. In connection therewith, the funds have agreed to pay its pro rata portion of commitment fees for each Facility. Interest is charged to the funds based on rates determined pursuant to the terms of the respective Facility at the time of borrowing. During the period ended February 28, 2011, the funds (with the exception of BNY Mellon Municipal Opportunities Fund) did not borrow under the Facilities.
For BNY Mellon Opportunities Fund, the average amount of borrowings outstanding under the Facilities during the period ended February 28, 2011, was approximately $12,700 with a related weighted average annualized interest rate of 1.43%.
NOTE 4—Investment Advisory Fee, Administration Fee and Other Transactions with Affiliates:
(a) Fees payable by the funds pursuant to the provisions of an Investment Advisory Agreement with the Investment Adviser are payable monthly, computed on the average daily value of each fund’s net assets at the following annual rates: .35% of BNY Mellon National Intermediate Municipal Bond Fund, .35% of BNY Mellon National Short-Term Municipal Bond Fund, .50% of BNY Mellon Pennsylvania Intermediate Municipal Bond Fund, .35% of BNY Mellon Massachusetts Intermediate Municipal Bond
Fund, .50% of BNY Mellon NewYork Intermediate Tax-Exempt Bond Fund and .50% of BNY Mellon Municipal Opportunities Fund.
Pursuant to the Administration Agreement,The Bank of New York Mellon provides or arranges for fund accounting, transfer agency and other fund administration services and receives a fee based on the total net assets of the Trust based on the following rates:
| | |
| 0 up to $6 billion | .15% |
| $6 billion up to $12 billion | .12% |
| In excess of $12 billion | .10% |
The Bank of New York Mellon has entered into a Sub-Administration Agreement with Dreyfus pursuant to which The Bank of New York Mellon pays Dreyfus for performing certain administrative services.
For BNY Mellon New York Intermediate Tax-Exempt Bond Fund, the Investment Adviser has contractually agreed until September 30, 2011, to waive receipt of its fees and/or assume the expenses of the fund so that the direct expenses of neither class (excluding shareholder services fees, taxes, interest, brokerage commissions, commitment fees on borrowings and extraordinary expenses) do not exceed .59% of the value of the fund’s average daily net assets. The reduction in investment advisory fee, pursuant to the undertaking, amounted to $109,868, during the period ended February 28, 2011.
Table 3—Tax Character of Distributions Paid
| | | |
| | Tax-Exempt | Ordinary | Long-Term |
| | Income ($) | Income ($) | Capital Gains ($) |
| | August 31, 2010 | August 31, 2010 | August 31, 2010 |
| BNY Mellon National Intermediate Municipal Bond Fund | 57,913,238 | 16,278 | — |
| BNY Mellon National Short-Term Municipal Bond Fund | 14,122,455 | 48 | — |
| BNY Mellon Pennsylvania Intermediate Municipal Bond Fund | 18,775,417 | 137,629 | — |
| BNY Mellon Massachusetts Intermediate Municipal Bond Fund | 13,937,145 | — | — |
| BNY Mellon New York Intermediate Tax-Exempt Bond Fund | 6,346,621 | — | 1,642 |
| BNY Mellon Municipal Opportunities Fund | 7,155,802 | 4,895,650 | 87,202 |
NOTES TO FINANCIAL STATEMENTS (Unaudited) (continued)
During the period ended February 28, 2011, the Distributor retained $173 from CDSCs on redemptions of BNY Mellon National Intermediate Municipal Bond Fund’s Dreyfus Premier shares.
(b) BNY Mellon National Intermediate Municipal Bond Fund and BNY Mellon Massachusetts Intermediate Municipal Bond Fund have adopted a Distribution Plan (the “Plan”) pursuant to Rule 12b-1 under the Act for distributing its Dreyfus Premier shares. The funds each pay the Distributor a fee at an annual rate of .50% of the value of the fund’s average daily net assets attributable to its Dreyfus Premier shares. During the period ended February 28, 2011, BNY Mellon National Intermediate Municipal Bond Fund’s and BNY Mellon Massachusetts Intermediate Municipal Bond Fund’s Dreyfus Premier shares were charged $276 and $48, respectively, pursuant to the Plan.
(c) The funds have adopted a Shareholder Services Plan with respect to its Investor shares, and BNY Mellon National Intermediate Municipal Bond Fund and BNY Mellon Massachusetts Intermediate Municipal Bond Fund have adopted a Shareholder Services Plan with respect to its Dreyfus Premier shares. Each fund pays the Distributor for the provision of certain services to holders of Investor shares and Dreyfus Premier shares a fee at an annual rate of .25% of the value of the average daily net assets attributable to Investor shares and Dreyfus Premier shares.The services provided may include personal services relating to shareholder accounts, such as answering shareholder inquiries regarding a fund, and providing reports and other information and services related to the maintenance of such shareholder accounts. The Shareholder Services Plan allows the Distributor to make payments from the shareholder services fees it collects from each fund to compensate service agents (certain banks, securities brokers or dealers and other financial institutions) in respect of these services. Table 4
summarizes the amounts Investor shares and Dreyfus Premier shares were charged during the period ended February 28, 2011, pursuant to the Shareholder Services Plan. Additional fees included in shareholder servicing costs in the Statements of Operations include fees paid for cash management charges.
| | |
| Table 4—Shareholder Service Plan Fees | | |
| |
| BNY Mellon National Intermediate | | |
| Municipal Bond Fund (Investor Shares) | $ | 41,519 |
| BNY Mellon National Intermediate | | |
| Municipal Bond Fund | | |
| (Dreyfus Premier Shares) | | 138 |
| BNY Mellon National Short-Term | | |
| Municipal Bond Fund (Investor Shares) | | 4,388 |
| BNY Mellon Pennsylvania Intermediate | | |
| Municipal Bond Fund (Investor Shares) | | 11,392 |
| BNY Mellon Massachusetts Intermediate | | |
| Municipal Bond Fund (Investor Shares) | | 10,205 |
| BNY Mellon Massachusetts Intermediate | | |
| Municipal Bond Fund | | |
| (Dreyfus Premier Shares) | | 24 |
| BNY Mellon New York Intermediate | | |
| Tax-Exempt Bond Fund | | |
| (Investor Shares) | | 21,344 |
| BNY Mellon Municipal | | |
| Opportunities Fund (Investor Shares) | | 1,436 |
The funds have arrangements with the custodian and cash management bank whereby the funds may receive earnings credits when positive cash balances are maintained, which are used to offset custody and cash management fees. For financial reporting purposes, the funds include net earnings credits as expense offsets in the Statements of Operations.
The funds compensate The Bank of New York Mellon under cash management agreements for performing cash management services related to fund subscriptions and redemptions. Table 5 summarizes the amount each fund was charged during the period ended February 28, 2011 pursuant to the cash management agreements, which is
114
included in Shareholder servicing costs in the Statements of Operations.These fees were partially offset by earnings credits, also summarized in Table 5.
| | | |
| Table 5—Cash Management Agreement Fees | | |
| Cash Management | Earnings | |
| | Fees ($) | Credits ($) | |
| |
| BNY Mellon National | | | |
| Intermediate Municipal | | | |
| Bond Fund | 745 | (31 | ) |
| BNY Mellon National | | | |
| Short-Term Municipal | | | |
| Bond Fund | 64 | (3 | ) |
| BNY Mellon Pennsylvania | | | |
| Intermediate Municipal | | | |
| Bond Fund | 56 | (2 | ) |
| BNY Mellon Massachusetts | | | |
| Intermediate Municipal | | | |
| Bond Fund | 241 | (10 | ) |
| BNY Mellon New York | | | |
| Intermediate Tax-Exempt | | | |
| Bond Fund | 837 | (35 | ) |
| BNY Mellon Municipal | | | |
| Opportunities Fund | 23 | (1 | ) |
The funds also compensate The Bank of New York Mellon under a custody agreement for providing custo-
dial services for the funds. Table 6 summarizes the amount each fund was charged during the period ended February 28, 2011, pursuant to the custody agreement.
| | |
| Table 6—Custody Agreement Fees | | |
| |
| BNY Mellon National Intermediate | | |
| Municipal Bond Fund | $ | 56,119 |
| BNY Mellon National Short-Term | | |
| Municipal Bond Fund | | 46,260 |
| BNY Mellon Pennsylvania Intermediate | | |
| Municipal Bond Fund | | 18,773 |
| BNY Mellon Massachusetts | | |
| Intermediate Municipal Bond Fund | | 15,539 |
| BNY Mellon New York Intermediate | | |
| Tax-Exempt Bond Fund | | 7,909 |
| BNY Mellon Municipal | | |
| Opportunities Fund | | 19,801 |
During the period ended February 28, 2011, each fund was charged $3,197 for services performed by the Chief Compliance Officer.
Table 7 summarizes the components of “Due to The Dreyfus Corporation and affiliates” in the Statements of Assets and Liabilities for each fund.
| | | | | | | |
| Table 7—Due to The Dreyfus Corporation and Affiliates | | | | |
| |
| | Investment | Rule 12b-1 | Shareholder | | Chief | |
| | Advisory | Distribution | Services | Custodian | Compliance | Less Expense |
| | Fees ($) | Plan Fees ($) | Plan Fees ($) | Fees ($) | Officer Fees ($) | Reimbursement ($) |
| BNY Mellon National Intermediate | | | | | | |
| Municipal Bond Fund | 400,626 | 38 | 6,390 | 46,858 | 1,433 | — |
| BNY Mellon National Short-Term | | | | | | |
| Municipal Bond Fund | 260,568 | — | 691 | 29,827 | 1,433 | — |
| BNY Mellon Pennsylvania Intermediate | | | | | | |
| Municipal Bond Fund | 173,406 | — | 1,703 | 15,900 | 1,433 | — |
| BNY Mellon Massachusetts Intermediate | | | | | | |
| Municipal Bond Fund | 97,179 | 7 | 1,602 | 13,136 | 1,433 | — |
| BNY Mellon New York Intermediate | | | | | | |
| Tax-Exempt Bond Fund | 76,612 | — | 3,238 | 6,075 | 1,433 | (16,022) |
| BNY Mellon Municipal Opportunities Fund | 191,249 | — | 211 | 14,455 | 1,433 | — |
NOTES TO FINANCIAL STATEMENTS (Unaudited) (continued)
(d) Each trustee who is not an “affiliated person” as defined in the Act receives from theTrust an annual fee of $68,000 and an attendance fee of $7,500 for each in person meeting attended and $500 for telephone meetings and is reimbursed for travel and out-of-pocket expenses. The Chairman of the Trust’s Board receives an additional annual fee of $15,000 and the Chairman of the Trust’s Audit Committee receives an additional fee of $10,000.
NOTE 5—Securities Transactions:
Table 8 summarizes each fund’s aggregate amount of purchases and sales of investment securities, excluding short-term securities, financial futures and swap transactions, during the period ended February 28, 2011.
Inverse Floater Securities: BNY Mellon Municipal Opportunities Fund participates in secondary inverse floater structures in which fixed-rate, tax-exempt municipal bonds are transferred to a trust.The trust subsequently issues two or more variable rate securities that are collateralized by the cash flows of the fixed-rate, tax-exempt municipal bonds. One or more of these variable rate securities pays interest based on a short- term floating rate set by a remarketing agent at predetermined intervals. A residual interest tax-exempt security is also created by the trust, which is transferred to the fund, and is paid interest based on the remaining cash flow of the trust, after payment of interest on the other securities and various expenses of the trust.
The fund accounts for the transfer of bonds to the trust as secured borrowings, with the securities transferred remaining in the fund’s investments, and the related
floating rate certificate securities reflected as fund liabilities in the Statement of Assets and Liabilities.
The average amount of borrowings outstanding under the inverse floater structure during the period ended February 28, 2011, was approximately $28,623,000, with a related weighted average annualized interest rate of .68%.
The provisions of ASC Topic 815 “Derivatives and Hedging” require qualitative disclosures about objectives and strategies for using derivatives, quantitative disclosures about fair value amounts of gains and losses on derivative instruments and disclosures about credit-risk-related contingent features in derivative agreements. BNY Mellon National Short-Term Municipal Bond Fund and BNY Mellon New York Intermediate Tax Exempt Bond Fund held no derivatives during the period ended February 28, 2011.
During the period, BNY Mellon National Intermediate Municipal Bond Fund, BNY Mellon Pennsylvania Intermediate Municipal Bond Fund and BNY Mellon Massachusetts Intermediate Municipal Bond Fund held derivatives. These disclosure requirements distinguish between derivatives, which are accounted for as “hedges” and those that do not qualify for hedge accounting. Because investment companies value their derivatives at fair value and recognize changes in fair value through the Statements of Operations, they do not qualify for such accounting. Accordingly, even though a fund’s investments in derivatives may represent economic hedges, they are considered to be non-hedge transactions for purposes of this disclosure.
| | |
| Table 8—Purchases and Sales | | |
| |
| | Purchases ($) | Sales ($) |
| BNY Mellon National Intermediate Municipal Bond Fund | 245,504,451 | 261,314,498 |
| BNY Mellon National Short-Term Municipal Bond Fund | 64,456,541 | 113,080,478 |
| BNY Mellon Pennsylvania Intermediate Municipal Bond Fund | 18,276,937 | 51,617,743 |
| BNY Mellon Massachusetts Intermediate Municipal Bond Fund | 9,849,031 | 41,652,147 |
| BNY Mellon New York Intermediate Tax-Exempt Bond Fund | 18,413,178 | 10,117,430 |
| BNY Mellon Municipal Opportunities Fund | 517,604,309 | 335,528,636 |
116
BNY Mellon Municipal Opportunities Fund held derivatives that subject the fund to multiple categories of risk exposure. Table 9 shows the fund’s exposure to different types of market risk as it relates to the Statement of Operations.
Futures Contracts: In the normal course of pursuing their investment objectives, the funds are exposed to market risk, including interest rate risk, as a result of changes in value of underlying financial instruments. The funds invest in financial futures contracts in order to manage their exposure to or protect against changes in the market. A futures contract represents a commitment for the future purchase or a sale of an asset at a specified date. Upon entering into such contracts, these investments require initial margin deposits with a broker, which consist of cash or cash equivalents. The amount of these deposits is determined by the exchange or Board ofTrade on which the contract is traded and is subject to change. Accordingly, variation margin payments are received or made to reflect daily unrealized gains or losses which are
recorded in the Statements of Operations. Futures contracts are valued daily at the last sales price established by the Board of Trade or exchange upon which they are traded. When the contracts are closed, the funds recognize a realized gain or loss.There is minimal counterparty credit risk to the funds with futures since futures are exchange traded, and the exchange’s clearinghouse guarantees the futures against default. At February 28, 2011, there were no financial futures contracts outstanding.
Swaps: The BNY Mellon Municipal Opportunities Fund enters into swap agreements to exchange the interest rate on, or return generated by, one nominal instrument for the return generated by another nominal instrument. The fund enters into these agreements to hedge certain market or interest rate risks, to manage the interest rate sensitivity (sometimes called duration) of fixed income securities, to provide a substitute for purchasing or selling particular securities or to increase potential returns.
Table 9—Derivatives and Hedging
The effect of derivative instruments in the Statement of Operations for BNY Mellon Municipal Opportunities Fund during the period ended February 28, 2011 is shown below:
| | | | | |
| | Amount of realized gain or (loss) on derivatives recognized in income ($) |
| Underlying risk | Futures1 | Swaps2 | Total |
| Interest rate | 2,871,874 | 69,491 | 2,941,365 |
| Credit | — | (532,956) | (532,956) |
| Total | 2,871,874 | (463,465) | 2,408,409 |
| |
| | Change in unrealized appreciation or (depreciation) on derivatives recognized in income ($) |
| Underlying risk | Futures3 | Swaps4 | Total |
| Interest rate | 1,245,078 | 75,380 | 1,320,458 |
| Credit | — | 121,689 | 121,689 |
| Total | 1,245,078 | 197,069 | 1,442,147 |
Statements of Operations location:
| |
| 1 | Net realized gain (loss) on financial futures. |
| 2 | Net realized gain (loss) on swap transactions. |
| 3 | Net unrealized appreciation (depreciation) on financial futures. |
| 4 | Net unrealized appreciation (depreciation) on swap transactions. |
The fund accrues for the interim payments on swap contracts on a daily basis, with the net amount recorded within unrealized appreciation (depreciation) on swap contracts in the Statement of Assets and Liabilities. Once the interim payments are settled in cash, the net amount is recorded as realized gain (loss) on swaps, in addition to realized gain (loss) recorded upon the termination of swaps contracts in the Statement of Operations. Upfront payments made and/or received by the fund, are recorded as an asset and/or liability in the Statement of Assets and Liabilities and are recorded as a realized gain or loss ratably over the contract’s term/event with the exception of forward starting interest rate swaps which are recorded as realized gains or losses on the termination date. Fluctuations in the value of swap contracts are recorded for financial statement purposes as unrealized appreciation or depreciation on swap transactions.
Interest Rate Swaps: Interest rate swaps involve the exchange of commitments to pay and receive interest based on a notional principal amount. The fund enters into these agreements for a variety of reasons, including to hedge certain market or interest rate risks, to manage the interest rate sensitivity (sometimes called duration) of fixed income securities, to provide a substitute for purchasing or selling particular securities or to increase potential returns.The fund may elect to pay a fixed rate and receive a floating rate, or receive a fixed rate and pay a floating rate on a notional principal amount. Interest rate swaps are valued daily and the change, if any, is recorded as an unrealized gain or loss in the Statement of Operations.When a swap contract is terminated early,
the fund records a realized gain or loss equal to the difference between the current realized value and the expected cash flows.
The fund’s maximum risk of loss from counterparty credit risk is the discounted net value of the cash flows to be received from the counterparty over the contract’s remaining life, to the extent that the amount is positive. This risk is mitigated by having a master netting arrangement between the fund and the counterparty and by the posting of collateral by the counterparty to the fund to cover the fund’s exposure to the counterparty. At February 28, 2011, there were no interest rate swap agreements outstanding.
Credit Default Swaps: Credit default swaps involve commitments to pay a fixed interest rate in exchange for payment if a credit event affecting a third party (the referenced company, obligation or index) occurs. Credit events may include a failure to pay interest or principal, bankruptcy, or restructuring.The fund enters into these agreements to manage its exposure to the market or certain sectors of the market, to reduce its risk exposure to defaults of corporate and sovereign issuers, or to create exposure to corporate or sovereign issuers to which it is not otherwise exposed. For those credit default swaps in which the fund is paying a fixed rate, the fund is buying credit protection on the instrument. In the event of a credit event, the fund would receive the full notional amount for the reference obligation. For those credit default swaps in which the fund is receiving a fixed rate, the fund is selling credit protection on the underlying
118
instrument. The maximum payouts for these contracts are limited to the notional amount of each swap. Credit default swaps may involve greater risks than if the fund had invested in the reference obligation directly and are subject to general market risk, liquidity risk, counter-party risk and credit risk. At February 28, 2011, there were no credit default swap agreements outstanding.
Table 10 summarizes each relevant fund’s average market value of derivatives outstanding, during the period ended February 28, 2011.
The following summarizes the average notional value of swap contracts outstanding during the period ended February 28, 2011 for BNY Mellon Municipal Opportunities Fund.
| |
| | Average Notional Value ($) |
| Interest rate swap contracts | 27,142,857 |
Table 11 summarizes accumulated net unrealized appreciation (depreciation) on investments for each fund at February 28, 2011.
| | | | |
| Table 10—Average Market Value of Derivatives | | | |
| |
| | | | Average |
| | | | Market Value ($) |
| BNY Mellon National Intermediate Municipal Bond Fund | | | |
| Interest rate futures contracts | | | 11,734,554 |
| BNY Mellon Pennsylvania Intermediate Municipal Bond Fund | | | |
| Interest rate futures contracts | | | 3,106,205 |
| BNY Mellon Massachusetts Intermediate Municipal Bond Fund | | | |
| Interest rate futures contracts | | | 2,415,938 |
| BNY Mellon Municipal Opportunities Fund | | | |
| Interest rate futures contracts | | | 78,767,154 |
| |
| |
| Table 11—Accumulated Net Unrealized Appreciation (Depreciation) | | | |
| |
| | Gross | Gross | |
| | Appreciation ($) | (Depreciation) ($) | Net ($) |
| BNY Mellon National Intermediate Municipal Bond Fund | 48,068,306 | 24,039,245 | 24,029,061 |
| BNY Mellon National Short-Term Municipal Bond Fund | 8,791,850 | 2,102,581 | 6,689,269 |
| BNY Mellon Pennsylvania Intermediate Municipal Bond Fund | 15,582,757 | 7,967,407 | 7,615,350 |
| BNY Mellon Massachusetts Intermediate Municipal Bond Fund | 12,649,040 | 3,636,947 | 9,012,093 |
| BNY Mellon New York Intermediate Tax-Exempt Bond Fund | 6,632,673 | 1,469,240 | 5,163,433 |
| BNY Mellon Municipal Opportunities Fund | 11,301,328 | 14,231,835 | (2,930,507) |
For More Information
| |
| BNY Mellon Funds Trust | Custodian |
| c/o The Dreyfus Corporation | |
| 200 Park Avenue | The Bank of New York Mellon |
| New York, NY 10166 | One Wall Street |
| | New York, NY 10286 |
| Investment Adviser | |
| | Transfer Agent & |
| BNY Mellon Fund Advisers, a division of | Dividend Disbursing Agent |
| The Dreyfus Corporation | |
| 200 Park Avenue | Dreyfus Transfer, Inc. |
| New York, NY 10166 | 200 Park Avenue |
| | New York, NY 10166 |
| Administrator | |
| | Distributor |
| The Bank of New York Mellon | |
| One Wall Street | MBSC Securities Corporation |
| New York, NY 10286 | 200 Park Avenue |
| | New York, NY 10166 |
| Sub-Administrator | |
| |
| The Dreyfus Corporation | |
| 200 Park Avenue | |
| New York, NY 10166 | |
| | | |
| Ticker Symbols: | | | |
| BNY Mellon National Intermediate Municipal Bond Fund | Class M: MPNIX | Investor: MINMX | Dreyfus Premier: MNMBX |
| BNY Mellon National Short-Term Municipal Bond Fund | Class M: MPSTX | Investor: MINSX | |
| BNY Mellon Pennsylvania Intermediate Municipal Bond Fund | Class M: MPPIX | Investor: MIPAX | |
| BNY Mellon Massachusetts Intermediate Municipal Bond Fund | Class M: MMBMX | Investor: MMBIX | Dreyfus Premier: MMBPX |
| BNY Mellon New York Intermediate Tax-Exempt Bond Fund | Class M: MNYMX | Investor: MNYIX | |
| BNY Mellon Municipal Opportunities Fund | Class M: MOTMX | Investor: MOTIX | |
Telephone Wealth Management (WM) Clients, please contact your Account Officer or call 1-888-281-7350. Brokerage Clients of BNY Mellon Wealth Advisors (BNYMWA), please contact your financial representative or call 1-800-830-0549, Option 2. Individual Account holders, please call Dreyfus at 1-800-645-6561.
Mail WM Clients, write to your Account Officer, c/o The Bank of New York Mellon, One Mellon Bank Center, Pittsburgh, PA 15258 BNYMWA Brokerage Clients, write to your financial representative, P.O. Box 9012, Hicksville, NY 11802–9012 Individual Account Holders, write to: BNY Mellon Funds, P.O. Box 55268, Boston, MA 02205–8502
The funds file their complete schedule of portfolio holdings with the Securities and Exchange Commission (“SEC”) for the first and third quarters of each fiscal year on Form N-Q. The funds’ Forms N-Q are available on the SEC’s website at http://www.sec.gov and may be reviewed and copied at the SEC’s Public Reference Room in Washington, DC. Information on the operation of the Public Reference Room may be obtained by calling 1-800-SEC-0330.
Information regarding how the funds voted proxies relating to portfolio securities for the most recent 12-month period ended June 30 is available on the SEC’s website at http://www.sec.gov and without charge, upon request, by calling 1-800-645-6561.
©2011 MBSC Securities Corporation
MFTSA0211-MB
The BNY Mellon Funds
|
| BNY Mellon Money Market Fund |
| BNY Mellon National Municipal Money Market Fund |
| |
| SEMIANNUAL REPORT | February 28, 2011 |

| |
| Contents | |
| |
| The Funds | |
| Letter from the President | 2 |
| Discussion of Funds’ Performance | |
| BNY Mellon Money Market Fund | 3 |
| BNY Mellon National Municipal | |
| Money Market Fund | 5 |
| Understanding Your Fund’s Expenses | 7 |
| Comparing Your Fund’s Expenses | |
| With Those of Other Funds | 7 |
| Statements of Investments | 8 |
| Statements of Assets and Liabilities | 18 |
| Statements of Operations | 19 |
| Statements of Changes in Net Assets | 20 |
| Financial Highlights | 21 |
| Notes to Financial Statements | 25 |
For More Information
Back cover
The views expressed herein are current to the date of this report. These views and the composition of the funds’ portfolios are subject to change at any time based on market and other conditions.
• Not FDIC-Insured
• Not Bank-Guaranteed
• May Lose Value
The Funds

LETTER FROM
THE PRESIDENT
Dear Shareholder:
We are pleased to present to you this semiannual report for the BNY Mellon Funds Trust, covering the reporting period ended February 28, 2011.
Money market funds continued to provide minimal yields over the past six months.The Federal Reserve Board has maintained an aggressively accommodative monetary policy, including record low short-term interest rates and a new round of quantitative easing which was announced in late August 2010. However, we recently have seen signs that the U.S. economy is gaining momentum, at least partly in response to these stimulative measures.The U.S. labor market has improved gradually, retail sales have moved higher and automobile sales have been better than most analysts expected.
We currently are optimistic regarding the economy’s prospects over the remainder of 2011. Improved economic conditions could lead to higher interest rates and current yields down the road, particularly if energy and housing prices stabilize. In the meantime, money market funds provide the valuable benefits of seeking capital preservation and maintaining liquidity. As always, your financial advisor can help you align your investment portfolio with the opportunities and challenges that 2011 has in store.
For information about how each fund performed during the reporting period, as well as market perspectives, we have provided a Discussion of Fund Performance for each fund.
Thank you for your continued confidence and support.

Christopher E. Sheldon
President
BNY Mellon Funds Trust
March 15, 2011

DISCUSSION OF
FUND PERFORMANCE
For the period of September 1, 2010, through February 28, 2011, as provided by Patricia A. Larkin, Portfolio Manager
Fund and Market Performance Overview
For the six-month period ended February 28, 2011, BNY Mellon Money Market Fund’s Class M shares produced an annualized yield of 0.03% and its Investor shares produced an annualized yield of 0.00%. Taking into account the effects of compounding, the fund’s Class M shares produced an annualized effective yield of 0.03% and its Investor shares produced an annualized effective yield of 0.00%.1
Despite mounting evidence of a stronger economic recovery during the reporting period, yields of short-term money market instruments remained anchored near zero percent by a historically low federal funds rate.
The Fund’s Investment Approach
The fund seeks as high a level of current income as is consistent with the preservation of capital and the maintenance of liquidity.To pursue its goal, the fund invests in a diversified portfolio of high-quality, short-term debt securities, including U.S. government securities; certificates of deposit, time deposits, bankers’ acceptances and other short-term domestic or foreign bank obligations; repurchase agreements; high-grade commercial paper and other short-term corporate obligations; and taxable municipal obligations. Normally, the fund invests at least 25% of its net assets in bank obligations.
Monetary Policy Unchanged Despite Stronger Recovery
The reporting period began in the midst of an economic recovery fueled, in part, by an overnight federal funds rate that has remained unchanged since December 2008 in a range between 0% and 0.25%. However, the
U.S. and global economic outlooks had taken turns for the worse in the months prior to the reporting period when a sovereign debt crisis in Europe rattled investors, U.S. industrial production moderated and private-sector job growth remained anemic. Economic data released in September appeared to confirm a tenuous domestic recovery as employment and housing data showed few signs of improvement. Indeed, U.S. GDP grew at only a 2.6% annualized rate in the third quarter of 2010.
In response to the sluggish rebound, the Fed announced in September that it would embark on a second round of quantitative easing of monetary policy by purchasing $600 million of U.S.Treasury securities.This move was designed to fight deflationary forces by injecting more cash into the financial system. Investors and analysts responded positively to this development, which many regarded as a sign that the Fed was committed to preventing the onset of a double-dip recession.
Indeed, October brought better economic news. The private sector added 159,000 jobs, with much of the gain coming from the services sector. Economic data remained encouraging in November, except for one critical measure: the unemployment rate climbed to 9.8% after the economy created only 39,000 jobs during the month.Yet, the manufacturing and service sectors continued to improve, and even the housing market posted better sales data. December continued to show signs of improvement, including better data from the labor market as new unemployment claims declined and the unemployment rate eased to 9.4%.The manufacturing sector expanded for the 17th consecutive month, and the holiday season proved to be a relatively healthy one for retailers, bolstering the services sector. It was later estimated that U.S. GDP expanded at a 2.8% annualized rate during the fourth quarter.
DISCUSSION OF FUND PERFORMANCE (continued)
January 2011 brought more good news, with existing home sales climbing to its highest level since May 2010. Amid these signs of more robust growth, food and fuel prices rose sharply, but core inflation remained tame. However, investors’ concerns intensified again in February when political unrest in the Middle East caused energy prices to rise sharply, potentially threatening the reinvigorated economic recovery. Nonetheless, U.S. manufacturing activity reached its highest level in seven years during February, and the unemployment rate fell to 8.9%, its lowest reading in two years.
An Unwavering Focus on Quality
The low federal funds rate kept money market yields near zero percent during the reporting period, and with narrow yield differences along the market’s maturity spectrum, we believe it continued to make little sense to incur the additional credit and interest-rate risks that longer-dated instruments typically entail. Therefore, we maintained the fund’s weighted average maturity in a range that was roughly in line with industry averages.As always, we focused exclusively on money market instruments meeting our stringent credit-quality criteria.
We believe that a more robust economic recovery is likely to persist despite ongoing headwinds, and we are hopeful that money market yields will respond to a more constructive market environment over the remainder of 2011. In the meantime, as we have for some time, we intend to maintain the fund’s focus on credit quality and liquidity.
March 15, 2011
| |
| | An investment in the fund is not insured or guaranteed by the FDIC or any |
| | other government agency. Although the fund seeks to preserve the value of |
| | your investment at $1.00 per share, it is possible to lose money by investing |
| | in the fund. |
| | Short-term corporate, asset-backed securities holdings and municipal securities |
| | holdings (as applicable), while rated in the highest rating category by one or |
| | more NRSRO (or unrated, if deemed of comparable quality by the investment |
| | adviser), involve credit and liquidity risks and risk of principal loss. |
| 1 | Annualized effective yield is based upon dividends declared daily and |
| | reinvested monthly. Past performance is no guarantee of future results.Yields |
| | fluctuate.Yields provided reflect the absorption of certain fund expenses by the |
| | investment adviser pursuant to an undertaking, which is voluntary and |
| | temporary, not contractual, and can be terminated at any time without notice. |
| | Had these expenses not been absorbed, fund yields would have been lower, and |
| | in some cases, 7-day yields during the reporting period would have been |
| | negative absent the expense absorption. |
4

DISCUSSION OF
FUND PERFORMANCE
For the period of September 1, 2010, through February 28, 2011, as provided by Joseph Irace, Senior Portfolio Manager
Fund and Market Performance Overview
For the six-month period ended February 28, 2011, BNY Mellon National Municipal Money Market Fund’s Class M shares produced an annualized yield of 0.05%, and Investor shares produced an annualized yield of 0.00%. Taking into account the effects of compounding, the fund’s Class M and Investor shares also produced annualized effective yields of 0.05% and 0.00%, respectively.1
Although the U.S. economic recovery gained momentum during the reporting period, yields of short-term municipal money market instruments remained anchored near zero percent by a historically low federal funds rate.
The Fund’s Investment Approach
The fund seeks as high a level of current income exempt from federal income tax as is consistent with the preservation of capital and maintenance of liquid-ity.To pursue its goal, the fund invests at least 80% of its assets in short-term municipal obligations that provide income exempt from federal income tax. Among these are municipal notes, short-term municipal bonds, tax-exempt commercial paper and municipal leases.The fund may invest up to 20% of its total assets in taxable money market securities, such as U.S. government obligations, bank and corporate obligations and commercial paper.The fund also may invest in custodial receipts.
Low Yields Persisted Despite a Stronger Economic Recovery
The U.S. economy continued to recover from recession at the start of the reporting period, but the recovery proved uncertain as unemployment remained stubbornly high and many U.S. housing markets had not improved meaningfully.A sovereign debt crisis in Europe also contributed to economic concerns at the time.
However, economic data improved in the fall when hiring activity improved and consumer spending increased, joining a rebounding manufacturing sector in supporting the economic expansion. In fact, the U.S. Department of Commerce estimated that U.S. GDP expanded at a 2.8% annualized rate during the fourth quarter of 2010, up marginally from a 2.6% annualized rate during the third quarter. Expectations of stronger economic growth in 2011 caused investors to turn from traditional safe havens to riskier assets, driving yields of longer-term U.S. Treasury securities and highly rated municipal bonds higher and their prices lower through the end of 2010.
Despite these signs of improving economic conditions, the Federal Reserve Board (the “Fed”) maintained its target for the overnight federal funds rate in a range between 0% and 0.25%. Consequently, tax-exempt money market instruments continued to provide historically low yields.
Supply-and-demand influences in the tax-exempt money markets generally were favorable over the reporting period.The supply of newly issued municipal money market instruments remained ample, despite the federally subsidized Build America Bonds program, which shifted a portion of municipal issuance to the taxable bond market. The expiration of the Build America Bonds program at the end of 2010 had relatively little impact on tax-exempt money market issuance volumes during January and February, which historically have seen low issuance volumes. Meanwhile, demand for municipal money market instruments remained robust, including from individuals seeking to shelter income from rising state taxes and non-traditional investors searching for alternatives to taxable money market instruments.
Most states and municipalities continued to confront heightened fiscal pressures during the reporting period, and many state governments have cut spending and raised taxes to bridge budget deficits. However, we
DISCUSSION OF FUND PERFORMANCE (continued)
believe that well publicized concerns regarding potential municipal defaults have been overstated. Although tax revenues remain below prerecession levels, receipts have trended up for the past three quarters. In addition, several banks have initiated programs providing municipal issuers with credit over the past several months, a positive development that we believe is likely to continue.
Focus on Liquidity and Capital Preservation
Throughout the reporting period, we maintained a conservative investment posture, emphasizing direct, high-quality municipal obligations and commercial paper that were deemed creditworthy by our analysts.We also favored instruments backed by pledged tax appropriations or dedicated revenues.We generally shied away from general obligation debt and instruments issued by localities that depend heavily on state aid. Finally, we maintained the fund’s weighted average maturity in a range that was roughly in line with industry averages.With yield differences narrow along the market’s maturity range, it has made little sense to us to incur the interest-rate risks that longer-dated instruments typically entail.
Increased Supply Could Lift Yields
Despite ongoing signs of economic recovery and higher commodity prices, core inflation has been negligible, and the Fed appears set to maintain its accommodative
monetary policy for some time to come.Therefore, we believe the prudent course continues to be an emphasis on preservation of capital and liquidity. However, we expect the supply of newly issued tax-exempt money market instruments to increase later in 2011, which could support higher yields. As always, we are prepared to adjust the fund’s strategies should economic and market conditions change.
March 15, 2011
| |
| | An investment in the fund is not insured or guaranteed by the FDIC or any |
| | other government agency.Although the fund seeks to preserve the value of |
| | your investment at $1.00 per share, it is possible to lose money by investing |
| | in the fund. |
| | Short-term corporate and asset-backed securities holdings, while rated in the |
| | highest rating category by one or more NRSRO (or unrated, if deemed of |
| | comparable quality by the investment adviser), involve credit and liquidity |
| | risks and risk of principal loss. |
| 1 | Annualized effective yield is based upon dividends declared daily and |
| | reinvested monthly. Past performance is no guarantee of future results.Yields |
| | fluctuate.Yields provided reflect the absorption of certain fund expenses by the |
| | investment adviser pursuant to an undertaking, which is voluntary and |
| | temporary, not contractual, and can be terminated at any time without notice. |
| | Had these expenses not been absorbed, fund yields would have been lower, |
| | and in some cases, 7-day yields during the reporting period would have been |
| | negative absent the expense absorption. |
6
UNDERSTANDING YOUR FUND’S EXPENSES (Unaudited)
As a mutual fund investor, you pay ongoing expenses, such as management fees and other expenses. Using the information below, you can estimate how these expenses affect your investment and compare them with the expenses of other funds.You also may pay one-time transaction expenses, including sales charges (loads) and redemption fees, which are not shown in this section and would have resulted in higher total expenses. For more information, see your fund’s prospectus or talk to your financial advisor.
Review your fund’s expenses
The table below shows the expenses you would have paid on a $1,000 investment in each class of each BNY Mellon money market fund from September 1, 2010 to February 28, 2011. It also shows how much a $1,000 investment would be worth at the close of the period, assuming actual returns and expenses.
| | | | |
| Expenses and Value of a $1,000 Investment | | | | |
| assuming actual returns for the six months ended February 28, 2011 | | | | |
| | | Class M Shares | | Investor Shares |
| BNY Mellon Money Market Fund | | | | |
| Expenses paid per $1,000† | $ | 1.44 | $ | 1.59 |
| Ending value (after expenses) | $ | 1,000.20 | $ | 1,000.00 |
| Annualized expense ratio (%) | | .29 | | .32 |
| BNY Mellon National Municipal Money Market Fund | | | | |
| Expenses paid per $1,000† | $ | 1.44 | $ | 1.69 |
| Ending value (after expenses) | $ | 1,000.30 | $ | 1,000.00 |
| Annualized expense ratio (%) | | .29 | | .34 |
COMPARING YOUR FUND’S EXPENSES WITH THOSE OF OTHER FUNDS (Unaudited)
Using the SEC’s method to compare expenses
The Securities and Exchange Commission (SEC) has established guidelines to help investors assess fund expenses. Per these guidelines, the table below shows your fund’s expenses based on a $1,000 investment, assuming a hypothetical 5% annualized return.You can use this information to compare the ongoing expenses (but not transaction expenses or total cost) of investing in each fund with those of other funds. All mutual fund shareholder reports will provide this information to help you make this comparison. Please note that you cannot use this information to estimate your actual ending account balance and expenses paid during the period.
| | | | |
| Expenses and Value of a $1,000 Investment | | | | |
| assuming a hypothetical 5% annualized return for the six months ended February 28, 2011 | | | | |
| | | Class M Shares | | Investor Shares |
| BNY Mellon Money Market Fund | | | | |
| Expenses paid per $1,000† | $ | 1.45 | $ | 1.61 |
| Ending value (after expenses) | $ | 1,023.36 | $ | 1,023.21 |
| Annualized expense ratio (%) | | .29 | | .32 |
| BNY Mellon National Municipal Money Market Fund | | | | |
| Expenses paid per $1,000† | $ | 1.45 | $ | 1.71 |
| Ending value (after expenses) | $ | 1,023.36 | $ | 1,023.11 |
| Annualized expense ratio (%) | | .29 | | .34 |
|
| † Expenses are equal to each fund’s annualized expense ratios as shown above, multiplied by the average account value over the period, multiplied by 181/365 (to reflect the |
| one-half year period). |
|
| STATEMENT OF INVESTMENTS |
| February 28, 2011 (Unaudited) |
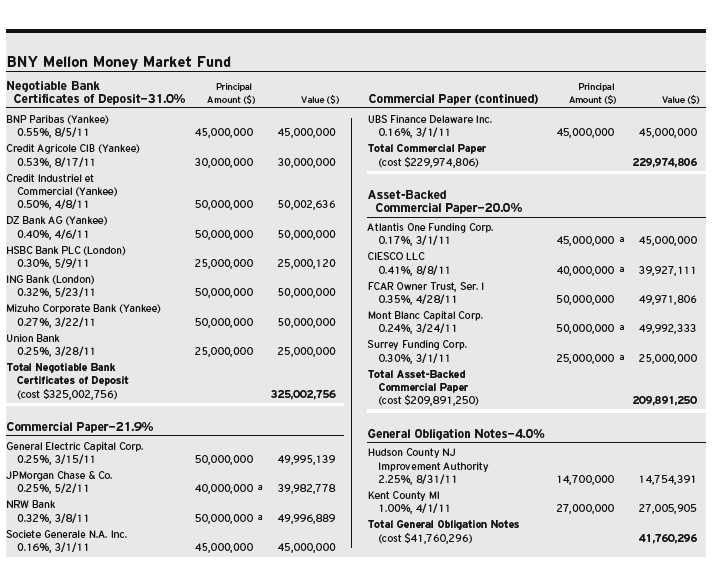
8
| | | | | | | |
| BNY Mellon Money Market Fund (continued) | | | | |
| |
| | Principal | | | | Principal | | |
| Time Deposits—5.7% | Amount ($) | | Value ($) | Repurchase Agreement—10.0% | Amount ($) | | Value ($) |
| |
| Dexia Credit Local (Grand Cayman) | | | | RBS Securities, Inc. | | | |
| 0.17%, 3/1/11 | 45,000,000 | | 45,000,000 | 0.18%, dated 2/28/11, | | | |
| KBC Bank (Grand Cayman) | | | | due 3/1/11 in the amount | | | |
| 0.17%, 3/1/11 | 15,000,000 | | 15,000,000 | of $105,000,525 | | | |
| Total Time Deposits | | | | (fully collateralized | | | |
| (cost $60,000,000) | | | 60,000,000 | by $105,962,000 | | | |
| | | | | U.S. Treasury Notes, | | | |
| | | | | 0.625%-3.25%, due | | | |
| U.S. Government Agency—4.8% | | | | 12/31/12-5/31/16, | | | |
| Straight-A Funding LLC | | | | value $107,102,663) | | | |
| 0.25%, 5/2/11 | | | | (cost $105,000,000) | 105,000,000 | | 105,000,000 |
| (cost $49,978,472) | 50,000,000 | a | 49,978,472 | | | | |
| | | | | Total Investments | | | |
| | | | | (cost $1,047,621,067) | 99.9 | % | 1,047,621,067 |
| U.S. Treasury Note—2.5% | | | | | | | |
| | | | | Cash and Receivables (Net) | .1 | % | 895,394 |
| 0.34%, 1/31/12 | | | | | | | |
| (cost $26,013,487) | 25,000,000 | | 26,013,487 | Net Assets | 100.0 | % | 1,048,516,461 |
|
| a Securities exempt from registration under Rule 144A of the Securities Act of 1933.These securities may be resold in transactions exempt from registration, normally to qualified |
| institutional buyers.At February 28, 2011, these securities amounted to $299,877,583 or 28.6% of net assets. |
| | | |
| Portfolio Summary (Unaudited) † | | | |
| |
| | Value (%) | | Value (%) |
| Banking | 53.8 | Finance | 4.8 |
| Repurchase Agreement | 10.0 | U.S. Government Agency | 4.8 |
| Asset-Backed/Multi-Seller Programs | 8.5 | General Obligations Notes | 4.0 |
| Asset-Backed/Banking | 6.7 | U.S. Treasury Note | 2.5 |
| Asset Backed/Single Seller | 4.8 | | 99.9 |
| |
| † Based on net assets. | | | |
| See notes to financial statements. | | | |
|
| STATEMENT OF INVESTMENTS |
| February 28, 2011 (Unaudited) |
| | | | | |
| BNY Mellon National Municipal Money Market Fund | | | | |
| |
| | Coupon | Maturity | Principal | | |
| Short-Term Investments—99.9% | Rate (%) | Date | Amount ($) | | Value ($) |
| Alabama—1.5% | | | | | |
| Mobile Infirmary Health System Special Care Facilities | | | | | |
| Financing Authority, Revenue (Infirmary Health | | | | | |
| System, Inc.) (LOC; Bank of Nova Scotia) | 0.24 | 3/7/11 | 25,000,000 | a | 25,000,000 |
| California—16.7% | | | | | |
| California, GO Notes (LOC; KBC Bank) | 0.26 | 3/1/11 | 14,000,000 | a | 14,000,000 |
| California Infrastructure and Economic | | | | | |
| Development Bank, Revenue (Orange County | | | | | |
| Performing Arts Center) (LOC; Bank of America) | 0.26 | 3/1/11 | 13,115,000 | a | 13,115,000 |
| California Pollution Control Financing Authority, SWDR | | | | | |
| (Big Bear Disposal, Inc. Project) (LOC; Union Bank NA) | 0.31 | 3/7/11 | 1,300,000 | a | 1,300,000 |
| California Pollution Control Financing Authority, SWDR | | | | | |
| (South Bay Recycling Project) (LOC; Union Bank NA) | 0.31 | 3/7/11 | 3,150,000 | a | 3,150,000 |
| California School Cash Reserve Program Authority, Revenue | 2.00 | 6/1/11 | 30,860,000 | | 30,944,750 |
| California Statewide Communities Development | | | | | |
| Authority, Revenue, CP (Kaiser Permanente) | 0.37 | 3/10/11 | 25,000,000 | | 25,000,000 |
| California Statewide Communities Development | | | | | |
| Authority, Revenue, CP (Kaiser Permanente) | 0.38 | 7/18/11 | 10,000,000 | | 10,000,000 |
| California Transit Finance Authority, Revenue (California Transit | | | | | |
| Finance Program) (Insured; Assured Guaranty Municipal Corp. | | | | | |
| and Liquidity Facility; Dexia Credit Locale) | 0.32 | 3/7/11 | 3,000,000 | a | 3,000,000 |
| Golden State Tobacco Securitization Corporation, Enhanced Tobacco | | | | | |
| Settlement Asset-Backed Bonds (Insured; Berkshire Hathaway | | | | | |
| Assurance Corporation and Liquidity Facility; Citibank NA) | 0.26 | 3/7/11 | 11,300,000 | a,b | 11,300,000 |
| Irvine Assessment District Number 04-20, | | | | | |
| Limited Obligation Improvement Bonds (LOC; KBC Bank) | 0.29 | 3/1/11 | 18,300,000 | a | 18,300,000 |
| Irvine Assessment District Number 05-21, Limited Obligation | | | | | |
| Improvement Bonds (LOC: California State Teachers | | | | | |
| Retirement System and U.S. Bank NA) | 0.24 | 3/1/11 | 28,100,000 | a | 28,100,000 |
| Irvine Assessment District Number 07-22, | | | | | |
| Limited Obligation Improvement Bonds (LOC; Key Bank) | 0.29 | 3/1/11 | 16,800,000 | a | 16,800,000 |
| Irvine Assessment District Number 97-17, Limited Obligation | | | | | |
| Improvement Bonds (LOC; State Street Bank and Trust Co.) | 0.24 | 3/1/11 | 10,700,000 | a | 10,700,000 |
| Los Angeles, GO Notes, TRAN | 2.00 | 5/31/11 | 29,000,000 | | 29,086,191 |
| Menlo Park Community Development Agency, Tax Allocation | | | | | |
| Revenue, Refunding (Las Pulgas Community Development | | | | | |
| Project) (LOC; State Street Bank and Trust Co.) | 0.22 | 3/1/11 | 21,100,000 | a | 21,100,000 |
| Pittsburg Redevelopment Agency, Subordinate Tax Allocation | | | | | |
| Revenue (Los Medanos Community Development Project) | | | | | |
| (Liquidity Facility: California State Teachers Retirement | | | | | |
| System and State Street Bank and Trust Co.) | 0.22 | 3/1/11 | 16,300,000 | a | 16,300,000 |
| Poway Unified School District Public Financing Authority, LR | | | | | |
| (Insured; Assured Guaranty Municipal Corp. and | | | | | |
| Liquidity Facility; Dexia Credit Locale) | 0.55 | 3/7/11 | 10,000,000 | a | 10,000,000 |
| Southern California Public Power Authority, Transmission | | | | | |
| Project Revenue, Refunding (Southern Transmission | | | | | |
| Project) (Insured; Assured Guaranty Municipal Corp. | | | | | |
| and Liquidity Facility; Dexia Credit Locale) | 0.32 | 3/7/11 | 20,300,000 | a | 20,300,000 |
10
| | | | | |
| BNY Mellon National Municipal Money Market Fund (continued) | | | | |
| |
| | Coupon | Maturity | Principal | | |
| Short-Term Investments (continued) | Rate (%) | Date | Amount ($) | | Value ($) |
| Colorado—2.7% | | | | | |
| Colorado Educational and Cultural Facilities Authority, Revenue | | | | | |
| (National Jewish Federation Bond Program) (LOC; Bank of America) | 0.26 | 3/1/11 | 1,500,000 | a | 1,500,000 |
| Colorado Educational and Cultural Facilities Authority, Revenue, | | | | | |
| Refunding (YMCA of the Rockies Project) (LOC; Bank of America) | 0.26 | 3/1/11 | 8,000,000 | a | 8,000,000 |
| Commerce City Northern Infrastructure General | | | | | |
| Improvement District, GO Notes (LOC; U.S. Bank NA) | 0.28 | 3/7/11 | 6,150,000 | a | 6,150,000 |
| Commerce City Northern Infrastructure General Improvement | | | | | |
| District, GO Notes, Refunding (LOC; U.S. Bank NA) | 0.28 | 3/7/11 | 9,390,000 | a | 9,390,000 |
| Parker Automotive Metropolitan District, | | | | | |
| GO Notes (LOC; U.S. Bank NA) | 0.28 | 3/7/11 | 900,000 | a | 900,000 |
| Southern Ute Indian Tribe of the | | | | | |
| Southern Ute Indian Reservation, Revenue | 0.27 | 3/7/11 | 20,000,000 | a | 20,000,000 |
| Connecticut—2.2% | | | | | |
| Connecticut, GO Notes (Liquidity Facility; Bayerische Landesbank) | 0.30 | 3/7/11 | 13,200,000 | a | 13,200,000 |
| Connecticut Health and Educational Facilities Authority, | | | | | |
| Revenue (Edgehill Issue) (LOC; JPMorgan Chase Bank) | 0.23 | 3/1/11 | 7,000,000 | a | 7,000,000 |
| Connecticut Health and Educational Facilities Authority, | | | | | |
| Revenue (Masonicare Issue) (LOC; Wells Fargo Bank) | 0.24 | 3/1/11 | 16,200,000 | a | 16,200,000 |
| District of Columbia—1.4% | | | | | |
| District of Columbia, GO Notes, Refunding (LOC; TD Bank) | 0.25 | 3/7/11 | 5,900,000 | a | 5,900,000 |
| Metropolitan Washington Airports Authority, | | | | | |
| Airport System Revenue (LOC; Bank of America) | 0.27 | 3/1/11 | 18,000,000 | a | 18,000,000 |
| Florida—5.2% | | | | | |
| Citizens Property Insurance Corporation, High-Risk | | | | | |
| Account Senior Secured Revenue, Refunding | 5.00 | 3/1/11 | 300,000 | | 300,000 |
| Jacksonville, Transportation Revenue (LOC; Wells Fargo Bank) | 0.25 | 3/7/11 | 12,500,000 | a | 12,500,000 |
| Jacksonville Health Facilities Authority, HR (Baptist Medical | | | | | |
| Center Project) (LOC; Branch Banking and Trust Co.) | 0.26 | 3/7/11 | 10,420,000 | a | 10,420,000 |
| Lee Memorial Health System, HR (LOC; Bank of America) | 0.27 | 3/1/11 | 8,715,000 | a | 8,715,000 |
| Miami-Dade County Health Facilities Authority, HR, Refunding | | | | | |
| (Miami Children’s Hospital Project) (LOC; Wells Fargo Bank) | 0.25 | 3/7/11 | 18,950,000 | a | 18,950,000 |
| Orlando-Orange County Expressway Authority, Revenue | | | | | |
| (Insured; Assured Guaranty Municipal Corp. and | | | | | |
| Liquidity Facility; Dexia Credit Locale) | 0.30 | 3/7/11 | 12,175,000 | a | 12,175,000 |
| Palm Beach County, IDR (Gulfstream Goodwill | | | | | |
| Industies, Inc. Project) (LOC; Wells Fargo Bank) | 0.35 | 3/7/11 | 1,155,000 | a | 1,155,000 |
| Polk County Industrial Development Authority, | | | | | |
| Health Care Facilities Revenue, Refunding | | | | | |
| (Winter Haven Hospital Project) (LOC; PNC Bank NA) | 0.23 | 3/7/11 | 9,750,000 | a | 9,750,000 |
| Tohopekaliga Water Authority, Utility System Revenue | | | | | |
| (LOC; Landesbank Hessen-Thuringen Girozentrale) | 0.27 | 3/7/11 | 12,700,000 | a | 12,700,000 |
| Georgia—1.8% | | | | | |
| Clayton County Housing Authority, MFHR, Refunding (Chateau Forest | | | | | |
| Apartments Project) (Insured; Assured Guaranty Municipal Corp. | | | | | |
| and Liquidity Facility; Societe Generale) | 1.03 | 3/7/11 | 6,530,000 | a | 6,530,000 |
STATEMENT OF INVESTMENTS (Unaudited) (continued)
| | | | | |
| BNY Mellon National Municipal Money Market Fund (continued) | | | | |
| | Coupon | Maturity | Principal | | |
| Short-Term Investments (continued) | Rate (%) | Date | Amount ($) | | Value ($) |
| Georgia (continued) | | | | | |
| Metropolitan Atlanta Rapid Transit Authority, Sales Tax | | | | | |
| Revenue (Second Indenture Series) (LOC: Bayerische | | | | | |
| Landesbank and Westdeutsche Landesbank) | 0.23 | 3/7/11 | 10,000,000 | a | 10,000,000 |
| Municipal Electric Authority of Georgia, Project One | | | | | |
| Subordinated Bonds (Insured; Assured Guaranty | | | | | |
| Municipal Corp. and Liquidity Facility; Dexia Credit Locale) | 0.45 | 3/7/11 | 13,150,000 | a | 13,150,000 |
| Hawaii—.3% | | | | | |
| Hawaii Housing Finance and Development Corporation, | | | | | |
| MFHR (Lokahi Ka’u) (Liquidity Facility; FHLMC) | 0.24 | 3/7/11 | 5,200,000 | a | 5,200,000 |
| Idaho—.5% | | | | | |
| Coeur D’Alene Tribe, Revenue (LOC; Bank of America) | 0.33 | 3/7/11 | 8,900,000 | a | 8,900,000 |
| Illinois—5.3% | | | | | |
| Chicago, Second Lien Water Revenue, Refunding | | | | | |
| (LOC; California Public Employees Retirement System) | 0.26 | 3/7/11 | 14,645,000 | a | 14,645,000 |
| Chicago, Second Lien Water Revenue, Refunding | | | | | |
| (LOC; State Street Bank and Trust Co.) | 0.25 | 3/7/11 | 3,180,000 | a | 3,180,000 |
| Illinois Educational Facilities Authority, Revenue | | | | | |
| (ACI/Cultural Pooled Financing Program) (LOC; Bank of America) | 0.29 | 3/7/11 | 10,940,000 | a | 10,940,000 |
| Illinois Finance Authority, Revenue (Gift of Hope Organ and | | | | | |
| Tissue Donor Network Project) (LOC; JPMorgan Chase Bank) | 0.33 | 3/7/11 | 7,240,000 | a | 7,240,000 |
| Illinois Finance Authority, Revenue | | | | | |
| (OSF Healthcare System) (LOC; National City Bank) | 0.23 | 3/7/11 | 7,100,000 | a | 7,100,000 |
| Illinois Finance Authority, Revenue | | | | | |
| (Resurrection Health Care) (LOC; JPMorgan Chase Bank) | 0.27 | 3/1/11 | 8,310,000 | a | 8,310,000 |
| Illinois Finance Authority, Revenue (The University of | | | | | |
| Chicago Medical Center) (LOC: Bank of America) | 0.26 | 3/1/11 | 37,000,000 | a | 37,000,000 |
| Indiana—1.1% | | | | | |
| Indiana Finance Authority, Revenue | | | | | |
| (Ascension Health Senior Credit Group) | 0.23 | 3/7/11 | 10,000,000 | a | 10,000,000 |
| Lawrenceburg, PCR, Refunding (Indiana Michigan Power | | | | | |
| Company Project) (LOC; Royal Bank of Scotland) | 0.32 | 3/7/11 | 8,600,000 | a | 8,600,000 |
| Iowa—1.5% | | | | | |
| Hills, Health Facilities Revenue | | | | | |
| (Mercy Hospital Project) (LOC; U.S. Bank NA) | 0.23 | 3/1/11 | 15,365,000 | a | 15,365,000 |
| Iowa Finance Authority, Health Facilities | | | | | |
| Revenue (Iowa Health System) (LOC; Bank of America) | 0.27 | 3/1/11 | 5,795,000 | a | 5,795,000 |
| Iowa Higher Education Loan Authority, Revenue, | | | | | |
| BAN (William Penn University Project) | 1.50 | 12/1/11 | 4,000,000 | | 4,026,989 |
| Kansas—.4% | | | | | |
| Olathe, Health Facilities Revenue | | | | | |
| (Olathe Medical Center) (LOC; Bank of America) | 0.24 | 3/1/11 | 7,000,000 | a | 7,000,000 |
| Kentucky—.5% | | | | | |
| Kentucky Rural Water Finance Corporation, | | | | | |
| Public Projects Construction Notes | 1.50 | 12/1/11 | 8,500,000 | | 8,554,149 |
12
| | | | | |
| BNY Mellon National Municipal Money Market Fund (continued) | | | | |
| |
| | Coupon | Maturity | Principal | | |
| Short-Term Investments (continued) | Rate (%) | Date | Amount ($) | | Value ($) |
| Maryland—1.8% | | | | | |
| Baltimore Mayor and City Council Industrial Development | | | | | |
| Authority, Revenue (City of Baltimore Capital Acquisition | | | | | |
| Program) (LOC; Bayerische Landesbank) | 0.35 | 3/7/11 | 10,400,000 | a | 10,400,000 |
| Howard County, Revenue, Refunding (Glenelg Country | | | | | |
| School, Inc. Facility) (LOC; PNC Bank NA) | 0.25 | 3/7/11 | 10,225,000 | a | 10,225,000 |
| Maryland Industrial Development Financing Authority, | | | | | |
| Recovery Zone Facility Revenue (Wexford Maryland | | | | | |
| Bio Park 3, LLC Facility) (LOC; M&T Trust) | 0.31 | 3/7/11 | 10,000,000 | a | 10,000,000 |
| Massachusetts—2.0% | | | | | |
| Massachusetts, GO Notes (Central Artery/Ted Williams Tunnel | | | | | |
| Infrastructure Loan Act of 2000) (Liquidity Facility; | | | | | |
| Landesbank Baden-Wurttemberg) | 0.25 | 3/1/11 | 4,000,000 | a | 4,000,000 |
| Massachusetts Development Finance Agency, | | | | | |
| Revenue (Worcester Polytechnic Institute) (LOC; TD Bank) | 0.32 | 3/7/11 | 1,500,000 | a | 1,500,000 |
| Massachusetts Health and Educational Facilities Authority, | | | | | |
| Revenue (Partners HealthCare System Issue) | | | | | |
| (Liquidity Facility; Bank of America) | 0.28 | 3/7/11 | 17,590,000 | a | 17,590,000 |
| Massachusetts Water Resources Authority, Subordinated General | | | | | |
| Revenue, Refunding (LOC; Landesbank Baden-Wurttemberg) | 0.23 | 3/1/11 | 11,150,000 | a | 11,150,000 |
| Michigan—1.8% | | | | | |
| Lenawee County Economic Development Corporation, Revenue, | | | | | |
| Refunding (Siena Heights University Project) (LOC; FHLB) | 0.27 | 3/7/11 | 8,580,000 | a | 8,580,000 |
| Michigan Higher Education Facilities Authority, LOR | | | | | |
| (Adrian College Project) (LOC; Comerica Bank) | 0.35 | 3/7/11 | 12,625,000 | a | 12,625,000 |
| Michigan Strategic Fund, LOR (MANS, LLC Project) | | | | | |
| (LOC; Comerica Bank) | 0.31 | 3/7/11 | 6,400,000 | a | 6,400,000 |
| Michigan Strategic Fund, LOR, Refunding (Waterfront Reclamation | | | | | |
| and Development Project) (LOC; Deutsche Bank AG) | 0.25 | 3/7/11 | 2,810,000 | a | 2,810,000 |
| Minnesota—.8% | | | | | |
| Minnesota Higher Education Facilities Authority, Revenue | | | | | |
| (Gustavus Adolphus College) (LOC; Wells Fargo Bank) | 0.25 | 3/7/11 | 12,950,000 | a | 12,950,000 |
| New Hampshire—4.1% | | | | | |
| New Hampshire Health and Education Facilities | | | | | |
| Authority, Revenue (Dartmouth College Issue) | | | | | |
| (Liquidity Facility; JPMorgan Chase Bank) | 0.27 | 3/1/11 | 14,200,000 | a | 14,200,000 |
| New Hampshire Health and Education Facilities Authority, | | | | | |
| Revenue (University System of New Hampshire Issue) | | | | | |
| (Liquidity Facility; JPMorgan Chase Bank) | 0.20 | 3/1/11 | 34,890,000 | a | 34,890,000 |
| New Hampshire Health and Education Facilities Authority, | | | | | |
| Revenue (University System of New Hampshire Issue) | | | | | |
| (Liquidity Facility; JPMorgan Chase Bank) | 0.26 | 3/1/11 | 19,000,000 | a | 19,000,000 |
| New Jersey—8.9% | | | | | |
| Hudson County Improvement Authority, County Guaranteed | | | | | |
| Pooled Notes (Local Unit Loan Program) | 1.50 | 8/31/11 | 30,450,000 | | 30,574,200 |
STATEMENT OF INVESTMENTS (Unaudited) (continued)
| | | | | |
| BNY Mellon National Municipal Money Market Fund (continued) | | | |
| |
| | Coupon | Maturity | Principal | | |
| Short-Term Investments (continued) | Rate (%) | Date | Amount ($) | | Value ($) |
| New Jersey (continued) | | | | | |
| JPMorgan Chase Putters/Drivers Trust (New Jersey, TRAN) | | | | | |
| (Liquidity Facility; JPMorgan Chase Bank) | 0.22 | 3/1/11 | 24,400,000 | a,b | 24,400,000 |
| New Jersey Economic Development Authority, School Facilities | | | | | |
| Construction Revenue, Refunding (LOC; Dexia Credit Locale) | 0.28 | 3/7/11 | 1,020,000 | a | 1,020,000 |
| New Jersey Housing and Mortgage Finance Agency, | | | | | |
| SFHR (LOC; Dexia Credit Locale) | 0.30 | 3/7/11 | 10,000,000 | a | 10,000,000 |
| New Jersey Transportation Trust Fund Authority | | | | | |
| (Transportation System) | 5.25 | 12/15/11 | 2,000,000 | | 2,074,560 |
| New Jersey Turnpike Authority, Turnpike Revenue (Insured; Assured | | | | | |
| Guaranty Municipal Corp. and Liquidity Facility; Dexia Credit Locale) | 0.33 | 3/7/11 | 35,875,000 | a | 35,875,000 |
| New Jersey Turnpike Authority, Turnpike Revenue | | | | | |
| (Insured; Assured Guaranty Municipal Corp. and | | | | | |
| Liquidity Facility; Westdeutsche Landesbank) | 0.33 | 3/7/11 | 22,200,000 | a | 22,200,000 |
| New Jersey Turnpike Authority, | | | | | |
| Turnpike Revenue (Liquidity Facility; Societe Generale) | 0.27 | 3/7/11 | 23,930,000 | a | 23,930,000 |
| New Mexico—1.2% | | | | | |
| Alamogordo, Hospital Improvement Revenue, | | | | | |
| Refunding (Gerald Champion Regional | | | | | |
| Medical Center Project) (LOC; Bank of America) | 0.33 | 3/7/11 | 20,000,000 | a | 20,000,000 |
| New York—14.2% | | | | | |
| Albany Industrial Development Agency, Civic Facility Revenue | | | | | |
| (Renaissance Corporation of Albany Project) (LOC; M&T Trust) | 0.31 | 3/7/11 | 1,000,000 | a | 1,000,000 |
| Amherst Industrial Development Agency, Multi-Mode Civic Facility | | | | | |
| Revenue (Daemen College Project) (LOC; M&T Trust) | 0.31 | 3/7/11 | 12,400,000 | a | 12,400,000 |
| Dutchess County Industrial Development Agency, Civic Facility | | | | | |
| Revenue (Brookview Inc. Project) (LOC; M&T Trust) | 0.31 | 3/7/11 | 8,610,000 | a | 8,610,000 |
| Erie County Industrial Development Agency, Civic Facility Revenue | | | | | |
| (The Canisius High School of Buffalo, N.Y. Project) (LOC; M&T Trust) | 0.31 | 3/1/11 | 21,445,000 | a | 21,445,000 |
| Long Island Power Authority, Electric System Subordinated Revenue | | | | | |
| (LOC: Bayerische Landesbank and Westdeutsche Landesbank) | 0.21 | 3/1/11 | 23,010,000 | a | 23,010,000 |
| Metropolitan Transportation Authority, Dedicated Tax Fund | | | | | |
| Revenue (Insured; Assured Guaranty Municipal Corp. | | | | | |
| and Liquidity Facility; Dexia Credit Locale) | 0.33 | 3/7/11 | 8,600,000 | a | 8,600,000 |
| Metropolitan Transportation Authority, Dedicated Tax | | | | | |
| Fund Revenue, Refunding (LOC; KBC Bank) | 0.24 | 3/7/11 | 24,335,000 | a | 24,335,000 |
| Metropolitan Transportation Authority, Transportation Revenue, | | | | | |
| Refunding (Insured; Assured Guaranty Municipal Corp. | | | | | |
| and Liquidity Facility; Westdeutsche Landesbank) | 0.37 | 3/7/11 | 4,000,000 | a | 4,000,000 |
| New York City, GO Notes (LOC; Bayerische Landesbank) | 0.25 | 3/1/11 | 15,700,000 | a | 15,700,000 |
| New York City Capital Resource Corporation, Recovery Zone | | | | | |
| Facility Revenue (WytheHotel Project) (LOC; M&T Trust) | 0.34 | 3/7/11 | 3,700,000 | a | 3,700,000 |
| New York City Housing Development Corporation, MFMR (The Crest | | | | | |
| Project) (LOC; Landesbank Hessen-Thuringen Girozentrale) | 0.32 | 3/7/11 | 17,145,000 | a | 17,145,000 |
| New York City Transitional Finance Authority, Future Tax Secured | | | | | |
| Revenue (Liquidity Facility; Dexia Credit Locale) | 0.31 | 3/7/11 | 10,000,000 | a | 10,000,000 |
14
| | | | | |
| BNY Mellon National Municipal Money Market Fund (continued) | | | | |
| |
| | Coupon | Maturity | Principal | | |
| Short-Term Investments (continued) | Rate (%) | Date | Amount ($) | | Value ($) |
| New York (continued) | | | | | |
| New York City Transitional Finance Authority, Revenue (New York | | | | | |
| City Recovery) (Liquidity Facility; Landesbank Baden-Wurttemberg) | 0.25 | 3/1/11 | 28,000,000 | a | 28,000,000 |
| New York Liberty Development Corporation, | | | | | |
| Liberty Revenue (World Trade Center Project) | 0.35 | 4/28/11 | 36,000,000 | | 36,000,000 |
| New York Liberty Development Corporation, | | | | | |
| Recovery Zone Revenue (3 World Trade Center Project) | 0.42 | 1/19/12 | 5,000,000 | | 5,000,000 |
| New York State Housing Finance Agency, Housing Revenue | | | | | |
| (25 Washington Street) (LOC; M&T Trust) | 0.33 | 3/7/11 | 7,800,000 | a | 7,800,000 |
| Onondaga County Industrial Development Agency, Civic Facility | | | | | |
| Revenue (Syracuse Research Corporation Facility) (LOC; M&T Trust) | 0.31 | 3/7/11 | 4,180,000 | a | 4,180,000 |
| Tompkins County Industrial Development Agency, | | | | | |
| Civic Facility Revenue (Community Development | | | | | |
| Properties Ithaca Inc. Project) (LOC; M&T Trust) | 0.36 | 3/7/11 | 6,730,000 | a | 6,730,000 |
| North Carolina—.8% | | | | | |
| North Carolina Medical Care Commission, Health Care | | | | | |
| Facilities Revenue (Union Regional Medical Center | | | | | |
| Project) (LOC; Wells Fargo Bank) | 0.26 | 3/7/11 | 13,000,000 | a | 13,000,000 |
| Ohio—1.5% | | | | | |
| Montgomery County, Revenue (Miami Valley Hospital) | | | | | |
| (Liquidity Facility; JPMorgan Chase Bank) | 0.27 | 3/1/11 | 15,100,000 | a | 15,100,000 |
| Warren County, Health Care Facilities Improvement | | | | | |
| Revenue (Otterbein Homes Project) (LOC; U.S. Bank NA) | 0.28 | 3/7/11 | 9,500,000 | a | 9,500,000 |
| Oregon—.4% | | | | | |
| Medford Hospital Facilities Authority, Revenue | | | | | |
| (Rogue Valley Manor Project) (LOC; Bank of America) | 0.21 | 3/1/11 | 7,180,000 | a | 7,180,000 |
| Pennsylvania—6.5% | | | | | |
| Allegheny County Industrial Development Authority, | | | | | |
| Revenue (The Watson Institute Friendship | | | | | |
| Academy Project) (LOC; PNC Bank NA) | 0.25 | 3/7/11 | 3,750,000 | a | 3,750,000 |
| Beaver County Industrial Development Authority, PCR, | | | | | |
| Refunding (FirstEnergy Nuclear Generation | | | | | |
| Corporation Project) (LOC; Bank of Nova Scotia) | 0.23 | 3/7/11 | 30,000,000 | a | 30,000,000 |
| Beaver County Industrial Development Authority, PCR, | | | | | |
| Refunding (FirstEnergy Nuclear Generation | | | | | |
| Corporation Project) (LOC; Citibank NA) | 0.23 | 3/7/11 | 26,900,000 | a | 26,900,000 |
| Lancaster County, GO Notes (Insured; Assured Guaranty | | | | | |
| Municipal Corp. and Liquidity Facility; Royal Bank of Canada) | 0.30 | 3/7/11 | 20,695,000 | a | 20,695,000 |
| Lower Merion School District, GO Notes | | | | | |
| (LOC; State Street Bank and Trust Co.) | 0.24 | 3/7/11 | 8,400,000 | a | 8,400,000 |
| Monroe County Hospital Authority, HR | | | | | |
| (Pocono Medical Center) (LOC; PNC Bank NA) | 0.28 | 3/7/11 | 3,430,000 | a | 3,430,000 |
| North Penn Water Authority, Water Revenue (Insured; Assured | | | | | |
| Guaranty Municipal Corp. and Liquidity Facility; Dexia Credit Locale) | 0.41 | 3/7/11 | 7,150,000 | a | 7,150,000 |
| Pittsburgh Water and Sewer Authority, Water and Sewer System | | | | | |
| First Lien Revenue, Refunding (LOC; PNC Bank NA) | 0.25 | 3/7/11 | 9,000,000 | a | 9,000,000 |
STATEMENT OF INVESTMENTS (Unaudited) (continued)
| | | | | |
| BNY Mellon National Municipal Money Market Fund (continued) | | | | |
| | Coupon | Maturity | Principal | | |
| Short-Term Investments (continued) | Rate (%) | Date | Amount ($) | | Value ($) |
| Rhode Island—.3% | | | | | |
| Rhode Island Health and Educational Building Corporation, | | | | | |
| Educational Institution Revenue (Portsmouth | | | | | |
| Abbey School Issue) (LOC; Bank of America) | 0.30 | 3/1/11 | 4,800,000 | a | 4,800,000 |
| Tennessee—1.4% | | | | | |
| Clarksville Public Building Authority, Financing Revenue | | | | | |
| (Metropolitan Government of Nashville and Davidson | | | | | |
| County Loan) (LOC; Bank of America) | 0.27 | 3/1/11 | 6,710,000 | a | 6,710,000 |
| Montgomery County Public Building Authority, Pooled Financing | | | | | |
| Revenue (Tennessee County Loan Pool) (LOC; Bank of America) | 0.27 | 3/1/11 | 17,130,000 | a | 17,130,000 |
| Texas—10.2% | | | | | |
| Harris County Health Facilities Development Corporation, | | | | | |
| Revenue (Saint Luke’s Episcopal Hospital) (Liquidity Facility: | | | | | |
| Bank of America, JPMorgan Chase Bank and Northern Trust Co.) | 0.22 | 3/1/11 | 33,220,000 | a | 33,220,000 |
| Jefferson County Industrial Development Corporation, | | | | | |
| Hurricane Ike Disaster Area Revenue (Jefferson | | | | | |
| Refinery, LLC Project) (LOC; Branch Banking and Trust Co.) | 0.55 | 3/30/11 | 40,000,000 | | 40,000,000 |
| JPMorgan Chase Putters/Drivers Trust (Texas, TRAN) | | | | | |
| (Liquidity Facility; JPMorgan Chase Bank) | 0.22 | 3/1/11 | 11,700,000 | a,b | 11,700,000 |
| Texas, TRAN | 2.00 | 8/31/11 | 59,490,000 | | 59,982,793 |
| Travis County Health Facilities Development Corporation, | | | | | |
| Retirement Facilities Revenue (Longhorn Village | | | | | |
| Project) (LOC; Bank of Scotland) | 0.26 | 3/7/11 | 25,800,000 | a | 25,800,000 |
| Utah—.2% | | | | | |
| Utah Housing Corporation, MFHR | | | | | |
| (Timbergate Apartments Project) (LOC; FHLMC) | 0.28 | 3/7/11 | 3,125,000 | a | 3,125,000 |
| Virginia—.5% | | | | | |
| Williamsburg Industrial Development Authority, Revenue | | | | | |
| (The Colonial Williamsburg Foundation) (LOC; Wells Fargo Bank) | 0.25 | 3/7/11 | 8,000,000 | a | 8,000,000 |
| Washington—.3% | | | | | |
| Vancouver Housing Authority, Pooled Housing Revenue, | | | | | |
| Refunding (Liquidity Facility; FHLMC and LOC; FHLMC) | 0.25 | 3/7/11 | 4,400,000 | a | 4,400,000 |
| Wisconsin—1.9% | | | | | |
| Wisconsin Health and Educational Facilities Authority, | | | | | |
| Revenue (Meriter Hospital, Inc.) (LOC; U.S. Bank NA) | 0.23 | 3/1/11 | 11,840,000 | a | 11,840,000 |
| Wisconsin Health and Educational Facilities Authority, Revenue | | | | | |
| (Wheaton Franciscan Services, Inc. System) (LOC; U.S. Bank NA) | 0.23 | 3/7/11 | 20,290,000 | a | 20,290,000 |
| |
| Total Investments (cost $1,677,088,632) | | | 99.9 | % | 1,677,088,632 |
| Cash and Receivables (Net) | | | .1 | % | 1,822,601 |
| Net Assets | | | 100.0 | % | 1,678,911,233 |
|
| a Variable rate demand note—rate shown is the interest rate in effect at February 28, 2011. Maturity date represents the next demand date, or the ultimate maturity date if earlier. |
| b Securities exempt from registration under Rule 144A of the Securities Act of 1933.These securities may be resold in transactions exempt from registration, normally to qualified |
| institutional buyers.At February 28, 2011, these securities amounted to $47,400,000 or 2.8% of net assets. |
16
| | | | | | |
| Summary of Abbreviations | | | | |
| |
| ABAG | Association of Bay Area Governments | | ACA | American Capital Access |
| AGC | ACE Guaranty Corporation | | AGIC | Asset Guaranty Insurance Company |
| AMBAC | American Municipal Bond Assurance Corporation | ARRN | Adjustable Rate Receipt Notes |
| BAN | Bond Anticipation Notes | | BPA | Bond Purchase Agreement |
| CIFG | CDC Ixis Financial Guaranty | | COP | Certificate of Participation |
| CP | Commercial Paper | | EDR | Economic Development Revenue |
| EIR | Environmental Improvement Revenue | | FGIC | Financial Guaranty Insurance Company |
| FHA | Federal Housing Administration | | FHLB | Federal Home Loan Bank |
| FHLMC | Federal Home Loan Mortgage Corporation | FNMA | Federal National Mortgage Association |
| GAN | Grant Anticipation Notes | | GIC | Guaranteed Investment Contract |
| GNMA | Government National Mortgage Association | GO | General Obligation | |
| HR | Hospital Revenue | | IDB | Industrial Development Board |
| IDC | Industrial Development Corporation | | IDR | Industrial Development Revenue |
| LOC | Letter of Credit | | | LOR | Limited Obligation Revenue |
| LR | Lease Revenue | | | MFHR | Multi-Family Housing Revenue |
| MFMR | Multi-Family Mortgage Revenue | | PCR | Pollution Control Revenue |
| PILOT | Payment in Lieu of Taxes | | PUTTERS | Puttable Tax-Exempt Receipts |
| RAC | Revenue Anticipation Certificates | | RAN | Revenue Anticipation Notes |
| RAW | Revenue Anticipation Warrants | | RRR | Resources Recovery Revenue |
| SAAN | State Aid Anticipation Notes | | SBPA | Standby Bond Purchase Agreement |
| SFHR | Single Family Housing Revenue | | SFMR | Single Family Mortgage Revenue |
| SONYMA | State of New York Mortgage Agency | | SWDR | Solid Waste Disposal Revenue |
| TAN | Tax Anticipation Notes | | TAW | Tax Anticipation Warrants |
| TRAN | Tax and Revenue Anticipation Notes | | XLCA | XL Capital Assurance | |
| |
| |
| |
| Summary of Combined Ratings (Unaudited) | | | |
| |
| Fitch | or | Moody’s | or | Standard & Poor’s | Value (%)† |
| F1+,F1 | | VMIG1,MIG1,P1 | | SP1+,SP1,A1+,A1 | 91.0 |
| AAA,AA,Ac | | Aaa,Aa,Ac | | AAA,AA,Ac | | 7.4 |
| Not Ratedd | | Not Ratedd | | Not Ratedd | | 1.6 |
| | | | | | | 100.0 |
|
| † Based on total investments. |
| c Notes which are not F, MIG and SP rated are represented by bond ratings of the issuers. |
| d Securities which, while not rated by Fitch, Moody’s and Standard & Poor’s, have been determined by the Manager to be of comparable quality to those rated securities in which the |
| fund may invest. |
See notes to financial statements.
STATEMENT OF ASSETS AND LIABILITIES
February 28, 2011 (Unaudited)
| | | | |
| | BNY Mellon | BNY Mellon |
| | Money Market | National Municipal |
| | Fund | Money Market Fund |
| Assets ($): | | |
| Investments in securities—See Statement of Investments† | | |
| (including Repurchase Agreement of $105,000,000 | | |
| for BNY Mellon Money Market Fund)—Note 2(c) | 1,047,621,067 | 1,677,088,632 |
| Cash | 719,890 | 107,741 |
| Interest receivable | 492,279 | 2,180,200 |
| Prepaid expenses | 20,227 | 19,789 |
| | 1,048,853,463 | 1,679,396,362 |
| Liabilities ($): | | |
| Due to The Dreyfus Corporation and affiliates—Note 3(b) | 157,277 | 236,852 |
| Due to Administrator—Note 3(a) | 101,242 | 159,156 |
| Accrued expenses | 78,483 | 89,121 |
| | 337,002 | 485,129 |
| Net Assets ($) | 1,048,516,461 | 1,678,911,233 |
| Composition of Net Assets ($): | | |
| Paid-in capital | 1,048,520,356 | 1,680,407,385 |
| Accumulated net realized gain (loss) on investments | (3,895) | (1,496,152) |
| Net Assets ($) | 1,048,516,461 | 1,678,911,233 |
| Net Asset Value Per Share | | |
| Class M Shares | | |
| Net Assets ($) | 1,045,454,289 | 1,678,910,126 |
| Shares Outstanding | 1,045,458,179 | 1,680,407,191 |
| Net Asset Value Per Share ($) | 1.00 | 1.00 |
| Investor Shares | | |
| Net Assets ($) | 3,062,172 | 1,107 |
| Shares Outstanding | 3,062,177 | 1,109 |
| Net Asset Value Per Share ($) | 1.00 | 1.00 |
| † Investments at cost ($) | 1,047,621,067 | 1,677,088,632 |
| |
| See notes to financial statements. | | |
18
STATEMENT OF OPERATIONS
Six Months Ended February 28, 2011 (Unaudited)
| | | | |
| | BNY Mellon | BNY Mellon |
| | Money Market | National Municipal |
| | Fund | Money Market Fund |
| Investment Income ($): | | |
| Interest Income | 1,770,670 | 2,694,965 |
| Expenses: | | |
| Investment advisory fee—Note 3(a) | 821,273 | 1,184,744 |
| Administration fee—Note 3(a) | 677,575 | 977,263 |
| Custodian fees—Note 3(b) | 44,804 | 50,868 |
| Professional fees | 20,445 | 22,888 |
| Trustees’ fees and expenses—Note 3(c) | 18,746 | 32,381 |
| Registration fees | 15,665 | 15,665 |
| Prospectus and shareholders’ reports | 3,459 | 4,571 |
| Shareholder servicing costs—Note 3(b) | 977 | 7 |
| Miscellaneous | 17,680 | 23,105 |
| Total Expenses | 1,620,624 | 2,311,492 |
| Less—reduction in expenses due to undertaking—Note 3(a) | (20,575) | (6,642) |
| Less—reduction in fees due to earnings credits—Note 3(b) | (4,806) | (1) |
| Net Expenses | 1,595,243 | 2,304,849 |
| Investment Income—Net | 175,427 | 390,116 |
| Net Realized Gain (Loss) on Investments—Note 2(b) ($) | — | 54,868 |
| Net Increase in Net Assets Resulting from Operations | 175,427 | 444,984 |
| |
| See notes to financial statements. | | |
STATEMENT OF CHANGES IN NET ASSETS
| | | | | | | | |
| | | | BNY Mellon National |
| | BNY Mellon Money Market Fund | Municipal Money Market Fund |
| | Six Months Ended | | Six Months Ended | |
| | February 28, 2011 | Year Ended | February 28, 2011 | Year Ended |
| | (Unaudited) | August 31, 2010 | (Unaudited) | August 31, 2010 |
| Operations ($): | | | | |
| Investment income—net | 175,427 | 1,029,904 | 390,116 | 720,481 |
| Net realized gain (loss) from investments | — | 1,161 | 54,868 | — |
| Net Increase (Decrease) in Net Assets | | | | |
| Resulting from Operations | 175,427 | 1,031,065 | 444,984 | 720,481 |
| Dividends to Shareholders from ($): | | | | |
| Investment income—net: | | | | |
| Class M Shares | (175,427) | (1,029,904) | (390,116) | (720,481) |
| Total Dividends | (175,427) | (1,029,904) | (390,116) | (720,481) |
| Beneficial Interest Transactions ($1.00 per share): | | | | |
| Net proceeds from shares sold: | | | | |
| Class M Shares | 1,285,476,855 | 2,172,447,209 | 1,902,335,152 | 3,010,169,507 |
| Investor Shares | 3,913,209 | 132,684 | 1 | — |
| Dividends reinvested: | | | | |
| Class M Shares | 19 | 80 | 8 | 70 |
| Cost of shares redeemed: | | | | |
| Class M Shares | (1,332,793,359) | (3,014,416,869) | (1,774,754,173) | (3,229,503,661) |
| Investor Shares | (1,163,517) | (1,520,918) | (1) | — |
| Increase (Decrease) in Net Assets from | | | | |
| Beneficial Interest Transactions | (44,566,793) | (843,357,814) | 127,580,987 | (219,334,084) |
| Total Increase (Decrease) In Net Assets | (44,566,793) | (843,356,653) | 127,635,855 | (219,334,084) |
| Net Assets ($): | | | | |
| Beginning of Period | 1,093,083,254 | 1,936,439,907 | 1,551,275,378 | 1,770,609,462 |
| End of Period | 1,048,516,461 | 1,093,083,254 | 1,678,911,233 | 1,551,275,378 |
| |
| See notes to financial statements. | | | | |
20
FINANCIAL HIGHLIGHTS
The following tables describe the performance for each share class of each BNY Mellon money market fund for the fiscal periods indicated.All information reflects financial results for a single fund share.Total return shows how much your investment in the fund would have increased (or decreased) during each period, assuming you had reinvested all dividends and distributions. These figures have been derived from the funds’ financial statements.
| | | | | | | | | | | | |
| | | | Class M Shares | | |
| | Six Months Ended | | | | | |
| | February 28, 2011 | | Year Ended August 31, | |
| BNY Mellon Money Market Fund | (Unaudited) | 2010 | 2009 | 2008 | 2007 | 2006 |
| Per Share Data ($): | | | | | | |
| Net asset value, beginning of period | 1.00 | 1.00 | 1.00 | 1.00 | 1.00 | 1.00 |
| Investment Operations: | | | | | | |
| Investment income—net | .000a | .001 | .012 | .037 | .050 | 0.43 |
| Distributions: | | | | | | |
| Dividends from investment income—net | (.000)a | (.001) | (.012) | (.037) | (.050) | (.043) |
| Net asset value, end of period | 1.00 | 1.00 | 1.00 | 1.00 | 1.00 | 1.00 |
| Total Return (%) | .04b | .07 | 1.24 | 3.72 | 5.16 | 4.35 |
| Ratios/Supplemental Data (%): | | | | | | |
| Ratio of total expenses to average net assets | .30b | .30 | .33 | .30 | .30 | .31 |
| Ratio of net expenses to average net assets | .29b | .29 | .33 | .30 | .30 | .31 |
| Ratio of net investment income to average net assets | .03b | .07 | 1.08 | 3.53 | 5.04 | 4.29 |
| Net Assets, end of period ($ x 1,000) | 1,045,454 | 1,092,771 | 1,934,739 | 1,175,866 | 843,242 | 754,727 |
| |
| a | Amount represents less than $.001 per share. |
| b | Annualized. |
See notes to financial statements.
FINANCIAL HIGHLIGHTS (continued)
| | | | | | | | | | | | |
| | | | Investor Shares | | | |
| | Six Months Ended | | | | | |
| | February 28, 2011 | | Year Ended August 31, | |
| BNY Mellon Money Market Fund | (Unaudited) | 2010 | 2009 | 2008 | 2007 | 2006 |
| Per Share Data ($): | | | | | | |
| Net asset value, beginning of period | 1.00 | 1.00 | 1.00 | 1.00 | 1.00 | 1.00 |
| Investment Operations: | | | | | | |
| Investment income—net | .000a | .000a | .010 | .034 | .048 | .040 |
| Distributions: | | | | | | |
| Dividends from investment income—net | (.000)a | (.000)a | (.010) | (.034) | (.048) | (.040) |
| Net asset value, end of period | 1.00 | 1.00 | 1.00 | 1.00 | 1.00 | 1.00 |
| Total Return (%) | .00b,c | .00c | .99 | 3.47 | 4.89 | 4.09 |
| Ratios/Supplemental Data (%): | | | | | | |
| Ratio of total expenses to average net assets | .55b | .55 | .58 | .55 | .55 | .56 |
| Ratio of net expenses to average net assets | .32b | .38 | .58 | .55 | .55 | .56 |
| Ratio of net investment income to average net assets | .00b,c | .00c | .97 | 3.39 | 4.80 | 4.09 |
| Net Assets, end of period ($ x 1,000) | 3,062 | 312 | 1,701 | 1,588 | 1,354 | 890 |
| |
| a | Amount represents less than $.001 per share. |
| b | Annualized. |
| c | Amount represents less than .01%. |
See notes to financial statements.
22
| | | | | | | | | | | | |
| | | | Class M Shares | | |
| | Six Months Ended | | | | | |
| | February 28, 2011 | | Year Ended August 31, | |
| BNY Mellon National Municipal Money Market Fund | (Unaudited) | 2010 | 2009 | 2008 | 2007 | 2006 |
| Per Share Data ($): | | | | | | |
| Net asset value, beginning of period | 1.00 | 1.00 | 1.00 | 1.00 | 1.00 | 1.00 |
| Investment Operations: | | | | | | |
| Investment income—net | .000a | .000a | .008 | .024 | .033 | .028 |
| Distributions: | | | | | | |
| Dividends from investment income—net | (.000)a | (.000)a | (.008) | (.024) | (.033) | (.028) |
| Net asset value, end of period | 1.00 | 1.00 | 1.00 | 1.00 | 1.00 | 1.00 |
| Total Return (%) | .06b | .05 | .79 | 2.39 | 3.40 | 2.88 |
| Ratios/Supplemental Data (%): | | | | | | |
| Ratio of total expenses to average net assets | .29b | .30 | .35 | .31 | .30 | .32 |
| Ratio of net expenses to average net assets | .29b | .28 | .34 | .28 | .30 | .31 |
| Ratio of net investment income to average net assets | .05b | .04 | .80 | 2.24 | 3.35 | 2.86 |
| Net Assets, end of period ($ x 1,000) | 1,678,910 | 1,551,274 | 1,770,608 | 1,629,931 | 940,257 | 734,525 |
| |
| a | Amount represents less than $.001 per share. |
| b | Annualized. |
See notes to financial statements.
FINANCIAL HIGHLIGHTS (continued)
| | | | | | | | | | | | |
| | | | Investor Shares | | | |
| | Six Months Ended | | | | | |
| | February 28, 2011 | | Year Ended August 31, | | |
| BNY Mellon National Municipal Money Market Fund | (Unaudited) | 2010 | 2009 | 2008 | 2007 | 2006 |
| Per Share Data ($): | | | | | | |
| Net asset value, beginning of period | 1.00 | 1.00 | 1.00 | 1.00 | 1.00 | 1.00 |
| Investment Operations: | | | | | | |
| Investment income—net | .000a | .000a | .006 | .021 | .031 | .026 |
| Distributions: | | | | | | |
| Dividends from investment income—net | (.000)a | (.000)a | (.006) | (.021) | (.031) | (.026) |
| Net asset value, end of period | 1.00 | 1.00 | 1.00 | 1.00 | 1.00 | 1.00 |
| Total Return (%) | .00b,c | .00c | .60 | 2.13 | 3.15 | 2.62 |
| Ratios/Supplemental Data (%): | | | | | | |
| Ratio of total expenses to average net assets | .54b | .55 | .60 | .56 | .56 | .57 |
| Ratio of net expenses to average net assets | .34b | .33 | .53 | .53 | .55 | .57 |
| Ratio of net investment income to average net assets | .00b,c | .00c | .57 | 2.05 | 3.16 | 2.60 |
| Net Assets, end of period ($ x 1,000) | 1 | 1 | 1 | 1 | 1 | 1 |
| |
| a | Amount represents less than $.001 per share. |
| b | Annualized. |
| c | Amount represents less than .01%. |
See notes to financial statements.
24
NOTES TO FINANCIAL STATEMENTS (Unaudited)
NOTE 1—General:
BNY Mellon FundsTrust (the “Trust”) was organized as a Massachusetts business trust which is registered under the Investment Company Act of 1940, as amended (the “Act”), as an open-end management investment company and operates as a series company currently consisting of twenty-five series, including the following diversified money market funds: BNY Mellon Money Market Fund and BNY Mellon National Municipal Money Market Fund (each, a “fund” and collectively, the “funds”). BNY Mellon Money Market Fund’s investment objective is to provide investors with as high a level of current income as is consistent with the preservation of capital and the maintenance of liquidity. BNY Mellon National Municipal Money Market Fund’s investment objective is to provide investors with as high a level of current income exempt from federal income tax as is consistent with the preservation of capital and the maintenance of liquidity.
BNY Mellon Fund Advisers, a division of The Dreyfus Corporation (the “Manager” or “Dreyfus), a wholly-owned subsidiary of The Bank of New York Mellon Corporation (“BNY Mellon”), serves as each fund’s investment adviser (“Investment Adviser”).The Bank of New York Mellon, a subsidiary of BNY Mellon and an affiliate of Dreyfus, serves as administrator for the funds pursuant to an Administration Agreement with the Trust (the “Administration Agreement”). The Bank of New York Mellon has entered into a Sub-Administration Agreement with Dreyfus pursuant to whichThe Bank of New York Mellon pays Dreyfus for performing certain administrative services. MBSC Securities Corporation (the “Distributor”), a wholly-owned subsidiary of Dreyfus, is the distributor of each fund’s shares, which are sold without a sales charge.
The Trust is authorized to issue an unlimited number of shares of Beneficial Interest, par value $.001 per share, in each of the Class M and Investor Class shares of each fund. Each class of shares has similar rights and privileges, except with respect to the expenses borne by and the shareholder services offered to each class and the shareholder services plan applicable to the Investor shares, the allocation of certain transfer agency costs, and certain voting rights. Income, expenses (other than expenses attributable to a specific class), and realized gains or losses on investments are allocated to each class of shares based on its relative net assets.
As of February 28, 2011, MBC Investments Corp., an indirect subsidiary of BNY Mellon, held 1,109 Investor shares of the BNY Mellon National Municipal Money Market Fund.
TheTrust accounts separately for the assets, liabilities and operations of each series. Expenses directly attributable to each series are charged to that series’ operations; expenses that are applicable to all series are allocated among them on a pro rata basis.
The Financial Accounting Standards Board (“FASB”) Accounting Standards Codification (“ASC”) is the exclusive reference of authoritative U.S. generally accepted accounting principles (“GAAP”) recognized by the FASB to be applied by nongovernmental entities. Rules and interpretive releases of the Securities and Exchange Commission (“SEC”) under authority of federal laws are also sources of authoritative GAAP for SEC registrants. Each fund’s financial statements are prepared in accordance with GAAP, which may require the use of management estimates and assumptions. Actual results could differ from those estimates.
NOTES TO FINANCIAL STATEMENTS (Unaudited) (continued)
NOTE 2—Significant Accounting Policies:
(a) Portfolio valuation: Investments in securities are valued at amortized cost in accordance with Rule 2a-7 of the Act, which has been determined by the Trust’s Board to represent the fair value of the funds’ investments.
It is the funds’ policy to maintain a continuous net asset value per share of $1.00; the funds have adopted certain investment, portfolio valuation and dividend and distribution policies to enable them to do so. There is no assurance, however, that the funds will be able to maintain a stable net asset value per share of $1.00.
The fair value of a financial instrument is the amount that would be received to sell an asset or paid to transfer a liability in an orderly transaction between market participants at the measurement date (i.e. the exit price). GAAP establishes a fair value hierarchy that prioritizes the inputs of valuation techniques used to measure fair value. This hierarchy gives the highest priority to unadjusted quoted prices in active markets for identical assets or liabilities (Level 1 measurements) and the lowest priority to unobservable inputs (Level 3 measurements).
Additionally, GAAP provides guidance on determining whether the volume and activity in a market has decreased significantly and whether such a decrease in activity results in transactions that are not orderly. GAAP requires enhanced disclosures around valuation inputs and techniques used during annual and interim periods.
Various inputs are used in determining the value of each fund’s investments relating to fair value measurements.
These inputs are summarized in the three broad levels listed below:
Level 1—unadjusted quoted prices in active markets for identical investments.
Level 2—other significant observable inputs (including quoted prices for similar investments, interest rates, prepayment speeds, credit risk, etc.).
Level 3—significant unobservable inputs (including the funds’ own assumptions in determining the fair value of investments).
The inputs or methodology used for valuing securities are not necessarily an indication of the risk associated with investing in those securities. For example, money market securities are valued using amortized cost, in accordance with rules under the Act. Generally, amortized cost approximates the current fair value of a security, but since the value is not obtained from a quoted price in an active market, such securities are reflected as Level 2.
Table 1 summarizes the inputs used as of February 28, 2011 in valuing each fund’s investments.
(b) Securities transactions and investment income:
Securities transactions are recorded on a trade date basis. Interest income, adjusted for accretion of discount and amortization of premium on investments, is earned from settlement date and recognized on the accrual basis. Realized gains and losses from securities transactions are recorded on the identified cost basis. Cost of investments represents amortized cost.
| | | | |
| Table 1—Fair Value Measurements | | | | |
| |
| |
| | | Short-Term Investments ($)† | |
| | Level 1—Unadjusted | Level 2—Other Significant | Level 3—Significant | |
| | Quoted Prices | Observable Inputs | Unobservable Inputs | Total |
| BNY Mellon Money Market Fund | — | 1,047,621,067 | — | 1,047,621,067 |
| BNY Mellon National Municipal | | | | |
| Money Market Fund | — | 1,677,088,632 | — | 1,677,088,632 |
| |
| † | See Statements of Investments for additional detailed categorizations. |
26
The funds have arrangements with the custodian and cash management bank whereby the funds may receive earnings credits when positive cash balances are maintained, which are used to offset custody and cash management fees. For financial reporting purposes, the funds include net earnings credits as an expense offset in the Statements of Operations.
(c) Repurchase agreements: The funds may engage in repurchase agreement transactions. Under the terms of a typical repurchase agreement, a fund, through its custodian and sub-custodian, takes possession of an underlying debt obligation subject to an obligation of the seller to repurchase, and the fund to resell, the obligation at an agreed upon price and time, thereby determining the yield during the fund’s holding period.This arrangement results in a fixed rate of return that is not subject to market fluctuations during the fund’s holding period. The value of the collateral is at least equal, at all times, to the total amount of the repurchase obligation, including interest. In the event of a counterparty default, the fund has the right to use the collateral to offset losses incurred. There is potential loss to the fund in the event the fund is delayed or prevented from exercising its rights to dispose of the collateral securities, including the risk of a possible decline in the value of the underlying securities during the period while the fund seeks to assert its rights. The Investment Adviser reviews the value of the collateral and the creditworthiness of those banks and dealers with which the fund enters into repurchase agreements to evaluate potential risks.
(d) Dividends to shareholders: Dividends payable to shareholders are recorded by the funds on the ex-dividend date.The funds declare dividends daily from investment income-net; such dividends are paid monthly.With respect to each series, dividends from net realized capital gains, if any, are normally declared and paid annually, but the funds may make distributions on a more frequent basis to comply with the distribution requirements of the Internal Revenue Code of 1986, as amended (the
“Code”).To the extent that net realized capital gains can be offset by capital loss carryovers of that fund, it is the policy of the fund not to distribute such gains.
(e) Federal income taxes: It is the policy of the BNY Mellon Money Market Fund to continue to qualify as a regulated investment company, if such qualification is in the best interests of its shareholders, by complying with the applicable provisions of the Code, and to make distributions of taxable income sufficient to relieve it from substantially all federal income and excise taxes. It is the policy of the BNY Mellon National Municipal Market Fund to continue to qualify as a regulated investment company, which can distribute tax exempt dividends, by complying with the applicable provisions of the Code, and to make distributions of income and net realized capital gain sufficient to relieve it from substantially all federal income and excise taxes. For federal income tax purposes, each series is treated as a single entity for the purpose of determining such qualification.
As of and during the period ended February 28, 2011, the funds did not have any liabilities for any uncertain tax positions.The funds recognize interest and penalties, if any, related to uncertain tax positions as income tax expense in the Statements of Operations. During the period, the funds did not incur any interest or penalties.
Each of the tax years in the three-year period ended August 31, 2010 remains subject to examination by the Internal Revenue Service and state taxing authorities.
BNY Mellon Money Market Fund has an unused capital loss carryover of $3,895 available for federal income tax purposes to be applied against future net securities profits, if any, realized subsequent to August 31, 2010. If not applied, the carryover expires in 2017.
BNY Mellon National Municipal Money Market Fund has an unused capital loss carryover of $1,551,020 available for federal income tax purposes to be applied against future net securities profits, if any, realized subsequent to August 31, 2010. If not applied, the carryover expires in 2017.
NOTES TO FINANCIAL STATEMENTS (Unaudited) (continued)
Under the recently enacted Regulated Investment Company Modernization Act of 2010, each fund will be permitted to carry forward capital losses incurred in taxable years beginning after December 22, 2010 for an unlimited period. However, any losses incurred during those future taxable years will be required to be utilized prior to the losses incurred in pre-enactment taxable years. As a result of this ordering rule, pre-enactment capital loss carryovers may be more likely to expire unused.
The tax character of distributions paid to shareholders during the fiscal year ended August 31, 2010 was all ordinary income for the BNY Mellon Money Market Fund and for the BNY Mellon National Municipal Money Market Fund was as follows: tax exempt income $719,560 and ordinary income $921.The tax character of current year distributions will be determined at the end of the current fiscal year.
At February 28, 2011, the cost of investments for federal income tax purposes was substantially the same as the cost for financial reporting purposes (see the Statements of Investments).
NOTE 3—Investment Advisory Fee, Administration Fee and Other Transactions With Affiliates:
(a) Fees payable by the funds pursuant to the provisions of an investment advisory agreement with the Investment Adviser are payable monthly, computed on the average daily value of each fund’s net assets at the following annual rates: .15% of the BNY Mellon Money Market Fund and .15% of the BNY Mellon National Municipal Money Market Fund.
Pursuant to the Administration Agreement,The Bank of New York Mellon provides or arranges for fund accounting, transfer agency and other fund administration services and receives a fee based on the total net assets of the Trust based on the following rates:
| | |
| 0 up to $6 billion | .15% |
| $6 billion up to $12 billion | .12% |
| In excess of $12 billion | .10% |
The Bank of NewYork Mellon has entered into a Sub-Administration Agreement with Dreyfus pursuant to which The Bank of New York Mellon pays Dreyfus for performing certain administrative services.
BNY Mellon Fund Advisors has undertaken to reimburse expenses in the event that current yields drop below a certain level. Such expense limitations may fluctuate daily, are voluntary and not contractual and may be terminated at any time. The reduction in expenses, pursuant to the undertaking, amounted to $20,575 for the BNY Mellon Money Market Fund and $6,642 for the BNY Mellon National Municipal Money Market Fund, respectively, during the period ended February 28, 2011.
(b) The funds have adopted a Shareholder Services Plan with respect to its Investor shares pursuant to which each fund pays the Distributor for the provision of certain services to holders of Investor shares a fee at an annual rate of .25% of the value of the average daily net assets attributable to Investor shares. The services provided may include personal services relating to shareholder accounts, such as answering shareholder inquiries regarding a fund, and providing reports and other information, and services related to the maintenance of such shareholder accounts. The Shareholder Services Plan allows the Distributor to make payments from the shareholder services fees it collects from each fund to compensate service agents (certain banks, securities brokers or dealers and other financial institutions) in respect of these services. Table 2 summarizes the amounts Investor shares were charged during the period ended February 28, 2011, pursuant to the Shareholder Services Plan. Additional fees included in shareholder servicing costs in the Statements of Operations include fees paid for cash management charges.
| | |
| Table 2—Shareholder Service Plan Fees | | |
| BNY Mellon Money Market Fund | $ | 970 |
| BNY Mellon National Municipal | | |
| Money Market Fund | | 1 |
The funds compensate The Bank of New York Mellon under cash management agreements for performing cash
28
management services related to fund subscriptions and redemptions. Table 3 summarizes the amount each fund was charged during the period ended February 28, 2011, pursuant to the cash management agreements, which is included in Shareholder servicing costs in the Statements of Operations.These fees were partially offset by earnings credits pursuant to the cash management agreements, also summarized in Table 3.
| | | |
| Table 3—Cash Management Agreement Fees | | |
| | Cash Management | Earnings | |
| | Fees ($) | Credits ($) | |
| BNY Mellon | | | |
| Money Market Fund | 17 | (1 | ) |
| BNY Mellon National | | | |
| Municipal Money | | | |
| Market Fund | 11 | (1 | ) |
The funds also compensate The Bank of New York Mellon under a custody agreement for providing custodial services for each fund. These fees were partially offset by earnings credits pursuant to the custody agreement, also summarized in Table 4 for each relevant fund
| | | |
| Table 4—Custody Agreement Fees | | |
| | Custody | Earnings |
| | Fees ($) | Credits ($) |
| BNY Mellon Money Market Fund | 44,804 | (4,805) |
| BNY Mellon National Municipal | | |
| Money Market Fund | 50,868 | — |
During the period ended February 28, 2011, each fund was charged $3,197 for services performed by the Chief Compliance Officer.
Table 5 summarizes the components of “Due to The Dreyfus Corporation and affiliates” in the Statement of Assets and Liabilities for each fund.
(c) Each trustee who is not an “affiliated person” as defined in the Act receives from the Trust an annual fee of $68,000 and an attendance fee of $7,500 for each in-person meeting attended and $500 for telephone meetings and is reimbursed for travel and out-of-pocket expenses.The Chairman of the Trust’s Board receives an additional annual fee of $15,000 and the Chairman of the Trust’s Audit Committee receives an additional annual fee of $10,000.
NOTE 4—Securities Transactions:
The funds are permitted to purchase or sell securities from or to certain affiliated funds under specified conditions outlined in procedures adopted by the Trust’s Board.The procedures have been designed to ensure that any purchase or sale of securities by the funds from or to another fund or portfolio that are, or could be, considered an affiliate by virtue of having a common investment adviser (or affiliated investment adviser), commonTrustee and/or common officers, complies with Rule 17a-7 of the Act. During the period ended February 28, 2011, BNY Mellon National Municipal Money Market Fund engaged in purchases and sales of securities pursuant to Rule 17a-7 of the Act amounting to $418,445,000 and $189,030,000, respectively.
| | | | | | |
| Table 5—Due to The Dreyfus Corporation and Affiliates | | | | |
| |
| | Investment | Shareholder | | Chief | |
| | Advisory | Services | Custody | Compliance | Less Expense |
| | Fees ($) | Plan Fees ($) | Fees ($) | Officer Fees ($) | Reimbursement ($) |
| BNY Mellon Money Market Fund | 123,385 | 585 | 32,415 | 1,433 | (541) |
| BNY Mellon National Municipal Money Market Fund | 194,156 | — | 41,263 | 1,433 | — |
For More Information
| |
| BNY Mellon Funds Trust | Custodian |
| c/o The Dreyfus Corporation | |
| 200 Park Avenue | The Bank of New York Mellon |
| New York, NY 10166 | One Wall Street |
| | New York, NY 10286 |
| Investment Adviser | |
| | Transfer Agent & |
| BNY Mellon Fund Advisers, a division of | Dividend Disbursing Agent |
| The Dreyfus Corporation | |
| 200 Park Avenue | Dreyfus Transfer, Inc. |
| New York, NY 10166 | 200 Park Avenue |
| | New York, NY 10166 |
| Administrator | |
| | Distributor |
| The Bank of New York Mellon | |
| One Wall Street | MBSC Securities Corporation |
| New York, NY 10286 | 200 Park Avenue |
| | New York, NY 10166 |
| Sub-Administrator | |
| |
| The Dreyfus Corporation | |
| 200 Park Avenue | |
| New York, NY 10166 | |
| | |
| Ticker Symbols: | | |
| BNY Mellon Money Market Fund | Class M: MLMXX | Investor: MLOXX |
| BNY Mellon National Municipal Money Market Fund | Class M: MOMXX | Investor: MNTXX |
Telephone Wealth Management (WM) Clients, please contact your Account Officer or call 1-888-281-7350. Brokerage Clients of BNY Mellon Wealth Advisors (BNYMWA), please contact your financial representative or call 1-800-830-0549, Option 2. Individual Account holders, please call Dreyfus at 1-800-645-6561.
Mail WM Clients, write to your Account Officer, c/o The Bank of New York Mellon, One Mellon Bank Center, Pittsburgh, PA 15258 BNYMWA Brokerage Clients, write to your financial representative, P.O. Box 9012, Hicksville, NY 11802–9012 Individual Account Holders, write to: BNY Mellon Funds, P.O. Box 55268, Boston, MA 02205–8502
Each fund will disclose daily, on http://www.dreyfus.com, the fund’s complete schedule of holdings as of the end of the previous business day. The schedule of holdings will remain on the website until the fund files its Form N-Q or Form N-CSR for the period that includes the date of the posted holdings.
The funds file their complete schedule of portfolio holdings with the Securities and Exchange Commission (“SEC”) for the first and third quarters of each fiscal year on Form N-Q. The funds’ Forms N-Q are available on the SEC’s website at http://www.sec.gov and may be reviewed and copied at the SEC’s Public Reference Room in Washington, DC. Information on the operation of the Public Reference Room may be obtained by calling 1-800-SEC-0330.
Information regarding how the funds voted proxies relating to portfolio securities for the most recent 12-month period ended June 30 is available on the SEC’s website at http://www.sec.gov and without charge, upon request, by calling 1-800-645-6561.
©2011 MBSC Securities Corporation
MFTSA0211-MM
Item 2. Code of Ethics.
Not applicable.
Item 3. Audit Committee Financial Expert.
Not applicable.
Item 4. Principal Accountant Fees and Services.
Not applicable.
Item 5. Audit Committee of Listed Registrants.
Not applicable.
Item 6. Investments.
(a) Not applicable.
Item 7. Disclosure of Proxy Voting Policies and Procedures for Closed-End Management Investment Companies.
Not applicable.
Item 8. Portfolio Managers of Closed-End Management Investment Companies.
Not applicable.
Item 9. Purchases of Equity Securities by Closed-End Management Investment Companies and Affiliated Purchasers.
Not applicable. [CLOSED END FUNDS ONLY]
Item 10. Submission of Matters to a Vote of Security Holders.
There have been no material changes to the procedures applicable to Item 10.
Item 11. Controls and Procedures.
(a) The Registrant's principal executive and principal financial officers have concluded, based on their evaluation of the Registrant's disclosure controls and procedures as of a date within 90 days of the filing date of this report, that the Registrant's disclosure controls and procedures are reasonably designed to ensure that information required to be disclosed by the Registrant on Form N-CSR is recorded, processed, summarized and reported within the required time periods and that information required to be disclosed by the Registrant in the reports that it files or submits on Form N-CSR is accumulated and communicated to the Registrant's management, including its principal executive and principal financial officers, as appropriate to allow timely decisions regarding required disclosure.
(b) There were no changes to the Registrant's internal control over financial reporting that occurred during the second fiscal quarter of the period covered by this report that have materially affected, or are reasonably likely to materially affect, the Registrant's internal control over financial reporting.
Item 12. Exhibits.
(a)(1) Not applicable.
(a)(2) Certifications of principal executive and principal financial officers as required by Rule 30a-2(a) under the Investment Company Act of 1940.
(a)(3) Not applicable.
(b) Certification of principal executive and principal financial officers as required by Rule 30a-2(b) under the Investment Company Act of 1940.
SIGNATURES
Pursuant to the requirements of the Securities Exchange Act of 1934 and the Investment Company Act of 1940, the Registrant has duly caused this Report to be signed on its behalf by the undersigned, thereunto duly authorized.
BNY Mellon Funds Trust
By: /s/ Christopher Sheldon |
Christopher Sheldon, President |
Date: | 4/26/2011 |
|
Pursuant to the requirements of the Securities Exchange Act of 1934 and the Investment Company Act of 1940, this Report has been signed below by the following persons on behalf of the Registrant and in the capacities and on the dates indicated. |
|
By: /s/ Christopher Sheldon |
Christopher Sheldon, President |
Date: | 4/26/2011 |
|
By: /s/ James Windels |
James Windels, Treasurer |
Date: | 4/26/2011 |
|
EXHIBIT INDEX
(a)(2) Certifications of principal executive and principal financial officers as required by Rule 30a-2(a) under the Investment Company Act of 1940. (EX-99.CERT)
(b) Certification of principal executive and principal financial officers as required by Rule 30a-2(b) under the Investment Company Act of 1940. (EX-99.906CERT)