UNITED STATES
SECURITIES AND EXCHANGE COMMISSION
Washington, D.C. 20549
FORM N-CSR
CERTIFIED SHAREHOLDER REPORT OF REGISTERED MANAGEMENT
INVESTMENT COMPANIES
Investment Company Act file number | 811-09903 | |||||
|
| |||||
| BNY Mellon Funds Trust |
| ||||
| (Exact name of Registrant as specified in charter) |
| ||||
|
|
| ||||
|
c/o The Dreyfus Corporation 200 Park Avenue New York, New York 10166 |
| ||||
| (Address of principal executive offices) (Zip code) |
| ||||
|
|
| ||||
| Janette E. Farragher, Esq. 200 Park Avenue New York, New York 10166 |
| ||||
| (Name and address of agent for service) |
| ||||
| ||||||
Registrant's telephone number, including area code: | (212) 922-6000 | |||||
|
| |||||
Date of fiscal year end:
| 8/31 |
| ||||
Date of reporting period: | 2/28/2013 |
| ||||
The BNY Mellon Funds
BNY Mellon Large Cap Stock Fund
BNY Mellon Large Cap Market Opportunities Fund
BNY Mellon Tax-Sensitive Large Cap Multi-Strategy Fund
BNY Mellon Income Stock Fund
BNY Mellon Mid Cap Multi-Strategy Fund
BNY Mellon Small Cap Multi-Strategy Fund
BNY Mellon U.S. Core Equity 130/30 Fund
BNY Mellon Focused Equity Opportunities Fund
BNY Mellon Small/Mid Cap Fund
BNY Mellon International Fund
BNY Mellon Emerging Markets Fund
BNY Mellon International Appreciation Fund
BNY Mellon International Equity Income Fund
BNY Mellon Asset Allocation Fund
SEMIANNUAL REPORT February 28, 2013

DISCUSSION OF
FUND PERFORMANCE
For the period of September 1, 2012, through February 28, 2013, as provided by Sean P. Fitzgibbon and Jeffrey D. McGrew, Portfolio Managers
Fund and Market Performance Overview
For the six-month period ended February 28, 2013, BNY Mellon Large Cap Stock Fund’s Class M shares produced a total return of 7.28%, and Investor shares returned 7.26%.1 In comparison, the total return of the Standard & Poor’s 500 Composite Stock Price Index (“S&P 500 Index”), the fund’s benchmark, was 8.94%.2
Stocks generally rallied over the reporting period as global and domestic economic concerns waned. The fund produced lower returns than its benchmark, mainly due to shortfalls stemming from our stock selection strategy in the information technology and energy sectors.
The Fund’s Investment Approach
The fund seeks capital appreciation.To pursue its goal, the fund normally invests at least 80% of its assets in stocks of large-cap companies.We choose stocks through a disciplined investment process that uses computer modeling techniques to identify and rank companies based on value, growth and other financial characteristics. Also, we use fundamental analysis, conducting independent research to select the most attractive of the higher-ranked securities. We also attempt to manage risks by diversifying the fund’s investments across companies and industries, maintaining weightings and risk characteristics that generally are similar to those of the S&P 500 Index.
Improving Macroeconomic Conditions Fueled Market Gains
Several positive developments drove stock prices broadly higher over the reporting period. In the wake of earlier market declines, a sustained market rally began near the start of the reporting period when various macroeconomic worries failed to materialize. Instead, investors responded positively to news of improved employment and housing market trends in the United States, a stated commitment from the European Central Bank in support of the euro, and expectations that new leadership in China might lead to stronger regional growth.
The U.S. stock market lost some ground in November when a contentious political debate intensified regarding automatic tax hikes and spending cuts scheduled for the start of 2013, but continued corporate earnings strength and last-minute legislation to address the scheduled tax increases enabled stocks to resume their rally through the reporting period’s end. In this environment, value-oriented stocks generally provided higher returns than their growth-oriented counterparts.
Stock Selection Strategy Produced Mixed Results
While the fund participated to a substantial degree in the U.S. stock market’s gains, its relative performance was undermined by our security selections in the information technology sector, where the fund held relatively few of the lower quality stocks that led the market segment higher. Instead, we focused on higher quality companies, such as digital storage provider
The Funds 3
DISCUSSION OF FUND PERFORMANCE (continued)
EMC, which trailed sector averages. In addition, consumer electronics leader Apple gave back some of its previous gains when investors responded negatively to mounting competitive pressures and a maturing product cycle. Suppliers to Apple also encountered deteriorating investor sentiment, leading to lower stock prices for holdings such as power amplifier manufacturer Skyworks Solutions.The energy sector also contained some disappointments, most notably National Oilwell Varco, which weakened in light of deteriorating profit margins and decelerating volume growth.
The fund achieved better relative returns in the materials sector, where our focus on domestically focused companies over their global counterparts proved effective, as did an emphasis on companies—such as LyondelBasell Industries—that stood to benefit from low domestic natural gas prices. Robust relative performance in the industrials sector was driven by a number of successful stock selections.Temporary staffing company Robert Half International benefited from an improving labor market, particularly among its customers in the information technology and financials industries. Diversified power management company Eaton gained value when investors responded positively to a recent acquisition, which resulted in better-than-expected cost savings.
Stocks May Be Poised for Additional Gains
We have been encouraged by recently positive economic data, which we believe could help drive further stock market gains. Interest rates remain near historical lows, and many companies have shored up their balance sheets with
large cash balances that can be used more productively through mergers and acquisitions, capital investments, share buyback programs and higher dividends as business conditions improve.
We have prepared for a constructive investment environment by emphasizing companies that tend to be more sensitive to economic cycles.We have found a number of opportunities meeting our investment criteria in the industrials, financials and information technology sectors, where we believe valuations remain attractive. In addition, we have identified companies across a variety of industry groups that we believe are poised to benefit from recovering U.S. housing markets and pent-up demand for capital investments among businesses. Conversely, we have found relatively few opportunities in the traditionally defensive utilities and telecommunications services sectors.
March 15, 2013
Equity funds are subject generally to market, market sector, market liquidity,
issuer and investment style risks, among other factors, to varying degrees, all of
which are more fully described in the fund’s prospectus.
1 Total return includes reinvestment of dividends and any capital gains paid.
Past performance is no guarantee of future results. Share price and investment
return fluctuate such that upon redemption, fund shares may be worth more or
less than their original cost.
2 SOURCE: LIPPER INC. — Reflects the monthly reinvestment of
dividends and, where applicable, capital gain distributions.The Standard &
Poor’s 500 Composite Stock Price Index is a widely accepted, unmanaged
index of U.S. stock market performance. Index return does not reflect fees and
expenses associated with operating a mutual fund. Investors cannot invest
directly in any index.
4

DISCUSSION OF
FUND PERFORMANCE
For the period of September 1, 2012, through February 28, 2013, as provided by Bernard Schoenfeld, Portfolio Manager
Fund and Market Performance Overview
For the six-month period ended February 28, 2013, BNY Mellon Large Cap Market Opportunities Fund’s Class M shares produced a total return of 7.54%, and Investor shares returned 7.44%.1 In comparison, the total return of the Standard & Poor’s 500 Composite Stock Price Index (“S&P 500 Index”), the fund’s benchmark, was 8.94%.2
Large-cap stocks generally rallied over the reporting period as investors responded positively to improving economic data.The fund produced lower returns than its primary benchmark, mainly due to shortfalls in its underlying Focused Equity Strategy and U.S. Core Equity 130/30 Strategy.
The Fund’s Investment Approach
The fund seeks long-term capital appreciation. To pursue its goal, the fund normally invests at least 80% of its assets in equity securities of large-cap companies, currently defined to be those companies with total market capitalizations of $5 billion or more at the time of the purchase. The fund normally allocates its assets among multiple investment strategies, each employed by the fund’s investment adviser or its affiliates that invest primarily in equity securities issued by large-cap companies. The fund is designed to provide exposure to various large-cap equity portfolio managers and investment strategies and styles, including some or all of the following: the Focused Equity Strategy, U.S. Large Cap Equity Strategy, U.S. Core Equity 130/30 Strategy, Dynamic Large CapValue Strategy, Large Cap Growth Strategy, U.S. Large Cap Growth Strategy, Income Stock Strategy, Appreciation Strategy and Large Cap Dividend Strategy, all as more particularly described in the fund’s prospectus. The fund invests directly in securities or in other mutual funds advised by the fund’s investment adviser or its affiliates.
The fund’s investment adviser determines the investment strategies, sets the target allocations, monitors portfolio trading activity within the investment strategies and executes all purchases and sales of portfolio securities of the fund.
Improving Economic Conditions Fueled Market Gains
Several positive developments drove stock prices broadly higher over the reporting period. In the wake of earlier market declines, a sustained market rally began near the start of the reporting period when the European financial crisis did not worsen, China appeared to have engineered a soft landing for its economy, and recession fears faded in the United States. Instead, investors responded positively to news of improved employment and housing market trends in the United States, a stated commitment from the European Central Bank in support of the euro, and expectations that new leadership in China might lead to stronger regional growth.
The U.S. stock market lost some ground in November when investors grew concerned about uncertainty surrounding the presidential election and automatic tax hikes and spending cuts scheduled for the start of 2013, but continued corporate earnings strength and last-minute legislation to address the scheduled tax increases enabled stocks to resume their rally through the reporting period’s end. In this environment, large-cap stocks lagged their mid- and small-cap counterparts, on average.
The Funds 5
DISCUSSION OF FUND PERFORMANCE (continued)
Underlying Investments Produced Mixed Results
Although the fund participated to a significant degree in gains posted by the S&P 500 Index over the reporting period, its performance compared to the benchmark was dampened by its allocation to the Focused Equity Strategy, which was hurt by disappointing security selections in the information technology, financials and health care sectors. Overweighted exposure to consumer electronics giant Apple accounted for a substantial portion of the Focused Equity Strategy’s lagging performance. After years of steady gains, Apple declined sharply during the reporting period due to concerns regarding intensifying competitive pressures in the smartphone and tablet computing categories. In addition, the U.S. Core Equity 130/30 Strategy was hurt by unfavorable stock picks in the information technology, consumer discretionary and energy sectors, where relative weakness was exacerbated by the fund’s leveraged investment approach.
The fund’s other underlying investments fared better. The fund’s U.S. Large Cap Growth Strategy outpaced its benchmark due to successful security selections in the information technology, consumer discretionary, and materials sectors, and its U.S. Large Cap Equity Strategy benefited from underweighted exposure to the financials sector.
We made no changes to the fund’s allocation during the reporting period.
Stocks May Be Poised for Additional Gains
We have been encouraged by recently positive economic data. Moreover, interest rates remain near historical lows, and many companies’ balance sheets contain large cash balances that can be used more productively through mergers and acquisitions, capital investments, share buy-back programs and higher dividends.Therefore, we have maintained the fund’s generally constructive investment posture. However, as always, we remain watchful for opportunities to enhance returns and manage risks more effectively through adjustments to the fund’s allocations.
March 15, 2013
Equity funds are subject generally to market, market sector, market liquidity,
issuer and investment style risks, among other factors, to varying degrees, all of
which are more fully described in the fund’s prospectus.
The fund may use derivative instruments, such as options, futures and options
on futures and swaps.A small investment in derivatives could have a
potentially large impact on the fund’s performance.The use of derivatives
involves risks different from, or possibly greater than, the risks associated with
investing directly in the underlying assets.
1 Total return includes reinvestment of dividends and any capital gains paid.
Past performance is no guarantee of future results. Share price and investment
return fluctuate such that upon redemption, fund shares may be worth more or
less than their original cost.
2 SOURCE: LIPPER INC. — Reflects monthly reinvestment of dividends
and, where applicable, capital gain distributions.The Standard & Poor’s 500
Composite Stock Price Index is a widely accepted, unmanaged index of U.S.
stock market performance. Investors cannot invest directly in any index.
6

DISCUSSION OF
FUND PERFORMANCE
For the period of September 1, 2012, through February 28, 2013, as provided by Bernard Schoenfeld, Portfolio Manager
Fund and Market Performance Overview
For the six-month period ended February 28, 2013, BNY Mellon Tax-Sensitive Large Cap Multi-Strategy Fund’s Class M shares produced a total return of 7.40%, and Investor shares returned 8.78%.1 In comparison, the total return of the Standard & Poor’s 500 Composite Stock Price Index (“S&P 500 Index”), the fund’s benchmark, was 8.94%.2
Large-cap stocks generally rallied over the reporting period as investors responded positively to improving economic data.The fund produced lower returns than its primary benchmark, mainly due to shortfalls in its underlying Focused Equity Strategy and U.S. Core Equity 130/30 Strategy.
The Fund’s Investment Approach
The fund seeks long-term capital appreciation. To pursue its goal, the fund normally invests at least 80% of its net assets in equity securities of large-cap companies, currently defined to be those companies with total market capitalizations of $5 billion or more at the time of purchase.The fund normally allocates its assets among multiple investment strategies, each employed by the fund’s investment adviser or its affiliates, that invest primarily in equity securities issued by large-cap compa-nies.The fund is designed to provide exposure to various large-cap equity portfolio managers and investment strategies and styles, and uses tax-sensitive strategies to reduce the impact of federal and state income taxes on its after-tax returns.The fund apportions its assets among some or all of the following: the Large Cap Core Strategy, Large Cap Tax-Sensitive Strategy, Focused Equity Strategy, U.S. Large Cap Equity Strategy, U.S. Core Equity 130/30 Strategy, Dynamic Large CapValue Strategy, Large Cap Growth Strategy, U.S. Large Cap Growth Strategy, Income Stock Strategy, Appreciation Strategy and Large Cap Dividend Strategy, all as more particularly described in the fund’s prospectus.The fund invests directly in securities or in other mutual funds advised by the fund’s investment adviser or its affiliates.
The fund’s investment adviser determines the investment strategies, sets the target allocations, monitors portfolio trading activity within the investment strategies and executes all purchases and sales of portfolio securities of the fund.
Improving Economic Conditions Fueled Market Gains
In the wake of earlier market declines, a sustained market rally began near the start of the reporting period when the European financial crisis did not worsen, China appeared to have engineered a soft landing for its economy, and recession fears faded in the United States. Instead, investors responded positively to news of improved employment and housing market trends in the United States, a stated commitment from the European Central Bank in support of the euro, and expectations that new leadership in China might lead to stronger regional growth.
The U.S. stock market lost some ground in November when investors grew concerned about uncertainty surrounding the presidential election and automatic tax hikes and spending cuts scheduled for the start of 2013, but continued corporate earnings strength and
The Funds 7
DISCUSSION OF FUND PERFORMANCE (continued)
last-minute legislation to address the scheduled tax increases enabled stocks to resume their rally through the reporting period’s end. In this environment, large-cap stocks produced lower returns than their mid- and small-cap counterparts, on average.
Underlying Investments Produced Mixed Results
Although the fund participated to a significant degree in gains posted by the S&P 500 Index over the reporting period, its performance compared to the benchmark was dampened by its allocation to the Focused Equity Strategy, which was hurt by disappointing security selections in the information technology, financials and health care sectors. Overweighted exposure to consumer electronics giant Apple accounted for a substantial portion of the Focused Equity Strategy’s lagging performance. After years of steady gains, Apple declined sharply during the reporting period due to concerns regarding intensifying competitive pressures in the smartphone and tablet computing categories. In addition, the U.S. Core Equity 130/30 Strategy was hurt by shortfalls in the information technology, consumer discretionary and energy sectors, where relative weakness was exacerbated by the fund’s leveraged investment approach.
The fund’s other underlying investments fared better. The U.S. Large Cap Growth Strategy outpaced its benchmark due to successful security selections in the information technology, consumer discretionary, and materials sectors, and the U.S. Large Cap Equity Strategy benefited from underweighted exposure to the financials sector. The fund’s Large Cap Core Strategy produced returns that were roughly in line with market averages.
We made no changes to the fund’s allocation during the reporting period.
Stocks May Be Poised for Additional Gains
We have been encouraged by recently positive economic data. Moreover, interest rates remain near historical lows, and many companies’ balance sheets contain large cash balances that can be used more productively through mergers and acquisitions, capital investments, share buy-back programs and higher dividends. Therefore, we have maintained the fund’s generally constructive investment posture. However, as always, we remain watchful for opportunities to enhance returns and manage risks more effectively through adjustments to the fund’s allocations.
March 15, 2013
Equity funds are subject generally to market, market sector, market liquidity,
issuer and investment style risks, among other factors, to varying degrees, all of
which are more fully described in the fund’s prospectus.
The fund may use derivative instruments, such as options, futures and options
on futures and swaps.A small investment in derivatives could have a
potentially large impact on the fund’s performance.The use of derivatives
involves risks different from, or possibly greater than, the risks associated with
investing directly in the underlying assets.
1 Total return includes reinvestment of dividends and any capital gains paid.
Past performance is no guarantee of future results. Share price and investment
return fluctuate such that upon redemption, fund shares may be worth more or
less than their original cost.
2 SOURCE: LIPPER INC. — Reflects monthly reinvestment of dividends
and, where applicable, capital gain distributions.The Standard & Poor’s 500
Composite Stock Price Index is a widely accepted, unmanaged index of U.S.
stock market performance. Investors cannot invest directly in any index.
8

DISCUSSION OF
FUND PERFORMANCE
For the period of September 1, 2012, through February 28, 2013, as provided by John C. Bailer, Portfolio Manager
Fund and Market Performance Overview
For the six-month period ended February 28, 2013, BNY Mellon Income Stock Fund’s Class M shares produced a total return of 12.33%, and its Investor shares returned 12.25%.1 In comparison, the fund’s benchmark, the Dow Jones U.S. Select Dividend Index, produced a total return of 8.98% for the same period.2 The fund’s previous benchmark, the Russell 1000 Value Index, produced a total return of 13.15% for the same period.3
Stocks generally rallied over the reporting period as global and domestic economic concerns waned. The fund produced higher returns than its benchmark, mainly due to the success of our stock selection strategy in nine of the 10 sectors represented in the Dow Jones U.S. Select Dividend Index.
The Fund’s Investment Approach
The fund seeks total return consisting of capital appreciation and income.To pursue its goal, the fund normally invests at least 80% of its assets in stocks.The fund seeks to focus on dividend-paying stocks and other investment techniques that produce income. We choose stocks through a disciplined investment process that combines quantitative modeling techniques, fundamental analysis and risk management.While we attempt to manage risks by diversifying broadly across companies and industries, the fund may at times overweight certain sectors in an attempt to earn higher yields. The fund may also use derivatives as a substitute for taking a position in an underlying asset, to increase returns or income, or as part of a hedging strategy.
Improving Macroeconomic Conditions Fueled Market Gains
Several positive developments drove stock prices broadly higher over the reporting period. In the wake of earlier market declines, a sustained market rally began near the start of the reporting period when various macroeconomic worries failed to materialize, boosting investor sentiment. Investors responded positively to news of improved employment and housing market trends in the United States, a stated commitment from the European Central Bank in support of the euro, and expectations that new leadership in China might lead to stronger regional growth.
The U.S. market lost some ground in November when a contentious political debate intensified regarding automatic tax hikes and spending cuts scheduled for the start of 2013, but continued corporate earnings strength and last-minute legislation to address the scheduled tax increases enabled stocks to resume their rally through the reporting period’s end. However, in this environment, well established, dividend-paying stocks generally lagged broader market averages as investors turned toward more speculative companies. Consequently, the Dow Jones U.S. Select Dividend Index produced lower returns than the Russell 1000 Value Index during the reporting period.
The Funds 9
DISCUSSION OF FUND PERFORMANCE (continued)
Strong Stock Selections Drove Fund Results Higher
The fund’s strong relative performance was mainly the result of our disciplined investment process as we believe investors paid greater attention to valuations and business fundamentals, and less to economic worries. The fund’s advance was led by the materials sector, where our focus on domestically focused companies over their global counterparts proved effective, as did an emphasis on companies—such as LyondelBasell Industries, Eastman Chemical and International Paper—that stood to benefit from low domestic natural gas prices. In addition, the fund avoided relative weakness in iron ore producer Cliffs Natural Resources.
Among consumer staples companies, agricultural producer ConAgra Foods posted better-than-expected earnings when input costs declined and prices for its products rose. The fund largely avoided pockets of weakness through underweighted exposure to companies such as tobacco producer Lorillard. In the consumer discretionary sector, media-related stocks generated higher levels of free cash flow, benefiting fund holdings such as movie theater operator Regal Entertainment Group and media conglomerate Time Warner.
Only the telecommunications services sector detracted from the fund’s relative results for the reporting period, primarily due to overweighted exposure to that sector. In addition, the fund suffered shortfalls from wireless carrier Vodafone Group and rural communications provider Windstream.
Stocks May Be Poised for Additional Gains
We have been encouraged by recently positive economic data, which we believe could help drive further stock market gains. Interest rates remain near historical lows, and many companies have shored up their balance sheets with
large cash balances that can be used more constructively through mergers and acquisitions, capital investments, share buyback programs and higher dividends as business conditions improve.
We have prepared for a more constructive investment environment by emphasizing companies that tend to be more sensitive to economic cycles. We have found a number of opportunities meeting our investment criteria in the information technology, health care and consumer discretionary sectors, where we believe valuations remain attractive. We have found fewer opportunities in the utilities sector, which comprises the largest segment of the Dow Jones U.S. Select Dividend Index, due to stretched valuations and limited growth prospects.
March 15, 2013
1 Total return includes reinvestment of dividends and any capital gains paid.
Past performance is no guarantee of future results. Share price and investment
return fluctuate such that upon redemption, fund shares may be worth more or
less than their original cost.
2 SOURCE: LIPPER INC. – Reflects the reinvestment of dividends and,
where applicable, capital gain distributions.The Dow Jones U.S. Select
Dividend Index is an unmanaged index which represents the country’s
leading stocks by dividend yield. One hundred U.S. stocks are selected to the
index by dividend yield, subject to screens for dividend-per-share growth rate,
dividend payout ratio and average daily dollar trading volume. Investors
cannot invest directly in any index. Effective March 15, 2011, BNY
Mellon Income Stock Fund changed its benchmark from the Russell 1000
Value Index to the Dow Jones U.S. Select Dividend Index.The Dow Jones
U.S. Select Dividend Index was first calculated on November 3, 2003.
Accordingly, the fund will continue to report the performance of the Russell
1000 Value Index until the Dow Jones U.S. Select Dividend Index has
been calculated for a 10-year period.
3 SOURCE: LIPPER INC. — Reflects the reinvestment of dividends and,
where applicable, capital gain distributions.The Russell 1000 Value Index is
an unmanaged index which measures the performance of those Russell 1000
companies with lower price-to-book ratios and lower forecasted growth values.
Investors cannot invest directly in any index.
10
DISCUSSION OF
FUND PERFORMANCE
For the period of September 1, 2012, through February 28, 2013, as provided by Bernard Schoenfeld, Portfolio Manager
Fund and Market Performance Overview
For the six-month period ended February 28, 2013, BNY Mellon Mid Cap Multi-Strategy Fund’s Class M shares produced a total return of 13.33%, and Investor shares returned 13.21%.1 In comparison, The Russell Midcap® Index, which became the fund’s new benchmark on August 20, 2012, produced a total return of 13.84% for the reporting period.2 The Standard & Poor’s MidCap 400 Index (“S&P 400 Index”), the fund’s former primary benchmark, produced a total return of 14.36% for the same period.3
Midcap stocks generally rallied over the reporting period as investors responded positively to improving economic data.The fund produced lower returns than its primary benchmark, mainly due to shortfalls in its underlying Mid Cap Growth Strategy.
The Fund’s Investment Approach
The fund seeks capital appreciation.The fund pursues its goal by normally investing at least 80% of its net assets in equity securities of midcap companies.The fund considers midcap companies to be those companies with market capitalizations, at the time of purchase, that are within the market capitalization range of companies comprising the Russell Midcap® Index as of the index’s most recent reconstitution date. Furthermore, the fund normally allocates assets across multiple investment strategies employed by the investment adviser and an unaffiliated sub-investment adviser that invest primarily
in equity securities issued by midcap companies. The investment adviser determines the investment strategies and sets target allocations and ranges. The fund is designed to provide exposure to investment strategies and styles, including the Mid Cap Tax-Sensitive Core Strategy, Opportunistic Mid Cap Value Strategy, Mid Cap Growth Strategy and Robeco Mid Cap Value Strategy, all as more particularly described in the fund’s prospectus.
Effective March 21, 2013, Geneva Capital Management Ltd. became an additional sub-investment adviser to the fund with respect to the Geneva Mid Cap Growth Strategy, which was added to the fund at that time.
Improving Economic Conditions Fueled Market Gains
In the wake of earlier market declines, a sustained market rally began near the start of the reporting period when the European financial crisis did not worsen, China appeared to have engineered a soft landing for its economy, and recession fears faded in the United States. Instead, investors responded positively to news of improved U.S. employment and housing market trends, a stated commitment from the European Central Bank in support of the euro, and expectations that new leadership in China might lead to stronger regional growth.
The U.S. stock market lost some ground in November when investors grew concerned about uncertainty surrounding the presidential election and automatic tax hikes and spending cuts scheduled for the start of
The Funds 11
DISCUSSION OF FUND PERFORMANCE (continued)
2013, but continued corporate earnings strength and last-minute legislation to address the scheduled tax increases enabled stocks to resume their rally through the reporting period’s end. In this environment, midcap stocks produced higher returns than their large- and small-cap counterparts, on average.
Underlying Investments Produced Mixed Results
The reporting period began in the midst of the fund’s transition to a modified investment strategy and new portfolio management team. Although the fund participated to a significant degree in gains posted by the Russell Midcap Index over the reporting period, lagging performance stemming from legacy positions during the transition dampened its results compared to its primary benchmark. In addition, the fund’s relative performance was undermined by its allocation to the Mid Cap Growth Strategy, which was hurt by shortfalls in its security selection strategy in the financials, health care and consumer staples sectors.
The fund’s other underlying investments fared better.The Opportunistic Mid Cap Strategy outpaced its benchmark due to successful security selections, particularly in the consumer discretionary sector. The Robeco Mid Cap Value Strategy also fared better than the benchmark.As it is designed to do, the Mid Cap Tax-Sensitive Core Strategy produced returns that were roughly in line with that of the Russell MidCap® Index.
We have implemented no changes to the fund’s allocation since completing the transition to the modified investment strategy.
Stocks May Be Poised for Additional Gains
We have been encouraged by recently positive economic data. Moreover, interest rates remain near historical lows, and many large-cap companies’ balance sheets contain large cash balances that can be used more productively, including through capital investments and acquisitions of small- and midcap businesses. Therefore, we have maintained the fund’s generally constructive investment posture. However, as always, we remain watchful for opportunities to enhance returns and manage risks more effectively through adjustments to the fund’s allocations among its underlying investments.
March 15, 2013
Equity funds are subject generally to market, market sector, market liquidity,
issuer and investment style risks, among other factors, to varying degrees, all of
which are more fully described in the fund’s prospectus.
Stocks of small- and/or midcap companies often experience sharper price
fluctuations than stocks of large-cap companies.
1 Total return includes reinvestment of dividends and any capital gains paid.
Past performance is no guarantee of future results. Share price and investment
return fluctuate such that upon redemption, fund shares may be worth more or
less than their original cost.
2 SOURCE: LIPPER INC. — Reflects reinvestment of dividends and, where
applicable, capital gain distributions.The Russell Midcap® Index is a widely
accepted, unmanaged index of medium-cap stock market performance. Index
return does not reflect the fees and expenses associated with operating a mutual
fund. Investors cannot invest directly in any index.
3 SOURCE: LIPPER INC. — Reflects reinvestment of dividends and, where
applicable, capital gain distributions.The Standard & Poor’s MidCap 400
Index is a widely accepted, unmanaged total return index measuring the
performance of the midsize company segment of the U.S. stock market. Index
return does not reflect the fees and expenses associated with operating a mutual
fund. Investors cannot invest directly in any index.
12

DISCUSSION OF
FUND PERFORMANCE
For the period of September 1, 2012, through February 28, 2013, as provided by Bernard Schoenfeld, Portfolio Manager
Fund and Market Performance Overview
For the six-month period ended February 28, 2013, BNY Mellon Small Cap Multi-Strategy Fund’s Class M shares produced a total return of 11.99%, and Investor shares returned 11.78%.1 In comparison, the fund’s primary benchmark, the Russell 2000® Index (“the Index”), produced a total return of 13.02% for the same period.2 The fund’s former primary benchmark, the Standard & Poor’s SmallCap 600 Index (“S&P 600 Index”), produced a total return of 12.20% for the same period.3
Small-cap stocks generally rallied over the reporting period as investors responded positively to improving economic data.The fund produced lower returns than its primary benchmark, mainly due to shortfalls in its underlying Small Cap Growth Strategy.
The Fund’s Investment Approach
The fund seeks capital appreciation.The fund pursues its goal by normally investing at least 80% of its net assets, plus any borrowings for investment purposes, in equity securities of small cap companies. The fund considers small cap companies to be those companies with market capitalizations, at the time of purchase, that are equal to or less than the market capitalization of the largest company included in the Russell 2000® Index as of the Index’s most recent reconstitution date. Furthermore, the fund normally allocates assets across multiple investment strategies employed by the investment adviser that invest primarily in equity securities issued by small
cap companies.The investment adviser determines the investment strategies and sets target allocations and ranges. The fund is designed to provide exposure to investment strategies and styles, including the Opportunistic Small Cap Strategy, Small Cap Value Strategy and Small Cap Growth Strategy, all as more particularly described in the fund’s prospectus.
Improving Economic Conditions Fueled Market Gains
Several positive developments drove stock prices broadly higher over the reporting period. In the wake of earlier market declines, a sustained market rally began near the start of the reporting period when the European financial crisis did not worsen, China appeared to have engineered a soft landing for its economy, and recession fears faded in the United States. Instead, investors responded positively to news of improved U.S. employment and housing market trends, a stated commitment from the European Central Bank in support of the euro, and expectations that new leadership in China might lead to stronger regional growth.
The U.S. stock market lost some ground in November when investors grew concerned about uncertainty surrounding the presidential election and automatic tax hikes and spending cuts scheduled for the start of 2013, but continued corporate earnings strength and last-minute legislation to address the scheduled tax increases enabled stocks to resume their rally through the reporting period’s end. In this environment, small-cap stocks produced higher returns than their large-cap counterparts, on average.
The Funds 13
DISCUSSION OF FUND PERFORMANCE (continued)
Underlying Investments Produced Mixed Results
The reporting period began in the midst of the fund’s transition to a modified investment strategy and new portfolio management team. Although the fund participated to a significant degree in gains posted by the Russell 2000® Index for the reporting period overall, lagging performance stemming from legacy positions during the transition dampened its results compared to its primary benchmark. In addition, the fund’s relative performance was undermined by its allocation to the Small Cap Growth Strategy, which was hurt by shortfalls in its security selection strategy.
The fund’s other underlying investments fared better. The Opportunistic Small Cap Strategy outpaced its benchmark due to successful security selections in the industrials, financials, consumer discretionary, and energy sectors. In fact, only the information technology sector significantly trailed the Opportunistic Small Cap Strategy’s respective benchmark segment during the reporting period. The fund’s Small Cap Value Strategy also fared better than the Index.
We have implemented no changes to the fund’s allocations since completing the transition to the modified investment strategy.
Stocks May Be Poised for Additional Gains
We have been encouraged by recently positive economic data. Moreover, interest rates remain near historical lows, and many large-cap companies’ balance sheets contain
large cash balances that can be used more productively, including through capital investments and acquisitions of small-cap businesses. Therefore, we have maintained the fund’s generally constructive investment posture. However, as always, we remain watchful for opportunities to enhance returns and manage risks more effectively through adjustments to the fund’s allocations among its underlying investments.
March 15, 2013
Equity funds are subject generally to market, market sector, market liquidity,
issuer and investment style risks, among other factors, to varying degrees, all of
which are more fully described in the fund’s prospectus.
Stocks of small- and/or midcap companies often experience sharper price
fluctuations than stocks of large-cap companies.
1 Total return includes reinvestment of dividends and any capital gains paid.
Past performance is no guarantee of future results. Share price and investment
return fluctuate such that upon redemption, fund shares may be worth more or
less than their original cost.
2 SOURCE: LIPPER INC. — Reflects reinvestment of dividends and, where
applicable, capital gain distributions.The Russell 2000® Index is an
unmanaged index of small-cap stock market performance and is composed of
the 2,000 smallest companies in the Russell 3000 Index.The Russell 3000
Index is composed of the 3,000 largest U.S. companies based on total market
capitalization.The index does not take into account fees and expenses to
which the fund is subject. Investors cannot invest directly in any index.
3 SOURCE: LIPPER INC. — Reflects reinvestment of dividends and, where
applicable, capital gain distributions.The Standard & Poor’s SmallCap 600
Index is a broad-based index and a widely accepted, unmanaged index of
overall small-cap stock market performance.The index does not take into
account fees and expenses to which the fund is subject. Investors cannot invest
directly in any index.
14

DISCUSSION OF
FUND PERFORMANCE
For the period of September 1, 2012, through February 28, 2013, as provided by Sean P. Fitzgibbon and Jeffrey D. McGrew, Portfolio Managers
Fund and Market Performance Overview
For the six-month period ended February 28, 2013, BNY Mellon U.S. Core Equity 130/30 Fund’s Class M shares produced a total return of 4.58%, and Investor shares returned 4.45%.1 In comparison, the total return of the Standard & Poor’s 500 Composite Stock Price Index (“S&P 500 Index”), the fund’s benchmark, was 8.94%.2
Stocks generally rallied over the reporting period as macroeconomic concerns waned.The fund produced lower returns than its benchmark, mainly due to shortfalls in the information technology, consumer discretionary and energy sectors.
The Fund’s Investment Approach
The fund seeks capital appreciation, normally investing at least 80% of its assets in stocks of large-cap companies. We choose stocks through a disciplined investment process that uses computer modeling techniques to identify and rank companies based on value, growth and other financial characteristics. The portfolio managers supplement and confirm this information using fundamental analysis, and generally buy “long” the most attractive of the higher-ranked securities and sell “short” those stocks identified by the computer model and fundamental analysis as being likely to underperform. Normally, up to 130% of the fund’s assets will be in long positions, and approximately 30% of the fund’s assets will be in short positions. However, the fund’s short positions may range in value from approximately 25% to 35% of the fund’s assets. We also attempt to mitigate risks by diversifying the fund’s investments across companies and industries, maintaining weightings and risk characteristics that generally are similar to those of the S&P 500 Index.
Recovering Economy Fueled Market Gains
A sustained market rally began near the start of the reporting period when various macroeconomic worries failed to materialize. Instead, investors responded positively to news of improved employment and housing market trends in the United States, a stated commitment from the European Central Bank in support of the euro, and expectations that new leadership in China might lead to stronger regional growth.
The U.S. stock market lost some ground in November when a contentious political debate intensified regarding automatic tax hikes and spending cuts scheduled for the start of 2013, but continued corporate earnings strength and last-minute legislation to address the scheduled tax increases enabled stocks to resume their rally through the reporting period’s end. In this environment, value-oriented stocks generally provided higher returns than their growth-oriented counterparts.
Stock Selection Strategy Produced Mixed Results
While the fund participated in the stock market’s gains, its relative performance was undermined by the information technology sector, where it held long positions in relatively few of the lower quality stocks that led the market segment higher. Instead, the fund’s long positions focused on higher quality companies, such as digital storage provider EMC, which trailed sector averages. In addition, power amplifier manufacturer Skyworks Solutions declined due to its role as a supplier to consumer electronics giant Apple, which gave back some of its previous gains.The fund established a short position in smartphone maker Research In Motion, which fared poorly when the stock rallied in response to new products.
In the consumer discretionary sector, long positions in retailers Dollar General and Coach also trailed market averages. Dollar General suffered when customers chose to shop at higher end stores in the recovering
The Funds 15
DISCUSSION OF FUND PERFORMANCE (continued)
economy, and Coach was hurt by investors’ concerns regarding the company’s profit margins and growth prospects.The energy sector also contained some disappointments, most notably National OilwellVarco, which weakened in light of deteriorating profit margins and decelerating volume growth.
The fund achieved better results in the materials sector, mainly due to an emphasis on companies—such as LyondellBasell Industries—that stood to benefit from low domestic natural gas prices. Excess returns in the industrials sector were driven by a number of long positions. Temporary staffing company Robert Half International benefited from an improving labor market, particularly among its customers in the information technology and financials industries. Eaton gained value when investors responded positively to a recent acquisition. J.B. Hunt Transport Services saw improvements in intermodal shipping volumes and greater pricing flexibility.
Stocks May Be Poised for Additional Gains
We have been encouraged by recently positive economic data. Moreover, interest rates remain near historical lows, and many companies have shored up their balance sheets with large cash balances that can be used more constructively through mergers and acquisitions, capital investments, share buyback programs and higher dividends.
Therefore, we have emphasized companies that tend to be more sensitive to economic cycles.We have found a number of opportunities in the industrials, financials and information technology, and industrials sectors, where we believe valuations remain attractive. In the health care sector, we have identified several attractively valued
pharmaceutical developers. Conversely, we have found relatively few opportunities in the traditionally defensive utilities and telecommunications services sectors.
March 15, 2013
Please note, the position in any security highlighted with italicized typeface was sold during the reporting period.
Equity funds are subject generally to market, market sector, market liquidity, issuer and investment style risks, among other factors, to varying degrees, all of which are more fully described in the fund’s prospectus.
The use of leverage may magnify the fund’s gains or losses. For derivatives with a leveraging component, adverse changes in the value or level of the underlying asset can result in a loss that is much greater than the original investment in the derivative.
Short sales involve selling a security the fund does not own in anticipation that the security’s price will decline. Short sales may involve substantial risk and leverage, and expose the fund to the risk that it will be required to buy the security sold short at a time when the security has appreciated in value, thus resulting in a loss to the fund. Short positions in stocks involve more risk than long positions in stocks because the maximum sustainable loss on a stock purchased is limited to the amount paid for the stock plus the transaction costs, whereas there is no maximum attainable price on the shorted stock. In theory, stocks sold short have unlimited risk. It is possible that the market value of securities the fund holds in long positions will decline at the same time that the market value of the securities in the fund has sold short increases, thereby increasing the fund’s potential volatility. Leveraging occurs when the fund increases its assets available for investment using borrowing or similar transactions. Short sales effectively leverage the fund’s assets.The use of leverage may magnify the fund’s gains or losses.
1 Total return includes reinvestment of dividends and any capital gains paid.
Past performance is no guarantee of future results. Share price and investment
return fluctuate such that upon redemption, fund shares may be worth more or
less than their original cost.
2 SOURCE: LIPPER INC. — Reflects the monthly reinvestment of
dividends and, where applicable, capital gain distributions.The Standard &
Poor’s 500 Composite Stock Price Index is a widely accepted, unmanaged
index of U.S. stock market performance. Index return does not reflect fees and
expenses associated with operating a mutual fund. Investors cannot invest
directly in any index.
16

DISCUSSION OF
FUND PERFORMANCE
For the period of September 1, 2012, through February 28, 2013, as provided by Irene D. O’Neill, Portfolio Manager
Fund and Market Performance Overview
For the six-month period ended February 28, 2013, BNY Mellon Focused Equity Opportunities Fund’s Class M shares produced a total return of 6.67%, and Investor shares returned 6.47%.1 In comparison, the total return of the Standard & Poor’s 500 Composite Stock Price Index (“S&P 500 Index”), the fund’s benchmark, was 8.94% for the reporting period.2
Stocks generally rallied over the reporting period amid improving economic data. The fund produced lower returns than its benchmark, mainly due to shortfalls in the information technology, financials, and health care sectors.
The Fund’s Investment Approach
The fund seeks capital appreciation.To pursue its goal, the fund normally invests at least 80% of its net assets in equity securities.We begin with a top-down assessment of broad economic, political and social trends. We strive to determine those sectors and industries most likely to benefit from identified trends, focusing on sectors we believe present the most attractive growth outlook. Within those sectors and industries, we then employ a bottom-up, fundamental approach to find individual companies with:
Unrecognized or underestimated earnings power
Sustainable revenue and cash flow
Positive operational or financial catalysts
Attractive valuation based on growth prospects
Strong or improving financial conditions
Finally, we select for investment the 25 to 30 best opportunities from the companies meeting these criteria.
Improving Economic Conditions Fueled Market Gains
In the wake of earlier market declines, a sustained market rally began near the start of the reporting period when several macroeconomic concerns failed to materialize. Instead, investors responded positively to news of improved employment and housing market trends in the United States, a stated commitment from the European Central Bank in support of the euro, and expectations that new leadership in China might lead to stronger regional growth.
The U.S. stock market lost some ground in November when investors grew concerned about automatic tax hikes and spending cuts scheduled for the start of 2013, but continued corporate earnings strength and last-minute legislation to address the scheduled tax increases enabled stocks to resume their rally through the reporting period’s end.
Security Selections Weighed on Fund’s Relative Results
Disappointments in a handful of industry groups caused the fund’s performance to lag that of the S&P 500 Index. Shortfalls were particularly severe in the information technology sector, where consumer electronics giant Apple declined sharply due to concerns regarding intensifying competitive pressures in the smartphone and tablet computing categories. In response, we reduced the fund’s position in Apple. In addition, data warehousing specialist Teradata reported weaker-than-expected earnings stemming from deferred capital spending by large corporations.
The fund did not own some of the top performers in the financials sector, including large banks that rallied from depressed levels. In contrast, the smaller, regional
The Funds 17
DISCUSSION OF FUND PERFORMANCE (continued)
banks on which the fund focused—such as PNC Financial Services—lagged sector averages as low interest rates put pressure on net interest margins. Insurer MetLife was hurt by delayed government approval of the sale of its banking operations.The fund’s results in the health care sector were dampened by pharmacy benefit manager Express Scripts, which failed to advance amid speculation, later proved to be unfounded, that earnings might disappoint. Drug maker Teva Pharmaceuticals Industries, ADR struggled due to research-and-development pipeline concerns in the midst of a major corporate restructuring. Specialty biopharma-ceutical company Shire was hurt by management turnover and generic competition for its attention deficit hyperactive disorder drug.
The fund achieved better results in the consumer discretionary sector, where home improvement retailer Lowe’s benefited from recovering U.S. housing markets. In addition, casino operator Las Vegas Sands and diversified industrial manufacturer Johnson Controls rebounded along with China’s economic prospects. In the energy sector, refiner Valero gained value when a new project proved accretive to earnings and the company announced the spin-off of its retail operations. Oil services provider Halliburton posted better-than-expected results due to its ability to pass along higher costs to its customers. Marathon Oil was lifted by production growth in one of its key reserve basins. Finally, returns from the industrials sector were buoyed by electrical components producer Eaton, which rallied when investors responded positively to a recent acquisition, and by diversified manufacturer Dover, which resolved operational issues and divested non-core businesses.
Stocks May Be Poised for Additional Gains
We have been encouraged by recently positive economic data. Moreover, interest rates remain near historical lows, and many companies’ balance sheets contain large cash balances that can be used more productively through mergers and acquisitions, capital investments, share buy-back programs and higher dividends. In light of these factors, we have maintained a generally constructive investment posture, including underweighted exposure to the traditionally defensive telecommunications services and utilities sectors. Instead, we have identified a number of opportunities in the energy, health care and consumer discretionary sectors.
March 15, 2013
Equity funds are subject generally to market, market sector, market liquidity,
issuer and investment style risks, among other factors, to varying degrees, all of
which are more fully described in the fund’s prospectus.
The fund is non-diversified, which means that a relatively high percentage of
the fund’s assets may be invested in a limited number of issuers.Therefore, the
fund’s performance may be more vulnerable to changes in the market value of
a single issuer or group of issuers and more susceptible to risks associated with
a single economic, political or regulatory occurrence than a diversified fund.
1 Total return includes reinvestment of dividends and any capital gains paid.
Past performance is no guarantee of future results. Share price and investment
return fluctuate such that upon redemption, fund shares may be worth more or
less than their original cost.
2 SOURCE: LIPPER INC. — Reflects the monthly reinvestment of
dividends and, where applicable, capital gain distributions.The Standard &
Poor’s 500 Composite Stock Price Index is a widely accepted, unmanaged
index of U.S. stock market performance. Index return does not reflect fees and
expenses associated with operating a mutual fund. Investors cannot invest
directly in any index.
18

DISCUSSION OF
FUND PERFORMANCE
For the period of September 1, 2012, through February 28, 2013, as provided by John Truschel, Portfolio Manager
Fund and Market Performance Overview
For the six-month period ended February 28, 2013, BNY Mellon Small/Mid Cap Stock Fund’s Class M shares produced a total return of 8.92%, and Investor shares returned 8.72%.1 In comparison, the Russell 2500™ Index, the fund’s benchmark, produced a total return of 14.32% for the same period.2
Small- and midcap stocks generally rallied over the reporting period as investors responded positively to improving economic data. The fund produced lower returns than its primary benchmark, mainly due to disappointing stock selections across several market sectors.
The Fund’s Investment Approach
The fund seeks capital appreciation.To pursue its goal, the fund normally invests at least 80% of its net assets in equity securities of small-cap and midcap companies with total market capitalizations of between $200 million and $7 billion at the time of investment.The fund invests in growth and value stocks, which are chosen through a disciplined investment process that combines computer modeling techniques, fundamental analysis and risk management.
In selecting securities, the fund first identifies as potential investments securities that have been selected pursuant to various investment strategies employed by the fund’s investment adviser and/or its affiliate, The Boston Company Asset Management, LLC (TBCAM), using proprietary investment processes of TBCAM, that have market capitalizations, at the time of purchase, that are
within the market capitalization range of companies comprising the Russell 2500™ Index. The fund’s portfolio managers next use quantitative models that combine various fundamental factors, and then evaluate the results of the quantitative models using an optimization process. Finally, the fund’s portfolio managers conduct a qualitative review of the securities ranked by the models to select for investment by the fund those securities deemed to be the most attractive of the higher ranked securities.
Improving Economic Conditions Fueled Market Gains
A sustained market rally began near the start of the reporting period when a number of macroeconomic concerns failed to materialize. Instead, investors responded positively to news of improved U.S. employment and housing market trends, a stated commitment from the European Central Bank in support of the euro, and expectations that new leadership in China might lead to stronger regional growth.
The U.S. stock market lost some ground in November when investors grew concerned about uncertainty surrounding the presidential election and automatic tax hikes and spending cuts scheduled for the start of 2013, but continued corporate earnings strength and last-minute legislation to address the scheduled tax increases enabled stocks to resume their rally through the reporting period’s end. In this environment, midcap stocks generally produced higher returns than small-cap stocks, and small-cap stocks outpaced their large-cap counterparts, on average.
The Funds 19
DISCUSSION OF FUND PERFORMANCE (continued)
Security Selections Weighed on Fund Performance
The reporting period began in the midst of the fund’s transition to a modified investment strategy and new portfolio manager. Although the fund participated to a degree in gains posted by the Russell 2500™ Index for the reporting period overall, lagging performance stemming from legacy positions during the transition dampened its results compared to the primary benchmark. In addition, relative performance was undermined by a number of disappointing stock selections after the transition was complete.
Chief among them was aircraft parts manufacturer Spirit AeroSystems Holdings, which fell sharply when a new management team announced substantial write-offs designed to prepare the company for future growth. In the information technology sector, power amplifier maker Skyworks Solutions was hurt by its position as a supplier to consumer electronics giant Apple, which encountered intensifying competitive pressures. Among health care companies, medical devices producer ABIOMED was hurt by a government investigation into allegations of improper marketing of one of its products, leading us to eliminate the stock from the fund’s portfolio. We also eliminated the fund’s position in apparel maker Under Armour, Cl. A when the company reduced the earnings guidance it provides to analysts. In the information technology sector, bandwidth management specialist Allot Communications suffered sluggish results in Europe, causing earnings to fall short of expectations.
The fund achieved better results with commercial real estate manager Jones Lang LaSalle, which benefited from rebounding commercial property values.Tank car manufacturer Trinity Industries saw orders increase
along with production of North American shale oil. In addition, the fund achieved above-average results from its security selections in the materials sector.
Stocks May Be Poised for Additional Gains
We have been encouraged by recently positive economic data. Moreover, interest rates remain near historical lows, and many large-cap companies’ balance sheets contain large cash balances that can be used more productively, including through capital investments and acquisitions of small- and midcap businesses.Therefore, we have maintained the fund’s generally constructive investment posture, with an emphasis on high quality companies with positive business momentum, attractive returns on equity, low debt levels, and the ability to self-finance future growth.
March 15, 2013
Please note, the position in any security highlighted with italicized typeface
was sold during the reporting period.
Equity funds are subject generally to market, market sector, market liquidity,
issuer and investment style risks, among other factors, to varying degrees, all of
which are more fully described in the fund’s prospectus.
Stocks of small- and/or midcap companies often experience sharper price
fluctuations than stocks of large-cap companies.
Part of the fund’s recent performance is attributable to positive returns from its
initial public offering (IPO) investments.There can be no guarantee that IPOs
will have or continue to have a positive effect on fund performance.
1 Total return includes reinvestment of dividends and any capital gains paid.
Past performance is no guarantee of future results. Share price and investment
return fluctuate such that upon redemption, fund shares may be worth more or
less than their original cost.
2 SOURCE: LIPPER INC. — Reflects the reinvestment of dividends and,
where applicable, capital gain distributions.The Russell 2500™ Index is a
widely accepted, unmanaged index, which measures the performance of those
Russell 2500 companies with lower price-to-book ratios and lower forecasted
growth value. Investors cannot invest directly in any index.
20
DISCUSSION OF
FUND PERFORMANCE
For the period of September 1, 2012, through February 28, 2013, as provided by D. Kirk Henry, Sean P. Fitzgibbon and Mark A. Bogar, Portfolio Managers
Fund and Market Performance Overview
For the six-month period ended February 28, 2013, BNY Mellon International Fund’s Class M shares produced a total return of 15.30%, and Investor shares produced a total return of 15.11%.1 In comparison, the fund’s benchmark, the Morgan Stanley Capital International Europe, Australasia, Far East Index (“MSCI EAFE Index”), produced a total return of 14.41% for the same period.2
International stocks generally rallied over the reporting period as investors responded positively to improved economic data.The fund produced higher returns than its benchmark, mainly due to successful stock selections in the United Kingdom, Japan, and Switzerland.
As of March 15, 2013, Clifford A. Smith became a primary portfolio manager of the fund with respect to the portion of the fund’s assets managed in accordance with a value investment style.
The Fund’s Investment Approach
The fund seeks long-term capital growth. To pursue this goal, the fund normally invests at least 65% of its total assets in equity securities of foreign issuers.
The fund allocates its assets between a core investment style and a value investment style at the discretion of the investment advisor.The fund is not managed to a specific target duration between these investment styles. However, under normal conditions, at least 30% of the fund’s assets will be invested in each of the core and value investment styles. Pursuant to the core
investment style, under normal circumstances, at least 80% of the fund’s cash inflows allocated to this style are invested in equity securities of companies located in the foreign countries represented in the MSCI EAFE Index and Canada.
The fund will continue to invest in stocks that appear to be undervalued (as measured by their price/earnings ratios), but stocks purchased pursuant to the core investment style may have value and/or growth characteristics. The core investment style portfolio manager employs a “bottom-up” investment approach, which emphasizes individual stock selection.The core investment style stock selection process is designed to produce a diversified portfolio that, relative to the MSCI EAFE Index, has a below-average price/earnings ratio and an above-average earnings growth trend.
The fund’s investment approach for the portion of the fund using the value-oriented investment style is research-driven and risk-averse.When selecting stocks, we identify potential investments through valuation screening and extensive fundamental research. Emphasizing individual stock selection over economic or industry trends, the fund focuses on three key factors: value, business health and business momentum.
Waning Economic Concerns Lifted International Stocks
Sustained stock market rallies began near the start of the reporting period when various macroeconomic worries failed to materialize. Instead, investors responded positively to news of improved employment and housing market trends in the United States, a stated commitment from the European Central Bank in support of the euro, and expectations that new leadership
The Funds 21
DISCUSSION OF FUND PERFORMANCE (continued)
in China might lead to stronger economic growth. Later, Japan’s stock market was lifted by the election of a new government that promised to devalue the yen in an attempt to stimulate renewed economic growth.
Stocks lost some ground in November when investors grew concerned about automatic tax hikes and spending cuts in the United States scheduled for the start of 2013, but improving global economic data, continued corporate earnings strength, and last-minute legislation to address the scheduled tax increases enabled the rallies to resume through the reporting period’s end.
Stock Selections Buoyed Relative Results
The United Kingdom led the fund’s advance during the reporting period. Rallying capital markets and reduced fears of a more severe banking crisis lifted the stocks of banks Barclays, HSBC Holding, and Lloyds Banking Group, as well as investment manager Aberdeen Asset Management. In Japan, automakers Toyota and Fuji Heavy Industries gained value as the effects of the 2011 earthquake waned and a depreciating yen boosted exports. More robust export activity also buoyed office and industrial equipment provider Ricoh and manufacturer Yamaha Motor. Mitsubishi UFJ Financial Group also gained value during the reporting period. In Switzerland, winners included global bank UBS, pharmaceuticals developer Novartis, chemical company Clariant, staffing agency Adecco Group, and power and automation technology provider ABB.
Disappointments during the reporting period were concentrated in Australia, Hong Kong and France. In France, natural gas and electricity supplier GDF Suez encountered weakening demand and struggled with a heavy debt load after the merger that formed the company,
and France Telecom was hurt by the deterioration of its legacy fixed-line business. In Germany, electricity producer E.ON was hurt by the nation’s divestment from nuclear energy. Other laggards included telecommunications companies Vodafone in the United Kingdom and Telecom Italia.
Positioned for Continued Growth
We have been encouraged by recent economic data, and it appears that the most serious potential consequences of ongoing macroeconomic headwinds in Europe, the United States, and China have been averted. Since the fund has tended to deliver its strongest relative performance during periods of positive investor sentiment, we believe that its investments should respond well to further improvements in the global economic climate.
March 15, 2013
Equity funds are subject generally to market, market sector, market liquidity,
issuer and investment style risks, among other factors, to varying degrees, all of
which are more fully described in the fund’s prospectus.
The fund’s performance will be influenced by political, social and economic
factors affecting investments in foreign companies. Special risks associated with
investments in foreign companies include exposure to currency fluctuations, less
liquidity, less developed or less efficient trading markets, lack of comprehensive
company information, political instability and differing auditing and legal
standards.These risks are enhanced in emerging market countries.
1 Total return includes reinvestment of dividends and any capital gains paid.
Past performance is no guarantee of future results. Share price and investment
return fluctuate such that upon redemption, fund shares may be worth more or
less than their original cost.
2 SOURCE: LIPPER INC. — Reflects reinvestment of net dividends and,
where applicable, capital gain distributions.The Morgan Stanley Capital
International Europe,Australasia, Far East (MSCI EAFE) Index is an
unmanaged index composed of a sample of companies representative of the
market structure of European and Pacific Basin countries. Index return does
not reflect fees and expenses associated with operating a mutual fund. Investors
cannot invest directly in any index.
22

DISCUSSION OF
FUND PERFORMANCE
For the period of September 1, 2012, through February 28, 2013, as provided by D. Kirk Henry, Sean P. Fitzgibbon and Jay Malikowski, Portfolio Managers
Fund and Market Performance Overview
For the six-month period ended February 28, 2013, BNY Mellon Emerging Markets Fund’s Class M shares produced a total return of 12.62%, and Investor shares returned 12.43%.1 This compares with a 12.06% total return produced by the Morgan Stanley Capital International Emerging Markets Index (“MSCI EM Index”), the fund’s benchmark, for the same period.2
Emerging markets equities generally rallied over the reporting period as global economic conditions improved.The fund produced higher returns than its benchmark, primarily due to successful security selections in South Korea, China, and Thailand.
The Fund’s Investment Approach
The fund seeks long-term capital growth.To pursue its goal, the fund invests at least 80% of its assets in equity securities of companies organized, or with a majority of assets or operations, in countries considered to be emerging markets.
The fund allocates its assets between a core investment style and a value investment style at the discretion of the investment advisor.The fund is not managed to a specific target duration between these investment styles. However, under normal conditions at least 30% of the fund’s assets will be invested in each of the core and value investment styles. Pursuant to the core investment style, under normal circumstances at least 80% of the fund’s cash inflows allocated to this style are invested in equity securities of companies located in the foreign countries represented in the MSCI EM Index.
The fund will continue to invest in stocks that appear to be undervalued (as measured by their price/earnings ratios), but stocks purchased pursuant to the core investment style may have value and/or growth char-acteristics.The core investment style portfolio manager employs a “bottom-up” investment approach, which emphasizes individual stock selection. The core investment style stock selection process is designed to produce a diversified portfolio that, relative to the MSCI EM Index, has a below-average price/earnings ratio and an above-average earnings growth trend.
When choosing stocks for the portion of the fund using the value-oriented investment style, we use a research-driven and risk-averse approach. We identify potential investments through valuation screening and extensive fundamental research. Emphasizing individual stock selection rather than economic and industry trends, we focus on three key factors: value, business health and business momentum.
Waning Economic Concerns Lifted Emerging Markets
The reporting period began in the midst of improving investor sentiment after several central banks announced measures to stimulate their economies, the head of the European Central Bank signaled the central bank’s commitment to supporting the euro, and the U.S. economic recovery gained momentum. In China, industrial production increased over the final months of 2012, supporting exporters and commodities producers.The apparent containment of the European Union’s financial issues led to a more constructive outlook for nearby Eastern European nations. Consequently, international investors turned their attention from near-term worries to longer term growth and valuation factors.
The Funds 23
DISCUSSION OF FUND PERFORMANCE (continued)
However, some developing economies did not experience market rebounds. Most notably, Brazil’s growth was undermined by government intervention in the nation’s electric utilities sector, and South Africa’s growth was hurt by labor unrest in its mining industry.
Fund Strategies Produced Positive Results
In this environment, the fund’s core and value-oriented strategies both produced positive relative results. Gains were especially robust in South Korea, where generally overweighted exposure and favorable stock selections in the information technology, utilities and financials sectors buoyed the fund’s returns. For example, Samsung Electronics advanced along with the popularity of its smartphones, spirits maker Hite Jinro achieved cost savings following the merger that created the company, Korea Electric Power benefited from lower input costs and better than expected tariff hikes, and brokerage firm Mirae Asset Securities climbed along with local equity markets. In China, stronger economic growth lifted automaker Great Wall Motor and China Railway Construction, while Huaneng Power International saw reduced input costs. In Thailand, Airports of Thailand benefited from rising air travel volumes.
Disappointments during the reporting period included unfavorable stock selections in India, including out-sourcing services provider Hexaware Technologies, which lost a major client, and iron ore producer NMDC, which suffered amid weak commodity prices. In Brazil, government intervention hurt power company Centrais Elétricas Brasileiras, with negative sentiment hitting oil giant Petroleo Brasileiro, which is majority owned by the government.
Other top performers included industrial companies Cosco Pacific in Hong Kong and Sinotrans in China, telecommunications service providers VimpelCom in Russia and SK Telecom and KT Corp. in South Korea. Conversely, the information technology and energy sectors generally lagged market averages.
Maintaining a Constructive Posture
While headwinds remain, we have been encouraged by recently positive economic data in many emerging mar-kets.Therefore, we have maintained the fund’s generally constructive investment posture. We recently reduced the fund’s exposure to stocks in South Africa, Indonesia, Thailand, and Malaysia, instead favoring what we believe are more attractively valued equities in India and Brazil.
March 15, 2013
Please note, the position in any security highlighted with italicized typeface
was sold during the reporting period.
Equity funds are subject generally to market, market sector, market liquidity,
issuer and investment style risks, among other factors, to varying degrees, all of
which are more fully described in the fund’s prospectus.
The fund’s performance will be influenced by political, social and economic
factors affecting investments in foreign companies. Special risks associated with
investments in foreign companies include exposure to currency fluctuations, less
liquidity, less developed or less efficient trading markets, lack of comprehensive
company information, political instability and differing auditing and legal
standards.These risks are enhanced in emerging markets countries.
1 Total return includes reinvestment of dividends and any capital gains paid.
Past performance is no guarantee of future results. Share price and investment
return fluctuate such that upon redemption, fund shares may be worth more or
less than their original cost.
2 SOURCE: LIPPER INC. — Reflects reinvestment of gross dividends and,
where applicable, capital gain distributions.The Morgan Stanley Capital
International Emerging Markets Index is a market capitalization-weighted
index composed of companies representative of the market structure of select
designated emerging market countries in Europe, Latin America and the Pacific
Basin. Index return does not reflect fees and expenses associated with operating
a mutual fund. Investors cannot invest directly in any index.
24

DISCUSSION OF
FUND PERFORMANCE
For the period of September 1, 2012, through February 28, 2013, as provided byThomas J. Durante, Richard A. Brown and Karen Q.Wong, Portfolio Managers
Fund and Market Performance Overview
For the six-month period ended February 28, 2013, BNY Mellon International Appreciation Fund’s Class M shares produced a total return of 13.70%, and Investor shares returned 13.59%.1 In comparison, the fund’s benchmark, the Morgan Stanley Capital International Europe, Australasia, Far East Index (“MSCI EAFE Index”), produced a total return of 14.41% for the same period.2
International stocks generally rallied over the reporting period as investors responded positively to improved economic data.The fund lagged its benchmark due to expenses and pricing disparities between the stocks of the companies comprising the MSCI EAFE Index and the related Depository Receipts (DRs) in which the fund invests.
The Fund’s Investment Approach
The fund seeks long-term capital appreciation. To pursue its goal, the fund normally invests at least 80% of its net assets in equity securities, including DRs, common stocks, preferred stocks, convertible securities, equity securities in foreign investment funds or trusts and other equity investments.
The fund invests primarily in DRs representing the local shares of non-U.S. companies, in particular, American Depositary Receipts (ADRs). In selecting securities, we screen the MSCI EAFE Index universe of approximately 1,000 issuers for the availability of issuers with a DR facility.The investment adviser then uses a
proprietary mathematical algorithm to reflect the characteristics of the developed markets that takes into consideration risk characteristics, including country weights and sector weights within each country. As a result of this process, we expect to hold ADRs representing 200 to 300 foreign issuers.The fund’s country allocation is expected to be within 5% of that of the MSCI EAFE Index, and under normal circumstances, the fund will invest in at least 10 different countries. The fund generally will not invest in securities from developing countries because they are not included in the MSCI EAFE Index.
Waning Economic Concerns Lifted International Stocks
In the wake of earlier market declines, sustained stock market rallies began near the start of the reporting period when various macroeconomic concerns failed to materialize. Instead, investors responded positively to news of improved U.S. employment and housing market trends, a stated commitment from the European Central Bank in support of the euro, and expectations that new leadership in China might lead to stronger regional growth. Later, Japan’s stock market was lifted by the election of a new government that promised new financial policies to stimulate renewed growth.
International stocks lost some ground in November when investors grew concerned about automatic tax hikes and spending cuts in the United States scheduled for the start of 2013, but improving global economic data, continued corporate earnings strength, and last-minute legislation to address the scheduled tax increases enabled the rallies to resume through the reporting period’s end.
The Funds 25
DISCUSSION OF FUND PERFORMANCE (continued)
Financial Stocks Led Global Markets Higher
Almost all of the countries represented in the MSCI EAFE Index produced positive absolute returns over the reporting period, evidence of the breadth of the market rally. Japan fared particularly well when its new prime minister implemented a quantitative easing program, which proved especially beneficial to exporters. In Europe, German automakers, technology companies and financial institutions posted substantial gains, and countries at the epicenter of the European financial crisis—including Spain, Portugal, and Italy—rebounded from depressed levels.
From an industry group perspective, the financials sector led the international stock market’s advance, as a number of global banking institutions rebounded from relatively low prices. Real estate-related companies benefited from inexpensive financing in the low interest rate environment, and investment banks in Japan and Europe encountered rising demand when bond issuers refinanced existing debt at lower rates.The materials sector also produced above-average returns, as natural resources producers in Australia responded to renewed demand for construction materials in the emerging markets, and Japanese steelmakers supplied a revitalized automobile manufacturing industry. Gains among automakers in Japan and Europe helped bolster returns from the consumer discretionary sector.
The energy sector generally lagged market averages, as European refiners and exploration-and-production companies were undercut by their North American counterparts that have easier access to low cost shale crude oil. Telecommunications services companies in Europe and the United Kingdom were hurt by rising costs, high debt levels and heavier regulation.
At times during the reporting period, we employed futures contracts to put cash to work more quickly in international equity markets.
A Constructive Outlook for Stocks
We have been encouraged by recent evidence of accelerating global growth, which has the potential to fuel further gains in international equity markets. As always, we have continued to monitor the factors considered by the fund’s investment model in light of current market conditions. In our experience, the fund’s broadly diversified portfolio may help limit the impact on the overall portfolio of unexpected losses in individual sectors or holdings.
March 15, 2013
Equity funds are subject generally to market, market sector, market liquidity,
issuer and investment style risks, among other factors, to varying degrees, all of
which are more fully described in the fund’s prospectus.
The fund’s performance will be influenced by political, social and economic
factors affecting investments in foreign companies. Special risks associated with
investments in foreign companies include exposure to currency fluctuations, less
liquidity, less developed or less efficient trading markets, lack of comprehensive
company information, political instability and differing auditing and legal
standards.These risks are enhanced in emerging market countries.
1 Total return includes reinvestment of dividends and any capital gains paid.
Past performance is no guarantee of future results. Share price and investment
return fluctuate such that upon redemption, fund shares may be worth more or
less than their original cost.
2 SOURCE: LIPPER INC. — Reflects reinvestment of net dividends and,
where applicable, capital gain distributions.The Morgan Stanley Capital
International Europe,Australasia, Far East (MSCI EAFE) Index is an
unmanaged index composed of a sample of companies representative of the
market structure of European and Pacific Basin countries. Index return does
not reflect fees and expenses associated with operating a mutual fund. Investors
cannot invest directly in any index.
26

DISCUSSION OF
FUND PERFORMANCE
For the period of September 1, 2012, through February 28, 2013, as provided by Jocelin A. Reed, CFA, C. Wesley Boggs, Warren Chiang, CFA, and Ronald Gala, CFA, Primary Portfolio Managers
Fund and Market Performance Overview
For the six-month period ended February 28, 2013, BNY Mellon International Equity Income Fund’s Class M shares produced a total return of 12.87%, and its Investor shares returned 12.73%.1 In comparison, the fund’s benchmark, the Morgan Stanley Capital International All Country World Index Ex-U.S. (MSCI ACWI Ex-US Index), provided a total return of 13.19% for the same period.2
International stocks generally rallied over the reporting period as investors responded positively to improved global economic data. The fund produced modestly lower returns than its benchmark, primarily due to shortfalls in the utilities and telecommunications services sectors.
The Fund’s Investment Approach
The fund seeks total return consisting of capital appreciation and income.To pursue its goal, the fund normally invests at least 80% of its net assets, plus any borrowings for investment purposes, in equity securities. The fund focuses on dividend-paying stocks of foreign companies, including those in developed and emerging-market countries.The fund may invest in the stocks of companies of any market capitalization.
We select stocks through a disciplined investment process using proprietary quantitative computer models that analyze a diverse set of characteristics to identify and rank stocks according to earnings quality. Based on this analysis, we generally select from the higher ranked dividend-paying securities those stocks that we believe will continue to pay above-average dividends.We seek
to overweight higher dividend-paying stocks, while maintaining country and sector weights generally similar to those of the MSCI ACWI Ex-US Index.
Effective April 15, 2013, the fund’s primary portfolio managers are C. Wesley Boggs, Warren Chiang, CFA, and Ronald Gala, CFA.
Waning Economic Concerns Lifted International Stocks
A number of positive developments helped drive international stocks higher during the reporting period. In the wake of earlier market declines, a sustained rally began near the start of the reporting period when the European financial crisis did not worsen, China appeared to have engineered a soft landing for its economy, and recession fears faded in the United States. Instead, investors responded positively to news of improved U.S. employment and housing market trends, a stated commitment from the European Central Bank in support of the euro, and expectations that new leadership in China might lead to stronger regional growth. Later, Japan’s stock market was lifted by the election of a new government that promised new financial policies to stimulate renewed growth.
International stocks lost some ground in November when investors grew concerned about automatic tax hikes and spending cuts in the United States scheduled for the start of 2013, but improving global economic data, continued corporate earnings strength, and last-minute legislation to address the scheduled tax increases enabled the rallies to resume through the reporting period’s end.
Financial Stocks Led Global Markets Higher
Although the fund participated to a substantial degree in the international stock markets’ gains over the reporting period, its relative performance was dampened by our
The Funds 27
DISCUSSION OF FUND PERFORMANCE (continued)
security selection strategy in the utilities sector, where Brazilian power company Light was hurt by constrained electricity prices and the high costs of hydroelectric generation, and Germany’s E.ON suffered amid sluggish European demand and investors’ concerns regarding its Latin American ventures. Results from the telecommunications services sector were undermined by overweighted exposure to the lagging market segment. In addition, France Telecom saw expenses rise due to new investments in fiber optic infrastructure. In other areas, British American Tobacco failed to advance despite its ample exposure to growing emerging markets.
The fund achieved better results from its country allocations, as overweighted exposure to Australia and an underweighted position in Canada helped buoy the fund’s relative performance. From an industry group perspective, overweighted exposure to the materials sector fared well, as did stock selections such as Polish copper producer KGHM Polska Miedz and Hong Kong-based mining company Shougang Fushan Resources Group. Underweighted exposure to the energy sector also helped support the fund’s results.
In other areas, successful stock selections included Chinese athletic apparel maker Anta Sports Products, which benefited from rising consumer spending. Turkish automaker Ford Otomotiv Sanayi achieved strong sales of trucks in the emerging markets. Australian gaming company Tatts Group benefited from mergers with former rivals that solidified its dominance of the nation’s lottery systems.
Stocks May Be Poised for Additional Gains
We have been encouraged by recently positive global economic data. Moreover, interest rates remain near historical lows in most major markets, and many companies’ balance sheets contain large cash balances that can be used more productively through mergers and acquisitions, capital investments, share buyback programs, and higher dividends.Therefore, we have maintained the fund’s generally constructive investment posture, and have continued to focus on companies with high dividends.We have found a number of stocks meeting our criteria in the telecommunications services, utilities, and financials sectors, but fewer in the information technology and consumer discretionary sectors.
March 15, 2013
Equity funds are subject generally to market, market sector, market liquidity,
issuer and investment style risks, among other factors, to varying degrees, all of
which are more fully described in the fund’s prospectus.
1 Total return includes reinvestment of dividends and any capital gains paid.
Past performance is no guarantee of future results. Share price and investment
return fluctuate such that upon redemption, fund shares may be worth more or
less than their original cost. Return figures provided reflect the absorption of
certain fund expenses by BNY Mellon Fund Advisers pursuant to an
agreement in effect until January 1, 2014, at which time it may be extended,
terminated or modified. Had these expenses not been absorbed, the fund’s
returns would have been lower.
2 SOURCE: LIPPER Inc. — Reflects reinvestment of gross dividends and,
where applicable, capital gain distributions.The MSCI ACWI Ex-US Index
captures large and mid cap representation across 23 of 24 Developed Markets
(DM) countries (excluding the US) and 21 Emerging Markets (EM)
countries. Investors cannot invest directly in any index.
28

DISCUSSION OF
FUND PERFORMANCE
For the period of September 1, 2012, through February 28, 2013, as provided by Sean Fitzgibbon, Jeffrey McGrew, John Flahive and Bernard Schoenfeld, Portfolio Managers
Fund and Market Performance Overview
For the six-month period ended February 28, 2013, BNY Mellon Asset Allocation Fund’s Class M shares produced a total return of 6.59%, and Investor shares returned 6.52%.1 The fund’s primary benchmark, the Standard & Poor’s 500 Composite Stock Price Index (“S&P 500 Index”), produced a total return of 8.94% and its secondary benchmark, the Barclays U.S. Aggregate Bond Index, produced a total return of 0.15% for the same period.2
Stocks rallied and bond prices were mixed over the reporting period as macroeconomic concerns waned. The fund produced lower returns than its primary benchmark, mainly due to the dampening effects of its fixed-income investments at a time when stocks outperformed bonds.
Effective March 15, 2013, Jeffrey M. Mortimer became the fund’s primary portfolio manager responsible for investment allocation decisions.
The Fund’s Investment Approach
The fund may invest in both individual securities and other investment companies, including other BNY Mellon funds, funds in the Dreyfus Family of Funds and unaffiliated open-end funds, closed-end funds and exchange-traded funds (collectively, the “underlying funds”). To pursue its goal, the fund may allocate its assets, directly in individual equity and debt securities and/or through investment in the underlying funds, to gain investment exposure to the following asset classes: Large Cap Equities, Small Cap and Mid Cap Equities, Developed International and Global Equities, Emerging Markets Equities, Investment Grade Bonds, High Yield
Bonds, Emerging Markets Debt, Diversifying Strategies and Money Market Instruments.
Further information about the fund’s investment strategy and process and the underlying funds is described in the fund’s prospectus.
Improving Economic Data Fueled Market Gains
A sustained stock market rally began near the start of the reporting period when investors responded positively to improved employment and housing market trends in the United States, a stated commitment from the European Central Bank in support of the euro, and expectations that new leadership in China might lead to stronger regional growth. Stocks lost some ground in November during a contentious U.S. political debate regarding automatic tax hikes and spending cuts scheduled for the start of 2013, but last-minute legislation to address the scheduled tax increases enabled stocks to resume their rally through the reporting period’s end.
Bonds responded more negatively to the improved economic data. While corporate-backed bonds continued to fare well, longer term U.S. government securities faltered when investors anticipated higher interest rates down the road.
Allocation Strategy Produced Positive Results
The fund’s bias toward stocks over bonds proved effective during the reporting period.We increased the allocation to stocks as various macroeconomic risks eased, positioning the fund to participate more fully in the stock market’s rally.Allocations to small- and midcap stocks and emerging markets equities also contributed positively to the fund’s relative performance.
The fund’s underlying investments produced mixed results. Dreyfus U.S. Equity Fund outpaced the S&P 500 Index, mainly due to underweighted exposure to
The Funds 29
DISCUSSION OF FUND PERFORMANCE (continued)
the financials sector. BNY Mellon Income Stock Fund, which was added to the portfolio during the reporting period, achieved above-average results in nine of the 10 sectors represented in its benchmark. BNY Mellon Mid Cap Multi-Strategy Fund was buoyed by strong contributions from its core and value-oriented investments. Dreyfus Global Real Estate Securities Fund participated in gains driven by rebounding commercial and residential property markets. On the other hand, direct investments in value-oriented equities were hurt by disappointments in the information technology and energy sectors; BNY Mellon Focused Equity Opportunities Fund struggled with overweighted exposure to consumer electronics giant Apple; and BNY Mellon U.S. Core Equity 130/30 Fund suffered shortfalls in the information technology, consumer discretionary and energy sectors.
The fund’s fixed-income investments produced higher returns than the Barclays U.S.Aggregate Bond Index, as overweighted exposure to corporate- and asset-backed securities bolstered relative returns. In addition, Dreyfus High Yield Fund and Dreyfus Emerging Market Debt Local Currency Fund benefited from relative strength among higher yielding securities in a low interest rate environment. We reduced the fund’s exposure to Dreyfus Emerging Market Debt Local Currency Fund as valuations became richer.
Over much of the reporting period, the fund held a position in Guggengheim Managed Futures Fund, which employs derivative instruments that are sensitive to changes in global fixed-income, currency, commodity, and equity markets. This investment detracted mildly from the fund’s relative performance, and we eliminated the fund’s position by the reporting period’s end.
Stocks May Be Poised for Additional Gains
We have been encouraged by recently positive economic data, which we believe could help drive further stock market gains. Interest rates remain near historical lows, and many companies’ balance sheets contain large cash balances. Conversely, bonds remain vulnerable to expectations of higher interest rates as the economic recovery continues. Therefore, we have maintained the fund’s tilt toward stocks over bonds, and we are watchful for opportunities to enhance returns and manage risks by adjusting the fund’s allocations among its underlying investments.
March 15, 2013
Equities are subject generally to market, market sector, market liquidity, issuer
and investment style risks, among other factors, to varying degrees, all of which
are more fully described in the fund’s prospectus.
Bonds are subject generally to interest rate, credit, liquidity and market risks, to
varying degrees, all of which are more fully described in the fund’s prospectus.
Generally, all other factors being equal, bond prices are inversely related to
interest-rate changes, and rate increases can cause price declines.
1 Total return includes reinvestment of dividends and any capital gains paid.
Past performance is no guarantee of future results. Share price and investment
return fluctuate such that upon redemption, fund shares may be worth more or
less than their original cost.The fund’s returns reflect the absorption of certain
fund expenses by BNY Mellon Fund Advisers pursuant to an agreement in
effect through December 31, 2013, at which time it may be extended,
terminated or modified. Had these expenses not been absorbed, the fund’s
returns would have been lower.
2 SOURCE: LIPPER INC. — Reflects reinvestment of dividends and, where
applicable, capital gain distributions.The Standard & Poor’s 500 Composite
Stock Price Index is a widely accepted, unmanaged index of U.S. stock market
performance.The Barclays U.S.Aggregate Bond Index is a widely accepted,
unmanaged total return index of corporate, U.S. government and U.S.
government agency debt instruments, mortgage-backed securities and asset-
backed securities with an average maturity of 1-10 years.The indices’ returns
do not reflect the fees and expenses associated with operating a mutual fund.
Investors cannot invest directly in any index.
30
UNDERSTANDING YOUR FUND’S EXPENSES (Unaudited)
As a mutual fund investor, you pay ongoing expenses, such as management fees and other expenses. Using the information below, you can estimate how these expenses affect your investment and compare them with the expenses of other funds.You also may pay one-time transaction expenses, including sales charges (loads) and redemption fees, which are not shown in this section and would have resulted in higher total expenses. For more information, see your fund’s prospectus or talk to your financial adviser.
Review your fund’s expenses
The table below shows the expenses you would have paid on a $1,000 investment in each class of each BNY Mellon equity fund from September 1, 2012 to February 28, 2013. It also shows how much a $1,000 investment would be worth at the close of the period, assuming actual returns and expenses.
| Expenses and Value of a $1,000 Investment | ||||
| assuming actual returns for the six months ended February 28, 2013 | ||||
| Class M Shares | Investor Shares | |||
| BNY Mellon Large Cap Stock Fund | ||||
| Expenses paid per $1,000† | $ | 4.16 | $ | 5.45 |
| Ending value (after expenses) | $ | 1,072.80 | $ | 1,072.60 |
| Annualized expense ratio (%) | .81 | 1.06 | ||
| BNY Mellon Large Cap Market | ||||
| Opportunities Fund | ||||
| Expenses paid per $1,000† | $ | 4.12 | $ | 5.40 |
| Ending value (after expenses) | $ | 1,075.40 | $ | 1,074.40 |
| Annualized expense ratio (%) | .80 | 1.05 | ||
| BNY Mellon Tax-Sensitive | ||||
| Large Cap Multi-Strategy Fund | ||||
| Expenses paid per $1,000† | $ | 4.47 | $ | 5.18 |
| Ending value (after expenses) | $ | 1,074.00 | $ | 1,087.80 |
| Annualized expense ratio (%) | .87 | 1.00 | ||
| BNY Mellon Income Stock Fund | ||||
| Expenses paid per $1,000† | $ | 4.32 | $ | 5.58 |
| Ending value (after expenses) | $ | 1,123.30 | $ | 1,122.50 |
| Annualized expense ratio (%) | .82 | 1.06 | ||
| BNY Mellon Mid Cap Multi-Strategy Fund | ||||
| Expenses paid per $1,000† | $ | 4.92 | $ | 6.24 |
| Ending value (after expenses) | $ | 1,133.30 | $ | 1,132.10 |
| Annualized expense ratio (%) | .93 | 1.18 | ||
| BNY Mellon Small Cap Multi-Strategy Fund | ||||
| Expenses paid per $1,000† | $ | 5.57 | $ | 6.83 |
| Ending value (after expenses) | $ | 1,119.90 | $ | 1,117.80 |
| Annualized expense ratio (%) | 1.06 | 1.30 | ||
| BNY Mellon U.S. Core Equity 130/30 Fund | ||||
| Expenses paid per $1,000† | $ | 10.35 | $ | 11.61 |
| Ending value (after expenses) | $ | 1,045.80 | $ | 1,044.50 |
| Annualized expense ratio (%) | 2.04 | 2.29 | ||
The Funds 31
| UNDERSTANDING YOUR FUND’S EXPENSES (Unaudited) (continued) | ||||
| Expenses and Value of a $1,000 Investment (continued) | ||||
| assuming actual returns for the six months ended February 28, 2013 | ||||
| Class M Shares | Investor Shares | |||
| BNY Mellon Focused | ||||
| Equity Opportunities Fund | ||||
| Expenses paid per $1,000† | $ | 4.41 | $ | 5.73 |
| Ending value (after expenses) | $ | 1,066.70 | $ | 1,064.70 |
| Annualized expense ratio (%) | .86 | 1.12 | ||
| BNY Mellon Small/Mid Cap Fund | ||||
| Expenses paid per $1,000† | $ | 4.82 | $ | 6.05 |
| Ending value (after expenses) | $ | 1,089.20 | $ | 1,087.20 |
| Annualized expense ratio (%) | .93 | 1.17 | ||
| BNY Mellon International Fund | ||||
| Expenses paid per $1,000† | $ | 5.71 | $ | 7.04 |
| Ending value (after expenses) | $ | 1,153.00 | $ | 1,151.10 |
| Annualized expense ratio (%) | 1.07 | 1.32 | ||
| BNY Mellon Emerging Markets Fund | ||||
| Expenses paid per $1,000† | $ | 7.43 | $ | 8.74 |
| Ending value (after expenses) | $ | 1,126.20 | $ | 1,124.30 |
| Annualized expense ratio (%) | 1.41 | 1.66 | ||
| BNY Mellon International Appreciation Fund | ||||
| Expenses paid per $1,000† | $ | 4.34 | $ | 5.67 |
| Ending value (after expenses) | $ | 1,137.00 | $ | 1,135.90 |
| Annualized expense ratio (%) | .82 | 1.07 | ||
| BNY Mellon International Equity Income Fund | ||||
| Expenses paid per $1,000† | $ | 6.23 | $ | 7.65 |
| Ending value (after expenses) | $ | 1,128.70 | $ | 1,127.30 |
| Annualized expense ratio (%) | 1.18 | 1.45 | ||
| BNY Mellon Asset Allocation Fund | ||||
| Expenses paid per $1,000† | $ | 1.23 | $ | 2.51 |
| Ending value (after expenses) | $ | 1,065.90 | $ | 1,065.20 |
| Annualized expense ratio (%) | .24 | .49 | ||
† Expenses are equal to each fund’s annualized expense ratios as shown above, multiplied by the average account value over the period, multiplied by 181/365 (to reflect the
one-half year period).
32
COMPARING YOUR FUND’S EXPENSES WITH THOSE OF OTHER FUNDS (Unaudited)
Using the SEC’s method to compare expenses
The Securities and Exchange Commission (SEC) has established guidelines to help investors assess fund expenses. Per these guidelines, the table below shows your fund’s expenses based on a $1,000 investment, assuming a hypothetical 5% annualized return.You can use this information to compare the ongoing expenses (but not transaction expenses or total cost) of investing in each fund with those of other funds. All mutual fund shareholder reports will provide this information to help you make this comparison. Please note that you cannot use this information to estimate your actual ending account balance and expenses paid during the period.
| Expenses and Value of a $1,000 Investment | ||||
| assuming a hypothetical 5% annualized return for the six months ended February 28, 2013 | ||||
| Class M Shares | Investor Shares | |||
| BNY Mellon Large Cap Stock Fund | ||||
| Expenses paid per $1,000† | $ | 4.06 | $ | 5.31 |
| Ending value (after expenses) | $ | 1,020.78 | $ | 1,019.54 |
| Annualized expense ratio (%) | .81 | 1.06 | ||
| BNY Mellon Large Cap Market | ||||
| Opportunities Fund | ||||
| Expenses paid per $1,000† | $ | 4.01 | $ | 5.26 |
| Ending value (after expenses) | $ | 1,020.83 | $ | 1,019.59 |
| Annualized expense ratio (%) | .80 | 1.05 | ||
| BNY Mellon Tax-Sensitive | ||||
| Large Cap Multi-Strategy Fund | ||||
| Expenses paid per $1,000† | $ | 4.36 | $ | 5.01 |
| Ending value (after expenses) | $ | 1,020.48 | $ | 1,019.84 |
| Annualized expense ratio (%) | .87 | 1.00 | ||
| BNY Mellon Income Stock Fund | ||||
| Expenses paid per $1,000† | $ | 4.11 | $ | 5.31 |
| Ending value (after expenses) | $ | 1,020.73 | $ | 1,019.54 |
| Annualized expense ratio (%) | .82 | 1.06 | ||
| BNY Mellon Mid Cap Multi-Strategy Fund | ||||
| Expenses paid per $1,000† | $ | 4.66 | $ | 5.91 |
| Ending value (after expenses) | $ | 1,020.18 | $ | 1,018.94 |
| Annualized expense ratio (%) | .93 | 1.18 | ||
| BNY Mellon Small Cap Multi-Strategy Fund | ||||
| Expenses paid per $1,000† | $ | 5.31 | $ | 6.51 |
| Ending value (after expenses) | $ | 1,019.54 | $ | 1,018.35 |
| Annualized expense ratio (%) | 1.06 | 1.30 | ||
| BNY Mellon U.S. Core Equity 130/30 Fund | ||||
| Expenses paid per $1,000† | $ | 10.19 | $ | 11.43 |
| Ending value (after expenses) | $ | 1,014.68 | $ | 1,013.44 |
| Annualized expense ratio (%) | 2.04 | 2.29 | ||
The Funds 33
| COMPARING YOUR FUND’S EXPENSES WITH THOSE OF OTHER FUNDS (Unaudited) (continued) | ||||
| Expenses and Value of a $1,000 Investment (continued) | ||||
| assuming a hypothetical 5% annualized return for the six months ended February 28, 2013 | ||||
| Class M Shares | Investor Shares | |||
| BNY Mellon Focused | ||||
| Equity Opportunities Fund | ||||
| Expenses paid per $1,000† | $ | 4.31 | $ | 5.61 |
| Ending value (after expenses) | $ | 1,020.53 | $ | 1,019.24 |
| Annualized expense ratio (%) | .86 | 1.12 | ||
| BNY Mellon Small/Mid Cap Fund | ||||
| Expenses paid per $1,000† | $ | 4.66 | $ | 5.86 |
| Ending value (after expenses) | $ | 1,020.18 | $ | 1,018.99 |
| Annualized expense ratio (%) | .93 | 1.17 | ||
| BNY Mellon International Fund | ||||
| Expenses paid per $1,000† | $ | 5.36 | $ | 6.61 |
| Ending value (after expenses) | $ | 1,019.49 | $ | 1,018.25 |
| Annualized expense ratio (%) | 1.07 | 1.32 | ||
| BNY Mellon Emerging Markets Fund | ||||
| Expenses paid per $1,000† | $ | 7.05 | $ | 8.30 |
| Ending value (after expenses) | $ | 1,017.80 | $ | 1,016.56 |
| Annualized expense ratio (%) | 1.41 | 1.66 | ||
| BNY Mellon International Appreciation Fund | ||||
| Expenses paid per $1,000† | $ | 4.11 | $ | 5.36 |
| Ending value (after expenses) | $ | 1,020.73 | $ | 1,019.49 |
| Annualized expense ratio (%) | .82 | 1.07 | ||
| BNY Mellon International Equity Income Fund | ||||
| Expenses paid per $1,000† | $ | 5.91 | $ | 7.25 |
| Ending value (after expenses) | $ | 1,018.94 | $ | 1,017.60 |
| Annualized expense ratio (%) | 1.18 | 1.45 | ||
| BNY Mellon Asset Allocation Fund | ||||
| Expenses paid per $1,000† | $ | 1.20 | $ | 2.46 |
| Ending value (after expenses) | $ | 1,023.60 | $ | 1,022.36 |
| Annualized expense ratio (%) | .24 | .49 | ||
† Expenses are equal to each fund’s annualized expense ratios as shown above, multiplied by the average account value over the period, multiplied by 181/365 (to reflect the
one-half year period).
34
STATEMENT OF INVESTMENTS
February 28, 2013 (Unaudited)
| BNY Mellon Large Cap Stock Fund | |||||||
| Common Stocks—99.9% | Shares | Value ($) | Shares | Value ($) | |||
| Banks—2.7% | Food, Beverage & Tobacco—11.2% | ||||||
| Wells Fargo & Co. | 585,780 | 20,549,162 | Beam | 200,250 | 12,221,257 | ||
| Capital Goods—5.1% | Coca-Cola Enterprises | 258,170 | 9,237,323 | ||||
| Danaher | 114,360 | 7,044,576 | ConAgra Foods | 198,520 | 6,771,517 | ||
| Eaton | 215,137 | 13,332,040 | PepsiCo | 257,140 | 19,483,498 | ||
| Fluor | 116,930 | 7,237,967 | Philip Morris International | 321,470 | 29,494,873 | ||
| General Electric | 500,486 | 11,621,285 | Unilever, ADR | 244,230 | 9,732,566 | ||
| 39,235,868 | 86,941,034 | ||||||
| Commercial & Professional | Health Care Equipment & | ||||||
| Services—2.6% | Services—4.2% | ||||||
| ADT | 136,520 | 6,537,943 | Allscripts Healthcare Solutions | 269,500 | a | 3,428,040 | |
| Robert Half International | 185,650 | 6,599,858 | Cigna | 117,550 | 6,871,973 | ||
| Tyco International | 216,780 | 6,939,128 | Covidien | 221,930 | 14,108,090 | ||
| 20,076,929 | McKesson | 77,890 | 8,266,466 | ||||
| Consumer Durables & | 32,674,569 | ||||||
| Apparel—1.6% | Insurance—2.2% | ||||||
| NIKE, Cl. B | 148,540 | 8,089,488 | American International Group | 236,230 | a | 8,979,102 | |
| PVH | 37,120 | 4,523,072 | Chubb | 95,090 | 7,990,413 | ||
| 12,612,560 | 16,969,515 | ||||||
| Diversified Financials—11.2% | Materials—2.5% | ||||||
| American Express | 198,620 | 12,344,233 | LyondellBasell Industries, Cl. A | 199,960 | 11,721,655 | ||
| Ameriprise Financial | 154,630 | 10,612,257 | Praxair | 68,610 | 7,756,361 | ||
| Bank of America | 1,102,030 | 12,375,797 | 19,478,016 | ||||
| Capital One Financial | 115,900 | 5,914,377 | Media—5.7% | ||||
| IntercontinentalExchange | 51,510 | a | 7,974,778 | CBS, Cl. B | 310,410 | b | 13,468,690 |
| JPMorgan Chase & Co. | 353,486 | 17,292,535 | News Corp., Cl. A | 559,000 | 16,099,200 | ||
| Moody’s | 257,770 | 12,388,426 | Walt Disney | 271,250 | 14,807,537 | ||
| T. Rowe Price Group | 123,310 | 8,778,439 | 44,375,427 | ||||
| 87,680,842 | Pharmaceuticals, Biotech & | ||||||
| Life Sciences—9.7% | |||||||
| Energy—10.8% | |||||||
| Eli Lilly & Co. | 310,220 | 16,956,625 | |||||
| Anadarko Petroleum | 115,590 | 9,198,652 | |||||
| Johnson & Johnson | 162,670 | 12,380,814 | |||||
| Ensco, Cl. A | 178,950 | 10,762,053 | |||||
| Merck & Co. | 211,200 | 9,024,576 | |||||
| EOG Resources | 48,420 | 6,086,878 | |||||
| Pfizer | 1,087,400 | 29,762,138 | |||||
| Exxon Mobil | 211,610 | 18,949,675 | |||||
| Sanofi, ADR | 147,280 | 6,953,089 | |||||
| National Oilwell Varco | 118,810 | 8,094,525 | |||||
| 75,077,242 | |||||||
| Occidental Petroleum | 118,260 | 9,736,346 | |||||
| Real Estate—1.8% | |||||||
| Schlumberger | 173,120 | 13,477,392 | |||||
| American Tower | 49,040 | c | 3,805,504 | ||||
| TransCanada | 152,370 | 7,086,729 | |||||
| CBRE Group, Cl. A | 408,180 | a | 9,865,711 | ||||
| 83,392,250 | |||||||
| 13,671,215 | |||||||
| Exchange-Traded Funds—1.0% | |||||||
| Retailing—2.3% | |||||||
| Standard & Poor’s Depository | |||||||
| Amazon.com | 38,630 | a | 10,208,750 | ||||
| Receipts S&P 500 ETF Trust | 50,310 | 7,627,499 | |||||
| Target | 123,220 | 7,757,931 | |||||
| Food & Staples Retailing—1.6% | |||||||
| 17,966,681 | |||||||
| Wal-Mart Stores | 175,060 | 12,390,747 | |||||
The Funds 35
| STATEMENT OF INVESTMENTS (Unaudited) (continued) | ||||||||
| BNY Mellon Large Cap Stock Fund (continued) | ||||||||
| Common Stocks (continued) | Shares | Value ($) | Shares | Value ($) | ||||
| Semiconductors & Semiconductor | Utilities—2.2% | |||||||
| Equipment—.7% | NextEra Energy | 233,140 | 16,755,772 | |||||
| Skyworks Solutions | 238,180 | a | 5,073,234 | Total Common Stocks | ||||
| Software & Services—8.1% | (cost $584,868,951) | 773,683,681 | ||||||
| Alliance Data Systems | 78,090 | a,b | 12,392,102 | |||||
| Cognizant Technology Solutions, Cl. A | 163,400 | a | 12,544,218 | Other Investment—.3% | ||||
| Facebook, Cl. A | 177,580 | 4,839,055 | Registered | |||||
| Informatica | 174,270 | a | 6,101,193 | Investment Company; | ||||
| Intuit | 132,800 | 8,562,944 | Dreyfus Institutional Preferred | |||||
| Oracle | 348,930 | 11,954,342 | Plus Money Market Fund | |||||
| Teradata | 104,248 | a | 6,052,639 | (cost $2,164,335) | 2,164,335 | d | 2,164,335 | |
| 62,446,493 | Investment of Cash Collateral | |||||||
| Technology Hardware & | for Securities Loaned—2.1% | |||||||
| Equipment—10.0% | ||||||||
| Registered | ||||||||
| Apple | 66,240 | 29,238,336 | Investment Company; | |||||
| Cisco Systems | 651,550 | 13,584,817 | Dreyfus Institutional Cash | |||||
| EMC | 590,220 | a | 13,580,962 | Advantage Fund | ||||
| Juniper Networks | 249,840 | a | 5,166,691 | (cost $16,742,745) | 16,742,745 | d | 16,742,745 | |
| QUALCOMM | 242,610 | 15,922,494 | ||||||
| Total Investments | ||||||||
| 77,493,300 | (cost $603,776,031) | 102.3 | % | 792,590,761 | ||||
| Telecommunication Services—.9% | ||||||||
| Liabilities, Less Cash | ||||||||
| AT&T | 195,819 | 7,031,860 | ||||||
| and Receivables | (2.3 | %) | (18,064,519 | ) | ||||
| Transportation—1.8% | ||||||||
| Net Assets | 100.0 | % | 774,526,242 | |||||
| FedEx | 134,340 | 14,163,466 | ||||||
ADR—American Depository Receipts
a Non-income producing security.
b Security, or portion thereof, on loan.At February 28, 2013, the value of the fund’s securities on loan was $20,782,782 and the value of the collateral held by the fund was
$26,660,016, consisting of cash collateral of $16,742,745 and U.S. Government and Agency securities valued at $9,917,271.
c Investment in real estate investment trust.
d Investment in affiliated money market mutual fund.
| Portfolio Summary (Unaudited) † | |||
| Value (%) | Value (%) | ||
| Diversified Financials | 11.2 | Money Market Investments | 2.4 |
| Food, Beverage & Tobacco | 11.2 | Retailing | 2.3 |
| Energy | 10.8 | Insurance | 2.2 |
| Technology Hardware & Equipment | 10.0 | Utilities | 2.2 |
| Pharmaceuticals, Biotech & Life Sciences | 9.7 | Transportation | 1.8 |
| Software & Services | 8.1 | Real Estate | 1.8 |
| Media | 5.7 | Consumer Durables & Apparel | 1.6 |
| Capital Goods | 5.1 | Food & Staples Retailing | 1.6 |
| Health Care Equipment & Services | 4.2 | Exchange-Traded Funds | 1.0 |
| Banks | 2.7 | Telecommunication Services | .9 |
| Commercial & Professional Services | 2.6 | Semiconductors & Semiconductor Equipment | .7 |
| Materials | 2.5 | 102.3 | |
| † Based on net assets. | |||
| See notes to financial statements. | |||
36
STATEMENT OF INVESTMENTS
February 28, 2013 (Unaudited)
| BNY Mellon Large Cap Market Opportunities Fund | |||||||
| Common Stocks—82.2% | Shares | Value ($) | Shares | Value ($) | |||
| Automobiles & Components—1.1% | Food & Staples Retailing—.9% | ||||||
| Johnson Controls | 65,609 | 2,064,715 | Wal-Mart Stores | 22,566 | 1,597,221 | ||
| Banks—2.8% | Food, Beverage & Tobacco—3.9% | ||||||
| PNC Financial Services Group | 38,750 | 2,417,613 | Coca-Cola | 35,020 | 1,355,974 | ||
| Wells Fargo & Co. | 79,880 | 2,802,190 | Mondelez International, Cl. A | 105,044 | 2,904,467 | ||
| 5,219,803 | PepsiCo | 39,095 | 2,962,228 | ||||
| Capital Goods—11.2% | 7,222,669 | ||||||
| Boeing | 17,132 | 1,317,451 | Health Care Equipment & | ||||
| Caterpillar | 30,150 | 2,784,955 | Services—5.8% | ||||
| Donaldson | 48,964 | 1,764,173 | C.R. Bard | 14,818 | 1,464,759 | ||
| Dover | 31,610 | 2,318,594 | Express Scripts Holding | 43,510 | a | 2,476,154 | |
| Eaton | 54,050 | 3,349,478 | Meridian Bioscience | 59,285 | 1,256,842 | ||
| Emerson Electric | 27,120 | 1,537,704 | ResMed | 53,030 | 2,359,305 | ||
| Flowserve | 12,570 | 2,017,485 | Stryker | 24,982 | 1,595,850 | ||
| MSC Industrial Direct, Cl. A | 18,666 | 1,592,583 | Varian Medical Systems | 21,026 | a | 1,485,066 | |
| Precision Castparts | 9,168 | 1,710,657 | 10,637,976 | ||||
| Rockwell Collins | 20,198 | 1,214,102 | Household & Personal Products—2.1% | ||||
| W.W. Grainger | 3,510 | 794,875 | Colgate-Palmolive | 14,763 | 1,689,330 | ||
| 20,402,057 | Procter & Gamble | 28,890 | 2,200,840 | ||||
| Consumer Durables & Apparel—1.5% | 3,890,170 | ||||||
| Coach | 22,340 | 1,079,692 | Insurance—1.6% | ||||
| NIKE, Cl. B | 31,398 | 1,709,935 | MetLife | 81,240 | 2,879,146 | ||
| 2,789,627 | Materials—4.0% | ||||||
| Consumer Services—3.8% | Celanese, Ser. A | 46,236 | 2,166,157 | ||||
| Las Vegas Sands | 41,130 | 2,117,784 | Monsanto | 19,928 | 2,013,326 | ||
| McDonald’s | 16,629 | 1,594,721 | Praxair | 12,795 | 1,446,475 | ||
| Panera Bread, Cl. A | 4,671 | a | 751,797 | Sigma-Aldrich | 20,810 | 1,603,619 | |
| Starbucks | 46,441 | 2,545,896 | 7,229,577 | ||||
| 7,010,198 | Media—2.3% | ||||||
| Diversified Financials—1.4% | Comcast, Cl. A | 37,050 | 1,474,219 | ||||
| Invesco | 92,803 | 2,486,192 | Walt Disney | 49,289 | 2,690,686 | ||
| Energy—9.7% | 4,164,905 | ||||||
| Apache | 13,889 | 1,031,536 | Pharmaceuticals, Biotech & | ||||
| CARBO Ceramics | 14,162 | 1,285,910 | Life Sciences—6.6% | ||||
| EOG Resources | 13,228 | 1,662,892 | Actavis | 39,776 | a | 3,387,324 | |
| Halliburton | 53,711 | 2,229,544 | Celgene | 21,468 | a | 2,215,068 | |
| Marathon Oil | 63,570 | 2,129,595 | Johnson & Johnson | 19,930 | 1,516,872 | ||
| National Oilwell Varco | 33,650 | 2,292,575 | Shire, ADR | 26,180 | 2,452,019 | ||
| Occidental Petroleum | 14,821 | 1,220,213 | Teva Pharmaceutical Industries, ADR | 64,590 | 2,415,666 | ||
| Schlumberger | 19,272 | 1,500,325 | 11,986,949 | ||||
| Southwestern Energy | 66,625 | a | 2,283,239 | Retailing—5.3% | |||
| Valero Energy | 44,195 | 2,014,850 | Family Dollar Stores | 25,911 | 1,491,178 | ||
| 17,650,679 | Lowe’s | 66,285 | 2,528,773 | ||||
The Funds 37
STATEMENT OF INVESTMENTS (Unaudited) (continued)
| BNY Mellon Large Cap Market Opportunities Fund (continued) | |||||||
| Common Stocks (continued) | Shares | Value ($) | Shares | Value ($) | |||
| Retailing (continued) | Technology Hardware & | ||||||
| The TJX Companies | 56,326 | 2,532,980 | Equipment (continued) | ||||
| Tractor Supply | 15,536 | 1,615,589 | Cisco Systems | 77,133 | 1,608,223 | ||
| Urban Outfitters | 35,460 | a | 1,436,839 | QUALCOMM | 22,512 | 1,477,463 | |
| 9,605,359 | 9,113,358 | ||||||
| Semiconductors & Semiconductor | Transportation—1.1% | ||||||
| Equipment—1.9% | C.H. Robinson Worldwide | 23,548 | 1,342,707 | ||||
| Broadcom, Cl. A | 69,350 | 2,365,528 | Expeditors International of Washington | 15,480 | 601,398 | ||
| Intel | 54,842 | 1,143,456 | 1,944,105 | ||||
| 3,508,984 | Total Common Stocks | ||||||
| Software & Services—10.2% | (cost $128,813,674) | 150,029,089 | |||||
| Adobe Systems | 76,067 | a | 2,989,433 | ||||
| Automatic Data Processing | 25,305 | 1,552,715 | Other Investment—17.4% | ||||
| Google, Cl. A | 2,365 | a | 1,894,838 | Registered Investment Companies: | |||
| International Business Machines | 14,620 | 2,936,135 | BNY Mellon U.S. Core Equity | ||||
| MasterCard, Cl. A | 4,939 | 2,557,513 | 130/30 Fund, Cl. M | 1,385,727 | b | 17,681,882 | |
| Microsoft | 44,299 | 1,231,512 | Dreyfus Institutional Preferred | ||||
| Oracle | 48,636 | 1,666,269 | Plus Money Market Fund | 3,309,650 | c | 3,309,650 | |
| Paychex | 44,136 | 1,460,902 | Dreyfus Research Growth Fund, Cl. I | 988,236 | b | 10,761,893 | |
| salesforce.com | 13,805 | a | 2,336,082 | Total Other Investment | |||
| (cost $28,958,824) | 31,753,425 | ||||||
| 18,625,399 | |||||||
| Technology Hardware & | Total Investments (cost $157,772,498) | 99.6 | % | 181,782,514 | |||
| Equipment—5.0% | |||||||
| Cash and Receivables (Net) | .4 | % | 808,296 | ||||
| Amphenol, Cl. A | 25,744 | 1,824,220 | |||||
| Apple | 9,523 | 4,203,452 | Net Assets | 100.0 | % | 182,590,810 | |
ADR—American Depository Receipts
a Non-income producing security.
b Investment in affiliated mutual fund.
c Investment in affiliated money market mutual fund
| Portfolio Summary (Unaudited) † | |||
| Value (%) | Value (%) | ||
| Mutual Funds: Domestic | 15.6 | Media | 2.3 |
| Capital Goods | 11.2 | Household & Personal Products | 2.1 |
| Software & Services | 10.2 | Semiconductors & Semiconductor Equipment | 1.9 |
| Energy | 9.7 | Money Market Investment | 1.8 |
| Pharmaceuticals, Biotech & Life Sciences | 6.6 | Insurance | 1.6 |
| Health Care Equipment & Services | 5.8 | Consumer Durables & Apparel | 1.5 |
| Retailing | 5.3 | Diversified Financials | 1.4 |
| Technology Hardware & Equipment | 5.0 | Automobiles & Components | 1.1 |
| Materials | 4.0 | Transportation | 1.1 |
| Food, Beverage & Tobacco | 3.9 | Food & Staples Retailing | .9 |
| Consumer Services | 3.8 | ||
| Banks | 2.8 | 99.6 | |
| † Based on net assets. | |||
| See notes to financial statements. | |||
38
STATEMENT OF INVESTMENTS
February 28, 2013 (Unaudited)
| BNY Mellon Tax-Sensitive Large Cap Multi-Strategy Fund | |||||||
| Common Stocks—86.1% | Shares | Value ($) | Shares | Value ($) | |||
| Automobiles & Components—.9% | Capital Goods (continued) | ||||||
| BorgWarner | 2,950 | a | 219,509 | Precision Castparts | 18,637 | 3,477,478 | |
| Ford Motor | 30,623 | 386,156 | Raytheon | 7,020 | 383,081 | ||
| Harley-Davidson | 2,664 | 140,206 | Rockwell Collins | 41,480 | 2,493,363 | ||
| Johnson Controls | 149,336 | 4,699,604 | Stanley Black & Decker | 3,083 | 242,632 | ||
| 5,445,475 | United Technologies | 29,607 | 2,680,914 | ||||
| Banks—3.3% | W.W. Grainger | 7,130 | 1,614,660 | ||||
| Bank of America | 121,854 | 1,368,420 | Xylem | 10,038 | 276,045 | ||
| BB&T | 50,757 | 1,540,983 | 58,689,590 | ||||
| Fifth Third Bancorp | 6,614 | 104,766 | Commercial & Professional | ||||
| First Horizon National | 23,720 | 252,144 | Services—.1% | ||||
| M&T Bank | 1,690 | 172,532 | ADT | 3,277 | 156,936 | ||
| PNC Financial Services Group | 106,680 | 6,655,765 | Tyco International | 8,534 | 273,173 | ||
| SunTrust Banks | 2,370 | 65,388 | Waste Management | 9,444 | 352,450 | ||
| U.S. Bancorp | 22,952 | 779,909 | 782,559 | ||||
| Wells Fargo & Co. | 251,403 | 8,819,217 | Consumer Durables & Apparel—1.1% | ||||
| 19,759,124 | Coach | 44,321 | 2,142,034 | ||||
| Capital Goods—9.8% | Lennar, Cl. A | 7,440 | 287,110 | ||||
| 3M | 6,854 | 712,816 | Mattel | 5,698 | 232,194 | ||
| Boeing | 38,501 | 2,960,727 | NIKE, Cl. B | 65,374 | 3,560,268 | ||
| Caterpillar | 72,167 | 6,666,066 | Ralph Lauren | 1,090 | 189,082 | ||
| Cummins | 1,926 | 223,166 | VF | 1,190 | 191,899 | ||
| Danaher | 6,502 | 400,523 | 6,602,587 | ||||
| Deere & Co. | 2,101 | 184,531 | Consumer Services—3.1% | ||||
| Donaldson | 87,880 | 3,166,316 | Carnival | 44,502 | 1,591,837 | ||
| Dover | 73,889 | 5,419,758 | Chipotle Mexican Grill | 500 | a | 158,395 | |
| Eaton | 124,389 | 7,708,386 | Las Vegas Sands | 91,600 | 4,716,484 | ||
| Emerson Electric | 60,060 | 3,405,402 | McDonald’s | 40,266 | 3,861,509 | ||
| Fastenal | 3,460 | 178,640 | Panera Bread, Cl. A | 8,378 | a | 1,348,439 | |
| Flowserve | 22,560 | 3,620,880 | Starbucks | 92,054 | 5,046,400 | ||
| Fluor | 2,597 | 160,754 | Starwood Hotels & | ||||
| General Dynamics | 741 | 50,366 | Resorts Worldwide | 1,760 | b | 106,181 | |
| General Electric | 198,222 | 4,602,715 | Wyndham Worldwide | 5,250 | 316,260 | ||
| Honeywell International | 34,090 | 2,389,709 | Yum! Brands | 26,546 | 1,738,232 | ||
| Illinois Tool Works | 1,000 | 61,500 | 18,883,737 | ||||
| Ingersoll-Rand | 38,210 | 2,011,756 | Diversified Financials—3.3% | ||||
| Joy Global | 2,140 | 135,548 | American Express | 10,379 | 645,055 | ||
| Lockheed Martin | 730 | 64,240 | Ameriprise Financial | 3,382 | 232,107 | ||
| MSC Industrial Direct, Cl. A | 33,497 | 2,857,964 | BlackRock | 1,500 | 359,625 | ||
| Northrop Grumman | 1,146 | 75,269 | Capital One Financial | 4,293 | 219,072 | ||
| PACCAR | 4,027 | 191,001 | Charles Schwab | 14,481 | 235,171 | ||
| Parker Hannifin | 1,802 | 170,253 | Citigroup | 33,420 | 1,402,637 | ||
| Pentair | 1,936 | 103,131 | CME Group | 5,075 | 303,586 | ||
The Funds 39
| STATEMENT OF INVESTMENTS (Unaudited) (continued) | |||||||
| BNY Mellon Tax-Sensitive Large Cap Multi-Strategy Fund (continued) | |||||||
| Common Stocks (continued) | Shares | Value ($) | Shares | Value ($) | |||
| Diversified Financials (continued) | Energy (continued) | ||||||
| Discover Financial Services | 5,797 | 223,358 | Pioneer Natural Resources | 1,610 | 202,554 | ||
| Franklin Resources | 1,250 | 176,562 | Range Resources | 2,180 | 167,424 | ||
| Goldman Sachs Group | 4,974 | 744,906 | Schlumberger | 65,700 | 5,114,745 | ||
| H&R Block | 6,930 | 172,280 | Southwestern Energy | 159,760 | a | 5,474,975 | |
| IntercontinentalExchange | 13,969 | a | 2,162,681 | Spectra Energy | 7,787 | 226,134 | |
| Invesco | 231,354 | 6,197,974 | Tesoro | 2,130 | 119,791 | ||
| JPMorgan Chase & Co. | 66,584 | 3,257,289 | Valero Energy | 108,783 | 4,959,417 | ||
| Legg Mason | 9,080 | 258,780 | Williams | 7,759 | 269,315 | ||
| McGraw-Hill | 898 | 41,802 | 59,776,822 | ||||
| Moody’s | 1,120 | 53,827 | Food & Staples Retailing—1.3% | ||||
| Morgan Stanley | 15,420 | 347,721 | Costco Wholesale | 19,985 | 2,024,281 | ||
| State Street | 44,696 | 2,529,347 | CVS Caremark | 12,760 | 652,291 | ||
| T. Rowe Price Group | 2,951 | 210,082 | Kroger | 7,546 | 220,419 | ||
| 19,773,862 | Sysco | 10,440 | 335,750 | ||||
| Energy—10.0% | Wal-Mart Stores | 58,069 | 4,110,124 | ||||
| Anadarko Petroleum | 5,331 | 424,241 | Walgreen | 9,727 | 398,223 | ||
| Apache | 31,234 | 2,319,749 | Whole Foods Market | 370 | 31,679 | ||
| Baker Hughes | 3,830 | 171,661 | 7,772,767 | ||||
| Cabot Oil & Gas | 2,560 | 158,643 | Food, Beverage & Tobacco—4.8% | ||||
| Cameron International | 3,106 | a | 197,914 | Altria Group | 21,099 | 707,871 | |
| CARBO Ceramics | 25,415 | 2,307,682 | Archer-Daniels-Midland | 7,790 | 248,189 | ||
| Chevron | 37,994 | 4,450,997 | Beam | 3,659 | 223,309 | ||
| ConocoPhillips | 11,366 | 658,660 | Coca-Cola | 146,314 | 5,665,278 | ||
| Devon Energy | 4,110 | 223,009 | ConAgra Foods | 5,040 | 171,914 | ||
| Ensco, Cl. A | 4,070 | 244,770 | Constellation Brands, Cl. A | 3,630 | a | 160,591 | |
| EOG Resources | 27,191 | 3,418,181 | General Mills | 6,450 | 298,312 | ||
| EQT | 2,950 | 186,115 | H.J. Heinz | 3,613 | 261,690 | ||
| Exxon Mobil | 70,864 | 6,345,871 | Hershey | 1,951 | 162,596 | ||
| FMC Technologies | 3,120 | a | 161,959 | Kraft Foods Group | 7,311 | 354,364 | |
| Halliburton | 126,426 | 5,247,943 | Lorillard | 5,970 | 230,084 | ||
| Hess | 3,680 | 244,720 | McCormick & Co | 4,672 | 314,285 | ||
| Kinder Morgan | 1,122 | 41,593 | Mead Johnson Nutrition | 16,047 | 1,202,081 | ||
| Marathon Oil | 155,947 | 5,224,225 | Molson Coors Brewing, Cl. B | 4,680 | 206,903 | ||
| Marathon Petroleum | 3,788 | 313,949 | Mondelez International, Cl. A | 261,295 | 7,224,807 | ||
| National Oilwell Varco | 80,400 | 5,477,652 | Monster Beverage | 2,300 | a | 115,989 | |
| Noble | 4,910 | 175,876 | PepsiCo | 100,531 | 7,617,234 | ||
| Noble Energy | 2,443 | 270,758 | Philip Morris International | 34,724 | 3,185,927 | ||
| Occidental Petroleum | 54,974 | 4,526,009 | Reynolds American | 7,740 | 338,083 | ||
| Peabody Energy | 990 | 21,344 | Tyson Foods, Cl. A | 9,190 | 208,337 | ||
| Phillips 66 | 6,813 | 428,946 | 28,897,844 | ||||
40
| BNY Mellon Tax-Sensitive Large Cap Multi-Strategy Fund (continued) | |||||||
| Common Stocks (continued) | Shares | Value ($) | Shares | Value ($) | |||
| Health Care Equipment & | Insurance (continued) | ||||||
| Services—4.7% | Allstate | 5,860 | 269,677 | ||||
| Abbott Laboratories | 18,243 | 616,431 | American International Group | 16,360 | a | 621,844 | |
| Aetna | 3,538 | 166,958 | Aon | 36,606 | 2,236,261 | ||
| AmerisourceBergen | 2,926 | 138,107 | Berkshire Hathaway, Cl. B | 19,082 | a | 1,949,417 | |
| Baxter International | 5,535 | 374,166 | Chubb | 3,521 | 295,870 | ||
| Boston Scientific | 31,709 | a | 234,330 | Cincinnati Financial | 6,450 | 290,313 | |
| C.R. Bard | 29,649 | 2,930,804 | Hartford Financial Services Group | 11,110 | 262,307 | ||
| Cardinal Health | 5,170 | 238,906 | Lincoln National | 2,076 | 61,325 | ||
| Cerner | 1,730 | a | 151,306 | Loews | 2,127 | 91,695 | |
| Cigna | 2,998 | 175,263 | Marsh & McLennan | 7,356 | 273,202 | ||
| Coventry Health Care | 400 | 18,144 | MetLife | 195,522 | 6,929,300 | ||
| Covidien | 32,261 | 2,050,832 | Prudential Financial | 1,376 | 76,464 | ||
| DaVita HealthCare Partners | 1,110 | a | 132,778 | Travelers | 23,911 | 1,922,923 | |
| Edwards Lifesciences | 1,390 | a | 119,443 | 15,902,483 | |||
| Express Scripts Holding | 110,038 | a | 6,262,263 | Materials—3.5% | |||
| Humana | 991 | 67,646 | Air Products & Chemicals | 16,469 | 1,421,933 | ||
| Intuitive Surgical | 440 | a | 224,352 | Alcoa | 37,410 | 318,733 | |
| Laboratory Corp. of America Holdings | 3,491 | a | 309,303 | Celanese, Ser. A | 99,494 | 4,661,294 | |
| McKesson | 2,139 | 227,012 | CF Industries Holdings | 200 | 40,166 | ||
| Medtronic | 7,086 | 318,587 | Dow Chemical | 6,906 | 219,058 | ||
| Meridian Bioscience | 106,407 | 2,255,828 | E.I. du Pont de Nemours & Co. | 9,581 | 458,930 | ||
| Quest Diagnostics | 640 | 35,949 | Freeport-McMoRan Copper & Gold | 42,654 | 1,361,516 | ||
| ResMed | 95,167 | 4,233,980 | International Paper | 7,644 | 336,412 | ||
| St. Jude Medical | 4,276 | 175,316 | LyondellBasell Industries, Cl. A | 6,220 | 364,616 | ||
| Stryker | 50,461 | 3,223,449 | Monsanto | 42,751 | 4,319,134 | ||
| UnitedHealth Group | 12,672 | 677,318 | Mosaic | 5,600 | 327,824 | ||
| Varian Medical Systems | 37,739 | a | 2,665,506 | Newmont Mining | 4,240 | 170,830 | |
| WellPoint | 2,174 | 135,179 | Nucor | 1,070 | 48,204 | ||
| 28,159,156 | PPG Industries | 3,168 | 426,603 | ||||
| Household & Personal Products—2.1% | Praxair | 27,257 | 3,081,404 | ||||
| Avon Products | 9,630 | 188,266 | Sigma-Aldrich | 41,506 | 3,198,452 | ||
| Clorox | 2,630 | 220,946 | Vulcan Materials | 679 | 34,581 | ||
| Colgate-Palmolive | 30,864 | 3,531,768 | 20,789,690 | ||||
| Estee Lauder, Cl. A | 2,950 | 189,095 | Media—2.7% | ||||
| Kimberly-Clark | 4,180 | 394,090 | CBS, Cl. B | 7,469 | 324,080 | ||
| Procter & Gamble | 107,046 | 8,154,764 | Comcast, Cl. A | 146,686 | 5,836,636 | ||
| 12,678,929 | DIRECTV | 2,452 | a | 118,113 | |||
| Insurance—2.7% | Discovery Communications, Cl. A | 4,640 | a | 340,251 | |||
| ACE | 6,189 | 528,479 | News Corp., Cl. A | 22,786 | 656,237 | ||
| Aflac | 1,870 | 93,406 | Omnicom Group | 3,720 | 214,012 | ||
The Funds 41
STATEMENT OF INVESTMENTS (Unaudited) (continued)
| BNY Mellon Tax-Sensitive Large Cap Multi-Strategy Fund (continued) | |||||||
| Common Stocks (continued) | Shares | Value ($) | Shares | Value ($) | |||
| Media (continued) | Real Estate (continued) | ||||||
| Time Warner | 10,832 | 575,937 | Prologis | 1,560 | b | 60,746 | |
| Time Warner Cable | 1,443 | 124,661 | Public Storage | 1,500 | b | 226,815 | |
| Viacom, Cl. B | 5,068 | 296,275 | Simon Property Group | 3,912 | b | 621,460 | |
| Walt Disney | 137,008 | 7,479,267 | Ventas | 3,510 | b | 248,438 | |
| 15,965,469 | Vornado Realty Trust | 4,460 | b | 357,737 | |||
| Pharmaceuticals, Biotech & | Weyerhaeuser | 4,300 | b | 126,463 | |||
| Life Sciences—7.1% | 3,352,448 | ||||||
| AbbVie | 17,853 | 659,133 | Retailing—4.7% | ||||
| Actavis | 78,067 | a | 6,648,186 | Amazon.com | 11,327 | a | 2,993,386 |
| Agilent Technologies | 416 | 17,256 | Bed Bath & Beyond | 2,158 | a | 122,467 | |
| Alexion Pharmaceuticals | 1,340 | a | 116,232 | Dollar Tree | 5,430 | a | 245,355 |
| Allergan | 4,149 | 449,835 | eBay | 11,742 | a | 642,053 | |
| Amgen | 8,210 | 750,476 | Family Dollar Stores | 60,963 | 3,508,421 | ||
| Biogen Idec | 2,542 | a | 422,836 | Genuine Parts | 3,594 | 255,282 | |
| Bristol-Myers Squibb | 21,362 | 789,753 | Home Depot | 52,413 | 3,590,291 | ||
| Celgene | 43,583 | a | 4,496,894 | Limited Brands | 2,529 | 115,120 | |
| Eli Lilly & Co. | 43,966 | 2,403,182 | Lowe’s | 118,002 | 4,501,776 | ||
| Gilead Sciences | 59,480 | a | 2,540,391 | Macy’s | 7,099 | 291,769 | |
| GlaxoSmithKline, ADR | 25,720 | 1,132,452 | Netflix | 670 | a | 126,014 | |
| Johnson & Johnson | 64,051 | 4,874,922 | Nordstrom | 750 | 40,665 | ||
| Life Technologies | 4,430 | a | 257,516 | O’Reilly Automotive | 1,734 | a | 176,417 |
| Merck & Co | 35,381 | 1,511,830 | priceline.com | 538 | a | 369,918 | |
| Perrigo | 1,880 | 212,760 | Ross Stores | 1,274 | 73,841 | ||
| Pfizer | 144,097 | 3,943,935 | Staples | 16,050 | 211,539 | ||
| Shire, ADR | 53,810 | 5,039,845 | Target | 8,120 | 511,235 | ||
| Teva Pharmaceutical | The TJX Companies | 111,592 | 5,018,292 | ||||
| Industries, ADR | 151,230 | 5,656,002 | |||||
| Tractor Supply | 27,878 | 2,899,033 | |||||
| Thermo Fisher Scientific | 4,740 | 349,812 | |||||
| Urban Outfitters | 61,800 | a | 2,504,136 | ||||
| 42,273,248 | |||||||
| 28,197,010 | |||||||
| Real Estate—.6% | |||||||
| Semiconductors & Semiconductor | |||||||
| American Tower | 2,205 | b | 171,108 | Equipment—1.9% | |||
| AvalonBay Communities | 199 | b | 24,841 | Altera | 4,018 | 142,318 | |
| Boston Properties | 3,730 | b | 387,472 | Analog Devices | 5,623 | 254,272 | |
| CBRE Group, Cl. A | 7,590 | a | 183,450 | Broadcom, Cl. A | 166,940 | 5,694,323 | |
| Equity Residential | 1,957 | b | 107,713 | Intel | 153,457 | 3,199,578 | |
| HCP | 5,210 | b | 254,665 | Lam Research | 4,510 | a | 190,773 |
| Health Care | 3,740 | b | 239,884 | NVIDIA | 19,350 | 244,971 | |
| Host Hotels & Resorts | 2,163 | b | 36,057 | NXP Semiconductors | 31,790 | a | 1,027,453 |
| Plum Creek Timber | 6,301 | b | 305,599 | ||||
42
| BNY Mellon Tax-Sensitive Large Cap Multi-Strategy Fund (continued) | |||||||
| Common Stocks (continued) | Shares | Value ($) | Shares | Value ($) | |||
| Semiconductors & Semiconductor | Technology Hardware & | ||||||
| Equipment (continued) | Equipment (continued) | ||||||
| Texas Instruments | 13,149 | 451,931 | SanDisk | 3,190 | a | 160,744 | |
| Xilinx | 8,784 | 327,380 | Seagate Technology | 5,890 | 189,422 | ||
| 11,532,999 | Teradata | 30,608 | a | 1,777,100 | |||
| Software & Services—9.1% | Western Digital | 2,160 | 101,866 | ||||
| Accenture, Cl. A | 25,943 | 1,929,121 | Xerox | 31,490 | 255,384 | ||
| Adobe Systems | 170,312 | a | 6,693,262 | 33,879,778 | |||
| Automatic Data Processing | 52,317 | 3,210,171 | Telecommunication Services—1.0% | ||||
| Citrix Systems | 2,474 | a | 175,407 | AT&T | 82,830 | 2,974,425 | |
| Cognizant Technology Solutions, Cl. A | 3,201 | a | 245,741 | CenturyLink | 430 | 14,908 | |
| Fiserv | 2,216 | a | 181,956 | Crown Castle International | 1,920 | a | 134,016 |
| Google, Cl. A | 7,088 | a | 5,678,906 | Sprint Nextel | 35,830 | a | 207,814 |
| International Business Machines | 50,047 | 10,050,939 | Verizon Communications | 48,440 | 2,253,913 | ||
| Intuit | 3,207 | 206,787 | Windstream | 32,230 | 276,856 | ||
| MasterCard, Cl. A | 10,091 | 5,225,322 | 5,861,932 | ||||
| Microsoft | 163,293 | 4,539,545 | Transportation—1.2% | ||||
| Oracle | 129,625 | 4,440,953 | C.H. Robinson Worldwide | 47,235 | 2,693,340 | ||
| Paychex | 84,964 | 2,812,308 | CSX | 11,138 | 255,506 | ||
| Red Hat | 6,540 | a | 332,297 | Expeditors International of Washington | 36,186 | 1,405,826 | |
| salesforce.com | 33,314 | a | 5,637,395 | FedEx | 2,858 | 301,319 | |
| Symantec | 8,934 | a | 209,413 | Norfolk Southern | 3,742 | 273,353 | |
| Visa, Cl. A | 5,530 | 877,279 | Southwest Airlines | 15,010 | 175,617 | ||
| Western Union | 12,012 | 168,528 | Union Pacific | 10,824 | 1,484,079 | ||
| Yahoo! | 99,962 | a | 2,130,190 | United Parcel Service, Cl. B | 5,163 | 426,722 | |
| 54,745,520 | 7,015,762 | ||||||
| Technology Hardware & | Utilities—1.4% | ||||||
| Equipment—5.7% | American Electric Power | 6,680 | 312,557 | ||||
| Amphenol, Cl. A | 49,757 | 3,525,781 | CenterPoint Energy | 101,440 | 2,173,859 | ||
| Apple | 35,278 | 15,571,709 | CMS Energy | 10,606 | 282,226 | ||
| Cisco Systems | 199,092 | 4,151,068 | Dominion Resources | 4,643 | 260,008 | ||
| Corning | 14,950 | 188,519 | DTE Energy | 2,070 | 138,276 | ||
| Dell | 16,020 | 223,479 | Duke Energy | 8,311 | 575,537 | ||
| EMC | 22,547 | a | 518,806 | Exelon | 12,550 | 388,925 | |
| F5 Networks | 940 | a | 88,764 | NextEra Energy | 6,780 | 487,279 | |
| Hewlett-Packard | 21,518 | 433,373 | NiSource | 10,290 | 285,033 | ||
| Juniper Networks | 3,850 | a | 79,618 | NRG Energy | 12,540 | 300,960 | |
| Motorola Solutions | 3,938 | 244,983 | Pepco Holdings | 13,280 | 269,451 | ||
| NetApp | 680 | a | 23,004 | Pinnacle West Capital | 5,155 | 288,371 | |
| QUALCOMM | 96,696 | 6,346,158 | SCANA | 5,910 | 288,644 | ||
The Funds 43
| STATEMENT OF INVESTMENTS (Unaudited) (continued) | |||||||
| BNY Mellon Tax-Sensitive Large Cap Multi-Strategy Fund (continued) | |||||||
| Common Stocks (continued) | Shares | Value ($) | Other Investment (continued) | Shares | Value ($) | ||
| Utilities (continued) | Registered Investment | ||||||
| Sempra Energy | 20,987 | 1,631,949 | Company (continued); | ||||
| Southern | 12,243 | 551,057 | Dreyfus Institutional Preferred | ||||
| TECO Energy | 15,010 | 258,923 | Plus Money Market Fund | 13,510,152 | d | 13,510,152 | |
| 8,493,055 | Dreyfus Research | ||||||
| Growth Fund, Cl. I | 2,634,517 | c | 28,689,886 | ||||
| Total Common Stocks | |||||||
| (cost $490,791,154) | 515,231,846 | Total Other Investment | |||||
| (cost $80,884,071) | 82,612,170 | ||||||
| Other Investment—13.8% | Total Investments | ||||||
| (cost $571,675,225) | 99.9 | % | 597,844,016 | ||||
| Registered Investment | |||||||
| Company; | Cash and Receivables (Net) | .1 | % | 664,474 | |||
| BNY Mellon U.S. Core Equity | Net Assets | 100.0 | % | 598,508,490 | |||
| 130/30 Fund, Cl. M | 3,167,095 | c | 40,412,132 | ||||
ADR—American Depository Receipts
a Non-income producing security.
b Investment in real estate investment trust.
c Investment in affiliated mutual fund.
d Investment in affiliated money market mutual fund.
| Portfolio Summary (Unaudited) † | |||
| Value (%) | Value (%) | ||
| Mutual Funds: Domestic | 11.5 | Media | 2.7 |
| Energy | 10.0 | Money Market Investment | 2.3 |
| Capital Goods | 9.8 | Household & Personal Products | 2.1 |
| Software & Services | 9.1 | Semiconductors & Semiconductor Equipment | 1.9 |
| Pharmaceuticals, Biotech & Life Sciences | 7.1 | Utilities | 1.4 |
| Technology Hardware & Equipment | 5.7 | Food & Staples Retailing | 1.3 |
| Food, Beverage & Tobacco | 4.8 | Transportation | 1.2 |
| Health Care Equipment & Services | 4.7 | Consumer Durables & Apparel | 1.1 |
| Retailing | 4.7 | Telecommunication Services | 1.0 |
| Materials | 3.5 | Automobiles & Components | .9 |
| Banks | 3.3 | Real Estate | .6 |
| Diversified Financials | 3.3 | Commercial & Professional Services | .1 |
| Consumer Services | 3.1 | ||
| Insurance | 2.7 | 99.9 | |
| † Based on net assets. | |||
| See notes to financial statements. | |||
44
| STATEMENT OF INVESTMENTS | |||||||
| February 28, 2013 (Unaudited) | |||||||
| BNY Mellon Income Stock Fund | |||||||
| Common Stocks—96.1% | Shares | Value ($) | Shares | Value ($) | |||
| Automobiles & Components—.8% | Insurance—2.5% | ||||||
| Johnson Controls | 182,650 | 5,747,995 | Arthur J. Gallagher & Co. | 242,060 | 9,314,469 | ||
| Banks—3.4% | MetLife | 221,540 | 7,851,378 | ||||
| U.S. Bancorp | 440,060 | 14,953,239 | 17,165,847 | ||||
| Wells Fargo & Co. | 223,210 | 7,830,207 | Materials—8.7% | ||||
| 22,783,446 | Eastman Chemical | 198,010 | 13,807,237 | ||||
| Capital Goods—8.2% | International Paper | 368,880 | 16,234,409 | ||||
| Eaton | 205,280 | 12,721,202 | LyondellBasell Industries, Cl. A | 193,880 | 11,365,246 | ||
| General Electric | 1,010,562 | 23,465,250 | Martin Marietta Materials | 114,530 | a | 11,124,299 | |
| Honeywell International | 275,860 | 19,337,786 | PPG Industries | 48,840 | 6,576,794 | ||
| 55,524,238 | 59,107,985 | ||||||
| Commercial & Professional | Media—9.4% | ||||||
| Services—1.1% | Omnicom Group | 158,570 | 9,122,532 | ||||
| Pitney Bowes | 583,120 | a | 7,638,872 | Regal Entertainment Group, Cl. A | 1,725,430 | a | 27,037,488 |
| Consumer Durables & Apparel—2.4% | Time Warner | 373,040 | 19,834,537 | ||||
| Garmin | 166,000 | a | 5,700,440 | Viacom, Cl. B | 132,390 | 7,739,519 | |
| Newell Rubbermaid | 451,590 | 10,540,111 | 63,734,076 | ||||
| 16,240,551 | Pharmaceuticals, Biotech & | ||||||
| Consumer Services—1.7% | Life Sciences—8.9% | ||||||
| Carnival | 331,970 | 11,874,567 | Johnson & Johnson | 161,820 | 12,316,120 | ||
| Diversified Financials—6.0% | Merck & Co. | 407,810 | 17,425,721 | ||||
| Invesco | 284,790 | 7,629,524 | Pfizer | 664,958 | 18,199,900 | ||
| JPMorgan Chase & Co. | 537,059 | 26,272,926 | Sanofi, ADR | 258,340 | 12,196,231 | ||
| Moody’s | 147,440 | 7,085,966 | 60,137,972 | ||||
| 40,988,416 | Semiconductors & Semiconductor | ||||||
| Energy—6.1% | Equipment—3.6% | ||||||
| BP, ADR | 408,670 | 16,510,268 | Microchip Technology | 136,170 | a | 4,966,120 | |
| Exxon Mobil | 105,790 | 9,473,494 | Texas Instruments | 559,600 | 19,233,452 | ||
| Occidental Petroleum | 78,770 | 6,485,134 | 24,199,572 | ||||
| Valero Energy | 199,700 | 9,104,323 | Software & Services—.6% | ||||
| 41,573,219 | Paychex | 117,190 | a | 3,878,989 | |||
| Food, Beverage & Tobacco—11.4% | Technology Hardware & | ||||||
| ConAgra Foods | 769,970 | 26,263,677 | Equipment—3.5% | ||||
| Kraft Foods Group | 493,343 | 23,912,335 | Cisco Systems | 666,540 | 13,897,359 | ||
| Lorillard | 210,300 | 8,104,962 | QUALCOMM | 147,020 | 9,648,923 | ||
| PepsiCo | 248,580 | 18,834,907 | 23,546,282 | ||||
| 77,115,881 | Telecommunication Services—3.9% | ||||||
| Health Care Equipment & | Vodafone Group, ADR | 232,230 | 5,838,262 | ||||
| Services—1.1% | Windstream | 2,380,862 | a | 20,451,605 | |||
| Baxter International | 114,310 | 7,727,356 | 26,289,867 | ||||
The Funds 45
| STATEMENT OF INVESTMENTS (Unaudited) (continued) | ||||||||
| BNY Mellon Income Stock Fund (continued) | ||||||||
| Common Stocks (continued) | Shares | Value ($) | Other Investment—3.4% | Shares | Value ($) | |||
| Utilities—12.8% | Registered Investment Company; | |||||||
| Dominion Resources | 112,950 | 6,325,200 | Dreyfus Institutional Preferred | |||||
| DTE Energy | 201,790 | 13,479,572 | Plus Money Market Fund | |||||
| National Grid, ADR | 297,700 | a | 16,403,270 | (cost $22,841,473) | 22,841,473 | b | 22,841,473 | |
| NextEra Energy | 305,560 | 21,960,597 | Investment of Cash Collateral | |||||
| NRG Energy | 692,370 | 16,616,880 | for Securities Loaned—10.9% | |||||
| PPL | 398,260 | 12,274,373 | Registered Investment Company; | |||||
| 87,059,892 | Dreyfus Institutional Cash | |||||||
| Total Common Stocks | Advantage Fund | |||||||
| (cost $558,612,430) | 652,335,023 | (cost $74,139,234) | 74,139,234 | b | 74,139,234 | |||
| Total Investments | ||||||||
| Preferred Stocks—.6% | (cost $659,936,266) | 111.0 | % | 753,541,183 | ||||
| Automobiles & Components | ||||||||
| Liabilities, Less Cash | ||||||||
| General Motors, | and Receivables | (11.0 | %) | (74,557,364 | ) | |||
| Ser. B, Conv., Cum. $2.38 | ||||||||
| (cost $4,343,129) | 101,160 | a | 4,225,453 | Net Assets | 100.0 | % | 678,983,819 | |
ADR—American Depository Receipts
a Security, or portion thereof, on loan.At February 28, 2013, the value of the fund’s securities on loan was $75,615,197 and the value of the collateral held by the fund was
$77,718,207, consisting of cash collateral of $74,139,234 and U.S. Government & Agency securities valued at $3,578,973.
b Investment in affiliated money market mutual fund.
| Portfolio Summary (Unaudited) † | |||
| Value (%) | Value (%) | ||
| Money Market Investments | 14.3 | Technology Hardware & Equipment | 3.5 |
| Utilities | 12.8 | Banks | 3.4 |
| Food, Beverage & Tobacco | 11.4 | Insurance | 2.5 |
| Media | 9.4 | Consumer Durables & Apparel | 2.4 |
| Pharmaceuticals, Biotech & Life Sciences | 8.9 | Consumer Services | 1.7 |
| Materials | 8.7 | Automobiles & Components | 1.4 |
| Capital Goods | 8.2 | Commercial & Professional Services | 1.1 |
| Energy | 6.1 | Health Care Equipment & Services | 1.1 |
| Diversified Financials | 6.0 | Software & Services | .6 |
| Telecommunication Services | 3.9 | ||
| Semiconductors & Semiconductor Equipment | 3.6 | 111.0 | |
| † Based on net assets. | |||
| See notes to financial statements. | |||
46
| STATEMENT OF INVESTMENTS | |||||||
| February 28, 2013 (Unaudited) | |||||||
| BNY Mellon Mid Cap Multi-Strategy Fund | |||||||
| Common Stocks—98.7% | Shares | Value ($) | Shares | Value ($) | |||
| Automobiles & Components—2.4% | Capital Goods—10.6% | ||||||
| BorgWarner | 94,140 | a | 7,004,957 | AECOM Technology | 19,270 | a | 584,074 |
| Dana Holding | 163,100 | 2,728,663 | AGCO | 37,585 | 1,934,876 | ||
| Delphi Automotive | 165,500 | 6,926,175 | AMETEK | 135,502 | 5,668,049 | ||
| Gentex | 19,680 | 369,000 | B/E Aerospace | 29,200 | a | 1,536,212 | |
| Goodyear Tire & Rubber | 38,240 | a | 496,355 | Chicago Bridge & Iron & Co. | 15,688 | 840,736 | |
| Harley-Davidson | 31,310 | 1,647,845 | Curtiss-Wright | 69,283 | 2,404,813 | ||
| Lear | 105,865 | 5,655,308 | Donaldson | 43,380 | 1,562,981 | ||
| Tesla Motors | 9,960 | a,b | 346,907 | Dover | 103,790 | 7,612,996 | |
| Thor Industries | 11,890 | 446,945 | Eaton | 50,560 | 3,133,203 | ||
| TRW Automotive Holdings | 126,365 | a | 7,416,362 | Fastenal | 18,630 | 961,867 | |
| Visteon | 7,780 | a | 453,418 | Flowserve | 31,255 | 5,016,427 | |
| 33,491,935 | Fluor | 72,990 | 4,518,081 | ||||
| Banks—4.1% | Fortune Brands Home & Security | 119,500 | a | 4,128,725 | |||
| BB&T | 80,920 | 2,456,731 | Foster Wheeler | 208,865 | a | 5,025,292 | |
| BOK Financial | 16,400 | 974,652 | GATX | 14,570 | 726,314 | ||
| CIT Group | 29,360 | a | 1,229,010 | Hubbell, Cl. B | 12,140 | 1,127,927 | |
| Comerica | 213,235 | 7,331,019 | Huntington Ingalls Industries | 42,575 | 2,045,303 | ||
| Commerce Bancshares | 1,184 | 45,099 | IDEX | 22,300 | 1,135,739 | ||
| Cullen/Frost Bankers | 17,560 | b | 1,063,434 | Ingersoll-Rand | 220,620 | 11,615,643 | |
| East West Bancorp | 139,955 | 3,442,893 | Jacobs Engineering Group | 82,060 | a | 4,007,810 | |
| Fifth Third Bancorp | 532,330 | 8,432,107 | Joy Global | 15,580 | 986,837 | ||
| First Citizens Bancshares, Cl. A | 3,670 | 658,948 | KBR | 30,280 | 920,209 | ||
| First Horizon National | 48,180 | 512,153 | L-3 Communications Holdings | 13,570 | 1,034,984 | ||
| First Niagara Financial Group | 94,460 | 772,683 | Lincoln Electric Holdings | 14,060 | 788,063 | ||
| First Republic Bank | 82,870 | 3,020,611 | Masco | 179,405 | 3,455,340 | ||
| Fulton Financial | 64,430 | 731,280 | MSC Industrial Direct, Cl. A | 46,200 | 3,941,784 | ||
| Hudson City Bancorp | 80,230 | 683,560 | Navistar International | 10,580 | a,b | 262,701 | |
| Huntington Bancshares | 250,075 | 1,758,027 | Nordson | 8,110 | 514,174 | ||
| KeyCorp | 44,020 | 413,348 | Owens Corning | 16,590 | a | 643,858 | |
| M&T Bank | 29,185 | b | 2,979,497 | PACCAR | 48,420 | b | 2,296,561 |
| New York Community Bancorp | 54,540 | 736,290 | Pall | 15,290 | 1,042,472 | ||
| People’s United Financial | 69,920 | 915,952 | Parker Hannifin | 145,025 | 13,701,962 | ||
| Popular | 19,830 | a | 553,654 | Pentair | 24,270 | 1,292,863 | |
| Prosperity Bancshares | 63,000 | 2,906,820 | Quanta Services | 30,320 | a | 861,088 | |
| Regions Financial | 170,780 | 1,306,467 | Regal-Beloit | 81,420 | 6,292,138 | ||
| Signature Bank | 14,100 | a | 1,047,207 | Rockwell Automation | 18,250 | 1,648,705 | |
| SunTrust Banks | 419,215 | 11,566,142 | Rockwell Collins | 20,940 | 1,258,703 | ||
| TCF Financial | 33,090 | 454,657 | Roper Industries | 64,420 | 8,027,376 | ||
| Valley National Bancorp | 32,220 | b | 323,167 | Snap-on | 8,960 | 719,219 | |
| Zions Bancorporation | 38,050 | 918,527 | SPX | 9,290 | 747,938 | ||
| 57,233,935 | Stanley Black & Decker | 54,460 | 4,286,002 | ||||
The Funds 47
| STATEMENT OF INVESTMENTS (Unaudited) (continued) | |||||||
| BNY Mellon Mid Cap Multi-Strategy Fund (continued) | |||||||
| Common Stocks (continued) | Shares | Value ($) | Shares | Value ($) | |||
| Capital Goods (continued) | Consumer Durables & | ||||||
| Tech Data | 12,470 | a | 661,658 | Apparel (continued) | |||
| Terex | 17,940 | a | 588,611 | Harman International Industries | 22,290 | 946,211 | |
| Textron | 86,725 | 2,502,016 | Jarden | 11,290 | a | 701,222 | |
| Timken | 12,610 | 684,975 | Leggett & Platt | 23,360 | 714,349 | ||
| TransDigm Group | 10,820 | 1,540,119 | Lennar, Cl. A | 21,440 | b | 827,370 | |
| Trinity Industries | 156,840 | 6,781,762 | Lowe’s | 109,270 | 4,168,651 | ||
| Triumph Group | 54,330 | 3,988,365 | Mattel | 42,970 | 1,751,028 | ||
| United Rentals | 15,850 | a | 846,548 | Michael Kors Holdings | 7,230 | a | 428,594 |
| W.W. Grainger | 5,290 | 1,197,973 | Mohawk Industries | 40,910 | a | 4,337,278 | |
| WABCO Holdings | 21,040 | a | 1,445,869 | Newell Rubbermaid | 582,060 | 13,585,280 | |
| Wabtec | 10,920 | 1,067,867 | NVR | 750 | a | 756,900 | |
| WESCO International | 52,345 | a,b | 3,868,295 | Polaris Industries | 13,010 | 1,136,684 | |
| Xylem | 34,070 | 936,925 | PulteGroup | 124,920 | a | 2,395,966 | |
| 146,421,028 | PVH | 13,620 | 1,659,597 | ||||
| Commercial & Professional | Ralph Lauren | 3,770 | 653,982 | ||||
| Services—2.8% | Toll Brothers | 123,520 | a | 4,214,502 | |||
| ADT | 107,680 | 5,156,795 | Tupperware Brands | 10,940 | 855,836 | ||
| Avery Dennison | 16,100 | 657,685 | Under Armour, Cl. A | 69,410 | a | 3,420,525 | |
| Chemed | 22,450 | 1,732,915 | VF | 20,450 | 3,297,767 | ||
| Cintas | 18,320 | 804,248 | Whirlpool | 10,860 | 1,226,637 | ||
| Clean Harbors | 6,380 | a | 328,570 | 54,748,000 | |||
| Corrections Corp. of America | 17,770 | 681,479 | Consumer Services—1.3% | ||||
| Dun & Bradstreet | 9,610 | b | 774,566 | Brinker International | 16,150 | 539,087 | |
| Equifax | 112,065 | 6,177,023 | Chipotle Mexican Grill | 3,620 | a | 1,146,780 | |
| FTI Consulting | 88,600 | a | 3,077,964 | Darden Restaurants | 16,570 | 766,694 | |
| IHS, Cl. A | 3,410 | a | 362,313 | DeVry | 17,340 | 519,853 | |
| Iron Mountain | 24,084 | 830,898 | H&R Block | 147,130 | 3,657,652 | ||
| Manpower | 42,985 | 2,346,981 | Hyatt Hotels, Cl. A | 12,060 | a | 495,545 | |
| Nielsen Holdings | 29,780 | 1,003,288 | International Game Technology | 42,400 | 675,856 | ||
| Republic Services | 40,380 | 1,269,547 | ITT Educational Services | 9,530 | a,b | 131,323 | |
| Robert Half International | 132,460 | 4,708,953 | Marriott International, Cl. A | 11,320 | 446,574 | ||
| Stericycle | 13,220 | a | 1,268,062 | MGM Resorts International | 64,880 | a | 810,351 |
| Towers Watson & Co., Cl. A | 49,910 | 3,322,509 | Panera Bread, Cl. A | 4,200 | a | 675,990 | |
| Verisk Analytics, Cl. A | 28,060 | a | 1,642,071 | Penn National Gaming | 9,080 | a | 452,638 |
| Waste Connections | 52,630 | 1,800,472 | Royal Caribbean Cruises | 20,850 | 727,040 | ||
| Weight Watchers International | 4,790 | b | 205,204 | Service Corporation International | 42,870 | 666,200 | |
| 38,151,543 | Starwood Hotels & Resorts Worldwide | 20,890 | c | 1,260,294 | |||
| Consumer Durables & Apparel—4.0% | Wyndham Worldwide | 6,700 | 403,608 | ||||
| Brunswick | 86,545 | 3,153,700 | Wynn Resorts | 34,470 | 4,029,543 | ||
| Diebold | 14,540 | 410,610 | 17,405,028 | ||||
| Fossil | 34,670 | a | 3,563,036 | Diversified Financials—4.6% | |||
| Hanesbrands | 13,680 | a | 542,275 | Affiliated Managers Group | 33,010 | a | 4,827,052 |
48
| BNY Mellon Mid Cap Multi-Strategy Fund (continued) | |||||||
| Common Stocks (continued) | Shares | Value ($) | Shares | Value ($) | |||
| Diversified | Energy (continued) | ||||||
| Financials (continued) | Marathon Petroleum | 44,460 | 3,684,845 | ||||
| American Capital | 49,960 | a | 698,441 | McDermott International | 247,960 | a | 3,154,051 |
| Ameriprise Financial | 30,420 | 2,087,725 | Murphy Oil | 27,940 | 1,700,987 | ||
| Capital One Financial | 33,125 | 1,690,369 | Nabors Industries | 41,600 | 697,216 | ||
| Charles Schwab | 93,585 | 1,519,820 | National Oilwell Varco | 24,780 | 1,688,261 | ||
| Discover Financial Services | 76,815 | 2,959,682 | Noble Energy | 62,410 | 6,916,900 | ||
| E*TRADE Financial | 570,600 | a | 6,111,126 | Oceaneering International | 24,390 | 1,550,960 | |
| IntercontinentalExchange | 7,620 | a | 1,179,728 | Patterson-UTI Energy | 28,230 | 658,888 | |
| Invesco | 60,020 | 1,607,936 | Peabody Energy | 37,880 | 816,693 | ||
| Jefferies Group | 19,660 | 427,015 | Pioneer Natural Resources | 32,820 | 4,129,084 | ||
| Legg Mason | 26,720 | b | 761,520 | Plains Exploration & Production | 22,030 | a | 999,501 |
| Leucadia National | 37,240 | b | 1,001,756 | QEP Resources | 158,230 | 4,819,686 | |
| Moody’s | 58,450 | 2,809,107 | Range Resources | 22,070 | 1,694,976 | ||
| NASDAQ OMX Group | 36,370 | 1,151,474 | Rosetta Resources | 32,690 | a | 1,591,349 | |
| Northern Trust | 83,520 | 4,440,758 | SandRidge Energy | 51,000 | a,b | 290,700 | |
| NYSE Euronext | 26,690 | 995,003 | SEACOR Holdings | 6,380 | 443,282 | ||
| Raymond James Financial | 237,860 | 10,437,297 | SM Energy | 53,690 | 3,107,577 | ||
| SEI Investments | 64,060 | 1,810,976 | Southwestern Energy | 96,415 | a | 3,304,142 | |
| SLM | 154,480 | 2,930,486 | Superior Energy Services | 22,230 | a | 587,984 | |
| T. Rowe Price Group | 34,480 | 2,454,631 | Tesoro | 17,430 | 980,263 | ||
| TD Ameritrade Holding | 606,935 | 11,537,834 | Ultra Petroleum | 23,090 | a,b | 393,915 | |
| 63,439,736 | Unit | 14,490 | a | 659,005 | |||
| Energy—6.6% | Valero Energy | 230,845 | 10,524,224 | ||||
| Alpha Natural Resources | 38,170 | a | 304,597 | Weatherford International | 78,830 | a | 936,500 |
| Cabot Oil & Gas | 85,180 | 5,278,605 | Whiting Petroleum | 14,690 | a | 715,403 | |
| Cameron International | 103,590 | a | 6,600,755 | World Fuel Services | 11,820 | 449,515 | |
| CARBO Ceramics | 3,510 | 318,708 | WPX Energy | 31,000 | a,b | 439,890 | |
| Cheniere Energy | 30,520 | a | 650,076 | 91,201,905 | |||
| Cimarex Energy | 12,940 | 870,991 | Exchange-Traded Funds—4.7% | ||||
| Cobalt International Energy | 21,450 | a | 529,172 | iShares Russell Midcap | |||
| Concho Resources | 57,490 | a | 5,171,800 | Growth Index Fund | 138,300 | b | 9,302,058 |
| CONSOL Energy | 31,970 | 1,027,836 | iShares Russell Midcap Index Fund | 162,820 | 19,935,681 | ||
| Denbury Resources | 60,360 | a | 1,093,723 | PowerShares QQQ Trust | 125,650 | b | 8,431,115 |
| Diamond Offshore Drilling | 10,640 | b | 741,395 | Standard & Poor’s | |||
| Dresser-Rand Group | 12,490 | a | 770,133 | Depository Receipts | |||
| Ensco, Cl. A | 38,345 | 2,306,068 | S&P MidCap 400 ETF Trust | 134,170 | b | 26,902,427 | |
| EQT | 51,405 | 3,243,141 | 64,571,281 | ||||
| EXCO Resources | 34,740 | b | 230,674 | Food & Staples Retailing—.7% | |||
| FMC Technologies | 20,630 | a | 1,070,903 | Kroger | 79,590 | 2,324,824 | |
| Helmerich & Payne | 15,950 | 1,056,847 | Safeway | 40,340 | b | 962,512 | |
| HollyFrontier | 34,740 | 1,952,388 | Whole Foods Market | 69,320 | 5,935,178 | ||
| Kosmos Energy | 95,910 | a | 1,048,296 | 9,222,514 | |||
The Funds 49
STATEMENT OF INVESTMENTS (Unaudited) (continued)
| BNY Mellon Mid Cap Multi-Strategy Fund (continued) | |||||||
| Common Stocks (continued) | Shares | Value ($) | Shares | Value ($) | |||
| Food, Beverage & Tobacco—2.6% | Health Care Equipment & | ||||||
| Beam | 13,330 | 813,530 | Services (continued) | ||||
| Brown-Forman, Cl. B | 21,890 | 1,436,422 | Health Management | ||||
| Bunge | 20,880 | 1,547,417 | Associates, Cl. A | 33,320 | a | 366,187 | |
| Campbell Soup | 2,810 | b | 115,660 | Health Net | 12,310 | a | 316,859 |
| Coca-Cola Enterprises | 90,865 | 3,251,150 | Henry Schein | 14,570 | a | 1,299,935 | |
| ConAgra Foods | 63,700 | 2,172,807 | Hill-Rom Holdings | 10,970 | 359,597 | ||
| Constellation Brands, Cl. A | 85,120 | a | 3,765,709 | Hologic | 249,410 | a | 5,444,620 |
| Crimson Wine Group | 3,724 | a | 29,978 | Humana | 92,675 | 6,325,996 | |
| Dean Foods | 24,640 | a | 409,024 | Laboratory Corp. of | |||
| America Holdings | 10,240 | a | 907,264 | ||||
| Dr. Pepper Snapple Group | 113,285 | 4,941,492 | |||||
| McKesson | 38,560 | 4,092,373 | |||||
| Green Mountain Coffee Roasters | 17,060 | a,b | 814,786 | ||||
| MEDNAX | 106,690 | a,b | 9,134,798 | ||||
| H.J. Heinz | 39,300 | 2,846,499 | |||||
| Omnicare | 96,955 | 3,612,543 | |||||
| Hershey | 18,990 | 1,582,627 | |||||
| Quest Diagnostics | 42,570 | 2,391,157 | |||||
| Hillshire Brands | 18,790 | 608,796 | |||||
| ResMed | 24,470 | b | 1,088,670 | ||||
| Ingredion | 13,840 | 916,208 | |||||
| Sirona Dental Systems | 8,750 | a | 621,425 | ||||
| J.M. Smucker | 13,530 | 1,289,409 | |||||
| St. Jude Medical | 31,190 | 1,278,790 | |||||
| Kellogg | 24,645 | 1,491,023 | |||||
| Tenet Healthcare | 19,077 | a | 749,917 | ||||
| Lorillard | 80,215 | 3,091,486 | |||||
| Universal Health Services, Cl. B | 60,970 | 3,529,553 | |||||
| McCormick & Co. | 17,370 | 1,168,480 | |||||
| Varian Medical Systems | 16,420 | a | 1,159,745 | ||||
| Mead Johnson Nutrition | 22,130 | 1,657,758 | |||||
| WellCare Health Plans | 56,890 | a | 3,253,539 | ||||
| Monster Beverage | 20,550 | a | 1,036,337 | ||||
| Zimmer Holdings | 24,300 | 1,821,528 | |||||
| Smithfield Foods | 26,260 | a | 584,022 | ||||
| 94,927,479 | |||||||
| Tyson Foods, Cl. A | 44,080 | 999,294 | |||||
| Household & Personal | |||||||
| 36,569,914 | Products—.8% | ||||||
| Health Care Equipment & | Avon Products | 360,680 | 7,051,294 | ||||
| Services—6.9% | |||||||
| Church & Dwight | 25,980 | 1,609,721 | |||||
| Alere | 19,360 | a | 440,634 | ||||
| Clorox | 13,360 | 1,122,374 | |||||
| Allscripts Healthcare Solutions | 20,770 | a | 264,194 | ||||
| Energizer Holdings | 9,300 | 854,949 | |||||
| AmerisourceBergen | 197,550 | 9,324,360 | |||||
| Herbalife | 11,840 | b | 477,034 | ||||
| Boston Scientific | 184,940 | a | 1,366,707 | ||||
| Nu Skin Enterprises, Cl. A | 8,170 | b | 336,604 | ||||
| Brookdale Senior Living | 12,110 | a | 335,205 | ||||
| 11,451,976 | |||||||
| C.R. Bard | 10,690 | 1,056,707 | |||||
| Insurance—4.1% | |||||||
| CareFusion | 209,770 | a | 6,867,870 | ||||
| Alleghany | 7,915 | a | 2,990,841 | ||||
| Catamaran | 110,770 | a | 5,949,457 | ||||
| Allstate | 24,210 | 1,114,144 | |||||
| Cerner | 19,250 | a | 1,683,605 | ||||
| Aon | 42,480 | 2,595,103 | |||||
| Cigna | 205,070 | 11,988,392 | |||||
| Arch Capital Group | 34,275 | a | 1,683,588 | ||||
| Community Health Systems | 16,030 | 677,428 | |||||
| Arthur J. Gallagher & Co. | 97,060 | 3,734,869 | |||||
| Cooper | 9,660 | 1,024,540 | |||||
| Assurant | 14,470 | 607,595 | |||||
| Coventry Health Care | 19,460 | 882,706 | |||||
| Assured Guaranty | 26,340 | 491,768 | |||||
| DaVita HealthCare Partners | 21,900 | a | 2,619,678 | ||||
| Axis Capital Holdings | 41,865 | 1,705,161 | |||||
| DENTSPLY International | 25,890 | 1,072,364 | |||||
| Brown & Brown | 46,780 | 1,403,400 | |||||
| Edwards Lifesciences | 8,410 | a | 722,671 | ||||
| Everest Re Group | 12,900 | 1,607,469 | |||||
| HCA Holdings | 24,170 | 896,465 | |||||
50
| BNY Mellon Mid Cap Multi-Strategy Fund (continued) | |||||||
| Common Stocks (continued) | Shares | Value ($) | Shares | Value ($) | |||
| Insurance (continued) | Materials (continued) | ||||||
| Fidelity National Financial, Cl. A | 175,770 | 4,383,704 | International Flavors & Fragrances | 12,370 | 902,763 | ||
| Genworth Financial, Cl. A | 75,150 | a | 641,781 | International Paper | 96,725 | 4,256,867 | |
| Hartford Financial Services Group | 69,620 | 1,643,728 | LyondellBasell Industries, Cl. A | 76,170 | 4,465,085 | ||
| Lincoln National | 41,380 | 1,222,365 | Martin Marietta Materials | 9,040 | b | 878,055 | |
| Loews | 48,280 | 2,081,351 | MeadWestvaco | 30,980 | 1,106,296 | ||
| Markel | 2,030 | a,b | 981,404 | Minerals Technologies | 31,805 | 1,279,833 | |
| Marsh & McLennan | 88,785 | 3,297,475 | Nucor | 45,810 | 2,063,741 | ||
| Old Republic International | 41,500 | 498,415 | Owens-Illinois | 95,915 | a | 2,445,833 | |
| PartnerRe | 11,690 | 1,043,216 | PPG Industries | 31,915 | 4,297,674 | ||
| Principal Financial Group | 169,090 | 5,344,935 | Reliance Steel & Aluminum | 60,420 | 4,023,368 | ||
| Progressive | 83,200 | 2,026,752 | Rock-Tenn, Cl. A | 15,345 | 1,357,265 | ||
| Protective Life | 43,060 | 1,374,475 | Royal Gold | 6,970 | 456,814 | ||
| Reinsurance Group of America | 61,640 | 3,544,300 | Sealed Air | 33,040 | 733,818 | ||
| StanCorp Financial Group | 11,030 | 439,104 | Sherwin-Williams | 55,360 | 8,945,622 | ||
| Symetra Financial | 101,015 | 1,330,368 | Sigma-Aldrich | 17,850 | 1,375,521 | ||
| Torchmark | 67,570 | 3,796,758 | Sonoco Products | 25,750 | 818,078 | ||
| Unum Group | 66,230 | 1,620,648 | Steel Dynamics | 43,240 | 660,275 | ||
| Validus Holdings | 30,260 | 1,078,164 | Tahoe Rescouces | 11,200 | a,b | 169,120 | |
| W.R. Berkley | 24,910 | 1,033,765 | United States Steel | 22,190 | b | 462,440 | |
| White Mountains Insurance Group | 730 | 412,450 | Valspar | 13,900 | 856,379 | ||
| XL Group | 45,250 | 1,295,960 | Vulcan Materials | 20,180 | 1,027,767 | ||
| 57,025,056 | W.R. Grace & Co. | 10,410 | a | 745,148 | |||
| Materials—5.0% | Walter Energy | 13,460 | b | 427,893 | |||
| Airgas | 10,130 | 1,015,836 | 69,150,447 | ||||
| Albemarle | 11,720 | 762,738 | Media—2.2% | ||||
| Alcoa | 149,790 | 1,276,211 | AMC Networks, Cl. A | 10,260 | a | 588,924 | |
| Allied Nevada Gold | 11,900 | a | 217,770 | CBS, Cl. B | 95,025 | b | 4,123,135 |
| Ashland | 18,520 | 1,444,004 | Discovery Communications, Cl. A | 34,420 | a | 2,524,019 | |
| Ball | 49,415 | 2,194,520 | DISH Network, Cl. A | 29,380 | 1,022,424 | ||
| Bemis | 19,490 | 727,757 | DreamWorks | ||||
| Cabot | 41,205 | 1,515,520 | Animation SKG, Cl. A | 17,530 | a,b | 290,998 | |
| Celanese, Ser. A | 22,070 | 1,033,980 | Gannett | 37,140 | 745,400 | ||
| CF Industries Holdings | 8,470 | 1,701,030 | Interpublic Group of Cos | 311,480 | 3,980,714 | ||
| Cliffs Natural Resources | 12,510 | b | 318,505 | John Wiley & Sons, Cl. A | 13,270 | 485,417 | |
| Commercial Metals | 39,620 | 646,202 | Lamar Advertising, Cl. A | 11,900 | a | 550,256 | |
| Crown Holdings | 92,340 | a | 3,589,256 | Liberty Global, Cl. A | 35,820 | a | 2,467,640 |
| Cytec Industries | 10,400 | 752,856 | Liberty Media | 13,870 | a | 1,497,960 | |
| Domtar | 7,060 | 526,394 | McGraw-Hill | 64,955 | 3,023,655 | ||
| Eastman Chemical | 20,140 | 1,404,362 | Omnicom Group | 86,910 | 4,999,932 | ||
| FMC | 13,030 | 785,188 | Sirius XM Radio | 495,360 | b | 1,535,616 | |
| Graphic Packaging Holding | 314,350 | a | 2,332,477 | Starz—Liberty Capital | 13,870 | a | 257,427 |
| H.B. Fuller | 64,865 | 2,651,033 | Virgin Media | 39,090 | b | 1,813,776 | |
| Huntsman | 28,970 | 499,153 | 29,907,293 | ||||
The Funds 51
STATEMENT OF INVESTMENTS (Unaudited) (continued)
| BNY Mellon Mid Cap Multi-Strategy Fund (continued) | |||||||
| Common Stocks (continued) | Shares | Value ($) | Shares | Value ($) | |||
| Pharmaceuticals, Biotech & | Real Estate (continued) | ||||||
| Life Sciences—4.1% | Equity Lifestyle Properties | 12,980 | c | 956,496 | |||
| Actavis | 16,890 | a | 1,438,352 | Equity Residential | 30,285 | c | 1,666,886 |
| Agilent Technologies | 46,590 | 1,932,553 | Essex Property Trust | 8,870 | c | 1,321,541 | |
| Alexion Pharmaceuticals | 51,350 | a | 4,454,099 | Extra Space Storage | 32,260 | c | 1,207,814 |
| Alkermes | 141,910 | a | 3,080,866 | Federal Realty Investment Trust | 960 | c | 101,962 |
| ARIAD Pharmaceuticals | 21,520 | a | 452,566 | Forest City Enterprises, Cl. A | 46,580 | a | 747,143 |
| BioMarin Pharmaceutical | 18,770 | a | 1,088,097 | General Growth Properties | 33,560 | c | 642,338 |
| Charles River Laboratories | Hatteras Financial | 22,380 | c | 597,322 | |||
| International | 17,250 | a | 702,765 | HCP | 107,390 | c | 5,249,223 |
| Covance | 41,710 | a | 2,777,469 | Health Care | 30,750 | c | 1,972,305 |
| Cubist Pharmaceuticals | 135,700 | a | 5,757,751 | Hospitality Properties Trust | 30,220 | c | 806,874 |
| Forest Laboratories | 39,130 | a | 1,439,984 | Host Hotels & Resorts | 158,259 | c | 2,638,178 |
| Hospira | 25,560 | a | 752,231 | Jones Lang LaSalle | 11,000 | 1,063,040 | |
| ICON | 43,890 | a | 1,367,612 | Kimco Realty | 239,905 | c | 5,222,732 |
| Illumina | 19,130 | a,b | 958,987 | Macerich | 34,140 | c | 2,052,155 |
| Life Technologies | 26,450 | a | 1,537,539 | Mack-Cali Realty | 25,180 | c | 714,608 |
| Medivation | 8,520 | a | 418,673 | Mid-America | |||
| Mylan | 230,230 | a | 6,817,110 | Apartment Communities | 41,770 | c | 2,900,509 |
| Myriad Genetics | 15,310 | a | 389,180 | Piedmont Office Realty Trust, Cl. A | 63,730 | c | 1,252,932 |
| Onyx Pharmaceuticals | 45,370 | a | 3,416,815 | Plum Creek Timber | 26,250 | c | 1,273,125 |
| Perrigo | 47,400 | 5,364,258 | Prologis | 57,550 | c | 2,240,997 | |
| Qiagen | 26,560 | a,b | 569,712 | Rayonier | 35,459 | b,c | 1,981,094 |
| Regeneron Pharmaceuticals | 11,580 | a | 1,933,860 | Regency Centers | 32,040 | c | 1,662,235 |
| Salix Pharmaceuticals | 125,200 | a | 6,116,020 | Senior Housing Properties Trust | 39,050 | c | 979,765 |
| Techne | 9,360 | 636,386 | SL Green Realty | 20,130 | c | 1,643,011 | |
| Vertex Pharmaceuticals | 29,010 | a | 1,358,248 | Taubman Centers | 18,170 | c | 1,394,002 |
| Waters | 14,140 | a | 1,311,061 | Ventas | 64,290 | c | 4,550,446 |
| 56,072,194 | Vornado Realty Trust | 45,115 | c | 3,618,674 | |||
| Real Estate—5.1% | Weingarten Realty Investors | 52,200 | b,c | 1,599,930 | |||
| American Assets Trust | 31,455 | c | 950,885 | Weyerhaeuser | 67,700 | c | 1,991,057 |
| American Campus Communities | 34,650 | c | 1,566,180 | 70,640,617 | |||
| American Capital Agency | 23,880 | c | 757,474 | Retailing—4.9% | |||
| Annaly Capital Management | 65,820 | c | 1,019,552 | Aaron’s | 13,020 | 355,316 | |
| Apartment Investment & | Abercrombie & Fitch, Cl. A | 11,910 | 555,363 | ||||
| Management, Cl. A | 29,660 | c | 878,529 | Advance Auto Parts | 10,440 | 796,990 | |
| AvalonBay Communities | 22,140 | c | 2,763,736 | American Eagle Outfitters | 25,790 | 533,337 | |
| Boston Properties | 10,700 | c | 1,111,516 | AutoZone | 4,850 | a | 1,843,728 |
| Camden Property Trust | 25,380 | c | 1,754,773 | Bed Bath & Beyond | 23,460 | a | 1,331,355 |
| CBRE Group, Cl. A | 52,820 | a | 1,276,659 | Best Buy | 18,690 | b | 306,703 |
| Chimera Investment | 152,200 | c | 453,556 | CarMax | 33,030 | a | 1,268,682 |
| Corporate Office | Dick’s Sporting Goods | 71,410 | 3,570,500 | ||||
| Properties Trust | 39,010 | c | 1,009,189 | ||||
| Dollar General | 20,890 | a | 968,043 | ||||
| Digital Realty Trust | 27,896 | b,c | 1,868,474 | ||||
| Dollar Tree | 21,830 | a | 986,389 | ||||
| Duke Realty | 73,125 | c | 1,181,700 | ||||
52
| BNY Mellon Mid Cap Multi-Strategy Fund (continued) | |||||||
| Common Stocks (continued) | Shares | Value ($) | Shares | Value ($) | |||
| Retailing (continued) | Semiconductors & Semiconductor | ||||||
| Expedia | 11,450 | 730,968 | Equipment (continued) | ||||
| Family Dollar Stores | 13,710 | 789,011 | LSI | 375,650 | a | 2,614,524 | |
| Foot Locker | 47,070 | 1,609,323 | Marvell Technology Group | 31,830 | 321,483 | ||
| GameStop, Cl. A | 21,860 | b | 547,812 | Maxim Integrated Products | 41,980 | 1,308,936 | |
| Gap | 36,720 | 1,208,822 | Micron Technology | 119,320 | a | 1,001,095 | |
| Genuine Parts | 19,850 | 1,409,946 | NVIDIA | 207,755 | 2,630,178 | ||
| GNC Holdings, Cl. A | 120,990 | 4,960,590 | ON Semiconductor | 147,705 | a | 1,181,640 | |
| Hasbro | 18,530 | b | 741,571 | Silicon Laboratories | 8,920 | a | 370,358 |
| Kohl’s | 31,680 | 1,460,448 | Skyworks Solutions | 28,600 | a | 609,180 | |
| Liberty Interactive, Cl. A | 74,390 | a | 1,553,263 | Xilinx | 120,230 | 4,480,972 | |
| Limited Brands | 31,020 | 1,412,030 | 46,733,606 | ||||
| LKQ | 43,100 | a | 913,289 | Software & Services—5.9% | |||
| Macy’s | 130,245 | 5,353,070 | Activision Blizzard | 51,530 | 736,879 | ||
| Netflix | 7,590 | a,b | 1,427,527 | Akamai Technologies | 140,350 | a | 5,187,336 |
| Nordstrom | 48,605 | 2,635,363 | Alliance Data Systems | 22,620 | a,b | 3,589,568 | |
| O’Reilly Automotive | 16,660 | a | 1,694,988 | Amdocs | 74,685 | 2,723,762 | |
| PetSmart | 17,630 | 1,147,889 | ANSYS | 13,400 | a | 1,015,720 | |
| Rent-A-Center | 75,230 | 2,729,344 | AOL | 12,910 | a | 476,379 | |
| Ross Stores | 21,570 | 1,250,197 | Autodesk | 32,100 | a | 1,178,712 | |
| Sally Beauty Holdings | 20,070 | a | 556,742 | BMC Software | 20,780 | a | 832,655 |
| Signet Jewelers | 13,450 | 823,409 | Broadridge Financial Solutions | 28,280 | 649,026 | ||
| Staples | 215,140 | b | 2,835,545 | CA | 149,700 | 3,666,153 | |
| Tiffany & Co. | 85,230 | b | 5,724,047 | Citrix Systems | 80,040 | a | 5,674,836 |
| Tractor Supply | 10,830 | 1,126,212 | Cognizant Technology Solutions, Cl. A | 81,640 | a | 6,267,503 | |
| TripAdvisor | 10,870 | a | 494,150 | Computer Sciences | 21,990 | 1,056,180 | |
| Ulta Salon Cosmetics & Fragrance | 13,230 | 1,171,649 | Compuware | 37,170 | a | 431,544 | |
| Urban Outfitters | 78,870 | a | 3,195,812 | Concur Technologies | 7,230 | a,b | 507,546 |
| Williams-Sonoma | 108,995 | 4,948,373 | CoreLogic | 12,990 | a | 336,571 | |
| 66,967,796 | Electronic Arts | 297,240 | a | 5,210,617 | |||
| Semiconductors & Semiconductor | Equinix | 7,440 | a | 1,573,932 | |||
| Equipment—3.4% | FactSet Research Systems | 6,900 | b | 671,301 | |||
| Altera | 26,510 | 938,984 | Fidelity National | ||||
| Analog Devices | 161,515 | 7,303,708 | Information Services | 37,760 | 1,421,664 | ||
| Applied Materials | 332,980 | 4,561,826 | Fiserv | 22,290 | a | 1,830,232 | |
| Atmel | 79,730 | a | 542,164 | Global Payments | 17,750 | 855,728 | |
| Avago Technologies | 27,410 | 937,970 | IAC/InterActiveCorp | 44,855 | 1,827,841 | ||
| Broadcom, Cl. A | 202,310 | 6,900,794 | Informatica | 16,990 | a | 594,820 | |
| Cree | 15,600 | a,b | 705,588 | Intuit | 121,780 | 7,852,374 | |
| Cypress Semiconductor | 48,040 | a | 505,861 | Jack Henry & Associates | 20,720 | 905,878 | |
| Fairchild Semiconductor International | 36,650 | a | 522,629 | LinkedIn, Cl. A | 8,070 | a | 1,357,213 |
| KLA-Tencor | 25,250 | 1,382,690 | NetSuite | 5,210 | a | 363,606 | |
| Lam Research | 150,140 | a | 6,350,922 | Nuance Communications | 34,840 | a,b | 641,404 |
| Linear Technology | 40,850 | 1,562,104 | Paychex | 23,210 | b | 768,251 | |
The Funds 53
| STATEMENT OF INVESTMENTS (Unaudited) (continued) | |||||||
| BNY Mellon Mid Cap Multi-Strategy Fund (continued) | |||||||
| Common Stocks (continued) | Shares | Value ($) | Shares | Value ($) | |||
| Software & Services (continued) | Telecommunication Services—.9% | ||||||
| Rackspace Hosting | 71,510 | a | 3,994,549 | Crown Castle International | 36,100 | a | 2,519,780 |
| Red Hat | 13,000 | a | 660,530 | Frontier Communications | 141,160 | b | 584,402 |
| Rovi | 19,510 | a | 347,083 | MetroPCS Communications | 43,790 | a | 429,142 |
| SolarWinds | 7,680 | a | 433,613 | NeuStar, Cl. A | 12,260 | a | 537,601 |
| Solera Holdings | 18,430 | 1,037,609 | NII Holdings | 34,660 | a,b | 167,061 | |
| Symantec | 198,410 | a | 4,650,730 | SBA Communications, Cl. A | 20,630 | a | 1,467,206 |
| Synopsys | 120,280 | a | 4,213,408 | Sprint Nextel | 378,790 | a | 2,196,982 |
| Teradata | 19,700 | a | 1,143,782 | TE Connectivity | 88,904 | 3,567,718 | |
| TIBCO Software | 30,100 | a | 645,645 | tw telecom | 24,190 | a | 612,491 |
| Vantiv, Cl. A | 144,060 | 3,134,746 | Windstream | 96,370 | b | 827,818 | |
| VeriFone Systems | 15,540 | a | 294,794 | 12,910,201 | |||
| Western Union | 32,160 | 451,205 | Transportation—1.9% | ||||
| 81,212,925 | C.H. Robinson Worldwide | 98,150 | 5,596,513 | ||||
| Technology Hardware & | Con-way | 90,920 | 3,195,838 | ||||
| Equipment—5.6% | Copa Holdings, Cl. A | 4,650 | 485,553 | ||||
| Acme Packet | 10,580 | a | 308,724 | Delta Air Lines | 112,270 | a | 1,602,093 |
| Amphenol, Cl. A | 18,940 | 1,342,088 | ERA Group | 6,380 | 128,812 | ||
| Arrow Electronics | 137,255 | a | 5,510,788 | Expeditors International | |||
| Avnet | 321,260 | a | 11,343,691 | of Washington | 31,510 | 1,224,164 | |
| AVX | 47,000 | 553,660 | Hertz Global Holdings | 31,790 | a | 634,211 | |
| Dolby Laboratories, Cl. A | 7,160 | b | 228,261 | J.B. Hunt Transport Services | 21,440 | 1,490,509 | |
| EchoStar, Cl. A | 16,150 | a | 611,116 | Kansas City Southern | 24,120 | 2,483,636 | |
| F5 Networks | 39,270 | a | 3,708,266 | Kirby | 96,300 | a | 7,316,874 |
| Flextronics International | 345,225 | a | 2,295,746 | Southwest Airlines | 78,270 | 915,759 | |
| FLIR Systems | 33,560 | 883,970 | United Continential Holdings | 44,930 | a,b | 1,200,080 | |
| Harris | 37,940 | 1,823,776 | 26,274,042 | ||||
| Ingram Micro, Cl. A | 39,010 | a | 735,729 | Utilities—3.5% | |||
| Itron | 3,830 | a | 161,128 | AES | 174,650 | 2,029,433 | |
| JDS Uniphase | 459,890 | a | 6,512,042 | Alliant Energy | 37,065 | 1,767,630 | |
| Juniper Networks | 576,760 | a | 11,927,397 | Ameren | 86,685 | 2,929,086 | |
| Lexmark International, Cl. A | 13,340 | b | 293,747 | American Electric Power | 45,215 | 2,115,610 | |
| Molex | 26,530 | b | 735,146 | American Water Works | 28,190 | 1,112,096 | |
| NCR | 25,070 | a | 691,431 | Aqua America | 36,410 | 1,060,623 | |
| NetApp | 41,360 | a | 1,399,209 | Calpine | 42,860 | a | 788,624 |
| Polycom | 29,840 | a | 271,842 | CenterPoint Energy | 31,710 | 679,545 | |
| Riverbed Technology | 22,190 | a | 339,063 | CMS Energy | 32,240 | 857,906 | |
| SanDisk | 156,770 | a | 7,899,640 | DTE Energy | 22,680 | 1,515,024 | |
| Seagate Technology | 270,305 | b | 8,693,009 | Edison International | 87,520 | 4,203,586 | |
| Trimble Navigation | 21,870 | a | 1,299,734 | Entergy | 29,420 | 1,831,689 | |
| Western Digital | 132,010 | 6,225,592 | Great Plains Energy | 219,835 | 4,798,998 | ||
| Xerox | 128,500 | 1,042,135 | ITC Holdings | 10,400 | 879,008 | ||
| Zebra Technologies, Cl. A | 16,600 | a | 742,352 | National Fuel Gas | 13,800 | 803,022 | |
| 77,579,282 | NiSource | 39,240 | 1,086,948 | ||||
54
| BNY Mellon Mid Cap Multi-Strategy Fund (continued) | ||||||||
| Common Stocks (continued) | Shares | Value ($) | Other Investment—1.2% | Shares | Value ($) | |||
| Utilities (continued) | Registered | |||||||
| Northeast Utilities | 43,830 | 1,819,383 | Investment Company; | |||||
| NRG Energy | 11,460 | 275,040 | Dreyfus | |||||
| NV Energy | 104,780 | 2,070,453 | Institutional Preferred | |||||
| Plus Money Market Fund | ||||||||
| OGE Energy | 17,400 | 1,007,634 | (cost $16,783,363) | 16,783,363 | d | 16,783,363 | ||
| ONEOK | 27,070 | 1,217,879 | ||||||
| Pepco Holdings | 67,620 | b | 1,372,010 | Investment of Cash Collateral | ||||
| Pinnacle West Capital | 22,870 | 1,279,348 | for Securities Loaned—4.3% | |||||
| PPL | 79,970 | 2,464,675 | Registered | |||||
| Questar | 37,960 | 892,440 | Investment Company; | |||||
| Sempra Energy | 28,940 | 2,250,374 | Dreyfus Institutional Cash | |||||
| Advantage Fund | ||||||||
| TECO Energy | 88,010 | 1,518,173 | ||||||
| (cost $59,109,391) | 59,109,391 | d | 59,109,391 | |||||
| Vectren | 45,170 | 1,490,610 | ||||||
| Westar Energy | 39,410 | 1,222,498 | Total Investments | |||||
| Wisconsin Energy | 10,730 | 443,149 | (cost $1,259,749,542) | 104.2 | % | 1,437,862,627 | ||
| Xcel Energy | 30,580 | 877,646 | Liabilities, Less Cash | |||||
| 48,660,140 | and Receivables | (4.2 | %) | (57,309,000 | ) | |||
| Total Common Stocks | Net Assets | 100.0 | % | 1,380,553,627 | ||||
| (cost $1,183,856,788) | 1,361,969,873 | |||||||
a Non-income producing security.
b Security, or portion thereof, on loan.At February 28, 2013, the value of the fund’s securities on loan was $73,194,974 and the value of the collateral held by the fund was
$78,202,347, consisting of cash collateral of $59,109,391 and U.S. Government and Agency securities valued at $19,092,956.
c Investment in real estate investment trust.
d Investment in affiliated money market mutual fund.
| Portfolio Summary (Unaudited) † | |||
| Value (%) | Value (%) | ||
| Capital Goods | 10.6 | Consumer Durables & Apparel | 4.0 |
| Health Care Equipment & Services | 6.9 | Utilities | 3.5 |
| Energy | 6.6 | Semiconductors & Semiconductor Equipment | 3.4 |
| Software & Services | 5.9 | Commercial & Professional Services | 2.8 |
| Technology Hardware & Equipment | 5.6 | Food, Beverage & Tobacco | 2.6 |
| Money Market Investments | 5.5 | Automobiles & Components | 2.4 |
| Real Estate | 5.1 | Media | 2.2 |
| Materials | 5.0 | Transportation | 1.9 |
| Retailing | 4.9 | Consumer Services | 1.3 |
| Exchange-Traded Funds | 4.7 | Telecommunication Services | .9 |
| Diversified Financials | 4.6 | Household & Personal Products | .8 |
| Banks | 4.1 | Food & Staples Retailing | .7 |
| Insurance | 4.1 | ||
| Pharmaceuticals, Biotech & Life Sciences | 4.1 | 104.2 | |
| † Based on net assets. | |||
| See notes to financial statements. | |||
The Funds 55
STATEMENT OF INVESTMENTS
February 28, 2013 (Unaudited)
| BNY Mellon Small Cap Multi-Strategy Fund | |||||||
| Common Stocks—98.4% | Shares | Value ($) | Shares | Value ($) | |||
| Automobiles & Components—4.6% | Capital Goods (continued) | ||||||
| American Axle & | Astec Industries | 14,850 | 528,809 | ||||
| Manufacturing Holdings | 262,510 | a | 3,320,752 | Beacon Roofing Supply | 12,880 | a | 475,272 |
| Dana Holding | 277,380 | 4,640,567 | Comfort Systems USA | 24,450 | 305,136 | ||
| Drew Industries | 24,650 | 896,767 | Commercial Vehicle Group | 34,250 | a | 270,575 | |
| Tenneco | 37,650 | a | 1,333,939 | Crane | 14,650 | 787,877 | |
| Thor Industries | 35,070 | 1,318,281 | DXP Enterprises | 11,160 | a | 694,152 | |
| Tower International | 56,090 | a | 675,324 | EMCOR Group | 16,850 | 649,905 | |
| 12,185,630 | Foster Wheeler | 35,300 | a | 849,318 | |||
| Banks—7.5% | FreightCar America | 11,520 | 242,266 | ||||
| Associated Banc-Corp | 43,860 | 631,145 | GrafTech International | 22,960 | a,b | 169,674 | |
| Bancorp | 25,010 | a | 319,378 | Granite Construction | 43,750 | 1,360,187 | |
| BancorpSouth | 27,450 | 419,985 | Hexcel | 21,060 | a | 573,885 | |
| Brookline Bancorp | 52,190 | 474,929 | II-VI | 23,570 | a | 408,468 | |
| Cardinal Financial | 22,890 | 364,638 | L.B. Foster, Cl. A | 1,380 | 60,941 | ||
| City National | 10,750 | 610,708 | Middleby | 3,880 | a | 579,323 | |
| CoBiz Financial | 22,800 | 189,012 | MRC Global | 32,290 | a | 991,949 | |
| CVB Financial | 63,210 | 670,026 | Orion Marine Group | 45,980 | a | 437,730 | |
| EverBank Financial | 60,230 | 909,473 | Primoris Services | 19,240 | 360,750 | ||
| First Commonwealth Financial | 117,290 | 852,698 | Rush Enterprises, Cl. A | 6,630 | a | 162,435 | |
| First Horizon National | 74,990 | 797,144 | Teledyne Technologies | 10,790 | a | 793,928 | |
| First Midwest Bancorp | 42,280 | 528,500 | Titan International | 27,690 | b | 584,536 | |
| Hancock Holding | 13,370 | 403,774 | Trinity Industries | 43,370 | 1,875,319 | ||
| MB Financial | 34,910 | 827,716 | Triumph Group | 8,010 | 588,014 | ||
| National Penn Bancshares | 41,360 | 405,328 | Watts Water Technologies, Cl. A | 56,830 | 2,667,600 | ||
| Oritani Financial | 24,560 | 361,278 | WESCO International | 11,580 | a,b | 855,762 | |
| PacWest Bancorp | 20,420 | 558,079 | 19,018,903 | ||||
| PrivateBancorp | 43,630 | 781,413 | Commercial & Professional | ||||
| Prosperity Bancshares | 11,900 | 549,066 | Services—6.9% | ||||
| Provident Financial Services | 32,390 | 485,526 | Brink’s | 22,500 | 595,125 | ||
| SCBT Financial | 20,110 | b | 957,638 | Corporate Executive Board | 18,520 | 1,002,673 | |
| SVB Financial Group | 57,130 | a | 3,831,138 | Encore Capital Group | 11,240 | a | 332,142 |
| Synovus Financial | 235,480 | 598,119 | Equifax | 4,580 | 252,450 | ||
| TCF Financial | 80,670 | b | 1,108,406 | Herman Miller | 131,910 | 3,165,840 | |
| Washington Trust Bancorp | 5,680 | 150,179 | InnerWorkings | 43,040 | a,b | 635,701 | |
| Webster Financial | 30,530 | 672,271 | Interface | 75,100 | 1,375,081 | ||
| Western Alliance Bancorp | 46,320 | a | 616,056 | Korn/Ferry International | 39,530 | a | 731,700 |
| Wintrust Financial | 22,370 | 816,505 | McGrath RentCorp | 15,000 | 442,350 | ||
| 19,890,128 | Portfolio Recovery Associates | 19,592 | a | 2,290,795 | |||
| Capital Goods—7.2% | Steelcase, Cl. A | 228,280 | 3,230,162 | ||||
| Aerovironment | 23,400 | a | 517,608 | Tetra Tech | 13,570 | a | 391,630 |
| Apogee Enterprises | 18,095 | 466,670 | TrueBlue | 198,040 | a | 3,839,996 | |
| Armstrong World Industries | 14,880 | 760,814 | 18,285,645 | ||||
56
| BNY Mellon Small Cap Multi-Strategy Fund (continued) | |||||||
| Common Stocks (continued) | Shares | Value ($) | Shares | Value ($) | |||
| Consumer Durables & Apparel—5.2% | Energy (continued) | ||||||
| Brunswick | 22,890 | 834,112 | Matrix Service | 19,640 | a | 305,598 | |
| Cavco Industries | 5,050 | a | 227,806 | McDermott International | 119,950 | a | 1,525,764 |
| Deckers Outdoor | 14,790 | a,b | 596,629 | Oasis Petroleum | 19,540 | a | 717,118 |
| Ethan Allen Interiors | 20,350 | b | 568,579 | Oil States International | 4,920 | a | 374,658 |
| Fifth & Pacific | 182,100 | a | 3,294,189 | PDC Energy | 40,040 | a | 1,867,466 |
| Jarden | 7,900 | a | 490,669 | Tesco | 53,390 | a | 678,587 |
| Jones Group | 258,550 | 2,983,667 | Unit | 16,470 | a | 749,056 | |
| KB Home | 22,040 | b | 411,928 | 11,511,965 | |||
| La-Z-Boy | 32,060 | 587,339 | Exchange-Traded Funds—2.3% | ||||
| M/I Homes | 19,370 | a | 443,573 | iShares Russell 2000 | |||
| Meritage Homes | 13,180 | a | 533,658 | Growth Index Fund | 32,210 | b | 3,307,323 |
| Oxford Industries | 17,100 | 831,231 | iShares Russell 2000 Index Fund | 16,130 | b | 1,459,442 | |
| Skechers USA, Cl. A | 28,340 | a | 592,306 | iShares Russell 2000 | |||
| Standard Pacific | 81,080 | a,b | 659,991 | Value Index Fund | 15,900 | b | 1,284,879 |
| Steven Madden | 9,880 | a | 435,609 | 6,051,644 | |||
| True Religion Apparel | 12,750 | 340,297 | Food & Staples Retailing—1.5% | ||||
| 13,831,583 | Casey’s General Stores | 25,100 | 1,420,409 | ||||
| Consumer Services—2.1% | Chefs’ Warehouse | 18,020 | a | 324,360 | |||
| Bloomin’ Brands | 23,519 | b | 404,762 | Harris Teeter Supermarkets | 35,040 | 1,506,720 | |
| Buffalo Wild Wings | 4,890 | a | 384,794 | United Natural Foods | 16,840 | a | 852,441 |
| Cheesecake Factory | 21,200 | 734,368 | 4,103,930 | ||||
| Grand Canyon Education | 15,980 | a | 382,721 | Food, Beverage & Tobacco—.8% | |||
| Papa John’s International | 7,340 | a | 381,753 | Boulder Brands | 59,960 | a,b | 510,859 |
| Scientific Games, Cl. A | 170,290 | a | 1,532,610 | Dole Food | 82,866 | a,b | 928,099 |
| SHFL Entertainment | 76,880 | a | 1,219,317 | Lancaster Colony | 7,520 | 550,238 | |
| Six Flags Entertainment | 8,570 | 572,562 | 1,989,196 | ||||
| 5,612,887 | Health Care Equipment & | ||||||
| Diversified Financials—1.1% | Services—7.0% | ||||||
| Duff & Phelps, Cl. A | 28,670 | 445,532 | Acadia Healthcare | 32,287 | a | 878,852 | |
| E*TRADE Financial | 109,030 | a | 1,167,711 | Air Methods | 14,580 | 653,038 | |
| Nelnet, Cl. A | 25,490 | 845,758 | Align Technology | 33,970 | a,b | 1,068,017 | |
| Piper Jaffray | 14,730 | a | 568,136 | Allscripts Healthcare Solutions | 43,960 | a | 559,171 |
| 3,027,137 | Analogic | 9,600 | 712,224 | ||||
| Energy—4.3% | athenahealth | 8,140 | a,b | 763,451 | |||
| Approach Resources | 25,880 | a,b | 640,530 | Catamaran | 17,780 | a | 954,964 |
| Cloud Peak Energy | 35,798 | a | 613,578 | Centene | 15,010 | a | 675,750 |
| Diamondback Energy | 24,330 | 552,534 | Computer Programs & Systems | 7,490 | 390,529 | ||
| Dril-Quip | 12,750 | a | 1,048,433 | Haemonetics | 2,350 | a | 96,937 |
| Exterran Holdings | 28,410 | a | 716,784 | Hanger | 117,110 | a | 3,473,483 |
| Geospace Technologies | 3,460 | a | 336,727 | HealthSouth | 35,200 | a | 849,024 |
| Helix Energy Solutions Group | 41,320 | a | 967,301 | HMS Holdings | 26,620 | a | 771,714 |
| Lufkin Industries | 6,450 | 417,831 | ICU Medical | 8,170 | a | 463,729 | |
The Funds 57
STATEMENT OF INVESTMENTS (Unaudited) (continued)
| BNY Mellon Small Cap Multi-Strategy Fund (continued) | |||||||
| Common Stocks (continued) | Shares | Value ($) | Shares | Value ($) | |||
| Health Care Equipment & | Pharmaceuticals, Biotech & | ||||||
| Services (continued) | Life Sciences (continued) | ||||||
| Insulet | 25,370 | a | 572,601 | Alkermes | 52,350 | a | 1,136,519 |
| LifePoint Hospitals | 27,650 | a | 1,219,088 | Alnylam Pharmaceuticals | 24,330 | a | 576,378 |
| Merit Medical Systems | 195,410 | a | 2,329,287 | ARIAD Pharmaceuticals | 29,770 | a | 626,063 |
| Natus Medical | 58,680 | a | 745,236 | Bruker | 23,940 | a | 419,908 |
| Omnicell | 32,330 | a | 582,587 | Charles River Laboratories | |||
| WellCare Health Plans | 16,060 | a | 918,471 | International | 13,650 | a | 556,101 |
| 18,678,153 | Cubist Pharmaceuticals | 13,510 | a | 573,229 | |||
| Household & Personal Products—.7% | Emergent BioSolutions | 153,290 | a | 2,374,462 | |||
| Elizabeth Arden | 18,600 | a | 723,540 | Jazz Pharmaceuticals | 11,500 | a | 669,070 |
| Inter Parfums | 40,900 | 1,024,954 | Nektar Therapeutics | 52,600 | a,b | 487,602 | |
| 1,748,494 | NPS Pharmaceuticals | 57,630 | a | 459,887 | |||
| Insurance—1.6% | Onyx Pharmaceuticals | 7,870 | a | 592,690 | |||
| Brown & Brown | 74,850 | 2,245,500 | Pharmacyclics | 10,040 | a,b | 881,311 | |
| ProAssurance | 12,900 | 604,881 | Puma Biotechnology | 17,170 | a | 441,441 | |
| Protective Life | 25,220 | 805,022 | Salix Pharmaceuticals | 60,650 | a | 2,962,752 | |
| RLI | 7,200 | 496,368 | Spectrum Pharmaceuticals | 84,070 | b | 958,398 | |
| 4,151,771 | Sunesis Pharmaceuticals | 63,050 | a,b | 329,121 | |||
| Materials—3.9% | 14,596,598 | ||||||
| AMCOL International | 16,830 | 492,109 | Real Estate—5.0% | ||||
| Axiall | 14,630 | 827,765 | Corporate Office Properties Trust | 20,570 | c | 532,146 | |
| Buckeye Technologies | 18,130 | 502,745 | DCT Industrial Trust | 56,170 | c | 407,794 | |
| Carpenter Technology | 13,890 | 656,025 | EastGroup Properties | 6,790 | c | 385,740 | |
| Cytec Industries | 10,560 | 764,438 | Education Realty Trust | 44,530 | c | 485,822 | |
| Flotek Industries | 41,750 | a | 586,170 | First Potomac Realty Trust | 37,670 | c | 532,277 |
| Innophos Holdings | 16,420 | 801,789 | Getty Realty | 20,959 | b,c | 416,665 | |
| Innospec | 28,500 | 1,147,125 | Hudson Pacific Properties | 30,400 | c | 686,128 | |
| KapStone Paper and Packaging | 45,440 | 1,210,522 | Jones Lang LaSalle | 21,280 | 2,056,499 | ||
| Louisiana-Pacific | 37,670 | a | 789,940 | LaSalle Hotel Properties | 43,610 | c | 1,107,258 |
| OMNOVA Solutions | 165,330 | a | 1,324,293 | Lexington Realty Trust | 29,610 | c | 339,331 |
| Zoltek | 141,280 | a,b | 1,320,968 | Mid-America Apartment Communities | 9,860 | c | 684,678 |
| 10,423,889 | National Health Investors | 12,450 | c | 806,760 | |||
| Media—1.1% | Pebblebrook Hotel Trust | 25,550 | c | 610,900 | |||
| DreamWorks Animation SKG, Cl. A | 72,090 | a,b | 1,196,694 | Potlatch | 22,440 | c | 987,584 |
| John Wiley & Sons, Cl. A | 6,870 | 251,305 | St. Joe | 87,490 | a,b | 1,951,027 | |
| Lions Gate Entertainment | 51,120 | a,b | 1,071,986 | Starwood Property Trust | 35,720 | c | 998,374 |
| Sinclair Broadcast Group, Cl. A | 32,510 | 457,741 | Urstadt Biddle Properties, Cl. A | 18,670 | c | 394,497 | |
| 2,977,726 | 13,383,480 | ||||||
| Pharmaceuticals, Biotech & | Retailing—3.7% | ||||||
| Life Sciences—5.5% | Asbury Automotive Group | 11,160 | a | 376,762 | |||
| Alexion Pharmaceuticals | 6,360 | a | 551,666 | Children’s Place Retail Stores | 9,884 | a | 449,327 |
58
| BNY Mellon Small Cap Multi-Strategy Fund (continued) | |||||||
| Common Stocks (continued) | Shares | Value ($) | Shares | Value ($) | |||
| Retailing (continued) | Software & | ||||||
| Express | 27,080 | a | 500,980 | Services (continued) | |||
| Finish Line, Cl. A | 31,210 | 565,213 | Jive Software | 59,610 | a,b | 988,334 | |
| Francesca’s Holdings | 26,260 | a,b | 668,317 | MAXIMUS | 22,010 | 1,601,888 | |
| Guess? | 28,370 | b | 785,565 | Millennial Media | 58,430 | b | 547,489 |
| Lumber Liquidators Holdings | 6,050 | a,b | 358,099 | Monotype Imaging Holdings | 32,380 | 679,980 | |
| OfficeMax | 72,850 | 872,014 | Proofpoint | 26,990 | 377,320 | ||
| PEP Boys- | PTC | 25,720 | a | 595,161 | |||
| Manny Moe & Jack | 46,814 | a | 521,040 | QLIK Technologies | 22,100 | a | 574,600 |
| Rent-A-Center | 14,730 | 534,404 | Qualys | 30,930 | 366,830 | ||
| Saks | 64,050 | a,b | 730,170 | SolarWinds | 6,630 | a | 374,330 |
| Select Comfort | 26,120 | a | 536,244 | Sourcefire | 9,380 | a | 503,049 |
| Tractor Supply | 3,570 | 371,244 | Take-Two | ||||
| Williams-Sonoma | 49,290 | 2,237,766 | Interactive Software | 60,000 | a | 878,400 | |
| Zumiez | 10,690 | a,b | 244,801 | WEX | 34,170 | a | 2,563,092 |
| 9,751,946 | Yelp | 18,040 | b | 400,308 | |||
| Semiconductors & Semiconductor | 21,504,084 | ||||||
| Equipment—4.1% | Technology Hardware & | ||||||
| Applied Micro Circuits | 327,490 | a | 2,603,546 | Equipment—8.4% | |||
| ATMI | 54,720 | a | 1,198,368 | Acme Packet | 18,530 | a | 540,705 |
| Entegris | 35,915 | a | 341,552 | Arrow Electronics | 55,130 | a | 2,213,470 |
| Kulicke & Soffa Industries | 34,470 | a | 372,965 | Aruba Networks | 16,060 | a,b | 400,215 |
| Lattice Semiconductor | 128,060 | a | 599,321 | Ciena | 162,730 | a | 2,480,005 |
| Micrel | 22,920 | 241,118 | Cognex | 13,030 | 536,706 | ||
| Microsemi | 92,280 | a | 1,903,736 | Coherent | 6,630 | 382,949 | |
| MKS Instruments | 20,800 | 564,512 | Extreme Networks | 94,360 | a | 330,260 | |
| Photronics | 84,730 | a | 562,607 | FARO Technologies | 12,030 | a | 509,471 |
| Power Integrations | 21,860 | 913,967 | FEI | 7,410 | 469,349 | ||
| Semtech | 19,620 | a | 599,783 | FLIR Systems | 24,150 | 636,111 | |
| Silicon Image | 114,180 | a | 526,370 | InvenSense | 38,160 | a,b | 458,683 |
| Teradyne | 32,500 | a | 544,700 | Ixia | 30,280 | a | 614,078 |
| 10,972,545 | JDS Uniphase | 168,950 | a | 2,392,332 | |||
| Software & Services—8.1% | KEMET | 47,560 | a | 307,713 | |||
| AVG Technologies | 47,330 | b | 743,081 | NETGEAR | 37,840 | a | 1,288,452 |
| Brightcove | 56,140 | a | 353,682 | Power-One | 51,940 | a,b | 221,264 |
| Cardtronics | 45,880 | a | 1,209,397 | RADWARE | 15,680 | a | 570,438 |
| CoreLogic | 84,440 | a | 2,187,840 | Ruckus Wireless | 16,870 | b | 360,343 |
| CSG Systems International | 90,070 | a | 1,748,259 | ScanSource | 89,480 | a | 2,685,295 |
| DealerTrack Technologies | 108,790 | a | 3,208,217 | Vishay Intertechnology | 366,430 | a | 4,833,212 |
| Fleetmatics Group | 14,650 | 347,938 | 22,231,051 | ||||
| Imperva | 11,950 | a | 436,175 | Transportation—4.6% | |||
| Infoblox | 38,820 | 818,714 | Allegiant Travel | 10,044 | 806,433 | ||
The Funds 59
| STATEMENT OF INVESTMENTS (Unaudited) (continued) | ||||||||
| BNY Mellon Small Cap Multi-Strategy Fund (continued) | ||||||||
| Common Stocks (continued) | Shares | Value ($) | Other Investment—1.3% | Shares | Value ($) | |||
| Transportation (continued) | Registered | |||||||
| Arkansas Best | 56,240 | 649,010 | Investment Company; | |||||
| Atlas Air Worldwide Holdings | 11,680 | a | 551,179 | Dreyfus Institutional Preferred | ||||
| Avis Budget Group | 97,210 | a | 2,271,798 | Plus Money Market Fund | ||||
| (cost $3,520,227) | 3,520,227 | d | 3,520,227 | |||||
| Con-way | 75,680 | 2,660,152 | ||||||
| Forward Air | 14,670 | 553,352 | Investment of Cash Collateral | |||||
| Landstar System | 60,810 | 3,422,995 | for Securities Loaned—9.5% | |||||
| Werner Enterprises | 54,799 | 1,261,473 | Registered | |||||
| 12,176,392 | Investment Company; | |||||||
| Utilities—1.2% | Dreyfus Institutional Cash | |||||||
| El Paso Electric | 14,780 | 492,913 | Advantage Fund | |||||
| (cost $25,229,484) | 25,229,484 | d | 25,229,484 | |||||
| Hawaiian Electric Industries | 28,770 | 776,502 | ||||||
| NorthWestern | 14,770 | 575,735 | Total Investments | |||||
| Portland General Electric | 24,320 | 722,061 | (cost $265,095,274) | 109.2 | % | 289,924,365 | ||
| WGL Holdings | 11,920 | 502,666 | Liabilities, Less Cash | |||||
| 3,069,877 | and Receivables | (9.2 | %) | (24,453,900 | ) | |||
| Total Common Stocks | Net Assets | 100.0 | % | 265,470,465 | ||||
| (cost $236,345,563) | 261,174,654 | |||||||
a Non-income producing security.
b Security, or portion thereof, on loan.At February 28, 2013, the value of the fund’s securities on loan was $25,125,322 and the value of the collateral held by the fund was
$25,959,968, consisting of cash collateral of $25,229,484 and U.S. Government & Agency securities valued at $730,484.
c Investment in real estate investment trust.
d Investment in affiliated money market mutual fund.
| Portfolio Summary (Unaudited) † | |||
| Value (%) | Value (%) | ||
| Money Market Investments | 10.8 | Semiconductors & Semiconductor Equipment | 4.1 |
| Technology Hardware & Equipment | 8.4 | Materials | 3.9 |
| Software & Services | 8.1 | Retailing | 3.7 |
| Banks | 7.5 | Exchange-Traded Funds | 2.3 |
| Capital Goods | 7.2 | Consumer Services | 2.1 |
| Health Care Equipment & Services | 7.0 | Insurance | 1.6 |
| Commercial & Professional Services | 6.9 | Food & Staples Retailing | 1.5 |
| Pharmaceuticals, Biotech & Life Sciences | 5.5 | Utilities | 1.2 |
| Consumer Durables & Apparel | 5.2 | Diversified Financials | 1.1 |
| Real Estate | 5.0 | Media | 1.1 |
| Automobiles & Components | 4.6 | Food, Beverage & Tobacco | .8 |
| Transportation | 4.6 | Household & Personal Products | .7 |
| Energy | 4.3 | 109.2 | |
| † Based on net assets. | |||
| See notes to financial statements. | |||
60
| STATEMENT OF INVESTMENTS | |||||||
| February 28, 2013 (Unaudited) | |||||||
| BNY Mellon U.S. Core Equity 130/30 Fund | |||||||
| Common Stocks—126.0% | Shares | Value ($) | Shares | Value ($) | |||
| Banks—2.7% | Diversified Financials (continued) | ||||||
| Wells Fargo & Co. | 158,910 | a | 5,574,563 | Waddell & Reed Financial, Cl. A | 24,010 | 984,890 | |
| Capital Goods—8.0% | 27,094,958 | ||||||
| Cummins | 19,210 | 2,225,863 | Energy—10.8% | ||||
| Eaton | 52,400 | a | 3,247,228 | Anadarko Petroleum | 34,920 | a | 2,778,934 |
| Fluor | 45,250 | a | 2,800,975 | Chevron | 48,750 | a | 5,711,062 |
| General Electric | 193,980 | a | 4,504,216 | Ensco, Cl. A | 28,310 | a | 1,702,563 |
| Oshkosh | 39,770 | b | 1,533,531 | EOG Resources | 16,530 | a | 2,077,986 |
| United Rentals | 20,280 | b | 1,083,155 | National Oilwell Varco | 29,320 | a | 1,997,572 |
| Valmont Industries | 5,770 | 909,064 | Occidental Petroleum | 23,250 | a | 1,914,173 | |
| 16,304,032 | Schlumberger | 45,690 | 3,556,967 | ||||
| Commercial & Professional | TransCanada | 47,820 | a | 2,224,108 | |||
| Services—3.2% | 21,963,365 | ||||||
| ADT | 36,835 | a | 1,764,028 | Food & Staples Retailing—3.9% | |||
| Manpower | 18,820 | 1,027,572 | Costco Wholesale | 10,530 | a | 1,066,584 | |
| Robert Half International | 51,950 | a | 1,846,823 | CVS Caremark | 71,260 | 3,642,811 | |
| Tyco International | 58,200 | a | 1,862,982 | Wal-Mart Stores | 45,110 | 3,192,886 | |
| 6,501,405 | 7,902,281 | ||||||
| Consumer Durables & Apparel—2.1% | Food, Beverage & | ||||||
| NIKE, Cl. B | 39,340 | 2,142,456 | Tobacco—11.1% | ||||
| PVH | 18,270 | a | 2,226,200 | Beam | 67,810 | a | 4,138,444 |
| 4,368,656 | ConAgra Foods | 49,430 | 1,686,057 | ||||
| Consumer Services—1.0% | Dean Foods | 89,710 | b | 1,489,186 | |||
| Starbucks | 37,700 | 2,066,714 | PepsiCo | 43,140 | 3,268,718 | ||
| Diversified Financials—13.3% | Philip Morris International | 90,550 | a | 8,307,963 | |||
| Affiliated Managers Group | 17,895 | a,b | 2,616,786 | Unilever, ADR | 93,830 | a | 3,739,126 |
| American Express | 53,760 | a | 3,341,184 | 22,629,494 | |||
| Ameriprise Financial | 48,380 | 3,320,319 | Health Care Equipment & | ||||
| Bank of America | 468,810 | a | 5,264,736 | Services—5.5% | |||
| Capital One Financial | 19,220 | a | 980,797 | AmerisourceBergen | 24,770 | 1,169,144 | |
| JPMorgan Chase & Co. | 107,900 | 5,278,468 | Cigna | 28,670 | a | 1,676,048 | |
| Legg Mason | 38,670 | a | 1,102,095 | Covidien | 86,760 | a | 5,515,333 |
| Moody’s | 36,380 | a | 1,748,423 | McKesson | 17,080 | a | 1,812,700 |
| SLM | 63,110 | a | 1,197,197 | MEDNAX | 12,610 | b | 1,079,668 |
| T. Rowe Price Group | 17,700 | a | 1,260,063 | 11,252,893 | |||
The Funds 61
| STATEMENT OF INVESTMENTS (Unaudited) (continued) | |||||||
| BNY Mellon U.S. Core Equity 130/30 Fund (continued) | |||||||
| Common Stocks (continued) | Shares | Value ($) | Shares | Value ($) | |||
| Household & Personal Products—.3% | Retailing—4.3% | ||||||
| Church & Dwight | 10,590 | 656,156 | Abercrombie & Fitch, Cl. A | 16,180 | a | 754,473 | |
| Insurance—3.6% | Amazon.com | 4,440 | a,b | 1,173,359 | |||
| Allstate | 24,610 | a | 1,132,552 | Cabela’s | 20,840 | a,b | 1,054,296 |
| American International Group | 74,220 | a,b | 2,821,102 | Foot Locker | 29,880 | 1,021,597 | |
| Chubb | 39,510 | a | 3,320,025 | Lowe’s | 40,910 | 1,560,717 | |
| 7,273,679 | Target | 16,010 | a | 1,007,990 | |||
| Materials—5.3% | Tractor Supply | 10,670 | 1,109,573 | ||||
| LyondellBasell Industries, Cl. A | 34,220 | a | 2,005,976 | Urban Outfitters | 27,450 | b | 1,112,274 |
| Monsanto | 59,050 | a | 5,965,822 | 8,794,279 | |||
| PPG Industries | 12,580 | a | 1,694,023 | Semiconductors & Semiconductor | |||
| Vulcan Materials | 21,490 | 1,094,486 | Equipment—5.2% | ||||
| 10,760,307 | Applied Materials | 73,850 | 1,011,745 | ||||
| Media—4.6% | Broadcom, Cl. A | 102,350 | a | 3,491,158 | |||
| AMC Networks, Cl. A | 35,100 | a,b | 2,014,740 | Skyworks Solutions | 136,610 | a,b | 2,909,793 |
| CBS, Cl. B | 41,680 | a | 1,808,495 | Xilinx | 85,700 | a | 3,194,039 |
| Walt Disney | 102,310 | a | 5,585,103 | 10,606,735 | |||
| 9,408,338 | Software & Services—8.0% | ||||||
| Pharmaceuticals, Biotech & | Akamai Technologies | 30,690 | a,b | 1,134,302 | |||
| Life Sciences—13.7% | Alliance Data Systems | 13,690 | a,b | 2,172,466 | |||
| Eli Lilly & Co. | 60,740 | 3,320,048 | Cognizant Technology Solutions, Cl. A | 38,040 | b | 2,920,331 | |
| Gilead Sciences | 33,120 | b | 1,414,555 | Facebook, Cl. A | 80,560 | 2,195,260 | |
| Illumina | 21,290 | b | 1,067,268 | International Business Machines | 6,250 | a | 1,255,188 |
| Johnson & Johnson | 95,240 | a | 7,248,716 | Oracle | 170,300 | a | 5,834,478 |
| Merck & Co. | 56,570 | a | 2,417,236 | Teradata | 13,380 | b | 776,843 |
| Pfizer | 325,630 | a | 8,912,493 | 16,288,868 | |||
| Sanofi, ADR | 55,040 | a | 2,598,438 | Technology Hardware & | |||
| Vertex Pharmaceuticals | 21,170 | a,b | 991,179 | Equipment—12.8% | |||
| 27,969,933 | Apple | 14,350 | a | 6,334,090 | |||
| Real Estate—2.0% | Ciena | 144,830 | a,b | 2,207,209 | |||
| American Tower | 14,030 | c | 1,088,728 | Cisco Systems | 172,370 | 3,593,914 | |
| CBRE Group, Cl. A | 77,270 | b | 1,867,616 | EMC | 198,470 | a,b | 4,566,795 |
| Prologis | 28,920 | c | 1,126,145 | Juniper Networks | 120,740 | b | 2,496,903 |
| 4,082,489 | QUALCOMM | 89,610 | a | 5,881,104 | |||
62
| BNY Mellon U.S. Core Equity 130/30 Fund (continued) | ||||||||
| Common Stocks (continued) | Shares | Value ($) | Other Investment—.8% | Shares | Value ($) | |||
| Technology Hardware & | Registered | |||||||
| Equipment (continued) | Investment Company; | |||||||
| Vishay Intertechnology | 76,890 | a,b | 1,014,179 | Dreyfus Institutional Preferred | ||||
| 26,094,194 | Plus Money Market Fund | |||||||
| Transportation—4.6% | (cost $1,556,897) | 1,556,897 | d | 1,556,897 | ||||
| FedEx | 34,860 | a | 3,675,290 | Total Investments | ||||
| J.B. Hunt Transport Services | 21,810 | a | 1,516,231 | (cost $216,838,857) | 126.8 | % | 258,615,476 | |
| Union Pacific | 31,170 | a | 4,273,719 | Liabilities, | ||||
| 9,465,240 | Less Cash and Receivables | (26.8 | %) | (54,593,845 | ) | |||
| Total Common Stocks | Net Assets | 100.0 | % | 204,021,631 | ||||
| (cost $215,281,960) | 257,058,579 | |||||||
ADR—American Depository Receipts
a Held by a broker as collateral for open short positions.
b Non-income producing security.
c Investment in real estate investment trust.
d Investment in affiliated money market mutual fund.
| Portfolio Summary (Unaudited) † | |||
| Value (%) | Value (%) | ||
| Pharmaceuticals, Biotech & Life Sciences | 13.7 | Retailing | 4.3 |
| Diversified Financials | 13.3 | Food & Staples Retailing | 3.9 |
| Technology Hardware & Equipment | 12.8 | Insurance | 3.6 |
| Food, Beverage & Tobacco | 11.1 | Commercial & Professional Services | 3.2 |
| Energy | 10.8 | Banks | 2.7 |
| Capital Goods | 8.0 | Consumer Durables & Apparel | 2.1 |
| Software & Services | 8.0 | Real Estate | 2.0 |
| Health Care Equipment & Services | 5.5 | Consumer Services | 1.0 |
| Materials | 5.3 | Money Market Investment | .8 |
| Semiconductors & Semiconductor Equipment | 5.2 | Household & Personal Products | .3 |
| Media | 4.6 | ||
| Transportation | 4.6 | 126.8 | |
| † Based on net assets. | |||
| See notes to financial statements. | |||
The Funds 63
STATEMENT OF SECURITIES SOLD SHORT
February 28, 2013 (Unaudited)
| BNY Mellon U.S. Core Equity 130/30 Fund | |||||||
| Common Stocks—26.9% | Shares | Value ($) | Shares | Value ($) | |||
| Automobiles & Components—.9% | Exchange-Traded Funds—.7% | ||||||
| Gentex | 46,810 | 877,687 | Standard & Poor’s Depository | ||||
| Johnson Controls | 32,590 | 1,025,607 | Receipts S&P 500 ETF Trust | 9,070 | 1,375,103 | ||
| 1,903,294 | Food, Beverage & | ||||||
| Banks—1.3% | Tobacco—2.0% | ||||||
| Comerica | 26,310 | 904,538 | Altria Group | 60,940 | 2,044,537 | ||
| KeyCorp | 92,840 | 871,768 | Hain Celestial Group | 36,610 | a | 2,004,397 | |
| New York Community Bancorp | 68,680 | 927,180 | 4,048,934 | ||||
| 2,703,486 | Health Care Equipment & | ||||||
| Services—4.8% | |||||||
| Capital Goods—2.2% | |||||||
| Haemonetics | 51,940 | a | 2,142,525 | ||||
| Boeing | 10,970 | 843,593 | |||||
| Masimo | 100,780 | 2,000,483 | |||||
| Caterpillar | 22,620 | 2,089,409 | |||||
| Omnicare | 16,020 | 596,905 | |||||
| Kennametal | 17,190 | 695,851 | |||||
| Owens & Minor | 79,840 | 2,431,128 | |||||
| MSC Industrial Direct, Cl. A | 9,450 | 806,274 | |||||
| Varian Medical Systems | 23,260 | a | 1,642,854 | ||||
| 4,435,127 | |||||||
| VCA Antech | 39,490 | a | 867,200 | ||||
| Commercial & Professional | |||||||
| Services—1.3% | 9,681,095 | ||||||
| Copart | 22,540 | a | 769,516 | Household & Personal | |||
| Products—.6% | |||||||
| Waste Management | 50,810 | 1,896,229 | |||||
| Estee Lauder, Cl. A | 18,550 | 1,189,055 | |||||
| 2,665,745 | |||||||
| Insurance—.7% | |||||||
| Consumer Services—2.0% | |||||||
| Aflac | 29,940 | 1,495,503 | |||||
| Chipotle Mexican Grill | 3,330 | a | 1,054,911 | ||||
| Materials—2.5% | |||||||
| Marriott International, Cl. A | 26,620 | 1,050,159 | |||||
| Air Products & Chemicals | 19,140 | 1,652,548 | |||||
| Panera Bread, Cl. A | 6,260 | a | 1,007,547 | ||||
| Albemarle | 23,120 | 1,504,650 | |||||
| Yum! Brands | 15,660 | 1,025,417 | |||||
| Alcoa | 112,240 | 956,285 | |||||
| 4,138,034 | |||||||
| E.I. du Pont de Nemours & Co. | 21,920 | 1,049,968 | |||||
| Diversified Financials—.5% | |||||||
| 5,163,451 | |||||||
| Discover Financial Services | 27,450 | 1,057,648 | |||||
64
| BNY Mellon U.S. Core Equity 130/30 Fund (continued) | |||||||
| Common Stocks (continued) | Shares | Value ($) | Shares | Value ($) | |||
| Real Estate—.5% | Software & Services (continued) | ||||||
| AvalonBay Communities | 7,230 | b | 902,521 | Microsoft | 73,190 | 2,034,682 | |
| Retailing—1.0% | SAP, ADR | 26,300 | 2,056,660 | ||||
| PetSmart | 31,640 | 2,060,080 | 8,242,688 | ||||
| Semiconductors & | Technology Hardware & | ||||||
| Semiconductor Equipment—.8% | Equipment—1.1% | ||||||
| Intel | 74,190 | 1,546,861 | Hewlett-Packard | 60,770 | 1,223,908 | ||
| Software & Services—4.0% | Research In Motion | 75,570 | a | 1,008,860 | |||
| Concur Technologies | 15,490 | a | 1,087,398 | 2,232,768 | |||
| Heartland Payment Systems | 37,150 | 1,155,365 | Total Securities Sold Short | ||||
| Infosys, ADR | 35,390 | 1,908,583 | (proceeds $53,419,980) | 54,841,393 | |||
| ADR—American Depository Receipts | |||||||
| a Non-income producing security. | |||||||
| b Investment in real estate investment trust. | |||||||
| Portfolio Summary (Unaudited) † | |||||||
| Value (%) | Value (%) | ||||||
| Health Care Equipment & Services | 4.8 | Retailing | 1.0 | ||||
| Software & Services | 4.0 | Automobiles & Components | .9 | ||||
| Materials | 2.5 | Semiconductors & Semiconductor Equipment | .8 | ||||
| Capital Goods | 2.2 | Exchange-Traded Funds | .7 | ||||
| Consumer Services | 2.0 | Insurance | .7 | ||||
| Food, Beverage & Tobacco | 2.0 | Household & Personal Products | .6 | ||||
| Banks | 1.3 | Diversified Financials | .5 | ||||
| Commercial & Professional Services | 1.3 | Real Estate | .5 | ||||
| Technology Hardware & Equipment | 1.1 | 26.9 | |||||
| † Based on net assets. | |||||||
| See notes to financial statements. | |||||||
The Funds 65
STATEMENT OF INVESTMENTS
February 28, 2013 (Unaudited)
| BNY Mellon Focused Equity Opportunities Fund | |||||||
| Common Stocks—98.0% | Shares | Value ($) | Shares | Value ($) | |||
| Automobiles & Components—2.6% | Health Care Equipment & | ||||||
| Johnson Controls | 365,755 | 11,510,310 | Services—3.2% | ||||
| Banks—6.8% | Express Scripts Holding | 252,190 | a | 14,352,133 | |||
| PNC Financial Services Group | 226,320 | 14,120,105 | Household & Personal Products—2.9% | ||||
| Wells Fargo & Co. | 467,910 | 16,414,283 | Procter & Gamble | 171,500 | 13,064,870 | ||
| 30,534,388 | Insurance—3.8% | ||||||
| Capital Goods—10.9% | MetLife | 474,700 | 16,823,368 | ||||
| Caterpillar | 169,385 | 15,646,092 | Materials—2.8% | ||||
| Dover | 184,700 | 13,547,745 | Celanese, Ser. A | 265,370 | 12,432,584 | ||
| Eaton | 311,830 | 19,324,105 | Media—5.4% | ||||
| 48,517,942 | Comcast, Cl. A | 219,800 | 8,745,842 | ||||
| Consumer Services—2.7% | Walt Disney | 283,805 | 15,492,915 | ||||
| Las Vegas Sands | 236,450 | 12,174,810 | 24,238,757 | ||||
| Diversified Financials—3.2% | Pharmaceuticals, Biotech & | ||||||
| Invesco | 528,930 | 14,170,035 | Life Sciences—10.9% | ||||
| Energy—14.4% | Actavis | 229,300 | a | 19,527,188 | |||
| Halliburton | 305,355 | 12,675,286 | Shire, ADR | 148,300 | 13,889,778 | ||
| Marathon Oil | 368,400 | 12,341,400 | Teva Pharmaceutical Industries, ADR | 400,300 | 14,971,220 | ||
| National Oilwell Varco | 205,000 | 13,966,650 | 48,388,186 | ||||
| Southwestern Energy | 399,100 | a | 13,677,157 | Retailing—3.3% | |||
| Valero Energy | 256,400 | 11,689,276 | Lowe’s | 382,180 | 14,580,167 | ||
| 64,349,769 | Semiconductors & Semiconductor | ||||||
| Equipment—3.1% | |||||||
| Food, Beverage & Tobacco—7.8% | |||||||
| Broadcom, Cl. A | 406,760 | 13,874,584 | |||||
| Mondelez International, Cl. A | 617,445 | 17,072,354 | |||||
| Software & Services—8.8% | |||||||
| PepsiCo | 231,480 | 17,539,240 | |||||
| Adobe Systems | 205,430 | a | 8,073,399 | ||||
| 34,611,594 | |||||||
66
| BNY Mellon Focused Equity Opportunities Fund (continued) | |||||||
| Common Stocks (continued) | Shares | Value ($) | Other Investment—1.5% | Shares | Value ($) | ||
| Software & Services (continued) | Registered Investment Company; | ||||||
| International Business Machines | 87,930 | 17,658,982 | Dreyfus Institutional Preferred | ||||
| salesforce.com | 78,530 | a | 13,288,847 | Plus Money Market Fund | |||
| 39,021,228 | (cost $6,736,721) | 6,736,721 | b | 6,736,721 | |||
| Technology Hardware & | Total Investments | ||||||
| Equipment—5.4% | (cost $366,407,612) | 99.5 | % | 443,277,076 | |||
| Apple | 54,136 | 23,895,630 | |||||
| Cash and Receivables (Net) | .5 | % | 2,402,761 | ||||
| Total Common Stocks | |||||||
| (cost $359,670,891) | 436,540,355 | Net Assets | 100.0 | % | 445,679,837 | ||
| ADR—American Depository Receipts | |||||||
| a Non-income producing security. | |||||||
| b Investment in affiliated money market mutual fund. | |||||||
| Portfolio Summary (Unaudited) † | |||||||
| Value (%) | Value (%) | ||||||
| Energy | 14.4 | Diversified Financials | 3.2 | ||||
| Capital Goods | 10.9 | Health Care Equipment & Services | 3.2 | ||||
| Pharmaceuticals, Biotech & Life Sciences | 10.9 | Semiconductors & Semiconductor Equipment | 3.1 | ||||
| Software & Services | 8.8 | Household & Personal Products | 2.9 | ||||
| Food, Beverage & Tobacco | 7.8 | Materials | 2.8 | ||||
| Banks | 6.8 | Consumer Services | 2.7 | ||||
| Media | 5.4 | Automobiles & Components | 2.6 | ||||
| Technology Hardware & Equipment | 5.4 | Money Market Investment | 1.5 | ||||
| Insurance | 3.8 | ||||||
| Retailing | 3.3 | 99.5 | |||||
| † Based on net assets. | |||||||
| See notes to financial statements. | |||||||
The Funds 67
| STATEMENT OF INVESTMENTS | |||||||
| February 28, 2013 (Unaudited) | |||||||
| BNY Mellon Small/Mid Cap Fund | |||||||
| Common Stocks—99.4% | Shares | Value ($) | Shares | Value ($) | |||
| Automobiles & Components—1.6% | Consumer Services—.5% | ||||||
| Dana Holding | 181,170 | 3,030,974 | Sonic | 216,530 | b | 2,444,624 | |
| Delphi Automotive | 63,810 | 2,670,448 | Diversified Financials—3.0% | ||||
| Thor Industries | 46,670 | 1,754,325 | E*TRADE Financial | 180,400 | b | 1,932,084 | |
| 7,455,747 | Portfolio Recovery Associates | 21,440 | b | 2,506,872 | |||
| Banks—3.7% | Raymond James Financial | 155,930 | 6,842,208 | ||||
| Hancock Holding | 48,500 | 1,464,700 | Solar Capital | 109,910 | 2,692,795 | ||
| Home Loan Servicing Solutions | 85,000 | 1,917,600 | 13,973,959 | ||||
| PacWest Bancorp | 103,900 | a | 2,839,587 | Energy—5.8% | |||
| Prosperity Bancshares | 31,310 | 1,444,643 | Alon USA Energy | 252,890 | 4,928,826 | ||
| SVB Financial Group | 92,290 | b | 6,188,967 | Dril-Quip | 37,980 | b | 3,123,095 |
| TCF Financial | 162,290 | 2,229,865 | EPL Oil & Gas | 85,440 | b | 2,198,371 | |
| Wilshire Bancorp | 264,900 | b | 1,554,963 | Helmerich & Payne | 32,690 | 2,166,039 | |
| 17,640,325 | McDermott International | 251,380 | b | 3,197,554 | |||
| Capital Goods—8.8% | Oceaneering International | 27,780 | 1,766,530 | ||||
| Armstrong World Industries | 30,930 | 1,581,451 | Oil States International | 113,210 | b | 8,620,942 | |
| Briggs & Stratton | 197,790 | a | 4,837,943 | Penn Virginia | 365,150 | a | 1,486,160 |
| Carlisle | 63,940 | 4,339,608 | 27,487,517 | ||||
| Granite Construction | 51,400 | 1,598,026 | Exchange-Traded Funds—3.8% | ||||
| Hyster-Yale Materials Handling | 29,930 | 1,533,314 | iShares Russell 2000 Index Fund | 196,650 | a | 17,792,892 | |
| Masco | 88,700 | 1,708,362 | Food & Staples Retailing—.5% | ||||
| Primoris Services | 92,550 | 1,735,313 | Casey’s General Stores | 40,990 | 2,319,624 | ||
| Regal-Beloit | 51,350 | 3,968,328 | Health Care Equipment & | ||||
| Snap-on | 67,130 | 5,388,525 | Services—4.6% | ||||
| Trinity Industries | 180,630 | 7,810,441 | Cigna | 54,250 | 3,171,455 | ||
| Triumph Group | 93,250 | 6,845,483 | Haemonetics | 53,120 | b | 2,191,200 | |
| 41,346,794 | HealthSouth | 86,520 | b | 2,086,862 | |||
| Commercial & Professional | HMS Holdings | 84,240 | b | 2,442,118 | |||
| Services—3.3% | MEDNAX | 50,850 | a,b | 4,353,777 | |||
| Brink’s | 65,710 | 1,738,029 | Orthofix International | 36,500 | b | 1,359,990 | |
| Corporate Executive Board | 44,770 | 2,423,848 | Photomedex | 96,430 | b | 1,422,343 | |
| Herman Miller | 114,170 | 2,740,080 | Universal Health Services, Cl. B | 53,560 | 3,100,588 | ||
| Quad Graphics | 71,120 | a | 1,546,860 | WellCare Health Plans | 27,110 | b | 1,550,421 |
| Robert Half International | 200,520 | 7,128,486 | 21,678,754 | ||||
| 15,577,303 | Household & Personal Products—.6% | ||||||
| Consumer Durables & Apparel—4.7% | USANA Health Sciences | 66,420 | a,b | 2,941,742 | |||
| Fifth & Pacific | 213,480 | b | 3,861,853 | Insurance—6.8% | |||
| Jones Group | 361,860 | 4,175,864 | Arthur J. Gallagher & Co. | 183,500 | 7,061,080 | ||
| Mohawk Industries | 14,000 | b | 1,484,280 | Brown & Brown | 226,400 | 6,792,000 | |
| Newell Rubbermaid | 92,410 | 2,156,849 | Fidelity National Financial, Cl. A | 408,290 | 10,182,753 | ||
| PVH | 84,530 | 10,299,981 | Horace Mann Educators | 72,090 | 1,474,961 | ||
| 21,978,827 | Maiden Holdings | 200,420 | 2,020,234 | ||||
68
| BNY Mellon Small/Mid Cap Fund (continued) | |||||||
| Common Stocks (continued) | Shares | Value ($) | Shares | Value ($) | |||
| Insurance (continued) | Retailing (continued) | ||||||
| Protective Life | 83,370 | 2,661,170 | Dick’s Sporting Goods | 129,140 | 6,457,000 | ||
| Stewart Information Services | 88,020 | a | 2,037,663 | Hot Topic | 262,320 | 2,833,056 | |
| 32,229,861 | Stage Stores | 115,430 | 2,849,967 | ||||
| Materials—5.6% | Urban Outfitters | 236,940 | b | 9,600,809 | |||
| Axiall | 38,690 | 2,189,080 | Williams-Sonoma | 79,010 | 3,587,054 | ||
| Boise | 171,810 | 1,475,848 | 38,492,319 | ||||
| Coeur d’Alene Mines | 111,440 | a,b | 2,118,474 | Semiconductors & Semiconductor | |||
| Cytec Industries | 93,400 | 6,761,226 | Equipment—1.8% | ||||
| Kraton Performance Polymers | 150,140 | b | 3,609,366 | Microsemi | 75,280 | b | 1,553,026 |
| Louisiana-Pacific | 158,060 | b | 3,314,518 | Skyworks Solutions | 318,960 | b | 6,793,848 |
| OM Group | 55,490 | b | 1,361,725 | 8,346,874 | |||
| Packaging Corporation of America | 91,830 | 3,836,657 | Software & Services—6.4% | ||||
| Sherwin-Williams | 9,310 | 1,504,403 | AVG Technologies | 261,800 | a | 4,110,260 | |
| 26,171,297 | CoreLogic | 254,560 | b | 6,595,650 | |||
| Media—1.0% | CSG Systems International | 74,460 | b | 1,445,269 | |||
| Scholastic | 100,500 | 3,025,050 | MAXIMUS | 27,770 | 2,021,101 | ||
| Valassis Communications | 60,320 | a | 1,658,197 | Mentor Graphics | 69,120 | b | 1,224,115 |
| 4,683,247 | Synopsys | 107,770 | b | 3,775,183 | |||
| Pharmaceuticals, Biotech & | Vantiv, Cl. A | 249,070 | 5,419,763 | ||||
| Life Sciences—5.0% | WEX | 72,420 | b | 5,432,224 | |||
| Alkermes | 189,470 | b | 4,113,394 | 30,023,565 | |||
| Cubist Pharmaceuticals | 160,160 | b | 6,795,589 | Technology Hardware & Equipment—7.2% | |||
| Jazz Pharmaceuticals | 26,600 | b | 1,547,588 | Aruba Networks | 87,820 | a,b | 2,188,474 |
| Onyx Pharmaceuticals | 66,740 | b | 5,026,189 | Benchmark Electronics | 195,350 | b | 3,402,997 |
| Salix Pharmaceuticals | 88,910 | b | 4,343,254 | Harmonic | 367,880 | b | 2,093,237 |
| Spectrum Pharmaceuticals | 147,210 | a | 1,678,194 | JDS Uniphase | 311,330 | b | 4,408,433 |
| 23,504,208 | NETGEAR | 88,150 | b | 3,001,508 | |||
| Real Estate—8.6% | Power-One | 673,020 | a,b | 2,867,065 | |||
| Ashford Hospitality Trust | 229,760 | c | 2,704,275 | SanDisk | 88,480 | b | 4,458,507 |
| Jones Lang LaSalle | 75,650 | 7,310,816 | Seagate Technology | 48,030 | 1,544,645 | ||
| LaSalle Hotel Properties | 345,260 | c | 8,766,151 | Vishay Intertechnology | 744,110 | b | 9,814,811 |
| Mid-America Apartment Communities | 33,380 | c | 2,317,907 | 33,779,677 | |||
| Pennsylvania Real Estate | Transportation—1.6% | ||||||
| Investment Trust | 91,880 | c | 1,658,434 | Celadon Group | 107,750 | 2,147,458 | |
| Potlatch | 165,260 | c | 7,273,093 | Landstar System | 66,480 | 3,742,159 | |
| Sabra Health Care | 142,400 | c | 3,763,632 | Republic Airways Holdings | 150,920 | b | 1,420,157 |
| Starwood Property Trust | 237,970 | c | 6,651,262 | 7,309,774 | |||
| 40,445,570 | Utilities—6.3% | ||||||
| Retailing—8.2% | Great Plains Energy | 301,720 | 6,586,548 | ||||
| American Eagle Outfitters | 485,560 | 10,041,381 | Hawaiian Electric Industries | 181,820 | 4,907,322 | ||
| Brown Shoe | 190,430 | 3,123,052 | Laclede Group | 66,740 | a | 2,720,322 | |
The Funds 69
| STATEMENT OF INVESTMENTS (Unaudited) (continued) | ||||||||
| BNY Mellon Small/Mid Cap Fund (continued) | ||||||||
| Investment of Cash Collateral | ||||||||
| Common Stocks (continued) | Shares | Value ($) | for Securities Loaned—9.0% | Shares | Value ($) | |||
| Utilities (continued) | Registered | |||||||
| Portland General Electric | 233,870 | 6,943,600 | Investment Company; | |||||
| UGI | 234,960 | 8,416,267 | Dreyfus | |||||
| 29,574,059 | Institutional Cash | |||||||
| Advantage Fund | ||||||||
| Total Common Stocks | (cost $42,478,408) | 42,478,408 | d | 42,478,408 | ||||
| (cost $427,860,622) | 467,198,559 | |||||||
| Total Investments | ||||||||
| Other Investment—.6% | (cost $473,124,461) | 109.0 | % | 512,462,398 | ||||
| Registered Investment Company; | Liabilities, Less Cash | |||||||
| Dreyfus Institutional Preferred | and Receivables | (9.0 | %) | (42,181,303 | ) | |||
| Plus Money Market Fund | Net Assets | 100.0 | % | 470,281,095 | ||||
| (cost $2,785,431) | 2,785,431 | d | 2,785,431 | |||||
a Security, or portion thereof, on loan.At February 28, 2013, the value of the fund’s securities on loan was $43,367,093 and the value of the collateral held by the fund was
$44,818,811, consisting of cash collateral of $42,478,408 and U.S. Government & Agency securities valued at $2,340,403.
b Non-income producing security.
c Investment in real estate investment trust.
d Investment in affiliated money market mutual fund.
| Portfolio Summary (Unaudited) † | |||
| Value (%) | Value (%) | ||
| Money Market Investments | 9.6 | Exchange-Traded Funds | 3.8 |
| Capital Goods | 8.8 | Banks | 3.7 |
| Real Estate | 8.6 | Commercial & Professional Services | 3.3 |
| Retailing | 8.2 | Diversified Financials | 3.0 |
| Technology Hardware & Equipment | 7.2 | Semiconductors & Semiconductor Equipment | 1.8 |
| Insurance | 6.8 | Automobiles & Components | 1.6 |
| Software & Services | 6.4 | Transportation | 1.6 |
| Utilities | 6.3 | Media | 1.0 |
| Energy | 5.8 | Household & Personal Products | .6 |
| Materials | 5.6 | Consumer Services | .5 |
| Pharmaceuticals, Biotech & Life Sciences | 5.0 | Food & Staples Retailing | .5 |
| Consumer Durables & Apparel | 4.7 | ||
| Health Care Equipment & Services | 4.6 | 109.0 | |
| † Based on net assets. | |||
| See notes to financial statements. | |||
70
| STATEMENT OF INVESTMENTS | |||||||
| February 28, 2013 (Unaudited) | |||||||
| BNY Mellon International Fund | |||||||
| Common Stocks—97.6% | Shares | Value ($) | Shares | Value ($) | |||
| Australia—5.1% | Germany (continued) | ||||||
| Australia & New Zealand | Daimler | 77,061 | 4,594,222 | ||||
| Banking Group | 129,848 | 3,809,228 | Deutsche Bank | 86,098 | 3,944,304 | ||
| Coca-Cola Amatil | 146,490 | 2,168,172 | Deutsche Lufthansa | 93,610 | 1,888,185 | ||
| Dexus Property Group | 2,357,420 | 2,624,707 | Deutsche Telekom | 138,570 | 1,488,348 | ||
| Primary Health Care | 437,888 | 2,209,568 | E.ON | 130,850 | 2,184,933 | ||
| QBE Insurance Group | 379,904 | 5,192,151 | Fresenius & Co. | 15,830 | 1,945,580 | ||
| Rio Tinto | 38,881 | 2,662,892 | Gerresheimer | 24,780 | a | 1,427,513 | |
| Spark Infrastructure Group | 1,436,320 | 2,406,093 | Hannover Rueckversicherung | 44,290 | 3,465,324 | ||
| Westfield Group | 151,510 | 1,733,312 | Muenchener Rueckversicherungs | 13,010 | 2,338,865 | ||
| Westpac Banking | 136,840 | 4,300,885 | Siemens | 79,960 | 8,311,681 | ||
| 27,107,008 | 48,494,836 | ||||||
| Belgium—.8% | Hong Kong—2.3% | ||||||
| Delhaize Group | 87,997 | 4,253,027 | Esprit Holdings | 3,207,731 | 4,185,651 | ||
| Finland—.8% | Foxconn International Holdings | 3,778,000 | a | 1,592,921 | |||
| Kemira | 71,450 | 1,044,754 | Hang Seng Bank | 186,800 | 3,020,362 | ||
| Sampo, Cl. A | 82,140 | 3,035,907 | Pacific Basin Shipping | 1,771,000 | 1,043,565 | ||
| 4,080,661 | SJM Holdings | 936,000 | 2,338,914 | ||||
| France—12.0% | 12,181,413 | ||||||
| Alstom | 77,226 | 3,407,800 | Ireland—.5% | ||||
| Arkema | 15,180 | 1,542,258 | Smurfit Kappa Group | 151,930 | 2,365,352 | ||
| BNP Paribas | 28,840 | 1,622,994 | Israel—.9% | ||||
| Cap Gemini | 46,470 | 2,286,917 | Teva Pharmaceutical | ||||
| Carrefour | 211,037 | 5,752,849 | Industries, ADR | 126,572 | 4,733,793 | ||
| Cie de St-Gobain | 82,660 | 3,297,400 | Italy—2.1% | ||||
| Danone | 68,080 | 4,727,630 | Eni | 62,260 | 1,419,212 | ||
| Dassault Systemes | 10,590 | 1,202,014 | Finmeccanica | 315,271 | a | 1,550,095 | |
| Electricite de France | 76,640 | 1,449,332 | Saras | 3,064,636 | a | 3,480,904 | |
| Fonciere Des Regions | 27,310 | 2,259,432 | STMicroelectronics | 372,890 | 2,973,052 | ||
| France Telecom | 181,403 | 1,757,048 | Telecom Italia | 2,343,510 | 1,730,188 | ||
| GDF Suez | 167,192 | 3,160,661 | 11,153,451 | ||||
| L’Oreal | 18,330 | 2,741,268 | Japan—23.0% | ||||
| Sanofi | 126,909 | 12,025,504 | Aisin Seiki | 103,300 | 3,739,039 | ||
| Schneider Electric | 44,910 | 3,454,615 | Astellas Pharma | 33,100 | 1,789,093 | ||
| Societe Generale | 66,814 | a | 2,565,408 | Daito Trust Construction | 39,300 | 3,519,150 | |
| Total | 205,782 | 10,288,294 | Dena | 52,500 | 1,472,651 | ||
| 63,541,424 | Denso | 33,100 | 1,389,136 | ||||
| Germany—9.2% | East Japan Railway | 17,800 | 1,313,540 | ||||
| Aixtron | 190,433 | 2,538,411 | Fuji Heavy Industries | 315,000 | 4,710,217 | ||
| Allianz | 10,245 | 1,400,401 | Fujitsu | 662,000 | 3,042,529 | ||
| Bayer | 49,820 | 4,934,129 | Hitachi | 834,000 | 4,678,822 | ||
| Celesio | 216,330 | 3,911,654 | Inpex | 1,012 | 5,382,630 | ||
| Continental | 35,110 | 4,121,286 | Japan Tobacco | 102,600 | 3,237,728 | ||
The Funds 71
| STATEMENT OF INVESTMENTS (Unaudited) (continued) | |||||||
| BNY Mellon International Fund (continued) | |||||||
| Common Stocks (continued) | Shares | Value ($) | Shares | Value ($) | |||
| Japan (continued) | Norway—2.1% | ||||||
| Kao | 126,500 | 4,045,161 | DNB | 109,080 | 1,624,600 | ||
| LIXIL Group | 58,700 | 1,203,258 | Norsk Hydro | 336,039 | 1,486,821 | ||
| Matsumotokiyoshi Holdings | 46,900 | 1,274,077 | Orkla | 292,900 | 2,397,507 | ||
| Mitsubishi | 150,300 | 2,982,001 | Petroleum Geo-Services | 127,840 | 2,015,350 | ||
| Mitsubishi UFJ Financial Group | 1,217,300 | 6,737,241 | Telenor | 56,030 | 1,206,353 | ||
| Nihon Kohden | 50,800 | 1,764,764 | TGS Nopec Geophysical | 67,248 | 2,544,335 | ||
| Nippon Electric Glass | 170,000 | 836,336 | 11,274,966 | ||||
| Nippon Express | 417,000 | 1,831,039 | Singapore—1.8% | ||||
| Nippon Shokubai | 379,000 | 3,524,630 | DBS Group Holdings | 266,987 | 3,257,569 | ||
| Nitto Denko | 39,900 | 2,346,046 | Oversea-Chinese Banking | 377,000 | 3,074,693 | ||
| Nomura Holdings | 275,100 | 1,578,953 | United Overseas Bank | 207,000 | 3,189,244 | ||
| Nomura Real Estate Holdings | 34,300 | 616,134 | 9,521,506 | ||||
| Nomura Research Institute | 115,400 | 2,614,522 | Spain—.3% | ||||
| Omron | 183,800 | 4,451,732 | Red Electrica | 26,980 | 1,492,783 | ||
| Ricoh | 321,800 | 3,450,957 | Sweden—2.3% | ||||
| Sega Sammy Holdings | 112,000 | 2,067,451 | Autoliv, SDR | 12,160 | 790,060 | ||
| Seven & I Holdings | 118,000 | 3,444,902 | Ericsson, Cl. B | 436,229 | a | 5,291,487 | |
| Shimachu | 105,700 | 2,252,212 | Svenska Cellulosa, Cl. B | 151,009 | 3,691,518 | ||
| Shimamura | 16,900 | 1,726,648 | Volvo, Cl. B | 143,370 | 2,150,306 | ||
| Shin-Etsu Chemical | 29,300 | 1,801,812 | 11,923,371 | ||||
| SMC | 7,100 | 1,231,719 | Switzerland—9.8% | ||||
| Sumitomo Electric Industries | 128,400 | 1,496,084 | ABB | 205,360 | a | 4,690,875 | |
| Sumitomo Mitsui | Adecco | 105,514 | a | 6,016,988 | |||
| Financial Group | 159,100 | 6,368,120 | Cie Financiere | ||||
| Sumitomo Mitsui | Richemont, Cl. A | 20,270 | 1,629,515 | ||||
| Trust Holdings | 580,860 | 2,256,010 | Clariant | 182,090 | a | 2,772,244 | |
| Taiyo Nippon Sanso | 462,000 | 3,244,816 | Novartis | 217,259 | 14,753,585 | ||
| THK | 70,000 | 1,307,261 | Partners Group Holding | 11,850 | 2,738,408 | ||
| Tokyo Electron | 59,400 | 2,755,637 | Roche Holding | 34,515 | 7,906,082 | ||
| Toyo Suisan Kaisha | 43,000 | 1,259,521 | Syngenta | 6,310 | 2,680,050 | ||
| Toyota Motor | 187,600 | 9,644,126 | UBS | 341,819 | a | 5,408,275 | |
| Yamaha Motor | 242,100 | 2,894,021 | Zurich Insurance Group | 10,770 | a | 2,947,301 | |
| Yamato Holdings | 252,100 | 4,218,439 | 51,543,323 | ||||
| 121,500,165 | United Arab Emirates—.4% | ||||||
| Netherlands—3.6% | Dragon Oil | 251,410 | 2,351,355 | ||||
| Aegon | 222,380 | 1,330,285 | United Kingdom—19.8% | ||||
| ING Groep | 382,870 | a | 3,078,116 | Aberdeen Asset | |||
| Koninklijke Philips Electronics | 283,357 | 8,035,033 | Management | 564,130 | 3,679,165 | ||
| Nutreco | 7,750 | 720,808 | Anglo American | 185,671 | 5,413,773 | ||
| SBM Offshore | 191,000 | a | 2,678,129 | Barclays | 1,199,750 | 5,587,682 | |
| Unilever | 74,340 | 2,883,494 | BHP Billiton | 55,870 | 1,770,597 | ||
| 18,725,865 | BP | 790,416 | 5,344,424 | ||||
72
| BNY Mellon International Fund (continued) | |||||||
| Common Stocks (continued) | Shares | Value ($) | Shares | Value ($) | |||
| United Kingdom (continued) | United Kingdom (continued) | ||||||
| Centrica | 422,230 | 2,255,369 | Vodafone Group | 3,586,607 | 9,007,734 | ||
| Diageo | 75,520 | 2,268,453 | 104,320,403 | ||||
| Direct Line Insurance Group | 565,860 | 1,811,315 | United States—.8% | ||||
| Experian | 202,050 | 3,353,349 | iShares MSCI EAFE Index Fund | 76,600 | 4,459,269 | ||
| Home Retail Group | 968,025 | 1,867,997 | Total Common Stocks | ||||
| HSBC Holdings | 1,098,567 | 12,189,449 | (cost $543,131,894) | 515,023,971 | |||
| ITV | 1,086,970 | 2,048,055 | |||||
| Kingfisher | 450,110 | 1,891,477 | Preferred Stocks—.5% | ||||
| Legal & General Group | 369,690 | 897,908 | Germany | ||||
| Lloyds Banking Group | 5,017,350 | a | 4,146,048 | ProSiebenSat.1 Media | |||
| Old Mutual | 623,118 | 1,914,247 | (cost $2,185,398) | 69,540 | 2,396,804 | ||
| Resolution | 465,759 | 1,845,598 | |||||
| Rexam | 142,885 | 1,115,256 | Other Investment—.7% | ||||
| Rio Tinto | 80,197 | 4,308,108 | Registered Investment Company; | ||||
| Rolls-Royce Holdings | 150,230 | a | 2,342,892 | Dreyfus Institutional Preferred | |||
| Royal Bank of Scotland Group | 559,394 | a | 2,748,725 | Plus Money Market Fund | |||
| Royal Dutch Shell, Cl. A | 214,741 | 7,069,314 | (cost $3,880,246) | 3,880,246 | b | 3,880,246 | |
| Royal Dutch Shell, Cl. B | 231,070 | 7,794,410 | Total Investments | ||||
| SABMiller | 45,080 | 2,241,109 | (cost $549,197,538) | 98.8 | % | 521,301,021 | |
| Smith & Nephew | 258,541 | 2,773,010 | |||||
| Cash and Receivables (Net) | 1.2 | % | 6,427,891 | ||||
| Tesco | 330,735 | 1,854,448 | |||||
| Unilever | 119,907 | 4,780,491 | Net Assets | 100.0 | % | 527,728,912 | |
ADR—American Depository Receipts
SDR—Swedish Depository Receipts
a Non-income producing security.
b Investment in affiliated money market mutual fund.
| Portfolio Summary (Unaudited) † | |||
| Value (%) | Value (%) | ||
| Financial | 23.5 | Materials | 7.2 |
| Industrial | 12.8 | Telecommunication Services | 2.9 |
| Health Care | 11.4 | Utilities | 2.5 |
| Consumer Discretionary | 10.3 | Exchange-Traded Fund | .8 |
| Consumer Staples | 9.7 | Money Market Investment | .7 |
| Energy | 9.6 | ||
| Information Technology | 7.4 | 98.8 | |
| † Based on net assets. | |||
| See notes to financial statements. | |||
The Funds 73
STATEMENT OF INVESTMENTS
February 28, 2013 (Unaudited)
| BNY Mellon Emerging Markets Fund | |||||||
| Common Stocks—94.5% | Shares | Value ($) | Shares | Value ($) | |||
| Brazil—10.1% | China (continued) | ||||||
| Arteris | 1,203,700 | 12,952,819 | China BlueChemical, Cl. H | 14,086,000 | 9,026,693 | ||
| Banco Santander Brasil, ADS | 3,393,150 | 24,803,926 | China Coal Energy, Cl. H | 10,334,000 | 10,246,591 | ||
| Brasil Insurance Participacoes e | China Communications | ||||||
| Administracao | 1,022,600 | 10,823,214 | Construction, Cl. H | 18,713,000 | 17,710,225 | ||
| Cia de Bebidas das Americas, ADR | 304,730 | 13,523,917 | China Communications | ||||
| Cia de Saneamento Basico do | Services, Cl. H | 7,694,000 | 4,811,478 | ||||
| Estado de Sao Paulo | 185,900 | a | 9,013,248 | China Construction Bank, Cl. H | 51,536,229 | 42,528,220 | |
| Cia de Saneamento de Minas Gerais | 203,600 | 5,276,690 | China Eastern Airlines, Cl. H | 360,000 | a | 154,108 | |
| Cia Energetica de Minas | China Life Insurance, Cl. H | 2,883,000 | 8,661,341 | ||||
| Gerais, ADR | 366,170 | 4,357,423 | China Petroleum & Chemical, Cl. H | 21,198,000 | 24,107,272 | ||
| Diagnosticos da America | 771,000 | 5,316,838 | China Railway Group, Cl. H | 7,384,000 | 4,008,283 | ||
| EDP—Energias do Brasil | 1,165,600 | 7,072,272 | China Telecom, Cl. H | 30,044,000 | 15,572,861 | ||
| Fleury | 746,800 | 8,300,293 | CNOOC | 7,728,000 | 15,185,765 | ||
| Gerdau, ADR | 969,680 | 8,067,738 | Datang International | ||||
| Itau Unibanco Holding, ADR | 1,245,504 | 21,995,601 | Power Generation, Cl. H | 1,336,000 | 580,525 | ||
| JBS | 2,478,700 | a | 8,590,422 | Dongfeng Motor Group, Cl. H | 2,086,000 | 3,055,464 | |
| Magnesita Refratarios | 1,350,100 | 5,388,395 | Great Wall Motor, Cl. H | 4,572,500 | 17,893,570 | ||
| Petroleo Brasileiro, ADR | 2,784,630 | 40,850,522 | Guangzhou Automobile | ||||
| Petroleo Brasileiro, ADR, Cl. A | 2,730 | 45,673 | Group, Cl. H | 14,239,254 | 11,860,537 | ||
| Porto Seguro | 464,200 | 6,156,032 | Huaneng Power International, ADR | 20,970 | 852,431 | ||
| Rossi Residencial | 3,484,171 | 6,178,357 | Huaneng Power | ||||
| Sul America | 676,853 | 6,452,570 | International, Cl. H | 15,098,100 | 15,534,947 | ||
| Telefonica Brasil, ADR | 365,650 | 9,638,534 | Industrial & Commercial | ||||
| Bank of China, Cl. H | 26,088,475 | 18,736,501 | |||||
| Vale, ADR | 705,280 | 13,393,267 | |||||
| Lianhua Supermarket | |||||||
| 228,197,751 | Holdings, Cl. H | 9,837,000 | 9,056,189 | ||||
| Chile—.4% | Mindray Medical International, ADR | 167,580 | 6,302,684 | ||||
| ENTEL | 465,700 | 9,816,129 | PetroChina, ADR | 48,650 | 6,664,077 | ||
| China—14.8% | PetroChina, Cl. H | 4,210,000 | 5,786,606 | ||||
| AAC Technologies Holdings | 3,393,000 | 14,415,306 | PICC Property & Casualty, Cl. H | 3,962,000 | 5,690,943 | ||
| Anhui Conch Cement, Cl. H | 1,180,500 | 4,315,227 | Sinotrans, Cl. H | 32,906,600 | 6,406,850 | ||
| Asia Cement China Holdings | 2,521,000 | 1,361,982 | Weiqiao Textile, Cl. H | 7,706,400 | 4,014,371 | ||
| Bank of China, Cl. H | 39,336,000 | 18,563,330 | WuXi PharmaTech, ADR | 660,435 | a | 10,791,508 | |
| Beijing Capital | Zhejiang Expressway, Cl. H | 9,394,000 | 7,885,262 | ||||
| International Airport, Cl. H | 6,496,000 | 5,109,289 | |||||
| 332,546,504 | |||||||
| BYD Electronic International | 15,666,500 | 5,656,068 | |||||
74
| BNY Mellon Emerging Markets Fund (continued) | ||||||
| Common Stocks (continued) | Shares | Value ($) | Shares | Value ($) | ||
| Czech Republic—.2% | India (continued) | |||||
| Komercni Banka | 24,017 | 4,887,647 | Punjab National Bank | 405,510 | 5,891,653 | |
| Hong Kong—4.6% | Reliance Industries | 1,706,302 | 25,524,747 | |||
| China Mobile | 560,000 | 6,169,993 | Rolta India | 3,007,690 | 3,621,059 | |
| China Mobile, ADR | 241,000 | 13,206,800 | State Bank of India | 201,618 | 7,711,550 | |
| China Overseas Land & Investment | 4,238,000 | 12,868,753 | State Bank of India, GDR | 56,240 | b | 4,611,680 |
| China Power International | Steel Authority of India | 4,324,102 | 5,635,122 | |||
| Development | 15,644,920 | 5,043,104 | Sterlite Industries India | 11,314,660 | 19,538,872 | |
| China Resources Power Holdings | 2,412,000 | 6,515,473 | 176,366,516 | |||
| COSCO Pacific | 5,447,881 | 8,724,365 | Indonesia—1.8% | |||
| Focus Media Holding, ADR | 282,642 | 7,125,405 | Aneka Tambang Persero | 12,068,000 | 1,610,982 | |
| Global Bio-Chem Technology Group | 40,275,920 | 4,621,895 | Bank Negara Indonesia Persero | 12,877,000 | 6,129,684 | |
| iShares FTSE A50 China Index ETF | 6,975,700 | 10,271,609 | Indofood Sukses Makmur | 12,635,000 | 9,544,730 | |
| NWS Holdings | 4,862,084 | 9,253,231 | Medco Energi Internasional | 23,278,996 | 4,047,055 | |
| Shanghai Industrial Holdings | 2,877,000 | 9,385,231 | Telekomunikasi | |||
| Shimao Property Holdings | 3,323,000 | 6,684,048 | Indonesia Persero | 17,250,000 | 19,189,476 | |
| Sino Biopharmaceutical | 7,260,000 | 4,174,996 | 40,521,927 | |||
| 104,044,903 | Malaysia—1.5% | |||||
| Hungary—.2% | AMMB Holdings | 5,442,500 | 11,129,785 | |||
| Richter Gedeon | 31,930 | 4,881,273 | CIMB Group Holdings | 918,200 | 2,139,149 | |
| India—7.8% | Genting | 2,952,600 | 9,066,550 | |||
| Apollo Tyres | 2,237,830 | 3,401,683 | Malayan Banking | 3,908,027 | 11,570,441 | |
| Bharat Heavy Electricals | 3,014,820 | 11,146,605 | 33,905,925 | |||
| Cairn India | 1,790,720 | 9,806,912 | Mexico—3.0% | |||
| Grasim Industries, GDR | 61,030 | 3,327,356 | Alfa, Cl. A | 2,942,300 | 7,078,826 | |
| Hindustan Petroleum | 1,123,398 | 5,982,990 | America Movil, ADR, Ser. L | 425,740 | 8,893,709 | |
| ICICI Bank | 684,250 | 13,085,079 | Consorcio ARA | 6,828,400 | a | 2,653,354 |
| ICICI Bank, ADR | 66,600 | 2,791,872 | Desarrolladora Homex, ADR | 661,000 | a | 7,865,900 |
| India Cements | 6,184,754 | 9,634,370 | Empresas ICA | 2,455,344 | a | 7,086,413 |
| JSW Steel | 350,110 | 4,757,262 | Fomento Economico | |||
| Jubilant Life Sciences | 1,445,682 | 4,497,412 | Mexicano, ADR | 94,000 | 10,503,560 | |
| NMDC | 5,744,483 | 14,470,754 | Grupo Financiero Banorte, Ser. O | 3,095,300 | 22,891,235 | |
| Oil & Natural Gas | 951,292 | 5,480,792 | 66,972,997 | |||
| Oriental Bank of Commerce | 1,382,423 | 6,986,439 | Peru—.4% | |||
| Power Finance | 2,285,390 | 8,462,307 | Credicorp | 51,440 | 7,714,971 | |
The Funds 75
| STATEMENT OF INVESTMENTS (Unaudited) (continued) | |||||||
| BNY Mellon Emerging Markets Fund (continued) | |||||||
| Common Stocks (continued) | Shares | Value ($) | Shares | Value ($) | |||
| Philippines—.5% | South Korea (continued) | ||||||
| Metropolitan Bank & Trust | 3,854,330 | 10,806,533 | DGB Financial Group | 716,190 | 10,747,893 | ||
| Poland—.4% | Hana Financial Group | 355,210 | 13,252,819 | ||||
| Asseco Poland | 346,943 | 4,714,066 | Hankook Tire | 131,579 | 5,990,668 | ||
| Bank Pekao | 102,660 | 5,182,760 | Hite Jinro | 253,272 | a | 7,975,966 | |
| 9,896,826 | Hyundai Development | 336,050 | a | 7,681,054 | |||
| Russia—7.7% | Hyundai Motor | 171,784 | 34,584,455 | ||||
| Gazprom, ADR | 4,971,920 | 44,250,088 | KB Financial Group | 510,108 | 18,608,054 | ||
| Lukoil, ADR | 696,470 | 45,061,609 | KB Financial Group, ADR | 158,300 | 5,608,569 | ||
| MMC Norilsk Nickel, ADR | 464,370 | 8,219,349 | Kia Motors | 149,772 | 7,731,863 | ||
| Mobile Telesystems, ADR | 775,790 | 16,051,095 | Korea Electric Power | 301,985 | a | 9,105,636 | |
| Pharmstandard, GDR | 545,324 | a | 11,086,437 | Korea Electric Power, ADR | 987,840 | 14,778,086 | |
| Sberbank of Russia, ADR | 1,833,850 | 25,092,724 | Korea Exchange Bank | 429,840 | a | 3,016,909 | |
| Surgutneftegas, ADR | 1,562,120 | 14,746,413 | KT | 290,130 | 9,592,182 | ||
| VimpelCom, ADR | 774,770 | 9,250,754 | KT, ADR | 318,700 | 5,156,566 | ||
| 173,758,469 | KT&G | 155,798 | 11,107,617 | ||||
| South Africa—5.0% | Kukdo Chemical | 82,130 | 3,090,802 | ||||
| ABSA Group | 242,400 | 4,369,675 | LG Electronics | 204,881 | 14,815,120 | ||
| Adcock Ingram Holdings | 1,035,366 | 6,418,203 | Mando | 70,656 | 8,547,952 | ||
| Anglo American Platinum | 224,201 | 10,570,357 | Mirae Asset Securities | 243,830 | 9,784,050 | ||
| AngloGold Ashanti | 258,030 | 6,309,060 | NongShim | 16,324 | 4,341,710 | ||
| AVI | 295,890 | 1,821,740 | POSCO | 21,918 | 7,155,370 | ||
| FirstRand | 2,047,450 | 7,006,992 | POSCO, ADR | 76,050 | 6,136,475 | ||
| Growthpoint Properties | 1,735,965 | 5,266,978 | Samsung Electronics | 50,929 | 72,619,653 | ||
| Imperial Holdings | 458,950 | 10,538,478 | Samsung Fire & Marine Insurance | 78,005 | 16,424,759 | ||
| JD Group | 1,775,047 | 7,730,780 | Shinhan Financial Group | 306,510 | 12,072,728 | ||
| MTN Group | 829,539 | 16,158,452 | Shinsegae | 63,350 | 13,251,241 | ||
| Murray & Roberts Holdings | 3,512,401 | a | 9,744,980 | SK Telecom | 65,236 | 10,753,932 | |
| Standard Bank Group | 1,263,619 | 16,329,315 | SK Telecom, ADR | 127,990 | 2,325,578 | ||
| Telkom | 2,517,869 | a | 4,245,608 | TONGYANG Life Insurance | 380,105 | 3,861,340 | |
| Tiger Brands | 200,460 | 6,749,158 | Youngone | 350,738 | 12,146,630 | ||
| 113,259,776 | 378,684,036 | ||||||
| South Korea—16.8% | Taiwan—9.0% | ||||||
| BS Financial Group | 518,980 | 7,500,785 | Chinatrust Financial Holding | 14,463,615 | 8,556,333 | ||
| Daelim Industrial | 99,857 | 8,917,574 | CTCI | 4,435,000 | 8,835,168 | ||
76
| BNY Mellon Emerging Markets Fund (continued) | |||||||
| Common Stocks (continued) | Shares | Value ($) | Shares | Value ($) | |||
| Taiwan (continued) | Turkey—3.1% | ||||||
| E.Sun Financial Holding | 12,192,000 | 7,294,693 | Aselsan Elektronik | ||||
| First Financial Holding | 12,232,000 | 7,792,790 | Sanayi Ve Ticaret | 1,354,520 | 7,680,520 | ||
| Hon Hai Precision Industry | 17,440,593 | 48,030,487 | Asya Katilim Bankasi | 3,163,030 | a | 3,885,981 | |
| King Yuan Electronics | 1,542,000 | 1,003,172 | Kardemir Karabuk Demir Celik | ||||
| Mega Financial Holding | 18,633,460 | 15,356,988 | Sanayi ve Ticaret, Cl. D | 8,432,530 | 7,265,987 | ||
| Nan Ya Printed Circuit Board | 5,807,983 | 6,646,589 | Koza Altin Isletmeleri | 286,520 | 6,785,308 | ||
| Novatek Microelectronics | 248,000 | 1,036,590 | Turkcell Iletisim Hizmetleri | 1,206,874 | a | 8,017,425 | |
| Powertech Technology | 3,915,200 | 5,694,668 | Turkiye Garanti Bankasi | 2,335,450 | 11,165,395 | ||
| Siliconware Precision Industries | 4,335,000 | 4,654,063 | Turkiye Halk Bankasi | 1,136,980 | 11,250,657 | ||
| Siliconware Precision Industries, ADR | 586,990 | 3,105,177 | Turkiye Is Bankasi, Cl. C | 3,387,370 | 12,089,343 | ||
| Simplo Technology | 961,000 | 4,259,737 | Turkiye Sise ve Cam Fabrikalari | 505,270 | 825,802 | ||
| SinoPac Financial Holdings | 2,474,153 | 1,125,885 | 68,966,418 | ||||
| Taiwan Semiconductor | United Arab Emirates—.3% | ||||||
| Manufacturing | 830,517 | 2,925,489 | Emaar Properties | 5,139,380 | 7,415,931 | ||
| Taiwan Semiconductor | United Kingdom—.3% | ||||||
| Manufacturing, ADR | 2,071,237 | 37,800,075 | African Barrick Gold | 1,261,340 | 5,028,751 | ||
| Tatung | 7,729,216 | a | 2,081,689 | JKX Oil & Gas | 1,483,440 | a | 1,513,439 |
| TPK Holding | 626,000 | 11,858,898 | 6,542,190 | ||||
| Transcend Information | 2,051,040 | 5,842,040 | United States—2.2% | ||||
| United Microelectronics | 24,438,397 | 9,143,856 | iShares MSCI Emerging | ||||
| United Microelectronics, ADR | 504,000 | 932,400 | Markets Index Fund | 1,163,840 | 50,289,526 | ||
| Young Fast Optoelectronics | 1,846,272 | 3,497,564 | Total Common Stocks | ||||
| Zhen Ding Technology Holding | 2,123,000 | 4,816,136 | (cost $1,980,536,264) | 2,129,671,491 | |||
| 202,290,487 | |||||||
| Thailand—4.4% | Preferred Stocks—3.1% | ||||||
| Airports of Thailand | 3,338,300 | 13,240,988 | Brazil—2.6% | ||||
| Asian Property Development | 19,118,820 | 6,619,289 | Bradespar | 506,500 | 7,433,477 | ||
| Bangkok Bank | 2,804,900 | 21,873,506 | Cia Brasileira de Distribuicao | ||||
| CP ALL | 4,547,100 | 7,221,865 | Grupo Pao de Acucar | 277,400 | 13,902,233 | ||
| PTT | 1,112,800 | 13,091,765 | Cia de Bebidas das Americas | 265,000 | 11,754,572 | ||
| PTT Global Chemical | 6,585,683 | 17,488,032 | Gerdau | 193,800 | 1,610,594 | ||
| Siam Commercial Bank | 1,166,500 | 6,979,395 | Itau Unibanco Holding | 189,600 | 3,359,236 | ||
| Thanachart Capital | 7,530,000 | 11,389,916 | Vale | 1,066,300 | 19,689,434 | ||
| 97,904,756 | 57,749,546 | ||||||
The Funds 77
| STATEMENT OF INVESTMENTS (Unaudited) (continued) | |||||||
| BNY Mellon Emerging Markets Fund (continued) | |||||||
| Preferred Stocks (continued) | Shares | Value ($) | Other Investment—1.3% | Shares | Value ($) | ||
| South Korea—.5% | Registered Investment Company; | ||||||
| Samsung Electronics | 14,945 | 12,145,638 | Dreyfus Institutional Preferred | ||||
| Total Preferred Stocks | Plus Money Market Fund | ||||||
| (cost $59,921,244) | 69,895,184 | (cost $30,034,767) | 30,034,767 c 30,034,767 | ||||
| Number of | Total Investments | ||||||
| Rights—.0% | Rights | Value ($) | (cost $2,070,588,756) | 98.9 | % | 2,229,708,245 | |
| Taiwan | Cash and Receivables (Net) | 1.1 | % | 25,449,618 | |||
| Chinatrust Financial Holding | Net Assets | 100.0 | % | 2,255,157,863 | |||
| (cost $96,481) | 1,242,538 | a | 106,803 | ||||
ADR—American Depository Receipts
ADS—American Depository Shares
GDR—Global Depository Receipts
a Non-income producing security.
b Security exempt from registration pursuant to Rule 144A under the Securities Act of 1933.This security may be resold in transactions exempt from registration, normally to
qualified institutional buyers.At February 28, 2013, this security was valued at $4,611,680 or .2% of net assets.
c Investment in affiliated money market mutual fund.
| Portfolio Summary (Unaudited) † | |||
| Value (%) | Value (%) | ||
| Financial | 27.1 | Consumer Staples | 5.4 |
| Information Technology | 12.4 | Utilities | 3.5 |
| Energy | 12.1 | Exchange-Traded Funds | 2.7 |
| Materials | 9.2 | Health Care | 2.7 |
| Consumer Discretionary | 7.8 | Money Market Investment | 1.3 |
| Telecommunication Services | 7.5 | ||
| Industrial | 7.2 | 98.9 | |
| † Based on net assets. | |||
| See notes to financial statements. | |||
78
STATEMENT OF INVESTMENTS
February 28, 2013 (Unaudited)
| BNY Mellon International Appreciation Fund | |||||||
| Common Stocks—98.6% | Shares | Value ($) | Shares | Value ($) | |||
| Automobiles & Components—5.0% | Banks (continued) | ||||||
| Bridgestone, ADR | 9,362 | 574,827 | Societe Generale, ADR | 47,845 | a | 365,057 | |
| Daimler | 16,057 | 956,676 | Sumitomo Mitsui Financial Group, ADR | 13,296 | 106,368 | ||
| Denso, ADR | 31,288 | 657,987 | Sumitomo Mitsui Trust Holdings, ADR | 8,240 | 31,724 | ||
| Fiat, ADR | 30,995 | a | 164,893 | United Overseas Bank, ADR | 13,700 | 422,508 | |
| Honda Motor, ADR | 17,948 | 671,973 | Westpac Banking, ADR | 10,123 | 1,583,743 | ||
| Nissan Motor, ADR | 14,962 | 303,579 | 14,448,181 | ||||
| Peugeot, ADR | 12,756 | 97,201 | Capital Goods—9.3% | ||||
| Toyota Motor, ADR | 15,548 | 1,595,225 | ABB, ADR | 372 | a | 8,452 | |
| Volkswagen, ADR | 12,300 | 507,990 | Asahi Glass, ADR | 38,076 | 259,298 | ||
| 5,530,351 | Atlas Copco, Cl. A, ADR | 16,547 | 482,345 | ||||
| Banks—13.2% | Atlas Copco, Cl. B, ADR | 17,820 | 459,934 | ||||
| Australia & New Zealand | BAE Systems, ADR | 121 | 2,628 | ||||
| Banking Group, ADR | 46,098 | 1,350,671 | European Aeronautic | ||||
| Banco Bilbao | Defence and Space, ADR | 7,893 | 404,911 | ||||
| Vizcaya Argentaria, ADR | 73,224 | 711,005 | Hutchison Whampoa, ADR | 14,325 | 310,136 | ||
| Banco Santander, ADR | 101,517 | 769,499 | Invensys, ADR | 28,090 | 151,405 | ||
| Bank of Yokohama, ADR | 13,208 | 269,839 | ITOCHU, ADR | 11,705 | 270,737 | ||
| Barclays, ADR | 33,044 | 612,966 | Kajima, ADR | 8,417 | 249,974 | ||
| BNP Paribas, ADR | 20,711 | 581,979 | Kawasaki Heavy Industries, ADR | 20,754 | 263,161 | ||
| Commerzbank, ADR | 37,925 | a | 71,678 | Keppel, ADR | 30,187 | 563,893 | |
| Commonwealth Bank of | Komatsu, ADR | 17,788 | 449,325 | ||||
| Australia, ADR | 6,823 | b | 1,409,654 | Kubota, ADR | 8,271 | 499,651 | |
| Credit Agricole, ADR | 22,091 | a | 103,275 | Marubeni, ADR | 4,423 | 325,312 | |
| Danske Bank, ADR | 27,008 | a | 250,094 | Metso, ADR | 10,062 | 432,867 | |
| Erste Group Bank, ADR | 11,283 | a | 181,600 | Mitsubishi, ADR | 10,957 | 436,856 | |
| Hachijuni Bank, ADR | 2,799 | 150,278 | Mitsui & Co., ADR | 811 | 243,495 | ||
| Hang Seng Bank, ADR | 24,669 | 401,858 | Nidec, ADR | 6,281 | 92,205 | ||
| HSBC Holdings, ADR | 40,978 | 2,271,820 | NSK, ADR | 20,210 | 315,882 | ||
| Intesa Sanpaolo, ADR | 30,734 | 298,427 | Orkla, ADR | 26,607 | 216,581 | ||
| Lloyds Banking Group, ADR | 149,180 | a | 492,294 | Rolls-Royce Holdings, ADR | 9,897 | 775,133 | |
| Mitsubishi UFJ Financial Group, ADR | 72,092 | 399,390 | Sandvik, ADR | 40,576 | 661,389 | ||
| National Australia Bank, ADR | 39,303 | 1,210,532 | Siemens, ADR | 161 | 16,709 | ||
| Shinsei Bank, ADR | 57,546 | 254,486 | SKF, ADR | 26,290 | 650,678 | ||
| Shizuoka Bank, ADR | 1,560 | 147,436 | |||||
The Funds 79
STATEMENT OF INVESTMENTS (Unaudited) (continued)
| BNY Mellon International Appreciation Fund (continued) | |||||||
| Common Stocks (continued) | Shares | Value ($) | Shares | Value ($) | |||
| Capital Goods (continued) | Energy—7.6% | ||||||
| Sumitomo, ADR | 24,536 | 300,811 | BG Group, ADR | 42,635 | 753,360 | ||
| Sumitomo Electric Industries, ADR | 2,702 | 316,297 | BP, ADR | 34,295 | 1,385,518 | ||
| Swire Pacific, Cl. A, ADR | 14,906 | 192,884 | ENI, ADR | 19,775 | 900,158 | ||
| TOTO, ADR | 20,445 | 371,895 | Repsol, ADR | 18,707 | 398,459 | ||
| Volvo, ADR | 29,652 | 445,373 | Royal Dutch Shell, Cl. A, ADR | 31,298 | 2,054,714 | ||
| 10,170,217 | Royal Dutch Shell, Cl. B, ADR | 1,593 | 107,273 | ||||
| Commercial & Professional | Statoil, ADR | 8,955 | 223,248 | ||||
| Services—1.3% | Technip, ADR | 14,012 | 380,286 | ||||
| Dai Nippon Printing, ADR | 12,828 | 112,245 | Total, ADR | 27,019 | 1,351,490 | ||
| Experian, ADR | 31,640 | 526,490 | Woodside Petroleum, ADR | 19,215 | 735,935 | ||
| Secom, ADR | 37,120 | 476,992 | 8,290,441 | ||||
| Toppan Printing, ADR | 39,905 | 266,565 | Food & Staples Retailing—1.8% | ||||
| 1,382,292 | Aeon, ADR | 52,968 | 596,949 | ||||
| Consumer Durables & Apparel—2.0% | Delhaize Group, ADR | 9,473 | 456,125 | ||||
| Adidas, ADR | 10,475 | 480,174 | J. Sainsbury, ADR | 13,245 | 276,291 | ||
| Casio Computer, ADR | 2,290 | 181,597 | Koninklijke Ahold, ADR | 8,454 | 121,822 | ||
| Electrolux, Cl. B, ADR | 7,167 | 367,162 | Tesco, ADR | 31,021 | 523,945 | ||
| LVMH Moet Hennessy | 1,975,132 | ||||||
| Louis Vuitton, ADR | 23,969 | 826,211 | Food, Beverage & Tobacco—8.0% | ||||
| Panasonic, ADR | 17,520 | 126,319 | Ajinomoto, ADR | 27,230 | 361,614 | ||
| Sega Sammy Holdings, ADR | 48,384 | 224,502 | British American Tobacco, ADR | 7,800 | 813,384 | ||
| Sharp, ADR | 2,118 | 6,693 | Coca-Cola Amatil, ADR | 17,181 | 510,276 | ||
| Sony, ADR | 2,522 | 36,771 | Coca-Cola Hellenic Bottling, ADR | 3,685 | a | 99,458 | |
| 2,249,429 | Danone, ADR | 31,852 | 440,513 | ||||
| Consumer Services—1.0% | Diageo, ADR | 5,698 | 682,108 | ||||
| Compass Group, ADR | 35,621 | 435,485 | Heineken, ADR | 14,209 | a | 531,843 | |
| InterContinental Hotels Group, ADR | 5,257 | 152,821 | Imperial Tobacco Group, ADR | 6,187 | 449,919 | ||
| Sodexo, ADR | 5,862 | 546,338 | Kirin Holdings, ADR | 29,382 | 426,509 | ||
| 1,134,644 | Nestle, ADR | 36,055 | 2,522,768 | ||||
| Diversified Financials—2.8% | SABMiller, ADR | 18,742 | 937,662 | ||||
| Credit Suisse Group, ADR | 16,474 | 440,844 | Unilever (NY Shares) | 13,003 | 506,077 | ||
| Daiwa Securities Group, ADR | 62,790 | 389,926 | Unilever, ADR | 4,990 | 198,852 | ||
| Deutsche Bank | 13,583 | 621,151 | Yamazaki Baking, ADR | 2,023 | 256,767 | ||
| ING Groep, ADR | 64,569 | a | 516,552 | 8,737,750 | |||
| Nomura Holdings, ADR | 10,857 | 62,536 | Health Care Equipment & | ||||
| ORIX, ADR | 6,179 | 343,367 | Services—1.2% | ||||
| UBS | 47,851 | a | 756,524 | Cie Generale d’Opitique Essilor | |||
| 3,130,900 | International, ADR | 14,234 | 738,175 | ||||
80
| BNY Mellon International Appreciation Fund (continued) | |||||||
| Common Stocks (continued) | Shares | Value ($) | Shares | Value ($) | |||
| Health Care Equipment & | Materials (continued) | ||||||
| Services (continued) | Kobe Steel, ADR | 35,450 | 239,642 | ||||
| Fresenius Medical Care & Co., ADR | 8,450 | 289,159 | Koninklijke DSM, ADR | 4,946 | 72,756 | ||
| Olympus, ADR | 6,140 | a | 134,466 | Lafarge, ADR | 13,770 | 231,749 | |
| Smith & Nephew, ADR | 2,393 | 128,480 | Newcrest Mining, ADR | 12,139 | 277,376 | ||
| 1,290,280 | Nippon Steel Sumitomo Metal, ADR | 19,082 | 516,931 | ||||
| Household & Personal Products—1.7% | Nitto Denko, ADR | 8,620 | 253,600 | ||||
| Henkel & Co., ADR | 6,972 | 618,765 | Norsk Hydro, ADR | 40,233 | 177,025 | ||
| Kao, ADR | 6,988 | 225,433 | OJI Holdings ADR | 200 | 7,652 | ||
| L’Oreal, ADR | 23,764 | 710,544 | Rexam, ADR | 3,182 | 124,703 | ||
| Shiseido, ADR | 4,862 | 64,227 | Rio Tinto, ADR | 19,600 | 1,051,344 | ||
| Svenska Cellulosa, ADR | 10,419 | 256,203 | Stora Enso, ADR | 2,684 | 17,902 | ||
| 1,875,172 | Syngenta, ADR | 8,195 | 696,329 | ||||
| Insurance—5.0% | Teijin, ADR | 5,424 | 126,271 | ||||
| Aegon (NY Shares) | 54,000 | 319,680 | Toray Industries, ADR | 3,528 | 218,701 | ||
| Ageas, ADR | 14,975 | 508,401 | UPM-Kymmene, ADR | 7,622 | 88,796 | ||
| Allianz, ADR | 69,670 | 954,479 | 10,534,189 | ||||
| AXA, ADR | 31,700 | 547,776 | Media—1.6% | ||||
| Legal & General Group, ADR | 58,300 | 717,090 | British Sky | ||||
| MS&AD Insurance | Broadcasting Group, ADR | 4,995 | 257,447 | ||||
| Group Holdings, ADR | 14,902 | 152,596 | Pearson, ADR | 1,012 | 17,801 | ||
| Prudential, ADR | 28,550 | 852,218 | Publicis Groupe, ADR | 30,764 | 508,221 | ||
| Tokio Marine Holdings, ADR | 19,055 | 536,398 | Reed Elsevier, ADR | 6,531 | 281,094 | ||
| Zurich Insurance Group, ADR | 32,897 | a | 900,720 | Wolters Kluwer, ADR | 7,972 | 158,324 | |
| 5,489,358 | WPP, ADR | 6,429 | 512,648 | ||||
| Materials—9.6% | 1,735,535 | ||||||
| Air Liquide, ADR | 25,611 | 622,603 | Pharmaceuticals, Biotech & | ||||
| Akzo Nobel, ADR | 13,015 | 275,658 | Life Sciences—8.6% | ||||
| Alumina, ADR | 8,220 | a | 40,360 | AstraZeneca, ADR | 8,312 | 377,697 | |
| Amcor, ADR | 10,296 | 386,924 | Bayer, ADR | 14,030 | 1,397,107 | ||
| Anglo American, ADR | 43,194 | 626,313 | Eisai, ADR | 11,123 | 497,309 | ||
| ArcelorMittal (NY Shares) | 4,455 | 66,736 | Elan, ADR | 15,218 | a | 172,572 | |
| Asahi Kasei, ADR | 17,985 | 212,763 | GlaxoSmithKline, ADR | 14,399 | 633,988 | ||
| BASF, ADR | 14,246 | 1,342,116 | Novartis, ADR | 27,537 | 1,867,009 | ||
| BHP Billiton Ltd., ADR | 9,704 | 726,441 | Novo Nordisk, ADR | 5,815 | 1,017,625 | ||
| BHP Billiton PLC, ADR | 19,534 | 1,234,353 | Roche Holding, ADR | 33,766 | 1,937,155 | ||
| Boral, ADR | 12,221 | 259,818 | Sanofi, ADR | 28,089 | 1,326,082 | ||
| James Hardie Industries, ADR | 6,824 | 342,497 | Teva Pharmaceutical Industries, ADR | 6,900 | 258,060 | ||
| Johnson Matthey, ADR | 4,251 | 296,830 | 9,484,604 | ||||
The Funds 81
STATEMENT OF INVESTMENTS (Unaudited) (continued)
| BNY Mellon International Appreciation Fund (continued) | |||||||
| Common Stocks (continued) | Shares | Value ($) | Shares | Value ($) | |||
| Real Estate—3.8% | Technology Hardware & | ||||||
| British Land, ADR | 12,476 | 106,795 | Equipment (continued) | ||||
| CapitaLand, ADR | 32,796 | 207,202 | Mitsubishi Electric, ADR | 21,575 | 353,614 | ||
| Cheung Kong Holdings, ADR | 25,243 | 390,509 | Omron, ADR | 11,660 | 283,727 | ||
| City Developments, ADR | 32,591 | 292,993 | Ricoh, ADR | 4,031 | 218,077 | ||
| Daiwa House Industry, ADR | 2,061 | 380,210 | TDK, ADR | 4,571 | 157,791 | ||
| Hysan Development, ADR | 23,301 | 239,774 | 2,700,252 | ||||
| Lend Lease Group, ADR | 40,816 | 445,013 | Telecommunication Services—4.5% | ||||
| Mitsubishi Estate, ADR | 25,000 | 625,000 | BT Group, ADR | 4,903 | 199,013 | ||
| Sino Land, ADR | 25,641 | 232,051 | Deutsche Telekom, ADR | 47,984 | 513,429 | ||
| Sun Hung Kai Properties, ADR | 26,037 | 405,136 | France Telecom, ADR | 11,452 | 111,772 | ||
| Tokyu Land, ADR | 3,001 | 227,693 | Koninklijke KPN, ADR | 15,329 | 51,659 | ||
| Westfield Group, ADR | 28,114 | 644,092 | Nippon Telegraph & Telephone, ADR | 682 | 15,488 | ||
| 4,196,468 | NTT DOCOMO, ADR | 1,465 | 22,649 | ||||
| Retailing—1.1% | Portugal Telecom, ADR | 17,340 | 87,394 | ||||
| Hennes & Mauritz, ADR | 82,506 | 590,743 | Singapore Telecommunications, ADR | 21,960 | 612,684 | ||
| Kingfisher, ADR | 43,728 | 369,502 | Swisscom, ADR | 7,236 | 328,514 | ||
| Marui Group, ADR | 17,401 | 294,425 | Telecom Corp of New Zealand, ADR | 7,128 | 70,938 | ||
| 1,254,670 | Telecom Italia, ADR | 22,896 | 167,828 | ||||
| Semiconductors & Semiconductor | Telecom Italia, Cl. A, ADR | 3,370 | 21,804 | ||||
| Equipment—.3% | Telefonica, ADR | 49,428 | 643,553 | ||||
| Advantest, ADR | 22,445 | 321,188 | Telenor, ADR | 6,496 | 420,616 | ||
| Software & Services—1.7% | Telstra, ADR | 17,148 | 401,092 | ||||
| Computershare, ADR | 21,542 | 223,606 | Vodafone Group, ADR | 51,724 | 1,300,341 | ||
| Dassault Systemes, ADR | 2,685 | 304,479 | 4,968,774 | ||||
| NICE Systems, ADR | 1,000 | a | 35,310 | Transportation—1.8% | |||
| Sage Group, ADR | 10,587 | 219,151 | ANA Holdings, ADR | 23,722 | 97,972 | ||
| SAP, ADR | 11,612 | 908,058 | Deutsche Lufthansa, ADR | 20,366 | 410,171 | ||
| Trend Micro, ADR | 4,337 | 123,041 | International Consolidated | ||||
| 1,813,645 | Airlines Group, ADR | 15,562 | a | 283,228 | |||
| Technology Hardware & | MTR, ADR | 18,662 | 770,078 | ||||
| Equipment—2.5% | Nippon Yusen, ADR | 60,373 | 303,676 | ||||
| Canon, ADR | 10,097 | 367,228 | Ryanair Holdings, ADR | 209 | 8,080 | ||
| Ericsson, ADR | 104 | 1,270 | TNT Express, ADR | 18,467 | 140,534 | ||
| Fujifilm Holdings, ADR | 9,819 | 188,819 | 2,013,739 | ||||
| Fujitsu, ADR | 10,602 | 244,482 | Utilities—3.2% | ||||
| Hitachi, ADR | 8,435 | 474,216 | Centrica, ADR | 26,440 | 566,609 | ||
| Kyocera, ADR | 4,712 | 411,028 | CLP Holdings, ADR | 22,613 | 194,924 | ||
82
| BNY Mellon International Appreciation Fund (continued) | |||||||
| Principal | |||||||
| Common Stocks (continued) | Shares | Value ($) | Short | -Term Investments—.1% | Amount ($) | Value ($) | |
| Utilities (continued) | U.S. Treasury Bills; | ||||||
| E.ON, ADR | 2,044 | 34,217 | 0.03%, 3/14/13 | ||||
| Enel, ADR | 114,307 | 409,219 | (cost $89,999) | 90,000 | c | 89,999 | |
| Energias de Portugal, ADR | 8,130 | 244,713 | |||||
| GDF Suez, ADR | 15,036 | 284,932 | Other Investment—.8% | Shares | Value ($) | ||
| Hong Kong & China Gas, ADR | 141,714 | 392,548 | Registered | ||||
| Iberdrola, ADR | 22,223 | 440,238 | Investment Company; | ||||
| National Grid, ADR | 308 | 16,971 | Dreyfus Institutional Preferred | ||||
| RWE, ADR | 10,330 | 380,867 | Plus Money Market Fund | ||||
| (cost $891,833) | 891,833 | d | 891,833 | ||||
| SSE, ADR | 16,682 | 368,339 | |||||
| United Utilities Group, ADR | 8,447 | 189,720 | Total Investments | ||||
| Veolia Environnement, ADR | 977 | 12,330 | (cost $137,777,690) | 99.5 | % | 109,244,670 | |
| 3,535,627 | Cash and Receivables (Net) | .5 | % | 520,122 | |||
| Total Common Stocks | |||||||
| Net Assets | 100.0 | % | 109,764,792 | ||||
| (cost $136,795,858) | 108,262,838 | ||||||
ADR—American Depository Receipts
a Non-income producing security.
b Security exempt from registration pursuant to Rule 144A under the Securities Act of 1933.This security may be resold in transactions exempt from registration, normally to
qualified institutional buyers.At February 28, 2013, this security was valued at $1,409,654 or 1.3% of net assets.
c Held by or on behalf of a counterparty for open financial futures positions.
d Investment in affiliated money market mutual fund.
| Portfolio Summary (Unaudited) † | |||
| Value (%) | Value (%) | ||
| Banks | 13.2 | Consumer Durables & Apparel | 2.0 |
| Materials | 9.6 | Food & Staples Retailing | 1.8 |
| Capital Goods | 9.3 | Transportation | 1.8 |
| Pharmaceuticals, Biotech & Life Sciences | 8.6 | Household & Personal Products | 1.7 |
| Food, Beverage & Tobacco | 8.0 | Software & Services | 1.7 |
| Energy | 7.6 | Media | 1.6 |
| Automobiles & Components | 5.0 | Commercial & Professional Services | 1.3 |
| Insurance | 5.0 | Health Care Equipment & Services | 1.2 |
| Telecommunication Services | 4.5 | Retailing | 1.1 |
| Real Estate | 3.8 | Consumer Services | 1.0 |
| Utilities | 3.2 | Short-Term/Money Market Investment | .9 |
| Diversified Financials | 2.8 | Semiconductors & Semiconductor Equipment | .3 |
| Technology Hardware & Equipment | 2.5 | 99.5 | |
| † Based on net assets. | |||
| See notes to financial statements. | |||
The Funds 83
STATEMENT OF FINANCIAL FUTURES
February 28, 2013 (Unaudited)
| Market Value | Unrealized | ||||
| BNY Mellon | Covered by | (Depreciation) | |||
| International Appreciation Fund | Contracts | Contracts ($) | Expiration | at 2/28/2013 | ($) |
| Financial Futures Long | |||||
| MSCI EAFE Index | 14 | 1,161,230 | March 2013 | (8,443 | ) |
| See notes to financial statements. | |||||
84
STATEMENT OF INVESTMENTS
February 28, 2013 (Unaudited)
| BNY Mellon International Equity Income Fund | |||||
| Common Stocks—95.0% | Shares | Value ($) | Shares | Value ($) | |
| Australia—15.5% | Germany—1.2% | ||||
| Australia & New Zealand | Deutsche Telekom | 31,200 | 335,112 | ||
| Banking Group | 17,500 | 513,381 | Muenchener | ||
| Bendigo and Adelaide Bank | 72,200 | 732,325 | Rueckversicherungs | 7,300 | 1,312,353 |
| Commonwealth Bank of Australia | 30,400 | 2,088,874 | RWE | 50 | 1,837 |
| Iluka Resources | 333,900 | 3,587,976 | 1,649,302 | ||
| Metcash | 227,300 | 947,277 | Hong Kong—3.5% | ||
| National Australia Bank | 64,200 | 1,980,429 | Hang Seng Bank | 59,200 | 957,203 |
| Tabcorp Holdings | 433,600 | 1,408,425 | NWS Holdings | 379,000 | 721,290 |
| Tatts Group | 1,517,900 | 4,945,966 | Shougang Fushan | ||
| Telstra | 293,500 | 1,376,062 | Resources Group | 6,871,000 | 3,029,917 |
| Westpac Banking | 107,000 | 3,363,013 | 4,708,410 | ||
| 20,943,728 | Israel—2.4% | ||||
| Brazil—2.0% | Bezeq Israeli | ||||
| Cielo | 75,840 | 2,277,039 | Telecommunication | 1,335,900 | 1,712,254 |
| Light | 45,100 | 439,744 | Israel Chemicals | 122,400 | 1,582,013 |
| 2,716,783 | 3,294,267 | ||||
| China—7.2% | Italy—.1% | ||||
| Anta Sports Products | 2,887,000 | 2,732,294 | Enel | 22,200 | 80,342 |
| Bank of China, Cl. H | 1,309,000 | 617,740 | STMicroelectronics | 11,700 | 93,284 |
| Bosideng International Holdings | 4,216,000 | 1,304,657 | 173,626 | ||
| Dongyue Group | 2,168,000 | 1,436,835 | Japan—4.0% | ||
| Guangzhou R&F Properties, Cl. H | 1,539,800 | 2,612,792 | Dai Nippon Printing | 153,300 | 1,347,929 |
| Jiangsu Expressway, Cl. H | 47,300 | 47,815 | Mizuho Financial Group | 741,300 | 1,631,516 |
| Zhejiang Expressway, Cl. H | 1,089,000 | 914,100 | NKSJ Holdings | 78,400 | 1,660,365 |
| 9,666,233 | Ricoh | 67,400 | 722,792 | ||
| France—2.3% | 5,362,602 | ||||
| France Telecom | 24,550 | 237,789 | Netherlands—2.8% | ||
| GDF Suez | 5,050 | 95,467 | Corio | 29,649 | 1,367,757 |
| Neopost | 6,900 | 399,023 | Koninklijke Philips Electronics | 6,900 | 195,660 |
| Total | 47,650 | 2,382,313 | Ziggo | 64,000 | 2,164,082 |
| 3,114,592 | 3,727,499 | ||||
The Funds 85
STATEMENT OF INVESTMENTS (Unaudited) (continued)
| BNY Mellon International Equity Income Fund (continued) | |||||
| Common Stocks (continued) | Shares | Value ($) | Shares | Value ($) | |
| New Zealand—3.1% | Taiwan—.2% | ||||
| Telecom Corporation of | Compal Electronics | 116,000 | 81,135 | ||
| New Zealand | 2,076,400 | 4,154,070 | Farglory Land Development | 101,000 | 191,674 |
| Norway—1.7% | 272,809 | ||||
| Seadrill | 62,100 | 2,259,775 | Thailand—1.6% | ||
| Poland—5.8% | Advanced Info Service | 316,500 | 2,202,202 | ||
| KGHM Polska Miedz | 100,600 | 5,721,522 | Turkey—6.5% | ||
| PGE | 84,800 | 433,181 | Ford Otomotiv Sanayi | 421,600 | 4,968,686 |
| Synthos | 963,600 | 1,677,171 | Tupras Turkiye Petrol Rafinerileri | 90,000 | 2,521,611 |
| 7,831,874 | Turk Telekomunikasyon | 313,200 | 1,291,905 | ||
| Portugal—.9% | 8,782,202 | ||||
| Portugal Telecom | 254,400 | 1,288,341 | United Kingdom—17.9% | ||
| Singapore—3.2% | AstraZeneca | 42,200 | 1,917,716 | ||
| Hutchison Port | Aviva | 236,100 | 1,277,978 | ||
| Holdings Trust | 4,878,000 | 3,951,180 | BAE Systems | 334,900 | 1,804,132 |
| StarHub | 105,000 | 355,257 | BP | 93,800 | 634,232 |
| 4,306,437 | British American Tobacco | 84,624 | 4,409,198 | ||
| South Africa—7.3% | GlaxoSmithKline | 47,900 | 1,058,034 | ||
| Growthpoint Properties | 45,300 | 137,442 | HSBC Holdings | 81,000 | 898,758 |
| Kumba Iron Ore | 64,300 | 4,053,916 | ICAP | 72,000 | 363,730 |
| MMI Holdings | 879,100 | 2,179,611 | Man Group | 179,100 | 272,520 |
| Vodacom Group | 267,300 | 3,533,102 | Marks & Spencer Group | 11,700 | 65,904 |
| 9,904,071 | Resolution | 349,700 | 1,385,707 | ||
| Spain—3.3% | Royal Dutch Shell, Cl. A | 34,377 | 1,131,697 | ||
| ACS Actividades de | Royal Dutch Shell, Cl. B | 8,200 | 276,601 | ||
| Construccion y Servicios | 56,500 | 1,342,498 | |||
| RSA Insurance Group | 1,952,400 | 3,575,021 | |||
| Ferrovial | 197,000 | 3,088,895 | |||
| SSE | 53,900 | 1,182,387 | |||
| 4,431,393 | |||||
| Standard Life | 425,500 | 2,275,418 | |||
| Sweden—.3% | |||||
| TUI Travel | 150,800 | 725,895 | |||
| Ratos, Cl. B | 19,200 | 197,273 | |||
| Vodafone Group | 373,400 | 937,791 | |||
| Skanska, Cl. B | 11,700 | 207,682 | |||
| 24,192,719 | |||||
| 404,955 | |||||
86
| BNY Mellon International Equity Income Fund (continued) | ||||||
| Common Stocks (continued) | Shares | Value ($) | Other Investment—1.7% | Shares | Value ($) | |
| United States—2.2% | Registered | |||||
| iShares MSCI EAFE Index Fund | 50,000 | 2,910,750 | Investment Company; | |||
| Total Common Stocks | Dreyfus | |||||
| (cost $115,683,897) | 128,298,640 | Institutional | ||||
| Preferred Plus | ||||||
| Preferred Stocks—1.9% | Money Market Fund | |||||
| (cost $2,365,562) | 2,365,562 | a | 2,365,562 | |||
| Brazil—1.0% | ||||||
| AES Tiete | 128,900 | 1,327,812 | Total Investments | |||
| Germany—.9% | (cost $120,614,187) | 98.6 | % | 133,182,833 | ||
| ProSiebenSat.1 Media | 34,550 | 1,190,819 | Cash and Receivables (Net) | 1.4 | % | 1,830,711 |
| Total Preferred Stocks | Net Assets | 100.0 | % | 135,013,544 | ||
| (cost $2,564,728) | 2,518,631 | |||||
| a Investment in affiliated money market mutual fund. | ||||||
| Portfolio Summary (Unaudited) † | ||||||
| Value (%) | Value (%) | |||||
| Financial | 23.4 | Utilities | 2.6 | |||
| Materials | 15.6 | Information Technology | 2.4 | |||
| Telecommunication Services | 14.5 | Exchange-Traded Fund | 2.2 | |||
| Consumer Discretionary | 12.8 | Health Care | 2.2 | |||
| Industrial | 10.4 | Money Market Investment | 1.7 | |||
| Energy | 6.8 | |||||
| Consumer Staples | 4.0 | 98.6 | ||||
| † Based on net assets. | ||||||
| See notes to financial statements. | ||||||
The Funds 87
STATEMENT OF INVESTMENTS
February 23, 2013 (Unaudited)
| BNY Mellon Asset Allocation Fund | |||||
| Coupon | Maturity | Principal | |||
| Bonds and Notes—16.6% | Rate (%) | Date | Amount ($) | Value ($) | |
| Asset-Backed Ctfs./Auto Receivables—.3% | |||||
| Ally Auto Receivables Trust, Ser. 2010-3, Cl. A4 | 1.55 | 8/17/15 | 300,000 | 303,131 | |
| AmeriCredit Automobile Receivables Trust, Ser. 2011-3, Cl. A3 | 1.17 | 1/8/16 | 485,000 | 486,923 | |
| Nissan Auto Receivables Owner Trust, Ser. 2010-A, Cl. A4 | 1.31 | 9/15/16 | 360,000 | 362,773 | |
| 1,152,827 | |||||
| Casinos—.2% | |||||
| Agua Caliente Band of Cahuilla Indians, Sr. Scd. Notes | 6.08 | 10/1/16 | 204,000 | a | 196,205 |
| Agua Caliente Band of Cahuilla Indians, Sr. Scd. Notes | 6.44 | 10/1/16 | 174,000 | a | 165,749 |
| Seminole Indian Tribe of Florida, Sr. Scd. Notes | 5.80 | 10/1/13 | 265,000 | a | 272,920 |
| Seminole Indian Tribe of Florida, Scd. Notes | 7.75 | 10/1/17 | 105,000 | a | 114,319 |
| 749,193 | |||||
| Commercial Mortgage Pass-Through Ctfs.—.3% | |||||
| JP Morgan Chase Commercial Mortgage | |||||
| Securities Trust, Ser. 2004-C1, Cl. A2 | 4.30 | 1/15/38 | 5,001 | 5,035 | |
| UBS Commercial Mortgage Trust, Ser. 2012-C1, Cl. A3 | 3.40 | 5/10/45 | 155,000 | 165,052 | |
| UBS-Citigroup Commercial Mortgage Trust, Ser. 2011-C1, Cl. A2 | 2.80 | 1/10/45 | 850,000 | 901,383 | |
| WFRBS Commercial Mortgage Trust, Ser. 2011-C5, Cl. A2 | 2.68 | 11/15/44 | 80,000 | 84,484 | |
| 1,155,954 | |||||
| Consumer Discretionary—.7% | |||||
| Amazon.com, Sr. Unscd. Notes | 2.50 | 11/29/22 | 345,000 | 336,430 | |
| Comcast, Gtd. Notes | 3.13 | 7/15/22 | 180,000 | 184,889 | |
| Comcast, Gtd. Notes | 5.90 | 3/15/16 | 435,000 | 498,510 | |
| Johnson Controls, Sr. Unscd. Notes | 3.75 | 12/1/21 | 440,000 | 465,819 | |
| News America, Gtd. Notes | 6.15 | 3/1/37 | 265,000 | 316,365 | |
| Time Warner Cable, Gtd. Notes | 4.13 | 2/15/21 | 565,000 | 604,961 | |
| Time Warner, Gtd. Notes | 4.00 | 1/15/22 | 350,000 | 377,528 | |
| 2,784,502 | |||||
| Consumer Staples—.4% | |||||
| Anheuser-Busch InBev Worldwide, Gtd. Notes | 2.50 | 7/15/22 | 305,000 | 299,656 | |
| ConAgra Foods, Sr. Unscd. Notes | 3.20 | 1/25/23 | 150,000 | 149,959 | |
| PepsiCo, Sr. Unscd. Notes | 4.50 | 1/15/20 | 375,000 | 431,969 | |
| Pernod-Ricard, Sr. Unscd. Notes | 4.45 | 1/15/22 | 290,000 | a | 319,815 |
| Walgreen, Sr. Unscd. Notes | 3.10 | 9/15/22 | 330,000 | 331,816 | |
| 1,533,215 | |||||
| Energy—.1% | |||||
| BP Capital Markets, Gtd. Notes | 3.88 | 3/10/15 | 290,000 | 308,305 | |
| Petrobras International Finance, Gtd. Notes | 5.38 | 1/27/21 | 100,000 | 109,669 | |
| 417,974 | |||||
| Financial—2.5% | |||||
| American International Group, Sr. Unscd. Notes | 5.85 | 1/16/18 | 450,000 | 530,545 | |
| Bank of America, Sub. Notes | 5.49 | 3/15/19 | 970,000 | 1,092,190 | |
| BBVA US Senior, Bank Gtd. Notes | 3.25 | 5/16/14 | 370,000 | 373,625 | |
| Bear Stearns, Sub. Notes | 5.55 | 1/22/17 | 395,000 | 450,637 |
88
| BNY Mellon Asset Allocation Fund (continued) | |||||
| Coupon | Maturity | Principal | |||
| Bonds and Notes (continued) | Rate (%) | Date | Amount ($) | Value ($) | |
| Financial (continued) | |||||
| BlackRock, Sr. Unscd. Notes | 6.25 | 9/15/17 | 420,000 | 510,982 | |
| Boston Properties, Sr. Unscd. Notes | 4.13 | 5/15/21 | 360,000 | 391,728 | |
| Citigroup, Sub. Notes | 5.00 | 9/15/14 | 415,000 | 436,707 | |
| Citigroup, Sr. Unscd. Notes | 6.13 | 11/21/17 | 195,000 | 230,918 | |
| Ford Motor Credit, Sr. Unscd. Notes | 3.00 | 6/12/17 | 320,000 | 328,435 | |
| General Electric Capital, Sub. Notes | 5.30 | 2/11/21 | 540,000 | 622,441 | |
| Goldman Sachs Group, Sub. Notes | 6.75 | 10/1/37 | 445,000 | 506,153 | |
| HSBC Finance, Sr. Sub. Notes | 6.68 | 1/15/21 | 582,000 | 697,288 | |
| Jefferies Group, Sr. Unscd. Notes | 5.13 | 4/13/18 | 320,000 | 347,200 | |
| Jefferies Group, Sr. Unscd. Notes | 8.50 | 7/15/19 | 335,000 | 419,395 | |
| MetLife, Sr. Unscd. Notes | 7.72 | 2/15/19 | 345,000 | 451,025 | |
| Morgan Stanley, Sub. Notes | 4.88 | 11/1/22 | 475,000 | b | 502,411 |
| NYSE Euronext, Sr. Unscd. Notes | 2.00 | 10/5/17 | 385,000 | 396,483 | |
| Prudential Financial, Sr. Unscd. Notes | 4.75 | 9/17/15 | 395,000 | 432,659 | |
| Rabobank Nederland, Bank Gtd. Notes | 5.25 | 5/24/41 | 330,000 | 380,760 | |
| RBS Citizens Financial Group, Sub. Notes | 4.15 | 9/28/22 | 445,000 | a | 456,196 |
| Simon Property Group, Sr. Unscd. Notes | 5.65 | 2/1/20 | 450,000 | 543,407 | |
| TD Ameritrade Holding, Gtd. Notes | 4.15 | 12/1/14 | 335,000 | 355,341 | |
| 10,456,526 | |||||
| Foreign/Governmental—.2% | |||||
| Mexican Government, Sr. Unscd. Notes | 5.63 | 1/15/17 | 315,000 | 365,085 | |
| Mexican Government, Sr. Unscd. Notes | 6.63 | 3/3/15 | 185,000 | 205,812 | |
| Province of Ontario Canada, Sr. Unscd. Bonds | 4.00 | 10/7/19 | 330,000 | 378,278 | |
| 949,175 | |||||
| Health Care—.2% | |||||
| Amgen, Sr. Unscd. Notes | 5.65 | 6/15/42 | 410,000 | 483,925 | |
| Thermo Fisher Scientific, Sr. Unscd. Notes | 3.60 | 8/15/21 | 290,000 | 301,068 | |
| 784,993 | |||||
| Industrial—.3% | |||||
| ABB Finance USA, Gtd. Notes | 2.88 | 5/8/22 | 575,000 | 582,976 | |
| CRH America, Gtd. Notes | 5.30 | 10/15/13 | 405,000 | 415,655 | |
| Tyco International Finance, Gtd. Notes | 3.38 | 10/15/15 | 56,000 | 59,176 | |
| 1,057,807 | |||||
| Information Technology—.3% | |||||
| Intel, Sr. Unscd. Notes | 2.70 | 12/15/22 | 575,000 | 569,464 | |
| Oracle, Sr. Unscd. Notes | 5.75 | 4/15/18 | 520,000 | 630,131 | |
| 1,199,595 | |||||
| Materials—.1% | |||||
| Eastman Chemical, Sr. Unscd. Notes | 3.60 | 8/15/22 | 365,000 | 380,310 | |
| Municipal Bonds—1.1% | |||||
| California, GO (Build America Bonds) | 7.30 | 10/1/39 | 575,000 | 808,381 |
The Funds 89
STATEMENT OF INVESTMENTS (Unaudited) (continued)
| BNY Mellon Asset Allocation Fund (continued) | ||||||
| Coupon | Maturity | Principal | ||||
| Bonds and Notes (continued) | Rate (%) | Date | Amount ($) | Value ($) | ||
| Municipal Bonds (continued) | ||||||
| Chicago, GO | 7.78 | 1/1/35 | 340,000 | 438,787 | ||
| Illinois, GO | 4.42 | 1/1/15 | 440,000 | 464,077 | ||
| Los Angeles Community College District, | ||||||
| GO (Build America Bonds) | 6.75 | 8/1/49 | 655,000 | 943,672 | ||
| Massachusetts, GO (Build America Bonds) | 4.20 | 12/1/21 | 210,000 | 239,337 | ||
| New Jersey Turnpike Authority, | ||||||
| Turnpike Revenue (Build America Bonds) | 7.10 | 1/1/41 | 435,000 | 618,975 | ||
| New York City Municipal Water Finance Authority, | ||||||
| Water and Sewer System Second General | ||||||
| Resolution Revenue (Build America Bonds) | 6.28 | 6/15/42 | 320,000 | 372,906 | ||
| Oakland Unified School District, GO (Build America Bonds) | 9.50 | 8/1/34 | 180,000 | 212,326 | ||
| Puerto Rico Commonwealth Government | ||||||
| Development Bank, Revenue Bonds | 3.67 | 5/1/14 | 415,000 | 415,000 | ||
| 4,513,461 | ||||||
| Telecommunications—.5% | ||||||
| AT&T, Sr. Unscd. Notes | 4.45 | 5/15/21 | 450,000 | 509,544 | ||
| Rogers Communications, Gtd. Notes | 6.38 | 3/1/14 | 380,000 | 400,883 | ||
| Telefonica Emisiones, Gtd. Notes | 5.13 | 4/27/20 | 495,000 | 512,514 | ||
| Verizon Communications, Sr. Unscd. Notes | 5.50 | 2/15/18 | 550,000 | 652,814 | ||
| 2,075,755 | ||||||
| U.S. Government Agencies—.1% | ||||||
| Federal National Mortgage Association, Notes | 2.63 | 10/10/24 | 350,000 | c | 350,953 | |
| U.S. Government Agencies/Mortgage-Backed—4.8% | ||||||
| Federal Home Loan Mortgage Corp.: | ||||||
| 3.00 | % | 655,000 | c,d | 687,238 | ||
| 3.50 | % | 815,000 | c,d | 858,169 | ||
| 2.50%, 3/1/28 | 585,000 | c | 607,212 | |||
| 3.00%, 11/1/42 | 750,842 | c | 775,010 | |||
| 4.00%, 4/1/24—1/1/41 | 907,364 | c | 964,829 | |||
| 4.50%, 5/1/39—11/1/41 | 3,125,603 | c | 3,426,130 | |||
| 5.00%, 7/1/40 | 896,609 | c | 973,081 | |||
| 5.50%, 12/1/37—12/1/38 | 1,012,873 | c | 1,104,532 | |||
| Federal National Mortgage Association: | ||||||
| 3.00 | % | 650,000 | c,d | 684,328 | ||
| 3.50 | % | 650,000 | c,d | 687,477 | ||
| 3.00%, 10/1/32 | 360,753 | c | 377,551 | |||
| 3.34%, 4/1/41 | 353,747 | c,e | 373,286 | |||
| 3.50%, 1/1/26—6/1/42 | 2,274,070 | c | 2,428,520 | |||
| 4.00%, 2/1/41—4/1/42 | 1,921,740 | c | 2,060,031 | |||
| 4.50%, 6/1/23—7/1/24 | 302,592 | c | 325,669 | |||
| 5.00%, 12/1/21—2/1/41 | 1,504,753 | c | 1,653,389 | |||
| 5.50%, 4/1/36—3/1/38 | 1,027,528 | c | 1,139,608 | |||
90
| BNY Mellon Asset Allocation Fund (continued) | |||||
| Coupon | Maturity | Principal | |||
| Bonds and Notes (continued) | Rate (%) | Date | Amount ($) | Value ($) | |
| U.S. Government Agencies/ | |||||
| Mortgage-Backed (continued) | |||||
| Federal National Mortgage Association (continued): | |||||
| 6.00%, 4/1/33—12/1/37 | 530,853 | c | 594,192 | ||
| 6.50%, 10/1/36 | 73,222 | c | 81,808 | ||
| 19,802,060 | |||||
| U.S. Government Securities—4.4% | |||||
| U.S. Treasury Inflation Protected: | |||||
| Bonds, 2.38%, 1/15/27 | 740,116 | b,f | 1,007,136 | ||
| Notes, 0.63%, 7/15/21 | 606,192 | f | 692,243 | ||
| Notes, 1.38%, 7/15/18 | 585,668 | b,f | 687,885 | ||
| Notes, 1.38%, 1/15/20 | 493,765 | f | 588,236 | ||
| Notes, 2.38%, 1/15/17 | 740,116 | b,f | 865,531 | ||
| U.S. Treasury Notes: | |||||
| 0.25%, 10/31/14 | 405,000 | b | 405,253 | ||
| 0.25%, 1/15/15 | 760,000 | b | 760,297 | ||
| 0.25%, 8/15/15 | 2,045,000 | b | 2,042,924 | ||
| 0.25%, 9/15/15 | 770,000 | 769,098 | |||
| 0.25%, 12/15/15 | 715,000 | b | 713,548 | ||
| 0.38%, 4/15/15 | 865,000 | b | 867,162 | ||
| 0.38%, 2/15/16 | 255,000 | b | 255,239 | ||
| 0.63%, 9/30/17 | 515,000 | b | 513,793 | ||
| 0.75%, 6/15/14 | 1,045,000 | b | 1,052,511 | ||
| 0.75%, 6/30/17 | 110,000 | b | 110,593 | ||
| 0.75%, 10/31/17 | 650,000 | 651,676 | |||
| 0.88%, 12/31/16 | 1,175,000 | b | 1,191,065 | ||
| 0.88%, 1/31/18 | 250,000 | b | 251,523 | ||
| 1.25%, 4/30/19 | 590,000 | b | 597,237 | ||
| 1.25%, 10/31/19 | 525,000 | b | 527,871 | ||
| 1.38%, 2/28/19 | 970,000 | b | 990,840 | ||
| 1.50%, 6/30/16 | 500,000 | b | 517,890 | ||
| 1.50%, 7/31/16 | 510,000 | b | 528,448 | ||
| 1.75%, 7/31/15 | 750,000 | b | 776,367 | ||
| 1.75%, 5/15/22 | 710,000 | b | 709,445 | ||
| 2.25%, 7/31/18 | 180,000 | b | 193,219 | ||
| 18,267,030 | |||||
| Utilities—.1% | |||||
| Boston Gas, | |||||
| Sr. Unscd. Notes | 4.49 | 2/15/42 | 250,000 | a | 263,547 |
| Hydro-Quebec, | |||||
| Gov’t Gtd. Notes | 2.00 | 6/30/16 | 280,000 | 291,771 | |
| 555,318 | |||||
| Total Bonds and Notes | |||||
| (cost $63,991,082) | 68,186,648 | ||||
The Funds 91
STATEMENT OF INVESTMENTS (Unaudited) (continued)
| BNY Mellon Asset Allocation Fund (continued) | |||||||
| Common Stocks—18.2% | Shares | Value ($) | Shares | Value ($) | |||
| Consumer Discretionary—2.1% | Financial (continued) | ||||||
| Amazon.com | 3,750 | g | 991,012 | American Tower | 4,760 | h | 369,376 |
| CBS, Cl. B | 30,130 | 1,307,341 | Ameriprise Financial | 15,010 | 1,030,136 | ||
| News Corp., Cl. A | 54,260 | 1,562,688 | Bank of America | 106,970 | 1,201,273 | ||
| NIKE, Cl. B | 14,380 | 783,135 | Capital One Financial | 11,250 | 574,087 | ||
| PVH | 3,590 | 437,442 | CBRE Group, Cl. A | 39,620 | g | 957,615 | |
| Target | 11,960 | 753,002 | Chubb | 9,230 | 775,597 | ||
| Wal-Mart Stores | 16,960 | 1,200,429 | IntercontinentalExchange | 5,000 | g | 774,100 | |
| Walt Disney | 26,330 | 1,437,355 | JPMorgan Chase & Co. | 34,312 | 1,678,543 | ||
| 8,472,404 | Moody’s | 25,020 | 1,202,461 | ||||
| Consumer Staples—2.0% | T. Rowe Price Group | 11,970 | 852,144 | ||||
| Beam | 19,390 | 1,183,372 | Wells Fargo & Co. | 56,860 | 1,994,649 | ||
| Coca-Cola Enterprises | 25,060 | 896,647 | 13,479,802 | ||||
| ConAgra Foods | 19,270 | 657,300 | Health Care—2.5% | ||||
| PepsiCo | 24,960 | 1,891,219 | Allscripts Healthcare Solutions | 26,160 | g | 332,755 | |
| Philip Morris International | 31,140 | 2,857,095 | Cigna | 11,410 | 667,029 | ||
| Unilever, ADR | 23,660 | 942,851 | Covidien | 21,542 | 1,369,425 | ||
| 8,428,484 | Eli Lilly & Co. | 29,310 | 1,602,085 | ||||
| Energy—2.0% | Johnson & Johnson | 15,790 | 1,201,777 | ||||
| Anadarko Petroleum | 11,220 | 892,888 | McKesson | 7,560 | 802,343 | ||
| Ensco, Cl. A | 17,370 | 1,044,632 | Merck & Co. | 20,500 | 875,965 | ||
| EOG Resources | 4,700 | 590,837 | Pfizer | 105,550 | 2,888,904 | ||
| Exxon Mobil | 20,540 | 1,839,357 | Sanofi, ADR | 14,270 | 673,687 | ||
| National Oilwell Varco | 11,390 | 776,001 | 10,413,970 | ||||
| Occidental Petroleum | 11,480 | 945,148 | Industrial—1.7% | ||||
| Schlumberger | 16,590 | 1,291,532 | ADT | 13,251 | 634,590 | ||
| TransCanada | 14,790 | 687,883 | Danaher | 11,100 | 683,760 | ||
| 8,068,278 | Eaton | 20,883 | 1,294,119 | ||||
| Exchange-Traded Funds—.2% | FedEx | 13,040 | 1,374,807 | ||||
| Standard & Poor’s Depository | Fluor | 11,350 | 702,565 | ||||
| Receipts S&P 500 ETF Trust | 4,920 | 745,921 | General Electric | 48,580 | 1,128,028 | ||
| Financial—3.3% | Robert Half International | 18,020 | 640,611 | ||||
| American Express | 19,280 | 1,198,252 | Tyco International | 21,042 | 673,554 | ||
| American International Group | 22,930 | g | 871,569 | 7,132,034 | |||
92
| BNY Mellon Asset Allocation Fund (continued) | ||||||||
| Common Stocks (continued) | Shares | Value ($) | Other Investment—65.2% | Shares | Value ($) | |||
| Information | Registered | |||||||
| Technology—3.4% | Investment Company: | |||||||
| Alliance Data Systems | 7,580 | g | 1,202,870 | ASG Global Alternatives | ||||
| Apple | 6,430 | 2,838,202 | Fund, Cl. Y | 780,248 | g | 8,496,897 | ||
| Cisco Systems | 61,820 | 1,288,947 | BNY Mellon Emerging | |||||
| Cognizant Technology | Markets Fund, Cl. M | 3,962,557 | i | 40,616,210 | ||||
| Solutions, Cl. A | 15,860 | g | 1,217,572 | BNY Mellon Focused Equity | ||||
| EMC | 56,000 | g | 1,288,560 | Opportunities Fund, Cl. M | 2,053,357 | i | 28,397,933 | |
| Facebook, Cl. A | 16,910 | 460,797 | BNY Mellon Income | |||||
| Stock Fund, Cl. M | 1,842,937 | i | 14,172,183 | |||||
| Informatica | 16,470 | g | 576,615 | |||||
| BNY Mellon Intermediate | ||||||||
| Intuit | 12,890 | 831,147 | Bond Fund, Cl. M | 1,050,455 | i | 13,844,995 | ||
| Juniper Networks | 23,780 | g | 491,770 | BNY Mellon | ||||
| Oracle | 33,870 | 1,160,386 | International Fund, Cl. M | 911,796 | i | 9,464,446 | ||
| QUALCOMM | 23,550 | 1,545,587 | BNY Mellon Mid Cap | |||||
| Skyworks Solutions | 23,120 | g | 492,456 | Multi-Strategy Fund, Cl. M | 1,670,145 | i | 20,225,459 | |
| Teradata | 9,855 | g | 572,181 | BNY Mellon Short-Term | ||||
| 13,967,090 | U.S. Government | |||||||
| Materials—.4% | Securities Fund, Cl. M | 746,005 | i | 9,056,500 | ||||
| LyondellBasell Industries, Cl. A | 19,410 | 1,137,814 | BNY Mellon Small/Mid Cap | |||||
| Fund, Cl. M | 659,950 | i | 9,186,508 | |||||
| Praxair | 6,660 | 752,913 | ||||||
| BNY Mellon U.S. Core Equity | ||||||||
| 1,890,727 | 130/30 Fund, Cl. M | 497,565 | i | 6,348,928 | ||||
| Telecommunications—.2% | Dreyfus Emerging Markets Debt | |||||||
| AT&T | 19,007 | 682,541 | Local Currency Fund, Cl. I | 265,704 | i | 4,086,530 | ||
| Utilities—.4% | Dreyfus Global Real Estate | |||||||
| NextEra Energy | 22,630 | 1,626,418 | Securities Fund, Cl. I | 1,130,873 | i | 9,408,864 | ||
| Total Common Stocks | Dreyfus High Yield Fund, Cl. I | 1,744,815 | i | 11,725,155 | ||||
| (cost $58,759,166) | 74,907,669 | Dreyfus Inflation Adjusted Securities | ||||||
| Fund, Institutional Shares | 842,814 | i | 11,580,261 | |||||
| Principal | ||||||||
| Short-Term Investments—.7% | Amount ($) | Value ($) | Dreyfus Institutional Preferred | |||||
| Plus Money Market Fund | 7,221,912 | j | 7,221,912 | |||||
| U.S. Treasury Bills: | Dreyfus Select Managers | |||||||
| 0.06%, 3/7/13 | 1,544,000 | 1,543,992 | Small Cap Growth Fund, Cl. I | 364,211 | g,i | 7,375,271 | ||
| 0.09%, 3/14/13 | 1,368,000 | 1,367,981 | Dreyfus Select Managers | |||||
| Total Short-Term Investments | Small Cap Value Fund, Cl. I | 544,284 | i | 11,380,978 | ||||
| (cost $2,911,939) | 2,911,973 | |||||||
The Funds 93
| STATEMENT OF INVESTMENTS (Unaudited) (continued) | ||||||||
| BNY Mellon Asset Allocation Fund (continued) | ||||||||
| Investment of Cash Collateral | ||||||||
| Other Investment (continued) | Shares | Value ($) | for Securities Loaned—.1% | Shares | Value ($) | |||
| Registered Investment | Registered Investment Company; | |||||||
| Company (continued): | Dreyfus Institutional Cash | |||||||
| Dreyfus U.S. Equity Fund, Cl. I | 1,006,696 | i | 16,550,082 | Advantage Fund | ||||
| Dreyfus/Newton International | (cost $522,500) | 522,500 | j | 522,500 | ||||
| Equity Fund, Cl. I | 254,922 | i | 4,680,365 | |||||
| Total Investments | ||||||||
| Global Stock Fund, Cl. I | 1,004,432 | i | 16,161,309 | (cost $365,841,119) | 100.8 | % | 414,691,322 | |
| TCW Emerging Markets | ||||||||
| Income Fund, Cl. I | 879,758 | 8,181,746 | Liabilities, Less Cash | |||||
| and Receivables | (.8 | %) | (3,371,422 | ) | ||||
| Total Other Investment | ||||||||
| (cost $239,656,432) | 268,162,532 | Net Assets | 100.0 | % | 411,319,900 | |||
ADR—American Depository Receipts
GO—General Obligation
a Securities exempt from registration pursuant to Rule 144A under the Securities Act of 1933.These securities may be resold in transactions exempt from registration, normally to
qualified institutional buyers.At February 28, 2013, these securities were valued at $1,788,751 or .4% of net assets.
b Security, or portion thereof, on loan.At February 28, 2013, the value of the fund’s securities on loan was $15,395,444 and the value of the collateral held by the fund was
$15,735,166, consisting of cash collateral of $522,500 and U.S. Government & Agency securities valued at $15,212,666.
c The Federal Housing Finance Agency (“FHFA”) placed Federal Home Loan Mortgage Corporation and Federal National Mortgage Association into conservatorship with FHFA
as the conservator.As such, the FHFA oversees the continuing affairs of these companies.
d Purchased on a forward commitment basis.
e Variable rate security—interest rate subject to periodic change.
f Principal amount for accrual purposes is periodically adjusted based on changes in the Consumer Price Index.
g Non-income producing security.
h Investment in real estate investment trust.
i Investment in affiliated mutual fund.
j Investment in affiliated money market mutual fund.
| Portfolio Summary (Unaudited) † | |||
| Value (%) | Value (%) | ||
| Mutual Funds: Domestic | 38.8 | Municipal Bonds | 1.1 |
| Mutual Funds: Foreign | 24.6 | Asset-Backed | .3 |
| Common Stocks | 18.0 | Commercial Mortgage-Backed | .3 |
| U.S. Government Agencies/Mortgage-Backed | 9.3 | Exchange-Traded Funds | .2 |
| Corporate Bonds | 5.4 | Foreign/Governmental | .2 |
| Short-Term/Money Market Investments | 2.6 | 100.8 | |
| † Based on net assets. | |||
| See notes to financial statements. | |||
94
STATEMENTS OF ASSETS AND LIABILITIES
February 28, 2013 (Unaudited)
| BNY Mellon | BNY Mellon | BNY Mellon | BNY Mellon | BNY Mellon | |
| Large Cap | Large Cap Market | Tax-Sensitive Large Cap | Income | Mid Cap | |
| Stock Fund | Opportunities Fund | Multi-Strategy Fund | Stock Fund | Multi-Strategy Fund | |
| Assets ($): | |||||
| Investments in securities— | |||||
| See Statement of Investments† | |||||
| (including securities on loan)††—Note 2(c): | |||||
| Unaffiliated issuers | 773,683,681 | 150,029,089 | 515,231,846 | 656,560,476 | 1,361,969,873 |
| Affiliated issuers | 18,907,080 | 31,753,425 | 82,612,170 | 96,980,707 | 75,892,754 |
| Cash | — | 381,974 | 91,078 | — | 1,862,799 |
| Receivable for | |||||
| investment securities sold | 19,765,456 | 2,138,217 | 16,568,148 | — | 7,794,400 |
| Dividends and securities | |||||
| lending income receivable | 1,818,589 | — | — | 2,764,396 | 1,581,642 |
| Receivable for shares of | |||||
| Beneficial Interest subscribed | 251,000 | 361,104 | 87,853 | 1,164,777 | 1,287,781 |
| Dividends receivable | — | 257,576 | 1,055,410 | — | — |
| Prepaid expenses and other assets | 17,251 | 11,358 | 13,853 | 16,589 | 63,618 |
| 814,443,057 | 184,932,743 | 615,660,358 | 757,486,945 | 1,450,452,867 | |
| Liabilities ($): | |||||
| Due to The Dreyfus Corporation | |||||
| and affiliates—Note 4(b) | 431,042 | 96,971 | 301,353 | 354,912 | 849,964 |
| Due to Administrator—Note 4(a) | 74,112 | 14,420 | 49,315 | 62,987 | 129,772 |
| Cash overdraft due to Custodian | 302,063 | — | — | 369,606 | — |
| Payable for investment | |||||
| securities purchased | 21,709,002 | 2,165,459 | 16,692,655 | 3,315,339 | 9,533,068 |
| Liability for securities on loan—Note 2(c) | 16,742,745 | — | — | 74,139,234 | 59,109,391 |
| Payable for shares of | |||||
| Beneficial Interest redeemed | 602,298 | 30,000 | 14,174 | 202,936 | 208,381 |
| Interest payable—Note 3 | 1,698 | — | — | — | — |
| Accrued expenses | 53,855 | 35,083 | 94,371 | 58,112 | 68,664 |
| 39,916,815 | 2,341,933 | 17,151,868 | 78,503,126 | 69,899,240 | |
| Net Assets ($) | 774,526,242 | 182,590,810 | 598,508,490 | 678,983,819 | 1,380,553,627 |
The Funds 95
STATEMENTS OF ASSETS AND LIABILITIES (continued)
| BNY Mellon | BNY Mellon | BNY Mellon | BNY Mellon | BNY Mellon | ||||
| Large Cap | Large Cap Market | Tax-Sensitive Large Cap | Income | Mid Cap | ||||
| Stock Fund | Opportunities Fund | Multi-Strategy Fund | Stock Fund | Multi-Strategy Fund | ||||
| Composition of Net Assets ($): | ||||||||
| Paid-in capital | 516,862,284 | 160,624,856 | 575,326,037 | 587,688,860 | 1,191,520,099 | |||
| Accumulated undistributed | ||||||||
| investment income—net | 130,885 | 115,021 | 720,311 | 267,481 | 3,472,763 | |||
| Accumulated net realized | ||||||||
| gain (loss) on investments | 68,718,343 | (2,159,083 | ) | (3,706,649 | ) | (2,577,439 | ) | 7,447,680 |
| Accumulated net unrealized appreciation | ||||||||
| (depreciation) on investments | 188,814,730 | 24,010,016 | 26,168,791 | 93,604,917 | 178,113,085 | |||
| Net Assets ($) | 774,526,242 | 182,590,810 | 598,508,490 | 678,983,819 | 1,380,553,627 | |||
| Net Asset Value Per Share | ||||||||
| Class M Shares | ||||||||
| Net Assets ($) | 762,210,072 | 182,560,841 | 598,494,987 | 677,425,265 | 1,355,582,014 | |||
| Shares Outstanding | 81,592,828 | 14,056,847 | 44,981,326 | 88,050,955 | 111,923,981 | |||
| Net Asset Value Per Share ($) | 9.34 | 12.99 | 13.31 | 7.69 | 12.11 | |||
| Investor Shares | ||||||||
| Net Assets ($) | 12,316,170 | 29,969 | 13,503 | 1,558,554 | 24,971,613 | |||
| Shares Outstanding | 1,317,446 | 2,292 | 1,000 | 201,099 | 2,083,947 | |||
| Net Asset Value Per Share ($) | 9.35 | 13.08 | 13.50 | 7.75 | 11.98 | |||
| † Investments at cost ($): | ||||||||
| Unaffiliated issuers | 584,868,951 | 128,813,674 | 490,791,154 | 562,955,559 | 1,183,856,788 | |||
| Affiliated issuers | 18,907,080 | 28,958,824 | 80,884,071 | 96,980,707 | 75,892,754 | |||
| ††Value of securities on loan ($) | 20,782,782 | — | — | 75,615,197 | 73,194,974 | |||
| See notes to financial statements. | ||||||||
96
| BNY Mellon | BNY Mellon | BNY Mellon | |||
| Small Cap | U.S. Core Equity | Focused Equity | BNY Mellon | ||
| Multi-Strategy Fund | 130/30 | Fund | Opportunities Fund | Small/Mid Cap Fund | |
| Assets ($): | |||||
| Investments in securities— | |||||
| See Statement of Investments† | |||||
| (including securities on loan)††—Note 2(c): | |||||
| Unaffiliated issuers | 261,174,654 | 257,058,579 | 436,540,355 | 467,198,559 | |
| Affiliated issuers | 28,749,711 | 1,556,897 | 6,736,721 | 45,263,839 | |
| Cash | 96,753 | 119,256 | 1,975,256 | 135,000 | |
| Receivable for investment securities sold | 4,745,298 | 6,466,265 | 12,220,153 | 508,488 | |
| Dividends and securities lending income receivable | 133,311 | — | 792,286 | 470,269 | |
| Receivable for shares of | |||||
| Beneficial Interest subscribed | 45,211 | 30,265 | 596,265 | 78,000 | |
| Receivable from brokers for | |||||
| proceeds on securities sold short | — | 1,357,436 | — | — | |
| Dividends receivable | — | 553,738 | — | — | |
| Prepaid expenses | 15,667 | 11,436 | 15,905 | 16,430 | |
| 294,960,605 | 267,153,872 | 458,876,941 | 513,670,585 | ||
| Liabilities ($): | |||||
| Due to The Dreyfus Corporation | |||||
| and affiliates—Note 4(b) | 204,874 | 148,813 | 256,403 | 301,362 | |
| Due to Administrator—Note 4(a) | 25,121 | 19,530 | 41,725 | 45,329 | |
| Liability for securities on loan—Note 2(c) | 25,229,484 | — | — | 42,478,408 | |
| Payable for investment securities purchased | 3,857,437 | 7,970,977 | 12,686,649 | — | |
| Payable for shares of | |||||
| Beneficial Interest redeemed | 134,683 | 21,746 | 165,524 | 498,781 | |
| Securities sold short, at value | |||||
| (proceeds $53,419,980)—See Statement | |||||
| of Securities Sold Short | — | 54,841,393 | — | — | |
| Dividends payable on securities sold short | — | 57,673 | — | — | |
| Due to Broker | — | 40,109 | — | — | |
| Interest payable—Note 3 | — | 471 | — | 171 | |
| Accrued expenses | 38,541 | 31,529 | 46,803 | 65,439 | |
| 29,490,140 | 63,132,241 | 13,197,104 | 43,389,490 | ||
| Net Assets ($) | 265,470,465 | 204,021,631 | 445,679,837 | 470,281,095 |
The Funds 97
STATEMENTS OF ASSETS AND LIABILITIES (continued)
| BNY Mellon | BNY Mellon | BNY Mellon | |||||
| Small Cap | U.S. Core Equity | Focused Equity | BNY Mellon | ||||
| Multi-Strategy Fund | 130/30 | Fund | Opportunities Fund | Small/Mid Cap Fund | |||
| Composition of Net Assets ($): | |||||||
| Paid-in capital | 299,055,949 | 204,052,751 | 361,046,771 | 431,878,155 | |||
| Accumulated undistributed (distributions | |||||||
| in excess of) investment income—net | (39,919 | ) | (141,327 | ) | 1,316,286 | (325,276 | ) |
| Accumulated net realized gain (loss) on investments | (58,374,656 | ) | (40,244,999 | ) | 6,447,316 | (609,721 | ) |
| Accumulated net unrealized appreciation | |||||||
| (depreciation) on investments | 24,829,091 | — | 76,869,464 | 39,337,937 | |||
| Accumulated net unrealized appreciation | |||||||
| (depreciation) on investments | |||||||
| and securities sold short | — | 40,355,206 | — | — | |||
| Net Assets ($) | 265,470,465 | 204,021,631 | 445,679,837 | 470,281,095 | |||
| Net Asset Value Per Share | |||||||
| Class M Shares | |||||||
| Net Assets ($) | 258,777,653 | 203,781,375 | 445,407,308 | 469,619,695 | |||
| Shares Outstanding | 20,092,372 | 15,973,341 | 32,197,467 | 33,744,942 | |||
| Net Asset Value Per Share ($) | 12.88 | 12.76 | 13.83 | 13.92 | |||
| Investor Shares | |||||||
| Net Assets ($) | 6,692,812 | 240,256 | 272,529 | 661,400 | |||
| Shares Outstanding | 534,042 | 18,891 | 19,743 | 47,664 | |||
| Net Asset Value Per Share ($) | 12.53 | 12.72 | 13.80 | 13.88 | |||
| † Investments at cost ($): | |||||||
| Unaffiliated issuers | 236,345,563 | 215,281,960 | 359,670,891 | 427,860,622 | |||
| Affiliated issuers | 28,749,711 | 1,556,897 | 6,736,721 | 45,263,839 | |||
| ††Value of securities on loan ($) | 25,125,322 | — | — | 43,367,093 | |||
| See notes to financial statements. | |||||||
98
| BNY Mellon | BNY Mellon | BNY Mellon | BNY Mellon | BNY Mellon | |
| International | Emerging | International | International | Asset Allocation | |
| Fund | Markets Fund | Appreciation Fund | Equity Income Fund | Fund | |
| Assets ($): | |||||
| Investments in securities— | |||||
| See Statement of Investments† | |||||
| (including securities on loan)††—Note 2(c): | |||||
| Unaffiliated issuers | 517,420,775 | 2,199,673,478 | 108,352,837 | 130,817,271 | 162,684,933 |
| Affiliated issuers | 3,880,246 | 30,034,767 | 891,833 | 2,365,562 | 252,006,389 |
| Cash | 199,130 | 2,111,437 | — | 513,482 | 47,550 |
| Cash denominated in foreign currencies††† | 474,386 | 16,100,832 | — | 821,565 | — |
| Receivable for investment securities sold | 5,498,334 | 25,242,189 | — | 633,439 | 1,861,846 |
| Dividends receivable | 2,028,084 | 5,899,711 | 333,668 | 643,888 | — |
| Receivable for shares of | |||||
| Beneficial Interest subscribed | 138,140 | 1,564,305 | 15,000 | 181,632 | 27,925 |
| Unrealized appreciation on forward foreign | |||||
| currency exchange contracts—Note 5 | 9,490 | 1,014 | — | — | — |
| Dividends, interest and securities | |||||
| lending income receivable | — | — | — | — | 748,624 |
| Prepaid expenses and other assets | 1,946,037 | 28,541 | 334,209 | 16,545 | 15,379 |
| 531,594,622 | 2,280,656,274 | 109,927,547 | 135,993,384 | 417,392,646 | |
| Liabilities ($): | |||||
| Due to The Dreyfus Corporation | |||||
| and affiliates—Note 4(b) | 515,294 | 2,814,660 | 54,861 | 117,441 | 62,139 |
| Due to Administrator—Note 4(a) | 50,602 | 214,976 | 10,505 | 12,388 | 13,447 |
| Payable for investment securities purchased | 2,999,206 | 21,065,799 | — | 740,985 | 4,985,251 |
| Payable for shares of | |||||
| Beneficial Interest redeemed | 260,397 | 1,296,306 | 21,000 | 70,000 | 442,199 |
| Unrealized depreciation on forward foreign | |||||
| currency exchange contracts—Note 5 | 455 | 37,811 | — | 3,801 | — |
| Liability for securities on loan—Note 2(c) | — | — | — | — | 522,500 |
| Payable for futures variation margin—Note 5 | — | — | 1,761 | — | — |
| Accrued expenses | 39,756 | 68,859 | 74,628 | 35,225 | 47,210 |
| 3,865,710 | 25,498,411 | 162,755 | 979,840 | 6,072,746 | |
| Net Assets ($) | 527,728,912 | 2,255,157,863 | 109,764,792 | 135,013,544 | 411,319,900 |
The Funds 99
STATEMENTS OF ASSETS AND LIABILITIES (continued)
| BNY Mellon | BNY Mellon | BNY Mellon | BNY Mellon | BNY Mellon | |||||||
| International | Emerging | International | International | Asset Allocation | |||||||
| Fund | Markets Fund | Appreciation Fund | Equity Income Fund | Fund | |||||||
| Composition of Net Assets ($): | |||||||||||
| Paid-in capital | 1,209,124,946 | 2,303,787,437 | 181,356,637 | 127,089,036 | 359,119,976 | ||||||
| Accumulated undistributed (distributions | |||||||||||
| in excess of) investment income—net | 1,537,915 | 462,851 | (51,370 | ) | 309,816 | (795,597 | ) | ||||
| Accumulated net realized | |||||||||||
| gain (loss) on investments | (654,969,342 | ) | (208,021,317 | ) | (42,999,012 | ) | (4,933,529 | ) | 4,145,318 | ||
| Accumulated net unrealized appreciation | |||||||||||
| (depreciation) on investments and | |||||||||||
| foreign currency transactions | (27,964,607 | ) | 158,928,892 | — | 12,548,221 | — | |||||
| Accumulated net unrealized appreciation | |||||||||||
| (depreciation) on investments [including | |||||||||||
| ($8,443) net unrealized (depreciation) | |||||||||||
| on financial futures for BNY Mellon | |||||||||||
| International Appreciation Fund] | — | — | (28,541,463 | ) | — | 48,850,203 | |||||
| Net Assets ($) | 527,728,912 | 2,255,157,863 | 109,764,792 | 135,013,544 | 411,319,900 | ||||||
| Net Asset Value Per Share | |||||||||||
| Class M Shares | |||||||||||
| Net Assets ($) | 523,780,016 | 2,239,819,430 | 105,359,937 | 134,985,885 | 406,163,808 | ||||||
| Shares Outstanding | 50,456,571 | 218,542,609 | 8,863,812 | 9,527,665 | 35,398,570 | ||||||
| Net Asset Value Per Share ($) | 10.38 | 10.25 | 11.89 | 14.17 | 11.47 | ||||||
| Investor Shares | |||||||||||
| Net Assets ($) | 3,948,896 | 15,338,433 | 4,404,855 | 27,659 | 5,156,092 | ||||||
| Shares Outstanding | 357,861 | 1,458,819 | 374,326 | 1,943 | 447,195 | ||||||
| Net Asset Value Per Share ($) | 11.03 | 10.51 | 11.77 | 14.24 | 11.53 | ||||||
| † | Investments at cost ($): | ||||||||||
| Unaffiliated issuers | 545,317,292 | 2,040,553,989 | 136,885,857 | 118,248,625 | 141,364,725 | ||||||
| Affiliated issuers | 3,880,246 | 30,034,767 | 891,833 | 2,365,562 | 224,476,394 | ||||||
| †† | Value of securities on loan ($) | — | — | — | — | 15,395,444 | |||||
| ††† | Cash denominated in foreign | ||||||||||
| currencies (cost) ($) | 479,505 | 16,219,074 | — | 835,477 | — | ||||||
| See notes to financial statements. | |||||||||||
100
STATEMENTS OF OPERATIONS
Six Months Ended February 28, 2013 (Unaudited)
| BNY Mellon | BNY Mellon | BNY Mellon | BNY Mellon | BNY Mellon | |||||
| Large Cap | Large Cap Market | Tax-Sensitive Large Cap | Income | Mid Cap | |||||
| Stock Fund | Opportunities Fund | Multi-Strategy Fund | Stock Fund | Multi-Strategy Fund | |||||
| Investment Income ($): | |||||||||
| Income: | |||||||||
| Cash dividends (net of $180,455, $7,974, | |||||||||
| $13,984, $168,196 and $67,808 foreign taxes | |||||||||
| withheld at source for BNY Mellon Large Cap | |||||||||
| Stock Fund, BNY Mellon Large Cap Market | |||||||||
| Opportunities Fund, BNY Mellon Tax-Sensitive | |||||||||
| Large Cap Multi-Strategy Fund, BNY Mellon | |||||||||
| Income Stock Fund and BNY Mellon Mid Cap | |||||||||
| Multi-Strategy Fund, respectively): | |||||||||
| Unaffiliated issuers | 9,910,316 | 1,303,791 | 2,136,475 | 14,013,143 | 11,138,769 | ||||
| Affiliated issuers | 476 | 78,560 | 70,641 | 3,663 | 28,012 | ||||
| Income from securities lending—Note 2(c) | 59,971 | — | — | 218,111 | 147,945 | ||||
| Total Income | 9,970,763 | 1,382,351 | 2,207,116 | 14,234,917 | 11,314,726 | ||||
| Expenses: | |||||||||
| Investment advisory fees—Note 4(a) | 3,031,692 | 491,424 | 677,395 | 1,908,953 | 4,701,701 | ||||
| Administration fees—Note 4(a) | 576,411 | 83,337 | 116,085 | 362,835 | 774,558 | ||||
| Custodian fees—Note 4(b) | 39,452 | 10,260 | 10,200 | 25,772 | 70,344 | ||||
| Trustees’ fees and expenses—Note 4(c) | 33,779 | 3,791 | 4,538 | 17,249 | 38,886 | ||||
| Professional fees | 27,485 | 23,744 | 24,053 | 32,847 | 156,571 | ||||
| Shareholder servicing costs—Note 4(b) | 15,336 | 44 | 331 | 2,129 | 31,274 | ||||
| Registration fees | 15,062 | 17,554 | 78,121 | 25,847 | 17,196 | ||||
| Prospectus and shareholders’ reports | 6,166 | 2,555 | 2,706 | 3,280 | 43,608 | ||||
| Loan commitment fees—Note 3 | 5,385 | 852 | 684 | 4,363 | 5,722 | ||||
| Interest expense—Note 3 | 4,796 | — | 2,275 | 135 | — | ||||
| Miscellaneous | 16,821 | 11,607 | 11,604 | 16,659 | 18,021 | ||||
| Total Expenses | 3,772,385 | 645,168 | 927,992 | 2,400,069 | 5,857,881 | ||||
| Less—reduction in expenses | |||||||||
| due to undertaking—Note 4(a) | — | — | (77 | ) | — | — | |||
| Less—reduction in fees due to | |||||||||
| earnings credits—Note 4(b) | (5 | ) | — | — | (2 | ) | (108 | ) | |
| Net Expenses | 3,772,380 | 645,168 | 927,915 | 2,400,067 | 5,857,773 | ||||
| Investment Income—Net | 6,198,383 | 737,183 | 1,279,201 | 11,834,850 | 5,456,953 | ||||
| Realized and Unrealized Gain (Loss) | |||||||||
| on Investments—Note 5 ($): | |||||||||
| Net realized gain (loss) on investments: | |||||||||
| Unaffiliated issuers | 73,809,530 | 1,720,786 | (593,085 | ) | 1,156,023 | 68,799,904 | |||
| Affiliated issuers | — | — | 23,312 | — | — | ||||
| Net realized gain (loss) on financial futures | 1,141,265 | — | — | — | 13,155,107 | ||||
| Net realized gain (loss) on options transactions | — | — | — | 186,943 | — | ||||
| Net Realized Gain (Loss) | 74,950,795 | 1,720,786 | (569,773 | ) | 1,342,966 | 81,955,011 | |||
| Net unrealized appreciation | |||||||||
| (depreciation) on investments: | |||||||||
| Unaffiliated issuers | (12,804,303 | ) | 8,126,551 | 10,691,495 | 56,372,962 | 70,950,802 | |||
| Affiliated issuers | — | 1,263,747 | 564,352 | — | — | ||||
| Net unrealized appreciation | |||||||||
| (depreciation) on financial futures | — | — | — | — | 167,924 | ||||
| Net Unrealized Appreciation (Depreciation) | (12,804,303 | ) | 9,390,298 | 11,255,847 | 56,372,962 | 71,118,726 | |||
| Net Realized and Unrealized | |||||||||
| Gain (Loss) on Investments | 62,146,492 | 11,111,084 | 10,686,074 | 57,715,928 | 153,073,737 | ||||
| Net Increase in Net Assets | |||||||||
| Resulting from Operations | 68,344,875 | 11,848,267 | 11,965,275 | 69,550,778 | 158,530,690 | ||||
| See notes to financial statements. | |||||||||
The Funds 101
STATEMENTS OF OPERATIONS (Unaudited) (continued)
| BNY Mellon | BNY Mellon | BNY Mellon | ||||||
| Small Cap | U.S. Core Equity | Focused Equity | BNY Mellon | |||||
| Multi-Strategy Fund | 130/30 | Fund | Opportunities Fund | Small/Mid Cap Fund | ||||
| Investment Income ($): | ||||||||
| Income: | ||||||||
| Cash dividends (net of $42,619 and $55,200 | ||||||||
| foreign taxes withheld at source for BNY Mellon | ||||||||
| U.S. Core Equity 130/30 Fund and BNY Mellon | ||||||||
| Focused Equity Opportunities Fund, respectively): | ||||||||
| Unaffiliated issuers | 1,599,613 | 3,237,999 | 5,099,235 | 4,713,797 | ||||
| Affiliated issuers | 1,929 | 636 | 1,864 | 1,440 | ||||
| Income from securities lending—Note 2(c) | 109,549 | — | 4,628 | 302,692 | ||||
| Total Income | 1,711,091 | 3,238,635 | 5,105,727 | 5,017,929 | ||||
| Expenses: | ||||||||
| Investment advisory fees—Note 4(a) | 1,037,107 | 1,037,264 | 1,645,028 | 1,805,394 | ||||
| Administration fees—Note 4(a) | 150,751 | 160,242 | 290,384 | 297,474 | ||||
| Custodian fees—Note 4(b) | 32,234 | 19,786 | 16,622 | 27,011 | ||||
| Professional fees | 24,845 | 21,451 | 23,804 | 47,862 | ||||
| Registration fees | 16,176 | 14,735 | 14,911 | 14,846 | ||||
| Shareholder servicing costs—Note 4(b) | 8,641 | 362 | 349 | 1,085 | ||||
| Prospectus and shareholders’ reports | 5,057 | 3,525 | 4,258 | 4,070 | ||||
| Trustees’ fees and expenses—Note 4(c) | 4,572 | 8,001 | 18,403 | 15,240 | ||||
| Loan commitment fees—Note 3 | 868 | 1,399 | 2,671 | 2,307 | ||||
| Dividends on securities sold short | — | 1,056,288 | — | — | ||||
| Interest on securities sold short | — | 307,950 | — | — | ||||
| Interest expense—Note 3 | — | 3,757 | 82 | 5,858 | ||||
| Miscellaneous | 15,210 | 12,256 | 13,678 | 14,053 | ||||
| Total Expenses | 1,295,461 | 2,647,016 | 2,030,190 | 2,235,200 | ||||
| Less—reduction in fees due to | ||||||||
| earnings credits—Note 4(b) | (29 | ) | (1 | ) | (1 | ) | (2 | ) |
| Net Expenses | 1,295,432 | 2,647,015 | 2,030,189 | 2,235,198 | ||||
| Investment Income—Net | 415,659 | 591,620 | 3,075,538 | 2,782,731 | ||||
| Realized and Unrealized Gain (Loss) | ||||||||
| on Investments—Note 5 ($): | ||||||||
| Net realized gain (loss) on investments | 20,963,062 | 31,576,141 | 23,288,220 | 40,017,006 | ||||
| Net realized gain (loss) on financial futures | 170,463 | 404,341 | 765,209 | — | ||||
| Net realized gain (loss) on short sale transactions | — | (4,946,630 | ) | — | — | |||
| Net Realized Gain (Loss) | 21,133,525 | 27,033,852 | 24,053,429 | 40,017,006 | ||||
| Net unrealized appreciation | ||||||||
| (depreciation) on investments | 6,611,956 | (9,930,417 | ) | 4,620,615 | (3,762,008 | ) | ||
| Net unrealized appreciation | ||||||||
| (depreciation) on financial futures | 11,374 | — | — | — | ||||
| Net unrealized appreciation | ||||||||
| (depreciation) on securities sold short | — | (5,170,702 | ) | — | — | |||
| Net Unrealized Appreciation (Depreciation) | 6,623,330 | (15,101,119 | ) | 4,620,615 | (3,762,008 | ) | ||
| Net Realized and Unrealized | ||||||||
| Gain (Loss) on Investments | 27,756,855 | 11,932,733 | 28,674,044 | 36,254,998 | ||||
| Net Increase in Net Assets | ||||||||
| Resulting from Operations | 28,172,514 | 12,524,353 | 31,749,582 | 39,037,729 | ||||
| See notes to financial statements. | ||||||||
102
| BNY Mellon | BNY Mellon | BNY Mellon | BNY Mellon | |||||||
| BNY Mellon | Emerging | International | International | Asset Allocation | ||||||
| International Fund | Markets Fund | Appreciation Fund | Equity Income Fund | Fund | ||||||
| Investment Income ($): | ||||||||||
| Income: | ||||||||||
| Cash dividends (net of $472,850, $2,473,873, | ||||||||||
| $89,020, $126,955 and $13,275 foreign taxes | ||||||||||
| withheld at source for BNY Mellon International | ||||||||||
| Fund, BNY Mellon Emerging Markets Fund, | ||||||||||
| BNY Mellon International Appreciation Fund, | ||||||||||
| BNY Mellon International Equity Income | ||||||||||
| Fund and BNY Mellon Asset Allocation | ||||||||||
| Fund, respectively): | ||||||||||
| Unaffiliated issuers | 5,245,353 | 19,218,274 | 1,213,684 | 1,961,254 | 1,192,883 | |||||
| Affiliated issuers | 1,562 | 11,587 | 452 | 966 | 2,714,390 | |||||
| Interest | 8,751 | 780 | 44 | 157 | 969,333 | |||||
| Income from securities lending—Note 2(c) | — | — | — | — | 4,585 | |||||
| Total Income | 5,255,666 | 19,230,641 | 1,214,180 | 1,962,377 | 4,881,191 | |||||
| Expenses: | ||||||||||
| Investment advisory fees—Note 4(a) | 2,292,824 | 12,777,575 | 293,685 | 444,762 | 561,465 | |||||
| Administration fees—Note 4(a) | 333,325 | 1,372,874 | 72,586 | 64,632 | 85,508 | |||||
| Custodian fees—Note 4(b) | 164,214 | 973,142 | 5,220 | 19,993 | 6,784 | |||||
| Professional fees | 23,746 | 72,006 | 19,433 | 36,786 | 32,040 | |||||
| Trustees’ fees and expenses—Note 4(c) | 17,646 | 73,484 | 3,927 | 3,161 | 13,750 | |||||
| Registration fees | 15,466 | 12,166 | 14,148 | 29,691 | 15,075 | |||||
| Shareholder servicing costs—Note 4(b) | 5,181 | 21,449 | 5,322 | 74 | 6,442 | |||||
| Prospectus and shareholders’ reports | 5,045 | 3,561 | 12,153 | 5,578 | 7,478 | |||||
| Interest expense—Note 3 | 3,570 | 3,858 | 88 | — | — | |||||
| Loan commitment fees—Note 3 | 2,977 | 12,214 | 224 | 217 | 1,900 | |||||
| Miscellaneous | 29,069 | 346,362 | 59,803 | 14,831 | 18,060 | |||||
| Total Expenses | 2,893,063 | 15,668,691 | 486,589 | 619,725 | 748,502 | |||||
| Less—reduction in expenses | ||||||||||
| due to undertaking—Note 4(a) | — | — | — | (9 | ) | (253,843 | ) | |||
| Less—reduction in fees due to | ||||||||||
| earnings credits—Note 4(b) | (6 | ) | (17 | ) | (12 | ) | (1 | ) | (1 | ) |
| Net Expenses | 2,893,057 | 15,668,674 | 486,577 | 619,715 | 494,658 | |||||
| Investment Income—Net | 2,362,609 | 3,561,967 | 727,603 | 1,342,662 | 4,386,533 |
The Funds 103
STATEMENTS OF OPERATIONS (Unaudited) (continued)
| BNY Mellon | BNY Mellon | BNY Mellon | BNY Mellon | |||||
| BNY Mellon | Emerging | International | International | Asset Allocation | ||||
| International Fund | Markets Fund | Appreciation Fund | Equity Income Fund | Fund | ||||
| Realized and Unrealized Gain (Loss) | ||||||||
| on Investments—Note 5 ($): | ||||||||
| Net realized gain (loss) on investments | ||||||||
| and foreign currency transactions | 11,552,479 | 9,413,124 | (4,012,269 | ) | (3,319,914 | ) | — | |
| Net realized gain (loss) on forward | ||||||||
| foreign currency exchange contracts | 80,005 | (279,744 | ) | 32,962 | (28,304 | ) | — | |
| Net realized gain (loss) on financial futures | — | — | 272,942 | — | — | |||
| Net realized gain (loss) on investments: | ||||||||
| Unaffiliated issuers | — | — | — | — | 1,098,611 | |||
| Affiliated issuers | — | — | — | — | 1,135,767 | |||
| Capital gain distributions from affiliated issuers | — | — | — | — | 2,654,404 | |||
| Net Realized Gain (Loss) | 11,632,484 | 9,133,380 | (3,706,365 | ) | (3,348,218 | ) | 4,888,782 | |
| Net unrealized appreciation (depreciation) | ||||||||
| on investments and foreign | ||||||||
| currency transactions | 63,779,946 | 250,169,832 | 18,238,697 | 14,000,842 | — | |||
| Net unrealized appreciation (depreciation) | ||||||||
| on forward foreign currency | ||||||||
| exchange contracts | 25,776 | 8,077 | (18,881 | ) | (3,801 | ) | — | |
| Net unrealized appreciation | ||||||||
| (depreciation) on financial futures | — | — | 18,121 | — | — | |||
| Net unrealized appreciation | ||||||||
| (depreciation) on investments: | ||||||||
| Unaffiliated issuers | — | — | — | — | 3,675,282 | |||
| Affiliated issuers | — | — | — | — | 13,166,207 | |||
| Net Unrealized Appreciation (Depreciation) | 63,805,722 | 250,177,909 | 18,237,937 | 13,997,041 | 16,841,489 | |||
| Net Realized and Unrealized | ||||||||
| Gain (Loss) on Investments | 75,438,206 | 259,311,289 | 14,531,572 | 10,648,823 | 21,730,271 | |||
| Net Increase in Net Assets | ||||||||
| Resulting from Operations | 77,800,815 | 262,873,256 | 15,259,175 | 11,991,485 | 26,116,804 | |||
| See notes to financial statements. | ||||||||
104
STATEMENT OF CASH FLOWS
Six Months Ended February 28, 2013 (Unaudited)
| BNY Mellon U.S. Core Equity 130/30 Fund | ||||
| Cash Flows from Operating Activities ($): | ||||
| Purchases of portfolio securities | (153,337,856 | ) | ||
| Proceeds from sales of portfolio securities | 272,299,821 | |||
| Purchases from securities sold short | (34,939,993 | ) | ||
| Net sale of short—term portfolio securities | 577,281 | |||
| Dividends received | 3,333,702 | |||
| Interest and dividends paid on securities sold short | (1,412,709 | ) | ||
| Operating expenses paid | (258,919 | ) | ||
| Paid to The Dreyfus Corporation | (1,096,148 | ) | 85,165,179 | |
| Cash Flows from Financing Activites ($): | ||||
| Net Beneficial Interest transactions | (84,210,816 | ) | ||
| Dividends paid | (1,305,690 | ) | ||
| Futures variation margin received | 404,341 | |||
| Cash at beginning of period | 66,242 | |||
| Cash at end of period | 119,256 | |||
| Reconciliation of Net Increase in Net Assets Resulting from | ||||
| Operations to Net Cash Used by Operating Activities ($): | ||||
| Net Increase in Net Assets Resulting from Operations | 12,524,353 | |||
| Adjustments to reconcile net increase in net assets resulting | ||||
| from operations to net cash provided by operating activities ($): | ||||
| Purchases of portfolio securities | (153,337,856 | ) | ||
| Proceeds from sales of portfolio securities | 272,299,821 | |||
| Purchases from securities sold short | (34,939,993 | ) | ||
| Net sale of short—term portfolio securities | 577,281 | |||
| Decrease in dividends payable on securities sold short | (43,728 | ) | ||
| Increase in interest payable | 413 | |||
| Decrease in accrued expenses | (13,578 | ) | ||
| Increase in prepaid expenses | 4,744 | |||
| Decrease in Due from The Dreyfus Corporation | (58,885 | ) | ||
| Decrease in Due to Administrator | (9,727 | ) | ||
| Net realized gain on investments, financial futures and short sale transactions | (27,033,852 | ) | ||
| Net unrealized depreciation on investments and securities sold short | 15,101,119 | |||
| Increase in dividends receivable | 95,067 | |||
| Net Cash Provided by Operating Activities | 85,165,179 | |||
| Supplemental non-cash financing disclosure: | ||||
| Reinvestment of dividends | 333,069 | |||
| See notes to financial statements. | ||||
The Funds 105
STATEMENTS OF CHANGES IN NET ASSETS
| BNY Mellon Large Cap | ||||||||
| BNY Mellon Large Cap Stock Fund | Market Opportunities Fund | |||||||
| Six Months Ended | Six Months Ended | |||||||
| February 28, 2013 | Year Ended | February 28, 2013 | Year Ended | |||||
| (Unaudited) | August 31, 2012 | (Unaudited) | August 31, 2012 | |||||
| Operations ($): | ||||||||
| Investment income—net | 6,198,383 | 9,616,967 | 737,183 | 736,707 | ||||
| Net realized gain (loss) on investments | 74,950,795 | 64,410,207 | 1,720,786 | (3,284,871 | ) | |||
| Net unrealized appreciation (depreciation) on investments | (12,804,303 | ) | 54,209,338 | 9,390,298 | 17,095,144 | |||
| Net Increase (Decrease) in Net Assets | ||||||||
| Resulting from Operations | 68,344,875 | 128,236,512 | 11,848,267 | 14,546,980 | ||||
| Dividends to Shareholders from ($): | ||||||||
| Investment income—net: | ||||||||
| Class M Shares | (6,187,480 | ) | (9,461,194 | ) | (1,053,761 | ) | (385,167 | ) |
| Investor Shares | (68,541 | ) | (90,719 | ) | (178 | ) | — | |
| Net realized gain on investments: | ||||||||
| Class M Shares | (41,986,273 | ) | — | — | — | |||
| Investor Shares | (546,696 | ) | — | — | — | |||
| Total Dividends | (48,788,990 | ) | (9,551,913 | ) | (1,053,939 | ) | (385,167 | ) |
| Beneficial Interest Transactions ($): | ||||||||
| Net proceeds from shares sold: | ||||||||
| Class M Shares | 48,467,311 | 58,258,330 | 34,662,963 | 66,139,968 | ||||
| Investor Shares | 2,889,662 | 8,552,499 | — | 308,238 | ||||
| Dividends reinvested: | ||||||||
| Class M Shares | 29,554,586 | 1,226,758 | 133,185 | 50,769 | ||||
| Investor Shares | 502,927 | 74,959 | 100 | — | ||||
| Cost of shares redeemed: | ||||||||
| Class M Shares | (306,988,141 | ) | (297,872,740 | ) | (15,485,300 | ) | (45,901,357 | ) |
| Investor Shares | (3,648,044 | ) | (10,755,874 | ) | — | (279,204 | ) | |
| Increase (Decrease) in Net Assets from | ||||||||
| Beneficial Interest Transactions | (229,221,699 | ) | (240,516,068 | ) | 19,310,948 | 20,318,414 | ||
| Total Increase (Decrease) in Net Assets | (209,665,814 | ) | (121,831,469 | ) | 30,105,276 | 34,480,227 | ||
| Net Assets ($): | ||||||||
| Beginning of Period | 984,192,056 | 1,106,023,525 | 152,485,534 | 118,005,307 | ||||
| End of Period | 774,526,242 | 984,192,056 | 182,590,810 | 152,485,534 | ||||
| Undistributed investment income—net | 130,885 | 188,523 | 115,021 | 431,777 | ||||
| Capital Share Transactions (Shares): | ||||||||
| Class M Shares | ||||||||
| Shares sold | 5,245,625 | 6,758,013 | 2,754,954 | 5,853,905 | ||||
| Shares issued for dividends reinvested | 3,328,598 | 144,190 | 10,655 | 4,701 | ||||
| Shares redeemed | (33,011,566 | ) | (35,109,525 | ) | (1,247,286 | ) | (4,049,515 | ) |
| Net Increase (Decrease) in Shares Outstanding | (24,437,343 | ) | (28,207,322 | ) | 1,518,323 | 1,809,091 | ||
| Investor Shares | ||||||||
| Shares sold | 309,796 | 1,002,451 | — | 27,572 | ||||
| Shares issued for dividends reinvested | 56,405 | 8,769 | 8 | — | ||||
| Shares redeemed | (394,746 | ) | (1,259,168 | ) | — | (26,288 | ) | |
| Net Increase (Decrease) in Shares Outstanding | (28,545 | ) | (247,948 | ) | 8 | 1,284 | ||
| See notes to financial statements. | ||||||||
106
| BNY Mellon Tax- Sensitive | ||||||||
| Large Cap Multi-Strategy Fund | BNY Mellon Income Stock Fund | |||||||
| Six Months Ended | Six Months Ended | |||||||
| February 28, 2013 | Year Ended | February 28, 2013 | Year Ended | |||||
| (Unaudited) | August 31, 2012 | (Unaudited) | August 31, 2012 | |||||
| Operations ($): | ||||||||
| Investment income—net | 1,279,201 | 781,061 | 11,834,850 | 12,540,050 | ||||
| Net realized gain (loss) on investments | (569,773 | ) | (2,567,846 | ) | 1,342,966 | 10,895,373 | ||
| Net unrealized appreciation (depreciation) on investments | 11,255,847 | 13,822,380 | 56,372,962 | 31,353,852 | ||||
| Net Increase (Decrease) in Net Assets | ||||||||
| Resulting from Operations | 11,965,275 | 12,035,595 | 69,550,778 | 54,789,275 | ||||
| Dividends to Shareholders from ($): | ||||||||
| Investment income—net: | ||||||||
| Class M Shares | (1,087,759 | ) | (415,070 | ) | (11,678,725 | ) | (12,444,436 | ) |
| Investor Shares | — | — | (30,175 | ) | (39,030 | ) | ||
| Net realized gain on investments: | ||||||||
| Class M Shares | — | — | (473,022 | ) | — | |||
| Investor Shares | — | — | (1,451 | ) | — | |||
| Total Dividends | (1,087,759 | ) | (415,070 | ) | (12,183,373 | ) | (12,483,466 | ) |
| Beneficial Interest Transactions ($): | ||||||||
| Net proceeds from shares sold: | ||||||||
| Class M Shares | 479,376,492 | 57,619,035 | 128,718,575 | 371,580,235 | ||||
| Investor Shares | 1,235,409 | 104,518 | 1,863,526 | 1,672,126 | ||||
| Dividends reinvested: | ||||||||
| Class M Shares | 83,183 | 36,517 | 2,057,490 | 2,028,416 | ||||
| Investor Shares | — | — | 24,007 | 36,246 | ||||
| Cost of shares redeemed: | ||||||||
| Class M Shares | (15,079,340 | ) | (21,350,864 | ) | (52,163,782 | ) | (78,969,231 | ) |
| Investor Shares | (1,246,928 | ) | (105,044 | ) | (1,722,184 | ) | (1,656,281 | ) |
| Increase (Decrease) in Net Assets from | ||||||||
| Beneficial Interest Transactions | 464,368,816 | 36,304,162 | 78,777,632 | 294,691,511 | ||||
| Total Increase (Decrease) in Net Assets | 475,246,332 | 47,924,687 | 136,145,037 | 336,997,320 | ||||
| Net Assets ($): | ||||||||
| Beginning of Period | 123,262,158 | 75,337,471 | 542,838,782 | 205,841,462 | ||||
| End of Period | 598,508,490 | 123,262,158 | 678,983,819 | 542,838,782 | ||||
| Undistributed investment income—net | 720,311 | 528,869 | 267,481 | 141,531 | ||||
| Capital Share Transactions (Shares): | ||||||||
| Class M Shares | ||||||||
| Shares sold | 36,288,639 | 4,930,627 | 17,388,303 | 56,409,960 | ||||
| Shares issued for dividends reinvested | 6,503 | 3,314 | 281,990 | 303,189 | ||||
| Shares redeemed | (1,171,660 | ) | (1,837,974 | ) | (7,147,583 | ) | (11,796,291 | ) |
| Net Increase (Decrease) in Shares Outstanding | 35,123,482 | 3,095,967 | 10,522,710 | 44,916,858 | ||||
| Investor Shares | ||||||||
| Shares sold | 99,656 | 8,893 | 250,061 | 245,187 | ||||
| Shares issued for dividends reinvested | — | — | 3,278 | 5,440 | ||||
| Shares redeemed | (99,656 | ) | (8,893 | ) | (227,714 | ) | (241,961 | ) |
| Net Increase (Decrease) in Shares Outstanding | — | — | 25,625 | 8,666 | ||||
| See notes to financial statements. | ||||||||
The Funds 107
STATEMENTS OF CHANGES IN NET ASSETS (continued)
| BNY Mellon Mid Cap Multi-Strategy Fund | BNY Mellon Small Cap Multi-Strategy Fund | |||||||
| Six Months Ended | Six Months Ended | |||||||
| February 28, 2013 | Year Ended | February 28, 2013 | Year Ended | |||||
| (Unaudited) | August 31, 2012a | (Unaudited) | August 31, 2012 | |||||
| Operations ($): | ||||||||
| Investment income (loss)—net | 5,456,953 | 1,092,299 | 415,659 | (39,965 | ) | |||
| Net realized gain (loss) on investments | 81,955,011 | 24,838,862 | 21,133,525 | (3,176,973 | ) | |||
| Net unrealized appreciation (depreciation) on investments | 71,118,726 | 39,555,770 | 6,623,330 | 31,452,582 | ||||
| Net Increase (Decrease) in Net Assets | ||||||||
| Resulting from Operations | 158,530,690 | 65,486,931 | 28,172,514 | 28,235,644 | ||||
| Dividends to Shareholders from ($): | ||||||||
| Investment income—net: | ||||||||
| Class M Shares | (2,758,781 | ) | (4,780,233 | ) | (580,713 | ) | (8,801,501 | ) |
| Investor Shares | — | (42,885 | ) | — | (192,431 | ) | ||
| Net realized gain on investments: | ||||||||
| Class M Shares | (97,703,444 | ) | (35,311,699 | ) | — | — | ||
| Investor Shares | (2,035,528 | ) | (818,540 | ) | — | — | ||
| Dreyfus Premier Shares | — | (12,100 | ) | — | — | |||
| Total Dividends | (102,497,753 | ) | (40,965,457 | ) | (580,713 | ) | (8,993,932 | ) |
| Beneficial Interest Transactions ($): | ||||||||
| Net proceeds from shares sold: | ||||||||
| Class M Shares | 179,512,883 | 153,113,475 | 23,645,944 | 13,590,917 | ||||
| Investor Shares | 4,445,901 | 12,230,890 | 965,350 | 2,583,340 | ||||
| Dreyfus Premier Shares | — | 99 | — | — | ||||
| Dividends reinvested: | ||||||||
| Class M Shares | 57,479,998 | 22,249,585 | 129,938 | 1,724,380 | ||||
| Investor Shares | 1,690,809 | 724,845 | — | 174,027 | ||||
| Dreyfus Premier Shares | — | 5,005 | — | — | ||||
| Cost of shares redeemed: | ||||||||
| Class M Shares | (124,765,417 | ) | (291,866,833 | ) | (24,816,045 | ) | (152,356,466 | ) |
| Investor Shares | (7,451,069 | ) | (16,185,413 | ) | (1,395,493 | ) | (4,545,765 | ) |
| Dreyfus Premier Shares | — | (461,467 | ) | — | — | |||
| Increase (Decrease) in Net Assets from | ||||||||
| Beneficial Interest Transactions | 110,913,105 | (120,189,814 | ) | (1,470,306 | ) | (138,829,567 | ) | |
| Total Increase (Decrease) in Net Assets | 166,946,042 | (95,668,340 | ) | 26,121,495 | (119,587,855 | ) | ||
| Net Assets ($): | �� | |||||||
| Beginning of Period | 1,213,607,585 | 1,309,275,925 | 239,348,970 | 358,936,825 | ||||
| End of Period | 1,380,553,627 | 1,213,607,585 | 265,470,465 | 239,348,970 | ||||
| Undistributed (distributions in excess of) | ||||||||
| investment income—net | 3,472,763 | 774,591 | (39,919 | ) | 125,135 | |||
108
| BNY Mellon Mid Cap Multi-Strategy Fund | BNY Mellon Small Cap Multi-Strategy Fund | |||||||
| Six Months Ended | Six Months Ended | |||||||
| February 28, 2013 | Year Ended | February 28, 2013 | Year Ended | |||||
| (Unaudited) | August 31, 2012a | (Unaudited) | August 31, 2012 | |||||
| Capital Share Transactions: | ||||||||
| Class M Shares | ||||||||
| Shares sold | 15,368,852 | 13,367,721 | 1,950,241 | 1,249,465 | ||||
| Shares issued for dividends reinvested | 5,234,972 | 2,065,885 | 11,192 | 163,673 | ||||
| Shares redeemed | (10,676,783 | ) | (25,688,434 | ) | (2,075,505 | ) | (13,781,151 | ) |
| Net Increase (Decrease) in Shares Outstanding | 9,927,041 | (10,254,828 | ) | (114,072 | ) | (12,368,013 | ) | |
| Investor Sharesb | ||||||||
| Shares sold | 379,801 | 1,084,492 | 83,503 | 242,974 | ||||
| Shares issued for dividends reinvested | 155,548 | 67,933 | — | 16,964 | ||||
| Shares redeemed | (645,650 | ) | (1,447,462 | ) | (120,304 | ) | (434,403 | ) |
| Net Increase (Decrease) in Shares Outstanding | (110,301 | ) | (295,037 | ) | (36,801 | ) | (174,465 | ) |
| Dreyfus Premier Sharesb | ||||||||
| Shares sold | — | 10 | — | — | ||||
| Shares issued for dividends reinvested | — | 504 | — | — | ||||
| Shares redeemed | — | (41,920 | ) | — | — | |||
| Net Increase (Decrease) in Shares Outstanding | — | (41,406 | ) | — | — | |||
a Effective March 13, 2012, BNY Mellon Mid Cap Multi-Strategy Fund no longer offers Premier shares.
b During the period ended August 31, 2012, 32,858 Dreyfus Premier shares of BNY Mellon Mid Cap Multi-Strategy Fund representing $366,736 were automatically converted
to 30,526 Investor shares.
See notes to financial statements.
The Funds 109
STATEMENTS OF CHANGES IN NET ASSETS (continued)
| BNY Mellon Focused | ||||||||
| BNY Mellon U.S. Core Equity 130/30 Fund | Equity Opportunities Fund | |||||||
| Six Months Ended | Six Months Ended | |||||||
| February 28, 2013 | Year Ended | February 28, 2013 | Year Ended | |||||
| (Unaudited) | August 31, 2012 | (Unaudited) | August 31, 2012 | |||||
| Operations ($): | ||||||||
| Investment income—net | 591,620 | 1,241,825 | 3,075,538 | 2,679,907 | ||||
| Net realized gain (loss) on investments | 27,033,852 | (6,944,974 | ) | 24,053,429 | (16,790,167 | ) | ||
| Net unrealized appreciation (depreciation) on investments | (15,101,119 | ) | 43,522,220 | 4,620,615 | 48,921,471 | |||
| Net Increase (Decrease) in Net Assets | ||||||||
| Resulting from Operations | 12,524,353 | 37,819,071 | 31,749,582 | 34,811,211 | ||||
| Dividends to Shareholders from ($): | ||||||||
| Investment income—net: | ||||||||
| Class M Shares | (1,304,992 | ) | (1,698,931 | ) | (4,210,323 | ) | (648,379 | ) |
| Investor Shares | (698 | ) | (88 | ) | (1,896 | ) | (353 | ) |
| Net realized gain on investments: | ||||||||
| Class M Shares | — | — | — | (904,880 | ) | |||
| Investor Shares | — | — | — | (934 | ) | |||
| Total Dividends | (1,305,690 | ) | (1,699,019 | ) | (4,212,219 | ) | (1,554,546 | ) |
| Beneficial Interest Transactions ($): | ||||||||
| Net proceeds from shares sold: | ||||||||
| Class M Shares | 51,332,146 | 60,749,125 | 90,702,132 | 124,858,793 | ||||
| Investor Shares | 788,145 | 3,312,383 | 400,129 | 1,463,419 | ||||
| Dividends reinvested: | ||||||||
| Class M Shares | 332,415 | 516,211 | 769,049 | 762,262 | ||||
| Investor Shares | 654 | 55 | 1,861 | 948 | ||||
| Cost of shares redeemed: | ||||||||
| Class M Shares | (135,728,502 | ) | (148,382,844 | ) | (141,488,318 | ) | (115,962,387 | ) |
| Investor Shares | (678,838 | ) | (3,525,730 | ) | (348,133 | ) | (1,315,616 | ) |
| Increase (Decrease) in Net Assets from | ||||||||
| Beneficial Interest Transactions | (83,953,980 | ) | (87,330,800 | ) | (49,963,280 | ) | 9,807,419 | |
| Total Increase (Decrease) in Net Assets | (72,735,317 | ) | (51,210,748 | ) | (22,425,917 | ) | 43,064,084 | |
| Net Assets ($): | ||||||||
| Beginning of Period | 276,756,948 | 327,967,696 | 468,105,754 | 425,041,670 | ||||
| End of Period | 204,021,631 | 276,756,948 | 445,679,837 | 468,105,754 | ||||
| Undistributed (distributions in excess of) | ||||||||
| investment income—net | (141,327 | ) | 572,743 | 1,316,286 | 2,452,967 | |||
| Capital Share Transactions (Shares): | ||||||||
| Class M Shares | ||||||||
| Shares sold | 4,045,038 | 5,449,336 | 6,759,613 | 10,196,685 | ||||
| Shares issued for dividends reinvested | 27,225 | 50,166 | 58,483 | 69,296 | ||||
| Shares redeemed | (10,670,238 | ) | (13,206,023 | ) | (10,383,184 | ) | (9,790,498 | ) |
| Net Increase (Decrease) in Shares Outstanding | (6,597,975 | ) | (7,706,521 | ) | (3,565,088 | ) | 475,483 | |
| Investor Shares | ||||||||
| Shares sold | 63,957 | 311,523 | 30,254 | 121,170 | ||||
| Shares issued for dividends reinvested | 54 | 6 | 142 | 86 | ||||
| Shares redeemed | (54,662 | ) | (319,681 | ) | (26,203 | ) | (107,834 | ) |
| Net Increase (Decrease) in Shares Outstanding | 9,349 | (8,152 | ) | 4,193 | 13,422 | |||
| See notes to financial statements. | ||||||||
110
| BNY Mellon Small/Mid Cap Fund | BNY Mellon International Fund | |||||||
| Six Months Ended | Six Months Ended | |||||||
| February 28, 2013 | Year Ended | February 28, 2013 | Year Ended | |||||
| (Unaudited) | August 31, 2012 | (Unaudited) | August 31, 2012 | |||||
| Operations ($): | ||||||||
| Investment income—net | 2,782,731 | 1,977,680 | 2,362,609 | 16,504,119 | ||||
| Net realized gain (loss) on investments | 40,017,006 | (23,204,523 | ) | 11,632,484 | (59,810,635 | ) | ||
| Net unrealized appreciation (depreciation) on investments | (3,762,008 | ) | 17,072,191 | 63,805,722 | 6,905,880 | |||
| Net Increase (Decrease) in Net Assets | ||||||||
| Resulting from Operations | 39,037,729 | (4,154,652 | ) | 77,800,815 | (36,400,636 | ) | ||
| Dividends to Shareholders from ($): | ||||||||
| Investment income—net: | ||||||||
| Class M Shares | (7,566,379 | ) | (6,813,784 | ) | (16,766,463 | ) | (26,606,906 | ) |
| Investor Shares | (10,362 | ) | (5,491 | ) | (109,039 | ) | (220,200 | ) |
| Net realized gain on investments: | ||||||||
| Class M Shares | — | — | — | — | ||||
| Investor Shares | — | — | — | — | ||||
| Total Dividends | (7,576,741 | ) | (6,819,275 | ) | (16,875,502 | ) | (26,827,106 | ) |
| Beneficial Interest Transactions ($): | ||||||||
| Net proceeds from shares sold: | ||||||||
| Class M Shares | 41,056,868 | 184,345,178 | 19,630,611 | 112,895,726 | ||||
| Investor Shares | 785,154 | 2,054,420 | 1,182,043 | 6,282,213 | ||||
| Dividends reinvested: | ||||||||
| Class M Shares | 1,058,235 | 1,101,837 | 3,256,938 | 5,380,959 | ||||
| Investor Shares | 10,104 | 4,161 | 93,855 | 187,542 | ||||
| Cost of shares redeemed: | ||||||||
| Class M Shares | (130,377,857 | ) | (158,527,610 | ) | (109,156,569 | ) | (385,294,395 | ) |
| Investor Shares | (1,152,980 | ) | (1,582,412 | ) | (1,920,640 | ) | (8,113,921 | ) |
| Increase (Decrease) in Net Assets from | ||||||||
| Beneficial Interest Transactions | (88,620,476 | ) | 27,395,574 | (86,913,762 | ) | (268,661,876 | ) | |
| Total Increase (Decrease) in Net Assets | (57,159,488 | ) | 16,421,647 | (25,988,449 | ) | (331,889,618 | ) | |
| Net Assets ($): | ||||||||
| Beginning of Period | 527,440,583 | 511,018,936 | 553,717,361 | 885,606,979 | ||||
| End of Period | 470,281,095 | 527,440,583 | 527,728,912 | 553,717,361 | ||||
| Undistributed (distributions in excess of) | ||||||||
| investment income—net | (325,276 | ) | 4,468,734 | 1,537,915 | 16,050,808 | |||
| Capital Share Transactions (Shares): | ||||||||
| Class M Shares | ||||||||
| Shares sold | 3,050,336 | 14,058,726 | 1,948,035 | 12,130,857 | ||||
| Shares issued for dividends reinvested | 81,906 | 93,773 | 326,020 | 626,421 | ||||
| Shares redeemed | (9,917,366 | ) | (12,466,688 | ) | (10,981,839 | ) | (42,094,378 | ) |
| Net Increase (Decrease) in Shares Outstanding | (6,785,124 | ) | 1,685,811 | (8,707,784 | ) | (29,337,100 | ) | |
| Investor Shares | ||||||||
| Shares sold | 59,881 | 158,468 | 113,134 | 640,603 | ||||
| Shares issued for dividends reinvested | 784 | 355 | 8,829 | 20,590 | ||||
| Shares redeemed | (86,941 | ) | (123,527 | ) | (182,484 | ) | (828,547 | ) |
| Net Increase (Decrease) in Shares Outstanding | (26,276 | ) | 35,296 | (60,521 | ) | (167,354 | ) | |
| See notes to financial statements. | ||||||||
The Funds 111
STATEMENTS OF CHANGES IN NET ASSETS (continued)
| BNY Mellon | ||||||||
| BNY Mellon Emerging Markets Fund | International Appreciation Fund | |||||||
| Six Months Ended | Six Months Ended | |||||||
| February 28, 2013 | Year Ended | February 28, 2013 | Year Ended | |||||
| (Unaudited) | August 31, 2012 | (Unaudited) | August 31, 2012 | |||||
| Operations ($): | ||||||||
| Investment income—net | 3,561,967 | 26,139,973 | 727,603 | 4,108,206 | ||||
| Net realized gain (loss) on investments | 9,133,380 | (186,152,134 | ) | (3,706,365 | ) | (22,862,234 | ) | |
| Net unrealized appreciation (depreciation) on investments | 250,177,909 | (94,824,770 | ) | 18,237,937 | 14,620,021 | |||
| Net Increase (Decrease) in Net Assets | ||||||||
| Resulting from Operations | 262,873,256 | (254,836,931 | ) | 15,259,175 | (4,134,007 | ) | ||
| Dividends to Shareholders from ($): | ||||||||
| Investment income—net: | ||||||||
| Class M Shares | (21,707,909 | ) | (23,405,669 | ) | (3,637,873 | ) | (6,416,671 | ) |
| Investor Shares | (115,068 | ) | (211,928 | ) | (133,114 | ) | (134,033 | ) |
| Net realized gain on investments: | ||||||||
| Class M Shares | — | (65,641,307 | ) | — | — | |||
| Investor Shares | — | (697,390 | ) | — | — | |||
| Total Dividends | (21,822,977 | ) | (89,956,294 | ) | (3,770,987 | ) | (6,550,704 | ) |
| Beneficial Interest Transactions ($): | ||||||||
| Net proceeds from shares sold: | ||||||||
| Class M Shares | 231,903,927 | 664,128,793 | 866,017 | 7,950,174 | ||||
| Investor Shares | 5,468,553 | 21,398,624 | 565,364 | 1,043,469 | ||||
| Dividends reinvested: | ||||||||
| Class M Shares | 4,437,020 | 46,472,969 | 169,947 | 283,334 | ||||
| Investor Shares | 86,532 | 601,542 | 131,579 | 115,340 | ||||
| Cost of shares redeemed: | ||||||||
| Class M Shares | (374,015,717 | ) | (582,928,145 | ) | (26,485,053 | ) | (76,113,808 | ) |
| Investor Shares | (8,409,768 | ) | (24,504,155 | ) | (732,891 | ) | (973,159 | ) |
| Increase (Decrease) in Net Assets from | ||||||||
| Beneficial Interest Transactions | (140,529,453 | ) | 125,169,628 | (25,485,037 | ) | (67,694,650 | ) | |
| Total Increase (Decrease) in Net Assets | 100,520,826 | (219,623,597 | ) | (13,996,849 | ) | (78,379,361 | ) | |
| Net Assets ($): | ||||||||
| Beginning of Period | 2,154,637,037 | 2,374,260,634 | 123,761,641 | 202,141,002 | ||||
| End of Period | 2,255,157,863 | 2,154,637,037 | 109,764,792 | 123,761,641 | ||||
| Undistributed (distributions in excess of) | ||||||||
| investment income—net | 462,851 | 18,723,861 | (51,370 | ) | 2,992,014 | |||
| Capital Share Transactions (Shares): | ||||||||
| Class M Shares | ||||||||
| Shares sold | 23,016,043 | 69,114,145 | 75,928 | 754,028 | ||||
| Shares issued for dividends reinvested | 438,441 | 5,299,084 | 14,727 | 29,331 | ||||
| Shares redeemed | (37,522,667 | ) | (62,578,705 | ) | (2,313,601 | ) | (7,218,048 | ) |
| Net Increase (Decrease) in Shares Outstanding | (14,068,183 | ) | 11,834,524 | (2,222,946 | ) | (6,434,689 | ) | |
| Investor Shares | ||||||||
| Shares sold | 537,812 | 2,148,836 | 50,011 | 101,517 | ||||
| Shares issued for dividends reinvested | 8,328 | 66,838 | 11,512 | 12,052 | ||||
| Shares redeemed | (821,639 | ) | (2,499,990 | ) | (64,608 | ) | (95,438 | ) |
| Net Increase (Decrease) in Shares Outstanding | (275,499 | ) | (284,316 | ) | (3,085 | ) | 18,131 | |
| See notes to financial statements. | ||||||||
112
| BNY Mellon | BNY Mellon | |||||||
| International Equity Income Fund | Asset Allocation Fund | |||||||
| Six Months Ended | Six Months Ended | |||||||
| February 28, 2013 | Year Ended | February 28, 2013 | Year Ended | |||||
| (Unaudited) | August 31, 2012a | (Unaudited) | August 31, 2012 | |||||
| Operations ($): | ||||||||
| Investment income—net | 1,342,662 | 3,015,416 | 4,386,533 | 6,046,631 | ||||
| Net realized gain (loss) on investments | (3,348,218 | ) | (1,753,710 | ) | 4,888,782 | 1,837,150 | ||
| Net unrealized appreciation (depreciation) on investments | 13,997,041 | (1,448,820 | ) | 16,841,489 | 13,518,865 | |||
| Net Increase (Decrease) in Net Assets | ||||||||
| Resulting from Operations | 11,991,485 | (187,114 | ) | 26,116,804 | 21,402,646 | |||
| Dividends to Shareholders from ($): | ||||||||
| Investment income—net: | ||||||||
| Class M Shares | (2,352,680 | ) | (1,534,538 | ) | (6,727,858 | ) | (7,223,957 | ) |
| Investor Shares | (303 | ) | (183 | ) | (83,473 | ) | (77,321 | ) |
| Net realized gain on investments: | ||||||||
| Class M Shares | — | — | (939,855 | ) | (1,683,683 | ) | ||
| Investor Shares | — | — | (11,962 | ) | (19,091 | ) | ||
| Total Dividends | (2,352,983 | ) | (1,534,721 | ) | (7,763,148 | ) | (9,004,052 | ) |
| Beneficial Interest Transactions ($): | ||||||||
| Net proceeds from shares sold: | ||||||||
| Class M Shares | 57,090,245 | 94,866,096 | 17,755,342 | 59,173,349 | ||||
| Investor Shares | 211,560 | 26,541 | 743,299 | 1,700,033 | ||||
| Dividends reinvested: | ||||||||
| Class M Shares | 601,672 | 319,558 | 1,214,670 | 1,782,388 | ||||
| Investor Shares | 96 | — | 86,414 | 85,945 | ||||
| Cost of shares redeemed: | ||||||||
| Class M Shares | (13,369,248 | ) | (12,431,214 | ) | (23,876,194 | ) | (45,887,130 | ) |
| Investor Shares | (203,919 | ) | (14,510 | ) | (995,786 | ) | (1,140,312 | ) |
| Increase (Decrease) in Net Assets from | ||||||||
| Beneficial Interest Transactions | 44,330,406 | 82,766,471 | (5,072,255 | ) | 15,714,273 | |||
| Total Increase (Decrease) in Net Assets | 53,968,908 | 81,044,636 | 13,281,401 | 28,112,867 | ||||
| Net Assets ($): | ||||||||
| Beginning of Period | 81,044,636 | — | 398,038,499 | 369,925,632 | ||||
| End of Period | 135,013,544 | 81,044,636 | 411,319,900 | 398,038,499 | ||||
| Undistributed (distributions in excess of) | ||||||||
| investment income—net | 309,816 | 1,320,137 | (795,597 | ) | 1,629,201 | |||
| Capital Share Transactions (Shares): | ||||||||
| Class M Shares | ||||||||
| Shares sold | 4,155,467 | 7,274,226 | 1,575,641 | 5,570,116 | ||||
| Shares issued for dividends reinvested | 45,087 | 27,863 | 108,735 | 173,015 | ||||
| Shares redeemed | (971,589 | ) | (1,003,389 | ) | (2,121,263 | ) | (4,314,255 | ) |
| Net Increase (Decrease) in Shares Outstanding | 3,228,965 | 6,298,700 | (436,887 | ) | 1,428,876 | |||
| Investor Shares | ||||||||
| Shares sold | 16,564 | 1,994 | 65,971 | 160,057 | ||||
| Shares issued for dividends reinvested | 7 | — | 7,686 | 8,184 | ||||
| Shares redeemed | (15,428 | ) | (1,194 | ) | (88,148 | ) | (105,598 | ) |
| Net Increase (Decrease) in Shares Outstanding | 1,143 | 800 | (14,491 | ) | 62,643 | |||
| a From December 15, 2011 (commencement of operations) to August 31, 2012. | ||||||||
| See notes to financial statements. | ||||||||
The Funds 113
FINANCIAL HIGHLIGHTS
The following tables describe the performance for each share class of each BNY Mellon equity fund for the fiscal periods indicated. All information (except portfolio turnover rate) reflects financial results for a single fund share.Total return shows how much your investment in each fund would have increased (or decreased) during each period, assuming you had reinvested all dividends and distributions.These figures have been derived from each fund’s financial statements.
| Class M Shares | ||||||||||||
| Six Months Ended | ||||||||||||
| February 28, 2013 | Year Ended August 31, | |||||||||||
| BNY Mellon Large Cap Stock Fund | (Unaudited) | 2012 | 2011 | 2010 | 2009 | 2008 | ||||||
| Per Share Data ($): | ||||||||||||
| Net asset value, beginning of period | 9.17 | 8.14 | 7.16 | 6.77 | 8.77 | 11.56 | ||||||
| Investment Operations: | ||||||||||||
| Investment income—neta | .06 | .08 | .09 | .06 | .09 | .11 | ||||||
| Net realized and unrealized | ||||||||||||
| gain (loss) on investments | .58 | 1.03 | .98 | .39 | (1.91 | ) | (1.05 | ) | ||||
| Total from Investment Operations | .64 | 1.11 | 1.07 | .45 | (1.82 | ) | (.94 | ) | ||||
| Distributions: | ||||||||||||
| Dividends from investment income—net | (.06 | ) | (.08 | ) | (.09 | ) | (.06 | ) | (.09 | ) | (.12 | ) |
| Dividends from net realized gain on investments | (.41 | ) | — | — | — | (.09 | ) | (1.73 | ) | |||
| Total Distributions | (.47 | ) | (.08 | ) | (.09 | ) | (.06 | ) | (.18 | ) | (1.85 | ) |
| Net asset value, end of period | 9.34 | 9.17 | 8.14 | 7.16 | 6.77 | 8.77 | ||||||
| Total Return (%) | 7.28 | b | 13.73 | 14.86 | 6.62 | (20.39 | ) | (9.95 | ) | |||
| Ratios/Supplemental Data (%): | ||||||||||||
| Ratio of total expenses to average net assets | .81 | c | .81 | .80 | .80 | .81 | .80 | |||||
| Ratio of net expenses to average net assets | .81 | c | .81 | .80 | .80 | .81 | .80 | |||||
| Ratio of net investment income | ||||||||||||
| to average net assets | 1.33 | c | .95 | .98 | .81 | 1.51 | 1.15 | |||||
| Portfolio Turnover Rate | 27.49 | b | 76.82 | 86.71 | 71.61 | 109.39 | 56.13 | |||||
| Net Assets, end of period ($ x 1,000) | 762,210 | 971,849 | 1,093,037 | 1,178,235 | 1,449,565 | 1,750,688 | ||||||
a Based on average shares outstanding at each month end.
b Not annualized.
c Annualized.
See notes to financial statements.
114
| Investor Shares | ||||||||||||
| Six Months Ended | ||||||||||||
| February 28, 2013 | Year Ended August 31, | |||||||||||
| BNY Mellon Large Cap Stock Fund | (Unaudited) | 2012 | 2011 | 2010 | 2009 | 2008 | ||||||
| Per Share Data ($): | ||||||||||||
| Net asset value, beginning of period | 9.17 | 8.15 | 7.16 | 6.78 | 8.78 | 11.58 | ||||||
| Investment Operations: | ||||||||||||
| Investment income—neta | .05 | .06 | .06 | .04 | .08 | .09 | ||||||
| Net realized and unrealized | ||||||||||||
| gain (loss) on investments | .59 | 1.02 | 1.00 | .38 | (1.91 | ) | (1.07 | ) | ||||
| Total from Investment Operations | .64 | 1.08 | 1.06 | .42 | (1.83 | ) | (.98 | ) | ||||
| Distributions: | ||||||||||||
| Dividends from investment income—net | (.05 | ) | (.06 | ) | (.07 | ) | (.04 | ) | (.08 | ) | (.09 | ) |
| Dividends from net realized gain on investments | (.41 | ) | — | — | — | (.09 | ) | (1.73 | ) | |||
| Total Distributions | (.46 | ) | (.06 | ) | (.07 | ) | (.04 | ) | (.17 | ) | (1.82 | ) |
| Net asset value, end of period | 9.35 | 9.17 | 8.15 | 7.16 | 6.78 | 8.78 | ||||||
| Total Return (%) | 7.26 | b | 13.33 | 14.78 | 6.21 | (20.56 | ) | (10.26 | ) | |||
| Ratios/Supplemental Data (%): | ||||||||||||
| Ratio of total expenses to average net assets | 1.06 | c | 1.06 | 1.05 | 1.05 | 1.06 | 1.05 | |||||
| Ratio of net expenses to average net assets | 1.06 | c | 1.06 | 1.05 | 1.05 | 1.06 | 1.05 | |||||
| Ratio of net investment income | ||||||||||||
| to average net assets | 1.12 | c | .71 | .68 | .56 | 1.25 | .89 | |||||
| Portfolio Turnover Rate | 27.49 | b | 76.82 | 86.71 | 71.61 | 109.39 | 56.13 | |||||
| Net Assets, end of period ($ x 1,000) | 12,316 | 12,344 | 12,986 | 7,473 | 8,274 | 9,829 | ||||||
a Based on average shares outstanding at each month end.
b Not annualized.
c Annualized.
See notes to financial statements.
The Funds 115
FINANCIAL HIGHLIGHTS (continued)
| Class M Shares | ||||||||
| Six Months Ended | ||||||||
| February 28, 2013 | Year Ended August 31, | |||||||
| BNY Mellon Large Cap Market Opportunities Fund | (Unaudited) | 2012 | 2011 | 2010 | a | |||
| Per Share Data ($): | ||||||||
| Net asset value, beginning of period | 12.16 | 11.00 | 9.48 | 10.00 | ||||
| Investment Operations: | ||||||||
| Investment income—netb | .06 | .06 | .02 | .00 | c | |||
| Net realized and unrealized | ||||||||
| gain (loss) on investments | .85 | 1.13 | 1.55 | (.52 | ) | |||
| Total from Investment Operations | .91 | 1.19 | 1.57 | (.52 | ) | |||
| Distributions: | ||||||||
| Dividends from investment income—net | (.08 | ) | (.03 | ) | (.02 | ) | — | |
| Dividends from net realized gain on investments | — | — | (.03 | ) | — | |||
| Total Distributions | (.08 | ) | (.03 | ) | (.05 | ) | — | |
| Net asset value, end of period | 12.99 | 12.16 | 11.00 | 9.48 | ||||
| Total Return (%) | 7.54 | d | 10.89 | 16.48 | (5.20 | )d | ||
| Ratios/Supplemental Data (%): | ||||||||
| Ratio of total expenses to average net assetse | .80 | f | .78 | .94 | 15.54 | f | ||
| Ratio of net expenses to average net assetse | .80 | f | .78 | .75 | .98 | f | ||
| Ratio of net investment income to average net assetse | .92 | f | .55 | .21 | .48 | f | ||
| Portfolio Turnover Rate | 11.94 | d | 43.61 | 22.06 | 2.12 | d | ||
| Net Assets, end of period ($ x 1,000) | 182,561 | 152,458 | 117,994 | 5,074 | ||||
a From July 30, 2010 (commencement of operations) to August 31, 2010.
b Based on average shares outstanding at each month end.
c Amount represents less than $.01 per share.
d Not annualized.
e Amount does not include the activity of the underlying funds.
f Annualized.
See notes to financial statements.
116
| Investor Shares | |||||||
| Six Months Ended | |||||||
| February 28, 2013 | Year Ended August 31, | ||||||
| BNY Mellon Large Cap Market Opportunities Fund | (Unaudited) | 2012 | 2011 | 2010 | a | ||
| Per Share Data ($): | |||||||
| Net asset value, beginning of period | 12.25 | 10.98 | 9.48 | 10.00 | |||
| Investment Operations: | |||||||
| Investment income—netb | .04 | .13 | .00 | c | .00 | c | |
| Net realized and unrealized | |||||||
| gain (loss) on investments | .87 | 1.14 | 1.54 | (.52 | ) | ||
| Total from Investment Operations | .91 | 1.27 | 1.54 | (.52 | ) | ||
| Distributions: | |||||||
| Dividends from investment income—net | (.08 | ) | — | (.01 | ) | — | |
| Dividends from net realized gain on investments | — | — | (.03 | ) | — | ||
| Total Distributions | (.08 | ) | — | (.04 | ) | — | |
| Net asset value, end of period | 13.08 | 12.25 | 10.98 | 9.48 | |||
| Total Return (%) | 7.44 | d | 11.57 | 16.16 | (5.20 | )d | |
| Ratios/Supplemental Data (%): | |||||||
| Ratio of total expenses to average net assetse | 1.05 | f | 1.02 | 1.24 | 9.38 | f | |
| Ratio of net expenses to average net assetse | 1.05 | f | 1.02 | 1.00 | 1.23 | f | |
| Ratio of net investment income to average net assetse | .67 | f | .95 | .03 | .16 | f | |
| Portfolio Turnover Rate | 11.94 | d | 43.61 | 22.06 | 2.12 | d | |
| Net Assets, end of period ($ x 1,000) | 30 | 28 | 11 | 9 | |||
a From July 30, 2010 (commencement of operations) to August 31, 2010.
b Based on average shares outstanding at each month end.
c Amount represents less than $.01 per share.
d Not annualized.
e Amount does not include the activity of the underlying funds.
f Annualized.
See notes to financial statements.
The Funds 117
FINANCIAL HIGHLIGHTS (continued)
| Class M Shares | ||||||||
| Six Months Ended | ||||||||
| February 28, 2013 | Year Ended August 31, | |||||||
| BNY Mellon Tax-Sensitive Large Cap Multi-Strategy Fund | (Unaudited) | 2012 | 2011 | 2010 | a | |||
| Per Share Data ($): | ||||||||
| Net asset value, beginning of period | 12.50 | 11.14 | 9.52 | 10.00 | ||||
| Investment Operations: | ||||||||
| Investment income—netb | .06 | .09 | .06 | .01 | ||||
| Net realized and unrealized | ||||||||
| gain (loss) on investments | .86 | 1.32 | 1.61 | (.49 | ) | |||
| Total from Investment Operations | .92 | 1.41 | 1.67 | (.48 | ) | |||
| Distributions: | ||||||||
| Dividends from investment income—net | (.11 | ) | (.05 | ) | (.02 | ) | — | |
| Dividends from net realized gain on investments | �� | — | (.03 | ) | — | |||
| Total Distributions | (.11 | ) | (.05 | ) | (.05 | ) | — | |
| Net asset value, end of period | 13.31 | 12.50 | 11.14 | 9.52 | ||||
| Total Return (%) | 7.40 | c | 12.75 | 17.54 | (4.80 | )c | ||
| Ratios/Supplemental Data (%): | ||||||||
| Ratio of total expenses to average net assetsd | .87 | e | .87 | 1.28 | 8.12 | e | ||
| Ratio of net expenses to average net assetsd | .87 | e | .87 | .88 | .99 | e | ||
| Ratio of net investment income to average net assetsd | 1.20 | e | .78 | .51 | .91 | e | ||
| Portfolio Turnover Rate | 15.89 | c | 32.62 | 29.24 | 1.53 | c | ||
| Net Assets, end of period ($ x 1,000) | 598,495 | 123,250 | 75,326 | 10,337 | ||||
a From July 30, 2010 (commencement of operations) to August 31, 2010.
b Based on average shares outstanding at each month end.
c Not annualized.
d Amount does not include the activity of the underlying funds.
e Annualized.
See notes to financial statements.
118
| Investor Shares | |||||||
| Six Months Ended | |||||||
| February 28, 2013 | Year Ended August 31, | ||||||
| BNY Mellon Tax-Sensitive Large Cap Multi-Strategy Fund | (Unaudited) | 2012 | 2011 | 2010 | a | ||
| Per Share Data ($): | |||||||
| Net asset value, beginning of period | 12.41 | 11.04 | 9.52 | 10.00 | |||
| Investment Operations: | |||||||
| Investment income—netb | .15 | .06 | .03 | .01 | |||
| Net realized and unrealized | |||||||
| gain (loss) on investments | .94 | 1.31 | 1.54 | (.49 | ) | ||
| Total from Investment Operations | 1.09 | 1.37 | 1.57 | (.48 | ) | ||
| Distributions: | |||||||
| Dividends from investment income—net | — | — | (.02 | ) | — | ||
| Dividends from net realized gain on investments | — | — | (.03 | ) | — | ||
| Total Distributions | — | — | (.05 | ) | — | ||
| Net asset value, end of period | 13.50 | 12.41 | 11.04 | 9.52 | |||
| Total Return (%) | 8.78 | c | 12.51 | 16.31 | (4.80 | )c | |
| Ratios/Supplemental Data (%): | |||||||
| Ratio of total expenses to average net assetsd | 1.06 | e | 1.11 | 1.77 | 5.88 | e | |
| Ratio of net expenses to average net assetsd | 1.00 | e | 1.11 | 1.13 | 1.24 | e | |
| Ratio of net investment income to average net assetsd | 1.87 | e | .46 | .26 | .65 | e | |
| Portfolio Turnover Rate | 15.89 | c | 32.62 | 29.24 | 1.53 | c | |
| Net Assets, end of period ($ x 1,000) | 14 | 12 | 11 | 10 | |||
a From July 30, 2010 (commencement of operations) to August 31, 2010.
b Based on average shares outstanding at each month end.
c Not annualized.
d Amount does not include the activity of the underlying funds.
e Annualized.
See notes to financial statements.
The Funds 119
FINANCIAL HIGHLIGHTS (continued)
| Class M Shares | ||||||||||||
| Six Months Ended | ||||||||||||
| February 28, 2013 | Year Ended August 31, | |||||||||||
| BNY Mellon Income Stock Fund | (Unaudited) | 2012 | 2011 | 2010 | 2009 | 2008 | ||||||
| Per Share Data ($): | ||||||||||||
| Net asset value, beginning of period | 6.99 | 6.28 | 5.49 | 5.39 | 7.22 | 10.61 | ||||||
| Investment Operations: | ||||||||||||
| Investment income—neta | .15 | .21 | .17 | .09 | .12 | .16 | ||||||
| Net realized and unrealized | ||||||||||||
| gain (loss) on investments | .71 | .70 | .79 | .10 | (1.35 | ) | (1.35 | ) | ||||
| Total from Investment Operations | .86 | .91 | .96 | .19 | (1.23 | ) | (1.19 | ) | ||||
| Distributions: | ||||||||||||
| Dividends from investment income—net | (.15 | ) | (.20 | ) | (.17 | ) | (.09 | ) | (.13 | ) | (.16 | ) |
| Dividends from net realized gain on investments | (.01 | ) | — | — | — | (.47 | ) | (2.04 | ) | |||
| Total Distributions | (.16 | ) | (.20 | ) | (.17 | ) | (.09 | ) | (.60 | ) | (2.20 | ) |
| Net asset value, end of period | 7.69 | 6.99 | 6.28 | 5.49 | 5.39 | 7.22 | ||||||
| Total Return (%) | 12.33 | b | 14.80 | 17.41 | 3.44 | (15.73 | ) | (13.79 | ) | |||
| Ratios/Supplemental Data (%): | ||||||||||||
| Ratio of total expenses to average net assets | .82 | c | .82 | .86 | .86 | .87 | .84 | |||||
| Ratio of net expenses to average net assets | .82 | c | .82 | .86 | .86 | .87 | .84 | |||||
| Ratio of net investment income | ||||||||||||
| to average net assets | 4.03 | c | 3.17 | 2.71 | 1.55 | 2.47 | 1.87 | |||||
| Portfolio Turnover Rate | 18.13 | b | 35.60 | 72.27 | 66.78 | 65.88 | 33.02 | |||||
| Net Assets, end of period ($ x 1,000) | 677,425 | 541,604 | 204,785 | 90,645 | 126,763 | 199,367 | ||||||
a Based on average shares outstanding at each month end.
b Not annualized.
c Annualized.
See notes to financial statements.
120
| Investor Shares | ||||||||||||
| Six Months Ended | ||||||||||||
| February 28, 2013 | Year Ended August 31, | |||||||||||
| BNY Mellon Income Stock Fund | (Unaudited) | 2012 | 2011 | 2010 | 2009 | 2008 | ||||||
| Per Share Data ($): | ||||||||||||
| Net asset value, beginning of period | 7.04 | 6.33 | 5.54 | 5.44 | 7.27 | 10.67 | ||||||
| Investment Operations: | ||||||||||||
| Investment income—neta | .14 | .19 | .15 | .08 | .11 | .14 | ||||||
| Net realized and unrealized | ||||||||||||
| gain (loss) on investments | .72 | .71 | .80 | .10 | (1.35 | ) | (1.36 | ) | ||||
| Total from Investment Operations | .86 | .90 | .95 | .18 | (1.24 | ) | (1.22 | ) | ||||
| Distributions: | ||||||||||||
| Dividends from investment income—net | (.14 | ) | (.19 | ) | (.16 | ) | (.08 | ) | (.12 | ) | (.14 | ) |
| Dividends from net realized gain on investments | (.01 | ) | — | — | — | (.47 | ) | (2.04 | ) | |||
| Total Distributions | (.15 | ) | (.19 | ) | (.16 | ) | (.08 | ) | (.59 | ) | (2.18 | ) |
| Net asset value, end of period | 7.75 | 7.04 | 6.33 | 5.54 | 5.44 | 7.27 | ||||||
| Total Return (%) | 12.25 | b | 14.45 | 17.02 | 3.19 | (15.84 | ) | (14.03 | ) | |||
| Ratios/Supplemental Data (%): | ||||||||||||
| Ratio of total expenses to average net assets | 1.06 | c | 1.06 | 1.12 | 1.11 | 1.12 | 1.09 | |||||
| Ratio of net expenses to average net assets | 1.06 | c | 1.06 | 1.12 | 1.11 | 1.12 | 1.09 | |||||
| Ratio of net investment income | ||||||||||||
| to average net assets | 3.80 | c | 2.91 | 2.32 | 1.29 | 2.19 | 1.62 | |||||
| Portfolio Turnover Rate | 18.13 | b | 35.60 | 72.27 | 66.78 | 65.88 | 33.02 | |||||
| Net Assets, end of period ($ x 1,000) | 1,559 | 1,235 | 1,056 | 988 | 1,045 | 1,407 | ||||||
a Based on average shares outstanding at each month end.
b Not annualized.
c Annualized.
See notes to financial statements.
The Funds 121
FINANCIAL HIGHLIGHTS (continued)
| Class M Shares | ||||||||||||
| Six Months Ended | ||||||||||||
| February 28, 2013 | Year Ended August 31, | |||||||||||
| BNY Mellon Mid Cap Multi-Strategy Fund | (Unaudited) | 2012 | 2011 | 2010 | 2009 | 2008 | ||||||
| Per Share Data ($): | ||||||||||||
| Net asset value, beginning of period | 11.65 | 11.41 | 9.31 | 8.64 | 11.11 | 14.19 | ||||||
| Investment Operations: | ||||||||||||
| Investment income (loss)—neta | .05 | .01 | (.00 | )b | .05 | .07 | .03 | |||||
| Net realized and unrealized | ||||||||||||
| gain (loss) on investments | 1.40 | .60 | 2.10 | .68 | (2.46 | ) | (.53 | ) | ||||
| Total from Investment Operations | 1.45 | .61 | 2.10 | .73 | (2.39 | ) | (.50 | ) | ||||
| Distributions: | ||||||||||||
| Dividends from investment income—net | (.03 | ) | (.04 | ) | (.00 | )b | (.06 | ) | (.06 | ) | (.04 | ) |
| Dividends from net realized gain on investments | (.96 | ) | (.33 | ) | — | — | (.02 | ) | (2.54 | ) | ||
| Total Distributions | (.99 | ) | (.37 | ) | (.00 | )b | (.06 | ) | (.08 | ) | (2.58 | ) |
| Net asset value, end of period | 12.11 | 11.65 | 11.41 | 9.31 | 8.64 | 11.11 | ||||||
| Total Return (%) | 13.33 | c | 5.66 | 22.59 | 8.49 | (21.33 | ) | (5.67 | ) | |||
| Ratios/Supplemental Data (%): | ||||||||||||
| Ratio of total expenses to average net assets | .93 | d | .90 | .90 | .90 | .92 | .90 | |||||
| Ratio of net expenses to average net assets | .93 | d | .90 | .90 | .90 | .92 | .90 | |||||
| Ratio of net investment income | ||||||||||||
| (loss) to average net assets | .88 | d | .09 | (.01 | ) | .53 | .86 | .28 | ||||
| Portfolio Turnover Rate | 65.12 | c | 156.98 | 132.20 | 123.41 | 147.50 | 121.12 | |||||
| Net Assets, end of period ($ x 1,000) | 1,355,582 | 1,188,324 | 1,280,742 | 1,162,906 | 1,185,376 | 1,540,821 | ||||||
a Based on average shares outstanding at each month end.
b Amount represents less than $.01 per share.
c Not Annualized.
d Annualized.
See notes to financial statements.
122
| Investor Shares | ||||||||||||
| Six Months Ended | ||||||||||||
| February 28, 2013 | Year Ended August 31, | |||||||||||
| BNY Mellon Mid Cap Multi-Strategy Fund | (Unaudited) | 2012 | 2011 | 2010 | 2009 | 2008 | ||||||
| Per Share Data ($): | ||||||||||||
| Net asset value, beginning of period | 11.52 | 11.29 | 9.24 | 8.57 | 11.00 | 14.07 | ||||||
| Investment Operations: | ||||||||||||
| Investment income (loss)—neta | .04 | (.02 | ) | (.03 | ) | .03 | .05 | .00 | b | |||
| Net realized and unrealized | ||||||||||||
| gain (loss) on investments | 1.38 | .60 | 2.08 | .68 | (2.43 | ) | (.53 | ) | ||||
| Total from Investment Operations | 1.42 | .58 | 2.05 | .71 | (2.38 | ) | (.53 | ) | ||||
| Distributions: | ||||||||||||
| Dividends from investment income—net | — | (.02 | ) | — | (.04 | ) | (.03 | ) | — | |||
| Dividends from net realized gain on investments | (.96 | ) | (.33 | ) | — | — | (.02 | ) | (2.54 | ) | ||
| Total Distributions | (.96 | ) | (.35 | ) | — | (.04 | ) | (.05 | ) | (2.54 | ) | |
| Net asset value, end of period | 11.98 | 11.52 | 11.29 | 9.24 | 8.57 | 11.00 | ||||||
| Total Return (%) | 13.21 | c | 5.36 | 22.19 | 8.30 | (21.51 | ) | (5.94 | ) | |||
| Ratios/Supplemental Data (%): | ||||||||||||
| Ratio of total expenses to average net assets | 1.18 | d | 1.15 | 1.15 | 1.15 | 1.17 | 1.15 | |||||
| Ratio of net expenses to average net assets | 1.18 | d | 1.15 | 1.15 | 1.15 | 1.17 | 1.15 | |||||
| Ratio of net investment income | ||||||||||||
| (loss) to average net assets | .64 | d | (.16 | ) | (.26 | ) | .27 | .63 | .03 | |||
| Portfolio Turnover Rate | 65.12 | c | 156.98 | 132.20 | 123.41 | 147.50 | 121.12 | |||||
| Net Assets, end of period ($ x 1,000) | 24,972 | 25,283 | 28,098 | 20,733 | 19,785 | 28,520 | ||||||
a Based on average shares outstanding at each month end.
b Amount represents less than $.01 per share.
c Not Annualized.
d Annualized.
See notes to financial statements.
The Funds 123
FINANCIAL HIGHLIGHTS (continued)
| Class M Shares | ||||||||||||
| Six Months Ended | ||||||||||||
| February 28, 2013 | Year Ended August 31, | |||||||||||
| BNY Mellon Small Cap Multi-Strategy Fund | (Unaudited) | 2012 | 2011 | 2010 | 2009 | 2008 | ||||||
| Per Share Data ($): | ||||||||||||
| Net asset value, beginning of period | 11.53 | 10.78 | 8.94 | 8.57 | 11.44 | 14.82 | ||||||
| Investment Operations: | ||||||||||||
| Investment income (loss)—neta | .02 | (.00 | )b | (.02 | ) | .00 | b | .07 | .03 | |||
| Net realized and unrealized | ||||||||||||
| gain (loss) on investments | 1.36 | 1.05 | 1.86 | .38 | (2.85 | ) | (1.15 | ) | ||||
| Total from Investment Operations | 1.38 | 1.05 | 1.84 | .38 | (2.78 | ) | (1.12 | ) | ||||
| Distributions: | ||||||||||||
| Dividends from investment income—net | (.03 | ) | (.30 | ) | — | (.01 | ) | (.08 | ) | — | ||
| Dividends from net realized gain on investments | — | — | — | — | (.01 | ) | (2.26 | ) | ||||
| Total Distributions | (.03 | ) | (.30 | ) | — | (.01 | ) | (.09 | ) | (2.26 | ) | |
| Net asset value, end of period | 12.88 | 11.53 | 10.78 | 8.94 | 8.57 | 11.44 | ||||||
| Total Return (%) | 11.99 | c | 10.05 | 20.58 | 4.45 | (24.11 | ) | (9.07 | ) | |||
| Ratios/Supplemental Data (%): | ||||||||||||
| Ratio of total expenses to average net assets | 1.06 | d | 1.04 | 1.01 | 1.00 | 1.03 | 1.01 | |||||
| Ratio of net expenses to average net assets | 1.06 | d | 1.04 | 1.01 | .98 | .99 | 1.01 | |||||
| Ratio of net investment income | ||||||||||||
| (loss) to average net assets | .35 | d | (.01 | ) | (.16 | ) | .01 | .88 | .28 | |||
| Portfolio Turnover Rate | 88.58 | c | 148.75 | 161.05 | 183.41 | 159.78 | 132.19 | |||||
| Net Assets, end of period ($ x 1,000) | 258,778 | 232,952 | 351,122 | 412,824 | 610,567 | 633,118 | ||||||
a Based on average shares outstanding at each month end.
b Amount represents less than $.01 per share.
c Not annualized.
d Annualized.
See notes to financial statements.
124
| Investor Shares | ||||||||||||
| Six Months Ended | ||||||||||||
| February 28, 2013 | Year Ended August 31, | |||||||||||
| BNY Mellon Small Cap Multi-Strategy Fund | (Unaudited) | 2012 | 2011 | 2010 | 2009 | 2008 | ||||||
| Per Share Data ($): | ||||||||||||
| Net asset value, beginning of period | 11.21 | 10.49 | 8.72 | 8.36 | 11.11 | 14.50 | ||||||
| Investment Operations: | ||||||||||||
| Investment income (loss)—neta | .01 | (.03 | ) | (.04 | ) | (.02 | ) | .05 | .00 | b | ||
| Net realized and unrealized | ||||||||||||
| gain (loss) on investments | 1.31 | 1.03 | 1.81 | .38 | (2.72 | ) | (1.13 | ) | ||||
| Total from Investment Operations | 1.32 | 1.00 | 1.77 | .36 | (2.67 | ) | (1.13 | ) | ||||
| Distributions: | ||||||||||||
| Dividends from investment income—net | — | (.28 | ) | — | — | (.07 | ) | — | ||||
| Dividends from net realized gain on investments | — | — | — | — | (.01 | ) | (2.26 | ) | ||||
| Total Distributions | — | (.28 | ) | — | — | (.08 | ) | (2.26 | ) | |||
| Net asset value, end of period | 12.53 | 11.21 | 10.49 | 8.72 | 8.36 | 11.11 | ||||||
| Total Return (%) | 11.78 | c | 9.76 | 20.30 | 4.31 | (23.92 | ) | (9.36 | ) | |||
| Ratios/Supplemental Data (%): | ||||||||||||
| Ratio of total expenses to average net assets | 1.30 | d | 1.29 | 1.26 | 1.25 | 1.28 | 1.26 | |||||
| Ratio of net expenses to average net assets | 1.30 | d | 1.29 | 1.26 | 1.23 | 1.23 | 1.26 | |||||
| Ratio of net investment income | ||||||||||||
| (loss) to average net assets | .10 | d | (.26 | ) | (.39 | ) | (.24 | ) | .61 | .02 | ||
| Portfolio Turnover Rate | 88.58 | c | 148.75 | 161.05 | 183.41 | 159.78 | 132.19 | |||||
| Net Assets, end of period ($ x 1,000) | 6,693 | 6,397 | 7,815 | 6,022 | 6,277 | 3,795 | ||||||
a Based on average shares outstanding at each month end.
b Amount represents less than $.01 per share.
c Not annualized.
d Annualized.
See notes to financial statements.
The Funds 125
FINANCIAL HIGHLIGHTS (continued)
| Class M Shares | ||||||||||||
| Six Months Ended | ||||||||||||
| February 28, 2013 | Year Ended August 31, | |||||||||||
| BNY Mellon U.S. Core Equity 130/30 Fund | (Unaudited) | 2012 | 2011 | 2010 | 2009 | 2008 | ||||||
| Per Share Data ($): | ||||||||||||
| Net asset value, beginning of period | 12.26 | 10.83 | 9.81 | 9.07 | 11.39 | 12.64 | ||||||
| Investment Operations: | ||||||||||||
| Investment income—neta | .03 | .05 | .06 | .03 | .07 | .07 | ||||||
| Net realized and unrealized | ||||||||||||
| gain (loss) on investments | .51 | 1.44 | 1.01 | .74 | (2.28 | ) | (1.32 | ) | ||||
| Total from Investment Operations | .54 | 1.49 | 1.07 | .77 | (2.21 | ) | (1.25 | ) | ||||
| Distributions: | ||||||||||||
| Dividends from investment income—net | (.04 | ) | (.06 | ) | (.05 | ) | (.03 | ) | (.11 | ) | — | |
| Net asset value, end of period | 12.76 | 12.26 | 10.83 | 9.81 | 9.07 | 11.39 | ||||||
| Total Return (%) | 4.58 | b | 13.86 | 10.86 | 8.53 | (19.19 | ) | (9.89 | ) | |||
| Ratios/Supplemental Data (%): | ||||||||||||
| Ratio of total expenses to average net assets | 2.04 | c | 1.79 | 1.69 | 1.79 | 2.02 | 2.39 | d | ||||
| Ratio of net expenses to average net assets | 2.04 | c | 1.79 | 1.69 | 1.79 | 2.02 | 2.28 | d | ||||
| Ratio of net investment income | ||||||||||||
| to average net assets | .46 | c | .42 | .55 | .26 | .87 | .58 | |||||
| Portfolio Turnover Rate | 49.89 | b | 128.54 | 144.04 | 117.53 | 138.97 | 163.66 | |||||
| Net Assets, end of period ($ x 1,000) | 203,781 | 276,640 | 327,778 | 186,137 | 80,952 | 180,803 | ||||||
a Based on average shares outstanding at each month end.
b Not annualized.
c Annualized.
d Higher costs are due to borrowing costs associated with the 130/30 fund structure.
See notes to financial statements.
126
| Investor Shares | ||||||||||||
| Six Months Ended | ||||||||||||
| February 28, 2013 | Year Ended August 31, | |||||||||||
| BNY Mellon U.S. Core Equity 130/30 Fund | (Unaudited) | 2012 | 2011 | 2010 | 2009 | 2008 | ||||||
| Per Share Data ($): | ||||||||||||
| Net asset value, beginning of period | 12.22 | 10.73 | 9.76 | 9.02 | 11.36 | 12.63 | ||||||
| Investment Operations: | ||||||||||||
| Investment income (loss)—neta | .03 | (.03 | ) | .02 | (.01 | ) | .04 | .02 | ||||
| Net realized and unrealized | ||||||||||||
| gain (loss) on investments | .53 | 1.52 | .99 | .75 | (2.27 | ) | (1.29 | ) | ||||
| Total from Investment Operations | .56 | 1.49 | 1.01 | .74 | (2.23 | ) | (1.27 | ) | ||||
| Distributions: | ||||||||||||
| Dividends from investment income—net | (.06 | ) | (.00 | )b | (.04 | ) | — | (.11 | ) | — | ||
| Net asset value, end of period | 12.72 | 12.22 | 10.73 | 9.76 | 9.02 | 11.36 | ||||||
| Total Return (%) | 4.45 | c | 13.93 | 10.34 | 8.20 | (19.47 | ) | (10.06 | ) | |||
| Ratios/Supplemental Data (%): | ||||||||||||
| Ratio of total expenses to average net assets | 2.29 | d | 1.81 | 1.97 | 2.09 | 2.25 | 2.81 | e | ||||
| Ratio of net expenses to average net assets | 2.29 | d | 1.81 | 1.97 | 2.09 | 2.25 | 2.71 | e | ||||
| Ratio of net investment income | ||||||||||||
| (loss) to average net assets | .44 | d | (.32 | ) | .20 | (.08 | ) | .56 | .16 | |||
| Portfolio Turnover Rate | 49.89 | c | 128.54 | 144.04 | 117.53 | 138.97 | 163.66 | |||||
| Net Assets, end of period ($ x 1,000) | 240 | 117 | 190 | 8 | 14 | 13 | ||||||
a Based on average shares outstanding at each month end.
b Amount represents less than $.01 per share.
c Not annualized.
d Annualized.
e Higher costs are due to borrowing costs associated with the 130/30 fund structure.
See notes to financial statements.
The Funds 127
FINANCIAL HIGHLIGHTS (continued)
| Class M Shares | ||||||||
| Six Months Ended | ||||||||
| February 28, 2013 | Year Ended August 31, | |||||||
| BNY Mellon Focused Equity Opportunities Fund | (Unaudited) | 2012 | 2011 | 2010 | a | |||
| Per Share Data ($): | ||||||||
| Net asset value, beginning of period | 13.08 | 12.04 | 10.09 | 10.00 | ||||
| Investment Operations: | ||||||||
| Investment income—netb | .09 | .08 | .04 | .06 | ||||
| Net realized and unrealized | ||||||||
| gain (loss) on investments | .78 | 1.01 | 1.96 | .04 | ||||
| Total from Investment Operations | .87 | 1.09 | 2.00 | .10 | ||||
| Distributions: | ||||||||
| Dividends from investment income—net | (.12 | ) | (.02 | ) | (.05 | ) | (.01 | ) |
| Dividends from net realized gain on investments | — | (.03 | ) | — | (.00 | )c | ||
| Total Distributions | (.12 | ) | (.05 | ) | (.05 | ) | (.01 | ) |
| Net asset value, end of period | 13.83 | 13.08 | 12.04 | 10.09 | ||||
| Total Return (%) | 6.67 | d | 9.07 | 19.82 | 1.01 | d | ||
| Ratios/Supplemental Data (%): | ||||||||
| Ratio of total expenses to average net assets | .86 | e | .87 | .87 | .98 | e | ||
| Ratio of net expenses to average net assets | .86 | e | .87 | .87 | .89 | e | ||
| Ratio of net investment income to average net assets | 1.31 | e | .62 | .29 | .59 | e | ||
| Portfolio Turnover Rate | 37.33 | d | 59.71 | 58.98 | 64.75 | d | ||
| Net Assets, end of period ($ x 1,000) | 445,407 | 467,903 | 425,016 | 238,332 | ||||
a From September 30, 2009 (commencement of operations) to August 31, 2010.
b Based on average shares outstanding at each month end.
c Amount represents less than $.01 per share.
d Not annualized.
e Annualized.
See notes to financial statements.
128
| Investor Shares | ||||||||
| Six Months Ended | ||||||||
| February 28, 2013 | Year Ended August 31, | |||||||
| BNY Mellon Focused Equity Opportunities Fund | (Unaudited) | 2012 | 2011 | 2010 | a | |||
| Per Share Data ($): | ||||||||
| Net asset value, beginning of period | 13.05 | 12.04 | 10.07 | 10.00 | ||||
| Investment Operations: | ||||||||
| Investment income—netb | .09 | .06 | .00 | c | .02 | |||
| Net realized and unrealized | ||||||||
| gain (loss) on investments | .75 | .99 | 1.99 | .06 | ||||
| Total from Investment Operations | .84 | 1.05 | 1.99 | .08 | ||||
| Distributions: | ||||||||
| Dividends from investment income—net | (.09 | ) | (.01 | ) | (.02 | ) | (.01 | ) |
| Dividends from net realized gain on investments | — | (.03 | ) | — | (.00 | )c | ||
| Total Distributions | (.09 | ) | (.04 | ) | (.02 | ) | (.01 | ) |
| Net asset value, end of period | 13.80 | 13.05 | 12.04 | 10.07 | ||||
| Total Return (%) | 6.47 | d | 8.73 | 19.80 | .75 | d | ||
| Ratios/Supplemental Data (%): | ||||||||
| Ratio of total expenses to average net assets | 1.12 | e | 1.13 | 1.12 | 1.53 | e | ||
| Ratio of net expenses to average net assets | 1.12 | e | 1.13 | 1.12 | 1.14 | e | ||
| Ratio of net investment income to average net assets | 1.26 | e | .52 | .00 | f | .23 | e | |
| Portfolio Turnover Rate | 37.33 | d | 59.71 | 58.98 | 64.75 | d | ||
| Net Assets, end of period ($ x 1,000) | 273 | 203 | 26 | 13 | ||||
a From September 30, 2009 (commencement of operations) to August 31, 2010.
b Based on average shares outstanding at each month end.
c Amount represents less than $.01 per share.
d Not annualized.
e Annualized.
f Amount represents less than .01%.
See notes to financial statements.
The Funds 129
FINANCIAL HIGHLIGHTS (continued)
| Class M Shares | ||||||||
| Six Months Ended | ||||||||
| February 28, 2013 | Year Ended August 31, | |||||||
| BNY Mellon Small/Mid Cap Fund | (Unaudited) | 2012 | 2011 | 2010 | a | |||
| Per Share Data ($): | ||||||||
| Net asset value, beginning of period | 12.99 | 13.14 | 10.92 | 10.00 | ||||
| Investment Operations: | ||||||||
| Investment income—netb | .08 | .05 | .04 | .01 | ||||
| Net realized and unrealized | ||||||||
| gain (loss) on investments | 1.06 | (.02 | ) | 2.31 | .95 | |||
| Total from Investment Operations | 1.14 | .03 | 2.35 | .96 | ||||
| Distributions: | ||||||||
| Dividends from investment income—net | (.21 | ) | (.18 | ) | (.04 | ) | (.01 | ) |
| Dividends from net realized gain on investments | — | — | (.09 | ) | (.03 | ) | ||
| Total Distributions | (.21 | ) | (.18 | ) | (.13 | ) | (.04 | ) |
| Net asset value, end of period | 13.92 | 12.99 | 13.14 | 10.92 | ||||
| Total Return (%) | 8.92 | c | .34 | 21.41 | 9.65 | c | ||
| Ratios/Supplemental Data (%): | ||||||||
| Ratio of total expenses to average net assets | .93 | d | .92 | .92 | 1.07 | d | ||
| Ratio of net expenses to average net assets | .93 | d | .92 | .92 | .92 | d | ||
| Ratio of net investment income to average net assets | 1.16 | d | .38 | .29 | .06 | d | ||
| Portfolio Turnover Rate | 118.79 | c | 149.30 | 107.81 | 109.25 | c | ||
| Net Assets, end of period ($ x 1,000) | 469,620 | 526,484 | 510,512 | 222,034 | ||||
a From September 30, 2009 (commencement of operations) to August 31, 2010.
b Based on average shares outstanding at each month end.
c Not annualized.
d Annualized.
See notes to financial statements.
130
| Investor Shares | ||||||||
| Six Months Ended | ||||||||
| February 28, 2013 | Year Ended August 31, | |||||||
| BNY Mellon Small/Mid Cap Fund | (Unaudited) | 2012 | 2011 | 2010 | a | |||
| Per Share Data ($): | ||||||||
| Net asset value, beginning of period | 12.94 | 13.11 | 10.89 | 10.00 | ||||
| Investment Operations: | ||||||||
| Investment income—net b | .06 | .00 | c | .01 | .01 | |||
| Net realized and unrealized | ||||||||
| gain (loss) on investments | 1.06 | (.01 | ) | 2.30 | .92 | |||
| Total from Investment Operations | 1.12 | (.01 | ) | 2.31 | .93 | |||
| Distributions: | ||||||||
| Dividends from investment income—net | (.18 | ) | (.16 | ) | — | (.01 | ) | |
| Dividends from net realized gain on investments | — | — | (.09 | ) | (.03 | ) | ||
| Total Distributions | (.18 | ) | (.16 | ) | (.09 | ) | (.04 | ) |
| Net asset value, end of period | 13.88 | 12.94 | 13.11 | 10.89 | ||||
| Total Return (%) | 8.72 | d | .08 | 21.14 | 9.34 | d | ||
| Ratios/Supplemental Data (%): | ||||||||
| Ratio of total expenses to average net assets | 1.17 | e | 1.17 | 1.20 | 2.35 | e | ||
| Ratio of net expenses to average net assets | 1.17 | e | 1.17 | 1.20 | 1.20 | e | ||
| Ratio of net investment income to average net assets | .92 | e | .04 | .06 | .08 | e | ||
| Portfolio Turnover Rate | 118.79 | d | 149.30 | 107.81 | 109.25 | d | ||
| Net Assets, end of period ($ x 1,000) | 661 | 957 | 507 | 16 | ||||
a From September 30, 2009 (commencement of operations) to August 31, 2010.
b Based on average shares outstanding at each month end.
c Amount represents less than $.01 per share.
d Not annualized.
e Annualized.
See notes to financial statements.
The Funds 131
FINANCIAL HIGHLIGHTS (continued)
| Class M Shares | ||||||||||||
| Six Months Ended | ||||||||||||
| February 28, 2013 | Year Ended August 31, | |||||||||||
| BNY Mellon International Fund | (Unaudited) | 2012 | 2011 | 2010 | 2009 | 2008 | ||||||
| Per Share Data ($): | ||||||||||||
| Net asset value, beginning of period | 9.29 | 9.94 | 9.38 | 10.12 | 12.11 | 17.56 | ||||||
| Investment Operations: | ||||||||||||
| Investment income—neta | .04 | .22 | .22 | .18 | .22 | .33 | ||||||
| Net realized and unrealized | ||||||||||||
| gain (loss) on investments | 1.37 | (.54 | ) | .55 | (.67 | ) | (1.54 | ) | (3.14 | ) | ||
| Total from Investment Operations | 1.41 | (.32 | ) | .77 | (.49 | ) | (1.32 | ) | (2.81 | ) | ||
| Distributions: | ||||||||||||
| Dividends from investment income—net | (.32 | ) | (.33 | ) | (.21 | ) | (.25 | ) | (.41 | ) | (.29 | ) |
| Dividends from net realized gain on investments | — | — | — | — | (.26 | ) | (2.35 | ) | ||||
| Total Distributions | (.32 | ) | (.33 | ) | (.21 | ) | (.25 | ) | (.67 | ) | (2.64 | ) |
| Net asset value, end of period | 10.38 | 9.29 | 9.94 | 9.38 | 10.12 | 12.11 | ||||||
| Total Return (%) | 15.30 | b | (2.98 | ) | 8.05 | (5.07 | ) | (9.95 | ) | (18.61 | ) | |
| Ratios/Supplemental Data (%): | ||||||||||||
| Ratio of total expenses to average net assets | 1.07 | c | 1.04 | 1.02 | 1.09 | 1.14 | 1.10 | |||||
| Ratio of net expenses to average net assets | 1.07 | c | 1.04 | 1.02 | 1.09 | 1.03 | 1.06 | |||||
| Ratio of net investment income | ||||||||||||
| to average net assets | .88 | c | 2.35 | 2.07 | 1.79 | 2.52 | 2.22 | |||||
| Portfolio Turnover Rate | 22.93 | b | 44.62 | 57.38 | 67.16 | 102.83 | 78.35 | |||||
| Net Assets, end of period ($ x 1,000) | 523,780 | 549,601 | 879,450 | 996,647 | 1,247,441 | 2,002,307 | ||||||
a Based on average shares outstanding at each month end.
b Not annualized.
c Annualized.
See notes to financial statements.
132
| Investor Shares | ||||||||||||
| Six Months Ended | ||||||||||||
| February 28, 2013 | Year Ended August 31, | |||||||||||
| BNY Mellon International Fund | (Unaudited) | 2012 | 2011 | 2010 | 2009 | 2008 | ||||||
| Per Share Data ($): | ||||||||||||
| Net asset value, beginning of period | 9.84 | 10.51 | 9.92 | 10.69 | 12.70 | 18.29 | ||||||
| Investment Operations: | ||||||||||||
| Investment income—neta | .03 | .18 | .21 | .16 | .20 | .28 | ||||||
| Net realized and unrealized | ||||||||||||
| gain (loss) on investments | 1.45 | (.54 | ) | .56 | (.70 | ) | (1.60 | ) | (3.26 | ) | ||
| Total from Investment Operations | 1.48 | (.36 | ) | .77 | (.54 | ) | (1.40 | ) | (2.98 | ) | ||
| Distributions: | ||||||||||||
| Dividends from investment income—net | (.29 | ) | (.31 | ) | (.18 | ) | (.23 | ) | (.35 | ) | (.26 | ) |
| Dividends from net realized gain on investments | — | — | — | — | (.26 | ) | (2.35 | ) | ||||
| Total Distributions | (.29 | ) | (.31 | ) | (.18 | ) | (.23 | ) | (.61 | ) | (2.61 | ) |
| Net asset value, end of period | 11.03 | 9.84 | 10.51 | 9.92 | 10.69 | 12.70 | ||||||
| Total Return (%) | 15.11 | b | (3.20 | ) | 7.67 | (5.26 | ) | (10.11 | ) | (18.87 | ) | |
| Ratios/Supplemental Data (%): | ||||||||||||
| Ratio of total expenses to average net assets | 1.32 | c | 1.29 | 1.27 | 1.34 | 1.38 | 1.35 | |||||
| Ratio of net expenses to average net assets | 1.32 | c | 1.29 | 1.27 | 1.34 | 1.28 | 1.32 | |||||
| Ratio of net investment income | ||||||||||||
| to average net assets | .64 | c | 1.85 | 1.79 | 1.46 | 2.27 | 1.82 | |||||
| Portfolio Turnover Rate | 22.93 | b | 44.62 | 57.38 | 67.16 | 102.83 | 78.35 | |||||
| Net Assets, end of period ($ x 1,000) | 3,949 | 4,116 | 6,157 | 4,319 | 5,099 | 6,627 | ||||||
a Based on average shares outstanding at each month end.
b Not annualized.
c Annualized.
See notes to financial statements.
The Funds 133
FINANCIAL HIGHLIGHTS (continued)
| Class M Shares | ||||||||||||
| Six Months Ended | ||||||||||||
| February 28, 2013 | Year Ended August 31, | |||||||||||
| BNY Mellon Emerging Markets Fund | (Unaudited) | 2012 | 2011 | 2010 | 2009 | 2008 | ||||||
| Per Share Data ($): | ||||||||||||
| Net asset value, beginning of period | 9.19 | 10.65 | 10.02 | 8.71 | 16.89 | 24.42 | ||||||
| Investment Operations: | ||||||||||||
| Investment income—neta | .02 | .12 | .14 | .08 | .14 | .23 | ||||||
| Net realized and unrealized | ||||||||||||
| gain (loss) on investments | 1.14 | (1.16 | ) | .54 | 1.31 | (3.58 | ) | (1.45 | ) | |||
| Total from Investment Operations | 1.16 | (1.04 | ) | .68 | 1.39 | (3.44 | ) | (1.22 | ) | |||
| Distributions: | ||||||||||||
| Dividends from investment income—net | (.10 | ) | (.11 | ) | (.05 | ) | (.08 | ) | (.42 | ) | (.21 | ) |
| Dividends from net realized gain on investments | — | (.31 | ) | — | — | (4.32 | ) | (6.10 | ) | |||
| Total Distributions | (.10 | ) | (.42 | ) | (.05 | ) | (.08 | ) | (4.74 | ) | (6.31 | ) |
| Net asset value, end of period | 10.25 | 9.19 | 10.65 | 10.02 | 8.71 | 16.89 | ||||||
| Total Return (%) | 12.62 | b | (9.55 | ) | 6.77 | 15.92 | (6.07 | ) | (9.11 | ) | ||
| Ratios/Supplemental Data (%): | ||||||||||||
| Ratio of total expenses to average net assets | 1.41 | c | 1.40 | 1.41 | 1.54 | 1.64 | 1.53 | |||||
| Ratio of net expenses to average net assets | 1.41 | c | 1.40 | 1.41 | 1.54 | 1.64 | 1.52 | |||||
| Ratio of net investment income | ||||||||||||
| to average net assets | .32 | c | 1.21 | 1.20 | .85 | 1.76 | 1.11 | |||||
| Portfolio Turnover Rate | 20.73 | b | 67.21 | 77.45 | 76.34 | 119.72 | 63.60 | |||||
| Net Assets, end of period ($ x 1,000) | 2,239,819 | 2,138,311 | 2,352,233 | 1,796,274 | 1,097,296 | 1,141,146 | ||||||
a Based on average shares outstanding at each month end.
b Not annualized.
c Annualized.
See notes to financial statements.
134
| Investor Shares | ||||||||||||
| Six Months Ended | ||||||||||||
| February 28, 2013 | Year Ended August 31, | |||||||||||
| BNY Mellon Emerging Markets Fund | (Unaudited) | 2012 | 2011 | 2010 | 2009 | 2008 | ||||||
| Per Share Data ($): | ||||||||||||
| Net asset value, beginning of period | 9.41 | 10.91 | 10.27 | 8.94 | 17.05 | 24.60 | ||||||
| Investment Operations: | ||||||||||||
| Investment income—neta | .00 | b | .09 | .13 | .06 | .11 | .20 | |||||
| Net realized and unrealized | ||||||||||||
| gain (loss) on investments | 1.17 | (1.19 | ) | .55 | 1.33 | (3.55 | ) | (1.50 | ) | |||
| Total from Investment Operations | 1.17 | (1.10 | ) | .68 | 1.39 | (3.44 | ) | (1.30 | ) | |||
| Distributions: | ||||||||||||
| Dividends from investment income—net | (.07 | ) | (.09 | ) | (.04 | ) | (.06 | ) | (.35 | ) | (.15 | ) |
| Dividends from net realized gain on investments | — | (.31 | ) | — | — | (4.32 | ) | (6.10 | ) | |||
| Total Distributions | (.07 | ) | (.40 | ) | (.04 | ) | (.06 | ) | (4.67 | ) | (6.25 | ) |
| Net asset value, end of period | 10.51 | 9.41 | 10.91 | 10.27 | 8.94 | 17.05 | ||||||
| Total Return (%) | 12.43 | c | (9.86 | ) | 6.59 | 15.56 | (6.32 | ) | (9.29 | ) | ||
| Ratios/Supplemental Data (%): | ||||||||||||
| Ratio of total expenses to average net assets | 1.66 | d | 1.65 | 1.67 | 1.77 | 1.91 | 1.78 | |||||
| Ratio of net expenses to average net assets | 1.66 | d | 1.65 | 1.67 | 1.77 | 1.91 | 1.78 | |||||
| Ratio of net investment income | ||||||||||||
| to average net assets | .07 | d | .87 | 1.10 | .54 | 1.32 | .96 | |||||
| Portfolio Turnover Rate | 20.73 | c | 67.21 | 77.45 | 76.34 | 119.72 | 63.60 | |||||
| Net Assets, end of period ($ x 1,000) | 15,338 | 16,326 | 22,027 | 7,091 | 4,476 | 7,187 | ||||||
a Based on average shares outstanding at each month end.
b Amount represents less than $.01 per share.
c Not annualized.
d Annualized.
See notes to financial statements.
The Funds 135
FINANCIAL HIGHLIGHTS (continued)
| Class M Shares | ||||||||||||||
| Six Months Ended | ||||||||||||||
| BNY Mellon International | February 28, 2013 | Year Ended August 31, | Eight Months Ended | Year Ended December 31, | ||||||||||
| Appreciation Fund† | (Unaudited) | 2012 | 2011 | 2010 | August 31, 2009a | 2008 | 2007 | |||||||
| Per Share Data ($): | ||||||||||||||
| Net asset value, beginning of period | 10.80 | 11.31 | 10.54 | 11.35 | 9.40 | 16.58 | 15.46 | |||||||
| Investment Operations: | ||||||||||||||
| Investment income—netb | .07 | .28 | .36 | .26 | .23 | .45 | .41 | |||||||
| Net realized and unrealized | ||||||||||||||
| gain (loss) on investments | 1.40 | (.39 | ) | .68 | (.73 | ) | 1.73 | (7.17 | ) | 1.10 | ||||
| Total from Investment Operations | 1.47 | (.11 | ) | 1.04 | (.47 | ) | 1.96 | (6.72 | ) | 1.51 | ||||
| Distributions: | ||||||||||||||
| Dividends from investment income—net | (.38 | ) | (.40 | ) | (.27 | ) | (.34 | ) | (.01 | ) | (.46 | ) | (.39 | ) |
| Net asset value, end of period | 11.89 | 10.80 | 11.31 | 10.54 | 11.35 | 9.40 | 16.58 | |||||||
| Total Return (%) | 13.70 | c | (.55 | ) | 9.75 | (4.35 | ) | 20.93 | c | (41.12 | ) | 9.79 | ||
| Ratios/Supplemental Data (%): | ||||||||||||||
| Ratio of total expenses | ||||||||||||||
| to average net assets | .82 | d | .83 | .70 | .68 | .70 | d | .70 | .69 | |||||
| Ratio of net expenses | ||||||||||||||
| to average net assets | .82 | d | .83 | .70 | .66 | .66 | d | .67 | .69 | |||||
| Ratio of net investment income | ||||||||||||||
| to average net assets | 1.25 | d | 2.66 | 2.94 | 2.29 | 3.80 | d | 3.32 | 2.45 | |||||
| Portfolio Turnover Rate | .69 | c | 1.49 | 9.39 | 2.71 | 2.63 | c | 10.62 | 11 | |||||
| Net Assets, end of period ($ x 1,000) | 105,360 | 119,730 | 198,122 | 218,067 | 256,140 | 267,393 | 545,392 | |||||||
† Represents information for Institutional shares of the fund’s predecessor, BNY Hamilton International Equity Fund, through September 12, 2008.
a The fund has changed its fiscal year end from December 31 to August 31.
b Based on average shares outstanding at each month end.
c Not annualized.
d Annualized.
See notes to financial statements.
136
| Investor Shares | ||||||||||||||
| Six Months Ended | ||||||||||||||
| BNY Mellon International | February 28, 2013 | Year Ended August 31, | Eight Months Ended | Year Ended December 31, | ||||||||||
| Appreciation Fund† | (Unaudited) | 2012 | 2011 | 2010 | August 31, 2009a | 2008 | 2007 | |||||||
| Per Share Data ($): | ||||||||||||||
| Net asset value, beginning of period | 10.68 | 11.19 | 10.43 | 11.24 | 9.31 | 16.37 | 15.27 | |||||||
| Investment Operations: | ||||||||||||||
| Investment income—netb | .05 | .27 | .33 | .23 | .22 | .40 | .36 | |||||||
| Net realized and unrealized | ||||||||||||||
| gain (loss) on investments | 1.39 | (.41 | ) | .67 | (.72 | ) | 1.71 | (7.06 | ) | 1.09 | ||||
| Total from Investment Operations | 1.44 | (.14 | ) | 1.00 | (.49 | ) | 1.93 | (6.66 | ) | 1.45 | ||||
| Distributions: | ||||||||||||||
| Dividends from investment income—net | (.35 | ) | (.37 | ) | (.24 | ) | (.32 | ) | — | (.40 | ) | (.35 | ) | |
| Net asset value, end of period | 11.77 | 10.68 | 11.19 | 10.43 | 11.24 | 9.31 | 16.37 | |||||||
| Total Return (%) | 13.59 | c | (.85 | ) | 9.50 | (4.60 | ) | 20.73 | c | (41.21 | ) | 9.50 | ||
| Ratios/Supplemental Data (%): | ||||||||||||||
| Ratio of total expenses | ||||||||||||||
| to average net assets | 1.07 | d | 1.09 | .95 | .93 | .95 | d | .95 | .94 | |||||
| Ratio of net expenses | ||||||||||||||
| to average net assets | 1.07 | d | 1.09 | .95 | .90 | .91 | d | .92 | .94 | |||||
| Ratio of net investment income | ||||||||||||||
| to average net assets | .94 | d | 2.52 | 2.75 | 2.08 | 3.56 | d | 3.02 | 2.20 | |||||
| Portfolio Turnover Rate | .69 | c | 1.49 | 9.39 | 2.71 | 2.63 | c | 10.62 | 11 | |||||
| Net Assets, end of period ($ x 1,000) | 4,405 | 4,032 | 4,019 | 3,462 | 4,171 | 3,179 | 5,623 | |||||||
† Represents information for Class A shares of the fund’s predecessor, BNY Hamilton International Equity Fund, through September 12, 2008.
a The fund has changed its fiscal year end from December 31 to August 31.
b Based on average shares outstanding at each month end.
c Not annualized.
d Annualized.
See notes to financial statements.
The Funds 137
FINANCIAL HIGHLIGHTS (continued)
| Class M Shares | ||||
| Six Months Ended | ||||
| February 28, 2013 | Year Ended | |||
| BNY Mellon International Equity Income Fund | (Unaudited) | August 31, 2012a | ||
| Per Share Data ($): | ||||
| Net asset value, beginning of period | 12.87 | 12.50 | ||
| Investment Operations: | ||||
| Investment income—netb | .17 | .65 | ||
| Net realized and unrealized | ||||
| gain (loss) on investments | 1.46 | (.02 | ) | |
| Total from Investment Operations | 1.63 | .63 | ||
| Distributions: | ||||
| Dividends from investment income—net | (.33 | ) | (.26 | ) |
| Net asset value, end of period | 14.17 | 12.87 | ||
| Total Return (%)c | 12.87 | 5.28 | ||
| Ratios/Supplemental Data (%): | ||||
| Ratio of total expenses to average net assetsd | 1.18 | 1.62 | ||
| Ratio of net expenses to average net assetsd | 1.18 | 1.20 | ||
| Ratio of net investment income | ||||
| to average net assetsd | 2.56 | 7.38 | ||
| Portfolio Turnover Ratec | 45.79 | 95.27 | ||
| Net Assets, end of period ($ x 1,000) | 134,986 | 81,034 | ||
a From December 15, 2011 (commencement of operations) to August 31, 2012.
b Based on average shares outstanding at each month end.
c Not annualized.
d Annualized.
See notes to financial statements.
138
| Investor Shares | ||||
| Six Months Ended | ||||
| February 28, 2013 | Year Ended | |||
| BNY Mellon International Equity Income Fund | (Unaudited) | August 31, 2012a | ||
| Per Share Data ($): | ||||
| Net asset value, beginning of period | 12.88 | 12.50 | ||
| Investment Operations: | ||||
| Investment income—netb | .73 | .65 | ||
| Net realized and unrealized | ||||
| gain (loss) on investments | .89 | (.04 | ) | |
| Total from Investment Operations | 1.62 | .61 | ||
| Distributions: | ||||
| Dividends from investment income—net | (.26 | ) | (.23 | ) |
| Net asset value, end of period | 14.24 | 12.88 | ||
| Total Return (%)c | 12.73 | 5.10 | ||
| Ratios/Supplemental Data (%): | ||||
| Ratio of total expenses to average net assetsd | 1.49 | 2.10 | ||
| Ratio of net expenses to average net assetsd | 1.45 | 1.45 | ||
| Ratio of net investment income | ||||
| to average net assetsd | 5.12 | 7.14 | ||
| Portfolio Turnover Ratec | 45.79 | 95.27 | ||
| Net Assets, end of period ($ x 1,000) | 28 | 10 | ||
a From December 15, 2011 (commencement of operations) to August 31, 2012.
b Based on average shares outstanding at each month end.
c Not annualized.
d Annualized.
See notes to financial statements.
The Funds 139
FINANCIAL HIGHLIGHTS (continued)
| Class M Shares | ||||||||||||
| Six Months Ended | ||||||||||||
| February 28, 2013 | Year Ended August 31, | |||||||||||
| BNY Mellon Asset Allocation Fund | (Unaudited) | 2012 | 2011 | 2010 | 2009 | 2008 | ||||||
| Per Share Data ($): | ||||||||||||
| Net asset value, beginning of period | 10.97 | 10.63 | 9.85 | 9.44 | 10.93 | 12.91 | ||||||
| Investment Operations: | ||||||||||||
| Investment income—neta | .12 | .17 | .16 | .19 | .24 | .30 | ||||||
| Net realized and unrealized | ||||||||||||
| gain (loss) on investments | .61 | .43 | .83 | .46 | (1.01 | ) | (.73 | ) | ||||
| Total from Investment Operations | .73 | .60 | .99 | .65 | (.77 | ) | (.43 | ) | ||||
| Distributions: | ||||||||||||
| Dividends from investment income—net | (.20 | ) | (.21 | ) | (.21 | ) | (.24 | ) | (.27 | ) | (.36 | ) |
| Dividends from net realized gain on investments | (.03 | ) | (.05 | ) | — | — | (.45 | ) | (1.19 | ) | ||
| Total Distributions | (.23 | ) | (.26 | ) | (.21 | ) | (.24 | ) | (.72 | ) | (1.55 | ) |
| Net asset value, end of period | 11.47 | 10.97 | 10.63 | 9.85 | 9.44 | 10.93 | ||||||
| Total Return (%) | 6.59 | b | 5.72 | 10.00 | 6.84 | (6.08 | ) | (3.99 | ) | |||
| Ratios/Supplemental Data (%): | ||||||||||||
| Ratio of total expenses to average net assetsc | .37 | d | .37 | .53 | .57 | .60 | .58 | |||||
| Ratio of net expenses to average net assetsc | .24 | d | .27 | .53 | .57 | .60 | .58 | |||||
| Ratio of net investment income | ||||||||||||
| to average net assetsc | 2.19 | d | 1.59 | 1.49 | 1.78 | 2.81 | 2.51 | |||||
| Portfolio Turnover Rate | 14.91 | b | 81.55 | 71.08 | 69.81 | 78.44 | e | 51.92 | e | |||
| Net Assets, end of period ($ x 1,000) | 406,164 | 392,948 | 365,661 | 335,138 | 301,643 | 317,545 | ||||||
a Based on average shares outstanding at each month end.
b Not annualized.
c Amount does not include the activity of the underlying funds.
d Annualized.
e The portfolio turnover rates excluding mortgage dollar roll transactions for the periods ended August 31, 2009 and 2008 were 77.77% and 51.44%, respectively.
See notes to financial statements.
140
| Investor Shares | ||||||||||||
| Six Months Ended | ||||||||||||
| February 28, 2013 | Year Ended August 31, | |||||||||||
| BNY Mellon Asset Allocation Fund | (Unaudited) | 2012 | 2011 | 2010 | 2009 | 2008 | ||||||
| Per Share Data ($): | ||||||||||||
| Net asset value, beginning of period | 11.03 | 10.69 | 9.90 | 9.50 | 10.98 | 12.96 | ||||||
| Investment Operations: | ||||||||||||
| Investment income—neta | .11 | .14 | .14 | .17 | .23 | .27 | ||||||
| Net realized and unrealized | ||||||||||||
| gain (loss) on investments | .61 | .43 | .83 | .44 | (1.01 | ) | (.74 | ) | ||||
| Total from Investment Operations | .72 | .57 | .97 | .61 | (.78 | ) | (.47 | ) | ||||
| Distributions: | ||||||||||||
| Dividends from investment income—net | (.19 | ) | (.18 | ) | (.18 | ) | (.21 | ) | (.25 | ) | (.32 | ) |
| Dividends from net realized gain on investments | (.03 | ) | (.05 | ) | — | — | (.45 | ) | (1.19 | ) | ||
| Total Distributions | (.22 | ) | (.23 | ) | (.18 | ) | (.21 | ) | (.70 | ) | (1.51 | ) |
| Net asset value, end of period | 11.53 | 11.03 | 10.69 | 9.90 | 9.50 | 10.98 | ||||||
| Total Return (%) | 6.52 | b | 5.44 | 9.77 | 6.44 | (6.11 | ) | (4.29 | ) | |||
| Ratios/Supplemental Data (%): | ||||||||||||
| Ratio of total expenses to average net assetsc | .62 | d | .62 | .78 | .82 | .85 | .81 | |||||
| Ratio of net expenses to average net assetsc | .49 | d | .53 | .78 | .82 | .85 | .81 | |||||
| Ratio of net investment income | ||||||||||||
| to average net assetsc | 1.93 | d | 1.28 | 1.23 | 1.54 | 2.57 | 2.28 | |||||
| Portfolio Turnover Rate | 14.91 | b | 81.55 | 71.08 | 69.81 | 78.44 | e | 51.92 | e | |||
| Net Assets, end of period ($ x 1,000) | 5,156 | 5,091 | 4,265 | 4,015 | 4,412 | 4,812 | ||||||
| a Based on average shares outstanding at each month end. | ||||||||||||
b Not annualized.
c Amount does not include the activity of the underlying funds.
d Annualized.
e The portfolio turnover rates excluding mortgage dollar roll transactions for the periods ended August 31, 2009 and 2008, were 77.77% and 51.44%, respectively.
See notes to financial statements.
The Funds 141
NOTES TO FINANCIAL STATEMENTS (Unaudited)
NOTE 1—General:
BNY Mellon Funds Trust (the “Trust”) was organized as a Massachusetts business trust which is registered under the Investment Company Act of 1940, as amended (the “Act”), as an open-end management investment company and operates as a series company currently consisting of twenty-six series including the following diversified equity funds: BNY Mellon Large Cap Stock Fund, BNY Mellon Large Cap Market Opportunities Fund, BNY Mellon Tax-Sensitive Large Cap Multi-Strategy Fund, BNY Mellon Income Stock Fund, BNY Mellon Mid Cap Multi-Strategy Fund, BNY Mellon Small Cap Multi-Strategy Fund, BNY Mellon U.S. Core Equity 130/30 Fund, BNY Mellon Small/Mid Cap Fund, BNY Mellon International Fund, BNY Mellon Emerging Markets Fund, BNY Mellon International Appreciation Fund, BNY Mellon International Equity Income Fund and BNY Mellon Asset Allocation Fund and the following non-diversified equity fund: BNY Mellon Focused Equity Opportunities Fund (each, a “fund” and collectively, the “funds”).The objectives of the funds are as follows: BNY Mellon Large Cap Stock Fund, BNY Mellon Tax-Sensitive Large Cap Multi-Strategy Fund, BNY Mellon Mid Cap Multi-Strategy Fund, BNY Mellon Small Cap Multi-Strategy Fund, BNY Mellon U.S. Core Equity 130/30 Fund, BNY Mellon Focused Equity Opportunities Fund and BNY Mellon Small/Mid Cap Fund seek capital appreciation. BNY Mellon Income Stock Fund and BNY Mellon International Equity Income Fund seek total return (consisting of capital appreciation and income). BNY Mellon International Fund and BNY Mellon Emerging Markets Fund seek long-term capital growth. BNY Mellon Large Cap Market Opportunities Fund and BNY Mellon International Appreciation Fund seek long-term capital appreciation. BNY Mellon Asset Allocation Fund seeks long-term growth of principal in conjunction with current income.
BNY Mellon Fund Advisers, a division of The Dreyfus Corporation (the “Manager” or “Dreyfus”), a wholly-owned subsidiary of The Bank of New York Mellon Corporation (“BNY Mellon”), serves as each fund’s investment adviser (“Investment Adviser”). The Bank of New York Mellon, a subsidiary of BNY Mellon and an affiliate of Dreyfus, serves as administrator for the funds pursuant to an Administration Agreement with the Trust (the “Administration Agreement”).The Bank of NewYork Mellon has entered into a Sub-Administration Agreement with Dreyfus pursuant to which The Bank of New York Mellon pays Dreyfus for performing certain administrative services.Walter Scott & Partners Limited (“Walter Scott”), also a subsidiary of BNY Mellon and an affiliate of Dreyfus, serves as the BNY Mellon Large Cap Market Opportunities Fund’s and BNY Mellon Tax-Sensitive Large Cap Multi-Strategy Fund’s sub-investment adviser with respect to the U.S. Large Cap Equity Strategy of each fund. Robeco Investment Management, Inc. (“Robeco”) and, effective March 21, 2013, Geneva Capital Management Ltd. (“Geneva”) serve as BNY Mellon Mid Cap Multi-Strategy Fund’s sub-investment advisers as it pertains to the Robeco Mid Cap Value Strategy and Geneva Mid Cap Growth Strategy of the fund, respectively. MBSC Securities Corporation (the “Distributor”), a wholly-owned subsidiary of Dreyfus, is the distributor of each fund’s shares, which are sold without a sales charge.
The Trust is authorized to issue an unlimited number of shares of Beneficial Interest, par value $.001 per share, in Class M and Investor class shares of each fund. Other differences between the classes include the services offered to and the expenses borne by each class, the allocation of certain transfer agency costs and certain voting rights. Income, expenses (other than expenses attributable to a specific class), and realized and unrealized gains or losses on investments are allocated to each class of shares based on its relative net assets.
142
TheTrust accounts separately for the assets, liabilities and operations of each series. Expenses directly attributable to each series are charged to that series’ operations; expenses which are applicable to all series are allocated among them on a pro rata basis.
The Financial Accounting Standards Board (“FASB”) Accounting Standards Codification is the exclusive reference of authoritative U.S. generally accepted accounting principles (“GAAP”) recognized by the FASB to be applied by nongovernmental entities. Rules and interpretive releases of the Securities and Exchange Commission (“SEC”) under authority of federal laws are also sources of authoritative GAAP for SEC registrants. Each fund’s financial statements are prepared in accordance with GAAP, which may require the use of management estimates and assumptions. Actual results could differ from those estimates.
NOTE 2—Significant Accounting Policies:
(a) Portfolio valuation: The fair value of a financial instrument is the amount that would be received to sell an asset or paid to transfer a liability in an orderly transaction between market participants at the measurement date (i.e., the exit price). GAAP establishes a fair value hierarchy that prioritizes the inputs of valuation techniques used to measure fair value. This hierarchy gives the highest priority to unadjusted quoted prices in active markets for identical assets or liabilities (Level 1 measurements) and the lowest priority to unobservable inputs (Level 3 measurements).
Additionally, GAAP provides guidance on determining whether the volume and activity in a market has decreased significantly and whether such a decrease in activity results in transactions that are not orderly. GAAP
requires enhanced disclosures around valuation inputs and techniques used during annual and interim periods.
Various inputs are used in determining the value of each fund’s investments relating to fair value measurements. These inputs are summarized in the three broad levels listed below:
Level 1—unadjusted quoted prices in active markets for identical investments.
Level 2—other significant observable inputs (including quoted prices for similar investments, interest rates, prepayment speeds, credit risk, etc.).
Level 3—significant unobservable inputs (including the funds’ own assumptions in determining the fair value of investments).
The inputs or methodology used for valuing securities are not necessarily an indication of the risk associated with investing in those securities.
Changes in valuation techniques may result in transfers in or out of an assigned level within the disclosure hierarchy. Valuation techniques used to value the funds’ investments are as follows:
Investments in equity securities are valued at the last sales price on the securities exchange or national securities market on which such securities are primarily traded. Securities listed on the National Market System for which market quotations are available are valued at the official closing price or, if there is no official closing price that day, at the last sales price. Securities not listed on an exchange or the national securities market, or securities for which there were no transactions, are valued at the average of the most recent bid and asked prices, except for open short positions, where the asked price is used for valuation purposes. Bid price is used
The Funds 143
NOTES TO FINANCIAL STATEMENTS (Unaudited) (continued)
when no asked price is available. Registered investment companies that are not traded on an exchange are valued at their net asset value.All of the preceding securities are categorized within Level 1 of the fair value hierarchy.
BNY Mellon Asset Allocation Fund: Investments in debt securities excluding short-term investments (other than U.S.Treasury Bills) are valued each business day by an independent pricing service (the “Service”) approved by theTrust’s Board ofTrustees (the “Board”). Debt securities for which quoted bid prices are readily available and are representative of the bid side of the market in the judgment of the Service are valued at the mean between the quoted bid prices (as obtained by the Service from dealers in such securities) and asked prices (as calculated by the Service based upon its evaluation of the market for such securities). Other debt securities are valued as determined by the Service, based on methods which include consideration of the following: yields or prices of securities of comparable quality, coupon, maturity and type; indications as to values from dealers; and general market conditions.These securities are generally categorized within Level 2 of the fair value hierarchy.
U.S.Treasury Bills are valued at the mean price between quoted bid prices and asked prices by the Service.These securities are generally categorized within Level 2 of the fair value hierarchy.
The Service’s procedures are reviewed by Dreyfus under the general supervision of the Board.
Fair valuing of securities may be determined with the assistance of a pricing service using calculations based on indices of domestic securities and other appropriate indicators, such as prices of relevant ADRs and financial futures. Utilizing these techniques may result in transfers between Level 1 and Level 2 of the fair value hierarchy.
When market quotations or official closing prices are not readily available, or are determined not to reflect accurately fair value, such as when the value of the security has been significantly affected by events after the close of the exchange or market on which the security is principally traded (for example, a foreign exchange or market),
but before the funds calculate their net asset values, the funds may value these investments at fair value as determined in accordance with the procedures approved by the Board. Certain factors may be considered when fair valuing investments such as: fundamental analytical data, the nature and duration of restrictions on disposition, an evaluation of the forces that influence the market in which the securities are purchased and sold, and public trading in similar securities of the issuer or comparable issuers. These securities are either categorized within Level 2 or 3 depending on the relevant inputs used.
For restricted securities where observable inputs are limited, assumptions about market activity and risk are used and are categorized within Level 3 of the fair value hierarchy.
Investments denominated in foreign currencies are translated to U.S. dollars at the prevailing rates of exchange.
Financial futures and options, which are traded on an exchange, are valued at the last sales price on the securities exchange on which such securities are primarily traded or at the last sales price on the national securities market on each business day.These securities are generally categorized within Level 1 of the fair value hierarchy. Options traded over-the-counter are valued at the mean between the bid and asked price. These securities are generally categorized within Level 2 of the fair value hierarchy. Forward foreign currency exchange contracts (“forward contracts”) are valued at the forward rate. These securities are generally categorized within Level 2 of the fair value hierarchy.
Table 1 summarizes the inputs used as of February 28, 2013 in valuing each fund’s investments.
At February 28, 2013, there were no transfers between Level 1 and Level 2 of the fair value hierarchy for any of the funds, except for BNY Mellon Emerging Markets Fund, which at August 31, 2012, held $6,058,009 of exchange-traded foreign equity securities that were classified within Level 2 of the fair value hierarchy pursuant to BNY Mellon Emerging Markets Fund’s fair valuation procedures.
144
| Table 1—Fair Value Measurements | |||||||
| Investments in Securities | |||||||
| Level 2—Other | Level 3—Significant | ||||||
| Level 1—Unadjusted | Significant | Unobservable | |||||
| Quoted Prices | Observable Inputs | Inputs | |||||
| Assets ($) | Liabilities ($) | Assets ($) | Liabilities ($) | Assets ($) | Liabilities ($) | Total ($) | |
| BNY Mellon Large Cap | |||||||
| Stock Fund | |||||||
| Equity Securities—Domestic | |||||||
| Common Stocks† | 731,521,745 | — | — | — | — | — | 731,521,745 |
| Equity Securities—Foreign | |||||||
| Common Stocks† | 34,534,437 | — | — | — | — | — | 34,534,437 |
| Exchange-Traded Funds | 7,627,499 | — | — | — | — | — | 7,627,499 |
| Mutual Funds | 18,907,080 | — | — | — | — | — | 18,907,080 |
| BNY Mellon Large Cap | |||||||
| Market Opportunities Fund | |||||||
| Equity Securities—Domestic | |||||||
| Common Stocks† | 145,161,404 | — | — | — | — | — | 145,161,404 |
| Equity Securities—Foreign | |||||||
| Common Stocks† | 4,867,685 | — | — | — | — | — | 4,867,685 |
| Mutual Funds | 31,753,425 | — | — | — | — | — | 31,753,425 |
| BNY Mellon Tax-Sensitive | |||||||
| Large Cap | |||||||
| Multi-Strategy Fund | |||||||
| Equity Securities—Domestic | |||||||
| Common Stocks† | 502,131,324 | — | — | — | — | — | 502,131,324 |
| Equity Securities—Foreign | |||||||
| Common Stocks† | 13,100,522 | — | — | — | — | — | 13,100,522 |
| Mutual Funds | 82,612,170 | — | — | — | — | — | 82,612,170 |
| BNY Mellon Income | |||||||
| Stock Fund | |||||||
| Equity Securities—Domestic | |||||||
| Common Stocks† | 601,386,992 | — | — | — | — | — | 601,386,992 |
| Equity Securities—Foreign | |||||||
| Common Stocks† | 50,948,031 | — | — | — | — | — | 50,948,031 |
| Mutual Funds | 96,980,707 | — | — | — | — | — | 96,980,707 |
| Preferred Stocks† | 4,225,453 | — | — | — | — | — | 4,225,453 |
| BNY Mellon Mid Cap | |||||||
| Multi-Strategy Fund | |||||||
| Equity Securities—Domestic | |||||||
| Common Stocks† | 1,287,105,764 | — | — | — | — | — | 1,287,105,764 |
| Equity Securities—Foreign | |||||||
| Common Stocks† | 10,292,828 | — | — | — | — | — | 10,292,828 |
| Exchange-Traded Funds | 64,571,281 | — | — | — | — | — | 64,571,281 |
| Mutual Funds | 75,892,754 | — | — | — | — | — | 75,892,754 |
| BNY Mellon Small Cap | |||||||
| Multi-Strategy Fund | |||||||
| Equity Securities—Domestic | |||||||
| Common Stocks† | 253,461,553 | — | — | — | — | — | 253,461,553 |
| Equity Securities—Foreign | |||||||
| Common Stocks† | 1,661,457 | — | — | — | — | — | 1,661,457 |
| Exchange-Traded Funds | 6,051,644 | — | — | — | — | — | 6,051,644 |
| Mutual Funds | 28,749,711 | — | — | — | — | — | 28,749,711 |
The Funds 145
| NOTES TO FINANCIAL STATEMENTS (Unaudited) (continued) | |||||||||||
| Table 1—Fair Value Measurements (continued) | |||||||||||
| Investments in Securities | |||||||||||
| Level 2—Other | Level 3—Significant | ||||||||||
| Level 1—Unadjusted | Significant | Unobservable | |||||||||
| Quoted Prices | Observable Inputs | Inputs | |||||||||
| Assets ($) | Liabilities ($) | Assets ($) | Liabilities ($) | Assets ($) | Liabilities ($) | Total ($) | |||||
| BNY Mellon U.S. Core | |||||||||||
| Equity 130/30 Fund | |||||||||||
| Equity Securities—Domestic | |||||||||||
| Common Stocks† | 246,794,344 | — | — | — | — | — | 246,794,344 | ||||
| Equity Securities—Foreign | |||||||||||
| Common Stocks† | 10,264,235 | — | — | — | — | — | 10,264,235 | ||||
| Mutual Funds | 1,556,897 | — | — | — | — | — | 1,556,897 | ||||
| Securities Sold Short: | |||||||||||
| Equity Securities—Domestic | |||||||||||
| Common Stocks††† | — | (48,492,187 | ) | — | — | — | — | (48,492,187 | ) | ||
| Equity Securities—Foreign | |||||||||||
| Common Stocks††† | — | (4,974,103 | ) | — | — | — | — | (4,974,103 | ) | ||
| Exchange-Traded Funds | — | (1,375,103 | ) | — | — | — | — | (1,375,103 | ) | ||
| BNY Mellon Focused Equity | |||||||||||
| Opportunities Fund | |||||||||||
| Equity Securities—Domestic | |||||||||||
| Common Stocks† | 407,679,357 | — | — | — | — | — | 407,679,357 | ||||
| Equity Securities—Foreign | |||||||||||
| Common Stocks† | 28,860,998 | — | — | — | — | — | 28,860,998 | ||||
| Mutual Funds | 6,736,721 | — | — | — | — | — | 6,736,721 | ||||
| BNY Mellon | |||||||||||
| Small/Mid Cap Fund | |||||||||||
| Equity Securities—Domestic | |||||||||||
| Common Stocks† | 445,295,407 | — | — | — | — | — | 445,295,407 | ||||
| Equity Securities—Foreign | |||||||||||
| Common Stocks† | 4,110,260 | — | — | — | — | — | 4,110,260 | ||||
| Exchange-Traded Funds | 17,792,892 | — | — | — | — | — | 17,792,892 | ||||
| Mutual Funds | 45,263,839 | — | — | — | — | — | 45,263,839 | ||||
| BNY Mellon | |||||||||||
| International Fund | |||||||||||
| Equity Securities—Foreign | |||||||||||
| Common Stocks† | 510,564,702 | — | — | — | — | — | 510,564,702 | ||||
| Exchange-Traded Funds | 4,459,269 | — | — | — | — | — | 4,459,269 | ||||
| Mutual Funds | 3,880,246 | — | — | — | — | — | 3,880,246 | ||||
| Preferred Stocks† | 2,396,804 | — | — | — | — | — | 2,396,804 | ||||
| Other Financial Instruments: | |||||||||||
| Forward Foreign | |||||||||||
| Currency Exchange | |||||||||||
| Contracts†† | — | — | 9,490 | (455 | ) | — | — | 9,035 | |||
| BNY Mellon Emerging | |||||||||||
| Markets Fund | |||||||||||
| Equity Securities—Foreign | |||||||||||
| Common Stocks† | 2,069,110,356 | — | — | — | — | — | 2,069,110,356 | ||||
| Exchange-Traded Funds | 60,561,135 | — | — | — | — | — | 60,561,135 | ||||
| Mutual Funds | 30,034,767 | — | — | — | — | — | 30,034,767 | ||||
| Preferred Stocks† | 69,895,184 | — | — | — | — | — | 69,895,184 | ||||
| Rights† | 106,803 | — | — | — | — | — | 106,803 | ||||
| Other Financial Instruments: | |||||||||||
| Forward Foreign Currency | |||||||||||
| Exchange Contracts†† | — | — | 1,014 | (37,811 | ) | — | — | (36,797 | ) | ||
146
| Table 1—Fair Value Measurements (continued) | ||||||||||
| Investments in Securities | ||||||||||
| Level 2—Other | Level 3—Significant | |||||||||
| Level 1—Unadjusted | Significant | Unobservable | ||||||||
| Quoted Prices | Observable Inputs | Inputs | ||||||||
| Assets ($) | Liabilities ($) | Assets ($) | Liabilities ($) | Assets ($) | Liabilities ($) | Total ($) | ||||
| BNY Mellon International | ||||||||||
| Appreciation Fund | ||||||||||
| Equity Securities—Foreign | ||||||||||
| Common Stocks† | 108,262,838 | — | — | — | — | — | 108,262,838 | |||
| Mutual Funds | 891,833 | — | — | — | — | — | 891,833 | |||
| U.S. Treasury | — | — | 89,999 | — | — | — | 89,999 | |||
| Other Financial Instruments: | ||||||||||
| Financial Futures†† | — | (8,443 | ) | — | — | — | — | (8,443 | ) | |
| BNY Mellon International | ||||||||||
| Equity Income Fund | ||||||||||
| Equity Securities—Foreign | ||||||||||
| Common Stocks† | 125,387,890 | — | — | — | — | — | 125,387,890 | |||
| Exchange-Traded Funds | 2,910,750 | — | — | — | — | — | 2,910,750 | |||
| Mutual Funds | 2,365,562 | — | — | — | — | — | 2,365,562 | |||
| Preferred Stocks† | 2,518,631 | — | — | — | — | — | 2,518,631 | |||
| Other Financial Instruments: | ||||||||||
| Forward Foreign Currency | ||||||||||
| Exchange Contracts†† | — | — | — | (3,801 | ) | — | — | (3,801 | ) | |
| BNY Mellon Asset | ||||||||||
| Allocation Fund | ||||||||||
| Asset—Backed | — | — | 1,152,827 | — | — | — | 1,152,827 | |||
| Commercial | ||||||||||
| Mortgage—Backed | — | — | 1,155,954 | — | — | — | 1,155,954 | |||
| Corporate Bonds† | — | — | 21,995,188 | — | — | — | 21,995,188 | |||
| Equity Securities—Domestic | ||||||||||
| Common Stocks† | 70,812,695 | — | — | — | — | — | 70,812,695 | |||
| Equity Securities—Foreign | ||||||||||
| Common Stocks† | 3,349,053 | — | — | — | — | — | 3,349,053 | |||
| Exchange-Traded Funds | 745,921 | — | — | — | — | — | 745,921 | |||
| Foreign Government | — | — | 949,175 | — | — | — | 949,175 | |||
| Municipal Bonds | — | — | 4,513,461 | — | — | — | 4,513,461 | |||
| Mutual Funds | 268,685,032 | — | — | — | — | — | 268,685,032 | |||
| U.S. Government | ||||||||||
| Agencies/ | ||||||||||
| Mortgage—Backed | — | — | 20,153,013 | — | — | — | 20,153,013 | |||
| U.S. Treasury | — | — | 21,179,003 | — | — | — | 21,179,003 | |||
| † | See Statement of Investments for additional detailed categorizations. |
| †† | Amount shown represents unrealized appreciation (depreciation) at period end. |
| ††† See Statement of Securities Sold Short for additional detailed categorizations. | |
The Funds 147
NOTES TO FINANCIAL STATEMENTS (Unaudited) (continued)
(b) Foreign currency transactions: BNY Mellon International Fund, BNY Mellon Emerging Markets Fund, BNY Mellon International Appreciation Fund and BNY Mellon International Equity Income Fund do not isolate that portion of the results of operations resulting from changes in foreign exchange rates on investments from the fluctuations arising from changes in the market prices of securities held. Such fluctuations are included with the net realized and unrealized gain or loss on investments.
Net realized foreign exchange gains or losses arise from sales of foreign currencies, currency gains or losses realized on securities transactions between trade and settlement date, and the difference between the amounts of dividends, interest and foreign withholding taxes recorded on the funds’ books and the U.S. dollar equivalent of the amounts actually received or paid. Net unrealized foreign exchange gains and losses arise from changes in the value of assets and liabilities other than investments resulting from changes in exchange rates. Foreign currency gains and losses on foreign currency transactions are also included with net realized and unrealized gain or loss on investments.
(c) Securities transactions and investment income:
Securities transactions are recorded on a trade date basis. Realized gains and losses from securities transactions are recorded on the identified cost basis. Dividend income is recognized on the ex-dividend date and interest income, including, where applicable, accretion of discount and amortization of premium on investments, is recognized on the accrual basis.
Pursuant to a securities lending agreement withThe Bank of New York Mellon, the funds may lend securities to qualified institutions. It is the funds’ policy that, at origination, all loans are secured by collateral of at least 102% of the value of U.S. securities loaned and 105% of the value of foreign securities loaned. Collateral equivalent to at least 100% of the market value of securities on loan is maintained at all times. Collateral is either in the form of cash, which can be invested in certain money market mutual funds managed by Dreyfus, U.S. Government and
Agency securities or letters of credit.The funds are entitled to receive all income on securities loaned, in addition to income earned as a result of the lending transaction. Although each security loaned is fully collateralized, the funds bear the risk of delay in recovery of, or loss of rights in, the securities loaned should a borrower fail to return the securities in a timely manner. Table 2 summarizes the amountThe Bank of NewYork Mellon earned from each relevant fund from lending portfolio securities, pursuant to the securities lending agreement during the period ended February 28, 2013.
| Table 2—Securities Lending Agreement | ||
| BNY Mellon Large Cap Stock Fund | $ | 25,702 |
| BNY Mellon Income Stock Fund | 93,476 | |
| BNY Mellon Mid Cap | ||
| Multi-Strategy Fund | 49,315 | |
| BNY Mellon Small Cap | ||
| Multi-Strategy Fund | 36,516 | |
| BNY Mellon Focused | ||
| Equity Opportunities Fund | 1,983 | |
| BNY Mellon Small/Mid Cap Fund | 100,897 | |
| BNY Mellon Asset Allocation Fund | 1,965 |
(d) Affiliated issuers: Investments in other investment companies advised by Dreyfus are defined as “affiliated” under the Act. Table 3 summarizes each fund’s investments in affiliated investment companies during the period ended February 28, 2013.
(e) Risk: BNY Mellon U. S. Core Equity 130/30 Fund enters into short sales. Short sales involve selling a security the fund does not own in anticipation that the security’s price will decline. Short sales may involve substantial risk and “leverage.” The fund may be required to buy the security sold short at a time when the security has appreciated in value, thus resulting in a loss to the fund. Short positions in stocks involve more risk than long positions in stocks. In theory, stocks sold short have unlimited risk. BNY Mellon Asset Allocation Fund invests in debt securities. Failure of an issuer of the debt securities to make timely interest or principal payments, or a decline or the perception of a decline in the credit quality of a debt
148
| Table 3—Affiliated Investment Companies | ||||||||||
| Net Unrealized | ||||||||||
| Affiliated | Value | Net Realized | Appreciation | Value | Net | Dividends/ | ||||
| Investment Companies | 8/31/2012 | ($) | Purchases ($)† | Sales ($) | Gain (Loss) ($) | (Depreciation) ($) | 2/28/2013 | ($) | Assets (%) | Distributions ($) |
| BNY Mellon Large Cap | ||||||||||
| Stock Fund | ||||||||||
| Dreyfus Institutional | ||||||||||
| Preferred Plus | ||||||||||
| Money Market Fund | 89,911 | 44,214,877 | 42,140,453 | — | — | 2,164,335 | .3 | — | ||
| Dreyfus Institutional Cash | ||||||||||
| Advantage Fund | 17,903,427 | 158,680,597 | 159,841,279 | — | — | 16,742,745 | 2.1 | — | ||
| Total | 17,993,338 | 202,895,474 | 201,981,732 | — | — | 18,907,080 | 2.4 | — | ||
| BNY Mellon | ||||||||||
| Large Cap Market | ||||||||||
| Opportunities Fund | ||||||||||
| BNY Mellon | ||||||||||
| U.S. Core Equity | ||||||||||
| 130/30 Fund, CI. M | 15,541,034 | 1,481,942 | — | — | 658,906 | 17,681,882 | 9.7 | 76,942 | ||
| Dreyfus Institutional | ||||||||||
| Preferred Plus | ||||||||||
| Money Market Fund | 3,619,171 | 26,852,101 | 27,161,622 | — | — | 3,309,650 | 1.8 | — | ||
| Dreyfus Research | ||||||||||
| Growth Fund, Cl. I | 8,922,714 | 1,234,338 | — | — | 604,841 | 10,761,893 | 5.9 | — | ||
| Total | 28,082,919 | 29,568,381 | 27,161,622 | — | 1,263,747 | 31,753,425 | 17.4 | 76,942 | ||
| BNY Mellon | ||||||||||
| Tax-Sensitive Large Cap | ||||||||||
| Multi-Strategy Fund | ||||||||||
| BNY Mellon U.S. Core | ||||||||||
| Equity 130/30 | ||||||||||
| Fund, CI. M | 9,212,362 | 31,604,667 | 642,979 | 23,312 | 214,770 | 40,412,132 | 6.7 | 44,667 | ||
| Dreyfus Institutional | ||||||||||
| Preferred Plus | ||||||||||
| Money Market Fund | 1,942,377 | 423,931,891 | 412,364,116 | — | — | 13,510,152 | 2.3 | — | ||
| Dreyfus Research | ||||||||||
| Growth Fund, Cl. I | 6,198,317 | 22,141,987 | — | — | 349,582 | 28,689,886 | 4.8 | 21,987 | ||
| Total | 17,353,056 | 477,678,545 | 413,007,095 | 23,312 | 564,352 | 82,612,170 | 13.8 | 66,654 | ||
| BNY Mellon | ||||||||||
| Income Stock Fund | ||||||||||
| Dreyfus Institutional | ||||||||||
| Preferred Plus | ||||||||||
| Money Market Fund | 6,406,257 | 92,868,880 | 76,433,664 | — | — | 22,841,473 | 3.4 | — | ||
| Dreyfus Institutional Cash | ||||||||||
| Advantage Fund | 71,135,350 | 156,999,701 | 153,995,817 | — | — | 74,139,234 | 10.9 | — | ||
| Total | 77,541,607 | 249,868,581 | 230,429,481 | — | — | 96,980,707 | 14.3 | — | ||
| BNY Mellon Mid Cap | ||||||||||
| Multi-Strategy Fund | ||||||||||
| Dreyfus Institutional | ||||||||||
| Preferred Plus | ||||||||||
| Money Market Fund | 202,961,050 | 494,472,593 | 680,650,280 | — | — | 16,783,363 | 1.2 | — | ||
| Dreyfus | ||||||||||
| Institutional Cash | ||||||||||
| Advantage Fund | 37,136,636 | 182,238,821 | 160,266,066 | — | — | 59,109,391 | 4.3 | — | ||
| Total | 240,097,686 | 676,711,414 | 840,916,346 | — | — | 75,892,754 | 5.5 | — | ||
The Funds 149
| NOTES TO FINANCIAL STATEMENTS (Unaudited) (continued) | ||||||||||
| Table 3—Affiliated Investment Companies (continued) | ||||||||||
| Net Unrealized | ||||||||||
| Affiliated | Value | Net Realized | Appreciation | Value | Net | Dividends/ | ||||
| Investment Companies | 8/31/2012 | ($) | Purchases ($)† | Sales ($) | Gain (Loss) ($) | (Depreciation) ($) | 2/28/2013 | ($) | Assets (%) | Distributions ($) |
| BNY Mellon Small Cap | ||||||||||
| Multi-Strategy Fund | ||||||||||
| Dreyfus Institutional | ||||||||||
| Preferred Plus | ||||||||||
| Money Market Fund | 12,351,731 | 34,666,459 | 43,497,963 | — | — | 3,520,227 | 1.3 | — | ||
| Dreyfus Institutional Cash | ||||||||||
| Advantage Fund | 17,350,832 | 99,906,575 | 92,027,923 | — | — | 25,229,484 | 9.5 | — | ||
| Total | 29,702,563 | 134,573,034 | 135,525,886 | — | — | 28,749,711 | 10.8 | — | ||
| BNY Mellon U.S. Core | ||||||||||
| Equity 130/30 Fund | ||||||||||
| Dreyfus Institutional | ||||||||||
| Preferred Plus | ||||||||||
| Money Market Fund | 2,134,177 | 34,270,397 | 34,847,677 | — | — | 1,556,897 | .8 | — | ||
| BNY Mellon | ||||||||||
| Focused Equity | ||||||||||
| Opportunities Fund | ||||||||||
| Dreyfus Institutional | ||||||||||
| Preferred Plus | ||||||||||
| Money Market Fund | 1,074,547 | 88,276,872 | 82,614,698 | — | — | 6,736,721 | 1.5 | — | ||
| Dreyfus Institutional Cash | ||||||||||
| Advantage Fund | — | 34,178,729 | 34,178,729 | — | — | — | — | — | ||
| Total | 1,074,547 | 122,455,601 | 116,793,427 | — | — | 6,736,721 | 1.5 | — | ||
| BNY Mellon | ||||||||||
| Small/Mid Cap Fund | ||||||||||
| Dreyfus Institutional | ||||||||||
| Preferred Plus | ||||||||||
| Money Market Fund | 2,287,790 | 91,110,674 | 90,613,033 | — | — | 2,785,431 | .6 | — | ||
| Dreyfus Institutional Cash | ||||||||||
| Advantage Fund | 49,509,775 | 175,216,537 | 182,247,904 | — | — | 42,478,408 | 9.0 | — | ||
| Total | 51,797,565 | 266,327,211 | 272,860,937 | — | — | 45,263,839 | 9.6 | — | ||
| BNY Mellon | ||||||||||
| International Fund | ||||||||||
| Dreyfus Institutional | ||||||||||
| Preferred Plus | ||||||||||
| Money Market Fund | 175,101 | 58,809,614 | 55,104,469 | — | — | 3,880,246 | .7 | — | ||
| BNY Mellon | ||||||||||
| Emerging Markets Fund | ||||||||||
| Dreyfus Institutional | ||||||||||
| Preferred Plus | ||||||||||
| Money Market Fund | 6,816,020 | 223,535,122 | 200,316,375 | — | — | 30,034,767 | 1.3 | — | ||
| BNY Mellon International | ||||||||||
| Appreciation Fund | ||||||||||
| Dreyfus Institutional | ||||||||||
| Preferred Plus | ||||||||||
| Money Market Fund | 1,396,388 | 17,574,296 | 18,078,851 | — | — | 891,833 | .8 | — | ||
| BNY Mellon International | ||||||||||
| Equity Income Fund | ||||||||||
| Dreyfus Institutional | ||||||||||
| Preferred Plus | ||||||||||
| Money Market Fund | 1,160,763 | 42,062,167 | 40,857,368 | — | — | 2,365,562 | 1.7 | — | ||
150
| Table 3—Affiliated Investment Companies (continued) | ||||||||||||
| Net Unrealized | ||||||||||||
| Affiliated | Value | Net Realized | Appreciation | Value | Net | Dividends/ | ||||||
| Investment Companies | 8/31/2012 | ($) | Purchases ($)† | Sales ($) | Gain (Loss) ($) | (Depreciation) ($) | 2/28/2013 | ($) | Assets (%) | Distributions ($) | ||
| BNY Mellon Asset | ||||||||||||
| Allocation Fund | ||||||||||||
| BNY Mellon Emerging | ||||||||||||
| Markets Fund, CI. M | 34,919,996 | 1,606,161 | — | — | 4,090,053 | 40,616,210 | 9.9 | 386,161 | ||||
| BNY Mellon Focused | ||||||||||||
| Equity Opportunities | ||||||||||||
| Fund, CI. M | 26,623,065 | 236,107 | — | — | 1,538,761 | 28,397,933 | 6.9 | 236,107 | ||||
| BNY Mellon Income | ||||||||||||
| Stock Fund, CI. M | — | 13,602,711 | — | — | 569,472 | 14,172,183 | 3.5 | 40,041 | ||||
| BNY Mellon Intermediate | ||||||||||||
| Bond Fund, CI. M | 13,770,808 | 157,724 | — | — | (83,537 | ) | 13,844,995 | 3.4 | 178,733 | |||
| BNY Mellon International | ||||||||||||
| Fund, CI. M | 8,208,635 | 281,691 | — | — | 974,120 | 9,464,446 | 2.3 | 281,691 | ||||
| BNY Mellon Mid Cap | ||||||||||||
| Multi-Strategy | ||||||||||||
| Fund, CI. M | 18,232,902 | 1,550,188 | 401,000 | (66,592 | ) | 909,961 | 20,225,459 | 4.9 | 1,550,188 | |||
| BNY Mellon Short-Term | ||||||||||||
| U.S. Government | ||||||||||||
| Securities Fund, CI. M | 15,004,958 | 55,222 | 5,915,000 | (65,058 | ) | (23,622 | ) | 9,056,500 | 2.2 | 62,682 | ||
| BNY Mellon | ||||||||||||
| Small/Mid Cap | ||||||||||||
| Fund, CI. M | 8,434,294 | 137,714 | — | — | 614,500 | 9,186,508 | 2.2 | 137,715 | ||||
| BNY Mellon U.S. Core | ||||||||||||
| Equity 130/30 | ||||||||||||
| Fund, CI. M | 11,731,343 | 56,456 | 5,725,000 | 762,704 | (476,575 | ) | 6,348,928 | 1.5 | 56,456 | |||
| Dreyfus Emerging | ||||||||||||
| Markets Debt Local | ||||||||||||
| Currency Fund, CI. I | 4,720,739 | 61,947 | 966,000 | 58,911 | 210,933 | 4,086,530 | 1.0 | 61,947 | ||||
| Dreyfus Global Real | ||||||||||||
| Estate Securities | ||||||||||||
| Fund, CI. I | 8,596,005 | 465,751 | — | — | 347,108 | 9,408,864 | 2.3 | 465,751 | ||||
| Dreyfus High Yield | ||||||||||||
| Fund, CI. I | 12,392,832 | 343,050 | 1,407,000 | 48,406 | 347,867 | 11,725,155 | 2.9 | 402,237 | ||||
| Dreyfus Inflation Adjusted | ||||||||||||
| Securities Fund, | ||||||||||||
| Institutional Shares | 11,532,917 | 562,531 | — | — | (515,187 | ) | 11,580,261 | 2.8 | 565,455 | |||
| Dreyfus Institutional Cash | ||||||||||||
| Advantage Fund | — | 2,360,050 | 1,837,550 | — | — | 522,500 | .1 | — | ||||
| Dreyfus Institutional | ||||||||||||
| Preferred Plus Money | ||||||||||||
| Market Fund | 6,438,816 | 28,074,314 | 27,291,218 | — | — | 7,221,912 | 1.8 | — | ||||
| Dreyfus Select Managers | ||||||||||||
| Small Cap Growth | ||||||||||||
| Fund, CI. I | 7,755,778 | — | 1,003,000 | 10,196 | 612,297 | 7,375,271 | 1.8 | — | ||||
| Dreyfus Select Managers | ||||||||||||
| Small Cap Value | ||||||||||||
| Fund, CI. I | 9,952,273 | 551,218 | — | — | 877,487 | 11,380,978 | 2.8 | 551,219 | ||||
| Dreyfus U.S. Equity | ||||||||||||
| Fund, CI. I | 19,269,275 | 196,262 | 4,522,000 | 387,200 | 1,219,345 | 16,550,082 | 4.0 | 196,261 | ||||
The Funds 151
NOTES TO FINANCIAL STATEMENTS (Unaudited) (continued)
| Table 3—Affiliated Investment Companies (continued) | ||||||||||
| Net Unrealized | ||||||||||
| Affiliated | Value | Net Realized | Appreciation | Value | Net | Dividends/ | ||||
| Investment Companies | 8/31/2012 | ($) | Purchases ($)† | Sales ($) | Gain (Loss) ($) | (Depreciation) ($) | 2/28/2013 | ($) | Assets (%) | Distributions ($) |
| BNY Mellon | ||||||||||
| Asset Allocation | ||||||||||
| Fund (continued) | ||||||||||
| Dreyfus/Newton | ||||||||||
| International | ||||||||||
| Equity Fund, CI. I | 4,089,966 | 65,906 | — | — | 524,493 | 4,680,365 | 1.1 | 65,906 | ||
| Global Stock Fund, CI. I | 14,605,058 | 127,520 | — | — | 1,428,731 | 16,161,309 | 3.9 | 127,520 | ||
| Total | 236,279,660 | 50,492,523 | 49,067,768 | 1,135,767 | 13,166,207 | 252,006,389 | 61.3 | 5,366,070 | ||
| † Includes reinvested dividends/distributions. | ||||||||||
security, can cause the debt security’s price to fall, potentially lowering the fund’s share price. In addition, the value of debt securities may decline due to general market conditions that are not specifically related to a particular issuer, such as real or perceived adverse economic conditions, changes in outlook for corporate earnings, changes in interest or currency rates or adverse investor sentiment. They may also decline because of factors that affect a particular industry.
BNY Mellon Focused Equity Opportunities Fund is non-diversified, which means that a relatively high percentage of the fund’s assets may be invested in a limited number of issuers. Therefore, the fund’s performance may be vulnerable to changes in market value of a single issuer or group of issuers and more susceptible to risks associated with a single economic, political or regulatory occurrence than a diversified fund.
BNY Mellon International Fund, BNY Mellon Emerging Markets Fund, BNY Mellon International Appreciation Fund and BNY Mellon International Equity Income Fund:
Investing in foreign markets may involve special risks and considerations not typically associated with investing in the U.S. These risks include revaluation of currencies, high rates of inflation, repatriation restrictions on income and capital, and adverse political and economic developments. Moreover, securities issued in these markets may be less liquid, subject to government ownership controls
and delayed settlements, and their prices may be more volatile than those of comparable securities in the U.S.
(f) Dividends to shareholders: Dividends payable to shareholders are recorded by the funds on the ex-dividend date. BNY Mellon Large Cap Stock Fund, BNY Mellon Income Stock Fund and BNY Mellon Asset Allocation Fund declare and pay dividends from investment income-net monthly. BNY Mellon International Equity Income Fund declares and pays dividends from investment income-net quarterly. BNY Mellon Large Cap Market Opportunities Fund, BNY Mellon Tax-Sensitive Large Cap Multi-Strategy Fund, BNY Mellon Mid Cap Multi-Strategy Fund, BNY Mellon Small Cap Multi-Strategy Fund, BNY Mellon U.S. Core Equity 130/30 Fund, BNY Mellon Focused Equity Opportunities Fund, BNY Mellon Small/Mid Cap Fund, BNY Mellon International Fund, BNY Mellon Emerging Markets Fund and BNY Mellon International Appreciation Fund declare and pay dividends from investment income-net annually. With respect to each series, dividends from net realized capital gains, if any, are normally declared and paid annually, but the funds may make distributions on a more frequent basis to comply with the distribution requirements of the Internal Revenue Code of 1986, as amended (the “Code”). To the extent that net realized capital gains can be offset by capital loss carryovers of that fund, it is the policy of the funds not to distribute such gains. Income and capital gain distributions are
152
determined in accordance with income tax regulations, which may differ from GAAP.
(g) Federal income taxes: It is the policy of each fund to continue to qualify as a regulated investment company, if such qualification is in the best interests of its shareholders, by complying with the applicable provisions of the Code, and to make distributions of taxable income sufficient to relieve it from substantially all federal income and excise taxes. For federal income tax purposes, each series is treated as a single entity for the purpose of determining such qualification.
As of and during the period ended February 28, 2013, the funds did not have any liabilities for any uncertain tax positions.The funds recognize interest and penalties, if any, related to uncertain tax positions as income tax expense in the Statements of Operations. During the period, the funds did not incur any interest or penalties.
Except for BNY Mellon International Equity Income Fund, each tax year in the three-year period ended August 31, 2012 remains subject to examination by the Internal Revenue Service and state taxing author-
ities. For BNY Mellon International Equity Income Fund, the period ended August 31, 2012 is subject to examination by the Internal Revenue Service and state taxing authorities.
Under the Regulated Investment Company Modernization Act of 2010 (the “2010 Act”), each relevant fund is permitted to carry forward capital losses incurred in taxable years beginning after December 22, 2010 (“post-enactment losses”) for an unlimited period. Furthermore, post-enactment capital loss carryovers retain their character as either short-term or long-term capital losses rather than short-term as they were under previous statute.The 2010 Act requires post-enactment losses to be utilized before the utilization of losses incurred in taxable years prior to the effective date of the 2010 Act (“pre-enactment losses”). As a result of this ordering rule, pre-enactment losses may be more likely to expire unused.
Table 4 summarizes each relevant fund’s unused capital loss carryover available for federal income tax purposes to be applied against future net realized capital gains, if any, realized subsequent to August 31, 2012.
| Table 4—Capital Loss Carryover | ||||||||
| Post-Enactment | Post-Enactment | |||||||
| Expiring in fiscal year | Short-Term | Long-Term | ||||||
| 2017 | ($)† | 2018($) | † | Losses ($)†† | Losses ($)††† | Total ($) | ||
| BNY Mellon Large Cap Market Opportunities Fund | — | — | 3,750,971 | 63,568 | 3,814,539 | |||
| BNY Mellon Tax-Sensitive | ||||||||
| Large Cap Multi-Strategy Fund | — | — | 2,955,508 | 79,509 | 3,035,017 | |||
| BNY Mellon Income Stock Fund | — | 2,076,295 | — | — | 2,076,295 | |||
| BNY Mellon Small Cap Multi-Strategy Fund | — | 75,753,597 | 2,131,428 | — | 77,885,025 | |||
| BNY Mellon U.S. Core Equity 130/30 Fund | 17,333,485 | 32,853,813 | — | — | 50,187,298 | |||
| BNY Mellon Focused Equity Opportunities Fund | — | — | 16,435,853 | — | 16,435,853 | |||
| BNY Mellon Small/Mid Cap Fund | — | — | 40,526,028 | — | 40,526,028 | |||
| BNY Mellon International Fund | 108,136,812 | 462,294,170 | 14,926,376 | 65,588,552 | 650,945,910 | |||
| BNY Mellon Emerging Markets Fund | — | — | 114,931,811 | 66,897,206 | 181,829,017 | |||
| BNY Mellon International Appreciation Fund | 15,657,135 | — | 1,001,755 | 21,848,035 | 38,506,925 | |||
| BNY Mellon International Equity Income Fund | — | — | 1,577,867 | — | 1,577,867 | |||
† If not applied, the carryovers expire in the above year.
The Funds 153
NOTES TO FINANCIAL STATEMENTS (Unaudited) (continued)
Table 5 summarizes each fund’s tax character of distributions paid to shareholders during the fiscal year ended August 31, 2012.The tax character of current year distributions will be determined at the end of the current fiscal year.
(h) New Accounting Pronouncements:
BNY Mellon Large Cap Stock Fund, BNY Mellon Income Stock Fund, BNY Mellon Mid Cap Multi-Strategy Fund, BNY Mellon Small Cap Multi-Strategy Fund, BNY Mellon U.S. Core Equity 130/30 Fund, BNY Mellon Focused Equity Opportunities Fund, BNY Mellon International Fund, BNY Mellon Emerging Markets Fund, BNY Mellon International Appreciation Fund and BNY Mellon International Equity Income Fund:
In January 2013, FASB issued Accounting Standards Update No. 2013-01 (“ASU 2013-01”), Clarifying the Scope of Disclosures about Offsetting Assets and Liabilities, replaced Accounting Standards Update No. 2011-11 (“ASU 2011-11”), Disclosures about Offsetting Assets and Liabilities.ASU 2013-01 is effective for fiscal years beginning on or after January 1, 2013, and interim periods within those annual periods. ASU 2011-11 was intended to enhance disclosure requirements on the offsetting of financial assets and liabilities.ASU 2013-01 limits the scope of the new balance sheet offsetting disclosures to derivatives, repurchase agreements, and securities lending transactions to the extent that they are (1) offset in the financial statements or (2) subject to an enforceable master netting arrangement or similar agreement. Management is currently evaluating the application of ASU 2013-01 and its impact on the fund’s financial statements.
NOTE 3—Bank Lines of Credit:
The funds participate with other Dreyfus-managed funds in a $210 million unsecured credit facility led by Citibank, N.A. and a $300 million unsecured credit facility provided by The Bank of New York Mellon (each, a “Facility”), each to be utilized primarily for temporary or emergency purposes, including the financing of redemptions. Prior to October 10, 2012, the unsecured credit facility with Citibank, N.A. was $225 million. In connection therewith, each fund has agreed to pay its pro rata portion of commitment fees for each Facility. Interest is charged to the funds based on rates deter-
Table 5—Tax Character of Distributions Paid
| Ordinary Income ($) | Long-Term Capital Gains ($) | |
| 2012 | 2012 | |
| BNY Mellon Large Cap Stock Fund | 9,551,913 | — |
| BNY Mellon Large Cap Market Opportunities Fund | 385,167 | — |
| BNY Mellon Tax-Sensitive Large Cap Multi-Strategy Fund | 415,070 | — |
| BNY Mellon Income Stock Fund | 12,483,466 | — |
| BNY Mellon Mid Cap Multi-Strategy Fund | 4,817,548 | 36,147,909 |
| BNY Mellon Small Cap Multi-Strategy Fund | 8,993,932 | — |
| BNY Mellon U.S. Core Equity 130/30 Fund | 1,699,019 | — |
| BNY Mellon Focused Equity Opportunities Fund | 650,631 | 903,915 |
| BNY Mellon Small/Mid Cap Fund | 6,819,275 | — |
| BNY Mellon International Fund | 26,827,106 | — |
| BNY Mellon Emerging Markets Fund | 23,631,029 | 66,325,265 |
| BNY Mellon International Appreciation Fund | 6,550,704 | — |
| BNY Mellon International Equity Income Fund | 1,534,721 | — |
| BNY Mellon Asset Allocation Fund | 7,301,278 | 1,702,774 |
154
mined pursuant to the terms of the respective Facility at the time of borrowing. During the period ended February 28, 2013, BNY Mellon Large Cap Market Opportunities Fund, BNY Mellon Mid Cap Multi-Strategy Fund, BNY Mellon Small Cap Multi-Strategy Fund, BNY Mellon International Equity Income Fund and BNY Mellon Asset Allocation Fund did not borrow under the Facilities.
The average amount of borrowings outstanding under the Facilities during the period ended February 28, 2013 for BNY Mellon Large Cap Stock Fund, was approximately $841,400 with a related weighted average annualized interest rate of 1.15%.
The average amount of borrowings outstanding under the Facilities during the period ended February 28, 2013 for BNY MellonTax-Sensitive Large Cap Multi-Strategy Fund, was approximately $402,800 with a related weighted average annualized interest rate of 1.14%.
The average amount of borrowings outstanding under the Facilities during the period ended February 28, 2013 for BNY Mellon Income Stock Fund, was approximately $23,800 with a related weighted average annualized interest rate of 1.15%.
The average amount of borrowings outstanding under the Facilities during the period ended February 28, 2013 for BNY Mellon U.S. Core Equity 130/30 Fund, was approximately $664,100 with a related weighted average annualized interest rate of 1.14%.
The average amount of borrowings outstanding under the Facilities during the period ended February 28, 2013 for BNY Mellon Focused Equity Opportunities Fund, was approximately $14,400 with a related weighted average annualized interest rate of 1.15%.
The average amount of borrowings outstanding under the Facilities during the period ended February 28, 2013 for BNY Mellon Small/Mid Cap Fund, was approximately $1,030,900 with a related weighted average annualized interest rate of 1.15%.
The average amount of borrowings outstanding under the Facilities during the period ended February 28, 2013 for BNY Mellon International Fund, was approximately $627,100 with a related weighted average annualized interest rate of 1.15%.
The average amount of borrowings outstanding under the Facilities during the period ended February 28, 2013 for BNY Mellon Emerging Markets Fund, was approximately $678,500 with a related weighted average annualized interest rate of 1.15%.
The average amount of borrowings outstanding under the Facilities during the period ended February 28, 2013 for BNY Mellon International Appreciation Fund, was approximately $15,500 with a related weighted average annualized interest rate of 1.15%.
NOTE 4—Investment Advisory Fee, Administration Fee, Sub-Investment Advisory Fee and Other Transactions With Affiliates:
(a) Fees payable by the funds pursuant to the provisions of an investment advisory agreement with the Investment Adviser are payable monthly, computed on the average daily value of each fund’s net assets at the following annual rates: .65% of BNY Mellon Large Cap Stock Fund, .70% (direct investment in securities) and .15% (other underlying funds, which may consist of affiliated funds, mutual funds and exchange traded funds) of BNY Mellon Large Cap Market Opportunities Fund, .70% (direct investment in securities) and .15% (other underlying funds, which may consist of affiliated funds, mutual funds and exchange traded funds) of BNY Mellon Tax-Sensitive Large Cap Multi-Strategy Fund, .65% of BNY Mellon Income Stock Fund, .75% of BNY Mellon Mid Cap Multi-Strategy Fund, .85% of BNY Mellon Small Cap Multi-Strategy Fund, .80% of BNY Mellon U.S. Core Equity 130/30 Fund, .70% of BNY Mellon Focused Equity Opportunities Fund, .75% of BNY Mellon Small/Mid Cap Fund, .85% of BNY Mellon International Fund, 1.15% of BNY Mellon Emerging
The Funds 155
NOTES TO FINANCIAL STATEMENTS (Unaudited) (continued)
Markets Fund, .50% of BNY Mellon International Appreciation Fund, .85% of BNY Mellon International Equity Income Fund and .65% (equity investments), .40% (debt securities) and .15% (money market investments and other underlying funds, which may consist of affiliated funds, mutual funds and exchange traded funds) of BNY Mellon Asset Allocation Fund.
For BNY Mellon Large Cap Market Opportunities Fund, the Investment Adviser had contractually agreed, from September 1, 2012 through January 1, 2013, to waive receipt of its fees and/or assume the expenses of the fund, so that the fund’s total annual operating expenses (including indirect fees and expenses of the underlying funds, but excluding Shareholder Services Plan fees, taxes, interest expense, brokerage commissions, commitment fees on borrowing and extraordinary expenses) did not exceed 1.25% of the value of the average daily net assets of their respective class. During the period ended February 28, 2013, there was no reduction in expenses.
For BNY Mellon Tax-Sensitive Large Cap Multi-Strategy Fund, the Investment Adviser had contractually agreed, from September 1, 2012 through January 1, 2013, to waive receipt of its fees and/or assume the expenses of the fund, so that the fund’s total annual operating expenses (including indirect fees and expenses of the underlying funds, but excluding Shareholder Services Plan fees, taxes, interest expense, brokerage commissions, commitment fees on borrowings and extraordinary expenses), did not exceed 1.15% of the value of the average daily net assets of their respective class.The reduction in expenses, pursuant to the undertaking, amounted to $77 during the period ended February 28, 2013.
For BNY Mellon International Equity Income Fund, the Investment Adviser has contractually agreed, from September 1, 2012 through January 1, 2014, to waive
receipt of its fees and/or assume the expenses of the fund, so that the fund’s total annual operating expenses (excluding Shareholder Services Plan fees, taxes, interest expense, brokerage commissions, commitment fees on borrowings and extraordinary expenses) do not exceed 1.20% of the value of the average daily net assets of their respective class. The reduction in expenses, pursuant to the undertaking, amounted to $9 during the period ended February 28, 2013.
For BNY Mellon Asset Allocation Fund, the Investment Adviser has contractually agreed, from September 1, 2012 through December 31, 2013, to waive receipt of its fees and/or assume the expenses of the fund, so that the fund’s total annual fund operating expenses (including indirect fees and expenses of the underlying funds, but excluding Shareholder Services Plan fees, taxes, interest expense, brokerage commissions, commitment fees on borrowings and extraordinary expenses) do not exceed .87% of the value of the average daily net assets of their respective class. The reduction in expenses, pursuant to the undertaking, amounted to $253,843 during the period ended February 28, 2013.
Pursuant to the Administration Agreement,The Bank of New York Mellon provides or arranges for fund accounting, transfer agency and other fund administration services and receives a fee based on the total net assets of the Trust based on the following rates:
| 0 up to $6 billion | .15 | % |
| $6 billion up to $12 billion | .12 | % |
| In excess of $12 billion | .10 | % |
No administration fee is applied to assets held by BNY Mellon Large Cap Market Opportunities Fund and BNY Mellon Tax-Sensitive Large Cap Multi-Strategy Fund which are invested in shares of other underlying funds.
156
No administration fee is applied to assets held by BNY Mellon Asset Allocation Fund which are invested in cash or money market instruments or shares of other underlying funds.
The Bank of NewYork Mellon pays each fund’s transfer agent fees out of the administration fee it receives from the Trust.
Pursuant to a Sub-Investment Advisory Agreement between Dreyfus and Walter Scott, Dreyfus pays Walter Scott a monthly fee at an annual rate of .41% of BNY Mellon Large Cap Market Opportunities Fund’s and BNY Mellon Tax-Sensitive Large Cap Multi-Strategy Fund’s average daily net assets allocated to the U.S. Large Cap Equity Strategy.
Pursuant to a Sub-Investment Advisory Agreement between Dreyfus and Robeco and a Sub-Investment Advisory Agreement between Dreyfus and Geneva, Dreyfus pays Robeco and Geneva separate monthly fees at an annual percentage of BNY Mellon Mid Cap Multi-Strategy Fund’s average daily net assets allocated to the Robeco Mid CapValue Strategy and Geneva Mid Cap Growth Strategy, respectively.
(b) The funds have adopted a Shareholder Services Plan with respect to their Investor shares. Each fund pays the Distributor for the provision of certain services to holders of Investor shares a fee at an annual rate of .25% of the value of the average daily net assets attributable to Investor shares.The services provided may include personal services relating to shareholder accounts, such as answering shareholder inquiries regarding a fund and providing reports and other information, and services related to the maintenance of such shareholder accounts. The Shareholder Services Plan allows the Distributor to make payments from the shareholder services fees it collects from each fund to compensate service agents (certain banks, securi-
ties brokers or dealers and other financial institutions) with respect to these services. Table 6 summarizes the amounts Investor shares were charged during the period ended February 28, 2013, pursuant to the Shareholder Services Plan. Additional fees included in Shareholder servicing costs in the Statements of Operations include fees paid for cash management charges.
| Table 6—Shareholder Services Plan Fees | ||
| BNY Mellon Large Cap Stock Fund | $ | 15,216 |
| BNY Mellon Large Cap | ||
| Market Opportunities Fund | 36 | |
| BNY Mellon Tax-Sensitive | ||
| Large Cap Multi-Strategy Fund | 320 | |
| BNY Mellon Income Stock Fund | 2,074 | |
| BNY Mellon Mid Cap | ||
| Multi-Strategy Fund | 30,753 | |
| BNY Mellon Small Cap | ||
| Multi-Strategy Fund | 7,970 | |
| BNY Mellon U.S. Core | ||
| Equity 130/30 Fund | 335 | |
| BNY Mellon Focused | ||
| Equity Opportunities Fund | 336 | |
| BNY Mellon Small/Mid Cap Fund | 1,065 | |
| BNY Mellon International Fund | 5,130 | |
| BNY Mellon Emerging Markets Fund | 21,022 | |
| BNY Mellon International | ||
| Appreciation Fund | 5,219 | |
| BNY Mellon International | ||
| Equity Income Fund | 56 | |
| BNY Mellon Asset Allocation Fund | 6,407 |
The funds have arrangements with the transfer agent and the custodian whereby the funds may receive earnings credits when positive cash balances are maintained, which are used to offset transfer agency and custody fees. For financial reporting purposes, the funds include net earnings credits as an expense offset in the Statements of Operations.
The Funds 157
NOTES TO FINANCIAL STATEMENTS (Unaudited) (continued)
The funds compensate The Bank of New York Mellon under a custody agreement for providing custodial services for the funds. Table 7 summarizes the amount each fund was charged during the period ended February 28, 2013, pursuant to the custody agreement.
| Table 7—Custody Agreement Fees | ||
| BNY Mellon Large Cap Stock Fund | $ | 39,452 |
| BNY Mellon Large Cap | ||
| Market Opportunities Fund | 10,260 | |
| BNY Mellon Tax-Sensitive | ||
| Large Cap Multi-Strategy Fund | 10,200 | |
| BNY Mellon Income Stock Fund | 25,772 | |
| BNY Mellon Mid Cap | ||
| Multi-Strategy Fund | 70,344 | |
| BNY Mellon Small Cap | ||
| Multi-Strategy Fund | 32,234 | |
| BNY Mellon U.S. Core | ||
| Equity 130/30 Fund | 19,786 | |
| BNY Mellon Focused Equity | ||
| Opportunities Fund | 16,622 | |
| BNY Mellon Small/Mid Cap Fund | 27,011 | |
| BNY Mellon International Fund | 164,214 | |
| BNY Mellon Emerging Markets Fund | 973,142 | |
| BNY Mellon International | ||
| Appreciation Fund | 5,220 |
| Table 7—Custody Agreement Fees (continued) | |
| BNY Mellon International | |
| Equity Income Fund | 19,993 |
| BNY Mellon Asset Allocation Fund | 6,784 |
The funds compensate Dreyfus Transfer, Inc., a wholly-owned subsidiary of Dreyfus, under a transfer agency agreement for providing cash management services related to fund subscriptions and redemptions.The funds also compensate The Bank of New York Mellon under a cash management agreement for providing certain cash management services. Table 8 summarizes the amount each fund was charged during the period ended February 28, 2013, for cash management services, which is included in “Shareholder servicing costs” in the Statements of Operations. These fees were partially offset by earnings credits for each fund, also summarized in Table 8.
During the period ended February 28, 2013, each fund was charged $3,981 for services performed by the Chief Compliance Officer and his staff.
Table 9 summarizes the components of “Due to The Dreyfus Corporation and affiliates” in the Statements of Assets and Liabilities for each fund.
| Table 8—Cash Management Agreement Fees | ||||
| The Bank of | The Bank of | |||
| New York Mellon | New York Mellon | Dreyfus Transfer, Inc. | Dreyfus Transfer, Inc. | |
| Cash Management Fees ($) | Earnings Credits ($) | Cash Management Fees ($) | Earnings Credits ($) | |
| BNY Mellon Large Cap Stock Fund | 21 | — | 33 | 5 |
| BNY Mellon Large Cap | ||||
| Market Opportunities Fund | 1 | — | 3 | — |
| BNY Mellon Tax-Sensitive | ||||
| Large Cap Multi-Strategy Fund | 1 | — | 3 | — |
| BNY Mellon Income Stock Fund | 10 | — | 16 | 2 |
| BNY Mellon Mid Cap Multi-Strategy Fund | 417 | 5 | 681 | 103 |
| BNY Mellon Small Cap Multi-Strategy Fund | 112 | 1 | 182 | 28 |
| BNY Mellon U.S. Core Equity 130/30 Fund | 3 | — | 6 | 1 |
| BNY Mellon Focused Equity Opportunities Fund | 4 | — | 6 | 1 |
| BNY Mellon Small/Mid Cap Fund | 6 | — | 9 | 2 |
| BNY Mellon International Fund | 22 | — | 37 | 6 |
| BNY Mellon Emerging Markets Fund | 68 | 1 | 109 | 16 |
| BNY Mellon International Appreciation Fund | 46 | 1 | 75 | 11 |
| BNY Mellon International Equity Income Fund | 3 | — | 5 | 1 |
| BNY Mellon Asset Allocation Fund | 6 | — | 9 | 1 |
158
(c) The Board members who are not “affiliated persons” as defined under the Act receive from the Trust an annual fee of $80,000 and an attendance fee of $7,500 for each in-person meeting attended and $500 for telephone meetings and are reimbursed for travel and out-of-pocket expenses. The Chairman of the Board receives an additional annual
fee of $20,000 and the Chairman of the Trust’s Audit Committee receives an additional annual fee of $15,000.
NOTE 5—Securities Transactions:
Table 10 summarizes each fund’s aggregate amount of purchases and sales (including paydowns) of investment
| Table 9—Due to The Dreyfus Corporation and Affiliates | ||||||
| Investment | Shareholder | Chief | ||||
| Advisory | Services | Custodian | Compliance | Less Expense | ||
| Fees ($) | Plan Fees ($) | Fees ($) | Officer Fees ($) | Reimbursement ($) | ||
| BNY Mellon Large Cap Stock Fund | 390,920 | 2,314 | 32,500 | 5,308 | — | |
| BNY Mellon Large Cap Market Opportunities Fund | 85,157 | 6 | 6,500 | 5,308 | — | |
| BNY Mellon Tax-Sensitive | ||||||
| Large Cap Multi-Strategy Fund | 288,002 | 3 | 8,040 | 5,308 | — | |
| BNY Mellon Income Stock Fund | 332,238 | 362 | 17,004 | 5,308 | — | |
| BNY Mellon Mid Cap Multi-Strategy Fund | 789,824 | 4,788 | 50,044 | 5,308 | — | |
| BNY Mellon Small Cap Multi-Strategy Fund | 173,280 | 1,286 | 25,000 | 5,308 | — | |
| BNY Mellon U.S. Core Equity 130/30 Fund | 126,791 | 52 | 16,662 | 5,308 | — | |
| BNY Mellon Focused Equity Opportunities Fund | 237,016 | 56 | 14,023 | 5,308 | — | |
| BNY Mellon Small/Mid Cap Fund | 275,881 | 140 | 20,033 | 5,308 | — | |
| BNY Mellon International Fund | 349,038 | 761 | 160,187 | 5,308 | — | |
| BNY Mellon Emerging Markets Fund | 2,006,203 | 3,098 | 800,051 | 5,308 | — | |
| BNY Mellon International Appreciation Fund | 42,627 | 856 | 6,070 | 5,308 | — | |
| BNY Mellon International Equity Income Fund | 87,128 | 5 | 25,000 | 5,308 | — | |
| BNY Mellon Asset Allocation Fund | 88,946 | 1,011 | 9,033 | 5,308 | (42,159 | ) |
| Table 10—Purchases and Sales | ||||||
| Purchases ($) | Sales ($) | |||||
| BNY Mellon Large Cap Stock Fund | 252,882,482 | 524,215,370 | ||||
| BNY Mellon Large Cap Market Opportunities Fund | 37,740,149 | 18,922,884 | ||||
| BNY Mellon Tax-Sensitive Large Cap Multi-Strategy Fund | 492,595,615 | 39,930,630 | ||||
| BNY Mellon Income Stock Fund | 167,063,158 | 105,896,410 | ||||
| BNY Mellon Mid Cap Multi-Strategy Fund | 1,019,134,177 | 789,266,215 | ||||
| BNY Mellon Small Cap Multi-Strategy Fund | 218,637,423 | 214,796,457 | ||||
| BNY Mellon Focused Equity Opportunities Fund | 172,404,529 | 230,537,817 | ||||
| BNY Mellon Small/Mid Cap Fund | 572,482,270 | 664,122,673 | ||||
| BNY Mellon International Fund | 122,387,589 | 229,071,552 | ||||
| BNY Mellon Emerging Markets Fund | 453,869,679 | 645,231,738 | ||||
| BNY Mellon International Appreciation Fund | 808,679 | 28,527,057 | ||||
| BNY Mellon International Equity Income Fund | 88,693,185 | 46,691,554 | ||||
| BNY Mellon Asset Allocation Fund | 59,275,215 | 65,385,051 | ||||
| BNY Mellon U.S. Core Equity 130/30 Fund | ||||||
| Long transactions | 160,663,953 | 278,766,086 | ||||
| Short sale transactions | 117,653,360 | 85,193,459 | ||||
| Total | 278,317,313 | 363,959,545 | ||||
The Funds 159
NOTES TO FINANCIAL STATEMENTS (Unaudited) (continued)
securities and securities sold short, excluding short-term securities, financial futures, options transactions and forward contracts, during the period ended February 28, 2013.
Short Sales: BNY Mellon U.S. Core Equity 130/30 Fund is engaged in short-selling which obligates the fund to replace the security borrowed by purchasing the security at current market value.The fund incurs a loss if the price of the security increases between the date of the short sale and the date on which the fund replaces the borrowed security. The fund realizes a gain if the price of the security declines between those dates. Until the fund replaces the borrowed security, the fund will maintain daily a segregated account with a broker or
custodian of permissible liquid assets sufficient to cover its short position. Securities Sold Short at February 28, 2013 and their related market values and proceeds, are set forth in the Statement of Securities Sold Short.
Derivatives: A derivative is a financial instrument whose performance is derived from the performance of another asset. Each type of derivative instrument that was held by each relevant fund during the period ended February 28, 2013 is discussed below.
Table 11 shows BNY Mellon International Appreciation Fund’s exposure to different types of market risk as it relates to the Statement of Assets and Liabilities and the Statement of Operations, respectively.
Table 11—Derivatives and Hedging
Fair value of derivative instruments for BNY Mellon International Appreciation Fund as of February 28, 2013 is shown below:
| Derivative | Derivative | |||
| Assets ($) | Liabilities ($) | |||
| Equity risk | — | Equity risk1 | (8,443 | ) |
| Gross fair value of derivatives contracts | — | (8,443 | ) |
Statement of Assets and Liabilities location:
1 Includes cumulative (depreciation) on financial futures as reported in the Statement of Financial Futures, but only the unpaid variation margin is reported in the
Statement of Assets and Liabilities.
The effect of derivative instruments in the Statement of Operations for BNY Mellon International Appreciation Fund during the period ended February 28, 2013 is shown below:
| Amount of realized gain (loss) on derivatives recognized in income ($) | |||||
| Underlying risk | Financial Futures2 | Forward Contracts3 | Total | ||
| Equity | 272,942 | — | 272,942 | ||
| Foreign exchange | — | 32,962 | 32,962 | ||
| Total | 272,942 | 32,962 | 305,904 | ||
| Change in unrealized appreciation (depreciation) on derivatives recognized in income ($) | |||||
| Underlying risk | Financial Futures4 | Forward Contracts5 | Total | ||
| Equity | 18,121 | — | 18,121 | ||
| Foreign exchange | — | (18,881 | ) | (18,881 | ) |
| Total | 18,121 | (18,881 | ) | (760 | ) |
Statement of Operations location:
2 Net realized gain (loss) on financial futures.
3 Net realized gain (loss) on forward foreign currency exchange contracts.
4 Net unrealized appreciation (depreciation) on financial futures.
5 Net unrealized appreciation (depreciation) on forward foreign currency exchange contracts.
160
Financial Futures: In the normal course of pursuing its investment objective, BNY Mellon Large Cap Stock Fund, BNY Mellon Mid Cap Multi-Strategy Fund, BNY Mellon Small Cap Multi-Strategy Fund, BNY Mellon U.S. Core Equity 130/30 Fund, BNY Mellon Focused Equity Opportunities Fund and BNY Mellon International Appreciation Fund are exposed to market risk, including equity price risk as a result of changes in value of underlying financial instruments. The funds invest in financial futures in order to manage their exposure to or protect against changes in the market.A financial futures contract represents a commitment for the future purchase or a sale of an asset at a specified date. Upon entering into such contracts, these investments require initial margin deposits with a counterparty, which consist of cash or cash equivalents.The amount of these deposits is determined by the exchange or Board ofTrade on which the contract is traded and is subject to change. Accordingly, variation margin payments are received or made to reflect daily unrealized gains or losses which are recorded in the Statements of Operations.When the contracts are closed, the funds recognize a realized gain or loss which is reflected in the Statements of Operations. There is minimal counterparty credit risk to the funds with financial futures since they are exchange traded, and the exchange’s clearinghouse guarantees the financial futures against default. Financial futures open at February 28, 2013 are set forth in the Statements of Financial Futures. At February 28, 2013, BNY Mellon Large Cap Stock Fund, BNY Mellon Mid Cap Multi-Strategy Fund, BNY Mellon Small Cap Multi-Strategy Fund, BNY Mellon U.S. Core Equity 130/30 Fund and BNY Mellon Focused Equity Opportunities Fund did not have open financial futures outstanding.
Options Transactions: BNY Mellon Income Stock Fund purchases and writes (sells) put and call options to hedge against changes in the values of equities, or as a substitute for an investment.The fund is subject to market risk in the course of pursuing its investment objectives through its investments in options contracts. A call
option gives the purchaser of the option the right (but not the obligation) to buy, and obligates the writer to sell, the underlying security or securities at the exercise price at any time during the option period, or at a specified date. Conversely, a put option gives the purchaser of the option the right (but not the obligation) to sell, and obligates the writer to buy the underlying security or securities at the exercise price at any time during the option period, or at a specified date.
As a writer of call options, the fund receives a premium at the outset and then bears the market risk of unfavorable changes in the price of the financial instrument underlying the option. Generally, the fund realizes a gain, to the extent of the premium, if the price of the underlying financial instrument decreases between the date the option is written and the date on which the option is terminated. Generally, the fund incurs a loss if the price of the financial instrument increases between those dates.
As a writer of put options, the fund receives a premium at the outset and then bears the market risk of unfavorable changes in the price of the financial instrument underlying the option. Generally, the fund realizes a gain, to the extent of the premium, if the price of the underlying financial instrument increases between the date the option is written and the date on which the option is terminated. Generally, the fund incurs a loss if the price of the financial instrument decreases between those dates.
As a writer of an option, the fund has no control over whether the underlying securities may be sold (call) or purchased (put) and as a result bears the market risk of an unfavorable change in the price of the security underlying the written option. There is a risk of loss from a change in value of such options which may exceed the related premiums received.The Statement of Operations reflects the following: any unrealized gains or losses which occurred during the period as well as any realized gains or losses which occurred upon the expiration or closing of the option transaction.
The Funds 161
NOTES TO FINANCIAL STATEMENTS (Unaudited) (continued)
Table 12 summarizes BNY Mellon Income Stock Fund’s call/put options written during the period ended February 28, 2013.
Forward Foreign Currency Exchange Contracts: BNY Mellon International Fund, BNY Mellon Emerging Markets Fund, BNY Mellon International Appreciation Fund and BNY Mellon International Equity Income Fund enter into forward contracts in order to hedge their exposure to changes in foreign currency exchange rates on its foreign portfolio holdings, to settle foreign currency transactions or as a part of their investment strategies. When executing forward contracts, each fund is obligated to buy or sell a foreign currency at a specified rate on a certain date in the future. With respect to sales of forward contracts, each fund incurs a loss if the value of the contract increases between the date the forward contract is opened and the
date the forward contract is closed. Each fund realizes a gain if the value of the contract decreases between those dates. With respect to purchases of forward contracts, each fund incurs a loss if the value of the contract decreases between the date the forward contract is opened and the date the forward contract is closed. Each fund realizes a gain if the value of the contract increases between those dates. Any realized or unrealized gains or losses which occurred during the period are reflected in the Statements of Operations. Each fund is exposed to foreign currency risk as a result of changes in value of underlying financial instruments. Each fund is also exposed to credit risk associated with counterparty nonperformance on these forward contracts, which is typically limited to the unrealized gain on each open contract. Table 13 summarizes open forward contracts for each relevant fund at February 28, 2013.
Table 12—Options Written
| BNY Mellon Income Stock Fund | Options Terminated | ||||||
| Number of | Premiums | Net Realized | |||||
| Options Written | Contracts | Received ($) | Cost ($) | Gain ($) | |||
| Contracts outstanding August 31, 2012 | — | — | |||||
| Contracts written | 5,246 | 207,617 | |||||
| Contracts terminated: | |||||||
| Contracts closed | 3,540 | 195,439 | 20,674 | 174,765 | |||
| Contracts expired | 1,706 | 12,178 | — | 12,178 | |||
| Total contracts terminated | 5,246 | 207,617 | 20,674 | 186,943 | |||
| Contracts outstanding February 28, 2013 | — | — | |||||
| Table 13—Forward Foreign Currency Exchange Contracts | |||||||
| BNY Mellon International Fund | |||||||
| Foreign | Unrealized | ||||||
| Currency | Appreciation | ||||||
| Forward Foreign Currency Exchange Contracts | Amounts | Cost ($) | Value ($) | (Depreciation) ($) | |||
| Purchases: | |||||||
| British Pound, Expiring 3/1/2013a | 83,508 | 126,610 | 126,687 | 77 | |||
| Japanese Yen, Expiring 3/4/2013b | 8,394,756 | 91,023 | 90,568 | (455 | ) | ||
| Sales; | Proceeds ($) | ||||||
| Japanese Yen, Expiring 3/4/2013c | 68,008,732 | 743,135 | 733,722 | 9,413 | |||
| Gross Unrealized Appreciation | 9,490 | ||||||
| Gross Unrealized Depreciation | (455 | ) | |||||
Counterparties:
a Barclays Bank
b Morgan Stanley
c JPMorgan Chase & Co.
162
| Table 13—Forward Foreign Currency Exchange Contracts (continued) | ||||||
| BNY Mellon Emerging Markets Fund | ||||||
| Foreign | Unrealized | |||||
| Currency | Appreciation | |||||
| Forward Foreign Currency Exchange Contracts | Amounts | Cost ($) | Value ($) | (Depreciation) ($) | ||
| Purchases: | ||||||
| Brazilian Real, Expiring 3/5/2013a | 5,772,551 | 2,933,505 | 2,916,314 | (17,191 | ) | |
| Hungarian Forint, Expiring 3/4/2013a | 11,079,916 | 49,093 | 48,955 | (138 | ) | |
| Indian Rupee, Expiring 3/1/2013b | 60,239,231 | 1,106,322 | 1,107,237 | 915 | ||
| Malaysian Ringgit, Expiring 3/1/2013c | 444,730 | 143,879 | 143,902 | 23 | ||
| Taiwan Dollar, Expiring 3/1/2013d | 221,760,000 | 7,491,892 | 7,475,098 | (16,794 | ) | |
| Sales: | Proceeds ($) | |||||
| South Korean Won, Expiring: | ||||||
| 3/4/2013c | 708,135,399 | 654,046 | 653,970 | 76 | ||
| 3/5/2013c | 358,502,277 | 327,998 | 331,081 | (3,083 | ) | |
| Thai Baht, Expiring 3/5/2013c | 107,062,756 | 3,598,143 | 3,598,748 | (605 | ) | |
| Gross Unrealized Appreciation | 1,014 | |||||
| Gross Unrealized Depreciation | (37,811 | ) | ||||
| Counterparties: | |
| a | Citigroup |
| b | Deutsche Bank |
| c | HSBC |
| d | Standard Chartered Bank |
| Table 13—Forward Foreign Currency Exchange Contracts (continued) | |||||
| BNY Mellon International Equity Income Fund | |||||
| Foreign | |||||
| Currency | Unrealized | ||||
| Forward Foreign Currency Exchange Contracts | Amounts | Cost ($) | Value ($) | (Depreciation) ($) | |
| Purchases; | |||||
| Euro, Expiring 3/1/2013a | 567,565 | 743,453 | 740,985 | (2,468 | ) |
| Sales; | Proceeds ($) | ||||
| Polish Zloty, Expiring 3/1/2013a | 2,012,563 | 632,106 | 633,439 | (1,333 | ) |
| (3,801 | ) | ||||
| Counterparty: |
| a Goldman Sachs |
The Funds 163
NOTES TO FINANCIAL STATEMENTS (Unaudited) (continued)
Table 14 summarizes each relevant fund’s average market value of derivatives outstanding during the period ended February 28, 2013.
Table 15 summarizes gross appreciation, gross depreciation and accumulated net unrealized appreciation (depreciation) on investments for each fund at February 28, 2013.
At February 28, 2013, the cost of investments for federal income tax purposes was substantially the same as the cost for financial reporting purposes (see the Statements of Investments).
| Table 14—Average Market Value of Derivatives | ||||
| Average | ||||
| Market Value ($) | ||||
| BNY Mellon Income Stock Fund | ||||
| Equity options contracts | 26,261 | |||
| BNY Mellon Mid Cap Multi-Strategy Fund | ||||
| Equity financial futures | 28,149,461 | |||
| BNY Mellon International Fund | ||||
| Forward contracts | 3,795,885 | |||
| BNY Mellon Emerging Markets Fund | ||||
| Forward contracts | 3,822,139 | |||
| BNY Mellon International Appreciation Fund | ||||
| Equity financial futures | 1,710,594 | |||
| Forward contracts | 887,250 | |||
| BNY Mellon International Equity Income Fund | ||||
| Forward contracts | 214,738 | |||
| Table 15—Accumulated Net Unrealized Appreciation (Depreciation) | ||||
| Gross | Gross | |||
| Appreciation ($) | Depreciation ($) | Net ($) | ||
| BNY Mellon Large Cap Stock Fund | 193,045,198 | 4,230,468 | 188,814,730 | |
| BNY Mellon Large Cap Market Opportunities Fund | 26,082,968 | 2,072,952 | 24,010,016 | |
| BNY Mellon Tax-Sensitive Large Cap Multi-Strategy Fund | 28,944,989 | 2,776,198 | 26,168,791 | |
| BNY Mellon Income Stock Fund | 106,056,894 | 12,451,977 | 93,604,917 | |
| BNY Mellon Mid Cap Multi-Strategy Fund | 190,052,405 | 11,939,320 | 178,113,085 | |
| BNY Mellon Small Cap Multi-Strategy Fund | 29,911,513 | 5,082,422 | 24,829,091 | |
| BNY Mellon U.S. Core Equity 130/30 Fund | 42,589,821 | 813,202 | 41,776,619 | |
| BNY Mellon Focused Equity Opportunities Fund | 79,883,718 | 3,014,254 | 76,869,464 | |
| BNY Mellon Small/Mid Cap Fund | 48,210,536 | 8,872,599 | 39,337,937 | |
| BNY Mellon International Fund | 48,778,035 | 76,674,552 | (27,896,517 | ) |
| BNY Mellon Emerging Markets Fund | 361,760,773 | 202,641,284 | 159,119,489 | |
| BNY Mellon International Appreciation Fund | 15,070,752 | 43,603,772 | (28,533,020 | ) |
| BNY Mellon International Equity Income Fund | 14,443,047 | 1,874,401 | 12,568,646 | |
| BNY Mellon Asset Allocation Fund | 49,446,764 | 596,561 | 48,850,203 | |
164
PROXY RESULTS (Unaudited)
BNY Mellon Funds Trust, on behalf of BNY Mellon Mid Cap Multi-Strategy Fund (the Fund), held a special meeting of shareholders on February 28, 2013.The proposals considered at the meeting and the results are as follows:
| Shares | |||||
| Votes For | Authority Withheld | Abstain | |||
| 1 | . | To approve the implementation of a multi-manager | |||
| arrangement whereby BNY Mellon Fund Advisers, | |||||
| a division of The Dreyfus Corporation, the Fund’s | |||||
| investment adviser (the Adviser), under certain | |||||
| circumstances, would be able to hire and replace | |||||
| sub-investment advisers for the Fund without | |||||
| obtaining shareholder approval. | 103,970,451 | 101,361 | 65,178 | ||
| 2 | . | To approve a sub-investment advisory agreement | |||
| for the Fund between the Adviser and | |||||
| Geneva Capital Management, Ltd. | 103,990,909 | 82,754 | 63,327 |
The Funds 165
INFORMATION ABOUT THE APPROVAL OF THE GENEVA
SUB-ADVISORY AGREEMENT (Unaudited)
At a meeting of the Board of Trustees of BNY Mellon Funds Trust (the “Trust”), a Massachusetts business trust, held on December 4, 2012 (the “Board Meeting”), BNY Mellon Fund Advisers, a division of The Dreyfus Corporation, the investment adviser (the “Adviser”) for BNY Mellon Mid Cap Multi-Strategy Fund (the “Fund”), a series of theTrust, recommended the appointment of Geneva Capital Management Ltd. (“Geneva”), an unaffiliated sub-investment adviser, to serve as a sub-investment adviser for the Fund.The recommendation of Geneva was based on, among other information, the Adviser’s review and due diligence report relating to Geneva and its investment advisory services. In the opinion of the Adviser, the proposed allocation to Geneva of a portion of the Fund’s assets, with no increase in the advisory fee paid by the Fund, would be in the best interests of the Fund’s shareholders.
At the Board Meeting, the Board, including a majority of theTrustees who are not “interested persons” (as that term is defined in the Investment Company Act of 1940, as amended (the “1940 Act”)) of the Fund or the Adviser (the “IndependentTrustees”), considered and approved the Geneva Sub-Advisory Agreement. In determining whether to approve the Geneva Sub-Advisory Agreement, the Board considered the due diligence materials prepared by the Adviser and other information received in advance of the Board Meeting, which was comprised of: (i) a copy of the Geneva Sub-Advisory Agreement between the Adviser and Geneva; (ii) information regarding the process by which the Adviser selected and recommended Geneva for Board approval; (iii) information regarding the nature, extent and quality of the services Geneva would provide to the Fund; (iv) information regarding Geneva’s investment process, reputation, investment management business, personnel, and operations; (v) information regarding Geneva’s brokerage and trading policies and practices; (vi) information regarding the level of sub-investment advisory fee to be charged by Geneva; (vii) information regarding Geneva’s compliance program; (viii) information regarding
Geneva’s historical performance returns managing investment mandates similar to the Fund’s investment mandate for the portion of the Fund’s assets to be allocated to Geneva, with such performance compared to relevant indices; and (ix) information regarding Geneva’s financial condition.The Board also considered the substance of discussions with representatives of the Adviser at the Board Meeting. Additionally, the Board reviewed materials supplied by counsel that were prepared for use by the Board in fulfilling its duties under the 1940 Act.
Nature, Extent and Quality of Services to be Provided by Geneva. In examining the nature, extent and quality of the services to be provided by Geneva to the Fund, the Board considered (i) Geneva’s organization, history, reputation, qualification and background, as well as the qualifications of its personnel; (ii) its expertise in providing portfolio management services to other similar investment portfolios and the performance history of those portfolios; (iii) its proposed investment strategy for the Fund; (iv) its long- and short-term performance relative to comparable mutual funds and unmanaged indices; and (v) its compliance program. The Board specifically took into account Geneva’s investment process and research resources and capabilities, evaluating how Geneva would complement the Adviser and the other strategies for the Fund. The Board also discussed the acceptability of the terms of the Geneva Sub-Advisory Agreement. The Board also considered the review process undertaken by the Adviser, and the Adviser’s favorable assessment of the nature and quality of the sub-investment advisory services expected to be provided to the Fund by Geneva.The Board concluded that the Fund will benefit from the quality and experience of Geneva’s investment professionals. Based on their consideration and review of the foregoing information, the Board concluded that the nature, extent and quality of the sub-investment advisory services to be provided by Geneva were adequate and appropriate in light of Geneva’s experience in managing mid cap
166
equity assets, Geneva’s portfolio management and research resources to be applied in managing a portion of the Fund’s portfolio, and the Adviser’s recommendation to engage Geneva, and supported a decision to approve the Geneva Sub-Advisory Agreement.
Investment Performance of Geneva. Because Geneva would be a new sub-investment adviser for the Fund, the Board could not consider Geneva’s investment performance in managing a portion of the Fund’s portfolio as a factor in evaluating the Geneva Sub-Advisory Agreement during the Board Meeting. However, the Board did review Geneva’s historical performance record in managing other portfolios that were comparable to the Fund with respect to its investment mandate.The Board also discussed with representatives of the Adviser the investment strategies to be employed by Geneva in the management of its portion of the Fund’s assets. The Board noted Geneva’s reputation and experience with respect to growth-oriented mid cap equity investing, each portfolio manager’s experience in selecting mid cap growth stocks, and the Adviser’s experience in selecting, evaluating, and overseeing investment managers. Based on these factors, the Board supported a decision to approve the Geneva Sub-Advisory Agreement.
Costs of Services to be Provided.The Board considered the proposed fee payable under the Geneva Sub-Advisory Agreement, noting that the proposed fee would be paid by the Adviser, and not the Fund, and, thus, would not impact the fees paid by the Fund. The Board concluded that the proposed fee payable to Geneva by the Adviser with respect to the assets to be allocated to Geneva in its capacity as sub-investment adviser was reasonable and appropriate.
Profitability and Economies of Scale to be Realized.The Board recognized that, because Geneva’s fee would be paid by the Adviser, and not the Fund, an analysis of economies of scale and profitability was more appropriate in the context of the Board’s consideration of the Investment Advisory Agreement between the Trust and the Adviser. Accordingly, considerations of profitability and economies of scale with respect to Geneva were not relevant to the Board’s determination to approve the Geneva Sub-Advisory Agreement.
The Board also considered whether there were any ancillary benefits that may accrue to Geneva as a result of Geneva’s relationship with the Fund. The Board concluded that Geneva may direct Fund brokerage transactions to certain brokers to obtain research and other services. However, the Board noted that Geneva was required to select brokers who met the Fund’s requirements for seeking best execution, and that the Adviser monitored and evaluated Geneva’s trade execution with respect to Fund brokerage transactions on a quarterly basis and provided reports to the Board on these matters. The Board concluded that the benefits that were expected to accrue to Geneva by virtue of its relationship with the Fund were reasonable.
In considering the materials and information described above, the Independent Trustees received assistance from, and met separately with, their independent legal counsel, and were provided with a written description of their statutory responsibilities and the legal standards that are applicable to the approval of investment advisory and sub-investment advisory agreements.
After full consideration of the factors discussed above, with no single factor identified as being of paramount importance, the Board, including a majority of the IndependentTrustees, with the assistance of independent legal counsel, concluded that the initial approval of the Geneva Sub-Advisory Agreement was in the best interests of the Fund, and approved the Geneva Sub-Advisory Agreement for the Fund.
The Funds 167
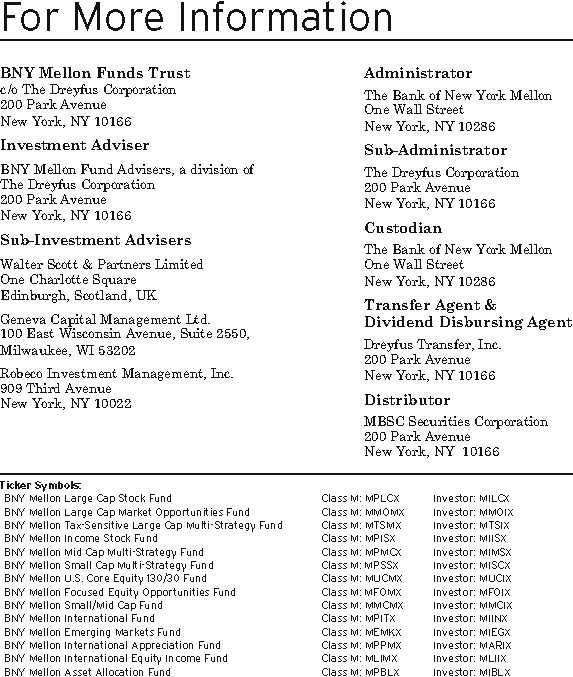
Telephone Wealth Management (WM) Clients, please contact your Account Officer or call 1-888-281-7350.
Brokerage Clients of BNY Mellon Wealth Advisors (BNYMWA), please contact your financial representative
or call 1-800-830-0549, Option 2. Individual Account holders, please call Dreyfus at 1-800-DREYFUS.
Mail WM Clients, write to your Account Officer, c/o The Bank of New York Mellon, One Mellon Bank Center, Pittsburgh, PA 15258
BNYMWA Brokerage Clients, write to your financial representative, P.O. Box 9012, Hicksville, NY 11802–9012
Individual Account Holders, write to: BNY Mellon Funds, P.O. Box 55268, Boston, MA 02205–8502
The funds file their complete schedule of portfolio holdings with the Securities and Exchange Commission (“SEC”) for the first and third
quarters of each fiscal year on Form N-Q. The funds’ Forms N-Q are available on the SEC’s website at http://www.sec.gov and may be
reviewed and copied at the SEC’s Public Reference Room in Washington, DC. Information on the operation of the Public Reference Room
may be obtained by calling 1-800-SEC-0330.
A description of the policies and procedures that the funds use to determine how to vote proxies relating to portfolio securities, and
information regarding how the funds voted these proxies for the most recent 12-month period ended June 30 is available at
http://www.dreyfus.com and on the SEC’s website at http://www.sec.gov. The description of the policies and procedures
is also available without charge, upon request, by calling 1-800-DREYFUS.
© 2013 MBSC Securities Corporation
MFTSA0213-EQ
The BNY Mellon Funds
BNY Mellon Bond Fund
BNY Mellon Intermediate Bond Fund
BNY Mellon Corporate Bond Fund
BNY Mellon Short-Term U.S. Government Securities Fund
SEMIANNUAL REPORT February 28, 2013


DISCUSSION OF
FUND PERFORMANCE
For the period of September 1, 2012, through February 28, 2013, as provided by John F. Flahive, CFA, Primary Portfolio Manager
Fund and Market Performance Overview
For the six-month period ended February 28, 2013, BNY Mellon Bond Fund’s Class M shares produced a total return of 0.86%, and Investor shares produced a total return of 0.73%.1 In comparison, the fund’s benchmark, the Barclays U.S. Aggregate Bond Index (the “Index”), produced a total return of 0.15% for the same period.2
With interest rates anchored on the short end of the market’s maturity spectrum by the Federal Reserve Board’s (the “Fed”) historically low target for the overnight federal funds rate, income-oriented investors continued to seek higher yields from longer-term and riskier market sectors over the reporting period. The fund produced higher returns than its benchmark in this environment, primarily due to its emphasis on better performing corporate bonds and taxable municipal securities.
The Fund’s Investment Approach
The fund seeks total return (consisting of capital appreciation and current income). To pursue its goal, the fund actively manages bond market and maturity exposure and invests at least 80% of its assets in bonds, such as U.S. Treasury and government agency bonds, corporate bonds, mortgage-related securities and foreign corporate and government bonds.The fund’s investments in bonds must be rated investment-grade quality at the time of purchase3 or, if unrated, deemed of comparable quality by the investment adviser. Generally, the average effective duration of the fund’s portfolio will not exceed eight years.
Accommodative Monetary Policies Kept Rates Low
Investor sentiment had begun to improve by the start of the reporting period when the European financial crisis did not worsen, China appeared to have engineered a soft landing for its economy, and recession fears faded in the United States. Instead, investors responded positively to news of improved U.S. employment and housing market trends, a stated commitment from the European Central Bank in support of the euro, and expectations that new leadership in China might lead to stronger regional growth. Although investor optimism faltered in November due to uncertainty surrounding the presidential election and automatic tax hikes and spending cuts scheduled for the start of 2013, encouraging economic data and last-minute legislation to address the scheduled tax increases helped alleviate investors’ worries.As a result, investors increasingly turned away from traditional safe havens, such as U.S.Treasuries, and toward riskier assets, including stocks and corporate-backed bonds.
While prices of longer-term U.S. government securities fell under these conditions, declines were cushioned by the Fed’s aggressively accommodative monetary policy initiatives, including a new, open-ended round of quantitative easing involving purchases of up to $40 billion of mortgage-backed securities per month. In addition, the Fed’s easy-money policies helped mitigate some of the impact of uncertainty stemming from the contentious political debate regarding U.S. tax and fiscal policies. Meanwhile, an improving business environment buoyed prices of investment grade corporate-backed securities, reducing yield differences along the market sector’s credit-quality spectrum.
The Funds 3
DISCUSSION OF FUND PERFORMANCE (continued)
Security Selection Strategy Produced Positive Results
The fund’s relative performance was bolstered during the reporting period by an underweighted position in U.S. Treasury and government agency securities, and overweighted exposure to higher yielding market sectors.The fund also benefited from an overweighted position in Treasury Inflation Protected Securities (“TIPS”).Among investment-grade corporate bonds, the fund achieved particularly robust results in the rebounding financials sector, including from holdings in the banking, brokerage and insurance industries.The fund also received relatively robust results from longer-term, taxable municipal bonds, which provided competitive yields compared to U.S. Treasury securities. The fund’s positions in commercial and residential mortgage-backed securities had relatively little impact on the fund’s relative performance over the reporting period, as our focus on AAA-rated, higher coupon residential mortgages with 15-year maturities helped mitigate weakness stemming from intensifying prepayment risks.
Our interest rate strategies also produced mildly positive results over the reporting period. We established the fund’s average duration in a range we considered to be slighter shorter than market averages, and we maintained a bias toward securities toward the longer end of the market’s maturity range.
Positioned for Further Economic Improvement
We have adopted a cautiously optimistic outlook as of the reporting period’s end. Although we are aware that
the U.S. economy remains vulnerable to a number of headwinds, including the ongoing European financial crisis and ongoing concerns about U.S. fiscal policies, recent economic data suggests that interest rates have little room for further declines and eventually will begin to rise as the U.S. economic recovery gains momentum. Therefore, we have retained the fund’s mildly short duration posture, and we have continued to seek opportunities for what we believe are competitive levels of current income from higher yielding market sectors. In our view, these are prudent strategies during a long and choppy economic recovery.
March 15, 2013
Bond funds are subject generally to interest rate, credit, liquidity and market
risks, to varying degrees, all of which are more fully described in the fund’s
prospectus. Generally, all other factors being equal, bond prices are inversely
related to interest-rate changes, and rate increases can cause price declines.
The fund may use derivative instruments, such as options, futures and options
on futures, forward contracts and swaps.A small investment in derivatives could
have a potentially large impact on the fund’s performance.The use of
derivatives involves risks different from, or possibly greater than, the risks
associated with investing directly in the underlying assets.
1 Total return includes reinvestment of dividends and any capital gains paid.
Past performance is no guarantee of future results. Share price, yield and
investment return fluctuate such that upon redemption, fund shares may be
worth more or less than their original cost.
2 SOURCE: LIPPER INC. — Reflects reinvestment of dividends and, where
applicable, capital gain distributions.The Barclays U.S.Aggregate Index is a
widely accepted, unmanaged total return index of corporate, U.S. government
and U.S. government agency debt instruments, mortgage-backed securities and
asset-backed securities with an average maturity of 1-10 years. Investors cannot
invest directly in any index.
3 The fund may continue to own investment-grade bonds (at the time of
purchase), which are subsequently downgraded to below investment grade.
4

DISCUSSION OF
FUND PERFORMANCE
For the period of September 1, 2012, through February 28, 2013, as provided by John F. Flahive, CFA, Primary Portfolio Manager
Fund and Market Performance Overview
For the six-month period ended February 28, 2013, BNY Mellon Intermediate Bond Fund’s Class M shares produced a total return of 0.69%, and Investor shares produced a total return of 0.56%.1 In comparison, the fund’s benchmark, the Barclays Intermediate Government/Credit Bond Index (the “Index”), produced a total return of 0.70%.2
With interest rates anchored on the short end of the market’s maturity spectrum by the Federal Reserve Board’s (the “Fed”) historically low target for the overnight federal funds rate, income-oriented investors continued to seek higher yields from riskier market sectors over the reporting period.The fund produced returns that were roughly in line with its benchmark.
The Fund’s Investment Approach
The fund seeks total return (consisting of capital appreciation and current income). To pursue its goal, the fund actively manages bond market and maturity exposure and invests at least 80% of its assets in bonds, such as U.S. government and agency bonds, corporate bonds, mortgage-related securities, foreign corporate and government bonds and municipal bonds. The fund’s investments in bonds must be rated investment grade at the time of purchase3 or, if unrated, deemed of comparable quality by the investment adviser. Generally, the fund’s average effective portfolio maturity will be between three and 10 years, and the average effective duration of the fund’s portfolio will be between 2.5
and 5.5 years.When managing the fund, we use a disciplined process to select securities and manage risk. We generally choose bonds based on yield, credit quality, the level of interest rates and inflation, general economic and financial trends and our outlook for the securities markets. Our management process also includes computer modeling and scenario testing of possible changes in market conditions.
Accommodative Monetary Policies Kept Rates Low
Investor sentiment had begun to improve by the start of the reporting period when the European financial crisis did not worsen, China appeared to have engineered a soft landing for its economy, and recession fears faded in the United States. Instead, investors responded positively to news of improved U.S. employment and housing market trends, a stated commitment from the European Central Bank in support of the euro, and expectations that new leadership in China might lead to stronger regional growth. Although investor optimism faltered in November due to uncertainty surrounding the presidential election and automatic tax hikes and spending cuts scheduled for the start of 2013, encouraging economic data and last-minute legislation to address the scheduled tax increases helped alleviate investors’ worries.As a result, investors increasingly turned away from traditional safe havens, such as U.S.Treasuries, and toward riskier assets, including stocks and corporate-backed bonds.
While prices of intermediate-term U.S. government securities fell under these conditions, declines were cushioned by the Fed’s aggressively accommodative
The Funds 5
DISCUSSION OF FUND PERFORMANCE (continued)
monetary policy initiatives, including a new, open-ended round of quantitative easing involving purchases of up to $40 billion of mortgage-backed securities per month. In addition, the Fed’s easy-money policies helped mitigate some of the impact of uncertainty stemming from the contentious political debate regarding U.S. tax and fiscal policies. Meanwhile, an improving business environment buoyed prices of investment grade corporate-backed securities, reducing yield differences along the market sector’s credit-quality spectrum.
Security Selection Strategy Produced Positive Results
The fund’s relative performance was bolstered during the reporting period by underweighted positions in U.S. Treasury and government agency securities, and overweighted exposure to higher yielding market sectors.The fund also benefited from an overweighted position in Treasury Inflation Protected Securities (“TIPS”).Among investment-grade corporate bonds, the fund achieved particularly robust results in the rebounding financials sector, including from holdings in the banking, brokerage and insurance industries. The fund’s positions in commercial and residential mortgage-backed securities had relatively little impact on the fund’s relative performance over the reporting period, as our focus on AAA-rated, higher coupon residential mortgages were affected to a mild degree by intensifying prepayment risks.
Our interest rate strategies also produced mildly positive results over the reporting period. We established the fund’s average duration in a range we considered to be slighter shorter than market averages, and we maintained a bias toward securities toward the longer end of the intermediate-term maturity range.
Positioned for Further Economic Improvement
We have adopted a cautiously optimistic outlook as of the reporting period’s end. Although we are aware that the U.S. economy remains vulnerable to a number of headwinds, recent economic data suggests that interest rates have little room for further declines and eventually will begin to rise as the economic recovery gains momentum. Therefore, we have retained the fund’s mildly short duration posture, and we have continued to seek opportunities for what we believe are competitive levels of current income from higher yielding market sectors. In our view, these are prudent strategies during a long and choppy economic recovery.
March 15, 2013
Bond funds are subject generally to interest rate, credit, liquidity and market
risks, to varying degrees, all of which are more fully described in the fund’s
prospectus. Generally, all other factors being equal, bond prices are inversely
related to interest-rate changes, and rate increases can cause price declines.
The fund may use derivative instruments, such as options, futures and options
on futures, forward contracts and swaps.A small investment in derivatives could
have a potentially large impact on the fund’s performance.The use of
derivatives involves risks different from, or possibly greater than, the risks
associated with investing directly in the underlying assets.
1 Total return includes reinvestment of dividends and any capital gains paid.
Past performance is no guarantee of future results. Share price, yield and
investment return fluctuate such that upon redemption, fund shares may be
worth more or less than their original cost.
2 SOURCE: LIPPER INC. — Reflects reinvestment of dividends and, where
applicable, capital gain distributions.The Barclays Intermediate
Government/Credit Bond Index is a widely accepted, unmanaged index of
government and credit bond market performance composed of U.S. government,
Treasury and agency securities, fixed-income securities and nonconvertible
investment-grade credit debt, with an average maturity of 1-10 years. Index
return does not reflect the fees and expenses associated with operating a mutual
fund. Investors cannot invest directly in any index.
3 The fund may continue to own investment-grade bonds (at the time of
purchase), which are subsequently downgraded to below investment grade.
6

DISCUSSION OF
FUND PERFORMANCE
For the period of September 1, 2012, through February 28, 2013, as provided by John F. Flahive, CFA, Primary Portfolio Manager
Fund and Market Performance Overview
For the six-month period ended February 28, 2013, BNY Mellon Corporate Bond Fund’s Class M shares produced a total return of 2.64%, and its Investor shares returned 2.52%1. In comparison, the fund’s benchmark, the Barclays U.S. Intermediate Credit Bond Index (the “Index”), produced a 1.96% total return for the same period.2
With interest rates anchored on the short end of the market’s maturity spectrum by the Federal Reserve Board’s (the “Fed”) historically low target for the overnight federal funds rate, income-oriented investors continued to seek higher yields from longer term and riskier market sectors over the reporting period. The fund produced higher returns than its benchmark in this environment, primarily due to the success of its security selection strategy.
The Fund’s Investment Approach
The fund seeks total return (consisting of capital appreciation and current income). To pursue its goal, the fund normally invests at least 80% of its net assets in corporate bonds.The remainder of the fund’s assets may be invested in U.S. government and agency bonds, mortgage-related securities, including commercial mortgage-backed securities, asset-backed securities, foreign corporate and government bonds denominated in foreign currencies, municipal bonds and commercial paper and other money market instruments. For additional yield, the fund may invest up to 20% of its assets in fixed-income securities rated below investment grade (“high yield” or “junk” bonds) or the unrated equivalent as determined by the investment adviser.
We employ a disciplined process to select bonds and manage risk, choosing bonds based on yield, credit quality, the level of interest rates and inflation, general economic and financial trends, and our outlook for the securities markets. In selecting corporate bonds for investment, we analyze fundamental metrics, including the issuer’s cash flow, leverage and operating margins, as well as its business strategy and operating performance, and macroeconomic factors.
Accommodative Monetary Policies Kept Rates Low
Investor sentiment had begun to improve by the start of the reporting period when the European financial crisis did not worsen, China appeared to have engineered a soft landing for its economy, and recession fears faded in the United States. Instead, investors responded positively to news of improved U.S. employment and housing market trends, a stated commitment from the European Central Bank in support of the euro, and expectations that new leadership in China might lead to stronger regional growth.Although investor optimism faltered in November due to uncertainty surrounding the presidential election and automatic tax hikes and spending cuts scheduled for the start of 2013, encouraging economic data and last-minute legislation to address the scheduled tax increases helped alleviate investors’ worries. As a result, investors increasingly turned away from traditional safe havens, such as U.S. government securities, and toward riskier assets, including stocks and corporate-backed bonds.
While prices of longer term U.S. government securities fell under these conditions, an improving business environment buoyed prices of investment grade corporate-backed securities. Consequently, yield differences narrowed along the market sector’s credit-quality spectrum over the reporting period.
The Funds 7
DISCUSSION OF FUND PERFORMANCE (continued)
Security Selection Strategy Produced Positive Results
The fund’s relative performance was bolstered during the reporting period by particularly robust results in the rebounding financials sector, including from portfolio holdings in the banking, brokerage and real estate-related industries. Underweighted exposure to, and favorable security selections within, the consumer non-cyclical sector also helped support the fund’s performance. In addition, the fund received relatively strong results from longer term, taxable municipal bonds, which provided competitive yields.
On the other hand, our security selection strategy in the corporate bond market’s industrials sector detracted mildly from the fund’s relative results. Our interest rate strategies also proved to be a slight drag on performance over the reporting period.We had established the fund’s average duration in a range we considered to be slighter longer than market averages, which increased the fund’s sensitivity to bouts of heightened market volatility during the reporting period.
Positioned for Further Economic Improvement
We have adopted a cautiously optimistic outlook as of the reporting period’s end. Although we are aware that the U.S. economy remains vulnerable to a number of headwinds, including the ongoing European financial
crisis and ongoing concerns about U.S. fiscal policies, recent economic data suggests that interest rates have little room for further declines and eventually will begin to rise as the U.S. economic recovery gains momentum. In addition, we expect the recovery to continue to support business conditions for corporate bond issuers. Therefore, we have maintained the fund’s mildly long duration posture, and we have continued to seek opportunities for competitive levels of current income from what we believe are attractively valued industry groups. In our view, these are prudent strategies during a long and choppy economic recovery.
March 15, 2013
Bond funds are subject generally to interest rate, credit, liquidity and market
risks, to varying degrees, all of which are more fully described in the fund’s
prospectus. Generally, all other factors being equal, bond prices are inversely
related to interest-rate changes, and rate increases can cause price declines.
The fund may use derivative instruments, such as options, futures and options
on futures, forward contracts and swaps.A small investment in derivatives could
have a potentially large impact on the fund’s performance.The use of
derivatives involves risks different from, or possibly greater than, the risks
associated with investing directly in the underlying assets.
1 Total return includes reinvestment of dividends and any capital gains paid.
Past performance is no guarantee of future results. Share price, yield and
investment return fluctuate such that upon redemption, fund shares may be
worth more or less than their original cost.
2 Source: Lipper Inc.
8

DISCUSSION OF
FUND PERFORMANCE
For the period of September 1, 2012, through February 28, 2013, as provided by Lawrence R. Dunn, CFA, Portfolio Manager
Fund and Market Performance Overview
For the six-month period ended February 28, 2013, BNY Mellon Short-Term U.S. Government Securities Fund’s Class M shares produced a total return of –0.16%, and Investor shares produced a total return of –0.29%.1 In comparison, the Barclays 1-3 Year U.S. Government Index (the “Index”), the fund’s benchmark, achieved a total return of 0.19%.2
Interest rates remained anchored on the short end of the market’s maturity spectrum by the Federal Reserve Board’s (the “Fed”) historically low target for the overnight federal funds rate, constraining returns from short-term U.S. government securities.The fund produced lower returns than its benchmark, mainly due to a relatively short duration posture.
The Fund’s Investment Approach
The fund seeks to provide as high a level of current income as is consistent with the preservation of capital. To pursue this goal, the fund invests at least 80% of its assets in securities issued or guaranteed by the U.S. government or its agencies or instrumentalities and in repurchase agreements.The fund may invest up to 35% of its net assets in mortgage-related securities issued by U.S. government agencies or instrumentalities, such as mortgage pass-through securities issued by the Government National Mortgage Association (“Ginnie Mae”), the Federal National Mortgage Association (“Fannie Mae”) and the Federal Home Loan Mortgage Corporation (“Freddie Mac”).The fund may also invest in collateralized mortgage obligations (“CMOs”), including stripped mortgage-backed securities. Generally, the fund’s average effective portfolio maturity and the average effective duration of the fund’s portfolio will be less than three years.
When choosing securities, we typically first examine U.S. and global economic conditions and other market factors to estimate long- and short-term interest rates. Using a research-driven investment process, we then seek to identify what we believe are potentially profitable sectors before they are widely perceived by the market. We also seek to identify underpriced or mispriced securities that appear likely to perform well over time.
Accommodative Monetary Policies Kept Rates Low
Investor sentiment had begun to improve by the start of the reporting period when the European financial crisis did not worsen, China appeared to have engineered a soft landing for its economy, and recession fears faded in the United States. Instead, investors responded positively to news of improved U.S. employment and housing market trends, a commitment from the European Central Bank in support of the euro, and expectations that new leadership in China might lead to stronger regional growth. Although investor optimism faltered in November due to uncertainty surrounding the presidential election and automatic tax hikes and spending cuts scheduled for the start of 2013, encouraging economic data and last-minute legislation to address the scheduled tax increases helped alleviate investors’ worries.As a result, investors increasingly turned away from traditional safe havens and toward riskier assets.
While prices of intermediate- and long-term U.S. government securities fell under these conditions, declines were cushioned by the Fed’s aggressively accommodative monetary policy initiatives, including a new, open-ended round of quantitative easing. In addition, the Fed’s easy-money policies helped mitigate some of the impact of uncertainty surrounding the “fiscal cliff” debate. Yields and prices of short-term U.S. government securities changed relatively little over
The Funds 9
DISCUSSION OF FUND PERFORMANCE (continued)
the reporting period as the Fed’s target for the overnight federal funds rate remained between 0% and 0.25%.
Security Selection Strategy Produced Positive Results
The fund’s relative performance was dampened during the reporting period by a relatively short average duration, which we had established in anticipation of stronger economic growth and potentially rising interest rates. However, rates generally fell at the longer end of the short-term maturity range when the Fed announced a new round of quantitative easing, and the fund did not participate fully in modest gains among short- to intermediate-term securities during the reporting period.
The fund offset some of its duration-related weakness through our security selection strategy.With yields of U.S. government securities at very low levels, we sought more competitive levels of current income from AAA-rated mortgage-backed securities, including project loans from Ginnie Mae and privately issued collateralized mortgage obligations.The fund also received positive contributions to its relative performance from taxable municipal bonds, which provided more attractive yields than comparable U.S. government securities.
Positioned for Further Economic Improvement
We are aware that the U.S. economy remains vulnerable to a number of headwinds, but recent economic data suggests that interest rates have little room for
further declines. Indeed, with the Fed committed to low short-term interest rates through mid-2015, we expect short-term interest rates to remain relatively steady at today’s low levels.
In this environment, we have increased the fund’s average duration toward a market-neutral position, and we have continued to seek what we believe are competitive levels of current income from higher yielding market sectors. In our view, these are prudent strategies during a long and choppy economic recovery.
March 15, 2013
Bond funds are subject generally to interest rate, credit, liquidity and market
risks, to varying degrees, all of which are more fully described in the fund’s
prospectus. Generally, all other factors being equal, bond prices are inversely
related to interest-rate changes, and rate increases can cause price declines.
The fund may use derivative instruments, such as options, futures and options
on futures, forward contracts and swaps.A small investment in derivatives could
have a potentially large impact on the fund’s performance.The use of
derivatives involves risks different from, or possibly greater than, the risks
associated with investing directly in the underlying assets.
1 Total return includes reinvestment of dividends and any capital gains paid.
Past performance is no guarantee of future results. Share price, yield and
investment return fluctuate such that upon redemption, fund shares may be
worth more or less than their original cost.
2 SOURCE: LIPPER INC. — Reflects reinvestment of dividends and, where
applicable, capital gain distributions.The Barclays 1-3Year U.S. Government
Index is a widely accepted, unmanaged index of government and credit bond
market performance composed of U.S. government,Treasury and agency
securities, fixed-income securities and nonconvertible investment-grade credit
debt, with an average maturity of 1-10 years. Index return does not reflect the
fees and expenses associated with operating a mutual fund. Investors cannot
invest directly in any index.
10
UNDERSTANDING YOUR FUND’S EXPENSES (Unaudited)
As a mutual fund investor, you pay ongoing expenses, such as management fees and other expenses. Using the information below, you can estimate how these expenses affect your investment and compare them with the expenses of other funds.You also may pay one-time transaction expenses, including sales charges (loads) and redemption fees, which are not shown in this section and would have resulted in higher total expenses. For more information, see your fund’s prospectus or talk to your financial advisor.
Review your fund’s expenses
The table below shows the expenses you would have paid on a $1,000 investment in each class of each BNY Mellon fixed income fund from September 1, 2012 to February 28, 2013. It also shows how much as $1,000 investment would be worth at the close of the period assuming actual returns and expenses.
| Expenses and Value of a $1,000 Investment | ||||
| assuming actual returns for the six months ended February 28, 2013 | ||||
| Class M Shares | Investor Shares | |||
| BNY Mellon Bond Fund | ||||
| Expenses paid per $1,000† | $ | 2.74 | $ | 3.98 |
| Ending value (after expenses) | $ | 1,008.60 | $ | 1,007.30 |
| Annualized expense ratio (%) | .55 | .80 | ||
| BNY Mellon Intermediate Bond Fund | ||||
| Expenses paid per $1,000† | $ | 2.79 | $ | 4.13 |
| Ending value (after expenses) | $ | 1,006.90 | $ | 1,005.60 |
| Annualized expense ratio (%) | .56 | .83 | ||
| BNY Mellon Corporate Bond Fund | ||||
| Expenses paid per $1,000† | $ | 2.96 | $ | 4.27 |
| Ending value (after expenses) | $ | 1,026.40 | $ | 1,025.20 |
| Annualized expense ratio (%) | .59 | .85 | ||
| BNY Mellon Short-Term U.S. Government Securities Fund | ||||
| Expenses paid per $1,000† | $ | 2.63 | $ | 3.86 |
| Ending value (after expenses) | $ | 998.40 | $ | 997.10 |
| Annualized expense ratio (%) | .53 | .78 |
† Expenses are equal to each fund’s annualized expense ratios as shown above, multiplied by the average account value over the period, multiplied by 181/365 (to reflect the one-half
year period).
The Funds 11
COMPARING YOUR FUND’S EXPENSES WITH THOSE OF OTHER FUNDS (Unaudited)
Using the SEC’s method to compare expenses
The Securities and Exchange Commission (SEC) has established guidelines to help investors assess fund expenses. Per these guidelines, the table below shows your fund’s expenses based on a $1,000 investment, assuming a hypothetical 5% annualized return.You can use this information to compare the ongoing expenses (but not transaction expenses or total cost) of investing in each fund with those of other funds. All mutual fund shareholder reports will provide this information to help you make this comparison. Please note that you cannot use this information to estimate your actual ending account balance and expenses paid during the period.
| Expenses and Value of a $1,000 Investment | ||||
| assuming a hypothetical 5% annualized return for the six months ended February 28, 2013 | ||||
| Class M Shares | Investor Shares | |||
| BNY Mellon Bond Fund | ||||
| Expenses paid per $1,000† | $ | 2.76 | $ | 4.01 |
| Ending value (after expenses) | $ | 1,022.07 | $ | 1,020.83 |
| Annualized expense ratio (%) | .55 | .80 | ||
| BNY Mellon Intermediate Bond Fund | ||||
| Expenses paid per $1,000† | $ | 2.81 | $ | 4.16 |
| Ending value (after expenses) | $ | 1,022.02 | $ | 1,020.68 |
| Annualized expense ratio (%) | .56 | .83 | ||
| BNY Mellon Corporate Bond Fund | ||||
| Expenses paid per $1,000† | $ | 2.96 | $ | 4.26 |
| Ending value (after expenses) | $ | 1,021.87 | $ | 1,020.58 |
| Annualized expense ratio (%) | .59 | .85 | ||
| BNY Mellon Short-Term U.S. Government Securities Fund | ||||
| Expenses paid per $1,000† | $ | 2.66 | $ | 3.91 |
| Ending value (after expenses) | $ | 1,022.17 | $ | 1,020.93 |
| Annualized expense ratio (%) | .53 | .78 |
† Expenses are equal to each fund’s annualized expense ratios as shown above, multiplied by the average account value over the period, multiplied by 181/365 (to reflect the one-half
year period).
12
STATEMENT OF INVESTMENTS
February 28, 2013 (Unaudited)
| BNY Mellon Bond Fund | |||||
| Coupon | Maturity | Principal | |||
| Bonds and Notes—98.4% | Rate (%) | Date | Amount ($) | Value ($) | |
| Asset-Backed Ctfs./Auto Receivables—1.0% | |||||
| Ally Auto Receivables Trust, Ser. 2010-3, Cl. A4 | 1.55 | 8/17/15 | 3,545,000 | 3,581,999 | |
| AmeriCredit Automobile Receivables Trust, Ser. 2011-3, Cl. A3 | 1.17 | 1/8/16 | 1,500,000 | 1,505,947 | |
| Nissan Auto Receivables Owner Trust, Ser. 2010-A, Cl. A4 | 1.31 | 9/15/16 | 3,965,000 | 3,995,540 | |
| World Omni Auto Receivables Trust, Ser. 2011-A, Cl. A3 | 1.11 | 5/15/15 | 3,816,102 | 3,829,228 | |
| 12,912,714 | |||||
| Casinos—.7% | |||||
| Agua Caliente Band of Cahuilla Indians, Sr. Scd. Notes | 6.08 | 10/1/16 | 1,351,000 | a | 1,299,378 |
| Agua Caliente Band of Cahuilla Indians, Scd. Notes | 6.35 | 10/1/15 | 1,097,000 | a | 1,069,608 |
| Agua Caliente Band of Cahuilla Indians, Sr. Scd. Notes | 6.44 | 10/1/16 | 1,608,000 | a | 1,531,749 |
| Seminole Indian Tribe of Florida, Sr. Scd. Notes | 5.80 | 10/1/13 | 3,296,000 | a | 3,394,504 |
| Seminole Indian Tribe of Florida, Scd. Notes | 7.75 | 10/1/17 | 1,130,000 | a | 1,230,287 |
| 8,525,526 | |||||
| Commercial Mortgage Pass-Through Ctfs.—1.9% | |||||
| Commercial Mortgage Asset Trust, Ser. 1999-C1, Cl. D | 7.35 | 1/17/32 | 2,260,000 | b | 2,333,204 |
| JP Morgan Chase Commercial Mortgage | |||||
| Securities Trust, Ser. 2004-C1, Cl. A2 | 4.30 | 1/15/38 | 56,528 | 56,921 | |
| UBS Commercial Mortgage Trust, Ser. 2012-C1, Cl. A3 | 3.40 | 5/10/45 | 8,670,000 | 9,232,254 | |
| UBS-Citigroup Commercial Mortgage Trust, Ser. 2011-C1, Cl. A2 | 2.80 | 1/10/45 | 10,750,000 | 11,399,843 | |
| WFRBS Commercial Mortgage Trust, Ser. 2011-C5, Cl. A2 | 2.68 | 11/15/44 | 1,110,000 | 1,172,220 | |
| 24,194,442 | |||||
| Consumer Discretionary—4.6% | |||||
| Amazon.com, Sr. Unscd. Notes | 2.50 | 11/29/22 | 6,675,000 | 6,509,180 | |
| Comcast, Gtd. Notes | 3.13 | 7/15/22 | 3,820,000 | 3,923,755 | |
| Comcast, Gtd. Notes | 5.90 | 3/15/16 | 8,010,000 | 9,179,468 | |
| Johnson Controls, Sr. Unscd. Notes | 3.75 | 12/1/21 | 8,110,000 | 8,585,887 | |
| News America, Gtd. Notes | 6.15 | 3/1/37 | 5,054,000 | 6,033,617 | |
| Time Warner, Gtd. Notes | 4.00 | 1/15/22 | 6,125,000 | 6,606,731 | |
| Time Warner Cable, Gtd. Notes | 4.13 | 2/15/21 | 10,550,000 | 11,296,180 | |
| Walgreen, Sr. Unscd. Notes | 3.10 | 9/15/22 | 6,500,000 | 6,535,763 | |
| 58,670,581 | |||||
| Consumer Staples—1.8% | |||||
| Anheuser-Busch InBev Worldwide, Gtd. Notes | 2.50 | 7/15/22 | 6,160,000 | 6,052,071 | |
| ConAgra Foods, Sr. Unscd. Notes | 3.20 | 1/25/23 | 2,795,000 | 2,794,234 | |
| PepsiCo, Sr. Unscd. Notes | 4.50 | 1/15/20 | 7,040,000 | 8,109,503 | |
| Pernod-Ricard, Sr. Unscd. Notes | 4.45 | 1/15/22 | 5,610,000 | a | 6,186,758 |
| 23,142,566 | |||||
| Energy—.6% | |||||
| BP Capital Markets, Gtd. Notes | 3.88 | 3/10/15 | 5,565,000 | 5,916,274 | |
| Petrobras International Finance, Gtd. Notes | 5.38 | 1/27/21 | 1,925,000 | 2,111,124 | |
| 8,027,398 |
The Funds 13
STATEMENT OF INVESTMENTS (Unaudited) (continued)
| BNY Mellon Bond Fund (continued) | |||||
| Coupon | Maturity | Principal | |||
| Bonds and Notes (continued) | Rate (%) | Date | Amount ($) | Value ($) | |
| Financial—15.8% | |||||
| American International Group, Sr. Unscd. Notes | 5.85 | 1/16/18 | 8,300,000 | 9,785,617 | |
| Bank of America, Sub. Notes | 5.49 | 3/15/19 | 19,975,000 | 22,491,231 | |
| BBVA US Senior, Bank Gtd. Notes | 3.25 | 5/16/14 | 6,655,000 | 6,720,192 | |
| Bear Stearns, Sub. Notes | 5.55 | 1/22/17 | 5,681,000 | 6,481,186 | |
| BlackRock, Sr. Unscd. Notes | 6.25 | 9/15/17 | 7,860,000 | 9,562,657 | |
| Boston Properties, Sr. Unscd. Notes | 4.13 | 5/15/21 | 7,185,000 | 7,818,236 | |
| Citigroup, Sub. Notes | 5.00 | 9/15/14 | 6,815,000 | 7,171,465 | |
| Citigroup, Sr. Unscd. Notes | 6.13 | 11/21/17 | 3,135,000 | 3,712,458 | |
| Ford Motor Credit, Sr. Unscd. Notes | 3.00 | 6/12/17 | 6,225,000 | 6,389,091 | |
| General Electric Capital, Sub. Notes | 5.30 | 2/11/21 | 12,835,000 | 14,794,507 | |
| Goldman Sachs Group, Sub. Notes | 6.75 | 10/1/37 | 8,270,000 | 9,406,488 | |
| HSBC Finance, Sr. Sub. Notes | 6.68 | 1/15/21 | 10,510,000 | 12,591,915 | |
| Jefferies Group, Sr. Unscd. Notes | 5.13 | 4/13/18 | 6,255,000 | 6,786,675 | |
| Jefferies Group, Sr. Unscd. Notes | 8.50 | 7/15/19 | 6,318,000 | 7,909,656 | |
| MetLife, Sr. Unscd. Notes | 7.72 | 2/15/19 | 6,865,000 | 8,974,745 | |
| Morgan Stanley, Sub. Notes | 4.88 | 11/1/22 | 9,035,000 | 9,556,383 | |
| NYSE Euronext, Sr. Unscd. Notes | 2.00 | 10/5/17 | 7,340,000 | 7,558,923 | |
| Prudential Financial, Sr. Unscd. Notes | 4.75 | 9/17/15 | 7,135,000 | 7,815,251 | |
| Rabobank Nederland, Bank Gtd. Notes | 5.25 | 5/24/41 | 6,335,000 | 7,309,431 | |
| RBS Citizens Financial Group, Sub. Notes | 4.15 | 9/28/22 | 8,555,000 | a | 8,770,244 |
| Simon Property Group, Sr. Unscd. Notes | 5.65 | 2/1/20 | 8,520,000 | 10,288,496 | |
| TD Ameritrade Holding, Gtd. Notes | 4.15 | 12/1/14 | 6,630,000 | 7,032,560 | |
| 198,927,407 | |||||
| Foreign/Governmental—1.3% | |||||
| Mexican Government, Sr. Unscd. Notes | 5.63 | 1/15/17 | 5,975,000 | 6,925,025 | |
| Mexican Government, Sr. Unscd. Notes | 6.63 | 3/3/15 | 1,480,000 | c | 1,646,500 |
| Province of Ontario Canada, Sr. Unscd. Bonds | 4.00 | 10/7/19 | 6,500,000 | 7,450,937 | |
| 16,022,462 | |||||
| Health Care—1.2% | |||||
| Amgen, Sr. Unscd. Notes | 5.65 | 6/15/42 | 7,955,000 | 9,389,334 | |
| Thermo Fisher Scientific, Sr. Unscd. Notes | 3.60 | 8/15/21 | 5,500,000 | 5,709,918 | |
| 15,099,252 | |||||
| Industrial—1.0% | |||||
| ABB Finance USA, Gtd. Notes | 2.88 | 5/8/22 | 11,060,000 | 11,213,424 | |
| Tyco International Finance, Gtd. Notes | 3.38 | 10/15/15 | 1,087,000 | 1,148,654 | |
| 12,362,078 | |||||
| Information Technology—1.9% | |||||
| Intel, Sr. Unscd. Notes | 2.70 | 12/15/22 | 10,900,000 | 10,795,066 | |
| Oracle, Sr. Unscd. Notes | 5.75 | 4/15/18 | 10,410,000 | 12,614,744 | |
| 23,409,810 |
14
| BNY Mellon Bond Fund (continued) | ||||||
| Coupon | Maturity | Principal | ||||
| Bonds and Notes (continued) | Rate (%) | Date | Amount ($) | Value ($) | ||
| Materials—1.2% | ||||||
| CRH America, Gtd. Notes | 5.30 | 10/15/13 | 7,100,000 | 7,286,787 | ||
| Eastman Chemical, Sr. Unscd. Notes | 3.60 | 8/15/22 | 7,075,000 | 7,371,761 | ||
| 14,658,548 | ||||||
| Municipal Bonds—6.6% | ||||||
| California, GO (Build America Bonds) | 7.30 | 10/1/39 | 11,215,000 | 15,766,944 | ||
| Chicago, GO | 7.78 | 1/1/35 | 6,460,000 | 8,336,953 | ||
| Illinois, GO | 4.42 | 1/1/15 | 4,935,000 | 5,205,043 | ||
| Los Angeles Community College District, | ||||||
| GO (Build America Bonds) | 6.75 | 8/1/49 | 13,725,000 | 19,773,882 | ||
| Massachusetts, GO (Build America Bonds) | 4.20 | 12/1/21 | 3,985,000 | 4,541,704 | ||
| New Jersey Turnpike Authority, | ||||||
| Turnpike Revenue (Build America Bonds) | 7.10 | 1/1/41 | 8,145,000 | 11,589,765 | ||
| New York City Municipal Water Finance Authority, | ||||||
| Water and Sewer System Second General | ||||||
| Resolution Revenue (Build America Bonds) | 6.28 | 6/15/42 | 5,430,000 | 6,327,742 | ||
| Oakland Unified School | ||||||
| District, GO (Build America Bonds) | 9.50 | 8/1/34 | 3,550,000 | 4,187,544 | ||
| Puerto Rico Commonwealth Government | ||||||
| Development Bank, Revenue Bonds | 3.67 | 5/1/14 | 8,010,000 | 8,010,000 | ||
| 83,739,577 | ||||||
| Telecommunications—3.1% | ||||||
| AT&T, Sr. Unscd. Notes | 4.45 | 5/15/21 | 7,980,000 | 9,035,914 | ||
| Rogers Communications, Gtd. Notes | 6.38 | 3/1/14 | 6,810,000 | 7,184,250 | ||
| Telefonica Emisiones, Gtd. Notes | 5.13 | 4/27/20 | 9,395,000 | 9,727,414 | ||
| Verizon Communications, Sr. Unscd. Notes | 5.50 | 2/15/18 | 10,755,000 | 12,765,475 | ||
| 38,713,053 | ||||||
| U.S. Government Agencies—.7% | ||||||
| Federal National Mortgage Association, Notes | 2.63 | 10/10/24 | 6,755,000 | d | 6,773,394 | |
| Federal National Mortgage Association, Notes | 3.00 | 9/16/14 | 1,480,000 | d | 1,544,210 | |
| 8,317,604 | ||||||
| U.S. Government Agencies/ | ||||||
| Mortgage-Backed—29.9% | ||||||
| Federal Home Loan Mortgage Corp.: | ||||||
| 3.00 | % | 12,130,000 | d,e | 12,727,023 | ||
| 3.50 | % | 17,440,000 | d,e | 18,363,774 | ||
| 2.50%, 3/1/28 | 10,945,000 | d | 11,360,569 | |||
| 3.00%, 11/1/42 | 14,141,606 | d | 14,596,789 | |||
| 4.00%, 4/1/24—1/1/41 | 20,932,635 | d | 22,257,604 | |||
| 4.50%, 5/1/39—11/1/41 | 56,903,653 | d | 62,240,923 | |||
| 5.00%, 12/1/39—7/1/40 | 16,154,274 | d | 17,643,028 | |||
| 5.50%, 12/1/37—12/1/38 | 14,871,595 | d | 16,178,772 | |||
| 6.00%, 5/1/38 | 3,003,248 | d | 3,287,081 |
The Funds 15
STATEMENT OF INVESTMENTS (Unaudited) (continued)
| BNY Mellon Bond Fund (continued) | ||||||
| Coupon | Maturity | Principal | ||||
| Bonds and Notes (continued) | Rate (%) | Date | Amount ($) | Value ($) | ||
| U.S. Government Agencies/Mortgage-Backed (continued) | ||||||
| Federal National Mortgage Association: | ||||||
| 3.00 | % | 12,090,000 | d,e | 12,728,503 | ||
| 3.50 | % | 12,065,000 | d,e | 12,760,623 | ||
| 3.00%, 10/1/32 | 6,829,398 | d | 7,147,392 | |||
| 3.34%, 4/1/41 | 8,088,864 | b,d | 8,535,634 | |||
| 3.50%, 1/1/26—6/2/42 | 41,810,555 | d | 44,683,499 | |||
| 4.00%, 2/1/41—4/1/42 | 34,217,964 | d | 36,657,359 | |||
| 4.50%, 3/1/23—7/1/24 | 5,756,390 | d | 6,195,892 | |||
| 5.00%, 12/1/21—2/1/41 | 17,328,377 | d | 19,002,357 | |||
| 5.50%, 2/1/38—5/1/38 | 17,819,013 | d | 19,619,088 | |||
| 6.00%, 4/1/33—10/1/38 | 13,329,246 | d | 14,900,552 | |||
| REMIC, Ser. 2011-8, Cl. PV, 4.00%, 1/25/30 | 3,777,000 | d | 4,190,986 | |||
| Government National Mortgage Association I; | ||||||
| 5.00%, 11/15/34—1/15/39 | 10,639,398 | 11,700,111 | ||||
| 376,777,559 | ||||||
| U.S. Government Securities—24.3% | ||||||
| U.S. Treasury Inflation Protected Securities: | ||||||
| Bonds, 2.38%, 1/15/27 | 14,363,944 | c,f | 19,546,182 | |||
| Notes, 0.63%, 7/15/21 | 8,257,455 | f | 9,429,626 | |||
| Notes, 1.38%, 7/15/18 | 12,666,391 | c,f | 14,877,069 | |||
| Notes, 1.38%, 1/15/20 | 10,321,279 | c,f | 12,296,029 | |||
| Notes, 2.38%, 1/15/17 | 14,381,023 | f | 16,817,931 | |||
| U.S. Treasury Notes: | ||||||
| 0.25%, 1/15/15 | 15,500,000 | c | 15,506,060 | |||
| 0.25%, 8/15/15 | 41,950,000 | c | 41,907,421 | |||
| 0.25%, 9/15/15 | 22,000,000 | c | 21,974,216 | |||
| 0.25%, 12/15/15 | 14,250,000 | c | 14,221,058 | |||
| 0.38%, 4/15/15 | 15,500,000 | c | 15,538,750 | |||
| 0.63%, 9/30/17 | 8,500,000 | c | 8,480,076 | |||
| 0.75%, 6/15/14 | 19,500,000 | c | 19,640,166 | |||
| 0.75%, 6/30/17 | 12,255,000 | c | 12,321,067 | |||
| 0.88%, 12/31/16 | 5,500,000 | c | 5,575,196 | |||
| 1.25%, 4/30/19 | 12,000,000 | c | 12,147,192 | |||
| 1.25%, 10/31/19 | 4,000,000 | c | 4,021,876 | |||
| 1.38%, 2/28/19 | 19,000,000 | c | 19,408,215 | |||
| 1.50%, 7/31/16 | 12,995,000 | c | 13,465,055 | |||
| 1.75%, 7/31/15 | 14,560,000 | c | 15,071,871 | |||
| 1.75%, 5/15/22 | 11,730,000 | c | 11,720,839 | |||
| 2.00%, 2/15/22 | 2,500,000 | c | 2,562,305 | |||
| 306,528,200 | ||||||
| Utilities—.8% | ||||||
| Boston Gas, Sr. Unscd. Notes | 4.49 | 2/15/42 | 4,750,000 | a | 5,007,402 | |
| Hydro-Quebec, Gov’t Gtd. Notes | 2.00 | 6/30/16 | 5,130,000 | 5,345,655 | ||
| 10,353,057 | ||||||
| Total Bonds and Notes | ||||||
| (cost $1,159,722,185) | 1,240,381,834 | |||||
16
| BNY Mellon Bond Fund (continued) | |||||||||
| Principal | Investment of Cash Collateral | ||||||||
| Short-Term Investments—4.5% | Amount ($) | Value ($) | for Securities Loaned—.0% | Shares | Value ($) | ||||
| U.S. Treasury Bills: | Registered | ||||||||
| 0.06%, 3/7/13 | 31,102,000 | 31,101,844 | Investment Company; | ||||||
| 0.09%, 3/14/13 | 25,397,000 | 25,396,644 | Dreyfus Institutional Cash | ||||||
| Total Short-Term Investments | Advantage Fund | ||||||||
| (cost $56,497,840) | 56,498,488 | (cost $518,400) | 518,400 g 518,400 | ||||||
| Total Investments | |||||||||
| Other Investment—.6% | Shares | Value ($) | (cost $1,223,979,544) | 103.5 | % | 1,304,639,841 | |||
| Registered Investment Company; | Liabilities, Less Cash | ||||||||
| Dreyfus Institutional Preferred | and Receivables | (3.5 | %) | (43,523,531 | ) | ||||
| Plus Money Market Fund | |||||||||
| Net Assets | 100.0 | % | 1,261,116,310 | ||||||
| (cost $7,241,119) | 7,241,119 | g | 7,241,119 | ||||||
GO—General Obligation
REMIC—Real Estate Mortgage Investment Conduit
a Securities exempt from registration pursuant to Rule 144A under the Securities Act of 1933.These securities may be resold in transactions exempt from registration, normally to
qualified institutional buyers.At February 28, 2013, these securities were valued at $28,489,930 or 2.3% of net assets.
b Variable rate security—interest rate subject to periodic change. Security, or portion thereof, on loan.
c At February 28, 2013, the value of the fund’s securities on loan was $219,666,414 and the value of the collateral held by the fund was $224,401,268, consisting of cash collateral
of $518,400 and U.S. Government & Agency securities valued at $223,882,868.
d The Federal Housing Finance Agency (“FHFA”) placed Federal Home Loan Mortgage Corporation and Federal National Mortgage Association into conservatorship with FHFA
as the conservator.As such, the FHFA oversees the continuing affairs of these companies.
e Purchased on a forward commitment basis.
f Principal amount for accrual purposes is periodically adjusted based on changes in the Consumer Price Index.
g Investment in affiliated money market mutual fund.
| Portfolio Summary (Unaudited) † | |||
| Value (%) | Value (%) | ||
| U.S. Government Agencies/Mortgage-Backed | 54.9 | Commercial Mortgage-Backed | 1.9 |
| Corporate Bonds | 32.7 | Foreign/Governmental | 1.3 |
| Municipal Bonds | 6.6 | Asset-Backed | 1.0 |
| Short-Term/Money Market Investments | 5.1 | 103.5 | |
| † Based on net assets. | |||
| See notes to financial statements. | |||
The Funds 17
STATEMENT OF INVESTMENTS
February 28, 2013 (Unaudited)
| BNY Mellon Intermediate Bond Fund | |||||
| Coupon | Maturity | Principal | |||
| Bonds and Notes—98.9% | Rate (%) | Date | Amount ($) | Value ($) | |
| Casinos—.6% | |||||
| Agua Caliente Band of Cahuilla Indians, Sr. Scd. Notes | 6.08 | 10/1/16 | 1,007,000 | a | 968,523 |
| Agua Caliente Band of Cahuilla Indians, Scd. Notes | 6.35 | 10/1/15 | 539,000 | a | 525,541 |
| Agua Caliente Band of Cahuilla Indians, Sr. Scd. Notes | 6.44 | 10/1/16 | 1,228,000 | a | 1,169,768 |
| Seminole Indian Tribe of Florida, Sr. Scd. Notes | 5.80 | 10/1/13 | 2,255,000 | a | 2,322,393 |
| Seminole Indian Tribe of Florida, Scd. Notes | 7.75 | 10/1/17 | 765,000 | a | 832,894 |
| 5,819,119 | |||||
| Consumer Discretionary—5.3% | |||||
| Daimler Finance North America, Gtd. Notes | 6.50 | 11/15/13 | 4,385,000 | 4,560,729 | |
| Grupo Televisa, Sr. Unscd. Notes | 6.00 | 5/15/18 | 5,665,000 | 6,696,109 | |
| Johnson Controls, Sr. Unscd. Notes | 5.50 | 1/15/16 | 6,075,000 | 6,817,869 | |
| NBCUniversal Media, Sr. Unscd. Notes | 4.38 | 4/1/21 | 6,000,000 | 6,769,476 | |
| Stanford University, Bonds | 4.75 | 5/1/19 | 5,000,000 | 5,985,455 | |
| Time Warner Cable, Gtd. Notes | 4.13 | 2/15/21 | 7,225,000 | 7,736,010 | |
| Time Warner, Gtd. Notes | 4.00 | 1/15/22 | 4,930,000 | 5,317,744 | |
| Wal-Mart Stores, Sr. Unscd. Notes | 3.63 | 7/8/20 | 7,920,000 | 8,730,256 | |
| 52,613,648 | |||||
| Consumer Staples—3.4% | |||||
| Anheuser-Busch InBev Worldwide, Gtd. Notes | 1.38 | 7/15/17 | 3,430,000 | 3,461,697 | |
| ConAgra Foods, Sr. Unscd. Notes | 3.20 | 1/25/23 | 2,000,000 | 1,999,452 | |
| Diageo Capital, Gtd. Notes | 1.50 | 5/11/17 | 2,345,000 | 2,374,857 | |
| Diageo Finance, Gtd. Notes | 5.50 | 4/1/13 | 2,080,000 | 2,087,800 | |
| Kroger, Sr. Unscd. Notes | 2.20 | 1/15/17 | 3,495,000 | 3,609,444 | |
| McDonald’s, Sr. Unscd. Notes | 5.80 | 10/15/17 | 4,460,000 | 5,387,163 | |
| Mondelez International, Sr. Unscd. Notes | 4.13 | 2/9/16 | 6,930,000 | 7,558,953 | |
| Pernod-Ricard, Sr. Unscd. Notes | 4.45 | 1/15/22 | 4,100,000 | a | 4,521,517 |
| Walgreen, Sr. Unscd. Notes | 1.80 | 9/15/17 | 2,975,000 | 3,020,860 | |
| 34,021,743 | |||||
| Energy—1.5% | |||||
| BP Capital Markets, Gtd. Notes | 3.20 | 3/11/16 | 6,250,000 | 6,676,281 | |
| Occidental Petroleum, Sr. Unscd. Notes | 4.13 | 6/1/16 | 3,005,000 | 3,324,513 | |
| Petrobras International Finance, Gtd. Notes | 3.88 | 1/27/16 | 4,860,000 | 5,104,599 | |
| 15,105,393 | |||||
| Financial—17.4% | |||||
| American Express Credit, Sr. Unscd. Notes | 2.75 | 9/15/15 | 3,650,000 | 3,819,973 | |
| American International Group, Sr. Unscd. Notes | 5.85 | 1/16/18 | 5,425,000 | 6,396,021 | |
| Bank of America, Sub. Notes | 5.49 | 3/15/19 | 10,965,000 | 12,346,250 | |
| BBVA US Senior, Bank Gtd. Notes | 3.25 | 5/16/14 | 4,800,000 | 4,847,021 | |
| Bear Stearns, Sub. Notes | 5.55 | 1/22/17 | 7,581,000 | 8,648,807 |
18
| BNY Mellon Intermediate Bond Fund (continued) | |||||
| Coupon | Maturity | Principal | |||
| Bonds and Notes (continued) | Rate (%) | Date | Amount ($) | Value ($) | |
| Financial (continued) | |||||
| Caterpillar Financial Services, | |||||
| Sr. Unscd. Notes | 6.13 | 2/17/14 | 4,975,000 | 5,249,307 | |
| Citigroup, Sub. Notes | 5.00 | 9/15/14 | 7,780,000 | 8,186,941 | |
| Citigroup, Sr. Unscd. Notes | 6.13 | 11/21/17 | 2,840,000 | 3,363,119 | |
| Ford Motor Credit, Sr. Unscd. Notes | 3.00 | 6/12/17 | 4,550,000 | 4,669,938 | |
| General Electric Capital, Sr. Unscd. Notes | 1.88 | 9/16/13 | 8,375,000 | 8,445,409 | |
| General Electric Capital, Sub. Notes | 5.30 | 2/11/21 | 1,955,000 | 2,253,468 | |
| Goldman Sachs Group, Sr. Unscd. Notes | 3.30 | 5/3/15 | 7,780,000 | 8,138,837 | |
| HSBC Finance, Sr. Sub. Notes | 6.68 | 1/15/21 | 6,797,000 | 8,143,411 | |
| Jefferies Group, Sr. Unscd. Notes | 5.13 | 4/13/18 | 4,545,000 | 4,931,325 | |
| Jefferies Group, Sr. Unscd. Notes | 8.50 | 7/15/19 | 4,695,000 | 5,877,783 | |
| John Deere Capital, Sr. Unscd. Notes | 1.25 | 12/2/14 | 3,000,000 | 3,044,577 | |
| MetLife, Sr. Unscd. Notes | 6.75 | 6/1/16 | 4,450,000 | 5,255,085 | |
| Morgan Stanley, Sub. Notes | 4.88 | 11/1/22 | 6,100,000 | 6,452,013 | |
| NYSE Euronext, Sr. Unscd. Notes | 2.00 | 10/5/17 | 5,300,000 | 5,458,078 | |
| Private Export Funding, Scd. Note | 2.45 | 7/15/24 | 19,750,000 | 19,935,847 | |
| Private Export Funding, Gov’t Gtd. Notes | 4.38 | 3/15/19 | 1,065,000 | 1,256,521 | |
| Prudential Financial, Sr. Unscd. Notes | 4.75 | 9/17/15 | 4,735,000 | 5,186,435 | |
| Rabobank Nederland, Bank Gtd. Notes | 3.38 | 1/19/17 | 4,785,000 | 5,157,402 | |
| Royal Bank of Canada, Covered Bonds | 1.20 | 9/19/17 | 3,330,000 | 3,340,723 | |
| Royal Bank of Scotland Group, Sr. Unscd. Notes | 2.55 | 9/18/15 | 5,470,000 | 5,634,067 | |
| Simon Property Group, Sr. Unscd. Notes | 4.20 | 2/1/15 | 6,682,000 | 7,063,689 | |
| TD Ameritrade Holding, Gtd. Notes | 4.15 | 12/1/14 | 3,650,000 | 3,871,621 | |
| Wachovia, Sub. Notes | 5.25 | 8/1/14 | 6,210,000 | 6,595,157 | |
| 173,568,825 | |||||
| Foreign/Governmental—1.5% | |||||
| Mexican Government, Sr. Unscd. Notes | 6.63 | 3/3/15 | 1,064,000 | b | 1,183,700 |
| Province of Nova Scotia Canada, | |||||
| Sr. Unscd. Bonds | 5.13 | 1/26/17 | 5,430,000 | 6,317,501 | |
| Province of Ontario Canada, Sr. Unscd. Bonds | 4.00 | 10/7/19 | 6,515,000 | 7,468,131 | |
| 14,969,332 | |||||
| Health Care—3.1% | |||||
| Amgen, Sr. Unscd. Notes | 5.70 | 2/1/19 | 2,905,000 | 3,494,201 | |
| AstraZeneca, Sr. Unscd. Notes | 5.90 | 9/15/17 | 6,090,000 | 7,330,703 | |
| GlaxoSmithKline Capital, Gtd. Bonds | 5.65 | 5/15/18 | 5,853,000 | 7,112,302 | |
| Pfizer, Sr. Unscd. Notes | 6.20 | 3/15/19 | 4,050,000 | 5,103,960 | |
| Thermo Fisher Scientific, Sr. Unscd. Notes | 3.20 | 3/1/16 | 7,090,000 | 7,510,884 | |
| 30,552,050 |
The Funds 19
STATEMENT OF INVESTMENTS (Unaudited) (continued)
| BNY Mellon Intermediate Bond Fund (continued) | |||||
| Coupon | Maturity | Principal | |||
| Bonds and Notes (continued) | Rate (%) | Date | Amount ($) | Value ($) | |
| Industrial—.7% | |||||
| ABB Finance USA, Gtd. Notes | 1.63 | 5/8/17 | 5,065,000 | 5,138,483 | |
| United Technologies, Sr. Unscd. Notes | 6.13 | 2/1/19 | 1,860,000 | 2,329,230 | |
| 7,467,713 | |||||
| Information Technology—2.0% | |||||
| FISERV, Gtd. Notes | 3.13 | 6/15/16 | 4,000,000 | 4,223,812 | |
| Intel, Sr. Unscd. Notes | 1.35 | 12/15/17 | 7,180,000 | 7,204,175 | |
| Oracle, Sr. Unscd. Notes | 5.75 | 4/15/18 | 7,000,000 | 8,482,537 | |
| 19,910,524 | |||||
| Materials—1.2% | |||||
| CRH America, Gtd. Notes | 5.30 | 10/15/13 | 4,784,000 | 4,909,857 | |
| Dow Chemical, Sr. Unscd. Notes | 4.25 | 11/15/20 | 6,245,000 | 6,882,234 | |
| 11,792,091 | |||||
| Municipal Bonds—3.8% | |||||
| California, GO (Various Purpose) | 5.45 | 4/1/15 | 4,550,000 | 4,999,949 | |
| California, GO (Various Purpose) | 5.95 | 4/1/16 | 3,255,000 | 3,726,031 | |
| Illinois, GO | 4.42 | 1/1/15 | 3,225,000 | 3,401,472 | |
| Massachusetts, GO (Build America Bonds) | 4.20 | 12/1/21 | 9,625,000 | 10,969,612 | |
| North Texas Tollway Authority, | |||||
| Special Projects System Revenue, BAN | 2.44 | 9/1/13 | 9,020,000 | 9,115,341 | |
| Puerto Rico Commonwealth Government | |||||
| Development Bank, Revenue Bonds | 3.67 | 5/1/14 | 5,830,000 | 5,830,000 | |
| 38,042,405 | |||||
| Telecommunications—2.2% | |||||
| AT&T, Sr. Unscd. Notes | 4.45 | 5/15/21 | 3,900,000 | 4,416,048 | |
| Rogers Communications, Gtd. Notes | 6.38 | 3/1/14 | 4,934,000 | 5,205,153 | |
| Telefonica Emisiones, Gtd. Notes | 4.95 | 1/15/15 | 6,635,000 | 6,983,337 | |
| Verizon Communications, Sr. Unscd. Notes | 8.75 | 11/1/18 | 4,244,000 | 5,796,553 | |
| 22,401,091 | |||||
| U.S. Government Agencies—1.6% | |||||
| Federal Farm Credit Bank, Bonds | 1.99 | 3/26/18 | 8,000,000 | 8,008,664 | |
| Federal Home Loan Bank, Bonds | 0.50 | 10/16/15 | 750,000 | 750,025 | |
| Federal National Mortgage Association, Notes | 0.52 | 2/22/16 | 705,000 | c | 705,025 |
| Federal National Mortgage Association, Notes | 0.75 | 12/19/14 | 1,000,000 | c | 1,008,585 |
| Federal National Mortgage Association, Notes | 3.00 | 9/16/14 | 4,895,000 | c | 5,107,370 |
| 15,579,669 |
20
| BNY Mellon Intermediate Bond Fund (continued) | |||||||
| Principal | Principal | ||||||
| Bonds and Notes (continued) | Amount ($) | Value ($) | Amount ($) | Value ($) | |||
| U.S. Government Agencies/ | U.S. Government | ||||||
| Mortgage-Backed—.0% | Securities (continued) | ||||||
| Federal Home Loan | U.S. Treasury Notes (continued): | ||||||
| Mortgage Corp.; | 0.75%, 6/30/17 | 1,750,000 | 1,759,434 | ||||
| REMIC, Ser. 2134, Cl. PM, | 0.88%, 12/31/16 | 5,500,000 | b | 5,575,196 | |||
| 5.50%, 3/15/14 | 70,420 | c | 71,758 | 0.88%, 1/31/17 | 22,750,000 | b | 23,050,368 |
| Government National | 0.88%, 2/28/17 | 21,350,000 | b | 21,625,223 | |||
| Mortgage Association I: | 0.88%, 4/30/17 | 19,000,000 | b | 19,224,143 | |||
| Ser. 2004-23, Cl. AB, | 1.00%, 9/30/16 | 6,250,000 | b | 6,368,656 | |||
| 3.63%, 9/16/27 | 82,727 | 84,155 | 1.25%, 2/15/14 | 12,500,000 | b | 12,630,375 | |
| Ser. 2005-76, Cl. A, | 1.25%, 3/15/14 | 3,305,000 | b | 3,341,795 | |||
| 3.96%, 5/16/30 | 20,884 | 20,925 | 1.25%, 4/15/14 | 6,000,000 | 6,071,952 | ||
| Ser. 2004-12, Cl. BA, | 1.25%, 4/30/19 | 7,720,000 | b | 7,814,693 | |||
| 4.81%, 8/16/32 | 42,107 | 42,324 | 1.50%, 6/30/16 | 10,175,000 | b | 10,539,072 | |
| 219,162 | 1.50%, 7/31/16 | 1,000,000 | 1,036,172 | ||||
| 1.63%, 11/15/22 | 4,000,000 | 3,917,500 | |||||
| U.S. Government | 1.75%, 7/31/15 | 2,280,000 | b | 2,360,156 | |||
| Securities—53.9% | 1.75%, 5/15/22 | 27,745,000 | b | 27,723,331 | |||
| U.S. Treasury Bonds; | 2.00%, 11/15/21 | 500,000 | b | 514,258 | |||
| 7.25%, 5/15/16 | 1,500,000 | 1,826,953 | 2.00%, 2/15/22 | 16,045,000 | b | 16,444,873 | |
| U.S. Treasury Inflation | 2.13%, 11/30/14 | 18,200,000 | b | 18,806,442 | |||
| Protected Securities: | 2.13%, 2/29/16 | 21,200,000 | b | 22,319,636 | |||
| Notes, 1.38%, 7/15/18 | 8,305,830 | b,d | 9,755,455 | 2.13%, 8/15/21 | 10,000,000 | b | 10,423,440 |
| Notes, 1.38%, 1/15/20 | 1,003,458 | d | 1,195,447 | 2.38%, 9/30/14 | 17,930,000 | b | 18,544,945 |
| Notes, 2.38%, 1/15/17 | 17,958,630 | d | 21,001,774 | 2.38%, 10/31/14 | 18,250,000 | b | 18,904,445 |
| Notes, 0.63%, 7/15/21 | 14,405,973 | d | 16,450,945 | 2.38%, 5/31/18 | 1,530,000 | 1,652,281 | |
| U.S. Treasury Notes: | 2.50%, 3/31/15 | 1,250,000 | 1,308,496 | ||||
| 0.25%, 10/31/14 | 80,000 | b | 80,050 | 2.50%, 4/30/15 | 3,000,000 | 3,144,843 | |
| 0.25%, 12/15/14 | 1,250,000 | 1,250,684 | 2.63%, 1/31/18 | 11,000,000 | 12,001,176 | ||
| 0.25%, 1/15/15 | 1,250,000 | 1,250,489 | 2.63%, 8/15/20 | 3,430,000 | b | 3,741,379 | |
| 0.25%, 5/15/15 | 5,825,000 | b | 5,823,637 | 2.63%, 11/15/20 | 970,000 | b | 1,056,315 |
| 0.25%, 8/15/15 | 550,000 | 549,442 | 3.13%, 5/15/21 | 6,500,000 | b | 7,308,437 | |
| 0.25%, 9/15/15 | 12,250,000 | 12,235,643 | 3.25%, 7/31/16 | 7,135,000 | b | 7,818,397 | |
| 0.25%, 12/15/15 | 30,000,000 | 29,939,070 | 3.38%, 11/15/19 | 7,000,000 | b | 8,010,079 | |
| 0.38%, 11/15/14 | 16,250,000 | b | 16,293,160 | 3.50%, 5/15/20 | 14,250,000 | b | 16,438,714 |
| 0.50%, 10/15/14 | 1,250,000 | 1,255,909 | 3.63%, 2/15/20 | 500,000 | b | 580,742 | |
| 0.63%, 7/15/14 | 20,110,000 | b | 20,227,060 | 3.75%, 11/15/18 | 2,405,000 | 2,785,103 | |
| 0.63%, 5/31/17 | 9,610,000 | b | 9,619,014 | 4.25%, 11/15/13 | 18,000,000 | 18,521,730 | |
| 0.63%, 9/30/17 | 17,560,000 | b | 17,518,839 | 4.50%, 11/15/15 | 6,070,000 | b | 6,752,402 |
| 0.75%, 12/15/13 | 9,000,000 | 9,042,192 | 5.13%, 5/15/16 | 1,000,000 | 1,150,235 | ||
| 0.75%, 6/15/14 | 11,250,000 | b | 11,330,865 | 537,913,062 | |||
The Funds 21
STATEMENT OF INVESTMENTS (Unaudited) (continued)
| BNY Mellon Intermediate Bond Fund (continued) | |||||
| Coupon | Maturity | Principal | |||
| Bonds and Notes (continued) | Rate (%) | Date | Amount ($) | Value ($) | |
| Utilities—.7% | |||||
| Duke Energy Carolinas, First Mortgage Bonds | 1.75 | 12/15/16 | 3,010,000 | 3,090,873 | |
| Hydro-Quebec, Gov’t Gtd. Notes | 2.00 | 6/30/16 | 3,655,000 | 3,808,649 | |
| 6,899,522 | |||||
| Total Bonds and Notes | |||||
| (cost $941,942,058) | 986,875,349 | ||||
| Other Investment—.6% | Shares | Value ($) | |||
| Registered Investment Company; | |||||
| Dreyfus Institutional Preferred Plus Money Market Fund | |||||
| (cost $5,649,631) | 5,649,631 | e | 5,649,631 | ||
| Investment of Cash Collateral | |||||
| for Securities Loaned—.1% | |||||
| Registered Investment Company; | |||||
| Dreyfus Institutional Cash Advantage Fund | |||||
| (cost $1,276,800) | 1,276,800 | e | 1,276,800 | ||
| Total Investments (cost $948,868,489) | 99.6 | % | 993,801,780 | ||
| Cash and Receivables (Net) | .4 | % | 3,650,579 | ||
| Net Assets | 100.0 | % | 997,452,359 | ||
BAN—Bond Anticipation Notes
GO—General Obligation
REMIC—Real Estate Mortgage Investment Conduit
a Securities exempt from registration pursuant to Rule 144A under the Securities Act of 1933.These securities may be resold in transactions exempt from registration, normally to
qualified institutional buyers.At February 28, 2013, these securities were valued at $10,340,636 or 1.0% of net assets.
b Security, or portion thereof, on loan.At February 28, 2013, the value of the fund’s securities on loan was $328,682,915 and the value of the collateral held by the fund was
$336,453,214, consisting of cash collateral of $1,276,800 and U.S. Government and agency securities valued at $335,176,414.
c The Federal Housing Finance Agency (“FHFA”) placed Federal Home Loan Mortgage Corporation and Federal National Mortgage Association into conservatorship with FHFA
as the conservator.As such, the FHFA oversees the continuing affairs of these companies.
d Principal amount for accrual purposes is periodically adjusted based on changes in the Consumer Price Index.
e Investment in affiliated money market mutual fund.
| Portfolio Summary (Unaudited) † | |||
| Value (%) | Value (%) | ||
| U.S. Government & Agencies | 55.5 | Foreign/Governmental | 1.5 |
| Corporate Bonds | 38.1 | Money Market Investments | .7 |
| Municipal Bonds | 3.8 | 99.6 | |
| † Based on net assets. | |||
| See notes to financial statements. | |||
22
STATEMENT OF INVESTMENTS
February 28, 2013 (Unaudited)
| BNY Mellon Corporate Bond Fund | |||||
| Coupon | Maturity | Principal | |||
| Bonds and Notes—97.4% | Rate (%) | Date | Amount ($) | Value ($) | |
| Automobiles & Components—1.7% | |||||
| Johnson Controls, Sr. Unscd. Notes | 3.75 | 12/1/21 | 4,150,000 | 4,393,518 | |
| Volkswagen International Finance, Gtd. Notes | 1.15 | 11/20/15 | 4,000,000 | a | 4,021,004 |
| 8,414,522 | |||||
| Banks—13.8% | |||||
| American Express Centurion Bank, Gtd. Notes | 0.74 | 11/13/15 | 2,375,000 | b | 2,382,381 |
| Bank of America, Sr. Unscd. Notes | 3.88 | 3/22/17 | 1,000,000 | 1,078,322 | |
| Bank of America, Sub. Notes | 5.49 | 3/15/19 | 4,450,000 | 5,010,562 | |
| Barclays Bank, Sr. Unscd. Notes | 2.75 | 2/23/15 | 4,500,000 | 4,663,436 | |
| BBVA US Senior, Bank Gtd. Notes | 3.25 | 5/16/14 | 5,250,000 | 5,301,429 | |
| Citigroup, Sub. Notes | 5.50 | 2/15/17 | 5,250,000 | 5,901,698 | |
| Goldman Sachs Group, Sub. Notes | 5.63 | 1/15/17 | 2,000,000 | 2,250,832 | |
| Goldman Sachs Group, Sr. Unscd. Notes | 6.25 | 9/1/17 | 3,750,000 | 4,426,208 | |
| Morgan Stanley, Sub. Notes | 4.88 | 11/1/22 | 6,000,000 | c | 6,346,242 |
| Rabobank Nederland, Bank Gtd. Notes | 3.38 | 1/19/17 | 5,000,000 | 5,389,135 | |
| RBS Citizens Financial Group, Sub. Notes | 4.15 | 9/28/22 | 6,000,000 | a | 6,150,960 |
| Royal Bank of Scotland Group, Sr. Unscd. Notes | 2.55 | 9/18/15 | 3,200,000 | 3,295,981 | |
| Santander US Debt, Bank Gtd. Notes | 3.78 | 10/7/15 | 5,300,000 | a | 5,413,818 |
| Societe Generale, Bank Gtd. Notes | 2.75 | 10/12/17 | 6,000,000 | c | 6,197,676 |
| Wachovia, Sub. Notes | 5.25 | 8/1/14 | 1,860,000 | 1,975,361 | |
| Wells Fargo & Co., Sub. Notes | 5.13 | 9/15/16 | 1,000,000 | 1,129,141 | |
| Westpac Banking, Sub. Notes | 4.63 | 6/1/18 | 2,750,000 | 3,042,732 | |
| 69,955,914 | |||||
| Capital Goods—4.1% | |||||
| ABB Finance USA, Gtd. Notes | 2.88 | 5/8/22 | 2,000,000 | 2,027,744 | |
| CRH America, Gtd. Notes | 4.13 | 1/15/16 | 250,000 | 264,174 | |
| CRH America, Gtd. Notes | 6.00 | 9/30/16 | 5,500,000 | 6,269,879 | |
| GATX, Sr. Unscd. Notes | 4.75 | 6/15/22 | 3,000,000 | 3,193,623 | |
| GATX, Sr. Unscd. Notes | 8.75 | 5/15/14 | 2,000,000 | 2,178,154 | |
| Stanley Black & Decker, Gtd. Notes | 2.90 | 11/1/22 | 1,000,000 | 1,003,082 | |
| Textron, Sr. Unscd. Notes | 4.63 | 9/21/16 | 4,500,000 | 4,950,378 | |
| United Technologies, Sr. Unscd. Notes | 3.10 | 6/1/22 | 1,000,000 | 1,048,105 | |
| 20,935,139 | |||||
| Casinos—.2% | |||||
| Seminole Indian Tribe of Florida, Scd. Notes | 7.75 | 10/1/17 | 1,000,000 | a | 1,088,750 |
| Commercial & Professional Services—2.3% | |||||
| ADT, Sr. Unscd. Notes | 2.25 | 7/15/17 | 5,500,000 | a | 5,498,339 |
| Republic Services, Gtd. Notes | 3.55 | 6/1/22 | 3,000,000 | 3,133,908 | |
| Waste Management, Gtd. Notes | 4.75 | 6/30/20 | 2,750,000 | 3,133,218 | |
| 11,765,465 |
The Funds 23
STATEMENT OF INVESTMENTS (Unaudited) (continued)
| BNY Mellon Corporate Bond Fund (continued) | |||||
| Coupon | Maturity | Principal | |||
| Bonds and Notes (continued) | Rate (%) | Date | Amount ($) | Value ($) | |
| Consumer Durables & Apparel—1.2% | |||||
| Leggett & Platt, Sr. Unscd. Notes | 3.40 | 8/15/22 | 2,000,000 | 2,029,594 | |
| NVR, Sr. Unscd. Notes | 3.95 | 9/15/22 | 4,000,000 | 4,105,548 | |
| 6,135,142 | |||||
| Consumer Services—.6% | |||||
| George Washington University, Notes | 1.83 | 9/15/17 | 3,000,000 | 3,059,058 | |
| Diversified Financials—12.6% | |||||
| American Express, Sr. Unscd. Notes | 7.00 | 3/19/18 | 3,250,000 | 4,073,586 | |
| Bear Stearns, Sub. Notes | 5.55 | 1/22/17 | 4,800,000 | 5,476,094 | |
| Blackstone Holdings Finance, Gtd. Notes | 4.75 | 2/15/23 | 3,000,000 | a | 3,256,653 |
| Blackstone Holdings Finance, Gtd. Notes | 6.63 | 8/15/19 | 2,000,000 | a | 2,406,720 |
| Carlyle Holdings Finance, Gtd. Notes | 3.88 | 2/1/23 | 3,790,000 | a | 3,887,793 |
| Caterpillar Financial Services, Sr. Unscd. Notes, Ser. G | 1.25 | 11/6/17 | 3,355,000 | 3,366,082 | |
| Ford Motor Credit, Sr. Unscd. Notes | 4.25 | 2/3/17 | 5,500,000 | 5,893,113 | |
| General Electric Capital, Sub. Notes | 5.30 | 2/11/21 | 5,250,000 | 6,051,512 | |
| HSBC Finance, Sr. Sub. Notes | 6.68 | 1/15/21 | 5,500,000 | 6,589,490 | |
| Jefferies Group, Sr. Unscd. Notes | 5.13 | 1/20/23 | 2,000,000 | 2,095,080 | |
| Jefferies Group, Sr. Unscd. Notes | 8.50 | 7/15/19 | 3,250,000 | 4,068,753 | |
| John Deere Capital, Sr. Unscd. Notes | 2.80 | 9/18/17 | 4,000,000 | 4,284,100 | |
| MassMutual Global Funding II, Sr. Scd. Notes | 2.00 | 4/5/17 | 600,000 | a | 615,995 |
| Moody’s, Sr. Unscd. Notes | 4.50 | 9/1/22 | 5,000,000 | 5,032,890 | |
| NYSE Euronext, Sr. Unscd. Notes | 2.00 | 10/5/17 | 4,500,000 | 4,634,217 | |
| TD Ameritrade Holding, Gtd. Notes | 4.15 | 12/1/14 | 1,750,000 | 1,856,257 | |
| 63,588,335 | |||||
| Energy—4.5% | |||||
| Devon Energy, Sr. Unscd. Notes | 1.88 | 5/15/17 | 3,250,000 | 3,284,502 | |
| Petrobras International Finance, Gtd. Notes | 5.38 | 1/27/21 | 5,250,000 | 5,757,612 | |
| Pioneer Natural Resource, Sr. Unscd. Notes | 3.95 | 7/15/22 | 3,000,000 | 3,132,411 | |
| Plains All American Pipeline, Sr. Unscd. Notes | 3.65 | 6/1/22 | 1,000,000 | 1,056,287 | |
| Schlumberger Investment, Gtd. Notes | 1.25 | 8/1/17 | 3,000,000 | a | 3,000,375 |
| Sunoco Logistics Partners Operations, Gtd. Notes | 3.45 | 1/15/23 | 4,000,000 | 4,005,508 | |
| Weatherford International, Gtd. Notes | 5.13 | 9/15/20 | 2,252,000 | 2,436,085 | |
| 22,672,780 | |||||
| Food & Staples Retailing—.7% | |||||
| Walgreen, Sr. Unscd. Notes | 3.10 | 9/15/22 | 3,500,000 | 3,519,257 | |
| Food, Beverage & Tobacco—6.1% | |||||
| Anheuser-Busch Inbev Finance, Gtd. Notes | 1.25 | 1/17/18 | 5,000,000 | 5,003,040 | |
| Anheuser-Busch InBev Worldwide, Gtd. Notes | 1.38 | 7/15/17 | 1,000,000 | 1,009,241 | |
| Beam, Sr. Unscd. Notes | 3.25 | 5/15/22 | 4,000,000 | 4,114,996 | |
| Campbell Soup, Sr. Unscd. Notes | 0.60 | 8/1/14 | 400,000 | b | 401,304 |
| Conagra Foods, Sr. Unscd. Notes | 3.20 | 1/25/23 | 3,725,000 | 3,723,979 | |
| Flowers Foods, Sr. Unscd. Notes | 4.38 | 4/1/22 | 2,850,000 | 2,883,758 |
24
| BNY Mellon Corporate Bond Fund (continued) | |||||
| Coupon | Maturity | Principal | |||
| Bonds and Notes (continued) | Rate (%) | Date | Amount ($) | Value ($) | |
| Food, Beverage & Tobacco (continued) | |||||
| General Mills, Sr. Unscd. Notes | 0.60 | 1/29/16 | 2,000,000 | b | 2,006,084 |
| Kraft Foods Group, Sr. Unscd. Notes | 1.63 | 6/4/15 | 3,500,000 | 3,558,429 | |
| Kroger, Sr. Unscd. Notes | 3.40 | 4/15/22 | 3,500,000 | 3,599,162 | |
| Pernod-Ricard, Sr. Unscd. Bonds | 5.75 | 4/7/21 | 4,000,000 | a | 4,774,272 |
| 31,074,265 | |||||
| Foreign/Governmental—1.1% | |||||
| Spanish Government, Notes | 4.00 | 3/6/18 | 5,500,000 | a | 5,426,300 |
| Health Care Equipment & Services—3.0% | |||||
| Dignity Health, Unscd. Notes | 3.13 | 11/1/22 | 5,000,000 | 4,951,260 | |
| Kaiser Foundation Hospitals, Gtd. Notes | 3.50 | 4/1/22 | 2,000,000 | 2,084,860 | |
| UnitedHealth Group, Sr. Unscd. Notes | 1.40 | 10/15/17 | 3,000,000 | 3,016,461 | |
| WellPoint, Sr. Unscd. Notes | 1.25 | 9/10/15 | 5,000,000 | 5,041,780 | |
| 15,094,361 | |||||
| Insurance—4.3% | |||||
| American International Group, | |||||
| Sr. Unscd. Notes | 5.85 | 1/16/18 | 4,750,000 | 5,600,202 | |
| Berkshire Hathaway Finance, Gtd. Notes | 1.60 | 5/15/17 | 1,000,000 | 1,022,216 | |
| Fidelity National Financial, Sr. Unscd. Notes | 5.50 | 9/1/22 | 5,075,000 | 5,751,295 | |
| MetLife, Sr. Unscd. Notes | 1.76 | 12/15/17 | 4,685,000 | b | 4,745,188 |
| Prudential Financial, Sr. Unscd. Notes | 4.75 | 9/17/15 | 4,250,000 | 4,655,195 | |
| 21,774,096 | |||||
| Materials—1.8% | |||||
| Dow Chemical, Sr. Unscd. Notes | 4.13 | 11/15/21 | 5,000,000 | 5,411,790 | |
| Eastman Chemical, Sr. Unscd. Notes | 3.60 | 8/15/22 | 3,000,000 | 3,125,835 | |
| Vale Overseas, Gtd. Notes | 4.38 | 1/11/22 | 600,000 | 627,415 | |
| 9,165,040 | |||||
| Media—5.7% | |||||
| British Sky Broadcasting Group, Gtd. Notes | 3.13 | 11/26/22 | 3,500,000 | a | 3,465,679 |
| Comcast, Gtd. Notes | 3.13 | 7/15/22 | 4,000,000 | 4,108,644 | |
| Grupo Televisa, Sr. Unscd. Notes | 6.00 | 5/15/18 | 5,600,000 | 6,619,278 | |
| News America, Gtd. Notes | 4.50 | 2/15/21 | 3,250,000 | 3,694,847 | |
| Time Warner Cable, Gtd. Notes | 4.13 | 2/15/21 | 5,250,000 | 5,621,322 | |
| Time Warner, Gtd. Notes | 4.00 | 1/15/22 | 5,000,000 | 5,393,250 | |
| 28,903,020 | |||||
| Municipal Bonds—7.1% | |||||
| California GO (Various Purpose) | 5.25 | 4/1/14 | 500,000 | 522,730 | |
| California, GO (Various Purpose) | 5.45 | 4/1/15 | 1,025,000 | 1,126,362 | |
| Connecticut GO | 2.55 | 10/15/22 | 3,035,000 | 3,110,875 | |
| Illinois, GO | 4.42 | 1/1/15 | 5,000,000 | 5,273,600 | |
| JobsOhio Beverage System, | |||||
| Statewide Senior Lien Liquor Profits Revenue | 1.82 | 1/1/18 | 5,000,000 | 5,043,850 |
The Funds 25
STATEMENT OF INVESTMENTS (Unaudited) (continued)
| BNY Mellon Corporate Bond Fund (continued) | |||||
| Coupon | Maturity | Principal | |||
| Bonds and Notes (continued) | Rate (%) | Date | Amount ($) | Value ($) | |
| Municipal Bonds (continued) | |||||
| Kentucky Asset/Liability Commission, | |||||
| General Fund Revenue (Funding Notes) | 1.03 | 4/1/16 | 5,000,000 | 5,031,500 | |
| Massachusetts, GO (Build America Bonds) | 4.20 | 12/1/21 | 600,000 | 683,820 | |
| Metropolitan Transportation Authority, | |||||
| Transportation Revenue (Build America Bonds) | 5.37 | 11/15/21 | 185,000 | 215,542 | |
| New Jersey Economic Development Authority, | |||||
| School Facilities Construction Revenue | 1.06 | 3/1/16 | 4,500,000 | 4,506,480 | |
| Oakland Unified School District, | |||||
| GO (Build America Bonds) | 9.50 | 8/1/34 | 2,500,000 | 2,948,975 | |
| Puerto Rico Commonwealth Government | |||||
| Development Bank, Revenue Bonds | 3.67 | 5/1/14 | 4,560,000 | 4,560,000 | |
| West Contra Costa Unified School District, | |||||
| GO (Build America Bonds) | 8.46 | 8/1/34 | 2,250,000 | 2,769,075 | |
| 35,792,809 | |||||
| Pharmaceuticals, Biotech & Life Sciences—3.2% | |||||
| AbbVie, Gtd. Notes | 1.75 | 11/6/17 | 5,000,000 | a | 5,068,135 |
| Agilent Technologies, Sr. Unscd. Notes | 3.20 | 10/1/22 | 3,000,000 | 3,004,122 | |
| Amgen, Sr. Unscd. Notes | 3.88 | 11/15/21 | 3,500,000 | 3,813,358 | |
| AstraZeneca, Sr. Unscd. Notes | 5.90 | 9/15/17 | 1,750,000 | 2,106,524 | |
| Teva Pharmaceutical Finance IV, Gtd. Notes | 2.25 | 3/18/20 | 2,320,000 | 2,342,198 | |
| 16,334,337 | |||||
| Real Estate—5.5% | |||||
| Boston Properties, Sr. Unscd. Notes | 3.70 | 11/15/18 | 4,490,000 | 4,943,288 | |
| Camden Property Trust, Sr. Unscd. Notes | 5.00 | 6/15/15 | 1,170,000 | 1,264,269 | |
| CubeSmart, Gtd. Notes | 4.80 | 7/15/22 | 4,200,000 | 4,618,328 | |
| Liberty Property, Sr. Unscd. Notes | 5.50 | 12/15/16 | 2,000,000 | 2,268,798 | |
| Liberty Property, Sr. Unscd. Notes | 6.63 | 10/1/17 | 2,500,000 | 2,977,800 | |
| Simon Property Group, Sr. Unscd. Notes | 3.38 | 3/15/22 | 1,000,000 | 1,051,416 | |
| Simon Property Group, Sr. Unscd. Notes | 6.13 | 5/30/18 | 1,250,000 | 1,527,560 | |
| UDR, Gtd. Notes, Ser. 1 | 4.63 | 1/10/22 | 2,250,000 | 2,492,345 | |
| WEA Finance, Gtd. Notes | 7.13 | 4/15/18 | 5,500,000 | a | 6,809,435 |
| 27,953,239 | |||||
| Retailing—2.2% | |||||
| Amazon.com, Sr. Unscd. Notes | 2.50 | 11/29/22 | 3,000,000 | 2,925,474 | |
| AutoZone, Sr. Unscd. Notes | 3.70 | 4/15/22 | 1,000,000 | 1,033,395 | |
| Macy’s Retail Holdings, Gtd. Notes | 2.88 | 2/15/23 | 2,000,000 | 1,926,274 | |
| Staples, Sr. Unscd. Notes | 4.38 | 1/12/23 | 5,000,000 | c | 5,043,745 |
| 10,928,888 | |||||
| Semiconductors & Semiconductor Equipment—.8% | |||||
| Altera, Sr. Unscd. Notes | 1.75 | 5/15/17 | 1,000,000 | 1,021,725 |
26
| BNY Mellon Corporate Bond Fund (continued) | |||||
| Coupon | Maturity | Principal | |||
| Bonds and Notes (continued) | Rate (%) | Date | Amount ($) | Value ($) | |
| Semiconductors & Semiconductor Equipment (continued) | |||||
| Intel, Sr. Unscd. Notes | 1.35 | 12/15/17 | 3,000,000 | 3,010,101 | |
| 4,031,826 | |||||
| Software & Services—4.4% | |||||
| Autodesk, Sr. Unscd. note | 1.95 | 12/15/17 | 1,000,000 | 991,536 | |
| Ebay, Sr. Unscd. Notes | 1.35 | 7/15/17 | 2,000,000 | 2,020,628 | |
| Fidelity National Information Services, Gtd. Notes | 7.63 | 7/15/17 | 5,000,000 | 5,406,250 | |
| Fiserv, Gtd. Notes | 3.50 | 10/1/22 | 5,500,000 | 5,445,578 | |
| IBM, Sr. Unscd. Notes | 0.55 | 2/6/15 | 2,000,000 | 2,005,232 | |
| Oracle, Sr. Unscd. Notes | 5.75 | 4/15/18 | 2,000,000 | 2,423,582 | |
| Symantec, Sr. Unscd. Notes | 2.75 | 6/15/17 | 4,000,000 | 4,132,008 | |
| 22,424,814 | |||||
| Technology Hardware & Equipment—2.5% | |||||
| Arrow Electronics, Sr. Unscd. Notes | 3.00 | 3/1/18 | 6,500,000 | 6,539,826 | |
| Avnet, Sr. Unscd. Notes | 4.88 | 12/1/22 | 5,000,000 | 5,125,145 | |
| Netapp, Sr. Unscd. Notes | 2.00 | 12/15/17 | 1,000,000 | 1,000,577 | |
| Xerox, Sr. Unscd. Notes | 1.71 | 9/13/13 | 250,000 | b | 251,060 |
| 12,916,608 | |||||
| Telecommunications—5.4% | |||||
| America Movil, Gtd. Notes | 5.63 | 11/15/17 | 4,500,000 | 5,355,958 | |
| AT&T, Sr. Unscd. Notes | 1.70 | 6/1/17 | 1,750,000 | 1,776,806 | |
| AT&T, Sr. Unscd. Notes | 4.45 | 5/15/21 | 2,000,000 | 2,264,640 | |
| British Telecommunications, Sr. Unscd. Notes | 2.00 | 6/22/15 | 3,000,000 | 3,077,406 | |
| Telefonica Emisiones, Gtd. Notes | 5.13 | 4/27/20 | 5,500,000 | 5,694,601 | |
| Verizon Communications, Sr. Unscd. Notes | 5.50 | 2/15/18 | 2,500,000 | 2,967,335 | |
| Vivendi, Sr. Unscd. Notes | 3.45 | 1/12/18 | 6,000,000 | a | 6,237,366 |
| 27,374,112 | |||||
| Transportation—.4% | |||||
| ERAC USA Finance, Gtd. Notes | 1.40 | 4/15/16 | 2,000,000 | a | 2,013,822 |
| Utilities—2.2% | |||||
| CMS Energy, Sr. Unscd. Notes | 4.25 | 9/30/15 | 1,400,000 | 1,496,806 | |
| CMS Energy, Sr. Unscd. Notes | 5.05 | 3/15/22 | 1,500,000 | 1,695,470 | |
| Dominion Resources, Sr. Unscd. Notes | 2.25 | 9/1/15 | 2,050,000 | 2,125,012 | |
| Duke Energy, Sr. Unscd. Notes | 1.63 | 8/15/17 | 2,000,000 | 2,016,990 | |
| Georgia Power, Sr. Unscd. Notes | 0.75 | 8/10/15 | 2,500,000 | 2,510,060 | |
| Northeast Utilities, Sr. Unscd. Notes | 1.06 | 9/20/13 | 300,000 | b | 301,040 |
| PSEG Power, Gtd. Notes | 2.75 | 9/15/16 | 1,000,000 | 1,041,985 | |
| 11,187,363 | |||||
| Total Bonds and Notes | |||||
| (cost $482,505,795) | 493,529,262 |
The Funds 27
| STATEMENT OF INVESTMENTS (Unaudited) (continued) | ||||
| BNY Mellon Corporate Bond Fund (continued) | ||||
| Other Investment—2.7% | Shares | Value ($) | ||
| Registered Investment Company; | ||||
| Dreyfus Institutional Preferred Plus Money Market Fund | ||||
| (cost $13,683,182) | 13,683,182 | d | 13,683,182 | |
| Investment of Cash Collateral for Securities Loaned—2.6% | ||||
| Registered Investment Company; | ||||
| Dreyfus Institutional Cash Advantage Fund | ||||
| (cost $13,157,667) | 13,157,667 | d | 13,157,667 | |
| Total Investments (cost $509,346,644) | 102.7 | % | 520,370,111 | |
| Liabilities, Less Cash and Receivables | (2.7 | %) | (13,807,276 | ) |
| Net Assets | 100.0 | % | 506,562,835 | |
GO—General Obligation
a Securities exempt from registration pursuant to Rule 144A under the Securities Act of 1933.These securities may be resold in transactions exempt from registration, normally to
qualified institutional buyers.At February 28, 2013, these securities were valued at $69,135,416 or 13.6% of net assets.
b Variable rate security—interest rate subject to periodic change.
c Security, or portion thereof, on loan. At February 28, 2013, the value of the fund’s securities on loan was $12,699,962 and the value of the collateral held by the fund
was $13,157,667.
d Investment in affiliated money market mutual fund.
| Portfolio Summary (Unaudited) † | |||
| Value (%) | Value (%) | ||
| Corporate Bonds | 89.2 | Foreign/Governmental | 1.1 |
| Municipal Bonds | 7.1 | ||
| Money Market Investments | 5.3 | 102.7 | |
| † Based on net assets. | |||
| See notes to financial statements. | |||
28
STATEMENT OF INVESTMENTS
February 28, 2013 (Unaudited)
| BNY Mellon Short-Term U.S. Government Securities Fund | |||||
| Coupon | Maturity | Principal | |||
| Bonds and Notes—99.1% | Rate (%) | Date | Amount ($) | Value ($) | |
| Commercial Mortgage Pass-Through Ctfs.—1.8% | |||||
| Bear Stearns Commercial Mortgage | |||||
| Securities Trust, Ser. 2006-T24, Cl. A3 | 5.53 | 10/12/41 | 2,490,317 | 2,524,814 | |
| JP Morgan Chase Commercial Mortgage | |||||
| Securities Trust, Ser. 2005-LDP1, Cl. A2 | 4.63 | 3/15/46 | 429,868 | 434,330 | |
| Morgan Stanley Capital I Trust, Ser. 2006-HQ8, Cl. AAB | 5.42 | 3/12/44 | 1,762,596 | a | 1,762,710 |
| Prudential Commercial Mortgage Trust, Ser. 2003-PWR1, Cl. A2 | 4.49 | 2/11/36 | 404,769 | 404,771 | |
| 5,126,625 | |||||
| Municipal Bonds—5.7% | |||||
| California, GO (Various Purpose) | 5.25 | 4/1/14 | 1,000,000 | 1,045,460 | |
| Illinois, GO | 4.42 | 1/1/15 | 1,700,000 | 1,793,024 | |
| Nassau County Interim Finance Authority, | |||||
| Sales Tax Secured Revenue | 0.86 | 11/15/15 | 2,500,000 | 2,529,375 | |
| New York City, GO | 5.13 | 12/1/15 | 1,100,000 | 1,230,636 | |
| North Texas Tollway Authority, | |||||
| Special Projects System Revenue, BAN | 2.44 | 9/1/13 | 2,960,000 | 2,991,287 | |
| Regional Transportation Authority of Illinois, | |||||
| GO Working Cash Notes | 1.06 | 6/1/14 | 3,000,000 | 3,018,780 | |
| University of California Regents, General Revenue | 0.78 | 7/1/14�� | 3,000,000 | a | 3,008,730 |
| University of California Regents, | |||||
| General Revenue (Build America Bonds) | 1.99 | 5/1/13 | 840,000 | 842,234 | |
| 16,459,526 | |||||
| U.S. Government Agencies—10.4% | |||||
| Federal Farm Credit Bank, Bonds | 0.50 | 6/23/15 | 3,500,000 | 3,511,956 | |
| Federal Home Loan Bank, Bonds | 0.50 | 10/16/15 | 4,000,000 | 4,000,136 | |
| Federal Home Loan Mortgage Corp., Notes | 0.63 | 8/21/15 | 2,750,000 | b | 2,759,631 |
| Federal National Mortgage Association, Notes | 0.48 | 1/29/16 | 6,600,000 | b | 6,599,611 |
| Federal National Mortgage Association, Notes | 0.52 | 2/22/16 | 4,700,000 | b | 4,700,169 |
| Federal National Mortgage Association, Notes, Ser. 0001 | 0.60 | 2/22/16 | 4,500,000 | b | 4,502,902 |
| Federal National Mortgage Association, Notes, Ser. 0001 | 0.70 | 4/30/15 | 4,250,000 | b | 4,252,393 |
| 30,326,798 | |||||
| U.S. Government Agencies/Mortgage-Backed—24.5% | |||||
| Federal Home Loan Mortgage Corp.: | |||||
| REMIC, Ser. 3565, Cl. XA, 4.00%, 8/15/22 | 1,462,537 | b | 1,491,029 | ||
| REMIC, Ser. 3689, Cl. AB, 2.00%, 12/15/27 | 490,115 | b | 493,851 | ||
| REMIC, Ser. 4079, Cl. WA, 2.00%, 8/15/40 | 5,179,392 | b | 5,234,464 | ||
| REMIC, Ser. 2627, Cl. KW, 3.14%, 11/15/17 | 510,242 | b | 514,628 | ||
| REMIC, Ser. 2675, Cl. CK, 4.00%, 9/15/18 | 301,443 | b | 318,431 | ||
| REMIC, Ser. 3653, Cl. DL, 4.00%, 7/15/22 | 1,010,458 | b | 1,022,995 | ||
| REMIC, Ser. 3578, Cl. AM, 4.50%, 9/15/16 | 1,341,221 | b | 1,389,444 | ||
| REMIC, Ser. 3835, Cl. CC , 4.50%, 12/15/2014 | 1,000,000 | b | 1,012,458 | ||
| REMIC, Ser. 2495, Cl. UC, 5.00%, 7/15/32 | 30,442 | b | 31,951 | ||
| REMIC, Ser. 3413, Cl. A, 5.50%, 4/15/37 | 1,789,025 | b | 1,796,911 | ||
The Funds 29
STATEMENT OF INVESTMENTS (Unaudited) (continued)
| BNY Mellon Short-Term U.S. Government Securities Fund (continued) | |||||||
| Principal | Principal | ||||||
| Bonds and Notes (continued) | Amount ($) | Value ($) | Amount ($) | Value ($) | |||
| U.S. Government Agencies/ | U.S. Government Agencies/ | ||||||
| Mortgage-Backed (continued) | Mortgage-Backed (continued) | ||||||
| Federal National Mortgage Association: | Government National | ||||||
| 2.50%, 3/1/22 | 2,364,436 | b | 2,468,619 | Mortgage Association I (continued): | |||
| 4.50%, 8/1/13 | 2,861 | b | 2,971 | Ser. 2004-12, Cl. BA, | |||
| 5.00%, 11/1/13 | 45,796 | b | 47,971 | 4.81%, 8/16/32 | 1,098,018 | 1,103,669 | |
| REMIC, Ser. 2012-94, Cl. E, | Ser. 2003-48, Cl. C, | ||||||
| 3.00%, 6/25/22 | 4,642,301 | b | 4,919,916 | 4.89%, 7/16/34 | 2,150,000 | 2,240,980 | |
| REMIC, Ser. 2008-23, Cl. A , | Ser. 2004-108, Cl. C, | ||||||
| 4.50%, 10/25/22 | 730,401 | b | 757,772 | 5.04%, 12/16/32 | 1,713,996 | a | 1,765,673 |
| REMIC, Ser. 2005-85, Cl. AJ, | Ser. 2007-75, Cl. B, | ||||||
| 4.50%, 2/25/24 | 319,007 | b | 320,298 | 5.05%, 3/16/36 | 753,889 | 767,899 | |
| REMIC, Ser. 2003-49, Cl. YD, | Ser. 2006-15, Cl. C, | ||||||
| 5.50%, 6/25/23 | 1,232,000 | b | 1,336,929 | 5.07%, 12/16/36 | 3,635,000 | a | 3,843,882 |
| REMIC, Ser. 2009-12, CI. KA, | Ser. 2006-3, Cl. B, | ||||||
| 5.50%, 2/25/38 | 442,484 | b | 445,166 | 5.09%, 1/16/37 | 1,943,909 | a | 2,032,284 |
| REMIC, Ser. 2010-13, CI. KA, | Ser. 2006-68, Cl. B, | ||||||
| 2.00%, 12/25/18 | 3,301,663 | b | 3,373,939 | 5.16%, 6/16/31 | 608,265 | a | 615,253 |
| Government National | Ser. 2003-64, Cl. E, | ||||||
| Mortgage Association I: | 5.18%, 4/16/39 | 723,083 | a | 726,744 | |||
| Ser. 2003-4, Cl. LD, | Ser. 2006-18, Cl. C, | ||||||
| 5.50%, 3/16/32 | 2,946,590 | 3,066,957 | 5.19%, 10/16/32 | 2,000,000 | a | 2,091,317 | |
| Ser. 2012-22, Cl. AB, | Ser. 2007-13, Cl. B, | ||||||
| 1.66%, 3/16/1933 | 968,871 | 988,991 | 5.19%, 5/16/39 | 446,294 | 450,013 | ||
| Ser. 2010-159, Cl. A, | Ser. 2007-39, Cl. D, | ||||||
| 2.16%, 1/16/1933 | 1,608,483 | 1,635,323 | 5.32%, 8/16/39 | 986,604 | a | 1,014,641 | |
| Ser. 2011-16, Cl. A, | Ser. 2006-32, Cl. B, | ||||||
| 2.21%, 11/16/34 | 2,698,239 | 2,753,191 | 5.35%, 7/16/36 | 1,197,937 | a | 1,250,139 | |
| Ser. 2010-100, Cl. A, | Ser. 2006-46, Cl. B, | ||||||
| 2.35%, 6/16/1950 | 29,054 | 29,168 | 5.63%, 6/16/34 | 1,146,518 | a | 1,198,253 | |
| Ser. 2011-49, Cl. A, | Ser. 2007-56, Cl. NC, | ||||||
| 2.45%, 7/16/38 | 1,082,345 | 1,120,616 | 5.75%, 9/20/36 | 2,686,944 | 2,765,794 | ||
| Ser. 2010-16, Cl. AB, | 71,265,082 | ||||||
| 2.68%, 5/16/1933 | 521,491 | 528,058 | U.S. Government | ||||
| Ser. 2004-23, Cl. AB, | Securities—56.7% | ||||||
| 3.63%, 9/16/2027 | 181,817 | 184,957 | U.S. Treasury Notes: | ||||
| Ser. 2005-76, Cl. A, | 0.25%, 5/31/14 | 5,750,000 | 5,754,267 | ||||
| 3.96%, 5/16/30 | 32,733 | 32,797 | 0.25%, 12/15/14 | 12,000,000 | 12,006,564 | ||
| Ser. 2009-37, Cl. AB, | 0.25%, 1/15/15 | 12,250,000 | c | 12,254,790 | |||
| 4.02%, 3/16/1937 | 1,487,549 | 1,507,782 | 0.25%, 2/15/15 | 11,500,000 | c | 11,501,794 | |
| Ser. 2009-19, Cl. AE, | 0.25%, 5/15/15 | 10,250,000 | c | 10,247,601 | |||
| 4.07%, 11/16/40 | 133,155 | 133,300 | 0.25%, 7/15/15 | 14,000,000 | c | 13,989,066 | |
| Ser. 2009-39, Cl. AD, | 0.25%, 8/15/15 | 12,000,000 | 11,987,820 | ||||
| 4.25%, 6/16/34 | 2,296,657 | 2,342,656 | 0.25%, 9/15/15 | 12,000,000 | 11,985,936 | ||
| Ser. 2007-55, Cl. B, | 0.25%, 10/15/15 | 12,000,000 | c | 11,983,128 | |||
| 4.63%, 6/16/33 | 5,754,342 | a | 5,828,858 | 0.38%, 4/15/15 | 12,000,000 | c | 12,030,000 |
| Ser. 2009-4, Cl. AB, | 0.38%, 6/15/15 | 8,000,000 | c | 8,018,752 | |||
| 4.80%, 11/16/37 | 2,194,350 | 2,266,144 | |||||
30
| BNY Mellon Short-Term U.S. Government Securities Fund (continued) | |||||||
| Principal | |||||||
| Bonds and Notes (continued) | Amount ($) | Value ($) | Other Investment—.7% | Shares | Value ($) | ||
| U.S. Government | Registered Investment Company; | ||||||
| Securities (continued) | Dreyfus Institutional Preferred | ||||||
| U.S. Treasury Notes (continued): | Plus Money Market Fund | ||||||
| 0.38%, 11/15/15 | 6,000,000 | c | 6,010,314 | (cost $2,112,277) | 2,112,277 | d | 2,112,277 |
| 1.25%, 8/31/15 | 12,000,000 | c | 12,285,936 | ||||
| 1.75%, 7/31/15 | 12,000,000 | c | 12,421,872 | Total Investments | |||
| 2.50%, 3/31/15 | 12,000,000 | c | 12,561,564 | (cost $290,087,325) | 99.8 | % | 290,329,712 |
| 165,039,404 | Cash and Receivables (Net) | .2 | % | 550,622 | |||
| Total Bonds and Notes | Net Assets | 100.0 | % | 290,880,334 | |||
| (cost $287,975,048) | 288,217,435 | ||||||
BAN—Bond Anticipation Notes
GO—General Obligation
REMIC—Real Mortagage Investment Conduit
a Variable rate security—interest rate subject to periodic change.
b The Federal Housing Finance Agency (“FHFA”) placed Federal Home Loan Mortgage Corporation and Federal National Mortgage Association into conservatorship with FHFA
as the conservator.As such, the FHFA oversees the continuing affairs of these companies.
c Security, or portion thereof, on loan.At February 28, 2013, the value of the fund’s securities on loan was $79,878,591 and the value of the collateral held by the fund was
$81,562,090, consisting of U.S. Government & Agency securities.
d Investment in affiliated money market mutual fund.
| Portfolio Summary (Unaudited) † | |||
| Value (%) | Value (%) | ||
| U.S. Government Agencies/Mortgage-Backed | 91.6 | Money Market Investment | .7 |
| Municipal Bonds | 5.7 | ||
| Commercial Mortgage-Backed | 1.8 | 99.8 | |
| † Based on net assets. | |||
| See notes to financial statements. | |||
The Funds 31
STATEMENTS OF ASSETS AND LIABILITIES
February 28, 2013 (Unaudited)
| BNY Mellon | ||||||||
| BNY Mellon | BNY Mellon | Short-Term | ||||||
| BNY Mellon | Intermediate | Corporate Bond | U.S. Government | |||||
| Bond Fund | Bond Fund | Fund | Securities Fund | |||||
| Assets ($): | ||||||||
| Investments in securities—See Statement of Investments† | ||||||||
| (including securities on loan)††—Note 2(b): | ||||||||
| Unaffiliated issuers | 1,296,880,322 | 986,875,349 | 493,529,262 | 288,217,435 | ||||
| Affiliated issuers | 7,759,519 | 6,926,431 | 26,840,849 | 2,112,277 | ||||
| Cash | — | — | 738,558 | 143,238 | ||||
| Receivable for investment securities sold | 7,948,053 | 3,074,724 | — | 4,012,984 | ||||
| Dividends, interest and securities lending income receivable | 7,571,945 | 6,636,025 | 4,509,741 | 605,145 | ||||
| Receivable for shares of Beneficial Interest subscribed | 973,808 | 557,948 | 2,176,430 | 68,508 | ||||
| Prepaid expenses | 21,134 | 20,391 | 31,374 | 14,540 | ||||
| 1,321,154,781 | 1,004,090,868 | 527,826,214 | 295,174,127 | |||||
| Liabilities ($): | ||||||||
| Due to The Dreyfus Corporation and affiliates—Note 4(b) | 431,744 | 344,069 | 167,524 | 94,646 | ||||
| Due to Administrator—Note 4(a) | 119,821 | 94,587 | 46,489 | 27,874 | ||||
| Cash overdraft due to Custodian | 1,298,618 | 1,040,187 | — | — | ||||
| Payable for investment securities purchased | 56,498,366 | 3,127,132 | 7,404,628 | 3,814,252 | ||||
| Payable for shares of Beneficial Interest redeemed | 1,110,666 | 658,749 | 439,723 | 326,014 | ||||
| Liability for securities on loan—Note 2(b) | 518,400 | 1,276,800 | 13,157,667 | — | ||||
| Accrued expenses | 60,856 | 96,985 | 47,348 | 31,007 | ||||
| 60,038,471 | 6,638,509 | 21,263,379 | 4,293,793 | |||||
| Net Assets ($) | 1,261,116,310 | 997,452,359 | 506,562,835 | 290,880,334 | ||||
| Composition of Net Assets ($): | ||||||||
| Paid-in capital | 1,180,210,290 | 955,103,685 | 496,961,406 | 303,411,338 | ||||
| Accumulated distributions in excess of | ||||||||
| investment income (investment loss)—net | (3,020,358 | ) | (2,504,514 | ) | (1,559,688 | ) | (1,761,590 | ) |
| Accumulated net realized gain (loss) on investments | 3,266,081 | (80,103 | ) | 137,650 | (11,011,801 | ) | ||
| Accumulated net unrealized appreciation | ||||||||
| (depreciation) on investments | 80,660,297 | 44,933,291 | 11,023,467 | 242,387 | ||||
| Net Assets ($) | 1,261,116,310 | 997,452,359 | 506,562,835 | 290,880,334 | ||||
| Net Asset Value Per Share | ||||||||
| Class M Shares | ||||||||
| Net Assets ($) | 1,251,917,427 | 989,585,429 | 506,276,163 | 289,880,948 | ||||
| Shares Outstanding | 92,571,853 | 75,103,524 | 38,919,600 | 23,870,847 | ||||
| Net Asset Value Per Share ($) | 13.52 | 13.18 | 13.01 | 12.14 | ||||
| Investor Shares | ||||||||
| Net Assets ($) | 9,198,883 | 7,866,930 | 286,672 | 999,386 | ||||
| Shares Outstanding | 681,389 | 596,917 | 22,037 | 82,389 | ||||
| Net Asset Value Per Share ($) | 13.50 | 13.18 | 13.01 | 12.13 | ||||
| † Investments at cost ($): | ||||||||
| Unaffiliated issuers | 1,216,220,025 | 941,942,058 | 482,505,795 | 287,975,048 | ||||
| Affiliated issuers | 7,759,519 | 6,926,431 | 26,840,849 | 2,112,277 | ||||
| ††Value of securities on loan ($) | 219,666,414 | 328,682,915 | 12,699,962 | 79,878,591 | ||||
| See notes to financial statements. | ||||||||
32
STATEMENTS OF OPERATIONS
Six Months Ended February 28, 2013 (Unaudited)
| BNY Mellon | ||||||||
| BNY Mellon | BNY Mellon | Short-Term | ||||||
| BNY Mellon | Intermediate | Corporate Bond | U.S. Government | |||||
| Bond Fund | Bond Fund | Fund | Securities Fund | |||||
| Investment Income ($): | ||||||||
| Income: | ||||||||
| Interest | 18,435,680 | 10,581,328 | 5,889,344 | 337,880 | ||||
| Income from securities lending—Note 2(b) | 71,891 | 91,466 | 10,979 | 35,175 | ||||
| Cash dividends; | ||||||||
| Affiliated issuers | 13,000 | 4,688 | 4,488 | 2,637 | ||||
| Total Income | 18,520,571 | 10,677,482 | 5,904,811 | 375,692 | ||||
| Expenses: | ||||||||
| Investment advisory fee—Note 4(a) | 2,604,710 | 1,888,984 | 819,277 | 505,448 | ||||
| Administration fee—Note 4(a) | 804,669 | 583,976 | 253,008 | 178,455 | ||||
| Trustees’ fees and expenses—Note 4(c) | 52,268 | 30,706 | 13,192 | 5,929 | ||||
| Custodian fees—Note 4(b) | 42,006 | 32,814 | 15,117 | 11,696 | ||||
| Professional fees | 40,215 | 31,750 | 24,533 | 21,282 | ||||
| Registration fees | 15,405 | 21,415 | 61,947 | 15,092 | ||||
| Shareholder servicing costs—Note 4(b) | 13,009 | 5,870 | 240 | 1,510 | ||||
| Loan commitment fees—Note 3 | 7,332 | 5,686 | 888 | 1,593 | ||||
| Prospectus and shareholders’ reports | 3,665 | 2,668 | 3,153 | 4,200 | ||||
| Miscellaneous | 27,629 | 23,526 | 23,881 | 17,832 | ||||
| Total Expenses | 3,610,908 | 2,627,395 | 1,215,236 | 763,037 | ||||
| Less—reduction in expenses | ||||||||
| due to undertaking—Note 4(a) | — | — | (26 | ) | — | |||
| Less—reduction in fees due to | ||||||||
| earnings credits—Note 4(b) | (13 | ) | (3 | ) | (1 | ) | (2 | ) |
| Net Expenses | 3,610,895 | 2,627,392 | 1,215,209 | 763,035 | ||||
| Investment Income (Loss)—Net | 14,909,676 | 8,050,090 | 4,689,602 | (387,343 | ) | |||
| Realized and Unrealized Gain (Loss) | ||||||||
| on Investments—Note 5 ($): | ||||||||
| Net realized gain (loss) on investments | 6,355,506 | 8,755,602 | 1,546,085 | 236,249 | ||||
| Net unrealized appreciation (depreciation) on investments | (10,090,568 | ) | (10,388,371 | ) | 3,684,219 | (248,601 | ) | |
| Net Realized and Unrealized Gain (Loss) on Investments | (3,735,062 | ) | (1,632,769 | ) | 5,230,304 | (12,352 | ) | |
| Net Increase (Decrease) in Net Assets | ||||||||
| Resulting from Operations | 11,174,614 | 6,417,321 | 9,919,906 | (399,695 | ) | |||
| See notes to financial statements. | ||||||||
The Funds 33
STATEMENTS OF CHANGES IN NET ASSETS
| BNY Mellon Bond Fund | BNY Mellon Intermediate Bond Fund | |||||||
| Six Months Ended | Six Months Ended | |||||||
| February 28, 2013 | Year Ended | February 28, 2013 | Year Ended | |||||
| (Unaudited) | August 31, 2012 | (Unaudited) | August 31, 2012 | |||||
| Operations ($): | ||||||||
| Investment income—net | 14,909,676 | 37,583,808 | 8,050,090 | 21,837,339 | ||||
| Net realized gain (loss) on investments | 6,355,506 | 20,816,573 | 8,755,602 | 9,517,595 | ||||
| Net unrealized appreciation (depreciation) on investments | (10,090,568 | ) | 21,012,734 | (10,388,371 | ) | 8,478,802 | ||
| Net Increase (Decrease) in Net Assets | ||||||||
| Resulting from Operations | 11,174,614 | 79,413,115 | 6,417,321 | 39,833,736 | ||||
| Dividends to Shareholders from ($): | ||||||||
| Investment income—net: | ||||||||
| Class M Shares | (18,813,580 | ) | (43,014,121 | ) | (10,688,113 | ) | (27,226,012 | ) |
| Investor Shares | (135,587 | ) | (288,668 | ) | (50,506 | ) | (114,080 | ) |
| Net realized gain on investments: | ||||||||
| Class M Shares | (10,432,257 | ) | (2,808,023 | ) | (1,640,163 | ) | (60,140 | ) |
| Investor Shares | (81,840 | ) | (18,581 | ) | (8,152 | ) | (260 | ) |
| Total Dividends | (29,463,264 | ) | (46,129,393 | ) | (12,386,934 | ) | (27,400,492 | ) |
| Beneficial Interest Transactions ($): | ||||||||
| Net proceeds from shares sold: | ||||||||
| Class M Shares | 98,731,946 | 206,008,402 | 118,217,034 | 176,135,350 | ||||
| Investor Shares | 5,287,783 | 11,350,777 | 2,930,455 | 7,416,300 | ||||
| Net assets received in connection | ||||||||
| with reorganization—Note 1 | — | — | 41,803,155 | — | ||||
| Dividends reinvested: | ||||||||
| Class M Shares | 9,267,385 | 7,167,581 | 1,789,061 | 4,791,137 | ||||
| Investor Shares | 197,722 | 243,191 | 46,714 | 106,927 | ||||
| Cost of shares redeemed: | ||||||||
| Class M Shares | (164,407,989 | ) | (273,348,411 | ) | (120,922,505 | ) | (215,758,016 | ) |
| Investor Shares | (5,383,209 | ) | (13,669,368 | ) | (3,231,586 | ) | (6,832,189 | ) |
| Increase (Decrease) in Net Assets from | ||||||||
| Beneficial Interest Transactions | (56,306,362 | ) | (62,247,828 | ) | 40,632,328 | (34,140,491 | ) | |
| Total Increase (Decrease) in Net Assets | (74,595,012 | ) | (28,964,106 | ) | 34,662,715 | (21,707,247 | ) | |
| Net Assets ($): | ||||||||
| Beginning of Period | 1,335,711,322 | 1,364,675,428 | 962,789,644 | 984,496,891 | ||||
| End of Period | 1,261,116,310 | 1,335,711,322 | 997,452,359 | 962,789,644 | ||||
| Undistributed (distributions in | ||||||||
| excess of) investment income—net | (3,020,358 | ) | 1,019,133 | (2,504,514 | ) | 184,015 | ||
| Capital Share Transactions (Shares): | ||||||||
| Class M Shares | ||||||||
| Shares sold | 7,240,139 | 15,291,765 | 8,951,180 | 13,417,074 | ||||
| Shares received in connection with reorganization—Note 1 | — | — | 2,936,786 | — | ||||
| Shares issued for dividends reinvested | 683,291 | 534,095 | 135,338 | 365,506 | ||||
| Shares redeemed | (12,072,392 | ) | (20,296,590 | ) | (9,148,004 | ) | (16,437,359 | ) |
| Net Increase (Decrease) in Shares Outstanding | (4,148,962 | ) | (4,470,730 | ) | 2,875,300 | (2,654,779 | ) | |
| Investor Shares | ||||||||
| Shares sold | 387,090 | 845,985 | 221,688 | 564,496 | ||||
| Shares received in connection with reorganization—Note 1 | — | — | 238,458 | — | ||||
| Shares issued for dividends reinvested | 14,565 | 18,109 | 3,534 | 8,081 | ||||
| Shares redeemed | (395,201 | ) | (1,019,276 | ) | (244,615 | ) | (520,154 | ) |
| Net Increase (Decrease) in Shares Outstanding | 6,454 | (155,182 | ) | 219,065 | 52,423 | |||
| See notes to financial statements. | ||||||||
34
| BNY Mellon | BNY Mellon Short-Term | |||||||
| Corporate Bond Fund | U.S. Government Securities Fund | |||||||
| Six Months Ended | Six Months Ended | |||||||
| February 28, 2013 | Year Ended | February 28, 2013 | Year Ended | |||||
| (Unaudited) | August 31, 2012a | (Unaudited) | August 31, 2012 | |||||
| Operations ($): | ||||||||
| Investment income (loss)—net | 4,689,602 | 1,714,638 | (387,343 | ) | (9,542 | ) | ||
| Net realized gain (loss) on investments | 1,546,085 | 640,915 | 236,249 | 1,164,338 | ||||
| Net unrealized appreciation (depreciation) on investments | 3,684,219 | 7,339,248 | (248,601 | ) | (1,044,804 | ) | ||
| Net Increase (Decrease) in Net Assets | ||||||||
| Resulting from Operations | 9,919,906 | 9,694,801 | (399,695 | ) | 109,992 | |||
| Dividends to Shareholders from ($): | ||||||||
| Investment income—net: | ||||||||
| Class M Shares | (6,338,831 | ) | (2,227,253 | ) | (1,451,381 | ) | (2,267,874 | ) |
| Investor Shares | (2,451 | ) | (169 | ) | (4,321 | ) | (8,604 | ) |
| Net realized gain on investments: | ||||||||
| Class M Shares | (1,451,053 | ) | — | — | — | |||
| Investor Shares | (504 | ) | — | — | — | |||
| Total Dividends | (7,792,839 | ) | (2,227,422 | ) | (1,455,702 | ) | (2,276,478 | ) |
| Beneficial Interest Transactions ($): | ||||||||
| Net proceeds from shares sold: | ||||||||
| Class M Shares | 222,935,177 | 321,812,668 | 82,450,337 | 135,465,998 | ||||
| Investor Shares | 358,277 | 40,000 | 441,315 | 2,846,663 | ||||
| Dividends reinvested: | ||||||||
| Class M Shares | 1,999,231 | 392,006 | 309,461 | 449,790 | ||||
| Investor Shares | 2,776 | 70 | 4,260 | 8,308 | ||||
| Cost of shares redeemed: | ||||||||
| Class M Shares | (33,017,332 | ) | (17,440,215 | ) | (93,787,239 | ) | (180,982,763 | ) |
| Investor Shares | (114,269 | ) | — | (581,144 | ) | (2,869,079 | ) | |
| Increase (Decrease) in Net Assets from | ||||||||
| Beneficial Interest Transactions | 192,163,860 | 304,804,529 | (11,163,010 | ) | (45,081,083 | ) | ||
| Total Increase (Decrease) in Net Assets | 194,290,927 | 312,271,908 | (13,018,407 | ) | (47,247,569 | ) | ||
| Net Assets ($): | ||||||||
| Beginning of Period | 312,271,908 | — | 303,898,741 | 351,146,310 | ||||
| End of Period | 506,562,835 | 312,271,908 | 290,880,334 | 303,898,741 | ||||
| Undistributed (distributions in excess of) | ||||||||
| investment income (loss)—net | (1,559,688 | ) | 91,992 | (1,761,590 | ) | 81,455 | ||
| Capital Share Transactions (Shares): | ||||||||
| Class M Shares | ||||||||
| Shares sold | 17,120,128 | 25,542,828 | 6,774,424 | 11,065,111 | ||||
| Shares issued for dividends reinvested | 153,767 | 30,735 | 25,435 | 36,763 | ||||
| Shares redeemed | (2,536,564 | ) | (1,391,294 | ) | (7,702,236 | ) | (14,785,231 | ) |
| Net Increase (Decrease) in Shares Outstanding | 14,737,331 | 24,182,269 | (902,377 | ) | (3,683,357 | ) | ||
| Investor Shares | ||||||||
| Shares sold | 27,412 | 3,129 | 36,322 | 232,479 | ||||
| Shares issued for dividends reinvested | 213 | 6 | 350 | 665 | ||||
| Shares redeemed | (8,723 | ) | — | (47,883 | ) | (234,861 | ) | |
| Net Increase (Decrease) in Shares Outstanding | 18,902 | 3,135 | (11,211 | ) | (1,717 | ) | ||
| a From March 2, 2012 (commencement of operations) to August 31, 2012. | ||||||||
| See notes to financial statements. | ||||||||
The Funds 35
FINANCIAL HIGHLIGHTS
The following tables describe the performance for each share class of each BNY Mellon fixed income fund for the fiscal periods indicated. All information (except portfolio turnover rate) reflects financial results for a single fund share. Total return shows how much your investment in each fund would have increased (or decreased) during the period, assuming you had reinvested all dividends and distributions.These figures have been derived from each fund’s financial statements.
| Class M Shares | ||||||||||||
| Six Months Ended | ||||||||||||
| February 28, 2013 | Year Ended August 31, | |||||||||||
| BNY Mellon Bond Fund | (Unaudited) | 2012 | 2011 | 2010 | 2009 | 2008 | ||||||
| Per Share Data ($): | ||||||||||||
| Net asset value, beginning of period | 13.71 | 13.38 | 13.36 | 12.90 | 12.38 | 12.24 | ||||||
| Investment Operations: | ||||||||||||
| Investment income—neta | .16 | .38 | .39 | .43 | .52 | .60 | ||||||
| Net realized and unrealized | ||||||||||||
| gain (loss) on investments | (.04 | ) | .42 | .14 | .56 | .56 | .15 | |||||
| Total from Investment Operations | .12 | .80 | .53 | .99 | 1.08 | .75 | ||||||
| Distributions: | ||||||||||||
| Dividends from investment income—net | (.20 | ) | (.44 | ) | (.49 | ) | (.53 | ) | (.56 | ) | (.61 | ) |
| Dividends from net realized gain on investments | (.11 | ) | (.03 | ) | (.02 | ) | — | — | — | |||
| Total Distributions | (.31 | ) | (.47 | ) | (.51 | ) | (.53 | ) | (.56 | ) | (.61 | ) |
| Net asset value, end of period | 13.52 | 13.71 | 13.38 | 13.36 | 12.90 | 12.38 | ||||||
| Total Return (%) | .86 | b | 6.05 | 4.06 | 7.84 | 8.95 | 6.17 | |||||
| Ratios/Supplemental Data (%): | ||||||||||||
| Ratio of total expenses to average net assets | .55 | c | .55 | .55 | .55 | .56 | .55 | |||||
| Ratio of net expenses to average net assets | .55 | c | .55 | .55 | .55 | .56 | .55 | |||||
| Ratio of net investment income | ||||||||||||
| to average net assets | 2.29 | c | 2.80 | 2.98 | 3.29 | 4.15 | 4.78 | |||||
| Portfolio Turnover Rate | 26.83 | b | 76.43 | 86.75 | d | 99.66 | 62.19 | 60.76 | ||||
| Net Assets, end of period ($ x 1,000) | 1,251,917 | 1,326,472 | 1,353,593 | 1,455,913 | 1,340,824 | 995,421 | ||||||
a Based on average shares outstanding at each month end.
b Not annualized.
c Annualized.
d The portfolio turnover rate excluding mortgage dollar roll transactions for the period ended August 31, 2011 was 79.13%.
See notes to financial statements.
36
| Investor Shares | ||||||||||||
| Six Months Ended | ||||||||||||
| February 28, 2013 | Year Ended August 31, | |||||||||||
| BNY Mellon Bond Fund | (Unaudited) | 2012 | 2011 | 2010 | 2009 | 2008 | ||||||
| Per Share Data ($): | ||||||||||||
| Net asset value, beginning of period | 13.69 | 13.35 | 13.34 | 12.88 | 12.36 | 12.21 | ||||||
| Investment Operations: | ||||||||||||
| Investment income—neta | .14 | .34 | .35 | .39 | .50 | .56 | ||||||
| Net realized and unrealized | ||||||||||||
| gain (loss) on investments | (.04 | ) | .43 | .13 | .57 | .54 | .16 | |||||
| Total from Investment Operations | .10 | .77 | .48 | .96 | 1.04 | .72 | ||||||
| Distributions: | ||||||||||||
| Dividends from investment income—net | (.18 | ) | (.40 | ) | (.45 | ) | (.50 | ) | (.52 | ) | (.57 | ) |
| Dividends from net realized gain on investments | (.11 | ) | (.03 | ) | (.02 | ) | — | — | — | |||
| Total Distributions | (.29 | ) | (.43 | ) | (.47 | ) | (.50 | ) | (.52 | ) | (.57 | ) |
| Net asset value, end of period | 13.50 | 13.69 | 13.35 | 13.34 | 12.88 | 12.36 | ||||||
| Total Return (%) | .73 | b | 5.87 | 3.72 | 7.60 | 8.74 | 5.81 | |||||
| Ratios/Supplemental Data (%): | ||||||||||||
| Ratio of total expenses to average net assets | .80 | c | .80 | .80 | .81 | .81 | .80 | |||||
| Ratio of net expenses to average net assets | .80 | c | .80 | .80 | .81 | .81 | .80 | |||||
| Ratio of net investment income | ||||||||||||
| to average net assets | 2.05 | c | 2.55 | 2.73 | 3.03 | 3.88 | 4.52 | |||||
| Portfolio Turnover Rate | 26.83 | b | 76.43 | 86.75 | d | 99.66 | 62.19 | 60.76 | ||||
| Net Assets, end of period ($ x 1,000) | 9,199 | 9,240 | 11,083 | 12,971 | 6,696 | 3,472 | ||||||
a Based on average shares outstanding at each month end.
b Not annualized.
c Annualized.
d The portfolio turnover rate excluding mortgage dollar roll transactions for the period ended August 31, 2011 was 79.13%.
See notes to financial statements.
The Funds 37
FINANCIAL HIGHLIGHTS (continued)
| Class M Shares | ||||||||||||
| Six Months Ended | ||||||||||||
| February 28, 2013 | Year Ended August 31, | |||||||||||
| BNY Mellon Intermediate Bond Fund | (Unaudited) | 2012 | 2011 | 2010 | 2009 | 2008 | ||||||
| Per Share Data ($): | ||||||||||||
| Net asset value, beginning of period | 13.26 | 13.09 | 13.15 | 12.81 | 12.37 | 12.19 | ||||||
| Investment Operations: | ||||||||||||
| Investment income—neta | .11 | .29 | .32 | .35 | .46 | .55 | ||||||
| Net realized and unrealized | ||||||||||||
| gain (loss) on investments | (.02 | ) | .25 | .04 | .47 | .50 | .21 | |||||
| Total from Investment Operations | .09 | .54 | .36 | .82 | .96 | .76 | ||||||
| Distributions: | ||||||||||||
| Dividends from investment income—net | (.15 | ) | (.37 | ) | (.42 | ) | (.48 | ) | (.52 | ) | (.58 | ) |
| Dividends from net realized gain on investments | (.02 | ) | (.00 | )b | — | — | — | — | ||||
| Total Distributions | (.17 | ) | (.37 | ) | (.42 | ) | (.48 | ) | (.52 | ) | (.58 | ) |
| Net asset value, end of period | 13.18 | 13.26 | 13.09 | 13.15 | 12.81 | 12.37 | ||||||
| Total Return (%) | .69 | c | 4.18 | 2.84 | 6.52 | 8.07 | 6.19 | |||||
| Ratios/Supplemental Data (%): | ||||||||||||
| Ratio of total expenses to average net assets | .56 | d | .55 | .55 | .55 | .56 | .55 | |||||
| Ratio of net expenses to average net assets | .56 | d | .55 | .55 | .55 | .56 | .55 | |||||
| Ratio of net investment income | ||||||||||||
| to average net assets | 1.71 | d | 2.23 | 2.42 | 2.72 | 3.75 | 4.43 | |||||
| Portfolio Turnover Rate | 20.30 | c | 39.00 | 45.15 | 44.58 | 53.05 | 53.28 | |||||
| Net Assets, end of period ($ x 1,000) | 989,585 | 957,778 | 980,237 | 988,555 | 856,808 | 785,841 | ||||||
a Based on average shares outstanding at each month end.
b Amount represents less than $.01 per share.
c Not annualized.
d Annualized.
See notes to financial statements.
38
| Investor Shares | ||||||||||||
| Six Months Ended | ||||||||||||
| February 28, 2013 | Year Ended August 31, | |||||||||||
| BNY Mellon Intermediate Bond Fund | (Unaudited) | 2012 | 2011 | 2010 | 2009 | 2008 | ||||||
| Per Share Data ($): | ||||||||||||
| Net asset value, beginning of period | 13.26 | 13.09 | 13.15 | 12.81 | 12.36 | 12.19 | ||||||
| Investment Operations: | ||||||||||||
| Investment income—neta | .09 | .26 | .29 | .31 | .43 | .53 | ||||||
| Net realized and unrealized | ||||||||||||
| gain (loss) on investments | (.02 | ) | .24 | .04 | .48 | .51 | .18 | |||||
| Total from Investment Operations | .07 | .50 | .33 | .79 | .94 | .71 | ||||||
| Distributions: | ||||||||||||
| Dividends from investment income—net | (.13 | ) | (.33 | ) | (.39 | ) | (.45 | ) | (.49 | ) | (.54 | ) |
| Dividends from net realized gain on investments | (.02 | ) | (.00 | )b | — | — | — | — | ||||
| Total Distributions | (.15 | ) | (.33 | ) | (.39 | ) | (.45 | ) | (.49 | ) | (.54 | ) |
| Net asset value, end of period | 13.18 | 13.26 | 13.09 | 13.15 | 12.81 | 12.36 | ||||||
| Total Return (%) | .56 | c | 3.91 | 2.57 | 6.26 | 7.78 | 5.91 | |||||
| Ratios/Supplemental Data (%): | ||||||||||||
| Ratio of total expenses to average net assets | .83 | d | .81 | .80 | .81 | .81 | .80 | |||||
| Ratio of net expenses to average net assets | .83 | d | .81 | .80 | .81 | .81 | .80 | |||||
| Ratio of net investment income | ||||||||||||
| to average net assets | 1.45 | d | 1.98 | 2.18 | 2.44 | 3.48 | 4.19 | |||||
| Portfolio Turnover Rate | 20.30 | c | 39.00 | 45.15 | 44.58 | 53.05 | 53.28 | |||||
| Net Assets, end of period ($ x 1,000) | 7,867 | 5,012 | 4,260 | 4,768 | 2,740 | 1,616 | ||||||
a Based on average shares outstanding at each month end.
b Amount represents less than $.01 per share.
c Not annualized.
d Annualized.
See notes to financial statements.
The Funds 39
FINANCIAL HIGHLIGHTS (continued)
| Class M Shares | ||||
| Six Months Ended | ||||
| February 28, 2013 | Period Ended | |||
| BNY Mellon Corporate Bond Fund | (Unaudited) | August 31, 2012a | ||
| Per Share Data ($): | ||||
| Net asset value, beginning of period | 12.91 | 12.50 | ||
| Investment Operations: | ||||
| Investment income—netb | .15 | .12 | ||
| Net realized and unrealized | ||||
| gain (loss) on investments | .19 | .43 | ||
| Total from Investment Operations | .34 | .55 | ||
| Distributions: | ||||
| Dividends from investment income—net | (.20 | ) | (.14 | ) |
| Dividends from net realized gain on investments | (.04 | ) | — | |
| Total Distributions | (.24 | ) | (.14 | ) |
| Net asset value, end of period | 13.01 | 12.91 | ||
| Total Return (%)c | 2.64 | 4.40 | ||
| Ratios/Supplemental Data (%): | ||||
| Ratio of total expenses to average net assetsd | .59 | .70 | ||
| Ratio of net expenses to average net assetsd | .59 | .60 | ||
| Ratio of net investment income | ||||
| to average net assetsd | 2.29 | 2.25 | ||
| Portfolio Turnover Ratec | 23.25 | 34.08 | ||
| Net Assets, end of period ($ x 1,000) | 506,276 | 312,231 | ||
a From March 2, 2012 (commencement of operations) to August 31, 2012.
b Based on average shares outstanding at each month end.
c Not annualized.
d Annualized.
See notes to financial statements.
40
| Investor Shares | ||||
| Six Months Ended | ||||
| February 28, 2013 | Period Ended | |||
| BNY Mellon Corporate Bond Fund | (Unaudited) | August 31, 2012a | ||
| Per Share Data ($): | ||||
| Net asset value, beginning of period | 12.91 | 12.50 | ||
| Investment Operations: | ||||
| Investment income—netb | .13 | .07 | ||
| Net realized and unrealized | ||||
| gain (loss) on investments | .19 | .46 | ||
| Total from Investment Operations | .32 | .53 | ||
| Distributions: | ||||
| Dividends from investment income—net | (.18 | ) | (.12 | ) |
| Dividends from net realized gain on investments | (.04 | ) | — | |
| Total Distributions | (.22 | ) | (.12 | ) |
| Net asset value, end of period | 13.01 | 12.91 | ||
| Total Return (%)c | 2.52 | 4.29 | ||
| Ratios/Supplemental Data (%): | ||||
| Ratio of total expenses to average net assetsd | .88 | 1.12 | ||
| Ratio of net expenses to average net assetsd | .85 | .85 | ||
| Ratio of net investment income | ||||
| to average net assetsd | 2.03 | 1.67 | ||
| Portfolio Turnover Ratec | 23.25 | 34.08 | ||
| Net Assets, end of period ($ x 1,000) | 287 | 40 | ||
a From March 2, 2012 (commencement of operations) to August 31, 2012.
b Based on average shares outstanding at each month end.
c Not annualized.
d Annualized.
See notes to financial statements.
The Funds 41
FINANCIAL HIGHLIGHTS (continued)
| Class M Shares | ||||||||||||
| Six Months Ended | ||||||||||||
| BNY Mellon Short-Term | February 28, 2013 | Year Ended August 31, | ||||||||||
| U.S. Government Securities Fund | (Unaudited) | 2012 | 2011 | 2010 | 2009 | 2008 | ||||||
| Per Share Data ($): | ||||||||||||
| Net asset value, beginning of period | 12.22 | 12.30 | 12.40 | 12.39 | 12.19 | 12.02 | ||||||
| Investment Operations: | ||||||||||||
| Investment income (loss)—neta | (.02 | ) | (.00 | )b | .07 | .13 | .29 | .46 | ||||
| Net realized and unrealized | ||||||||||||
| gain (loss) on investments | .00 | b | .01 | .02 | .11 | .30 | .23 | |||||
| Total from Investment Operations | (.02 | ) | .01 | .09 | .24 | .59 | .69 | |||||
| Distributions: | ||||||||||||
| Dividends from investment income—net | (.06 | ) | (.09 | ) | (.19 | ) | (.23 | ) | (.39 | ) | (.52 | ) |
| Net asset value, end of period | 12.14 | 12.22 | 12.30 | 12.40 | 12.39 | 12.19 | ||||||
| Total Return (%) | (.16 | )c | .07 | .71 | 1.96 | 4.90 | 5.83 | |||||
| Ratios/Supplemental Data (%): | ||||||||||||
| Ratio of total expenses to average net assets | .53 | d | .52 | .52 | .53 | .56 | .55 | |||||
| Ratio of net expenses to average net assets | .53 | d | .52 | .52 | .53 | .56 | .55 | |||||
| Ratio of net investment income | ||||||||||||
| (loss) to average net assets | (.27 | )d | (.00 | )e | .56 | 1.07 | 2.32 | 3.79 | ||||
| Portfolio Turnover Rate | 67.63 | c | 152.13 | 143.65 | 59.58 | 117.43 | 84.77 | |||||
| Net Assets, end of period ($ x 1,000) | 289,881 | 302,756 | 349,975 | 304,707 | 177,005 | 133,857 | ||||||
a Based on average shares outstanding at each month end.
b Amount represents less than $.01 per share.
c Not annualized.
d Annualized.
e Amount represents less than .01%.
See notes to financial statements.
42
| Investor Shares | ||||||||||||
| Six Months Ended | ||||||||||||
| BNY Mellon Short-Term | February 28, 2013 | Year Ended August 31, | ||||||||||
| U.S. Government Securities Fund | (Unaudited) | 2012 | 2011 | 2010 | 2009 | 2008 | ||||||
| Per Share Data ($): | ||||||||||||
| Net asset value, beginning of period | 12.21 | 12.29 | 12.40 | 12.39 | 12.20 | 12.02 | ||||||
| Investment Operations: | ||||||||||||
| Investment income (loss)—neta | (.03 | ) | (.04 | ) | .04 | .11 | .23 | .45 | ||||
| Net realized and unrealized | ||||||||||||
| gain (loss) on investments | .00 | b | .02 | .00 | b | .10 | .32 | .22 | ||||
| Total from Investment Operations | (.03 | ) | (.02 | ) | .04 | .21 | .55 | .67 | ||||
| Distributions: | ||||||||||||
| Dividends from investment income—net | (.05 | ) | (.06 | ) | (.15 | ) | (.20 | ) | (.36 | ) | (.49 | ) |
| Net asset value, end of period | 12.13 | 12.21 | 12.29 | 12.40 | 12.39 | 12.20 | ||||||
| Total Return (%) | (.29 | )c | (.15 | ) | .34 | 1.73 | 4.63 | 5.55 | ||||
| Ratios/Supplemental Data (%): | ||||||||||||
| Ratio of total expenses to average net assets | .78 | d | .78 | .78 | .78 | .82 | .79 | |||||
| Ratio of net expenses to average net assets | .78 | d | .78 | .78 | .78 | .82 | .79 | |||||
| Ratio of net investment income | ||||||||||||
| (loss) to average net assets | (.52 | )d | (.29 | ) | .34 | .84 | 1.93 | 3.61 | ||||
| Portfolio Turnover Rate | 67.63 | c | 152.13 | 143.65 | 59.58 | 117.43 | 84.77 | |||||
| Net Assets, end of period ($ x 1,000) | 999 | 1,142 | 1,171 | 987 | 837 | 94 | ||||||
a Based on average shares outstanding at each month end.
b Amount represents less than $.01 per share.
c Not annualized.
d Annualized.
See notes to financial statements.
The Funds 43
NOTES TO FINANCIAL STATEMENTS (Unaudited)
NOTE 1—General:
BNY Mellon Funds Trust (the “Trust”) was organized as a Massachusetts business trust which is registered under the Investment Company Act of 1940, as amended (the “Act”), as an open-end management investment company and operates as a series company currently consisting of twenty-six series including the following diversified fixed income funds: BNY Mellon Bond Fund, BNY Mellon Intermediate Bond Fund, BNY Mellon Corporate Bond Fund and BNY Mellon Short-Term U.S. Government Securities Fund (each, a “fund” and collectively, the “funds”).The objectives of the funds are as follows: BNY Mellon Bond Fund, BNY Mellon Intermediate Bond Fund and BNY Mellon Corporate Bond Fund seek total return (consisting of capital appreciation and current income). BNY Mellon Short-Term U.S. Government Securities Fund seeks as high a level of current income as is consistent with the preservation of capital.
BNY Mellon Fund Advisers, a division of The Dreyfus Corporation (the “Manager” or “Dreyfus”), a wholly-owned subsidiary of The Bank of New York Mellon Corporation (“BNY Mellon”), serves as each fund’s investment adviser (“Investment Adviser”). The Bank of New York Mellon, a subsidiary of BNY Mellon and an affiliate of Dreyfus, serves as administrator for the funds pursuant to an Administration Agreement with the Trust (the “Administration Agreement”). The Bank of New York Mellon has entered into a Sub-Administration Agreement with Dreyfus pursuant to which The Bank of New York Mellon pays Dreyfus for performing certain administrative services. MBSC Securities Corporation (the “Distributor”), a wholly-owned subsidiary of Dreyfus, is the distributor of each fund’s shares, which are sold without a sales charge.
As of the close of business on February 22, 2013, pursuant to an Agreement and Plan of Reorganization
previously approved by the Trust’s Board of Trustees (the “Board”), all of the assets, subject to the liabilities, of BNY Mellon Intermediate U.S. Government Fund (the “Intermediate U.S. Government Fund”) were transferred to BNY Mellon Intermediate Bond Fund in exchange for corresponding classes of shares of Beneficial Interest of BNY Mellon Intermediate Bond Fund of equal value. The purpose of the transaction was to combine two funds with comparable investment objectives and strategies. Shareholders of Class M and Investor shares of the Intermediate U.S. Government Fund received Class M and Investor shares of BNY Mellon Intermediate Bond Fund, in an amount equal to the aggregate net asset value of their investment in the Intermediate U.S. Government Fund at the time of the exchange.The exchange ratio for each class was as follows: Class M—.77 to 1 and Investor shares—.77 to 1. The net asset value of BNY Mellon Intermediate Bond Fund’s shares as of the close of business February 22, 2013, after the reorganization, was $13.16 for Class M and $13.16 for Investor shares, and a total 2,936,786 Class M shares and 238,458 Investor shares were issued to shareholders of the Intermediate U.S. Government Fund in the exchange.
The net unrealized appreciation on investments and net assets prior to the acquisition as of the merger date for the Intermediate U.S. Government Fund and BNY Mellon Intermediate Bond Fund, were as follows:
| Unrealized | ||
| Appreciation ($) | Net Assets ($) | |
| Intermediate | ||
| U.S. Government Fund | 1,250,668 | 41,803,155 |
| BNY Mellon Intermediate | ||
| Bond Fund | 35,241,040 | 957,490,197 |
| Total | 36,491,708 | 999,293,352 |
Assuming the merger had been completed on September 1, 2012, BNY Mellon Intermediate Bond
44
Fund’s pro forma results in the Statement of Operations during the period ended February 28, 2013 would have been as follows:
| Net investment income (loss) | $8,215,1631 | ||
| Net realized and unrealized | |||
| gain (loss) on investments | ($2,114,086 | )2 | |
| Net increase (decrease) in net | |||
| assets resulting from operations | $6,101,077 | ||
1 $8,050,090 as reported in the Statement of Operations plus $165,073
Intermediate U.S. Government Fund pre-merger.
2 ($1,632,769) as reported in the Statement of Operations plus ($481,317)
Intermediate U.S. Government Fund pre-merger.
Because the combined funds have been managed as a single integrated fund since the merger was completed, it is not practicable to separate the amounts of revenue and earnings of the Intermediate U.S. Government Fund that have been included in BNY Mellon Intermediate Bond Fund’s Statement of Operations during the period ended February 28, 2013.
The Trust is authorized to issue an unlimited number of shares of Beneficial Interest, par value $.001 per share, in Class M and Investor class shares of each fund. Other differences between the classes include the services offered to and the expenses borne by each class, the allocation of certain transfer agency costs and certain voting rights. Income, expenses (other than expenses attributable to a specific class), and realized and unrealized gains or losses on investments are allocated to each class of shares based on its relative net assets.
TheTrust accounts separately for the assets, liabilities and operations of each series. Expenses directly attributable to each series are charged to that series’ operations; expenses that are applicable to all series are allocated among them on a pro rata basis.
The Financial Accounting Standards Board (“FASB”) Accounting Standards Codification is the exclusive reference of authoritative U.S. generally accepted accounting principles (“GAAP”) recognized by the FASB to be applied by nongovernmental entities. Rules and interpretive releases of the Securities and Exchange Commission (“SEC”) under authority of federal laws are also sources of authoritative GAAP for SEC registrants. Each fund’s financial statements are prepared in accordance with GAAP, which may require the use of management estimates and assumptions. Actual results could differ from those estimates.
NOTE 2—Significant Accounting Policies:
(a) Portfolio valuation: The fair value of a financial instrument is the amount that would be received to sell an asset or paid to transfer a liability in an orderly transaction between market participants at the measurement date (i.e., the exit price). GAAP establishes a fair value hierarchy that prioritizes the inputs of valuation techniques used to measure fair value. This hierarchy gives the highest priority to unadjusted quoted prices in active markets for identical assets or liabilities (Level 1 measurements) and the lowest priority to unobservable inputs (Level 3 measurements).
Additionally, GAAP provides guidance on determining whether the volume and activity in a market has decreased significantly and whether such a decrease in activity results in transactions that are not orderly. GAAP requires enhanced disclosures around valuation inputs and techniques used during annual and interim periods.
Various inputs are used in determining the value of each fund’s investments relating to fair value measurements.
The Funds 45
NOTES TO FINANCIAL STATEMENTS (Unaudited) (continued)
These inputs are summarized in the three broad levels listed below:
Level 1—unadjusted quoted prices in active markets for identical investments.
Level 2—other significant observable inputs (including quoted prices for similar investments, interest rates, prepayment speeds, credit risk, etc.).
Level 3—significant unobservable inputs (including the funds’ own assumptions in determining the fair value of investments).
The inputs or methodology used for valuing securities are not necessarily an indication of the risk associated with investing in those securities.
Changes in valuation techniques may result in transfers in or out of an assigned level within the disclosure hierarchy. Valuation techniques used to value the funds’ investments are as follows:
Registered investment companies that are not traded on an exchange are valued at their net asset value and are categorized within Level 1 of the fair value hierarchy.
Investments in securities, excluding short-term investments (other than U.S. Treasury Bills) are valued each business day by an independent pricing service (the “Service”) approved by the Board. Investments for which quoted bid prices are readily available and are representative of the bid side of the market in the judgment of the Service are valued at the mean between the quoted bid prices (as obtained by the Service from dealers in such securities) and asked prices (as calculated by the Service based upon its evaluation of the market for such securities). Other investments (which constitute a majority of the portfolio securities) are valued as determined by the Service, based on methods which include consideration of the following: yields or prices of securities of comparable quality, coupon, maturity and type; indications as to values
from dealers; and general market conditions.These securities are generally categorized within Level 2 of the fair value hierarchy.
U.S.Treasury Bills are valued at the mean price between quoted bid prices and asked prices by the Service.These securities are generally categorized within Level 2 of the fair value hierarchy.
The Service’s procedures are reviewed by Dreyfus under the general supervision of the Board.
When market quotations or official closing prices are not readily available, or are determined not to reflect accurately fair value, such as when the value of a security has been significantly affected by events after the close of the exchange or market on which the security is principally traded (for example, a foreign exchange or market), but before the funds calculate their net asset value, the funds may value these investments at fair value as determined in accordance with the procedures approved by the Board. Certain factors may be considered when fair valuing investments such as: fundamental analytical data, the nature and duration of restrictions on disposition, an evaluation of the forces that influence the market in which the securities are purchased and sold, and public trading in similar securities of the issuer or comparable issuers. These securities are either categorized within Level 2 or 3 depending on the relevant inputs used.
For restricted securities where observable inputs are limited, assumptions about market activity and risk are used and are categorized within Level 3 of the fair value hierarchy.
Table 1 summarizes the inputs used as of February 28, 2013 in valuing each fund’s investments.
At February 28, 2013, there were no transfers between Level 1 and Level 2 of the fair value hierarchy.
46
| Table 1—Fair Value Measurements | |||||||
| Investments in Securities | |||||||
| Level 2—Other | |||||||
| Level 1—Unadjusted | Significant | Level 3—Significant | |||||
| Quoted Prices | Observable Inputs | Unobservable Inputs | |||||
| Assets ($) | Liabilities ($) | Assets ($) | Liabilities ($) | Assets ($) | Liabilities ($) | Total ($) | |
| BNY Mellon Bond Fund | |||||||
| Asset-Backed | — | — | 12,912,714 | — | — | — | 12,912,714 |
| Commercial | |||||||
| Mortgage-Backed | — | — | 24,194,442 | — | — | — | 24,194,442 |
| Corporate Bonds† | — | — | 411,889,276 | — | — | — | 411,889,276 |
| Foreign Government | — | — | 16,022,462 | — | — | — | 16,022,462 |
| Municipal Bonds | — | — | 83,739,577 | — | — | — | 83,739,577 |
| Mutual Funds | 7,759,519 | — | — | — | — | — | 7,759,519 |
| U.S. Government Agencies/ | |||||||
| Mortgage-Backed | — | — | 385,095,163 | — | — | — | 385,095,163 |
| U.S. Treasury | — | — | 363,026,688 | — | — | — | 363,026,688 |
| BNY Mellon Intermediate | |||||||
| Bond Fund | |||||||
| Corporate Bonds† | — | — | 380,151,719 | — | — | — | 380,151,719 |
| Foreign Government | — | — | 14,969,332 | — | — | — | 14,969,332 |
| Municipal Bonds | — | — | 38,042,405 | — | — | — | 38,042,405 |
| Mutual Funds | 6,926,431 | — | — | — | — | — | 6,926,431 |
| U.S. Government Agencies/ | |||||||
| Mortgage-Backed | — | — | 15,798,831 | — | — | — | 15,798,831 |
| U.S. Treasury | — | — | 537,913,062 | — | — | — | 537,913,062 |
| BNY Mellon | |||||||
| Corporate Bond Fund | |||||||
| Corporate Bonds† | — | — | 452,310,153 | — | — | — | 452,310,153 |
| Municipal Bonds | — | — | 35,792,809 | — | — | — | 35,792,809 |
| Foreign Government | — | — | 5,426,300 | — | — | — | 5,426,300 |
| Mutual Funds | 26,840,849 | — | — | — | — | — | 26,840,849 |
| BNY Mellon Short-Term | |||||||
| U.S. Government | |||||||
| Securities Fund | |||||||
| Commercial | |||||||
| Mortgage-Backed | — | — | 5,126,625 | — | — | — | 5,126,625 |
| Municipal Bonds | — | — | 16,459,526 | — | — | — | 16,459,526 |
| Mutual Funds | 2,112,277 | — | — | — | — | — | 2,112,277 |
| U.S. Government Agencies/ | |||||||
| Mortgage-Backed | — | — | 101,591,880 | — | — | — | 101,591,880 |
| U.S. Treasury | — | — | 165,039,404 | — | — | — | 165,039,404 |
† See Statements of Investments for additional detailed categorizations.
The Funds 47
NOTES TO FINANCIAL STATEMENTS (Unaudited) (continued)
(b) Securities transactions and investment income:
Securities transactions are recorded on a trade date basis. Realized gains and losses from securities transactions are recorded on the identified cost basis. Dividend income is recorded on the ex-dividend date and interest income, including, where applicable, accretion of discount and amortization of premium on investments, is recognized on the accrual basis.
Pursuant to a securities lending agreement with The Bank of NewYork Mellon, the funds may lend securities to qualified institutions. It is the funds’ policy that, at origination, all loans are secured by collateral of at least 102% of the value of U.S. securities loaned and 105% of the value of foreign securities loaned. Collateral equivalent to at least 100% of the market value of securities on loan is maintained at all times. Collateral is either in the form of cash, which can be invested in certain money market mutual funds managed by Dreyfus, U.S. Government and Agency securities or letters of credit. The funds are entitled to receive all income on securities
loaned, in addition to income earned as a result of the lending transaction. Although each security loaned is fully collateralized, the funds bear the risk of delay in recovery of, or loss of rights in, the securities loaned should a borrower fail to return the securities in a timely manner. Table 2 summarizes the amount The Bank of New York Mellon earned from each fund from lending portfolio securities pursuant to the securities lending agreement during the period ended February 28, 2013.
| Table 2—Securities Lending Agreement | ||
| BNY Mellon Bond Fund | $ | 38,710 |
| BNY Mellon Intermediate Bond Fund | 49,251 | |
| BNY Mellon Corporate Bond Fund | 5,912 | |
| BNY Mellon Short-Term U.S. | ||
| Government Securities Fund | 18,940 |
(c) Affiliated issuers: Investments in other investment companies advised by Dreyfus are defined as “affiliated” under the Act. Table 3 summarizes each fund’s investments in affiliated investment companies during the period ended February 28, 2013.
| Table 3—Affiliated Investment Companies | |||||||
| Value | Value | Net | |||||
| Affiliated Investment Companies | 8/31/2012 | ($) | Purchases ($) | Sales ($) | 2/28/2013 | ($) | Assets (%) |
| BNY Mellon Bond Fund | |||||||
| Dreyfus Institutional Preferred | |||||||
| Plus Money Market Fund | 19,144,189 | 199,316,550 | 211,219,620 | 7,241,119 | .6 | ||
| Dreyfus Institutional Cash Advantage Fund | 10,261,300 | 23,489,913 | 33,232,813 | 518,400 | .0 | ||
| Total | 29,405,489 | 222,806,463 | 244,452,433 | 7,759,519 | .6 | ||
| BNY Mellon Intermediate Bond Fund | |||||||
| Dreyfus Institutional Preferred | |||||||
| Plus Money Market Fund | 6,814,149 | 82,780,523 | 83,945,041 | 5,649,631 | .6 | ||
| Dreyfus Institutional Cash Advantage Fund | 6,403,950 | 9,871,155 | 14,998,305 | 1,276,800 | .1 | ||
| Total | 13,218,099 | 92,651,678 | 98,943,346 | 6,926,431 | .7 | ||
| BNY Mellon Corporate Bond Fund | |||||||
| Dreyfus Institutional Preferred | |||||||
| Plus Money Market Fund | 10,709,490 | 119,294,605 | 116,320,913 | 13,683,182 | 2.7 | ||
| Dreyfus Institutional Cash Advantage Fund | 4,547,500 | 69,578,957 | 60,968,790 | 13,157,667 | 2.6 | ||
| Total | 15,256,990 | 188,873,562 | 177,289,703 | 26,840,849 | 5.3 | ||
| BNY Mellon Short-Term U.S. | |||||||
| Government Securities Fund | |||||||
| Dreyfus Institutional Preferred | |||||||
| Plus Money Market Fund | 2,433,767 | 107,763,270 | 108,084,760 | 2,112,277 | .7 | ||
| Dreyfus Institutional Cash Advantage Fund | — | 1,275,704 | 1,275,704 | — | — | ||
| Total | 2,433,767 | 109,038,974 | 109,360,464 | 2,112,277 | .7 | ||
48
(d) Risk: The funds invest primarily in debt securities. Failure of an issuer of the debt securities to make timely interest or principal payments, or a decline or the perception of a decline in the credit quality of a debt security, can cause the debt security’s price to fall, potentially lowering each fund’s share price. In addition, the value of debt securities may decline due to general market conditions that are not specifically related to a particular issuer, such as real or perceived adverse economic conditions, changes in outlook for corporate earnings, changes in interest or currency rates or adverse investor sentiment.They may also decline because of factors that affect a particular industry.
(e) Dividends to shareholders: Dividends payable to shareholders are recorded by the funds on the ex-dividend date. The funds declare and pay dividends from investment income-net monthly. With respect to each series, dividends from net realized capital gains, if any, are normally declared and paid annually, but the funds may make distributions on a more frequent basis to comply with the distribution requirements of the Internal Revenue Code of 1986, as amended (the “Code”). To the extent that net realized capital gains can be offset by capital loss carryovers of that fund, it is the policy of the funds not to distribute such gains. Income and capital gain distributions are determined in accordance with income tax regulations, which may differ from GAAP.
(f) Federal income taxes: It is the policy of each fund to continue to qualify as a regulated investment company, if such qualification is in the best interests of its shareholders, by complying with the applicable provisions of the Code, and to make distributions of taxable income sufficient to relieve it from substantially all federal income and excise taxes. For federal income tax purposes, each series is treated as a single entity for the purpose of determining such qualification.
As of and during the period ended February 28, 2013, the funds did not have any liabilities for any uncertain tax positions.The funds recognize interest and penalties, if any, related to uncertain tax positions as income tax expense in the Statements of Operations. During the period, the funds did not incur any interest or penalties.
Except for BNY Mellon Corporate Bond Fund, each tax year in the three-year period ended August 31, 2012 remains subject to examination by the Internal Revenue Service and state taxing authorities. For BNY Mellon Corporate Bond Fund, the tax year for the period ended August 31, 2012 is subject to examination by the Internal Revenue Service and state taxing authorities.
Under the Regulated Investment Company Modernization Act of 2010 (the “2010 Act”), the funds are permitted to carry forward capital losses incurred in taxable years beginning after December 22, 2010 (“post-enactment losses”) for an unlimited period. Furthermore, post-enactment capital loss carryovers retain their character as either short-term or long-term capital losses rather than short-term as they were under previous statute.The 2010 Act requires post-enactment losses to be utilized before the utilization of losses incurred in taxable years prior to the effective date of the 2010 Act (“pre-enactment losses”). As a result of this ordering rule, pre-enactment losses may be more likely to expire unused.
Table 4 summarizes BNY Mellon Short-Term U.S. Government Securities Fund’s unused capital loss carryover available for federal income tax purposes to be
| Table 4—Capital Loss Carryover | ||||||||||
| Post-Enactment Post-Enactment | ||||||||||
| Expiring in fiscal year | Short-Term | Long-Term | ||||||||
| 2014 | ($)† | 2015 | ($)† | 2018 | ($)† | 2019 | ($)† | Losses ($)†† | Losses ($)††† Total ($) | |
| BNY Mellon Short-Term U.S. | ||||||||||
| Government Securities Fund | 2,822,720 | 4,701,996 | 28,529 | 64,834 | 1,723,677 | 1,633,555 10,975,311 | ||||
| † | If not applied, the carryover expires in the above year. |
| †† | Post-enactment short-term losses that can be carried forward for an unlimited period. |
| ††† Post-enactment long-term losses that can be carried forward for an unlimited period. | |
The Funds 49
NOTES TO FINANCIAL STATEMENTS (Unaudited) (continued)
applied against future net realized capital gains, if any, realized subsequent to August 31, 2012.
Table 5 summarizes each fund’s tax character of distributions paid to shareholders during the fiscal year ended August 31, 2012.The tax character of current year distributions will be determined at the end of the current fiscal year.
NOTE 3—Bank Lines of Credit:
The funds participates with other Dreyfus-managed funds in a $210 million unsecured credit facility led by Citibank, N.A. and a $300 million unsecured credit facility provided by The Bank of New York Mellon (each, a “Facility”), each to be utilized primarily for temporary or emergency purposes, including the financing of redemptions. Prior to October 10, 2012, the unsecured credit facility with Citibank, N.A. was $225 million. In connection therewith, each fund has agreed to pay its pro rata portion of commitment fees for each Facility. Interest is charged to the funds based on rates determined pursuant to the terms of the respective Facility at the time of borrowing. During the period ended February 28, 2013, the funds did not borrow under the Facilities.
NOTE 4—Investment Advisory Fee, Administration Fee and Other Transactions With Affiliates:
(a) Fees payable by the funds pursuant to the provisions of an investment advisory agreement with the Investment Adviser are payable monthly, computed on the average daily value of each fund’s net assets at the following annual rates: .40% of BNY Mellon Bond Fund, .40% of BNY Mellon Intermediate Bond Fund, .40% of BNY Mellon Corporate Bond Fund and .35% of BNY Mellon Short-Term U.S. Government Securities Fund.
For BNY Mellon Corporate Bond Fund, the Investment Adviser had contractually agreed, from September 1, 2012 through March 1, 2013, to waive receipt of its fees and/or assume the expenses of the fund, so that the fund’s total annual operating expenses of none of the classes (excluding Shareholder Services Plan fees, taxes, interest expense, brokerage commissions and extraordinary expenses) exceeded .60% of the value of the average daily net assets of their class.The reduction in expenses, pursuant to the undertaking, amounted to $26 during the period ended February 28, 2013.
Pursuant to the Administration Agreement,The Bank of New York Mellon provides or arranges for fund accounting, transfer agency and other fund administration services and receives a fee based on the total net assets of the Trust based on the following rates:
| 0 up to $6 billion | .15 | % |
| $6 billion up to $12 billion | .12 | % |
| In excess of $12 billion | .10 | % |
The Bank of NewYork Mellon pays each fund’s transfer agent fees out of the administration fee it receives from the Trust.
(b) Each fund has adopted a Shareholder Services Plan with respect to its Investor shares. Each fund pays the Distributor for the provision of certain services to holders of Investor shares a fee at an annual rate of .25% of
| Table 5—Tax Character of Distributions Paid | ||
| Long-Term | ||
| Ordinary Income ($) | Capital Gains ($) | |
| 2012 | 2012 | |
| BNY Mellon Bond Fund | 43,302,789 | 2,826,604 |
| BNY Mellon Intermediate Bond Fund | 27,343,037 | 57,455 |
| BNY Mellon Corporate Bond Fund | 2,227,422 | — |
| BNY Mellon Short-Term U.S. Government Securities Fund | 2,276,478 | — |
50
the value of the average daily net assets attributable to Investor shares.The services provided may include personal services relating to shareholder accounts, such as answering shareholder inquiries regarding a fund and providing reports and other information and services related to the maintenance of such shareholder accounts. The Shareholder Services Plan allows the Distributor to make payments from the shareholder services fees it collects from each fund to compensate service agents (certain banks, securities brokers or dealers and other financial institutions) with respect to these services. Table 6 summarizes the amounts Investor shares of each fund were charged during the period ended February 28, 2013, pursuant to the Shareholder Services Plan. Additional fees included in Shareholder servicing costs in the Statements of Operations include fees paid for cash management charges.
| Table 6—Shareholder Service Plan Fees | ||
| BNY Mellon Bond Fund | $ | 12,733 |
| BNY Mellon Intermediate Bond Fund | 5,814 | |
| BNY Mellon Corporate Bond Fund | 196 | |
| BNY Mellon Short-Term | ||
| U.S. Government Securities Fund | 1,471 |
The funds have arrangements with the transfer agent and the custodian whereby the funds may receive earnings credits when positive cash balances are maintained, which are used to offset transfer agency and custody fees. For financial reporting purposes, the funds include net earnings credits as an expense offset in the Statements of Operations.
The funds compensate The Bank of New York Mellon under a custody agreement for providing custodial services for the funds. Table 7 summarizes the amount each fund was charged during the period ended February 28, 2013, pursuant to the custody agreement.
| Table 7—Custody Agreement Fees | ||
| BNY Mellon Bond Fund | $ | 42,006 |
| BNY Mellon Intermediate Bond Fund | 32,814 | |
| BNY Mellon Corporate Bond Fund | 15,117 | |
| BNY Mellon Short-Term | ||
| U.S. Government Securities Fund | 11,696 | |
The funds compensate Dreyfus Transfer, Inc., a wholly-owned subsidiary of Dreyfus, under a transfer agency agreement for providing cash management services related to fund subscriptions and redemptions, except for shareholder redemption draft processing, which continues to be performed by The Bank of New York Mellon.The funds also compensate The Bank of New York Mellon under a cash management agreement for providing certain cash management services. Table 8 summarizes the amount each fund was charged during the period ended February 28, 2013, for cash management services, which is included in “Shareholder servicing costs” in the Statements of Operations. These fees were partially offset by earnings credits for each fund, also summarized in Table 8.
| Table 8—Cash Management Agreement Fees | ||||||
| The Bank of | The Bank of | |||||
| New York Mellon | New York Mellon | Dreyfus Transfer, Inc. | Dreyfus Transfer, Inc. | |||
| Cash Management Fees ($) | Earnings Credits ($) | Cash Management Fees ($) | Earnings Credits ($) | |||
| BNY Mellon Bond Fund | 49 | (1 | ) | 81 | (12 | ) |
| BNY Mellon Intermediate Bond Fund | 10 | — | 16 | (3 | ) | |
| BNY Mellon Corporate Bond Fund | 3 | — | 4 | (1 | ) | |
| BNY Mellon Short-Term | ||||||
| U.S. Government Securities Fund | 8 | — | 12 | (2 | ) | |
The Funds 51
NOTES TO FINANCIAL STATEMENTS (Unaudited) (continued)
During the period ended February 28, 2013, each fund was charged $3,981 for services performed by the Chief Compliance Officer and his staff.
Table 9 summarizes the components of “Due to The Dreyfus Corporation and affiliates” in the Statement of Assets and Liabilities for each fund.
(c) The Board members who are not “affiliated persons” as defined under the Act receive from the Trust an annual fee of $80,000 and an attendance fee of $7,500 for each in-person meeting attended and $500 for telephone meetings and are reimbursed for travel and out-of-pocket expenses. The Chairman of the Board receives an additional annual fee of $20,000 and the Chairman of the Trust’s Audit Committee receives an additional annual fee of $15,000.
NOTE 5—Securities Transactions:
Table 10 summarizes each fund’s aggregate amount of purchases and sales (including paydowns) of investment securities, excluding short-term securities, during the period ended February 28, 2013.
Table 11 summarizes gross appreciation, gross depreciation and accumulated net unrealized appreciation on investments for each fund at February 28, 2013.
At February 28, 2013, the cost of investments for federal income tax purposes was substantially the same as the cost for financial reporting purposes (see the Statements of Investments).
| Table 9—Due to The Dreyfus Corporation and Affiliates | ||||
| Investment | Shareholder | Chief | ||
| Advisory | Custodian | Services | Compliance | |
| Fees ($) | Fees ($) | Plan Fees ($) | Officer Fees ($) | |
| BNY Mellon Bond Fund | 388,937 | 35,677 | 1,822 | 5,308 |
| BNY Mellon Intermediate Bond Fund | 308,107 | 29,768 | 886 | 5,308 |
| BNY Mellon Corporate Bond Fund | 150,876 | 11,287 | 53 | 5,308 |
| BNY Mellon Short-Term | ||||
| U.S. Government Securities Fund | 79,169 | 9,940 | 229 | 5,308 |
| Table 10—Purchases and Sales | ||||
| Purchases ($) | Sales ($) | |||
| BNY Mellon Bond Fund | 345,243,089 | 408,467,673 | ||
| BNY Mellon Intermediate Bond Fund | 192,491,472 | 192,507,487 | ||
| BNY Mellon Corporate Bond Fund | 284,820,988 | 93,473,556 | ||
| BNY Mellon Short-Term U.S. Government Securities Fund | 196,469,537 | 206,807,843 | ||
| Table 11—Accumulated Net Unrealized Appreciation | ||||
| Gross | Gross | |||
| Appreciation ($) | Depreciation ($) | Net ($) | ||
| BNY Mellon Bond Fund | 81,694,742 | 1,034,445 | 80,660,297 | |
| BNY Mellon Intermediate Bond Fund | 45,425,105 | 491,814 | 44,933,291 | |
| BNY Mellon Corporate Bond Fund | 11,464,313 | 440,846 | 11,023,467 | |
| BNY Mellon Short-Term U.S. Government Securities Fund | 686,290 | 443,903 | 242,387 | |
52
NOTES
For More Information
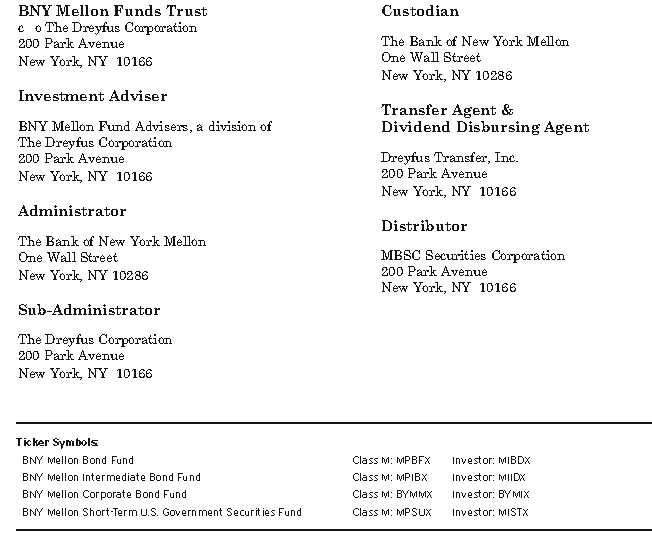
Telephone Wealth Management (WM) Clients, please contact your Account Officer or call 1-888-281-7350.
Brokerage Clients of BNY Mellon Wealth Advisors (BNYMWA), please contact your financial representative
or call 1-800-830-0549, Option 2. Individual Account holders, please call Dreyfus at 1-800-DREYFUS.
Mail WM Clients, write to your Account Officer, c/o The Bank of New York Mellon, One Mellon Bank Center, Pittsburgh, PA 15258
BNYMWA Brokerage Clients, write to your financial representative, P.O. Box 9012, Hicksville, NY 11802–9012
Individual Account Holders, write to: BNY Mellon Funds, P.O. Box 55268, Boston, MA 02205–8502
The funds file their complete schedule of portfolio holdings with the Securities and Exchange Commission (“SEC”) for the first and
third quarters of each fiscal year on Form N-Q. The funds’ Forms N-Q are available on the SEC’s website at http://www.sec.gov and
may be reviewed and copied at the SEC’s Public Reference Room in Washington, DC. Information on the operation of the
Public Reference Room may be obtained by calling 1-800-SEC-0330.
A description of the policies and procedures that the fund uses to determine how to vote proxies relating to portfolio securities, and
information regarding how the fund voted these proxies for the most recent 12-month period ended June 30 is available at
http://www.dreyfus.com and on the SEC’s website at http://www.sec.gov. The description of the policies and procedures is also
available without charge, upon request, by calling 1-800-DREYFUS.
©2013 MBSC Securities Corporation
MFTSA0213-TB
The BNY Mellon Funds
BNY Mellon National Intermediate Municipal Bond Fund
BNY Mellon National Short-Term Municipal Bond Fund
BNY Mellon Pennsylvania Intermediate Municipal Bond Fund
BNY Mellon Massachusetts Intermediate Municipal Bond Fund
BNY Mellon New York Intermediate Tax-Exempt Bond Fund
BNY Mellon Municipal Opportunities Fund
SEMIANNUAL REPORT February 28, 2013

DISCUSSION OF
FUND PERFORMANCE
For the period of September 1, 2012, through February 28, 2013, as provided by John F. Flahive and Mary Collette O’Brien, Portfolio Managers
Fund and Market Performance Overview
For the six-month period ended February 28, 2013, BNY Mellon National Intermediate Municipal Bond Fund’s Class M shares produced a total return of 1.80%, and its Investor shares returned 1.67%.1 In comparison, the S&P Municipal Bond Intermediate Index (the “Index”), the fund’s benchmark, achieved a total return of 2.06% for the same period.2
Falling long-term interest rates and favorable supply-and-demand dynamics helped municipal bonds produce positive absolute returns over the reporting period. The fund produced modestly lower returns than its benchmark, primarily due to shortfalls in our security selection strategy.
The Fund’s Investment Approach
The fund seeks to maximize current income exempt from federal income tax to the extent consistent with the preservation of capital.To pursue its goal, the fund normally invests at least 80% of its net assets in municipal bonds that provide income exempt from federal income tax.The fund may occasionally, including for temporary defensive purposes, invest in taxable bonds. The fund’s investments in municipal and taxable bonds must be rated investment grade at the time of purchase or, if unrated, deemed of comparable quality by the investment adviser.3 Generally, the fund’s average effective portfolio maturity will be between three and 10 years, and the average effective duration of the fund’s portfolio will not exceed eight years.
Supply-and-Demand Dynamics Buoyed Municipal Bonds
Investor sentiment had begun to improve by the start of the reporting period when a number of economic concerns failed to materialize. Instead, investors responded positively to improved U.S. employment and housing market trends, a stated commitment from the European Central Bank in support of the euro, and expectations that new leadership in China might lead to stronger regional growth. Although investor optimism faltered in November due to uncertainty surrounding automatic tax hikes and spending cuts scheduled for 2013, last-minute legislation to address the scheduled tax increases helped alleviate investors’ worries. Consequently, investors increasingly turned away from traditional safe havens, such as AAA-rated municipal bonds, and toward riskier assets.
While prices of intermediate-term municipal bonds ended the reporting period little changed from where they began, their returns were supported by the Federal Reserve Board’s (the “Fed”) aggressively accommodative monetary policy initiatives, which fueled robust demand from investors seeking higher levels of after-tax income. Meanwhile, new issuance remained muted when political pressure led to less borrowing for capital projects. From a credit quality perspective, higher tax receipts and reduced spending have enabled many states and municipalities to balance their budgets.
Fund Strategies Produced Mixed Results
The fund’s relative performance was mildly undermined by our security selection strategy, particularly
The Funds 3
DISCUSSION OF FUND PERFORMANCE (continued)
among lower-rated municipal bonds. For example, the fund’s focus on higher quality bonds backed by the settlement of litigation with U.S. tobacco companies weighed on the fund’s relative performance, as did overweighted exposure to highly rated escrowed bonds.
The fund’s interest rate strategy generally fared better.We set the fund’s average duration in a range we considered slightly shorter than market averages, which helped cushion the effects of rising long-term interest rates. An emphasis on bonds with maturities of 25 years and more generally buoyed the fund’s performance, but a concurrent focus on securities in the one- to three-year range produced less favorable relative results.The fund employed futures contracts, a derivative instrument, at times to implement its interest rate strategies.
Adjusting to Changing Market Conditions
We have been encouraged by recently improved data, but the U.S. economy remains vulnerable to fiscal uncertainty, suggesting to us that Fed policy will remain accommodative and municipal bonds will likely trade within a relatively tight range over the foreseeable future.At the same time, rising federal and state tax rates for high earners should support demand for a limited supply of municipal bonds. Therefore, we have main-
tained our relative value approach, which has identified a number of opportunities among revenue-backed bonds from educational institutions, transportation facilities, and industrial development projects. We have found relative few securities meeting our investment criteria among the general obligation bonds issued by states and local municipalities.
March 15, 2013
Bond funds are subject generally to interest rate, credit, liquidity and market risks, to varying degrees, all of which are more fully described in the fund’s prospectus. Generally, all other factors being equal, bond prices are inversely related to interest-rate changes, and rate increases can cause price declines.
1 Total return includes reinvestment of dividends and any capital gains paid. Past performance is no guarantee of future results. Share price, yield and investment return fluctuate such that upon redemption fund shares may be worth more or less than their original cost. Income may be subject to state and local taxes, and some income may be subject to the federal alternative minimum tax (AMT) for certain investors. Capital gains, if any, are fully taxable.
2 SOURCE: BLOOMBERG L.P. — Reflects reinvestment of dividends and, where applicable, capital gain distributions.The S&P Municipal Bond Intermediate Index is composed of bonds in the S&P Municipal Bond Index with a minimum maturity of three years and a maximum maturity of up to but not including 15 years as measured from the date on which the Index is rebalanced. Index returns do not reflect the fees and expenses associated with operating a mutual fund. Investors cannot invest directly in any index.
3 The fund may continue to own investment-grade bonds (at the time of purchase), which are subsequently downgraded to below investment grade.
4

DISCUSSION OF
FUND PERFORMANCE
For the period of September 1, 2012, through February 28, 2013, as provided by Timothy J. Sanville and Jeremy N. Baker, Portfolio Managers
Fund and Market Performance Overview
For the six-month period ended February 28, 2013, BNY Mellon National Short-Term Municipal Bond Fund’s Class M shares produced a total return of 0.40%, and Investor shares produced a total return of 0.28%.1 In comparison, the S&P Municipal Bond Short Index (the “Index”), the fund’s benchmark, achieved a total return of 0.59% for the same period.2
Short-term municipal bond prices were little changed over the reporting period as yields remained anchored by historically low short-term interest rates. The fund produced modestly lower returns than its benchmark, primarily due to the dampening impact of its cash reserves.
The Fund’s Investment Approach
The fund seeks to maximize current income exempt from federal income tax to the extent consistent with the preservation of capital.To pursue its goal, the fund normally invests at least 80% of its net assets in municipal bonds that provide income exempt from federal income tax.The fund occasionally may invest in taxable bonds, including for temporary defensive purposes.The fund’s investments in municipal and taxable bonds must be rated investment grade at the time of purchase or, if unrated, deemed of comparable quality by the investment adviser.3 Generally, the average effective portfolio maturity and the average effective portfolio duration of the fund’s portfolio will be less than three years.
Accommodative Monetary Policies Kept Rates Low
Investor sentiment had begun to improve by the start of the reporting period when a number of macroeconomic concerns failed to materialize. Instead, investors responded positively to news of improved U.S. employment and housing market trends, a commitment from the European Central Bank in support of the euro, and expectations that new leadership in China might lead to stronger regional growth. Although investor optimism faltered in November due to uncertainty surrounding the presidential election and automatic tax hikes and spending cuts scheduled for the start of 2013, last-minute legislation to address the scheduled tax increases helped alleviate investors’ worries.As a result, investors increasingly turned away from traditional safe havens, such as short-term, high quality municipal bonds, and toward riskier assets.
While prices of short-term municipal bonds ended the reporting period little changed from where they began, their returns were supported by the Federal Reserve Board’s (the “Fed”) aggressively accommodative monetary policy initiatives.The Fed left the federal funds rate unchanged at between 0% and 0.25%, which fueled robust demand from investors seeking higher levels of after-tax income. Meanwhile, new issuance remained muted when political pressure led to less borrowing for capital projects. From a credit quality perspective, higher tax receipts and reduced spending have enabled many states and municipalities to achieve balanced budgets.
The Funds 5
DISCUSSION OF FUND PERFORMANCE (continued)
Fund Strategies Produced Mixed Results
The fund’s relative performance was mildly undermined by its cash reserves, which earned lower yields than municipal bonds with maturities of one year or more.To a more modest extent, the fund’s relative results were constrained by our security selection strategy among A-rated municipal bonds, and by overweighted exposure to higher quality bonds backed by revenues from educational institutions. On the other hand, the fund’s relative performance was supported by an overweighted position in bonds backed by industrial development projects and underweighted exposure to escrowed bonds.
The fund’s interest rate strategy generally helped bolster the fund’s relative performance, as we established its average duration in a range we considered slightly longer than average.This positioning proved effective when yield differences narrowed along the market’s maturity spectrum.
Maintaining a Constructive Posture
We have been encouraged by recently improved data, but the U.S. economy remains vulnerable to fiscal uncertainty, suggesting to us that Fed policy will remain accommodative and short-term municipal bonds will likely continue to trade within a tight range over the
foreseeable future. At the same time, rising federal and state tax rates for high earners should support investor demand. Therefore, we have maintained our relative value approach, which has identified a number of opportunities among revenue-backed bonds as well as securities with credit ratings toward the lower end of the investment-grade range.
March 15, 2013
Bond funds are subject generally to interest rate, credit, liquidity and market
risks, to varying degrees, all of which are more fully described in the fund’s
prospectus. Generally, all other factors being equal, bond prices are inversely
related to interest-rate changes, and rate increases can cause price declines.
1 Total return includes reinvestment of dividends and any capital gains paid.
Past performance is no guarantee of future results. Share price, yield and
investment return fluctuate such that upon redemption fund shares may be
worth more or less than their original cost. Income may be subject to state and
local taxes, and some income may be subject to the federal alternative minimum
tax (AMT) for certain investors. Capital gains, if any, are fully taxable.
2 SOURCE: BLOOMBERG L.P. — Reflects reinvestment of dividends
and, where applicable, capital gain distributions.The S&P Municipal Bond
Short Index is composed of bonds in the S&P Municipal Bond Index with a
minimum maturity of six months and a maximum maturity of up to but not
including four years as measured from the date on which the Index is
rebalanced. Index returns do not reflect the fees and expenses associated with
operating a mutual fund. Investors cannot invest directly in any index.
3 The fund may continue to own investment-grade bonds (at the time of
purchase), which are subsequently downgraded to below investment grade.
6

DISCUSSION OF
FUND PERFORMANCE
For the period of September 1, 2012, through February 28, 2013, as provided by Mary Collette O’Brien and Jeremy N. Baker, Portfolio Managers
Fund and Market Performance Overview
For the six-month period ended February 28, 2013, BNY Mellon Pennsylvania Intermediate Municipal Bond Fund’s Class M shares produced a total return of 1.50%, and its Investor shares returned 1.30%.1 In comparison, the S&P Municipal Bond Intermediate Index (the “Index”), the fund’s benchmark, achieved a total return of 2.06% for the same period.2
Despite rising long-term interest rates, favorable supply-and-demand dynamics helped municipal bonds provide positive absolute returns over the reporting period.The fund produced lower returns than its benchmark, primarily due to lack of exposure to rallying California municipal bonds. However, unlike the fund, the Index is not limited to obligations issued by a single state or municipalities in that state.
The Fund’s Investment Approach
The fund seeks as high a level of income exempt from federal and Pennsylvania state income taxes as is consistent with the preservation of capital.To pursue its goal, the fund normally invests at least 80% of its net assets in municipal bonds, the interest from which is exempt from federal and Pennsylvania state personal income taxes.The fund may also invest in municipal bonds that are exempt from federal income taxes, but not Pennsylvania personal income taxes, and in taxable bonds.The fund’s investments in municipal and taxable bonds must be rated investment grade at the time of purchase or, if unrated, deemed of comparable quality by the investment adviser.3 Generally, the fund’s average effective portfolio maturity will be between three and
10 years, and the average effective duration of the fund’s portfolio will not exceed eight years.
Supply-and-Demand Dynamics Buoyed Municipal Bonds
Investor sentiment had begun to improve by the start of the reporting period when a number of economic concerns failed to materialize. Instead, investors responded positively to improved U.S. employment and housing market trends and statements from the European Central Bank in support of the euro.Although investor optimism faltered in November due to uncertainty surrounding automatic tax hikes and spending cuts scheduled for 2013, last-minute legislation to address the tax increases helped alleviate investors’ worries. Consequently, investors turned away from traditional safe havens and toward riskier assets.
While intermediate-term municipal bond prices ended the reporting period little changed from where they began, they were supported by the Federal Reserve Board’s (the “Fed”) aggressively accommodative monetary policy initiatives, which fueled robust demand from investors seeking higher levels of after-tax income. Meanwhile, new issuance remained muted when political pressure led to less borrowing for capital projects. From a credit quality perspective, Pennsylvania has taken the difficult steps necessary to balance its budget, and fiscal conditions generally have remained sound.
Fund Strategies Produced Mixed Results
The fund’s lagging relative performance mainly stemmed from the underperformance of Pennsylvania bonds compared to other states, most notably California, that rallied from depressed levels as fiscal conditions improved. In addition, the fund suffered mild shortfalls in its security selection strategy among
The Funds 7
DISCUSSION OF FUND PERFORMANCE (continued)
lower-rated municipal bonds, including bonds backed by revenues from educational institutions. The fund also suffered mild shortfalls among high quality escrowed bonds and from underweighted exposure to bonds backed by health care facilities, utilities and the state’s settlement of litigation with U.S. tobacco companies. In contrast, Pennsylvania general obligation bonds helped bolster the fund’s relative performance.
The fund’s interest rate strategy generally proved effective. We set its average duration in a range we considered slightly shorter than market averages, which helped cushion the effects of rising long-term interest rates.The fund employed futures contracts, a derivative instrument, at times to implement its interest rate strategies.
Maintaining a Constructive Posture
We have been encouraged by recently improved data, but the U.S. economy remains vulnerable to fiscal uncertainty, suggesting to us that Fed policy will remain accommodative and municipal bonds will likely trade within a relatively tight range over the foreseeable future.At the same time, rising federal and state tax rates for high earners should support investor demand. Our relative value approach has identified a number of
opportunities among revenue-backed bonds from educational institutions, but relative few among the bonds issued by hospitals, utilities and the state’s settlement of litigation with U.S. tobacco companies.
March 15, 2013
Bond funds are subject generally to interest rate, credit, liquidity and market
risks, to varying degrees, all of which are more fully described in the fund’s
prospectus. Generally, all other factors being equal, bond prices are inversely
related to interest-rate changes, and rate increases can cause price declines.
1 Total return includes reinvestment of dividends and any capital gains paid.
Past performance is no guarantee of future results. Share price, yield and
investment return fluctuate such that upon redemption fund shares may be
worth more or less than their original cost. Income may be subject to state and
local taxes for non-Pennsylvania residents, and some income may be subject to
the federal alternative minimum tax (AMT) for certain investors. Capital
gains, if any, are fully taxable.
2 SOURCE: BLOOMBERG L.P. — Reflects reinvestment of dividends
and, where applicable, capital gain distributions.The S&P Municipal Bond
Intermediate Index is composed of bonds in the S&P Municipal Bond Index
with a minimum maturity of three years and a maximum maturity of up to
but not including 15 years as measured from the date on which the Index is
rebalanced. Index returns do not reflect the fees and expenses associated with
operating a mutual fund. Investors cannot invest directly in any index.
3 The fund may continue to own investment-grade bonds (at the time of
purchase), which are subsequently downgraded to below investment grade.
8

DISCUSSION OF
FUND PERFORMANCE
For the period of September 1, 2012, through February 28, 2013, as provided by John F. Flahive and Mary Collette O’Brien, Portfolio Managers
Fund and Market Performance Overview
For the six-month period ended February 28, 2013, BNY Mellon Massachusetts Intermediate Municipal Bond Fund’s Class M shares produced a total return of 1.46%, and its Investor shares returned 1.34%.1 In comparison, the S&P Municipal Bond Intermediate Index (the “Index”), the fund’s benchmark, achieved a total return of 2.06% for the same period.2
Despite rising long-term interest rates, favorable supply-and-demand dynamics helped municipal bonds produce positive absolute returns over the reporting period. The fund produced modestly lower returns than its benchmark, primarily due to lack of exposure to rallying California municipal bonds. However, unlike the fund, the Index is not limited to obligations issued by a single state or municipalities in that state.
The Fund’s Investment Approach
The fund seeks as high a level of income exempt from federal and Massachusetts state income taxes as is consistent with the preservation of capital.To pursue its goal, the fund normally invests at least 80% of its net assets in municipal bonds, the interest from which is exempt from federal and Massachusetts state personal income taxes. The fund may also invest in municipal bonds that are exempt from federal income taxes, but not Massachusetts personal income taxes, and in taxable bonds.The fund’s investments in municipal and taxable bonds must be rated investment grade at the time of
purchase or, if unrated, deemed of comparable quality by the investment adviser.3 Generally, the fund’s average effective portfolio maturity will be between three and 10 years, and the average effective duration of the fund’s portfolio will not exceed eight years.
Supply-and-Demand Dynamics Buoyed Municipal Bonds
Investor sentiment had begun to improve by the start of the reporting period when a number of economic concerns failed to materialize. Instead, investors responded positively to improved U.S. employment and housing market trends and a stated commitment from the European Central Bank in support of the euro. Although investor optimism faltered in November due to uncertainty surrounding automatic tax hikes and spending cuts scheduled for 2013, last-minute legislation to address the scheduled tax increases helped alleviate investors’ worries. Consequently, investors turned away from traditional safe havens, such as AAA-rated municipal bonds, and toward riskier assets.
While prices of intermediate-term municipal bonds ended the reporting period little changed from where they began, their returns were supported by the Federal Reserve Board’s (the “Fed”) aggressively accommodative monetary policy initiatives, which fueled robust demand from investors seeking higher levels of after-tax income. Meanwhile, new issuance remained muted when political pressure led to less borrowing for capital projects. From a credit quality perspective, Massachusetts has continued to fare well compared to most other states, mainly due to sound fiscal management and a well-diversified economic base.
The Funds 9
DISCUSSION OF FUND PERFORMANCE (continued)
Fund Strategies Produced Mixed Results
The fund’s lagging relative performance was mainly the result of the underperformance of Massachusetts bonds compared to other states, most notably California, that rallied from depressed levels as fiscal conditions improved. In addition, the fund suffered mild shortfalls in its security selection strategy among lower-rated municipal bonds, including BBB-rated holdings of Puerto Rico bonds.
The fund’s interest rate strategy generally fared better. We set the fund’s average duration in a range we considered slightly shorter than market averages, which helped cushion the effects of rising long-term interest rates.An emphasis on bonds with maturities of 15 years and more generally buoyed fund performance, but a concurrent emphasis on the one- to three-year range produced less favorable results. The fund employed future contracts, a derivative instrument, at times to implement its interest rate strategies.
Maintaining a Constructive Posture
We have been encouraged by recently improved data, but the U.S. economy remains vulnerable to fiscal uncertainty, suggesting to us that Fed policy will remain accommodative and municipal bonds will likely trade within a relatively tight range over the foreseeable future. At the
same time, rising federal and state tax rates for high earners should support investor demand. Our relative value approach has identified a number of opportunities among revenue-backed bonds from educational institutions, but relative few among the general obligation bonds issued by utilities and the state’s settlement of litigation with U.S. tobacco companies.
March 15, 2013
Bond funds are subject generally to interest rate, credit, liquidity and market
risks, to varying degrees, all of which are more fully described in the fund’s
prospectus. Generally, all other factors being equal, bond prices are inversely
related to interest-rate changes, and rate increases can cause price declines.
1 Total return includes reinvestment of dividends and any capital gains paid.
Past performance is no guarantee of future results. Share price, yield and
investment return fluctuate such that upon redemption fund shares may be
worth more or less than their original cost. Income may be subject to state and
local taxes for non-Massachusetts residents, and some income may be subject to
the federal alternative minimum tax (AMT) for certain investors. Capital
gains, if any, are fully taxable.
2 SOURCE: BLOOMBERG L.P. — Reflects reinvestment of dividends
and, where applicable, capital gain distributions.The S&P Municipal Bond
Intermediate Index is composed of bonds in the S&P Municipal Bond Index
with a minimum maturity of three years and a maximum maturity of up to
but not including 15 years as measured from the date on which the Index is
rebalanced. Index returns do not reflect the fees and expenses associated with
operating a mutual fund. Investors cannot invest directly in any index.
3 The fund may continue to own investment-grade bonds (at the time of
purchase), which are subsequently downgraded to below investment grade.
10
DISCUSSION OF
FUND PERFORMANCE
For the period of September 1, 2012, through February 28, 2013, as provided by John F. Flahive, Portfolio Manager and Director of Fixed Income
Fund and Market Performance Overview
For the six-month period ended February 28, 2013, BNY Mellon New York Intermediate Tax-Exempt Bond Fund’s Class M shares produced a total return of 1.31%, and its Investor shares returned 1.19%.1 In comparison, the S&P Municipal Bond Intermediate Index (the “Index”), the fund’s benchmark, achieved a total return of 2.06% for the same period.2
Despite rising long-term interest rates, favorable supply-and-demand dynamics helped municipal bonds produce positive absolute returns over the reporting period. The fund produced lower returns than its national benchmark, primarily due to lack of exposure to rallying municipal bonds from other states, particularly California. However, unlike the fund, the Index is not limited to obligations issued by a single state or municipalities in that state.
The Fund’s Investment Approach
The fund seeks as high a level of income exempt from federal, NewYork state and NewYork city income taxes as is consistent with the preservation of capital. This objective may be changed without shareholder approval.To pursue its goal, the fund normally invests at least 80% of its net assets in municipal bonds that provide income exempt from federal, New York state and NewYork city personal income taxes.These municipal bonds include those issued by NewYork state and New York city as well as those issued by U.S. territories and possessions.3 Generally, the fund’s average effective portfolio maturity will be between three and 10 years.
Supply-and-Demand Dynamics Buoyed Municipal Bonds
Investor sentiment had begun to improve by the start of the reporting period when a number of economic concerns failed to materialize. Instead, investors responded positively to improved U.S. employment and housing market trends and a stated commitment from the European Central Bank in support of the euro. Although investor optimism faltered in November due to uncertainty surrounding automatic tax hikes and spending cuts scheduled for the start of 2013, last-minute legislation to address the scheduled tax increases helped alleviate investors’ worries. Consequently, investors turned away from traditional safe havens, such as AAA-rated municipal bonds, and toward riskier assets.
While prices of intermediate-term municipal bonds ended the reporting period little changed from where they began, their returns were supported by the Federal Reserve Board’s (the “Fed”) aggressively accommodative monetary policy initiatives, which fueled robust demand from investors seeking higher levels of after-tax income. Meanwhile, new issuance remained muted when political pressure led to less borrowing for capital projects. From a credit quality perspective, NewYork has continued to take the difficult steps required to balance its budget and shore up its fiscal condition.
Fund Strategies Produced Mixed Results
The fund’s lagging relative performance was mainly the result of the underperformance of NewYork bonds compared to other states, most notably California, that rallied from depressed levels as fiscal conditions improved. In addition, our security selections in the
The Funds 11
DISCUSSION OF FUND PERFORMANCE (continued)
seven- to nine-year maturity range hurt the fund’s relative performance.The fund also suffered mild shortfalls in its security selection strategy among lower-rated municipal bonds, including those rated BBB andA. On the other hand, the fund received positive contributions to its relative results from NewYork municipal bonds backed by state tax appropriations, educational institutions, industrial development projects, and certain counties and cities.
The fund’s interest rate strategy had little impact on relative performance, as we maintained its average duration in a range we considered in line with market averages.The fund employed futures contracts, a derivative instrument, at times to implement its interest rate strategies.
Adjusting to Changing Market Conditions
We have been encouraged by recently improved data, but the U.S. economy remains vulnerable to fiscal uncertainty, suggesting to us that Fed policy will remain accommodative and municipal bonds will likely trade within a relatively tight range over the foreseeable future.At the same time, rising federal and state tax rates for high earners should support investor demand. Our relative value approach has identified a number of opportunities among revenue-backed bonds from edu-
cational institutions, but relatively few among bonds issued on behalf of transportation facilities and the state’s settlement of litigation with U.S. tobacco companies.
March 15, 2013
Bond funds are subject generally to interest rate, credit, liquidity and market
risks, to varying degrees, all of which are more fully described in the fund’s
prospectus. Generally, all other factors being equal, bond prices are inversely
related to interest-rate changes and rate increases can cause price declines.
1 Total return includes reinvestment of dividends and any capital gains paid.
Past performance is no guarantee of future results. Share price, yield and
investment return fluctuate such that upon redemption fund shares may be
worth more or less than their original cost. Income may be subject to state and
local taxes for non-NewYork residents, and some income may be subject to the
federal alternative minimum tax (AMT) for certain investors. Capital gains, if
any, are fully taxable. Return figures provided reflect the absorption of certain
fund expenses by BNY Mellon Fund Advisors pursuant to an agreement in
effect through December 31, 2013, at which time it may be extended,
modified or terminated. Had these expenses not been absorbed, the fund’s
returns would have been lower.
2 SOURCE: BLOOMBERG L.P. — Reflects reinvestment of dividends
and, where applicable, capital gain distributions.The S&P Municipal Bond
Intermediate Index is composed of bonds in the S&P Municipal Bond Index
with a minimum maturity of three years and a maximum maturity of up to
but not including 15 years as measured from the date on which the Index is
rebalanced. Index returns do not reflect the fees and expenses associated with
operating a mutual fund. Investors cannot invest directly in any index.
3 The fund may continue to own investment-grade bonds (at the time of
purchase), which are subsequently downgraded to below investment grade.
12

DISCUSSION OF
FUND PERFORMANCE
For the period of September 1, 2012, through February 28, 2013, as provided by John F. Flahive, Portfolio Manager and Director of Fixed Income
Fund and Market Performance Overview
For the six-month period ended February 28, 2013, BNY Mellon Municipal Opportunities Fund’s Class M shares produced a total return of 3.86%, and its Investor shares returned 3.66%.1 In comparison, the Barclays Municipal Bond Index (the “Index”), the fund’s benchmark, achieved a total return of 2.01% for the same period.2
Despite rising long-term interest rates, favorable supply-and-demand dynamics helped municipal bonds provide positive absolute returns over the reporting period. The fund produced higher returns than its benchmark, primarily due to overweighted exposure to securities with credit ratings at the lower end of the investment-grade range.
The Fund’s Investment Approach
The fund seeks to maximize total return consisting of high current income exempt from federal income tax and capital appreciation.This objective may be changed without shareholder approval. To pursue its goal, the fund normally invests at least 80% of its net assets in U.S. dollar-denominated fixed-income securities that provide income exempt from federal income tax (municipal bonds).While the fund typically invests in a diversified portfolio of municipal bonds, it may invest up to 20% of its assets in taxable fixed-income securities, including taxable municipal bonds and non-U.S. dollar-denomi-
nated foreign debt securities, such as Brady bonds and sovereign debt obligations.
We seek to deliver value-added excess returns (“alpha”) by applying an investment approach designed to identify and exploit relative value opportunities within the municipal bond market and other fixed-income markets. Although the fund seeks to be diversified by geography and sector, the fund may at times invest a significant portion of its assets in a particular state or region or in a particular sector due to market conditions.
Supply-and-Demand Dynamics Buoyed Municipal Bonds
In the wake of earlier market declines, a sustained market rally began near the start of the reporting period when the European financial crisis did not worsen, China appeared to have engineered a soft landing for its economy, and recession fears faded in the United States. Instead, investors responded positively to improved U.S. employment and housing market trends, a stated commitment from the European Central Bank in support of the euro, and expectations that new leadership in China might lead to stronger regional growth. Although investor optimism faltered in November due to uncertainty surrounding automatic tax hikes and spending cuts scheduled for the start of 2013, last-minute legislation to address the scheduled tax increases helped alleviate investors’ worries. As a result, investors increasingly turned away from traditional safe havens, such as AAA-rated municipal bonds, and toward riskier assets.
The Funds 13
DISCUSSION OF FUND PERFORMANCE (continued)
While municipal bond prices ended the reporting period close to where they began, their returns were supported by the Federal Reserve Board’s (the “Fed”) aggressively accommodative monetary policy initiatives, which fueled robust demand from investors seeking higher levels of after-tax income. Meanwhile, new issuance remained muted when political pressure led to less borrowing for capital projects. From a credit quality perspective, higher tax receipts and reduced spending have enabled many states and municipalities to achieve balanced budgets.
Security Selections Buoyed Fund Performance
The fund’s relative performance was boosted to a degree by its emphasis on BBB-rated municipal bonds, which reside in the lower tier of the investment-grade range. These higher yielding securities were the subject of robust demand from income-oriented investors. In addition, the fund achieved above-average results from municipal bonds backed by revenues from health care facilities and industrial development projects. Longer-dated municipal bonds also contributed positively to the fund’s relative performance.
While a mildly short average duration helped cushion the impact of rising long-term interest rates, the fund’s leveraging strategies proved relatively ineffective over the reporting period due to its focus on the intermediate-term segment of the market’s maturity spectrum. The fund’s cash reserves also detracted modestly from its results compared to the benchmark.The fund employed futures contracts, a derivative instrument, at times to implement its interest rate strategies, but these instruments dampened results during the reporting period.
Maintaining a Constructive Investment Posture
We have been encouraged by recently improved data, but the U.S. economy remains vulnerable to fiscal uncertainty, suggesting to us that Fed policy will remain accommodative and municipal bonds will likely trade within a relatively tight range over the foreseeable future.At the same time, rising federal and state tax rates for high earners should support demand for a limited supply of municipal bonds. Therefore, we have maintained our relative value approach, which has identified a number of opportunities among BBB-rated, revenue-backed municipal bonds.We have found relative few securities meeting our investment criteria among the general obligation bonds issued by states and local municipalities.
March 15, 2013
Bond funds are subject generally to interest rate, credit, liquidity and market
risks, to varying degrees, all of which are more fully described in the fund’s
prospectus. Generally, all other factors being equal, bond prices are inversely
related to interest-rate changes, and rate increases can cause price declines.
1 Total return includes reinvestment of dividends and any capital gains paid.
Past performance is no guarantee of future results. Share price, yield and
investment return fluctuate such that upon redemption, fund shares may be
worth more or less than their original cost. Income may be subject to state and
local taxes, and some income may be subject to the federal alternative minimum
tax (AMT) for certain investors. Capital gains, if any, are fully taxable.
2 SOURCE: LIPPER INC. — Reflects reinvestment of dividends and, where
applicable, capital gain distributions.The Barclays Municipal Bond Index is an
unmanaged total return performance benchmark for the investment-grade,
geographically unrestricted tax-exempt bond market. Index return does not
reflect the fees and expenses associated with operating a mutual fund. Investors
cannot invest directly in any index.
14
UNDERSTANDING YOUR FUND’S EXPENSES (Unaudited)
As a mutual fund investor, you pay ongoing expenses, such as management fees and other expenses. Using the information below, you can esti-
mate how these expenses affect your investment and compare them with the expenses of other funds.You also may pay one-time transaction
expenses, including sales charges (loads) and redemptions fees, which are not shown in this section and would have resulted in higher total
expenses. For more information, see your fund’s prospectus or talk to your financial adviser.
Review your fund’s expenses
The table below shows the expenses you would have paid on a $1,000 investment in each class of each BNY Mellon municipal
bond fund from September 1, 2012 to February 28, 2013. It also shows how much a $1,000 investment would be worth at the close
of the period, assuming actual returns and expenses.
| Expenses and Value of a $1,000 Investment | ||||
| assuming actual returns for the six months ended February 28, 2013 | ||||
| Class M Shares | Investor Shares | |||
| BNY Mellon National Intermediate | ||||
| Municipal Bond Fund | ||||
| Expenses paid per $1,000† | $2.50 | $3.75 | ||
| Ending value (after expenses) | $1,018.00 | $1,016.70 | ||
| Annualized expense ratio (%) | .50 | .75 | ||
| BNY Mellon National Short-Term | ||||
| Municipal Bond Fund | ||||
| Expenses paid per $1,000† | $2.48 | $3.72 | ||
| Ending value (after expenses) | $1,004.00 | $1,002.80 | ||
| Annualized expense ratio (%) | .50 | .75 | ||
| BNY Mellon Pennsylvania | ||||
| Intermediate Municipal Bond Fund | ||||
| Expenses paid per $1,000† | $3.35 | $4.59 | ||
| Ending value (after expenses) | $1,015.00 | $1,013.00 | ||
| Annualized expense ratio (%) | .67 | .92 | ||
| BNY Mellon Massachusetts | ||||
| Intermediate Municipal Bond Fund | ||||
| Expenses paid per $1,000† | $2.65 | $3.89 | ||
| Ending value (after expenses) | $1,014.60 | $1,013.40 | ||
| Annualized expense ratio (%) | .53 | .78 | ||
| BNY Mellon New York | ||||
| Intermediate Tax-Exempt Bond Fund | ||||
| Expenses paid per $1,000† | $2.94 | $4.19 | ||
| Ending value (after expenses) | $1,013.10 | $1,011.90 | ||
| Annualized expense ratio (%) | .59 | .84 | ||
| BNY Mellon Municipal | ||||
| Opportunities Fund | ||||
| Expenses paid per $1,000† | $3.69 | $4.85 | ||
| Ending value (after expenses) | $1,038.60 | $1,036.60 | ||
| Annualized expense ratio (%) | .73 | .96 | ||
† Expenses are equal to each fund’s annualized expense ratio as shown above, multiplied by the average account value over the period, multiplied by 181/365 (to reflect the
one-half year period).
The Funds 15
COMPARING YOUR FUND’S EXPENSES WITH THOSE OF OTHER FUNDS (Unaudited)
Using the SEC’s method to compare expenses
The Securities and Exchange Commission (SEC) has established guidelines to help investores assess fund expenses. Per these guidelines, the table below shows your fund’s expenses based on a $1,000 investment, assuming a hypothetical 5% annualized return.You can use this information to compare the ongoing expenses (but not transaction expenses or total cost) of investing in each fund with those of other funds. All mutual fund shareholder reports will provide this information to help you make this comparison. Please note that you cannot use this information to estimate your actual ending account balance and expenses paid during the period.
| Expenses and Value of a $1,000 Investment | |||
| assuming actual returns for the six months ended February 28, 2013 | |||
| Class M Shares | Investor Shares | ||
| BNY Mellon National Intermediate | |||
| Municipal Bond Fund | |||
| Expenses paid per $1,000† | $ 2.51 | $3.76 | |
| Ending value (after expenses) | $1,022.32 | $1,021.08 | |
| Annualized expense ratio (%) | .50 | .75 | |
| BNY Mellon National Short-Term | |||
| Municipal Bond Fund | |||
| Expenses paid per $1,000† | $2.51 | $3.76 | |
| Ending value (after expenses) | $1,022.32 | $1,021.08 | |
| Annualized expense ratio (%) | .50 | .75 | |
| BNY Mellon Pennsylvania | |||
| Intermediate Municipal Bond Fund | |||
| Expenses paid per $1,000† | $3.36 | $4.61 | |
| Ending value (after expenses) | $1,021.47 | $1,020.23 | |
| Annualized expense ratio (%) | .67 | .92 | |
| BNY Mellon Massachusetts | |||
| Intermediate Municipal Bond Fund | |||
| Expenses paid per $1,000† | $2.66 | $3.91 | |
| Ending value (after expenses) | $1,022.17 | $1,020.93 | |
| Annualized expense ratio (%) | .53 | .78 | |
| BNY Mellon New York | |||
| Intermediate Tax-Exempt Bond Fund | |||
| Expenses paid per $1,000† | $2.96 | $4.21 | |
| Ending value (after expenses) | $ 1,021.87 | $1,020.63 | |
| Annualized expense ratio (%) | .59 | .84 | |
| BNY Mellon Municipal | |||
| Opportunities Fund | |||
| Expenses paid per $1,000† | $3.66 | $4.81 | |
| Ending value (after expenses) | $1,021.17 | $1,020.03 | |
| Annualized expense ratio (%) | .73 | .96 | |
† Expenses are equal to each fund’s annualized expense ratio as shown above, multiplied by the average account value over the period, multiplied by 181/365 (to reflect the
one-half year period).
16
| STATEMENT OF INVESTMENTS | |||||
| February 28, 2013 (Unaudited) | |||||
| BNY Mellon National Intermediate Municipal Bond Fund | |||||
| Long-Term Municipal | Coupon | Maturity | Principal | ||
| Investments—97.1% | Rate (%) | Date | Amount ($) | Value ($) | |
| Alabama—1.7% | |||||
| Alabama 21st Century Authority, Tobacco Settlement Revenue | 5.00 | 6/1/20 | 1,500,000 | 1,767,615 | |
| Birmingham Special Care Facilities Financing Authority-Baptist | |||||
| Medical Centers, Revenue (Baptist Health System, Inc.) | 5.00 | 11/15/15 | 5,000,000 | 5,489,950 | |
| Jefferson County, Limited Obligation School Warrants | 5.25 | 1/1/15 | 1,180,000 | 1,181,168 | |
| Jefferson County, Limited Obligation School Warrants | 5.25 | 1/1/16 | 4,810,000 | 4,813,944 | |
| Jefferson County, Limited Obligation School Warrants | |||||
| (Insured; Assured Guaranty Municipal Corp.) | 5.00 | 1/1/24 | 13,325,000 | 13,539,932 | |
| Montgomery BMC Special Care Facilities Financing | |||||
| Authority, Revenue (Baptist Health) (Insured; | |||||
| National Public Finance Guarantee Corp.) | 5.00 | 11/15/13 | 1,365,000 | 1,411,314 | |
| Montgomery BMC Special Care Facilities Financing | |||||
| Authority, Revenue (Baptist Health) (Insured; | |||||
| National Public Finance Guarantee Corp.) | 5.00 | 11/15/14 | 2,500,000 | 2,688,825 | |
| Alaska—1.0% | |||||
| Alaska Industrial Development and | |||||
| Export Authority, Revolving Fund Revenue | 5.25 | 4/1/27 | 2,295,000 | 2,733,988 | |
| Valdez, Marine Terminal Revenue (BP Pipelines (Alaska) Inc. Project) | 5.00 | 1/1/16 | 5,000,000 | 5,580,550 | |
| Valdez, Marine Terminal Revenue (BP Pipelines (Alaska) Inc. Project) | 5.00 | 1/1/18 | 8,000,000 | 9,440,080 | |
| Arizona—4.1% | |||||
| Arizona Board of Regents, Arizona State University | |||||
| System Revenue (Polytechnic Campus Project) | 6.00 | 7/1/25 | 2,500,000 | 3,037,800 | |
| Arizona Board of Regents, Arizona State University | |||||
| System Revenue (Polytechnic Campus Project) | 6.00 | 7/1/26 | 1,000,000 | 1,215,120 | |
| Arizona Board of Regents, Arizona State University | |||||
| System Revenue (Polytechnic Campus Project) | 6.00 | 7/1/28 | 1,100,000 | 1,319,362 | |
| Arizona Transportation Board, Highway Revenue | 5.00 | 7/1/26 | 5,000,000 | 5,886,000 | |
| Arizona Transportation Board, Highway Revenue (Prerefunded) | 5.00 | 7/1/16 | 15,000,000 | a | 17,263,650 |
| Arizona Transportation Board, Subordinated Highway Revenue | 5.00 | 7/1/31 | 10,000,000 | 11,846,700 | |
| Arizona Water Infrastructure Finance | |||||
| Authority, Water Quality Revenue | 5.00 | 10/1/21 | 3,000,000 | 3,821,220 | |
| Glendale, Senior Lien Water and Sewer Revenue Obligations | 5.00 | 7/1/25 | 6,325,000 | 7,702,585 | |
| Glendale, Senior Lien Water and Sewer Revenue Obligations | 5.00 | 7/1/26 | 4,425,000 | 5,337,302 | |
| Phoenix, GO | 6.25 | 7/1/16 | 1,250,000 | 1,484,438 | |
| Phoenix Civic Improvement Corporation, Transit | |||||
| Excise Tax Revenue (Light Rail Project) (Insured; AMBAC) | 5.00 | 7/1/16 | 6,000,000 | 6,381,060 | |
| University Medical Center Corporation, HR | 5.25 | 7/1/16 | 2,310,000 | 2,428,549 | |
| University of Arizona Board of Regents, System Revenue | 6.20 | 6/1/16 | 7,990,000 | 8,605,709 | |
| California—17.0% | |||||
| Agua Caliente Band, Cahuilla Indians Revenue | 5.60 | 7/1/13 | 475,000 | b | 473,984 |
| Alameda Corridor Transportation Authority, | |||||
| Subordinate Lien Revenue (Insured; AMBAC) | 5.25 | 10/1/21 | 5,000,000 | 5,692,250 | |
| Bay Area Toll Authority, San Francisco Bay Area Toll Bridge Revenue | 1.36 | 4/1/27 | 15,000,000 | c | 14,997,750 |
| California, Economic Recovery Bonds | 5.00 | 7/1/15 | 2,950,000 | 3,141,485 | |
The Funds 17
| STATEMENT OF INVESTMENTS (Unaudited) (continued) | |||||
| BNY Mellon National Intermediate Municipal Bond Fund (continued) | |||||
| Long-Term Municipal | Coupon | Maturity | Principal | ||
| Investments (continued) | Rate (%) | Date | Amount ($) | Value ($) | |
| California (continued) | |||||
| California, GO | 0.79 | 5/1/15 | 7,500,000 | c | 7,506,000 |
| California, GO | 5.50 | 6/1/20 | 115,000 | 115,516 | |
| California, GO | 5.25 | 11/1/26 | 10,500,000 | 10,834,740 | |
| California, GO (Various Purpose) | 5.00 | 9/1/21 | 11,200,000 | 13,976,592 | |
| California, GO (Various Purpose) | 5.00 | 9/1/21 | 5,000,000 | 6,239,550 | |
| California, GO (Various Purpose) | 5.25 | 10/1/23 | 5,000,000 | 6,164,500 | |
| California, GO (Various Purpose) | 5.00 | 9/1/25 | 20,000,000 | 24,287,400 | |
| California, GO (Various Purpose) | 6.00 | 3/1/33 | 11,445,000 | 14,217,551 | |
| California, GO (Various Purpose) | 6.50 | 4/1/33 | 3,000,000 | 3,765,660 | |
| California, GO (Various Purpose) | 5.50 | 3/1/40 | 7,950,000 | 9,415,582 | |
| California, GO (Various Purpose) (Prerefunded) | 5.00 | 2/1/14 | 1,825,000 | a | 1,906,833 |
| California Department of Water Resources, Power Supply Revenue | 5.00 | 5/1/22 | 5,000,000 | 6,176,550 | |
| California Department of Water Resources, Power Supply | |||||
| Revenue (Insured; Assured Guaranty Municipal Corp.) | 5.00 | 5/1/21 | 11,985,000 | 14,408,127 | |
| California Department of Water Resources, | |||||
| Water System Revenue (Central Valley Project) | 5.00 | 12/1/19 | 5,000,000 | 6,269,250 | |
| California Health Facilities Financing Authority, | |||||
| Revenue (Cedars-Sinai Medical Center) | 5.00 | 8/15/18 | 2,500,000 | 3,003,600 | |
| California Health Facilities Financing Authority, | |||||
| Revenue (City of Hope) | 5.00 | 11/15/23 | 1,500,000 | 1,815,675 | |
| California Health Facilities Financing Authority, | |||||
| Revenue (City of Hope) | 5.00 | 11/15/24 | 1,600,000 | 1,922,080 | |
| California Health Facilities Financing Authority, | |||||
| Revenue (Providence Health and Services) | 6.25 | 10/1/24 | 8,500,000 | 10,449,475 | |
| California Health Facilities Financing Authority, | |||||
| Revenue (Providence Health and Services) | 6.25 | 10/1/28 | 4,000,000 | 4,861,240 | |
| California Health Facilities Financing Authority, | |||||
| Revenue (Providence Health and Services) | 6.50 | 10/1/38 | 3,440,000 | 4,176,814 | |
| California Health Facilities Financing Authority, | |||||
| Revenue (Providence Health and Services) (Prerefunded) | 6.50 | 10/1/18 | 60,000 | a | 77,966 |
| California Infrastructure and Economic Development Bank, Revenue | |||||
| (California Independent System Operator Corporation Project) | 6.00 | 2/1/30 | 8,000,000 | 8,667,280 | |
| California State Public Works Board, LR (Department of | |||||
| General Services) (Capitol East End Complex—Blocks | |||||
| 171-174 and 225) (Insured; AMBAC) | 5.25 | 12/1/19 | 5,000,000 | 5,019,200 | |
| California State Public Works Board, LR (Department of | |||||
| General Services) (Capitol East End Complex—Blocks | |||||
| 171-174 and 225) (Insured; AMBAC) | 5.00 | 12/1/23 | 4,000,000 | 4,013,000 | |
| California State Public Works Board, LR (Department | |||||
| of Mental Health-Coalinga State Hospital) | 5.00 | 6/1/24 | 1,500,000 | 1,568,670 | |
18
| BNY Mellon National Intermediate Municipal Bond Fund (continued) | |||||
| Long-Term Municipal | Coupon | Maturity | Principal | ||
| Investments (continued) | Rate (%) | Date | Amount ($) | Value ($) | |
| California (continued) | |||||
| California State Public Works Board, LR (Various Capital Projects) | 5.00 | 4/1/19 | 8,760,000 | 10,527,680 | |
| California State Public Works Board, LR (Various Capital Projects) | 5.00 | 11/1/19 | 5,000,000 | 6,054,800 | |
| California State Public Works Board, LR (Various Capital Projects) | 5.00 | 10/1/20 | 2,000,000 | 2,426,900 | |
| California State Public Works Board, LR (Various Capital Projects) | 5.00 | 11/1/20 | 1,350,000 | 1,639,791 | |
| California Statewide Communities Development Authority, | |||||
| Mortgage Revenue (Methodist Hospital of Southern | |||||
| California Project) (Collateralized; FHA) | 6.25 | 8/1/24 | 4,345,000 | 5,341,265 | |
| California Statewide Communities Development Authority, | |||||
| Revenue (Saint Joseph Health System) (Insured; | |||||
| Assured Guaranty Municipal Corp.) | 4.50 | 7/1/18 | 3,125,000 | 3,345,906 | |
| California Statewide Communities Development | |||||
| Authority, Revenue (The California Endowment) | 5.25 | 7/1/15 | 1,740,000 | 1,770,224 | |
| East Bay Municipal Utility District, | |||||
| Water System Revenue | 5.00 | 6/1/22 | 10,000,000 | 12,830,500 | |
| Golden State Tobacco Securitization Corporation, | |||||
| Enhanced Tobacco Settlement Asset-Backed Bonds | 5.00 | 6/1/18 | 590,000 | 593,676 | |
| Los Angeles County Metropolitan Transportation Authority, | |||||
| Proposition A First Tier Senior Sales Tax Revenue | 5.00 | 7/1/20 | 7,165,000 | d | 8,903,157 |
| Los Angeles Department of Airports, Senior | |||||
| Revenue (Los Angeles International Airport) | 5.25 | 5/15/26 | 15,520,000 | 18,658,765 | |
| Los Angeles Unified School District, GO | |||||
| (Insured; Assured Guaranty Municipal Corp.) | 5.00 | 7/1/24 | 2,395,000 | 2,786,151 | |
| Los Angeles Unified School District, GO | |||||
| (Insured; National Public Finance Guarantee Corp.) | 5.75 | 7/1/16 | 2,000,000 | 2,341,700 | |
| New Haven Unified School District, GO | |||||
| (Insured; Assured Guaranty Municipal Corp.) | 0.00 | 8/1/33 | 4,000,000 | e | 1,573,000 |
| Oakland Joint Powers Financing Authority, LR | |||||
| (Oakland Convention Centers) (Insured; AMBAC) | 5.50 | 10/1/13 | 1,500,000 | 1,535,235 | |
| Port of Oakland, Revenue | 5.00 | 5/1/18 | 1,835,000 | 2,174,603 | |
| Port of Oakland, Revenue | 5.00 | 5/1/19 | 2,250,000 | 2,686,207 | |
| Port of Oakland, Revenue | 5.00 | 5/1/20 | 3,000,000 | 3,624,300 | |
| Port of Oakland, Revenue | 5.00 | 5/1/21 | 2,785,000 | 3,377,509 | |
| Port of Oakland, Revenue | 5.00 | 5/1/23 | 1,875,000 | 2,222,475 | |
| Sacramento County Water Financing Authority, Revenue (Sacramento | |||||
| County Water Agency Zones 40 and 41 Water System Project) | |||||
| (Insured; National Public Finance Guarantee Corp.) | 0.76 | 6/1/34 | 8,000,000 | c | 7,364,720 |
| Sacramento Municipal Utility District, Electric Revenue | |||||
| (Insured; Assured Guaranty Municipal Corp.) | 5.00 | 8/15/23 | 6,350,000 | 7,457,440 | |
| San Francisco City and County Airport Commission, | |||||
| Second Series Revenue (San Francisco International Airport) | 5.00 | 5/1/25 | 5,000,000 | 5,997,400 | |
The Funds 19
| STATEMENT OF INVESTMENTS (Unaudited) (continued) | |||||
| BNY Mellon National Intermediate Municipal Bond Fund (continued) | |||||
| Long-Term Municipal | Coupon | Maturity | Principal | ||
| Investments (continued) | Rate (%) | Date | Amount ($) | Value ($) | |
| California (continued) | |||||
| San Francisco City and County Airport Commission, | |||||
| Second Series Revenue (San Francisco International Airport) | 5.00 | 5/1/26 | 5,000,000 | 5,942,450 | |
| Westside Unified School District, GO (Insured; AMBAC) | 6.00 | 8/1/14 | 385,000 | 408,277 | |
| Colorado—3.9% | |||||
| Colorado Health Facilities Authority, | |||||
| Revenue (Catholic Health Initiatives) | 6.00 | 10/1/23 | 2,000,000 | 2,439,420 | |
| Colorado Health Facilities Authority, | |||||
| Revenue (Catholic Health Initiatives) | 6.25 | 10/1/33 | 1,600,000 | 1,936,800 | |
| Colorado Health Facilities Authority, Revenue | |||||
| (Vail Valley Medical Center Project) | 5.00 | 1/15/20 | 280,000 | 292,085 | |
| Colorado Health Facilities Authority, Revenue | |||||
| (Vail Valley Medical Center Project) (Prerefunded) | 5.00 | 1/15/15 | 970,000 | a | 1,053,566 |
| Colorado Housing and Finance Authority, | |||||
| Single Family Program Senior and Subordinate Bonds | 6.75 | 4/1/15 | 15,000 | 15,234 | |
| Colorado Housing and Finance Authority, | |||||
| Single Family Program Senior and Subordinate Bonds | 6.05 | 10/1/16 | 20,000 | 20,129 | |
| Denver City and County, Airport System Revenue | |||||
| (Insured: Assured Guaranty Municipal Corp. and | |||||
| National Public Finance Guarantee Corp.) | 5.25 | 11/15/19 | 4,445,000 | 5,178,514 | |
| E-470 Public Highway Authority, Senior Revenue | |||||
| (Insured; National Public Finance Guarantee Corp.) | 5.00 | 9/1/16 | 3,565,000 | 3,898,969 | |
| E-470 Public Highway Authority, Senior Revenue | |||||
| (Insured; National Public Finance Guarantee Corp.) | 5.25 | 9/1/16 | 5,000,000 | 5,510,400 | |
| E-470 Public Highway Authority, Senior Revenue | |||||
| (Insured; National Public Finance Guarantee Corp.) | 5.00 | 9/1/17 | 3,500,000 | 3,883,495 | |
| Northwest Parkway Public Highway Authority, | |||||
| Revenue (Insured; AMBAC) (Prerefunded) | 5.45 | 6/15/16 | 7,690,000 | a | 8,897,330 |
| Northwest Parkway Public Highway Authority, | |||||
| Revenue (Insured; AMBAC) (Prerefunded) | 5.70 | 6/15/16 | 7,345,000 | a | 8,557,953 |
| Northwest Parkway Public Highway Authority, Revenue | |||||
| (Insured; Assured Guaranty Municipal Corp.) (Prerefunded) | 5.55 | 6/15/16 | 10,960,000 | a | 12,716,340 |
| Public Authority for Colorado Energy, | |||||
| Natural Gas Purchase Revenue | 5.75 | 11/15/18 | 2,515,000 | 2,888,855 | |
| Public Authority for Colorado Energy, | |||||
| Natural Gas Purchase Revenue | 6.13 | 11/15/23 | 5,350,000 | 6,581,035 | |
| Regional Transportation District, COP | 5.00 | 6/1/19 | 1,750,000 | 2,074,765 | |
| Regional Transportation District, COP | 5.00 | 6/1/20 | 2,700,000 | 3,231,117 | |
| Regional Transportation District, COP | 5.50 | 6/1/22 | 2,200,000 | 2,646,050 | |
| Connecticut—1.3% | |||||
| Connecticut, GO | 5.00 | 4/15/22 | 5,000,000 | 6,291,650 | |
| Connecticut, GO | 5.00 | 5/15/23 | 12,500,000 | 15,287,875 | |
| Connecticut, GO (Insured; AMBAC) | 5.25 | 6/1/18 | 1,500,000 | 1,830,390 | |
20
| BNY Mellon National Intermediate Municipal Bond Fund (continued) | |||||
| Long-Term Municipal | Coupon | Maturity | Principal | ||
| Investments (continued) | Rate (%) | Date | Amount ($) | Value ($) | |
| Connecticut (continued) | |||||
| Connecticut Health and Educational Facilities Authority, | |||||
| Revenue (Connecticut State University System Issue) | |||||
| (Insured; Assured Guaranty Municipal Corp.) | 5.00 | 11/1/14 | 1,260,000 | 1,360,132 | |
| District of Columbia—.7% | |||||
| District of Columbia, GO (Insured; Assured Guaranty Municipal Corp.) | 0.67 | 6/1/16 | 5,000,000 | c | 5,315,400 |
| Metropolitan Washington Airports Authority, | |||||
| Airport System Revenue | 5.00 | 10/1/23 | 4,250,000 | 5,079,515 | |
| Metropolitan Washington Airports Authority, | |||||
| Airport System Revenue | 5.00 | 10/1/24 | 2,500,000 | 2,958,625 | |
| Florida—6.3% | |||||
| Florida Department of Transportation, | |||||
| State Infrastructure Bank Revenue | 5.00 | 7/1/19 | 4,220,000 | 4,850,130 | |
| Florida Department of Transportation, | |||||
| State Infrastructure Bank Revenue | 5.00 | 7/1/20 | 2,500,000 | 2,873,400 | |
| Florida Hurricane Catastrophe Fund | |||||
| Finance Corporation, Revenue | 5.00 | 7/1/15 | 10,000,000 | 11,021,500 | |
| Florida Municipal Loan Council, Revenue | |||||
| (Insured; National Public Finance Guarantee Corp.) | 5.75 | 11/1/15 | 45,000 | 45,198 | |
| Florida Municipal Loan Council, Revenue (Insured; | |||||
| National Public Finance Guarantee Corp.) (Prerefunded) | 5.75 | 5/1/13 | 10,000 | a | 10,097 |
| Hillsborough County Aviation Authority, Revenue | |||||
| (Tampa International Airport) (Insured; AMBAC) | 5.13 | 10/1/20 | 3,540,000 | 3,940,905 | |
| Hillsborough County Aviation Authority, Revenue | |||||
| (Tampa International Airport) (Insured; AMBAC) | 5.13 | 10/1/21 | 3,675,000 | 4,079,140 | |
| Jacksonville, Better Jacksonville Sales Tax Revenue | 5.00 | 10/1/17 | 2,000,000 | 2,346,540 | |
| Jacksonville, Better Jacksonville Sales Tax Revenue | 5.00 | 10/1/21 | 2,500,000 | 3,093,325 | |
| Jacksonville Electric Authority, Revenue | |||||
| (Saint Johns River Power Park System) | 5.00 | 10/1/18 | 8,500,000 | 10,264,685 | |
| Jacksonville Electric Authority, Revenue | |||||
| (Saint Johns River Power Park System) | 5.00 | 10/1/21 | 2,000,000 | 2,426,280 | |
| Jacksonville Electric Authority, Revenue | |||||
| (Saint Johns River Power Park System) | 5.00 | 10/1/22 | 1,625,000 | 1,949,837 | |
| Jacksonville Electric Authority, Revenue | |||||
| (Saint Johns River Power Park System) | 5.00 | 10/1/24 | 1,000,000 | 1,182,150 | |
| Lee County, Airport Revenue | 5.50 | 10/1/23 | 2,500,000 | 2,979,125 | |
| Lee County, Airport Revenue | 5.50 | 10/1/24 | 5,000,000 | 5,914,650 | |
| Miami-Dade County, Aviation Revenue | |||||
| (Miami International Airport) | 5.50 | 10/1/25 | 4,175,000 | 4,986,704 | |
| Miami-Dade County, Subordinate Special Obligation | |||||
| Bonds (Insured; National Public Finance Guarantee Corp.) | 0/5.00 | 10/1/22 | 2,000,000 | f | 2,082,400 |
| Orlando Utilities Commission, Utility System Revenue | 2.79 | 10/1/16 | 13,400,000 | c | 14,174,520 |
| Orlando Utilities Commission, Utility System Revenue | 5.00 | 10/1/21 | 3,000,000 | 3,780,030 | |
The Funds 21
| STATEMENT OF INVESTMENTS (Unaudited) (continued) | |||||
| BNY Mellon National Intermediate Municipal Bond Fund (continued) | |||||
| Long-Term Municipal | Coupon | Maturity | Principal | ||
| Investments (continued) | Rate (%) | Date | Amount ($) | Value ($) | |
| Florida (continued) | |||||
| Orlando-Orange County Expressway Authority, Revenue | 5.00 | 7/1/40 | 7,500,000 | 8,322,375 | |
| Sarasota County, Revenue (Environmentally | |||||
| Sensitive Lands and Parkland Program) | 5.25 | 10/1/24 | 1,790,000 | 1,980,993 | |
| Sarasota County, Revenue (Environmentally | |||||
| Sensitive Lands and Parkland Program) | 5.25 | 10/1/25 | 6,170,000 | 6,791,134 | |
| Sarasota County, Revenue (Environmentally | |||||
| Sensitive Lands and Parkland Program) | 5.25 | 10/1/28 | 2,105,000 | 2,285,525 | |
| Sarasota County, Revenue (Environmentally | |||||
| Sensitive Lands and Parkland Program) | 5.25 | 10/1/29 | 1,085,000 | 1,172,907 | |
| Sarasota County, Revenue (Environmentally Sensitive | |||||
| Lands and Parkland Program) (Prerefunded) | 5.25 | 10/1/18 | 245,000 | a | 302,945 |
| Sarasota County, Revenue (Environmentally Sensitive | |||||
| Lands and Parkland Program) (Prerefunded) | 5.25 | 10/1/18 | 240,000 | a | 296,762 |
| Sarasota County, Revenue (Environmentally Sensitive | |||||
| Lands and Parkland Program) (Prerefunded) | 5.25 | 10/1/18 | 210,000 | a | 259,667 |
| Sarasota County, Revenue (Environmentally Sensitive | |||||
| Lands and Parkland Program) (Prerefunded) | 5.25 | 10/1/18 | 725,000 | a | 896,470 |
| Tallahassee, Capital Bonds Revenue (Insured; | |||||
| Assured Guaranty Municipal Corp.) (Prerefunded) | 5.00 | 10/1/14 | 5,725,000 | a | 6,160,043 |
| Tampa Bay Water, A Regional Water Supply | |||||
| Authority, Utility System Revenue | 5.00 | 10/1/20 | 5,000,000 | 6,235,750 | |
| Georgia—2.0% | |||||
| Burke County Development Authority, PCR | |||||
| (Georgia Power Company Plant Vogtle Project) | 1.40 | 4/1/15 | 5,000,000 | 5,082,500 | |
| Burke County Development Authority, PCR | |||||
| (Oglethorpe Power Corporation Vogtle Project) | 7.00 | 1/1/23 | 6,000,000 | 7,104,960 | |
| Chatham County Hospital Authority, HR Improvement | |||||
| (Memorial Health University Medical Center, Inc.) (Prerefunded) | 5.75 | 1/1/14 | 5,000,000 | a | 5,229,950 |
| Crisp County Development Authority, EIR | |||||
| (International Paper Company Project) | 5.55 | 2/1/15 | 1,000,000 | 1,078,440 | |
| DeKalb County, Water and Sewerage Revenue | 5.25 | 10/1/36 | 3,500,000 | 4,047,960 | |
| Main Street Natural Gas Inc., Gas Project Revenue | 6.38 | 7/15/38 | 1,335,000 | g | 526,684 |
| Municipal Electric Authority of Georgia, GO | |||||
| (Project One Subordinated Bonds) | 5.75 | 1/1/20 | 5,000,000 | 6,062,450 | |
| Private Colleges and Universities | |||||
| Authority, Revenue (Emory University) | 5.00 | 9/1/18 | 2,000,000 | 2,222,900 | |
| Putnam County Development Authority, | |||||
| PCR (Georgia Power Company) | 5.10 | 6/1/23 | 6,120,000 | 6,196,194 | |
| Hawaii—.9% | |||||
| Hawaii, GO | 5.00 | 12/1/16 | 9,830,000 | 11,443,693 | |
| Hawaii, GO | 5.00 | 12/1/17 | 5,000,000 | 5,992,450 | |
22
| BNY Mellon National Intermediate Municipal Bond Fund (continued) | |||||
| Long-Term Municipal | Coupon | Maturity | Principal | ||
| Investments (continued) | Rate (%) | Date | Amount ($) | Value ($) | |
| Idaho—.7% | |||||
| University of Idaho Regents, General Revenue | 5.25 | 4/1/21 | 10,360,000 | 12,291,622 | |
| Illinois—4.5% | |||||
| Chicago, GO | 5.00 | 1/1/20 | 5,000,000 | 5,977,500 | |
| Chicago, GO (Modern Schools Across | |||||
| Chicago Program) (Insured; AMBAC) | 5.00 | 12/1/17 | 1,110,000 | 1,267,431 | |
| Cook County, GO | 5.00 | 11/15/24 | 7,500,000 | 8,937,450 | |
| Illinois, GO | 5.00 | 8/1/18 | 16,000,000 | 18,545,120 | |
| Illinois, GO | 5.00 | 8/1/19 | 10,000,000 | 11,618,200 | |
| Illinois, GO | 5.00 | 9/1/19 | 7,500,000 | 7,943,475 | |
| Illinois, GO (Insured; Assured Guaranty Municipal Corp.) | 5.00 | 1/1/20 | 5,000,000 | 5,803,600 | |
| Illinois Finance Authority, Gas Supply Revenue (The Peoples | |||||
| Gas Light and Coke Company Project) (Insured; AMBAC) | 4.30 | 6/1/16 | 2,500,000 | 2,754,900 | |
| Railsplitter Tobacco Settlement Authority, | |||||
| Tobacco Settlement Revenue | 5.00 | 6/1/15 | 3,500,000 | 3,797,185 | |
| Railsplitter Tobacco Settlement Authority, | |||||
| Tobacco Settlement Revenue | 6.25 | 6/1/24 | 10,000,000 | 11,187,300 | |
| Will County Forest Preserve District, GO Unlimited Tax Bonds | 5.00 | 12/15/20 | 4,000,000 | 4,964,000 | |
| Indiana—.4% | |||||
| Indiana Finance Authority, Acquisition Revenue | |||||
| (National Collegiate Athletic Association Project) | 5.00 | 5/1/15 | 1,000,000 | 1,097,790 | |
| Indiana Finance Authority, State Revolving Fund Program Bonds | 5.00 | 2/1/24 | 5,000,000 | 6,202,450 | |
| Kansas—2.0% | |||||
| Kansas Development Finance Authority, | |||||
| Revenue (University of Kansas Projects) | 4.00 | 5/1/20 | 3,025,000 | 3,529,721 | |
| Kansas Development Finance Authority, | |||||
| Revenue (University of Kansas Projects) | 4.00 | 5/1/21 | 3,370,000 | 3,878,870 | |
| Kansas Development Finance Authority, | |||||
| Revenue (University of Kansas Projects) | 4.00 | 5/1/24 | 3,850,000 | 4,285,396 | |
| Wichita, Water and Sewer Utility Revenue | 5.00 | 10/1/21 | 7,990,000 | 10,038,396 | |
| Wichita, Water and Sewer Utility Revenue | 5.00 | 10/1/22 | 8,390,000 | 10,386,400 | |
| Wyandotte County/Kansas City Unified Government, | |||||
| Utility System Revenue (Insured; AMBAC) | 5.65 | 9/1/22 | 4,700,000 | 5,263,060 | |
| Kentucky—.2% | |||||
| Kentucky Housing Corporation, Housing Revenue | 4.80 | 7/1/20 | 2,025,000 | 2,095,105 | |
| Kentucky Property and Buildings Commission, | |||||
| Revenue (Project Number 100) | 5.00 | 8/1/21 | 1,785,000 | 2,202,797 | |
| Louisiana—3.2% | |||||
| Jefferson Sales Tax District, Special Sales | |||||
| Tax Revenue (Insured; AMBAC) | 5.25 | 12/1/21 | 4,000,000 | 4,717,560 | |
| Louisiana, Gasoline and Fuels Tax Second Lien Revenue | 0.86 | 6/1/13 | 5,000,000 | c | 5,003,450 |
The Funds 23
| STATEMENT OF INVESTMENTS (Unaudited) (continued) | |||||
| BNY Mellon National Intermediate Municipal Bond Fund (continued) | |||||
| Long-Term Municipal | Coupon | Maturity | Principal | ||
| Investments (continued) | Rate (%) | Date | Amount ($) | Value ($) | |
| Louisiana (continued) | |||||
| Louisiana Citizens Property Insurance Corporation, | |||||
| Assessment Revenue (Insured; AMBAC) | 5.25 | 6/1/13 | 4,000,000 | 4,046,920 | |
| Louisiana Citizens Property Insurance Corporation, | |||||
| Assessment Revenue (Insured; AMBAC) | 5.00 | 6/1/21 | 5,500,000 | 6,050,715 | |
| Louisiana Citizens Property Insurance Corporation, Assessment | |||||
| Revenue (Insured; Assured Guaranty Municipal Corp.) | 6.13 | 6/1/25 | 14,500,000 | 17,642,150 | |
| Louisiana Local Government Environmental Facilities | |||||
| and Community Development Authority, Revenue | |||||
| (Louisiana Community and Technical College | |||||
| System Facilities Corporation Project) | 5.00 | 10/1/22 | 5,000,000 | 5,953,800 | |
| Louisiana Public Facilities Authority, | |||||
| Revenue (CHRISTUS Health Obligated Group) | 6.00 | 7/1/29 | 2,000,000 | 2,340,920 | |
| Louisiana Stadium and Exposition District, Senior Revenue | 5.00 | 7/1/28 | 3,650,000 | 4,250,644 | |
| Louisiana Stadium and Exposition District, Senior Revenue | 5.00 | 7/1/29 | 2,750,000 | 3,184,115 | |
| Louisiana Stadium and Exposition District, Senior Revenue | 5.00 | 7/1/31 | 5,000,000 | 5,732,350 | |
| Maine—.1% | |||||
| Maine Housing Authority, Mortgage Purchase Bonds | 4.75 | 11/15/21 | 2,450,000 | 2,561,181 | |
| Maryland—.3% | |||||
| Howard County, Consolidated Public Improvement GO | 5.00 | 8/15/17 | 5,030,000 | 6,002,651 | |
| Massachusetts—1.9% | |||||
| Massachusetts, Consolidated Loan (Insured; | |||||
| National Public Finance Guarantee Corp.) | 5.50 | 10/1/20 | 3,285,000 | 4,244,121 | |
| Massachusetts, GO | 0.66 | 11/1/18 | 2,000,000 | c | 2,015,140 |
| Massachusetts Development Finance Agency, | |||||
| Revenue (Combined Jewish Philanthropies | |||||
| of Greater Boston, Inc. Project) | 4.75 | 2/1/15 | 1,320,000 | 1,383,716 | |
| Massachusetts Development Finance Agency, | |||||
| Revenue (Olin College Issue) (Insured; XLCA) | 5.25 | 7/1/33 | 8,050,000 | 8,158,514 | |
| Massachusetts Health and Educational Facilities | |||||
| Authority, Revenue (Simmons College Issue) | 7.50 | 10/1/22 | 2,000,000 | 2,504,520 | |
| Massachusetts Health and Educational Facilities | |||||
| Authority, Revenue (Simmons College Issue) | 8.00 | 10/1/29 | 5,000,000 | 5,783,750 | |
| Massachusetts Health and Educational Facilities | |||||
| Authority, Revenue (Simmons College Issue) | 8.00 | 10/1/39 | 1,500,000 | 1,735,125 | |
| Massachusetts Housing Finance Agency, Housing Revenue | 5.13 | 12/1/34 | 350,000 | 354,470 | |
| Massachusetts School Building Authority, | |||||
| Dedicated Sales Tax Revenue (Insured; AMBAC) | 5.00 | 8/15/20 | 6,000,000 | 7,054,980 | |
| Massachusetts School Building Authority, Dedicated Sales | |||||
| Tax Revenue (Insured; Assured Guaranty Municipal Corp.) | 5.00 | 8/15/30 | 60,000 | 65,948 | |
| Massachusetts School Building Authority, Dedicated | |||||
| Sales Tax Revenue (Insured; Assured Guaranty | |||||
| Municipal Corp.) (Prerefunded) | 5.00 | 8/15/15 | 190,000 | a | 211,620 |
24
| BNY Mellon National Intermediate Municipal Bond Fund (continued) | |||||
| Long-Term Municipal | Coupon | Maturity | Principal | ||
| Investments (continued) | Rate (%) | Date | Amount ($) | Value ($) | |
| Massachusetts (continued) | |||||
| Massachusetts School Building Authority, Dedicated | |||||
| Sales Tax Revenue (Insured; Assured Guaranty | |||||
| Municipal Corp.) (Prerefunded) | 5.00 | 8/15/15 | 1,250,000 | a | 1,392,238 |
| Massachusetts Water Pollution Abatement Trust (Pool Program) | 5.25 | 8/1/17 | 275,000 | 294,440 | |
| Massachusetts Water Pollution Abatement Trust, | |||||
| Water Pollution Abatement Revenue (MWRA Program) | 5.75 | 8/1/29 | 380,000 | 381,702 | |
| Michigan—.5% | |||||
| Detroit, Water Supply System Second Lien Revenue (Insured; FGIC) | 5.75 | 7/1/22 | 7,000,000 | 8,243,760 | |
| Michigan Municipal Bond Authority, | |||||
| Drinking Water Revolving Fund Revenue | 5.50 | 10/1/15 | 1,000,000 | 1,130,940 | |
| Minnesota—1.3% | |||||
| Minneapolis, Health Care System Revenue (Fairview Health Services) | 6.63 | 11/15/28 | 12,000,000 | 14,807,640 | |
| Minnesota Higher Education Facilities Authority, | |||||
| Revenue (Macalester College) | 5.00 | 3/1/14 | 1,410,000 | 1,476,806 | |
| University of Minnesota Regents, Special Purpose | |||||
| Revenue (State Supported Stadium Debt) | 5.00 | 8/1/19 | 6,300,000 | 7,137,459 | |
| Mississippi—.1% | |||||
| Mississippi Home Corporation, SFMR | |||||
| (Collateralized: FHLMC, FNMA and GNMA) | 4.38 | 12/1/18 | 1,410,000 | 1,529,046 | |
| Mississippi State University Educational Building Corporation, | |||||
| Revenue (Insured; National Public Finance Guarantee Corp.) | 5.25 | 8/1/16 | 400,000 | 461,928 | |
| Missouri—.1% | |||||
| Missouri Environmental Improvement and | |||||
| Energy Resource Authority, Water PCR | |||||
| (State Revolving Fund Program—Master Trust) | 5.50 | 7/1/14 | 1,250,000 | 1,317,038 | |
| Missouri Housing Development Commission, SFMR (Homeownership | |||||
| Loan Program) (Collateralized: FNMA and GNMA) | 5.05 | 9/1/24 | 565,000 | 565,853 | |
| Nebraska—.1% | |||||
| Nebraska Investment Finance Authority, SFHR | |||||
| (Collateralized: FHLMC, FNMA and GNMA) | 4.70 | 9/1/21 | 520,000 | 537,155 | |
| Omaha City, GO (City of Omaha Convention Center/Arena Project) | 6.50 | 12/1/16 | 1,000,000 | 1,219,220 | |
| Nevada—1.5% | |||||
| Clark County, Highway Revenue (Motor Vehicle Fuel Tax) | 5.00 | 7/1/28 | 10,000,000 | 11,590,900 | |
| Clark County School District, GO (Insured; | |||||
| National Public Finance Guarantee Corp.) | 5.00 | 6/15/20 | 12,930,000 | 15,308,473 | |
| New Hampshire—.1% | |||||
| New Hampshire Business Finance Authority, PCR | |||||
| (Central Maine Power Company) | 5.38 | 5/1/14 | 1,000,000 | 1,048,430 | |
| New Jersey—4.4% | |||||
| Garden State Preservation Trust, Open Space and Farmland | |||||
| Preservation Revenue (Insured; Assured Guaranty Municipal Corp.) | 5.13 | 11/1/16 | 1,000,000 | 1,164,940 | |
The Funds 25
| STATEMENT OF INVESTMENTS (Unaudited) (continued) | |||||
| BNY Mellon National Intermediate Municipal Bond Fund (continued) | |||||
| Long-Term Municipal | Coupon | Maturity | Principal | ||
| Investments (continued) | Rate (%) | Date | Amount ($) | Value ($) | |
| New Jersey (continued) | |||||
| Garden State Preservation Trust, Open Space and | |||||
| Farmland Preservation Revenue (Insured; | |||||
| Assured Guaranty Municipal Corp.) (Prerefunded) | 5.80 | 11/1/15 | 5,000,000 | a | 5,722,150 |
| Garden State Preservation Trust, Open Space and | |||||
| Farmland Preservation Revenue (Insured; | |||||
| Assured Guaranty Municipal Corp.) (Prerefunded) | 5.80 | 11/1/15 | 5,000,000 | a | 5,722,150 |
| Garden State Preservation Trust, Open Space and | |||||
| Farmland Preservation Revenue (Insured; | |||||
| Assured Guaranty Municipal Corp.) (Prerefunded) | 5.80 | 11/1/15 | 5,000,000 | a | 5,722,150 |
| Garden State Preservation Trust, Open Space and | |||||
| Farmland Preservation Revenue (Insured; | |||||
| Assured Guaranty Municipal Corp.) (Prerefunded) | 5.80 | 11/1/15 | 2,500,000 | a | 2,861,075 |
| New Jersey Economic Development Authority, | |||||
| Cigarette Tax Revenue | 5.38 | 6/15/15 | 4,400,000 | 4,911,148 | |
| New Jersey Economic Development Authority, | |||||
| School Facilities Construction Revenue | 2.04 | 2/1/18 | 10,000,000 | c | 10,320,100 |
| New Jersey Economic Development Authority, | |||||
| School Facilities Construction Revenue | 5.00 | 3/1/21 | 12,000,000 | 14,685,600 | |
| New Jersey Economic Development Authority, | |||||
| School Facilities Construction Revenue (Prerefunded) | 5.00 | 3/1/15 | 2,000,000 | a | 2,184,340 |
| New Jersey Economic Development Authority, | |||||
| School Facilities Construction Revenue (Prerefunded) | 5.00 | 3/1/15 | 1,000,000 | a | 1,092,170 |
| New Jersey Educational Facilities Authority, Revenue | |||||
| (University of Medicine and Dentistry of New Jersey Issue) | 7.50 | 12/1/32 | 3,750,000 | 4,695,150 | |
| New Jersey Health Care Facilities Financing | |||||
| Authority, Revenue (Barnabas Health Issue) | 5.00 | 7/1/22 | 1,830,000 | 2,207,291 | |
| New Jersey Health Care Facilities Financing | |||||
| Authority, Revenue (Barnabas Health Issue) | 5.00 | 7/1/24 | 1,000,000 | 1,187,390 | |
| New Jersey Health Care Facilities Financing Authority, | |||||
| Revenue (Meridian Health System Obligated Group Issue) | 5.00 | 7/1/19 | 2,000,000 | 2,398,480 | |
| New Jersey Transportation Trust Fund | |||||
| Authority (Transportation System) | 0.00 | 12/15/29 | 10,000,000 | e | 5,028,400 |
| New Jersey Transportation Trust Fund | |||||
| Authority (Transportation System) | 5.50 | 6/15/31 | 5,000,000 | 5,942,200 | |
| New Jersey Turnpike Authority, Turnpike Revenue | 5.00 | 1/1/20 | 5,000,000 | 6,106,500 | |
| New Mexico—.4% | |||||
| New Mexico Finance Authority, Revenue | |||||
| (Public Project Revolving Fund) (Insured; AMBAC) | 5.25 | 6/1/17 | 1,000,000 | 1,062,330 | |
| New Mexico Finance Authority, State | |||||
| Transportation Senior Lien Revenue | 5.00 | 6/15/18 | 5,000,000 | 6,070,200 | |
26
| BNY Mellon National Intermediate Municipal Bond Fund (continued) | |||||
| Long-Term Municipal | Coupon | Maturity | Principal | ||
| Investments (continued) | Rate (%) | Date | Amount ($) | Value ($) | |
| New York—6.8% | |||||
| Albany Industrial Development Agency, Civic Facility | |||||
| Revenue (Saint Peter’s Hospital of the City of Albany Project) | 5.75 | 11/15/22 | 1,000,000 | 1,155,480 | |
| Greece Central School District, GO (Insured; FGIC) | 6.00 | 6/15/13 | 950,000 | 966,616 | |
| Greece Central School District, GO (Insured; FGIC) | 6.00 | 6/15/14 | 950,000 | 1,021,564 | |
| Greece Central School District, GO (Insured; FGIC) | 6.00 | 6/15/15 | 950,000 | 1,073,586 | |
| Metropolitan Transportation Authority, Dedicated Tax Fund | |||||
| Revenue (Insured; National Public Finance Guarantee Corp.) | 5.00 | 11/15/28 | 2,880,000 | 3,294,490 | |
| Metropolitan Transportation Authority, | |||||
| State Service Contract Revenue | 5.75 | 1/1/18 | 1,500,000 | 1,822,035 | |
| Metropolitan Transportation Authority, Transportation Revenue | 5.00 | 11/15/24 | 5,000,000 | 5,766,100 | |
| Metropolitan Transportation Authority, Transportation Revenue | 6.50 | 11/15/28 | 12,000,000 | 15,289,320 | |
| Metropolitan Transportation Authority, Transportation | |||||
| Revenue (Insured; Assured Guaranty Municipal Corp.) | 0.40 | 11/1/22 | 10,000,000 | c | 9,700,000 |
| New York City, GO | 5.13 | 12/1/24 | 5,000,000 | 5,888,450 | |
| New York City Transitional Finance Authority, | |||||
| Future Tax Secured Subordinate Revenue | 5.00 | 2/1/23 | 13,000,000 | 15,886,520 | |
| New York Liberty Development Corporation, | |||||
| Revenue (Goldman Sachs Headquarters Issue) | 5.00 | 10/1/15 | 1,000,000 | 1,093,580 | |
| New York State Dormitory Authority, Revenue | |||||
| (Consolidated City University System) | |||||
| (Insured; Assured Guaranty Municipal Corp.) | 5.75 | 7/1/18 | 200,000 | 230,802 | |
| New York State Dormitory Authority, State Personal | |||||
| Income Tax Revenue (General Purpose) | 5.00 | 12/15/24 | 7,000,000 | 8,703,380 | |
| New York State Dormitory Authority, State Personal | |||||
| Income Tax Revenue (General Purpose) | 5.00 | 12/15/25 | 8,000,000 | 9,882,400 | |
| New York State Dormitory Authority, Third General Resolution | |||||
| Revenue (State University Educational Facilities Issue) | 5.00 | 5/15/24 | 5,000,000 | 6,150,900 | |
| New York State Dormitory Authority, Third General Resolution | |||||
| Revenue (State University Educational Facilities Issue) | 5.00 | 5/15/25 | 3,000,000 | 3,663,420 | |
| New York State Thruway Authority, Second General | |||||
| Highway and Bridge Trust Fund Bonds | 5.00 | 4/1/16 | 5,000,000 | 5,694,050 | |
| New York State Thruway Authority, Second General | |||||
| Highway and Bridge Trust Fund Bonds | 5.00 | 4/1/21 | 5,000,000 | 5,875,900 | |
| New York State Thruway Authority, Second General | |||||
| Highway and Bridge Trust Fund Bonds (Insured; | |||||
| Assured Guaranty Municipal Corp.) | 5.00 | 4/1/24 | 4,500,000 | 5,214,150 | |
| Port Authority of New York and New Jersey | |||||
| (Consolidated Bonds, 139th Series) (Insured; | |||||
| National Public Finance Guarantee Corp. ) | 5.00 | 10/1/16 | 5,440,000 | 5,993,846 | |
The Funds 27
| STATEMENT OF INVESTMENTS (Unaudited) (continued) | |||||
| BNY Mellon National Intermediate Municipal Bond Fund (continued) | |||||
| Long-Term Municipal | Coupon | Maturity | Principal | ||
| Investments (continued) | Rate (%) | Date | Amount ($) | Value ($) | |
| New York (continued) | |||||
| Tobacco Settlement Financing Corporation of | |||||
| New York, Asset-Backed Revenue Bonds | |||||
| (State Contingency Contract Secured) | 5.50 | 6/1/19 | 5,000,000 | 5,067,250 | |
| Tobacco Settlement Financing Corporation of New York, | |||||
| Asset-Backed Revenue Bonds (State Contingency Contract | |||||
| Secured) (Insured; National Public Finance Guarantee Corp.) | 5.50 | 6/1/18 | 175,000 | 175,819 | |
| Triborough Bridge and Tunnel Authority, | |||||
| Subordinate Revenue (MTA Bridges and Tunnels) | 0.00 | 11/15/29 | 10,000,000 | e | 5,532,700 |
| North Carolina—3.2% | |||||
| North Carolina Eastern Municipal Power | |||||
| Agency, Power System Revenue | 5.00 | 1/1/17 | 8,000,000 | 9,260,320 | |
| North Carolina Eastern Municipal Power | |||||
| Agency, Power System Revenue | 5.00 | 1/1/17 | 8,050,000 | 9,057,699 | |
| North Carolina Eastern Municipal Power | |||||
| Agency, Power System Revenue | 5.25 | 1/1/20 | 5,000,000 | 5,860,900 | |
| North Carolina Eastern Municipal Power | |||||
| Agency, Power System Revenue | 5.00 | 1/1/26 | 18,000,000 | 20,520,360 | |
| North Carolina Municipal Power Agency | |||||
| Number 1, Catawba Electric Revenue | 5.00 | 1/1/24 | 5,500,000 | 6,341,335 | |
| Wake County, LOR | 5.00 | 1/1/24 | 5,955,000 | 7,238,362 | |
| Ohio—.6% | |||||
| Columbus, GO (Various Purpose Limited Tax) | 5.00 | 7/1/21 | 3,005,000 | 3,817,282 | |
| Cuyahoga County, Revenue (Cleveland Clinic | |||||
| Health System Obligated Group) | 6.00 | 1/1/15 | 1,110,000 | 1,132,033 | |
| Montgomery County, Revenue (Catholic Health Initiatives) | 6.00 | 10/1/23 | 3,055,000 | 3,709,900 | |
| Ohio Housing Finance Agency, MFHR (Uptown Towers | |||||
| Apartments Project) (Collateralized; GNMA) | 4.75 | 10/20/15 | 540,000 | 563,231 | |
| Toledo-Lucas County Port Authority, | |||||
| Port Facilities Revenue (Cargill, Inc. Project) | 4.50 | 12/1/15 | 900,000 | 958,194 | |
| Oregon—1.4% | |||||
| Oregon, GO | 5.00 | 11/1/18 | 5,000,000 | 6,131,000 | |
| Oregon, GO | 5.00 | 11/1/19 | 5,000,000 | 6,240,650 | |
| Oregon, GO | 5.00 | 11/1/20 | 3,100,000 | 3,917,098 | |
| Oregon, GO (Oregon Department of Transportation Project) | 5.00 | 5/1/17 | 7,565,000 | 8,938,426 | |
| Pennsylvania—2.3% | |||||
| Allegheny County Hospital Development Authority, | |||||
| Revenue (University of Pittsburgh Medical Center) | 5.25 | 6/15/15 | 1,620,000 | 1,788,448 | |
| Commonwealth Financing Authority of Pennsylvania, Revenue | 5.00 | 6/1/28 | 5,000,000 | 5,871,400 | |
| Pennsylvania Turnpike Commission, | |||||
| Turnpike Subordinate Revenue | 5.00 | 6/1/18 | 5,000,000 | 5,877,400 | |
| Pennsylvania Turnpike Commission, | |||||
| Turnpike Subordinate Revenue | 5.00 | 12/1/20 | 3,675,000 | 4,421,099 | |
28
| BNY Mellon National Intermediate Municipal Bond Fund (continued) | |||||
| Long-Term Municipal | Coupon | Maturity | Principal | ||
| Investments (continued) | Rate (%) | Date | Amount ($) | Value ($) | |
| Pennsylvania (continued) | |||||
| Pennsylvania Turnpike Commission, | |||||
| Turnpike Subordinate Revenue | 5.00 | 12/1/21 | 3,740,000 | 4,522,258 | |
| Philadelphia School District, GO (Insured; AMBAC) | 5.00 | 4/1/17 | 2,165,000 | 2,346,990 | |
| Pittsburgh, GO | 5.00 | 9/1/25 | 10,000,000 | 11,777,800 | |
| State Public School Building Authority, School Lease | |||||
| Revenue (The School District of Philadelphia Project) | 5.00 | 4/1/22 | 1,000,000 | 1,192,750 | |
| State Public School Building Authority, School Lease | |||||
| Revenue (The School District of Philadelphia Project) | 5.00 | 4/1/24 | 1,750,000 | 2,048,375 | |
| State Public School Building Authority, School Lease | |||||
| Revenue (The School District of Philadelphia Project) | 5.00 | 4/1/25 | 2,750,000 | 3,197,810 | |
| Rhode Island—.1% | |||||
| Rhode Island Health and Educational Building Corporation, | |||||
| Higher Educational Facility Revenue (Providence | |||||
| College Issue) (Insured; XLCA) (Prerefunded) | 4.50 | 11/1/13 | 795,000 | a | 818,278 |
| Rhode Island Health and Educational Building Corporation, | |||||
| Higher Educational Facility Revenue (Providence | |||||
| College Issue) (Insured; XLCA) (Prerefunded) | 5.00 | 11/1/13 | 250,000 | a | 258,163 |
| South Carolina—.3% | |||||
| Greenville County School District, Installment Purchase | |||||
| Revenue (Building Equity Sooner for Tomorrow) | 5.50 | 12/1/18 | 3,000,000 | 3,710,910 | |
| Greenville County School District, Installment Purchase | |||||
| Revenue (Building Equity Sooner for Tomorrow) (Prerefunded) | 5.00 | 12/1/13 | 350,000 | a | 362,828 |
| Newberry Investing in Children’s Education, | |||||
| Installment Purchase Revenue (School District | |||||
| of Newberry County, South Carolina Project) | 5.25 | 12/1/20 | 1,000,000 | 1,064,280 | |
| Tennessee—.6% | |||||
| Metropolitan Government of Nashville and | |||||
| Davidson County, GO Improvement Bonds | 5.00 | 7/1/25 | 10,000,000 | 11,944,500 | |
| Texas—10.0% | |||||
| Austin, Water and Wastewater System Revenue | 5.00 | 11/15/25 | 3,000,000 | 3,707,310 | |
| Dallas and Fort Worth, Joint Revenue | |||||
| (Dallas/Fort Worth International Airport) | 5.00 | 11/1/26 | 3,000,000 | 3,502,020 | |
| Dallas and Fort Worth, Joint Revenue | |||||
| (Dallas/Fort Worth International Airport) | 5.00 | 11/1/27 | 3,400,000 | 3,945,836 | |
| Forney Independent School District, Unlimited Tax School | |||||
| Building Bonds (Permanent School Fund Guarantee Program) | 5.75 | 8/15/33 | 1,000,000 | 1,207,270 | |
| Harris County, Toll Road Senior Lien Revenue | 5.00 | 8/15/23 | 12,500,000 | 14,923,625 | |
| Harris County, Toll Road Senior Lien Revenue (Insured; | |||||
| National Public Finance Guarantee Corp.) (Prerefunded) | 5.00 | 8/15/14 | 4,000,000 | a | 4,279,160 |
| Harris County, Unlimited Tax Road Bonds | 5.00 | 10/1/21 | 13,705,000 | 16,675,833 | |
| Harris County Health Facilities Development Corporation, | |||||
| HR (Memorial Hermann Healthcare System) | 7.00 | 12/1/27 | 5,000,000 | 6,191,900 | |
The Funds 29
| STATEMENT OF INVESTMENTS (Unaudited) (continued) | |||||
| BNY Mellon National Intermediate Municipal Bond Fund (continued) | |||||
| Long-Term Municipal | Coupon | Maturity | Principal | ||
| Investments (continued) | Rate (%) | Date | Amount ($) | Value ($) | |
| Texas (continued) | |||||
| Houston, Public Improvement GO | 5.00 | 3/1/18 | 5,000,000 | 5,991,400 | |
| Houston, Public Improvement GO (Insured; AMBAC) | 5.00 | 3/1/18 | 3,895,000 | 4,335,291 | |
| Houston, Public Improvement GO | |||||
| (Insured; AMBAC) (Prerefunded) | 5.00 | 9/1/15 | 1,295,000 | a | 1,443,808 |
| Houston Community College System, Limited Tax Bonds | 5.00 | 2/15/21 | 2,250,000 | 2,817,585 | |
| Katy Independent School District, Unlimited Tax Refunding | |||||
| Bonds (Permanent School Fund Guarantee Program) | 0.00 | 2/15/16 | 1,505,000 | e | 1,476,375 |
| Lower Colorado River Authority, Junior Lien Revenue | |||||
| (Seventh Supplemental Series) (Insured; | |||||
| Assured Guaranty Municipal Corp.) | 5.00 | 1/1/15 | 1,135,000 | 1,231,906 | |
| Lower Colorado River Authority, Revenue | 5.00 | 5/15/16 | 15,000 | 17,107 | |
| Lower Colorado River Authority, Revenue | 5.00 | 5/15/16 | 35,000 | 40,025 | |
| Lower Colorado River Authority, Revenue | 5.00 | 5/15/16 | 13,950,000 | 15,847,200 | |
| Lower Colorado River Authority, Revenue | 5.00 | 5/15/26 | 12,970,000 | 15,339,749 | |
| North Texas Tollway Authority, First Tier System Revenue | 5.00 | 1/1/21 | 7,615,000 | 9,176,303 | |
| Royse City Independent School District, Unlimited Tax School | |||||
| Building Bonds (Permanent School Fund Guarantee Program) | 0.00 | 8/15/14 | 3,260,000 | e | 3,241,451 |
| San Antonio, Electric and Gas Systems Revenue | 5.00 | 2/1/17 | 5,000,000 | 5,844,900 | |
| San Antonio, Electric and Gas Systems Revenue (Prerefunded) | 5.00 | 2/1/16 | 10,000,000 | a | 11,294,400 |
| Texas Department of Housing and Community Affairs, | |||||
| SFMR (Collateralized: FNMA and GNMA and | |||||
| Insured; National Public Finance Guarantee Corp.) | 5.45 | 9/1/23 | 875,000 | 876,601 | |
| Texas Public Finance Authority, GO | 5.00 | 10/1/23 | 9,385,000 | 11,685,263 | |
| Texas Public Finance Authority, Unemployment | |||||
| Compensation Obligation Assessment Revenue | 5.00 | 7/1/17 | 7,500,000 | 8,443,125 | |
| Texas Public Finance Authority, Unemployment | |||||
| Compensation Obligation Assessment Revenue | 5.00 | 1/1/20 | 10,000,000 | 10,188,800 | |
| Texas Transportation Commission, | |||||
| State Highway Fund First Tier Revenue | 5.00 | 4/1/20 | 15,000,000 | 17,478,900 | |
| Texas Water Development Board, State | |||||
| Revolving Fund Subordinate Lien Revenue | 5.00 | 7/15/24 | 3,650,000 | 4,264,259 | |
| Utah—1.7% | |||||
| Metropolitan Water District of Salt Lake | |||||
| and Sandy, Water Revenue Project Bonds | 4.00 | 7/1/21 | 6,005,000 | 7,097,850 | |
| Utah, GO | 5.00 | 7/1/20 | 20,000,000 | 25,229,200 | |
| Virginia—3.4% | |||||
| Norfolk, GO | 5.00 | 10/1/21 | 4,060,000 | 5,130,419 | |
| Virginia, GO | 5.00 | 6/1/23 | 5,490,000 | 6,941,117 | |
| Virginia College Building Authority, Educational Facilities | |||||
| Revenue (21st Century College and Equipment Programs) | 5.00 | 2/1/19 | 7,000,000 | 8,562,190 | |
30
| BNY Mellon National Intermediate Municipal Bond Fund (continued) | |||||
| Long-Term Municipal | Coupon | Maturity | Principal | ||
| Investments (continued) | Rate (%) | Date | Amount ($) | Value ($) | |
| Virginia (continued) | |||||
| Virginia College Building Authority, Educational Facilities | |||||
| Revenue (21st Century College and Equipment Programs) | 5.00 | 2/1/20 | 5,000,000 | 6,203,350 | |
| Virginia College Building Authority, Educational Facilities | |||||
| Revenue (21st Century College and Equipment Programs) | 5.00 | 2/1/21 | 2,235,000 | 2,804,702 | |
| Virginia College Building Authority, Educational Facilities | |||||
| Revenue (21st Century College and Equipment Programs) | 5.00 | 2/1/23 | 11,285,000 | 13,864,187 | |
| Virginia Public Building Authority, Public Facilities Revenue | 5.00 | 8/1/18 | 8,370,000 | 10,164,612 | |
| Virginia Public Building Authority, Public Facilities Revenue | 5.00 | 8/1/19 | 6,950,000 | 8,588,949 | |
| Washington—1.7% | |||||
| Energy Northwest, Electric Revenue | |||||
| (Columbia Generating Station) | 5.00 | 7/1/20 | 10,955,000 | 13,662,638 | |
| FYI Properties, LR (State of Washington | |||||
| Department of Information Services Project) | 5.25 | 6/1/29 | 5,625,000 | 6,371,156 | |
| Washington, Motor Vehicle Fuel Tax GO | 5.00 | 8/1/23 | 3,570,000 | 4,411,520 | |
| Washington Health Care Facilities Authority, | |||||
| Revenue (Providence Health and Services) | 5.00 | 10/1/21 | 5,000,000 | 6,100,500 | |
| West Virginia—.4% | |||||
| Monongalia County Building Commission, HR | |||||
| (Monongalia General Hospital) | 5.25 | 7/1/20 | 3,140,000 | 3,325,543 | |
| West Virginia Economic Development Authority, PCR | |||||
| (Appalachian Power Company—Amos Project) | 4.85 | 9/4/13 | 1,000,000 | 1,018,990 | |
| West Virginia Economic Development Authority, PCR | |||||
| (Appalachian Power Company—Amos Project) | 4.85 | 9/4/13 | 2,600,000 | 2,649,374 | |
| Wisconsin—1.1% | |||||
| Wisconsin, GO | 5.00 | 5/1/20 | 5,800,000 | 6,875,958 | |
| Wisconsin, Transportation Revenue (Insured; National | |||||
| Public Finance Guarantee Corp.) (Prerefunded) | 5.00 | 7/1/15 | 11,825,000 | a | 13,107,658 |
| U.S. Related—2.8% | |||||
| Puerto Rico Commonwealth, Public Improvement GO | 5.50 | 7/1/19 | 5,715,000 | 6,266,097 | |
| Puerto Rico Commonwealth, Public Improvement | |||||
| GO (Insured; National Public Finance Guarantee Corp.) | 6.25 | 7/1/13 | 1,380,000 | 1,400,990 | |
| Puerto Rico Electric Power Authority, Power Revenue | 5.25 | 7/1/18 | 5,000,000 | 5,499,400 | |
| Puerto Rico Electric Power Authority, Power Revenue | 5.25 | 7/1/23 | 5,000,000 | 5,351,250 | |
| Puerto Rico Electric Power Authority, Power Revenue | |||||
| (Insured; National Public Finance Guarantee Corp.) | 5.00 | 7/1/17 | 3,940,000 | 4,123,683 | |
| Puerto Rico Government Development Bank, Senior Notes | 5.00 | 12/1/13 | 4,000,000 | 4,094,200 | |
| Puerto Rico Public Buildings Authority, | |||||
| Government Facilities Revenue | 5.50 | 7/1/14 | 1,000,000 | 1,041,410 | |
| Puerto Rico Public Buildings Authority, | |||||
| Government Facilities Revenue | 5.50 | 7/1/15 | 995,000 | 1,054,183 | |
The Funds 31
| STATEMENT OF INVESTMENTS (Unaudited) (continued) | |||||
| BNY Mellon National Intermediate Municipal Bond Fund (continued) | |||||
| Long-Term Municipal | Coupon | Maturity | Principal | ||
| Investments (continued) | Rate (%) | Date | Amount ($) | Value ($) | |
| U.S. Related (continued) | |||||
| Puerto Rico Public Buildings Authority, | |||||
| Government Facilities Revenue | 5.50 | 7/1/15 | 5,000 | 5,594 | |
| Puerto Rico Public Buildings Authority, | |||||
| Government Facilities Revenue | 5.50 | 7/1/16 | 5,000 | 5,825 | |
| Puerto Rico Public Buildings Authority, | |||||
| Government Facilities Revenue | 5.50 | 7/1/16 | 1,995,000 | 2,143,169 | |
| Puerto Rico Public Buildings Authority, | |||||
| Government Facilities Revenue | 5.75 | 7/1/17 | 1,940,000 | 2,124,533 | |
| Puerto Rico Public Buildings Authority, | |||||
| Government Facilities Revenue | 5.75 | 7/1/17 | 5,000 | 6,080 | |
| Puerto Rico Public Buildings Authority, | |||||
| Government Facilities Revenue | 5.75 | 7/1/22 | 2,500,000 | 2,606,425 | |
| Puerto Rico Sales Tax Financing Corporation, | |||||
| Sales Tax Revenue (First Subordinate Series) | 0/6.75 | 8/1/32 | 11,000,000 | f | 11,660,110 |
| Puerto Rico Sales Tax Financing Corporation, | |||||
| Sales Tax Revenue (First Subordinate Series) | 0/6.25 | 8/1/33 | 2,500,000 | f | 2,041,925 |
| Puerto Rico Sales Tax Financing Corporation, | |||||
| Sales Tax Revenue (First Subordinate Series) | 6.50 | 8/1/44 | 2,500,000 | 2,848,675 | |
| Total Long-Term Municipal Investments | |||||
| (cost $1,659,528,740) | 1,795,840,545 | ||||
| Short-Term Municipal Investments—3.3% | |||||
| Illinois—.3% | |||||
| Chicago Board of Education, Unlimited Tax GO Notes, | |||||
| Refunding (Dedicated Revenues) (LOC; JPMorgan Chase Bank) | 0.11 | 3/1/13 | 6,000,000 | h | 6,000,000 |
| Iowa—.1% | |||||
| Iowa Finance Authority, Private College Revenue, | |||||
| Refunding (Drake University Project) (LOC; Wells Fargo Bank) | 0.11 | 3/1/13 | 2,200,000 | h | 2,200,000 |
| Kansas—.2% | |||||
| Wichita, Hospital Facilities Revenue (Via Christi | |||||
| Health, Inc.) (LOC; JPMorgan Chase Bank) | 0.11 | 3/1/13 | 3,200,000 | h | 3,200,000 |
| Kentucky—.0% | |||||
| Christian County, Lease Program Revenue (Kentucky | |||||
| Association of Counties Leasing Trust) (LOC; U.S. Bank NA) | 0.11 | 3/1/13 | 400,000 | h | 400,000 |
| Massachusetts—1.0% | |||||
| Massachusetts, GO Notes | 0.40 | 3/7/13 | 10,000,000 | h | 9,999,800 |
| Massachusetts, GO Notes (Consolidated Loan) | 0.56 | 3/7/13 | 5,000,000 | h | 5,013,450 |
| Massachusetts, GO Notes (Consolidated Loan) | |||||
| (LOC; JPMorgan Chase Bank) | 0.11 | 3/1/13 | 2,060,000 | h | 2,060,000 |
32
| BNY Mellon National Intermediate Municipal Bond Fund (continued) | ||||||
| Short-Term Municipal | Coupon | Maturity | Principal | |||
| Investments (continued) | Rate (%) | Date | Amount ($) | Value ($) | ||
| Mississippi—.1% | ||||||
| Jackson County, PCR, Refunding (Chevron U.S.A. Inc. Project) | 0.10 | 3/1/13 | 1,900,000 | h | 1,900,000 | |
| Mississippi Business Finance Corporation, Gulf Opportunity | ||||||
| Zone IDR (Chevron U.S.A. Inc. Project) | 0.10 | 3/1/13 | 800,000 | h | 800,000 | |
| Missouri—.2% | ||||||
| Missouri Health and Educational Facilities Authority, | ||||||
| Educational Facilities Revenue (The Washington | ||||||
| University) (Liquidity Facility; JPMorgan Chase Bank) | 0.10 | 3/1/13 | 2,200,000 | h | 2,200,000 | |
| Missouri Health and Educational Facilities Authority, Health | ||||||
| Facilities Revenue (SSM Health Care) (LOC; PNC Bank NA) | 0.10 | 3/1/13 | 1,435,000 | h | 1,435,000 | |
| New Hampshire—.8% | ||||||
| New Hampshire Business Finance Authority, Revenue | ||||||
| (Littleton Regional Hospital Issue) (LOC; TD Bank) | 0.11 | 3/1/13 | 6,000,000 | h | 6,000,000 | |
| New Hampshire Health and Education Facilities Authority, | ||||||
| Revenue (Dartmouth College Issue) (Liquidity | ||||||
| Facility; JPMorgan Chase Bank) | 0.10 | 3/1/13 | 7,500,000 | h | 7,500,000 | |
| New York—.5% | ||||||
| New York City, GO Notes (LOC; JPMorgan Chase Bank) | 0.11 | 3/1/13 | 4,000,000 | h | 4,000,000 | |
| New York City, GO Notes (LOC; JPMorgan Chase Bank) | 0.11 | 3/1/13 | 5,200,000 | h | 5,200,000 | |
| Ohio—.1% | ||||||
| Ohio University, General Receipts Bonds | ||||||
| (Insured; Assured Guaranty Municipal Corp.) | 1.25 | 3/7/13 | 2,265,000 | h | 2,265,000 | |
| Total Short-Term Municipal Investments | ||||||
| (cost $60,160,000) | 60,173,250 | |||||
| Total Investments (cost $1,719,688,740) | 100.4 | % | 1,856,013,795 | |||
| Liabilities, Less Cash and Receivables | (.4 | %) | (7,231,522 | ) | ||
| Net Assets | 100.0 | % | 1,848,782,273 | |||
a These securities are prerefunded; the date shown represents the prerefunded date. Bonds which are prerefunded are collateralized by U.S. Government securities which are held in
escrow and are used to pay principal and interest on the municipal issue and to retire the bonds in full at the earliest refunding date.
b Security exempt from registration pursuant to Rule 144A under the Securities Act of 1933.This security may be resold in transactions exempt from registration, normally to
qualified institutional buyers.At February 28, 2013, this security was valued at $473,984 or 0.03% of net assets.
c Variable rate security—interest rate subject to periodic change.
d Purchased on a delayed delivery basis.
e Security issued with a zero coupon. Income is recognized through the accretion of discount.
f Zero coupon until a specified date at which time the stated coupon rate becomes effective until maturity.
g Non-income producing—security in default.
h Variable rate demand note—rate shown is the interest rate in effect at February 28, 2013. Maturity date represents the next demand date, or the ultimate maturity date if earlier.
The Funds 33
STATEMENT OF INVESTMENTS (Unaudited) (continued)
| Summary of Abbreviations | ||||||
| ABAG | Association of Bay Area Governments | ACA | American Capital Access | |||
| AGC | ACE Guaranty Corporation | AGIC | Asset Guaranty Insurance Company | |||
| AMBAC | American Municipal Bond Assurance Corporation | ARRN | Adjustable Rate Receipt Notes | |||
| BAN | Bond Anticipation Notes | BPA | Bond Purchase Agreement | |||
| CIFG | CDC Ixis Financial Guaranty | COP | Certificate of Participation | |||
| CP | Commercial Paper | DRIVERS | Derivative Inverse Tax-Exempt Receipts | |||
| EDR | Economic Development Revenue | EIR | Environmental Improvement Revenue | |||
| FGIC | Financial Guaranty Insurance Company | FHA | Federal Housing Administration | |||
| FHLB | Federal Home Loan Bank | FHLMC | Federal Home Loan Mortgage Corporation | |||
| FNMA | Federal National Mortgage Association | GAN | Grant Anticipation Notes | |||
| GIC | Guaranteed Investment Contract | GNMA | Government National Mortgage Association | |||
| GO | General Obligation | HR | Hospital Revenue | |||
| IDB | Industrial Development Board | IDC | Industrial Development Corporation | |||
| IDR | Industrial Development Revenue | LIFERS | Long Inverse Floating Exempt Receipts | |||
| LOC | Letter of Credit | LOR | Limited Obligation Revenue | |||
| LR | Lease Revenue | MERLOTS | Municipal Exempt Receipt Liquidity Option Tender | |||
| MFHR | Multi-Family Housing Revenue | MFMR | Multi-Family Mortgage Revenue | |||
| PCR | Pollution Control Revenue | P-FLOATS | Puttable Floating Option Tax-Exempt Receipts | |||
| PILOT | Payment in Lieu of Taxes | PUTTERS | Puttable Tax-Exempt Receipts | |||
| RAC | Revenue Anticipation Certificates | RAN | Revenue Anticipation Notes | |||
| RAW | Revenue Anticipation Warrants | ROCS | Reset Options Certificates | |||
| RRR | Resources Recovery Revenue | SAAN | State Aid Anticipation Notes | |||
| SBPA | Standby Bond Purchase Agreement | SFHR | Single Family Housing Revenue | |||
| SFMR | Single Family Mortgage Revenue | SONYMA | State of New York Mortgage Agency | |||
| SPEARS | Short Puttable Exempt Adjustable Receipts | SWDR | Solid Waste Disposal Revenue | |||
| TAN | Tax Anticipation Notes | TAW | Tax Anticipation Warrants | |||
| TRAN | Tax and Revenue Anticipation Notes | XLCA | XL Capital Assurance | |||
| Summary of Combined Ratings (Unaudited) | ||||||
| Fitch | or | Moody’s | or | Standard & Poor’s | Value (%)† | |
| AAA | Aaa | AAA | 15.2 | |||
| AA | Aa | AA | 45.4 | |||
| A | A | A | 31.7 | |||
| BBB | Baa | BBB | 5.1 | |||
| B | B | B | .3 | |||
| F1 | MIG1/P1 | SP1/A1 | 1.3 | |||
| Not Ratedi | Not Ratedi | Not Ratedi | 1.0 | |||
| 100.0 | ||||||
† Based on total investments.
i Securities which, while not rated by Fitch, Moody’s and Standard & Poor’s, have been determined by the Manager to be of comparable quality to those rated securities in which the
fund may invest.
See notes to financial statements.
34
STATEMENT OF FINANCIAL FUTURES
February 28, 2013 (Unaudited)
| Market Value | Unrealized | |||||
| BNY Mellon National | Covered by | Appreciation | ||||
| Intermediate Municipal Bond Fund | Contracts | Contracts ($) | Expiration | at 2/28/2013 | ($) | |
| Financial Futures Short | ||||||
| U.S. Treasury 10 Year Notes | 340 | (45,119,063 | ) | March 2013 | 239,062 | |
| See notes to financial statements. | ||||||
The Funds 35
| STATEMENT OF INVESTMENTS | ||||
| February 28, 2013 (Unaudited) | ||||
| BNY Mellon National Short-Term Municipal Bond Fund | ||||
| Long-Term Municipal | Coupon | Maturity | Principal | |
| Investments—98.5% | Rate (%) | Date | Amount ($) | Value ($) |
| Alabama—.2% | ||||
| Alabama 21st Century Authority, Tobacco Settlement Revenue | 4.00 | 6/1/16 | 1,000,000 | 1,087,290 |
| Jefferson County, Limited Obligation School Warrants | ||||
| (Insured; Assured Guaranty Municipal Corp.) | 5.50 | 2/15/16 | 1,055,000 | 1,055,011 |
| Alaska—.9% | ||||
| Alaska Industrial Development and Export | ||||
| Authority, Revolving Fund Revenue | 5.00 | 4/1/14 | 2,370,000 | 2,492,861 |
| North Slope Borough, GO | 2.50 | 6/30/14 | 3,400,000 | 3,501,014 |
| Valdez, Marine Terminal Revenue (BP Pipelines (Alaska) Inc. Project) | 5.00 | 1/1/14 | 2,000,000 | 2,075,060 |
| Valdez, Marine Terminal Revenue (BP Pipelines (Alaska) Inc. Project) | 5.00 | 1/1/16 | 2,500,000 | 2,790,275 |
| Arizona—3.2% | ||||
| Arizona School Facilities Board, COP (Lease-to-Own-Agreement) | 5.50 | 9/1/13 | 3,300,000 | 3,389,430 |
| Arizona School Facilities Board, COP (Lease-to-Own-Agreement) | ||||
| (Insured; National Public Finance Guarantee Corp.) | 5.00 | 9/1/13 | 10,950,000 | 11,218,932 |
| Arizona Transportation Board, Subordinated Highway Revenue | 5.00 | 7/1/14 | 2,165,000 | 2,302,802 |
| Arizona Transportation Board, Subordinated Highway Revenue | 5.00 | 7/1/15 | 9,380,000 | 10,371,841 |
| Arizona Transportation Board, Subordinated Highway Revenue | 5.00 | 7/1/16 | 5,000,000 | 5,725,850 |
| Arizona Transportation Board, Transportation Excise Tax | ||||
| Revenue (Maricopa County Regional Area Road Fund) | 5.00 | 7/1/16 | 2,300,000 | 2,640,492 |
| University of Arizona Board of Regents, System Revenue | 6.20 | 6/1/16 | 3,995,000 | 4,302,855 |
| California—8.5% | ||||
| California, GO | 5.00 | 8/1/18 | 2,000,000 | 2,317,780 |
| California, GO (Economic Recovery) (Insured; | ||||
| National Public Finance Guarantee Corp.) | 5.25 | 7/1/14 | 6,820,000 | 7,275,030 |
| California, GO (Various Purpose) | 4.00 | 10/1/15 | 17,050,000 | 18,635,480 |
| California, GO (Various Purpose) | 5.00 | 9/1/16 | 10,000,000 | 11,529,400 |
| California Health Facilities Financing Authority, | ||||
| Revenue (Cedars-Sinai Medical Center) | 5.00 | 8/15/15 | 1,000,000 | 1,110,450 |
| California Health Facilities Financing Authority, Revenue | ||||
| (Lucile Salter Packard Children’s Hospital at Stanford) | 1.45 | 3/15/17 | 3,000,000 | 3,044,070 |
| California Municipal Finance Authority, SWDR | ||||
| (Waste Management, Inc. Project) | 0.70 | 2/3/14 | 3,000,000 | 3,000,540 |
| California Municipal Finance Authority, SWDR | ||||
| (Waste Management, Inc. Project) | 2.00 | 9/2/14 | 4,000,000 | 4,085,640 |
| California Statewide Communities Development Authority, | ||||
| MFHR (Clara Park / Cypress Sunrise/Wysong | ||||
| Plaza Apartments) (Collateralized; GNMA) | 4.55 | 1/20/16 | 670,000 | 697,262 |
| California Statewide Communities Development Authority, | ||||
| PCR (Southern California Edison Company) (Insured; XLCA) | 4.10 | 4/1/13 | 1,000,000 | 1,003,450 |
| California Statewide Communities Development | ||||
| Authority, Revenue (Kaiser Permanente) | 5.00 | 4/1/14 | 1,000,000 | 1,051,520 |
| California Statewide Communities Development | ||||
| Authority, Revenue (Kaiser Permanente) | 5.00 | 5/1/17 | 3,500,000 | 4,052,055 |
36
| BNY Mellon National Short-Term Municipal Bond Fund (continued) | |||||
| Long-Term Municipal | Coupon | Maturity | Principal | ||
| Investments (continued) | Rate (%) | Date | Amount ($) | Value ($) | |
| California (continued) | |||||
| California Statewide Communities Development Authority, | |||||
| Student Housing Revenue (University of California, Irvine | |||||
| East Campus Apartments, Phase 1 Refunding—CHF—Irvine, L.L.C.) | 4.00 | 5/15/13 | 600,000 | 604,434 | |
| California Statewide Communities Development Authority, | |||||
| Student Housing Revenue (University of California, Irvine | |||||
| East Campus Apartments, Phase 1 Refunding—CHF—Irvine, L.L.C.) | 4.00 | 5/15/14 | 900,000 | 932,931 | |
| California Statewide Communities Development Authority, | |||||
| Student Housing Revenue (University of California, Irvine | |||||
| East Campus Apartments, Phase 1 Refunding—CHF—Irvine, L.L.C.) | 4.00 | 5/15/15 | 1,150,000 | 1,216,493 | |
| California Statewide Communities Development Authority, | |||||
| Student Housing Revenue (University of California, Irvine | |||||
| East Campus Apartments, Phase 1 Refunding—CHF—Irvine, L.L.C.) | 4.00 | 5/15/16 | 1,450,000 | 1,558,228 | |
| Chula Vista, IDR (San Diego Gas and Electric Company) | 1.65 | 7/1/18 | 5,500,000 | 5,612,585 | |
| Contra Costa Transportation Authority, | |||||
| Sales Tax Revenue (Limited Tax Bonds) | 0.51 | 12/15/15 | 4,000,000 | a | 3,998,760 |
| Irvine Reassessment District Number 12-1, | |||||
| Limited Obligation Improvement Bonds | 3.00 | 9/2/16 | 2,000,000 | 2,140,100 | |
| Los Angeles County Metropolitan Transportation Authority, | |||||
| Proposition A First Tier Senior Sales Tax Revenue | 5.00 | 7/1/17 | 1,500,000 | b | 1,767,075 |
| Los Angeles Department of Water and | |||||
| Power, Power System Revenue | 5.00 | 1/1/16 | 10,000,000 | 11,213,300 | |
| Los Angeles Unified School District, GO | 4.00 | 7/1/16 | 4,000,000 | 4,452,080 | |
| Metropolitan Water District of | |||||
| Southern California, Water Revenue | 3.50 | 10/1/16 | 5,900,000 | 6,464,158 | |
| Sacramento County Sanitation Districts Financing Authority, | |||||
| Revenue (Sacramento Regional County Sanitation | |||||
| District) (Insured; AMBAC) (Prerefunded) | 5.00 | 12/1/14 | 1,000,000 | c | 1,083,100 |
| Southern California Public Power Authority, | |||||
| Revenue (Mead-Phoenix Project) | 5.00 | 7/1/17 | 5,260,000 | 6,163,931 | |
| Colorado—1.3% | |||||
| City and County of Denver, Airport System Revenue | 4.00 | 11/15/14 | 1,310,000 | 1,392,072 | |
| City and County of Denver, Airport System Revenue | 4.00 | 11/15/15 | 1,000,000 | 1,087,680 | |
| City and County of Denver, Airport System Revenue | 5.00 | 11/15/16 | 1,000,000 | 1,151,310 | |
| City and County of Denver, GO Medical Facilities Bonds | 5.00 | 8/1/15 | 7,620,000 | 7,777,810 | |
| Colorado Health Facilities Authority, | |||||
| Revenue (Catholic Health Initiatives) | 5.00 | 11/12/13 | 4,900,000 | 5,065,326 | |
| Colorado Health Facilities Authority, Revenue | |||||
| (Catholic Health Initiatives) (Prerefunded) | 5.00 | 11/12/13 | 100,000 | c | 103,390 |
| Connecticut—3.6% | |||||
| Connecticut, GO (Economic Recovery) | 5.00 | 1/1/14 | 10,010,000 | 10,416,006 | |
| Connecticut, GO (Economic Recovery) | 5.00 | 1/1/16 | 8,425,000 | 9,481,832 | |
| Connecticut, Special Tax Obligation Revenue | |||||
| (Transportation Infrastructure Purposes) | 5.00 | 12/1/16 | 2,900,000 | 3,376,064 | |
The Funds 37
| STATEMENT OF INVESTMENTS (Unaudited) (continued) | |||||
| BNY Mellon National Short-Term Municipal Bond Fund (continued) | |||||
| Long-Term Municipal | Coupon | Maturity | Principal | ||
| Investments (continued) | Rate (%) | Date | Amount ($) | Value ($) | |
| Connecticut (continued) | |||||
| Connecticut Development Authority, PCR | |||||
| (The Connecticut Light and Power Company Project) | 1.25 | 9/3/13 | 2,600,000 | 2,612,350 | |
| Connecticut Health and Educational Facilities | |||||
| Authority, Revenue (Yale University Issue) | 2.50 | 2/12/15 | 5,000,000 | 5,217,600 | |
| Connecticut Health and Educational Facilities | |||||
| Authority, Revenue (Yale University Issue) | 0.88 | 2/8/18 | 10,000,000 | 9,992,800 | |
| New Haven, GO | 4.00 | 11/1/15 | 3,000,000 | 3,233,310 | |
| Florida—6.6% | |||||
| Citizens Property Insurance Corporation, | |||||
| High-Risk Account Senior Secured Revenue | 5.00 | 6/1/13 | 10,000,000 | 10,123,000 | |
| Citizens Property Insurance Corporation, Personal Lines | |||||
| Account/Commercial Lines Account Senior Secured Revenue | 5.00 | 6/1/16 | 10,000,000 | 11,256,700 | |
| Florida Department of Management Services, Florida Facilities | |||||
| Pool Revenue (Insured; Assured Guaranty Municipal Corp.) | 5.25 | 9/1/13 | 1,825,000 | 1,868,599 | |
| Florida Hurricane Catastrophe Fund Finance Corporation, Revenue | 5.00 | 7/1/13 | 4,060,000 | 4,127,152 | |
| Florida Hurricane Catastrophe Fund Finance Corporation, Revenue | 5.00 | 7/1/15 | 10,000,000 | 11,021,500 | |
| Florida State Board of Education, Lottery Revenue (Insured; AMBAC) | 5.25 | 7/1/14 | 5,000,000 | 5,333,250 | |
| Florida State Board of Education, | |||||
| Public Education Capital Outlay Bonds | 5.00 | 6/1/16 | 10,000,000 | 11,436,100 | |
| Fort Pierce Utilities Authority, Utilities | |||||
| Revenue (Insured; AMBAC) (Prerefunded) | 5.00 | 10/1/13 | 4,640,000 | c | 4,770,616 |
| Jacksonville, Special Revenue | 5.00 | 10/1/16 | 3,000,000 | 3,455,580 | |
| Jacksonville Electric Authority, Revenue | |||||
| (Saint Johns River Power Park System) | 5.00 | 10/1/16 | 5,000,000 | 5,774,750 | |
| Kissimmee Utility Authority, Electric System Revenue | 4.00 | 10/1/14 | 1,250,000 | 1,316,338 | |
| Miami-Dade County, Double-Barreled Aviation GO | 5.00 | 7/1/14 | 1,000,000 | 1,062,180 | |
| Orange County School Board, COP | |||||
| (Master Lease Purchase Agreement) | 5.00 | 8/1/15 | 1,500,000 | 1,651,680 | |
| Orlando, Waste Water System Revenue | |||||
| (Insured; National Public Finance Guarantee Corp.) | 4.00 | 10/1/14 | 3,025,000 | 3,204,322 | |
| Palm Beach County School Board, COP (Master Lease Purchase | |||||
| Agreement) (Insured; Assured Guaranty Municipal Corp.) | 5.00 | 8/1/17 | 5,000,000 | 5,484,400 | |
| Georgia—1.9% | |||||
| Atlanta, Water and Wastewater Revenue | 5.00 | 11/1/15 | 5,000,000 | 5,558,550 | |
| Burke County Development Authority, PCR | |||||
| (Georgia Power Company Plant Vogtle Project) | 1.40 | 4/1/15 | 5,000,000 | 5,082,500 | |
| Floyd County Development Authority, PCR | |||||
| (Georgia Power Company Plant Hammond Project) | 0.85 | 11/19/15 | 5,000,000 | 5,035,100 | |
| Fulton County, Water and Sewerage Revenue | 5.00 | 1/1/16 | 1,550,000 | 1,745,378 | |
| Georgia, GO | 5.00 | 7/1/15 | 5,000,000 | 5,543,600 | |
| Municipal Electric Authority of Georgia, | |||||
| Revenue (Project One Subordinated Bonds) | 5.00 | 1/1/17 | 1,000,000 | 1,150,980 | |
38
| BNY Mellon National Short-Term Municipal Bond Fund (continued) | |||||
| Long-Term Municipal | Coupon | Maturity | Principal | ||
| Investments (continued) | Rate (%) | Date | Amount ($) | Value ($) | |
| Illinois—6.6% | |||||
| Central Lake County Joint Action Water Agency, Water Revenue | 4.00 | 5/1/17 | 5,430,000 | 6,140,841 | |
| Chicago, General Airport Senior Lien Revenue | |||||
| (Chicago O’Hare International Airport) | 5.00 | 1/1/17 | 4,000,000 | 4,610,480 | |
| Chicago, Second Lien Revenue (Chicago | |||||
| Midway Airport) (Insured; AMBAC) | 5.00 | 1/1/17 | 4,110,000 | 4,400,988 | |
| Chicago Board of Education, Unlimited Tax GO | |||||
| (Dedicated Revenues) (Insured; AMBAC) | 5.25 | 12/1/15 | 1,425,000 | 1,598,380 | |
| Chicago Board of Education, Unlimited Tax GO (Dedicated | |||||
| Revenues) (Insured; National Public Finance Guarantee Corp.) | 5.00 | 12/1/14 | 2,000,000 | 2,157,520 | |
| Chicago Board of Education, Unlimited Tax GO (Dedicated | |||||
| Revenues) (Insured; National Public Finance Guarantee Corp.) | 5.00 | 12/1/16 | 17,000,000 | 18,363,060 | |
| Chicago Park District, GO Limited Tax Bonds (Insured; AMBAC) | 5.00 | 1/1/16 | 2,100,000 | 2,232,489 | |
| Chicago Transit Authority, Capital Grant Receipts | |||||
| Revenue (Federal Transit Administration | |||||
| Section 5307 Formula Funds) (Insured; AMBAC) | 5.00 | 6/1/14 | 3,815,000 | 4,012,999 | |
| Illinois, GO | 5.00 | 1/1/14 | 1,415,000 | 1,471,784 | |
| Illinois, GO | 5.00 | 1/1/14 | 4,585,000 | 4,753,086 | |
| Illinois, GO (Insured; Assured Guaranty Municipal Corp.) | 5.00 | 1/1/16 | 7,500,000 | 8,310,450 | |
| Illinois, GO (Insured; National Public Finance Guarantee Corp.) | 5.38 | 4/1/16 | 4,465,000 | 5,024,688 | |
| Illinois Department of Employment Security, Unemployment | |||||
| Insurance Fund Building Receipts Revenue | 5.00 | 6/15/17 | 2,000,000 | 2,323,400 | |
| Illinois Development Finance Authority, | |||||
| Revenue (Saint Vincent de Paul Center Project) | 1.88 | 3/1/19 | 3,500,000 | 3,519,075 | |
| Kane, McHenry, Cook and DeKalb Counties Community | |||||
| Unit School District Number 300, GO (Insured; XLCA) | 5.00 | 12/1/17 | 3,145,000 | 3,455,978 | |
| Railsplitter Tobacco Settlement Authority, | |||||
| Tobacco Settlement Revenue | 5.00 | 6/1/15 | 8,330,000 | 9,037,300 | |
| Indiana—1.4% | |||||
| Indiana Finance Authority, Second Lien Water | |||||
| Utility Revenue (Citizens Energy Group Project) | 3.00 | 10/1/14 | 2,000,000 | 2,071,860 | |
| Indiana Health Facility Financing Authority, | |||||
| Revenue (Ascension Health Credit Group) | 1.50 | 8/1/14 | 2,000,000 | 2,032,240 | |
| Indiana Health Facility Financing Authority, | |||||
| Revenue (Ascension Health Credit Group) | 1.60 | 2/1/17 | 2,500,000 | 2,559,825 | |
| Indiana Health Facility Financing Authority, Revenue | |||||
| (Ascension Health Subordinate Credit Group) | 1.70 | 9/1/14 | 1,500,000 | 1,531,920 | |
| Indiana Health Facility Financing Authority, Revenue | |||||
| (Ascension Health Subordinate Credit Group) | 5.00 | 7/28/16 | 2,000,000 | 2,278,620 | |
| Indiana Transportation Finance Authority, | |||||
| Highway Revenue (Insured; FGIC) (Prerefunded) | 5.25 | 6/1/14 | 1,000,000 | c | 1,063,540 |
| Whiting, Environmental Facilities Revenue | |||||
| (BP Products North America, Inc.) | 2.80 | 6/2/14 | 6,000,000 | 6,187,200 | |
The Funds 39
| STATEMENT OF INVESTMENTS (Unaudited) (continued) | |||||
| BNY Mellon National Short-Term Municipal Bond Fund (continued) | |||||
| Long-Term Municipal | Coupon | Maturity | Principal | ||
| Investments (continued) | Rate (%) | Date | Amount ($) | Value ($) | |
| Iowa—.1% | |||||
| Iowa Higher Education Loan Authority, Private | |||||
| College Facility Revenue (Grinnell College Project) | 4.00 | 12/1/13 | 1,000,000 | 1,028,890 | |
| Kentucky—1.5% | |||||
| Kentucky Property and Buildings Commission, Revenue (Project | |||||
| Number 82) (Insured; Assured Guaranty Municipal Corp.) | 5.25 | 10/1/13 | 8,480,000 | 8,727,192 | |
| Kentucky Property and Buildings Commission, | |||||
| Revenue (Project Number 99) | 5.00 | 11/1/17 | 4,200,000 | 4,949,196 | |
| Louisville/Jefferson County Metro Government, PCR | |||||
| (Louisville Gas and Electric Company Project) | 1.65 | 4/3/17 | 4,940,000 | 5,052,533 | |
| Louisiana—1.0% | |||||
| Louisiana, GO | 0.94 | 7/15/14 | 4,765,000 | a | 4,767,716 |
| Louisiana Offshore Terminal Authority, | |||||
| Deepwater Port Revenue (LOOP LLC Project) | 1.88 | 10/1/13 | 2,000,000 | 2,015,560 | |
| Louisiana Public Facilities Authority, Revenue (Loyola University | |||||
| Project) (Insured; National Public Finance Guarantee Corp.) | 5.25 | 10/1/16 | 5,000,000 | 5,726,800 | |
| Maryland—.5% | |||||
| Anne Arundel County, Consolidated General Improvements GO | 4.00 | 4/1/14 | 4,000,000 | 4,166,320 | |
| Maryland Health and Higher Educational Facilities | |||||
| Authority, Revenue (The Johns Hopkins | |||||
| Health System Obligated Group Issue) | 1.29 | 11/15/16 | 2,245,000 | a | 2,281,459 |
| Massachusetts—3.5% | |||||
| Massachusetts, GO (Consolidated Loan) | 5.25 | 8/1/13 | 1,500,000 | 1,532,910 | |
| Massachusetts, GO (Consolidated Loan) | 5.00 | 8/1/14 | 5,000,000 | 5,343,800 | |
| Massachusetts, GO (Consolidated Loan) (Insured; FGIC) | 5.50 | 11/1/13 | 1,700,000 | 1,762,101 | |
| Massachusetts Bay Transportation Authority, Assessment Revenue | 4.00 | 7/1/13 | 1,250,000 | 1,266,450 | |
| Massachusetts Bay Transportation Authority, | |||||
| Assessment Revenue (Prerefunded) | 5.00 | 7/1/14 | 12,705,000 | c | 13,535,018 |
| Massachusetts Development Finance Agency, Recovery Zone | |||||
| Facility Revenue (Dominion Energy Brayton Point Issue) | 2.25 | 9/1/16 | 5,000,000 | 5,159,750 | |
| Massachusetts Development Finance Agency, | |||||
| Revenue (Brandeis University Issue) | 3.00 | 10/1/13 | 1,140,000 | 1,158,069 | |
| Massachusetts Development Finance Agency, | |||||
| Revenue (UMass Memorial Issue) | 4.00 | 7/1/14 | 4,525,000 | 4,695,231 | |
| Massachusetts Health and Educational Facilities | |||||
| Authority, Revenue (Amherst College Issue) | 1.00 | 11/1/14 | 1,850,000 | 1,875,197 | |
| Massachusetts Health and Educational Facilities | |||||
| Authority, Revenue (Amherst College Issue) | 1.70 | 11/1/16 | 2,915,000 | 3,011,428 | |
| Massachusetts Health and Educational Facilities | |||||
| Authority, Revenue (Partners HealthCare System Issue) | 5.00 | 7/1/13 | 1,350,000 | 1,372,424 | |
| Massachusetts Health and Educational Facilities | |||||
| Authority, Revenue (Partners HealthCare System Issue) | 5.00 | 7/1/14 | 1,600,000 | 1,701,840 | |
| Massachusetts Health and Educational Facilities | |||||
| Authority, Revenue (Simmons College Issue) | 6.13 | 10/1/14 | 1,000,000 | 1,078,630 | |
40
| BNY Mellon National Short-Term Municipal Bond Fund (continued) | |||||
| Long-Term Municipal | Coupon | Maturity | Principal | ||
| Investments (continued) | Rate (%) | Date | Amount ($) | Value ($) | |
| Michigan—2.8% | |||||
| Detroit School District, School Building and | |||||
| Site Improvement Bonds (GO—Unlimited Tax) | 5.00 | 5/1/16 | 1,490,000 | 1,670,558 | |
| Michigan Finance Authority, Unemployment | |||||
| Obligation Assessment Revenue | 5.00 | 7/1/17 | 10,000,000 | 11,882,800 | |
| Michigan Hospital Finance Authority, HR | |||||
| (Oakwood Obligated Group) (Prerefunded) | 5.50 | 11/1/13 | 10,000,000 | c | 10,358,100 |
| Michigan Hospital Finance Authority, Project Revenue | |||||
| (Ascension Health Senior Credit Group) | 1.50 | 3/1/17 | 10,000,000 | 10,173,000 | |
| Minnesota—1.9% | |||||
| Minnesota, GO | 5.00 | 8/1/16 | 5,200,000 | 5,997,472 | |
| Minnesota, GO (State Trunk Highway Bonds) | 4.00 | 8/1/13 | 1,310,000 | 1,331,497 | |
| Minnesota, GO (Various Purpose) | 4.00 | 8/1/13 | 11,500,000 | 11,688,715 | |
| Minnesota, GO (Various Purpose) | 5.00 | 8/1/15 | 4,000,000 | 4,449,760 | |
| Missouri—.1% | |||||
| Saint Louis, Airport Revenue (Lambert-Saint Louis International | |||||
| Airport) (Insured; Assured Guaranty Municipal Corp.) | 5.00 | 7/1/13 | 1,800,000 | 1,824,390 | |
| Nebraska—.6% | |||||
| Lincoln, GO | 4.00 | 12/1/15 | 2,035,000 | 2,236,343 | |
| University of Nebraska Facilities Corporation, | |||||
| Deferred Maintenance Bonds (Insured; AMBAC) | 5.00 | 7/15/13 | 5,125,000 | 5,219,197 | |
| Nevada—3.8% | |||||
| Clark County, Limited Tax GO Public Safety Bonds | |||||
| (Insured; Assured Guaranty Municipal Corp.) | 5.00 | 1/1/14 | 1,000,000 | 1,039,950 | |
| Clark County, Passenger Facility Charge Revenue | |||||
| (Las Vegas-McCarran International Airport) | 5.00 | 7/1/14 | 2,500,000 | 2,648,350 | |
| Clark County School District, Limited Tax GO | 5.00 | 6/15/16 | 10,000,000 | 11,413,100 | |
| Clark County School District, Limited Tax GO | |||||
| (Insured; National Public Finance Guarantee Corp.) | 5.00 | 6/15/15 | 6,800,000 | 7,498,020 | |
| Clark County School District, Limited Tax GO | |||||
| (Insured; National Public Finance Guarantee Corp.) | 5.25 | 6/15/15 | 4,075,000 | 4,516,526 | |
| Las Vegas Convention and Visitors | |||||
| Authority, Revenue (Insured; AMBAC) | 5.00 | 7/1/16 | 3,500,000 | 3,829,595 | |
| Las Vegas Valley Water District, GO (Additionally | |||||
| Secured by Pledged Revenues) | 5.00 | 6/1/17 | 13,640,000 | 15,018,458 | |
| Las Vegas Valley Water District, GO (Additionally Secured | |||||
| by Southern Nevada Water Authority Pledged Revenues) | 5.00 | 6/1/14 | 450,000 | 476,379 | |
| New Hampshire—1.9% | |||||
| Manchester, School Facilities Revenue (Insured; National | |||||
| Public Finance Guarantee Corp.) (Prerefunded) | 5.50 | 6/1/13 | 4,465,000 | c | 4,525,903 |
| New Hampshire, Turnpike System Revenue | 4.00 | 10/1/14 | 5,315,000 | 5,622,473 | |
| New Hampshire, Turnpike System Revenue | 5.00 | 10/1/15 | 5,565,000 | 6,198,297 | |
| New Hampshire, Turnpike System Revenue | 5.00 | 2/1/17 | 6,000,000 | 6,935,520 | |
The Funds 41
| STATEMENT OF INVESTMENTS (Unaudited) (continued) | |||||
| BNY Mellon National Short-Term Municipal Bond Fund (continued) | |||||
| Long-Term Municipal | Coupon | Maturity | Principal | ||
| Investments (continued) | Rate (%) | Date | Amount ($) | Value ($) | |
| New Jersey—3.4% | |||||
| Monmouth County Improvement Authority, | |||||
| Governmental Pooled Loan Revenue | 4.00 | 12/1/17 | 2,300,000 | 2,658,547 | |
| New Jersey, GO | 5.00 | 8/15/15 | 10,000,000 | 11,110,700 | |
| New Jersey Economic Development | |||||
| Authority, Cigarette Tax Revenue | 5.38 | 6/15/14 | 2,935,000 | 3,133,142 | |
| New Jersey Economic Development Authority, Exempt Facilities | |||||
| Revenue (Waste Management of New Jersey, Inc. Project) | 2.20 | 11/1/13 | 2,000,000 | 2,022,200 | |
| New Jersey Economic Development Authority, | |||||
| School Facilities Construction Revenue (Insured; AMBAC) | 5.00 | 9/1/17 | 5,000,000 | 5,561,200 | |
| New Jersey Educational Facilities Authority, | |||||
| Revenue (Princeton University) | 5.00 | 7/1/14 | 2,185,000 | 2,327,134 | |
| New Jersey Sports and Exposition | |||||
| Authority, State Contract Bonds | 5.00 | 9/1/16 | 1,665,000 | 1,892,056 | |
| New Jersey Transportation Trust Fund | |||||
| Authority (Transportation System) | 5.00 | 6/15/15 | 1,800,000 | 1,977,966 | |
| New Jersey Transportation Trust Fund | |||||
| Authority (Transportation System) | 5.00 | 6/15/16 | 2,000,000 | 2,265,780 | |
| New Jersey Transportation Trust Fund Authority (Transportation | |||||
| System) (Insured; Assured Guaranty Municipal Corp.) | 5.75 | 12/15/14 | 2,820,000 | 3,090,382 | |
| New Jersey Transportation Trust Fund Authority | |||||
| (Transportation System) (Insured; National Public | |||||
| Finance Guarantee Corp.) (Prerefunded) | 5.25 | 6/15/15 | 5,000,000 | c | 5,561,650 |
| New Mexico—1.0% | |||||
| New Mexico Educational Assistance | |||||
| Foundation, Education Loan Revenue | 1.01 | 12/1/20 | 2,920,000 | a | 2,902,860 |
| New Mexico Finance Authority, State Transportation | |||||
| Senior Lien Revenue (Insured; National Public | |||||
| Finance Guarantee Corp.) (Prerefunded) | 5.25 | 6/15/14 | 4,790,000 | c | 5,102,356 |
| New Mexico Finance Authority, State Transportation | |||||
| Subordinate Lien Revenue (Insured; AMBAC) | 5.00 | 6/15/13 | 1,000,000 | 1,014,210 | |
| New Mexico Finance Authority, Subordinate Lien | |||||
| Public Project Revolving Fund Revenue | |||||
| (Insured; National Public Finance Guarantee Corp.) | 5.25 | 6/15/18 | 2,605,000 | 3,060,120 | |
| New York—11.5% | |||||
| Long Island Power Authority, Electric System General Revenue | 5.00 | 5/1/15 | 5,400,000 | 5,900,526 | |
| Metropolitan Transportation Authority, Transportation Revenue | 5.00 | 11/15/13 | 11,125,000 | 11,504,696 | |
| Nassau County, GO (Insured; Assured Guaranty Municipal Corp.) | 5.00 | 7/1/16 | 4,595,000 | 5,211,327 | |
| Nassau County Interim Finance Authority, | |||||
| Sales Tax Secured Revenue | 4.00 | 11/15/15 | 7,820,000 | 8,582,450 | |
| Nassau Health Care Corporation, RAN | |||||
| (Insured; Assured Guaranty Municipal Corp.) | 2.25 | 12/15/13 | 7,500,000 | 7,612,725 | |
| New York City, GO | 5.00 | 8/15/13 | 5,000,000 | 5,112,950 | |
| New York City, GO | 5.00 | 8/1/14 | 4,000,000 | 4,273,480 | |
42
| BNY Mellon National Short-Term Municipal Bond Fund (continued) | |||||
| Long-Term Municipal | Coupon | Maturity | Principal | ||
| Investments (continued) | Rate (%) | Date | Amount ($) | Value ($) | |
| New York (continued) | |||||
| New York City, GO | 5.00 | 8/1/15 | 1,000,000 | 1,111,490 | |
| New York City, GO | 5.25 | 8/1/16 | 4,670,000 | 5,001,523 | |
| New York City Transitional Finance | |||||
| Authority, Future Tax Secured Revenue | 5.00 | 11/1/14 | 10,000,000 | 10,798,900 | |
| New York City Transitional Finance Authority, Future Tax Secured | |||||
| Revenue (Insured; National Public Finance Guarantee Corp.) | 5.50 | 11/1/14 | 240,000 | 241,159 | |
| New York State, GO | 3.00 | 2/1/14 | 10,000,000 | 10,261,500 | |
| New York State, GO | 5.00 | 2/15/15 | 4,320,000 | 4,730,962 | |
| New York State Dormitory Authority, LR (State University | |||||
| Dormitory Facilities Issue) (Insured; XLCA) | 5.25 | 7/1/13 | 1,000,000 | 1,017,110 | |
| New York State Dormitory Authority, Revenue | |||||
| (Mental Health Services Facilities Improvement) | 5.00 | 8/15/15 | 5,000 | 5,565 | |
| New York State Dormitory Authority, Revenue | |||||
| (Mental Health Services Facilities Improvement) | 5.00 | 8/15/15 | 995,000 | 1,105,883 | |
| New York State Dormitory Authority, Revenue | |||||
| (School Districts Revenue Financing Program) | |||||
| (Insured; National Public Finance Guarantee Corp.) | 5.75 | 10/1/17 | 25,000 | 25,123 | |
| New York State Dormitory Authority, | |||||
| State Personal Income Tax Revenue (Education) | 5.00 | 3/15/14 | 4,075,000 | 4,280,991 | |
| New York State Dormitory Authority, State | |||||
| Personal Income Tax Revenue (General Purpose) | 5.00 | 8/15/15 | 11,380,000 | 12,672,540 | |
| New York State Dormitory Authority, State | |||||
| Personal Income Tax Revenue (General Purpose) | 5.00 | 3/15/17 | 3,600,000 | 4,222,800 | |
| New York State Dormitory Authority, Third General Resolution | |||||
| Revenue (State University Educational Facilities Issue) | 4.00 | 5/15/17 | 4,825,000 | 5,436,762 | |
| New York State Environmental Facilities Corporation, | |||||
| SWDR (Waste Management, Inc. Project) | 0.55 | 5/1/13 | 3,250,000 | 3,250,000 | |
| New York State Thruway Authority, Second General Highway | |||||
| and Bridge Trust Fund Bonds (Insured; AMBAC) (Prerefunded) | 5.00 | 4/1/14 | 1,475,000 | c | 1,550,077 |
| New York State Urban Development Corporation, | |||||
| Correctional Capital Facilities Revenue | |||||
| (Insured; Assured Guaranty Municipal Corp.) | 5.25 | 1/1/14 | 375,000 | 390,964 | |
| New York State Urban Development | |||||
| Corporation, Service Contract Revenue | 5.00 | 1/1/14 | 1,000,000 | 1,040,470 | |
| New York State Urban Development | |||||
| Corporation, Service Contract Revenue | 5.00 | 1/1/15 | 5,610,000 | 6,060,820 | |
| Port Authority of New York and New Jersey (Consolidated Bonds, | |||||
| 139th Series) (Insured; National Public Finance Guarantee Corp. ) | 5.00 | 10/1/16 | 5,000,000 | 5,509,050 | |
| Tobacco Settlement Financing Corporation of | |||||
| New York, Asset-Backed Revenue Bonds | |||||
| (State Contingency Contract Secured) | 5.00 | 6/1/14 | 3,000,000 | 3,179,850 | |
| Triborough Bridge and Tunnel Authority, | |||||
| General Revenue (MTA Bridges and Tunnels) | 4.00 | 11/15/16 | 2,500,000 | 2,816,525 | |
The Funds 43
| STATEMENT OF INVESTMENTS (Unaudited) (continued) | |||||
| BNY Mellon National Short-Term Municipal Bond Fund (continued) | |||||
| Long-Term Municipal | Coupon | Maturity | Principal | ||
| Investments (continued) | Rate (%) | Date | Amount ($) | Value ($) | |
| New York (continued) | |||||
| Triborough Bridge and Tunnel Authority, | |||||
| General Revenue (MTA Bridges and Tunnels) | 5.00 | 11/15/16 | 1,900,000 | 2,210,308 | |
| Triborough Bridge and Tunnel Authority, | |||||
| General Revenue (MTA Bridges and Tunnels) | 4.00 | 11/15/17 | 3,500,000 | 4,024,965 | |
| Triborough Bridge and Tunnel Authority, | |||||
| General Revenue (MTA Bridges and Tunnels) | 5.00 | 11/15/17 | 3,325,000 | 3,977,398 | |
| North Carolina—2.2% | |||||
| Charlotte, Water and Sewer System Revenue | 3.00 | 12/1/14 | 1,250,000 | 1,309,363 | |
| Forsyth County, GO | 3.00 | 7/1/13 | 1,495,000 | 1,509,621 | |
| North Carolina, Public Improvement GO | 5.00 | 3/1/16 | 10,000,000 | 10,924,500 | |
| North Carolina Medical Care Commission, Health Care | |||||
| Facilities Revenue (Wake Forest Baptist Obligated Group) | 0.85 | 12/1/17 | 2,500,000 | a | 2,500,200 |
| Wake County, GO | 4.00 | 2/1/15 | 10,560,000 | 11,310,710 | |
| Ohio—3.3% | |||||
| Cleveland, GO (Various Purpose) (Insured; AMBAC) | 5.25 | 10/1/14 | 5,050,000 | 5,425,569 | |
| Cleveland, Water Revenue | 5.00 | 1/1/16 | 3,000,000 | 3,379,980 | |
| Ohio, Common Schools GO Bonds | 5.00 | 9/15/16 | 5,780,000 | 6,675,206 | |
| Ohio, GO Highway Capital Improvements Bonds | |||||
| (Full Faith and Credit/Highway User Receipts) | |||||
| (Buckeye Savers Bond Program) | 5.00 | 5/1/16 | 4,650,000 | 5,297,512 | |
| Ohio Building Authority, State Facilities Revenue | |||||
| (Administrative Building Fund Projects) (Insured; | |||||
| National Public Finance Guarantee Corp.) | 5.00 | 10/1/16 | 3,585,000 | 4,132,179 | |
| Ohio Water Development Authority, | |||||
| Drinking Water Assistance Fund Revenue | 5.00 | 12/1/17 | 1,925,000 | 2,311,097 | |
| Ohio Water Development Authority, Solid Waste | |||||
| Revenue (Waste Management, Inc. Project) | 1.75 | 6/1/13 | 2,500,000 | 2,510,200 | |
| Ohio Water Development Authority, Solid Waste | |||||
| Revenue (Waste Management, Inc. Project) | 2.25 | 11/2/15 | 6,000,000 | 6,163,860 | |
| Ohio Water Development Authority, | |||||
| Water Pollution Control Loan Fund Notes | 0.51 | 7/15/15 | 5,000,000 | a | 5,000,550 |
| Oklahoma—.3% | |||||
| Oklahoma Capitol Improvement Authority, | |||||
| State Highway Capital Improvement Revenue | 4.00 | 10/1/16 | 2,960,000 | 3,326,063 | |
| Oregon—.4% | |||||
| Oregon Department of Transportation, | |||||
| Highway User Tax Revenue (Prerefunded) | 5.25 | 11/15/14 | 4,375,000 | c | 4,746,875 |
| Pennsylvania—6.6% | |||||
| Allegheny County Hospital Development Authority, | |||||
| Revenue (University of Pittsburgh Medical Center) | 5.00 | 6/15/13 | 1,000,000 | 1,014,370 | |
| Allegheny County Hospital Development Authority, | |||||
| Revenue (University of Pittsburgh Medical Center) | 5.00 | 5/15/14 | 2,875,000 | 3,038,329 | |
44
| BNY Mellon National Short-Term Municipal Bond Fund (continued) | |||||
| Long-Term Municipal | Coupon | Maturity | Principal | ||
| Investments (continued) | Rate (%) | Date | Amount ($) | Value ($) | |
| Pennsylvania (continued) | |||||
| Berks County Municipal Authority, Revenue | |||||
| (The Reading Hospital and Medical Center Project) | 5.00 | 11/1/13 | 3,035,000 | 3,129,662 | |
| Chester County Industrial Development Authority, Student | |||||
| Housing Revenue, BAN (University Student Housing, LLC | |||||
| Project at West Chester University of Pennsylvania) | 1.60 | 2/1/15 | 2,500,000 | 2,515,275 | |
| Jim Thorpe Area School District, GO | |||||
| (Insured; National Public Finance Guarantee Corp.) | 5.30 | 3/15/16 | 1,000,000 | 1,057,070 | |
| Monroeville Finance Authority, Revenue | |||||
| (University of Pittsburgh Medical Center) | 4.00 | 2/15/16 | 1,000,000 | 1,094,930 | |
| Pennsylvania, GO | 5.00 | 7/15/14 | 6,740,000 | 7,187,738 | |
| Pennsylvania, GO | 5.00 | 9/1/16 | 5,000,000 | 5,355,850 | |
| Pennsylvania, GO | 5.00 | 5/1/17 | 14,000,000 | 16,497,320 | |
| Pennsylvania, GO (Insured; National Public | |||||
| Finance Guarantee Corp.) (Prerefunded) | 4.00 | 2/1/14 | 5,000,000 | c | 5,176,550 |
| Pennsylvania Economic Development Financing Authority, | |||||
| SWDR (Waste Management, Inc. Project) | 1.75 | 12/1/15 | 2,000,000 | 2,042,900 | |
| Pennsylvania Economic Development Financing Authority, | |||||
| Unemployment Compensation Revenue | 5.00 | 7/1/16 | 10,000,000 | 11,505,500 | |
| Pennsylvania Economic Development Financing Authority, | |||||
| Unemployment Compensation Revenue | 5.00 | 7/1/17 | 5,000,000 | 5,941,400 | |
| Philadelphia, Airport Revenue | 5.00 | 6/15/15 | 1,000,000 | 1,095,550 | |
| Philadelphia, Water and Wastewater Revenue | |||||
| (Insured; Assured Guaranty Municipal Corp.) | 5.00 | 8/1/17 | 3,690,000 | 4,317,005 | |
| Pittsburgh, GO (Insured; Assured Guaranty Municipal Corp.) | 5.00 | 9/1/13 | 5,000,000 | 5,117,400 | |
| State Public School Building Authority, College Revenue | |||||
| (Northampton County Area Community College Project) | 4.00 | 3/1/14 | 2,165,000 | 2,235,471 | |
| State Public School Building Authority, School Revenue | |||||
| (Chester Upland School District Project) (Insured; | |||||
| Assured Guaranty Municipal Corp.) | 4.00 | 9/15/14 | 1,810,000 | 1,898,762 | |
| Swarthmore Borough Authority, | |||||
| Revenue (Swarthmore College) | 5.00 | 9/15/13 | 1,500,000 | 1,537,545 | |
| South Carolina—.4% | |||||
| Piedmont Municipal Power Agency, Electric Revenue | 5.00 | 1/1/15 | 2,000,000 | 2,149,980 | |
| Piedmont Municipal Power Agency, Electric Revenue | 5.00 | 1/1/17 | 1,060,000 | 1,209,269 | |
| South Carolina Jobs-Economic Development Authority, | |||||
| EDR (Waste Management of South Carolina, Inc. Project) | 2.88 | 2/1/15 | 2,100,000 | 2,148,174 | |
| Tennessee—.9% | |||||
| Metropolitan Government of Nashville and | |||||
| Davidson County, GO Improvement Bonds | 5.00 | 7/1/16 | 5,750,000 | 6,611,522 | |
| Metropolitan Government of Nashville and Davidson | |||||
| County, Subordinate Lien Water and Sewer Revenue | 5.00 | 7/1/16 | 1,250,000 | 1,426,987 | |
| Tennessee, GO | 5.00 | 8/1/16 | 3,100,000 | 3,574,269 | |
The Funds 45
| STATEMENT OF INVESTMENTS (Unaudited) (continued) | |||||
| BNY Mellon National Short-Term Municipal Bond Fund (continued) | |||||
| Long-Term Municipal | Coupon | Maturity | Principal | ||
| Investments (continued) | Rate (%) | Date | Amount ($) | Value ($) | |
| Texas—7.0% | |||||
| Austin, Water and Wastewater System Revenue | 4.00 | 11/15/13 | 1,500,000 | 1,541,235 | |
| Frisco Independent School District, Unlimited Tax School | |||||
| Building Bonds (Permanent School Fund Guarantee Program) | 5.00 | 8/15/15 | 1,000,000 | 1,112,930 | |
| Gulf Coast Waste Disposal Authority, Environmental Facilities | |||||
| Revenue (BP Products North America, Inc. Project) | 2.30 | 9/3/13 | 4,000,000 | 4,040,800 | |
| Harris County, Toll Road Senior Lien Revenue (Insured; | |||||
| National Public Finance Guarantee Corp.) (Prerefunded) | 5.00 | 8/15/14 | 1,500,000 | c | 1,604,685 |
| Houston, Combined Utility System First Lien Revenue | 5.00 | 11/15/16 | 3,750,000 | 4,346,813 | |
| Houston Convention and Entertainment Facilities | |||||
| Department, Hotel Occupancy Tax and Special Revenue | 4.88 | 9/1/17 | 5,000,000 | 5,606,500 | |
| Houston Independent School District, Limited Tax Schoolhouse | |||||
| Bonds (Permament School Fund Guarantee Program) | 1.50 | 6/1/15 | 10,000,000 | 10,255,000 | |
| Houston Independent School District, Limited Tax Schoolhouse | |||||
| Bonds (Permament School Fund Guarantee Program) | 2.00 | 6/1/16 | 6,000,000 | 6,262,500 | |
| Katy Independent School District, Unlimited Tax Bonds | |||||
| (Permament School Fund Guarantee Program) | 1.60 | 8/15/17 | 2,000,000 | 2,007,220 | |
| Katy Independent School District, Unlimited Tax Bonds | |||||
| (Permament School Fund Guarantee Program) | 5.00 | 8/15/17 | 4,000,000 | 4,731,560 | |
| Lower Colorado River Authority, Revenue | |||||
| (Insured; Assured Guaranty Municipal Corp.) | 5.88 | 5/15/15 | 1,070,000 | 1,075,179 | |
| North Central Texas Health Facilities Development | |||||
| Corporation, HR (Children’s Medical Center of Dallas Project) | 5.00 | 8/15/17 | 1,000,000 | 1,170,760 | |
| Plano, GO | 5.25 | 9/1/14 | 1,225,000 | 1,317,255 | |
| Richardson Independent School District, Unlimited | |||||
| Tax Bonds (Permanent School Fund Guarantee Program) | 4.00 | 2/15/15 | 1,000,000 | 1,071,580 | |
| Sam Rayburn Municipal Power Agency, | |||||
| Power Supply System Revenue | 5.00 | 10/1/16 | 2,320,000 | 2,626,797 | |
| San Antonio, Electric and Gas Systems Junior Lien Revenue | 2.00 | 12/1/16 | 3,000,000 | 3,126,660 | |
| San Antonio, Water System Revenue | 5.00 | 5/15/17 | 2,160,000 | 2,545,474 | |
| Tarrant Regional Water District, A Water Control | |||||
| and Improvement District, Water Revenue | 5.00 | 3/1/15 | 1,650,000 | 1,803,235 | |
| Tarrant Regional Water District, A Water Control | |||||
| and Improvement District, Water Revenue | 5.00 | 3/1/16 | 1,500,000 | 1,700,760 | |
| Texas A&M University System Board of Regents, | |||||
| Financing System Revenue | 5.00 | 5/15/13 | 1,375,000 | 1,389,382 | |
| Texas Municipal Gas Acquisition and Supply | |||||
| Corporation I, Gas Supply Revenue | 5.00 | 12/15/13 | 720,000 | 744,264 | |
| Texas Municipal Power Agency, Revenue | |||||
| (Insured; National Public Finance Guarantee Corp.) | 0.00 | 9/1/14 | 5,000,000 | d | 4,957,100 |
| Texas Public Finance Authority, GO | 5.00 | 10/1/14 | 2,000,000 | 2,153,140 | |
| Texas Public Finance Authority, Unemployment | |||||
| Compensation Obligation Assessment Revenue | 5.00 | 7/1/15 | 6,000,000 | 6,641,880 | |
46
| BNY Mellon National Short-Term Municipal Bond Fund (continued) | |||||
| Long-Term Municipal | Coupon | Maturity | Principal | ||
| Investments (continued) | Rate (%) | Date | Amount ($) | Value ($) | |
| Texas (continued) | |||||
| Trinity River Authority, | |||||
| Regional Wastewater System Revenue | 5.00 | 8/1/15 | 3,280,000 | 3,635,486 | |
| Trinity River Authority, Regional Wastewater System | |||||
| Revenue (Insured; National Public Finance Guarantee Corp.) | 5.38 | 8/1/15 | 8,865,000 | 9,058,434 | |
| Utah—.2% | |||||
| Timpanogos Special Service District, Sewer Revenue | |||||
| (Insured; Assured Guaranty Municipal Corp.) | 5.00 | 6/1/14 | 1,775,000 | 1,877,435 | |
| Virginia—3.0% | |||||
| Portsmouth, GO | 4.00 | 1/15/15 | 2,750,000 | 2,789,215 | |
| Roanoke Economic Development Authority, | |||||
| HR (Carilion Clinic Obligated Group) | 5.00 | 7/1/15 | 2,000,000 | 2,205,540 | |
| Tobacco Settlement Financing Corporation of Virginia, | |||||
| Tobacco Settlement Asset-Backed Bonds (Prerefunded) | 5.63 | 6/1/15 | 12,500,000 | c | 13,972,750 |
| Virginia College Building Authority, Educational Facilities | |||||
| Revenue (21st Century College and Equipment Programs) | 5.00 | 2/1/14 | 2,610,000 | 2,726,354 | |
| Virginia College Building Authority, Educational Facilities | |||||
| Revenue (Public Higher Education Financing Program) | 5.00 | 9/1/16 | 5,000,000 | 5,766,600 | |
| Virginia Commonwealth Transportation Board, Federal | |||||
| Transportation Grant Anticipation Revenue Notes | 5.00 | 9/15/16 | 1,000,000 | 1,155,650 | |
| Virginia Commonwealth Transportation Board, Federal | |||||
| Transportation Grant Anticipation Revenue Notes | 5.00 | 3/15/17 | 2,500,000 | 2,931,825 | |
| Virginia Public Building Authority, Public Facilities Revenue | 5.00 | 8/1/15 | 5,000,000 | 5,558,600 | |
| Washington—2.5% | |||||
| Energy Northwest, Electric Revenue (Project 1) | 5.25 | 7/1/16 | 2,500,000 | 2,888,050 | |
| Energy Northwest, Electric Revenue (Project 3) | 5.00 | 7/1/16 | 2,255,000 | 2,586,395 | |
| Energy Northwest, Electric Revenue (Project 3) | 5.00 | 7/1/17 | 5,000,000 | 5,915,450 | |
| Energy Northwest, Electric Revenue (Project 3) | 5.00 | 7/1/18 | 12,445,000 | 14,245,294 | |
| King County, Limited Tax GO | |||||
| (Payable From Sewer Revenues) | 5.00 | 1/1/14 | 1,000,000 | 1,041,000 | |
| Washington, GO (Various Purpose) (Insured; AMBAC) | 5.00 | 1/1/14 | 3,810,000 | 3,964,534 | |
| U.S. Related—3.9% | |||||
| Puerto Rico Commonwealth, Public Improvement GO | 5.00 | 7/1/13 | 2,140,000 | 2,163,476 | |
| Puerto Rico Commonwealth, Public Improvement GO | 5.50 | 7/1/13 | 1,335,000 | 1,351,914 | |
| Puerto Rico Commonwealth, Public Improvement GO | 5.50 | 7/1/13 | 5,000,000 | 5,063,350 | |
| Puerto Rico Commonwealth, Public Improvement GO | 5.50 | 7/1/17 | 1,795,000 | 1,951,542 | |
| Puerto Rico Government Development Bank, Senior Notes | 5.00 | 12/1/13 | 3,530,000 | 3,613,131 | |
| Puerto Rico Government Development Bank, Senior Notes | 5.00 | 12/1/14 | 5,520,000 | 5,769,449 | |
| Puerto Rico Highways and Transportation Authority, | |||||
| Transportation Revenue | 5.00 | 7/1/17 | 5,385,000 | 5,586,345 | |
| Puerto Rico Highways and Transportation Authority, | |||||
| Transportation Revenue (Insured; FGIC) | 5.25 | 7/1/14 | 465,000 | 470,998 | |
The Funds 47
| STATEMENT OF INVESTMENTS (Unaudited) (continued) | |||||
| BNY Mellon National Short-Term Municipal Bond Fund (continued) | |||||
| Long-Term Municipal | Coupon | Maturity | Principal | ||
| Investments (continued) | Rate (%) | Date | Amount ($) | Value ($) | |
| U.S. Related (continued) | |||||
| Puerto Rico Highways and Transportation Authority, | |||||
| Transportation Revenue (Insured; FGIC) (Prerefunded) | 5.25 | 7/1/13 | 1,785,000 | c | 1,816,237 |
| Puerto Rico Infrastructure Financing Authority, Revenue | |||||
| (Ports Authority Project) (LOC; Government | |||||
| Development Bank for Puerto Rico) | 2.75 | 6/17/13 | 10,000,000 | 10,021,600 | |
| Puerto Rico Public Buildings Authority, | |||||
| Government Facilities Revenue (Insured; XLCA) | 5.25 | 7/1/13 | 4,530,000 | 4,580,781 | |
| University of Puerto Rico, University System Revenue | 5.00 | 6/1/13 | 2,315,000 | 2,330,163 | |
| University of Puerto Rico, University System Revenue | 5.00 | 6/1/14 | 2,930,000 | 2,993,933 | |
| Total Long-Term Municipal Investments | |||||
| (cost $1,202,794,148) | 1,218,841,775 | ||||
| Short-Term Municipal Investments—.9% | |||||
| Kentucky—.1% | |||||
| Christian County, Lease Program Revenue (Kentucky | |||||
| Association of Counties Leasing Trust) (LOC; U.S. Bank NA) | 0.11 | 3/1/13 | 305,000 | e | 305,000 |
| Trimble County, Lease Program Revenue (Kentucky | |||||
| Association of Counties Leasing Trust) (LOC; U.S. Bank NA) | 0.11 | 3/1/13 | 1,200,000 | e | 1,200,000 |
| Massachusetts—.8% | |||||
| Massachusetts, GO Notes (Consolidated Loan) | |||||
| (LOC; JPMorgan Chase Bank) | 0.11 | 3/1/13 | 200,000 | e | 200,000 |
| Massachusetts, GO Notes, Refunding | 0.40 | 3/7/13 | 6,000,000 | e | 5,999,880 |
| Massachusetts, GO Notes, Refunding | 0.64 | 3/7/13 | 3,700,000 | e | 3,708,399 |
| Total Short-Term Municipal Investments | |||||
| (cost $11,405,000) | 11,413,279 | ||||
| Total Investments (cost $1,214,199,148) | 99.4 | % | 1,230,255,054 | ||
| Cash and Receivables (Net) | .6 | % | 7,599,684 | ||
| Net Assets | 100.0 | % | 1,237,854,738 | ||
a Variable rate security—interest rate subject to periodic change.
b Purchased on a delayed delivery basis.
c These securities are prerefunded; the date shown represents the prerefunded date. Bonds which are prerefunded are collateralized by U.S. Government securities which are held in
escrow and are used to pay principal and interest on the municipal issue and to retire the bonds in full at the earliest refunding date.
d Security issued with a zero coupon. Income is recognized through the accretion of discount.
e Variable rate demand note—rate shown is the interest rate in effect at February 28, 2013. Maturity date represents the next demand date, or the ultimate maturity date if earlier.
48
| Summary of Abbreviations | ||||||
| ABAG | Association of Bay Area Governments | ACA | American Capital Access | |||
| AGC | ACE Guaranty Corporation | AGIC | Asset Guaranty Insurance Company | |||
| AMBAC | American Municipal Bond Assurance Corporation | ARRN | Adjustable Rate Receipt Notes | |||
| BAN | Bond Anticipation Notes | BPA | Bond Purchase Agreement | |||
| CIFG | CDC Ixis Financial Guaranty | COP | Certificate of Participation | |||
| CP | Commercial Paper | DRIVERS | Derivative Inverse Tax-Exempt Receipts | |||
| EDR | Economic Development Revenue | EIR | Environmental Improvement Revenue | |||
| FGIC | Financial Guaranty Insurance Company | FHA | Federal Housing Administration | |||
| FHLB | Federal Home Loan Bank | FHLMC | Federal Home Loan Mortgage Corporation | |||
| FNMA | Federal National Mortgage Association | GAN | Grant Anticipation Notes | |||
| GIC | Guaranteed Investment Contract | GNMA | Government National Mortgage Association | |||
| GO | General Obligation | HR | Hospital Revenue | |||
| IDB | Industrial Development Board | IDC | Industrial Development Corporation | |||
| IDR | Industrial Development Revenue | LIFERS | Long Inverse Floating Exempt Receipts | |||
| LOC | Letter of Credit | LOR | Limited Obligation Revenue | |||
| LR | Lease Revenue | MERLOTS | Municipal Exempt Receipt Liquidity Option Tender | |||
| MFHR | Multi-Family Housing Revenue | MFMR | Multi-Family Mortgage Revenue | |||
| PCR | Pollution Control Revenue | P-FLOATS | Puttable Floating Option Tax-Exempt Receipts | |||
| PILOT | Payment in Lieu of Taxes | PUTTERS | Puttable Tax-Exempt Receipts | |||
| RAC | Revenue Anticipation Certificates | RAN | Revenue Anticipation Notes | |||
| RAW | Revenue Anticipation Warrants | ROCS | Reset Options Certificates | |||
| RRR | Resources Recovery Revenue | SAAN | State Aid Anticipation Notes | |||
| SBPA | Standby Bond Purchase Agreement | SFHR | Single Family Housing Revenue | |||
| SFMR | Single Family Mortgage Revenue | SONYMA | State of New York Mortgage Agency | |||
| SPEARS | Short Puttable Exempt Adjustable Receipts | SWDR | Solid Waste Disposal Revenue | |||
| TAN | Tax Anticipation Notes | TAW | Tax Anticipation Warrants | |||
| TRAN | Tax and Revenue Anticipation Notes | XLCA | XL Capital Assurance | |||
| Summary of Combined Ratings (Unaudited) | ||||||
| Fitch | or | Moody’s | or | Standard & Poor’s | Value (%)† | |
| AAA | Aaa | AAA | 23.4 | |||
| AA | Aa | AA | 46.6 | |||
| A | A | A | 22.7 | |||
| BBB | Baa | BBB | 6.8 | |||
| F1 | MIG1/P1 | SP1/A1 | .1 | |||
| F2 | MIG2/P2 | SP2/A2 | .2 | |||
| Not Ratedf | Not Ratedf | Not Ratedf | .2 | |||
| 100.0 | ||||||
† Based on total investments.
f Securities which, while not rated by Fitch, Moody’s and Standard & Poor’s, have been determined by the Manager to be of comparable quality to those rated securities in which the
fund may invest.
See notes to financial statements.
The Funds 49
| STATEMENT OF INVESTMENTS | |||||
| February 28, 2013 (Unaudited) | |||||
| BNY Mellon Pennsylvania Intermediate Municipal Bond Fund | |||||
| Long-Term Municipal | Coupon | Maturity | Principal | ||
| Investments—98.1% | Rate (%) | Date | Amount ($) | Value ($) | |
| Alabama—1.5% | |||||
| Jefferson County, Limited Obligation School Warrants | 5.25 | 1/1/15 | 2,500,000 | 2,502,475 | |
| Jefferson County, Limited Obligation School Warrants | |||||
| (Insured; Assured Guaranty Municipal Corp.) | 5.50 | 1/1/21 | 3,500,000 | 3,556,490 | |
| Arizona—.3% | |||||
| University Medical Center Corporation, HR | 5.25 | 7/1/15 | 1,160,000 | 1,225,285 | |
| California—3.3% | |||||
| Agua Caliente Band, Cahuilla Indians Revenue | 6.00 | 7/1/18 | 1,500,000 | a | 1,473,855 |
| Alameda Corridor Transportation Authority, | |||||
| Subordinate Lien Revenue (Insured; AMBAC) | 5.25 | 10/1/21 | 2,000,000 | 2,276,900 | |
| California, GO | 5.50 | 6/1/20 | 45,000 | 45,202 | |
| California, GO (Various Purpose) | 6.50 | 4/1/33 | 1,000,000 | 1,255,220 | |
| Foothill/Eastern Transportation Corridor Agency, Toll Road | |||||
| Revenue (Insured; National Public Finance Guarantee Corp.) | 5.88 | 1/15/27 | 6,000,000 | 6,173,820 | |
| Golden State Tobacco Securitization Corporation, Enhanced | |||||
| Tobacco Settlement Asset-Backed Bonds (Insured; AMBAC) | 5.00 | 6/1/21 | 2,000,000 | 2,012,460 | |
| Colorado—1.5% | |||||
| Northwest Parkway Public Highway Authority, | |||||
| Revenue (Insured; AMBAC) (Prerefunded) | 5.70 | 6/15/16 | 5,000,000 | b | 5,825,700 |
| Florida—1.6% | |||||
| Lake County School Board, COP | |||||
| (Master Lease Purchase Agreement) | 5.00 | 6/1/27 | 1,620,000 | 1,845,990 | |
| Miami-Dade County School Board, COP (Master Lease Purchase | |||||
| Agreement) (Insured; National Public Finance Guarantee Corp.) | 5.00 | 5/1/25 | 3,000,000 | 3,393,810 | |
| Tampa, Sales Tax Revenue | 5.00 | 10/1/25 | 1,000,000 | 1,202,200 | |
| Illinois—.3% | |||||
| Illinois, GO (Insured; National Public Finance Guarantee Corp.) | 5.50 | 8/1/17 | 1,000,000 | 1,170,480 | |
| Massachusetts—.1% | |||||
| Massachusetts Housing Finance Agency, Housing Revenue | 5.13 | 12/1/34 | 350,000 | 354,469 | |
| Michigan—.6% | |||||
| Detroit City School District, School Buildings and | |||||
| Site Improvement Bonds (Insured; FGIC) | 5.25 | 5/1/17 | 2,000,000 | 2,303,160 | |
| New York—.8% | |||||
| New York State Dormitory Authority, State Personal | |||||
| Income Tax Revenue (General Purpose) | 5.00 | 12/15/30 | 2,500,000 | 3,014,700 | |
| Ohio—.9% | |||||
| Ohio, HR (Cleveland Clinic Health System Obligated Group) | 5.00 | 1/1/25 | 3,000,000 | 3,522,810 | |
| Pennsylvania—79.1% | |||||
| Allegheny County Airport Authority, Airport Revenue (Pittsburgh | |||||
| International Airport) (Insured; Assured Guaranty Municipal Corp.) | 5.00 | 1/1/17 | 1,000,000 | 1,152,620 | |
| Allegheny County Higher Education Building | |||||
| Authority, Revenue (Carnegie Mellon University) | 5.00 | 3/1/28 | 2,385,000 | 2,932,596 | |
50
| BNY Mellon Pennsylvania Intermediate Municipal Bond Fund (continued) | |||||
| Long-Term Municipal | Coupon | Maturity | Principal | ||
| Investments (continued) | Rate (%) | Date | Amount ($) | Value ($) | |
| Pennsylvania (continued) | |||||
| Allegheny County Higher Education Building Authority, | |||||
| University Revenue (Duquesne University) | 4.00 | 3/1/21 | 915,000 | 1,041,233 | |
| Allegheny County Hospital Development Authority, | |||||
| Revenue (University of Pittsburgh Medical Center) | 5.00 | 10/15/22 | 1,250,000 | 1,545,875 | |
| Allegheny County Port Authority, | |||||
| Special Transportation Revenue | 5.25 | 3/1/24 | 5,000,000 | 5,931,300 | |
| Allegheny County Sanitary Authority, Sewer Revenue | |||||
| (Insured; Assured Guaranty Municipal Corp.) | 5.00 | 6/1/24 | 1,000,000 | 1,177,900 | |
| Allegheny County Sanitary Authority, Sewer Revenue | |||||
| (Insured; National Public Finance Guarantee Corp.) | 5.00 | 12/1/18 | 2,560,000 | 2,849,818 | |
| Allegheny County Sanitary Authority, Sewer Revenue | |||||
| (Insured; National Public Finance Guarantee Corp.) | 5.00 | 12/1/21 | 4,815,000 | 5,326,642 | |
| Allentown School District, GO | 5.00 | 2/15/22 | 5,875,000 | 6,833,036 | |
| Beaver County Hospital Authority, Revenue | |||||
| (Heritage Valley Health System, Inc.) | 5.00 | 5/15/19 | 1,205,000 | 1,448,844 | |
| Beaver County Hospital Authority, Revenue | |||||
| (Heritage Valley Health System, Inc.) | 5.00 | 5/15/23 | 1,370,000 | 1,630,807 | |
| Beaver County Hospital Authority, Revenue | |||||
| (Heritage Valley Health System, Inc.) | 5.00 | 5/15/25 | 1,250,000 | 1,452,187 | |
| Berks County Municipal Authority, Revenue | |||||
| (The Reading Hospital and Medical Center Project) | 5.00 | 11/1/19 | 2,000,000 | 2,425,300 | |
| Bucks County, GO | 5.00 | 6/1/23 | 1,955,000 | 2,447,543 | |
| Central Bucks School District, GO (Insured; | |||||
| National Public Finance Guarantee Corp.) | 5.00 | 5/15/19 | 1,080,000 | 1,328,357 | |
| Central Bucks School District, GO (Prerefunded) | 5.00 | 5/15/18 | 5,000,000 | b | 6,073,650 |
| Central Dauphin School District, GO (Insured; National | |||||
| Public Finance Guarantee Corp.) (Prerefunded) | 6.75 | 2/1/16 | 5,000,000 | b | 5,913,950 |
| Central Dauphin School District, GO (Insured; National | |||||
| Public Finance Guarantee Corp.) (Prerefunded) | 7.00 | 2/1/16 | 1,630,000 | b | 1,939,260 |
| Chester County, GO | 5.00 | 8/15/18 | 4,545,000 | 5,054,949 | |
| Chester County, GO | 5.00 | 7/15/25 | 3,060,000 | 3,610,096 | |
| Chester County, GO (Prerefunded) | 5.00 | 7/15/19 | 1,940,000 | b | 2,413,050 |
| Commonwealth Financing Authority of Pennsylvania, Revenue | 5.00 | 6/1/24 | 5,000,000 | 5,902,650 | |
| Commonwealth Financing Authority of Pennsylvania, Revenue | 5.00 | 6/1/29 | 5,000,000 | 5,840,350 | |
| Delaware County Authority, University Revenue | |||||
| (Villanova University) (Insured; AMBAC) | 5.00 | 8/1/20 | 2,095,000 | 2,367,434 | |
| Downingtown Area School District, GO | 5.00 | 11/1/18 | 2,010,000 | 2,458,431 | |
| East Stroudsburg Area School District, GO (Insured; | |||||
| Assured Guaranty Municipal Corp.) (Prerefunded) | 7.50 | 9/1/16 | 2,500,000 | b | 3,105,375 |
| Easton Area School District, GO (Insured; | |||||
| Assured Guaranty Municipal Corp.) | 7.50 | 4/1/18 | 1,000,000 | 1,201,390 | |
The Funds 51
| STATEMENT OF INVESTMENTS (Unaudited) (continued) | ||||
| BNY Mellon Pennsylvania Intermediate Municipal Bond Fund (continued) | ||||
| Long-Term Municipal | Coupon | Maturity | Principal | |
| Investments (continued) | Rate (%) | Date | Amount ($) | Value ($) |
| Pennsylvania (continued) | ||||
| Easton Area School District, GO (Insured; | ||||
| Assured Guaranty Municipal Corp.) | 7.50 | 4/1/21 | 3,000,000 | 3,553,560 |
| Easton Area School District, GO (Insured; | ||||
| Assured Guaranty Municipal Corp.) | 7.50 | 4/1/22 | 3,000,000 | 3,553,560 |
| Easton Area School District, GO (Insured; | ||||
| Assured Guaranty Municipal Corp.) | 5.50 | 4/1/23 | 2,260,000 | 2,710,350 |
| Erie County, GO (Insured; | ||||
| National Public Finance Guarantee Corp.) | 5.50 | 9/1/22 | 1,640,000 | 2,116,371 |
| Fox Chapel Area School District, GO | 5.00 | 8/1/28 | 1,295,000 | 1,564,684 |
| Greater Johnstown School District, GO | 5.00 | 8/1/23 | 3,545,000 | 4,187,283 |
| Lehigh County General Purpose Authority, | ||||
| Revenue (Good Shepherd Group) | 5.25 | 11/1/14 | 1,405,000 | 1,481,362 |
| Lower Merion School District, GO | 5.00 | 5/15/18 | 4,735,000 | 5,752,031 |
| Lower Merion School District, GO | 5.00 | 9/1/22 | 2,980,000 | 3,501,291 |
| Monroeville Finance Authority, Revenue | ||||
| (University of Pittsburgh Medical Center) | 5.00 | 2/15/22 | 1,500,000 | 1,822,020 |
| Montgomery County, GO | 5.00 | 12/15/17 | 2,025,000 | 2,426,578 |
| Montgomery County, GO | 5.00 | 12/15/24 | 2,890,000 | 3,451,960 |
| Montgomery County Industrial Development | ||||
| Authority, FHA Insured Mortgage Revenue | ||||
| (New Regional Medical Center Project) | 5.50 | 8/1/25 | 1,000,000 | 1,189,890 |
| Pennsylvania, GO | 5.00 | 7/1/20 | 10,000,000 | 12,511,100 |
| Pennsylvania, GO | 5.00 | 7/1/22 | 1,000,000 | 1,274,490 |
| Pennsylvania, GO | 5.00 | 11/15/23 | 2,300,000 | 2,860,648 |
| Pennsylvania Economic Development Financing | ||||
| Authority, Exempt Facilities Revenue (Amtrak Project) | 5.00 | 11/1/26 | 1,000,000 | 1,136,940 |
| Pennsylvania Economic Development Financing | ||||
| Authority, Exempt Facilities Revenue (Amtrak Project) | 5.00 | 11/1/27 | 1,535,000 | 1,742,486 |
| Pennsylvania Economic Development Financing | ||||
| Authority, Exempt Facilities Revenue (Amtrak Project) | 5.00 | 11/1/32 | 2,425,000 | 2,694,951 |
| Pennsylvania Economic Development Financing | ||||
| Authority, Governmental LR (Forum Place Project) | 5.00 | 3/1/25 | 1,000,000 | 1,183,620 |
| Pennsylvania Economic Development Financing | ||||
| Authority, Unemployment Compensation Revenue | 5.00 | 7/1/20 | 10,000,000 | 12,252,000 |
| Pennsylvania Economic Development Financing | ||||
| Authority, Unemployment Compensation Revenue | 5.00 | 1/1/22 | 5,000,000 | 5,835,100 |
| Pennsylvania Higher Educational Facilities | ||||
| Authority, Revenue (Saint Joseph’s University) | 5.00 | 11/1/25 | 2,010,000 | 2,312,224 |
| Pennsylvania Higher Educational Facilities Authority, | ||||
| Revenue (State System of Higher Education) | 5.25 | 6/15/24 | 5,000,000 | 6,164,300 |
52
| BNY Mellon Pennsylvania Intermediate Municipal Bond Fund (continued) | ||||
| Long-Term Municipal | Coupon | Maturity | Principal | |
| Investments (continued) | Rate (%) | Date | Amount ($) | Value ($) |
| Pennsylvania (continued) | ||||
| Pennsylvania Higher Educational Facilities Authority, | ||||
| Revenue (The Trustees of the University of Pennsylvania) | 5.00 | 9/1/19 | 10,140,000 | 12,543,991 |
| Pennsylvania Higher Educational Facilities Authority, | ||||
| Revenue (Thomas Jefferson University) (Insured; AMBAC) | 5.25 | 9/1/17 | 1,700,000 | 1,970,623 |
| Pennsylvania Higher Educational Facilities Authority, | ||||
| Revenue (Thomas Jefferson University) (Insured; AMBAC) | 5.25 | 9/1/18 | 1,485,000 | 1,756,369 |
| Pennsylvania Industrial Development Authority, EDR | 5.00 | 7/1/19 | 3,000,000 | 3,617,760 |
| Pennsylvania Industrial Development Authority, EDR | 5.00 | 7/1/21 | 3,450,000 | 4,232,529 |
| Pennsylvania Intergovernmental Cooperation | ||||
| Authority, Special Tax Revenue | ||||
| (City of Philadelphia Funding Program) | 5.00 | 6/15/22 | 3,395,000 | 4,120,749 |
| Pennsylvania State University, GO | 5.25 | 8/15/18 | 1,200,000 | 1,471,812 |
| Pennsylvania State University, GO | 5.00 | 3/1/21 | 2,805,000 | 3,323,112 |
| Pennsylvania State University, GO | 5.25 | 8/15/22 | 1,865,000 | 2,372,336 |
| Pennsylvania State University, GO | 5.00 | 3/1/27 | 2,195,000 | 2,547,757 |
| Pennsylvania Turnpike Commission, Registration Fee | ||||
| Revenue (Insured; Assured Guaranty Municipal Corp.) | 5.25 | 7/15/24 | 2,500,000 | 3,110,975 |
| Pennsylvania Turnpike Commission, Registration Fee | ||||
| Revenue (Insured; Assured Guaranty Municipal Corp.) | 5.25 | 7/15/25 | 5,000,000 | 6,231,850 |
| Pennsylvania Turnpike Commission, | ||||
| Turnpike Revenue (Insured; AMBAC) | 5.00 | 12/1/29 | 5,000,000 | 5,368,550 |
| Pennsylvania Turnpike Commission, | ||||
| Turnpike Subordinate Revenue | 5.00 | 12/1/19 | 2,195,000 | 2,619,689 |
| Pennsylvania Turnpike Commission, | ||||
| Turnpike Subordinate Revenue | 5.00 | 6/1/26 | 5,000,000 | 5,802,450 |
| Pennsylvania Turnpike Commission, Turnpike Subordinate | ||||
| Revenue (Insured; Assured Guaranty Municipal Corp.) | 6.00 | 6/1/28 | 1,500,000 | 1,816,695 |
| Philadelphia, Airport Revenue | 5.00 | 6/15/20 | 1,750,000 | 2,096,745 |
| Philadelphia, Airport Revenue | ||||
| (Insured; Assured Guaranty Municipal Corp.) | 5.00 | 6/15/18 | 1,370,000 | 1,611,819 |
| Philadelphia, Water and Wastewater Revenue | 5.00 | 11/1/18 | 1,100,000 | 1,314,291 |
| Philadelphia, Water and Wastewater Revenue | ||||
| (Insured; Assured Guaranty Municipal Corp.) | 5.25 | 7/1/18 | 5,000,000 | 5,475,850 |
| Philadelphia School District, GO | 5.00 | 9/1/20 | 1,805,000 | 2,153,708 |
| Philadelphia School District, GO (Insured; AMBAC) | 5.00 | 4/1/17 | 5,000,000 | 5,420,300 |
| Pittsburgh, GO | 5.00 | 9/1/25 | 2,000,000 | 2,355,560 |
| Pittsburgh, GO | 5.00 | 9/1/26 | 5,000,000 | 5,849,900 |
| Pittsburgh School District, GO (Insured; | ||||
| Assured Guaranty Municipal Corp.) | 5.50 | 9/1/16 | 4,000,000 | 4,599,280 |
The Funds 53
| STATEMENT OF INVESTMENTS (Unaudited) (continued) | |||||
| BNY Mellon Pennsylvania Intermediate Municipal Bond Fund (continued) | |||||
| Long-Term Municipal | Coupon | Maturity | Principal | ||
| Investments (continued) | Rate (%) | Date | Amount ($) | Value ($) | |
| Pennsylvania (continued) | |||||
| Pittsburgh School District, GO (Insured; | |||||
| Assured Guaranty Municipal Corp.) | 5.50 | 9/1/18 | 1,000,000 | 1,212,190 | |
| Pocono Mountain School District, GO | |||||
| (Insured; Assured Guaranty Municipal Corp.) | 5.00 | 9/1/22 | 5,270,000 | 5,991,358 | |
| Saint Mary Hospital Authority, Health System | |||||
| Revenue (Catholic Health East Issue) | 5.00 | 11/15/17 | 2,085,000 | 2,419,788 | |
| Saint Mary Hospital Authority, Health System | |||||
| Revenue (Catholic Health East Issue) | 5.00 | 11/15/21 | 1,000,000 | 1,040,960 | |
| Saint Mary Hospital Authority, Health System | |||||
| Revenue (Catholic Health East Issue) | 5.00 | 11/15/22 | 2,000,000 | 2,273,760 | |
| Southeastern Pennsylvania Transportation | |||||
| Authority, Capital Grant Receipts Bonds | |||||
| (Federal Transit Administration Section 5309 | |||||
| Fixed Guideway Modernization Formula Funds) | 5.00 | 6/1/23 | 2,000,000 | 2,389,360 | |
| Southeastern Pennsylvania | |||||
| Transportation Authority, Revenue | 5.00 | 3/1/26 | 3,000,000 | 3,465,240 | |
| State Public School Building Authority, College | |||||
| Revenue (Harrisburg Area Community College Poject) | 5.00 | 10/1/20 | 2,265,000 | 2,641,013 | |
| State Public School Building Authority, School Lease | |||||
| Revenue (The School District of Philadelphia Project) | 5.00 | 4/1/21 | 1,000,000 | 1,190,160 | |
| State Public School Building Authority, School Revenue | |||||
| (Chester Upland School District Project) | |||||
| (Insured; Assured Guaranty Municipal Corp.) | 5.25 | 9/15/24 | 5,780,000 | 6,883,633 | |
| Susquehanna Area Regional Airport | |||||
| Authority, Airport System Revenue | 5.00 | 1/1/22 | 1,000,000 | 1,101,190 | |
| Susquehanna Area Regional Airport | |||||
| Authority, Airport System Revenue | 5.00 | 1/1/23 | 1,500,000 | 1,647,870 | |
| Susquehanna Area Regional Airport | |||||
| Authority, Airport System Revenue | 5.00 | 1/1/27 | 2,500,000 | 2,703,725 | |
| University of Pittsburgh—of the Commonwealth System | |||||
| of Higher Education, University Capital Project Bonds | 5.50 | 9/15/21 | 2,500,000 | 3,112,500 | |
| University of Pittsburgh—of the Commonwealth System | |||||
| of Higher Education, University Capital Project Bonds | 5.00 | 9/15/28 | 1,580,000 | 1,871,731 | |
| West Chester Area School District, GO | 4.00 | 5/15/21 | 5,000,000 | 5,925,600 | |
| West Mifflin Area School District, GO (Insured; | |||||
| Assured Guaranty Municipal Corp.) | 5.50 | 4/1/24 | 1,060,000 | 1,260,520 | |
| Westmoreland County, GO (Insured; National | |||||
| Public Finance Guarantee Corp.) | 0.00 | 12/1/15 | 1,500,000 | c | 1,422,795 |
| York County Solid Waste and Refuse Authority, | |||||
| Solid Waste System Revenue (Insured; National | |||||
| Public Finance Guarantee Corp.) | 5.50 | 12/1/14 | 1,000,000 | 1,085,240 | |
54
| BNY Mellon Pennsylvania Intermediate Municipal Bond Fund (continued) | |||||
| Long-Term Municipal | Coupon | Maturity | Principal | ||
| Investments (continued) | Rate (%) | Date | Amount ($) | Value ($) | |
| South Carolina—.6% | |||||
| Greenville County School District, Installment Purchase | |||||
| Revenue (Building Equity Sooner for Tomorrow) | 5.50 | 12/1/18 | 2,000,000 | 2,473,940 | |
| U.S. Related—7.5% | |||||
| Guam, Business Privilege Tax Revenue | 5.00 | 1/1/24 | 1,500,000 | 1,763,895 | |
| Guam, LOR (Section 30) | 5.63 | 12/1/29 | 1,000,000 | 1,116,970 | |
| Puerto Rico Commonwealth, Public | |||||
| Improvement GO (Insured; AMBAC) | 5.50 | 7/1/19 | 3,000,000 | 3,289,290 | |
| Puerto Rico Commonwealth, | |||||
| Public Improvement GO (Insured; FGIC) | 5.50 | 7/1/18 | 5,000,000 | 5,470,350 | |
| Puerto Rico Electric Power Authority, Power Revenue | 5.38 | 7/1/24 | 2,000,000 | 2,098,120 | |
| Puerto Rico Electric Power Authority, Power | |||||
| Revenue (Insured; National Public Finance Guarantee Corp.) | 5.25 | 7/1/14 | 5,000,000 | 5,203,750 | |
| Puerto Rico Government Development Bank, Senior Notes | 5.00 | 12/1/15 | 1,870,000 | 1,972,289 | |
| Puerto Rico Infrastructure Financing Authority, | |||||
| Revenue (Ports Authority Project) | 6.00 | 12/15/26 | 2,500,000 | 2,748,025 | |
| Puerto Rico Infrastructure Financing | |||||
| Authority, Special Tax Revenue | 5.00 | 7/1/21 | 5,000,000 | 5,098,200 | |
| Puerto Rico Sales Tax Financing Corporation, | |||||
| Sales Tax Revenue (First Subordinate Series) | 0/6.75 | 8/1/32 | 1,000,000 | d | 1,060,010 |
| Puerto Rico Sales Tax Financing Corporation, | |||||
| Sales Tax Revenue (First Subordinate Series) | 0/6.25 | 8/1/33 | 500,000 | d | 408,385 |
| Total Long-Term Municipal Investments | |||||
| (cost $364,484,993) | 391,965,025 | ||||
| Short-Term Municipal Investments—1.5% | |||||
| Florida—.1% | |||||
| Orange County School Board, COP (Master Lease | |||||
| Purchase Agreement) (LOC; Wells Fargo Bank) | 0.10 | 3/1/13 | 500,000 | e | 500,000 |
| Kentucky—.0% | |||||
| Christian County, Lease Program Revenue (Kentucky | |||||
| Association of Counties Leasing Trust) (LOC; U.S. Bank) | 0.11 | 3/1/13 | 200,000 | e | 200,000 |
| Massachusetts—.4% | |||||
| Massachusetts, GO Notes (Central Artery/Ted Williams | |||||
| Tunnel Infrastructure Loan Act of 2000) | |||||
| (Liquidity Facility; Bank of America) | 0.15 | 3/1/13 | 1,600,000 | e | 1,600,000 |
| New Hampshire—.6% | |||||
| New Hampshire Health and Education Facilities | |||||
| Authority, Revenue (Dartmouth College Issue) | |||||
| (Liquidity Facility; JPMorgan Chase Bank) | 0.10 | 3/1/13 | 2,300,000 | e | 2,300,000 |
The Funds 55
| STATEMENT OF INVESTMENTS (Unaudited) (continued) | |||||
| BNY Mellon Pennsylvania Intermediate Municipal Bond Fund (continued) | |||||
| Short-Term Municipal | Coupon | Maturity | Principal | ||
| Investments (continued) | Rate (%) | Date | Amount ($) | Value ($) | |
| Texas—.2% | |||||
| Dallas Performing Arts Cultural Facilities Corporation, | |||||
| Cultural Facility Revenue (Dallas Center for the Performing | |||||
| Arts Foundation, Inc. Project) (LOC; JPMorgan Chase Bank) | 0.11 | 3/1/13 | 700,000 | e | 700,000 |
| Vermont—.2% | |||||
| Vermont Educational and Health Buildings Financing | |||||
| Agency, Revenue (Landmark College Project) (LOC; TD Bank) | 0.10 | 3/1/13 | 900,000 | e | 900,000 |
| Total Short-Term Municipal Investments | |||||
| (cost $6,200,000) | 6,200,000 | ||||
| Total Investments (cost $370,684,993) | 99.6 | % | 398,165,025 | ||
| Cash and Receivables (Net) | .4 | % | 1,512,157 | ||
| Net Assets | 100.0 | % | 399,677,182 | ||
a Security exempt from registration pursuant to Rule 144A under the Securities Act of 1933.This security may be resold in transactions exempt from registration, normally to
qualified institutional buyers.At February 28, 2013, this security was valued at $1,473,855 or 0.4% of net assets.
b These securities are prerefunded; the date shown represents the prerefunded date. Bonds which are prerefunded are collateralized by U.S. Government securities which are held in
escrow and are used to pay principal and interest on the municipal issue and to retire the bonds in full at the earliest refunding date.
c Security issued with a zero coupon. Income is recognized through the accretion of discount.
d Zero coupon until a specified date at which time the stated coupon rate becomes effective until maturity.
e Variable rate demand note—rate shown is the interest rate in effect at February 28, 2013. Maturity date represents the next demand date, or the ultimate maturity date if earlier.
56
| Summary of Abbreviations | ||||||
| ABAG | Association of Bay Area Governments | ACA | American Capital Access | |||
| AGC | ACE Guaranty Corporation | AGIC | Asset Guaranty Insurance Company | |||
| AMBAC | American Municipal Bond Assurance Corporation | ARRN | Adjustable Rate Receipt Notes | |||
| BAN | Bond Anticipation Notes | BPA | Bond Purchase Agreement | |||
| CIFG | CDC Ixis Financial Guaranty | COP | Certificate of Participation | |||
| CP | Commercial Paper | DRIVERS | Derivative Inverse Tax-Exempt Receipts | |||
| EDR | Economic Development Revenue | EIR | Environmental Improvement Revenue | |||
| FGIC | Financial Guaranty Insurance Company | FHA | Federal Housing Administration | |||
| FHLB | Federal Home Loan Bank | FHLMC | Federal Home Loan Mortgage Corporation | |||
| FNMA | Federal National Mortgage Association | GAN | Grant Anticipation Notes | |||
| GIC | Guaranteed Investment Contract | GNMA | Government National Mortgage Association | |||
| GO | General Obligation | HR | Hospital Revenue | |||
| IDB | Industrial Development Board | IDC | Industrial Development Corporation | |||
| IDR | Industrial Development Revenue | LIFERS | Long Inverse Floating Exempt Receipts | |||
| LOC | Letter of Credit | LOR | Limited Obligation Revenue | |||
| LR | Lease Revenue | MERLOTS | Municipal Exempt Receipt Liquidity Option Tender | |||
| MFHR | Multi-Family Housing Revenue | MFMR | Multi-Family Mortgage Revenue | |||
| PCR | Pollution Control Revenue | P-FLOATS | Puttable Floating Option Tax-Exempt Receipts | |||
| PILOT | Payment in Lieu of Taxes | PUTTERS | Puttable Tax-Exempt Receipts | |||
| RAC | Revenue Anticipation Certificates | RAN | Revenue Anticipation Notes | |||
| RAW | Revenue Anticipation Warrants | ROCS | Reset Options Certificates | |||
| RRR | Resources Recovery Revenue | SAAN | State Aid Anticipation Notes | |||
| SBPA | Standby Bond Purchase Agreement | SFHR | Single Family Housing Revenue | |||
| SFMR | Single Family Mortgage Revenue | SONYMA | State of New York Mortgage Agency | |||
| SPEARS | Short Puttable Exempt Adjustable Receipts | SWDR | Solid Waste Disposal Revenue | |||
| TAN | Tax Anticipation Notes | TAW | Tax Anticipation Warrants | |||
| TRAN | Tax and Revenue Anticipation Notes | XLCA | XL Capital Assurance | |||
| Summary of Combined Ratings (Unaudited) | ||||||
| Fitch | or | Moody’s | or | Standard & Poor’s | Value (%)† | |
| AAA | Aaa | AAA | 12.5 | |||
| AA | Aa | AA | 49.7 | |||
| A | A | A | 23.2 | |||
| BBB | Baa | BBB | 10.9 | |||
| BB | Ba | BB | .4 | |||
| B | B | B | .6 | |||
| F1 | MIG1/P1 | SP1/A1 | .6 | |||
| Not Ratedf | Not Ratedf | Not Ratedf | 2.1 | |||
| 100.0 | ||||||
† Based on total investments.
f Securities which, while not rated by Fitch, Moody’s and Standard & Poor’s, have been determined by the Manager to be of comparable quality to those rated securities in which the
fund may invest.
See notes to financial statements.
The Funds 57
STATEMENT OF FINANCIAL FUTURES
February 28, 2013 (Unaudited)
| Market Value | Unrealized | |||||
| BNY Mellon Pennsylvania | Covered by | Appreciation | ||||
| Intermediate Municipal Bond Fund | Contracts | Contracts ($) | Expiration | at 2/28/2013 | ($) | |
| Financial Futures Short | ||||||
| U.S. Treasury 10 Year Notes | 90 | (11,943,281 | ) | March 2013 | 63,281 | |
| See notes to financial statements. | ||||||
58
| STATEMENT OF INVESTMENTS | |||||
| February 28, 2013 (Unaudited) | |||||
| BNY Mellon Massachusetts Intermediate Municipal Bond Fund | |||||
| Long-Term Municipal | Coupon | Maturity | Principal | ||
| Investments—96.5% | Rate (%) | Date | Amount ($) | Value ($) | |
| Massachusetts—88.2% | |||||
| Ashland, GO (Insured; AMBAC) | 5.25 | 5/15/21 | 1,305,000 | 1,440,955 | |
| Auburn, GO (Insured; AMBAC) | 5.13 | 6/1/20 | 1,225,000 | 1,294,409 | |
| Barnstable, GO | 4.00 | 9/15/21 | 580,000 | 695,188 | |
| Barnstable, GO | 4.00 | 9/15/22 | 560,000 | 671,972 | |
| Boston, GO | 4.00 | 4/1/18 | 3,000,000 | 3,479,640 | |
| Boston, GO | 4.00 | 10/1/19 | 910,000 | 1,077,986 | |
| Boston, GO | 5.00 | 4/1/20 | 5,000,000 | 6,271,700 | |
| Boston, GO | 5.00 | 3/1/21 | 2,000,000 | 2,307,500 | |
| Boston Water and Sewer Commission, General Revenue | 5.00 | 11/1/17 | 2,000,000 | 2,394,120 | |
| Boston Water and Sewer Commission, General Revenue | 5.00 | 11/1/18 | 1,500,000 | 1,834,650 | |
| Boston Water and Sewer Commission, General Revenue | 5.00 | 11/1/24 | 1,000,000 | 1,254,970 | |
| Boston Water and Sewer Commission, General Revenue | 5.00 | 11/1/25 | 2,500,000 | 3,006,550 | |
| Boston Water and Sewer Commission, General Revenue | 5.00 | 11/1/26 | 2,480,000 | 2,935,080 | |
| Brockton, GO (Municipal Purpose Loan) (Insured; AMBAC) | 5.00 | 6/1/19 | 1,430,000 | 1,555,912 | |
| Everett, GO (Insured; National Public Finance Guarantee Corp.) | 5.38 | 12/15/17 | 1,250,000 | 1,353,888 | |
| Falmouth, GO (Municipal Purpose Loan) | 4.00 | 11/15/19 | 625,000 | 735,125 | |
| Falmouth, GO (Municipal Purpose Loan) | 4.00 | 11/15/20 | 605,000 | 715,455 | |
| Groton-Dunstable Regional School District, GO | 5.00 | 9/1/20 | 725,000 | 888,676 | |
| Haverhill, GO (State Qualified Municipal Purpose Loan) | |||||
| (Insured; National Public Finance Guarantee Corp.) | 5.00 | 6/1/16 | 1,580,000 | 1,803,143 | |
| Haverhill, GO (State Qualified Municipal Purpose Loan) | |||||
| (Insured; National Public Finance Guarantee Corp.) | 5.00 | 6/1/18 | 505,000 | 570,110 | |
| Hopedale, GO (Insured; AMBAC) | 5.00 | 11/15/19 | 650,000 | 699,927 | |
| Lynnfield, GO (Municipal Purpose Loan) (Prerefunded) | 5.00 | 7/1/14 | 525,000 | a | 559,151 |
| Lynnfield, GO (Municipal Purpose Loan) (Prerefunded) | 5.00 | 7/1/14 | 585,000 | a | 623,054 |
| Lynnfield, GO (Municipal Purpose Loan) (Prerefunded) | 5.00 | 7/1/14 | 585,000 | a | 623,054 |
| Mansfield, GO (Insured; AMBAC) | 5.00 | 8/15/17 | 1,395,000 | 1,545,325 | |
| Massachusetts, GO | 0.66 | 11/1/18 | 2,500,000 | b | 2,518,925 |
| Massachusetts, GO | 5.25 | 8/1/20 | 1,060,000 | 1,346,571 | |
| Massachusetts, GO | 5.25 | 8/1/23 | 1,000,000 | 1,288,990 | |
| Massachusetts, GO (Consolidated Loan) | 5.00 | 8/1/20 | 4,000,000 | 4,801,360 | |
| Massachusetts, GO (Consolidated Loan) | |||||
| (Insured; Assured Guaranty Municipal Corp.) | 5.25 | 8/1/22 | 5,825,000 | 6,879,500 | |
| Massachusetts, GO (Consolidated Loan) (Insured; FGIC) | 5.50 | 8/1/18 | 1,035,000 | 1,284,849 | |
| Massachusetts, GO (Consolidated Loan) (Prerefunded) | 5.00 | 8/1/16 | 1,000,000 | a | 1,152,920 |
| Massachusetts, GO (Insured; AMBAC) | 5.50 | 10/1/18 | 225,000 | 280,620 | |
| Massachusetts, GO (Insured; National | |||||
| Public Finance Guarantee Corp.) | 5.50 | 10/1/20 | 1,500,000 | 1,937,955 | |
| Massachusetts, Special Obligation Dedicated Tax Revenue | |||||
| (Insured; National Public Finance Guarantee Corp.) | 0.85 | 1/1/16 | 3,540,000 | b | 3,743,515 |
The Funds 59
STATEMENT OF INVESTMENTS (Unaudited) (continued)
| BNY Mellon Massachusetts Intermediate Municipal Bond Fund (continued) | |||||
| Long-Term Municipal | Coupon | Maturity | Principal | ||
| Investments (continued) | Rate (%) | Date | Amount ($) | Value ($) | |
| Massachusetts (continued) | |||||
| Massachusetts Bay Transportation Authority, Assessment Revenue | 5.00 | 7/1/18 | 4,000,000 | 4,852,240 | |
| Massachusetts Bay Transportation Authority, | |||||
| Senior Sales Tax Revenue | 5.50 | 7/1/16 | 105,000 | 122,433 | |
| Massachusetts Bay Transportation Authority, | |||||
| Senior Sales Tax Revenue | 5.25 | 7/1/18 | 1,250,000 | 1,534,775 | |
| Massachusetts Bay Transportation Authority, | |||||
| Senior Sales Tax Revenue | 5.00 | 7/1/20 | 2,500,000 | 3,137,700 | |
| Massachusetts Bay Transportation Authority, | |||||
| Senior Sales Tax Revenue | 5.25 | 7/1/21 | 2,000,000 | 2,572,400 | |
| Massachusetts Bay Transportation Authority, | |||||
| Senior Sales Tax Revenue | 5.25 | 7/1/22 | 2,430,000 | 3,153,897 | |
| Massachusetts College Building Authority, Project Revenue | 5.00 | 5/1/23 | 1,000,000 | 1,190,640 | |
| Massachusetts College Building Authority, Revenue | 5.00 | 5/1/24 | 2,500,000 | 3,080,500 | |
| Massachusetts Development Finance Agency, | |||||
| Education Revenue (Dexter School Project) | 5.00 | 5/1/23 | 1,400,000 | 1,563,394 | |
| Massachusetts Development Finance Agency, | |||||
| Education Revenue (Dexter School Project) | 5.00 | 5/1/24 | 1,465,000 | 1,626,736 | |
| Massachusetts Development Finance Agency, | |||||
| Higher Education Revenue (Emerson College Issue) | 5.00 | 1/1/16 | 1,000,000 | 1,100,670 | |
| Massachusetts Development Finance Agency, | |||||
| Higher Education Revenue (Emerson College Issue) | 5.00 | 1/1/19 | 1,055,000 | 1,172,063 | |
| Massachusetts Development Finance Agency, | |||||
| Higher Education Revenue (Emerson College Issue) | 5.00 | 1/1/22 | 2,000,000 | 2,187,760 | |
| Massachusetts Development Finance Agency, Recovery Zone | |||||
| Facility Revenue (Dominion Energy Brayton Point Issue) | 2.25 | 9/1/16 | 2,560,000 | 2,641,792 | |
| Massachusetts Development Finance Agency, | |||||
| Revenue (Boston College Issue) | 5.00 | 7/1/20 | 1,000,000 | 1,161,930 | |
| Massachusetts Development Finance Agency, | |||||
| Revenue (College of the Holy Cross Issue) | 5.00 | 9/1/21 | 1,800,000 | 2,140,164 | |
| Massachusetts Development Finance Agency, | |||||
| Revenue (Curry College Issue) (Insured; ACA) | 4.75 | 3/1/20 | 530,000 | 565,605 | |
| Massachusetts Development Finance Agency, | |||||
| Revenue (Curry College Issue) (Insured; ACA) | 5.25 | 3/1/26 | 1,000,000 | 1,057,230 | |
| Massachusetts Development Finance Agency, | |||||
| Revenue (Curry College Issue) (Insured; ACA) | 5.00 | 3/1/36 | 1,000,000 | 1,031,650 | |
| Massachusetts Development Finance Agency, | |||||
| Revenue (Emerson College Issue) | 4.00 | 1/1/14 | 225,000 | 230,573 | |
| Massachusetts Development Finance Agency, | |||||
| Revenue (Harvard University Issue) | 5.00 | 10/15/20 | 1,700,000 | 2,157,895 | |
| Massachusetts Development Finance Agency, Revenue | |||||
| (Massachusetts College of Pharmacy and Allied Health Sciences | |||||
| Issue) (Insured; Assured Guaranty Municipal Corp.) (Prerefunded) | 5.00 | 7/1/15 | 2,750,000 | a | 3,048,980 |
| Massachusetts Development Finance Agency, Revenue | |||||
| (Massachusetts College of Pharmacy and Allied Health Sciences | |||||
| Issue) (Insured; Assured Guaranty Municipal Corp.) (Prerefunded) | 5.00 | 7/1/15 | 1,000,000 | a | 1,108,720 |
60
BNY Mellon Massachusetts Intermediate Municipal Bond Fund (continued)
| Long-Term Municipal | Coupon | Maturity | Principal | |
| Investments (continued) | Rate (%) | Date | Amount ($)�� | Value ($) |
| Massachusetts (continued) | ||||
| Massachusetts Development Finance Agency, | ||||
| Revenue (Olin College Issue) (Insured; XLCA) | 5.25 | 7/1/33 | 5,000,000 | 5,067,400 |
| Massachusetts Development Finance Agency, | ||||
| Revenue (Partners HealthCare System Issue) | 5.00 | 7/1/25 | 1,825,000 | 2,177,152 |
| Massachusetts Development Finance Agency, | ||||
| Revenue (Partners HealthCare System Issue) | 5.00 | 7/1/26 | 2,000,000 | 2,371,820 |
| Massachusetts Development Finance Agency, Revenue | ||||
| (Southcoast Health System Obligated Group Issue) | 4.00 | 7/1/20 | 530,000 | 607,094 |
| Massachusetts Development Finance Agency, Revenue | ||||
| (Southcoast Health System Obligated Group Issue) | 5.00 | 7/1/27 | 500,000 | 590,525 |
| Massachusetts Development Finance Agency, | ||||
| Revenue (The Broad Institute Issue) | 5.25 | 4/1/23 | 3,630,000 | 4,355,637 |
| Massachusetts Development Finance Agency, | ||||
| Revenue (The Broad Institute Issue) | 5.25 | 4/1/24 | 2,500,000 | 2,977,150 |
| Massachusetts Development Finance Agency, | ||||
| Revenue (The Park School Issue) | 5.00 | 9/1/21 | 300,000 | 355,344 |
| Massachusetts Development Finance Agency, | ||||
| Revenue (Tufts Medical Center Issue) | 5.00 | 1/1/15 | 600,000 | 637,938 |
| Massachusetts Development Finance Agency, | ||||
| Revenue (Tufts Medical Center Issue) | 5.00 | 1/1/17 | 925,000 | 1,030,182 |
| Massachusetts Development Finance Agency, | ||||
| Revenue (UMass Memorial Issue) | 5.00 | 7/1/17 | 2,500,000 | 2,842,150 |
| Massachusetts Development Finance Agency, | ||||
| Revenue (UMass Memorial Issue) | 5.00 | 7/1/19 | 2,000,000 | 2,331,020 |
| Massachusetts Development Finance Agency, Revenue | ||||
| (Worcester City Campus Corporation Issue) | ||||
| (University of Massachusetts Project) | 4.00 | 10/1/17 | 730,000 | 833,047 |
| Massachusetts Development Finance Agency, Revenue | ||||
| (Worcester City Campus Corporation Issue) | ||||
| (University of Massachusetts Project) | 5.00 | 10/1/19 | 910,000 | 1,119,118 |
| Massachusetts Development Finance Agency, Revenue | ||||
| (Worcester City Campus Corporation Issue) | ||||
| (University of Massachusetts Project) | 5.00 | 10/1/20 | 905,000 | 1,125,739 |
| Massachusetts Development Finance Agency, Revenue | ||||
| (Worcester City Campus Corporation Issue) | ||||
| (University of Massachusetts Project) | 5.00 | 10/1/21 | 830,000 | 1,042,040 |
| Massachusetts Development Finance Agency, | ||||
| RRR (Waste Management, Inc. Project) | 2.13 | 12/1/15 | 1,250,000 | 1,279,213 |
| Massachusetts Development Finance Agency, | ||||
| SWDR (Dominion Energy Brayton Point Issue) | 5.75 | 5/1/19 | 2,000,000 | 2,443,200 |
| Massachusetts Development Finance Agency, | ||||
| SWDR (Waste Management, Inc. Project) | 5.45 | 6/1/14 | 1,000,000 | 1,057,110 |
| Massachusetts Health and Educational | ||||
| Facilities Authority, Revenue | ||||
| (Berklee College of Music Issue) | 5.00 | 10/1/24 | 2,155,000 | 2,478,207 |
The Funds 61
STATEMENT OF INVESTMENTS (Unaudited) (continued)
| BNY Mellon Massachusetts Intermediate Municipal Bond Fund (continued) | ||||
| Long-Term Municipal | Coupon | Maturity | Principal | |
| Investments (continued) | Rate (%) | Date | Amount ($) | Value ($) |
| Massachusetts (continued) | ||||
| Massachusetts Health and Educational Facilities Authority, | ||||
| Revenue (Berklee College of Music Issue) | 5.00 | 10/1/32 | 2,000,000 | 2,234,460 |
| Massachusetts Health and Educational Facilities Authority, | ||||
| Revenue (Berklee College of Music Issue) | 5.00 | 10/1/37 | 3,250,000 | 3,596,742 |
| Massachusetts Health and Educational Facilities Authority, | ||||
| Revenue (Cape Cod Healthcare Obligated Group Issue) | ||||
| (Insured; Assured Guaranty Municipal Corp.) | 5.13 | 11/15/35 | 1,000,000 | 1,098,000 |
| Massachusetts Health and Educational Facilities | ||||
| Authority, Revenue (CareGroup Issue) | 5.00 | 7/1/18 | 590,000 | 703,469 |
| Massachusetts Health and Educational Facilities Authority, | ||||
| Revenue (CareGroup Issue) (Capital Asset Program) | ||||
| (Insured; National Public Finance Guarantee Corp.) | 5.38 | 2/1/27 | 1,650,000 | 1,879,350 |
| Massachusetts Health and Educational Facilities Authority, | ||||
| Revenue (CareGroup Issue) (Insured; National | ||||
| Public Finance Guarantee Corp.) | 5.25 | 7/1/20 | 1,000,000 | 1,163,190 |
| Massachusetts Health and Educational Facilities Authority, | ||||
| Revenue (CareGroup Issue) (Insured; National | ||||
| Public Finance Guarantee Corp.) | 5.25 | 7/1/23 | 1,000,000 | 1,163,190 |
| Massachusetts Health and Educational Facilities Authority, | ||||
| Revenue (Dana-Farber Cancer Institute Issue) | 5.25 | 12/1/22 | 2,750,000 | 3,228,032 |
| Massachusetts Health and Educational Facilities Authority, | ||||
| Revenue (Dana-Farber Cancer Institute Issue) | 5.25 | 12/1/27 | 2,000,000 | 2,320,760 |
| Massachusetts Health and Educational Facilities Authority, | ||||
| Revenue (Dana-Farber Cancer Institute Issue) | 5.00 | 12/1/37 | 2,500,000 | 2,768,350 |
| Massachusetts Health and Educational Facilities Authority, | ||||
| Revenue (Dartmouth-Hitchcock Obligated Group Issue) | ||||
| (Insured; Assured Guaranty Municipal Corp.) | 5.13 | 8/1/22 | 2,000,000 | 2,004,920 |
| Massachusetts Health and Educational Facilities Authority, | ||||
| Revenue (Harvard University Issue) | 5.00 | 12/15/21 | 5,385,000 | 6,938,411 |
| Massachusetts Health and Educational Facilities Authority, | ||||
| Revenue (Harvard University Issue) | 5.00 | 12/15/25 | 2,500,000 | 3,039,050 |
| Massachusetts Health and Educational Facilities Authority, | ||||
| Revenue (Harvard University Issue) | 5.00 | 12/15/27 | 3,230,000 | 3,919,508 |
| Massachusetts Health and Educational Facilities Authority, | ||||
| Revenue (Isabella Stewart Gardner Museum Issue) | 5.00 | 5/1/21 | 1,400,000 | 1,650,096 |
| Massachusetts Health and Educational Facilities Authority, | ||||
| Revenue (Isabella Stewart Gardner Museum Issue) | 5.00 | 5/1/26 | 2,525,000 | 2,911,350 |
| Massachusetts Health and Educational Facilities Authority, | ||||
| Revenue (Isabella Stewart Gardner Museum Issue) | 5.00 | 5/1/27 | 1,000,000 | 1,152,270 |
| Massachusetts Health and Educational Facilities Authority, | ||||
| Revenue (Massachusetts Eye and Ear Infirmary Issue) | 5.00 | 7/1/14 | 500,000 | 522,635 |
| Massachusetts Health and Educational Facilities Authority, | ||||
| Revenue (Massachusetts Eye and Ear Infirmary Issue) | 5.00 | 7/1/15 | 500,000 | 538,850 |
| Massachusetts Health and Educational Facilities Authority, | ||||
| Revenue (Massachusetts Institute of Technology Issue) | 5.50 | 7/1/22 | 1,800,000 | 2,409,606 |
62
| BNY Mellon Massachusetts Intermediate Municipal Bond Fund (continued) | ||||
| Long-Term Municipal | Coupon | Maturity | Principal | |
| Investments (continued) | Rate (%) | Date | Amount ($) | Value ($) |
| Massachusetts (continued) | ||||
| Massachusetts Health and Educational Facilities Authority, | ||||
| Revenue (Massachusetts Institute of Technology Issue) | 5.00 | 7/1/23 | 3,335,000 | 4,332,365 |
| Massachusetts Health and Educational Facilities Authority, | ||||
| Revenue (Massachusetts Institute of Technology Issue) | 5.00 | 7/1/38 | 1,000,000 | 1,153,170 |
| Massachusetts Health and Educational Facilities Authority, | ||||
| Revenue (Milford Regional Medical Center Issue) | 5.00 | 7/15/22 | 500,000 | 526,190 |
| Massachusetts Health and Educational Facilities Authority, | ||||
| Revenue (Northeastern University Issue) | 5.00 | 10/1/24 | 2,495,000 | 2,934,569 |
| Massachusetts Health and Educational Facilities Authority, | ||||
| Revenue (Northeastern University Issue) | 5.00 | 10/1/24 | 1,000,000 | 1,215,540 |
| Massachusetts Health and Educational Facilities Authority, | ||||
| Revenue (Northeastern University Issue) | 5.63 | 10/1/29 | 3,000,000 | 3,625,170 |
| Massachusetts Health and Educational Facilities Authority, | ||||
| Revenue (Northeastern University Issue) | 5.00 | 10/1/30 | 3,000,000 | 3,434,130 |
| Massachusetts Health and Educational Facilities Authority, | ||||
| Revenue (Partners HealthCare System Issue) | 5.00 | 7/1/16 | 95,000 | 96,402 |
| Massachusetts Health and Educational Facilities Authority, | ||||
| Revenue (Partners HealthCare System Issue) | 5.00 | 7/1/18 | 1,500,000 | 1,745,250 |
| Massachusetts Health and Educational Facilities Authority, | ||||
| Revenue (Partners HealthCare System Issue) | 5.00 | 7/1/21 | 1,235,000 | 1,423,659 |
| Massachusetts Health and Educational Facilities Authority, | ||||
| Revenue (Partners HealthCare System Issue) | 5.00 | 7/1/22 | 250,000 | 288,190 |
| Massachusetts Health and Educational Facilities Authority, | ||||
| Revenue (Simmons College Issue) | 7.50 | 10/1/22 | 1,000,000 | 1,252,260 |
| Massachusetts Health and Educational Facilities Authority, | ||||
| Revenue (Simmons College Issue) | 8.00 | 10/1/29 | 1,800,000 | 2,082,150 |
| Massachusetts Health and Educational Facilities Authority, | ||||
| Revenue (Simmons College Issue) | 8.00 | 10/1/39 | 1,500,000 | 1,735,125 |
| Massachusetts Health and Educational Facilities Authority, | ||||
| Revenue (Tufts University Issue) | 5.25 | 8/15/23 | 1,000,000 | 1,198,390 |
| Massachusetts Health and Educational Facilities Authority, | ||||
| Revenue (Tufts University Issue) | 5.38 | 8/15/38 | 2,000,000 | 2,363,040 |
| Massachusetts Health and Educational Facilities Authority, | ||||
| Revenue (UMass Memorial Issue) | 5.25 | 7/1/25 | 2,000,000 | 2,139,840 |
| Massachusetts Housing Finance Agency, Housing Revenue | 4.00 | 6/1/19 | 3,255,000 | 3,592,316 |
| Massachusetts Housing Finance Agency, Housing Revenue | 5.13 | 12/1/34 | 200,000 | 202,554 |
| Massachusetts Industrial Finance Agency, Education Revenue | ||||
| (Saint John’s High School of Worcester County, Inc. Issue) | 5.70 | 6/1/18 | 1,135,000 | 1,136,555 |
| Massachusetts Port Authority, Revenue | 4.00 | 7/1/20 | 1,000,000 | 1,176,210 |
| Massachusetts Port Authority, Revenue | 5.00 | 7/1/28 | 2,500,000 | 2,999,675 |
| Massachusetts Port Authority, | ||||
| Revenue (Insured; AMBAC) | 5.00 | 7/1/19 | 5,000,000 | 5,529,300 |
| Massachusetts School Building Authority, | ||||
| Dedicated Sales Tax Revenue (Insured; AMBAC) | 5.00 | 8/15/20 | 4,000,000 | 4,703,320 |
The Funds 63
STATEMENT OF INVESTMENTS (Unaudited) (continued)
| BNY Mellon Massachusetts Intermediate Municipal Bond Fund (continued) | ||||
| Long-Term Municipal | Coupon | Maturity | Principal | |
| Investments (continued) | Rate (%) | Date | Amount ($) | Value ($) |
| Massachusetts (continued) | ||||
| Massachusetts School Building Authority, | ||||
| Senior Dedicated Sales Tax Revenue | 5.00 | 8/15/21 | 5,000,000 | 6,344,300 |
| Massachusetts School Building Authority, | ||||
| Senior Dedicated Sales Tax Revenue | 5.00 | 8/15/25 | 6,380,000 | 7,898,695 |
| Massachusetts School Building Authority, | ||||
| Senior Dedicated Sales Tax Revenue | 5.00 | 10/15/27 | 4,655,000 | 5,648,656 |
| Massachusetts Turnpike Authority, | ||||
| Turnpike Revenue (Insured; National | ||||
| Public Finance Guarantee Corp.) | 5.00 | 1/1/20 | 5,000,000 | 5,810,800 |
| Massachusetts Water Pollution Abatement Trust (Pool Program) | 5.63 | 8/1/13 | 25,000 | 25,122 |
| Massachusetts Water Pollution Abatement Trust (Pool Program) | 5.00 | 8/1/18 | 75,000 | 75,319 |
| Massachusetts Water Pollution Abatement Trust (Pool Program) | 5.00 | 8/1/21 | 2,625,000 | 3,076,867 |
| Massachusetts Water Pollution Abatement Trust (Pool Program) | 5.25 | 8/1/23 | 1,500,000 | 1,961,265 |
| Massachusetts Water Pollution Abatement Trust (Pool Program) | 5.00 | 8/1/32 | 605,000 | 607,226 |
| Massachusetts Water Pollution Abatement Trust, | ||||
| State Revolving Fund Bonds | 5.00 | 8/1/18 | 3,120,000 | 3,807,461 |
| Massachusetts Water Pollution Abatement Trust, | ||||
| Water Pollution Abatement Revenue (MWRA Program) | 5.75 | 8/1/29 | 155,000 | 155,694 |
| Massachusetts Water Resources Authority, General Revenue | 5.00 | 8/1/19 | 2,475,000 | 3,056,947 |
| Massachusetts Water Resources Authority, General Revenue | 5.00 | 8/1/22 | 2,500,000 | 3,181,925 |
| Massachusetts Water Resources Authority, General Revenue | 5.00 | 8/1/27 | 5,000,000 | 6,068,600 |
| Massachusetts Water Resources Authority, General Revenue | ||||
| (Insured; National Public Finance Guarantee Corp.) | 5.25 | 8/1/19 | 1,500,000 | 1,782,285 |
| Massachusetts Water Resources Authority, General Revenue | ||||
| (Insured; National Public Finance Guarantee Corp.) | 5.25 | 8/1/21 | 1,000,000 | 1,188,190 |
| Massachusetts Water Resources Authority, General Revenue | ||||
| (Insured; National Public Finance Guarantee Corp.) | 5.25 | 8/1/24 | 2,500,000 | 2,958,525 |
| Middleborough, GO (Insured; | ||||
| National Public Finance Guarantee Corp.) | 5.00 | 12/15/16 | 1,000,000 | 1,156,320 |
| Middleborough, GO (Insured; | ||||
| National Public Finance Guarantee Corp.) | 5.00 | 12/15/18 | 1,275,000 | 1,461,150 |
| Milton, GO School Bonds | 5.00 | 3/1/23 | 500,000 | 544,840 |
| Milton, GO School Bonds | 5.00 | 3/1/24 | 500,000 | 544,315 |
| Milton, GO School Bonds | 5.00 | 3/1/25 | 500,000 | 543,790 |
| Northampton, GO (Insured; | ||||
| National Public Finance Guarantee Corp.) | 5.13 | 10/15/16 | 1,985,000 | 2,143,582 |
| Northbridge, GO (Insured; AMBAC) | 5.25 | 2/15/17 | 60,000 | 60,565 |
| Pembroke, GO (Insured; | ||||
| National Public Finance Guarantee Corp.) | 5.00 | 8/1/20 | 960,000 | 1,087,613 |
| Randolph, GO (Insured; AMBAC) | 5.00 | 9/1/24 | 490,000 | 523,874 |
| Springfield Water and Sewer Commission, | ||||
| General Revenue (Insured; AMBAC) | 5.00 | 7/15/22 | 1,175,000 | 1,316,070 |
64
| BNY Mellon Massachusetts Intermediate Municipal Bond Fund (continued) | |||||
| Long-Term Municipal | Coupon | Maturity | Principal | ||
| Investments (continued) | Rate (%) | Date | Amount ($) | Value ($) | |
| Massachusetts (continued) | |||||
| Springfield Water and Sewer Commission, | |||||
| General Revenue (Insured; AMBAC) | 5.00 | 7/15/23 | 1,235,000 | 1,380,236 | |
| University of Massachusetts Building Authority, Project Revenue | 5.00 | 11/1/18 | 1,370,000 | 1,668,879 | |
| Waltham, GO (Municipal Purpose Loan) | 5.00 | 2/1/19 | 1,195,000 | 1,461,843 | |
| Westwood, GO | 4.00 | 6/1/18 | 1,105,000 | 1,283,435 | |
| Worcester, GO (Insured; National Public Finance Guarantee Corp.) | 5.25 | 8/15/16 | 1,000,000 | 1,073,030 | |
| Worcester, GO (Insured; National Public Finance Guarantee Corp.) | 5.25 | 8/15/17 | 1,000,000 | 1,080,230 | |
| Worcester, GO (Insured; National Public Finance Guarantee Corp.) | 5.00 | 4/1/18 | 625,000 | 681,087 | |
| U.S. Related—8.3% | |||||
| Guam, Business Privilege Tax Revenue | 5.00 | 1/1/25 | 1,500,000 | 1,745,970 | |
| Guam, Hotel Occupancy Tax Revenue | 6.00 | 11/1/26 | 500,000 | 590,045 | |
| Guam, LOR (Section 30) | 5.63 | 12/1/29 | 1,000,000 | 1,116,970 | |
| Puerto Rico Commonwealth, Public Improvement GO | 5.50 | 7/1/18 | 2,500,000 | 2,735,175 | |
| Puerto Rico Commonwealth, Public Improvement GO | 5.25 | 7/1/22 | 1,500,000 | 1,539,600 | |
| Puerto Rico Commonwealth, Public Improvement GO | |||||
| (Insured; National Public Finance Guarantee Corp.) | 5.50 | 7/1/15 | 1,135,000 | 1,204,110 | |
| Puerto Rico Commonwealth, Public Improvement GO | |||||
| (Insured; National Public Finance Guarantee Corp.) | 5.50 | 7/1/19 | 1,000,000 | 1,096,430 | |
| Puerto Rico Electric Power Authority, Power Revenue | 5.25 | 7/1/23 | 2,000,000 | 2,140,500 | |
| Puerto Rico Electric Power Authority, Power Revenue | |||||
| (Insured; National Public Finance Guarantee Corp.) | 5.00 | 7/1/17 | 1,000,000 | 1,046,620 | |
| Puerto Rico Government Development Bank, Senior Notes | 5.25 | 1/1/15 | 2,000,000 | 2,032,120 | |
| Puerto Rico Government Development Bank, Senior Notes | 5.00 | 12/1/15 | 1,090,000 | 1,149,623 | |
| Puerto Rico Highways and Transportation Authority, | |||||
| Highway Revenue (Insured; FGIC) | 5.50 | 7/1/16 | 3,265,000 | 3,810,647 | |
| Puerto Rico Highways and Transportation Authority, | |||||
| Transportation Revenue (Insured; FGIC) | 5.25 | 7/1/15 | 305,000 | 308,617 | |
| Puerto Rico Highways and Transportation Authority, | |||||
| Transportation Revenue (Insured; FGIC) | 5.25 | 7/1/16 | 330,000 | 333,914 | |
| Puerto Rico Infrastructure Financing Authority, | |||||
| Revenue (Ports Authority Project) | 6.00 | 12/15/26 | 2,500,000 | 2,748,025 | |
| Puerto Rico Infrastructure Financing | |||||
| Authority, Special Tax Revenue | 5.00 | 7/1/20 | 2,260,000 | 2,319,958 | |
| Puerto Rico Public Buildings Authority, | |||||
| Government Facilities Revenue | 5.75 | 7/1/22 | 1,780,000 | 1,855,775 | |
| Puerto Rico Sales Tax Financing Corporation, | |||||
| Sales Tax Revenue (First Subordinate Series) | 0/6.75 | 8/1/32 | 1,000,000 | c | 1,060,010 |
| Puerto Rico Sales Tax Financing Corporation, | |||||
| Sales Tax Revenue (First Subordinate Series) | 0/6.25 | 8/1/33 | 750,000 | c | 612,577 |
| Total Long-Term Municipal Investments | |||||
| (cost $316,040,693) | 341,966,609 | ||||
The Funds 65
STATEMENT OF INVESTMENTS (Unaudited) (continued)
| BNY Mellon Massachusetts Intermediate Municipal Bond Fund (continued) | ||||||
| Short-Term Municipal | Coupon | Maturity | Principal | |||
| Investments—3.9% | Rate (%) | Date | Amount ($) | Value ($) | ||
| Massachusetts; | ||||||
| Massachusetts, GO Notes (Central Artery/Ted Williams | ||||||
| Tunnel Infrastructure Loan Act of 2000) | ||||||
| (Liquidity Facility; U.S. Bank NA) | 0.10 | 3/1/13 | 2,000,000 | d | 2,000,000 | |
| Massachusetts, GO Notes (Consolidated Loan) | 0.45 | 3/7/13 | 3,500,000 | d | 3,501,435 | |
| Massachusetts, GO Notes (Consolidated Loan) | 0.54 | 3/7/13 | 1,500,000 | d | 1,500,690 | |
| Massachusetts, GO Notes (Consolidated Loan) | ||||||
| (LOC; JPMorgan Chase Bank) | 0.11 | 3/1/13 | 2,800,000 | d | 2,800,000 | |
| Massachusetts Health and Educational Facilities | ||||||
| Authority, Revenue (Baystate Medical Center Issue) | ||||||
| (LOC; JPMorgan Chase Bank) | 0.11 | 3/1/13 | 2,850,000 | d | 2,850,000 | |
| Massachusetts Health and Educational Facilities | ||||||
| Authority, Revenue (Children’s Hospital Issue) | ||||||
| (LOC; JPMorgan Chase Bank) | 0.10 | 3/1/13 | 500,000 | d | 500,000 | |
| Massachusetts Health and Educational Facilities | ||||||
| Authority, Revenue (Museum of Fine Arts Issue) | ||||||
| (Liquidity Facility; Bank of America) | 0.13 | 3/1/13 | 200,000 | d | 200,000 | |
| Massachusetts Health and Educational Facilities Authority, | ||||||
| Revenue (Stonehill College Issue) (LOC; JPMorgan Chase Bank) | 0.09 | 3/1/13 | 600,000 | d | 600,000 | |
| Total Short-Term Municipal Investments | ||||||
| (cost $13,950,000) | 13,952,125 | |||||
| Total Investments (cost $329,990,693) | 100.4 | % | 355,918,734 | |||
| Liabilities, Less Cash and Receivables | (.4 | %) | (1,603,018 | ) | ||
| Net Assets | 100.0 | % | 354,315,716 | |||
a These securities are prerefunded; the date shown represents the prerefunded date. Bonds which are prerefunded are collateralized by U.S. Government securities which are held in
escrow and are used to pay principal and interest on the municipal issue and to retire the bonds in full at the earliest refunding date.
b Variable rate security—interest rate subject to periodic change.
c Zero coupon until a specified date at which time the stated coupon rate becomes effective until maturity.
d Variable rate demand note—rate shown is the interest rate in effect at February 28, 2013. Maturity date represents the next demand date, or the ultimate maturity date if earlier.
66
| Summary of Abbreviations | ||||||
| ABAG | Association of Bay Area Governments | ACA | American Capital Access | |||
| AGC | ACE Guaranty Corporation | AGIC | Asset Guaranty Insurance Company | |||
| AMBAC | American Municipal Bond Assurance Corporation | ARRN | Adjustable Rate Receipt Notes | |||
| BAN | Bond Anticipation Notes | BPA | Bond Purchase Agreement | |||
| CIFG | CDC Ixis Financial Guaranty | COP | Certificate of Participation | |||
| CP | Commercial Paper | DRIVERS | Derivative Inverse Tax-Exempt Receipts | |||
| EDR | Economic Development Revenue | EIR | Environmental Improvement Revenue | |||
| FGIC | Financial Guaranty Insurance Company | FHA | Federal Housing Administration | |||
| FHLB | Federal Home Loan Bank | FHLMC | Federal Home Loan Mortgage Corporation | |||
| FNMA | Federal National Mortgage Association | GAN | Grant Anticipation Notes | |||
| GIC | Guaranteed Investment Contract | GNMA | Government National Mortgage Association | |||
| GO | General Obligation | HR | Hospital Revenue | |||
| IDB | Industrial Development Board | IDC | Industrial Development Corporation | |||
| IDR | Industrial Development Revenue | LIFERS | Long Inverse Floating Exempt Receipts | |||
| LOC | Letter of Credit | LOR | Limited Obligation Revenue | |||
| LR | Lease Revenue | MERLOTS | Municipal Exempt Receipt Liquidity Option Tender | |||
| MFHR | Multi-Family Housing Revenue | MFMR | Multi-Family Mortgage Revenue | |||
| PCR | Pollution Control Revenue | P-FLOATS | Puttable Floating Option Tax-Exempt Receipts | |||
| PILOT | Payment in Lieu of Taxes | PUTTERS | Puttable Tax-Exempt Receipts | |||
| RAC | Revenue Anticipation Certificates | RAN | Revenue Anticipation Notes | |||
| RAW | Revenue Anticipation Warrants | ROCS | Reset Options Certificates | |||
| RRR | Resources Recovery Revenue | SAAN | State Aid Anticipation Notes | |||
| SBPA | Standby Bond Purchase Agreement | SFHR | Single Family Housing Revenue | |||
| SFMR | Single Family Mortgage Revenue | SONYMA | State of New York Mortgage Agency | |||
| SPEARS | Short Puttable Exempt Adjustable Receipts | SWDR | Solid Waste Disposal Revenue | |||
| TAN | Tax Anticipation Notes | TAW | Tax Anticipation Warrants | |||
| TRAN | Tax and Revenue Anticipation Notes | XLCA | XL Capital Assurance | |||
| Summary of Combined Ratings (Unaudited) | ||||||
| Fitch | or | Moody’s | or | Standard & Poor’s | Value (%)† | |
| AAA | Aaa | AAA | 19.4 | |||
| AA | Aa | AA | 47.7 | |||
| A | A | A | 17.5 | |||
| BBB | Baa | BBB | 13.6 | |||
| F1 | MIG1/P1 | SP1/A1 | 1.7 | |||
| Not Ratede | Not Ratede | Not Ratede | .1 | |||
| 100.0 | ||||||
† Based on total investments.
e Securities which, while not rated by Fitch, Moody’s and Standard & Poor’s, have been determined by the Manager to be of comparable quality to those rated securities in which the
fund may invest.
See notes to financial statements.
The Funds 67
STATEMENT OF FINANCIAL FUTURES
February 28, 2013 (Unaudited)
| Market Value | Unrealized | |||||
| BNY Mellon Massachusetts | Covered by | Appreciation | ||||
| Intermediate Municipal Bond Fund | Contracts | Contracts ($) | Expiration | at 2/28/2013 | ($) | |
| Financial Futures Short | ||||||
| U.S. Treasury 10 Year Notes | 70 | (9,289,219 | ) | March 2013 | 49,219 | |
| See notes to financial statements. | ||||||
68
| STATEMENT OF INVESTMENTS | |||||
| February 28, 2013 (Unaudited) | |||||
| BNY Mellon New York Intermediate Tax-Exempt Bond Fund | |||||
| Long-Term Municipal | Coupon | Maturity | Principal | ||
| Investments—97.9% | Rate (%) | Date | Amount ($) | Value ($) | |
| New York—91.2% | |||||
| Albany County Airport Authority, Airport Revenue | |||||
| (Insured; Assured Guaranty Municipal Corp.) | 5.00 | 12/15/23 | 1,500,000 | 1,736,640 | |
| Albany Industrial Development Agency, Civic Facility | |||||
| Revenue (Saint Peter’s Hospital of the City of Albany Project) | 5.75 | 11/15/22 | 2,500,000 | 2,888,700 | |
| Buffalo, General Improvement GO | 4.00 | 4/1/21 | 2,175,000 | 2,448,767 | |
| Erie County Fiscal Stability Authority, | |||||
| Sales Tax and State Aid Secured Revenue | 5.00 | 12/1/24 | 2,000,000 | 2,419,200 | |
| Erie County Industrial Development Agency, | |||||
| Revenue (City School District of the City of Buffalo Project) | 5.00 | 5/1/17 | 2,500,000 | 2,903,300 | |
| Hempstead, Public Improvement GO | 5.00 | 8/15/20 | 1,255,000 | 1,579,907 | |
| Long Island Power Authority, Electric System General Revenue | 5.00 | 5/1/21 | 1,000,000 | 1,209,420 | |
| Long Island Power Authority, Electric System General Revenue | 5.00 | 9/1/22 | 2,000,000 | 2,434,980 | |
| Long Island Power Authority, Electric System General | |||||
| Revenue (Insured; National Public Finance Guarantee Corp.) | 5.00 | 12/1/17 | 2,780,000 | 3,171,980 | |
| Long Island Power Authority, Electric System General Revenue | |||||
| (Insured; National Public Finance Guarantee Corp.) | 5.00 | 12/1/18 | 1,000,000 | 1,144,180 | |
| Madison County Capital Resource Corporation, | |||||
| Revenue (Colgate University Project) | 5.00 | 7/1/31 | 1,000,000 | 1,203,790 | |
| Metropolitan Transportation Authority, Dedicated Tax Fund | |||||
| Revenue (Insured; National Public Finance Guarantee Corp.) | 5.00 | 11/15/28 | 5,000,000 | 5,719,600 | |
| Metropolitan Transportation Authority, Transportation Revenue | 5.00 | 11/15/17 | 1,000,000 | 1,141,490 | |
| Metropolitan Transportation Authority, Transportation Revenue | 6.25 | 11/15/23 | 300,000 | 378,438 | |
| Metropolitan Transportation Authority, Transportation | |||||
| Revenue (Insured; Assured Guaranty Municipal Corp.) | 0.40 | 11/1/22 | 2,500,000 | a | 2,425,000 |
| Monroe County Industrial Development Corporation, | |||||
| Revenue (Saint John Fisher College Project) | 5.00 | 6/1/17 | 1,740,000 | 1,965,452 | |
| Nassau County, General Improvement GO | 4.00 | 10/1/16 | 1,545,000 | 1,709,836 | |
| Nassau County, General Improvement GO | 5.00 | 10/1/18 | 1,310,000 | 1,564,729 | |
| Nassau County, General Improvement GO | 4.00 | 4/1/23 | 2,895,000 | 3,217,532 | |
| Nassau County, GO (Insured; Assured Guaranty Municipal Corp.) | 5.00 | 7/1/22 | 1,000,000 | 1,173,830 | |
| Nassau County Interim Finance Authority, | |||||
| Sales Tax Secured Revenue | 4.00 | 11/15/18 | 2,000,000 | 2,348,680 | |
| Nassau County Interim Finance Authority, | |||||
| Sales Tax Secured Revenue | 4.00 | 11/15/20 | 2,750,000 | 3,270,822 | |
| Nassau County Sewer and Storm Water Finance | |||||
| Authority, System Revenue (Insured; Berkshire | |||||
| Hathaway Assurance Corporation) | 5.38 | 11/1/28 | 1,000,000 | 1,188,630 | |
| New York City, GO | 5.00 | 8/1/17 | 1,535,000 | 1,816,795 | |
| New York City, GO | 5.00 | 8/1/18 | 1,000,000 | 1,146,400 | |
| New York City, GO | 5.00 | 8/1/22 | 1,140,000 | 1,432,877 | |
| New York City, GO | 5.13 | 12/1/22 | 1,000,000 | 1,188,890 | |
| New York City, GO | 5.25 | 9/1/23 | 1,000,000 | 1,206,890 | |
The Funds 69
| STATEMENT OF INVESTMENTS (Unaudited) (continued) | ||||
| BNY Mellon New York Intermediate Tax-Exempt Bond Fund (continued) | ||||
| Long-Term Municipal | Coupon | Maturity | Principal | |
| Investments (continued) | Rate (%) | Date | Amount ($) | Value ($) |
| New York (continued) | ||||
| New York City Industrial Development Agency, Civic Facility | ||||
| Revenue (United Jewish Appeal—Federation of Jewish | ||||
| Philanthropies of New York, Inc. Project) | 5.00 | 7/1/27 | 1,250,000 | 1,319,387 |
| New York City Industrial Development Agency, PILOT | ||||
| Revenue (Queens Baseball Stadium Project) | ||||
| (Insured; Assured Guaranty Municipal Corp.) | 6.50 | 1/1/46 | 325,000 | 381,430 |
| New York City Industrial Development Agency, PILOT | ||||
| Revenue (Yankee Stadium Project) (Insured; | ||||
| Assured Guaranty Municipal Corp.) | 7.00 | 3/1/49 | 1,000,000 | 1,239,330 |
| New York City Industrial Development Agency, Special | ||||
| Revenue (New York City—New York Stock Exchange Project) | 5.00 | 5/1/21 | 1,000,000 | 1,172,920 |
| New York City Municipal Water Finance Authority, Water and | ||||
| Sewer System Second General Resolution Revenue | 5.00 | 6/15/20 | 2,500,000 | 2,990,375 |
| New York City Transitional Finance Authority, Building Aid Revenue | 5.25 | 1/15/25 | 1,545,000 | 1,870,980 |
| New York City Transitional Finance Authority, Building Aid Revenue | 5.25 | 1/15/27 | 1,650,000 | 1,923,653 |
| New York City Transitional Finance Authority, | ||||
| Future Tax Secured Revenue | 5.50 | 11/15/17 | 5,000 | 5,024 |
| New York City Transitional Finance Authority, | ||||
| Future Tax Secured Subordinate Revenue | 5.00 | 11/1/18 | 1,750,000 | 2,140,320 |
| New York City Transitional Finance Authority, | ||||
| Future Tax Secured Subordinate Revenue | 5.00 | 11/1/20 | 1,000,000 | 1,248,960 |
| New York City Transitional Finance Authority, | ||||
| Future Tax Secured Subordinate Revenue | 5.00 | 11/1/21 | 1,145,000 | 1,446,959 |
| New York City Transitional Finance Authority, | ||||
| Future Tax Secured Subordinate Revenue | 5.00 | 8/1/22 | 255,000 | 291,865 |
| New York City Trust for Cultural Resources, Revenue | ||||
| (Lincoln Center for the Performing Arts, Inc.) | 5.75 | 12/1/16 | 1,000,000 | 1,169,230 |
| New York City Trust for Cultural Resources, | ||||
| Revenue (The Juilliard School) | 5.00 | 1/1/34 | 2,000,000 | 2,324,160 |
| New York City Trust for Cultural Resources, | ||||
| Revenue (The Juilliard School) | 5.00 | 1/1/39 | 2,500,000 | 2,899,525 |
| New York City Trust for Cultural Resources, | ||||
| Revenue (The Museum of Modern Art) | 5.00 | 4/1/25 | 1,150,000 | 1,366,050 |
| New York City Trust for Cultural Resources, | ||||
| Revenue (The Museum of Modern Art) | 5.00 | 4/1/31 | 1,965,000 | 2,304,316 |
| New York City Trust for Cultural Resources, | ||||
| Revenue (Whitney Museum of American Art) | 5.00 | 7/1/21 | 2,000,000 | 2,412,460 |
| New York Liberty Development Corporation, | ||||
| Liberty Revenue (7 World Trade Center Project) | 5.00 | 9/15/29 | 3,000,000 | 3,543,930 |
| New York Liberty Development Corporation, | ||||
| Revenue (Goldman Sachs Headquarters Issue) | 5.00 | 10/1/15 | 3,175,000 | 3,472,116 |
| New York Local Government Assistance | ||||
| Corporation, Senior Lien Revenue | 5.00 | 4/1/18 | 2,500,000 | 2,929,325 |
| New York Local Government Assistance | ||||
| Corporation, Subordinate Lien Revenue | 5.00 | 4/1/17 | 1,150,000 | 1,353,447 |
70
| BNY Mellon New York Intermediate Tax-Exempt Bond Fund (continued) | ||||
| Long-Term Municipal | Coupon | Maturity | Principal | |
| Investments (continued) | Rate (%) | Date | Amount ($) | Value ($) |
| New York (continued) | ||||
| New York Local Government Assistance | ||||
| Corporation, Subordinate Lien Revenue | 5.00 | 4/1/19 | 2,500,000 | 3,078,725 |
| New York Local Government Assistance | ||||
| Corporation, Subordinate Lien Revenue | 5.00 | 4/1/20 | 1,000,000 | 1,247,420 |
| New York Local Government Assistance | ||||
| Corporation, Subordinate Lien Revenue | 5.00 | 4/1/20 | 1,000,000 | 1,247,420 |
| New York State, GO | 5.00 | 3/1/19 | 1,000,000 | 1,160,280 |
| New York State, GO | 5.00 | 2/15/26 | 2,600,000 | 3,114,332 |
| New York State Bridge Authority, General Revenue | 4.00 | 1/1/22 | 2,010,000 | 2,351,117 |
| New York State Dormitory Authority, Consolidated | ||||
| Fifth General Resolution Revenue (City University System) | 5.00 | 7/1/19 | 1,000,000 | 1,137,890 |
| New York State Dormitory Authority, Consolidated | ||||
| Revenue (City University System) (Insured; FGIC) | 5.75 | 7/1/18 | 2,370,000 | 2,640,701 |
| New York State Dormitory Authority, LR | ||||
| (State University Dormitory Facilities Issue) | 5.00 | 7/1/18 | 1,000,000 | 1,089,540 |
| New York State Dormitory Authority, Mental Health | ||||
| Services Facilities Improvement Revenue | ||||
| (Insured; Assured Guaranty Municipal Corp.) | 5.00 | 2/15/17 | 1,460,000 | 1,690,169 |
| New York State Dormitory Authority, Mental Health | ||||
| Services Facilities Improvement Revenue | ||||
| (Insured; Assured Guaranty Municipal Corp.) | 5.00 | 2/15/27 | 2,005,000 | 2,356,156 |
| New York State Dormitory Authority, Revenue (Columbia University) | 5.00 | 7/1/18 | 1,500,000 | 1,718,610 |
| New York State Dormitory Authority, Revenue (Columbia University) | 5.00 | 10/1/20 | 1,000,000 | 1,267,630 |
| New York State Dormitory Authority, Revenue (Convent of the | ||||
| Sacred Heart) (Insured; Assured Guaranty Municipal Corp.) | 5.63 | 11/1/35 | 1,000,000 | 1,172,780 |
| New York State Dormitory Authority, Revenue (Memorial | ||||
| Sloan-Kettering Cancer Center) (Insured; National | ||||
| Public Finance Guarantee Corp.) | 5.50 | 7/1/23 | 2,000,000 | 2,615,000 |
| New York State Dormitory Authority, Revenue | ||||
| (Mount Sinai Hospital Obligated Group) | 5.00 | 7/1/26 | 3,000,000 | 3,421,260 |
| New York State Dormitory Authority, Revenue (New York University) | 5.25 | 7/1/34 | 2,650,000 | 3,144,861 |
| New York State Dormitory Authority, Revenue (New York University) | ||||
| (Insured; National Public Finance Guarantee Corp.) | 5.00 | 7/1/21 | 1,500,000 | 1,588,785 |
| New York State Dormitory Authority, Revenue | ||||
| (Rochester Institute of Technology) | 5.00 | 7/1/23 | 1,000,000 | 1,175,130 |
| New York State Dormitory Authority, Revenue | ||||
| (School Districts Revenue Financing Program) | 5.00 | 10/1/18 | 3,040,000 | 3,623,893 |
| New York State Dormitory Authority, Revenue | ||||
| (State University Educational Facilities) | ||||
| (Insured; National Public Finance Guarantee Corp.) | 5.25 | 5/15/15 | 500,000 | 533,925 |
| New York State Dormitory Authority, | ||||
| Revenue (The Rockefeller University) | 5.00 | 7/1/25 | 1,000,000 | 1,198,970 |
| New York State Dormitory Authority, | ||||
| Revenue (The Rockefeller University) | 5.00 | 7/1/40 | 3,000,000 | 3,376,320 |
The Funds 71
| STATEMENT OF INVESTMENTS (Unaudited) (continued) | ||||
| BNY Mellon New York Intermediate Tax-Exempt Bond Fund (continued) | ||||
| Long-Term Municipal | Coupon | Maturity | Principal | |
| Investments (continued) | Rate (%) | Date | Amount ($) | Value ($) |
| New York (continued) | ||||
| New York State Dormitory Authority, Revenue (Yeshiva University) | 5.00 | 11/1/20 | 3,190,000 | 3,872,756 |
| New York State Dormitory Authority, State Personal | ||||
| Income Tax Revenue (Education) | 5.75 | 3/15/36 | 1,000,000 | 1,214,810 |
| New York State Dormitory Authority, State Personal | ||||
| Income Tax Revenue (General Purpose) | 5.00 | 2/15/20 | 1,110,000 | 1,370,195 |
| New York State Dormitory Authority, State Personal | ||||
| Income Tax Revenue (General Purpose) | 5.00 | 3/15/21 | 1,000,000 | 1,254,130 |
| New York State Dormitory Authority, Third General Resolution | ||||
| Revenue (State University Educational Facilities Issue) | 4.00 | 5/15/20 | 1,000,000 | 1,163,620 |
| New York State Environmental Facilities Corporation, State Clean | ||||
| Water and Drinking Water Revolving Funds Revenue | ||||
| (New York City Municipal Water Finance Authority Projects) | 5.00 | 6/15/23 | 3,000,000 | 3,568,050 |
| New York State Environmental Facilities Corporation, State Clean | ||||
| Water and Drinking Water Revolving Funds Revenue | ||||
| (New York City Municipal Water Finance Authority Projects) | 5.00 | 6/15/30 | 1,000,000 | 1,054,110 |
| New York State Medical Care Facilities Finance Agency, | ||||
| Secured Mortgage Revenue (Collateralized; SONYMA) | 6.38 | 11/15/20 | 210,000 | 211,023 |
| New York State Mortgage Agency, Homeowner Mortgage Revenue | 5.38 | 10/1/17 | 225,000 | 225,644 |
| New York State Municipal Bond Bank Agency, Recovery Act | ||||
| Revenue (Insured; Assured Guaranty Municipal Corp.) | 5.00 | 5/15/16 | 2,000,000 | 2,274,040 |
| New York State Thruway Authority, General Revenue | 5.00 | 1/1/20 | 1,500,000 | 1,827,600 |
| New York State Thruway Authority, | ||||
| General Revenue (Insured; AMBAC) | 5.00 | 1/1/19 | 1,000,000 | 1,081,330 |
| New York State Thruway Authority, General Revenue | ||||
| (Insured; National Public Finance Guarantee Corp.) | 5.00 | 1/1/24 | 1,000,000 | 1,152,480 |
| New York State Thruway Authority, Second General Highway | ||||
| and Bridge Trust Fund Bonds (Insured; AMBAC) | 5.00 | 4/1/25 | 2,000,000 | 2,246,060 |
| New York State Thruway Authority, State Personal | ||||
| Income Tax Revenue (Transportation) | 5.00 | 3/15/26 | 2,200,000 | 2,634,610 |
| New York State Urban Development Corporation, Revenue | 5.50 | 1/1/19 | 1,140,000 | 1,408,117 |
| New York State Urban Development Corporation, | ||||
| Service Contract Revenue | 5.00 | 1/1/21 | 5,000,000 | 6,020,150 |
| New York State Urban Development Corporation, | ||||
| Service Contract Revenue | 5.25 | 1/1/24 | 2,375,000 | 2,794,164 |
| Onondaga County Trust for Cultural Resources, | ||||
| Revenue (Syracuse University Project) | 5.00 | 12/1/19 | 2,500,000 | 3,041,850 |
| Oyster Bay, Public Improvement GO | 5.00 | 2/15/16 | 1,000,000 | 1,113,200 |
| Oyster Bay, Public Improvement GO | 3.00 | 8/15/16 | 2,000,000 | 2,123,400 |
| Patchogue-Medford Union Free School District, GO | ||||
| (Insured; Assured Guaranty Municipal Corp.) | 4.00 | 10/1/21 | 1,555,000 | 1,753,745 |
72
| BNY Mellon New York Intermediate Tax-Exempt Bond Fund (continued) | |||||
| Long-Term Municipal | Coupon | Maturity | Principal | ||
| Investments (continued) | Rate (%) | Date | Amount ($) | Value ($) | |
| New York (continued) | |||||
| Port Authority of New York and New Jersey (Consolidated Bonds, | |||||
| 140th Series) (Insured; Assured Guaranty Municipal Corp.) | 5.00 | 12/1/19 | 1,000,000 | 1,112,400 | |
| Port Authority of New York and New Jersey | |||||
| (Consolidated Bonds, 142nd Series) | 5.00 | 7/15/21 | 1,000,000 | 1,120,600 | |
| Port Authority of New York and New Jersey | |||||
| (Consolidated Bonds, 173rd Series) | 5.00 | 12/1/18 | 1,000,000 | 1,220,580 | |
| Port Authority of New York and New Jersey | |||||
| (Consolidated Bonds, 173rd Series) | 4.00 | 12/1/23 | 1,000,000 | 1,151,090 | |
| Sales Tax Asset Receivable Corporation, Sales Tax Asset Revenue | |||||
| (Insured; National Public Finance Guarantee Corp.) | 5.00 | 10/15/25 | 1,450,000 | 1,560,809 | |
| Suffolk County, GO | 5.00 | 4/1/19 | 1,400,000 | 1,644,118 | |
| Suffolk County Industrial Development Agency, Civic Facility | |||||
| Revenue (New York Institute of Technology Project) | 5.00 | 3/1/26 | 750,000 | 773,130 | |
| Triborough Bridge and Tunnel Authority, | |||||
| General Purpose Revenue (Prerefunded) | 5.25 | 1/1/22 | 1,000,000 | b | 1,291,690 |
| Triborough Bridge and Tunnel Authority, | |||||
| General Revenue (MTA Bridges and Tunnels) | 5.00 | 11/15/23 | 1,500,000 | 1,902,825 | |
| Westchester County Health Care Corporation, Senior Lien Revenue | 5.00 | 11/1/20 | 1,400,000 | 1,663,438 | |
| Westchester County Health Care Corporation, Senior Lien Revenue | 5.00 | 11/1/24 | 1,500,000 | 1,724,250 | |
| U.S. Related—6.7% | |||||
| Guam, Business Privilege Tax Revenue | 5.00 | 1/1/24 | 1,000,000 | 1,175,930 | |
| Guam, Hotel Occupancy Tax Revenue | 5.00 | 11/1/16 | 1,000,000 | 1,104,080 | |
| Puerto Rico Commonwealth, Public Improvement GO | |||||
| (Insured; National Public Finance Guarantee Corp.) | 5.50 | 7/1/19 | 2,500,000 | 2,741,075 | |
| Puerto Rico Electric Power Authority, Power Revenue | 5.38 | 7/1/24 | 1,000,000 | 1,049,060 | |
| Puerto Rico Electric Power Authority, | |||||
| Power Revenue (Insured; XLCA) | 5.50 | 7/1/17 | 1,000,000 | 1,104,280 | |
| Puerto Rico Government Development Bank, Senior Notes | 5.00 | 12/1/15 | 3,500,000 | 3,691,450 | |
| Puerto Rico Housing Finance Authority, Capital Fund Program | |||||
| Revenue (Puerto Rico Housing Administration Projects) | 5.00 | 12/1/18 | 260,000 | 268,346 | |
| Puerto Rico Housing Finance Authority, Capital Fund Program | |||||
| Revenue (Puerto Rico Housing Administration Projects) | 5.00 | 12/1/19 | 270,000 | 278,459 | |
| Puerto Rico Public Buildings Authority, Government Facilities Revenue | 5.75 | 7/1/22 | 1,000,000 | 1,042,570 | |
| Puerto Rico Sales Tax Financing Corporation, | |||||
| Sales Tax Revenue (First Subordinate Series) | 0/6.75 | 8/1/32 | 1,700,000 | c | 1,802,017 |
| Puerto Rico Sales Tax Financing Corporation, | |||||
| Sales Tax Revenue (First Subordinate Series) | 0/6.25 | 8/1/33 | 500,000 | c | 408,385 |
| Total Long-Term Municipal Investments | |||||
| (cost $199,830,489) | 215,029,097 | ||||
The Funds 73
| STATEMENT OF INVESTMENTS (Unaudited) (continued) | |||||
| BNY Mellon New York Intermediate Tax-Exempt Bond Fund (continued) | |||||
| Short-Term Municipal | Coupon | Maturity | Principal | ||
| Investments—1.2% | Rate (%) | Date | Amount ($) | Value ($) | |
| New York; | |||||
| New York City, GO Notes (LOC; Fortis Bank) | 0.11 | 3/1/13 | 100,000 | d | 100,000 |
| New York City, GO Notes (LOC; Fortis Bank) | 0.11 | 3/1/13 | 1,100,000 | d | 1,100,000 |
| New York City Trust for Cultural Resources, | |||||
| Revenue, Refunding (Lincoln Center for the | |||||
| Performing Arts, Inc.) (LOC; Bank of America) | 0.12 | 3/1/13 | 1,500,000 | d | 1,500,000 |
| Total Short-Term Municipal Investments | |||||
| (cost $2,700,000) | 2,700,000 | ||||
| Total Investments (cost $202,530,489) | 99.1 | % | 217,729,097 | ||
| Cash and Receivables (Net) | .9 | % | 1,923,280 | ||
| Net Assets | 100.0 | % | 219,652,377 | ||
a Variable rate security—interest rate subject to periodic change.
b This security is prerefunded; the date shown represents the prerefunded date. Bonds which are prerefunded are collateralized by U.S. Government securities which are held in escrow
and are used to pay principal and interest on the municipal issue and to retire the bonds in full at the earliest refunding date.
c Zero coupon until a specified date at which time the stated coupon rate becomes effective until maturity.
d Variable rate demand note—rate shown is the interest rate in effect at February 28, 2013. Maturity date represents the next demand date, or the ultimate maturity date if earlier.
74
| Summary of Abbreviations | ||||||
| ABAG | Association of Bay Area Governments | ACA | American Capital Access | |||
| AGC | ACE Guaranty Corporation | AGIC | Asset Guaranty Insurance Company | |||
| AMBAC | American Municipal Bond Assurance Corporation | ARRN | Adjustable Rate Receipt Notes | |||
| BAN | Bond Anticipation Notes | BPA | Bond Purchase Agreement | |||
| CIFG | CDC Ixis Financial Guaranty | COP | Certificate of Participation | |||
| CP | Commercial Paper | DRIVERS | Derivative Inverse Tax-Exempt Receipts | |||
| EDR | Economic Development Revenue | EIR | Environmental Improvement Revenue | |||
| FGIC | Financial Guaranty Insurance Company | FHA | Federal Housing Administration | |||
| FHLB | Federal Home Loan Bank | FHLMC | Federal Home Loan Mortgage Corporation | |||
| FNMA | Federal National Mortgage Association | GAN | Grant Anticipation Notes | |||
| GIC | Guaranteed Investment Contract | GNMA | Government National Mortgage Association | |||
| GO | General Obligation | HR | Hospital Revenue | |||
| IDB | Industrial Development Board | IDC | Industrial Development Corporation | |||
| IDR | Industrial Development Revenue | LIFERS | Long Inverse Floating Exempt Receipts | |||
| LOC | Letter of Credit | LOR | Limited Obligation Revenue | |||
| LR | Lease Revenue | MERLOTS | Municipal Exempt Receipt Liquidity Option Tender | |||
| MFHR | Multi-Family Housing Revenue | MFMR | Multi-Family Mortgage Revenue | |||
| PCR | Pollution Control Revenue | P-FLOATS | Puttable Floating Option Tax-Exempt Receipts | |||
| PILOT | Payment in Lieu of Taxes | PUTTERS | Puttable Tax-Exempt Receipts | |||
| RAC | Revenue Anticipation Certificates | RAN | Revenue Anticipation Notes | |||
| RAW | Revenue Anticipation Warrants | ROCS | Reset Options Certificates | |||
| RRR | Resources Recovery Revenue | SAAN | State Aid Anticipation Notes | |||
| SBPA | Standby Bond Purchase Agreement | SFHR | Single Family Housing Revenue | |||
| SFMR | Single Family Mortgage Revenue | SONYMA | State of New York Mortgage Agency | |||
| SPEARS | Short Puttable Exempt Adjustable Receipts | SWDR | Solid Waste Disposal Revenue | |||
| TAN | Tax Anticipation Notes | TAW | Tax Anticipation Warrants | |||
| TRAN | Tax and Revenue Anticipation Notes | XLCA | XL Capital Assurance | |||
| Summary of Combined Ratings (Unaudited) | ||||||
| Fitch | or | Moody’s | or | Standard & Poor’s | Value (%)† | |
| AAA | Aaa | AAA | 19.3 | |||
| AA | Aa | AA | 46.7 | |||
| A | A | A | 26.6 | |||
| BBB | Baa | BBB | 6.2 | |||
| F1 | MIG1/P1 | SP1/A1 | 1.2 | |||
| 100.0 | ||||||
| † Based on total investments. | ||||||
| See notes to financial statements. | ||||||
The Funds 75
STATEMENT OF FINANCIAL FUTURES
February 28, 2013 (Unaudited)
| Market Value | Unrealized | |||||
| BNY Mellon New York | Covered by | Appreciation | ||||
| Intermediate Tax-Exempt Bond Fund | Contracts | Contracts ($) | Expiration | at 2/28/2013 | ($) | |
| Financial Futures Short | ||||||
| U.S. Treasury 10 Year Notes | 40 | (5,308,125 | ) | March 2013 | 28,125 | |
| See notes to financial statements. | ||||||
76
| STATEMENT OF INVESTMENTS | |||||
| February 28, 2013 (Unaudited) | |||||
| BNY Mellon Municipal Opportunities Fund | |||||
| Long-Term Municipal | Coupon | Maturity | Principal | ||
| Investments—95.3% | Rate (%) | Date | Amount ($) | Value ($) | |
| Alabama—1.0% | |||||
| Jefferson County, Limited Obligation School Warrants | |||||
| (Insured; Assured Guaranty Municipal Corp.) | 5.50 | 2/15/16 | 3,850,000 | 3,850,038 | |
| Jefferson County, Limited Obligation School Warrants | |||||
| (Insured; Assured Guaranty Municipal Corp.) | 5.25 | 1/1/18 | 5,000,000 | 5,080,700 | |
| Tuscaloosa Public Educational Building Authority, | |||||
| Student Housing Revenue (Ridgecrest Student Housing, LLC | |||||
| University of Alabama Ridgecrest Residential Project) | |||||
| (Insured; Assured Guaranty Municipal Corp.) | 6.75 | 7/1/33 | 1,100,000 | 1,345,619 | |
| Arizona—1.1% | |||||
| Arizona Board of Regents, Arizona State University | |||||
| System Revenue (Polytechnic Campus Project) | 6.00 | 7/1/27 | 750,000 | 899,565 | |
| Arizona Health Facilities Authority, HR (Phoenix Children’s Hospital) | 5.00 | 2/1/43 | 1,500,000 | 1,632,735 | |
| Arizona Transportation Board, Subordinated Highway Revenue | 5.00 | 7/1/31 | 4,335,000 | 5,135,544 | |
| University Medical Center Corporation, HR | 6.00 | 7/1/39 | 2,500,000 | 2,896,675 | |
| California—14.6% | |||||
| California, GO (Various Purpose) | 6.50 | 4/1/33 | 6,700,000 | 8,409,974 | |
| California, GO (Various Purpose) | 5.50 | 3/1/40 | 7,950,000 | 9,415,583 | |
| California Health Facilities Financing Authority, | |||||
| Revenue (Providence Health and Services) | 6.50 | 10/1/38 | 490,000 | 594,953 | |
| California Health Facilities Financing Authority, | |||||
| Revenue (Providence Health and Services) (Prerefunded) | 6.50 | 10/1/18 | 10,000 | a | 12,994 |
| California Infrastructure and Economic Development Bank, | |||||
| Revenue (The J. David Gladstone Institutes Project) | 5.25 | 10/1/34 | 750,000 | 838,088 | |
| California Municipal Finance Authority, Charter School | |||||
| Revenue (Partnerships to Uplift Communities Project) | 5.00 | 8/1/32 | 675,000 | 683,579 | |
| California Municipal Finance Authority, | |||||
| Revenue (Emerson College Issue) | 6.00 | 1/1/42 | 6,000,000 | 7,287,180 | |
| California Municipal Finance Authority, | |||||
| Revenue (Southwestern Law School) | 6.50 | 11/1/31 | 300,000 | 370,743 | |
| California Pollution Control Financing Authority, | |||||
| Water Furnishing Revenue (San Diego County | |||||
| Water Authority Desalination Project Pipeline) | 5.00 | 11/21/45 | 16,000,000 | 16,518,400 | |
| California State Public Works Board, LR (Judicial | |||||
| Council of California) (Various Judicial Council Projects) | 5.00 | 12/1/31 | 2,000,000 | 2,265,640 | |
| California Statewide Communities Development Authority, | |||||
| Mortgage Revenue (Methodist Hospital of Southern | |||||
| California Project) (Collateralized; FHA) | 6.75 | 2/1/38 | 2,230,000 | 2,710,231 | |
| California Statewide Communities Development | |||||
| Authority, Revenue (Sutter Health) | 6.00 | 8/15/42 | 6,000,000 | 7,358,940 | |
| California Statewide Communities Development Authority, Student | |||||
| Housing Revenue (University of California, Irvine East Campus | |||||
| Apartments, Phase 1 Refunding—CHF—Irvine, L.L.C.) | 5.38 | 5/15/38 | 1,500,000 | 1,657,455 | |
| East Bay Municipal Utility District, Water System Revenue | 5.00 | 6/1/20 | 2,695,000 | b | 3,392,628 |
| East Bay Municipal Utility District, Water System Revenue | 5.00 | 6/1/21 | 2,585,000 | b | 3,293,755 |
The Funds 77
| STATEMENT OF INVESTMENTS (Unaudited) (continued) | |||||
| BNY Mellon Municipal Opportunities Fund (continued) | |||||
| Long-Term Municipal | Coupon | Maturity | Principal | ||
| Investments (continued) | Rate (%) | Date | Amount ($) | Value ($) | |
| California (continued) | |||||
| Gilroy School Facilities Financing Authority, Revenue | 5.00 | 8/1/46 | 5,000,000 | 5,399,150 | |
| Irvine Reassessment District Number 12-1, | |||||
| Limited Obligation Improvement Bonds | 4.00 | 9/2/29 | 1,000,000 | 1,051,320 | |
| JPMorgan Chase Putters/Drivers Trust (Los Angeles Department | |||||
| of Airports, Senior Revenue (Los Angeles International Airport)) | 5.25 | 5/15/18 | 10,000,000 | c,d | 12,022,400 |
| Los Angeles County Metropolitan Transportation Authority, | |||||
| Proposition A First Tier Senior Sales Tax Revenue | 5.00 | 7/1/21 | 5,000,000 | b | 6,279,650 |
| Los Angeles Unified School District, GO | 5.00 | 1/1/34 | 1,000,000 | 1,128,280 | |
| Metropolitan Water District of Southern California, | |||||
| Water Revenue (Build America Bonds) | 6.54 | 7/1/39 | 4,600,000 | 5,463,144 | |
| New Haven Unified School District, GO | |||||
| (Insured; Assured Guaranty Municipal Corp.) | 0.00 | 8/1/32 | 2,500,000 | e | 1,042,475 |
| Newport Beach, Revenue (Hoag Memorial Hospital Presbyterian) | 6.00 | 12/1/40 | 4,630,000 | 5,678,602 | |
| Northern California Gas Authority Number 1, Gas Project Revenue | 0.93 | 7/1/27 | 660,000 | f | 566,458 |
| Oakland Unified School District, GO (Build America Bonds) | 9.50 | 8/1/34 | 10,000,000 | 11,795,900 | |
| Sacramento Transportation Authority, | |||||
| Limited Tax Measure A Sales Tax Revenue | 5.00 | 10/1/24 | 1,000,000 | 1,237,700 | |
| Sacramento Transportation Authority, | |||||
| Limited Tax Measure A Sales Tax Revenue | 5.00 | 10/1/26 | 1,250,000 | 1,528,150 | |
| San Diego County Regional Airport Authority, | |||||
| Senior Airport Revenue | 5.00 | 7/1/43 | 6,000,000 | 6,918,600 | |
| San Diego Regional Building Authority, LR (County | |||||
| Operations Center and Annex Redevelopment Project) | 5.38 | 2/1/36 | 2,000,000 | 2,284,600 | |
| San Diego Unified School District, GO | 0.00 | 7/1/25 | 4,000,000 | e | 2,541,160 |
| San Francisco City and County Redevelopment Agency | |||||
| Community Facilities District Number 6, Special Tax | |||||
| Revenue (Mission Bay South Public Improvements) | 0.00 | 8/1/38 | 2,000,000 | e | 478,440 |
| San Francisco City and County Redevelopment Agency | |||||
| Community Facilities District Number 6, Special Tax | |||||
| Revenue (Mission Bay South Public Improvements) | 0.00 | 8/1/43 | 2,835,000 | e | 495,558 |
| San Francisco City and County Redevelopment Financing Authority, | |||||
| Tax Allocation Revenue (San Francisco Redevelopment Projects) | 6.63 | 8/1/41 | 1,250,000 | 1,470,462 | |
| South Bayside Waste Management Authority, Solid Waste | |||||
| Enterprise Revenue (Shoreway Environmental Center) | 6.00 | 9/1/36 | 1,000,000 | 1,117,550 | |
| West Contra Costa Unified School District, | |||||
| GO (Build America Bonds) | 8.46 | 8/1/34 | 9,250,000 | 11,383,975 | |
| Colorado—.4% | |||||
| Colorado Health Facilities Authority, | |||||
| Revenue (Catholic Health Initiatives) | 6.00 | 10/1/23 | 500,000 | 609,855 | |
| Denver City and County, Airport System Revenue | 5.00 | 11/15/21 | 1,500,000 | 1,817,430 | |
| Denver City and County, Airport System Revenue | |||||
| (Insured: Assured Guaranty Municipal Corp. and | |||||
| National Public Finance Guarantee Corp.) | 5.25 | 11/15/19 | 1,000,000 | 1,165,020 | |
78
| BNY Mellon Municipal Opportunities Fund (continued) | |||||
| Long-Term Municipal | Coupon | Maturity | Principal | ||
| Investments (continued) | Rate (%) | Date | Amount ($) | Value ($) | |
| Connecticut—.8% | |||||
| Bridgeport, GO | 5.00 | 2/15/32 | 2,175,000 | 2,428,562 | |
| Connecticut Health and Educational Facilities | |||||
| Authority, Revenue (Yale University Issue) | 5.05 | 7/1/42 | 5,000,000 | 5,752,600 | |
| District of Columbia—.5% | |||||
| District of Columbia, Revenue (Friendship | |||||
| Public Charter School, Inc. Issue) | 5.00 | 6/1/32 | 3,000,000 | 3,178,020 | |
| District of Columbia, Revenue (Friendship | |||||
| Public Charter School, Inc. Issue) | 5.00 | 6/1/42 | 2,000,000 | 2,084,560 | |
| Florida—3.3% | |||||
| Brevard County Health Facilities Authority, | |||||
| Health Facilities Revenue (Health First, Inc. Project) | 7.00 | 4/1/39 | 1,675,000 | 2,065,895 | |
| Florida Municipal Power Agency, All-Requirements | |||||
| Power Supply Project Revenue | 6.25 | 10/1/31 | 1,000,000 | 1,206,320 | |
| Hillsborough County Industrial Development Authority, | |||||
| HR (Tampa General Hospital Project) | 5.00 | 10/1/34 | 5,750,000 | 6,445,463 | |
| Jacksonville, Better Jacksonville Sales Tax Revenue | 5.00 | 10/1/30 | 500,000 | 584,390 | |
| Miami Beach Health Facilities Authority, HR | |||||
| (Mount Sinai Medical Center of Florida) | 5.00 | 11/15/29 | 1,000,000 | 1,107,370 | |
| Miami-Dade County, Aviation Revenue (Miami International Airport) | 5.50 | 10/1/41 | 1,200,000 | 1,377,276 | |
| Miami-Dade County Educational Facilities Authority, | |||||
| Revenue (University of Miami Issue) (Insured; | |||||
| Berkshire Hathaway Assurance Corporation) | 5.50 | 4/1/38 | 600,000 | 665,310 | |
| Miami-Dade County Expressway Authority, Toll System Revenue | 5.00 | 7/1/40 | 650,000 | 710,632 | |
| Orlando-Orange County Expressway Authority, Revenue | 5.00 | 7/1/40 | 9,540,000 | 10,586,061 | |
| Sarasota County Public Hospital District, HR | |||||
| (Sarasota Memorial Hospital Project) | 5.63 | 7/1/39 | 2,000,000 | 2,221,120 | |
| Tampa-Hillsborough County Expressway Authority, Revenue | 5.00 | 7/1/42 | 5,000,000 | 5,582,450 | |
| Georgia—1.3% | |||||
| Burke County Development Authority, PCR | |||||
| (Oglethorpe Power Corporation Vogtle Project) | 7.00 | 1/1/23 | 1,000,000 | 1,184,160 | |
| DeKalb County, GO | 5.00 | 1/1/19 | 500,000 | 517,295 | |
| DeKalb County, GO (Special Transportation, Parks | |||||
| and Greenspace and Libraries Tax District) | 5.00 | 12/1/18 | 750,000 | 828,398 | |
| DeKalb County, Water and Sewerage Revenue | 5.25 | 10/1/41 | 9,000,000 | 10,328,760 | |
| Hawaii—3.4% | |||||
| Hawaii Department of Budget and Finance, Special Purpose Revenue | |||||
| (Hawaiian Electric Company, Inc. and Subsidiary Projects) | 6.50 | 7/1/39 | 6,000,000 | 7,052,700 | |
| Hawaii Department of Budget and Finance, | |||||
| Special Purpose Senior Living Revenue (Kahala Nui) | 5.13 | 11/15/32 | 1,000,000 | 1,082,640 | |
| Hawaii Department of Budget and Finance, | |||||
| Special Purpose Senior Living Revenue (Kahala Nui) | 5.25 | 11/15/37 | 1,000,000 | 1,084,230 | |
| JPMorgan Chase Putters/Drivers Trust (Hawaii, GO) | 5.00 | 12/1/19 | 20,000,000 | c,d | 24,581,957 |
The Funds 79
| STATEMENT OF INVESTMENTS (Unaudited) (continued) | |||||
| BNY Mellon Municipal Opportunities Fund (continued) | |||||
| Long-Term Municipal | Coupon | Maturity | Principal | ||
| Investments (continued) | Rate (%) | Date | Amount ($) | Value ($) | |
| Illinois—2.4% | |||||
| Chicago, General Airport Third Lien Revenue | |||||
| (Chicago O’Hare International Airport) | 5.75 | 1/1/39 | 2,500,000 | 2,939,850 | |
| Chicago, General Airport Third Lien Revenue | |||||
| (Chicago O’Hare International Airport) | 6.50 | 1/1/41 | 5,000,000 | 6,475,850 | |
| Illinois Finance Authority, Revenue (Franciscan Communities, Inc.) | 5.13 | 5/15/43 | 2,650,000 | 2,727,327 | |
| Illinois Finance Authority, Revenue (Franciscan Communities, Inc.) | 5.25 | 5/15/47 | 4,250,000 | 4,370,148 | |
| Illinois Finance Authority, Revenue | |||||
| (Lutheran Home and Services Obligated Group) | 5.63 | 5/15/42 | 3,000,000 | 3,133,440 | |
| Illinois Finance Authority, Revenue | |||||
| (Northwestern Memorial HealthCare) | 5.00 | 8/15/43 | 1,500,000 | 1,692,165 | |
| Illinois Finance Authority, Revenue (The Art Institute of Chicago) | 6.00 | 3/1/38 | 1,000,000 | 1,141,090 | |
| Metropolitan Pier and Exposition Authority, Revenue | |||||
| (McCormick Place Expansion Project) (Insured; | |||||
| Assured Guaranty Municipal Corp.) | 0.00 | 6/15/26 | 2,000,000 | e | 1,216,360 |
| Kentucky—.2% | |||||
| Kentucky Property and Buildings Commission, | |||||
| Revenue (Project Number 90) | 5.38 | 11/1/23 | 1,500,000 | 1,801,380 | |
| Louisiana—2.6% | |||||
| Jefferson Parish Hospital Service District Number 2, | |||||
| HR (East Jefferson General Hospital) | 6.25 | 7/1/31 | 5,000,000 | 5,889,950 | |
| Louisiana Citizens Property Insurance Corporation, Assessment | |||||
| Revenue (Insured; Assured Guaranty Municipal Corp.) | 6.13 | 6/1/25 | 4,000,000 | 4,866,800 | |
| Louisiana Public Facilities Authority, Revenue | |||||
| (CHRISTUS Health Obligated Group) | 6.00 | 7/1/29 | 1,000,000 | 1,170,460 | |
| Louisiana Stadium and Exposition District, Senior Revenue | 5.00 | 7/1/30 | 4,500,000 | 5,188,950 | |
| Louisiana Stadium and Exposition District, Senior Revenue | 5.00 | 7/1/32 | 2,250,000 | 2,577,420 | |
| Louisiana Stadium and Exposition District, Senior Revenue | 5.00 | 7/1/36 | 3,500,000 | 3,992,870 | |
| New Orleans Aviation Board, Revenue | |||||
| (Insured; Assured Guaranty Municipal Corp.) | 6.00 | 1/1/23 | 2,000,000 | 2,387,180 | |
| Maine—.8% | |||||
| Maine Health and Higher Educational Facilities Authority, | |||||
| Revenue (MaineGeneral Medical Center Issue) | 6.00 | 7/1/26 | 825,000 | 1,000,651 | |
| Maine Health and Higher Educational Facilities Authority, | |||||
| Revenue (MaineGeneral Medical Center Issue) | 6.75 | 7/1/41 | 2,500,000 | 3,033,800 | |
| Maine Health and Higher Educational Facilities Authority, | |||||
| Revenue (MaineGeneral Medical Center Issue) | 7.00 | 7/1/41 | 3,500,000 | 4,309,515 | |
| Maryland—4.0% | |||||
| Maryland, GO (State and Local Facilities Loan) | 4.00 | 3/15/25 | 27,810,000 | 31,776,818 | |
| Maryland Economic Development Corporation, | |||||
| EDR (Terminal Project) | 5.75 | 6/1/35 | 3,500,000 | 3,995,880 | |
| Maryland Economic Development Corporation, Port Facilities | |||||
| Revenue (CNX Marine Terminals Inc. Port of Baltimore Facility) | 5.75 | 9/1/25 | 1,000,000 | 1,117,340 | |
| Maryland Health and Higher Educational Facilities Authority, | |||||
| Revenue (Anne Arundel Health System Issue) | 6.75 | 7/1/29 | 2,000,000 | 2,506,880 | |
80
| BNY Mellon Municipal Opportunities Fund (continued) | |||||
| Long-Term Municipal | Coupon | Maturity | Principal | ||
| Investments (continued) | Rate (%) | Date | Amount ($) | Value ($) | |
| Maryland (continued) | |||||
| Maryland Health and Higher Educational Facilities Authority, | |||||
| Revenue (University of Maryland Medical System Issue) | 5.13 | 7/1/39 | 250,000 | 275,827 | |
| Massachusetts—6.1% | |||||
| JPMorgan Chase Putters/Drivers Trust | |||||
| (Massachusetts, GO Consolidated Loan) | 5.00 | 4/1/19 | 15,000,000 | c,d | 18,476,663 |
| Massachusetts, GO (Consolidated Loan) | 4.00 | 6/1/28 | 12,500,000 | 13,654,750 | |
| Massachusetts Development Finance Agency, | |||||
| Revenue (Tufts Medical Center Issue) | 7.25 | 1/1/32 | 3,090,000 | 3,906,316 | |
| Massachusetts Development Finance Agency, | |||||
| Revenue (Tufts Medical Center Issue) | 6.75 | 1/1/36 | 1,165,000 | 1,420,380 | |
| Massachusetts Development Finance Agency, | |||||
| Revenue (Tufts Medical Center Issue) | 6.88 | 1/1/41 | 1,000,000 | 1,204,890 | |
| Massachusetts Health and Educational Facilities | |||||
| Authority, Revenue (Simmons College Issue) | 7.50 | 10/1/22 | 500,000 | 626,130 | |
| Massachusetts Health and Educational Facilities | |||||
| Authority, Revenue (Simmons College Issue) | 8.00 | 10/1/39 | 2,000,000 | 2,313,500 | |
| Massachusetts School Building Authority, | |||||
| Senior Dedicated Sales Tax Revenue | 5.00 | 8/15/27 | 6,000,000 | 7,330,140 | |
| Massachusetts School Building Authority, | |||||
| Senior Dedicated Sales Tax Revenue | 5.00 | 8/15/30 | 10,000,000 | 12,053,100 | |
| Massachusetts Water Pollution Abatement Trust, | |||||
| Water Pollution Abatement Revenue (MWRA Program) | 5.75 | 8/1/29 | 50,000 | 50,224 | |
| Michigan—1.3% | |||||
| Detroit, Water Supply System Second Lien Revenue | |||||
| (Insured; Assured Guaranty Municipal Corp.) | 5.00 | 7/1/22 | 950,000 | 1,031,539 | |
| Michigan Building Authority, Revenue (Facilities Program) | 5.38 | 10/15/41 | 3,000,000 | 3,455,580 | |
| Michigan Finance Authority, Revenue | |||||
| (School District of the City of Detroit) | 5.00 | 6/1/19 | 1,000,000 | 1,160,930 | |
| Michigan Finance Authority, Revenue | |||||
| (School District of the City of Detroit) | 5.00 | 6/1/20 | 500,000 | 582,125 | |
| Michigan Strategic Fund, LOR (State of Michigan | |||||
| Cadillac Place Office Building Project) | 5.25 | 10/15/31 | 5,500,000 | 6,324,065 | |
| Minnesota—5.0% | |||||
| JPMorgan Chase Putters/Drivers Trust | |||||
| (Minnesota, GO (Various Purpose)) | 5.00 | 8/1/18 | 17,125,000 | c,d | 21,389,599 |
| JPMorgan Chase Putters/Drivers Trust | |||||
| (Minnesota, GO (Various Purpose)) | 5.00 | 8/1/18 | 10,000,000 | c,d | 12,624,400 |
| Minneapolis, Health Care System Revenue | |||||
| (Fairview Health Services) | 6.63 | 11/15/28 | 1,000,000 | 1,233,970 | |
| Minnesota, State General Fund Appropriation Revenue | 5.00 | 3/1/25 | 7,000,000 | 8,631,700 | |
| Minnesota, State General Fund Appropriation Revenue | 5.00 | 3/1/28 | 5,000,000 | 6,027,300 | |
| Mississippi—.2% | |||||
| Warren County, Gulf Opportunity Zone Revenue | |||||
| (International Paper Company Projects) | 5.80 | 5/1/34 | 1,500,000 | 1,703,910 | |
The Funds 81
| STATEMENT OF INVESTMENTS (Unaudited) (continued) | |||||
| BNY Mellon Municipal Opportunities Fund (continued) | |||||
| Long-Term Municipal | Coupon | Maturity | Principal | ||
| Investments (continued) | Rate (%) | Date | Amount ($) | Value ($) | |
| Nevada—1.2% | |||||
| Clark County, Airport System Revenue (Build America Bonds) | 6.88 | 7/1/42 | 10,000,000 | 11,538,500 | |
| New Jersey—5.8% | |||||
| New Jersey, COP (Equipment Lease Purchase Agreement) | 5.25 | 6/15/28 | 1,000,000 | 1,129,110 | |
| New Jersey Economic Development Authority, | |||||
| Cigarette Tax Revenue | 5.00 | 6/15/26 | 2,500,000 | 2,862,750 | |
| New Jersey Economic Development Authority, | |||||
| Cigarette Tax Revenue | 5.00 | 6/15/28 | 2,000,000 | 2,262,520 | |
| New Jersey Economic Development Authority, | |||||
| School Facilities Construction Revenue | 5.00 | 3/1/21 | 20,000,000 | 24,476,000 | |
| New Jersey Educational Facilities Authority, Revenue | |||||
| (University of Medicine and Dentistry of New Jersey Issue) | 7.50 | 12/1/32 | 2,000,000 | 2,504,080 | |
| New Jersey Health Care Facilities Financing Authority, Revenue | |||||
| (Saint Peter’s University Hospital Obligated Group Issue) | 6.00 | 7/1/26 | 2,500,000 | 2,969,525 | |
| New Jersey Health Care Facilities Financing Authority, Revenue | |||||
| (Saint Peter’s University Hospital Obligated Group Issue) | 6.25 | 7/1/35 | 1,500,000 | 1,768,170 | |
| New Jersey Transportation Trust Fund | |||||
| Authority (Transportation System) | 0.00 | 12/15/29 | 5,000,000 | e | 2,514,200 |
| New Jersey Turnpike Authority, Turnpike Revenue | 5.00 | 1/1/29 | 10,000,000 | 11,772,400 | |
| New Jersey Turnpike Authority, Turnpike Revenue | 5.00 | 1/1/30 | 5,000,000 | 5,862,800 | |
| New York—13.8% | |||||
| Albany Industrial Development Agency, Civic Facility Revenue | |||||
| (Saint Peter’s Hospital of the City of Albany Project) | 5.75 | 11/15/22 | 4,225,000 | 4,881,903 | |
| Brooklyn Arena Local Development Corporation, | |||||
| PILOT Revenue (Barclays Center Project) | 6.00 | 7/15/30 | 8,000,000 | 9,597,280 | |
| Hudson Yards Infrastructure Corporation, | |||||
| Hudson Yards Senior Revenue | 5.75 | 2/15/47 | 5,000,000 | 5,960,550 | |
| Metropolitan Transportation Authority, Transportation Revenue | 5.00 | 11/15/26 | 6,065,000 | 7,237,122 | |
| Metropolitan Transportation Authority, Transportation Revenue | 6.50 | 11/15/28 | 665,000 | 847,283 | |
| Metropolitan Transportation Authority, Transportation Revenue | 5.00 | 11/15/43 | 3,000,000 | 3,371,160 | |
| Metropolitan Transportation Authority, Transportation | |||||
| Revenue (Insured; Assured Guaranty Municipal Corp.) | 0.40 | 11/1/22 | 12,500,000 | f | 12,125,000 |
| New York City, GO | 6.00 | 10/15/23 | 500,000 | 626,010 | |
| New York City Industrial Development Agency, PILOT | |||||
| Revenue (Queens Baseball Stadium Project) | |||||
| (Insured; Assured Guaranty Municipal Corp.) | 6.50 | 1/1/46 | 325,000 | 381,430 | |
| New York City Industrial Development Agency, PILOT | |||||
| Revenue (Yankee Stadium Project) (Insured; | |||||
| Assured Guaranty Municipal Corp.) | 7.00 | 3/1/49 | 1,300,000 | 1,611,129 | |
| New York City Industrial Development Agency, PILOT | |||||
| Revenue (Yankee Stadium Project) (Insured; FGIC) | 2.55 | 3/1/20 | 5,000,000 | f | 4,928,400 |
| New York City Industrial Development Agency, | |||||
| Senior Airport Facilities Revenue (Transportation | |||||
| Infrastructure Properties, LLC Obligated Group) | 5.00 | 7/1/28 | 5,000,000 | 5,326,050 | |
| New York City Municipal Water Finance Authority, | |||||
| Water and Sewer System Revenue | 5.75 | 12/15/16 | 5,090,000 | c,d | 6,081,172 |
82
| BNY Mellon Municipal Opportunities Fund (continued) | |||||
| Long-Term Municipal | Coupon | Maturity | Principal | ||
| Investments (continued) | Rate (%) | Date | Amount ($) | Value ($) | |
| New York (continued) | |||||
| New York City Municipal Water Finance Authority, | |||||
| Water and Sewer System Revenue | 5.75 | 12/15/16 | 9,000,000 | c,d | 10,752,570 |
| New York Liberty Development Corporation, Liberty | |||||
| Revenue (4 World Trade Center Project) | 5.75 | 11/15/51 | 5,000,000 | 5,935,450 | |
| New York Liberty Development Corporation, Liberty | |||||
| Revenue (7 World Trade Center Project) | 5.00 | 3/15/44 | 2,000,000 | 2,165,540 | |
| New York State Dormitory Authority, Revenue (Pace University) | 4.00 | 5/1/33 | 750,000 | 746,880 | |
| New York State Dormitory Authority, Revenue (Pace University) | 5.00 | 5/1/38 | 500,000 | 540,480 | |
| New York State Dormitory Authority, Revenue (Pace University) | 4.25 | 5/1/42 | 1,000,000 | 975,440 | |
| New York State Dormitory Authority, | |||||
| Revenue (Yeshiva University) | 5.00 | 11/1/40 | 500,000 | 557,850 | |
| New York State Dormitory Authority, | |||||
| State Personal Income Tax Revenue (Education) | 5.75 | 3/15/36 | 1,000,000 | 1,214,810 | |
| New York State Dormitory Authority, Third General Resolution | |||||
| Revenue (State University Educational Facilities Issue) | 5.00 | 11/15/19 | 10,000,000 | c,d | 12,394,900 |
| New York State Energy Research and Development Authority, | |||||
| PCR (New York State Electric and Gas Corporation Project) | |||||
| (Insured; National Public Finance Guarantee Corp.) | 0.56 | 4/1/34 | 17,410,000 | f | 16,104,250 |
| Port Authority of New York and New Jersey, Special Project | |||||
| Revenue (JFK International Air Terminal LLC Project) | 6.00 | 12/1/42 | 5,000,000 | 5,939,700 | |
| Triborough Bridge and Tunnel Authority, | |||||
| General Revenue (MTA Bridges and Tunnels) | 0.00 | 11/15/27 | 2,000,000 | e | 1,285,800 |
| Triborough Bridge and Tunnel Authority, | |||||
| General Revenue (MTA Bridges and Tunnels) | 0.00 | 11/15/28 | 4,715,000 | e | 2,875,018 |
| Triborough Bridge and Tunnel Authority, | |||||
| General Revenue (MTA Bridges and Tunnels) | 0.00 | 11/15/30 | 2,415,000 | e | 1,326,318 |
| Triborough Bridge and Tunnel Authority, | |||||
| General Revenue (MTA Bridges and Tunnels) | 0.00 | 11/15/32 | 4,000,000 | e | 1,972,360 |
| Triborough Bridge and Tunnel Authority, | |||||
| Subordinate Revenue (MTA Bridges and Tunnels) | 0.00 | 11/15/30 | 10,000,000 | e | 5,277,300 |
| Triborough Bridge and Tunnel Authority, | |||||
| Subordinate Revenue (MTA Bridges and Tunnels) | 0.00 | 11/15/31 | 5,000,000 | e | 2,498,800 |
| Triborough Bridge and Tunnel Authority, | |||||
| Subordinate Revenue (MTA Bridges and Tunnels) | 0.00 | 11/15/32 | 3,000,000 | e | 1,438,890 |
| North Carolina—1.3% | |||||
| North Carolina Eastern Municipal Power Agency, | |||||
| Power System Revenue | 5.00 | 1/1/26 | 11,415,000 | 13,013,328 | |
| North Carolina Eastern Municipal Power Agency, Power System | |||||
| Revenue (Insured; Assured Guaranty Municipal Corp.) | 6.00 | 1/1/19 | 250,000 | 282,762 | |
| Ohio—.6% | |||||
| JobsOhio Beverage System, Statewide | |||||
| Senior Lien Liquor Profits Revenue | 4.53 | 1/1/35 | 5,000,000 | 5,218,000 | |
| Montgomery County, Revenue (Catholic Health Initiatives) | 6.25 | 10/1/33 | 1,000,000 | 1,195,400 | |
| Oregon—.2% | |||||
| Oregon Health and Science University, Revenue | 5.75 | 7/1/39 | 2,000,000 | 2,367,340 | |
The Funds 83
| STATEMENT OF INVESTMENTS (Unaudited) (continued) | |||||
| BNY Mellon Municipal Opportunities Fund (continued) | |||||
| Long-Term Municipal | Coupon | Maturity | Principal | ||
| Investments (continued) | Rate (%) | Date | Amount ($) | Value ($) | |
| Pennsylvania—1.8% | |||||
| Clairton Municipal Authority, Sewer Revenue | 5.00 | 12/1/37 | 2,000,000 | 2,077,340 | |
| Clairton Municipal Authority, Sewer Revenue | 5.00 | 12/1/42 | 1,000,000 | 1,032,370 | |
| Commonwealth Financing Authority of Pennsylvania, Revenue | 5.00 | 6/1/42 | 10,000,000 | 11,299,400 | |
| Pennsylvania Higher Educational Facilities Authority, Revenue | |||||
| (The Foundation for Indiana University of Pennsylvania Student | |||||
| Housing Project at Indiana University of Pennsylvania) | 5.00 | 7/1/32 | 650,000 | 710,554 | |
| Pennsylvania Higher Educational Facilities Authority, | |||||
| Revenue (University of Pennsylvania Health System) | 5.75 | 8/15/41 | 2,550,000 | 3,000,840 | |
| Texas—12.6% | |||||
| Central Texas Regional Mobility Authority, Senior Lien Revenue | 6.00 | 1/1/41 | 5,000,000 | 5,831,800 | |
| Clifton Higher Education Finance Corporation, | |||||
| Education Revenue (IDEA Public Schools) | 5.50 | 8/15/31 | 1,250,000 | 1,413,175 | |
| Clifton Higher Education Finance Corporation, | |||||
| Education Revenue (IDEA Public Schools) | 5.00 | 8/15/32 | 2,000,000 | 2,214,400 | |
| Clifton Higher Education Finance Corporation, | |||||
| Education Revenue (IDEA Public Schools) | 5.75 | 8/15/41 | 1,000,000 | 1,136,120 | |
| Clifton Higher Education Finance Corporation, | |||||
| Education Revenue (IDEA Public Schools) | 5.00 | 8/15/42 | 2,750,000 | 2,998,820 | |
| Clifton Higher Education Finance Corporation, | |||||
| Education Revenue (Uplift Education) | 3.95 | 12/1/32 | 1,800,000 | 1,811,520 | |
| Clifton Higher Education Finance Corporation, | |||||
| Education Revenue (Uplift Education) | 4.35 | 12/1/42 | 1,700,000 | 1,729,699 | |
| Forney Independent School District, Unlimited Tax School | |||||
| Building Bonds (Permanent School Fund Guarantee Program) | 5.75 | 8/15/33 | 1,000,000 | 1,207,270 | |
| Harris County Cultural Education Facilities Finance | |||||
| Corporation, Revenue (Young Men’s Christian | |||||
| Association of the Greater Houston Area) | 5.00 | 6/1/38 | 2,500,000 | 2,689,975 | |
| Harris County Health Facilities Development Corporation, HR | |||||
| (Memorial Hermann Healthcare System) | 7.00 | 12/1/27 | 1,000,000 | 1,238,380 | |
| Houston, Airport System Subordinate Lien Revenue | 5.00 | 7/1/32 | 500,000 | 559,510 | |
| Houston, Airport System Subordinate Lien Revenue | |||||
| (Insured; Assured Guaranty Municipal Corp.) | 0.22 | 7/1/30 | 700,000 | f | 633,500 |
| Houston, Airport System Subordinate Lien Revenue | |||||
| (Insured; Assured Guaranty Municipal Corp.) | 0.32 | 7/1/30 | 3,800,000 | f | 3,439,000 |
| Houston, Airport System Subordinate Lien Revenue | |||||
| (Insured; Assured Guaranty Municipal Corp.) | 0.32 | 7/1/30 | 11,525,000 | f | 10,430,125 |
| Houston, Combined Utility System First Lien Revenue | 5.00 | 11/15/30 | 5,350,000 | 6,333,758 | |
| Houston Higher Education Finance Corporation, | |||||
| Higher Education Revenue (Cosmos Foundation, Inc.) | 5.88 | 5/15/21 | 1,000,000 | 1,148,970 | |
| Houston Higher Education Finance Corporation, | |||||
| Higher Education Revenue (Cosmos Foundation, Inc.) | 6.50 | 5/15/31 | 2,800,000 | 3,501,652 | |
| Houston Higher Education Finance Corporation, | |||||
| Higher Education Revenue (Cosmos Foundation, Inc.) | 6.88 | 5/15/41 | 3,000,000 | 3,810,510 | |
| Lower Colorado River Authority, Revenue | 5.00 | 5/15/30 | 11,460,000 | 13,317,666 | |
84
| BNY Mellon Municipal Opportunities Fund (continued) | |||||
| Long-Term Municipal | Coupon | Maturity | Principal | ||
| Investments (continued) | Rate (%) | Date | Amount ($) | Value ($) | |
| Texas (continued) | |||||
| North Texas Education Finance Corporation, | |||||
| Education Revenue (Uplift Education) | 4.88 | 12/1/32 | 3,630,000 | 3,861,957 | |
| North Texas Tollway Authority, First Tier System Revenue | 6.00 | 1/1/38 | 7,000,000 | 8,240,540 | |
| North Texas Tollway Authority, Special Projects System Revenue | 5.50 | 9/1/41 | 2,500,000 | 2,975,550 | |
| Texas Private Activity Bond Surface Transportation | |||||
| Corporation, Senior Lien Revenue (LBJ Infrastructure | |||||
| Group LLC IH-635 Managed Lanes Project) | 7.00 | 6/30/40 | 7,000,000 | 8,512,490 | |
| Texas Private Activity Bond Surface Transportation | |||||
| Corporation, Senior Lien Revenue (NTE Mobility | |||||
| Partners LLC North Tarrant Express Managed Lanes Project) | 7.50 | 12/31/31 | 2,500,000 | 3,108,525 | |
| Texas Transportation Commission, Central Texas | |||||
| Turnpike System First Tier Revenue | 5.00 | 8/15/41 | 20,000,000 | 21,984,400 | |
| Waco Education Finance Corporation, | |||||
| Revenue (Baylor University Issue) | 5.00 | 3/1/43 | 10,000,000 | 11,411,700 | |
| Virginia—2.8% | |||||
| Chesapeake, Transportation System Senior Toll Road Revenue | 0/4.88 | 7/15/40 | 2,000,000 | g | 1,213,780 |
| Chesapeake, Transportation System Senior Toll Road Revenue | 5.00 | 7/15/47 | 2,000,000 | 2,134,100 | |
| Route 460 Funding Corporation of Virginia, | |||||
| Toll Road Senior Lien Revenue | 5.13 | 7/1/49 | 10,000,000 | 10,926,900 | |
| Virginia Small Business Financing Authority, Senior Lien | |||||
| Revenue (Elizabeth River Crossing Opco, LLC Project) | 5.25 | 1/1/32 | 4,000,000 | 4,452,320 | |
| Virginia Small Business Financing Authority, Senior Lien | |||||
| Revenue (Elizabeth River Crossing Opco, LLC Project) | 6.00 | 1/1/37 | 2,000,000 | 2,326,060 | |
| Virginia Small Business Financing Authority, Senior Lien | |||||
| Revenue (Elizabeth River Crossing Opco, LLC Project) | 5.50 | 1/1/42 | 6,155,000 | 6,817,832 | |
| Washington—1.3% | |||||
| Washington, GO (Motor Vehicle Fuel Tax) | 4.00 | 8/1/29 | 4,615,000 | 5,080,930 | |
| Washington, GO (Motor Vehicle Fuel Tax) | 4.00 | 8/1/30 | 7,095,000 | 7,768,174 | |
| Wisconsin—.9% | |||||
| Oneida Tribe of Indians, Retail Sales Revenue | 6.50 | 2/1/31 | 1,325,000 | d | 1,527,102 |
| University of Wisconsin Hospitals and | |||||
| Clinics Authority, Revenue | 5.00 | 4/1/38 | 3,000,000 | 3,359,460 | |
| Wisconsin, General Fund Annual Appropriation Bonds | 5.38 | 5/1/25 | 1,000,000 | 1,206,010 | |
| Wisconsin, General Fund Annual Appropriation Bonds | 5.75 | 5/1/33 | 1,500,000 | 1,808,625 | |
| Wisconsin, General Fund Annual Appropriation Bonds | 6.00 | 5/1/33 | 1,000,000 | 1,223,360 | |
| U.S. Related—4.0% | |||||
| Guam, Business Privilege Tax Revenue | 5.13 | 1/1/42 | 1,500,000 | 1,670,040 | |
| Guam, Hotel Occupancy Tax Revenue | 6.00 | 11/1/26 | 2,500,000 | 2,950,225 | |
| Guam, Hotel Occupancy Tax Revenue | 6.13 | 11/1/31 | 5,000,000 | 5,811,950 | |
| Guam, Hotel Occupancy Tax Revenue | 6.50 | 11/1/40 | 2,000,000 | 2,355,500 | |
| Guam Government Department of Education, COP | |||||
| (John F. Kennedy High School Project) | 6.63 | 12/1/30 | 1,000,000 | 1,101,450 | |
| Puerto Rico Electric Power Authority, Power Revenue | 5.00 | 7/1/22 | 2,000,000 | 2,135,880 | |
The Funds 85
| STATEMENT OF INVESTMENTS (Unaudited) (continued) | |||||
| BNY Mellon Municipal Opportunities Fund (continued) | |||||
| Long-Term Municipal | Coupon | Maturity | Principal | ||
| Investments (continued) | Rate (%) | Date | Amount ($) | Value ($) | |
| U.S. Related (continued) | |||||
| Puerto Rico Electric Power Authority, Power Revenue | |||||
| (Insured; National Public Finance Guarantee Corp.) | 5.00 | 7/1/17 | 750,000 | 784,965 | |
| Puerto Rico Sales Tax Financing Corporation, | |||||
| Sales Tax Revenue (First Subordinate Series) | 0/6.75 | 8/1/32 | 6,000,000 | g | 6,360,060 |
| Puerto Rico Sales Tax Financing Corporation, | |||||
| Sales Tax Revenue (First Subordinate Series) | 0/6.25 | 8/1/33 | 750,000 | g | 612,577 |
| Virgin Islands Public Finance Authority, | |||||
| Revenue (Gross Receipts Taxes Loan Notes) | 4.00 | 10/1/22 | 3,000,000 | 3,199,110 | |
| Virgin Islands Public Finance Authority, | |||||
| Revenue (Gross Receipts Taxes Loan Notes) | 5.25 | 10/1/27 | 4,000,000 | d | 4,045,000 |
| Virgin Islands Public Finance Authority, | |||||
| Revenue (Gross Receipts Taxes Loan Notes) | 5.00 | 10/1/32 | 6,000,000 | d | 6,576,540 |
| Virgin Islands Public Finance Authority, Subordinated Revenue | |||||
| (Virgin Islands Matching Fund Loan Note—Diageo Project) | 6.75 | 10/1/37 | 2,000,000 | 2,352,560 | |
| Total Long-Term Municipal Investments | |||||
| (cost $883,810,779) | 948,747,985 | ||||
| Short-Term Municipal Investments—12.7% | |||||
| Colorado—.1% | |||||
| Colorado Educational and Cultural Facilities Authority, | |||||
| Revenue (National Jewish Federation Bond | |||||
| Program) (LOC; Northern Trust Company) | 0.11 | 3/1/13 | 1,380,000 | h | 1,380,000 |
| Florida—1.3% | |||||
| Orange County School Board, COP (Master Lease | |||||
| Purchase Agreement) (LOC; Wells Fargo Bank) | 0.10 | 3/1/13 | 6,780,000 | h | 6,780,000 |
| Sarasota County Public Hospital District, HR, Refunding (Sarasota | |||||
| Memorial Hospital Project) (LOC: Northern Trust Company) | 0.09 | 3/1/13 | 6,100,000 | h | 6,100,000 |
| Iowa—2.1% | |||||
| Iowa Finance Authority, Health Facilities Revenue (Great River | |||||
| Medical Center Project) (LOC; JPMorgan Chase Bank) | 0.13 | 3/1/13 | 4,800,000 | h | 4,800,000 |
| Iowa Finance Authority, Private College Revenue, Refunding | |||||
| (Drake University Project) (LOC; Wells Fargo Bank) | 0.11 | 3/1/13 | 10,200,000 | h | 10,200,000 |
| Iowa Higher Education Loan Authority, Private College | |||||
| Faciliity Revenue, Refunding (Des Moines University | |||||
| Project) (LOC; Allied Irish Banks) | 0.13 | 3/1/13 | 4,690,000 | h | 4,690,000 |
| Kentucky—1.7% | |||||
| Christian County, Lease Program Revenue (Kentucky | |||||
| Association of Counties Leasing Trust) (LOC; U.S. Bank NA) | 0.11 | 3/1/13 | 4,760,000 | h | 4,760,000 |
| Kentucky Economic Development Finance Authority, | |||||
| HR (Baptist Healthcare System Obligated Group) | |||||
| (LOC; JPMorgan Chase Bank) | 0.12 | 3/1/13 | 5,900,000 | h | 5,900,000 |
| Louisville and Jefferson County Visitors and Convention Commission, | |||||
| Dedicated Tax Revenue, Refunding (Kentucky International | |||||
| Convention Center Expansion Project) (Insured; Assured Guaranty | |||||
| Municipal Corp. and Liquidity Facility; JPMorgan Chase Bank) | 0.19 | 3/1/13 | 6,525,000 | h | 6,525,000 |
86
| BNY Mellon Municipal Opportunities Fund (continued) | |||||
| Short-Term Municipal | Coupon | Maturity | Principal | ||
| Investments (continued) | Rate (%) | Date | Amount ($) | Value ($) | |
| Massachusetts—1.9% | |||||
| Massachusetts, GO Notes (Consolidated Loan) | |||||
| (LOC; JPMorgan Chase Bank) | 0.11 | 3/1/13 | 10,000,000 | h | 10,000,000 |
| Massachusetts Water Resources Authority, Subordinated | |||||
| General Revenue, Refunding (LOC; Landesbank | |||||
| Hessen-Thuringen Girozentrale) | 0.10 | 3/1/13 | 8,390,000 | h | 8,390,000 |
| Missouri—1.2% | |||||
| Missouri Health and Educational Facilities Authority, | |||||
| Educational Facilities Revenue (Ranken Technology | |||||
| College) (LOC; Northern Trust Company) | 0.13 | 3/1/13 | 3,175,000 | h | 3,175,000 |
| Missouri Health and Educational Facilities Authority, | |||||
| Educational Facilities Revenue (The Washington | |||||
| University) (Liquidity Facility; JPMorgan Chase Bank) | 0.10 | 3/1/13 | 1,500,000 | h | 1,500,000 |
| Missouri Health and Educational Facilities Authority, Health | |||||
| Facilities Revenue (SSM Health Care) (LOC; PNC Bank NA) | 0.10 | 3/1/13 | 7,200,000 | h | 7,200,000 |
| New Hampshire—.8% | |||||
| New Hampshire Business Finance Authority, Revenue | |||||
| (Huggins Hospital Issue) (LOC; TD Bank) | 0.11 | 3/1/13 | 2,000,000 | h | 2,000,000 |
| New Hampshire Health and Education Facilities | |||||
| Authority, Revenue (Dartmouth College Issue) | |||||
| (Liquidity Facility; JPMorgan Chase Bank) | 0.10 | 3/1/13 | 6,300,000 | h | 6,300,000 |
| New York—.5% | |||||
| New York City, GO Notes (LOC; Fortis Bank) | 0.11 | 3/1/13 | 3,400,000 | h | 3,400,000 |
| New York City Trust for Cultural Resources, Revenue, | |||||
| Refunding (Lincoln Center for the Performing | |||||
| Arts, Inc.) (LOC; Bank of America) | 0.12 | 3/1/13 | 2,000,000 | h | 2,000,000 |
| Ohio—.3% | |||||
| Cleveland-Cuyahoga County Port Authority, | |||||
| Educational Facility Revenue (Laurel School | |||||
| Project) (LOC; JPMorgan Chase Bank) | 0.13 | 3/1/13 | 3,315,000 | h | 3,315,000 |
| Oregon—.2% | |||||
| Medford Hospital Facilities Authority, Revenue | |||||
| (Rogue Valley Manor Project) (LOC; Bank of America) | 0.13 | 3/1/13 | 2,300,000 | h | 2,300,000 |
| Pennsylvania—.3% | |||||
| Lancaster County Hospital Authority, Health Center Revenue | |||||
| (Masonic Homes Project) (LOC; JPMorgan Chase Bank) | 0.10 | 3/1/13 | 3,000,000 | h | 3,000,000 |
| Vermont—.3% | |||||
| Vermont Educational and Health Buildings | |||||
| Financing Agency, Revenue (Brattleboro | |||||
| Memorial Hospital Project) (LOC; TD Bank) | 0.10 | 3/1/13 | 1,000,000 | h | 1,000,000 |
| Vermont Educational and Health Buildings Financing | |||||
| Agency, Revenue (Southwestern Vermont | |||||
| Medical Center Project) (LOC; TD Bank) | 0.10 | 3/1/13 | 2,300,000 | h | 2,300,000 |
| Virginia—.7% | |||||
| Virginia Commonwealth University Health System Authority, | |||||
| General Revenue (LOC; Branch Banking and Trust Co.) | 0.09 | 3/1/13 | 6,550,000 | h | 6,550,000 |
The Funds 87
| STATEMENT OF INVESTMENTS (Unaudited) (continued) | ||||||
| BNY Mellon Municipal Opportunities Fund (continued) | ||||||
| Short-Term Municipal | Coupon | Maturity | Principal | |||
| Investments (continued) | Rate (%) | Date | Amount ($) | Value ($) | ||
| Wisconsin—1.3% | ||||||
| Wisconsin Health and Educational Facilities Authority, | ||||||
| Revenue (Froedtert and Community Health, Inc. | ||||||
| Obligated Group) (LOC; U.S. Bank NA) | 0.12 | 3/1/13 | 10,000,000 | h | 10,000,000 | |
| Wisconsin Health and Educational Facilities Authority, | ||||||
| Revenue (Wausau Hospital, Inc.) (LOC; JPMorgan Chase Bank) | 0.11 | 3/1/13 | 2,700,000 | h | 2,700,000 | |
| Total Short-Term Municipal Investments | ||||||
| (cost $126,265,000) | 126,265,000 | |||||
| Total Investments (cost $1,010,075,779) | 108.0 | % | 1,075,012,985 | |||
| Liabilities, Less Cash and Receivables | (8.0 | %) | (79,803,236 | ) | ||
| Net Assets | 100.0 | % | 995,209,749 | |||
a This security is prerefunded; the date shown represents the prerefunded date. Bonds which are prerefunded are collateralized by U.S. Government securities which are held in escrow
and are used to pay principal and interest on the municipal issue and to retire the bonds in full at the earliest refunding date.
b Purchased on a delayed delivery basis.
c Collateral for floating rate borrowings.
d Securities exempt from registration pursuant to Rule 144A under the Securities Act of 1933.These securities may be resold in transactions exempt from registration, normally to
qualified institutional buyers.At February 28, 2013, these securities were valued at $130,472,303 or 13.1% of net assets.
e Security issued with a zero coupon. Income is recognized through the accretion of discount.
f Variable rate security—interest rate subject to periodic change.
g Zero coupon until a specified date at which time the stated coupon rate becomes effective until maturity.
h Variable rate demand note—rate shown is the interest rate in effect at February 28, 2013. Maturity date represents the next demand date, or the ultimate maturity date if earlier.
88
| Summary of Abbreviations | ||||||
| ABAG | Association of Bay Area Governments | ACA | American Capital Access | |||
| AGC | ACE Guaranty Corporation | AGIC | Asset Guaranty Insurance Company | |||
| AMBAC | American Municipal Bond Assurance Corporation | ARRN | Adjustable Rate Receipt Notes | |||
| BAN | Bond Anticipation Notes | BPA | Bond Purchase Agreement | |||
| CIFG | CDC Ixis Financial Guaranty | COP | Certificate of Participation | |||
| CP | Commercial Paper | DRIVERS | Derivative Inverse Tax-Exempt Receipts | |||
| EDR | Economic Development Revenue | EIR | Environmental Improvement Revenue | |||
| FGIC | Financial Guaranty Insurance Company | FHA | Federal Housing Administration | |||
| FHLB | Federal Home Loan Bank | FHLMC | Federal Home Loan Mortgage Corporation | |||
| FNMA | Federal National Mortgage Association | GAN | Grant Anticipation Notes | |||
| GIC | Guaranteed Investment Contract | GNMA | Government National Mortgage Association | |||
| GO | General Obligation | HR | Hospital Revenue | |||
| IDB | Industrial Development Board | IDC | Industrial Development Corporation | |||
| IDR | Industrial Development Revenue | LIFERS | Long Inverse Floating Exempt Receipts | |||
| LOC | Letter of Credit | LOR | Limited Obligation Revenue | |||
| LR | Lease Revenue | MERLOTS | Municipal Exempt Receipt Liquidity Option Tender | |||
| MFHR | Multi-Family Housing Revenue | MFMR | Multi-Family Mortgage Revenue | |||
| PCR | Pollution Control Revenue | P-FLOATS | Puttable Floating Option Tax-Exempt Receipts | |||
| PILOT | Payment in Lieu of Taxes | PUTTERS | Puttable Tax-Exempt Receipts | |||
| RAC | Revenue Anticipation Certificates | RAN | Revenue Anticipation Notes | |||
| RAW | Revenue Anticipation Warrants | ROCS | Reset Options Certificates | |||
| RRR | Resources Recovery Revenue | SAAN | State Aid Anticipation Notes | |||
| SBPA | Standby Bond Purchase Agreement | SFHR | Single Family Housing Revenue | |||
| SFMR | Single Family Mortgage Revenue | SONYMA | State of New York Mortgage Agency | |||
| SPEARS | Short Puttable Exempt Adjustable Receipts | SWDR | Solid Waste Disposal Revenue | |||
| TAN | Tax Anticipation Notes | TAW | Tax Anticipation Warrants | |||
| TRAN | Tax and Revenue Anticipation Notes | XLCA | XL Capital Assurance | |||
| Summary of Combined Ratings (Unaudited) | ||||||
| Fitch | or | Moody’s | or | Standard & Poor’s | Value (%)† | |
| AAA | Aaa | AAA | 6.5 | |||
| AA | Aa | AA | 30.5 | |||
| A | A | A | 26.6 | |||
| BBB | Baa | BBB | 23.5 | |||
| BB | Ba | BB | .6 | |||
| B | B | B | .1 | |||
| F1 | MIG1/P1 | SP1/A1 | 10.6 | |||
| Not Ratedi | Not Ratedi | Not Ratedi | 1.6 | |||
| 100.0 | ||||||
† Based on total investments.
i Securities which, while not rated by Fitch, Moody’s and Standard & Poor’s, have been determined by the Manager to be of comparable quality to those rated securities in which the
fund may invest.
See notes to financial statements.
The Funds 89
STATEMENT OF FINANCIAL FUTURES
February 28, 2013 (Unaudited)
| Market Value | Unrealized | |||||
| BNY Mellon | Covered by | Appreciation | ||||
| Municipal Opportunities Fund | Contracts | Contracts ($) | Expiration | at 2/28/2013 | ($) | |
| Financial Futures Short | ||||||
| U.S. Treasury 10 Year Notes | 500 | (66,351,563 | ) | March 2013 | 351,563 | |
| U.S. Treasury 30 Year Bonds | 300 | (43,584,375 | ) | March 2013 | 1,151,923 | |
| U.S. Treasury Ultra 30 Year Bonds | 400 | (63,312,500 | ) | March 2013 | 1,032,312 | |
| 2,535,798 |
See notes to financial statements.
90
STATEMENTS OF ASSETS AND LIABILITIES
February 28, 2013 (Unaudited)
| BNY Mellon | BNY Mellon | BNY Mellon | BNY Mellon | |
| National | National | Pennsylvania | Massachusetts | |
| Intermediate | Short-Term | Intermediate | Intermediate | |
| Municipal Bond Fund | Municipal Bond Fund | Municipal Bond Fund | Municipal Bond Fund | |
| Assets ($): | ||||
| Investments in securities— | ||||
| See Statement of Investments† | 1,856,013,795 | 1,230,255,054 | 398,165,025 | 355,918,734 |
| Cash on Initial Margin—Note 5 | 374,000 | 247,827 | 99,000 | 77,000 |
| Interest receivable | 19,016,004 | 11,844,530 | 4,764,881 | 3,202,595 |
| Receivable for shares of Beneficial Interest subscribed | 11,452,975 | — | — | — |
| Receivable for investment securites sold | 3,384,000 | 2,796,015 | — | 190,000 |
| Prepaid expenses and other assets | 24,870 | 20,049 | 63,910 | 12,204 |
| 1,890,265,644 | 1,245,163,475 | 403,092,816 | 359,400,533 | |
| Liabilities ($): | ||||
| Due to The Dreyfus Corporation | ||||
| and affiliates—Note 4(c) | 548,198 | 373,091 | 172,597 | 113,087 |
| Due to Administrator—Note 4(a) | 174,265 | 118,159 | 37,744 | 33,332 |
| Cash overdraft due to Custodian | 2,373,842 | — | 555,301 | 471,086 |
| Payable for investment securities purchased | 35,787,522 | 4,252,930 | 2,597,629 | 4,256,826 |
| Payable for shares of Beneficial Interest redeemed | 2,475,442 | 2,563,889 | 11,751 | 165,598 |
| Payable for futures variation margin—Note 5 | 42,500 | — | 11,250 | 8,750 |
| Accrued expenses and other liabilities | 81,602 | 668 | 29,362 | 36,138 |
| 41,483,371 | 7,308,737 | 3,415,634 | 5,084,817 | |
| Net Assets ($) | 1,848,782,273 | 1,237,854,738 | 399,677,182 | 354,315,716 |
| Composition of Net Assets ($): | ||||
| Paid—in capital | 1,706,868,525 | 1,221,029,693 | 369,331,642 | 326,073,639 |
| Accumulated undistributed investment income—net | 1,938,812 | 16,826 | 12,416 | — |
| Accumulated net realized gain (loss) on investments | 3,410,819 | 752,313 | 2,789,811 | 2,264,817 |
| Accumulated net unrealized appreciation (depreciation) | ||||
| on investments (including $239,062 appreciation on | ||||
| financial futures for BNY Mellon National Intermediate | ||||
| Municipal Bond Fund, $63,281 appreciation on financial | ||||
| futures for BNY Mellon Pennsylvania Intermediate | ||||
| Municipal Bond Fund and $49,219 appreciation on | ||||
| financial futures for BNY Mellon Massachusetts | ||||
| Intermediate Municipal Bond Fund) | 136,564,117 | 16,055,906 | 27,543,313 | 25,977,260 |
| Net Assets ($) | 1,848,782,273 | 1,237,854,738 | 399,677,182 | 354,315,716 |
| Net Asset Value Per Share | ||||
| Class M Shares | ||||
| Net Assets ($) | 1,806,555,551 | 1,234,602,533 | 394,957,701 | 344,374,496 |
| Shares Outstanding | 129,214,182 | 94,946,214 | 30,228,198 | 25,694,295 |
| Net Asset Value Per Share ($) | 13.98 | 13.00 | 13.07 | 13.40 |
| Investor Shares | ||||
| Net Assets ($) | 42,226,722 | 3,252,205 | 4,719,481 | 9,941,220 |
| Shares Outstanding | 3,023,552 | 250,427 | 361,623 | 741,833 |
| Net Asset Value Per Share ($) | 13.97 | 12.99 | 13.05 | 13.40 |
| † Investments at cost ($) | 1,719,688,740 | 1,214,199,148 | 370,684,993 | 329,990,693 |
| See notes to financial statements. | ||||
The Funds 91
STATEMENTS OF ASSETS AND LIABILITIES (continued)
| BNY Mellon | ||
| New York | BNY Mellon | |
| Intermediate | Municipal | |
| Tax-Exempt Bond Fund | Opportunities Fund | |
| Assets ($): | ||
| Investments in securities—See Statement of Investments† | 217,729,097 | 1,075,012,985 |
| Cash | — | 872,286 |
| Cash on Initial Margin—Note 5 | 44,000 | 2,830,000 |
| Interest receivable | 2,359,392 | 8,058,245 |
| Receivable for investment securites sold | 67,030 | 15,920,556 |
| Receivable for shares of Beneficial Interest subscribed | — | 1,861,340 |
| Unrealized appreciation on swap contracts—Note 5 | — | 1,339,702 |
| Prepaid expenses | 18,055 | 21,779 |
| 220,217,574 | 1,105,916,893 | |
| Liabilities ($): | ||
| Due to The Dreyfus Corporation and affiliates—Note 4(c) | 80,994 | 403,098 |
| Due to Administrator—Note 4(a) | 20,801 | 91,249 |
| Cash overdraft due to Custodian | 330,218 | — |
| Payable for investment securities purchased | — | 48,589,002 |
| Payable for floating rate notes issued—Note 5 | — | 61,205,000 |
| Payable for shares of Beneficial Interest redeemed | 85,623 | 46,194 |
| Payable for future variation margin—Note 5 | 5,000 | 200,000 |
| Interest and expense payable related | ||
| to floating rate notes issued—Note 5 | — | 103,542 |
| Accrued expenses and other liabilities | 42,561 | 69,059 |
| 565,197 | 110,707,144 | |
| Net Assets ($) | 219,652,377 | 995,209,749 |
| Composition of Net Assets ($): | ||
| Paid—in capital | 201,661,416 | 915,956,685 |
| Accumulated undistributed investment income—net | 9,334 | 158,466 |
| Accumulated net realized gain (loss) on investments | 2,754,894 | 10,281,892 |
| Accumulated net unrealized appreciation (depreciation) on investments | ||
| (including $28,125 appreciation on financial futures for BNY Mellon | ||
| New York Intermediate Tax-Exempt Bond Fund and $2,535,798 appreciation | ||
| on financial futures and $1,339,702 appreciation on swap transactions | ||
| for BNY Mellon Municipal Opportunities Fund) | 15,226,733 | 68,812,706 |
| Net Assets ($) | 219,652,377 | 995,209,749 |
| Net Asset Value Per Share | ||
| Class M Shares | ||
| Net Assets ($) | 200,462,925 | 992,710,727 |
| Shares Outstanding | 16,987,192 | 73,072,176 |
| Net Asset Value Per Share ($) | 11.80 | 13.59 |
| Investor Shares | ||
| Net Assets ($) | 19,189,452 | 2,499,022 |
| Shares Outstanding | 1,625,140 | 183,946 |
| Net Asset Value Per Share ($) | 11.81 | 13.59 |
| † Investments at cost ($) | 202,530,489 | 1,010,075,779 |
| See notes to financial statements. | ||
92
STATEMENTS OF OPERATIONS
Six Months Ended February 28, 2013 (Unaudited)
| BNY Mellon | BNY Mellon | BNY Mellon | BNY Mellon | |||||
| National | National | Pennsylvania | Massachusetts | |||||
| Intermediate | Short-Term | Intermediate | Intermediate | |||||
| Municipal Bond Fund | Municipal Bond Fund | Municipal Bond Fund | Municipal Bond Fund | |||||
| Investment Income ($): | ||||||||
| Interest Income | 31,458,722 | 9,295,069 | 7,106,879 | 5,904,048 | ||||
| Expenses: | ||||||||
| Investment advisory fee—Note 4(a) | 3,119,087 | 2,224,802 | 1,006,070 | 612,635 | ||||
| Administration fee—Note 4(a) | 1,101,134 | 785,486 | 248,643 | 216,294 | ||||
| Shareholder servicing costs—Note 4(b) | 51,648 | 4,516 | 8,021 | 11,519 | ||||
| Trustees’ fees and expenses—Note 4(c) | 50,693 | 45,018 | 12,403 | 8,348 | ||||
| Custodian fees—Note 4(b) | 46,897 | 39,021 | 15,756 | 13,880 | ||||
| Professional fees | 42,322 | 27,878 | 24,149 | 28,344 | ||||
| Registration fees | 32,761 | 15,784 | 15,277 | 14,843 | ||||
| Loan commitment fees—Note 3 | 12,191 | 7,075 | 2,234 | 1,935 | ||||
| Prospectus and shareholders’ reports | 6,035 | 3,879 | 3,782 | 3,733 | ||||
| Miscellaneous | 52,204 | 44,646 | 23,677 | 29,988 | ||||
| Total Expenses | 4,514,972 | 3,198,105 | 1,360,012 | 941,519 | ||||
| Less—reduction in fees due to | ||||||||
| earnings credits—Note 4(b) | (22 | ) | (3 | ) | (2 | ) | (7 | ) |
| Net Expenses | 4,514,950 | 3,198,102 | 1,360,010 | 941,512 | ||||
| Investment Income—Net | 26,943,772 | 6,096,967 | 5,746,869 | 4,962,536 | ||||
| Realized and Unrealized Gain (Loss) | ||||||||
| on Investments—Note 5 ($): | ||||||||
| Net realized gain (loss) on investments | 2,703,816 | 819,167 | 3,383,217 | 2,328,923 | ||||
| Net realized gain (loss) on financial futures | (266,985 | ) | — | (70,672 | ) | (54,968 | ) | |
| Net Realized Gain (Loss) | 2,436,831 | 819,167 | 3,312,545 | 2,273,955 | ||||
| Net unrealized appreciation | ||||||||
| (depreciation) on investments | 2,046,898 | (1,788,109 | ) | (3,313,035 | ) | (2,160,030 | ) | |
| Net unrealized appreciation | ||||||||
| (depreciation) on financial futures | 435,625 | — | 115,312 | 89,688 | ||||
| Net Unrealized Appreciation (Depreciation) | 2,482,523 | (1,788,109 | ) | (3,197,723 | ) | (2,070,342 | ) | |
| Net Realized and Unrealized | ||||||||
| Gain (Loss) on Investments | 4,919,354 | (968,942 | ) | 114,822 | 203,613 | |||
| Net Increase in Net Assets | ||||||||
| Resulting from Operations | 31,863,126 | 5,128,025 | 5,861,691 | 5,166,149 | ||||
| See notes to financial statements. | ||||||||
The Funds 93
STATEMENTS OF OPERATIONS (continued)
| BNY Mellon | BNY Mellon | |||
| New York Intermediate | Municipal | |||
| Tax-Exempt Bond Fund | Opportunities Fund | |||
| Investment Income ($): | ||||
| Interest Income | 3,556,902 | 15,779,374 | ||
| Expenses: | ||||
| Investment advisory fee—Note 4(a) | 554,771 | 1,951,802 | ||
| Administration fee—Note 4(a) | 137,106 | 482,216 | ||
| Interest and expense for floating rate notes issued—Note 5 | — | 221,633 | ||
| Shareholder servicing costs—Note 4(b) | 25,287 | 2,822 | ||
| Professional fees | 22,516 | 29,025 | ||
| Registration fees | 15,134 | 52,161 | ||
| Custodian fees—Note 4(b) | 9,806 | 32,333 | ||
| Prospectus and shareholders’ reports | 7,714 | 3,976 | ||
| Trustees’ fees and expenses—Note 4(c) | 6,682 | 23,669 | ||
| Loan commitment fees—Note 3 | 1,225 | 4,851 | ||
| Interest expense—Note 3 | — | 410 | ||
| Miscellaneous | 25,527 | 33,866 | ||
| Total Expenses | 805,768 | 2,838,764 | ||
| Less—reduction in expenses due to undertaking—Note 4(a) | (126,011 | ) | — | |
| Less—reduction in fees due to earnings credits—Note 4(b) | (28 | ) | (2 | ) |
| Net Expenses | 679,729 | 2,838,762 | ||
| Investment Income—Net | 2,877,173 | 12,940,612 | ||
| Realized and Unrealized Gain (Loss) on Investments—Note 5 ($): | ||||
| Net realized gain (loss) on investments | 2,896,576 | 15,514,123 | ||
| Net realized gain (loss) on financial futures | (31,410 | ) | 1,421,343 | |
| Net realized gain (loss) options transactions | — | (270,473 | ) | |
| Net Realized Gain (Loss) | 2,865,166 | 16,664,993 | ||
| Net unrealized appreciation (depreciation) on investments | (2,927,776 | ) | (6,213,993 | ) |
| Net unrealized appreciation (depreciation) on financial futures | 51,250 | 3,724,861 | ||
| Net unrealized appreciation (depreciation) on swap transactions | — | 1,339,702 | ||
| Net Unrealized Appreciation (Depreciation) | (2,876,526 | ) | (1,149,430 | ) |
| Net Realized and Unrealized Gain (Loss) on Investments | (11,360 | ) | 15,515,563 | |
| Net Increase in Net Assets Resulting from Operations | 2,865,813 | 28,456,175 | ||
| See notes to financial statements. | ||||
94
STATEMENT OF CASH FLOWS
February 28, 2013 (Unaudited)
| BNY Mellon Municipal Opportunities Fund | ||||
| Cash Flows from Operating Activities ($): | ||||
| Purchases of portfolio securities | (550,041,867 | ) | ||
| Proceeds from sale of portfolio securities | 386,231,108 | |||
| Financial futures transactions | 5,265,141 | |||
| Options transactions | (270,473 | ) | ||
| Net purchase of short-term portfolio securities | (90,210,000 | ) | ||
| Interest received | 17,511,269 | |||
| Operating expenses paid | (789,481 | ) | ||
| Cash paid to The Dreyfus Corporation for investment advisory fee | (1,880,114 | ) | (234,184,417 | ) |
| Cash Flows from Financing Activities ($): | ||||
| Net Beneficial Interest transactions | 252,717,347 | |||
| Dividends paid | (12,698,738 | ) | ||
| Increase in cash | 5,834,192 | |||
| Cash at beginning of period | (4,961,906 | ) | ||
| Cash at end of period | 872,286 | |||
| Reconciliation of Net Increase in Net Assets Resulting from | ||||
| Operations to Net Cash Used by Operating Activities ($): | ||||
| Net Increase in Net Assets Resulting From Operations | 28,456,175 | |||
| Adjustments to reconcile net increase in net assets resulting | ||||
| from operations to net cash used by operating activities ($): | ||||
| Purchases of portfolio securities | (550,041,867 | ) | ||
| Proceeds from sales of portfolio securities | 386,231,108 | |||
| Financial futures transactions | 5,265,141 | |||
| Options transactions | (270,473 | ) | ||
| Net purchase of short-term portfolio securities | (90,210,000 | ) | ||
| Decrease in interest receivable | 80,851 | |||
| Increase in accrued operating expenses | 69,059 | |||
| Decrease in prepaid expenses | 13,317 | |||
| Increase in Due to The Dreyfus Corporation | 71,688 | |||
| Increase in Due to Administrator | 15,104 | |||
| Decrease in interest and expense payable related to floating rate notes issued | (20,742 | ) | ||
| Net realized gain on investments, financial futures and options transactions | (16,664,993 | ) | ||
| Net unrealized appreciation on investments, financial futures and swaps | 1,149,430 | |||
| Net amortization of premiums on investments | 1,671,785 | |||
| Net Cash Used by Operating Activities | (234,184,417 | ) | ||
| Supplemental non-cash financing disclosure | ||||
| Reinvestment of dividends | 6,554,756 |
The Funds 95
STATEMENTS OF CHANGES IN NET ASSETS
| BNY Mellon National Intermediate | BNY Mellon National Short-Term | |||||||
| Municipal Bond Fund | Municipal Bond Fund | |||||||
| Six Months Ended | Six Months Ended | |||||||
| February 28, 2013 | Year Ended | February 28, 2013 | Year Ended | |||||
| (Unaudited) | August 31, 2012a | (Unaudited) | August 31, 2012 | |||||
| Operations ($): | ||||||||
| Investment income—net | 26,943,772 | 52,398,260 | 6,096,967 | 13,700,305 | ||||
| Net realized gain (loss) on investments | 2,436,831 | 6,028,731 | 819,167 | 993,238 | ||||
| Net unrealized appreciation (depreciation) on investments | 2,482,523 | 57,136,300 | (1,788,109 | ) | 984,819 | |||
| Net Increase (Decrease) in Net Assets | ||||||||
| Resulting from Operations | 31,863,126 | 115,563,291 | 5,128,025 | 15,678,362 | ||||
| Dividends to Shareholders from ($): | ||||||||
| Investment income—net: | ||||||||
| Class M Shares | (24,477,106 | ) | (50,905,720 | ) | (6,067,373 | ) | (13,635,591 | ) |
| Investor Shares | (527,854 | ) | (1,155,316 | ) | (12,768 | ) | (32,144 | ) |
| Dreyfus Premier Shares | — | (1,170 | ) | — | — | |||
| Net realized gain on investments: | ||||||||
| Class M Shares | (6,792,322 | ) | (58,171 | ) | — | — | ||
| Investor Shares | (168,134 | ) | (1,569 | ) | — | — | ||
| Dreyfus Premier Shares | — | (3 | ) | — | — | |||
| Total Dividends | (31,965,416 | ) | (52,121,949 | ) | (6,080,141 | ) | (13,667,735 | ) |
| Beneficial Interest Transactions ($): | ||||||||
| Net proceeds from shares sold: | ||||||||
| Class M Shares | 277,953,755 | 388,344,807 | 473,997,766 | 752,779,194 | ||||
| Investor Shares | 8,505,916 | 18,114,581 | 2,488,334 | 8,153,985 | ||||
| Dreyfus Premier Shares | — | 237 | — | — | ||||
| Dividends reinvested: | ||||||||
| Class M Shares | 6,810,856 | 6,244,171 | 1,455,413 | 3,431,867 | ||||
| Investor Shares | 468,728 | 699,051 | 9,382 | 23,413 | ||||
| Cost of shares redeemed: | ||||||||
| Class M Shares | (175,664,625 | ) | (294,488,925 | ) | (481,030,729 | ) | (605,418,416 | ) |
| Investor Shares | (4,779,404 | ) | (23,562,985 | ) | (3,252,042 | ) | (8,196,436 | ) |
| Dreyfus Premier Shares | — | (105,177 | ) | — | — | |||
| Increase (Decrease) in Net Assets from | ||||||||
| Beneficial Interest Transactions | 113,295,226 | 95,245,760 | (6,331,876 | ) | 150,773,607 | |||
| Total Increase (Decrease) in Net Assets | 113,192,936 | 158,687,102 | (7,283,992 | ) | 152,784,234 | |||
| Net Assets ($): | ||||||||
| Beginning of Period | 1,735,589,337 | 1,576,902,235 | 1,245,138,730 | 1,092,354,496 | ||||
| End of Period | 1,848,782,273 | 1,735,589,337 | 1,237,854,738 | 1,245,138,730 | ||||
| Undistributed investment income—net | 1,938,812 | — | 16,826 | — | ||||
96
| BNY Mellon National Intermediate | BNY Mellon National Short-Term | |||||||
| Municipal Bond Fund | Municipal Bond Fund | |||||||
| Six Months Ended | Six Months Ended | |||||||
| February 28, 2013 | Year Ended | February 28, 2013 | Year Ended | |||||
| (Unaudited) | August 31, 2012a | (Unaudited) | August 31, 2012 | |||||
| Capital Share Transactions: | ||||||||
| Class M Shares | ||||||||
| Shares sold | 19,854,999 | 28,248,506 | 36,465,685 | 57,983,432 | ||||
| Shares issued for dividends reinvested | 485,622 | 453,507 | 111,977 | 264,380 | ||||
| Shares redeemed | (12,544,570 | ) | (21,411,046 | ) | (37,024,181 | ) | (46,629,162 | ) |
| Net Increase (Decrease) in Shares Outstanding | 7,796,051 | 7,290,967 | (446,519 | ) | 11,618,650 | |||
| Investor Sharesb | ||||||||
| Shares sold | 606,203 | 1,323,229 | 191,608 | 628,933 | ||||
| Shares issued for dividends reinvested | 33,443 | 50,854 | 723 | 1,805 | ||||
| Shares redeemed | (341,833 | ) | (1,716,591 | ) | (250,429 | ) | (632,148 | ) |
| Net Increase (Decrease) in Shares Outstanding | 297,813 | (342,508 | ) | (58,098 | ) | (1,410 | ) | |
| Dreyfus Premier Sharesb | ||||||||
| Shares sold | — | 17 | — | — | ||||
| Shares redeemed | — | (7,669 | ) | — | — | |||
| Net Increase (Decrease) in Shares Outstanding | — | (7,652 | ) | — | — | |||
a Effective as of the close of business on March 13, 2012, the fund no longer offers Dreyfus Premier shares.
b During the period ended August 31, 2012, one Dreyfus Premier share of BNY Mellon National Intermediate Municipal Bond Fund representing $17 was automatically converted
to one Investor share.
See notes to financial statements.
The Funds 97
STATEMENTS OF CHANGES IN NET ASSETS (continued)
| BNY Mellon Pennsylvania | ||||
| Intermediate Municipal Bond Fund | ||||
| Six Months Ended | ||||
| February 28, 2013 | Year Ended | |||
| (Unaudited) | August 31, 2012 | |||
| Operations ($): | ||||
| Investment income—net | 5,746,869 | 13,584,565 | ||
| Net realized gain (loss) on investments | 3,312,545 | 4,827,446 | ||
| Net unrealized appreciation (depreciation) on investments | (3,197,723 | ) | 7,653,982 | |
| Net Increase (Decrease) in Net Assets | ||||
| Resulting from Operations | 5,861,691 | 26,065,993 | ||
| Dividends to Shareholders from ($): | ||||
| Investment income—net: | ||||
| Class M Shares | (5,650,307 | ) | (13,289,825 | ) |
| Investor Shares | (84,146 | ) | (268,889 | ) |
| Net realized gain on investments: | ||||
| Class M Shares | (2,706,193 | ) | — | |
| Investor Shares | (34,536 | ) | — | |
| Total Dividends | (8,475,182 | ) | (13,558,714 | ) |
| Beneficial Interest Transactions ($): | ||||
| Net proceeds from shares sold: | ||||
| Class M Shares | 25,048,693 | 34,679,794 | ||
| Investor Shares | 219,240 | 2,084,794 | ||
| Dividends reinvested: | ||||
| Class M Shares | 1,941,679 | 662,149 | ||
| Investor Shares | 70,142 | 98,474 | ||
| Cost of shares redeemed: | ||||
| Class M Shares | (32,791,363 | ) | (64,834,148 | ) |
| Investor Shares | (4,088,942 | ) | (3,046,840 | ) |
| Increase (Decrease) in Net Assets from | ||||
| Beneficial Interest Transactions | (9,600,551 | ) | (30,355,777 | ) |
| Total Increase (Decrease) in Net Assets | (12,214,042 | ) | (17,848,498 | ) |
| Net Assets ($): | ||||
| Beginning of Period | 411,891,224 | 429,739,722 | ||
| End of Period | 399,677,182 | 411,891,224 | ||
| Undistributed investment income—net | 12,416 | — | ||
| Capital Share Transactions (Shares): | ||||
| Class M Shares | ||||
| Shares sold | 1,910,371 | 2,673,353 | ||
| Shares issued for dividends reinvested | 147,962 | 50,980 | ||
| Shares redeemed | (2,495,440 | ) | (5,000,188 | ) |
| Net Increase (Decrease) in Shares Outstanding | (437,107 | ) | (2,275,855 | ) |
| Investor Shares | ||||
| Shares sold | 16,771 | 157,871 | ||
| Shares issued for dividends reinvested | 5,347 | 7,595 | ||
| Shares redeemed | (308,927 | ) | (234,744 | ) |
| Net Increase (Decrease) in Shares Outstanding | (286,809 | ) | (69,278 | ) |
| See notes to financial statements. | ||||
98
| BNY Mellon Massachusetts | ||||
| Intermediate Municipal Bond Fund | ||||
| Six Months Ended | ||||
| February 28, 2013 | Year Ended | |||
| (Unaudited) | August 31, 2012a | |||
| Operations ($): | ||||
| Investment income—net | 4,962,536 | 10,962,315 | ||
| Net realized gain (loss) on investments | 2,273,955 | 3,690,166 | ||
| Net unrealized appreciation (depreciation) on investments | (2,070,342 | ) | 7,610,276 | |
| Net Increase (Decrease) in Net Assets | ||||
| Resulting from Operations | 5,166,149 | 22,262,757 | ||
| Dividends to Shareholders from ($): | ||||
| Investment income—net: | ||||
| Class M Shares | (4,841,767 | ) | (10,709,968 | ) |
| Investor Shares | (120,769 | ) | (252,170 | ) |
| Dreyfus Premier Shares | — | (177 | ) | |
| Net realized gain on investments: | ||||
| Class M Shares | (3,698,997 | ) | (132,840 | ) |
| Investor Shares | (104,182 | ) | (3,141 | ) |
| Dreyfus Premier Shares | — | (8 | ) | |
| Total Dividends | (8,765,715 | ) | (11,098,304 | ) |
| Beneficial Interest Transactions ($): | ||||
| Net proceeds from shares sold: | ||||
| Class M Shares | 28,934,538 | 49,070,188 | ||
| Investor Shares | 2,030,564 | 2,348,637 | ||
| Dividends reinvested: | ||||
| Class M Shares | 3,092,226 | 2,779,118 | ||
| Investor Shares | 181,442 | 209,532 | ||
| Dreyfus Premier Shares | — | 178 | ||
| Cost of shares redeemed: | ||||
| Class M Shares | (30,792,428 | ) | (65,862,538 | ) |
| Investor Shares | (1,285,057 | ) | (2,152,642 | ) |
| Dreyfus Premier Shares | — | (20,751 | ) | |
| Increase (Decrease) in Net Assets from | ||||
| Beneficial Interest Transactions | 2,161,285 | (13,628,278 | ) | |
| Total Increase (Decrease) in Net Assets | (1,438,281 | ) | (2,463,825 | ) |
| Net Assets ($): | ||||
| Beginning of Period | 355,753,997 | 358,217,822 | ||
| End of Period | 354,315,716 | 355,753,997 | ||
The Funds 99
STATEMENTS OF CHANGES IN NET ASSETS (continued)
| BNY Mellon Massachusetts | ||||
| Intermediate Municipal Bond Fund | ||||
| Six Months Ended | ||||
| February 28, 2013 | Year Ended | |||
| (Unaudited) | August 31, 2012a | |||
| Capital Share Transactions: | ||||
| Class M Shares | ||||
| Shares sold | 2,150,515 | 3,667,157 | ||
| Shares issued for dividends reinvested | 229,447 | 208,041 | ||
| Shares redeemed | (2,283,297 | ) | (4,937,793 | ) |
| Net Increase (Decrease) in Shares Outstanding | 96,665 | (1,062,595 | ) | |
| Investor Sharesb | ||||
| Shares sold | 151,353 | 175,459 | ||
| Shares issued for dividends reinvested | 13,456 | 15,664 | ||
| Shares redeemed | (95,562 | ) | (161,128 | ) |
| Net Increase (Decrease) in Shares Outstanding | 69,247 | 29,995 | ||
| Dreyfus Premier Sharesb | ||||
| Shares issued for dividends reinvested | — | 13 | ||
| Shares redeemed | — | (1,554 | ) | |
| Net Increase (Decrease) in Shares Outstanding | — | (1,541 | ) | |
a Effective as of the close of business on January 5, 2012, the fund no longer offers Dreyfus Premier shares.
b During the period ended August 31, 2012, 1,554 Dreyfus Premier shares of BNY Mellon Massachusetts Intermediate Municipal Bond Fund representing $20,745 were
automatically converted to 1,557 Investor shares.
See notes to financial statements.
100
| BNY Mellon New York | ||||
| Intermediate Tax-Exempt Bond Fund | ||||
| Six Months Ended | ||||
| February 28, 2013 | Year Ended | |||
| (Unaudited) | August 31, 2012 | |||
| Operations ($): | ||||
| Investment income—net | 2,877,173 | 6,302,334 | ||
| Net realized gain (loss) on investments | 2,865,166 | 2,163,412 | ||
| Net unrealized appreciation (depreciation) on investments | (2,876,526 | ) | 6,400,523 | |
| Net Increase (Decrease) in Net Assets | ||||
| Resulting from Operations | 2,865,813 | 14,866,269 | ||
| Dividends to Shareholders from ($): | ||||
| Investment income—net: | ||||
| Class M Shares | (2,642,970 | ) | (5,768,871 | ) |
| Investor Shares | (224,869 | ) | (517,357 | ) |
| Net realized gain on investments: | ||||
| Class M Shares | (2,118,837 | ) | (423,352 | ) |
| Investor Shares | (198,769 | ) | (40,654 | ) |
| Total Dividends | (5,185,445 | ) | (6,750,234 | ) |
| Beneficial Interest Transactions ($): | ||||
| Net proceeds from shares sold: | ||||
| Class M Shares | 18,427,518 | 45,176,021 | ||
| Investor Shares | 2,217,926 | 4,430,027 | ||
| Dividends reinvested: | ||||
| Class M Shares | 261,054 | 826,208 | ||
| Investor Shares | 173,908 | 431,771 | ||
| Cost of shares redeemed: | ||||
| Class M Shares | (19,872,537 | ) | (32,145,416 | ) |
| Investor Shares | (2,101,082 | ) | (3,693,098 | ) |
| Increase (Decrease) in Net Assets from | ||||
| Beneficial Interest Transactions | (893,213 | ) | 15,025,513 | |
| Total Increase (Decrease) in Net Assets | (3,212,845 | ) | 23,141,548 | |
| Net Assets ($): | ||||
| Beginning of Period | 222,865,222 | 199,723,674 | ||
| End of Period | 219,652,377 | 222,865,222 | ||
| Undistributed investment income—net | 9,334 | — | ||
| Capital Share Transactions (Shares): | ||||
| Class M Shares | ||||
| Shares sold | 1,550,242 | 3,850,572 | ||
| Shares issued for dividends reinvested | 21,956 | 70,843 | ||
| Shares redeemed | (1,679,912 | ) | (2,752,217 | ) |
| Net Increase (Decrease) in Shares Outstanding | (107,714 | ) | 1,169,198 | |
| Investor Shares | ||||
| Shares sold | 186,488 | 380,692 | ||
| Shares issued for dividends reinvested | 14,624 | 36,867 | ||
| Shares redeemed | (177,162 | ) | (314,001 | ) |
| Net Increase (Decrease) in Shares Outstanding | 23,950 | 103,558 | ||
| See notes to financial statements. | ||||
The Funds 101
STATEMENTS OF CHANGES IN NET ASSETS (continued)
| BNY Mellon | ||||
| Municipal Opportunities Fund | ||||
| Six Months Ended | ||||
| February 28, 2013 | Year Ended | |||
| (Unaudited) | August 31, 2012 | |||
| Operations ($): | ||||
| Investment income—net | 12,940,612 | 24,488,246 | ||
| Net realized gain (loss) on investments | 16,664,993 | 9,621,583 | ||
| Net unrealized appreciation (depreciation) on investments | (1,149,430 | ) | 43,842,061 | |
| Net Increase (Decrease) in Net Assets | ||||
| Resulting from Operations | 28,456,175 | 77,951,890 | ||
| Dividends to Shareholders from ($): | ||||
| Investment income—net: | ||||
| Class M Shares | (12,747,751 | ) | (24,108,462 | ) |
| Investor Shares | (34,395 | ) | (67,339 | ) |
| Net realized gain on investments: | ||||
| Class M Shares | (6,451,408 | ) | — | |
| Investor Shares | (19,941 | ) | — | |
| Total Dividends | (19,253,495 | ) | (24,175,801 | ) |
| Beneficial Interest Transactions ($): | ||||
| Net proceeds from shares sold: | ||||
| Class M Shares | 308,257,719 | 214,900,164 | ||
| Investor Shares | 1,085,504 | 3,016,344 | ||
| Dividends reinvested: | ||||
| Class M Shares | 6,509,531 | 6,161,952 | ||
| Investor Shares | 45,225 | 56,348 | ||
| Cost of shares redeemed: | ||||
| Class M Shares | (53,177,148 | ) | (57,764,262 | ) |
| Investor Shares | (984,156 | ) | (2,063,395 | ) |
| Increase (Decrease) in Net Assets from | ||||
| Beneficial Interest Transactions | 261,736,675 | 164,307,151 | ||
| Total Increase (Decrease) in Net Assets | 270,939,355 | 218,083,240 | ||
| Net Assets ($): | ||||
| Beginning of Period | 724,270,394 | 506,187,154 | ||
| End of Period | 995,209,749 | 724,270,394 | ||
| Undistributed investment income—net | 158,466 | — | ||
| Capital Share Transactions (Shares): | ||||
| Class M Shares | ||||
| Shares sold | 22,745,911 | 16,614,946 | ||
| Shares issued for dividends reinvested | 477,647 | 474,189 | ||
| Shares redeemed | (3,927,868 | ) | (4,483,416 | ) |
| Net Increase (Decrease) in Shares Outstanding | 19,295,690 | 12,605,719 | ||
| Investor Shares | ||||
| Shares sold | 80,009 | 233,679 | ||
| Shares issued for dividends reinvested | 3,320 | 4,346 | ||
| Shares redeemed | (72,776 | ) | (158,561 | ) |
| Net Increase (Decrease) in Shares Outstanding | 10,553 | 79,464 | ||
| See notes to financial statements. | ||||
102
FINANCIAL HIGHLIGHTS
The following tables describe the performance for each share class of each BNY Mellon municipal bond fund for the fiscal periods indicated. All information (except portfolio turnover rate) reflects financial results for a single fund share. Total return shows how much your investment in each fund would have increased (or decreased) during the period, assuming you had reinvested all dividends and distributions.These figures have been derived from each fund’s financial statements.
| Class M Shares | ||||||||||||
| Six Months Ended | ||||||||||||
| BNY Mellon National | February 28, 2013 | Year Ended August 31, | ||||||||||
| Intermediate Municipal Bond Fund | (Unaudited) | 2012 | 2011 | 2010 | 2009 | 2008 | ||||||
| Per Share Data ($): | ||||||||||||
| Net asset value, beginning of period | 13.98 | 13.45 | 13.75 | 13.10 | 12.84 | 12.81 | ||||||
| Investment Operations: | ||||||||||||
| Investment income—neta | .21 | .43 | .48 | .50 | .52 | .52 | ||||||
| Net realized and unrealized | ||||||||||||
| gain (loss) on investments | .04 | .53 | (.22 | ) | .65 | .27 | .02 | |||||
| Total from Investment Operations | .25 | .96 | .26 | 1.15 | .79 | .54 | ||||||
| Distributions: | ||||||||||||
| Dividends from investment income—net | (.20 | ) | (.43 | ) | (.48 | ) | (.50 | ) | (.52 | ) | (.51 | ) |
| Dividends from net realized gain on investments | (.05 | ) | (.00 | )b | (.08 | ) | — | (.01 | ) | — | ||
| Total Distributions | (.25 | ) | (.43 | ) | (.56 | ) | (.50 | ) | (.53 | ) | (.51 | ) |
| Net asset value, end of period | 13.98 | 13.98 | 13.45 | 13.75 | 13.10 | 12.84 | ||||||
| Total Return (%) | 1.80 | c | 7.25 | 2.07 | 8.96 | 6.37 | 4.32 | |||||
| Ratios/Supplemental Data (%): | ||||||||||||
| Ratio of total expenses to average net assets | .50 | d | .50 | .50 | .50 | .51 | .51 | |||||
| Ratio of net expenses to average net assets | .50 | d | .50 | .50 | .50 | .51 | .51 | |||||
| Ratio of net investment income | ||||||||||||
| to average net assets | 3.03 | d | 3.16 | 3.65 | 3.76 | 4.11 | 4.01 | |||||
| Portfolio Turnover Rate | 10.27 | c | 25.31 | 39.88 | 42.75 | 42.82 | 49.50 | |||||
| Net Assets, end of period ($ x 1,000) | 1,806,556 | 1,697,522 | 1,535,563 | 1,638,004 | 1,366,960 | 1,045,019 | ||||||
a Based on average shares outstanding at each month end.
b Amount represents less than $.01 per share.
c Not annualized.
d Annualized.
See notes to financial statements.
The Funds 103
FINANCIAL HIGHLIGHTS (continued)
| Investor Shares | ||||||||||||
| Six Months Ended | ||||||||||||
| BNY Mellon National | February 28, 2013 | Year Ended August 31, | ||||||||||
| Intermediate Municipal Bond Fund | (Unaudited) | 2012 | 2011 | 2010 | 2009 | 2008 | ||||||
| Per Share Data ($): | ||||||||||||
| Net asset value, beginning of period | 13.97 | 13.44 | 13.73 | 13.09 | 12.83 | 12.80 | ||||||
| Investment Operations: | ||||||||||||
| Investment income—neta | .19 | .40 | .45 | .47 | .49 | .48 | ||||||
| Net realized and unrealized | ||||||||||||
| gain (loss) on investments | .04 | .53 | (.21 | ) | .64 | .27 | .03 | |||||
| Total from Investment Operations | .23 | .93 | .24 | 1.11 | .76 | .51 | ||||||
| Distributions: | ||||||||||||
| Dividends from investment income—net | (.18 | ) | (.40 | ) | (.45 | ) | (.47 | ) | (.49 | ) | (.48 | ) |
| Dividends from net realized gain on investments | (.05 | ) | (.00 | )b | (.08 | ) | — | (.01 | ) | — | ||
| Total Distributions | (.23 | ) | (.40 | ) | (.53 | ) | (.47 | ) | (.50 | ) | (.48 | ) |
| Net asset value, end of period | 13.97 | 13.97 | 13.44 | 13.73 | 13.09 | 12.83 | ||||||
| Total Return (%) | 1.67 | c | 6.99 | 1.90 | 8.61 | 6.11 | 4.06 | |||||
| Ratios/Supplemental Data (%): | ||||||||||||
| Ratio of total expenses to average net assets | .75 | d | .75 | .75 | .75 | .76 | .76 | |||||
| Ratio of net expenses to average net assets | .75 | d | .75 | .75 | .75 | .76 | .76 | |||||
| Ratio of net investment income | ||||||||||||
| to average net assets | 2.78 | d | 2.92 | 3.41 | 3.51 | 3.88 | 3.77 | |||||
| Portfolio Turnover Rate | 10.27 | c | 25.31 | 39.88 | 42.75 | 42.82 | 49.50 | |||||
| Net Assets, end of period ($ x 1,000) | 42,227 | 38,067 | 41,237 | 33,931 | 26,368 | 21,668 | ||||||
a Based on average shares outstanding at each month end.
b Amount represents less than $.01 per share.
c Not annualized.
d Annualized.
See notes to financial statements.
104
| Class M Shares | ||||||||||||
| Six Months Ended | ||||||||||||
| BNY Mellon National Short-Term | February 28, 2013 | Year Ended August 31, | ||||||||||
| Municipal Bond Fund | (Unaudited) | 2012 | 2011 | 2010 | 2009 | 2008 | ||||||
| Per Share Data ($): | ||||||||||||
| Net asset value, beginning of period | 13.01 | 12.99 | 13.01 | 12.80 | 12.69 | 12.59 | ||||||
| Investment Operations: | ||||||||||||
| Investment income—neta | .06 | .15 | .18 | .21 | .31 | .41 | ||||||
| Net realized and unrealized | ||||||||||||
| gain (loss) on investments | (.01 | ) | .02 | (.02 | ) | .21 | .14 | .10 | ||||
| Total from Investment Operations | .05 | .17 | .16 | .42 | .45 | .51 | ||||||
| Distributions: | ||||||||||||
| Dividends from investment income—net | (.06 | ) | (.15 | ) | (.18 | ) | (.21 | ) | (.34 | ) | (.41 | ) |
| Net asset value, end of period | 13.00 | 13.01 | 12.99 | 13.01 | 12.80 | 12.69 | ||||||
| Total Return (%) | .40 | b | 1.34 | 1.31 | 3.22 | 3.61 | 4.09 | |||||
| Ratios/Supplemental Data (%): | ||||||||||||
| Ratio of total expenses to average net assets | .50 | c | .51 | .51 | .51 | .54 | .54 | |||||
| Ratio of net expenses to average net assets | .50 | c | .51 | .51 | .51 | .54 | .54 | |||||
| Ratio of net investment income | ||||||||||||
| to average net assets | .96 | c | 1.18 | 1.38 | 1.60 | 2.50 | 3.23 | |||||
| Portfolio Turnover Rate | 11.70 | b | 34.17 | 24.33 | 16.46 | 12.61 | 22.93 | |||||
| Net Assets, end of period ($ x 1,000) | 1,234,603 | 1,241,129 | 1,088,334 | 1,060,685 | 536,597 | 168,243 | ||||||
a Based on average shares outstanding at each month end.
b Not annualized.
c Annualized.
See notes to financial statements.
The Funds 105
FINANCIAL HIGHLIGHTS (continued)
| Investor Shares | ||||||||||||
| Six Months Ended | ||||||||||||
| BNY Mellon National Short-Term | February 28, 2013 | Year Ended August 31, | ||||||||||
| Municipal Bond Fund | (Unaudited) | 2012 | 2011 | 2010 | 2009 | 2008 | ||||||
| Per Share Data ($): | ||||||||||||
| Net asset value, beginning of period | 13.00 | 12.97 | 12.99 | 12.78 | 12.68 | 12.58 | ||||||
| Investment Operations: | ||||||||||||
| Investment income—neta | .05 | .12 | .15 | .19 | .31 | .38 | ||||||
| Net realized and unrealized | ||||||||||||
| gain (loss) on investments | (.01 | ) | .03 | (.02 | ) | .20 | .10 | .10 | ||||
| Total from Investment Operations | .04 | .15 | .13 | .39 | .41 | .48 | ||||||
| Distributions: | ||||||||||||
| Dividends from investment income—net | (.05 | ) | (.12 | ) | (.15 | ) | (.18 | ) | (.31 | ) | (.38 | ) |
| Net asset value, end of period | 12.99 | 13.00 | 12.97 | 12.99 | 12.78 | 12.68 | ||||||
| Total Return (%) | .28 | b | 1.17 | .98 | 3.05 | 3.28 | 3.83 | |||||
| Ratios/Supplemental Data (%): | ||||||||||||
| Ratio of total expenses to average net assets | .75 | c | .76 | .77 | .77 | .80 | .80 | |||||
| Ratio of net expenses to average net assets | .75 | c | .76 | .77 | .77 | .80 | .80 | |||||
| Ratio of net investment income | ||||||||||||
| to average net assets | .72 | c | .92 | 1.15 | 1.39 | 2.38 | 2.99 | |||||
| Portfolio Turnover Rate | 11.70 | b | 34.17 | 24.33 | 16.46 | 12.61 | 22.93 | |||||
| Net Assets, end of period ($ x 1,000) | 3,252 | 4,009 | 4,021 | 2,356 | 1,420 | 662 | ||||||
a Based on average shares outstanding at each month end.
b Not annualized.
c Annualized.
See notes to financial statements.
106
| Class M Shares | ||||||||||||
| Six Months Ended | ||||||||||||
| BNY Mellon Pennsylvania | February 28, 2013 | Year Ended August 31, | ||||||||||
| Intermediate Municipal Bond Fund | (Unaudited) | 2012 | 2011 | 2010 | 2009 | 2008 | ||||||
| Per Share Data ($): | ||||||||||||
| Net asset value, beginning of period | 13.15 | 12.77 | 12.96 | 12.40 | 12.35 | 12.43 | ||||||
| Investment Operations: | ||||||||||||
| Investment income—neta | .19 | .42 | .46 | .46 | .48 | .48 | ||||||
| Net realized and unrealized | ||||||||||||
| gain (loss) on investments | .01 | .38 | (.19 | ) | .56 | .09 | (.06 | ) | ||||
| Total from Investment Operations | .20 | .80 | .27 | 1.02 | .57 | .42 | ||||||
| Distributions: | ||||||||||||
| Dividends from investment income—net | (.19 | ) | (.42 | ) | (.46 | ) | (.46 | ) | (.48 | ) | (.48 | ) |
| Dividends from net realized gain on investments | (.09 | ) | — | — | (.00 | )b | (.04 | ) | (.02 | ) | ||
| Total Distributions | (.28 | ) | (.42 | ) | (.46 | ) | (.46 | ) | (.52 | ) | (.50 | ) |
| Net asset value, end of period | 13.07 | 13.15 | 12.77 | 12.96 | 12.40 | 12.35 | ||||||
| Total Return (%) | 1.50 | c | 6.34 | 2.21 | 8.44 | 4.90 | 3.43 | |||||
| Ratios/Supplemental Data (%): | ||||||||||||
| Ratio of total expenses to average net assets | .67 | d | .67 | .66 | .66 | .67 | .66 | |||||
| Ratio of net expenses to average net assets | .67 | d | .67 | .66 | .66 | .67 | .66 | |||||
| Ratio of net investment income | ||||||||||||
| to average net assets | 2.86 | d | 3.23 | 3.67 | 3.68 | 4.02 | 3.87 | |||||
| Portfolio Turnover Rate | 17.57 | c | 27.16 | 9.72 | 7.11 | 12.75 | 10.14 | |||||
| Net Assets, end of period ($ x 1,000) | 394,958 | 403,371 | 420,586 | 500,892 | 501,978 | 566,767 | ||||||
a Based on average shares outstanding at each month end.
b Amount represents less than $.01 per share.
c Not annualized.
d Annualized.
See notes to financial statements.
The Funds 107
FINANCIAL HIGHLIGHTS (continued)
| Investor Shares | ||||||||||||
| Six Months Ended | ||||||||||||
| BNY Mellon Pennsylvania | February 28, 2013 | Year Ended August 31, | ||||||||||
| Intermediate Municipal Bond Fund | (Unaudited) | 2012 | 2011 | 2010 | 2009 | 2008 | ||||||
| Per Share Data ($): | ||||||||||||
| Net asset value, beginning of period | 13.14 | 12.75 | 12.94 | 12.39 | 12.33 | 12.41 | ||||||
| Investment Operations: | ||||||||||||
| Investment income—neta | .17 | .38 | .43 | .44 | .46 | .46 | ||||||
| Net realized and unrealized | ||||||||||||
| gain (loss) on investments | .00 | b | .41 | (.19 | ) | .54 | .09 | (.07 | ) | |||
| Total from Investment Operations | .17 | .79 | .24 | .98 | .55 | .39 | ||||||
| Distributions: | ||||||||||||
| Dividends from investment income—net | (.17 | ) | (.40 | ) | (.43 | ) | (.43 | ) | (.45 | ) | (.45 | ) |
| Dividends from net realized gain on investments | (.09 | ) | — | — | (.00 | )b | (.04 | ) | (.02 | ) | ||
| Total Distributions | (.26 | ) | (.40 | ) | (.43 | ) | (.43 | ) | (.49 | ) | (.47 | ) |
| Net asset value, end of period | 13.05 | 13.14 | 12.75 | 12.94 | 12.39 | 12.33 | ||||||
| Total Return (%) | 1.30 | c | 6.28 | 1.95 | 8.08 | 4.72 | 3.17 | |||||
| Ratios/Supplemental Data (%): | ||||||||||||
| Ratio of total expenses to average net assets | .92 | d | .92 | .91 | .92 | .92 | .91 | |||||
| Ratio of net expenses to average net assets | .92 | d | .92 | .91 | .92 | .92 | .91 | |||||
| Ratio of net investment income | ||||||||||||
| to average net assets | 2.64 | d | 2.97 | 3.42 | 3.42 | 3.76 | 3.63 | |||||
| Portfolio Turnover Rate | 17.57 | c | 27.16 | 9.72 | 7.11 | 12.75 | 10.14 | |||||
| Net Assets, end of period ($ x 1,000) | 4,719 | 8,520 | 9,153 | 9,385 | 2,563 | 1,442 | ||||||
a Based on average shares outstanding at each month end.
b Amount represents less than $.01 per share.
c Not annualized.
d Annualized.
See notes to financial statements.
108
| Class M Shares | ||||||||||||
| Six Months Ended | ||||||||||||
| BNY Mellon Massachusetts | February 28, 2013 | Year Ended August 31, | ||||||||||
| Intermediate Municipal Bond Fund | (Unaudited) | 2012 | 2011 | 2010 | 2009 | 2008 | ||||||
| Per Share Data ($): | ||||||||||||
| Net asset value, beginning of period | 13.54 | 13.12 | 13.39 | 12.86 | 12.57 | 12.42 | ||||||
| Investment Operations: | ||||||||||||
| Investment income—neta | .19 | .41 | .45 | .45 | .46 | .47 | ||||||
| Net realized and unrealized | ||||||||||||
| gain (loss) on investments | .01 | .44 | (.20 | ) | .53 | .29 | .14 | |||||
| Total from Investment Operations | .20 | .85 | .25 | .98 | .75 | .61 | ||||||
| Distributions: | ||||||||||||
| Dividends from investment income—net | (.19 | ) | (.42 | ) | (.45 | ) | (.45 | ) | (.46 | ) | (.46 | ) |
| Dividends from net realized gain on investments | (.15 | ) | (.01 | ) | (.07 | ) | — | — | — | |||
| Total Distributions | (.34 | ) | (.43 | ) | (.52 | ) | (.45 | ) | (.46 | ) | (.46 | ) |
| Net asset value, end of period | 13.40 | 13.54 | 13.12 | 13.39 | 12.86 | 12.57 | ||||||
| Total Return (%) | 1.46 | b | 6.50 | 2.02 | 7.75 | 6.18 | 5.02 | |||||
| Ratios/Supplemental Data (%): | ||||||||||||
| Ratio of total expenses to average net assets | .53 | c | .53 | .53 | .52 | .54 | .52 | |||||
| Ratio of net expenses to average net assets | .53 | c | .53 | .52 | .52 | .54 | .52 | |||||
| Ratio of net investment income | ||||||||||||
| to average net assets | 2.84 | c | 3.11 | 3.49 | 3.44 | 3.70 | 3.71 | |||||
| Portfolio Turnover Rate | 8.59 | b | 29.39 | 10.43 | 21.44 | 16.78 | 8.75 | |||||
| Net Assets, end of period ($ x 1,000) | 344,374 | 346,647 | 349,768 | 407,667 | 381,129 | 374,115 | ||||||
a Based on average shares outstanding at each month end.
b Not annualized.
c Annualized.
See notes to financial statements.
The Funds 109
FINANCIAL HIGHLIGHTS (continued)
| Investor Shares | ||||||||||||
| Six Months Ended | ||||||||||||
| BNY Mellon Massachusetts | February 28, 2013 | Year Ended August 31, | ||||||||||
| Intermediate Municipal Bond Fund | (Unaudited) | 2012 | 2011 | 2010 | 2009 | 2008 | ||||||
| Per Share Data ($): | ||||||||||||
| Net asset value, beginning of period | 13.54 | 13.12 | 13.39 | 12.86 | 12.57 | 12.42 | ||||||
| Investment Operations: | ||||||||||||
| Investment income—neta | .17 | .38 | .42 | .42 | .43 | .44 | ||||||
| Net realized and unrealized | ||||||||||||
| gain (loss) on investments | .01 | .43 | (.20 | ) | .53 | .29 | .14 | |||||
| Total from Investment Operations | .18 | .81 | .22 | .95 | .72 | .58 | ||||||
| Distributions: | ||||||||||||
| Dividends from investment income—net | (.17 | ) | (.38 | ) | (.42 | ) | (.42 | ) | (.43 | ) | (.43 | ) |
| Dividends from net realized gain on investments | (.15 | ) | (.01 | ) | (.07 | ) | — | — | — | |||
| Total Distributions | (.32 | ) | (.39 | ) | (.49 | ) | (.42 | ) | (.43 | ) | (.43 | ) |
| Net asset value, end of period | 13.40 | 13.54 | 13.12 | 13.39 | 12.86 | 12.57 | ||||||
| Total Return (%) | 1.34 | b | 6.23 | 1.77 | 7.49 | 5.92 | 4.76 | |||||
| Ratios/Supplemental Data (%): | ||||||||||||
| Ratio of total expenses to average net assets | .78 | c | .78 | .78 | .77 | .79 | .77 | |||||
| Ratio of net expenses to average net assets | .78 | c | .78 | .77 | .77 | .79 | .77 | |||||
| Ratio of net investment income | ||||||||||||
| to average net assets | 2.60 | c | 2.86 | 3.24 | 3.20 | 3.45 | 3.47 | |||||
| Portfolio Turnover Rate | 8.59 | b | 29.39 | 10.43 | 21.44 | 16.78 | 8.75 | |||||
| Net Assets, end of period ($ x 1,000) | 9,941 | 9,107 | 8,430 | 8,143 | 9,096 | 8,574 | ||||||
a Based on average shares outstanding at each month end.
b Not annualized.
c Annualized.
See notes to financial statements.
110
| Class M Shares† | ||||||||||||||
| Six Months Ended | ||||||||||||||
| BNY Mellon New York Intermediate February 28, 2013 | Year Ended August 31, | Eight Months Ended | Year Ended December 31, | |||||||||||
| Tax-Exempt Bond Fund | (Unaudited) | 2012 | 2011 | 2010 | August 31, 2009a | 2008 | 2007 | |||||||
| Per Share Data ($): | ||||||||||||||
| Net asset value, beginning of period | 11.92 | 11.46 | 11.60 | 11.16 | 10.71 | 10.81 | 10.75 | |||||||
| Investment Operations: | ||||||||||||||
| Investment income—netb | .15 | .36 | .38 | .38 | .25 | .37 | .38 | |||||||
| Net realized and unrealized | ||||||||||||||
| gain (loss) on investments | (.00 | )c | .49 | (.13 | ) | .44 | .45 | (.09 | ) | .07 | ||||
| Total from Investment Operations | .15 | .85 | .25 | .82 | .70 | .28 | .45 | |||||||
| Distributions: | ||||||||||||||
| Dividends from investment income—net | (.15 | ) | (.36 | ) | (.38 | ) | (.38 | ) | (.25 | ) | (.37 | ) | (.38 | ) |
| Dividends from net realized | ||||||||||||||
| gain on investments | (.12 | ) | (.03 | ) | (.01 | ) | (.00 | )c | (.00 | )c | (.01 | ) | (.01 | ) |
| Total Distributions | (.27 | ) | (.39 | ) | (.39 | ) | (.38 | ) | (.25 | ) | (.38 | ) | (.39 | ) |
| Net asset value, end of period | 11.80 | 11.92 | 11.46 | 11.60 | 11.16 | 10.71 | 10.81 | |||||||
| Total Return (%) | 1.31 | d | 7.48 | 2.31 | 7.45 | 6.58 | d | 2.64 | 4.33 | |||||
| Ratios/Supplemental Data (%): | ||||||||||||||
| Ratio of total expenses to average net assets | .70 | e | .71 | .70 | .72 | .72 | e | .75 | .75 | |||||
| Ratio of net expenses to average net assets | .59 | e | .59 | .59 | .59 | .59 | e | .59 | .59 | |||||
| Ratio of net investment income | ||||||||||||||
| to average net assets | 2.61 | e | 3.06 | 3.41 | 3.33 | 3.40 | e | 3.49 | 3.56 | |||||
| Portfolio Turnover Rate | 22.54 | d | 30.96 | 21.91 | 4.80 | 1.47 | d | 6 | 17 | |||||
| Net Assets, end of period ($ x 1,000) | 200,463 | 203,768 | 182,547 | 196,795 | 153,785 | 113,699 | 97,935 | |||||||
† Represents information for Institutional shares of the fund’s predecessor, BNY Hamilton Intermediate NewYork Tax-Exempt Fund, through September 12, 2008.
a The fund has changed its fiscal year end from December 31 to August 31.
b Based on average shares outstanding at each month end.
c Amount represents less than $.01 per share.
d Not annualized.
e Annualized.
See notes to financial statements.
The Funds 111
FINANCIAL HIGHLIGHTS (continued)
| Investor Shares† | ||||||||||||||
| Six Months Ended | ||||||||||||||
| BNY Mellon New York Intermediate February 28, 2013 | Year Ended August 31, | Eight Months Ended | Year Ended December 31, | |||||||||||
| Tax-Exempt Bond Fund | (Unaudited) | 2012 | 2011 | 2010 | August 31, 2009a | 2008 | 2007 | |||||||
| Per Share Data ($): | ||||||||||||||
| Net asset value, beginning of period | 11.93 | 11.47 | 11.61 | 11.17 | 10.72 | 10.82 | 10.76 | |||||||
| Investment Operations: | ||||||||||||||
| Investment income—netb | .14 | .33 | .36 | .35 | .23 | .34 | .35 | |||||||
| Net realized and unrealized | ||||||||||||||
| gain (loss) on investments | (.00 | )c | .49 | (.14 | ) | .44 | .45 | (.08 | ) | .08 | ||||
| Total from Investment Operations | .14 | .82 | .22 | .79 | .68 | .26 | .43 | |||||||
| Distributions: | ||||||||||||||
| Dividends from investment income—net | (.14 | ) | (.33 | ) | (.35 | ) | (.35 | ) | (.23 | ) | (.35 | ) | (.36 | ) |
| Dividends from net realized | ||||||||||||||
| gain on investments | (.12 | ) | (.03 | ) | (.01 | ) | (.00 | )c | (.00 | )c | (.01 | ) | (.01 | ) |
| Total Distributions | (.26 | ) | (.36 | ) | (.36 | ) | (.35 | ) | (.23 | ) | (.36 | ) | (.37 | ) |
| Net asset value, end of period | 11.81 | 11.93 | 11.47 | 11.61 | 11.17 | 10.72 | 10.82 | |||||||
| Total Return (%) | 1.19 | d | 7.20 | 2.05 | 7.17 | 6.40 | d | 2.39 | e | 4.07 | e | |||
| Ratios/Supplemental Data (%): | ||||||||||||||
| Ratio of total expenses to average net assets | .95 | f | .96 | .95 | .97 | .96 | f | 1.00 | 1.00 | |||||
| Ratio of net expenses to average net assets | .84 | f | .84 | .84 | .84 | .84 | f | .84 | .84 | |||||
| Ratio of net investment income | ||||||||||||||
| to average net assets | 2.36 | f | 2.81 | 3.16 | 3.08 | 3.15 | f | 3.24 | 3.31 | |||||
| Portfolio Turnover Rate | 22.54 | d | 30.96 | 21.91 | 4.80 | 1.47 | d | 6 | 17 | |||||
| Net Assets, end of period ($ x 1,000) | 19,189 | 19,097 | 17,177 | 17,352 | 16,810 | 16,198 | 17,153 | |||||||
† Represents information for Class A shares of the fund’s predecessor, BNY Hamilton Intermediate NewYork Tax-Exempt Fund, through September 12, 2008.
a The fund has changed its fiscal year end from December 31 to August 31.
b Based on average shares outstanding at each month end.
c Amount represents less than $.01 per share.
d Not annualized.
e Exclusive of sales charge.
f Annualized.
See notes to financial statements.
112
| Class M Shares | ||||||||||
| Six Months Ended | ||||||||||
| February 28, 2013 | Year Ended August 31, | |||||||||
| BNY Mellon Municipal Opportunities Fund | (Unaudited) | 2012 | 2011 | 2010 | 2009 | a | ||||
| Per Share Data ($): | ||||||||||
| Net asset value, beginning of period | 13.42 | 12.27 | 12.78 | 12.22 | 10.00 | |||||
| Investment Operations: | ||||||||||
| Investment income—netb | .22 | .50 | .52 | .50 | .43 | |||||
| Net realized and unrealized | ||||||||||
| gain (loss) on investments | .29 | 1.15 | (.35 | ) | .95 | 2.19 | ||||
| Total from Investment Operations | .51 | 1.65 | .17 | 1.45 | 2.62 | |||||
| Distributions: | ||||||||||
| Dividends from investment income—net | (.22 | ) | (.50 | ) | (.50 | ) | (.52 | ) | (.39 | ) |
| Dividends from net realized gain on investments | (.12 | ) | — | (.18 | ) | (.37 | ) | (.01 | ) | |
| Total Distributions | (.34 | ) | (.50 | ) | (.68 | ) | (.89 | ) | (.40 | ) |
| Net asset value, end of period | 13.59 | 13.42 | 12.27 | 12.78 | 12.22 | |||||
| Total Return (%) | 3.86 | c | 13.65 | 1.54 | 12.38 | 26.58 | c | |||
| Ratios/Supplemental Data (%): | ||||||||||
| Ratio of total expenses to average net assets | .73 | d | .73 | .73 | .71 | .87 | d | |||
| Ratio of net expenses to average net assets | .73 | d | .73 | .73 | .71 | .75 | d | |||
| Ratio of interest and expense related to | ||||||||||
| floating rate notes issued to average net assets | .06 | d | .06 | .06 | .01 | — | ||||
| Ratio of net investment income | ||||||||||
| to average net assets | 3.32 | d | 3.84 | 4.22 | 4.12 | 4.36 | d | |||
| Portfolio Turnover Rate | 49.99 | c | 119.90 | 129.00 | 145.57 | 161.70 | c | |||
| Net Assets, end of period ($ x 1,000) | 992,711 | 721,943 | 505,035 | 384,933 | 140,887 | |||||
a From October 15, 2008 (commencement of operations) to August 31, 2009.
b Based on average shares outstanding at each month end.
c Not annualized.
d Annualized.
See notes to financial statements.
The Funds 113
FINANCIAL HIGHLIGHTS (continued)
| Investor Shares | ||||||||||
| Six Months Ended | ||||||||||
| February 28, 2013 | Year Ended August 31, | |||||||||
| BNY Mellon Municipal Opportunities Fund | (Unaudited) | 2012 | 2011 | 2010 | 2009 | a | ||||
| Per Share Data ($): | ||||||||||
| Net asset value, beginning of period | 13.43 | 12.27 | 12.79 | 12.22 | 10.00 | |||||
| Investment Operations: | ||||||||||
| Investment income—netb | .20 | .47 | .48 | .50 | .42 | |||||
| Net realized and unrealized | ||||||||||
| gain (loss) on investments | .29 | 1.16 | (.35 | ) | .93 | 2.18 | ||||
| Total from Investment Operations | .49 | 1.63 | .13 | 1.43 | 2.60 | |||||
| Distributions: | ||||||||||
| Dividends from investment income—net | (.21 | ) | (.47 | ) | (.47 | ) | (.49 | ) | (.37 | ) |
| Dividends from net realized gain on investments | (.12 | ) | — | (.18 | ) | (.37 | ) | (.01 | ) | |
| Total Distributions | (.33 | ) | (.47 | ) | (.65 | ) | (.86 | ) | (.38 | ) |
| Net asset value, end of period | 13.59 | 13.43 | 12.27 | 12.79 | 12.22 | |||||
| Total Return (%) | 3.66 | c | 13.46 | 1.21 | 12.19 | 26.29 | c | |||
| Ratios/Supplemental Data (%): | ||||||||||
| Ratio of total expenses to average net assets | .96 | d | .99 | .98 | .96 | 1.11 | d | |||
| Ratio of net expenses to average net assets | .96 | d | .99 | .98 | .95 | .99 | d | |||
| Ratio of interest and expense related to | ||||||||||
| floating rate notes issued to average net assets | .06 | d | .06 | .06 | .01 | — | ||||
| Ratio of net investment income | ||||||||||
| to average net assets | 3.08 | d | 3.63 | 3.93 | 4.00 | 4.48 | d | |||
| Portfolio Turnover Rate | 49.99 | c | 119.90 | 129.00 | 145.57 | 161.70 | c | |||
| Net Assets, end of period ($ x 1,000) | 2,499 | 2,328 | 1,152 | 1,157 | 1,208 | |||||
a From October 15, 2008 (commencement of initial operations) to August 31, 2009.
b Based on average shares outstanding at each month end.
c Not annualized.
d Annualized.
See notes to financial statements.
114
NOTES TO FINANCIAL STATEMENTS (Unaudited)
NOTE 1—General:
BNY Mellon FundsTrust (the “Trust”) was organized as a Massachusetts business trust which is registered under the Investment Company Act of 1940, as amended (the “Act”), as an open-end management investment company and operates as a series company currently comprised of twenty-six series, including the following non-diversified municipal bond funds: BNY Mellon National Intermediate Municipal Bond Fund, BNY Mellon National Short-Term Municipal Bond Fund, BNY Mellon Pennsylvania Intermediate Municipal Bond Fund, BNY Mellon Massachusetts Intermediate Municipal Bond Fund, BNY Mellon New York Intermediate Tax-Exempt Bond Fund and BNY Mellon Municipal Opportunities Fund (each, a “fund” and collectively, the “funds”). The objectives of the funds are as follows: BNY Mellon National Intermediate Municipal Bond Fund, BNY Mellon National Short-Term Municipal Bond Fund and BNY Mellon Municipal Opportunities Fund seek to maximize current income exempt from federal income tax to the extent consistent with the preservation of capital. BNY Mellon Pennsylvania Intermediate Municipal Bond Fund seeks as high a level of income exempt from federal and Pennsylvania state income taxes as is consistent with the preservation of capital. BNY Mellon Massachusetts Intermediate Municipal Bond Fund seeks as high a level of income exempt from federal and Massachusetts state income taxes as is consistent with the preservation of capital. BNY Mellon New York Intermediate Tax-Exempt Bond Fund seeks as high a level of current income exempt from federal, New York state and New York city income taxes as is consistent with the preservation of capital.
BNY Mellon Fund Advisers, a division of The Dreyfus Corporation (the “Manager” or “Dreyfus”), a wholly-owned subsidiary of The Bank of New York Mellon Corporation (“BNY Mellon”), serves as each fund’s investment adviser (“Investment Adviser”).The Bank of New York Mellon, a subsidiary of BNY Mellon and an affiliate of Dreyfus, serves as administrator for the funds pursuant to an Administration Agreement with the Trust
(the “Administration Agreement”). The Bank of New York Mellon has entered into a Sub-Administration Agreement with Dreyfus pursuant to whichThe Bank of New York Mellon pays Dreyfus for performing certain administrative services. MBSC Securities Corporation (the “Distributor”), a wholly-owned subsidiary of Dreyfus, is the distributor of each fund’s shares.
The Trust is authorized to issue an unlimited number of shares of Beneficial Interest, par value $.001 per share, in Class M and Investor class shares of each fund. Other differences between the classes include the services offered to and the expenses borne by each class, the allocation of certain transfer agency costs and certain voting rights. Income, expenses (other than expenses attributable to a specific class), and realized and unrealized gains or losses on investments are allocated to each class of shares based on its relative net assets.
TheTrust accounts separately for the assets, liabilities and operations of each series. Expenses directly attributable to each series are charged to that series’ operations; expenses which are applicable to all series are allocated among them on a pro rata basis.
The Financial Accounting Standards Board (“FASB”) Accounting Standards Codification is the exclusive reference of authoritative U.S. generally accepted accounting principles (“GAAP”) recognized by the FASB to be applied by nongovernmental entities. Rules and interpretive releases of the Securities and Exchange Commission (“SEC”) under authority of federal laws are also sources of authoritative GAAP for SEC registrants. The funds’ financial statements are prepared in accordance with GAAP, which may require the use of management estimates and assumptions. Actual results could differ from those estimates.
NOTE 2—Significant Accounting Policies:
(a) Portfolio valuation: The fair value of a financial instrument is the amount that would be received to sell an asset or paid to transfer a liability in an orderly trans-
The Funds 115
NOTES TO FINANCIAL STATEMENTS (Unaudited) (continued)
action between market participants at the measurement date (i.e., the exit price). GAAP establishes a fair value hierarchy that prioritizes the inputs of valuation techniques used to measure fair value. This hierarchy gives the highest priority to unadjusted quoted prices in active markets for identical assets or liabilities (Level 1 measurements) and the lowest priority to unobservable inputs (Level 3 measurements).
Additionally, GAAP provides guidance on determining whether the volume and activity in a market has decreased significantly and whether such a decrease in activity results in transactions that are not orderly. GAAP requires enhanced disclosures around valuation inputs and techniques used during annual and interim periods.
Various inputs are used in determining the value of the fund’s investments relating to fair value measurements. These inputs are summarized in the three broad levels listed below:
Level 1—unadjusted quoted prices in active markets for identical investments.
Level 2—other significant observable inputs (including quoted prices for similar investments, interest rates, prepayment speeds, credit risk, etc.).
Level 3—significant unobservable inputs (including the funds’ own assumptions in determining the fair value of investments).
The inputs or methodology used for valuing securities are not necessarily an indication of the risk associated with investing in those securities.
Changes in valuation techniques may result in transfers in or out of an assigned level within the disclosure hierarchy. Valuation techniques used to value the fund’s investments are as follows:
Investments in securities are valued each business day by an independent pricing service (the “Service”) approved by the Trust’s Board of Trustees (the “Board”). Investments for which quoted bid prices are readily available and are representative of the bid side of the market in the judgment of the Service are valued at the mean
between the quoted bid prices (as obtained by the Service from dealers in such securities) and asked prices (as calculated by the Service based upon its evaluation of the market for such securities). Other investments (which constitute a majority of the portfolio securities) are carried at fair value as determined by the Service, based on methods which include consideration of the following: yields or prices of municipal securities of comparable quality, coupon, maturity and type; indications as to values from dealers; and general market conditions.All of the preceding securities are categorized within Level 2 of the fair value hierarchy. Options and financial futures on municipal and U.S. Treasury securities are valued at the last sales price on the securities exchange on which such securities are primarily traded or at the last sales price on the national securities market on each business day. Investments in swap transactions are valued each business day by the Service. Swaps are valued by the Service by using a swap pricing model which incorporates among other factors, default probabilities, recovery rates, credit curves of the underlying issuer and swap spreads on interest rates.These securities are generally categorized within Level 2 of the fair value hierarchy.
The Service’s procedures are reviewed by Dreyfus under the general supervision of the Board.
When market quotations or official closing prices are not readily available, or are determined not to reflect accurately fair value, such as when the value of a security has been significantly affected by events after the close of the exchange or market on which the security is principally traded, but before the fund calculates its net asset value, the fund may value these investments at fair value as determined in accordance with the procedures approved by the Board. Certain factors may be considered when fair valuing investments such as: fundamental analytical data, the nature and duration of restrictions on disposition, an evaluation of the forces that influence the market in which the securities are purchased and sold, and public trading in similar securities of the issuer or comparable issuers.These securities are either categorized within Level 2 or 3 depending on the relevant inputs used.
116
For restricted securities where observable inputs are limited, assumptions about market activity and risk are used and are categorized within Level 3 of the fair value hierarchy.
Table 1 summarizes the inputs used as of February 28, 2013 in valuing each fund’s investments.
At February 28, 2013, there were no transfers between Level 1 and Level 2 of the fair value hierarchy.
(b) Securities transactions and investment income:
Securities transactions are recorded on a trade date basis. Realized gain and loss from securities transactions are recorded on the identified cost basis. Interest income, adjusted for accretion of discount and amortization of premium on investments, is earned from settlement date and recognized on the accrual basis. Securities purchased or sold on a when issued or delayed-delivery basis may be settled a month or more after the trade date.
| Table 1—Fair Value Measurements | ||||||||||
| Investments in Securities | ||||||||||
| Level 2—Other | Level 3— | |||||||||
| Level 1—Unadjusted | Significant | Significant | ||||||||
| Quoted Prices | Observable Inputs | Unobservable Inputs | ||||||||
| Assets ($) | Liabilities ($) | Assets ($) | Liabilities ($) | Assets ($) | Liabilities ($) | Total ($) | ||||
| BNY Mellon National | ||||||||||
| Intermediate Municipal | ||||||||||
| Bond Fund | ||||||||||
| Municipal Bonds | — | — | 1,856,013,795 | — | — | — | 1,856,013,795 | |||
| Other Financial Instruments: | ||||||||||
| Financial Futures† | 239,062 | — | — | — | — | — | 239,062 | |||
| BNY Mellon National | ||||||||||
| Short-Term Municipal | ||||||||||
| Bond Fund | ||||||||||
| Municipal Bonds | — | — | 1,230,255,054 | — | — | — | 1,230,255,054 | |||
| BNY Mellon Pennsylvania | ||||||||||
| Intermediate Municipal | ||||||||||
| Bond Fund | ||||||||||
| Municipal Bonds | — | — | 398,165,025 | — | — | — | 398,165,025 | |||
| Other Financial Instruments: | ||||||||||
| Financial Futures† | 63,281 | — | — | — | — | — | 63,281 | |||
| BNY Mellon Massachusetts | ||||||||||
| Intermediate Municipal | ||||||||||
| Bond Fund | ||||||||||
| Municipal Bonds | — | — | 355,918,734 | — | — | — | 355,918,734 | |||
| Other Financial Instruments: | ||||||||||
| Financial Futures† | 49,219 | — | — | — | — | — | 49,219 | |||
| BNY Mellon New York | ||||||||||
| Intermediate Tax-Exempt | ||||||||||
| Bond Fund | ||||||||||
| Municipal Bonds | — | — | 217,729,097 | — | — | — | 217,729,097 | |||
| Other Financial Instruments: | ||||||||||
| Financial Futures† | 28,125 | — | — | — | — | — | 28,125 | |||
| BNY Mellon Municipal | ||||||||||
| Opportunities Fund | ||||||||||
| Municipal Bonds | — | — | 1,075,012,985 | — | — | — | 1,075,012,985 | |||
| Floating Rate Notes†† | — | — | — | (61,205,000 | ) | — | — | (61,205,000 | ) | |
| Other Financial Instruments: | ||||||||||
| Financial Futures† | 2,535,798 | — | — | — | — | — | 2,535,798 | |||
| Swaps† | — | — | 1,339,702 | — | — | — | 1,339,702 | |||
| † Amount shown represents unrealized appreciation at period end. |
| †† Certain of the fund's liabilities are held at carrying amount, which approximates fair value for financial reporting purposes. |
The Funds 117
NOTES TO FINANCIAL STATEMENTS (Unaudited) (continued)
BNY Mellon Pennsylvania Intermediate Municipal Bond Fund, BNY Mellon Massachusetts Intermediate Municipal Bond Fund and BNY Mellon New York Intermediate Tax-Exempt Bond Fund each follow an investment policy of investing primarily in municipal obligations of one state. Economic changes affecting the state and certain of its public bodies and municipalities may affect the ability of issuers within the state to pay interest on, or repay principal of, municipal obligations held by the fund.
(c) Dividends to shareholders: The funds declare dividends daily from investment income-net; such dividends are paid monthly. With respect to each series, dividends from net realized capital gains, if any, are normally declared and paid annually, but the funds may make distributions on a more frequent basis to comply with the distribution requirements of the Internal Revenue Code of 1986, as amended (the “Code”). To the extent that net realized capital gains can be offset by capital loss carryovers of that fund, it is the policy of each fund not to distribute such gains. Income and capital gain distributions are determined in accordance with income tax regulations, which may differ from GAAP.
(d) Federal income taxes: It is the policy of each fund to continue to qualify as a regulated investment company, which can distribute tax-exempt dividends, by complying with the applicable provisions of the Code, and to make distributions of income and net realized capital gain sufficient to relieve it from substantially all federal income and excise taxes. For federal income tax purposes, each series is treated as a single entity for the purpose of determining such qualification.
As of and during the period ended February 28, 2013, the funds did not have any liabilities for any uncertain tax positions.The funds recognize interest and penalties, if any, related to uncertain tax positions as income tax expense in the Statements of Operations. During the period, the funds did not incur any interest or penalties.
Each tax year in the three-year period ended August 31, 2012, remains subject to examination by the Internal Revenue Service and state taxing authorities.
Under the Regulated Investment Company Modernization Act of 2010 (the “2010 Act”), the funds are permitted to carry forward capital losses incurred in taxable years beginning after December 22, 2010 (“post-enactment losses”) for an unlimited period. Furthermore, post-enactment capital loss carryovers retain their character as either short-term or long-term capital losses rather than short-term as they were under previous statute. The 2010 Act requires post-enactment losses to be utilized before the utilization of losses incurred in taxable years prior to the effective date of the 2010 Act (“pre-enactment losses”).As a result of this ordering rule, pre-enactment losses may be more likely to expire unused.
Table 2 summarizes each relevant fund’s unused capital loss carryover available for federal income tax purposes to be applied against future net realized capital gains, if any, realized subsequent to August 31, 2012.
Table 2—Capital Loss Carryover
| Post-Enactment | |||
| Expiring in | Long-Term | ||
| fiscal year 2018 ($)† | Losses ($)†† | Total ($) | |
| BNY Mellon National Short-Term Municipal Bond Fund | 147,084 | — | 147,084 |
| BNY Mellon Municipal Opportunities Fund | — | 1,878,891 | 1,878,891 |
| † If not applied, the carryover expires in the above year. |
| †† Post-enactment long-term losses that can be carried forward for an unlimited period. |
118
Table 3 summarizes each fund’s tax character of distributions paid to shareholders during the fiscal year ended August 31, 2012.The tax character of current year distributions will be determined at the end of the current fiscal year.
(e) New Accounting Pronouncement: In January 2013, FASB issued Accounting Standards Update No. 2013-01 (“ASU 2013-01”), Clarifying the Scope of Disclosures about Offsetting Assets and Liabilities, replaced Accounting Standards Update No. 2011-11 (“ASU 2011-11”), Disclosures about Offsetting Assets and Liabilities. ASU 2013-01 is effective for fiscal years beginning on or after January 1, 2013, and interim periods within those annual periods. ASU 2011-11 was intended to enhance disclosure requirements on the offsetting of financial assets and liabilities. ASU 2013-01 limits the scope of the new balance sheet offsetting disclosures to derivatives, repurchase agreements, and securities lending transactions to the extent that they are (1) offset in the financial statements or (2) subject to an enforceable master netting arrangement or similar agreement. Management is currently evaluating the application of ASU 2013-01 and its impact on the funds’ financial statements.
NOTE 3—Bank Lines of Credit:
The funds participate with other Dreyfus-managed funds in a $210 million unsecured credit facility led by Citibank, N.A. and a $300 million unsecured credit facility provided by The Bank of New York Mellon (each, a “Facility”), each to be utilized primarily for temporary or emergency purposes, including the financing of redemptions. Prior to October 10, 2012, the unsecured credit facility with Citibank, N.A. was $225 million. In connection therewith, each fund has agreed to pay its pro rata portion of commitment fees for each Facility. Interest is charged to the fund based on rates determined pursuant to the terms of the respective Facility at the time of borrowing. During the period ended February 28, 2013, the funds, with the exception of BNY Mellon Municipal Opportunities Fund, did not borrow under the Facilities.
For BNY Mellon Municipal Opportunities Fund, the average amount of borrowings outstanding under the Facilities during the period ended February 28, 2013 was approximately $72,400 with a related weighted average annualized interest rate of 1.14%.
NOTE 4—Investment Advisory Fee, Administration Fee and Other Transactions with Affiliates:
(a) Fees payable by the funds pursuant to the provisions of an Investment Advisory Agreement with the Investment Adviser are payable monthly, computed on the average daily value of each fund’s net assets at the following annual rates: .35% of BNY Mellon National Intermediate Municipal Bond Fund, .35% of BNY Mellon National Short-Term Municipal Bond Fund, .50% of BNY Mellon Pennsylvania Intermediate Municipal Bond Fund, .35% of BNY Mellon Massachusetts Intermediate Municipal Bond Fund, .50% of BNY Mellon New York
Table 3—Tax Character of Distributions Paid
| Tax-Exempt | Ordinary | Long-Term | |
| Income ($) | Income ($) | Capital Gains ($) | |
| 2012 | 2012 | 2012 | |
| BNY Mellon National Intermediate Municipal Bond Fund | 52,062,206 | — | 59,743 |
| BNY Mellon National Short-Term Municipal Bond Fund | 13,667,735 | — | — |
| BNY Mellon Pennsylvania Intermediate Municipal Bond Fund | 13,517,783 | 40,931 | — |
| BNY Mellon Massachusetts Intermediate Municipal Bond Fund | 10,962,315 | — | 135,989 |
| BNY Mellon New York Intermediate Tax-Exempt Bond Fund | 6,286,228 | — | 464,006 |
| BNY Mellon Municipal Opportunities Fund | 22,994,410 | 1,181,391 | — |
The Funds 119
NOTES TO FINANCIAL STATEMENTS (Unaudited) (continued)
Intermediate Tax- Exempt Bond Fund and .50% of BNY Mellon Municipal Opportunities Fund.
Pursuant to the Administration Agreement,The Bank of New York Mellon provides or arranges for fund accounting, transfer agency and other fund administration services and receives a fee based on the total net assets of the Trust based on the following rates:
| 0 up to $6 billion | .15 | % |
| $6 billion up to $12 billion | .12 | % |
| In excess of $12 billion | .10 | % |
The Bank of NewYork Mellon pays each fund’s transfer agent fees out of the administration fee it receives from the Trust.
For BNY Mellon New York Intermediate Tax-Exempt Bond Fund, the Investment Adviser has contractually agreed from September 1, 2012 through December 31, 2013, to waive receipt of its fees and/or assume the expenses of the fund so that the direct expenses of neither class (excluding Shareholder Services Plan fees, taxes, interest expense, brokerage commissions, commitment fees on borrowings and extraordinary expenses) exceed .59% of the value of the fund’s average daily net assets.The reduction in expenses, pursuant to the undertaking, amounted to $126,011, during the period ended February 28, 2013.
(b) Each fund has adopted a Shareholder Services Plan with respect to its Investor shares. Each fund pays the Distributor for the provision of certain services to holders of Investor shares a fee at an annual rate of .25% of the value of the average daily net assets attributable to Investor shares.The services provided may include personal services relating to shareholder accounts, such as answering shareholder inquiries regarding a fund, and providing reports and other information and services related to the maintenance of such shareholder accounts. The Shareholder Services Plan allows the Distributor to make payments from the shareholder services fees it collects from each fund to compensate service agents (securities dealers, financial institutions or other industry professionals) with respect to these services. Table 4 summarizes the amounts Investor shares of each
fund were charged during the period ended February 28, 2013, pursuant to the Shareholder Services Plan. Additional fees included in Shareholder servicing costs in the Statements of Operations include fees paid for cash management charges.
| Table 4—Shareholder Services Plan Fees | ||
| BNY Mellon National Intermediate | ||
| Municipal Bond Fund | $ | 51,410 |
| BNY Mellon National Short-Term | ||
| Municipal Bond Fund | 4,455 | |
| BNY Mellon Pennsylvania Intermediate | ||
| Municipal Bond Fund | 7,975 | |
| BNY Mellon Massachusetts Intermediate | ||
| Municipal Bond Fund | 11,612 | |
| BNY Mellon New York Intermediate | ||
| Tax-Exempt Bond Fund | 23,875 | |
| BNY Mellon Municipal | ||
| Opportunities Fund | 2,820 | |
The funds have arrangements with the transfer agent and the custodian whereby the funds may receive earnings credits when positive cash balances are maintained, which are used to offset transfer agency and custody fees. For financial reporting purposes, the funds include net earnings credits as expense offsets in the Statements of Operations.
The funds compensate The Bank of New York Mellon under a custody agreement for providing custodial services for the funds. Table 5 summarizes the amount each fund was charged during the period ended February 28, 2013, pursuant to the custody agreement.
| Table 5—Custody Agreement Fees | ||
| BNY Mellon National Intermediate | ||
| Municipal Bond Fund | $ | 46,897 |
| BNY Mellon National Short-Term | ||
| Municipal Bond Fund | 39,021 | |
| BNY Mellon Pennsylvania Intermediate | ||
| Municipal Bond Fund | 15,756 | |
| BNY Mellon Massachusetts Intermediate | ||
| Municipal Bond Fund | 13,880 | |
| BNY Mellon New York Intermediate | ||
| Tax-Exempt Bond Fund | 9,806 | |
| BNY Mellon Municipal | ||
| Opportunities Fund | 32,333 | |
120
The funds compensate Dreyfus Transfer, Inc., a wholly-owned subsidiary of Dreyfus, under a transfer agency agreement for providing cash management services related to fund subscriptions and redemptions, except for shareholder redemption draft processing, which continues to be performed by The Bank of New York Mellon.The funds also compensate The Bank of New York Mellon under a cash management agreement for providing certain cash management services. Table 6 summarizes the amount each fund was charged during the period ended February 28, 2013, for cash management services, which is included in “Shareholder servicing costs” in the Statements of
Operations. These fees were partially offset by earnings credits for each fund, also summarized in Table 6.
During the period ended February 28, 2013, each fund was charged $3,981 for services performed by the Chief Compliance Officer and his staff.
Table 7 summarizes the components of “Due to The Dreyfus Corporation and affiliates” in the Statement of Assets and Liabilities for each fund.
(c) The Board members who are not “affiliated persons” as defined under the Act receive from theTrust an annual
Table 6—Cash Management Agreement Fees
| The Bank of | The Bank of | |||||||
| New York Mellon | New York Mellon | Dreyfus Transfer, Inc. Dreyfus Transfer, Inc. | ||||||
| Cash Management Fees ($) | Earnings Credits ($) Cash Management Fees ($) | Earnings Credits ($) | ||||||
| BNY Mellon National Intermediate | ||||||||
| Municipal Bond Fund | 84 | (1 | ) | 137 | (21 | ) | ||
| BNY Mellon National Short-Term | ||||||||
| Municipal Bond Fund | 12 | — | 19 | (3 | ) | |||
| BNY Mellon Pennsylvania Intermediate | ||||||||
| Municipal Bond Fund | 8 | — | 13 | (2 | ) | |||
| BNY Mellon Massachusetts Intermediate | ||||||||
| Municipal Bond Fund | 28 | — | 46 | (7 | ) | |||
| BNY Mellon New York Intermediate | ||||||||
| Tax-Exempt Bond Fund | 108 | (1 | ) | 177 | (27 | ) | ||
| BNY Mellon Municipal Opportunities Fund | 8 | — | 13 | (2 | ) | |||
| Table 7—Due to The Dreyfus Corporation and Affiliates | ||||||||
| Investment | Shareholder | Chief | ||||||
| Advisory | Services | Custodian | Compliance | Less Expense | ||||
| Fees ($) | Plan Fees ($) | Fees ($) | Officer Fees ($) | Reimbursement ($) | ||||
| BNY Mellon National Intermediate | ||||||||
| Municipal Bond Fund | 494,955 | 8,099 | 39,836 | 5,308 | — | |||
| BNY Mellon National Short-Term | ||||||||
| Municipal Bond Fund | 335,551 | 630 | 31,602 | 5,308 | — | |||
| BNY Mellon Pennsylvania Intermediate | ||||||||
| Municipal Bond Fund | 153,247 | 876 | 13,166 | 5,308 | — | |||
| BNY Mellon Massachusetts Intermediate | ||||||||
| Municipal Bond Fund | 94,672 | 1,752 | 11,355 | 5,308 | — | |||
| BNY Mellon New York Intermediate | ||||||||
| Tax-Exempt Bond Fund | 84,400 | 3,719 | 7,831 | 5,308 | (20,264 | ) | ||
| BNY Mellon Municipal Opportunities Fund | 370,241 | 486 | 27,063 | 5,308 | — | |||
The Funds 121
NOTES TO FINANCIAL STATEMENTS (Unaudited) (continued)
fee of $80,000 and an attendance fee of $7,500 for each in-person meeting attended and $500 for telephone meetings and are reimbursed for travel and out-of-pocket expenses.The Chairman of the Board receives an additional annual fee of $20,000 and the Chairman of the Trust’s Audit Committee receives an additional annual fee of $15,000.
NOTE 5—Securities Transactions:
Table 8 summarizes each fund’s aggregate amount of purchases and sales of investment securities, excluding short-term securities, financial futures, options transactions and swap transactions, during the period ended February 28, 2013.
Inverse Floater Securities: BNY Mellon Municipal Opportunities Fund participates in secondary inverse floater structures in which fixed-rate, tax-exempt municipal bonds are transferred to a trust.The trust subsequently issues two or more variable rate securities that are collateralized by the cash flows of the fixed-rate, tax-exempt municipal bonds. One or more of these variable rate securities pays interest based on a short- term floating rate set by a remarketing agent at predetermined intervals. A residual interest tax-exempt security is also created by the trust, which is transferred to the fund, and is paid interest based on the remaining cash flow of the trust, after payment of interest on the other securities and various expenses of the trust.
The fund accounts for the transfer of bonds to the trust as secured borrowings, with the securities transferred remaining in the fund’s investments, and the related floating rate certificate securities reflected as fund liabilities in the Statement of Assets and Liabilities.
The average amount of borrowings outstanding under the inverse floater structure during the period ended February 28, 2013, was approximately $61,205,000 with a related weighted average annualized interest rate of .73%.
Derivatives: A derivative is a financial instrument whose performance is derived from the performance of another asset. Each type of derivative instrument that was held by the fund during the period ended February 28, 2013 is discussed below.
Financial Futures: In the normal course of pursuing its investment objective, the funds are exposed to market risk, including interest rate risk, as a result of changes in value of underlying financial instruments.The funds invest in financial futures in order to manage its exposure to or protect against changes in the market. A financial futures contract represents a commitment for the future purchase or a sale of an asset at a specified date. Upon entering into such contracts, these investments require initial margin deposits with a counterparty, which consist of cash or cash equivalents. The amount of these deposits is determined by the exchange or Board ofTrade on which the contract is traded and is subject to change. Accordingly, variation
Table 8—Purchases and Sales
| Purchases ($) | Sales ($) | |
| BNY Mellon National Intermediate Municipal Bond Fund | 275,218,684 | 179,956,717 |
| BNY Mellon National Short-Term Municipal Bond Fund | 214,562,501 | 143,997,071 |
| BNY Mellon Pennsylvania Intermediate Municipal Bond Fund | 69,907,688 | 82,569,060 |
| BNY Mellon Massachusetts Intermediate Municipal Bond Fund | 29,577,262 | 34,066,993 |
| BNY Mellon New York Intermediate Tax-Exempt Bond Fund | 49,259,281 | 49,277,428 |
| BNY Mellon Municipal Opportunities Fund | 533,557,952 | 381,551,087 |
122
margin payments are received or made to reflect daily unrealized gains or losses which are recorded in the Statements of Operations.When the contracts are closed, the funds recognize a realized gain or loss which is reflected in the Statements of Operations.There is minimal counterparty credit risk to the funds with financial futures since they are exchange traded, and the exchange’s clearinghouse guarantees the financial futures against default. Financial futures open at February 28, 2013 are set forth in the Statements of Financial Futures.
Options Transactions: BNY Mellon Municipal Opportunities Fund purchases and writes (sells) put and call options to hedge against changes in interest rates or as a substitute for an investment.The fund is subject to market risk and interest rate risk in the course of pursuing its investment objectives through its investments in options contracts.A call option gives the purchaser of the option the right (but not the obligation) to buy, and obligates the writer to sell, the underlying security or securities at the exercise price at any time during the option period, or at a specified date. Conversely, a put option gives the purchaser of the option the right (but not the obligation) to sell, and obligates the writer to buy the underlying security or securities at the exercise price at any time during the option period, or at a specified date.
As a writer of call options, the fund receives a premium at the outset and then bears the market risk of unfavorable changes in the price of the financial instrument underlying the option. Generally, the fund realizes a gain, to the extent of the premium, if the price of the underlying financial instrument decreases between the date the option is written and the date on which the option is terminated. Generally, the fund incurs a loss if the price of the financial instrument increases between those dates.
As a writer of put options, the fund receives a premium at the outset and then bears the market risk of unfavorable changes in the price of the financial instrument underlying the option. Generally, the fund realizes a gain, to the extent of the premium, if the price of the underlying financial instrument increases between the date the option is written and the date on which the option is terminated. Generally, the fund incurs a loss if the price of the financial instrument decreases between those dates.
As a writer of an option, the fund has no control over whether the underlying securities may be sold (call) or purchased (put) and as a result bears the market risk of an unfavorable change in the price of the security underlying the written option. There is a risk of loss from a change in value of such options which may exceed the related premiums received.The Statement of Operations reflects the following: any unrealized gains or losses which occurred during the period as well as any realized gains or losses which occurred upon the expiration or closing of the option transaction.At February 28, 2013, there were no options written outstanding.
Swap Transactions: BNY Mellon Municipal Opportunities Fund enters into swap agreements to exchange the interest rate on, or return generated by, one nominal instrument for the return generated by another nominal instrument. The fund enters into these agreements to hedge certain market or interest rate risks, to manage the interest rate sensitivity (sometimes called duration) of fixed income securities, to provide a substitute for purchasing or selling particular securities or to increase potential returns.
The fund accrues for the interim payments on swap contracts on a daily basis, with the net amount recorded within unrealized appreciation (depreciation) on swap
The Funds 123
NOTES TO FINANCIAL STATEMENTS (Unaudited) (continued)
contracts in the Statement of Assets and Liabilities. Once the interim payments are settled in cash, the net amount is recorded as a realized gain (loss) on swaps, in addition to realized gain (loss) recorded upon the termination of swap contracts in the Statement of Operations. Upfront payments made and/or received by the fund, are recorded as an asset and/or liability in the Statement of Assets and Liabilities and are recorded as a realized gain or loss ratably over the contract’s term/event with the exception of forward starting interest rate swaps which are recorded as realized gains or losses on the termination date. Fluctuations in the value of swap contracts are recorded for financial statement purposes as unrealized appreciation or depreciation on swap transactions.
Interest Rate Swaps: Interest rate swaps involve the exchange of commitments to pay and receive interest based on a notional principal amount. The fund may elect to pay a fixed rate and receive a floating rate, or
receive a fixed rate and pay a floating rate on a notional principal amount. The net interest received or paid on interest rate swap agreements is included within realized gain (loss) on swap contracts in the Statement of Operations. Interest rate swap agreements are subject to general market risk, liquidity risk, counterparty risk and interest rate risk. For financial reporting purposes, forward rate agreements are classified as interest rate swaps.
The fund’s maximum risk of loss from counterparty risk is the discounted value of the cash flows to be received from the counterparty over the contract’s remaining life, to the extent that the amount is positive.This risk is mitigated by having a master netting arrangement between the fund and the counterparty and by the posting of collateral by the counterparty to the fund to cover the fund’s exposure to the counterparty. Table 9 summarizes open interest rate swaps entered into by the fund at February 28, 2013:
Table 9—Interest Rate Swaps
| BNY Mellon Municipal Opportunities | ||||
| Determination | Unrealized | |||
| Notional Amount | Counterparty | Reference Index | Date | Appreciation ($) |
| 50,000,000 | Citibank | Forward Rate Agreement, | 3/6/2013 | 913,775 |
| Municipal Market Data | ||||
| General Obligation, | ||||
| 2023, AAA Indexa | ||||
| 50,000,000 | Citibank | Forward Rate Agreement, | 3/28/2013 | 425,927 |
| Municipal Market Data | ||||
| General Obligation, | ||||
| 2028, AAA Indexa | ||||
| Gross Unrealized Appreciation | 1,339,702 |
a The fund will receive a payment from the counterparty if the value of the reference index is less than the base index value on the determination date.The fund will make
a payment to the counterparty if the value of the reference index is greater than the base index value on the determination date.
124
Table 10 summarizes each relevant fund’s average market value of derivatives outstanding, during the period ended February 28, 2013.
Table 10—Average Market Value of Derivatives
| Average | |
| Market Value ($) | |
| BNY Mellon National Intermediate | |
| Municipal Bond Fund | |
| Interest rate financial futures | 45,226,071 |
| BNY Mellon Pennsylvania | |
| Intermediate Municipal Bond Fund | |
| Interest rate financial futures | 11,971,607 |
| BNY Mellon Massachusetts | |
| Intermediate Municipal Bond Fund | |
| Interest rate financial futures | 9,311,250 |
| BNY Mellon New York Intermediate | |
| Tax-Exempt Bond Fund | |
| Interest rate financial futures | 5,320,714 |
| BNY Mellon Municipal | |
| Opportunities Fund | |
| Interest rate financial futures | 171,755,357 |
| Interest rate options contracts | 23,438 |
| Interest rate swaps | 35,714,286 |
Table 11 summarizes gross appreciation, gross depreciation and accumulated net unrealized appreciation on investments for each fund at February 28, 2013.
At February 28, 2013, the cost of investments for federal income tax purposes was substantially the same as the cost for financial reporting purposes (see the Statements of Investments).
Table 11—Accumulated Net Unrealized Appreciation
| Gross | Gross | ||
| Appreciation ($) | (Depreciation) ($) | Net ($) | |
| BNY Mellon National Intermediate Municipal Bond Fund | 138,637,161 | 2,312,106 | 136,325,055 |
| BNY Mellon National Short-Term Municipal Bond Fund | 16,238,652 | 182,746 | 16,055,906 |
| BNY Mellon Pennsylvania Intermediate Municipal Bond Fund | 27,687,790 | 207,758 | 27,480,032 |
| BNY Mellon Massachusetts Intermediate Municipal Bond Fund | 26,013,133 | 85,092 | 25,928,041 |
| BNY Mellon New York Intermediate Tax-Exempt Bond Fund | 15,423,367 | 224,759 | 15,198,608 |
| BNY Mellon Municipal Opportunities Fund | 68,004,377 | 3,067,171 | 64,937,206 |
The Funds 125
NOTES
For More Information
Telephone Wealth Management (WM) Clients, please contact your Account Officer or call 1-888-281-7350. Brokerage Clients of BNY Mellon Wealth Advisors (BNYMWA), please contact your financial representative or call 1-800-830-0549, Option 2. Individual Account holders, please call Dreyfus at 1-800-DREYFUS.
Mail WM Clients, write to your Account Officer, c/o The Bank of New York Mellon, One Mellon Bank Center, Pittsburgh, PA 15258 BNYMWA Brokerage Clients, write to your financial representative, P.O. Box 9012, Hicksville, NY 11802–9012 Individual Account Holders, write to: BNY Mellon Funds, P.O. Box 55268, Boston, MA 02205–8502
The funds file their complete schedule of portfolio holdings with the Securities and Exchange Commission (“SEC”) for the first and third quarters of each fiscal year on Form N-Q. The funds’ Forms N-Q are available on the SEC’s website at http://www.sec.gov and may be reviewed and copied at the SEC’s Public Reference Room in Washington, DC. Information on the operation of the Public Reference Room may be obtained by calling 1-800-SEC-0330.
Information regarding how the funds voted proxies relating to portfolio securities for the most recent 12-month period ended June 30 is available on the SEC’s website at http://www.sec.gov and without charge, upon request, by calling 1-800-DREYFUS.
©2013 MBSC Securities Corporation
MFTSA0213-MB
The BNY Mellon Funds
BNY Mellon Money Market Fund
BNY Mellon National Municipal Money Market Fund
SEMIANNUAL REPORT
February 28, 2013
| Contents | |
| The Funds | |
| Letter from the President | 2 |
| Discussion of Funds’ Performance | |
| BNY Mellon Money Market Fund | 3 |
| BNY Mellon National Municipal | |
| Money Market Fund | 5 |
| UnderstandingYour Fund’s Expenses | 7 |
| ComparingYour Fund’s Expenses | |
| With Those of Other Funds | 7 |
| Statements of Investments | 8 |
| Statements of Assets and Liabilities | 18 |
| Statements of Operations | 19 |
| Statements of Changes in Net Assets | 20 |
| Financial Highlights | 21 |
| Notes to Financial Statements | 25 |
For More Information
Back cover
The views expressed herein are current to the date of this report. These views and the composition of the funds’ portfolios are subject to change at any time based on market and other conditions.
Not FDIC-Insured
Not Bank-Guaranteed
May Lose Value
The Funds

LETTER FROM
THE PRESIDENT
Dear Shareholder:
We are pleased to present this semiannual report for the BNY Mellon Funds Trust, covering the six-month period from September 1, 2012, through February 28, 2013. For information about how each fund performed during the reporting period, as well as general market perspectives, we provide a Discussion of Fund Performance on the pages that follow.
Despite heightened turbulence during the spring of 2012, most financial markets advanced over the reporting period as investors responded to encouraging macroeconomic developments. Most notably, a number of negative economic scenarios were avoided: China averted a hard landing, the European financial crisis did not deteriorate into a breakup of the euro, and the threat of U.S. fiscal tightening was reduced when last-minute legislation mitigated scheduled tax increases. However, as has been the case since December 2008, short-term interest rates and money market yields remained near historical lows in the United States.
The muted pace of economic growth compared to historical norms has helped to prevent new imbalances from developing, even as monetary policymakers throughout the world maintain aggressively accommodative postures. Therefore, in our analysis, the economic expansion is likely to continue over the foreseeable future. As always, we encourage you to discuss our observations with your financial adviser, who can help you respond to the challenges and opportunities the financial markets provide.
Thank you for your continued confidence and support.

David Mossman
President
BNY Mellon Funds Trust
March 15, 2013

DISCUSSION OF
FUND PERFORMANCE
For the period of September 1, 2012, through February 28, 2013, as provided by Patricia A. Larkin, Portfolio Manager
Fund and Market Performance Overview
For the six-month period ended February 28, 2013, BNY Mellon Money Market Fund’s Class M shares produced an annualized yield of 0.00%, and its Investor shares produced an annualized yield of 0.00%. Taking into account the effects of compounding, the fund’s Class M shares produced an annualized effective yield of 0.00%, and its Investor shares produced an annualized effective yield of 0.00%.1
Yields of money market instruments remained near zero percent throughout the reporting period as the Federal Reserve Board (the “Fed”) left short-term interest rates unchanged despite evidence of more robust economic growth.
The Fund’s Investment Approach
The fund seeks as high a level of current income as is consistent with the preservation of capital and the maintenance of liquidity. To pursue its goal, the fund invests in a diversified portfolio of high-quality, short-term debt securities, including U.S. government securities; certificates of deposit, time deposits, bankers’ acceptances and other short-term domestic or foreign bank obligations; repurchase agreements; high-grade commercial paper and other short-term corporate obligations; and taxable municipal obligations. Normally, the fund invests at least 25% of its net assets in bank obligations.
U.S. Economic Recovery Gained Momentum
The reporting period began in the midst of a rebound after several months of disappointing economic news, which had sparked fears of a worsening financial crisis in Europe, a severe economic slowdown in China, and a potential double-dip recession in the United States. However, it became clearer in the weeks prior to the reporting period that these concerns were unlikely to materialize. Investors were encouraged by improved U.S. employment and housing market trends, a stated commitment from the European Central Bank in support of the euro, and the prospect of more stimulative policies under new political leadership in China.
The U.S. economic recovery seemed to gain traction in September with the addition of 148,000 new jobs and a sharp drop in the unemployment rate to 7.8%, its lowest level since January 2009. The manufacturing sector rebounded after three months of modest declines, and the service sector posted its 33rd consecutive month of expansion. In the housing market, sales prices reached five-year highs.The U.S. economy grew at a respectable 3.1% annualized rate during the third quarter. However, due to concerns that the economic recovery was not robust enough to support sustained employment growth, the Fed announced a third round of quantitative easing involving the purchase of $40 billion of mortgage-backed securities per month over an indefinite period of time. In addition, the Fed extended its commitment to maintaining historically low short-term interest rates through mid-2015.
The unemployment rate ticked higher in October to 7.9% as more workers joined the labor force. Manufacturing activity increased at a faster rate in October than in September, and home prices posted modest gains. In November, the unemployment rate remained steady while 146,000 new jobs were added. Home prices rose for the sixth straight month, and pending home sales reached their highest level in more than five years. On the other hand, manufacturing activity contracted slightly.
| The Funds | 3 |
DISCUSSION OF FUND PERFORMANCE (continued)
December saw the addition of 164,000 jobs to the labor force, a 7.8% unemployment rate, and a mild rebound in manufacturing activity. However, consumer confidence declined somewhat, and retailers reported relatively sluggish sales during the 2012 holiday season. Many analysts were surprised when the U.S. Department of Commerce estimated that U.S. GDP grew at only a 0.4% annualized rate during the fourth quarter, which was attributed mainly to reductions in federal spending, particularly on defense. Other indicators proved somewhat more encouraging, including gains in personal consumption, durable goods purchases, and housing market activity.
Data from January 2013 also portrayed a sluggish economic recovery, as the economy added 157,000 jobs, but the unemployment rate inched upwards to 7.9%. However, the uptick was reversed in February, when the unemployment rate moved lower to 7.7%, its lowest level since December 2008, as 236,000 new jobs were created. Employment trends were particularly strong in the professional and business services, construction, and health care industries. Moreover, manufacturing activity increased in February for the third consecutive month, and retail sales posted significant gains during the month.
Focusing on Quality and Liquidity
Money market yields remained near zero percent throughout the reporting period, and yield differences along the market’s maturity spectrum stayed relatively narrow. Therefore, we maintained the fund’s weighted average maturity in a position that was roughly in line with market averages, and we continued to focus on well-established issuers that historically have demonstrated good liquidity characteristics, including banks in Australia, Canada and Japan, but relatively few in Europe.
The Fed has continued to maintain an aggressively accommodative monetary policy amid low inflation and moderate economic growth. Therefore, as we have for some time, we intend to keep the fund’s focus on quality and liquidity.
March 15, 2013
An investment in the fund is not insured or guaranteed by the FDIC or any other government agency.Although the fund seeks to preserve the value of your investment at $1.00 per share, it is possible to lose money by investing in the fund.
Short-term corporate, asset-backed securities holdings and municipal securities holdings (as applicable), while rated in the highest rating category by one or more NRSRO (or unrated, if deemed of comparable quality by the investment adviser), involve credit and liquidity risks and risk of principal loss.
| 1 | Annualized effective yield is based upon dividends declared daily and |
| reinvested monthly. Past performance is no guarantee of future results.Yields | |
| fluctuate.Yields provided reflect the absorption of certain fund expenses by the | |
| investment adviser pursuant to an undertaking, which is voluntary and | |
| temporary, not contractual, and can be terminated at any time without notice. | |
| Had these expenses not been absorbed, fund yields would have been lower, and | |
| in some cases, 7-day yields during the reporting period would have been | |
| negative absent the expense absorption. |
4

DISCUSSION OF
FUND PERFORMANCE
For the period of September 1, 2012, through February 28, 2013, as provided by Joseph Irace, Senior Portfolio Manager
Fund and Market Performance Overview
For the six-month period ended February 28, 2013, BNY Mellon National Municipal Money Market Fund’s Class M shares produced an annualized yield of 0.00%, and Investor shares produced an annualized yield of 0.00%. Taking into account the effects of compounding, the fund’s Class M and Investor shares also produced annualized effective yields of 0.00% and 0.00%, respectively.1
Yields of tax-exempt money market instruments stayed near historical lows throughout the reporting period, as short-term interest rates remained anchored by an overnight federal funds rate between 0% and 0.25%.
The Fund’s Investment Approach
The fund seeks as high a level of current income exempt from federal income tax as is consistent with the preservation of capital and maintenance of liquidity. To pursue its goal, the fund invests at least 80% of its assets in short-term municipal obligations that provide income exempt from federal income tax.Among these are municipal notes, short-term municipal bonds, tax-exempt commercial paper and municipal leases. The fund may invest up to 20% of its total assets in taxable money market securities, such as U.S. government obligations, bank and corporate obligations and commercial paper. The fund also may invest in custodial receipts.
Economic Recovery Gained Traction
Despite occasional bouts of heightened volatility, the reporting period saw a generally improving economic environment. At the start of the reporting period, economists were encouraged by U.S. employment gains, signs of a recovering housing market, and increased manufacturing activity as the Federal Reserve Board (the “Fed”) embarked on a third round of quantitative easing and extended its forecast for low interest rates through mid-2015.
The Fed’s aggressively accommodative monetary policy actions appeared to be effective, as U.S. GDP growth climbed to an annualized rate of 3.1% for the third quarter of 2012 from just 0.33% in the second quarter. However, many analysts were surprised when the U.S. Department of Commerce estimated that U.S. GDP grew at only a 0.1% annualized rate during the fourth quarter of 2012. The slowdown was attributed mainly to reductions in federal spending stemming from a contentious political debate regarding automatic tax hikes and spending cuts scheduled for the start of 2013. Other economic indicators proved somewhat more encouraging, including gains in personal consumption, durable goods purchases, and housing market activity. In the wake of last-minute legislation to address the tax increases, economic data released over the first two months of 2013 portrayed a somewhat more robust economic recovery.
With short-term interest rates remaining near historical lows, demand from individual investors shifted to the municipal bond market, where yields were incrementally higher. However, any reduction in demand for shorter-term, tax-exempt money market instruments stemming from individual investors was offset by the effects of higher rates on short-term repurchase agreements, which helped to boost yields of variable rate demand notes (VRDNs). As a result, municipal money market instruments generally provided higher yields than comparable U.S.Treasury obligations, sparking increased demand from non-traditional investors, including institutional investors. Non-traditional investors also favored municipal money market instruments due to regulatory changes affecting funds’ liquidity requirements.
| The Funds | 5 |
DISCUSSION OF FUND PERFORMANCE (continued)
Municipal credit quality continued to improve over the reporting period as most states and many local governments recovered gradually from the recession. Most notably, the credit rating on California’s general obligation debt received an upgrade after voters approved increases in sales and income taxes in order to shore up the state’s fiscal condition.
Focusing on Quality and Liquidity
Most tax-exempt money market funds have maintained relatively short weighted average maturities compared to historical averages. Due to narrow yield differences along the money market’s maturity spectrum, as well as ongoing regulatory uncertainty, it has made little sense for fund managers to extend weighted average maturities. The funds were no exception to these considerations, and we maintained their weighted average maturities in ranges that were consistent with industry averages.
Moreover, careful and well-researched credit selection has remained paramount.As we have for some time, we continued to favor state general obligation bonds; essential service revenue bonds backed by revenues from water, sewer and electric facilities; and certain local credits with strong financial positions and stable tax bases.We generally continued to shy away from instruments issued by localities that depend heavily on state aid.
Rates Likely to Stay Low
We are cautiously optimistic regarding U.S. economic prospects. While the Fed expects moderate economic growth and a gradually declining unemployment rate, it also has made clear that short-term interest rates are likely to remain low until the unemployment rate drops well below current levels. Consequently, we believe that the prudent course continues to be an emphasis on preservation of capital and liquidity.
March 15, 2013
| An investment in the fund is not insured or guaranteed by the FDIC or any | |
| other government agency.Although the fund seeks to preserve the value of | |
| your investment at $1.00 per share, it is possible to lose money by investing | |
| in the fund. | |
| Short-term corporate and asset-backed securities holdings, while rated in the | |
| highest rating category by one or more NRSRO (or unrated, if deemed of | |
| comparable quality by the investment adviser), involve credit and liquidity | |
| risks and risk of principal loss. | |
| 1 | Annualized effective yield is based upon dividends declared daily and |
| reinvested monthly. Past performance is no guarantee of future results.Yields | |
| fluctuate.Yields provided reflect the absorption of certain fund expenses by the | |
| investment adviser pursuant to an undertaking, which is voluntary and | |
| temporary, not contractual, and can be terminated at any time without notice. | |
| Had these expenses not been absorbed, fund yields would have been lower, | |
| and in some cases, 7-day yields during the reporting period would have been | |
| negative absent the expense absorption. |
6
UNDERSTANDING YOUR FUND’S EXPENSES (Unaudited)
As a mutual fund investor, you pay ongoing expenses, such as management fees and other expenses. Using the information below, you can estimate how these expenses affect your investment and compare them with the expenses of other funds.You also may pay one-time transaction expenses, including sales charges (loads) and redemption fees, which are not shown in this section and would have resulted in higher total expenses. For more information, see your fund’s prospectus or talk to your financial adviser.
Review your fund’s expenses
The table below shows the expenses you would have paid on a $1,000 investment in each class of each BNY Mellon money market fund from September 1, 2012 to February 28, 2013. It also shows how much a $1,000 investment would be worth at the close of the period, assuming actual returns and expenses.
| Expenses and Value of a $1,000 Investment | ||
| assuming actual returns for the six months ended February 28, 2013 | ||
| Class M Shares | Investor Shares | |
| BNY Mellon Money Market Fund | ||
| Expenses paid per $1,000† | $1.04 | $1.04 |
| Ending value (after expenses) | $1,000.00 | $1,000.00 |
| Annualized expense ratio (%) | .21 | .21 |
| BNY Mellon National Municipal Money Market Fund | ||
| Expenses paid per $1,000† | $1.19 | $1.24 |
| Ending value (after expenses) | 1,000.00 | $1,000.00 |
| Annualized expense ratio (%) | .24 | .25 |
COMPARING YOUR FUND’S EXPENSES WITH THOSE OF OTHER FUNDS (Unaudited)
Using the SEC’s method to compare expenses
The Securities and Exchange Commission (SEC) has established guidelines to help investors assess fund expenses. Per these guidelines, the table below shows your fund’s expenses based on a $1,000 investment, assuming a hypothetical 5% annualized return.You can use this information to compare the ongoing expenses (but not transaction expenses or total cost) of investing in each fund with those of other funds. All mutual fund shareholder reports will provide this information to help you make this comparison. Please note that you cannot use this information to estimate your actual ending account balance and expenses paid during the period.
| Expenses and Value of a $1,000 Investment | ||
| assuming a hypothetical 5% annualized return for the six months ended February 28, 2013 | ||
| Class M Shares | Investor Shares | |
| BNY Mellon Money Market Fund | ||
| Expenses paid per $1,000† | $1.05 | $1.05 |
| Ending value (after expenses) | $1,023.75 | $1,023.75 |
| Annualized expense ratio (%) | .21 | .21 |
| BNY Mellon National Municipal Money Market Fund | ||
| Expenses paid per $1,000† | $1.20 | $1.25 |
| Ending value (after expenses) | $1,023.60 | $1,023.55 |
| Annualized expense ratio (%) | .24 | .25 |
| † Expenses are equal to each fund’s annualized expense ratios as shown above, multiplied by the average account value over the period, multiplied by 181/365 (to reflect the |
| one-half year period). |
| The Funds | 7 |
| STATEMENT OF INVESTMENTS |
| February 28, 2013 (Unaudited) |
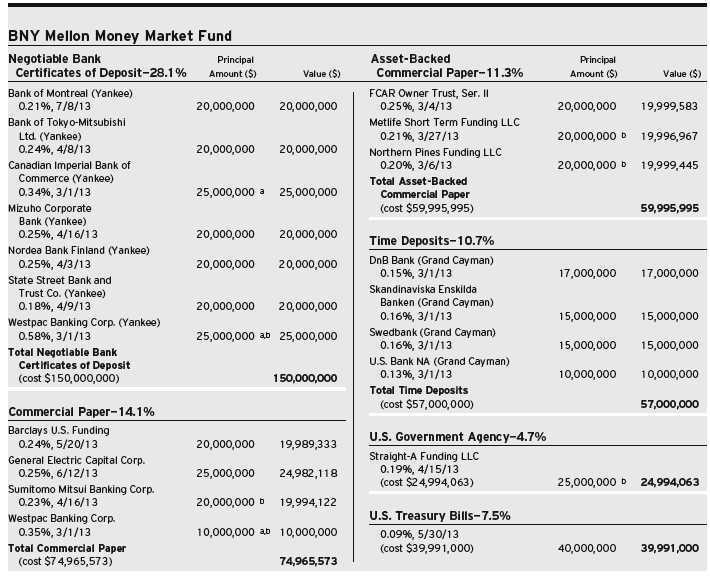
8
| BNY Mellon Money Market Fund (continued) | ||||||
| Principal | Principal | |||||
| Repurchase Agreement—23.5% | Amount ($) | Value ($) | Amount ($) | Value ($) | ||
| Citigroup Global Markets Holdings Inc. | Association, 0.50%-4.13%, | |||||
| 0.18% dated 2/28/13, due 3/1/13 in | due 4/15/14-10/11/22, | |||||
| the amount of $125,000,625 (fully | value $35,420,392 and | |||||
| collateralized by $5,992,000 Federal | $2,933,000 Tennessee Valley | |||||
| Farm Credit Bank, 1.80%-3.50%, | Authority, 5.38%-6.24%, | |||||
| due 1/15/21-2/28/33, value $6,018,279, | due 4/1/36-4/1/56, | |||||
| $29,170,000 Federal Home Loan Bank, | value $3,922,534) | |||||
| 0.38%-5%, due 8/28/13-3/10/23, | (cost $125,000,000) | 125,000,000 | 125,000,000 | |||
| value $31,634,840, $49,702,174 | ||||||
| Federal Home Loan Mortgage Corp., | Total Investments (cost $531,946,631) | 99.9 | % | 531,946,631 | ||
| 0%-5.13%, due 3/18/13-8/15/22, | Cash and Receivables (Net) | .1 | % | 403,469 | ||
| value $50,503,976, $35,164,000 | ||||||
| Federal National Mortgage | Net Assets | 100.0 | % | 532,350,100 | ||
| a Variable rate security—interest rate subject to periodic change. |
| b Securities exempt from registration pursuant to Rule 144A under the Securities Act of 1933.These securities may be resold in transactions exempt from registration, normally to |
| qualified institutional buyers.At February 28, 2013, these securities amounted to $119,984,597 or 22.5% of net assets. |
| Portfolio Summary (Unaudited) † | |||
| Value (%) | Value (%) | ||
| Banking | 48.2 | Asset-Backed/Banking | 3.8 |
| Repurchase Agreement | 23.5 | Asset-Backed/Single Seller | 3.8 |
| U.S. Government/Agency | 12.2 | Asset-Backed/Insurance | 3.7 |
| Finance | 4.7 | 99.9 | |
| † Based on net assets. | |||
| See notes to financial statements. | |||
| The Funds | 9 |
STATEMENT OF INVESTMENTS
February 28, 2013 (Unaudited)
| BNY Mellon National Municipal Money Market Fund | |||||
| Coupon | Maturity | Principal | |||
| Short-Term Investments—101.9% | Rate (%) | Date | Amount ($) | Value ($) | |
| Alabama—1.2% | |||||
| Columbia Industrial Development Board, PCR, | |||||
| Refunding (Alabama Power Company Project) | 0.14 | 3/1/13 | 13,000,000 | a | 13,000,000 |
| Colorado—.1% | |||||
| Parker Automotive Metropolitan District, | |||||
| GO Notes (LOC; U.S. Bank NA) | 0.12 | 3/7/13 | 850,000 | a | 850,000 |
| Connecticut—1.4% | |||||
| Connecticut Health and Educational Facilities Authority, Revenue | |||||
| (Community Renewal Team Issue) (LOC; Bank of America) | 0.20 | 3/7/13 | 1,345,000 | a | 1,345,000 |
| Connecticut Health and Educational Facilities Authority, Revenue | |||||
| (Westminster School Issue) (LOC; Bank of America) | 0.18 | 3/7/13 | 2,200,000 | a,b | 2,200,000 |
| Connecticut Housing Finance Authority, Revenue (Housing Mortgage | |||||
| Finance Program) (Liquidity Facility; JPMorgan Chase Bank) | 0.11 | 3/1/13 | 12,135,000 | a | 12,135,000 |
| Florida—1.3% | |||||
| Deutsche Bank Spears/Lifers Trust (Series DBE-594) | |||||
| (University of North Florida Financing Corporation, | |||||
| Capital Improvement Revenue (Housing Project)) (Liquidity | |||||
| Facility; Deutsche Bank AG and LOC; Deutsche Bank AG) | 0.21 | 3/7/13 | 5,185,000 | a,c,d | 5,185,000 |
| Jacksonville, IDR (University of Florida Health Sciences | |||||
| Center Clinic) (LOC; Branch Banking and Trust Co.) | 0.13 | 3/7/13 | 2,300,000 | a | 2,300,000 |
| Palm Beach County, IDR (Gulfstream Goodwill | |||||
| Industies, Inc. Project) (LOC; Wells Fargo Bank) | 0.21 | 3/7/13 | 1,055,000 | a | 1,055,000 |
| Palm Beach County, Revenue (The Benjamin Private | |||||
| School, Inc. Project) (LOC; Northern Trust Company) | 0.11 | 3/7/13 | 5,825,000 | a,b | 5,825,000 |
| Georgia—.9% | |||||
| Fulton County Development Authority, Revenue (King’s Ridge | |||||
| Christian School Project) (LOC; Branch Banking and Trust Co.) | 0.12 | 3/7/13 | 9,495,000 | a,b | 9,495,000 |
| Illinois—7.0% | |||||
| Chicago, Second Lien Water Revenue, Refunding | |||||
| (LOC; California Public Employees Retirement System) | 0.13 | 3/7/13 | 14,155,000 | a | 14,155,000 |
| Deutsche Bank Spears/Lifers Trust (Series DBE-555) | |||||
| (DeWitt, Ford, Livingston, Logan, McLean and Tazewell | |||||
| Counties and Illinois Community College District | |||||
| Number 540, Community College GO) (Liquidity | |||||
| Facility; Deutsche Bank AG and LOC; Deutsche Bank AG) | 0.21 | 3/7/13 | 3,135,000 a,c,d | 3,135,000 | |
| Illinois Finance Authority, Revenue (Franciscan Communities, Inc.— | |||||
| The Village at Victory Lakes) (LOC; Bank of America) | 0.31 | 3/7/13 | 7,555,000 | a | 7,555,000 |
| Illinois Finance Authority, Revenue (Gift of Hope Organ and | |||||
| Tissue Donor Network Project) (LOC; JPMorgan Chase Bank) | 0.12 | 3/7/13 | 13,780,000 | a | 13,780,000 |
| Illinois Finance Authority, Revenue (Joan W. and Irving B. Harris | |||||
| Theater for Music and Dance Project) (LOC; PNC Bank NA) | 0.12 | 3/7/13 | 14,000,000 | a | 14,000,000 |
| Illinois Finance Authority, Revenue (Kohl Children’s Museum of | |||||
| Greater Chicago Inc. Project) (LOC; Northern Trust Company) | 0.11 | 3/7/13 | 2,275,000 | a | 2,275,000 |
| Illinois Finance Authority, Revenue (Saint Ignatius College | |||||
| Preparatory Project) (LOC; PNC Bank NA) | 0.12 | 3/7/13 | 13,000,000 | a,b | 13,000,000 |
10
| BNY Mellon National Municipal Money Market Fund (continued) | |||||
| Coupon | Maturity | Principal | |||
| Short-Term Investments (continued) | Rate (%) | Date | Amount ($) | Value ($) | |
| Illinois (continued) | |||||
| Illinois Finance Authority, Revenue (YMCA of | |||||
| Metropolitan Chicago Project) (LOC; BMO Harris Bank NA) | 0.11 | 3/7/13 | 4,400,000 | a | 4,400,000 |
| Illinois Health Facilities Authority, Revenue, | |||||
| Refunding (Franciscan Eldercare and Community | |||||
| Services—Franciscan Village) (LOC; Bank of America) | 0.33 | 3/7/13 | 4,050,000 | a | 4,050,000 |
| Indiana—7.6% | |||||
| Deutsche Bank Spears/Lifers Trust (Series DBE-565) | |||||
| (Indiana Bond Bank, Special Program Revenue) (Liquidity | |||||
| Facility; Deutsche Bank AG and LOC; Deutsche Bank AG) | 0.22 | 3/7/13 | 5,820,000 | a,c,d | 5,820,000 |
| Goshen, EDR (Goshen College Project) (LOC; JPMorgan Chase Bank) | 0.13 | 3/7/13 | 19,350,000 | a,b | 19,350,000 |
| Indiana Development Finance Authority, Educational | |||||
| Facilities Revenue (Indianapolis Museum of Art, Inc. | |||||
| Project) (LOC; JPMorgan Chase Bank) | 0.11 | 3/7/13 | 43,600,000 | a | 43,600,000 |
| Indiana Health Facility Financing Authority, Revenue | |||||
| (Franciscan Eldercare Services, Inc.,—University | |||||
| Place Project) (LOC; Bank of America) | 0.31 | 3/7/13 | 14,290,000 | a | 14,290,000 |
| Iowa—3.3% | |||||
| Hills, Health Facilities Revenue (Mercy Hospital | |||||
| Project) (LOC; U.S. Bank NA) | 0.13 | 3/1/13 | 23,245,000 | a | 23,245,000 |
| Iowa Higher Education Loan Authority, Private | |||||
| College Facility Revenue (Des Moines University | |||||
| Project) (LOC; U.S. Bank NA) | 0.13 | 3/1/13 | 13,070,000 | a,b | 13,070,000 |
| Kentucky—.2% | |||||
| Mason County, PCR (East Kentucky Power Cooperative, Inc. | |||||
| Project) (Liquidity Facility; National Rural Utilities | |||||
| Cooperative Finance Corporation) | 0.31 | 3/7/13 | 2,325,000 | a | 2,325,000 |
| Louisiana—1.3% | |||||
| Deutsche Bank Spears/Lifers Trust (Series DBE-577) (Jefferson | |||||
| Sales Tax District, Special Sales Tax Revenue) (Liquidity | |||||
| Facility; Deutsche Bank AG and LOC; Deutsche Bank AG) | 0.21 | 3/7/13 | 4,205,000 | a,c,d | 4,205,000 |
| Louisiana Public Facilities Authority, Revenue | |||||
| (Tiger Athletic Foundation Project) (LOC; FHLB) | 0.11 | 3/7/13 | 9,590,000 | a,b | 9,590,000 |
| Maryland—4.8% | |||||
| Baltimore Mayor and City Council Industrial Development | |||||
| Authority, Revenue (City of Baltimore Capital Acquisition | |||||
| Program) (LOC; Bayerische Landesbank) | 0.18 | 3/7/13 | 10,400,000 | a | 10,400,000 |
| Maryland Economic Development Corporation, EDR | |||||
| (Catholic Relief Services Facility) (LOC; Bank of America) | 0.17 | 3/7/13 | 14,875,000 | a | 14,875,000 |
| Maryland Industrial Development Financing Authority, | |||||
| Recovery Zone Facility Revenue (Wexford Maryland | |||||
| BioPark 3, LLC Facility) (LOC; M&T Trust) | 0.16 | 3/7/13 | 10,000,000 | a | 10,000,000 |
| Montgomery County, EDR (George Meany Center for | |||||
| Labor Studies—The National Labor College Facility) | |||||
| (LOC; Bank of America) | 0.17 | 3/7/13 | 16,880,000 | a,b | 16,880,000 |
| The Funds | 11 |
STATEMENT OF INVESTMENTS (Unaudited) (continued)
| BNY Mellon National Municipal Money Market Fund (continued) | |||||
| Coupon | Maturity | Principal | |||
| Short-Term Investments (continued) | Rate (%) | Date | Amount ($) | Value ($) | |
| Massachusetts—3.9% | |||||
| Massachusetts Bay Transportation Authority, General Transportation | |||||
| System Revenue (Liquidity Facility; Bank of America) | 0.19 | 3/7/13 | 33,750,000 | a | 33,750,000 |
| Massachusetts Health and Educational Facilities Authority, Revenue | |||||
| (Hebrew Rehabilitation Center Issue) (LOC; Bank of America) | 0.21 | 3/7/13 | 8,175,000 | a | 8,175,000 |
| Michigan—2.9% | |||||
| Lenawee County Economic Development Corporation, Revenue, | |||||
| Refunding (Siena Heights University Project) (LOC; FHLB) | 0.12 | 3/7/13 | 8,045,000 | a,b | 8,045,000 |
| Michigan Higher Education Facilities Authority, LOR | |||||
| (Adrian College Project) (LOC; Comerica Bank) | 0.16 | 3/7/13 | 12,230,000 | a,b | 12,230,000 |
| University of Michigan Regents, General Revenue | |||||
| (Liquidity Facility; Northern Trust Company) | 0.10 | 3/1/13 | 10,775,000 | a,b | 10,775,000 |
| Minnesota—.8% | |||||
| Minnesota Higher Education Facilities Authority, | |||||
| Revenue (Macalester College) | 0.11 | 3/7/13 | 8,565,000 | a,b | 8,565,000 |
| Missouri—3.8% | |||||
| Deutsche Bank Spears/Lifers Trust (Series DBE-712) | |||||
| (Kansas City Industrial Development Authority, MFHR, | |||||
| Refunding (The Orchards Apartments Project)) (Liquidity | |||||
| Facility; Deutsche Bank AG and LOC; Deutsche Bank AG) | 0.22 | 3/7/13 | 9,110,000 | a,c,d | 9,110,000 |
| Missouri Development Finance Board, Cultural Facilities | |||||
| Revenue (Kauffman Center for the Preforming Arts | |||||
| Project) (Liquidity Facility; Northern Trust Company) | 0.12 | 3/1/13 | 30,500,000 | a | 30,500,000 |
| Missouri Health and Educational Facilities Authority, | |||||
| Educational Facilities Revenue (Saint John Vianney | |||||
| High School Project) (LOC; Bank of America) | 0.20 | 3/7/13 | 1,235,000 | a,b | 1,235,000 |
| Nevada—1.7% | |||||
| Deutsche Bank Spears/Lifers Trust (Series DBE-668) (Clark County | |||||
| School District, Limited Tax Building Bonds GO) (Liquidity Facility; | |||||
| Deutsche Bank AG and LOC; Deutsche Bank AG) | 0.24 | 3/7/13 | 17,975,000 | a,b,c,d | 17,975,000 |
| New Jersey—13.5% | |||||
| Bergenfield Borough, GO Notes, BAN | 1.00 | 2/28/14 | 6,390,000 | 6,411,982 | |
| Branch Banking and Trust Co. Municipal Trust (Series 2044) | |||||
| (Port Authority-Port Newark, Marine Terminal Rent-Backed | |||||
| Revenue (Newark Redevelopment Projects)) (Liquidity | |||||
| Facility; Branch Banking and Trust Co. and LOC; | |||||
| Branch Banking and Trust Co.) | 0.14 | 3/7/13 | 8,220,000 | a,c,d | 8,220,000 |
| Branch Banking and Trust Co. Municipal Trust (Series 2056) | |||||
| (New Jersey Economic Development Authority, School Facilities | |||||
| Construction Revenue) (Liquidity Facility; Branch Banking and | |||||
| Trust Co. and LOC; Branch Banking and Trust Co.) | 0.14 | 3/7/13 | 10,100,000 | a,b,c,d | 10,100,000 |
| Camden County Improvement Authority, Special Revenue | |||||
| (Congregation Beth El Project) (LOC; TD Bank) | 0.11 | 3/7/13 | 1,500,000 | a,b | 1,500,000 |
| Cumberland County, GO Notes, BAN | 1.50 | 12/27/13 | 1,833,000 | 1,845,784 | |
12
| BNY Mellon National Municipal Money Market Fund (continued) | |||||
| Coupon | Maturity | Principal | |||
| Short-Term Investments (continued) | Rate (%) | Date | Amount ($) | Value ($) | |
| New Jersey (continued) | |||||
| Deutsche Bank Spears/Lifers Trust (Series DBE-511) | |||||
| (Newark Housing Authority, Marine Terminal | |||||
| Additional Rent-Backed Revenue, Refunding (City of | |||||
| Newark Redevelopment Projects)) (Liquidity Facility; | |||||
| Deutsche Bank AG and LOC; Deutsche Bank AG) | 0.19 | 3/7/13 | 8,000,000 | a,c,d | 8,000,000 |
| East Brunswick Township, GO Notes, BAN | 1.00 | 4/10/13 | 11,927,000 | 11,932,119 | |
| East Brunswick Township, GO Notes, BAN | 1.25 | 8/6/13 | 15,000,000 | 15,039,748 | |
| Garfield, GO Notes, BAN (General Bond Anticipation Notes | |||||
| and Water Utility Bond Anticipation Notes) | 1.00 | 10/15/13 | 11,433,000 | 11,468,442 | |
| Kearny Board of Education, GO Notes, GAN | 1.25 | 10/11/13 | 3,000,000 | b | 3,006,370 |
| New Jersey Economic Development Authority, EDR | |||||
| (Diocese of Metuchen Project) (LOC; Bank of America) | 0.17 | 3/7/13 | 13,570,000 | a,b | 13,570,000 |
| New Jersey Economic Development Authority, EDR (Volunteers | |||||
| of America Delaware Valley Property, Inc. Project) (LOC; TD Bank) | 0.11 | 3/7/13 | 1,770,000 | a | 1,770,000 |
| New Jersey Economic Development Authority, EDR, Refunding | |||||
| (Stolthaven Perth Amboy Inc. Project) (LOC; Citibank NA) | 0.13 | 3/7/13 | 23,000,000 | a | 23,000,000 |
| New Jersey Economic Development Authority, Revenue | |||||
| (Somerset Hills YMCA Project) (LOC; TD Bank) | 0.11 | 3/7/13 | 2,620,000 | a,b | 2,620,000 |
| Paterson, GO Notes, BAN (General Improvement and Tax Appeal) | 1.50 | 6/6/13 | 7,000,000 | 7,004,576 | |
| Rahway, GO Notes, BAN | 1.25 | 8/9/13 | 10,000,000 | 10,028,485 | |
| Rahway, GO Notes, BAN | 1.25 | 10/2/13 | 8,000,000 | 8,026,651 | |
| Sussex County Municipal Utilities Authority, | |||||
| Project Note (Paulins Kill Basin Water Reclamation System) | 1.50 | 2/14/14 | 2,750,000 | 2,777,024 | |
| New York—19.9% | |||||
| Albany Industrial Development Agency, Civic Facility Revenue | |||||
| (Renaissance Corporation of Albany Project) (LOC; M&T Trust) | 0.16 | 3/7/13 | 2,800,000 | a | 2,800,000 |
| Amherst Industrial Development Agency, Civic Facility | |||||
| Revenue (Daemen College Project) (LOC; M&T Trust) | 0.16 | 3/7/13 | 12,000,000 | a,b | 12,000,000 |
| Amsterdam Enlarged City School District, GO Notes, BAN | 1.25 | 6/28/13 | 13,595,000 | b | 13,621,417 |
| Deposit Central School District, GO Notes, BAN | 1.25 | 6/28/13 | 7,000,000 | b | 7,012,461 |
| Dutchess County Industrial Development Agency, Civic Facility | |||||
| Revenue (Brookview, Inc. Project) (LOC; M&T Trust) | 0.16 | 3/7/13 | 8,250,000 | a | 8,250,000 |
| Erie County Industrial Development Agency, | |||||
| Civic Facility Revenue (The Canisius High School of | |||||
| Buffalo, N.Y. Project) (LOC; M&T Trust) | 0.16 | 3/7/13 | 19,680,000 | a,b | 19,680,000 |
| Hannibal Central School District, GO Notes, BAN | 1.00 | 6/28/13 | 6,910,000 | b | 6,916,691 |
| Jamestown City School District, GO Notes, BAN | 1.00 | 6/27/13 | 6,000,000 | b | 6,005,761 |
| Monroe County Industrial Development Agency, | |||||
| Civic Facility Revenue (Margaret Woodbury | |||||
| Strong Museum Project) (LOC; M&T Trust) | 0.14 | 3/7/13 | 22,000,000 | a | 22,000,000 |
| New York City, GO Notes (LOC; California | |||||
| Public Employees Retirement System) | 0.11 | 3/1/13 | 11,800,000 | a | 11,800,000 |
| The Funds | 13 |
STATEMENT OF INVESTMENTS (Unaudited) (continued)
| BNY Mellon National Municipal Money Market Fund (continued) | |||||
| Coupon | Maturity | Principal | |||
| Short-Term Investments (continued) | Rate (%) | Date | Amount ($) | Value ($) | |
| New York (continued) | |||||
| New York City Capital Resource Corporation, Recovery Zone | |||||
| Facility Revenue (WytheHotel Project) (LOC; M&T Trust) | 0.17 | 3/7/13 | 3,700,000 | a | 3,700,000 |
| New York Liberty Development Corporation, Liberty | |||||
| Revenue, Refunding (3 World Trade Center Project) | |||||
| (LOC; JPMorgan Chase Bank) | 0.14 | 3/7/13 | 5,000,000 | a | 5,000,000 |
| New York State Housing Finance Agency, Housing | |||||
| Revenue (25 Washington Street) (LOC; M&T Trust) | 0.16 | 3/7/13 | 7,800,000 | a | 7,800,000 |
| Oneida County Industrial Development Agency, | |||||
| Civic Facility Revenue (Saint Elizabeth Medical | |||||
| Center Facility) (LOC; HSBC Bank USA) | 0.12 | 3/7/13 | 5,550,000 | a | 5,550,000 |
| Onondaga County Industrial Development Agency, | |||||
| Civic Facility Revenue (Syracuse Research | |||||
| Corporation Facility) (LOC; M&T Trust) | 0.16 | 3/7/13 | 3,640,000 | a | 3,640,000 |
| Salina, GO Notes BAN | 1.25 | 6/21/13 | 7,230,000 | 7,243,222 | |
| Seaford Union Free School District, GO Notes, TAN | 1.25 | 6/20/13 | 2,500,000 | b | 2,505,664 |
| South Jefferson Central School District, GO Notes, BAN | 1.50 | 6/21/13 | 18,930,000 | b | 18,980,768 |
| Tompkins County Industrial Development Agency, | |||||
| Civic Facility Revenue (Community Development | |||||
| Properties Ithaca, Inc. Project) (LOC; M&T Trust) | 0.21 | 3/7/13 | 6,300,000 | a | 6,300,000 |
| Triborough Bridge and Tunnel Authority, General Revenue, | |||||
| Refunding (MTA Bridges and Tunnels) (Liquidity Facility; | |||||
| Landesbank Hessen-Thuringen Girozentrale) | 0.16 | 3/1/13 | 40,000,000 | a | 40,000,000 |
| Wappingers Central School District, GO Notes, BAN | 1.25 | 7/12/13 | 5,825,554 | b | 5,838,205 |
| North Carolina—.5% | |||||
| North Carolina Capital Facilities Finance Agency, Educational | |||||
| Facilities Revenue (High Point University Project) | |||||
| (LOC; Branch Banking and Trust Co.) | 0.12 | 3/7/13 | 5,025,000 | a,b | 5,025,000 |
| Ohio—1.7% | |||||
| Cuyahoga County, Health Care Facilities Revenue | |||||
| (Franciscan Communities, Inc.—Mount Alverna | |||||
| Project) (LOC; Bank of America) | 0.31 | 3/7/13 | 10,205,000 | a | 10,205,000 |
| Union Township, GO Notes, Refunding, BAN (Various Purpose) | 1.00 | 9/11/13 | 8,200,000 | 8,223,862 | |
| Oklahoma—3.0% | |||||
| Oklahoma Turnpike Authority, Second Senior | |||||
| Revenue, Refunding (Oklahoma Turnpike System) | |||||
| (Liquidity Facility; JPMorgan Chase Bank) | 0.11 | 3/1/13 | 32,300,000 | a | 32,300,000 |
| Pennsylvania—1.3% | |||||
| Erie County Hospital Authority, Health Facilities Revenue | |||||
| (Saint Mary’s Home of Erie Project) (LOC; Bank of America) | 0.17 | 3/7/13 | 6,000,000 | a | 6,000,000 |
14
| BNY Mellon National Municipal Money Market Fund (continued) | |||||
| Coupon | Maturity | Principal | |||
| Short-Term Investments (continued) | Rate (%) | Date | Amount ($) | Value ($) | |
| Pennsylvania (continued) | |||||
| Montgomery County Industrial Development Authority, | |||||
| Revenue (Fountain of Life Christian Academy | |||||
| Project) (LOC; JPMorgan Chase Bank) | 0.18 | 3/7/13 | 3,220,000 | a | 3,220,000 |
| Philadelphia Authority for Industrial Development, | |||||
| Educational Facilities Revenue (Chestnut Hill College | |||||
| Project) (LOC; Wells Fargo Bank) | 0.21 | 3/7/13 | 5,425,000 | a,b | 5,425,000 |
| South Carolina—.4% | |||||
| South Carolina Jobs-Economic Development Authority, EDR | |||||
| (Lexington-Richland Alcohol and Drug Abuse Council, Inc. | |||||
| Project) (LOC; Branch Banking and Trust Co.) | 0.14 | 3/7/13 | 4,320,000 | a | 4,320,000 |
| South Dakota—1.5% | |||||
| South Dakota Health and Educational Facilities | |||||
| Authority, Revenue (Regional Health) (LOC; U.S. Bank NA) | 0.13 | 3/1/13 | 16,000,000 | a | 16,000,000 |
| Tennessee—.8% | |||||
| Blount County Public Building Authority, Local Government | |||||
| Public Improvement Revenue (Liquidity Facility; | |||||
| Branch Banking and Trust Co.) | 0.12 | 3/7/13 | 5,275,000 | a | 5,275,000 |
| Sevier County Public Building Authority, Local Government | |||||
| Public Improvement Revenue (LOC; Bank of America) | 0.14 | 3/7/13 | 4,000,000 | a | 4,000,000 |
| Texas—14.8% | |||||
| Atascosa County Industrial Development Corporation, PCR, | |||||
| Refunding (San Miguel Electric Cooperative, Inc. Project) | |||||
| (LOC; National Rural Utilities Cooperative Finance Corporation) | 0.24 | 3/7/13 | 34,200,000 | a | 34,200,000 |
| Harris County Health Facilities Development Corporation, | |||||
| HR, Refunding (Texas Children’s Hospital Project) | |||||
| (Liquidity Facility; Wells Fargo Bank) | 0.11 | 3/1/13 | 40,000,000 | a | 40,000,000 |
| Harris County Health Facilities Development Corporation, | |||||
| Revenue, Refunding (The Methodist Hospital System) | 0.10 | 3/1/13 | 21,600,000 | a | 21,600,000 |
| Harris County Health Facilities Development Corporation, | |||||
| Revenue, Refunding (The Methodist Hospital System) | 0.10 | 3/1/13 | 32,625,000 | a | 32,625,000 |
| Jefferson County Industrial Development Corporation, | |||||
| Hurricane Ike Disaster Area Revenue (Jefferson | |||||
| Refinery, L.L.C. Project) (LOC; Branch Banking and Trust Co.) | 0.45 | 3/15/13 | 28,900,000 | 28,900,000 | |
| Jefferson County Industrial Development Corporation, | |||||
| Hurricane Ike Disaster Area Revenue (Jefferson | |||||
| Refinery, L.L.C. Project) (LOC; Branch Banking and Trust Co.) | 0.45 | 3/15/13 | 3,000,000 | 3,000,000 | |
| Utah—.3% | |||||
| Utah Housing Corporation, MFHR (Timbergate | |||||
| Apartments Project) (LOC; FHLMC) | 0.16 | 3/7/13 | 3,125,000 | a | 3,125,000 |
| The Funds | 15 |
STATEMENT OF INVESTMENTS (Unaudited) (continued)
| BNY Mellon National Municipal Money Market Fund (continued) | ||||||
| Coupon | Maturity | Principal | ||||
| Short-Term Investments (continued) | Rate (%) | Date | Amount ($) | Value ($) | ||
| Virginia—.9% | ||||||
| Alexandria Industrial Development Authority, | ||||||
| Revenue (Institute for Defense Analyses Project) | ||||||
| (LOC; Branch Banking and Trust Co.) | 0.11 | 3/7/13 | 9,875,000 | a | 9,875,000 | |
| Wisconsin—1.1% | ||||||
| Wisconsin Health and Educational Facilities Authority, | ||||||
| Revenue (Cedar Crest, Inc.) (LOC; Bank of Montreal) | 0.11 | 3/7/13 | 6,985,000 | a | 6,985,000 | |
| Wisconsin Rural Water Construction Loan | ||||||
| Program Commission, Revenue, BAN | 1.00 | 10/1/13 | 5,500,000 | 5,521,542 | ||
| Total Investments (cost $1,106,540,774) | 101.9 | % | 1,106,540,774 | |||
| Liabilities, Less Cash and Receivables | (1.9 | %) | (20,565,774 | ) | ||
| Net Assets | 100.0 | % | 1,085,975,000 | |||
| a Variable rate demand note—rate shown is the interest rate in effect at February 28, 2013. Maturity date represents the next demand date, or the ultimate maturity date if earlier. |
| b At February 28, 2013, the fund had $282,042,337 or 26.0% of net assets invested in securities whose payment of principal and interest is dependent upon revenues generated |
| from education. |
| c Securities exempt from registration pursuant to Rule 144A under the Securities Act of 1933.These securities may be resold in transactions exempt from registration, normally to |
| qualified institutional buyers.At February 28, 2013 these securities amounted to $71,750,000 or 6.6% of net assets. |
| d The fund does not directly own the municipal security indicated; the fund owns an interest in a special purpose entity that, in turn, owns the underlying municipal security.The |
| special purpose entity permits the fund to own interests in underlying assets, but in a manner structured to provide certain advantages not inherent in the underlying bonds (e.g., |
| enhanced liquidity, yields linked to short-term rates). |
16
| Summary of Abbreviations | |||
| ABAG | Association of Bay Area Governments | ACA | American Capital Access |
| AGC | ACE Guaranty Corporation | AGIC | Asset Guaranty Insurance Company |
| AMBAC | American Municipal Bond Assurance Corporation | ARRN | Adjustable Rate Receipt Notes |
| BAN | Bond Anticipation Notes | BPA | Bond Purchase Agreement |
| CIFG | CDC Ixis Financial Guaranty | COP | Certificate of Participation |
| CP | Commercial Paper | DRIVERS | Derivative Inverse Tax-Exempt Receipts |
| EDR | Economic Development Revenue | EIR | Environmental Improvement Revenue |
| FGIC | Financial Guaranty Insurance Company | FHA | Federal Housing Administration |
| FHLB | Federal Home Loan Bank | FHLMC | Federal Home Loan Mortgage Corporation |
| FNMA | Federal National Mortgage Association | GAN | Grant Anticipation Notes |
| GIC | Guaranteed Investment Contract | GNMA | Government National Mortgage Association |
| GO | General Obligation | HR | Hospital Revenue |
| IDB | Industrial Development Board | IDC | Industrial Development Corporation |
| IDR | Industrial Development Revenue | LIFERS | Long Inverse Floating Exempt Receipts |
| LOC | Letter of Credit | LOR | Limited Obligation Revenue |
| LR | Lease Revenue | MERLOTS | Municipal Exempt Receipt Liquidity Option Tender |
| MFHR | Multi-Family Housing Revenue | MFMR | Multi-Family Mortgage Revenue |
| PCR | Pollution Control Revenue | P-FLOATS | Puttable Floating Option Tax-Exempt Receipts |
| PILOT | Payment in Lieu of Taxes | PUTTERS | Puttable Tax-Exempt Receipts |
| RAC | Revenue Anticipation Certificates | RAN | Revenue Anticipation Notes |
| RAW | Revenue Anticipation Warrants | ROCS | Reset Options Certificates |
| RRR | Resources Recovery Revenue | SAAN | State Aid Anticipation Notes |
| SBPA | Standby Bond Purchase Agreement | SFHR | Single Family Housing Revenue |
| SFMR | Single Family Mortgage Revenue | SONYMA | State of New York Mortgage Agency |
| SPEARS | Short Puttable Exempt Adjustable Receipts | SWDR | Solid Waste Disposal Revenue |
| TAN | Tax Anticipation Notes | TAW | Tax Anticipation Warrants |
| TRAN | Tax and Revenue Anticipation Notes | XLCA | XL Capital Assurance |
| Summary of Combined Ratings (Unaudited) | |||||
| Fitch | or | Moody’s | or | Standard & Poor’s | Value (%)† |
| F1 +,F1 | VMIG1,MIG1,P1 | SP1+,SP1,A1+,A1 | 74.3 | ||
| F2 | VMIG2,MIG2,P2 | SP2,A2 | 2.9 | ||
| AAA,AA,Ae | Aaa,Aa,Ae | AAA,AA,Ae | 7.0 | ||
| Not Ratedf | Not Ratedf | Not Ratedf | 15.8 | ||
| 100.0 | |||||
| † Based on total investments. |
| e Notes which are not F, MIG and SP rated are represented by bond ratings of the issuers. |
| f Securities which, while not rated by Fitch, Moody’s and Standard & Poor’s, have been determined by the Manager to be of comparable quality to those rated securities in which the |
| fund may invest. |
See notes to financial statements.
| The Funds | 17 |
STATEMENT OF ASSETS AND LIABILITIES
February 28, 2013 (Unaudited)
| BNY Mellon | BNY Mellon | ||
| Money Market | National Municipal | ||
| Fund | Money Market Fund | ||
| Assets ($): | |||
| Investments in securities—See Statement of Investments+ | |||
| (including Repurchase Agreement of $125,000,000 | |||
| for BNY Mellon Money Market Fund)—Note 2(c) | 531,946,631 | 1,106,540,774 | |
| Cash | 444,303 | 692,290 | |
| Interest receivable | 109,896 | 1,178,986 | |
| Prepaid expenses | 21,478 | 25,160 | |
| 532,522,308 | 1,108,437,210 | ||
| Liabilities ($): | |||
| Due to The Dreyfus Corporation and affiliates—Note 3(b) | 63,610 | 97,417 | |
| Due to Administrator—Note 3(a) | 63,957 | 116,758 | |
| Payable for shares of investment securities purchased | — | 22,200,490 | |
| Accrued expenses | 44,641 | 47,545 | |
| 172,208 | 22,462,210 | ||
| Net Assets ($) | 532,350,100 | 1,085,975,000 | |
| Composition of Net Assets ($): | |||
| Paid-in capital | 532,345,986 | 1,087,400,617 | |
| Accumulated net realized gain (loss) on investments | 4,114 | (1,425,617 | ) |
| Net Assets ($) | 532,350,100 | 1,085,975,000 | |
| Net Asset Value Per Share | |||
| Class M Shares | |||
| Net Assets ($) | 527,754,122 | 1,084,725,024 | |
| Shares Outstanding | 527,752,834 | 1,086,149,771 | |
| Net Asset Value Per Share ($) | 1.00 | 1.00 | |
| Investor Shares | |||
| Net Assets ($) | 4,595,978 | 1,249,976 | |
| Shares Outstanding | 4,595,946 | 1,251,761 | |
| Net Asset Value Per Share ($) | 1.00 | 1.00 | |
| † Investments at cost ($) | 531,946,631 | 1,106,540,774 | |
| See notes to financial statements. | |||
18
STATEMENT OF OPERATIONS
Six Months Ended February 28, 2013 (Unaudited)
| BNY Mellon | BNY Mellon | |||
| Money Market | National Municipal | |||
| Fund | Money Market Fund | |||
| Investment Income ($): | ||||
| Interest Income | 885,135 | 1,657,128 | ||
| Expenses: | ||||
| Investment advisory fee—Note 3(a) | 627,940 | 1,029,738 | ||
| Administration fee—Note 3(a) | 517,309 | 848,182 | ||
| Custodian fees—Note 3(b) | 47,061 | 42,262 | ||
| Trustees’ fees and expenses—Note 3(c) | 26,008 | 39,648 | ||
| Professional fees | 24,391 | 37,844 | ||
| Registration fees | 15,710 | 15,737 | ||
| Shareholder servicing costs—Note 3(b) | 6,731 | 1,512 | ||
| Prospectus and shareholders’ reports | 6,151 | 5,167 | ||
| Miscellaneous | 13,840 | 23,980 | ||
| Total Expenses | 1,285,141 | 2,044,070 | ||
| Less—reduction in expenses due to undertaking—Note 3(a) | (399,603 | ) | (387,193 | ) |
| Less—reduction in fees due to earnings credits—Note 3(b) | (579 | ) | — | |
| Net Expenses | 884,959 | 1,656,877 | ||
| Investment Income—Net | 176 | 251 | ||
| Net Realized Gain (Loss) on Investments—Note 2(b) ($) | 5,547 | 34,000 | ||
| Net Increase in Net Assets Resulting from Operations | 5,723 | 34,251 | ||
| See notes to financial statements. | ||||
| The Funds | 19 |
STATEMENT OF CHANGES IN NET ASSETS
| BNY Mellon National | ||||||||
| BNY Mellon Money Market Fund | Municipal Money Market Fund | |||||||
| Six Months Ended | Six Months Ended | |||||||
| February 28, 2013 | Year Ended | February 28, 2013 | Year Ended | |||||
| (Unaudited) | August 31, 2012 | (Unaudited) | August 31, 2012 | |||||
| Operations ($): | ||||||||
| Investment income—net | 176 | 357 | 251 | 1,109 | ||||
| Net realized gain (loss) from investments | 5,547 | 600 | 34,000 | 20,434 | ||||
| Net Increase (Decrease) in Net Assets | ||||||||
| Resulting from Operations | 5,723 | 957 | 34,251 | 21,543 | ||||
| Dividends to Shareholders from ($): | ||||||||
| Investment income—net: | ||||||||
| Class M Shares | (175 | ) | (3,143 | ) | (251 | ) | (1,109 | ) |
| Investor Shares | (1 | ) | (8 | ) | — | — | ||
| Total Dividends | (176 | ) | (3,151 | ) | (251 | ) | (1,109 | ) |
| Beneficial Interest Transactions ($1.00 per share): | ||||||||
| Net proceeds from shares sold: | ||||||||
| Class M Shares | 638,625,431 | 1,815,675,115 | 1,298,238,115 | 2,470,726,782 | ||||
| Investor Shares | 7,950,845 | 22,198,820 | 2,232,366 | 4,424,263 | ||||
| Dividends reinvested: | ||||||||
| Investor Shares | 1 | 8 | — | — | ||||
| Cost of shares redeemed: | ||||||||
| Class M Shares | (968,477,297 | ) | (1,964,183,372 | ) | (1,530,214,058 | ) | (2,506,842,284 | ) |
| Investor Shares | (13,694,570 | ) | (13,381,228 | ) | (2,003,289 | ) | (3,673,895 | ) |
| Increase (Decrease) in Net Assets from | ||||||||
| Beneficial Interest Transactions | (335,595,590 | ) | (139,690,657 | ) | (231,746,866 | ) | (35,365,134 | ) |
| Total Increase (Decrease) In Net Assets | (335,590,043 | ) | (139,692,851 | ) | (231,712,866 | ) | (35,344,700 | ) |
| Net Assets ($): | ||||||||
| Beginning of Period | 867,940,143 | 1,007,632,994 | 1,317,687,866 | 1,353,032,566 | ||||
| End of Period | 532,350,100 | 867,940,143 | 1,085,975,000 | 1,317,687,866 | ||||
| See notes to financial statements. | ||||||||
20
FINANCIAL HIGHLIGHTS
The following tables describe the performance for each share class of each BNY Mellon money market fund for the fiscal periods indicated.All information reflects financial results for a single fund share.Total return shows how much your investment in each fund would have increased (or decreased) during each period, assuming you had reinvested all dividends and distributions.These figures have been derived from each fund’s financial statements.
| Class M Shares | ||||||||||||
| Six Months Ended | ||||||||||||
| February 28, 2013 | Year Ended August 31, | |||||||||||
| BNY Mellon Money Market Fund | (Unaudited) | 2012 | 2011 | 2010 | 2009 | 2008 | ||||||
| Per Share Data ($): | ||||||||||||
| Net asset value, beginning of period | 1.00 | 1.00 | 1.00 | 1.00 | 1.00 | 1.00 | ||||||
| Investment Operations: | ||||||||||||
| Investment income—net | .000 | a | .000 | a | .000 | a | .001 | .012 | .037 | |||
| Distributions: | ||||||||||||
| Dividends from investment income—net | (.000 | )a | (.000 | )a | (.000 | )a | (.001 | ) | (.012 | ) | (.037 | ) |
| Net asset value, end of period | 1.00 | 1.00 | 1.00 | 1.00 | 1.00 | 1.00 | ||||||
| Total Return (%) | .00 | b,c | .00 | c | .02 | .07 | 1.24 | 3.72 | ||||
| Ratios/Supplemental Data (%): | ||||||||||||
| Ratio of total expenses to average net assets | .31 | b | .30 | .30 | .30 | .33 | .30 | |||||
| Ratio of net expenses to average net assets | .21 | b | .21 | .26 | .29 | .33 | .30 | |||||
| Ratio of net investment income to average net assets | .00 | b,c | .00 | c | .02 | .07 | 1.08 | 3.53 | ||||
| Net Assets, end of period ($ x 1,000) | 527,754 | 857,600 | 1,006,111 | 1,092,771 | 1,934,739 | 1,175,866 | ||||||
| a | Amount represents less than $.001 per share. |
| b | Annualized. |
| c | Amount represents less than .01%. |
See notes to financial statements.
| The Funds | 21 |
FINANCIAL HIGHLIGHTS (continued)
| Investor Shares | ||||||||||||
| Six Months Ended | ||||||||||||
| February 28, 2013 | Year Ended August 31, | |||||||||||
| BNY Mellon Money Market Fund | (Unaudited) | 2012 | 2011 | 2010 | 2009 | 2008 | ||||||
| Per Share Data ($): | ||||||||||||
| Net asset value, beginning of period | 1.00 | 1.00 | 1.00 | 1.00 | 1.00 | 1.00 | ||||||
| Investment Operations: | ||||||||||||
| Investment income—net | .000 | a | .000 | a | .000 | a | .000 | a | .010 | .034 | ||
| Distributions: | ||||||||||||
| Dividends from investment income—net | (.000 | )a | (.000 | )a | (.000 | )a | (.000 | )a | (.010 | ) | (.034 | ) |
| Net asset value, end of period | 1.00 | 1.00 | 1.00 | 1.00 | 1.00 | 1.00 | ||||||
| Total Return (%) | .00 | b,c | .00 | c | .00 | c | .00 | c | .99 | 3.47 | ||
| Ratios/Supplemental Data (%): | ||||||||||||
| Ratio of total expenses to average net assets | .56 | b | .58 | .55 | .55 | .58 | .55 | |||||
| Ratio of net expenses to average net assets | .21 | b | .22 | .26 | .38 | .58 | .55 | |||||
| Ratio of net investment income to average net assets | .00 | b,c | .00 | c | .00 | c | .00 | c | .97 | 3.39 | ||
| Net Assets, end of period ($ x 1,000) | 4,596 | 10,340 | 1,522 | 312 | 1,701 | 1,588 | ||||||
| a | Amount represents less than $.001 per share. |
| b | Annualized. |
| c | Amount represents less than .01%. |
See notes to financial statements.
22
| Class M Shares | ||||||||||||
| Six Months Ended | ||||||||||||
| February 28, 2013 | Year Ended August 31, | |||||||||||
| BNY Mellon National Municipal Money Market Fund | (Unaudited) | 2012 | 2011 | 2010 | 2009 | 2008 | ||||||
| Per Share Data ($): | ||||||||||||
| Net asset value, beginning of period | 1.00 | 1.00 | 1.00 | 1.00 | 1.00 | 1.00 | ||||||
| Investment Operations: | ||||||||||||
| Investment income—net | .000 | a | .000 | a | .000 | a | .000 | a | .008 | .024 | ||
| Distributions: | ||||||||||||
| Dividends from investment income—net | (.000 | )a | (.000 | )a | (.000 | )a | (.000 | )a | (.008 | ) | (.024 | ) |
| Net asset value, end of period | 1.00 | 1.00 | 1.00 | 1.00 | 1.00 | 1.00 | ||||||
| Total Return (%) | .00 | b,c | .00 | c | .03 | .05 | .79 | 2.39 | ||||
| Ratios/Supplemental Data (%): | ||||||||||||
| Ratio of total expenses to average net assets | .30 | b | .30 | .29 | .30 | .35 | .31 | |||||
| Ratio of net expenses to average net assets | .24 | b | .22 | .26 | .28 | .34 | .28 | |||||
| Ratio of net investment income to average net assets | .00 | b,c | .00 | c | .03 | .04 | .80 | 2.24 | ||||
| Net Assets, end of period ($ x 1,000) | 1,084,725 | 1,316,666 | 1,352,760 | 1,551,274 | 1,770,608 | 1,629,931 | ||||||
| a | Amount represents less than $.001 per share. |
| b | Annualized. |
| c | Amount represents less than .01%. |
See notes to financial statements.
| The Funds | 23 |
FINANCIAL HIGHLIGHTS (continued)
| Investor Shares | ||||||||||||
| Six Months Ended | ||||||||||||
| February 28, 2013 | Year Ended August 31, | |||||||||||
| BNY Mellon National Municipal Money Market Fund | (Unaudited) | 2012 | 2011 | 2010 | 2009 | 2008 | ||||||
| Per Share Data ($): | ||||||||||||
| Net asset value, beginning of period | 1.00 | 1.00 | 1.00 | 1.00 | 1.00 | 1.00 | ||||||
| Investment Operations: | ||||||||||||
| Investment income—net | .000 | a | .000 | a | .000 | a | .000 | a | .006 | .021 | ||
| Distributions: | ||||||||||||
| Dividends from investment income—net | (.000 | )a | (.000 | )a | (.000 | )a | (.000 | )a | (.006 | ) | (.021 | ) |
| Net asset value, end of period | 1.00 | 1.00 | 1.00 | 1.00 | 1.00 | 1.00 | ||||||
| Total Return (%) | .00 | b,c | .00 | c | .00 | c | .00 | c | .60 | 2.13 | ||
| Ratios/Supplemental Data (%): | ||||||||||||
| Ratio of total expenses to average net assets | .55 | b | .56 | .54 | .55 | .60 | .56 | |||||
| Ratio of net expenses to average net assets | .25 | b | .23 | .29 | .33 | .53 | .53 | |||||
| Ratio of net investment income to average net assets | .00 | b,c | .00 | c | .00 | c | .00 | c | .57 | 2.05 | ||
| Net Assets, end of period ($ x 1,000) | 1,250 | 1,022 | 272 | 1 | 1 | 1 | ||||||
| a | Amount represents less than $.001 per share. |
| b | Annualized. |
| c | Amount represents less than .01%. |
See notes to financial statements.
24
NOTES TO FINANCIAL STATEMENTS (Unaudited)
NOTE 1—General:
BNY Mellon Funds Trust (the “Trust”) was organized as a Massachusetts business trust which is registered under the Investment Company Act of 1940, as amended (the “Act”), as an open-end management investment company and operates as a series company currently consisting of twenty-six series, including the following diversified money market funds: BNY Mellon Money Market Fund and BNY Mellon National Municipal Money Market Fund (each, a “fund” and collectively, the “funds”). BNY Mellon Money Market Fund’s investment objective is to seek as high a level of current income as is consistent with the preservation of capital and the maintenance of liquidity. BNY Mellon National Municipal Money Market Fund’s investment objective is to provide investors with as high a level of current income exempt from federal income tax as is consistent with the preservation of capital and the maintenance of liquidity.
BNY Mellon Fund Advisers, a division of The Dreyfus Corporation (the “Manager” or “Dreyfus), a wholly-owned subsidiary of The Bank of New York Mellon Corporation (“BNY Mellon”), serves as each fund’s investment adviser (“Investment Adviser”).The Bank of New York Mellon, a subsidiary of BNY Mellon and an affiliate of Dreyfus, serves as administrator for the funds pursuant to an Administration Agreement with the Trust (the “Administration Agreement”). The Bank of New York Mellon has entered into a Sub-Administration Agreement with Dreyfus pursuant to whichThe Bank of New York Mellon pays Dreyfus for performing certain administrative services. MBSC Securities Corporation (the “Distributor”), a wholly-owned subsidiary of Dreyfus, is the distributor of each fund’s shares, which are sold without a sales charge.
The Trust is authorized to issue an unlimited number of shares of Beneficial Interest, par value $.001 per share, in Class M and Investor Class shares of each fund. . Other differences between the classes include the services
offered to and the expenses borne by each class, the allocation of certain transfer agency costs and certain voting rights. Income, expenses (other than expenses attributable to a specific class), and realized and unrealized gains or losses on investments are allocated to each class of shares based on its relative net assets.
It is each fund’s policy to maintain a continuous net asset value per share of $1.00; each fund has adopted certain investment, portfolio valuation and dividend and distribution policies to enable it to do so.There is no assurance, however, that either fund will be able to maintain a stable net asset value per share of $1.00.
TheTrust accounts separately for the assets, liabilities and operations of each series. Expenses directly attributable to each series are charged to that series’ operations; expenses that are applicable to all series are allocated among them on a pro rata basis.
The Financial Accounting Standards Board (“FASB”) Accounting Standards Codification is the exclusive reference of authoritative U.S. generally accepted accounting principles (“GAAP”) recognized by the FASB to be applied by nongovernmental entities. Rules and interpretive releases of the Securities and Exchange Commission (“SEC”) under authority of federal laws are also sources of authoritative GAAP for SEC registrants. Each fund’s financial statements are prepared in accordance with GAAP, which may require the use of management estimates and assumptions. Actual results could differ from those estimates.
NOTE 2—Significant Accounting Policies:
(a) Portfolio valuation: Investments in securities are valued at amortized cost in accordance with Rule 2a-7 under the Act. If amortized cost is determined not to approximate market value, the fair value of the portfolio securities will be determined by procedures established by and under the general supervision of the Trust’s Board of Trustees (the “Board”).
| The Funds | 25 |
NOTES TO FINANCIAL STATEMENTS (Unaudited) (continued)
The fair value of a financial instrument is the amount that would be received to sell an asset or paid to transfer a liability in an orderly transaction between market participants at the measurement date (i.e., the exit price). GAAP establishes a fair value hierarchy that prioritizes the inputs of valuation techniques used to measure fair value. This hierarchy gives the highest priority to unadjusted quoted prices in active markets for identical assets or liabilities (Level 1 measurements) and the lowest priority to unobservable inputs (Level 3 measurements).
Additionally, GAAP provides guidance on determining whether the volume and activity in a market has decreased significantly and whether such a decrease in activity results in transactions that are not orderly. GAAP requires enhanced disclosures around valuation inputs and techniques used during annual and interim periods.
Various inputs are used in determining the value of each fund’s investments relating to fair value measurements. These inputs are summarized in the three broad levels listed below:
Level 1—unadjusted quoted prices in active markets for identical investments.
Level 2—other significant observable inputs (including quoted prices for similar investments, interest rates, prepayment speeds, credit risk, etc.).
Level 3—significant unobservable inputs (including the funds’ own assumptions in determining the fair value of investments).
The inputs or methodology used for valuing securities are not necessarily an indication of the risk associated with investing in those securities. For example, money market securities are valued using amortized cost, in accordance with rules under the Act. Generally, amortized cost approximates the current fair value of a security, but since the value is not obtained from a quoted price in an active market, such securities are reflected within Level 2 of the fair value hierarchy.
At February 28, 2013, all of the securities in each fund were considered Level 2 of the fair value hierarchy.
At February 28, 2013, there were no transfers for either fund, between Level 1 and Level 2 of the fair value hierarchy.
(b) Securities transactions and investment income:
Securities transactions are recorded on a trade date basis. Interest income, adjusted for accretion of discount and amortization of premium on investments, is earned from settlement date and recognized on the accrual basis. Realized gains and losses from securities transactions are recorded on the identified cost basis. Cost of investments represents amortized cost.
(c) Repurchase agreements: BNY Mellon Money Market Fund may enter into repurchase agreements with financial institutions, deemed to be creditworthy by the Manager, subject to the seller’s agreement to repurchase and the fund’s agreement to resell such securities at a mutually agreed upon price. Pursuant to the terms of the repurchase agreement, such securities must have an aggregate market value greater than or equal to the terms of the repurchase price plus accrued interest at all times. If the value of the underlying securities falls below the value of the repurchase price plus accrued interest, the fund will require the seller to deposit additional collateral by the next business day. If the request for additional collateral is not met, or the seller defaults on its repurchase obligation, the fund maintains its right to sell the underlying securities at market value and may claim any resulting loss against the seller.
(d) Dividends to shareholders: Dividends payable to shareholders are recorded by the funds on the ex-dividend date.The funds declare dividends daily from investment income-net; such dividends are paid monthly.With respect to each series, dividends from net realized capital gains, if any, are normally declared and paid annually, but the funds may make distributions on a more frequent basis to comply with the distribution requirements of the Internal Revenue Code of 1986, as amended (the “Code”).To the extent that net realized capital gains can be offset by capital loss carryovers of that fund, it is the policy of the funds not to distribute such gains.
26
(e) Federal income taxes: It is the policy of BNY Mellon Money Market Fund to continue to qualify as a regulated investment company, if such qualification is in the best interests of its shareholders, by complying with the applicable provisions of the Code, and to make distributions of taxable income sufficient to relieve it from substantially all federal income and excise taxes. It is the policy of BNY Mellon National Municipal Market Fund to continue to qualify as a regulated investment company, which can distribute tax-exempt dividends, by complying with the applicable provisions of the Code, and to make distributions of income and net realized capital gain sufficient to relieve it from substantially all federal income and excise taxes. For federal income tax purposes, each series is treated as a single entity for the purpose of determining such qualification.
As of and during the period ended February 28, 2013, the funds did not have any liabilities for any uncertain tax positions.The funds recognize interest and penalties, if any, related to uncertain tax positions as income tax expense in the Statements of Operations. During the period, the funds did not incur any interest or penalties.
Each tax year in the three-year period ended August 31, 2012 remains subject to examination by the Internal Revenue Service and state taxing authorities.
Under the Regulated Investment Company Modernization Act of 2010 (the “2010 Act”), each fund is permitted to carry forward capital losses incurred in taxable years beginning after December 22, 2010 (“post-enactment losses”) for an unlimited period. Furthermore, post-enactment capital loss carryovers retain their character as either short-term or long-term capital losses rather than short-term as they were under previous statute. The 2010 Act requires post-enactment losses to be utilized before the utilization of losses incurred in taxable years prior to the effective date of the 2010 Act (“pre-enactment losses”).As a result of this ordering rule, pre-enactment losses may be more likely to expire unused.
BNY Mellon Money Market Fund has an unused capital loss carryover of $1,433 available for federal income tax purposes to be applied against future net realized capital gains, if any, realized subsequent to August 31, 2012. If not applied, the carryover expires in fiscal year 2017.
BNY Mellon National Municipal Money Market Fund has an unused capital loss carryover of $1,459,617 available for federal income tax purposes to be applied against future net realized capital gains, if any, realized subsequent to August 31, 2012. If not applied, the carryover expires in fiscal year 2017.
The tax character of distributions paid to shareholders during the fiscal year ended August 31, 2012 was all ordinary income for BNY Mellon Money Market Fund and for BNY Mellon National Municipal Money Market Fund was all tax-exempt income.The tax character of current year distributions will be determined at the end of the current fiscal year.
At February 28, 2013, the cost of investments for federal income tax purposes was substantially the same as the cost for financial reporting purposes (see the Statements of Investments).
NOTE 3—Investment Advisory Fee, Administration Fee and Other Transactions With Affiliates:
(a) Fees payable by the funds pursuant to the provisions of an investment advisory agreement with the Investment Adviser are payable monthly, computed on the average daily value of each fund’s net assets at the following annual rates: .15% of BNY Mellon Money Market Fund and .15% of BNY Mellon National Municipal Money Market Fund.
Investment Adviser have undertaken to waive receipt of the management fee and/or reimburse operating expenses in order to facilitate a daily yield at or above a certain level which may change from time to time.This undertaking is voluntary and not contractual, and may
| The Funds | 27 |
NOTES TO FINANCIAL STATEMENTS (Unaudited) (continued)
be terminated at any time. Table 1 summarizes the reduction in expenses for each class of shares of each fund, pursuant to these undertakings during the period ended February 28, 2013.
| Table 1—Expense Reductions | ||
| Class M | Investor | |
| Shares ($) | Shares ($) | |
| BNY Mellon | ||
| Money Market Fund | 390,238 | 9,365 |
| BNY Mellon National Municipal | ||
| Money Market Fund | 385,338 | 1,855 |
Pursuant to the Administration Agreement,The Bank of New York Mellon provides or arranges for fund accounting, transfer agency and other fund administration services and receives a fee based on the total net assets of the Trust based on the following rates:
| 0 up to $6 billion | .15 | % |
| $6 billion up to $12 billion | .12 | % |
| In excess of $12 billion | .10 | % |
The Bank of NewYork Mellon pays each fund’s transfer agent fees out of the administration free it receives from the Trust.
(b) Each fund has adopted a Shareholder Services Plan with respect to its Investor shares. Each fund pays the Distributor for the provision of certain services to holders of Investor shares a fee at an annual rate of .25% of the value of the average daily net assets attributable to Investor shares.The services provided may include personal services relating to shareholder accounts, such as answering shareholder inquiries regarding a fund and providing reports and other information, and services related to the maintenance of such shareholder accounts. The Shareholder Services Plan allows the Distributor to make payments from the shareholder services fees it collects from each fund to compensate service agents (certain banks, securities brokers or dealers and other financial institutions) with respect to these services. Table 2 summarizes the amount Investor shares of were charged during the period ended February 28, 2013, pursuant to the Shareholder Services Plan. Additional fees included in Shareholder servicing costs in the Statements of Operations include fees paid for cash management charges.
| Table 2—Shareholder Services Plan Fees | ||
| BNY Mellon Money Market Fund | $ | 6,729 |
| BNY Mellon National Municipal | ||
| Money Market Fund | 1,507 |
The funds have arrangements with the transfer agent and the custodian whereby the funds may receive earnings credits when positive cash balances are maintained, which are used to offset transfer agency and custody fees. For financial reporting purposes, the funds include net earnings credits as an expense offset in the Statement of Operations.
The fund compensates The Bank of New York Mellon under a custody agreement for providing custodial services for the funds. Table 3 summarizes the amount each fund was charged during the period ended February 28, 2013, pursuant to the custody agreement. These fees were partially offset by earnings credits for each relevant fund, also summarized in Table 3.
| Table 3—Custody Agreement Fees | |||
| Custody | Earnings | ||
| Fees ($) | Credits ($) | ||
| BNY Mellon Money Market Fund | 47,061 | (578 | ) |
| BNY Mellon National Municipal | |||
| Money Market Fund | 42,262 | — |
The funds compensate Dreyfus Transfer, Inc., a wholly-owned subsidiary of the Manager, under a transfer agency agreement for providing cash management services related to fund subscriptions and redemptions, except for shareholder redemption draft processing, which continues to be performed by The Bank of New York Mellon. The funds also compensate The Bank of NewYork Mellon under a cash management agreement
28
for providing certain cash management services. Table 4 summarizes the amount each fund was charged during the period ended February 28, 2013, for cash management services, which is included in “Shareholder servicing costs” in the Statement of Operations. These fees were partially offset by earnings credits for each fund, also summarized in Table 4.
During the period ended February 28, 2013, each fund was charged $3,981 for services performed by the Chief Compliance Officer and his staff.
Table 5 summarizes the components of “Due to The Dreyfus Corporation and affiliates” in the Statements of Assets and Liabilities for each fund.
(c) The Board members who are not “affiliated persons” as defined under the Act receives from theTrust an annual fee of $80,000 and an attendance fee of $7,500 for each in-person meeting attended and $500 for telephone meetings and are reimbursed for travel and out-of-pocket expenses.The Chairman of the Board receives an additional annual fee of $20,000 and the Chairman of the Trust’s Audit Committee receives an additional annual fee of $15,000.
NOTE 4—Securities Transactions:
BNY Mellon National Municipal Money Market Fund is permitted to purchase or sell securities from or to certain affiliated funds under specified conditions outlined in procedures adopted by the Board. The procedures have been designed to ensure that any purchase or sale of securities by the fund from or to another fund or portfolio that are, or could be, considered an affiliate by virtue of having a common investment adviser (or affiliated investment adviser), common Trustees and/or common officers, complies with Rule 17a-7 under the Act. During the period ended February 28, 2013, the fund engaged in purchases and sales of securities pursuant to Rule 17a-7 under the Act amounting to $333,795,000 and $225,185,000, respectively.
| Table 4—Cash Management Agreement Fees | ||||||
| The Bank of New York Mellon | The Bank of New York Mellon | Dreyfus Transfer, Inc. | Dreyfus Transfer, Inc. | |||
| Cash Management Fees ($) | Earnings Credits ($) | Cash Management Fees ($) | Earnings Credits ($) | |||
| BNY Mellon Money Market Fund | 2 | — | 4 | 1 | ||
| BNY Mellon National | ||||||
| Municipal Money Market Fund | 1 | — | 2 | — | ||
| Table 5—Due to The Dreyfus Corporation and Affiliates | ||||||
| Investment | Shareholder | Chief | ||||
| Advisory | Services | Custody | Compliance | Less Expense | ||
| Fees ($) | Plan Fees ($) | Fees ($) | Officer Fees ($) | Reimbursement ($) | ||
| BNY Mellon Money Market Fund | 77,783 | 908 | 37,500 | 5,308 | (57,889 | ) |
| BNY Mellon National | ||||||
| Municipal Money Market Fund | 142,123 | 234 | 36,000 | 5,308 | (86,248 | ) |
| The Funds | 29 |
NOTES
For More Information
Telephone Wealth Management (WM) Clients, please contact your Account Officer or call 1-888-281-7350. Brokerage Clients of BNY Mellon Wealth Advisors (BNYMWA), please contact your financial representative or call 1-800-830-0549, Option 2. Individual Account holders, please call Dreyfus at 1-800-DREYFUS.
Mail WM Clients, write to your Account Officer, c/o The Bank of New York Mellon, One Mellon Bank Center, Pittsburgh, PA 15258 BNYMWA Brokerage Clients, write to your financial representative, P.O. Box 9012, Hicksville, NY 11802–9012 Individual Account Holders, write to: BNY Mellon Funds, P.O. Box 55268, Boston, MA 02205–8502
Each fund will disclose daily, on http://www.dreyfus.com, the fund’s complete schedule of holdings as of the end of the previous business day. The schedule of holdings will remain on the website until the fund files its Form N-Q or Form N-CSR for the period that includes the date of the posted holdings.
The funds file their complete schedule of portfolio holdings with the Securities and Exchange Commission (“SEC”) for the first and third quarters of each fiscal year on Form N-Q. The funds’ Forms N-Q are available on the SEC’s website at http://www.sec.gov and may be reviewed and copied at the SEC’s Public Reference Room in Washington, DC. Information on the operation of the Public Reference Room may be obtained by calling 1-800-SEC-0330.
Information regarding how the funds voted proxies relating to portfolio securities for the most recent 12-month period ended June 30 is available on the SEC’s website at http://www.sec.gov and without charge, upon request, by calling 1-800-DREYFUS.
©2013 MBSC Securities Corporation
MFTSA0213-MM
Item 2. Code of Ethics.
Not applicable.
Item 3. Audit Committee Financial Expert.
Not applicable.
Item 4. Principal Accountant Fees and Services.
Not applicable.
Item 5. Audit Committee of Listed Registrants.
Not applicable.
Item 6. Investments.
(a) Not applicable.
Item 7. Disclosure of Proxy Voting Policies and Procedures for Closed-End Management Investment Companies.
Not applicable.
Item 8. Portfolio Managers of Closed-End Management Investment Companies.
Not applicable.
Item 9. Purchases of Equity Securities by Closed-End Management Investment Companies and Affiliated Purchasers.
Not applicable.
Item 10. Submission of Matters to a Vote of Security Holders.
There have been no material changes to the procedures applicable to Item 10.
Item 11. Controls and Procedures.
(a) The Registrant's principal executive and principal financial officers have concluded, based on their evaluation of the Registrant's disclosure controls and procedures as of a date within 90 days of the filing date of this report, that the Registrant's disclosure controls and procedures are reasonably designed to ensure that information required to be disclosed by the Registrant on Form N-CSR is recorded, processed, summarized and reported within the required time periods and that information required to be disclosed by the Registrant in the reports that it files or submits on Form N-CSR is accumulated and communicated to the Registrant's management, including its principal executive and principal financial officers, as appropriate to allow timely decisions regarding required disclosure.
(b) There were no changes to the Registrant's internal control over financial reporting that occurred during the second fiscal quarter of the period covered by this report that have materially affected, or are reasonably likely to materially affect, the Registrant's internal control over financial reporting.
Item 12. Exhibits.
(a)(1) Not applicable.
(a)(2) Certifications of principal executive and principal financial officers as required by Rule 30a-2(a) under the Investment Company Act of 1940.
(a)(3) Not applicable.
(b) Certification of principal executive and principal financial officers as required by Rule 30a-2(b) under the Investment Company Act of 1940.
SIGNATURES
Pursuant to the requirements of the Securities Exchange Act of 1934 and the Investment Company Act of 1940, the Registrant has duly caused this Report to be signed on its behalf by the undersigned, thereunto duly authorized.
BNY Mellon Funds Trust
By: /s/ David K. Mossman | |
David K. Mossman, President
| |
Date: | April 26, 2013 |
| |
Pursuant to the requirements of the Securities Exchange Act of 1934 and the Investment Company Act of 1940, this Report has been signed below by the following persons on behalf of the Registrant and in the capacities and on the dates indicated. | |
| |
By: /s/ David K. Mossman | |
David K. Mossman, President
| |
Date: | April 26, 2013 |
| |
By: /s/ James Windels | |
James Windels, Treasurer
| |
Date: | April 26, 2013 |
| |
EXHIBIT INDEX
(a)(2) Certifications of principal executive and principal financial officers as required by Rule 30a-2(a) under the Investment Company Act of 1940. (EX-99.CERT)
(b) Certification of principal executive and principal financial officers as required by Rule 30a-2(b) under the Investment Company Act of 1940. (EX-99.906CERT)