UNITED STATES
SECURITIES AND EXCHANGE COMMISSION
Washington, D.C. 20549
FORM N-CSR
CERTIFIED SHAREHOLDER REPORT OF REGISTERED MANAGEMENT
INVESTMENT COMPANIES
Investment Company Act file number | 811-09903 | |||||
|
| |||||
| BNY Mellon Funds Trust |
| ||||
| (Exact name of Registrant as specified in charter) |
| ||||
|
|
| ||||
|
c/o The Dreyfus Corporation 200 Park Avenue New York, New York 10166 |
| ||||
| (Address of principal executive offices) (Zip code) |
| ||||
|
|
| ||||
| Michael A. Rosenberg, Esq. 200 Park Avenue New York, New York 10166 |
| ||||
| (Name and address of agent for service) |
| ||||
| ||||||
Registrant's telephone number, including area code: | (212) 922-6000 | |||||
|
| |||||
Date of fiscal year end:
| 8/31 |
| ||||
Date of reporting period: | 8/31/2011 |
| ||||
The BNY Mellon Funds
| BNY Mellon Large Cap Stock Fund |
| BNY Mellon Large Cap Market Opportunities Fund |
| BNY Mellon Tax-Sensitive Large Cap Multi-Strategy Fund |
| BNY Mellon Income Stock Fund |
| BNY Mellon Mid Cap Stock Fund |
| BNY Mellon Small Cap Stock Fund |
| BNY Mellon U.S. Core Equity 130/30 Fund |
| BNY Mellon Focused Equity Opportunities Fund |
| BNY Mellon Small/Mid Cap Fund |
| BNY Mellon International Fund |
| BNY Mellon Emerging Markets Fund |
| BNY Mellon InternationalAppreciation Fund |
| BNY Mellon Asset Allocation Fund |
| ANNUAL REPORT | August 31, 2011 |

DISCUSSION OF
FUND PERFORMANCE
For the period of September 1, 2010, through August 31, 2011, as provided by Sean P. Fitzgibbon and Jeffrey D. McGrew, Portfolio Managers
Market and Fund Performance Overview
For the 12-month period ended August 31, 2011, BNY Mellon Large Cap Stock Fund’s Class M shares produced a total return of 14.86%, and Investor shares returned 14.78%.1 In comparison, the total return of the Standard & Poor’s 500 Composite Stock Price Index (“S&P 500 Index”), the fund’s benchmark, was 18.48%.2
U.S. stocks rallied through the first quarter of 2011 amid expectations of continued economic recovery. However, several macroeconomic disappointments later derailed investor sentiment, erasing many of the market’s previous gains. The fund produced lower returns than its benchmark, mainly due to a constructive investment posture later in the reporting period when traditionally defensive stocks fared better.
The Fund’s Investment Approach
The fund seeks capital appreciation.To pursue its goal, the fund normally invests at least 80% of its assets in stocks of large-cap companies. We choose stocks through a disciplined investment process that uses computer modeling techniques to identify and rank companies based on value, growth and other financial characteristics. Also, we use fundamental analysis, conducting independent research to select the most
attractive of the higher-ranked securities. We also attempt to manage risks by diversifying the fund’s investments across companies and industries, maintaining weightings and risk characteristics that generally are similar to those of the S&P 500 Index.
Shifting Sentiment Sparked Heightened Volatility
Investors’ outlooks began to improve markedly at the start of the reporting period when the Federal Reserve Board announced a second round of quantitative easing to jump-start the U.S. economy. Subsequent upturns in economic data and corporate earnings helped support rising stock prices into the first quarter of 2011. However, the rally was interrupted in February when political unrest in the Middle East led to sharply rising energy prices, and in March when devastating natural and nuclear disasters in Japan threatened the global industrial supply chain.
In late April, investor sentiment began to deteriorate in earnest when Greece appeared headed for default on its sovereign debt, economic data proved disappointing and a contentious debate regarding U.S. government spending and borrowing intensified. Stocks suffered bouts of heightened volatility as newly risk-averse investors shifted their focus to industry groups that historically have held up well under uncertain economic conditions.The reporting period ended on a pessimistic note after a major credit-rating agency downgraded U.S.Treasury bonds despite the eventual passage of an increase in the nation’s debt ceiling.
| The Funds | 3 |
DISCUSSION OF FUND PERFORMANCE (continued)
Constructive Posture Hindered Relative Results
Although the fund’s bias toward some of the more economically sensitive market sectors buoyed its relative performance early in the reporting period, it undermined results for the reporting period overall. We took steps to reduce the fund’s risk profile as market conditions deteriorated by carefully monitoring valuations, reducing holdings as they met price targets and trading out of companies whose investment propositions may have been postponed by the extended lull in economic activity.
Although these measures helped cushion the effect of declining market values, a number of holdings in the consumer discretionary sector undermined the fund’s relative performance. Cruise line operator Carnival suffered amid rising fuel costs, consumer products maker Newell Rubbermaid reduced earnings guidance in anticipation of sluggish consumer spending, Ford Motor encountered rising input costs, and advertising conglomerate Omnicom Group declined on economic concerns. In the health care sector, biotechnology firms were hurt by regulatory and economic issues, including Amylin Pharmaceuticals, Human Genome Sciences and Dendreon.While underweighted exposure to the financials sector helped bolster relative results, the sector’s contributions were undermined by Bank of America and Citigroup, which continued to struggle with the consequences of past lending issues.
The fund achieved better results in the information technology sector, where a focus on emerging trends toward “cloud computing” and wireless devices proved beneficial. Electronics innovator Apple gained value on the strength of its popular iPhone and iPad, International Business Machines produced solid results from global consulting services, Amazon.com saw sales rise sharply, and Electronic Arts was bolstered by a new product cycle
centered on digital downloads of gaming software. The fund also avoided some of the sector’s weaker performers.
In the materials sector, chemical companies such as CF Industries Holdings and E.I. du Pont de Nemours & Co. buoyed relative performance. Similarly, an emphasis on machinery producers—including Caterpillar, Textron and Dover—helped drive gains in the industrials sector. Other winners for the reporting period included NextEra Energy, Newfield Exploration and Unilever.
Seeing Encouraging Signs of Growth
Global economic turmoil and the recent slowdown in U.S. growth have given us cause for caution.Therefore, we have maintained a relatively defensive investment posture with an emphasis on risk management. Our cautious outlook is reflected in the fund’s current composition, including underweighted positions in the consumer discretionary, financials, industrials and materials sectors.We have found what we believe are more opportunities in the health care, information technology and utilities sectors.
September 15, 2011
| Please note, the position in any security highlighted with italicized typeface |
| was sold during the reporting period. |
| Equity funds are subject generally to market, market sector, market liquidity, |
| issuer and investment style risks, among other factors, to varying degrees, all of |
| which are more fully described in the fund’s prospectus. |
| Total return includes reinvestment of dividends and any capital gains paid. |
| Past performance is no guarantee of future results. Share price and investment |
| return fluctuate such that upon redemption, fund shares may be worth more or |
| less than their original cost. |
| SOURCE: LIPPER INC. — Reflects the monthly reinvestment of |
| dividends and, where applicable, capital gain distributions.The Standard & |
| Poor’s 500 Composite Stock Price Index is a widely accepted, unmanaged |
| index of U.S. stock market performance. Index return does not reflect fees and |
| expenses associated with operating a mutual fund. Investors cannot invest |
| directly in any index. |
4
FUND PERFORMANCE

Comparison of change in value of $10,000 investment in BNY Mellon Large Cap Stock Fund Class M shares and Investor shares and the Standard & Poor’s 500 Composite Stock Price Index
| Average Annual Total Returns as of 8/31/11 | |||
| 1 Year | 5 Years | 10 Years | |
| Class M shares | 14.86% | 0.30% | 1.55% |
| Investor shares | 14.78% | 0.04% | 1.31% |
| Standard & Poor’s 500 | |||
| Composite Stock Price Index | 18.48% | 0.78% | 2.70% |
| † Source: Lipper Inc. |
| Past performance is not predictive of future performance.The fund’s performance shown in the graph and table does not reflect the deduction of taxes that a shareholder |
| would pay on fund distributions or the redemption of fund shares. |
| The above graph compares a $10,000 investment made in Class M shares and Investor shares of BNY Mellon Large Cap Stock Fund on 8/31/01 to a $10,000 |
| investment made in the Standard & Poor’s 500 Composite Stock Price Index (the “Index”) on that date.All dividends and capital gain distributions are reinvested. |
| The fund’s performance shown in the line graph takes into account all applicable fees and expenses for all share classes.The Index is a widely accepted, unmanaged |
| index of U.S. stock market performance. Unlike a mutual fund, the Index is not subject to charges, fees and other expenses. Investors cannot invest directly in any |
| index. Further information relating to fund performance, including expense reimbursements, if applicable, is contained in the Financial Highlights section of the |
| prospectus and elsewhere in this report. |
| The Funds | 5 |
DISCUSSION OF FUND PERFORMANCE (continued)

DISCUSSION OF
FUND PERFORMANCE
For the period of September 1, 2010, through August 31, 2011, as provided by Christopher E. Sheldon, CFA, Portfolio Manager
Fund and Market Performance Overview
For the 12-month period ended August 31, 2011, BNY Mellon Large Cap Market Opportunities Fund’s Class M shares produced a total return of 16.48%, and Investor shares returned 16.16%.1 In comparison, the total return of the Standard & Poor’s 500 Composite Stock Price Index (“S&P 500 Index”), the fund’s benchmark, was 18.48% for the same period.2
Stocks rallied through the first quarter of 2011 amid expectations of continued economic recovery. However, macroeconomic disappointments later erased many of those gains. The fund produced lower returns than its benchmark, mainly due to shortfalls posted by the U.S. Core Equity 130/30 Strategy.
The Fund’s Investment Approach
The fund seeks long-term capital appreciation.To pursue its goal, the fund normally invests at least 80% of its assets in equity securities of large cap companies, currently defined to be those companies with total market capitalizations of $5 billion or more at the time of the purchase. The fund normally allocates its assets among multiple investment strategies, each employed by the fund’s investment adviser or its affiliates that invest primarily in equity securities issued by large-cap companies. The fund is designed to provide exposure to various large-cap equity portfolio managers and investment strategies and styles, including some or all of the following: the Focused Equity Strategy, U.S. Large Cap Equity Strategy, U.S. Core Equity 130/30 Strategy, Dynamic Large Cap Value Strategy, Large Cap Growth Strategy and U.S. Large Cap
Growth Strategy, all as more particularly described in the fund’s prospectus. The fund invests directly in securities or in other mutual funds advised by the fund’s investment adviser or its affiliates.
The fund’s investment adviser determines the investment strategies, sets the target allocations, monitors portfolio trading activity within the investment strategies and executes all purchases and sales of portfolio securities of the fund.
Shifting Sentiment Sparked Heightened Volatility
Investors’ outlooks began to improve markedly at the start of the reporting period when the Federal Reserve Board announced new measures to jump-start the U.S. economy. Subsequent upturns in economic data and corporate earnings helped support rising stock prices into the first quarter of 2011. However, the rally was interrupted in February 2011 when political unrest in the Middle East led to sharply rising energy prices, and in March when devastating natural and nuclear disasters in Japan threatened the global industrial supply chain. Still, stocks generally bounced back quickly from these unexpected shocks.
In late April, investor sentiment began to deteriorate in earnest when Greece appeared headed for default, U.S. economic data proved disappointing and a contentious debate in Congress regarding government spending and borrowing intensified. Stocks suffered bouts of heightened volatility as newly risk-averse investors shifted their focus to industry groups that historically have held up well under uncertain economic conditions. Market volatility was particularly severe in August after a major credit-rating agency downgraded its assessment of long-term U.S. debt securities.
6
Underlying Strategies Produced Mixed Results
Although the fund participated to a significant degree in the large-cap stock market’s gains for the reporting period, its results compared to the S&P 500 Index were held back by the U.S. Core Equity 130/30 Strategy, where a constructive investment posture weighed on returns at a time when traditionally defensive stocks fared better. Stock selections were particularly disappointing in the consumer discretionary sector, where short positions in certain stocks also fared poorly, and among biotechnology firms in the health care sector. The strategy achieved better results in the information technology, materials and industrials sectors.
In contrast, the Focused Equity Strategy produced higher returns than the S&P 500 Index over the reporting period. In the strategy’s information technology sector, a Chinese search engine and a major innovator in consumer electronics fared particularly well, as did health care companies offering new products or penetrating new markets.Winners in these sectors more than offset relative weakness in the financials and consumer discretionary sectors.
Finally, the U.S. Large Cap Equity strategy benefited from strength among machinery producers in the industrials sector, chemical companies in the materials sector and strong stock selections in the health care sector, while consumer discretionary and consumer staples holdings generally lagged market averages. Lack of exposure to certain large banks also supported the strategy’s relative results.
Adjusting to a Slower-Growth Economy
During the reporting period, allocations to the Focused Equity Strategy and U.S. Large Cap Equity Strategy were reduced modestly, while the U.S. Core Equity 130/30 Strategy was increased. We believe that the fund’s underlying investment strategies are reasonably positioned for a slower growing economy, as evidenced by a general preference for fundamentally strong companies that appear poised to grow organically through new products and markets. In addition, the managers of some underlying strategies have attempted to reduce their risk profiles by carefully monitoring valuations and trading out of companies whose investment propositions may have weakened as economic conditions deteriorated.
September 15, 2011
| Equity funds are subject generally to market, market sector, market liquidity, | |
| issuer and investment style risks, among other factors, to varying degrees, all | |
| of which are more fully described in the fund’s prospectus. | |
| The fund may use derivative instruments, such as options, futures and | |
| options on futures and swaps.A small investment in derivatives could have | |
| a potentially large impact on the fund’s performance.The use of derivatives | |
| involves risks different from, or possibly greater than, the risks associated | |
| with investing directly in the underlying assets. | |
| 1 | Total return includes reinvestment of dividends and any capital gains paid. |
| Past performance is no guarantee of future results. Share price and | |
| investment return fluctuate such that upon redemption, fund shares may be | |
| worth more or less than their original cost. Return figures provided reflect | |
| the absorption of certain fund expenses by BNY Mellon Fund Advisors | |
| pursuant to an agreement in effect until January 1, 2012, at which time it | |
| may be extended, terminated or modified. Had these expenses not been | |
| absorbed, the fund’s returns would have been lower. | |
| 2 | SOURCE: LIPPER INC. — Reflects monthly reinvestment of dividends |
| and, where applicable, capital gain distributions.The Standard & Poor’s 500 | |
| Composite Stock Price Index is a widely accepted, unmanaged index of | |
| U.S. stock market performance. Investors cannot invest directly in any index. |
| The Funds | 7 |
| Average Annual Total Returns as of 8/31/11 | |||
| Inception | From | ||
| Date | 1 Year | Inception | |
| Class M shares | 7/30/10 | 16.48% | 9.53% |
| Investor shares | 7/30/10 | 16.16% | 9.24% |
| Standard & Poor’s 500 | |||
| Composite Stock Price Index | 7/30/10 | 18.48% | 12.07% |
| † Source: Lipper Inc. |
| Past performance is not predictive of future performance.The fund’s performance shown in the graph and table does not reflect the deduction of taxes that a shareholder |
| would pay on fund distributions or the redemption of fund shares. |
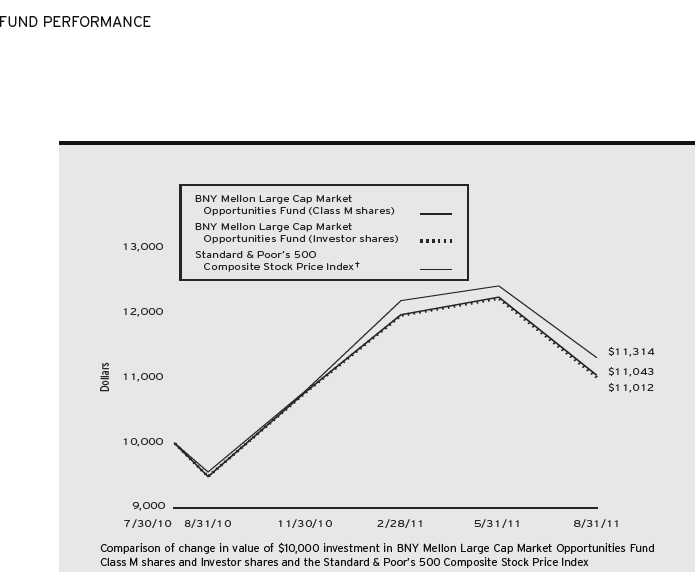
| The above graph compares a $10,000 investment made in Class M shares and Investor shares of BNY Mellon Large Cap Market Opportunities Fund on 7/30/10 |
| (inception date) to a $10,000 investment made in the Standard & Poor’s 500 Composite Stock Price Index (the “Index”) on that date.All dividends and capital |
| gain distributions are reinvested. |
| The fund’s performance shown in the line graph takes into account all applicable fees and expenses for all share classes.The Index is a widely accepted, unmanaged |
| index of U.S. stock market performance. Unlike a mutual fund, the Index is not subject to charges, fees and other expenses. Investors cannot invest directly in any |
| index. Further information relating to fund performance, including expense reimbursements, if applicable, is contained in the Financial Highlights section of the |
| prospectus and elsewhere in this report. |
8

DISCUSSION OF
FUND PERFORMANCE
For the period of September 1, 2010, through August 31, 2011, as provided by Christopher E. Sheldon, CFA, Portfolio Manager
Fund and Market Performance Overview
For the 12-month period ended August 31, 2011, BNY Mellon Tax-Sensitive Large Cap Multi-Strategy Fund’s Class M shares produced a total return of 17.54%, and Investor shares returned 16.31%.1 In comparison, the total return of the Standard & Poor’s 500 Composite Stock Price Index (“S&P 500 Index”), the fund’s benchmark, was 18.48% for the same period.2
Stocks rallied through the first quarter of 2011 amid expectations of continued economic recovery. However, macroeconomic disappointments later erased many of those gains.The fund produced lower returns than its benchmark, mainly due to shortfalls from the Large Cap Core Strategy and the U.S. Core Equity 130/30 Strategy.
The Fund’s Investment Approach
The fund seeks long-term capital appreciation. To pursue its goal, the fund normally invests at least 80% of its assets in equity securities of large cap companies, currently defined to be those companies with total market capitalizations of $5 billion or more at the time of purchase. The fund normally allocates its assets among multiple investment strategies, each employed by the fund’s investment adviser or its affiliates, that invest primarily in equity securities issued by large-cap companies.The fund is designed to provide exposure to various large-cap equity portfolio managers and investment strategies and styles, and uses tax-sensitive strategies to reduce the impact of federal and state income taxes on its after-tax returns.The fund appor-
tions its assets among some or all of the following: the Large Cap Core Strategy, Large Cap Tax-Sensitive Strategy, Focused Equity Strategy, U.S. Large Cap Equity Strategy, U.S. Core Equity 130/30 Strategy, Dynamic Large Cap Value Strategy, Large Cap Growth Strategy and U.S. Large Cap Growth Strategy, all as more particularly described in the fund’s prospectus. The fund invests directly in securities or in other mutual funds advised by the fund’s investment adviser or its affiliates.
The fund’s investment adviser determines the investment strategies, sets the target allocations, monitors portfolio trading activity within the investment strategies and executes all purchases and sales of portfolio securities of the fund.
Shifting Sentiment Sparked Heightened Volatility
Investors’ outlooks improved markedly at the start of the reporting period when the Federal Reserve Board announced new measures to jump-start the U.S. economy. Subsequent upturns in economic data and corporate earnings helped support rising stock prices into the first quarter of 2011. However, the rally was interrupted in February when political unrest in the Middle East led to sharply rising energy prices, and in March when natural and nuclear disasters in Japan threatened the global industrial supply chain. Still, stocks generally bounced back from these unexpected shocks.
In late April, investor sentiment began to deteriorate in earnest when Greece appeared headed for default, U.S. economic data proved disappointing and a contentious debate regarding government spending and borrowing intensified. Stocks suffered bouts of volatility as investors shifted their focus to traditionally defensive
| The Funds | 9 |
DISCUSSION OF FUND PERFORMANCE (continued)
industry groups. Market volatility was particularly severe in August after a major credit-rating agency downgraded its assessment of long-term U.S. debt securities.
Underlying Strategies Produced Mixed Results
Although the fund participated significantly in the market’s gains for the reporting period, its relative performance was held back by the Large Cap Core Strategy, where investment positioning reflected a more constructive outlook than what had transpired during the reporting period. Stock selections were particularly disappointing in the consumer discretionary sector and among biotechnology firms in the health care sector. The strategy achieved better results in the information technology, materials and industrials sectors. Results from the U.S. Core Equity 130/30 Strategy were constrained, in part, by certain short positions when valuation factors fell out of favor among investors.
In contrast, the Focused Equity Strategy produced higher returns than the S&P 500 Index. In the information technology sector, a Chinese search engine and a major innovator in consumer electronics fared particularly well, as did health care companies offering new products or penetrating new markets.These winners more than offset relative weakness in the financials and consumer discretionary sectors. The U.S. Large Cap Equity Strategy benefited from strength among machinery producers in the industrials sector, chemical companies in the materials sector and strong stock selections in the health care sector, while consumer discretionary and consumer staples holdings generally lagged market averages. Finally, the Large Cap Tax-Sensitive Strategy produced returns that were roughly in line with the S&P 500 Index.
Adjusting to a Slower-Growth Economy
During the reporting period, allocations to the Large Cap Core Strategy and the Focused Equity Strategy were modestly reduced, while the U.S. Core Equity 130/30 Strategy was increased.The advisor believes that the fund is reasonably positioned in light of expectations for a continued slower-growth economy, as evidenced by their general preference for fundamentally strong companies that appear poised to grow organically through new products and markets. In addition, managers of some underlying strategies have attempted to reduce their risk profiles by carefully monitoring valuations and trading out of companies whose investment theses may have been violated as economic conditions deteriorated.
September 15, 2011
| Equity funds are subject generally to market, market sector, market liquidity, | |
| issuer and investment style risks, among other factors, to varying degrees, all of | |
| which are more fully described in the fund’s prospectus. | |
| The fund may use derivative instruments, such as options, futures and options | |
| on futures and swaps.A small investment in derivatives could have a | |
| potentially large impact on the fund’s performance.The use of derivatives | |
| involves risks different from, or possibly greater than, the risks associated with | |
| investing directly in the underlying assets. | |
| 1 | Total return includes reinvestment of dividends and any capital gains paid. |
| Past performance is no guarantee of future results. Share price and investment | |
| return fluctuate such that upon redemption, fund shares may be worth more or | |
| less than their original cost. Return figures provided reflect the absorption of | |
| certain fund expenses by BNY Mellon Fund Advisors pursuant to an | |
| agreement in effect until January 1, 2012, at which time it may be extended, | |
| terminated or modified. Had these expenses not been absorbed, the fund’s | |
| returns would have been lower. | |
| 2 | SOURCE: LIPPER INC. — Reflects monthly reinvestment of dividends |
| and, where applicable, capital gain distributions.The Standard & Poor’s 500 | |
| Composite Stock Price Index is a widely accepted, unmanaged index of U.S. | |
| stock market performance. Investors cannot invest directly in any index. |
10
FUND PERFORMANCE
![]()
Comparison of change in value of $10,000 investment in BNY Mellon Tax-Sensitive Large Cap Multi-Strategy Fund Class M shares and Investor shares and the Standard & Poor’s 500 Composite Stock Price Index
| Average Annual Total Returns as of 8/31/11 | |||
| Inception | From | ||
| Date | 1 Year | Inception | |
| Class M shares | 7/30/10 | 17.54% | 10.87% |
| Investor shares | 7/30/10 | 16.31% | 9.80% |
| Standard & Poor’s 500 | |||
| Composite Stock Price Index | 7/30/10 | 18.48% | 12.07% |
| † Source: Lipper Inc. |
| Past performance is not predictive of future performance.The fund’s performance shown in the graph and table does not reflect the deduction of taxes that a shareholder |
| would pay on fund distributions or the redemption of fund shares. |
| The above graph compares a $10,000 investment made in Class M shares and Investor shares of BNY Mellon Tax-Sensitive Large Cap Multi-Strategy Fund on |
| 7/30/10 (inception date) to a $10,000 investment made in the Standard & Poor’s 500 Composite Stock Price Index (the “Index”) on that date.All dividends and |
| capital gain distributions are reinvested. |
| The fund’s performance shown in the line graph takes into account all applicable fees and expenses for all share classes.The Index is a widely accepted, unmanaged |
| index of U.S. stock market performance. Unlike a mutual fund, the Index is not subject to charges, fees and other expenses. Investors cannot invest directly in any |
| index. Further information relating to fund performance, including expense reimbursements, if applicable, is contained in the Financial Highlights section of the |
| prospectus and elsewhere in this report. |
| The Funds | 11 |
DISCUSSION OF FUND PERFORMANCE (continued)

DISCUSSION OF
FUND PERFORMANCE
For the period of September 1, 2010, through August 31, 2011, as provided by Brian C. Ferguson, Portfolio Manager
Fund and Market Performance Overview
For the 12-month period ended August 31, 2011, BNY Mellon Income Stock Fund’s Class M shares produced a total return of 17.41%, and its Investor shares returned 17.02%.1 In comparison, the fund’s new benchmark, the Dow Jones U.S. Select Dividend Index, produced a total return of 20.49% for the same period.2 The fund’s previous benchmark, the Russell 1000Value Index, produced a total return of 14.37% for the same period.3
Stocks generally rallied early in the reporting period as an economic recovery appeared to gain traction, but renewed macroeconomic concerns later caused the market to give back many of its previous gains and the fund underper-formed its new benchmark. The fund benefited from strong absolute returns in the energy and consumer staples sectors, but the utilities and financial sectors produced weaker results.
The Fund’s Investment Approach
The fund seeks total return consisting of capital appreciation and income. To pursue its goal, the fund normally invests at least 80% of its assets in stocks.The fund seeks to focus on dividend-paying stocks and other investment techniques that produce income. We choose stocks through a disciplined investment process that combines quantitative modeling techniques, fundamental analysis and risk management.While we attempt to manage risks by diversifying broadly across companies and industries, the fund may at times overweight certain sectors in an attempt to earn higher yields.The fund may also use derivatives as a substitute for taking a position in an underlying asset, to increase returns or income, or as part of a hedging strategy.
Shifting Sentiment Sparked Heightened Market Volatility
Market sentiment improved markedly at the start of the reporting period after the Federal Reserve Board announced a new round of quantitative easing and investors looked forward to better economic and business conditions. Subsequent gains in employment, consumer spending and corporate earnings supported higher stock prices into the first quarter of 2011. However, the market rally was interrupted in February when political unrest in the Middle East led to sharply rising crude oil prices, and again in March when catastrophic natural and nuclear disasters in Japan disrupted the global industrial supply chain. Nonetheless, investors proved resilient and the U.S. stock market rebounded relatively quickly from these unexpected shocks.
Investor sentiment began to deteriorate in earnest in late April when Greece again appeared headed for default on its sovereign debt and pressures mounted on the banking systems in Portugal, Italy, Ireland and Spain. In addition, U.S. economic data proved more disappointing than expected, and investors reacted cautiously to a contentious debate regarding U.S. government spending and borrowing. Stocks suffered bouts of heightened volatility when newly risk-averse investors shifted their focus from economically sensitive industry groups and relatively speculative companies to those that historically have held up well under uncertain economic conditions. Dividend-paying stocks produced higher returns, on average, than broader market averages in this environment.
Stock Selections Produced Mixed Results
The fund achieved positive absolute returns in all 10 of the market sectors represented in its benchmarks during
12
the reporting period. Results were particularly robust in the energy sector, where the fund maintained an overweighted position. Oil services giant Schlumberger and integrated oil producer ConocoPhillips ranked among the fund’s top performers in the sector. The consumer staples sector also produced above-average results as investors increasingly turned to traditionally defensive industry groups.Tobacco producers Lorillard and Philip Morris International advanced strongly due to their defensive characteristics and greater penetration of emerging markets.
On the other hand, the financials sector gained only modest value for the fund, as the sector was constrained by concerns surrounding persistently low interest rates and recent regulatory reform legislation on the future earnings of U.S. banks. In addition, fund holding Comerica was hurt when an acquisition was regarded poorly by investors. The utilities sector also produced below-average results due in part to higher fuel costs, and the fund’s high exposure to the sector hurt performance.
Finding Opportunities Among Dividend-Paying Stocks
Despite ongoing headwinds, including a persistently sluggish U.S. labor market and weak housing markets, we believe the economic expansion is likely to persist. Indeed, the stock market seems recently to have reacted more to macroeconomic developments than to the fundamental strengths and weaknesses of individual companies. In our analysis, many stocks have declined to lower valuations than are warranted by their fundamentals, including companies paying relatively high dividends.
Our bottom-up security selection process has identified a number of potential opportunities in the telecommunications services, health care and information technology sectors.We also have seen signs of potential improvement among certain banks in the financials sector that we believe are attractively valued. Conversely, we have found fewer opportunities meeting our investment criteria in the utilities sector, where stocks generally appear more expensive.
September 15, 2011
| Please note, the position in any security highlighted with italicized typeface | |
| was sold during the reporting period. | |
| Equity funds are subject generally to market, market sector, market liquidity, | |
| issuer and investment style risks, among other factors, to varying degrees, all | |
| of which are more fully described in the fund’s prospectus. | |
| 1 | Total return includes reinvestment of dividends and any capital gains paid. |
| Past performance is no guarantee of future results. Share price and | |
| investment return fluctuate such that upon redemption, fund shares may be | |
| worth more or less than their original cost. | |
| 2 | SOURCE: LIPPER INC. – Reflects the reinvestment of dividends and, |
| where applicable, capital gain distributions.The Dow Jones U.S. Select | |
| Dividend Index is an unmanaged index which represents the country’s | |
| leading stocks by dividend yield. One hundred U.S. stocks are selected to the | |
| index by dividend yield, subject to screens for dividend-per-share growth rate, | |
| dividend payout ratio and average daily dollar trading volume. Investors | |
| cannot invest directly in any index. Effective March 15, 2011, BNY | |
| Mellon Income Stock Fund changed its benchmark from the Russell 1000 | |
| Value Index to the Dow Jones U.S. Select Dividend Index.The Dow Jones | |
| U.S. Select Dividend Index was first calculated on November 3, 2003. | |
| Accordingly, the fund will continue to report the performance of the Russell | |
| 1000 Value Index until the Dow Jones U.S. Select Dividend Index has | |
| been calculated for a 10-year period. | |
| 3 | SOURCE: LIPPER INC. — Reflects the reinvestment of dividends |
| and, where applicable, capital gain distributions.The Russell 1000 Value | |
| Index is an unmanaged index which measures the performance of those | |
| Russell 1000 companies with lower price-to-book ratios and lower | |
| forecasted growth values. Investors cannot invest directly in any index. |
| The Funds | 13 |
FUND PERFORMANCE

Comparison of change in value of $10,000 investment in BNY Mellon Income Stock Fund Class M shares and Investor shares and the Russell 1000 Value Index
| Average Annual Total Returns as of 8/31/11 | |||
| 1 Year | 5 Years | 10 Years | |
| Class M shares | 17.41% | –0.22% | 2.74% |
| Investor shares | 17.02% | –0.47% | 2.48% |
| Russell 1000 Value Index | 14.37% | –1.62% | 3.41% |
| † Source: Lipper Inc. |
| Past performance is not predictive of future performance.The fund’s performance shown in the graph and table does not reflect the deduction of taxes that a shareholder |
| would pay on fund distributions or the redemption of fund shares. |
| The above graph compares a $10,000 investment made in Class M shares and Investor shares of BNY Mellon Income Stock Fund on 8/31/01 to a $10,000 |
| investment made in the Russell 1000 Value Index (the “Russell Index”) on that date.All dividends and capital gain distributions are reinvested. |
| Effective 3/15/11, the fund changed its benchmark from the Russell Index to the Dow Jones U.S. Select Dividend Index (the “Dow Jones Index”).The Dow Jones |
| Index was first calculated on 11/3/03.Accordingly, the fund will continue to report the performance of the Russell Index until the Dow Jones Index has been |
| calculated for a 10-year period. Performance information for the fund versus the Dow Jones Index is included in the graph and table on the next page. |
| The fund’s performance shown in the line graph takes into account all applicable fees and expenses for all share classes.The Russell Index uses company price-to-book |
| ratios and long-term growth rates to calculate a composite ranking, which is used to determine if a stock is “growth” or “value.” Unlike a mutual fund, the Russell |
| Index is not subject to charges, fees and other expenses. Investors cannot invest directly in any index. Further information relating to fund performance, including |
| expense reimbursements, if applicable, is contained in the Financial Highlights section of the prospectus and elsewhere in this report. |
14

Comparison of change in value of $10,000 investment in BNY Mellon Income Stock Fund Class M shares and Investor shares and the Dow Jones U.S. Select Dividend Index
| Average Annual Total Returns as of 8/31/11 | ||||
| Inception | From | |||
| Date | 1 Year | 5 Years | Inception | |
| Class M shares | 11/3/03 | 17.41% | –0.22% | 4.32% |
| Investor shares | 11/3/03 | 17.02% | –0.47% | 4.06% |
| Dow Jones U.S. Select Dividend Index | 11/3/03 | 20.49% | –0.36% | 4.66% |
| † Source: Lipper Inc. |
| Past performance is not predictive of future performance.The fund’s performance shown in the graph and table does not reflect the deduction of taxes that a shareholder |
| would pay on fund distributions or the redemption of fund shares. |
| The above graph compares a $10,000 investment made in Class M shares and Investor shares of BNY Mellon Income Stock Fund on 11/3/03 (inception date of |
| Dow Jones Index) to a $10,000 investment made in the Dow Jones Index on that date.All dividends and capital gain distributions are reinvested. |
| Effective 3/15/11, the fund changed its benchmark from the Russell Index to the Dow Jones U.S. Select Dividend Index (the “Dow Jones Index”).The Dow Jones |
| Index was first calculated on 11/3/03.Accordingly, the fund will continue to report the performance of the Russell Index until the Dow Jones Index has been |
| calculated for a 10-year period. |
| The fund’s performance shown in the line graph takes into account all applicable fees and expenses for all share classes.The Dow Jones Index is comprised of 100 of |
| the highest dividend-yielding securities from the universe of all dividend-paying companies in the Dow Jones U.S. Index, a broad-based index that is representative of |
| the total U.S. equity market. Unlike a mutual fund, the Dow Jones Index is not subject to charges, fees and other expenses. Investors cannot invest directly in any |
| index. Further information relating to fund performance, including expense reimbursements, if applicable, is contained in the Financial Highlights section of the |
| prospectus and elsewhere in this report. |
| The Funds | 15 |
DISCUSSION OF FUND PERFORMANCE (continued)

DISCUSSION OF
FUND PERFORMANCE
For the period from September 1, 2010, through August 31, 2011, as provided by Stephen A. Mozur, Portfolio Manager
Fund and Market Performance Overview
For the 12-month period ended August 31, 2011, BNY Mellon Mid Cap Stock Fund’s Class M shares produced a total return of 22.59%, Investor shares returned 22.19% and Dreyfus Premier shares returned 21.31%.1 In comparison, the Standard & Poor’s MidCap 400 Index (“S&P 400 Index”), the fund’s benchmark, produced a total return of 22.89% for the same period.2
Midcap stocks rallied through the first quarter of 2011 amid expectations of continued economic recovery. However, several macroeconomic disappointments later erased many of those gains. The fund’s Class M shares produced a return that was roughly in line with its benchmark, as strong results in the energy, information technology and industrials sectors were balanced by disappointments in the materials and health care sectors.
The Fund’s Investment Approach
The fund seeks capital appreciation. To pursue its goal, the fund normally invests at least 80% of its assets in stocks of domestic companies with market capitalizations generally in the range of companies included in the S&P 400 Index at the time of purchase. The fund invests in growth and value stocks, which are chosen through a disciplined investment process that combines computer modeling techniques, fundamental analysis and risk management. Based on fundamental analysis, the investment adviser generally selects the most attractive securities, drawing on a variety of sources, including internal as well as Wall Street research, and company management. Finally, we manage risk by diversifying across companies and industries. Our goal is to keep those risks at levels that are similar to those of the S&P 400 Index.
Shifting Sentiment Sparked Heightened Volatility
Investors’ outlooks improved markedly at the start of the reporting period when the Federal Reserve Board announced a second round of quantitative easing to jump-start the U.S. economy. Subsequent upturns in economic data and corporate earnings supported rising stock prices into the first quarter of 2011. However, the rally was interrupted in February when political unrest in the Middle East led to sharply rising energy prices, and in March when devastating natural and nuclear disasters in Japan threatened the global industrial supply chain. Still, stocks generally recovered quickly from these unexpected shocks.
In late April, investor sentiment began to deteriorate in earnest when Greece appeared headed for default, U.S. economic data proved disappointing and a contentious debate in Congress regarding government spending and borrowing intensified. Stocks suffered bouts of heightened volatility as newly risk-averse investors shifted their focus to industry groups that historically have held up well under uncertain economic conditions. Midcap stocks produced slightly higher returns than large-cap stocks for the overall reporting period.
Stock Selections Produced Mixed Results
Our security selection strategy drove above-average returns in several market sectors. Among energy companies, shale gas producer Cabot Oil & Gas more than doubled in value due to production increases and inventory growth. Brigham Exploration also increased production as commodity prices climbed, and International Coal climbed sharply as a result of rising commodity prices and an acquisition offer.
In the information technology sector, “cloud computing” infrastructure specialist Savvis advanced after agreeing to
16
merge with high-speed Internet provider CenturyLink. Managed hosting provider Rackspace Hosting continued to benefit from a leading position in data centers and cloud computing products. JDS Uniphase, a leading provider of fiber optic components, fared well early in the reporting period. In the industrials sector, BE Aerospace benefited from increased commercial airplane production, including new models of aircraft. Kansas City Southern encountered improved demand for railroad shipping in its automotive, coal and intermodal divisions. Diversified industrial manufacturer AMETEK achieved substantial sales and earnings growth.
There were a handful of setbacks, which balanced the positive impact of the fund’s better performing stocks. In the materials sector, gains in the metals and agriculture industries were offset by declines among chemicals producers, such as Albemarle and KronosWorldwide, which slid due to general economic concerns over the final month of the reporting period. In addition, platinum producer Stillwater Mining lost value when investors reacted negatively to a new acquisition. Shortfalls in the health care sector were mainly the result of company-specific issues rather than macroeconomic developments. Inspire Pharma lost considerable value due to disappointing data from a cystic fibrosis drug trial.Thoratec declined due to intensifying competitive pressures in the market for heart devices. Circulatory support devices maker Abiomed reported disappointing earnings. Finally, Zoll Medical declined amid concerns regarding reimbursement rates for its wearable resuscitation device.
Focusing on Growth Opportunities
Historically, companies that can grow faster than average have become scarcer, and therefore more valuable, during economic downturns. Our bottom-up security selection process has identified a number of growing businesses in the energy, consumer discretionary and health care sectors.We have found fewer opportunities meeting our investment criteria in the utilities, financials and consumer staples sectors.
September 15, 2011
| Please note, the position in any security highlighted in italicized typeface | |
| was sold during the reporting period. | |
| Equity funds are subject generally to market, market sector, market liquidity, | |
| issuer and investment style risks, among other factors, to varying degrees, all | |
| of which are more fully described in the fund’s prospectus. | |
| Stocks of small- and/or midcap companies often experience sharper price | |
| fluctuations than stocks of large-cap companies. | |
| 1 | Total return includes reinvestment of dividends and any capital gains paid, |
| and does not take into consideration the contingent deferred sales charges | |
| imposed on redemptions in the case of Dreyfus Premier shares. Had these | |
| charges been reflected, returns would have been lower. Past performance is no | |
| guarantee of future results. Share price and investment return fluctuate such | |
| that upon redemption, fund shares may be worth more or less than their | |
| original cost. | |
| 2 | SOURCE: LIPPER INC. — Reflects reinvestment of dividends and, |
| where applicable, capital gain distributions.The Standard & Poor’s | |
| MidCap 400 Index is a widely accepted, unmanaged total return index | |
| measuring the performance of the midsize company segment of the U.S. | |
| stock market. Index return does not reflect the fees and expenses associated | |
| with operating a mutual fund. Investors cannot invest directly in any index. |
| The Funds | 17 |

| Average Annual Total Returns as of 8/31/11 | |||||
| Inception | From | ||||
| Date | 1 Year | 5 Years | 10 Years | Inception | |
| Class M shares | 1/1/85 | 22.59% | 2.88% | 5.98% | — |
| Investor shares | 7/11/01 | 22.19% | 2.61% | 5.71% | — |
| Dreyfus Premier shares | |||||
| with applicable redemption†† | 9/6/02 | 17.31% | 1.56% | — | 7.40% |
| without redemption | 9/6/02 | 21.31% | 1.85% | — | 7.40% |
| Standard & Poor’s MidCap 400 Index | 8/31/02 | 22.89% | 4.65% | 7.28% | 9.29%††† |
| † Source: Lipper Inc. |
| Past performance is not predictive of future performance.The fund’s performance shown in the graph and table does not reflect the deduction of taxes that a shareholder |
| would pay on fund distributions or the redemption of fund shares. |
| Part of the fund’s recent performance is attributable to positive returns from its initial public offering (IPO) investments.There can be no guarantee that IPOs will have |
| or continue to have a positive effect on fund performance. |
| The above graph compares a $10,000 investment made in Class M shares and Investor shares of BNY Mellon Mid Cap Stock Fund on 8/31/01 to a $10,000 |
| investment made in the Standard & Poor’s MidCap 400 Index (the “Index”) on that date.All dividends and capital gain distributions are reinvested. |
| The fund’s performance shown in the line graph takes into account all applicable fees and expenses for Class M and Investor shares. Performance for Dreyfus Premier |
| shares will vary from the performance of Class M and Investor shares shown above due to differences in charges and expenses.The Index is a widely accepted, |
| unmanaged total return index measuring the performance of the midsize company segment of the U.S. stock market. Unlike a mutual fund, the Index is not subject to |
| charges, fees and other expenses. Investors cannot invest directly in any index. Further information relating to fund performance, including expense reimbursements, if |
| applicable, is contained in the Financial Highlights section of the prospectus and elsewhere in this report. |
| †† The maximum contingent deferred sales charge for Dreyfus Premier shares is 4%.After six years Dreyfus Premier shares convert to Investor shares. |
| ††† The Index date is based on the life of Dreyfus Premier shares. For comparative purposes, the value of the Index as of 8/31/02 is used as the beginning value on |
| 9/6/02 (the inception date for Dreyfus Premier shares). |
18

DISCUSSION OF
FUND PERFORMANCE
For the period from September 1, 2010, through August 31, 2011, as provided by Stephen A. Mozur, Portfolio Manager
Fund and Market Performance Overview
For the 12-month period ended August 31, 2011, BNY Mellon Small Cap Stock Fund’s Class M shares produced a total return of 20.58%, and Investor shares returned 20.30%.1 In comparison, the fund’s benchmark, the Standard & Poor’s SmallCap 600 Index (the “Index”), produced a total return of 24.44% for the same period.2
Small-cap stocks rallied through the first quarter of 2011 amid expectations of continued economic recovery. However, several macroeconomic disappointments later weighed on investor sentiment, erasing many of those gains.The fund produced modestly lower returns than its benchmark, mainly due to disappointments in the technology and materials sectors.
The Fund’s Investment Approach
The fund seeks capital appreciation. To pursue its goal, the fund normally invests at least 80% of its assets in stocks of small-cap companies. We choose stocks through a disciplined investment process that uses computer modeling techniques to identify and rank companies based on value, growth and other financial characteristics. Also, we use fundamental analysis, conducting independent research to select the most attractive of the higher-ranked securities. We also attempt to manage risks by diversifying the fund’s investments across companies and industries, maintaining weightings and risk characteristics that generally are similar to those of the S&P 600 Index.
Shifting Sentiment Sparked Heightened Volatility
Investors’ outlooks improved markedly at the start of the reporting period when the Federal Reserve Board announced a second round of quantitative easing to jump-start the U.S. economy. Subsequent upturns in economic data and corporate earnings supported rising stock prices into the first quarter of 2011. However, the rally was interrupted in February when political unrest in the Middle East led to sharply rising energy prices, and in March when devastating natural and nuclear disasters in Japan threatened the global industrial supply chain. Still, stocks generally recovered quickly from these unexpected shocks.
In late April, investor sentiment began to deteriorate in earnest when Greece appeared headed for default and other European countries struggled with a sovereign debt crisis, U.S. economic data proved disappointing and a contentious debate in Congress regarding government spending and borrowing intensified. Stocks suffered bouts of heightened volatility as newly risk-averse investors shifted their focus to industry groups that historically have held up well under uncertain economic conditions.Although small-cap stocks declined relatively sharply over the summer of 2011, they produced slightly higher returns than large-cap stocks for the overall reporting period.
Stock Selections Produced Mixed Results
In this challenging environment, our security selection strategy drove above-average returns in several market sectors.
| The Funds | 19 |
DISCUSSION OF FUND PERFORMANCE (continued)
Among health care companies,Amarin more than tripled in value due to takeover speculation and positive results in trials for a new drug. Eyecare specialist Cooper advanced steadily as its new contact lens products gained market share. Pharmacy benefits manager SXC Health Solutions attracted new customers while retaining existing ones. In the consumer discretionary sector, electronics accessories maker Zagg achieved higher sales and earnings as smart-phones and tablet computers gained popularity. Among retailers,Vitamin Shoppe continued to grow its store base while productivity and same-store sales increased, and Pier
1 Imports climbed as new merchandise, advertising initiatives and cost reductions boosted the company’s progress in engineering a turnaround.
In the information technology sector, solar equipment maker GT Advanced Technologies continued to win new contracts and increase its backlog of orders. Top performers in the energy sector included Brigham Exploration, which increased production as oil prices climbed, and International Coal Group, which more than doubled due to rising commodity prices and an acquisition offer from Arch Coal.
However, a handful of setbacks more than offset the positive impact on relative performance of the fund’s better performing stocks. In the information technology sector, economic concerns later in the reporting period sparked pullbacks in MKS Instruments, Ultratech and Rudolph Technologies. In addition, OmniVision Technologies, which manufactures cameras for phones and tablets, declined late in the reporting period amid worries regarding market share losses for a key customer. Better performance in the semiconductors industry, including gains in Skyworks Solutions, Microsemi and Cypress Semiconductor, were not enough to fully balance weakness in other areas of the information technology sector.
Similarly, in the materials sector, gains in the metals and agriculture industries were offset by declines among chemicals producers. Kraton Performance Polymers suffered from lower than expected butadiene pricing, while PolyOne and KronosWorldwide slid due to economic concerns during the final month of the reporting period.
Focusing on Growth Opportunities
Historically, companies that can grow faster than average have become scarcer, and therefore more valuable, during economic downturns. Our bottom-up security selection process has identified a number of growing businesses in the energy, consumer discretionary and health care sectors. We have found fewer opportunities meeting our investment criteria in the utilities and consumer staples sectors.
September 15, 2011
| Please note, the position in any security highlighted in italicized typeface was | |
| sold during the reporting period. | |
| Equity funds are subject generally to market, market sector, market liquidity, | |
| issuer and investment style risks, among other factors, to varying degrees, all of | |
| which are more fully described in the fund’s prospectus. | |
| Stocks of small- and/or midcap companies often experience sharper price | |
| fluctuations than stocks of large-cap companies. | |
| 1 | Total return includes reinvestment of dividends and any capital gains paid. |
| Past performance is no guarantee of future results. Share price and investment | |
| return fluctuate such that upon redemption, fund shares may be worth more or | |
| less than their original cost.The fund’s returns reflect the absorption of certain | |
| fund expenses by BNY Mellon Fund Advisors pursuant to an agreement in | |
| effect until January 1, 2011, at which time it was terminated. Had these | |
| expenses not been absorbed, the fund’s returns would have been lower. | |
| 2 | SOURCE: LIPPER INC. — Reflects the reinvestment of dividends and, |
| where applicable, capital gain distributions.The Standard & Poor’s SmallCap | |
| 600 Index is a broad-based index and a widely accepted, unmanaged index of | |
| overall small-cap stock market performance.The index does not take into | |
| account fees and expenses to which the fund is subject. Investors cannot invest | |
| directly in any index. |
20
FUND PERFORMANCE
![]()
Comparison of change in value of $10,000 investment in BNY Mellon Small Cap Stock Fund Class M shares and Investor shares and the Standard & Poor’s SmallCap 600 Index
| Average Annual Total Returns as of 8/31/11 | |||
| 1 Year | 5 Years | 10 Years | |
| Class M shares | 20.58% | –0.44% | 4.19% |
| Investor shares | 20.30% | –0.57% | 3.98% |
| Standard & Poor’s SmallCap 600 Index | 24.44% | 2.65% | 7.01% |
| † Source: Lipper Inc. |
| Past performance is not predictive of future performance.The fund’s performance shown in the graph and table does not reflect the deduction of taxes that a shareholder |
| would pay on fund distributions or the redemption of fund shares. |
| The above graph compares a $10,000 investment made in Class M shares and Investor shares of BNY Mellon Small Cap Stock Fund on 8/31/01 to a $10,000 |
| investment made in the Standard & Poor’s SmallCap 600 Index (the “Index”) on that date.All dividends and capital gain distributions are reinvested. |
| The fund’s performance shown in the line graph takes into account all applicable fees and expenses for all share classes.The Index is a widely accepted, unmanaged |
| index of overall small-cap stock market performance. Unlike a mutual fund, the Index is not subject to charges, fees and other expenses. Investors cannot invest directly |
| in any index. Further information relating to fund performance, including expense reimbursements, if applicable, is contained in the Financial Highlights section of the |
| prospectus and elsewhere in this report. |
| The Funds | 21 |
DISCUSSION OF FUND PERFORMANCE (continued)

DISCUSSION OF
FUND PERFORMANCE
For the period of September 1, 2010, through August 31, 2011, as provided by Sean P. Fitzgibbon and Jeffrey D. McGrew, Portfolio Managers
Market and Fund Performance Overview
For the 12-month period ended August 31, 2011, BNY Mellon U.S. Core Equity 130/30 Fund’s Class M shares produced a total return of 10.86%, and Investor shares returned 10.34%.1 In comparison, the total return of the Standard & Poor’s 500 Composite Stock Price Index (“S&P 500 Index”), the fund’s benchmark, was 18.48%.2
U.S. stocks rallied through the first quarter of 2011 amid expectations of continued economic recovery, but macroeconomic disappointments later erased many of those gains. The fund produced lower returns than its benchmark, mainly due to a constructive investment posture when traditionally defensive stocks fared better.
The Fund’s Investment Approach
The fund seeks capital appreciation, normally investing at least 80% of its assets in stocks of large-cap companies.We choose stocks through a disciplined investment process that uses computer modeling techniques to identify and rank companies based on value, growth and other financial characteristics. The portfolio managers supplement and confirm this information using fundamental analysis, and generally buy “long” the most attractive of the higher-ranked securities and sell “short” those stocks identified by the computer model and fundamental analysis as being likely to underperform. Normally, up to 130% of the fund’s assets will be in long positions, and approximately 30% of the fund’s assets will be in short positions. However, the fund’s short positions may range in value from approximately 25% to 35% of the fund’s assets.We also attempt to mitigate risks by diversifying the fund’s investments across companies and industries, maintaining weightings and risk characteristics that generally are similar to those of the S&P 500 Index.
Shifting Sentiment Sparked Heightened Volatility
Investors’ outlooks improved at the start of the reporting period after the Federal Reserve Board announced new measures to jump-start the U.S. economy. Subsequent upturns in economic data and corporate earnings helped support rising stock prices into the first quarter of 2011. However, the rally was interrupted in February when political unrest in the Middle East led to sharply rising energy prices, and in March when natural and nuclear disasters in Japan threatened the global industrial supply chain.
In late April, investor sentiment began to deteriorate in earnest when Greece appeared headed for default on its sovereign debt, economic data proved disappointing and a contentious debate regarding U.S. government spending and borrowing intensified. Stocks suffered bouts of heightened volatility as newly risk-averse investors shifted their focus to industry groups that historically have held up well under uncertain economic conditions.
Constructive Posture Hindered Relative Results
Although the fund’s bias toward some of the more economically sensitive market sectors buoyed its relative performance early in the reporting period, it undermined results for the reporting period overall. We reduced the fund’s risk profile as market conditions deteriorated by carefully monitoring valuations, reducing holdings as they met price targets and trading out of companies whose investment propositions may have been postponed by the extended lull in economic activity.
Although these measures helped cushion the effect of market declines, stock selections in the consumer discretionary sector undermined the fund’s relative performance. Consumer products maker Newell Rubbermaid reduced earnings guidance in anticipation of sluggish consumer spending, Ford Motor encountered rising input costs, and advertising conglomerate Omnicom Group declined on
22
economic concerns. Short positions in retailers J. Crew Group and J.C. Penney also hindered results when both stocks gained value.
In the health care sector, biotechnology firms were hurt by regulatory and economic issues, including
Amylin Pharmaceuticals, Human Genome Sciences and
Dendreon.While underweighted exposure to the financials sector helped bolster relative results, the sector’s contributions were undermined by Bank of America and Citigroup.
The fund achieved better results in the information technology sector, where a focus on trends toward “cloud computing” and wireless devices proved beneficial. Electronics innovator Apple gained value on the strength of its popular iPhone and iPad, International Business Machines produced solid results from global consulting services,Amazon.com saw sales rise sharply, and Electronic Arts was bolstered by a new product cycle centered on digital downloads of gaming software. The fund also benefited from short positions in Hewlett-Packard, Research In Motion and Nokia.
In the materials sector, chemical companies such as CF Industries Holdings and E.I. du Pont de Nemours & Co. buoyed relative performance. In consumer staples, household goods maker Unilever and grocer Whole Foods Market drove relative gains.
Seeing Encouraging Signs of Growth
The recent economic slowdown has given us cause for caution. Therefore, we have maintained a relatively defensive investment posture with an emphasis on risk management. Our cautious outlook is reflected in
underweighted positions in the consumer discretionary, financials, industrials and materials sectors. We have found what we believe are more opportunities in the health care, information technology and utilities sectors.
September 15, 2011
| Please note, the position in any security highlighted with italicized typeface | |
| was sold during the reporting period. | |
| Equity funds are subject generally to market, market sector, market liquidity, | |
| issuer and investment style risks, among other factors, to varying degrees, all | |
| of which are more fully described in the fund’s prospectus. | |
| The use of leverage may magnify the fund’s gains or losses. For derivatives | |
| with a leveraging component, adverse changes in the value or level of the | |
| underlying asset can result in a loss that is much greater than the original | |
| investment in the derivative. | |
| Short sales involve selling a security the fund does not own in anticipation | |
| that the security’s price will decline. Short sales may involve substantial risk | |
| and leverage, and expose the fund to the risk that it will be required to buy | |
| the security sold short at a time when the security has appreciated in value, | |
| thus resulting in a loss to the fund. Short positions in stocks involve more | |
| risk than long positions in stocks because the maximum sustainable loss on | |
| a stock purchased is limited to the amount paid for the stock plus the | |
| transaction costs, whereas there is no maximum attainable price on the | |
| shorted stock. In theory, stocks sold short have unlimited risk. It is possible | |
| that the market value of securities the fund holds in long positions will | |
| decline at the same time that the market value of the securities in the fund | |
| has sold short increases, thereby increasing the fund’s potential volatility. | |
| Leveraging occurs when the fund increases its assets available for investment | |
| using borrowing or similar transactions. Short sales effectively leverage the | |
| fund’s assets.The use of leverage may magnify the fund’s gains or losses. | |
| 1 | Total return includes reinvestment of dividends and any capital gains paid. |
| Past performance is no guarantee of future results. Share price and | |
| investment return fluctuate such that upon redemption, fund shares may be | |
| worth more or less than their original cost. | |
| 2 | SOURCE: LIPPER INC. — Reflects the monthly reinvestment of |
| dividends and, where applicable, capital gain distributions.The Standard & | |
| Poor’s 500 Composite Stock Price Index is a widely accepted, unmanaged | |
| index of U.S. stock market performance. Index return does not reflect fees | |
| and expenses associated with operating a mutual fund. Investors cannot | |
| invest directly in any index. |
| The Funds | 23 |

| Average Annual Total Returns as of 8/31/11 | |||
| Inception | From | ||
| Date | 1 Year | Inception | |
| Class M shares | 8/1/07 | 10.86% | –2.93% |
| Investor shares | 8/1/07 | 10.34% | –3.25% |
| Standard & Poor’s 500 | |||
| Composite Stock Price Index†† | 7/31/07 | 18.48% | –2.11% |
| † Source: Lipper Inc. |
| Past performance is not predictive of future performance.The fund’s performance shown in the graph and table does not reflect the deduction of taxes that a shareholder |
| would pay on fund distributions or the redemption of fund shares. |
| The above graph compares a $10,000 investment made in Class M shares and Investor shares of BNY Mellon U.S. Core Equity 130/30 Fund on 8/1/07 |
| (inception date) to a $10,000 investment made in the Standard & Poor’s 500 Composite Stock Price Index (the “Index”) on that date.All dividends and capital |
| gain distributions are reinvested. |
| The fund’s performance shown in the line graph takes into account all applicable fees and expenses for all share classes.The Index is a widely accepted, unmanaged |
| index of U.S. stock market performance. Unlike a mutual fund, the Index is not subject to charges, fees and other expenses. Investors cannot invest directly in any |
| index. Further information relating to fund performance, including expense reimbursements, if applicable, is contained in the Financial Highlights section of the |
| prospectus and elsewhere in this report. |
| †† For comparative purposes, the value of the Index as of 7/31/07 is used as the beginning value on 8/1/07. |
24

DISCUSSION OF
FUND PERFORMANCE
For the period of September 1, 2010, through August 31, 2011, as provided by Irene D. O’Neill, Portfolio Manager
Fund and Market Performance Overview
For the 12-month period ended August 31, 2011, BNY Mellon Focused Equity Opportunities Fund’s Class M shares produced a total return of 19.82%, and Investor shares returned 19.80%.1 In comparison, the total return of the Russell 1000 Index (the “Index”), the fund’s benchmark during the reporting period, was 19.06%.2 As of September 15, 2011, the fund’s benchmark changed to the Standard & Poor’s 500 Composite Stock Price Index (the “S&P 500”), which produced a total return of 18.48% during the reporting period.3
Although stocks rallied early in the year as an economic recovery appeared to gain traction, renewed economic concerns later caused the market to give back some of its previous gains. The fund produced higher returns than its benchmark, mainly due to strong stock selections in the technology, health care, materials and industrials sectors.
The Fund’s Investment Approach
The fund seeks capital appreciation.To pursue its goal, the fund normally invests at least 80% of its assets in equity securities.We begin with a top-down assessment of broad economic, political and social trends.We strive to determine those sectors and industries most likely to benefit from identified trends, focusing on areas we believe present the most attractive growth outlook. Within those sectors and industries, we then employ a bottom-up, fundamental approach to find individual companies with:
Unrecognized or underestimated earnings power
Sustainable revenues and cash flow
Positive operational or financial catalysts
Attractive valuations based on growth prospects
Strong or improving financial conditions
Finally, we select for investment the 25 to 30 best opportunities from the companies meeting these criteria.
Shifting Sentiment Sparked Heightened Volatility
Investors’ outlooks began to improve markedly at the start of the reporting period when the Federal Reserve Board announced new measures to jump-start the U.S. economy. Subsequent upturns in economic data and corporate earnings helped support rising stock prices into the first quarter of 2011. However, the rally was interrupted in February 2011 when political unrest in the Middle East led to sharply rising energy prices, and in March when devastating natural and nuclear disasters in Japan threatened the global industrial supply chain. Still, stocks generally bounced back quickly from these unexpected shocks.
In late April, investor sentiment began to deteriorate in earnest when Greece appeared headed for default on its sovereign debt, economic data proved disappointing and a contentious debate regarding U.S. government spending and borrowing intensified. Stocks suffered bouts of heightened volatility as newly risk-averse investors shifted their focus to industry groups that historically have held up well under uncertain economic conditions.
Security Selections Produced Positive Results
Our investment process helped us identify a number of strong performers over the reporting period. In the information technology sector, electronics innovator Apple continued to drive sales and earnings growth through its popular iPhone and iPad products, and Chinese internet search engine Baidu gained market share when former rival Google withdrew from the market. In the health care sector, Covidien, Baxter International and Watson Pharmaceuticals benefited from the introduction of new products and the penetration of new markets, including the emerging markets. Lack of exposure to large pharmaceutical companies also supported relative performance.
| The Funds | 25 |
DISCUSSION OF FUND PERFORMANCE (continued)
The fund’s investments in the materials sector fared well on the strength of chemicals producer Celanese and iron-ore processor Cliff’s Natural Resources, both of which benefited from robust demand from the emerging markets and rising commodity prices. In the industrials sector, machinery producer Caterpillar expanded into mining equipment, an area of significant growth potential, and industrial conglomerate Honeywell International climbed from an attractive valuation after implementing cost-cutting measures.
Disappointments during the reporting period included the financials sector, where Citigroup and Morgan Stanley suffered from generally negative investor sentiment stemming from the economic slowdown and a stricter regulatory environment. Among consumer discretionary companies, casino equipment maker International Game Technology lagged when an expected upgrade cycle for slot machines failed to materialize. Cruise operator Carnival Corp. was hurt by higher fuel costs and the need to reroute itineraries to avoid political unrest in Northern Africa. The Walt Disney Company lagged other media companies due to fear that sluggish consumer spending would impact theme park attendance.
Finding Opportunities in a Slower Economy
As economic growth slowed over the reporting period’s second half, we intensified our focus on companies that we believe can grow organically through new products and markets in a slow-growth economy. We identified a number of new opportunities meeting our criteria, including Asian resort developer Las Vegas Sands, Latin
American casual dining franchisee Arcos Dorados Holdings, semiconductor maker ARM Holdings, business analytics specialist Teradata, energy producer Newfield Exploration and energy-industry equipment manufacturer Cameron International. In our view, the fund is well positioned for what we expect will be an extended period of subpar economic growth.
September 15, 2011
| Equity funds are subject generally to market, market sector, market liquidity, | |
| issuer and investment style risks, among other factors, to varying degrees, all of | |
| which are more fully described in the fund’s prospectus. | |
| The fund is non-diversified, which means that a relatively high percentage of | |
| the fund’s assets may be invested in a limited number of issuers.Therefore, the | |
| fund’s performance may be more vulnerable to changes in the market value of a | |
| single issuer or group of issuers and more susceptible to risks associated with a | |
| single economic, political or regulatory occurrence than a diversified fund. | |
| 1 | Total return includes reinvestment of dividends and any capital gains paid. |
| Past performance is no guarantee of future results. Share price and investment | |
| return fluctuate such that upon redemption, fund shares may be worth more or | |
| less than their original cost. | |
| 2 | SOURCE: LIPPER INC. — Reflects the monthly reinvestment of |
| dividends and, where applicable, capital gain distributions.The Russell 1000 | |
| Index is a widely accepted, unmanaged index of U.S. stock market | |
| performance. Index return does not reflect fees and expenses associated with | |
| operating a mutual fund. Investors cannot invest directly in any index. | |
| Effective September 15, 2011, BNY Mellon Focused Equity Opportunities | |
| Fund changed its benchmark from the Russell 1000 Index to the S&P 500 | |
| Index. In future annual reports, the fund’s performance will no longer be | |
| compared to the Russell 1000 Index because the S&P 500 Index is more | |
| reflective of the fund’s portfolio investment profile. | |
| 3 | SOURCE: LIPPER INC. — Reflects the monthly reinvestment of |
| dividends and, where applicable, capital gain distributions.The Standard &�� | |
| Poor’s 500 Composite Stock Price Index is a widely accepted, unmanaged | |
| index of U.S. stock market performance. Index return does not reflect fees and | |
| expenses associated with operating a mutual fund. Investors cannot invest | |
| directly in any index. |
26

| Average Annual Total Returns as of 8/31/11 | |||
| Inception | From | ||
| Date | 1 Year | Inception | |
| Class M shares | 9/30/09 | 19.82% | 10.45% |
| Investor shares | 9/30/09 | 19.80% | 10.29% |
| Russell 1000 Index | 9/30/09 | 19.06% | 10.35% |
| Standard & Poor’s 500 | |||
| Composite Stock Price Index | 9/30/09 | 18.48% | 9.91% |
| † Source: Lipper Inc. |
| Past performance is not predictive of future performance.The fund’s performance shown in the graph and table does not reflect the deduction of taxes that a shareholder |
| would pay on fund distributions or the redemption of fund shares. |
| The above graph compares a $10,000 investment made in Class M shares and Investor shares of BNY Mellon Focused Equity Opportunities Fund on 9/30/09 |
| (inception date) to a $10,000 investment made in the Russell 1000 Index and the Standard & Poor’s Composite Stock Price Index (the “S&P 500”) on that |
| date.All dividends and capital gain distributions are reinvested. |
| Effective September 15, 2011, BNY Mellon Focused Equity Opportunities Fund changed its benchmark from the Russell 1000 Index to the S&P 500 Index. In |
| future annual reports, the fund’s performance will no longer be compared to the Russell 1000 Index because the S&P 500 Index is more reflective of the fund’s |
| portfolio investment profile. |
| The fund’s performance shown in the line graph takes into account all applicable fees and expenses for all share classes.The Russell 1000 Index is an unmanaged |
| index which measures the performance of the large-cap segment of the U.S. equity universe.The S&P 500 Index is a widely recognized unmanaged index of 500 |
| common stocks designed to measure the performance of the broad domestic economy through changes in the aggregate value of 500 stocks chosen to reflect the industries |
| of the U.S. economy. Unlike a mutual fund, the Indices are not subject to charges, fees and other expenses. Investors cannot invest directly in any index. Further |
| information relating to fund performance, including expense reimbursements, if applicable, is contained in the Financial Highlights section of the prospectus and |
| elsewhere in this report. |
| The Funds | 27 |
DISCUSSION OF FUND PERFORMANCE (continued)

DISCUSSION OF
FUND PERFORMANCE
For the period from September 1, 2010, through August 31, 2011, as provided by John M. Chambers, Portfolio Manager
Fund and Market Performance Overview
For the 12-month period ended August 31, 2011, BNY Mellon Small/Mid Cap Stock Fund’s Class M shares produced a total return of 21.41%, and Investor shares returned 21.14%.1 In comparison, the Russell 2500 Index (the “Index”), the fund’s benchmark, produced a total return of 22.16% for the same period.2
Small and midcap stocks rallied through the first quarter of 2011 amid expectations of continued economic recovery. However, several macroeconomic disappointments later erased many of those gains. The fund produced modestly lower returns than its benchmark, mainly due to a few disappointments in the telecommunications services, consumer staples and utilities sectors.
The Fund’s Investment Approach
The fund seeks capital appreciation. To pursue its goal, the fund normally invests at least 80% of its assets in equity securities of small-cap and midcap companies with total market capitalizations of between $200 million and $7 billion at the time of investment.The fund invests in growth and value stocks, which are chosen through a disciplined investment process that combines computer modeling techniques, fundamental analysis and risk management to identify and rank stocks within an industry or sector based on several characteristics, including value, growth and the company’s financial health. Using fundamental analysis, the investment adviser generally selects the most attractive securities. Finally, we seek to manage risk by diversifying across companies and industries.The fund is structured so that its sector weightings and risk characteristics are generally similar to those of the Russell 2500 Index.
Shifting Sentiment Sparked Heightened Volatility
Investors’ outlooks improved markedly at the start of the reporting period when the Federal Reserve Board announced a second round of quantitative easing to jump-start the U.S. economy. Subsequent upturns in economic data and corporate earnings supported rising stock prices into the first quarter of 2011. However, the rally was interrupted in February, when political unrest in the Middle East led to sharply rising energy prices, and in March, when devastating natural and nuclear disasters in Japan threatened the global industrial supply chain. Still, stocks generally recovered quickly from these unexpected shocks.
In late April, investor sentiment began to deteriorate in earnest when Greece appeared headed for default, economic data proved disappointing and a contentious debate regarding U.S. government spending and borrowing intensified. Stocks suffered bouts of heightened volatility as newly risk-averse investors shifted their focus to industry groups that historically have held up well under uncertain economic conditions. Small and midcap stocks produced slightly higher returns than large-cap stocks for the overall reporting period.
Stock Selections Produced Mixed Results
In this challenging environment, our security selection strategy drove above-average returns in several market sectors. Among health care companies, Amarin Corp. and Savient Pharmaceuticals advanced due to takeover speculation and positive results in trials for new drugs. King Pharmaceuticals was acquired by Pfizer at a premium to its then-prevailing stock price. Pharmacy benefits manager SXC Health Solutions attracted new customers while retaining existing ones. In the consumer discretionary sector, electronics accessories maker Zagg
28
achieved higher sales and earnings as smartphones and tablet computers gained popularity. Vitamin Shoppe continued to grow its store base while productivity and same-store sales increased. Abercrombie & Fitch continued to show positive same-store sales and accelerating international growth.
In the financials sector, DFC Global grew its international pawn shop operations through accretive acquisitions and organic growth. Top performers in the energy sector included Brigham Exploration, which increased production as oil prices climbed, and International Coal, which more than doubled due to rising commodity prices and an acquisition offer from Arch Coal.
However, a handful of setbacks offset the positive impact of the fund’s better performing stocks. In the telecommunications services sector, mobile data services provider Motricity fell sharply when the company failed to sign new international contracts and its domestic business continued to slow. Underweighted exposure to the traditionally defensive utilities sector hurt the fund’s performance, and Chinese solar panels producer ReneSola suffered from oversupply and weak demand. Clean energy solutions provider EnerNOC did not meet analysts’ earnings expectations due to higher operating expenses and acquisition integration issues. Finally, in the consumer staples sector, Primo Water failed to meet earnings expectations due to delayed shipments of water coolers to large retailers.
Focusing on Growth Opportunities
Historically, companies that can grow faster than average have become more scarce and valuable during economic downturns. We have identified a relatively
large number of growing businesses in the technology sector, particularly among companies engaged in the trends toward cloud computing, centralized data management and mobile devices. Potential opportunities in the consumer discretionary sector include lodging companies benefiting from supply constraints in urban markets and media companies providing content through mobile and Internet distribution channels. We have found fewer opportunities meeting our investment criteria in the utilities, consumer staples and financials sectors.
September 15, 2011
| Please note, the position in any security highlighted in italicized typeface | |
| was sold during the reporting period. | |
| Equity funds are subject generally to market, market sector, market liquidity, | |
| issuer and investment style risks, among other factors, to varying degrees, all | |
| of which are more fully described in the fund’s prospectus. | |
| Stocks of small- and/or midcap companies often experience sharper price | |
| fluctuations than stocks of large-cap companies. | |
| Part of the fund’s recent performance is attributable to positive returns from | |
| its initial public offering (IPO) investments.There can be no guarantee that | |
| IPOs will have or continue to have a positive effect on fund performance. | |
| Currently, the fund is relatively small in asset size. IPOs tend to have a | |
| reduced effect on performance as a fund’s asset base grows. | |
| 1 | Total return includes reinvestment of dividends and any capital gains paid. |
| Past performance is no guarantee of future results. Share price and | |
| investment return fluctuate such that upon redemption, fund shares may be | |
| worth more or less than their original cost.The fund’s returns reflect the | |
| absorption of certain fund expenses by BNY Mellon Fund Advisors | |
| pursuant to an agreement in effect until January 1, 2011, at which time it | |
| was terminated. Had these expenses not been absorbed, the fund’s returns | |
| would have been lower. | |
| 2 | SOURCE: LIPPER INC. — Reflects the reinvestment of dividends |
| and, where applicable, capital gain distributions.The Russell 2500 Index is | |
| a widely accepted, unmanaged index, which measures the performance of | |
| those Russell 2500 companies with lower price-to-book ratios and lower | |
| forecasted growth value. Investors cannot invest directly in any index. |
| The Funds | 29 |
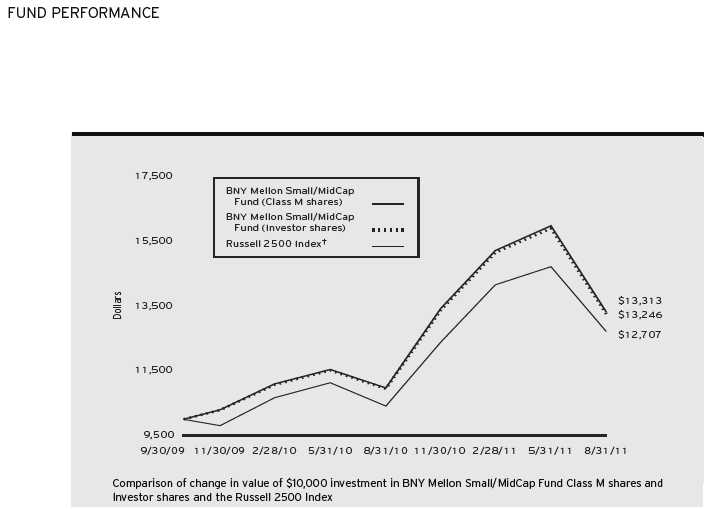
| Average Annual Total Returns as of 8/31/11 | |||
| Inception | From | ||
| Date | 1 Year | Inception | |
| Class M shares | 9/30/09 | 21.41% | 16.07% |
| Investor shares | 9/30/09 | 21.14% | 15.77% |
| Russell 2500 Index | 9/30/09 | 22.16% | 13.32% |
| † Source: Lipper Inc. |
| Past performance is not predictive of future performance.The fund’s performance shown in the graph and table does not reflect the deduction of taxes that a shareholder |
| would pay on fund distributions or the redemption of fund shares. |
| Part of the fund’s recent performance is attributable to positive returns from its initial public offering (IPO) investments.There can be no guarantee that IPOs will |
| have or continue to have a positive effect on fund performance. |
| The above graph compares a $10,000 investment made in Class M shares and Investor shares of BNY Mellon Small/Mid Cap Fund on 9/30/09 (inception date) |
| to a $10,000 investment made in the Russell 2500 Index (the “Index”) on that date.All dividends and capital gain distributions are reinvested. |
| The fund’s performance shown in the line graph takes into account all applicable fees and expenses for all share classes.The Index is an unmanaged index designed to |
| track the performance of small- to mid-cap U.S. stocks. Unlike a mutual fund, the Index is not subject to charges, fees and other expenses. Investors cannot invest |
| directly in any index. Further information relating to fund performance, including expense reimbursements, if applicable, is contained in the Financial Highlights |
| section of the prospectus and elsewhere in this report. |
30
DISCUSSION OF
FUND PERFORMANCE
For the period of September 1, 2010, through August 31, 2011, as provided by D. Kirk Henry, Sean P. Fitzgibbon and Mark A. Bogar, Portfolio Managers
Fund and Market Performance Overview
For the 12-month period ended August 31, 2011, BNY Mellon International Fund’s Class M shares produced a total return of 8.05%, and Investor shares produced a total return of 7.67%.1 In comparison, the fund’s benchmark, the Morgan Stanley Capital International Europe, Australasia, Far East Index (“MSCI EAFE Index”), produced a total return of 10.01% for the same period.2
Strong corporate earnings buoyed international stocks over the reporting period’s first half, but macroeconomic challenges later erased many of those gains.The fund produced lower returns than its benchmark, as the valuation factors considered by our investment process fell out of favor among investors.
The Fund’s Investment Approach
The fund seeks long-term capital growth. To pursue this goal, the fund normally invests at least 65% of its total assets in equity securities of foreign issuers.
The fund allocates its assets between a core investment style and a value investment style at the discretion of the investment adviser.The fund is not managed to a specific target duration between these investment styles. However, under normal conditions, at least 30% of the fund’s assets will be invested in each of the core and value investment styles. Pursuant to the core investment style, under normal circumstances, at least 80% of the fund’s cash inflows allocated to this style are invested in equity securities of companies located in the foreign countries represented in the MSCI EAFE Index and Canada.
The fund will continue to invest in stocks that appear to be undervalued (as measured by their price/earnings ratios), but stocks purchased pursuant to the core investment style may have value and/or growth characteristics. The core investment style portfolio manager employs a “bottom-up” investment approach, which emphasizes individual stock selection.The core investment style stock selection process is designed to produce a diversified portfolio that, relative to the MSCI EAFE Index, has a below-average price/earnings ratio and an above-average earnings growth trend.
The fund’s investment approach for the portion of the fund using the value-oriented investment style is research-driven and risk-averse. When selecting stocks, we identify potential investments through valuation screening and extensive fundamental research. Emphasizing individual stock selection over economic or industry trends, the fund focuses on three key factors: value, business health and business momentum.
Macroeconomic Developments Challenged Global Markets
International stocks generally advanced over the final months of 2010 due to expectations of continued economic recovery. However, during the first quarter of 2011 investors grew concerned about a sovereign debt crisis in Europe, inflationary pressures in China and rising energy prices stemming from political unrest in the Middle East. Catastrophic natural and nuclear disasters struck Japan in March, causing disruptions in the industrial supply chain. Still, most equity markets rebounded quickly from these unexpected shocks.
By May, investor sentiment began to deteriorate in earnest. U.S. economic growth proved more sluggish than expected amid a contentious debate regarding
| The Funds | 31 |
DISCUSSION OF FUND PERFORMANCE (continued)
government spending and borrowing. In Europe, debt problems facing Greece, Ireland, Portugal, Spain and Italy intensified. Consequently, international stocks fell sharply.
Valuation Criteria Fell Out of Favor
Companies that met near-term expectations tended to hold up well in this environment, but those that fell short were punished, often regardless of attractive valuations and longer-term fundamental strengths. In Hong Kong, apparel retailer Esprit Holdings suffered amid slower economic growth in European markets despite apparent progress in engineering a turnaround, and contract manufacturer Foxconn International Holdings was hurt by the business difficulties of a key customer.A number of French financial companies struggled with exposure to the troubled debt of nearby nations, and food retailer Carrefour encountered competitive pressures. In Australia, some better-performing metals-and-mining companies did not meet our investment criteria. U.K. catalog retailer Home Retail Group and the Netherlands’ Koninklijke Philips Electronics also detracted from the fund’s relative performance.
The fund achieved better results in Japan, where we avoided sharp declines in Tokyo Electric Power and participated in gains from chemical producers Asahi Kasei and Shin-Etsu Chemical. Companies poised to participate in Japan’s reconstruction also fared well, including Daito Trust Construction and Daiwa House. In the United Kingdom, the fund benefited from a focus on non-bank financial institutions, and consumer staples companies Unilever and British American Tobacco advanced when investors turned to traditionally defensive market sectors. In Norway, energy service companies TGS-NOPEC Geophysical and Subsea 7 posted higher earnings. The
Netherlands’ Royal Dutch Shell and Japan’s INPEX also advanced along with energy prices.
Identifying Opportunities Despite Global Challenges
Although we expect the global recovery to persist, current challenges could affect some regions and industry groups more than others. We have found few opportunities among financial companies in the European Union, but we believe some in Japan and the United Kingdom look more attractive. We also have identified values among consumer discretionary companies that we believe are compelling, and we have continued to find growth opportunities in the health care sector.
September 15, 2011
| Please note, the position in any security highlighted with italicized typeface | |
| was sold during the reporting period. | |
| Equity funds are subject generally to market, market sector, market liquidity, | |
| issuer and investment style risks, among other factors, to varying degrees, all of | |
| which are more fully described in the fund’s prospectus. | |
| The portfolio’s performance will be influenced by political, social and economic | |
| factors affecting investments in foreign companies. Special risks associated with | |
| investments in foreign companies include exposure to currency fluctuations, less | |
| liquidity, less developed or less efficient trading markets, lack of comprehensive | |
| company information, political instability and differing auditing and legal | |
| standards.These risks are enhanced in emerging market countries. | |
| 1 | Total return includes reinvestment of dividends and any capital gains paid. |
| Past performance is no guarantee of future results. Share price and investment | |
| return fluctuate such that upon redemption, fund shares may be worth more or | |
| less than their original cost. | |
| 2 | SOURCE: LIPPER INC. — Reflects reinvestment of net dividends and, |
| where applicable, capital gain distributions.The Morgan Stanley Capital | |
| International Europe,Australasia, Far East (MSCI EAFE) Index is an | |
| unmanaged index composed of a sample of companies representative of the | |
| market structure of European and Pacific Basin countries. Index return does | |
| not reflect fees and expenses associated with operating a mutual fund. Investors | |
| cannot invest directly in any index. |
32

| Average Annual Total Returns as of 8/31/11 | |||
| 1 Year | 5 Years | 10 Years | |
| Class M shares | 8.05% | –3.22% | 4.31% |
| Investor shares | 7.67% | –3.46% | 4.22% |
| Morgan Stanley Capital International | |||
| Europe, Australasia, Far East Index | 10.01% | –1.48% | 4.96% |
| † Source: Lipper Inc. |
| Past performance is not predictive of future performance.The fund’s performance shown in the graph and table does not reflect the deduction of taxes that a shareholder |
| would pay on fund distributions or the redemption of fund shares. |
| The above graph compares a $10,000 investment made in Class M shares and Investor shares of BNY Mellon International Fund on 8/31/01 to a $10,000 |
| investment made in the Morgan Stanley Capital International Europe,Australasia, Far East Index (the “Index”) on that date.All dividends and capital gain |
| distributions are reinvested. |
| The fund’s performance shown in the line graph takes into account all applicable fees and expenses for all share classes.The Index is an unmanaged index composed of |
| a sample of companies representative of the market structure of European and Pacific Basin countries. Unlike a mutual fund, the Index is not subject to charges, fees |
| and other expenses. Investors cannot invest directly in any index. Further information relating to fund performance, including expense reimbursements, if applicable, is |
| contained in the Financial Highlights section of the prospectus and elsewhere in this report. |
| The Funds | 33 |
DISCUSSION OF FUND PERFORMANCE (continued)

DISCUSSION OF
FUND PERFORMANCE
For the period of September 1, 2010, through August 31, 2011, as provided by D. Kirk Henry, Sean P. Fitzgibbon and Jay Malikowski, Portfolio Managers
Fund and Market Performance Overview
For the 12-month period ended August 31, 2011, BNY Mellon Emerging Markets Fund’s Class M shares produced a total return of 6.77%, and Investor shares returned 6.59%.1 This compares with a 9.40% total return produced by the Morgan Stanley Capital International Emerging Markets Index (“MSCI EM Index”), the fund’s benchmark, for the same period.2
Strong corporate earnings buoyed emerging markets stocks over the reporting period’s first half, but macroeconomic concerns later erased many of those gains.The fund produced lower returns than its benchmark, as the valuation factors considered by our investment process fell out of favor among investors.
The Fund’s Investment Approach
The fund seeks long-term capital growth.To pursue its goal, the fund invests at least 80% of its assets in equity securities of companies organized, or with a majority of assets or operations, in countries considered to be emerging markets.
The fund allocates its assets between a core investment style and a value investment style at the discretion of the investment adviser.The fund is not managed to a specific target duration between these investment styles. However, under normal conditions at least 30% of the fund’s assets will be invested in each of the core and value investment styles. Pursuant to the core investment style, under normal circumstances at least 80% of the fund’s cash inflows allocated to this style are invested in equity securities of companies located in the foreign countries represented in the MSCI EM Index.
The fund will continue to invest in stocks that appear to be undervalued (as measured by their price/earnings ratios), but stocks purchased pursuant to the core investment style may have value and/or growth characteristics. The core investment style portfolio manager employs a “bottom-up” investment approach, which emphasizes individual stock selection. The core investment style stock selection process is designed to produce a diversified portfolio that, relative to the MSCI EM Index, has a below-average price/earnings ratio and an above-average earnings growth trend.
When choosing stocks for the portion of the fund using the value-oriented investment style, we use a research-driven and risk-averse approach. We identify potential investments through valuation screening and extensive fundamental research. Emphasizing individual stock selection rather than economic and industry trends, we focus on three key factors: value, business health and business momentum.
Macroeconomic Developments Challenged Global Markets
Emerging-markets stocks generally advanced over the final months of 2010 due to expectations of continued global economic recovery. However, during the first quarter of 2011 investors grew concerned about inflationary pressures in China and India and the potential impact of rising interest rates. In addition, investors worried about a sovereign debt crisis in Europe, rising energy prices stemming from political unrest in the Middle East and catastrophic natural and nuclear disasters in Japan. Still, most equity markets rebounded quickly from these unexpected shocks.
By May, investor sentiment began to deteriorate in earnest. U.S. economic growth proved more sluggish than expected amid a contentious debate regarding
34
government spending and borrowing. In Europe, debt problems facing Greece, Ireland, Portugal, Spain and Italy intensified. Consequently, investors became more averse to risks, and emerging-markets stocks fell sharply despite continued economic growth in many parts of Asia and Latin America.
Valuation Criteria Fell Out of Favor
Companies that met near-term expectations tended to hold up well in this environment, but those that fell short were punished, often regardless of attractive valuations and longer-term fundamental strengths. In India, materials producers such as India Cements were hurt by rising interest rates, and carmaker Tata Motors and budget airline SpiceJet declined due to economic concerns. Our stock selections in Russia also disappointed, due to underweighted exposure to materials stocks and a sharp decline posted by Sberbank of Russia. In addition, the fund did not participate in gains among chemical producers in Taiwan. Mexican homebuilder Desarrolladora Homex and South African retailer JD Group also undermined the fund’s relative results.
The fund achieved better results in China, where it avoided weakness among financial institutions but participated in gains from automobile seller Great Wall Motor. In Taiwan, banks First Financial Holding and Chinatrust Financial Holding gained value.A number of South Korean insurance companies rebounded from low valuations due to the beneficial effects of higher interest rates on their investment portfolios. Korean consumer staples companies including tobacco producer KT&G and noodle maker NongShim also fared well. From an industry group perspective, Taiwanese technology companies HTC
and Catcher Technology benefited from robust sales of smartphones and tablet computers, and India’s Tata Consultancy Services and Hexaware prospered amid robust global demand for outsourced services.
Emerging Markets May Be Poised to Rally
Although we expect macroeconomic headwinds to continue to dampen global growth, we believe the emerging markets have the potential for gains. Inflationary pressures seem to be receding and equity valuations have declined, potentially setting the stage for a sustained rally.
September 15, 2011
| Please note, the position in any security highlighted with italicized typeface | |
| was sold during the reporting period. | |
| Equity funds are subject generally to market, market sector, market liquidity, | |
| issuer and investment style risks, among other factors, to varying degrees, all | |
| of which are more fully described in the fund’s prospectus. | |
| The fund’s performance will be influenced by political, social and economic | |
| factors affecting investments in foreign companies. Special risks associated | |
| with investments in foreign companies include exposure to currency | |
| fluctuations, less liquidity, less developed or less efficient trading markets, | |
| lack of comprehensive company information, political instability and | |
| differing auditing and legal standards.These risks are enhanced in emerging | |
| markets countries. | |
| 1 | Total return includes reinvestment of dividends and any capital gains paid. |
| Past performance is no guarantee of future results. Share price and | |
| investment return fluctuate such that upon redemption, fund shares may be | |
| worth more or less than their original cost. | |
| 2 | SOURCE: LIPPER INC. — Reflects reinvestment of gross dividends |
| and, where applicable, capital gain distributions.The Morgan Stanley | |
| Capital International Emerging Markets Index is a market capitalization- | |
| weighted index composed of companies representative of the market structure | |
| of select designated emerging market countries in Europe, Latin America and | |
| the Pacific Basin. Index return does not reflect fees and expenses associated | |
| with operating a mutual fund. Investors cannot invest directly in any index. |
| The Funds | 35 |
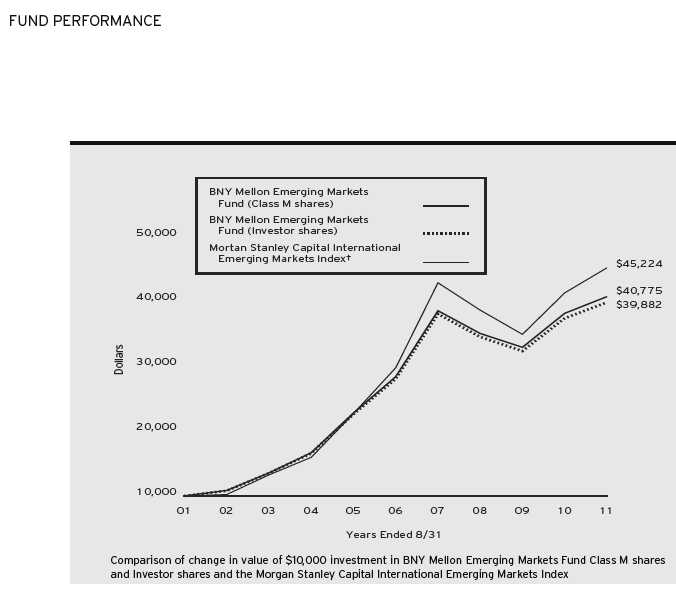
| Average Annual Total Returns as of 8/31/11 | |||
| 1 Year | 5 Years | 10 Years | |
| Class M shares | 6.77% | 7.49% | 15.09% |
| Investor shares | 6.59% | 7.24% | 14.84% |
| Morgan Stanley Capital International | |||
| Emerging Markets Index | 9.40% | 8.72% | 16.29% |
| † Source: Lipper Inc. |
| Past performance is not predictive of future performance.The fund’s performance shown in the graph and table does not reflect the deduction of taxes that a shareholder |
| would pay on fund distributions or the redemption of fund shares. |
| The above graph compares a $10,000 investment made in Class M shares and Investor shares of BNY Mellon Emerging Markets Fund on 8/31/01 to a |
| $10,000 investment made in the Morgan Stanley Capital International Emerging Markets Index (the “Index”) on that date. All dividends and capital gain |
| distributions are reinvested. |
| The fund’s performance shown in the line graph takes into account all applicable fees and expenses for all share classes.The Index is a market capitalization-weighted |
| index composed of companies representative of the market structure of select designated emerging market countries in Europe, Latin America and the Pacific Basin.The |
| Index excludes closed markets and those shares in otherwise free markets, which are not purchasable by foreigners.The Index includes gross dividends reinvested and |
| does not take into account charges, fees and other expenses.These factors can contribute to the Index potentially outperforming the fund. Unlike a mutual fund, the |
| Index is not subject to charges, fees and other expenses. Investors cannot invest directly in any index. Further information relating to fund performance, including |
| expense reimbursements, if applicable, is contained in the Financial Highlights section of the prospectus and elsewhere in this report. |
36

DISCUSSION OF
FUND PERFORMANCE
For the period of September 1, 2010, through August 31, 2011, as provided byThomas J. Durante, Richard A. Brown and Karen Q.Wong, Portfolio Managers
Fund and Market Performance Overview
For the 12-month period ended August 31, 2011, BNY Mellon International Appreciation Fund’s Class M shares produced a total return of 9.75%, and Investor shares returned 9.50%.1 In comparison, the fund’s benchmark, the Morgan Stanley Capital International Europe, Australasia, Far East Index (“MSCI EAFE Index”), produced a total return of 10.01% for the same period.2
Strong corporate earnings drove international stocks higher over the reporting period’s first half, but macroeconomic challenges later erased many of those gains. The fund’s return lagged the benchmark primarily due to expenses and pricing disparities between the common stocks of the companies comprising the MSCI EAFE Index and the related Depository Receipts (DRs) in which the fund invests.
The Fund’s Investment Approach
The fund seeks long-term capital appreciation. To pursue its goal, the fund normally invests at least 80% of its assets in equity securities, including DRs, common stocks, preferred stocks, convertible securities, equity securities in foreign investment funds or trusts and other equity investments.
The fund invests primarily in DRs representing the local shares of non-U.S. companies, in particular, American Depositary Receipts (ADRs). In selecting securities, we screen the MSCI EAFE Index universe of approximately 1,000 issuers for the availability of issuers with a DR facility.The investment adviser then uses a proprietary mathematical algorithm to reflect
the characteristics of the developed markets that takes into consideration risk characteristics, including country weights and sector weights within each country.As a result of this process, we expect to hold ADRs representing 200 to 300 foreign issuers.The fund’s country allocation is expected to be within 5% of that of the MSCI EAFE Index, and under normal circumstances, the fund will invest in at least 10 different countries. The fund generally will not invest in securities from developing countries because they are not included in the MSCI EAFE Index.
Macroeconomic Developments Challenged Global Growth
Positive market sentiment generally prevailed through the first quarter of 2011 amid expectations of continued global economic recovery. In addition, a weaker U.S. dollar supported exports to the United States, fueling corporate earnings growth for international companies.
While global markets continued to advance during the spring of 2011, investors grew concerned about several economic challenges, including a sovereign debt crisis in Europe, inflationary pressures in China and rising energy prices stemming from political unrest in the Middle East. In March, catastrophic natural and nuclear disasters struck Japan, causing some markets to fall sharply in anticipation of disruptions in the industrial supply chain. However, most equity markets rebounded quickly, and in April the MSCI EAFE Index hit new highs for the reporting period.
By May, investor sentiment began to deteriorate in earnest. U.S. economic growth proved more sluggish than expected, and investors worried about a contentious debate regarding government spending and borrowing. In Europe, the debt problems facing Ireland, Portugal, Spain and Italy intensified, and Greece faced
| The Funds | 37 |
DISCUSSION OF FUND PERFORMANCE (continued)
the possibility of default. Consequently, international markets lost much of the ground they had gained earlier.
Commodity Producers Led Global Markets
Exporters of natural resources — including Australia, New Zealand and Norway — ranked among the better-performing stock markets as industrial, agricultural and energy commodity prices climbed. In addition, Northern European markets proved less sensitive to the region’s sovereign debt crisis than their southern neighbors.
Although Japan’s stock market generally lagged international market averages, it managed to produce a positive absolute return despite the effects of the earthquake and tsunami.
From an industry group perspective, the consumer durables sector held up relatively well during the reporting period as European carmakers captured market share from temporarily idled Japanese companies. The energy sector benefited from rising energy prices, and a number of mining companies advanced along with gold and copper prices.Alcohol and tobacco producers benefited when skittish investors turned to companies with a history of stable earnings and dividends. Large pharmaceutical developers benefited from renewed investor interest in traditionally defensive market sectors and increased mergers-and-acquisitions activity.
Laggards during the reporting period included the financials sector, where the European sovereign debt crisis weighed on performance, and transportation companies, which were hurt by higher fuel prices. Utilities with nuclear power plants suffered in the wake of the disaster at Japan’s Fukushima reactors.
Macroeconomic Headwinds Remain
In light of current macroeconomic challenges, we believe that heightened market volatility is likely to persist until the direction and strength of the global economy becomes clearer. Nonetheless, it is important to note that the fund does not attempt to take active positions in markets or industry groups. Instead, we strive to replicate the returns of the MSCI EAFE Index by closely approximating its composition. In our experience, this passive investment approach can help investors manage risks through broad diversification, potentially limiting the impact on the overall portfolio of unexpected losses in any single industry group or holding.
September 15, 2011
| Equity funds are subject generally to market, market sector, market liquidity, | |
| issuer and investment style risks, among other factors, to varying degrees, all of | |
| which are more fully described in the fund’s prospectus. | |
| The fund’s performance will be influenced by political, social and economic | |
| factors affecting investments in foreign companies. Special risks associated with | |
| investments in foreign companies include exposure to currency fluctuations, less | |
| liquidity, less developed or less efficient trading markets, lack of comprehensive | |
| company information, political instability and differing auditing and legal | |
| standards.These risks are enhanced in emerging market countries. | |
| 1 | Total return includes reinvestment of dividends and any capital gains paid. |
| Past performance is no guarantee of future results. Share price and investment | |
| return fluctuate such that upon redemption, fund shares may be worth more or | |
| less than their original cost.The fund’s returns reflect the absorption of certain | |
| fund expenses by BNY Mellon Fund Advisors pursuant to an agreement in | |
| effect until September 30, 2010, at which time it was terminated. Had these | |
| expenses not been absorbed, the fund’s returns would have been lower. | |
| 2 | SOURCE: LIPPER INC. — Reflects reinvestment of net dividends and, |
| where applicable, capital gain distributions.The Morgan Stanley Capital | |
| International Europe,Australasia, Far East (MSCI EAFE) Index is an | |
| unmanaged index composed of a sample of companies representative of the | |
| market structure of European and Pacific Basin countries. Index return does | |
| not reflect fees and expenses associated with operating a mutual fund. Investors | |
| cannot invest directly in any index. |
38

| Average Annual Total Returns as of 8/31/11 | |||
| 1 Year | 5 Years | 10 Years | |
| Class M shares | 9.75% | –2.06% | 2.88% |
| Investor shares | 9.50% | –2.29% | 2.66% |
| Morgan Stanley Capital International | |||
| Europe, Australasia, Far East Index | 10.01% | –1.48% | 4.96% |
| † Source: Lipper Inc. |
| Past performance is not predictive of future performance.The fund’s performance shown in the graph and table does not reflect the deduction of taxes that a shareholder |
| would pay on fund distributions or the redemption of fund shares. |
| The above graph compares a $10,000 investment made in Class M shares and Investor shares of BNY Mellon International Appreciation Fund on 8/31/01 to a |
| $10,000 investment made in the Morgan Stanley Capital International Europe,Australasia, Far East Index (the “Index”) on that date.All dividends and capital |
| gain distributions are reinvested. |
| As of the close of business on September 12, 2008, substantially all of the assets of another investment company advised by an affiliate of the fund’s investment |
| adviser, BNY Hamilton International Equity Fund (the “predecessor fund”), a series of BNY Hamilton Funds, Inc., were transferred to BNY Mellon International |
| Appreciation Fund in a tax-free reorganization and the fund commenced operations.The performance figures for the fund’s Class M shares represent the performance |
| of the predecessor fund’s Institutional shares prior to the commencement of operations for BNY Mellon International Appreciation Fund and the performance of BNY |
| Mellon International Appreciation Fund’s Class M shares thereafter.The performance figures for Investor shares represent the performance of the predecessor fund’s |
| Class A shares prior to the commencement of operations for BNY Mellon International Appreciation Fund and the performance of BNY Mellon International |
| Appreciation Fund’s Investor shares thereafter. Investor shares are subject to a Shareholder Services Plan. |
| The fund’s performance shown in the line graph takes into account all applicable fees and expenses for all shares classes.The Index is an unmanaged index composed |
| of a sample of companies representative of the market structure of European and Pacific Basin countries. Unlike a mutual fund, the Index is not subject to charges, fees |
| and other expenses. Investors cannot invest directly in any index. Further information relating to fund performance, including expense reimbursements, if applicable, is |
| contained in the Financial Highlights section of the prospectus and elsewhere in this report. |
| The Funds | 39 |
DISCUSSION OF FUND PERFORMANCE (continued)

DISCUSSION OF
FUND PERFORMANCE
For the period of September 1, 2010, through August 31, 2011, as provided by Sean P. Fitzgibbon, Jeffrey D. McGrew and John F. Flahive, Portfolio Managers
Market and Fund Performance Overview
For the 12-month period ended August 31, 2011, BNY Mellon Asset Allocation Fund’s Class M shares produced a total return of 10.00%, and Investor shares returned 9.77%.1 In comparison, the fund’s benchmark, a blended index composed of 60% Standard & Poor’s 500 Composite Stock Price Index (“S&P 500 Index”) and 40% Barclays Capital U.S. Aggregate Bond Index, produced a 12.94% total return for the same period.2 Separately, the S&P 500 Index and the Barclays Capital U.S. Aggregate Bond Index produced total returns of 18.48% and 4.62%, respectively, for the same period.
Stocks and higher yielding bonds rallied through the first quarter of 2011 amid expectations of continued economic recovery, but macroeconomic disappointments later erased many of those gains. The fund produced lower returns than its benchmark, mainly due to shortfalls in economically sensitive sectors of the stock and bond markets.
Effective September 15, 2011, the fund changed its investment strategy to become an asset allocation fund and the fund changed its name to BNY Mellon Asset Allocation Fund from BNY Mellon Balanced Fund.
The Fund’s Investment Approach
The fund seeks long-term growth of principal in conjunction with current income. During the reporting period, to pursue its goal the fund invested in equity securities, income producing bonds, BNY Mellon Small Cap Stock Fund, BNY Mellon Mid Cap Stock Fund, BNY Mellon International Fund and BNY Mellon Emerging Markets Fund (collectively, the “BNY Mellon Funds”). The fund had established target allocations of 60% to equity securities and 40% to bonds and money
market instruments.The fund was permitted to deviate from these targets within ranges of 15% above or below the target amount.The fund’s investments in each of the BNY Mellon Funds were subject to a separate limit of 20% of the fund’s total assets, as were the fund’s investment in money market instruments.
Effective September 15, 2011, the fund began implementing changes to the fund’s investment strategy pursuant to which the fund may invest in both individual securities and other investment companies, including other BNY Mellon funds, funds in the Dreyfus Family of Funds and unaffiliated open-end funds, closed-end funds and exchange-traded funds (collectively, the “underlying funds”). To pursue its goal, the fund may allocate its assets, directly in individual equity and debt securities and/or through investment in the underlying funds, to gain investment exposure to the following asset classes: Large Cap Equities, Small Cap and Mid Cap Equities, Developed International and Global Equities, Emerging Markets Equities, Investment Grade Bonds, HighYield Bonds, Emerging Markets Debt, Diversifying Strategies and Money Market Instruments.
Further information about the fund's investment strategy and investment process is described in the Supplement to the fund’s prospectus dated September 15, 2011.
Shifting Sentiment Sparked Heightened Volatility
A more stimulative monetary policy, improved economic data and rising corporate earnings generally supported investor sentiment into the first quarter of 2011. While investor confidence was shaken in February due to political unrest in the Middle East, and again in March when natural and nuclear disasters struck Japan, most markets bounced back quickly from these unexpected shocks. Economic sentiment began to deteriorate in earnest in late April when U.S. economic data disap-
40
pointed and the debate regarding government spending and borrowing intensified. Turbulence in the financial markets was particularly severe in August, after a major credit-rating agency downgraded its assessment of long-term U.S. debt securities.
Optimistic Posture Hindered Relative Results
Although the fund’s bias toward some of the more economically sensitive stock market sectors buoyed relative performance early in the reporting period, it undermined results for the reporting period overall. We took steps to reduce risks in the stock portfolio as market conditions deteriorated, but several holdings in the consumer discretionary sector undermined relative performance. In the health care sector, biotech-nology firms were hurt by regulatory and economic issues, and the financials sector was hurt by large banks that continued to struggle with the consequences of past lending issues.The fund achieved better results in the information technology sector, where a focus on emerging trends toward “cloud computing” and wireless devices proved beneficial. Chemical companies buoyed relative performance in the materials sector, and machinery producers helped drive gains in the industrials sector.
Among bonds, the fund’s relative performance was undermined by relatively light exposure to lower-rated asset-backed securities and commercial mortgage-backed securities. In addition, a relatively short average duration among U.S. Treasury securities hurt relative performance over the reporting period’s second half. On a more positive note, modestly overweighted positions in investment-grade corporate bonds and taxable municipal bonds buoyed relative results.
Positioned for a Slower-Growth Environment
The recent slowdown in economic growth has given us cause for caution. We have maintained a relatively defensive investment posture with an emphasis on risk management. Our cautious outlook is reflected in underweighted positions in the consumer discretionary, financials, industrials and materials sectors of the stock portfolio. We have found more opportunities in the health care, information technology and utilities sectors. In the bond portfolio, the fund ended the reporting period with a mild emphasis on investment-grade corporate bonds and a lower-than-average sensitivity to interest rate risks.These positions are subject to change as the fund implements its revised investment strategy.
September 15, 2011
| Equities are subject generally to market, market sector, market liquidity, |
| issuer and investment style risks, among other factors, to varying degrees, all |
| of which are more fully described in the fund’s prospectus. |
| Bonds are subject generally to interest rate, credit, liquidity and market |
| risks, to varying degrees, all of which are more fully described in the fund’s |
| prospectus. Generally, all other factors being equal, bond prices are inversely |
| related to interest-rate changes, and rate increases can cause price declines. |
| Total return includes reinvestment of dividends and any capital gains paid. |
| Past performance is no guarantee of future results. Share price and |
| investment return fluctuate such that upon redemption, fund shares may be |
| worth more or less than their original cost. |
| SOURCE: LIPPER INC. — Reflects reinvestment of dividends and, |
| where applicable, capital gain distributions.The Standard & Poor’s 500 |
| Composite Stock Price Index is a widely accepted, unmanaged index of |
| U.S. stock market performance.The Barclays Capital U.S.Aggregate Bond |
| Index is a widely accepted, unmanaged total return index of corporate, U.S. |
| government and U.S. government agency debt instruments, mortgage-backed |
| securities and asset-backed securities with an average maturity of 1-10 |
| years.The indices’ returns do not reflect the fees and expenses associated |
| with operating a mutual fund. Investors cannot invest directly in any index. |
| The Funds | 41 |

| Average Annual Total Returns as of 8/31/11 | |||
| 1 Year | 5 Years | 10 Years | |
| Class M shares | 10.00% | 3.50% | 4.75% |
| Investor shares | 9.77% | 3.25% | 4.50% |
| Standard & Poor’s 500 | |||
| Composite Stock Price Index | 18.48% | 0.78% | 2.70% |
| Barclays Capital U.S. Aggregate Bond Index | 4.62% | 6.56% | 5.71% |
| Customized Blended Index | 12.93% | 3.39% | 4.18% |
| † Source: Lipper Inc. |
| Past performance is not predictive of future performance.The fund’s performance shown in the graph and table does not reflect the deduction of taxes that a shareholder |
| would pay on fund distributions or the redemption of fund shares. |
| The above graph compares a $10,000 investment made in Class M shares and Investor shares of BNY Mellon Asset Allocation Fund on 8/31/01 to a $10,000 |
| investment made in three different indices: (1) the Standard & Poor’s 500 Composite Stock Price Index (the “S&P 500 Index”), (2) the Barclays Capital U.S. |
| Aggregate Bond Index (the “Barclays Index”) and (3) the Customized Blended Index on that date.The Customized Blended Index is calculated on a year-to-year |
| basis.All dividends and capital gain distributions are reinvested. |
| Effective 9/15/11, BNY Mellon Balanced Fund changed its name to BNY Mellon Asset Allocation Fund. |
| The fund’s performance shown in the line graph takes into account all applicable fees and expenses for all share classes.The S&P 500 Index is a widely accepted, |
| unmanaged index of U.S. stock market performance.The Barclays Index is a widely accepted, unmanaged index of corporate, government and government agency debt |
| instruments, mortgage-backed securities and asset-backed securities with an average maturity of 1-10 years. Unlike a mutual fund, the indices are not subject to |
| charges, fees and other expenses. Investors cannot invest directly in any index.The Customized Blended Index is composed of the S&P 500 Index, 60%, and the |
| Barclays Index, 40%. Further information relating to fund performance, including expense reimbursements, if applicable, is contained in the Financial Highlights |
| section of the prospectus and elsewhere in this report. |
42
UNDERSTANDING YOUR FUND’S EXPENSES (Unaudited)
As a mutual fund investor, you pay ongoing expenses, such as management fees and other expenses. Using the information below, you can estimate how these expenses affect your investment and compare them with the expenses of other funds.You also may pay one-time transaction expenses, including sales charges (loads) and redemptions fees, which are not shown in this section and would have resulted in higher total expenses. For more information, see your fund’s prospectus or talk to your financial adviser.
Review your fund’s expenses
The table below shows the expenses you would have paid on a $1,000 investment in each class of each BNY Mellon equity fund from March 1, 2011 to August 31, 2011. It also shows how much a $1,000 investment would be worth at the close of the period, assuming actual returns and expenses.
| Expenses and Value of a $1,000 Investment | |||
| assuming actual returns for the six months ended August 31, 2011 | |||
| Dreyfus | |||
| Class M Shares | Investor Shares | Premier Shares | |
| BNY Mellon Large Cap Stock Fund | |||
| Expenses paid per $1,000† | $ 3.82 | $ 4.87 | — |
| Ending value (after expenses) | $894.20 | $893.40 | — |
| Annualized expense ratio (%) | .80 | 1.02 | — |
| BNY Mellon Large Cap Market | |||
| Opportunities Fund | |||
| Expenses paid per $1,000† | $ 3.44 | $ 4.40 | — |
| Ending value (after expenses) | $922.00 | $920.40 | — |
| Annualized expense ratio (%) | .71 | .91 | — |
| BNY Mellon Tax-Sensitive | |||
| Large Cap Multi-Strategy Fund | |||
| Expenses paid per $1,000† | $ 4.12 | $ 5.26 | — |
| Ending value (after expenses) | $921.40 | $913.10 | — |
| Annualized expense ratio (%) | .85 | 1.09 | — |
| BNY Mellon Income Stock Fund | |||
| Expenses paid per $1,000† | $ 4.12 | $ 5.33 | — |
| Ending value (after expenses) | $922.60 | $921.00 | — |
| Annualized expense ratio (%) | .85 | 1.10 | — |
| BNY Mellon Mid Cap Stock Fund | |||
| Expenses paid per $1,000† | $ 4.25 | $ 5.43 | $ 8.96 |
| Ending value (after expenses) | $875.00 | $873.80 | $870.20 |
| Annualized expense ratio (%) | .90 | 1.15 | 1.90 |
| BNY Mellon Small Cap Stock Fund | |||
| Expenses paid per $1,000† | $ 4.77 | $ 5.95 | — |
| Ending value (after expenses) | $875.00 | $874.90 | — |
| Annualized expense ratio (%) | 1.01 | 1.26 | — |
| BNY Mellon U.S. Core Equity 130/30 Fund | |||
| Expenses paid per $1,000† | $ 8.17 | $ 9.39 | — |
| Ending value (after expenses) | $884.10 | $881.70 | — |
| Annualized expense ratio (%) | 1.72 | 1.98 | — |
| BNY Mellon Focused | |||
| Equity Opportunities Fund | |||
| Expenses paid per $1,000† | $ 4.19 | $ 5.40 | — |
| Ending value (after expenses) | $912.10 | $912.80 | — |
| Annualized expense ratio (%) | .87 | 1.12 | — |
| The Funds | 43 |
UNDERSTANDING YOUR FUND’S EXPENSES ( U naudited) (continued)
| Expenses and Value of a $1,000 Investment (continued) | |||
| assuming actual returns for the six months ended August 31, 2011 | |||
| Dreyfus | |||
| Class M Shares | Investor Shares | Premier Shares | |
| BNY Mellon Small/Mid Cap Fund | |||
| Expenses paid per $1,000† | $ 4.35 | $ 5.72 | — |
| Ending value (after expenses) | $ 875.40 | $ 874.60 | — |
| Annualized expense ratio (%) | .92 | 1.21 | — |
| BNY Mellon International Fund | |||
| Expenses paid per $1,000† | $ 4.88 | $ 6.05 | — |
| Ending value (after expenses) | $ 862.10 | $ 860.80 | — |
| Annualized expense ratio (%) | 1.04 | 1.29 | — |
| BNY Mellon Emerging Markets Fund | |||
| Expenses paid per $1,000† | $ 6.88 | $ 8.19 | — |
| Ending value (after expenses) | $ 936.70 | $ 934.90 | — |
| Annualized expense ratio (%) | 1.41 | 1.68 | — |
| BNY Mellon International Appreciation Fund | |||
| Expenses paid per $1,000† | $ 3.40 | $ 4.62 | — |
| Ending value (after expenses) | $ 873.40 | $ 872.20 | — |
| Annualized expense ratio (%) | .72 | .98 | — |
| BNY Mellon Asset Allocation Fund | |||
| Expenses paid per $1,000† | $ 2.55 | $ 3.77 | — |
| Ending value (after expenses) | $ 945.80 | $ 944.90 | — |
| Annualized expense ratio (%) | .52 | .77 | — |
| † Expenses are equal to each fund’s annualized expense ratios as shown above, multiplied by the average account value over the period, multiplied by 184/365 (to reflect the |
| one-half year period). |
44
COMPARING YOUR FUND’S EXPENSES WITH THOSE OF OTHER FUNDS (Unaudited)
Using the SEC’s method to compare expenses
The Securities and Exchange Commission (SEC) has established guidelines to help investors assess fund expenses. Per these guidelines, the table below shows your fund’s expenses based on a $1,000 investment, assuming a hypothetical 5% annualized return.You can use this information to compare the ongoing expenses (but not transaction expenses or total cost) of investing in the fund with those of other funds.All mutual fund shareholder reports will provide this information to help you make this comparison. Please note that you cannot use this information to estimate your actual ending account balance and expenses paid during the period.
| Expenses and Value of a $1,000 Investment | |||
| assuming a hypothetical 5% annualized return for the six months ended August 31, 2011 | |||
| Dreyfus | |||
| Class M Shares | Investor Shares | Premier Shares | |
| BNY Mellon Large Cap Stock Fund | |||
| Expenses paid per $1,000† | $ 4.08 | $ 5.19 | — |
| Ending value (after expenses) | $1,021.17 | $1,020.06 | — |
| Annualized expense ratio (%) | .80 | 1.02 | — |
| BNY Mellon Large Cap Market | |||
| Opportunities Fund | |||
| Expenses paid per $1,000† | $ 3.62 | $ 4.63 | — |
| Ending value (after expenses) | $1,021.63 | $1,020.62 | — |
| Annualized expense ratio (%) | .71 | .91 | — |
| BNY Mellon Tax-Sensitive | |||
| Large Cap Multi-Strategy Fund | |||
| Expenses paid per $1,000† | $ 4.33 | $ 5.55 | — |
| Ending value (after expenses) | $1,020.92 | $1,019.71 | — |
| Annualized expense ratio (%) | .85 | 1.09 | — |
| BNY Mellon Income Stock Fund | |||
| Expenses paid per $1,000† | $ 4.33 | $ 5.60 | — |
| Ending value (after expenses) | $1,020.92 | $1,019.66 | — |
| Annualized expense ratio (%) | .85 | 1.10 | — |
| BNY Mellon Mid Cap Stock Fund | |||
| Expenses paid per $1,000† | $ 4.58 | $ 5.85 | $ 9.65 |
| Ending value (after expenses) | $1,020.67 | $1,019.41 | $1,015.63 |
| Annualized expense ratio (%) | .90 | 1.15 | 1.90 |
| BNY Mellon Small Cap Stock Fund | |||
| Expenses paid per $1,000† | $ 5.14 | $ 6.41 | — |
| Ending value (after expenses) | $1,020.11 | $1,018.85 | — |
| Annualized expense ratio (%) | 1.01 | 1.26 | — |
| BNY Mellon U.S. Core Equity 130/30 Fund | |||
| Expenses paid per $1,000† | $ 8.74 | $ 10.06 | — |
| Ending value (after expenses) | $1,016.53 | $1,015.22 | — |
| Annualized expense ratio (%) | 1.72 | 1.98 | — |
| BNY Mellon Focused | |||
| Equity Opportunities Fund | |||
| Expenses paid per $1,000† | $ 4.43 | $ 5.70 | — |
| Ending value (after expenses) | $1,020.82 | $1,019.56 | — |
| Annualized expense ratio (%) | .87 | 1.12 | — |
| The Funds | 45 |
| COMPARING YOUR FUND’S EXPENSES WITH THOSE OF OTHER FUNDS (Unaudited) (continued) | |||
| Expenses and Value of a $1,000 Investment (continued) | |||
| assuming a hypothetical 5% annualized return for the six months ended August 31, 2011 | |||
| Dreyfus | |||
| Class M Shares | Investor Shares | Premier Shares | |
| BNY Mellon Small/Mid Cap Fund | |||
| Expenses paid per $1,000† | $ 4.69 | $ 6.16 | — |
| Ending value (after expenses) | $1,020.57 | $1,019.11 | — |
| Annualized expense ratio (%) | .92 | 1.21 | — |
| BNY Mellon International Fund | |||
| Expenses paid per $1,000† | $ 5.30 | $ 6.56 | — |
| Ending value (after expenses) | $1,019.96 | $1,018.70 | — |
| Annualized expense ratio (%) | 1.04 | 1.29 | — |
| BNY Mellon Emerging Markets Fund | |||
| Expenses paid per $1,000† | $ 7.17 | $ 8.54 | — |
| Ending value (after expenses) | $1,018.10 | $1,016.74 | — |
| Annualized expense ratio (%) | 1.41 | 1.68 | — |
| BNY Mellon International Appreciation Fund | |||
| Expenses paid per $1,000† | $ 3.67 | $ 4.99 | — |
| Ending value (after expenses) | $1,021.58 | $1,020.27 | — |
| Annualized expense ratio (%) | .72 | .98 | — |
| BNY Mellon Asset Allocation Fund | |||
| Expenses paid per $1,000† | $ 2.65 | $ 3.92 | — |
| Ending value (after expenses) | $1,022.58 | $1,021.32 | — |
| Annualized expense ratio (%) | .52 | .77 | — |
| † Expenses are equal to each fund’s annualized expense ratios as shown above, multiplied by the average account value over the period, multiplied by 184/365 (to reflect the |
| one-half year period). |
46
| STATEMENT OF INVESTMENTS |
| August 31, 2011 |
| BNY Mellon Large Cap Stock Fund | |||||
| Common Stocks—98.3% | Shares | Value ($) | Shares | Value ($) | |
| Consumer Discretionary—9.8% | Financial (continued) | ||||
| Amazon.com | 66,520 a,b | 14,321,091 | Wells Fargo & Co. | 1,074,570 | 28,046,277 |
| Carnival | 460,660 | 15,215,600 | 132,404,248 | ||
| CBS, Cl. B | 364,660 | 9,134,733 | Health Care—14.7% | ||
| DIRECTV, Cl. A | 321,310 a,b | 14,128,001 | Allscripts Healthcare Solutions | 455,940 b | 8,186,403 |
| Mattel | 550,060 a | 14,780,112 | Baxter International | 436,510 | 24,435,830 |
| McDonald’s | 186,700 | 16,888,882 | CIGNA | 362,070 | 16,923,152 |
| Melco Crown Entertainment, ADR | 409,520 b | 5,323,760 | Covidien | 375,690 | 19,603,504 |
| Omnicom Group | 465,640 a | 18,881,702 | McKesson | 153,900 | 12,301,227 |
| 108,673,881 | Pfizer | 1,361,100 | 25,833,678 | ||
| Consumer Staples—11.0% | Sanofi, ADR | 353,230 | 12,917,621 | ||
| Coca-Cola Enterprises | 436,790 a | 12,064,140 | St. Jude Medical | 241,020 | 10,976,051 |
| ConAgra Foods | 365,770 a | 8,932,103 | Warner Chilcott, Cl. A | 535,030 | 9,127,612 |
| Hansen Natural | 61,300 b | 5,230,116 | Watson Pharmaceuticals | 135,850 b | 9,118,252 |
| Kimberly-Clark | 231,130 a | 15,984,951 | Zimmer Holdings | 237,530 a,b | 13,513,082 |
| Lorillard | 47,890 | 5,335,904 | 162,936,412 | ||
| PepsiCo | 542,567 a | 34,957,592 | Industrial—7.7% | ||
| Unilever, ADR | 981,870 a | 33,128,294 | Caterpillar | 64,380 | 5,858,580 |
| Walgreen | 152,620 | 5,373,750 | Cummins | 138,700 | 12,888,004 |
| 121,006,850 | Dover | 198,450 | 11,414,844 | ||
| Energy—11.5% | General Electric | 1,536,556 | 25,061,228 | ||
| Anadarko Petroleum | 195,630 | 14,427,712 | Norfolk Southern | 173,080 | 11,714,054 |
| Apache | 107,080 | 11,036,736 | Owens Corning | 173,800 a,b | 5,050,628 |
| Chevron | 281,880 | 27,880,751 | Thomas & Betts | 136,080 a,b | 5,943,974 |
| ENSCO, ADR | 238,180 | 11,494,567 | Tyco International | 177,450 | 7,378,371 |
| Halliburton | 315,520 | 13,999,622 | 85,309,683 | ||
| Hess | 233,340 | 13,846,396 | Information Technology—20.5% | ||
| National Oilwell Varco | 309,490 | 20,463,479 | Alliance Data Systems | 60,450 a,b | 5,646,634 |
| Occidental Petroleum | 122,370 | 10,614,374 | Apple | 138,960 b | 53,475,977 |
| TransCanada | 88,820 | 3,832,583 | BMC Software | 181,270 b | 7,361,375 |
| 127,596,220 | Electronic Arts | 653,480 a,b | 14,755,578 | ||
| Financial—12.0% | EMC | 677,100 b | 15,295,689 | ||
| American Express | 291,920 a | 14,511,343 | F5 Networks | 90,860 b | 7,415,993 |
| Bank of America | 904,990 | 7,393,768 | Google, Cl. A | 13,240 b | 7,162,310 |
| Capital One Financial | 473,520 a | 21,805,596 | Informatica | 135,960 b | 5,680,409 |
| Citigroup | 448,191 | 13,916,331 | International Business Machines | 95,800 | 16,468,978 |
| Discover Financial Services | 256,620 | 6,456,559 | Intuit | 224,710 | 11,084,944 |
| Hartford Financial Services Group | 476,420 a | 9,118,679 | NetApp | 615,140 b | 23,141,567 |
| JPMorgan Chase & Co. | 271,936 | 10,213,916 | Oracle | 590,450 | 16,573,932 |
| Lincoln National | 565,690 a | 11,738,067 | QUALCOMM | 400,550 | 20,612,303 |
| MetLife | 273,920 | 9,203,712 | Riverbed Technology | 302,700 b | 7,500,906 |
| The Funds | 47 |
STATEMENT OF INVESTMENTS (continued)
| BNY Mellon Large Cap Stock Fund (continued) | |||||
| Common Stocks (continued) | Shares | Value ($) | Other Investment—.2% | Shares | Value ($) |
| Information Technology (continued) | Registered Investment Company; | ||||
| Teradata | 274,904 b | 14,393,973 | Dreyfus Institutional Preferred | ||
| 226,570,568 | Plus Money Market Fund | ||||
| Materials—2.0% | (cost $2,293,000) | 2,293,000 c | 2,293,000 | ||
| CF Industries Holdings | 44,210 | 8,082,472 | Investment of Cash Collateral | ||
| E.I. du Pont de Nemours & Co. | 276,480 | 13,345,690 | for Securities Loaned—20.4% | ||
| 21,428,162 | Registered Investment Company; | ||||
| Telecommunication Services—2.6% | Dreyfus Institutional Cash | ||||
| AT&T | 1,009,449 a | 28,749,108 | Advantage Fund | ||
| Utilities—6.5% | (cost $225,880,181) | 225,880,181 c | 225,880,181 | ||
| Exelon | 278,560 a | 12,011,507 | |||
| Total Investments | |||||
| NextEra Energy | 680,770 a | 38,613,274 | (cost $1,167,231,284) | 118.9% 1,314,640,979 | |
| PPL | 732,960 a | 21,167,885 | |||
| Liabilities, Less Cash | |||||
| 71,792,666 | and Receivables | (18.9%) | (208,617,454) | ||
| Total Common Stocks | |||||
| (cost $939,058,103) | 1,086,467,798 | Net Assets | 100.0% 1,106,023,525 | ||
ADR—American Depository Receipts
| a Security, or portion thereof, on loan.At August 31, 2011, the value of the fund’s securities on loan was $221,706,550 and the value of the collateral held by the fund was |
| $225,880,181. |
| b Non-income producing security. |
| c Investment in affiliated money market mutual fund. |
| Portfolio Summary (Unaudited) † | |||
| Value (%) | Value (%) | ||
| Money Market Investments | 20.6 | Consumer Discretionary | 9.8 |
| Information Technology | 20.5 | Industrial | 7.7 |
| Health Care | 14.7 | Utilities | 6.5 |
| Financial | 12.0 | Telecommunication Services | 2.6 |
| Energy | 11.5 | Materials | 2.0 |
| Consumer Staples | 11.0 | 118.9 | |
| † Based on net assets. | |||
| See notes to financial statements. | |||
48
| STATEMENT OF INVESTMENTS | |||||
| August 31, 2011 | |||||
| BNY Mellon Large Cap Market Opportunities Fund | |||||
| Common Stocks—67.5% | Shares | Value ($) | Shares | Value ($) | |
| Consumer Discretionary—10.9% | Financial (continued) | ||||
| Arcos Dorados Holdings, Cl. A | 29,680 | 818,278 | Citigroup | 44,318 | 1,376,074 |
| Coach | 15,600 | 877,032 | Invesco | 44,313 | 810,928 |
| Family Dollar Stores | 18,131 | 968,014 | 4,133,468 | ||
| Johnson Controls | 37,209 | 1,186,223 | Health Care—11.0% | ||
| Las Vegas Sands | 29,680 a | 1,382,198 | Abbott Laboratories | 16,443 | 863,422 |
| McDonald’s | 11,649 | 1,053,769 | Agilent Technologies | 30,524 a | 1,125,420 |
| NIKE, Cl. B | 10,989 | 952,197 | Baxter International | 21,321 | 1,193,549 |
| Panera Bread, Cl. A | 5,551 a | 639,198 | C.R. Bard | 10,378 | 988,608 |
| Starbucks | 32,471 | 1,254,030 | Celgene | 15,028 a | 893,715 |
| TJX | 19,693 | 1,075,632 | Covidien | 25,503 | 1,330,746 |
| Tractor Supply | 10,896 | 668,688 | Gilead Sciences | 24,139 a | 962,784 |
| Urban Outfitters | 30,080 a | 787,344 | Johnson & Johnson | 13,940 | 917,252 |
| Walt Disney | 34,154 | 1,163,285 | Meridian Bioscience | 41,505 | 767,843 |
| 12,825,888 | Resmed | 25,235 a | 781,528 | ||
| Consumer Staples—5.2% | Stryker | 17,442 | 851,867 | ||
| Coca-Cola | 32,750 | 2,307,237 | Varian Medical Systems | 14,736 a | 839,363 |
| Colgate-Palmolive | 10,323 | 928,760 | Watson Pharmaceuticals | 22,576 a | 1,515,301 |
| Kraft Foods, Cl. A | 37,624 | 1,317,592 | 13,031,398 | ||
| PepsiCo | 12,459 | 802,733 | Industrial—8.4% | ||
| Wal-Mart Stores | 15,746 | 837,845 | Boeing | 11,982 | 801,117 |
| 6,194,167 | C.H. Robinson Worldwide | 12,488 | 880,404 | ||
| Energy—9.2% | Caterpillar | 17,140 | 1,559,740 | ||
| Apache | 8,439 | 869,808 | Donaldson | 17,107 | 1,008,971 |
| Cameron International | 24,250 a | 1,260,030 | Dover | 17,980 | 1,034,210 |
| CARBO Ceramics | 9,912 | 1,587,407 | Emerson Electric | 18,950 | 882,122 |
| EOG Resources | 9,248 | 856,272 | Honeywell International | 24,246 | 1,159,201 |
| Exxon Mobil | 15,890 | 1,176,496 | MSC Industrial Direct, Cl. A | 13,046 | 804,547 |
| Halliburton | 25,081 | 1,112,844 | Precision Castparts | 6,398 | 1,048,312 |
| Newfield Exploration | 18,400 a | 939,320 | Rockwell Collins | 14,118 | 712,394 |
| Occidental Petroleum | 10,351 | 897,846 | 9,891,018 | ||
| Schlumberger | 13,475 | 1,052,667 | Information Technology—15.8% | ||
| Valero Energy | 51,010 | 1,158,947 | Adobe Systems | 28,027 a | 707,401 |
| 10,911,637 | Amphenol, Cl. A | 17,974 | 844,418 | ||
| Financial—3.5% | Apple | 5,893 a | 2,267,803 | ||
| Allstate | 42,230 | 1,107,693 | ARM Holdings, ADR | 38,880 | 1,072,310 |
| BB&T | 37,630 | 838,773 | Automatic Data Processing | 17,725 | 886,782 |
| The Funds | 49 |
| STATEMENT OF INVESTMENTS (continued) | |||||
| BNY Mellon Large Cap Market Opportunities Fund (continued) | |||||
| Common Stocks (continued) | Shares | Value ($) | Shares | Value ($) | |
| Information Technology (continued) | Materials (continued) | ||||
| Baidu, ADR | 8,863 a | 1,292,048 | Praxair | 8,955 | 881,978 |
| Cisco Systems | 34,673 | 543,673 | 4,079,679 | ||
| FLIR Systems | 27,149 | 702,345 | Total Common Stocks | ||
| Google, Cl. A | 1,645 a | 889,879 | (cost $79,497,664) | 79,651,806 | |
| Intel | 38,362 | 772,227 | |||
| MasterCard, Cl. A | 3,449 | 1,137,170 | Other Investment—33.3% | ||
| Microsoft | 31,109 | 827,499 | Registered Investment Companies: | ||
| Oracle | 33,956 | 953,145 | BNY Mellon U.S. Core Equity | ||
| Paychex | 30,846 | 832,225 | 130/30 Fund, Cl. M | 3,308,561 b | 35,831,718 |
| QUALCOMM | 15,792 | 812,656 | Dreyfus Institutional Preferred | ||
| Rovi | 24,666 a | 1,205,921 | Plus Money Market Fund | 3,414,000 c | 3,414,000 |
| Salesforce.com | 11,665 a | 1,501,869 | Total Other Investment | ||
| (cost $41,875,286) | 39,245,718 | ||||
| Teradata | 25,500 a | 1,335,180 | |||
| 18,584,551 | Total Investments | ||||
| Materials—3.5% | (cost $121,372,950) | 100.8% | 118,897,524 | ||
| Celanese, Ser. A | 31,356 | 1,474,045 | Liabilities, Less Cash and Receivables | (.8%) | (892,217) |
| Cliffs Natural Resources | 9,200 | 762,220 | |||
| Net Assets | 100.0% | 118,005,307 | |||
| Monsanto | 13,948 | 961,436 | |||
ADR—American Depository Receipts
| a | Non-income producing security. |
| b | Investment in affiliated mutual fund. |
| c | Investment in affiliated money market mutual fund. |
| Portfolio Summary (Unaudited) † | |||
| Value (%) | Value (%) | ||
| Mutual Funds: Domestic | 30.4 | Consumer Staples | 5.2 |
| Information Technology | 15.8 | Financial | 3.5 |
| Health Care | 11.0 | Materials | 3.5 |
| Consumer Discretionary | 10.9 | Money Market Investment | 2.9 |
| Energy | 9.2 | ||
| Industrial | 8.4 | 100.8 | |
| † Based on net assets. | |||
| See notes to financial statements. | |||
50
| STATEMENT OF INVESTMENTS | |||||
| August 31, 2011 | |||||
| BNY Mellon Tax-Sensitive Large Cap Multi-Strategy Fund | |||||
| Common Stocks—81.1% | Shares | Value ($) | Shares | Value ($) | |
| Consumer Discretionary—10.5% | Consumer Discretionary (continued) | ||||
| Amazon.com | 1,757 a | 378,265 | Viacom, Cl. B | 548 | 26,436 |
| Arcos Dorados Holdings, Cl. A | 10,710 | 295,275 | Walt Disney | 21,433 | 730,008 |
| Bed Bath & Beyond | 208 a | 11,827 | Whirlpool | 450 | 28,211 |
| Carnival | 6,162 | 203,531 | Wyndham Worldwide | 370 | 12,018 |
| CBS, Cl. B | 959 | 24,023 | Wynn Resorts | 160 | 24,755 |
| Coach | 6,341 | 356,491 | Yum! Brands | 4,263 | 231,779 |
| Comcast, Cl. A | 4,926 | 105,958 | 7,911,869 | ||
| DIRECTV, Cl. A | 1,132 a | 49,774 | Consumer Staples—7.7% | ||
| eBay | 1,102 a | 34,019 | Altria Group | 3,719 | 101,120 |
| Family Dollar Stores | 6,693 | 357,339 | Clorox | 430 | 29,971 |
| Ford Motor | 6,543 a | 72,758 | Coca-Cola | 19,983 | 1,407,802 |
| Fortune Brands | 329 | 18,792 | Coca-Cola Enterprises | 1,620 | 44,744 |
| Genuine Parts | 414 | 22,778 | Colgate-Palmolive | 4,674 | 420,520 |
| Harley-Davidson | 294 | 11,366 | ConAgra Foods | 910 | 22,222 |
| Home Depot | 8,143 | 271,813 | Constellation Brands, Cl. A | 1,300 a | 25,701 |
| International Game Technology | 1,569 | 23,943 | Costco Wholesale | 3,155 | 247,794 |
| Johnson Controls | 22,406 | 714,303 | CVS Caremark | 2,750 | 98,752 |
| Kohl’s | 845 | 39,157 | Dean Foods | 830 a | 7,171 |
| Las Vegas Sands | 15,050 a | 700,879 | Dr. Pepper Snapple Group | 520 | 20,010 |
| Limited Brands | 289 | 10,907 | General Mills | 1,650 | 62,552 |
| Lowe’s | 682 | 13,592 | H.J. Heinz | 173 | 9,107 |
| Macy’s | 429 | 11,133 | Hershey | 171 | 10,029 |
| Marriott International, Cl. A | 931 | 27,260 | J.M. Smucker | 119 | 8,579 |
| Mattel | 488 | 13,113 | Kimberly-Clark | 750 | 51,870 |
| McDonald’s | 5,816 | 526,115 | Kraft Foods, Cl. A | 24,525 | 858,865 |
| McGraw-Hill | 348 | 14,654 | Kroger | 326 | 7,681 |
| News, Cl. A | 4,556 | 78,682 | Lorillard | 30 | 3,343 |
| NIKE, Cl. B | 4,792 | 415,227 | McCormick & Co. | 412 | 19,689 |
| O’Reilly Automotive | 164 a | 10,640 | Mead Johnson Nutrition | 1,087 | 77,449 |
| Omnicom Group | 210 | 8,516 | PepsiCo | 9,690 | 624,327 |
| Panera Bread, Cl. A | 2,048 a | 235,827 | Philip Morris International | 5,114 | 354,502 |
| Priceline.com | 58 a | 31,161 | Procter & Gamble | 8,476 | 539,752 |
| Ross Stores | 577 | 44,155 | Reynolds American | 490 | 18,409 |
| Staples | 1,830 | 26,974 | Sara Lee | 848 | 15,298 |
| Starbucks | 13,474 | 520,366 | SUPERVALU | 1,580 | 12,593 |
| Target | 1,370 | 70,788 | Tyson Foods, Cl. A | 1,350 | 23,585 |
| Tiffany & Co. | 720 | 51,811 | Wal-Mart Stores | 8,609 | 458,085 |
| Time Warner | 1,522 | 48,187 | Walgreen | 7,467 | 262,913 |
| Time Warner Cable | 293 | 19,192 | 5,844,435 | ||
| TJX | 8,256 | 450,943 | Energy—11.0% | ||
| Tractor Supply | 4,018 | 246,585 | Alpha Natural Resources | 390 a | 12,897 |
| Urban Outfitters | 11,100 a | 290,543 | Anadarko Petroleum | 451 | 33,261 |
| The Funds | 51 |
STATEMENT OF INVESTMENTS (continued)
| BNY Mellon Tax-Sensitive Large Cap Multi-Strategy Fund (continued) | |||||
| Common Stocks (continued) | Shares | Value ($) | Shares | Value ($) | |
| Energy (continued) | Financial (continued) | ||||
| Apache | 3,804 | 392,078 | AON | 471 | 22,010 |
| Baker Hughes | 320 | 19,555 | Apartment Investment & | ||
| Cameron International | 14,766 a | 767,241 | Management, Cl. A | 1,810 b | 48,092 |
| CARBO Ceramics | 3,665 | 586,950 | Assurant | 950 | 33,411 |
| Chesapeake Energy | 540 | 17,491 | AvalonBay Communities | 199 b | 27,140 |
| Chevron | 5,544 | 548,357 | Bank of America | 16,484 | 134,674 |
| ConocoPhillips | 2,256 | 153,566 | BB&T | 24,789 | 552,547 |
| Consol Energy | 266 | 12,146 | Berkshire Hathaway, Cl. B | 2,072 a | 151,256 |
| Denbury Resources | 1,290 a | 20,575 | BlackRock | 230 | 37,893 |
| Devon Energy | 419 | 28,421 | Capital One Financial | 553 | 25,466 |
| El Paso | 2,205 | 42,204 | Charles Schwab | 511 | 6,301 |
| EOG Resources | 3,971 | 367,675 | Chubb | 201 | 12,440 |
| Exxon Mobil | 20,420 | 1,511,897 | Cincinnati Financial | 1,350 | 37,692 |
| FMC Technologies | 250 a | 11,115 | Citigroup | 29,026 | 901,257 |
| Halliburton | 14,456 | 641,413 | CME Group | 35 | 9,349 |
| Hess | 463 | 27,474 | Discover Financial Services | 817 | 20,556 |
| Marathon Oil | 1,077 | 28,993 | E*TRADE Financial | 1,830 a | 22,619 |
| Marathon Petroleum | 538 | 19,938 | Equity Residential | 377 b | 23,065 |
| Murphy Oil | 109 | 5,840 | Fifth Third Bancorp | 284 | 3,016 |
| Nabors Industries | 990 a | 18,256 | Franklin Resources | 77 | 9,234 |
| National Oilwell Varco | 910 | 60,169 | Goldman Sachs Group | 914 | 106,225 |
| Newfield Exploration | 10,490 a | 535,515 | Hartford Financial Services Group | 136 | 2,603 |
| Noble | 370 | 12,491 | Host Hotels & Resorts | 483 b | 5,714 |
| Noble Energy | 113 | 9,985 | Huntington Bancshares | 4,180 | 21,025 |
| Occidental Petroleum | 5,214 | 452,262 | IntercontinentalExchange | 279 a | 32,908 |
| Peabody Energy | 710 | 34,648 | Invesco | 27,424 | 501,859 |
| Plains Exploration & Production | 4,061 a | 119,434 | JPMorgan Chase & Co. | 16,344 | 613,881 |
| QEP Resources | 4,248 | 149,572 | Kimco Realty | 940 b | 16,638 |
| Range Resources | 460 | 29,790 | Leucadia National | 340 | 10,074 |
| Schlumberger | 9,160 | 715,579 | Lincoln National | 406 | 8,425 |
| Southwestern Energy | 4,392 a | 166,676 | Loews | 157 | 5,906 |
| Spectra Energy | 537 | 13,946 | Marsh & McLennan | 896 | 26,629 |
| Tesoro | 400 a | 9,624 | MetLife | 5,702 | 191,587 |
| Valero Energy | 29,523 | 670,763 | Moody’s | 690 | 21,273 |
| Williams | 759 | 20,485 | Morgan Stanley | 426 | 7,455 |
| 8,268,282 | Nasdaq OMX Group | 880 a | 20,847 | ||
| Financial—8.1% | NYSE Euronext | 203 | 5,538 | ||
| ACE | 649 | 41,912 | People’s United Financial | 2,403 | 28,235 |
| Aflac | 1,048 | 39,531 | Plum Creek Timber | 501 b | 19,023 |
| Allstate | 23,235 | 609,454 | PNC Financial Services Group | 4,950 | 248,193 |
| American Express | 1,959 | 97,382 | Principal Financial Group | 759 | 19,248 |
| American International Group | 870 a | 22,037 | ProLogis | 1,774 b | 48,306 |
| Ameriprise Financial | 152 | 6,946 | Prudential Financial | 386 | 19,381 |
52
| BNY Mellon Tax-Sensitive Large Cap Multi-Strategy Fund (continued) | |||||
| Common Stocks (continued) | Shares | Value ($) | Shares | Value ($) | |
| Financial (continued) | Health Care (continued) | ||||
| Regions Financial | 4,840 | 21,974 | Medco Health Solutions | 233 a | 12,615 |
| Simon Property Group | 762 b | 89,535 | Medtronic | 1,906 | 66,843 |
| State Street | 7,065 | 250,949 | Merck & Co. | 5,111 | 169,276 |
| SunTrust Banks | 1,540 | 30,646 | Meridian Bioscience | 15,317 | 283,365 |
| T. Rowe Price Group | 151 | 8,075 | Mylan | 880 a | 18,269 |
| Torchmark | 930 | 35,535 | Pfizer | 28,717 | 545,049 |
| Travelers | 241 | 12,161 | Resmed | 9,312 a | 288,393 |
| U.S. Bancorp | 10,740 | 249,275 | Shire, ADR | 2,080 | 201,968 |
| Unum Group | 1,500 | 35,310 | St. Jude Medical | 236 | 10,747 |
| Wells Fargo & Co. | 16,913 | 441,429 | Stryker | 7,221 | 352,674 |
| Weyerhaeuser | 990 b | 17,850 | Thermo Fisher Scientific | 390 a | 21,423 |
| XL Group | 1,380 | 28,718 | UnitedHealth Group | 1,322 | 62,821 |
| 6,097,710 | Varian Medical Systems | 5,439 a | 309,805 | ||
| Health Care—11.5% | Watson Pharmaceuticals | 11,187 a | 750,871 | ||
| Abbott Laboratories | 8,685 | 456,049 | WellPoint | 254 | 16,078 |
| Aetna | 208 | 8,326 | Zimmer Holdings | 3,555 a | 202,244 |
| Agilent Technologies | 15,600 a | 575,172 | 8,637,043 | ||
| Allergan | 279 | 22,825 | Industrial—9.4% | ||
| AmerisourceBergen | 846 | 33,485 | 3M | 884 | 73,354 |
| Amgen | 690 | 38,229 | Boeing | 5,721 | 382,506 |
| Baxter International | 12,904 | 722,366 | C.H. Robinson Worldwide | 5,225 | 368,362 |
| Becton Dickinson & Co. | 137 | 11,149 | Caterpillar | 10,297 | 937,027 |
| Biogen Idec | 212 a | 19,970 | CSX | 2,878 | 63,143 |
| Boston Scientific | 2,149 a | 14,570 | Cummins | 136 | 12,637 |
| Bristol-Myers Squibb | 2,552 | 75,922 | Danaher | 332 | 15,209 |
| C.R. Bard | 4,379 | 417,144 | Deere & Co | 3,197 | 258,382 |
| Cardinal Health | 4,752 | 201,960 | Donaldson | 6,315 | 372,459 |
| Celgene | 6,403 a | 380,786 | Dover | 10,839 | 623,459 |
| CIGNA | 468 | 21,874 | Eaton | 4,952 | 212,688 |
| Coventry Health Care | 370 a | 12,166 | Emerson Electric | 7,660 | 356,573 |
| Covidien | 14,256 | 743,878 | Expeditors International | ||
| DaVita | 180 a | 13,244 | of Washington | 666 | 30,303 |
| Eli Lilly & Co. | 2,086 | 78,246 | FedEx | 208 | 16,374 |
| Express Scripts | 1,316 a | 61,773 | Fluor | 377 | 22,891 |
| Forest Laboratories | 310 a | 10,614 | General Dynamics | 291 | 18,647 |
| Gilead Sciences | 10,600 a | 422,781 | General Electric | 28,727 | 468,537 |
| Hospira | 4,847 a | 223,931 | Goodrich | 111 | 9,899 |
| Humana | 151 | 11,724 | Honeywell International | 14,317 | 684,496 |
| Intuitive Surgical | 110 a | 41,948 | Illinois Tool Works | 1,363 | 63,434 |
| Johnson & Johnson | 9,511 | 625,824 | Ingersoll-Rand | 960 | 32,170 |
| Laboratory Corp. of America Holdings | 241 a | 20,131 | ITT | 448 | 21,208 |
| Life Technologies | 710 a | 29,820 | MSC Industrial Direct, Cl. A | 4,817 | 297,064 |
| McKesson | 359 | 28,695 | |||
| The Funds | 53 |
| STATEMENT OF INVESTMENTS (continued) | |||||
| BNY Mellon Tax-Sensitive Large Cap Multi-Strategy Fund (continued) | |||||
| Common Stocks (continued) | Shares | Value ($) | Shares | Value ($) | |
| Industrial (continued) | Information Technology (continued) | ||||
| Norfolk Southern | 282 | 19,086 | Intel | 33,497 | 674,295 |
| Northrop Grumman | 846 | 46,209 | International Business Machines | 4,407 | 757,607 |
| PACCAR | 777 | 29,239 | Intuit | 177 | 8,731 |
| Parker Hannifin | 112 | 8,224 | KLA-Tencor | 720 | 26,410 |
| Pitney Bowes | 1,230 | 24,981 | Linear Technology | 835 | 23,906 |
| Precision Castparts | 2,727 | 446,819 | MasterCard, Cl. A | 1,441 | 475,112 |
| Rockwell Automation | 298 | 19,111 | Microsoft | 23,453 | 623,850 |
| Rockwell Collins | 6,030 | 304,274 | Molex | 304 | 6,642 |
| Southwest Airlines | 2,460 | 21,205 | Motorola Solutions | 238 | 10,017 |
| Stanley Black & Decker | 193 | 11,962 | NetApp | 850 a | 31,977 |
| Tyco International | 434 | 18,046 | NVIDIA | 750 a | 9,983 |
| Union Pacific | 3,301 | 304,253 | NXP Semiconductors | 9,410 a | 153,289 |
| United Parcel Service, Cl. B | 1,633 | 110,048 | Oracle | 19,115 | 536,558 |
| United Technologies | 4,597 | 341,327 | Paychex | 12,684 | 342,214 |
| Waste Management | 1,344 | 44,406 | QUALCOMM | 8,406 | 432,573 |
| 7,090,012 | Rovi | 13,053 a | 638,161 | ||
| Information Technology—17.2% | SAIC | 1,780 a | 26,700 | ||
| Accenture, Cl. A | 2,723 | 145,926 | Salesforce.com | 6,364 a | 819,365 |
| Acme Packet | 3,530 a | 166,228 | SanDisk | 180 a | 6,597 |
| Adobe Systems | 12,032 a | 303,688 | Symantec | 664 a | 11,388 |
| Altera | 278 | 10,116 | Teradata | 15,498 a | 811,475 |
| Amphenol, Cl. A | 7,417 | 348,451 | Texas Instruments | 2,559 | 67,071 |
| Analog Devices | 413 | 13,637 | Visa, Cl. A | 690 | 60,637 |
| Apple | 5,462 a | 2,101,941 | Western Union | 1,042 | 17,214 |
| Applied Materials | 3,270 | 37,016 | Xilinx | 304 | 9,467 |
| ARM Holdings, ADR | 14,030 | 386,947 | Yahoo! | 3,192 a | 43,427 |
| Autodesk | 384 a | 10,829 | 12,986,356 | ||
| Automatic Data Processing | 7,587 | 379,578 | Materials—3.5% | ||
| Baidu, ADR | 4,716 a | 687,498 | Air Products & Chemicals | 3,109 | 254,534 |
| Broadcom, Cl. A | 1,070 a | 38,145 | Alcoa | 840 | 10,760 |
| Cisco Systems | 22,292 | 349,539 | Allegheny Technologies | 530 | 26,564 |
| Citrix Systems | 184 a | 11,119 | Bemis | 191 | 5,932 |
| Cognizant Technology | Celanese, Ser. A | 15,654 | 735,895 | ||
| Solutions, Cl. A | 811 a | 51,458 | Cliffs Natural Resources | 3,787 | 313,753 |
| Compuware | 918 a | 7,766 | Dow Chemical | 1,086 | 30,897 |
| Dell | 2,432 a | 36,152 | E.I. du Pont de Nemours & Co. | 781 | 37,699 |
| EMC | 14,990 a | 338,624 | Ecolab | 1,032 | 55,315 |
| Fidelity National | Freeport-McMoRan Copper & Gold | 4,994 | 235,417 | ||
| Information Services | 1,100 | 30,998 | International Paper | 404 | 10,969 |
| Fiserv | 346 a | 19,317 | Monsanto | 6,101 | 420,542 |
| FLIR Systems | 10,016 | 259,114 | Newmont Mining | 810 | 50,722 |
| Google, Cl. A | 988 a | 534,468 | PPG Industries | 158 | 12,101 |
| Hewlett-Packard | 3,578 | 93,135 | |||
54
| BNY Mellon Tax-Sensitive Large Cap Multi-Strategy Fund (continued) | |||||
| Common Stocks (continued) | Shares | Value ($) | Shares | Value ($) | |
| Materials (continued) | Utilities (continued) | ||||
| Praxair | 3,927 | 386,770 | NRG Energy | 1,050 a | 24,612 |
| Sigma-Aldrich | 276 | 17,772 | Pepco Holdings | 285 | 5,552 |
| Vulcan Materials | 679 | 23,785 | Pinnacle West Capital | 375 | 16,590 |
| 2,629,427 | Sempra Energy | 4,783 | 251,203 | ||
| Telecommunication Services—1.1% | Southern | 1,463 | 60,510 | ||
| American Tower, Cl. A | 925 a | 49,821 | TECO Energy | 1,040 | 19,032 |
| AT&T | 15,680 | 446,566 | Wisconsin Energy | 878 | 27,780 |
| CenturyLink | 1,410 | 50,972 | 828,838 | ||
| Frontier Communications | 1,078 | 8,074 | Total Common Stocks | ||
| Sprint Nextel | 4,694 a | 17,649 | (cost $59,535,527) | 61,133,989 | |
| Verizon Communications | 7,380 | 266,935 | |||
| 840,017 | Other Investment—20.9% | ||||
| Utilities—1.1% | Registered Investment Companies: | ||||
| AES | 1,483 a | 16,105 | BNY Mellon U.S. Core | ||
| American Electric Power | 1,260 | 48,674 | Equity 130/30 Fund, Cl. M | 1,208,213 c | 13,084,944 |
| CenterPoint Energy | 1,210 | 24,212 | Dreyfus Institutional Preferred | ||
| CMS Energy | 2,676 | 52,717 | Money Market Fund | 2,666,000 d | 2,666,000 |
| Constellation Energy Group | 700 | 26,943 | Total Other Investment | ||
| (cost $16,258,842) | 15,750,944 | ||||
| Dominion Resources | 333 | 16,230 | |||
| DTE Energy | 540 | 27,302 | Total Investments | ||
| Duke Energy | 3,083 | 58,300 | (cost $75,794,369) | 102.0% | 76,884,933 |
| Exelon | 1,219 | 52,563 | Liabilities, Less Cash | ||
| NextEra Energy | 980 | 55,586 | and Receivables | (2.0%) | (1,547,462) |
| NiSource | 1,010 | 21,574 | Net Assets | 100.0% | 75,337,471 |
| Northeast Utilities | 673 | 23,353 | |||
ADR—American Depository Receipts
| a | Non-income producing security. |
| b | Investment in real estate investment trust. |
| c | Investment in affiliated mutual fund. |
| d | Investment in affiliated money market mutual fund. |
| Portfolio Summary (Unaudited) † | |||
| Value (%) | Value (%) | ||
| Mutual Funds: Domestic | 17.4 | Consumer Staples | 7.7 |
| Information Technology | 17.2 | Money Market Investments | 3.5 |
| Health Care | 11.5 | Materials | 3.5 |
| Energy | 11.0 | Telecommunication Services | 1.1 |
| Consumer Discretionary | 10.5 | Utilities | 1.1 |
| Industrial | 9.4 | ||
| Financial | 8.1 | 102.0 | |
| † Based on net assets. | |||
| See notes to financial statements. | |||
| The Funds | 55 |
| STATEMENT OF INVESTMENTS | |||||
| August 31, 2011 | |||||
| BNY Mellon Income Stock Fund | |||||
| Common Stocks—97.5% | Shares | Value ($) | Shares | Value ($) | |
| Consumer Discretionary—13.3% | Industrial (continued) | ||||
| Carnival | 49,540 | 1,636,306 | Dover | 59,160 | 3,402,883 |
| Johnson Controls | 61,600 a | 1,963,808 | Eaton | 38,230 | 1,641,979 |
| McGraw-Hill | 65,520 a | 2,759,047 | General Electric | 516,102 | 8,417,624 |
| Omnicom Group | 152,610 | 6,188,336 | Hubbell, Cl. B | 29,500 a | 1,744,335 |
| Regal Entertainment Group, Cl. A | 521,650 a | 6,817,965 | Pitney Bowes | 171,050 a | 3,474,026 |
| Time Warner | 250,640 a | 7,935,262 | Stanley Black & Decker | 31,560 a | 1,956,089 |
| 27,300,724 | United Technologies | 24,280 a | 1,802,790 | ||
| Consumer Staples—15.1% | 23,506,246 | ||||
| ConAgra Foods | 121,670 a | 2,971,181 | Information Technology—3.7% | ||
| Dr. Pepper Snapple Group | 56,360 a | 2,168,733 | Cisco Systems | 107,240 | 1,681,523 |
| Kraft Foods, Cl. A | 100,790 | 3,529,666 | Paychex | 39,860 a | 1,075,423 |
| Lorillard | 54,110 a,b | 6,028,936 | QUALCOMM | 95,930 | 4,936,558 |
| PepsiCo | 125,360 | 8,076,945 | 7,693,504 | ||
| Procter & Gamble | 130,880 | 8,334,438 | Materials—3.3% | ||
| 31,109,899 | Air Products & Chemicals | 23,660 a | 1,937,044 | ||
| Energy—5.5% | Dow Chemical | 63,370 | 1,802,877 | ||
| Exxon Mobil | 115,920 a | 8,582,717 | Eastman Chemical | 24,390 | 2,017,785 |
| Occidental Petroleum | 31,880 | 2,765,271 | Freeport-McMoRan Copper & Gold | 22,630 | 1,066,778 |
| 11,347,988 | 6,824,484 | ||||
| Financial—11.7% | Telecommunication | ||||
| Arthur J. Gallagher & Co. | 54,830 | 1,546,754 | Services—8.7% | ||
| Comerica | 98,810 a | 2,528,548 | AT&T | 127,925 | 3,643,304 |
| JPMorgan Chase & Co. | 226,149 | 8,494,156 | Vodafone Group, ADR | 233,000 | 6,137,220 |
| Marsh & McLennan | 80,780 a | 2,400,782 | Windstream | 638,342 a | 8,106,943 |
| MetLife | 52,950 | 1,779,120 | 17,887,467 | ||
| New York Community Bancorp | 287,980 | 3,689,024 | Utilities—15.6% | ||
| U.S. Bancorp | 155,490 a | 3,608,923 | Dominion Resources | 86,890 a,b | 4,235,019 |
| 24,047,307 | DTE Energy | 44,020 a | 2,225,651 | ||
| Health Care—9.2% | Exelon | 180,710 a | 7,792,215 | ||
| Johnson & Johnson | 122,150 | 8,037,470 | National Grid, ADR | 78,450 b | 3,978,984 |
| Merck & Co. | 54,100 | 1,791,792 | NextEra Energy | 107,100 b | 6,074,712 |
| Pfizer | 477,128 | 9,055,889 | PPL | 269,430 | 7,781,138 |
| 18,885,151 | 32,087,719 | ||||
| Industrial—11.4% | Total Common Stocks | ||||
| Caterpillar | 11,720 a | 1,066,520 | (cost $194,252,907) | 200,690,489 | |
56
| BNY Mellon Income Stock Fund (continued) | |||||
| Investment of Cash Collateral | |||||
| Preferred Stocks—.8% | Shares | Value ($) | for Securities Loaned—21.2% | Shares | Value ($) |
| Financial | Registered Investment Company; | ||||
| Citigroup, | Dreyfus Institutional Cash | ||||
| Conv., Cum. $7.5 | Advantage Fund | ||||
| (cost $2,075,695) | 16,850 | 1,594,179 | (cost $43,732,836) | 43,732,836 c | 43,732,836 |
| Total Investments | |||||
| Other Investment—4.9% | (cost $250,065,438) | 124.4% | 256,021,504 | ||
| Registered Investment Company; | Liabilities, Less Cash | ||||
| Dreyfus Institutional Preferred | and Receivables | (24.4%) | (50,180,042) | ||
| Plus Money Market Fund | |||||
| (cost $10,004,000) | 10,004,000 c | 10,004,000 | Net Assets | 100.0% | 205,841,462 |
| ADR—American Depository Receipts |
| a Security, or portion thereof, on loan.At August 31, 2011, the value of the fund’s securities on loan was $42,931,518 and the |
| value of the collateral held by the fund was $43,732,836. |
| b Held by broker as collateral for open options written. |
| c Investment in affiliated money market mutual fund. |
| Portfolio Summary (Unaudited) † | |||
| Value (%) | Value (%) | ||
| Money Market Investments | 26.1 | Health Care | 9.2 |
| Utilities | 15.6 | Telecommunication Services | 8.7 |
| Consumer Staples | 15.1 | Energy | 5.5 |
| Consumer Discretionary | 13.3 | Information Technology | 3.7 |
| Financial | 12.5 | Materials | 3.3 |
| Industrial | 11.4 | 124.4 | |
| † Based on net assets. |
| See notes to financial statements. |
| The Funds | 57 |
| STATEMENT OF OPTIONS WRITTEN |
| August 31, 2011 |
| BNY Mellon | Number of | ||
| Income Stock Fund | Contracts | Value ($) | |
| Call Options: | |||
| Dominion Resources, | |||
| January 2012 @ $50 | 261 | a | (52,200) |
| Lorillard, | |||
| September 2011 @ $120 | 176 | a | (4,400) |
| National Grid, | |||
| December 2011 @ $50 | 265 | a | (67,575) |
| Nextera Energy, | |||
| December 2011 @ $55 | 246 | a | (81,180) |
| (premiums received $127,392) | (205,355) | ||
| a Non-income producing security. | |||
| See notes to financial statements. | |||
58
| STATEMENT OF INVESTMENTS | |||||
| August 31, 2011 | |||||
| BNY Mellon Mid Cap Stock Fund | |||||
| Common Stocks—98.5% | Shares | Value ($) | Shares | Value ($) | |
| Consumer Discretionary—14.3% | Energy (continued) | ||||
| Abercrombie & Fitch, Cl. A | 144,000 | 9,159,840 | Oil States International | 164,500 a,b | 10,870,160 |
| Avon Products | 283,800 | 6,402,528 | Patterson-UTI Energy | 429,700 | 10,501,868 |
| BorgWarner | 138,400 a,b | 9,880,376 | SandRidge Energy | 935,000 a,b | 6,862,900 |
| Chico’s FAS | 851,300 a | 11,850,096 | SM Energy | 162,800 | 12,454,200 |
| Coach | 122,700 | 6,898,194 | 118,617,085 | ||
| Darden Restaurants | 155,800 a | 7,493,980 | Financial—18.2% | ||
| Deckers Outdoor | 167,200 a,b | 14,874,112 | Affiliated Managers Group | 131,800 b | 11,487,688 |
| Foot Locker | 545,600 | 11,386,672 | Alexandria Real Estate Equities | 155,800 a,c | 11,343,798 |
| Fossil | 138,300 b | 13,361,163 | Boston Properties | 97,200 a,c | 10,136,988 |
| Lear | 196,600 | 9,393,548 | Camden Property Trust | 250,800 a,c | 16,758,456 |
| Mattel | 295,600 a | 7,942,772 | CB Richard Ellis Group, Cl. A | 449,300 b | 6,811,388 |
| PVH | 321,200 | 21,411,192 | CNO Financial Group | 1,999,200 a,b | 12,854,856 |
| Royal Caribbean Cruises | 321,200 a | 8,338,352 | East West Bancorp | 401,300 a | 6,697,697 |
| Tempur-Pedic International | 158,900 b | 9,254,336 | Endurance Specialty Holdings | 187,400 | 6,776,384 |
| Tupperware Brands | 209,100 | 13,905,150 | EZCORP, Cl. A | 208,200 a,b | 6,985,110 |
| Ulta Salon, Cosmetics & Fragrance | 156,600 a,b | 9,251,928 | Hartford Financial Services Group | 320,600 a | 6,136,284 |
| Visteon | 129,500 b | 6,614,860 | Host Hotels & Resorts | 798,259 a,c | 9,443,404 |
| Vitamin Shoppe | 220,700 a,b | 9,777,010 | Huntington Bancshares | 1,701,700 | 8,559,551 |
| 187,196,109 | Macerich | 293,100 c | 14,373,624 | ||
| Consumer Staples—4.2% | Prosperity Bancshares | 227,500 a | 8,610,875 | ||
| Energizer Holdings | 199,800 b | 15,080,904 | Raymond James Financial | 331,300 a | 9,302,904 |
| Green Mountain Coffee Roasters | 128,200 b | 13,427,668 | Rayonier | 338,529 a,c | 14,197,906 |
| Hansen Natural | 139,900 b | 11,936,268 | Reinsurance Group of America | 221,200 | 11,805,444 |
| Ralcorp Holdings | 65,800 b | 5,696,306 | Signature Bank | 137,100 b | 7,624,131 |
| Spectrum Brands Holdings | 341,200 b | 9,137,336 | SL Green Realty | 137,200 a,c | 9,911,328 |
| 55,278,482 | Transatlantic Holdings | 196,300 | 9,938,669 | ||
| Energy—9.1% | Waddell & Reed Financial, Cl. A | 296,900 | 9,269,218 | ||
| Atwood Oceanics | 242,300 a,b | 10,198,407 | Webster Financial | 547,100 | 9,902,510 |
| Brigham Exploration | 349,300 b | 10,164,630 | Weingarten Realty Investors | 489,200 a,c | 11,921,804 |
| Cabot Oil & Gas | 134,400 | 10,195,584 | Willis Group Holdings | 192,900 a | 7,548,177 |
| CARBO Ceramics | 78,100 a | 12,507,715 | 238,398,194 | ||
| Complete Production Services | 201,200 a,b | 5,846,872 | Health Care—11.2% | ||
| Dresser-Rand Group | 100,900 b | 4,283,205 | Abiomed | 437,800 b | 5,446,232 |
| EQT | 152,400 a | 9,116,568 | Alere | 190,000 b | 4,744,300 |
| HollyFrontier | 217,600 | 15,614,976 | |||
| The Funds | 59 |
| STATEMENT OF INVESTMENTS (continued) | |||||
| BNY Mellon Mid Cap Stock Fund (continued) | |||||
| Common Stocks (continued) | Shares | Value ($) | Shares | Value ($) | |
| Health Care (continued) | Industrial (continued) | ||||
| Health Management | Tech Data | 149,800 b | 7,052,584 | ||
| Associates, Cl. A | 1,025,000 b | 8,425,500 | Towers Watson & Co., Cl. A | 182,500 | 10,765,675 |
| Hologic | 680,100 b | 11,316,864 | Triumph Group | 222,000 a | 11,628,360 |
| Humana | 111,300 | 8,641,332 | United Rentals | 304,300 a,b | 5,075,724 |
| Kindred Healthcare | 375,400 a,b | 4,857,676 | WABCO Holdings | 144,000 b | 6,717,600 |
| MAP Pharmaceuticals | 439,200 b | 6,148,800 | Waste Connections | 406,300 a | 14,053,917 |
| Medicis Pharmaceutical, Cl. A | 321,300 a | 12,498,570 | 210,905,597 | ||
| Mednax | 162,000 b | 10,580,220 | Information Technology—14.3% | ||
| NxStage Medical | 408,600 a,b | 7,514,154 | Acme Packet | 159,700 a,b | 7,520,273 |
| Pharmasset | 58,700 b | 7,708,484 | Alliance Data Systems | 155,500 a,b | 14,525,255 |
| Resmed | 180,300 a,b | 5,583,891 | Altera | 186,900 | 6,801,291 |
| SXC Health Solutions | 141,600 b | 7,744,104 | Aruba Networks | 226,900 a,b | 4,839,777 |
| Thoratec | 110,100 a,b | 3,772,026 | Atmel | 1,255,000 b | 11,433,050 |
| United Therapeutics | 156,800 b | 6,765,920 | Check Point Software Technologies | 169,800 a,b | 9,243,912 |
| Universal Health Services, Cl. B | 276,800 | 11,514,880 | Commvault Systems | 258,800 a,b | 8,775,908 |
| Vertex Pharmaceuticals | 258,600 a,b | 11,706,822 | Cypress Semiconductor | 758,400 a,b | 12,013,056 |
| Warner Chilcott, Cl. A | 332,800 | 5,677,568 | Equinix | 135,900 b | 12,780,036 |
| Zoll Medical | 139,500 a,b | 6,232,860 | Fairchild Semiconductor | ||
| 146,880,203 | International | 553,500 b | 7,339,410 | ||
| Industrial—16.1% | Informatica | 269,400 b | 11,255,532 | ||
| AMETEK | 408,175 | 15,951,479 | IPG Photonics | 135,300 b | 7,844,694 |
| BE Aerospace | 332,300 a,b | 11,574,009 | MICROS Systems | 250,400 b | 11,934,064 |
| Crane | 265,400 | 11,213,150 | Polycom | 489,600 b | 11,652,480 |
| Donaldson | 215,900 a | 12,733,782 | Rackspace Hosting | 347,200 a,b | 12,693,632 |
| Flowserve | 76,000 a | 7,169,840 | Riverbed Technology | 381,400 a,b | 9,451,092 |
| Gardner Denver | 166,800 | 13,142,172 | Rovi | 140,000 a,b | 6,844,600 |
| IDEX | 277,800 | 10,328,604 | Teradata | 126,300 b | 6,613,068 |
| JB Hunt Transport Services | 268,600 a | 10,795,034 | TIBCO Software | 605,900 b | 13,560,042 |
| Joy Global | 82,700 a | 6,901,315 | 187,121,172 | ||
| Kansas City Southern | 272,300 b | 14,747,768 | Materials—6.7% | ||
| KBR | 464,500 | 13,958,225 | Ashland | 94,500 | 5,009,445 |
| Manpower | 217,300 | 8,752,844 | Carpenter Technology | 310,800 a | 15,686,076 |
| Navistar International | 126,100 b | 5,220,540 | Cliffs Natural Resources | 165,300 | 13,695,105 |
| Nordson | 111,900 a | 4,912,410 | Cytec Industries | 201,300 | 9,139,020 |
| Roper Industries | 106,700 a | 8,210,565 | Globe Specialty Metals | 390,500 a | 6,540,875 |
60
| BNY Mellon Mid Cap Stock Fund (continued) | |||||
| Common Stocks (continued) | Shares | Value ($) | Other Investment—1.2% | Shares | Value ($) |
| Materials (continued) | Registered | ||||
| Kronos Worldwide | 355,700 a | 7,786,273 | Investment Company; | ||
| Molycorp | 193,000 a,b | 10,908,360 | Dreyfus Institutional Preferred | ||
| NewMarket | 50,800 a | 8,518,144 | Plus Money Market Fund | ||
| (cost $15,997,000) | 15,997,000 d 15,997,000 | ||||
| Rock-Tenn, Cl. A | 70,000 | 3,756,900 | |||
| Rockwood Holdings | 131,000 b | 6,681,000 | Investment of Cash Collateral | ||
| 87,721,198 | for Securities Loaned—13.4% | ||||
| Telecommunication Services—.8% | Registered | ||||
| TW Telecom | 555,200 a,b | 10,709,808 | Investment Company; | ||
| Utilities—3.6% | Dreyfus Institutional Cash | ||||
| ITC Holdings | 188,400 a | 14,254,344 | Advantage Fund | ||
| (cost $174,890,111) | 174,890,111 d 174,890,111 | ||||
| National Fuel Gas | 99,500 | 6,104,325 | |||
| Northeast Utilities | 221,900 | 7,699,930 | Total Investments | ||
| Questar | 425,000 | 7,964,500 | (cost $1,413,854,397) | 113.1% | 1,481,292,986 |
| Wisconsin Energy | 365,200 a | 11,554,928 | Liabilities, Less Cash | ||
| 47,578,027 | and Receivables | (13.1%) | (172,017,061) | ||
| Total Common Stocks | Net Assets | 100.0% | 1,309,275,925 | ||
| (cost $1,222,967,286) | 1,290,405,875 | ||||
| a Security, or portion thereof, on loan.At August 31, 2011, the value of the fund’s securities on loan was $177,019,615 and the value of the collateral held by the fund was |
| $181,531,744, consisting of cash collateral of $174,890,111 and US Government and agency securities valued at $6,641,633. |
| b Non-income producing security. |
| c Investment in real estate investment trust. |
| d Investment in affiliated money market mutual fund. |
| Portfolio Summary (Unaudited) † | |||
| Value (%) | Value (%) | ||
| Financial | 18.2 | Energy | 9.1 |
| Industrial | 16.1 | Materials | 6.7 |
| Money Market Investments | 14.6 | Consumer Staples | 4.2 |
| Consumer Discretionary | 14.3 | Utilities | 3.6 |
| Information Technology | 14.3 | Telecommunication Services | .8 |
| Health Care | 11.2 | 113.1 | |
| † Based on net assets. | |||
| See notes to financial statements. | |||
| The Funds | 61 |
| STATEMENT OF INVESTMENTS | |||||
| August 31, 2011 | |||||
| BNY Mellon Small Cap Stock Fund | |||||
| Common Stocks—98.0% | Shares | Value ($) | Shares | Value ($) | |
| Consumer Discretionary—16.5% | Financial—18.9% | ||||
| Ameristar Casinos | 126,400 | 2,359,888 | Bank of the Ozarks | 146,300 | 3,323,936 |
| Chico’s FAS | 186,900 a | 2,601,648 | BioMed Realty Trust | 102,340 a,c | 1,871,799 |
| Cinemark Holdings | 155,500 a | 3,257,725 | CNO Financial Group | 411,700 b | 2,647,231 |
| Coinstar | 89,400 a,b | 4,075,746 | Colonial Properties Trust | 152,100 a,c | 3,197,142 |
| CROCS | 197,800 b | 5,411,808 | Endurance Specialty Holdings | 56,100 | 2,028,576 |
| Deckers Outdoor | 35,000 a,b | 3,113,600 | Entertainment Properties Trust | 72,370 a,c | 3,048,948 |
| DSW, Cl. A | 56,500 | 2,622,165 | EZCORP, Cl. A | 133,200 b | 4,468,860 |
| Finish Line, Cl. A | 181,000 a | 3,638,100 | F.N.B | 314,100 a | 2,817,477 |
| Hot Topic | 318,700 | 2,638,836 | First Cash Financial Services | 84,300 a,b | 3,937,653 |
| Krispy Kreme Doughnuts | 379,500 a,b | 3,449,655 | Hersha Hospitality Trust | 464,000 c | 1,721,440 |
| Lear | 84,600 | 4,042,188 | Home Properties | 30,500 a,c | 2,039,535 |
| MDC Partners, Cl. A | 181,500 a | 2,894,925 | Inland Real Estate | 295,900 a,c | 2,399,749 |
| Perry Ellis International | 78,070 b | 1,794,049 | Kilroy Realty | 82,100 a,c | 2,933,433 |
| Royal Caribbean Cruises | 93,300 a | 2,422,068 | Kite Realty Group Trust | 501,300 c | 2,150,577 |
| Ruth’s Hospitality Group | 597,700 a,b | 3,161,833 | Lexington Realty Trust | 365,000 a,c | 2,693,700 |
| Shuffle Master | 297,300 b | 2,634,078 | Pinnacle Financial Partners | 250,700 a,b | 3,178,876 |
| Sonic Automotive, Cl. A | 218,100 a | 3,027,228 | Post Properties | 87,600 c | 3,661,680 |
| Vitamin Shoppe | 79,000 b | 3,499,700 | Signature Bank | 86,040 a,b | 4,784,684 |
| Zagg | 181,600 a,b | 2,729,448 | Stifel Financial | 99,950 a,b | 3,006,496 |
| 59,374,688 | Strategic Hotels & Resorts | 438,900 b,c | 2,097,942 | ||
| Consumer Staples—4.1% | Texas Capital Bancshares | 111,700 a,b | 2,867,339 | ||
| Energizer Holdings | 45,400 b | 3,426,792 | Tower Group | 120,600 a | 2,895,606 |
| Ralcorp Holdings | 40,800 b | 3,532,056 | U-Store-It Trust | 208,900 c | 2,243,586 |
| Smart Balance | 581,700 b | 2,937,585 | Willis Group Holdings | 47,300 | 1,850,849 |
| Spectrum Brands Holdings | 114,900 b | 3,077,022 | 67,867,114 | ||
| United Natural Foods | 38,000 a,b | 1,545,460 | Health Care—12.3% | ||
| 14,518,915 | Abiomed | 150,900 b | 1,877,196 | ||
| Energy—5.8% | Achillion Pharmaceuticals | 249,500 a,b | 1,534,425 | ||
| Atwood Oceanics | 47,700 a,b | 2,007,693 | Amarin, ADR | 207,300 b | 2,386,023 |
| Basic Energy Services | 104,400 a,b | 2,282,184 | Cadence Pharmaceuticals | 279,100 a,b | 1,825,314 |
| Brigham Exploration | 62,100 b | 1,807,110 | Chemed | 41,600 | 2,414,880 |
| CARBO Ceramics | 11,500 a | 1,841,725 | Cooper | 31,200 | 2,348,424 |
| Gulfport Energy | 92,200 a,b | 2,664,580 | Cubist Pharmaceuticals | 49,900 a,b | 1,731,031 |
| ION Geophysical | 368,400 a,b | 2,604,588 | Kindred Healthcare | 130,800 a,b | 1,692,552 |
| Pioneer Drilling | 217,100 a,b | 2,744,144 | MAP Pharmaceuticals | 175,700 b | 2,459,800 |
| SandRidge Energy | 241,900 a,b | 1,775,546 | Merit Medical Systems | 149,575 b | 2,176,316 |
| Stone Energy | 110,100 b | 2,907,741 | NuVasive | 84,300 a,b | 2,042,589 |
| 20,635,311 | NxStage Medical | 163,500 b | 3,006,765 | ||
62
| BNY Mellon Small Cap Stock Fund (continued) | |||||
| Common Stocks (continued) | Shares | value ($) | Shares | Value ($) | |
| Health Care (continued) | Information | ||||
| Quality Systems | 38,600 a | 3,551,972 | Technology (continued) | ||
| Questcor Pharmaceuticals | 129,700 a,b | 3,897,485 | Anixter International | 52,100 a | 3,074,421 |
| Regeneron Pharmaceuticals | 56,500 a,b | 3,335,195 | Aruba Networks | 117,200 a,b | 2,499,876 |
| SXC Health Solutions | 46,600 b | 2,548,554 | Cardtronics | 136,300 a,b | 3,374,788 |
| Universal American | 265,900 | 2,922,241 | Cognex | 104,000 a | 3,328,000 |
| Zoll Medical | 53,900 b | 2,408,252 | Coherent | 38,800 a,b | 1,715,348 |
| 44,159,014 | Commvault Systems | 88,300 b | 2,994,253 | ||
| Industrial—16.1% | FARO Technologies | 21,800 b | 827,746 | ||
| Actuant, Cl. A | 156,400 a | 3,140,512 | FEI | 87,300 a,b | 2,792,727 |
| AMETEK | 46,450 | 1,815,266 | Fortinet | 106,300 b | 2,033,519 |
| BE Aerospace | 60,800 b | 2,117,664 | GT Advanced Technologies | 252,000 a,b | 3,076,920 |
| CLARCOR | 81,900 a | 3,811,626 | Interactive | ||
| Crane | 43,500 | 1,837,875 | Intelligence Group | 80,900 b | 2,614,688 |
| EMCOR Group | 85,300 a,b | 1,954,223 | IPG Photonics | 39,200 b | 2,272,816 |
| Esterline Technologies | 30,400 a,b | 2,288,816 | Littelfuse | 59,900 a | 2,778,761 |
| Gardner Denver | 27,200 | 2,143,088 | Logmein | 66,500 a,b | 2,078,125 |
| Hub Group, Cl. A | 84,900 b | 2,673,501 | MAXIMUS | 79,100 a | 2,925,909 |
| II-VI | 138,400 b | 2,734,092 | MicroStrategy, Cl. A | 14,100 b | 1,732,608 |
| Interface, Cl. A | 214,700 a | 3,237,676 | MKS Instruments | 131,700 a | 3,058,074 |
| Kansas City Southern | 38,900 b | 2,106,824 | Netgear | 96,100 a,b | 2,672,541 |
| KAR Auction Services | 151,200 b | 2,218,104 | OmniVision Technologies | 122,400 a,b | 2,252,160 |
| LSB Industries | 32,900 b | 1,314,355 | Rudolph Technologies | 227,100 b | 1,546,551 |
| Manpower | 29,200 | 1,176,176 | Sourcefire | 105,800 a,b | 2,922,196 |
| MasTec | 120,100 a,b | 2,666,220 | Taleo, Cl. A | 89,900 a,b | 2,320,319 |
| Navistar International | 35,100 b | 1,453,140 | Triquint Semiconductor | 257,300 a,b | 1,950,334 |
| Old Dominion Freight Line | 76,200 a,b | 2,447,544 | Ultratech | 89,900 b | 1,835,758 |
| Robbins & Myers | 84,600 | 4,065,030 | Veeco Instruments | 52,000 a,b | 1,890,720 |
| SYKES Enterprises | 131,900 a,b | 2,064,235 | Wright Express | 68,900 a,b | 2,903,446 |
| Towers Watson & Co., Cl. A | 35,600 | 2,100,044 | 68,240,904 | ||
| TransDigm Group | 31,700 b | 2,911,962 | Materials—4.2% | ||
| Triumph Group | 46,100 | 2,414,718 | American Vanguard | 25,800 | 308,052 |
| United Rentals | 97,000 a,b | 1,617,960 | Buckeye Technologies | 113,700 a | 3,091,503 |
| WABCO Holdings | 34,200 b | 1,595,430 | Globe Specialty Metals | 166,800 | 2,793,900 |
| 57,906,081 | Haynes International | 25,400 | 1,473,962 | ||
| Information | Kronos Worldwide | 72,347 | 1,583,676 | ||
| Technology—19.0% | PolyOne | 231,300 a | 2,921,319 | ||
| Acme Packet | 48,100 b | 2,265,029 | RTI International Metals | 114,300 b | 3,044,952 |
| Ancestry.com | 70,100 a,b | 2,503,271 | 15,217,364 | ||
| The Funds | 63 |
| STATEMENT OF INVESTMENTS (continued) | |||||
| BNY Mellon Small Cap Stock Fund (continued) | |||||
| Investment of Cash Collateral | |||||
| Common Stocks (continued) | Shares | Value ($) | for Securities Loaned—29.5% | Shares | Value ($) |
| Utilities—1.1% | Registered Investment Company; | ||||
| Cleco | 107,700 a | 3,826,581 | Dreyfus Institutional Cash | ||
| Total Common Stocks | Advantage Fund | ||||
| (cost $364,992,793) | 351,745,972 | (cost $106,062,686) | 106,062,686 d | 106,062,686 | |
| Total Investments | |||||
| Other Investment—2.7% | (cost $480,736,479) | 130.2% | 467,489,658 | ||
| Registered Investment Company; | Liabilities, Less Cash | ||||
| Dreyfus Institutional Preferred | and Receivables | (30.2%) | (108,552,833) | ||
| Plus Money Market Fund | |||||
| Net Assets | 100.0% | 358,936,825 | |||
| (cost $9,681,000) | 9,681,000 d | 9,681,000 | |||
| ADR—American Depository Receipts |
| a Security, or portion thereof, on loan.At August 31, 2011, the value of the fund’s securities on loan was $103,307,186 and the value of the collateral held by the fund was |
| $106,062,686. |
| b Non-income producing security. |
| c Investment in real estate investment trust. |
| d Investment in affiliated money market mutual fund. |
| Portfolio Summary (Unaudited) † | |||
| Value (%) | Value (%) | ||
| Money Market Investments | 32.2 | Energy | 5.8 |
| Information Technology | 19.0 | Materials | 4.2 |
| Financial | 18.9 | Consumer Staples | 4.1 |
| Consumer Discretionary | 16.5 | Utilities | 1.1 |
| Industrial | 16.1 | ||
| Health Care | 12.3 | 130.2 | |
| † Based on net assets. | |||
| See notes to financial statements. | |||
64
| STATEMENT OF INVESTMENTS | |||||
| August 31, 2011 | |||||
| BNY Mellon U.S. Core Equity 130/30 Fund | |||||
| Common Stocks—124.8% | Shares | Value ($) | Shares | Value ($) | |
| Consumer Discretionary—14.7% | Energy (continued) | ||||
| Amazon.com | 19,390 a,b | 4,174,473 | ENSCO, ADR | 70,490 | 3,401,847 |
| Carnival | 133,980 b | 4,425,359 | Halliburton | 90,890 b | 4,032,789 |
| CBS, Cl. B | 106,760 b | 2,674,338 | Hess | 65,390 b | 3,880,243 |
| DIRECTV, Cl. A | 102,120 a,b | 4,490,216 | National Oilwell Varco | 90,330 | 5,972,620 |
| Guess? | 78,880 b | 2,690,597 | Occidental Petroleum | 35,760 | 3,101,822 |
| Limited Brands | 73,090 b | 2,758,417 | TransCanada | 26,280 | 1,133,982 |
| Macy’s | 92,740 | 2,406,603 | 38,239,732 | ||
| Mattel | 163,870 b | 4,403,187 | Financial—15.3% | ||
| McDonald’s | 54,260 | 4,908,360 | American Express | 87,470 b | 4,348,134 |
| Melco Crown Entertainment, ADR | 398,540 a | 5,181,020 | Ameriprise Financial | 35,900 b | 1,640,630 |
| Omnicom Group | 138,930 b | 5,633,612 | AON | 24,600 | 1,149,558 |
| Viacom, Cl. B | 91,400 | 4,409,136 | Bank of America | 267,910 b | 2,188,825 |
| 48,155,318 | Capital One Financial | 143,960 b | 6,629,358 | ||
| Consumer Staples—12.2% | Citigroup | 130,386 | 4,048,485 | ||
| Coca-Cola Enterprises | 128,400 b | 3,546,408 | Discover Financial Services | 75,340 | 1,895,554 |
| ConAgra Foods | 106,920 b | 2,610,986 | Hartford Financial Services Group | 272,050 b | 5,207,037 |
| Hansen Natural | 18,100 a | 1,544,292 | IntercontinentalExchange | 13,860 a | 1,634,787 |
| Kimberly-Clark | 67,170 b | 4,645,477 | JPMorgan Chase & Co. | 76,240 b | 2,863,574 |
| Lorillard | 13,990 | 1,558,766 | Lincoln National | 161,240 b | 3,345,730 |
| PepsiCo | 161,540 b | 10,408,022 | Marsh & McLennan | 46,430 | 1,379,900 |
| Unilever, ADR | 298,750 b | 10,079,825 | MetLife | 77,710 b | 2,611,056 |
| Walgreen | 99,950 b | 3,519,240 | Public Storage | 22,600 c | 2,796,298 |
| Whole Foods Market | 33,000 b | 2,178,990 | Wells Fargo & Co. | 318,290 b | 8,307,369 |
| 40,092,006 | 50,046,295 | ||||
| Energy—11.7% | Health Care—23.2% | ||||
| Anadarko Petroleum | 54,010 | 3,983,238 | Amarin, ADR | 86,780 a | 998,838 |
| Apache | 30,080 b | 3,100,346 | Baxter International | 129,830 b | 7,267,883 |
| Chevron | 97,390 b | 9,632,845 | Biogen Idec | 19,800 a | 1,865,160 |
| The Funds | 65 |
STATEMENT OF INVESTMENTS (continued)
| BNY Mellon U.S. Core Equity 130/30 Fund (continued) | |||||
| Common Stocks (continued) | Shares | Value ($) | Shares | Value ($) | |
| Health Care (continued) | Industrial (continued) | ||||
| CIGNA | 107,150 b | 5,008,191 | United Technologies | 21,770 b | 1,616,422 |
| Covidien | 152,140 b | 7,938,665 | 29,812,882 | ||
| Cubist Pharmaceuticals | 55,520 a | 1,925,989 | Information Technology—26.4% | ||
| Express Scripts | 39,540 a | 1,856,008 | Alliance Data Systems | 52,860 a,b | 4,937,653 |
| McKesson | 79,220 | 6,332,055 | Apple | 39,890 a,b | 15,350,869 |
| Medicis Pharmaceutical, Cl. A | 26,690 | 1,038,241 | BMC Software | 53,760 a,b | 2,183,194 |
| Pfizer | 511,150 b | 9,701,627 | Cognizant Technology | ||
| Salix Pharmaceuticals | 32,000 a | 974,400 | Solutions, Cl. A | 41,610 a,b | 2,640,155 |
| Sanofi, ADR | 154,650 | 5,655,551 | Electronic Arts | 333,600 a,b | 7,532,688 |
| St. Jude Medical | 140,180 b | 6,383,797 | EMC | 197,370 a | 4,458,588 |
| Thermo Fisher Scientific | 30,340 a | 1,666,576 | F5 Networks | 47,430 a | 3,871,237 |
| UnitedHealth Group | 40,290 | 1,914,581 | Google, Cl. A | 3,920 a | 2,120,563 |
| Vertex Pharmaceuticals | 37,350 a | 1,690,835 | Informatica | 39,550 a | 1,652,399 |
| Warner Chilcott, Cl. A | 269,850 b | 4,603,641 | International Business Machines | 28,330 b | 4,870,210 |
| Watson Pharmaceuticals | 69,280 a | 4,650,074 | Intuit | 66,310 | 3,271,072 |
| Zimmer Holdings | 83,370 a,b | 4,742,919 | NetApp | 242,320 a,b | 9,116,078 |
| 76,215,031 | Oracle | 174,620 b | 4,901,583 | ||
| Industrial—9.1% | QUALCOMM | 148,700 b | 7,652,102 | ||
| Caterpillar | 18,810 | 1,711,710 | RenaissanceRe Holdings | 17,520 | 1,148,786 |
| Cummins | 33,620 b | 3,123,970 | Riverbed Technology | 123,510 a | 3,060,578 |
| Dover | 58,030 b | 3,337,886 | Symantec | 139,670 a | 2,395,340 |
| Eaton | 35,120 | 1,508,404 | Teradata | 105,890 a | 5,544,400 |
| General Electric | 494,400 b | 8,063,664 | 86,707,495 | ||
| Goodrich | 18,940 | 1,689,069 | Materials—3.0% | ||
| Norfolk Southern | 50,900 b | 3,444,912 | Alcoa | 289,890 b | 3,713,491 |
| Owens Corning | 50,750 a,b | 1,474,795 | CF Industries Holdings | 11,860 b | 2,168,245 |
| Thomas & Betts | 39,430 a | 1,722,302 | E.I. du Pont de Nemours & Co. | 84,460 | 4,076,884 |
| Tyco International | 50,980 b | 2,119,748 | 9,958,620 | ||
66
| BNY Mellon U.S. Core Equity 130/30 Fund (continued) | |||||
| Common Stocks (continued) | Shares | Value ($) | Other Investment—.2% | Shares | Value ($) |
| Telecommunication Services—2.7% | Registered Investment Company; | ||||
| AT&T | 304,200 b | 8,663,616 | Dreyfus Institutional Preferred | ||
| Utilities—6.5% | Plus Money Market Fund | ||||
| Exelon | 81,190 | 3,500,913 | (cost $786,000) | 786,000 d | 786,000 |
| NextEra Energy | 203,250 b | 11,528,340 | Total Investments | ||
| PPL | 222,140 b | 6,415,403 | (cost $404,110,615) | 125.0% | 410,121,651 |
| 21,444,656 | Liabilities, Less Cash and Receivables | (25.0%) | (82,153,955) | ||
| Total Common Stocks | |||||
| (cost $403,324,615) | 409,335,651 | Net Assets | 100.0% | 327,967,696 | |
| ADR—American Depository Receipts | |
| a | Non-income producing security. |
| b | Held by broker as collateral for open short positions. |
| c | Investment in real estate investment trust. |
| d | Investment in affiliated money market mutual fund. |
| Portfolio Summary (Unaudited) † | |||
| Value (%) | Value (%) | ||
| Information Technology | 26.4 | Industrial | 9.1 |
| Health Care | 23.2 | Utilities | 6.5 |
| Financial | 15.3 | Materials | 3.0 |
| Consumer Discretionary | 14.7 | Telecommunication Services | 2.7 |
| Consumer Staples | 12.2 | Money Market Investment | .2 |
| Energy | 11.7 | 125.0 | |
| † Based on net assets. | |||
| See notes to financial statements. | |||
| The Funds | 67 |
| STATEMENT OF SECURITIES SOLD SHORT |
| August 31, 2011 |
| BNY Mellon U.S. Core Equity 130/30 Fund | |||||
| Common Stocks—25.3% | Shares | Value ($) | Shares | Value ($) | |
| Consumer Discretionary—4.4% | Health Care (continued) | ||||
| Analog Devices | 29,350 | 969,137 | Edwards Lifesciences | 26,350 a | 1,988,107 |
| Kohl’s | 52,920 | 2,452,313 | Haemonetics | 33,490 a | 2,093,460 |
| Marriott International, Cl. A | 72,840 | 2,132,755 | Novo Nordisk, ADR | 39,650 | 4,229,069 |
| MKS Instruments | 53,160 | 1,234,375 | Owens & Minor | 65,260 | 1,921,254 |
| Thomson Reuters | 135,320 | 4,186,801 | Quest Diagnostics | 22,850 | 1,144,100 |
| Wynn Resorts | 21,580 | 3,338,858 | Regeneron Pharmaceuticals | 32,450 a | 1,915,524 |
| 14,314,239 | Varian Medical Systems | 33,740 a | 1,921,830 | ||
| Consumer Staples—.9% | VCA Antech | 104,120 a | 1,927,261 | ||
| Hormel Foods | 53,490 | 1,476,859 | 27,608,491 | ||
| Sysco | 46,460 | 1,297,628 | Industrial—1.9% | ||
| 2,774,487 | Boeing | 48,620 | 3,250,733 | ||
| Exchange Traded Funds—.5% | Lockheed Martin | 29,920 | 2,219,765 | ||
| Standard & Poor’s Depository | Nvidia | 60,950 a | 811,244 | ||
| Receipts S&P 500 ETF Trust | 13,820 | 1,689,080 | 6,281,742 | ||
| Financial—4.0% | Information | ||||
| BlackRock | 14,910 | 2,456,423 | Technology—4.0% | ||
| Federated Investors, Cl. B | 54,960 | 973,342 | Adobe Systems | 51,720 a | 1,305,413 |
| Goldman Sachs Group | 13,910 | 1,616,620 | Altera | 57,750 | 2,101,522 |
| Jefferies Group | 219,010 | 3,593,954 | Hewlett-Packard | 102,690 | 2,673,021 |
| Legg Mason | 70,650 | 2,011,405 | Infosys Technologies, ADR | 44,080 | 2,275,410 |
| Progressive | 62,610 | 1,200,860 | Intel | 40,340 | 812,044 |
| T. Rowe Price Group | 24,470 | 1,308,656 | Microsoft | 89,120 | 2,370,592 |
| 13,161,260 | ON Semiconductor | 114,740 a | 834,160 | ||
| Health Care—8.4% | Research In Motion | 25,230 a | 819,723 | ||
| AstraZeneca, ADR | 39,180 | 1,857,916 | 13,191,885 | ||
| Auxilium Pharmaceuticals | 59,600 a | 1,013,796 | Materials—1.2% | ||
| C.R. Bard | 8,590 | 818,283 | Greif, Cl. A | 73,210 | 4,089,510 |
| Covance | 46,730 a | 2,315,939 | Total Securities Sold Short | ||
| Dentsply International | 126,760 | 4,461,952 | (proceeds $89,033,763) | 83,110,694 | |
| ADR—American Depository Receipts |
| a Non-income producing security. |
| Portfolio Summary (Unaudited) † | |||
| Value (%) | Value (%) | ||
| Health Care | 8.4 | Industrial | 1.9 |
| Information Technology | 4.0 | Materials | 1.2 |
| Consumer Discretionary | 4.4 | Exchange Traded Funds | .5 |
| Financial | 4.0 | ||
| Consumer Staples | .9 | 25.3 | |
| † Based on net assets. |
| See notes to financial statements. |
68
| STATEMENT OF INVESTMENTS |
| August 31, 2011 |
| BNY Mellon Focused Equity Opportunities Fund | |||||
| Common Stocks—99.5% | Shares | Value ($) | Shares | Value ($) | |
| Consumer | Financial (continued) | ||||
| Discretionary—12.0% | Invesco | 506,660 | 9,271,878 | ||
| Arcos Dorados | 47,693,203 | ||||
| Holdings, Cl. A | 350,270 | 9,656,944 | Health Care—13.9% | ||
| Johnson Controls | 400,555 | 12,769,693 | Agilent Technologies | 356,330 a | 13,137,887 |
| Las Vegas Sands | 349,970 a | 16,298,103 | Baxter International | 238,100 | 13,328,838 |
| Walt Disney | 356,715 | 12,149,713 | Covidien | 278,575 | 14,536,044 |
| 50,874,453 | Watson Pharmaceuticals | 265,500 a | 17,820,360 | ||
| Consumer Staples—7.3% | 58,823,129 | ||||
| Coca-Cola | 229,750 | 16,185,887 | Industrial—10.0% | ||
| Kraft Foods, Cl. A | 423,645 | 14,836,048 | Caterpillar | 187,985 | 17,106,635 |
| 31,021,935 | Dover | 214,000 | 12,309,280 | ||
| Energy—16.0% | Honeywell International | 275,805 | 13,186,237 | ||
| Cameron International | 305,400 a | 15,868,584 | 42,602,152 | ||
| Exxon Mobil | 196,500 | 14,548,860 | Information Technology—23.0% | ||
| Halliburton | 283,555 | 12,581,335 | Apple | 62,596 a | 24,088,819 |
| Newfield Exploration | 218,100 a | 11,134,005 | ARM Holdings, ADR | 466,400 | 12,863,312 |
| Valero Energy | 615,600 | 13,986,432 | Baidu, ADR | 98,300 a | 14,330,174 |
| 68,119,216 | Rovi | 278,450 a,b | 13,613,421 | ||
| Financial—11.2% | Salesforce.com | 133,900 a,b | 17,239,625 | ||
| Allstate | 488,200 | 12,805,486 | Teradata | 300,400 a | 15,728,944 |
| BB&T | 454,100 b | 10,121,889 | 97,864,295 | ||
| Citigroup | 499,000 | 15,493,950 | |||
| The Funds | 69 |
| STATEMENT OF INVESTMENTS (continued) | |||||
| BNY Mellon Focused Equity Opportunities Fund (continued) | |||||
| Investment of Cash Collateral | |||||
| Common Stocks (continued) | Shares | Value ($) | for Securities Loaned—4.7% | Shares | Value ($) |
| Materials—6.1% | Registered | ||||
| Celanese, Ser. A | 361,700 | 17,003,517 | Investment Company; | ||
| Cliffs Natural Resources | 106,085 | 8,789,142 | Dreyfus | ||
| 25,792,659 | Institutional Cash | ||||
| Advantage Fund | |||||
| Total Common Stocks | (cost $19,835,759) | 19,835,759 c | 19,835,759 | ||
| (cost $399,463,664) | 422,791,042 | ||||
| Total Investments | |||||
| Other Investment—.2% | (cost $420,229,423) | 104.4% | 443,556,801 | ||
| Registered Investment Company; | Liabilities, Less Cash | ||||
| Dreyfus Institutional Preferred | and Receivables | (4.4%) | (18,515,131) | ||
| Plus Money Market Fund | Net Assets | 100.0% | 425,041,670 | ||
| (cost $930,000) | 930,000 c | 930,000 | |||
| ADR—American Depository Receipts |
| a Non-income producing security. |
| b Security, or portion thereof, on loan.At August 31, 2011, the value of the fund’s securities on loan was $19,649,756 and the value of the collateral held by the fund was |
| $19,835,759. |
| c Investment in affiliated money market mutual fund. |
| Portfolio Summary (Unaudited) † | |||
| Value (%) | Value (%) | ||
| Information Technology | 23.0 | Industrial | 10.0 |
| Energy | 16.0 | Consumer Staples | 7.3 |
| Health Care | 13.9 | Materials | 6.1 |
| Consumer Discretionary | 12.0 | Money Market Investments | 4.9 |
| Financial | 11.2 | 104.4 | |
| † Based on net assets. | |||
| See notes to financial statements. | |||
70
| STATEMENT OF INVESTMENTS | |||||
| August 31, 2011 | |||||
| BNY Mellon Small/Mid Cap Fund | |||||
| Common Stocks—95.3% | Shares | Value ($) | Shares | Value ($) | |
| Consumer Discretionary—20.6% | Energy (continued) | ||||
| Abercrombie & Fitch, Cl. A | 73,655 | 4,685,194 | Dresser-Rand Group | 90,000 b | 3,820,500 |
| Arcos Dorados Holdings, Cl. A | 100,000 | 2,757,000 | Energy XXI | 110,000 b | 2,949,100 |
| Bravo Brio Restaurant Group | 160,000 | 3,320,000 | EQT | 90,000 | 5,383,800 |
| Chico’s FAS | 200,000 a | 2,784,000 | Gulfport Energy | 90,000 b | 2,601,000 |
| DFC Global | 700,000 a,b | 15,449,000 | ION Geophysical | 265,000 a,b | 1,873,550 |
| DSW, Cl. A | 80,000 | 3,712,800 | Patterson-UTI Energy | 120,000 | 2,932,800 |
| EZCORP, Cl. A | 84,000 b | 2,818,200 | Rowan | 162,000 a,b | 5,843,340 |
| HSN | 126,900 b | 4,078,566 | SandRidge Energy | 425,000 a,b | 3,119,500 |
| Interface, Cl. A | 162,890 | 2,456,381 | 42,546,726 | ||
| Kenexa | 80,000 b | 1,684,000 | Financial—13.3% | ||
| Lear | 75,000 | 3,583,500 | Affiliated Managers Group | 18,060 b | 1,574,110 |
| Liberty Media-Starz, Ser. A | 72,000 b | 4,958,640 | American Financial Group | 100,000 | 3,328,000 |
| MDC Partners, Cl. A | 632,304 a | 10,085,249 | Annaly Capital Management | 100,000 a,c | 1,813,000 |
| Morgans Hotel Group | 643,995 b | 4,424,246 | Blackstone Group | 180,000 a | 2,467,800 |
| Navistar International | 63,910 b | 2,645,874 | Boston Properties | 34,000 c | 3,545,860 |
| Perry Ellis International | 131,930 b | 3,031,751 | Camden Property Trust | 27,000 c | 1,804,140 |
| Stanley Black & Decker | 45,000 | 2,789,100 | Cathay General Bancorp | 110,000 | 1,410,200 |
| Starwood Hotels & | CNO Financial Group | 364,930 b | 2,346,500 | ||
| Resorts Worldwide | 75,000 c | 3,342,000 | Cohen & Steers | 87,000 | 3,365,160 |
| TiVo | 840,000 a,b | 8,904,000 | Douglas Emmett | 82,015 c | 1,479,551 |
| Ulta Salon, Cosmetics & Fragrance | 60,000 b | 3,544,800 | East West Bancorp | 80,000 | 1,335,200 |
| United Rentals | 130,000 a,b | 2,168,400 | Endurance Specialty Holdings | 155,000 | 5,604,800 |
| Vera Bradley | 110,000 a | 3,861,000 | Enstar Group | 30,454 b | 3,135,544 |
| Vitamin Shoppe | 127,026 b | 5,627,252 | Forestar Group | 235,185 b | 2,960,979 |
| WABCO Holdings | 53,515 b | 2,496,475 | Host Hotels & Resorts | 152,030 c | 1,798,515 |
| 105,207,428 | Huntington Bancshares | 596,700 | 3,001,401 | ||
| Consumer Staples—2.5% | Inland Real Estate | 370,000 c | 3,000,700 | ||
| Avon Products | 120,000 | 2,707,200 | KKR & Co. | 110,000 c | 1,408,000 |
| Fresh Market | 126,250 a | 4,874,512 | National Penn Bancshares | 170,000 | 1,232,500 |
| Primo Water | 350,000 a | 2,474,500 | Signature Bank | 65,000 a,b | 3,614,650 |
| Smart Balance | 500,000 b | 2,525,000 | SL Green Realty | 60,000 a,c | 4,334,400 |
| 12,581,212 | SLM | 170,000 | 2,334,100 | ||
| Energy—8.3% | Strategic Hotels & Resorts | 400,000 b,c | 1,912,000 | ||
| Brigham Exploration | 148,360 b | 4,317,276 | SunTrust Banks | 99,710 | 1,984,229 |
| Cabot Oil & Gas | 95,000 | 7,206,700 | Webster Financial | 139,320 | 2,521,692 |
| Complete Production Services | 86,000 b | 2,499,160 | |||
| The Funds | 71 |
STATEMENT OF INVESTMENTS (continued)
| BNY Mellon Small/Mid Cap Fund (continued) | |||||
| Common Stocks (continued) | Shares | Value ($) | Shares | Value ($) | |
| Financial (continued) | Industrials (continued) | ||||
| Willis Group Holdings | 75,000 | 2,934,750 | Polypore International | 54,000 b | 3,330,180 |
| Zions Bancorporation | 102,000 a | 1,778,880 | Roper Industries | 35,265 | 2,713,642 |
| 68,026,661 | TransDigm Group | 48,000 b | 4,409,280 | ||
| Health Care—14.9% | Triumph Group | 75,800 a | 3,970,404 | ||
| Achillion Pharmaceuticals | 606,300 a,b | 3,728,745 | 48,607,315 | ||
| Amarin, ADR | 1,200,000 b | 13,812,000 | Information Technology—15.8% | ||
| Cadence Pharmaceuticals | 355,000 a,b | 2,321,700 | Altera | 90,000 | 3,275,100 |
| Cardiome Pharma | 730,000 b | 2,803,200 | Ancestry.com | 125,264 a,b | 4,473,177 |
| Endologix | 375,000 b | 3,570,000 | Cypress Semiconductor | 123,500 b | 1,956,240 |
| Health Management | F5 Networks | 38,240 b | 3,121,149 | ||
| Associates, Cl. A | 300,000 b | 2,466,000 | FARO Technologies | 65,000 b | 2,468,050 |
| Healthcare Services Group | 107,145 a | 1,680,034 | Fortinet | 274,940 b | 5,259,602 |
| MAP Pharmaceuticals | 679,290 b | 9,510,060 | GT Advanced Technologies | 300,000 a,b | 3,663,000 |
| Medicis Pharmaceutical, Cl. A | 111,700 | 4,345,130 | Interactive Intelligence Group | 80,000 b | 2,585,600 |
| Mednax | 29,000 b | 1,893,990 | KIT Digital | 270,000 a,b | 2,988,900 |
| Merit Medical Systems | 365,800 b | 5,322,390 | Mitek Systems | 96,900 b | 1,061,055 |
| NxStage Medical | 220,000 b | 4,045,800 | NetSuite | 80,000 b | 2,572,000 |
| Pharmacyclics | 348,300 a,b | 4,012,416 | OmniVision Technologies | 153,000 a,b | 2,815,200 |
| Pharmasset | 30,000 b | 3,939,600 | ON Semiconductor | 272,725 b | 1,982,711 |
| SXC Health Solutions | 92,100 b | 5,036,949 | Opnet Technologies | 64,485 | 2,224,732 |
| Universal American | 250,000 | 2,747,500 | Rackspace Hosting | 74,140 b | 2,710,558 |
| Universal Health Services, Cl. B | 48,000 | 1,996,800 | Riverbed Technology | 176,730 b | 4,379,369 |
| Zoll Medical | 60,000 b | 2,680,800 | Rovi | 50,680 b | 2,477,745 |
| 75,913,114 | Sourcefire | 134,000 a,b | 3,701,080 | ||
| Industrials—9.5% | Super Micro Computer | 120,000 b | 1,645,800 | ||
| AMETEK | 116,317 | 4,545,668 | Synchronoss Technologies | 100,000 a,b | 2,716,000 |
| Atlas Air Worldwide Holdings | 54,000 a,b | 2,650,320 | Teradata | 68,800 b | 3,602,368 |
| BE Aerospace | 96,810 b | 3,371,892 | Velti | 240,000 b | 2,270,400 |
| Crane | 88,900 | 3,756,025 | Zagg | 1,129,480 a,b | 16,976,084 |
| Flowserve | 28,000 | 2,641,520 | 80,925,920 | ||
| Gardner Denver | 49,600 | 3,907,984 | Materials—4.0% | ||
| Joy Global | 31,500 | 2,628,675 | Carpenter Technology | 78,800 | 3,977,036 |
| Kansas City Southern | 65,455 b | 3,545,043 | CF Industries Holdings | 25,000 | 4,570,500 |
| KBR | 94,935 | 2,852,797 | Cliffs Natural Resources | 28,440 | 2,356,254 |
| LSB Industries | 90,000 b | 3,595,500 | Globe Specialty Metals | 154,585 a | 2,589,299 |
| Manpower | 17,090 | 688,385 | |||
72
| BNY Mellon Small/Mid Cap Fund (continued) | |||||
| Common Stocks (continued) | Shares | Value ($) | Other Investment—5.2% | Shares | Value ($) |
| Materials (continued) | Registered | ||||
| Kronos Worldwide | 140,000 | 3,064,600 | Investment Company; | ||
| Molycorp | 70,000 a,b | 3,956,400 | Dreyfus Institutional | ||
| 20,514,089 | Preferred Plus | ||||
| Money Market Fund | |||||
| Telecommunications—3.4% | (cost $26,815,000) | 26,815,000 d | 26,815,000 | ||
| Acme Packet | 105,740 b | 4,979,297 | |||
| Aruba Networks | 181,360 a,b | 3,868,409 | Investment of Cash Collateral | ||
| GeoEye | 70,000 b | 2,531,900 | for Securities Loaned—16.0% | ||
| IPG Photonics | 60,000 b | 3,478,800 | Registered | ||
| Logmein | 74,500 a,b | 2,328,125 | Investment Company; | ||
| 17,186,531 | Dreyfus Institutional Cash | ||||
| Advantage Fund | |||||
| Utilities—3.0% | |||||
| (cost $81,958,309) | 81,958,309 d | 81,958,309 | |||
| Cleco | 110,600 | 3,929,618 | |||
| ITC Holdings | 61,460 | 4,650,064 | Total Investments | ||
| Northeast Utilities | 140,000 | 4,858,000 | (cost $569,464,073) | 116.5% | 595,491,827 |
| Wisconsin Energy | 56,000 | 1,771,840 | Liabilities, Less Cash | ||
| 15,209,522 | and Receivables | (16.5%) | (84,472,891) | ||
| Total Common Stocks | Net Assets | 100.0% | 511,018,936 | ||
| (cost $460,690,764) | 486,718,518 | ||||
| ADR—American Depository Receipts |
| a Security, or portion thereof, on loan.At August 31, 2011, the value of the fund’s securities on loan was $80,147,294 and the value of the collateral held by the fund was |
| $82,187,454, consisting of cash collateral of $81,958,309 and US Government and Agency securities valued at $229,145. |
| b Non-income producing security. |
| c Investment in real estate investment trust. |
| d Investment in affiliated money market mutual fund. |
| Portfolio Summary (Unaudited) † | |||
| Value (%) | Value (%) | ||
| Money Market Investments | 21.2 | Energy | 8.3 |
| Consumer Discretionary | 20.6 | Materials | 4.0 |
| Information Technology | 15.8 | Telecommunications | 3.4 |
| Health Care | 14.9 | Utilities | 3.0 |
| Financial | 13.3 | Consumer Staples | 2.5 |
| Industrials | 9.5 | 116.5 | |
| † Based on net assets. | |||
| See notes to financial statements. | |||
| The Funds | 73 |
| STATEMENT OF INVESTMENTS |
| August 31, 2011 |
| BNY Mellon International Fund | |||||
| Common Stocks—97.3% | Shares | Value ($) | Shares | Value ($) | |
| Australia—7.2% | France (continued) | ||||
| Atlas Iron | 863,310 a | 3,589,819 | GDF Suez | 157,130 | 4,955,597 |
| Australia & New Zealand | Lagardere | 50,370 | 1,722,438 | ||
| Banking Group | 100,210 | 2,173,448 | Sanofi | 287,809 | 20,944,643 |
| BHP Billiton | 73,910 | 3,139,694 | Societe Generale | 231,692 | 7,774,765 |
| Billabong International | 506,115 | 1,861,075 | Technip | 31,890 | 3,113,231 |
| BlueScope Steel | 1,461,698 | 1,281,232 | Total | 409,372 | 19,991,095 |
| Coca-Cola Amatil | 526,310 | 6,627,399 | Vivendi | 267,040 | 6,507,791 |
| Commonwealth Bank of Australia | 87,570 | 4,513,763 | 99,198,517 | ||
| Dexus Property Group | 3,832,180 | 3,522,902 | Germany—7.2% | ||
| National Australia Bank | 286,927 | 7,275,156 | Aixtron | 72,423 | 1,623,468 |
| Nufarm | 755,887 a | 3,094,652 | Allianz | 44,255 | 4,560,018 |
| Primary Health Care | 1,374,167 | 4,553,627 | Bayer | 76,403 | 4,926,783 |
| Qantas Airways | 1,008,220 a | 1,692,042 | Celesio | 135,470 | 2,255,433 |
| QBE Insurance Group | 496,004 | 7,486,453 | Commerzbank | 1,256,010 a | 3,732,991 |
| Rio Tinto | 48,610 | 3,768,249 | Daimler | 61,151 | 3,309,044 |
| Spark Infrastructure Group | 2,334,860 b | 3,132,281 | Deutsche Bank | 90,228 | 3,660,887 |
| Stockland | 741,260 | 2,369,179 | Deutsche Lufthansa | 152,190 | 2,578,621 |
| Toll Holdings | 652,431 | 3,382,459 | Deutsche Telekom | 263,420 | 3,332,198 |
| 63,463,430 | E.ON | 452,700 | 9,920,330 | ||
| Belgium—.2% | Fresenius & Co. | 35,890 | 3,715,105 | ||
| Delhaize Group | 30,077 | 2,016,828 | Gerresheimer | 61,320 | 2,906,829 |
| China—.5% | Hannover Rueckversicherung | 79,740 | 3,761,688 | ||
| Foxconn International Holdings | 5,658,000 a | 2,812,340 | Metro | 98,480 | 4,340,171 |
| Sands China | 642,000 a | 1,995,466 | Muenchener | ||
| 4,807,806 | Rueckversicherungs | 29,250 | 3,818,122 | ||
| Denmark—.2% | RWE | 63,291 | 2,377,481 | ||
| Carlsberg, Cl. B | 25,840 | 1,938,249 | SAP | 63,030 | 3,440,601 |
| Finland—1.5% | 64,259,770 | ||||
| Nokia | 1,412,289 | 9,129,342 | Hong Kong—2.3% | ||
| Sampo, Cl. A | 133,540 | 3,828,911 | Esprit Holdings | 3,680,543 | 10,328,977 |
| 12,958,253 | Hang Seng Bank | 453,100 | 6,675,003 | ||
| France—11.2% | Hongkong Land Holdings | 299,000 | 1,734,200 | ||
| Alstom | 99,356 | 4,613,559 | Pacific Basin Shipping | 3,521,000 | 1,704,910 |
| Arkema | 30,530 | 2,370,423 | 20,443,090 | ||
| BNP Paribas | 86,890 | 4,477,180 | Ireland—.4% | ||
| Carrefour | 296,824 | 7,913,715 | Dragon Oil | 408,690 | 3,366,884 |
| Credit Agricole | 318,210 | 3,117,922 | Israel—1.2% | ||
| EDF | 146,880 | 4,498,350 | Teva Pharmaceutical | ||
| France Telecom | 376,743 | 7,197,808 | Industries, ADR | 255,282 | 10,558,463 |
74
| BNY Mellon International Fund (continued) | |||||
| Common Stocks (continued) | Shares | Value ($) | Shares | Value ($) | |
| Italy—4.0% | Japan (continued) | ||||
| Banco Popolare | 315,380 | 540,931 | NTN | 657,000 | 3,269,126 |
| Buzzi Unicem | 83,295 a | 835,176 | Panasonic | 529,500 | 5,594,430 |
| Enel | 1,432,050 | 6,994,240 | Ricoh | 604,800 | 5,450,072 |
| ENI | 147,194 | 2,960,203 | Sekisui House | 338,000 | 3,028,183 |
| Finmeccanica | 614,281 | 4,570,885 | Seven & I Holdings | 134,500 | 3,544,743 |
| Saras | 4,618,979 a | 8,400,074 | Shimachu | 73,100 | 1,702,198 |
| Telecom Italia | 7,031,480 | 8,530,015 | Shimizu | 618,000 | 2,760,298 |
| Unipol Gruppo Finanziario | 4,632,597 a | 2,214,681 | Shin-Etsu Chemical | 144,400 | 7,260,546 |
| 35,046,205 | Softbank | 97,800 | 3,227,643 | ||
| Japan—22.6% | Sumitomo Mitsui | ||||
| Asahi Kasei | 570,000 | 3,766,749 | Financial Group | 356,000 | 10,484,263 |
| Astellas Pharma | 66,200 | 2,488,228 | Sumitomo Mitsui | ||
| Canon | 103,000 | 4,835,902 | Trust Holdings | 2,284,940 | 7,699,027 |
| CAPCOM | 63,400 | 1,843,129 | Taiyo Nippon Sanso | 704,000 | 5,213,112 |
| Central Japan Railway | 630 | 5,232,859 | Tokyo Electron | 83,300 | 3,976,250 |
| Daito Trust Construction | 88,400 | 8,139,219 | Tokyo Gas | 519,000 | 2,379,117 |
| East Japan Railway | 97,100 | 5,801,652 | Tokyo Steel Manufacturing | 682,100 | 6,431,712 |
| Fuji Heavy Industries | 893,000 | 5,551,365 | Toyo Suisan Kaisha | 121,000 | 3,192,112 |
| Fujitsu | 656,000 | 3,306,987 | Toyoda Gosei | 207,200 | 3,712,660 |
| Hitachi | 1,352,000 | 7,292,360 | Toyota Motor | 279,200 | 9,969,085 |
| INPEX | 643 | 4,324,736 | Yamada Denki | 39,130 | 2,856,689 |
| Kao | 154,200 | 4,078,033 | 200,183,577 | ||
| Keihin | 256,200 | 4,761,298 | Luxembourg—.3% | ||
| Kirin Holdings | 188,000 | 2,489,643 | ArcelorMittal | 51,700 | 1,141,850 |
| Matsumotokiyoshi Holdings | 171,700 | 3,495,890 | Subsea 7 | 55,679 a | 1,294,341 |
| Medipal Holdings | 553,100 | 5,085,313 | 2,436,191 | ||
| Miraca Holdings | 63,800 | 2,695,481 | Netherlands—3.6% | ||
| Mitsubishi | 322,800 | 7,702,176 | Aegon | 796,542 a | 3,583,718 |
| Mitsubishi | Heineken | 21,525 | 1,077,425 | ||
| Chemical Holdings | 163,000 | 1,136,764 | ING Groep | 449,960 a | 3,894,345 |
| Mitsubishi | Koninklijke Ahold | 132,440 | 1,542,920 | ||
| Tanabe Pharma | 216,800 | 3,641,175 | Koninklijke | ||
| Mitsubishi UFJ | Philips Electronics | 620,827 | 13,136,412 | ||
| Financial Group | 1,941,100 | 8,720,627 | Nutreco | 27,720 | 1,887,448 |
| NEC | 871,000 | 1,774,533 | Royal Dutch Shell, Cl. A | 32,207 | 1,077,052 |
| Nintendo | 10,720 | 1,876,035 | Unilever | 168,830 | 5,715,056 |
| Nippon Express | 705,000 | 2,937,116 | 31,914,376 | ||
| Nippon Shokubai | 242,000 | 3,021,444 | Norway—.7% | ||
| Nomura Holdings | 580,500 | 2,433,597 | Norsk Hydro | 351,729 | 2,147,388 |
| The Funds | 75 |
STATEMENT OF INVESTMENTS (continued)
| BNY Mellon International Fund (continued) | |||||
| Common Stocks (continued) | Shares | Value ($) | Shares | Value ($) | |
| Norway (continued) | Switzerland (continued) | ||||
| TGS Nopec Geophysical | 163,000 | 4,086,965 | Zurich Financial Services | 17,570 a | 3,963,797 |
| 6,234,353 | 63,914,933 | ||||
| Portugal—.2% | United Kingdom—20.0% | ||||
| Jeronimo Martins | 101,740 | 1,899,934 | Aberdeen Asset Management | 748,410 | 2,437,074 |
| Singapore—1.3% | Anglo American | 158,102 | 6,589,401 | ||
| DBS Group Holdings | 785,680 | 8,644,241 | BAE Systems | 856,767 | 3,828,839 |
| United Overseas Bank | 210,380 | 3,240,512 | Barclays | 1,237,210 | 3,429,275 |
| 11,884,753 | BP | 1,640,968 | 10,720,380 | ||
| Spain—2.1% | British American Tobacco | 168,270 | 7,493,933 | ||
| Banco Bilbao | British Land | 440,500 | 3,854,187 | ||
| Vizcaya Argentaria | 734,543 | 6,687,640 | BT Group | 1,121,420 | 3,121,983 |
| Banco Santander | 476,390 | 4,393,403 | Burberry Group | 132,800 | 2,968,453 |
| Gamesa Corp Tecnologica | 592,574 | 3,581,117 | easyJet | 246,054 a | 1,371,604 |
| Inditex | 22,290 | 1,898,752 | Experian | 427,150 | 4,878,010 |
| Red Electrica | 43,830 | 2,157,690 | GlaxoSmithKline | 386,060 | 8,212,776 |
| 18,718,602 | Home Retail Group | 2,374,725 | 4,914,979 | ||
| Sweden—3.1% | HSBC Holdings | 1,911,402 | 16,649,486 | ||
| Autoliv, SDR | 32,970 | 1,856,073 | Kingfisher | 936,290 | 3,594,510 |
| Husqvarna, Cl. B | 457,969 | 2,394,019 | Legal & General Group | 1,069,530 | 1,822,974 |
| Investor, Cl. B | 163,840 | 3,229,520 | Lonmin | 284,398 | 6,061,630 |
| Svenska Cellulosa, Cl. B | 361,179 | 4,872,485 | Man Group | 562,890 | 2,046,773 |
| Telefonaktiebolaget LM | Old Mutual | 1,157,660 | 2,253,193 | ||
| Ericsson, Cl. B | 771,979 | 8,710,100 | QinetiQ Group | 917,065 | 1,847,439 |
| Volvo, Cl. B | 481,610 | 5,988,323 | Reed Elsevier | 312,718 | 2,553,401 |
| 27,050,520 | Resolution | 897,304 | 3,880,359 | ||
| Switzerland—7.2% | Rexam | 543,570 | 3,122,728 | ||
| ABB | 312,330 a | 6,697,354 | Rio Tinto | 152,950 | 9,439,733 |
| Adecco | 120,434 a | 5,623,790 | Royal Dutch Shell, Cl. A | 316,449 | 10,607,717 |
| Cie Financiere Richemont, Cl. A | 32,900 | 1,909,862 | Royal Dutch Shell, Cl. B | 427,180 | 14,420,090 |
| Lonza Group | 51,800 a | 3,410,052 | Smith & Nephew | 313,280 | 3,180,959 |
| Nestle | 58,975 | 3,652,593 | Tesco | 1,294,135 | 7,953,501 |
| Novartis | 222,106 | 12,951,245 | Unilever | 421,919 | 14,136,338 |
| Partners Group Holding | 11,590 | 1,970,379 | Vodafone Group | 1,930,822 | 5,046,221 |
| Roche Holding | 72,955 | 12,774,028 | WPP | 485,630 | 5,076,794 |
| Transocean | 53,990 | 3,000,152 | 177,514,740 | ||
| UBS | 549,779 a | 7,961,681 | |||
76
| BNY Mellon International Fund (continued) | |||||
| Common Stocks (continued) | Shares | Value ($) | Other Investment—.5% | Shares | Value ($) |
| United States—.3% | Registered | ||||
| iShares MSCI EAFE Index Fund | 48,580 | 2,602,431 | Investment Company; | ||
| Total Common Stocks | Dreyfus | ||||
| (cost $962,698,719) | 862,411,905 | Institutional Preferred | |||
| Plus Money Market Fund | |||||
| (cost $4,200,000) | 4,200,000 c | 4,200,000 | |||
| Preferred Stocks—1.3% | |||||
| Germany | Total Investments | ||||
| (cost $976,726,495) | 99.1% | 877,821,279 | |||
| ProSieben Sat.1 Media | 242,000 | 4,832,074 | |||
| Volkswagen | 38,288 | 6,377,300 | Cash and Receivables (Net) | .9% | 7,785,700 |
| Total Preferred Stocks | Net Assets | 100.0% | 885,606,979 | ||
| (cost $9,827,776) | 11,209,374 | ||||
| ADR—American Depository Receipts |
| SDR—Swedish Depository Receipts |
| a Non-income producing security. |
| b Security exempt from registration under Rule 144A of the Securities Act of 1933.This security may be resold in transactions exempt from registration, normally to qualified |
| institutional buyers.At August 31, 2011, this security was valued at $3,132,281 or .4% of net assets. |
| c Investment in affiliated money market mutual fund. |
| Portfolio Summary (Unaudited) † | |||
| Value (%) | Value (%) | ||
| Financial | 22.4 | Information Technology | 6.3 |
| Health Care | 11.8 | Utilities | 4.1 |
| Consumer Discretionary | 11.5 | Telecommunication Services | 3.4 |
| Industrial | 10.5 | Money Market Investment | .5 |
| Energy | 9.9 | Exchange Traded Funds | .3 |
| Consumer Staples | 9.6 | ||
| Materials | 8.8 | 99.1 | |
| † Based on net assets. | |||
| See notes to financial statements. | |||
| The Funds | 77 |
| STATEMENT OF INVESTMENTS | |||||
| August 31, 2011 | |||||
| BNY Mellon Emerging Markets Fund | |||||
| Common Stocks—91.1% | Shares | Value ($) | Shares | Value ($) | |
| Brazil—10.4% | China (continued) | ||||
| Banco Santander Brasil, ADS | 1,677,290 | 16,135,530 | China Life Insurance, Cl. H | 5,771,000 | 14,498,194 |
| Brasil Insurance | China Minsheng Banking, Cl. H | 8,031,500 | 6,674,134 | ||
| Participacoes e Administracao | 99,100 | 1,182,800 | China Petroleum & Chemical, ADR | 34,178 | 3,367,217 |
| Centrais Eletricas Brasileiras | 1,217,603 a | 12,467,447 | China Petroleum & Chemical, Cl. H | 19,834,000 | 19,589,828 |
| Cia de Bebidas das Americas, ADR | 216,700 | 7,723,188 | China Railway Construction, Cl. H | 8,274,500 | 4,399,832 |
| Cia de Saneamento de Minas Gerais | 122,300 | 2,404,667 | China Railway Group, Cl. H | 15,820,000 | 4,551,436 |
| Cielo | 31,906 | 819,747 | Evergrande Real Estate Group | 13,267,000 | 8,213,225 |
| EDP—Energias do Brasil | 165,800 | 3,982,783 | Focus Media Holding, ADR | 327,590 a | 10,273,222 |
| Embraer, ADR | 86,240 | 2,198,258 | Great Wall Motor, Cl. H | 11,160,500 | 16,054,458 |
| Fibria Celulose, ADR | 676,100 | 6,693,390 | Guangzhou Automobile Group, Cl. H | 7,437,254 | 8,052,563 |
| Fleury | 774,600 | 11,191,532 | Huaneng Power International, ADR | 96,150 | 1,880,694 |
| Gerdau, ADR | 1,380,420 | 11,913,025 | Huaneng Power International, Cl. H | 24,248,200 | 11,896,983 |
| Grendene | 648,310 | 3,009,618 | Industrial & Commercial | ||
| Itau Unibanco Holding, ADR | 712,314 | 12,935,622 | Bank of China, Cl. H | 50,067,475 | 32,924,533 |
| JBS | 3,999,200 a | 10,727,171 | Maanshan Iron & Steel, Cl. H | 8,202,000 | 2,886,452 |
| Magnesita Refratarios | 1,350,100 a | 5,173,447 | Mindray Medical International, ADR | 373,630 | 9,733,061 |
| Obrascon Huarte Lain Brasil | 287,500 | 11,244,268 | Perfect World, ADR | 242,180 a | 5,199,605 |
| Petroleo Brasileiro, ADR | 1,890,120 | 53,663,803 | PetroChina, ADR | 49,380 | 6,345,330 |
| Porto Seguro | 341,300 | 4,206,487 | PetroChina, Cl. H | 8,996,000 | 11,600,511 |
| Redecard | 922,500 | 14,197,657 | Renhe Commercial Holdings | 51,092,000 | 10,040,106 |
| Rossi Residencial | 2,025,600 | 15,523,789 | Shanda Games, ADR | 285,103 a | 1,605,130 |
| Tele Norte Leste Participacoes, ADR | 821,676 | 10,763,956 | Sinotrans, Cl. H | 25,630,600 | 5,003,758 |
| Tim Participacoes | 2,182,365 | 13,325,327 | Tencent Holdings | 731,000 | 17,369,330 |
| Tim Participacoes, ADR | 131,486 | 4,094,474 | TPV Technology | 6,979,680 | 3,128,635 |
| Vale, ADR | 421,850 | 11,913,044 | Weiqiao Textile, Cl. H | 5,445,400 | 2,888,509 |
| 247,491,030 | WuXi PharmaTech, ADR | 662,330 a | 9,080,544 | ||
| Chile—1.1% | Zhejiang Expressway, Cl. H | 8,226,000 | 5,134,746 | ||
| Cencosud | 1,581,055 | 9,840,037 | 334,906,191 | ||
| ENTEL | 780,540 | 17,258,851 | Czech Republic—.1% | ||
| 27,098,888 | Komercni Banka | 13,000 | 2,732,759 | ||
| China—14.1% | Egypt—.3% | ||||
| Baidu, ADR | 83,470 a | 12,168,257 | Commercial International Bank | 1,541,293 | 7,106,789 |
| Bank of Communications, Cl. H | 7,448,100 | 5,548,396 | Hong Kong—7.0% | ||
| Beijing Capital International | BYD Electronic International | 16,436,500 a | 4,939,912 | ||
| Airport, Cl. H | 19,724,000 | 9,423,927 | China Agri-Industries Holdings | 20,634,519 | 19,267,383 |
| Changyou.com, ADR | 316,470 a | 12,994,258 | China Dongxiang Group | 40,460,000 | 9,094,062 |
| China Coal Energy, Cl. H | 6,098,000 | 8,176,772 | China Mobile | 3,186,400 | 32,331,165 |
| China Communications | China Mobile, ADR | 250,020 | 12,793,523 | ||
| Construction, Cl. H | 26,531,000 | 19,218,819 | China Power International | ||
| China Construction Bank, Cl. H | 47,124,229 | 34,983,726 | Development | 25,880,920 | 5,684,206 |
78
| BNY Mellon Emerging Markets Fund (continued) | |||||
| Common Stocks (continued) | Shares | Value ($) | Shares | Value ($) | |
| Hong Kong (continued) | India (continued) | ||||
| China Shanshui | Sterlite Industries India | 6,189,890 | 17,292,711 | ||
| Cement Group | 15,104,000 | 14,995,655 | Sterlite Industries | ||
| China Vanadium | India, ADR | 810 | 9,388 | ||
| Titano-Magnetite Mining | 29,709,000 | 8,814,425 | Welspun | 2,213,410 | 5,904,830 |
| CNOOC | 4,897,000 | 10,000,488 | 180,256,684 | ||
| Cosco Pacific | 966,000 | 1,322,599 | Indonesia—2.1% | ||
| Country Garden Holdings | 18,305,000 | 8,087,646 | Aneka Tambang | 8,213,000 | 1,809,497 |
| Global Bio-Chem | Astra Agro Lestari | 940,500 | 2,369,712 | ||
| Technology Group | 15,847,920 | 4,864,790 | Bank Mandiri | 10,821,500 | 8,687,129 |
| Guangdong Investment | 11,798,000 | 7,137,124 | Bank Rakyat | ||
| Lonking Holdings | 20,491,000 | 8,316,569 | Indonesia Persero | 17,346,500 | 13,315,314 |
| NWS Holdings | 4,664,532 | 6,602,123 | Indofood Sukses Makmur | 8,931,000 | 6,384,519 |
| Shanghai Industrial Holdings | 1,872,000 | 6,131,122 | Indosat | 10,414,500 | 6,407,609 |
| Yingde Gases | 5,550,500 | 5,524,943 | Medco Energi Internasional | 23,614,996 | 6,572,790 |
| 165,907,735 | Telekomunikasi Indonesia | 4,442,400 | 3,774,452 | ||
| Hungary—.6% | 49,321,022 | ||||
| MOL Hungarian Oil and Gas | 144,620 a | 13,372,161 | Malaysia—2.1% | ||
| Richter Gedeon | 2,663 | 492,746 | AMMB Holdings | 7,327,500 | 15,573,701 |
| 13,864,907 | Genting | 3,496,600 | 11,041,895 | ||
| India—7.6% | Genting Malaysia | 1,867,260 | 2,078,211 | ||
| Apollo Tyres | 5,785,710 | 7,429,961 | Malayan Banking | 1,895,168 | 5,540,015 |
| Bank of India | 483,210 | 3,243,436 | Tenaga Nasional | 8,347,412 | 14,691,221 |
| Glenmark Pharmaceuticals | 673,130 | 4,727,713 | 48,925,043 | ||
| Hexaware Technologies | 8,927,000 | 14,234,032 | Mexico—2.2% | ||
| Hindustan Petroleum | 360,390 | 2,897,536 | America Movil, ADR, Ser. L | 777,200 | 19,865,232 |
| India Cements | 5,352,845 | 7,788,070 | Consorcio ARA | 6,122,400 | 2,485,997 |
| Jubilant Life Sciences | 1,537,169 | 6,199,806 | Desarrolladora Homex, ADR | 312,160 a | 6,480,442 |
| Mahanagar Telephone Nigam | 2,845,081 a | 2,187,098 | Fomento Economico | ||
| Mahanagar | Mexicano, ADR | 227,750 | 15,696,530 | ||
| Telephone Nigam, ADR | 274,750 a | 458,832 | Grupo Financiero | ||
| NMDC | 1,470,046 | 7,037,386 | Banorte, Cl. O | 1,812,300 | 7,336,801 |
| Oil & Natural Gas | 1,277,162 | 7,302,427 | Industrias CH, Ser. B | 345,300 a | 1,109,637 |
| Oriental Bank Of Commerce | 716,694 | 4,832,511 | 52,974,639 | ||
| Reliance Industries | 1,757,732 | 29,870,403 | Netherlands—.5% | ||
| Rolta India | 2,691,050 | 5,811,322 | VimpelCom, ADR | 931,080 | 10,642,244 |
| Shree Renuka Sugars | 10,981,022 | 13,782,911 | Peru—.4% | ||
| Sintex Industries | 6,166,450 | 19,356,359 | Credicorp | 88,150 | 8,783,266 |
| State Bank of India | 200,070 | 8,575,422 | Philippines—.1% | ||
| State Bank of India, GDR | 76,760 b | 7,292,215 | Bank of the | ||
| Steel Authority of India | 1,716,660 | 4,022,315 | Philippine Islands | 2,033,098 | 2,771,696 |
| The Funds | 79 |
| STATEMENT OF INVESTMENTS (continued) | |||||
| BNY Mellon Emerging Markets Fund (continued) | |||||
| Common Stocks (continued) | Shares | Value ($) | Shares | Value ($) | |
| Poland—.9% | South Korea (continued) | ||||
| Asseco Poland | 482,063 | 7,117,855 | Hana Financial Group | 282,500 | 9,519,497 |
| Bank Pekao | 73,050 | 3,753,572 | Hite Brewery | 65,141 c | 6,041,319 |
| KGHM Polska Miedz | 184,190 | 11,185,718 | Hyundai Development | 265,650 | 6,212,652 |
| 22,057,145 | Hyundai Mobis | 62,820 | 19,843,783 | ||
| Russia—6.4% | Jinro | 97,640 | 2,988,186 | ||
| Gazprom, ADR | 5,379,790 | 66,978,385 | KB Financial Group | 322,188 | 13,318,171 |
| Lukoil, ADR | 844,230 | 50,822,646 | KB Financial Group, ADR | 158,300 | 6,534,624 |
| Magnitogorsk Iron & | Kolon Industries | 85,437 | 9,089,469 | ||
| Steel Works, GDR | 435,630 b,c | 3,471,971 | Korea Electric Power | 232,305 | 4,910,229 |
| MMC Norilsk Nickel, ADR | 106,069 | 2,663,393 | Korea Electric Power, ADR | 574,820 a | 6,041,358 |
| Mobile Telesystems, ADR | 725,760 | 12,287,117 | Korea Exchange Bank | 1,686,310 | 12,755,797 |
| Sberbank of Russia, ADR | 1,381,560 a | 15,976,036 | KT&G | 174,037 | 11,223,457 |
| 152,199,548 | KT, ADR | 328,630 | 5,616,287 | ||
| South Africa—9.3% | Kukdo Chemical | 83,230 | 4,142,581 | ||
| ABSA Group | 683,370 | 13,630,268 | LG Electronics | 163,137 | 10,184,116 |
| Anglo American Platinum | 217,541 | 18,212,662 | Mirae Asset Securities | 96,780 | 3,683,056 |
| ArcelorMittal South Africa | 281,544 | 2,495,993 | NongShim | 38,879 | 8,709,829 |
| Aveng | 1,800,181 | 8,751,863 | POSCO | 35,043 | 13,286,679 |
| Exxaro Resources | 593,940 | 15,977,398 | POSCO, ADR | 39,010 | 3,711,411 |
| FirstRand | 4,112,080 | 11,889,077 | Samsung Electronics | 79,415 | 55,382,444 |
| Growthpoint Properties | 5,357,060 | 14,669,007 | Samsung Fire & | ||
| JD Group | 1,477,182 | 8,607,302 | Marine Insurance | 10,704 | 2,307,653 |
| MTN Group | 1,445,229 | 29,807,654 | Shinsegae | 9,604 | 2,876,204 |
| Murray & Roberts Holdings | 2,047,350 | 8,141,389 | SK Chemicals | 7,440 | 569,062 |
| Nedbank Group | 994,796 | 20,234,465 | SK Telecom | 39,489 | 5,737,259 |
| Sappi | 1,716,437 a | 6,602,153 | SK Telecom, ADR | 531,580 | 8,547,806 |
| Sasol | 513,823 | 24,870,106 | Tong Yang Life Insurance | 724,960 | 8,833,932 |
| Sasol, ADR | 36,790 | 1,770,335 | Woori Finance Holdings | 920,350 | 10,222,756 |
| Standard Bank Group | 2,082,704 | 29,721,007 | Youngone | 384,018 | 6,497,188 |
| Telkom | 1,143,858 | 5,855,454 | Youngone Holdings | 39,666 | 1,609,915 |
| 221,236,133 | Yuhan | 79,673 | 9,111,033 | ||
| South Korea—12.7% | 300,149,656 | ||||
| BS Financial Group | 916,890 a | 11,387,536 | Taiwan—8.8% | ||
| DGB Financial Group | 683,710 a | 9,933,454 | Advanced Semiconductor | ||
| Grand Korea Leisure | 445,920 | 9,320,913 | Engineering | 7,297,694 | 6,540,617 |
80
| BNY Mellon Emerging Markets Fund (continued) | |||||
| Common Stocks (continued) | Shares | Value ($) | Shares | Value ($) | |
| Taiwan (continued) | Thailand (continued) | ||||
| Asia Cement | 4,460,549 | 5,881,383 | PTT Chemical | 3,492,200 | 15,905,415 |
| AU Optronics | 7,228,000 | 3,438,405 | 32,663,978 | ||
| AU Optronics, ADR | 1,161,870 | 5,460,789 | Turkey—1.6% | ||
| Catcher Technology | 1,528,000 | 11,982,971 | Asya Katilim Bankasi | 2,894,690 a | 3,241,175 |
| Chinatrust Financial Holding | 3,683,599 | 3,009,404 | Ford Otomotiv Sanayi | 746,620 | 4,963,679 |
| CTCI | 4,678,000 | 6,184,226 | Turk Telekomunikasyon | 3,305,270 | 15,112,009 |
| E Ink Holdings | 4,386,000 | 9,434,371 | Turkcell Iletisim Hizmetleri | 1,199,620 a | 5,330,867 |
| First Financial Holding | 770,910 | 592,609 | Turkcell Iletisim | ||
| Fubon Financial Holding | 10,007,009 | 14,246,694 | Hizmetleri, ADR | 34,040 a | 383,290 |
| Grand Pacific Petrochemical | 11,940,000 | 7,058,757 | Turkiye Is Bankasi, Cl. C | 3,808,481 | 9,794,665 |
| Hon Hai Precision Industry | 9,023,724 | 22,800,771 | 38,825,685 | ||
| KGI Securities | 8,434,765 | 3,779,863 | United Kingdom—.4% | ||
| Nan Ya Printed Circuit Board | 3,142,983 | 10,357,613 | African Barrick Gold | 877,846 | 7,787,654 |
| Novatek Microelectronics | 2,214,000 | 5,800,307 | JKX Oil & Gas | 784,702 | 2,387,110 |
| Powertech Technology | 2,703,200 | 6,494,874 | 10,174,764 | ||
| Siliconware | United States—1.0% | ||||
| Precision Industries | 4,335,000 | 3,952,524 | iShares MSCI Emerging | ||
| Siliconware Precision | Markets Index Fund | 574,130 | 24,544,058 | ||
| Industries, ADR | 303,570 | 1,393,386 | Total Common Stocks | ||
| SinoPac Financial Holdings | 32,895,411 | 12,586,879 | (cost $2,178,562,210) | 2,162,779,867 | |
| Taishin Financial Holdings | 20,982,875 | 9,475,367 | |||
| Taiwan Semiconductor | Preferred Stocks—5.4% | ||||
| Manufacturing | 3,227,517 | 7,721,253 | Brazil | ||
| Taiwan Semiconductor | Banco Bradesco | 1,122,356 | 19,846,926 | ||
| Manufacturing, ADR | 2,066,567 | 24,736,807 | |||
| Banco do Estado do | |||||
| Tatung | 8,777,216 a | 3,782,044 | Rio Grande do Sul | 1,240,100 | 13,694,929 |
| Transcend Information | 2,787,040 | 6,388,878 | Bradespar | 473,700 | 10,519,062 |
| United Microelectronics | 21,495,397 | 8,373,050 | Cia de Bebidas das Americas | 248,000 | 8,622,903 |
| United Microelectronics, ADR | 504,000 | 1,002,960 | Cia de Tecidos do Norte | ||
| Young Fast Optoelectronics | 1,921,271 | 5,669,205 | de Minas—Coteminas | 721,960 | 1,496,619 |
| 208,146,007 | Cia Paranaense de | ||||
| Thailand—1.4% | Energia, Cl. B | 1,039,600 | 22,856,963 | ||
| Asian Property Development | 34,768,720 | 6,780,097 | Gerdau | 81,600 | 697,129 |
| Bangkok Bank | 1,207,700 | 6,315,460 | Itau Unibanco Holding | 128,000 | 2,319,744 |
| Kasikornbank | 946,500 | 3,663,006 | Petroleo Brasileiro | 1,259,400 | 16,455,506 |
| The Funds | 81 |
| STATEMENT OF INVESTMENTS (continued) | |||||
| BNY Mellon Emerging Markets Fund (continued) | |||||
| Preferred Stocks (continued) | Shares | Value ($) | Other Investment—1.2% | Shares | Value ($) |
| Brazil (continued) | Registered | ||||
| Randon Participacoes | 1,120,100 | 7,338,805 | Investment Company; | ||
| Vale, Cl. A | 997,600 | 25,474,238 | Dreyfus Institutional Preferred | ||
| Total Preferred Stocks | Plus Money Market Fund | ||||
| (cost $109,884,698) | 129,322,824 | (cost $27,500,000) | 27,500,000 d 27,500,000 | ||
| Total Investments | |||||
| Rights—.0% | (cost $2,316,140,112) | 97.7% | 2,319,618,953 | ||
| Taiwan | Cash and Receivables (Net) | 2.3% | 54,641,681 | ||
| First Financial | Net Assets | 100.0% | 2,374,260,634 | ||
| (cost $193,204) | 262,088 a | 16,262 | |||
| ADR—American Depository Receipts |
| ADS—American Depository Shares |
| GDR—Global Depository Receipts |
| a Non-income producing security. |
| b Securities exempt from registration under Rule 144A of the Securities Act of 1933.These securities may be resold in transactions exempt from registration, normally to qualified |
| institutional buyers.At August 31, 2011, these securities were valued at $10,764,186 or .5% of net assets. |
| c The valuation of these securities have been determined in good faith by management under the direction of the Board of Directors.At August 31, 2011, the value of these securities |
| have amounted to $9,513,290 or .4% of net assets. |
| d Investment in affiliated money market mutual fund. |
| Portfolio Summary (Unaudited) † | |||
| Value (%) | Value (%) | ||
| Financial | 24.4 | Industrial | 5.1 |
| Energy | 14.3 | Utilities | 3.7 |
| Information Technology | 12.5 | Health Care | 2.1 |
| Materials | 11.9 | Money Market Investment | 1.2 |
| Telecommunication Services | 9.4 | Exchange Traded Funds | 1.0 |
| Consumer Discretionary | 6.6 | Telecommunications | .2 |
| Consumer Staples | 5.3 | 97.7 | |
| † Based on net assets. | |||
| See notes to financial statements. | |||
82
| STATEMENT OF INVESTMENTS | |||||
| August 31, 2011 | |||||
| BNY Mellon International Appreciation Fund | |||||
| Common Stocks—99.4% | Shares | Value ($) | Shares | Value ($) | |
| Consumer Discretionary—10.5% | Consumer Staples—11.5% | ||||
| Adidas, ADR | 11,075 | 386,628 | Aeon, ADR | 79,968 | 1,001,999 |
| Bridgestone, ADR | 14,362 | 641,263 | Ajinomoto, ADR | 4,423 | 521,714 |
| British Sky Broadcasting Group, ADR | 13,695 | 585,461 | British American Tobacco, ADR | 8,300 | 743,763 |
| Casio Computer, ADR | 4,290 | 272,087 | Coca Cola Hellenic Bottling, ADR | 11,185 a | 242,155 |
| Compass Group, ADR | 42,121 | 381,195 | Coca-Cola Amatil, ADR | 65,681 | 1,664,357 |
| Daimler | 31,607 | 1,704,882 | Danone, ADR | 76,602 | 1,054,044 |
| Denso, ADR | 46,288 | 742,922 | Delhaize Group, ADR | 14,473 | 971,862 |
| Electrolux, Cl. B, ADR | 12,867 | 431,044 | Diageo, ADR | 11,998 | 962,959 |
| Fiat, ADR | 39,395 | 248,188 | Foster’s Group, ADR | 120,506 | 637,477 |
| Hennes & Mauritz, ADR | 170,906 | 1,063,035 | Heineken, ADR | 18,509 | 464,206 |
| Honda Motor, ADR | 43,548 | 1,414,004 | Henkel & Co., ADR | 13,772 | 813,925 |
| Intercontinental Hotels Group, ADR | 25,633 | 437,812 | Imperial Tobacco Group, ADR | 13,287 | 879,599 |
| Kingfisher, ADR | 66,928 | 511,330 | J. Sainsbury, ADR | 14,245 | 276,068 |
| LVMH Moet Hennessy | Kao, ADR | 22,970 | 606,408 | ||
| Louis Vuitton, ADR | 38,319 | 1,299,780 | Kirin Holdings, ADR | 35,382 | 471,288 |
| Marks & Spencer Group, ADR | 33,455 | 345,256 | Koninklijke Ahold, ADR | 35,754 | 415,461 |
| Marui Group, ADR | 32,401 | 502,539 | L’Oreal, ADR | 44,914 | 979,574 |
| Mediaset, ADR | 18,320 | 212,512 | Nestle, ADR | 91,655 | 5,689,484 |
| Nissan Motor, ADR | 52,962 | 973,971 | Sabmiller, ADR | 24,142 | 875,148 |
| Panasonic, ADR | 43,520 | 462,618 | Shiseido, ADR | 22,862 | 435,064 |
| Pearson, ADR | 21,712 | 392,336 | Tesco, ADR | 75,521 | 1,405,446 |
| Peugeot, ADR | 12,756 | 391,227 | Unilever (NY Shares) | 25,103 | 853,502 |
| Publicis Groupe, ADR | 42,032 | 990,694 | Unilever, ADR | 15,990 | 539,503 |
| Reed Elsevier, ADR | 10,831 | 356,232 | Yamazaki Baking, ADR | 5,023 | 735,682 |
| Sega Sammy Holdings, ADR | 109,384 | 627,864 | 23,240,688 | ||
| Sharp, ADR | 40,118 | 332,578 | Energy—8.6% | ||
| Sodexo, ADR | 11,162 | 832,802 | BG Group, ADR | 12,387 | 1,348,201 |
| Sony, ADR | 29,922 | 656,788 | BP, ADR | 78,395 | 3,087,979 |
| Sumitomo Electric Industries, ADR | 3,702 | 491,373 | ENI, ADR | 40,675 | 1,637,982 |
| Toyota Motor, ADR | 34,148 | 2,453,192 | Repsol, ADR | 29,557 | 851,833 |
| Volkswagen, ADR | 11,000 | 331,100 | Royal Dutch Shell, Cl. A, ADR | 43,798 | 2,936,656 |
| Wolters Kluwer, ADR | 11,972 | 226,750 | Royal Dutch Shell, Cl. B, ADR | 39,993 | 2,698,728 |
| WPP, ADR | 8,629 | 451,901 | Statoil, ADR | 32,955 | 793,886 |
| 21,151,364 | |||||
| The Funds | 83 |
| STATEMENT OF INVESTMENTS (continued) | |||||
| BNY Mellon International Appreciation Fund (continued) | |||||
| Common Stocks (continued) | Shares | Value ($) | Shares | Value ($) | |
| Energy (continued) | Financial (continued) | ||||
| Technip, ADR | 14,012 | 343,714 | Intesa Sanpaolo, ADR | 146,334 | 1,423,830 |
| Total, ADR | 59,569 | 2,921,264 | Legal & General Group, ADR | 92,800 | 806,432 |
| Woodside Petroleum, ADR | 21,015 | 788,063 | Lend Lease Group, ADR | 184,716 | 1,661,705 |
| 17,408,306 | Lloyds Banking Group, ADR | 191,480 a | 417,426 | ||
| Financial—21.8% | Mitsubishi Estate, ADR | 3,600 | 592,632 | ||
| Aegon (NY Shares) | 99,300 a | 449,829 | Mitsubishi UFJ Financial Group, ADR | 151,092 | 679,914 |
| Ageas, ADR | 140,757 | 292,775 | Mizuho Financial Group, ADR | 109,542 | 331,912 |
| Allianz, ADR | 154,170 | 1,587,951 | MS&AD Insurance | ||
| Alpha Bank, ADR | 55,424 a | 47,110 | Group Holdings, ADR | 41,902 | 490,253 |
| Australian & New Zealand | National Australia Bank, ADR | 65,803 | 1,687,189 | ||
| Banking Group, ADR | 84,598 | 1,853,542 | National Bank of Greece, ADR | 136,731 | 120,323 |
| AXA, ADR | 72,000 | 1,144,800 | Nomura Holdings, ADR | 119,257 | 499,687 |
| Banco Bilbao Vizcaya | ORIX, ADR | 10,179 | 462,941 | ||
| Argentaria, ADR | 106,198 | 965,340 | Prudential, ADR | 60,650 | 1,220,278 |
| Banco Santander, ADR | 186,227 | 1,728,187 | Shinsei Bank, ADR | 57,546 | 139,261 |
| Bank of Yokohama, ADR | 8,083 | 402,614 | Shizuoka Bank, ADR | 3,560 | 350,088 |
| Barclays, ADR | 69,444 | 775,689 | Sino Land, ADR | 37,855 | 293,755 |
| BNP Paribas, ADR | 49,361 | 1,270,059 | Social Generale, ADR | 107,745 | 726,201 |
| British Land, ADR | 39,676 | 343,991 | Sumitomo Mitsui | ||
| Capitaland, ADR | 32,796 | 140,367 | Financial Group, ADR | 112,296 | 659,178 |
| Cheung Kong Holdings, ADR | 50,143 | 699,495 | Sumitomo Mitsui | ||
| City Developments, ADR | 87,591 | 734,389 | Trust Holdings, ADR | 113,140 a | 383,545 |
| Commerzbank, ADR | 37,925 | 116,051 | Sun Hung Kai Properties, ADR | 45,037 | 630,518 |
| Commonwealth | Tokio Marine Holdings, ADR | 21,055 | 572,064 | ||
| Bank of Australia, ADR | 13,623 b | 2,110,526 | Tokyu Land, ADR | 10,001 | 408,044 |
| Credit Agricole, ADR | 22,091 | 108,246 | UBS | 106,851 a | 1,547,202 |
| Credit Suisse Group, ADR | 34,774 | 998,014 | United Overseas Bank, ADR | 24,700 | 752,856 |
| Daiwa House Industry, ADR | 4,061 | 505,595 | Westfield Group, ADR | 28,114 | 493,401 |
| Daiwa Securities Group, ADR | 89,390 | 356,666 | Westpac Banking, ADR | 13,323 | 1,478,986 |
| Danske Bank, ADR | 27,008 | 198,509 | Zurich Financial Services, ADR | 49,197 a | 1,110,868 |
| Deutsche Bank | 28,183 | 1,140,566 | 44,174,493 | ||
| Erste Group Bank, ADR | 4,433 | 80,902 | Health Care—9.2% | ||
| Hachijuni Bank, ADR | 2,799 | 154,729 | AstraZeneca, ADR | 31,412 | 1,489,557 |
| Hang Seng Bank, ADR | 32,669 | 484,155 | Bayer, ADR | 23,630 | 1,520,354 |
| HSBC Holdings, ADR | 81,278 | 3,540,470 | Cie Generale d’Opitique Essilor | ||
| Hysan Development, ADR | 89,301 | 726,821 | International, ADR | 15,084 | 576,209 |
| ING Groep, ADR | 146,569 a | 1,276,616 | Eisai, ADR | 28,123 | 1,204,227 |
84
| BNY Mellon International Appreciation Fund (continued) | |||||
| Common Stocks (continued) | Shares | Value ($) | shares | value ($) | |
| Health Care (continued) | Industrial (continued) | ||||
| Elan, ADR | 9,218 a | 98,356 | Marubeni, ADR | 5,423 | 343,005 |
| Fresenius Medical Care & Co., ADR | 6,975 | 474,719 | Metso, ADR | 18,812 | 713,539 |
| GlaxoSmithKline, ADR | 53,399 | 2,287,079 | Mitsubishi, ADR | 10,957 | 529,771 |
| Novartis, ADR | 37,887 | 2,214,874 | Mitsui & Co., ADR | 2,811 | 964,257 |
| Novo Nordisk, ADR | 11,515 | 1,228,190 | MTR, ADR | 10,662 | 361,442 |
| Olympus, ADR | 62,140 | 1,814,488 | Neptune Orient Lines, ADR | 105,500 | 405,415 |
| Roche Holding, ADR | 67,516 | 2,953,825 | Nidec, ADR | 25,281 | 555,424 |
| Sanofi, ADR | 48,739 | 1,782,385 | Nippon Yusen, ADR | 60,373 | 360,427 |
| Smith & Nephew, ADR | 5,293 | 269,784 | NSK, ADR | 36,210 | 575,377 |
| Teva Pharmaceutical | Orkla, ADR | 26,607 | 224,829 | ||
| Industries, ADR | 17,900 | 740,344 | PostNL, ADR | 18,567 | 108,803 |
| 18,654,391 | Rolls-Royce Group, ADR | 14,497 | 752,539 | ||
| Industrial—11.8% | Ryanair Holdings, ADR | 160 | 4,227 | ||
| ABB, ADR | 60,572 a | 1,288,366 | Sandvik, ADR | 50,376 | 672,268 |
| Air France, ADR | 40,458 a | 398,511 | Secom, ADR | 37,120 | 430,592 |
| All Nippon Airways, ADR | 79,722 | 527,520 | Siemens, ADR | 21,311 | 2,199,295 |
| Asahi Glass, ADR | 66,076 | 646,223 | SKF, ADR | 38,690 | 913,084 |
| Atlas Copco, Cl. A, ADR | 19,547 | 441,176 | Sumitomo, ADR | 28,536 | 372,966 |
| Atlas Copco, Cl. B, ADR | 47,220 | 945,344 | Swire Pacific, Cl. A, ADR | 43,906 | 583,072 |
| Bae Systems, ADR | 121 | 2,180 | TNT Express NV,ADR | 18,567 | 172,673 |
| Dai Nippon Printing, ADR | 30,828 | 319,995 | Toppan Printing, ADR | 7,981 | 296,404 |
| Deutsche Lufthansa, ADR | 34,416 | 583,695 | TOTO, ADR | 4,089 | 330,457 |
| European Aeronautic Defence | Vestas Wind Systems, ADR | 708 a | 4,921 | ||
| and Space, ADR | 19,043 | 600,235 | Volvo, ADR | 65,152 | 813,097 |
| Experian, ADR | 32,340 | 368,676 | 23,873,558 | ||
| Hutchison Whampoa, ADR | 23,325 | 442,009 | Information | ||
| International Consolidated | Technology—4.4% | ||||
| Airlines Group, ADR | 22,962 a | 327,668 | Advantest, ADR | 17,445 | 226,262 |
| Invensys, ADR | 88,290 | 393,773 | Canon, ADR | 29,197 | 1,379,266 |
| ITOCHU, ADR | 29,705 | 638,658 | Computershare, ADR | 47,642 | 392,094 |
| Kajima, ADR | 12,417 | 392,953 | Dassault Systemes, ADR | 6,885 | 557,685 |
| Kawasaki Heavy Industries, ADR | 38,754 | 464,219 | Fujifilm Holdings, ADR | 19,819 | 478,629 |
| Keppel, ADR | 41,187 | 631,809 | Fujitsu, ADR | 13,602 | 341,954 |
| Komatsu, ADR | 34,788 | 930,579 | Hitachi, ADR | 11,435 | 619,320 |
| Koninklijke Philips Electronics | Kyocera, ADR | 4,712 | 435,389 | ||
| (NY Shares) | 11,842 | 250,695 | |||
| Mitsubishi Electric, ADR | 38,575 | 776,129 | |||
| Kubota, ADR | 14,271 | 591,390 | |||
| The Funds | 85 |
STATEMENT OF INVESTMENTS (continued)
| BNY Mellon International Appreciation Fund (continued) | |||||
| Common Stocks (continued) | Shares | Value ($) | Shares | Value ($) | |
| Information Technology (continued) | Materials (continued) | ||||
| NICE Systems, ADR | 4,300 a | 134,203 | Teijin, ADR | 14,424 | 552,666 |
| Nokia, ADR | 93,814 | 604,162 | Toray Industries, ADR | 8,528 | 646,849 |
| Omron, ADR | 21,660 | 513,992 | UPM-Kymmene, ADR | 39,622 | 521,822 |
| Ricoh, ADR | 4,031 | 182,685 | 21,481,219 | ||
| Sage Group, ADR | 16,187 | 262,068 | Telecommunications—6.3% | ||
| SAP, ADR | 20,862 | 1,137,188 | Alcatel-Lucent, ADR | 87,481 a | 320,180 |
| TDK, ADR | 8,571 | 376,095 | BT Group, ADR | 23,103 | 645,960 |
| Trend Micro, ADR | 12,337 | 387,505 | Deutsche Telekom, ADR | 61,534 | 786,405 |
| 8,804,626 | France Telecom, ADR | 38,702 | 707,860 | ||
| Materials—10.6% | Hellenic Telecommunications | ||||
| Air Liquide, ADR | 36,988 | 960,948 | Organization, ADR | 7,159 | 22,264 |
| Akzo Nobel, ADR | 5,605 | 285,351 | Koninklijke KPN, ADR | 40,229 | 568,033 |
| Alumina, ADR | 49,520 | 378,828 | Nippon Telegraph & Telephone, ADR | 15,682 | 367,272 |
| Amcor, ADR | 26,296 | 752,854 | NTT DOCOMO, ADR | 36,465 | 666,216 |
| Anglo American, ADR | 79,594 | 1,651,576 | Portugal Telecom, ADR | 17,340 | 149,297 |
| ArcelorMittal (NY Shares) | 12,405 | 272,538 | Singapore | ||
| Asahi Kasei, ADR | 17,985 | 237,222 | Telecommunications, ADR | 23,960 | 617,928 |
| BASF, ADR | 19,396 | 1,381,189 | Swisscom, ADR | 7,236 | 324,390 |
| BHP Billiton, ADR | 55,938 | 4,287,965 | Telecom Corp of New Zealand, ADR | 13,228 | 144,317 |
| Boral, ADR | 24,621 | 389,189 | Telecom Italia, ADR | 50,766 | 586,977 |
| CRH, ADR | 553 | 9,954 | Telefonaktiebolaget | ||
| LM Ericsson, ADR | 64,904 | 727,574 | |||
| James Hardie Industries, ADR | 15,724 a | 502,225 | |||
| Telefonica, ADR | 98,128 | 2,045,969 | |||
| Johnson Matthey, ADR | 6,130 | 340,356 | |||
| Telenor, ADR | 6,496 | 325,644 | |||
| Kobe Steel, ADR | 52,450 | 486,983 | |||
| Telstra, ADR | 30,948 | 502,286 | |||
| Koninklijke DSM, ADR | 9,446 | 118,169 | |||
| Vodafone Group, ADR | 120,224 | 3,166,700 | |||
| Lafarge, ADR | 18,820 | 194,975 | |||
| 12,675,272 | |||||
| Newcrest Mining, ADR | 15,539 | 665,069 | |||
| Utilities—4.7% | |||||
| Nippon Steel, ADR | 21,965 | 657,773 | |||
| Centrica, ADR | 44,440 | 871,913 | |||
| Nisshin Steel, ADR | 6,880 | 268,110 | |||
| CLP Holdings, ADR | 34,613 | 317,055 | |||
| Nitto Denko, ADR | 15,310 | 593,263 | |||
| E.ON, ADR | 51,294 | 1,125,390 | |||
| Norsk Hydro, ADR | 40,233 | 245,019 | |||
| Enel, ADR | 133,407 | 644,356 | |||
| OJI Paper, ADR | 848 | 45,244 | |||
| Energias de Portugal, ADR | 11,130 | 362,504 | |||
| Rexam, ADR | 12,136 | 350,730 | |||
| GDF Suez, ADR | 36,436 | 1,148,827 | |||
| Rio Tinto, ADR | 38,400 | 2,348,544 | |||
| Hong Kong & China Gas, ADR | 280,559 | 648,091 | |||
| Stora Enso, ADR | 38,934 | 285,776 | |||
| Iberdrola, ADR | 49,223 | 1,454,047 | |||
| Sumitomo Metal Industries, ADR | 22,929 | 485,178 | |||
| International Power, ADR | 3,394 | 186,738 | |||
| Svenska Cellulosa, ADR | 38,119 | 514,225 | |||
| National Grid, ADR | 13,708 | 695,270 | |||
| Syngenta, ADR | 16,595 a | 1,050,629 | |||
86
| BNY Mellon International Appreciation Fund (continued) | |||||
| Principal | |||||
| Common Stocks (continued) | Shares | Value ($) | Short-Term Investment—.1% | Amount ($) | Value ($) |
| Utilities (continued) | U.S. Treasury Bills; | ||||
| RWE, ADR | 21,130 | 793,643 | 0.04%, 9/22/11 | ||
| Scottish & Southern Energy, ADR | 26,482 | 561,683 | (cost $124,997) | 125,000 c | 124,999 |
| United Utilities Group, ADR | 14,047 | 274,478 | Total Investments | ||
| Veolia Enviroment, ADR | 25,277 | 422,884 | (cost $262,477,506) | 99.5% | 201,095,795 |
| 9,506,879 | |||||
| Cash and Receivables (Net) | .5% | 1,045,207 | |||
| Total Common Stocks | |||||
| (cost $262,352,509) | 200,970,796 | Net Assets | 100.0% | 202,141,002 | |
ADR—American Depository Receipts
| a Non-income producing security. |
| b Securities exempt from registration under Rule 144A of the Securities Act of 1933.These securities may be resold in transactions exempt from registration, normally to qualified |
| institutional buyers.At August 31, 2011, these securities were valued at $2,110,526 or 1.04% of net assets. |
| c Held by a broker as collateral for open financial futures positions. |
| Portfolio Summary (Unaudited) † | |||
| Value (%) | Value (%) | ||
| Financial | 21.8 | Energy | 8.6 |
| Industrial | 11.8 | Telecommunications | 6.3 |
| Consumer Staples | 11.5 | Information Technology | 4.4 |
| Materials | 10.6 | Utilities | 4.7 |
| Consumer Discretionary | 10.5 | Short-Term Investment | .1 |
| Health Care | 9.2 | 99.5 | |
| † Based on net assets. | |||
| See notes to financial statements. | |||
| The Funds | 87 |
| STATEMENT OF FINANCIAL FUTURES |
| August 31, 2011 |
| Market Value | ||||
| BNY Mellon | Number of | Covered by | Unrealized | |
| International Appreciation Fund | Contracts | Contracts ($) | Expiration | (Depreciation) ($) |
| Financial Futures Long | ||||
| DJ Euro Stoxx 50 | 9 | 296,837 | September 2011 | (22,015) |
| FTSE 100 | 3 | 262,292 | September 2011 | (1,764) |
| SPI 200 Futures | 1 | 114,618 | September 2011 | (5,593) |
| TOPIX | 2 | 201,384 | September 2011 | (8,219) |
| Gross Unrealized Depreciation | (37,591) | |||
| See notes to financial statements. | ||||
88
| STATEMENT OF INVESTMENTS |
| August 31, 2011 |
| BNY Mellon Asset Allocation Fund | ||||
| Coupon | Maturity | Principal | ||
| Bonds and Notes—38.5% | Rate (%) | Date | Amount ($) | Value ($) |
| Asset-Backed Ctfs./Auto Receivables—1.0% | ||||
| Ally Auto Receivables Trust, Ser. 2010-3, Cl. A4 | 1.55 | 8/17/15 | 300,000 | 305,753 |
| Americredit Automobile Receivables Trust, Ser. 2010-3, Cl. A3 | 1.14 | 4/8/15 | 650,000 | 652,884 |
| Americredit Automobile Receivables Trust, Ser. 2011-3, Cl. A3 | 1.17 | 1/8/16 | 485,000 | 486,491 |
| Franklin Auto Trust, Ser. 2007-1, Cl. A4 | 5.03 | 2/16/15 | 63,595 | 63,605 |
| Harley-Davidson Motorcycle Trust, Ser. 2009-2, Cl. A3 | 2.62 | 3/15/14 | 998,274 | 1,004,080 |
| Harley-Davidson Motorcycle Trust, Ser. 2007-1, Cl. A4 | 5.21 | 6/15/13 | 75,797 | 76,321 |
| Nissan Auto Receivables Owner Trust, Ser. 2010-A, Cl. A4 | 1.31 | 9/15/16 | 360,000 | 363,928 |
| World Omni Auto Receivables Trust, Ser. 2011-A, Cl. A3 | 1.11 | 5/15/15 | 655,000 | 657,856 |
| 3,610,918 | ||||
| Automotive, Trucks & Parts—.2% | ||||
| Johnson Controls, Sr. Unscd. Notes | 5.50 | 1/15/16 | 750,000 | 844,716 |
| Banks—3.0% | ||||
| Bank of America, Sub. Notes | 5.49 | 3/15/19 | 2,520,000 | 2,378,215 |
| Barclays Bank, Sr. Unscd. Notes, Ser. 1 | 5.00 | 9/22/16 | 1,415,000 | 1,460,886 |
| BBVA US Senior, Gtd. Notes | 3.25 | 5/16/14 | 600,000 | 585,732 |
| Citigroup, Sub. Notes | 5.00 | 9/15/14 | 780,000 | 801,537 |
| Citigroup, Sr. Unscd. Notes | 6.13 | 11/21/17 | 470,000 | 515,516 |
| Cooperatieve Centrale | ||||
| Raiffeisen-Boerenleenbank, Bank Gtd. Notes | 5.25 | 5/24/41 | 665,000 | 704,635 |
| Goldman Sachs Group, Sub. Notes | 6.75 | 10/1/37 | 835,000 | 794,955 |
| JPMorgan Chase & Co., Sub. Notes | 5.13 | 9/15/14 | 760,000 | 807,247 |
| Lloyds TSB Bank, Bank Gtd. Notes | 6.38 | 1/21/21 | 900,000 | 940,585 |
| Morgan Stanley, Sub. Notes | 4.75 | 4/1/14 | 1,090,000 | 1,105,991 |
| Royal Bank of Scotland, Bank Gtd. Notes | 4.88 | 3/16/15 | 1,100,000 | 1,115,882 |
| 11,211,181 | ||||
| Commercial & Professional Services—.3% | ||||
| Seminole Tribe of Florida, Sr. Scd. Notes | 5.80 | 10/1/13 | 870,000 a | 872,639 |
| Seminole Tribe of Florida, Notes | 7.75 | 10/1/17 | 105,000 a | 107,100 |
| 979,739 | ||||
| Commercial Mortgage Pass-Through Ctfs.—.2% | ||||
| Bear Stearns Commercial Mortgage | ||||
| Securities, Ser. 2004-PWR5, Cl. A3 | 4.57 | 7/11/42 | 241,249 | 241,095 |
| GE Capital Commercial Mortgage, Ser. 2004-C3, Cl. A3 | 4.87 | 7/10/39 | 140,211 b | 140,418 |
| GMAC Commercial Mortgage Securities, Ser. 2001-C2, Cl. B | 6.79 | 4/15/34 | 380,000 | 379,365 |
| JP Morgan Chase Commercial Mortgage | ||||
| Securities, Ser. 2004-C1, Cl. A2 | 4.30 | 1/15/38 | 20,293 | 20,570 |
| LB-UBS Commercial Mortgage Trust, Ser. 2003-C7, Cl. A2 | 4.06 | 9/15/27 | 25,004 b | 25,009 |
| Wachovia Bank Commercial Mortgage Trust, Ser. 2003-C3, Cl. A1 | 4.04 | 2/15/35 | 14,670 | 14,651 |
| 821,108 |
| The Funds | 89 |
STATEMENT OF INVESTMENTS (continued)
| BNY Mellon Asset Allocation Fund (continued) | ||||
| Coupon | Maturity | Principal | ||
| Bonds and Notes (continued) | Rate (%) | Date | Amount ($) | Value ($) |
| Diversified Financial Services—1.4% | ||||
| Blackrock, Sr. Unscd. Notes | 6.25 | 9/15/17 | 710,000 | 835,974 |
| General Electric Capital, Sub. Notes | 5.30 | 2/11/21 | 280,000 | 298,714 |
| General Electric Capital, Notes | 5.63 | 9/15/17 | 1,120,000 | 1,245,824 |
| HSBC Finance, Sr. Sub Notes | 6.68 | 1/15/21 | 1,042,000 a | 1,008,937 |
| NYSE Euronext, Sr. Unscd. Notes | 4.80 | 6/28/13 | 840,000 | 892,894 |
| TD Ameritrade Holding, Gtd. Notes | 4.15 | 12/1/14 | 790,000 | 839,345 |
| 5,121,688 | ||||
| Electric Utilities—.3% | ||||
| Hydro-Quebec, Gtd. Notes | 2.00 | 6/30/16 | 530,000 c | 542,812 |
| Xcel Energy, Sr. Unscd. Notes | 4.70 | 5/15/20 | 510,000 | 563,751 |
| 1,106,563 | ||||
| Entertainment—.2% | ||||
| Agua Caliente Band of Cahuilla Indians, Sr. Scd. Notes | 6.08 | 10/1/16 | 289,000 a | 286,919 |
| Agua Caliente Band of Cahuilla Indians, Sr. Scd. Notes | 6.44 | 10/1/16 | 362,000 a | 359,394 |
| 646,313 | ||||
| Food & Beverages—.5% | ||||
| General Mills, Sr. Unscd. Notes | 5.65 | 2/15/19 | 195,000 | 230,015 |
| Kraft Foods, Sr. Unscd. Notes | 5.38 | 2/10/20 | 1,020,000 | 1,160,510 |
| Pepsico, Sr. Unscd. Notes | 4.50 | 1/15/20 | 570,000 | 641,976 |
| 2,032,501 | ||||
| Foreign/Governmental—.4% | ||||
| Mexican Government, Sr. Unscd. Notes | 5.63 | 1/15/17 | 825,000 | 952,875 |
| Mexican Government, Sr. Unscd. Notes | 6.63 | 3/3/15 | 185,000 | 214,323 |
| Province of Ontario Canada, Sr. Unscd. Bonds | 4.00 | 10/7/19 | 330,000 | 367,002 |
| 1,534,200 | ||||
| Health Care—.1% | ||||
| Thermo Fisher Scientific, Sr. Unscd. Notes | 2.25 | 8/15/16 | 475,000 | 479,932 |
| Industrials—.2% | ||||
| CRH America, Gtd. Notes | 5.30 | 10/15/13 | 605,000 | 640,072 |
| Manufacturing—.3% | ||||
| Tyco International Finance, Gtd. Notes | 3.38 | 10/15/15 | 900,000 | 945,726 |
| Media & Telecommunications—2.2% | ||||
| AT&T, Sr. Unscd. Notes | 4.45 | 5/15/21 | 190,000 | 204,312 |
| AT&T, Sr. Unscd. Notes | 5.88 | 8/15/12 | 695,000 | 727,817 |
| Cisco Systems, Sr. Unscd. Notes | 5.50 | 2/22/16 | 640,000 | 741,723 |
| Comcast, Gtd. Notes | 5.90 | 3/15/16 | 1,015,000 | 1,177,422 |
| News America, Gtd. Notes | 6.15 | 3/1/37 | 250,000 | 262,667 |
| Rogers Communications, Gtd. Notes | 6.38 | 3/1/14 | 530,000 | 596,411 |
| Telefonica Emisiones, Gtd. Notes | 4.95 | 1/15/15 | 1,080,000 | 1,105,784 |
90
| BNY Mellon Asset Allocation Fund (continued) | ||||
| Coupon | Maturity | Principal | ||
| Bonds and Notes (continued) | Rate (%) | Date | Amount ($) | Value ($) |
| Media & Telecommunications (continued) | ||||
| Time Warner Cable, Gtd. Notes | 4.13 | 2/15/21 | 1,215,000 c | 1,222,540 |
| Time Warner, Gtd. Notes | 3.15 | 7/15/15 | 700,000 | 728,995 |
| Verizon Communications, Sr. Unscd. Notes | 5.50 | 2/15/18 | 1,145,000 | 1,330,069 |
| 8,097,740 | ||||
| Municipal Bonds—1.9% | ||||
| California, GO (Build America Bonds) | 7.30 | 10/1/39 | 1,350,000 | 1,588,869 |
| Illinois, GO | 4.42 | 1/1/15 | 440,000 | 463,250 |
| Los Angeles Community College District, | ||||
| GO (Build America Bonds) | 6.75 | 8/1/49 | 1,275,000 | 1,604,256 |
| Massachusetts, GO (Build America Bonds) | 4.20 | 12/1/21 | 525,000 | 571,027 |
| New Jersey Turnpike Authority, | ||||
| Turnpike Revenue (Build America Bonds) | 7.10 | 1/1/41 | 750,000 | 948,623 |
| New York City Municipal Water Finance Authority, | ||||
| Water and Sewer System Second General | ||||
| Resolution Revenue (Build America Bonds) | 6.28 | 6/15/42 | 495,000 | 547,851 |
| Puerto Rico Commonwealth Government | ||||
| Development Bank, Revenue Bonds | 3.67 | 5/1/14 | 825,000 | 840,271 |
| University of California Regents, | ||||
| General Revenue (Build America Bonds) | 1.99 | 5/1/13 | 365,000 | 371,942 |
| 6,936,089 | ||||
| Oil & Gas—.5% | ||||
| BP Capital Markets, Gtd. Notes | 3.88 | 3/10/15 | 700,000 | 746,791 |
| Petrobras International Finance, Gtd. Notes | 5.38 | 1/27/21 | 675,000 | 726,300 |
| Shell International Finance, Gtd. Notes | 3.10 | 6/28/15 | 250,000 | 265,927 |
| 1,739,018 | ||||
| Property & Casualty Insurance—.4% | ||||
| MetLife, Sr. Unscd. Notes | 7.72 | 2/15/19 | 535,000 | 658,205 |
| Prudential Financial, Sr. Unscd. Notes | 4.75 | 9/17/15 | 805,000 | 861,955 |
| 1,520,160 | ||||
| Real Estate—.3% | ||||
| Boston Properties, Sr. Unscd Notes | 4.13 | 5/15/21 | 565,000 | 553,254 |
| Simon Property Group, Sr. Unscd. Notes | 5.65 | 2/1/20 | 685,000 | 754,939 |
| 1,308,193 | ||||
| Software—.3% | ||||
| Oracle, Sr. Unscd. Notes | 5.75 | 4/15/18 | 1,060,000 | 1,271,117 |
| U.S. Government Agencies—.4% | ||||
| Federal Home Loan Banks, Bonds | 3.63 | 10/18/13 | 470,000 | 502,238 |
| Federal National Mortgage Association, Notes | 4.38 | 7/17/13 | 775,000 d | 832,942 |
| 1,335,180 |
| The Funds | 91 |
STATEMENT OF INVESTMENTS (continued)
| BNY Mellon Asset Allocation Fund (continued) | |||||
| Principal | Principal | ||||
| Bonds and Notes (continued) | Amount ($) | Value ($) | Amount ($) | Value ($) | |
| U.S. Government Agencies/ | U.S. Government Securities (continued) | ||||
| Mortgage-Backed—12.1% | U.S. Treasury Notes (continued): | ||||
| Federal Home Loan Mortgage Corp.: | 1.38%, 5/15/13 | 140,000 | 142,850 | ||
| 4.00%, 11/1/40—1/1/41 | 2,615,005 d | 2,714,361 | 1.50%, 6/30/16 | 390,000 | 401,152 |
| 4.50%, 3/1/21—12/1/40 | 3,189,297 d | 3,396,917 | 1.50%, 7/31/16 | 1,750,000 c | 1,798,942 |
| 5.00%, 6/1/28—7/1/40 | 2,932,596 d | 3,167,651 | 1.75%, 7/31/15 | 2,140,000 | 2,236,465 |
| 5.50%, 12/1/37—12/1/38 | 3,003,587 d | 3,292,054 | 2.13%, 8/15/21 | 1,750,000 c | 1,735,505 |
| 6.00%, 12/1/37—6/1/39 | 1,879,630 d | 2,087,128 | 2.25%, 7/31/18 | 1,500,000 | 1,571,603 |
| 6.50%, 4/1/39 | 1,128,073 d | 1,271,956 | 4.25%, 8/15/13 | 2,710,000 | 2,924,261 |
| Federal National Mortgage Association: | 4.25%, 11/15/13 | 1,065,000 | 1,159,519 | ||
| 3.50%, 1/1/26—8/1/26 | 2,797,560 d | 2,925,224 | 45,446,075 | ||
| 4.00%, 9/1/24—2/1/41 | 4,155,020 d | 4,367,240 | Total Bonds and Notes | ||
| 4.50%, 3/1/23—4/1/41 | 7,158,155 d | 7,605,170 | (cost $135,857,698) | 142,544,208 | |
| 5.00%, 12/1/21—2/1/41 | 3,169,038 d | 3,427,603 | |||
| 5.50%, 2/1/38—5/1/38 | 2,711,310 d | 2,981,786 | |||
| 6.00%, 4/1/33—10/1/38 | 2,993,847 d | 3,340,119 | Common Stocks—33.2% | Shares | Value ($) |
| 6.50%, 10/1/36—1/1/39 | 1,437,478 d | 1,620,620 | Consumer Discretionary—3.3% | ||
| REMIC,Ser. 2003-64, Cl. BC, | Amazon.com | 7,480 f�� | 1,610,369 | ||
| 5.50%, 3/25/30 | 658,123 d | 681,231 | |||
| Carnival | 51,450 | 1,699,393 | |||
| Government National | |||||
| CBS, Cl. B | 40,410 | 1,012,270 | |||
| Mortgage Association I | |||||
| 5.00%, 11/15/34—3/15/36 | 1,837,683 | 2,036,919 | DIRECTV, Cl. A | 37,300 f | 1,640,081 |
| 44,915,979 | Mattel | 61,740 c | 1,658,954 | ||
| U.S. Government | McDonald’s | 20,890 | 1,889,709 | ||
| Securities—12.3% | Melco Crown | ||||
| U.S. Treasury Inflation | Entertainment, ADR | 46,030 f | 598,390 | ||
| Protected Securities: | Omnicom Group | 52,470 | 2,127,659 | ||
| Bonds, 2.38%, 1/15/27 | 1,449,532 e | 1,808,631 | 12,236,825 | ||
| Notes, 0.63%, 7/15/21 | 1,191,833 e | 1,247,234 | Consumer Staples—3.7% | ||
| Notes, 1.38%, 7/15/18 | 1,146,235 e | 1,284,678 | |||
| Coca-Cola Enterprises | 48,950 | 1,351,999 | |||
| Notes, 1.38%, 1/15/20 | 965,571 e | 1,081,741 | |||
| Notes, 2.38%, 1/15/17 | 1,449,532 e | 1,685,648 | ConAgra Foods | 40,620 | 991,940 |
| U.S. Treasury Notes: | Hansen Natural | 6,900 f | 588,708 | ||
| 0.50%, 10/15/13 | 1,650,000 | 1,660,184 | Kimberly-Clark | 25,860 | 1,788,478 |
| 0.63%, 7/15/14 | 1,250,000 c | 1,261,621 | Lorillard | 5,380 c | 599,440 |
| 0.75%, 3/31/13 | 3,000,000 | 3,027,318 | PepsiCo | 61,070 | 3,934,740 |
| 0.75%, 8/15/13 | 3,000,000 | 3,033,048 | |||
| Unilever, ADR | 109,040 c | 3,679,010 | |||
| 0.75%, 9/15/13 | 1,550,000 c | 1,567,196 | |||
| 0.75%, 12/15/13 | 470,000 | 475,765 | Walgreen | 16,944 | 596,598 |
| 0.75%, 6/15/14 | 1,250,000 c | 1,266,211 | 13,530,913 | ||
| 1.00%, 1/15/14 | 1,000,000 c | 1,018,516 | Energy—3.8% | ||
| 1.00%, 5/15/14 | 1,000,000 c | 1,019,927 | Anadarko Petroleum | 21,880 | 1,613,650 |
| 1.13%, 12/15/12 | 4,030,000 | 4,080,375 | |||
| Apache | 11,750 | 1,211,073 | |||
| 1.25%, 2/15/14 | 2,180,000 | 2,233,990 | |||
| 1.25%, 3/15/14 | 4,080,000 | 4,184,554 | Chevron | 31,810 | 3,146,327 |
| 1.25%, 4/15/14 | 1,500,000 | 1,539,141 | ENSCO, ADR | 27,060 | 1,305,916 |
92
| BNY Mellon Asset Allocation Fund (continued) | |||||
| Common Stocks (continued) | Shares | Value ($) | Shares | Value ($) | |
| Energy (continued) | Industrial (continued) | ||||
| Halliburton | 34,610 c | 1,535,646 | Norfolk Southern | 19,030 | 1,287,950 |
| Hess | 25,570 | 1,517,324 | Owens Corning | 19,290 f | 560,567 |
| National Oilwell Varco | 34,900 | 2,307,588 | Thomas & Betts | 14,820 f | 647,338 |
| Occidental Petroleum | 12,690 | 1,100,731 | Tyco International | 19,062 | 792,598 |
| TransCanada | 10,050 | 433,657 | 10,586,079 | ||
| 14,171,912 | Information Technology—6.5% | ||||
| Exchange Traded Funds—.4% | Alliance Data Systems | 6,800 c,f | 635,188 | ||
| Standard & Poor’s Depository | Apple | 15,460 f | 5,949,472 | ||
| Receipts S&P 500 ETF Trust | 12,970 c | 1,585,193 | BMC Software | 20,730 f | 841,845 |
| Financial—4.0% | Electronic Arts | 73,380 c,f | 1,656,920 | ||
| American Express | 31,880 | 1,584,755 | EMC | 76,130 f | 1,719,777 |
| Bank of America | 103,510 | 845,677 | F5 Networks | 10,270 c,f | 838,237 |
| Capital One Financial | 52,510 c | 2,418,086 | Google, Cl. A | 1,500 f | 811,440 |
| Citigroup | 50,286 | 1,561,380 | Informatica | 15,260 f | 637,563 |
| Discover Financial Services | 28,940 | 728,130 | International Business Machines | 10,840 | 1,863,504 |
| Hartford Financial Services Group | 51,810 | 991,643 | NetApp | 69,110 f | 2,599,918 |
| JPMorgan Chase & Co. | 30,042 | 1,128,378 | Oracle | 66,820 | 1,875,637 |
| Lincoln National | 62,720 | 1,301,440 | QUALCOMM | 45,310 | 2,331,653 |
| MetLife | 30,930 | 1,039,248 | Riverbed Technology | 34,200 c,f | 847,476 |
| Wells Fargo & Co. | 120,990 | 3,157,839 | Teradata | 30,905 f | 1,618,186 |
| 14,756,576 | 24,226,816 | ||||
| Health Care—4.9% | Materials—.6% | ||||
| Allscripts Healthcare Solutions | 48,950 c,f | 878,897 | CF Industries Holdings | 4,850 | 886,677 |
| Baxter International | 49,110 | 2,749,178 | E.I. du Pont de Nemours & Co. | 30,900 | 1,491,543 |
| CIGNA | 37,880 | 1,770,511 | 2,378,220 | ||
| Covidien | 41,952 | 2,189,055 | Telecommunication Services—.9% | ||
| McKesson | 17,330 | 1,385,187 | AT&T | 113,387 | 3,229,262 |
| Pfizer | 151,170 | 2,869,207 | Utilities—2.2% | ||
| Sanofi, ADR | 38,480 | 1,407,214 | Exelon | 31,370 | 1,352,674 |
| St. Jude Medical | 27,240 | 1,240,510 | NextEra Energy | 76,070 | 4,314,690 |
| Warner Chilcott, Cl. A | 59,420 | 1,013,705 | PPL | 82,930 c | 2,395,018 |
| Watson Pharmaceuticals | 15,290 f | 1,026,265 | 8,062,382 | ||
| Zimmer Holdings | 26,380 f | 1,500,758 | Total Common Stocks | ||
| 18,030,487 | (cost $109,980,435) | 122,794,665 | |||
| Industrial—2.9% | |||||
| Caterpillar | 7,240 | 658,840 | Other Investments—27.7% | ||
| Cummins | 13,930 | 1,294,376 | |||
| Registered Investment Companies: | |||||
| Dover | 22,090 | 1,270,617 | |||
| BNY Mellon Emerging | |||||
| General Electric | 172,980 | 2,821,304 | Markets Fund, Cl. M | 3,127,773 g | 33,310,787 |
| Intuit | 25,390 | 1,252,489 | |||
| The Funds | 93 |
| STATEMENT OF INVESTMENTS (continued) | |||||
| BNY Mellon Asset Allocation Fund (continued) | |||||
| Investment of Cash Collateral | |||||
| Other Investments (continued) | Shares | Value ($) | for Securities Loaned—4.9% | Shares | Value ($) |
| Registered Investment | Registered | ||||
| Companies (continued): | Investment Company; | ||||
| BNY Mellon International | Dreyfus | ||||
| Fund, Cl. M | 2,937,194 g | 29,195,711 | Institutional Cash | ||
| BNY Mellon Mid Cap | Advantage Fund | ||||
| Stock Fund, Cl. M | 2,060,597 g | 23,511,412 | (cost $18,242,094) | 18,242,094 h | 18,242,094 |
| BNY Mellon Small Cap | Total Investments | ||||
| Stock Fund, Cl. M | 1,283,994 f,g | 13,841,460 | (cost $367,420,488) | 104.3% | 385,910,337 |
| Dreyfus Institutional Preferred | |||||
| Plus Money Market Fund | 2,470,000 h | 2,470,000 | Liabilities, Less Cash | ||
| and Receivables | (4.3%) | (15,984,705) | |||
| Total Other Investment | |||||
| (cost $103,340,261) | 102,329,370 | Net Assets | 100.0% | 369,925,632 | |
| ADR—American Depository Receipts |
| GO—General Obligations |
| a Securities exempt from registration under Rule 144A of the Securities Act of 1933.These securities may be resold in transactions exempt from registration, normally to qualified |
| institutional buyers.At August 31, 2011, these securities were valued at $2,634,989 or .7% of net assets. |
| b Variable rate security—interest rate subject to periodic change. |
| c Security, or portion thereof, on loan.At August 31, 2011, the value of the fund’s securities on loan was $27,603,303 and the value of the collateral held by the fund was |
| $28,258,179, consisting of cash collateral of $18,242,094 and U.S. Government and Agency securities valued at $10,016,085. |
| d The Federal Housing Finance Agency (FHFA) placed Federal Home Loan Mortgage Corporation and Federal National Mortgage Association into conservatorship with FHFA as |
| the conservator.As such, the FHFA oversees the continuing affairs of these companies. |
| e Principal amount for accrual purposes is periodically adjusted based on changes in the Consumer Price Index. |
| f Non-income producing security. |
| g Investment in affiliated mutual fund. |
| h Investment in affiliated money market mutual fund. |
| Portfolio Summary (Unaudited) † | |||
| Value (%) | Value (%) | ||
| Common Stocks | 33.2 | Money Market Investments | 5.6 |
| U.S. Government & Agencies | 24.8 | Municipal Bonds | 1.9 |
| Mutual Funds: Foreign | 16.9 | Asset/Mortgage-Backed | 1.2 |
| Corporate Bonds | 10.2 | Foreign/Governmental | .4 |
| Mutual Funds: Domestic | 10.1 | 104.3 | |
| † Based on net assets. | |||
| See notes to financial statements. | |||
94
| STATEMENTS OF ASSETS AND LIABILITIES |
| August 31, 2011 |
| BNY Mellon | BNY Mellon | BNY Mellon | BNY Mellon | BNY Mellon | |
| Large Cap | Large Cap Market | Tax-Sensitive Large Cap | Income | Mid Cap | |
| Stock Fund | Opportunities Fund | Multi-Strategy Fund | Stock Fund | Stock Fund | |
| Assets ($): | |||||
| Investments in securities—See Statement of | |||||
| Investments† (including securities | |||||
| on loan)††—Note 2(b): | |||||
| Unaffiliated issuers | 1,086,467,798 | 79,651,806 | 61,133,989 | 202,284,668 | 1,290,405,875 |
| Affiliated issuers | 228,173,181 | 39,245,718 | 15,750,944 | 53,736,836 | 190,887,111 |
| Cash | — | 250,821 | 168,395 | 657,475 | 241,016 |
| Receivable for investment securities sold | 37,970,894 | — | — | 747,859 | 29,328,891 |
| Dividends and interest receivable | 3,011,554 | 113,942 | 110,989 | 733,499 | 1,028,094 |
| Receivable for shares of | |||||
| Beneficial Interest subscribed | 49,691 | 215,147 | 250,833 | 1,297,497 | 310,162 |
| Prepaid expenses | 22,101 | 18,606 | 18,522 | 16,887 | 32,529 |
| 1,355,695,219 | 119,496,040 | 77,433,672 | 259,474,721 | 1,512,233,678 | |
| Liabilities ($): | |||||
| Due to The Dreyfus Corporation | |||||
| and affiliates—Note 4(c) | 637,699 | 61,259 | 25,235 | 97,584 | 864,176 |
| Due to Administrator—Note 4(a) | 114,679 | 8,198 | 6,187 | 17,079 | 135,016 |
| Cash overdraft due to Custodian | 1,767,205 | — | — | — | — |
| Liability for securities on loan—Note 2(b) | 225,880,181 | — | — | 43,732,836 | 174,890,111 |
| Payable for shares of | |||||
| Beneficial Interest redeemed | 493,554 | 100,000 | 616,601 | 37,552 | 643,310 |
| Payable for investment | |||||
| securities purchased | 20,710,672 | 1,229,234 | 1,361,027 | 9,507,314 | 26,340,139 |
| Interest payable—Note 3 | 1,260 | — | — | — | — |
| Outstanding options written, | |||||
| at value (premiums received | |||||
| $127,392)—See Statement of | |||||
| Options Written—Note 5 | — | — | — | 205,355 | — |
| Accrued expenses | 66,444 | 92,042 | 87,151 | 35,539 | 85,001 |
| 249,671,694 | 1,490,733 | 2,096,201 | 53,633,259 | 202,957,753 | |
| Net Assets ($) | 1,106,023,525 | 118,005,307 | 75,337,471 | 205,841,462 | 1,309,275,925 |
| The Funds | 95 |
STATEMENTS OF ASSETS AND LIABILITIES (continued)
| BNY Mellon | BNY Mellon | BNY Mellon | BNY Mellon | BNY Mellon | |
| Large Cap | Large Cap Market | Tax-Sensitive Large Cap | Income | Mid Cap | |
| Stock Fund | Opportunities Fund | Multi-Strategy Fund | Stock Fund | Stock Fund | |
| Composition of Net Assets ($): | |||||
| Paid-in capital | 986,600,051 | 120,995,494 | 74,653,059 | 214,219,717 | 1,199,225,666 |
| Accumulated undistributed | |||||
| investment income—net | 123,469 | 80,237 | 167,398 | 84,947 | 854,267 |
| Accumulated net realized | |||||
| gain (loss) on investments | (28,109,690) | (594,998) | (573,550) | (14,341,305) | 41,757,403 |
| Accumulated net unrealized appreciation | |||||
| (depreciation) on investments | 147,409,695 | (2,475,426) | 1,090,564 | — | 67,438,589 |
| Accumulated net unrealized appreciation | |||||
| (depreciation) on investments | |||||
| and options transactions | — | — | — | 5,878,103 | — |
| Net Assets ($) | 1,106,023,525 | 118,005,307 | 75,337,471 | 205,841,462 | 1,309,275,925 |
| Net Asset Value Per Share | |||||
| Class M Shares | |||||
| Net Assets ($) | 1,093,037,446 | 117,994,324 | 75,326,436 | 204,785,474 | 1,280,742,158 |
| Shares Outstanding | 134,237,493 | 10,729,433 | 6,761,877 | 32,611,387 | 112,251,768 |
| Net Asset Value Per Share ($) | 8.14 | 11.00 | 11.14 | 6.28 | 11.41 |
| Investor Shares | |||||
| Net Assets ($) | 12,986,079 | 10,983 | 11,035 | 1,055,988 | 28,097,588 |
| Shares Outstanding | 1,593,939 | 1,000 | 1,000 | 166,808 | 2,489,285 |
| Net Asset Value Per Share ($) | 8.15 | 10.98 | 11.04 | 6.33 | 11.29 |
| Dreyfus Premier Shares | |||||
| Net Assets ($) | — | — | — | — | 436,179 |
| Shares Outstanding | — | — | — | — | 41,406 |
| Net Asset Value Per Share ($) | — | — | — | — | 10.53 |
| † Investments at cost ($): | |||||
| Unaffiliated issuers | 939,058,103 | 79,497,664 | 59,535,527 | 196,328,602 | 1,222,967,286 |
| Affiliated issuers | 228,173,181 | 41,875,286 | 16,258,842 | 53,736,836 | 190,887,111 |
| ††Value of securities on loan ($) | 221,706,550 | — | — | 42,931,518 | 177,019,615 |
| See notes to financial statements. | |||||
96
| BNY Mellon | BNY Mellon | BNY Mellon | ||
| Small Cap | U.S. Core Equity | Focused Equity | BNY Mellon | |
| Stock Fund | 130/30 Fund | Opportunities Fund | Small/Mid Cap Fund | |
| Assets ($): | ||||
| Investments in securities— | ||||
| See Statement of Investments† | ||||
| (including securities on loan)††—Note 2(b): | ||||
| Unaffiliated issuers | 351,745,972 | 409,335,651 | 422,791,042 | 486,718,518 |
| Affiliated issuers | 115,743,686 | 786,000 | 20,765,759 | 108,773,309 |
| Cash | — | 1,313,768 | 1,265,049 | 538,132 |
| Receivable for investment securities sold | 4,137,221 | 12,637,883 | — | — |
| Dividends and interest receivable | 358,010 | 974,549 | 503,618 | 732,961 |
| Receivable for shares of | ||||
| Beneficial Interest subscribed | 140,370 | 21,766 | 261,704 | 432,862 |
| Receivable from brokers for proceeds | ||||
| on securities sold short | — | 10,404,500 | — | — |
| Prepaid expenses | 20,647 | 21,169 | 27,660 | 27,087 |
| 472,145,906 | 435,495,286 | 445,614,832 | 597,222,869 | |
| Liabilities ($): | ||||
| Due to The Dreyfus Corporation | ||||
| and affiliates—Note 4(c) | 280,871 | 232,561 | 258,451 | 331,726 |
| Due to Administrator—Note 4(a) | 37,259 | 33,497 | 42,958 | 51,764 |
| Cash overdraft due to Custodian | 1,072,428 | — | — | — |
| Liability for securities on loan—Note 2(b) | 106,062,686 | — | 19,835,759 | 81,958,309 |
| Payable for investment securities purchased | 5,372,588 | 23,765,559 | — | 3,672,210 |
| Payable for shares of Beneficial Interest redeemed | 324,758 | 74,794 | 377,924 | 108,415 |
| Securities sold short, at value (proceeds | ||||
| $89,033,763)—See Statement of | ||||
| Securities Sold Short | — | 83,110,694 | — | — |
| Dividends payable on securities sold short | — | 200,866 | — | — |
| Due to Broker | — | 56,398 | — | — |
| Accrued expenses | 58,491 | 53,221 | 58,070 | 81,509 |
| 113,209,081 | 107,527,590 | 20,573,162 | 86,203,933 | |
| Net Assets ($) | 358,936,825 | 327,967,696 | 425,041,670 | 511,018,936 |
| The Funds | 97 |
STATEMENTS OF ASSETS AND LIABILITIES (continued)
| BNY Mellon | BNY Mellon | BNY Mellon | ||
| Small Cap | U.S. Core Equity | Focused Equity | BNY Mellon | |
| Stock Fund | 130/30 Fund | Opportunities Fund | Small/Mid Cap Fund | |
| Composition of Net Assets ($): | ||||
| Paid-in capital | 439,575,943 | 375,337,531 | 401,202,632 | 493,064,095 |
| Accumulated undistributed | ||||
| investment income—net | 9,188,971 | 1,006,864 | 423,691 | 239,611 |
| Accumulated net realized gain (loss) on investments | (76,581,268) | (60,310,804) | 87,969 | (8,312,524) |
| Accumulated net unrealized appreciation | ||||
| (depreciation) on investments | (13,246,821) | — | 23,327,378 | 26,027,754 |
| Accumulated net unrealized appreciation | ||||
| (depreciation) on investments | ||||
| and securities sold short | — | 11,934,105 | — | — |
| Net Assets ($) | 358,936,825 | 327,967,696 | 425,041,670 | 511,018,936 |
| Net Asset Value Per Share | ||||
| Class M Shares | ||||
| Net Assets ($) | 351,121,909 | 327,777,833 | 425,016,048 | 510,512,428 |
| Shares Outstanding | 32,574,457 | 30,277,837 | 35,287,072 | 38,844,255 |
| Net Asset Value Per Share ($) | 10.78 | 10.83 | 12.04 | 13.14 |
| Investor Shares | ||||
| Net Assets ($) | 7,814,916 | 189,863 | 25,622 | 506,508 |
| Shares Outstanding | 745,308 | 17,694 | 2,128 | 38,644 |
| Net Asset Value Per Share ($) | 10.49 | 10.73 | 12.04 | 13.11 |
| † Investments at cost ($): | ||||
| Unaffiliated issuers | 364,992,793 | 403,324,615 | 399,463,664 | 460,690,764 |
| Affiliated issuers | 115,743,686 | 786,000 | 20,765,759 | 108,773,309 |
| ††Value of securities on loan ($) | 103,307,186 | — | 19,649,756 | 80,147,294 |
| See notes to financial statements. | ||||
98
| BNY Mellon | BNY Mellon | |||
| BNY Mellon | Emerging | International | BNY Mellon | |
| International Fund | Markets Fund | Appreciation Fund | Asset Allocation Fund | |
| Assets ($): | ||||
| Investments in securities— | ||||
| See Statement of Investments† | ||||
| (including securities on loan)††—Note 2(b): | ||||
| Unaffiliated issuers | 873,621,279 | 2,292,118,953 | 201,095,795 | 265,338,873 |
| Affiliated issuers | 4,200,000 | 27,500,000 | — | 120,571,464 |
| Cash | 516,058 | 10,027,149 | 50,368 | — |
| Cash denominated in foreign currencies††† | 1,661,603 | 30,864,384 | — | — |
| Dividends and interest receivable | 4,280,035 | 5,708,519 | 673,245 | 1,256,575 |
| Receivable for investment securities sold | 2,375,728 | 13,223,514 | 25,511 | 4,672,318 |
| Receivable for shares of Beneficial Interest subscribed | 756,620 | 3,657,790 | — | 187,000 |
| Unrealized appreciation on forward foreign | ||||
| currency exchange contracts—Note 5 | — | 47,352 | 20,754 | — |
| Receivable for futures variation margin—Note 5 | — | �� | 16,993 | — |
| Prepaid expenses and other assets | 55,338 | 30,073 | 535,018 | — |
| 887,466,661 | 2,383,177,734 | 202,417,684 | 392,026,230 | |
| Liabilities ($): | ||||
| Due to The Dreyfus Corporation | ||||
| and affiliates—Note 4(c) | 767,906 | 2,987,809 | 92,554 | 139,251 |
| Due to Administrator—Note 4(a) | 92,889 | 244,218 | 21,160 | 27,307 |
| Cash overdraft due to Custodian | — | — | — | 619,491 |
| Payable for shares of Beneficial Interest redeemed | 894,044 | 575,459 | 64,214 | 131,889 |
| Interest payable—Note 3 | 3,542 | 10,695 | — | — |
| Unrealized depreciation on forward foreign | ||||
| currency exchange contracts—Note 5 | 737 | 18,615 | 873 | — |
| Payable for investment securities purchased | — | 4,956,331 | 22,030 | 2,902,133 |
| Liability for securities on loan—Note 2(b) | — | — | — | 18,242,094 |
| Accrued expenses | 100,564 | 123,973 | 75,851 | 38,433 |
| 1,859,682 | 8,917,100 | 276,682 | 22,100,598 | |
| Net Assets ($) | 885,606,979 | 2,374,260,634 | 202,141,002 | 369,925,632 |
| The Funds | 99 |
STATEMENTS OF ASSETS AND LIABILITIES (continued)
| BNY Mellon | BNY Mellon | ||||
| BNY Mellon | Emerging | International | BNY Mellon | ||
| International Fund | Markets Fund | Appreciation Fund | Asset Allocation Fund | ||
| Composition of Net Assets ($): | |||||
| Paid-in capital | 1,563,688,261 | 2,319,147,262 | 274,536,324 | 348,477,958 | |
| Accumulated undistributed investment income—net | 24,988,789 | 19,435,956 | 5,570,989 | 2,166,321 | |
| Accumulated net realized gain (loss) on investments | (604,393,862) | 32,101,663 | (16,566,890) | 791,504 | |
| Accumulated net unrealized appreciation | |||||
| (depreciation) on investments and foreign | |||||
| currency transactions [including ($37,591) | |||||
| net unrealized (depreciation) on financial futures | |||||
| for BNY Mellon International Appreciation Fund] | (98,676,209) | 3,575,753 | (61,399,421) | — | |
| Accumulated net unrealized appreciation | |||||
| (depreciation) on investments | — | — | — | 18,489,849 | |
| Net Assets ($) | 885,606,979 | 2,374,260,634 | 202,141,002 | 369,925,632 | |
| Net Asset Value Per Share | |||||
| Class M Shares | |||||
| Net Assets ($) | 879,449,540 | 2,352,233,410 | 198,122,188 | 365,660,862 | |
| Shares Outstanding | 88,501,455 | 220,776,268 | 17,521,447 | 34,406,581 | |
| Net Asset Value Per Share ($) | 9.94 | 10.65 | 11.31 | 10.63 | |
| Investor Shares | |||||
| Net Assets ($) | 6,157,439 | 22,027,224 | 4,018,814 | 4,264,770 | |
| Shares Outstanding | 585,736 | 2,018,634 | 359,280 | 399,043 | |
| Net Asset Value Per Share ($) | 10.51 | 10.91 | 11.19 | 10.69 | |
| † | Investments at cost ($): | ||||
| Unaffiliated issuers | 972,526,495 | 2,288,640,112 | 262,477,506 | 245,838,133 | |
| Affiliated issuers | 4,200,000 | 27,500,000 | — | 121,582,355 | |
| †† | Value of securities on loan ($) | — | — | — | 27,603,303 |
| ††† Cash denominated in foreign currencies (cost) ($) | 1,659,946 | 30,855,636 | — | — | |
See notes to financial statements.
100
| STATEMENTS OF OPERATIONS |
| Year Ended August 31, 2011 |
| BNY Mellon | BNY Mellon | BNY Mellon | BNY Mellon | BNY Mellon | |
| Large Cap | Large Cap Market | Tax-Sensitive Large Cap | Income | Mid Cap | |
| Stock Fund | Opportunities Fund | Multi-Strategy Fund | Stock Fund | Stock Fund | |
| Investment Income ($): | |||||
| Income: | |||||
| Cash dividends (net of $170,514, $997 | |||||
| and $4,038 foreign taxes withheld at source | |||||
| for BNY Mellon Large Cap Stock Fund, | |||||
| BNY Mellon Tax-Sensitive Large Cap | |||||
| Multi-Strategy Fund and BNY Mellon | |||||
| Mid Cap Stock Fund, respectively): | |||||
| Unaffiliated issuers | 23,457,214 | 646,897 | 664,755 | 4,038,206 | 12,787,576 |
| Affiliated issuers | 3,562 | 57,968 | 30,780 | 944 | 18,717 |
| Income from securities lending—Note 2(b) | 60,267 | — | — | 5,838 | 151,701 |
| Total Income | 23,521,043 | 704,865 | 695,535 | 4,044,988 | 12,957,994 |
| Expenses: | |||||
| Investment advisory fees—Note 4(a) | 8,586,198 | 394,412 | 306,297 | 736,322 | 10,950,857 |
| Administration fees—Note 4(a) | 1,605,420 | 63,664 | 51,502 | 139,782 | 1,801,370 |
| Custodian fees—Note 4(c) | 95,231 | 36,877 | 89,956 | 17,930 | 108,837 |
| Shareholder servicing costs—Note 4(c) | 71,880 | 29 | 410 | 2,654 | 74,890 |
| Trustees’ fees and expenses—Note 4(d) | 53,350 | 2,683 | 3,468 | 3,962 | 66,775 |
| Loan commitment fees—Note 3 | 32,646 | 650 | 419 | 1,034 | 20,418 |
| Auditing fees | 31,646 | 30,320 | 30,307 | 27,593 | 29,325 |
| Legal fees | 29,220 | 79,628 | 88,042 | 2,098 | 20,839 |
| Registration fees | 27,334 | 57,258 | 51,254 | 27,307 | 39,870 |
| Interest expense—Note 3 | 26,349 | — | — | 2,094 | 2,739 |
| Prospectus and shareholders’ reports | 10,419 | 8,277 | 8,196 | 5,886 | 23,196 |
| Distribution fees—Note 4(b) | — | — | — | — | 4,258 |
| Miscellaneous | 31,590 | 14,182 | 14,809 | 15,198 | 31,820 |
| Total Expenses | 10,601,283 | 687,980 | 644,660 | 981,860 | 13,175,194 |
| Less—reduction in investment advisory fee | |||||
| due to undertakings—Note 4(a) | — | (135,991) | (202,664) | — | — |
| Less—reduction in fees due to | |||||
| earnings credits—Note 4(c) | (8) | (1) | (1) | (3) | (217) |
| Net Expenses | 10,601,275 | 551,988 | 441,995 | 981,857 | 13,174,977 |
| Investment Income (Loss)—Net | 12,919,768 | 152,877 | 253,540 | 3,063,131 | (216,983) |
| Realized and Unrealized Gain (Loss) | |||||
| on Investments—Note 5 ($): | |||||
| Net realized gain (loss) on investments: | |||||
| Unaffiliated issuers | 163,670,036 | (487,853) | (489,572) | 12,809,128 | 256,166,734 |
| Affiliated issuers | — | — | 10,732 | — | — |
| Net realized gain (loss) on options transactions: | — | — | — | 69,273 | — |
| Net Realized Gain (Loss) | 163,670,036 | (487,853) | (478,840) | 12,878,401 | 256,166,734 |
| Net unrealized appreciation | |||||
| (depreciation) on investments: | |||||
| Unaffiliated issuers | 21,118,761 | 292,839 | 1,861,902 | 819,761 | 12,513,235 |
| Affiliated issuers | — | (2,600,928) | (486,118) | — | — |
| Net unrealized appreciation | |||||
| (depreciation) on options transactions | — | — | — | (77,963) | — |
| Net Unrealized Appreciation (Depreciation) | 21,118,761 | (2,308,089) | 1,375,784 | 741,798 | 12,513,235 |
| Net Realized and Unrealized | |||||
| Gain (Loss) on Investments | 184,788,797 | (2,795,942) | 896,944 | 13,620,199 | 268,679,969 |
| Net Increase (Decrease) in Net Assets | |||||
| Resulting from Operations | 197,708,565 | (2,643,065) | 1,150,484 | 16,683,330 | 268,462,986 |
See notes to financial statements.
| The Funds | 101 |
STATEMENTS OF OPERATIONS (continued)
| BNY Mellon | BNY Mellon | BNY Mellon | ||
| Small Cap | U.S. Core Equity | Focused Equity | BNY Mellon | |
| Stock Fund | 130/30 Fund | Opportunities Fund | Small/Mid Cap Fund | |
| Investment Income ($): | ||||
| Income: | ||||
| Cash dividends (net of $16,000, $50,420, and | ||||
| $45,423 foreign taxes withheld at source for | ||||
| BNY Mellon Small Cap Stock Fund, BNY Mellon | ||||
| U.S. Core Equity 130/30 Fund and BNY Mellon | ||||
| Small/Mid Cap Fund, respectively): | ||||
| Unaffiliated issuers | 3,038,306 | 6,387,679 | 4,369,022 | 3,600,252 |
| Affiliated issuers | 7,780 | 4,858 | 6,026 | 23,898 |
| Income from securities lending—Note 2(b) | 729,601 | — | 7,125 | 1,763,923 |
| Total Income | 3,775,687 | 6,392,537 | 4,382,173 | 5,388,073 |
| Expenses: | ||||
| Investment advisory fees—Note 4(a) | 3,764,096 | 2,286,511 | 2,646,459 | 3,342,820 |
| Administration fees—Note 4(a) | 546,485 | 352,491 | 466,232 | 549,475 |
| Custodian fees—Note 4(c) | 63,346 | 48,423 | 42,793 | 51,187 |
| Registration fees | 28,544 | 40,129 | 52,231 | 72,803 |
| Auditing fees | 28,249 | 30,331 | 29,336 | 29,240 |
| Shareholder servicing costs—Note 4(c) | 20,133 | 506 | 152 | 433 |
| Trustees’ fees and expenses—Note 4(d) | 14,984 | 10,147 | 14,645 | 22,102 |
| Legal fees | 9,610 | 4,702 | 5,008 | 3,263 |
| Prospectus and shareholders’ reports | 9,538 | 5,397 | 4,845 | 7,554 |
| Loan commitment fees—Note 3 | 4,060 | 4,577 | 6,113 | 7,333 |
| Interest expense—Note 3 | 715 | 1,776 | — | — |
| Dividends on securities sold short | — | 1,459,099 | — | — |
| Interest on securities sold short | — | 565,473 | — | — |
| Miscellaneous | 20,394 | 13,737 | 17,707 | 22,422 |
| Total Expenses | 4,510,154 | 4,823,299 | 3,285,521 | 4,108,632 |
| Less—reduction in investment advisory fee | ||||
| due to undertakings—Note 4(a) | (5,069) | — | (5,365) | (3,558) |
| Less—reduction in fees due to | ||||
| earnings credits—Note 4(c) | (57) | (1) | (1) | (1) |
| Net Expenses | 4,505,028 | 4,823,298 | 3,280,155 | 4,105,073 |
| Investment Income (Loss)—Net | (729,341) | 1,569,239 | 1,102,018 | 1,283,000 |
| Realized and Unrealized Gain (Loss) | ||||
| on Investments—Note 5 ($): | ||||
| Net realized gain (loss) on investments | 102,587,344 | 13,320,485 | 4,085,622 | (6,070,260) |
| Net realized gain (loss) on short sale transactions | — | (13,713,042) | — | — |
| Net realized gain (loss) on options transactions | — | — | 462,745 | — |
| Net Realized Gain (Loss) | 102,587,344 | (392,557) | 4,548,367 | (6,070,260) |
| Net unrealized appreciation | ||||
| (depreciation) on investments | (10,074,115) | 4,748,188 | 34,447,873 | 31,383,687 |
| Net unrealized appreciation | ||||
| (depreciation) on securities sold short | — | 2,124,969 | — | — |
| Net unrealized appreciation | ||||
| (depreciation) on options transactions | — | — | (29,171) | — |
| Net Unrealized Appreciation (Depreciation) | (10,074,115) | 6,873,157 | 34,418,702 | 31,383,687 |
| Net Realized and Unrealized | ||||
| Gain (Loss) on Investments | 92,513,229 | 6,480,600 | 38,967,069 | 25,313,427 |
| Net Increase in Net Assets | ||||
| Resulting from Operations | 91,783,888 | 8,049,839 | 40,069,087 | 26,596,427 |
| See notes to financial statements. | ||||
102
| BNY Mellon | BNY Mellon | BNY Mellon | ||
| BNY Mellon | Emerging | International | Asset Allocation | |
| International Fund | Markets Fund | Appreciation Fund | Fund | |
| Investment Income ($): | ||||
| Income: | ||||
| Cash dividends (net of $2,860,284, $7,428,219, | ||||
| $831,382 and $21,608 foreign taxes withheld at | ||||
| source for BNY Mellon International Fund, | ||||
| BNY Mellon Emerging Markets Fund, | ||||
| BNY Mellon International Appreciation | ||||
| Fund and BNY Mellon Asset Allocation | ||||
| Fund, respectively): | ||||
| Unaffiliated issuers | 32,679,896 | 60,688,133 | 8,778,803 | 2,307,502 |
| Affiliated issuers | 10,869 | 52,137 | 2,901 | 763,103 |
| Interest | 5,182 | 14,179 | 14,513 | 4,748,382 |
| Income from securities lending—Note 2(b) | — | 7,077 | — | 9,503 |
| Total Income | 32,695,947 | 60,761,526 | 8,796,217 | 7,828,490 |
| Expenses: | ||||
| Investment advisory fees—Note 4(a) | 8,976,089 | 26,771,591 | 1,208,670 | 1,570,955 |
| Administration fees—Note 4(a) | 1,303,210 | 2,871,838 | 298,316 | 330,400 |
| Custodian fees—Note 4(c) | 239,033 | 2,734,375 | 74,160 | 35,625 |
| Trustees’ fees and expenses—Note 4(d) | 49,132 | 95,746 | 12,127 | 18,292 |
| Auditing fees | 35,934 | 120,068 | 31,541 | 29,985 |
| Legal fees | 31,602 | 23,503 | 1,891 | 468 |
| Registration fees | 28,444 | 95,318 | 35,593 | 27,302 |
| Loan commitment fees—Note 3 | 26,547 | 50,028 | 1,879 | 9,439 |
| Shareholder servicing costs—Note 4(c) | 13,929 | 36,184 | 11,148 | 11,812 |
| Interest expense—Note 3 | 9,204 | 10,695 | 1,722 | — |
| Prospectus and shareholders’ reports | 3,794 | 11,340 | 5,689 | 375 |
| Miscellaneous | 83,842 | 84,097 | 17,607 | 39,059 |
| Total Expenses | 10,800,760 | 32,904,783 | 1,700,343 | 2,073,712 |
| Less—reduction in investment advisory fee | ||||
| due to undertaking—Note 4(a) | — | — | (4,044) | — |
| Less—reduction in fees due to | ||||
| earnings credits—Note 4(c) | (13) | (19) | (23) | (2) |
| Net Expenses | 10,800,747 | 32,904,764 | 1,696,276 | 2,073,710 |
| Investment Income—Net | 21,895,200 | 27,856,762 | 7,099,941 | 5,754,780 |
| The Funds | 103 |
STATEMENTS OF OPERATIONS (continued)
| BNY Mellon | BNY Mellon | BNY Mellon | ||
| BNY Mellon | Emerging | International | Asset Allocation | |
| International Fund | Markets Fund | Appreciation Fund | Fund | |
| Realized and Unrealized Gain (Loss) | ||||
| on Investments—Note 5 ($): | ||||
| Net realized gain (loss) on investments | ||||
| and foreign currency transactions | 96,391,184 | 215,582,840 | 17,973,687 | — |
| Net realized gain (loss) on forward | ||||
| foreign currency exchange contracts | (168,307) | (2,031,418) | 400,025 | — |
| Net realized gain (loss) on financial futures | — | — | (16,371) | — |
| Net realized gain (loss) on investments: | ||||
| Unaffiliated issuers | — | — | — | 18,284,088 |
| Affiliated issuers | — | — | — | (6,420,209) |
| Net Realized Gain (Loss) | 96,222,877 | 213,551,422 | 18,357,341 | 11,863,879 |
| Net unrealized appreciation (depreciation) on | ||||
| investments and foreign currency transactions | (23,828,922) | (162,857,750) | 210,639 | — |
| Net unrealized appreciation (depreciation) on | ||||
| forward foreign currency exchange contracts | 24,717 | 36,757 | (109,723) | — |
| Net unrealized appreciation | ||||
| (depreciation) on financial futures | — | — | 20,334 | — |
| Net unrealized appreciation | ||||
| (depreciation) on investments: | ||||
| Unaffiliated issuers | — | — | — | 2,039,746 |
| Affiliated issuers | — | — | — | 14,627,034 |
| Net Unrealized Appreciation (Depreciation) | (23,804,205) | (162,820,993) | 121,250 | 16,666,780 |
| Net Realized and Unrealized | ||||
| Gain (Loss) on Investments | 72,418,672 | 50,730,429 | 18,478,591 | 28,530,659 |
| Net Increase in Net Assets | ||||
| Resulting from Operations | 94,313,872 | 78,587,191 | 25,578,532 | 34,285,439 |
| See notes to financial statements. | ||||
104
| STATEMENT OF CASH FLOWS |
| Year Ended August 31, 2011 |
| BNY Mellon U.S. Core Equity 130/30 Fund | ||
| Cash Flows from Operating Activities ($): | ||
| Purchases of portfolio securities | (641,699,936) | |
| Proceeds from sales of portfolio securities | 503,015,175 | |
| Purchases from securities sold short | (1,222,084) | |
| Net sale of short—term portfolio securities | 2,163,000 | |
| Dividends received | 5,884,223 | |
| Interest and dividends paid | (1,887,010) | |
| Operating expenses paid | (488,230) | |
| Paid to The Dreyfus Corporation | (2,186,802) | (136,421,664) |
| Cash Flows from Financing Activites ($): | ||
| Net Beneficial Interest transactions | 138,009,417 | |
| Dividends paid | (1,000,686) | |
| Cash at beginning of period | 726,701 | |
| Cash at end of period | 1,313,768 | |
| Reconciliation of Net Increase in Net Assets Resulting from | ||
| Operations to Net Cash Used by Operating Activities ($): | ||
| Net Increase in Net Assets Resulting from Operations | 8,049,839 | |
| Adjustments to reconcile net increase in net assets resulting | ||
| from operations to net cash used by operating activities ($): | ||
| Purchases of portfolio securities | (641,699,936) | |
| Proceeds from sales of portfolio securities | 503,015,175 | |
| Purchases from securities sold short | (1,222,084) | |
| Net sale of short—term portfolio securities | 2,163,000 | |
| Increase in interest and dividends payable on | ||
| securities sold short and loan commitment fees | 143,915 | |
| Increase in accrued operating expenses | 21,105 | |
| Decrease in prepaid expenses | (3,468) | |
| Increase in Due from The Dreyfus Corporation | 99,709 | |
| Net realized losses on investments | 392,557 | |
| Net unrealized appreciation on investments | (6,873,157) | |
| Decrease in dividends and income receivable | (508,319) | |
| Net Cash Used by Operating Activities | (136,421,664) | |
| See notes to financial statements. | ||
| The Funds | 105 |
STATEMENTS OF CHANGES IN NET ASSETS
| BNY Mellon Large Cap | ||||
| BNY Mellon Large Cap Stock Fund | Market Opportunities Fund | |||
| Year Ended August 31, | Year Ended August 31, | |||
| 2011 | 2010 | 2011 | 2010a | |
| Operations ($): | ||||
| Investment income—net | 12,919,768 | 11,371,345 | 152,877 | 1,014 |
| Net realized gain (loss) on investments | 163,670,036 | 186,677,267 | (487,853) | (602) |
| Net unrealized appreciation (depreciation) on investments | 21,118,761 | (90,064,732) | (2,308,089) | (167,337) |
| Net Increase (Decrease) in Net Assets | ||||
| Resulting from Operations | 197,708,565 | 107,983,880 | (2,643,065) | (166,925) |
| Dividends to Shareholders from ($): | ||||
| Investment income—net: | ||||
| Class M Shares | (13,063,004) | (11,021,302) | (75,193) | — |
| Investor Shares | (228,248) | (44,449) | (7) | — |
| Net realized gain on investments: | ||||
| Class M Shares | — | — | (107,832) | — |
| Investor Shares | — | — | (26) | — |
| Total Dividends | (13,291,252) | (11,065,751) | (183,058) | — |
| Beneficial Interest Transactions ($): | ||||
| Net proceeds from shares sold: | ||||
| Class M Shares | 120,134,622 | 208,779,258 | 136,856,625 | 5,337,671 |
| Investor Shares | 39,843,670 | 2,684,994 | — | 10,000 |
| Dividends reinvested: | ||||
| Class M Shares | 1,798,959 | 1,341,554 | 88,903 | — |
| Investor Shares | 211,866 | 39,778 | — | — |
| Cost of shares redeemed: | ||||
| Class M Shares | (386,382,886) | (577,935,600) | (21,197,774) | (97,070) |
| Investor Shares | (39,707,910) | (3,958,994) | — | — |
| Increase (Decrease) in Net Assets from | ||||
| Beneficial Interest Transactions | (264,101,679) | (369,049,010) | 115,747,754 | 5,250,601 |
| Total Increase (Decrease) in Net Assets | (79,684,366) | (272,130,881) | 112,921,631 | 5,083,676 |
| Net Assets ($): | ||||
| Beginning of Period | 1,185,707,891 | 1,457,838,772 | 5,083,676 | — |
| End of Period | 1,106,023,525 | 1,185,707,891 | 118,005,307 | 5,083,676 |
| Undistributed investment income—net | 123,469 | 494,953 | 80,237 | 1,202 |
| Capital Share Transactions (Shares): | ||||
| Class M Shares | ||||
| Shares sold | 13,972,431 | 28,089,959 | 12,030,294 | 545,214 |
| Shares issued for dividends reinvested | 207,884 | 182,062 | 7,791 | — |
| Shares redeemed | (44,593,462) | (77,703,853) | (1,844,101) | (9,765) |
| Net Increase (Decrease) in Shares Outstanding | (30,413,147) | (49,431,832) | 10,193,984 | 535,449 |
| Investor Shares | ||||
| Shares sold | 4,923,057 | 359,559 | — | 1,000 |
| Shares issued for dividends reinvested | 24,656 | 5,397 | — | — |
| Shares redeemed | (4,397,230) | (541,583) | — | — |
| Net Increase (Decrease) in Shares Outstanding | 550,483 | (176,627) | — | 1,000 |
| a From July 30, 2010 (commencement of operations) to August 31, 2010. | ||||
| See notes to financial statements. | ||||
106
| BNY Mellon Tax-Sensitive | ||||
| Large Cap Multi-Strategy Fund | BNY Mellon Income Stock Fund | |||
| Year Ended August 31, | Year Ended August 31, | |||
| 2011 | 2010a | 2011 | 2010 | |
| Operations ($): | ||||
| Investment income—net | 253,540 | 3,610 | 3,063,131 | 1,759,613 |
| Net realized gain (loss) on investments | (478,840) | (1,044) | 12,878,401 | 8,116,861 |
| Net unrealized appreciation (depreciation) on investments | 1,375,784 | (285,220) | 741,798 | (3,722,472) |
| Net Increase (Decrease) in Net Assets | ||||
| Resulting from Operations | 1,150,484 | (282,654) | 16,683,330 | 6,154,002 |
| Dividends to Shareholders from ($): | ||||
| Investment income—net: | ||||
| Class M Shares | (89,598) | — | (3,079,872) | (1,709,209) |
| Investor Shares | (265) | — | (24,812) | (14,414) |
| Net realized gain on investments: | ||||
| Class M Shares | (96,101) | — | — | — |
| Investor Shares | (405) | — | — | — |
| Total Dividends | (186,369) | — | (3,104,684) | (1,723,623) |
| Beneficial Interest Transactions ($): | ||||
| Net proceeds from shares sold: | ||||
| Class M Shares | 79,366,131 | 10,618,723 | 140,640,067 | 6,266,202 |
| Investor Shares | 145,000 | 10,000 | 346,200 | 172,180 |
| Dividends reinvested: | ||||
| Class M Shares | 75,037 | — | 356,226 | 160,533 |
| Investor Shares | — | — | 22,150 | 12,512 |
| Cost of shares redeemed: | ||||
| Class M Shares | (15,412,029) | — | (40,276,849) | (46,945,226) |
| Investor Shares | (146,852) | — | (457,707) | (271,337) |
| Increase (Decrease) in Net Assets from | ||||
| Beneficial Interest Transactions | 64,027,287 | 10,628,723 | 100,630,087 | (40,605,136) |
| Total Increase (Decrease) in Net Assets | 64,991,402 | 10,346,069 | 114,208,733 | (36,174,757) |
| Net Assets ($): | ||||
| Beginning of Period | 10,346,069 | — | 91,632,729 | 127,807,486 |
| End of Period | 75,337,471 | 10,346,069 | 205,841,462 | 91,632,729 |
| Undistributed investment income—net | 167,398 | 3,957 | 84,947 | 126,500 |
| Capital Share Transactions (Shares): | ||||
| Class M Shares | ||||
| Shares sold | 7,002,957 | 1,085,576 | 22,303,229 | 1,086,244 |
| Shares issued for dividends reinvested | 6,519 | — | 54,463 | 28,378 |
| Shares redeemed | (1,333,175) | — | (6,258,300) | (8,114,105) |
| Net Increase (Decrease) in Shares Outstanding | 5,676,301 | 1,085,576 | 16,099,392 | (6,999,483) |
| Investor Shares | ||||
| Shares sold | 14,244 | 1,000 | 53,075 | 29,558 |
| Shares issued for dividends reinvested | — | — | 3,360 | 2,194 |
| Shares redeemed | (14,244) | — | (68,026) | (45,435) |
| Net Increase (Decrease) in Shares Outstanding | — | 1,000 | (11,591) | (13,683) |
| a From July 30, 2010 (commencement of operations) to August 31, 2010. | ||||
| See notes to financial statements. | ||||
| The Funds | 107 |
STATEMENTS OF CHANGES IN NET ASSETS (continued)
| BNY Mellon Mid Cap Stock Fund | BNY Mellon Small Cap Stock Fund | |||
| Year Ended August 31, | Year Ended August 31, | |||
| 2011 | 2010 | 2011 | 2010 | |
| Operations ($): | ||||
| Investment income (loss)—net | (216,983) | 6,748,867 | (729,341) | 66,349 |
| Net realized gain (loss) on investments | 256,166,734 | 127,211,257 | 102,587,344 | 44,616,451 |
| Net unrealized appreciation (depreciation) on investments | 12,513,235 | (26,653,307) | (10,074,115) | (2,612,330) |
| Net Increase (Decrease) in Net Assets | ||||
| Resulting from Operations | 268,462,986 | 107,306,817 | 91,783,888 | 42,070,470 |
| Dividends to Shareholders from ($): | ||||
| Investment income—net: | ||||
| Class M Shares | (358,451) | (8,420,413) | — | (754,676) |
| Investor Shares | — | (92,947) | — | — |
| Total Dividends | (358,451) | (8,513,360) | — | (754,676) |
| Beneficial Interest Transactions ($): | ||||
| Net proceeds from shares sold: | ||||
| Class M Shares | 174,144,431 | 204,861,905 | 33,278,117 | 57,811,400 |
| Investor Shares | 18,040,505 | 6,321,719 | 4,418,630 | 3,207,091 |
| Dreyfus Premier Shares | — | 9 | — | — |
| Dividends reinvested: | ||||
| Class M Shares | 77,865 | 1,904,825 | — | 151,608 |
| Investor Shares | — | 84,880 | — | — |
| Cost of shares redeemed: | ||||
| Class M Shares | (320,363,965) | (326,317,292) | (185,736,261) | (296,691,618) |
| Investor Shares | (14,671,888) | (7,108,008) | (3,653,353) | (3,791,821) |
| Dreyfus Premier Shares | (220,873) | (246,586) | — | — |
| Increase (Decrease) in Net Assets from | ||||
| Beneficial Interest Transactions | (142,993,925) | (120,498,548) | (151,692,867) | (239,313,340) |
| Total Increase (Decrease) in Net Assets | 125,110,610 | (21,705,091) | (59,908,979) | (197,997,546) |
| Net Assets ($): | ||||
| Beginning of Period | 1,184,165,315 | 1,205,870,406 | 418,845,804 | 616,843,350 |
| End of Period | 1,309,275,925 | 1,184,165,315 | 358,936,825 | 418,845,804 |
| Undistributed investment income—net | 854,267 | 535,372 | 9,188,971 | 206,519 |
108
| BNY Mellon Mid Cap Stock Fund | BNY Mellon Small Cap Stock Fund | |||
| Year Ended August 31, | Year Ended August 31, | |||
| 2011 | 2010 | 2011 | 2010 | |
| Capital Share Transactions: | ||||
| Class M Shares | ||||
| Shares sold | 14,184,799 | 21,189,689 | 2,854,251 | 6,192,288 |
| Shares issued for dividends reinvested | 6,510 | 208,405 | — | 16,977 |
| Shares redeemed | (26,788,259) | (33,694,346) | (16,462,903) | (31,292,076) |
| Net Increase (Decrease) in Shares Outstanding | (12,596,950) | (12,296,252) | (13,608,652) | (25,082,811) |
| Investor Sharesa | ||||
| Shares sold | 1,472,070 | 661,836 | 388,679 | 351,180 |
| Shares issued for dividends reinvested | — | 9,348 | — | — |
| Shares redeemed | (1,227,310) | (734,495) | (334,224) | (410,745) |
| Net Increase (Decrease) in Shares Outstanding | 244,760 | (63,311) | 54,455 | (59,565) |
| Dreyfus Premier Sharesa | ||||
| Shares sold | — | 1 | — | — |
| Shares redeemed | (19,199) | (27,146) | — | — |
| Net Increase (Decrease) in Shares Outstanding | (19,199) | (27,145) | — | — |
| a During the period ended August 31, 2011, 9,365 Dreyfus Premier shares of BNY Mellon Mid Cap Stock Fund representing $107,544 were automatically converted to 8,776 |
| Investor shares and during the period ended August 31, 2010, 15,060 Dreyfus Premier shares of BNY Mellon Mid Cap Stock Fund representing $138,528 were automatically |
| converted to 14,199 Investor shares. |
See notes to financial statements.
| The Funds | 109 |
STATEMENTS OF CHANGES IN NET ASSETS (continued)
| BNY Mellon Focused Equity | ||||
| BNY Mellon U.S. Core Equity 130/30 Fund | Opportunities Fund | |||
| Year Ended August 31, | Year Ended August 31, | |||
| 2011 | 2010 | 2011 | 2010a | |
| Operations ($): | ||||
| Investment income—net | 1,569,239 | 371,824 | 1,102,018 | 641,504 |
| Net realized gain (loss) on investments | (392,557) | 8,006,974 | 4,548,367 | (4,460,111) |
| Net unrealized appreciation (depreciation) on investments | 6,873,157 | (3,208,945) | 34,418,702 | (11,091,324) |
| Net Increase (Decrease) in Net Assets | ||||
| Resulting from Operations | 8,049,839 | 5,169,853 | 40,069,087 | (14,909,931) |
| Dividends to Shareholders from ($): | ||||
| Investment income—net: | ||||
| Class M Shares | (1,000,193) | (307,480) | (1,301,814) | (23,592) |
| Investor Shares | (493) | — | (30) | (5) |
| Net realized gain on investments: | ||||
| Class M Shares | — | — | — | (403) |
| Investor Shares | — | — | — | —b |
| Total Dividends | (1,000,686) | (307,480) | (1,301,844) | (24,000) |
| Beneficial Interest Transactions ($): | ||||
| Net proceeds from shares sold: | ||||
| Class M Shares | 190,055,378 | 148,604,687 | 225,547,506 | 262,921,709 |
| Investor Shares | 798,035 | 3,158 | 202,819 | 16,190 |
| Dividends reinvested: | ||||
| Class M Shares | 244,480 | 120,318 | 204,553 | 6,026 |
| Investor Shares | 459 | — | 30 | 5 |
| Cost of shares redeemed: | ||||
| Class M Shares | (55,715,743) | (48,400,711) | (77,836,582) | (9,662,634) |
| Investor Shares | (609,123) | (10,269) | (188,137) | (3,127) |
| Increase (Decrease) in Net Assets from | ||||
| Beneficial Interest Transactions | 134,773,486 | 100,317,183 | 147,930,189 | 253,278,169 |
| Total Increase (Decrease) in Net Assets | 141,822,639 | 105,179,556 | 186,697,432 | 238,344,238 |
| Net Assets ($): | ||||
| Beginning of Period | 186,145,057 | 80,965,501 | 238,344,238 | — |
| End of Period | 327,967,696 | 186,145,057 | 425,041,670 | 238,344,238 |
| Undistributed investment income—net | 1,006,864 | 388,109 | 423,691 | 620,294 |
| Capital Share Transactions (Shares): | ||||
| Class M Shares | ||||
| Shares sold | 16,096,335 | 14,900,619 | 17,917,906 | 24,529,894 |
| Shares issued for dividends reinvested | 21,389 | 12,202 | 16,658 | 552 |
| Shares redeemed | (4,820,334) | (4,858,891) | (6,260,367) | (917,571) |
| Net Increase (Decrease) in Shares Outstanding | 11,297,390 | 10,053,930 | 11,674,197 | 23,612,875 |
| Investor Shares | ||||
| Shares sold | 67,603 | 288 | 15,584 | 1,525 |
| Shares issued for dividends reinvested | 40 | — | 2 | 1 |
| Shares redeemed | (50,749) | (1,040) | (14,718) | (266) |
| Net Increase (Decrease) in Shares Outstanding | 16,894 | (752) | 868 | 1,260 |
| a | From September 30, 2009 (commencement of operations) to August 31, 2010. |
| b | Amount represents less than $1. |
See notes to financial statements.
110
| BNY Mellon Small/Mid Cap Fund | BNY Mellon International Fund | |||
| Year Ended August 31, | Year Ended August 31, | |||
| 2011 | 2010a | 2011 | 2010 | |
| Operations ($): | ||||
| Investment income—net | 1,283,000 | 59,283 | 21,895,200 | 20,938,942 |
| Net realized gain (loss) on investments | (6,070,260) | (41,857) | 96,222,877 | 17,897,604 |
| Net unrealized appreciation (depreciation) on investments | 31,383,687 | (5,355,933) | (23,804,205) | (88,400,400) |
| Net Increase (Decrease) in Net Assets | ||||
| Resulting from Operations | 26,596,427 | (5,338,507) | 94,313,872 | (49,563,854) |
| Dividends to Shareholders from ($): | ||||
| Investment income—net: | ||||
| Class M Shares | (946,111) | (46,121) | (21,098,723) | (29,900,390) |
| Investor Shares | — | (500) | (85,465) | (109,581) |
| Net realized gain on investments: | ||||
| Class M Shares | (2,188,505) | (128,453) | — | — |
| Investor Shares | (548) | (1,533) | — | — |
| Total Dividends | (3,135,164) | (176,607) | (21,184,188) | (30,009,971) |
| Beneficial Interest Transactions ($): | ||||
| Net proceeds from shares sold: | ||||
| Class M Shares | 323,181,126 | 240,567,850 | 134,251,212 | 175,302,528 |
| Investor Shares | 959,983 | 538,931 | 8,693,135 | 4,187,465 |
| Dividends reinvested: | ||||
| Class M Shares | 1,483,925 | 102,901 | 4,224,852 | 5,828,151 |
| Investor Shares | 130 | 1,742 | 71,118 | 96,704 |
| Cost of shares redeemed: | ||||
| Class M Shares | (59,653,073) | (13,099,812) | (328,629,083) | (352,584,183) |
| Investor Shares | (464,930) | (545,986) | (7,099,308) | (4,832,167) |
| Increase (Decrease) in Net Assets from | ||||
| Beneficial Interest Transactions | 265,507,161 | 227,565,626 | (188,488,074) | (172,001,502) |
| Total Increase (Decrease) in Net Assets | 288,968,424 | 222,050,512 | (115,358,390) | (251,575,327) |
| Net Assets ($): | ||||
| Beginning of Period | 222,050,512 | — | 1,000,965,369 | 1,252,540,696 |
| End of Period | 511,018,936 | 222,050,512 | 885,606,979 | 1,000,965,369 |
| Undistributed investment income—net | 239,611 | 9,614 | 24,988,789 | 18,767,438 |
| Capital Share Transactions (Shares): | ||||
| Class M Shares | ||||
| Shares sold | 22,681,253 | 21,480,182 | 12,368,759 | 17,152,076 |
| Shares issued for dividends reinvested | 106,223 | 9,254 | 397,446 | 557,184 |
| Shares redeemed | (4,270,027) | (1,162,630) | (30,470,215) | (34,733,321) |
| Net Increase (Decrease) in Shares Outstanding | 18,517,449 | 20,326,806 | (17,704,010) | (17,024,061) |
| Investor Shares | ||||
| Shares sold | 68,447 | 49,168 | 761,362 | 394,948 |
| Shares issued for dividends reinvested | 9 | 157 | 6,316 | 8,735 |
| Shares redeemed | (31,293) | (47,844) | (617,346) | (445,265) |
| Net Increase (Decrease) in Shares Outstanding | 37,163 | 1,481 | 150,332 | (41,582) |
| a From September 30, 2009 (commencement of operations) to August 31, 2010. | ||||
| See notes to financial statements. | ||||
| The Funds | 111 |
STATEMENTS OF CHANGES IN NET ASSETS (continued)
| BNY Mellon | ||||
| BNY Mellon Emerging Markets Fund | International Appreciation Fund | |||
| Year Ended August 31, | Year Ended August 31, | |||
| 2011 | 2010 | 2011 | 2010 | |
| Operations ($): | ||||
| Investment income—net | 27,856,762 | 13,341,492 | 7,099,941 | 5,693,232 |
| Net realized gain (loss) on investments | 213,551,422 | 144,710,956 | 18,357,341 | (6,443,823) |
| Net unrealized appreciation (depreciation) on investments | (162,820,993) | 24,777,402 | 121,250 | (8,229,860) |
| Net Increase (Decrease) in Net Assets | ||||
| Resulting from Operations | 78,587,191 | 182,829,850 | 25,578,532 | (8,980,451) |
| Dividends to Shareholders from ($): | ||||
| Investment income—net: | ||||
| Class M Shares | (9,688,664) | (11,020,148) | (5,520,095) | (7,535,695) |
| Investor Shares | (44,586) | (35,030) | (79,745) | (113,186) |
| Total Dividends | (9,733,250) | (11,055,178) | (5,599,840) | (7,648,881) |
| Beneficial Interest Transactions ($): | ||||
| Net proceeds from shares sold: | ||||
| Class M Shares | 786,084,683 | 712,314,185 | 16,566,755 | 31,858,519 |
| Investor Shares | 28,979,601 | 11,306,226 | 530,032 | 583,760 |
| Dividends reinvested: | ||||
| Class M Shares | 2,266,421 | 2,790,469 | 230,727 | 327,197 |
| Investor Shares | 31,912 | 29,682 | 74,816 | 105,666 |
| Cost of shares redeemed: | ||||
| Class M Shares | (301,781,598) | (187,116,932) | (56,515,796) | (53,896,689) |
| Investor Shares | (13,538,636) | (9,505,611) | (253,286) | (1,130,199) |
| Increase (Decrease) in Net Assets from | ||||
| Beneficial Interest Transactions | 502,042,383 | 529,818,019 | (39,366,752) | (22,151,746) |
| Total Increase (Decrease) in Net Assets | 570,896,324 | 701,592,691 | (19,388,060) | (38,781,078) |
| Net Assets ($): | ||||
| Beginning of Period | 1,803,364,310 | 1,101,771,619 | 221,529,062 | 260,310,140 |
| End of Period | 2,374,260,634 | 1,803,364,310 | 202,141,002 | 221,529,062 |
| Undistributed investment income—net | 19,435,956 | 7,544,968 | 5,570,989 | 3,670,857 |
| Capital Share Transactions (Shares): | ||||
| Class M Shares | ||||
| Shares sold | 68,268,713 | 71,964,613 | 1,359,433 | 2,798,262 |
| Shares issued for dividends reinvested | 196,227 | 282,722 | 19,308 | 28,576 |
| Shares redeemed | (27,016,759) | (18,909,854) | (4,542,340) | (4,702,781) |
| Net Increase (Decrease) in Shares Outstanding | 41,448,181 | 53,337,481 | (3,163,599) | (1,875,943) |
| Investor Shares | ||||
| Shares sold | 2,465,784 | 1,123,587 | 42,610 | 52,060 |
| Shares issued for dividends reinvested | 2,693 | 2,930 | 6,319 | 9,310 |
| Shares redeemed | (1,140,047) | (937,083) | (21,495) | (100,485) |
| Net Increase (Decrease) in Shares Outstanding | 1,328,430 | 189,434 | 27,434 | (39,115) |
| See notes to financial statements. | ||||
112
| BNY Mellon Asset Allocation Fund | ||
| Year Ended August 31, | ||
| 2011 | 2010 | |
| Operations ($): | ||
| Investment income—net | 5,754,780 | 5,992,687 |
| Net realized gain (loss) on investments | 11,863,879 | 14,897,600 |
| Net unrealized appreciation (depreciation) on investments | 16,666,780 | 52,840 |
| Net Increase (Decrease) in Net Assets | ||
| Resulting from Operations | 34,285,439 | 20,943,127 |
| Dividends to Shareholders from ($): | ||
| Investment income—net: | ||
| Class M Shares | (7,304,859) | (7,815,981) |
| Investor Shares | (77,588) | (91,647) |
| Total Dividends | (7,382,447) | (7,907,628) |
| Beneficial Interest Transactions ($): | ||
| Net proceeds from shares sold: | ||
| Class M Shares | 47,084,573 | 60,552,191 |
| Investor Shares | 1,183,019 | 327,865 |
| Dividends reinvested: | ||
| Class M Shares | 396,007 | 388,019 |
| Investor Shares | 69,403 | 84,534 |
| Cost of shares redeemed: | ||
| Class M Shares | (43,560,968) | (40,292,941) |
| Investor Shares | (1,301,987) | (996,979) |
| Increase (Decrease) in Net Assets from | ||
| Beneficial Interest Transactions | 3,870,047 | 20,062,689 |
| Total Increase (Decrease) in Net Assets | 30,773,039 | 33,098,188 |
| Net Assets ($): | ||
| Beginning of Period | 339,152,593 | 306,054,405 |
| End of Period | 369,925,632 | 339,152,593 |
| Undistributed investment income—net | 2,166,321 | 2,912,663 |
| Capital Share Transactions (Shares): | ||
| Class M Shares | ||
| Shares sold | 4,280,972 | 6,064,420 |
| Shares issued for dividends reinvested | 35,728 | 39,027 |
| Shares redeemed | (3,931,969) | (4,025,443) |
| Net Increase (Decrease) in Shares Outstanding | 384,731 | 2,078,004 |
| Investor Shares | ||
| Shares sold | 106,670 | 32,318 |
| Shares issued for dividends reinvested | 6,231 | 8,457 |
| Shares redeemed | (119,218) | (99,995) |
| Net Increase (Decrease) in Shares Outstanding | (6,317) | (59,220) |
| See notes to financial statements. | ||
| The Funds | 113 |
FINANCIAL HIGHLIGHTS
The following tables describe the performance for each share class of each BNY Mellon equity fund for the fiscal periods indicated. All information (except portfolio turnover rate) reflects financial results for a single fund share.Total return shows how much your investment in each fund would have increased (or decreased) during each period, assuming you had reinvested all dividends and distributions.These figures have been derived from each fund’s financial statements.
| Class M Shares | |||||
| Year Ended August 31, | |||||
| BNY Mellon Large Cap Stock Fund | 2011 | 2010 | 2009 | 2008 | 2007 |
| Per Share Data ($): | |||||
| Net asset value, beginning of period | 7.16 | 6.77 | 8.77 | 11.56 | 10.31 |
| Investment Operations: | |||||
| Investment income—neta | .09 | .06 | .09 | .11 | .09 |
| Net realized and unrealized | |||||
| gain (loss) on investments | .98 | .39 | (1.91) | (1.05) | 1.49 |
| Total from Investment Operations | 1.07 | .45 | (1.82) | (.94) | 1.58 |
| Distributions: | |||||
| Dividends from investment income—net | (.09) | (.06) | (.09) | (.12) | (.08) |
| Dividends from net realized gain on investments | — | — | (.09) | (1.73) | (.25) |
| Total Distributions | (.09) | (.06) | (.18) | (1.85) | (.33) |
| Net asset value, end of period | 8.14 | 7.16 | 6.77 | 8.77 | 11.56 |
| Total Return (%) | 14.86 | 6.62 | (20.39) | (9.95) | 15.60 |
| Ratios/Supplemental Data (%): | |||||
| Ratio of total expenses to average net assets | .80 | .80 | .81 | .80 | .80 |
| Ratio of net expenses to average net assets | .80 | .80 | .81 | .80 | .79 |
| Ratio of net investment income | |||||
| to average net assets | .98 | .81 | 1.51 | 1.15 | .76 |
| Portfolio Turnover Rate | 86.71 | 71.61 | 109.39 | 56.13 | 77.46 |
| Net Assets, end of period ($ x 1,000) | 1,093,037 | 1,178,235 | 1,449,565 | 1,750,688 | 1,970,482 |
| a Based on average shares outstanding at each month end. | |||||
| See notes to financial statements. | |||||
114
| Investor Shares | |||||
| Year Ended August 31, | |||||
| BNY Mellon Large Cap Stock Fund | 2011 | 2010 | 2009 | 2008 | 2007 |
| Per Share Data ($): | |||||
| Net asset value, beginning of period | 7.16 | 6.78 | 8.78 | 11.58 | 10.33 |
| Investment Operations: | |||||
| Investment income—neta | .06 | .04 | .08 | .09 | .06 |
| Net realized and unrealized | |||||
| gain (loss) on investments | 1.00 | .38 | (1.91) | (1.07) | 1.50 |
| Total from Investment Operations | 1.06 | .42 | (1.83) | (.98) | 1.56 |
| Distributions: | |||||
| Dividends from investment income—net | (.07) | (.04) | (.08) | (.09) | (.06) |
| Dividends from net realized gain on investments | — | — | (.09) | (1.73) | (.25) |
| Total Distributions | (.07) | (.04) | (.17) | (1.82) | (.31) |
| Net asset value, end of period | 8.15 | 7.16 | 6.78 | 8.78 | 11.58 |
| Total Return (%) | 14.78 | 6.21 | (20.56) | (10.26) | 15.29 |
| Ratios/Supplemental Data (%): | |||||
| Ratio of total expenses to average net assets | 1.05 | 1.05 | 1.06 | 1.05 | 1.05 |
| Ratio of net expenses to average net assets | 1.05 | 1.05 | 1.06 | 1.05 | 1.04 |
| Ratio of net investment income | |||||
| to average net assets | .68 | .56 | 1.25 | .89 | .51 |
| Portfolio Turnover Rate | 86.71 | 71.61 | 109.39 | 56.13 | 77.46 |
| Net Assets, end of period ($ x 1,000) | 12,986 | 7,473 | 8,274 | 9,829 | 11,704 |
| a Based on average shares outstanding at each month end. | |||||
| See notes to financial statements. | |||||
| The Funds | 115 |
FINANCIAL HIGHLIGHTS (continued)
| Class M Shares | ||
| Year Ended August 31, | ||
| BNY Mellon Large Cap Market Opportunities Fund | 2011 | 2010a |
| Per Share Data ($): | ||
| Net asset value, beginning of period | 9.48 | 10.00 |
| Investment Operations: | ||
| Investment income—netb | .02 | .00c |
| Net realized and unrealized | ||
| gain (loss) on investments | 1.55 | (.52) |
| Total from Investment Operations | 1.57 | (.52) |
| Distributions: | ||
| Dividends from investment income—net | (.02) | — |
| Dividends from net realized gain on investments | (.03) | — |
| Total Distributions | (.05) | — |
| Net asset value, end of period | 11.00 | 9.48 |
| Total Return (%) | 16.48 | (5.20)d |
| Ratios/Supplemental Data (%): | ||
| Ratio of total expenses to average net assetse | .94 | 15.54f |
| Ratio of net expenses to average net assetse | .75 | .98f |
| Ratio of net investment income | ||
| to average net assetse | .21 | .48f |
| Portfolio Turnover Rate | 22.06 | 2.12d |
| Net Assets, end of period ($ x 1,000) | 117,994 | 5,074 |
| a | From July 30, 2010 (commencement of operations) to August 31, 2010. |
| b | Based on average shares outstanding at each month end. |
| c | Amount represents less than $.01 per share. |
| d | Not annualized. |
| e | Amount does not include the activity of the underlying funds. |
| f | Annualized. |
See notes to financial statements.
116
| Investor Shares | ||
| Year Ended August 31, | ||
| BNY Mellon Large Cap Market Opportunities Fund | 2011 | 2010a |
| Per Share Data ($): | ||
| Net asset value, beginning of period | 9.48 | 10.00 |
| Investment Operations: | ||
| Investment income—netb,c | .00 | .00 |
| Net realized and unrealized | ||
| gain (loss) on investments | 1.54 | (.52) |
| Total from Investment Operations | 1.54 | (.52) |
| Distributions: | ||
| Dividends from investment income—net | (.01) | — |
| Dividends from net realized gain on investments | (.03) | — |
| Total Distributions | (.04) | — |
| Net asset value, end of period | 10.98 | 9.48 |
| Total Return (%) | 16.16 | (5.20)d |
| Ratios/Supplemental Data (%): | ||
| Ratio of total expenses to average net assetse | 1.24 | 9.38f |
| Ratio of net expenses to average net assetse | 1.00 | 1.23f |
| Ratio of net investment income | ||
| to average net assetse | .03 | .16f |
| Portfolio Turnover Rate | 22.06 | 2.12d |
| Net Assets, end of period ($ x 1,000) | 11 | 9 |
| a | From July 30, 2010 (commencement of operations) to August 31, 2010. |
| b | Based on average shares outstanding at each month end. |
| c | Amount represents less than $.01 per share. |
| d | Not annualized. |
| e | Amount does not include the activity of the underlying funds. |
| f | Annualized. |
See notes to financial statements.
| The Funds | 117 |
FINANCIAL HIGHLIGHTS (continued)
| Class M Shares | ||
| Year Ended August 31, | ||
| BNY Mellon Tax-Sensitive Large Cap Multi-Strategy Fund | 2011 | 2010a |
| Per Share Data ($): | ||
| Net asset value, beginning of period | 9.52 | 10.00 |
| Investment Operations: | ||
| Investment income—netb | .06 | .01 |
| Net realized and unrealized | ||
| gain (loss) on investments | 1.61 | (.49) |
| Total from Investment Operations | 1.67 | (.48) |
| Distributions: | ||
| Dividends from investment income—net | (.02) | — |
| Dividends from net realized gain on investments | (.03) | — |
| Total Distributions | (.05) | — |
| Net asset value, end of period | 11.14 | 9.52 |
| Total Return (%) | 17.54 | (4.80)c |
| Ratios/Supplemental Data (%): | ||
| Ratio of total expenses to average net assetsd | 1.28 | 8.12e |
| Ratio of net expenses to average net assetsd | .88 | .99e |
| Ratio of net investment income | ||
| to average net assetsd | .51 | .91e |
| Portfolio Turnover Rate | 29.24 | 1.53c |
| Net Assets, end of period ($ x 1,000) | 75,326 | 10,337 |
| a | From July 30, 2010 (commencement of operations) to August 31, 2010. |
| b | Based on average shares outstanding at each month end. |
| c | Not annualized. |
| d | Amount does not include the activity of the underlying funds. |
| e | Annualized. |
See notes to financial statements.
118
| Investor Shares | ||
| Year Ended August 31, | ||
| BNY Mellon Tax-Sensitive Large Cap Multi-Strategy Fund | 2011 | 2010a |
| Per Share Data ($): | ||
| Net asset value, beginning of period | 9.52 | 10.00 |
| Investment Operations: | ||
| Investment income—netb | .03 | .01 |
| Net realized and unrealized | ||
| gain (loss) on investments | 1.54 | (.49) |
| Total from Investment Operations | 1.57 | (.48) |
| Distributions: | ||
| Dividends from investment income—net | (.02) | — |
| Dividends from net realized gain on investments | (.03) | — |
| Total Distributions | (.05) | — |
| Net asset value, end of period | 11.04 | 9.52 |
| Total Return (%) | 16.31 | (4.80)c |
| Ratios/Supplemental Data (%): | ||
| Ratio of total expenses to average net assetsd | 1.77 | 5.88e |
| Ratio of net expenses to average net assetsd | 1.13 | 1.24e |
| Ratio of net investment income | ||
| to average net assetsd | .26 | .65e |
| Portfolio Turnover Rate | 29.24 | 1.53c |
| Net Assets, end of period ($ x 1,000) | 11 | 10 |
| a | From July 30, 2010 (commencement of operations) to August 31, 2010. |
| b | Based on average shares outstanding at each month end. |
| c | Not annualized. |
| d | Amount does not include the activity of the underlying funds. |
| e | Annualized. |
See notes to financial statements.
| The Funds | 119 |
FINANCIAL HIGHLIGHTS (continued)
| Class M Shares | |||||
| Year Ended August 31, | |||||
| BNY Mellon Income Stock Fund | 2011 | 2010 | 2009 | 2008 | 2007 |
| Per Share Data ($): | |||||
| Net asset value, beginning of period | 5.49 | 5.39 | 7.22 | 10.61 | 10.43 |
| Investment Operations: | |||||
| Investment income—neta | .17 | .09 | .12 | .16 | .19 |
| Net realized and unrealized | |||||
| gain (loss) on investments | .79 | .10 | (1.35) | (1.35) | 1.04 |
| Total from Investment Operations | .96 | .19 | (1.23) | (1.19) | 1.23 |
| Distributions: | |||||
| Dividends from investment income—net | (.17) | (.09) | (.13) | (.16) | (.19) |
| Dividends from net realized gain on investments | — | — | (.47) | (2.04) | (.86) |
| Total Distributions | (.17) | (.09) | (.60) | (2.20) | (1.05) |
| Net asset value, end of period | 6.28 | 5.49 | 5.39 | 7.22 | 10.61 |
| Total Return (%) | 17.41 | 3.44 | (15.73) | (13.79) | 12.11 |
| Ratios/Supplemental Data (%): | |||||
| Ratio of total expenses to average net assets | .86 | .86 | .87 | .84 | .81 |
| Ratio of net expenses to average net assets | .86 | .86 | .87 | .84 | .81 |
| Ratio of net investment income | |||||
| to average net assets | 2.71 | 1.55 | 2.47 | 1.87 | 1.81 |
| Portfolio Turnover Rate | 72.27 | 66.78 | 65.88 | 33.02 | 62.06 |
| Net Assets, end of period ($ x 1,000) | 204,785 | 90,645 | 126,763 | 199,367 | 414,866 |
| a Based on average shares outstanding at each month end. | |||||
| See notes to financial statements. | |||||
120
| Investor Shares | |||||
| Year Ended August 31, | |||||
| BNY Mellon Income Stock Fund | 2011 | 2010 | 2009 | 2008 | 2007 |
| Per Share Data ($): | |||||
| Net asset value, beginning of period | 5.54 | 5.44 | 7.27 | 10.67 | 10.49 |
| Investment Operations: | |||||
| Investment income—neta | .15 | .08 | .11 | .14 | .17 |
| Net realized and unrealized | |||||
| gain (loss) on investments | .80 | .10 | (1.35) | (1.36) | 1.04 |
| Total from Investment Operations | .95 | .18 | (1.24) | (1.22) | 1.21 |
| Distributions: | |||||
| Dividends from investment income—net | (.16) | (.08) | (.12) | (.14) | (.17) |
| Dividends from net realized gain on investments | — | — | (.47) | (2.04) | (.86) |
| Total Distributions | (.16) | (.08) | (.59) | (2.18) | (1.03) |
| Net asset value, end of period | 6.33 | 5.54 | 5.44 | 7.27 | 10.67 |
| Total Return (%) | 17.02 | 3.19 | (15.84) | (14.03) | 11.78 |
| Ratios/Supplemental Data (%): | |||||
| Ratio of total expenses to average net assets | 1.12 | 1.11 | 1.12 | 1.09 | 1.06 |
| Ratio of net expenses to average net assets | 1.12 | 1.11 | 1.12 | 1.09 | 1.06 |
| Ratio of net investment income | |||||
| to average net assets | 2.32 | 1.29 | 2.19 | 1.62 | 1.55 |
| Portfolio Turnover Rate | 72.27 | 66.78 | 65.88 | 33.02 | 62.06 |
| Net Assets, end of period ($ x 1,000) | 1,056 | 988 | 1,045 | 1,407 | 1,719 |
| a Based on average shares outstanding at each month end. | |||||
| See notes to financial statements. | |||||
| The Funds | 121 |
FINANCIAL HIGHLIGHTS (continued)
| Class M Shares | |||||
| Year Ended August 31, | |||||
| BNY Mellon Mid Cap Stock Fund | 2011 | 2010 | 2009 | 2008 | 2007 |
| Per Share Data ($): | |||||
| Net asset value, beginning of period | 9.31 | 8.64 | 11.11 | 14.19 | 14.26 |
| Investment Operations: | |||||
| Investment income (loss)—neta | (.00)b | .05 | .07 | .03 | .06 |
| Net realized and unrealized | |||||
| gain (loss) on investments | 2.10 | .68 | (2.46) | (.53) | 2.17 |
| Total from Investment Operations | 2.10 | .73 | (2.39) | (.50) | 2.23 |
| Distributions: | |||||
| Dividends from investment income—net | (.00)b | (.06) | (.06) | (.04) | (.08) |
| Dividends from net realized gain on investments | — | — | (.02) | (2.54) | (2.22) |
| Total Distributions | (.00) | (.06) | (.08) | (2.58) | (2.30) |
| Net asset value, end of period | 11.41 | 9.31 | 8.64 | 11.11 | 14.19 |
| Total Return (%) | 22.59 | 8.49 | (21.33) | (5.67) | 16.76 |
| Ratios/Supplemental Data (%): | |||||
| Ratio of total expenses to average net assets | .90 | .90 | .92 | .90 | .90 |
| Ratio of net expenses to average net assets | .90 | .90 | .92 | .90 | .90 |
| Ratio of net investment income | |||||
| (loss) to average net assets | (.01) | .53 | .86 | .28 | .42 |
| Portfolio Turnover Rate | 132.20 | 123.41 | 147.50 | 121.12 | 112.31 |
| Net Assets, end of period ($ x 1,000) | 1,280,742 | 1,162,906 | 1,185,376 | 1,540,821 | 1,708,747 |
| a | Based on average shares outstanding at each month end. |
| b | Amount represents less than $.01 per share. |
See notes to financial statements.
122
| Investor Shares | |||||
| Year Ended August 31, | |||||
| BNY Mellon Mid Cap Stock Fund | 2011 | 2010 | 2009 | 2008 | 2007 |
| Per Share Data ($): | |||||
| Net asset value, beginning of period | 9.24 | 8.57 | 11.00 | 14.07 | 14.16 |
| Investment Operations: | |||||
| Investment income (loss)—neta | (.03) | .03 | .05 | .00b | .02 |
| Net realized and unrealized | |||||
| gain (loss) on investments | 2.08 | .68 | (2.43) | (.53) | 2.15 |
| Total from Investment Operations | 2.05 | .71 | (2.38) | (.53) | 2.17 |
| Distributions: | |||||
| Dividends from investment income—net | — | (.04) | (.03) | — | (.04) |
| Dividends from net realized gain on investments | — | — | (.02) | (2.54) | (2.22) |
| Total Distributions | — | (.04) | (.05) | (2.54) | (2.26) |
| Net asset value, end of period | 11.29 | 9.24 | 8.57 | 11.00 | 14.07 |
| Total Return (%) | 22.19 | 8.30 | (21.51) | (5.94) | 16.44 |
| Ratios/Supplemental Data (%): | |||||
| Ratio of total expenses to average net assets | 1.15 | 1.15 | 1.17 | 1.15 | 1.15 |
| Ratio of net expenses to average net assets | 1.15 | 1.15 | 1.17 | 1.15 | 1.15 |
| Ratio of net investment income | |||||
| (loss) to average net assets | (.26) | .27 | .63 | .03 | .16 |
| Portfolio Turnover Rate | 132.20 | 123.41 | 147.50 | 121.12 | 112.31 |
| Net Assets, end of period ($ x 1,000) | 28,098 | 20,733 | 19,785 | 28,520 | 35,139 |
| a | Based on average shares outstanding at each month end. |
| b | Amount represents less than $.01 per share. |
See notes to financial statements.
| The Funds | 123 |
FINANCIAL HIGHLIGHTS (continued)
| Dreyfus Premier Shares | |||||
| Year Ended August 31, | |||||
| BNY Mellon Mid Cap Stock Fund | 2011 | 2010 | 2009 | 2008 | 2007 |
| Per Share Data ($): | |||||
| Net asset value, beginning of period | 8.68 | 8.08 | 10.40 | 13.52 | 13.74 |
| Investment Operations: | |||||
| Investment (loss)—neta | (.11) | (.04) | (.01) | (.09) | (.07) |
| Net realized and unrealized | |||||
| gain (loss) on investments | 1.96 | .64 | (2.29) | (.49) | 2.07 |
| Total from Investment Operations | 1.85 | .60 | (2.30) | (.58) | 2.00 |
| Distributions: | |||||
| Dividends from net realized gain on investments | — | — | (.02) | (2.54) | (2.22) |
| Net asset value, end of period | 10.53 | 8.68 | 8.08 | 10.40 | 13.52 |
| Total Return (%) | 21.31 | 7.43 | (22.09) | (6.63) | 15.58 |
| Ratios/Supplemental Data (%): | |||||
| Ratio of total expenses to average net assets | 1.90 | 1.90 | 1.92 | 1.90 | 1.90 |
| Ratio of net expenses to average net assets | 1.90 | 1.90 | 1.92 | 1.90 | 1.90 |
| Ratio of net investment (loss) | |||||
| to average net assets | (1.00) | (.45) | (.11) | (.73) | (.53) |
| Portfolio Turnover Rate | 132.20 | 123.41 | 147.50 | 121.12 | 112.31 |
| Net Assets, end of period ($ x 1,000) | 436 | 526 | 709 | 1,669 | 3,635 |
| a Based on average shares outstanding at each month end. | |||||
| See notes to financial statements. | |||||
124
| Class M Shares | |||||
| Year Ended August 31, | |||||
| BNY Mellon Small Cap Stock Fund | 2011 | 2010 | 2009 | 2008 | 2007 |
| Per Share Data ($): | |||||
| Net asset value, beginning of period | 8.94 | 8.57 | 11.44 | 14.82 | 15.39 |
| Investment Operations: | |||||
| Investment income (loss)—neta | (.02) | .00b | .07 | .03 | .00b |
| Net realized and unrealized | |||||
| gain (loss) on investments | 1.86 | .38 | (2.85) | (1.15) | 1.83 |
| Total from Investment Operations | 1.84 | .38 | (2.78) | (1.12) | 1.83 |
| Distributions: | |||||
| Dividends from investment income—net | — | (.01) | (.08) | — | — |
| Dividends from net realized gain on investments | — | — | (.01) | (2.26) | (2.40) |
| Total Distributions | — | (.01) | (.09) | (2.26) | (2.40) |
| Net asset value, end of period | 10.78 | 8.94 | 8.57 | 11.44 | 14.82 |
| Total Return (%) | 20.58 | 4.45 | (24.11) | (9.07) | 12.53 |
| Ratios/Supplemental Data (%): | |||||
| Ratio of total expenses to average net assets | 1.01 | 1.00 | 1.03 | 1.01 | 1.01 |
| Ratio of net expenses to average net assets | 1.01 | .98 | .99 | 1.01 | 1.00 |
| Ratio of net investment income | |||||
| (loss) to average net assets | (.16) | .01 | .88 | .28 | .02 |
| Portfolio Turnover Rate | 161.05 | 183.41 | 159.78 | 132.19 | 167.04 |
| Net Assets, end of period ($ x 1,000) | 351,122 | 412,824 | 610,567 | 633,118 | 670,238 |
| a | Based on average shares outstanding at each month end. |
| b | Amount represents less than $.01 per share. |
See notes to financial statements.
| The Funds | 125 |
FINANCIAL HIGHLIGHTS (continued)
| Investor Shares | |||||
| Year Ended August 31, | |||||
| BNY Mellon Small Cap Stock Fund | 2011 | 2010 | 2009 | 2008 | 2007 |
| Per Share Data ($): | |||||
| Net asset value, beginning of period | 8.72 | 8.36 | 11.11 | 14.50 | 15.13 |
| Investment Operations: | |||||
| Investment income (loss)—neta | (.04) | (.02) | .05 | .00b | (.03) |
| Net realized and unrealized | |||||
| gain (loss) on investments | 1.81 | .38 | (2.72) | (1.13) | 1.80 |
| Total from Investment Operations | 1.77 | .36 | (2.67) | (1.13) | 1.77 |
| Distributions: | |||||
| Dividends from investment income—net | — | — | (.07) | — | — |
| Dividends from net realized gain on investments | — | — | (.01) | (2.26) | (2.40) |
| Total Distributions | — | — | (.08) | (2.26) | (2.40) |
| Net asset value, end of period | 10.49 | 8.72 | 8.36 | 11.11 | 14.50 |
| Total Return (%) | 20.30 | 4.31 | (23.92) | (9.36) | 12.33 |
| Ratios/Supplemental Data (%): | |||||
| Ratio of total expenses to average net assets | 1.26 | 1.25 | 1.28 | 1.26 | 1.26 |
| Ratio of net expenses to average net assets | 1.26 | 1.23 | 1.23 | 1.26 | 1.25 |
| Ratio of net investment income | |||||
| (loss) to average net assets | (.39) | (.24) | .61 | .02 | (.23) |
| Portfolio Turnover Rate | 161.05 | 183.41 | 159.78 | 132.19 | 167.04 |
| Net Assets, end of period ($ x 1,000) | 7,815 | 6,022 | 6,277 | 3,795 | 5,341 |
| a | Based on average shares outstanding at each month end. |
| b | Amount represents less than $.01 per share. |
See notes to financial statements.
126
| Class M Shares | |||||
| Year Ended August 31, | |||||
| BNY Mellon U.S. Core Equity 130/30 Fund | 2011 | 2010 | 2009 | 2008 | 2007a |
| Per Share Data ($): | |||||
| Net asset value, beginning of period | 9.81 | 9.07 | 11.39 | 12.64 | 12.50 |
| Investment Operations: | |||||
| Investment income (loss)—netb | .06 | .03 | .07 | .07 | (.00)c |
| Net realized and unrealized | |||||
| gain (loss) on investments | 1.01 | .74 | (2.28) | (1.32) | .14 |
| Total from Investment Operations | 1.07 | .77 | (2.21) | (1.25) | .14 |
| Distributions: | |||||
| Dividends from investment income—net | (.05) | (.03) | (.11) | — | — |
| Net asset value, end of period | 10.83 | 9.81 | 9.07 | 11.39 | 12.64 |
| Total Return (%) | 10.86 | 8.53 | (19.19) | (9.89) | 1.12d |
| Ratios/Supplemental Data (%): | |||||
| Ratio of total expenses to average net assets | 1.69 | 1.79 | 2.02 | 2.39e | .50d |
| Ratio of net expenses to average net assets | 1.69 | 1.79 | 2.02 | 2.28e | .28d |
| Ratio of net investment income | |||||
| (loss) to average net assets | .55 | .26 | .87 | .58 | (.03)d |
| Portfolio Turnover Rate | 144.04 | 117.53 | 138.97 | 163.66 | 11.94d |
| Net Assets, end of period ($ x 1,000) | 327,778 | 186,137 | 80,952 | 180,803 | 26,064 |
| a | From August 1, 2007 (commencement of operations) to August 31, 2007. |
| b | Based on average shares outstanding at each month end. |
| c | Amount represents less than $.01 per share. |
| d | Not annualized. |
| e | Higher costs are due to borrowing costs associated with the 130/30 fund structure. |
See notes to financial statements.
| The Funds | 127 |
FINANCIAL HIGHLIGHTS (continued)
| Investor Shares | |||||
| Year Ended August 31, | |||||
| BNY Mellon U.S. Core Equity 130/30 Fund | 2011 | 2010 | 2009 | 2008 | 2007a |
| Per Share Data ($): | |||||
| Net asset value, beginning of period | 9.76 | 9.02 | 11.36 | 12.63 | 12.50 |
| Investment Operations: | |||||
| Investment income (loss)—netb | .02 | (.01) | .04 | .02 | (.00)c |
| Net realized and unrealized | |||||
| gain (loss) on investments | .99 | .75 | (2.27) | (1.29) | .13 |
| Total from Investment Operations | 1.01 | .74 | (2.23) | (1.27) | .13 |
| Distributions: | |||||
| Dividends from investment income—net | (.04) | — | (.11) | — | — |
| Net asset value, end of period | 10.73 | 9.76 | 9.02 | 11.36 | 12.63 |
| Total Return (%) | 10.34 | 8.20 | (19.47) | (10.06) | 1.04d |
| Ratios/Supplemental Data (%): | |||||
| Ratio of total expenses to average net assets | 1.97 | 2.09 | 2.25 | 2.81e | .50d |
| Ratio of net expenses to average net assets | 1.97 | 2.09 | 2.25 | 2.71e | .28d |
| Ratio of net investment income | |||||
| (loss) to average net assets | .20 | (.08) | .56 | .16 | (.03)d |
| Portfolio Turnover Rate | 144.04 | 117.53 | 138.97 | 163.66 | 11.94d |
| Net Assets, end of period ($ x 1,000) | 190 | 8 | 14 | 13 | 10 |
| a | From August 1, 2007 (commencement of operations) to August 31, 2007. |
| b | Based on average shares outstanding at each month end. |
| c | Amount represents less than $.01 per share. |
| d | Not annualized. |
| e | Higher costs are due to borrowing costs associated with the 130/30 fund structure. |
See notes to financial statements.
128
| Class M Shares | ||
| Year Ended August 31, | ||
| BNY Mellon Focused Equity Opportunities Fund | 2011 | 2010a |
| Per Share Data ($): | ||
| Net asset value, beginning of period | 10.09 | 10.00 |
| Investment Operations: | ||
| Investment income—netb | .04 | .06 |
| Net realized and unrealized | ||
| gain (loss) on investments | 1.96 | .04 |
| Total from Investment Operations | 2.00 | .10 |
| Distributions: | ||
| Dividends from investment income—net | (.05) | (.01) |
| Dividends from net realized gain on investments | — | (.00)c |
| Total Distributions | (.05) | (.01) |
| Net asset value, end of period | 12.04 | 10.09 |
| Total Return (%) | 19.82 | 1.01d |
| Ratios/Supplemental Data (%): | ||
| Ratio of total expenses to average net assets | .87 | .98e |
| Ratio of net expenses to average net assets | .87 | .89e |
| Ratio of net investment income | ||
| to average net assets | .29 | .59e |
| Portfolio Turnover Rate | 58.98 | 64.75d |
| Net Assets, end of period ($ x 1,000) | 425,016 | 238,332 |
| a | From September 30, 2009 (commencement of operations) to August 31, 2010. |
| b | Based on average shares outstanding at each month end. |
| c | Amount represents less than $.01 per share. |
| d | Not annualized. |
| e | Annualized. |
See notes to financial statements.
| The Funds | 129 |
FINANCIAL HIGHLIGHTS (continued)
| Investor Shares | ||
| Year Ended August 31, | ||
| BNY Mellon Focused Equity Opportunities Fund | 2011 | 2010a |
| Per Share Data ($): | ||
| Net asset value, beginning of period | 10.07 | 10.00 |
| Investment Operations: | ||
| Investment income—netb | .00c | .02 |
| Net realized and unrealized | ||
| gain (loss) on investments | 1.99 | .06 |
| Total from Investment Operations | 1.99 | .08 |
| Distributions: | ||
| Dividends from investment income—net | (.02) | (.01) |
| Dividends from net realized gain on investments | — | (.00)c |
| Total Distributions | (.02) | (.01) |
| Net asset value, end of period | 12.04 | 10.07 |
| Total Return (%) | 19.80 | .75d |
| Ratios/Supplemental Data (%): | ||
| Ratio of total expenses to average net assets | 1.12 | 1.53e |
| Ratio of net expenses to average net assets | 1.12 | 1.14e |
| Ratio of net investment income | ||
| to average net assets | .00f | .23e |
| Portfolio Turnover Rate | 58.98 | 64.75d |
| Net Assets, end of period ($ x 1,000) | 26 | 13 |
| a | From September 30, 2009 (commencement of operations) to August 31, 2010. |
| b | Based on average shares outstanding at each month end. |
| c | Amount represents less than $.01 per share. |
| d | Not annualized. |
| e | Annualized. |
| f | Amount represents less than .01%. |
See notes to financial statements.
130
| Class M Shares | ||
| Year Ended August 31, | ||
| BNY Mellon Small/Mid Cap Fund | 2011 | 2010a |
| Per Share Data ($): | ||
| Net asset value, beginning of period | 10.92 | 10.00 |
| Investment Operations: | ||
| Investment income—netb | .04 | .01 |
| Net realized and unrealized | ||
| gain (loss) on investments | 2.31 | .95 |
| Total from Investment Operations | 2.35 | .96 |
| Distributions: | ||
| Dividends from investment income—net | (.04) | (.01) |
| Dividends from net realized gain on investments | (.09) | (.03) |
| Total Distributions | (.13) | (.04) |
| Net asset value, end of period | 13.14 | 10.92 |
| Total Return (%) | 21.41 | 9.65c |
| Ratios/Supplemental Data (%): | ||
| Ratio of total expenses to average net assets | .92 | 1.07d |
| Ratio of net expenses to average net assets | .92 | .92d |
| Ratio of net investment income | ||
| to average net assets | .29 | .06d |
| Portfolio Turnover Rate | 107.81 | 109.25c |
| Net Assets, end of period ($ x 1,000) | 510,512 | 222,034 |
| a | From September 30, 2009 (commencement of operations) to August 31, 2010. |
| b | Based on average shares outstanding at each month end. |
| c | Not annualized. |
| d | Annualized. |
See notes to financial statements.
| The Funds | 131 |
FINANCIAL HIGHLIGHTS (continued)
| Investor Shares | ||
| Year Ended August 31, | ||
| BNY Mellon Small/Mid Cap Fund | 2011 | 2010a |
| Per Share Data ($): | ||
| Net asset value, beginning of period | 10.89 | 10.00 |
| Investment Operations: | ||
| Investment income—netb | .01 | .01 |
| Net realized and unrealized | ||
| gain (loss) on investments | 2.30 | .92 |
| Total from Investment Operations | 2.31 | .93 |
| Distributions: | ||
| Dividends from investment income—net | — | (.01) |
| Dividends from net realized gain on investments | (.09) | (.03) |
| Total Distributions | (.09) | (.04) |
| Net asset value, end of period | 13.11 | 10.89 |
| Total Return (%) | 21.14 | 9.34c |
| Ratios/Supplemental Data (%): | ||
| Ratio of total expenses to average net assets | 1.20 | 2.35d |
| Ratio of net expenses to average net assets | 1.20 | 1.20d |
| Ratio of net investment income | ||
| to average net assets | .06 | .08d |
| Portfolio Turnover Rate | 107.81 | 109.25c |
| Net Assets, end of period ($ x 1,000) | 507 | 16 |
| a | From September 30, 2009 (commencement of operations) to August 31, 2010. |
| b | Based on average shares outstanding at each month end. |
| c | Not annualized. |
| d | Annualized. |
See notes to financial statements.
132
| Class M Shares | |||||
| Year Ended August 31, | |||||
| BNY Mellon International Fund | 2011 | 2010 | 2009 | 2008 | 2007 |
| Per Share Data ($): | |||||
| Net asset value, beginning of period | 9.38 | 10.12 | 12.11 | 17.56 | 17.77 |
| Investment Operations: | |||||
| Investment income—neta | .22 | .18 | .22 | .33 | .28 |
| Net realized and unrealized | |||||
| gain (loss) on investments | .55 | (.67) | (1.54) | (3.14) | 1.92 |
| Total from Investment Operations | .77 | (.49) | (1.32) | (2.81) | 2.20 |
| Distributions: | |||||
| Dividends from investment income—net | (.21) | (.25) | (.41) | (.29) | (.30) |
| Dividends from net realized gain on investments | — | — | (.26) | (2.35) | (2.11) |
| Total Distributions | (.21) | (.25) | (.67) | (2.64) | (2.41) |
| Net asset value, end of period | 9.94 | 9.38 | 10.12 | 12.11 | 17.56 |
| Total Return (%) | 8.05 | (5.07) | (9.95) | (18.61) | 12.93 |
| Ratios/Supplemental Data (%): | |||||
| Ratio of total expenses to average net assets | 1.02 | 1.09 | 1.14 | 1.10 | 1.08 |
| Ratio of net expenses to average net assets | 1.02 | 1.09 | 1.03 | 1.06 | 1.08 |
| Ratio of net investment income | |||||
| to average net assets | 2.07 | 1.79 | 2.52 | 2.22 | 1.59 |
| Portfolio Turnover Rate | 57.38 | 67.16 | 102.83 | 78.35 | 72.83 |
| Net Assets, end of period ($ x 1,000) | 879,450 | 996,647 | 1,247,441 | 2,002,307 | 2,836,968 |
| a Based on average shares outstanding at each month end. | |||||
| See notes to financial statements. | |||||
| The Funds | 133 |
FINANCIAL HIGHLIGHTS (continued)
| Investor Shares | |||||
| Year Ended August 31, | |||||
| BNY Mellon International Fund | 2011 | 2010 | 2009 | 2008 | 2007 |
| Per Share Data ($): | |||||
| Net asset value, beginning of period | 9.92 | 10.69 | 12.70 | 18.29 | 18.41 |
| Investment Operations: | |||||
| Investment income—neta | .21 | .16 | .20 | .28 | .23 |
| Net realized and unrealized | |||||
| gain (loss) on investments | .56 | (.70) | (1.60) | (3.26) | 2.03 |
| Total from Investment Operations | .77 | (.54) | (1.40) | (2.98) | 2.26 |
| Distributions: | |||||
| Dividends from investment income—net | (.18) | (.23) | (.35) | (.26) | (.27) |
| Dividends from net realized gain on investments | — | — | (.26) | (2.35) | (2.11) |
| Total Distributions | (.18) | (.23) | (.61) | (2.61) | (2.38) |
| Net asset value, end of period | 10.51 | 9.92 | 10.69 | 12.70 | 18.29 |
| Total Return (%) | 7.67 | (5.26) | (10.11) | (18.87) | 12.73 |
| Ratios/Supplemental Data (%): | |||||
| Ratio of total expenses to average net assets | 1.27 | 1.34 | 1.38 | 1.35 | 1.33 |
| Ratio of net expenses to average net assets | 1.27 | 1.34 | 1.28 | 1.32 | 1.32 |
| Ratio of net investment income | |||||
| to average net assets | 1.79 | 1.46 | 2.27 | 1.82 | 1.26 |
| Portfolio Turnover Rate | 57.38 | 67.16 | 102.83 | 78.35 | 72.83 |
| Net Assets, end of period ($ x 1,000) | 6,157 | 4,319 | 5,099 | 6,627 | 13,634 |
| a Based on average shares outstanding at each month end. | |||||
| See notes to financial statements. |
134
| Class M Shares | |||||
| Year Ended August 31, | |||||
| BNY Mellon Emerging Markets Fund | 2011 | 2010 | 2009 | 2008 | 2007 |
| Per Share Data ($): | |||||
| Net asset value, beginning of period | 10.02 | 8.71 | 16.89 | 24.42 | 24.53 |
| Investment Operations: | |||||
| Investment income—neta | .14 | .08 | .14 | .23 | .25 |
| Net realized and unrealized | |||||
| gain (loss) on investments | .54 | 1.31 | (3.58) | (1.45) | 7.18 |
| Total from Investment Operations | .68 | 1.39 | (3.44) | (1.22) | 7.43 |
| Distributions: | |||||
| Dividends from investment income—net | (.05) | (.08) | (.42) | (.21) | (.22) |
| Dividends from net realized gain on investments | — | — | (4.32) | (6.10) | (7.32) |
| Total Distributions | (.05) | (.08) | (4.74) | (6.31) | (7.54) |
| Net asset value, end of period | 10.65 | 10.02 | 8.71 | 16.89 | 24.42 |
| Total Return (%) | 6.77 | 15.92 | (6.07) | (9.11) | 35.81 |
| Ratios/Supplemental Data (%): | |||||
| Ratio of total expenses to average net assets | 1.41 | 1.54 | 1.64 | 1.53 | 1.50 |
| Ratio of net expenses to average net assets | 1.41 | 1.54 | 1.64 | 1.52 | 1.50 |
| Ratio of net investment income | |||||
| to average net assets | 1.20 | .85 | 1.76 | 1.11 | 1.05 |
| Portfolio Turnover Rate | 77.45 | 76.34 | 119.72 | 63.60 | 60.72 |
| Net Assets, end of period ($ x 1,000) | 2,352,233 | 1,796,274 | 1,097,296 | 1,141,146 | 1,521,024 |
| a Based on average shares outstanding at each month end. | |||||
| See notes to financial statements. | |||||
| The Funds | 135 |
FINANCIAL HIGHLIGHTS (continued)
| Investor Shares | |||||
| Year Ended August 31, | |||||
| BNY Mellon Emerging Markets Fund | 2011 | 2010 | 2009 | 2008 | 2007 |
| Per Share Data ($): | |||||
| Net asset value, beginning of period | 10.27 | 8.94 | 17.05 | 24.60 | 24.65 |
| Investment Operations: | |||||
| Investment income—neta | .13 | .06 | .11 | .20 | .15 |
| Net realized and unrealized | |||||
| gain (loss) on investments | .55 | 1.33 | (3.55) | (1.50) | 7.27 |
| Total from Investment Operations | .68 | 1.39 | (3.44) | (1.30) | 7.42 |
| Distributions: | |||||
| Dividends from investment income—net | (.04) | (.06) | (.35) | (.15) | (.15) |
| Dividends from net realized gain on investments | — | — | (4.32) | (6.10) | (7.32) |
| Total Distributions | (.04) | (.06) | (4.67) | (6.25) | (7.47) |
| Net asset value, end of period | 10.91 | 10.27 | 8.94 | 17.05 | 24.60 |
| Total Return (%) | 6.59 | 15.56 | (6.32) | (9.29) | 35.52 |
| Ratios/Supplemental Data (%): | |||||
| Ratio of total expenses to average net assets | 1.67 | 1.77 | 1.91 | 1.78 | 1.75 |
| Ratio of net expenses to average net assets | 1.67 | 1.77 | 1.91 | 1.78 | 1.74 |
| Ratio of net investment income | |||||
| to average net assets | 1.10 | .54 | 1.32 | .96 | .65 |
| Portfolio Turnover Rate | 77.45 | 76.34 | 119.72 | 63.60 | 60.72 |
| Net Assets, end of period ($ x 1,000) | 22,027 | 7,091 | 4,476 | 7,187 | 10,846 |
| a Based on average shares outstanding at each month end. | |||||
| See notes to financial statements. | |||||
136
| Class M Shares | ||||||
| BNY Mellon International | Year Ended August 31, | Eight Months Ended | Year Ended December 31, | |||
| Appreciation Fund† | 2011 | 2010 | August 31, 2009a | 2008 | 2007 | 2006 |
| Per Share Data ($): | ||||||
| Net asset value, beginning of period | 10.54 | 11.35 | 9.40 | 16.58 | 15.46 | 12.62 |
| Investment Operations: | ||||||
| Investment income—netb | .36 | .26 | .23 | .45 | .41 | .30 |
| Net realized and unrealized | ||||||
| gain (loss) on investments | .68 | (.73) | 1.73 | (7.17) | 1.10 | 2.81 |
| Total from Investment Operations | 1.04 | (.47) | 1.96 | (6.72) | 1.51 | 3.11 |
| Distributions: | ||||||
| Dividends from investment income—net | (.27) | (.34) | (.01) | (.46) | (.39) | (.27) |
| Net asset value, end of period | 11.31 | 10.54 | 11.35 | 9.40 | 16.58 | 15.46 |
| Total Return (%) | 9.75 | (4.35) | 20.93c | (41.12) | 9.79 | 24.68 |
| Ratios/Supplemental Data (%): | ||||||
| Ratio of total expenses to average net assets | .70 | .68 | .70d | .70 | .69 | .68 |
| Ratio of net expenses to average net assets | .70 | .66 | .66d | .67 | .69 | .68 |
| Ratio of net investment income | ||||||
| to average net assets | 2.94 | 2.29 | 3.80d | 3.32 | 2.45 | 2.14 |
| Portfolio Turnover Rate | 9.39 | 2.71 | 2.63c | 10.62 | 11 | 15 |
| Net Assets, end of period ($ x 1,000) | 198,122 | 218,067 | 256,140 | 267,393 | 545,392 | 456,316 |
| † Represents information for Institutional shares of the fund’s predecessor, BNY Hamilton International Equity Fund, through September 12, 2008. |
| a The fund has changed its fiscal year end from December 31 to August 31. |
| b Based on average shares outstanding at each month end. |
| c Not annualized. |
| d Annualized. |
See notes to financial statements.
| The Funds | 137 |
FINANCIAL HIGHLIGHTS (continued)
| Investor Shares | ||||||
| BNY Mellon International | Year Ended August 31, | Eight Months Ended | Year Ended December 31, | |||
| Appreciation Fund† | 2011 | 2010 | August 31, 2009a | 2008 | 2007 | 2006 |
| Per Share Data ($): | ||||||
| Net asset value, beginning of period | 10.43 | 11.24 | 9.31 | 16.37 | 15.27 | 12.47 |
| Investment Operations:�� | ||||||
| Investment income—netb | .33 | .23 | .22 | .40 | .36 | .27 |
| Net realized and unrealized | ||||||
| gain (loss) on investments | .67 | (.72) | 1.71 | (7.06) | 1.09 | 2.77 |
| Total from Investment Operations | 1.00 | (.49) | 1.93 | (6.66) | 1.45 | 3.04 |
| Distributions: | ||||||
| Dividends from investment income—net | (.24) | (.32) | — | (.40) | (.35) | (.24) |
| Net asset value, end of period | 11.19 | 10.43 | 11.24 | 9.31 | 16.37 | 15.27 |
| Total Return (%) | 9.50 | (4.60) | 20.73c | (41.21) | 9.50 | 24.38 |
| Ratios/Supplemental Data (%): | ||||||
| Ratio of total expenses to average net assets | .95 | .93 | .95d | .95 | .94 | .93 |
| Ratio of net expenses to average net assets | .95 | .90 | .91d | .92 | .94 | .93 |
| Ratio of net investment income | ||||||
| to average net assets | 2.75 | 2.08 | 3.56d | 3.02 | 2.20 | 1.92 |
| Portfolio Turnover Rate | 9.39 | 2.71 | 2.63c | 10.62 | 11 | 15 |
| Net Assets, end of period ($ x 1,000) | 4,019 | 3,462 | 4,171 | 3,179 | 5,623 | 5,366 |
| † Represents information for Class A shares of the fund’s predecessor, BNY Hamilton International Equity Fund, through September 12, 2008. |
| a The fund has changed its fiscal year end from December 31 to August 31. |
| b Based on average shares outstanding at each month end. |
| c Not annualized. |
| d Annualized. |
See notes to financial statements.
138
| Class M Shares | |||||
| Year Ended August 31, | |||||
| BNY Mellon Asset Allocation Fund | 2011 | 2010 | 2009 | 2008 | 2007 |
| Per Share Data ($): | |||||
| Net asset value, beginning of period | 9.85 | 9.44 | 10.93 | 12.91 | 13.17 |
| Investment Operations: | |||||
| Investment income—neta | .16 | .19 | .24 | .30 | .29 |
| Net realized and unrealized | |||||
| gain (loss) on investments | .83 | .46 | (1.01) | (.73) | 1.21 |
| Total from Investment Operations | .99 | .65 | (.77) | (.43) | 1.50 |
| Distributions: | |||||
| Dividends from investment income—net | (.21) | (.24) | (.27) | (.36) | (.32) |
| Dividends from net realized gain on investments | — | — | (.45) | (1.19) | (1.44) |
| Total Distributions | (.21) | (.24) | (.72) | (1.55) | (1.76) |
| Net asset value, end of period | 10.63 | 9.85 | 9.44 | 10.93 | 12.91 |
| Total Return (%) | 10.00 | 6.84 | (6.08) | (3.99) | 12.09 |
| Ratios/Supplemental Data (%): | |||||
| Ratio of total expenses to average net assetsb | .53 | .57 | .60 | .58 | .58 |
| Ratio of net expenses to average net assetsb | .53 | .57 | .60 | .58 | .58 |
| Ratio of net investment income | |||||
| to average net assetsb | 1.49 | 1.78 | 2.81 | 2.51 | 2.26 |
| Portfolio Turnover Rate | 71.08 | 69.81 | 78.44c | 51.92c | 89.78c |
| Net Assets, end of period ($ x 1,000) | 365,661 | 335,138 | 301,643 | 317,545 | 358,068 |
| a Based on average shares outstanding at each month end. |
| b Amount does not include the activity of the underlying funds. |
| c The portfolio turnover rates excluding mortgage dollar roll transactions for the periods ended August 31, 2009, 2008, and 2007 were 77.77%, 51.44% and 75.75%, respectively. |
See notes to financial statements.
| The Funds | 139 |
FINANCIAL HIGHLIGHTS (continued)
| Investor Shares | |||||
| Year Ended August 31, | |||||
| BNY Mellon Asset Allocation Fund | 2011 | 2010 | 2009 | 2008 | 2007 |
| Per Share Data ($): | |||||
| Net asset value, beginning of period | 9.90 | 9.50 | 10.98 | 12.96 | 13.21 |
| Investment Operations: | |||||
| Investment income—neta | .14 | .17 | .23 | .27 | .26 |
| Net realized and unrealized | |||||
| gain (loss) on investments | .83 | .44 | (1.01) | (.74) | 1.21 |
| Total from Investment Operations | .97 | .61 | (.78) | (.47) | 1.47 |
| Distributions: | |||||
| Dividends from investment income—net | (.18) | (.21) | (.25) | (.32) | (.28) |
| Dividends from net realized gain on investments | — | — | (.45) | (1.19) | (1.44) |
| Total Distributions | (.18) | (.21) | (.70) | (1.51) | (1.72) |
| Net asset value, end of period | 10.69 | 9.90 | 9.50 | 10.98 | 12.96 |
| Total Return (%) | 9.77 | 6.44 | (6.11) | (4.29) | 11.73 |
| Ratios/Supplemental Data (%): | |||||
| Ratio of total expenses to average net assetsb | .78 | .82 | .85 | .81 | .86 |
| Ratio of net expenses to average net assetsb | .78 | .82 | .85 | .81 | .86 |
| Ratio of net investment income | |||||
| to average net assetsb | 1.23 | 1.54 | 2.57 | 2.28 | 1.98 |
| Portfolio Turnover Rate | 71.08 | 69.81 | 78.44c | 51.92c | 89.78c |
| Net Assets, end of period ($ x 1,000) | 4,265 | 4,015 | 4,412 | 4,812 | 4,274 |
| a Based on average shares outstanding at each month end. |
| b Amount does not include the activity of the underlying funds. |
| c The portfolio turnover rates excluding mortgage dollar roll transactions for the periods ended August 31, 2009, 2008, and 2007 were 77.77%, 51.44% and 75.75%, respectively. |
See notes to financial statements.
140
NOTES TO FINANCIAL STATEMENTS
NOTE 1—General:
BNY Mellon Funds Trust (the “Trust”) was organized as a Massachusetts business trust which is registered under the Investment Company Act of 1940, as amended (the “Act”), as an open-end management investment company and operates as a series company currently consisting of twenty-five series including the following diversified equity funds and balanced fund: BNY Mellon Large Cap Stock Fund, BNY Mellon Large Cap Market Opportunities Fund, BNY Mellon Tax-Sensitive Large Cap Multi-Strategy Fund, BNY Mellon Income Stock Fund, BNY Mellon Mid Cap Stock Fund, BNY Mellon Small Cap Stock Fund, BNY Mellon U.S. Core Equity 130/30 Fund, BNY Mellon Small/Mid Cap Fund, BNY Mellon International Fund, BNY Mellon Emerging Markets Fund, BNY Mellon International Appreciation Fund and BNY Mellon Asset Allocation Fund (formerly the BNY Mellon Balanced Fund) and the following non-diversified equity fund: BNY Mellon Focused Equity Opportunities Fund (each, a “fund” and collectively, the “funds”). BNY Mellon Large Cap Stock Fund, BNY Mellon Large Cap Market Opportunities Fund, BNY Mellon Tax-Sensitive Large Cap Multi-Strategy Fund, BNY Mellon Mid Cap Stock Fund, BNY Mellon Small Cap Stock Fund, BNY Mellon U.S. Core Equity 130/30 Fund, BNY Mellon Focused Equity Opportunities Fund and BNY Mellon Small/Mid Cap Fund seek capital appreciation and BNY Mellon Income Stock Fund seeks total return (consisting of capital appreciation and income). BNY Mellon International Fund and BNY Mellon Emerging Markets Fund seek long-term capital growth. BNY Mellon International Appreciation Fund seeks long-term capital appreciation. BNY Mellon Asset Allocation Fund seeks long-term growth of principal in conjunction with current income.
At a meeting of the Trust’s Board held on September 13, 2011, the Trust’s Board approved, effective September 15, 2011, a proposal to change the name of BNY Mellon Asset Allocation Fund from “BNY Mellon Balanced Fund” to “BNY Mellon Asset Allocation Fund”.
BNY Mellon Fund Advisers, a division of The Dreyfus Corporation (the “Manager” or “Dreyfus”), a wholly-owned subsidiary of The Bank of New York Mellon Corporation (“BNY Mellon”), serves as each fund’s investment adviser (“Investment Adviser”). The Bank of New York Mellon, a subsidiary of BNY Mellon and an affiliate of Dreyfus, serves as administrator for the funds pursuant to an Administration Agreement with the Trust (the “Administration Agreement”).The Bank of NewYork Mellon has entered into a Sub-Administration Agreement with Dreyfus pursuant to which The Bank of New York Mellon pays Dreyfus for performing certain administrative services.Walter Scott & Partners Limited (“Walter Scott”), also a subsidiary of BNY Mellon and an affiliate of Dreyfus, serves as the BNY Mellon Large Cap Market Opportunities Fund’s and BNY Mellon Tax-Sensitive Large Cap Multi-Strategy Fund’s sub-investment adviser. MBSC Securities Corporation (the “Distributor”), a wholly-owned subsidiary of Dreyfus, is the distributor of each fund’s shares.
The Trust is authorized to issue an unlimited number of shares of Beneficial Interest, par value $.001 per share, in Class M and Investor class shares of each fund and in the Dreyfus Premier class shares of BNY Mellon Mid Cap Stock Fund. Dreyfus Premier shares of BNY Mellon Mid Cap Stock Fund are subject to a contingent deferred sales charge (“CDSC”) imposed on redemptions of Dreyfus Premier shares made within six years of purchase and automatically convert to Investor class shares after six years. BNY Mellon Mid Cap Stock Fund no longer offers Dreyfus Premier shares, except in connection with dividend reinvestment and permitted exchanges of Dreyfus Premier shares from other funds. Other differences between the classes include the services offered to and the expenses borne by each class, the allocation of certain transfer agency costs and certain voting rights. Income, expenses (other than expenses attributable to a specific class), and realized and unrealized gains or losses on investments are allocated to each class of shares based on its relative net assets.
| The Funds | 141 |
NOTES TO FINANCIAL STATEMENTS (continued)
As of August 31, 2011, MBC Investments Corp., an indirect subsidiary of BNY Mellon, held the following shares:
| BNY Mellon Large Cap Market | |
| Opportunities Fund, Investor shares | 1,000 |
| BNY Mellon Tax-Sensitive Large Cap | |
| Multi-Strategy Fund, Investor shares | 1,000 |
| BNY Mellon Focused Equity | |
| Opportunities Fund, Investor shares | 1,002 |
TheTrust accounts separately for the assets, liabilities and operations of each series. Expenses directly attributable to each series are charged to that series’ operations; expenses which are applicable to all series are allocated among them on a pro rata basis.
The Financial Accounting Standards Board (“FASB”) Accounting Standards Codification (“ASC”) is the exclusive reference of authoritative U.S. generally accepted accounting principles (“GAAP”) recognized by the FASB to be applied by nongovernmental entities. Rules and interpretive releases of the Securities and Exchange Commission (“SEC”) under authority of federal laws are also sources of authoritative GAAP for SEC registrants. Each fund’s financial statements are prepared in accordance with GAAP, which may require the use of management estimates and assumptions. Actual results could differ from those estimates.
NOTE 2—Significant Accounting Policies:
(a) Portfolio valuation: The fair value of a financial instrument is the amount that would be received to sell an asset or paid to transfer a liability in an orderly transaction between market participants at the measurement date (i.e. the exit price). GAAP establishes a fair value hierarchy that prioritizes the inputs of valuation techniques used to measure fair value.This hierarchy gives the highest priority to unadjusted quoted prices in active markets for identical assets or liabilities (Level 1 measurements) and the lowest priority to unobservable inputs (Level 3 measurements).
Additionally, GAAP provides guidance on determining whether the volume and activity in a market has decreased significantly and whether such a decrease in
activity results in transactions that are not orderly. GAAP requires enhanced disclosures around valuation inputs and techniques used during annual and interim periods.
Various inputs are used in determining the value of each fund’s investments relating to fair value measurements. These inputs are summarized in the three broad levels listed below:
Level 1—unadjusted quoted prices in active markets for identical investments.
Level 2—other significant observable inputs (including quoted prices for similar investments, interest rates, prepayment speeds, credit risk, etc.).
Level 3—significant unobservable inputs (including the funds’ own assumptions in determining the fair value of investments).
The inputs or methodology used for valuing securities are not necessarily an indication of the risk associated with investing in those securities.
Changes in valuation techniques may result in transfers in or out of an assigned level within the disclosure hierarchy. Valuation techniques used to value the fund’s investments are as follows:
Investments in equity securities are valued at the last sales price on the securities exchange or national securities market on which such securities are primarily traded. Securities listed on the National Market System for which market quotations are available are valued at the official closing price or, if there is no official closing price that day, at the last sales price. Securities not listed on an exchange or the national securities market, or securities for which there were no transactions, are valued at the average of the most recent bid and asked prices, except for open short positions, where the asked price is used for valuation purposes. Bid price is used when no asked price is available. Registered investment companies that are not traded on an exchange are valued at their net asset value. All preceding securities are categorized as Level 1 in the hierarchy.
142
U.S.Treasury Bills are valued at the mean price between quoted bid prices and asked prices by an independent pricing service approved by theTrust’s Board.These securities are generally categorized as Level 2 in the hierarchy.
Fair valuing of securities may be determined with the assistance of a pricing service using calculations based on indices of domestic securities and other appropriate indicators, such as prices of relevant ADRs and futures contracts. Utilizing these techniques may result in transfers between Level 1 and Level 2 of the fair value hierarchy.
When market quotations or official closing prices are not readily available, or are determined not to reflect accurately fair value, such as when the value of the security has been significantly affected by events after the close of the exchange or market on which the security is principally traded (for example, a foreign exchange or market), but before the funds calculate their net asset values, the funds may value these investments at fair value as determined in accordance with the procedures approved by the Trust’s Board. Certain factors may be considered when fair valuing investments such as: fundamental analytical data, the nature and duration of restrictions on disposition, an evaluation of the forces that influence the market in which securities are purchased and sold, and public trading in similar securities of the issuer or comparable issuers. These securities are either categorized as Level 2 or 3 depending on the relevant inputs used.
For restricted securities where observable inputs are limited, assumptions about market activity and risk are used and are categorized as Level 3 in hierarchy.
Financial futures and options, which are traded on an exchange, are valued at the last sales price on the securities exchange on which such securities are primarily traded or at the last sales price on the national securities market on each business day.These securities are generally categorized as Level 1 in the hierarchy. Options traded over-the-counter are valued at the mean between the bid and asked price. These securities are generally categorized as Level 2 in the hierarchy. Investments denominated in foreign currencies are translated to U.S. dollars at the prevailing rates of exchange. Forward foreign currency exchange contracts (“forward contracts”) are valued at the forward rate. These securities are generally categorized as Level 2 in the hierarchy.
BNY Mellon Asset Allocation Fund
Investments in debt securities are valued each business day by an independent pricing service (the “Service”) approved by the Trust’s Board. Debt securities for which quoted bid prices are readily available and are representative of the bid side of the market in the judgment of the Service are valued at the mean between the quoted bid prices (as obtained by the Service from dealers in such securities) and asked prices (as calculated by the Service based upon its evaluation of the market for such securities). Other debt securities (which constitute a majority of the portfolio securities) are valued as determined by the Service, based on methods which include consideration of: yields or prices of securities of comparable quality, coupon, maturity and type; indications as to values from dealers; and general market conditions.These securities are generally categorized as Level 2 in the hierarchy.
Table 1 summarizes the inputs used as of August 31, 2011 in valuing each fund’s investments.
In January 2010, FASB issued Accounting Standards Update (“ASU”) No. 2010-06 “Improving Disclosures about Fair Value Measurements” (“ASU 2010-06”). The portions of ASU 2010-06 which require reporting entities to prepare new disclosures surrounding amounts and reasons for significant transfers in and out of Level 1 and Level 2 fair value measurements as well as inputs and valuation techniques used to measure fair value for both recurring and nonrecurring fair value measurements that fall in either Level 2 or Level 3 have been adopted by each fund. No significant transfers between Level 1 or Level 2 fair value measurements occurred at August 31, 2011.
In May 2011, FASB issued ASU No. 2011-04 “Amendments to Achieve Common Fair Value Measure-
| The Funds | 143 |
| NOTES TO FINANCIAL STATEMENTS (continued) |
| Table 1—Fair Value Measurements | |||||||
| Investments in Securities | |||||||
| Level 2—Other | Level 3— Significant | ||||||
| Level 1—Unadjusted | Significant | Unobservable | |||||
| Quoted Prices | Observable Inputs | Inputs | |||||
| Assets ($) | Liabilities ($) | Assets ($) | Liabilities ($) | Assets ($) | Liabilities ($) | Total ($) | |
| BNY Mellon Large Cap | |||||||
| Stock Fund | |||||||
| Equity Securities— | |||||||
| Domestic† | 1,019,770,973 | — | — | — | — | — | 1,019,770,973 |
| Equity Securities— | |||||||
| Foreign† | 66,696,825 | — | — | — | — | — | 66,696,825 |
| Mutual Funds | 228,173,181 | — | — | — | — | — | 228,173,181 |
| BNY Mellon Large | |||||||
| Cap Market | |||||||
| Opportunities Fund | |||||||
| Equity Securities— | |||||||
| Domestic† | 76,469,170 | — | — | — | — | — | 76,469,170 |
| Equity Securities— | |||||||
| Foreign† | 3,182,636 | — | — | — | — | — | 3,182,636 |
| Mutual Funds | 39,245,718 | — | — | — | — | — | 39,245,718 |
| BNY Mellon | |||||||
| Tax-Sensitive Large | |||||||
| Cap Multi-Strategy Fund | |||||||
| Equity Securities— | |||||||
| Domestic† | 59,409,012 | — | — | — | — | — | 59,409,012 |
| Equity Securities— | |||||||
| Foreign† | 1,724,977 | — | — | — | — | — | 1,724,977 |
| Mutual Funds | 15,750,944 | — | — | — | — | — | 15,750,944 |
| BNY Mellon Income | |||||||
| Stock Fund | |||||||
| Equity Securities— | |||||||
| Domestic† | 192,168,464 | — | — | — | — | — | 192,168,464 |
| Equity Securities— | |||||||
| Foreign† | 10,116,204 | — | — | — | — | — | 10,116,204 |
| Mutual Funds | 53,736,836 | — | — | — | — | — | 53,736,836 |
| Other Financial | |||||||
| Instruments: | |||||||
| Options Written | — | (205,355) | — | — | — | — | (205,355) |
| BNY Mellon Mid Cap | |||||||
| Stock Fund | |||||||
| Equity Securities— | |||||||
| Domestic† | 1,273,613,786 | — | — | — | — | — | 1,273,613,786 |
| Equity Securities— | |||||||
| Foreign† | 16,792,089 | — | — | — | — | — | 16,792,089 |
| Mutual Funds | 190,887,111 | — | — | — | — | — | 190,887,111 |
| BNY Mellon Small Cap | |||||||
| Stock Fund | |||||||
| Equity Securities— | |||||||
| Domestic† | 344,614,175 | — | — | — | — | — | 344,614,175 |
| Equity Securities— | |||||||
| Foreign† | 7,131,797 | — | — | — | — | — | 7,131,797 |
| Mutual Funds | 115,743,686 | — | — | — | — | — | 115,743,686 |
144
| Table 1—Fair Value Measurements (continued) | |||||||
| Investments in Securities | |||||||
| Level 2—Other | Level 3— Significant | ||||||
| Level 1—Unadjusted | Significant | Unobservable | |||||
| Quoted Prices | Observable Inputs | Inputs | |||||
| Assets ($) | Liabilities ($) | Assets ($) | Liabilities ($) | Assets ($) | Liabilities ($) | Total ($) | |
| BNY Mellon U.S. Core | |||||||
| Equity 130/30 Fund | |||||||
| Equity Securities— | |||||||
| Domestic† | 382,884,588 | — | — | — | — | — | 382,884,588 |
| Equity Securities— | |||||||
| Foreign† | 26,451,063 | — | — | — | — | — | 26,451,063 |
| Mutual Funds | 786,000 | — | — | — | — | — | 786,000 |
| Securities Sold Short: | |||||||
| Equity Securities— | |||||||
| Domestic†† | — | (72,239,496) | — | — | — | — | (72,239,496) |
| Equity Securities— | |||||||
| Foreign†† | — | (9,182,118) | — | — | — | — | (9,182,118) |
| Exchange | |||||||
| Traded Funds | — | (1,689,080) | — | — | — | — | (1,689,080) |
| BNY Mellon | |||||||
| Focused Equity | |||||||
| Opportunities Fund | |||||||
| Equity Securities— | |||||||
| Domestic† | 395,597,556 | — | — | — | — | — | 395,597,556 |
| Equity Securities— | |||||||
| Foreign† | 27,193,486 | — | — | — | — | — | 27,193,486 |
| Mutual Funds | 20,765,759 | — | — | — | — | — | 20,765,759 |
| BNY Mellon | |||||||
| Small/Mid Cap Fund | |||||||
| Equity Securities— | |||||||
| Domestic† | 452,055,919 | — | — | — | — | — | 452,055,919 |
| Equity Securities— | |||||||
| Foreign† | 34,662,599 | — | — | — | — | — | 34,662,599 |
| Mutual Funds | 108,773,309 | — | — | — | — | — | 108,773,309 |
| BNY Mellon | |||||||
| International Fund | |||||||
| Equity Securities— | |||||||
| Foreign† | 871,018,848 | — | — | — | — | — | 871,018,848 |
| Mutual Funds/ | |||||||
| Exchange | |||||||
| Traded Funds | 6,802,431 | — | — | — | — | — | 6,802,431 |
| Other Financial | |||||||
| Instruments: | |||||||
| Forward Foreign | |||||||
| Currency Exchange | |||||||
| Contracts††† | — | — | — | (737) | — | — | (737) |
| The Funds | 145 |
NOTES TO FINANCIAL STATEMENTS (continued)
| Table 1—Fair Value Measurements (continued) | |||||||
| Investments in Securities | |||||||
| Level 2—Other | Level 3— Significant | ||||||
| Level 1—Unadjusted | Significant | Unobservable | |||||
| Quoted Prices | Observable Inputs | Inputs | |||||
| Assets ($) | Liabilities ($) | Assets ($) | Liabilities ($) | Assets ($) | Liabilities ($) | Total ($) | |
| BNY Mellon Emerging | |||||||
| Markets Fund | |||||||
| Equity Securities— | |||||||
| Foreign† | 2,258,045,343 | — | 9,513,290 | — | — | — | 2,267,558,633 |
| Mutual Funds/ | |||||||
| Exchange | |||||||
| Traded Funds | 52,044,058 | — | — | — | — | — | 52,044,058 |
| Rights† | 16,262 | — | — | — | — | — | 16,262 |
| Other Financial | |||||||
| Instruments: | |||||||
| Forward Foreign | |||||||
| Currency Exchange | |||||||
| Contracts††† | — | — | 47,352 | (18,615) | — | — | 28,737 |
| BNY Mellon International | |||||||
| Appreciation Fund | |||||||
| Equity Securities— | |||||||
| Foreign† | 200,970,796 | — | — | — | — | — | 200,970,796 |
| U.S. Treasury | — | — | 124,999 | — | — | — | 124,999 |
| Other Financial | |||||||
| Instruments: | |||||||
| Forward Foreign | |||||||
| Currency Exchange | |||||||
| Contracts††† | — | — | 20,754 | (873) | — | — | 19,881 |
| Futures††† | — | (37,591) | — | — | — | — | (37,591) |
| BNY Mellon Asset | |||||||
| Allocation Fund | |||||||
| Asset—Backed | — | — | 3,610,918 | — | — | — | 3,610,918 |
| Commercial | |||||||
| Mortgage—Backed | — | — | 821,108 | — | — | — | 821,108 |
| Corporate Bonds† | — | — | 37,944,659 | — | — | — | 37,944,659 |
| Equity Securities— | |||||||
| Domestic† | 121,209,472 | — | — | — | — | — | 121,209,472 |
| Foreign Government | — | — | 1,534,200 | — | — | — | 1,534,200 |
| Municipal Bonds | — | — | 6,936,089 | — | — | — | 6,936,089 |
| Mutual Funds/Exchange | |||||||
| Traded Funds | 122,156,657 | — | — | — | — | — | 122,156,657 |
| U.S. Government | |||||||
| Agencies/ | |||||||
| Mortgage—Backed | — | — | 46,251,159 | — | — | — | 46,251,159 |
| U.S. Treasury | — | — | 45,446,075 | — | — | — | 45,446,075 |
| † | See Statement of Investments for additional detailed categorizations. |
| †† | See Statement of Securities Sold Short for additional detailed categorizations. |
| ††† Amount shown represents unrealized appreciation (depreciation) at period end. | |
146
ment and Disclosure Requirements in GAAP and International Financial Reporting Standards (“IFRS”)” (“ASU 2011-04”). ASU 2011-04 includes common requirements for measurement of and disclosure about fair value between GAAP and IFRS. ASU 2011-04 will require reporting entities to disclose the following information for fair value measurements categorized within Level 3 of the fair value hierarchy: quantitative information about the unobservable inputs used in the fair value measurement, the valuation processes used by the reporting entity and a narrative description of the sensitivity of the fair value measurement to changes in unobservable inputs and the interrelationships between those unobservable inputs. In addition, ASU 2011-04 will require reporting entities to make disclosures about amounts and reasons for all transfers in and out of Level 1 and Level 2 fair value measurements. The new and revised disclosures are effective for interim and annual reporting periods beginning after December 15, 2011.At this time, management is evaluating the implications of ASU 2011-04 and its impact on the financial statements.
(b) Securities transactions and investment income:
Securities transactions are recorded on a trade date basis. Realized gains and losses from securities transactions are recorded on the identified cost basis. Dividend income is recognized on the ex-dividend date and interest income, including, where applicable, accretion of discount and amortization of premium on investments, is recognized on the accrual basis.
BNY Mellon International Fund, BNY Mellon Emerging Markets Fund and BNY Mellon International Appreciation Fund
Investing in foreign markets may involve special risks and considerations not typically associated with investing in the U.S.These risks include revaluation of currencies, high rates of inflation, repatriation restrictions on income and capital, and adverse political and economic developments. Moreover, securities issued in these markets may be less liquid, subject to government ownership controls and delayed settlements, and their prices may be more volatile than those of comparable securities in the U.S.
Pursuant to a securities lending agreement withThe Bank of New York Mellon, the funds may lend securities to qualified institutions. It is the funds’ policy that, at origination, all loans are secured by collateral of at least 102% of the value of U.S. securities loaned and 105% of the value of foreign securities loaned. Collateral equivalent to at least 100% of the market value of securities on loan is maintained at all times. Collateral is either in the form of cash, which can be invested in certain money market mutual funds managed by Dreyfus, U.S. Government and Agency securities or letters of credit.The funds are entitled to receive all income on securities loaned, in addition to income earned as a result of the lending transaction. Although each security loaned is fully collateralized, the funds bear the risk of delay in recovery of, or loss of rights in, the securities loaned should a borrower fail to return the securities in a timely manner. Table 2 summarizes the amountThe Bank of NewYork Mellon earned from each relevant fund from lending portfolio securities, pursuant to the securities lending agreement during the period ended August 31, 2011.
| Table 2—Securities Lending Agreement | |
| BNY Mellon Large Cap Stock Fund | $ 25,829 |
| BNY Mellon Income Stock Fund | 2,502 |
| BNY Mellon Mid Cap Stock Fund | 50,567 |
| BNY Mellon Small Cap Stock Fund | 243,200 |
| BNY Mellon Focused | |
| Equity Opportunities Fund | 3,054 |
| BNY Mellon Small/Mid Cap Fund | 587,974 |
| BNY Mellon Emerging Markets Fund | 3,811 |
| BNY Mellon Asset Allocation Fund | 4,073 |
(c) Affiliated issuers: Investments in other investment companies advised by Dreyfus are defined as “affiliated” in the Act.
The funds may invest in shares of certain affiliated investment companies also advised or managed by Dreyfus. Table 3 summarizes each fund’s investments in affiliated investment companies for the period ended August 31, 2011.
| The Funds | 147 |
NOTES TO FINANCIAL STATEMENTS (continued)
| Table 3—Affiliated Investment Companies | ||||||||
| Net | Net Unrealized | |||||||
| Affiliated | Value | Realized | Appreciation | Value | Net | |||
| Investment Companies | 8/31/2010 ($) | Purchases ($) | Sales ($) | Dividends ($) | Gain (Loss) ($) (Depreciation) ($) | 8/31/2011 ($) | Assets (%) | |
| BNY Mellon Large | ||||||||
| Cap Stock Fund | ||||||||
| Dreyfus Institutional | ||||||||
| Preferred Plus Money | ||||||||
| Market Fund | 92,000 | 249,303,000 | 247,102,000 | — | — | — | 2,293,000 | .2 |
| Dreyfus Institutional | ||||||||
| Cash Advantage | ||||||||
| Fund† | 48,126,233 | 976,613,995 | 798,860,047 | — | — | — | 225,880,181 | 20.4 |
| Total | 48,218,233 | 1,225,916,995 | 1,045,962,047 | — | — | — | 228,173,181 | 20.6 |
| BNY Mellon Large | ||||||||
| Cap Market | ||||||||
| Opportunities Fund | ||||||||
| BNY Mellon U.S. | ||||||||
| Core Equity | ||||||||
| 130/30 Fund, CI. M | 969,360 | 37,463,286 | — | 54,286 | — | (2,600,928) | 35,831,718 | 30.4 |
| Dreyfus Institutional | ||||||||
| Preferred Plus Money | ||||||||
| Market Fund | 1,349,000 | 72,570,000 | 70,505,000 | — | — | — | 3,414,000 | 2.9 |
| Total | 2,318,360 | 110,033,286 | 70,505,000 | 54,286 | — | (2,600,928) | 39,245,718 | 33.3 |
| BNY Mellon | ||||||||
| Tax-Sensitive | ||||||||
| Large Cap | ||||||||
| Multi-Strategy Fund | ||||||||
| BNY Mellon U.S. Core | ||||||||
| Equity 130/30 | ||||||||
| Fund, CI. M | 968,220 | 13,042,110 | 450,000 | 28,110 | 10,732 | (486,118) | 13,084,944 | 17.4 |
| Dreyfus Institutional | ||||||||
| Preferred Plus Money | ||||||||
| Market Fund | 486,000 | 56,589,000 | 54,409,000 | — | — | — | 2,666,000 | 3.5 |
| Total | 1,454,220 | 69,631,110 | 54,859,000 | 28,110 | 10,732 | (486,118) | 15,750,944 | 20.9 |
| BNY Mellon Income | ||||||||
| Stock Fund | ||||||||
| Dreyfus Institutional | ||||||||
| Preferred Plus | ||||||||
| Money Market Fund | — | 75,941,000 | 65,937,000 | — | — | — | 10,004,000 | 4.9 |
| Dreyfus Institutional | ||||||||
| Cash Advantage | ||||||||
| Fund† | 226,325 | 103,935,560 | 60,429,049 | — | — | — | 43,732,836 | 21.2 |
| Total | 226,325 | 179,876,560 | 126,366,049 | — | — | — | 53,736,836 | 26.1 |
| BNY Mellon Mid Cap | ||||||||
| Stock Fund | ||||||||
| Dreyfus Institutional | ||||||||
| Preferred | ||||||||
| Plus Money | ||||||||
| Market Fund | 7,623,000 | 598,097,000 | 589,723,000 | — | — | — | 15,997,000 | 1.2 |
| Dreyfus Institutional | ||||||||
| Cash Advantage | ||||||||
| Fund† | 106,687,288 | 720,198,624 | 651,995,801 | — | — | — | 174,890,111 | 13.4 |
| Total | 114,310,288 | 1,318,295,624 | 1,241,718,801 | — | — | — | 190,887,111 | 14.6 |
148
| Table 3—Affiliated Investment Companies (continued) | ||||||||
| Net | Net Unrealized | |||||||
| Affiliated | Value | Realized | Appreciation | Value | Net | |||
| Investment Companies | 8/31/2010 ($) | Purchases ($) | Sales ($) | Dividends ($) | Gain (Loss) ($) (Depreciation) ($) | 8/31/2011 ($) | Assets (%) | |
| BNY Mellon Small Cap | ||||||||
| Stock Fund | ||||||||
| Dreyfus Institutional | ||||||||
| Preferred Plus Money | ||||||||
| Market Fund | 3,332,000 | 287,843,000 | 281,494,000 | — | — | — | 9,681,000 | 2.7 |
| Dreyfus Institutional | ||||||||
| Cash Advantage | ||||||||
| Fund† | 70,173,617 | 342,659,912 | 306,770,843 | — | — | — | 106,062,686 | 29.5 |
| Total | 73,505,617 | 630,502,912 | 588,264,843 | — | — | — | 115,743,686 | 32.2 |
| BNY Mellon U.S. Core | ||||||||
| Equity 130/30 Fund | ||||||||
| Dreyfus Institutional | ||||||||
| Preferred Plus Money | ||||||||
| Market Fund | 2,949,000 | 160,366,000 | 162,529,000 | — | — | — | 786,000 | .2 |
| BNY Mellon | ||||||||
| Focused Equity | ||||||||
| Opportunities Fund | ||||||||
| Dreyfus Institutional | ||||||||
| Preferred Plus Money | ||||||||
| Market Fund | 1,644,000 | 140,377,000 | 141,091,000 | — | — | — | 930,000 | .2 |
| Dreyfus Institutional | ||||||||
| Cash Advantage Fund — | 165,035,810 | 145,200,051 | — | — | — | 19,835,759 | 4.7 | |
| Total | 1,644,000 | 305,412,810 | 286,291,051 | — | — | — | 20,765,759 | 4.9 |
| BNY Mellon Small/Mid | ||||||||
| Cap Fund | ||||||||
| Dreyfus Institutional | ||||||||
| Preferred Plus Money | ||||||||
| Market Fund | 7,326,000 | 283,602,000 | 264,113,000 | — | — | — | 26,815,000 | 5.2 |
| Dreyfus Institutional | ||||||||
| Cash Advantage | ||||||||
| Fund | 18,044,546 | 445,646,276 | 381,732,513 | — | — | — | 81,958,309 | 16.0 |
| Total | 25,370,546 | 729,248,276 | 645,845,513 | — | — | — | 108,773,309 | 21.2 |
| BNY Mellon | ||||||||
| International Fund | ||||||||
| Dreyfus Institutional | ||||||||
| Preferred Plus Money | ||||||||
| Market Fund | 2,800,000 | 197,050,000 | 195,650,000 | — | — | — | 4,200,000 | .5 |
| BNY Mellon Emerging | ||||||||
| Markets Fund | ||||||||
| Dreyfus Institutional | ||||||||
| Preferred Plus Money | ||||||||
| Market Fund | 27,100,000 | 800,600,000 | 800,200,000 | — | — | — | 27,500,000 | 1.2 |
| BNY Mellon | ||||||||
| International | ||||||||
| Appreciation Fund | ||||||||
| Dreyfus Institutional | ||||||||
| Preferred Plus Money | ||||||||
| Market Fund | 1,978,000 | 28,642,000 | 30,620,000 | — | — | — | — | — |
| The Funds | 149 |
NOTES TO FINANCIAL STATEMENTS (continued)
| Table 3—Affiliated Investment Companies (continued) | ||||||||
| Net | Net Unrealized | |||||||
| Affiliated | Value | Realized | Appreciation | Value | Net | |||
| Investment Companies | 8/31/2010 ($) | Purchases ($) | Sales ($) | Dividends ($) | Gain (Loss) ($) (Depreciation) ($) | 8/31/2011 ($) | Assets (%) | |
| BNY Mellon Asset | ||||||||
| Allocation Fund | ||||||||
| BNY Mellon | ||||||||
| Emerging Markets | ||||||||
| Fund, CI. M | 28,114,308 | 7,797,586 | 3,600,000 | 147,586 | (3,532,074) | 4,530,967 | 33,310,787 | 9.0 |
| BNY Mellon | ||||||||
| International | ||||||||
| Fund, CI. M | 26,854,293 | 4,473,066 | 3,200,000 | 598,066 | (2,346,300) | 3,414,652 | 29,195,711 | 7.9 |
| BNY Mellon Mid Cap | ||||||||
| Stock Fund, CI. M | 20,046,439 | 741,460 | 1,600,000 | 6,460 | (410,054) | 4,733,567 | 23,511,412 | 6.4 |
| BNY Mellon Small Cap | ||||||||
| Stock Fund, CI. M | 9,965,393 | 2,360,000 | 300,000 | — | (131,781) | 1,947,848 | 13,841,460 | 3.7 |
| Dreyfus Institutional | ||||||||
| Preferred Plus | ||||||||
| Money Market Fund | 2,020,000 | 120,169,000 | 119,719,000 | — | — | — | 2,470,000 | .7 |
| Dreyfus Institutional | ||||||||
| Cash Advantage | ||||||||
| Fund† | 3,312,094 | 87,542,913 | 72,612,913 | — | — | — | 18,242,094 | 4.9 |
| Total | 90,312,527 | 223,084,025 | 201,031,913 | 752,112 | (6,420,209) | 14,627,034 | 120,571,464 | 32.6 |
| † On June 7, 2011, Dreyfus Institutional Cash Advantage Plus Fund was acquired by Dreyfus Institutional Cash Advantage Fund, resulting in a transfer of shares. |
(d) Foreign currency transactions: BNY Mellon Emerging Markets Fund, BNY Mellon International Fund and BNY Mellon International Appreciation Fund do not isolate that portion of the results of operations resulting from changes in foreign exchange rates on investments from the fluctuations arising from changes in the market prices of securities held. Such fluctuations are included with the net realized and unrealized gain or loss on investments.
Net realized foreign exchange gains or losses arise from sales of foreign currencies, currency gains or losses realized on securities transactions between trade and settlement date, and the difference between the amounts of dividends, interest and foreign withholding taxes recorded on the funds’ books and the U.S. dollar equivalent of the amounts actually received or paid. Net unrealized foreign exchange gains and losses arise from changes in the value of assets and liabilities other than investments resulting from changes in exchange rates. Foreign currency gains and losses on investments are included with net realized and unrealized gain or loss on investments.
(e) Concentration of risk: BNY Mellon U. S. Core Equity 130/30 Fund enters into short sales. Short sales involve selling a security the fund does not own in anticipation that the security’s price will decline. Short sales may involve substantial risk and “leverage.” The fund may be required to buy the security sold short at a time when the security has appreciated in value, thus resulting in a loss to the fund. Short positions in stocks involve more risk than long positions in stocks. In theory, stocks sold short have unlimited risk. BNY Mellon Asset Allocation Fund invests in debt securities. Failure of an issuer of the debt securities to make timely interest or principal payments, or a decline or the perception of a
150
decline in the credit quality of a debt security, can cause the debt security’s price to fall, potentially lowering the fund’s share price. In addition, the value of debt securities may decline due to general market conditions that are not specifically related to a particular company, such as real or perceived adverse economic conditions, changes in outlook for corporate earnings, changes in interest or currency rates or adverse investor sentiment. They may also decline because of factors that affect a particular industry.
BNY Mellon Focused Equity Opportunities Fund is non-diversified, which means that a relatively high percentage of the fund’s assets may be invested in a limited number of issuers. Therefore, the fund’s performance may be vulnerable to changes in market value of a single issuer or group of issuers and more susceptible to risks associated with a single economic, political or regulatory occurrence than a diversified fund.
(f) Dividends to shareholders: Dividends payable to shareholders are recorded by the funds on the ex-dividend date. BNY Mellon Large Cap Stock Fund, BNY Mellon Income Stock Fund and BNY Mellon Asset Allocation Fund declare and pay dividends from investment income-net monthly. BNY Mellon Large Cap Market Opportunities Fund, BNY Mellon Tax-Sensitive Large Cap Multi-Strategy Fund, BNY Mellon Mid Cap Stock Fund, BNY Mellon Small Cap Stock Fund, BNY Mellon U.S. Core Equity 130/30 Fund, BNY Mellon Focused Equity Opportunities Fund, BNY Mellon Small/Mid Cap Fund, BNY Mellon International Fund, BNY Mellon Emerging Markets Fund and BNY Mellon International Appreciation Fund declare and pay dividends from investment income-net annually. With respect to each series, dividends from net realized capital gains, if any, are normally declared and paid annually, but the funds may make distributions on a more frequent basis to comply with the distribution requirements of the Internal Revenue Code of 1986, as amended (the “Code”). To the extent that net realized capital gains can be offset by capital loss carryovers of that fund, it is the policy of the funds not to distribute such gains. Income and capital gain distributions are determined in accordance with income tax regulations, which may differ from GAAP.
(g) Federal income taxes: It is the policy of each fund to continue to qualify as a regulated investment company, if such qualification is in the best interests of its shareholders, by complying with the applicable provisions of the Code, and to make distributions of taxable income sufficient to relieve it from substantially all federal income and excise taxes. For federal income tax purposes, each series is treated as a single entity for the purpose of determining such qualification.
As of and during the period ended August 31, 2011, the funds did not have any liabilities for any uncertain tax positions. The funds recognize interest and penalties, if any, related to uncertain tax positions as income tax expense in the Statements of Operations. During the period, the funds did not incur any interest or penalties.
Except for BNY Mellon Large Cap Market Opportunities Fund, BNY Mellon Tax-Sensitive Large Cap Multi-Strategy Fund, BNY Mellon Focused Equity Opportunities Fund and BNY Mellon Small/Mid Cap Fund, each of the tax years in the four-year period ended August 31, 2011 remains subject to examination by the Internal Revenue Service and state taxing authorities. For the BNY Mellon Large Cap Market Opportunities Fund, BNY Mellon Tax-Sensitive Large Cap Multi-Strategy Fund, BNY Mellon Focused Equity Opportunities Fund and BNY Mellon Small/Mid Cap Fund, each of the tax years in the two-year period ended August 31, 2011 remains subject to examination by the Internal Revenue Service and state taxing authorities.
| The Funds | 151 |
NOTES TO FINANCIAL STATEMENTS (continued)
Table 4 summarizes each fund’s components of accumulated earnings on a tax basis at August 31, 2011.
Table 5 summarizes each relevant fund’s accumulated capital loss carryover available for federal income tax purposes to be applied against future net securities profits, if any, realized subsequent to August 31, 2011.
Under the recently enacted Regulated Investment Company Modernization Act of 2010 (the “2010 Act”), each fund will be permitted to carry forward capital losses incurred in taxable years beginning after December 22, 2010 (“post-enactment losses”) for an unlimited period. However, the 2010 Act requires post-enactment losses to be utilized before the utilization of losses incurred in taxable years prior to the effective date of the 2010 Act. As a result of this ordering rule, capital loss carry forwards related to taxable years beginning prior to the effective date of the 2010 Act may be more likely to expire unused.
| Table 4—Components of Accumulated Earnings | |||||
| Undistributed | Accumulated | Undistributed | Unrealized | Capital (Losses) | |
| Ordinary | Capital | Capital | Appreciation | Realized After | |
| Income ($) | (Losses) ($) | Gains ($) | (Depreciation) ($) | October 31, 2010 ($)† | |
| BNY Mellon Large Cap Stock Fund | 123,469 | (25,090,340) | — | 144,390,345 | — |
| BNY Mellon Large Cap Market Opportunities Fund | 80,237 | — | — | (2,514,382) | (556,042) |
| BNY Mellon Tax-Sensitive Large Cap | |||||
| Multi-Strategy Fund | 167,163 | — | — | 1,029,108 | (511,859) |
| BNY Mellon Income Stock Fund | 84,947 | (12,929,226) | — | 4,466,024 | — |
| BNY Mellon Mid Cap Stock Fund | — | — | 42,730,040 | 67,320,219 | — |
| BNY Mellon Small Cap Stock Fund | 8,563,051 | (74,949,412) | — | (14,252,757) | — |
| BNY Mellon U.S. Core Equity 130/30 Fund | 1,106,295 | (51,408,663) | — | 7,312,529 | (4,379,996) |
| BNY Mellon Focused Equity Opportunities Fund | 423,691 | — | 903,915 | 22,511,432 | — |
| BNY Mellon Small/Mid Cap Fund | 6,817,868 | — | — | 19,236,159 | (8,099,186) |
| BNY Mellon International Fund | 26,822,626 | (569,418,659) | — | (135,150,263) | (334,986)†† |
| BNY Mellon Emerging Markets Fund | 23,601,571 | — | 66,325,266 | (33,604,472) | (1,208,993)†† |
| BNY Mellon International Appreciation Fund | 5,887,319 | (15,657,135) | — | (62,455,796) | (169,710)†† |
| BNY Mellon Asset Allocation Fund | 2,165,850 | — | 1,700,674 | 17,581,150 | — |
| † | These losses were deferred for tax purposes to the first day of the following fiscal year. |
| †† These are passive foreign investment companies post-October losses of $334,986, $1,208,993 and $169,710 for BNY Mellon International Fund, BNY Mellon | |
| Emerging Markets Fund and BNY Mellon International Appreciation Fund, respectively. | |
| Table 5—Capital Loss Carryover | |||
| Expiring in fiscal | 2017 ($)† | 2018 ($)† | Total ($) |
| BNY Mellon Large Cap Stock Fund | — | 25,090,340 | 25,090,340 |
| BNY Mellon Income Stock Fund | — | 12,929,226 | 12,929,226 |
| BNY Mellon Small Cap Stock Fund | — | 74,949,412 | 74,949,412 |
| BNY Mellon U.S. Core Equity 130/30 Fund | 18,554,851 | 32,853,812 | 51,408,663 |
| BNY Mellon International Fund | 107,124,489 | 462,294,170 | 569,418,659 |
| BNY Mellon International Appreciation Fund | 15,657,135 | — | 15,657,135 |
| † | If not applied, the carryovers expire in the above years. |
152
Table 6 summarizes each fund’s tax character of distributions paid to shareholders during the fiscal periods ended August 31, 2011 and August 31, 2010, respectively.
During the period ended August 31, 2011, as a result of permanent book to tax differences, where indicated, each identified fund increased (decreased) accumulated undistributed investment income-net, increased (decreased) accumulated net realized gain (loss) on investments and (decreased) paid-in capital as summarized in Table 7. These permanent book to tax differences are primarily due to fund start-up costs and dividend reclassification for BNY Mellon Large Cap Market Opportunities Fund, fund start-up costs, real estate investment trusts and dividend reclassification for BNY Mellon Tax-Sensitive Large Cap Multi-Strategy Fund, real estate investment trusts, dividend reclassification and net operating losses
| Table 6—Tax Character of Distributions Paid | ||||
| Long-Term | ||||
| Ordinary Income ($) | Capital Gains ($) | |||
| 2011 | 2010 | 2011 | 2010 | |
| BNY Mellon Large Cap Stock Fund | 13,291,252 | 11,065,751 | — | — |
| BNY Mellon Large Cap Market Opportunities Fund | 183,058 | — | — | — |
| BNY Mellon Tax-Sensitive Large Cap Multi-Strategy Fund | 186,294 | — | 75 | — |
| BNY Mellon Income Stock Fund | 3,104,684 | 1,723,623 | — | — |
| BNY Mellon Mid Cap Stock Fund | — | 8,513,360 | 358,451 | — |
| BNY Mellon Small Cap Stock Fund | — | 754,676 | — | — |
| BNY Mellon U.S. Core Equity 130/30 Fund | 1,000,686 | 307,480 | — | — |
| BNY Mellon Focused Equity Opportunities Fund | 1,301,844 | 24,000 | — | — |
| BNY Mellon Small/Mid Cap Fund | 2,897,589 | 176,607 | 237,575 | — |
| BNY Mellon International Fund | 21,184,188 | 30,009,971 | — | — |
| BNY Mellon Emerging Markets Fund | 9,733,250 | 11,055,178 | — | — |
| BNY Mellon International Appreciation Fund | 5,599,840 | 7,648,881 | — | — |
| BNY Mellon Asset Allocation Fund | 7,382,447 | 7,907,628 | — | — |
| Table 7—Return of Capital Statement of Position | ||||
| Accumulated | Accumulated | |||
| Undistributed | Net Realized | Paid-in | ||
| Investment Income—Net ($) | Gain (Loss) ($) | Capital ($) | ||
| BNY Mellon Large Cap Market Opportunities Fund | 1,358 | 1,315 | (2,673) | |
| BNY Mellon Tax-Sensitive Large Cap Multi-Strategy Fund | (236) | 2,824 | (2,588) | |
| BNY Mellon Mid Cap Stock Fund | 894,329 | 1,016,481 | (1,910,810) | |
| BNY Mellon Small Cap Stock Fund | 9,711,793 | (9,179,235) | (532,558) | |
| BNY Mellon U.S. Core Equity 130/30 Fund | 50,202 | (50,202) | — | |
| BNY Mellon Focused Equity Opportunities Fund | 3,223 | — | (3,223) | |
| BNY Mellon Small/Mid Cap Fund | (106,892) | 103,541 | 3,351 | |
| BNY Mellon International Fund | 5,510,339 | (3,485,695) | (2,024,644) | |
| BNY Mellon Emerging Markets Fund | (6,232,524) | 6,232,524 | — | |
| BNY Mellon International Appreciation Fund | 400,031 | (400,031) | — | |
| BNY Mellon Asset Allocation Fund | 881,325 | (881,325) | — | |
| The Funds | 153 |
NOTES TO FINANCIAL STATEMENTS (continued)
for BNY Mellon Mid Cap Stock Fund, real estate investment trusts, limited partnerships, passive foreign investment companies and net operating losses for BNY Mellon Small Cap Stock Fund, short sales reclassification for BNY Mellon U.S. Core Equity 130/30 Fund, fund start-up costs for BNY Mellon Focused Equity Opportunities Fund, real estate investment trusts, limited partnerships and dividend reclassification for BNY Mellon Small/Mid Cap Fund, foreign exchange gains and losses, passive foreign investment companies and adjustments for the taxable reorganization for BNY Mellon International Fund, foreign exchange gains and losses, passive foreign investment companies, and Thailand and India capital gains taxes for BNY Mellon Emerging Markets Fund, foreign exchange gains and losses for BNY Mellon International Appreciation Fund and paydown gains and losses on mortgage backed securities and amortization adjustments for BNY Mellon Asset Allocation Fund. Net assets and net asset values per share were not affected by these reclassifications.
BNY Mellon Asset Allocation Fund
(h) New Accounting Pronouncement: In April 2011, FASB issued ASU No. 2011-03 “Transfers and Servicing (Topic 860) Reconsideration of Effective Control for Repurchase Agreements (“ASU 2011-03”) which relates to the accounting for repurchase agreements and similar agreements including mortgage dollar rolls, that both entitle and obligate a transferor to repurchase or redeem financial assets before their maturity.ASU 2011-03 modifies the criteria for determining effective control of transferred assets and as a result certain agreements may now be accounted for as secured borrowings.ASU 2011-03 is effective prospectively for new transfers and existing transactions that are modified in the first interim or annual period beginning on or after December 15, 2011. Management is currently evaluating the implications of this change and its impact on the financial statements.
NOTE 3—Bank Lines of Credit:
The funds participate with other Dreyfus-managed funds in a $225 million unsecured credit facility led by
Citibank, N.A. and a $300 million unsecured credit facility provided by The Bank of New York Mellon (each, a “Facility”), each to be utilized primarily for temporary or emergency purposes, including the financing of redemptions. In connection therewith, each fund has agreed to pay its pro rata portion of commitment fees for each Facility. Interest is charged to the funds based on rates determined pursuant to the terms of the respective Facility at the time of borrowing. During the period ended August 31, 2011, BNY Mellon Large Cap Market Opportunities Fund, BNY Mellon Tax-Sensitive Large Cap Multi-Strategy Fund, BNY Mellon Focused Equity Opportunities Fund, BNY Mellon Small/Mid Cap Fund and BNY Mellon Asset Allocation Fund did not borrow under the Facilities.
The average amount of borrowings outstanding under the Facilities during the period ended August 31, 2011 for BNY Mellon Large Cap Stock Fund, was approximately $1,819,200 with a related weighted average annualized interest rate of 1.45%.
The average amount of borrowings outstanding under the Facilities during the period ended August 31, 2011 for BNY Mellon Income Stock Fund, was approximately $147,000 with a related weighted average annualized interest rate of 1.42%.
The average amount of borrowings outstanding under the Facilities during the period ended August 31, 2011 for BNY Mellon Mid Cap Stock Fund, was approximately $192,600 with a related weighted average annualized interest rate of 1.42%.
The average amount of borrowings outstanding under the Facilities during the period ended August 31, 2011 for BNY Mellon Small Cap Stock Fund, was approximately $50,100 with a related weighted average annualized interest rate of 1.43%.
The average amount of borrowings outstanding under the Facilities during the period ended August 31, 2011 for BNY Mellon U.S. Core Equity 130/30 Fund, was approximately $125,800 with a related weighted average annualized interest rate of 1.41%.
154
The average amount of borrowings outstanding under the Facilities during the period ended August 31, 2011 for BNY Mellon International Fund, was approximately $648,500 with a related weighted average annualized interest rate of 1.42%.
The average amount of borrowings outstanding under the Facilities during the period ended August 31, 2011 for BNY Mellon Emerging Markets Fund, was approximately $775,900 with a related weighted average annualized interest rate of 1.38%.
The average amount of borrowings outstanding under the Facilities during the period ended August 31, 2011 for BNY Mellon International Appreciation Fund, was approximately $125,800 with a related weighted average annualized interest rate of 1.37%.
NOTE 4—Investment Advisory Fee, Administration Fee, Sub-Investment Advisory Fee and Other Transactions With Affiliates:
(a) Fees payable by the funds pursuant to the provisions of an investment advisory agreement with the Investment Adviser are payable monthly, computed on the average daily value of each fund’s net assets at the following annual rates: .65% of BNY Mellon Large Cap Stock Fund, .70% (direct investment in securities) and .15% (other underlying BNY Mellon funds), of BNY Mellon Large Cap Market Opportunities Fund, .70% (direct investment in securities) and .15% (other underlying BNY Mellon funds), of BNY MellonTax-Sensitive Large Cap Multi-Strategy Fund, .65% of BNY Mellon Income Stock Fund, .75% of BNY Mellon Mid Cap Stock Fund, .85% of BNY Mellon Small Cap Stock Fund, .80% of BNY Mellon U.S. Core Equity 130/30 Fund, .70% of BNY Mellon Focused Equity Opportunities Fund, .75% of BNY Mellon Small/Mid Cap Fund, .85% of BNY Mellon International Fund, 1.15% of BNY Mellon Emerging Markets Fund, .50% of BNY Mellon International Appreciation Fund and .65% (equity investments), .40% (debt securities) and .15% (money market
investments and other underlying funds, which may consist of affiliated funds, mutual funds and exchange traded funds) of BNY Mellon Asset Allocation Fund.
For BNY Mellon Large Cap Market Opportunities Fund, the Investment Adviser has contractually agreed, until January 1, 2012, to waive receipt of its fees and/or assume the expenses of the fund, so that the fund’s total annual operating expenses, (excluding shareholder services fees, taxes, interest, brokerage commissions and extraordinary expenses), do not exceed 1.25% of the value of the average daily net assets of their respective class.The reduction in investment advisory fee, amounted to $135,991 during the period ended August 31, 2011.
For BNY Mellon Tax-Sensitive Large Cap Multi-Strategy Fund, the Investment Adviser has contractually agreed, until January 1, 2012, to waive receipt of its fees and/or assume the expenses of the fund, so that the fund’s total annual operating expenses, (excluding shareholder services fees, taxes, interest, brokerage commissions and extraordinary expenses), do not exceed 1.15% of the value of the average daily net assets of their respective class.The reduction in investment advisory fee, amounted to $202,664 during the period ended August 31, 2011.
For BNY Mellon Small Cap Stock Fund, the Investment Adviser had contractually agreed until, September 30, 2010, to waive receipt of its fees and/or assume the expenses of the fund so that the direct expenses of Class M shares and Investor shares of the fund, (exclusive of taxes, interest, brokerage commissions, commitment fees on borrowings and extraordinary expenses), did not exceed an annual rate of .99% and 1.24% of the value of the average daily net assets of their respective class. The reduction in investment advisory fee, pursuant to the undertaking, amounted to $5,069 during the period ended August 31, 2011.This undertaking is no longer in effect.
For BNY Mellon Focused Equity Opportunities Fund, the Investment Adviser had contractually agreed until, January 1, 2011, to waive receipt of its fees and/or
| The Funds | 155 |
NOTES TO FINANCIAL STATEMENTS (continued)
assume the expenses of the fund so that the direct expenses of neither class, (excluding shareholder services fees, taxes, interest, brokerage commissions, commitment fees on borrowings and extraordinary expenses), did not exceed .90% of the value of the average daily net assets of their respective class. The reduction in investment advisory fee, pursuant to the undertaking, amounted to $5,365 during the period ended August 31, 2011. This undertaking is no longer in effect.
For BNY Mellon Small/Mid Cap Fund, the Investment Adviser had contractually agreed, until January 1, 2011, to waive receipt of its fees and/or assume the expenses of the fund so that the direct expenses of neither class, (excluding shareholder services fees, taxes, interest, brokerage commissions, commitment fees on borrowings and extraordinary expenses), did not exceed .95% of the value of the average daily net assets of their respective class.The reduction in investment advisory fee, pursuant to the undertaking, amounted to $3,558 during the period ended August 31, 2011. This undertaking is no longer in effect.
For BNY Mellon International Appreciation Fund, the Investment Adviser had contractually agreed, until September 30, 2010, to waive receipt of its fees and/or assume the expenses of the fund so that the direct expenses of neither class, (excluding shareholder services fees, taxes, interest, brokerage commissions, commitment fees on borrowings and extraordinary expenses), did not exceed .67% of the value of the average daily net assets of their respective class. The reduction in investment advisory fee, pursuant to the undertaking, amounted to $4,044 during the period ended August 31, 2011. This undertaking is no longer in effect.
For BNY Mellon Asset Allocation Fund, the Investment Adviser has contractually agreed, from September 15, 2011 until December 31, 2012, to waive receipt of its fees and/or assume the expenses of the fund, so that the fund’s total annual fund operating expenses (including indirect fees and expense of the underlying funds, but excluding shareholder services fees, taxes, interest, brokerage commissions, commitment fees on borrowings and extraordinary expenses) did not exceed .87% of the value of the average daily net assets of their respective class.
Pursuant to the Administration Agreement,The Bank of New York Mellon provides or arranges for fund accounting, transfer agency and other fund administration services and receives a fee based on the total net assets of the Trust based on the following rates:
| 0 up to $6 billion | .15% |
| $6 billion up to $12 billion | .12% |
| In excess of $12 billion | .10% |
No administration fee is applied to assets held by BNY Mellon Large Cap Market Opportunities Fund and BNY Mellon Tax-Sensitive Large Cap Multi-Strategy Fund which are invested in shares of certain other series of the Trust.
No administration fee is applied to assets held by BNY Mellon Asset Allocation Fund which are invested in cash or money market instruments or shares of certain other series of the Trust.
The Bank of New York Mellon has entered into a Sub-Administration Agreement with Dreyfus pursuant to which The Bank of New York Mellon pays Dreyfus for performing certain administrative services.
156
Pursuant to a Sub-Investment Advisory Agreement between Dreyfus and Walter Scott, Dreyfus pays Walter Scott a monthly fee at an annual rate of .41% of BNY Mellon Large Cap Market Opportunities Fund’s and BNY Mellon Tax-Sensitive Large Cap Multi-Strategy Fund’s average daily net assets.
During the period ended August 31, 2011, the Distributor retained $249 from CDSCs on redemptions of BNY Mellon Mid Cap Stock Fund’s Dreyfus Premier shares.
(b) BNY Mellon Mid Cap Stock Fund has adopted a Distribution Plan (the “Plan”) pursuant to Rule 12b-1 under the Act for distributing its Dreyfus Premier shares. BNY Mellon Mid Cap Stock Fund pays the Distributor a fee at an annual rate of .75% of the value of the fund’s average daily net assets attributable to its Dreyfus Premier shares. During the period ended August 31, 2011, BNY Mellon Mid Cap Stock Fund’s Dreyfus Premier shares were charged $4,258 pursuant to the Plan.
(c) The funds have adopted a Shareholder Services Plan with respect to their Investor shares and BNY Mellon Mid Cap Stock Fund has adopted a Shareholder Services Plan with respect to its Dreyfus Premier shares. Each fund pays the Distributor for the provision of certain services to holders of Investor shares and Dreyfus Premier shares a fee at an annual rate of .25% of the value of the average daily net assets attributable to Investor shares and Dreyfus Premier shares.The services provided may include personal services relating to shareholder accounts, such as answering shareholder inquiries regarding a fund, and providing reports and other information and services related to the maintenance of such shareholder accounts. The Shareholder Services Plan allows the Distributor to make payments from the shareholder services fees it collects from each fund to compensate service agents (certain banks, securities brokers or dealers and other financial institutions) in respect of these services. Table 8 summarizes the amounts Investor shares and Dreyfus Premier shares were charged during the period ended August 31, 2011, pursuant to the Shareholder Services Plan. Additional fees included in shareholder servicing costs in the Statements of Operations include fees paid for cash management charges.
| Table 8—Shareholder Services Plan Fees | |
| BNY Mellon Large Cap Stock Fund | $71,629 |
| BNY Mellon Large Cap Market | |
| Opportunities Fund | 28 |
| BNY Mellon Tax-Sensitive | |
| Large Cap Multi-Strategy Fund | 409 |
| BNY Mellon Income Stock Fund | 2,568 |
| BNY Mellon Mid Cap Stock Fund, | |
| Investor shares | 65,317 |
| BNY Mellon Mid Cap Stock Fund, | |
| Dreyfus Premier shares | 1,420 |
| BNY Mellon Small Cap Stock Fund | 18,335 |
| BNY Mellon U.S. Core | |
| Equity 130/30 Fund | 422 |
| BNY Mellon Focused Equity | |
| Opportunities Fund | 119 |
| BNY Mellon Small/Mid Cap Fund | 386 |
| BNY Mellon International Fund | 13,426 |
| BNY Mellon Emerging Markets Fund | 35,691 |
| BNY Mellon International | |
| Appreciation Fund | 10,255 |
| BNY Mellon Asset Allocation Fund | 11,735 |
The funds have arrangements with the custodian and cash management bank whereby the funds may receive earnings credits when positive cash balances are maintained, which are used to offset custody and cash man-
| The Funds | 157 |
NOTES TO FINANCIAL STATEMENTS (continued)
agement fees. For financial reporting purposes, the funds include net earnings credits as an expense offset in the Statement of Operations.
The funds compensate The Bank of New York Mellon under cash management agreements for performing cash management services related to fund subscriptions and redemptions. Table 9 summarizes the amount each fund was charged during the period ended August 31, 2011, pursuant to the cash management agreements, which is included in Shareholder servicing costs in the Statements of Operations.These fees were partially offset by earnings credits, also summarized in Table 9.
| Table 9—Cash Management Agreement Fees | ||
| Cash Management | Earnings | |
| Fees ($) | Credits ($) | |
| BNY Mellon Large Cap | ||
| Stock Fund | 256 | (8) |
| BNY Mellon Large Cap | ||
| Market Opportunities Fund | 13 | (1) |
| BNY Mellon Tax-Sensitive | ||
| Large Cap Multi-Strategy Fund | 15 | (1) |
| BNY Mellon Income Stock Fund | 85 | (3) |
| BNY Mellon Mid Cap Stock Fund | 6,823 | (217) |
| BNY Mellon Small Cap Stock Fund | 1,785 | (57) |
| BNY Mellon U.S. Core | ||
| Equity 130/30 Fund | 46 | (1) |
| BNY Mellon Focused | ||
| Equity Opportunities Fund | 37 | (1) |
| BNY Mellon Small/Mid Cap Fund | 38 | (1) |
| BNY Mellon International Fund | 400 | (13) |
| BNY Mellon Emerging | ||
| Markets Fund | 668 | (19) |
| BNY Mellon International | ||
| Appreciation Fund | 730 | (23) |
| BNY Mellon Asset Allocation Fund | 69 | (2) |
The funds also compensate The Bank of New York Mellon under a custody agreement for providing custodial services for the funds. Table 10 summarizes the amount each fund was charged during the period ended August 31, 2011, pursuant to the custody agreement.
| Table 10—Custody Agreement Fees | |
| BNY Mellon Large Cap Stock Fund | $95,231 |
| BNY Mellon Large Cap | |
| Market Opportunities Fund | 36,877 |
| BNY Mellon Tax-Sensitive | |
| Large Cap Multi-Strategy Fund | 89,956 |
| BNY Mellon Income Stock Fund | 17,930 |
| BNY Mellon Mid Cap Stock Fund | 108,837 |
| BNY Mellon Small Cap Stock Fund | 63,346 |
| BNY Mellon U.S. Core | |
| Equity 130/30 Fund | 48,423 |
| BNY Mellon Focused Equity | |
| Opportunities Fund | 42,793 |
| BNY Mellon Small/Mid Cap Fund | 51,187 |
| BNY Mellon International Fund | 239,033 |
| BNY Mellon Emerging Markets Fund | 2,734,375 |
| BNY Mellon International | |
| Appreciation Fund | 74,160 |
| BNY Mellon Asset Allocation Fund | 35,625 |
During the period ended August 31, 2011, each fund was charged $7,225 for services performed by the Chief Compliance Officer.
Table 11 summarizes the components of “Due to The Dreyfus Corporation and affiliates” in the Statements of Assets and Liabilities for each fund.
(d) Each Trustee who is not an “affiliated person” as defined in the Act receives from the Trust an annual fee of $68,000 and an attendance fee of $7,500 for each in-person meeting attended and $500 for telephone meetings and is reimbursed for travel and out-of-pocket expenses.The Chairman of the Trust’s Board receives an additional annual fee of $15,000 and the Chairman of the Trust’s Audit Committee receives an additional annual fee of $10,000.
NOTE 5—Securities Transactions:
Table 12 summarizes each fund’s aggregate amount of purchases and sales (including paydowns) of investment securities and securities sold short, excluding short-term
158
| Table 11—Due to The Dreyfus Corporation and Affiliates | ||||||
| Investment | Rule 12b-1 | Shareholder | Chief | (Less) | ||
| Advisory | Distribution | Services | Custodian | Compliance | Expense | |
| Fees ($) | Plan Fees ($) | Plan Fees ($) | Fees ($) | Officer Fees ($) | Reimbursement ($) | |
| BNY Mellon Large Cap Stock Fund | 599,860 | — | 2,586 | 32,000 | 3,253 | — |
| BNY Mellon Large Cap Market | ||||||
| Opportunities Fund | 50,511 | — | 2 | 10,000 | 3,253 | (2,507) |
| BNY Mellon Tax-Sensitive | ||||||
| Large Cap Multi-Strategy Fund | 36,367 | — | 21 | 12,880 | 3,253 | (27,286) |
| BNY Mellon Income Stock Fund | 89,334 | — | 197 | 4,800 | 3,253 | — |
| BNY Mellon Mid Cap Stock Fund | 814,894 | 269 | 5,760 | 40,000 | 3,253 | — |
| BNY Mellon Small Cap Stock Fund | 254,859 | — | 1,559 | 21,200 | 3,253 | — |
| BNY Mellon U.S. Core | ||||||
| Equity 130/30 Fund | 215,653 | — | 36 | 13,619 | 3,253 | — |
| BNY Mellon Focused Equity | ||||||
| Opportunities Fund | 241,992 | — | 6 | 13,200 | 3,253 | — |
| BNY Mellon Small/Mid Cap Fund | 312,423 | — | 50 | 16,000 | 3,253 | — |
| BNY Mellon International Fund | 635,383 | — | 1,166 | 128,104 | 3,253 | — |
| BNY Mellon Emerging Markets Fund | 2,260,113 | — | 4,372 | 720,071 | 3,253 | — |
| BNY Mellon International | ||||||
| Appreciation Fund | 85,142 | — | 839 | 3,320 | 3,253 | — |
| BNY Mellon Asset Allocation Fund | 124,048 | — | 915 | 11,035 | 3,253 | — |
| Table 12—Purchases and Sales | ||
| Purchases ($) | Sales ($) | |
| BNY Mellon Large Cap Stock Fund | 1,133,793,236 | 1,415,874,689 |
| BNY Mellon Large Cap Market Opportunities Fund | 129,060,782 | 15,613,467 |
| BNY Mellon Tax-Sensitive Large Cap Multi-Strategy Fund | 77,803,197 | 14,089,868 |
| BNY Mellon Income Stock Fund | 180,251,934 | 83,585,878 |
| BNY Mellon Mid Cap Stock Fund | 1,908,665,109 | 2,073,544,847 |
| BNY Mellon Small Cap Stock Fund | 701,518,481 | 859,571,860 |
| BNY Mellon Focused Equity Opportunities Fund | 366,745,855 | 220,536,236 |
| BNY Mellon Small/Mid Cap Fund | 711,730,334 | 463,435,513 |
| BNY Mellon International Fund | 594,044,580 | 781,602,464 |
| BNY Mellon Emerging Markets Fund | 2,219,564,260 | 1,751,280,265 |
| BNY Mellon International Appreciation Fund | 22,287,503 | 57,486,173 |
| BNY Mellon Asset Allocation Fund | 269,914,906 | 269,290,150 |
| BNY Mellon U.S. Core Equity 130/30 Fund | ||
| Long transactions | 660,694,573 | 514,573,388 |
| Short sale transactions | 268,214,351 | 278,216,182 |
| Total | 928,908,924 | 792,789,570 |
| The Funds | 159 |
NOTES TO FINANCIAL STATEMENTS (continued)
securities, financial futures, options transactions and forward contracts, during the period ended August 31, 2011.
Short Sales: BNY Mellon U.S. Core Equity 130/30 Fund is engaged in short-selling which obligates the fund to replace the security borrowed by purchasing the security at current market value.The fund incurs a loss if the price of the security increases between the date of the short sale and the date on which the fund replaces the borrowed security. The fund realizes a gain if the price of the security declines between those dates. Until the fund replaces the borrowed security, the fund will maintain daily a segregated account with a broker or custodian of permissible liquid assets sufficient to cover its short position. Securities sold short at August 31, 2011, and their related market values and proceeds, are set forth in the Statement of Securities Sold Short.
Table 13 shows BNY Mellon International Appreciation Fund’s exposure to different types of market risk as it relates to the Statement of Assets and Liabilities and the Statement of Operations, respectively.
Futures Contracts: In the normal course of pursuing its investment objective, BNY Mellon International Appreciation Fund is exposed to market risk, including equity price risk as a result of changes in value of underlying financial instruments.The fund invests in financial futures contracts in order to manage its exposure to or protect against changes in the market.A futures contract represents a commitment for the future purchase or a sale of an asset at a specified date. Upon entering into such contracts, these investments require initial margin
deposits with a broker, which consist of cash or cash equivalents.The amount of these deposits is determined by the exchange or Board of Trade on which the contract is traded and is subject to change.Accordingly, variation margin payments are received or made to reflect daily unrealized gains or losses which are recorded in the Statement of Operations. Futures contracts are valued daily at the last sales price established by the Board of Trade or exchange upon which they are traded. When the contracts are closed, the fund recognizes a realized gain or loss.There is minimal counterparty credit risk to the fund with futures since futures are exchange traded, and the exchange’s clearinghouse guarantees the futures against default. Contracts open at August 31, 2011 are set forth in the Statement of Financial Futures.
Options: BNY Mellon Income Stock Fund and BNY Mellon Focused Equity Opportunities Fund purchases and writes (sells) put and call options to hedge against changes in the values of equities, or as a substitute for an investment. Each fund is subject to market risk in the course of pursuing its investment objectives through its investments in options contracts. A call option gives the purchaser of the option the right (but not the obligation) to buy, and obligates the writer to sell, the underlying security or securities at the exercise price at any time during the option period, or at a specified date. Conversely, a put option gives the purchaser of the option the right (but not the obligation) to sell, and obligates the writer to buy the underlying security or securities at the exercise price at any time during the option period, or at a specified date.
160
Table 13—Derivatives and Hedging
Fair value of derivative instruments for BNY Mellon International Appreciation Fund as of August 31, 2011 is shown below:
| Derivative | Derivative | ||
| Assets ($) | Liabilities ($) | ||
| Equity risk | — | Equity risk1 | (37,591) |
| Foreign exchange risk2 | 20,754 | Foreign exchange risk3 | (873) |
| Gross fair value of derivatives contracts | 20,754 | (38,464) |
| Statement of Assets and Liabilities location: |
| 1 Includes cumulative appreciation (depreciation) on futures contracts as reported in the Statement of Financial Futures, but only the unpaid variation margin is reported in |
| the Statement of Assets and Liabilities. |
| 2 Unrealized appreciation on forward foreign currency exchange contracts. |
| 3 Unrealized depreciation on forward foreign currency exchange contracts. |
The effect of derivative instruments in the Statement of Operations for BNY Mellon International Appreciation Fund during the period ended August 31, 2011 is shown below:
| Amount of realized gain or (loss) on derivatives recognized in income ($) | |||
| Underlying risk | Futures4 | Forward Contracts5 | Total |
| Equity | (16,371) | — | (16,371) |
| Foreign exchange | — | 400,025 | 400,025 |
| Total | (16,371) | 400,025 | 383,654 |
| Change in unrealized appreciation or (depreciation) on derivatives recognized in income ($) | |||
| Underlying risk | Futures6 | Forward Contracts7 | Total |
| Equity | 20,334 | — | 20,334 |
| Foreign exchange | — | (109,723) | (109,723) |
| Total | 20,334 | (109,723) | (89,389) |
| Statement of Operations location: | |
| 4 | Net realized gain (loss) on financial futures. |
| 5 | Net realized gain (loss) on forward foreign currency exchange contracts. |
| 6 | Net unrealized appreciation (depreciation) on financial futures. |
| 7 | Net unrealized appreciation (depreciation) on forward foreign currency exchange contracts. |
| The Funds | 161 |
NOTES TO FINANCIAL STATEMENTS (continued)
As a writer of call options, each fund receives a premium at the outset and then bears the market risk of unfavorable changes in the price of the financial instrument underlying the option. Generally, each fund realizes a gain, to the extent of the premium, if the price of the underlying financial instrument decreases between the date the option is written and the date on which the option is terminated. Generally, each fund incurs a loss, if the price of the financial instrument increases between those dates.
As a writer of put options, each fund receives a premium at the outset and then bears the market risk of unfavorable changes in the price of the financial instrument underlying the option. Generally, each fund realizes a gain, to the extent of the premium, if the price of the underlying financial instrument increases between the date the option is written and the date on which the option is terminated. Generally, each fund incurs a loss, if the price of the financial instrument decreases between those dates.
As a writer of an option, each fund has no control over whether the underlying securities may be sold (call) or purchased (put) and as a result bears the market risk of an unfavorable change in the price of the security underlying the written option. There is a risk of loss from a change in value of such options which may exceed the related premiums received. One risk of holding a put or a call option is that if the option is not sold or exercised prior to its expiration, it becomes worthless. However, this risk is limited to the premium paid by each fund. Upon the expiration or closing of the option transaction, a gain or loss is reported in the Statements of Operations.
Table 14 summarizes BNY Mellon Income Stock Fund’s and BNY Mellon Focused Equity Opportunities Fund’s call/put options written during the period ended August 31, 2011.
Forward Foreign Currency Exchange Contracts:
BNY Mellon International Fund, BNY Mellon Emerging Markets Fund and BNY Mellon International Appreciation Fund enter into forward contracts in order to hedge their exposure to changes in foreign currency exchange rates on its foreign portfolio holdings, to settle foreign currency transactions or as a part of their investment strategies.When executing forward contracts, each fund is obligated to buy or sell a foreign currency at a specified rate on a certain date in the future.With respect to sales of forward contracts, each fund incurs a loss if the value of the contract increases between the date the forward contract is opened and the date the forward contract is closed. Each fund realizes a gain if the value of the contract decreases between those dates.With respect to purchases of forward contracts, each fund incurs a loss if the value of the contract decreases between the date the forward contract is opened and the date the forward contract is closed. Each fund realizes a gain if the value of the contract increases between those dates. Any realized gain or loss which occurred during the period is reflected in the Statements of Operations. Each fund is exposed to foreign currency risk as a result of changes in value of underlying financial instruments. Each fund is also exposed to credit risk associated with counterparty nonperformance on these forward contracts, which is typically limited to the unrealized gain on each open contract. Table 15 summarizes open forward contracts for each fund at August 31, 2011.
162
| Table 14—Options Written | ||||||
| BNY Mellon Income Stock Fund | Options Terminated | |||||
| Number of | Premiums | Net Realized | ||||
| Options Written | Contracts | Received ($) | Cost ($) | Gain ($) | ||
| Contracts outstanding August 31, 2010 | — | — | ||||
| Contracts written | 2,176 | 237,674 | ||||
| Contracts terminated: | ||||||
| Contracts closed | 412 | 78,471 | 41,009 | 37,462 | ||
| Contracts expired | 816 | 31,811 | — | 31,811 | ||
| Total contracts terminated | 1,228 | 110,282 | 41,009 | 69,273 | ||
| Contracts outstanding August 31, 2011 | 948 | 127,392 | ||||
| Table 14—Options Written (continued) | ||||||
| BNY Mellon Focused Equity Opportunities Fund | Options Terminated | |||||
| Number of | Premiums | Net Realized | ||||
| Options Written | Contracts | Received ($) | Cost ($) | Gain ($) | ||
| Contracts outstanding August 31, 2010 | 400 | 53,971 | ||||
| Contracts written | 4,342 | 677,233 | ||||
| Contracts terminated; | ||||||
| Contracts closed | 4,742 | 731,204 | 268,459 | 462,745 | ||
| Contracts outstanding August 31, 2011 | — | — | ||||
| Table 15—Forward Foreign Currency Exchange Contracts | ||||||
| BNY Mellon International Fund | ||||||
| Foreign | ||||||
| Currency | Unrealized | |||||
| Forward Foreign Currency Exchange Contracts | Amounts | Proceeds ($) | Value ($) | (Depreciation) ($) | ||
| Sales: | ||||||
| Japanese Yen, Expiring 9/1/2011 | 20,632,162 | 268,879 | 269,455 | (576) | ||
| Japanese Yen, Expiring 9/2/2011 | 5,571,779 | 72,606 | 72,767 | (161) | ||
| Gross Unrealized Depreciation | (737) | |||||
| The Funds | 163 |
NOTES TO FINANCIAL STATEMENTS (continued)
| Table 15—Forward Foreign Currency Exchange Contracts (continued) | ||||
| BNY Mellon Emerging Markets Fund | ||||
| Foreign | Unrealized | |||
| Currency | Appreciation | |||
| Forward Foreign Currency Exchange Contracts | Amounts | Cost ($) | Value ($) | (Depreciation) ($) |
| Purchases: | ||||
| Brazilian Real, Expiring 9/1/2011 | 1,393,354 | 867,160 | 875,277 | 8,117 |
| Brazilian Real, Expiring 9/2/2011 | 1,197,198 | 732,590 | 752,056 | 19,466 |
| Brazilian Real, Expiring 9/2/2011 | 1,074,929 | 657,771 | 675,249 | 17,478 |
| Sales: | Proceeds ($) | |||
| Brazilian Real, Expiring 9/6/2011 | 481,829 | 289,752 | 302,675 | (12,923) |
| Indian Rupee, Expiring 9/2/2011 | 15,129,993 | 329,307 | 328,556 | 751 |
| Indian Rupee, Expiring 9/2/2011 | 11,272,172 | 245,340 | 244,781 | 559 |
| Philippine Peso, Expiring 9/2/2011 | 2,826,391 | 66,897 | 66,838 | 59 |
| Philippine Peso, Expiring 9/6/2011 | 10,769,846 | 254,847 | 254,681 | 166 |
| South Korean Won, Expiring 9/1/2011 | 1,004,520,911 | 936,180 | 941,577 | (5,397) |
| South Korean Won, Expiring 9/1/2011 | 54,993,990 | 51,253 | 51,548 | (295) |
| South Korean Won, Expiring 9/2/2011 | 1,162,680,281 | 1,090,388 | 1,089,826 | 562 |
| South Korean Won, Expiring 9/2/2011 | 401,303,008 | 376,351 | 376,157 | 194 |
| Gross Unrealized Appreciation | 47,352 | |||
| Gross Unrealized Depreciation | (18,615) | |||
| Table 15—Forward Foreign Currency Exchange Contracts (continued) | ||||
| BNY Mellon International Appreciation Fund | ||||
| Foreign | Unrealized | |||
| Currency | Appreciation | |||
| Forward Foreign Currency Exchange Contracts | Amounts | Cost ($) | Value ($) | (Depreciation) ($) |
| Purchases: | ||||
| Australian Dollar, Expiring 9/21/2011 | 160,056 | 168,111 | 170,609 | 2,498 |
| British Pound, Expiring 9/21/2011 | 14,679 | 23,526 | 23,823 | 297 |
| British Pound, Expiring 9/21/2011 | 58,200 | 93,744 | 94,454 | 710 |
| British Pound, Expiring 9/21/2011 | 57,600 | 93,785 | 93,480 | (305) |
| British Pound, Expiring 9/21/2011 | 55,700 | 90,959 | 90,397 | (562) |
| Euro, Expiring 9/21/2011 | 27,293 | 39,202 | 39,196 | (6) |
| Euro, Expiring 9/21/2011 | 39,100 | 54,910 | 56,152 | 1,242 |
| Euro, Expiring 9/21/2011 | 54,000 | 76,113 | 77,550 | 1,437 |
| Euro, Expiring 9/21/2011 | 53,600 | 75,123 | 76,975 | 1,852 |
| Euro, Expiring 9/21/2011 | 76,600 | 109,336 | 110,006 | 670 |
| Euro, Expiring 9/21/2011 | 41,319 | 58,413 | 59,338 | 925 |
| Japanese Yen, Expiring 9/21/2011 | 8,054,898 | 100,968 | 105,213 | 4,245 |
| Japanese Yen, Expiring 9/21/2011 | 65,000 | 822 | 849 | 27 |
| Japanese Yen, Expiring 9/21/2011 | 16,540,000 | 209,194 | 216,045 | 6,851 |
| Gross Unrealized Appreciation | 20,754 | |||
| Gross Unrealized Depreciation | (873) | |||
164
Table 16 summarizes each relevant fund’s average market value of derivatives outstanding during the period ended August 31, 2011.
Table 17 summarizes the cost of investments for federal income tax purposes and accumulated net unrealized appreciation (depreciation) on investments for each fund at August 31, 2011.
| Table 16—Average Market Value of Derivatives | |
| Average | |
| Market Value ($) | |
| BNY Mellon Income Stock Fund | |
| Equity options contracts | 32,950 |
| BNY Mellon Focused Equity Opportunities Fund | |
| Equity options contracts | 91,999 |
| BNY Mellon International Fund | |
| Forward contracts | 4,925,372 |
| BNY Mellon Emerging Markets Fund | |
| Forward contracts | 11,230,140 |
| BNY Mellon International Appreciation Fund | |
| Equity futures contracts | 2,599,787 |
| Forward contracts | 2,649,365 |
| Table 17—Accumulated Net Unrealized Appreciation (Depreciation) | ||||
| Cost of | Gross | Gross | ||
| Investments ($) | Appreciation ($) | Depreciation ($) | Net ($) | |
| BNY Mellon Large Cap Stock Fund | 1,170,250,634 | 182,649,653 | 38,259,308 | 144,390,345 |
| BNY Mellon Large Cap Market Opportunities Fund | 121,411,906 | 4,477,111 | 6,991,493 | (2,514,382) |
| BNY Mellon Tax-Sensitive Large Cap Multi-Strategy Fund | 75,855,825 | 3,968,958 | 2,939,850 | 1,029,108 |
| BNY Mellon Income Stock Fund | 251,477,517 | 10,156,893 | 5,612,906 | 4,543,987 |
| BNY Mellon Mid Cap Stock Fund | 1,413,972,767 | 160,518,376 | 93,198,157 | 67,320,219 |
| BNY Mellon Small Cap Stock Fund | 481,742,415 | 29,804,726 | 44,057,483 | (14,252,757) |
| BNY Mellon U.S. Core Equity 130/30 Fund | 408,732,191 | 27,916,509 | 26,527,049 | 1,389,460 |
| BNY Mellon Focused Equity Opportunities Fund | 421,045,369 | 47,234,830 | 24,723,398 | 22,511,432 |
| BNY Mellon Small/Mid Cap Fund | 576,255,668 | 62,623,513 | 43,387,354 | 19,236,159 |
| BNY Mellon International Fund | 1,013,200,549 | 62,404,181 | 197,783,451 | (135,379,270) |
| BNY Mellon Emerging Markets Fund | 2,353,333,260 | 238,752,727 | 272,467,034 | (33,714,307) |
| BNY Mellon International Appreciation Fund | 263,515,764 | 14,635,097 | 77,055,066 | (62,419,969) |
| BNY Mellon Asset Allocation Fund | 368,329,187 | 31,857,839 | 14,276,689 | 17,581,150 |
| The Funds | 165 |
REPORT OF INDEPENDENT REGISTERED PUBLIC ACCOUNTING FIRM
The Board of Trustees and Shareholders of BNY Mellon Funds Trust:
We have audited the accompanying statements of assets and liabilities of BNY Mellon Large Cap Stock Fund, BNY Mellon Large Cap Market Opportunities Fund, BNY Mellon Tax-Sensitive Large Cap Multi-Strategy Fund, BNY Mellon Income Stock Fund, BNY Mellon Mid Cap Stock Fund, BNY Mellon Small Cap Stock Fund, BNY Mellon U.S. Core Equity 130/30 Fund, BNY Mellon Focused Equity Opportunities Fund, BNY Mellon Small/Mid Cap Fund, BNY Mellon International Fund, BNY Mellon Emerging Markets Fund, BNY Mellon International Appreciation Fund, and BNY Mellon Asset Allocation Fund (formerly known as BNY Mellon Balanced Fund), (collectively the “Funds”), each a series of BNY Mellon Funds Trust, including the statements of investments, statements of financial futures (with respect to BNY Mellon International Appreciation Fund), statement of options written (with respect to BNY Mellon Income Stock Fund) and statement of securities sold short (with respect to BNY Mellon U.S. Core Equity 130/30 Fund) as of August 31, 2011, and the related statements of operations for the year or periods then ended, the statements of changes in net assets for each of the years or periods in the two-year period then ended, the statement of cash flows for the year then ended (with respect to the BNY Mellon U.S. Core Equity 130/30 Fund), and the financial highlights for each of the years or periods in the five-year period then ended. These financial statements and financial highlights are the responsibility of the Funds’ management. Our responsibility is to express an opinion on these financial statements and financial highlights based on our audits.With respect to the BNY Mellon International Appreciation Fund, the financial highlights for each of the years in the two-year period ended December 31, 2007 were audited by other independent registered public accountants whose report thereon, dated February 28, 2008, expressed an unqualified opinion on those financial highlights.
We conducted our audits in accordance with the auditing standards of the Public Company Accounting Oversight Board (United States). Those standards require that we plan and perform the audit to obtain reasonable assurance about whether the financial statements and financial highlights are free of material misstatement.An audit also includes examining, on a test basis, evidence supporting the amounts and disclosures in the financial statements. Our procedures included confirmations of securities owned as of August 31, 2011, by correspondence with the custodian and brokers or by other appropriate auditing procedures where replies from brokers were not received. An audit also includes assessing the accounting principles used and significant estimates made by management, as well as evaluating the overall financial statement presentation.We believe that our audits provide a reasonable basis for our opinion.
In our opinion, the financial statements and financial highlights referred to above present fairly, in all material respects, the financial position of BNY Mellon Large Cap Stock Fund, BNY Mellon Large Cap Market Opportunities Fund, BNY Mellon Tax-Sensitive Large Cap Multi-Strategy Fund, BNY Mellon Income Stock Fund, BNY Mellon Mid Cap Stock Fund, BNY Mellon Small Cap Stock Fund, BNY Mellon U.S. Core Equity 130/30 Fund, BNY Mellon Focused Equity Opportunities Fund, BNY Mellon Small/Mid Cap Fund, BNY Mellon International Fund, BNY Mellon Emerging Markets Fund, BNY Mellon International Appreciation Fund, and BNY Mellon Asset Allocation Fund (formerly known as BNY Mellon Balanced Fund), each a series of BNY Mellon Funds Trust, as of August 31, 2011, and the results of their operations, the changes in their net assets, its cash flows (with respect to BNY Mellon U.S. Core Equity 130/30 Fund), and the financial highlights for the periods described in the first paragraph above, in conformity with U.S. generally accepted accounting principles.

New York, New York
October 26, 2011
166
IMPORTANT TAX INFORMATION (Unaudited)
BNY Mellon Large Cap Stock Fund
For federal tax purposes, the fund designates the maximum amount allowable, but not less than $13,291,252 as ordinary income dividends paid during the year ended August 31, 2011 as qualified dividend income in accordance with Section 854(b)(1)(B) of the Internal Revenue Code.Also, the fund designates 100% of ordinary income dividends paid during the year ended August 31, 2011 as eligible for the corporate dividends received deduction provided under Section 243 of the Internal Revenue Code in accordance with Section 854(b)(1)(A) of the Internal Revenue Code. Shareholders will receive notification in early 2012 of the percentage applicable to the preparation of their 2011 income tax returns.
BNY Mellon Large Cap Market Opportunities Fund
For federal tax purposes, the fund designates the maximum amount allowable, but not less than $183,058 as ordinary income dividends paid during the year ended August 31, 2011 as qualified dividend income in accordance with Section 854(b)(1)(B) of the Internal Revenue Code.Also, the fund designates 100% of ordinary income dividends paid during the year ended August 31, 2011 as eligible for the corporate dividends received deduction provided under Section 243 of the Internal Revenue Code in accordance with Section 854(b)(1)(A) of the Internal Revenue Code. Also the fund designates the maximum amount allowable but not less than $.0261 per share as a short-term captial gain dividend in accordance with Sections 871(k)(2) and 881(e) of the Internal Revenue Code. Shareholders will receive notification in early 2012 of the percentage applicable to the preparation of their 2011 income tax returns.
BNY Mellon Tax-Sensitive Large Cap Multi-Strategy Fund
For federal tax purposes, the fund designates the maximum amount allowable, but not less than $186,294 as ordinary income dividends paid during the year ended August 31, 2011 as qualified dividend income in accordance with Section 854(b)(1)(B) of the Internal Revenue Code.Also, the fund designates 100% of ordinary income dividends paid during the year ended August 31, 2011 as eligible for the corporate dividends received deduction provided under Section 243 of the Internal Revenue Code in accordance with Section 854(b)(1)(A) of the Internal Revenue Code. Also the fund designates the maximum amount allowable but not less than $.0266 per share as a short-term captial gain dividend in accordance with Sections 871(k)(2) and 881(e) of the Internal Revenue Code. Also, the fund designates the maximum allowable but not less than $75 as a capital gain dividend in accordance with Section 852(b)(3)(C) of the Internal Revenue Code. Shareholders will receive notification in early 2012 of the percentage applicable to the preparation of their 2011 income tax returns.
BNY Mellon Income Stock Fund
For federal tax purposes, the fund designates the maximum amount allowable, but not less than $3,104,684 as ordinary income dividends paid during the year ended August 31, 2011 as qualified dividend income in accordance with Section 854(b)(1)(B) of the Internal Revenue Code. Also, the fund designates 100% of ordinary income dividends paid during the year ended August 31, 2011 as eligible for the corporate dividends received deduction provided under Section 243 of the Internal Revenue Code in accordance with Section 854(b)(1)(A) of the Internal Revenue Code. Shareholders will receive notification in early 2012 of the percentage applicable to the preparation of their 2011 income tax returns.
BNY Mellon Mid Cap Stock Fund
The fund designates the maximum amount allowable but not less than $358,451 as a capital gain dividend in accordance with Section 852(b)(3)(C) of the Internal Revenue Code.
| The Funds | 167 |
IMPORTANT TAX INFORMATION (Unaudited) (continued)
BNY Mellon U.S. Core Equity 130/30 Fund
For federal tax purposes, the fund designates the maximum amount allowable, but not less than $1,000,686 as ordinary income dividends paid during the year ended August 31, 2011 as qualified dividend income in accordance with Section 854(b)(1)(B) of the Internal Revenue Code.Also, the fund designates 100% of ordinary income dividends paid during the year ended August 31, 2011 as eligible for the corporate dividends received deduction provided under Section 243 of the Internal Revenue Code in accordance with Section 854(b)(1)(A) of the Internal Revenue Code. Shareholders will receive notification in early 2012 of the percentage applicable to the preparation of their 2011 income tax returns.
BNY Mellon Focused Equity Opportunities Fund
For federal tax purposes, the fund designates the maximum amount allowable, but not less than $1,301,844 as ordinary income dividends paid during the year ended August 31, 2011 as qualified dividend income in accordance with Section 854(b)(1)(B) of the Internal Revenue Code.Also, the fund designates 100% of ordinary income dividends paid during the year ended August 31, 2011 as eligible for the corporate dividends received deduction provided under Section 243 of the Internal Revenue Code in accordance with Section 854(b)(1)(A) of the Internal Revenue Code. Shareholders will receive notification in early 2012 of the percentage applicable to the preparation of their 2011 income tax returns.
BNY Mellon Small/Mid Cap Fund
For federal tax purposes, the fund designates the maximum amount allowable, but not less than $2,297,251 as ordinary income dividends paid during the year ended August 31, 2011 as qualified dividend income in accordance with Section 854(b)(1)(B) of the Internal Revenue Code.Also, the fund designates the maximum amount allowable but not less than 16.79% of ordinary income dividends paid during the year ended August 31, 2011 as eligible for the corporate dividends received deduction provided under Section 243 of the Internal Revenue Code in accordance with Section 854(b)(1)(A) of the Internal Revenue Code. Also the fund designates the maximum amount allowable but not less than $.0797 per share as a short-term captial gain dividend in accordance with Sections 871(k)(2) and 881(e) of the Internal Revenue Code.Also the fund designates the maximum amount allowable but not less than $.0081 per share as a capital gain dividend in accordance with Section 852(b)(3)(C) of the Internal Revenue Code. Shareholders will receive notification in early 2012 of the percentage applicable to the preparation of their 2011 income tax returns.
BNY Mellon International Fund
For federal tax purposes, the fund elects to provide each shareholder with their portion of the fund’s income sourced from foreign countries and taxes paid from foreign countries. The fund designates the maximum amount allowable but not less than $36,453,133 as income sourced from foreign countries for the fiscal year ended August 31, 2011 in accordance with Section 853(c)(2) of the Internal Revenue Code and also the fund designates the maximum amount allowable but not less than $2,658,843 as taxes paid from foreign countries for the fiscal year ended August 31, 2011 in accordance with Section 853(a) of the Internal Revenue Code. Where required by federal tax rules, shareholders will receive notification of their proportionate share of foreign sourced income and foreign taxes paid for the 2011 calendar year with Form 1099-DIV which will be mailed in early 2012. Also, the fund designates the maximum amount allowable, but not less than $21,184,188 as ordinary income dividends paid during the fiscal year ended August 31, 2011 as qualified dividend income in accordance with Section 854(b)(1)(B) of the Internal Revenue Code.
168
BNY Mellon Emerging Markets Fund
For federal tax purposes, the fund elects to provide each shareholder with their portion of the fund’s income sourced from foreign countries and taxes paid from foreign countries. The fund designates the maximum amount allowable but not less than $68,118,295 as income sourced from foreign countries for the fiscal year ended August 31, 2011 in accordance with Section 853(c)(2) of the Internal Revenue Code and also the fund designates the maximum amount allowable but not less than $10,140,123 as taxes paid from foreign countries for the fiscal year ended August 31, 2011 in accordance with Section 853(a) of the Internal Revenue Code.Where required by federal tax rules, shareholders will receive notification of their proportionate share of foreign sourced income and foreign taxes paid for the 2011 calendar year with Form 1099-DIV which will be mailed in early 2012.Also, the fund designates the maximum amount allowable, but not less than $9,733,250 as ordinary income dividends paid during the fiscal year ended August 31, 2011 as qualified dividend income in accordance with Section 854(b)(1)(B) of the Internal Revenue Code.
BNY Mellon International Appreciation Fund
For federal tax purposes, the fund elects to provide each shareholder with their portion of the fund’s income sourced from foreign countries and taxes paid from foreign countries. The fund designates the maximum amount allowable but not less than $9,610,185 as income sourced from foreign countries for the fiscal year ended
August 31, 2011 in accordance with Section 853(c)(2) of the Internal Revenue Code and also the fund designates the maximum amount allowable but not less than $799,042 as taxes paid from foreign countries for the fiscal year ended August 31, 2011 in accordance with Section 853(a) of the Internal Revenue Code.Also the fund designates the maximum amount allowable, but not less than $5,599,840 as ordinary income dividends paid during the fiscal year ended August 31, 2011 as qualified dividend income in accordance with Section 854(b)(1)(B) of the Internal Revenue Code. Where required by federal tax rules, shareholders will receive notification of their proportionate share of foreign sourced income and foreign taxes paid for the 2011 calendar year with Form 1099-DIV which will be mailed in early 2012.
BNY Mellon Asset Allocation Fund
For federal tax purposes, the fund designates the maximum amount allowable, but not less than $3,010,052 as ordinary income dividends paid during the year ended August 31, 2011 as qualified dividend income in accordance with Section 854(b)(1)(B) of the Internal Revenue Code. Also, the fund designates the maximum amount allowable but not less than 41.24% of ordinary income dividends paid during the year ended August 31, 2011 as eligible for the corporate dividends received deduction provided under Section 243 of the Internal Revenue Code in accordance with Section 854(b)(1)(A) of the Internal Revenue Code. Shareholders will receive notification in early 2012 of the percentage applicable to the preparation of their 2011 income tax returns.
| The Funds | 169 |
| INFORMATION ABOUT THE RENEWAL OF EACH FUND’S |
| INVESTMENT ADVISORY AGREEMENT AND THE APPROVAL OF |
| EACH FUND’S ADMINISTRATION AGREEMENT (Unaudited) |
At a meeting of the Trust’s Board of Trustees held on March 8-9, 2011, the Board considered the renewal of the Trust’s Investment Advisory Agreement and the Administration Agreement (together, the “Agreement”) pursuant to which BNY Mellon Fund Advisers, a division of Dreyfus, provides the funds with investment advisory services andThe Bank of NewYork Mellon provides the funds with administrative services.The Bank of New York Mellon has entered into a Sub-Administration Agreement with Dreyfus pursuant to whichThe Bank of NewYork Mellon pays Dreyfus for performing certain of these administrative services. The Board members who are not “interested persons” (as defined in the Investment Company Act of 1940, as amended) of the Trust were assisted in their review by independent legal counsel and met with counsel in executive session separate from representatives of Dreyfus. In considering the renewal of the Agreement, the Board considered all factors that it believed to be relevant, including those discussed below. The Board did not identify any one factor as dispositive, and each Board member may have attributed different weights to the factors considered.
Analysis of Nature, Extent, and Quality of Services Provided to the Funds.The Board members considered information previously provided to them in presentations from representatives of Dreyfus regarding the nature, extent, and quality of the services provided to the funds, and representatives of Dreyfus confirmed that there had been no material changes in this information. Dreyfus provided the number of open accounts in each fund, the fund’s asset size and the allocation of fund assets among distribution channels. Dreyfus also had previously provided information regarding the diverse intermediary relationships and distribution channels of the funds and Dreyfus’ corresponding need for broad, deep, and diverse resources to be able to provide ongoing shareholder services to each distribution channel, including the distribution channel(s) for each fund.
The Board members also considered research support available to, and portfolio management capabilities of, each fund’s portfolio management personnel and that Dreyfus also provides oversight of day-to-day fund operations, including fund accounting and administration and assistance in meeting legal and regulatory requirements. The Board members also considered Dreyfus’ extensive administrative, accounting, and compliance infrastructures.The Board also considered Dreyfus’ brokerage policies and practices (including policies and practices regarding soft dollars) and the standards applied in seeking best execution.
Comparative Analysis of the Funds’ Performance and Advisory Fees and Expense Ratios.The Board members reviewed reports prepared by Lipper, Inc. (“Lipper”), an independent provider of investment company data, which included information comparing (1) each fund’s performance with that of a group of comparable funds (the “Performance Group”) and with a broader group of funds (the “Performance Universe”), all for various periods ended January 31, 2011, and (2) each fund’s actual and contractual advisory fees and total expenses with those of a group of comparable funds (the “Expense Group”) and with a broader group of funds (the “Expense Universe”), the information for which was derived in part from each fund’s financial statements available to Lipper as of January 31, 2011. Dreyfus previously had furnished the Board with a description of the methodology Lipper used to select the Performance Group and Performance Universe and the Expense Group and Expense Universe.
Dreyfus representatives stated that the usefulness of performance comparisons may be affected by a number of factors, including different investment limitations that may be applicable to the fund and comparison funds.They also noted that performance generally should be considered over longer periods of time, although it is possible that long-term performance can be adversely affected by even
170
one period of significant underperformance so that a single investment decision or theme has the ability to affect disproportionately long term performance.
As applicable to each fund, representatives of Dreyfus reviewed with the Board members the management or investment advisory fees (1) paid by funds advised or administered by Dreyfus that are in the same Lipper category as the fund and (2) paid to Dreyfus or the Dreyfus-affiliated primary employer of the fund’s primary portfolio manager for advising any separate accounts and/or other types of client portfolios that are considered to have similar investment strategies and policies as the fund (the “Similar Clients”), and explained the nature of the Similar Clients. They discussed differences in fees paid and the relationship of the fees paid in light of any differences in the services provided and other relevant factors.The Board members considered the relevance of the fee information provided for the Similar Clients to evaluate the appropriateness and reasonableness of the fund’s advisory fee.
BNY Mellon Large Cap Stock Fund
The Board members discussed the results of the comparisons and noted that the fund’s total return performance was generally at or above the Performance Group and Performance Universe medians. Dreyfus also provided a comparison of the fund’s calendar year total returns to the returns of the fund’s benchmark index.
The Board members also reviewed the range of actual and contractual advisory fees and total expenses of the Expense Group and Expense Universe funds and discussed the results of the comparisons.They noted that the fund’s contractual advisory fee was above the Expense Group median, the fund’s actual advisory fee was above the Expense Group and Expense Universe medians and the fund’s total expenses were below the Expense Group and Expense Universe medians.
BNY Mellon U.S. Core Equity 130/30 Fund
The Board members discussed the results of the comparisons and noted that the fund’s total return performance was above the Performance Group and Performance Universe medians and ranked first in the Performance Group for the one- and three-year periods. Dreyfus also provided a comparison of the fund’s calendar year total returns to the returns of the fund’s benchmark index.
The Board members also reviewed the range of actual and contractual advisory fees and total expenses of the Expense Group and Expense Universe funds and discussed the results of the comparisons. They noted that the fund’s contractual advisory fee was below the Expense Group median, the fund’s actual advisory fee was above the Expense Group and Expense Universe medians and the fund’s total expenses were below the Expense Group and Expense Universe medians.
BNY Mellon Asset Allocation Fund
The Board members discussed the results of the comparisons and noted that the fund’s total return performance was above the Performance Group and Performance Universe medians for the various periods, except for the one- and two-year periods when the fund’s performance was below the Performance Group and Performance Universe medians.
The Board members also reviewed the range of actual and contractual advisory fees and total expenses of the Expense Group and Expense Universe funds and discussed the results of the comparisons. They noted that the fund’s contractual advisory fee was below the Expense Group median and the fund’s actual advisory fee and total expenses were below the Expense Group and Expense Universe medians.
BNY Mellon Income Stock Fund
The Board members discussed the results of the comparisons and noted that the fund’s total return performance was below the Performance Group and Performance Universe medians for the various periods, except for the two-year period when the fund’s performance was above the Performance Group and Performance Universe medians, and ranked in the fourth quartile in the
| The Funds | 171 |
| INFORMATION ABOUT THE RENEWAL OF EACH FUND’S INVESTMENT ADVISORY AGREEMENT AND |
| THE APPROVAL OF EACH FUND’S ADMINISTRATION AGREEMENT (Unaudited) (continued) |
Performance Group for most of the periods. Dreyfus also provided a comparison of the fund’s calendar year total returns to the returns of the fund’s benchmark index.The Board also received a presentation from an analyst who assists the fund’s primary portfolio manager regarding the factors which, over the past year, influenced the fund’s performance results. The Board also noted the recent steps that management had taken to improve the fund’s performance by changing the fund’s investment approach to focus on securities with a higher current dividend.
The Board members also reviewed the range of actual and contractual advisory fees and total expenses of the Expense Group and Expense Universe funds and discussed the results of the comparisons.They noted that the fund’s contractual advisory fee was above the Expense Group median, the fund’s actual advisory fee was above the Expense Group and Expense Universe medians and the fund’s total expenses were below the Expense Group and Expense Universe medians.
BNY Mellon Mid Cap Stock Fund
The Board members discussed the results of the comparisons and noted that the fund’s total return performance was above the Performance Group and Performance Universe medians for the various periods, except for the two-year period when the fund’s performance was below the Performance Group and Performance Universe medians. Dreyfus also provided a comparison of the fund’s calendar year total returns to the returns of the fund’s benchmark index.
The Board members also reviewed the range of actual and contractual advisory fees and total expenses of the Expense Group and Expense Universe funds and discussed the results of the comparisons.They noted that the fund’s contractual advisory fee was above the Expense Group median, the fund’s actual advisory fee was above the Expense Group and Expense Universe medians and the fund’s total expenses were above the Expense Group median and below the Expense Universe median.
BNY Mellon Small Cap Stock Fund
The Board members discussed the results of the comparisons and noted that the fund’s total return performance was below the Performance Group and Performance Universe medians for the various periods, except for the one-year period when the fund’s performance was above the Performance Group median, and ranked in the fourth quartile in the Performance Group and Performance Universe for most of the periods. Dreyfus also provided a comparison of the fund’s calendar year total returns to the returns of the fund’s benchmark index. The Board considered management’s efforts to improve the fund’s performance by appointing a new primary portfolio manager of the fund last year. The Board also stated its expectation for continued improvement in the fund’s performance results in the future.
The Board members also reviewed the range of actual and contractual advisory fees and total expenses of the Expense Group and Expense Universe funds and discussed the results of the comparisons. They noted that the fund’s contractual advisory fee was above the Expense Group median, the fund’s actual advisory fee was above the Expense Group and Expense Universe medians and the fund’s total expenses were below the Expense Group and Expense Universe medians. The Board also considered the fee waiver and expense reimbursement arrangement undertaken by the investment adviser that was in effect until September 30, 2010.
BNY Mellon Focused Equity Opportunities Fund
The Board members discussed the results of the comparisons and noted that the fund’s total return performance was above the Performance Group and Performance Universe medians. Dreyfus also provided a comparison of the fund’s calendar year total returns to the returns of the fund’s benchmark index.
The Board members also reviewed the range of actual and contractual advisory fees and total expenses of the
172
Expense Group and Expense Universe funds and discussed the results of the comparisons.They noted that the fund’s contractual advisory fee was below the Expense Group median, the fund’s actual advisory fee was below the Expense Group median and above the Expense Universe median and the fund’s total expenses were below the Expense Group and Expense Universe medi-ans.The Board also considered the fee waiver and expense reimbursement arrangement undertaken by the investment adviser that was in effect until January 1, 2011.
BNY Mellon Small/Mid Cap Fund
The Board members discussed the results of the comparisons and noted that the fund’s total return performance was above the Performance Group and Performance Universe medians and ranked in the first quartile in the Performance Group and Performance Universe for the one-year period. Dreyfus also provided a comparison of the fund’s calendar year total returns to the returns of the fund’s benchmark index.
The Board members also reviewed the range of actual and contractual advisory fees and total expenses of the Expense Group and Expense Universe funds and discussed the results of the comparisons.They noted that the fund’s contractual advisory fee was above the Expense Group median and the fund’s actual advisory fee and total expenses were below the Expense Group and Expense Universe medians. The Board also considered the fee waiver and expense reimbursement arrangement undertaken by the investment adviser that was in effect until January 1, 2011.
BNY Mellon International Fund
The Board members discussed the results of the comparisons and noted that the fund’s total return performance was below the Performance Group and Performance Universe medians for the various periods, except for the three-year period when the fund’s performance was at the Performance Group median and the ten-year period when the fund’s performance was above the Performance Universe median. Dreyfus also provided a comparison of the fund’s calendar year total returns to the returns of the fund’s benchmark index. The Board also received a presentation from the fund’s portfolio managers regarding the factors which, over the past year, influenced the fund’s performance results, including the effects of value investing in a rising market.
The Board members also reviewed the range of actual and contractual advisory fees and total expenses of the Expense Group and Expense Universe funds and discussed the results of the comparisons.They noted that the fund’s contractual advisory fee was above the Expense Group median, the fund’s actual advisory fee was above the Expense Group and Expense Universe medians and the fund’s total expenses were above the Expense Group median and below the Expense Universe median.
BNY Mellon Emerging Markets Fund
The Board members discussed the results of the comparisons and noted that the fund’s total return performance was above the Performance Group and Performance Universe medians for the various periods, except for the one-year period when the fund’s performance was below the Performance Group and Performance Universe medians and the two-year period when the fund’s performance was at the Performance Group median and below the Performance Universe median. Dreyfus also provided a comparison of the fund’s calendar year total returns to the returns of the fund’s benchmark index.
The Board members also reviewed the range of actual and contractual advisory fees and total expenses of the Expense Group and Expense Universe funds and discussed the results of the comparisons.They noted that the fund’s contractual advisory fee was above the Expense Group median and the fund’s actual advisory fee and total expenses were above the Expense Group and Expense Universe medians.
| The Funds | 173 |
| INFORMATION ABOUT THE RENEWAL OF EACH FUND’S INVESTMENT ADVISORY AGREEMENT AND |
| THE APPROVAL OF EACH FUND’S ADMINISTRATION AGREEMENT (Unaudited) (continued) |
BNY Mellon International Appreciation Fund
The Board members discussed the results of the comparisons and noted that the fund’s total return performance was generally at or above the Performance Group and Performance Universe medians. Dreyfus also provided a comparison of the fund’s calendar year total returns to the returns of the fund’s benchmark index.
The Board members also reviewed the range of actual and contractual advisory fees and total expenses of the Expense Group and Expense Universe funds and discussed the results of the comparisons.They noted that the fund’s contractual advisory fee was below the Expense Group median and the fund’s actual advisory fee and total expenses were below the Expense Group and Expense Universe medians. The Board also considered the fee waiver and expense reimbursement arrangement undertaken by the investment adviser that was in effect until September 30, 2010.
Analysis of Profitability and Economies of Scale. Dreyfus’ representatives reviewed the expenses allocated and profit received by Dreyfus and its affiliates and the resulting profitability percentage for managing each fund, and the method used to determine the expenses and profit.The Board concluded that the profitability results were not unreasonable, given the services rendered and service levels provided by Dreyfus to each fund.The Board also noted the expense limitation arrangements for certain funds and their effect on Dreyfus’ profitability.The Board previously had been provided with information prepared by an independent consulting firm regarding Dreyfus’ approach to allocating costs to, and determining the profitability of, individual funds and the entire Dreyfus fund complex. The consulting firm also analyzed where any economies of scale might emerge in connection with the management of the funds.
The Board’s counsel stated that the Board members should consider the profitability analysis with respect to each fund (1) as part of their evaluation of whether the fees under the Agreement bear a reasonable relationship to the mix of services provided by Dreyfus, including the nature, extent and quality of such services, and (2) in light of the relevant circumstances for each fund and the extent to which economies of scale would be realized if the relevant fund grows and whether fee levels reflect these economies of scale for the benefit of each fund’s shareholders. Dreyfus representatives noted that a discussion of economies of scale is predicated on a fund having achieved a substantial size with increasing assets and that, if a fund’s assets had been stable or decreasing, the possibility that Dreyfus may have realized any economies of scale would be less. They also noted that, as a result of shared and allocated costs among the funds and the funds in the Dreyfus funds complex, the extent of economies of scale could depend substantially on the level of assets in the complex as a whole, so that increases and decreases in complex-wide assets can affect potential economies of scale in a manner that is disproportionate to, or even in the opposite direction from, changes in each fund’s asset level.The Board members also considered potential benefits to Dreyfus from acting as investment adviser and noted the soft dollar arrangements in effect for trading each fund’s investments.
At the conclusion of these discussions, the Board agreed that it had been furnished with sufficient information to make an informed business decision with respect to the renewal of the Agreement. Based on the discussions and considerations as described above, the Board concluded and determined as follows.
The Board concluded that the nature, extent and quality of the services provided by Dreyfus to each fund are adequate and appropriate.
174
With respect to BNY Mellon U.S. Core Equity 130/30 Fund and BNY Mellon Small/Mid Cap Fund, the Board was satisfied with each fund’s performance.
With respect to BNY Mellon Large Cap Stock Fund, BNY Mellon Balanced Fund, BNY Mellon Mid Cap Stock Fund, BNY Mellon Focused Equity Opportunities Fund, BNY Mellon International Fund, BNY Mellon Emerging Markets Fund and BNY Mellon International Appreciation Fund, the Board generally was satisfied with each fund’s overall performance.
With respect to BNY Mellon Small Cap Stock Fund, the Board generally was satisfied with the fund’s improved performance, in light of the considerations described above.
With respect to BNY Mellon Income Stock Fund, the Board noted Dreyfus’ efforts to improve the fund’s per- formance and agreed to closely monitor performance.
The Board concluded that the fee paid to Dreyfus by each fund was reasonable in light of the considerations described above.
The Board determined that the economies of scale which may accrue to Dreyfus and its affiliates in con- nection with the management of the funds had been adequately considered by Dreyfus in connection with the advisory fee rate charged to each fund pursuant to the Agreement and that, to the extent in the future it were determined that material economies of scale had not been shared with a fund, the Board would seek to have those economies of scale shared with the fund.
The Board members considered these conclusions and determinations, along with information received on a routine and regular basis throughout the year. In addition, it should be noted that the Board’s consideration of the contractual fee arrangements for each fund had the benefit of a number of years of reviews of prior or similar
agreements during which lengthy discussions took place between the Board members and Dreyfus representatives. Certain aspects of the arrangements may receive greater scrutiny in some years than in others, and the Board members’ conclusions may be based, in part, on their consideration of the same or similar arrangements in prior years.The Board members determined that renewal of the Agreement was in the best interests of each fund and its respective shareholders.
At a meeting of the Trust’s Board of Trustees held on September 13, 2011, the Board approved amendments to the Agreement with respect to BNY Mellon Balanced Fund (which as of September 15, 2011 is known as BNY Mellon Asset Allocation Fund) which provide that, as of September 15, 2011, the fund will pay an investment advisory fee to BNY Mellon Fund Advisers at the annual rate of 0.15% applied to the portion of the fund’s average daily net assets allocated to investments in funds in the Dreyfus Family of Funds (Dreyfus funds) and unaffiliated funds and will pay no administration fee on that portion of the fund’s average daily net assets allocated to investments in Dreyfus funds and unaffiliated funds.The Board members determined that the amendments to the Agreement were in the best interests of the fund and its shareholders.
BNY Mellon Large Cap Market Opportunities Fund and BNY Mellon Tax-Sensitive Large Cap Multi-Strategy Fund
The re-approval date of the Agreement pertaining to BNY Mellon Large Cap Market Opportunities Fund and BNY Mellon Tax-Sensitive Large Cap Multi-Strategy Fund is June 1, 2012 and, therefore, the Board was not required to consider the re-approval of the Agreement with respect to these Funds at its meeting held on March 8-9, 2011.
| The Funds | 175 |
BOARD MEMBERS INFORMATION (Unaudited)
176

Once elected all Board Members serve for an indefinite term.The address of the Board Members and Officers is in c/o The Dreyfus Corporation, 200 Park Avenue, New York, NewYork 10166.Additional information about the Board Members is available in the fund’s Statement of Additional Information which can be obtained from Dreyfus free of charge by calling this toll free number: 1-800-DREYFUS. For individual account holders for Private Wealth Management clients, please contact your account officer or call 1-888-281-7350.
| The Funds | 177 |
OFFICERS OF THE TRUST (Unaudited)
CHRISTOPHER SHELDON, President since September 2006.
As director of Investment Strategy for BNY Mellon Wealth Management group since April 2003, Mr. Sheldon manages the analysis and development of investment and asset allocation strategies and oversees investment product research. He also oversaw the alternative investment groups from June 2006 to September 2008. He was previously a Vice President of the Trust. He is 46 years old has been employed by BNY Mellon since January 1995.
MICHAEL A. ROSENBERG, Vice President and Secretary since August 2005.
Assistant General Counsel of BNY Mellon, and an officer of 76 investment companies (comprised of 192 portfolios) managed by the Manager. He is 51 years old and has been an employee of the Manager since October 1991.
KIESHA ASTWOOD, Vice President and Assistant Secretary since January 2010.
Counsel of BNY Mellon, and an officer of 76 investment companies (comprised of 192 portfolios) managed by the Manager. She is 38 years old and has been an employee of the Manager since July 1995.
JAMES BITETTO, Vice President and Assistant Secretary since August 2005.
Senior Counsel of BNY Mellon and Secretary of the Manager, and an officer of 76 investment companies (comprised of 192 portfolios) managed by the Manager. He is 45 years old and has been an employee of the Manager since December 1996.
JONI LACKS CHARATAN, Vice President and Assistant Secretary since August 2005.
Senior Counsel of BNY Mellon, and an officer of 76 investment companies (comprised of 192 portfolios) managed by the Manager. She is 55 years old and has been an employee of the Manager since October 1988.
JOSEPH M. CHIOFFI, Vice President and Assistant Secretary since August 2005.
Senior Counsel of BNY Mellon, and an officer of 76 investment companies (comprised of 192 portfolios) managed by the Manager. He is 49 years old and has been an employee of the Manager since June 2000.
KATHLEEN DENICHOLAS, Vice President and Assistant Secretary since January 2010.
Managing Counsel of BNY Mellon, and an officer of 76 investment companies (comprised of 192 portfolios) managed by the Manager. She is 36 years old and has been an employee of the Manager since February 2001.
JANETTE E. FARRAGHER, Vice President and Assistant Secretary since August 2005.
Assistant General Counsel of BNY Mellon, and an officer of 76 investment companies (comprised of 192 portfolios) managed by the Manager. She is 48 years old and has been an employee of the Manager since February 1984.
JOHN B. HAMMALIAN, Vice President and Assistant Secretary since August 2005.
Senior Managing Counsel of BNY Mellon, and an officer of 76 investment companies (comprised of 192 portfolios) managed by the Manager. He is 48 years old and has been an employee of the Manager since February 1991.
M. CRISTINA MEISER, Vice President and Assistant Secretary since January 2010.
Senior Counsel of BNY Mellon, and an officer of 76 investment companies (comprised of 192 portfolios) managed by the Manager. She is 41 years old and has been an employee of the Manager since August 2001.
ROBERT R. MULLERY, Vice President and Assistant Secretary since August 2005.
Managing Counsel of BNY Mellon, and an officer of 76 investment companies (comprised of 192 portfolios) managed by the Manager. He is 59 years old and has been an employee of the Manager since May 1986.
JEFF PRUSNOFSKY, Vice President and Assistant Secretary since August 2005.
Senior Managing Counsel of BNY Mellon, and an officer of 76 investment companies (comprised of 192 portfolios) managed by the Manager. He is 46 years old and has been an employee of the Manager since October 1990.
178
JAMES WINDELS, Treasurer since November 2001.
Director – Mutual Fund Accounting of the Manager, and an officer of 76 investment companies (comprised of 192 portfolios) managed by the Manager. He is 52 years old and has been an employee of the Manager since April 1985.
RICHARD CASSARO, Assistant Treasurer since January 2008.
Senior Accounting Manager – Money Market and Municipal Bond Funds of the Manager, and an officer of 76 investment companies (comprised of 192 portfolios) managed by the Manager. He is 52 years old and has been an employee of the Manager since September 1982.
GAVIN C. REILLY, Assistant Treasurer since December 2005.
Tax Manager of the Investment Accounting and Support Department of the Manager, and an officer of 76 investment companies (comprised of 192 portfolios) managed by the Manager. He is 43 years old and has been an employee of the Manager since April 1991.
ROBERT ROBOL, Assistant Treasurer since December 2002.
Senior Accounting Manager – Fixed Income Funds of the Manager, and an officer of 76 investment companies (comprised of 192 portfolios) managed by the Manager. He is 47 years old and has been an employee of the Manager since October 1988.
ROBERT SALVIOLO, Assistant Treasurer since July 2007.
Senior Accounting Manager – Equity Funds of the Manager, and an officer of 76 investment companies (comprised of 192 portfolios) managed by the Manager. He is 44 years old and has been an employee of the Manager since June 1989.
ROBERT SVAGNA, Assistant Treasurer since December 2002.
Senior Accounting Manager – Equity Funds of the Manager, and an officer of 76 investment companies (comprised of 192 portfolios) managed by the Manager. He is 44 years old and has been an employee of the Manager since November 1990.
JOSEPH W. CONNOLLY, Chief Compliance Officer since October 2004.
Chief Compliance Officer of the Manager and The Dreyfus Family of Funds (76 investment companies, comprised of 192 portfolios). From November 2001 through March 2004, Mr. Connolly was first Vice-President, Mutual Fund Servicing for Mellon Global Securities Services. In that capacity, Mr. Connolly was responsible for managing Mellon’s Custody, Fund Accounting and Fund Administration services to third-party mutual fund clients. He is 54 years old and has served in various capacities with the Manager since 1980, including manager of the firm’s Fund Accounting Department from 1997 through October 2001.
STEPHEN J. STOREN, Anti-Money Laundering Compliance Officer since May 2011.
Chief Compliance Officer of the Distributor, and the Anti-Money Laundering Compliance Officer of 72 investment companies (comprised of 188 portfolios) managed by the Manager. He is 56 years old and has been an employee of the Distributor since October 1999.
| The Funds | 179 |


DISCUSSION OF
FUND PERFORMANCE
For the period of September 1, 2010, through August 31, 2011, as provided by John F. Flahive, Portfolio Manager and Director of Fixed Income
Fund and Market Performance Overview
For the 12-month period ended August 31, 2011, BNY Mellon Bond Fund’s Class M shares produced a total return of 4.06%, and Investor shares returned 3.72%.1 In comparison, the fund’s benchmark, the Barclays Capital U.S. Aggregate Index (the “Index”), produced a total return of 4.62%.2
After encountering bouts of market weakness over the final months of 2010, higher yielding sectors of the U.S. bond market generally rallied over the first half of 2011 when investors refocused on riskier assets. However, higher yielding bonds again struggled amid heightened market volatility during the reporting period’s final months due to a sharp downturn in economic sentiment. The fund produced lower returns than its benchmark over the full reporting period, primarily due to its underweighted exposure to some of the riskier assets that fared well in the fall of 2010 and the spring of 2011.
The Fund’s Investment Approach
The fund seeks to maximize total return consisting of capital appreciation and current income. To pursue its goal, the fund actively manages bond market and maturity exposure and invests at least 80% of its assets in bonds, such as U.S.Treasury and government agency bonds, corporate bonds, mortgage-related securities and foreign corporate and government bonds. The fund’s investments in bonds must be rated investment-grade quality at the time of purchase3 or, if unrated, deemed of comparable quality by the investment adviser. Generally, the average effective duration of the fund’s portfolio will not exceed eight years.
Market Volatility Intensified Along with Economic Uncertainty
Investors’ outlooks had improved dramatically by the start of the reporting period when the Federal Reserve Board announced a new round of quantitative easing designed to jump-start the U.S. economy. Subsequent improvements in economic data and corporate earnings further buoyed market sentiment into the first quarter of 2011.These developments supported prices of higher yielding fixed-income securities, such as corporate bonds, but they sent prices of traditionally defensive U.S. government securities lower as investors anticipated higher interest rates. However, investors’ optimism was shaken in February 2011 when political unrest in the Middle East led to sharply rising energy prices, and again in March when devastating natural and nuclear disasters in Japan threatened to disrupt the global industrial supply chain. Nonetheless, investors proved resilient, and the more economically sensitive sectors of the bond market bounced back quickly from these unexpected shocks.
In late April, economic sentiment began to deteriorate in earnest when Greece again appeared headed for default on its sovereign debt, economic data proved more disappointing than expected and the debate regarding U.S. government spending and borrowing intensified. Higher yielding bonds suffered bouts of heightened volatility and U.S. Treasury securities recovered earlier losses as newly risk-averse investors shifted their focus from riskier market sectors to traditionally defensive investments. Market turbulence was particularly severe in August after a major credit-rating agency downgraded its assessment of long-term U.S. debt securities. Ironically, this development sparked a renewed “flight to quality” that drove prices of U.S. Treasury securities higher.
| The Funds | 3 |
DISCUSSION OF FUND PERFORMANCE (continued)
Defensive Investment Posture Dampened Relative Results
The fund’s results compared to the benchmark were undermined by its conservative investment approach, which resulted in underweighted exposure to riskier assets—such as lower-rated asset-backed securities and commercial mortgage-backed securities—that fared relatively well over the fall of 2010 and the spring of 2011. In addition, we managed the fund to mitigate the risks of rising interest rates, but a relatively short average duration among U.S. Treasury securities hurt the fund’s relative performance over the reporting period’s second half, offsetting the benefits of the same strategy over the first half.
On a more positive note, the fund received relatively strong contributions to performance from modestly overweighted positions in investment-grade corporate bonds and taxable municipal bonds. A focus on mortgage-backed pass-through securities with 15-year maturities produced returns that were roughly in line with broader market averages.
Positioned for a Slower-Growth Environment
We currently expect the U.S. economic recovery to persist, but at a more sluggish pace than historical norms, as concerns currently weighing on market sentiment may be slow to recede.We remain committed to the fund’s longstanding investment approach, including
a bias toward market sectors and individual securities that seek to produce consistent levels of current income while helping to mute volatility during times of heightened market turbulence. Consequently, the fund ended the reporting period with a mild emphasis on investment-grade corporate bonds and a lower-than-average sensitivity to interest rate risks, a positioning that we believe strikes the right balance between income and safety in an uncertain market environment.
September 15, 2011
| Bond funds are subject generally to interest rate, credit, liquidity and market | |
| risks, to varying degrees, all of which are more fully described in the fund’s | |
| prospectus. Generally, all other factors being equal, bond prices are inversely | |
| related to interest-rate changes, and rate increases can cause price declines. | |
| The fund may use derivative instruments, such as options, futures and options | |
| on futures, forward contracts and swaps.A small investment in derivatives could | |
| have a potentially large impact on the fund’s performance.The use of | |
| derivatives involves risks different from, or possibly greater than, the risks | |
| associated with investing directly in the underlying assets. | |
| 1 | Total return includes reinvestment of dividends and any capital gains paid. |
| Past performance is no guarantee of future results. Share price, yield and | |
| investment return fluctuate such that upon redemption, fund shares may be | |
| worth more or less than their original cost. | |
| 2 | SOURCE: LIPPER INC. — Reflects reinvestment of dividends and, where |
| applicable, capital gain distributions.The Barclays Capital U.S.Aggregate | |
| Index is a widely accepted, unmanaged total return index of corporate, U.S. | |
| government and U.S. government agency debt instruments, mortgage-backed | |
| securities and asset-backed securities with an average maturity of 1-10 years. | |
| Investors cannot invest directly in any index. | |
| 3 | The fund may continue to own investment-grade bonds (at the time of |
| purchase), which are subsequently downgraded to below investment grade. |
4
FUND PERFORMANCE

| Average Annual Total Returns as of 8/31/11 | |||
| 1 Year | 5 Years | 10 Years | |
| Class M shares | 4.06% | 6.40% | 5.18% |
| Investor shares | 3.72% | 6.12% | 4.90% |
| Barclays Capital U.S. Aggregate Bond Index | 4.62% | 6.56% | 5.71% |
| † Source: Lipper Inc. | |||
| Past performance is not predictive of future performance.The fund’s performance shown in the graph and table does not reflect the deduction of taxes that a shareholder | |||
| would pay on fund distributions or the redemption of fund shares. | |||
| The above graph compares a $10,000 investment made in Class M shares and Investor shares of BNY Mellon Bond Fund on 8/31/01 to a $10,000 investment | |||
| made in the Barclays Capital U.S.Aggregate Bond Index (the “Index”) on that date.All dividends and capital gain distributions are reinvested. | |||
| The fund’s performance shown in the line graph takes into account all applicable fees and expenses for all share classes.The Index is a widely accepted, unmanaged | |||
| index of corporate, government and government agency debt instruments, mortgage-backed securities, and asset-backed securities with an average maturity of 1-10 | |||
| years. Unlike a mutual fund, the Index is not subject to charges, fees and other expenses. Investors cannot invest directly in any index. Further information relating to | |||
| fund performance, including expense reimbursements, if applicable, is contained in the Financial Highlights section of the prospectus and elsewhere in this report. | |||
| The Funds | 5 |

DISCUSSION OF
FUND PERFORMANCE
For the period of September 1, 2010, through August 31, 2011, as provided by John F. Flahive, Portfolio Manager and Director of Fixed Income
Fund and Market Performance Overview
For the 12-month period ended August 31, 2011, BNY Mellon Intermediate Bond Fund’s Class M shares produced a total return of 2.84%, and Investor shares returned 2.57%.1 In comparison, the fund’s benchmark, the Barclays Capital Intermediate Government/Credit Bond Index (the “Index”), produced a total return of 4.01%.2
After encountering bouts of market weakness over the final months of 2010, higher yielding sectors of the U.S. bond market generally rallied over the first half of 2011 when investors refocused on riskier assets. However, higher yielding bonds again struggled amid heightened market volatility during the reporting period’s final months due to a sharp downturn in economic sentiment. The fund produced lower returns than its benchmark, primarily due to its underweighted exposure to some of the riskier assets that fared well in the fall of 2010 and the spring of 2011.
The Fund’s Investment Approach
The fund seeks total return (consisting of capital appreciation and current income). To pursue its goal, the fund actively manages bond market and maturity exposure and invests at least 80% of its assets in bonds, such as U.S. government and agency bonds, corporate bonds, mortgage-related securities, foreign corporate and government bonds and municipal bonds. The fund’s investments in bonds must be rated investment grade at the time of purchase3 or, if unrated, deemed of comparable quality by the investment adviser. Generally, the fund’s average effective portfolio maturity will be between three and 10 years, and the average effective duration of the fund’s portfolio will be between 2.5 and 5.5 years.
When managing the fund, we use a disciplined process to select securities and manage risk. We generally choose bonds based on yield, credit quality, the level of interest rates and inflation, general economic and financial trends and our outlook for the securities markets. Our management process also includes computer modeling and scenario testing of possible changes in market conditions.
Market Volatility Intensified Along with Economic Uncertainty
Investors’ outlooks had improved dramatically by the start of the reporting period when the Federal Reserve Board announced new measures designed to jump-start the U.S. economy. Subsequent improvements in economic data and corporate earnings further buoyed market sentiment into the first quarter of 2011.These developments supported prices of higher yielding fixed-income securities, such as corporate bonds, but they sent prices of traditionally defensive U.S. government securities lower. However, investors’ optimism was shaken in February 2011 when political unrest in the Middle East led to sharply rising energy prices, and again in March when devastating natural and nuclear disasters in Japan threatened to disrupt the global industrial supply chain. Nonetheless, investors proved resilient, and the more economically sensitive sectors of the bond market bounced back quickly from these unexpected shocks.
In late April, economic sentiment began to deteriorate in earnest when Greece again appeared headed for default on its sovereign debt, economic data proved more disappointing than expected and the debate regarding U.S. government spending and borrowing intensified. Higher yielding bonds suffered bouts of heightened volatility and U.S.Treasury securities recovered earlier losses as newly risk-averse investors shifted their focus to traditionally defensive investments. Market
6
turbulence was particularly severe in August after a major credit-rating agency downgraded its assessment of long-term U.S. debt securities.
Defensive Investment Posture Dampened Relative Results
The fund’s results compared to the benchmark were undermined by its conservative investment approach, which resulted in underweighted exposure to riskier assets—such as lower-rated asset-backed securities—that fared relatively well over the fall of 2010 and the spring of 2011. In addition, we managed the fund to mitigate the risks of rising interest rates, and a relatively short average duration among U.S. Treasury securities hurt the fund’s relative performance over the reporting period’s second half, offsetting the benefits of the same strategy over the first half.
On a more positive note, the fund received relatively strong contributions to performance from modestly overweighted positions in investment-grade corporate bonds and taxable municipal bonds.
Positioned for a Slower-Growth Environment
We currently expect the U.S. economic recovery to persist, but at a more sluggish pace than historical norms, as concerns currently weighing on market sentiment may be slow to recede.We remain committed to the fund’s longstanding investment approach, including a bias toward market sectors and individual securities
that seek to produce consistent levels of current income while helping to mute volatility during times of heightened market turbulence. Consequently, the fund ended the reporting period with a mild emphasis on investment-grade corporate bonds and a lower-than-average sensitivity to interest rate risks, a positioning that we believe strikes the right balance between income and safety in an uncertain market environment.
September 15, 2011
| Bond funds are subject generally to interest rate, credit, liquidity and market | |
| risks, to varying degrees, all of which are more fully described in the fund’s | |
| prospectus. Generally, all other factors being equal, bond prices are inversely | |
| related to interest-rate changes, and rate increases can cause price declines. | |
| The fund may use derivative instruments, such as options, futures and | |
| options on futures, forward contracts and swaps.A small investment in | |
| derivatives could have a potentially large impact on the fund’s performance. | |
| The use of derivatives involves risks different from, or possibly greater than, | |
| the risks associated with investing directly in the underlying assets. | |
| 1 | Total return includes reinvestment of dividends and any capital gains paid. |
| Past performance is no guarantee of future results. Share price, yield and | |
| investment return fluctuate such that upon redemption, fund shares may be | |
| worth more or less than their original cost. | |
| 2 | SOURCE: LIPPER INC. – Reflects reinvestment of dividends and, |
| where applicable, capital gain distributions. The Barclays Capital | |
| Intermediate Government/Credit Bond Index is a widely accepted, | |
| unmanaged index of government and credit bond market performance | |
| composed of U. S. government, Treasury and agency securities, fixed- | |
| income securities and nonconvertible investment-grade credit debt, with an | |
| average maturity of 1-10 years. Index return does not reflect the fees and | |
| expenses associated with operating a mutual fund. Investors cannot invest | |
| directly in any index. | |
| 3 | The fund may continue to own investment-grade bonds (at the time of |
| purchase), which are subsequently downgraded to below investment grade. |
| The Funds | 7 |
FUND PERFORMANCE

| Average Annual Total Returns as of 8/31/11 | |||
| 1 Year | 5 Years | 10 Years | |
| Class M shares | 2.84% | 5.75% | 4.72% |
| Investor shares | 2.57% | 5.48% | 4.44% |
| Barclays Capital Intermediate | |||
| Government/Credit Bond Index | 4.01% | 6.11% | 5.29% |
| † Source: Lipper Inc. |
| Past performance is not predictive of future performance.The fund’s performance shown in the graph and table does not reflect the deduction of taxes that a shareholder |
| would pay on fund distributions or the redemption of fund shares. |
| The above graph compares a $10,000 investment made in Class M shares and Investor shares of BNY Mellon Intermediate Bond Fund on 8/31/01 to a |
| $10,000 investment made in the Barclays Capital Intermediate Government/Credit Bond Index (the “Index”) on that date. All dividends and capital gain |
| distributions are reinvested. |
| The fund’s performance shown in the line graph takes into account all applicable fees and expenses for all share classes.The Index is a widely accepted, unmanaged |
| index of Government and credit bond market performance composed of U.S. Government,Treasury and Agency securities, fixed-income securities and nonconvertible |
| investment-grade credit debt, with an average maturity of 1-10 years. Unlike a mutual fund, the Index is not subject to charges, fees and other expenses. Investors |
| cannot invest directly in any index. Further information relating to fund performance, including expense reimbursements, if applicable, is contained in the Financial |
| Highlights section of the prospectus and elsewhere in this report. |
8

DISCUSSION OF
FUND PERFORMANCE
For the period of September 1, 2010, through August 31, 2011, as provided by John F. Flahive, Portfolio Manager and Director of Fixed Income
Fund and Market Performance Overview
For the 12-month period ended August 31, 2011, BNY Mellon Intermediate U.S. Government Fund’s Class M shares produced a total return of 2.59%, and Investor shares returned 2.36%.1 In comparison, the fund’s benchmark, the Barclays Capital Intermediate Government Index (the “Index”), produced a total return of 3.74%.2
After encountering bouts of market weakness over the first half of the reporting period amid expectations of rising interest rates, U.S. government securities generally rallied over the second half when economic sentiment deteriorated as a result of several adverse macroeconomic developments.The fund produced lower returns than its benchmark, primarily due to its relatively defensive interest-rate and sector allocation strategies, which prevented the fund from participating fully in rallies among U.S.Treasury securities, especially over the summer of 2011.
The Fund’s Investment Approach
The fund seeks to provide as high a level of current income as is consistent with the preservation of capi-tal.This objective may be changed without shareholder approval.To pursue its goal, the fund normally invests at least 80% of its assets in securities issued or guaranteed by the U.S. government or its agencies or instrumentalities.
The fund allocates broadly among U.S. Treasury obligations, direct U.S. government agency debt obligations and U.S. government agency mortgage-backed securities, including mortgage pass-through securities and collateralized mortgage obligations
(CMOs). The securities in which the fund invests include those backed by the full faith and credit of the U.S. government and those that are neither insured nor guaranteed by the U.S. government. Under normal market conditions, the fund maintains an average effective portfolio maturity between three and 10 years. The fund attempts to manage interest rate risk by adjusting its duration. The fund may invest in individual bonds of any maturity or duration and does not expect to target any specific range of duration.
Market Volatility Intensified Along with Economic Uncertainty
Investors’ outlooks had improved dramatically by the start of the reporting period when the Federal Reserve Board announced a new round of quantitative easing designed to jump-start the U.S. economy. Subsequent improvements in economic data and corporate earnings further buoyed market sentiment into the first quarter of 2011.These developments supported prices of higher yielding fixed-income securities, such as corporate bonds, but they drove prices of traditionally defensive U.S. government securities lower as investors anticipated higher interest rates. However, investors’ optimism was shaken in February 2011 when political unrest in the Middle East led to sharply rising energy prices, and again in March when devastating natural and nuclear disasters in Japan threatened to disrupt the global industrial supply chain. Nonetheless, investors proved resilient, and U.S. government securities soon gave back any gains achieved in the aftermath of these unexpected shocks.
In late April, economic sentiment began to deteriorate in earnest when Greece again appeared headed for default on its sovereign debt, economic data proved more disappointing than expected and the debate regarding U.S. government spending and borrowing
| The Funds | 9 |
DISCUSSION OF FUND PERFORMANCE (continued)
intensified. Higher yielding bonds suffered bouts of heightened volatility, but U.S. Treasury securities recovered earlier losses as newly risk-averse investors shifted their focus from riskier market sectors to traditionally defensive investments. Market turbulence was particularly severe in August, after a major credit-rating agency downgraded its assessment of long-term U.S. debt securities. Ironically, the downgrade sparked a renewed “flight to quality” among investors that drove prices of U.S.Treasury securities higher.
Defensive Investment Posture Dampened Relative Results
The fund’s results compared to the benchmark were undermined by its conservative investment approach. We managed the fund to mitigate the risks of heightened market volatility and potentially rising interest rates, but a relatively short average duration hurt the fund’s relative performance over the reporting period’s second half, offsetting the benefits of the same strategy over the first half. The fund’s overweighted exposure to U.S. government agency securities also undermined relative performance.
Positioned for a Slower-Growth Environment
We currently expect the U.S. economic recovery to persist, but at a more sluggish pace than historical norms, as concerns currently weighing on market sentiment may be slow to recede. We remain committed to the fund’s longstanding investment approach, including a bias toward
U.S. government securities that seek to produce consistent levels of current income while helping to mute volatility during times of heightened market turbulence. Consequently, the fund ended the reporting period with a mild emphasis on U.S. government agency securities and a lower-than-average sensitivity to interest rate risks. We believe that this positioning strikes the right balance between income and safety in an uncertain market environment.
September 15, 2011
| Bond funds are subject generally to interest rate, credit, liquidity and market | |
| risks, to varying degrees, all of which are more fully described in the fund’s | |
| prospectus. Generally, all other factors being equal, bond prices are inversely | |
| related to interest-rate changes, and rate increases can cause price declines. | |
| The fund may use derivative instruments, such as options, futures and options | |
| on futures and swaps.A small investment in derivatives could have a | |
| potentially large impact on the fund’s performance.The use of derivatives | |
| involves risks different from, or possibly greater than, the risks associated with | |
| investing directly in the underlying assets. | |
| 1 | Total return includes reinvestment of dividends and any capital gains paid. |
| Past performance is no guarantee of future results. Share price, yield and | |
| investment return fluctuate such that upon redemption, fund shares may be | |
| worth more or less than their original cost. | |
| 2 | SOURCE: FactSet – Reflects reinvestment of dividends and, where |
| applicable, capital gain distributions. The Barclays Capital Intermediate | |
| Government Index is a widely accepted, unmanaged index of government | |
| bond market performance composed of U. S. Treasury and agency securities | |
| with maturities of 1-10 years. Index return does not reflect the fees and | |
| expenses associated with operating a mutual fund. Investors cannot invest | |
| directly in any index. |
10
FUND PERFORMANCE
![]()
| Average Annual Total Returns as of 8/31/11 | |||
| 1 Year | 5 Years | 10 Years | |
| Class M shares | 2.59% | 4.95% | 4.51% |
| Investor shares | 2.36% | 4.69% | 4.25% |
| Barclays Capital Intermediate | |||
| Government Index | 3.74% | 6.01% | 4.99% |
| † Source: Lipper Inc. |
| Past performance is not predictive of future performance.The fund’s performance shown in the graph and table does not reflect the deduction of taxes that a shareholder |
| would pay on fund distributions or the redemption of fund shares. |
| The above graph compares a $10,000 investment made in Class M shares and Investor shares of BNY Mellon Intermediate U. S. Government Fund on |
| 8/31/01 to a $10,000 investment made in the Barclays Capital Intermediate Government Index (the “Index”) on that date. All dividends and capital gain |
| distributions are reinvested. |
| As of the close of business on September 12, 2008, substantially all of the assets of another investment company advised by an affiliate of the fund’s investment |
| adviser, BNY Hamilton Intermediate Government Fund (the “predecessor fund”), a series of BNY Hamilton Funds, Inc., were transferred to BNY Mellon |
| Intermediate U.S. Government Fund in a tax-free reorganization and the fund commenced operations.The performance figures for the fund’s Class M shares represent |
| the performance of the predecessor fund’s Institutional shares prior to the commencement of operations for BNY Mellon Intermediate U.S. Government Fund and the |
| performance of BNY Mellon Intermediate U.S. Government Fund’s Class M shares thereafter.The performance figures for Investor shares represent the performance of |
| the predecessor fund’s Class A shares prior to the commencement of operations for BNY Mellon Intermediate U.S. Government Fund and the performance of BNY |
| Mellon Intermediate U.S. Government Fund’s Investor shares thereafter. Investor shares are subject to a Shareholder Services Plan. |
| The fund’s performance shown in the line graph takes into account all applicable fees and expenses for all share classes.The Index is an unmanaged index designed to |
| measure the performance of intermediate-term government bonds. Unlike a mutual fund, the Index is not subject to charges, fees and other expenses. Investors cannot |
| invest directly in any index. Further information relating to fund performance, including expense reimbursements, if applicable, is contained in the Financial Highlights |
| section of the prospectus and elsewhere in this report. |
| The Funds | 11 |

DISCUSSION OF
FUND PERFORMANCE
For the period of September 1, 2010, through August 31, 2011, as provided by Lawrence R. Dunn, CFA, Portfolio Manager
Fund and Market Performance Overview
For the 12-month period ended August 31, 2011, BNY Mellon Short-Term U.S. Government Securities Fund’s Class M shares produced a total return of 0.71%, and Investor shares returned 0.34%.1 In comparison, the Barclays Capital 1-3 Year U.S. Government Index (the “Index”), the fund’s benchmark, achieved a total return of 1.53%.2
After encountering bouts of market weakness over the first half of the reporting period amid expectations of rising interest rates, U.S. government securities generally rallied over the second half when economic sentiment deteriorated sharply due to several adverse macroeconomic developments.The fund produced lower returns than its benchmark, primarily due to its relatively defensive interest-rate and sector allocation strategies, which prevented the fund from participating fully in rallies among U.S.Treasury securities, especially over the summer of 2011.
The Fund’s Investment Approach
The fund seeks to provide as high a level of current income as is consistent with the preservation of capital.To pursue this goal, the fund invests at least 80% of its assets in securities issued or guaranteed by the U.S. government or its agencies or instrumentalities and in repurchase agreements. The fund may invest up to 35% of its net assets in mortgage-related securities issued by U.S. government agencies or instrumentalities, such as mortgage pass-through securities issued by the Government National Mortgage Association (“Ginnie Mae”), the Federal National Mortgage Association (“Fannie Mae”) and the Federal Home Loan Mortgage Corporation
(“Freddie Mac”).The fund may also invest in collateralized mortgage obligations (“CMOs”), including stripped mortgage-backed securities. Generally, the fund’s average effective portfolio maturity and the average effective duration of the fund’s portfolio will be less than three years.
When choosing securities, we typically first examine U.S. and global economic conditions and other market factors to estimate long- and short-term interest rates. Using a research-driven investment process, we then seek to identify what we believe are potentially profitable sectors before they are widely perceived by the market.We also seek to identify underpriced or mispriced securities that appear likely to perform well over time.
Market Volatility Intensified along with Economic Uncertainty
Investors’ outlooks had improved dramatically by the start of the reporting period when the Federal Reserve Board announced a new round of quantitative easing designed to jump-start the U.S. economy. Subsequent improvements in economic data and corporate earnings further buoyed market sentiment into the first quarter of 2011. These developments supported prices of higher yielding fixed-income securities, such as corporate bonds, but they drove prices of traditionally defensive U.S. government securities lower as investors anticipated higher interest rates. However, investors’ optimism was shaken in February 2011 when political unrest in the Middle East led to sharply rising energy prices, and again in March when devastating natural and nuclear disasters in Japan threatened to disrupt the global industrial supply chain. Nonetheless, investors proved resilient, and U.S. government securities soon gave back any gains achieved in the aftermath of these unexpected shocks.
12
In late April, economic sentiment began to deteriorate in earnest when Greece again appeared headed for default on its sovereign debt, economic data proved more disappointing than expected and the debate regarding U.S. government spending and borrowing intensified. U.S. Treasury securities recovered earlier losses as newly risk-averse investors shifted their focus from riskier market sectors to traditionally defensive investments. Market turbulence was particularly severe in August after a major credit-rating agency downgraded its assessment of long-term U.S. debt securities. Ironically, the downgrade sparked a renewed “flight to quality” among investors that drove prices of U.S. Treasury securities higher.
Defensive Investment Posture Dampened Relative Results
Although the fund produced positive absolute returns for the reporting period, its results compared to the benchmark were undermined by its conservative investment approach.We managed the fund to mitigate the risks of heightened market volatility and potentially rising interest rates, but a relatively short average duration hurt the fund’s relative performance over the reporting period’s second half, offsetting the benefits of the same strategy over the first half. The fund’s overweighted exposure to U.S. government agency securities also undermined relative performance.
Positioned for a Slower-Growth Environment
We currently expect the U.S. economic recovery to persist, but at a more sluggish pace than historical norms,
as concerns currently weighing on market sentiment may be slow to recede. We remain committed to the fund’s longstanding investment approach, including a bias toward U.S. government securities that seek to produce competitive levels of current income while helping to mute volatility during times of heightened market turbulence. Consequently, the fund ended the reporting period with a mild emphasis on U.S. government agency securities and a lower-than-average sensitivity to interest rate risks.We believe that this positioning strikes the right balance between income and safety in an uncertain market environment.
September 15, 2011
| Bond funds are subject generally to interest rate, credit, liquidity and market | |
| risks, to varying degrees, all of which are more fully described in the fund’s | |
| prospectus. Generally, all other factors being equal, bond prices are inversely | |
| related to interest-rate changes, and rate increases can cause price declines. | |
| The fund may use derivative instruments, such as options, futures and | |
| options on futures.A small investment in derivatives could have a | |
| potentially large impact on the fund’s performance.The use of derivatives | |
| involves risks different from, or possibly greater than, the risks associated | |
| with investing directly in the underlying assets. | |
| 1 | Total return includes reinvestment of dividends and any capital gains paid. |
| Past performance is no guarantee of future results. Share price, yield and | |
| investment return fluctuate such that upon redemption, fund shares may be | |
| worth more or less than their original cost. | |
| 2 | SOURCE: LIPPER INC. – Reflects reinvestment of dividends and, |
| where applicable, capital gain distributions.The Barclays Capital 1-3Year | |
| U.S. Government Index is a widely accepted, unmanaged index of | |
| government bond market performance composed of U.S.Treasury and | |
| agency securities with maturities of 1-3 years. Index return does not reflect | |
| the fees and expenses associated with operating a mutual fund. Investors | |
| cannot invest directly in any index. |
| The Funds | 13 |
FUND PERFORMANCE

| Average Annual Total Returns as of 8/31/11 | |||
| 1 Year | 5 Years | 10 Years | |
| Class M shares | 0.71% | 3.67% | 3.16% |
| Investor shares | 0.34% | 3.37% | 2.87% |
| Barclays Capital 1-3 Year | |||
| U.S. Government Index | 1.53% | 4.09% | 3.63% |
| † Source: Lipper Inc. |
| Past performance is not predictive of future performance.The fund’s performance shown in the graph and table does not reflect the deduction of taxes that a shareholder |
| would pay on fund distributions or the redemption of fund shares. |
| The above graph compares a $10,000 investment made in Class M shares and Investor shares of BNY Mellon Short-Term U.S. Government Securities Fund on |
| 8/31/01 to a $10,000 investment made in the Barclays Capital 1-3Year U.S. Government Index (the “Index”) on that date.All dividends and capital gain |
| distributions are reinvested. |
| The fund’s performance shown in the line graph takes into account all applicable fees and expenses for all share classes.The Index is a widely accepted, unmanaged |
| index of government bond market performance composed of U.S.Treasury and agency securities with maturities of 1-3 years. Unlike a mutual fund, the Index is not |
| subject to charges, fees and other expenses. Investors cannot invest directly in any index. Further information relating to fund performance, including expense |
| reimbursements, if applicable, is contained in the Financial Highlights section of the prospectus and elsewhere in this report. |
14
UNDERSTANDING YOUR FUND’S EXPENSES (Unaudited)
As a mutual fund investor, you pay ongoing expenses, such as management fees and other expenses. Using the information below, you can estimate how these expenses affect your investment and compare them with the expenses of other funds.You also may pay one-time transaction expenses, including sales charges (loads) and redemption fees, which are not shown in this section and would have resulted in higher total expenses. For more information, see your fund’s prospectus or talk to your financial advisor.
Review your fund’s expenses
The table below shows the expenses you would have paid on a $1,000 investment in each class of each BNY Mellon fixed income fund from March 1, 2011 to August 31, 2011. It also shows how much as $1,000 investment would be worth at the close of the period assuming actual returns and expenses.
| Expenses and Value of a $1,000 Investment | ||
| assuming actual returns for the six months ended August 31, 2011 | ||
| Class M Shares | Investor Shares | |
| BNY Mellon Bond Fund | ||
| Expenses paid per $1,000† | $ 2.78 | $ 4.06 |
| Ending value (after expenses) | $1,040.40 | $1,038.40 |
| Annualized expense ratio (%) | .54 | .79 |
| BNY Mellon Intermediate Bond Fund | ||
| Expenses paid per $1,000† | $ 2.82 | $ 4.09 |
| Ending value (after expenses) | $1,031.70 | $1,030.40 |
| Annualized expense ratio (%) | .55 | .80 |
| BNY Mellon Intermediate U.S. Government Fund | ||
| Expenses paid per $1,000† | $ 4.21 | $ 5.48 |
| Ending value (after expenses) | $1,034.60 | $1,033.40 |
| Annualized expense ratio (%) | .82 | 1.07 |
| BNY Mellon Short-Term U.S. Government Securities Fund | ||
| Expenses paid per $1,000† | $ 2.63 | $ 3.95 |
| Ending value (after expenses) | $1,008.30 | $1,006.80 |
| Annualized expense ratio (%) | .52 | .78 |
† Expenses are equal to each fund’s annualized expense ratio as shown above, multiplied by the average account value over the period, multiplied by 184/365 (to reflect the one-half year period).
| The Funds | 15 |
COMPARING YOUR FUND’S EXPENSES WITH THOSE OF OTHER FUNDS (Unaudited)
Using the SEC’s method to compare expenses
The Securities and Exchange Commission (SEC) has established guidelines to help investors assess fund expenses. Per these guidelines, the table below shows your fund’s expenses based on a $1,000 investment, assuming a hypothetical 5% annualized return.You can use this information to compare the ongoing expenses (but not transaction expenses or total cost) of investing in the fund with those of other funds. All mutual fund shareholder reports will provide this information to help you make this comparison. Please note that you cannot use this information to estimate your actual ending account balance and expenses paid during the period.
| Expenses and Value of a $1,000 Investment | ||
| assuming a hypothetical 5% annualized return for the six months ended August 31, 2011 | ||
| Class M Shares | Investor Shares | |
| BNY Mellon Bond Fund | ||
| Expenses paid per $1,000† | $ 2.75 | $ 4.02 |
| Ending value (after expenses) | $1,022.48 | $1,021.22 |
| Annualized expense ratio (%) | .54 | .79 |
| BNY Mellon Intermediate Bond Fund | ||
| Expenses paid per $1,000† | $ 2.80 | $ 4.08 |
| Ending value (after expenses) | $1,022.43 | $1,021.17 |
| Annualized expense ratio (%) | .55 | .80 |
| BNY Mellon Intermediate U.S. Government Fund | ||
| Expenses paid per $1,000† | $ 4.18 | $ 5.45 |
| Ending value (after expenses) | $1,021.07 | $1,019.81 |
| Annualized expense ratio (%) | .82 | 1.07 |
| BNY Mellon Short-Term U.S. Government Securities Fund | ||
| Expenses paid per $1,000† | $ 2.65 | $ 3.97 |
| Ending value (after expenses) | $1,022.58 | $1,021.27 |
| Annualized expense ratio (%) | .52 | .78 |
† Expenses are equal to each fund’s annualized expense ratio as shown above, multiplied by the average account value over the period, multiplied by 184/365 (to reflect the one-half year period).
16
| STATEMENT OF INVESTMENTS |
| August 31, 2011 |
| BNY Mellon Bond Fund | ||||
| Coupon | Maturity | Principal | ||
| Bonds and Notes—98.2% | Rate (%) | Date | Amount ($) | Value ($) |
| Asset-Backed Ctfs./Auto Receivables—2.5% | ||||
| Ally Auto Receivables Trust, Ser. 2010-3, Cl. A4 | 1.55 | 8/17/15 | 3,545,000 | 3,612,980 |
| Americredit Automobile Receivables Trust, Ser. 2010-3, Cl. A3 | 1.14 | 4/8/15 | 6,905,000 | 6,935,640 |
| Americredit Automobile Receivables Trust, Ser. 2011-3, Cl. A3 | 1.17 | 1/8/16 | 1,500,000 | 1,504,613 |
| Ford Credit Auto Owner Trust, Ser. 2007-A, Cl. A4A | 5.47 | 6/15/12 | 63,268 | 63,487 |
| Franklin Auto Trust, Ser. 2007-1, Cl. A4 | 5.03 | 2/16/15 | 507,466 | 507,539 |
| Harley-Davidson Motorcycle Trust, Ser. 2009-2, Cl. A3 | 2.62 | 3/15/14 | 10,090,532 | 10,149,222 |
| Harley-Davidson Motorcycle Trust, Ser. 2007-1, Cl. A4 | 5.21 | 6/15/13 | 897,504 | 903,708 |
| Nissan Auto Receivables Owner Trust, Ser. 2010-A, Cl. A4 | 1.31 | 9/15/16 | 3,965,000 | 4,008,267 |
| World Omni Auto Receivables Trust, Ser. 2011-A, Cl. A3 | 1.11 | 5/15/15 | 6,250,000 | 6,277,254 |
| 33,962,710 | ||||
| Automotive, Trucks & Parts—.7% | ||||
| Johnson Controls, Sr. Unscd. Notes | 5.50 | 1/15/16 | 8,414,000 | 9,476,587 |
| Banks—7.6% | ||||
| Bank of America, Sub. Notes | 5.49 | 3/15/19 | 19,975,000 | 18,851,127 |
| BankAmerica Capital II, Gtd. Secs., Ser. 2 | 8.00 | 12/15/26 | 6,775,000 | 6,775,000 |
| Barclays Bank, Sr. Unscd. Notes, Ser. 1 | 5.00 | 9/22/16 | 12,610,000 | 13,018,917 |
| BBVA US Senior, Gtd. Notes | 3.25 | 5/16/14 | 6,600,000 | 6,443,052 |
| Citigroup, Sub. Notes | 5.00 | 9/15/14 | 6,815,000 | 7,003,176 |
| Citigroup, Sr. Unscd. Notes | 6.13 | 11/21/17 | 3,135,000 | 3,438,600 |
| Cooperatieve Centrale | ||||
| Raiffeisen-Boerenleenbank, Bank Gtd. Notes | 5.25 | 5/24/41 | 6,335,000 | 6,712,579 |
| Goldman Sachs Group, Sub. Notes | 6.75 | 10/1/37 | 8,270,000 | 7,873,387 |
| JPMorgan Chase & Co., Sub. Notes | 5.13 | 9/15/14 | 4,805,000 | 5,103,712 |
| Lloyds TSB Bank, Bank Gtd. Notes | 6.38 | 1/21/21 | 9,015,000 | 9,421,522 |
| Morgan Stanley, Sub. Notes | 4.75 | 4/1/14 | 9,590,000 a | 9,730,695 |
| Royal Bank of Scotland, Bank Gtd. Notes | 4.88 | 3/16/15 | 9,115,000 | 9,246,602 |
| 103,618,369 | ||||
| Building & Construction—.6% | ||||
| CRH America, Gtd. Notes | 5.30 | 10/15/13 | 7,100,000 | 7,511,587 |
| Commercial & Professional Services—.8% | ||||
| Seminole Tribe of Florida, Sr. Scd. Notes | 5.80 | 10/1/13 | 9,136,000 b | 9,163,710 |
| Seminole Tribe of Florida, Notes | 7.75 | 10/1/17 | 1,130,000 b | 1,152,600 |
| 10,316,310 |
| The Funds | 17 |
STATEMENT OF INVESTMENTS (continued)
| BNY Mellon Bond Fund (continued) | ||||
| Coupon | Maturity | Principal | ||
| Bonds and Notes (continued) | Rate (%) | Date | Amount ($) | Value ($) |
| Commercial Mortgage Pass-Through Ctfs.—1.4% | ||||
| Bear Stearns Commercial Mortgage | ||||
| Securities, Ser. 2004-PWR5, Cl. A3 | 4.57 | 7/11/42 | 2,749,889 | 2,748,136 |
| Commercial Mortgage Asset Trust, Ser. 1999-C1, Cl. D | 7.35 | 1/17/32 | 2,260,000 c | 2,357,590 |
| GE Capital Commercial Mortgage, Ser. 2004-C3, Cl. A3 | 4.87 | 7/10/39 | 1,317,817 c | 1,319,770 |
| GMAC Commercial Mortgage Securities, Ser. 2001-C2, Cl. B | 6.79 | 4/15/34 | 4,400,000 | 4,392,643 |
| Greenwich Capital Commercial Funding, Ser. 2005-GG3, Cl. A2 | 4.31 | 8/10/42 | 2,536,644 | 2,537,156 |
| JP Morgan Chase Commercial | ||||
| Mortgage Securities, Ser. 2004-C1, Cl. A2 | 4.30 | 1/15/38 | 229,396 | 232,534 |
| JPMorgan Chase Commercial Mortgage | ||||
| Securities, Ser. 2006-LDP9, Cl. A1S | 5.28 | 5/15/47 | 4,833,723 | 4,830,468 |
| LB-UBS Commercial Mortgage Trust, Ser. 2003-C7, Cl. A2 | 4.06 | 9/15/27 | 231,893 c | 231,934 |
| Wachovia Bank Commercial | ||||
| Mortgage Trust, Ser. 2003-C3, Cl. A1 | 4.04 | 2/15/35 | 157,940 | 157,739 |
| 18,807,970 | ||||
| Diversified Financial Services—3.6% | ||||
| Blackrock, Sr. Unscd. Notes | 6.25 | 9/15/17 | 7,860,000 | 9,254,584 |
| General Electric Capital, Sub. Notes | 5.30 | 2/11/21 | 2,765,000 | 2,949,802 |
| General Electric Capital, Notes | 5.63 | 9/15/17 | 10,070,000 a | 11,201,294 |
| HSBC Finance, Sr. Sub. Notes | 6.68 | 1/15/21 | 10,510,000 b | 10,176,518 |
| NYSE Euronext, Sr. Unscd. Notes | 4.80 | 6/28/13 | 8,451,000 | 8,983,151 |
| TD Ameritrade Holding, Gtd. Notes | 4.15 | 12/1/14 | 6,485,000 | 6,890,066 |
| 49,455,415 | ||||
| Electric Utilities—1.1% | ||||
| Emerson Electric, Sr. Unscd. Notes | 5.00 | 12/15/14 | 3,500,000 a | 3,935,309 |
| Hydro-Quebec, Gtd. Notes | 2.00 | 6/30/16 | 5,130,000 | 5,254,013 |
| Xcel Energy, Sr. Unscd. Notes | 4.70 | 5/15/20 | 5,785,000 | 6,394,704 |
| 15,584,026 | ||||
| Entertainment—.4% | ||||
| Agua Caliente Band of Cahuilla Indians, Sr. Scd. Notes | 6.08 | 10/1/16 | 1,912,000 b | 1,898,234 |
| Agua Caliente Band of Cahuilla Indians, Scd. Notes | 6.35 | 10/1/15 | 1,724,000 b | 1,715,673 |
| Agua Caliente Band of Cahuilla Indians, Sr. Scd. Notes | 6.44 | 10/1/16 | 2,273,000 b | 2,256,634 |
| 5,870,541 |
18
| BNY Mellon Bond Fund (continued) | ||||
| Coupon | Maturity | Principal | ||
| Bonds and Notes (continued) | Rate (%) | Date | Amount ($) | Value ($) |
| Food & Beverages—1.5% | ||||
| General Mills, Sr. Unscd. Notes | 5.65 | 2/15/19 | 2,215,000 | 2,612,737 |
| Kraft Foods, Sr. Unscd. Notes | 5.38 | 2/10/20 | 9,265,000 | 10,541,300 |
| Pepsico, Sr. Unscd. Notes | 4.50 | 1/15/20 | 7,040,000 a | 7,928,969 |
| 21,083,006 | ||||
| Foreign/Governmental—1.7% | ||||
| Mexican Government, Sr. Unscd. Notes | 5.63 | 1/15/17 | 5,975,000 | 6,901,125 |
| Mexican Government, Sr. Unscd. Notes | 6.63 | 3/3/15 | 1,480,000 | 1,714,580 |
| Province of Ontario Canada, Sr. Unscd. Bonds | 4.00 | 10/7/19 | 6,500,000 | 7,228,826 |
| Puerto Rico Commonwealth Government | ||||
| Development Bank, Revenue Bonds | 3.67 | 5/1/14 | 8,010,000 | 8,158,265 |
| 24,002,796 | ||||
| Manufacturing—.8% | ||||
| Tyco International Finance, Gtd. Notes | 3.38 | 10/15/15 | 10,415,000 | 10,944,155 |
| Media & Telecommunications—5.6% | ||||
| America Movil Sab de CV, Gtd. Notes | 3.63 | 3/30/15 | 3,000,000 | 3,202,971 |
| AT&T, Sr. Unscd. Notes | 5.88 | 8/15/12 | 5,995,000 a | 6,278,072 |
| AT&T, Sr. Unscd. Notes | 4.45 | 5/15/21 | 1,985,000 a | 2,134,518 |
| Cisco Systems, Sr. Unscd. Notes | 5.50 | 2/22/16 | 5,550,000 a | 6,432,128 |
| Comcast, Gtd. Notes | 5.90 | 3/15/16 | 8,975,000 a | 10,411,197 |
| News America, Gtd. Notes | 6.15 | 3/1/37 | 2,375,000 | 2,495,339 |
| Rogers Communications, Gtd. Notes | 6.38 | 3/1/14 | 6,810,000 | 7,663,313 |
| Telefonica Emisiones, Gtd. Notes | 4.95 | 1/15/15 | 9,295,000 | 9,516,909 |
| Time Warner Cable, Gtd. Notes | 4.13 | 2/15/21 | 10,550,000 a | 10,615,473 |
| Time Warner, Gtd. Notes | 3.15 | 7/15/15 | 4,715,000 | 4,910,305 |
| Verizon Communications, Sr. Unscd. Notes | 5.50 | 2/15/18 | 10,755,000 | 12,493,352 |
| 76,153,577 | ||||
| Municipal Bonds—4.5% | ||||
| California, GO (Build America Bonds) | 7.30 | 10/1/39 | 11,215,000 | 13,199,382 |
| Illinois, GO | 4.42 | 1/1/15 | 4,935,000 | 5,195,765 |
| Los Angeles Community College District, | ||||
| GO (Build America Bonds) | 6.75 | 8/1/49 | 13,725,000 | 17,269,344 |
| The Funds | 19 |
STATEMENT OF INVESTMENTS (continued)
| BNY Mellon Bond Fund (continued) | ||||
| Coupon | Maturity | Principal | ||
| Bonds and Notes (continued) | Rate (%) | Date | Amount ($) | Value ($) |
| Municipal Bonds (continued) | ||||
| Massachusetts, GO (Build America Bonds) | 4.20 | 12/1/21 | 5,340,000 | 5,808,158 |
| New Jersey Turnpike Authority, | ||||
| Turnpike Revenue (Build America Bonds) | 7.10 | 1/1/41 | 8,145,000 | 10,302,040 |
| New York City Municipal Water Finance Authority, | ||||
| Water and Sewer System Second General | ||||
| Resolution Revenue (Build America Bonds) | 6.28 | 6/15/42 | 5,430,000 | 6,009,761 |
| University of California Regents, | ||||
| General Revenue (Build America Bonds) | 1.99 | 5/1/13 | 3,610,000 | 3,678,662 |
| 61,463,112 | ||||
| Oil & Gas—1.1% | ||||
| BP Capital Markets, Gtd. Notes | 3.88 | 3/10/15 | 7,540,000 | 8,044,004 |
| Petrobras International Finance, Gtd. Notes | 5.38 | 1/27/21 | 6,825,000 | 7,343,700 |
| 15,387,704 | ||||
| Property & Casualty Insurance—1.2% | ||||
| MetLife, Sr. Unscd. Notes | 7.72 | 2/15/19 | 6,865,000 a | 8,445,941 |
| Prudential Financial, Sr. Unscd. Notes | 4.75 | 9/17/15 | 7,135,000 | 7,639,808 |
| 16,085,749 | ||||
| Real Estate—1.1% | ||||
| Boston Properties, Sr. Unscd. Notes | 4.13 | 5/15/21 | 6,700,000 | 6,560,714 |
| Simon Property Group, Sr. Unscd. Notes | 5.65 | 2/1/20 | 8,285,000 | 9,130,899 |
| 15,691,613 | ||||
| Residential Mortgage Pass-Through Ctfs.—.0% | ||||
| GMAC Mortgage Corporation Loan Trust, Ser. 2004-JR1, Cl. A6 | 0.67 | 12/25/33 | 174,777 c | 172,904 |
| GMAC Mortgage Corporation Loan Trust, Ser. 2004-J2, Cl. A2 | 0.72 | 6/25/34 | 292,225 c | 288,331 |
| 461,235 | ||||
| Scientific Instruments—.4% | ||||
| Thermo Fisher Scientific, Sr. Unscd. Notes | 2.25 | 8/15/16 | 5,335,000 a | 5,390,393 |
| Software—1.1% | ||||
| Microsoft, Sr. Unscd. Notes | 5.30 | 2/8/41 | 2,105,000 a | 2,416,603 |
| Oracle, Sr. Unscd. Notes | 5.75 | 4/15/18 | 10,410,000 | 12,483,328 |
| 14,899,931 | ||||
| U.S. Government Agencies—1.8% | ||||
| Federal Home Loan Banks, Bonds | 3.63 | 10/18/13 | 11,670,000 | 12,470,469 |
| Federal National Mortgage Association, Notes | 3.00 | 9/16/14 | 1,480,000 d | 1,592,683 |
| Federal National Mortgage Association, Notes | 4.38 | 7/17/13 | 9,520,000 d | 10,231,753 |
| 24,294,905 |
20
| BNY Mellon Bond Fund (continued) | |||||
| Principal | Principal | ||||
| Bonds and Notes (continued) | Amount ($) | Value ($) | Amount ($) | Value ($) | |
| U.S. Government Agencies/ | U.S. Government Securities (continued) | ||||
| Mortgage-Backed—33.2% | U.S. Treasury Inflation | ||||
| Federal Home Loan Mortgage Corp.: | Protected (continued): | ||||
| 4.00%, 11/1/40—1/1/41 | 24,037,560 d | 24,950,862 | Notes, 0.63%, 7/15/21 | 8,117,482 e | 8,494,815 |
| 4.50%, 3/1/21—12/1/40 | 28,565,605 d | 30,424,834 | Notes, 1.38%, 1/15/20 | 10,146,319 e | 11,367,053 |
| 5.00%, 6/1/28—7/1/40 | 33,427,639 d | 36,132,503 | Notes, 2.38%, 1/15/17 | 14,137,138 e | 16,439,950 |
| 5.50%, 12/1/37—12/1/38 | 28,292,807 d | 30,995,534 | Notes, 2.38%, 1/15/27 | 14,120,348 e | 17,618,438 |
| 6.00%, 12/1/37—6/1/39 | 19,997,201 d | 22,204,752 | U.S. Treasury Notes: | ||
| 6.50%, 4/1/39 | 11,731,032 d | 13,227,293 | 0.50%, 10/15/13 | 25,775,000 | 25,934,083 |
| REMIC, Ser. 2587, Cl. WB, | 0.63%, 7/15/14 | 3,500,000 | 3,532,540 | ||
| 5.00%, 11/15/16 | 132,554 d | 132,937 | 0.75%, 3/31/13 | 30,750,000 | 31,030,010 |
| Federal National Mortgage Association: | 0.75%, 8/15/13 | 38,750,000 | 39,176,870 | ||
| 3.50%, 1/1/26—8/1/26 | 26,828,689 d | 28,052,995 | 0.75%, 9/15/13 | 19,890,000 a | 20,110,660 |
| 4.00%, 9/1/24—2/1/41 | 41,177,568 d | 43,213,135 | 0.75%, 12/15/13 | 5,490,000 a | 5,557,340 |
| 4.50%, 3/1/23—4/1/41 | 73,638,050 d | 78,238,592 | 0.75%, 6/15/14 | 19,500,000 a | 19,752,896 |
| 5.00%, 12/1/21—2/1/41 | 26,620,159 d | 28,798,214 | 1.00%, 1/15/14 | 10,000,000 a | 10,185,160 |
| 5.50%, 2/1/38—5/1/38 | 32,378,654 d | 35,585,357 | 1.25%, 2/15/14 | 9,975,000 | 10,222,041 |
| 6.00%, 4/1/33—9/1/39 | 29,910,733 d | 33,365,427 | 1.25%, 3/15/14 | 32,710,000 | 33,548,226 |
| 6.50%, 10/1/36—1/1/39 | 15,365,561 d | 17,322,507 | 1.50%, 6/30/16 | 3,140,000 | 3,229,791 |
| REMIC, Ser. 2003-64, Cl. BC, | 1.50%, 7/31/16 | 12,500,000 a | 12,849,588 | ||
| 5.50%, 3/25/30 | 7,288,129 d | 7,544,032 | 1.75%, 7/31/15 | 14,560,000 | 15,216,321 |
| Government National | 2.13%, 8/15/21 | 3,000,000 a | 2,975,151 | ||
| Mortgage Association I; | 2.25%, 7/31/18 | 6,500,000 | 6,810,278 | ||
| 5.00%, 11/15/34—1/15/39 | 20,340,958 | 22,535,718 | 4.25%, 8/15/13 | 23,450,000 | 25,304,027 |
| 452,724,692 | 4.25%, 11/15/13 | 12,960,000 | 14,110,200 | ||
| U.S. Government Securities—25.5% | 347,420,918 | ||||
| U.S. Treasury Inflation Protected: | Total Bonds and Notes | ||||
| Bonds, 1.38%, 7/15/18 | 12,451,567 e | 13,955,480 | (cost $1,270,957,967) | 1,340,607,301 | |
| The Funds | 21 |
STATEMENT OF INVESTMENTS (continued)
| BNY Mellon Bond Fund (continued) | |||||
| Investment of Cash Collateral | |||||
| Common Stocks—.0% | Shares | Value ($) | for Securities Loaned—2.5% | Shares | Value ($) |
| Diversified—.0% | Registered | ||||
| Leucadia National | 370 | 10,963 | Investment Company; | ||
| Internet—.0% | Dreyfus | ||||
| AboveNet | 1,266 | 77,834 | Institutional Cash | ||
| Advantage Fund | |||||
| Total Common Stocks | (cost $33,781,241) | 33,781,241 f | 33,781,241 | ||
| (cost $0) | 88,797 | ||||
| Total Investments | |||||
| Other Investment—1.2% | (cost $1,320,639,208) | 101.9% | 1,390,377,339 | ||
| Registered Investment Company; | Liabilities, Less Cash | ||||
| Dreyfus Institutional Preferred | and Receivables | (1.9%) | (25,701,911) | ||
| Plus Money Market Fund | Net Assets | 100.0% | 1,364,675,428 | ||
| (cost $15,900,000) | 15,900,000 f | 15,900,000 | |||
| GO—General Obligation |
| a Security, or portion thereof, on loan.At August 31, 2011, the value of the fund’s securities on loan was $102,218,481 and the value of the collateral held by the fund was |
| $105,679,184, consisting of cash collateral of $33,781,241 and U.S Government & Agency securities valued at $71,897,943. |
| b Securities exempt from registration under Rule 144A of the Securities Act of 1933.These securities may be resold in transactions exempt from registration, normally to qualified |
| institutional buyers.At August 31, 2011, these securities were valued at $26,363,369 or 1.9% of net assets. |
| c Variable rate security—interest rate subject to periodic change. |
| d The Federal Housing Finance Agency (FHFA) placed Federal Home Loan Mortgage Corporation and Federal National Mortgage Association into conservatorship with FHFA as |
| the conservator.As such, the FHFA oversees the continuing affairs of these companies. |
| e Principal amount for accrual purposes is periodically adjusted based on changes in the Consumer Price Index. |
| f Investment in affiliated money market mutual fund. |
| Portfolio Summary (Unaudited)† | |||
| Value (%) | Value (%) | ||
| U.S. Government & Agencies | 60.5 | Money Market Investments | 3.7 |
| Corporate Bonds | 27.6 | Foreign/Governmental | 1.7 |
| Municipal Bonds | 4.5 | ||
| Asset/Mortgage-Backed | 3.9 | 101.9 | |
| † Based on net assets. | |||
| See notes to financial statements. | |||
22
| STATEMENT OF INVESTMENTS |
| August 31, 2011 |
| BNY Mellon Intermediate Bond Fund | ||||
| Coupon | Maturity | Principal | ||
| Bonds and Notes—98.6% | Rate (%) | Date | Amount ($) | Value ($) |
| Aerospace & Defense—.6% | ||||
| General Dynamics, Gtd. Notes | 5.25 | 2/1/14 | 3,050,000 a | 3,378,439 |
| United Technologies, Sr. Unscd. Notes | 6.13 | 2/1/19 | 1,860,000 a | 2,312,328 |
| 5,690,767 | ||||
| Asset-Backed Ctfs./Auto Receivables—.0% | ||||
| Harley-Davidson Motorcycle Trust, Ser. 2007-1, Cl. A4 | 5.21 | 6/17/13 | 347,977 | 350,382 |
| Automotive, Trucks & Parts—1.1% | ||||
| Daimler Finance North America, Gtd. Notes | 6.50 | 11/15/13 | 4,385,000 | 4,858,764 |
| Johnson Controls, Sr. Unscd. Notes | 5.50 | 1/15/16 | 5,430,000 | 6,115,744 |
| 10,974,508 | ||||
| Banks & Finance—15.5% | ||||
| American Express Credit, Sr. Unscd. Notes | 2.75 | 9/15/15 | 3,325,000 | 3,400,484 |
| Bank of America, Sub. Notes | 5.42 | 3/15/17 | 20,645,000 | 20,166,057 |
| BankAmerica Capital II, Gtd. Secs., Ser. 2 | 8.00 | 12/15/26 | 4,975,000 | 4,975,000 |
| Barclays Bank, Sr. Unscd. Notes, Ser. 1 | 5.00 | 9/22/16 | 8,510,000 | 8,785,962 |
| BBVA US Senior, Gtd. Notes | 3.25 | 5/16/14 | 4,800,000 | 4,685,856 |
| Caterpillar Financial Services, Sr. Unscd. Notes | 6.13 | 2/17/14 | 4,975,000 | 5,583,134 |
| Citigroup, Sub. Notes | 5.00 | 9/15/14 | 7,780,000 | 7,994,821 |
| Citigroup, Sr. Unscd. Notes | 6.13 | 11/21/17 | 2,840,000 | 3,115,031 |
| Comerica, Sr. Unscd. Notes | 3.00 | 9/16/15 | 4,000,000 a | 4,095,004 |
| General Electric Capital, Sr. Unscd. Notes | 1.88 | 9/16/13 | 8,375,000 a | 8,459,119 |
| General Electric Capital, Sub. Notes | 5.30 | 2/11/21 | 1,955,000 | 2,085,664 |
| Goldman Sachs Group, Sr. Unscd. Notes | 4.75 | 7/15/13 | 7,780,000 a | 8,099,883 |
| HSBC Finance, Sr. Unscd. Notes | 6.38 | 11/27/12 | 5,860,000 | 6,150,351 |
| HSBC Finance, Sr. Sub. Notes | 6.68 | 1/15/21 | 2,956,000 b | 2,862,206 |
| John Deere Capital, Sr. Unscd. Notes | 7.00 | 3/15/12 | 1,888,000 | 1,951,242 |
| JPMorgan Chase & Co., Sub. Notes | 5.13 | 9/15/14 | 4,500,000 | 4,779,752 |
| Lloyds TSB Bank, Bank Gtd. Notes | 4.88 | 1/21/16 | 6,400,000 a | 6,421,402 |
| Morgan Stanley, Sub. Notes | 4.75 | 4/1/14 | 5,985,000 | 6,072,806 |
| NYSE Euronext, Sr. Unscd. Notes | 4.80 | 6/28/13 | 3,630,000 | 3,858,577 |
| Private Export Funding, Gov’t Gtd. Notes | 4.38 | 3/15/19 | 15,935,000 | 17,991,300 |
| Rabobank Nederland, Gtd. Notes | 2.13 | 10/13/15 | 4,765,000 | 4,822,547 |
| Royal Bank of Scotland, Bank Gtd. Notes | 4.88 | 3/16/15 | 5,260,000 | 5,335,944 |
| TD Ameritrade Holding, Gtd. Notes | 4.15 | 12/1/14 | 3,650,000 | 3,877,986 |
| Wachovia, Sub. Notes | 5.25 | 8/1/14 | 6,210,000 | 6,647,128 |
| 152,217,256 |
| The Funds | 23 |
STATEMENT OF INVESTMENTS (continued)
| BNY Mellon Intermediate Bond Fund (continued) | ||||
| Coupon | Maturity | Principal | ||
| Bonds and Notes (continued) | Rate (%) | Date | Amount ($) | Value ($) |
| Building & Construction—.5% | ||||
| CRH America, Gtd. Notes | 5.30 | 10/15/13 | 4,784,000 | 5,061,328 |
| Commercial & Professional Services—1.3% | ||||
| Seminole Tribe of Florida, Sr. Scd. Notes | 5.80 | 10/1/13 | 6,380,000 b | 6,399,351 |
| Seminole Tribe of Florida, Notes | 7.75 | 10/1/17 | 765,000 b | 780,300 |
| Stanford University, Bonds | 4.75 | 5/1/19 | 5,000,000 | 5,811,425 |
| 12,991,076 | ||||
| Entertainment—.4% | ||||
| Agua Caliente Band of Cahuilla Indians, Sr. Scd. Notes | 6.08 | 10/1/16 | 1,425,000 b | 1,414,740 |
| Agua Caliente Band of Cahuilla Indians, Scd. Notes | 6.35 | 10/1/15 | 849,000 b | 844,899 |
| Agua Caliente Band of Cahuilla Indians, Sr. Scd. Notes | 6.44 | 10/1/16 | 1,735,000 b | 1,722,508 |
| 3,982,147 | ||||
| Food & Beverages—2.1% | ||||
| Diageo Finance, Gtd. Notes | 5.50 | 4/1/13 | 4,415,000 | 4,744,381 |
| Dr Pepper Snapple Group, Gtd. Notes | 2.90 | 1/15/16 | 3,250,000 a | 3,377,254 |
| Kraft Foods, Sr. Unscd. Notes | 4.13 | 2/9/16 | 6,930,000 | 7,490,069 |
| McDonald’s, Sr. Unscd. Notes | 5.80 | 10/15/17 | 4,460,000 | 5,421,826 |
| 21,033,530 | ||||
| Foreign/Governmental—1.5% | ||||
| Mexican Government, Sr. Unscd. Notes | 6.63 | 3/3/15 | 1,064,000 | 1,232,644 |
| Province of Nova Scotia Canada, Sr. Unscd. Bonds | 5.13 | 1/26/17 | 5,430,000 | 6,430,423 |
| Province of Ontario Canada, Sr. Unscd. Bonds | 4.00 | 10/7/19 | 6,515,000 | 7,245,507 |
| 14,908,574 | ||||
| Health Care—3.0% | ||||
| Amgen, Sr. Notes | 5.70 | 2/1/19 | 2,905,000 | 3,427,409 |
| Astrazeneca, Sr. Unscd. Notes | 5.90 | 9/15/17 | 5,895,000 | 7,090,671 |
| GlaxoSmithKline Capital, Gtd. Bonds | 5.65 | 5/15/18 | 5,853,000 | 7,024,261 |
| Pfizer, Sr. Unscd. Notes | 6.20 | 3/15/19 | 4,050,000 | 4,989,260 |
| Thermo Fisher Scientific, Sr. Unscd. Notes | 3.20 | 3/1/16 | 7,090,000 a | 7,438,367 |
| 29,969,968 | ||||
| Industrials—3.2% | ||||
| BP Capital Markets, Gtd. Notes | 3.20 | 3/11/16 | 6,250,000 | 6,581,013 |
| Emerson Electric, Sr. Unscd. Notes | 4.63 | 10/15/12 | 3,000,000 a | 3,127,437 |
| Hydro-Quebec, Gov’t Gtd. Notes | 2.00 | 6/30/16 | 3,655,000 a | 3,743,356 |
| Occidental Petroleum, Sr. Unscd. Notes | 4.13 | 6/1/16 | 3,005,000 | 3,357,264 |
| Petrobras International Finance, Gtd. Notes | 3.88 | 1/27/16 | 4,860,000 | 5,008,959 |
| Progress Energy, Sr. Unscd. Notes | 6.85 | 4/15/12 | 5,093,000 | 5,282,083 |
| Xcel Energy, Sr. Unscd. Notes | 4.70 | 5/15/20 | 3,705,000 | 4,095,485 |
| 31,195,597 |
24
| BNY Mellon Intermediate Bond Fund (continued) | ||||
| Coupon | Maturity | Principal | ||
| Bonds and Notes (continued) | Rate (%) | Date | Amount ($) | Value ($) |
| Media & Telecommunications—6.5% | ||||
| AT&T, Sr. Unscd. Notes | 4.45 | 5/15/21 | 3,400,000 a | 3,656,102 |
| Cisco Systems, Sr. Unscd. Notes | 5.50 | 2/22/16 | 7,135,000 | 8,269,051 |
| Comcast, Gtd. Notes | 5.90 | 3/15/16 | 5,135,000 | 5,956,713 |
| News America, Gtd. Notes | 5.30 | 12/15/14 | 5,260,000 | 5,821,379 |
| Rogers Communications, Gtd. Notes | 6.38 | 3/1/14 | 4,934,000 | 5,552,245 |
| Telefonica Emisiones, Gtd. Notes | 4.95 | 1/15/15 | 6,635,000 | 6,793,404 |
| Time Warner Cable, Gtd. Notes | 4.13 | 2/15/21 | 7,225,000 a | 7,269,838 |
| Time Warner, Gtd. Notes | 3.15 | 7/15/15 | 5,010,000 | 5,217,524 |
| Verizon Communications, Sr. Unscd. Notes | 8.75 | 11/1/18 | 6,530,000 a | 8,857,638 |
| Vodafone Group, Sr. Unscd. Notes | 5.35 | 2/27/12 | 6,200,000 | 6,338,607 |
| 63,732,501 | ||||
| Multi-Line Insurance—1.1% | ||||
| MetLife, Sr. Unscd. Notes | 6.75 | 6/1/16 | 4,450,000 | 5,220,451 |
| Prudential Financial, Sr. Unscd. Notes | 4.75 | 9/17/15 | 4,735,000 | 5,070,006 |
| 10,290,457 | ||||
| Municipal Bonds—4.6% | ||||
| California, GO (Various Purpose) | 5.45 | 4/1/15 | 4,550,000 | 5,075,070 |
| California, GO (Various Purpose) | 5.95 | 4/1/16 | 3,255,000 | 3,714,118 |
| Illinois, GO | 4.42 | 1/1/15 | 3,225,000 | 3,395,409 |
| Massachusetts, GO (Build America Bonds) | 4.20 | 12/1/21 | 14,370,000 | 15,629,818 |
| North Texas Tollway Authority, | ||||
| Special Projects System Revenue, BAN | 2.44 | 9/1/13 | 9,020,000 | 9,300,883 |
| Puerto Rico Commonwealth Government | ||||
| Development Bank, Revenue Bonds | 3.67 | 5/1/14 | 5,830,000 | 5,937,913 |
| University of California Regents, | ||||
| General Revenue (Build America Bonds) | 1.99 | 5/1/13 | 2,590,000 | 2,639,262 |
| 45,692,473 | ||||
| Real Estate—.7% | ||||
| Simon Property Group, Sr. Unscd. Notes | 4.20 | 2/1/15 | 6,122,000 a | 6,536,147 |
| Retail—.9% | ||||
| Wal-Mart Stores, Sr. Unscd. Notes | 2.80 | 4/15/16 | 7,920,000 a | 8,381,079 |
| Software & Services—1.4% | ||||
| FISERV, Gtd. Notes | 3.13 | 6/15/16 | 5,000,000 | 5,122,015 |
| Oracle, Sr. Unscd. Notes | 5.75 | 4/15/18 | 7,000,000 | 8,394,169 |
| 13,516,184 | ||||
| U.S. Government Agencies—6.0% | ||||
| Federal Farm Credit Banks, Bonds | 2.13 | 6/18/12 | 9,065,000 | 9,200,631 |
| Federal Farm Credit Banks, Bonds | 2.25 | 4/24/12 | 12,935,000 | 13,101,758 |
| The Funds | 25 |
STATEMENT OF INVESTMENTS (continued)
| BNY Mellon Intermediate Bond Fund (continued) | ||||
| Coupon | Maturity | Principal | ||
| Bonds and Notes (continued) | Rate (%) | Date | Amount ($) | Value ($) |
| U.S. Government Agencies (continued) | ||||
| Federal Farm Credit Banks, Bonds | 3.40 | 2/7/13 | 15,800,000 | 16,502,831 |
| Federal Home Loan Banks, Bonds | 3.63 | 10/18/13 | 6,850,000 | 7,319,855 |
| Federal Home Loan Banks, Bonds | 4.25 | 6/14/13 | 7,500,000 | 8,025,165 |
| Federal National Mortgage Association, Notes | 3.00 | 9/16/14 | 4,895,000 c | 5,267,691 |
| 59,417,931 | ||||
| U.S. Government Agencies/Mortgage-Backed—1.4% | ||||
| Federal Home Loan Mortgage Corp.; | ||||
| REMIC, Ser. 2134, Cl. PM, 5.50%, 3/15/14 | 266,962 c | 278,796 | ||
| Federal National Mortgage Association; | ||||
| 4.38%, 7/17/13 | 12,055,000 c | 12,956,280 | ||
| 13,235,076 | ||||
| U.S. Government Securities—46.8% | ||||
| U.S. Treasury Inflation Protected Securities: | ||||
| Notes, 0.63%, 7/15/21 | 13,650,990 d | 14,285,543 | ||
| Notes, 1.38%, 7/15/18 | 8,144,026 d | 9,127,670 | ||
| Notes, 2.38%, 1/15/17 | 15,558,687 d | 18,093,057 | ||
| U.S. Treasury Notes: | ||||
| 0.38%, 9/30/12 | 11,400,000 | 11,429,834 | ||
| 0.50%, 11/30/12 | 1,500,000 | 1,506,738 | ||
| 0.63%, 7/15/14 | 22,000,000 a | 22,204,534 | ||
| 0.75%, 3/31/13 | 4,000,000 | 4,036,424 | ||
| 0.75%, 9/15/13 | 3,025,000 a | 3,058,559 | ||
| 0.75%, 12/15/13 | 10,500,000 | 10,628,793 | ||
| 0.75%, 6/15/14 | 11,250,000 a | 11,395,901 | ||
| 1.00%, 3/31/12 | 5,330,000 | 5,359,347 | ||
| 1.00%, 4/30/12 | 27,710,000 | 27,881,996 | ||
| 1.13%, 12/15/12 | 10,965,000 | 11,102,063 | ||
| 1.25%, 2/15/14 | 12,500,000 | 12,809,575 | ||
| 1.25%, 3/15/14 | 3,305,000 | 3,389,694 | ||
| 1.25%, 4/15/14 | 6,000,000 | 6,156,564 | ||
| 1.38%, 10/15/12 | 16,670,000 | 16,901,813 | ||
| 1.50%, 7/15/12 | 9,000,000 | 9,109,692 | ||
| 1.50%, 6/30/16 | 14,000,000 | 14,400,344 | ||
| 1.50%, 7/31/16 | 4,000,000 a | 4,111,868 | ||
| 1.75%, 7/31/15 | 5,065,000 | 5,293,315 | ||
| 2.13%, 8/15/21 | 4,180,000 a | 4,145,377 | ||
| 2.25%, 7/31/18 | 3,750,000 | 3,929,006 | ||
| 2.38%, 7/31/17 | 6,500,000 | 6,915,389 | ||
| 2.63%, 1/31/18 | 5,250,000 | 5,651,956 | ||
| 2.63%, 8/15/20 | 2,430,000 | 2,548,652 | ||
26
| BNY Mellon Intermediate Bond Fund (continued) | |||||
| Principal | |||||
| Bonds and Notes (continued) | Amount ($) | Value ($) | Other Investment—.8% | Shares | Value ($) |
| U.S. Government Securities (continued) | Registered Investment Company; | ||||
| U.S. Treasury Notes (continued): | Dreyfus Institutional Preferred | ||||
| 2.63%, 11/15/20 | 7,470,000 a | 7,805,567 | Plus Money Market Fund | ||
| 3.13%, 5/15/19 | 6,345,000 | 7,008,249 | (cost $8,293,000) | 8,293,000 e | 8,293,000 |
| 3.13%, 5/15/21 | 9,000,000 | 9,749,583 | |||
| 3.38%, 11/15/19 | 7,000,000 | 7,834,533 | Investment of Cash Collateral | ||
| 3.50%, 5/15/20 | 8,000,000 | 9,005,656 | for Securities Loaned—3.7% | ||
| 3.75%, 11/15/18 | 2,575,000 | 2,962,257 | Registered Investment Company; | ||
| 4.00%, 11/15/12 | 43,500,000 | 45,518,661 | |||
| Dreyfus Institutional Cash | |||||
| 4.25%, 8/15/13 | 37,430,000 | 40,389,328 | |||
| Advantage Fund | |||||
| 4.25%, 11/15/13 | 27,510,000 | 29,951,513 | |||
| (cost $36,135,590) | 36,135,590 e | 36,135,590 | |||
| 4.50%, 4/30/12 | 8,500,000 | 8,749,356 | |||
| 4.50%, 11/15/15 | 4,070,000 | 4,712,616 | Total Investments | ||
| 4.63%, 2/29/12 | 20,750,000 | 21,223,370 | (cost $969,142,312) | 103.1% 1,014,734,504 | |
| 4.75%, 5/31/12 | 10,000,000 | 10,348,050 | |||
| 4.88%, 6/30/12 | 10,000,000 | 10,396,490 | Liabilities, Less Cash | ||
| and Receivables | (3.1%) | (30,237,613) | |||
| 461,128,933 | |||||
| Total Bonds and Notes | Net Assets | 100.0% | 984,496,891 | ||
| (cost $924,713,722) | 970,305,914 | ||||
| BAN—Bond Anticipation Note |
| GO—General Obligations |
| a Security, or portion thereof, on loan.At August 31, 2011, the total market value of the fund’s securities on loan was $68,812,123 and the total market value of the collateral held |
| by the fund was $70,949,339, consisting of cash collateral of $36,135,590 and U.S. Government and Agency securities valued at $34,813,749. |
| b Securities exempt from registration under Rule 144A of the Securities Act of 1933.These securities may be resold in transactions exempt from registration, normally to qualified |
| institutional buyers.At August 31, 2011, these securities were valued at $14,024,004 or 1.4% of net assets. |
| c The Federal Housing Finance Agency (FHFA) placed Federal Home Loan Mortgage Corporation and Federal National Mortgage Association into conservatorship with FHFA as |
| the conservator.As such, the FHFA oversees the continuing affairs of these companies. |
| d Principal amount for accrual purposes is periodically adjusted based on changes in the Consumer Price Index. |
| e Investment in affiliated money market mutual fund. |
| Portfolio Summary (Unaudited)† | |||
| Value (%) | Value (%) | ||
| U.S. Government & Agencies | 54.2 | Foreign/Governmental | 1.5 |
| Corporate Bonds | 38.3 | Asset/Mortgage-Backed | .0 |
| Municipal Bonds | 4.6 | ||
| Money Market Investments | 4.5 | 103.1 | |
| † Based on net assets. | |||
| See notes to financial statements. | |||
| The Funds | 27 |
| STATEMENT OF INVESTMENTS |
| August 31, 2011 |
| BNY Mellon Intermediate U.S. Government Fund | ||||
| Coupon | Maturity | Principal | ||
| Bonds and Notes—101.4% | Rate (%) | Date | Amount ($) | Value ($) |
| Diversified Financial Services—3.5% | ||||
| Private Export Funding, Gov’t Gtd. Notes | 4.38 | 3/15/19 | 1,635,000 | 1,845,985 |
| U.S. Government Agencies—31.9% | ||||
| Federal Farm Credit Banks, Bonds, Ser. 1 | 1.18 | 6/6/14 | 1,000,000 | 1,005,233 |
| Federal Farm Credit Banks, Bonds | 1.02 | 3/1/13 | 1,250,000 | 1,250,000 |
| Federal Farm Credit Banks, Bonds | 1.70 | 2/24/14 | 1,000,000 | 1,005,897 |
| Federal Home Loan Banks, Bonds | 3.63 | 10/18/13 | 1,280,000 | 1,367,798 |
| Federal Home Loan Banks, Bonds | 4.88 | 12/13/13 | 3,750,000 | 4,128,630 |
| Federal Home Loan Mortgage Corp., Notes | 0.63 | 5/23/13 | 1,000,000 a | 1,000,919 |
| Federal Home Loan Mortgage Corp., Notes | 1.00 | 7/30/14 | 1,000,000 a | 1,014,651 |
| Federal Home Loan Mortgage Corp., Notes | 1.38 | 6/2/14 | 1,000,000 a | 1,000,029 |
| Federal National Mortgage Association, Notes | 0.45 | 9/6/13 | 1,250,000 a | 1,249,320 |
| Federal National Mortgage Association, Notes | 0.85 | 9/12/14 | 1,000,000 a | 999,780 |
| Federal National Mortgage Association, Notes | 1.13 | 9/17/13 | 500,000 a | 506,916 |
| Federal National Mortgage Association, Notes | 1.50 | 12/30/13 | 915,000 a | 917,929 |
| Federal National Mortgage Association, Notes | 1.50 | 1/27/14 | 1,000,000 a | 1,003,946 |
| Federal National Mortgage Association, Sub. Notes | 5.13 | 1/2/14 | 440,000 a | 483,186 |
| 16,934,234 | ||||
| U.S. Government Agencies/Mortgage-Backed—9.7% | ||||
| Federal Home Loan Mortgage Corp.: | ||||
| REMIC, Ser. 2999, Cl. NB, 4.50%, 7/15/17 | 93,353 a | 94,072 | ||
| REMIC, Ser. 2587, Cl. WB, 5.00%, 11/15/16 | 34,366 a | 34,465 | ||
| REMIC, Ser. 3137, Cl. PA, 5.13%, 12/15/13 | 99,399 a | 100,691 | ||
| Government National Mortgage Association I: | ||||
| Ser. 2008-45, Cl. A, 3.58%, 11/16/27 | 48,174 | 48,433 | ||
| Ser. 2004-23, Cl. AB, 3.63%, 9/16/27 | 201,181 | 208,733 | ||
| Ser. 2005-76, Cl. A, 3.96%, 5/16/30 | 383,943 | 396,910 | ||
| Ser. 2005-29, Cl. A, 4.02%, 7/16/27 | 77,843 | 79,993 | ||
| Ser. 2006-3, Cl. A, 4.21%, 1/16/28 | 38,881 | 39,095 | ||
| Ser. 2003-47, Cl. C, 4.23%, 10/16/27 | 93,958 | 94,682 | ||
| Ser. 2008-78, Cl. B, 4.52%, 6/16/32 | 1,227,755 | 1,237,578 | ||
| Ser. 2005-79, Cl. B, 4.65%, 8/16/39 | 188,583 | 189,870 | ||
| Ser. 2004-12, Cl. BA, 4.81%, 8/16/32 | 252,331 | 259,440 | ||
| Ser. 2003-36, Cl. D, 4.88%, 3/16/36 | 26,826 | 26,866 | ||
| Ser. 2003-98, Cl. PD, 5.00%, 4/20/30 | 338,895 | 344,018 | ||
| Ser. 2006-32, Cl. A, 5.08%, 1/16/30 | 1,123,581 | 1,164,431 | ||
| Ser. 2004-60, Cl. C, 5.24%, 3/16/28 | 718,058 b | 737,979 | ||
| Ser. 2004-50, Cl. C, 5.32%, 8/16/30 | 58,936 b | 60,649 | ||
| 5,117,905 | ||||
28
| BNY Mellon Intermediate U.S. Government Fund (continued) | |||||
| Principal | Principal | ||||
| Bonds and Notes (continued) | Amount ($) | Value ($) | Amount ($) | Value ($) | |
| U.S. Government Securities—56.3% | U.S. Government Securities (continued) | ||||
| U.S. Treasury Bonds; | U.S. Treasury Notes (continued): | ||||
| 7.25%, 5/15/16 | 1,500,000 | 1,944,961 | 4.50%, 11/15/15 | 2,000,000 | 2,315,782 |
| U.S. Treasury Inflation | 5.13%, 5/15/16 | 1,000,000 | 1,197,891 | ||
| Protected Securities: | 29,827,223 | ||||
| Notes 0.63%, 7/15/21 | 510,785 c | 534,529 | Total Bonds and Notes | ||
| Notes 1.38%, 7/15/18 | 20,936 c | 23,464 | (cost $51,261,092) | 53,725,347 | |
| Notes 1.38%, 1/15/20 | 986,448 c | 1,105,130 | |||
| Notes 2.38%, 1/15/17 | 2,095,386 c | 2,436,705 | |||
| Other Investment—2.5% | Shares | Value ($) | |||
| U.S. Treasury Notes: | |||||
| 0.63%, 7/15/14 | 2,250,000 | 2,270,918 | Registered | ||
| 1.25%, 4/15/14 | 750,000 | 769,571 | Investment Company; | ||
| 1.38%, 11/30/15 | 2,000,000 | 2,056,720 | Dreyfus | ||
| 1.50%, 7/31/16 | 1,000,000 | 1,027,967 | Institutional Preferred | ||
| 2.13%, 12/31/15 | 750,000 | 795,059 | Plus Money Market Fund | ||
| 2.38%, 5/31/18 | 1,530,000 | 1,618,690 | (cost $1,316,000) | 1,316,000 d | 1,316,000 |
| 2.50%, 4/30/15 | 3,750,000 | 4,020,116 | |||
| 2.63%, 8/15/20 | 500,000 | 524,414 | Total Investments | ||
| 3.13%, 1/31/17 | 1,250,000 | 1,384,180 | (cost $52,577,092) | 103.9% | 55,041,347 |
| 3.13%, 5/15/21 | 1,250,000 | 1,354,109 | Liabilities, Less Cash | ||
| 3.50%, 5/15/20 | 1,250,000 | 1,407,134 | and Receivables | (3.9%) | (2,065,977) |
| 3.63%, 2/15/20 | 1,250,000 | 1,421,289 | |||
| 4.25%, 8/15/13 | 1,500,000 | 1,618,594 | Net Assets | 100.0% | 52,975,370 |
| a The Federal Housing Finance Agency (FHFA) placed Federal Home Loan Mortgage Corporation and Federal National Mortgage Association into conservatorship with FHFA as |
| the conservator.As such, the FHFA oversees the continuing affairs of these companies. |
| b Variable rate security—interest rate subject to periodic change. |
| c Principal amount for accrual purposes is periodically adjusted based on changes in the Consumer Price Index. |
| d Investment in affiliated money market mutual fund. |
| Portfolio Summary (Unaudited)† | |||
| Value (%) | Value (%) | ||
| U.S. Government & Agencies | 97.9 | Money Market Investment | 2.5 |
| Corporate Bonds | 3.5 | 103.9 | |
| † Based on net assets. | |||
| See notes to financial statements. |
| The Funds | 29 |
| STATEMENT OF INVESTMENTS |
| August 31, 2011 |
| BNY Mellon Short-Term U.S. Government Securities Fund | ||||
| Coupon | Maturity | Principal | ||
| Bonds and Notes—101.0% | Rate (%) | Date | Amount ($) | Value ($) |
| Municipal Bonds—1.4% | ||||
| California, GO | 5.25 | 4/1/14 | 1,000,000 | 1,093,860 |
| North Texas Tollway Authority, | ||||
| Special Projects System Revenue, BAN | 2.44 | 9/1/13 | 2,960,000 | 3,052,174 |
| University of California Regents, | ||||
| General Revenue | ||||
| (Build America Bonds) | 1.99 | 5/1/13 | 840,000 | 855,977 |
| 5,002,011 | ||||
| U.S. Government Agencies—38.9% | ||||
| Federal Farm Credit Banks, Bonds | 1.13 | 2/27/14 | 4,680,000 | 4,750,673 |
| Federal Farm Credit Banks, Bonds, Ser.1 | 1.18 | 6/6/14 | 10,500,000 | 10,554,946 |
| Federal Farm Credit Banks, Bonds | 1.50 | 12/8/14 | 1,000,000 | 1,002,258 |
| Federal Farm Credit Banks, Bonds | 1.02 | 3/1/13 | 9,500,000 | 9,500,000 |
| Federal Farm Credit Banks, Bonds | 1.70 | 2/24/14 | 5,000,000 | 5,029,485 |
| Federal Home Loan Banks, Bonds, Ser.1 | 0.50 | 8/28/13 | 6,250,000 | 6,269,331 |
| Federal Home Loan Mortgage Corp., Notes | 0.63 | 5/23/13 | 5,000,000 a | 5,004,595 |
| Federal Home Loan Mortgage Corp., Notes | 1.00 | 7/30/14 | 5,250,000 a | 5,326,918 |
| Federal Home Loan Mortgage Corp., Notes | 1.15 | 10/7/13 | 2,196,000 a | 2,197,867 |
| Federal Home Loan Mortgage Corp., Notes | 1.35 | 5/23/14 | 1,760,000 a | 1,763,751 |
| Federal Home Loan Mortgage Corp., Notes | 1.38 | 6/2/14 | 6,000,000 a | 6,000,174 |
| Federal Home Loan Mortgage Corp., Notes | 1.65 | 4/28/14 | 3,250,000 a | 3,256,198 |
| Federal Home Loan Mortgage Corp., Notes | 2.00 | 12/22/14 | 3,250,000 a | 3,265,493 |
| Federal Home Loan Mortgage Corp., Notes | 2.18 | 2/19/14 | 1,200,000 a | 1,250,452 |
| Federal Home Loan Mortgage, Notes | 1.00 | 8/27/14 | 8,230,000 a | 8,348,594 |
| Federal National Mortgage Association, Notes | 0.45 | 9/6/13 | 8,000,000 a | 7,995,646 |
| Federal National Mortgage Association, Notes | 0.85 | 9/12/14 | 10,750,000 a | 10,747,635 |
| Federal National Mortgage Association, Notes | 0.88 | 11/8/13 | 2,700,000 a | 2,702,298 |
| Federal National Mortgage Association, Notes | 0.88 | 8/28/14 | 6,680,000 a | 6,751,509 |
| Federal National Mortgage Association, Notes | 1.13 | 9/17/13 | 7,000,000 a | 7,096,824 |
| Federal National Mortgage Association, Notes | 1.38 | 1/27/14 | 4,250,000 a | 4,266,350 |
| Federal National Mortgage Association, Notes | 1.45 | 1/24/14 | 4,500,000 a | 4,520,457 |
| Federal National Mortgage Association, Notes | 1.50 | 12/30/13 | 4,695,000 a | 4,710,029 |
| Federal National Mortgage Association, Notes | 1.50 | 1/27/14 | 5,000,000 a | 5,019,730 |
| Federal National Mortgage Association, Notes | 1.63 | 3/21/14 | 4,430,000 a | 4,432,782 |
| Federal National Mortgage Association, Notes | 1.80 | 6/2/14 | 4,770,000 a | 4,770,191 |
| 136,534,186 | ||||
| U.S. Government Agencies/ | ||||
| Mortgage-Backed—11.2% | ||||
| Federal Home Loan Mortgage Corp.: | ||||
| 4.00%, 11/1/11 | 416,847 a | 420,666 | ||
| 5.00%, 12/1/11—6/15/14 | 1,330,740 a | 1,370,543 | ||
| REMIC, Ser. 2627, Cl. KW, 3.14%, 11/15/17 | 2,038,265 a | 2,086,595 | ||
| REMIC, Ser. 2625, Cl. JD, 3.25%, 7/15/17 | 519,618 a | 527,225 | ||
| REMIC, Ser. 2892, Cl. GA, 4.00%, 12/15/12 | 644,374 a | 647,473 | ||
| REMIC, Ser. 2999, Cl. NB, 4.50%, 7/15/17 | 440,095 a | 443,483 | ||
| REMIC, Ser. 2707, Cl. PD, 5.00%, 11/15/17 | 431,439 a | 439,779 | ||
30
| BNY Mellon Short-Term U.S. Government Securities Fund (continued) | |||||
| Principal | Principal | ||||
| Bonds and Notes (continued) | Amount ($) | Value ($) | Amount ($) | Value ($) | |
| U.S. Government Agencies/ | U.S. Government Agencies/ | ||||
| Mortgage-Backed (continued) | Mortgage-Backed (continued) | ||||
| Federal Home Loan | Government National | ||||
| Mortgage Corp. continued): | Mortgage Association I (continued): | ||||
| REMIC, Ser. 2495, Cl. UC, | Ser. 2003-47, Cl. C, 4.23%, | ||||
| 5.00%, 7/15/32 | 48,379 a | 51,365 | 10/16/27 | 375,832 | 378,729 |
| REMIC, Ser. 3137, Cl. PA, | Ser. 2006-55, Cl. A, 4.25%, | ||||
| 5.13%, 12/15/13 | 312,397 a | 316,457 | 7/16/29 | 4,711,833 | 4,854,952 |
| REMIC, Ser. 1961, Cl. H, | Ser. 2008-78, Cl. B, 4.52%, | ||||
| 6.50%, 5/15/12 | 59 a | 60 | 6/16/32 | 4,823,321 | 4,861,913 |
| Federal National | Ser. 2005-79, Cl. B, 4.65%, | ||||
| Mortgage Association: | 8/16/39 | 756,093 | 761,253 | ||
| 4.50%, 8/1/13 | 25,108 a | 26,468 | Ser. 2004-12, Cl. BA, | ||
| 5.00%, 11/1/12—11/1/13 | 372,878 a | 397,910 | 4.81%, 8/16/32 | 2,814,465 | 2,893,756 |
| REMIC, Ser. 2003-65, | Ser. 2003-36, Cl. D, 4.88%, | ||||
| Cl. CA, 3.75%, 7/25/18 | 1,860,107 a | 1,919,240 | 3/16/36 | 152,013 | 152,240 |
| REMIC, Ser.2005-44, CI. PC, | Ser. 2003-98, Cl. PD, 5.00%, | ||||
| 5.00%, 11/25/27 | 117,040 a | 117,725 | 4/20/30 | 1,016,685 | 1,032,054 |
| Ser. 2002-T11, Cl. A, | Ser. 2006-31, Cl. C, 5.07%, | ||||
| 4.77%, 4/25/12 | 80,792 a | 81,621 | 5/16/34 | 2,284,669 b | 2,354,723 |
| Ser. 2002-T3, Cl. A, 5.14%, | Ser. 2006-32, Cl. A, 5.08%, | ||||
| 12/25/11 | 78,829 a | 78,774 | 1/16/30 | 2,140,600 b | 2,218,424 |
| Ser. 2002-T3, Cl. B, 5.76%, | Ser. 2004-60, Cl. C, 5.24%, | ||||
| 12/25/11 | 270,000 a | 273,167 | 3/16/28 | 2,872,233 b | 2,951,917 |
| Ser. 2004-51, Cl. C, 5.30%, | |||||
| Government National | 7/16/28 | 2,000,000 b | 2,067,374 | ||
| Mortgage Association I: | Ser. 2004-50, Cl. C, 5.32%, | ||||
| Ser.2011-16, CI. A , 2.21%, | 8/16/30 | 176,808 b | 181,948 | ||
| 11/16/34 | 1,061,567 | 1,086,054 | |||
| 39,509,967 | |||||
| Ser. 2008-52, Cl. A, 3.44%, | |||||
| 5/16/22 | 217,284 | 217,964 | U.S. Government Securities—49.5% | ||
| Ser. 2008-45, Cl. A, 3.58%, | U.S. Treasury Notes: | ||||
| 11/16/27 | 192,695 | 193,732 | 0.38%, 6/30/13 | 12,750,000 | 12,795,849 |
| Ser. 2004-23, Cl. AB, | 0.38%, 7/31/13 | 4,500,000 | 4,516,348 | ||
| 3.63%, 9/16/27 | 442,155 | 458,755 | 0.50%, 5/31/13 | 2,250,000 | 2,262,568 |
| Ser. 2006-68, Cl. A, 3.89%, | 0.50%, 10/15/13 | 11,000,000 | 11,067,892 | ||
| 7/16/26 | 564,379 | 571,560 | 0.50%, 11/15/13 | 11,000,000 | 11,070,466 |
| Ser. 2006-67, Cl. A, 3.95%, | 0.50%, 8/15/14 | 8,750,000 | 8,798,536 | ||
| 11/16/30 | 1,039,658 | 1,067,365 | 0.63%, 4/30/13 | 11,000,000 | 11,082,896 |
| Ser. 2005-76, Cl. A, 3.96%, | 0.63%, 7/15/14 | 5,000,000 | 5,046,485 | ||
| 5/16/30 | 601,791 | 622,117 | 0.75%, 8/15/13 | 11,000,000 | 11,121,176 |
| Ser. 2005-29, Cl. A, 4.02%, | 0.75%, 9/15/13 | 11,000,000 | 11,122,034 | ||
| 7/16/27 | 311,371 | 319,971 | 0.75%, 12/15/13 | 11,000,000 | 11,134,926 |
| Ser. 2006-3, Cl. A, 4.21%, | 1.00%, 7/15/13 | 12,250,000 | 12,436,641 | ||
| 1/16/28 | 99,695 | 100,242 | 1.00%, 1/15/14 | 6,750,000 | 6,874,983 |
| Ser. 2009-19, Cl. AC, | 1.13%, 12/15/12 | 500,000 | 506,250 | ||
| 4.22%, 3/16/34 | 915,660 | 964,373 | 1.13%, 6/15/13 | 11,000,000 | 11,183,887 |
| The Funds | 31 |
STATEMENT OF INVESTMENTS (continued)
| BNY Mellon Short-Term U.S. Government Securities Fund (continued) | |||||
| Principal | |||||
| Bonds and Notes (continued) | Amount ($) | Value ($) | Other Investment—4.0% | Shares | Value ($) |
| U.S. Government Securities (continued) | Registered | ||||
| U.S. Treasury Notes (continued): | Investment Company; | ||||
| 1.25%, 3/15/14 | 10,000,000 | 10,256,260 | Dreyfus Institutional Preferred | ||
| 1.25%, 4/15/14 | 11,000,000 | 11,287,034 | Plus Money Market Fund | ||
| 1.38%, 1/15/13 | 5,500,000 | 5,591,525 | (cost $14,051,000) | 14,051,000 c | 14,051,000 |
| 1.38%, 2/15/13 | 5,500,000 | 5,596,464 | |||
| 1.38%, 3/15/13 | 4,500,000 | 4,582,966 | Total Investments | ||
| 1.38%, 5/15/13 | 3,750,000 | 3,826,335 | (cost $367,321,213) | 105.0% | 368,857,005 |
| 2.63%, 6/30/14 | 1,500,000 | 1,598,320 | Liabilities, Less Cash | ||
| 173,759,841 | and Receivables | (5.0%) | (17,710,695) | ||
| Total Bonds and Notes | Net Assets | 100.0% | 351,146,310 | ||
| (cost $353,270,213) | 354,806,005 | ||||
| BAN—Bond Anticipation Notes |
| GO—General Obligation |
| a The Federal Housing Finance Agency (FHFA) placed Federal Home Loan Mortgage Corporation and Federal National Mortgage Association into conservatorship with FHFA as |
| the conservator.As such, the FHFA oversees the continuing affairs of these companies. |
| b Variable rate security—interest rate subject to periodic change. |
| c Investment in affiliated money market mutual fund. |
| Portfolio Summary (Unaudited)† | |||
| Value (%) | Value (%) | ||
| U.S. Government & Agencies | 99.6 | Municipal Bonds | 1.4 |
| Money Market Investment | 4.0 | 105.0 | |
| † Based on net assets. | |||
| See notes to financial statements. |
32
| STATEMENTS OF ASSETS AND LIABILITIES |
| August 31, 2011 |
| BNY Mellon | BNY Mellon | |||
| BNY Mellon | BNY Mellon | Intermediate | Short-Term | |
| Bond | Intermediate | U.S. Government | U.S. Government | |
| Fund | Bond Fund | Fund | Securities Fund | |
| Assets ($): | ||||
| Investments in securities—See Statement of Investments† | ||||
| (including securities on loan)††—Note 2(b): | ||||
| Unaffiliated issuers | 1,340,696,098 | 970,305,914 | 53,725,347 | 354,806,005 |
| Affiliated issuers | 49,681,241 | 44,428,590 | 1,316,000 | 14,051,000 |
| Cash | — | — | — | 96,741 |
| Dividends and interest receivable | 9,171,651 | 8,639,599 | 310,870 | 866,488 |
| Receivable for investment securities sold | 6,299,274 | — | — | — |
| Receivable for shares of Beneficial Interest subscribed | 1,265,800 | 316,981 | — | 374,762 |
| Prepaid expenses | 9,429 | 10,194 | 15,380 | 14,631 |
| 1,407,123,493 | 1,023,701,278 | 55,367,597 | 370,209,627 | |
| Liabilities ($): | ||||
| Due to The Dreyfus Corporation and affiliates—Note 4(b) | 505,008 | 362,954 | 29,227 | 115,617 |
| Due to Administrator—Note 4(a) | 145,202 | 104,347 | 5,658 | 36,647 |
| Cash overdraft due to Custodian | 3,026,288 | 2,048,611 | 69,329 | — |
| Liability for securities on loan—Note 2(b) | 33,781,241 | 36,135,590 | — | — |
| Payable for investment securities purchased | 3,685,867 | — | 2,250,000 | 18,750,000 |
| Payable for shares of Beneficial Interest redeemed | 1,232,981 | 493,381 | 291 | 114,491 |
| Accrued expenses | 71,478 | 59,504 | 37,722 | 46,562 |
| 42,448,065 | 39,204,387 | 2,392,227 | 19,063,317 | |
| Net Assets ($) | 1,364,675,428 | 984,496,891 | 52,975,370 | 351,146,310 |
| Composition of Net Assets ($): | ||||
| Paid-in capital | 1,298,764,480 | 949,862,516 | 51,422,198 | 359,655,431 |
| Accumulated undistributed investment income—net | 931,256 | 496,207 | 114,134 | 36,324 |
| Accumulated net realized gain (loss) on investments | (4,758,439) | (11,454,024) | (1,025,217) | (10,081,237) |
| Accumulated net unrealized appreciation | ||||
| (depreciation) on investments | 69,738,131 | 45,592,192 | 2,464,255 | 1,535,792 |
| Net Assets ($) | 1,364,675,428 | 984,496,891 | 52,975,370 | 351,146,310 |
| Net Asset Value Per Share | ||||
| Class M Shares | ||||
| Net Assets ($) | 1,353,592,830 | 980,237,146 | 47,258,287 | 349,975,023 |
| Shares Outstanding | 101,191,545 | 74,883,003 | 4,600,981 | 28,456,581 |
| Net Asset Value Per Share ($) | 13.38 | 13.09 | 10.27 | 12.30 |
| Investor Shares | ||||
| Net Assets ($) | 11,082,598 | 4,259,745 | 5,717,083 | 1,171,287 |
| Shares Outstanding | 830,117 | 325,429 | 557,225 | 95,317 |
| Net Asset Value Per Share ($) | 13.35 | 13.09 | 10.26 | 12.29 |
| † Investments at cost ($): | ||||
| Unaffiliated issuers | 1,270,957,967 | 924,713,722 | 51,261,092 | 353,270,213 |
| Affiliated issuers | 49,681,241 | 44,428,590 | 1,316,000 | 14,051,000 |
| ††Value of securities on loan ($) | 102,218,481 | 68,812,123 | — | — |
| See notes to financial statements. |
| The Funds | 33 |
| STATEMENTS OF OPERATIONS |
| Year Ended August 31, 2011 |
| BNY Mellon | BNY Mellon | |||
| BNY Mellon | Intermediate | Short-Term | ||
| BNY Mellon | Intermediate | U.S. Government | U.S. Government | |
| Bond Fund | Bond Fund | Fund | Securities Fund | |
| Investment Income ($): | ||||
| Income: | ||||
| Interest | 49,598,553 | 29,271,221 | 1,456,053 | 3,560,083 |
| Cash dividends: | ||||
| Unaffiliated issuers | 6,330 | — | — | — |
| Affiliated issuers | 43,941 | 16,032 | 1,424 | 8,086 |
| Income from securities lending—Note 2(b) | 62,105 | 30,216 | — | 10,919 |
| Total Income | 49,710,929 | 29,317,469 | 1,457,477 | 3,579,088 |
| Expenses: | ||||
| Investment advisory fee—Note 4(a) | 5,635,285 | 3,946,145 | 311,870 | 1,156,096 |
| Administration fee—Note 4(a) | 1,738,875 | 1,217,579 | 76,986 | 407,634 |
| Custodian fees—Note 4(b) | 93,535 | 69,704 | 5,974 | 26,417 |
| Trustees’ fees and expenses—Note 4(c) | 65,200 | 37,591 | 3,421 | 17,718 |
| Loan commitment fees—Note 3 | 34,376 | 31,824 | 651 | 7,574 |
| Registration fees | 33,288 | 32,940 | 28,240 | 41,822 |
| Auditing fees | 26,254 | 30,231 | 32,793 | 25,600 |
| Shareholder servicing costs—Note 4(b) | 21,617 | 11,497 | 15,071 | 1,838 |
| Legal fees | 19,800 | 13,297 | 1,407 | 6,321 |
| Prospectus and shareholders’ reports | 9,662 | 6,307 | 4,950 | 10,911 |
| Miscellaneous | 60,449 | 43,850 | 24,734 | 33,103 |
| Total Expenses | 7,738,341 | 5,440,965 | 506,097 | 1,735,034 |
| Less—reduction in investment advisory fee | ||||
| due to undertaking—Note 4(a) | — | — | (6,758) | — |
| Less—reduction in fees due to earnings credits—Note 4(b) | (23) | (3) | (17) | (3) |
| Net Expenses | 7,738,318 | 5,440,962 | 499,322 | 1,735,031 |
| Investment Income—Net | 41,972,611 | 23,876,507 | 958,155 | 1,844,057 |
| Realized and Unrealized Gain (Loss) | ||||
| on Investments—Note 5 ($): | ||||
| Net realized gain (loss) on investments | 15,898,386 | 9,837,850 | 586,651 | 1,954,973 |
| Net unrealized appreciation (depreciation) on investments | (3,613,978) | (6,121,654) | (162,448) | (1,321,553) |
| Net Realized and Unrealized Gain (Loss) on Investments | 12,284,408 | 3,716,196 | 424,203 | 633,420 |
| Net Increase in Net Assets Resulting from Operations | 54,257,019 | 27,592,703 | 1,382,358 | 2,477,477 |
| See notes to financial statements. | ||||
34
STATEMENTS OF CHANGES IN NET ASSETS
| BNY Mellon Bond Fund | BNY Mellon Intermediate Bond Fund | |||
| Year Ended August 31, | Year Ended August 31, | |||
| 2011 | 2010 | 2011 | 2010 | |
| Operations ($): | ||||
| Investment income—net | 41,972,611 | 46,809,985 | 23,876,507 | 25,172,141 |
| Net realized gain (loss) on investments | 15,898,386 | 26,793,639 | 9,837,850 | 9,510,348 |
| Net unrealized appreciation (depreciation) on investments | (3,613,978) | 33,824,361 | (6,121,654) | 24,451,432 |
| Net Increase (Decrease) in Net Assets | ||||
| Resulting from Operations | 54,257,019 | 107,427,985 | 27,592,703 | 59,133,921 |
| Dividends to Shareholders from ($): | ||||
| Investment income—net: | ||||
| Class M Shares | (51,511,414) | (57,273,181) | (31,959,623) | (34,238,003) |
| Investor Shares | (280,940) | (317,453) | (132,490) | (105,565) |
| Net realized gain on investments: | ||||
| Class M Shares | (1,949,838) | — | — | — |
| Investor Shares | (10,235) | — | — | — |
| Total Dividends | (53,752,427) | (57,590,634) | (32,092,113) | (34,343,568) |
| Beneficial Interest Transactions ($): | ||||
| Net proceeds from shares sold: | ||||
| Class M Shares | 207,907,988 | 367,138,065 | 231,106,543 | 345,023,068 |
| Investor Shares | 9,227,569 | 9,726,748 | 10,465,058 | 6,082,988 |
| Dividends reinvested: | ||||
| Class M Shares | 7,550,755 | 7,264,737 | 5,667,103 | 6,687,797 |
| Investor Shares | 218,048 | 230,353 | 125,034 | 94,585 |
| Cost of shares redeemed: | ||||
| Class M Shares | (318,242,341) | (308,825,208) | (240,636,818) | (244,678,747) |
| Investor Shares | (11,374,764) | (4,008,682) | (11,053,561) | (4,224,495) |
| Increase (Decrease) in Net Assets from | ||||
| Beneficial Interest Transactions | (104,712,745) | 71,526,013 | (4,326,641) | 108,985,196 |
| Total Increase (Decrease) in Net Assets | (104,208,153) | 121,363,364 | (8,826,051) | 133,775,549 |
| Net Assets ($): | ||||
| Beginning of Period | 1,468,883,581 | 1,347,520,217 | 993,322,942 | 859,547,393 |
| End of Period | 1,364,675,428 1,468,883,581 | 984,496,891 | 993,322,942 | |
| Undistributed investment income—net | 931,256 | 2,360,137 | 496,207 | 1,123,674 |
| Capital Share Transactions (Shares): | ||||
| Class M Shares | ||||
| Shares sold | 15,717,645 | 28,162,871 | 17,777,662 | 26,754,599 |
| Shares issued for dividends reinvested | 573,560 | 555,927 | 435,762 | 517,830 |
| Shares redeemed | (24,057,698) | (23,661,002) | (18,514,059) | (18,985,466) |
| Net Increase (Decrease) in Shares Outstanding | (7,766,493) | 5,057,796 | (300,635) | 8,286,963 |
| Investor Shares | ||||
| Shares sold | 696,544 | 741,666 | 804,396 | 469,607 |
| Shares issued for dividends reinvested | 16,541 | 17,645 | 9,616 | 7,308 |
| Shares redeemed | (855,464) | (306,534) | (851,234) | (328,177) |
| Net Increase (Decrease) in Shares Outstanding | (142,379) | 452,777 | (37,222) | 148,738 |
| See notes to financial statements. | ||||
| The Funds | 35 |
STATEMENTS OF CHANGES IN NET ASSETS (continued)
| BNY Mellon Intermediate | BNY Mellon Short-Term | |||
| U.S. Government Fund | U.S. Government Securities Fund | |||
| Year Ended August 31, | Year Ended August 31, | |||
| 2011 | 2010 | 2011 | 2010 | |
| Operations ($): | ||||
| Investment income—net | 958,155 | 1,073,308 | 1,844,057 | 2,672,649 |
| Net realized gain (loss) on investments | 586,651 | 718,436 | 1,954,973 | 1,181,656 |
| Net unrealized appreciation (depreciation) on investments | (162,448) | 1,360,631 | (1,321,553) | 937,169 |
| Net Increase (Decrease) in Net Assets | ||||
| Resulting from Operations | 1,382,358 | 3,152,375 | 2,477,477 | 4,791,474 |
| Dividends to Shareholders from ($): | ||||
| Investment income—net: | ||||
| Class M Shares | (1,571,148) | (1,804,997) | (5,009,459) | (4,677,556) |
| Investor Shares | (143,938) | (190,012) | (8,790) | (15,711) |
| Net realized gain on investments: | ||||
| Class M Shares | (41,533) | (829,682) | — | — |
| Investor Shares | (3,710) | (95,399) | — | — |
| Total Dividends | (1,760,329) | (2,920,090) | (5,018,249) | (4,693,267) |
| Beneficial Interest Transactions ($): | ||||
| Net proceeds from shares sold: | ||||
| Class M Shares | 18,119,371 | 17,557,948 | 209,438,125 | 257,459,398 |
| Investor Shares | 422,484 | 287,498 | 3,271,802 | 903,260 |
| Dividends reinvested: | ||||
| Class M Shares | 345,524 | 890,528 | 1,052,784 | 1,087,611 |
| Investor Shares | 131,905 | 262,075 | 6,565 | 3,820 |
| Cost of shares redeemed: | ||||
| Class M Shares | (30,681,299) | (14,862,578) | (162,688,297) | (130,942,023) |
| Investor Shares | (1,499,197) | (477,536) | (3,088,010) | (757,806) |
| Increase (Decrease) in Net Assets from | ||||
| Beneficial Interest Transactions | (13,161,212) | 3,657,935 | 47,992,969 | 127,754,260 |
| Total Increase (Decrease) in Net Assets | (13,539,183) | 3,890,220 | 45,452,197 | 127,852,467 |
| Net Assets ($): | ||||
| Beginning of Period | 66,514,553 | 62,624,333 | 305,694,113 | 177,841,646 |
| End of Period | 52,975,370 | 66,514,553 | 351,146,310 | 305,694,113 |
| Undistributed investment income—net | 114,134 | 241,799 | 36,324 | 260,652 |
| Capital Share Transactions (Shares): | ||||
| Class M Shares | ||||
| Shares sold | 1,786,003 | 1,723,129 | 17,006,597 | 20,783,982 |
| Shares issued for dividends reinvested | 34,048 | 87,814 | 85,552 | 87,811 |
| Shares redeemed | (3,027,438) | (1,461,517) | (13,217,225) | (10,571,625) |
| Net Increase (Decrease) in Shares Outstanding | (1,207,387) | 349,426 | 3,874,924 | 10,300,168 |
| Investor Shares | ||||
| Shares sold | 41,554 | 27,940 | 265,750 | 72,868 |
| Shares issued for dividends reinvested | 12,996 | 25,807 | 534 | 308 |
| Shares redeemed | (146,743) | (46,765) | (250,572) | (61,105) |
| Net Increase (Decrease) in Shares Outstanding | (92,193) | 6,982 | 15,712 | 12,071 |
| See notes to financial statements. | ||||
36
FINANCIAL HIGHLIGHTS
The following tables describe the performance for each share class of each BNY Mellon fixed income fund for the fiscal periods indicated. All information (except portfolio turnover rate) reflects financial results for a single fund share. Total return shows how much your investment in each fund would have increased (or decreased) during the period, assuming you had reinvested all dividends and distributions.These figures have been derived from each fund’s financial statements.
| Class M Shares | |||||
| Year Ended August 31, | |||||
| BNY Mellon Bond Fund | 2011 | 2010 | 2009 | 2008 | 2007 |
| Per Share Data ($): | |||||
| Net asset value, beginning of period | 13.36 | 12.90 | 12.38 | 12.24 | 12.23 |
| Investment Operations: | |||||
| Investment income—neta | .39 | .43 | .52 | .60 | .57 |
| Net realized and unrealized | |||||
| gain (loss) on investments | .14 | .56 | .56 | .15 | .04 |
| Total from Investment Operations | .53 | .99 | 1.08 | .75 | .61 |
| Distributions: | |||||
| Dividends from investment income—net | (.49) | (.53) | (.56) | (.61) | (.60) |
| Dividends from net realized gain on investments | (.02) | — | — | — | — |
| Total Distributions | (.51) | (.53) | (.56) | (.61) | (.60) |
| Net asset value, end of period | 13.38 | 13.36 | 12.90 | 12.38 | 12.24 |
| Total Return (%) | 4.06 | 7.84 | 8.95 | 6.17 | 5.06 |
| Ratios/Supplemental Data (%): | |||||
| Ratio of total expenses to average net assets | .55 | .55 | .56 | .55 | .56 |
| Ratio of net expenses to average net assets | .55 | .55 | .56 | .55 | .56 |
| Ratio of net investment income to average net assets | 2.98 | 3.29 | 4.15 | 4.78 | 4.67 |
| Portfolio Turnover Rate | 86.75b | 99.66 | 62.19 | 60.76 | 134.49 |
| Net Assets, end of period ($ x 1,000) | 1,353,593 | 1,455,913 | 1,340,824 | 995,421 | 944,416 |
| a Based on average shares outstanding at each month end. |
| b The portfolio turnover rate excluding mortgage dollar roll transactions for the period ended August 31, 2011 was 79.13%. |
| See notes to financial statements. |
| The Funds | 37 |
FINANCIAL HIGHLIGHTS (continued)
| Investor Shares | |||||
| Year Ended August 31, | |||||
| BNY Mellon Bond Fund | 2011 | 2010 | 2009 | 2008 | 2007 |
| Per Share Data ($): | |||||
| Net asset value, beginning of period | 13.34 | 12.88 | 12.36 | 12.21 | 12.21 |
| Investment Operations: | |||||
| Investment income—neta | .35 | .39 | .50 | .56 | .53 |
| Net realized and unrealized | |||||
| gain (loss) on investments | .13 | .57 | .54 | .16 | .04 |
| Total from Investment Operations | .48 | .96 | 1.04 | .72 | .57 |
| Distributions: | |||||
| Dividends from investment income—net | (.45) | (.50) | (.52) | (.57) | (.57) |
| Dividends from net realized gain on investments | (.02) | — | — | — | — |
| Total Distributions | (.47) | (.50) | (.52) | (.57) | (.57) |
| Net asset value, end of period | 13.35 | 13.34 | 12.88 | 12.36 | 12.21 |
| Total Return (%) | 3.72 | 7.60 | 8.74 | 5.81 | 4.82 |
| Ratios/Supplemental Data (%): | |||||
| Ratio of total expenses to average net assets | .80 | .81 | .81 | .80 | .81 |
| Ratio of net expenses to average net assets | .80 | .81 | .81 | .80 | .81 |
| Ratio of net investment income to average net assets | 2.73 | 3.03 | 3.88 | 4.52 | 4.42 |
| Portfolio Turnover Rate | 86.75b | 99.66 | 62.19 | 60.76 | 134.49 |
| Net Assets, end of period ($ x 1,000) | 11,083 | 12,971 | 6,696 | 3,472 | 4,621 |
| a Based on average shares outstanding at each month end. |
| b The portfolio turnover rate excluding mortgage dollar roll transactions for the period ended August 31, 2011 was 79.13%. |
| See notes to financial statements. |
38
| Class M Shares | |||||
| Year Ended August 31, | |||||
| BNY Mellon Intermediate Bond Fund | 2011 | 2010 | 2009 | 2008 | 2007 |
| Per Share Data ($): | |||||
| Net asset value, beginning of period | 13.15 | 12.81 | 12.37 | 12.19 | 12.14 |
| Investment Operations: | |||||
| Investment income—neta | .32 | .35 | .46 | .55 | .53 |
| Net realized and unrealized | |||||
| gain (loss) on investments | .04 | .47 | .50 | .21 | .09 |
| Total from Investment Operations | .36 | .82 | .96 | .76 | .62 |
| Distributions: | |||||
| Dividends from investment income—net | (.42) | (.48) | (.52) | (.58) | (.57) |
| Net asset value, end of period | 13.09 | 13.15 | 12.81 | 12.37 | 12.19 |
| Total Return (%) | 2.84 | 6.52 | 8.07 | 6.19 | 5.22 |
| Ratios/Supplemental Data (%): | |||||
| Ratio of total expenses to average net assets | .55 | .55 | .56 | .55 | .56 |
| Ratio of net expenses to average net assets | .55 | .55 | .56 | .55 | .56 |
| Ratio of net investment income to average net assets | 2.42 | 2.72 | 3.75 | 4.43 | 4.36 |
| Portfolio Turnover Rate | 45.15 | 44.58 | 53.05 | 53.28 | 84.24 |
| Net Assets, end of period ($ x 1,000) | 980,237 | 988,555 | 856,808 | 785,841 | 725,064 |
| a Based on average shares outstanding at each month end. |
| See notes to financial statements. |
| The Funds | 39 |
FINANCIAL HIGHLIGHTS (continued)
| Investor Shares | |||||
| Year Ended August 31, | |||||
| BNY Mellon Intermediate Bond Fund | 2011 | 2010 | 2009 | 2008 | 2007 |
| Per Share Data ($): | |||||
| Net asset value, beginning of period | 13.15 | 12.81 | 12.36 | 12.19 | 12.14 |
| Investment Operations: | |||||
| Investment income—neta | .29 | .31 | .43 | .53 | .48 |
| Net realized and unrealized | |||||
| gain (loss) on investments | .04 | .48 | .51 | .18 | .11 |
| Total from Investment Operations | .33 | .79 | .94 | .71 | .59 |
| Distributions: | |||||
| Dividends from investment income—net | (.39) | (.45) | (.49) | (.54) | (.54) |
| Net asset value, end of period | 13.09 | 13.15 | 12.81 | 12.36 | 12.19 |
| Total Return (%) | 2.57 | 6.26 | 7.78 | 5.91 | 4.96 |
| Ratios/Supplemental Data (%): | |||||
| Ratio of total expenses to average net assets | .80 | .81 | .81 | .80 | .81 |
| Ratio of net expenses to average net assets | .80 | .81 | .81 | .80 | .81 |
| Ratio of net investment income to average net assets | 2.18 | 2.44 | 3.48 | 4.19 | 4.10 |
| Portfolio Turnover Rate | 45.15 | 44.58 | 53.05 | 53.28 | 84.24 |
| Net Assets, end of period ($ x 1,000) | 4,260 | 4,768 | 2,740 | 1,616 | 1,931 |
| a Based on average shares outstanding at each month end. |
| See notes to financial statements. |
40
| Class M Shares† | ||||||
| BNY Mellon Intermediate | Year Ended August 31, | Eight Months Ended | Year Ended December 31, | |||
| U.S. Government Fund | 2011 | 2010 | August 31, 2009a | 2008 | 2007 | 2006 |
| Per Share Data ($): | ||||||
| Net asset value, beginning of period | 10.30 | 10.27 | 10.43 | 9.99 | 9.81 | 9.94 |
| Investment Operations: | ||||||
| Investment income—netb | .16 | .17 | .14 | .42 | .42 | .42 |
| Net realized and unrealized | ||||||
| gain (loss) on investments | .10 | .33 | (.10) | .39 | .23 | (.08) |
| Total from Investment Operations | .26 | .50 | .04 | .81 | .65 | .34 |
| Distributions: | ||||||
| Dividends from investment income—net | (.28) | (.32) | (.20) | (.37) | (.47) | (.47) |
| Dividends from net realized gain on investments | (.01) | (.15) | (.00)c | — | — | — |
| Total Distributions | (.29) | (.47) | (.20) | (.37) | (.47) | (.47) |
| Net asset value, end of period | 10.27 | 10.30 | 10.27 | 10.43 | 9.99 | 9.81 |
| Total Return (%) | 2.59 | 5.03 | .41d | 8.31 | 6.80 | 3.58 |
| Ratios/Supplemental Data (%): | ||||||
| Ratio of total expenses to average net assets | .79 | .74 | .78e | .76 | .77 | .78 |
| Ratio of net expenses to average net assets | .78 | .65 | .65e | .65 | .65 | .65 |
| Ratio of net investment income | ||||||
| to average net assets | 1.56 | 1.71 | 2.08e | 4.12 | 4.31 | 4.27 |
| Portfolio Turnover Rate | 70.98 | 60.52 | 56.74d | 85.47 | 57 | 21 |
| Net Assets, end of period ($ x 1,000) | 47,258 | 59,832 | 56,037 | 120,970 | 106,650 | 103,686 |
| † Represents information for Institutional shares of the fund’s predecessor, BNY Hamilton Intermediate Government Fund, through September 12, 2008. |
| a The fund has changed its fiscal year end from December 31 to August 31. |
| b Based on average shares outstanding at each month end. |
| c Amount represents less than $.01 per share. |
| d Not annualized. |
| e Annualized. |
| See notes to financial statements. |
| The Funds | 41 |
FINANCIAL HIGHLIGHTS (continued)
| Investor Shares† | ||||||
| BNY Mellon Intermediate | Year Ended August 31, | Eight Months Ended | Year Ended December 31, | |||
| U.S. Government Fund | 2011 | 2010 | August 31, 2009a | 2008 | 2007 | 2006 |
| Per Share Data ($): | ||||||
| Net asset value, beginning of period | 10.29 | 10.25 | 10.42 | 9.98 | 9.80 | 9.93 |
| Investment Operations: | ||||||
| Investment income—netb | .13 | .15 | .13 | .39 | .40 | .39 |
| Net realized and unrealized | ||||||
| gain (loss) on investments | .11 | .34 | (.12) | .40 | .23 | (.07) |
| Total from Investment Operations | .24 | .49 | .01 | .79 | .63 | .32 |
| Distributions: | ||||||
| Dividends from investment income—net | (.26) | (.30) | (.18) | (.35) | (.45) | (.45) |
| Dividends from net realized gain on investments | (.01) | (.15) | (.00)c | — | — | — |
| Total Distributions | (.27) | (.45) | (.18) | (.35) | (.45) | (.45) |
| Net asset value, end of period | 10.26 | 10.29 | 10.25 | 10.42 | 9.98 | 9.80 |
| Total Return (%) | 2.36 | 4.87 | .14d | 8.06 | 6.53 | 3.32 |
| Ratios/Supplemental Data (%): | ||||||
| Ratio of total expenses to average net assets | 1.04 | .99 | 1.04e | 1.01 | 1.02 | 1.03 |
| Ratio of net expenses to average net assets | 1.03 | .90 | .90e | .90 | .90 | .90 |
| Ratio of net investment income | ||||||
| to average net assets | 1.30 | 1.46 | 1.89e | 3.87 | 4.06 | 4.02 |
| Portfolio Turnover Rate | 70.98 | 60.52 | 56.74d | 85.47 | 57 | 21 |
| Net Assets, end of period ($ x 1,000) | 5,717 | 6,682 | 6,588 | 6,292 | 6,015 | 6,319 |
| † Represents information for Class A shares of the fund’s predecessor, BNY Hamilton Intermediate Government Fund, through September 12, 2008. |
| a The fund has changed its fiscal year end from December 31 to August 31. |
| b Based on average shares outstanding at each month end. |
| c Amount represents less than $.01 per share. |
| d Not annualized. |
| e Annualized. |
| See notes to financial statements. |
42
| Class M Shares | |||||
| Year Ended August 31, | |||||
| BNY Mellon Short-Term U.S. Government Securities Fund | 2011 | 2010 | 2009 | 2008 | 2007 |
| Per Share Data ($): | |||||
| Net asset value, beginning of period | 12.40 | 12.39 | 12.19 | 12.02 | 11.99 |
| Investment Operations: | |||||
| Investment income—neta | .07 | .13 | .29 | .46 | .56 |
| Net realized and unrealized | |||||
| gain (loss) on investments | .02 | .11 | .30 | .23 | .03 |
| Total from Investment Operations | .09 | .24 | .59 | .69 | .59 |
| Distributions: | |||||
| Dividends from investment income—net | (.19) | (.23) | (.39) | (.52) | (.56) |
| Net asset value, end of period | 12.30 | 12.40 | 12.39 | 12.19 | 12.02 |
| Total Return (%) | .71 | 1.96 | 4.90 | 5.83 | 5.05 |
| Ratios/Supplemental Data (%): | |||||
| Ratio of total expenses to average net assets | .52 | .53 | .56 | .55 | .55 |
| Ratio of net expenses to average net assets | .52 | .53 | .56 | .55 | .55 |
| Ratio of net investment income to average net assets | .56 | 1.07 | 2.32 | 3.79 | 4.65 |
| Portfolio Turnover Rate | 143.65 | 59.58 | 117.43 | 84.77 | 127.30 |
| Net Assets, end of period ($ x 1,000) | 349,975 | 304,707 | 177,005 | 133,857 | 128,628 |
| a Based on average shares outstanding at each month end. |
| See notes to financial statements. |
| The Funds | 43 |
FINANCIAL HIGHLIGHTS (continued)
| Investor Shares | |||||
| Year Ended August 31, | |||||
| BNY Mellon Short-Term U.S. Government Securities Fund | 2011 | 2010 | 2009 | 2008 | 2007 |
| Per Share Data ($): | |||||
| Net asset value, beginning of period | 12.40 | 12.39 | 12.20 | 12.02 | 12.00 |
| Investment Operations: | |||||
| Investment income—neta | .04 | .11 | .23 | .45 | .49 |
| Net realized and unrealized | |||||
| gain (loss) on investments | .00b | .10 | .32 | .22 | .06 |
| Total from Investment Operations | .04 | .21 | .55 | .67 | .55 |
| Distributions: | |||||
| Dividends from investment income—net | (.15) | (.20) | (.36) | (.49) | (.53) |
| Net asset value, end of period | 12.29 | 12.40 | 12.39 | 12.20 | 12.02 |
| Total Return (%) | .34 | 1.73 | 4.63 | 5.55 | 4.67 |
| Ratios/Supplemental Data (%): | |||||
| Ratio of total expenses to average net assets | .78 | .78 | .82 | .79 | .80 |
| Ratio of net expenses to average net assets | .78 | .78 | .82 | .79 | .80 |
| Ratio of net investment income to average net assets | .34 | .84 | 1.93 | 3.61 | 4.51 |
| Portfolio Turnover Rate | 143.65 | 59.58 | 117.43 | 84.77 | 127.30 |
| Net Assets, end of period ($ x 1,000) | 1,171 | 987 | 837 | 94 | 140 |
| a | Based on average shares outstanding at each month end. |
| b | Amount represents less than $.01 per share. |
| See notes to financial statements. | |
44
NOTES TO FINANCIAL STATEMENTS
NOTE 1—General:
BNY Mellon FundsTrust (the “Trust”) was organized as a Massachusetts business trust which is registered under the Investment Company Act of 1940, as amended (the “Act”), as an open-end management investment company and operates as a series company currently consisting of twenty-five series including the following diversified fixed income funds: BNY Mellon Bond Fund, BNY Mellon Intermediate Bond Fund, BNY Mellon Intermediate U.S. Government Fund and BNY Mellon Short-Term U.S. Government Securities Fund (each, a “fund” and collectively, the “funds”). BNY Mellon Bond Fund’s and BNY Mellon Intermediate Bond Fund’s investment objective seek total return (consisting of capital appreciation and current income). BNY Mellon Intermediate U.S. Government Fund’s and BNY Mellon Short-Term U.S. Government Securities Fund’s investment objective seek to provide as high a level of current income as is consistent with the preservation of capital.
BNY Mellon Fund Advisers, a division of The Dreyfus Corporation (the “Manager” or “Dreyfus”), a wholly-owned subsidiary of The Bank of New York Mellon Corporation (“BNY Mellon”), serves as each fund’s investment adviser (“Investment Adviser”). The Bank of New York Mellon, a subsidiary of BNY Mellon and an affiliate of Dreyfus, serves as administrator for the funds pursuant to an Administration Agreement with the Trust (the “Administration Agreement”). The Bank of New York Mellon has entered into a Sub-Administration Agreement with Dreyfus pursuant to which The Bank of New York Mellon pays Dreyfus for performing certain administrative services. MBSC Securities Corporation (the “Distributor”), a wholly-owned subsidiary of Dreyfus, is the distributor of each fund’s shares, which are sold without a sales charge.
The Trust is authorized to issue an unlimited number of shares of Beneficial Interest, par value $.001 per share, in Class M and Investor Class shares of each fund. Each
class of shares has similar rights and privileges, except with respect to the expenses borne by and the shareholder services offered to each class and the shareholder services plan applicable to the Investor shares, the allocation of certain transfer agency costs and certain voting rights. Income, expenses (other than expenses attributable to a specific class), and realized and unrealized gains or losses on investments are allocated to each class of shares based on its relative net assets.
TheTrust accounts separately for the assets, liabilities and operations of each series. Expenses directly attributable to each series are charged to that series’ operations; expenses that are applicable to all series are allocated among them on a pro rata basis.
The Financial Accounting Standards Board (“FASB”) Accounting Standards Codification (“ASC”) is the exclusive reference of authoritative U.S. generally accepted accounting principles (“GAAP”) recognized by the FASB to be applied by nongovernmental entities. Rules and interpretive releases of the Securities and Exchange Commission (“SEC”) under authority of federal laws are also sources of authoritative GAAP for SEC registrants. Each fund’s financial statements are prepared in accordance with GAAP, which may require the use of management estimates and assumptions. Actual results could differ from those estimates.
NOTE 2—Significant Accounting Policies:
(a) Portfolio valuation: The fair value of a financial instrument is the amount that would be received to sell an asset or paid to transfer a liability in an orderly transaction between market participants at the measurement date (i.e. the exit price). GAAP establishes a fair value hierarchy that prioritizes the inputs of valuation techniques used to measure fair value. This hierarchy gives the highest priority to unadjusted quoted prices in active markets for identical assets or liabilities (Level 1 measurements) and the lowest priority to unobservable inputs (Level 3 measurements).
| The Funds | 45 |
NOTES TO FINANCIAL STATEMENTS (continued)
Additionally, GAAP provides guidance on determining whether the volume and activity in a market has decreased significantly and whether such a decrease in activity results in transactions that are not orderly. GAAP requires enhanced disclosures around valuation inputs and techniques used during annual and interim periods.
Various inputs are used in determining the value of each fund’s investments relating to fair value measurements. These inputs are summarized in the three broad levels listed below:
Level 1—unadjusted quoted prices in active markets for identical investments.
Level 2—other significant observable inputs (including quoted prices for similar investments, interest rates, prepayment speeds, credit risk, etc.).
Level 3—significant unobservable inputs (including the funds’ own assumptions in determining the fair value of investments).
The inputs or methodology used for valuing securities are not necessarily an indication of the risk associated with investing in those securities.
Changes in valuation techniques may result in transfers in or out of an assigned level within the disclosure hierarchy. Valuation techniques used to value the funds’ investments are as follows:
Registered investment companies that are not traded on an exchange are valued at their net asset value and are categorized as Level 1 in the hierarchy.
Investments in securities excluding short-term investments (other than U.S. Treasury Bills) are valued each business day by an independent pricing service (the “Service”) approved by the Trust’s Board. Investments for which quoted bid prices are readily available and are representative of the bid side of the market in the judgment of the Service are valued at the mean between the quoted bid prices (as obtained by the Service from dealers in such securities) and asked prices (as calculated by the Service based upon its evaluation of the market for such securities). Other investments (which constitute a majority of
the portfolio securities) are valued as determined by the Service, based on methods which include consideration of: yields or prices of securities of comparable quality, coupon, maturity and type; indications as to values from dealers; and general market conditions.These securities are generally categorized as Level 2 in the hierarchy.
When market quotations or official closing prices are not readily available, or are determined not to reflect accurately fair value, such as when the value of a security has been significantly affected by events after the close of the exchange or market on which the security is principally traded (for example, a foreign exchange or market), but before the fund calculates its net asset value, the fund may value these investments at fair value as determined in accordance with the procedures approved by the Trust’s Board. Certain factors may be considered when fair valuing investments such as: fundamental analytical data, the nature and duration of restrictions on disposition, an evaluation of the forces that influence the market in which the securities are purchased and sold, and public trading in similar securities of the issuer or comparable issuers. Short-term investments, excluding U.S. Treasury Bills, are carried at amortized cost, which approximates market value. These securities are either categorized as Level 2 or 3 depending on the relevant inputs used.
For restricted securities where observable inputs are limited, assumptions about market activity and risk are used and are categorized as Level 3 in the hierarchy.
Table 1 summarizes the inputs used as of August 31, 2011 in valuing each fund’s investments.
In January 2010, FASB issued Accounting Standards Update (“ASU”) No. 2010-06 “Improving Disclosures about FairValue Measurements” (“ASU 2010-06”).The portions of ASU 2010-06 which require reporting entities to prepare new disclosures surrounding amounts and reasons for significant transfers in and out of Level 1 and Level 2 fair value measurements as well as inputs and valuation techniques used to measure fair value for both recurring and nonrecurring fair value measurements that
46
| Table 1—Fair Value Measurements | |||||||
| Investments in Securities | |||||||
| Level 2—Other | |||||||
| Level 1—Unadjusted | Significant | Level 3—Significant | |||||
| Quoted Prices | Observable Inputs | Unobservable Inputs | |||||
| Assets ($) | Liabilities ($) | Assets ($) | Liabilities ($) | Assets ($) | Liabilities ($) | Total | |
| BNY Mellon Bond Fund | |||||||
| Asset-Backed | — | — | 33,962,710 | — | — | — | 33,962,710 |
| Commercial | |||||||
| Mortgage-Backed | — | — | 18,807,970 | — | — | — | 18,807,970 |
| Corporate Bonds† | — | — | 377,468,963 | — | — | — | 377,468,963 |
| Equity Securities— | |||||||
| Domestic† | 88,797 | — | — | — | — | — | 88,797 |
| Foreign Government | — | — | 24,002,796 | — | — | — | 24,002,796 |
| Municipal Bonds | — | — | 61,463,112 | — | — | — | 61,463,112 |
| Mutual Funds | 49,681,241 | — | — | — | — | — | 49,681,241 |
| Residential | |||||||
| Mortgage-Backed | — | — | 461,235 | — | — | — | 461,235 |
| U.S. Government Agencies/ | |||||||
| Mortgage-Backed | — | — | 477,019,597 | — | — | — | 477,019,597 |
| U.S. Treasury | — | — | 347,420,918 | — | — | — | 347,420,918 |
| BNY Mellon Intermediate | |||||||
| Bond Fund | |||||||
| Asset-Backed | — | — | 350,382 | — | — | — | 350,382 |
| Corporate Bonds† | — | — | 375,572,545 | — | — | — | 375,572,545 |
| Foreign Government | — | — | 14,908,574 | — | — | — | 14,908,574 |
| Municipal Bonds | — | — | 45,692,473 | — | — | — | 45,692,473 |
| Mutual Funds | 44,428,590 | — | — | — | — | — | 44,428,590 |
| U.S. Government | |||||||
| Agencies/ | |||||||
| Mortgage-Backed | — | — | 72,653,007 | — | — | — | 72,653,007 |
| U.S. Treasury | — | — | 461,128,933 | — | — | — | 461,128,933 |
| BNY Mellon Intermediate | |||||||
| U.S. Government Fund | |||||||
| Corporate Bonds† | — | — | 1,845,985 | — | — | — | 1,845,985 |
| Mutual Funds | 1,316,000 | — | — | — | — | — | 1,316,000 |
| U.S. Government | |||||||
| Agencies/ | |||||||
| Mortgage-Backed | — | — | 22,052,139 | — | — | — | 22,052,139 |
| U.S. Treasury | — | — | 29,827,223 | — | — | — | 29,827,223 |
| BNY Mellon Short-Term U.S. | |||||||
| Government Securities Fund | |||||||
| Municipal Bonds | — | — | 5,002,011 | — | — | — | 5,002,011 |
| Mutual Funds | 14,051,000 | — | — | — | — | — | 14,051,000 |
| U.S. Government | |||||||
| Agencies/ | |||||||
| Mortgage-Backed | — | — | 176,044,153 | — | — | — | 176,044,153 |
| U.S. Treasury | — | — | 173,759,841 | — | — | — | 173,759,841 |
† See Statements of Investments for additional detailed categorizations.
| The Funds | 47 |
NOTES TO FINANCIAL STATEMENTS (continued)
fall in either Level 2 or Level 3 have been adopted by the funds. No significant transfers between Level 1 or Level 2 fair value measurements occurred at August 31, 2011.
In May 2011, FASB issued ASU No. 2011-04 “Amendments to Achieve Common Fair Value Measurement and Disclosure Requirements in GAAP and International Financial Reporting Standards (“IFRS”)” (“ASU 2011-04”). ASU 2011-04 includes common requirements for measurement of and disclosure about fair value between GAAP and IFRS.ASU 2011-04 will require reporting entities to disclose the following information for fair value measurements categorized within Level 3 of the fair value hierarchy: quantitative information about the unobservable inputs used in the fair value measurement, the valuation processes used by the reporting entity and a narrative description of the sensitivity of the fair value measurement to changes in unobservable inputs and the interrelationships between those unobservable inputs. In addition, ASU 2011-04 will require reporting entities to make disclosures about amounts and reasons for all transfers in and out of Level 1 and Level 2 fair value measurements.The new and revised disclosures are effective for interim and annual reporting periods beginning after December 15, 2011.At this time, management is evaluating the implications of ASU 2011-04 and its impact on the financial statements.
(b) Securities transactions and investment income:
Securities transactions are recorded on a trade date basis. Realized gains and losses from securities transactions are recorded on the identified cost basis. Dividend income is recorded on the ex-dividend date and interest income, including, where applicable, accretion of discount and amortization of premium on investments, is recognized on the accrual basis.
Pursuant to a securities lending agreement withThe Bank of New York Mellon, the funds may lend securities to certain qualified institutions. It is the funds’ policy that, at origination, all loans are secured by collateral of at least 102% of the value of U.S. securities loaned and 105% of
the value of foreign securities loaned. Collateral equivalent to at least 100% of the market value of securities on loan is maintained at all times. Collateral is either in the form of cash, which can be invested in certain money market mutual funds managed by Dreyfus, U.S. Government and Agency securities or letters of credit. The funds are entitled to receive all income on securities loaned, in addition to income earned as a result of the lending transaction.Although each security loaned is fully collateralized, the funds bear the risk of delay in recovery of, or loss of rights in, the securities loaned should a borrower fail to return the securities in a timely manner. Table 2 summarizes the amount The Bank of NewYork Mellon earned from each relevant fund from lending portfolio securities pursuant to the securities lending agreement during the period ended August 31, 2011.
| Table 2—Securities Lending Agreement | |
| BNY Mellon Bond Fund | $33,441 |
| BNY Mellon Intermediate Bond Fund | 16,270 |
| BNY Mellon Short-Term | |
| U.S. Government Securities Fund | 5,879 |
(c) Affiliated issuers: Investments in other investment companies advised by Dreyfus are defined as “affiliated” in the Act.
The funds may invest in shares of certain affiliated investment companies also advised or managed by Dreyfus. Table 3 summarizes each fund’s investments in affiliated investment companies for the period ended August 31, 2011.
(d) Concentration of risk: The funds invest primarily in debt securities. Failure of an issuer of the debt securities to make timely interest or principal payments, or a decline or the perception of a decline in the credit quality of a debt security, can cause the debt security’s price to fall, potentially lowering each fund’s share price. In addition, the value of the debt securities may decline due to general market conditions that are not specifically related to a particular company, such as real or perceived
48
adverse economic conditions, changes in outlook for corporate earnings, changes in interest or currency rates or adverse investor sentiment. They may also decline because of factors that affect a particular industry.
(e) Dividends to shareholders: Dividends payable to shareholders are recorded by the funds on the ex-dividend date. The funds declare and pay dividends from investment income-net monthly. With respect to each series, dividends from net realized capital gains, if any, are normally declared and paid annually, but the funds may make distributions on a more frequent basis to comply with the distribution requirements of the Internal Revenue Code of 1986, as amended (the “Code”). To the extent that net realized capital gains can be offset by capital loss carryovers of that fund, it is the policy of the funds not to distribute such gains. Income and capital
gain distributions are determined in accordance with income tax regulations, which may differ from GAAP.
(f) Federal income taxes: It is the policy of each fund to continue to qualify as a regulated investment company, if such qualification is in the best interests of its shareholders, by complying with the applicable provisions of the Code, and to make distributions of taxable income sufficient to relieve it from substantially all federal income and excise taxes. For federal income tax purposes, each series is treated as a single entity for the purpose of determining such qualification.
As of and during the period ended August 31, 2011, the funds did not have any liabilities for any uncertain tax positions. The funds recognize interest and penalties, if any, related to uncertain tax positions as income tax
| Table 3—Affiliated Investment Companies | |||||
| Value | Value | Net | |||
| 8/31/2010 ($) | Purchases ($) | Sales ($) | 8/31/2011 ($) | Assets (%) | |
| BNY Mellon Bond Fund | |||||
| Dreyfus Institutional Preferred | |||||
| Plus Money Market Fund | 12,219,000 | 621,358,000 | 617,677,000 | 15,900,000 | 1.2 |
| Dreyfus Institutional Cash | |||||
| Advantage Fund† | 962,574 | 364,542,633 | 331,723,966 | 33,781,241 | 2.5 |
| Total | 13,181,574 | 985,900,633 | 949,400,966 | 49,681,241 | 3.7 |
| BNY Mellon Intermediate Bond Fund | |||||
| Dreyfus Institutional Preferred | |||||
| Plus Money Market Fund | 10,833,000 | 208,036,000 | 210,576,000 | 8,293,000 | .8 |
| Dreyfus Institutional Cash | |||||
| Advantage Fund† | 13,308,666 | 264,766,741 | 241,939,817 | 36,135,590 | 3.7 |
| Total | 24,141,666 | 472,802,741 | 452,515,817 | 44,428,590 | 4.5 |
| BNY Mellon Intermediate | |||||
| U.S. Government Fund | |||||
| Dreyfus Institutional Preferred | |||||
| Plus Money Market Fund | 935,000 | 28,461,000 | 28,080,000 | 1,316,000 | 2.5 |
| BNY Mellon Short-Term | |||||
| U.S. Government Securities Fund | |||||
| Dreyfus Institutional Preferred | |||||
| Plus Money Market Fund | 4,348,000 | 201,550,000 | 191,847,000 | 14,051,000 | 4.0 |
| Dreyfus Institutional Cash | |||||
| Advantage Fund† | 5,970,000 | 142,527,419 | 148,497,419 | — | — |
| Total | 10,318,000 | 344,077,419 | 340,344,419 | 14,051,000 | 4.0 |
† On June 7, 2011, Dreyfus Institutional Cash Advantage Plus Fund was acquired by Dreyfus Institutional Cash Advantage Fund, resulting in a transfer of shares.
| The Funds | 49 |
NOTES TO FINANCIAL STATEMENTS (continued)
expense in the Statements of Operations. During the period, the funds did not incur any interest or penalties.
Each of the tax years in the four-year period ended August 31, 2011 remains subject to examination by the Internal Revenue Service and state taxing authorities.
Table 4 summarizes each fund’s components of accumulated earnings on a tax basis at August 31, 2011.
Under the recently enacted Regulated Investment Company Modernization Act of 2010 (the “2010 Act”), each fund will be permitted to carry forward capital losses incurred in taxable years beginning after December 22, 2010 (“post-enactment losses”) for an unlimited period. However, the 2010 Act requires any
Table 4—Components of Accumulated Earnings
post-enactment losses to be utilized before the utilization of losses incurred in taxable years prior to the effective date of the 2010 Act.As a result of this ordering rule, capital loss carry forwards related to taxable years beginning prior to the effective date of the 2010 Act may be more likely to expire unused.
Table 5 summarizes each relevant fund’s accumulated capital loss carryover available for federal income tax purposes to be applied against future net securities profits, if any, realized subsequent to August 31, 2011.
Table 6 summarizes each fund’s tax character of distributions paid to shareholders during the fiscal periods ended August 31, 2011 and August 31, 2010.
| Undistributed | Accumulated | Undistributed | Capital (Losses) | ||
| Ordinary | Capital | Capital | Unrealized | Realized After | |
| Income ($) | (Losses) ($) | Gains ($) | Appreciation ($) | October 31, 2010 ($)† | |
| BNY Mellon Bond Fund | 928,051 | — | — | 65,046,440 | (63,543) |
| BNY Mellon Intermediate Bond Fund | 490,818 | — | 57,455 | 34,086,102 | — |
| BNY Mellon Intermediate U.S. Government Fund | 113,932 | (4,383) | — | 1,992,290 | (548,667) |
| BNY Mellon Short-Term | |||||
| U.S. Government Securities Fund | 36,324 | (7,618,079) | — | 1,295,997 | (2,223,363) |
| † These losses were deferred for tax purposes to the first day of the following fiscal year. |
| Table 5—Capital Loss Carryover |
| Expiring in fiscal | 2014 ($)† | 2015 ($)† | 2016 ($)† | 2017 ($)† | 2018 ($)† | 2019 ($)† | Total ($) |
| BNY Mellon Intermediate | |||||||
| U.S. Government Fund | — | — | — | — | — | 4,383 | 4,383 |
| BNY Mellon Short-Term | |||||||
| U.S. Government Securities Fund | 2,822,720 | 4,701,996 | — | — | 28,529 | 64,834 | 7,618,079 |
| † If not applied, the carryovers expire in the above years. | |||||||
| Table 6—Tax Character of Distributions Paid | |||||||
| Ordinary Income ($) | Long Term Capital Gains ($) | ||||||
| 2011 | 2010 | 2011 | 2010 | ||||
| BNY Mellon Bond Fund | 51,792,354 | 57,590,634 | 1,960,073 | — | |||
| BNY Mellon Intermediate Bond Fund | 32,092,113 | 34,343,568 | — | — | |||
| BNY Mellon Intermediate U.S. Government Fund | 1,716,640 | 2,309,590 | 43,689 | 610,500 | |||
| BNY Mellon Short-Term | |||||||
| U.S. Government Securities Fund | 5,018,249 | 4,693,267 | — | — | |||
50
During the period ended August 31, 2011, as a result of permanent book to tax differences, primarily due to the tax treatment for amortization of premiums and paydown gains and losses on mortgage backed securities and for BNY Mellon Bond Fund, non-deductible losses related to the write-off of a worthless security in a prior year, the funds increased accumulated undistributed investment income-net, decreased accumulated net realized gain (loss) on investments and decreased paid-in capital as summarized in Table 7. Net assets and net asset value per share were not affected by these reclassifications.
(g) New Accounting Pronouncement: In April 2011, FASB issued ASU No. 2011-03 “Transfers and Servicing (Topic 860) Reconsideration of Effective Control for Repurchase Agreements (“ASU 2011-03”) which relates to the accounting for repurchase agreements and similar agreements including mortgage dollar rolls, that both entitle and obligate a transferor to repurchase or redeem financial assets before their maturity.ASU 2011-03 modifies the criteria for determining effective control of transferred assets and as a result certain agreements may now be accounted for as secured borrowings.ASU 2011-03 is effective prospectively for new transfers and existing transactions that are modified in the first interim or annual period beginning on or after December 15, 2011. Management is currently evaluating the implications of this change and its impact on the financial statements.
NOTE 3—Bank Lines of Credit:
The funds participate with other Dreyfus-managed funds in a $225 million unsecured credit facility led by Citibank, N.A. and a $300 million unsecured credit facility provided
by The Bank of New York Mellon (each, a “Facility”), each to be utilized primarily for temporary or emergency purposes, including the financing of redemptions. In connection therewith, the funds have agreed to pay its pro rata portion of commitment fees for each Facility. Interest is charged to the funds based on rates determined pursuant to the terms of the respective Facility at the time of borrowing. During the period ended on August 31, 2011, the funds did not borrow under the Facilities.
NOTE 4—Investment Advisory Fee, Administration Fee and Other Transactions With Affiliates:
(a) Fees payable by the funds pursuant to the provisions of an investment advisory agreement with the Investment Adviser are payable monthly, computed on the average daily value of each fund’s net assets at the following annual rates: .40% of BNY Mellon Bond Fund, .40% of BNY Mellon Intermediate Bond Fund, .50% of BNY Mellon Intermediate U.S. Government Fund and .35% of BNY Mellon Short-Term U.S. Government Securities Fund.
The Investment Adviser had contractually agreed, from September 1, 2010 through September 30, 2010, to waive receipt of its fees and/or assume expenses of BNY Mellon Bond Fund so that the direct expenses of Class M and Investor shares of the fund (excluding taxes, interest, brokerage commissions, commitment fees on borrowings and extraordinary expenses) did not exceed .69% and .94% of the value of the average daily net assets of their respective class. During the period ended August 31, 2011, there was no expense reimbursement pursuant to the undertaking. This undertaking is no longer in effect.
Table 7—Return of Capital Statement of Position
| Accumulated | |||
| Undistributed | Accumulated | ||
| Investment | Net Realized | Paid-in | |
| Income—Net ($) | Gain (Loss) ($) | Capital ($) | |
| BNY Mellon Bond Fund | 8,390,862 | (6,984,862) | (1,406,000) |
| BNY Mellon Intermediate Bond Fund | 7,588,139 | (7,588,139) | — |
| BNY Mellon Intermediate U.S. Government Fund | 629,266 | (629,266) | — |
| BNY Mellon Short-Term U.S. Government Securities Fund | 2,949,864 | (2,949,864) | — |
| The Funds | 51 |
NOTES TO FINANCIAL STATEMENTS (continued)
The Investment Adviser had contractually agreed, from September 1, 2010 through September 30, 2010, to waive receipt of its fees and/or assume the expenses of BNY Mellon Intermediate U.S. Government Fund so that the direct expenses of neither class (excluding shareholder services fees, taxes, interest, brokerage commissions, commitment fees on borrowings, and extraordinary expenses) did not exceed .65% of the value of the average daily net assets of their respective class. The reduction in investment advisory fee, pursuant to the undertaking, amounted to $6,758 during the period ended August 31, 2011.This undertaking is no longer in effect.
Pursuant to the Administration Agreement,The Bank of New York Mellon provides or arranges for fund accounting, transfer agency and other fund administration services and receives a fee based on the total net assets of the Trust based on the following rates:
| 0 up to $6 billion | .15% |
| $6 billion up to $12 billion | .12% |
| In excess of $12 billion | .10% |
The Bank of New York Mellon has entered into a Sub-Administration Agreement with Dreyfus pursuant to which The Bank of New York Mellon pays Dreyfus for performing certain administrative services.
(b) The funds have adopted a Shareholder Services Plan with respect to its Investor shares. Each fund pays the Distributor for the provision of certain services to holders of Investor shares a fee at an annual rate of .25% of the value of the average daily net assets attributable to Investor shares.The services provided may include personal services relating to shareholder accounts, such as answering share-
holder inquiries regarding a fund and providing reports and other information and services related to the maintenance of such shareholder accounts. The Shareholder Services Plan allows the Distributor to make payments from the shareholder services fees it collects from each fund to compensate service agents (certain banks, securities brokers or dealers and other financial institutions) in respect of these services. Table 8 summarizes the amount Investor shares of each fund were charged during the period ended August 31, 2011, pursuant to the Shareholder Services Plan. Additional fees included in shareholder servicing costs in the Statements of Operations include fees paid for cash management charges.
| Table 8—Shareholder Services Plan Fees | |
| BNY Mellon Bond Fund | $20,701 |
| BNY Mellon Intermediate Bond Fund | 11,360 |
| BNY Mellon Intermediate | |
| U.S. Government Fund | 14,372 |
| BNY Mellon Short-Term | |
| U.S. Government Securities Fund | 1,750 |
The funds have arrangements with the custodian and cash management bank whereby the funds may receive earnings credits when positive cash balances are maintained, which are used to offset custody and cash management fees. For financial reporting purposes, the funds include net earnings credits as an expense offset in the Statements of Operations.
The funds compensate The Bank of New York Mellon under cash management agreements for performing cash management services related to fund subscriptions and redemptions. Table 9 summarizes the amount each fund
Table 9—Cash Management Agreement Fees
| Cash Management Fees ($) | Earnings Credits ($) | |
| BNY Mellon Bond Fund | 716 | (23) |
| BNY Mellon Intermediate Bond Fund | 105 | (3) |
| BNY Mellon Intermediate U.S. Government Fund | 547 | (17) |
| BNY Mellon Short-Term U.S. Government Securities Fund | 84 | (3) |
52
was charged during the period ended August 31, 2011, pursuant to the cash management agreements, which is included in Shareholder servicing costs in the Statements of Operations. These fees were offset by earnings credits pursuant to the cash management agreements, also summarized in Table 9.
The funds also compensate The Bank of New York Mellon under a custody agreement for providing custodial services for the funds. Table 10 summarizes the amount each fund was charged during the period ended August 31, 2011, pursuant to the custody agreement.
| Table 10—Custody Agreement Fees | |
| BNY Mellon Bond Fund | $93,535 |
| BNY Mellon Intermediate Bond Fund | 69,704 |
| BNY Mellon Intermediate | |
| U.S. Government Fund | 5,974 |
| BNY Mellon Short-Term | |
| U.S. Government Securities Fund | 26,417 |
During the period ended August 31, 2011, each fund was charged $7,225 for services performed by the Chief Compliance Officer.
Table 11 summarizes the components of “Due to The Dreyfus Corporation and affiliates” in the Statement of Assets and Liabilities for each fund.
(c) Each Trustee who is not an “affiliated person” as defined in the Act receives from the Trust an annual fee of $68,000 and an attendance fee of $7,500 for each in-person meeting attended and $500 for telephone meetings and is reimbursed for travel and out-of-pocket expenses.The Chairman of the Trust’s Board receives an additional annual fee of $15,000 and the Chairman of the Trust’s Audit Committee receives an additional annual fee of $10,000.
NOTE 5—Securities Transactions:
Table 12 summarizes each fund’s aggregate amount of purchases and sales (including paydowns) of investment securities, excluding short-term securities, during the period ended August 31, 2011, of which $105,782,649 in purchases and $106,147,275 in sales were from mortgage dollar roll transactions for BNY Mellon Bond Fund.
Table 11—Due to The Dreyfus Corporation and Affiliates
| Investment | Shareholder | Chief | ||
| Advisory | Custodian | Services | Compliance | |
| Fees ($) | Fees ($) | Plan Fees ($) | Officer Fees ($) | |
| BNY Mellon Bond Fund | 467,399 | 32,300 | 2,056 | 3,253 |
| BNY Mellon Intermediate Bond Fund | 335,887 | 22,940 | 874 | 3,253 |
| BNY Mellon Intermediate U.S. Government Fund | 22,765 | 2,000 | 1,209 | 3,253 |
| BNY Mellon Short-Term U.S. Government Securities Fund | 103,218 | 8,962 | 184 | 3,253 |
| Table 12—Purchases and Sales | ||||
| Purchases ($) | Sales ($) | |||
| BNY Mellon Bond Fund | 1,204,050,973 | 1,318,327,165 | ||
| BNY Mellon Intermediate Bond Fund | 437,581,299 | 440,177,936 | ||
| BNY Mellon Intermediate U.S. Government Fund | 43,435,843 | 54,820,973 | ||
| BNY Mellon Short-Term U.S. Government Securities Fund | 523,697,021 | 467,094,030 | ||
| The Funds | 53 |
NOTES TO FINANCIAL STATEMENTS (continued)
Mortgage Dollar Rolls: A mortgage dollar roll transaction involves a sale by the funds of mortgage related securities that it holds with an agreement by the funds to repurchase similar securities at an agreed upon price and date. The securities purchased will bear the same interest rate as those sold, but generally will be collater-
alized by pools of mortgages with different prepayment histories than those securities sold.
Table 13 summarizes the cost of investments for federal income tax purposes and accumulated net unrealized appreciation on investments for each fund at August 31, 2011.
Table 13—Accumulated Net Unrealized Appreciation
| Cost of | Gross | Gross | ||
| Investments ($) | Appreciation ($) | Depreciation ($) | Net ($) | |
| BNY Mellon Bond Fund | 1,325,330,899 | 72,063,796 | 7,017,356 | 65,046,440 |
| BNY Mellon Intermediate Bond Fund | 980,648,402 | 46,770,892 | 12,684,790 | 34,086,102 |
| BNY Mellon Intermediate U.S. Government Fund | 53,049,057 | 2,599,491 | 607,201 | 1,992,290 |
| BNY Mellon Short-Term U.S. Government Securities Fund | 367,561,008 | 2,256,611 | 960,614 | 1,295,997 |
54
REPORT OF INDEPENDENT REGISTERED PUBLIC ACCOUNTING FIRM
The Board of Trustees and Shareholders of
BNY Mellon Funds Trust:
We have audited the accompanying statements of assets and liabilities of BNY Mellon Bond Fund, BNY Mellon Intermediate Bond Fund, BNY Mellon Intermediate U.S. Government Fund, and BNY Mellon Short-Term U.S. Government Securities Fund, (collectively the “Funds”), each a series of BNY Mellon Funds Trust, including the statements of investments as of August 31, 2011, and the related statements of operations for the year then ended, the statements of changes in net assets for each of the years or period in the two-year period then ended, and the financial highlights for each of the years or period in the five-year period then ended except for the BNY Mellon Intermediate U.S. Government Fund, which was for the years in the two-year period ended August 31, 2011, the eight-month period ended August 31, 2009 and the year ended December 31, 2008.These financial statements and financial highlights are the responsibility of the Fund’s management. Our responsibility is to express an opinion on these financial statements and financial highlights based on our audits.With respect to the BNY Mellon Intermediate U.S. Government Fund, the financial highlights for each of the years in the two-year period ended December 31, 2007 were audited by other independent registered public accountants whose report thereon, dated February 28, 2008, expressed an unqualified opinion on those financial highlights.
We conducted our audits in accordance with the auditing standards of the Public Company Accounting Oversight Board (United States). Those standards require that we
plan and perform the audit to obtain reasonable assurance about whether the financial statements and financial highlights are free of material misstatement.An audit also includes examining, on a test basis, evidence supporting the amounts and disclosures in the financial statements. Our procedures included confirmations of securities owned as of August 31, 2011, by correspondence with the custodian and brokers or by other appropriate procedures where replies from brokers were not received. An audit also includes assessing the accounting principles used and significant estimates made by management, as well as evaluating the overall financial statement presentation. We believe that our audits provide a reasonable basis for our opinion.
In our opinion, the financial statements and financial highlights referred to above present fairly, in all material respects, the financial position of BNY Mellon Bond Fund, BNY Mellon Intermediate Bond Fund, BNY Mellon Intermediate U.S. Government Fund, and BNY Mellon Short-Term U.S. Government Securities Fund as of August 31, 2011, and the results of their operations for the year then ended, the changes in their net assets, and the financial highlights for the periods described in the first paragraph above, in conformity with U.S. generally accepted accounting principles.

New York, New York
October 26, 2011
| The Funds | 55 |
IMPORTANT TAX INFORMATION (Unaudited)
BNY Mellon Bond Fund
For federal tax purposes the fund designates the maximum amount allowable but not less than 93.58% as interest-related dividends in accordance with Sections 871(k)(1) and 881(e) of the Internal Revenue Code. Also the fund designates the maximum amount allowable but not less than $.0182 per share as a capital gain dividend in accordance with Section 852(b)(3)(C) of the Internal Revenue Code. Where required by federal tax law rules, shareholders will receive notification of their portion of the fund’s taxable ordinary dividends and capital gains distributions paid for the 2011 calendar year on Form 1099-DIV which will be mailed in early 2012.
BNY Mellon Intermediate Bond Fund
For federal tax purposes the fund designates the maximum amount allowable but not less than 92.56% as interest-related dividends in accordance with Sections 871(k)(1) and 881(e) of the Internal Revenue Code.
BNY Mellon Intermediate U.S. Government Fund
For federal tax purposes the fund designates the maximum amount allowable but not less than 100% as interest-related dividends in accordance with Sections 871(k)(1) and 881(e) of the Internal Revenue Code.Also for state individual income tax purposes, the fund hereby designates 64.31% of the ordinary income dividends paid
during its fiscal year ended August 31, 2011 as attributable to interest income from direct obligations of the United States. Such dividends are taxable for individual income tax purposes in most states, including New York, California and the District of Columbia. Also the fund designates the maximum amount allowable but not less than $.0070 per share as a capital gain dividend in accordance with Section 852(b)(3)(C) of the Internal Revenue Code.Where required by federal tax law rules, shareholders will receive notification of their portion of the fund’s taxable ordinary dividends and capital gains distributions paid for the 2011 calendar year on Form 1099-DIV which will be mailed in early 2012.
BNY Mellon Short-Term U.S. Government Securities Fund
For federal tax purposes the fund designates the maximum amount allowable but not less than 100% as interest-related dividends in accordance with Sections 871(k)(1) and 881(e) of the Internal Revenue Code.Also for state individual income tax purposes, the fund hereby designates 51.59% of the ordinary income dividends paid during its fiscal year ended August 31, 2011 as attributable to interest income from direct obligations of the United States. Such dividends are taxable for individual income tax purposes in most states, including New York, California and the District of Columbia.
56
| INFORMATION ABOUT THE RENEWAL OF EACH FUND’S |
| INVESTMENT ADVISORY AGREEMENT AND THE APPROVAL OF |
| EACH FUND’S ADMINISTRATION AGREEMENT (Unaudited) |
At a meeting of the Trust’s Board of Trustees held on March 8-9, 2011, the Board considered the renewal of the Trust’s Investment Advisory Agreement and the Administration Agreement (together, the “Agreement”) pursuant to which BNY Mellon Fund Advisers, a division of Dreyfus, provides the funds with investment advisory services and The Bank of NewYork Mellon provides the funds with administrative services.The Bank of NewYork Mellon has entered into a Sub-Administration Agreement with Dreyfus pursuant to which The Bank of New York Mellon pays Dreyfus for performing certain of these administrative services.The Board members who are not “interested persons” (as defined in the Investment Company Act of 1940, as amended) of the Trust were assisted in their review by independent legal counsel and met with counsel in executive session separate from representatives of Dreyfus. In considering the renewal of the Agreement, the Board considered all factors that it believed to be relevant, including those discussed below. The Board did not identify any one factor as dispositive, and each Board member may have attributed different weights to the factors considered.
Analysis of Nature, Extent, and Quality of Services Provided to the Funds.The Board members considered information previously provided to them in presentations from representatives of Dreyfus regarding the nature, extent, and quality of the services provided to the funds, and representatives of Dreyfus confirmed that there had been no material changes in this information. Dreyfus provided the number of open accounts in each fund, the fund’s asset size and the allocation of fund assets among distribution channels. Dreyfus also had previously provided information regarding the diverse intermediary relationships and distribution channels of the funds and Dreyfus’ corresponding need for broad, deep, and diverse resources to be able to provide ongoing shareholder services to each distribution channel, including the distribution channel(s) for each fund.
The Board members also considered research support available to, and portfolio management capabilities of, each fund’s portfolio management personnel and that Dreyfus also provides oversight of day-to-day fund operations, including fund accounting and administration and assistance in meeting legal and regulatory requirements. The Board members also considered Dreyfus’ extensive administrative, accounting, and compliance infrastructures.
Comparative Analysis of the Funds’ Performance and Advisory Fees and Expense Ratios.The Board members reviewed reports prepared by Lipper, Inc. (“Lipper”), an independent provider of investment company data, which included information comparing (1) each fund’s performance with that of a group of comparable funds (the “Performance Group”) and with a broader group of funds (the “Performance Universe”), all for various periods ended January 31, 2011, and (2) each fund’s actual and contractual advisory fees and total expenses with those of a group of comparable funds (the “Expense Group”) and with a broader group of funds (the “Expense Universe”), the information for which was derived in part from each fund’s financial statements available to Lipper as of January 31, 2011. Dreyfus previously had furnished the Board with a description of the methodology Lipper used to select the Performance Group and Performance Universe and the Expense Group and Expense Universe.
Dreyfus representatives stated that the usefulness of performance comparisons may be affected by a number of factors, including different investment limitations that may be applicable to the fund and comparison funds.They also noted that performance generally should be considered over longer periods of time, although it is possible that long-term performance can be adversely affected by even one period of significant underperformance so that a single investment decision or theme has the ability to affect disproportionately long term performance.
| The Funds | 57 |
| INFORMATION ABOUT THE RENEWAL OF EACH FUND’S INVESTMENT ADVISORY AGREEMENT AND |
| THE APPROVAL OF EACH FUND’S ADMINISTRATION AGREEMENT (Unaudited) (continued) |
As applicable to each fund, representatives of Dreyfus reviewed with the Board members the management or investment advisory fees (1) paid by funds advised or administered by Dreyfus that are in the same Lipper category as the fund and (2) paid to Dreyfus or the Dreyfus-affiliated primary employer of the fund’s primary portfolio manager for advising any separate accounts and/or other types of client portfolios that are considered to have similar investment strategies and policies as the fund (the “Similar Clients”), and explained the nature of the Similar Clients. They discussed differences in fees paid and the relationship of the fees paid in light of any differences in the services provided and other relevant factors.The Board members considered the relevance of the fee information provided for the Similar Clients to evaluate the appropriateness and reasonableness of the fund’s advisory fee.
BNY Mellon Bond Fund
The Board members discussed the results of the comparisons and noted that the fund’s total return performance was generally below the Performance Group and Performance Universe medians for the various periods and ranked in the fourth quartile in the Performance Group for most of the periods. The Board also noted that the fund’s yield performance was above the Performance Group medians for three of the one-year periods, at the Performance Group medians for two of the one-year periods and below the Performance Group medians for five of the one-year periods, ended January 31st, and was above the Performance Universe medians for nine of the one-year periods and below the Performance Universe medians for one of the one-year periods, ended January 31st. Dreyfus also provided a comparison of the fund’s calendar year total returns to
the returns of the fund’s benchmark index. The Board also received a presentation from the fund’s primary portfolio manager regarding the factors which, over the past year, influenced the fund’s performance results, including the fact that the fund’s target duration generally was shorter than that of, and that the fund typically held higher quality securities than those held by some of the funds in, the fund’s peer group.
The Board members also reviewed the range of actual and contractual advisory fees and total expenses of the Expense Group and Expense Universe funds and discussed the results of the comparisons.They noted that the fund’s contractual advisory fee was above the Expense Group median, the fund’s actual advisory fee was above the Expense Group and Expense Universe medians and the fund’s total expenses were above the Expense Group median and below the Expense Universe median. The Board also considered the fee waiver and expense reimbursement arrangement undertaken by the investment adviser that was in effect until September 30, 2010.
BNY Mellon Intermediate Bond Fund
The Board members discussed the results of the comparisons and noted that the fund’s total return performance was below the Performance Group and Performance Universe medians for the various periods, except for the three-, four-, five- and ten-year periods when the fund’s performance was above the Performance Universe medians, and ranked in the fourth quartile in the Performance Group for most of the periods.The Board also noted that the fund’s yield performance was above the Performance Group medians for four of the one-year periods, at the Performance Group median for one of the one-year periods and below the Performance Group medians for
58
five of the one-year periods, ended January 31st, and was above the Performance Universe medians for each of the one-year periods ended January 31st. Dreyfus also provided a comparison of the fund’s calendar year total returns to the returns of the fund’s benchmark index.The Board also received a presentation from the fund’s primary portfolio manager regarding the factors which, over the past year, influenced the fund’s performance results, including the fact that the fund’s target duration generally was shorter than that of, and that the fund typically held higher quality securities than those held by some of the funds in, the fund’s peer group.
The Board members also reviewed the range of actual and contractual advisory fees and total expenses of the Expense Group and Expense Universe funds and discussed the results of the comparisons. They noted that the fund’s contractual advisory fee was above the Expense Group median, the fund’s actual advisory fee was above the Expense Group and Expense Universe medians and the fund’s total expenses were below the Expense Group and Expense Universe medians.
BNY Mellon Intermediate U.S. Government Fund
The Board members discussed the results of the comparisons and noted that the fund’s total return performance was below the Performance Group and Performance Universe medians and ranked in the fourth quartile of the Performance Group for all periods.The Board also noted that the fund’s yield performance was above the Performance Group medians for eight of the one-year periods, at the Performance Group median for one of the one-year periods and below the Performance Group median for one of the one-year periods, ended January
31st, and was above the Performance Universe medians for nine of the one-year periods, and below the Performance Universe median for one of the one-year periods, ended January 31st. Dreyfus also provided a comparison of the fund’s calendar year total returns to the returns of the fund’s benchmark index. The Board also received a presentation from the fund’s primary portfolio manager regarding the factors which, over the past year, influenced the fund’s performance results, including the fact that the fund’s target duration generally was shorter than that of the funds in the fund’s peer group.
The Board members also reviewed the range of actual and contractual advisory fees and total expenses of the Expense Group and Expense Universe funds and discussed the results of the comparisons. They noted that the fund’s contractual advisory fee was at the Expense Group median, the fund’s actual advisory fee was above the Expense Group and Expense Universe medians and fund’s total expenses were at the Expense Group and Expense Universe medians. The Board also considered the fee waiver and expense reimbursement arrangement undertaken by the investment adviser that was in effect until September 30, 2010.
BNY Mellon Short-Term U.S. Government Securities Fund
The Board members discussed the results of the comparisons and noted that the fund’s total return performance was below the Performance Group and Performance Universe medians for the various periods, except for the four-, five- and ten-year periods when the fund’s performance was above the Performance Universe medians, and ranked in the fourth quartile in the Performance
| The Funds | 59 |
| INFORMATION ABOUT THE RENEWAL OF EACH FUND’S INVESTMENT ADVISORY AGREEMENT AND |
| THE APPROVAL OF EACH FUND’S ADMINISTRATION AGREEMENT (Unaudited) (continued) |
Group for most of the periods.The Board also noted that the fund’s yield performance was above the Performance Group medians for eight of the one-year periods, and below the Performance Group medians for two of the one-year periods, ended January 31st, and was above the Performance Universe medians for each of the one-year periods ended January 31st. Dreyfus also provided a comparison of the fund’s calendar year total returns to the returns of the fund’s benchmark index. The Board also received a presentation from the fund’s portfolio manager regarding the factors which, over the past year, influenced the fund’s performance results, including the fact that the fund’s target duration generally was shorter than that of the funds in the fund’s peer group.
The Board members also reviewed the range of actual and contractual advisory fees and total expenses of the Expense Group and Expense Universe funds and discussed the results of the comparisons. They noted that the fund’s contractual advisory fee was below the Expense Group median, the fund’s actual advisory fee was above the Expense Group and Expense Universe medians and the fund’s total expenses were below the Expense Group and Expense Universe medians.
Analysis of Profitability and Economies of Scale. Dreyfus’ representatives reviewed the expenses allocated and profit received by Dreyfus and its affiliates and the resulting profitability percentage for managing each fund, and the method used to determine the expenses and profit.The
Board concluded that the profitability results were not unreasonable, given the services rendered and service levels provided by Dreyfus to each fund. The Board also noted the expense limitation arrangements for certain funds and their effect on Dreyfus’ profitability.The Board previously had been provided with information prepared by an independent consulting firm regarding Dreyfus’ approach to allocating costs to, and determining the profitability of, individual funds and the entire Dreyfus fund complex. The consulting firm also analyzed where any economies of scale might emerge in connection with the management of the funds.
The Board’s counsel stated that the Board members should consider the profitability analysis with respect to each fund (1) as part of their evaluation of whether the fees under the Agreement bear a reasonable relationship to the mix of services provided by Dreyfus, including the nature, extent and quality of such services, and (2) in light of the relevant circumstances for each fund and the extent to which economies of scale would be realized if the relevant fund grows and whether fee levels reflect these economies of scale for the benefit of each fund’s shareholders. Dreyfus representatives noted that a discussion of economies of scale is predicated on a fund having achieved a substantial size with increasing assets and that, if a fund’s assets had been stable or decreasing, the possibility that Dreyfus may have realized any economies of scale would be less. They also noted that, as a result of shared and allocated costs among the funds and the funds
60
in the Dreyfus funds complex, the extent of economies of scale could depend substantially on the level of assets in the complex as a whole, so that increases and decreases in complex-wide assets can affect potential economies of scale in a manner that is disproportionate to, or even in the opposite direction from, changes in each fund’s asset level.The Board members also considered potential benefits to Dreyfus from acting as investment adviser and noted that there were no soft dollar arrangements in effect for trading the funds’ investments.
At the conclusion of these discussions, the Board agreed that it had been furnished with sufficient information to make an informed business decision with respect to the renewal of the Agreement. Based on the discussions and considerations as described above, the Board concluded and determined as follows.
The Board concluded that the nature, extent and quality of the services provided by Dreyfus to each fund are adequate and appropriate.
With respect to each fund, the Board was satisfied with the fund’s yield performance, and noted the con- siderations described above with respect to total return performance.
The Board concluded that the fee paid to Dreyfus by each fund was reasonable in light of the considerations described above.
The Board determined that the economies of scale which may accrue to Dreyfus and its affiliates in con- nection with the management of the funds had been adequately considered by Dreyfus in connection with the advisory fee rate charged to each fund pursuant to the Agreement and that, to the extent in the future it were determined that material economies of scale had not been shared with a fund, the Board would seek to have those economies of scale shared with the fund.
The Board members considered these conclusions and determinations, along with information received on a routine and regular basis throughout the year. In addition, it should be noted that the Board’s consideration of the contractual fee arrangements for each fund had the benefit of a number of years of reviews of prior or similar agreements during which lengthy discussions took place between the Board members and Dreyfus representatives. Certain aspects of the arrangements may receive greater scrutiny in some years than in others, and the Board members’ conclusions may be based, in part, on their consideration of the same or similar arrangements in prior years.The Board members determined that renewal of the Agreement was in the best interests of each fund and its respective shareholders.
| The Funds | 61 |
BOARD MEMBERS INFORMATION (Unaudited)

62

Once elected all Board Members serve for an indefinite term.The address of the Board Members and Officers is in c/o The Dreyfus Corporation, 200 Park Avenue, New York, NewYork 10166.Additional information about the Board Members is available in the fund’s Statement of Additional Information which can be obtained from Dreyfus free of charge by calling this toll free number: 1-800-DREYFUS. For individual account holders for Private Wealth Management clients, please contact your account officer or call 1-888-281-7350.
| The Funds | 63 |
OFFICERS OF THE TRUST (Unaudited)
CHRISTOPHER SHELDON, President since September 2006.
As director of Investment Strategy for BNY Mellon Wealth Management group since April 2003, Mr. Sheldon manages the analysis and development of investment and asset allocation strategies and oversees investment product research. He also oversaw the alternative investment groups from June 2006 to September 2008. He was previously a Vice President of the Trust. He is 46 years old has been employed by BNY Mellon since January 1995.
MICHAEL A. ROSENBERG, Vice President and Secretary since August 2005.
Assistant General Counsel of BNY Mellon, and an officer of 76 investment companies (comprised of 192 portfolios) managed by the Manager. He is 51 years old and has been an employee of the Manager since October 1991.
KIESHA ASTWOOD, Vice President and Assistant Secretary since January 2010.
Counsel of BNY Mellon, and an officer of 76 investment companies (comprised of 192 portfolios) managed by the Manager. She is 38 years old and has been an employee of the Manager since July 1995.
JAMES BITETTO, Vice President and Assistant Secretary since August 2005.
Senior Counsel of BNY Mellon and Secretary of the Manager, and an officer of 76 investment companies (comprised of 192 portfolios) managed by the Manager. He is 45 years old and has been an employee of the Manager since December 1996.
JONI LACKS CHARATAN, Vice President and Assistant Secretary since August 2005.
Senior Counsel of BNY Mellon, and an officer of 76 investment companies (comprised of 192 portfolios) managed by the Manager. She is 55 years old and has been an employee of the Manager since October 1988.
JOSEPH M. CHIOFFI, Vice President and Assistant Secretary since August 2005.
Senior Counsel of BNY Mellon, and an officer of 76 investment companies (comprised of 192 portfolios) managed by the Manager. He is 49 years old and has been an employee of the Manager since June 2000.
KATHLEEN DENICHOLAS, Vice President and Assistant Secretary since January 2010.
Managing Counsel of BNY Mellon, and an officer of 76 investment companies (comprised of 192 portfolios) managed by the Manager. She is 36 years old and has been an employee of the Manager since February 2001.
JANETTE E. FARRAGHER, Vice President and Assistant Secretary since August 2005.
Assistant General Counsel of BNY Mellon, and an officer of 76 investment companies (comprised of 192 portfolios) managed by the Manager. She is 48 years old and has been an employee of the Manager since February 1984.
JOHN B. HAMMALIAN, Vice President and Assistant Secretary since August 2005.
Senior Managing Counsel of BNY Mellon, and an officer of 76 investment companies (comprised of 192 portfolios) managed by the Manager. He is 48 years old and has been an employee of the Manager since February 1991.
M. CRISTINA MEISER, Vice President and Assistant Secretary since January 2010.
Senior Counsel of BNY Mellon, and an officer of 76 investment companies (comprised of 192 portfolios) managed by the Manager. She is 41 years old and has been an employee of the Manager since August 2001.
ROBERT R. MULLERY, Vice President and Assistant Secretary since August 2005.
Managing Counsel of BNY Mellon, and an officer of 76 investment companies (comprised of 192 portfolios) managed by the Manager. He is 59 years old and has been an employee of the Manager since May 1986.
JEFF PRUSNOFSKY, Vice President and Assistant Secretary since August 2005.
Senior Managing Counsel of BNY Mellon, and an officer of 76 investment companies (comprised of 192 portfolios) managed by the Manager. He is 46 years old and has been an employee of the Manager since October 1990.
64
JAMES WINDELS, Treasurer since November 2001.
Director – Mutual Fund Accounting of the Manager, and an officer of 76 investment companies (comprised of 192 portfolios) managed by the Manager. He is 52 years old and has been an employee of the Manager since April 1985.
RICHARD CASSARO, Assistant Treasurer since January 2008.
Senior Accounting Manager – Money Market and Municipal Bond Funds of the Manager, and an officer of 76 investment companies (comprised of 192 portfolios) managed by the Manager. He is 52 years old and has been an employee of the Manager since September 1982.
GAVIN C. REILLY, Assistant Treasurer since December 2005.
Tax Manager of the Investment Accounting and Support Department of the Manager, and an officer of 76 investment companies (comprised of 192 portfolios) managed by the Manager. He is 43 years old and has been an employee of the Manager since April 1991.
ROBERT ROBOL, Assistant Treasurer since December 2002.
Senior Accounting Manager – Fixed Income Funds of the Manager, and an officer of 76 investment companies (comprised of 192 portfolios) managed by the Manager. He is 47 years old and has been an employee of the Manager since October 1988.
ROBERT SALVIOLO, Assistant Treasurer since July 2007.
Senior Accounting Manager – Equity Funds of the Manager, and an officer of 76 investment companies (comprised of 192 portfolios) managed by the Manager. He is 44 years old and has been an employee of the Manager since June 1989.
ROBERT SVAGNA, Assistant Treasurer since December 2002.
Senior Accounting Manager – Equity Funds of the Manager, and an officer of 76 investment companies (comprised of 192 portfolios) managed by the Manager. He is 44 years old and has been an employee of the Manager since November 1990.
JOSEPH W. CONNOLLY, Chief Compliance Officer since October 2004.
Chief Compliance Officer of the Manager and The Dreyfus Family of Funds (76 investment companies, comprised of 192 portfolios). From November 2001 through March 2004, Mr. Connolly was first Vice-President, Mutual Fund Servicing for Mellon Global Securities Services. In that capacity, Mr. Connolly was responsible for managing Mellon’s Custody, Fund Accounting and Fund Administration services to third-party mutual fund clients. He is 54 years old and has served in various capacities with the Manager since 1980, including manager of the firm’s Fund Accounting Department from 1997 through October 2001.
STEPHEN J. STOREN, Anti-Money Laundering Compliance Officer since May 2011.
Chief Compliance Officer of the Distributor, and the Anti-Money Laundering Compliance Officer of 72 investment companies (comprised of 188 portfolios) managed by the Manager. He is 56 years old and has been an employee of the Distributor since October 1999.
| The Funds | 65 |
NOTES

The BNY Mellon Funds
| BNY Mellon National Intermediate Municipal Bond Fund |
| BNY Mellon National Short-Term Municipal Bond Fund |
| BNY Mellon Pennsylvania Intermediate Municipal Bond Fund |
| BNY Mellon Massachusetts Intermediate Municipal Bond Fund |
| BNY Mellon New York Intermediate Tax-Exempt Bond Fund |
| BNY Mellon Municipal Opportunities Fund |
| ANNUAL REPORT | August 31, 2011 |


DISCUSSION OF
FUND PERFORMANCE
For the period of September 1, 2010, through August 31, 2011, as provided by John F. Flahive and Mary Collette O’Brien, Portfolio Managers
Fund and Market Performance Overview
For the 12-month period ended August 31, 2011, BNY Mellon National Intermediate Municipal Bond Fund’s Class M shares produced a total return of 2.07%, Investor shares returned 1.90% and Dreyfus Premier shares returned 1.39%.1 In comparison, the BofA Merrill Lynch 2-17 Year Municipal Bond Index, the fund’s benchmark, returned 3.20% for the same period.2 Effective September 15, 2011, the fund changed its benchmark to the S&P Municipal Bond Intermediate Index, which produced a 3.49% total return for the same period.3
After declining over the final months of 2010, municipal bonds rebounded in 2011 when a reduced supply of newly issued securities was met by robust investor demand.The fund lagged its benchmark, primarily due to its shorter, more conservative maturity positioning.
The Fund’s Investment Approach
The fund seeks to maximize current income exempt from federal income tax to the extent consistent with the preservation of capital.To pursue its goal, the fund normally invests at least 80% of its assets in municipal bonds that provide income exempt from federal income tax.The fund may occasionally, including for temporary defensive purposes, invest in taxable bonds.The fund’s investments in municipal and taxable bonds must be rated investment grade at the time of purchase or, if unrated, deemed of comparable quality by the investment adviser.4 Generally, the fund’s average effective portfolio maturity will be between three and 10 years, and the average effective duration of the fund’s portfolio will not exceed eight years.
Rather than focusing on economic or market trends, we search for securities that, in our opinion, will help us enhance the fund’s yield without sacrificing quality. We use a more tactical approach with respect to the fund’s average duration. If we expect the supply of securities to increase temporarily, we may reduce the fund’s average duration to make cash available for the purchase of higher yielding securities. This is due to the fact that yields generally tend to rise if issuers are competing for investor interest. If we expect demand to surge at a time when we anticipate little issuance and therefore lower yields, we may increase the fund’s average duration to maintain current yields for as long as practical.At other times, we typically try to maintain a neutral average duration.
Municipal Bonds Held Up Relatively Well
New stimulative measures from the Federal Reserve Board, improved economic data and rising corporate earnings buoyed economic sentiment into the first quarter of 2011. However, confidence was shaken in February due to political unrest in the Middle East, and again in March when natural and nuclear disasters struck Japan. Nonetheless, most financial markets bounced back quickly from these unexpected shocks.
Economic sentiment began to deteriorate in earnest in late April when Greece appeared headed for default, U.S. economic data disappointed and the debate regarding government spending and borrowing intensified. Riskier assets suffered bouts of volatility as investors shifted their focus to traditionally defensive investments. Turbulence in the financial markets was particularly severe in August, after a major credit-rating agency downgraded its assessment of long-term U.S. debt securities.
| The Funds | 3 |
DISCUSSION OF FUND PERFORMANCE (continued)
Despite these developments, municipal bonds were buoyed in 2011 by strong investor demand for a limited supply of newly issued securities, offsetting the effects of pronounced market weakness at the end of 2010.The termination of the federally subsidized Build America Bonds program and political pressure to reduce spending led to less municipal borrowing over the first eight months of 2011.Yet, demand remained robust from investors seeking competitive levels of tax-exempt income.
Fund Strategies Produced Mixed Results
The fund produced positive total returns during the reporting period, but relative results were undermined by a “barbell” yield curve strategy that emphasized three-and 15-year maturities when intermediate-term bonds generally fared better. In addition, to reduce the fund’s sensitivity to changing interest rates, we set the fund’s average duration in a relatively short position. Although this strategy bolstered relative performance early in the reporting period, it later proved counterproductive.
The fund achieved better results from municipal bonds with seven- to 10-year maturities. Bonds with A and BBB credit ratings, which are at the lower end of the investment-grade range, also buoyed results over the first eight months of 2011. Bonds backed by revenues from health care facilities ranked among the reporting period’s top performers.
Positioned for a Slower-Growth Environment
We currently expect the U.S. economic recovery to persist, but at a more sluggish pace than historical norms, as concerns currently weighing on market sentiment
may be slow to recede. Until economic uncertainty wanes, we intend to favor municipal bonds that seek to produce consistent levels of current income while helping to mute market turbulence. In our judgment, this positioning strikes the right balance between income and safety in a potentially volatile market environment.
September 15, 2011
| Bond funds are subject generally to interest rate, credit, liquidity and market |
| risks, to varying degrees, all of which are more fully described in the fund’s |
| prospectus. Generally, all other factors being equal, bond prices are inversely |
| related to interest-rate changes, and rate increases can cause price declines. |
| Total return includes reinvestment of dividends and any capital gains paid |
| and does not take into consideration the applicable contingent deferred sales |
| charges imposed on redemptions in the case of Dreyfus Premier shares. Past |
| performance is no guarantee of future results. Share price, yield and investment |
| return fluctuate such that upon redemption, fund shares may be worth more |
| or less than their original cost. Income may be subject to state and local taxes, |
| and some income may be subject to the federal alternative minimum tax |
| (AMT) for certain investors. Capital gains, if any, are fully taxable. |
| SOURCE: FACTSET — Reflects reinvestment of dividends and, where |
| applicable, capital gain distributions.The BofA Merrill Lynch 2-17Year |
| Municipal Bond Index is a broad-based, unmanaged, market-weighted index |
| of investment grade municipal bonds maturing in the 2-17 year range. |
| SOURCE: LIPPER INC. — Reflects reinvestment of dividends and, |
| where applicable, capital gain distributions.The S&P Municipal Bond |
| Intermediate Index is comprised of bonds in the S&P Municipal Bond Index |
| with a minimum maturity of 3 years and a maximum maturity of up to but |
| not including 15 years as measured from the date on which the Index is |
| rebalanced. Index returns do not reflect the fees and expenses associated with |
| operating a mutual fund. Investors cannot invest directly in any index. In |
| future annual reports, the fund’s performance will no longer be compared to |
| the BofA Merrill Lynch 2-17Year Municipal Bond Index because the S&P |
| Municipal Bond Intermediate Index is deemed to be more reflective of the |
| fund’s current investment profile. |
| The fund may continue to own investment-grade bonds (at the time of |
| purchase), which are subsequently downgraded to below investment grade. |
4

| Average Annual Total Returns as of 8/31/11 | |||||
| Inception | From | ||||
| Date | 1 Year | 5 Years | 10 Years | Inception | |
| Class M shares | 1/1/87 | 2.07% | 4.79% | 4.43% | — |
| Investor shares | 7/11/01 | 1.90% | 4.53% | 4.17% | — |
| Dreyfus Premier shares | |||||
| with applicable redemption †† | 10/11/02 | –1.54% | 3.85% | — | 3.63% |
| without redemption | 10/11/02 | 1.39% | 4.02% | — | 3.63% |
| BofA Merrill Lynch 2-17 Year | |||||
| Municipal Bond Index | 9/30/02 | 3.20% | 5.59% | 5.15% | 4.74%††† |
| S&P Municipal Bond Intermediate Index | 9/30/02 | 3.49% | 5.69% | 5.20% | 4.88%††† |
| † | Source: Lipper Inc. |
| †† | Source: Bloomberg L.P. |
| Past performance is not predictive of future performance.The fund’s performance shown in the graph and table does not reflect the deduction of taxes that a shareholder | |
| would pay on fund distributions or the redemption of fund shares. | |
| The above graph compares a $10,000 investment made in Class M shares and Investor shares of BNY Mellon National Intermediate Municipal Bond Fund on | |
| 8/31/01 to a $10,000 investment made in the BofA Merrill Lynch 2-17Year Municipal Bond Index and the S&P Municipal Bond Intermediate Index on that | |
| date.All dividends and capital gain distributions are reinvested. | |
| Effective September 15, 2011, BNY Mellon National Intermediate Municipal Bond Fund changed its benchmark from the BofA Merrill Lynch 2-17Year Municipal | |
| Bond Index to the S&P Municipal Bond Intermediate Index. In future annual reports, the fund’s performance will no longer be compared to the BofA Merrill Lynch | |
| 2-17Year Municipal Bond Index because the S&P Municipal Bond Intermediate Index is deemed to be more reflective of the fund’s current investment profile. | |
| The fund’s performance shown in the line graph takes into account all applicable fees and expenses for Class M and Investor shares. Performance for Dreyfus Premier | |
| shares will vary from the performance of Class M and Investor shares shown above due to differences in charges and expenses.The BofA Merrill Lynch 2-17Year | |
| Municipal Bond Index is a broad-based, unmanaged, market-weighted index of investment grade municipal bonds maturing in the 2-17 year range.The S&P | |
| Municipal Bond Intermediate Index is comprised of bonds in the S&P Municipal Bond Index with a minimum maturity of 3 years and a maximum maturity of up | |
| to but not including 15 years as measured from the date on which the Index is rebalanced. Unlike a mutual fund, the Indices are not subject to charges, fees and other | |
| expenses. Investors cannot invest directly in any index. Further information relating to fund performance, including expense reimbursements, if applicable, is contained in | |
| the Financial Highlights section of the prospectus and elsewhere in this report. | |
| †† | The maximum contingent deferred sales charge for Dreyfus Premier shares is 3%.After six years Dreyfus Premier shares convert to Investor shares. |
| ††† The Index date is based on the life of Dreyfus Premier shares. For comparative purposes, the value of the Index as of 9/30/02 is used as the beginning value on | |
| 10/11/02 (the inception date for Dreyfus Premier shares). | |
| The Funds | 5 |

DISCUSSION OF
FUND PERFORMANCE
For the period of September 1, 2010, through August 31, 2011, as provided by Timothy J. Sanville and Jeremy N. Baker, Portfolio Managers
Fund and Market Performance Overview
For the 12-month period ended August 31, 2011, BNY Mellon National Short-Term Municipal Bond Fund’s Class M shares produced a total return of 1.31%, and Investor shares produced a total return of 0.98%.1 In comparison, the BofA Merrill Lynch 1-5Year Municipal Bond Index, the fund’s benchmark, produced a total return of 2.28% for the same period.2 Effective September 15, 2011, the fund changed its benchmark to the S&P Municipal Bond Short Index, which produced a 1.96% total return for the same period.3
After declining over the final months of 2010, municipal bonds rebounded in 2011 when a reduced supply of newly issued securities was met by robust investor demand.The fund lagged its benchmark, primarily due to its shorter, more conservative maturity positioning.
The Fund’s Investment Approach
The fund seeks to maximize current income exempt from federal income tax to the extent consistent with the preservation of capital.To pursue its goal, the fund normally invests at least 80% of its assets in municipal bonds that provide income exempt from federal income tax.The fund occasionally may invest in taxable bonds, including for temporary defensive purposes.The fund’s investments in municipal and taxable bonds must be rated investment grade at the time of purchase or, if unrated, deemed of comparable quality by the investment adviser.4 Generally, the average effective portfolio maturity and the average effective portfolio duration of the fund’s portfolio will be less than three years.
Rather than focusing on economic or market trends, we search for securities that, in our opinion, will help us enhance the fund’s yield without sacrificing quality.We use a more tactical approach with respect to the fund’s average duration. If we expect the supply of securities to increase temporarily, we may reduce the fund’s average duration to make cash available for the purchase of higher yielding securities.This is due to the fact that yields generally tend to rise if issuers are competing for investor interest. If we expect demand to surge at a time when we anticipate little issuance and therefore lower yields, we may increase the fund’s average duration to maintain current yields for as long as practical.At other times, we typically try to maintain a neutral average duration.
Municipal Bonds Held Up Relatively Well
New stimulative measures from the Federal Reserve Board, improved economic data and rising corporate earnings buoyed economic sentiment into the first quarter of 2011. However, confidence was shaken in February due to political unrest in the Middle East, and again in March when natural and nuclear disasters struck Japan. Nonetheless, most financial markets bounced back quickly from these unexpected shocks.
Economic sentiment began to deteriorate in earnest in late April when Greece appeared headed for default on its sovereign debt, U.S. economic data disappointed and the debate regarding government spending and borrowing intensified. Riskier assets suffered bouts of volatility as investors shifted their focus to traditionally defensive investments.Turbulence in the financial markets was particularly severe in August, after a major credit-rating agency downgraded its assessment of long-term U.S. debt securities.
6
Despite these developments, municipal bonds were buoyed in 2011 by strong investor demand for a limited supply of newly issued securities, offsetting the effects of pronounced market weakness at the end of 2010.The termination of the federally subsidized Build America Bonds program and political pressure to reduce spending led to less municipal borrowing over the first eight months of 2011.Yet, demand remained robust from investors seeking competitive levels of tax-exempt income. The market rebound was less robust among short-term municipal bonds than among their intermediate-term counterparts.
Fund Strategies Produced Mixed Results
The fund produced positive total returns during the reporting period, but relative results were undermined by a generally defensive interest-rate posture, including an emphasis on securities with one- to two-year maturities at a time when intermediate-term municipal bonds generally fared better. In addition, we favored higher-quality securities with strong liquidity characteristics, preventing the fund from participating as fully as the benchmark in relative strength among bonds with lower credit ratings. Indeed, the fund achieved better results from municipal bonds with A and BBB credit ratings, which are at the lower end of the investment-grade range, over the first eight months of 2011.
Positioned for a Slower-Growth Environment
We currently expect the U.S. economic recovery to persist, but at a more sluggish pace than historical norms, as concerns currently weighing on market sentiment may
be slow to recede. Until economic uncertainty wanes, we intend to favor municipal bonds that seek to produce consistent levels of current income while helping to mute market turbulence. In our judgment, this positioning strikes the right balance between income and safety in a potentially volatile market environment.
September 15, 2011
| Bond funds are subject generally to interest rate, credit, liquidity and market | |
| risks, to varying degrees, all of which are more fully described in the fund’s | |
| prospectus. Generally, all other factors being equal, bond prices are inversely | |
| related to interest-rate changes, and rate increases can cause price declines. | |
| 1 | Total return includes reinvestment of dividends and any capital gains paid. |
| Past performance is no guarantee of future results. Share price, yield and | |
| investment return fluctuate such that upon redemption, fund shares may | |
| be worth more or less than their original cost. Income may be subject to | |
| state and local taxes, and some income may be subject to the federal | |
| alternative minimum tax (AMT) for certain investors. Capital gains, if | |
| any, are fully taxable. | |
| 2 | SOURCE: FACTSET — Reflects reinvestment of dividends and, where |
| applicable, capital gain distributions.The BofA Merrill Lynch 1-5Year | |
| Municipal Bond Index is a broad-based, unmanaged, market-weighted | |
| index of investment-grade municipal bonds maturing in the 1- to (but not | |
| including) 5-year range. | |
| 3 | SOURCE: LIPPER INC. — Reflects reinvestment of dividends and, |
| where applicable, capital gain distributions.The S&P Municipal Bond Short | |
| Index is comprised of bonds in the S&P Municipal Bond Index with a | |
| minimum maturity of 6 months and a maximum maturity of up to but not | |
| including 4 years as measured from the date on which the Index is | |
| rebalanced. Index returns do not reflect the fees and expenses associated with | |
| operating a mutual fund. Investors cannot invest directly in any index. In | |
| future annual reports, the fund’s performance will no longer be compared to | |
| the BofA Merrill Lynch 1-5Year Municipal Bond Index because the S&P | |
| Municipal Bond Short Index is deemed to be more reflective of the fund’s | |
| current investment profile. | |
| 4 | The fund may continue to own investment-grade bonds (at the time of |
| purchase), which are subsequently downgraded to below investment grade. |
| The Funds | 7 |

| Average Annual Total Returns as of 8/31/11 | |||
| 1 Year | 5 Years | 10 Years | |
| Class M shares | 1.31% | 3.08% | 2.74% |
| Investor shares | 0.98% | 2.81% | 2.47% |
| BofA Merrill Lynch 1-5 Year | |||
| Municipal Bond Index | 2.28% | 4.49% | 3.80% |
| S&P Municipal Bond Short Index | 1.96% | 3.94% | 3.35% |
| † Source: Lipper Inc. |
| †† Source: Bloomberg L.P. |
| Past performance is not predictive of future performance.The fund’s performance shown in the graph and table does not reflect the deduction of taxes that a shareholder |
| would pay on fund distributions or the redemption of fund shares. |
| The above graph compares a $10,000 investment made in Class M shares and Investor shares of BNY Mellon National Short-Term Municipal Bond Fund on |
| 8/31/01 to a $10,000 investment made in the BofA Merrill Lynch 1-5Year Municipal Bond Index and S&P Municipal Bond Short Index on that date.All |
| dividends and capital gain distributions are reinvested. |
| Effective September 15, 2011, BNY Mellon National Short-Term Municipal Bond Fund changed its benchmark from the BofA Merrill Lynch 1-5Year Municipal |
| Bond Index to the S&P Municipal Bond Short Index. In future annual reports, the fund’s performance will no longer be compared to the BofA Merrill Lynch 1-5 |
| Year Municipal Bond Index because the S&P Municipal Bond Short Index is deemed to be more reflective of the fund’s current investment profile. |
| The fund’s performance shown in the line graph takes into account all applicable fees and expenses for all share classes.The BofA Merrill Lynch 1-5Year Municipal |
| Bond Index is a broad-based, unmanaged, market-weighted index of investment grade municipal bonds maturing in the 1- to (but not including) 5-year range.The |
| S&P Municipal Bond Short Index is comprised of bonds in the S&P Municipal Bond Index with a minimum maturity of 6 months and a maximum maturity of up |
| to but not including 4 years as measured from the date on which the Index is rebalanced. Unlike a mutual fund, the Indices are not subject to charges, fees and other |
| expenses. Investors cannot invest directly in any index. Further information relating to fund performance, including expense reimbursements, if applicable, is contained in |
| the Financial Highlights section of the prospectus and elsewhere in this report. |
8

DISCUSSION OF
FUND PERFORMANCE
For the period of September 1, 2010, through August 31, 2011, as provided by Mary Collette O’Brien and Jeremy N. Baker, Portfolio Managers
Fund and Market Performance Overview
For the 12-month period ended August 31, 2011, BNY Mellon Pennsylvania Intermediate Municipal Bond Fund’s Class M shares produced a total return of 2.21% and Investor shares returned 1.95%.1 In comparison, the BofA Merrill Lynch 2-17 Year Municipal Bond Index, the fund’s benchmark, returned 3.20% for the same period.2 Effective September 15, 2011, the fund changed its benchmark to the S&P Municipal Bond Intermediate Index, which produced a 3.49% total return for the same period.3
After declining over the final months of 2010, municipal bonds rebounded in 2011 when a reduced supply of newly issued securities was met by robust investor demand.The fund lagged its benchmark, primarily due to its shorter, more conservative maturity positioning.
The Fund’s Investment Approach
The fund seeks as high a level of income exempt from federal and Pennsylvania state income taxes as is consistent with the preservation of capital.To pursue its goal, the fund normally invests at least 80% of its assets in municipal bonds, the interest from which is exempt from federal and Pennsylvania state personal income taxes.The fund may also invest in municipal bonds that are exempt from federal income taxes, but not Pennsylvania personal income taxes, and in taxable bonds.The fund’s investments in municipal and taxable bonds must be rated investment grade at the time of purchase or, if unrated, deemed of comparable quality by the investment adviser.4 Generally, the fund’s average effective portfolio maturity will be between three and 10 years, and the average effective duration of the fund’s portfolio will not exceed eight years.
Rather than focusing on economic or market trends, we search for securities that, in our opinion, will help us enhance the fund’s yield without sacrificing quality. We use a more tactical approach with respect to the fund’s average duration. If we expect the supply of securities to increase temporarily, we may reduce the fund’s average duration to make cash available for the purchase of higher yielding securities. This is due to the fact that yields generally tend to rise if issuers are competing for investor interest. If we expect demand to surge at a time when we anticipate little issuance and therefore lower yields, we may increase the fund’s average duration to maintain current yields for as long as practical. At other times, we typically try to maintain a neutral average duration.
Municipal Bonds Held Up Relatively Well
New stimulative measures from the Federal Reserve Board, improved economic data and rising corporate earnings buoyed economic sentiment into the first quarter of 2011. However, confidence was shaken in February due to political unrest in the Middle East, and in March when natural and nuclear disasters struck Japan. Nonetheless, most financial markets bounced back quickly from these unexpected shocks.
Economic sentiment began to deteriorate in earnest in late April when Greece appeared headed for default, U.S. economic data disappointed and the debate regarding government spending and borrowing intensified. Riskier assets suffered bouts of volatility as investors became more risk-averse. General market turbulence was particularly severe in August, after a major credit-rating agency downgraded its assessment of long-term U.S. debt securities.
Despite these developments, municipal bonds were buoyed in 2011 by strong investor demand for a limited supply of newly issued securities, offsetting market
| The Funds | 9 |
DISCUSSION OF FUND PERFORMANCE (continued)
weakness at the end of 2010. The termination of the federally subsidized Build America Bonds program and political pressure to reduce spending led to less municipal borrowing over the first eight months of 2011, while investor demand remained robust.
Like many states, Pennsylvania reduced spending to bridge its budget deficit during the reporting period. Although tax revenues have remained below prereces-sion levels, receipts have trended up and credit concerns have eased.
Fund Strategies Produced Mixed Results
The fund produced positive total returns during the reporting period, but relative results were undermined by a “barbell” yield curve strategy that placed mild emphasis on three- and 15-year maturities when intermediate-term bonds generally fared better. Although this strategy bolstered relative performance early in the reporting period, it later proved counterproductive.
The fund achieved better results from municipal bonds with seven- to 10-year maturities. Bonds with A and BBB credit ratings ranked among the reporting period’s top performers.
Positioned for a Slower-Growth Environment
We currently expect the U.S. economic recovery to persist, but at a more sluggish pace than historical norms, as concerns currently weighing on market sentiment may be slow to recede. Until economic uncertainty wanes,
we intend to favor municipal bonds that seek to produce consistent levels of current income while helping to mute market turbulence. In our judgment, this positioning strikes the right balance between income and safety in a potentially volatile market environment.
September 15, 2011
| Bond funds are subject generally to interest rate, credit, liquidity and market | |
| risks, to varying degrees, all of which are more fully described in the fund’s | |
| prospectus. Generally, all other factors being equal, bond prices are inversely | |
| related to interest-rate changes, and rate increases can cause price declines. | |
| 1 | Total return includes reinvestment of dividends and any capital gains paid. |
| Past performance is no guarantee of future results. Share price, yield and | |
| investment return fluctuate such that upon redemption, fund shares may be | |
| worth more or less than their original cost. Income may be subject to state and | |
| local taxes for non-Pennsylvania residents, and some income may be subject to | |
| the federal alternative minimum tax (AMT) for certain investors. Capital | |
| gains, if any, are fully taxable. | |
| 2 | SOURCE: FACTSET — Reflects reinvestment of dividends and, where |
| applicable, capital gain distributions.The BofA Merrill Lynch 2-17Year | |
| Municipal Bond Index is a broad-based, unmanaged, market-weighted index | |
| of investment grade municipal bonds maturing in the 2-17 year range. | |
| 3 | SOURCE: LIPPER INC.— Reflects reinvestment of dividends and, where |
| applicable, capital gain distributions.The S&P Municipal Bond Intermediate | |
| Index is comprised of bonds in the S&P Municipal Bond Index with a | |
| minimum maturity of 3 years and a maximum maturity of up to but not | |
| including 15 years as measured from the date on which the Index is | |
| rebalanced. Index returns do not reflect the fees and expenses associated with | |
| operating a mutual fund. Investors cannot invest directly in any index. In | |
| future annual reports, the fund’s performance will no longer be compared to | |
| the BofA Merrill Lynch 2-17Year Municipal Bond Index because the S&P | |
| Municipal Bond Intermediate Index is deemed to be more reflective of the | |
| fund’s current investment profile. | |
| 4 | The fund may continue to own investment-grade bonds (at the time of |
| purchase), which are subsequently downgraded to below investment grade. |
10
| Average Annual Total Returns as of 8/31/11 | |||
| 1 Year | 5 Years | 10 Years | |
| Class M shares | 2.21% | 4.22% | 3.93% |
| Investor shares | 1.95% | 3.94% | 3.65% |
| BofA Merrill Lynch 2-17 Year | |||
| Municipal Bond Index | 3.20% | 5.59% | 5.15% |
| S&P Municipal Bond Intermediate Index | 3.49% | 5.69% | 5.20% |
| † Source: Lipper Inc. |
| †† Source: Bloomberg L.P. |
| Past performance is not predictive of future performance.The fund’s performance shown in the graph and table does not reflect the deduction of taxes that a shareholder |
| would pay on fund distributions or the redemption of fund shares. |
| The above graph compares a $10,000 investment made in Class M shares and Investor shares of BNY Mellon Pennsylvania Intermediate Municipal Bond Fund on |
| 8/31/01 to a $10,000 investment made in the BofA Merrill Lynch 2-17Year Municipal Bond Index and the S&P Municipal Bond Intermediate Index on that |
| date.All dividends and capital gain distributions are reinvested. |
| Effective September 15, 2011, BNY Mellon Pennsylvania Intermediate Municipal Bond Fund changed its benchmark from the BofA Merrill Lynch 2-17Year |
| Municipal Bond Index to the S&P Municipal Bond Intermediate Index. In future annual reports, the fund’s performance will no longer be compared to the BofA Merrill |
| Lynch 2-17Year Municipal Bond Index because the S&P Municipal Bond Intermediate Index is deemed to be more reflective of the fund’s current investment profile. |
| The fund invests primarily in Pennsylvania investment-grade municipal bonds.The fund’s performance shown in the line graph takes into account all applicable fees |
| and expenses for all share classes.The Indices are not limited to investments principally in Pennsylvania municipal obligations.The BofA Merrill Lynch 2-17Year |
| Municipal Bond Index is a broad-based, unmanaged, market-weighted index of investment grade municipal bonds maturing in the 2-17 year range.The S&P |
| Municipal Bond Intermediate Index is comprised of bonds in the S&P Municipal Bond Index with a minimum maturity of 3 years and a maximum maturity of up |
| to but not including 15 years as measured from the date on which the Index is rebalanced.These factors can contribute to the Index potentially outperforming the fund. |
| Unlike a mutual fund, the Indices are not subject to charges, fees and other expenses. Investors cannot invest directly in any index. Further information relating to fund |
| performance, including expense reimbursements, if applicable, is contained in the Financial Highlights section of the prospectus and elsewhere in this report. |
| The Funds | 11 |

DISCUSSION OF
FUND PERFORMANCE
For the period of September 1, 2010, through August 31, 2011, as provided by John F. Flahive and Mary Collette O’Brien, Portfolio Managers
Fund and Market Performance Overview
For the 12-month period ended August 31, 2011, BNY Mellon Massachusetts Intermediate Municipal Bond Fund’s Class M shares produced a total return of 2.02%, Investor shares returned 1.77% and Dreyfus Premier shares returned 1.26%.1 In comparison, the BofA Merrill Lynch 2-17 Year Municipal Bond Index, the fund’s benchmark, returned 3.20% for the same period.2 Effective September 15, 2011, the fund changed its benchmark to the S&P Municipal Bond Intermediate Index, which produced a 3.49% total return for the same period.3
After declining over the final months of 2010, municipal bonds rebounded in 2011 when a reduced supply of newly issued securities was met by robust investor demand.The fund lagged its benchmark, primarily due to its shorter, more conservative maturity positioning.
The Fund’s Investment Approach
The fund seeks as high a level of income exempt from federal and Massachusetts state income taxes as is consistent with the preservation of capital. To pursue its goal, the fund normally invests at least 80% of its assets in municipal bonds, the interest from which is exempt from federal and Massachusetts state personal income taxes. The fund may also invest in municipal bonds that are exempt from federal income taxes, but not Massachusetts personal income taxes, and in taxable bonds.The fund’s investments in municipal and taxable bonds must be rated investment grade at the time of purchase or, if unrated, deemed of comparable quality by the investment
adviser.4 Generally, the fund’s average effective portfolio maturity will be between three and 10 years, and the average effective duration of the fund’s portfolio will not exceed eight years.
Rather than focusing on economic or market trends, we search for securities that, in our opinion, will help us enhance the fund’s yield without sacrificing quality.We use a more tactical approach with respect to the fund’s average duration. If we expect the supply of securities to increase temporarily, we may reduce the fund’s average duration to make cash available for the purchase of higher yielding securities.This is because yields generally tend to rise if issuers are competing for investor interest. If we expect demand to surge at a time when we anticipate little issuance and therefore lower yields, we may increase the fund’s average duration to maintain current yields for as long as practical.At other times, we typically try to maintain a neutral average duration.
Municipal Bonds Held Up Relatively Well amid Uncertainty
New stimulative measures from the Federal Reserve Board, improved economic data and rising corporate earnings buoyed economic sentiment into the first quarter of 2011. However, confidence was shaken in February due to political unrest in the Middle East, and in March when natural and nuclear disasters struck Japan. Nonetheless, most financial markets bounced back quickly from these unexpected shocks.
Economic sentiment began to deteriorate in earnest in late April when Greece appeared headed for default, U.S. economic data disappointed and the debate regarding government spending and borrowing intensified. Riskier assets suffered bouts of volatility as investors
12
became more risk-averse. General market turbulence was particularly severe in August, after a major credit-rating agency downgraded its assessment of long-term U.S. debt securities.
Despite these developments, municipal bonds were buoyed in 2011 by strong investor demand for a limited supply of newly issued securities, offsetting market weakness at the end of 2010.The termination of the federally subsidized Build America Bonds program and political pressure to reduce spending led to less municipal borrowing over the first eight months of 2011, while investor demand remained robust.
Like many states, Massachusetts reduced spending and raised some taxes to bridge its budget deficit during the reporting period. Although tax revenues have remained below prerecession levels, receipts have trended up and credit concerns have eased.
Fund Strategies Produced Mixed Results
The fund produced positive total returns during the reporting period, but relative results were undermined by a “barbell” yield curve strategy that emphasized three- and 15-year maturities when intermediate-term bonds generally fared better. In addition, to reduce the fund’s sensitivity to changing interest rates, we set the fund’s average duration in a relatively short position. Although this strategy bolstered relative performance early in the reporting period, it later proved counterproductive.
The fund achieved better results from municipal bonds with seven- to 10-year maturities. Bonds with A and BBB credit ratings ranked among the reporting period’s top performers.
Positioned for a Slower-Growth Environment
We currently expect the U.S. economic recovery to persist, but at a more sluggish pace than historical norms, as concerns currently weighing on market sentiment may be slow to recede. Until economic uncertainty wanes, we intend to favor municipal bonds that seek to produce consistent levels of current income while helping to mute market turbulence. In our judgment, this positioning strikes the right balance between income and safety in a volatile market environment.
September 15, 2011
| Bond funds are subject generally to interest rate, credit, liquidity and market | |
| risks, to varying degrees, all of which are more fully described in the fund’s | |
| prospectus. Generally, all other factors being equal, bond prices are inversely | |
| related to interest-rate changes, and rate increases can cause price declines. | |
| 1 | Total return includes reinvestment of dividends and any capital gains paid |
| and does not take into consideration the applicable contingent deferred sales | |
| charges imposed on redemptions in the case of Dreyfus Premier shares. Past | |
| performance is no guarantee of future results. Share price, yield and | |
| investment return fluctuate such that upon redemption, fund shares may be | |
| worth more or less than their original cost. Income may be subject to state | |
| and local taxes for non-Massachusetts residents, and some income may be | |
| subject to the federal alternative minimum tax (AMT) for certain investors. | |
| Capital gains, if any, are fully taxable. | |
| 2 | SOURCE: FACTSET — Reflects reinvestment of dividends and, where |
| applicable, capital gain distributions.The BofA Merrill Lynch 2-17Year | |
| Municipal Bond Index is a broad-based, unmanaged, market-weighted | |
| index of investment grade municipal bonds maturing in the 2-17 year range. | |
| 3 | SOURCE: LIPPER INC. — Reflects reinvestment of dividends and, |
| where applicable, capital gain distributions.The S&P Municipal Bond | |
| Intermediate Index is comprised of bonds in the S&P Municipal Bond | |
| Index with a minimum maturity of 3 years and a maximum maturity of | |
| up to but not including 15 years as measured from the date on which the | |
| Index is rebalanced. Index returns do not reflect the fees and expenses | |
| associated with operating a mutual fund. Investors cannot invest directly in | |
| any index. In future annual reports, the fund’s performance will no longer | |
| be compared to the BofA Merrill Lynch 2-17Year Municipal Bond Index | |
| because the S&P Municipal Bond Intermediate Index is deemed to be more | |
| reflective of the fund’s current investment profile. | |
| 4 | The fund may continue to own investment-grade bonds (at the time of |
| purchase), which are subsequently downgraded to below investment grade. |
| The Funds | 13 |
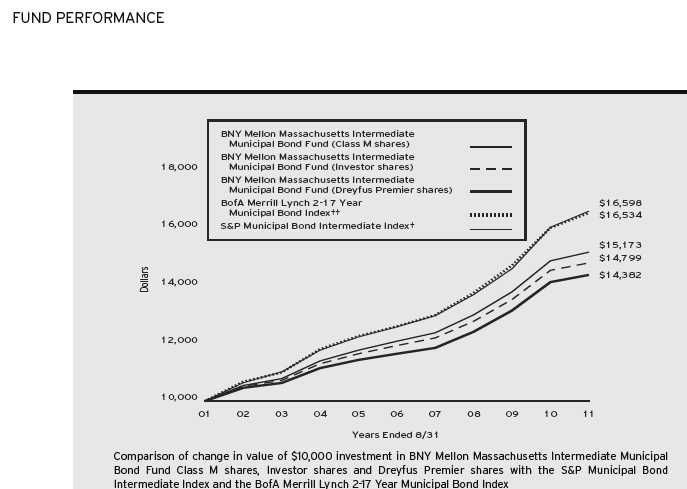
| Average Annual Total Returns as of 8/31/11 | |||
| 1 Year | 5 Years | 10 Years | |
| Class M shares | 2.02% | 4.67% | 4.26% |
| Investor shares | 1.77% | 4.40% | 4.00% |
| Dreyfus Premier shares | |||
| with applicable redemption †† | –1.68% | 3.71% | 3.70% |
| without redemption | 1.26% | 3.89% | 3.70% |
| BofA Merrill Lynch 2-17 Year Municipal Bond Index | 3.20% | 5.59% | 5.15% |
| S&P Municipal Bond Intermediate Index | 3.49% | 5.69% | 5.20% |
| † Source: Lipper Inc. |
| †† Source: Bloomberg L.P. |
| Past performance is not predictive of future performance. |
| The above graph compares a $10,000 investment made in Class M shares, Investor shares and Dreyfus Premier shares of BNY Mellon Massachusetts Intermediate |
| Municipal Bond Fund (the “BNY Mellon Massachusetts Fund”) on 8/31/01 to a $10,000 investment made in the BofA Merrill Lynch 2-17Year Municipal |
| Bond Index and the S&P Municipal Bond Intermediate Index on that date.All dividends and capital gain distributions are reinvested. |
| Effective September 15, 2011, the BNY Mellon Massachusetts Intermediate Municipal Bond Fund changed its benchmark from the BofA Merrill Lynch 2-17Year |
| Municipal Bond Index to the S&P Municipal Bond Intermediate Index. In future annual reports, the fund’s performance will no longer be compared to the BofA Merrill |
| Lynch 2-17Year Municipal Bond Index because the S&P Municipal Bond Intermediate Index is deemed to be more reflective of the fund’s current investment profile. |
| As of the close of business on September 6, 2002, substantially all of the assets of another investment company managed by Dreyfus, Dreyfus Premier Limited Term |
| Massachusetts Municipal Fund (the “Premier Massachusetts Fund”), were transferred to the BNY Mellon Massachusetts Fund in a tax-free reorganization and the fund |
| commenced operations.The performance shown in the line graph for Class M shares represents the performance of the Premier Massachusetts Fund’s Class R shares prior to |
| the commencement of operations of the BNY Mellon Massachusetts Fund and the performance of the BNY Mellon Massachusetts Fund’s Class M shares thereafter. |
| The performance shown in the line graph for Investor shares represents the performance of the Premier Massachusetts Fund’s Class A shares prior to the commencement |
| of operations of the BNY Mellon Massachusetts Fund, and the performance of the BNY Mellon Massachusetts Fund’s Investor shares thereafter. |
| The fund’s performance shown in the line graph takes into account all applicable fees and expenses for all share classes.The BofA Merrill Lynch 2-17Year Municipal |
| Bond Index is a broad-based, unmanaged, market-weighted index of investment grade municipal bonds maturing in the 2-17 year range.The S&P Municipal Bond |
| Intermediate Index is comprised of bonds in the S&P Municipal Bond Index with a minimum maturity of 3 years and a maximum maturity of up to but not |
| including 15 years as measured from the date on which the Index is rebalanced.These factors can contribute to the Index outperforming or underperforming the fund. |
| Unlike a mutual fund, the Indices are not subject to charges, fees and other expenses and are not limited to investments principally in Massachusetts municipal |
| obligations. Investors cannot invest directly in any index. Further information relating to fund performance, including expense reimbursements, if applicable, is contained |
| in the Financial Highlights section of the prospectus and elsewhere in this report. Performance for Dreyfus Premier shares assumes the conversion of Dreyfus Premier |
| shares to Investor shares at the end of the sixth year following the date of purchase. |
| †† The maximum contingent deferred sales charge for Dreyfus Premier shares is 3%.After six years Dreyfus Premier shares convert to Investor shares. |
14

DISCUSSION OF
FUND PERFORMANCE
For the period of September 1, 2010, through August 31, 2011, as provided by John F. Flahive, Portfolio Manager and Director of Fixed Income
Fund and Market Performance Overview
For the 12-month period ended August 31, 2011, BNY Mellon New York Intermediate Tax-Exempt Bond Fund’s Class M shares produced a total return of 2.31%, and Investor shares returned 2.05%.1 In comparison, the BofA Merrill Lynch 2-17 Year Municipal Bond Index, the fund’s benchmark, returned 3.20% for the same period.2 Effective September 15, 2011, the fund changed its benchmark to the S&P Municipal Bond Intermediate Index, which produced a 3.49% total return for the same period.3
After declining over the final months of 2010, municipal bonds rebounded in 2011 when a reduced supply of newly issued securities was met by robust investor demand.The fund lagged its benchmark, primarily due to its shorter, more conservative maturity positioning.
The Fund’s Investment Approach
The fund seeks as high a level of income exempt from federal, NewYork state and NewYork city income taxes as is consistent with the preservation of capital. This objective may be changed without shareholder approval. To pursue its goal, the fund normally invests at least 80% of its assets in municipal bonds that provide income exempt from federal, NewYork state and NewYork city personal income taxes. These municipal bonds include those issued by New York state and New York city as well as those issued by U.S. territories and possessions.4 Generally, the fund’s average effective portfolio maturity will be between three and 10 years.
Rather than focusing on economic or market trends, we search for securities that, in our opinion, will help us enhance the fund’s yield without sacrificing quality.We
use a more tactical approach with respect to the fund’s average duration. If we expect the supply of securities to increase temporarily, we may reduce the fund’s average duration to make cash available for the purchase of higher yielding securities.This is because yields generally tend to rise if issuers are competing for investor interest. If we expect demand to surge at a time when we anticipate little issuance and therefore lower yields, we may increase the fund’s average duration to maintain current yields for as long as practical.At other times, we typically try to maintain a neutral average duration.
Municipal Bonds Held Up Relatively Well Amid Uncertainty
Investors’ outlooks had improved dramatically by the start of the reporting period when the Federal Reserve Board announced new measures designed to jump-start the U.S. economy. Subsequent improvements in economic data and corporate earnings further buoyed market sentiment into the first quarter of 2011. However, confidence was shaken in February due to political unrest in the Middle East, and in March when natural and nuclear disasters struck Japan. Nonetheless, most financial markets bounced back quickly from these unexpected shocks.
Economic sentiment began to deteriorate in earnest in late April when Greece appeared headed for default, U.S. economic data disappointed and the debate regarding government spending and borrowing intensified. Riskier assets suffered bouts of volatility as investors became more risk-averse. General market turbulence was particularly severe in August, after a major credit-rating agency downgraded its assessment of long-term U.S. debt securities.
Despite these developments, municipal bonds were buoyed in 2011 by strong investor demand for a limited supply of newly issued securities, offsetting market weakness at the end of 2010. The termination of the federally subsidized Build America Bonds program and
| The Funds | 15 |
DISCUSSION OF FUND PERFORMANCE (continued)
political pressure to reduce spending led to less municipal borrowing over the first eight months of 2011, while investor demand remained robust.
Like many states, New York reduced spending and raised some taxes to bridge its budget deficit during the reporting period. Although tax revenues have remained below prerecession levels, receipts have trended up and credit concerns have eased.
Fund Strategies Produced Mixed Results
The fund produced positive total returns during the reporting period, but relative results were undermined by a “barbell” yield curve strategy that de-emphasized maturities in the five- to 10-year range when bonds toward the longer end of the intermediate-term spectrum generally fared better. Although this strategy bolstered relative performance early in the reporting period, it later proved counterproductive.
The fund achieved better results from municipal bonds with seven- to 10-year maturities. Bonds with A and BBB credit ratings, including securities backed by revenues from health care facilities, ranked among the fund’s top performers over the reporting period.
Positioned for a Slower-Growth Environment
We currently expect the U.S. economic recovery to persist, but at a more sluggish pace than historical norms, as concerns currently weighing on market sentiment may be slow to recede. Until economic uncertainty wanes, we intend to favor municipal bonds that seek to produce consistent levels of current income while help-
ing to mute market turbulence. In our judgment, this positioning strikes the right balance between income and safety in a potentially volatile market environment.
September 15, 2011
| Bond funds are subject generally to interest rate, credit, liquidity and market | |
| risks, to varying degrees, all of which are more fully described in the fund’s | |
| prospectus. Generally, all other factors being equal, bond prices are inversely | |
| related to interest-rate changes and rate increases can cause price declines. | |
| 1 | Total return includes reinvestment of dividends and any capital gains paid. |
| Past performance is no guarantee of future results. Share price, yield and | |
| investment return fluctuate such that upon redemption, fund shares may be | |
| worth more or less than their original cost. Income may be subject to state | |
| and local taxes for non-NewYork residents, and some income may be | |
| subject to the federal alternative minimum tax (AMT) for certain investors. | |
| Capital gains, if any, are fully taxable. Return figures provided reflect the | |
| absorption of certain fund expenses by BNY Mellon Fund Advisors | |
| pursuant to an agreement in effect through December 31, 2012, at which | |
| time it may be extended, modified or terminated. Had these expenses not | |
| been absorbed, the fund’s returns would have been lower. | |
| 2 | SOURCE: FACTSET — Reflects reinvestment of dividends and, where |
| applicable, capital gain distributions.The BofA Merrill Lynch 2-17Year | |
| Municipal Bond Index is a broad-based, unmanaged, market-weighted | |
| index of investment grade municipal bonds maturing in the 2-17 year range. | |
| 3 | SOURCE: LIPPER INC. — Reflects reinvestment of dividends and, |
| where applicable, capital gain distributions.The S&P Municipal Bond | |
| Intermediate Index is comprised of bonds in the S&P Municipal Bond | |
| Index with a minimum maturity of 3 years and a maximum maturity of | |
| up to but not including 15 years as measured from the date on which the | |
| Index is rebalanced. Index returns do not reflect the fees and expenses | |
| associated with operating a mutual fund. Investors cannot invest directly in | |
| any index. In future annual reports, the fund’s performance will no longer | |
| be compared to the BofA Merrill Lynch 2-17Year Municipal Bond Index | |
| because the S&P Municipal Bond Intermediate Index is deemed to be more | |
| reflective of the fund’s current investment profile. | |
| 4 | The fund may continue to own investment-grade bonds (at the time of |
| purchase), which are subsequently downgraded to below investment grade. |
16

| Average Annual Total Returns as of 8/31/11 | |||
| 1 Year | 5 Years | 10 Years | |
| Class M shares | 2.31% | 4.90% | 4.25% |
| Investor shares | 2.05% | 4.64% | 4.00% |
| BofA Merrill Lynch 2-17 Year Municipal Bond Index | 3.20% | 5.59% | 5.15% |
| S&P Municipal Bond Intermediate Index | 3.49% | 5.69% | 5.20% |
| † | Source: Lipper Inc. |
| †† | Source: Bloomberg L.P. |
| Past performance is not predictive of future performance.The fund’s performance shown in the graph and table does not reflect the deduction of taxes that a shareholder | |
| would pay on fund distributions or the redemption of fund shares. | |
| The above graph compares a $10,000 investment made in Class M shares and Investor shares of BNY Mellon NewYork Intermediate Tax-Exempt Bond Fund on | |
| 8/31/01 to a $10,000 investment made in the BofA Merrill Lynch 2-17Year Municipal Bond Index and the S&P Municipal Bond Intermediate Index on that | |
| date.All dividends and capital gain distributions are reinvested. | |
| Effective September 15, 2011, BNY Mellon NewYork Intermediate Tax-Exempt Bond Fund changed its benchmark from the BofA Merrill Lynch 2-17Year Municipal | |
| Bond Index to the S&P Municipal Bond Intermediate Index. In future annual reports, the fund’s performance will no longer be compared to the BofA Merrill Lynch | |
| 2-17Year Municipal Bond Index because the S&P Municipal Bond Intermediate Index is deemed to be more reflective of the fund’s current investment profile. | |
| As of the close of business on September 12, 2008, substantially all of the assets of another investment company advised by an affiliate of the fund’s investment adviser, | |
| BNY Hamilton NewYork Intermediate Tax-Exempt Fund (the “predecessor fund”), a series of BNY Hamilton Funds, Inc., were transferred to BNY Mellon NewYork | |
| Intermediate Tax-Exempt Bond Fund in a tax-free reorganization and the fund commenced operations.The performance figures for the fund’s Class M shares represent | |
| the performance of the predecessor fund’s Institutional shares prior to the commencement of operations for BNY Mellon NewYork Intermediate Tax-Exempt Bond Fund | |
| and the performance of BNY Mellon NewYork Intermediate Tax-Exempt Bond Fund’s Class M shares thereafter.The performance figures for Investor shares represent | |
| the performance of the predecessor fund’s Class A shares prior to the commencement of operations for BNY Mellon NewYork Intermediate Tax-Exempt Bond Fund and | |
| the performance of BNY Mellon NewYork Intermediate Tax-Exempt Bond Fund’s Investor shares thereafter. Investor shares are subject to a Shareholder Services Plan. | |
| The fund’s performance shown in the line graph takes into account all applicable fees and expenses for all share classes.The Indices are not limited to investments principally | |
| in NewYork municipal obligations.The BofA Merrill Lynch 2-17Year Municipal Bond Index is a broad-based, unmanaged, market-weighted index of investment grade | |
| municipal bonds maturing in the 2-17 year range.The S&P Municipal Bond Intermediate Index is comprised of bonds in the S&P Municipal Bond Index with a | |
| minimum maturity of 3 years and a maximum maturity of up to but not including 15 years as measured from the date on which the Index is rebalanced. Unlike a mutual | |
| fund, the Indices are not subject to charges, fees and other expenses. Investors cannot invest directly in any index. Further information relating to fund performance, including | |
| expense reimbursements, if applicable, is contained in the Financial Highlights section of the prospectus and elsewhere in this report. | |
| T h e | F u n d s | 17 |

DISCUSSION OF
FUND PERFORMANCE
For the period of September 1, 2010, through August 31, 2011, as provided by John F. Flahive, Portfolio Manager and Director of Fixed Income
Fund and Market Performance Overview
For the 12-month period ended August 31, 2011, BNY Mellon Municipal Opportunities Fund’s Class M shares produced a total return of 1.54%, and Investor shares returned 1.21%.1 In comparison, the Barclays Capital Municipal Bond Index (the “Index”), the fund’s benchmark, achieved a total return of 2.66% for the same period.2
After losing value as a result of weak market conditions over the final months of 2010, municipal bonds generally rebounded in 2011 when a reduced supply of newly issued securities was met by robust investor demand.The fund lagged its benchmark, primarily due to shortfalls in a strategy designed to capture relative-value opportunities between municipal bonds and U.S.Treasury securities.
The Fund’s Investment Approach
The fund seeks to maximize total return consisting of high current income exempt from federal income tax and capital appreciation.This objective may be changed without shareholder approval. To pursue its goal, the fund normally invests at least 80% of its assets in U.S. dollar-denominated fixed-income securities that provide income exempt from federal income tax (municipal bonds). While the fund typically invests in a diversified portfolio of municipal bonds, it may invest up to 20% of its assets in taxable fixed-income securities, including taxable municipal bonds and non-U.S. dollar-denominated foreign debt securities, such as Brady bonds and sovereign debt obligations.
We will seek to deliver value-added excess returns (“alpha”) by applying an investment approach designed to identify and exploit relative value opportunities within the municipal bond market and other fixed-income markets. Although the fund seeks to be diversified by geography and sector, the fund may at times invest a significant portion of its assets in a particular state or region or in a particular sector due to market conditions.
Municipal Bonds Held Up Relatively Well
Investors’ outlooks had improved dramatically by the start of the reporting period when the Federal Reserve Board announced new measures designed to jump-start the U.S. economy. Subsequent improvements in economic data and corporate earnings further buoyed market sentiment into the first quarter of 2011. However, investor confidence was shaken in February due to political unrest in the Middle East, and again in March when natural and nuclear disasters in Japan threatened the global industrial supply chain. Nonetheless, most markets bounced back quickly from these unexpected shocks.
Economic sentiment began to deteriorate in earnest in late April when Greece appeared headed for default on its sovereign debt, U.S. economic data disappointed and the debate regarding U.S. government spending and borrowing intensified. Riskier assets suffered bouts of volatility as investors shifted their focus to traditionally defensive investments.Turbulence in the financial markets was particularly severe in August, after a major credit-rating agency downgraded its assessment of long-term U.S. debt securities.
Despite these developments, municipal bond prices were buoyed in 2011 by strong investor demand for a limited
18
supply of newly issued securities, offsetting the effects of market weakness at the end of 2010.The termination of the federally subsidized Build America Bonds program and political pressure to reduce spending led to less municipal borrowing over the first eight months of 2011.Yet, demand remained robust from investors seeking competitive levels of tax-exempt income.
Fund Strategies Produced Mixed Results
The fund produced mildly positive total returns during the reporting period, but relative results were undermined by shortfalls in one of the fund’s three main strategies. Our use of futures contracts to identify and exploit relative values between municipal bonds and U.S.Treasury securities proved ineffective due to heightened volatility in the taxable bond market.
The fund achieved better results from its core holdings of long-term municipal bonds, where revenue bonds issued to finance charter schools, transportation projects and health care facilities fared especially well. In addition, the fund received relatively strong results from general obligation bonds from California and Puerto Rico, which rebounded from depressed levels over the first eight months of 2011.The fund also benefited from its leveraging strategy, which employs tender option bonds to take advantage of changing yield differences along the market’s maturity spectrum.
Positioned for a Slower-Growth Environment
We currently expect the U.S. economic recovery to persist, but at a more sluggish pace than historical norms, as concerns currently weighing on market
sentiment may be slow to recede.We remain committed to the fund’s investment approach, and we believe our relative-value strategy has the potential to become more effective as the relationship between municipal bonds and U.S. Treasury securities normalizes. In addition, until U.S. economic uncertainty wanes, we intend to favor market sectors and individual securities that seek to produce consistent levels of current income while helping to mute market turbulence. In our judgment, this positioning strikes the right balance between income and safety in a potentially volatile market environment.
September 15, 2011
| Bond funds are subject generally to interest rate, credit, liquidity and market | |
| risks, to varying degrees, all of which are more fully described in the fund’s | |
| prospectus. Generally, all other factors being equal, bond prices are inversely | |
| related to interest-rate changes, and rate increases can cause price declines. | |
| 1 | Total return includes reinvestment of dividends and any capital gains |
| paid. Past performance is no guarantee of future results. Share price, yield | |
| and investment return fluctuate such that upon redemption, fund shares | |
| may be worth more or less than their original cost. Income may be subject | |
| to state and local taxes, and some income may be subject to the federal | |
| alternative minimum tax (AMT) for certain investors. Capital gains, if | |
| any, are fully taxable. | |
| 2 | SOURCE: LIPPER INC. — Reflects reinvestment of dividends and, |
| where applicable, capital gain distributions.The Barclays Capital Municipal | |
| Bond Index is an unmanaged total return performance benchmark for the | |
| investment-grade, geographically unrestricted tax-exempt bond market. | |
| Index return does not reflect the fees and expenses associated with operating | |
| a mutual fund. Investors cannot invest directly in any index. |
| The Funds | 19 |

| Average Annual Total Returns as of 8/31/11 | |||
| Inception | From | ||
| Date | 1 Year | Inception | |
| Class M shares | 10/15/08 | 1.54% | 13.61% |
| Investor shares | 10/15/08 | 1.21% | 13.33% |
| Barclays Capital Municipal Bond Index | 9/30/08 | 2.66% | 7.93%†† |
| † Source: Lipper Inc. |
| Past performance is not predictive of future performance.The fund’s performance shown in the graph and table does not reflect the deduction of taxes that a shareholder |
| would pay on fund distributions or the redemption of fund shares. |
| The above graph compares a $10,000 investment made in Class M shares and Investor shares of BNY Mellon Municipal Opportunities Fund on 10/15/08 |
| (inception date) to a $10,000 investment made in the Barclays Capital Municipal Bond Index (the “Index”) on that date.All dividends and capital gain |
| distributions are reinvested. |
| The fund’s performance shown in the line graph takes into account all applicable fees and expenses for all share classes.The Index is an unmanaged total return |
| performance benchmark for the long-term, investment-grade, tax-exempt bond market.These factors can contribute to the Index potentially outperforming or |
| underperforming the fund. Unlike a mutual fund, the Index is not subject to charges, fees and other expenses. Investors cannot invest directly in any index. Further |
| information relating to fund performance, including expense reimbursements, if applicable, is contained in the Financial Highlights section of the prospectus and |
| elsewhere in this report. |
| †† For comparative purposes, the value of the Index as of 9/30/08 is used as the beginning value on 10/15/08. |
20
UNDERSTANDING YOUR FUND’S EXPENSES (Unaudited)
As a mutual fund investor, you pay ongoing expenses, such as management fees and other expenses. Using the information below, you can estimate how these expenses affect your investment and compare them with the expenses of other funds.You also may pay one-time transaction expenses, including sales charges (loads) and redemptions fees, which are not shown in this section and would have resulted in higher total expenses. For more information, see your fund’s prospectus or talk to your financial adviser.
Review your fund’s expenses
The table below shows the expenses you would have paid on a $1,000 investment in each class of each BNY Mellon municipal bond fund from March 1, 2011 to August 31, 2011. It also shows how much a $1,000 investment would be worth at the close of the period, assuming actual returns and expenses.
| Expenses and Value of a $1,000 Investment | |||
| assuming actual returns for the six months ended August 31, 2011 | |||
| Dreyfus | |||
| Class M Shares | Investor Shares | Premier Shares | |
| BNY Mellon National Intermediate | |||
| Municipal Bond Fund | |||
| Expenses paid per $1,000† | $ 2.59 | $ 3.88 | $ 6.46 |
| Ending value (after expenses) | $1,053.50 | $1,052.20 | $1,050.40 |
| Annualized expense ratio (%) | .50 | .75 | 1.25 |
| BNY Mellon National Short-Term | |||
| Municipal Bond Fund | |||
| Expenses paid per $1,000† | $ 2.59 | $ 3.91 | — |
| Ending value (after expenses) | $1,017.00 | $1,015.80 | — |
| Annualized expense ratio (%) | .51 | .77 | |
| BNY Mellon Pennsylvania | |||
| Intermediate Municipal Bond Fund | |||
| Expenses paid per $1,000† | $ 3.42 | $ 4.70 | — |
| Ending value (after expenses) | $1,053.20 | $1,051.10 | — |
| Annualized expense ratio (%) | .66 | .91 | |
| BNY Mellon Massachusetts | |||
| Intermediate Municipal Bond Fund | |||
| Expenses paid per $1,000† | $ 2.69 | $ 3.97 | $ 6.55 |
| Ending value (after expenses) | $1,049.00 | $1,047.70 | $1,045.00 |
| Annualized expense ratio (%) | .52 | .77 | 1.27 |
| BNY Mellon New York | |||
| Intermediate Tax-Exempt Bond Fund | |||
| Expenses paid per $1,000† | $ 3.05 | $ 4.34 | — |
| Ending value (after expenses) | $1,053.40 | $1,052.00 | — |
| Annualized expense ratio (%) | .59 | .84 | |
| BNY Mellon Municipal | |||
| Opportunities Fund | |||
| Expenses paid per $1,000† | $ 3.83 | $ 5.17 | — |
| Ending value (after expenses) | $1,052.50 | $1,050.20 | — |
| Annualized expense ratio (%) | .74 | 1.00 | |
| † Expenses are equal to each fund’s annualized expense ratio as shown above, multiplied by the average account value over the period, multiplied by 184/365 (to reflect the |
| one-half year period) |
| The Funds | 21 |
COMPARING YOUR FUND’S EXPENSES WITH THOSE OF OTHER FUNDS (Unaudited)
Using the SEC’s method to compare expenses
The Securities and Exchange Commission (SEC) has established guidelines to help investors assess fund expenses. Per these guidelines, the table below shows your fund’s expenses based on a $1,000 investment, assuming a hypothetical 5% annualized return.You can use this information to compare the ongoing expenses (but not transaction expenses or total cost) of investing in the fund with those of other funds.All mutual fund shareholder reports will provide this information to help you make this comparison. Please note that you cannot use this information to estimate your actual ending account balance and expenses paid during the period.
| Expenses and Value of a $1,000 Investment | |||
| assuming a hypothetical 5% annualized return for the six months ended August 31, 2011 | |||
| Dreyfus | |||
| Class M Shares | Investor Shares | Premier Shares | |
| BNY Mellon National Intermediate | |||
| Municipal Bond Fund | |||
| Expenses paid per $1,000† | $ 2.55 | $ 3.82 | $ 6.36 |
| Ending value (after expenses) | $1,022.68 | $1,021.42 | $1,018.90 |
| Annualized expense ratio (%) | .50 | .75 | 1.25 |
| BNY Mellon National Short-Term | |||
| Municipal Bond Fund | |||
| Expenses paid per $1,000† | $ 2.60 | $ 3.92 | — |
| Ending value (after expenses) | $1,022.63 | $1,021.32 | — |
| Annualized expense ratio (%) | .51 | .77 | |
| BNY Mellon Pennsylvania | |||
| Intermediate Municipal Bond Fund | |||
| Expenses paid per $1,000† | $ 3.36 | $1,020.62 | — |
| Ending value (after expenses) | $1,021.88 | $ 4.63 | — |
| Annualized expense ratio (%) | .66 | .91 | |
| BNY Mellon Massachusetts | |||
| Intermediate Municipal Bond Fund | |||
| Expenses paid per $1,000† | $ 2.65 | $ 3.92 | $ 6.46 |
| Ending value (after expenses) | $1,022.58 | $1,021.32 | $1,018.80 |
| Annualized expense ratio (%) | .52 | .77 | 1.27 |
| BNY Mellon New York | |||
| Intermediate Tax-Exempt Bond Fund | |||
| Expenses paid per $1,000† | $ 3.01 | $ 4.28 | — |
| Ending value (after expenses) | $1,022.23 | $1,020.97 | — |
| Annualized expense ratio (%) | .59 | .84 | |
| BNY Mellon Municipal | |||
| Opportunities Fund | |||
| Expenses paid per $1,000† | $ 3.77 | $ 5.09 | — |
| Ending value (after expenses) | $1,021.48 | $1,020.16 | — |
| Annualized expense ratio (%) | .74 | 1.00 | |
| † Expenses are equal to each fund’s annualized expense ratio as shown above, multiplied by the average account value over the period, multiplied by 184/365 (to reflect the |
| one-half year period) |
22
| STATEMENT OF INVESTMENTS |
| August 31, 2011 |
| BNY Mellon National Intermediate Municipal Bond Fund | ||||
| Long-Term Municipal | Coupon | Maturity | Principal | |
| Investments—97.0% | Rate (%) | Date | Amount ($) | Value ($) |
| Alabama—1.8% | ||||
| Birmingham Special Care Facilities Financing Authority-Baptist | ||||
| Medical Centers, Revenue (Baptist Health System, Inc.) | 5.00 | 11/15/15 | 5,000,000 | 5,238,800 |
| Jefferson County, Limited Obligation School Warrants | 5.25 | 1/1/15 | 1,180,000 | 1,158,146 |
| Jefferson County, Limited Obligation School Warrants | 5.25 | 1/1/16 | 4,810,000 | 4,661,275 |
| Jefferson County, Limited Obligation School Warrants | ||||
| (Insured; Assured Guaranty Municipal Corp.) | 5.00 | 1/1/24 | 13,325,000 | 12,550,817 |
| Montgomery BMC Special Care Facilities Financing | ||||
| Authority, Revenue (Baptist Health) (Insured; | ||||
| National Public Finance Guarantee Corp.) | 5.00 | 11/15/13 | 1,365,000 | 1,490,539 |
| Montgomery BMC Special Care Facilities Financing | ||||
| Authority, Revenue (Baptist Health) (Insured; | ||||
| National Public Finance Guarantee Corp.) | 5.00 | 11/15/14 | 2,500,000 | 2,828,225 |
| Alaska—.2% | ||||
| Valdez, Marine Terminal Revenue (BP Pipelines Inc. Project) | 5.00 | 1/1/21 | 2,500,000 | 2,811,100 |
| Arizona—3.3% | ||||
| Arizona Board of Regents, Arizona State University | ||||
| System Revenue (Polytechnic Campus Project) | 6.00 | 7/1/25 | 2,500,000 | 2,871,075 |
| Arizona Board of Regents, Arizona State University | ||||
| System Revenue (Polytechnic Campus Project) | 6.00 | 7/1/26 | 1,000,000 | 1,143,210 |
| Arizona Board of Regents, Arizona State University | ||||
| System Revenue (Polytechnic Campus Project) | 6.00 | 7/1/28 | 1,100,000 | 1,246,850 |
| Arizona Transportation Board, Highway Revenue | 5.00 | 7/1/25 | 15,000,000 | 16,531,500 |
| Arizona Transportation Board, Highway Revenue | 5.00 | 7/1/26 | 5,000,000 | 5,482,350 |
| Phoenix, GO | 6.25 | 7/1/16 | 1,250,000 | 1,550,525 |
| Phoenix Civic Improvement Corporation, Transit Excise | ||||
| Tax Revenue (Light Rail Project) (Insured; AMBAC) | 5.00 | 7/1/16 | 6,000,000 | 6,631,380 |
| Scottsdale Industrial Development Authority, | ||||
| HR (Scottsdale Healthcare) (Prerefunded) | 5.70 | 12/1/11 | 1,000,000 a | 1,023,560 |
| Scottsdale Unified School District Number 48 of | ||||
| Maricopa County, School Improvement Bonds | 6.60 | 7/1/12 | 1,250,000 | 1,313,612 |
| University Medical Center Corporation, HR | 5.25 | 7/1/16 | 2,310,000 | 2,432,060 |
| University of Arizona Board of Regents, System Revenue | 6.20 | 6/1/16 | 10,000,000 | 11,180,800 |
| California—13.2% | ||||
| Agua Caliente Band, Cahuilla Indians Revenue | 5.60 | 7/1/13 | 820,000 b | 804,732 |
| Alameda Corridor Transportation Authority, | ||||
| Revenue (Insured; AMBAC) | 0/5.25 | 10/1/21 | 5,000,000 c | 4,536,500 |
| California, Economic Recovery Bonds | 5.00 | 7/1/15 | 2,950,000 | 3,293,291 |
| California, Economic Recovery Bonds (Prerefunded) | 5.00 | 7/1/14 | 2,050,000 a | 2,326,299 |
| California, GO | 5.00 | 11/1/12 | 345,000 | 347,625 |
| California, GO | 5.50 | 6/1/20 | 270,000 | 270,926 |
| California, GO | 5.25 | 11/1/26 | 10,500,000 | 10,988,145 |
| California, GO (Various Purpose) | 6.00 | 3/1/33 | 8,000,000 | 9,041,840 |
| California, GO (Various Purpose) | 6.50 | 4/1/33 | 3,000,000 | 3,466,140 |
The Funds 23
STATEMENT OF INVESTMENTS (continued)
| BNY Mellon National Intermediate Municipal Bond Fund (continued) | ||||
| Long-Term Municipal | Coupon | Maturity | Principal | |
| Investments (continued) | Rate (%) | Date | Amount ($) | Value ($) |
| California (continued) | ||||
| California, GO (Various Purpose) (Prerefunded) | 5.00 | 2/1/14 | 1,825,000 a | 2,029,509 |
| California County Tobacco Securitization Agency, | ||||
| Tobacco Settlement Asset-Backed Bonds | ||||
| (Golden Gate Tobacco Funding Corporation) | 4.50 | 6/1/21 | 2,350,000 | 1,986,996 |
| California County Tobacco Securitization Agency, | ||||
| Tobacco Settlement Asset-Backed Bonds | ||||
| (Los Angeles County Securitization Corporation) | 5.25 | 6/1/21 | 1,145,000 | 1,044,251 |
| California Department of Water Resources, Power Supply Revenue | 5.00 | 5/1/22 | 5,000,000 | 5,829,350 |
| California Department of Water Resources, Power Supply | ||||
| Revenue (Insured; Assured Guaranty Municipal Corp.) | 5.00 | 5/1/21 | 11,985,000 | 13,712,638 |
| California Department of Water Resources, | ||||
| Water System Revenue (Central Valley Project) | 5.00 | 12/1/19 | 8,925,000 d | 10,978,464 |
| California Health Facilities Financing Authority, | ||||
| Revenue (Providence Health and Services) | 6.25 | 10/1/24 | 8,500,000 | 9,931,740 |
| California Health Facilities Financing Authority, | ||||
| Revenue (Providence Health and Services) | 6.25 | 10/1/28 | 4,000,000 | 4,531,760 |
| California Health Facilities Financing Authority, | ||||
| Revenue (Providence Health and Services) | 6.50 | 10/1/38 | 3,440,000 | 3,804,881 |
| California Health Facilities Financing Authority, | ||||
| Revenue (Providence Health and Services) (Prerefunded) | 6.50 | 10/1/18 | 60,000 a | 79,189 |
| California Infrastructure and Economic Development | ||||
| Bank, Clean Water State Revolving Fund Revenue | 5.00 | 10/1/17 | 2,500,000 | 2,618,875 |
| California Infrastructure and Economic Development | ||||
| Bank, Revenue (California Independent System | ||||
| Operator Corporation Project) | 6.00 | 2/1/30 | 8,000,000 | 8,554,720 |
| California Infrastructure and Economic Development | ||||
| Bank, Revenue (The J. David Gladstone Institutes Project) | 5.50 | 10/1/22 | 3,990,000 | 4,035,007 |
| California State Public Works Board, LR (Department of | ||||
| General Services) (Capitol East End Complex—Blocks | ||||
| 171-174 and 225) (Insured; AMBAC) | 5.25 | 12/1/19 | 5,000,000 | 5,195,850 |
| California State Public Works Board, LR (Department of | ||||
| Mental Health-Coalinga State Hospital) | 5.00 | 6/1/24 | 1,500,000 | 1,517,850 |
| California Statewide Communities Development Authority, | ||||
| Mortgage Revenue (Methodist Hospital of Southern | ||||
| California Project) (Collateralized; FHA) | 6.25 | 8/1/24 | 5,000,000 | 5,864,150 |
| California Statewide Communities Development Authority, | ||||
| Revenue (Saint Joseph Health System) (Insured; | ||||
| Assured Guaranty Municipal Corp.) | 4.50 | 7/1/18 | 3,545,000 | 3,765,499 |
| California Statewide Communities Development Authority, | ||||
| Revenue (The California Endowment) | 5.25 | 7/1/15 | 1,740,000 | 1,881,288 |
| Golden State Tobacco Securitization Corporation, | ||||
| Enhanced Tobacco Settlement Asset-Backed Bonds | 5.00 | 6/1/18 | 590,000 | 590,189 |
| Golden State Tobacco Securitization Corporation, | ||||
| Tobacco Settlement Asset-Backed Bonds | 4.50 | 6/1/27 | 4,955,000 | 3,859,152 |
| Hesperia Public Financing Authority, Revenue | ||||
| (Redevelopment and Housing Projects) (Insured; XLCA) | 5.00 | 9/1/37 | 2,940,000 | 1,946,074 |
24
| BNY Mellon National Intermediate Municipal Bond Fund (continued) | ||||
| Long-Term Municipal | Coupon | Maturity | Principal | |
| Investments (continued) | Rate (%) | Date | Amount ($) | Value ($) |
| California (continued) | ||||
| Los Angeles Department of Airports, Senior Revenue | ||||
| (Los Angeles International Airport) | 5.25 | 5/15/26 | 15,520,000 | 17,204,230 |
| Los Angeles Unified School District, GO | ||||
| (Insured; Assured Guaranty Municipal Corp.) | 5.00 | 7/1/24 | 2,395,000 | 2,598,743 |
| Los Angeles Unified School District, GO | ||||
| (Insured; National Public Finance Guarantee Corp.) | 5.75 | 7/1/16 | 2,000,000 | 2,417,140 |
| New Haven Unified School District, GO | ||||
| (Insured; Assured Guaranty Municipal Corp.) | 0.00 | 8/1/33 | 4,000,000 e | 990,800 |
| Novato Unified School District, GO | ||||
| (Insured; National Public Finance Guarantee Corp.) | 5.00 | 8/1/26 | 6,285,000 | 6,363,374 |
| Oakland Joint Powers Financing Authority, LR | ||||
| (Oakland Convention Centers) (Insured; AMBAC) | 5.50 | 10/1/13 | 1,500,000 | 1,568,340 |
| Oceanside Unified School District, GO | ||||
| (Insured; Assured Guaranty Municipal Corp.) | 0.00 | 8/1/36 | 11,100,000 e | 2,260,404 |
| Port of Oakland, Revenue | 5.00 | 5/1/18 | 1,835,000 | 2,036,923 |
| Port of Oakland, Revenue | 5.00 | 5/1/19 | 2,250,000 | 2,478,938 |
| Port of Oakland, Revenue | 5.00 | 5/1/20 | 3,000,000 | 3,262,170 |
| Port of Oakland, Revenue | 5.00 | 5/1/21 | 2,785,000 | 3,007,243 |
| Port of Oakland, Revenue | 5.00 | 5/1/23 | 1,875,000 | 1,958,194 |
| Sacramento County, Airport System Subordinate and | ||||
| Passenger Facility Charges Grant Revenue | 6.00 | 7/1/35 | 3,000,000 | 3,196,620 |
| Sacramento County Water Financing Authority, | ||||
| Revenue (Sacramento County Water Agency | ||||
| Zones 40 and 41 Water System Project) | ||||
| (Insured; National Public Finance Guarantee Corp.) | 0.72 | 6/1/34 | 8,000,000 f | 5,214,160 |
| Sacramento Municipal Utility District, Electric Revenue | 5.30 | 7/1/12 | 200,000 | 206,836 |
| Sacramento Municipal Utility District, Electric Revenue | ||||
| (Insured; National Public Finance Guarantee Corp.) | 5.25 | 5/15/13 | 3,530,000 | 3,807,564 |
| San Francisco City and County Airport Commission, | ||||
| Second Series Revenue (San Francisco International Airport) | 5.00 | 5/1/25 | 5,000,000 | 5,475,000 |
| San Francisco City and County Airport Commission, | ||||
| Second Series Revenue (San Francisco International Airport) | 5.00 | 5/1/26 | 5,000,000 | 5,428,650 |
| San Francisco City and County Public Utilities | ||||
| Commission, San Francisco Water Revenue | 5.00 | 11/1/26 | 5,000,000 | 5,478,300 |
| Southern California Public Power Authority, | ||||
| Power Project Revenue (San Juan Unit 3) | ||||
| (Insured; Assured Guaranty Municipal Corp.) | 5.50 | 1/1/13 | 3,010,000 | 3,202,008 |
| Southern California Public Power Authority, | ||||
| Power Project Revenue (San Juan Unit 3) | ||||
| (Insured; Assured Guaranty Municipal Corp.) | 5.50 | 1/1/14 | 2,000,000 | 2,210,700 |
| Westside Unified School District, | ||||
| GO (Insured; AMBAC) | 6.00 | 8/1/14 | 385,000 | 427,177 |
| Colorado—4.9% | ||||
| Colorado Health Facilities Authority, | ||||
| Revenue (Catholic Health Initiatives) | 6.00 | 10/1/23 | 2,000,000 | 2,300,380 |
| The Funds | 25 |
| STATEMENT OF INVESTMENTS (continued) | ||||
| BNY Mellon National Intermediate Municipal Bond Fund (continued) | ||||
| Long-Term Municipal | Coupon | Maturity | Principal | |
| Investments (continued) | Rate (%) | Date | Amount ($) | Value ($) |
| Colorado (continued) | ||||
| Colorado Health Facilities Authority, | ||||
| Revenue (Catholic Health Initiatives) | 6.25 | 10/1/33 | 1,600,000 | 1,753,936 |
| Colorado Health Facilities Authority, Revenue | ||||
| (Vail Valley Medical Center Project) | 5.00 | 1/15/20 | 1,250,000 | 1,294,925 |
| Colorado Housing and Finance Authority, SFMR | 4.90 | 11/1/11 | 1,210,000 | 1,217,393 |
| Colorado Housing and Finance Authority, Single Family | ||||
| Program Senior and Subordinate Bonds | 6.75 | 4/1/15 | 40,000 | 40,705 |
| Colorado Housing and Finance Authority, Single Family | ||||
| Program Senior and Subordinate Bonds | 6.05 | 10/1/16 | 50,000 | 52,567 |
| Colorado Housing and Finance Authority, Single Family | ||||
| Program Senior and Subordinate Bonds | 6.70 | 10/1/16 | 20,000 | 20,887 |
| Colorado Housing and Finance Authority, Single Family | ||||
| Program Senior and Subordinate Bonds (Collateralized; FHA) | 6.75 | 10/1/21 | 115,000 | 118,131 |
| Colorado Housing and Finance Authority, Single Family | ||||
| Program Senior and Subordinate Bonds (Collateralized; FHA) | 7.15 | 10/1/30 | 30,000 | 30,605 |
| Denver City and County, Airport System Revenue | ||||
| (Insured: Assured Guaranty Municipal Corp. and | ||||
| National Public Finance Guarantee Corp.) | 5.25 | 11/15/19 | 4,445,000 | 4,952,397 |
| E-470 Public Highway Authority, Senior Revenue | ||||
| (Insured; National Public Finance Guarantee Corp.) | 0/5.00 | 9/1/16 | 3,565,000 c | 3,807,990 |
| E-470 Public Highway Authority, Senior Revenue | ||||
| (Insured; National Public Finance Guarantee Corp.) | 5.25 | 9/1/16 | 5,000,000 | 5,292,300 |
| E-470 Public Highway Authority, Senior Revenue | ||||
| (Insured; National Public Finance Guarantee Corp.) | 0/5.00 | 9/1/17 | 3,500,000 c | 3,716,090 |
| Northwest Parkway Public Highway Authority, | ||||
| Revenue (Insured; AMBAC) (Prerefunded) | 5.45 | 6/15/16 | 7,690,000 a | 9,225,078 |
| Northwest Parkway Public Highway Authority, | ||||
| Revenue (Insured; AMBAC) (Prerefunded) | 5.70 | 6/15/21 | 7,345,000 a | 8,896,558 |
| Northwest Parkway Public Highway Authority, Revenue | ||||
| (Insured; Assured Guaranty Municipal Corp.) (Prerefunded) | 5.55 | 6/15/16 | 10,960,000 a | 13,173,372 |
| Public Authority for Colorado Energy, | ||||
| Natural Gas Purchase Revenue | 5.75 | 11/15/18 | 2,965,000 | 3,119,921 |
| Public Authority for Colorado Energy, | ||||
| Natural Gas Purchase Revenue | 6.13 | 11/15/23 | 4,645,000 | 4,782,213 |
| Regional Transportation District, COP | 5.00 | 6/1/19 | 1,750,000 | 1,996,068 |
| Regional Transportation District, COP | 5.00 | 6/1/20 | 2,700,000 | 3,069,117 |
| Regional Transportation District, COP | 5.50 | 6/1/22 | 2,200,000 | 2,508,924 |
| University of Colorado Regents, Participation Interest | ||||
| (Sempra Energy Colorado, Inc., Lease, Development | ||||
| and Operating Agreement) (Insured; National Public | ||||
| Finance Guarantee Corp.) (Prerefunded) | 6.00 | 6/1/12 | 5,000,000 a | 5,208,200 |
| Connecticut—.4% | ||||
| Connecticut, GO (Insured; AMBAC) | 5.25 | 6/1/18 | 1,500,000 | 1,845,165 |
26
| BNY Mellon National Intermediate Municipal Bond Fund (continued) | ||||
| Long-Term Municipal | Coupon | Maturity | Principal | |
| Investments (continued) | Rate (%) | Date | Amount ($) | Value ($) |
| Connecticut (continued) | ||||
| Connecticut Health and Educational Facilities Authority, | ||||
| Revenue (Connecticut State University System Issue) | ||||
| (Insured; Assured Guaranty Municipal Corp.) | 5.00 | 11/1/14 | 1,260,000 | 1,428,147 |
| Connecticut Health and Educational Facilities Authority, | ||||
| Revenue (Stamford Hospital Issue) | 5.00 | 7/1/30 | 3,150,000 | 3,258,927 |
| District of Columbia—.3% | ||||
| District of Columbia, GO (Insured; Assured | ||||
| Guaranty Municipal Corp.) | 3.84 | 6/1/16 | 5,000,000 f | 5,032,900 |
| Florida—5.4% | ||||
| Florida Department of Transportation, | ||||
| State Infrastructure Bank Revenue | 5.00 | 7/1/19 | 4,220,000 | 4,774,086 |
| Florida Department of Transportation, | ||||
| State Infrastructure Bank Revenue | 5.00 | 7/1/20 | 2,500,000 | 2,793,075 |
| Florida Hurricane Catastrophe Fund | ||||
| Finance Corporation, Revenue | 5.00 | 7/1/15 | 10,000,000 | 11,203,600 |
| Florida Municipal Loan Council, Revenue | ||||
| (Insured; National Public Finance Guarantee Corp.) | 5.75 | 11/1/15 | 295,000 | 296,932 |
| Hillsborough County Aviation Authority, Revenue | ||||
| (Tampa International Airport) (Insured; AMBAC) | 5.13 | 10/1/20 | 3,540,000 | 3,834,351 |
| Hillsborough County Aviation Authority, Revenue | ||||
| (Tampa International Airport) (Insured; AMBAC) | 5.13 | 10/1/21 | 3,675,000 | 3,949,816 |
| Hillsborough County Educational Facilities Authority, | ||||
| Revenue (University of Tampa Project) (Insured; Radian) | 5.75 | 4/1/18 | 2,045,000 | 2,057,720 |
| Lee County, Airport Revenue | 5.50 | 10/1/23 | 2,500,000 | 2,685,275 |
| Lee County, Airport Revenue | 5.50 | 10/1/24 | 5,000,000 | 5,292,600 |
| Miami-Dade County, Subordinate Special Obligation | ||||
| Bonds (Insured; National Public Finance Guarantee Corp.) | 0/5.00 | 10/1/22 | 2,000,000 c | 1,839,920 |
| Orlando Utilities Commission, Utility System Revenue | 4.61 | 10/1/16 | 13,400,000 f | 13,282,080 |
| Orlando-Orange County Expressway Authority, | ||||
| Revenue (Insured; AMBAC) | 5.00 | 7/1/13 | 4,710,000 | 5,075,543 |
| Sarasota County, Revenue (Environmentally | ||||
| Sensitive Lands and Parkland Program) | 5.25 | 10/1/24 | 1,790,000 | 1,842,680 |
| Sarasota County, Revenue (Environmentally | ||||
| Sensitive Lands and Parkland Program) | 5.25 | 10/1/25 | 6,170,000 | 6,327,335 |
| Sarasota County, Revenue (Environmentally | ||||
| Sensitive Lands and Parkland Program) | 5.25 | 10/1/28 | 2,105,000 | 2,138,491 |
| Sarasota County, Revenue (Environmentally | ||||
| Sensitive Lands and Parkland Program) | 5.25 | 10/1/29 | 1,085,000 | 1,095,166 |
| Sarasota County, Revenue (Environmentally | ||||
| Sensitive Lands and Parkland Program) (Prerefunded) | 5.25 | 10/1/18 | 240,000 a | 298,620 |
| Sarasota County, Revenue (Environmentally | ||||
| Sensitive Lands and Parkland Program) (Prerefunded) | 5.25 | 10/1/18 | 210,000 a | 261,293 |
| The Funds | 27 |
| STATEMENT OF INVESTMENTS (continued) | ||||
| BNY Mellon National Intermediate Municipal Bond Fund (continued) | ||||
| Long-Term Municipal | Coupon | Maturity | Principal | |
| Investments (continued) | Rate (%) | Date | Amount ($) | Value ($) |
| Florida (continued) | ||||
| Sarasota County, Revenue (Environmentally | ||||
| Sensitive Lands and Parkland Program) (Prerefunded) | 5.25 | 10/1/18 | 725,000 a | 902,081 |
| Sarasota County, Revenue (Environmentally Sensitive | ||||
| Lands and Parkland Program) (Prerefunded) | 5.25 | 10/1/18 | 245,000 a | 304,841 |
| Tallahassee, Capital Bonds Revenue | ||||
| (Insured; Assured Guaranty Municipal Corp.) | 5.00 | 10/1/19 | 5,725,000 | 6,167,371 |
| Tallahassee, Capital Bonds Revenue | ||||
| (Insured; Assured Guaranty Municipal Corp.) | 5.00 | 10/1/20 | 3,000,000 | 3,209,640 |
| Tampa Bay Water, A Regional Water Supply | ||||
| Authority, Utility System Revenue | 5.00 | 10/1/20 | 5,000,000 | 5,975,000 |
| Georgia—3.5% | ||||
| Burke County Development Authority, PCR | ||||
| (Oglethorpe Power Corporation Vogtle Project) | 7.00 | 1/1/23 | 6,000,000 | 6,961,440 |
| Chatham County Hospital Authority, HR Improvement | ||||
| (Memorial Health University Medical Center, Inc.) | 5.75 | 1/1/29 | 5,000,000 | 4,112,200 |
| Crisp County Development Authority, EIR | ||||
| (International Paper Company Project) | 5.55 | 2/1/15 | 1,000,000 | 1,074,650 |
| Fulton County, Water and Sewerage Revenue | ||||
| (Insured; National Public Finance Guarantee Corp.) | 5.00 | 1/1/35 | 4,400,000 | 4,506,216 |
| Fulton County Development Authority, Revenue (Spelman College) | 5.00 | 6/1/24 | 2,010,000 | 2,102,761 |
| Georgia, GO | 5.00 | 7/1/22 | 17,335,000 | 21,201,918 |
| Main Street Natural Gas Inc., Gas Project Revenue | 6.38 | 7/15/38 | 1,335,000 g | 1,006,670 |
| Municipal Electric Authority of Georgia, GO | ||||
| (Project One Subordinated Bonds) | 5.75 | 1/1/20 | 5,000,000 | 5,902,850 |
| Private Colleges and Universities Authority, | ||||
| Revenue (Emory University) | 5.00 | 9/1/18 | 2,000,000 | 2,280,220 |
| Putnam County Development Authority, | ||||
| PCR (Georgia Power Company) | 5.10 | 6/1/23 | 6,120,000 | 6,261,678 |
| Hawaii—.3% | ||||
| Hawaii Department of Budget and Finance, | ||||
| Special Purpose Revenue (Hawaiian Electric | ||||
| Company, Inc. and Subsidiary Projects) | 6.50 | 7/1/39 | 5,000,000 | 5,320,800 |
| Idaho—.8% | ||||
| University of Idaho Regents, General Revenue | 5.25 | 4/1/21 | 10,515,000 | 12,148,295 |
| Illinois—5.1% | ||||
| Chicago, GO (Insured; Assured Guaranty Municipal Corp.) | 5.00 | 1/1/14 | 5,000,000 | 5,391,300 |
| Chicago, GO (Modern Schools Across | ||||
| Chicago Program) (Insured; AMBAC) | 5.00 | 12/1/17 | 1,110,000 | 1,253,212 |
| Chicago Metropolitan Water Reclamation | ||||
| District, GO Capital Improvement | 7.25 | 12/1/12 | 8,500,000 | 9,236,185 |
| Cook County, GO Capital Improvement (Insured; AMBAC) | 5.00 | 11/15/25 | 5,000,000 | 5,055,350 |
| DuPage, Cook and Will Counties Community College | ||||
| District Number 502, GO (Prerefunded) | 5.25 | 6/1/13 | 5,980,000 a | 6,498,645 |
28
| BNY Mellon National Intermediate Municipal Bond Fund (continued) | ||||
| Long-Term Municipal | Coupon | Maturity | Principal | |
| Investments (continued) | Rate (%) | Date | Amount ($) | Value ($) |
| Illinois (continued) | ||||
| Illinois, GO | 5.00 | 9/1/19 | 7,500,000 | 8,124,600 |
| Illinois, GO (Fund for Infrastructure, Roads, School and Transit) | 5.25 | 10/1/15 | 3,000,000 | 3,147,390 |
| Illinois, GO (Insured; Assured Guaranty Municipal Corp.) | 5.00 | 1/1/20 | 5,000,000 | 5,593,400 |
| Illinois, GO (Insured; Assured Guaranty Municipal Corp.) | 5.00 | 1/1/23 | 5,000,000 | 5,338,300 |
| Illinois Finance Authority, Gas Supply Revenue (The Peoples | ||||
| Gas Light and Coke Company Project) (Insured; AMBAC) | 4.30 | 6/1/16 | 2,500,000 | 2,739,400 |
| Illinois Toll Highway Authority, Toll Highway Senior Priority | ||||
| Revenue (Insured; Assured Guaranty Municipal Corp.) | 5.00 | 1/1/24 | 15,000,000 | 15,967,800 |
| Metropolitan Pier and Exposition Authority, | ||||
| Revenue (McCormick Place Expansion Project) | 5.00 | 6/15/50 | 1,000,000 | 952,330 |
| Railsplitter Tobacco Settlement Authority, | ||||
| Tobacco Settlement Revenue | 5.00 | 6/1/15 | 3,500,000 | 3,889,480 |
| Regional Transportation Authority, GO (Insured; | ||||
| National Public Finance Guarantee Corp.) | 7.75 | 6/1/12 | 1,890,000 | 1,993,383 |
| Will County School District Number 161, GO (Insured; | ||||
| National Public Finance Guarantee Corp.) | 5.00 | 1/1/23 | 4,355,000 | 4,615,647 |
| Indiana—.4% | ||||
| Indiana Finance Authority, Acquisition Revenue | ||||
| (National Collegiate Athletic Association Project) | 5.00 | 5/1/15 | 1,000,000 | 1,159,130 |
| Indiana Health Facility Financing Authority, HR | ||||
| (The Methodist Hospitals, Inc.) | 5.25 | 9/15/11 | 750,000 | 750,532 |
| Indiana Municipal Power Agency, Power Supply | ||||
| System Revenue (Insured; AMBAC) | 5.13 | 1/1/20 | 4,045,000 | 4,092,488 |
| Kansas—.3% | ||||
| Wyandotte County/Kansas City Unified Government, | ||||
| Utility System Revenue (Insured; AMBAC) | 5.65 | 9/1/22 | 4,700,000 | 5,357,013 |
| Kentucky—.6% | ||||
| Kentucky Housing Corporation, Housing Revenue | 4.80 | 7/1/20 | 2,585,000 | 2,629,023 |
| Kentucky Property and Buildings Commission, | ||||
| Revenue (Project Number 100) | 5.00 | 8/1/21 | 1,785,000 | 2,074,420 |
| Louisville and Jefferson County Metropolitan Sewer | ||||
| District, Sewer and Drainage System Revenue (Insured; | ||||
| National Public Finance Guarantee Corp.) (Prerefunded) | 5.50 | 11/15/11 | 4,000,000 a | 4,071,080 |
| Louisiana—2.8% | ||||
| Jefferson Sales Tax District, Special Sales Tax | ||||
| Revenue (Insured; AMBAC) | 5.25 | 12/1/21 | 4,375,000 | 4,909,187 |
| Louisiana, Gasoline and Fuels Tax Second Lien Revenue | 0.95 | 6/1/13 | 5,000,000 f | 5,008,150 |
| Louisiana Citizens Property Insurance Corporation, | ||||
| Assessment Revenue (Insured; AMBAC) | 5.25 | 6/1/13 | 4,000,000 | 4,231,240 |
| Louisiana Citizens Property Insurance Corporation, | ||||
| Assessment Revenue (Insured; AMBAC) | 5.00 | 6/1/21 | 5,500,000 | 5,593,445 |
| Louisiana Citizens Property Insurance Corporation, | ||||
| Assessment Revenue (Insured; Assured Guaranty Municipal Corp.) | 6.13 | 6/1/25 | 14,500,000 | 16,131,975 |
| The Funds | 29 |
| STATEMENT OF INVESTMENTS (continued) | ||||
| BNY Mellon National Intermediate Municipal Bond Fund (continued) | ||||
| Long-Term Municipal | Coupon | Maturity | Principal | |
| Investments (continued) | Rate (%) | Date | Amount ($) | Value ($) |
| Louisiana (continued) | ||||
| Louisiana Local Government Environmental Facilities and Community | ||||
| Development Authority, Revenue (Louisiana Community and | ||||
| Technical College System Facilities Corporation Project) | 5.00 | 10/1/22 | 5,000,000 | 5,611,400 |
| Louisiana Public Facilities Authority, Revenue | ||||
| (CHRISTUS Health Obligated Group) | 6.00 | 7/1/29 | 2,000,000 | 2,148,260 |
| Maine—.2% | ||||
| Maine Housing Authority, Mortgage Purchase Bonds | 4.75 | 11/15/21 | 2,450,000 | 2,498,951 |
| Maine Housing Authority, Mortgage Purchase Bonds | 5.30 | 11/15/23 | 715,000 | 716,594 |
| Maryland—1.7% | ||||
| Howard County, Consolidated Public Improvement GO | 5.00 | 8/15/17 | 5,030,000 | 6,123,472 |
| Montgomery County, Consolidated Public Improvement GO | 5.00 | 7/1/24 | 16,000,000 | 18,502,560 |
| University System of Maryland, Auxiliary Facility | ||||
| and Tuition Revenue (Prerefunded) | 5.00 | 4/1/13 | 2,405,000 a | 2,585,207 |
| Massachusetts—2.7% | ||||
| Boston Water and Sewer Commission, General Revenue | 5.00 | 11/1/26 | 2,155,000 | 2,447,498 |
| Massachusetts, Consolidated Loan | ||||
| (Insured; National Public Finance Guarantee Corp.) | 5.50 | 10/1/20 | 3,285,000 | 4,146,820 |
| Massachusetts Development Finance Agency, | ||||
| Revenue (Combined Jewish Philanthropies of | ||||
| Greater Boston, Inc. Project) | 4.75 | 2/1/15 | 2,525,000 | 2,672,056 |
| Massachusetts Development Finance Agency, | ||||
| Revenue (Olin College Issue) (Insured; XLCA) | 5.25 | 7/1/33 | 8,050,000 | 8,091,941 |
| Massachusetts Health and Educational Facilities | ||||
| Authority, Revenue (Partners HealthCare System Issue) | 5.25 | 7/1/29 | 3,500,000 | 3,502,065 |
| Massachusetts Health and Educational Facilities | ||||
| Authority, Revenue (Simmons College Issue) | 7.50 | 10/1/22 | 2,000,000 | 2,457,780 |
| Massachusetts Health and Educational Facilities | ||||
| Authority, Revenue (Simmons College Issue) | 8.00 | 10/1/29 | 5,000,000 | 5,699,850 |
| Massachusetts Health and Educational Facilities | ||||
| Authority, Revenue (Simmons College Issue) | 8.00 | 10/1/39 | 1,500,000 | 1,687,215 |
| Massachusetts Housing Finance Agency, Housing Revenue | 5.13 | 12/1/34 | 350,000 | 344,691 |
| Massachusetts Municipal Wholesale Electric Company, | ||||
| Power Supply Project Revenue (Nuclear Project Number 4 | ||||
| Issue) (Insured; National Public Finance Guarantee Corp.) | 5.25 | 7/1/12 | 2,000,000 | 2,049,800 |
| Massachusetts School Building Authority, | ||||
| Dedicated Sales Tax Revenue (Insured; AMBAC) | 5.00 | 8/15/20 | 6,000,000 | 6,940,140 |
| Massachusetts School Building Authority, Dedicated Sales Tax | ||||
| Revenue (Insured; Assured Guaranty Municipal Corp.) | 5.00 | 8/15/30 | 1,500,000 | 1,565,220 |
| Massachusetts Water Pollution Abatement Trust (Pool Program) | 5.25 | 8/1/17 | 275,000 | 309,697 |
| Massachusetts Water Pollution Abatement Trust, | ||||
| Water Pollution Abatement Revenue (MWRA Program) | 5.75 | 8/1/29 | 380,000 | 381,281 |
| Michigan—1.0% | ||||
| Detroit, Water Supply System Second Lien | ||||
| Revenue (Insured; FGIC) | 5.75 | 7/1/22 | 7,000,000 | 7,765,450 |
30
| BNY Mellon National Intermediate Municipal Bond Fund (continued) | ||||
| Long-Term Municipal | Coupon | Maturity | Principal | |
| Investments (continued) | Rate (%) | Date | Amount ($) | Value ($) |
| Michigan (continued) | ||||
| Michigan Municipal Bond Authority, | ||||
| Clean Water Revolving Fund Revenue | 5.25 | 10/1/18 | 2,000,000 | 2,007,740 |
| Michigan Municipal Bond Authority, | ||||
| Clean Water Revolving Fund Revenue | 5.00 | 10/1/21 | 5,000,000 | 5,017,600 |
| Michigan Municipal Bond Authority, | ||||
| Drinking Water Revolving Fund Revenue | 5.50 | 10/1/15 | 1,000,000 | 1,191,990 |
| Minnesota—1.4% | ||||
| Minneapolis, Health Care System Revenue (Fairview Health Services) | 6.63 | 11/15/28 | 12,000,000 | 13,311,960 |
| Minnesota Higher Education Facilities Authority, | ||||
| Revenue (Macalester College) | 5.00 | 3/1/14 | 1,410,000 | 1,564,790 |
| University of Minnesota Regents, Special Purpose | ||||
| Revenue (State Supported Stadium Debt) | 5.00 | 8/1/19 | 6,300,000 | 7,223,958 |
| Mississippi—.2% | ||||
| Mississippi Home Corporation, SFMR | ||||
| (Collateralized: FHLMC, FNMA and GNMA) | 4.38 | 12/1/18 | 1,865,000 | 1,912,054 |
| Mississippi State University Educational Building Corporation, | ||||
| Revenue (Insured; National Public Finance Guarantee Corp.) | 5.25 | 8/1/16 | 400,000 | 478,024 |
| Missouri—.3% | ||||
| Curators of the University of Missouri, System Facilities Revenue | 5.00 | 11/1/12 | 2,000,000 | 2,109,920 |
| Missouri Environmental Improvement and Energy | ||||
| Resource Authority, Water PCR (State Revolving | ||||
| Fund Program—Master Trust) | 5.50 | 7/1/14 | 1,250,000 | 1,395,850 |
| Missouri Housing Development Commission, | ||||
| SFMR (Homeownership Loan Program) | ||||
| (Collateralized: FNMA and GNMA) | 5.05 | 9/1/24 | 565,000 | 568,141 |
| Nebraska—.1% | ||||
| Nebraska Investment Finance Authority, SFHR | ||||
| (Collateralized: FHLMC, FNMA and GNMA) | 4.70 | 9/1/21 | 735,000 | 746,532 |
| Omaha City, GO (City of Omaha Convention Center/Arena Project) | 6.50 | 12/1/16 | 1,000,000 | 1,284,140 |
| Nevada—1.9% | ||||
| Clark County, Highway Revenue (Motor Vehicle Fuel Tax) | 5.00 | 7/1/28 | 15,000,000 | 15,818,700 |
| Clark County School District, GO (Insured; | ||||
| National Public Finance Guarantee Corp.) | 5.00 | 6/15/20 | 12,930,000 | 14,517,287 |
| New Hampshire—.1% | ||||
| Nashua, Capital Improvement Bonds (Prerefunded) | 5.50 | 7/15/12 | 560,000 a | 585,894 |
| New Hampshire Business Finance Authority, PCR | ||||
| (Central Maine Power Company) | 5.38 | 5/1/14 | 1,000,000 | 1,077,180 |
| New Jersey—6.3% | ||||
| Essex County Improvement Authority, Project Consolidation | ||||
| Revenue (County Guaranteed) (Refunding Project) | ||||
| (Insured; National Public Finance Guarantee Corp.) | 5.50 | 10/1/24 | 12,725,000 | 15,112,337 |
| Essex County Improvement Authority, Project Consolidation | ||||
| Revenue (County Guaranteed) (Refunding Project) | ||||
| (Insured; National Public Finance Guarantee Corp.) | 5.50 | 10/1/25 | 5,630,000 | 6,656,011 |
| The Funds | 31 |
| STATEMENT OF INVESTMENTS (continued) | ||||
| BNY Mellon National Intermediate Municipal Bond Fund (continued) | ||||
| Long-Term Municipal | Coupon | Maturity | Principal | |
| Investments (continued) | Rate (%) | Date | Amount ($) | Value ($) |
| New Jersey (continued) | ||||
| Garden State Preservation Trust, Open Space and | ||||
| Farmland Preservation Revenue (Insured; | ||||
| Assured Guaranty Municipal Corp.) | 5.13 | 11/1/16 | 1,000,000 | 1,200,940 |
| Garden State Preservation Trust, Open Space and | ||||
| Farmland Preservation Revenue (Insured; | ||||
| Assured Guaranty Municipal Corp.) | 5.80 | 11/1/17 | 2,500,000 | 2,974,500 |
| Garden State Preservation Trust, Open Space and | ||||
| Farmland Preservation Revenue (Insured; | ||||
| Assured Guaranty Municipal Corp.) | 5.80 | 11/1/18 | 5,000,000 | 5,910,900 |
| Garden State Preservation Trust, Open Space and Farmland | ||||
| Preservation Revenue (Insured; Assured Guaranty Municipal Corp.) | 5.80 | 11/1/19 | 5,000,000 | 5,897,550 |
| Garden State Preservation Trust, Open Space and Farmland | ||||
| Preservation Revenue (Insured; Assured Guaranty Municipal Corp.) | 5.80 | 11/1/23 | 5,000,000 | 5,791,600 |
| New Jersey Economic Development Authority, | ||||
| Cigarette Tax Revenue | 5.38 | 6/15/15 | 4,400,000 | 4,704,656 |
| New Jersey Economic Development Authority, | ||||
| Cigarette Tax Revenue | 5.50 | 6/15/24 | 3,000,000 | 2,924,520 |
| New Jersey Economic Development Authority, | ||||
| School Facilities Construction Revenue | 5.00 | 3/1/17 | 2,000,000 | 2,223,120 |
| New Jersey Economic Development Authority, | ||||
| School Facilities Construction Revenue | 2.03 | 2/1/18 | 10,000,000 f | 10,214,800 |
| New Jersey Economic Development Authority, | ||||
| School Facilities Construction Revenue | 5.00 | 3/1/18 | 1,000,000 | 1,091,140 |
| New Jersey Educational Facilities Authority, Revenue | ||||
| (University of Medicine and Dentistry of New Jersey Issue) | 7.50 | 12/1/32 | 3,750,000 | 4,351,050 |
| New Jersey Transportation Trust, | ||||
| Fund Authority (Transportation System) | 0.00 | 12/15/29 | 10,000,000 e | 3,489,700 |
| New Jersey Turnpike Authority, Turnpike Revenue | ||||
| (Insured; National Public Finance Guarantee Corp.) | 5.00 | 1/1/19 | 18,500,000 | 19,714,895 |
| Tobacco Settlement Financing Corporation of New Jersey, | ||||
| Tobacco Settlement Asset-Backed Bonds | 4.50 | 6/1/23 | 8,775,000 | 7,770,877 |
| New Mexico—.5% | ||||
| New Mexico Finance Authority, Revenue | ||||
| (Public Project Revolving Fund) (Insured; AMBAC) | 5.25 | 6/1/17 | 1,000,000 | 1,121,080 |
| New Mexico Finance Authority, | ||||
| State Transportation Senior Lien Revenue | 5.00 | 6/15/18 | 5,000,000 | 6,084,350 |
| New York—7.4% | ||||
| Albany Industrial Development Agency, Civic Facility | ||||
| Revenue (Saint Peter’s Hospital of the City of Albany Project) | 5.75 | 11/15/22 | 1,000,000 | 1,049,180 |
| Greece Central School District, GO (Insured; FGIC) | 6.00 | 6/15/12 | 950,000 | 993,662 |
| Greece Central School District, GO (Insured; FGIC) | 6.00 | 6/15/13 | 950,000 | 1,047,052 |
| Greece Central School District, GO (Insured; FGIC) | 6.00 | 6/15/14 | 950,000 | 1,097,962 |
| Greece Central School District, GO (Insured; FGIC) | 6.00 | 6/15/15 | 950,000 | 1,148,208 |
32
| BNY Mellon National Intermediate Municipal Bond Fund (continued) | ||||
| Long-Term Municipal | Coupon | Maturity | Principal | |
| Investments (continued) | Rate (%) | Date | Amount ($) | Value ($) |
| New York (continued) | ||||
| Long Island Power Authority, Electric System General Revenue | 5.25 | 12/1/12 | 4,000,000 | 4,236,800 |
| Metropolitan Transportation Authority, Dedicated Tax | ||||
| Fund Revenue (Insured; National Public Finance Guarantee Corp.) | 5.00 | 11/15/28 | 2,880,000 | 3,075,898 |
| Metropolitan Transportation Authority, | ||||
| State Service Contract Revenue | 5.50 | 7/1/16 | 5,000,000 | 5,738,650 |
| Metropolitan Transportation Authority, | ||||
| State Service Contract Revenue | 5.75 | 1/1/18 | 1,500,000 | 1,825,530 |
| Metropolitan Transportation Authority, Transportation Revenue | 6.50 | 11/15/28 | 12,000,000 | 14,086,680 |
| New York City, GO | 5.13 | 12/1/24 | 10,000,000 | 11,004,200 |
| New York City, GO | 5.13 | 12/1/25 | 10,000,000 | 10,932,800 |
| New York City Transitional Finance Authority, | ||||
| Future Tax Secured Revenue | 5.50/14.00 | 11/1/26 | 3,000,000 h | 3,024,630 |
| New York City Transitional Finance Authority, | ||||
| Future Tax Secured Revenue (Prerefunded) | 5.38 | 11/15/12 | 1,050,000 a | 1,114,796 |
| New York City Transitional Finance Authority, | ||||
| Future Tax Secured Subordinate Revenue | 5.00 | 2/1/23 | 13,000,000 | 15,074,930 |
| New York Liberty Development Corporation, | ||||
| Revenue (Goldman Sachs Headquarters Issue) | 5.00 | 10/1/15 | 1,000,000 | 1,100,130 |
| New York Local Government Assistance Corporation, Revenue | 6.00 | 4/1/12 | 705,000 | 722,949 |
| New York State Dormitory Authority, Revenue | ||||
| (Consolidated City University System) | ||||
| (Insured; Assured Guaranty Municipal Corp.) | 5.75 | 7/1/18 | 200,000 | 234,594 |
| New York State Mortgage Agency, Homeowner Mortgage Revenue | 5.00 | 10/1/18 | 1,500,000 | 1,501,185 |
| New York State Thruway Authority, Second General | ||||
| Highway and Bridge Trust Fund Bonds | 5.00 | 4/1/15 | 5,000,000 | 5,736,500 |
| New York State Thruway Authority, Second General | ||||
| Highway and Bridge Trust Fund Bonds | 5.00 | 4/1/16 | 5,000,000 | 5,850,900 |
| New York State Thruway Authority, Second General | ||||
| Highway and Bridge Trust Fund Bonds | 5.00 | 4/1/21 | 5,000,000 | 5,663,550 |
| New York State Thruway Authority, Second General | ||||
| Highway and Bridge Trust Fund Bonds (Insured; AMBAC) | 5.00 | 4/1/25 | 3,000,000 | 3,250,380 |
| New York State Thruway Authority, Second General | ||||
| Highway and Bridge Trust Fund Bonds | ||||
| (Insured; Assured Guaranty Municipal Corp.) | 5.00 | 4/1/24 | 4,500,000 | 4,918,230 |
| Port Authority of New York and New Jersey | ||||
| (Consolidated Bonds, 139th Series) (Insured; | ||||
| National Public Finance Guarantee Corp. ) | 5.00 | 10/1/16 | 5,440,000 | 6,064,240 |
| Tobacco Settlement Financing Corporation of | ||||
| New York, Asset-Backed Revenue Bonds | ||||
| (State Contingency Contract Secured) | 5.50 | 6/1/19 | 5,000,000 | 5,352,150 |
| Tobacco Settlement Financing Corporation of New York, | ||||
| Asset-Backed Revenue Bonds (State Contingency Contract | ||||
| Secured) (Insured; National Public Finance Guarantee Corp.) | 5.50 | 6/1/18 | 2,000,000 | 2,062,640 |
| The Funds | 33 |
| STATEMENT OF INVESTMENTS (continued) | ||||
| BNY Mellon National Intermediate Municipal Bond Fund (continued) | ||||
| Long-Term Municipal | Coupon | Maturity | Principal | |
| Investments (continued) | Rate (%) | Date | Amount ($) | Value ($) |
| North Carolina—3.7% | ||||
| Charlotte, GO | 5.00 | 4/1/13 | 1,000,000 | 1,075,510 |
| North Carolina Eastern Municipal Power | ||||
| Agency, Power System Revenue | 5.38 | 1/1/16 | 1,500,000 | 1,570,290 |
| North Carolina Eastern Municipal Power | ||||
| Agency, Power System Revenue | 5.00 | 1/1/17 | 8,050,000 | 9,500,127 |
| North Carolina Eastern Municipal Power | ||||
| Agency, Power System Revenue | 5.25 | 1/1/20 | 5,000,000 | 5,678,250 |
| North Carolina Eastern Municipal Power | ||||
| Agency, Power System Revenue | 5.00 | 1/1/26 | 18,000,000 | 19,298,880 |
| North Carolina Eastern Municipal Power Agency, | ||||
| Power System Revenue (Insured; National | ||||
| Public Finance Guarantee Corp.) | 6.00 | 1/1/25 | 4,075,000 | 4,948,395 |
| North Carolina Municipal Power Agency | ||||
| Number 1, Catawba Electric Revenue | 5.50 | 1/1/13 | 2,770,000 | 2,883,792 |
| North Carolina Municipal Power Agency | ||||
| Number 1, Catawba Electric Revenue | 5.00 | 1/1/24 | 5,500,000 | 6,012,545 |
| Wake County, LOR | 5.00 | 1/1/24 | 5,955,000 | 6,944,185 |
| Ohio—1.3% | ||||
| Akron, Sanitary Sewer System Special Revenue (Insured; AMBAC) | 6.00 | 12/1/14 | 500,000 | 502,215 |
| Columbus, GO (Various Purpose Limited Tax) | 5.00 | 7/1/21 | 3,005,000 | 3,679,743 |
| Cuyahoga County, Revenue (Cleveland | ||||
| Clinic Health System Obligated Group) | 6.00 | 1/1/15 | 2,265,000 | 2,446,857 |
| Cuyahoga County, Revenue (Cleveland | ||||
| Clinic Health System Obligated Group) | 6.00 | 1/1/17 | 3,900,000 | 4,207,242 |
| Cuyahoga County, Revenue (Cleveland | ||||
| Clinic Health System Obligated Group) | 5.75 | 1/1/24 | 4,000,000 | 4,252,520 |
| Montgomery County, Revenue (Catholic Health Initiatives) | 6.00 | 10/1/23 | 3,055,000 | 3,520,032 |
| Ohio Housing Finance Agency, MFHR (Uptown Towers | ||||
| Apartments Project) (Collateralized; GNMA) | 4.75 | 10/20/15 | 780,000 | 824,881 |
| Toledo-Lucas County Port Authority, | ||||
| Port Facilities Revenue (Cargill, Inc. Project) | 4.50 | 12/1/15 | 900,000 | 973,629 |
| Pennsylvania—1.1% | ||||
| Allegheny County Hospital Development Authority, | ||||
| Revenue (University of Pittsburgh Medical Center) | 5.25 | 6/15/15 | 1,620,000 | 1,851,530 |
| Pennsylvania Turnpike Commission, Turnpike Subordinate Revenue | 5.00 | 6/1/18 | 5,000,000 | 5,686,900 |
| Philadelphia School District, GO | 5.00 | 9/1/13 | 5,000,000 | 5,367,650 |
| Philadelphia School District, GO (Insured; AMBAC) | 5.00 | 4/1/17 | 2,165,000 | 2,359,309 |
| Swarthmore Borough Authority, Revenue (Swarthmore College) | 5.00 | 9/15/11 | 1,000,000 | 1,001,890 |
| Swarthmore Borough Authority, Revenue (Swarthmore College) | 5.00 | 9/15/12 | 1,400,000 | 1,469,356 |
| Rhode Island—.1% | ||||
| Rhode Island Health and Educational Building Corporation, | ||||
| Higher Educational Facility Revenue (Providence | ||||
| College Issue) (Insured; XLCA) | 4.50 | 11/1/17 | 795,000 | 833,947 |
34
| BNY Mellon National Intermediate Municipal Bond Fund (continued) | ||||
| Long-Term Municipal | Coupon | Maturity | Principal | |
| Investments (continued) | Rate (%) | Date | Amount ($) | Value ($) |
| Rhode Island (continued) | ||||
| Rhode Island Health and Educational Building Corporation, | ||||
| Higher Educational Facility Revenue (Providence | ||||
| College Issue) (Insured; XLCA) | 5.00 | 11/1/22 | 250,000 | 258,408 |
| South Carolina—.5% | ||||
| Greenville County School District, Installment | ||||
| Purchase Revenue (Building Equity Sooner for Tomorrow) | 5.50 | 12/1/18 | 3,000,000 | 3,672,360 |
| Greenville County School District, Installment | ||||
| Purchase Revenue (Building Equity Sooner for Tomorrow) | 5.00 | 12/1/24 | 350,000 | 362,936 |
| Newberry Investing in Children’s Education, Installment | ||||
| Purchase Revenue (School District of Newberry | ||||
| County, South Carolina Project) | 5.25 | 12/1/20 | 1,000,000 | 1,062,810 |
| South Carolina Jobs and Economic Development | ||||
| Authority, Hospital Facilities Revenue | ||||
| (Georgetown Memorial Hospital) (Insured; Radian) | 5.25 | 2/1/21 | 1,250,000 | 1,250,600 |
| Spartanburg Sanitary Sewer District, Sewer System | ||||
| Revenue (Insured; Assured Guaranty Municipal Corp.) | 4.13 | 3/1/26 | 950,000 | 1,005,148 |
| Spartanburg Sanitary Sewer District, Sewer System | ||||
| Revenue (Insured; Assured Guaranty Municipal Corp.) | 4.25 | 3/1/27 | 830,000 | 878,870 |
| Texas—10.1% | ||||
| Cities of Dallas and Fort Worth, Dallas/Fort Worth International | ||||
| Airport, Joint Revenue Improvement Bonds (Insured; | ||||
| National Public Finance Guarantee Corp.) | 5.50 | 11/1/31 | 1,000,000 | 1,000,420 |
| Dallas, GO | 5.00 | 2/15/27 | 2,500,000 | 2,721,750 |
| Forney Independent School District, Unlimited Tax School | ||||
| Building Bonds (Permanent School Fund Guarantee Program) | 5.75 | 8/15/33 | 1,000,000 | 1,114,630 |
| Harris County, Toll Road Senior Lien Revenue | 5.00 | 8/15/23 | 12,500,000 | 14,174,250 |
| Harris County, Toll Road Senior Lien Revenue | ||||
| (Insured; National Public Finance Guarantee Corp.) | 5.00 | 8/15/25 | 4,000,000 | 4,338,240 |
| Harris County, Unlimited Tax Road Bonds | 5.00 | 10/1/21 | 13,705,000 | 16,185,057 |
| Harris County Health Facilities Development Corporation, HR | ||||
| (Memorial Hermann Healthcare System) | 7.00 | 12/1/27 | 5,000,000 | 5,633,750 |
| Houston, Combined Utility System First Lien Revenue | 5.00 | 11/15/24 | 5,355,000 | 6,169,710 |
| Houston, Public Improvement GO | 5.00 | 3/1/18 | 5,000,000 | 5,978,700 |
| Houston, Public Improvement GO (Insured; AMBAC) | 5.00 | 3/1/18 | 5,190,000 | 5,829,045 |
| Katy Independent School District, Unlimited Tax Refunding | ||||
| Bonds (Permanent School Fund Guarantee Program) | 0.00 | 2/15/16 | 1,505,000 e | 1,414,866 |
| Klein Independent School District, Unlimited Tax | ||||
| Schoolhouse Bonds (Permanent School | ||||
| Fund Guarantee Program) (Prerefunded) | 5.00 | 8/1/12 | 1,575,000 a | 1,644,316 |
| Lower Colorado River Authority, Junior Lien | ||||
| Revenue (Seventh Supplemental Series) | ||||
| (Insured; Assured Guaranty Municipal Corp.) | 5.00 | 1/1/15 | 1,135,000 | 1,301,391 |
| Lower Colorado River Authority, Revenue | 5.00 | 5/15/16 | 14,000,000 | 16,370,620 |
| The Funds | 35 |
| STATEMENT OF INVESTMENTS (continued) | ||||
| BNY Mellon National Intermediate Municipal Bond Fund (continued) | ||||
| Long-Term Municipal | Coupon | Maturity | Principal | |
| Investments (continued) | Rate (%) | Date | Amount ($) | Value ($) |
| Texas (continued) | ||||
| Royse City Independent School District, Unlimited Tax School | ||||
| Building Bonds (Permanent School Fund Guarantee Program) | 0.00 | 8/15/14 | 3,260,000 e | 3,182,086 |
| San Antonio, Electric and Gas Systems Revenue | 5.00 | 2/1/17 | 5,000,000 | 5,971,200 |
| San Antonio, Electric and Gas Systems Revenue | 5.00 | 2/1/25 | 10,000,000 | 11,129,400 |
| Socorro Independent School District, Unlimited Tax School | ||||
| Building Bonds (Permanent School Fund Guarantee Program) | 5.38 | 8/15/19 | 90,000 | 90,078 |
| Texas Department of Housing and Community Affairs, | ||||
| SFMR (Collateralized: FNMA and GNMA and Insured; | ||||
| National Public Finance Guarantee Corp.) | 5.45 | 9/1/23 | 960,000 | 965,050 |
| Texas Public Finance Authority, GO | 5.00 | 10/1/23 | 9,385,000 | 11,280,958 |
| Texas Public Finance Authority, Unemployment | ||||
| Compensation Obligation Assessment Revenue | 5.00 | 7/1/17 | 7,500,000 | 8,689,500 |
| Texas Public Finance Authority, Unemployment | ||||
| Compensation Obligation Assessment Revenue | 5.00 | 1/1/20 | 10,000,000 | 10,711,400 |
| Texas Tech University System Board of Regents, Finance | ||||
| System and Improvement Revenue (Insured; AMBAC) | 5.00 | 2/15/12 | 2,000,000 | 2,044,100 |
| Texas Transportation Commission, | ||||
| State Highway Fund First Tier Revenue | 5.00 | 4/1/20 | 15,000,000 | 17,495,250 |
| Texas Water Development Board, State Revolving | ||||
| Fund Subordinate Lien Revenue | 5.00 | 7/15/24 | 4,500,000 | 4,981,860 |
| Utah—1.6% | ||||
| Utah, GO | 5.00 | 7/1/20 | 20,000,000 | 24,790,000 |
| Vermont—.2% | ||||
| Burlington, Electric Revenue (Insured; National | ||||
| Public Finance Guarantee Corp.) | 6.25 | 7/1/12 | 2,500,000 | 2,613,325 |
| Virginia—2.6% | ||||
| Chesterfield County Industrial Development Authority, | ||||
| PCR (Virginia Electric and Power Company Project) | 5.88 | 6/1/17 | 2,500,000 | 2,557,350 |
| Virginia College Building Authority, Educational Facilities | ||||
| Revenue (21st Century College and Equipment Programs) | 5.00 | 2/1/19 | 7,000,000 | 8,524,180 |
| Virginia College Building Authority, Educational Facilities | ||||
| Revenue (21st Century College and Equipment Programs) | 5.00 | 2/1/20 | 5,000,000 | 6,111,050 |
| Virginia College Building Authority, Educational Facilities | ||||
| Revenue (21st Century College and Equipment Programs) | 5.00 | 2/1/21 | 5,235,000 | 6,409,106 |
| Virginia College Building Authority, Educational Facilities | ||||
| Revenue (21st Century College and Equipment Programs) | 5.00 | 2/1/23 | 11,285,000 | 13,244,640 |
| Virginia College Building Authority, Educational Facilities | ||||
| Revenue (Public Higher Education Financing Program) | 5.00 | 9/1/16 | 4,070,000 | 4,863,813 |
| Washington—2.0% | ||||
| Energy Northwest, Electric Revenue (Columbia Generating Station) | 5.00 | 7/1/20 | 10,955,000 d | 12,582,584 |
| Energy Northwest, Electric Revenue (Project Number 1) | ||||
| (Insured; Assured Guaranty Municipal Corp.) | 5.50 | 7/1/13 | 1,000,000 | 1,043,540 |
| FYI Properties, LR (State of Washington | ||||
| Department of Information Services Project) | 5.25 | 6/1/29 | 5,625,000 | 5,990,850 |
36
| BNY Mellon National Intermediate Municipal Bond Fund (continued) | ||||
| Long-Term Municipal | Coupon | Maturity | Principal | |
| Investments (continued) | Rate (%) | Date | Amount ($) | Value ($) |
| Washington (continued) | ||||
| Tumwater Office Properties, LR | ||||
| (Washington State Office Building) | 5.00 | 7/1/28 | 7,500,000 | 7,659,300 |
| Washington, Motor Vehicle Fuel Tax GO | 5.00 | 8/1/23 | 3,570,000 | 4,220,097 |
| West Virginia—.5% | ||||
| Monongalia County Building Commission, HR | ||||
| (Monongalia General Hospital) | 5.25 | 7/1/20 | 3,395,000 | 3,559,012 |
| West Virginia Economic Development Authority, PCR | ||||
| (Appalachian Power Company—Amos Project) | 4.85 | 9/4/13 | 1,000,000 | 1,060,870 |
| West Virginia Economic Development Authority, PCR | ||||
| (Appalachian Power Company—Amos Project) | 4.85 | 9/4/13 | 2,600,000 | 2,758,262 |
| Wisconsin—1.3% | ||||
| Wisconsin, GO | 5.00 | 5/1/20 | 5,800,000 | 6,823,352 |
| Wisconsin, Transportation Revenue | ||||
| (Insured; National Public Finance Guarantee Corp.) | 5.00 | 7/1/18 | 11,825,000 | 13,379,869 |
| U.S. Related—4.9% | ||||
| Puerto Rico Commonwealth, Public Improvement GO | 5.00 | 7/1/12 | 2,000,000 | 2,047,860 |
| Puerto Rico Commonwealth, Public Improvement GO | ||||
| (Insured; National Public Finance Guarantee Corp.) | 6.25 | 7/1/13 | 1,380,000 | 1,491,656 |
| Puerto Rico Electric Power Authority, Power Revenue | 5.25 | 7/1/18 | 5,000,000 | 5,562,800 |
| Puerto Rico Electric Power Authority, Power Revenue | 5.25 | 7/1/23 | 5,000,000 | 5,313,600 |
| Puerto Rico Electric Power Authority, Power Revenue | ||||
| (Insured; National Public Finance Guarantee Corp.) | 5.25 | 7/1/15 | 2,000,000 | 2,219,580 |
| Puerto Rico Electric Power Authority, Power Revenue | ||||
| (Insured; National Public Finance Guarantee Corp.) | 5.00 | 7/1/17 | 3,940,000 | 4,265,523 |
| Puerto Rico Government Development Bank, Senior Notes | 5.00 | 12/1/12 | 10,000,000 | 10,445,000 |
| Puerto Rico Government Development Bank, Senior Notes | 5.00 | 12/1/13 | 4,000,000 | 4,279,800 |
| Puerto Rico Housing Finance Authority, Capital Fund Program | ||||
| Revenue (Puerto Rico Public Housing Administration Projects) | 5.00 | 12/1/11 | 580,000 | 586,827 |
| Puerto Rico Housing Finance Authority, Capital Fund Program | ||||
| Revenue (Puerto Rico Public Housing Administration Projects) | 5.00 | 12/1/11 | 420,000 | 424,574 |
| Puerto Rico Public Buildings Authority, | ||||
| Government Facilities Revenue | 5.75 | 7/1/22 | 2,500,000 | 2,594,100 |
| Puerto Rico Public Buildings Authority, Government Facility Revenue | 5.50 | 7/1/14 | 1,000,000 | 1,084,700 |
| Puerto Rico Public Buildings Authority, Government Facility Revenue | 5.50 | 7/1/15 | 995,000 | 1,088,401 |
| Puerto Rico Public Buildings Authority, Government Facility Revenue | 5.50 | 7/1/15 | 5,000 | 5,939 |
| Puerto Rico Public Buildings Authority, Government Facility Revenue | 5.50 | 7/1/16 | 5,000 | 6,108 |
| Puerto Rico Public Buildings Authority, Government Facility Revenue | 5.50 | 7/1/16 | 1,995,000 | 2,195,118 |
| Puerto Rico Public Buildings Authority, Government Facility Revenue | 5.75 | 7/1/17 | 1,940,000 | 2,164,613 |
| Puerto Rico Public Buildings Authority, Government Facility Revenue | 5.75 | 7/1/17 | 5,000 | 6,297 |
| Puerto Rico Sales Tax Financing Corporation, | ||||
| Sales Tax Revenue (First Subordinate Series) | 0/6.75 | 8/1/32 | 11,000,000 c | 9,475,730 |
| Puerto Rico Sales Tax Financing Corporation, | ||||
| Sales Tax Revenue (First Subordinate Series) | 0/6.25 | 8/1/33 | 2,500,000 c | 1,747,600 |
| The Funds | 37 |
| STATEMENT OF INVESTMENTS (continued) | ||||
| BNY Mellon National Intermediate Municipal Bond Fund (continued) | ||||
| Long-Term Municipal | Coupon | Maturity | Principal | |
| Investments (continued) | Rate (%) | Date | Amount ($) | Value ($) |
| U.S. Related (continued) | ||||
| Puerto Rico Sales Tax Financing Corporation, | ||||
| Sales Tax Revenue (First Subordinate Series) | 6.00 | 8/1/42 | 16,500,000 | 17,467,560 |
| Puerto Rico Sales Tax Financing Corporation, | ||||
| Sales Tax Revenue (First Subordinate Series) | 6.50 | 8/1/44 | 2,500,000 | 2,737,425 |
| Total Long-Term Municipal Investments | ||||
| (cost $1,450,143,013) | 1,529,609,088 | |||
| Short-Term Municipal Investments—3.0% | ||||
| Colorado—.1% | ||||
| Colorado Educational and Cultural Facilities Authority, | ||||
| Revenue (National Jewish Federation Bond | ||||
| Program) (LOC; Bank of America) | 0.17 | 9/1/11 | 300,000 i | 300,000 |
| Colorado Educational and Cultural Facilities Authority, | ||||
| Revenue (National Jewish Federation Bond | ||||
| Program) (LOC; Bank of America) | 0.17 | 9/1/11 | 1,000,000 i | 1,000,000 |
| Colorado Educational and Cultural Facilities Authority, | ||||
| Revenue (National Jewish Federation Bond | ||||
| Program) (LOC; JPMorgan Chase Bank) | 0.14 | 9/1/11 | 500,000 i | 500,000 |
| Colorado Educational and Cultural Facilities Authority, | ||||
| Revenue (National Jewish Federation Bond | ||||
| Program) (LOC; Northern Trust Company) | 0.14 | 9/1/11 | 100,000 i | 100,000 |
| Colorado Educational and Cultural Facilities Authority, | ||||
| Revenue (National Jewish Federation Bond | ||||
| Program) (LOC; TD Bank) | 0.14 | 9/1/11 | 100,000 i | 100,000 |
| New Jersey—1.5% | ||||
| New Jersey Turnpike Authority, Turnpike Revenue | ||||
| (Insured; Assured Guaranty Municipal Corp. and | ||||
| Liquidity Facility; Dexia Credit Locale) | 2.40 | 9/7/11 | 25,000,000 i | 25,000,000 |
| New York—1.0% | ||||
| Metropolitan Transportation Authority, Dedicated Tax Fund | ||||
| Revenue (Insured; Assured Guaranty Municipal Corp. | ||||
| and Liquidity Facility; Dexia Credit Locale) | 2.50 | 9/7/11 | 15,000,000 i | 15,000,000 |
| Ohio—.3% | ||||
| Cleveland-Cuyahoga County Port Authority, | ||||
| Educational Facility Revenue (Laurel School | ||||
| Project) (LOC; JPMorgan Chase Bank) | 0.15 | 9/1/11 | 1,850,000 i | 1,850,000 |
38
| BNY Mellon National Intermediate Municipal Bond Fund (continued) | ||||
| Short-Term Municipal | Coupon | Maturity | Principal | |
| Investments (continued) | Rate (%) | Date | Amount ($) | Value ($) |
| Ohio (continued) | ||||
| Ohio University, General Receipts Bonds | ||||
| (Insured; Assured Guaranty Municipal Corp.) | 3.25 | 9/7/11 | 3,065,000 i | 3,065,000 |
| Vermont—.1% | ||||
| Vermont Educational and Health Buildings Financing Agency, | ||||
| Revenue (Brattleboro Memorial Hospital Project) (LOC; TD Bank) | 0.12 | 9/1/11 | 920,000 i | 920,000 |
| Total Short-Term Municipal Investments | ||||
| (cost $47,835,000) | 47,835,000 | |||
| Total Investments (cost $1,497,978,013) | 100.0% | 1,577,444,088 | ||
| Liabilities, Less Cash and Receivables | (.0%) | (541,853) | ||
| Net Assets | 100.0% | 1,576,902,235 | ||
| a These securities are prerefunded; the date shown represents the prerefunded date. Bonds which are prerefunded are collateralized by U.S. Government securities which are held in |
| escrow and are used to pay principal and interest on the municipal issue and to retire the bonds in full at the earliest refunding date. |
| b Security exempt from registration under Rule 144A of the Securities Act of 1933.This security may be resold in transactions exempt from registration, normally to qualified |
| institutional buyers.At August 31, 2011, this security was valued at $804,732 or 0.1% of net assets. |
| c Zero coupon until a specified date at which time the stated coupon rate becomes effective until maturity. |
| d Purchased on a delayed delivery basis. |
| e Security issued with a zero coupon. Income is recognized through the accretion of discount. |
| f Variable rate security—interest rate subject to periodic change. |
| g Non-income producing—security in default. |
| h Subject to interest rate change on November 1, 2011. |
| i Variable rate demand note—rate shown is the interest rate in effect at August 31, 2011. Maturity date represents the next demand date, or the ultimate maturity date if earlier. |
| The Funds | 39 |
| STATEMENT OF INVESTMENTS (continued) | ||||||
| Summary of Abbreviations | ||||||
| ABAG | Association of Bay Area Governments | ACA | American Capital Access | |||
| AGC | ACE Guaranty Corporation | AGIC | Asset Guaranty Insurance Company | |||
| AMBAC | American Municipal Bond Assurance Corporation | ARRN | Adjustable Rate Receipt Notes | |||
| BAN | Bond Anticipation Notes | BPA | Bond Purchase Agreement | |||
| CIFG | CDC Ixis Financial Guaranty | COP | Certificate of Participation | |||
| CP | Commercial Paper | EDR | Economic Development Revenue | |||
| EIR | Environmental Improvement Revenue | FGIC | Financial Guaranty Insurance Company | |||
| FHA | Federal Housing Administration | FHLB | Federal Home Loan Bank | |||
| FHLMC | Federal Home Loan Mortgage Corporation | FNMA | Federal National Mortgage Association | |||
| GAN | Grant Anticipation Notes | GIC | Guaranteed Investment Contract | |||
| GNMA | Government National Mortgage Association | GO | General Obligation | |||
| HR | Hospital Revenue | IDB | Industrial Development Board | |||
| IDC | Industrial Development Corporation | IDR | Industrial Development Revenue | |||
| LOC | Letter of Credit | LOR | Limited Obligation Revenue | |||
| LR | Lease Revenue | MFHR | Multi-Family Housing Revenue | |||
| MFMR | Multi-Family Mortgage Revenue | PCR | Pollution Control Revenue | |||
| PILOT | Payment in Lieu of Taxes | PUTTERS | Puttable Tax-Exempt Receipts | |||
| RAC | Revenue Anticipation Certificates | RAN | Revenue Anticipation Notes | |||
| RAW | Revenue Anticipation Warrants | RRR | Resources Recovery Revenue | |||
| SAAN | State Aid Anticipation Notes | SBPA | Standby Bond Purchase Agreement | |||
| SFHR | Single Family Housing Revenue | SFMR | Single Family Mortgage Revenue | |||
| SONYMA | State of New York Mortgage Agency | SWDR | Solid Waste Disposal Revenue | |||
| TAN | Tax Anticipation Notes | TAW | Tax Anticipation Warrants | |||
| TRAN | Tax and Revenue Anticipation Notes | XLCA | XL Capital Assurance | |||
| Summary of Combined Ratings (Unaudited) | ||||||
| Fitch | or | Moody’s | or | Standard & Poor’s | Value (%)† | |
| AAA | Aaa | AAA | 31.9 | |||
| AA | Aa | AA | 38.2 | |||
| A | A | A | 21.0 | |||
| BBB | Baa | BBB | 8.1 | |||
| BB | Ba | BB | .1 | |||
| F1 | MIG1/P1 | SP1/A1 | .3 | |||
| Not Ratedj | Not Ratedj | Not Ratedj | .4 | |||
| 100.0 | ||||||
| † Based on total investments. |
| j Securities which, while not rated by Fitch, Moody’s and Standard & Poor’s, have been determined by the Manager to be of comparable quality to those rated securities in which the |
| fund may invest. |
See notes to financial statements.
40
| STATEMENT OF FINANCIAL FUTURES |
| August 31, 2011 |
| Market Value | Unrealized | |||
| BNY Mellon National | Covered by | (Depreciation) | ||
| Intermediate Municipal Bond Fund | Contracts | Contracts ($) | Expiration | at 8/31/2011 ($) |
| Financial Futures Short | ||||
| U.S. Treasury 10 Year Notes | 340 | (44,210,625) | September 2011 | (2,520,781) |
| See notes to financial statements. | ||||
| The Funds | 41 |
| STATEMENT OF INVESTMENTS | ||||
| August 31, 2011 | ||||
| BNY Mellon National Short-Term Municipal Bond Fund | ||||
| Long-Term Municipal | Coupon | Maturity | Principal | |
| Investments—95.5% | Rate (%) | Date | Amount ($) | Value ($) |
| Alabama—.4% | ||||
| Jefferson County, Limited Obligation School Warrants | ||||
| (Insured; Assured Guaranty Municipal Corp.) | 5.50 | 2/15/16 | 1,370,000 | 1,359,780 |
| Jefferson County, Sewer Revenue Warrants | ||||
| (Insured; Assured Guaranty Municipal Corp.) | 5.25 | 2/1/13 | 3,000,000 | 2,912,400 |
| Alaska—.5% | ||||
| Alaska Industrial Development and Export | ||||
| Authority, Revolving Fund Revenue | 5.00 | 4/1/14 | 2,370,000 | 2,604,630 |
| North Slope Borough, GO | 5.00 | 6/30/12 | 1,000,000 | 1,039,900 |
| Valdez, Marine Terminal Revenue (BP Pipelines Inc. Project) | 5.00 | 1/1/14 | 2,000,000 | 2,173,840 |
| Arizona—2.9% | ||||
| Arizona Health Facilities Authority, Health Facility | ||||
| Revenue (Catholic Healthcare West) | 5.00 | 7/2/12 | 4,000,000 | 4,149,800 |
| Arizona School Facilities Board, COP (Lease-to-Own-Agreement) | 5.50 | 9/1/13 | 3,300,000 | 3,566,343 |
| Arizona School Facilities Board, COP (Lease-to-Own-Agreement) | ||||
| (Insured; National Public Finance Guarantee Corp.) | 5.00 | 9/1/12 | 1,275,000 | 1,326,969 |
| Arizona School Facilities Board, COP (Lease-to-Own-Agreement) | ||||
| (Insured; National Public Finance Guarantee Corp.) | 5.00 | 9/1/13 | 10,950,000 | 11,726,136 |
| Arizona Transportation Board, Subordinated Highway Revenue | 5.00 | 7/1/14 | 2,165,000 | 2,429,282 |
| Scottsdale, GO (Projects of 2000 and 2004) | 5.00 | 7/1/13 | 3,000,000 | 3,255,570 |
| University of Arizona Board of Regents, System Revenue | 6.20 | 6/1/16 | 5,000,000 | 5,590,400 |
| California—5.0% | ||||
| California, Economic Recovery Bonds | 2.50 | 7/1/12 | 2,000,000 | 2,035,820 |
| California, GO (Various Purpose) | 5.00 | 9/1/12 | 3,220,000 | 3,365,190 |
| California Department of Water Resources, Power Supply Revenue | 5.00 | 5/1/13 | 5,000,000 | 5,384,950 |
| California Health Facilities Financing Authority, | ||||
| Health Facility Revenue (Catholic Healthcare West) | 5.00 | 7/2/12 | 1,500,000 | 1,555,530 |
| California Health Facilities Financing Authority, | ||||
| Health Facility Revenue (Catholic Healthcare West) | 5.00 | 7/2/12 | 3,000,000 | 3,111,060 |
| California Infrastructure and Economic Development | ||||
| Bank, Revenue (The J. Paul Getty Trust) | 3.90 | 12/1/11 | 2,000,000 | 2,018,160 |
| California Infrastructure and Economic Development | ||||
| Bank, Revenue (The J. Paul Getty Trust) | 2.25 | 4/2/12 | 2,500,000 | 2,530,075 |
| California Municipal Finance Authority, SWDR | ||||
| (Waste Management, Inc. Project) | 2.00 | 9/2/14 | 4,000,000 | 4,003,960 |
| California Statewide Communities Development Authority, | ||||
| MFHR (Clara Park / Cypress Sunrise / Wysong Plaza | ||||
| Apartments) (Collateralized; GNMA) | 4.55 | 1/20/16 | 970,000 | 1,025,891 |
| California Statewide Communities Development Authority, | ||||
| PCR (Southern California Edison Company) (Insured; XLCA) | 4.10 | 4/1/13 | 1,000,000 | 1,048,330 |
| California Statewide Communities Development | ||||
| Authority, Revenue (Kaiser Permanente) | 5.00 | 4/1/13 | 5,000,000 | 5,357,700 |
| California Statewide Communities Development Authority, | ||||
| Revenue (Proposition 1A Receivables Program) | 5.00 | 6/15/13 | 13,000,000 | 13,984,100 |
42
| BNY Mellon National Short-Term Municipal Bond Fund (continued) | ||||
| Long-Term Municipal | Coupon | Maturity | Principal | |
| Investments (continued) | Rate (%) | Date | Amount ($) | Value ($) |
| California (continued) | ||||
| Los Angeles County Capital Asset Leasing Corporation, | ||||
| LR (LAC-CAL Equipment Program) | 5.00 | 12/1/11 | 3,105,000 | 3,139,559 |
| Mount San Antonio Community College District, GO | ||||
| (Insured; National Public Finance Guarantee Corp.) | 5.00 | 8/1/15 | 2,000,000 | 2,077,440 |
| Sacramento County Sanitation Districts Financing Authority, | ||||
| Revenue (Sacramento Regional County Sanitation | ||||
| District) (Insured; AMBAC) (Prerefunded) | 5.00 | 12/1/14 | 1,000,000 a | 1,149,260 |
| San Bernardino County Transportation | ||||
| Authority, Sales Tax Revenue Notes | 5.00 | 5/1/12 | 1,500,000 | 1,547,370 |
| Tuolumne Wind Project Authority, Revenue | ||||
| (Tuolumne Company Project) | 4.00 | 1/1/13 | 1,000,000 | 1,042,480 |
| Colorado—1.9% | ||||
| Black Hawk, Device Tax Revenue | 5.00 | 12/1/11 | 600,000 | 603,708 |
| Colorado Health Facilities Authority, | ||||
| Revenue (Catholic Health Initiatives) | 5.00 | 11/12/13 | 5,000,000 | 5,472,550 |
| Denver City and County, Airport System Revenue | 4.00 | 11/15/14 | 1,310,000 | 1,400,665 |
| Denver City and County, Airport System Revenue | ||||
| (Insured; National Public Finance Guarantee Corp.) | 5.50 | 11/15/15 | 5,000,000 | 5,039,700 |
| Denver City and County, GO Medical Facilities Bonds | 5.00 | 8/1/15 | 7,620,000 | 8,268,614 |
| Connecticut—2.7% | ||||
| Connecticut, GO (Economic Recovery) | 5.00 | 1/1/13 | 10,000,000 | 10,624,200 |
| Connecticut, GO (Economic Recovery) | 5.00 | 1/1/14 | 10,010,000 | 11,074,563 |
| Connecticut Health and Educational Facilities Authority, | ||||
| Revenue (Ascension Health Credit Group) | 3.50 | 2/1/12 | 1,395,000 | 1,412,982 |
| Connecticut Health and Educational Facilities Authority, | ||||
| Revenue (Quinnipiac University Issue) (Insured; | ||||
| National Public Finance Guarantee Corp.) | 5.00 | 7/1/12 | 1,190,000 | 1,231,626 |
| Connecticut Health and Educational Facilities | ||||
| Authority, Revenue (Yale University Issue) | 2.50 | 2/12/15 | 5,000,000 | 5,286,850 |
| Delaware—.3% | ||||
| Delaware, GO | 5.00 | 10/1/13 | 3,275,000 | 3,597,325 |
| Florida—5.2% | ||||
| Capital Trust Agency, Revenue (Seminole Tribe of Florida | ||||
| Convention and Resort Hotel Facilities) (Prerefunded) | 8.95 | 10/1/12 | 1,500,000 a | 1,668,300 |
| Citizens Property Insurance Corporation, | ||||
| High-Risk Account Senior Secured Revenue | 5.00 | 6/1/13 | 10,000,000 | 10,637,400 |
| Escambia County, SWDR (Gulf Power Company Project) | 2.00 | 4/3/12 | 2,500,000 | 2,519,800 |
| Florida Department of Environmental Protection, Florida Forever | ||||
| Revenue (Insured; National Public Finance Guarantee Corp.) | 5.00 | 7/1/12 | 1,100,000 | 1,143,461 |
| Florida Department of Environmental Protection, Florida Forever | ||||
| Revenue (Insured; National Public Finance Guarantee Corp.) | 5.00 | 7/1/13 | 6,100,000 | 6,594,405 |
| Florida Department of Environmental Protection, Florida Forever | ||||
| Revenue (Insured; National Public Finance Guarantee Corp.) | 5.25 | 7/1/16 | 3,250,000 | 3,390,660 |
| The Funds | 43 |
| STATEMENT OF INVESTMENTS (continued) | ||||
| BNY Mellon National Short-Term Municipal Bond Fund (continued) | ||||
| Long-Term Municipal | Coupon | Maturity | Principal | |
| Investments (continued) | Rate (%) | Date | Amount ($) | Value ($) |
| Florida (continued) | ||||
| Florida Department of Management Services, Florida Facilities | ||||
| Pool Revenue (Insured; Assured Guaranty Municipal Corp.) | 5.25 | 9/1/13 | 1,825,000 | 1,980,672 |
| Florida Hurricane Catastrophe Fund Finance Corporation, Revenue | 5.00 | 7/1/13 | 4,060,000 | 4,348,910 |
| Florida Hurricane Catastrophe Fund Finance Corporation, Revenue | 5.00 | 7/1/15 | 10,000,000 | 11,203,600 |
| Florida State Board of Education, Lottery Revenue (Insured; AMBAC) | 5.25 | 7/1/14 | 5,000,000 | 5,626,550 |
| Florida State Board of Education, Public Education Capital | ||||
| Outlay Bonds (Insured; National Public Finance Guarantee Corp.) | 5.25 | 6/1/13 | 3,000,000 | 3,255,240 |
| Kissimmee Utility Authority, Electric System Revenue | 4.00 | 10/1/14 | 1,250,000 | 1,361,300 |
| Miami-Dade County, Double-Barreled Aviation GO | 5.00 | 7/1/14 | 1,000,000 | 1,110,860 |
| Orlando-Orange County Expressway Authority, | ||||
| Revenue (Insured; AMBAC) | 5.00 | 7/1/12 | 2,000,000 | 2,076,100 |
| Georgia—2.9% | ||||
| Forsyth County, GO | 5.00 | 3/1/12 | 2,000,000 | 2,048,640 |
| Georgia, GO | 4.00 | 7/1/13 | 5,000,000 | 5,342,250 |
| Georgia, GO | 5.00 | 7/1/15 | 5,000,000 | 5,845,900 |
| Georgia, GO (Prerefunded) | 5.00 | 8/1/12 | 5,000,000 a | 5,221,200 |
| Georgia Environmental Loan Acquisition Corporation, | ||||
| Local Government Loan Securitization Revenue (Loan Pool) | 2.40 | 3/15/16 | 2,000,000 | 2,089,260 |
| Gwinnett County School District, GO | 5.00 | 2/1/13 | 3,000,000 | 3,202,260 |
| Main Street Natural Gas, Inc., Gas Project Revenue | 5.00 | 3/15/12 | 5,790,000 | 5,892,020 |
| Metropolitan Atlanta Rapid Transit Authority, | ||||
| Sales Tax Revenue (Insured; National Public | ||||
| Finance Guarantee Corp.) (Prerefunded) | 5.00 | 1/1/13 | 2,000,000 a | 2,126,500 |
| Hawaii—1.1% | ||||
| Hawaii, GO (Insured; Assured Guaranty | ||||
| Municipal Corp.) (Prerefunded) | 5.25 | 7/1/12 | 10,850,000 a | 11,307,327 |
| Hawaii, GO (Insured; National Public Finance Guarantee Corp.) | 5.00 | 10/1/12 | 1,000,000 | 1,051,640 |
| Illinois—2.5% | ||||
| Chicago, Second Lien Passenger Facility Charge Revenue | ||||
| (Chicago O’Hare International Airport) (Insured; AMBAC) | 5.50 | 1/1/14 | 500,000 | 506,795 |
| Chicago Board of Education, Unlimited Tax GO (Dedicated | ||||
| Revenues) (Insured; National Public Finance Guarantee Corp.) | 5.00 | 12/1/14 | 2,000,000 | 2,213,600 |
| Chicago Transit Authority, Capital Grant Receipts | ||||
| Revenue (Federal Transit Administration Section | ||||
| 5307 Formula Funds) (Insured; AMBAC) | 5.00 | 6/1/14 | 3,815,000 | 4,077,739 |
| Cook County, GO Capital Equipment Bonds | 5.00 | 11/15/12 | 1,000,000 | 1,050,190 |
| Illinois, GO | 5.00 | 1/1/12 | 1,000,000 | 1,014,540 |
| Illinois, GO | 5.00 | 1/1/14 | 13,500,000 | 14,763,465 |
| Illinois, GO (Fund for Infrastructure, Roads, Schools and | ||||
| Transit) (Insured; Assured Guaranty Municipal Corp.) | 5.25 | 10/1/11 | 2,000,000 | 2,007,980 |
| Illinois Finance Authority, SWDR (Waste Management, Inc. Project) | 1.45 | 10/3/11 | 1,500,000 | 1,500,495 |
| Indiana—1.4% | ||||
| Indiana Finance Authority, Second Lien Water Utility | ||||
| Revenue (Citizens Energy Group Project) | 3.00 | 10/1/14 | 2,000,000 | 2,085,300 |
44
| BNY Mellon National Short-Term Municipal Bond Fund (continued) | ||||
| Long-Term Municipal | Coupon | Maturity | Principal | |
| Investments (continued) | Rate (%) | Date | Amount ($) | Value ($) |
| Indiana (continued) | ||||
| Indiana Health Facility Financing Authority, | ||||
| Revenue (Ascension Health Credit Group) | 1.50 | 8/1/14 | 2,000,000 | 2,028,380 |
| Indiana Health Facility Financing Authority, Revenue | ||||
| (Ascension Health Subordinate Credit Group) | 1.70 | 9/1/14 | 1,500,000 | 1,530,240 |
| Indiana Transportation Finance Authority, Highway | ||||
| Revenue (Insured; FGIC) (Prerefunded) | 5.25 | 6/1/14 | 1,000,000 a | 1,132,360 |
| Purdue University Trustees, Purdue University | ||||
| Student Facilities System Revenue | 5.25 | 7/1/12 | 2,000,000 | 2,083,960 |
| Whiting, Environmental Facilities Revenue | ||||
| (BP Products North America, Inc.) | 2.80 | 6/2/14 | 6,000,000 | 6,148,920 |
| Iowa—.3% | ||||
| Iowa Higher Education Loan Authority, Private | ||||
| College Facility Revenue (Grinnell College Project) | 2.10 | 12/1/11 | 2,500,000 | 2,511,550 |
| Iowa Higher Education Loan Authority, Private | ||||
| College Facility Revenue (Grinnell College Project) | 4.00 | 12/1/13 | 1,000,000 | 1,081,630 |
| Kentucky—1.2% | ||||
| Kentucky Economic Development Finance Authority, | ||||
| Health System Revenue (Norton Healthcare, Inc.) | 6.25 | 10/1/12 | 665,000 | 667,421 |
| Kentucky Property and Buildings Commission, Revenue (Project | ||||
| Number 82) (Insured; Assured Guaranty Municipal Corp.) | 5.25 | 10/1/13 | 8,480,000 | 9,300,694 |
| Louisville/Jefferson County Metro Government, PCR | ||||
| (Louisville Gas and Electric Company Project) | 1.90 | 4/2/12 | 3,000,000 | 3,020,130 |
| Louisiana—1.2% | ||||
| Louisiana, GO | 0.93 | 7/15/14 | 5,000,000 b | 5,017,450 |
| Louisiana Offshore Terminal Authority, | ||||
| Deepwater Port Revenue (LOOP LLC Project) | 1.88 | 10/1/13 | 2,000,000 | 2,023,140 |
| Louisiana Public Facilities Authority, Revenue (Loyola University | ||||
| Project) (Insured; National Public Finance Guarantee Corp.) | 5.25 | 10/1/16 | 5,000,000 | 5,861,350 |
| Maryland—1.6% | ||||
| Anne Arundel County, Consolidated General Improvements GO | 4.00 | 4/1/14 | 4,000,000 | 4,370,800 |
| Maryland, GO (State and Local Facilities | ||||
| Loan—Capital Improvement Bonds) | 5.00 | 8/1/12 | 1,195,000 | 1,247,652 |
| Maryland, GO (State and Local Facilities | ||||
| Loan—Capital Improvement Bonds) | 5.00 | 7/15/13 | 5,000,000 | 5,444,400 |
| Maryland Department of Transportation, | ||||
| Consolidated Transportation Revenue | 5.00 | 3/1/13 | 4,950,000 | 5,306,053 |
| Maryland Health and Higher Educational Facilities | ||||
| Authority, Revenue (The Johns Hopkins Health | ||||
| System Obligated Group Issue) | 5.00 | 11/15/11 | 1,000,000 | 1,009,840 |
| Massachusetts—6.4% | ||||
| Massachusetts, Consolidated Loan | 5.25 | 8/1/13 | 1,500,000 | 1,642,185 |
| Massachusetts, Consolidated Loan | 5.00 | 8/1/14 | 5,000,000 | 5,651,750 |
| Massachusetts, Consolidated Loan (Insured; | ||||
| Assured Guaranty Municipal Corp.) | 5.50 | 11/1/12 | 2,000,000 | 2,123,400 |
| The Funds | 45 |
| STATEMENT OF INVESTMENTS (continued) | ||||
| BNY Mellon National Short-Term Municipal Bond Fund (continued) | ||||
| Long-Term Municipal | Coupon | Maturity | Principal | |
| Investments (continued) | Rate (%) | Date | Amount ($) | Value ($) |
| Massachusetts (continued) | ||||
| Massachusetts, Consolidated Loan (Insured; FGIC) | 5.50 | 11/1/13 | 1,700,000 | 1,889,907 |
| Massachusetts, Consolidated Loan (Insured; FGIC) (Prerefunded) | 5.25 | 11/1/12 | 2,000,000 a | 2,113,320 |
| Massachusetts, Consolidated Loan (Insured; | ||||
| National Public Finance Guarantee Corp.) | 5.50 | 11/1/12 | 1,700,000 | 1,804,890 |
| Massachusetts, Consolidated Loan (Insured; XLCA) (Prerefunded) | 5.25 | 11/1/12 | 15,000,000 a | 15,858,900 |
| Massachusetts Bay Transportation Authority, Assessment Revenue | 4.00 | 7/1/13 | 1,250,000 | 1,334,850 |
| Massachusetts Bay Transportation Authority, | ||||
| Assessment Revenue (Prerefunded) | 5.00 | 7/1/14 | 12,705,000 a | 14,332,510 |
| Massachusetts Development Finance Agency, Recovery Zone | ||||
| Facility Revenue (Dominion Energy Brayton Point Issue) | 2.25 | 9/1/16 | 5,000,000 | 5,029,500 |
| Massachusetts Development Finance Agency, | ||||
| Revenue (Brandeis University Issue) | 3.00 | 10/1/12 | 1,375,000 | 1,408,344 |
| Massachusetts Development Finance Agency, | ||||
| Revenue (Brandeis University Issue) | 3.00 | 10/1/13 | 1,140,000 | 1,186,090 |
| Massachusetts Development Finance Agency, | ||||
| Revenue (UMass Memorial Issue) | 4.00 | 7/1/14 | 4,525,000 | 4,736,001 |
| Massachusetts Health and Educational Facilities | ||||
| Authority, Revenue (Dana-Farber Cancer Institute Issue) | 4.00 | 12/1/11 | 1,725,000 | 1,738,748 |
| Massachusetts Health and Educational Facilities | ||||
| Authority, Revenue (Northeastern University Issue) | 4.13 | 2/16/12 | 1,000,000 | 1,017,370 |
| Massachusetts Health and Educational Facilities | ||||
| Authority, Revenue (Northeastern University Issue) | 4.10 | 4/19/12 | 1,000,000 | 1,023,820 |
| Massachusetts Health and Educational Facilities | ||||
| Authority, Revenue (Partners HealthCare System Issue) | 5.00 | 7/1/13 | 1,350,000 | 1,460,457 |
| Massachusetts Health and Educational Facilities | ||||
| Authority, Revenue (Partners HealthCare System Issue) | 5.00 | 7/1/14 | 1,600,000 | 1,785,472 |
| Massachusetts Health and Educational Facilities | ||||
| Authority, Revenue (Simmons College Issue) | 6.13 | 10/1/14 | 1,000,000 | 1,128,490 |
| Massachusetts Water Pollution Abatement Trust | ||||
| (Pool Program) (Prerefunded) | 5.00 | 8/1/12 | 3,000,000 a | 3,130,440 |
| Minnesota—3.3% | ||||
| Minnesota, GO (Prerefunded) | 5.25 | 11/1/12 | 13,175,000 a | 13,947,055 |
| Minnesota, GO (State Trunk Highway Bonds) | 5.00 | 8/1/12 | 1,720,000 | 1,795,456 |
| Minnesota, GO (State Trunk Highway Bonds) | 4.00 | 8/1/13 | 1,310,000 | 1,402,224 |
| Minnesota, GO (Various Purpose) | 4.00 | 8/1/13 | 11,500,000 | 12,309,600 |
| Minnesota, GO (Various Purpose) | 5.00 | 8/1/15 | 4,000,000 | 4,693,000 |
| Northern Municipal Power Agency, Electric System | ||||
| Revenue (Insured; Assured Guaranty Municipal Corp.) | 5.00 | 1/1/12 | 2,000,000 | 2,031,180 |
| Mississippi—.1% | ||||
| Mississippi Business Finance Corporation, | ||||
| Revenue (Mississippi Power Company Project) | 2.25 | 1/15/13 | 1,150,000 | 1,162,443 |
| Missouri—.2% | ||||
| Saint Louis, Airport Revenue (Lambert-Saint Louis International | ||||
| Airport) (Insured; Assured Guaranty Municipal Corp.) | 5.00 | 7/1/13 | 1,800,000 | 1,911,150 |
46
| BNY Mellon National Short-Term Municipal Bond Fund (continued) | ||||
| Long-Term Municipal | Coupon | Maturity | Principal | |
| Investments (continued) | Rate (%) | Date | Amount ($) | Value ($) |
| Montana—.1% | ||||
| Montana Board of Regents of Higher Education of the | ||||
| University of Montana, Facilities Improvement Revenue | ||||
| (Insured; National Public Finance Guarantee Corp.) | 5.75 | 5/15/24 | 1,610,000 | 1,631,606 |
| Nebraska—.8% | ||||
| Lincoln, GO | 4.00 | 12/1/15 | 2,035,000 | 2,319,839 |
| Nebraska Public Power District, General Revenue | ||||
| (Insured; Assured Guaranty Municipal Corp.) | 5.00 | 1/1/13 | 1,300,000 | 1,379,521 |
| University of Nebraska Facilities Corporation, | ||||
| Deferred Maintenance Bonds (Insured; AMBAC) | 5.00 | 7/15/13 | 5,125,000 | 5,574,360 |
| Nevada—2.9% | ||||
| Clark County, Airport System Junior Subordinate Lien Revenue | 5.00 | 7/1/12 | 10,000,000 | 10,383,500 |
| Clark County, Limited Tax GO Public Safety Bonds | ||||
| (Insured; Assured Guaranty Municipal Corp.) | 5.00 | 1/1/14 | 1,000,000 | 1,093,350 |
| Clark County, Passenger Facility Charge Revenue | ||||
| (Las Vegas-McCarran International Airport) | 5.00 | 7/1/14 | 2,500,000 | 2,760,125 |
| Clark County School District, Limited Tax GO | ||||
| (Insured; National Public Finance Guarantee Corp.) | 5.00 | 6/15/14 | 6,745,000 | 7,535,649 |
| Clark County School District, Limited Tax GO | ||||
| (Insured; National Public Finance Guarantee Corp.) | 5.00 | 6/15/15 | 6,800,000 | 7,799,668 |
| Las Vegas Valley Water District, GO (Additionally | ||||
| Secured by Pledged Revenues) | 5.00 | 2/1/13 | 1,000,000 | 1,061,340 |
| Las Vegas Valley Water District, GO (Additionally Secured by | ||||
| Southern Nevada Water Authority Pledged Revenues) | 5.00 | 6/1/14 | 450,000 | 500,373 |
| New Hampshire—.8% | ||||
| Manchester, School Facilities Revenue (Insured; | ||||
| National Public Finance Guarantee Corp.) (Prerefunded) | 5.50 | 6/1/13 | 4,465,000 a | 4,842,382 |
| New Hampshire Health and Education Facilities Authority, | ||||
| Revenue (Dartmouth-Hitchcock Obligated Group Issue) | 3.50 | 8/1/12 | 2,535,000 | 2,596,803 |
| Portsmouth, GO | 5.00 | 9/15/13 | 1,000,000 | 1,059,070 |
| New Jersey—3.9% | ||||
| New Jersey, COP (Equipment Lease Purchase Agreement) | 5.00 | 6/15/12 | 2,000,000 | 2,071,820 |
| New Jersey, GO | 5.25 | 7/1/12 | 2,000,000 | 2,083,360 |
| New Jersey, GO | 5.00 | 8/15/15 | 10,000,000 | 11,624,400 |
| New Jersey Economic Development Authority, Cigarette Tax Revenue | 5.38 | 6/15/14 | 2,935,000 | 3,112,744 |
| New Jersey Economic Development Authority, | ||||
| Cigarette Tax Revenue (Insured; FGIC) | 5.00 | 6/15/13 | 5,000,000 | 5,191,300 |
| New Jersey Economic Development Authority, Exempt Facilities | ||||
| Revenue (Waste Management of New Jersey, Inc. Project) | 2.20 | 11/1/13 | 2,000,000 | 2,022,020 |
| New Jersey Economic Development Authority, School Facilities | ||||
| Construction Revenue (Insured; Assured Guaranty Municipal Corp.) | 5.00 | 3/1/12 | 2,000,000 | 2,048,620 |
| New Jersey Economic Development Authority, School Facilities | ||||
| Construction Revenue (Insured; Assured Guaranty Municipal Corp.) | 5.00 | 9/1/12 | 2,750,000 | 2,881,752 |
| New Jersey Educational Facilities Authority, | ||||
| Revenue (Princeton University) | 5.00 | 7/1/14 | 2,185,000 | 2,475,518 |
| The Funds | 47 |
| STATEMENT OF INVESTMENTS (continued) | ||||
| BNY Mellon National Short-Term Municipal Bond Fund (continued) | ||||
| Long-Term Municipal | Coupon | Maturity | Principal | |
| Investments (continued) | Rate (%) | Date | Amount ($) | Value ($) |
| New Jersey (continued) | ||||
| New Jersey Transportation Trust Fund (Transportation | ||||
| System) (Insured; Assured Guaranty Municipal Corp.) | 5.75 | 12/15/14 | 2,820,000 | 3,224,642 |
| New Jersey Transportation Trust Fund Authority | ||||
| (Transportation System) (Insured; National Public | ||||
| Finance Guarantee Corp.) (Prerefunded) | 5.25 | 6/15/15 | 5,000,000 a | 5,883,850 |
| New Mexico—1.9% | ||||
| Albuquerque Bernalillo County Water Utility | ||||
| Authority, Joint Water and Sewer System Revenue | 5.00 | 7/1/12 | 3,700,000 | 3,849,221 |
| New Mexico Educational Assistance | ||||
| Foundation, Education Loan Revenue | 0.95 | 12/1/20 | 4,585,000 b | 4,546,761 |
| New Mexico Finance Authority, | ||||
| State Transportation Senior Lien Revenue | 5.00 | 6/15/13 | 4,940,000 | 5,358,369 |
| New Mexico Finance Authority, State Transportation Senior Lien | ||||
| Revenue (Insured; National Public Finance Guarantee Corp.) | 5.25 | 6/15/16 | 4,790,000 | 5,377,493 |
| New Mexico Finance Authority, State Transportation | ||||
| Subordinate Lien Revenue (Insured; AMBAC) | 5.00 | 6/15/13 | 1,000,000 | 1,081,680 |
| New York—11.8% | ||||
| Long Island Power Authority, Electric System General Revenue | 5.00 | 5/1/15 | 5,400,000 | 6,172,740 |
| Metropolitan Transportation Authority, Transportation Revenue | 5.00 | 11/15/13 | 11,125,000 | 12,091,874 |
| New York City, GO | 5.00 | 8/15/13 | 5,000,000 | 5,448,400 |
| New York City, GO | 5.00 | 8/1/14 | 4,000,000 | 4,513,800 |
| New York City, GO | 5.00 | 8/1/15 | 1,000,000 | 1,160,410 |
| New York City, GO | 5.25 | 8/1/16 | 4,670,000 | 5,234,790 |
| New York City Transitional Finance Authority, | ||||
| Future Tax Secured Revenue | 5.00 | 11/1/14 | 10,000,000 | 11,396,700 |
| New York City Transitional Finance Authority, | ||||
| Future Tax Secured Revenue | 5.50/14.00 | 11/1/26 | 3,345,000 c | 3,372,462 |
| New York City Transitional Finance Authority, | ||||
| Future Tax Secured Revenue (Insured; | ||||
| National Public Finance Guarantee Corp.) | 5.50 | 11/1/14 | 3,910,000 | 4,142,645 |
| New York City Trust for Cultural Resources, | ||||
| Revenue (The Juilliard School) | 2.75 | 7/1/12 | 3,500,000 | 3,572,065 |
| New York State, GO | 3.00 | 2/1/14 | 10,000,000 | 10,591,100 |
| New York State, GO | 5.00 | 2/15/15 | 4,320,000 | 4,980,830 |
| New York State Dormitory Authority, LR (State University | ||||
| Dormitory Facilities Issue) (Insured; XLCA) | 5.25 | 7/1/13 | 1,000,000 | 1,080,340 |
| New York State Dormitory Authority, Revenue | ||||
| (Mental Health Services Facilities Improvement) | 5.00 | 8/15/15 | 1,000,000 | 1,150,630 |
| New York State Dormitory Authority, Revenue (New York | ||||
| State Association for Retarded Children, Inc.) | ||||
| (Insured; Assured Guaranty Municipal Corp.) | 5.00 | 7/1/12 | 1,100,000 | 1,126,279 |
| New York State Dormitory Authority, Revenue | ||||
| (School Districts Revenue Financing Program) | ||||
| (Insured; National Public Finance Guarantee Corp.) | 5.75 | 10/1/17 | 2,500,000 | 2,624,825 |
48
| BNY Mellon National Short-Term Municipal Bond Fund (continued) | ||||
| Long-Term Municipal | Coupon | Maturity | Principal | |
| Investments (continued) | Rate (%) | Date | Amount ($) | Value ($) |
| New York (continued) | ||||
| New York State Dormitory Authority, | ||||
| State Personal Income Tax Revenue (Education) | 5.00 | 3/15/14 | 4,075,000 | 4,537,146 |
| New York State Environmental Facilities Corporation, State Clean | ||||
| Water and Drinking Water Revolving Funds Revenue | ||||
| (New York City Municipal Water Finance Authority Project) | 5.38 | 6/15/16 | 5,000,000 | 5,197,000 |
| New York State Municipal Bond Bank Agency, | ||||
| Special School Purpose Revenue (Prior Year Claims) | 5.50 | 6/1/13 | 5,000,000 | 5,419,200 |
| New York State Thruway Authority, | ||||
| Local Highway and Bridge Service Contract Bonds | 5.50 | 4/1/15 | 2,675,000 | 2,752,468 |
| New York State Thruway Authority, Second General Highway | ||||
| and Bridge Trust Fund Bonds (Insured; AMBAC) (Prerefunded) | 5.00 | 4/1/14 | 1,475,000 a | 1,642,117 |
| New York State Urban Development Corporation, | ||||
| Correctional Capital Facilities Revenue | ||||
| (Insured; Assured Guaranty Municipal Corp.) | 5.25 | 1/1/14 | 1,075,000 | 1,138,522 |
| New York State Urban Development Corporation, | ||||
| Service Contract Revenue | 5.00 | 1/1/14 | 1,000,000 | 1,102,410 |
| Port Authority of New York and New Jersey | ||||
| (Consolidated Bonds, 139th Series) (Insured; | ||||
| National Public Finance Guarantee Corp. ) | 5.00 | 10/1/16 | 5,000,000 | 5,573,750 |
| Tobacco Settlement Financing Corporation of | ||||
| New York, Asset-Backed Revenue Bonds | ||||
| (State Contingency Contract Secured) | 5.00 | 6/1/12 | 1,055,000 | 1,090,944 |
| Tobacco Settlement Financing Corporation of | ||||
| New York, Asset-Backed Revenue Bonds | ||||
| (State Contingency Contract Secured) | 5.00 | 6/1/14 | 3,000,000 | 3,324,570 |
| Triborough Bridge and Tunnel Authority, | ||||
| General Revenue (MTA Bridges and Tunnels) | 4.00 | 11/15/12 | 12,325,000 | 12,859,535 |
| Troy Industrial Development Authority, Civic Facility | ||||
| Revenue (Rensselaer Polytechnic Institute Project) | 4.05 | 9/1/11 | 3,500,000 | 3,500,000 |
| Westchester County, GO | 3.00 | 6/1/13 | 1,350,000 | 1,415,516 |
| North Carolina—2.6% | ||||
| Brunswick County, GO | 5.00 | 5/1/13 | 2,445,000 | 2,637,397 |
| Charlotte, Water and Sewer System Revenue | 3.00 | 12/1/14 | 1,250,000 | 1,350,737 |
| Forsyth County, GO | 3.00 | 7/1/13 | 1,495,000 | 1,570,572 |
| Mecklenburg County, Public Improvement GO | 5.00 | 3/1/12 | 5,000,000 | 5,121,150 |
| North Carolina, GO | 5.00 | 6/1/13 | 10,000,000 | 10,832,600 |
| North Carolina Eastern Municipal Power | ||||
| Agency, Power System Revenue | 5.50 | 1/1/12 | 5,000,000 | 5,082,950 |
| North Carolina Eastern Municipal Power Agency, Power System | ||||
| Revenue (Insured; Assured Guaranty Municipal Corp.) | 5.00 | 1/1/13 | 2,000,000 | 2,111,580 |
| Ohio—1.6% | ||||
| Cleveland, GO (Various Purpose) (Insured; AMBAC) | 5.25 | 10/1/14 | 5,050,000 | 5,712,358 |
| Lorain County, Hospital Facilities Improvement | ||||
| Revenue (Catholic Healthcare Partners) | 5.63 | 10/1/12 | 2,500,000 | 2,535,450 |
| The Funds | 49 |
| STATEMENT OF INVESTMENTS (continued) | ||||
| BNY Mellon National Short-Term Municipal Bond Fund (continued) | ||||
| Long-Term Municipal | Coupon | Maturity | Principal | |
| Investments (continued) | Rate (%) | Date | Amount ($) | Value ($) |
| Ohio (continued) | ||||
| Ohio, GO Highway Captial Improvements Bonds | ||||
| (Full Faith and Credit/Highway User Receipts) | 5.25 | 5/1/12 | 525,000 | 542,766 |
| Ohio, Mental Health Capital Facilities Bonds | ||||
| (Insured; Assured Guaranty Municipal Corp.) | 5.00 | 6/1/13 | 2,230,000 | 2,403,583 |
| Ohio Water Development Authority, Fresh Water Revenue | 5.00 | 12/1/12 | 1,905,000 | 2,020,043 |
| Ohio Water Development Authority, Solid Waste | ||||
| Revenue (Waste Management, Inc. Project) | 1.75 | 6/1/13 | 2,500,000 | 2,511,600 |
| Ohio Water Development Authority, Water Development | ||||
| Revenue (Fresh Water Improvement Series) | 5.00 | 6/1/13 | 2,060,000 | 2,231,124 |
| Oklahoma—.5% | ||||
| Oklahoma Building Bonds Commission, GO (Insured; | ||||
| National Public Finance Guarantee Corp.) (Prerefunded) | 5.00 | 7/15/13 | 5,460,000 a | 5,995,080 |
| Oregon—.5% | ||||
| Oregon Department of Transportation, Highway User Tax Revenue | 5.25 | 11/15/16 | 4,375,000 | 4,983,169 |
| Pennsylvania—6.8% | ||||
| Allegheny County Airport Authority, Airport | ||||
| Revenue (Pittsburgh International Airport) | 5.00 | 1/1/13 | 1,400,000 | 1,449,504 |
| Allegheny County Hospital Development Authority, | ||||
| Revenue (University of Pittsburgh Medical Center) | 5.00 | 6/15/13 | 1,000,000 | 1,075,740 |
| Allegheny County Hospital Development Authority, | ||||
| Revenue (University of Pittsburgh Medical Center) | 5.00 | 5/15/14 | 2,875,000 | 3,177,594 |
| Berks County Municipal Authority, Revenue | ||||
| (The Reading Hospital and Medical Center Project) | 5.00 | 11/1/13 | 3,035,000 | 3,304,326 |
| Delaware County Industrial Development Authority, | ||||
| PCR (PECO Energy Company Project) | 4.00 | 12/1/12 | 8,490,000 | 8,807,271 |
| Delaware Valley Regional Finance Authority, | ||||
| Local Government Revenue | 5.50 | 7/1/12 | 1,500,000 | 1,550,865 |
| Jim Thorpe Area School District, GO (Insured; | ||||
| National Public Finance Guarantee Corp.) | 5.30 | 3/15/16 | 1,000,000 | 1,086,200 |
| Pennsylvania, GO | 5.50 | 2/1/13 | 1,100,000 | 1,181,290 |
| Pennsylvania, GO | 5.00 | 2/15/13 | 10,750,000 | 11,489,493 |
| Pennsylvania, GO | 5.00 | 7/15/14 | 6,740,000 | 7,614,380 |
| Pennsylvania, GO | 5.00 | 9/1/16 | 5,000,000 | 5,632,400 |
| Pennsylvania, GO (Insured; National | ||||
| Public Finance Guarantee Corp.) | 5.00 | 1/1/13 | 1,950,000 | 2,072,811 |
| Pennsylvania, GO (Insured; National Public | ||||
| Finance Guarantee Corp.) (Prerefunded) | 4.00 | 2/1/14 | 5,000,000 a | 5,436,900 |
| Pennsylvania Higher Educational Facilities Authority, Revenue | ||||
| (The University of Pennsylvania Health System) (Insured; AMBAC) | 5.00 | 8/15/12 | 6,325,000 | 6,587,361 |
| Pennsylvania Intergovernmental Cooperation Authority, | ||||
| Special Tax Revenue (City of Philadelphia Funding Program) | 5.00 | 6/15/12 | 1,500,000 | 1,556,220 |
| Philadelphia School District, GO | 5.00 | 9/1/12 | 5,000,000 | 5,207,750 |
| State Public School Building Authority, College Revenue | ||||
| (Northampton County Area Community College Project) | 4.00 | 3/1/14 | 2,165,000 | 2,307,609 |
50
| BNY Mellon National Short-Term Municipal Bond Fund (continued) | ||||
| Long-Term Municipal | Coupon | Maturity | Principal | |
| Investments (continued) | Rate (%) | Date | Amount ($) | Value ($) |
| Pennsylvania (continued) | ||||
| State Public School Building Authority, School | ||||
| Revenue (Chester Upland School District Project) | ||||
| (Insured; Assured Guaranty Municipal Corp.) | 4.00 | 9/15/14 | 1,810,000 | 1,951,035 |
| Swarthmore Borough Authority, Revenue (Swarthmore College) | 5.00 | 9/15/13 | 1,500,000 | 1,636,695 |
| South Carolina—.2% | ||||
| Piedmont Municipal Power Agency, Electric Revenue | 5.00 | 1/1/15 | 2,000,000 | 2,245,820 |
| Texas—8.5% | ||||
| Austin, Water and Wastewater System Revenue | 4.00 | 11/15/13 | 1,500,000 | 1,619,595 |
| Cities of Dallas and Fort Worth, Dallas/Fort Worth | ||||
| International Airport, Joint Revenue | 4.00 | 11/1/11 | 1,775,000 | 1,785,916 |
| Cities of Dallas and Fort Worth, Dallas/Fort Worth | ||||
| International Airport, Joint Revenue | 4.00 | 11/1/12 | 2,220,000 | 2,308,511 |
| Cypress-Fairbanks Independent School District, Unlimited Tax | ||||
| Schoolhouse Bonds (Permanent School Fund Guarantee Program) | 5.00 | 2/15/13 | 1,550,000 | 1,656,903 |
| Dallas Area Rapid Transit, Senior Lien Sales Tax | ||||
| Revenue (Insured; AMBAC) (Prerefunded) | 5.38 | 12/1/11 | 2,135,000 a | 2,162,968 |
| Frisco Independent School District, Unlimited Tax School Building | ||||
| Bonds (Permanent School Fund Guarantee Program) | 5.00 | 8/15/15 | 1,000,000 | 1,170,800 |
| Frisco Independent School District, Unlimited | ||||
| Tax School Building Bonds (Permanent School | ||||
| Fund Guarantee Program) (Prerefunded) | 6.25 | 8/15/12 | 1,905,000 a | 2,015,071 |
| Gulf Coast Waste Disposal Authority, Environmental Facilities | ||||
| Revenue (BP Products North America, Inc. Project) | 2.30 | 9/3/13 | 4,000,000 | 4,075,720 |
| Harris County, GO and Revenue (Prerefunded) | 5.00 | 8/15/12 | 15,000,000 a | 15,687,750 |
| Harris County, Toll Road Senior Lien Revenue | ||||
| (Insured; National Public Finance Guarantee Corp.) | 5.00 | 8/15/16 | 1,500,000 | 1,679,670 |
| Harris County, Unlimited Tax Road Bonds | 5.00 | 10/1/12 | 1,000,000 | 1,051,690 |
| Harris County, Unlimited Tax Toll Road | ||||
| and Subordinate Lien Revenue | 5.00 | 8/15/12 | 2,100,000 | 2,195,760 |
| Harris County Cultural Education Facilities Finance | ||||
| Corporation, Revenue (The Methodist Hospital System) | 5.25 | 12/1/12 | 1,800,000 | 1,908,126 |
| Lower Colorado River Authority, Revenue | ||||
| (Insured; Assured Guaranty Municipal Corp.) | 5.88 | 5/15/15 | 1,075,000 | 1,079,633 |
| North Texas Tollway Authority, First Tier System Revenue | 5.00 | 1/1/13 | 2,050,000 | 2,166,050 |
| Northside Independent School District, Unlimited Tax School | ||||
| Building Bonds (Permanent School Fund Guarantee Program) | 1.50 | 8/1/12 | 10,000,000 | 10,095,900 |
| Plano, GO | 5.25 | 9/1/14 | 1,225,000 | 1,401,523 |
| Richardson Independent School District, Unlimited Tax | ||||
| Bonds (Permanent School Fund Guarantee Program) | 4.00 | 2/15/15 | 1,000,000 | 1,117,560 |
| Texas A&M University System Board of Regents, | ||||
| Financing System Revenue | 5.00 | 5/15/13 | 1,375,000 | 1,485,413 |
| Texas Municipal Gas Acquisition and Supply | ||||
| Corporation I, Gas Supply Revenue | 5.00 | 12/15/13 | 720,000 | 759,672 |
| Texas Public Finance Authority, GO | 5.00 | 10/1/14 | 2,000,000 | 2,278,980 |
| The Funds | 51 |
| STATEMENT OF INVESTMENTS (continued) | ||||
| BNY Mellon National Short-Term Municipal Bond Fund (continued) | ||||
| Long-Term Municipal | Coupon | Maturity | Principal | |
| Investments (continued) | Rate (%) | Date | Amount ($) | Value ($) |
| Texas (continued) | ||||
| Texas Public Finance Authority, Unemployment | ||||
| Compensation Obligation Assessment Revenue | 5.00 | 7/1/15 | 6,000,000 | 6,990,240 |
| Trinity River Authority, Regional Wastewater System Revenue | 5.00 | 8/1/15 | 3,280,000 | 3,825,759 |
| Trinity River Authority, Regional Wastewater System | ||||
| Revenue (Insured; National Public Finance Guarantee Corp.) | 5.38 | 8/1/15 | 8,865,000 | 9,634,837 |
| University of Texas System Board of Regents, | ||||
| Financing System Revenue | 5.25 | 8/15/12 | 4,485,000 | 4,700,235 |
| University of Texas System Board of Regents, | ||||
| Financing System Revenue | 5.00 | 8/15/13 | 6,485,000 | 7,079,221 |
| Utah—1.1% | ||||
| Salt Lake County, Sales Tax Revenue | 5.00 | 8/1/12 | 1,000,000 | 1,044,050 |
| Timpanogos Special Service District, Sewer Revenue | ||||
| (Insured; Assured Guaranty Municipal Corp.) | 5.00 | 6/1/14 | 1,775,000 | 1,982,143 |
| Utah, GO | 4.00 | 7/1/13 | 8,000,000 | 8,552,160 |
| Virginia—4.7% | ||||
| Hampton, Public Improvement GO | 4.25 | 1/15/13 | 4,015,000 | 4,235,584 |
| Louisa Industrial Development Authority, PCR | ||||
| (Virginia Electric and Power Company Project) | 5.00 | 12/1/11 | 1,500,000 | 1,515,525 |
| Newport News, GO General Improvement | ||||
| Bonds and GO Water Bonds | 5.00 | 1/15/13 | 1,000,000 | 1,065,210 |
| Portsmouth, GO | 4.00 | 1/15/15 | 2,750,000 | 2,920,088 |
| Richmond, GO Public Improvement (Insured; | ||||
| Assured Guaranty Municipal Corp.) | 5.25 | 7/15/16 | 6,040,000 | 6,558,051 |
| Tobacco Settlement Financing Corporation of Virginia, | ||||
| Tobacco Settlement Asset-Backed Bonds (Prerefunded) | 5.63 | 6/1/15 | 12,500,000 a | 14,782,125 |
| Virginia College Building Authority, Educational Facilities | ||||
| Revenue (21st Century College and Equipment Programs) | 5.00 | 2/1/13 | 2,000,000 | 2,134,560 |
| Virginia College Building Authority, Educational Facilities | ||||
| Revenue (21st Century College and Equipment Programs) | 5.00 | 2/1/14 | 2,610,000 | 2,898,797 |
| Virginia College Building Authority, | ||||
| Educational Facilities Revenue (21st Century | ||||
| College and Equipment Programs) (Prerefunded) | 5.00 | 2/1/12 | 1,200,000 a | 1,224,252 |
| Virginia College Building Authority, Educational Facilities | ||||
| Revenue (Public Higher Education Financing Program) | 5.00 | 9/1/12 | 1,555,000 | 1,629,609 |
| Virginia Commonwealth Transportation Board, Transportation | ||||
| Revenue (U.S. Route 58 Corridor Development Program) | 5.25 | 5/15/12 | 5,000,000 | 5,178,600 |
| Virginia Public Building Authority, Public Facilities Revenue | 5.00 | 8/1/15 | 5,000,000 | 5,848,850 |
| Virginia Resources Authority, Infrastructure Revenue | ||||
| (Virginia Pooled Financing Program) | 5.00 | 5/1/12 | 1,430,000 | 1,476,346 |
| Washington—2.1% | ||||
| Chelan County Public Utility District Number 1, | ||||
| Chelan Hydro Consolidated System Revenue | ||||
| (Insured; National Public Finance Guarantee Corp.) | 5.00 | 7/1/12 | 4,000,000 | 4,139,040 |
| Energy Northwest, Electric Revenue | ||||
| (Project Number 3) (Insured; AMBAC) | 6.00 | 7/1/16 | 5,000,000 | 5,230,950 |
52
| BNY Mellon National Short-Term Municipal Bond Fund (continued) | ||||
| Long-Term Municipal | Coupon | Maturity | Principal | |
| Investments (continued) | Rate (%) | Date | Amount ($) | Value ($) |
| Washington (continued) | ||||
| King County, Limited Tax GO (Baseball Stadium) | 5.50 | 12/1/12 | 4,795,000 | 5,110,655 |
| King County, Limited Tax GO (Baseball Stadium) | 5.50 | 12/1/12 | 310,000 | 330,370 |
| King County, Limited Tax GO (Payable From Sewer Revenues) | 5.00 | 1/1/14 | 1,000,000 | 1,107,340 |
| Seattle, Municipal Light and Power Improvement Revenue | 5.00 | 4/1/12 | 1,145,000 | 1,177,163 |
| Snohomish County, Unlimited Tax GO (Edmonds School District | ||||
| Number 15) (Insured; Assured Guaranty Municipal Corp.) | 5.00 | 12/1/12 | 1,500,000 | 1,588,920 |
| Washington, GO (Various Purpose) (Insured; AMBAC) | 5.00 | 1/1/14 | 3,810,000 | 4,219,918 |
| Wisconsin—.3% | ||||
| Wisconsin, Petroleum Inspection Fee Revenue | 5.00 | 7/1/13 | 3,500,000 | 3,790,080 |
| U.S. Related—3.3% | ||||
| Puerto Rico Commonwealth, Public Improvement GO | 5.00 | 7/1/13 | 2,140,000 | 2,265,104 |
| Puerto Rico Commonwealth, Public Improvement GO | 5.50 | 7/1/13 | 1,335,000 | 1,425,032 |
| Puerto Rico Commonwealth, Public Improvement GO | 5.50 | 7/1/13 | 5,000,000 | 5,337,200 |
| Puerto Rico Government Development Bank, GO | ||||
| (Insured; National Public Finance Guarantee Corp.) | 4.75 | 12/1/15 | 5,000,000 | 5,161,200 |
| Puerto Rico Government Development Bank, Senior Notes | 5.00 | 12/1/13 | 3,530,000 | 3,776,924 |
| Puerto Rico Government Development Bank, Senior Notes | 5.00 | 12/1/14 | 4,275,000 | 4,626,063 |
| Puerto Rico Highways and Transportation Authority, | ||||
| Transportation Revenue (Insured; FGIC) | 5.25 | 7/1/14 | 2,250,000 | 2,377,373 |
| Puerto Rico Highways and Transportation Authority, | ||||
| Transportation Revenue (Prerefunded) | 5.25 | 7/1/12 | 1,000,000 a | 1,041,290 |
| Puerto Rico Public Buildings Authority, | ||||
| Government Facilities Revenue (Insured; XLCA) | 5.25 | 7/1/13 | 4,530,000 | 4,792,423 |
| University of Puerto Rico, University System Revenue | 5.00 | 6/1/13 | 2,315,000 | 2,414,777 |
| University of Puerto Rico, University System Revenue | 5.00 | 6/1/14 | 2,930,000 | 3,108,789 |
| Total Long-Term Municipal Investments | ||||
| (cost $1,026,023,565) | 1,042,821,280 | |||
| Short-Term Municipal Investments—3.8% | ||||
| Colorado—.2% | ||||
| Pitkin County, IDR, Refunding (Aspen Skiing | ||||
| Company Project) (LOC; JPMorgan Chase Bank) | 0.14 | 9/1/11 | 2,100,000 d | 2,100,000 |
| Florida—.8% | ||||
| Lakeland, Energy System Revenue, Refunding | 0.96 | 9/7/11 | 8,500,000 d | 8,529,240 |
| Illinois—.0% | ||||
| Quincy, Revenue, Refunding (Blessing Hospital) | ||||
| (LOC; JPMorgan Chase Bank) | 0.12 | 9/1/11 | 500,000 d | 500,000 |
| Massachusetts—.3% | ||||
| Massachusetts, GO Notes, Refunding | 0.74 | 9/7/11 | 3,700,000 d | 3,703,441 |
| New Jersey—1.0% | ||||
| New Jersey Turnpike Authority, Turnpike Revenue | ||||
| (Insured; Assured Guaranty Municipal Corp. and | ||||
| Liquidity Facility; Dexia Credit Locale) | 2.40 | 9/7/11 | 10,000,000 d | 10,000,000 |
| The Funds | 53 |
| STATEMENT OF INVESTMENTS (continued) | ||||
| BNY Mellon National Short-Term Municipal Bond Fund (continued) | ||||
| Short-Term Municipal | Coupon | Maturity | Principal | |
| Investments (continued) | Rate (%) | Date | Amount ($) | Value ($) |
| North Carolina—.4% | ||||
| North Carolina Medical Care Commission, Health Care | ||||
| Facilities Revenue (Duke University Health System) | 0.51 | 12/1/11 | 4,800,000 | 4,800,000 |
| Pennsylvania—.9% | ||||
| Pennsylvania Turnpike Commission, Turnpike Revenue | 0.83 | 9/7/11 | 10,000,000 d | 10,028,800 |
| Tennessee—.2% | ||||
| Montgomery County Public Building Authority, Pooled Financing | ||||
| Revenue (Tennessee County Loan Pool) (LOC; Bank of America) | 0.18 | 9/1/11 | 2,000,000 d | 2,000,000 |
| Total Short-Term Municipal Investments | ||||
| (cost $41,600,000) | 41,661,481 | |||
| Total Investments (cost $1,067,623,565) | 99.3% | 1,084,482,761 | ||
| Cash and Receivables (Net) | .7% | 7,871,735 | ||
| Net Assets | 100.0% | 1,092,354,496 | ||
| a These securities are prerefunded; the date shown represents the prerefunded date. Bonds which are prerefunded are collateralized by U.S. Government securities which are held in |
| escrow and are used to pay principal and interest on the municipal issue and to retire the bonds in full at the earliest refunding date. |
| b Variable rate security—interest rate subject to periodic change. |
| c Subject to interest rate change on November 1, 2011. |
| d Variable rate demand note—rate shown is the interest rate in effect at August 31, 2011. Maturity date represents the next demand date, or the ultimate maturity date if earlier. |
54
| Summary of Abbreviations | ||||||
| ABAG | Association of Bay Area Governments | ACA | American Capital Access | |||
| AGC | ACE Guaranty Corporation | AGIC | Asset Guaranty Insurance Company | |||
| AMBAC | American Municipal Bond Assurance Corporation | ARRN | Adjustable Rate Receipt Notes | |||
| BAN | Bond Anticipation Notes | BPA | Bond Purchase Agreement | |||
| CIFG | CDC Ixis Financial Guaranty | COP | Certificate of Participation | |||
| CP | Commercial Paper | EDR | Economic Development Revenue | |||
| EIR | Environmental Improvement Revenue | FGIC | Financial Guaranty Insurance Company | |||
| FHA | Federal Housing Administration | FHLB | Federal Home Loan Bank | |||
| FHLMC | Federal Home Loan Mortgage Corporation | FNMA | Federal National Mortgage Association | |||
| GAN | Grant Anticipation Notes | GIC | Guaranteed Investment Contract | |||
| GNMA | Government National Mortgage Association | GO | General Obligation | |||
| HR | Hospital Revenue | IDB | Industrial Development Board | |||
| IDC | Industrial Development Corporation | IDR | Industrial Development Revenue | |||
| LOC | Letter of Credit | LOR | Limited Obligation Revenue | |||
| LR | Lease Revenue | MFHR | Multi-Family Housing Revenue | |||
| MFMR | Multi-Family Mortgage Revenue | PCR | Pollution Control Revenue | |||
| PILOT | Payment in Lieu of Taxes | PUTTERS | Puttable Tax-Exempt Receipts | |||
| RAC | Revenue Anticipation Certificates | RAN | Revenue Anticipation Notes | |||
| RAW | Revenue Anticipation Warrants | RRR | Resources Recovery Revenue | |||
| SAAN | State Aid Anticipation Notes | SBPA | Standby Bond Purchase Agreement | |||
| SFHR | Single Family Housing Revenue | SFMR | Single Family Mortgage Revenue | |||
| SONYMA | State of New York Mortgage Agency | SWDR | Solid Waste Disposal Revenue | |||
| TAN | Tax Anticipation Notes | TAW | Tax Anticipation Warrants | |||
| TRAN | Tax and Revenue Anticipation Notes | XLCA | XL Capital Assurance | |||
| Summary of Combined Ratings (Unaudited) | ||||||
| Fitch | or | Moody’s | or | Standard & Poor’s | Value (%)† | |
| AAA | Aaa | AAA | 33.1 | |||
| AA | Aa | AA | 40.2 | |||
| A | A | A | 20.6 | |||
| BBB | Baa | BBB | 4.9 | |||
| F1 | MIG1/P1 | SP1/A1 | 1.0 | |||
| Not Ratede | Not Ratede | Not Ratede | .2 | |||
| 100.0 | ||||||
| † Based on total investments. |
| e Securities which, while not rated by Fitch, Moody’s and Standard & Poor’s, have been determined by the Manager to be of comparable quality to those rated securities in which the |
| fund may invest. |
See notes to financial statements.
| The Funds | 55 |
| STATEMENT OF INVESTMENTS | ||||
| August 31, 2011 | ||||
| BNY Mellon Pennsylvania Intermediate Municipal Bond Fund | ||||
| Long-Term Municipal | Coupon | Maturity | Principal | |
| Investments—98.4% | Rate (%) | Date | Amount ($) | Value ($) |
| Alabama—1.4% | ||||
| Jefferson County, Limited Obligation School Warrants | 5.25 | 1/1/15 | 2,500,000 | 2,453,700 |
| Jefferson County, Limited Obligation School Warrants | ||||
| (Insured; Assured Guaranty Municipal Corp.) | 5.50 | 1/1/21 | 3,500,000 | 3,459,540 |
| Arizona—.3% | ||||
| University Medical Center Corporation, HR | 5.25 | 7/1/15 | 1,160,000 | 1,235,214 |
| California—7.2% | ||||
| Agua Caliente Band, Cahuilla Indians Revenue | 6.00 | 7/1/18 | 1,500,000 a | 1,427,805 |
| Alameda Corridor Transportation Authority, | ||||
| Revenue (Insured; AMBAC) | 0/5.25 | 10/1/21 | 2,000,000 b | 1,814,600 |
| California, GO | 5.50 | 6/1/20 | 110,000 | 110,377 |
| California, GO | 5.50 | 11/1/33 | 6,200,000 | 6,545,278 |
| California, GO (Various Purpose) | 6.50 | 4/1/33 | 1,000,000 | 1,155,380 |
| California, GO (Various Purpose) | 6.00 | 4/1/38 | 5,000,000 | 5,458,700 |
| California County Tobacco Securitization Agency, | ||||
| Tobacco Settlement Asset-Backed Bonds | ||||
| (Los Angeles County Securitization Corporation) | 5.25 | 6/1/21 | 1,150,000 | 1,048,812 |
| Foothill/Eastern Transportation Corridor | ||||
| Agency, Toll Road Revenue | 5.75 | 1/15/40 | 2,000,000 | 1,787,740 |
| Foothill/Eastern Transportation Corridor Agency, Toll Road | ||||
| Revenue (Insured; National Public Finance Guarantee Corp.) | 5.88 | 1/15/27 | 6,000,000 | 5,960,580 |
| Foothill/Eastern Transportation Corridor Agency, Toll Road | ||||
| Revenue (Insured; National Public Finance Guarantee Corp.) | 5.88 | 1/15/29 | 2,000,000 | 1,918,980 |
| Golden State Tobacco Securitization Corporation, Enhanced | ||||
| Tobacco Settlement Asset-Backed Bonds (Insured; AMBAC) | 5.00 | 6/1/21 | 2,000,000 | 2,000,140 |
| Golden State Tobacco Securitization Corporation, | ||||
| Tobacco Settlement Asset-Backed Bonds | 4.50 | 6/1/27 | 1,935,000 | 1,507,055 |
| Colorado—1.4% | ||||
| Northwest Parkway Public Highway Authority, | ||||
| Revenue (Insured; AMBAC) (Prerefunded) | 5.70 | 6/15/16 | 5,000,000 c | 6,056,200 |
| Florida—1.2% | ||||
| Miami-Dade County, Water and Sewer System | ||||
| Revenue (Insured; Assured Guaranty Municipal Corp.) | 5.00 | 10/1/39 | 5,000,000 | 5,126,400 |
| Massachusetts—.1% | ||||
| Massachusetts Housing Finance Agency, Housing Revenue | 5.13 | 12/1/34 | 350,000 | 344,690 |
| Michigan—.5% | ||||
| Detroit City School District, School Buildings | ||||
| and Site Improvement Bonds (Insured; FGIC) | 5.25 | 5/1/17 | 2,000,000 | 2,236,900 |
| New Jersey—.7% | ||||
| Tobacco Settlement Financing Corporation of | ||||
| New Jersey, Tobacco Settlement Asset-Backed Bonds | 4.50 | 6/1/23 | 3,360,000 | 2,975,515 |
| North Carolina—.7% | ||||
| North Carolina Eastern Municipal Power | ||||
| Agency, Power System Revenue | 5.30 | 1/1/15 | 1,500,000 | 1,577,955 |
56
| BNY Mellon Pennsylvania Intermediate Municipal Bond Fund (continued) | ||||
| Long-Term Municipal | Coupon | Maturity | Principal | |
| Investments (continued) | Rate (%) | Date | Amount ($) | Value ($) |
| North Carolina (continued) | ||||
| North Carolina Eastern Municipal Power | ||||
| Agency, Power System Revenue | 5.13 | 1/1/23 | 1,500,000 | 1,531,995 |
| Ohio—1.3% | ||||
| Cuyahoga County, Revenue (Cleveland Clinic Health System) | 6.00 | 1/1/16 | 5,000,000 | 5,401,450 |
| Pennsylvania—70.4% | ||||
| Allegheny County Airport Authority, Airport Revenue | ||||
| (Pittsburgh International Airport) (Insured; | ||||
| Assured Guaranty Municipal Corp.) | 5.00 | 1/1/17 | 1,000,000 | 1,086,040 |
| Allegheny County Hospital Development Authority, | ||||
| Revenue (University of Pittsburgh Medical Center) | 5.00 | 6/15/14 | 5,000,000 | 5,539,750 |
| Allegheny County Port Authority, Special Transportation Revenue | 5.25 | 3/1/24 | 5,000,000 | 5,571,500 |
| Allegheny County Sanitary Authority, Sewer Revenue | ||||
| (Insured; National Public Finance Guarantee Corp.) | 5.00 | 12/1/18 | 2,560,000 | 2,839,347 |
| Allegheny County Sanitary Authority, Sewer Revenue | ||||
| (Insured; National Public Finance Guarantee Corp.) | 5.00 | 12/1/22 | 6,860,000 | 7,348,706 |
| Allentown School District, GO | 5.00 | 2/15/22 | 5,875,000 | 6,506,798 |
| Beaver County Industrial Development Authority, PCR | ||||
| (Duquesne Light Company Project) (Insured; AMBAC) | 4.50 | 11/1/29 | 6,500,000 | 6,211,790 |
| Berks County Municipal Authority, Revenue | ||||
| (The Reading Hospital and Medical Center Project) | 5.00 | 11/1/19 | 2,000,000 | 2,297,120 |
| Central Bucks School District, GO (Prerefunded) | 5.00 | 5/15/18 | 5,000,000 c | 6,138,450 |
| Central Dauphin School District, GO (Insured; National | ||||
| Public Finance Guarantee Corp.) (Prerefunded) | 6.75 | 2/1/16 | 5,000,000 c | 6,302,350 |
| Central Dauphin School District, GO (Insured; National | ||||
| Public Finance Guarantee Corp.) (Prerefunded) | 7.00 | 2/1/16 | 1,630,000 c | 2,071,420 |
| Central Dauphin School District, GO (Insured; National | ||||
| Public Finance Guarantee Corp.) (Prerefunded) | 7.50 | 2/1/16 | 3,100,000 c | 4,003,588 |
| Central York School District, GO (Insured; FGIC) (Prerefunded) | 5.50 | 6/1/12 | 80,000 c | 83,195 |
| Chester County, GO | 5.00 | 8/15/18 | 4,545,000 | 5,196,571 |
| Chester County, GO | 5.00 | 7/15/25 | 3,060,000 | 3,505,567 |
| Chester County, GO (Prerefunded) | 5.00 | 7/15/19 | 1,940,000 c | 2,415,630 |
| Coatesville Area School District, GO (Insured; | ||||
| Assured Guaranty Municipal Corp.) (Prerefunded) | 5.25 | 8/15/14 | 6,515,000 c | 7,436,221 |
| Commonwealth Financing Authority of Pennsylvania, Revenue | 5.00 | 6/1/24 | 5,000,000 | 5,548,900 |
| Delaware County Authority, University Revenue | ||||
| (Villanova University) (Insured; AMBAC) | 5.00 | 8/1/20 | 2,095,000 | 2,312,482 |
| Delaware River Joint Toll Bridge Commission, Bridge | ||||
| Revenue (Insured; National Public Finance Guarantee Corp.) | 5.25 | 7/1/17 | 1,485,000 | 1,703,622 |
| Downingtown Area School District, GO | 5.00 | 11/1/18 | 2,010,000 | 2,456,642 |
| East Stroudsburg Area School District, GO (Insured; | ||||
| Assured Guaranty Municipal Corp.) (Prerefunded) | 7.50 | 9/1/16 | 2,500,000 c | 3,312,875 |
| Easton Area School District, GO (Insured; | ||||
| Assured Guaranty Municipal Corp.) | 7.50 | 4/1/18 | 1,000,000 | 1,238,960 |
| The Funds | 57 |
| STATEMENT OF INVESTMENTS (continued) | ||||
| BNY Mellon Pennsylvania Intermediate Municipal Bond Fund (continued) | ||||
| Long-Term Municipal | Coupon | Maturity | Principal | |
| Investments (continued) | Rate (%) | Date | Amount ($) | Value ($) |
| Pennsylvania (continued) | ||||
| Easton Area School District, GO (Insured; | ||||
| Assured Guaranty Municipal Corp.) | 7.50 | 4/1/21 | 3,000,000 | 3,618,660 |
| Easton Area School District, GO (Insured; | ||||
| Assured Guaranty Municipal Corp.) | 7.50 | 4/1/22 | 3,000,000 | 3,593,160 |
| Easton Area School District, GO (Insured; | ||||
| Assured Guaranty Municipal Corp.) | 5.50 | 4/1/23 | 2,260,000 | 2,580,400 |
| Erie County, GO (Insured; National Public Finance Guarantee Corp.) | 5.50 | 9/1/22 | 1,640,000 | 2,032,501 |
| Lancaster Higher Education Authority, | ||||
| College Revenue (Franklin and Marshall College Project) | 5.25 | 4/15/16 | 1,815,000 | 1,927,149 |
| Lehigh County General Purpose Authority, | ||||
| Revenue (Good Shepherd Group) | 5.25 | 11/1/14 | 2,670,000 | 2,807,959 |
| Lehigh County Industrial Development Authority, PCR | ||||
| (People Electric Utilities Corporation Project) | ||||
| (Insured; National Public Finance Guarantee Corp.) | 4.75 | 2/15/27 | 2,000,000 | 1,969,840 |
| Lower Merion School District, GO | 5.00 | 9/1/22 | 2,980,000 | 3,391,270 |
| Lower Merion School District, GO | 5.00 | 5/15/29 | 5,000,000 | 5,136,650 |
| Montgomery County, GO | 5.00 | 12/15/17 | 2,025,000 | 2,477,507 |
| Montgomery County, GO | 5.00 | 12/15/24 | 2,890,000 | 3,354,510 |
| Montgomery County Industrial Development Authority, FHA | ||||
| Insured Mortgage Revenue (New Regional Medical Center Project) | 5.50 | 8/1/25 | 1,000,000 | 1,100,190 |
| Muhlenberg School District, GO (Insured; | ||||
| National Public Finance Guarantee Corp.) | 5.38 | 4/1/15 | 1,000,000 | 1,027,220 |
| Parkland School District, GO (Insured; | ||||
| National Public Finance Guarantee Corp.) | 5.38 | 9/1/14 | 3,110,000 | 3,543,378 |
| Parkland School District, GO (Insured; | ||||
| National Public Finance Guarantee Corp.) | 5.38 | 9/1/16 | 1,490,000 | 1,795,912 |
| Pennsylvania, GO | 5.00 | 7/1/20 | 10,000,000 | 12,187,100 |
| Pennsylvania Economic Development Financing | ||||
| Authority, SWDR (Waste Management, Inc. Project) | 4.70 | 11/1/14 | 5,000,000 | 5,442,650 |
| Pennsylvania Higher Educational Facilities Authority, | ||||
| Revenue (Bryn Mawr College) (Insured; AMBAC) | 5.25 | 12/1/12 | 3,000,000 | 3,174,030 |
| Pennsylvania Higher Educational Facilities | ||||
| Authority, Revenue (La Salle University) | 5.50 | 5/1/34 | 2,250,000 | 2,260,822 |
| Pennsylvania Higher Educational Facilities | ||||
| Authority, Revenue (Saint Joseph’s University) | 5.00 | 11/1/25 | 2,010,000 | 2,147,745 |
| Pennsylvania Higher Educational Facilities | ||||
| Authority, Revenue (State System of Higher Education) | 5.25 | 6/15/24 | 5,000,000 | 5,863,600 |
| Pennsylvania Higher Educational Facilities Authority, | ||||
| Revenue (The Trustees of the University of Pennsylvania) | 5.00 | 9/1/19 | 5,090,000 | 6,224,256 |
| Pennsylvania Higher Educational Facilities Authority, | ||||
| Revenue (Thomas Jefferson University) (Insured; AMBAC) | 5.25 | 9/1/17 | 1,700,000 | 1,967,393 |
| Pennsylvania Higher Educational Facilities Authority, | ||||
| Revenue (Thomas Jefferson University) (Insured; AMBAC) | 5.25 | 9/1/18 | 1,485,000 | 1,725,570 |
58
| BNY Mellon Pennsylvania Intermediate Municipal Bond Fund (continued) | ||||
| Long-Term Municipal | Coupon | Maturity | Principal | |
| Investments (continued) | Rate (%) | Date | Amount ($) | Value ($) |
| Pennsylvania (continued) | ||||
| Pennsylvania Industrial Development | ||||
| Authority, EDR (Insured; AMBAC) | 5.50 | 7/1/12 | 5,335,000 | 5,554,429 |
| Pennsylvania Intergovernmental Cooperation Authority, | ||||
| Special Tax Revenue (City of Philadelphia Funding Program) | 5.00 | 6/15/22 | 3,395,000 | 3,947,061 |
| Pennsylvania Turnpike Commission, Oil Franchise Tax Subordinated | ||||
| Revenue (Insured; National Public Finance Guarantee Corp.) | 5.00 | 12/1/21 | 5,000,000 | 5,345,850 |
| Pennsylvania Turnpike Commission, Oil Franchise Tax | ||||
| Subordinated Revenue (Insured; National Public | ||||
| Finance Guarantee Corp.) (Prerefunded) | 5.25 | 12/1/13 | 2,500,000 c | 2,775,000 |
| Pennsylvania Turnpike Commission, Registration Fee | ||||
| Revenue (Insured; Assured Guaranty Municipal Corp.) | 5.25 | 7/15/24 | 5,000,000 | 5,826,300 |
| Pennsylvania Turnpike Commission, Registration Fee | ||||
| Revenue (Insured; Assured Guaranty Municipal Corp.) | 5.25 | 7/15/25 | 5,000,000 | 5,810,550 |
| Pennsylvania Turnpike Commission, | ||||
| Turnpike Revenue (Insured; AMBAC) | 5.00 | 12/1/29 | 5,000,000 | 5,145,300 |
| Pennsylvania Turnpike Commission, Turnpike Revenue | ||||
| (Insured; National Public Finance Guarantee Corp.) | 5.50 | 12/1/12 | 2,000,000 | 2,126,260 |
| Pennsylvania Turnpike Commission, | ||||
| Turnpike Subordinate Revenue | 5.00 | 6/1/26 | 5,000,000 | 5,207,300 |
| Pennsylvania Turnpike Commission, Turnpike Subordinate | ||||
| Revenue (Insured; Assured Guaranty Municipal Corp.) | 6.00 | 6/1/28 | 1,500,000 | 1,673,475 |
| Philadelphia, GO (Insured; Assured Guaranty Municipal Corp.) | 5.25 | 8/1/17 | 2,500,000 | 2,867,150 |
| Philadelphia, Water and Wastewater Revenue (Insured; AMBAC) | 5.25 | 12/15/12 | 10,000,000 | 10,623,100 |
| Philadelphia, Water and Wastewater Revenue | ||||
| (Insured; Assured Guaranty Municipal Corp.) | 5.25 | 7/1/18 | 5,000,000 | 5,519,700 |
| Philadelphia School District, GO (Insured; AMBAC) | 5.00 | 4/1/17 | 5,000,000 | 5,448,750 |
| Pittsburgh School District, GO (Insured; | ||||
| Assured Guaranty Municipal Corp.) | 5.50 | 9/1/16 | 4,000,000 | 4,735,120 |
| Pittsburgh School District, GO (Insured; | ||||
| Assured Guaranty Municipal Corp.) | 5.50 | 9/1/18 | 1,000,000 | 1,211,210 |
| Pocono Mountain School District, GO | ||||
| (Insured; Assured Guaranty Municipal Corp.) | 5.00 | 9/1/22 | 5,270,000 | 5,770,545 |
| Saint Mary Hospital Authority, Health System | ||||
| Revenue (Catholic Health East Issue) | 5.00 | 11/15/21 | 1,000,000 | 1,042,130 |
| Southeastern Pennsylvania Transportation Authority, | ||||
| Capital Grant Receipts Bonds (Federal Transit Administration | ||||
| Section 5309 Fixed Guideway Modernization Formula Funds) | 5.00 | 6/1/23 | 2,000,000 | 2,216,600 |
| Southeastern Pennsylvania Transportation Authority, Revenue | 5.00 | 3/1/26 | 3,000,000 | 3,269,640 |
| State Public School Building Authority, School LR | ||||
| (Richland School District Project) (Insured; FGIC) (Prerefunded) | 5.00 | 11/15/14 | 1,265,000 c | 1,447,527 |
| State Public School Building Authority, School LR (The School | ||||
| District of Philadelphia Project) (Insured; Assured | ||||
| Guaranty Municipal Corp.) (Prerefunded) | 5.00 | 6/1/13 | 5,000,000 c | 5,411,850 |
| The Funds | 59 |
| STATEMENT OF INVESTMENTS (continued) | ||||
| BNY Mellon Pennsylvania Intermediate Municipal Bond Fund (continued) | ||||
| Long-Term Municipal | Coupon | Maturity | Principal | |
| Investments (continued) | Rate (%) | Date | Amount ($) | Value ($) |
| Pennsylvania (continued) | ||||
| State Public School Building Authority, School Revenue | ||||
| (Chester Upland School District Project) (Insured; | ||||
| Assured Guaranty Municipal Corp.) | 5.25 | 9/15/24 | 5,780,000 | 6,424,470 |
| State Public School Building Authority, School Revenue | ||||
| (Tuscarora School District Project) (Insured; | ||||
| Assured Guaranty Municipal Corp.) | 5.25 | 4/1/17 | 840,000 | 897,036 |
| State Public School Building Authority, School Revenue | ||||
| (Tuscarora School District Project) (Insured; Assured | ||||
| Guaranty Municipal Corp.) (Prerefunded) | 5.25 | 4/1/13 | 195,000 c | 209,863 |
| Susquehanna Area Regional Airport Authority, | ||||
| Airport System Revenue | 5.38 | 1/1/18 | 6,000,000 | 5,506,260 |
| Susquehanna Area Regional Airport Authority, | ||||
| Airport System Revenue (Insured; AMBAC) | 5.50 | 1/1/20 | 4,370,000 | 4,374,064 |
| Susquehanna Area Regional Airport Authority, | ||||
| Airport System Revenue (Insured; AMBAC) | 5.00 | 1/1/33 | 2,290,000 | 2,028,848 |
| Swarthmore Borough Authority, College Revenue | 5.25 | 9/15/17 | 1,000,000 | 1,049,280 |
| Twin Valley School District, GO (Insured; Assured | ||||
| Guaranty Municipal Corp.) (Prerefunded) | 5.25 | 10/1/15 | 1,000,000 c | 1,189,070 |
| University of Pittsburgh of the Commonwealth System of | ||||
| Higher Education, University Capital Project Bonds | 5.50 | 9/15/21 | 2,500,000 | 3,030,175 |
| Upper Darby School District, GO (Insured; | ||||
| National Public Finance Guarantee Corp.) | 5.00 | 5/1/18 | 2,870,000 | 3,195,142 |
| Upper Merion Area School District, GO (Insured; | ||||
| National Public Finance Guarantee Corp.) | 5.00 | 2/15/19 | 1,165,000 | 1,281,372 |
| West Mifflin Area School District, GO (Insured; | ||||
| Assured Guaranty Municipal Corp.) | 5.50 | 4/1/24 | 1,060,000 | 1,204,266 |
| Westmoreland County, GO (Insured; | ||||
| National Public Finance Guarantee Corp.) | 0.00 | 12/1/15 | 1,500,000 d | 1,317,720 |
| Wilson School District, GO (Insured; Assured | ||||
| Guaranty Municipal Corp.) (Prerefunded) | 5.38 | 5/15/12 | 1,785,000 c | 1,848,671 |
| Wilson School District, GO (Insured; Assured | ||||
| Guaranty Municipal Corp.) (Prerefunded) | 5.38 | 5/15/12 | 1,500,000 c | 1,553,505 |
| York County, GO (Insured; AMBAC) | 5.00 | 6/1/17 | 1,100,000 | 1,180,113 |
| York County Solid Waste and Refuse Authority, | ||||
| Solid Waste System Revenue (Insured; | ||||
| National Public Finance Guarantee Corp.) | 5.50 | 12/1/14 | 1,000,000 | 1,142,630 |
| South Carolina—.6% | ||||
| Greenville County School District, Installment | ||||
| Purchase Revenue (Building Equity Sooner for Tomorrow) | 5.50 | 12/1/18 | 2,000,000 | 2,448,240 |
| Texas—.5% | ||||
| Cities of Dallas and Fort Worth, Dallas/Fort Worth International | ||||
| Airport, Joint Revenue Improvement Bonds (Insured; | ||||
| National Public Finance Guarantee Corp.) | 5.50 | 11/1/31 | 2,000,000 | 2,000,840 |
60
| BNY Mellon Pennsylvania Intermediate Municipal Bond Fund (continued) | ||||
| Long-Term Municipal | Coupon | Maturity | Principal | |
| Investments (continued) | Rate (%) | Date | Amount ($) | Value ($) |
| U.S. Related—12.1% | ||||
| Government of Guam, LOR (Section 30) | 5.63 | 12/1/29 | 1,000,000 | 1,016,390 |
| Puerto Rico Commonwealth, | ||||
| Public Improvement GO (Insured; AMBAC) | 5.50 | 7/1/19 | 3,000,000 | 3,324,360 |
| Puerto Rico Commonwealth, | ||||
| Public Improvement GO (Insured; FGIC) | 5.50 | 7/1/18 | 5,000,000 | 5,571,000 |
| Puerto Rico Commonwealth, Public Improvement GO | ||||
| (Insured; National Public Finance Guarantee Corp.) | 5.50 | 7/1/14 | 7,500,000 | 8,169,750 |
| Puerto Rico Electric Power Authority, Power Revenue | ||||
| (Insured; National Public Finance Guarantee Corp.) | 5.25 | 7/1/14 | 7,875,000 | 8,623,125 |
| Puerto Rico Electric Power Authority, Power Revenue | ||||
| (Insured; National Public Finance Guarantee Corp.) | 5.50 | 7/1/17 | 6,000,000 | 6,790,440 |
| Puerto Rico Government Development Bank, Senior Notes | 5.00 | 12/1/12 | 3,000,000 | 3,133,500 |
| Puerto Rico Government Development Bank, Senior Notes | 5.00 | 12/1/13 | 3,000,000 | 3,209,850 |
| Puerto Rico Highways and Transportation Authority, | ||||
| Highway Revenue (Insured; Assured Guaranty Municipal Corp.) | 5.50 | 7/1/13 | 980,000 | 1,033,381 |
| Puerto Rico Highways and Transportation Authority, Highway | ||||
| Revenue (Insured; National Public Finance Guarantee Corp.) | 5.50 | 7/1/13 | 2,620,000 | 2,736,983 |
| Puerto Rico Infrastructure Financing | ||||
| Authority, Special Tax Revenue | 5.00 | 7/1/21 | 5,000,000 | 5,096,350 |
| Puerto Rico Sales Tax Financing Corporation, | ||||
| Sales Tax Revenue (First Subordinate Series) | 0/6.75 | 8/1/32 | 1,000,000 b | 861,430 |
| Puerto Rico Sales Tax Financing Corporation, | ||||
| Sales Tax Revenue (First Subordinate Series) | 0/6.25 | 8/1/33 | 500,000 b | 349,520 |
| Puerto Rico Sales Tax Financing Corporation, | ||||
| Sales Tax Revenue (First Subordinate Series) | 0.00 | 8/1/36 | 3,750,000 d | 759,975 |
| Puerto Rico Sales Tax Financing Corporation, | ||||
| Sales Tax Revenue (First Subordinate Series) | 6.00 | 8/1/42 | 1,500,000 | 1,587,960 |
| Total Long-Term Municipal Investments | ||||
| (cost $398,978,108) | 422,732,428 | |||
| Short-Term Municipal Investments—.8% | ||||
| Colorado—.1% | ||||
| Colorado Educational and Cultural Facilities Authority, | ||||
| Revenue (National Jewish Federation Bond | ||||
| Program) (LOC; Bank of America) | 0.17 | 9/1/11 | 100,000 e | 100,000 |
| Colorado Educational and Cultural Facilities Authority, Revenue | ||||
| (National Jewish Federation Bond Program) (LOC; U.S. Bank NA) | 0.14 | 9/1/11 | 200,000 e | 200,000 |
| Colorado Health Facilities Authority, Revenue (The Visiting Nurse | ||||
| Corporation of Colorado, Inc.) (LOC; Wells Fargo Bank) | 0.19 | 9/1/11 | 100,000 e | 100,000 |
| Illinois—.1% | ||||
| Chicago Board of Education, GO Notes, Refunding | ||||
| (LOC; JPMorgan Chase Bank) | 0.14 | 9/1/11 | 300,000 e | 300,000 |
| The Funds | 61 |
| STATEMENT OF INVESTMENTS (continued) | ||||
| BNY Mellon Pennsylvania Intermediate Municipal Bond Fund (continued) | ||||
| Short-Term Municipal | Coupon | Maturity | Principal | |
| Investments (continued) | Rate (%) | Date | Amount ($) | Value ($) |
| Pennsylvania—.2% | ||||
| Lancaster County Hospital Authority, Health System | ||||
| Revenue (The Lancaster General Hospital | ||||
| Refunding Project) (LOC; Bank of America) | 0.16 | 9/1/11 | 300,000 e | 300,000 |
| Lehigh County General Purpose Authority, HR | ||||
| (Lehigh Valley Health Network) (LOC; Bank of America) | 0.16 | 9/1/11 | 500,000 e | 500,000 |
| Tennessee—.4% | ||||
| Chattanooga Industrial Development Board, Revenue | ||||
| (Hunter Museum of American Art Project) (LOC; Bank of America) | 0.55 | 9/7/11 | 100,000 e | 100,000 |
| Clarksville Public Building Authority, Financing Revenue | ||||
| (Metropolitan Government of Nashville and Davidson | ||||
| County Loan) (LOC; Bank of America) | 0.18 | 9/1/11 | 1,200,000 e | 1,200,000 |
| Clarksville Public Building Authority, Revenue | ||||
| (City of Morristown Loans) (LOC; Bank of America) | 0.18 | 9/1/11 | 200,000 e | 200,000 |
| Montgomery County Public Building Authority, Pooled Financing | ||||
| Revenue (Tennessee County Loan Pool) (LOC; Bank of America) | 0.18 | 9/1/11 | 400,000 e | 400,000 |
| Total Short-Term Municipal Investments | ||||
| (cost $3,400,000) | 3,400,000 | |||
| Total Investments (cost $402,378,108) | 99.2% | 426,132,428 | ||
| Cash and Receivables (Net) | .8% | 3,607,294 | ||
| Net Assets | 100.0% | 429,739,722 | ||
| a Security exempt from registration under Rule 144A of the Securities Act of 1933.This security may be resold in transactions exempt from registration, normally to qualified |
| institutional buyers.At August 31, 2011, this security was valued at $1,427,805 or 0.3% of net assets. |
| b Zero coupon until a specified date at which time the stated coupon rate becomes effective until maturity. |
| c These securities are prerefunded; the date shown represents the prerefunded date. Bonds which are prerefunded are collateralized by U.S. Government securities which are held in |
| escrow and are used to pay principal and interest on the municipal issue and to retire the bonds in full at the earliest refunding date. |
| d Security issued with a zero coupon. Income is recognized through the accretion of discount. |
| e Variable rate demand note—rate shown is the interest rate in effect at August 31, 2011. Maturity date represents the next demand date, or the ultimate maturity date if earlier. |
62
| Summary of Abbreviations | ||||||
| ABAG | Association of Bay Area Governments | ACA | American Capital Access | |||
| AGC | ACE Guaranty Corporation | AGIC | Asset Guaranty Insurance Company | |||
| AMBAC | American Municipal Bond Assurance Corporation | ARRN | Adjustable Rate Receipt Notes | |||
| BAN | Bond Anticipation Notes | BPA | Bond Purchase Agreement | |||
| CIFG | CDC Ixis Financial Guaranty | COP | Certificate of Participation | |||
| CP | Commercial Paper | EDR | Economic Development Revenue | |||
| EIR | Environmental Improvement Revenue | FGIC | Financial Guaranty Insurance Company | |||
| FHA | Federal Housing Administration | FHLB | Federal Home Loan Bank | |||
| FHLMC | Federal Home Loan Mortgage Corporation | FNMA | Federal National Mortgage Association | |||
| GAN | Grant Anticipation Notes | GIC | Guaranteed Investment Contract | |||
| GNMA | Government National Mortgage Association | GO | General Obligation | |||
| HR | Hospital Revenue | IDB | Industrial Development Board | |||
| IDC | Industrial Development Corporation | IDR | Industrial Development Revenue | |||
| LOC | Letter of Credit | LOR | Limited Obligation Revenue | |||
| LR | Lease Revenue | MFHR | Multi-Family Housing Revenue | |||
| MFMR | Multi-Family Mortgage Revenue | PCR | Pollution Control Revenue | |||
| PILOT | Payment in Lieu of Taxes | PUTTERS | Puttable Tax-Exempt Receipts | |||
| RAC | Revenue Anticipation Certificates | RAN | Revenue Anticipation Notes | |||
| RAW | Revenue Anticipation Warrants | RRR | Resources Recovery Revenue | |||
| SAAN | State Aid Anticipation Notes | SBPA | Standby Bond Purchase Agreement | |||
| SFHR | Single Family Housing Revenue | SFMR | Single Family Mortgage Revenue | |||
| SONYMA | State of New York Mortgage Agency | SWDR | Solid Waste Disposal Revenue | |||
| TAN | Tax Anticipation Notes | TAW | Tax Anticipation Warrants | |||
| TRAN | Tax and Revenue Anticipation Notes | XLCA | XL Capital Assurance | |||
| Summary of Combined Ratings (Unaudited) | ||||||
| Fitch | or | Moody’s | or | Standard & Poor’s | Value (%)† | |
| AAA | Aaa | AAA | 35.7 | |||
| AA | Aa | AA | 33.9 | |||
| A | A | A | 17.9 | |||
| BBB | Baa | BBB | 9.7 | |||
| F1 | MIG1/P1 | SP1/A1 | .8 | |||
| Not Ratedf | Not Ratedf | Not Ratedf | 2.0 | |||
| 100.0 | ||||||
| † Based on total investments. |
| f Securities which, while not rated by Fitch, Moody’s and Standard & Poor’s, have been determined by the Manager to be of comparable quality to those rated securities in which the |
| fund may invest. |
See notes to financial statements.
| The Funds | 63 |
| STATEMENT OF FINANCIAL FUTURES |
| August 31, 2011 |
| Market Value | Unrealized | |||
| BNY Mellon Pennsylvania | Covered by | (Depreciation) | ||
| Intermediate Municipal Bond Fund | Contracts | Contracts ($) | Expiration | at 8/31/2011 ($) |
| Financial Futures Short | ||||
| U.S. Treasury 10 Year Notes | 90 | (11,702,813) | September 2011 | (667,266) |
| See notes to financial statements. | ||||
64
| STATEMENT OF INVESTMENTS | ||||
| August 31, 2011 | ||||
| BNY Mellon Massachusetts Intermediate Municipal Bond Fund | ||||
| Long-Term Municipal | Coupon | Maturity | Principal | |
| Investments—97.6% | Rate (%) | Date | Amount ($) | Value ($) |
| Massachusetts—86.7% | ||||
| Ashland, GO (Insured; AMBAC) | 5.25 | 5/15/21 | 1,305,000 | 1,466,807 |
| Auburn, GO (Insured; AMBAC) | 5.13 | 6/1/20 | 1,225,000 | 1,349,399 |
| Boston, GO | 5.00 | 4/1/15 | 1,905,000 | 2,208,695 |
| Boston, GO | 5.00 | 3/1/20 | 1,700,000 | 1,961,987 |
| Boston, GO | 5.00 | 3/1/21 | 2,000,000 | 2,288,600 |
| Boston Water and Sewer Commission, General Revenue | 5.00 | 11/1/17 | 2,000,000 | 2,440,560 |
| Boston Water and Sewer Commission, General Revenue | 5.00 | 11/1/18 | 1,500,000 | 1,844,565 |
| Boston Water and Sewer Commission, General Revenue | 5.00 | 11/1/19 | 2,170,000 | 2,430,465 |
| Boston Water and Sewer Commission, General Revenue | 5.00 | 11/1/23 | 3,920,000 | 4,343,321 |
| Boston Water and Sewer Commission, General Revenue | 5.00 | 11/1/25 | 2,500,000 | 2,859,300 |
| Boston Water and Sewer Commission, General Revenue | 5.00 | 11/1/26 | 2,480,000 | 2,798,333 |
| Brockton, GO (Municipal Purpose Loan) (Insured; AMBAC) | 5.00 | 6/1/19 | 1,430,000 | 1,595,122 |
| Burlington, GO | 5.25 | 2/1/12 | 200,000 | 204,252 |
| Burlington, GO | 5.25 | 2/1/13 | 250,000 | 267,702 |
| Cambridge, GO (Municipal Purpose Loan) | 5.00 | 12/15/11 | 10,000 | 10,141 |
| Cohasset, GO | 5.00 | 6/15/22 | 895,000 | 977,268 |
| Cohasset, GO | 5.00 | 6/15/23 | 895,000 | 950,481 |
| Everett, GO (Insured; National Public Finance Guarantee Corp.) | 5.38 | 12/15/17 | 1,250,000 | 1,405,487 |
| Haverhill, GO (State Qualified Municipal Purpose Loan) | ||||
| (Insured; National Public Finance Guarantee Corp.) | 5.00 | 6/1/16 | 1,580,000 | 1,874,623 |
| Haverhill, GO (State Qualified Municipal Purpose Loan) | ||||
| (Insured; National Public Finance Guarantee Corp.) | 5.00 | 6/1/18 | 505,000 | 582,346 |
| Hopedale, GO (Insured; AMBAC) | 5.00 | 11/15/19 | 650,000 | 715,052 |
| Ipswich, GO (Insured; National Public Finance Guarantee Corp.) | 5.00 | 11/15/14 | 500,000 | 572,110 |
| Lynnfield, GO (Municipal Purpose Loan) | 5.00 | 7/1/20 | 505,000 | 554,136 |
| Lynnfield, GO (Municipal Purpose Loan) | 5.00 | 7/1/21 | 525,000 | 576,082 |
| Lynnfield, GO (Municipal Purpose Loan) | 5.00 | 7/1/22 | 585,000 | 639,616 |
| Lynnfield, GO (Municipal Purpose Loan) | 5.00 | 7/1/23 | 585,000 | 621,276 |
| Mansfield, GO (Insured; AMBAC) | 5.00 | 8/15/17 | 1,395,000 | 1,591,514 |
| Marblehead, GO | 5.00 | 8/15/18 | 1,340,000 | 1,475,903 |
| Marblehead, GO | 5.00 | 8/15/22 | 1,750,000 | 1,920,275 |
| Massachusetts, Consolidated Loan | 5.50 | 11/1/16 | 1,000,000 | 1,223,660 |
| Massachusetts, Consolidated Loan | 5.00 | 8/1/20 | 4,000,000 | 4,696,680 |
| Massachusetts, Consolidated Loan | ||||
| (Insured; Assured Guaranty Municipal Corp.) | 5.25 | 8/1/22 | 5,825,000 | 6,700,148 |
| Massachusetts, Consolidated Loan (Insured; | ||||
| Assured Guaranty Municipal Corp.) (Prerefunded) | 5.00 | 12/1/14 | 5,000,000 a | 5,711,350 |
| Massachusetts, Consolidated Loan (Insured; FGIC) | 5.50 | 8/1/18 | 1,035,000 | 1,288,244 |
| Massachusetts, Consolidated Loan (Insured; National | ||||
| Public Finance Guarantee Corp.) (Prerefunded) | 5.00 | 8/1/12 | 420,000 a | 438,064 |
| Massachusetts, Consolidated Loan (Prerefunded) | 5.25 | 10/1/13 | 10,000,000 a | 11,001,900 |
| The Funds | 65 |
| STATEMENT OF INVESTMENTS (continued) | ||||
| BNY Mellon Massachusetts Intermediate Municipal Bond Fund (continued) | ||||
| Long-Term Municipal | Coupon | Maturity | Principal | |
| Investments (continued) | Rate (%) | Date | Amount ($) | Value ($) |
| Massachusetts (continued) | ||||
| Massachusetts, Consolidated Loan (Prerefunded) | 5.00 | 3/1/15 | 1,500,000 a | 1,735,155 |
| Massachusetts, Consolidated Loan (Prerefunded) | 5.00 | 3/1/15 | 1,800,000 a | 2,082,186 |
| Massachusetts, Consolidated Loan (Prerefunded) | 5.00 | 8/1/16 | 1,000,000 a | 1,206,440 |
| Massachusetts, GO | 5.25 | 8/1/23 | 1,000,000 | 1,228,070 |
| Massachusetts, GO (Insured; AMBAC) | 5.50 | 10/1/18 | 225,000 | 280,926 |
| Massachusetts, GO (Insured; XLCA) | 4.11 | 12/1/12 | 2,470,000 b | 2,479,188 |
| Massachusetts, Special Obligation Dedicated | ||||
| Tax Revenue (Insured; FGIC) (Prerefunded) | 5.25 | 1/1/14 | 2,500,000 a | 2,772,950 |
| Massachusetts, Special Obligation Dedicated Tax | ||||
| Revenue (Insured; National Public Finance Guarantee Corp.) | 2.65 | 1/1/16 | 3,540,000 b | 3,619,615 |
| Massachusetts, Special Obligation Revenue | 5.50 | 6/1/13 | 1,000,000 | 1,084,980 |
| Massachusetts Bay Transportation Authority, | ||||
| Assessment Revenue | 5.00 | 7/1/18 | 4,000,000 | 4,856,720 |
| Massachusetts Bay Transportation Authority, | ||||
| Assessment Revenue (Prerefunded) | 5.25 | 7/1/14 | 1,045,000 a | 1,186,211 |
| Massachusetts Bay Transportation Authority, | ||||
| Assessment Revenue (Prerefunded) | 5.25 | 7/1/14 | 1,000,000 a | 1,135,130 |
| Massachusetts Bay Transportation Authority, GO | ||||
| (General Transportation System) (Insured; | ||||
| National Public Finance Guarantee Corp.) | 5.25 | 3/1/15 | 1,000,000 | 1,155,130 |
| Massachusetts Bay Transportation Authority, | ||||
| Senior Sales Tax Revenue | 5.00 | 7/1/15 | 3,500,000 | 4,083,415 |
| Massachusetts Bay Transportation Authority, | ||||
| Senior Sales Tax Revenue | 5.50 | 7/1/16 | 105,000 | 128,658 |
| Massachusetts Bay Transportation Authority, | ||||
| Senior Sales Tax Revenue | 5.50 | 7/1/16 | 2,395,000 | 2,907,937 |
| Massachusetts Bay Transportation Authority, | ||||
| Senior Sales Tax Revenue | 5.25 | 7/1/21 | 2,000,000 | 2,480,720 |
| Massachusetts Bay Transportation Authority, | ||||
| Senior Sales Tax Revenue | 5.25 | 7/1/22 | 2,430,000 | 2,961,319 |
| Massachusetts Bay Transportation Authority, | ||||
| Senior Sales Tax Revenue | 5.25 | 7/1/22 | 3,415,000 | 4,161,690 |
| Massachusetts College Building Authority, Project Revenue | 5.00 | 5/1/23 | 1,000,000 | 1,146,500 |
| Massachusetts Development Finance Agency, | ||||
| Education Revenue (Dexter School Project) | 5.00 | 5/1/23 | 1,400,000 | 1,487,052 |
| Massachusetts Development Finance Agency, | ||||
| Education Revenue (Dexter School Project) | 5.00 | 5/1/24 | 1,465,000 | 1,546,146 |
| Massachusetts Development Finance Agency, | ||||
| Higher Education Revenue (Emerson College Issue) | 5.00 | 1/1/16 | 1,000,000 | 1,109,850 |
| Massachusetts Development Finance Agency, | ||||
| Higher Education Revenue (Emerson College Issue) | 5.00 | 1/1/22 | 2,000,000 | 2,115,760 |
| Massachusetts Development Finance Agency, Recovery Zone | ||||
| Facility Revenue (Dominion Energy Brayton Point Issue) | 2.25 | 9/1/16 | 2,560,000 | 2,575,104 |
66
| BNY Mellon Massachusetts Intermediate Municipal Bond Fund (continued) | ||||
| Long-Term Municipal | Coupon | Maturity | Principal | |
| Investments (continued) | Rate (%) | Date | Amount ($) | Value ($) |
| Massachusetts (continued) | ||||
| Massachusetts Development Finance Agency, | ||||
| Revenue (Belmont Hill School Issue) | 4.50 | 9/1/36 | 1,130,000 | 1,084,450 |
| Massachusetts Development Finance Agency, | ||||
| Revenue (Boston College Issue) | 5.00 | 7/1/20 | 1,000,000 | 1,139,250 |
| Massachusetts Development Finance Agency, | ||||
| Revenue (College of the Holy Cross Issue) | 5.00 | 9/1/21 | 1,800,000 | 2,071,746 |
| Massachusetts Development Finance Agency, Revenue | ||||
| (Combined Jewish Philanthropies of Greater Boston, Inc. Project) | 5.25 | 2/1/22 | 955,000 | 981,597 |
| Massachusetts Development Finance Agency, | ||||
| Revenue (Curry College Issue) (Insured; ACA) | 4.75 | 3/1/20 | 530,000 | 533,413 |
| Massachusetts Development Finance Agency, | ||||
| Revenue (Curry College Issue) (Insured; ACA) | 5.25 | 3/1/26 | 1,000,000 | 1,003,970 |
| Massachusetts Development Finance Agency, | ||||
| Revenue (Curry College Issue) (Insured; ACA) | 5.00 | 3/1/36 | 1,000,000 | 916,810 |
| Massachusetts Development Finance Agency, | ||||
| Revenue (Emerson College Issue) | 4.00 | 1/1/14 | 225,000 | 236,520 |
| Massachusetts Development Finance Agency, Revenue | ||||
| (Massachusetts College of Pharmacy and Allied Health | ||||
| Sciences Issue) (Insured; Assured Guaranty Municipal Corp.) | 5.00 | 7/1/24 | 2,750,000 | 2,910,820 |
| Massachusetts Development Finance Agency, Revenue | ||||
| (Massachusetts College of Pharmacy and Allied Health | ||||
| Sciences Issue) (Insured; Assured Guaranty Municipal Corp.) | 5.00 | 7/1/27 | 1,000,000 | 1,043,650 |
| Massachusetts Development Finance Agency, Revenue | ||||
| (Massachusetts College of Pharmacy and Allied | ||||
| Health Sciences Issue) (Prerefunded) | 6.38 | 7/1/13 | 1,000,000 a | 1,119,450 |
| Massachusetts Development Finance Agency, | ||||
| Revenue (Milton Academy Issue) (Prerefunded) | 5.00 | 9/1/13 | 1,000,000 a | 1,091,500 |
| Massachusetts Development Finance Agency, | ||||
| Revenue (Olin College Issue) (Insured; XLCA) | 5.25 | 7/1/33 | 5,000,000 | 5,026,050 |
| Massachusetts Development Finance Agency, | ||||
| Revenue (The Park School Issue) | 4.50 | 9/1/31 | 1,000,000 | 996,860 |
| Massachusetts Development Finance Agency, | ||||
| Revenue (Tufts Medical Center Issue) | 5.00 | 1/1/15 | 600,000 | 646,470 |
| Massachusetts Development Finance Agency, | ||||
| Revenue (Tufts Medical Center Issue) | 5.00 | 1/1/17 | 925,000 | 1,005,059 |
| Massachusetts Development Finance Agency, | ||||
| Revenue (UMass Memorial Issue) | 5.00 | 7/1/17 | 2,500,000 | 2,733,450 |
| Massachusetts Development Finance Agency, | ||||
| RRR (Waste Management, Inc. Project) | 3.40 | 12/1/12 | 1,250,000 | 1,280,200 |
| Massachusetts Development Finance Agency, | ||||
| SWDR (Dominion Energy Brayton Point Issue) | 5.75 | 5/1/19 | 2,000,000 | 2,273,540 |
| Massachusetts Development Finance Agency, | ||||
| SWDR (Waste Management, Inc. Project) | 5.45 | 6/1/14 | 1,000,000 | 1,097,190 |
| The Funds | 67 |
| STATEMENT OF INVESTMENTS (continued) | ||||
| BNY Mellon Massachusetts Intermediate Municipal Bond Fund (continued) | ||||
| Long-Term Municipal | Coupon | Maturity | Principal | |
| Investments (continued) | Rate (%) | Date | Amount ($) | Value ($) |
| Massachusetts (continued) | ||||
| Massachusetts Health and Educational | ||||
| Facilities Authority, Revenue | ||||
| (Berklee College of Music Issue) | 5.00 | 10/1/24 | 2,155,000 | 2,286,994 |
| Massachusetts Health and Educational Facilities Authority, | ||||
| Revenue (Berklee College of Music Issue) | 5.00 | 10/1/32 | 2,000,000 | 2,027,120 |
| Massachusetts Health and Educational Facilities Authority, | ||||
| Revenue (Berklee College of Music Issue) | 5.00 | 10/1/37 | 3,250,000 | 3,271,872 |
| Massachusetts Health and Educational Facilities Authority, | ||||
| Revenue (Cape Cod Healthcare Obligated Group Issue) | ||||
| (Insured; Assured Guaranty Municipal Corp.) | 5.13 | 11/15/35 | 1,000,000 | 1,016,670 |
| Massachusetts Health and Educational Facilities Authority, | ||||
| Revenue (CareGroup Issue) (Insured; National | ||||
| Public Finance Guarantee Corp.) | 5.25 | 7/1/20 | 1,000,000 | 1,078,380 |
| Massachusetts Health and Educational Facilities Authority, | ||||
| Revenue (CareGroup Issue) (Insured; National | ||||
| Public Finance Guarantee Corp.) | 5.25 | 7/1/23 | 1,000,000 | 1,038,870 |
| Massachusetts Health and Educational Facilities Authority, | ||||
| Revenue (Dana-Farber Cancer Institute Issue) | 5.25 | 12/1/22 | 2,750,000 | 3,019,637 |
| Massachusetts Health and Educational Facilities Authority, | ||||
| Revenue (Dana-Farber Cancer Institute Issue) | 5.25 | 12/1/27 | 2,000,000 | 2,088,000 |
| Massachusetts Health and Educational Facilities Authority, | ||||
| Revenue (Dana-Farber Cancer Institute Issue) | 5.00 | 12/1/37 | 2,500,000 | 2,522,500 |
| Massachusetts Health and Educational Facilities Authority, | ||||
| Revenue (Dartmouth-Hitchcock Obligated Group Issue) | ||||
| (Insured; Assured Guaranty Municipal Corp.) | 5.13 | 8/1/22 | 2,000,000 | 2,029,520 |
| Massachusetts Health and Educational Facilities Authority, | ||||
| Revenue (Harvard University Issue) | 5.00 | 12/15/25 | 2,500,000 | 2,889,425 |
| Massachusetts Health and Educational Facilities Authority, | ||||
| Revenue (Harvard University Issue) | 5.00 | 12/15/27 | 3,230,000 | 3,684,299 |
| Massachusetts Health and Educational Facilities Authority, | ||||
| Revenue (Isabella Stewart Gardner Museum Issue) | 5.00 | 5/1/26 | 2,525,000 | 2,716,925 |
| Massachusetts Health and Educational Facilities Authority, | ||||
| Revenue (Isabella Stewart Gardner Museum Issue) | 5.00 | 5/1/27 | 1,000,000 | 1,069,160 |
| Massachusetts Health and Educational Facilities Authority, | ||||
| Revenue (Massachusetts Eye and Ear Infirmary Issue) | 5.00 | 7/1/14 | 500,000 | 532,555 |
| Massachusetts Health and Educational Facilities Authority, | ||||
| Revenue (Massachusetts Eye and Ear Infirmary Issue) | 5.00 | 7/1/15 | 500,000 | 539,890 |
| Massachusetts Health and Educational Facilities Authority, | ||||
| Revenue (Massachusetts Eye and Ear Infirmary Issue) | 5.38 | 7/1/35 | 1,550,000 | 1,484,652 |
| Massachusetts Health and Educational Facilities Authority, | ||||
| Revenue (Massachusetts Institute of Technology Issue) | 5.50 | 7/1/22 | 1,500,000 | 1,940,385 |
| Massachusetts Health and Educational Facilities Authority, | ||||
| Revenue (Massachusetts Institute of Technology Issue) | 5.00 | 7/1/23 | 3,335,000 | 4,092,245 |
| Massachusetts Health and Educational Facilities Authority, | ||||
| Revenue (Massachusetts Institute of Technology Issue) | 5.00 | 7/1/38 | 1,000,000 | 1,063,010 |
68
| BNY Mellon Massachusetts Intermediate Municipal Bond Fund (continued) | ||||
| Long-Term Municipal | Coupon | Maturity | Principal | |
| Investments (continued) | Rate (%) | Date | Amount ($) | Value ($) |
| Massachusetts (continued) | ||||
| Massachusetts Health and Educational Facilities Authority, | ||||
| Revenue (Milford Regional Medical Center Issue) | 5.00 | 7/15/22 | 500,000 | 500,930 |
| Massachusetts Health and Educational Facilities Authority, | ||||
| Revenue (Northeastern University Issue) | 5.00 | 10/1/12 | 975,000 | 1,018,534 |
| Massachusetts Health and Educational Facilities Authority, | ||||
| Revenue (Northeastern University Issue) | 5.00 | 10/1/24 | 2,495,000 | 2,759,445 |
| Massachusetts Health and Educational Facilities Authority, | ||||
| Revenue (Northeastern University Issue) | 5.63 | 10/1/29 | 3,000,000 | 3,275,310 |
| Massachusetts Health and Educational Facilities Authority, | ||||
| Revenue (Northeastern University Issue) | 5.00 | 10/1/30 | 3,000,000 | 3,151,830 |
| Massachusetts Health and Educational Facilities Authority, | ||||
| Revenue (Partners HealthCare System Issue) | 6.00 | 7/1/14 | 60,000 | 60,838 |
| Massachusetts Health and Educational Facilities Authority, | ||||
| Revenue (Partners HealthCare System Issue) | 5.00 | 7/1/16 | 1,045,000 | 1,111,075 |
| Massachusetts Health and Educational Facilities Authority, | ||||
| Revenue (Partners HealthCare System Issue) | 5.00 | 7/1/18 | 1,500,000 | 1,719,855 |
| Massachusetts Health and Educational Facilities Authority, | ||||
| Revenue (Partners HealthCare System Issue) | 5.00 | 7/1/21 | 1,235,000 | 1,361,365 |
| Massachusetts Health and Educational Facilities Authority, | ||||
| Revenue (Partners HealthCare System Issue) | 5.75 | 7/1/21 | 85,000 | 86,140 |
| Massachusetts Health and Educational Facilities Authority, | ||||
| Revenue (Partners HealthCare System Issue) | 5.00 | 7/1/22 | 250,000 | 273,067 |
| Massachusetts Health and Educational Facilities Authority, | ||||
| Revenue (Partners HealthCare System Issue) | 5.25 | 7/1/29 | 2,350,000 | 2,351,386 |
| Massachusetts Health and Educational Facilities Authority, | ||||
| Revenue (Simmons College Issue) | 7.50 | 10/1/22 | 1,000,000 | 1,228,890 |
| Massachusetts Health and Educational Facilities Authority, | ||||
| Revenue (Simmons College Issue) | 8.00 | 10/1/29 | 1,800,000 | 2,051,946 |
| Massachusetts Health and Educational Facilities Authority, | ||||
| Revenue (Simmons College Issue) | 8.00 | 10/1/39 | 1,500,000 | 1,687,215 |
| Massachusetts Health and Educational Facilities Authority, | ||||
| Revenue (Southcoast Health System Obligated Group Issue) | 5.00 | 7/1/29 | 1,400,000 | 1,399,902 |
| Massachusetts Health and Educational Facilities Authority, | ||||
| Revenue (Southcoast Health System Obligated Group Issue) | 5.00 | 7/1/39 | 1,500,000 | 1,428,495 |
| Massachusetts Health and Educational Facilities | ||||
| Authority, Revenue (Tufts University Issue) | 5.50 | 8/15/14 | 1,000,000 | 1,142,160 |
| Massachusetts Health and Educational Facilities | ||||
| Authority, Revenue (Tufts University Issue) | 5.25 | 8/15/23 | 1,000,000 | 1,142,450 |
| Massachusetts Health and Educational Facilities | ||||
| Authority, Revenue (Tufts University Issue) | 5.38 | 8/15/38 | 2,000,000 | 2,162,340 |
| Massachusetts Health and Educational Facilities | ||||
| Authority, Revenue (UMass Memorial Issue) | 5.25 | 7/1/25 | 2,000,000 | 2,002,260 |
| Massachusetts Health and Educational Facilities | ||||
| Authority, Revenue (Wellesley College Issue) | 5.00 | 7/1/24 | 1,000,000 | 1,063,510 |
| The Funds | 69 |
| STATEMENT OF INVESTMENTS (continued) | ||||
| BNY Mellon Massachusetts Intermediate Municipal Bond Fund (continued) | ||||
| Long-Term Municipal | Coupon | Maturity | Principal | |
| Investments (continued) | Rate (%) | Date | Amount ($) | Value ($) |
| Massachusetts (continued) | ||||
| Massachusetts Housing Finance Agency, Housing Revenue | 4.00 | 6/1/19 | 3,430,000 | 3,621,703 |
| Massachusetts Housing Finance Agency, Housing Revenue | 5.13 | 12/1/34 | 200,000 | 196,966 |
| Massachusetts Industrial Finance Agency, Education Revenue | ||||
| (Saint John’s High School of Worcester County, Inc. Issue) | 5.70 | 6/1/18 | 1,290,000 | 1,292,270 |
| Massachusetts Municipal Wholesale Electric Company, | ||||
| Power Supply Project Revenue (Nuclear Project Number 4 | ||||
| Issue) (Insured; National Public Finance Guarantee Corp.) | 5.25 | 7/1/14 | 5,000,000 | 5,106,250 |
| Massachusetts Port Authority, Revenue | 5.00 | 7/1/28 | 2,500,000 | 2,730,075 |
| Massachusetts School Building Authority, | ||||
| Dedicated Sales Tax Revenue (Insured; AMBAC) | 5.00 | 8/15/16 | 2,720,000 | 3,248,795 |
| Massachusetts School Building Authority, | ||||
| Dedicated Sales Tax Revenue (Insured; AMBAC) | 5.00 | 8/15/20 | 4,000,000 | 4,626,760 |
| Massachusetts School Building Authority, Dedicated Sales Tax | ||||
| Revenue (Insured; Assured Guaranty Municipal Corp.) | 5.00 | 8/15/15 | 1,900,000 | 2,222,069 |
| Massachusetts School Building Authority, Dedicated Sales Tax | ||||
| Revenue (Insured; Assured Guaranty Municipal Corp.) | 5.00 | 8/15/18 | 5,000,000 | 5,689,850 |
| Massachusetts School Building Authority, Dedicated Sales Tax | ||||
| Revenue (Insured; Assured Guaranty Municipal Corp.) | 5.00 | 8/15/21 | 2,000,000 | 2,253,480 |
| Massachusetts School Building Authority, Dedicated Sales Tax | ||||
| Revenue (Insured; Assured Guaranty Municipal Corp.) | 5.00 | 8/15/24 | 205,000 | 225,119 |
| Massachusetts School Building Authority, Dedicated Sales Tax | ||||
| Revenue (Insured; National Public Finance Guarantee Corp.) | 5.00 | 8/15/27 | 1,500,000 | 1,633,830 |
| Massachusetts Turnpike Authority, Turnpike Revenue | ||||
| (Insured; National Public Finance Guarantee Corp.) | 5.00 | 1/1/20 | 5,000,000 | 5,848,800 |
| Massachusetts Water Pollution Abatement Trust (Pool Program) | 5.63 | 8/1/13 | 25,000 | 25,110 |
| Massachusetts Water Pollution Abatement Trust (Pool Program) | 5.50 | 8/1/14 | 30,000 | 30,128 |
| Massachusetts Water Pollution Abatement Trust (Pool Program) | 5.25 | 8/1/17 | 170,000 | 191,449 |
| Massachusetts Water Pollution Abatement Trust (Pool Program) | 5.00 | 8/1/18 | 75,000 | 78,095 |
| Massachusetts Water Pollution Abatement Trust (Pool Program) | 5.00 | 8/1/21 | 2,625,000 | 3,024,814 |
| Massachusetts Water Pollution Abatement Trust (Pool Program) | 5.25 | 8/1/23 | 1,500,000 | 1,864,290 |
| Massachusetts Water Pollution Abatement Trust (Pool Program) | 5.00 | 8/1/32 | 2,000,000 | 2,021,980 |
| Massachusetts Water Pollution Abatement | ||||
| Trust (Pool Program) (Prerefunded) | 5.25 | 8/1/14 | 1,330,000 a | 1,516,227 |
| Massachusetts Water Pollution Abatement Trust, | ||||
| Water Pollution Abatement Revenue (MWRA Program) | 5.75 | 8/1/29 | 155,000 | 155,522 |
| Massachusetts Water Pollution Abatement Trust, Water Pollution | ||||
| Abatement Revenue (South Essex Sewer District Loan Program) | 6.38 | 2/1/15 | 195,000 | 195,971 |
| Massachusetts Water Resources Authority, General Revenue | 5.00 | 8/1/19 | 2,475,000 | 3,015,095 |
| Massachusetts Water Resources Authority, General Revenue | 5.00 | 8/1/27 | 5,000,000 | 5,612,800 |
| Massachusetts Water Resources Authority, General Revenue | 5.00 | 8/1/39 | 1,000,000 | 1,058,550 |
70
| BNY Mellon Massachusetts Intermediate Municipal Bond Fund (continued) | ||||
| Long-Term Municipal | Coupon | Maturity | Principal | |
| Investments (continued) | Rate (%) | Date | Amount ($) | Value ($) |
| Massachusetts (continued) | ||||
| Massachusetts Water Resources Authority, General Revenue | ||||
| (Insured; Assured Guaranty Municipal Corp.) | 5.25 | 8/1/18 | 500,000 | 614,590 |
| Massachusetts Water Resources Authority, General Revenue | ||||
| (Insured; National Public Finance Guarantee Corp.) | 6.00 | 8/1/14 | 1,000,000 | 1,157,690 |
| Massachusetts Water Resources Authority, General Revenue | ||||
| (Insured; National Public Finance Guarantee Corp.) | 5.25 | 8/1/19 | 1,500,000 | 1,770,270 |
| Massachusetts Water Resources Authority, General Revenue | ||||
| (Insured; National Public Finance Guarantee Corp.) | 5.25 | 8/1/21 | 1,000,000 | 1,153,500 |
| Massachusetts Water Resources Authority, General Revenue | ||||
| (Insured; National Public Finance Guarantee Corp.) | 5.25 | 8/1/24 | 2,500,000 | 2,810,025 |
| Middleborough, GO (Insured; | ||||
| National Public Finance Guarantee Corp.) | 5.00 | 12/15/16 | 1,000,000 | 1,184,680 |
| Middleborough, GO (Insured; | ||||
| National Public Finance Guarantee Corp.) | 5.00 | 12/15/18 | 1,275,000 | 1,465,332 |
| Milton, GO School Bonds | 5.00 | 3/1/23 | 500,000 | 550,070 |
| Milton, GO School Bonds | 5.00 | 3/1/24 | 500,000 | 547,710 |
| Milton, GO School Bonds | 5.00 | 3/1/25 | 500,000 | 544,025 |
| Northampton, GO (Insured; National Public Finance Guarantee Corp.) | 5.13 | 10/15/16 | 1,985,000 | 2,232,807 |
| Northbridge, GO (Insured; AMBAC) | 5.25 | 2/15/17 | 1,000,000 | 1,031,020 |
| Pembroke, GO (Insured; National Public Finance Guarantee Corp.) | 4.50 | 8/1/13 | 695,000 | 745,923 |
| Pembroke, GO (Insured; National Public Finance Guarantee Corp.) | 5.00 | 8/1/20 | 960,000 | 1,066,656 |
| Randolph, GO (Insured; AMBAC) | 5.00 | 9/1/17 | 1,045,000 | 1,150,263 |
| Randolph, GO (Insured; AMBAC) | 5.00 | 9/1/24 | 490,000 | 514,245 |
| Springfield Water and Sewer Commission, | ||||
| General Revenue (Insured; AMBAC) | 5.00 | 7/15/22 | 1,175,000 | 1,271,162 |
| Springfield Water and Sewer Commission, | ||||
| General Revenue (Insured; AMBAC) | 5.00 | 7/15/23 | 1,235,000 | 1,324,253 |
| University of Massachusetts Building Authority, Revenue | 6.88 | 5/1/14 | 1,500,000 | 1,644,855 |
| Worcester, GO (Insured; National Public Finance Guarantee Corp.) | 5.25 | 8/15/16 | 1,000,000 | 1,119,190 |
| Worcester, GO (Insured; National Public Finance Guarantee Corp.) | 5.25 | 8/15/17 | 1,000,000 | 1,108,860 |
| Worcester, GO (Insured; National Public Finance Guarantee Corp.) | 5.00 | 4/1/18 | 625,000 | 688,488 |
| U.S. Related—10.9% | ||||
| Government of Guam, LOR (Section 30) | 5.63 | 12/1/29 | 1,000,000 | 1,016,390 |
| Guam, Hotel Occupancy Tax Revenue | 6.00 | 11/1/26 | 500,000 | 533,965 |
| Guam Economic Development Authority, | ||||
| Tobacco Settlement Asset-Backed Bonds | 5.20 | 5/15/12 | 300,000 | 310,113 |
| Guam Economic Development Authority, | ||||
| Tobacco Settlement Asset-Backed Bonds | 5.20 | 5/15/13 | 1,175,000 | 1,268,036 |
| Puerto Rico Commonwealth, Public Improvement GO | 5.50 | 7/1/18 | 2,500,000 | 2,785,500 |
| The Funds | 71 |
| STATEMENT OF INVESTMENTS (continued) | ||||
| BNY Mellon Massachusetts Intermediate Municipal Bond Fund (continued) | ||||
| Long-Term Municipal | Coupon | Maturity | Principal | |
| Investments (continued) | Rate (%) | Date | Amount ($) | Value ($) |
| U.S. Related (continued) | ||||
| Puerto Rico Commonwealth, Public Improvement GO | 5.25 | 7/1/22 | 1,500,000 | 1,534,545 |
| Puerto Rico Commonwealth, Public Improvement GO | ||||
| (Insured; National Public Finance Guarantee Corp.) | 5.50 | 7/1/14 | 500,000 | 544,650 |
| Puerto Rico Commonwealth, Public Improvement GO | ||||
| (Insured; National Public Finance Guarantee Corp.) | 5.50 | 7/1/15 | 1,135,000 | 1,244,312 |
| Puerto Rico Commonwealth, Public Improvement GO | ||||
| (Insured; National Public Finance Guarantee Corp.) | 5.50 | 7/1/19 | 1,000,000 | 1,108,120 |
| Puerto Rico Electric Power Authority, Power Revenue | 5.25 | 7/1/23 | 2,000,000 | 2,125,440 |
| Puerto Rico Electric Power Authority, Power Revenue | ||||
| (Insured; National Public Finance Guarantee Corp.) | 5.00 | 7/1/17 | 1,000,000 | 1,082,620 |
| Puerto Rico Government Development Bank, Senior Notes | 5.00 | 12/1/12 | 3,205,000 | 3,347,623 |
| Puerto Rico Government Development Bank, Senior Notes | 5.00 | 12/1/13 | 3,000,000 | 3,209,850 |
| Puerto Rico Government Development Bank, Senior Notes | 5.25 | 1/1/15 | 2,000,000 | 2,130,520 |
| Puerto Rico Government Development Bank, Senior Notes | 5.00 | 12/1/15 | 1,090,000 | 1,181,179 |
| Puerto Rico Highways and Transportation | ||||
| Authority, Highway Revenue | 5.00 | 7/1/16 | 1,000,000 | 1,087,680 |
| Puerto Rico Highways and Transportation | ||||
| Authority, Highway Revenue (Insured; FGIC) | 5.50 | 7/1/16 | 3,265,000 | 3,624,150 |
| Puerto Rico Highways and Transportation Authority, | ||||
| Transportation Revenue (Insured; FGIC) | 5.25 | 7/1/15 | 1,905,000 | 1,986,725 |
| Puerto Rico Highways and Transportation Authority, | ||||
| Transportation Revenue (Insured; FGIC) | 5.25 | 7/1/16 | 1,550,000 | 1,610,714 |
| Puerto Rico Infrastructure Financing | ||||
| Authority, Special Tax Revenue | 5.00 | 7/1/20 | 2,260,000 | 2,323,280 |
| Puerto Rico Public Buildings Authority, | ||||
| Government Facilities Revenue | 5.75 | 7/1/22 | 1,780,000 | 1,846,999 |
| Puerto Rico Sales Tax Financing Corporation, | ||||
| Sales Tax Revenue (First Subordinate Series) | 0/6.75 | 8/1/32 | 1,000,000 c | 861,430 |
| Puerto Rico Sales Tax Financing Corporation, | ||||
| Sales Tax Revenue (First Subordinate Series) | 0/6.25 | 8/1/33 | 750,000 c | 524,280 |
| Puerto Rico Sales Tax Financing Corporation, | ||||
| Sales Tax Revenue (First Subordinate Series) | 6.00 | 8/1/42 | 1,500,000 | 1,587,960 |
| Total Long-Term Municipal Investments | ||||
| (cost $328,776,746) | 349,733,056 | |||
72
| BNY Mellon Massachusetts Intermediate Municipal Bond Fund (continued) | ||||
| Short-Term Municipal | Coupon | Maturity | Principal | |
| Investments—1.7% | Rate (%) | Date | Amount ($) | Value ($) |
| Massachusetts; | ||||
| Massachusetts, Consolidated Loan | ||||
| (Liquidity Facility; Wells Fargo Bank) | 0.11 | 9/1/11 | 1,300,000 d | 1,300,000 |
| Massachusetts, Consolidated Loan (LOC; Bank of America) | 0.14 | 9/1/11 | 1,700,000 d | 1,700,000 |
| Massachusetts Health and Educational Facilities Authority, | ||||
| Revenue (Stonehill College Issue) (LOC; Bank of America) | 0.14 | 9/1/11 | 3,000,000 d | 3,000,000 |
| Total Short-Term Municipal Investments | ||||
| (cost $6,000,000) | 6,000,000 | |||
| Total Investments (cost $334,776,746) | 99.3% | 355,733,056 | ||
| Cash and Receivables (Net) | .7% | 2,484,766 | ||
| Net Assets | 100.0% | 358,217,822 | ||
| a These securities are prerefunded; the date shown represents the prerefunded date. Bonds which are prerefunded are collateralized by U.S. Government securities which are held in |
| escrow and are used to pay principal and interest on the municipal issue and to retire the bonds in full at the earliest refunding date. |
| b Variable rate security—interest rate subject to periodic change. |
| c Zero coupon until a specified date at which time the stated coupon rate becomes effective until maturity. |
| d Variable rate demand note—rate shown is the interest rate in effect at August 31, 2011. Maturity date represents the next demand date, or the ultimate maturity date if earlier. |
| The Funds | 73 |
STATEMENT OF INVESTMENTS (continued)
| Summary of Abbreviations | ||||||
| ABAG | Association of Bay Area Governments | ACA | American Capital Access | |||
| AGC | ACE Guaranty Corporation | AGIC | Asset Guaranty Insurance Company | |||
| AMBAC | American Municipal Bond Assurance Corporation | ARRN | Adjustable Rate Receipt Notes | |||
| BAN | Bond Anticipation Notes | BPA | Bond Purchase Agreement | |||
| CIFG | CDC Ixis Financial Guaranty | COP | Certificate of Participation | |||
| CP | Commercial Paper | EDR | Economic Development Revenue | |||
| EIR | Environmental Improvement Revenue | FGIC | Financial Guaranty Insurance Company | |||
| FHA | Federal Housing Administration | FHLB | Federal Home Loan Bank | |||
| FHLMC | Federal Home Loan Mortgage Corporation | FNMA | Federal National Mortgage Association | |||
| GAN | Grant Anticipation Notes | GIC | Guaranteed Investment Contract | |||
| GNMA | Government National Mortgage Association | GO | General Obligation | |||
| HR | Hospital Revenue | IDB | Industrial Development Board | |||
| IDC | Industrial Development Corporation | IDR | Industrial Development Revenue | |||
| LOC | Letter of Credit | LOR | Limited Obligation Revenue | |||
| LR | Lease Revenue | MFHR | Multi-Family Housing Revenue | |||
| MFMR | Multi-Family Mortgage Revenue | PCR | Pollution Control Revenue | |||
| PILOT | Payment in Lieu of Taxes | PUTTERS | Puttable Tax-Exempt Receipts | |||
| RAC | Revenue Anticipation Certificates | RAN | Revenue Anticipation Notes | |||
| RAW | Revenue Anticipation Warrants | RRR | Resources Recovery Revenue | |||
| SAAN | State Aid Anticipation Notes | SBPA | Standby Bond Purchase Agreement | |||
| SFHR | Single Family Housing Revenue | SFMR | Single Family Mortgage Revenue | |||
| SONYMA | State of New York Mortgage Agency | SWDR | Solid Waste Disposal Revenue | |||
| TAN | Tax Anticipation Notes | TAW | Tax Anticipation Warrants | |||
| TRAN | Tax and Revenue Anticipation Notes | XLCA | XL Capital Assurance | |||
| Summary of Combined Ratings (Unaudited) | ||||||
| Fitch | or | Moody’s | or | Standard & Poor’s | Value (%)† | |
| AAA | Aaa | AAA | 38.4 | |||
| AA | Aa | AA | 30.2 | |||
| A | A | A | 19.3 | |||
| BBB | Baa | BBB | 10.0 | |||
| F1 | MIG1/P1 | SP1/A1 | 1.2 | |||
| F2 | MIG2/MIG3/P2 | SP2/A2 | .4 | |||
| Not Ratede | Not Ratede | Not Ratede | .5 | |||
| 100.0 | ||||||
| † Based on total investments. |
| e Securities which, while not rated by Fitch, Moody’s and Standard & Poor’s, have been determined by the Manager to be of comparable quality to those rated securities in which the |
| fund may invest. |
See notes to financial statements.
74
| STATEMENT OF FINANCIAL FUTURES |
| August 31, 2011 |
| Market Value | Unrealized | |||
| BNY Mellon Massachusetts | Covered by | (Depreciation) | ||
| Intermediate Municipal Bond Fund | Contracts | Contracts ($) | Expiration | at 8/31/2011 ($) |
| Financial Futures Short | ||||
| U.S. Treasury 10 Year Notes | 70 | (9,102,188) | September 2011 | (518,984) |
| See notes to financial statements. | ||||
| The Funds | 75 |
| STATEMENT OF INVESTMENTS | ||||
| August 31, 2011 | ||||
| BNY Mellon New York Intermediate Tax-Exempt Bond Fund | ||||
| Long-Term Municipal | Coupon | Maturity | Principal | |
| Investments—97.8% | Rate (%) | Date | Amount ($) | Value ($) |
| New York—88.6% | ||||
| Albany County Airport Authority, Airport Revenue | ||||
| (Insured; Assured Guaranty Municipal Corp.) | 5.00 | 12/15/23 | 1,500,000 | 1,643,790 |
| Albany Industrial Development Agency, Civic Facility Revenue | ||||
| (Saint Peter’s Hospital of the City of Albany Project) | 5.75 | 11/15/22 | 2,500,000 | 2,622,950 |
| Battery Park City Authority, Senior Revenue | 5.25 | 11/1/22 | 1,000,000 | 1,083,760 |
| Erie County Fiscal Stability Authority, Sales Tax | ||||
| and State Aid Secured Revenue | 5.00 | 12/1/24 | 2,000,000 | 2,296,740 |
| Erie County Industrial Development Agency, Revenue | ||||
| (City School District of the City of Buffalo Project) | 5.00 | 5/1/17 | 2,500,000 a | 2,931,875 |
| Katonah-Lewisboro Union Free School District, GO | ||||
| (Insured; National Public Finance Guarantee Corp.) | 5.00 | 9/15/15 | 1,000,000 a | 1,175,790 |
| Long Island Power Authority, Electric System General Revenue | 5.25 | 6/1/14 | 2,000,000 | 2,238,600 |
| Long Island Power Authority, Electric System General | ||||
| Revenue (Insured; National Public Finance Guarantee Corp.) | 5.00 | 12/1/18 | 1,000,000 | 1,145,820 |
| Metropolitan Transportation Authority, Dedicated Tax Fund | ||||
| Revenue (Insured; National Public Finance Guarantee Corp.) | 5.00 | 11/15/28 | 5,000,000 | 5,340,100 |
| Metropolitan Transportation Authority, Transportation Revenue | 5.00 | 11/15/17 | 1,000,000 | 1,138,770 |
| Nassau County, GO (General Improvement) | 4.00 | 10/1/16 | 1,545,000 | 1,718,287 |
| Nassau County, GO (Insured; Assured Guaranty Municipal Corp.) | 5.00 | 7/1/22 | 1,000,000 | 1,103,840 |
| Nassau County Interim Finance Authority, | ||||
| Sales Tax Secured Revenue (Insured; AMBAC) | 5.00 | 11/15/16 | 1,500,000 | 1,620,765 |
| Nassau County Interim Finance Authority, | ||||
| Sales Tax Secured Revenue (Insured; AMBAC) | 5.00 | 11/15/17 | 1,500,000 | 1,618,035 |
| Nassau County Interim Finance Authority, Sales Tax Secured | ||||
| Revenue (Insured; National Public Finance Guarantee Corp.) | 5.00 | 11/15/16 | 1,000,000 | 1,162,750 |
| Nassau County Sewer and Storm Water Finance | ||||
| Authority, System Revenue (Insured; | ||||
| Berkshire Hathaway Assurance Corporation) | 5.38 | 11/1/28 | 1,000,000 | 1,102,230 |
| New York City, GO | 5.00 | 8/1/17 | 1,535,000 | 1,833,941 |
| New York City, GO | 5.00 | 8/1/18 | 1,000,000 | 1,153,780 |
| New York City, GO | 5.25 | 9/1/20 | 1,000,000 | 1,174,540 |
| New York City, GO | 5.13 | 12/1/22 | 1,000,000 | 1,124,480 |
| New York City, GO | 5.25 | 9/1/23 | 1,000,000 | 1,130,000 |
| New York City, GO (Insured; | ||||
| Assured Guaranty Municipal Corp.) | 5.00 | 4/1/18 | 1,000,000 | 1,126,690 |
| New York City Industrial Development Agency, Civic Facility | ||||
| Revenue (United Jewish Appeal—Federation of | ||||
| Jewish Philanthropies of New York, Inc. Project) | 5.00 | 7/1/27 | 1,250,000 a | 1,322,612 |
| New York City Industrial Development Agency, PILOT | ||||
| Revenue (Queens Baseball Stadium Project) | ||||
| (Insured; Assured Guaranty Municipal Corp.) | 6.50 | 1/1/46 | 500,000 | 532,895 |
| New York City Industrial Development Agency, PILOT | ||||
| Revenue (Yankee Stadium Project) (Insured; | ||||
| Assured Guaranty Municipal Corp.) | 7.00 | 3/1/49 | 1,000,000 | 1,129,810 |
76
| BNY Mellon New York Intermediate Tax-Exempt Bond Fund (continued) | ||||
| Long-Term Municipal | Coupon | Maturity | Principal | |
| Investments (continued) | Rate (%) | Date | Amount ($) | Value ($) |
| New York (continued) | ||||
| New York City Industrial Development Agency, Special Revenue | ||||
| (New York City—New York Stock Exchange Project) | 5.00 | 5/1/21 | 1,000,000 | 1,119,960 |
| New York City Municipal Water Finance Authority, | ||||
| Water and Sewer System Revenue | 5.00 | 6/15/22 | 1,000,000 | 1,087,060 |
| New York City Municipal Water Finance Authority, | ||||
| Water and Sewer System Revenue | 5.75 | 6/15/40 | 1,275,000 | 1,422,058 |
| New York City Municipal Water Finance Authority, | ||||
| Water and Sewer System Second General Resolution Revenue | 5.00 | 6/15/20 | 2,500,000 | 2,908,975 |
| New York City Municipal Water Finance Authority, | ||||
| Water and Sewer System Second General Resolution Revenue | 5.00 | 6/15/26 | 1,200,000 | 1,348,572 |
| New York City Transitional Finance Authority, Building Aid Revenue | 5.25 | 1/15/25 | 1,545,000 a | 1,716,634 |
| New York City Transitional Finance Authority, Building Aid Revenue | 5.25 | 1/15/27 | 1,650,000 | 1,807,493 |
| New York City Transitional Finance Authority, | ||||
| Future Tax Secured Revenue | 5.50 | 11/15/17 | 5,000 | 5,303 |
| New York City Transitional Finance Authority, | ||||
| Future Tax Secured Revenue | 5.00 | 8/1/22 | 2,000,000 | 2,272,660 |
| New York City Transitional Finance Authority, | ||||
| Future Tax Secured Revenue (Prerefunded) | 5.50 | 11/15/12 | 1,750,000 b | 1,860,635 |
| New York City Transitional Finance Authority, | ||||
| Future Tax Secured Subordinate Revenue | 5.00 | 11/1/18 | 1,750,000 | 2,120,317 |
| New York City Trust for Cultural Resources, Revenue | ||||
| (Lincoln Center for the Performing Arts, Inc.) | 5.75 | 12/1/16 | 1,000,000 | 1,210,060 |
| New York City Trust for Cultural Resources, | ||||
| Revenue (The Juilliard School) | 5.00 | 1/1/34 | 2,000,000 a | 2,122,660 |
| New York City Trust for Cultural Resources, | ||||
| Revenue (The Juilliard School) | 5.00 | 1/1/39 | 3,750,000 a | 3,931,425 |
| New York City Trust for Cultural Resources, | ||||
| Revenue (The Museum of Modern Art) | 5.00 | 4/1/25 | 1,150,000 | 1,266,828 |
| New York City Trust for Cultural Resources, | ||||
| Revenue (The Museum of Modern Art) | 5.00 | 4/1/31 | 1,000,000 | 1,062,710 |
| New York City Trust for Cultural Resources, | ||||
| Revenue (Whitney Museum of American Art) | 5.00 | 7/1/21 | 2,000,000 | 2,266,820 |
| New York Liberty Development Corporation, | ||||
| Revenue (Goldman Sachs Headquarters Issue) | 5.00 | 10/1/15 | 3,175,000 | 3,492,913 |
| New York Local Government Assistance Corporation, Revenue | 5.00 | 4/1/18 | 2,500,000 | 2,964,000 |
| New York State, GO | 5.00 | 4/15/14 | 1,000,000 | 1,073,300 |
| New York State, GO | 5.00 | 3/1/19 | 1,000,000 | 1,152,470 |
| New York State, GO | 5.00 | 2/15/26 | 2,600,000 | 2,880,020 |
| New York State Dormitory Authority, Consolidated | ||||
| Fifth General Resolution Revenue (City University System) | 5.00 | 7/1/19 | 1,000,000 a | 1,116,020 |
| New York State Dormitory Authority, Consolidated | ||||
| Revenue (City University System) (Insured; FGIC) | 5.75 | 7/1/18 | 2,370,000 a | 2,726,258 |
| New York State Dormitory Authority, LR | ||||
| (State University Dormitory Facilities Issue) | 5.00 | 7/1/18 | 1,000,000 a | 1,105,270 |
| The Funds | 77 |
| STATEMENT OF INVESTMENTS (continued) | ||||
| BNY Mellon New York Intermediate Tax-Exempt Bond Fund (continued) | ||||
| Long-Term Municipal | Coupon | Maturity | Principal | |
| Investments (continued) | Rate (%) | Date | Amount ($) | Value ($) |
| New York (continued) | ||||
| New York State Dormitory Authority, | ||||
| Revenue (Columbia University) | 5.00 | 7/1/18 | 1,500,000 a | 1,758,075 |
| New York State Dormitory Authority, | ||||
| Revenue (Columbia University) | 5.00 | 7/1/38 | 500,000 a | 536,875 |
| New York State Dormitory Authority, Revenue (Convent of the | ||||
| Sacred Heart) (Insured; Assured Guaranty Municipal Corp.) | 5.63 | 11/1/35 | 1,000,000 a | 1,072,740 |
| New York State Dormitory Authority, Revenue (Fordham | ||||
| University) (Insured; National Public Finance Guarantee Corp.) | 5.00 | 7/1/18 | 405,000 a | 414,554 |
| New York State Dormitory Authority, Revenue | ||||
| (Memorial Sloan-Kettering Cancer Center) | ||||
| (Insured; National Public Finance Guarantee Corp.) | 5.00 | 7/1/20 | 3,250,000 | 3,450,623 |
| New York State Dormitory Authority, Revenue | ||||
| (Memorial Sloan-Kettering Cancer Center) | ||||
| (Insured; National Public Finance Guarantee Corp.) | 5.50 | 7/1/23 | 2,000,000 | 2,358,140 |
| New York State Dormitory Authority, Revenue | ||||
| (Mental Health Services Facilities Improvement) | ||||
| (Insured; Assured Guaranty Municipal Corp.) | 5.00 | 2/15/17 | 1,460,000 | 1,691,921 |
| New York State Dormitory Authority, | ||||
| Revenue (Mount Sinai Hospital Obligated Group) | 5.00 | 7/1/26 | 3,000,000 | 3,125,940 |
| New York State Dormitory Authority, Revenue | ||||
| (Mount Sinai School of Medicine of New York University) | 5.13 | 7/1/39 | 5,000,000 a | 5,088,400 |
| New York State Dormitory Authority, | ||||
| Revenue (New York University) | 5.25 | 7/1/34 | 2,500,000 a | 2,689,950 |
| New York State Dormitory Authority, Revenue (New York | ||||
| University) (Insured; National Public Finance Guarantee Corp.) | 5.00 | 7/1/21 | 1,500,000 a | 1,634,580 |
| New York State Dormitory Authority, Revenue | ||||
| (Rochester Institute of Technology) | 5.00 | 7/1/23 | 1,000,000 a | 1,115,100 |
| New York State Dormitory Authority, Revenue | ||||
| (School Districts Financing Program) | 5.00 | 10/1/23 | 2,000,000 a | 2,239,440 |
| New York State Dormitory Authority, Revenue | ||||
| (School Districts Revenue Financing Program) | 5.00 | 10/1/18 | 2,000,000 a | 2,333,300 |
| New York State Dormitory Authority, Revenue | ||||
| (State University Educational Facilities) | ||||
| (Insured; National Public Finance Guarantee Corp.) | 5.25 | 5/15/15 | 500,000 a | 560,045 |
| New York State Dormitory Authority, | ||||
| Revenue (The Rockefeller University) | 5.00 | 7/1/25 | 1,000,000 a | 1,125,280 |
| New York State Dormitory Authority, | ||||
| Revenue (The Rockefeller University) | 5.00 | 7/1/40 | 5,000,000 a | 5,303,800 |
| New York State Dormitory Authority, Revenue (Vassar College) | 5.00 | 7/1/15 | 675,000 a | 771,761 |
| New York State Dormitory Authority, | ||||
| Secured HR (The Bronx-Lebanon Hospital Center) | 4.00 | 8/15/14 | 1,000,000 | 1,081,880 |
| New York State Dormitory Authority, | ||||
| State Personal Income Tax Revenue (Education) | 5.00 | 3/15/16 | 1,000,000 a | 1,098,250 |
| New York State Dormitory Authority, | ||||
| State Personal Income Tax Revenue (Education) | 5.75 | 3/15/36 | 1,000,000 a | 1,121,550 |
78
| BNY Mellon New York Intermediate Tax-Exempt Bond Fund (continued) | ||||
| Long-Term Municipal | Coupon | Maturity | Principal | |
| Investments (continued) | Rate (%) | Date | Amount ($) | Value ($) |
| New York (continued) | ||||
| New York State Environmental Facilities Corporation, State Clean | ||||
| Water and Drinking Water Revolving Funds Revenue | ||||
| (New York City Municipal Water Finance Authority Projects) | 5.25 | 6/15/14 | 1,500,000 | 1,702,905 |
| New York State Environmental Facilities Corporation, State Clean | ||||
| Water and Drinking Water Revolving Funds Revenue | ||||
| (New York City Municipal Water Finance Authority Projects) | 5.38 | 6/15/15 | 1,000,000 | 1,038,100 |
| New York State Environmental Facilities Corporation, State Clean | ||||
| Water and Drinking Water Revolving Funds Revenue | ||||
| (New York City Municipal Water Finance Authority Projects) | 5.25 | 6/15/19 | 775,000 | 801,629 |
| New York State Environmental Facilities Corporation, State Clean | ||||
| Water and Drinking Water Revolving Funds Revenue | ||||
| (New York City Municipal Water Finance Authority Projects) | 5.00 | 6/15/30 | 1,000,000 | 1,067,740 |
| New York State Environmental Facilities Corporation, State Water | ||||
| Pollution Control Revolving Fund Revenue (New York City | ||||
| Municipal Water Finance Authority Project) | 7.00 | 6/15/12 | 50,000 | 50,280 |
| New York State Medical Care Facilities Finance Agency, | ||||
| Secured Mortgage Revenue (Collateralized; SONYMA) | 6.38 | 11/15/20 | 245,000 | 245,696 |
| New York State Mortgage Agency, Homeowner Mortgage Revenue | 5.10 | 10/1/17 | 1,000,000 | 1,002,000 |
| New York State Mortgage Agency, Homeowner Mortgage Revenue | 5.38 | 10/1/17 | 820,000 | 821,525 |
| New York State Municipal Bond Bank Agency, Recovery Act | ||||
| Revenue (Insured; Assured Guaranty Municipal Corp.) | 5.00 | 5/15/16 | 2,000,000 | 2,288,440 |
| New York State Power Authority, Revenue (Insured; FGIC) | 5.00 | 11/15/20 | 1,000,000 | 1,135,540 |
| New York State Power Authority, Revenue (Prerefunded) | 5.00 | 11/15/12 | 2,500,000 b | 2,643,775 |
| New York State Thruway Authority, | ||||
| General Revenue (Insured; AMBAC) | 5.00 | 1/1/19 | 1,000,000 | 1,104,420 |
| New York State Thruway Authority, Local Highway | ||||
| and Bridge Service Contract Bonds | 5.50 | 4/1/14 | 1,000,000 | 1,028,960 |
| New York State Thruway Authority, Second General | ||||
| Highway and Bridge Trust Fund Bonds (Insured; AMBAC) | 5.00 | 4/1/25 | 2,000,000 | 2,166,920 |
| New York State Urban Development Corporation, | ||||
| Service Contract Revenue | 5.00 | 1/1/16 | 2,000,000 | 2,311,240 |
| New York State Urban Development Corporation, | ||||
| Service Contract Revenue | 5.25 | 1/1/24 | 2,375,000 | 2,627,819 |
| Onondaga County, GO | 5.00 | 5/1/17 | 1,150,000 | 1,187,168 |
| Onondaga County Trust for Cultural Resources, | ||||
| Revenue (Syracuse University Project) | 5.00 | 12/1/19 | 2,500,000 a | 2,986,675 |
| Orange County, GO | 5.00 | 7/15/19 | 1,000,000 | 1,112,450 |
| Orange County, GO | 5.00 | 7/15/20 | 1,000,000 | 1,103,790 |
| Port Authority of New York and New Jersey (Consolidated Bonds, | ||||
| 125th Series) (Insured; Assured Guaranty Municipal Corp.) | 5.00 | 10/15/19 | 2,000,000 | 2,072,720 |
| Port Authority of New York and New Jersey (Consolidated Bonds, | ||||
| 128th Series) (Insured; Assured Guaranty Municipal Corp.) | 5.00 | 11/1/18 | 1,000,000 | 1,058,540 |
| Port Authority of New York and New Jersey (Consolidated Bonds, | ||||
| 140th Series) (Insured; Assured Guaranty Municipal Corp.) | 5.00 | 12/1/19 | 1,000,000 | 1,135,770 |
| The Funds | 79 |
| STATEMENT OF INVESTMENTS (continued) | ||||
| BNY Mellon New York Intermediate Tax-Exempt Bond Fund (continued) | ||||
| Long-Term Municipal | Coupon | Maturity | Principal | |
| Investments (continued) | Rate (%) | Date | Amount ($) | Value ($) |
| New York (continued) | ||||
| Port Authority of New York and New Jersey | ||||
| (Consolidated Bonds, 142nd Series) | 5.00 | 7/15/21 | 1,000,000 | 1,127,170 |
| Sales Tax Asset Receivable Corporation, | ||||
| Sales Tax Asset Revenue (Insured; AMBAC) | 5.00 | 10/15/29 | 2,500,000 | 2,649,175 |
| Sales Tax Asset Receivable Corporation, Sales Tax Asset | ||||
| Revenue (Insured; National Public Finance Guarantee Corp.) | 5.00 | 10/15/25 | 1,450,000 | 1,578,557 |
| Suffolk County Industrial Development Agency, Civic Facility | ||||
| Revenue (New York Institute of Technology Project) | 5.00 | 3/1/26 | 750,000 a | 764,205 |
| Suffolk County Water Authority, Water System Revenue | ||||
| (Insured; National Public Finance Guarantee Corp.) (Prerefunded) | 4.00 | 6/1/13 | 1,000,000 b | 1,075,060 |
| Triborough Bridge and Tunnel Authority, General Purpose Revenue | 5.25 | 1/1/16 | 1,000,000 | 1,016,410 |
| Triborough Bridge and Tunnel Authority, | ||||
| General Purpose Revenue (Prerefunded) | 5.25 | 1/1/22 | 1,000,000 b | 1,266,230 |
| Triborough Bridge and Tunnel Authority, General Revenue | 5.25 | 11/15/15 | 1,000,000 | 1,179,480 |
| Triborough Bridge and Tunnel Authority, General Revenue | 5.25 | 11/15/16 | 2,000,000 | 2,117,660 |
| Triborough Bridge and Tunnel Authority, General Revenue | 5.25 | 11/15/17 | 775,000 | 820,299 |
| Triborough Bridge and Tunnel Authority, General Revenue | 5.00 | 11/15/21 | 1,000,000 | 1,054,070 |
| Triborough Bridge and Tunnel Authority, Subordinate Revenue | ||||
| (Insured; National Public Finance Guarantee Corp.) | 5.50 | 11/15/21 | 1,375,000 | 1,692,213 |
| Westchester County, GO | 4.00 | 11/15/15 | 1,000,000 | 1,115,160 |
| U.S. Related—9.2% | ||||
| Guam, Hotel Occupancy Tax Revenue | 5.00 | 11/1/16 | 1,000,000 | 1,080,000 |
| Puerto Rico Commonwealth, Public Improvement GO | ||||
| (Insured; National Public Finance Guarantee Corp.) | 5.50 | 7/1/19 | 2,500,000 | 2,770,300 |
| Puerto Rico Electric Power Authority, Power Revenue (Insured; XLCA) | 5.50 | 7/1/17 | 2,000,000 | 2,253,120 |
| Puerto Rico Government Development Bank, Senior Notes | 5.00 | 12/1/15 | 3,500,000 | 3,792,775 |
| Puerto Rico Housing Finance Authority, Capital Fund Program | ||||
| Revenue (Puerto Rico Housing Administration Projects) | 5.00 | 12/1/18 | 260,000 | 272,204 |
| Puerto Rico Housing Finance Authority, Capital Fund Program | ||||
| Revenue (Puerto Rico Housing Administration Projects) | 5.00 | 12/1/19 | 270,000 | 280,989 |
| Puerto Rico Housing Finance Authority, Capital Fund | ||||
| Program Revenue (Puerto Rico Housing | ||||
| Administration Projects) (Prerefunded) | 5.00 | 12/1/13 | 730,000 b | 804,132 |
| Puerto Rico Housing Finance Authority, Capital Fund | ||||
| Program Revenue (Puerto Rico Housing | ||||
| Administration Projects) (Prerefunded) | 5.00 | 12/1/13 | 740,000 b | 815,147 |
| Puerto Rico Public Buildings Authority, | ||||
| Government Facilities Revenue | 5.75 | 7/1/22 | 1,000,000 | 1,037,640 |
| Puerto Rico Sales Tax Financing Corporation, | ||||
| Sales Tax Revenue (First Subordinate Series) | 0/6.75 | 8/1/32 | 1,700,000 c | 1,464,431 |
80
| BNY Mellon New York Intermediate Tax-Exempt Bond Fund (continued) | ||||
| Long-Term Municipal | Coupon | Maturity | Principal | |
| Investments (continued) | Rate (%) | Date | Amount ($) | Value ($) |
| U.S. Related (continued) | ||||
| Puerto Rico Sales Tax Financing Corporation, | ||||
| Sales Tax Revenue (First Subordinate Series) | 0/6.25 | 8/1/33 | 500,000 c | 349,520 |
| Puerto Rico Sales Tax Financing Corporation, | ||||
| Sales Tax Revenue (First Subordinate Series) | 0.00 | 8/1/34 | 2,000,000 d | 470,020 |
| Puerto Rico Sales Tax Financing Corporation, | ||||
| Sales Tax Revenue (First Subordinate Series) | 0.00 | 8/1/36 | 1,250,000 d | 253,325 |
| Puerto Rico Sales Tax Financing Corporation, | ||||
| Sales Tax Revenue (First Subordinate Series) | 6.00 | 8/1/42 | 2,500,000 | 2,646,600 |
| Total Long-Term Municipal Investments | ||||
| (cost $183,526,170) | 195,525,469 | |||
| Short-Term Municipal Investments—1.0% | ||||
| New York; | ||||
| Long Island Power Authority, Electric System | ||||
| Subordinated Revenue (LOC; Westdeutsche Landesbank) | 0.15 | 9/1/11 | 1,200,000 e | 1,200,000 |
| New York City, GO Notes (LOC; JPMorgan Chase Bank) | 0.10 | 9/1/11 | 100,000 e | 100,000 |
| New York City, GO Notes (LOC; Westdeutsche Landesbank) | 0.25 | 9/1/11 | 600,000 e | 600,000 |
| Total Short-Term Municipal Investments | ||||
| (cost $1,900,000) | 1,900,000 | |||
| Total Investments (cost $185,426,170) | 98.8% | 197,425,469 | ||
| Cash and Receivables (Net) | 1.2% | 2,298,205 | ||
| Net Assets | 100.0% | 199,723,674 | ||
| a At August 31, 2011, the fund had $50,763,124 or 25.4% of net assets invested in securities whose payment of principal and interest is dependent upon revenues generated |
| from education. |
| b These securities are prerefunded; the date shown represents the prerefunded date. Bonds which are prerefunded are collateralized by U.S. Government securities which are held in |
| escrow and are used to pay principal and interest on the municipal issue and to retire the bonds in full at the earliest refunding date. |
| c Zero coupon until a specified date at which time the stated coupon rate becomes effective until maturity. |
| d Security issued with a zero coupon. Income is recognized through the accretion of discount. |
| e Variable rate demand note—rate shown is the interest rate in effect at August 31, 2011. Maturity date represents the next demand date, or the ultimate maturity date if earlier. |
| The Funds | 81 |
STATEMENT OF INVESTMENTS (continued)
| Summary of Abbreviations | ||||||
| ABAG | Association of Bay Area Governments | ACA | American Capital Access | |||
| AGC | ACE Guaranty Corporation | AGIC | Asset Guaranty Insurance Company | |||
| AMBAC | American Municipal Bond Assurance Corporation | ARRN | Adjustable Rate Receipt Notes | |||
| BAN | Bond Anticipation Notes | BPA | Bond Purchase Agreement | |||
| CIFG | CDC Ixis Financial Guaranty | COP | Certificate of Participation | |||
| CP | Commercial Paper | EDR | Economic Development Revenue | |||
| EIR | Environmental Improvement Revenue | FGIC | Financial Guaranty Insurance Company | |||
| FHA | Federal Housing Administration | FHLB | Federal Home Loan Bank | |||
| FHLMC | Federal Home Loan Mortgage Corporation | FNMA | Federal National Mortgage Association | |||
| GAN | Grant Anticipation Notes | GIC | Guaranteed Investment Contract | |||
| GNMA | Government National Mortgage Association | GO | General Obligation | |||
| HR | Hospital Revenue | IDB | Industrial Development Board | |||
| IDC | Industrial Development Corporation | IDR | Industrial Development Revenue | |||
| LOC | Letter of Credit | LOR | Limited Obligation Revenue | |||
| LR | Lease Revenue | MFHR | Multi-Family Housing Revenue | |||
| MFMR | Multi-Family Mortgage Revenue | PCR | Pollution Control Revenue | |||
| PILOT | Payment in Lieu of Taxes | PUTTERS | Puttable Tax-Exempt Receipts | |||
| RAC | Revenue Anticipation Certificates | RAN | Revenue Anticipation Notes | |||
| RAW | Revenue Anticipation Warrants | RRR | Resources Recovery Revenue | |||
| SAAN | State Aid Anticipation Notes | SBPA | Standby Bond Purchase Agreement | |||
| SFHR | Single Family Housing Revenue | SFMR | Single Family Mortgage Revenue | |||
| SONYMA | State of New York Mortgage Agency | SWDR | Solid Waste Disposal Revenue | |||
| TAN | Tax Anticipation Notes | TAW | Tax Anticipation Warrants | |||
| TRAN | Tax and Revenue Anticipation Notes | XLCA | XL Capital Assurance | |||
| Summary of Combined Ratings (Unaudited) | ||||||
| Fitch | or | Moody’s | or | Standard & Poor’s | Value (%)† | |
| AAA | Aaa | AAA | 27.5 | |||
| AA | Aa | AA | 46.1 | |||
| A | A | A | 19.2 | |||
| BBB | Baa | BBB | 6.1 | |||
| F1 | MIG1/P1 | SP1/A1 | 1.0 | |||
| Not Ratedf | Not Ratedf | Not Ratedf | .1 | |||
| 100.0 | ||||||
| † Based on total investments. |
| f Securities which, while not rated by Fitch, Moody’s and Standard & Poor’s, have been determined by the Manager to be of comparable quality to those rated securities in which the |
| fund may invest. |
See notes to financial statements.
82
| STATEMENT OF FINANCIAL FUTURES |
| August 31, 2011 |
| Market Value | Unrealized | |||
| BNY Mellon New York | Covered by | (Depreciation) | ||
| Intermediate Tax-Exempt Bond Fund | Contracts | Contracts ($) | Expiration | at 8/31/2011 ($) |
| Financial Futures Short | ||||
| U.S. Treasury 10 Year Notes | 40 | (5,201,250) | September 2011 | (296,563) |
| See notes to financial statements. | ||||
| The Funds | 83 |
| STATEMENT OF INVESTMENTS | ||||
| August 31, 2011 | ||||
| BNY Mellon Municipal Opportunities Fund | ||||
| Long-Term Municipal | Coupon | Maturity | Principal | |
| Investments—109.4% | Rate (%) | Date | Amount ($) | Value ($) |
| Alabama—1.2% | ||||
| Jefferson County, Limited Obligation School Warrants | ||||
| (Insured; Assured Guaranty Municipal Corp.) | 5.50 | 2/15/16 | 5,000,000 | 4,962,700 |
| Tuscaloosa Public Educational Building Authority, Student Housing | ||||
| Revenue (Ridgecrest Student Housing, LLC University of | ||||
| Alabama Ridgecrest Residential Project) (Insured; | ||||
| Assured Guaranty Municipal Corp.) | 6.75 | 7/1/33 | 1,100,000 | 1,258,378 |
| Alaska—.6% | ||||
| Valdez, Marine Terminal Revenue (BP Pipelines Inc. Project) | 5.00 | 1/1/21 | 2,500,000 | 2,811,100 |
| Arizona—1.2% | ||||
| Arizona Board of Regents, Arizona State University | ||||
| System Revenue (Polytechnic Campus Project) | 6.00 | 7/1/27 | 750,000 | 854,482 |
| Pima County Industrial Development Authority, IDR | ||||
| (Tucson Electric Power Company Project) | 5.25 | 10/1/40 | 3,250,000 | 2,950,253 |
| University Medical Center Corporation, HR | 6.00 | 7/1/39 | 2,500,000 | 2,508,950 |
| California—15.0% | ||||
| California, GO | 4.50 | 8/1/30 | 4,000,000 | 3,844,560 |
| California, GO (Various Purpose) | 6.50 | 4/1/33 | 1,000,000 | 1,155,380 |
| California, GO (Various Purpose) | 6.00 | 4/1/38 | 2,250,000 | 2,456,415 |
| California Department of Water Resources, | ||||
| Water System Revenue (Central Valley Project) | 5.00 | 12/1/20 | 9,570,000 a | 11,778,852 |
| California Health Facilities Financing Authority, | ||||
| Revenue (Providence Health and Services) | 6.50 | 10/1/38 | 490,000 | 541,974 |
| California Health Facilities Financing Authority, | ||||
| Revenue (Providence Health and Services) (Prerefunded) | 6.50 | 10/1/18 | 10,000 b | 13,198 |
| California Municipal Finance Authority, | ||||
| Revenue (Eisenhower Medical Center) | 5.75 | 7/1/40 | 3,300,000 | 3,276,735 |
| California Statewide Communities Development Authority, | ||||
| Charter School Revenue (Green Dot Public Schools) | ||||
| (Animo Inglewood Charter High School Project) | 7.25 | 8/1/41 | 1,500,000 | 1,514,100 |
| California Statewide Communities Development Authority, | ||||
| Mortgage Revenue (Methodist Hospital of Southern | ||||
| California Project) (Collateralized; FHA) | 6.75 | 2/1/38 | 2,500,000 | 2,823,075 |
| California Statewide Communities Development | ||||
| Authority, Revenue (Sutter Health) | 6.00 | 8/15/42 | 6,000,000 | 6,478,200 |
| Golden State Tobacco Securitization Corporation, | ||||
| Tobacco Settlement Asset-Backed Bonds | 4.50 | 6/1/27 | 495,000 | 385,526 |
| JPMorgan Chase Putters/Drivers Trust (Los Angeles | ||||
| Department of Airports, Senior Revenue | ||||
| (Los Angeles International Airport)) | 5.25 | 5/15/18 | 10,000,000 c,d | 11,085,200 |
| Los Angeles Department of Water and | ||||
| Power, Water System Revenue | 5.00 | 7/1/41 | 5,000,000 | 5,221,450 |
| Los Angeles Unified School District, GO | 5.00 | 1/1/34 | 1,000,000 | 1,027,650 |
| M-S-R Energy Authority, Gas Revenue | 7.00 | 11/1/34 | 3,730,000 | 4,198,786 |
| New Haven Unified School District, GO | ||||
| (Insured; Assured Guaranty Municipal Corp.) | 0.00 | 8/1/32 | 4,500,000 e | 1,190,340 |
84
| BNY Mellon Municipal Opportunities Fund (continued) | ||||
| Long-Term Municipal | Coupon | Maturity | Principal | |
| Investments (continued) | Rate (%) | Date | Amount ($) | Value ($) |
| California (continued) | ||||
| Newport Beach, Revenue (Hoag Memorial Hospital Presbyterian) | 6.00 | 12/1/40 | 4,630,000 | 5,091,009 |
| Northern California Gas Authority Number 1, Gas Project Revenue | 0.89 | 7/1/27 | 660,000 f | 474,408 |
| Oceanside Unified School District, GO | ||||
| (Insured; Assured Guaranty Municipal Corp.) | 0.00 | 8/1/35 | 8,000,000 e | 1,740,560 |
| Sacramento County, Airport System Subordinate and | ||||
| Passenger Facility Charges Grant Revenue | 6.00 | 7/1/35 | 3,000,000 | 3,196,620 |
| San Diego County Regional Airport Authority, | ||||
| Subordinate Airport Revenue | 5.00 | 7/1/34 | 1,000,000 | 1,005,610 |
| San Diego Regional Building Authority, LR (County | ||||
| Operations Center and Annex Redevelopment Project) | 5.38 | 2/1/36 | 2,000,000 | 2,120,240 |
| San Diego Unified School District, GO | 0.00 | 7/1/25 | 4,000,000 e | 1,885,880 |
| San Francisco City and County Redevelopment | ||||
| Financing Authority, Tax Allocation Revenue | ||||
| (San Francisco Redevelopment Projects) | 6.63 | 8/1/41 | 1,750,000 | 1,867,128 |
| South Bayside Waste Management Authority, Solid Waste | ||||
| Enterprise Revenue (Shoreway Environmental Center) | 6.00 | 9/1/36 | 1,000,000 | 1,033,320 |
| Colorado—.8% | ||||
| Colorado Health Facilities Authority, | ||||
| Revenue (Catholic Health Initiatives) | 6.00 | 10/1/23 | 500,000 | 575,095 |
| Denver City and County, Airport System Revenue | 5.00 | 11/15/21 | 1,500,000 | 1,673,205 |
| Denver City and County, Airport System Revenue | ||||
| (Insured: Assured Guaranty Municipal Corp. and | ||||
| National Public Finance Guarantee Corp.) | 5.25 | 11/15/19 | 1,000,000 | 1,114,150 |
| Northern Colorado Water Conservancy District Building | ||||
| Corporation, COP (Lease Purchase Agreement) | ||||
| (Insured; National Public Finance Guarantee Corp.) | 5.50 | 10/1/16 | 500,000 | 522,735 |
| Connecticut—3.1% | ||||
| Connecticut Development Authority, PCR | ||||
| (Connecticut Light and Power Company Project) | 5.95 | 9/1/28 | 9,000,000 | 9,044,280 |
| Connecticut Health and Educational Facilities Authority, | ||||
| Revenue (Western Connecticut Health Network Issue) | 5.38 | 7/1/41 | 1,250,000 | 1,279,137 |
| Connecticut Health and Educational Facilities | ||||
| Authority, Revenue (Yale University Issue) | 5.05 | 7/1/42 | 5,000,000 | 5,306,550 |
| Delaware—.4% | ||||
| Delaware Economic Development Authority, | ||||
| Exempt Facility Revenue (Indian River Power LLC Project) | 5.38 | 10/1/45 | 2,500,000 | 2,241,375 |
| Florida—6.0% | ||||
| Brevard County Health Facilities Authority, | ||||
| Health Facilities Revenue (Health First, Inc. Project) | 7.00 | 4/1/39 | 1,500,000 | 1,646,655 |
| Florida Municipal Power Agency, | ||||
| All-Requirements Power Supply Project Revenue | 6.25 | 10/1/31 | 1,000,000 | 1,142,550 |
| Miami-Dade County, Aviation Revenue (Miami International Airport) | 5.50 | 10/1/41 | 1,200,000 | 1,234,488 |
| Miami-Dade County Educational Facilities Authority, | ||||
| Revenue (University of Miami Issue) (Insured; | ||||
| Berkshire Hathaway Assurance Corporation) | 5.50 | 4/1/38 | 600,000 | 622,686 |
| The Funds | 85 |
| STATEMENT OF INVESTMENTS (continued) | ||||
| BNY Mellon Municipal Opportunities Fund (continued) | ||||
| Long-Term Municipal | Coupon | Maturity | Principal | |
| Investments (continued) | Rate (%) | Date | Amount ($) | Value ($) |
| Florida (continued) | ||||
| Miami-Dade County Expressway Authority, Toll System Revenue | 5.00 | 7/1/40 | 2,000,000 | 1,983,260 |
| Miami-Dade County School Board, COP | ||||
| (Master Lease Purchase Agreement) (Insured; AMBAC) | 5.00 | 11/1/25 | 5,000,000 | 5,132,350 |
| Mid-Bay Bridge Authority, Springing Lien Revenue | 7.25 | 10/1/34 | 5,000,000 | 5,164,800 |
| Mid-Bay Bridge Authority, Springing Lien Revenue | 7.25 | 10/1/40 | 5,000,000 | 5,077,000 |
| Palm Beach County School Board, COP (Master Lease Purchase | ||||
| Agreement) (Insured; National Public Finance Guarantee Corp.) | 5.00 | 8/1/12 | 500,000 | 519,215 |
| Sarasota County Public Hospital District, HR | ||||
| (Sarasota Memorial Hospital Project) | 5.63 | 7/1/39 | 2,000,000 | 2,044,920 |
| Seminole Tribe, Special Obligation Revenue | 5.25 | 10/1/27 | 2,500,000 d | 2,206,850 |
| Tampa Bay Water, A Regional Water Supply | ||||
| Authority, Utility System Revenue | 5.00 | 10/1/18 | 3,000,000 | 3,586,140 |
| Georgia—2.1% | ||||
| Burke County Development Authority, PCR | ||||
| (Oglethorpe Power Corporation Vogtle Project) | 7.00 | 1/1/23 | 1,000,000 | 1,160,240 |
| Chatham County Hospital Authority, HR Improvement | ||||
| (Memorial Health University Medical Center, Inc.) | 5.75 | 1/1/29 | 2,140,000 | 1,760,022 |
| DeKalb County, GO | 5.00 | 1/1/19 | 500,000 | 516,870 |
| DeKalb County, GO (Special Transportation, | ||||
| Parks and Greenspace and Libraries Tax District) | 5.00 | 12/1/18 | 750,000 | 798,975 |
| Municipal Electric Authority of Georgia, GO | ||||
| (Project One Subordinated Bonds) | 5.75 | 1/1/20 | 1,000,000 | 1,180,570 |
| Private Colleges and Universities Authority, | ||||
| Revenue (Emory University) | 5.00 | 9/1/41 | 5,000,000 | 5,330,200 |
| Hawaii—1.5% | ||||
| Hawaii Department of Budget and Finance, Special Purpose | ||||
| Revenue (Hawai’i Pacific Health Obligated Group) | 5.63 | 7/1/30 | 1,350,000 | 1,358,748 |
| Hawaii Department of Budget and Finance, Special Purpose | ||||
| Revenue (Hawaiian Electric Company, Inc. and Subsidiary Projects) | 6.50 | 7/1/39 | 6,000,000 | 6,384,960 |
| Idaho—1.0% | ||||
| University of Idaho Regents, General Revenue | 5.25 | 4/1/21 | 4,485,000 | 5,181,655 |
| Illinois—3.7% | ||||
| Chicago, General Airport Third Lien Revenue | ||||
| (Chicago O’Hare International Airport) | 5.75 | 1/1/39 | 2,500,000 | 2,674,850 |
| Chicago, General Airport Third Lien Revenue | ||||
| (Chicago O’Hare International Airport) | 6.50 | 1/1/41 | 5,000,000 | 5,641,050 |
| Illinois Finance Authority, Revenue (The Art Institute of Chicago) | 6.00 | 3/1/38 | 1,000,000 | 1,069,190 |
| Metropolitan Pier and Exposition Authority, Revenue | ||||
| (McCormick Place Expansion Project) | ||||
| (Insured; Assured Guaranty Municipal Corp.) | 0.00 | 6/15/26 | 2,000,000 e | 922,700 |
| Metropolitan Pier and Exposition Authority, Revenue | ||||
| (McCormick Place Expansion Project) | ||||
| (Insured; Assured Guaranty Municipal Corp.) | 5.00 | 6/15/50 | 5,605,000 | 5,337,810 |
86
| BNY Mellon Municipal Opportunities Fund (continued) | ||||
| Long-Term Municipal | Coupon | Maturity | Principal | |
| Investments (continued) | Rate (%) | Date | Amount ($) | Value ($) |
| Illinois (continued) | ||||
| Railsplitter Tobacco Settlement Authority, | ||||
| Tobacco Settlement Revenue | 6.00 | 6/1/28 | 3,000,000 | 3,075,330 |
| Indiana—1.3% | ||||
| Indiana Finance Authority, First Lien Wastewater | ||||
| Utility Revenue (CWA Authority Project) | 5.25 | 10/1/38 | 2,500,000 | 2,600,750 |
| Indiana Finance Authority, First Lien Wastewater | ||||
| Utility Revenue (CWA Authority Project) | 5.00 | 10/1/41 | 2,330,000 | 2,362,154 |
| Whiting, Environmental Facilities Revenue | ||||
| (BP Products North America, Inc.) | 2.80 | 6/2/14 | 1,570,000 | 1,608,967 |
| Kentucky—.1% | ||||
| Kentucky Property and Buildings Commission, | ||||
| Revenue (Project Number 90) | 5.38 | 11/1/23 | 500,000 | 563,945 |
| Louisiana—1.5% | ||||
| Louisiana Citizens Property Insurance Corporation, Assessment | ||||
| Revenue (Insured; Assured Guaranty Municipal Corp.) | 6.13 | 6/1/25 | 4,000,000 | 4,450,200 |
| Louisiana Public Facilities Authority, Revenue | ||||
| (CHRISTUS Health Obligated Group) | 6.00 | 7/1/29 | 1,000,000 | 1,074,130 |
| New Orleans Aviation Board, Revenue | ||||
| (Insured; Assured Guaranty Municipal Corp.) | 6.00 | 1/1/23 | 2,000,000 | 2,313,820 |
| Maine—1.2% | ||||
| Maine Health and Higher Educational Facilities | ||||
| Authority, Revenue (MaineGeneral Medical Center Issue) | 6.75 | 7/1/41 | 2,500,000 | 2,506,800 |
| Maine Health and Higher Educational Facilities Authority, | ||||
| Revenue (MaineGeneral Medical Center Issue) | 7.00 | 7/1/41 | 3,500,000 | 3,571,785 |
| Maryland—1.8% | ||||
| Frederick County, Special Obligation Bonds | ||||
| (Urbana Community Development Authority) | 5.00 | 7/1/40 | 2,000,000 | 2,017,640 |
| Maryland Economic Development | ||||
| Corporation, EDR (Terminal Project) | 5.75 | 6/1/35 | 3,500,000 | 3,459,435 |
| Maryland Economic Development Corporation, | ||||
| Port Facilities Revenue (CNX Marine | ||||
| Terminals Inc. Port of Baltimore Facility) | 5.75 | 9/1/25 | 1,000,000 | 987,530 |
| Maryland Health and Higher Educational Facilities | ||||
| Authority, Revenue (Anne Arundel Health System Issue) | 6.75 | 7/1/29 | 2,000,000 | 2,292,740 |
| Maryland Health and Higher Educational Facilities Authority, | ||||
| Revenue (University of Maryland Medical System Issue) | 5.13 | 7/1/39 | 250,000 | 253,767 |
| Massachusetts—11.5% | ||||
| JPMorgan Chase Putters/Drivers Trust | ||||
| (Massachusetts, GO Consolidated Loan) | 5.00 | 4/1/19 | 15,000,000 c,d | 17,697,037 |
| JPMorgan Chase Putters/Drivers Trust (Massachusetts Development | ||||
| Finance Authority, Revenue (Harvard University Issue)) | 5.00 | 10/15/18 | 12,000,000 c,d | 13,115,400 |
| Massachusetts Development Finance Agency, | ||||
| Revenue (Tufts Medical Center Issue) | 7.25 | 1/1/32 | 3,090,000 | 3,418,498 |
| The Funds | 87 |
| STATEMENT OF INVESTMENTS (continued) | ||||
| BNY Mellon Municipal Opportunities Fund (continued) | ||||
| Long-Term Municipal | Coupon | Maturity | Principal | |
| Investments (continued) | Rate (%) | Date | Amount ($) | Value ($) |
| Massachusetts (continued) | ||||
| Massachusetts Development Finance Agency, | ||||
| Revenue (Tufts Medical Center Issue) | 6.88 | 1/1/41 | 1,000,000 | 1,060,260 |
| Massachusetts Development Finance Agency, | ||||
| Revenue (UMass Memorial Issue) | 5.50 | 7/1/31 | 1,750,000 | 1,768,393 |
| Massachusetts Development Finance Agency, | ||||
| SWDR (Dominion Energy Brayton Point Issue) | 5.75 | 5/1/19 | 2,000,000 | 2,273,540 |
| Massachusetts Development Finance Agency, | ||||
| SWDR (Waste Management, Inc. Project) | 5.50 | 5/1/14 | 1,000,000 | 1,095,610 |
| Massachusetts Health and Educational Facilities | ||||
| Authority, Revenue (Harvard University Issue) | 5.00 | 12/15/34 | 10,000,000 | 10,916,400 |
| Massachusetts Health and Educational Facilities Authority, | ||||
| Revenue (Massachusetts Eye and Ear Infirmary Issue) | 5.38 | 7/1/35 | 2,000,000 | 1,915,680 |
| Massachusetts Health and Educational Facilities | ||||
| Authority, Revenue (Simmons College Issue) | 7.50 | 10/1/22 | 500,000 | 614,445 |
| Massachusetts Health and Educational Facilities | ||||
| Authority, Revenue (Simmons College Issue) | 8.00 | 10/1/39 | 2,000,000 | 2,249,620 |
| Massachusetts Water Pollution Abatement Trust, | ||||
| Water Pollution Abatement Revenue (MWRA Program) | 5.75 | 8/1/29 | 50,000 | 50,169 |
| Metropolitan Boston Transit Parking Corporation, | ||||
| Systemwide Senior Lien Parking Revenue | 5.00 | 7/1/41 | 1,915,000 | 1,924,479 |
| Michigan—1.2% | ||||
| Detroit, Water Supply System Second Lien Revenue | ||||
| (Insured; Assured Guaranty Municipal Corp.) | 5.00 | 7/1/22 | 950,000 | 980,780 |
| Michigan Building Authority, Revenue (Facilities Program) | 5.38 | 10/15/41 | 3,000,000 | 3,119,760 |
| Michigan Strategic Fund, LOR (State of | ||||
| Michigan Cadillac Place Office Building Project) | 5.25 | 10/15/31 | 2,000,000 | 2,073,000 |
| Minnesota—6.7% | ||||
| JPMorgan Chase Putters/Drivers Trust | ||||
| (Minnesota, GO (Various Purpose)) | 5.00 | 8/1/18 | 17,125,000 c,d | 20,367,709 |
| JPMorgan Chase Putters/Drivers Trust | ||||
| (Minnesota, GO (Various Purpose)) | 5.00 | 8/1/18 | 10,000,000 c,d | 12,406,500 |
| Minneapolis, Health Care System | ||||
| Revenue (Fairview Health Services) | 6.63 | 11/15/28 | 1,000,000 | 1,109,330 |
| Mississippi—.3% | ||||
| Warren County, Gulf Opportunity Zone | ||||
| Revenue (International Paper Company Projects) | 5.80 | 5/1/34 | 1,500,000 | 1,513,170 |
| Missouri—1.8% | ||||
| Cape Girardeau County Industrial Development Authority, | ||||
| Health Facilities Revenue (Saint Francis Medical Center) | 5.50 | 6/1/34 | 385,000 | 388,380 |
| Missouri Health and Educational Facilities Authority, | ||||
| Educational Facilities Revenue (The Washington University) | 5.00 | 11/15/37 | 4,000,000 | 4,372,600 |
| Missouri Health and Educational Facilities Authority, | ||||
| Educational Facilities Revenue (The Washington University) | 5.00 | 11/15/41 | 4,000,000 | 4,369,080 |
88
| BNY Mellon Municipal Opportunities Fund (continued) | ||||
| Long-Term Municipal | Coupon | Maturity | Principal | |
| Investments (continued) | Rate (%) | Date | Amount ($) | Value ($) |
| New Jersey—3.4% | ||||
| New Jersey, COP (Equipment Lease Purchase Agreement) | 5.25 | 6/15/28 | 1,000,000 | 1,044,070 |
| New Jersey Educational Facilities Authority, | ||||
| Revenue (University of Medicine and Dentistry of New Jersey Issue) | 7.50 | 12/1/32 | 2,000,000 | 2,320,560 |
| New Jersey Health Care Facilities Financing Authority, | ||||
| Revenue (AHS Hospital Corporation Issue) | 6.00 | 7/1/41 | 1,000,000 | 1,065,650 |
| New Jersey Health Care Facilities Financing Authority, Revenue | ||||
| (Saint Peter’s University Hospital Obligated Group Issue) | 6.00 | 7/1/26 | 2,500,000 | 2,525,650 |
| New Jersey Health Care Facilities Financing Authority, Revenue | ||||
| (Saint Peter’s University Hospital Obligated Group Issue) | 6.25 | 7/1/35 | 1,500,000 | 1,494,315 |
| New Jersey Transportation Trust Fund | ||||
| Authority (Transportation System) | 5.13 | 6/15/29 | 5,000,000 | 5,246,900 |
| New Jersey Transportation Trust Fund | ||||
| Authority (Transportation System) | 0.00 | 12/15/29 | 5,000,000 e | 1,744,850 |
| New Jersey Transportation Trust Fund | ||||
| Authority (Transportation System) | 0.00 | 12/15/30 | 5,000,000 e | 1,616,650 |
| New York—12.3% | ||||
| Albany Industrial Development Agency, Civic Facility | ||||
| Revenue (Saint Peter’s Hospital of the City of Albany Project) | 5.75 | 11/15/22 | 4,225,000 | 4,432,785 |
| Brooklyn Arena Local Development Corporation, | ||||
| PILOT Revenue (Barclays Center Project) | 6.00 | 7/15/30 | 6,000,000 | 6,082,200 |
| Metropolitan Transportation Authority, Transportation Revenue | 6.50 | 11/15/28 | 500,000 | 586,945 |
| New York City, GO | 6.00 | 10/15/23 | 500,000 | 598,650 |
| New York City Industrial Development Agency, PILOT | ||||
| Revenue (Queens Baseball Stadium Project) | ||||
| (Insured; Assured Guaranty Municipal Corp.) | 6.50 | 1/1/46 | 500,000 | 532,895 |
| New York City Industrial Development Agency, PILOT | ||||
| Revenue (Yankee Stadium Project) (Insured; | ||||
| Assured Guaranty Municipal Corp.) | 7.00 | 3/1/49 | 1,300,000 | 1,468,753 |
| New York City Municipal Water Finance Authority, | ||||
| Water and Sewer System Revenue | 5.75 | 12/15/16 | 5,090,000 c,d | 5,677,074 |
| New York City Municipal Water Finance Authority, | ||||
| Water and Sewer System Revenue | 5.75 | 12/15/16 | 9,000,000 c,d | 10,038,060 |
| New York City Municipal Water Finance Authority, | ||||
| Water and Sewer System Second General Resolution Revenue | 5.00 | 6/15/29 | 10,000,000 | 11,002,800 |
| New York State Dormitory Authority, | ||||
| Revenue (Columbia University) | 5.00 | 7/1/38 | 10,595,000 | 11,376,381 |
| New York State Dormitory Authority, | ||||
| State Personal Income Tax Revenue (Education) | 5.75 | 3/15/36 | 1,000,000 | 1,121,550 |
| Port Authority of New York and New Jersey, Special | ||||
| Project Revenue (JFK International Air Terminal LLC Project) | 6.00 | 12/1/42 | 9,000,000 | 9,151,020 |
| North Carolina—.6% | ||||
| North Carolina Eastern Municipal Power | ||||
| Agency, Power System Revenue | 5.00 | 1/1/26 | 2,500,000 | 2,680,400 |
| The Funds | 89 |
| STATEMENT OF INVESTMENTS (continued) | ||||
| BNY Mellon Municipal Opportunities Fund (continued) | ||||
| Long-Term Municipal | Coupon | Maturity | Principal | |
| Investments (continued) | Rate (%) | Date | Amount ($) | Value ($) |
| North Carolina (continued) | ||||
| North Carolina Eastern Municipal Power Agency, Power System | ||||
| Revenue (Insured; Assured Guaranty Municipal Corp.) | 6.00 | 1/1/19 | 250,000 | 283,495 |
| North Carolina Eastern Municipal Power Agency, | ||||
| Power System Revenue (Insured; FGIC) | 5.50 | 1/1/17 | 150,000 | 150,416 |
| Ohio—.2% | ||||
| Montgomery County, Revenue (Catholic Health Initiatives) | 6.25 | 10/1/33 | 1,000,000 | 1,091,170 |
| Oregon—.4% | ||||
| Oregon Health and Science University, Revenue | 5.75 | 7/1/39 | 2,000,000 | 2,153,800 |
| Pennsylvania—.5% | ||||
| Pennsylvania Higher Educational Facilities Authority, | ||||
| Revenue (University of Pennsylvania Health System) | 5.75 | 8/15/41 | 2,550,000 | 2,706,698 |
| Texas—14.7% | ||||
| Central Texas Regional Mobility Authority, Senior Lien Revenue | 6.00 | 1/1/41 | 5,000,000 | 4,805,800 |
| Dallas, GO | 5.00 | 2/15/27 | 515,000 | 560,680 |
| Forney Independent School District, Unlimited Tax School | ||||
| Building Bonds (Permanent School Fund Guarantee Program) | 5.75 | 8/15/33 | 1,000,000 | 1,114,630 |
| Harris County Health Facilities Development Corporation, | ||||
| HR (Memorial Hermann Healthcare System) | 7.00 | 12/1/27 | 1,000,000 | 1,126,750 |
| Houston Higher Education Finance Corporation, | ||||
| Higher Education Revenue (Cosmos Foundation, Inc.) | 5.88 | 5/15/21 | 1,000,000 | 1,040,020 |
| Houston Higher Education Finance Corporation, | ||||
| Higher Education Revenue (Cosmos Foundation, Inc.) | 6.50 | 5/15/31 | 2,800,000 | 2,899,456 |
| Houston Higher Education Finance Corporation, | ||||
| Higher Education Revenue (Cosmos Foundation, Inc.) | 6.88 | 5/15/41 | 3,000,000 | 3,131,640 |
| Liberty Hill Independent School District, Unlimited Tax School | ||||
| Building Bonds (Permanent School Fund Guarantee Program) | 5.00 | 8/1/40 | 2,000,000 | 2,119,880 |
| Love Field Airport Modernization Corporation, Special Facilities | ||||
| Revenue (Southwest Airlines Company—Love Field | ||||
| Modernization Program Project) | 5.25 | 11/1/40 | 4,000,000 | 3,772,240 |
| North Texas Tollway Authority, Special Projects System Revenue | 5.50 | 9/1/41 | 2,500,000 | 2,694,325 |
| North Texas Tollway Authority, Special Projects System Revenue | 0.00 | 9/1/43 | 2,000,000 e | 236,780 |
| North Texas Tollway Authority, System First Tier Revenue | 6.00 | 1/1/38 | 7,000,000 | 7,396,130 |
| Texas Private Activity Bond Surface Transportation | ||||
| Corporation, Senior Lien Revenue (LBJ Infrastructure | ||||
| Group LLC IH-635 Managed Lanes Project) | 7.00 | 6/30/40 | 5,000,000 | 5,208,000 |
| Texas Private Activity Bond Surface Transportation | ||||
| Corporation, Senior Lien Revenue (NTE Mobility | ||||
| Partners LLC North Tarrant Express Managed Lanes Project) | 7.50 | 12/31/31 | 2,500,000 | 2,712,125 |
| Texas Public Finance Authority Charter School Finance | ||||
| Corporation, Education Revenue (Cosmos Foundation, Inc.) | 6.20 | 2/15/40 | 5,900,000 | 5,837,578 |
90
| BNY Mellon Municipal Opportunities Fund (continued) | ||||
| Long-Term Municipal | Coupon | Maturity | Principal | |
| Investments (continued) | Rate (%) | Date | Amount ($) | Value ($) |
| Texas (continued) | ||||
| Texas Public Finance Authority, Unemployment | ||||
| Compensation Obligation Assessment Revenue | 5.00 | 1/1/20 | 10,000,000 | 10,711,400 |
| Waxahachie Independent School District, Unlimited Tax School | ||||
| Building Bonds (Permanent School Fund Guarantee Program) | 5.00 | 8/15/37 | 17,605,000 | 18,429,090 |
| Washington—1.8% | ||||
| Energy Northwest, Electric Revenue (Columbia Generating Station) | 5.00 | 7/1/21 | 8,000,000 a | 9,181,360 |
| Wisconsin—1.3% | ||||
| Oneida Tribe of Indians, Retail Sales Revenue | 6.50 | 2/1/31 | 1,325,000 d | 1,439,374 |
| Southeast Wisconsin Professional Baseball | ||||
| Park District, Sales Tax Revenue (Insured; | ||||
| National Public Finance Guarantee Corp.) | 5.50 | 12/15/23 | 1,000,000 | 1,168,730 |
| Wisconsin, General Fund Annual Appropriation Bonds | 5.38 | 5/1/25 | 1,000,000 | 1,129,950 |
| Wisconsin, General Fund Annual Appropriation Bonds | 5.75 | 5/1/33 | 1,500,000 | 1,667,370 |
| Wisconsin, General Fund Annual Appropriation Bonds | 6.00 | 5/1/33 | 1,000,000 | 1,132,850 |
| U.S. Related—10.2% | ||||
| Guam, Hotel Occupancy Tax Revenue | 6.00 | 11/1/26 | 2,500,000 | 2,669,825 |
| Guam, Hotel Occupancy Tax Revenue | 6.13 | 11/1/31 | 5,000,000 | 5,220,000 |
| Guam, Hotel Occupancy Tax Revenue | 6.50 | 11/1/40 | 2,000,000 | 2,105,300 |
| Guam Government Department of Education, | ||||
| COP (John F. Kennedy High School Project) | 6.63 | 12/1/30 | 1,000,000 | 1,005,150 |
| Puerto Rico Aqueduct and | ||||
| Sewer Authority, Senior Lien Revenue | 6.00 | 7/1/38 | 9,105,000 | 9,139,508 |
| Puerto Rico Commonwealth, Public Improvement GO | 6.00 | 7/1/40 | 10,000,000 | 10,124,900 |
| Puerto Rico Commonwealth, Public Improvement GO | 5.75 | 7/1/41 | 2,000,000 | 1,975,920 |
| Puerto Rico Electric Power Authority, Power Revenue | 5.75 | 7/1/36 | 5,000,000 | 5,123,000 |
| Puerto Rico Electric Power Authority, Power Revenue | ||||
| (Insured; National Public Finance Guarantee Corp.) | 5.00 | 7/1/17 | 750,000 | 811,965 |
| Puerto Rico Sales Tax Financing Corporation, | ||||
| Sales Tax Revenue (First Subordinate Series) | 0/6.75 | 8/1/32 | 6,000,000 g | 5,168,580 |
| Puerto Rico Sales Tax Financing Corporation, | ||||
| Sales Tax Revenue (First Subordinate Series) | 0/6.25 | 8/1/33 | 750,000 g | 524,280 |
| Puerto Rico Sales Tax Financing Corporation, | ||||
| Sales Tax Revenue (First Subordinate Series) | 5.38 | 8/1/39 | 1,500,000 | 1,513,065 |
| Puerto Rico Sales Tax Financing Corporation, | ||||
| Sales Tax Revenue (First Subordinate Series) | 6.00 | 8/1/42 | 3,870,000 | 4,096,937 |
| Virgin Islands Public Finance Authority, Subordinated Revenue | ||||
| (Virgin Islands Matching Fund Loan Note—Diageo Project) | 6.75 | 10/1/37 | 2,000,000 | 2,123,740 |
| Total Long-Term Municipal Investments | ||||
| (cost $523,892,808) | 553,438,258 | |||
| The Funds | 91 |
| STATEMENT OF INVESTMENTS (continued) | ||||
| BNY Mellon Municipal Opportunities Fund (continued) | ||||
| Short-Term Municipal | Coupon | Maturity | Principal | |
| Investments—1.8% | Rate (%) | Date | Amount ($) | Value ($) |
| Colorado—.2% | ||||
| Colorado Educational and Cultural Facilities Authority, | ||||
| Revenue (National Jewish Federation Bond | ||||
| Program) (LOC; JPMorgan Chase Bank) | 0.14 | 9/1/11 | 1,100,000 h | 1,100,000 |
| Florida—.4% | ||||
| Florida Municipal Power Agency, Revenue, Refunding | ||||
| (All-Requirements Power Supply Project) (LOC; Bank of America) | 0.17 | 9/1/11 | 1,200,000 h | 1,200,000 |
| Jacksonville Health Facilities Authority, HR, | ||||
| Refunding (Baptist Medical Center) (LOC; Wells Fargo Bank) | 0.12 | 9/1/11 | 1,175,000 h | 1,175,000 |
| Massachusetts—.2% | ||||
| Massachusetts Health and Educational Facilities Authority, | ||||
| Revenue (Children’s Hospital Issue) (LOC; JPMorgan Chase Bank) | 0.13 | 9/1/11 | 1,000,000 h | 1,000,000 |
| Pennsylvania—.5% | ||||
| Lancaster County Hospital Authority, Health System | ||||
| Revenue (The Lancaster General Hospital | ||||
| Refunding Project) (LOC; Bank of America) | 0.16 | 9/1/11 | 2,500,000 h | 2,500,000 |
| Utah—.5% | ||||
| Utah Transit Authority, Subordinated Sales Tax | ||||
| Revenue (LOC; Fortis Bank) | 0.16 | 9/1/11 | 2,300,000 h | 2,300,000 |
| Total Short-Term Municipal Investments | ||||
| (cost $9,275,000) | 9,275,000 | |||
| Total Investments (cost $533,167,808) | 111.2% | 562,713,258 | ||
| Liabilities, Less Cash and Receivables | (11.2%) | (56,526,104) | ||
| Net Assets | 100.0% | 506,187,154 | ||
| a Purchased on a delayed delivery basis. |
| b This security is prerefunded; the date shown represents the prerefunded date. Bonds which are prerefunded are collateralized by U.S. Government securities which are held in escrow |
| and are used to pay principal and interest on the municipal issue and to retire the bonds in full at the earliest refunding date. |
| c Collateral for floating rate borrowings. |
| d Securities exempt from registration under Rule 144A of the Securities Act of 1933.These securities may be resold in transactions exempt from registration, normally to qualified |
| institutional buyers.At August 31, 2011, these securities were valued at $94,033,204 or 18.6% of net assets. |
| e Security issued with a zero coupon. Income is recognized through the accretion of discount. |
| f Variable rate security—interest rate subject to periodic change. |
| g Zero coupon until a specified date at which time the stated coupon rate becomes effective until maturity. |
| h Variable rate demand note—rate shown is the interest rate in effect at August 31, 2011. Maturity date represents the next demand date, or the ultimate maturity date if earlier. |
92
| Summary of Abbreviations | ||||||
| ABAG | Association of Bay Area Governments | ACA | American Capital Access | |||
| AGC | ACE Guaranty Corporation | AGIC | Asset Guaranty Insurance Company | |||
| AMBAC | American Municipal Bond Assurance Corporation | ARRN | Adjustable Rate Receipt Notes | |||
| BAN | Bond Anticipation Notes | BPA | Bond Purchase Agreement | |||
| CIFG | CDC Ixis Financial Guaranty | COP | Certificate of Participation | |||
| CP | Commercial Paper | EDR | Economic Development Revenue | |||
| EIR | Environmental Improvement Revenue | FGIC | Financial Guaranty Insurance Company | |||
| FHA | Federal Housing Administration | FHLB | Federal Home Loan Bank | |||
| FHLMC | Federal Home Loan Mortgage Corporation | FNMA | Federal National Mortgage Association | |||
| GAN | Grant Anticipation Notes | GIC | Guaranteed Investment Contract | |||
| GNMA | Government National Mortgage Association | GO | General Obligation | |||
| HR | Hospital Revenue | IDB | Industrial Development Board | |||
| IDC | Industrial Development Corporation | IDR | Industrial Development Revenue | |||
| LOC | Letter of Credit | LOR | Limited Obligation Revenue | |||
| LR | Lease Revenue | MFHR | Multi-Family Housing Revenue | |||
| MFMR | Multi-Family Mortgage Revenue | PCR | Pollution Control Revenue | |||
| PILOT | Payment in Lieu of Taxes | PUTTERS | Puttable Tax-Exempt Receipts | |||
| RAC | Revenue Anticipation Certificates | RAN | Revenue Anticipation Notes | |||
| RAW | Revenue Anticipation Warrants | RRR | Resources Recovery Revenue | |||
| SAAN | State Aid Anticipation Notes | SBPA | Standby Bond Purchase Agreement | |||
| SFHR | Single Family Housing Revenue | SFMR | Single Family Mortgage Revenue | |||
| SONYMA | State of New York Mortgage Agency | SWDR | Solid Waste Disposal Revenue | |||
| TAN | Tax Anticipation Notes | TAW | Tax Anticipation Warrants | |||
| TRAN | Tax and Revenue Anticipation Notes | XLCA | XL Capital Assurance | |||
| Summary of Combined Ratings (Unaudited) | ||||||
| Fitch | or | Moody’s | or | Standard & Poor’s | Value (%)† | |
| AAA | Aaa | AAA | 26.5 | |||
| AA | Aa | AA | 22.3 | |||
| A | A | A | 20.3 | |||
| BBB | Baa | BBB | 29.1 | |||
| BB | Ba | BB | .2 | |||
| B | B | B | .2 | |||
| F1i | MIG1/P1i | SP1/A1i | 1.4 | |||
| 100.0 | ||||||
| † Based on total investments. |
| i Securities which, while not rated by Fitch, Moody’s and Standard & Poor’s, have been determined by the Manager to be of comparable quality to those rated securities in which the |
| fund may invest. |
See notes to financial statements.
| The Funds | 93 |
| STATEMENT OF FINANCIAL FUTURES |
| August 31, 2011 |
| Unrealized | ||||
| Market Value | Appreciation/ | |||
| BNY Mellon | Covered by | (Depreciation) | ||
| Municipal Opportunities Fund | Contracts | Contracts ($) | Expiration | at 8/31/2011 ($) |
| Financial Futures Short | ||||
| U.S. Treasury 30 Year Bonds | 300 | (40,809,375) | September 2011 | 281,656 |
| U.S. Treasury 10 Year Notes | 500 | (65,015,625) | September 2011 | (3,707,031) |
| Gross Unrealized Appreciation | 281,656 | |||
| Gross Unrealized Depreciation | (3,707,031) |
See notes to financial statements.
94
| STATEMENTS OF ASSETS AND LIABILITIES |
| August 31, 2011 |
| BNY Mellon | BNY Mellon | BNY Mellon | BNY Mellon | |
| National | National | Pennsylvania | Massachusetts | |
| Intermediate | Short-Term | Intermediate | Intermediate | |
| Municipal Bond Fund | Municipal Bond Fund | Municipal Bond Fund | Municipal Bond Fund | |
| Assets ($): | ||||
| Investments in securities— | ||||
| See Statement of Investments† | 1,577,444,088 | 1,084,482,761 | 426,132,428 | 355,733,056 |
| Cash | — | 2,278,856 | — | — |
| Cash on Initial Margin—Note 5 | 544,000 | — | 144,000 | 112,000 |
| Interest receivable | 16,579,460 | 10,414,151 | 5,058,910 | 3,519,135 |
| Receivable for investment securites sold | 8,598,551 | 1,207,365 | — | 150,991 |
| Receivable for shares of Beneficial Interest subscribed | 1,241,992 | — | — | — |
| Receivable for futures variation margin—Note 5 | 122,188 | — | 32,344 | 25,156 |
| Prepaid expenses and other receivables | 31,221 | 22,309 | 19,307 | 25,143 |
| 1,604,561,500 | 1,098,405,442 | 431,386,989 | 359,565,481 | |
| Liabilities ($): | ||||
| Due to The Dreyfus Corporation | ||||
| and affiliates—Note 4(c) | 512,221 | 351,748 | 199,777 | 120,935 |
| Due to Administrator—Note 4(a) | 166,406 | 114,807 | 45,498 | 37,742 |
| Cash overdraft due to Custodian | 3,404,839 | — | 1,307,834 | 728,494 |
| Payable for investment securities purchased | 22,298,042 | 4,000,000 | — | — |
| Payable for shares of Beneficial Interest redeemed | 1,184,249 | 1,559,163 | 55,747 | 408,207 |
| Accrued expenses and other liabilities | 93,508 | 25,228 | 38,411 | 52,281 |
| 27,659,265 | 6,050,946 | 1,647,267 | 1,347,659 | |
| Net Assets ($) | 1,576,902,235 | 1,092,354,496 | 429,739,722 | 358,217,822 |
| Composition of Net Assets ($): | ||||
| Paid—in capital | 1,498,327,105 | 1,076,587,962 | 409,239,957 | 337,540,632 |
| Accumulated net realized | ||||
| gain (loss) on investments | 1,629,836 | (1,092,662) | (2,587,289) | 239,864 |
| Accumulated net unrealized appreciation | ||||
| (depreciation) on investments [including | ||||
| ($2,520,781) (depreciation) on financial | ||||
| futures for BNY Mellon National Intermediate | ||||
| Municipal Bond Fund, ($667,266) (depreciation) | ||||
| on financial futures for BNY Mellon Pennsylvania | ||||
| Intermediate Municipal Bond Fund and ($518,984) | ||||
| (depreciation) on financial futures for BNY Mellon | ||||
| Massachusetts Intermediate Municipal Bond Fund] | 76,945,294 | 16,859,196 | 23,087,054 | 20,437,326 |
| Net Assets ($) | 1,576,902,235 | 1,092,354,496 | 429,739,722 | 358,217,822 |
| Net Asset Value Per Share | ||||
| Class M Shares | ||||
| Net Assets ($) | 1,535,562,762 | 1,088,333,699 | 420,586,458 | 349,767,991 |
| Shares Outstanding | 114,127,164 | 83,774,083 | 32,941,160 | 26,660,225 |
| Net Asset Value Per Share ($) | 13.45 | 12.99 | 12.77 | 13.12 |
| Investor Shares | ||||
| Net Assets ($) | 41,236,583 | 4,020,797 | 9,153,264 | 8,429,564 |
| Shares Outstanding | 3,068,247 | 309,935 | 717,710 | 642,591 |
| Net Asset Value Per Share ($) | 13.44 | 12.97 | 12.75 | 13.12 |
| Dreyfus Premier Shares | ||||
| Net Assets ($) | 102,890 | — | — | 20,267 |
| Shares Outstanding | 7,652 | — | — | 1,541 |
| Net Asset Value Per Share ($) | 13.45 | — | — | 13.15 |
| † Investments at cost ($) | 1,497,978,013 | 1,067,623,565 | 402,378,108 | 334,776,746 |
See notes to financial statements.
| The Funds | 95 |
STATEMENTS OF ASSETS AND LIABILITIES (continued)
| BNY Mellon | ||
| New York | BNY Mellon | |
| Intermediate | Municipal | |
| Tax-Exempt Bond Fund | Opportunities Fund | |
| Assets ($): | ||
| Investments in securities—See Statement of Investments† | 197,425,469 | 562,713,258 |
| Cash on Initial Margin—Note 5 | 64,000 | 1,625,000 |
| Interest receivable | 2,183,593 | 6,038,629 |
| Receivable for investment securites sold | 916,800 | 5,463,778 |
| Receivable for futures variation margin—Note 5 | 14,375 | 564,062 |
| Prepaid expenses and other receivables | 16,508 | 23,976 |
| 200,620,745 | 576,428,703 | |
| Liabilities ($): | ||
| Due to The Dreyfus Corporation and affiliates—Note 4(c) | 66,025 | 235,661 |
| Due to Administrator—Note 4(a) | 21,081 | 54,044 |
| Cash overdraft due to Custodian | 484,898 | 1,569,881 |
| Payable for investment securities purchased | — | 19,706,896 |
| Payable for floating rate notes issued—Note 5 | — | 48,375,000 |
| Payable for shares of Beneficial Interest redeemed | 278,218 | 169,888 |
| Interest and expense payable related | ||
| to floating rate notes issued—Note 4 | — | 89,846 |
| Accrued expenses and other liabilities | 46,849 | 40,333 |
| 897,071 | 70,241,549 | |
| Net Assets ($) | 199,723,674 | 506,187,154 |
| Composition of Net Assets ($): | ||
| Paid—in capital | 187,529,116 | 489,851,087 |
| Accumulated net realized gain (loss) on investments | 491,822 | (9,784,008) |
| Accumulated net unrealized appreciation (depreciation) on investments | ||
| [including ($296,563) (depreciation) on financial futures for BNY Mellon | ||
| New York Intermediate Tax-Exempt Bond Fund and ($3,425,375) (depreciation) | ||
| on financial futures for BNY Mellon Municipal Opportunities Fund] | 11,702,736 | 26,120,075 |
| Net Assets ($) | 199,723,674 | 506,187,154 |
| Net Asset Value Per Share | ||
| Class M Shares | ||
| Net Assets ($) | 182,546,674 | 505,034,831 |
| Shares Outstanding | 15,925,708 | 41,170,767 |
| Net Asset Value Per Share ($) | 11.46 | 12.27 |
| Investor Shares | ||
| Net Assets ($) | 17,177,000 | 1,152,323 |
| Shares Outstanding | 1,497,632 | 93,929 |
| Net Asset Value Per Share ($) | 11.47 | 12.27 |
| † Investments at cost ($) | 185,426,170 | 533,167,808 |
| See notes to financial statements. | ||
96
| STATEMENT OF OPERATIONS |
| Year Ended August 31, 2011 |
| BNY Mellon | BNY Mellon | BNY Mellon | BNY Mellon | |
| National | National | Pennsylvania | Massachusetts | |
| Intermediate | Short-Term | Intermediate | Intermediate | |
| Municipal Bond Fund | Municipal Bond Fund | Municipal Bond Fund | Municipal Bond Fund | |
| Investment Income ($): | ||||
| Interest Income | 64,730,868 | 19,635,571 | 19,770,136 | 15,012,325 |
| Expenses: | ||||
| Investment advisory fee—Note 4(a) | 5,452,986 | 3,637,557 | 2,281,731 | 1,309,398 |
| Administration fee—Note 4(a) | 1,923,109 | 1,282,802 | 563,335 | 461,822 |
| Custodian fees—Note 4(c) | 92,079 | 83,917 | 34,562 | 28,814 |
| Shareholder servicing costs—Note 4(c) | 88,237 | 8,480 | 22,976 | 21,674 |
| Trustees’ fees and expenses—Note 4(d) | 76,024 | 41,770 | 16,523 | 16,418 |
| Loan commitment fees—Note 3 | 43,932 | 24,327 | 11,818 | 10,930 |
| Registration fees | 40,961 | 32,769 | 28,737 | 40,090 |
| Auditing fees | 33,773 | 33,116 | 28,650 | 32,525 |
| Legal fees | 17,446 | 23,814 | — | 206 |
| Prospectus and shareholders’ reports | 1,579 | 5,861 | 5,614 | 7,323 |
| Distribution fees—Note 4(b) | 530 | — | — | 98 |
| Miscellaneous | 104,509 | 94,991 | 49,172 | 61,149 |
| Total Expenses | 7,875,165 | 5,269,404 | 3,043,118 | 1,990,447 |
| Less—reduction in fees due to | ||||
| earnings credits—Note 4(c) | (40) | (4) | (3) | (13) |
| Net Expenses | 7,875,125 | 5,269,400 | 3,043,115 | 1,990,434 |
| Investment Income—Net | 56,855,743 | 14,366,171 | 16,727,021 | 13,021,891 |
| Realized and Unrealized Gain (Loss) | ||||
| on Investments—Note 5 ($): | ||||
| Net realized gain (loss) on investments | 3,427,809 | 551,530 | 153,946 | 591,748 |
| Net realized gain (loss) on financial futures | (1,013,870) | — | (268,377) | (208,738) |
| Net Realized Gain (Loss) | 2,413,939 | 551,530 | (114,431) | 383,010 |
| Net unrealized appreciation | ||||
| (depreciation) on investments | (28,149,977) | (1,849,883) | (8,440,603) | (7,429,940) |
| Net unrealized appreciation | ||||
| (depreciation) on financial futures | (2,520,781) | — | (667,266) | (518,984) |
| Net Unrealized Appreciation (Depreciation) | (30,670,758) | (1,849,883) | (9,107,869) | (7,948,924) |
| Net Realized and Unrealized | ||||
| Gain (Loss) on Investments | (28,256,819) | (1,298,353) | (9,222,300) | (7,565,914) |
| Net Increase in Net Assets | ||||
| Resulting from Operations | 28,598,924 | 13,067,818 | 7,504,721 | 5,455,977 |
| See notes to financial statements. | ||||
| The Funds | 97 |
STATEMENT OF OPERATIONS (continued)
| BNY Mellon | BNY Mellon | |
| New York Intermediate | Municipal | |
| Tax-Exempt Bond Fund | Opportunities Fund | |
| Investment Income ($): | ||
| Interest Income | 8,131,363 | 23,178,701 |
| Expenses: | ||
| Investment advisory fee—Note 4(a) | 1,016,459 | 2,341,946 |
| Administration fee—Note 4(a) | 250,930 | 577,787 |
| Interest and expense for floating rate notes issued—Note 3 | — | 304,393 |
| Shareholder servicing costs—Note 4(c) | 45,249 | 2,879 |
| Auditing fees | 31,409 | 32,603 |
| Registration fees | 29,977 | 44,721 |
| Custodian fees—Note 4(c) | 17,274 | 44,136 |
| Trustees’ fees and expenses—Note 4(d) | 8,075 | 18,228 |
| Prospectus and shareholders’ reports | 5,445 | 8,040 |
| Legal fees | 4,234 | 3,839 |
| Loan commitment fees—Note 3 | 2,084 | 8,328 |
| Interest expense—Note 3 | — | 90 |
| Miscellaneous | 60,680 | 49,801 |
| Total Expenses | 1,471,816 | 3,436,791 |
| Less—reduction in investment advisory fee | ||
| due to undertaking—Note 4(a) | (227,408) | — |
| Less—reduction in fees due to earnings credits—Note 4(c) | (45) | (2) |
| Net Expenses | 1,244,363 | 3,436,789 |
| Investment Income—Net | 6,887,000 | 19,741,912 |
| Realized and Unrealized Gain (Loss) on Investments—Note 5 ($): | ||
| Net realized gain (loss) on investments | 655,960 | 4,229,810 |
| Net realized gain (loss) on financial futures | (200,169) | (10,130,580) |
| Net realized gain (loss) on swap transactions | — | (463,465) |
| Net Realized Gain (Loss) | 455,791 | (6,364,235) |
| Net unrealized appreciation (depreciation) on investments | (3,178,502) | 3,114,930 |
| Net unrealized appreciation (depreciation) on financial futures | (296,563) | (2,180,297) |
| Net unrealized appreciation (depreciation) on swap transactions | — | 197,069 |
| Net Unrealized Appreciation (Depreciation) | (3,475,065) | 1,131,702 |
| Net Realized and Unrealized Gain (Loss) on Investments | (3,019,274) | (5,232,533) |
| Net Increase in Net Assets Resulting from Operations | 3,867,726 | 14,509,379 |
| See notes to financial statements. | ||
98
STATEMENT OF CASH FLOWS
August 31, 2011
| BNY Mellon Municipal Opportunities Fund | ||
| Cash Flows from Operating Activities ($): | ||
| Purchases of portfolio securities | (775,328,663) | |
| Proceeds from sales of portfolio securities | 589,734,106 | |
| Net sale of short-term portfolio securities | 77,068,040 | |
| Financial futures transactions | (13,687,908) | |
| Swap transactions | (1,335,013) | |
| Interest received | 20,358,771 | |
| Operating expenses paid | (1,104,166) | |
| Paid to The Dreyfus Corporation | (2,272,349) | (106,567,182) |
| Cash Flows from Financing Activities ($): | ||
| Net Beneffical interest transactions | 123,593,934 | |
| Dividends paid | (17,836,502) | |
| Cash at beginning of period | (760,131) | |
| Cash at end of period | (1,569,881) | |
| Reconciliation of Net Increase in Net Assets Resulting from | ||
| Operations to Net Cash Used by Operating Activities ($): | ||
| Net Increase in Net Assets Resulting From Operations | 14,509,379 | |
| Adjustments to reconcile net increase in net assets resulting | ||
| from operations to net cash provided by operating activities ($): | ||
| Purchases of portfolio securities | (775,328,663) | |
| Proceeds from sales of portfolio securities | 589,734,106 | |
| Net sale of short-term portfolio securities | 77,068,040 | |
| Financial futures transactions | (13,687,908) | |
| Swap transactions | (1,335,013) | |
| Increase in interest receivable | (3,423,719) | |
| Decrease in accrued operating expenses | (8,465) | |
| Increase in prepaid expenses | (858) | |
| Increase in Due to The Dreyfus Corporation | 69,597 | |
| Net realized loss on investments | 6,364,235 | |
| Net unrealized appreciation on investments | (1,131,702) | |
| Net amortization of premiums on investments | 603,789 | |
| Net Cash Provided by Operating Activities | 106,567,182 | |
| See notes to financial statements. | ||
| The Funds | 99 |
STATEMENT OF CHANGES IN NET ASSETS
| BNY Mellon National Intermediate | BNY Mellon National Short-Term | |||
| Municipal Bond Fund | Municipal Bond Fund | |||
| Year Ended August 31, | Year Ended August 31, | |||
| 2011 | 2010 | 2011 | 2010 | |
| Operations ($): | ||||
| Investment income—net | 56,855,743 | 58,231,021 | 14,366,171 | 14,175,472 |
| Net realized gain (loss) on investments | 2,413,939 | 9,629,291 | 551,530 | (424,283) |
| Net unrealized appreciation (depreciation) on investments | (30,670,758) | 64,500,398 | (1,849,883) | 13,173,941 |
| Net Increase (Decrease) in Net Assets | ||||
| Resulting from Operations | 28,598,924 | 132,360,710 | 13,067,818 | 26,925,130 |
| Dividends to Shareholders from ($): | ||||
| Investment income—net: | ||||
| Class M Shares | (55,351,649) | (56,871,848) | (14,287,423) | (14,102,984) |
| Investor Shares | (1,172,675) | (1,053,314) | (37,079) | (19,519) |
| Dreyfus Premier Shares | (3,074) | (4,354) | — | — |
| Net realized gain on investments: | ||||
| Class M Shares | (9,584,383) | — | — | — |
| Investor Shares | (208,965) | — | — | — |
| Dreyfus Premier Shares | (715) | — | — | — |
| Total Dividends | (66,321,461) | (57,929,516) | (14,324,502) | (14,122,503) |
| Beneficial Interest Transactions ($): | ||||
| Net proceeds from shares sold: | ||||
| Class M Shares | 325,713,494 | 508,110,745 | 745,588,285 | 1,122,401,893 |
| Investor Shares | 24,852,532 | 12,382,325 | 9,654,306 | 5,081,076 |
| Dreyfus Premier Shares | 617 | 783 | — | — |
| Dividends reinvested: | ||||
| Class M Shares | 11,909,817 | 6,841,545 | 3,634,774 | 3,498,579 |
| Investor Shares | 871,371 | 735,891 | 20,763 | 17,320 |
| Dreyfus Premier Shares | 244 | 1,064 | — | — |
| Cost of shares redeemed: | ||||
| Class M Shares | (402,966,796) | (316,873,597) | (720,325,268) | (614,591,338) |
| Investor Shares | (17,796,785) | (7,014,088) | (8,002,347) | (4,186,369) |
| Dreyfus Premier Shares | (14,621) | (54,912) | — | — |
| Increase (Decrease) in Net Assets from | ||||
| Beneficial Interest Transactions | (57,430,127) | 204,129,756 | 30,570,513 | 512,221,161 |
| Total Increase (Decrease) in Net Assets | (95,152,664) | 278,560,950 | 29,313,829 | 525,023,788 |
| Net Assets ($): | ||||
| Beginning of Period | 1,672,054,899 | 1,393,493,949 | 1,063,040,667 | 538,016,879 |
| End of Period | 1,576,902,235 | 1,672,054,899 | 1,092,354,496 1,063,040,667 | |
100
| BNY Mellon National Intermediate | BNY Mellon National Short-Term | |||
| Municipal Bond Fund | Municipal Bond Fund | |||
| Year Ended August 31, | Year Ended August 31, | |||
| 2011 | 2010 | 2011 | 2010 | |
| Capital Share Transactions: | ||||
| Class M Shares | ||||
| Shares sold | 24,656,277 | 37,999,991 | 57,722,325 | 86,959,713 |
| Shares issued for dividends reinvested | 905,280 | 510,831 | 281,309 | 270,826 |
| Shares redeemed | (30,570,651) | (23,686,559) | (55,789,246) | (47,599,781) |
| Net Increase (Decrease) in Shares Outstanding | (5,009,094) | 14,824,263 | 2,214,388 | 39,630,758 |
| Investor Sharesa | ||||
| Shares sold | 1,882,584 | 926,442 | 748,410 | 394,015 |
| Shares issued for dividends reinvested | 66,043 | 54,999 | 1,607 | 1,343 |
| Shares redeemed | (1,350,880) | (525,254) | (621,431) | (325,131) |
| Net Increase (Decrease) in Shares Outstanding | 597,747 | 456,187 | 128,586 | 70,227 |
| Dreyfus Premier Sharesa | ||||
| Shares sold | 47 | 58 | — | — |
| Shares issued for dividends reinvested | 18 | 80 | — | — |
| Shares redeemed | (1,126) | (4,088) | — | — |
| Net Increase (Decrease) in Shares Outstanding | (1,061) | (3,950) | — | — |
| a During the year ended August 31, 2010, 2 Dreyfus Premier shares of BNY Mellon National Intermediate Municipal Bond Fund representing $24 were automatically converted |
| to 2 Investor shares. |
See notes to financial statements.
| The Funds | 101 |
STATEMENT OF CHANGES IN NET ASSETS (continued)
| BNY Mellon Pennsylvania Intermediate Municipal Bond Fund | ||
| Year Ended August 31, | ||
| 2011 | 2010 | |
| Operations ($): | ||
| Investment income—net | 16,727,021 | 18,860,064 |
| Net realized gain (loss) on investments | (114,431) | (554,785) |
| Net unrealized appreciation (depreciation) on investments | (9,107,869) | 22,794,719 |
| Net Increase (Decrease) in Net Assets | ||
| Resulting from Operations | 7,504,721 | 41,099,998 |
| Dividends to Shareholders from ($): | ||
| Investment income—net: | ||
| Class M Shares | (16,374,997) | (18,568,757) |
| Investor Shares | (307,935) | (229,463) |
| Net realized gain on investments: | ||
| Class M Shares | — | (113,887) |
| Investor Shares | — | (939) |
| Total Dividends | (16,682,932) | (18,913,046) |
| Beneficial Interest Transactions ($): | ||
| Net proceeds from shares sold: | ||
| Class M Shares | 31,935,369 | 77,631,357 |
| Investor Shares | 3,374,139 | 8,956,905 |
| Dividends reinvested: | ||
| Class M Shares | 731,683 | 834,142 |
| Investor Shares | 94,258 | 81,604 |
| Cost of shares redeemed: | ||
| Class M Shares | (103,950,517) | (101,436,721) |
| Investor Shares | (3,543,447) | (2,518,488) |
| Increase (Decrease) in Net Assets from | ||
| Beneficial Interest Transactions | (71,358,515) | (16,451,201) |
| Total Increase (Decrease) in Net Assets | (80,536,726) | 5,735,751 |
| Net Assets ($): | ||
| Beginning of Period | 510,276,448 | 504,540,697 |
| End of Period | 429,739,722 | 510,276,448 |
| Capital Share Transactions (Shares): | ||
| Class M Shares | ||
| Shares sold | 2,553,355 | 6,152,736 |
| Shares issued for dividends reinvested | 58,398 | 66,009 |
| Shares redeemed | (8,332,855) | (8,031,887) |
| Net Increase (Decrease) in Shares Outstanding | (5,721,102) | (1,813,142) |
| Investor Shares | ||
| Shares sold | 269,703 | 706,411 |
| Shares issued for dividends reinvested | 7,522 | 5,835 |
| Shares redeemed | (284,727) | (200,092) |
| Net Increase (Decrease) in Shares Outstanding | (7,502) | 512,154 |
| See notes to financial statements. | ||
102
| BNY Mellon Massachusetts Intermediate Municipal Bond Fund | ||
| Year Ended August 31, | ||
| 2011 | 2010 | |
| Operations ($): | ||
| Investment income—net | 13,021,891 | 13,939,034 |
| Net realized gain (loss) on investments | 383,010 | 2,973,105 |
| Net unrealized appreciation (depreciation) on investments | (7,948,924) | 13,425,742 |
| Net Increase (Decrease) in Net Assets | ||
| Resulting from Operations | 5,455,977 | 30,337,881 |
| Dividends to Shareholders from ($): | ||
| Investment income—net: | ||
| Class M Shares | (12,749,845) | (13,669,090) |
| Investor Shares | (270,869) | (267,539) |
| Dreyfus Premier Shares | (538) | (516) |
| Net realized gain on investments: | ||
| Class M Shares | (2,090,359) | — |
| Investor Shares | (45,562) | — |
| Dreyfus Premier Shares | (105) | — |
| Total Dividends | (15,157,278) | (13,937,145) |
| Beneficial Interest Transactions ($): | ||
| Net proceeds from shares sold: | ||
| Class M Shares | 54,639,613 | 100,466,494 |
| Investor Shares | 2,820,454 | 1,526,575 |
| Dividends reinvested: | ||
| Class M Shares | 4,508,772 | 3,506,780 |
| Investor Shares | 243,502 | 167,469 |
| Dreyfus Premier Shares | 643 | 516 |
| Cost of shares redeemed: | ||
| Class M Shares | (107,515,944) | (93,496,329) |
| Investor Shares | (2,607,668) | (2,986,356) |
| Increase (Decrease) in Net Assets from | ||
| Beneficial Interest Transactions | (47,910,628) | 9,185,149 |
| Total Increase (Decrease) in Net Assets | (57,611,929) | 25,585,885 |
| Net Assets ($): | ||
| Beginning of Period | 415,829,751 | 390,243,866 |
| End of Period | 358,217,822 | 415,829,751 |
| The Funds | 103 |
STATEMENT OF CHANGES IN NET ASSETS (continued)
| BNY Mellon Massachusetts Intermediate Municipal Bond Fund | ||
| Year Ended August 31, | ||
| 2011 | 2010 | |
| Capital Share Transactions (Shares): | ||
| Class M Shares | ||
| Shares sold | 4,234,325 | 7,724,233 |
| Shares issued for dividends reinvested | 350,081 | 268,880 |
| Shares redeemed | (8,370,437) | (7,182,891) |
| Net Increase (Decrease) in Shares Outstanding | (3,786,031) | 810,222 |
| Investor Shares | ||
| Shares sold | 217,763 | 117,346 |
| Shares issued for dividends reinvested | 18,896 | 12,845 |
| Shares redeemed | (202,297) | (229,363) |
| Net Increase (Decrease) in Shares Outstanding | 34,362 | (99,172) |
| Dreyfus Premier Shares | ||
| Shares issued for dividends reinvested | 50 | 39 |
| See notes to financial statements. | ||
104
| BNY Mellon New York Intermediate Tax-Exempt Bond Fund | ||
| Year Ended August 31, | ||
| 2011 | 2010 | |
| Operations ($): | ||
| Investment income—net | 6,887,000 | 6,364,090 |
| Net realized gain (loss) on investments | 455,791 | 180,657 |
| Net unrealized appreciation (depreciation) on investments | (3,475,065) | 7,406,706 |
| Net Increase (Decrease) in Net Assets | ||
| Resulting from Operations | 3,867,726 | 13,951,453 |
| Dividends to Shareholders from ($): | ||
| Investment income—net: | ||
| Class M Shares | (6,330,855) | (5,819,185) |
| Investor Shares | (541,015) | (527,436) |
| Net realized gain on investments: | ||
| Class M Shares | (169,336) | (1,490) |
| Investor Shares | (15,169) | (152) |
| Total Dividends | (7,056,375) | (6,348,263) |
| Beneficial Interest Transactions ($): | ||
| Net proceeds from shares sold: | ||
| Class M Shares | 33,908,897 | 65,072,584 |
| Investor Shares | 2,734,033 | 1,610,885 |
| Dividends reinvested: | ||
| Class M Shares | 785,105 | 779,460 |
| Investor Shares | 428,850 | 418,543 |
| Cost of shares redeemed: | ||
| Class M Shares | (45,978,230) | (29,785,020) |
| Investor Shares | (3,112,881) | (2,148,320) |
| Increase (Decrease) in Net Assets from | ||
| Beneficial Interest Transactions | (11,234,226) | 35,948,132 |
| Total Increase (Decrease) in Net Assets | (14,422,875) | 43,551,322 |
| Net Assets ($): | ||
| Beginning of Period | 214,146,549 | 170,595,227 |
| End of Period | 199,723,674 | 214,146,549 |
| Capital Share Transactions (Shares): | ||
| Class M Shares | ||
| Shares sold | 3,003,814 | 5,743,485 |
| Shares issued for dividends reinvested | 70,015 | 68,768 |
| Shares redeemed | (4,108,386) | (2,628,307) |
| Net Increase (Decrease) in Shares Outstanding | (1,034,557) | 3,183,946 |
| Investor Shares | ||
| Shares sold | 242,235 | 142,185 |
| Shares issued for dividends reinvested | 38,167 | 36,891 |
| Shares redeemed | (277,334) | (189,528) |
| Net Increase (Decrease) in Shares Outstanding | 3,068 | (10,452) |
| See notes to financial statements. | ||
| The Funds | 105 |
STATEMENT OF CHANGES IN NET ASSETS (continued)
| BNY Mellon Municipal Opportunities Fund | ||
| Year Ended August 31, | ||
| 2011 | 2010a | |
| Operations ($): | ||
| Investment income—net | 19,741,912 | 7,638,142 |
| Net realized gain (loss) on investments | (6,364,235) | 2,595,299 |
| Net unrealized appreciation (depreciation) on investments | 1,131,702 | 14,993,700 |
| Net Increase (Decrease) in Net Assets | ||
| Resulting from Operations | 14,509,379 | 25,227,141 |
| Dividends to Shareholders from ($): | ||
| Investment income—net: | ||
| Class M Shares | (19,364,294) | (7,435,840) |
| Investor Shares | (43,687) | (48,955) |
| Net realized gain on investments: | ||
| Class M Shares | (5,311,842) | (4,605,769) |
| Investor Shares | (14,701) | (48,090) |
| Total Dividends | (24,734,524) | (12,138,654) |
| Beneficial Interest Transactions ($): | ||
| Net proceeds from shares sold: | ||
| Class M Shares | 222,249,291 | 256,211,257 |
| Investor Shares | 1,698,372 | 688,290 |
| Dividends reinvested: | ||
| Class M Shares | 6,846,926 | 4,694,015 |
| Investor Shares | 51,096 | 87,415 |
| Cost of shares redeemed: | ||
| Class M Shares | (98,825,673) | (29,907,595) |
| Investor Shares | (1,697,687) | (866,650) |
| Increase (Decrease) in Net Assets from | ||
| Beneficial Interest Transactions | 130,322,325 | 230,906,732 |
| Total Increase (Decrease) in Net Assets | 120,097,180 | 243,995,219 |
| Net Assets ($): | ||
| Beginning of Period | 386,089,974 | 142,094,755 |
| End of Period | 506,187,154 | 386,089,974 |
| Capital Share Transactions (Shares): | ||
| Class M Shares | ||
| Shares sold | 18,734,411 | 20,613,460 |
| Shares issued for dividends reinvested | 565,817 | 381,307 |
| Shares redeemed | (8,240,383) | (2,410,868) |
| Net Increase (Decrease) in Shares Outstanding | 11,059,845 | 18,583,899 |
| Investor Shares | ||
| Shares sold | 140,036 | 54,942 |
| Shares issued for dividends reinvested | 4,206 | 7,093 |
| Shares redeemed | (140,799) | (70,361) |
| Net Increase (Decrease) in Shares Outstanding | 3,443 | (8,326) |
| See notes to financial statements. | ||
106
FINANCIAL HIGHLIGHTS
The following tables describe the performance for each share class of each BNY Mellon Municipal Bond fund for the fiscal periods indicated.All information (except portfolio turnover rate) reflects financial results for a single fund share.Total return shows how much your investment in each fund would have increased (or decreased) during the period, assuming you had reinvested all dividends and distributions.These figures have been derived from each fund’s financial statements.
| Class M Shares | |||||
| Year Ended August 31, | |||||
| BNY Mellon National Intermediate Municipal Bond Fund | 2011 | 2010 | 2009 | 2008 | 2007 |
| Per Share Data ($): | |||||
| Net asset value, beginning of period | 13.75 | 13.10 | 12.84 | 12.81 | 13.01 |
| Investment Operations: | |||||
| Investment income—neta | .48 | .50 | .52 | .52 | .50 |
| Net realized and unrealized | |||||
| gain (loss) on investments | (.22) | .65 | .27 | .02 | (.20) |
| Total from Investment Operations | .26 | 1.15 | .79 | .54 | .30 |
| Distributions: | |||||
| Dividends from investment income—net | (.48) | (.50) | (.52) | (.51) | (.50) |
| Dividends from net realized gain on investments | (.08) | — | (.01) | — | — |
| Total Distributions | (.56) | (.50) | (.53) | (.51) | (.50) |
| Net asset value, end of period | 13.45 | 13.75 | 13.10 | 12.84 | 12.81 |
| Total Return (%) | 2.07 | 8.96 | 6.37 | 4.32 | 2.36 |
| Ratios/Supplemental Data (%): | |||||
| Ratio of total expenses to average net assets | .50 | .50 | .51 | .51 | .51 |
| Ratio of net expenses to average net assets | .50 | .50 | .51 | .51 | .51 |
| Ratio of net investment income | |||||
| to average net assets | 3.65 | 3.76 | 4.11 | 4.01 | 3.90 |
| Portfolio Turnover Rate | 39.88 | 42.75 | 42.82 | 49.50 | 27.18 |
| Net Assets, end of period ($ x 1,000) | 1,535,563 | 1,638,004 | 1,366,960 | 1,045,019 | 944,909 |
| a Based on average shares outstanding at each month end. | |||||
| See notes to financial statements. | |||||
| The Funds | 107 |
FINANCIAL HIGHLIGHTS (continued)
| Investor Shares | |||||
| Year Ended August 31, | |||||
| BNY Mellon National Intermediate Municipal Bond Fund | 2011 | 2010 | 2009 | 2008 | 2007 |
| Per Share Data ($): | |||||
| Net asset value, beginning of period | 13.73 | 13.09 | 12.83 | 12.80 | 13.00 |
| Investment Operations: | |||||
| Investment income—neta | .45 | .47 | .49 | .48 | .47 |
| Net realized and unrealized | |||||
| gain (loss) on investments | (.21) | .64 | .27 | .03 | (.20) |
| Total from Investment Operations | .24 | 1.11 | .76 | .51 | .27 |
| Distributions: | |||||
| Dividends from investment income—net | (.45) | (.47) | (.49) | (.48) | (.47) |
| Dividends from net realized gain on investments | (.08) | — | (.01) | — | — |
| Total Distributions | (.53) | (.47) | (.50) | (.48) | (.47) |
| Net asset value, end of period | 13.44 | 13.73 | 13.09 | 12.83 | 12.80 |
| Total Return (%) | 1.90 | 8.61 | 6.11 | 4.06 | 2.11 |
| Ratios/Supplemental Data (%): | |||||
| Ratio of total expenses to average net assets | .75 | .75 | .76 | .76 | .76 |
| Ratio of net expenses to average net assets | .75 | .75 | .76 | .76 | .76 |
| Ratio of net investment income | |||||
| to average net assets | 3.41 | 3.51 | 3.88 | 3.77 | 3.65 |
| Portfolio Turnover Rate | 39.88 | 42.75 | 42.82 | 49.50 | 27.18 |
| Net Assets, end of period ($ x 1,000) | 41,237 | 33,931 | 26,368 | 21,668 | 25,262 |
| a Based on average shares outstanding at each month end. | |||||
| See notes to financial statements. | |||||
108
| Dreyfus Premier Shares | |||||
| Year Ended August 31, | |||||
| BNY Mellon National Intermediate Municipal Bond Fund | 2011 | 2010 | 2009 | 2008 | 2007 |
| Per Share Data ($): | |||||
| Net asset value, beginning of period | 13.74 | 13.10 | 12.84 | 12.81 | 13.00 |
| Investment Operations: | |||||
| Investment income—neta | .38 | .40 | .42 | .41 | .39 |
| Net realized and unrealized | |||||
| gain (loss) on investments | (.21) | .64 | .27 | .04 | (.17) |
| Total from Investment Operations | .17 | 1.04 | .69 | .45 | .22 |
| Distributions: | |||||
| Dividends from investment income—net | (.38) | (.40) | (.42) | (.42) | (.41) |
| Dividends from net realized gain on investments | (.08) | — | (.01) | — | — |
| Total Distributions | (.46) | (.40) | (.43) | (.42) | (.41) |
| Net asset value, end of period | 13.45 | 13.74 | 13.10 | 12.84 | 12.81 |
| Total Return (%)b | 1.39 | 8.06 | 5.66 | 3.46 | 1.68 |
| Ratios/Supplemental Data (%): | |||||
| Ratio of total expenses to average net assets | 1.25 | 1.25 | 1.26 | 1.26 | 1.26 |
| Ratio of net expenses to average net assets | 1.25 | 1.25 | 1.26 | 1.26 | 1.26 |
| Ratio of net investment income | |||||
| to average net assets | 2.92 | 3.02 | 3.37 | 3.27 | 3.13 |
| Portfolio Turnover Rate | 39.88 | 42.75 | 42.82 | 49.50 | 27.18 |
| Net Assets, end of period ($ x 1,000) | 103 | 120 | 166 | 177 | 327 |
| a | Based on average shares outstanding at each month end. |
| b | Exclusive of sales charge. |
See notes to financial statements.
| The Funds | 109 |
FINANCIAL HIGHLIGHTS (continued)
| Class M Shares | |||||
| Year Ended August 31, | |||||
| BNY Mellon National Short-Term Municipal Bond Fund | 2011 | 2010 | 2009 | 2008 | 2007 |
| Per Share Data ($): | |||||
| Net asset value, beginning of period | 13.01 | 12.80 | 12.69 | 12.59 | 12.59 |
| Investment Operations: | |||||
| Investment income—neta | .18 | .21 | .31 | .41 | .40 |
| Net realized and unrealized | |||||
| gain (loss) on investments | (.02) | .21 | .14 | .10 | — |
| Total from Investment Operations | .16 | .42 | .45 | .51 | .40 |
| Distributions: | |||||
| Dividends from investment income—net | (.18) | (.21) | (.34) | (.41) | (.40) |
| Net asset value, end of period | 12.99 | 13.01 | 12.80 | 12.69 | 12.59 |
| Total Return (%) | 1.31 | 3.22 | 3.61 | 4.09 | 3.21 |
| Ratios/Supplemental Data (%): | |||||
| Ratio of total expenses to average net assets | .51 | .51 | .54 | .54 | .55 |
| Ratio of net expenses to average net assets | .51 | .51 | .54 | .54 | .54 |
| Ratio of net investment income | |||||
| to average net assets | 1.38 | 1.60 | 2.50 | 3.23 | 3.14 |
| Portfolio Turnover Rate | 24.33 | 16.46 | 12.61 | 22.93 | 33.74 |
| Net Assets, end of period ($ x 1,000) | 1,088,334 | 1,060,685 | 536,597 | 168,243 | 145,395 |
| a Based on average shares outstanding at each month end. | |||||
| See notes to financial statements. | |||||
110
| Investor Shares | |||||
| Year Ended August 31, | |||||
| BNY Mellon National Short-Term Municipal Bond Fund | 2011 | 2010 | 2009 | 2008 | 2007 |
| Per Share Data ($): | |||||
| Net asset value, beginning of period | 12.99 | 12.78 | 12.68 | 12.58 | 12.58 |
| Investment Operations: | |||||
| Investment income—neta | .15 | .19 | .31 | .38 | .37 |
| Net realized and unrealized | |||||
| gain (loss) on investments | (.02) | .20 | .10 | .10 | (.01) |
| Total from Investment Operations | .13 | .39 | .41 | .48 | .36 |
| Distributions: | |||||
| Dividends from investment income—net | (.15) | (.18) | (.31) | (.38) | (.36) |
| Net asset value, end of period | 12.97 | 12.99 | 12.78 | 12.68 | 12.58 |
| Total Return (%) | .98 | 3.05 | 3.28 | 3.83 | 2.95 |
| Ratios/Supplemental Data (%): | |||||
| Ratio of total expenses to average net assets | .77 | .77 | .80 | .80 | .80 |
| Ratio of net expenses to average net assets | .77 | .77 | .80 | .80 | .80 |
| Ratio of net investment income | |||||
| to average net assets | 1.15 | 1.39 | 2.38 | 2.99 | 2.94 |
| Portfolio Turnover Rate | 24.33 | 16.46 | 12.61 | 22.93 | 33.74 |
| Net Assets, end of period ($ x 1,000) | 4,021 | 2,356 | 1,420 | 662 | 635 |
| a Based on average shares outstanding at each month end. | |||||
| See notes to financial statements. | |||||
| The Funds | 111 |
FINANCIAL HIGHLIGHTS (continued)
| Class M Shares | |||||
| Year Ended August 31, | |||||
| BNY Mellon Pennsylvania Intermediate Municipal Bond Fund | 2011 | 2010 | 2009 | 2008 | 2007 |
| Per Share Data ($): | |||||
| Net asset value, beginning of period | 12.96 | 12.40 | 12.35 | 12.43 | 12.66 |
| Investment Operations: | |||||
| Investment income—neta | .46 | .46 | .48 | .48 | .48 |
| Net realized and unrealized | |||||
| gain (loss) on investments | (.19) | .56 | .09 | (.06) | (.20) |
| Total from Investment Operations | .27 | 1.02 | .57 | .42 | .28 |
| Distributions: | |||||
| Dividends from investment income—net | (.46) | (.46) | (.48) | (.48) | (.48) |
| Dividends from net realized gain on investments | — | (.00)b | (.04) | (.02) | (.03) |
| Total Distributions | (0.46) | (.46) | (.52) | (.50) | (.51) |
| Net asset value, end of period | 12.77 | 12.96 | 12.40 | 12.35 | 12.43 |
| Total Return (%) | 2.21 | 8.44 | 4.90 | 3.43 | 2.23 |
| Ratios/Supplemental Data (%): | |||||
| Ratio of total expenses to average net assets | .66 | .66 | .67 | .66 | .66 |
| Ratio of net expenses to average net assets | .66 | .66 | .67 | .66 | .66 |
| Ratio of net investment income | |||||
| to average net assets | 3.67 | 3.68 | 4.02 | 3.87 | 3.83 |
| Portfolio Turnover Rate | 9.72 | 7.11 | 12.75 | 10.14 | 20.18 |
| Net Assets, end of period ($ x 1,000) | 420,586 | 500,892 | 501,978 | 566,767 | 610,618 |
| a | Based on average shares outstanding at each month end. |
| b | Amount represents less than $.01 per share. |
See notes to financial statements.
112
| Investor Shares | |||||
| Year Ended August 31, | |||||
| BNY Mellon Pennsylvania Intermediate Municipal Bond Fund | 2011 | 2010 | 2009 | 2008 | 2007 |
| Per Share Data ($): | |||||
| Net asset value, beginning of period | 12.94 | 12.39 | 12.33 | 12.41 | 12.65 |
| Investment Operations: | |||||
| Investment income—neta | .43 | .44 | .46 | .46 | .45 |
| Net realized and unrealized | |||||
| gain (loss) on investments | (.19) | .54 | .09 | (.07) | (.21) |
| Total from Investment Operations | .24 | .98 | .55 | .39 | .24 |
| Distributions: | |||||
| Dividends from investment income—net | (.43) | (.43) | (.45) | (.45) | (.45) |
| Dividends from net realized gain on investments | — | (.00)b | (.04) | (.02) | (.03) |
| Total Distributions | (.43) | (.43) | (.49) | (.47) | (.48) |
| Net asset value, end of period | 12.75 | 12.94 | 12.39 | 12.33 | 12.41 |
| Total Return (%) | 1.95 | 8.08 | 4.72 | 3.17 | 1.89 |
| Ratios/Supplemental Data (%): | |||||
| Ratio of total expenses to average net assets | .91 | .92 | .92 | .91 | .91 |
| Ratio of net expenses to average net assets | .91 | .92 | .92 | .91 | .91 |
| Ratio of net investment income | |||||
| to average net assets | 3.42 | 3.42 | 3.76 | 3.63 | 3.59 |
| Portfolio Turnover Rate | 9.72 | 7.11 | 12.75 | 10.14 | 20.18 |
| Net Assets, end of period ($ x 1,000) | 9,153 | 9,385 | 2,563 | 1,442 | 1,295 |
| a | Based on average shares outstanding at each month end. |
| b | Amount represents less than $.01 per share. |
See notes to financial statements.
| The Funds | 113 |
FINANCIAL HIGHLIGHTS (continued)
| Class M Shares | |||||
| Year Ended August 31, | |||||
| BNY Mellon Massachusetts Intermediate Municipal Bond Fund | 2011 | 2010 | 2009 | 2008 | 2007 |
| Per Share Data ($): | |||||
| Net asset value, beginning of period | 13.39 | 12.86 | 12.57 | 12.42 | 12.58 |
| Investment Operations: | |||||
| Investment income—neta | .45 | .45 | .46 | .47 | .47 |
| Net realized and unrealized | |||||
| gain (loss) on investments | (.20) | .53 | .29 | .14 | (.16) |
| Total from Investment Operations | .25 | .98 | .75 | .61 | .31 |
| Distributions: | |||||
| Dividends from investment income—net | (.45) | (.45) | (.46) | (.46) | (.47) |
| Dividends from net realized gain on investments | (.07) | — | — | — | — |
| Total Distributions | (.52) | (.45) | (.46) | (.46) | (.47) |
| Net asset value, end of period | 13.12 | 13.39 | 12.86 | 12.57 | 12.42 |
| Total Return (%) | 2.02 | 7.75 | 6.18 | 5.02 | 2.47 |
| Ratios/Supplemental Data (%): | |||||
| Ratio of total expenses to average net assets | .53 | .52 | .54 | .52 | .53 |
| Ratio of net expenses to average net assets | .52 | .52 | .54 | .52 | .50 |
| Ratio of net investment income | |||||
| to average net assets | 3.49 | 3.44 | 3.70 | 3.71 | 3.72 |
| Portfolio Turnover Rate | 10.43 | 21.44 | 16.78 | 8.75 | 18.85 |
| Net Assets, end of period ($ x 1,000) | 349,768 | 407,667 | 381,129 | 374,115 | 342,583 |
| a Based on average shares outstanding at each month end. | |||||
| See notes to financial statements. | |||||
114
| Investor Shares | |||||
| Year Ended August 31, | |||||
| BNY Mellon Massachusetts Intermediate Municipal Bond Fund | 2011 | 2010 | 2009 | 2008 | 2007 |
| Per Share Data ($): | |||||
| Net asset value, beginning of period | 13.39 | 12.86 | 12.57 | 12.42 | 12.58 |
| Investment Operations: | |||||
| Investment income—neta | .42 | .42 | .43 | .44 | .44 |
| Net realized and unrealized | |||||
| gain (loss) on investments | (.20) | .53 | .29 | .14 | (.16) |
| Total from Investment Operations | .22 | .95 | .72 | .58 | .28 |
| Distributions: | |||||
| Dividends from investment income—net | (.42) | (.42) | (.43) | (.43) | (.44) |
| Dividends from net realized gain on investments | (.07) | — | — | — | — |
| Total Distributions | (.49) | (.42) | (.43) | (.43) | (.44) |
| Net asset value, end of period | 13.12 | 13.39 | 12.86 | 12.57 | 12.42 |
| Total Return (%) | 1.77 | 7.49 | 5.92 | 4.76 | 2.21 |
| Ratios/Supplemental Data (%): | |||||
| Ratio of total expenses to average net assets | .78 | .77 | .79 | .77 | .78 |
| Ratio of net expenses to average net assets | .77 | .77 | .79 | .77 | .75 |
| Ratio of net investment income | |||||
| to average net assets | 3.24 | 3.20 | 3.45 | 3.47 | 3.48 |
| Portfolio Turnover Rate | 10.43 | 21.44 | 16.78 | 8.75 | 18.85 |
| Net Assets, end of period ($ x 1,000) | 8,430 | 8,143 | 9,096 | 8,574 | 9,024 |
| a Based on average shares outstanding at each month end. |
| See notes to financial statements. |
| The Funds | 115 |
FINANCIAL HIGHLIGHTS (continued)
| Dreyfus Premier Shares | |||||
| Year Ended August 31, | |||||
| BNY Mellon Massachusetts Intermediate Municipal Bond Fund | 2011 | 2010 | 2009 | 2008 | 2007 |
| Per Share Data ($): | |||||
| Net asset value, beginning of period | 13.42 | 12.89 | 12.60 | 12.45 | 12.61 |
| Investment Operations: | |||||
| Investment income—neta | .36 | .35 | .37 | .38 | .35 |
| Net realized and unrealized | |||||
| gain (loss) on investments | (.21) | .53 | .29 | .14 | (.14) |
| Total from Investment Operations | .15 | .88 | .66 | .52 | .21 |
| Distributions: | |||||
| Dividends from investment income—net | (.35) | (.35) | (.37) | (.37) | (.37) |
| Dividends from net realized gain on investments | (.07) | — | — | — | — |
| Total Distributions | (.42) | (.35) | (.37) | (.37) | (.37) |
| Net asset value, end of period | 13.15 | 13.42 | 12.89 | 12.60 | 12.45 |
| Total Return (%)b | 1.26 | 6.94 | 5.38 | 4.25 | 1.71 |
| Ratios/Supplemental Data (%): | |||||
| Ratio of total expenses to average net assets | 1.28 | 1.28 | 1.29 | 1.27 | 1.28 |
| Ratio of net expenses to average net assets | 1.27 | 1.27 | 1.29 | 1.27 | 1.25 |
| Ratio of net investment income | |||||
| to average net assets | 2.74 | 2.69 | 2.95 | 2.97 | 2.96 |
| Portfolio Turnover Rate | 10.43 | 21.44 | 16.78 | 8.75 | 18.85 |
| Net Assets, end of period ($ x 1,000) | 20 | 20 | 19 | 18 | 17 |
| a | Based on average shares outstanding at each month end. |
| b | Exclusive of sales charge. |
See notes to financial statements.
116
| Class M Shares† | ||||||
| BNY Mellon New York Intermediate | Year Ended August 31, | Eight Months Ended | Year Ended December 31, | |||
| Tax-Exempt Bond Fund | 2011 | 2010 | August 31, 2009a | 2008 | 2007 | 2006 |
| Per Share Data ($): | ||||||
| Net asset value, beginning of period | 11.60 | 11.16 | 10.71 | 10.81 | 10.75 | 10.74 |
| Investment Operations: | ||||||
| Investment income—netb | .38 | .38 | .25 | .37 | .38 | .37 |
| Net realized and unrealized | ||||||
| gain (loss) on investments | (.13) | .44 | .45 | (.09) | .07 | .01 |
| Total from Investment Operations | .25 | .82 | .70 | .28 | .45 | .38 |
| Distributions: | ||||||
| Dividends from investment income—net | (.38) | (.38) | (.25) | (.37) | (.38) | (.37) |
| Dividends from net realized gain on investments | (.01) | (.00)c | (.00)c | (.01) | (.01) | (.00)c |
| Total Distributions | (.39) | (.38) | (.25) | (.38) | (.39) | (.37) |
| Net asset value, end of period | 11.46 | 11.60 | 11.16 | 10.71 | 10.81 | 10.75 |
| Total Return (%) | 2.31 | 7.45 | 6.58d | 2.64 | 4.33 | 3.64 |
| Ratios/Supplemental Data (%): | ||||||
| Ratio of total expenses to average net assets | .70 | .72 | .72e | .75 | .75 | .76 |
| Ratio of net expenses to average net assets | .59 | .59 | .59e | .59 | .59 | .59 |
| Ratio of net investment income | ||||||
| to average net assets | 3.41 | 3.33 | 3.40e | 3.49 | 3.56 | 3.46 |
| Portfolio Turnover Rate | 21.91 | 4.80 | 1.47d | 6 | 17 | 13 |
| Net Assets, end of period ($ x 1,000) | 182,547 | 196,795 | 153,785 | 113,699 | 97,935 | 94,789 |
| † Represents information for Institutional shares of the fund’s predecessor, BNY Hamilton Intermediate NewYork Tax-Exempt Fund, through September 12, 2008. |
| a The fund has changed its fiscal year end from December 31 to August 31. |
| b Based on average shares outstanding at each month end. |
| c Amount represents less than $.01 per share. |
| d Not annualized. |
| e Annualized. |
| See notes to financial statements. |
| The Funds | 117 |
FINANCIAL HIGHLIGHTS (continued)
| Investor Shares† | ||||||
| BNY Mellon New York Intermediate | Year Ended August 31, | Eight Months Ended | Year Ended December 31, | |||
| Tax-Exempt Bond Fund | 2011 | 2010 | August 31, 2009a | 2008 | 2007 | 2006 |
| Per Share Data ($): | ||||||
| Net asset value, beginning of period | 11.61 | 11.17 | 10.72 | 10.82 | 10.76 | 10.75 |
| Investment Operations: | ||||||
| Investment income—netb | .36 | .35 | .23 | .34 | .35 | .34 |
| Net realized and unrealized | ||||||
| gain (loss) on investments | (.14) | .44 | .45 | (.08) | .08 | .01 |
| Total from Investment Operations | .22 | .79 | .68 | .26 | .43 | .35 |
| Distributions: | ||||||
| Dividends from investment income—net | (.35) | (.35) | (.23) | (.35) | (.36) | (.34) |
| Dividends from net realized gain on investments | (.01) | (.00)c | (.00)c | (.01) | (.01) | (.00)c |
| Total Distributions | (.36) | (.35) | (.23) | (.36) | (.37) | (.34) |
| Net asset value, end of period | 11.47 | 11.61 | 11.17 | 10.72 | 10.82 | 10.76 |
| Total Return (%) | 2.05 | 7.17 | 6.40d | 2.39e | 4.07e | 3.38e |
| Ratios/Supplemental Data (%): | ||||||
| Ratio of total expenses to average net assets | .95 | .97 | .96f | 1.00 | 1.00 | 1.01 |
| Ratio of net expenses to average net assets | .84 | .84 | .84f | .84 | .84 | .84 |
| Ratio of net investment income | ||||||
| to average net assets | 3.16 | 3.08 | 3.15f | 3.24 | 3.31 | 3.21 |
| Portfolio Turnover Rate | 21.91 | 4.80 | 1.47d | 6 | 17 | 13 |
| Net Assets, end of period ($ x 1,000) | 17,177 | 17,352 | 16,810 | 16,198 | 17,153 | 18,131 |
| † Represents information for Class A shares of the fund’s predecessor, BNY Hamilton Intermediate NewYork Tax-Exempt Fund, through September 12, 2008. |
| a The fund has changed its fiscal year end from December 31 to August 31. |
| b Based on average shares outstanding at each month end. |
| c Amount represents less than $.01 per share. |
| d Not annualized. |
| e Exclusive of sales charge. |
| f Annualized. |
| See notes to financial statements. |
118
| Class M Shares | |||
| Year Ended August 31, | |||
| BNY Mellon Municipal Opportunities Fund | 2011 | 2010 | 2009a |
| Per Share Data ($): | |||
| Net asset value, beginning of period | 12.78 | 12.22 | 10.00 |
| Investment Operations: | |||
| Investment income—netb | .52 | .50 | .43 |
| Net realized and unrealized�� | |||
| gain (loss) on investments | (.35) | .95 | 2.19 |
| Total from Investment Operations | .17 | 1.45 | 2.62 |
| Distributions: | |||
| Dividends from investment income—net | (.50) | (.52) | (.39) |
| Dividends from net realized gain on investments | (.18) | (.37) | (.01) |
| Total Distributions | (.68) | (.89) | (.40) |
| Net asset value, end of period | 12.27 | 12.78 | 12.22 |
| Total Return (%) | 1.54 | 12.38 | 26.58c |
| Ratios/Supplemental Data (%): | |||
| Ratio of total expenses to average net assets | .73 | .71 | .87d |
| Ratio of net expenses to average net assets | .73 | .71 | .75d |
| Ratio of interest and expense related to | |||
| floating rate notes issued to average net assets | .06 | .01 | — |
| Ratio of net investment income to average net assets | 4.22 | 4.12 | 4.36d |
| Portfolio Turnover Rate | 129.00 | 145.57 | 161.70c |
| Net Assets, end of period ($ x 1,000) | 505,035 | 384,933 | 140,887 |
| a | From October 15, 2008 (commencement of initial offering) to August 31, 2009. |
| b | Based on average shares outstanding at each month end. |
| c | Not annualized. |
| d | Annualized. |
| See notes to financial statements. | |
| The Funds | 119 |
FINANCIAL HIGHLIGHTS (continued)
| Investor Shares | |||
| Year Ended August 31, | |||
| BNY Mellon Municipal Opportunities Fund | 2011 | 2010 | 2009a |
| Per Share Data ($): | |||
| Net asset value, beginning of period | 12.79 | 12.22 | 10.00 |
| Investment Operations: | |||
| Investment income—netb | .48 | .50 | .42 |
| Net realized and unrealized | |||
| gain (loss) on investments | (.35) | .93 | 2.18 |
| Total from Investment Operations | .13 | 1.43 | 2.60 |
| Distributions: | |||
| Dividends from investment income—net | (.47) | (.49) | (.37) |
| Dividends from net realized gain on investments | (.18) | (.37) | (.01) |
| Total Distributions | (.65) | (.86) | (.38) |
| Net asset value, end of period | 12.27 | 12.79 | 12.22 |
| Total Return (%) | 1.21 | 12.19 | 26.29c |
| Ratios/Supplemental Data (%): | |||
| Ratio of total expenses to average net assets | .98 | .96 | 1.11d |
| Ratio of net expenses to average net assets | .98 | .95 | .99d |
| Ratio of interest and expense related to | |||
| floating rate notes issued to average net assets | .06 | .01 | — |
| Ratio of net investment income to average net assets | 3.93 | 4.00 | 4.48d |
| Portfolio Turnover Rate | 129.00 | 145.57 | 161.70c |
| Net Assets, end of period ($ x 1,000) | 1,152 | 1,157 | 1,208 |
| a | From October 15, 2008 (commencement of initial offering) to August 31, 2009. |
| b | Based on average shares outstanding at each month end. |
| c | Not annualized. |
| d Annualized. | |
| See notes to financial statements. | |
120
NOTES TO FINANCIAL STATEMENTS
NOTE 1—General:
BNY Mellon FundsTrust (the “Trust”) was organized as a Massachusetts business trust which is registered under the Investment Company Act of 1940, as amended (the “Act”), as an open-end management investment company and operates as a series company currently comprised of twenty-five series, including the following non-diversified municipal bond funds: BNY Mellon National Intermediate Municipal Bond Fund, BNY Mellon National Short-Term Municipal Bond Fund, BNY Mellon Pennsylvania Intermediate Municipal Bond Fund, BNY Mellon Massachusetts Intermediate Municipal Bond Fund, BNY Mellon New York Intermediate Tax-Exempt Bond Fund and BNY Mellon Municipal Opportunities Fund, (each, a “fund” and collectively, the “funds”). BNY Mellon National Intermediate Municipal Bond Fund, BNY Mellon National Short-Term Municipal Bond Fund and BNY Mellon Municipal Opportunities Fund seek to maximize current income exempt from federal income tax to the extent consistent with the preservation of capital. BNY Mellon Pennsylvania Intermediate Municipal Bond Fund seeks as high a level of income exempt from federal and Pennsylvania state income taxes as is consistent with the preservation of capital. BNY Mellon Massachusetts Intermediate Municipal Bond Fund seeks as high a level of income exempt from federal and Massachusetts state income taxes as is consistent with the preservation of capital. BNY Mellon New York Intermediate Tax-Exempt Bond Fund seeks as high a level of current income exempt from federal, New York state and New York city income taxes as is consistent with the preservation of capital.
BNY Mellon Fund Advisers, a division of The Dreyfus Corporation (the “Manager” or “Dreyfus”), a wholly-owned subsidiary of The Bank of New York Mellon Corporation (“BNY Mellon”), serves as each fund’s investment adviser (“Investment Adviser”).The Bank of
New York Mellon, a subsidiary of BNY Mellon and an affiliate of Dreyfus, serves as administrator for the funds pursuant to an Administration Agreement with the Trust (the “Administration Agreement”). The Bank of New York Mellon has entered into a Sub-Administration Agreement with Dreyfus pursuant to which The Bank of New York Mellon pays Dreyfus for performing certain administrative services. MBSC Securities Corporation (the “Distributor”), a wholly-owned subsidiary of Dreyfus, is the distributor of each fund’s shares.
The Trust is authorized to issue an unlimited number of shares of Beneficial Interest, par value $.001 per share, in Class M and Investor class shares of each fund and in the Dreyfus Premier class shares of BNY Mellon National Intermediate Municipal Bond Fund and BNY Mellon Massachusetts Intermediate Municipal Bond Fund. Dreyfus Premier shares of BNY Mellon National Intermediate Municipal Bond Fund and BNY Mellon Massachusetts Intermediate Municipal Bond Fund are subject to a contingent deferred sales charge (“CDSC”) imposed on redemptions of Dreyfus Premier shares made within six years of purchase and automatically convert to Investor class shares after six years. Other differences between the classes include the services offered to and the expenses borne by each class, the allocation of certain transfer agency costs and certain voting rights. Income, expenses (other than expenses attributable to a specific class), and realized and unrealized gains or losses on investments are allocated to each class of shares based on its relative net assets.
TheTrust accounts separately for the assets, liabilities and operations of each series. Expenses directly attributable to each series are charged to that series’ operations; expenses which are applicable to all series are allocated among them on a pro rata basis.
The Financial Accounting Standards Board (“FASB”) Accounting Standards Codification (“ASC”) is the
| The Funds | 121 |
NOTES TO FINANCIAL STATEMENTS (continued)
exclusive reference of authoritative U.S. generally accepted accounting principles (“GAAP”) recognized by the FASB to be applied by nongovernmental entities. Rules and interpretive releases of the Securities and Exchange Commission (“SEC”) under authority of federal laws are also sources of authoritative GAAP for SEC registrants. The fund’s financial statements are prepared in accordance with GAAP, which may require the use of management estimates and assumptions. Actual results could differ from those estimates.
NOTE 2—Significant Accounting Policies:
(a) Portfolio valuation: The fair value of a financial instrument is the amount that would be received to sell an asset or paid to transfer a liability in an orderly transaction between market participants at the measurement date (i.e. the exit price). GAAP establishes a fair value hierarchy that prioritizes the inputs of valuation techniques used to measure fair value.This hierarchy gives the highest priority to unadjusted quoted prices in active markets for identical assets or liabilities (Level 1 measurements) and the lowest priority to unobservable inputs (Level 3 measurements).
Additionally, GAAP provides guidance on determining whether the volume and activity in a market has decreased significantly and whether such a decrease in activity results in transactions that are not orderly. GAAP requires enhanced disclosures around valuation inputs and techniques used during annual and interim periods.
Various inputs are used in determining the value of the fund’s investments relating to fair value measurements. These inputs are summarized in the three broad levels listed below:
Level 1—unadjusted quoted prices in active markets for identical investments.
Level 2—other significant observable inputs (including quoted prices for similar investments, interest rates, prepayment speeds, credit risk, etc.).
Level 3—significant unobservable inputs (including the funds’ own assumptions in determining the fair value of investments).
The inputs or methodology used for valuing securities are not necessarily an indication of the risk associated with investing in those securities.
Changes in valuation techniques may result in transfers in or out of an assigned level within the disclosure hierarchy. Valuation techniques used to value the fund’s investments are as follows:
Investments in securities are valued each business day by an independent pricing service (the “Service”) approved by the Board of Trustees. Investments for which quoted bid prices are readily available and are representative of the bid side of the market in the judgment of the Service are valued at the mean between the quoted bid prices (as obtained by the Service from dealers in such securities) and asked prices (as calculated by the Service based upon its evaluation of the market for such securities). Other investments (which constitute a majority of the portfolio securities) are carried at fair value as determined by the Service, based on methods which include consideration of: yields or prices of municipal securities of comparable quality, coupon, maturity and type; indications as to values from dealers; and general market conditions.All preceding securities are categorized as Level 2 in the hierarchy. Options and financial futures on municipal and U.S. Treasury securities are valued at the last sales price on the securities exchange on which such securities are primarily traded or at the last sales price on the national securities market on each business day. These securities are generally categorized as level 2 in the hierarchy.
When market quotations or official closing prices are not readily available, or are determined not to reflect accurately fair value, such as when the value of a security has been significantly affected by events after the close of the exchange or market on which the security is principally traded (for example, a foreign exchange or market), but before the fund calculates its net asset value, the fund may value these investments at fair value as determined in accordance with the procedures approved by the Trust’s Board of Trustees. Certain factors may be considered when fair valuing investments such as: fundamental ana-
122
lytical data, the nature and duration of restrictions on disposition, an evaluation of the forces that influence the market in which the securities are purchased and sold, and public trading in similar securities of the issuer or comparable issuers.These securities are either categorized as Level 2 or 3 depending on the relevant inputs used.
For restricted securities where observable inputs are limited, assumptions about market activity and risk are used and are categorized as Level 3 in the hierarchy.
The following is a summary of the inputs used as of August 31, 2011 in valuing the fund’s investments:
| Table 1—Fair Value Measurements | |||||||
| Investments in Securities | |||||||
| Level 2—Other | Level 3— | ||||||
| Level 1—Unadjusted | Significant | Significant | |||||
| Quoted Prices | Observable Inputs | Unobservable Inputs | |||||
| Assets ($) | Liabilities ($) | Assets ($) | Liabilities ($) | Assets ($) | Liabilities ($) | Total | |
| BNY Mellon National | |||||||
| Intermediate Municipal | |||||||
| Bond Fund | |||||||
| Municipal Bonds | — | — | 1,577,444,088 | — | — | — | 1,577,444,088 |
| Other Financial Instruments: | |||||||
| Futures† | — | (2,520,781) | — | — | — | — | (2,520,781) |
| BNY Mellon National | |||||||
| Short-Term Municipal | |||||||
| Bond Fund | |||||||
| Municipal Bonds | — | — | 1,084,482,761 | — | — | — | 1,084,482,761 |
| BNY Mellon Pennsylvania | |||||||
| Intermediate Municipal | |||||||
| Bond Fund | |||||||
| Municipal Bonds | — | — | 426,132,428 | — | — | — | 426,132,428 |
| Other Financial Instruments: | |||||||
| Futures† | — | (667,266) | — | — | — | — | (667,266) |
| BNY Mellon Massachusetts | |||||||
| Intermediate Municipal | |||||||
| Bond Fund | |||||||
| Municipal Bonds | — | — | 355,733,056 | — | — | — | 355,733,056 |
| Other Financial Instruments: | |||||||
| Futures† | — | (518,984) | — | — | — | — | (518,984) |
| BNY Mellon New York | |||||||
| Intermediate Tax-Exempt | |||||||
| Bond Fund | |||||||
| Municipal Bonds | — | — | 197,425,469 | — | — | — | 197,425,469 |
| Other Financial Instruments: | |||||||
| Futures† | — | (296,563) | — | — | — | — | (296,563) |
| BNY Mellon Municipal | |||||||
| Opportunities Fund | |||||||
| Municipal Bonds | — | — | 562,713,258 | — | — | — | 562,713,258 |
| Other Financial Instruments: | |||||||
| Futures† | 281,656 | (3,707,031) | — | — | — | — | (3,425,375) |
| † | Amounts shown represent unrealized appreciation (depreciation) at period end. |
| The Funds | 123 |
NOTES TO FINANCIAL STATEMENTS (continued)
In January 2010, FASB issued Accounting Standards Update (“ASU”) No. 2010-06 “Improving Disclosures about Fair Value Measurements” (“ASU 2010-06”).The portions of ASU 2010-06 which require reporting entities to prepare new disclosures surrounding amounts and reasons for significant transfers in and out of Level 1 and Level 2 fair value measurements as well as inputs and valuation techniques used to measure fair value for both recurring and nonrecurring fair value measurements that fall in either Level 2 or Level 3 have been adopted by the fund. No significant transfers between Level 1 or Level 2 fair value measurements occurred at August 31, 2011.
In May 2011, FASB issued ASU No. 2011-04 “Amendments to Achieve Common Fair Value Measurement and Disclosure Requirements in GAAP and International Financial Reporting Standards (“IFRS”)” (“ASU 2011-04”). ASU 2011-04 includes common requirements for measurement of and disclosure about fair value between GAAP and IFRS.ASU 2011-04 will require reporting entities to disclose the following information for fair value measurements categorized within Level 3 of the fair value hierarchy: quantitative information about the unobservable inputs used in the fair value measurement, the valuation processes used by the reporting entity and a narrative description of the sensitivity of the fair value measurement to changes in unobservable inputs and the interrelationships between those unobservable inputs. In addition, ASU 2011-04 will require reporting entities to make disclosures about amounts and reasons for all transfers in and out of Level 1 and Level 2 fair value measurements.The new and revised disclosures are effective for interim and annual reporting periods beginning after December 15, 2011.At this time, management is evaluating the implications of ASU 2011-04 and its impact on the financial statements.
(b) Securities transactions and investment income:
Securities transactions are recorded on a trade date basis. Realized gain and loss from securities transactions are recorded on the identified cost basis. Interest income, adjusted for accretion of discount and amortization of premium on investments, is earned from settlement date and recognized on the accrual basis. Securities purchased or sold on a when issued or delayed-delivery basis may be settled a month or more after the trade date.
(c) Concentration of risk: BNY Mellon Pennsylvania Intermediate Municipal Bond Fund, BNY Mellon Massachusetts Intermediate Municipal Bond Fund and BNY Mellon New York Intermediate Tax-Exempt Bond Fund each follow an investment policy of investing primarily in municipal obligations of one state. Economic changes affecting the state and certain of its public bodies and municipalities may affect the ability of issuers within the state to pay interest on, or repay principal of, municipal obligations held by the fund.
(d) Dividends to shareholders: The funds declare dividends daily from investment income-net; such dividends are paid monthly. With respect to each series, dividends from net realized capital gain, if any, are normally declared and paid annually, but the funds may make distributions on a more frequent basis to comply with the distribution requirements of the Internal Revenue Code of 1986, as amended (the “Code”).To the extent that net realized capital gain can be offset by capital loss carryovers of that fund, it is the policy of each fund not to distribute such gain. Income and capital gain distributions are determined in accordance with income tax regulations, which may differ from GAAP.
(e) Federal income taxes: It is the policy of each fund to continue to qualify as a regulated investment company, which can distribute tax exempt dividends, by complying with the applicable provisions of the Code, and to make distributions of income and net realized capital gain sufficient to relieve it from substantially all federal income and excise taxes. For federal income tax purposes, each series is treated as a single entity for the purpose of determining such qualification.
As of and during the period ended August 31, 2011, the funds did not have any liabilities for any uncertain tax positions. The funds recognize interest and penalties, if
124
any, related to uncertain tax positions as income tax expense in the Statements of Operations. During the period, the funds did not incur any interest or penalties.
Each of the tax years in the four-year period ended August 31, 2011, and December 31, 2008 as to BNY Mellon New York Intermediate Tax-Exempt Bond Fund, remain subject to examination by the Internal Revenue Service and state taxing authorities.
Table 2 summarizes each fund’s components of accumulated earnings on a tax basis at August 31, 2011.
Under the recently earned Regulated Investment Company Modernization Act of 2010 (the “2010” Act”), each fund will be permitted to carry forward capital losses incurred in taxable years beginning after December 22, 2010 (“post-enactment losses”) for an unlimited period. However, the 2010 Act requires any post-enactment losses to be utilized before the utilization of losses incurred in taxable years prior to the effective date of the 2010 Act.As a result of this ordering rule, capital loss carry forwards related to taxable years beginning prior to the effective date of the 2010 Act may be more likely to expire unused.
Table 3 summarizes BNY Mellon National Short-Term Municipal Bond Fund and BNY Mellon New York Intermediate Tax-Exempt Bond Fund unused capital loss carryover available to be applied against future net securities profits, if any, realized subsequent to August 31, 2011.
| Table 2—Components of Accumulated Earnings | ||||
| Undistributed | Undistributed | Unrealized | Capital Losses | |
| Tax Exempt | Capital Gains | Appreciation | Realized After | |
| Income ($) | (Losses) ($) | (Depreciation) ($) | October 31, 2010† | |
| BNY Mellon National Intermediate | ||||
| Municipal Bond Fund | 326,272 | — | 80,362,904 | 1,787,774 |
| BNY Mellon National Short-Term | ||||
| Municipal Bond Fund | 76,397 | (1,158,635) | 16,925,169 | — |
| BNY Mellon Pennsylvania Intermediate | ||||
| Municipal Bond Fund | 100,348 | (2,118,450) | 23,874,762 | 1,256,547 |
| BNY Mellon Massachusetts Intermediate | ||||
| Municipal Bond Fund | 14,228 | — | 20,956,310 | 279,120 |
| BNY Mellon New York Intermediate | ||||
| Tax-Exempt Bond Fund | 668 | 156,808 | 12,037,750 | — |
| BNY Mellon Municipal Opportunities Fund | — | — | 29,965,991 | 13,641,348 |
| † | These losses were deferred for tax purposes to the first day of the following fiscal year. |
| Table 3—Capital Loss Carryover | |||||||
| Expiring in fiscal† | 2014 ($)† | 2015 ($)† | 2016 ($)† | 2017 ($)† | 2018 ($)† | 2019 ($)† | Total ($) |
| BNY Mellon National Short-Term | |||||||
| Municipal Bond Fund | 323,023 | 501,053 | 99,584 | 62,757 | 172,218 | — | 1,158,635 |
| BNY Mellon Pennsylvania Intermediate | |||||||
| Municipal Bond Fund | — | — | — | — | 2,118,450 | — | 2,118,450 |
| † | If not applied, the carryovers expire in the above years. |
| The Funds | 125 |
NOTES TO FINANCIAL STATEMENTS (continued)
Table 4 summarizes each relevant fund’s tax character of distributions paid to shareholders during the fiscal periods ended August 31, 2011 and August 31, 2010, respectively.
During the period ended August 31, 2011, as a result of permanent book to tax differences, primarily due to the tax treatment for amortization of premiums/discounts, the funds increased (decreased) accumulated undistributed investment income—net, increased (decreased) accumulated net realized gain (loss) on investments and increased (decreased) paid-in capital as summarized in Table 5 Net assets and net asset value per share were not affected by this reclassification.
NOTE 3—Bank Lines of Credit:
The funds participate with other Dreyfus-managed funds in a $225 million unsecured credit facility led by Citibank, N.A. and a $300 million unsecured credit facility provided by The Bank of New York Mellon, (each, a “Facility”), each to be utilized primarily for temporary or emergency purposes, including the financing of redemptions. In connection therewith, the funds have agreed to pay its pro rata portion of commitment fees for each Facility. Interest is charged to the funds based on rates determined pursuant to the terms of the respective Facility at the time of borrowing. During the period ended August 31, 2011, the funds (with the exception of BNY Mellon Municipal Opportunities Fund) did not borrow under the Facilities.
For BNY Mellon Municipal Opportunities Fund, the average amount of borrowings outstanding under the Facilities during the period ended August 31, 2011 was approximately $6,300 with a related weighted average annualized interest rate of 1.43%.
| Table 4—Tax Character of Distributions Paid | ||||||
| Ordinary | Long-Term | |||||
| Tax-Exempt Income ($) | Income ($) | Capital Gains ($) | ||||
| 2011 | 2010 | 2011 | 2010 | 2011 | 2010 | |
| BNY Mellon National Intermediate | ||||||
| Municipal Bond Fund | 56,527,164 | 57,913,238 | 9,046,388 | 16,278 | 747,909 | — |
| BNY Mellon National Short-Term | ||||||
| Municipal Bond Fund | 14,286,069 | 14,122,455 | 38,433 | 48 | — | — |
| BNY Mellon Pennsylvania Intermediate | ||||||
| Municipal Bond Fund | 16,682,932 | 18,775,417 | — | 137,629 | — | — |
| BNY Mellon Massachusetts Intermediate | ||||||
| Municipal Bond Fund | 13,011,649 | 13,937,145 | 14,495 | — | 2,131,134 | — |
| BNY Mellon New York Intermediate | ||||||
| Tax-Exempt Bond Fund | 6,871,870 | 6,346,621 | 67,294 | — | 117,211 | 1,642 |
| BNY Mellon Municipal Opportunities Fund | 18,588,402 | 7,155,802 | 6,146,122 | 4,895,650 | — | 87,202 |
| Table 5—Return of Capital Statement of Position | ||||||
| Accumulated | Accumulated | |||||
| Undistributed | Net Realized | Paid-in | ||||
| Investment Income—Net ($) | Gain (Loss) ($) | Capital ($) | ||||
| BNY Mellon National Intermediate Municipal Bond Fund | (328,345) | 327,195 | 1,150 | |||
| BNY Mellon National Short-Term Municipal Bond Fund | (41,669) | (2,051) | 43,720 | |||
| BNY Mellon Pennsylvania Intermediate Municipal Bond Fund | (44,089) | 44,089 | — | |||
| BNY Mellon Massachusetts Intermediate Municipal Bond Fund | (639) | (10,825) | 11,464 | |||
| BNY Mellon New York Intermediate Tax-Exempt Bond Fund | (15,130) | 15,130 | — | |||
| BNY Mellon Municipal Opportunities Fund | (333,931) | 713,728 | (379,797) | |||
126
NOTE 4—Investment Advisory Fee, Administration Fee and Other Transactions with Affiliates:
(a) Fees payable by the funds pursuant to the provisions of an Investment Advisory Agreement with the Investment Adviser are payable monthly, computed on the average daily value of each fund’s net assets at the following annual rates: .35% of BNY Mellon National Intermediate Municipal Bond Fund, .35% of BNY Mellon National Short-Term Municipal Bond Fund, .50% of BNY Mellon Pennsylvania Intermediate Municipal Bond Fund, .35% of BNY Mellon Massachusetts Intermediate Municipal Bond Fund, .50% of BNY Mellon New York Intermediate Tax- Exempt Bond Fund and .50% of BNY Mellon Municipal Opportunities Fund.
Pursuant to the Administration Agreement,The Bank of New York Mellon provides or arranges for fund accounting, transfer agency and other fund administration services and receives a fee based on the total net assets of the Trust based on the following rates:
| 0 up to $6 billion | .15% |
| $6 billion up to $12 billion | .12% |
| In excess of $12 billion | .10% |
The Bank of New York Mellon has entered into a Sub-Administration Agreement with Dreyfus pursuant to which The Bank of New York Mellon pays Dreyfus for performing certain administrative services.
For BNY Mellon New York Intermediate Tax-Exempt Bond Fund, the Investment Adviser has contractually agreed until December 31, 2012, to waive receipt of its fees and/or assume the expenses of the fund so that the direct expenses of neither class (excluding shareholder services fees, taxes, interest, brokerage commissions, commitment fees on borrowings and extraordinary expenses) do not exceed .59% of the value of the fund’s average daily net assets. The reduction in investment advisory fee, pursuant to the undertaking, amounted to $227,408, during the period ended August 31, 2011.
During the period ended August 31, 2011, the Distributor retained $173 from CDSCs on redemptions of BNY Mellon National Intermediate Municipal Bond Fund’s Dreyfus Premier shares.
(b) BNY Mellon National Intermediate Municipal Bond Fund and BNY Mellon Massachusetts Intermediate Municipal Bond Fund have adopted a Distribution Plan (the “Plan”) pursuant to Rule 12b-1 under the Act for distributing its Dreyfus Premier shares.The funds each pay the Distributor a fee at an annual rate of .50% of the value of the fund’s average daily net assets attributable to its Dreyfus Premier shares. During the period ended August 31, 2011, BNY Mellon National Intermediate Municipal Bond Fund’s and BNY Mellon Massachusetts Intermediate Municipal Bond Fund’s Dreyfus Premier shares were charged $530 and $98, respectively, pursuant to the Plan.
(c) The funds have adopted a Shareholder Services Plan with respect to its Investor shares, and BNY Mellon National Intermediate Municipal Bond Fund and BNY Mellon Massachusetts Intermediate Municipal Bond Fund have adopted a Shareholder Services Plan with respect to its Dreyfus Premier shares. Each fund pays the Distributor for the provision of certain services to holders of Investor shares and Dreyfus Premier shares a fee at an annual rate of .25% of the value of the average daily net assets attributable to Investor shares and Dreyfus Premier shares.The services provided may include personal services relating to shareholder accounts, such as answering shareholder inquiries regarding a fund, and providing reports and other information and services related to the maintenance of such shareholder accounts.The Shareholder Services Plan allows the Distributor to make payments from the shareholder ser-
| The Funds | 127 |
NOTES TO FINANCIAL STATEMENTS (continued)
vices fees it collects from each fund to compensate service agents (certain banks, securities brokers or dealers and other financial institutions) in respect of these services. Table 6 summarizes the amounts Investor shares and Dreyfus Premier shares were charged during the period ended August 31, 2011, pursuant to the Shareholder Services Plan.Additional fees included in shareholder servicing costs in the Statements of Operations include fees paid for cash management charges.
| Table 6—Shareholder Service Plan Fees | |
| BNY Mellon National Intermediate | |
| Municipal Bond Fund (Investor Shares) | 86,510 |
| BNY Mellon National Intermediate | |
| Municipal Bond Fund | |
| (Dreyfus Premier Shares) | 265 |
| BNY Mellon National Short-Term | |
| Municipal Bond Fund (Investor Shares) | 8,094 |
| BNY Mellon Pennsylvania Intermediate | |
| Municipal Bond Fund (Investor Shares) | 22,579 |
| BNY Mellon Massachusetts Intermediate | |
| Municipal Bond Fund (Investor Shares) | 20,878 |
| BNY Mellon Massachusetts Intermediate | |
| Municipal Bond Fund | |
| (Dreyfus Premier Shares) | 49 |
| BNY Mellon New York Intermediate | |
| Tax-Exempt Bond Fund | |
| (Investor Shares) | 42,857 |
| BNY Mellon Municipal | |
| Opportunities Fund (Investor Shares) | 2,824 |
The funds have arrangements with the custodian and cash management bank whereby the funds may receive earnings credits when positive cash balances are maintained, which are used to offset custody and cash management fees. For financial reporting purposes, the funds include net earnings credits as expense offsets in the Statements of Operations.
The funds compensate The Bank of New York Mellon under cash management agreements for performing cash management services related to fund subscriptions and redemptions. Table 7 summarizes the amount each fund was charged during the period ended August 31, 2011 pursuant to the cash management agreements, which is included in Shareholder servicing costs in the Statements of Operations.These fees were partially offset by earnings credits, also summarized in Table 7.
| Table 7—Cash Management Agreement Fees | ||
| Cash Management | Earnings | |
| Fees ($) | Credits ($) | |
| BNY Mellon National | ||
| Intermediate Municipal | ||
| Bond Fund | 1,252 | (40) |
| BNY Mellon National | ||
| Short-Term Municipal | ||
| Bond Fund | 102 | (4) |
| BNY Mellon Pennsylvania | ||
| Intermediate Municipal | ||
| Bond Fund | 98 | (3) |
| BNY Mellon Massachusetts | ||
| Intermediate Municipal | ||
| Bond Fund | 403 | (13) |
| BNY Mellon New York | ||
| Intermediate Tax-Exempt | ||
| Bond Fund | 1,402 | (45) |
| BNY Mellon Municipal | ||
| Opportunities Fund | 48 | (2) |
The funds also compensate The Bank of New York Mellon under a custody agreement for providing custodial services for the funds. Table 8 summarizes the amount each fund was charged during the period ended August 31, 2011, pursuant to the custody agreement. These fees were partially offset by earnings credits, also summarized in Table 8.
| Table 8—Custody Agreement Fees | |
| Custody | |
| Fees ($) | |
| BNY Mellon National Intermediate | |
| Municipal Bond Fund | 92,079 |
| BNY Mellon National Short-Term | |
| Municipal Bond Fund | 83,917 |
| BNY Mellon Pennsylvania Intermediate | |
| Municipal Bond Fund | 34,562 |
| BNY Mellon Massachusetts Intermediate | |
| Municipal Bond Fund | 28,814 |
| BNY Mellon New York Intermediate | |
| Tax-Exempt Bond Fund | 17,274 |
| BNY Mellon Municipal | |
| Opportunities Fund | 44,136 |
128
During the period ended August 31, 2011, each fund was charged $7,225 for services performed by the Chief Compliance Officer.
Table 9 summarizes the components of “Due to The Dreyfus Corporation and affiliates” in the Statements of Assets and Liabilities for each fund.
(d) Each trustee who is not an “affiliated person” as defined in the Act receives from theTrust an annual fee of $68,000 and an attendance fee of $7,500 for each in person meeting attended and $500 for telephone meetings and is reimbursed for travel and out-of-pocket expenses. The Chairman of the Trust’s Board receives an additional annual fee of $15,000 and the Chairman of the Trust’s Audit Committee receives an additional fee of $10,000.
NOTE 5—Securities Transactions:
Table 10 summarizes each fund’s aggregate amount of purchases and sales of investment securities, excluding short-term securities, financial futures and swap transactions, during the period ended August 31, 2011.
Inverse Floater Securities: BNY Mellon Municipal Opportunities Fund participates in secondary inverse floater structures in which fixed-rate, tax-exempt municipal bonds are transferred to a trust.The trust subsequently issues two or more variable rate securities that are collateralized by the cash flows of the fixed-rate, tax-exempt municipal bonds. One or more of these variable rate securities pays interest based on a short- term floating rate set by a remarketing agent at predetermined inter-
| Table 9—Due to The Dreyfus Corporation and Affiliates | ||||||
| Investment | Rule 12b-1 | Shareholder | Chief | |||
| Advisory | Distribution | Services | Custodian | Compliance | Expense | |
| Fees ($) | Plan Fees ($) | Plan Fees ($) | Fees ($) | Officer Fees ($) | Reimbursement ($) | |
| BNY Mellon National Intermediate | ||||||
| Municipal Bond Fund | 468,698 | 44 | 8,779 | 31,447 | 3,253 | — |
| BNY Mellon National Short-Term | ||||||
| Municipal Bond Fund | 323,315 | — | 821 | 24,359 | 3,253 | — |
| BNY Mellon Pennsylvania Intermediate | ||||||
| Municipal Bond Fund | 183,168 | — | 1,948 | 11,408 | 3,253 | — |
| BNY Mellon Massachusetts Intermediate | ||||||
| Municipal Bond Fund | 106,305 | 9 | 1,791 | 9,577 | 3,253 | — |
| BNY Mellon New York Intermediate | ||||||
| Tax-Exempt Bond Fund | 84,823 | — | 3,677 | 5,724 | 3,253 | (31,452) |
| BNY Mellon Municipal Opportunities Fund | 217,457 | — | 256 | 14,695 | 3,253 | — |
| Table 10—Purchases and Sales | ||
| Purchases ($) | Sales ($) | |
| BNY Mellon National Intermediate Municipal Bond Fund | 606,476,436 | 631,778,438 |
| BNY Mellon National Short-Term Municipal Bond Fund | 332,843,349 | 234,810,722 |
| BNY Mellon Pennsylvania Intermediate Municipal Bond Fund | 43,697,066 | 114,345,827 |
| BNY Mellon Massachusetts Intermediate Municipal Bond Fund | 38,344,295 | 86,027,011 |
| BNY Mellon New York Intermediate Tax-Exempt Bond Fund | 43,565,396 | 42,982,275 |
| BNY Mellon Municipal Opportunities Fund | 744,254,187 | 544,654,406 |
| The Funds | 129 |
NOTES TO FINANCIAL STATEMENTS (continued)
vals.A residual interest tax-exempt security is also created by the trust, which is transferred to the fund, and is paid interest based on the remaining cash flow of the trust, after payment of interest on the other securities and various expenses of the trust.
The fund accounts for the transfer of bonds to the trust as secured borrowings, with the securities transferred remaining in the fund’s investments, and the related floating rate certificate securities reflected as fund liabilities in the Statement of Assets and Liabilities.
The average amount of borrowings outstanding under the inverse floater structure during the period ended August 31, 2011, was approximately $40,887,100, with a related weighted average annualized interest rate of .74%.
BNY Mellon Municipal Opportunities Fund held derivatives that subject the fund to multiple categories of risk exposure. Table 11 shows the fund’s exposure to different types of market risk as it relates to the Statement of Operations.
Futures Contracts: In the normal course of pursuing its investment objective, the fund is exposed to market risk, including interest rate risk, as a result of changes in value of underlying financial instruments.The fund invests in financial futures contracts in order to manage its exposure to or protect against changes in the market. A futures contract represents a commitment for the future purchase or a sale of an asset at a specified date. Upon entering into such contracts, these investments require initial margin deposits with a broker, which consist of cash or cash equivalents.The amount of these deposits is determined by the exchange or Board of Trade on which the contract is traded and is subject to change. Accordingly, variation margin payments are received or made to reflect daily unrealized gains or losses which are recorded in the Statement of Operations. Futures contracts are valued daily at the last sales price established by the Board of Trade or exchange upon which they are traded. When the contracts are closed, the fund recognizes a realized gain or loss. There is minimal counter-
Table 11—Derivatives and Hedging
The effect of derivative instruments in the Statement of Operations for BNY Mellon Municipal Opportunities Fund during the period ended August 31, 2011 is shown below:
| Amount of realized gain or (loss) on derivatives recognized in income ($) | |||
| Underlying risk | Futures1 | Swaps2 | Total |
| Interest rate | (10,130,580) | 69,491 | (10,061,089) |
| Credit | — | (532,956) | (532,956) |
| Total | (10,130,580) | (463,465) | (10,594,045) |
| Change in unrealized appreciation or (depreciation) on derivatives recognized in income ($) | |||
| Underlying risk | Futures3 | Swaps4 | Total |
| Interest rate | (2,180,297) | 75,380 | (2,104,917) |
| Credit | — | 121,689 | 121,689 |
| Total | (2,180,297) | 197,069 | (1,983,228) |
Statement of Operations location:
| 1 | Net realized gain (loss) on financial futures. |
| 2 | Net realized gain (loss) on swap transactions. |
| 3 | Net unrealized appreciation (depreciation) on financial futures. |
| 4 | Net unrealized appreciation (depreciation) on swap transactions. |
130
party credit risk to the fund with futures since futures are exchange traded, and the exchange’s clearinghouse guarantees the futures against default. Contracts open at August 31, 2011 are set forth each relevant fund’s in Statement of Financial Futures.
Swaps: BNY Mellon Municipal Opportunities Fund enters into swap agreements to exchange the interest rate on, or return generated by, one nominal instrument for the return generated by another nominal instrument. The fund enters into these agreements to hedge certain market or interest rate risks, to manage the interest rate sensitivity (sometimes called duration) of fixed income securities, to provide a substitute for purchasing or selling particular securities or to increase potential returns.
The fund accrues for the interim payments on swap contracts on a daily basis, with the net amount recorded within unrealized appreciation (depreciation) on swap contracts in the Statement of Assets and Liabilities. Once the interim payments are settled in cash, the net amount is recorded as realized gain (loss) on swaps, in addition to realized gain (loss) recorded upon the termination of swaps contracts in the Statement of Operations. Upfront payments made and/or received by the fund, are recorded as an asset and/or liability in the Statement of Assets and Liabilities and are recorded as a realized gain or loss ratably over the contract’s term/event with the exception of forward starting interest rate swaps which are recorded as realized gains or losses on the termination date. Fluctuations in the value of swap contracts are recorded for financial statement purposes as unrealized appreciation or depreciation on swap transactions.
Interest Rate Swaps: Interest rate swaps involve the exchange of commitments to pay and receive interest based on a notional principal amount. The fund enters into these agreements for a variety of reasons, including to hedge certain market or interest rate risks, to manage the interest rate sensitivity (sometimes called duration) of fixed income securities, to provide a substitute for purchasing or selling particular securities or to increase potential returns.The fund may elect to pay a fixed rate and receive a floating rate, or receive a fixed rate and pay a floating rate on a notional principal amount. Interest rate swaps are valued daily and the change, if any, is recorded as an unrealized gain or loss in the Statement of Operations.When a swap contract is terminated early, the fund records a realized gain or loss equal to the difference between the current realized value and the expected cash flows.
The fund’s maximum risk of loss from counterparty credit risk is the discounted net value of the cash flows to be received from the counterparty over the contract’s remaining life, to the extent that the amount is positive. This risk is mitigated by having a master netting arrangement between the fund and the counterparty and by the posting of collateral by the counterparty to the fund to cover the fund’s exposure to the counter-party. At August 31, 2011, there were no interest rate swap agreements outstanding.
Credit Default Swaps: Credit default swaps involve commitments to pay a fixed interest rate in exchange for payment if a credit event affecting a third party (the referenced company, obligation or index) occurs. Credit events may include a failure to pay interest or principal, bankruptcy, or restructuring.The fund enters into these agreements to manage its exposure to the market or certain sectors of the market, to reduce its risk exposure to defaults of corporate and sovereign issuers, or to create exposure to corporate or sovereign issuers to which it is not otherwise exposed. For those credit default swaps in which the fund is paying a fixed rate, the fund is buying
| The Funds | 131 |
NOTES TO FINANCIAL STATEMENTS (continued)
credit protection on the instrument. In the event of a credit event, the fund would receive the full notional amount for the reference obligation. For those credit default swaps in which the fund is receiving a fixed rate, the fund is selling credit protection on the underlying instrument. The maximum payouts for these contracts are limited to the notional amount of each swap. Credit default swaps may involve greater risks than if the fund had invested in the reference obligation directly and are subject to general market risk, liquidity risk, counter-party risk and credit risk.At August 31, 2011, there were no credit default swap agreements outstanding.
GAAP requires disclosure for (i) the nature and terms of the credit derivative, reasons for entering into the credit derivative, the events or circumstances that would require the seller to perform under the credit derivative, and the current status of the payment/performance risk of the credit derivative, (ii) the maximum potential amount of future payments (undiscounted) the seller could be required to make under the credit derivative, (iii) the fair value of the credit derivative, and (iv) the nature of any recourse provisions and assets held either as collateral or by third parties. All required disclosures have been made and are incorporated within the current period as part of the Notes to the Statement of Investments and disclosures within this Note.
Table 12 summarizes each relevant fund’s average market value of derivatives outstanding, during the period ended August 31, 2011.
| Table 12—Average Market Value of Derivatives | |
| Average | |
| Market Values ($) | |
| BNY Mellon National Intermediate | |
| Municipal Bond Fund | |
| Interest rate futures contracts | 25,731,298 |
| BNY Mellon Pennsylvania | |
| Intermediate Municipal Bond Fund | |
| Interest rate futures contracts | 6,811,226 |
| BNY Mellon Massachusetts | |
| Intermediate Municipal Bond Fund | |
| Interest rate futures contracts | 5,297,620 |
| BNY Mellon New York Intermediate | |
| Tax-Exempt Bond Fund | |
| Interest rate futures contracts | 2,283,846 |
| BNY Mellon Municipal | |
| Opportunities Fund | |
| Interest rate futures contracts | 95,883,395 |
The following summarizes the average notional value of swap contracts outstanding during the period ended August 31, 2011 for BNY Mellon Municipal Opportunities Fund.
| Average Notional Value ($) | |
| Interest rate swap contracts | 14,615,385 |
Table 13 summarizes accumulated net unrealized appreciation (depreciation) on investments for each fund at August 31, 2011.
| Table 13—Accumulated Net Unrealized Appreciation (Depreciation) | ||||
| Cost of | Gross | Gross | ||
| Investments ($) | Appreciation ($) | (Depreciation) ($) | Net ($) | |
| BNY Mellon National Intermediate Municipal Bond Fund | 1,497,081,184 | 85,662,550 | 5,299,646 | 80,362,904 |
| BNY Mellon National Short-Term Municipal Bond Fund | 1,067,557,592 | 17,921,505 | 996,336 | 16,925,169 |
| BNY Mellon Pennsylvania Intermediate Municipal Bond Fund | 402,257,666 | 26,069,770 | 2,195,008 | 23,874,762 |
| BNY Mellon Massachusetts Intermediate Municipal Bond Fund | 334,776,746 | 21,257,283 | 300,973 | 20,956,310 |
| BNY Mellon New York Intermediate Tax-Exempt Bond Fund | 185,387,719 | 12,048,178 | 10,428 | 12,037,750 |
| BNY Mellon Municipal Opportunities Fund | 484,372,267 | 32,180,024 | 2,214,033 | 29,965,991 |
132
REPORT OF INDEPENDENT REGISTERED PUBLIC ACCOUNTING FIRM
The Board of Trustees and Shareholders of BNY Mellon Funds Trust:
We have audited the accompanying statements of assets and liabilities of BNY Mellon National Intermediate Municipal Bond Fund, BNY Mellon National Short-Term Municipal Bond Fund, BNY Mellon Pennsylvania Intermediate Municipal Bond Fund, BNY Mellon Massachusetts Intermediate Municipal Bond Fund, BNY Mellon NewYork IntermediateTax-Exempt Bond Fund, and BNY Mellon Municipal Opportunities Fund, each a series of BNY Mellon Funds Trust (collectively “the Funds”), including the statements of investments and statement of financial futures as of August 31, 2011, and the related statements of operations for the year then ended, the statements of changes in net assets for each of the years in the two-year period then ended, statement of cash flows (with respect to BNY Mellon Municipal Opportunities Fund) and the financial highlights for each of the years or period in the five-year period then ended, except for the BNY Mellon New York Intermediate Tax-Exempt Bond Fund, which was for the eight-month period ended August 31, 2009 and the BNY Mellon Municipal Opportunities Fund, which was for the eleven-month period ended August 31, 2009.These financial statements and financial highlights are the responsibility of the Funds’ management. Our responsibility is to express an opinion on these financial statements and financial highlights based on our audits.With respect to the BNY Mellon New York Intermediate Tax-Exempt Bond Fund, the financial highlights for each of the years in the two-year period ended December 31, 2007 were audited by other independent registered public accountants whose report thereon, dated February 28, 2008, expressed an unqualified opinion on those financial highlights.
We conducted our audits in accordance with the standards of the Public Company Accounting Oversight Board (United States).Those standards require that we plan and perform the audit to obtain reasonable assurance about whether the financial statements and financial highlights are free of material misstatement. An audit also includes examining, on a test basis, evidence supporting the amounts and disclosures in the financial statements. Our procedures included confirmation of securities owned as of August 31, 2011 by correspondence with the custodian and brokers or by other appropriate auditing procedures where replies from brokers were not received.An audit also includes assessing the accounting principles used and significant estimates made by management, as well as evaluating the overall financial statement presentation.We believe that our audits provide a reasonable basis for our opinion.
In our opinion, the financial statements and financial highlights referred to above present fairly, in all material respects, the financial position of BNY Mellon National Intermediate Municipal Bond Fund, BNY Mellon National Short-Term Municipal Bond Fund, BNY Mellon Pennsylvania Intermediate Municipal Bond Fund, BNY Mellon Massachusetts Intermediate Municipal Bond Fund, BNY Mellon New York Intermediate Tax-Exempt Bond Fund, and BNY Mellon Municipal Opportunities Fund as of August 31, 2011, and the results of their operations, the changes in their net assets, its cash flows (with respect to BNY Mellon Municipal Opportunities Fund), and the financial highlights for the periods described in the first paragraph above, in conformity with U.S. generally accepted accounting principles.

New York, New York
October 26, 2011
| The Funds | 133 |
IMPORTANT TAX INFORMATION (Unaudited)
BNY Mellon National Intermediate Municipal Bond Fund
In accordance with federal tax law, the fund hereby designates all the dividends paid from investment income-net during its fiscal year ended August 31, 2011 as “exempt-interest dividends” (not generally subject to regular federal income tax), except $233 that is being designated as an ordinary income distribution for reporting purposes. Also the fund designates the maximum amount allowable but not less than $.0756 per share as a short-term capital gain dividend in accordance with Sections 871(k)(2) and 881(e) of the Internal Revenue Code.Also the fund designates the maximum amount allowable but not less than $.0063 per share as a capital gain dividend in accordance with Section 852(b)(3)(C) of the Internal Revenue Code. Where required by federal tax law rules, shareholders will receive notification of their portion of the fund’s taxable ordinary dividends (if any) and capital gains distributions (if any) paid for the 2011 calendar year on Form 1099-DIV and their portion of the fund’s tax-exempt dividends paid for the 2011 calendar year on Form 1099-INT, both of which will be mailed in early 2012.
BNY Mellon National Short-Term Municipal Bond Fund
In accordance with federal tax law, the fund hereby designates all the dividends paid from investment income-net during its fiscal year ended August 31, 2011 as “exempt-interest dividends” (not generally subject to regular federal income tax), except $38,433 that is being designated as an ordinary income distribution for reporting purposes. Where required by federal tax law rules, shareholders will receive notification of their portion of the fund’s taxable ordinary dividends (if any) and capital gains distributions (if any) paid for the 2011 calendar year on Form 1099-DIV and their portion of the fund’s tax-exempt dividends paid for the 2011 calendar year on Form 1099-INT, both of which will be mailed in early 2012.
BNY Mellon Pennsylvania Intermediate Municipal Bond Fund
In accordance with federal tax law, the fund hereby designates all the dividends paid from investment income-net during its fiscal year ended August 31, 2011 as “exempt-interest dividends” (not generally subject to regular federal income tax).Where required by federal tax law rules, shareholders will receive notification of their portion of the fund’s taxable ordinary dividends (if any) and capital gains distributions (if any) paid for the 2011 calendar year on Form 1099-DIV and their portion of the fund’s tax-exempt dividends paid for the 2011 calendar year on Form 1099-INT, both of which will be mailed in early 2012.
BNY Mellon Massachusetts Intermediate Municipal Bond Fund
In accordance with federal tax law, the fund hereby designates all the dividends paid from investment income-net during its fiscal year ended August 31, 2011 as “exempt-interest dividends” (not generally subject to regular federal income tax), except $9,603 that is being designated as an ordinary income distribution for reporting purposes. Also the fund designates the maximum amount allowable but not less than $.0002 per share as a short-term capital gain dividend in accordance
134
with Sections 871(k)(2) and 881(e) of the Internal Revenue Code. Also the fund designates the maximum amount allowable but not less than $.0697 per share as a capital gain dividend in accordance with Section 852(b)(3)(C) of the Internal Revenue Code. Where required by federal tax law rules, shareholders will receive notification of their portion of the fund’s taxable ordinary dividends (if any) and capital gains distributions (if any) paid for the 2011 calendar year on Form 1099-DIV and their portion of the fund’s tax-exempt dividends paid for the 2011 calendar year on Form 1099-INT, both of which will be mailed in early 2012.
BNY Mellon New York Intermediate Tax-Exempt Bond Fund
In accordance with federal tax law, the fund hereby designates all the dividends paid from investment income-net during its fiscal year ended August 31, 2011 as “exempt-interest dividends” (not generally subject to regular federal income tax). Also the fund designates the maximum amount allowable but not less than $.0036 per share as a short-term capital gain dividend in accordance with Sections 871(k)(2) and 881(e) of the Internal Revenue Code. Also the fund designates the maximum amount allowable but not less than $.0062 per share as a capital gain dividend in accordance with Section 852(b)(3)(C) of the Internal Revenue Code. Where required by federal tax law rules, shareholders will receive notification of their portion of the fund’s taxable ordinary dividends (if any) and capital gains distributions (if any) paid for the 2011 calendar year on Form 1099-DIV and their portion of the fund’s tax-exempt dividends paid for the 2011 calendar year on Form 1099-INT, both of which will be mailed in early 2012.
BNY Mellon Municipal Opportunities Fund
In accordance with federal tax law, the fund hereby designates $18,588,402 of dividends paid from investment income-net during its fiscal year ended August 31, 2011 as “exempt-interest dividends” (not generally subject to regular federal income tax). Also the fund designates the maximum amount allowable but not less than $.1808 per share as a short-term capital gain dividend in accordance with Sections 871(k)(2) and 881(e) of the Internal Revenue Code. Where required by federal tax law rules, shareholders will receive notification of their portion of the fund’s taxable ordinary dividends (if any) and capital gains distributions (if any) paid for the 2011 calendar year on Form 1099-DIV and their portion of the fund’s tax-exempt dividends paid for the 2011 calendar year on Form 1099-INT, both of which will be mailed in early 2012.
| The Funds | 135 |
| INFORMATION ABOUT THE RENEWAL OF |
| EACH FUND’S MANAGEMENT AGREEMENT (Unaudited) |
At a meeting of the Trust’s Board of Trustees held on March 8-9, 2011, the Board considered the renewal of the Trust’s Investment Advisory Agreement and the Administration Agreement (together, the “Agreement”) pursuant to which BNY Mellon Fund Advisers, a division of Dreyfus, provides the funds with investment advisory services andThe Bank of NewYork Mellon provides the funds with administrative services.The Bank of New York Mellon has entered into a Sub-Administration Agreement with Dreyfus pursuant to which The Bank of NewYork Mellon pays Dreyfus for performing certain of these administrative services. The Board members who are not “interested persons” (as defined in the Investment Company Act of 1940, as amended) of the Trust were assisted in their review by independent legal counsel and met with counsel in executive session separate from representatives of Dreyfus. In considering the renewal of the Agreement, the Board considered all factors that it believed to be relevant, including those discussed below. The Board did not identify any one factor as dispositive, and each Board member may have attributed different weights to the factors considered.
Analysis of Nature, Extent, and Quality of Services Provided to the Funds. The Board members considered information previously provided to them in presentations from representatives of Dreyfus regarding the nature, extent, and quality of the services provided to the funds, and representatives of Dreyfus confirmed that there had been no material changes in this information. Dreyfus provided the number of open accounts in each fund, the fund’s asset size and the allocation of fund assets among distribution channels. Dreyfus also had previously provided information regarding the diverse intermediary relationships and distribution channels of the funds and Dreyfus’ corresponding need for broad, deep, and diverse resources to be able to provide ongoing shareholder services to each distribution channel, including the distribution channel(s) for each fund.
The Board members also considered research support available to, and portfolio management capabilities of, each fund’s portfolio management personnel and that Dreyfus also provides oversight of day-to-day fund operations, including fund accounting and administration and assistance in meeting legal and regulatory requirements. The Board members also considered Dreyfus’ extensive administrative, accounting, and compliance infrastructures.
Comparative Analysis of the Funds’ Performance and Advisory Fees and Expense Ratios.The Board members reviewed reports prepared by Lipper, Inc. (“Lipper”), an independent provider of investment company data, which included information comparing (1) each fund’s performance with that of a group of comparable funds (the “Performance Group”) and with a broader group of funds (the “Performance Universe”), all for various periods ended January 31, 2011, and (2) each fund’s actual and contractual advisory fees and total expenses with those of a group of comparable funds (the “Expense Group”) and with a broader group of funds (the “Expense Universe”), the information for which was derived in part from each fund’s financial statements available to Lipper as of January 31, 2011. Dreyfus also provided a comparison of each fund’s calendar year total returns to the performance of the relevant fund’s benchmark. Dreyfus previously had furnished the Board with a description of the methodology Lipper used to select the Performance Group and Performance Universe and the Expense Group and Expense Universe.
Dreyfus representatives stated that the usefulness of performance comparisons may be affected by a number of factors, including different investment limitations that may be applicable to the fund and comparison funds.They also noted that performance generally should be considered over longer periods of time, although it is possible that long-term performance can be adversely affected by even one period of significant underperformance so that a sin-
136
gle investment decision or theme has the ability to affect disproportionately long term performance.
As applicable to each fund, representatives of Dreyfus reviewed with the Board members the management or investment advisory fees (1) paid by funds advised or administered by Dreyfus that are in the same Lipper category as the fund and (2) paid to Dreyfus or the Dreyfus-affiliated primary employer of the fund’s primary portfolio manager for advising any separate accounts and/or other types of client portfolios that are considered to have similar investment strategies and policies as the fund (the “Similar Clients”), and explained the nature of the Similar Clients. They discussed differences in fees paid and the relationship of the fees paid in light of any differences in the services provided and other relevant factors. The Board members considered the relevance of the fee information provided for the Similar Clients to evaluate the appropriateness and reasonableness of the fund’s advisory fee.
BNY Mellon National Intermediate Municipal Bond Fund
The Board members discussed the results of the comparisons and noted that the fund’s total return performance was generally at or above the Performance Group and Performance Universe medians.The Board also noted that the fund’s yield performance was above the Performance Group median for one of the one-year periods, and below the Performance Group medians for nine of the one-year periods, ended January 31st, and was above the Performance Universe medians for each of the one-year periods ended January 31st. Dreyfus also provided a comparison of the fund’s calendar year total returns to the returns of the fund’s Lipper category average.
The Board members also reviewed the range of actual and contractual advisory fees and total expenses of the
Expense Group and Expense Universe funds and discussed the results of the comparisons. They noted that the fund’s contractual advisory fee was at the Expense Group median, the fund’s actual advisory fee was above the Expense Group and Expense Universe medians and the fund’s total expenses were below the Expense Group and Expense Universe medians. The Board also considered the fee waiver and expense reimbursement arrangement undertaken by the investment adviser that was in effect until September 30, 2010.
BNY Mellon National Short-Term Municipal Bond Fund
The Board members discussed the results of the comparisons and noted that the fund’s total return performance was generally at or above the Performance Group and Performance Universe medians. The Board also noted that the fund’s yield performance was at the Performance Group medians for two of the one-year periods, and below the Performance Group medians for eight of the one-year periods, ended January 31st, and was above the Performance Universe medians for six of the one-year periods, at the Performance Universe medians for two of the one-year periods and below the Performance Group medians for two of the one-year periods, ended January 31st. Dreyfus also provided a comparison of the fund’s calendar year total returns to the returns of the fund’s Lipper category average.
The Board members also reviewed the range of actual and contractual advisory fees and total expenses of the Expense Group and Expense Universe funds and discussed the results of the comparisons. They noted that the fund’s contractual advisory fee was above the Expense Group median and the fund’s actual advisory fee and total expenses were above the Expense Group and Expense Universe medians.
| The Funds | 137 |
| INFORMATION ABOUT THE RENEWAL OF EACH FUND’S |
| INVESTMENT ADVISORY AGREEMENT (Unaudited) (continued) |
BNY Mellon Pennsylvania Intermediate Municipal Bond Fund
The Board members discussed the results of the comparisons and noted that the fund’s total return performance was variously above, at and below the Performance Group and Performance Universe medians and ranked first in the Performance Group for the two-year period. The Board also noted that the fund’s yield performance was above the Performance Group medians for seven of the one-year periods, and below the Performance Group medians for three of the one-year periods, ended January 31st, and was above the Performance Universe medians for each of the one-year periods ended January 31st. Dreyfus also provided a comparison of the fund’s calendar year total returns to the returns of the fund’s Lipper category average.
The Board members also reviewed the range of actual and contractual advisory fees and total expenses of the Expense Group and Expense Universe funds and discussed the results of the comparisons. They noted that the fund’s contractual advisory fee was at the Expense Group median, the fund’s actual advisory fee was above the Expense Group and Expense Universe medians and the fund’s total expenses were below the Expense Group and Expense Universe medians.
BNY Mellon Massachusetts Intermediate Municipal Bond Fund
The Board members discussed the results of the comparisons and noted that the fund’s total return performance was above the Performance Group and Performance Universe medians for the various periods, except for the one-, three- and four-year periods when the fund’s performance was below the Performance Group medians. The Board also noted that the fund’s yield performance was above the Performance Group and Performance Universe medians for each of the one-year periods ended January 31st. Dreyfus also provided a comparison of the fund’s calendar year total returns to the returns of the fund’s Lipper category average.
The Board members also reviewed the range of actual and contractual advisory fees and total expenses of the Expense Group and Expense Universe funds and discussed the results of the comparisons. They noted that the fund’s contractual advisory fee was below the Expense Group median, the fund’s actual advisory fee was above the Expense Group and Expense Universe medians and the fund’s total expenses were below the Expense Group and Expense Universe medians.
BNY Mellon New York Intermediate Tax-Exempt Bond Fund
The Board members discussed the results of the comparisons and noted that the fund’s total return performance was above the Performance Group and Performance Universe medians for the various periods, except for the one- and two-year periods when the fund’s performance was below the Performance Group medians and the one-year period when the fund’s performance was below the Performance Universe median, and ranked first in the Performance Group for the three- and five-year periods. The Board also noted that the fund’s yield performance was below the Performance Group medians for nine of the one-year periods, and at the Performance Group median for one of the one-year periods, ended January 31st, and was above the Performance Universe medians for eight of the one-year periods, and below the Performance Universe median for two of the one-year periods, ended January 31st. Dreyfus also provided a comparison of the fund’s calendar year total returns to the returns of the fund’s Lipper category average.
The Board members also reviewed the range of actual and contractual advisory fees and total expenses of the Expense Group and Expense Universe funds and dis-
138
cussed the results of the comparisons.They noted that the fund’s contractual advisory fee was above the Expense Group median, the fund’s actual advisory fee was above the Expense Group and Expense Universe medians and the fund’s total expenses were above the Expense Group and below the Expense Universe medians.
A representative of Dreyfus noted that the investment adviser has contractually agreed to waive receipt of its fees and/or assume the expenses of the fund, until September 30, 2011, so that annual direct operating expenses of Class M shares and Investor shares (excluding shareholder services fees, taxes, interest, brokerage commissions, commitment fees on borrowings and extraordinary expenses) do not exceed 0.59% of the fund’s average daily net assets.
BNY Mellon Municipal Opportunities Fund
The Board members discussed the results of the comparisons and noted that the fund’s total return performance was above the Performance Group and Performance Universe medians and ranked first in the Performance Group for the one-year period. The Board also noted that the fund’s yield performance was below the Performance Group and Performance Universe medians for each of the one-year periods ended January 31st. Dreyfus also provided a comparison of the fund’s calendar year total returns to the returns of the fund’s Lipper category average.
The Board members also reviewed the range of actual and contractual advisory fees and total expenses of the Expense Group and Expense Universe funds and discussed the results of the comparisons. They noted that the fund’s contractual advisory fee was above the Expense Group median and the fund’s actual advisory fee and total expenses were above the Expense Group and Expense Universe medians.
Analysis of Profitability and Economies of Scale. Dreyfus’ representatives reviewed the expenses allocated and profit received by Dreyfus and its affiliates and the resulting profitability percentage for managing each fund, and the method used to determine the expenses and profit.The Board concluded that the profitability results were not unreasonable, given the services rendered and service levels provided by Dreyfus to each fund. The Board also noted the expense limitation arrangements for certain funds and their effect on Dreyfus’ profitability.The Board previously had been provided with information prepared by an independent consulting firm regarding Dreyfus’ approach to allocating costs to, and determining the profitability of, individual funds and the entire Dreyfus fund complex. The consulting firm also analyzed where any economies of scale might emerge in connection with the management of the funds.
The Board’s counsel stated that the Board members should consider the profitability analysis with respect to each fund (1) as part of their evaluation of whether the fees under the Agreement bear a reasonable relationship to the mix of services provided by Dreyfus, including the nature, extent and quality of such services, and (2) in light of the relevant circumstances for each fund and the extent to which economies of scale would be realized if the relevant fund grows and whether fee levels reflect these economies of scale for the benefit of each fund’s shareholders. Dreyfus representatives noted that a discussion of economies of scale is predicated on a fund having achieved a substantial size with increasing assets and that, if a fund’s assets had been stable or decreasing, the possibility that Dreyfus may have realized any economies of scale would be less. They also noted that, as a result of shared and allocated costs among the funds and the funds in the Dreyfus funds complex, the extent of economies of scale could depend substantially on the level of assets
| The Funds | 139 |
| INFORMATION ABOUT THE RENEWAL OF EACH FUND’S |
| INVESTMENT ADVISORY AGREEMENT (Unaudited) (continued) |
in the complex as a whole, so that increases and decreases in complex-wide assets can affect potential economies of scale in a manner that is disproportionate to, or even in the opposite direction from, changes in each fund’s asset level.The Board members also considered potential benefits to Dreyfus from acting as investment adviser and noted that there were no soft dollar arrangements in effect for trading each fund’s investments.
At the conclusion of these discussions, the Board agreed that it had been furnished with sufficient information to make an informed business decision with respect to the renewal of the Agreement. Based on the discussions and considerations as described above, the Board concluded and determined as follows.
The Board concluded that the nature, extent and quality of the services provided by Dreyfus to each fund are adequate and appropriate.
With respect to BNY Mellon National Intermediate Municipal Bond Fund, BNY Mellon National Short- Term Municipal Bond Fund and BNY Mellon Municipal Opportunities Fund, the Board was satis- fied with each fund’s overall performance.
With respect to BNY Mellon Pennsylvania Intermediate Municipal Bond Fund, BNY Mellon Massachusetts Intermediate Municipal Bond Fund and BNY Mellon New York Intermediate Tax-Exempt Bond Fund, the Board generally was satisfied with each fund’s overall performance.
The Board concluded that the fee paid to Dreyfus by each fund was reasonable in light of the considerations described above.
The Board determined that the economies of scale which may accrue to Dreyfus and its affiliates in con- nection with the management of the funds had been adequately considered by Dreyfus in connection with the advisory fee rate charged to each fund pursuant to the Agreement and that, to the extent in the future it were determined that material economies of scale had not been shared with a fund, the Board would seek to have those economies of scale shared with the fund.
The Board members considered these conclusions and determinations, along with information received on a routine and regular basis throughout the year. In addition, it should be noted that the Board’s consideration of the contractual fee arrangements for each fund had the benefit of a number of years of reviews of prior or similar agreements during which lengthy discussions took place between the Board members and Dreyfus representatives. Certain aspects of the arrangements may receive greater scrutiny in some years than in others, and the Board members’ conclusions may be based, in part, on their consideration of the same or similar arrangements in prior years.The Board members determined that renewal of the Agreement was in the best interests of each fund and its respective shareholders.
140
BOARD MEMBERS INFORMATION (Unaudited)
| The Funds | 141 |
BOARD MEMBERS INFORMATION (Unaudited) (continued)

Once elected all Board Members serve for an indefinite term.The address of the Board Members and Officers is in c/o The Dreyfus Corporation, 200 Park Avenue, New York, NewYork 10166.Additional information about the Board Members is available in the fund’s Statement of Additional Information which can be obtained from Dreyfus free of charge by calling this toll free number: 1-800-DREYFUS. For individual account holders for Private Wealth Management clients, please contact your account officer or call 1-888-281-7350.
142
OFFICERS OF THE TRUST (Unaudited)
CHRISTOPHER SHELDON, President since September 2006.
As director of Investment Strategy for BNY Mellon Wealth Management group since April 2003, Mr. Sheldon manages the analysis and development of investment and asset allocation strategies and oversees investment product research. He also oversaw the alternative investment groups from June 2006 to September 2008. He was previously a Vice President of the Trust. He is 46 years old has been employed by BNY Mellon since January 1995.
MICHAEL A. ROSENBERG, Vice President and Secretary since August 2005.
Assistant General Counsel of BNY Mellon, and an officer of 76 investment companies (comprised of 192 portfolios) managed by the Manager. He is 51 years old and has been an employee of the Manager since October 1991.
KIESHA ASTWOOD, Vice President and Assistant Secretary since January 2010.
Counsel of BNY Mellon, and an officer of 76 investment companies (comprised of 192 portfolios) managed by the Manager. She is 38 years old and has been an employee of the Manager since July 1995.
JAMES BITETTO, Vice President and Assistant Secretary since August 2005.
Senior Counsel of BNY Mellon and Secretary of the Manager, and an officer of 76 investment companies (comprised of 192 portfolios) managed by the Manager. He is 45 years old and has been an employee of the Manager since December 1996.
JONI LACKS CHARATAN, Vice President and Assistant Secretary since August 2005.
Senior Counsel of BNY Mellon, and an officer of 76 investment companies (comprised of 192 portfolios) managed by the Manager. She is 55 years old and has been an employee of the Manager since October 1988.
JOSEPH M. CHIOFFI, Vice President and Assistant Secretary since August 2005.
Senior Counsel of BNY Mellon, and an officer of 76 investment companies (comprised of 192 portfolios) managed by the Manager. He is 49 years old and has been an employee of the Manager since June 2000.
KATHLEEN DENICHOLAS, Vice President and Assistant Secretary since January 2010.
Senior Counsel of BNY Mellon, and an officer of 76 investment companies (comprised of 192 portfolios) managed by the Manager. She is 36 years old and has been an employee of the Manager since February 2001.
JANETTE E. FARRAGHER, Vice President and Assistant Secretary since August 2005.
Assistant General Counsel of BNY Mellon, and an officer of 76 investment companies (comprised of 192 portfolios) managed by the Manager. She is 48 years old and has been an employee of the Manager since February 1984.
JOHN B. HAMMALIAN, Vice President and Assistant Secretary since August 2005.
Managing Counsel of BNY Mellon, and an officer of 76 investment companies (comprised of 192 portfolios) managed by the Manager. He is 48 years old and has been an employee of the Manager since February 1991.
M. CRISTINA MEISER, Vice President and Assistant Secretary since January 2010.
Senior Counsel of BNY Mellon, and an officer of 76 investment companies (comprised of 192 portfolios) managed by the Manager. She is 41 years old and has been an employee of the Manager since August 2001.
ROBERT R. MULLERY, Vice President and Assistant Secretary since August 2005.
Managing Counsel of BNY Mellon, and an officer of 76 investment companies (comprised of 192 portfolios) managed by the Manager. He is 59 years old and has been an employee of the Manager since May 1986.
JEFF PRUSNOFSKY, Vice President and Assistant Secretary since August 2005.
Managing Counsel of BNY Mellon, and an officer of 76 investment companies (comprised of 192 portfolios) managed by the Manager. He is 46 years old and has been an employee of the Manager since October 1990.
| The Funds | 143 |
OFFICERS OF THE TRUST (Unaudited) (continued)
JAMES WINDELS, Treasurer since November 2001.
Director – Mutual Fund Accounting of the Manager, and an officer of 76 investment companies (comprised of 192 portfolios) managed by the Manager. He is 52 years old and has been an employee of the Manager since April 1985.
RICHARD CASSARO, Assistant Treasurer since January 2008.
Senior Accounting Manager – Money Market and Municipal Bond Funds of the Manager, and an officer of 76 investment companies (comprised of 192 portfolios) managed by the Manager. He is 52 years old and has been an employee of the Manager since September 1982.
GAVIN C. REILLY, Assistant Treasurer since December 2005.
Tax Manager of the Investment Accounting and Support Department of the Manager, and an officer of 76 investment companies (comprised of 192 portfolios) managed by the Manager. He is 43 years old and has been an employee of the Manager since April 1991.
ROBERT ROBOL, Assistant Treasurer since December 2002.
Senior Accounting Manager – Fixed Income Funds of the Manager, and an officer of 76 investment companies (comprised of 192 portfolios) managed by the Manager. He is 47 years old and has been an employee of the Manager since October 1988.
ROBERT SALVIOLO, Assistant Treasurer since July 2007.
Senior Accounting Manager – Equity Funds of the Manager, and an officer of 76 investment companies (comprised of 192 portfolios) managed by the Manager. He is 44 years old and has been an employee of the Manager since June 1989.
ROBERT SVAGNA, Assistant Treasurer since December 2002.
Senior Accounting Manager – Equity Funds of the Manager, and an officer of 76 investment companies (comprised of 192 portfolios) managed by the Manager. He is 44 years old and has been an employee of the Manager since November 1990.
JOSEPH W. CONNOLLY, Chief Compliance Officer since October 2004.
Chief Compliance Officer of the Manager and The Dreyfus Family of Funds (76 investment companies, comprised of 192 portfolios). From November 2001 through March 2004, Mr. Connolly was first Vice-President, Mutual Fund Servicing for Mellon Global Securities Services. In that capacity, Mr. Connolly was responsible for managing Mellon’s Custody, Fund Accounting and Fund Administration services to third-party mutual fund clients. He is 54 years old and has served in various capacities with the Manager since 1980, including manager of the firm’s Fund Accounting Department from 1997 through October 2001.
STEPHEN J. STOREN, Anti-Money Laundering Compliance Officer since May 2011.
Chief Compliance Officer of the Distributor, and the Anti-Money Laundering Compliance Officer of 72 investment companies (comprised of 188 portfolios) managed by the Manager. He is 56 years old and has been an employee of the Distributor since October 1999.
144
NOTES
For More Information

Telephone Wealth Management (WM) Clients, please contact your Account Officer or call 1-888-281-7350. Brokerage Clients of BNY Mellon Wealth Advisors (BNYMWA), please contact your financial representative or call 1-800-830-0549, Option 2. Individual Account holders, please call Dreyfus at 1-800-DREYFUS.
Mail WM Clients, write to your Account Officer, c/o The Bank of New York Mellon, One Mellon Bank Center, Pittsburgh, PA 15258 BNYMWA Brokerage Clients, write to your financial representative, P.O. Box 9012, Hicksville, NY 11802–9012 Individual Account Holders, write to: BNY Mellon Funds, P.O. Box 55268, Boston, MA 02205–8502
The funds file their complete schedule of portfolio holdings with the Securities and Exchange Commission (“SEC”) for the first and third quarters of each fiscal year on Form N-Q. The funds’ Forms N-Q are available on the SEC’s website at http://www.sec.gov and may be reviewed and copied at the SEC’s Public Reference Room in Washington, DC. Information on the operation of the Public Reference Room may be obtained by calling 1-800-SEC-0330.
Information regarding how the funds voted proxies relating to portfolio securities for the most recent 12-month period ended June 30 is available on the SEC’s website at http://www.sec.gov and without charge, upon request, by calling 1-800-DREYFUS.


DISCUSSION OF
FUND PERFORMANCE
For the period of September 1, 2010, through August 31, 2011, as provided by Patricia A. Larkin, Portfolio Manager
Fund and Market Performance Overview
For the 12-month period ended August 31, 2011, BNY Mellon Money Market Fund’s Class M shares produced a yield of 0.02%, and its Investor shares produced a yield of 0.00%.Taking into account the effects of compounding, the fund’s Class M shares produced an effective yield of 0.02%, and its Investor shares produced an effective yield of 0.00%.1
Yields of money market instruments hovered near historically low levels throughout the reporting period as short-term interest rates remained unchanged in a faltering U.S. economy.
The Fund’s Investment Approach
The fund seeks as high a level of current income as is consistent with the preservation of capital and the maintenance of liquidity.To pursue its goal, the fund invests in a diversified portfolio of high-quality, short-term debt securities, including U.S. government securities; certificates of deposit, time deposits, bankers’ acceptances and other short-term domestic or foreign bank obligations; repurchase agreements; high-grade commercial paper and other short-term corporate obligations; and taxable municipal obligations. Normally, the fund invests at least 25% of its net assets in bank obligations.
Mixed Economic Data Sparked Shifts in Market Sentiment
Investors’ outlooks had improved markedly by the start of the reporting period when the Federal Reserve Board (the “Fed”) announced a new round of quantitative easing to jump-start the U.S. economy. Subsequent improvements in employment, consumer spending and corporate earnings further buoyed market sentiment, and rising food and fuel prices signaled a potential
increase in inflationary pressures. Nonetheless, as they have since December 2008, the Fed maintained an aggressively accommodative monetary policy, keeping short-term interest rates within a historically low range between 0% and 0.25%.
In February 2011, a wave of political unrest in the Middle East and North Africa caused energy prices to surge higher, potentially threatening the reinvigorated economic recovery. Still, U.S. manufacturing activity reached its highest level in seven years, and the unemployment rate fell to 8.9% during the month.The global economy took another hit in March, when Japan suffered a devastating earthquake, tsunami and nuclear disaster, disrupting the global industrial supply chain. Yet, these events had relatively little short-term impact on the U.S. economy, as activity expanded across several economic sectors in March, the private sector added 233,000 jobs and the unemployment rate dropped to 8.8%, its lowest reading in two years. However, it was later announced that the U.S. economy grew at a surprisingly anemic 0.4% annualized rate during the first quarter of 2011. Slowdowns in consumer and government spending appeared to be the main factors behind the deceleration of economic growth.
Economic headwinds seemed to intensify in April as Greece appeared headed toward defaulting on its sovereign debt. In addition, a contentious debate about government spending and borrowing intensified in the United States as the federal government approached the upper limits of its debt authorization. However, some parts of the U.S. economy continued to fare well, including domestic manufacturing. May produced more mixed economic data. While industrial production picked up, employment data continued to disappoint. The housing market continued to deteriorate, posting declines in existing home sales and housing starts.
| The Funds | 3 |
DISCUSSION OF FUND PERFORMANCE (continued)
The Fed ended its quantitative easing program in June, and investors were relieved when the program’s termination had relatively little immediate impact on the financial markets. Meanwhile, energy prices moderated and manufacturing activity continued to increase.These positive developments were largely offset by declining consumer confidence, weakness in U.S. housing markets and sluggish job creation.
July saw heightened turmoil in the financial markets as Greece moved closer to default, other peripheral European nations struggled with heavy debt loads and the U.S. Congress continued to engage in a rancorous debate about the federal budget deficit. Some of these worries came to a head in early August, when Congress passed legislation cutting government spending and raising the U.S. debt ceiling, and Standard & Poor’s downgraded its credit rating on long-term U.S. debt securities. The rating on short-term government debt, including securities purchased by many money market funds, was unchanged. Later in the month, hurricanes, drought and wildfires inflicted additional damage on an already battered economy.
Outlook Clouded by Recent Events
Yields of money market instruments remained near zero percent throughout the reporting period, and with narrow yield differences along the market’s maturity spectrum, it
continued to make little sense to incur the additional risks that longer-dated securities typically entail.Therefore, we maintained the fund’s weighted average maturity in a range that was roughly in line with industry averages.
The reporting period ended with a cloudy economic outlook for the remainder of the year and beyond. However, the Fed recently signaled that it is prepared to keep short-term interest rates near historical lows “at least through mid-2013.”Therefore, we intend to maintain the fund’s focus on quality and liquidity.
September 15, 2011
| An investment in the fund is not insured or guaranteed by the FDIC or any | |
| other government agency. Although the fund seeks to preserve the value of | |
| your investment at $1.00 per share, it is possible to lose money by investing | |
| in the fund. | |
| Short-term corporate, asset-backed securities holdings and municipal securities | |
| holdings (as applicable), while rated in the highest rating category by one or | |
| more NRSRO (or unrated, if deemed of comparable quality by the investment | |
| adviser), involve credit and liquidity risks and risk of principal loss. | |
| 1 | Effective yield is based upon dividends declared daily and reinvested monthly. |
| Past performance is no guarantee of future results.Yields fluctuate.Yields | |
| provided reflect the absorption of certain fund expenses by the investment | |
| adviser pursuant to an undertaking, which is voluntary and temporary, not | |
| contractual, and can be terminated at any time without notice. Had these | |
| expenses not been absorbed, fund yields would have been lower, and in some | |
| cases, 7-day yields during the reporting period would have been negative | |
| absent the expense absorption. |
4

DISCUSSION OF
FUND PERFORMANCE
For the period of September 1, 2010, through August 31, 2011, as provided by Joseph Irace, Senior Portfolio Manager
Fund and Market Performance Overview
For the 12-month period ended August 31, 2011, BNY Mellon National Municipal Money Market Fund’s Class M shares produced a yield of 0.03%, and Investor shares produced a yield of 0.00%.Taking into account the effects of compounding, the fund’s Class M and Investor shares also produced effective yields of 0.03% and 0.00%, respectively.1
Despite heightened volatility among stocks and bonds during the reporting period, tax-exempt money market yields remained stable at historically low levels as short-term interest rates were unchanged in a faltering U.S. economy.
The Fund’s Investment Approach
The fund seeks as high a level of current income exempt from federal income tax as is consistent with the preservation of capital and maintenance of liq-uidity.To pursue its goal, the fund invests at least 80% of its assets in short-term municipal obligations that provide income exempt from federal income tax. Among these are municipal notes, short-term municipal bonds, tax-exempt commercial paper and municipal leases. The fund may invest up to 20% of its total assets in taxable money market securities, such as U.S. government obligations, bank and corporate obligations and commercial paper.The fund also may invest in custodial receipts.
Yields Stay Steady Despite Shifting Economic Sentiment
The reporting period began amid improved investor sentiment after the Federal Reserve Board (the “Fed”) implemented new measures designed to stimulate greater economic growth through a new round of quantitative easing. Investors responded positively to this renewed commitment to avoiding a double-dip recession, and they looked forward to better economic conditions in 2011. Despite unexpected economic shocks early in the new year stemming from political uprisings in the Middle East and devastating natural and nuclear disasters in Japan, greater economic optimism generally was reinforced by reports of improved hiring activity and consumer spending through the first quarter of 2011.
It wasn’t until late April that investor sentiment began to deteriorate in earnest, when Greece again appeared headed toward default on its sovereign debt, U.S. economic data proved disappointing and a contentious debate regarding government spending and borrowing intensified. Some of these worries came to a head during the final month of the reporting period, when Congress passed legislation cutting government spending and raising the U.S. debt ceiling, and Standard & Poor’s downgraded its credit rating on long-term U.S. debt securities.
Throughout a reporting period characterized by changing economic sentiment, the Fed maintained its aggressively accommodative policy stance, leaving the
| The Funds | 5 |
DISCUSSION OF FUND PERFORMANCE (continued)
overnight federal funds rate in a range between 0% and 0.25%. Consequently, municipal money market yields remained near zero percent.
The supply of newly issued municipal money market instruments also stayed relatively steady during the reporting period. New issuance was ample in advance of the expiration of the federally subsidized Build America Bonds program at the end of 2010, but this surge in supply had relatively little impact on issuance volumes over the first eight months of 2011. Meanwhile, demand for municipal money market instruments remained robust as individuals sought to shelter income from rising state taxes, and institutional investors searched for alternatives to low yielding taxable money market instruments.
From a credit-quality perspective, many states and municipalities reduced spending to address budget deficits during the reporting period. Although tax revenues generally have remained below prerecession levels, receipts have trended up over the past year, and several banks have initiated programs providing municipal issuers with credit, a positive development that we believe appears likely to continue.
Maintaining a Credit-Conscious Investment Posture
We have maintained the fund’s conservative investment posture, emphasizing direct, high-quality municipal obligations and commercial paper deemed creditworthy by our analysts.We also favored instruments backed by pledged tax appropriations or dedicated revenues. We generally shied away from general obligation debt and instruments issued by localities that depend heavily on
state aid. Finally, we maintained the fund’s weighted average maturity in a range that was roughly in line with industry averages, as it has made little sense to us to incur the interest-rate risks that longer-dated instruments typically entail.
Outlook Clouded by Recent Events
Although the U.S. economy has continued to grow, developments currently roiling the financial markets have clouded the outlook for the remainder of 2011 and beyond. However, the Fed recently signaled that it is prepared to keep short-term interest rates near historical lows “at least through mid-2013,” and we believe the prudent course continues to be an emphasis on preservation of capital and liquidity. However, the supply of newly issued tax-exempt money market instruments may increase later this year, which could put upward pressure on yields.
September 15, 2011
| An investment in the fund is not insured or guaranteed by the FDIC or any | |
| other government agency.Although the fund seeks to preserve the value of | |
| your investment at $1.00 per share, it is possible to lose money by investing | |
| in the fund. | |
| Short-term corporate and asset-backed securities holdings, while rated in the | |
| highest rating category by one or more NRSRO (or unrated, if deemed of | |
| comparable quality by the investment adviser), involve credit and liquidity | |
| risks and risk of principal loss. | |
| 1 | Effective yield is based upon dividends declared daily and reinvested monthly. |
| Past performance is no guarantee of future results.Yields fluctuate.Yields | |
| provided reflect the absorption of certain fund expenses by the investment | |
| adviser pursuant to an undertaking, which is voluntary and temporary, not | |
| contractual, and can be terminated at any time without notice. Had these | |
| expenses not been absorbed, fund yields would have been lower, and in some | |
| cases, 7-day yields during the reporting period would have been negative | |
| absent the expense absorption. |
6
UNDERSTANDING YOUR FUND’S EXPENSES (Unaudited)
As a mutual fund investor, you pay ongoing expenses, such as management fees and other expenses. Using the information below, you can estimate how these expenses affect your investment and compare them with the expenses of other funds.You also may pay one-time transaction expenses, including sales charges (loads) and redemption fees, which are not shown in this section and would have resulted in higher total expenses. For more information, see your fund’s prospectus or talk to your financial advisor.
Review your fund’s expenses
The table below shows the expenses you would have paid on a $1,000 investment in each class of each BNY Mellon money market fund from March 1, 2011 to August 31, 2011. It also shows how much a $1,000 investment would be worth at the close of the period, assuming actual returns and expenses.
| Expenses and Value of a $1,000 Investment | ||
| assuming actual returns for the six months ended August 31, 2011 | ||
| Class M Shares | Investor Shares | |
| BNY Mellon Money Market Fund | ||
| Expenses paid per $1,000† | $ 1.16 | $ 1.21 |
| Ending value (after expenses) | $1,000.00 | $1,000.00 |
| Annualized expense ratio (%) | .23 | .24 |
| BNY Mellon National Municipal Money Market Fund | ||
| Expenses paid per $1,000† | $ 1.16 | $ 1.21 |
| Ending value (after expenses) | $1,000.10 | $1,000.00 |
| Annualized expense ratio (%) | .23 | .24 |
COMPARING YOUR FUND’S EXPENSES WITH THOSE OF OTHER FUNDS (Unaudited)
Using the SEC’s method to compare expenses
The Securities and Exchange Commission (SEC) has established guidelines to help investors assess fund expenses. Per these guidelines, the table below shows your fund’s expenses based on a $1,000 investment, assuming a hypothetical 5% annualized return.You can use this information to compare the ongoing expenses (but not transaction expenses or total cost) of investing in the fund with those of other funds.All mutual fund shareholder reports will provide this information to help you make this comparison. Please note that you cannot use this information to estimate your actual ending account balance and expenses paid during the period.
| Expenses and Value of a $1,000 Investment | ||
| assuming a hypothetical 5% annualized return for the six months ended August 31, 2011 | ||
| Class M Shares | Investor Shares | |
| BNY Mellon Money Market Fund | ||
| Expenses paid per $1,000† | $ 1.17 | $ 1.22 |
| Ending value (after expenses) | $1,024.05 | $1,024.00 |
| Annualized expense ratio (%) | .23 | .24 |
| BNY Mellon National Municipal Money Market Fund | ||
| Expenses paid per $1,000† | $1.17 | $1.22 |
| Ending value (after expenses) | $1,024.05 | $1,024.00 |
| Annualized expense ratio (%) | .23 | .24 |
† Expenses are equal to each fund’s annualized expense ratios as shown above, multiplied by the average account value over the period, multiplied by 184/365 (to reflect the one-half year period).
| The Funds | 7 |
| STATEMENT OF INVESTMENTS |
| August 31, 2011 |
| BNY Mellon Money Market Fund | |||||
| Negotiable Bank | Principal | Asset-Backed | Principal | ||
| Certificates of Deposit—4.5% | Amount ($) | Value ($) | Commercial Paper—7.9% | Amount ($) | Value ($) |
| Natixis New York (Yankee) | Atlantis One Funding Corp. | ||||
| 0.49%, 10/13/11 | 0.06%, 9/1/11 | 40,000,000 a | 40,000,000 | ||
| (cost $45,000,000) | 45,000,000 | 45,000,000 | Cancara Asset Securitization | ||
| 0.21%, 9/12/11 | 40,000,000 a | 39,997,433 | |||
| Commercial Paper—16.4% | Total Asset-Backed | ||||
| Commercial Paper | |||||
| Commonwealth Bank of Australia | |||||
| (cost $79,997,433) | 79,997,433 | ||||
| 0.17%, 9/14/11 | 40,000,000 a | 39,997,544 | |||
| Deutsche Bank Financial LLC | |||||
| 0.10%, 9/1/11 | 40,000,000 | 40,000,000 | Time Deposits—19.2% | ||
| Societe Generale N.A. Inc. | Bank of America N.A. | ||||
| 0.53%, 9/8/11 | 45,000,000 | 44,995,363 | (Grand Cayman) | ||
| UBS Finance Delaware Inc. | 0.01%, 9/1/11 | 33,000,000 | 33,000,000 | ||
| 0.07%, 9/1/11 | 40,000,000 | 40,000,000 | Bank of Tokyo-Mitsubishi Ltd. | ||
| Total Commercial Paper | (Grand Cayman) | ||||
| (cost $164,992,907) | 164,992,907 | 0.08%, 9/1/11 | 40,000,000 | 40,000,000 | |
8
| BNY Mellon Money Market Fund (continued) | |||||
| Principal | Principal | ||||
| Time Deposits (continued) | Amount ($) | Value ($) | Repurchase Agreement—22.3% | Amount ($) | Value ($) |
| Canadian Imperial Bank of | RBS Securities, Inc. | ||||
| Commerce (Grand Cayman) | 0.07%, dated 8/31/11, | ||||
| 0.03%, 9/1/11 | 40,000,000 | 40,000,000 | due 9/1/11 | ||
| KBC Bank (Grand Cayman) | in the amount | ||||
| 0.06%, 9/1/11 | 40,000,000 | 40,000,000 | of $225,000,438 | ||
| National Australia Bank | (fully collateralized | ||||
| (Grand Cayman) | by $215,173,300 | ||||
| 0.03%, 9/1/11 | 40,000,000 | 40,000,000 | U.S. Treasury Notes, | ||
| 2.38%-2.63%, | |||||
| Total Time Deposits | due 5/31/18-8/15/20, | ||||
| (cost $193,000,000) | 193,000,000 | value $229,501,840) | |||
| (cost $225,000,000) | 225,000,000 | 225,000,000 | |||
| U.S. Treasury Bills—27.2% | |||||
| Total Investments | |||||
| 0.01%-0.02%, 9/1/11—10/13/11 | |||||
| (cost $1,007,215,859) | 100.0% | 1,007,215,859 | |||
| (cost $273,767,036) | 273,770,000 | 273,767,036 | |||
| Cash and | |||||
| U.S. Treasury Notes—2.5% | Receivables (Net) | .0% | 417,135 | ||
| 0.31%, 1/31/12 | Net Assets | 100.0% | 1,007,632,994 | ||
| (cost $25,458,483) | 25,000,000 | 25,458,483 | |||
a Securities exempt from registration under Rule 144A of the Securities Act of 1933.These securities may be resold in transactions exempt from registration, normally to qualified institutional buyers.At August 31, 2011, these securities amounted to $119,994,977 or 11.9% of net assets.
| Portfolio Summary (Unaudited) † | |||
| Value (%) | Value (%) | ||
| Banking | 40.1 | Asset-Backed/Multi-Seller Programs | 3.9 |
| U.S. Treasury Bills | 27.2 | U.S. Treasury Notes | 2.5 |
| Repurchase Agreement | 22.3 | ||
| Asset-Backed/Banking | 4.0 | 100.0 | |
| † Based on net assets. | |||
| See notes to financial statements. | |||
| The Funds | 9 |
| STATEMENT OF INVESTMENTS |
| August 31, 2011 |
| BNY Mellon National Municipal Money Market Fund | ||||
| Coupon | Maturity | Principal | ||
| Short-Term Investments—100.0% | Rate (%) | Date | Amount ($) | Value ($) |
| Alabama—1.8% | ||||
| Mobile Infirmary Health System Special Care Facilities | ||||
| Financing Authority, Revenue (Infirmary Health | ||||
| System, Inc.) (LOC; Bank of Nova Scotia) | 0.15 | 9/7/11 | 25,000,000 a,b | 25,000,000 |
| California—6.1% | ||||
| California Statewide Communities Development Authority, Revenue | ||||
| (Rady Children’s Hospital—San Diego) (LOC; Wells Fargo Bank) | 0.06 | 9/1/11 | 18,400,000 a,b | 18,400,000 |
| California Statewide Communities Development Authority, | ||||
| Revenue, CP (Kaiser Permanente) | 0.22 | 1/4/12 | 25,000,000 | 25,000,000 |
| California Statewide Communities Development Authority, | ||||
| Revenue, CP (Kaiser Permanente) | 0.26 | 2/16/12 | 10,000,000 | 10,000,000 |
| Golden State Tobacco Securitization Corporation, Enhanced Tobacco | ||||
| Settlement Asset-Backed Bonds (Insured; Berkshire Hathaway | ||||
| Assurance Corporation and Liquidity Facility; Citibank NA) | 0.22 | 9/7/11 | 13,500,000 a,c,d | 13,500,000 |
| Los Angeles County Metropolitan Transportation Authority, | ||||
| Proposition C Sales Tax Revenue, Refunding | ||||
| (Liquidity Facility; Bank of Nova Scotia) | 0.11 | 9/1/11 | 2,900,000 a | 2,900,000 |
| Orange County Sanitation District, COP, | ||||
| Refunding (Liquidity Facility; Lloyds TSB Bank PLC) | 0.08 | 9/1/11 | 12,700,000 a | 12,700,000 |
| Colorado—3.7% | ||||
| Colorado Educational and Cultural Facilities Authority, | ||||
| Revenue (National Jewish Federation Bond | ||||
| Program) (LOC; Bank of America) | 0.18 | 9/1/11 | 13,105,000 a | 13,105,000 |
| Commerce City Northern Infrastructure General | ||||
| Improvement District, GO Notes (LOC; U.S. Bank NA) | 0.24 | 9/7/11 | 6,150,000 a | 6,150,000 |
| Commerce City Northern Infrastructure General Improvement | ||||
| District, GO Notes, Refunding (LOC; U.S. Bank NA) | 0.24 | 9/7/11 | 9,390,000 a | 9,390,000 |
| Parker Automotive Metropolitan District, | ||||
| GO Notes (LOC; U.S. Bank NA) | 0.24 | 9/7/11 | 900,000 a | 900,000 |
| Southern Ute Indian Tribe of the | ||||
| Southern Ute Indian Reservation, Revenue | 0.21 | 9/7/11 | 20,000,000 a | 20,000,000 |
| Connecticut—4.6% | ||||
| Connecticut Health and Educational Facilities Authority, Revenue | ||||
| (Eastern Connecticut Health Network Issue) (LOC; TD Bank) | 0.18 | 9/7/11 | 3,700,000 a,b | 3,700,000 |
| Connecticut Housing Finance Authority, Revenue (Housing Mortgage | ||||
| Finance Program) (Liquidity Facility; Bank of Tokyo-Mitsubishi UFJ) | 0.24 | 9/7/11 | 5,000,000 a | 5,000,000 |
| Connecticut Housing Finance Authority, Revenue (Housing Mortgage | ||||
| Finance Program) (Liquidity Facility; Bank of Tokyo-Mitsubishi UFJ) | 0.24 | 9/7/11 | 13,240,000 a | 13,240,000 |
| Connecticut Housing Finance Authority, Revenue (Housing Mortgage | ||||
| Finance Program) (Liquidity Facility; Bank of Tokyo-Mitsubishi UFJ) | 0.24 | 9/7/11 | 12,780,000 a | 12,780,000 |
| Connecticut Housing Finance Authority, Revenue (Housing Mortgage | ||||
| Finance Program) (Liquidity Facility; Bank of Tokyo-Mitsubishi UFJ) | 0.24 | 9/7/11 | 20,935,000 a | 20,935,000 |
| Connecticut Housing Finance Authority, Revenue (Housing Mortgage | ||||
| Finance Program) (Liquidity Facility; Bank of Tokyo-Mitsubishi UFJ) | 0.24 | 9/7/11 | 1,300,000 a | 1,300,000 |
| Connecticut Housing Finance Authority, Revenue (Housing | ||||
| Mortgage Finance Program) Liquidity Facility; FHLB) | 0.23 | 9/7/11 | 2,920,000 a | 2,920,000 |
10
| BNY Mellon National Municipal Money Market Fund (continued) | ||||
| Coupon | Maturity | Principal | ||
| Short-Term Investments (continued) | Rate (%) | Date | Amount ($) | Value ($) |
| Connecticut (continued) | ||||
| New Canaan Housing Authority, Revenue (The Village at | ||||
| Waveny Care Center Project) (LOC; Bank of America) | 0.17 | 9/7/11 | 2,300,000 a | 2,300,000 |
| Delaware—1.2% | ||||
| Delaware Health Facilities Authority, | ||||
| Revenue (Christiana Care Health Services) | 0.11 | 9/1/11 | 7,400,000 a,b | 7,400,000 |
| University of Delaware, Revenue (Liquidity Facility; TD Bank) | 0.09 | 9/1/11 | 8,365,000 a | 8,365,000 |
| District of Columbia—.4% | ||||
| District of Columbia, GO Notes, Refunding (LOC; TD Bank) | 0.18 | 9/7/11 | 5,900,000 a | 5,900,000 |
| Florida—6.2% | ||||
| Broward County Educational Facilities Authority, | ||||
| Educational Facilities Revenue (Nova Southeastern | ||||
| University Project) (LOC; Bank of America) | 0.17 | 9/1/11 | 5,400,000 a | 5,400,000 |
| Jacksonville, Transportation Revenue (LOC; Wells Fargo Bank) | 0.19 | 9/7/11 | 12,500,000 a | 12,500,000 |
| Jacksonville Health Facilities Authority, HR (Baptist Medical | ||||
| Center Project) (LOC; Branch Banking and Trust Co.) | 0.20 | 9/7/11 | 9,710,000 a,b | 9,710,000 |
| Miami-Dade County Health Facilities Authority, HR, Refunding | ||||
| (Miami Children’s Hospital Project) (LOC; Wells Fargo Bank) | 0.18 | 9/7/11 | 18,425,000 a,b | 18,425,000 |
| Miami-Dade County Health Facilities Authority, HR, Refunding | ||||
| (Miami Children’s Hospital Project) (LOC; Wells Fargo Bank) | 0.18 | 9/7/11 | 36,725,000 a,b | 36,725,000 |
| Palm Beach County, IDR (Gulfstream Goodwill | ||||
| Industies, Inc. Project) (LOC; Wells Fargo Bank) | 0.29 | 9/7/11 | 1,155,000 a | 1,155,000 |
| Georgia—1.2% | ||||
| Fulton County Development Authority, Revenue | ||||
| (King’s Ridge Christian School Project) | ||||
| (LOC; Branch Banking and Trust Co.) | 0.21 | 9/7/11 | 6,865,000 a | 6,865,000 |
| Metropolitan Atlanta Rapid Transit Authority, Sales Tax | ||||
| Revenue (Second Indenture Series) (LOC: U.S. Bank NA) | 0.16 | 9/7/11 | 10,000,000 a | 10,000,000 |
| Idaho—.6% | ||||
| Coeur D’Alene Tribe, Revenue (LOC; Bank of America) | 0.31 | 9/7/11 | 8,400,000 a | 8,400,000 |
| Illinois—8.0% | ||||
| Chicago, Second Lien Water Revenue, Refunding | ||||
| (LOC; California Public Employees Retirement System) | 0.22 | 9/7/11 | 14,645,000 a | 14,645,000 |
| Chicago, Second Lien Water Revenue, | ||||
| Refunding (LOC; State Street Bank and Trust Co.) | 0.18 | 9/7/11 | 3,180,000 a | 3,180,000 |
| Chicago Board of Education, GO Notes, | ||||
| Refunding (LOC; JPMorgan Chase Bank) | 0.14 | 9/1/11 | 13,425,000 a | 13,425,000 |
| Illinois Finance Authority, Revenue (Elmhurst Memorial | ||||
| Healthcare) (LOC; JPMorgan Chase Bank) | 0.13 | 9/1/11 | 11,600,000 a,b | 11,600,000 |
| Illinois Finance Authority, Revenue (Gift of Hope Organ and | ||||
| Tissue Donor Network Project) (LOC; JPMorgan Chase Bank) | 0.25 | 9/7/11 | 7,010,000 a,b | 7,010,000 |
| Illinois Finance Authority, Revenue (Resurrection | ||||
| Health Care) (LOC; JPMorgan Chase Bank) | 0.14 | 9/1/11 | 11,960,000 a,b | 11,960,000 |
| Illinois Finance Authority, Revenue (The University of | ||||
| Chicago Medical Center) (LOC: Bank of America) | 0.13 | 9/1/11 | 46,250,000 a | 46,250,000 |
| The Funds | 11 |
STATEMENT OF INVESTMENTS (continued)
| BNY Mellon National Municipal Money Market Fund (continued) | ||||
| Coupon | Maturity | Principal | ||
| Short-Term Investments (continued) | Rate (%) | Date | Amount ($) | Value ($) |
| Indiana—1.0% | ||||
| Indiana Finance Authority, Environmental Revenue, Refunding | ||||
| (Duke Energy Indiana, Inc. Project) (LOC; Bank of America) | 0.13 | 9/1/11 | 3,400,000 a | 3,400,000 |
| Indiana Finance Authority, Revenue | ||||
| (Ascension Health Senior Credit Group) | 0.16 | 9/7/11 | 10,000,000 a,b | 10,000,000 |
| Iowa—1.5% | ||||
| Hills, Health Facilities Revenue (Mercy Hospital | ||||
| Project) (LOC; U.S. Bank NA) | 0.12 | 9/1/11 | 15,920,000 a,b | 15,920,000 |
| Iowa Higher Education Loan Authority, Revenue, | ||||
| BAN (William Penn University Project) | 1.50 | 12/1/11 | 4,000,000 | 4,008,931 |
| Kansas—.6% | ||||
| Olathe, Health Facilities Revenue (Olathe | ||||
| Medical Center) (LOC; Bank of America) | 0.17 | 9/1/11 | 8,100,000 a,b | 8,100,000 |
| Kentucky—2.6% | ||||
| Kentucky Rural Water Finance Corporation, | ||||
| Public Projects Construction Notes | 1.50 | 12/1/11 | 8,500,000 | 8,517,918 |
| Louisville/Jefferson County Metro Government, Health System | ||||
| Revenue (Norton Healthcare, Inc.) (LOC; JPMorgan Chase Bank) | 0.13 | 9/1/11 | 27,000,000 a,b | 27,000,000 |
| Louisiana—4.2% | ||||
| Louisiana Public Facilities Authority, Revenue | ||||
| (Air Products and Chemicals Project) | 0.08 | 9/1/11 | 13,000,000 a | 13,000,000 |
| Louisiana Public Facilities Authority, Revenue | ||||
| (Air Products and Chemicals Project) | 0.08 | 9/1/11 | 25,100,000 a | 25,100,000 |
| Saint James Parish, PCR, Refunding | ||||
| (Chevron Corp.) (LOC; Chevron Corp.) | 0.07 | 9/1/11 | 18,585,000 a | 18,585,000 |
| Maryland—1.1% | ||||
| Howard County, Revenue, Refunding (Glenelg Country | ||||
| School, Inc. Facility) (LOC; PNC Bank NA) | 0.21 | 9/7/11 | 4,435,000 a | 4,435,000 |
| Maryland Industrial Development Financing Authority, | ||||
| Recovery Zone Facility Revenue (Wexford Maryland | ||||
| Bio Park 3, LLC Facility) (LOC; M&T Trust) | 0.26 | 9/7/11 | 10,000,000 a | 10,000,000 |
| Michigan—3.5% | ||||
| Lenawee County Economic Development Corporation, Revenue, | ||||
| Refunding (Siena Heights University Project) (LOC; FHLB) | 0.22 | 9/7/11 | 8,420,000 a | 8,420,000 |
| Michigan Higher Education Facilities Authority, LOR | ||||
| (Adrian College Project) (LOC; Comerica Bank) | 0.26 | 9/7/11 | 12,625,000 a | 12,625,000 |
| Michigan Strategic Fund, LOR (Air Products | ||||
| and Chemicals, Inc. Project) | 0.08 | 9/1/11 | 10,000,000 a | 10,000,000 |
| Michigan Strategic Fund, LOR (MANS, LLC | ||||
| Project) (LOC; Comerica Bank) | 0.26 | 9/7/11 | 6,400,000 a | 6,400,000 |
| University of Michigan, CP | 0.09 | 9/19/11 | 10,000,000 | 10,000,000 |
| Minnesota—1.4% | ||||
| Minnesota Higher Education Facilities Authority, Revenue | ||||
| (Gustavus Adolphus College) (LOC; Wells Fargo Bank) | 0.19 | 9/7/11 | 12,950,000 a | 12,950,000 |
12
| BNY Mellon National Municipal Money Market Fund (continued) | ||||
| Coupon | Maturity | Principal | ||
| Short-Term Investments (continued) | Rate (%) | Date | Amount ($) | Value ($) |
| Minnesota (continued) | ||||
| Minnesota Higher Education Facilities Authority, Revenue | ||||
| (The College of Saint Catherine) (LOC; U.S. Bank NA) | 0.19 | 9/7/11 | 2,740,000 a | 2,740,000 |
| Saint Louis Park, MFHR, Refunding (Parkshore Senior | ||||
| Campus Project) (Liquidity Facility; FHLMC and LOC; FHLMC) | 0.22 | 9/7/11 | 2,600,000 a | 2,600,000 |
| Mississippi—.7% | ||||
| Jackson County, Port Facility Revenue, Refunding | ||||
| (Chevron U.S.A. Inc. Project) (LOC; Chevron Corp.) | 0.06 | 9/1/11 | 10,000,000 a | 10,000,000 |
| Missouri—.4% | ||||
| Missouri Health and Educational Facilities Authority, | ||||
| Educational Facilities Revenue (Saint Louis University) | ||||
| (Liquidity Facility; Bank of America) | 0.13 | 9/1/11 | 5,600,000 a | 5,600,000 |
| Nebraska—1.3% | ||||
| Lancaster County Hospital Authority Number 1, HR, | ||||
| Refunding (BryanLGH Medical Center) (LOC; U.S. Bank NA) | 0.18 | 9/7/11 | 17,565,000 a,b | 17,565,000 |
| New Hampshire—4.1% | ||||
| New Hampshire Health and Education Facilities Authority, | ||||
| Revenue (University System of New Hampshire Issue) | ||||
| (Liquidity Facility; JPMorgan Chase Bank) | 0.14 | 9/1/11 | 32,000,000 a | 32,000,000 |
| New Hampshire Health and Education Facilities Authority, | ||||
| Revenue (University System of New Hampshire Issue) | ||||
| (Liquidity Facility; U.S. Bank NA) | 0.14 | 9/1/11 | 23,700,000 a,b | 23,700,000 |
| New Jersey—1.6% | ||||
| East Brunswick Township, GO Notes, BAN | 2.00 | 4/13/12 | 14,400,000 | 14,507,032 |
| Montclair Township, Temporary Notes | 1.50 | 3/9/12 | 5,000,000 | 5,012,832 |
| New Jersey Transportation Trust Fund Authority | ||||
| (Transportation System) | 5.25 | 12/15/11 | 2,000,000 | 2,027,089 |
| New Mexico—1.5% | ||||
| Alamogordo, Hospital Improvement Revenue, | ||||
| Refunding (Gerald Champion Regional Medical | ||||
| Center Project) (LOC; Bank of America) | 0.30 | 9/7/11 | 20,000,000 a,b | 20,000,000 |
| New York—8.3% | ||||
| Albany Industrial Development Agency, Civic Facility Revenue | ||||
| (Renaissance Corporation of Albany Project) (LOC; M&T Trust) | 0.26 | 9/7/11 | 1,000,000 a | 1,000,000 |
| Amherst Industrial Development Agency, Civic Facility | ||||
| Revenue (Daemen College Project) (LOC; M&T Trust) | 0.26 | 9/7/11 | 12,400,000 a | 12,400,000 |
| Dutchess County Industrial Development Agency, Civic Facility | ||||
| Revenue (Brookview Inc. Project) (LOC; M&T Trust) | 0.26 | 9/7/11 | 8,610,000 a | 8,610,000 |
| Elmira City School District, GO Notes, BAN | 1.75 | 2/15/12 | 5,000,000 | 5,013,453 |
| Erie County Industrial Development Agency, Civic Facility Revenue | ||||
| (The Canisius High School of Buffalo, N.Y. Project) (LOC; M&T Trust) | 0.26 | 9/1/11 | 21,445,000 a | 21,445,000 |
| New York City, GO Notes (LOC; State Street Bank and Trust Co.) | 0.12 | 9/1/11 | 5,900,000 a | 5,900,000 |
| New York City Capital Resource Corporation, Recovery Zone | ||||
| Facility Revenue (WytheHotel Project) (LOC; M&T Trust) | 0.28 | 9/7/11 | 3,700,000 a | 3,700,000 |
| The Funds | 13 |
STATEMENT OF INVESTMENTS (continued)
| BNY Mellon National Municipal Money Market Fund (continued) | ||||
| Coupon | Maturity | Principal | ||
| Short-Term Investments (continued) | Rate (%) | Date | Amount ($) | Value ($) |
| New York (continued) | ||||
| New York Liberty Development Corporation, | ||||
| Liberty Revenue (World Trade Center Project) | 0.35 | 2/1/12 | 16,000,000 | 16,000,000 |
| New York Liberty Development Corporation, Recovery | ||||
| Zone Revenue (3 World Trade Center Project) | 0.42 | 1/19/12 | 5,000,000 | 5,000,000 |
| New York State Housing Finance Agency, Housing | ||||
| Revenue (25 Washington Street) (LOC; M&T Trust) | 0.27 | 9/7/11 | 7,800,000 a | 7,800,000 |
| New York State Thruway Authority, General Revenue, BAN | 2.00 | 7/12/12 | 13,300,000 | 13,488,126 |
| Onondaga County Industrial Development Agency, Civic Facility | ||||
| Revenue (Syracuse Research Corporation Facility) (LOC; M&T Trust) | 0.26 | 9/7/11 | 4,180,000 a | 4,180,000 |
| Tompkins County Industrial Development Agency, | ||||
| Civic Facility Revenue (Community Development | ||||
| Properties Ithaca Inc. Project) (LOC; M&T Trust) | 0.31 | 9/7/11 | 6,500,000 a | 6,500,000 |
| North Carolina—.4% | ||||
| North Carolina Capital Facilities Finance Agency, Educational | ||||
| Facilities Revenue (High Point University Project) | ||||
| (LOC; Branch Banking and Trust Co.) | 0.21 | 9/7/11 | 5,325,000 a | 5,325,000 |
| Ohio—1.0% | ||||
| Allen County, Hospital Facilities Revenue (Catholic | ||||
| Healthcare Partners) (LOC; Bank of America) | 0.14 | 9/1/11 | 4,800,000 a,b | 4,800,000 |
| Warren County, Health Care Facilities Improvement | ||||
| Revenue (Otterbein Homes Project) (LOC; U.S. Bank NA) | 0.20 | 9/7/11 | 9,200,000 a,b | 9,200,000 |
| Oklahoma—1.5% | ||||
| Oklahoma Turnpike Authority, Second Senior | ||||
| Revenue, Refunding (Oklahoma Turnpike System) | ||||
| (Liquidity Facility; JPMorgan Chase Bank) | 0.13 | 9/1/11 | 9,975,000 a | 9,975,000 |
| Oklahoma Turnpike Authority, Second Senior | ||||
| Revenue, Refunding (Oklahoma Turnpike System) | ||||
| (Liquidity Facility; JPMorgan Chase Bank) | 0.13 | 9/1/11 | 10,000,000 a | 10,000,000 |
| Oregon—2.2% | ||||
| Medford Hospital Facilities Authority, Revenue | ||||
| (Rogue Valley Manor Project) (LOC; Bank of America) | 0.18 | 9/1/11 | 8,895,000 a,b | 8,895,000 |
| Umatilla Indian Reservation Confederated Tribes, | ||||
| Tribal Infrastructure Revenue (LOC; Wells Fargo Bank) | 0.19 | 9/7/11 | 21,145,000 a | 21,145,000 |
| Pennsylvania—4.8% | ||||
| Allegheny County Industrial Development Authority, | ||||
| Revenue (The Watson Institute Friendship | ||||
| Academy Project) (LOC; PNC Bank NA) | 0.21 | 9/7/11 | 3,750,000 a | 3,750,000 |
| Allentown Commercial and Industrial Development Authority, | ||||
| Revenue (Diocese of Allentown) (LOC; Wells Fargo Bank) | 0.12 | 9/1/11 | 1,350,000 a | 1,350,000 |
| Beaver County Industrial Development Authority, PCR, | ||||
| Refunding (FirstEnergy Nuclear Generation | ||||
| Corporation Project) (LOC; Citibank NA) | 0.15 | 9/7/11 | 26,900,000 a | 26,900,000 |
| Emmaus General Authority, Local Government | ||||
| Revenue (LOC; U.S. Bank NA) | 0.17 | 9/7/11 | 3,400,000 a | 3,400,000 |
14
| BNY Mellon National Municipal Money Market Fund (continued) | ||||
| Coupon | Maturity | Principal | ||
| Short-Term Investments (continued) | Rate (%) | Date | Amount ($) | Value ($) |
| Pennsylvania (continued) | ||||
| Lower Merion School District, GO Notes | ||||
| (LOC; State Street Bank and Trust Co.) | 0.17 | 9/7/11 | 8,000,000 a | 8,000,000 |
| Monroe County Hospital Authority, HR | ||||
| (Pocono Medical Center) (LOC; PNC Bank NA) | 0.20 | 9/7/11 | 3,430,000 a,b | 3,430,000 |
| Philadelphia Hospitals and Higher Education Facilities | ||||
| Authority, HR (The Children’s Hospital of Philadelphia | ||||
| Project) (Liquidity Facility; JPMorgan Chase Bank) | 0.13 | 9/1/11 | 9,700,000 a,b | 9,700,000 |
| Pittsburgh Water and Sewer Authority, Water and Sewer | ||||
| System First Lien Revenue, Refunding (LOC; PNC Bank NA) | 0.17 | 9/7/11 | 9,000,000 a | 9,000,000 |
| Rhode Island—.4% | ||||
| Rhode Island Health and Educational Building Corporation, | ||||
| Educational Institution Revenue (Portsmouth Abbey | ||||
| School Issue) (LOC; Bank of America) | 0.21 | 9/1/11 | 4,900,000 a | 4,900,000 |
| South Carolina—1.3% | ||||
| South Carolina Association of | ||||
| Governmental Organizations, COP | 1.50 | 4/13/12 | 18,000,000 | 18,139,854 |
| Tennessee—2.2% | ||||
| Clarksville Public Building Authority, Financing Revenue | ||||
| (Metropolitan Government of Nashville and Davidson | ||||
| County Loan) (LOC; Bank of America) | 0.18 | 9/1/11 | 13,235,000 a | 13,235,000 |
| Montgomery County Public Building Authority, | ||||
| Pooled Financing Revenue (Tennessee County | ||||
| Loan Pool) (LOC; Bank of America) | 0.18 | 9/1/11 | 16,145,000 a | 16,145,000 |
| Texas—13.5% | ||||
| Gulf Coast Waste Disposal Authority, | ||||
| Environmental Facilities Revenue (Air Products Project) | 0.15 | 9/7/11 | 6,400,000 a | 6,400,000 |
| Harris County, GO Notes, TAN | 1.50 | 2/29/12 | 45,000,000 | 45,295,385 |
| Harris County Health Facilities Development Corporation, HR | ||||
| (Baylor College of Medicine) (LOC; Bank of America) | 0.13 | 9/1/11 | 9,900,000 a | 9,900,000 |
| Harris County Health Facilities Development Corporation, | ||||
| Revenue (Saint Luke’s Episcopal Hospital) (Liquidity Facility: | ||||
| Bank of America, JPMorgan Chase Bank and Northern Trust Co.) | 0.14 | 9/1/11 | 46,920,000 a,b | 46,920,000 |
| Harris County Health Facilities Development Corporation, | ||||
| Revenue, Refunding (The Methodist Hospital System) | 0.11 | 9/1/11 | 9,970,000 a,b | 9,970,000 |
| Jefferson County Industrial Development Corporation, | ||||
| Hurricane Ike Disaster Area Revenue (Jefferson | ||||
| Refinery, LLC Project) (LOC; Branch Banking and Trust Co.) | 0.50 | 9/29/11 | 39,300,000 | 39,300,000 |
| Travis County Health Facilities Development Corporation, | ||||
| Retirement Facilities Revenue (Longhorn Village | ||||
| Project) (LOC; Bank of Scotland) | 0.18 | 9/7/11 | 23,300,000 a | 23,300,000 |
| Utah—.2% | ||||
| Utah Housing Corporation, MFHR | ||||
| (Timbergate Apartments Project) (LOC; FHLMC) | 0.27 | 9/7/11 | 3,125,000 a | 3,125,000 |
| The Funds | 15 |
STATEMENT OF INVESTMENTS (continued)
| BNY Mellon National Municipal Money Market Fund (continued) | ||||
| Coupon | Maturity | Principal | ||
| Short-Term Investments (continued) | Rate (%) | Date | Amount ($) | Value ($) |
| Virginia—1.3% | ||||
| Alexandria Industrial Development Authority, Revenue | ||||
| (Institute for Defense Analyses Project) | ||||
| (LOC; Branch Banking and Trust Co.) | 0.21 | 9/7/11 | 9,875,000 a | 9,875,000 |
| Williamsburg Industrial Development Authority, Revenue | ||||
| (The Colonial Williamsburg Foundation) (LOC; Wells Fargo Bank) | 0.19 | 9/7/11 | 8,000,000 a | 8,000,000 |
| Washington—.5% | ||||
| Tulalip Tribes of the Tulalip Reservation, Revenue, | ||||
| Refunding (Capital Projects) (LOC; Wells Fargo Bank) | 0.26 | 9/7/11 | 2,625,000 a | 2,625,000 |
| Vancouver Housing Authority, Pooled Housing Revenue, | ||||
| Refunding (Liquidity Facility; FHLMC and LOC; FHLMC) | 0.19 | 9/7/11 | 4,400,000 a | 4,400,000 |
| Wisconsin—3.1% | ||||
| Wisconsin Health and Educational Facilities Authority, | ||||
| Revenue (Cedar Crest, Inc.) (LOC; Bank of Montreal) | 0.26 | 9/7/11 | 7,250,000 a,b | 7,250,000 |
| Wisconsin Health and Educational Facilities Authority, | ||||
| Revenue (Meriter Hospital, Inc.) (LOC; U.S. Bank NA) | 0.12 | 9/1/11 | 15,045,000 a,b | 15,045,000 |
| Wisconsin Health and Educational Facilities Authority, Revenue | ||||
| (Wheaton Franciscan Services, Inc. System) (LOC; U.S. Bank NA) | 0.13 | 9/7/11 | 20,290,000 a,b | 20,290,000 |
| Total Investments (cost $1,352,370,620) | 100.0% | 1,352,370,620 | ||
| Cash and Receivables (Net) | .0% | 661,946 | ||
| Net Assets | 100.0% | 1,353,032,566 | ||
| a Variable rate demand note—rate shown is the interest rate in effect at August 31, 2011. Maturity date represents the next demand date, or the ultimate maturity date if earlier. |
| b At August 31, 2011, the fund had $407,715,000 or 30.1% of net assets invested in securities whose payment of principal and interest is dependent upon revenues generated |
| from health care. |
| c Security exempt from registration under Rule 144A of the Securities Act of 1933.This security may be resold in transactions exempt from registration, normally to qualified |
| institutional buyers.At August 31, 2011, this security amounted to $13,500,000 or 1.0% of net assets. |
| d The fund does not directly own the municipal security indicated; the fund owns an interest in a special purpose entity that, in turn, owns the underlying municipal security.The |
| special purpose entity permits the fund to own interests in underlying assets, but in a manner structured to provide certain advantages not inherent in the underlying bonds (e.g., |
| enhanced liquidity, yields linked to short-term rates). |
16
| Summary of Abbreviations | ||||||
| ABAG | Association of Bay Area Governments | ACA | American Capital Access | |||
| AGC | ACE Guaranty Corporation | AGIC | Asset Guaranty Insurance Company | |||
| AMBAC | American Municipal Bond Assurance Corporation | ARRN | Adjustable Rate Receipt Notes | |||
| BAN | Bond Anticipation Notes | BPA | Bond Purchase Agreement | |||
| CIFG | CDC Ixis Financial Guaranty | COP | Certificate of Participation | |||
| CP | Commercial Paper | EDR | Economic Development Revenue | |||
| EIR | Environmental Improvement Revenue | FGIC | Financial Guaranty Insurance Company | |||
| FHA | Federal Housing Administration | FHLB | Federal Home Loan Bank | |||
| FHLMC | Federal Home Loan Mortgage Corporation | FNMA | Federal National Mortgage Association | |||
| GAN | Grant Anticipation Notes | GIC | Guaranteed Investment Contract | |||
| GNMA | Government National Mortgage Association | GO | General Obligation | |||
| HR | Hospital Revenue | IDB | Industrial Development Board | |||
| IDC | Industrial Development Corporation | IDR | Industrial Development Revenue | |||
| LOC | Letter of Credit | LOR | Limited Obligation Revenue | |||
| LR | Lease Revenue | MFHR | Multi-Family Housing Revenue | |||
| MFMR | Multi-Family Mortgage Revenue | PCR | Pollution Control Revenue | |||
| PILOT | Payment in Lieu of Taxes | PUTTERS | Puttable Tax-Exempt Receipts | |||
| RAC | Revenue Anticipation Certificates | RAN | Revenue Anticipation Notes | |||
| RAW | Revenue Anticipation Warrants | RRR | Resources Recovery Revenue | |||
| SAAN | State Aid Anticipation Notes | SBPA | Standby Bond Purchase Agreement | |||
| SFHR | Single Family Housing Revenue | SFMR | Single Family Mortgage Revenue | |||
| SONYMA | State of New York Mortgage Agency | SWDR | Solid Waste Disposal Revenue | |||
| TAN | Tax Anticipation Notes | TAW | Tax Anticipation Warrants | |||
| TRAN | Tax and Revenue Anticipation Notes | XLCA | XL Capital Assurance | |||
| Summary of Combined Ratings (Unaudited) | ||||||
| Fitch | or | Moody’s | or | Standard & Poor’s | Value (%)† | |
| F1+,F1 | VMIG1,MIG1,P1 | SP1+,SP1,A1+,A1 | 93.7 | |||
| AAA,AA,Ae | Aaa,Aa,Ae | AAA,AA,Ae | 2.4 | |||
| Not Ratedf | Not Ratedf | Not Ratedf | 3.9 | |||
| 100.0 | ||||||
| † Based on total investments. |
| e Notes which are not F, MIG and SP rated are represented by bond ratings of the issuers. |
| f Securities which, while not rated by Fitch, Moody’s and Standard & Poor’s, have been determined by the Manager to be of comparable quality to those rated securities in which the |
| fund may invest. |
| See notes to financial statements. |
| The Funds | 17 |
| STATEMENTS OF ASSETS AND LIABILITIES |
| August 31, 2011 |
| BNY Mellon | BNY Mellon | |
| Money Market | National Municipal | |
| Fund | Money Market Fund | |
| Assets ($): | ||
| Investments in securities—See Statement of Investments† | ||
| (including Repurchase Agreement of $225,000,000 | ||
| for BNY Mellon Money Market Fund)—Note 2(c) | 1,007,215,859 | 1,352,370,620 |
| Cash | 429,196 | 353,343 |
| Interest receivable | 187,612 | 652,322 |
| Prepaid expenses | 12,796 | 14,668 |
| 1,007,845,463 | 1,353,390,953 | |
| Liabilities ($): | ||
| Due to The Dreyfus Corporation and affiliates—Note 3(b) | 24,483 | 126,094 |
| Due to Administrator—Note 3(a) | 111,413 | 151,778 |
| Accrued expenses | 76,573 | 80,515 |
| 212,469 | 358,387 | |
| Net Assets ($) | 1,007,632,994 | 1,353,032,566 |
| Composition of Net Assets ($): | ||
| Paid-in capital | 1,007,635,027 | 1,354,512,617 |
| Accumulated net realized gain (loss) on investments | (2,033) | (1,480,051) |
| Net Assets ($) | 1,007,632,994 | 1,353,032,566 |
| Net Asset Value Per Share | ||
| Class M Shares | ||
| Net Assets ($) | 1,006,110,925 | 1,352,760,405 |
| Shares Outstanding | 1,006,112,957 | 1,354,241,216 |
| Net Asset Value Per Share ($) | 1.00 | 1.00 |
| Investor Shares | ||
| Net Assets ($) | 1,522,069 | 272,161 |
| Shares Outstanding | 1,522,070 | 272,316 |
| Net Asset Value Per Share ($) | 1.00 | 1.00 |
| † Investments at cost ($) | 1,007,215,859 | 1,352,370,620 |
| See notes to financial statements. | ||
18
| STATEMENTS OF OPERATIONS |
| Year Ended August 31, 2011 |
| BNY Mellon | BNY Mellon | |
| Money Market | National Municipal | |
| Fund | Money Market Fund | |
| Investment Income ($): | ||
| Interest Income | 2,986,124 | 4,574,759 |
| Expenses: | ||
| Investment advisory fee—Note 3(a) | 1,606,562 | 2,335,501 |
| Administration fee—Note 3(a) | 1,321,991 | 1,921,479 |
| Custodian fees—Note 3(b) | 95,922 | 94,680 |
| Professional fees | 44,175 | 49,112 |
| Trustees’ fees and expenses—Note 3(c) | 40,205 | 68,397 |
| Registration fees | 30,501 | 30,533 |
| Prospectus and shareholders’ reports | 9,929 | 10,519 |
| Shareholder servicing costs—Note 3(b) | 3,806 | 185 |
| Miscellaneous | 28,280 | 43,401 |
| Total Expenses | 3,181,371 | 4,553,807 |
| Less—reduction in expenses due to undertaking—Note 3(a) | (378,300) | (480,528) |
| Less—reduction in fees due to earnings credits—Note 3(b) | (5,242) | (1) |
| Net Expenses | 2,797,829 | 4,073,278 |
| Investment Income—Net | 188,295 | 501,481 |
| Net Realized Gain (Loss) on Investments—Note 2(b) ($) | 1,862 | 70,969 |
| Net Increase in Net Assets Resulting from Operations | 190,157 | 572,450 |
| See notes to financial statements. | ||
| The Funds | 19 |
STATEMENTS OF CHANGES IN NET ASSETS
| BNY Mellon National Municipal | ||||
| BNY Mellon Money Market Fund | Money Market Fund | |||
| Year Ended August 31, | Year Ended August 31, | |||
| 2011 | 2010 | 2011 | 2010 | |
| Operations ($): | ||||
| Investment income—net | 188,295 | 1,029,904 | 501,481 | 720,481 |
| Net realized gain (loss) from investments | 1,862 | 1,161 | 70,969 | — |
| Net Increase (Decrease) in Net Assets | ||||
| Resulting from Operations | 190,157 | 1,031,065 | 572,450 | 720,481 |
| Dividends to Shareholders from ($): | ||||
| Investment income—net: | ||||
| Class M Shares | (188,295) | (1,029,904) | (501,481) | (720,481) |
| Beneficial Interest Transactions ($1.00 per share): | ||||
| Net proceeds from shares sold: | ||||
| Class M Shares | 2,272,717,006 | 2,172,447,209 | 3,261,289,405 | 3,010,169,507 |
| Investor Shares | 5,353,986 | 132,684 | 1,016,239 | — |
| Dividends reinvested: | ||||
| Class M Shares | 20 | 80 | 9 | 70 |
| Cost of shares redeemed: | ||||
| Class M Shares | (2,359,378,733) | (3,014,416,869) | (3,459,874,403) | (3,229,503,661) |
| Investor Shares | (4,144,401) | (1,520,918) | (745,031) | — |
| Increase (Decrease) in Net Assets from | ||||
| Beneficial Interest Transactions | (85,452,122) | (843,357,814) | (198,313,781) | (219,334,084) |
| Total Increase (Decrease) In Net Assets | (85,450,260) | (843,356,653) | (198,242,812) | (219,334,084) |
| Net Assets ($): | ||||
| Beginning of Period | 1,093,083,254 | 1,936,439,907 | 1,551,275,378 | 1,770,609,462 |
| End of Period | 1,007,632,994 | 1,093,083,254 | 1,353,032,566 | 1,551,275,378 |
| See notes to financial statements. | ||||
20
FINANCIAL HIGHLIGHTS
The following tables describe the performance for each share class of each BNY Mellon money market fund for the fiscal periods indicated.All information reflects financial results for a single fund share.Total return shows how much your investment in each fund would have increased (or decreased) during each period, assuming you had reinvested all dividends and distributions.These figures have been derived from the funds’ financial statements.
| Class M Shares | |||||
| Year Ended August 31, | |||||
| BNY Mellon Money Market Fund | 2011 | 2010 | 2009 | 2008 | 2007 |
| Per Share Data ($): | |||||
| Net asset value, beginning of period | 1.00 | 1.00 | 1.00 | 1.00 | 1.00 |
| Investment Operations: | |||||
| Investment income—net | .000a | .001 | .012 | .037 | .050 |
| Distributions: | |||||
| Dividends from investment income—net | (.000)a | (.001) | (.012) | (.037) | (.050) |
| Net asset value, end of period | 1.00 | 1.00 | 1.00 | 1.00 | 1.00 |
| Total Return (%) | .02 | .07 | 1.24 | 3.72 | 5.16 |
| Ratios/Supplemental Data (%): | |||||
| Ratio of total expenses to average net assets | .30 | .30 | .33 | .30 | .30 |
| Ratio of net expenses to average net assets | .26 | .29 | .33 | .30 | .30 |
| Ratio of net investment income to average net assets | .02 | .07 | 1.08 | 3.53 | 5.04 |
| Net Assets, end of period ($ x 1,000) | 1,006,111 | 1,092,771 | 1,934,739 | 1,175,866 | 843,242 |
| a Amount represents less than $.001 per share. | |||||
| See notes to financial statements. | |||||
| The Funds | 21 |
FINANCIAL HIGHLIGHTS (continued)
| Investor Shares | |||||
| Year Ended August 31, | |||||
| BNY Mellon Money Market Fund | 2011 | 2010 | 2009 | 2008 | 2007 |
| Per Share Data ($): | |||||
| Net asset value, beginning of period | 1.00 | 1.00 | 1.00 | 1.00 | 1.00 |
| Investment Operations: | |||||
| Investment income—net | .000a | .000a | .010 | .034 | .048 |
| Distributions: | |||||
| Dividends from investment income—net | (.000)a | (.000)a | (.010) | (.034) | (.048) |
| Net asset value, end of period | 1.00 | 1.00 | 1.00 | 1.00 | 1.00 |
| Total Return (%) | .00b | .00b | .99 | 3.47 | 4.89 |
| Ratios/Supplemental Data (%): | |||||
| Ratio of total expenses to average net assets | .55 | .55 | .58 | .55 | .55 |
| Ratio of net expenses to average net assets | .26 | .38 | .58 | .55 | .55 |
| Ratio of net investment income to average net assets | .00b | .00b | .97 | 3.39 | 4.80 |
| Net Assets, end of period ($ x 1,000) | 1,522 | 312 | 1,701 | 1,588 | 1,354 |
| a | Amount represents less than $.001 per share. |
| b | Amount represents less than .01%. |
| See notes to financial statements. | |
22
| Class M Shares | |||||
| Year Ended August 31, | |||||
| BNY Mellon National Municipal Money Market Fund | 2011 | 2010 | 2009 | 2008 | 2007 |
| Per Share Data ($): | |||||
| Net asset value, beginning of period | 1.00 | 1.00 | 1.00 | 1.00 | 1.00 |
| Investment Operations: | |||||
| Investment income—net | .000a | .000a | .008 | .024 | .033 |
| Distributions: | |||||
| Dividends from investment income—net | (.000)a | (.000)a | (.008) | (.024) | (.033) |
| Net asset value, end of period | 1.00 | 1.00 | 1.00 | 1.00 | 1.00 |
| Total Return (%) | .03 | .05 | .79 | 2.39 | 3.40 |
| Ratios/Supplemental Data (%): | |||||
| Ratio of total expenses to average net assets | .29 | .30 | .35 | .31 | .30 |
| Ratio of net expenses to average net assets | .26 | .28 | .34 | .28 | .30 |
| Ratio of net investment income to average net assets | .03 | .04 | .80 | 2.24 | 3.35 |
| Net Assets, end of period ($ x 1,000) | 1,352,760 | 1,551,274 | 1,770,608 | 1,629,931 | 940,257 |
| a Amount represents less than $.001 per share. |
| See notes to financial statements. |
| The Funds | 23 |
FINANCIAL HIGHLIGHTS (continued)
| Investor Shares | |||||
| Year Ended August 31, | |||||
| BNY Mellon National Municipal Money Market Fund | 2011 | 2010 | 2009 | 2008 | 2007 |
| Per Share Data ($): | |||||
| Net asset value, beginning of period | 1.00 | 1.00 | 1.00 | 1.00 | 1.00 |
| Investment Operations: | |||||
| Investment income—net | .000a | .000a | .006 | .021 | .031 |
| Distributions: | |||||
| Dividends from investment income—net | (.000)a | (.000)a | (.006) | (.021) | (.031) |
| Net asset value, end of period | 1.00 | 1.00 | 1.00 | 1.00 | 1.00 |
| Total Return (%) | .00b | .00b | .60 | 2.13 | 3.15 |
| Ratios/Supplemental Data (%): | |||||
| Ratio of total expenses to average net assets | .54 | .55 | .60 | .56 | .56 |
| Ratio of net expenses to average net assets | .29 | .33 | .53 | .53 | .55 |
| Ratio of net investment income to average net assets | .00b | .00b | .57 | 2.05 | 3.16 |
| Net Assets, end of period ($ x 1,000) | 272 | 1 | 1 | 1 | 1 |
| a | Amount represents less than $.001 per share. |
| b | Amount represents less than .01%. |
| See notes to financial statements. | |
24
NOTES TO FINANCIAL STATEMENTS
NOTE 1—General:
BNY Mellon Funds Trust (the “Trust”) was organized as a Massachusetts business trust which is registered under the Investment Company Act of 1940, as amended (the “Act”), as an open-end management investment company and operates as a series company currently consisting of twenty-five series, including the following diversified money market funds: BNY Mellon Money Market Fund and BNY Mellon National Municipal Money Market Fund (each, a “fund” and collectively, the “funds”). BNY Mellon Money Market Fund’s investment objective is to seek as high a level of current income as is consistent with the preservation of capital and the maintenance of liquidity. BNY Mellon National Municipal Money Market Fund’s investment objective is to provide investors with as high a level of current income exempt from federal income tax as is consistent with the preservation of capital and the maintenance of liquidity.
BNY Mellon Fund Advisers, a division of The Dreyfus Corporation (the “Manager” or “Dreyfus), a wholly-owned subsidiary of The Bank of New York Mellon Corporation (“BNY Mellon”), serves as each fund’s investment adviser (“Investment Adviser”).The Bank of New York Mellon, a subsidiary of BNY Mellon and an affiliate of Dreyfus, serves as administrator for the funds pursuant to an Administration Agreement with the Trust (the “Administration Agreement”). The Bank of New York Mellon has entered into a Sub-Administration Agreement with Dreyfus pursuant to whichThe Bank of New York Mellon pays Dreyfus for performing certain administrative services. MBSC Securities Corporation (the “Distributor”), a wholly-owned subsidiary of Dreyfus, is the distributor of each fund’s shares, which are sold without a sales charge.
The Trust is authorized to issue an unlimited number of shares of Beneficial Interest, par value $.001 per share, in Class M and Investor Class shares of each fund. Each class of shares has similar rights and privileges, except with
respect to the expenses borne by and the shareholder services offered to each class and the shareholder services plan applicable to the Investor shares, the allocation of certain transfer agency costs, and certain voting rights. Income, expenses (other than expenses attributable to a specific class), and realized gains or losses on investments are allocated to each class of shares based on its relative net assets.
TheTrust accounts separately for the assets, liabilities and operations of each series. Expenses directly attributable to each series are charged to that series’ operations; expenses that are applicable to all series are allocated among them on a pro rata basis.
The Financial Accounting Standards Board (“FASB”) Accounting Standards Codification (“ASC”) is the exclusive reference of authoritative U.S. generally accepted accounting principles (“GAAP”) recognized by the FASB to be applied by nongovernmental entities. Rules and interpretive releases of the Securities and Exchange Commission (“SEC”) under authority of federal laws are also sources of authoritative GAAP for SEC registrants. Each fund’s financial statements are prepared in accordance with GAAP, which may require the use of management estimates and assumptions. Actual results could differ from those estimates.
NOTE 2—Significant Accounting Policies:
(a) Portfolio valuation: Investments in securities are valued at amortized cost in accordance with Rule 2a-7 of the Act, which has been determined by the Trust’s Board to represent the fair value of the funds’ investments.
It is the funds’ policy to maintain a continuous net asset value per share of $1.00; the funds have adopted certain investment, portfolio valuation and dividend and distribution policies to enable them to do so. There is no assurance, however, that the funds will be able to maintain a stable net asset value per share of $1.00.
| The Funds | 25 |
NOTES TO FINANCIAL STATEMENTS (continued)
The fair value of a financial instrument is the amount that would be received to sell an asset or paid to transfer a liability in an orderly transaction between market participants at the measurement date (i.e. the exit price). GAAP establishes a fair value hierarchy that prioritizes the inputs of valuation techniques used to measure fair value. This hierarchy gives the highest priority to unadjusted quoted prices in active markets for identical assets or liabilities (Level 1 measurements) and the lowest priority to unobservable inputs (Level 3 measurements).
Additionally, GAAP provides guidance on determining whether the volume and activity in a market has decreased significantly and whether such a decrease in activity results in transactions that are not orderly. GAAP requires enhanced disclosures around valuation inputs and techniques used during annual and interim periods.
Various inputs are used in determining the value of each fund’s investments relating to fair value measurements. These inputs are summarized in the three broad levels listed below:
Level 1—unadjusted quoted prices in active markets for identical investments.
Level 2—other significant observable inputs (including quoted prices for similar investments, interest rates, prepayment speeds, credit risk, etc.).
Level 3—significant unobservable inputs (including the funds’ own assumptions in determining the fair value of investments).
The inputs or methodology used for valuing securities are not necessarily an indication of the risk associated with investing in those securities. For example, money market
| Table 1—Fair Value Measurements | ||||
| Short-Term Investments ($)† | ||||
| Level 1—Unadjusted | Level 2—Other Significant | Level 3—Significant | ||
| Quoted Prices | Observable Inputs | Unobservable Inputs | Total | |
| BNY Mellon Money Market Fund | — | 1,007,215,859 | — | 1,007,215,859 |
| BNY Mellon National Municipal | ||||
| Money Market Fund | — | 1,352,370,620 | — | 1,352,370,620 |
| † See Statements of Investments for additional detailed categorizations. | ||||
securities are valued using amortized cost, in accordance with rules under the Act. Generally, amortized cost approximates the current fair value of a security, but since the value is not obtained from a quoted price in an active market, such securities are reflected as Level 2.
Table 1 summarizes the inputs used as of August 31, 2011 in valuing each fund’s investments.
(b) Securities transactions and investment income:
Securities transactions are recorded on a trade date basis. Interest income, adjusted for accretion of discount and amortization of premium on investments, is earned from settlement date and recognized on the accrual basis. Realized gains and losses from securities transactions are recorded on the identified cost basis. Cost of investments represents amortized cost.
(c) Repurchase agreements: The funds may engage in repurchase agreement transactions. Under the terms of a typical repurchase agreement, a fund, through its custodian and sub-custodian, takes possession of an underlying debt obligation subject to an obligation of the seller to repurchase, and the fund to resell, the obligation at an agreed upon price and time, thereby determining the yield during the fund’s holding period.This arrangement results in a fixed rate of return that is not subject to market fluctuations during the fund’s holding period. The value of the collateral is at least equal, at all times, to the total amount of the repurchase obligation, including interest. In the event of a counterparty default, the fund has the right to use the collateral to offset losses incurred. There is potential loss to the fund in the event the fund is delayed or prevented from exercising its rights to
26
dispose of the collateral securities, including the risk of a possible decline in the value of the underlying securities during the period while the fund seeks to assert its rights. The Investment Adviser reviews the value of the collateral and the creditworthiness of those banks and dealers with which the fund enters into repurchase agreements to evaluate potential risks.
(d) Dividends to shareholders: Dividends payable to shareholders are recorded by the funds on the ex-dividend date. The funds declare dividends daily from investment income-net; such dividends are paid monthly. With respect to each series, dividends from net realized capital gains, if any, are normally declared and paid annually, but the funds may make distributions on a more frequent basis to comply with the distribution requirements of the Internal Revenue Code of 1986, as amended (the “Code”).To the extent that net realized capital gains can be offset by capital loss carryovers of that fund, it is the policy of the fund not to distribute such gains.
(e) Federal income taxes: It is the policy of BNY Mellon Money Market Fund to continue to qualify as a regulated investment company, if such qualification is in the best interests of its shareholders, by complying with the applicable provisions of the Code, and to make distributions of taxable income sufficient to relieve it from substantially all federal income and excise taxes. It is the policy of BNY Mellon National Municipal Market Fund to continue to qualify as a regulated investment company, which can distribute tax exempt dividends, by complying with the applicable provisions of the Code, and to make distributions of income and net realized capital gain sufficient to relieve it from substantially all federal income and excise taxes. For federal income tax purposes, each series is treated as a single entity for the purpose of determining such qualification.
As of and during the period ended August 31, 2011, the funds did not have any liabilities for any uncertain tax positions. The funds recognize interest and penalties, if any, related to uncertain tax positions as income tax expense in the Statements of Operations. During the period, the funds did not incur any interest or penalties.
Each of the tax years in the four-year period ended August 31, 2011 remains subject to examination by the Internal Revenue Service and state taxing authorities.
At August 31, 2011, the components of accumulated earnings on a tax basis were substantially the same as for financial reporting purposes.
BNY Mellon Money Market Fund has an accumulated capital loss carryover of $2,033 available for federal income tax purposes to be applied against future net securities profits, if any, realized subsequent to August 31, 2011. If not applied, the carryover expires in fiscal 2017.
BNY Mellon National Municipal Money Market Fund has an accumulated capital loss carryover of $1,480,051 available for federal income tax purposes to be applied against future net securities profits, if any, realized subsequent to August 31, 2011. If not applied, the carryover expires in fiscal 2017.
Under the recently enacted Regulated Investment Company Modernization Act of 2010 (the “2010 Act”), each fund will be permitted to carry forward capital losses incurred in taxable years beginning after December 22, 2010 (“post-enactment losses”) for the unlimited period. However, the 2010 Act requires post-enactment losses to be utilized before the utilization of losses incurred in taxable years prior to the effective date of the 2010 Act.As a result of this ordering rule, capital loss carry forwards related to taxable years beginning prior to the effective date of the 2010 Act may be more likely to expire unused.
| The Funds | 27 |
NOTES TO FINANCIAL STATEMENTS (continued)
The tax character of distributions paid to shareholders during the fiscal periods ended August 31, 2011 and August 31, 2010 were all ordinary income for BNY Mellon Money Market Fund and for BNY Mellon National Municipal Money Market Fund was as follows: tax exempt income $501,481 and $719,560 and ordinary income $0 and $921, respectively.
At August 31, 2011, the cost of investments for federal income tax purposes was substantially the same as the cost for financial reporting purposes (see the Statements of Investments).
NOTE 3—Investment Advisory Fee, Administration Fee and Other Transactions With Affiliates:
(a) Fees payable by the funds pursuant to the provisions of an investment advisory agreement with the Investment Adviser are payable monthly, computed on the average daily value of each fund’s net assets at the following annual rates: .15% of BNY Mellon Money Market Fund and .15% of BNY Mellon National Municipal Money Market Fund.
Pursuant to the Administration Agreement,The Bank of New York Mellon provides or arranges for fund accounting, transfer agency and other fund administration services and receives a fee based on the total net assets of the Trust based on the following rates:
| 0 up to $6 billion | .15% |
| $6 billion up to $12 billion | .12% |
| In excess of $12 billion | .10% |
The Bank of New York Mellon has entered into a Sub-Administration Agreement with Dreyfus pursuant to which The Bank of New York Mellon pays Dreyfus for performing certain administrative services.
BNY Mellon Fund Advisors have undertaken to waive receipt of the management fee and/or reimburse operating expenses in order to facilitate a daily yield at or
above a certain level. Such level may change from time to time, is voluntary and not contractual, and may be terminated at any time. Table 2 summarizes the amount of the reduction in expenses for Class M and Investor shares of each fund
Table 2—Yield Floor Expense Reimbursement Amounts
| Class M | Investor | |
| Shares | Shares | |
| BNY Mellon | ||
| Money Market Fund | 373,941 | 4,359 |
| BNY Mellon National Municipal | ||
| Money Market Fund | 480,291 | 237 |
(b) The funds have adopted a Shareholder Services Plan with respect to its Investor shares pursuant to which each fund pays the Distributor for the provision of certain services to holders of Investor shares a fee at an annual rate of .25% of the value of the average daily net assets attributable to Investor shares.The services provided may include personal services relating to shareholder accounts, such as answering shareholder inquiries regarding a fund, and providing reports and other information, and services related to the maintenance of such shareholder accounts. The Shareholder Services Plan allows the Distributor to make payments from the shareholder services fees it collects from each fund to compensate service agents (certain banks, securities brokers or dealers and other financial institutions) in respect of these services. Table 3 summarizes the amount Investor shares of each fund was charged during the period ended August 31, 2011, pursuant to the Shareholder Services Plan. Additional fees included in shareholder servicing costs in the Statements of Operations include fees paid for cash management charges.
| Table 3—Shareholder Services Plan Fees | |
| BNY Mellon Money Market Fund | $3,785 |
| BNY Mellon National Municipal | |
| Money Market Fund | 170 |
28
| The funds have arrangements with the custodian and cash |
| management bank whereby the funds may receive earn- |
| ings credits when positive cash balances are maintained, |
| which are used to offset custody and cash management |
| fees. For financial reporting purposes, the funds include |
| net earnings credits as an expense offset in the Statements |
| of Operations. |
| The funds compensate The Bank of New York Mellon |
| under cash management agreements for performing cash |
| management services related to fund subscriptions and |
| redemptions. Table 4 summarizes the amount each fund |
| was charged during the period ended August 31, 2011, |
| pursuant to the cash management agreements, which is |
| included in Shareholder servicing costs in the |
| Statements of Operations.These fees were partially off- |
| set by earnings credits pursuant to the cash management |
| agreements, also summarized in Table 4. |
| Table 4—Cash Management Agreement Fees | ||
| Cash Management | Earnings | |
| Fees ($) | Credits ($) | |
| BNY Mellon | ||
| Money Market Fund | 30 | (1) |
| BNY Mellon National | ||
| Municipal Money | ||
| Market Fund | 22 | (1) |
The funds also compensate The Bank of New York Mellon under a custody agreement for providing custo-
dial services for each fund.These fees were partially offset by earnings credits, if any, pursuant to the custody agreement, also summarized in Table 5 for each relevant fund.
| Table 5—Custody Agreement Fees | ||
| Custody | Earnings | |
| Fees ($) | Credits ($) | |
| BNY Mellon Money Market Fund | 95,922 | (5,241) |
| BNY Mellon National Municipal | ||
| Money Market Fund | 94,680 | — |
During the period ended August 31, 2011, each fund was charged $7,225 for services performed by the Chief Compliance Officer.
Table 6 summarizes the components of “Due to The Dreyfus Corporation and affiliates” in the Statements of Assets and Liabilities for each fund.
(c) Each trustee who is not an “affiliated person” as defined in the Act receives from the Trust an annual fee of $68,000 and an attendance fee of $7,500 for each in-person meeting attended and $500 for telephone meetings and is reimbursed for travel and out-of-pocket expenses.The Chairman of the Trust’s Board receives an additional annual fee of $15,000 and the Chairman of the Trust’s Audit Committee receives an additional annual fee of $10,000.
| Table 6—Due to The Dreyfus Corporation and Affiliates | |||||
| Investment | Shareholder | Chief | |||
| Advisory | Services | Custodian | Compliance | Less Expense | |
| Fees ($) | Plan Fees ($) | Fees ($) | Officer Fees ($) | Reimbursement ($) | |
| BNY Mellon Money Market Fund | 134,442 | 334 | 31,360 | 3,253 | (144,906) |
| BNY Mellon National | |||||
| Municipal Money Market Fund | 183,212 | 44 | 30,161 | 3,253 | (90,576) |
| The Funds | 29 |
NOTES TO FINANCIAL STATEMENTS (continued)
NOTE 4—Securities Transactions:
BNY Mellon National Municipal Money Market Fund is permitted to purchase or sell securities from or to certain affiliated funds under specified conditions outlined in procedures adopted by theTrust’s Board.The procedures have been designed to ensure that any purchase or sale of securities by the fund from or to another fund or portfolio that are, or could be, considered an affiliate by virtue of
having a common investment adviser (or affiliated investment adviser), common Trustee and/or common officers, complies with Rule 17a-7 of the Act. During the period ended August 31, 2011, BNY Mellon National Municipal Money Market Fund engaged in purchases and sales of securities pursuant to Rule 17a-7 of the Act amounting to $893,530,000 and $848,544,000, respectively.
30
REPORT OF INDEPENDENT REGISTERED PUBLIC ACCOUNTING FIRM
The Board of Trustees and Shareholders of BNY Mellon Funds Trust:
We have audited the accompanying statements of assets and liabilities of BNY Mellon Money Market Fund and BNY Mellon National Municipal Money Market Fund, (collectively the “Funds”), each a series of BNY Mellon FundsTrust, including the statements of investments as of August 31, 2011, and the related statements of operations for the year then ended, the statements of changes in net assets for each of the years in the two-year period then ended, and the financial highlights for each of the years in the five-year period then ended.These financial statements and financial highlights are the responsibility of the Funds’ management. Our responsibility is to express an opinion on these financial statements and financial highlights based on our audits.
We conducted our audits in accordance with the auditing standards of the Public Company Accounting Oversight Board (United States).Those standards require that we plan and perform the audit to obtain reasonable assurance about whether the financial statements and financial highlights are free of material misstatement. An audit also includes examining, on a test basis, evidence supporting the amounts and disclosures in the financial
statements. Our procedures included confirmations of securities owned as of August 31, 2011, by correspondence with the custodian and brokers or by other appropriate auditing procedures where replies from brokers were not received. An audit also includes assessing the accounting principles used and significant estimates made by management, as well as evaluating the overall financial statement presentation.We believe that our audits provide a reasonable basis for our opinion.
In our opinion, the financial statements and financial highlights referred to above present fairly, in all material respects, the financial position of BNY Mellon Money Market Fund and BNY Mellon National Municipal Money Market Fund, as of August 31, 2011, and the results of their operations for the year then ended, the changes in their net assets for each of the years in the two-year period then ended, and the financial highlights for each of the years in the five-year period then ended, in conformity with U.S. generally accepted accounting principles.
![]()
New York, New York
October 26, 2011
| The Funds | 31 |
IMPORTANT TAX INFORMATION (Unaudited)
BNY Mellon Money Market Fund
For federal tax purposes the fund designates the maximum amount allowable but not less than 90.33% as interest-related dividends in accordance with Sections 871(k)(1) and 881(e) of the Internal Revenue Code.
BNY Mellon National Municipal Money Market Fund
In accordance with federal tax law, the fund hereby designates all the dividends paid from investment income-net during its fiscal year ended August 31,
2011 as “exempt-interest dividends” (not generally subject to regular federal income tax).Where required by federal tax law rules, shareholders will receive notification of their portion of the fund’s taxable ordinary dividends (if any) and capital gains distributions (if any) paid for the 2011 calendar year on Form 1099-DIV and their portion of the fund’s tax-exempt dividends paid for the 2011 calendar year on Form 1099-INT, both of which will be mailed in early 2012.
32
| INFORMATION ABOUT THE RENEWAL OF EACH FUND’S |
| INVESTMENT ADVISORY AGREEMENT AND THE APPROVAL |
| OF EACH FUND’S ADMINISTRATION AGREEMENT (Unaudited) |
At a meeting of the Trust’s Board of Trustees held on March 8-9, 2011, the Board considered the renewal of the Trust’s Investment Advisory Agreement and the Administration Agreement (together, the “Agreement”) pursuant to which BNY Mellon Fund Advisers, a division of Dreyfus, provides the funds with investment advisory services and The Bank of New York Mellon provides the funds with administrative services.The Bank of NewYork Mellon has entered into a Sub-Administration Agreement with Dreyfus pursuant to whichThe Bank of NewYork Mellon pays Dreyfus for performing certain of these administrative services. The Board members who are not “interested persons” (as defined in the Investment Company Act of 1940, as amended) of the Trust were assisted in their review by independent legal counsel and met with counsel in executive session separate from representatives of Dreyfus. In considering the renewal of the Agreement, the Board considered all factors that it believed to be relevant, including those discussed below. The Board did not identify any one factor as dispositive, and each Board member may have attributed different weights to the factors considered.
Analysis of Nature, Extent, and Quality of Services Provided to the Funds. The Board members considered information previously provided to them in presentations from representatives of Dreyfus regarding the nature, extent, and quality of the services provided to the funds, and representatives of Dreyfus confirmed that there had been no material changes in this information. Dreyfus provided the number of open accounts in each fund, the fund’s asset size and the allocation of fund assets among distribution channels. Dreyfus also had previously provided information regarding the diverse intermediary relationships and distribution channels of the funds and Dreyfus’ corresponding need for broad, deep, and diverse resources to be able to provide ongoing shareholder services to each distribution channel, including the distribution channel(s) for each fund.
The Board members also considered research support available to, and portfolio management capabilities of, each fund’s portfolio management personnel and that Dreyfus also provides oversight of day-to-day fund operations, including fund accounting and administration and assistance in meeting legal and regulatory requirements.The Board members also considered Dreyfus’ extensive administrative, accounting, and compliance infrastructures.
Comparative Analysis of the Funds’ Performance and Advisory Fees and Expense Ratios. The Board members reviewed reports prepared by Lipper, Inc. (“Lipper”), an independent provider of investment company data, which included information comparing (1) each fund’s performance with that of a group of comparable funds (the “Performance Group”) and with a broader group of funds (the “Performance Universe”), all for various periods ended January 31, 2011, and (2) each fund’s actual and contractual advisory fees and total expenses with those of a group of comparable funds (the “Expense Group”) and with a broader group of funds (the “Expense Universe”), the information for which was derived in part from each fund’s financial statements available to Lipper as of January 31, 2011. Dreyfus also provided a comparison of each fund’s calendar year total returns to the performance of the relevant fund’s benchmark. Dreyfus previously had furnished the Board with a description of the methodology Lipper used to select the Performance Group and Performance Universe and the Expense Group and Expense Universe.
Dreyfus representatives stated that the usefulness of performance comparisons may be affected by a number of factors, including different investment limitations that may be applicable to the fund and comparison funds.
As applicable to each fund, representatives of Dreyfus reviewed with the Board members the management or investment advisory fees (1) paid by funds advised or administered by Dreyfus that are in the same Lipper cat-
| The Funds | 33 |
| INFORMATION ABOUT THE RENEWAL OF EACH FUND’S INVESTMENT ADVISORY AGREEMENT |
| AND THE APPROVAL OF EACH FUND’S ADMINISTRATION AGREEMENT (Unaudited) (continued) |
egory as the fund and (2) paid to Dreyfus or the Dreyfus-affiliated primary employer of the fund’s primary portfolio manager for advising any separate accounts and/or other types of client portfolios that are considered to have similar investment strategies and policies as the fund (the “Similar Clients”), and explained the nature of the Similar Clients. They discussed differences in fees paid and the relationship of the fees paid in light of any differences in the services provided and other relevant factors. The Board members considered the relevance of the fee information provided for the Similar Clients to evaluate the appropriateness and reasonableness of the fund’s advisory fee.
BNY Mellon Money Market Fund
The Board members discussed the results of the comparisons and noted that the fund’s total return performance was above the Performance Group and Performance Universe medians.
The Board members also reviewed the range of actual and contractual advisory fees and total expenses of the Expense Group and Expense Universe funds and discussed the results of the comparisons.They noted that the fund’s contractual advisory fee was below the Expense Group median, the fund’s actual advisory fee was above the Expense Group and Expense Universe medians and the fund’s total expenses were below the Expense Group median and above the Expense Universe median. The Board noted the investment adviser’s voluntary undertaking to maintain a minimum yield of zero percent with respect to the fund and that such voluntary undertaking may be terminated at any time.
BNY Mellon National Municipal Money Market Fund
The Board members discussed the results of the comparisons and noted that the fund’s total return performance was below the Performance Group and Performance
Universe medians, except for the one-year period when the fund’s performance was above the Performance Universe median.
The Board members also reviewed the range of actual and contractual advisory fees and total expenses of the Expense Group and Expense Universe funds and discussed the results of the comparisons.They noted that the fund’s contractual advisory fee was above the Expense Group median, the fund’s actual advisory fee was above the Expense Group and Expense Universe medians and the fund’s total expenses were above the Expense Group median and below the Expense Universe median. The Board noted the investment adviser’s voluntary undertaking to maintain a minimum yield of zero percent with respect to the fund and that such voluntary undertaking may be terminated at any time.
Analysis of Profitability and Economies of Scale. Dreyfus’ representatives reviewed the expenses allocated and profit received by Dreyfus and its affiliates and the resulting profitability percentage for managing each fund, and the method used to determine the expenses and profit.The Board concluded that the profitability results were not unreasonable, given the services rendered and service levels provided by Dreyfus to each fund. The Board also noted the voluntary expense limitation arrangement for each fund and its effect on Dreyfus’ profitability. The Board previously had been provided with information prepared by an independent consulting firm regarding Dreyfus’ approach to allocating costs to, and determining the profitability of, individual funds and the entire Dreyfus fund complex.The consulting firm also analyzed where any economies of scale might emerge in connection with the management of the funds.
The Board’s counsel stated that the Board members should consider the profitability analysis with respect to each fund (1) as part of their evaluation of whether the
34
fees under the Agreement bear a reasonable relationship to the mix of services provided by Dreyfus, including the nature, extent and quality of such services, and (2) in light of the relevant circumstances for each fund and the extent to which economies of scale would be realized if the relevant fund grows and whether fee levels reflect these economies of scale for the benefit of each fund’s shareholders. Dreyfus representatives noted that a discussion of economies of scale is predicated on a fund having achieved a substantial size with increasing assets and that, if a fund’s assets had been stable or decreasing, the possibility that Dreyfus may have realized any economies of scale would be less. They also noted that, as a result of shared and allocated costs among the funds and the funds in the Dreyfus funds complex, the extent of economies of scale could depend substantially on the level of assets in the complex as a whole, so that increases and decreases in complex-wide assets can affect potential economies of scale in a manner that is disproportionate to, or even in the opposite direction from, changes in each fund’s asset level.The Board members also considered potential benefits to Dreyfus from acting as investment adviser and noted that there were no soft dollar arrangements in effect for trading each fund’s investments.
At the conclusion of these discussions, the Board agreed that it had been furnished with sufficient information to make an informed business decision with respect to the renewal of the Agreement. Based on the discussions and considerations as described above, the Board concluded and determined as follows.
The Board concluded that the nature, extent and quality of the services provided by Dreyfus to each fund are adequate and appropriate.
With respect to BNY Mellon Money Market Fund, the Board was satisfied with the fund’s performance.
With respect to BNY Mellon National Municipal Money Market Fund, the Board was generally satis- fied with the fund’s overall performance.
The Board concluded that the fee paid to Dreyfus by each fund was reasonable in light of the considerations described above.
The Board determined that the economies of scale which may accrue to Dreyfus and its affiliates in con- nection with the management of the funds had been adequately considered by Dreyfus in connection with the advisory fee rate charged to each fund pursuant to the Agreement and that, to the extent in the future it were determined that material economies of scale had not been shared with a fund, the Board would seek to have those economies of scale shared with the fund.
The Board members considered these conclusions and determinations, along with information received on a routine and regular basis throughout the year. In addition, it should be noted that the Board’s consideration of the contractual fee arrangements for each fund had the benefit of a number of years of reviews of prior or similar agreements during which lengthy discussions took place between the Board members and Dreyfus representatives. Certain aspects of the arrangements may receive greater scrutiny in some years than in others, and the Board members’ conclusions may be based, in part, on their consideration of the same or similar arrangements in prior years.The Board members determined that renewal of the Agreement was in the best interests of each fund and its respective shareholders.
| The Funds | 35 |
BOARD MEMBERS INFORMATION (Unaudited)

36

Once elected all Board Members serve for an indefinite term.The address of the Board Members and Officers is in c/o The Dreyfus Corporation, 200 Park Avenue, New York, NewYork 10166.Additional information about the Board Members is available in the fund’s Statement of Additional Information which can be obtained from Dreyfus free of charge by calling this toll free number: 1-800-DREYFUS. For individual account holders for Private Wealth Management clients, please contact your account officer or call 1-888-281-7350.
The Funds 37
OFFICERS OF THE FUND (Unaudited)
CHRISTOPHER SHELDON, President since September 2006.
As director of Investment Strategy for BNY Mellon Wealth Management group since April 2003, Mr. Sheldon manages the analysis and development of investment and asset allocation strategies and oversees investment product research. He also oversaw the alternative investment groups from June 2006 to September 2008. He was previously a Vice President of the Trust. He is 46 years old has been employed by BNY Mellon since January 1995.
MICHAEL A. ROSENBERG, Vice President and Secretary since August 2005.
Assistant General Counsel of BNY Mellon, and an officer of 76 investment companies (comprised of 192 portfolios) managed by the Manager. He is 51 years old and has been an employee of the Manager since October 1991.
KIESHA ASTWOOD, Vice President and Assistant Secretary since January 2010.
Counsel of BNY Mellon, and an officer of 76 investment companies (comprised of 192 portfolios) managed by the Manager. She is 38 years old and has been an employee of the Manager since July 1995.
JAMES BITETTO, Vice President and Assistant Secretary since August 2005.
Senior Counsel of BNY Mellon and Secretary of the Manager, and an officer of 76 investment companies (comprised of 192 portfolios) managed by the Manager. He is 45 years old and has been an employee of the Manager since December 1996.
JONI LACKS CHARATAN, Vice President and Assistant Secretary since August 2005.
Senior Counsel of BNY Mellon, and an officer of 76 investment companies (comprised of 192 portfolios) managed by the Manager. She is 55 years old and has been an employee of the Manager since October 1988.
JOSEPH M. CHIOFFI, Vice President and Assistant Secretary since August 2005.
Senior Counsel of BNY Mellon, and an officer of 76 investment companies (comprised of 192 portfolios) managed by the Manager. He is 49 years old and has been an employee of the Manager since June 2000.
KATHLEEN DENICHOLAS, Vice President and Assistant Secretary since January 2010.
Managing Counsel of BNY Mellon, and an officer of 76 investment companies (comprised of 192 portfolios) managed by the Manager. She is 36 years old and has been an employee of the Manager since February 2001.
JANETTE E. FARRAGHER, Vice President and Assistant Secretary since August 2005.
Assistant General Counsel of BNY Mellon, and an officer of 76 investment companies (comprised of 192 portfolios) managed by the Manager. She is 48 years old and has been an employee of the Manager since February 1984.
JOHN B. HAMMALIAN, Vice President and Assistant Secretary since August 2005.
Senior Managing Counsel of BNY Mellon, and an officer of 76 investment companies (comprised of 192 portfolios) managed by the Manager. He is 48 years old and has been an employee of the Manager since February 1991.
M. CRISTINA MEISER, Vice President and Assistant Secretary since January 2010.
Senior Counsel of BNY Mellon, and an officer of 76 investment companies (comprised of 192 portfolios) managed by the Manager. She is 41 years old and has been an employee of the Manager since August 2001.
ROBERT R. MULLERY, Vice President and Assistant Secretary since August 2005.
Managing Counsel of BNY Mellon, and an officer of 76 investment companies (comprised of 192 portfolios) managed by the Manager. He is 59 years old and has been an employee of the Manager since May 1986.
JEFF PRUSNOFSKY, Vice President and Assistant Secretary since August 2005.
Senior Managing Counsel of BNY Mellon, and an officer of 76 investment companies (comprised of 192 portfolios) managed by the Manager. He is 46 years old and has been an employee of the Manager since October 1990.
38
JAMES WINDELS, Treasurer since November 2001.
Director – Mutual Fund Accounting of the Manager, and an officer of 76 investment companies (comprised of 192 portfolios) managed by the Manager. He is 52 years old and has been an employee of the Manager since April 1985.
RICHARD CASSARO, Assistant Treasurer since January 2008.
Senior Accounting Manager – Money Market and Municipal Bond Funds of the Manager, and an officer of 76 investment companies (comprised of 192 portfolios) managed by the Manager. He is 52 years old and has been an employee of the Manager since September 1982.
GAVIN C. REILLY, Assistant Treasurer since December 2005.
Tax Manager of the Investment Accounting and Support Department of the Manager, and an officer of 76 investment companies (comprised of 192 portfolios) managed by the Manager. He is 43 years old and has been an employee of the Manager since April 1991.
ROBERT ROBOL, Assistant Treasurer since December 2002.
Senior Accounting Manager – Fixed Income Funds of the Manager, and an officer of 76 investment companies (comprised of 192 portfolios) managed by the Manager. He is 47 years old and has been an employee of the Manager since October 1988.
ROBERT SALVIOLO, Assistant Treasurer since July 2007.
Senior Accounting Manager – Equity Funds of the Manager, and an officer of 76 investment companies (comprised of 192 portfolios) managed by the Manager. He is 44 years old and has been an employee of the Manager since June 1989.
ROBERT SVAGNA, Assistant Treasurer since December 2002.
Senior Accounting Manager – Equity Funds of the Manager, and an officer of 76 investment companies (comprised of 192 portfolios) managed by the Manager. He is 44 years old and has been an employee of the Manager since November 1990.
JOSEPH W. CONNOLLY, Chief Compliance Officer since October 2004.
Chief Compliance Officer of the Manager and The Dreyfus Family of Funds (76 investment companies, comprised of 192 portfolios). From November 2001 through March 2004, Mr. Connolly was first Vice-President, Mutual Fund Servicing for Mellon Global Securities Services. In that capacity, Mr. Connolly was responsible for managing Mellon’s Custody, Fund Accounting and Fund Administration services to third-party mutual fund clients. He is 54 years old and has served in various capacities with the Manager since 1980, including manager of the firm’s Fund Accounting Department from 1997 through October 2001.
STEPHEN J. STOREN, Anti-Money Laundering Compliance Officer since May 2011.
Chief Compliance Officer of the Distributor, and the Anti-Money Laundering Compliance Officer of 72 investment companies (comprised of 188 portfolios) managed by the Manager. He is 56 years old and has been an employee of the Distributor since October 1999.
| The Funds | 39 |
Item 2. Code of Ethics.
The Registrant has adopted a code of ethics that applies to the Registrant's principal executive officer, principal financial officer, principal accounting officer or controller, or persons performing similar functions. There have been no amendments to, or waivers in connection with, the Code of Ethics during the period covered by this Report.
Item 3. Audit Committee Financial Expert.
The Registrant's Board has determined that Thomas F. Ryan, a member of the Audit Committee of the Board, is an audit committee financial expert as defined by the Securities and Exchange Commission (the "SEC"). Thomas F. Ryan is "independent" as defined by the SEC for purposes of audit committee financial expert determinations.
Item 4. Principal Accountant Fees and Services.
(a) Audit Fees. The aggregate fees billed for each of the last two fiscal years (the "Reporting Periods") for professional services rendered by the Registrant's principal accountant (the "Auditor") for the audit of the Registrant's annual financial statements or services that are normally provided by the Auditor in connection with the statutory and regulatory filings or engagements for the Reporting Periods, were $546,545.00 in 2010 and $558,100.00 in 2011.
(b) Audit-Related Fees. The aggregate fees billed in the Reporting Periods for assurance and related services by the Auditor that are reasonably related to the performance of the audit of the Registrant's financial statements and are not reported under paragraph (a) of this Item 4 were $74,330.00 in 2010 and $85,330.00 in 2011. These services consisted of one or more of the following: (i) agreed upon procedures related to compliance with Internal Revenue Code section 817(h), (ii) security counts required by Rule 17f-2 under the Investment Company Act of 1940, as amended, (iii) advisory services as to the accounting or disclosure treatment of Registrant transactions or events and (iv) advisory services to the accounting or disclosure treatment of the actual or potential impact to the Registrant of final or proposed rules, standards or interpretations by the Securities and Exchange Commission, the Financial Accounting Standards Boards or other regulatory or standard-setting bodies.
The aggregate fees billed in the Reporting Periods for non-audit assurance and related services by the Auditor to the Registrant's investment adviser (not including any sub-investment adviser whose role is primarily portfolio management and is subcontracted with or overseen by another investment adviser), and any entity controlling, controlled by or under common control with the investment adviser that provides ongoing services to the Registrant ("Service Affiliates"), that were reasonably related to the performance of the annual audit of the Service Affiliate, which required pre-approval by the Audit Committee were $0 in 2010 and $0 in 2011.
(c) Tax Fees. The aggregate fees billed in the Reporting Periods for professional services rendered by the Auditor for tax compliance, tax advice, and tax planning ("Tax Services") were $49,770.00 in 2010 and $62,240.00 in 2011. These services consisted of review or preparation of U.S. federal, state, local and excise tax returns.
The aggregate fees billed in the Reporting Periods for Tax Services by the Auditor to Service Affiliates, which required pre-approval by the Audit Committee were $0 in 2010 and $0 in 2011.
(d) All Other Fees. The aggregate fees billed in the Reporting Periods for products and services provided by the Auditor, other than the services reported in paragraphs (a) through (c) of this Item, were $0 in 2010 and $0 in 2011.
The aggregate fees billed in the Reporting Periods for Non-Audit Services by the Auditor to Service Affiliates, other than the services reported in paragraphs (b) through (c) of this Item, which required pre-approval by the Audit Committee, were $0 in 2010 and $0 in 2011.
(e)(1) Audit Committee Pre-Approval Policies and Procedures. The Registrant's Audit Committee has established policies and procedures (the "Policy") for pre-approval (within specified fee limits) of the Auditor's engagements for non-audit services to the Registrant and Service Affiliates without specific case-by-case consideration. The pre-approved services in the Policy can include pre-approved audit services, pre-approved audit-related services, pre-approved tax services and pre-approved all other services. Pre-approval considerations include whether the proposed services are compatible with maintaining the Auditor's independence. Pre-approvals pursuant to the Policy are considered annually.
(e)(2) Note: None of the services described in paragraphs (b) through (d) of this Item 4 were approved by the Audit Committee pursuant to paragraph (c)(7)(i)(C) of Rule 2-01 of Regulation S-X.
(f) None of the hours expended on the principal accountant's engagement to audit the registrant's financial statements for the most recent fiscal year were attributed to work performed by persons other than the principal account's full-time, permanent employees.
Non-Audit Fees. The aggregate non-audit fees billed by the Auditor for services rendered to the Registrant, and rendered to Service Affiliates, for the Reporting Periods were $4,710,000.00 in 2010 and $12,003,000.00 in 2011.
Auditor Independence. The Registrant's Audit Committee has considered whether the provision of non-audit services that were rendered to Service Affiliates, which were not pre-approved (not requiring pre-approval), is compatible with maintaining the Auditor's independence.
Item 5. Audit Committee of Listed Registrants.
Not applicable.
Item 6. Investments.
(a) Not applicable.
Item 7. Disclosure of Proxy Voting Policies and Procedures for Closed-End Management Investment Companies.
Not applicable.
Item 8. Portfolio Managers of Closed-End Management Investment Companies.
Not applicable.
Item 9. Purchases of Equity Securities by Closed-End Management Investment Companies and Affiliated Purchasers.
Not applicable.
Item 10. Submission of Matters to a Vote of Security Holders.
There have been no material changes to the procedures applicable to Item 10.
Item 11. Controls and Procedures.
(a) The Registrant's principal executive and principal financial officers have concluded, based on their evaluation of the Registrant's disclosure controls and procedures as of a date within 90 days of the filing date of this report, that the Registrant's disclosure controls and procedures are reasonably designed to ensure that information required to be disclosed by the Registrant on Form N-CSR is recorded, processed, summarized and reported within the required time periods and that information required to be disclosed by the Registrant in the reports that it files or submits on Form N-CSR is accumulated and communicated to the Registrant's management, including its principal executive and principal financial officers, as appropriate to allow timely decisions regarding required disclosure.
(b) There were no changes to the Registrant's internal control over financial reporting that occurred during the second fiscal quarter of the period covered by this report that have materially affected, or are reasonably likely to materially affect, the Registrant's internal control over financial reporting.
Item 12. Exhibits.
(a)(1) Code of ethics referred to in Item 2.
(a)(2) Certifications of principal executive and principal financial officers as required by Rule 30a-2(a) under the Investment Company Act of 1940.
(a)(3) Not applicable.
(b) Certification of principal executive and principal financial officers as required by Rule 30a-2(b) under the Investment Company Act of 1940.
SIGNATURES
Pursuant to the requirements of the Securities Exchange Act of 1934 and the Investment Company Act of 1940, the Registrant has duly caused this Report to be signed on its behalf by the undersigned, thereunto duly authorized.
BNY Mellon Funds Trust
By: /s/ Christopher Sheldon | |
Christopher Sheldon, President
| |
Date: | 10/25/2011 |
| |
Pursuant to the requirements of the Securities Exchange Act of 1934 and the Investment Company Act of 1940, this Report has been signed below by the following persons on behalf of the Registrant and in the capacities and on the dates indicated. | |
| |
By: /s/ Christopher Sheldon | |
Christopher Sheldon, President
| |
Date: | 10/25/2011 |
| |
By: /s/ James Windels___ | |
James Windels, Treasurer
| |
Date: | 10/25/2011 |
| |
EXHIBIT INDEX
(a)(1) Code of ethics referred to in Item 2.
(a)(2) Certifications of principal executive and principal financial officers as required by Rule 30a-2(a) under the Investment Company Act of 1940. (EX-99.CERT)
(b) Certification of principal executive and principal financial officers as required by Rule 30a-2(b) under the Investment Company Act of 1940. (EX-99.906CERT)