UNITED STATES
SECURITIES AND EXCHANGE COMMISSION
Washington, D.C. 20549
FORM N-CSR
CERTIFIED SHAREHOLDER REPORT OF REGISTERED MANAGEMENT
INVESTMENT COMPANIES
Investment Company Act file number | 811-09903 | |||||
|
| |||||
| BNY Mellon Funds Trust |
| ||||
| (Exact name of Registrant as specified in charter) |
| ||||
|
|
| ||||
| c/o The Dreyfus Corporation 200 Park Avenue New York, New York 10166 |
| ||||
| (Address of principal executive offices) |
| ||||
|
|
| ||||
| John Pak, Esq. 200 Park Avenue New York, New York 10166 |
| ||||
| (Name and address of agent for service) |
| ||||
| ||||||
Registrant's telephone number, including area code: | (212) 922-6000 | |||||
|
| |||||
Date of fiscal year end:
| 8/31 |
| ||||
Date of reporting period: | 8/31/14 |
| ||||
The BNY Mellon Funds
| BNY Mellon Large Cap Stock Fund | |
| BNY Mellon Large Cap Market Opportunities Fund | |
| BNY Mellon Tax-Sensitive Large Cap Multi-Strategy Fund | |
| BNY Mellon Income Stock Fund | |
| BNY Mellon Mid Cap Multi-Strategy Fund | |
| BNY Mellon Small Cap Multi-Strategy Fund | |
| BNY Mellon Focused Equity Opportunities Fund | |
| BNY Mellon Small/Mid Cap Multi-Strategy Fund | |
| BNY Mellon International Fund | |
| BNY Mellon Emerging Markets Fund | |
| BNY Mellon International Appreciation Fund | |
| BNY Mellon International Equity Income Fund | |
| BNY Mellon Asset Allocation Fund | |
| ANNUAL REPORT | August 31, 2014 |

DISCUSSION OF
FUND PERFORMANCE
For the period of September 1, 2013, through August 31, 2014, as provided by Warren Chiang, CFA, and Ronald P. Gala, CFA
Fund and Market Performance Overview
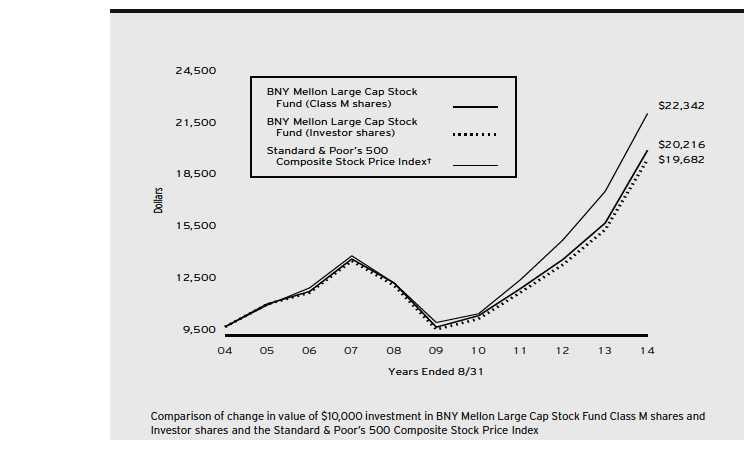
For the 12-month period ended August 31, 2014, BNY Mellon Large Cap Stock Fund’s Class M shares produced a total return of 26.27%, and Investor shares returned 25.96%.1 In comparison, the total return of the Standard & Poor’s 500® Composite Stock Price Index (“S&P 500® Index”), the fund’s benchmark, was 25.21%.2
Despite occasional bouts of heightened volatility, U.S stocks generally climbed during the reporting period in an environment of improving economic growth. The fund produced higher returns than its benchmark, primarily due to the success of our security selection strategy in the consumer staples, consumer discretionary, and energy sectors.
The Fund’s Investment Approach
The fund seeks long-term capital growth. To pursue its goal, the fund normally invests at least 80% of its net assets, plus any borrowings for investment purposes, in stocks of large capitalization companies with market capitalizations of $5 billion or more at the time of purchase.
Effective October 21, 2013, the fund modified its investment strategy.We apply a systematic, quantitative investment approach designed to identify and exploit relative misvaluations primarily within large-cap U.S. stocks. We use a proprietary valuation model that identifies and ranks stocks to construct the fund’s portfolio. We construct the fund’s portfolio through a systematic structured approach, focusing on stock selection as opposed to making proactive decisions as to industry or sector exposure.Within each sector and style subset, the fund overweights the most attractive stocks and underweights or zero weights the stocks that have been ranked least attractive. The fund typically will hold between 100 and 175 securities.
Previously, the fund’s investment adviser selected securities for the fund using a proprietary computer model, along with fundamental analysis, to identify and rank stocks within industries or sectors, based on several characteristics, including value, growth and financial profile.
Stocks Advanced Strongly in a Broad Market Rally
U.S. stocks generally gained value over the fall of 2013 in response to encouraging economic data, enabling the S&P 500® Index to end 2013 near record highs. The market relinquished some of its gains in January 2014 due to concerns regarding a more moderately accommodative U.S. monetary policy and economic slowdowns in the world’s emerging markets, but stocks rebounded sharply in February when those worries proved to be overblown.Another bout of stock market weakness in the spring stemmed from the adverse impact of unusually harsh winter weather in much of the U.S. on domestic economic activity. This market downturn hit formerly high-flying, growth-oriented companies in the information technology and biotech-nology industry groups particularly hard, signaling a shift in market leadership from smaller, more aggressive stocks to their better established, value-oriented counterparts. Investor sentiment rebounded when the economic recovery resumed in warmer weather, driving the U.S. stock market to a series of new record highs over the reporting period’s final three months.
The Funds 3
DISCUSSION OF FUND PERFORMANCE (continued)
While stocks of all capitalization ranges produced double-digit returns, on average, in this constructive environment, the shift in market leadership to more conservative companies helped large-cap stocks lead the broad market’s advance for the reporting period overall.
Security Selections Buoyed Relative Results
The fund participated more than fully in the S&P 500® Index’s gains over the reporting period. Our security selection strategy proved particularly effective in the consumer staples sector, where non-carbonated beverages producer Monster Beverage gained value after the sale of minority ownership interests to The Coca-Cola Companies. In addition, grocery chain Kroger continued to execute well on its business plan and was rewarded late in the reporting period for making an accretive acquisition.
In the consumer discretionary sector, apparel producer Hanesbrands achieved 10 consecutive quarters of better-than-expected earnings due, in part, to falling cotton prices. Walt Disney received strong contributions to financial results from its film, television, and theme park units. Among energy companies, refiners Marathon Petroleum and Phillips 66 continued to benefit from the availability of low cost shale oil from North American sources. Individual winners during the reporting period included multi-specialty health care company Allergan, which announced strong earnings and received an acquisition offer, and biotechnology firm Gilead Sciences, which reported better-than-expected financial results.
Disappointments during the reporting period included the information technology sector. Underweighted exposure to consumer electronics giant Apple prevented the fund from participating more fully in its gains. In the financials sector, the fund’s holdings in real estate investment trusts suffered broad-based declines, and a relatively new position in investment manager Waddell & Reed Financial encountered heightened volatility stemming from employee turnover.
Continuing to Find Attractive Opportunities
We recently have been encouraged by improved U.S. economic activity, including a stronger labor market and stable interest rates. In our judgment, an extended economic recovery should generally be good for equities. However, valuations have climbed, suggesting that selectivity is likely to become more critical to investment success. As of the reporting period’s end, our disciplined, bottom-up investment process has continued to identify an ample number of stocks meeting our criteria across the full range of market sectors.
September 15, 2014
Equity funds are subject generally to market, market sector, market liquidity, issuer, and investment style risks, among other factors, to varying degrees, all of which are more fully described in the fund’s prospectus.
| 1 | Total return includes reinvestment of dividends and any capital gains paid. |
| Past performance is no guarantee of future results. Share price and investment | |
| return fluctuate such that upon redemption, fund shares may be worth more or | |
| less than their original cost. | |
| 2 | SOURCE: LIPPER INC. — Reflects the monthly reinvestment of |
| dividends and, where applicable, capital gain distributions.The Standard & | |
| Poor’s 500® Composite Stock Price Index is a widely accepted, unmanaged | |
| index of U.S. stock market performance. Index return does not reflect fees and | |
| expenses associated with operating a mutual fund. Investors cannot invest | |
| directly in any index. |
4
FUND PERFORMANCE
| Average Annual Total Returns as of 8/31/14 | ||||||
| 1 Year | 5 Years | 10 Years | ||||
| Class M shares | 26.27 | % | 15.16 | % | 7.29 | % |
| Investor shares | 25.96 | % | 14.86 | % | 7.01 | % |
| Standard & Poor’s 500 | ||||||
| Composite Stock Price Index | 25.21 | % | 16.87 | % | 8.37 | % |
† Source: Lipper Inc.
Past performance is not predictive of future performance.The fund’s performance shown in the graph and table does not reflect the deduction of taxes that a shareholder would pay on fund distributions or the redemption of fund shares.
The above graph compares a $10,000 investment made in Class M shares and Investor shares of BNY Mellon Large Cap Stock Fund on 8/31/04 to a $10,000 investment made in the Standard & Poor’s 500 Composite Stock Price Index (the “Index”) on that date. All dividends and capital gain distributions are reinvested. The fund changed its investment strategy on October 21, 2013. Prior to that date, the investment adviser selected securities for the fund using a proprietary computer model, along with fundamental analysis, to identify and rank stocks within industries or sectors, based on several characteristics, including value, growth and financial profile. Different investment strategies may lead to different performance results. The fund’s performance for the periods prior to October 21, 2013 reflects the fund’s investment strategy in effect prior to that date.
The fund’s performance shown in the line graph above takes into account all applicable fees and expenses for Class M and Investor shares.The Index is a widely accepted, unmanaged index of U.S. stock market performance. Unlike a mutual fund, the Index is not subject to charges, fees and other expenses. Investors cannot invest directly in any index. Further information relating to fund performance, including expense reimbursements, if applicable, is contained in the Financial Highlights section of the prospectus and elsewhere in this report.
The Funds 5
DISCUSSION OF FUND PERFORMANCE (continued)

DISCUSSION OF
FUND PERFORMANCE
For the period of September 1, 2013, through August 31, 2014, as provided by Bernard Schoenfeld, Portfolio Manager, responsible for investment allocation decisions
Fund and Market Performance Overview
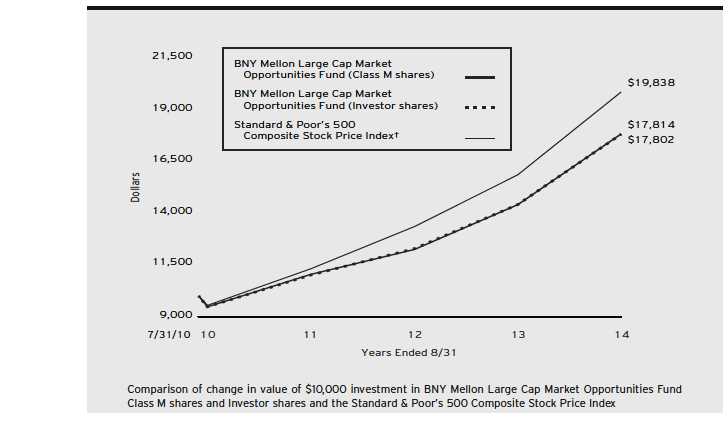
For the 12-month period ended August 31, 2014, BNY Mellon Large Cap Market Opportunities Fund’s Class M shares produced a total return of 23.67%, and Investor shares returned 23.54%.1 In comparison, the fund’s benchmark, the Standard & Poor’s 500 Composite Stock Price Index (“S&P 500 Index”), produced a total return of 25.21% for the same period.2
Stocks rallied strongly over the reporting period amid continued U.S. economic growth. The fund underper-formed its benchmark, mainly due to security selection shortfalls in the U.S. Large Cap Equity Strategy, U.S. Large Cap Growth Strategy and Dynamic Large Cap Value Strategy.
The Fund’s Investment Approach
The fund seeks long-term capital appreciation.To pursue its goal, the fund normally invests at least 80% of its assets in equity securities of large-cap companies, currently defined to be those companies with total market capitalizations of $5 billion or more at the time of the purchase. The fund normally allocates its assets among multiple investment strategies, each employed by the fund’s investment adviser or its affiliates that invest primarily in equity securities issued by large-cap companies.The fund is designed to provide exposure to various large-cap equity portfolio managers and investment strategies and styles, including some or all of the following: the Focused Equity Strategy, U.S. Large Cap Equity Strategy, Dynamic Large CapValue Strategy, Large Cap Growth Strategy, U.S. Large Cap Growth Strategy, Income Stock Strategy, Appreciation Strategy and Large Cap Dividend Strategy, all as more particularly described in the fund’s prospectus.The fund invests directly in securities or in other mutual funds advised by the fund’s investment adviser or its affiliates.
The fund’s investment adviser determines the investment strategies, sets the target allocations, monitors portfolio trading activity within the investment strategies, and executes all purchases and sales of portfolio securities of the fund.
Stocks Advanced Strongly in a Broad Market Rally
U.S. stocks generally gained value over the fall of 2013 in response to encouraging economic data, enabling the S&P 500 Index to end 2013 near record highs.The market relinquished some of its gains in January 2014 due to concerns regarding a more moderately accommodative U.S. monetary policy and economic slowdowns in the world’s emerging markets, but stocks rebounded in February when those worries proved to be overblown. Another bout of weakness in the spring stemmed from the adverse economic impact of unusually harsh winter weather in much of the U.S.This market downturn hit growth-oriented companies in the information technology and biotechnology industry groups particularly hard, triggering a shift in market leadership from more aggressive growth stocks to their better established, value-oriented counterparts. The economic recovery subsequently resumed, and positive data drove stocks to a series of new record highs over the reporting period’s final three months.
While all capitalization ranges produced double-digit returns, on average, in this constructive environment, the shift in market leadership to more conservative companies helped large-cap stocks lead the broad market’s advance for the reporting period overall.
6
Underlying Investments Delivered Mixed Results
While the fund participated substantially in the stock market’s gains, its relative performance was constrained by disappointing security selections in some of its underlying strategies. The U.S. Large Cap Equity Strategy, managed by Walter Scott & Partners Limited, produced especially weak results, largely due to its focus early in the reporting period on high-quality companies at a time when more speculative investments led the market higher. Dreyfus Research Growth Fund, part of the U.S. Large Cap Growth Strategy, was hurt by shortfalls in the information technology, consumer staples and consumer discretionary sectors. Dreyfus Strategic Value Fund, part of the Dynamic Large Cap Value Strategy, struggled with weakness in the financials and information technology sectors.
The fund achieved better relative performance through the Focused Equity Strategy, which utilizes a concentrated, bottom-up security selection strategy. Performance of the Focused Equity Strategy was helped by its holdings in the health care and information technology sectors. The Income Stock Strategy, which invests in BNY Mellon Income Stock Fund, made strong selections in the information technology, telecommunications services and consumer discretionary sectors.
Positioned for Further Equity Gains
We remain optimistic regarding equities’ prospects.The economic recovery is expected to accelerate as labor markets recover, consumer confidence improves, and businesses become more comfortable with increased capital spending. Nonetheless, equity valuations have risen and short-term interest rates may rise, suggesting that selectivity is likely to become more critical to investment success.
Therefore, in April, we implemented a number of changes to the fund’s allocation strategy. In response to shifting market trends and the performance records of its underlying strategies, we increased the fund’s allocation to the Large Cap Growth Strategy and the Focused Equity Strategy, and reduced its position in the U.S. Large Cap Equity Strategy. In our view, these allocation changes position the fund well for a constructive, but more selective, stock market environment.
September 15, 2014
Equity funds are subject generally to market, market sector, market liquidity, issuer and investment style risks, among other factors, to varying degrees, all of which are more fully described in the fund’s prospectus. The fund may use derivative instruments, such as options, futures, and options on futures and swaps. A small investment in derivatives could have a potentially large impact on the fund’s performance.The use of derivatives involves risks different from, or possibly greater than, the risks associated with investing directly in the underlying assets.
| 1 | Total return includes reinvestment of dividends and any capital gains paid. |
| Past performance is no guarantee of future results. Share price and | |
| investment return fluctuate such that upon redemption, fund shares may be | |
| worth more or less than their original cost. | |
| 2 | SOURCE: LIPPER INC. — Reflects monthly reinvestment of |
| dividends and, where applicable, capital gain distributions.The Standard & | |
| Poor’s 500 Composite Stock Price Index is a widely accepted, unmanaged | |
| index of U.S. stock market performance. Investors cannot invest directly in | |
| any index. |
The Funds 7
FUND PERFORMANCE
| Average Annual Total Returns as of 8/31/14 | |||||
| Inception | From | ||||
| Date | 1 Year | Inception | |||
| Class M shares | 7/30/10 | 23.67 | % | 15.16 | % |
| Investor shares | 7/30/10 | 23.54 | % | 15.14 | % |
| Standard & Poor’s 500 | |||||
| Composite Stock Price Index | 7/31/10 | 25.21 | % | 18.27 | % |
† Source: Lipper Inc.
Past performance is not predictive of future performance.The fund’s performance shown in the graph and table does not reflect the deduction of taxes that a shareholder would pay on fund distributions or the redemption of fund shares.
The above graph compares a $10,000 investment made in Class M shares and Investor shares of BNY Mellon Large Cap Market Opportunities Fund on 7/30/10 (inception date) to a $10,000 investment made in the Standard & Poor’s 500 Composite Stock Price Index (the “Index”) on that date. All dividends and capital gain distributions are reinvested.
The fund’s performance shown in the line graph above takes into account all applicable fees and expenses for Class M and Investor shares.The Index is a widely accepted, unmanaged index of U.S. stock market performance. Unlike a mutual fund, the Index is not subject to charges, fees and other expenses. Investors cannot invest directly in any index. Further information relating to fund performance, including expense reimbursements, if applicable, is contained in the Financial Highlights section of the prospectus and elsewhere in this report.
8

DISCUSSION OF
FUND PERFORMANCE
For the period of September 1, 2013, through August 31, 2014, as provided by Bernard Schoenfeld, Portfolio Manager, responsible for investment allocation decisions
Fund and Market Performance Overview
For the 12-month period ended August 31, 2014, BNY Mellon Tax-Sensitive Large Cap Multi-Strategy Fund’s Class M shares produced a total return of 23.82%, and Investor shares returned 23.47%.1 In comparison, the fund’s benchmark, the Standard & Poor’s 500 Composite Stock Price Index (“S&P 500 Index”), produced a total return of 25.21% for the same period.2
Stocks rallied strongly over the reporting period amid continued U.S. economic growth. The fund underperformed its benchmark, mainly due to security selection shortfalls in the U.S. Equity Strategy, U.S. Large Cap Growth Strategy and Dynamic Large Cap Value Strategy.
The Fund’s Investment Approach
The fund seeks long-term capital appreciation. To pursue its goal, the fund normally invests at least 80% of its net assets in equity securities of large-cap companies, currently defined to be those companies with total market capitalizations of $5 billion or more at the time of purchase.The fund normally allocates its assets among multiple investment strategies, each employed by the fund’s investment adviser or its affiliates that invest primarily in equity securities issued by large-cap companies. The fund is designed to provide exposure to various large-cap equity portfolio managers and investment strategies and styles, and uses tax-sensitive strategies to reduce the impact of federal and state income taxes on its after-tax returns.The fund allocates its assets among some or all of the following: the Large Cap Core Strategy, Large Cap Tax-Sensitive Strategy, Focused Equity Strategy, U.S. Large Cap Equity Strategy, Dynamic Large CapValue Strategy, Large Cap Growth Strategy, U.S. Large Cap Growth Strategy, Income Stock Strategy, Appreciation Strategy and Large Cap Dividend Strategy, all as more particularly described in the fund’s prospectus. The fund invests directly in securities or in other mutual funds advised by the fund’s investment adviser or its affiliates.
The fund’s investment adviser determines the investment strategies, sets the target allocations, monitors portfolio trading activity within the investment strategies, and executes all purchases and sales of portfolio securities of the fund.
Stocks Responded Positively to Economic Recovery
U.S. stocks generally advanced over the fall of 2013 in response to encouraging economic data, enabling the S&P 500 Index to end 2013 near record highs. The market relinquished some of its gains in January 2014 amid concerns regarding economic slowdowns in the emerging markets, but stocks rebounded in February when those worries proved overblown. Additional weakness in the spring — mainly due to the performance of companies in the information technology and biotechnology sectors — sparked a shift in market leadership from economically sensitive growth stocks to their more defensive, value-oriented counterparts. By June, however, positive economic data again bolstered investor sentiment, driving the benchmark to new record highs over the reporting period’s final three months.
Underlying Investments Delivered Mixed Results
While the fund participated substantially in the stock market’s gains, its results compared to the benchmark were constrained by disappointing security selections in
The Funds 9
DISCUSSION OF FUND PERFORMANCE (continued)
some of its underlying strategies. The U.S. Large Cap Equity Strategy, managed by Walter Scott & Partners Limited, produced especially weak relative results, largely due to its focus on high-quality companies at a time when more speculative investments led the market higher. Dreyfus Research Growth Fund, part of the U.S. Large Cap Growth Strategy, was hurt by shortfalls in the information technology, consumer staples and consumer discretionary sectors. Dreyfus Strategic Value Fund, part of the Dynamic Large Cap Value Strategy, struggled with weakness in the financials and information technology sectors.
The fund achieved better relative performance through the Focused Equity Strategy, which utilizes a concentrated, bottom-up security selection strategy. Performance of the Focused Equity Strategy was helped by its holdings in the health care and information technology sectors. The Income Stock Strategy, which invests in BNY Mellon Income Stock Fund, made strong security selections in the information technology, telecommunications services and consumer discretionary sectors. Finally, as it is designed to do, the fund’s Large Cap Tax-Sensitive Strategy produced returns that were roughly in line with market averages while effectively reducing the tax impact of its investments.
Positioned for Further Equity Gains
We remain optimistic regarding equities’ prospects. U.S. economic conditions are expected to improve as labor markets continue to recover, consumer confidence improves, and businesses become more comfortable with increased capital spending. Nonetheless, we are aware that equity valuations have risen and short-term interest rates may rise, suggesting that selectivity is likely to become more critical to investment success.
In April, we implemented a number of changes to the fund’s allocation strategy. In response to shifting market trends and the performance records of its underlying strategies, we increased the fund’s allocation to the Large Cap Growth Strategy and the Focused Equity Strategy, and reduced its position in the U.S. Large Cap Equity Strategy. In our view, these allocation changes position the fund well for a constructive, but more selective, stock market environment.
September 15, 2014
Equity funds are subject generally to market, market sector, market liquidity, issuer and investment style risks, among other factors, to varying degrees, all of which are more fully described in the fund’s prospectus.
The fund may use derivative instruments, such as options, futures, and options on futures and swaps. A small investment in derivatives could have a potentially large impact on the fund’s performance.The use of derivatives involves risks different from, or possibly greater than, the risks associated with investing directly in the underlying assets.
| 1 | Total return includes reinvestment of dividends and any capital gains paid. |
| Past performance is no guarantee of future results. Share price and investment | |
| return fluctuate such that upon redemption, fund shares may be worth more or | |
| less than their original cost. | |
| 2 | SOURCE: LIPPER INC. — Reflects monthly reinvestment of dividends |
| and, where applicable, capital gain distributions.The Standard & Poor’s 500 | |
| Composite Stock Price Index is a widely accepted, unmanaged index of U.S. | |
| stock market performance. Investors cannot invest directly in any index. |
10
FUND PERFORMANCE
| Average Annual Total Returns as of 8/31/14 | |||||
| Inception | From | ||||
| Date | 1 Year | Inception | |||
| Class M shares | 7/30/10 | 23.82 | % | 15.79 | % |
| Investor shares | 7/30/10 | 23.47 | % | 15.68 | % |
| Standard & Poor’s 500 | |||||
| Composite Stock Price Index | 7/31/10 | 25.21 | % | 18.27 | % |
† Source: Lipper Inc.
Past performance is not predictive of future performance.The fund’s performance shown in the graph and table does not reflect the deduction of taxes that a shareholder would pay on fund distributions or the redemption of fund shares.
The above graph compares a $10,000 investment made in Class M shares and Investor shares of BNY Mellon Tax-Sensitive Large Cap Multi-Strategy Fund on 7/30/10 (inception date) to a $10,000 investment made in the Standard & Poor’s 500 Composite Stock Price Index (the “Index”) on that date. All dividends and capital gain distributions are reinvested.
The fund’s performance shown in the line graph above takes into account all applicable fees and expenses for Class M and Investor shares.The Index is a widely accepted, unmanaged index of U.S. stock market performance. Unlike a mutual fund, the Index is not subject to charges, fees and other expenses. Investors cannot invest directly in any index. Further information relating to fund performance, including expense reimbursements, if applicable, is contained in the Financial Highlights section of the prospectus and elsewhere in this report.
The Funds 11
DISCUSSION OF FUND PERFORMANCE (continued)

DISCUSSION OF
FUND PERFORMANCE
For the period of September 1, 2013, through August 31, 2014, as provided by John C. Bailer, Portfolio Manager
Fund and Market Performance Overview
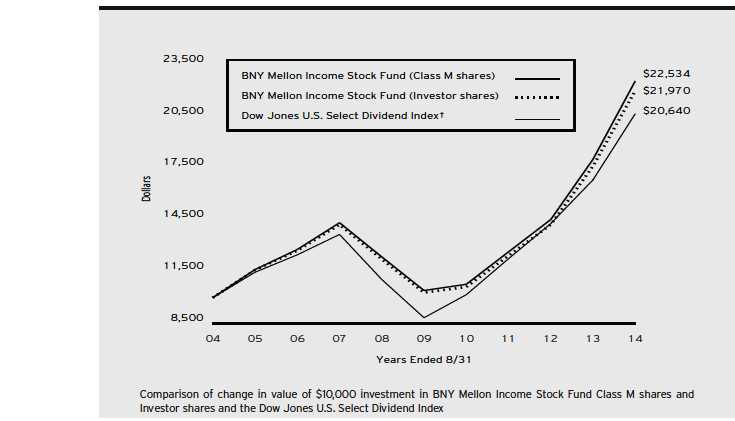
For the 12-month period ended August 31, 2014, BNY Mellon Income Stock Fund’s Class M shares produced a total return of 25.17%, and its Investor shares returned 24.75%.1 In comparison, the fund’s benchmark, the Dow Jones U.S. Select Dividend Index, produced a total return of 22.74% for the same period.2
Despite occasional bouts of heightened volatility, U.S. stocks generally climbed during the reporting period in an environment of improving economic growth. The fund produced higher returns than its benchmark, primarily due to the success of our sector allocation and security selection strategies across a variety of market segments.
The Fund’s Investment Approach
The fund seeks total return consisting of capital appreciation and income.To pursue its goal, the fund normally invests at least 80% of its assets in stocks.The fund seeks to focus on dividend-paying stocks and other investment techniques that produce income. We choose stocks through a disciplined investment process that combines quantitative modeling techniques, fundamental analysis, and risk management.While we attempt to manage risks by diversifying broadly across companies and industries, the fund may at times overweight certain sectors in an attempt to earn higher yields. The fund may also use derivatives as a substitute for taking a position in an underlying asset, to increase returns or income, or as part of a hedging strategy.
Stocks Advanced Strongly in a Broad Market Rally
U.S. stocks generally gained value over the fall of 2013 in response to encouraging global and domestic economic data, enabling several broad measures of stock market performance to end 2013 near record highs.The market relinquished some of its gains in January 2014 due to concerns regarding economic slowdowns in the world’s emerging markets and some overall profit taking after a strong 2013, but stocks rebounded when those worries proved to be overblown.Another bout of weakness in the spring stemmed from the adverse impact of unusually harsh winter weather in much of the U.S. on domestic economic activity. The market downturn hit growth-oriented companies in the information technology and biotechnology industry groups particularly hard, triggering a shift in market leadership from smaller, more aggressive stocks to their better established, value-oriented, and dividend-paying counterparts. The economic recovery resumed in warmer weather, and positive economic data drove the U.S. stock market to a series of new record highs over the reporting period’s final three months.
While stocks of all capitalization ranges and investment styles produced double-digit returns, on average, in this constructive environment, the shift in market leadership to more conservative companies helped large-cap stocks lead the broad market’s advance for the reporting period overall. The dividend-paying stocks represented in the fund’s benchmark produced modestly lower returns than the broader equity market.
12
Allocation and Selection Strategies Buoyed Relative Results
Our security selection strategy proved particularly effective in the utilities sector, where NRG Yield, a recent spin-off from NRG Energy, advanced strongly while paying a highly competitive dividend. In the telecommunications services sector, lack of exposure to industry giant AT&T helped the fund avoid the company’s relatively weak returns over the reporting period. Instead, we focused on smaller service providers, such as Windstream Holdings, where management reorganized the company and unlocked shareholder value. Among materials companies, the fund benefited from underweighted exposure to commodities producers with a substantial presence in struggling emerging markets. Rather, we favored U.S. centric businesses. For example, aggregates provider Martin Marietta Materials advanced when demand intensified from local governments for the materials used in infrastructure construction, and chemicals producer Dow Chemical benefited from lower input costs.
Only the fund’s investments in the industrials sector significantly lagged their respective components in the benchmark.The fund’s relative performance was hurt by underweighted exposure to a relatively strong performing market sector, where the fund held few of the defense contractors that rallied when fears of government spending cuts did not materialize.
At times during the reporting period, the fund employed a covered call writing strategy using derivative instruments to enhance its overall yield.
Continuing to Find Attractive Dividend-Paying Opportunities
We recently have been encouraged by improved U.S. economic activity, including a stronger labor market. In our judgment, an extended economic recovery should be good for equities, including those that pay generous dividends. However, valuations have climbed and interest rates may rise, suggesting that selectivity is likely to become more critical to investment success. As of the reporting period’s end, we have identified an ample number of stocks meeting our investment criteria in the financials, information technology, and health care sectors, but relatively few in the utilities and materials sectors.
September 15, 2014
| 1 | Total return includes reinvestment of dividends and any capital gains paid. |
| Past performance is no guarantee of future results. Share price and | |
| investment return fluctuate such that upon redemption, fund shares may be | |
| worth more or less than their original cost. | |
| 2 | SOURCE: LIPPER INC. – Reflects the reinvestment of dividends and, |
| where applicable, capital gain distributions.The Dow Jones U.S. Select | |
| Dividend Index is an unmanaged index which represents the country’s | |
| leading stocks by dividend yield. One hundred U.S. stocks are selected to | |
| the index by dividend yield, subject to screens for dividend-per-share growth | |
| rate, dividend payout ratio, and average daily dollar trading volume. | |
| Investors cannot invest directly in any index. |
The Funds 13
FUND PERFORMANCE
| Average Annual Total Returns as of 8/31/14 | ||||||
| 1 Year | 5 Years | 10 Years | ||||
| Class M shares | 25.17 | % | 16.70 | % | 8.46 | % |
| Investor shares | 24.75 | % | 16.38 | % | 8.19 | % |
| Dow Jones U.S. Select Dividend Index | 22.74 | % | 18.49 | % | 7.52 | % |
† Source: Lipper Inc.
Past performance is not predictive of future performance.The fund's performance shown in the graph and table does not reflect the deduction of taxes that a shareholder would pay on fund distributions or the redemption of fund shares.
The above graph compares a $10,000 investment made in Class M shares and Investor shares of BNY Mellon Income Stock Fund on 8/31/04 to a $10,000 investment made in the Dow Jones U.S. Select Dividend Index (the “Dow Jones Index”) on that date. All dividends and capital gain distributions are reinvested. The fund's performance shown in the line graph above takes into account all applicable fees and expenses for Class M and Investor shares.The Dow Jones Index is an unmanaged index which represents the country’s leading stocks by dividend yield. Unlike a mutual fund, the Dow Jones Index is not subject to charges, fees and other expenses. Investors cannot invest directly in any index. Further information relating to fund performance, including expense reimbursements, if applicable, is contained in the Financial Highlights section of the prospectus and elsewhere in this report.
14

DISCUSSION OF
FUND PERFORMANCE
For the period of September 1, 2013, through August 31, 2014, as provided by Bernard Schoenfeld, Portfolio Manager, responsible for investment allocation decisions
Fund and Market Performance Overview
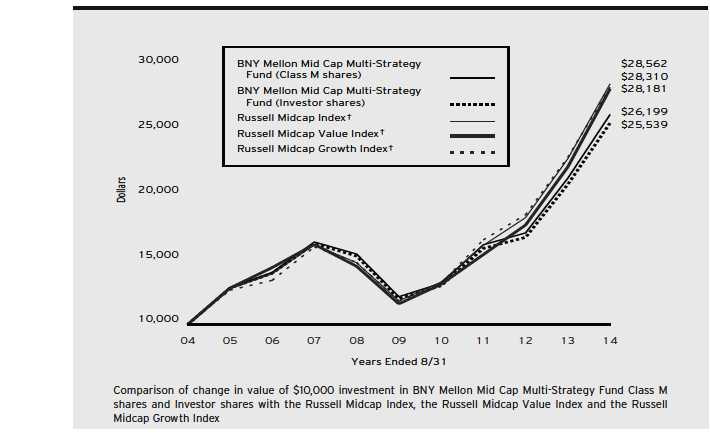
For the 12-month period ended August 31, 2014, BNY Mellon Mid Cap Multi-Strategy Fund’s Class M shares produced a total return of 23.09%, and Investor shares returned 22.74%.1 In comparison, the fund’s benchmark, the Russell Midcap® Index, produced a total return of 25.32% for the reporting period.2 The Russell Mid Cap Value and Russell Mid Cap Growth Indexes are secondary benchmarks.
Stocks generally rallied strongly over the reporting period amid continued U.S. economic growth.The fund produced lower returns than its benchmark, mainly due to shortfalls in the Geneva Mid Cap Growth Strategy and, to a lesser extent, the Mid Cap Growth Strategy and the Robeco Mid Cap Value Strategy.
The Fund’s Investment Approach
The fund seeks capital appreciation.The fund pursues its goal by normally investing at least 80% of its net assets in equity securities of midcap companies. The fund considers midcap companies to be those companies with market capitalizations that are within the market capitalization range of companies comprising the Russell Midcap® Index. Furthermore, the fund normally allocates assets across multiple investment strategies employed by the investment adviser and unaffiliated sub-investment advisers that invest primarily in equity securities issued by midcap companies. The investment adviser determines the investment strategies and sets target allocations and ranges. The fund is designed to provide exposure to various investment strategies and styles, including the Mid Cap Tax-Sensitive Core Strategy, Opportunistic Mid Cap Value Strategy, Mid Cap Growth Strategy, Robeco Mid Cap Value Strategy and Geneva Mid Cap Growth Strategy, all as more particularly described in the fund’s prospectus.
Stocks Advanced Strongly in a Broad Market Rally
U.S. stocks generally gained value over the fall of 2013 in response to encouraging economic data, enabling several broad measures of stock market performance to end 2013 near record highs. The market relinquished some of its gains in January 2014 due to concerns regarding a shift to more moderately accommodative U.S. monetary policy and economic slowdowns in the world’s emerging markets, but stocks rebounded in February when those worries proved to be overblown. Another bout of weakness in the spring stemmed from the adverse economic impact of unusually harsh winter weather in much of the U.S.This market downturn hit growth-oriented companies in the information technology and biotechnology industry groups particularly hard, signaling a shift in market leadership from more aggressive growth stocks to their better established, value-oriented counterparts. The economic recovery subsequently resumed in warmer weather, and positive data drove stocks to a series of new record highs over the reporting period’s final three months.
The Funds 15
DISCUSSION OF FUND PERFORMANCE (continued)
While all capitalization ranges produced double-digit returns, on average, in this constructive environment, the shift in market leadership to more conservative companies caused midcap stocks to lag their large-cap counterparts for the reporting period overall. In addition, value-oriented midcap stocks generally outperformed midsize growth stocks.
Underlying Investments Delivered Mixed Results
While the fund participated substantially in the midcap stock market’s gains, its performance compared to the Russell Midcap® Index was constrained by disappointing results from the Geneva Mid Cap Growth Strategy, which fell short of market averages due to its focus on higher quality companies.The strategy’s underperformance was especially severe early in the reporting period, when more speculative stocks fared better. More specifically, the strategy’s emphasis on companies with low debt-to-capital ratios proved relatively ineffective over the reporting period.
The fund’s Mid Cap Growth Strategy, which employs a proprietary investment process of The Boston Company Asset Management (“TBCAM”), lagged market averages more modestly. Security selection shortfalls in the information technology sector more than balanced stronger returns from health care stocks. The Robeco Mid Cap Value Strategy mildly underper-formed the benchmark as disappointments in the financials sector offset better relative results in the energy and capital goods industry groups.
The fund achieved above-average relative performance through the Opportunistic Mid CapValue Strategy, which also employs a proprietary investment process of TBCAM. This strategy’s results were bolstered by particularly favorable security selections in the financials sector. Finally, as it is designed to do, the fund’s Mid Cap Tax-Sensitive Core Strategy produced returns that were roughly in line with market averages, while seeking to improve the tax sensitivity of the portfolio’s investment performance.
Positioned for Further Equity Gains
We remain optimistic regarding the prospects for midcap stocks.The economic recovery is expected to accelerate as labor markets continue to recover, consumer confidence improves, and businesses become more comfortable with increased capital spending. Greater mergers-and-acquisitions activity also could lift midcap companies that are considered takeover candidates. Nonetheless, we are aware that equity valuations have risen and short-term interest rates may rise, suggesting that selectivity is likely to become more critical to investment success.
The fund made no changes to its allocation strategy over the reporting period, but we remain prepared to alter its composition as economic and market conditions change. In our view, the fund is well positioned for a constructive, but more selective, stock market environment.
September 15, 2014
Equity funds are subject generally to market, market sector, market liquidity, issuer, and investment style risks, among other factors, to varying degrees, all of which are more fully described in the fund’s prospectus.
Stocks of small- and/or midcap companies often experience sharper price fluctuations than stocks of large-cap companies.
| 1 | Total return includes reinvestment of dividends and any capital gains paid. |
| Past performance is no guarantee of future results. Share price and investment | |
| return fluctuate such that upon redemption, fund shares may be worth more or | |
| less than their original cost. | |
| 2 | SOURCE: LIPPER INC. — Reflects reinvestment of dividends and, where |
| applicable, capital gain distributions.The Russell Midcap® Index is a widely | |
| accepted, unmanaged index of medium-cap stock market performance. Index | |
| return does not reflect the fees and expenses associated with operating a mutual | |
| fund. Investors cannot invest directly in any index. |
16
FUND PERFORMANCE
| Average Annual Total Returns as of 8/31/14 | ||||||
| 1 Year | 5 Years | 10 Years | ||||
| Class M shares | 23.09 | % | 16.62 | % | 10.11 | % |
| Investor shares | 22.74 | % | 16.32 | % | 9.83 | % |
| Russell Midcap Index | 25.32 | % | 19.29 | % | 11.07 | % |
| Russell Midcap Value Index | 27.20 | % | 19.45 | % | 10.92 | % |
| Russell Midcap Growth Index | 23.67 | % | 19.14 | % | 10.97 | % |
† Source: Lipper Inc.
Past performance is not predictive of future performance.The fund’s performance shown in the graph and table does not reflect the deduction of taxes that a shareholder would pay on fund distributions or the redemption of fund shares.
The above graph compares a $10,000 investment made in Class M shares and Investor shares of BNY Mellon Mid Cap Multi-Strategy Fund on 8/31/04 to a $10,000 investment made in each of the (1) the Russell Midcap Index, (2) the Russell Midcap Value Index and (3) the Russell Midcap Growth Index on that date. All dividends and capital gain distributions are reinvested.
The fund changed its investment strategy on August 20, 2012. Prior to that date, the fund generally had a single primary portfolio manager and investment strategy — selecting stocks of mid cap domestic companies through a disciplined investment process that combined computer modeling techniques, fundamental analysis and risk management. Different investment strategies may lead to different performance results.The fund's performance for periods prior to August 20, 2012, reflects the fund’s investment strategy in effect prior to that date.
The fund’s performance shown in the line graph above takes into account all applicable fees and expenses for Class M and Investor shares.The Russell Midcap Index is a widely accepted, unmanaged index of medium-cap stock market performance.The Russell Midcap Value Index is a widely accepted, unmanaged index of medium-cap stock market performance and measures the performance of those Russell Midcap companies with lower price-to-book ratios and lower forecasted growth values.The Russell Midcap Growth Index measures the performance of those companies among the 800 smallest companies in the Russell 1000 Index with higher price-to-book ratios and higher forecasted growth values.The Russell 1000 Index measures the performance of the largest 1,000 publicly traded U.S. companies. Unlike a mutual fund, the indices are not subject to charges, fees and other expenses. Investors cannot invest directly in any index. Further information relating to fund performance, including expense reimbursements, if applicable, is contained in the Financial Highlights section of the prospectus and elsewhere in this report.
The Funds 17
DISCUSSION OF FUND PERFORMANCE (continued)

DISCUSSION OF
FUND PERFORMANCE
For the period of September 1, 2013, through August 31, 2014, as provided by Bernard Schoenfeld, Portfolio Manager, responsible for investment allocation decisions
Fund and Market Performance Overview
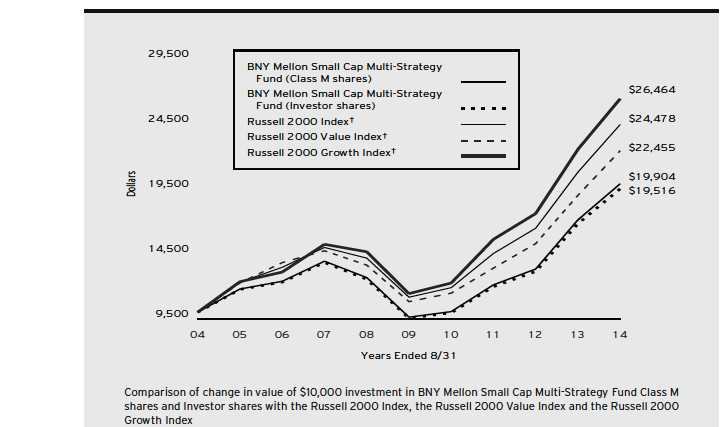
For the 12-month period ended August 31, 2014, BNY Mellon Small Cap Multi-Strategy Fund’s Class M shares produced a total return of 16.24%, and Investor shares returned 15.95%.1 In comparison, the fund’s primary benchmark, the Russell 2000 Index, produced a total return of 17.68% for the same period.2 The fund’s secondary benchmarks, the Russell 2000 Growth Index and the Russell 2000 Value Index, produced total returns of 17.30% and 18.10%, respectively, for the same period.3
Despite occasional bouts of heightened market volatility, stocks generally rallied strongly over the reporting period amid continued U.S. economic growth.The fund produced lower returns than its benchmark, mainly due to shortfalls in the Small Cap Growth Strategy.
The Fund’s Investment Approach
The fund seeks capital appreciation.The fund pursues its goal by normally investing at least 80% of its net assets, plus any borrowings for investment purposes, in equity securities of small-cap companies. The fund currently considers small-cap companies to be those companies with market capitalizations that are equal to or less than the market capitalization of the largest company included in the Russell 2000 Index. Furthermore, the fund normally allocates assets across multiple investment strategies employed by the investment adviser that invest primarily in equity securities issued by small-cap companies. The investment adviser determines the investment strategies and sets target allocations and ranges. The fund is designed to provide exposure to various investment strategies and styles, including the Opportunistic Small Cap Strategy, Small Cap Value Strategy and Small Cap Growth Strategy, all as more particularly described in the fund’s prospectus.
Stocks Advanced Strongly in a Broad Market Rally
U.S. stocks generally gained value over the fall of 2013 in response to encouraging economic data, enabling several broad measures of stock market performance to end 2013 near record highs. The market relinquished some of its gains in January 2014 due to concerns regarding a shift to more moderately accommodative U.S. monetary policy and economic slowdowns in the world’s emerging markets, but stocks rebounded in February when those worries proved to be overblown. Another bout of market weakness in the spring stemmed from the adverse economic impact of unusually harsh winter weather in much of the U.S. This market downturn hit growth-oriented companies in the information technology and biotechnology industry groups particularly hard, signaling a shift in market leadership from smaller, more aggressive growth stocks to their better established, value-oriented counterparts. The economic recovery subsequently resumed in warmer weather, and new releases of positive data drove stocks to a series of new record highs over the reporting period’s final three months.
While all capitalization ranges of the broad stock market produced double-digit returns, on average, in this constructive environment, the shift in market leadership to more conservative companies caused small-cap stocks to lag their mid- and large-cap counterparts for the reporting period overall. In addition, value-oriented small-cap stocks generally outperformed small growth stocks.
18
Underlying Investments Delivered Mixed Results
Allocations among the fund’s underlying investment strategies remained constant throughout the reporting period. We continued to apportion 40% of the fund’s assets to the Opportunistic Small Cap Value Strategy, 30% to the Small Cap Growth Strategy and 30% to the Small Cap Value Strategy.
While the fund participated substantially in the small-cap stock market’s gains over the reporting period, its performance compared to the Russell 2000 Index was constrained by relatively disappointing results from the Small Cap Growth Strategy.The strategy’s returns fell short of market averages primarily due to unfavorable security selections in the information technology sector.
The fund achieved better relative results through the Small Cap Value Strategy, which was bolstered by the success of its security selections in the financials and information technology sectors. The Opportunistic Small Cap Value Strategy also fared relatively well on the strength of positive stock selections in the health care sector.
Positioned for Further Equity Gains
As of the reporting period’s end, we remain optimistic regarding the prospects for small-cap stocks. The economic recovery currently is expected to accelerate as labor markets continue to recover, consumer confidence improves, and businesses become more comfortable with increased capital spending. Greater mergers-and-acquisitions activity also could lift stocks of small-cap companies that are considered takeover candidates. Nonetheless, we are aware that equity valuations have risen, short-term interest rates may rise, and geopolitical instability may intensify, suggesting to us that selectivity is likely to become more critical to investment success.
The fund made no changes to its allocation strategy over the reporting period, but we remain prepared to alter its composition as economic and market conditions change. In our view, the fund is well positioned for a constructive, but more selective, stock market environment.
September 15, 2014
Equity funds are subject generally to market, market sector, market liquidity, issuer and investment style risks, among other factors, to varying degrees, all of which are more fully described in the fund’s prospectus. Stocks of small- and/or midcap companies often experience sharper price fluctuations than stocks of large-cap companies.
| 1 | Total return includes reinvestment of dividends and any capital gains paid. |
| Past performance is no guarantee of future results. Share price and | |
| investment return fluctuate such that upon redemption, fund shares may be | |
| worth more or less than their original cost. | |
| 2 | SOURCE: LIPPER INC. – Reflects reinvestment of dividends and, |
| where applicable, capital gain distributions.The Russell 2000® Index is | |
| an unmanaged index of small-cap stock market performance and is | |
| composed of the 2,000 smallest companies in the Russell 3000 Index.The | |
| Russell 3000 Index is composed of the 3,000 largest U.S. companies | |
| based on total market capitalization.The index does not take into account | |
| fees and expenses to which the fund is subject. Investors cannot invest | |
| directly in any index. | |
| 3 | SOURCE: LIPPER INC. – The Russell 2000 Growth Index is an |
| unmanaged index that measures the performance of those Russell 2000 | |
| companies with higher price-to-book ratios and higher forecasted growth | |
| values.The total return figure cited for this index assumes change in | |
| security prices and reinvestment of dividends, but does not reflect the costs of | |
| managing a mutual fund.The Russell 2000 Value Index is an unmanaged | |
| index that measures the performance of those Russell 2000 companies with | |
| lower price-to-book ratios and lower forecasted growth values. Investors | |
| cannot invest directly in any index. |
The Funds 19
FUND PERFORMANCE
| Average Annual Total Returns as of 8/31/14 | ||||||
| 1 Year | 5 Years | 10 Years | ||||
| Class M shares | 16.24 | % | 15.67 | % | 7.13 | % |
| Investor shares | 15.95 | % | 15.39 | % | 6.92 | % |
| Russell 2000 Index | 17.68 | % | 17.03 | % | 9.36 | % |
| Russell 2000 Value Index | 18.10 | % | 15.74 | % | 8.43 | % |
| Russell 2000 Growth Index | 17.30 | % | 18.29 | % | 10.22 | % |
† Source: Lipper Inc.
Past performance is not predictive of future performance.The fund’s performance shown in the graph and table does not reflect the deduction of taxes that a shareholder would pay on fund distributions or the redemption of fund shares.
The above graph compares a $10,000 investment made in Class M shares and Investor shares of BNY Mellon Small Cap Multi-Strategy Fund on 8/31/04 to a $10,000 investment made in each of the (1) the Russell 2000 Index, (2) the Russell 2000 Value Index and (3) the Russell 2000 Growth Index on that date. All dividends and capital gain distributions are reinvested.
The fund changed its investment strategy on August 20, 2012. Prior to that date, the fund generally had a single primary portfolio manager and investment strategy — selecting stocks of small cap domestic companies through a disciplined investment process that combined computer modeling techniques, fundamental analysis and risk management. Different investment strategies may lead to different performance results.The fund's performance for periods prior to August 20, 2012, reflects the fund’s investment strategy in effect prior to that date.
The fund’s performance shown in the line graph above takes into account all applicable fees and expenses for Class M and Investor shares.The Russell 2000 Index is an unmanaged index and is composed of the 2,000 smallest companies in the Russell 3000 Index.The Russell 3000 Index measures the performance of the largest 3,000 U.S. companies representing approximately 98% of the investable U.S. equity market.The Russell 2000 Value Index is an unmanaged index which measures the performance of those Russell 2000 companies with lower price-to-book ratios and lower forecasted growth values.The Russell 2000 Growth Index is an unmanaged index which measures the performance of those Russell 2000 companies with higher price-to-book ratios and higher forecasted growth values. Unlike a mutual fund, the indices are not subject to charges, fees and other expenses. Investors cannot invest directly in any index. Further information relating to fund performance, including expense reimbursements, if applicable, is contained in the Financial Highlights section of the prospectus and elsewhere in this report.
20
DISCUSSION OF
FUND PERFORMANCE
For the period of September 1, 2013, through August 31, 2014, as provided by Irene D. O’Neill, Portfolio Manager
Fund and Market Performance Overview
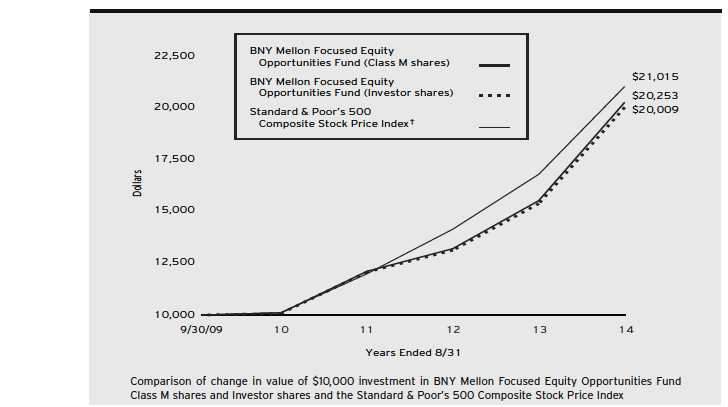
For the 12-month period ended August 31, 2014, BNY Mellon Focused Equity Opportunities Fund’s Class M shares produced a total return of 30.54%, and Investor shares returned 30.18%.1 In comparison, the Standard & Poor’s 500 Composite Stock Price Index (“S&P 500 Index”), the fund’s benchmark, produced a 25.21% total return for the reporting period.2
Despite occasional bouts of volatility, stocks generally rallied strongly over the reporting period as the U.S. economic recovery gained momentum. The fund outperformed its benchmark due to favorable security selections in the information technology, health care, energy, and financials sectors.
The Fund’s Investment Approach
The fund seeks capital appreciation. To pursue its goal, the fund normally invests at least 80% of its net assets in equity securities.We begin with a top-down assessment of broad economic, political, and social trends.We strive to determine those sectors and industries most likely to benefit from identified trends, focusing on sectors we believe present the most attractive growth outlook. Within those sectors and industries, we then employ a bottom-up, fundamental approach to find individual companies with:
Unrecognized or underestimated earnings power
Sustainable revenue and cash flow
Positive operational or financial catalysts
Attractive valuation based on growth prospects
Strong or improving financial conditions
Finally, we select for investment the 25 to 30 best opportunities from the companies meeting these criteria.
Large-Cap Stocks Led a Broad Market Rally
Stocks advanced over the final months of 2013 in response to encouraging global and domestic economic data, enabling the S&P 500 Index to end 2013 near record highs.The market relinquished some of its gains in January 2014 amid concerns regarding economic slowdowns in the world’s emerging markets, but stocks rebounded sharply in February when those worries proved to be overblown. Another bout of weakness in the spring—mainly in the information technology and biotechnology industry groups—signaled a shift in market leadership from economically sensitive growth stocks to their more defensive, value-oriented counterparts. By June, however, positive economic data again bolstered investor sentiment, driving stocks to a series of new record highs over the reporting period’s final three months.
While large-, mid-, and small-cap stocks all produced double-digit returns, on average, in this positive environment, the shift in market leadership to more conservative, well-established companies helped large-cap stocks to generally outperform their smaller counterparts during the reporting period.
Security Selections Buoyed Fund’s Relative Performance
The fund achieved especially strong results from its holdings in the information technology sector. Semiconductor maker Micron Technology benefited from a consolidating industry and a solid pricing environment. Specialty chip producer Avago Technologies
The Funds 21
DISCUSSION OF FUND PERFORMANCE (continued)
saw rising sales of semiconductors used in smartphones. Software developer Adobe Systems saw strong growth after changing its business model to cloud-based subscriptions. Business-oriented social network LinkedIn, Cl. A recovered from previous weakness. The fund also benefited from fortunate timing in the sale of media giant Google in advance of a traditionally weak seasonal period for advertising sales.
In the health care sector, specialty biopharmaceutical developer Shire reported higher earnings after a new management team restructured the company and it received an acquisition offer. Teva Pharmaceuticals hired a new CEO, who accelerated restructuring plans. Hospitals operator HCA Holdings achieved higher utilization rates and fewer bad debts as a result of national health care reform.
Among energy companies, services provider Halliburton advanced amid a shale oil production boom in North America and improving prospects in international markets, while refinerValero Energy’s profit margins benefited from its access to low-cost domestic crude oil. In addition, solid cash flow generation enabled Valero Energy to raise its dividend three times over 12 months. The fund also avoided relative weakness in energy giants Chevron and ExxonMobil. Winners in the financials sector included asset manager Invesco, which saw higher assets under management when equity markets climbed. Wells Fargo & Co. proved less sensitive to regulatory changes than its peers, and the bank raised its dividend and launched a major share repurchasing program.
On a more negative note, the fund suffered shortfalls in the consumer staples sector, where tobacco producer Philip Morris International reduced earnings guidance due to higher investments in future growth initiatives. Household goods purveyor Procter & Gamble struggled with weaker consumer demand. The fund’s holdings in the consumer discretionary sector also trailed market averages, as motorcycle manufacturer Harley-Davidson and retailer Lowes were hurt by the unusually harsh winter weather in much of the U.S., and media giant Comcast, Cl.A was held back by uncertainty surrounding its proposed acquisition of Time Warner Cable.
Maintaining a Disciplined Investment Approach
We have been encouraged by recent economic data, which suggest to us that the economic recovery is likely to be sustained. Therefore, we have maintained an emphasis on companies that tend to be relatively sensitive to changing economic conditions. We also have continued to seek companies benefiting from secular growth trends and efforts by management to boost earnings growth.
September 15, 2014
Please note, the position in any security highlighted with italicized typeface was sold during the reporting period.
Equity funds are subject generally to market, market sector, market liquidity, issuer, and investment style risks, among other factors, to varying degrees, all of which are more fully described in the fund’s prospectus.
The fund is non-diversified, which means that a relatively high percentage of the fund’s assets may be invested in a limited number of issuers.Therefore, the fund’s performance may be more vulnerable to changes in the market value of a single issuer or group of issuers and more susceptible to risks associated with a single economic, political, or regulatory occurrence than a diversified fund.
| 1 | Total return includes reinvestment of dividends and any capital gains paid. |
| Past performance is no guarantee of future results. Share price and investment | |
| return fluctuate such that upon redemption, fund shares may be worth more or | |
| less than their original cost. | |
| 2 | SOURCE: LIPPER INC. — Reflects the monthly reinvestment of |
| dividends and, where applicable, capital gain distributions.The Standard & | |
| Poor’s 500 Composite Stock Price Index is a widely accepted, unmanaged | |
| index of U.S. stock market performance. Index return does not reflect fees and | |
| expenses associated with operating a mutual fund. Investors cannot invest | |
| directly in any index. |
22
FUND PERFORMANCE
| Average Annual Total Returns as of 8/31/14 | |||||
| Inception | From | ||||
| Date | 1 Year | Inception | |||
| Class M shares | 9/30/09 | 30.54 | % | 15.42 | % |
| Investor shares | 9/30/09 | 30.18 | % | 15.14 | % |
| Standard & Poor’s 500 | |||||
| Composite Stock Price Index | 9/30/09 | 25.21 | % | 16.31 | % |
† Source: Lipper Inc.
Past performance is not predictive of future performance.The fund’s performance shown in the graph and table does not reflect the deduction of taxes that a shareholder would pay on fund distributions or the redemption of fund shares.
The above graph compares a $10,000 investment made in Class M shares and Investor shares of BNY Mellon Focused Equity Opportunities Fund on 9/30/09 (inception date) to a $10,000 investment made in the Standard & Poor’s 500 Composite Stock Price Index (the “Index”) on that date. All dividends and capital gain distributions are reinvested.
The fund’s performance shown in the line graph above takes into account all applicable fees and expenses for Class M and Investor shares.The Index is a widely accepted, unmanaged index of U.S. stock market performance. Unlike a mutual fund, the Index is not subject to charges, fees and other expenses. Investors cannot invest directly in any index. Further information relating to fund performance, including expense reimbursements, if applicable, is contained in the Financial Highlights section of the prospectus and elsewhere in this report.
The Funds 23
DISCUSSION OF FUND PERFORMANCE (continued)

DISCUSSION OF
FUND PERFORMANCE
For the period of September 1, 2013, through August 31, 2014, as provided by Bernard Schoenfeld, Portfolio Manager, responsible for investment allocation decisions
Fund and Market Performance Overview
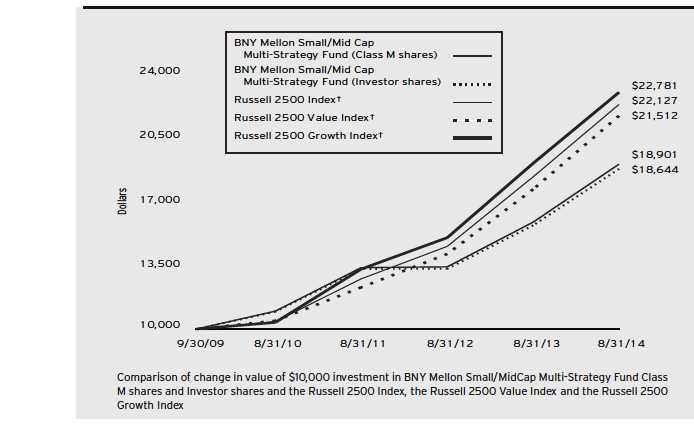
For the 12-month period ended August 31, 2014, BNY Mellon Small/Mid Cap Multi-Strategy Fund’s Class M shares produced a total return of 19.84%, and Investor shares returned 19.53%.1 In comparison, the Russell 2500™ Index, the fund’s benchmark, produced a total return of 21.45% for the same period.2 Russell 2500 Growth and Russell 2500 Value Indexes are secondary benchmarks.
Despite occasional bouts of heightened volatility, stocks generally rallied strongly over the reporting period amid continued U.S. economic growth. The fund produced lower returns than its benchmark, mainly due to shortfalls among a handful of individual investments over the reporting period’s first half.
Effective April 28, 2014, the fund changed its name and modified its investment strategy to provide exposure to various small-cap and midcap equity portfolio managers, investment strategies and styles. On that date, Bernard Schoenfeld became the fund’s primary portfolio manager responsible for investment allocation decisions.
The Fund’s Investment Approach
The fund seeks capital appreciation.The fund pursues its goal by normally investing at least 80% of its net assets in equity securities of small- and midcap companies. The fund currently considers small- and midcap companies to be those companies with total market capitalizations that are within the market capitalization range of the smallest company included in the Russell 2000 Index and the largest company included in the Russell Midcap Index.
Prior to April 28, 2014, the fund invested in growth and value stocks chosen through a disciplined investment process that combined computer modeling techniques, fundamental analysis, and risk management.
As of April 28, 2014, the fund normally allocates assets across multiple investment strategies employed by the investment adviser that invest primarily in equity securities issued by small- and midcap companies. The investment adviser determines the investment strategies and sets target allocations and ranges. The fund is designed to provide exposure to various investment strategies and styles, including the Opportunistic Small/Mid Cap Strategy, the Small/Mid Cap Value Strategy and the Small/Mid Cap Growth Strategy, all as more particularly described in the fund’s prospectus.
Stocks Advanced Strongly in a Broad Market Rally
U.S. stocks generally gained value over the fall of 2013 in response to encouraging economic data, enabling several broad measures of stock market performance to end 2013 near record highs.The market relinquished some of its gains in January 2014 due to concerns regarding a shift to more moderately accommodative U.S. monetary policy and economic slowdowns in the world’s emerging markets, but stocks rebounded in February when those worries proved to be overblown.Another bout of market weakness in the early spring stemmed from the adverse economic impact of unusually harsh winter weather in much of the U.S. This downturn hit growth-oriented companies in the information technology and biotech-nology industry groups particularly hard, signaling a shift in market leadership from more aggressive growth stocks to their better established, value-oriented counterparts. The economic recovery subsequently resumed, driving stocks to a series of new record highs over the reporting period’s final three months.
24
Underlying Investments Delivered Mixed Results
The fund’s relative performance from the start of the reporting period through its restructuring on April 28, 2014, was constrained by a handful of disappointing security selections in the consumer discretionary, energy, and information technology sectors. The performance of those securities offset above-average returns in the industrials, financials and materials sectors.
Upon the fund’s restructuring to a multi-strategy approach, we apportioned 40% of its assets to the Opportunistic Small/Mid Cap Strategy, 30% to the Small/Mid Cap Value Strategy and 30% to the Small/Mid Cap Growth Strategy.These new investments enabled the fund to produce higher returns than its benchmark through the reporting period’s end. We attribute the fund’s relative success since April 28 primarily to the Small/Mid Cap Value Strategy, which achieved especially favorable results in the health care sector and also benefited from the broader shift in investor sentiment in favor of value-oriented stocks.
On the other hand, the Small/Mid Cap Growth Strategy produced results that trailed the fund’s benchmark, primarily due to underperforming security selections in the industrials sector. Likewise, relative results from the Opportunistic Small/Mid Cap Strategy were mildly undermined by shortfalls in the information technology sector.
Positioned for Further Equity Gains
We remain optimistic regarding the prospects for small- and midcap stocks. The economic recovery is expected to continue to accelerate as labor markets recover, consumer confidence improves, and businesses become more comfortable with increased capital spending. Greater mergers-and-acquisitions activity also could lift the stocks of smaller companies that are considered takeover candidates. Nonetheless, we are aware that equity valuations have risen and short-term interest rates may rise, suggesting that selectivity is likely to become more critical to investment success.
The fund made no changes to its allocation strategy between April 28, 2014 and the end of the reporting period, but we remain prepared to alter its composition as economic and market conditions change. In our view, the fund is well positioned for a constructive, but more selective, stock market environment.
September 15, 2014
Equity funds are subject generally to market, market sector, market liquidity, issuer, and investment style risks, among other factors, to varying degrees, all of which are more fully described in the fund’s prospectus. Stocks of small- and/or midcap companies often experience sharper price fluctuations than stocks of large-cap companies.
Part of the fund’s recent performance is attributable to positive returns from its initial public offering (IPO) investments.There can be no guarantee that IPOs will have or continue to have a positive effect on fund performance.
| 1 | Total return includes reinvestment of dividends and any capital gains paid. |
| Past performance is no guarantee of future results. Share price and | |
| investment return fluctuate such that upon redemption, fund shares may be | |
| worth more or less than their original cost. | |
| 2 | SOURCE: LIPPER INC. — Reflects the reinvestment of dividends |
| and, where applicable, capital gain distributions.The Russell 2500™ Index | |
| is a widely accepted, unmanaged index, which measures the performance of | |
| those Russell 2500 companies with lower price-to-book ratios and lower | |
| forecasted growth value. Investors cannot invest directly in any index. |
The Funds 25
FUND PERFORMANCE
| Average Annual Total Returns as of 8/31/14 | |||||
| Inception | From | ||||
| Date | 1 Year | Inception | |||
| Class M shares | 9/30/09 | 19.84 | % | 13.81 | % |
| Investor shares | 9/30/09 | 19.53 | % | 13.50 | % |
| Russell 2500 Index | 9/30/09 | 21.45 | % | 17.53 | % |
| Russell 2500 Value Index | 9/30/09 | 22.61 | % | 16.86 | % |
| Russell 2500 Growth Index | 9/30/09 | 20.25 | % | 18.23 | % |
† Source: Lipper Inc.
Past performance is not predictive of future performance.The fund’s performance shown in the graph and table does not reflect the deduction of taxes that a shareholder would pay on fund distributions or the redemption of fund shares.
The above graph compares a $10,000 investment made in Class M shares and Investor shares of BNY Mellon Small/Mid Cap Multi-Strategy Fund on 9/30/09 (inception date) to a $10,000 investment made in each of (1) the Russell 2500 Index, (2) the Russell 2500 Value Index and (3) the Russell 2500 Growth Index on that date. All dividends and capital gain distributions are reinvested.
On April 28, 2014, the fund changed its name from BNY Mellon Small/Mid Cap Fund to BNY Mellon Small/Mid Cap Multi-Strategy Fund and the fund’s investment strategy changed. From August 20, 2012 through April 27, 2014, the investment adviser selected securities for the fund using a disciplined investment process that combined quantitative modeling techniques, fundamental analysis and risk management. Prior to August 20, 2012, the investment adviser selected securities for the fund using proprietary computer models, along with fundamental analysis to identify and rank stocks within industries or sectors, based on several characteristics, including value, growth and financial profile. Different investment strategies may lead to different performance results.The fund’s performance for the period August 20, 2012 through April 27, 2014 and for the periods prior to August 20, 2012 reflects the fund’s investment strategy in effect during those periods. The fund’s performance shown in the line graph above takes into account all applicable fees and expenses for Class M and Investor shares.The Russell 2500 Index is an unmanaged index designed to track the performance of small- to mid-cap U.S. stocks.The Russell 2500 Value Index is an unmanaged index which measures the performance of those Russell 2500 companies with lower price-to-book ratios and lower forecasted growth values.The Russell 2500 Growth Index is an unmanaged index which measures the performance of those Russell 2500 companies with higher price-to-book ratios and higher forecasted growth values. Unlike a mutual fund, the indices are not subject to charges, fees and other expenses. Investors cannot invest directly in any index. Further information relating to fund performance, including expense reimbursements, if applicable, is contained in the Financial Highlights section of the prospectus and elsewhere in this report.
26

DISCUSSION OF
FUND PERFORMANCE
For the period of September 1, 2013, through August 31, 2014, as provided by D. Kirk Henry, Sean P. Fitzgibbon, Clifford A. Smith, and Mark A. Bogar, Portfolio Managers
Fund and Market Performance Overview
For the 12-month period ended August 31, 2014, BNY Mellon International Fund’s Class M shares produced a total return of 16.11%, and Investor shares returned 15.85%.1 In comparison, the fund’s benchmark, the Morgan Stanley Capital International Europe, Australasia, Far East Index (“MSCI EAFE Index”), produced a total return of 16.43% for the same period.2
Developed equity markets generally rose during the reporting period in response to signs of improving economic fundamentals.The fund produced modestly lower returns than its benchmark, mainly due to shortfalls in Hong Kong, Spain, and Australia.
The Fund’s Investment Approach
The fund seeks long-term capital growth. To pursue this goal, the fund normally invests at least 65% of its total assets in equity securities of foreign issuers.
The fund allocates its assets between a core investment style and a value investment style at the discretion of the investment advisor. The fund is not managed to a specific target duration between these investment styles. Pursuant to the core investment style, under normal circumstances, at least 80% of the fund’s cash inflows allocated to this style are invested in equity securities of companies located in the foreign countries represented in the MSCI EAFE Index and Canada.
The fund will continue to invest in stocks that appear to be undervalued (as measured by their price/earnings ratios), but stocks purchased pursuant to the core investment style may have value and/or growth char-acteristics.The core investment style portfolio manager employs a “bottom-up” investment approach, which emphasizes individual stock selection. The core investment style stock selection process is designed to produce a diversified portfolio that, relative to the MSCI EAFE Index, has a below-average price/earnings ratio and an above-average earnings growth trend.
The fund’s investment approach for the portion of the fund using the value-oriented investment style is research-driven and risk-averse. When selecting stocks, we identify potential investments through valuation screening and extensive fundamental research. Emphasizing individual stock selection over economic or industry trends, the fund focuses on three key factors: value, business health, and business momentum.
Developed Markets Gained Ground
Western European stock markets climbed during the first nine months of the reporting period as economic growth appeared to pick up in some countries, such as Germany, and long-awaited signs of recovery emerged in some of the region’s more troubled economies, including Italy and Spain. Investors also responded positively to an unexpected reduction in short-term interest rates by the European Central Bank. However, many European stocks came under pressure in June and July due to disappointing quarterly GDP growth rates. Concerns regarding the impact on energy prices relating to the geopolitical tensions in Ukraine and the Middle East also weighed on investor sentiment. Nevertheless, the region’s equities markets ended the reporting period with robust gains.
The Funds 27
DISCUSSION OF FUND PERFORMANCE (continued)
Most developed markets in Asia generated more modestly positive returns. The Japanese stock market struggled with stalling economic growth and the fading benefits of aggressively stimulative monetary and fiscal policies. Hong Kong and Australian stocks were hampered by slowing growth in China.
Selection and Allocation Strategies Delivered Mixed Results
Although the fund participated substantially in the MSCI EAFE Index’s gains, a few of the fund’s holdings and country allocations detracted from its relative returns. In Hong Kong, casino operator SJM Holdings was hurt by the slowing Chinese economy, apparel retailer Esprit Holdings experienced declining brand popularity, and mobile phone and consumer electronics assembler FIH Mobile lost ground due to profit-taking. Individual stock selections in Spain performed relatively well, but the fund’s underweighted exposure to the rebounding Spanish market detracted from its relative returns. In Australia, QBE Insurance Group and Metcash grocery chain suffered declines.
On the other hand, the fund outperformed its benchmark in several areas. A diverse mix of Japanese holdings bolstered returns, led by technology businesses, such as Fujitsu and Tokyo Electron; industrial companies, such as Hitachi; and energy producers, such as INPEX. In the United Kingdom, pharmaceutical maker Shire more than doubled in value after receiving an acquisition offer, while other holdings, such as merchandiser Home Retail Group and hotel and restaurant operator Whitbread, also posted strong gains. The fund’s overweighted exposure to the Italian market further bolstered the fund’s performance, as did good individual stock selections, such as telecommunications operator Telecom Italia and aerospace and defense contractor Finmeccanica.
Valuations Have Remained Attractive
Despite the run-up in some international equity markets, we have continued to see prospects for additional gains. We believe valuations appear attractive in Japan, where a weakening currency may prove positive for exporters. In Europe, discussions of full scale quantitative easing and the possibility of a resolution to the conflict in Ukraine could set the stage for earnings growth and improved investor confidence. We have identified a relatively large number of what we believe are attractive investment opportunities in Europe, and we recently have increased the fund’s exposure to the Australian market.
September 15, 2014
Please note, the position in any security highlighted with italicized typeface was sold during the reporting period.
Equity funds are subject generally to market, market sector, market liquidity, issuer, and investment style risks, among other factors, to varying degrees, all of which are more fully described in the fund’s prospectus.
The fund’s performance will be influenced by political, social, and economic factors affecting investments in foreign companies. Special risks associated with investments in foreign companies include exposure to currency fluctuations, less liquidity, less developed or less efficient trading markets, lack of comprehensive company information, political instability, and differing auditing and legal standards.These risks are enhanced in emerging market countries.
| 1 | Total return includes reinvestment of dividends and any capital gains paid. |
| Past performance is no guarantee of future results. Share price and investment | |
| return fluctuate such that upon redemption fund shares may be worth more or | |
| less than their original cost. | |
| 2 | SOURCE: LIPPER INC. — Reflects reinvestment of net dividends and, |
| where applicable, capital gain distributions.The Morgan Stanley Capital | |
| International Europe,Australasia, Far East (MSCI EAFE) Index is an | |
| unmanaged index composed of a sample of companies representative of the | |
| market structure of European and Pacific Basin countries. Index return does | |
| not reflect fees and expenses associated with operating a mutual fund. Investors | |
| cannot invest directly in any index. |
28
FUND PERFORMANCE
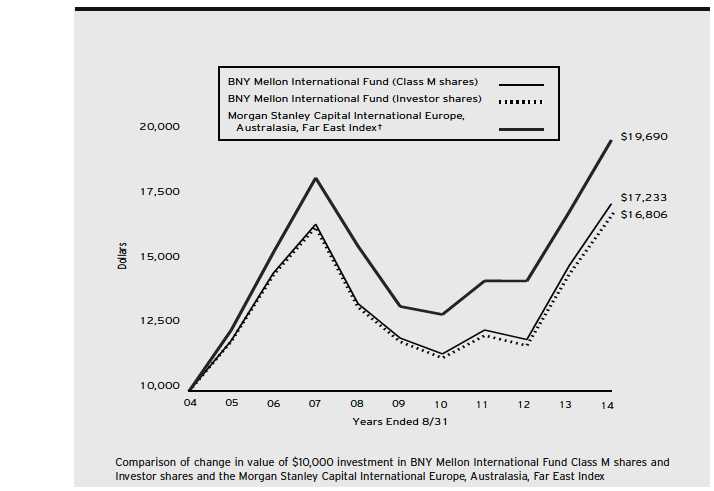
| Average Annual Total Returns as of 8/31/14 | ||||||
| 1 Year | 5 Years | 10 Years | ||||
| Class M shares | 16.11 | % | 7.41 | % | 5.59 | % |
| Investor shares | 15.85 | % | 7.13 | % | 5.33 | % |
| Morgan Stanley Capital International | ||||||
| Europe, Australasia, Far East Index | 16.43 | % | 8.21 | % | 7.01 | % |
† Source: Lipper Inc.
Past performance is not predictive of future performance.The fund’s performance shown in the graph and table does not reflect the deduction of taxes that a shareholder would pay on fund distributions or the redemption of fund shares.
The above graph compares a $10,000 investment made in Class M shares and Investor shares of BNY Mellon International Fund on 8/31/04 to a $10,000 investment made in the Morgan Stanley Capital International Europe, Australasia, Far East Index (the “Index”) on that date. All dividends and capital gain distributions are reinvested.
The fund’s performance shown in the line graph above takes into account all applicable fees and expenses for Class M and Investor shares.The Index is an unmanaged index composed of a sample of companies representative of the market structure of European and Pacific Basin countries. Unlike a mutual fund, the Index is not subject to charges, fees and other expenses. Investors cannot invest directly in any index. Further information relating to fund performance, including expense reimbursements, if applicable, is contained in the Financial Highlights section of the prospectus and elsewhere in this report.
The Funds 29
DISCUSSION OF FUND PERFORMANCE (continued)

DISCUSSION OF
FUND PERFORMANCE
For the period of September 1, 2013, through August 31, 2014, as provided by D. Kirk Henry, Sean P. Fitzgibbon, and Jay Malikowski, Portfolio Managers
Fund and Market Performance Overview
For the 12-month period ended August 31, 2014, BNY Mellon Emerging Markets Fund’s Class M shares produced a total return of 21.82%, and Investor shares returned 21.57%.1 This compares with a 19.98% total return produced by the Morgan Stanley Capital International Emerging Markets Index (“MSCI EM Index”), the fund’s benchmark, for the same period.2
Emerging-markets equities rallied despite bouts of heightened market volatility stemming from economic and geopolitical concerns. The fund outperformed its benchmark largely on the strength of overweighted exposure to and favorable security selections within India’s stock market.
The Fund’s Investment Approach
The fund seeks long-term capital growth. To pursue its goal, the fund invests at least 80% of its assets in equity securities of companies organized, or with a majority of assets or operations, in countries considered to be emerging markets.
The fund allocates its assets between a core investment style and a value investment style at the discretion of the investment advisor. The fund is not managed to a specific target duration between these investment styles. Pursuant to the core investment style, under normal circumstances at least 80% of the fund’s assets allocated to this style are invested in equity securities of companies located in the foreign countries represented in the MSCI EM Index.
The fund will continue to invest in stocks that appear to be undervalued (as measured by their price/earnings ratios), but stocks purchased pursuant to the core investment style may have value and/or growth character-istics.The core investment style portfolio manager employs a “bottom-up” investment approach, which emphasizes individual stock selection.The core investment style stock selection process is designed to produce a diversified portfolio that, relative to the MSCI EM Index, has a below-average price/earnings ratio and an above-average earnings growth trend.
When choosing stocks for the portion of the fund using the value-oriented investment style, we use a research-driven and risk-averse approach. We identify potential investments through valuation screening and extensive fundamental research. Emphasizing individual stock selection rather than economic and industry trends, we focus on three key factors: value, business health, and business momentum.
Positive Developments Lifted Emerging Markets
Stocks of Indian companies delivered robust gains, posting solid increases during the first half of the reporting period amid a strengthening currency and improving trade balances, then soaring during the second half after the election of new, pro-business government leadership. Most other Asian emerging markets produced more modest gains, with China continuing to exhibit slowing, though stabilizing, economic growth. Eastern European emerging markets, on the other hand, were negatively affected by increasing geopolitical tensions surrounding Russia and Ukraine, while Latin American markets remained vulnerable to national fiscal difficulties and weakening demand from China for commodities.
Indian Gains Drove Fund Outperformance
India’s fragile economy appeared to turn a corner during the reporting period. In addition to the election of a Prime Minister with a declared pro-business, pro-reform policy agenda, the country also saw the appointment of
30
new central bank leadership and improving domestic economic fundamentals. The fund benefited both from overweighted exposure to this fast-rising market and from strong individual stock selections. We generally emphasized domestically oriented companies, with top performers including materials producers, such as India Cements and Steel Authority of India; mining groups such as NMDC; financial institutions, such as ICICI Bank, Punjab National Bank, State Bank of India, and Oriental Bank of Commerce; and consumer discretionary companies, such as auto makers Maruti Suzuki India and Tata Motors. To a lesser degree, the fund also outperformed its benchmark with good individual stock selections in South Korea, underweighted exposure to the relatively weak Chilean market, and an emphasis on information technology stocks in Taiwan.
On a more negative note, the fund’s relative results suffered from overweighted exposure to the Russian market, which declined due to concerns over the impact of Western sanctions related to the conflict in Ukraine. Relatively heavy exposure to Chinese stocks also detracted from the fund’s returns compared to the benchmark, as did a few Hong Kong based holdings hurt by the weakening Chinese economy.
Positioned for Continued Recovery
We believe that recent gains in emerging markets may represent the start of investment dollars flowing again into this previously beaten down asset class. We have positioned the fund to benefit from policy changes and economic reforms currently taking place in several countries. In particular, the fund has maintained an overweighted position in the Indian market, although we have trimmed our allocation to that market by taking some profits.We have also taken profits in a few South Korean holdings, and we have substantially reduced exposure to Russian stocks.We have increased exposure to China, where we believe the economic growth rate appears to be bottoming, possibly setting the stage for future gains.
September 15, 2014
Equity funds are subject generally to market, market sector, market liquidity, issuer, and investment style risks, among other factors, to varying degrees, all of which are more fully described in the fund’s prospectus.
The fund’s performance will be influenced by political, social, and economic factors affecting investments in foreign companies. Special risks associated with investments in foreign companies include exposure to currency fluctuations, less liquidity, less developed or less efficient trading markets, lack of comprehensive company information, political instability, and differing auditing and legal standards.These risks are enhanced in emerging markets countries.
| 1 | Total return includes reinvestment of dividends and any capital gains paid. |
| Past performance is no guarantee of future results. Share price and | |
| investment return fluctuate such that upon redemption, fund shares may be | |
| worth more or less than their original cost. | |
| 2 | SOURCE: LIPPER INC. — Reflects reinvestment of net dividends |
| and, where applicable, capital gain distributions.The Morgan Stanley | |
| Capital International Emerging Markets Index is a market capitalization- | |
| weighted index composed of companies representative of the market | |
| structure of select designated emerging market countries in Europe, Latin | |
| America, and the Pacific Basin. Index return does not reflect fees and | |
| expenses associated with operating a mutual fund. Investors cannot invest | |
| directly in any index. |
The Funds 31
FUND PERFORMANCE
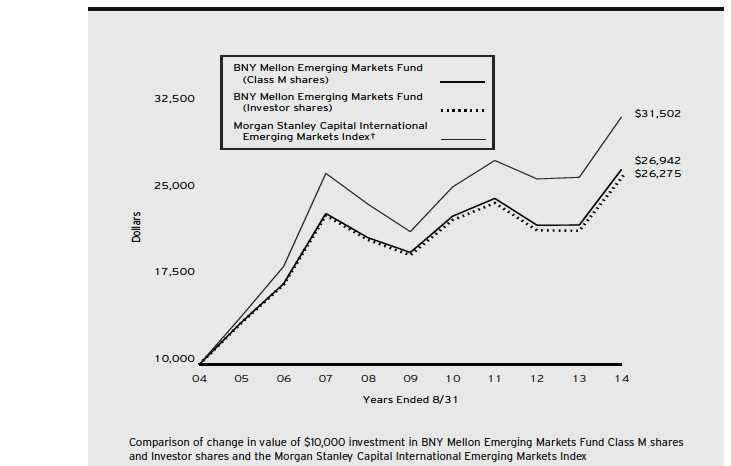
| Average Annual Total Returns as of 8/31/14 | ||||||
| 1 Year | 5 Years | 10 Years | ||||
| Class M shares | 21.82 | % | 6.42 | % | 10.42 | % |
| Investor shares | 21.57 | % | 6.14 | % | 10.14 | % |
| Morgan Stanley Capital International | ||||||
| Emerging Markets Index | 19.98 | % | 7.90 | % | 12.16 | % |
† Source: Lipper Inc.
Past performance is not predictive of future performance.The fund’s performance shown in the graph and table does not reflect the deduction of taxes that a shareholder would pay on fund distributions or the redemption of fund shares.
The above graph compares a $10,000 investment made in Class M shares and Investor shares of BNY Mellon Emerging Markets Fund on 8/31/04 to a $10,000 investment made in the Morgan Stanley Capital International Emerging Markets Index (the “Index”) on that date. All dividends and capital gain distributions are reinvested.
The fund’s performance shown in the line graph above takes into account all applicable fees and expenses for Class M and Investor shares.The Index is a market capitalization-weighted index composed of companies representative of the market structure of select designated emerging market countries in Europe, Latin America and the Pacific Basin.The Index excludes closed markets and those shares in otherwise free markets that are not purchasable by foreigners.The Index includes gross dividends reinvested and, unlike a mutual fund, does not take into account charges, fees and other expenses.These factors can contribute to the Index potentially outperforming the fund. Investors cannot invest directly in any index. Further information relating to fund performance, including expense reimbursements, if applicable, is contained in the Financial Highlights section of the prospectus and elsewhere in this report.
32

DISCUSSION OF
FUND PERFORMANCE
For the period of September 1, 2013, through August 31, 2014, as provided by Thomas J. Durante, Richard A. Brown, and Karen Q.Wong, Portfolio Managers
Fund and Market Performance Overview
For the 12-month period ended August 31, 2014, BNY Mellon International Appreciation Fund’s Class M shares produced a total return of 14.65%, and Investor shares returned 14.39%.1 In comparison, the fund’s benchmark, the Morgan Stanley Capital International Europe, Australasia, Far East Index (“MSCI EAFE Index”), produced a total return of 16.43% for the same period.2
International equity markets generally rose in response to improving economic fundamentals. The fund underperformed its benchmark due to expenses and pricing disparities between the stocks of the companies comprising the MSCI EAFE Index and the related Depository Receipts (DRs) in which the fund invests.
The Fund’s Investment Approach
The fund seeks long-term capital appreciation. To pursue its goal, the fund normally invests at least 80% of its net assets in equity securities, including DRs, common stocks, preferred stocks, convertible securities, equity securities in foreign investment funds, or trusts and other equity investments.
The fund invests primarily in DRs representing the local shares of non-U.S. companies, in particular, American Depositary Receipts (ADRs). In selecting securities, we screen the MSCI EAFE Index universe of approximately 1,000 issuers for the availability of issuers with a DR facility.The investment adviser then uses a proprietary mathematical algorithm to reflect the characteristics of the developed markets that takes into consideration risk characteristics, including country weights and sector weights within each country. As a result of this process, we expect to hold ADRs representing 200 to 300 foreign issuers. The fund’s country allocation is expected to be within 5% of that of the MSCI EAFE Index, and under normal circumstances, the fund will invest in at least 10 different countries.The fund generally will not invest in securities from developing countries because they are not included in the MSCI EAFE Index.
International Stock Markets Gained Ground
With some exceptions, international stock markets fared well over the reporting period. In Western Europe, stocks climbed during the first nine months of the reporting period as economic growth appeared to pick up in some countries, such as Germany, and long-awaited signs of recovery emerged in others, including Italy and Spain. Investors also responded positively to an unexpected reduction in short-term interest rates by the European Central Bank. However, European stocks came under pressure over the summer of 2014 after the release of disappointing economic data which sparked concerns regarding potential deflationary pressures. Geopolitical instability in Ukraine and the Middle East also weighed on European investor sentiment over the reporting period’s second half.
Most developed markets in Asia generated more modestly positive returns. Despite lower interest rates, the Japanese stock market struggled with the impact an increase in the consumption tax had on economic growth, as well as the fading benefits of aggressively stimulative monetary and fiscal policies. Meanwhile, Hong Kong and Australian stocks were hampered by slowing economic growth in China.
The Funds 33
DISCUSSION OF FUND PERFORMANCE (continued)
Financials, Health Care, and Energy Sectors Buoyed Results
The rise of international equity markets over the reporting period was supported by robust gains among European banks, which responded positively to increased lending activity and higher prices among their sovereign bond holdings. Banks in the United Kingdom and Australia also fared well, mainly due to above-trend economic growth in their markets.
Among health care companies, large pharmaceutical developers posted solid gains stemming from their expansion into the emerging markets and robust research-and-development activity. Drug companies also benefited from strong investor demand for stocks with competitive dividend yields, as did a number of companies in the utilities and telecommunications services sectors. In the energy sector, oil and gas producers intensified their focus on increasing shareholder value, leading to a more cost-conscious approach to new projects.
Disappointments during the reporting period included food retailers, which encountered earnings pressure due to lower agricultural commodity prices and greater competitive pressures. Sanctions imposed by Russia on Western European governments depressed exports from a number of industry groups, including footwear manufacturers in the consumer discretionary sector and food producers in the consumer staples sector, and airlines were forced to fly longer routes after being denied use of Russian airspace. The economic impact of the geopolitical conflict in Ukraine also dampened exports to several Eastern European nations. Meanwhile, Japanese automakers were hurt by a depreciating currency, which undermined sales in China.
At times during the reporting period, the fund employed futures contracts to manage cash flows.
Fully Invested in International Stocks
Despite the recent run-up in international stock prices, we continue to believe that international stock markets have the potential to produce good results, as the global economy gradually strengthens.As always, we continue to monitor the factors considered by the fund’s investment model in light of current market conditions.
September 15, 2014
Equity funds are subject generally to market, market sector, market liquidity, issuer, and investment style risks, among other factors, to varying degrees, all of which are more fully described in the fund’s prospectus.
The fund’s performance will be influenced by political, social, and economic factors affecting investments in foreign companies. Special risks associated with investments in foreign companies include exposure to currency fluctuations, less liquidity, less developed or less efficient trading markets, lack of comprehensive company information, political instability, and differing auditing and legal standards.These risks are enhanced in emerging market countries.
| 1 | Total return includes reinvestment of dividends and any capital gains paid. |
| Past performance is no guarantee of future results. Share price and investment | |
| return fluctuate such that upon redemption, fund shares may be worth more or | |
| less than their original cost. | |
| 2 | SOURCE: LIPPER INC. — Reflects reinvestment of net dividends and, |
| where applicable, capital gain distributions.The Morgan Stanley Capital | |
| International Europe,Australasia, Far East (MSCI EAFE) Index is an | |
| unmanaged index composed of a sample of companies representative of the | |
| market structure of European and Pacific Basin countries. Index return does | |
| not reflect fees and expenses associated with operating a mutual fund. Investors | |
| cannot invest directly in any index. |
34
FUND PERFORMANCE
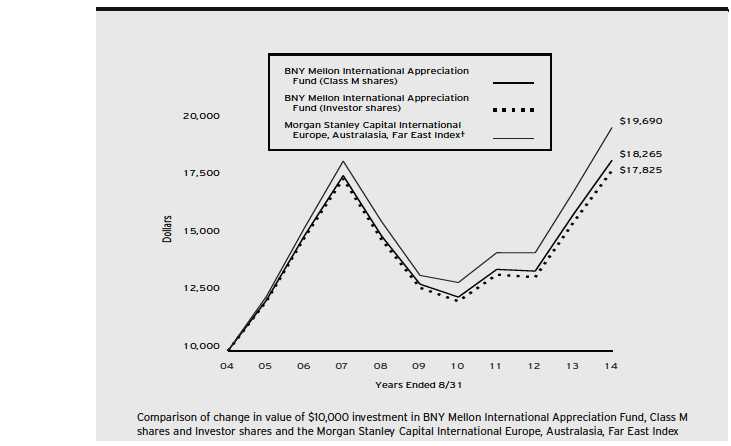
| Average Annual Total Returns as of 8/31/14 | ||||||
| 1 Year | 5 Years | 10 Years | ||||
| Class M shares | 14.65 | % | 7.22 | % | 6.21 | % |
| Investor shares | 14.39 | % | 6.96 | % | 5.95 | % |
| Morgan Stanley Capital International | ||||||
| Europe, Australasia, Far East Index | 16.43 | % | 8.21 | % | 7.01 | % |
† Source: Lipper Inc.
Past performance is not predictive of future performance.The fund’s performance shown in the graph and table does not reflect the deduction of taxes that a shareholder would pay on fund distributions or the redemption of fund shares.
The above graph compares a $10,000 investment made in Class M shares and Investor shares of BNY Mellon International Appreciation Fund on 8/31/04 to a $10,000 investment made in the Morgan Stanley Capital International Europe, Australasia, Far East Index (the “Index”) on that date. All dividends and capital gain distributions are reinvested.
As of the close of business on September 12, 2008, substantially all of the assets of another investment company advised by an affiliate of the fund’s investment adviser, BNY Hamilton International Equity Fund (the “predecessor fund”), a series of BNY Hamilton Funds, Inc., were transferred to BNY Mellon International Appreciation Fund in a tax-free reorganization and the fund commenced operations.The performance figures for the fund’s Class M shares represent the performance of the predecessor fund’s Institutional shares prior to the commencement of operations for BNY Mellon International Appreciation Fund and the performance of BNY Mellon International Appreciation Fund’s Class M shares thereafter.The performance figures for Investor shares represent the performance of the predecessor fund’s Class A shares prior to the commencement of operations for BNY Mellon International Appreciation Fund and the performance of BNY Mellon International Appreciation Fund’s Investor shares thereafter. Investor shares are subject to a Shareholder Services Plan.
The fund’s performance shown in the line graph above takes into account all applicable fees and expenses for Class M and Investor shares.The Index is an unmanaged index composed of a sample of companies representative of the market structure of European and Pacific Basin countries. Unlike a mutual fund, the Index is not subject to charges, fees and other expenses. Investors cannot invest directly in any index. Further information relating to fund performance, including expense reimbursements, if applicable, is contained in the Financial Highlights section of the prospectus and elsewhere in this report.
The Funds 35
DISCUSSION OF FUND PERFORMANCE (continued)

DISCUSSION OF
FUND PERFORMANCE
For the period of September 1, 2013, through August 31, 2014, as provided by C.Wesley Boggs,Warren Chiang, CFA, and Ronald Gala, CFA, Primary Portfolio Managers
Fund and Market Performance Overview
For the 12-month period ended August 31, 2014, BNY Mellon International Equity Income Fund’s Class M shares produced a total return of 12.08%, and Investor shares returned 11.79%.1 In comparison, the fund’s benchmark, the Morgan Stanley Capital International All Country World Index Ex-U.S. (MSCI ACWI Ex-US Index), provided a total return of 17.75% for the same period.2
International equity markets generally rose during the reporting period in response to improving economic fundamentals. The fund produced lower returns than its benchmark, mainly due to shortfalls in the consumer discretionary and energy sectors, as well as overweighted exposure to Turkey.
The Fund’s Investment Approach
The fund seeks total return consisting of capital appreciation and income. To pursue its goal, the fund normally invests at least 80% of its net assets, plus any borrowings for investment purposes, in equity securities. The fund focuses on dividend-paying stocks of foreign companies, including those in developed and emerging-market countries. The fund may invest in the stocks of companies of any market capitalization.
We select stocks through a disciplined investment process using proprietary quantitative computer models that analyze a diverse set of characteristics to identify and rank stocks according to earnings quality. Based on this analysis, we generally select from the higher ranked dividend-paying securities those stocks that we believe will continue to pay above-average dividends.We seek to overweight higher dividend-paying stocks, while maintaining country and sector weights generally similar to those of the MSCI ACWI Ex-US Index.
International Stock Markets Gained Ground
With some exceptions, international stock markets fared well over the past year. In Western Europe, stocks climbed during the first nine months of the reporting period as economic growth appeared to pick up in some countries, such as Germany, and long-awaited signs of recovery emerged in others, including Italy and Spain. Investors also responded positively to an unexpected reduction in short-term interest rates by the European Central Bank. However, many European stocks came under pressure in June and July due to new releases of disappointing economic data. Concerns regarding geopolitical tensions in Ukraine and the Middle East also weighed on investor sentiment in Europe over the reporting period’s second half.
Most developed markets in Asia generated more modestly positive returns. The Japanese stock market struggled with stalling economic growth and the fading benefits of aggressively stimulative monetary and fiscal policies. Hong Kong and Australian stocks were hampered by slowing economic growth in China. In the emerging markets, a number of regional equity markets rebounded from previous weakness, most notably India, Brazil, and, to a lesser extent, China. Other developing markets, such as Russia and Turkey, lagged market averages due to geopolitical developments.
Selection and Allocation Strategies Delivered Mixed Results
Although the fund participated substantially in its benchmark’s gains, overweighted exposure to Turkey’s struggling stock market weighed on its relative results. Although Turkish stocks provided highly competitive dividend
36
yields, on average, local political unrest and a depreciating currency undermined stock prices. Most significantly, in the consumer discretionary sector, Turkish automaker Ford Otomotiv Sanayi was hurt by higher taxes and the weakening Turkish lira. The company paid no dividends in 2013, further pressuring its stock price. Among energy companies, Norwegian offshore oil driller Seadrill missed earnings targets as a result of intensifying competitive pressures in a challenging environment for oil rig leases. German television broadcaster ProSiebenSat.1 Media offered an attractive dividend yield, but its stock price fell amid concerns regarding the company’s high debt levels.
On the other hand, the fund outperformed market averages in the utilities and financials sectors. Utilities stocks, such as Red Electrica in Spain, benefited from low interest rates, which drove investors from bonds to relatively stable sources of dividend income in the equity markets. Australian financial institution Insurance Australia and New Zealand Banking Group gained value when it posted better-than-expected profits and raised the future guidance it provides to analysts. In other areas, U.K.-based pharmaceuticals developer AstraZeneca climbed sharply after receiving a takeover bid from U.S. drugmaker Pfizer, and Spanish construction firm Ferrovial advanced when infrastructure development activity increased in a recovering local economy.
Finding Attractive Income Opportunities Worldwide
Despite the recent run-up in international stock prices, we continue to believe that companies with generous dividend yields have the potential to perform well. Increasingly, investors are turning to dividend-paying stocks for competitive levels of current income in a persistently low interest rate environment.
Our disciplined investment approach has identified an ample number of income-oriented stocks meeting our investment criteria in the emerging markets, as well as in the financials, utilities, and telecommunications services sectors.The fund also ended the reporting period with overweighted exposure to value-oriented companies, which tend to pay higher dividends than their more growth-oriented counterparts. In contrast, we have found relatively few opportunities in the health care, consumer staples, and materials sectors that meet our investment criteria.
September 15, 2014
Please note, the position in any security highlighted with italicized typeface was sold during the reporting period.
Equity funds are subject generally to market, market sector, market liquidity, issuer, and investment style risks, among other factors, to varying degrees, all of which are more fully described in the fund’s prospectus.
| 1 | Total return includes reinvestment of dividends and any capital gains paid. |
| Past performance is no guarantee of future results. Share price and | |
| investment return fluctuate such that upon redemption, fund shares may be | |
| worth more or less than their original cost. | |
| 2 | SOURCE: LIPPER — Reflects reinvestment of net dividends and, |
| where applicable, capital gain distributions.The MSCI ACWI Ex-US | |
| Index captures large and midcap representation across 22 of 23 Developed | |
| Markets (DM) countries (excluding the US) and 23 Emerging Markets | |
| (EM) countries. Investors cannot invest directly in any index. |
The Funds 37
FUND PERFORMANCE
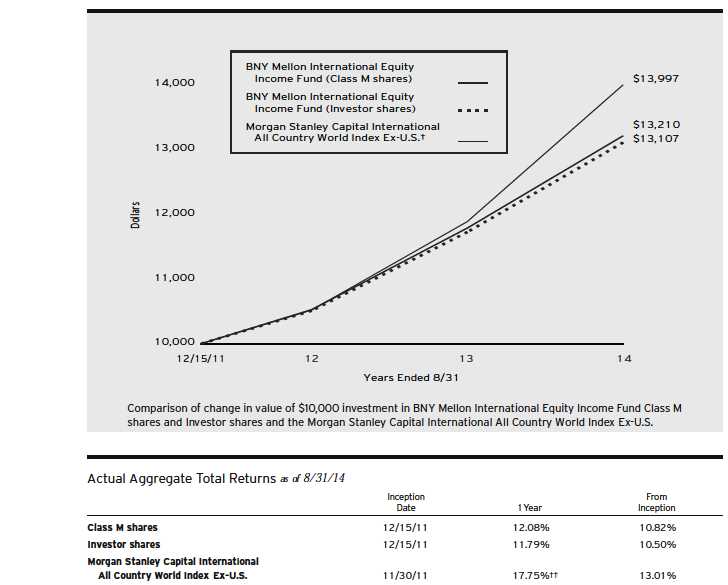
| † Source: Lipper Inc. |
| Past performance is not predictive of future performance.The fund’s performance shown in the graph and table does not reflect the deduction of taxes that a shareholder |
| would pay on fund distributions or the redemption of fund shares. |
| The above graph compares a $10,000 investment made in Class M shares and Investor shares of BNY Mellon International Equity Income Fund on 12/15/11 |
| (inception date) to a $10,000 investment made in the Morgan Stanley Capital International All Country World Index Ex-U.S. (the “Index”) on that date.All |
| dividends and capital gain distributions are reinvested. |
| The fund’s performance shown in the line graph above takes into account all applicable fees and expenses for Class M and Investor shares.The Index captures large |
| and mid cap representation across 23 of 24 Developed Markets (DM) countries (excluding the U.S.) and 21 Emerging Markets (EM) countries. Unlike a mutual |
| fund, the Index is not subject to charges, fees and other expenses. Investors cannot invest directly in any index. Further information relating to fund performance, |
| including expense reimbursements, if applicable, is contained in the Financial Highlights section of the prospectus and elsewhere in this report. |
| †† For comparative purposes, the value of the Index on 11/30/11 is used as the beginning value on 12/15/11. |
38

DISCUSSION OF
FUND PERFORMANCE
For the period of September 1, 2013, through August 31, 2014, as provided by Warren Chiang, Ronald P. Gala, John Flahive, and Jeffrey M. Mortimer, Portfolio Managers
Fund and Market Performance Overview
For the 12-month period ended August 31, 2014, BNY Mellon Asset Allocation Fund’s Class M shares produced a total return of 16.25%, and Investor shares returned 15.96%.1 In comparison, the fund’s benchmark, the Morningstar Moderate Target Risk Index, produced a total return of 14.69%.2 The fund’s previous benchmarks, the Standard & Poor’s 500 Composite Stock Price Index (“S&P 500 Index”) and the Barclays U.S. Aggregate Bond Index (the “Barclays Index”), produced total returns of 25.21% and 5.66%, respectively, for the same period.3
Effective July 1, 2014, the fund changed its primary benchmark to the Morningstar Moderate Target Risk Index (the “Morningstar Index”) from the S&P 500 Index and discontinued its use of the Barclays Index as a secondary benchmark because the Morningstar Index is more reflective of the manner in which the fund’s assets may be allocated.
Stocks rallied over the reporting period amid continued U.S. economic growth, while bonds responded positively to supply-and-demand dynamics. The fund outperformed its benchmark, mainly due to successful security selections across a variety of its underlying investment strategies.
The Fund’s Investment Approach
The fund seeks long-term growth of principal in conjunction with current income. The fund may invest in both individual securities and other investment companies, including other BNY Mellon funds, funds in the Dreyfus Family of Funds and unaffiliated open-end funds, closed-end funds, and exchange-traded funds (collectively, the “underlying funds”). To pursue its goal, the fund may allocate its assets, directly in individual equity and debt securities and/or through investment in the underlying funds, to gain investment exposure to the following asset classes: Large Cap Equities, Small Cap and Mid Cap Equities, Developed International and Global Equities, Emerging Market Equities, Investment Grade Bonds, High Yield Bonds, Emerging Markets Debt, Diversifying Strategies, and Money Market Instruments.
Further information about the fund’s investment strategy and process and the underlying funds is described in the fund’s prospectus.
Stocks and Bonds Advanced in Economic Recovery
Stocks generally gained value over the fall of 2013 in response to encouraging economic data, enabling the S&P 500 Index to end 2013 near record highs. The market relinquished some of its gains in January 2014 amid concerns regarding economic slowdowns in the emerging markets, but it rebounded in February when those worries proved overblown. Additional weakness in the spring—mainly in the information technology and biotechnology industry groups—sparked a shift in market leadership from economically sensitive growth stocks to their more defensive, value-oriented counterparts. New releases of positive economic data again drove stocks to new record highs over the reporting period’s final three months.
Bonds also fared relatively well during the reporting period.Yields of long-term U.S. government securities climbed and prices fell during late 2013, when investors responded to stronger economic growth and anticipated a more moderately accommodative monetary policy. However, yields declined in early 2014 due to geopolitical instability and a domestic economic soft patch. Yields subsequently remained low amid robust demand from investors seeking alternatives to low yielding European sovereign bonds.
The Funds 39
DISCUSSION OF FUND PERFORMANCE (continued)
Underlying Investments Delivered Mixed Results
The fund’s relative performance was bolstered by its direct equity investments. This sleeve of the portfolio benefited from favorable stock selections in the consumer staples, consumer discretionary, and energy sectors. The fund also received positive contributions from a number of underlying equity mutual funds, particularly BNY Mellon Focused Equity Opportunities Fund, which made successful security selections in the information technology, health care, energy, and financials sectors. Other above-average performers included Dreyfus Select Managers Small Cap Value Fund and BNY Mellon Emerging Markets Fund. On the other hand, Dreyfus Select Managers Small Cap Growth Fund, Global Stock Fund, and Dreyfus/Newton International Equity Fund lagged their respective stock market averages.
The fund’s direct investments in bonds mildly underper-formed the broader market, as a relatively short average duration prevented those investments from participating more fully in the 2014 rally. Shortfalls experienced by Dreyfus Inflation Adjusted Securities Fund also weighed on the fund’s fixed-income performance. The fund’s bond portfolio achieved better relative results through Dreyfus HighYield Fund and BNY Mellon Corporate Bond Fund, which proved less sensitive to changing long-term interest rates. The fund also received good relative performance from the unaffiliated investment company in the fund’s Emerging Markets Debt asset class.
Among the fund’s alternative investments, the fund received excellent results from one of its unaffiliated investment companies after its addition to the portfolio in May 2014. In contrast, Dreyfus Dynamic Total Return Fund and one of the other unaffiliated investment companies were slight drags on relative performance. Dreyfus Global Real Estate Securities Fund underperformed its benchmark but provided attractive returns in absolute terms.
Positioned for Further Equity Gains
We remain optimistic regarding equities’ prospects as the economic recovery continues, consumer confidence improves, and businesses become more comfortable with increased capital spending. We view bonds less favorably, primarily due to the possibility that interest rates may rise.
Therefore, beginning in May we implemented a number of changes to the fund’s allocation strategy, reducing its exposure to potential interest-rate risks and adding new positions that we believe can provide greater diversification for the overall portfolio. New underlying investments included BNY Mellon Corporate Bond Fund, Dreyfus Floating Rate Income Fund, an unaffiliated investment company that pursues a managed futures strategy, and Dreyfus Dynamic Total Return Fund. In our view, these changes should position the fund well as economic conditions and financial markets evolve.
September 15, 2014
Equities are subject generally to market, market sector, market liquidity, issuer, and investment style risks, among other factors, to varying degrees, all of which are more fully described in the fund’s prospectus.
Bonds are subject generally to interest rate, credit, liquidity, and market risks, to varying degrees, all of which are more fully described in the fund’s prospectus. Generally, all other factors being equal, bond prices are inversely related to interest-rate changes, and rate increases can cause price declines.
| 1 | Total return includes reinvestment of dividends and any capital gains paid. |
| Past performance is no guarantee of future results. Share price and investment | |
| return fluctuate such that upon redemption, fund shares may be worth more or | |
| less than their original cost.The fund’s returns reflect the absorption of certain | |
| fund expenses by the fund’s investment adviser pursuant to an agreement in | |
| effect through December 31, 2014, at which time it may be extended, | |
| terminated, or modified. Had these expenses not been absorbed, the fund’s | |
| returns would have been lower. | |
| 2 | SOURCE: BLOOMBERG. — Reflects reinvestment of dividends and, |
| where applicable, capital gain distributions.The Morningstar Moderate Target | |
| Risk Index is an unmanaged index of global equities, bonds and traditional | |
| inflation hedges such as commodities and Treasury Inflation Protected | |
| Securities (TIPS). | |
| 3 | SOURCE: LIPPER INC. — Reflects reinvestment of dividends and, where |
| applicable, capital gain distributions.The Standard & Poor’s 500 Composite | |
| Stock Price Index is a widely accepted, unmanaged index of U.S. stock market | |
| performance.The Barclays U.S.Aggregate Bond Index is a widely accepted, | |
| unmanaged total return index of corporate, U.S. government and U.S. | |
| government agency debt instruments, mortgage-backed securities, and asset- | |
| backed securities with an average maturity of 1-10 years.The indices’ returns | |
| do not reflect the fees and expenses associated with operating a mutual fund. | |
| Investors cannot invest directly in any index. |
40
FUND PERFORMANCE
| Average Annual Total Returns as of 8/31/14 | ||||||
| 1 Year | 5 Years | 10 Years | ||||
| Class M shares | 16.25 | % | 9.54 | % | 6.78 | % |
| Investor shares | 15.96 | % | 9.23 | % | 6.51 | % |
| Standard & Poor’s 500 | ||||||
| Composite Stock Price Index | 25.21 | % | 16.87 | % | 8.37 | % |
| Barclays U.S. Aggregate Bond Index | 5.66 | % | 4.48 | % | 4.72 | % |
| Morningstar Moderate Target Risk Index | 14.69 | % | 10.41 | % | 7.65 | % |
| † | Source: Lipper Inc. |
| †† | Source: Morningstar Inc. |
| Past performance is not predictive of future performance.The fund’s performance shown in the graph and table does not reflect the deduction of taxes that a shareholder | |
| would pay on fund distributions or the redemption of fund shares. | |
| The above graph compares a $10,000 investment made in Class M shares and Investor shares of BNY Mellon Asset Allocation Fund on 8/31/04 to a $10,000 | |
| investment made in each of (1) the Standard & Poor’s 500 Composite Stock Price Index (the “S&P 500 Index”), (2) the Barclays U.S.Aggregate Bond Index | |
| (the “Barclays Index”) and (3) the Morningstar Moderate Target Risk Index (the “Morningstar Index”) on that date.All dividends and capital gain distributions | |
| are reinvested. | |
| Effective July 1, 2014, the fund changed its primary benchmark index from the S&P 500 Index to the Morningstar Index and discontinued the use of the Barclays | |
| Index as a secondary benchmark index. In future annual reports, the fund’s performance will be compared to the Morningstar Index because it is more reflective of the | |
| manner in which the fund’s assets may be allocated than the S&P 500 Index and the Barclays Index. | |
| The fund changed its investment strategy on September 15, 2011. Prior to that date, the fund invested in individual securities and BNY Mellon funds only and its | |
| target allocation was 60% of its assets invested in equity securities (directly and through underlying funds) and 40% of its assets invested in bonds and money market | |
| instruments (directly), with a range of 15% above or below such target amount. Different investment strategies may lead to different performance results.The fund's | |
| performance for periods prior to September 15, 2011 reflects the investment strategy in effect prior to that date. | |
| The fund’s performance shown in the line graph above takes into account all applicable fees and expenses for Class M and Investor shares.The S&P 500 Index | |
| is a widely accepted, unmanaged index of U.S. stock market performance.The Barclays Index is a widely accepted, unmanaged index of corporate, government and | |
| government agency debt instruments, mortgage-backed securities and asset-backed securities with an average maturity of 1-10 years.The Morningstar Index is an | |
| unmanaged index of global equities, bonds and traditional inflation hedges such as commodities and Treasury Inflation Protected Securities (TIPS). Unlike a mutual | |
| fund, the indices are not subject to charges, fees and other expenses. Investors cannot invest directly in any index. Further information relating to fund performance, | |
| including expense reimbursements, if applicable, is contained in the Financial Highlights section of the prospectus and elsewhere in this report. | |
The Funds 41
UNDERSTANDING YOUR FUND’S EXPENSES (Unaudited)
As a mutual fund investor, you pay ongoing expenses, such as management fees and other expenses. Using the information below, you can estimate how these expenses affect your investment and compare them with the expenses of other funds.You also may pay one-time transaction expenses, including sales charges (loads) and redemptions fees, which are not shown in this section and would have resulted in higher total expenses. For more information, see your fund’s prospectus or talk to your financial adviser.
Review your fund’s expenses
The table below shows the expenses you would have paid on a $1,000 investment in each class of each BNY Mellon equity fund from March 1, 2014 to August 31, 2014. It also shows how much a $1,000 investment would be worth at the close of the period, assuming actual returns and expenses.
| Expenses and Value of a $1,000 Investment | ||
| assuming actual returns for the six months ended August 31, 2014 | ||
| Class M Shares | Investor Shares | |
| BNY Mellon Large Cap Stock Fund | ||
| Expenses paid per $1,000† | $4.29 | $5.61 |
| Ending value (after expenses) | $ 1,102.70 | $ 1,101.40 |
| Annualized expense ratio (%) | .81 | 1.06 |
| BNY Mellon Large Cap Market | ||
| Opportunities Fund | ||
| Expenses paid per $1,000† | $ 2.81 | $ 4.11 |
| Ending value (after expenses) | $1,063.70 | $ 1,062.60 |
| Annualized expense ratio (%) | .54 | .79 |
| BNY Mellon Tax-Sensitive | ||
| Large Cap Multi-Strategy Fund | ||
| Expenses paid per $1,000† | $ 3.19 | $4.54 |
| Ending value (after expenses) | $1,072.00 | $ 1,070.10 |
| Annualized expense ratio (%) | .61 | .87 |
| BNY Mellon Income Stock Fund | ||
| Expenses paid per $1,000† | $ 4.23 | $5.65 |
| Ending value (after expenses) | $ 1,096.40 | $ 1,094.10 |
| Annualized expense ratio (%) | .80 | 1.07 |
| BNY Mellon Mid Cap Multi-Strategy Fund | ||
| Expenses paid per $1,000† | $4.64 | $ 5.93 |
| Ending value (after expenses) | $ 1,046.30 | $ 1,044.90 |
| Annualized expense ratio (%) | .90 | 1.15 |
| BNY Mellon Small Cap Multi-Strategy Fund | ||
| Expenses paid per $1,000† | $ 5.25 | $ 6.49 |
| Ending value (after expenses) | $982.30 | $ 981.10 |
| Annualized expense ratio (%) | 1.05 | 1.30 |
| BNY Mellon Focused | ||
| Equity Opportunities Fund | ||
| Expenses paid per $1,000† | $4.51 | $ 5.88 |
| Ending value (after expenses) | $ 1,103.10 | $ 1,101.00 |
| Annualized expense ratio (%) | .85 | 1.11 |
42
| Expenses and Value of a $1,000 Investment (continued) | ||
| assuming actual returns for the six months ended August 31, 2014 | ||
| Class M Shares | Investor Shares | |
| BNY Mellon Small/Mid Cap Multi-Strategy Fund | ||
| Expenses paid per $1,000† | $ 4.67 | $5.99 |
| Ending value (after expenses) | $ 1,034.10 | $ 1,032.40 |
| Annualized expense ratio (%) | .91 | 1.17 |
| BNY Mellon International Fund | ||
| Expenses paid per $1,000† | $ 5.19 | $6.44 |
| Ending value (after expenses) | $997.60 | $996.30 |
| Annualized expense ratio (%) | 1.03 | 1.28 |
| BNY Mellon Emerging Markets Fund | ||
| Expenses paid per $1,000† | $ 7.75 | $ 9.11 |
| Ending value (after expenses) | $ 1,165.60 | $ 1,164.60 |
| Annualized expense ratio (%) | 1.42 | 1.67 |
| BNY Mellon International Appreciation Fund | ||
| Expenses paid per $1,000† | $ 4.16 | $ 5.42 |
| Ending value (after expenses) | $1,011.60 | $ 1,010.30 |
| Annualized expense ratio (%) | .82 | 1.07 |
| BNY Mellon International Equity Income Fund | ||
| Expenses paid per $1,000† | $ 5.52 | $ 7.01 |
| Ending value (after expenses) | $ 1,045.10 | $ 1,043.90 |
| Annualized expense ratio (%) | 1.07 | 1.36 |
| BNY Mellon Asset Allocation Fund | ||
| Expenses paid per $1,000† | $ 1.30 | $ 2.59 |
| Ending value (after expenses) | $ 1,056.10 | $1,054.40 |
| Annualized expense ratio (%) | .25 | .50 |
| † Expenses are equal to each fund’s annualized expense ratios as shown above, multiplied by the average account value over the period, multiplied by 184/365 (to reflect the one-half |
| year period). |
The Funds 43
COMPARING YOUR FUND’S EXPENSES WITH THOSE OF OTHER FUNDS (Unaudited)
Using the SEC’s method to compare expenses
The Securities and Exchange Commission (SEC) has established guidelines to help investors assess fund expenses. Per these guidelines, the table below shows your fund’s expenses based on a $1,000 investment, assuming a hypothetical 5% annualized return.You can use this information to compare the ongoing expenses (but not transaction expenses or total cost) of investing in the fund with those of other funds. All mutual fund shareholder reports will provide this information to help you make this comparison. Please note that you cannot use this information to estimate your actual ending account balance and expenses paid during the period.
| Expenses and Value of a $1,000 Investment | ||
| assuming a hypothetical 5% annualized return for the six months ended August 31, 2014 | ||
| Class M Shares | Investor Shares | |
| BNY Mellon Large Cap Stock Fund | ||
| Expenses paid per $1,000† | $4.13 | $5.40 |
| Ending value (after expenses) | $1,021.12 | $1,019.86 |
| Annualized expense ratio (%) | .81 | 1.06 |
| BNY Mellon Large Cap Market | ||
| Opportunities Fund | ||
| Expenses paid per $1,000† | $ 2.75 | $4.02 |
| Ending value (after expenses) | $ 1,022.48 | $ 1,021.22 |
| Annualized expense ratio (%) | .54 | .79 |
| BNY Mellon Tax-Sensitive | ||
| Large Cap Multi-Strategy Fund | ||
| Expenses paid per $1,000† | $3.11 | $ 4.43 |
| Ending value (after expenses) | $ 1,022.13 | $ 1,020.82 |
| Annualized expense ratio (%) | .61 | .87 |
| BNY Mellon Income Stock Fund | ||
| Expenses paid per $1,000† | $ 4.08 | $5.45 |
| Ending value (after expenses) | $ 1,021.17 | $ 1,019.81 |
| Annualized expense ratio (%) | .80 | 1.07 |
| BNY Mellon Mid Cap Multi-Strategy Fund | ||
| Expenses paid per $1,000† | $ 4.58 | $ 5.85 |
| Ending value (after expenses) | $ 1,020.67 | $ 1,019.41 |
| Annualized expense ratio (%) | .90 | 1.15 |
| BNY Mellon Small Cap Multi-Strategy Fund | ||
| Expenses paid per $1,000† | $ 5.35 | $6.61 |
| Ending value (after expenses) | $1,019.91 | $ 1,018.65 |
| Annualized expense ratio (%) | 1.05 | 1.30 |
| BNY Mellon Focused | ||
| Equity Opportunities Fund | ||
| Expenses paid per $1,000† | $4.33 | $ 5.65 |
| Ending value (after expenses) | $ 1,020.92 | $ 1,019.61 |
| Annualized expense ratio (%) | .85 | 1.11 |
44
| Expenses and Value of a $1,000 Investment (continued) | ||
| assuming a hypothetical 5% annualized return for the six months ended August 31, 2014 | ||
| Class M Shares | Investor Shares | |
| BNY Mellon Small/Mid Cap Multi-Strategy Fund | ||
| Expenses paid per $1,000† | $ 4.63 | $5.96 |
| Ending value (after expenses) | $ 1,020.62 | $1,019.31 |
| Annualized expense ratio (%) | .91 | 1.17 |
| BNY Mellon International Fund | ||
| Expenses paid per $1,000† | $ 5.24 | $6.51 |
| Ending value (after expenses) | $ 1,020.01 | $1,018.75 |
| Annualized expense ratio (%) | 1.03 | 1.28 |
| BNY Mellon Emerging Markets Fund | ||
| Expenses paid per $1,000† | $ 7.22 | $8.49 |
| Ending value (after expenses) | $ 1,018.05 | $1,016.79 |
| Annualized expense ratio (%) | 1.42 | 1.67 |
| BNY Mellon International Appreciation Fund | ||
| Expenses paid per $1,000† | $4.18 | $5.45 |
| Ending value (after expenses) | $ 1,021.07 | $1,019.81 |
| Annualized expense ratio (%) | .82 | 1.07 |
| BNY Mellon International Equity Income Fund | ||
| Expenses paid per $1,000† | $ 5.45 | $6.92 |
| Ending value (after expenses) | $ 1,019.81 | $1,018.35 |
| Annualized expense ratio (%) | 1.07 | 1.36 |
| BNY Mellon Asset Allocation Fund | ||
| Expenses paid per $1,000† | $ 1.28 | $2.55 |
| Ending value (after expenses) | $1,023.95 | $1,022.68 |
| Annualized expense ratio (%) | .25 | .50 |
| † Expenses are equal to each fund’s annualized expense ratios as shown above, multiplied by the average account value over the period, multiplied by 184/365 (to reflect the one-half |
| year period). |
The Funds 45
| STATEMENT OF INVESTMENTS | |||||||
| August 31, 2014 | |||||||
| BNY Mellon Large Cap Stock Fund | |||||||
| Common Stocks—99.6% | Shares | Value ($) | Shares | Value ($) | |||
| Banks—4.4% | Energy—10.6% | ||||||
| Bank of America | 489,775 | 7,880,480 | Chesapeake Energy | 120,915 | 3,288,888 | ||
| Citigroup | 110,035 | 5,683,308 | Chevron | 13,330 | 1,725,568 | ||
| JPMorgan Chase & Co. | 25,491 | 1,515,440 | ConocoPhillips | 74,755 | 6,071,601 | ||
| Wells Fargo & Co. | 122,655 | 6,309,373 | EOG Resources | 45,090 | 4,954,489 | ||
| 21,388,601 | EQT | 32,440 | 3,213,506 | ||||
| Capital Goods—6.1% | Exxon Mobil | 142,800 | 14,202,888 | ||||
| AECOM Technology | 91,840 | a | 3,475,226 | Marathon Petroleum | 54,385 | 4,949,579 | |
| Caterpillar | 13,215 | 1,441,360 | National Oilwell Varco | 20,270 | 1,751,936 | ||
| Emerson Electric | 14,045 | 899,161 | Occidental Petroleum | 43,510 | 4,513,292 | ||
| General Electric | 154,751 | 4,020,431 | Phillips 66 | 7,285 | 633,941 | ||
| Honeywell International | 13,855 | 1,319,412 | Schlumberger | 11,580 | 1,269,631 | ||
| Lockheed Martin | 25,735 | 4,477,890 | Valero Energy | 80,040 | 4,333,366 | ||
| Masco | 163,955 | 3,848,024 | 50,908,685 | ||||
| Northrop Grumman | 38,895 | 4,948,222 | Food & Staples Retailing—3.1% | ||||
| Oshkosh | 57,200 | 2,841,696 | CVS Health | 79,385 | 6,307,138 | ||
| Raytheon | 15,020 | 1,447,027 | Kroger | 90,315 | 4,604,259 | ||
| Rockwell Automation | 6,985 | 814,521 | Wal-Mart Stores | 54,530 | 4,117,015 | ||
| 29,532,970 | 15,028,412 | ||||||
| Consumer Durables & Apparel—1.7% | Food, Beverage & | ||||||
| Hanesbrands | 42,080 | 4,320,774 | Tobacco—6.0% | ||||
| Whirlpool | 25,010 | 3,827,030 | Altria Group | 133,710 | 5,760,227 | ||
| 8,147,804 | Archer-Daniels-Midland | 82,295 | 4,103,229 | ||||
| Consumer Services—2.5% | Coca-Cola | 21,410 | 893,225 | ||||
| Las Vegas Sands | 51,875 | 3,450,206 | Hershey | 32,020 | 2,927,268 | ||
| Royal Caribbean Cruises | 62,840 | 4,006,678 | Mondelez International, Cl. A | 87,210 | 3,156,130 | ||
| Wyndham Worldwide | 54,415 | 4,404,350 | Monster Beverage | 32,465 | a | 2,870,231 | |
| 11,861,234 | PepsiCo | 59,235 | 5,478,645 | ||||
| Diversified Financials—6.4% | Tyson Foods, Cl. A | 97,295 | 3,703,048 | ||||
| Affiliated Managers Group | 16,345 | a | 3,451,247 | 28,892,003 | |||
| American Express | 10,265 | 919,231 | Health Care Equipment & | ||||
| Berkshire Hathaway, Cl. B | 59,495 | a | 8,165,689 | Services—4.5% | |||
| Franklin Resources | 72,050 | 4,072,266 | Abbott Laboratories | 61,180 | 2,584,243 | ||
| Moody’s | 11,705 | 1,095,237 | Boston Scientific | 303,485 | a | 3,848,190 | |
| Navient | 41,100 | 737,334 | C.R. Bard | 17,730 | 2,631,841 | ||
| SLM | 138,770 | 1,229,502 | Cigna | 19,905 | 1,883,013 | ||
| State Street | 54,385 | 3,917,352 | Medtronic | 81,560 | 5,207,606 | ||
| T. Rowe Price Group | 53,360 | 4,321,893 | Stryker | 5,745 | 478,616 | ||
| Waddell & Reed Financial, Cl. A | 50,265 | 2,739,443 | WellPoint | 44,105 | 5,138,674 | ||
| 30,649,194 | 21,772,183 | ||||||
46
| BNY Mellon Large Cap Stock Fund (continued) | |||||||
| Common Stocks (continued) | Shares | Value ($) | Shares | Value ($) | |||
| Household & Personal Products—1.8% | Retailing (continued) | ||||||
| Procter & Gamble | 106,520 | 8,852,877 | Lowe’s | 103,495 | 5,434,522 | ||
| Insurance—1.6% | Macy’s | 18,755 | 1,168,249 | ||||
| Travelers | 45,305 | 4,290,837 | 17,825,008 | ||||
| XL Group | 101,025 | 3,453,034 | Semiconductors & Semiconductor | ||||
| 7,743,871 | Equipment—1.7% | ||||||
| Materials—1.6% | Intel | 71,565 | 2,499,050 | ||||
| Cabot | 25,405 | 1,391,686 | Micron Technology | 167,985 | a | 5,476,311 | |
| Dow Chemical | 38,720 | 2,073,456 | 7,975,361 | ||||
| PPG Industries | 5,095 | 1,048,857 | Software & Services—11.5% | ||||
| Scotts Miracle-Gro, Cl. A | 55,565 | 3,207,767 | Accenture, Cl. A | 58,910 | 4,775,245 | ||
| 7,721,766 | ANSYS | 12,645 | a | 1,028,038 | |||
| Media—4.3% | Cognizant Technology Solutions, Cl. A | 86,520 | a | 3,956,560 | |||
| CBS, Cl. B | 72,555 | 4,301,786 | DST Systems | 9,505 | 882,159 | ||
| Comcast, Cl. A | 84,905 | 4,646,851 | Facebook, Cl. A | 92,945 | a | 6,954,145 | |
| Time Warner | 44,765 | 3,448,248 | Google, Cl. A | 10,280 | a | 5,986,661 | |
| Walt Disney | 90,675 | 8,149,869 | Google, Cl. C | 10,280 | a | 5,876,048 | |
| 20,546,754 | International Business Machines | 12,420 | 2,388,366 | ||||
| Pharmaceuticals, Biotech & | Intuit | 20,160 | 1,676,909 | ||||
| Life Sciences—10.8% | MasterCard, Cl. A | 43,675 | 3,311,002 | ||||
| AbbVie | 36,940 | 2,042,043 | Microsoft | 83,603 | 3,798,084 | ||
| Allergan | 6,550 | 1,072,104 | Oracle | 194,900 | 8,094,197 | ||
| Amgen | 48,500 | 6,759,930 | Visa, Cl. A | 29,895 | 6,353,285 | ||
| Biogen Idec | 7,270 | a | 2,493,901 | 55,080,699 | |||
| Covance | 23,565 | a | 1,953,538 | Technology Hardware & Equipment—7.2% | |||
| Eli Lilly & Co | 12,490 | 793,864 | Apple | 111,090 | 11,386,725 | ||
| Gilead Sciences | 79,990 | a | 8,605,324 | Corning | 163,810 | 3,417,077 | |
| Johnson & Johnson | 104,270 | 10,815,927 | Hewlett-Packard | 179,080 | 6,805,040 | ||
| Merck & Co | 95,340 | 5,730,887 | NetApp | 82,385 | 3,473,352 | ||
| Mettler-Toledo International | 11,440 | a | 3,094,291 | QUALCOMM | 93,710 | 7,131,331 | |
| Pfizer | 294,860 | 8,665,935 | SanDisk | 23,920 | 2,343,203 | ||
| 52,027,744 | 34,556,728 | ||||||
| Real Estate—1.7% | Telecommunication Services—3.9% | ||||||
| Corrections Corporation of America | 89,540 | b | 3,191,206 | AT&T | 242,719 | 8,485,456 | |
| Public Storage | 22,430 | b | 3,929,287 | CenturyLink | 44,540 | 1,825,695 | |
| Simon Property Group | 5,225 | b | 888,407 | Verizon Communications | 170,495 | 8,494,061 | |
| 8,008,900 | 18,805,212 | ||||||
| Retailing—3.7% | Transportation—2.2% | ||||||
| Bed Bath & Beyond | 62,470 | a | 4,014,322 | Copa Holdings, Cl. A | 19,510 | 2,399,340 | |
| Home Depot | 77,090 | 7,207,915 | Kirby | 30,225 | a | 3,605,540 | |
The Funds 47
STATEMENT OF INVESTMENTS (continued)
| BNY Mellon Large Cap Stock Fund (continued) | |||||||
| Common Stocks (continued) | Shares | Value ($) | Other Investment—.4% | Shares | Value ($) | ||
| Transportation (continued) | Registered | ||||||
| Southwest Airlines | 150,145 | 4,806,141 | Investment Company; | ||||
| 10,811,021 | Dreyfus Institutional Preferred | ||||||
| Utilities—2.3% | Plus Money Market Fund | ||||||
| (cost $1,762,927) | 1,762,927 | c | 1,762,927 | ||||
| Ameren | 22,900 | 915,771 | |||||
| Duke Energy | 48,020 | 3,553,000 | Total Investments | ||||
| Entergy | 54,880 | 4,248,261 | (cost $394,636,078) | 100.0 | % | 481,187,023 | |
| NextEra Energy | 26,105 | 2,570,037 | Liabilities, Less Cash | ||||
| 11,287,069 | and Receivables | (.0 | %) | (69,825 | ) | ||
| Total Common Stocks | Net Assets | 100.0 | % | 481,117,198 | |||
| (cost $392,873,151) | 479,424,096 | ||||||
| a | Non-income producing security. |
| b | Investment in real estate investment trust. |
| c | Investment in affiliated money market mutual fund. |
| Portfolio Summary (Unaudited) † | |||
| Value (%) | Value (%) | ||
| Software & Services | 11.5 | Food & Staples Retailing | 3.1 |
| Pharmaceuticals, Biotech & Life Sciences | 10.8 | Consumer Services | 2.5 |
| Energy | 10.6 | Utilities | 2.3 |
| Technology Hardware & Equipment | 7.2 | Transportation | 2.2 |
| Diversified Financials | 6.4 | Household & Personal Products | 1.8 |
| Capital Goods | 6.1 | Consumer Durables & Apparel | 1.7 |
| Food, Beverage & Tobacco | 6.0 | Real Estate | 1.7 |
| Health Care Equipment & Services | 4.5 | Semiconductors & Semiconductor Equipment | 1.7 |
| Banks | 4.4 | Insurance | 1.6 |
| Media | 4.3 | Materials | 1.6 |
| Telecommunication Services | 3.9 | Money Market Investment | .4 |
| Retailing | 3.7 | 100.0 | |
| † Based on net assets. | |||
| See notes to financial statements. | |||
48
| STATEMENT OF INVESTMENTS |
| August 31, 2014 |
| BNY Mellon Large Cap Market Opportunities Fund | |||||||
| Common Stocks—46.2% | Shares | Value ($) | Shares | Value ($) | |||
| Automobiles & Components—1.6% | Energy (continued) | ||||||
| Harley-Davidson | 24,430 | 1,552,771 | Halliburton | 28,561 | 1,931,009 | ||
| Johnson Controls | 32,744 | 1,598,235 | Nabors Industries | 59,560 | 1,620,628 | ||
| 3,151,006 | Occidental Petroleum | 5,431 | 563,358 | ||||
| Capital Goods—5.3% | Schlumberger | 8,036 | 881,067 | ||||
| Boeing | 6,269 | 794,909 | Southwestern Energy | 30,200 | a | 1,243,636 | |
| Caterpillar | 15,046 | 1,641,067 | Valero Energy | 33,090 | 1,791,493 | ||
| Donaldson | 17,924 | 750,299 | 11,174,896 | ||||
| Dover | 18,665 | 1,640,093 | Food & Staples Retailing—.9% | ||||
| Eaton | 26,975 | 1,883,125 | Costco Wholesale | 9,210 | 1,115,147 | ||
| Emerson Electric | 9,925 | 635,398 | Wal-Mart Stores | 8,261 | 623,706 | ||
| Flowserve | 13,810 | 1,048,041 | 1,738,853 | ||||
| MSC Industrial Direct, Cl. A | 6,831 | 615,746 | Food, Beverage & Tobacco—1.2% | ||||
| Precision Castparts | 3,354 | 818,577 | Coca-Cola | 12,820 | 534,850 | ||
| W.W. Grainger | 1,283 | 315,875 | PepsiCo | 19,515 | 1,804,942 | ||
| 10,143,130 | 2,339,792 | ||||||
| Consumer Durables & Apparel—.8% | Health Care Equipment & | ||||||
| DSW, Cl. A | 20,560 | 636,126 | Services—4.5% | ||||
| NIKE, Cl. B | 11,493 | 902,775 | Abbott Laboratories | 49,890 | 2,107,354 | ||
| 1,538,901 | C.R. Bard | 5,429 | 805,881 | ||||
| Consumer Services—.8% | HCA Holdings | 35,970 | a | 2,511,425 | |||
| McDonald’s | 6,094 | 571,130 | Intuitive Surgical | 844 | a | 396,688 | |
| Panera Bread, Cl. A | 1,711 | a | 256,547 | Meridian Bioscience | 21,705 | b | 424,767 |
| Starbucks | 8,541 | 664,575 | ResMed | 19,420 | b | 1,030,231 | |
| 1,492,252 | Stryker | 9,142 | 761,620 | ||||
| Diversified Financials—3.2% | Varian Medical Systems | 7,701 | a | 654,739 | |||
| Capital One Financial | 24,605 | 2,019,086 | 8,692,705 | ||||
| IntercontinentalExchange Group | 10,674 | 2,017,386 | Household & Personal | ||||
| Invesco | 50,398 | 2,058,254 | Products—1.2% | ||||
| 6,094,726 | Colgate-Palmolive | 10,811 | 699,796 | ||||
| Energy—5.8% | Procter & Gamble | 19,855 | 1,650,149 | ||||
| Apache | 5,089 | 518,213 | 2,349,945 | ||||
| Devon Energy | 20,700 | 1,561,194 | Insurance—.9% | ||||
| EOG Resources | 9,686 | 1,064,298 | Aflac | 28,340 | 1,735,542 | ||
The Funds 49
| STATEMENT OF INVESTMENTS (continued) | |||||||
| BNY Mellon Large Cap Market Opportunities Fund (continued) | |||||||
| Common Stocks (continued) | Shares | Value ($) | Shares | Value ($) | |||
| Materials—2.2% | Semiconductors & Semiconductor | ||||||
| Celanese, Ser. A | 23,081 | 1,443,486 | Equipment (continued) | ||||
| FMC | 9,465 | 626,015 | Micron Technology | 83,320 | a | 2,716,232 | |
| Monsanto | 7,294 | 843,551 | 4,679,825 | ||||
| Praxair | 4,678 | 615,391 | Software & Services—6.5% | ||||
| Sigma-Aldrich | 7,620 | 792,480 | Adobe Systems | 36,727 | a | 2,640,671 | |
| 4,320,923 | Automatic Data Processing | 9,265 | 773,442 | ||||
| Media—1.7% | Google, Cl. A | 864 | a | 503,159 | |||
| Comcast, Cl. A | 31,735 | 1,736,856 | Google, Cl. C | 864 | a | 493,862 | |
| Time Warner | 19,005 | 1,463,955 | LinkedIn, Cl. A | 9,210 | a | 2,079,157 | |
| 3,200,811 | MasterCard, Cl. A | 18,085 | 1,371,024 | ||||
| Pharmaceuticals, Biotech & | Microsoft | 16,219 | 736,829 | ||||
| Life Sciences—3.3% | Oracle | 17,806 | 739,483 | ||||
| AbbVie | 33,260 | 1,838,613 | Paychex | 16,161 | 673,106 | ||
| Celgene | 9,846 | a | 935,567 | salesforce.com | 34,275 | a | 2,025,310 |
| Gilead Sciences | 6,910 | a | 743,378 | Teradata | 10,730 | a | 490,039 |
| Johnson & Johnson | 7,300 | 757,229 | 12,526,082 | ||||
| Merck & Co. | 35,970 | 2,162,157 | Technology Hardware & Equipment—1.2% | ||||
| 6,436,944 | Amphenol, Cl. A | 9,429 | 971,281 | ||||
| Retailing—2.0% | Cisco Systems | 28,238 | 705,668 | ||||
| Lowe’s | 33,085 | 1,737,293 | QUALCOMM | 8,237 | 626,836 | ||
| The TJX Companies | 20,626 | 1,229,516 | 2,303,785 | ||||
| Tractor Supply | 5,349 | 358,116 | Transportation—.7% | ||||
| Urban Outfitters | 12,985 | a | 516,673 | C.H. Robinson Worldwide | 8,623 | b | 588,606 |
| 3,841,598 | Expeditors International of Washington | 15,880 | 655,844 | ||||
| Semiconductors & Semiconductor | 1,244,450 | ||||||
| Equipment—2.4% | Total Common Stocks | ||||||
| Avago Technologies | 23,920 | 1,963,593 | (cost $62,542,279) | 89,006,166 | |||
50
| BNY Mellon Large Cap Market Opportunities Fund (continued) | ||||||||
| Investment of Cash Collateral | ||||||||
| Other Investment—54.2% | Shares | Value ($) | for Securities Loaned—.6% | Shares | Value ($) | |||
| Registered Investment Companies: | Registered Investment Company; | |||||||
| BNY Mellon Income | Dreyfus Institutional Cash | |||||||
| Stock Fund, Cl. M | 2,687,054 | c | 26,709,319 | Advantage Fund | ||||
| Dreyfus Institutional Preferred | (cost $1,218,848) | 1,218,848 | d | 1,218,848 | ||||
| Plus Money Market Fund | 1,186,380 | d | 1,186,380 | |||||
| Total Investments | ||||||||
| Dreyfus Research | (cost $152,550,676) | 101.0 | % | 194,705,002 | ||||
| Growth Fund, Cl. Y | 2,915,361 | c | 41,747,965 | |||||
| Dreyfus Strategic Value Fund, Cl. Y | 801,757 | c | 34,836,324 | Liabilities, Less Cash | ||||
| and Receivables | (1.0 | %) | (1,864,921 | ) | ||||
| Total Other Investment | ||||||||
| (cost $88,789,549) | 104,479,988 | Net Assets | 100.0 | % | 192,840,081 | |||
| a Non-income producing security. |
| b Security, or portion thereof, on loan.At August 31, 2014, the value of the fund’s securities on loan was $1,188,304 and the value of the collateral held by the fund was $1,218,848. |
| c Investment in affiliated mutual fund. |
| d Investment in affiliated money market mutual fund. |
| Portfolio Summary (Unaudited) † | |||
| Value (%) | Value (%) | ||
| Mutual Funds: Domestic | 53.6 | Automobiles & Components | 1.6 |
| Software & Services | 6.5 | Food, Beverage & Tobacco | 1.2 |
| Energy | 5.8 | Household & Personal Products | 1.2 |
| Capital Goods | 5.3 | Money Market Investments | 1.2 |
| Health Care Equipment & Services | 4.5 | Technology Hardware & Equipment | 1.2 |
| Pharmaceuticals, Biotech & Life Sciences | 3.3 | Food & Staples Retailing | .9 |
| Diversified Financials | 3.2 | Insurance | .9 |
| Semiconductors & Semiconductor Equipment | 2.4 | Consumer Services | .8 |
| Materials | 2.2 | Consumer Durables & Apparel | .8 |
| Retailing | 2.0 | Transportation | .7 |
| Media | 1.7 | 101.0 | |
| † Based on net assets. | |||
| See notes to financial statements. | |||
The Funds 51
| STATEMENT OF INVESTMENTS | ||||||
| August 31, 2014 | ||||||
| BNY Mellon Tax-Sensitive Large Cap Multi-Strategy Fund | ||||||
| Common Stocks—61.7% | Shares | Value ($) | Shares | Value ($) | ||
| Automobiles & Components—1.2% | Capital Goods (continued) | |||||
| BorgWarner | 1,040 | 64,678 | MSC Industrial Direct, Cl. A | 7,457 | 672,174 | |
| Delphi Automotive | 655 | 45,575 | Northrop Grumman | 1,406 | 178,871 | |
| Ford Motor | 31,238 | 543,854�� | PACCAR | 5,737 | 360,341 | |
| General Motors | 5,760 | 200,448 | Parker Hannifin | 612 | 70,686 | |
| Harley-Davidson | 36,469 | 2,317,970 | Pentair | 306 | 20,829 | |
| Johnson Controls | 54,989 | 2,684,013 | Precision Castparts | 4,557 | 1,112,181 | |
| 5,856,538 | Raytheon | 5,885 | 566,961 | |||
| Banks—2.3% | Rockwell Collins | 5,348 | 411,689 | |||
| Bank of America | 121,854 | 1,960,631 | Stanley Black & Decker | 653 | 59,750 | |
| BB&T | 11,947 | 445,982 | United Technologies | 7,861 | 848,831 | |
| Citigroup | 29,195 | 1,507,922 | Veritiv | 25 | 1,113 | |
| Fifth Third Bancorp | 6,614 | 134,959 | W.W. Grainger | 1,927 | 474,427 | |
| JPMorgan Chase & Co. | 41,574 | 2,471,574 | Xylem | 2,698 | 100,527 | |
| M&T Bank | 1,690 | 208,935 | 26,386,601 | |||
| People’s United Financial | 5,315 | 79,459 | Commercial & Professional Services—.2% | |||
| PNC Financial Services Group | 8,936 | 757,326 | Iron Mountain | 2,055 | 73,939 | |
| SunTrust Banks | 1,700 | 64,736 | Robert Half International | 7,900 | 396,659 | |
| U.S. Bancorp | 15,577 | 658,596 | Tyco International | 5,399 | 240,903 | |
| Wells Fargo & Co. | 50,632 | 2,604,510 | Waste Management | 9,074 | 426,206 | |
| 10,894,630 | 1,137,707 | |||||
| Capital Goods—5.5% | Consumer Durables & Apparel—.8% | |||||
| 3M | 8,489 | 1,222,416 | Coach | 61 | 2,247 | |
| Allegion | 2,996 | 154,084 | DSW, Cl. A | 22,420 | 693,675 | |
| Boeing | 16,446 | 2,085,353 | Leggett & Platt | 9,855 | 345,812 | |
| Caterpillar | 24,415 | 2,662,944 | Lennar, Cl. A | 8,785 | 344,196 | |
| Cummins | 2,516 | 365,097 | Mattel | 618 | 21,315 | |
| Danaher | 4,112 | 315,020 | NIKE, Cl. B | 23,934 | 1,880,016 | |
| Deere & Co. | 861 | 72,401 | PulteGroup | 6,040 | 116,089 | |
| Donaldson | 19,560 | 818,782 | VF | 5,240 | 335,989 | |
| Dover | 29,119 | 2,558,687 | 3,739,339 | |||
| Eaton | 43,406 | 3,030,173 | Consumer Services—1.0% | |||
| Emerson Electric | 18,715 | 1,198,134 | Carnival | 2,398 | 90,836 | |
| Flowserve | 20,040 | 1,520,836 | Chipotle Mexican Grill | 620 | a | 420,763 |
| Fluor | 3,557 | 262,827 | McDonald’s | 15,311 | 1,434,947 | |
| General Dynamics | 2,581 | 318,108 | Panera Bread, Cl. A | 1,868 | a | 280,088 |
| General Electric | 105,775 | 2,748,034 | Starbucks | 19,494 | 1,516,828 | |
| Honeywell International | 11,461 | 1,091,431 | Starwood Hotels & Resorts Worldwide | 3,700 | b | 312,798 |
| Illinois Tool Works | 2,190 | 193,180 | Wyndham Worldwide | 5,110 | 413,603 | |
| Ingersoll-Rand | 7,570 | 455,714 | Yum! Brands | 5,192 | 376,057 | |
| Lockheed Martin | 2,500 | 435,000 | 4,845,920 | |||
52
| BNY Mellon Tax-Sensitive Large Cap Multi-Strategy Fund (continued) | |||||||
| Common Stocks (continued) | Shares | Value ($) | Shares | Value ($) | |||
| Diversified Financials—3.7% | Energy (continued) | ||||||
| American Express | 7,769 | 695,714 | Noble Energy | 2,146 | 154,812 | ||
| Ameriprise Financial | 3,382 | 425,320 | Occidental Petroleum | 12,654 | 1,312,599 | ||
| Berkshire Hathaway, Cl. B | 19,082 | a | 2,619,005 | Phillips 66 | 9,543 | 830,432 | |
| BlackRock | 863 | 285,247 | Pioneer Natural Resources | 585 | 122,060 | ||
| Capital One Financial | 41,318 | 3,390,555 | Range Resources | 480 | 37,723 | ||
| Charles Schwab | 12,266 | 349,704 | Schlumberger | 21,127 | 2,316,364 | ||
| CME Group | 5,075 | 388,491 | Southwestern Energy | 45,330 | a | 1,866,689 | |
| Discover Financial Services | 5,797 | 361,559 | Spectra Energy | 7,787 | 324,406 | ||
| Franklin Resources | 1,040 | 58,781 | Tesoro | 2,130 | 137,896 | ||
| Goldman Sachs Group | 3,469 | 621,333 | Valero Energy | 51,448 | 2,785,395 | ||
| H&R Block | 6,930 | 232,363 | Williams | 12,569 | 747,101 | ||
| IntercontinentalExchange Group | 15,589 | 2,946,321 | 33,270,219 | ||||
| Invesco | 76,805 | 3,136,716 | Food & Staples Retailing—1.3% | ||||
| Legg Mason | 6,695 | 330,197 | Costco Wholesale | 16,153 | 1,955,805 | ||
| McGraw-Hill Financial | 2,118 | 171,833 | CVS Caremark | 16,450 | 1,306,952 | ||
| Moody’s | 720 | 67,370 | Kroger | 7,546 | 384,695 | ||
| Morgan Stanley | 9,425 | 323,372 | Sysco | 6,600 | 249,678 | ||
| State Street | 8,606 | 619,890 | Wal-Mart Stores | 23,944 | 1,807,772 | ||
| T. Rowe Price Group | 5,016 | 406,271 | Walgreen | 10,617 | 642,541 | ||
| 17,430,042 | 6,347,443 | ||||||
| Energy—7.0% | Food, Beverage & Tobacco—2.6% | ||||||
| Anadarko Petroleum | 3,336 | 375,934 | Altria Group | 16,814 | 724,347 | ||
| Apache | 7,654 | 779,407 | Archer-Daniels-Midland | 8,255 | 411,594 | ||
| Baker Hughes | 4,240 | 293,154 | Coca-Cola | 50,490 | 2,106,443 | ||
| Cabot Oil & Gas | 5,120 | 171,725 | ConAgra Foods | 960 | 30,912 | ||
| Chevron | 18,564 | 2,403,110 | Constellation Brands, Cl. A | 5,020 | a | 437,192 | |
| ConocoPhillips | 10,286 | 835,429 | General Mills | 6,450 | 344,301 | ||
| Devon Energy | 32,890 | 2,480,564 | Hershey | 1,951 | 178,360 | ||
| EOG Resources | 23,272 | 2,557,127 | Kraft Foods Group | 6,351 | 374,074 | ||
| EQT | 1,940 | 192,176 | Lorillard | 7,270 | 434,019 | ||
| Exxon Mobil | 43,994 | 4,375,643 | McCormick & Co. | 3,462 | 241,267 | ||
| FMC Technologies | 3,120 | a | 192,941 | Mead Johnson Nutrition | 2,347 | 224,373 | |
| Halliburton | 49,608 | 3,353,997 | Molson Coors Brewing, Cl. B | 6,350 | 469,582 | ||
| Hess | 3,680 | 372,048 | Mondelez International, Cl. A | 26,375 | 954,511 | ||
| Kinder Morgan | 1,697 | 68,321 | Monster Beverage | 755 | a | 66,750 | |
| Marathon Oil | 10,727 | 447,209 | PepsiCo | 41,511 | 3,839,352 | ||
| Marathon Petroleum | 4,888 | 444,857 | Philip Morris International | 13,249 | 1,133,849 | ||
| Nabors Industries | 89,720 | 2,441,281 | Reynolds American | 3,410 | 199,383 | ||
| National Oilwell Varco | 5,575 | 481,847 | Tyson Foods, Cl. A | 1,390 | 52,903 | ||
| Newfield Exploration | 8,210 | a | 367,972 | 12,223,212 | |||
The Funds 53
STATEMENT OF INVESTMENTS (continued)
| BNY Mellon Tax-Sensitive Large Cap Multi-Strategy Fund (continued) | |||||||
| Common Stocks (continued) | Shares | Value ($) | Shares | Value ($) | |||
| Health Care Equipment & | Insurance (continued) | ||||||
| Services—3.9% | Allstate | 7,240 | 445,188 | ||||
| Abbott Laboratories | 75,963 | 3,208,677 | American International Group | 16,360 | 917,142 | ||
| Aetna | 3,693 | 303,306 | Aon | 6,506 | 567,063 | ||
| AmerisourceBergen | 2,496 | 193,165 | Chubb | 711 | 65,376 | ||
| Baxter International | 4,425 | 331,787 | Cincinnati Financial | 6,710 | 322,684 | ||
| Becton Dickinson & Co. | 3,380 | 396,035 | Hartford Financial Services Group | 11,110 | 411,626 | ||
| Boston Scientific | 21,064 | a | 267,092 | Lincoln National | 3,356 | 184,714 | |
| C.R. Bard | 8,604 | 1,277,178 | Marsh & McLennan | 8,816 | 468,130 | ||
| Cardinal Health | 1,135 | 83,650 | MetLife | 14,502 | 793,839 | ||
| Cerner | 700 | a | 40,362 | Prudential Financial | 2,891 | 259,323 | |
| Cigna | 2,998 | 283,611 | Travelers | 5,461 | 517,211 | ||
| Covidien | 8,598 | 746,564 | 7,596,280 | ||||
| Express Scripts Holding | 7,208 | a | 532,887 | Materials—2.4% | |||
| HCA Holdings | 46,200 | a | 3,225,684 | Air Products & Chemicals | 3,778 | 503,267 | |
| Humana | 2,671 | 343,865 | Bemis | 335 | 13,648 | ||
| Intuitive Surgical | 1,610 | a | 756,716 | Celanese, Ser. A | 29,608 | 1,851,684 | |
| Laboratory Corporation of | Dow Chemical | 18,821 | 1,007,865 | ||||
| America Holdings | 2,331 | a | 249,953 | E.I. du Pont de Nemours & Co. | 9,581 | 633,400 | |
| McKesson | 2,759 | 538,088 | Ecolab | 3,515 | 403,592 | ||
| Medtronic | 8,776 | 560,348 | FMC | 10,330 | 683,226 | ||
| Meridian Bioscience | 23,687 | 463,555 | Freeport-McMoRan | 5,798 | 210,873 | ||
| ResMed | 21,187 | 1,123,970 | International Paper | 1,354 | 65,601 | ||
| St. Jude Medical | 2,716 | 178,142 | LyondellBasell Industries, Cl. A | 3,425 | 391,649 | ||
| Stryker | 10,961 | 913,161 | Monsanto | 12,071 | 1,396,011 | ||
| Tenet Healthcare | 3,165 | a | 193,635 | Newmont Mining | 7,400 | 200,466 | |
| UnitedHealth Group | 13,932 | 1,207,626 | Nucor | 8,850 | 480,732 | ||
| Varian Medical Systems | 8,399 | a | 714,083 | PPG Industries | 2,913 | 599,670 | |
| WellPoint | 2,774 | 323,199 | Praxair | 6,922 | 910,589 | ||
| 18,456,339 | Sherwin-Williams | 1,290 | 281,362 | ||||
| Household & Personal Products—1.4% | Sigma-Aldrich | 10,861 | 1,129,544 | ||||
| Clorox | 2,630 | 233,018 | United States Steel | 11,435 | 441,963 | ||
| Colgate-Palmolive | 22,053 | 1,427,491 | Vulcan Materials | 4,154 | 263,281 | ||
| Estee Lauder, Cl. A | 1,095 | 84,129 | 11,468,423 | ||||
| Kimberly-Clark | 4,350 | 469,800 | Media—2.3% | ||||
| Procter & Gamble | 52,696 | 4,379,565 | CBS, Cl. B | 3,064 | 181,665 | ||
| 6,594,003 | Comcast, Cl. A | 69,396 | 3,798,043 | ||||
| Insurance—1.6% | DIRECTV | 7,322 | a | 632,987 | |||
| ACE | 2,214 | 235,415 | Discovery Communications, Cl. A | 1,955 | a | 85,473 | |
| Aflac | 39,330 | 2,408,569 | |||||
54
| BNY Mellon Tax-Sensitive Large Cap Multi-Strategy Fund (continued) | |||||||
| Common Stocks (continued) | Shares | Value ($) | Shares | Value ($) | |||
| Media (continued) | Real Estate (continued) | ||||||
| Discovery | Kimco Realty | 16,900 | b | 396,981 | |||
| Communications, Cl. C | 1,955 | a | 84,006 | Macerich | 5,895 | b | 384,885 |
| News Corp., Cl. A | 5,696 | a | 100,392 | Prologis | 1,560 | b | 63,866 |
| Omnicom Group | 820 | 59,048 | Simon Property Group | 2,307 | b | 392,259 | |
| Time | 1,274 | 29,914 | Ventas | 2,870 | b | 188,789 | |
| Time Warner | 34,552 | 2,661,541 | Washington Prime Group | 383 | 7,476 | ||
| Time Warner Cable | 3,688 | 545,566 | Weyerhaeuser | 5,510 | b | 187,065 | |
| Twenty-First Century Fox, Cl. A | 21,996 | 779,098 | 4,329,170 | ||||
| Viacom, Cl. B | 3,798 | 308,208 | Retailing—2.6% | ||||
| Walt Disney | 21,118 | 1,898,086 | Amazon.com | 3,944 | a | 1,337,174 | |
| 11,164,027 | AutoZone | 50 | a | 26,942 | |||
| Pharmaceuticals, Biotech & | Bed Bath & Beyond | 568 | a | 36,500 | |||
| Life Sciences—5.3% | Best Buy | 10 | 319 | ||||
| AbbVie | 57,648 | 3,186,781 | Dollar Tree | 5,430 | a | 291,184 | |
| Actavis | 1,330 | a | 301,883 | eBay | 7,047 | a | 391,109 |
| Agilent Technologies | 6,475 | 370,111 | Family Dollar Stores | 2,595 | 207,159 | ||
| Alexion Pharmaceuticals | 1,150 | a | 194,684 | Genuine Parts | 3,594 | 315,338 | |
| Allergan | 4,019 | 657,830 | Home Depot | 18,754 | 1,753,499 | ||
| Amgen | 9,855 | 1,373,590 | L Brands | 2,529 | 161,477 | ||
| Biogen Idec | 3,172 | a | 1,088,123 | Lowe’s | 55,062 | 2,891,306 | |
| Bristol-Myers Squibb | 17,472 | 884,957 | Macy’s | 7,099 | 442,197 | ||
| Celgene | 19,456 | a | 1,848,709 | Netflix | 462 | a | 220,670 |
| Eli Lilly & Co. | 9,816 | 623,905 | O’Reilly Automotive | 1,734 | a | 270,469 | |
| Gilead Sciences | 25,343 | a | 2,726,400 | Priceline Group | 638 | a | 793,870 |
| Johnson & Johnson | 41,491 | 4,303,861 | Ross Stores | 2,294 | 173,013 | ||
| Merck & Co. | 82,916 | 4,984,081 | Target | 2,070 | 124,345 | ||
| Pfizer | 69,348 | 2,038,138 | The TJX Companies | 34,722 | 2,069,778 | ||
| Regeneron Pharmaceuticals | 252 | a | 88,331 | Tractor Supply | 5,836 | 390,720 | |
| Thermo Fisher Scientific | 5,530 | 664,761 | Urban Outfitters | 14,990 | a | 596,452 | |
| 25,336,145 | 12,493,521 | ||||||
| Real Estate—.9% | Semiconductors & Semiconductor | ||||||
| American Tower | 2,360 | b | 232,696 | Equipment—2.2% | |||
| AvalonBay Communities | 3,329 | b | 512,999 | Analog Devices | 1,503 | 76,833 | |
| CBRE Group, Cl. A | 9,650 | a | 306,677 | Applied Materials | 11,620 | 268,480 | |
| Crown Castle International | 2,870 | 228,194 | Avago Technologies | 30,680 | 2,518,521 | ||
| Equity Residential | 7,217 | b | 479,714 | Intel | 61,832 | 2,159,173 | |
| General Growth Properties | 10,720 | b | 263,390 | Lam Research | 6,610 | 475,325 | |
| HCP | 7,720 | b | 334,508 | Micron Technology | 110,740 | a | 3,610,124 |
| Host Hotels & Resorts | 15,323 | b | 349,671 | ||||
The Funds 55
STATEMENT OF INVESTMENTS (continued)
| BNY Mellon Tax-Sensitive Large Cap Multi-Strategy Fund (continued) | |||||||
| Common Stocks (continued) | Shares | Value ($) | Shares | Value ($) | |||
| Semiconductors & Semiconductor | Technology Hardware & | ||||||
| Equipment (continued) | Equipment (continued) | ||||||
| NVIDIA | 21,230 | 412,923 | QUALCOMM | 30,826 | 2,345,859 | ||
| Texas Instruments | 13,759 | 662,909 | SanDisk | 3,190 | 312,492 | ||
| Xilinx | 7,919 | 334,578 | Seagate Technology | 6,510 | 407,396 | ||
| 10,518,866 | Teradata | 13,772 | a | 628,967 | |||
| Software & Services—6.8% | Western Digital | 3,310 | 340,963 | ||||
| Accenture, Cl. A | 5,925 | 480,280 | 16,171,157 | ||||
| Adobe Systems | 52,452 | a | 3,771,299 | Telecommunication Services—1.0% | |||
| Autodesk | 8,005 | a | 429,388 | AT&T | 53,880 | 1,883,645 | |
| Automatic Data Processing | 15,932 | 1,330,003 | CenturyLink | 755 | 30,947 | ||
| Cognizant Technology | Frontier Communications | 58,645 | 398,786 | ||||
| Solutions, Cl. A | 5,182 | a | 236,973 | TE Connectivity | 1,445 | 90,573 | |
| Facebook, Cl. A | 15,070 | a | 1,127,537 | Verizon Communications | 47,680 | 2,375,418 | |
| Fiserv | 4,612 | a | 297,336 | 4,779,369 | |||
| Google, Cl. A | 4,099 | a | 2,387,094 | Transportation—1.1% | |||
| Google, Cl. C | 4,099 | a | 2,342,988 | C.H. Robinson Worldwide | 9,405 | 641,985 | |
| International Business Machines | 8,547 | 1,643,588 | CSX | 14,548 | 449,679 | ||
| Intuit | 2,117 | 176,092 | Delta Air Lines | 3,995 | 158,122 | ||
| LinkedIn, Cl. A | 11,810 | a | 2,666,108 | Expeditors International of Washington | 17,320 | 715,316 | |
| MasterCard, Cl. A | 28,403 | 2,153,231 | FedEx | 2,998 | 443,344 | ||
| Microsoft | 96,888 | 4,401,622 | Norfolk Southern | 4,842 | 518,094 | ||
| Oracle | 52,045 | 2,161,429 | Ryder System | 1,665 | 150,416 | ||
| Paychex | 26,464 | 1,102,226 | Southwest Airlines | 19,165 | 613,472 | ||
| salesforce.com | 54,563 | a | 3,224,128 | Union Pacific | 7,746 | 815,421 | |
| Visa, Cl. A | 6,675 | 1,418,571 | United Parcel Service, Cl. B | 8,588 | 835,870 | ||
| Western Union | 11,942 | 208,627 | 5,341,719 | ||||
| Xerox | 30,800 | 425,348 | Utilities—1.2% | ||||
| Yahoo! | 17,792 | a | 685,170 | AGL Resources | 1,600 | 85,296 | |
| 32,669,038 | American Electric Power | 2,915 | 156,535 | ||||
| Technology Hardware & | CenterPoint Energy | 4,780 | 118,735 | ||||
| Equipment—3.4% | CMS Energy | 10,336 | 315,661 | ||||
| Amphenol, Cl. A | 12,237 | 1,260,533 | Dominion Resources | 4,433 | 311,285 | ||
| Apple | 68,607 | 7,032,217 | DTE Energy | 660 | 51,645 | ||
| Cisco Systems | 80,742 | 2,017,743 | Duke Energy | 5,131 | 379,643 | ||
| Corning | 20,990 | 437,851 | Exelon | 17,435 | 582,678 | ||
| EMC | 15,397 | 454,673 | Integrys Energy Group | 5,435 | 368,982 | ||
| Hewlett-Packard | 23,338 | 886,844 | NextEra Energy | 5,805 | 571,502 | ||
| Motorola Solutions | 768 | 45,619 | |||||
56
| BNY Mellon Tax-Sensitive Large Cap Multi-Strategy Fund (continued) | ||||||
| Common Stocks (continued) | Shares | Value ($) | Other Investment—37.7% | Shares | Value ($) | |
| Utilities (continued) | Registered Investment Companies: | |||||
| NiSource | 10,190 | 404,237 | BNY Mellon Income | |||
| Northeast Utilities | 9,415 | 432,054 | Stock Fund, Cl. M | 5,742,127 | c | 57,076,741 |
| NRG Energy | 12,100 | 372,438 | Dreyfus Institutional Preferred | |||
| PG&E | 775 | 36,022 | Plus Money Market Fund | 1,308,884 | d | 1,308,884 |
| Pinnacle West Capital | 1,425 | 81,154 | Dreyfus Research | |||
| Growth Fund, Cl. Y | 4,506,856 | c | 64,538,184 | |||
| PPL | 1,380 | 47,789 | ||||
| Dreyfus Strategic Value Fund, Cl. Y | 1,325,514 | c | 57,593,596 | |||
| Public Service Enterprise Group | 150 | 5,609 | ||||
| Total Other Investment | ||||||
| SCANA | 4,035 | 209,578 | (cost $153,231,218) | 180,517,405 | ||
| Sempra Energy | 5,285 | 560,051 | ||||
| Southern | 5,373 | 238,561 | Total Investments | |||
| Xcel Energy | 14,385 | 461,039 | (cost $356,465,372) | 99.4 | % | 475,357,607 |
| 5,790,494 | Cash and Receivables (Net) | .6 | % | 2,997,529 | ||
| Total Common Stocks | Net Assets | 100.0 | % | 478,355,136 | ||
| (cost $203,234,154) | 294,840,202 | |||||
| a | Non-income producing security. |
| b | Investment in real estate investment trust. |
| c | Investment in affiliated mutual fund. |
| d | Investment in affiliated money market mutual fund. |
| Portfolio Summary (Unaudited) † | |||
| Value (%) | Value (%) | ||
| Mutual Funds: Domestic | 37.4 | Insurance | 1.6 |
| Energy | 7.0 | Household & Personal Products | 1.4 |
| Software & Services | 6.8 | Food & Staples Retailing | 1.3 |
| Capital Goods | 5.5 | Automobiles & Components | 1.2 |
| Pharmaceuticals, Biotech & Life Sciences | 5.3 | Utilities | 1.2 |
| Health Care Equipment & Services | 3.9 | Transportation | 1.1 |
| Diversified Financials | 3.7 | Consumer Services | 1.0 |
| Technology Hardware & Equipment | 3.4 | Telecommunication Services | 1.0 |
| Food, Beverage & Tobacco | 2.6 | Real Estate | .9 |
| Retailing | 2.6 | Consumer Durables & Apparel | .8 |
| Materials | 2.4 | Money Market Investment | .3 |
| Banks | 2.3 | Commercial & Professional Services | .2 |
| Media | 2.3 | ||
| Semiconductors & Semiconductor Equipment | 2.2 | 99.4 | |
| † Based on net assets. |
| See notes to financial statements. |
The Funds 57
STATEMENT OF INVESTMENTS
August 31, 2014
| BNY Mellon Income Stock Fund | |||||
| Common Stocks—95.5% | Shares | Value ($) | Shares | Value ($) | |
| Automobiles & Components—1.0% | Health Care Equipment & | ||||
| General Motors | 362,349 | 12,609,745 | Services—3.0% | ||
| Banks—17.0% | Cardinal Health | 345,990 | 25,499,463 | ||
| Fifth Third Bancorp | 605,540 | 12,356,044 | UnitedHealth Group | 149,820 | 12,986,398 |
| HSBC Holdings, ADR | 352,030 | 19,030,742 | 38,485,861 | ||
| JPMorgan Chase & Co. | 985,249 | 58,573,053 | Insurance—1.9% | ||
| People’s United Financial | 901,100 | 13,471,445 | MetLife | 441,990 | 24,194,533 |
| PNC Financial Services Group | 417,990 | 35,424,652 | Materials—5.0% | ||
| U.S. Bancorp | 715,140 | 30,236,119 | Dow Chemical | 700,370 | 37,504,813 |
| Wells Fargo & Co. | 912,580 | 46,943,115 | Martin Marietta Materials | 204,560 | 26,789,178 |
| 216,035,170 | 64,293,991 | ||||
| Capital Goods—6.5% | Media—7.1% | ||||
| Eaton | 218,250 | 15,236,032 | Cinemark Holdings | 574,390 | 20,270,223 |
| General Electric | 443,652 | 11,526,079 | Omnicom Group | 430,740 | 31,017,587 |
| Honeywell International | 246,730 | 23,496,098 | Regal Entertainment | ||
| Lockheed Martin | 116,230 | 20,224,020 | Group, Cl. A | 1,214,770 | 25,570,909 |
| PACCAR | 196,230 | 12,325,206 | Time Warner | 172,860 | 13,315,406 |
| 82,807,435 | 90,174,125 | ||||
| Consumer Services—1.3% | Pharmaceuticals, Biotech & | ||||
| Life Sciences—9.4% | |||||
| Carnival | 429,610 | 16,273,627 | |||
| AbbVie | 773,650 | 42,767,372 | |||
| Diversified Financials—2.1% | |||||
| Johnson & Johnson | 120,340 | 12,482,868 | |||
| Invesco | 645,989 | 26,382,191 | |||
| Merck & Co. | 713,410 | 42,883,075 | |||
| Energy—9.2% | |||||
| Pfizer | 730,208 | 21,460,813 | |||
| Exxon Mobil | 242,540 | 24,123,028 | |||
| 119,594,128 | |||||
| Marathon Oil | 387,100 | 16,138,199 | |||
| Retailing—1.0% | |||||
| Occidental Petroleum | 608,770 | 63,147,712 | |||
| Kohl’s | 213,950 | 12,578,121 | |||
| Phillips 66 | 149,099 | 12,974,595 | |||
| Semiconductors & Semiconductor | |||||
| 116,383,534 | Equipment—2.8% | ||||
| Food, Beverage & Tobacco—9.8% | Microchip Technology | 394,500 | 19,263,435 | ||
| Coca-Cola Enterprises | 257,500 | 12,303,350 | Texas Instruments | 326,970 | 15,753,415 |
| Molson Coors Brewing, Cl. B | 183,290 | 13,554,295 | 35,016,850 | ||
| PepsiCo | 543,500 | 50,268,315 | Software & Services—1.1% | ||
| Philip Morris International | 560,270 | 47,947,907 | Microsoft | 304,180 | 13,818,897 |
| 124,073,867 | |||||
58
| BNY Mellon Income Stock Fund (continued) | ||||||
| Common Stocks (continued) | Shares | Value ($) | Preferred Stocks—1.0% | Shares | Value ($) | |
| Technology Hardware & | Utilities | |||||
| Equipment—6.9% | NextEra Energy, | |||||
| Apple | 436,150 | 44,705,375 | Conv., Cum., $2.71 | |||
| Cisco Systems | 1,699,930 | 42,481,251 | (cost $11,701,589) | 219,730 | 12,107,123 | |
| 87,186,626 | ||||||
| Telecommunication Services—3.9% | Other Investment—1.8% | |||||
| Windstream Holdings | 4,340,582 | 49,048,577 | Registered | |||
| Utilities—6.5% | Investment Company; | |||||
| Exelon | 506,250 | 16,918,875 | Dreyfus Institutional Preferred | |||
| National Grid, ADR | 167,660 | 12,530,908 | Plus Money Market Fund | |||
| (cost $22,923,853) | 22,923,853 a 22,923,853 | |||||
| NRG Energy | 390,060 | 12,006,047 | ||||
| NRG Yield, Cl. A | 521,298 | 28,353,398 | Total Investments | |||
| TerraForm Power, Cl. A | 428,386 | 13,382,779 | (cost $1,008,372,526) | 98.3 | % | 1,247,180,261 |
| 83,192,007 | Cash and Receivables (Net) | 1.7 | % | 21,354,437 | ||
| Total Common Stocks | ||||||
| Net Assets | 100.0 | % | 1,268,534,698 | |||
| (cost $973,747,084) | 1,212,149,285 | |||||
| ADR—American Depository Receipts |
| a Investment in affiliated money market mutual fund. |
| Portfolio Summary (Unaudited) † | |||
| Value (%) | Value (%) | ||
| Banks | 17.0 | Health Care Equipment & Services | 3.0 |
| Food, Beverage & Tobacco | 9.8 | Semiconductors & Semiconductor Equipment | 2.8 |
| Pharmaceuticals, Biotech & Life Sciences | 9.4 | Diversified Financials | 2.1 |
| Energy | 9.2 | Insurance | 1.9 |
| Utilities | 7.5 | Money Market Investment | 1.8 |
| Media | 7.1 | Consumer Services | 1.3 |
| Technology Hardware & Equipment | 6.9 | Software & Services | 1.1 |
| Capital Goods | 6.5 | Automobiles & Components | 1.0 |
| Materials | 5.0 | Retailing | 1.0 |
| Telecommunication Services | 3.9 | 98.3 | |
| † Based on net assets. |
| See notes to financial statements. |
The Funds 59
STATEMENT OF OPTIONS WRITTEN
August 31, 2014
| Number of | |||
| BNY Mellon Income Stock Fund | Contracts | Value ($) | |
| Call Options: | |||
| Lockheed Martin, | |||
| September 2014 @ $170 | 22 | (11,220 | ) |
| Microsoft, | |||
| September 2014 @ $46 | 1,476 | (45,756 | ) |
| Microchip Technology, | |||
| September 2014 @ $48 | 1,982 | (257,660 | ) |
| Total Options Written | |||
| (premiums received $96,488) | (314,636 | ) | |
| See notes to financial statements. | |||
60
| STATEMENT OF INVESTMENTS | |||||||
| August 31, 2014 | |||||||
| BNY Mellon Mid Cap Multi-Strategy Fund | |||||||
| Common Stocks—98.6% | Shares | Value ($) | Shares | Value ($) | |||
| Automobiles & Components—1.9% | Capital Goods—10.2% | ||||||
| BorgWarner | 54,140 | 3,366,967 | AECOM Technology | 17,410 | a | 658,794 | |
| Delphi Automotive | 31,160 | 2,168,113 | Allegion | 13,756 | 707,471 | ||
| Gentex | 13,500 | 398,925 | AMETEK | 205,933 | 10,902,093 | ||
| Goodyear Tire & Rubber | 23,150 | 601,206 | B/E Aerospace | 17,250 | a | 1,461,765 | |
| Harley-Davidson | 22,210 | 1,411,668 | Beacon Roofing Supply | 71,748 | a | 2,046,253 | |
| Lear | 150,121 | 15,181,737 | Carlisle | 21,175 | 1,755,407 | ||
| Tesla Motors | 8,990 | a | 2,424,603 | Chart Industries | 50,208 | a | 3,358,413 |
| Thor Industries | 7,630 | 409,807 | Chicago Bridge & Iron Co. | 14,398 | 913,121 | ||
| TRW Automotive Holdings | 113,118 | a | 10,892,132 | Curtiss-Wright | 29,637 | 2,129,122 | |
| Visteon | 7,780 | a | 787,258 | Donaldson | 135,340 | 5,665,332 | |
| 37,642,416 | Dover | 72,105 | 6,335,866 | ||||
| Banks—4.3% | Fastenal | 95,559 | b | 4,326,912 | |||
| BB&T | 133,030 | 4,966,010 | Flowserve | 79,579 | 6,039,250 | ||
| BOK Financial | 11,500 | 774,870 | Fluor | 109,719 | 8,107,137 | ||
| CIT Group | 19,940 | 956,322 | Fortune Brands Home & Security | 14,200 | 613,582 | ||
| Comerica | 351,414 | 17,690,181 | Graco | 53,710 | 4,128,151 | ||
| Cullen/Frost Bankers | 14,850 | 1,167,210 | Hexcel | 93,770 | a | 3,862,386 | |
| East West Bancorp | 279,561 | 9,739,905 | Hubbell, Cl. B | 8,366 | 1,011,449 | ||
| Fifth Third Bancorp | 470,123 | 9,592,860 | Huntington Ingalls Industries | 44,920 | 4,586,781 | ||
| First Citizens Bancshares, Cl. A | 2,500 | 574,475 | IDEX | 123,761 | 9,522,171 | ||
| First Horizon National | 48,180 | 585,869 | Ingersoll-Rand | 151,710 | 9,132,942 | ||
| First Niagara Financial Group | 63,160 | 549,492 | KBR | 26,080 | 574,282 | ||
| First Republic Bank | 74,650 | 3,650,385 | L-3 Communications Holdings | 9,060 | 996,147 | ||
| Fulton Financial | 74,230 | 856,243 | Lincoln Electric Holdings | 11,160 | 793,476 | ||
| Hudson City Bancorp | 80,230 | 791,870 | Masco | 178,606 | 4,191,883 | ||
| Huntington Bancshares | 337,575 | 3,323,426 | McDermott International | 42,685 | a,b | 307,332 | |
| KeyCorp | 44,020 | 599,112 | Middleby | 58,830 | a | 5,072,911 | |
| M&T Bank | 11,260 | 1,392,074 | MSC Industrial Direct, Cl. A | 85,470 | 7,704,266 | ||
| New York Community Bancorp | 61,590 | 982,361 | Navistar International | 9,390 | a | 354,097 | |
| People’s United Financial | 56,980 | 851,851 | Nordson | 9,685 | 785,066 | ||
| Popular | 18,490 | a | 572,450 | Owens Corning | 18,420 | 663,120 | |
| Prosperity Bancshares | 72,660 | 4,388,664 | PACCAR | 95,220 | 5,980,768 | ||
| Regions Financial | 126,240 | 1,281,336 | Pall | 54,444 | 4,593,440 | ||
| Signature Bank | 56,839 | a | 6,733,148 | Parker Hannifin | 187,934 | 21,706,377 | |
| SunTrust Banks | 305,308 | 11,626,129 | Pentair | 11,890 | 809,352 | ||
| TCF Financial | 33,090 | 522,822 | Quanta Services | 29,180 | a | 1,060,401 | |
| Zions Bancorporation | 31,720 | 924,321 | Regal-Beloit | 133,550 | 9,491,399 | ||
| 85,093,386 | Rockwell Automation | 8,570 | 999,348 | ||||
The Funds 61
| STATEMENT OF INVESTMENTS (continued) | |||||||
| BNY Mellon Mid Cap Multi-Strategy Fund (continued) | |||||||
| Common Stocks (continued) | Shares | Value ($) | Shares | Value ($) | |||
| Capital Goods (continued) | Consumer Durables & | ||||||
| Rockwell Collins | 16,770 | 1,290,955 | Apparel—4.1% | ||||
| Roper Industries | 34,158 | 5,142,828 | Brunswick | 81,454 | 3,502,522 | ||
| Sensata Technologies Holding | 118,020 | a | 5,803,043 | Coach | 14,590 | 537,350 | |
| Snap-on | 3,705 | 462,940 | D.R. Horton | 12,075 | 261,786 | ||
| SPX | 5,555 | 577,998 | Deckers Outdoor | 63,940 | a | 5,897,826 | |
| Stanley Black & Decker | 30,716 | 2,810,514 | DSW, Cl. A | 108,576 | 3,359,341 | ||
| Terex | 17,940 | 671,135 | Fossil Group | 8,220 | a | 832,604 | |
| Textron | 26,790 | 1,018,020 | Garmin | 13,590 | b | 738,345 | |
| Timken | 40,760 | 1,846,020 | Hanesbrands | 12,810 | 1,315,331 | ||
| TransDigm Group | 8,180 | 1,537,758 | Harman International Industries | 3,115 | 358,474 | ||
| Trinity Industries | 139,900 | b | 6,768,362 | Hasbro | 11,850 | 623,962 | |
| Triumph Group | 11,410 | 791,512 | Jarden | 72,725 | a | 4,348,228 | |
| United Rentals | 56,200 | a | 6,611,930 | Leggett & Platt | 22,780 | 799,350 | |
| Veritiv | 771 | 34,325 | Lennar, Cl. A | 9,160 | 358,889 | ||
| W.W. Grainger | 4,718 | 1,161,572 | Mattel | 27,510 | 948,820 | ||
| WABCO Holdings | 13,350 | a | 1,377,720 | Michael Kors Holdings | 48,700 | a | 3,901,844 |
| Wabtec | 84,428 | 7,037,918 | Mohawk Industries | 1,835 | a | 267,947 | |
| WESCO International | 32,775 | a | 2,752,772 | Newell Rubbermaid | 396,161 | 13,279,317 | |
| Xylem | 21,890 | 815,621 | NVR | 650 | a | 762,574 | |
| 201,861,006 | Polaris Industries | 82,351 | 11,972,188 | ||||
| Commercial & Professional | PulteGroup | 29,770 | 572,179 | ||||
| Services—2.9% | PVH | 46,830 | 5,466,934 | ||||
| ADT | 17,325 | b | 638,599 | Ralph Lauren | 37,885 | 6,410,142 | |
| Avery Dennison | 13,850 | 666,600 | Toll Brothers | 36,670 | a | 1,305,085 | |
| Cintas | 16,745 | 1,107,514 | Tupperware Brands | 8,780 | 643,223 | ||
| Copart | 255,816 | a | 8,807,745 | Under Armour, Cl. A | 124,109 | a | 8,484,091 |
| DeVry Education Group | 14,200 | 609,606 | VF | 28,880 | 1,851,786 | ||
| FTI Consulting | 22,700 | a | 842,170 | Whirlpool | 8,340 | 1,276,187 | |
| IHS, Cl. A | 81,213 | a | 11,570,416 | 80,076,325 | |||
| Iron Mountain | 26,655 | 959,047 | Consumer Services—1.3% | ||||
| Manpowergroup | 58,028 | 4,501,812 | Brinker International | 12,330 | 602,937 | ||
| Pitney Bowes | 20,740 | 561,224 | Chipotle Mexican Grill | 11,389 | a | 7,729,145 | |
| R.R. Donnelley & Sons | 37,630 | 664,922 | Darden Restaurants | 10,680 | 505,378 | ||
| Republic Services | 29,945 | 1,177,737 | Hyatt Hotels, Cl. A | 9,770 | a | 596,849 | |
| Robert Half International | 127,359 | 6,394,695 | International Game Technology | 41,950 | 707,277 | ||
| Steelcase, Cl. A | 7,386 | 115,960 | Marriott International, Cl. A | 11,320 | 785,608 | ||
| Stericycle | 41,690 | a | 4,954,857 | MGM Resorts International | 53,440 | a | 1,307,677 |
| Towers Watson & Co., Cl. A | 71,515 | 7,840,189 | Panera Bread, Cl. A | 24,750 | a | 3,711,015 | |
| Verisk Analytics, Cl. A | 80,724 | a | 5,181,674 | Royal Caribbean Cruises | 10,310 | 657,366 | |
| Waste Connections | 27,740 | 1,360,924 | Service Corporation International | 28,130 | 623,642 | ||
| 57,955,691 | Starwood Hotels & Resorts Worldwide | 70,780 | c | 5,983,741 | |||
62
| BNY Mellon Mid Cap Multi-Strategy Fund (continued) | |||||||
| Common Stocks (continued) | Shares | Value ($) | Shares | Value ($) | |||
| Consumer Services (continued) | Energy (continued) | ||||||
| Wyndham Worldwide | 13,420 | 1,086,215 | Cobalt International Energy | 29,260 | a | 449,141 | |
| Wynn Resorts | 9,360 | 1,805,357 | Concho Resources | 86,641 | a | 12,306,488 | |
| 26,102,207 | CONSOL Energy | 119,100 | 4,797,348 | ||||
| Diversified Financials—8.7% | Denbury Resources | 53,490 | 921,098 | ||||
| Affiliated Managers Group | 37,714 | a | 7,963,311 | Dresser-Rand Group | 7,850 | a | 544,005 |
| Ameriprise Financial | 22,290 | 2,803,190 | Energen | 60,892 | 4,900,588 | ||
| Blackstone Group | 78,930 | 2,646,523 | EQT | 48,959 | 4,849,879 | ||
| Charles Schwab | 92,674 | 2,642,136 | Exterran Holdings | 106,650 | 4,973,089 | ||
| Discover Financial Services | 292,209 | 18,225,075 | FMC Technologies | 13,305 | a | 822,781 | |
| Dun & Bradstreet | 9,890 | 1,160,888 | Golar LNG | 11,750 | 740,250 | ||
| E*TRADE Financial | 521,690 | a | 11,612,819 | Helmerich & Payne | 51,190 | 5,377,510 | |
| Equifax | 119,485 | 9,410,639 | HollyFrontier | 64,230 | 3,213,427 | ||
| FNF Group | 270,870 | 7,668,330 | Kosmos Energy | 117,458 | a | 1,176,929 | |
| FNFV Group | 90,280 | 1,352,394 | Laredo Petroleum | 11,650 | a | 275,406 | |
| H&R Block | 30,380 | 1,018,641 | Marathon Petroleum | 43,828 | 3,988,786 | ||
| IntercontinentalExchange Group | 36,831 | 6,961,059 | Murphy Oil | 20,310 | 1,268,766 | ||
| Invesco | 262,500 | 10,720,500 | Nabors Industries | 64,540 | 1,756,133 | ||
| Legg Mason | 19,970 | 984,920 | Newfield Exploration | 26,800 | a | 1,201,176 | |
| Leucadia National | 37,484 | 934,476 | Noble Energy | 67,479 | 4,867,935 | ||
| McGraw-Hill Financial | 62,033 | 5,032,737 | Oceaneering International | 77,474 | 5,389,091 | ||
| Moody’s | 35,672 | 3,337,829 | ONEOK | 16,190 | 1,136,538 | ||
| NASDAQ OMX Group | 23,680 | 1,029,370 | Patterson-UTI Energy | 17,430 | 602,032 | ||
| Navient | 161,521 | 2,897,687 | Peabody Energy | 26,850 | 426,378 | ||
| Northern Trust | 19,900 | 1,380,065 | Pioneer Natural Resources | 13,960 | 2,912,754 | ||
| Principal Financial Group | 32,030 | 1,738,909 | QEP Resources | 85,133 | 3,028,181 | ||
| Raymond James Financial | 319,214 | 17,441,853 | Range Resources | 196,372 | 15,432,875 | ||
| SEI Investments | 86,469 | 3,276,743 | Rice Energy | 49,076 | 1,436,945 | ||
| SLM | 896,764 | 7,945,329 | RPC | 15,280 | 347,926 | ||
| State Street | 34,896 | 2,513,559 | SandRidge Energy | 58,150 | a,b | 304,706 | |
| T. Rowe Price Group | 74,460 | 6,030,888 | Seadrill | 19,235 | b | 716,504 | |
| TD Ameritrade Holding | 667,495 | 22,100,759 | Seventy Seven Energy | 2,485 | 58,323 | ||
| Voya Financial | 267,930 | 10,473,384 | SM Energy | 30,551 | 2,720,261 | ||
| 171,304,013 | Southwestern Energy | 34,280 | a | 1,411,650 | |||
| Energy—6.4% | Superior Energy Services | 21,720 | 778,445 | ||||
| Antero Resources | 34,249 | 1,981,305 | Tesoro | 116,492 | 7,541,692 | ||
| Cabot Oil & Gas | 39,160 | 1,313,426 | Ultra Petroleum | 18,690 | a,b | 495,846 | |
| Cameron International | 34,811 | a | 2,587,502 | Unit | 9,140 | a | 601,503 |
| Cheniere Energy | 25,110 | a | 2,015,329 | Valero Energy | 31,273 | 1,693,120 | |
| Chesapeake Energy | 34,790 | 946,288 | Weatherford International | 277,630 | a | 6,577,055 | |
| Cimarex Energy | 7,960 | 1,155,474 | Western Refining | 45,941 | 2,137,635 | ||
The Funds 63
STATEMENT OF INVESTMENTS (continued)
| BNY Mellon Mid Cap Multi-Strategy Fund (continued) | |||||||
| Common Stocks (continued) | Shares | Value ($) | Shares | Value ($) | |||
| Energy (continued) | Health Care Equipment & | ||||||
| Whiting Petroleum | 14,550 | a | 1,348,203 | Services—8.4% | |||
| World Fuel Services | 9,455 | 419,613 | Alere | 14,850 | a | 526,432 | |
| WPX Energy | 22,110 | a | 588,568 | Align Technology | 163,837 | a | 8,922,563 |
| 126,535,903 | Allscripts Healthcare Solutions | 20,770 | a | 306,877 | |||
| Exchange-Traded Funds—.5% | AmerisourceBergen | 118,962 | 9,206,469 | ||||
| iShares Russell Mid-Cap Growth ETF | 79,380 | 7,244,219 | Boston Scientific | 298,938 | a | 3,790,534 | |
| Standard & Poor’s Depository | Brookdale Senior Living | 168,430 | a | 5,886,628 | |||
| Receipts S&P MidCap 400 ETF Trust | 11,190 | 2,928,871 | C.R. Bard | 30,991 | 4,600,304 | ||
| 10,173,090 | Cardinal Health | 64,201 | 4,731,614 | ||||
| Food & Staples Retailing—.6% | CareFusion | 131,226 | a | 6,024,586 | |||
| Kroger | 56,060 | 2,857,939 | Catamaran | 380,928 | a | 17,949,327 | |
| Rite Aid | 303,394 | a | 1,887,111 | Cerner | 127,567 | a | 7,355,513 |
| Safeway | 30,090 | 1,046,530 | Cigna | 97,180 | 9,193,228 | ||
| United Natural Foods | 66,930 | a | 4,302,930 | Community Health Systems | 13,803 | a | 749,227 |
| Whole Foods Market | 43,480 | 1,701,807 | Cooper | 55,900 | 9,113,377 | ||
| 11,796,317 | DaVita HealthCare Partners | 42,428 | a | 3,168,523 | |||
| Food, Beverage & Tobacco—2.4% | DENTSPLY International | 11,620 | 554,332 | ||||
| Brown-Forman, Cl. B | 16,310 | 1,511,285 | Edwards Lifesciences | 9,665 | a | 959,348 | |
| Bunge | 14,820 | 1,254,513 | HCA Holdings | 19,930 | a | 1,391,513 | |
| Campbell Soup | 3,715 | 166,506 | Health Net | 13,485 | a | 636,492 | |
| Coca-Cola Enterprises | 68,711 | 3,283,012 | Henry Schein | 13,220 | a | 1,582,302 | |
| ConAgra Foods | 51,610 | 1,661,842 | Hill-Rom Holdings | 10,970 | 480,596 | ||
| Constellation Brands, Cl. A | 70,195 | a | 6,113,283 | Hologic | 500 | a | 12,435 |
| Dr. Pepper Snapple Group | 17,770 | 1,118,088 | Humana | 14,690 | 1,891,191 | ||
| Hain Celestial Group | 57,396 | a | 5,645,471 | IDEXX Laboratories | 22,626 | a | 2,804,945 |
| Hershey | 12,140 | 1,109,839 | IMS Health Holdings | 169,400 | 4,726,260 | ||
| Hormel Foods | 1,880 | 95,278 | Laboratory Corporation of | ||||
| Ingredion | 10,390 | 828,706 | America Holdings | 46,871 | a | 5,025,977 | |
| J.M. Smucker | 35,542 | 3,646,609 | McKesson | 25,379 | 4,949,666 | ||
| Keurig Green Mountain | 27,240 | 3,631,637 | MEDNAX | 197,340 | a | 11,297,715 | |
| Lorillard | 70,478 | 4,207,537 | Omnicare | 100,336 | 6,398,427 | ||
| McCormick & Co. | 13,680 | 953,359 | Quest Diagnostics | 20,900 | 1,321,089 | ||
| Mead Johnson Nutrition | 14,500 | 1,386,200 | ResMed | 19,620 | b | 1,040,841 | |
| Molson Coors Brewing, Cl. B | 7,145 | 528,373 | Sirona Dental Systems | 64,400 | a | 5,249,244 | |
| Monster Beverage | 15,620 | a | 1,380,964 | St. Jude Medical | 28,330 | 1,858,165 | |
| Tyson Foods, Cl. A | 91,528 | 3,483,556 | Teleflex | 11,900 | 1,302,812 | ||
| WhiteWave Foods | 128,790 | a | 4,510,226 | Tenet Healthcare | 13,327 | a | 815,346 |
| 46,516,284 | Universal Health Services, Cl. B | 43,710 | 5,002,172 | ||||
64
| BNY Mellon Mid Cap Multi-Strategy Fund (continued) | |||||||
| Common Stocks (continued) | Shares | Value ($) | Shares | Value ($) | |||
| Health Care Equipment & | Insurance (continued) | ||||||
| Services (continued) | W.R. Berkley | 47,639 | 2,303,346 | ||||
| Varian Medical Systems | 127,877 | a | 10,872,103 | XL Group | 96,079 | 3,283,980 | |
| Zimmer Holdings | 35,793 | 3,554,603 | 62,995,214 | ||||
| 165,252,776 | Materials—5.2% | ||||||
| Household & Personal Products—.4% | Airgas | 47,350 | 5,226,493 | ||||
| Avon Products | 45,390 | 637,276 | Albemarle | 9,110 | 579,214 | ||
| Church & Dwight | 86,803 | 5,923,437 | Alcoa | 51,445 | 854,501 | ||
| Clorox | 9,230 | 817,778 | Allegheny Technologies | 15,220 | 641,827 | ||
| Energizer Holdings | 7,260 | 882,235 | Ashland | 9,860 | 1,057,189 | ||
| Herbalife | 7,270 | b | 370,625 | Bemis | 19,490 | 794,023 | |
| Nu Skin Enterprises, Cl. A | 5,340 | 238,805 | Celanese, Ser. A | 17,280 | 1,080,691 | ||
| 8,870,156 | CF Industries Holdings | 4,080 | 1,051,294 | ||||
| Insurance—3.2% | Cliffs Natural Resources | 26,950 | b | 406,135 | |||
| Alleghany | 8,095 | a | 3,489,997 | Crown Holdings | 116,025 | a | 5,600,527 |
| Allstate | 75,262 | 4,627,860 | Cytec Industries | 10,400 | 1,071,616 | ||
| Aon | 28,850 | 2,514,566 | Eastman Chemical | 15,290 | 1,260,966 | ||
| Arthur J. Gallagher & Co. | 5,750 | 271,572 | FMC | 10,010 | 662,061 | ||
| Assurant | 14,390 | 960,532 | Graphic Packaging Holding | 570,062 | a | 7,291,093 | |
| Assured Guaranty | 22,780 | 550,137 | H.B. Fuller | 39,013 | 1,835,172 | ||
| Brown & Brown | 108,338 | 3,533,986 | Huntsman | 82,736 | 2,224,771 | ||
| Cincinnati Financial | 5,090 | 244,778 | International Flavors & | ||||
| Everest Re Group | 8,640 | 1,415,578 | Fragrances | 12,210 | 1,240,414 | ||
| Genworth Financial, Cl. A | 56,510 | a | 801,877 | International Paper | 116,755 | 5,656,780 | |
| Hartford Financial Services Group | 222,540 | 8,245,107 | Martin Marietta Materials | 7,580 | 992,677 | ||
| Lincoln National | 33,780 | 1,859,251 | MeadWestvaco | 18,200 | 782,600 | ||
| Loews | 47,152 | 2,062,428 | Minerals Technologies | 27,920 | 1,748,350 | ||
| Markel | 1,080 | a | 712,584 | Mosaic | 24,205 | 1,156,031 | |
| Marsh & McLennan | 112,932 | 5,996,689 | New Gold | 350,470 | a | 2,274,550 | |
| Old Republic International | 41,500 | 637,025 | Newmont Mining | 227,534 | 6,163,896 | ||
| PartnerRe | 7,730 | 863,364 | Nucor | 37,730 | 2,049,494 | ||
| Progressive | 80,080 | 2,003,602 | Owens-Illinois | 143,815 | a | 4,428,064 | |
| Protective Life | 22,080 | 1,532,352 | Packaging Corporation of America | 11,370 | 773,046 | ||
| Reinsurance Group of America | 59,574 | 4,943,451 | Rayonier Advanced Materials | 8,266 | b | 274,514 | |
| StanCorp Financial Group | 11,030 | 722,686 | Reliance Steel & Aluminum | 66,830 | 4,672,754 | ||
| Symetra Financial | 66,313 | 1,614,058 | Rock-Tenn, Cl. A | 36,620 | 1,800,239 | ||
| Torchmark | 100,477 | 5,481,020 | Royal Gold | 16,340 | 1,270,435 | ||
| Unum Group | 45,080 | 1,635,052 | Sealed Air | 29,410 | 1,061,701 | ||
| Validus Holdings | 17,600 | 688,336 | Sherwin-Williams | 25,920 | 5,653,411 | ||
The Funds 65
STATEMENT OF INVESTMENTS (continued)
| BNY Mellon Mid Cap Multi-Strategy Fund (continued) | |||||||
| Common Stocks (continued) | Shares | Value ($) | Shares | Value ($) | |||
| Materials (continued) | Pharmaceuticals, Biotech & | ||||||
| Sigma-Aldrich | 44,532 | 4,631,328 | Life Sciences (continued) | ||||
| Sonoco Products | 25,750 | 1,059,870 | Endo International | 20,865 | a | 1,329,309 | |
| Steel Dynamics | 43,240 | 1,004,898 | Hospira | 17,310 | a | 930,239 | |
| Tahoe Rescouces | 20,620 | a | 528,284 | ICON | 44,927 | a | 2,225,684 |
| TimkenSteel | 6,362 | 303,976 | Illumina | 13,980 | a | 2,507,453 | |
| Valspar | 145,433 | 11,745,169 | Incyte | 14,730 | a | 798,366 | |
| Vulcan Materials | 15,290 | 969,080 | Jazz Pharmaceuticals | 2,690 | a | 438,255 | |
| W.R. Grace & Co. | 8,520 | a | 843,736 | Medivation | 10,610 | a | 968,269 |
| Yamana Gold | 999,343 | 8,494,416 | Mettler-Toledo International | 2,610 | a | 705,953 | |
| 103,217,286 | Mylan | 45,520 | a | 2,212,272 | |||
| Media—1.8% | Myriad Genetics | 24,140 | a,b | 873,627 | |||
| AMC Networks, Cl. A | 10,100 | a | 632,007 | PAREXEL International | 153,650 | a | 8,672,006 |
| CBS, Cl. B | 75,160 | 4,456,236 | Perrigo Company | 45,015 | 6,695,531 | ||
| Charter Communications, Cl. A | 2,165 | a | 339,624 | Pharmacyclics | 4,400 | a,b | 547,316 |
| Cinemark Holdings | 23,625 | 833,726 | QIAGEN | 14,085 | a,b | 340,364 | |
| Discovery Communications, Cl. A | 22,600 | a | 988,072 | Salix Pharmaceuticals | 70,180 | a | 11,166,340 |
| Discovery Communications, Cl. C | 22,600 | a | 971,122 | Techne | 7,290 | 696,341 | |
| DISH Network, Cl. A | 18,320 | a | 1,187,319 | Vertex Pharmaceuticals | 81,000 | a | 7,579,170 |
| DreamWorks Animation SKG, Cl. A | 11,540 | a | 251,976 | Waters | 14,140 | a | 1,462,500 |
| Gannett | 30,760 | 1,038,458 | Zoetis | 35,200 | 1,247,488 | ||
| IMAX | 172,780 | a,b | 4,789,462 | 102,932,523 | |||
| Interpublic Group of Companies | 317,680 | 6,204,290 | Real Estate—4.5% | ||||
| John Wiley & Sons, Cl. A | 18,390 | 1,102,481 | American Assets Trust | 38,117 | c | 1,336,001 | |
| Liberty Media, Cl. A | 10,210 | a | 502,638 | American Capital Agency | 34,960 | c | 826,804 |
| Liberty Media, Cl. C | 20,420 | a | 989,757 | Annaly Capital Management | 49,240 | c | 585,956 |
| Nielsen | 28,240 | 1,326,998 | Apartment Investment & | ||||
| Omnicom Group | 115,448 | 8,313,410 | Management, Cl. A | 26,530 | c | 909,183 | |
| Scripps Networks Interactive, Cl. A | 5,610 | 447,173 | AvalonBay Communities | 7,330 | c | 1,129,553 | |
| Starz, Cl. A | 13,870 | a | 433,992 | Boston Properties | 49,827 | c | 6,049,994 |
| 34,808,741 | Camden Property Trust | 19,110 | c | 1,430,192 | |||
| Pharmaceuticals, Biotech & | CBRE Group, Cl. A | 167,090 | a | 5,310,120 | |||
| Life Sciences—5.2% | Corrections Corporation of America | 12,179 | c | 434,060 | |||
| Actavis | 24,795 | a | 5,627,969 | Crown Castle International | 23,510 | 1,869,280 | |
| Agilent Technologies | 219,190 | 12,528,900 | Digital Realty Trust | 11,390 | b,c | 743,197 | |
| Alexion Pharmaceuticals | 45,360 | a | 7,678,994 | Equity Commonwealth | 40,985 | 1,101,677 | |
| Alkermes | 101,805 | a | 4,553,738 | Equity Lifestyle Properties | 25,960 | c | 1,186,112 |
| ARIAD Pharmaceuticals | 10,210 | a,b | 63,506 | Equity Residential | 83,523 | c | 5,551,774 |
| BioMarin Pharmaceutical | 14,270 | a | 1,016,309 | Essex Property Trust | 21,630 | c | 4,184,323 |
| Bruker | 7,122 | a | 142,867 | Extra Space Storage | 22,840 | c | 1,203,668 |
| Charles River Laboratories International | 8,470 | a | 500,577 | Federal Realty Investment Trust | 2,485 | c | 310,078 |
| Covance | 96,020 | a | 7,960,058 | Forest City Enterprises, Cl. A | 28,360 | a | 589,888 |
| Cubist Pharmaceuticals | 166,060 | a | 11,463,122 | Gaming and Leisure Properties | 23,245 | 774,058 | |
66
| BNY Mellon Mid Cap Multi-Strategy Fund (continued) | |||||||
| Common Stocks (continued) | Shares | Value ($) | Shares | Value ($) | |||
| Real Estate (continued) | Retailing (continued) | ||||||
| General Growth Properties | 24,840 | c | 610,319 | GameStop, Cl. A | 17,020 | b | 718,244 |
| Hatteras Financial | 38,970 | c | 775,503 | Gap | 18,975 | 875,696 | |
| HCP | 38,155 | c | 1,653,256 | Genuine Parts | 13,330 | 1,169,574 | |
| Health Care | 16,570 | c | 1,119,801 | GNC Holdings, Cl. A | 6,170 | 234,151 | |
| Healthcare Trust of | Groupon | 37,460 | a,b | 254,728 | |||
| America, Cl. A | 53,510 | 666,200 | J.C. Penney | 38,875 | a,b | 419,850 | |
| Home Properties | 9,510 | c | 610,732 | Kohl’s | 15,600 | 917,124 | |
| Hospitality Properties Trust | 29,490 | c | 867,891 | L Brands | 16,100 | 1,027,985 | |
| Host Hotels & Resorts | 105,409 | c | 2,405,433 | Liberty Interactive, Cl. A | 52,410 | a | 1,547,143 |
| Kimco Realty | 189,611 | c | 4,453,962 | LKQ | 398,106 | a | 11,306,210 |
| Macerich | 75,842 | c | 4,951,724 | Macy’s | 137,417 | 8,559,705 | |
| MFA Financial | 132,670 | c | 1,119,735 | Murphy USA | 9,507 | a | 517,846 |
| Plum Creek Timber | 22,180 | c | 901,173 | Netflix | 5,570 | a | 2,660,455 |
| Prologis | 43,040 | c | 1,762,058 | Nordstrom | 9,970 | 690,423 | |
| Rayonier | 24,799 | c | 849,862 | O’Reilly Automotive | 60,004 | a | 9,359,424 |
| Realogy Holdings | 284,735 | a | 11,608,646 | PetSmart | 13,160 | 941,861 | |
| Realty Income | 14,755 | b,c | 659,844 | Ross Stores | 13,910 | 1,049,092 | |
| Regency Centers | 54,390 | c | 3,107,845 | Sally Beauty Holdings | 18,675 | a | 520,659 |
| SL Green Realty | 51,105 | c | 5,588,332 | Signet Jewelers | 10,690 | 1,260,030 | |
| Spirit Realty Capital | 64,200 | 758,202 | Staples | 72,040 | 841,427 | ||
| Starwood Property Trust | 10,850 | c | 258,773 | Tiffany & Co. | 54,260 | 5,477,004 | |
| Two Harbors Investment | 106,240 | 1,138,893 | Tractor Supply | 115,613 | 7,740,290 | ||
| UDR | 28,390 | c | 849,429 | TripAdvisor | 9,380 | a | 929,464 |
| Ventas | 25,810 | c | 1,697,782 | Ulta Salon, Cosmetics & Fragrance | 61,510 | a | 5,985,538 |
| Vornado Realty Trust | 14,720 | c | 1,558,406 | Williams-Sonoma | 106,720 | 7,018,974 | |
| Weingarten Realty Investors | 36,400 | c | 1,245,608 | 92,903,056 | |||
| Weyerhaeuser | 48,470 | c | 1,645,557 | Semiconductors & Semiconductor | |||
| WP Carey | 9,295 | 634,663 | Equipment—2.6% | ||||
| 89,025,547 | Altera | 16,240 | 573,922 | ||||
| Retailing—4.7% | Analog Devices | 75,037 | 3,835,891 | ||||
| Advance Auto Parts | 13,190 | 1,799,380 | Applied Materials | 692,270 | 15,994,898 | ||
| AutoZone | 3,700 | a | 1,993,708 | Atmel | 57,050 | a | 505,463 |
| Bed Bath & Beyond | 11,510 | a | 739,633 | Avago Technologies | 49,505 | 4,063,865 | |
| Best Buy | 18,690 | 596,024 | Broadcom, Cl. A | 24,145 | 950,830 | ||
| Big Lots | 13,740 | 636,849 | Cree | 12,790 | a,b | 582,712 | |
| CarMax | 24,630 | a | 1,290,612 | KLA-Tencor | 14,680 | 1,121,846 | |
| Dick’s Sporting Goods | 11,300 | 509,291 | Lam Research | 21,200 | 1,524,492 | ||
| Dollar General | 29,430 | a | 1,883,226 | Linear Technology | 28,610 | 1,290,597 | |
| Dollar Tree | 14,350 | a | 769,519 | Marvell Technology Group | 31,830 | 442,755 | |
| Expedia | 61,850 | 5,312,915 | Maxim Integrated Products | 28,335 | 875,268 | ||
| Family Dollar Stores | 380 | 30,335 | Mellanox Technologies | 96,300 | a | 4,024,377 | |
| Foot Locker | 94,790 | 5,318,667 | Microchip Technology | 102,200 | b | 4,990,426 | |
The Funds 67
STATEMENT OF INVESTMENTS (continued)
| BNY Mellon Mid Cap Multi-Strategy Fund (continued) | |||||||
| Common Stocks (continued) | Shares | Value ($) | Shares | Value ($) | |||
| Semiconductors & Semiconductor | Software & Services (continued) | ||||||
| Equipment (continued) | Manhattan Associates | 123,596 | a | 3,569,452 | |||
| Micron Technology | 105,170 | a | 3,428,542 | NetEase, ADR | 17,924 | b | 1,578,029 |
| NVIDIA | 37,660 | 732,487 | NetSuite | 4,650 | a | 407,526 | |
| ON Semiconductor | 340,420 | a | 3,322,499 | Nuance Communications | 32,365 | a | 550,529 |
| Silicon Laboratories | 5,465 | a | 247,728 | Pandora Media | 8,475 | a | 229,164 |
| Skyworks Solutions | 14,710 | 833,469 | Paychex | 23,210 | 966,697 | ||
| Xilinx | 30,960 | 1,308,060 | Rackspace Hosting | 21,400 | a | 740,440 | |
| 50,650,127 | Red Hat | 99,459 | a | 6,059,042 | |||
| Software & Services—6.6% | Rovi | 16,780 | a | 388,121 | |||
| Activision Blizzard | 182,065 | 4,285,810 | ServiceNow | 7,010 | a | 428,521 | |
| Akamai Technologies | 86,430 | a | 5,222,101 | Solera Holdings | 16,800 | 1,024,128 | |
| Alliance Data Systems | 17,949 | a | 4,750,023 | Splunk | 9,070 | a | 489,327 |
| Amdocs | 100,814 | 4,748,339 | Symantec | 72,220 | 1,753,502 | ||
| ANSYS | 120,829 | a | 9,823,398 | Synopsys | 134,110 | a | 5,485,099 |
| AOL | 9,880 | a | 427,014 | TIBCO Software | 20,500 | a | 427,220 |
| Autodesk | 28,790 | a | 1,544,296 | Total System Services | 94,758 | 2,981,087 | |
| Blackhawk Network Holdings, Cl. B | 4,943 | 135,784 | 43,445 | 2,161,389 | |||
| Broadridge Financial Solutions | 17,830 | 758,488 | Tyler Technologies | 43,882 | a | 3,908,131 | |
| CA | 28,780 | 812,747 | Ultimate Software Group | 21,112 | a | 3,103,253 | |
| Citrix Systems | 21,090 | a | 1,481,783 | Vantiv, Cl. A | 23,204 | a | 725,821 |
| Cognizant Technology Solutions, Cl. A | 105,550 | a | 4,826,801 | VeriSign | 13,110 | a | 748,253 |
| CommVault Systems | 37,582 | a | 2,072,271 | Western Union | 37,975 | 663,423 | |
| Computer Sciences | 19,100 | 1,141,989 | Xerox | 117,500 | 1,622,675 | ||
| Concur Technologies | 50,270 | a,b | 5,046,103 | 129,801,444 | |||
| CoreLogic | 7,780 | a | 219,941 | Technology Hardware & | |||
| CoStar Group | 22,457 | a | 3,250,651 | Equipment—7.2% | |||
| DST Systems | 35,570 | 3,301,252 | 3D Systems | 6,515 | a,b | 348,618 | |
| Electronic Arts | 55,365 | a | 2,095,012 | Amphenol, Cl. A | 139,106 | 14,329,309 | |
| Fidelity National Information Services | 85,142 | 4,831,808 | Arrow Electronics | 163,724 | a | 10,191,819 | |
| Fiserv | 127,766 | a | 8,237,074 | Avnet | 417,013 | 18,561,249 | |
| FleetCor Technologies | 1,295 | a | 186,079 | AVX | 47,000 | 647,660 | |
| Gartner | 8,970 | a | 669,072 | Brocade Communications Systems | 189,144 | 1,995,469 | |
| Global Payments | 33,550 | 2,439,756 | CommScope Holding | 115,930 | 2,986,357 | ||
| IAC/InterActiveCorp | 17,377 | 1,209,265 | EchoStar, Cl. A | 15,280 | a | 770,570 | |
| Informatica | 11,140 | a | 379,373 | F5 Networks | 46,030 | a | 5,716,466 |
| Intuit | 92,269 | 7,674,935 | Flextronics International | 159,162 | a | 1,757,148 | |
| Jack Henry & Associates | 13,080 | 756,155 | FLIR Systems | 109,270 | 3,692,233 | ||
| LinkedIn, Cl. A | 33,060 | a | 7,463,295 | Harris | 22,898 | 1,634,688 | |
68
| BNY Mellon Mid Cap Multi-Strategy Fund (continued) | |||||||
| Common Stocks (continued) | Shares | Value ($) | Shares | Value ($) | |||
| Technology Hardware & | Transportation (continued) | ||||||
| Equipment (continued) | Kansas City Southern | 15,910 | 1,835,378 | ||||
| Ingram Micro, Cl. A | 179,740 | a | 5,181,904 | Kirby | 78,400 | a | 9,352,336 |
| Jabil Circuit | 118,896 | 2,565,776 | Landstar System | 15,410 | 1,045,800 | ||
| JDS Uniphase | 598,170 | a | 6,908,864 | Southwest Airlines | 62,550 | 2,002,226 | |
| Juniper Networks | 401,150 | 9,302,669 | Spirit Airlines | 69,290 | a | 4,877,323 | |
| Knowles | 36,053 | a | 1,186,865 | United Continential Holdings | 34,750 | a | 1,654,448 |
| Lexmark International, Cl. A | 9,760 | 493,466 | 42,092,864 | ||||
| Motorola Solutions | 52,345 | 3,109,293 | Utilities—3.0% | ||||
| NCR | 22,350 | a | 763,476 | AES | 279,767 | 4,246,863 | |
| NetApp | 26,050 | 1,098,268 | Alliant Energy | 46,257 | 2,705,572 | ||
| Palo Alto Networks | 12,380 | a | 1,052,176 | Ameren | 63,512 | 2,539,845 | |
| Riverbed Technology | 36,540 | a | 688,414 | American Electric Power | 74,213 | 3,985,238 | |
| SanDisk | 68,730 | 6,732,791 | American Water Works | 22,760 | 1,151,884 | ||
| Seagate Technology | 240,158 | 15,029,088 | Aqua America | 32,225 | 805,947 | ||
| Stratasys | 36,830 | a,b | 4,418,127 | Calpine | 42,860 | a | 1,018,782 |
| Tech Data | 9,120 | a | 615,600 | CenterPoint Energy | 49,060 | 1,218,650 | |
| Teradata | 15,870 | a | 724,783 | CMS Energy | 32,050 | 978,807 | |
| Trimble Navigation | 178,112 | a | 5,924,005 | Consolidated Edison | 16,640 | 963,290 | |
| Western Digital | 119,117 | 12,270,242 | DTE Energy | 20,060 | 1,569,695 | ||
| Zebra Technologies, Cl. A | 15,970 | a | 1,246,139 | Edison International | 80,901 | 4,784,485 | |
| 141,943,532 | Entergy | 7,725 | 597,992 | ||||
| Telecommunication Services—.4% | FirstEnergy | 75,041 | 2,569,404 | ||||
| SBA Communications, Cl. A | 14,210 | a | 1,567,221 | Great Plains Energy | 266,663 | 6,845,239 | |
| T-Mobile US | 20,045 | a | 602,954 | ITC Holdings | 31,200 | 1,165,320 | |
| TE Connectivity | 50,218 | 3,147,664 | MDU Resources Group | 5,440 | 170,326 | ||
| Telephone & Data Systems | 16,670 | 439,088 | National Fuel Gas | 12,450 | 951,678 | ||
| tw telecom | 24,475 | a | 1,004,332 | NiSource | 42,260 | 1,676,454 | |
| Windstream Holdings | 33,420 | b | 377,646 | Northeast Utilities | 37,690 | 1,729,594 | |
| 7,138,905 | NRG Energy | 20,740 | 638,377 | ||||
| Transportation—2.1% | OGE Energy | 27,595 | 1,035,364 | ||||
| American Airlines Group | 9,640 | 375,092 | ONE Gas | 4,047 | 151,479 | ||
| C.H. Robinson Worldwide | 20,960 | 1,430,730 | Pepco Holdings | 60,380 | 1,664,073 | ||
| Copa Holdings, Cl. A | 3,475 | 427,355 | PG&E | 30,155 | 1,401,604 | ||
| Delta Air Lines | 85,620 | 3,388,840 | Pinnacle West Capital | 23,710 | 1,350,285 | ||
| Expeditors International of Washington | 26,345 | 1,088,048 | PPL | 40,610 | 1,406,324 | ||
| Genesee & Wyoming, Cl. A | 49,719 | a | 4,888,869 | Public Service Enterprise Group | 29,385 | 1,098,705 | |
| Hertz Global Holdings | 23,400 | a | 691,470 | Questar | 37,960 | 892,440 | |
| J.B. Hunt Transport Services | 119,589 | 9,034,949 | |||||
The Funds 69
STATEMENT OF INVESTMENTS (continued)
| BNY Mellon Mid Cap Multi-Strategy Fund (continued) | ||||||||
| Common Stocks (continued) | Shares | Value ($) | Other Investment—1.3% | Shares | Value ($) | |||
| Utilities (continued) | Registered Investment Company; | |||||||
| SCANA | 27,690 | b | 1,438,219 | Dreyfus Institutional Preferred | ||||
| Sempra Energy | 21,360 | 2,263,519 | Plus Money Market Fund | |||||
| Vectren | 28,135 | 1,160,006 | (cost $26,314,856) | 26,314,856 | d | 26,314,856 | �� | |
| Westar Energy | 48,662 | b | 1,797,088 | Investment of Cash Collateral | ||||
| Wisconsin Energy | 14,830 | 672,244 | for Securities Loaned—1.4% | |||||
| Xcel Energy | 26,435 | 847,242 | Registered Investment Company; | |||||
| 59,492,034 | Dreyfus Institutional | |||||||
| Total Common Stocks | Cash Advantage Fund | |||||||
| (cost $1,424,864,651) | 1,946,180,843 | (cost $26,858,910) | 26,858,910 | d | 26,858,910 | |||
| Number of | Total Investments | |||||||
| Rights—.0% | Rights | Value ($) | (cost $1,478,040,468) | 101.3% 1,999,355,908 | ||||
| Health Care Equipment & Services | Liabilities, Less Cash and Receivables | (1.3 | %) | (24,835,469 | ) | |||
| Community Health Systems | Net Assets | 100.0% 1,974,520,439 | ||||||
| (cost $2,051) | 33,320 | a | 1,299 | |||||
ADR—American Depository Receipts
ETF—Exchange-Traded Funds
| a Non-income producing security. |
| b Security, or portion thereof, on loan.At August 31, 2014, the value of the fund’s securities on loan was $31,425,396 and the value of the collateral held by the fund was |
| $31,965,525, consisting of cash collateral of $26,858,910 and U.S. Government & Agency securities valued at $5,106,615. |
| c Investment in real estate investment trust. |
| d Investment in affiliated money market mutual fund. |
| Portfolio Summary (Unaudited) † | |||
| Value (%) | Value (%) | ||
| Capital Goods | 10.2 | Commercial & Professional Services | 2.9 |
| Diversified Financials | 8.7 | Money Market Investments | 2.7 |
| Health Care Equipment & Services | 8.4 | Semiconductors & Semiconductor Equipment | 2.6 |
| Technology Hardware & Equipment | 7.2 | Food, Beverage & Tobacco | 2.4 |
| Software & Services | 6.6 | Transportation | 2.1 |
| Energy | 6.4 | Automobiles & Components | 1.9 |
| Materials | 5.2 | Media | 1.8 |
| Pharmaceuticals, Biotech & Life Sciences | 5.2 | Consumer Services | 1.3 |
| Retailing | 4.7 | Food & Staples Retailing | .6 |
| Real Estate | 4.5 | Exchange-Traded Funds | .5 |
| Banks | 4.3 | Household & Personal Products | .4 |
| Consumer Durables & Apparel | 4.1 | Telecommunication Services | .4 |
| Insurance | 3.2 | ||
| Utilities | 3.0 | 101.3 | |
| † Based on net assets. | |||
| See notes to financial statements. | |||
70
| STATEMENT OF INVESTMENTS |
| August 31, 2014 |
| BNY Mellon Small Cap Multi-Strategy Fund | |||||||
| Common Stocks—99.1% | Shares | Value ($) | Shares | Value ($) | |||
| Automobiles & Components—1.8% | Capital Goods (continued) | ||||||
| Dana Holding | 94,150 | 2,187,105 | Armstrong World Industries | 16,490 | a | 951,143 | |
| Drew Industries | 7,190 | 319,164 | Astec Industries | 16,320 | 677,933 | ||
| Motorcar Parts of America | 4,970 | a | 150,690 | Chart Industries | 23,930 | a | 1,600,678 |
| Tenneco | 28,920 | a | 1,853,194 | Comfort Systems USA | 86,080 | 1,308,416 | |
| Thor Industries | 12,810 | 688,025 | Crane | 10,680 | 743,221 | ||
| Winnebago Industries | 55,550 | a | 1,373,751 | DXP Enterprises | 17,370 | a | 1,391,684 |
| 6,571,929 | FreightCar America | 18,831 | 560,975 | ||||
| Banks—11.5% | Global Power Equipment Group | 13,940 | 234,889 | ||||
| Boston Private Financial Holdings | 200,220 | 2,430,671 | Graco | 6,020 | 462,697 | ||
| Brookline Bancorp | 60,680 | 555,222 | Granite Construction | 15,490 | 546,332 | ||
| Cardinal Financial | 29,582 | 528,630 | Great Lakes Dredge and Dock | 77,130 | a | 587,731 | |
| CoBiz Financial | 46,560 | 537,768 | Hexcel | 30,610 | a | 1,260,826 | |
| Columbia Banking System | 82,820 | 2,154,148 | L.B. Foster, Cl. A | 12,700 | 666,242 | ||
| CVB Financial | 170,426 | 2,648,420 | Lindsay | 9,360 | b | 728,021 | |
| EverBank Financial | 160,320 | 3,026,842 | MRC Global | 177,020 | a | 4,393,636 | |
| First Horizon National | 105,410 | 1,281,786 | Mueller Industries | 23,640 | 691,234 | ||
| First Midwest Bancorp | 55,000 | 926,750 | Powell Industries | 15,250 | 803,522 | ||
| Hancock Holding | 39,040 | 1,297,690 | Primoris Services | 46,710 | 1,356,458 | ||
| IBERIABANK | 30,460 | 1,987,515 | Regal-Beloit | 14,790 | 1,051,125 | ||
| Ladder Capital, Cl. A | 80,950 | 1,505,670 | Sun Hydraulics | 25,980 | 1,039,979 | ||
| National Bank Holdings, Cl. A | 40,250 | 817,880 | Taser International | 33,700 | a | 528,079 | |
| PrivateBancorp | 44,440 | 1,311,424 | Thermon Group Holdings | 130,710 | a | 3,548,776 | |
| Prosperity Bancshares | 21,080 | 1,273,232 | Trex | 34,010 | a | 1,278,776 | |
| Sandy Spring Bancorp | 32,830 | 793,501 | Watsco | 19,730 | 1,824,828 | ||
| South State | 30,710 | 1,798,378 | Watts Water Technologies, Cl. A | 30,190 | 1,910,725 | ||
| Square 1 Financial, Cl. A | 2,595 | 49,798 | 34,678,596 | ||||
| SVB Financial Group | 48,490 | a | 5,397,907 | Commercial & Professional | |||
| Synovus Financial | 84,007 | 2,028,769 | Services—5.8% | ||||
| UMB Financial | 69,170 | 3,994,567 | Advisory Board | 25,400 | a | 1,259,840 | |
| United Community Banks | 57,240 | 970,790 | Herman Miller | 82,400 | 2,448,928 | ||
| Valley National Bancorp | 78,960 | b | 789,600 | HNI | 32,850 | 1,245,344 | |
| Washington Trust Bancorp | 10,970 | 385,925 | Interface | 107,450 | 1,829,874 | ||
| Webster Financial | 30,530 | 900,635 | Knoll | 106,750 | 1,952,458 | ||
| WesBanco | 25,020 | 776,871 | Korn/Ferry International | 61,360 | a | 1,856,140 | |
| Wintrust Financial | 24,840 | 1,156,799 | McGrath RentCorp | 19,280 | 713,360 | ||
| 41,327,188 | On Assignment | 35,570 | a | 1,051,449 | |||
| Capital Goods—9.7% | Steelcase, Cl. A | 316,630 | 4,971,091 | ||||
| Aerovironment | 29,180 | a | 920,337 | TrueBlue | 123,530 | a | 3,352,604 |
| Altra Industrial Motion | 22,070 | 734,048 | 20,681,088 | ||||
| American Woodmark | 18,130 | a | 711,059 | Consumer Durables & Apparel—2.2% | |||
| Apogee Enterprises | 59,305 | 2,165,226 | Brookfield Residential Properties | 25,350 | a | 512,070 | |
The Funds 71
STATEMENT OF INVESTMENTS (continued)
| BNY Mellon Small Cap Multi-Strategy Fund (continued) | |||||||
| Common Stocks (continued) | Shares | Value ($) | Shares | Value ($ | |||
| Consumer Durables & Apparel (continued) | Energy (continued) | ||||||
| Cavco Industries | 6,800 | a | 485,724 | Navigator Holdings | 35,955 | a | 1,060,313 |
| Ethan Allen Interiors | 34,380 | 867,407 | Oil States International | 17,910 | a | 1,156,091 | |
| Malibu Boats, Cl. A | 34,490 | 717,737 | PDC Energy | 49,530 | a | 2,976,258 | |
| Oxford Industries | 12,870 | 789,317 | RSP Permian | 42,680 | 1,220,648 | ||
| Skechers USA, Cl. A | 1,170 | a | 68,293 | Synergy Resources | 143,520 | a | 1,931,779 |
| Standard Pacific | 95,670 | a | 800,758 | Tesco | 9,680 | 205,410 | |
| Steven Madden | 23,145 | a | 786,699 | Western Refining | 53,810 | 2,503,779 | |
| Taylor Morrison Home, Cl. A | 31,810 | a | 631,110 | 20,714,590 | |||
| Universal Electronics | 6,850 | a | 374,489 | Exchange-Traded Funds—.4% | |||
| Vera Bradley | 26,800 | a,b | 549,936 | iShares Russell 2000 ETF | 4,430 | b | 516,361 |
| Wolverine World Wide | 49,980 | b | 1,327,469 | iShares Russell 2000 Value ETF | 9,430 | b | 948,186 |
| 7,911,009 | 1,464,547 | ||||||
| Consumer Services—2.0% | Food & Staples Retailing—.8% | ||||||
| Apollo Education Group | 64,380 | a | 1,787,833 | Casey’s General Stores | 17,550 | 1,258,159 | |
| Belmond, Cl. A | 67,340 | a | 860,605 | Fresh Market | 9,290 | a | 309,822 |
| Capella Education | 2,430 | 158,217 | United Natural Foods | 21,400 | a | 1,375,806 | |
| Cheesecake Factory | 21,760 | 978,112 | 2,943,787 | ||||
| Del Frisco’s Restaurant Group | 47,690 | a | 1,055,380 | Food, Beverage & Tobacco—1.1% | |||
| LifeLock | 145,710 | a | 2,159,422 | Dean Foods | 58,455 | 945,802 | |
| Multimedia Games Holding Company | 2,990 | a | 83,152 | Fresh Del Monte Produce | 24,310 | 776,461 | |
| 7,082,721 | TreeHouse Foods | 14,490 | a | 1,195,715 | |||
| Diversified Financials—2.7% | WhiteWave Foods | 32,220 | a | 1,128,344 | |||
| FNFV Group | 49,710 | 744,656 | 4,046,322 | ||||
| FXCM, Cl. A | 57,390 | b | 831,581 | Health Care Equipment & Services—4.8% | |||
| Nelnet, Cl. A | 17,160 | 754,525 | Air Methods | 19,900 | a | 1,167,334 | |
| Piper Jaffray | 19,060 | a | 1,017,042 | Align Technology | 28,980 | a | 1,578,251 |
| Portfolio Recovery Associates | 31,566 | a | 1,793,896 | athenahealth | 6,950 | a,b | 1,003,858 |
| Raymond James Financial | 53,870 | 2,943,457 | Centene | 13,494 | a | 1,054,286 | |
| SLM | 180,110 | 1,595,775 | Computer Programs & Systems | 11,440 | 702,874 | ||
| 9,680,932 | Endologix | 70,370 | a | 971,810 | |||
| Energy—5.8% | Globus Medical, Cl. A | 31,450 | a | 570,503 | |||
| Bill Barrett | 39,300 | a | 894,861 | Hanger | 28,310 | a | 634,144 |
| CARBO Ceramics | 13,380 | 1,439,554 | HealthSouth | 28,460 | 1,121,039 | ||
| Cloud Peak Energy | 2,010 | a | 31,577 | HealthStream | 44,740 | a | 1,161,450 |
| CONSOL Energy | 37,330 | 1,503,652 | HeartWare International | 6,980 | a | 566,078 | |
| Forum Energy Technologies | 39,740 | a | 1,353,147 | Insulet | 29,160 | a | 1,052,968 |
| Geospace Technologies | 15,820 | a | 650,518 | LDR Holding | 40,099 | 1,085,480 | |
| Gulf Island Fabrication | 16,080 | 338,806 | LifePoint Hospitals | 11,600 | a | 867,680 | |
| Key Energy Services | 169,910 | a | 1,070,433 | Natus Medical | 25,900 | a | 728,049 |
| McDermott International | 109,500 | a,b | 788,400 | Omnicell | 26,440 | a | 744,286 |
| Natural Gas Services Group | 53,550 | a | 1,589,364 | Select Medical Holdings | 24,080 | 337,602 | |
72
| BNY Mellon Small Cap Multi-Strategy Fund (continued) | |||||||
| Common Stocks (continued) | Shares | Value ($) | Shares | Value ($) | |||
| Health Care Equipment & | Pharmaceuticals, Biotech & | ||||||
| Services (continued) | Life Sciences—6.8% | ||||||
| Spectranetics | 55,350 | a | 1,570,833 | ACADIA Pharmaceuticals | 45,530 | a,b | 1,091,809 |
| WellCare Health Plans | 6,550 | a | 431,383 | Anacor Pharmaceuticals | 81,430 | a,b | 1,896,505 |
| 17,349,908 | BioDelivery Sciences International | 119,520 | a | 1,912,320 | |||
| Household & Personal Products—.4% | Celldex Therapeutics | 71,050 | a,b | 1,130,406 | |||
| Elizabeth Arden | 22,760 | a | 389,196 | Cepheid | 22,640 | a | 906,279 |
| Inter Parfums | 37,160 | 1,131,894 | Cubist Pharmaceuticals | 11,940 | a | 824,218 | |
| 1,521,090 | Emergent BioSolutions | 185,080 | a | 4,608,492 | |||
| Insurance—.4% | KYTHERA Biopharmaceuticals | 37,350 | a,b | 1,404,734 | |||
| Safety Insurance Group | 10,810 | 596,712 | Nektar Therapeutics | 122,830 | a | 1,751,556 | |
| Stewart Information Services | 22,990 | 740,738 | NPS Pharmaceuticals | 34,555 | a | 1,042,870 | |
| 1,337,450 | PAREXEL International | 29,140 | a | 1,644,662 | |||
| Materials—6.0% | TherapeuticsMD | 609,390 | a,b | 3,382,114 | |||
| Allied Nevada Gold | 623,460 | a,b | 2,381,617 | Vanda Pharmaceuticals | 90,100 | a,b | 1,165,894 |
| AuRico Gold | 430,710 | 1,955,423 | WuXi PharmaTech, ADR | 42,380 | a | 1,568,908 | |
| Carpenter Technology | 18,240 | 998,275 | 24,330,767 | ||||
| Chemtura | 200,720 | a | 4,955,777 | Real Estate—2.8% | |||
| Constellium, Cl. A | 29,150 | a | 830,192 | Acadia Realty Trust | 32,640 | c | 940,685 |
| Cytec Industries | 10,560 | 1,088,102 | American Assets Trust | 21,790 | c | 763,740 | |
| Haynes International | 10,710 | 531,002 | American Residential Properties | 117,730 | a,c | 2,234,515 | |
| IAMGOLD | 371,220 | a | 1,488,592 | Corporate Office Properties Trust | 36,140 | c | 1,025,653 |
| Louisiana-Pacific | 22,240 | a | 317,365 | CyrusOne | 22,750 | 592,410 | |
| New Gold | 180,810 | a | 1,173,457 | EPR Properties | 12,410 | c | 706,253 |
| OMNOVA Solutions | 223,570 | a | 1,875,752 | Getty Realty | 24,739 | c | 464,104 |
| Royal Gold | 3,950 | 307,112 | Healthcare Trust of America, Cl. A | 94,340 | 1,174,533 | ||
| Schnitzer Steel Industries, Cl. A | 15,050 | 416,734 | Pebblebrook Hotel Trust | 21,380 | c | 828,261 | |
| Scotts Miracle-Gro, Cl. A | 17,120 | 988,338 | Re/Max Holdings, Cl. A | 25,080 | 760,426 | ||
| Stillwater Mining | 36,210 | a | 672,058 | Summit Hotel Properties | 18,740 | c | 205,203 |
| TimkenSteel | 11,240 | 537,047 | Urstadt Biddle Properties, Cl. A | 22,323 | c | 475,926 | |
| Trecora Resources | 19,299 | a | 253,589 | 10,171,709 | |||
| Trinseo | 35,528 | 698,480 | Retailing—4.1% | ||||
| 21,468,912 | American Eagle Outfitters | 93,600 | b | 1,317,888 | |||
| Media—2.5% | Core-Mark Holding Company | 17,710 | 852,914 | ||||
| DreamWorks Animation SKG, Cl. A | 16,650 | a | 363,553 | Express | 49,678 | a | 861,417 |
| E.W. Scripps, Cl. A | 65,690 | a | 1,245,482 | Kirkland’s | 56,920 | a | 1,014,884 |
| IMAX | 60,670 | a,b | 1,681,772 | Office Depot | 1,020,684 | a | 5,225,902 |
| LIN Media, Cl. A | 67,520 | a | 1,574,566 | PEP Boys-Manny Moe & Jack | 67,644 | a | 752,201 |
| Lions Gate Entertainment | 37,130 | 1,203,383 | Restoration Hardware Holdings | 8,850 | a,b | 742,249 | |
| Media General, Cl. A | 33,700 | a | 519,317 | Shutterfly | 15,150 | a | 772,801 |
| New York Times, Cl. A | 183,080 | 2,266,530 | The Children’s Place | 20,004 | 1,075,415 | ||
| 8,854,603 | Vitamin Shoppe | 26,950 | a | 1,056,170 | |||
The Funds 73
STATEMENT OF INVESTMENTS (continued)
| BNY Mellon Small Cap Multi-Strategy Fund (continued) | |||||||
| Common Stocks (continued) | Shares | Value ($) | Shares | Value ($) | |||
| Retailing (continued) | Software & Services (continued) | ||||||
| Zumiez | 29,160 | a | 943,326 | Sapient | 62,600 | a | 908,326 |
| 14,615,167 | SS&C Technologies Holdings | 29,400 | a | 1,330,644 | |||
| Semiconductors & Semiconductor | 31,056,556 | ||||||
| Equipment—6.5% | Technology Hardware & | ||||||
| Applied Micro Circuits | 314,140 | a | 2,660,766 | Equipment—8.4% | |||
| Brooks Automation | 86,820 | 984,539 | Arrow Electronics | 54,060 | a | 3,365,235 | |
| GT Advanced Technologies | 56,770 | a,b | 1,011,074 | Aruba Networks | 72,540 | a | 1,548,729 |
| Inphi | 68,670 | a | 1,033,484 | Belden | 11,770 | 860,034 | |
| Lattice Semiconductor | 223,830 | a | 1,680,963 | Ciena | 182,990 | a | 3,786,063 |
| Mellanox Technologies | 107,740 | a | 4,502,455 | Coherent | 17,010 | a | 1,096,635 |
| Microsemi | 73,960 | a | 1,970,294 | FARO Technologies | 13,770 | a | 798,798 |
| MKS Instruments | 18,550 | 629,587 | FEI | 7,410 | 622,736 | ||
| Nanometrics | 21,847 | a | 365,282 | Infinera | 109,400 | a | 1,157,452 |
| Photronics | 96,780 | a | 854,567 | Ixia | 26,330 | a | 253,295 |
| Power Integrations | 22,630 | 1,352,821 | Jabil Circuit | 192,700 | 4,158,466 | ||
| Silicon Laboratories | 24,660 | a | 1,117,838 | JDS Uniphase | 268,030 | a | 3,095,747 |
| Teradyne | 56,060 | 1,154,275 | Lexmark International, Cl. A | 17,670 | 893,395 | ||
| Veeco Instruments | 93,410 | a | 3,303,912 | Littelfuse | 11,430 | 1,050,531 | |
| Xcerra | 85,922 | a | 897,885 | RADWARE | 52,170 | a | 904,106 |
| 23,519,742 | ScanSource | 34,960 | a | 1,348,058 | |||
| Software & Services—8.6% | Sonus Networks | 319,070 | a | 1,202,894 | |||
| Advent Software | 17,940 | 579,641 | Tech Data | 32,290 | a | 2,179,575 | |
| Cardtronics | 49,880 | a | 1,770,740 | Universal Display | 15,320 | a,b | 532,217 |
| comScore | 33,700 | a | 1,291,047 | Vishay Intertechnology | 89,180 | 1,426,880 | |
| Conversant | 29,450 | a,b | 811,053 | 30,280,846 | |||
| CoreLogic | 153,090 | a | 4,327,854 | Transportation—2.5% | |||
| CSG Systems International | 147,060 | 4,076,503 | Con-way | 38,003 | 1,947,654 | ||
| Dealertrack Technologies | 78,090 | a | 3,495,308 | Forward Air | 28,500 | 1,319,265 | |
| DST Systems | 5,510 | 511,383 | Hub Group, Cl. A | 29,920 | a | 1,301,221 | |
| FleetMatics Group | 33,930 | a,b | 1,113,583 | Landstar System | 34,940 | 2,371,203 | |
| Infoblox | 128,920 | a | 1,733,974 | Saia | 15,920 | a | 755,722 |
| LogMeIn | 34,990 | a | 1,479,377 | Spirit Airlines | 18,790 | a | 1,322,628 |
| MAXIMUS | 32,210 | 1,327,052 | 9,017,693 | ||||
| Mentor Graphics | 97,570 | 2,128,002 | Utilities—1.5% | ||||
| Monotype Imaging Holdings | 35,040 | 1,029,826 | Chesapeake Utilities | 11,550 | 796,604 | ||
| NetScout Systems | 22,750 | a | 1,048,093 | El Paso Electric | 23,240 | 914,262 | |
| Proofpoint | 39,080 | a | 1,558,510 | Hawaiian Electric Industries | 62,480 | b | 1,586,367 |
| Q2 Holdings | 36,290 | 535,640 | |||||
74
| BNY Mellon Small Cap Multi-Strategy Fund (continued) | ||||||||
| Investment of Cash Collateral | ||||||||
| Common Stocks (continued) | Shares | Value ($) | for Securities Loaned—6.1% | Shares | Value ($) | |||
| Utilities (continued) | Registered | |||||||
| NorthWestern | 16,960 | b | 818,829 | Investment Company; | ||||
| Portland General Electric | 33,096 | 1,140,819 | Dreyfus | |||||
| 5,256,881 | Institutional Cash | |||||||
| Advantage Fund | ||||||||
| Total Common Stocks | (cost $22,096,154) | 22,096,154 | d | 22,096,154 | ||||
| (cost $313,383,200) | 355,884,033 | |||||||
| Total Investments | ||||||||
| Other Investment—1.0% | (cost $338,902,632) | 106.2 | % | 381,403,465 | ||||
| Registered Investment Company; | Liabilities, Less Cash | |||||||
| Dreyfus Institutional Preferred | and Receivables | (6.2 | %) | (22,305,632 | ) | |||
| Plus Money Market Fund | Net Assets | 100.0 | % | 359,097,833 | ||||
| (cost $3,423,278) | 3,423,278 | d | 3,423,278 | |||||
ADR—American Depository Receipts
ETF—Exchange Traded Funds
| a Non-income producing security. |
| b Security, or portion thereof, on loan.At August 31, 2014, the value of the fund’s securities on loan was $23,512,477 and the value of the collateral held by the fund was |
| $23,947,525, consisting of cash collateral of $22,096,154 and U.S. Government & Agency securities valued at $1,851,371. |
| c Investment in real estate investment trust. |
| d Investment in affiliated money market mutual fund. |
| Portfolio Summary (Unaudited) † | |||
| Value (%) | Value (%) | ||
| Banks | 11.5 | Diversified Financials | 2.7 |
| Capital Goods | 9.7 | Media | 2.5 |
| Software & Services | 8.6 | Transportation | 2.5 |
| Technology Hardware & Equipment | 8.4 | Consumer Durables & Apparel | 2.2 |
| Money Market Investments | 7.1 | Consumer Services | 2.0 |
| Pharmaceuticals, Biotech & Life Sciences | 6.8 | Automobiles & Components | 1.8 |
| Semiconductors & Semiconductor Equipment | 6.5 | Utilities | 1.5 |
| Materials | 6.0 | Food, Beverage & Tobacco | 1.1 |
| Commercial & Professional Services | 5.8 | Food & Staples Retailing | .8 |
| Energy | 5.8 | Exchange-Traded Funds | .4 |
| Health Care Equipment & Services | 4.8 | Household & Personal Products | .4 |
| Retailing | 4.1 | Insurance | .4 |
| Real Estate | 2.8 | 106.2 | |
| † Based on net assets. | |||
| See notes to financial statements. | |||
The Funds 75
| STATEMENT OF INVESTMENTS |
| August 31, 2014 |
| BNY Mellon Focused Equity Opportunities Fund | |||||||
| Common Stocks—99.4% | Shares | Value ($) | Shares | Value ($) | |||
| Automobiles & | Health Care Equipment & | ||||||
| Components—5.5% | Services—8.7% | ||||||
| Harley-Davidson | 299,700 | 19,048,932 | Abbott Laboratories | 641,000 | 27,075,840 | ||
| Johnson Controls | 377,055 | 18,404,055 | HCA Holdings | 457,435 | a | 31,938,112 | |
| 37,452,987 | 59,013,952 | ||||||
| Capital Goods—9.1% | Household & Personal Products—3.0% | ||||||
| Caterpillar | 174,485 | 19,031,079 | Procter & Gamble | 246,500 | 20,486,615 | ||
| Dover | 228,520 | 20,080,052 | Insurance—3.2% | ||||
| Eaton | 321,230 | 22,425,066 | Aflac | 352,040 | 21,558,930 | ||
| 61,536,197 | Materials—2.5% | ||||||
| Diversified Financials—11.1% | Celanese, Ser. A | 273,570 | 17,109,068 | ||||
| Capital One Financial | 308,200 | 25,290,892 | Media—5.9% | ||||
| IntercontinentalExchange Group | 133,970 | 25,320,330 | Comcast, Cl. A | 400,760 | 21,933,595 | ||
| Invesco | 599,170 | 24,470,103 | Time Warner | 238,440 | 18,367,033 | ||
| 75,081,325 | 40,300,628 | ||||||
| Energy—14.3% | Pharmaceuticals, Biotech & | ||||||
| Devon Energy | 257,000 | 19,382,940 | Life Sciences—7.7% | ||||
| Halliburton | 287,945 | 19,467,961 | AbbVie | 436,000 | 24,102,080 | ||
| Nabors Industries | 752,590 | 20,477,974 | Merck & Co. | 467,420 | 28,096,616 | ||
| Southwestern Energy | 372,800 | a | 15,351,904 | 52,198,696 | |||
| Valero Energy | 410,510 | 22,225,011 | Retailing—3.1% | ||||
| 96,905,790 | Lowe’s | 393,880 | 20,682,639 | ||||
| Food & Staples Retailing—2.1% | Semiconductors & Semiconductor | ||||||
| Costco Wholesale | 116,700 | 14,130,036 | Equipment—8.8% | ||||
| Food, Beverage & | Avago Technologies | 303,150 | 24,885,584 | ||||
| Tobacco—3.3% | Micron Technology | 1,072,750 | a | 34,971,650 | |||
| PepsiCo | 238,580 | 22,066,264 | 59,857,234 | ||||
76
| BNY Mellon Focused Equity Opportunities Fund (continued) | |||||||
| Common Stocks (continued) | Shares | Value ($) | Other Investment—.4% | Shares | Value ($) | ||
| Software & | Registered Investment Company; | ||||||
| Services—11.1% | Dreyfus Institutional Preferred | ||||||
| Adobe Systems | 330,280 | a | 23,747,132 | Plus Money Market Fund | |||
| LinkedIn, Cl. A | 116,540 | a | 26,308,905 | (cost $2,904,985) | 2,904,985 | b | 2,904,985 |
| salesforce.com | 422,820 | a | 24,984,434 | Total Investments (cost $525,775,287) | 99.8 | % | 676,325,817 |
| 75,040,471 | |||||||
| Cash and Receivables (Net) | .2 | % | 1,464,935 | ||||
| Total Common Stocks | |||||||
| (cost $522,870,302) | 673,420,832 | Net Assets | 100.0 | % | 677,790,752 | ||
| a | Non-income producing security. |
| b | Investment in affiliated money market mutual fund. |
| Portfolio Summary (Unaudited) † | |||
| Value (%) | Value (%) | ||
| Energy | 14.3 | Food, Beverage & Tobacco | 3.3 |
| Diversified Financials | 11.1 | Insurance | 3.2 |
| Software & Services | 11.1 | Retailing | 3.1 |
| Capital Goods | 9.1 | Household & Personal Products | 3.0 |
| Semiconductors & Semiconductor Equipment | 8.8 | Materials | 2.5 |
| Health Care Equipment & Services | 8.7 | Food & Staples Retailing | 2.1 |
| Pharmaceuticals, Biotech & Life Sciences | 7.7 | Money Market Investment | .4 |
| Media | 5.9 | ||
| Automobiles & Components | 5.5 | 99.8 | |
| † Based on net assets. |
| See notes to financial statements. |
The Funds 77
| STATEMENT OF INVESTMENTS |
| August 31, 2014 |
| BNY Mellon Small/Mid Cap Multi-Strategy Fund | |||||||
| Common Stocks—98.7% | Shares | Value ($) | Shares | Value ($) | |||
| Automobiles & Components—1.0% | Capital Goods (continued) | ||||||
| Lear | 18,412 | 1,862,006 | MSC Industrial Direct, Cl. A | 25,340 | 2,284,148 | ||
| Motorcar Parts of America | 3,540 | a | 107,333 | Parker Hannifin | 12,660 | 1,462,230 | |
| Tenneco | 10,140 | a | 649,771 | Regal-Beloit | 55,990 | 3,979,209 | |
| TRW Automotive Holdings | 14,910 | a | 1,435,684 | Sensata Technologies Holding | 21,010 | a | 1,033,062 |
| 4,054,794 | Snap-on | 17,200 | 2,149,140 | ||||
| Banks—10.1% | Timken | 19,140 | 866,851 | ||||
| BankUnited | 44,940 | 1,417,857 | Universal Display | 24,610 | a,b | 854,951 | |
| Boston Private Financial Holdings | 76,880 | 933,323 | Watts Water Technologies, Cl. A | 13,810 | 874,035 | ||
| City National | 26,390 | 2,002,473 | Woodward | 13,340 | 696,748 | ||
| Columbia Banking System | 41,450 | 1,078,114 | 34,729,872 | ||||
| Comerica | 95,770 | 4,821,062 | Commercial & Professional | ||||
| CVB Financial | 108,850 | 1,691,529 | Services—3.7% | ||||
| EverBank Financial | 199,610 | 3,768,637 | Advisory Board | 18,122 | a | 898,851 | |
| First American Financial | 43,860 | 1,243,431 | Clean Harbors | 31,700 | a | 1,919,118 | |
| First Horizon National | 119,170 | 1,449,107 | Copart | 28,430 | a | 978,845 | |
| First Republic Bank | 14,720 | 719,808 | Herman Miller | 87,450 | 2,599,014 | ||
| Hancock Holding | 38,300 | 1,273,092 | IHS, Cl. A | 5,490 | a | 782,160 | |
| IBERIABANK | 40,770 | 2,660,242 | Interface | 65,740 | 1,119,552 | ||
| National Bank Holdings, Cl. A | 28,750 | 584,200 | Steelcase, Cl. A | 315,390 | 4,951,623 | ||
| PrivateBancorp | 31,030 | 915,695 | Towers Watson & Co., Cl. A | 7,160 | 784,951 | ||
| Prosperity Bancshares | 28,610 | 1,728,044 | TrueBlue | 51,930 | a | 1,409,380 | |
| SVB Financial Group | 64,596 | a | 7,190,827 | 15,443,494 | |||
| Synovus Financial | 89,422 | 2,159,541 | Consumer Durables & Apparel—2.3% | ||||
| UMB Financial | 84,890 | 4,902,398 | Deckers Outdoor | 11,320 | a | 1,044,157 | |
| Webster Financial | 46,230 | 1,363,785 | Inter Parfums | 25,900 | 788,914 | ||
| 41,903,165 | Jarden | 10,880 | a | 650,515 | |||
| Capital Goods—8.4% | Lennar, Cl. A | 25,470 | 997,915 | ||||
| AGCO | 18,020 | 880,097 | Michael Kors Holdings | 6,000 | a | 480,720 | |
| AMETEK | 15,030 | 795,688 | PVH | 6,560 | 765,814 | ||
| Armstrong World Industries | 31,910 | a | 1,840,569 | Ralph Lauren | 4,680 | 791,856 | |
| Carlisle | 22,500 | 1,865,250 | Steven Madden | 16,270 | a | 553,017 | |
| Chart Industries | 19,840 | a | 1,327,098 | Toll Brothers | 30,060 | a | 1,069,835 |
| Comfort Systems USA | 34,040 | 517,408 | Watsco | 13,830 | 1,279,137 | ||
| Crane | 7,521 | 523,386 | Wolverine World Wide | 35,120 | b | 932,787 | |
| Donaldson | 18,250 | 763,945 | 9,354,667 | ||||
| DXP Enterprises | 12,390 | a | 992,687 | Consumer Services—2.4% | |||
| Equifax | 35,070 | 2,762,113 | Apollo Education Group | 90,330 | a | 2,508,464 | |
| Graco | 32,190 | 2,474,123 | Cheesecake Factory | 30,750 | 1,382,212 | ||
| Hexcel | 45,780 | a | 1,885,678 | Del Frisco’s Restaurant Group | 34,040 | a | 753,305 |
| MRC Global | 157,190 | a | 3,901,456 | Hyatt Hotels, Cl. A | 31,820 | a | 1,943,884 |
78
| BNY Mellon Small/Mid Cap Multi-Strategy Fund (continued) | |||||||
| Common Stocks (continued) | Shares | Value ($) | Shares | Value ($) | |||
| Consumer Services (continued) | Exchange-Traded Funds (continued) | ||||||
| Malibu Boats, Cl. A | 24,790 | 515,880 | iShares Russell Mid-Cap Growth ETF | 26,970 | 2,461,282 | ||
| MAXIMUS | 22,670 | 934,004 | PowerShares QQQ Trust | 18,300 | 1,825,974 | ||
| On Assignment | 25,020 | a | 739,591 | 6,805,249 | |||
| Restoration Hardware Holdings | 6,230 | a,b | 522,510 | Food & Staples Retailing—.8% | |||
| Starwood Hotels & | Core-Mark Holding Company | 13,020 | 627,043 | ||||
| Resorts Worldwide | 9,990 | c | 844,555 | TreeHouse Foods | 10,010 | a | 826,025 |
| 10,144,405 | United Natural Foods | 27,150 | a | 1,745,474 | |||
| Diversified Financials—4.0% | 3,198,542 | ||||||
| E*TRADE Financial | 198,939 | a | 4,428,382 | Food, Beverage & Tobacco—.4% | |||
| FNF Group | 100,610 | 2,848,269 | WhiteWave Foods | 46,230 | a | 1,618,975 | |
| FNFV Group | 110,153 | 1,650,092 | Health Care Equipment & | ||||
| Raymond James Financial | 77,719 | 4,246,566 | Services—8.6% | ||||
| T. Rowe Price Group | 9,470 | 767,023 | Air Methods | 38,321 | a | 2,247,910 | |
| Voya Financial | 62,340 | 2,436,871 | Align Technology | 39,170 | a | 2,133,198 | |
| 16,377,203 | AmerisourceBergen | 10,553 | 816,697 | ||||
| Energy—5.5% | Brookdale Senior Living | 32,110 | a | 1,122,244 | |||
| CARBO Ceramics | 14,670 | 1,578,345 | Catamaran | 81,850 | a | 3,856,772 | |
| Concho Resources | 5,780 | a | 820,991 | Centene | 24,807 | a | 1,938,171 |
| CONSOL Energy | 29,410 | 1,184,635 | Cepheid | 15,900 | a | 636,477 | |
| Energen | 23,300 | 1,875,184 | Cigna | 10,450 | 988,570 | ||
| Exterran Holdings | 22,810 | 1,063,630 | Cooper | 5,290 | 862,429 | ||
| Forum Energy Technologies | 28,370 | a | 965,999 | Endologix | 50,170 | a | 692,848 |
| Geospace Technologies | 16,150 | a | 664,088 | Globus Medical, Cl. A | 22,040 | a | 399,806 |
| Helmerich & Payne | 7,220 | 758,461 | Hanger | 31,050 | a | 695,520 | |
| Key Energy Services | 230,120 | a | 1,449,756 | HealthSouth | 52,668 | 2,074,593 | |
| Nabors Industries | 16,690 | 454,135 | HeartWare International | 4,980 | a | 403,878 | |
| Natural Gas Services Group | 28,710 | a | 852,113 | IMS Health Holdings | 31,870 | 889,173 | |
| Oil States International | 24,260 | a | 1,565,983 | Insulet | 20,750 | a | 749,283 |
| PDC Energy | 26,880 | a | 1,615,219 | LDR Holding | 28,150 | 762,021 | |
| Primoris Services | 33,240 | 965,290 | MEDNAX | 60,290 | a | 3,451,603 | |
| Range Resources | 9,010 | 708,096 | Omnicare | 31,180 | 1,988,349 | ||
| RSP Permian | 30,130 | 861,718 | PerkinElmer | 19,750 | 885,788 | ||
| Tesoro | 14,950 | 967,863 | Select Medical Holdings | 65,720 | 921,394 | ||
| Trecora Resources | 13,650 | a | 179,361 | Spectranetics | 38,760 | a | 1,100,009 |
| Western Refining | 39,644 | 1,844,635 | Universal Health Services, Cl. B | 28,746 | 3,289,692 | ||
| Whiting Petroleum | 27,660 | a | 2,562,976 | Varian Medical Systems | 24,310 | a | 2,066,836 |
| 22,938,478 | WellCare Health Plans | 9,960 | a | 655,966 | |||
| Exchange-Traded Funds—1.6% | 35,629,227 | ||||||
| iShares Russell 2000 ETF | 7,990 | b | 931,314 | Insurance—.3% | |||
| iShares Russell 2000 Value ETF | 15,780 | b | 1,586,679 | Old Republic International | 87,736 | 1,346,748 | |
The Funds 79
STATEMENT OF INVESTMENTS (continued)
| BNY Mellon Small/Mid Cap Multi-Strategy Fund (continued) | |||||||
| Common Stocks (continued) | Shares | Value ($) | Shares | Value ($) | |||
| Materials—5.5% | Pharmaceuticals, Biotech & | ||||||
| Airgas | 7,090 | 782,594 | Life Sciences (continued) | ||||
| Allegheny Technologies | 40,840 | 1,722,223 | Salix Pharmaceuticals | 31,330 | a | 4,984,916 | |
| Apogee Enterprises | 26,460 | 966,055 | Vanda Pharmaceuticals | 63,380 | a,b | 820,137 | |
| AuRico Gold | 313,560 | 1,423,562 | WuXi PharmaTech, ADR | 30,160 | a | 1,116,523 | |
| Chemtura | 162,920 | a | 4,022,495 | 25,458,810 | |||
| Constellium, Cl. A | 20,800 | a | 592,384 | Real Estate—3.4% | |||
| Packaging Corporation of America | 21,316 | 1,449,275 | Acadia Realty Trust | 43,550 | c | 1,255,111 | |
| Reliance Steel & Aluminum | 9,920 | 693,606 | American Residential Properties | 62,010 | a,c | 1,176,950 | |
| Scotts Miracle-Gro, Cl. A | 12,040 | 695,069 | CBRE Group, Cl. A | 22,430 | a | 712,825 | |
| Steel Dynamics | 70,740 | 1,643,998 | Corporate Office Properties Trust | 55,810 | c | 1,583,888 | |
| Stillwater Mining | 58,180 | a | 1,079,821 | Corrections Corporation of America | 43,950 | c | 1,566,378 |
| Sun Hydraulics | 18,280 | 731,748 | Douglas Emmett | 4,430 | c | 126,565 | |
| TimkenSteel | 16,645 | 795,298 | Healthcare Trust of America, Cl. A | 133,970 | 1,667,927 | ||
| Trex | 24,160 | a | 908,416 | RE/MAX Holdings, Cl. A | 17,820 | 540,302 | |
| Valspar | 26,810 | 2,165,176 | Realogy Holdings | 117,000 | a | 4,770,090 | |
| Yamana Gold | 380,010 | 3,230,085 | RLJ Lodging Trust | 25,000 | c | 745,250 | |
| 22,901,805 | 14,145,286 | ||||||
| Media—1.4% | Retailing—3.8% | ||||||
| E.W. Scripps, Cl. A | 82,710 | a | 1,568,182 | American Eagle Outfitters | 123,450 | b | 1,738,176 |
| Interpublic Group of Cos. | 51,550 | 1,006,772 | Casey’s General Stores | 22,455 | 1,609,799 | ||
| Lions Gate Entertainment | 26,070 | 844,929 | Kirkland’s | 40,910 | a | 729,425 | |
| Media General | 23,790 | a | 366,604 | LKQ | 26,670 | a | 757,428 |
| New York Times, Cl. A | 107,900 | 1,335,802 | Office Depot | 819,950 | a | 4,198,144 | |
| Shutterfly | 10,770 | a | 549,378 | Staples | 69,850 | b | 815,848 |
| 5,671,667 | Tiffany & Co. | 7,630 | 770,172 | ||||
| Pharmaceuticals, Biotech & | Ulta Salon, Cosmetics & Fragrance | 12,620 | a | 1,228,052 | |||
| Life Sciences—6.1% | Urban Outfitters | 46,970 | a | 1,868,936 | |||
| ACADIA Pharmaceuticals | 32,099 | a,b | 769,734 | Vera Bradley | 30,340 | a | 622,577 |
| Alexion Pharmaceuticals | 4,910 | a | 831,214 | Vitamin Shoppe | 18,810 | a | 737,164 |
| Alkermes | 17,950 | a | 802,904 | Williams-Sonoma | 12,920 | 849,748 | |
| Anacor Pharmaceuticals | 57,290 | a,b | 1,334,284 | 15,925,469 | |||
| BioDelivery Sciences International | 84,430 | a | 1,350,880 | Semiconductors & Semiconductor | |||
| Celldex Therapeutics | 49,950 | a,b | 794,705 | Equipment—4.9% | |||
| Covance | 24,370 | a | 2,020,273 | Applied Micro Circuits | 127,040 | a | 1,076,029 |
| Cubist Pharmaceuticals | 79,630 | a | 5,496,859 | Coherent | 11,940 | a | 769,772 |
| KYTHERA Biopharmaceuticals | 26,080 | a,b | 980,869 | Inphi | 48,780 | a | 734,139 |
| Nektar Therapeutics | 85,710 | a | 1,222,225 | First Solar | 8,730 | a | 608,306 |
| NPS Pharmaceuticals | 24,240 | a | 731,563 | Lattice Semiconductor | 257,060 | a | 1,930,521 |
| PAREXEL International | 39,010 | a | 2,201,724 | Mellanox Technologies | 120,460 | a,b | 5,034,023 |
80
| BNY Mellon Small/Mid Cap Multi-Strategy Fund (continued) | |||||||
| Common Stocks (continued) | Shares | Value ($) | Shares | Value ($) | |||
| Semiconductors & Semiconductor | Technology Hardware & Equipment—9.0% | ||||||
| Equipment (continued) | Amphenol, Cl. A | 11,780 | 1,213,458 | ||||
| Microchip Technology | 16,350 | 798,370 | Arrow Electronics | 72,510 | a | 4,513,747 | |
| Microsemi | 46,480 | a | 1,238,227 | Aruba Networks | 51,220 | a | 1,093,547 |
| Photronics | 66,870 | a | 590,462 | Avnet | 86,480 | 3,849,225 | |
| Power Integrations | 16,080 | 961,262 | Ciena | 275,270 | a,b | 5,695,336 | |
| Silicon Laboratories | 17,220 | a | 780,583 | CommScope Holding | 29,190 | 751,934 | |
| Teradyne | 86,163 | 1,774,096 | FLIR Systems | 98,850 | 3,340,141 | ||
| Veeco Instruments | 92,420 | a | 3,268,895 | IMAX | 75,540 | a,b | 2,093,969 |
| Xcerra | 61,350 | a | 641,108 | Infinera | 78,080 | a,b | 826,086 |
| 20,205,793 | Ingram Micro, Cl. A | 128,240 | a | 3,697,159 | |||
| Software & Services—9.1% | IPG Photonics | 28,650 | a,b | 1,967,682 | |||
| Akamai Technologies | 28,280 | a | 1,708,678 | Jabil Circuit | 80,510 | 1,737,406 | |
| Amdocs | 34,190 | 1,610,349 | JDS Uniphase | 357,900 | a | 4,133,745 | |
| ANSYS | 9,700 | a | 788,610 | Lexmark International, Cl. A | 19,490 | 985,414 | |
| athenahealth | 4,900 | a,b | 707,756 | Littelfuse | 8,070 | 741,714 | |
| Cardtronics | 30,220 | a | 1,072,810 | Stratasys | 6,490 | a,b | 778,540 |
| comScore | 23,740 | a | 909,479 | 37,419,103 | |||
| Concur Technologies | 10,730 | a | 1,077,077 | Telecommunication Services—.5% | |||
| CoreLogic | 177,140 | a | 5,007,748 | LogMeIn | 24,660 | a | 1,042,625 |
| CSG Systems International | 36,820 | 1,020,650 | Sonus Networks | 227,810 | a | 858,844 | |
| Dealertrack Technologies | 75,580 | a | 3,382,961 | 1,901,469 | |||
| F5 Networks | 15,280 | a | 1,897,623 | Transportation—4.7% | |||
| FleetMatics Group | 23,800 | a | 781,116 | Alaska Air Group | 44,960 | 2,083,446 | |
| HealthStream | 31,940 | a | 829,162 | Con-way | 73,403 | 3,761,904 | |
| IAC/InterActiveCorp | 20,790 | 1,446,776 | Forward Air | 20,040 | 927,652 | ||
| Infoblox | 150,950 | a | 2,030,278 | Hub Group, Cl. A | 20,960 | a | 911,550 |
| Mentor Graphics | 51,390 | 1,120,816 | J.B. Hunt Transport Services | 9,910 | 748,700 | ||
| Monotype | Kirby | 34,160 | a | 4,074,946 | |||
| Imaging Holdings | 33,230 | 976,630 | Landstar System | 20,770 | 1,409,556 | ||
| NICE Systems, ADR | 33,940 | 1,337,575 | Navigator Holdings | 25,100 | a | 740,199 | |
| Proofpoint | 27,410 | a | 1,093,111 | Ryder System | 23,230 | 2,098,598 | |
| PTC | 48,860 | a | 1,890,393 | Saia | 11,320 | a | 537,360 |
| Q2 Holdings | 25,570 | b | 377,413 | Spirit Airlines | 28,097 | a | 1,977,748 |
| RADWARE | 36,690 | a | 635,838 | 19,271,659 | |||
| Sapient | 44,030 | a | 638,875 | Utilities—1.2% | |||
| Solera Holdings | 23,050 | 1,405,128 | CMS Energy | 51,540 | 1,574,032 | ||
| SS&C Technologies Holdings | 20,720 | a | 937,787 | NiSource | 31,380 | 1,244,845 | |
| Synopsys | 69,240 | a | 2,831,916 | Portland General Electric | 31,135 | 1,073,223 | |
| 37,516,555 | |||||||
The Funds 81
STATEMENT OF INVESTMENTS (continued)
| BNY Mellon Small/Mid Cap Multi-Strategy Fund (continued) | ||||||||
| Investment of Cash Collateral | ||||||||
| Common Stocks (continued) | Shares | Value ($) | for Securities Loaned—3.8% | Shares | Value ($) | |||
| Utilities (continued) | Registered | |||||||
| UGI | 20,401 | 1,080,845 | Investment Company; | |||||
| 4,972,945 | Dreyfus Institutional Cash | |||||||
| Total Common Stocks | Advantage Fund | |||||||
| (cost $377,601,009) | 408,935,380 | (cost $15,829,594) | 15,829,594 | d | 15,829,594 | |||
| Total Investments | ||||||||
| Other Investment—1.3% | (cost $399,037,377) | 103.8 | % | 430,371,748 | ||||
| Registered Investment Company; | Liabilities, Less Cash | |||||||
| Dreyfus Institutional Preferred | and Receivables | (3.8 | %) | (15,949,745 | ) | |||
| Plus Money Market Fund | Net Assets | 100.0 | % | 414,422,003 | ||||
| (cost $5,606,774) | 5,606,774 | d | 5,606,774 | |||||
ADR—American Depository Receipts
ETF—Exchange-Traded Funds
| a Non-income producing security. |
| b Security, or portion thereof, on loan.At August 31, 2014, the value of the fund’s securities on loan was $19,050,638 and the value of the collateral held by the fund was |
| $19,430,446, consisting of cash collateral of $15,829,594 and U.S. Government & Agency securities valued at $3,600,852. |
| c Investment in real estate investment trust. |
| d Investment in affiliated money market mutual fund. |
| Portfolio Summary (Unaudited) † | |||
| Value (%) | Value (%) | ||
| Banks | 10.1 | Commercial & Professional Services | 3.7 |
| Software & Services | 9.1 | Real Estate | 3.4 |
| Technology Hardware & Equipment | 9.0 | Consumer Services | 2.4 |
| Health Care Equipment & Services | 8.6 | Consumer Durables & Apparel | 2.3 |
| Capital Goods | 8.4 | Exchange-Traded Funds | 1.6 |
| Pharmaceuticals, Biotech & Life Sciences | 6.1 | Media | 1.4 |
| Energy | 5.5 | Utilities | 1.2 |
| Materials | 5.5 | Automobiles & Components | 1.0 |
| Money Market Investments | 5.1 | Food & Staples Retailing | .8 |
| Semiconductors & Semiconductor Equipment | 4.9 | Telecommunication Services | .5 |
| Transportation | 4.7 | Food, Beverage & Tobacco | .4 |
| Diversified Financials | 4.0 | Insurance | .3 |
| Retailing | 3.8 | 103.8 | |
| † Based on net assets. | |||
| See notes to financial statements. | |||
82
| STATEMENT OF INVESTMENTS |
| August 31, 2014 |
| BNY Mellon International Fund | |||||||
| Common Stocks—96.3% | Shares | Value ($) | Shares | Value ($ | |||
| Australia—6.5% | Germany (continued) | ||||||
| ASX | 103,330 | 3,617,978 | Bayer | 84,730 | 11,361,386 | ||
| Australia & New Zealand | Commerzbank | 904,870 | a | 13,696,821 | |||
| Banking Group | 90,748 | 2,833,332 | Continental | 23,670 | 5,053,971 | ||
| Dexus Property Group | 5,687,020 | 6,400,234 | Deutsche Bank | 175,464 | 6,003,577 | ||
| Fortescue Metals Group | 915,590 | 3,565,834 | Deutsche Lufthansa | 180,650 | 3,127,301 | ||
| Insurance Australia Group | 1,484,330 | 8,969,306 | E.ON | 106,480 | 1,934,957 | ||
| Metcash | 951,077 | 2,496,009 | Evonik Industries | 71,180 | 2,566,393 | ||
| QBE Insurance Group | 439,087 | 4,724,188 | HeidelbergCement | 79,660 | 6,010,140 | ||
| Rio Tinto | 264,371 | 15,463,945 | Infineon Technologies | 403,310 | 4,687,248 | ||
| Spark Infrastructure Group | 2,595,280 | 4,775,013 | LANXESS | 43,220 | 2,675,624 | ||
| Westpac Banking | 377,510 | 12,354,257 | Muenchener Rueckversicherungs | 6,130 | 1,229,125 | ||
| 65,200,096 | OSRAM Licht | 69,840 | a | 2,920,018 | |||
| Austria—.2% | Siemens | 95,530 | 11,967,296 | ||||
| Erste Group Bank | 88,070 | 2,260,015 | 85,346,569 | ||||
| Belgium—1.0% | Hong Kong—3.7% | ||||||
| bpost | 103,580 | 2,551,188 | BOC Hong Kong Holdings | 2,801,500 | 9,416,594 | ||
| Solvay | 47,430 | 7,462,936 | Cheung Kong Holdings | 421,000 | 7,675,731 | ||
| 10,014,124 | CITIC Pacific | 1,179,000 | 2,294,091 | ||||
| China—.1% | Esprit Holdings | 1,819,926 | 2,954,132 | ||||
| FIH Mobile | 1,866,000 | a | 1,052,176 | Pacific Basin Shipping | 1,764,000 | 1,083,430 | |
| Denmark—.3% | SJM Holdings | 4,706,000 | 11,840,827 | ||||
| Carlsberg, Cl. B | 31,623 | 2,883,997 | Yue Yuen Industrial Holdings | 692,500 | 2,148,970 | ||
| France—11.0% | 37,413,775 | ||||||
| Airbus Group | 128,180 | 7,883,038 | Ireland—1.0% | ||||
| AXA | 453,260 | 11,226,383 | CRH | 112,140 | 2,600,763 | ||
| BNP Paribas | 39,560 | 2,670,739 | Smurfit Kappa Group | 312,490 | 7,088,981 | ||
| Bouygues | 82,998 | 3,046,473 | 9,689,744 | ||||
| Cap Gemini | 71,370 | 5,074,279 | Israel—1.3% | ||||
| Carrefour | 328,985 | 11,405,499 | Teva Pharmaceutical | ||||
| Cie de St-Gobain | 35,555 | 1,804,706 | Industries, ADR | 243,442 | 12,785,574 | ||
| Danone | 42,562 | 2,971,835 | Italy—3.9% | ||||
| Electricite de France | 270,151 | 8,783,652 | Assicurazioni Generali | 177,880 | 3,636,787 | ||
| GDF Suez | 156,922 | 3,865,008 | Enel | 1,198,790 | 6,341,587 | ||
| Safran | 101,730 | 6,668,070 | Eni | 493,880 | 12,316,824 | ||
| Sanofi | 76,335 | 8,375,125 | Finmeccanica | 252,391 | a | 2,361,212 | |
| Societe Generale | 287,080 | 14,543,360 | Saras | 1,192,277 | a | 1,424,040 | |
| Thales | 147,310 | 8,225,289 | Telecom Italia | 9,260,150 | a | 10,652,591 | |
| Total | 117,022 | 7,717,308 | UniCredit | 293,020 | 2,267,742 | ||
| Unibail-Rodamco | 19,320 | 5,188,826 | 39,000,783 | ||||
| 109,449,590 | Japan—20.9% | ||||||
| Germany—8.5% | Aisin Seiki | 253,900 | 9,382,916 | ||||
| Aixtron | 194,223 | a | 2,548,178 | Asahi Glass | 1,108,000 | 5,999,781 | |
| Allianz | 56,080 | 9,564,534 | Credit Saison | 158,200 | 3,142,865 | ||
The Funds 83
STATEMENT OF INVESTMENTS (continued)
| BNY Mellon International Fund (continued) | |||||||
| Common Stocks (continued) | Shares | Value ($) | Shares | Value ($) | |||
| Japan (continued) | Norway—.2% | ||||||
| East Japan Railway | 39,190 | 3,044,575 | Norsk Hydro | 286,692 | 1,683,716 | ||
| Fujitsu | 1,417,000 | 9,719,957 | Singapore—.5% | ||||
| Hitachi | 1,118,000 | 8,451,218 | DBS Group Holdings | 166,583 | 2,389,950 | ||
| Honda Motor | 441,300 | 14,900,158 | Singapore Exchange | 491,000 | 2,861,759 | ||
| INPEX | 953,900 | 13,660,541 | 5,251,709 | ||||
| Isuzu Motors | 588,000 | 4,062,792 | Spain—1.3% | ||||
| Japan Tobacco | 265,700 | 9,101,397 | ACS Actividades de | ||||
| KDDI | 190,800 | 11,001,098 | Construccion y Servicios | 138,078 | 5,815,692 | ||
| Matsumotokiyoshi Holdings | 76,470 | 2,414,378 | Banco Popular Espanol | 283,390 | 1,769,093 | ||
| Mitsubishi Electric | 678,000 | 8,484,367 | Repsol | 210,520 | 5,225,242 | ||
| Mitsubishi UFJ Financial Group | 1,272,700 | 7,317,306 | 12,810,027 | ||||
| Nippon Express | 551,640 | 2,523,722 | Sweden—2.5% | ||||
| Nippon Shokubai | 501,000 | 6,076,813 | Electrolux, Ser. B | 120,360 | 3,053,236 | ||
| Nippon Telegraph & Telephone | 105,500 | 7,077,611 | Ericsson, Cl. B | 379,749 | 4,735,147 | ||
| Nippon Telegraph & | Getinge, Cl. B | 99,390 | 2,598,069 | ||||
| Telephone, ADR | 8,760 | 294,686 | Nordea Bank | 616,340 | 8,033,562 | ||
| Nissan Motor | 198,900 | 1,909,761 | Svenska Cellulosa, Cl. B | 261,050 | 6,274,836 | ||
| Nomura Real Estate Holdings | 167,400 | 3,019,941 | 24,694,850 | ||||
| Omron | 124,100 | 5,373,353 | Switzerland—8.0% | ||||
| Panasonic | 566,000 | 6,914,181 | ABB | 177,393 | a | 4,024,940 | |
| Ricoh | 273,500 | 2,958,568 | Adecco | 79,860 | a | 6,045,716 | |
| Sawai Pharmaceutical | 43,400 | 2,473,564 | Cie Financiere Richemont | 39,480 | 3,765,017 | ||
| Secom | 148,500 | 9,075,991 | Credit Suisse Group | 178,760 | a | 5,039,278 | |
| Seven & I Holdings | 205,900 | 8,257,175 | Holcim | 30,360 | a | 2,414,117 | |
| Shimamura | 33,400 | 3,011,120 | Novartis | 337,759 | 30,297,319 | ||
| Shionogi & Co. | 323,600 | 7,619,972 | Roche Holding | 61,665 | 17,981,287 | ||
| Sumco | 260,900 | 2,246,782 | Swiss Life Holding | 31,270 | a | 7,881,791 | |
| Sumitomo Electric Industries | 205,940 | 3,014,529 | UBS | 115,429 | a | 2,069,562 | |
| Sumitomo Metal Mining | 173,000 | 2,624,638 | 79,519,027 | ||||
| Sumitomo Mitsui Financial Group | 482,700 | 19,487,542 | United Kingdom—20.9% | ||||
| Sumitomo Mitsui Trust Holdings | 525,860 | 2,157,621 | Anglo American | 114,699 | 2,913,365 | ||
| Yamada Denki | 738,100 | 2,369,411 | ArcelorMittal | 184,210 | 2,680,637 | ||
| 209,170,330 | AstraZeneca | 102,650 | 7,782,764 | ||||
| Netherlands—3.2% | Aviva | 648,800 | 5,611,674 | ||||
| Aegon | 265,797 | 2,101,063 | Barclays | 855,806 | 3,188,885 | ||
| ING Groep | 628,580 | a | 8,643,326 | BHP Billiton | 110,650 | 3,503,966 | |
| Koninklijke Philips | 511,901 | 15,597,961 | BP | 1,016,719 | 8,129,735 | ||
| NN Group | 101,940 | 2,978,262 | British Sky Broadcasting Group | 466,170 | 6,760,069 | ||
| Randstad Holding | 61,220 | 2,971,872 | Compass Group | 321,975 | 5,235,648 | ||
| 32,292,484 | Drax Group | 712,640 | 7,423,826 | ||||
84
| BNY Mellon International Fund (continued) | |||||||
| Common Stocks (continued) | Shares | Value ($) | Shares | Value ($) | |||
| United Kingdom (continued) | United States—1.3% | ||||||
| esure Group | 790,454 | 3,477,494 | iShares MSCI EAFE ETF | 194,380 | 12,967,090 | ||
| Friends Life Group | 412,277 | 2,099,166 | Total Common Stocks | ||||
| GlaxoSmithKline | 252,340 | 6,176,959 | (cost $977,290,979) | 962,627,714 | |||
| Home Retail Group | 941,536 | 2,863,560 | |||||
| HSBC Holdings | 649,514 | 7,030,399 | Preferred Stocks—1.3% | ||||
| Imperial Tobacco Group | 184,250 | 8,035,473 | Germany | ||||
| ITV | 1,638,990 | 5,746,641 | Volkswagen | ||||
| National Grid | 557,812 | 8,325,138 | (cost $14,032,878) | 56,940 | 12,782,434 | ||
| Prudential | 496,530 | 11,952,462 | |||||
| Reckitt Benckiser Group | 136,880 | 11,930,075 | Other Investment—1.5% | ||||
| Royal Bank of Scotland Group | 2,937,820 | a | 17,694,420 | Registered | |||
| Royal Dutch Shell, Cl. A | 194,118 | 7,856,758 | Investment Company; | ||||
| SABMiller | 147,570 | 8,140,898 | Dreyfus | ||||
| Serco Group | 597,133 | 3,077,065 | Institutional Preferred | ||||
| Standard Chartered | 331,080 | 6,667,110 | Plus Money Market Fund | ||||
| (cost $14,680,791) | 14,680,791 | b | 14,680,791 | ||||
| Subsea 7 | 345,190 | 5,742,074 | |||||
| Tesco | 1,087,640 | 4,152,049 | Total Investments | ||||
| Unilever | 500,249 | 22,082,510 | (cost $1,006,004,648) | 99.1 | % | 990,090,939 | |
| Whitbread | 66,660 | 4,857,074 | Cash and Receivables (Net) | .9 | % | 8,979,443 | |
| WPP | 381,740 | 8,004,144 | Net Assets | 100.0 | % | 999,070,382 | |
| 209,142,038 | |||||||
ADR—American Depository Receipts
| a | Non-income producing security. |
| b | Investment in affiliated money market mutual fund. |
| Portfolio Summary (Unaudited) † | |||
| Value (%) | Value (%) | ||
| Financial | 27.3 | Information Technology | 4.7 |
| Industrial | 12.4 | Utilities | 4.1 |
| Consumer Discretionary | 11.8 | Telecommunication Services | 2.9 |
| Health Care | 10.7 | Money Market Investment | 1.5 |
| Consumer Staples | 10.0 | Exchange-Traded Fund | 1.3 |
| Energy | 6.2 | ||
| Materials | 6.2 | 99.1 | |
| † Based on net assets. | |||
| See notes to financial statements. | |||
The Funds 85
| STATEMENT OF INVESTMENTS |
| August 31, 2014 |
| BNY Mellon Emerging Markets Fund | ||||||
| Common Stocks—93.0% | Shares | Value ($) | Shares | Value ($) | ||
| Brazil—9.2% | China (continued) | |||||
| Ambev | 1,312,400 | 9,556,453 | China Communications | |||
| Ambev, ADR | 1,509,290 | 11,002,724 | Services, Cl. H | 12,848,000 | 6,200,156 | |
| Arteris | 1,300,300 | 10,891,501 | China Construction Bank, Cl. H | 64,955,939 | 48,276,619 | |
| Banco Santander Brasil, ADS | 358,740 | 2,464,544 | China Life Insurance, Cl. H | 2,804,000 | 8,050,142 | |
| BM&FBovespa | 769,200 | 4,638,910 | China Machinery Engineering, Cl. H | 5,214,000 | 3,020,737 | |
| Brasil Insurance Participacoes e | China Petroleum & Chemical, Cl. H | 16,589,400 | 16,824,754 | |||
| Administracao | 769,843 | 2,747,843 | China Railway Group, Cl. H | 9,016,000 | 4,665,023 | |
| Cia de Saneamento Basico do | China Shenhua Energy, Cl. H | 3,260,000 | 9,401,359 | |||
| Estado de Sao Paulo | 970,200 | 9,270,752 | China Telecom, Cl. H | 7,388,000 | 4,566,231 | |
| Cia de Saneamento Basico do | China ZhengTong | |||||
| Estado de Sao Paulo, ADR | 542,080 | 5,117,235 | Auto Services Holdings | 3,945,500 | 2,107,647 | |
| Cia Hering | 422,800 | 5,286,653 | CNOOC | 23,418,000 | 47,077,430 | |
| EDP—Energias do Brasil | 2,860,400 | 14,439,366 | CSR, Cl. H | 9,003,000 | 8,120,073 | |
| Fibria Celulose, ADR | 390,480 | 4,045,373 | Dongfang Electric, Cl. H | 3,216,800 | 5,370,984 | |
| Gerdau, ADR | 1,169,510 | 6,771,463 | Guangzhou | |||
| Grupo BTG Pactual | 611,100 | 10,264,624 | Automobile Group, Cl. H | 4,419,254 | 4,595,995 | |
| Itau Unibanco Holding, ADR | 390,312 | 7,025,616 | Industrial & Commercial | |||
| JBS | 1,079,000 | 4,878,034 | Bank of China, Cl. H | 22,935,475 | 15,211,301 | |
| Magnesita Refratarios | 2,148,900 | 3,695,897 | Lianhua Supermarket | |||
| Multiplus | 388,100 | 5,686,701 | Holdings, Cl. H | 9,867,000 | a | 5,729,189 |
| Oi, ADR | 4,266,140 | 2,858,314 | New China Life Insurance, Cl. H | 3,177,900 | 11,337,854 | |
| Petroleo Brasileiro | 2,292,700 | 22,676,068 | PICC Property & Casualty, Cl. H | 10,437,240 | 17,318,973 | |
| Petroleo Brasileiro, ADR | 1,707,260 | 33,411,078 | Ping An Insurance Group | |||
| Company of China, Cl. H | 513,000 | 4,176,786 | ||||
| Telefonica Brasil, ADR | 319,292 | 6,832,849 | ||||
| Shanghai Pharmaceuticals | ||||||
| Vale, ADR | 604,740 | 7,045,221 | Holding, Cl. H | 3,812,600 | 7,821,929 | |
| 190,607,219 | Sihuan Pharmaceutical | |||||
| Chile—.6% | Holdings Group | 14,272,000 | 9,557,574 | |||
| Banco Santander Chile, ADR | 278,360 | 6,641,669 | Tencent Holdings | 1,987,000 | 32,432,759 | |
| Cencosud | 278,930 | 836,657 | Vipshop Holdings, ADS | 34,320 | a | 6,748,341 |
| ENTEL Chile | 386,190 | 4,472,290 | Weichai Power, Cl. H | 4,270,000 | 17,300,275 | |
| 11,950,616 | Weiqiao Textile, Cl. H | 1,803,400 | 914,492 | |||
| China—17.5% | West China Cement | 17,428,000 | 1,866,471 | |||
| Air China, Cl. H | 6,044,000 | 3,743,357 | Wumart Stores, Cl. H | 6,086,000 | 5,811,111 | |
| Anhui Conch Cement, Cl. H | 4,722,000 | 17,060,019 | WuXi PharmaTech Cayman, ADR | 144,490 | a | 5,349,020 |
| ANTA Sports Products | 3,277,000 | 6,291,799 | 361,825,864 | |||
| Baoxin Auto Group | 1,855,000 | 1,376,281 | Colombia—.2% | |||
| Beijing Capital | Bancolombia, ADR | 73,240 | 4,634,627 | |||
| International Airport, Cl. H | 10,544,000 | 8,244,675 | Greece—.5% | |||
| China Cinda Asset | National Bank of Greece | 649,110 | a | 2,226,076 | ||
| Management, Cl. H | 19,030,970 | 9,748,705 | ||||
| OPAP | 564,770 | 8,971,788 | ||||
| China Communications | ||||||
| Construction, Cl. H | 7,555,000 | 5,507,803 | 11,197,864 | |||
86
| BNY Mellon Emerging Markets Fund (continued) | |||||||
| Common Stocks (continued) | Shares | Value ($) | Shares | Value ($) | |||
| Hong Kong—5.6% | India (continued) | ||||||
| China Mobile, ADR | 215,790 | 13,439,401 | Steel Authority of India | 3,660,107 | 4,874,956 | ||
| China Overseas Land & Investment | 3,406,000 | 9,580,687 | Tata Motors | 2,204,563 | 18,292,878 | ||
| China Resources Power Holdings | 6,303,000 | 19,071,535 | UPL | 1,145,320 | 5,948,970 | ||
| COSCO Pacific | 11,452,733 | 16,048,500 | 218,143,221 | ||||
| Global Bio-Chem Technology Group | 33,691,920 | a | 1,304,195 | Indonesia—.9% | |||
| Haier Electronics Group | 3,432,000 | 9,919,523 | Aneka Tambang Persero | 7,568,000 | 773,136 | ||
| iShares FTSE A50 China Index ETF | 6,281,700 | 7,481,254 | Bank Negara Indonesia Persero | 25,792,400 | 11,796,481 | ||
| NWS Holdings | 2,730,360 | 5,157,705 | Indocement Tunggal Prakarsa | 2,651,500 | 5,496,805 | ||
| Parkson Retail Group | 32,438,000 | 10,714,935 | 18,066,422 | ||||
| PAX Global Technology | 2,965,000 | a | 2,697,176 | Macau—.4% | |||
| Shanghai Industrial Holdings | 3,721,000 | 12,411,255 | Sands China | 1,159,200 | 7,553,448 | ||
| SJM Holdings | 3,386,000 | 8,519,558 | Malaysia—.6% | ||||
| 116,345,724 | CIMB Group Holdings | 5,434,544 | 12,724,281 | ||||
| Hungary—.7% | Mexico—1.1% | ||||||
| OTP Bank | 417,010 | 7,204,227 | Alpek | 1,437,300 | 2,899,495 | ||
| Richter Gedeon | 412,606 | 6,635,717 | America Movil, ADR, Ser. L | 104,180 | 2,553,452 | ||
| 13,839,944 | Arca Continental | 1,324,900 | 9,726,453 | ||||
| India—10.5% | Consorcio ARA | 5,679,016 | a | 2,592,672 | |||
| Bank of Baroda | 832,470 | 11,956,124 | Controladora Vuela Compania | ||||
| Bank of India | 919,651 | 4,209,193 | de Aviacion, ADR | 648,822 | 5,709,633 | ||
| Bharat Heavy Electricals | 1,453,860 | 5,778,393 | 23,481,705 | ||||
| Coal India | 1,621,130 | 9,521,461 | Peru—.6% | ||||
| Grasim Industries | 13,660 | 758,701 | Credicorp | 82,200 | 12,746,754 | ||
| Grasim Industries, GDR | 123,329 | 6,926,156 | Philippines—1.1% | ||||
| HCL Technologies | 471,300 | 12,640,176 | Metropolitan Bank & Trust | 8,065,362 | 15,899,492 | ||
| Hindustan Petroleum | 494,952 | 3,735,795 | Universal Robina | 1,710,490 | 6,375,106 | ||
| ICICI Bank | 610,260 | 15,656,769 | 22,274,598 | ||||
| IDFC | 935,180 | 2,200,109 | Poland—1.1% | ||||
| India Cements | 6,321,821 | 11,379,574 | Asseco Poland | 154,344 | 2,038,356 | ||
| Jubilant Life Sciences | 88,391 | 243,702 | Energa | 1,764,088 | 11,483,549 | ||
| Maruti Suzuki India | 434,480 | 19,805,287 | Powszechna Kasa | ||||
| NMDC | 2,637,965 | 7,370,912 | Oszczednosci Bank Polski | 770,726 | 9,204,099 | ||
| Oil & Natural Gas | 2,721,532 | 19,168,073 | 22,726,004 | ||||
| Oriental Bank of Commerce | 474,458 | 2,044,673 | Qatar—.2% | ||||
| Power Grid Corporation of India | 2,625,020 | 5,446,974 | Commercial Bank of Qatar | 230,940 | 4,319,184 | ||
| Punjab National Bank | 356,920 | 5,577,022 | Russia—4.8% | ||||
| Reliance Industries | 1,587,127 | 25,779,167 | Gazprom, ADR | 2,153,273 | 15,395,902 | ||
| Rolta India | 2,381,222 | 4,075,338 | JKX Oil & Gas | 1,483,440 | a | 1,111,299 | |
| Sesa Sterlite | 1,039,712 | 4,748,783 | Lukoil, ADR | 329,190 | 18,352,342 | ||
| South Indian Bank | 1,353,107 | 624,969 | MMC Norilsk Nickel, ADR | 662,860 | 12,972,170 | ||
| State Bank of India | 233,138 | 9,379,066 | Mobile Telesystems | 1,710,160 | b | 12,986,203 | |
The Funds 87
STATEMENT OF INVESTMENTS (continued)
| BNY Mellon Emerging Markets Fund (continued) | |||||||
| Common Stocks (continued) | Shares | Value ($) | Shares | Value ($) | |||
| Russia (continued) | South Korea (continued) | ||||||
| Moscow Exchange | 387,310 | a | 662,567 | Tongyang Life Insurance | 598,865 | 6,733,134 | |
| Rosneft, GDR | 2,451,906 | 14,971,338 | 338,522,437 | ||||
| Sberbank of Russia, ADR | 912,110 | 7,433,697 | Taiwan—10.5% | ||||
| Sberbank of Russia, ADR | 1,103,970 | a | 8,997,356 | Advanced | |||
| X5 Retail Group, GDR | 295,950 | a | 5,586,500 | Semiconductor Engineering | 9,169,842 | 11,427,598 | |
| 98,469,374 | Catcher Technology | 1,584,000 | 16,057,008 | ||||
| South Africa—2.6% | China Life Insurance | 17,867,784 | 16,588,247 | ||||
| Barclays Africa Group | 352,389 | 5,503,430 | Compal Electronics | 22,266,160 | 19,814,987 | ||
| Bidvest Group | 223,760 | 5,901,621 | CTBC Financial Holding | 5,862,720 | 4,266,043 | ||
| Mediclinic International | 1,492,270 | 12,938,486 | Delta Electronics | 2,221,000 | 15,603,954 | ||
| MTN Group | 983,839 | 22,233,170 | E.Sun Financial Holding | 18,438,978 | 12,121,775 | ||
| Murray & Roberts Holdings | 301,938 | a | 747,043 | Epistar | 1,582,000 | 3,440,223 | |
| Tiger Brands | 198,570 | 5,715,316 | First Financial Holding | 8,721,377 | 5,397,885 | ||
| 53,039,066 | Fubon Financial Holding | 11,908,490 | 19,442,107 | ||||
| South Korea—16.4% | Hon Hai Precision Industry | 4,247,490 | 14,494,371 | ||||
| DGB Financial Group | 625,240 | 10,914,491 | Largan Precision | 114,000 | 9,439,454 | ||
| Hana Financial Group | 414,073 | 17,376,405 | Mega Financial Holding | 17,180,598 | 14,829,442 | ||
| Hite Jinro | 308,412 | 7,026,300 | Nan Ya Printed Circuit Board | 3,139,013 | a | 5,828,448 | |
| Hyundai Mobis | 41,703 | 12,091,999 | Radiant Opto-Electronics | 1,584,460 | 6,838,137 | ||
| Hyundai Motor | 156,130 | 35,877,795 | Shin Kong Financial Holding | 13,662,940 | 4,456,723 | ||
| KB Financial Group | 390,398 | 15,997,867 | Simplo Technology | 527,000 | 2,962,011 | ||
| KB Financial Group, ADR | 158,300 | 6,441,227 | Taiwan Semiconductor | ||||
| Korea Electric Power | 34,605 | 1,440,240 | Manufacturing | 1,456,517 | 6,042,325 | ||
| Korea Electric Power, ADR | 664,929 | 13,883,717 | Taiwan Semiconductor | ||||
| Manufacturing, ADR | 1,085,910 | 22,738,955 | |||||
| Korean Reinsurance | 148,301 | 1,725,876 | |||||
| United Microelectronics | 10,069,397 | 4,598,360 | |||||
| KT | 55,830 | 1,927,166 | |||||
| United Microelectronics, ADR | 504,000 | 1,118,880 | |||||
| KT, ADR | 269,430 | 4,607,253 | |||||
| 217,506,933 | |||||||
| LG Chem | 18,640 | 4,954,367 | |||||
| Thailand—3.5% | |||||||
| LG Electronics | 426,996 | 31,836,775 | |||||
| Advanced Info Service | 1,562,100 | 10,221,631 | |||||
| Lotte Shopping | 21,445 | 7,021,786 | |||||
| Bangkok Bank | 1,813,800 | 11,641,484 | |||||
| Mirae Asset Securities | 97,601 | 4,663,710 | |||||
| Jasmine International | 59,187,500 | 11,859,737 | |||||
| NAVER | 24,502 | 18,558,643 | |||||
| PTT | 838,400 | 8,425,999 | |||||
| NongShim | 25,129 | 6,245,385 | |||||
| PTT Global Chemical | 11,174,983 | 21,692,202 | |||||
| POSCO | 19,574 | 6,447,770 | |||||
| Thai Beverage | 11,964,000 | 6,800,721 | |||||
| POSCO, ADR | 56,320 | 4,663,296 | |||||
| Thai Oil | 1,746,100 | 2,829,076 | |||||
| Samsung Electronics | 46,958 | 57,148,944 | |||||
| 73,470,850 | |||||||
| Samsung Fire & | |||||||
| Marine Insurance | 56,292 | 15,406,115 | Turkey—2.2% | ||||
| Shinhan Financial Group | 490,660 | 25,405,247 | Emlak Konut Gayrimenkul | ||||
| Yatirim Ortakligi | 11,508,930 | 14,482,669 | |||||
| Shinsegae | 39,220 | 9,012,535 | |||||
| Ford Otomotiv Sanayi | 193,060 | a | 2,545,552 | ||||
| SK Telecom | 41,280 | 11,114,394 | |||||
88
| BNY Mellon Emerging Markets Fund (continued) | ||||||
| Common Stocks (continued) | Shares | Value ($) | Preferred Stocks (continued) | Shares | Value ($) | |
| Turkey (continued) | Brazil (continued) | |||||
| Turkiye Garanti Bankasi | 177,930 | 697,232 | Itausa—Investimentos Itau | 978,500 | 4,764,642 | |
| Turkiye Halk Bankasi | 3,701,206 | 27,140,465 | Metalurgica Gerdau | 121,100 | 858,006 | |
| 44,865,918 | Randon Participacoes | 46,500 | 150,811 | |||
| United Arab Emirates—.1% | Suzano Papel e Celulose, Cl. A | 427,200 | 1,700,403 | |||
| Emaar Properties | 975,333 | 2,721,761 | Vale | 1,056,300 | 12,254,684 | |
| United States—2.1% | Total Preferred Stocks | |||||
| iShares MSCI Emerging Markets ETF | 964,150 | 43,444,599 | (cost $90,934,906) | 100,104,662 | ||
| Total Common Stocks | ||||||
| (cost $1,676,623,546) | 1,924,478,413 | Other Investment—.9% | ||||
| Registered | ||||||
| Preferred Stocks—4.9% | Investment Company; | |||||
| Brazil | Dreyfus Institutional Preferred | |||||
| Banco Bradesco | 852,000 | 15,544,195 | Plus Money Market Fund | |||
| (cost $19,099,791) | 19,099,791 c 19,099,791 | |||||
| Banco do Estado do | ||||||
| Rio Grande do Sul, Cl. B | 1,712,800 | 11,821,648 | Total Investments | |||
| Braskem, Cl. A | 380,900 | 2,594,918 | (cost $1,786,658,243) | 98.8 | % | 2,043,682,866 |
| Cia Brasileira de Distribuicao | 411,800 | 20,957,005 | Cash and Receivables (Net) | 1.2 | % | 25,581,031 |
| Gerdau | 634,400 | 3,672,917 | ||||
| Net Assets | 100.0 | % | 2,069,263,897 | |||
| Itau Unibanco Holding | 1,430,146 | 25,785,433 | ||||
| ADR—American Depository Receipts |
| ADS—American Depository Shares |
| ETF—Exchange-Traded Funds |
| GDR—Global Depository Receipts |
| a Non-income producing security. |
| b The valuation of this security has been determined in good faith by management under the direction of the Board of Directors.At August 31, 2014, the value of this security |
| amounted to $12,986,203 or .6% of net assets. |
| c Investment in affiliated money market mutual fund. |
| Portfolio Summary (Unaudited) † | |||
| Value (%) | Value (%) | ||
| Financial | 29.4 | Consumer Staples | 5.2 |
| Information Technology | 14.6 | Utilities | 3.9 |
| Energy | 12.0 | Exchange-Traded Funds | 2.5 |
| Consumer Discretionary | 9.0 | Health Care | 2.1 |
| Materials | 7.9 | Money Market Investment | .9 |
| Industrial | 5.7 | ||
| Telecommunications | 5.6 | 98.8 | |
| † Based on net assets. | |||
| See notes to financial statements. | |||
The Funds 89
| STATEMENT OF INVESTMENTS |
| August 31, 2014 |
| BNY Mellon International Appreciation Fund | |||||||
| Common Stocks—97.5% | Shares | Value ($) | Shares | Value ($) | |||
| Automobiles & Components—4.7% | Capital Goods—9.0% | ||||||
| Bridgestone, ADR | 30,448 | 523,097 | ABB, ADR | 7,972 | a | 181,522 | |
| Daimler | 12,157 | 992,254 | Airbus Group, ADR | 31,572 | 485,577 | ||
| Denso, ADR | 27,288 | 592,559 | Asahi Glass, ADR | 38,076 | 204,468 | ||
| Fiat, ADR | 21,195 | a | 208,135 | Atlas Copco, Cl. A, ADR | 13,747 | 400,588 | |
| Honda Motor, ADR | 17,948 | 611,129 | Atlas Copco, Cl. B, ADR | 17,820 | 475,972 | ||
| Nissan Motor, ADR | 14,962 | 287,420 | BAE Systems, ADR | 121 | 3,571 | ||
| Toyota Motor, ADR | 15,548 | 1,777,447 | Hutchison Whampoa, ADR | 14,325 | 371,877 | ||
| Volkswagen, ADR | 10,750 | 483,428 | ITOCHU, ADR | 11,705 | 297,658 | ||
| 5,475,469 | Kajima, ADR | 7,417 | 379,828 | ||||
| Banks—13.4% | Kawasaki Heavy Industries, ADR | 17,754 | 266,132 | ||||
| Australia & New Zealand | Keppel, ADR | 28,187 | 491,863 | ||||
| Banking Group, ADR | 36,898 | 1,147,159 | Komatsu, ADR | 15,788 | 356,493 | ||
| Banco Bilbao Vizcaya Argentaria, ADR | 76,283 | 925,313 | Kubota, ADR | 5,271 | 377,404 | ||
| Banco Santander, ADR | 122,411 | 1,214,319 | Marubeni, ADR | 4,423 | 319,650 | ||
| Bank of Ireland, ADR | 17,000 | a | 274,380 | Metso, ADR | 11,062 | 434,184 | |
| Bank of Yokohama, ADR | 13,208 | 290,312 | Mitsubishi, ADR | 10,957 | 451,976 | ||
| Barclays, ADR | 41,305 | 619,575 | Mitsubishi Electric, ADR | 18,575 | 463,632 | ||
| BNP Paribas, ADR | 20,711 | 698,996 | Mitsui & Co., ADR | 811 | 264,792 | ||
| Commerzbank, ADR | 15,142 | a | 229,098 | Nidec, ADR | 16,562 | 265,489 | |
| Commonwealth Bank of Australia, ADR | 6,823 | b | 1,556,837 | NSK, ADR | 16,210 | 431,672 | |
| Credit Agricole, ADR | 25,691 | 188,829 | Rolls-Royce Holdings, ADR | 6,622 | 562,274 | ||
| Danske Bank, ADR | 27,008 | 380,273 | Sandvik, ADR | 34,476 | 428,537 | ||
| Erste Group Bank, ADR | 11,283 | 145,099 | Siemens, ADR | 4,961 | 621,613 | ||
| Hachijuni Bank, ADR | 2,799 | 169,396 | SKF, ADR | 22,490 | 520,194 | ||
| Hang Seng Bank, ADR | 24,669 | 415,673 | Sumitomo, ADR | 24,536 | 315,288 | ||
| HSBC Holdings, ADR | 35,078 | 1,896,317 | Sumitomo Electric Industries, ADR | 27,020 | 396,654 | ||
| Intesa Sanpaolo, ADR | 31,934 | 566,829 | TOTO, ADR | 16,445 | 398,627 | ||
| Lloyds Banking Group, ADR | 139,680 | a | 716,558 | Volvo, ADR | 29,652 | 354,934 | |
| Mitsubishi UFJ Financial Group, ADR | 72,092 | 415,971 | 10,522,469 | ||||
| National Australia Bank, ADR | 64,206 | 1,056,189 | Commercial & Professional | ||||
| Shinsei Bank, ADR | 57,546 | 238,816 | Services—1.3% | ||||
| Societe Generale, ADR | 40,745 | 416,006 | Dai Nippon Printing, ADR | 12,828 | 133,539 | ||
| Sumitomo Mitsui Financial Group, ADR | 25,296 | 206,162 | Experian, ADR | 31,640 | 547,214 | ||
| Sumitomo Mitsui Trust Holdings, ADR | 18,240 | 73,963 | Secom, ADR | 37,120 | 566,451 | ||
| United Overseas Bank, ADR | 13,700 | 504,845 | Toppan Printing, ADR | 39,905 | 293,473 | ||
| Westpac Banking, ADR | 38,815 | 1,275,461 | 1,540,677 | ||||
| 15,622,376 | |||||||
90
| BNY Mellon International Appreciation Fund (continued) | |||||||
| Common Stocks (continued) | Shares | Value ($) | Shares | Value ($) | |||
| Consumer Durables & Apparel—2.3% | Food & Staples Retailing—1.5% | ||||||
| Adidas, ADR | 10,475 | 391,765 | Aeon, ADR | 36,968 | 397,036 | ||
| Casio Computer, ADR | 2,290 | 399,430 | Delhaize Group, ADR | 17,892 | 310,605 | ||
| Electrolux, Cl. B, ADR | 6,467 | 328,951 | J. Sainsbury, ADR | 13,245 | 258,410 | ||
| LVMH Moet Hennessy | Koninklijke Ahold, ADR | 19,603 | 335,407 | ||||
| Louis Vuitton, ADR | 19,319 | 669,597 | Tesco, ADR | 34,486 | 399,003 | ||
| Panasonic, ADR | 25,520 | 313,386 | 1,700,461 | ||||
| Pandora, ADR | 10,200 | 190,638 | Food, Beverage & Tobacco—7.7% | ||||
| Sega Sammy Holdings, ADR | 37,384 | 180,939 | Ajinomoto, ADR | 21,230 | 346,261 | ||
| Sharp, ADR | 2,118 | a | 6,629 | Anheuser-Busch InBev, ADR | 3,775 | 421,970 | |
| Sony, ADR | 11,522 | 220,185 | British American Tobacco, ADR | 7,800 | 923,676 | ||
| 2,701,520 | Coca-Cola Amatil, ADR | 23,162 | 195,487 | ||||
| Consumer Services—1.1% | Coca-Cola HBC, ADR | 3,685 | a | 86,008 | |||
| Compass Group, ADR | 33,525 | 541,764 | Danone, ADR | 32,712 | 456,660 | ||
| InterContinental Hotels Group | 6,214 | 238,058 | Diageo, ADR | 5,698 | 683,019 | ||
| Sodexo, ADR | 4,962 | 486,127 | Heineken, ADR | 11,309 | 428,498 | ||
| 1,265,949 | Imperial Tobacco Group, ADR | 5,587 | 489,980 | ||||
| Diversified Financials—3.1% | Kirin Holdings, ADR | 25,382 | 338,088 | ||||
| Credit Suisse Group, ADR | 16,875 | a | 476,550 | Nestle, ADR | 31,905 | 2,474,871 | |
| Daiwa Securities Group, ADR | 57,790 | 472,722 | Orkla, ADR | 26,607 | 242,124 | ||
| Deutsche Bank | 16,206 | 556,028 | SABMiller, ADR | 13,542 | 746,029 | ||
| ING Groep, ADR | 43,569 | a | 599,945 | Unilever (NY Shares) | 13,003 | 541,445 | |
| Nomura Holdings, ADR | 46,857 | 299,416 | Unilever, ADR | 7,390 | 325,603 | ||
| ORIX, ADR | 5,179 | 392,050 | Yamazaki Baking, ADR | 2,023 | 266,592 | ||
| UBS | 47,851 | a | 858,447 | 8,966,311 | |||
| 3,655,158 | Health Care Equipment & Services—1.0% | ||||||
| Energy—7.2% | Essilor International, ADR | 9,284 | 491,866 | ||||
| BG Group, ADR | 37,135 | 743,814 | Fresenius Medical Care & Co., ADR | 8,450 | 297,102 | ||
| BP, ADR | 27,414 | 1,311,486 | Olympus, ADR | 5,140 | a | 182,624 | |
| ENI, ADR | 15,875 | 791,528 | Smith & Nephew, ADR | 2,943 | 255,747 | ||
| Repsol, ADR | 13,755 | 342,087 | 1,227,339 | ||||
| Royal Dutch Shell, Cl. A, ADR | 25,774 | 2,086,921 | Household & Personal Products—1.6% | ||||
| Royal Dutch Shell, Cl. B, ADR | 1,593 | 135,166 | Henkel & Co., ADR | 5,822 | 607,875 | ||
| Statoil, ADR | 13,455 | 381,987 | Kao, ADR | 6,988 | 300,624 | ||
| Technip, ADR | 14,012 | 324,588 | L’Oreal, ADR | 19,014 | 629,554 | ||
| Total, ADR | 24,569 | 1,620,571 | Shiseido, ADR | 4,862 | 89,558 | ||
| Woodside Petroleum, ADR | 15,115 | 604,600 | Svenska Cellulosa, ADR | 10,419 | 250,994 | ||
| 8,342,748 | 1,878,605 | ||||||
The Funds 91
STATEMENT OF INVESTMENTS (continued)
| BNY Mellon International Appreciation Fund (continued) | ||||||
| Common Stocks (continued) | Shares | Value ($) | Shares | Value ($) | ||
| Insurance—5.1% | Materials (continued) | |||||
| Aegon (NY Shares) | 42,610 | 337,897 | Teijin, ADR | 5,424 | 133,430 | |
| Ageas, ADR | 14,975 | 500,465 | Toray Industries, ADR | 3,528 | 240,874 | |
| Allianz, ADR | 69,670 | 1,192,402 | UPM-Kymmene, ADR | 14,622 | 218,453 | |
| AXA, ADR | 28,100 | 698,847 | 9,446,527 | |||
| Legal & General Group, ADR | 41,000 | 817,950 | Media—1.7% | |||
| MS&AD Insurance Group Holdings, ADR | 14,902 | 167,648 | British Sky Broadcasting Group, ADR | 2,995 | 176,271 | |
| Prudential, ADR | 21,350 | 1,030,351 | Pearson, ADR | 5,020 | 92,519 | |
| Tokio Marine Holdings, ADR | 13,055 | 399,091 | Publicis Groupe, ADR | 24,564 | 456,153 | |
| Zurich Insurance Group, ADR | 26,797 | a | 810,609 | Reed Elsevier, ADR | 6,531 | 429,283 |
| 5,955,260 | Wolters Kluwer, ADR | 7,972 | 220,187 | |||
| Materials—8.1% | WPP, ADR | 5,529 | 579,826 | |||
| Air Liquide, ADR | 25,367 | 648,634 | 1,954,239 | |||
| Akzo Nobel, ADR | 13,015 | 305,202 | Pharmaceuticals, Biotech & | |||
| Alumina, ADR | 19,620 | a | 112,737 | Life Sciences—9.5% | ||
| Amcor, ADR | 7,596 | 325,033 | AstraZeneca, ADR | 11,434 | 869,098 | |
| Anglo American, ADR | 29,277 | 369,769 | Bayer, ADR | 10,580 | 1,420,894 | |
| ArcelorMittal (NY Shares) | 4,455 | 64,865 | Eisai, ADR | 11,123 | 466,165 | |
| Asahi Kasei, ADR | 17,985 | 287,220 | GlaxoSmithKline, ADR | 14,399 | 706,991 | |
| BASF, ADR | 10,546 | 1,085,183 | Novartis, ADR | 25,237 | 2,267,292 | |
| BHP Billiton Ltd., ADR | 11,504 | 789,520 | Novo Nordisk, ADR | 26,075 | 1,198,407 | |
| BHP Billiton PLC, ADR | 15,134 | 960,706 | Roche Holding, ADR | 61,632 | 2,250,184 | |
| Boral, ADR | 12,221 | 251,922 | Sanofi, ADR | 27,039 | 1,479,033 | |
| James Hardie Industries, ADR | 5,924 | 355,677 | Teva Pharmaceutical Industries, ADR | 7,700 | 404,404 | |
| Johnson Matthey, ADR | 3,051 | 320,027 | 11,062,468 | |||
| Kobe Steel, ADR | 24,450 | 198,876 | Real Estate—3.2% | |||
| Koninklijke DSM, ADR | 5,053 | 84,587 | British Land, ADR | 23,035 | 278,493 | |
| Lafarge, ADR | 13,770 | 262,732 | CapitaLand, ADR | 32,796 | 174,803 | |
| Newcrest Mining, ADR | 12,139 | a | 127,945 | Cheung Kong Holdings, ADR | 22,243 | 401,375 |
| Nippon Steel & Sumitomo Metal, ADR | 14,082 | 398,521 | City Developments, ADR | 27,591 | 219,348 | |
| Nitto Denko, ADR | 8,620 | 226,016 | Daiwa House Industry, ADR | 20,610 | 389,941 | |
| Norsk Hydro, ADR | 40,233 | 235,765 | Hysan Development, ADR | 23,301 | 228,497 | |
| OJI Holdings, ADR | 200 | 8,144 | Lend Lease Group, ADR | 31,616 | 423,971 | |
| Rexam, ADR | 339 | 14,458 | Mitsubishi Estate, ADR | 19,000 | 438,330 | |
| Rio Tinto, ADR | 15,000 | 806,100 | Sino Land, ADR | 25,641 | 226,628 | |
| Stora Enso, ADR | 2,684 | 23,190 | Sun Hung Kai Properties, ADR | 26,037 | 392,898 | |
| Syngenta, ADR | 8,195 | 590,941 | Swire Pacific, Cl. A, ADR | 14,906 | 199,144 | |
92
| BNY Mellon International Appreciation Fund (continued) | |||||||
| Common Stocks (continued) | Shares | Value ($) | Shares | Value ($) | |||
| Real Estate (continued) | Telecommunication | ||||||
| Westfield Group, ADR | 26,214 | 372,239 | Services (continued) | ||||
| 3,745,667 | NTT DOCOMO, ADR | 5,465 | 94,435 | ||||
| Retailing—1.1% | Orange, ADR | 16,852 | 255,813 | ||||
| Hennes & Mauritz, ADR | 82,506 | 697,588 | Singapore Telecommunications, ADR | 17,960 | 560,756 | ||
| Kingfisher, ADR | 32,128 | 327,224 | Spark New Zealand, ADR | 7,128 | 87,603 | ||
| Marui Group, ADR | 15,401 | 259,142 | Swisscom, ADR | 7,236 | 419,977 | ||
| 1,283,954 | Telecom Italia, ADR | 22,896 | a | 263,304 | |||
| Semiconductors & Semiconductor | Telecom Italia, Cl. A, ADR | 3,370 | 30,903 | ||||
| Equipment—.4% | Telefonica, ADR | 40,428 | 640,784 | ||||
| Advantest, ADR | 36,445 | 423,855 | Telenor, ADR | 6,496 | 448,987 | ||
| Software & Services—1.8% | Telstra, ADR | 17,148 | 446,534 | ||||
| Computershare, ADR | 17,042 | 195,813 | Vodafone Group, ADR | 25,540 | 877,044 | ||
| Dassault Systemes, ADR | 4,670 | 308,220 | 5,465,998 | ||||
| Fujitsu, ADR | 9,602 | 330,057 | Transportation—1.8% | ||||
| NICE Systems, ADR | 1,700 | 66,997 | ANA Holdings, ADR | 23,722 | 115,498 | ||
| Sage Group, ADR | 10,064 | 262,711 | Deutsche Lufthansa, ADR | 15,916 | 276,700 | ||
| SAP, ADR | 9,612 | 749,063 | International Consolidated | ||||
| Trend Micro, ADR | 4,337 | 139,912 | Airlines Group, ADR | 13,062 | a | 391,338 | |
| 2,052,773 | MTR, ADR | 18,662 | 740,447 | ||||
| Technology Hardware & | Nippon Yusen, ADR | 60,373 | 356,201 | ||||
| Equipment—2.5% | Ryanair Holdings, ADR | 1,709 | a | 93,824 | |||
| Alcatel-Lucent, ADR | 69,950 | 238,530 | TNT Express, ADR | 12,356 | 92,299 | ||
| Canon, ADR | 10,097 | 329,869 | 2,066,307 | ||||
| Ericsson, ADR | 23,904 | 298,561 | Utilities—3.7% | ||||
| FUJIFILM Holdings, ADR | 9,819 | 296,435 | Centrica, ADR | 26,440 | 566,609 | ||
| Hitachi, ADR | 7,435 | 564,688 | CLP Holdings, ADR | 22,613 | 189,497 | ||
| Kyocera, ADR | 7,424 | 347,517 | E.ON, ADR | 2,044 | 37,017 | ||
| Omron, ADR | 9,660 | 417,312 | Enel, ADR | 114,307 | 595,539 | ||
| Ricoh, ADR | 4,031 | 219,125 | Energias de Portugal, ADR | 8,130 | 390,565 | ||
| TDK, ADR | 4,571 | 227,923 | GDF Suez, ADR | 15,036 | 369,886 | ||
| 2,939,960 | Hong Kong & China Gas, ADR | 171,474 | 381,014 | ||||
| Telecommunication Services—4.7% | Iberdrola, ADR | 21,274 | 626,519 | ||||
| BT Group, ADR | 6,958 | 449,835 | National Grid, ADR | 1,447 | 108,149 | ||
| Deutsche Telekom, ADR | 47,984 | 714,962 | RWE, ADR | 9,180 | 358,112 | ||
| Koninklijke KPN, ADR | 15,329 | a | 51,199 | SSE, ADR | 16,682 | 424,557 | |
| Nippon Telegraph & Telephone, ADR | 3,682 | 123,862 | United Utilities Group, ADR | 8,447 | 248,088 | ||
The Funds 93
STATEMENT OF INVESTMENTS (continued)
| BNY Mellon International Appreciation Fund (continued) | ||||||||
| Common Stocks (continued) | Shares | Value ($) | Other Investment—2.0% | Shares | Value ($) | |||
| Utilities (continued) | Registered | |||||||
| Veolia Environnement, ADR | 977 | 18,054 | Investment Company; | |||||
| 4,313,606 | Dreyfus | |||||||
| Total Common Stocks | Institutional Preferred | |||||||
| (cost $128,664,385) | 113,609,696 | Plus Money Market Fund | ||||||
| (cost $2,288,421) | 2,288,421 | d | 2,288,421 | |||||
| Principal | Total Investments | |||||||
| Short-Term Investments—.1% | Amount ($) | Value ($) | (cost $131,087,806) | 99.6 | % | 116,033,117 | ||
| U.S. Treasury Bills; | ||||||||
| Cash and Receivables (Net) | .4 | % | 501,403 | |||||
| 0.01%, 9/11/14 | ||||||||
| (cost $135,000) | 135,000 | c | 135,000 | Net Assets | 100.0 | % | 116,534,520 | |
ADR—American Depository Receipts
| a Non-income producing security. |
| b Security exempt from registration pursuant to Rule 144A under the Securities Act of 1933.This security may be resold in transactions exempt from registration, normally to |
| qualified institutional buyers.At August 31, 2014, this security was valued at $1,556,837 or 1.3% of net assets. |
| c Held by or on behalf of a counterparty for open financial futures contracts. |
| d Investment in affiliated money market mutual fund. |
| Portfolio Summary (Unaudited) † | |||
| Value (%) | Value (%) | ||
| Banks | 13.4 | Consumer Durables & Apparel | 2.3 |
| Pharmaceuticals, Biotech & Life Sciences | 9.5 | Short-Term/Money Market Investments | 2.1 |
| Capital Goods | 9.0 | Software & Services | 1.8 |
| Materials | 8.1 | Transportation | 1.8 |
| Food, Beverage & Tobacco | 7.7 | Media | 1.7 |
| Energy | 7.2 | Household & Personal Products | 1.6 |
| Insurance | 5.1 | Food & Staples Retailing | 1.5 |
| Automobiles & Components | 4.7 | Commercial & Professional Services | 1.3 |
| Telecommunication Services | 4.7 | Consumer Services | 1.1 |
| Utilities | 3.7 | Retailing | 1.1 |
| Real Estate | 3.2 | Health Care Equipment & Services | 1.0 |
| Diversified Financials | 3.1 | Semiconductors & Semiconductor Equipment | .4 |
| Technology Hardware & Equipment | 2.5 | 99.6 | |
| † Based on net assets. | |||
| See notes to financial statements. | |||
94
STATEMENT OF FINANCIAL FUTURES
August 31, 2014
| Market Value | Unrealized | ||||
| BNY Mellon | Covered by | (Depreciation) | |||
| International Appreciation Fund | Contracts | Contracts ($) | Expiration | at 8/31/2014 | ($) |
| Financial Futures Long | |||||
| MSCI EAFE Index | 28 | 2,689,120 | September 2014 | (29,624 | ) |
| See notes to financial statements. | |||||
The Funds 95
STATEMENT OF INVESTMENTS
August 31, 2014
| BNY Mellon International Equity Income Fund | ||||||
| Common Stocks—96.2% | Shares | Value ($) | Shares | Value ($) | ||
| Australia—15.5% | France—3.8% | |||||
| Australia & New Zealand | GDF Suez | 87,400 | 2,152,673 | |||
| Banking Group | 94,500 | 2,950,477 | Neopost | 88,700 | 5,924,133 | |
| Bendigo and Adelaide Bank | 338,800 | 3,939,461 | Total | 76,850 | 5,068,065 | |
| Commonwealth Bank of Australia | 65,300 | 4,959,463 | 13,144,871 | |||
| Insurance Australia Group | 1,714,400 | 10,359,541 | Germany—4.1% | |||
| Metcash | 2,435,800 | 6,392,519 | Deutsche Telekom | 11,850 | 177,191 | |
| National Australia Bank | 187,600 | 6,167,364 | Muenchener Rueckversicherungs | 11,250 | 2,255,735 | |
| Tabcorp Holdings | 662,300 | 2,220,615 | ProSiebenSat.1 Media | 292,150 | 11,713,869 | |
| Tatts Group | 1,819,800 | 5,642,685 | 14,146,795 | |||
| Telstra | 943,600 | 4,899,895 | Hong Kong—1.1% | |||
| Westpac Banking | 172,700 | 5,651,718 | NWS Holdings | 549,000 | 1,037,072 | |
| 53,183,738 | Shougang Fushan | |||||
| Belgium—3.5% | Resources Group | 9,930,700 | 2,729,323 | |||
| Belgacom | 234,000 | 8,343,087 | 3,766,395 | |||
| Telenet Group Holding | 63,000 | a | 3,681,195 | Israel—2.2% | ||
| 12,024,282 | Bezeq The Israeli | |||||
| Brazil—3.0% | Telecommunication | 4,006,000 | 7,571,558 | |||
| Cielo | 375,796 | 7,044,181 | Italy—.1% | |||
| EcoRodovias | Enel | 27,500 | 145,475 | |||
| Infraestrutura e Logistrica | 484,700 | 3,096,364 | STMicroelectronics | 14,550 | 121,859 | |
| 10,140,545 | 267,334 | |||||
| Canada—.5% | Japan—4.9% | |||||
| Crescent Point Energy | 43,200 | 1,787,915 | Aozora Bank | 2,795,000 | 9,536,499 | |
| China—2.2% | Canon | 6,000 | 196,011 | |||
| Bank of China, Cl. H | 4,232,500 | 1,966,052 | Chugoku Electric Power | 15,000 | 197,799 | |
| Bosideng International Holdings | 6,094,100 | 967,186 | Dai Nippon Printing | 22,300 | 233,942 | |
| Guangzhou R&F | Daito Trust Construction | 13,000 | 1,607,429 | |||
| Properties, Cl. H | 2,352,300 | 2,834,883 | Eisai | 11,000 | 459,421 | |
| Jiangsu Expressway, Cl. H | 53,300 | 60,727 | Hokuriku Electric Power | 16,000 | 207,141 | |
| Zhejiang Expressway, Cl. H | 1,722,700 | 1,713,798 | Japan Airlines | 4,000 | 224,903 | |
| 7,542,646 | NTT DoCoMo | 72,000 | 1,244,577 | |||
| Denmark—1.1% | Showa Shell Sekiyu | 21,000 | 225,249 | |||
| TDC | 453,100 | 3,889,263 | ||||
96
| BNY Mellon International Equity Income Fund (continued) | ||||||
| Common Stocks (continued) | Shares | Value ($) | Shares | Value ($) | ||
| Japan (continued) | Spain (continued) | |||||
| Sumitomo | 90,000 | 1,161,709 | Red Electrica | 93,500 | 7,873,775 | |
| Takeda Pharmaceutical | 13,000 | 593,493 | 34,128,748 | |||
| TonenGeneral Sekiyu | 110,000 | 1,003,316 | Sweden—.9% | |||
| 16,891,489 | Ratos, Cl. B | 23,800 | 192,906 | |||
| Netherlands—3.0% | Skanska, Cl. B | 140,400 | 2,904,724 | |||
| Corio | 62,249 | 3,344,086 | 3,097,630 | |||
| Ziggo | 145,300 | a | 6,911,229 | Taiwan—.1% | ||
| 10,255,315 | Compal Electronics | 136,000 | 121,028 | |||
| New Zealand—2.9% | Farglory Land Development | 117,000 | 162,443 | |||
| Auckland International Airport | 1,977,219 | 6,069,604 | 283,471 | |||
| Spark New Zealand | 1,584,200 | 3,889,176 | Thailand—.9% | |||
| 9,958,780 | Advanced Info Service | 454,300 | 2,972,721 | |||
| Norway—7.2% | Turkey—.9% | |||||
| Aker Solutions | 368,800 | 5,581,433 | Tupras Turkiye Petrol Rafinerileri | 130,500 | 3,067,037 | |
| Gjensidige Forsikring | 453,500 | 9,431,530 | United Kingdom—20.5% | |||
| Seadrill | 257,900 | 9,495,523 | AstraZeneca | 67,200 | 5,095,000 | |
| 24,508,486 | Aviva | 190,000 | 1,643,369 | |||
| Poland—1.3% | BAE Systems | 540,800 | 3,996,117 | |||
| KGHM Polska Miedz | 33,800 | 1,390,855 | BP | 603,100 | 4,822,417 | |
| PGE | 123,100 | 838,231 | British American Tobacco | 294,524 | 17,374,843 | |
| Synthos | 1,472,000 | 2,114,051 | Friends Life Group | 534,100 | 2,719,445 | |
| 4,343,137 | GlaxoSmithKline | 146,800 | 3,593,476 | |||
| Russia—.5% | HSBC Holdings | 302,900 | 3,278,617 | |||
| Lukoil, ADR | 31,600 | 1,761,700 | ICAP | 159,900 | 1,006,609 | |
| South Africa—3.2% | Legal & General Group | 1,130,400 | 4,535,787 | |||
| Kumba Iron Ore | 93,400 | 2,788,975 | National Grid | 254,400 | 3,796,826 | |
| MMI Holdings | 1,274,400 | 3,284,496 | Royal Dutch Shell, Cl. A | 79,177 | 3,204,621 | |
| Vodacom Group | 409,600 | 4,928,832 | Royal Dutch Shell, Cl. B | 11,800 | 498,654 | |
| 11,002,303 | SSE | 154,800 | 3,901,096 | |||
| Spain—10.0% | Standard Life | 624,200 | 3,983,373 | |||
| Banco Santander | 1,492,200 | 14,881,610 | Vodafone Group | 1,992,745 | 6,839,765 | |
| Ferrovial | 558,800 | 11,373,363 | 70,290,014 | |||
The Funds 97
| BNY Mellon International Equity Income Fund (continued) | ||||||
| Common Stocks (continued) | Shares | Value ($) | Other Investment—1.0% | Shares | Value ($) | |
| United States—2.8% | Registered | |||||
| Vanguard FTSE | Investment Company; | |||||
| Developed Markets ETF | 230,000 | 9,588,700 | Dreyfus Institutional Preferred | |||
| Total Common Stocks | Plus Money Market Fund | |||||
| (cost $309,990,542) | 329,614,873 | (cost $3,435,128) | 3,435,128 | b | 3,435,128 | |
| Total Investments | ||||||
| Preferred Stocks—1.6% | (cost $318,791,048) | 98.8 | % | 338,530,982 | ||
| Brazil | Cash and Receivables (Net) | 1.2 | % | 4,032,789 | ||
| AES Tiete | ||||||
| Net Assets | 100.0 | % | 342,563,771 | |||
| (cost $5,365,378) | 609,800 | 5,480,981 | ||||
ADR—American Depository Receipts
ETF—Exchange-Traded Funds
| a | Non-income producing security. |
| b | Investment in affiliated money market mutual fund. |
| Portfolio Summary (Unaudited) † | |||
| Value (%) | Value (%) | ||
| Financial | 29.4 | Exchange-Traded Funds | 2.8 |
| Telecommunication Services | 16.2 | Health Care | 2.8 |
| Industrial | 12.7 | Materials | 2.6 |
| Energy | 9.0 | Information Technology | 2.2 |
| Utilities | 7.2 | Money Market Investment | 1.0 |
| Consumer Staples | 6.9 | ||
| Consumer Discretionary | 6.0 | 98.8 | |
| † Based on net assets. | |||
| See notes to financial statements. | |||
98
STATEMENT OF INVESTMENTS
August 31, 2014
| BNY Mellon Asset Allocation Fund | |||||
| Coupon | Maturity | Principal | |||
| Bonds and Notes—13.0% | Rate (%) | Date | Amount ($) | Value ($) | |
| Asset-Backed Ctfs./Auto Receivables—.1% | |||||
| AmeriCredit Automobile Receivables Trust, Ser. 2013-2, Cl. A3 | 0.65 | 12/8/17 | 375,000 | 375,074 | |
| Casinos—.1% | |||||
| Agua Caliente Band of Cahuilla Indians, Sr. Scd. Notes | 6.08 | 10/1/16 | 158,000 | a | 160,100 |
| Agua Caliente Band of Cahuilla Indians, Sr. Scd. Notes | 6.44 | 10/1/16 | 134,000 | a | 132,019 |
| 292,119 | |||||
| Commercial Mortgage Pass-Through Ctfs.—.1% | |||||
| WFRBS Commercial Mortgage Trust, Ser. 2011-C5, Cl. A2 | 2.68 | 11/15/44 | 80,000 | 82,505 | |
| WFRBS Commerical Mortgage Trust, Ser. 2013-C13, Cl. A4 | 3.00 | 5/15/45 | 540,000 | 536,711 | |
| 619,216 | |||||
| Consumer Discretionary—.6% | |||||
| 21st Century Fox America, Gtd. Notes | 6.15 | 3/1/37 | 265,000 | 322,480 | |
| Amazon.com, Sr. Unscd. Notes | 2.50 | 11/29/22 | 435,000 | 416,610 | |
| Comcast, Gtd. Notes | 3.13 | 7/15/22 | 720,000 | 738,456 | |
| Discovery Communications, Gtd. Notes | 3.70 | 6/1/15 | 390,000 | 399,346 | |
| eBay, Sr. Unscd. Notes | 2.88 | 8/1/21 | 325,000 | 326,151 | |
| Time Warner, Gtd. Notes | 4.00 | 1/15/22 | 470,000 | 496,070 | |
| Time Warner Cable, Gtd. Notes | 4.13 | 2/15/21 | 305,000 | 330,371 | |
| 3,029,484 | |||||
| Consumer Staples—.4% | |||||
| Anheuser-Busch InBev Worldwide, Gtd. Notes | 2.50 | 7/15/22 | 425,000 | 417,234 | |
| ConAgra Foods, Sr. Unscd. Notes | 3.20 | 1/25/23 | 149,000 | 147,107 | |
| PepsiCo, Sr. Unscd. Notes | 4.50 | 1/15/20 | 375,000 | 419,245 | |
| Pernod Ricard, Sr. Unscd. Notes | 4.45 | 1/15/22 | 385,000 | a | 414,508 |
| Walgreen, Sr. Unscd. Notes | 3.10 | 9/15/22 | 520,000 | 515,981 | |
| 1,914,075 | |||||
| Energy—.1% | |||||
| BP Capital Markets, Gtd. Notes | 3.20 | 3/11/16 | 275,000 | 286,006 | |
| Petrobras International Finance, Gtd. Notes | 5.38 | 1/27/21 | 325,000 | 344,272 | |
| 630,278 | |||||
| Financial—2.3% | |||||
| American International Group, Sr. Unscd. Notes | 5.85 | 1/16/18 | 500,000 | 567,461 | |
| Bank of America, Sr. Unscd. Notes | 2.60 | 1/15/19 | 1,070,000 | 1,081,540 | |
| BlackRock, Sr. Unscd. Notes | 6.25 | 9/15/17 | 420,000 | 479,912 | |
| Boston Properties, Sr. Unscd. Notes | 4.13 | 5/15/21 | 360,000 | 387,686 | |
| Citigroup, Sr. Unscd. Notes | 2.50 | 9/26/18 | 465,000 | 472,506 | |
| Citigroup, Sr. Unscd. Notes | 6.13 | 11/21/17 | 195,000 | 221,387 | |
| Citizens Financial Group, Sub. Notes | 4.15 | 9/28/22 | 445,000 | a | 452,612 |
| Ford Motor Credit, Sr. Unscd. Notes | 3.00 | 6/12/17 | 390,000 | 404,755 | |
| General Electric Capital, Jr. Sub. Cap. Secs., Ser. C | 5.25 | 6/29/49 | 270,000 | b,c | 276,412 |
| General Electric Capital, Sub. Notes | 5.30 | 2/11/21 | 495,000 | 568,358 |
The Funds 99
STATEMENT OF INVESTMENTS (continued)
| BNY Mellon Asset Allocation Fund (continued) | ||||
| Coupon | Maturity | Principal | ||
| Bonds and Notes (continued) | Rate (%) | Date | Amount ($) | Value ($) |
| Financial (continued) | ||||
| Goldman Sachs Group, Sub. Notes | 6.75 | 10/1/37 | 495,000 | 611,768 |
| HSBC Finance, Sr. Sub. Notes | 6.68 | 1/15/21 | 582,000 | 699,480 |
| JPMorgan Chase & Co., Sub. Notes | 3.38 | 5/1/23 | 395,000 | 389,443 |
| MetLife, Sr. Unscd. Notes | 7.72 | 2/15/19 | 345,000 | 427,307 |
| Morgan Stanley, Sub. Notes | 4.88 | 11/1/22 | 735,000 | 795,313 |
| NYSE Euronext, Gtd. Notes | 2.00 | 10/5/17 | 460,000 | 467,554 |
| Prudential Financial, Sr. Unscd. Notes | 4.75 | 9/17/15 | 395,000 | 411,627 |
| Rabobank Nederland, Gtd. Notes | 4.50 | 1/11/21 | 530,000 | 589,921 |
| Royal Bank of Canada, Sr. Unscd. Notes | 1.25 | 6/16/17 | 520,000 | 520,796 |
| Simon Property Group, Sr. Unscd. Notes | 5.65 | 2/1/20 | 450,000 | 525,124 |
| TD Ameritrade Holding, Gtd. Notes | 4.15 | 12/1/14 | 335,000 | 338,035 |
| Toyota Motor Credit, Sr. Unscd. Notes | 1.13 | 5/16/17 | 350,000 | 350,010 |
| Wachovia, Sub. Notes | 5.63 | 10/15/16 | 340,000 | 372,084 |
| 11,411,091 | ||||
| Foreign/Governmental—.3% | ||||
| Mexican Government, Sr. Unscd. Notes | 5.63 | 1/15/17 | 315,000 | 348,862 |
| Mexican Government, Sr. Unscd. Notes | 6.63 | 3/3/15 | 185,000 | 190,530 |
| Petroleos Mexicanos, Gtd. Notes | 4.88 | 1/24/22 | 330,000 | 359,370 |
| Province of Ontario Canada, Sr. Unscd. Bonds | 4.00 | 10/7/19 | 330,000 | 362,334 |
| 1,261,096 | ||||
| Health Care—.1% | ||||
| Amgen, Sr. Unscd. Notes | 5.65 | 6/15/42 | 485,000 | 577,847 |
| Industrial—.2% | ||||
| ABB Finance USA, Gtd. Notes | 2.88 | 5/8/22 | 650,000 | 651,551 |
| Burlington Northern Santa Fe, Sr. Unscd. Debs. | 3.45 | 9/15/21 | 430,000 | 449,329 |
| 1,100,880 | ||||
| Information Technology—.3% | ||||
| Intel, Sr. Unscd. Notes | 2.70 | 12/15/22 | 730,000 | 718,782 |
| Oracle, Sr. Unscd. Notes | 5.75 | 4/15/18 | 620,000 | 710,028 |
| 1,428,810 | ||||
| Materials—.1% | ||||
| Eastman Chemical, Sr. Unscd. Notes | 3.60 | 8/15/22 | 460,000 | 473,428 |
| Municipal Bonds—.7% | ||||
| Chicago, GO | 7.78 | 1/1/35 | 340,000 | 409,265 |
| Florida Hurricane Catastrophe Fund Finance Corporation, Revenue | 3.00 | 7/1/20 | 750,000 | 763,493 |
| Illinois, GO | 4.42 | 1/1/15 | 440,000 | 445,795 |
| Massachusetts, GO (Build America Bonds) | 4.20 | 12/1/21 | 210,000 | 229,877 |
| Metropolitan Transportation Authority, | ||||
| Special Obligation Taxable Bonds | 3.02 | 7/1/24 | 600,000 | 603,924 |
| New Jersey Economic Development Authority, | ||||
| School Facilities Construction Revenue | 1.10 | 6/15/16 | 475,000 | 473,988 |
100
| BNY Mellon Asset Allocation Fund (continued) | |||||
| Coupon | Maturity | Principal | |||
| Bonds and Notes (continued) | Rate (%) | Date | Amount ($) | Value ($) | |
| Municipal Bonds (continued) | |||||
| New York City Municipal Water Finance Authority, | |||||
| Water and Sewer System Second General Resolution | |||||
| Revenue (Build America Bonds) | 6.28 | 6/15/42 | 320,000 | 370,176 | |
| Oakland Unified School District, GO (Build America Bonds) | 9.50 | 8/1/34 | 180,000 | 213,952 | |
| University of California Regents, | |||||
| Medical Center Pooled Revenue (Build America Bonds) | 5.44 | 5/15/23 | 135,000 | 157,301 | |
| 3,667,771 | |||||
| Telecommunication Services—.3% | |||||
| AT&T, Sr. Unscd. Notes | 4.45 | 5/15/21 | 450,000 | 499,396 | |
| Telefonica Emisiones, Gtd. Notes | 5.13 | 4/27/20 | 575,000 | 641,346 | |
| Verizon Communications, Sr. Unscd. Notes | 5.15 | 9/15/23 | 535,000 | 606,166 | |
| 1,746,908 | |||||
| U.S. Government Agencies/Mortgage-Backed—3.8% | |||||
| Federal Home Loan Mortgage Corp.: | |||||
| 3.00%, 9/1/27—11/1/28 | 1,212,940 | d | 1,256,745 | ||
| 3.50%, 12/1/28—6/1/43 | 1,153,637 | d | 1,193,839 | ||
| 4.00%, 6/1/26—4/1/44 | 986,951 | d | 1,053,366 | ||
| 4.50%, 5/1/39—11/1/41 | 2,141,277 | d | 2,335,110 | ||
| 5.00%, 7/1/40 | 633,726 | d | 698,695 | ||
| 5.50%, 12/1/37—12/1/38 | 623,182 | d | 692,724 | ||
| Federal National Mortgage Association: | |||||
| 2.50%, 3/1/28—7/1/28 | 1,864,555 | d | 1,896,922 | ||
| 3.00%, 10/1/32—5/1/43 | 1,130,794 | d | 1,143,198 | ||
| 3.35%, 4/1/41 | 201,097 | c,d | 212,940 | ||
| 3.50%, 9/1/26—8/1/44 | 2,720,503 | d | 2,824,719 | ||
| 4.00%, 2/1/41—4/1/42 | 1,060,322 | d | 1,126,022 | ||
| 4.50%, 6/1/23—4/1/44 | 338,117 | d | 363,071 | ||
| 5.00%, 12/1/21—11/1/43 | 1,242,942 | d | 1,372,167 | ||
| 5.50%, 4/1/36—1/1/39 | 1,363,761 | d | 1,524,872 | ||
| 6.00%, 4/1/33—9/1/34 | 246,784 | d | 280,608 | ||
| 6.50%, 10/1/36 | 34,531 | d | 38,972 | ||
| REMIC, Ser. 2014-28, Cl. ND, 3.00%, 3/25/40 | 440,210 | d | 451,204 | ||
| Government National Mortgage Association II; | |||||
| 3.00%, 1/20/44 | 635,106 | 645,611 | |||
| 19,110,785 | |||||
| U.S. Government Securities—3.4% | |||||
| U.S. Treasury Inflation Protected Securities: | |||||
| Notes, 0.13%, 4/15/18 | 783,568 | e | 800,218 | ||
| Notes, 0.13%, 1/15/23 | 655,650 | e | 651,706 | ||
| Notes, 0.63%, 7/15/21 | 629,171 | b,e | 657,631 | ||
| Notes, 1.38%, 7/15/18 | 801,284 | e | 863,791 | ||
| Notes, 1.38%, 1/15/20 | 512,486 | b,e | 555,607 | ||
| U.S. Treasury Notes: | |||||
| 0.25%, 4/15/16 | 465,000 | 464,264 | |||
| 0.50%, 6/15/16 | 275,000 | 275,392 | |||
The Funds 101
STATEMENT OF INVESTMENTS (continued)
| BNY Mellon Asset Allocation Fund (continued) | |||||
| Coupon | Maturity | Principal | |||
| Bonds and Notes (continued) | Rate (%) | Date | Amount ($) | Value ($) | |
| U.S. Government Securities (continued) | |||||
| U.S. Treasury Notes (continued): | |||||
| 0.63%, 10/15/16 | 420,000 | 420,443 | |||
| 0.63%, 9/30/17 | 1,565,000 | b | 1,546,599 | ||
| 0.63%, 4/30/18 | 315,000 | 307,777 | |||
| 0.75%, 10/31/17 | 650,000 | 643,856 | |||
| 0.88%, 9/15/16 | 1,005,000 | 1,011,909 | |||
| 0.88%, 12/31/16 | 640,000 | 642,975 | |||
| 0.88%, 1/31/17 | 835,000 | 838,490 | |||
| 0.88%, 5/15/17 | 3,115,000 | b | 3,118,529 | ||
| 0.88%, 1/31/18 | 250,000 | 247,617 | |||
| 1.00%, 5/31/18 | 675,000 | 667,670 | |||
| 1.25%, 4/30/19 | 780,000 | b | 768,909 | ||
| 1.38%, 9/30/18 | 785,000 | 783,866 | |||
| 1.38%, 2/28/19 | 220,000 | 218,453 | |||
| 2.00%, 11/30/20 | 715,000 | b | 717,989 | ||
| 2.63%, 1/31/18 | 805,000 | 844,118 | |||
| 2.75%, 2/15/24 | 30,000 | 31,120 | |||
| 17,078,929 | |||||
| Utilities—.1% | |||||
| Hydro-Quebec, Gov’t Gtd. Notes | 2.00 | 6/30/16 | 280,000 | 286,751 | |
| Total Bonds and Notes | |||||
| (cost $63,313,578) | 65,004,542 | ||||
| Common Stocks—18.1% | Shares | Value ($) | |||
| Consumer Discretionary—2.2% | |||||
| Bed Bath & Beyond | 11,615 | f | 746,380 | ||
| CBS, Cl. B | 13,755 | 815,534 | |||
| Comcast, Cl. A | 15,850 | 867,470 | |||
| Hanesbrands | 7,965 | 817,846 | |||
| Home Depot | 14,615 | 1,366,503 | |||
| Las Vegas Sands | 9,815 | 652,796 | |||
| Lowe’s | 19,585 | 1,028,408 | |||
| Macy’s | 3,445 | 214,589 | |||
| Royal Caribbean Cruises | 11,885 | 757,788 | |||
| Time Warner | 8,430 | 649,363 | |||
| Walt Disney | 17,190 | 1,545,037 | |||
| Whirlpool | 4,730 | 723,785 | |||
| Wyndham Worldwide | 10,315 | 834,896 | |||
| 11,020,395 | |||||
| Consumer Staples—2.0% | |||||
| Altria Group | 25,350 | 1,092,078 | |||
| Archer-Daniels-Midland | 15,545 | 775,074 | |||
| Coca-Cola | 3,865 | 161,248 | |||
| CVS Caremark | 15,045 | 1,195,325 | |||
| Hershey | 6,015 | 549,891 | |||
102
| BNY Mellon Asset Allocation Fund (continued) | |||||||
| Common Stocks (continued) | Shares | Value ($) | Shares | Value ($) | |||
| Consumer Staples (continued) | Financial (continued) | ||||||
| Kroger | 17,015 | 867,425 | Wells Fargo & Co. | 23,255 | 1,196,237 | ||
| Mondelez International, Cl. A | 16,455 | 595,506 | XL Group | 18,910 | 646,344 | ||
| Monster Beverage | 6,160 | f | 544,606 | 12,797,558 | |||
| PepsiCo | 11,235 | 1,039,125 | Health Care—2.8% | ||||
| Procter & Gamble | 20,195 | 1,678,406 | Abbott Laboratories | 11,595 | 489,773 | ||
| Tyson Foods, Cl. A | 18,455 | 702,397 | AbbVie | 6,875 | 380,050 | ||
| Wal-Mart Stores | 10,155 | 766,702 | Allergan | 1,240 | 202,963 | ||
| 9,967,783 | Amgen | 9,110 | 1,269,752 | ||||
| Energy—1.9% | Biogen Idec | 1,380 | f | 473,395 | |||
| Chesapeake Energy | 23,205 | 631,176 | Boston Scientific | 57,445 | f | 728,403 | |
| Chevron | 2,510 | 324,920 | C.R. Bard | 3,355 | 498,016 | ||
| ConocoPhillips | 14,180 | 1,151,700 | Cigna | 3,770 | 356,642 | ||
| EOG Resources | 8,530 | 937,276 | Covance | 4,355 | f | 361,030 | |
| EQT | 6,045 | 598,818 | Eli Lilly & Co. | 2,365 | 150,319 | ||
| Exxon Mobil | 27,070 | 2,692,382 | Gilead Sciences | 15,160 | f | 1,630,913 | |
| Marathon Petroleum | 10,315 | 938,768 | Johnson & Johnson | 19,770 | 2,050,742 | ||
| National Oilwell Varco | 3,835 | 331,459 | Medtronic | 15,465 | 987,440 | ||
| Occidental Petroleum | 8,235 | 854,217 | Merck & Co. | 18,050 | 1,084,985 | ||
| Phillips 66 | 1,325 | 115,301 | Mettler-Toledo International | 2,155 | f | 582,884 | |
| Schlumberger | 2,155 | 236,274 | Pfizer | 55,895 | 1,642,754 | ||
| Valero Energy | 15,180 | 821,845 | Stryker | 1,025 | 85,393 | ||
| 9,634,136 | WellPoint | 8,140 | 948,391 | ||||
| Exchange-Traded Funds—.1% | 13,923,845 | ||||||
| Standard & Poor’s Depository | Industrial—1.5% | ||||||
| Receipts S&P 500 ETF Trust | 3,225 | 647,290 | AECOM Technology | 17,190 | f | 650,470 | |
| Financial—2.5% | Caterpillar | 2,505 | 273,220 | ||||
| Affiliated Managers Group | 3,080 | f | 650,342 | Copa Holdings, Cl. A | 3,640 | 447,647 | |
| American Express | 1,940 | 173,727 | Emerson Electric | 2,580 | 165,172 | ||
| Bank of America | 92,830 | 1,493,635 | General Electric | 29,320 | 761,734 | ||
| Berkshire Hathaway, Cl. B | 11,255 | f | 1,544,749 | Honeywell International | 2,580 | 245,693 | |
| Citigroup | 20,655 | 1,066,831 | Kirby | 5,605 | f | 668,620 | |
| Corrections Corporation of America | 16,755 | g | 597,148 | Lockheed Martin | 4,880 | 849,120 | |
| Franklin Resources | 13,665 | 772,346 | Masco | 30,535 | 716,656 | ||
| JPMorgan Chase & Co. | 4,727 | 281,020 | Northrop Grumman | 7,305 | 929,342 | ||
| Moody’s | 2,160 | 202,111 | Oshkosh | 10,750 | 534,060 | ||
| Navient | 7,765 | 139,304 | Raytheon | 2,845 | 274,087 | ||
| Public Storage | 4,215 | g | 738,384 | Rockwell Automation | 1,290 | 150,427 | |
| Simon Property Group | 990 | g | 168,330 | Southwest Airlines | 28,420 | 909,724 | |
| SLM | 26,215 | 232,265 | 7,575,972 | ||||
| State Street | 10,315 | 742,989 | Information Technology—3.7% | ||||
| T. Rowe Price Group | 10,120 | 819,669 | Accenture, Cl. A | 11,170 | 905,440 | ||
| Travelers | 8,590 | 813,559 | ANSYS | 2,390 | f | 194,307 | |
| Waddell & Reed Financial, Cl. A | 9,515 | 518,568 | Apple | 21,070 | 2,159,675 | ||
The Funds 103
STATEMENT OF INVESTMENTS (continued)
| BNY Mellon Asset Allocation Fund (continued) | |||||||
| Common Stocks (continued) | Shares | Value ($) | Other Investments—68.9% | Shares | Value ($) | ||
| Information Technology (continued) | Registered | ||||||
| Cognizant Technology Solutions, Cl. A | 16,370 | f | 748,600 | Investment Companies: | |||
| Corning | 31,015 | 646,973 | ASG Global Alternatives | ||||
| DST Systems | 1,735 | 161,025 | Fund, Cl. Y | 1,194,188 | 13,518,212 | ||
| Facebook, Cl. A | 17,585 | f | 1,315,710 | ASG Managed Futures | |||
| Strategy Fund, Cl. Y | 697,625 | 7,876,187 | |||||
| Google, Cl. A | 1,910 | f | 1,112,308 | ||||
| BNY Mellon Corporate | |||||||
| Google, Cl. C | 1,915 | f | 1,094,614 | Bond Fund, Cl. M | 871,800 | h | 11,298,530 |
| Hewlett-Packard | 33,955 | 1,290,290 | BNY Mellon Emerging | ||||
| Intel | 12,960 | 452,563 | Markets Fund, Cl. M | 3,669,635 | h | 40,292,594 | |
| International Business Machines | 2,355 | 452,866 | BNY Mellon Focused Equity | ||||
| Intuit | 3,820 | 317,748 | Opportunities Fund, Cl. M | 2,151,111 | h | 39,365,337 | |
| MasterCard, Cl. A | 8,055 | 610,650 | BNY Mellon Income | ||||
| Micron Technology | 31,765 | f | 1,035,539 | Stock Fund, Cl. M | 2,249,607 | h | 22,361,095 |
| Microsoft | 15,905 | 722,564 | BNY Mellon Intermediate | ||||
| NetApp | 15,465 | 652,004 | Bond Fund, Cl. M | 1,822,022 | h | 23,230,778 | |
| Oracle | 36,955 | 1,534,741 | BNY Mellon | ||||
| International Fund, Cl. M | 1,895,364 | h | 24,109,035 | ||||
| QUALCOMM | 17,745 | 1,350,395 | |||||
| BNY Mellon Mid Cap | |||||||
| SanDisk | 4,535 | 444,249 | Multi-Strategy Fund, Cl. M | 1,535,714 | h | 23,926,427 | |
| Visa, Cl. A | 5,640 | 1,198,613 | BNY Mellon Short-Term | ||||
| 18,400,874 | U.S. Government | ||||||
| Materials—.3% | Securities Fund, Cl. M | 832,040 | h | 9,942,881 | |||
| Cabot | 4,820 | 264,040 | BNY Mellon Small/Mid Cap | ||||
| Dow Chemical | 7,265 | 389,041 | Multi-Strategy Fund, Cl. M | 467,147 | h,j | 7,932,152 | |
| PPG Industries | 950 | 195,567 | Dreyfus Floating Rate | ||||
| Scotts Miracle-Gro, Cl. A | 10,375 | 598,949 | Income Fund, Cl. Y | 760,867 | h | 9,609,754 | |
| 1,447,597 | Dreyfus Global Real Estate | ||||||
| Securities Fund, Cl. Y | 809,538 | h | 7,447,751 | ||||
| Telecommunication Services—.7% | |||||||
| Dreyfus High Yield Fund, Cl. I | 1,020,374 | h | 6,958,949 | ||||
| AT&T | 46,002 | 1,608,230 | |||||
| Dreyfus Inflation Adjusted | |||||||
| CenturyLink | 8,165 | 334,683 | Securities Fund, Cl. Y | 430,949 | h | 5,542,001 | |
| Verizon Communications | 32,340 | 1,611,179 | Dreyfus Institutional | ||||
| 3,554,092 | Preferred Plus | ||||||
| Utilities—.4% | Money Market Fund | 8,543,763 | i | 8,543,763 | |||
| Ameren | 4,325 | 172,957 | Dreyfus Research | ||||
| Duke Energy | 9,085 | 672,199 | Growth Fund, Cl. Y | 524,611 | h | 7,512,435 | |
| Entergy | 10,405 | 805,451 | Dreyfus Select Managers Small Cap | ||||
| NextEra Energy | 4,815 | 474,037 | Growth Fund, Cl. Y | 467,623 | h | 11,592,369 | |
| 2,124,644 | Dreyfus Select Managers Small Cap | ||||||
| Value Fund, Cl. Y | 407,509 | h | 10,362,960 | ||||
| Total Common Stocks | |||||||
| (cost $75,442,138) | 91,094,186 | Dreyfus U.S. Equity Fund, Cl. Y | 477,275 | h | 9,769,812 | ||
104
| BNY Mellon Asset Allocation Fund (continued) | ||||||||
| Investment of Cash Collateral | ||||||||
| Other Investments (continued) | Shares | Value ($) | for Securities Loaned—.1% | Shares | Value ($) | |||
| Registered Investment | Registered Investment Company; | |||||||
| Companies (continued): | Dreyfus Institutional Cash | |||||||
| Dreyfus/Newton International | Advantage Fund | |||||||
| Equity Fund, Cl.Y | 557,049 | h | 11,620,052 | (cost $286,200) | 286,200 | i | 286,200 | |
| Dynamic Total Return Fund, Cl. Y | 486,666 | h | 7,567,657 | Total Investments | ||||
| Global Stock Fund, Cl. Y | 896,123 | h | 17,160,762 | (cost $426,502,107) | 100.1 | % | 502,265,173 | |
| TCW Emerging Markets | Liabilities, Less Cash | |||||||
| Income Fund, Cl. I | 956,279 | 8,338,752 | and Receivables | (.1 | %) | (267,562 | ) | |
| Total Other Investments | ||||||||
| (cost $287,460,191) | 345,880,245 | Net Assets | 100.0 | % | 501,997,611 | |||
ETF—Exchange-Traded Funds
GO—General Obligation
REMIC—Real Estate Mortgage Investment Conduit
| a Securities exempt from registration pursuant to Rule 144A under the Securities Act of 1933.These securities may be resold in transactions exempt from registration, normally to |
| qualified institutional buyers.At August 31, 2014, these securities were valued at $1,159,239 or .2% of net assets. |
| b Security, or portion thereof, on loan.At August 31, 2014, the value of the fund’s securities on loan was $6,471,206 and the value of the collateral held by the fund was |
| $6,722,000, consisting of cash collateral of $286,200 and U.S. Government & Agency securities valued at $6,435,800. |
| c Variable rate security—interest rate subject to periodic change. |
| d The Federal Housing Finance Agency (“FHFA”) placed the Federal Home Loan Mortgage Corporation and Federal National Mortgage Association into conservatorship with |
| FHFA as the conservator.As such, the FHFA oversees the continuing affairs of these companies. |
| e Principal amount for accrual purposes is periodically adjusted based on changes in the Consumer Price Index. |
| f Non-income producing security. |
| g Investment in real estate investment trust. |
| h Investment in affiliated mutual fund. |
| i Investment in affiliated money market mutual fund. |
| j Formally, BNY Mellon Small/Mid Cap Fund. |
| Portfolio Summary (Unaudited) † | |||
| Value (%) | Value (%) | ||
| Mutual Funds: Domestic | 42.8 | Municipal Bonds | .7 |
| Mutual Funds: Foreign | 24.4 | Foreign/Governmental | .3 |
| Common Stocks | 18.0 | Asset-Backed | .1 |
| U.S. Government Agencies/Mortgage-Backed | 7.2 | Commercial Mortgage-Backed | .1 |
| Corporate Bonds | 4.6 | Exchange-Traded Funds | .1 |
| Money Market Investments | 1.8 | 100.1 | |
| † Based on net assets. | |||
| See notes to financial statements. | |||
The Funds 105
STATEMENTS OF ASSETS AND LIABILITIES
August 31, 2014
| BNY Mellon | BNY Mellon | BNY Mellon | BNY Mellon | |
| Large Cap | Large Cap Market | Tax-Sensitive Large Cap | Income | |
| Stock Fund | Opportunities Fund | Multi-Strategy Fund | Stock Fund | |
| Assets ($): | ||||
| Investments in securities— | ||||
| See Statement of Investments:† | ||||
| (including securities on loan)††—Note 2(c): | ||||
| Unaffiliated issuers | 479,424,096 | 89,006,166 | 294,840,202 | 1,224,256,408 |
| Affiliated issuers | 1,762,927 | 105,698,836 | 180,517,405 | 22,923,853 |
| Cash | — | 6,400 | 109,629 | — |
| Dividends receivable | 1,140,709 | — | 615,879 | 2,891,614 |
| Receivable for shares of Beneficial Interest subscribed | 156,564 | 31,700 | — | 1,444,061 |
| Receivable for investment securities sold | — | 464,974 | 3,192,713 | 39,015,188 |
| Dividends and securities lending income receivable | — | 152,334 | — | — |
| Prepaid expenses | 17,172 | 16,340 | 19,330 | 20,004 |
| 482,501,468 | 195,376,750 | 479,295,158 | 1,290,551,128 | |
| Liabilities ($): | ||||
| Due to The Dreyfus Corporation and affiliates—Note 4(b) | 295,633 | 80,367 | 215,535 | 719,571 |
| Due to Administrator—Note 4(a) | 49,316 | 9,236 | 30,665 | 129,728 |
| Cash overdraft due to Custodian | 536,790 | — | — | 1,095,395 |
| Payable for shares of Beneficial Interest redeemed | 452,932 | 752,765 | 86,996 | 657,124 |
| Liability for securities on loan—Note 2 (c) | — | 1,218,848 | — | — |
| Payable for investment securities purchased | — | 433,998 | 557,348 | 19,030,677 |
| Outstanding options written, at value | ||||
| (premiums received $96,488 for | ||||
| BNY Mellon Income Stock Fund)— | ||||
| See statement of Options Written—Note 5 | — | — | — | 314,636 |
| Accrued expenses | 49,599 | 41,455 | 49,478 | 69,299 |
| 1,384,270 | 2,536,669 | 940,022 | 22,016,430 | |
| Net Assets ($) | 481,117,198 | 192,840,081 | 478,355,136 | 1,268,534,698 |
106
| BNY Mellon | BNY Mellon | BNY Mellon | BNY Mellon | |
| Large Cap | Large Cap Market | Tax-Sensitive Large Cap | Income | |
| Stock Fund | Opportunities Fund | Multi-Strategy Fund | Stock Fund | |
| Composition of Net Assets ($): | ||||
| Paid-in capital | 320,148,990 | 125,063,986 | 301,789,836 | 925,450,855 |
| Accumulated undistributed investment income—net | 102,520 | 562,590 | 2,608,730 | 53,324 |
| Accumulated net realized gain (loss) on investments | 74,314,743 | 25,059,179 | 55,064,335 | 104,440,932 |
| Accumulated net unrealized appreciation | ||||
| (depreciation) on investments | 86,550,945 | 42,154,326 | 118,892,235 | — |
| Accumulated net unrealized appreciation (depreciation) | ||||
| on investments and options transactions | — | — | — | 238,589,587 |
| Net Assets ($) | 481,117,198 | 192,840,081 | 478,355,136 | 1,268,534,698 |
| Net Asset Value Per Share | ||||
| Class M Shares | ||||
| Net Assets ($) | 468,445,597 | 192,209,333 | 474,495,708 | 1,254,621,506 |
| Shares Outstanding | 65,543,536 | 11,854,637 | 27,715,145 | 126,202,817 |
| Net Asset Value Per Share ($) | 7.15 | 16.21 | 17.12 | 9.94 |
| Investor Shares | ||||
| Net Assets ($) | 12,671,601 | 630,748 | 3,859,428 | 13,913,192 |
| Shares Outstanding | 1,772,251 | 38,711 | 221,765 | 1,388,996 |
| Net Asset Value Per Share ($) | 7.15 | 16.29 | 17.40 | 10.02 |
| † Investments at cost ($): | ||||
| Unaffiliated issuers | 392,873,151 | 62,542,279 | 203,234,154 | 985,448,673 |
| Affiliated issuers | 1,762,927 | 90,008,397 | 153,231,218 | 22,923,853 |
| ††Value of securities on loan ($) | — | 1,188,304 | — | — |
| See notes to financial statements. | ||||
The Funds 107
STATEMENTS OF ASSETS AND LIABILITIES (continued)
| BNY Mellon | BNY Mellon | BNY Mellon | BNY Mellon | |
| Mid Cap | Small Cap | Focused Equity | Small/Mid Cap | |
| Multi-Strategy Fund | Multi-Strategy Fund | Opportunities Fund | Multi-Strategy Fund | |
| Assets ($): | ||||
| Investments in securities— | ||||
| See Statement of Investments† | ||||
| (including securities on loan)††—Note 2(c): | ||||
| Unaffiliated issuers | 1,946,182,142 | 355,884,033 | 673,420,832 | 408,935,380 |
| Affiliated issuers | 53,173,766 | 25,519,432 | 2,904,985 | 21,436,368 |
| Cash | 841,421 | 174,250 | 153,005 | 43,595 |
| Dividends and securities | ||||
| lending income receivable | 1,988,587 | 205,387 | — | 216,796 |
| Receivable for shares of | ||||
| Beneficial Interest subscribed | 1,181,348 | 106,692 | 931,960 | 1,000 |
| Receivable for investment securities sold | 220,129 | 1,370,794 | 6,038,956 | 533,888 |
| Dividends receivable | — | — | 605,343 | — |
| Prepaid expenses | 23,914 | 18,413 | 20,604 | 22,480 |
| 2,003,611,307 | 383,279,001 | 684,075,685 | 431,189,507 | |
| Liabilities ($): | ||||
| Due to The Dreyfus Corporation | ||||
| and affiliates—Note 4(b) | 1,286,537 | 289,985 | 412,245 | 274,337 |
| Due to Administrator—Note 4(a) | 201,686 | 36,597 | 69,035 | 42,434 |
| Liability for securities on loan—Note 2(c) | 26,858,910 | 22,096,154 | — | 15,829,594 |
| Payable for shares of | ||||
| Beneficial Interest redeemed | 460,047 | 61,525 | 199,043 | 139,513 |
| Payable for investment securities purchased | 184,295 | 1,643,498 | 5,553,653 | 432,148 |
| Accrued expenses | 99,393 | 53,409 | 50,957 | 49,478 |
| 29,090,868 | 24,181,168 | 6,284,933 | 16,767,504 | |
| Net Assets ($) | 1,974,520,439 | 359,097,833 | 677,790,752 | 414,422,003 |
108
| BNY Mellon | BNY Mellon | BNY Mellon | BNY Mellon | ||
| Mid Cap | Small Cap | Focused Equity | Small/Mid Cap | ||
| Multi-Strategy Fund | Multi-Strategy Fund | Opportunities Fund | Multi-Strategy Fund | ||
| Composition of Net Assets ($): | |||||
| Paid-in capital | 1,363,138,794 | 302,609,830 | 433,328,974 | 282,671,446 | |
| Accumulated undistributed | |||||
| investment income (loss)—net | 3,410,763 | (592,232 | ) | 2,717,811 | 5,503 |
| Accumulated net realized | |||||
| gain (loss) on investments | 86,655,442 | 14,579,402 | 91,193,437 | 100,410,683 | |
| Accumulated net unrealized appreciation | |||||
| (depreciation) on investments | 521,315,440 | 42,500,833 | 150,550,530 | 31,334,371 | |
| Net Assets ($) | 1,974,520,439 | 359,097,833 | 677,790,752 | 414,422,003 | |
| Net Asset Value Per Share | |||||
| Class M Shares | |||||
| Net Assets ($) | 1,922,073,127 | 347,612,907 | 674,221,655 | 411,334,048 | |
| Shares Outstanding | 123,390,435 | 20,238,085 | 36,848,791 | 24,226,402 | |
| Net Asset Value Per Share ($) | 15.58 | 17.18 | 18.30 | 16.98 | |
| Investor Shares | |||||
| Net Assets ($) | 52,447,312 | 11,484,926 | 3,569,097 | 3,087,955 | |
| Shares Outstanding | 3,411,693 | 689,804 | 196,082 | 182,927 | |
| Net Asset Value Per Share ($) | 15.37 | 16.65 | 18.20 | 16.88 | |
| † Investments at cost ($): | |||||
| Unaffiliated issuers | 1,424,866,702 | 313,383,200 | 522,870,302 | 377,601,009 | |
| Affiliated issuers | 53,173,766 | 25,519,432 | 2,904,985 | 21,436,368 | |
| ††Value of securities on loan ($) | 31,425,396 | 23,512,477 | — | 19,050,638 | |
| See notes to financial statements. | |||||
The Funds 109
STATEMENTS OF ASSETS AND LIABILITIES (continued)
| BNY Mellon | BNY Mellon | BNY Mellon | BNY Mellon | ||
| BNY Mellon | Emerging | International | International | Asset Allocation | |
| International Fund | Markets Fund | Appreciation Fund | Equity Income Fund | Fund | |
| Assets ($): | |||||
| Investments in securities— | |||||
| See Statement of Investments† | |||||
| (including securities on loan)††—Note 2(c): | |||||
| Unaffiliated issuers | 975,410,148 | 2,024,583,075 | 113,744,696 | 335,095,854 | 185,831,879 |
| Affiliated issuers | 14,680,791 | 19,099,791 | 2,288,421 | 3,435,128 | 316,433,294 |
| Cash | 1,303,986 | 420,588 | 23,432 | 807,194 | — |
| Cash denominated in foreign currencies††† | 6,116,111 | 20,515,282 | — | 1,241,848 | — |
| Receivable for investment securities sold | 15,810,236 | 21,444,618 | 251,445 | — | — |
| Dividends receivable | 2,644,333 | 4,964,765 | 336,998 | 1,803,111 | — |
| Receivable for shares of | |||||
| Beneficial Interest subscribed | 1,101,854 | 526,372 | 25,000 | 598,503 | 53,500 |
| Unrealized appreciation on forward foreign | |||||
| currency exchange contracts—Note 5 | 2,301 | 1,911 | — | — | — |
| Dividends, interest and | |||||
| securities lending income receivable | — | — | — | — | 593,200 |
| Prepaid expenses and other assets | 17,755 | 22,427 | 268,067 | 5,904 | 18,937 |
| 1,017,087,515 | 2,091,578,829 | 116,938,059 | 342,987,542 | 502,930,810 | |
| Liabilities ($): | |||||
| Due to The Dreyfus Corporation | |||||
| and affiliates—Note 4(b) | 814,556 | 2,788,264 | 56,181 | 294,878 | 118,895 |
| Due to Administrator—Note 4(a) | 103,004 | 213,163 | 12,075 | 34,764 | 15,989 |
| Cash overdraft due to Custodian | — | — | — | — | 442,989 |
| Payable for investment securities purchased | 17,027,025 | 18,769,734 | 252,483 | 2,322 | — |
| Payable for shares of | |||||
| Beneficial Interest redeemed | 22,810 | 408,883 | 26,932 | 27,943 | 15,421 |
| Unrealized depreciation on forward foreign | |||||
| currency exchange contracts—Note 5 | 377 | 54,237 | — | — | — |
| Interest payable—Note 3 | — | 168 | — | — | — |
| Payable for futures variation margin—Note 5 | — | — | 700 | — | — |
| Liability for securities on loan—Note 2(c) | — | — | — | — | 286,200 |
| Accrued expenses | 49,361 | 80,483 | 55,168 | 63,864 | 53,705 |
| 18,017,133 | 22,314,932 | 403,539 | 423,771 | 933,199 | |
| Net Assets ($) | 999,070,382 | 2,069,263,897 | 116,534,520 | 342,563,771 | 501,997,611 |
110
| BNY Mellon | BNY Mellon | BNY Mellon | BNY Mellon | |||||||
| BNY Mellon | Emerging | International | International | Asset Allocation | ||||||
| International Fund | Markets Fund | Appreciation Fund | Equity Income Fund | Fund | ||||||
| Composition of Net Assets ($): | ||||||||||
| Paid-in capital | 1,563,388,401 | 2,004,698,491 | 171,053,889 | 323,171,756 | 407,728,435 | |||||
| Accumulated undistributed | ||||||||||
| investment income—net | 12,852,542 | 19,989,036 | 2,855,923 | 4,184,813 | 432,191 | |||||
| Accumulated net realized | ||||||||||
| gain (loss) on investments | (561,218,956 | ) | (212,361,507 | ) | (42,290,979 | ) | (4,519,938 | ) | 18,073,919 | |
| Accumulated net unrealized appreciation | ||||||||||
| (depreciation) on investments | ||||||||||
| and foreign currency transactions | (15,951,605 | ) | 256,937,877 | — | 19,727,140 | — | ||||
| Accumulated net unrealized appreciation | ||||||||||
| (depreciation) on investments [including | ||||||||||
| ($29,624) net unrealized (depreciation) | ||||||||||
| on financial futures for BNY Mellon | ||||||||||
| International Appreciation Fund] | — | — | (15,084,313 | ) | — | 75,763,066 | ||||
| Net Assets ($) | 999,070,382 | 2,069,263,897 | 116,534,520 | 342,563,771 | 501,997,611 | |||||
| Net Asset Value Per Share | ||||||||||
| Class M Shares | ||||||||||
| Net Assets ($) | 990,118,570 | 2,046,317,336 | 111,224,522 | 341,644,989 | 493,659,510 | |||||
| Shares Outstanding | 77,839,870 | 186,327,350 | 8,003,164 | 23,046,691 | 39,285,177 | |||||
| Net Asset Value Per Share ($) | 12.72 | 10.98 | 13.90 | 14.82 | 12.57 | |||||
| Investor Shares | ||||||||||
| Net Assets ($) | 8,951,812 | 22,946,561 | 5,309,998 | 918,782 | 8,338,101 | |||||
| Shares Outstanding | 663,067 | 2,039,996 | 386,592 | 61,714 | 659,482 | |||||
| Net Asset Value Per Share ($) | 13.50 | 11.25 | 13.74 | 14.89 | 12.64 | |||||
| † | Investments at cost ($): | |||||||||
| Unaffiliated issuers | 991,323,857 | 1,767,558,452 | 128,799,385 | 315,355,920 | 167,088,241 | |||||
| Affiliated issuers | 14,680,791 | 19,099,791 | 2,288,421 | 3,435,128 | 259,413,866 | |||||
| †† | Value of securities on loan ($) | — | — | — | — | 6,471,206 | ||||
| ††† | Cash denominated in | |||||||||
| foreign currencies (cost) ($) | 6,131,949 | 20,513,310 | — | 1,247,428 | — | |||||
| See notes to financial statements. | ||||||||||
The Funds 111
| STATEMENTS OF OPERATIONS |
| Year Ended August 31, 2014 |
| BNY Mellon | BNY Mellon | BNY Mellon | BNY Mellon | |||||
| Large Cap | Large Cap Market | Tax-Sensitive Large Cap | Income | |||||
| Stock Fund | Opportunities Fund | Multi-Strategy Fund | Stock Fund | |||||
| Investment Income ($): | ||||||||
| Income: | ||||||||
| Cash dividends (net of $9,039, $6,263 and $8,987 | ||||||||
| foreign taxes withheld at source for BNY Mellon | ||||||||
| Large Cap Stock Fund, BNY Mellon Large Cap Market | ||||||||
| Opportunities Fund and BNY Mellon Tax-Sensitive | ||||||||
| Large Cap Multi-Strategy Fund, respectively): | ||||||||
| Unaffiliated issuers | 11,237,046 | 1,497,072 | 6,822,397 | 32,942,047 | ||||
| Affiliated issuers | 1,323 | 1,066,001 | 2,420,259 | 20,301 | ||||
| Income from securities lending—Note 2(c) | 3,858 | 16,038 | 6,631 | 142,937 | ||||
| Total Income | 11,242,227 | 2,579,111 | 9,249,287 | 33,105,285 | ||||
| Expenses: | ||||||||
| Investment advisory fees—Note 4(a) | 3,639,968 | 886,998 | 2,957,523 | 7,470,746 | ||||
| Administration fees—Note 4(a) | 693,301 | 128,274 | 465,968 | 1,422,492 | ||||
| Custodian fees—Note 4(b) | 77,712 | 20,457 | 35,872 | 79,220 | ||||
| Trustees’ fees and expenses—Note 4(c) | 37,232 | 12,651 | 40,872 | 64,879 | ||||
| Shareholder servicing costs—Note 4(b) | 35,697 | 651 | 5,036 | 15,017 | ||||
| Registration fees | 29,295 | 30,929 | 28,220 | 37,485 | ||||
| Professional fees | 25,439 | 19,505 | 40,816 | 43,714 | ||||
| Interest expense—Note 3 | 6,960 | 138 | 270 | 125 | ||||
| Prospectus and shareholders’ reports | 6,744 | 6,296 | 6,524 | 6,257 | ||||
| Loan commitment fees—Note 3 | 4,532 | 1,975 | 5,399 | 9,138 | ||||
| Miscellaneous | 26,418 | 19,446 | 27,906 | 31,783 | ||||
| Total Expenses | 4,583,298 | 1,127,320 | 3,614,406 | 9,180,856 | ||||
| Less—reduction in fees | ||||||||
| due to earnings credits—Note 4(b) | (6 | ) | (1 | ) | (1 | ) | (8 | ) |
| Net Expenses | 4,583,292 | 1,127,319 | 3,614,405 | 9,180,848 | ||||
| Investment Income—Net | 6,658,935 | 1,451,792 | 5,634,882 | 23,924,437 | ||||
| Realized and Unrealized Gain (Loss) | ||||||||
| on Investments—Note 5 ($): | ||||||||
| Net realized gain (loss) on investments: | ||||||||
| Unaffiliated issuers | 240,523,951 | 20,927,852 | 39,505,114 | 119,310,926 | ||||
| Affiliated issuers | — | 2,247,683 | 10,176,030 | — | ||||
| Capital gain distributions: | ||||||||
| Affiliated issuers | — | 4,533,684 | 9,158,531 | — | ||||
| Net realized gain (loss) on options transactions | — | — | — | 1,037,685 | ||||
| Net Realized Gain (Loss) | 240,523,951 | 27,709,219 | 58,839,675 | 120,348,611 | ||||
| Net unrealized appreciation (depreciation) on investments: | ||||||||
| Unaffiliated issuers | (104,929,782 | ) | 1,082,972 | 39,750,638 | 109,630,640 | |||
| Affiliated issuers | — | 15,691,443 | 27,897,898 | — | ||||
| Net unrealized appreciation | ||||||||
| (depreciation) on options transactions | — | — | — | (353,256 | ) | |||
| Net Unrealized Appreciation (Depreciation) | (104,929,782 | ) | 16,774,415 | 67,648,536 | 109,277,384 | |||
| Net Realized and Unrealized Gain (Loss) on Investments | 135,594,169 | 44,483,634 | 126,488,211 | 229,625,995 | ||||
| Net Increase in Net Assets Resulting from Operations | 142,253,104 | 45,935,426 | 132,123,093 | 253,550,432 | ||||
| See notes to financial statements. |
112
| BNY Mellon | BNY Mellon | BNY Mellon | BNY Mellon | |||||
| Mid Cap | Small Cap | Focused Equity | Small/Mid Cap | |||||
| Multi-Strategy Fund | Multi-Strategy Fund | Opportunities Fund | Multi-Strategy Fund | |||||
| Investment Income ($): | ||||||||
| Income: | ||||||||
| Cash dividends (net of $12,757, $1,749, $70,432 | ||||||||
| and $5,933 foreign taxes withheld at source for | ||||||||
| BNY Mellon Mid Cap Multi-Strategy Fund, BNY Mellon | ||||||||
| Small Cap Multi-Strategy Fund, BNY Mellon Focused | ||||||||
| Equity Opportunities Fund and BNY Mellon | ||||||||
| Small/Mid Cap Multi-Strategy Fund, respectively): | ||||||||
| Unaffiliated issuers | 22,293,027 | 2,642,726 | 9,184,587 | 5,989,106 | ||||
| Affiliated issuers | 20,564 | 3,896 | 2,111 | 1,788 | ||||
| Income from securities lending—Note 2(c) | 252,248 | 224,099 | 3,192 | 165,614 | ||||
| Total Income | 22,565,839 | 2,870,721 | 9,189,890 | 6,156,508 | ||||
| Expenses: | ||||||||
| Investment advisory fees—Note 4(a) | 13,742,729 | 2,975,238 | 4,290,288 | 3,384,907 | ||||
| Administration fees—Note 4(a) | 2,267,940 | 433,264 | 758,563 | 558,740 | ||||
| Trustees’ fees and expenses—Note 4(c) | 121,768 | 18,200 | 31,853 | 29,844 | ||||
| Custodian fees—Note 4(b) | 118,620 | 79,869 | 45,942 | 35,368 | ||||
| Shareholder servicing costs—Note 4(b) | 103,788 | 26,730 | 5,728 | 4,400 | ||||
| Professional fees | 70,290 | 37,116 | 26,803 | 24,864 | ||||
| Prospectus and shareholders’ reports | 43,222 | 15,388 | 7,453 | 7,337 | ||||
| Registration fees | 29,427 | 27,863 | 35,922 | 33,914 | ||||
| Loan commitment fees—Note 3 | 19,252 | 2,971 | 5,659 | 4,366 | ||||
| Interest expense—Note 3 | — | — | 224 | 4,687 | ||||
| Miscellaneous | 40,359 | 21,878 | 21,437 | 18,664 | ||||
| Total Expenses | 16,557,395 | 3,638,517 | 5,229,872 | 4,107,091 | ||||
| Less—reduction in fees due to | ||||||||
| earnings credits—Note 4(b) | (91 | ) | (36 | ) | (2 | ) | (3 | ) |
| Net Expenses | 16,557,304 | 3,638,481 | 5,229,870 | 4,107,088 | ||||
| Investment Income (Loss)—Net | 6,008,535 | (767,760 | ) | 3,960,020 | 2,049,420 | |||
| Realized and Unrealized Gain (Loss) | ||||||||
| on Investments—Note 5 ($): | ||||||||
| Net realized gain (loss) on investments | 110,864,828 | 53,222,106 | 107,670,666 | 107,737,911 | ||||
| Net unrealized appreciation | ||||||||
| (depreciation) on investments | 253,946,236 | (2,358,237 | ) | 49,308,976 | (25,461,563 | ) | ||
| Net Realized and Unrealized | ||||||||
| Gain (Loss) on Investments | 364,811,064 | 50,863,869 | 156,979,642 | 82,276,348 | ||||
| Net Increase in Net Assets | ||||||||
| Resulting from Operations | 370,819,599 | 50,096,109 | 160,939,662 | 84,325,768 | ||||
| See notes to financial statements. | ||||||||
The Funds 113
STATEMENTS OF OPERATIONS (continued)
| BNY Mellon | BNY Mellon | BNY Mellon | BNY Mellon | |||||||
| BNY Mellon | Emerging | International | International | Asset Allocation | ||||||
| International Fund | Markets Fund | Appreciation Fund | Equity Income Fund | Fund | ||||||
| Investment Income ($): | ||||||||||
| Income: | ||||||||||
| Cash dividends (net of $1,728,157, $5,792,297, | ||||||||||
| $257,566, $1,006,999 and $975 foreign taxes | ||||||||||
| withheld at source for BNY Mellon International | ||||||||||
| Fund, BNY Mellon Emerging Markets Fund, | ||||||||||
| BNY Mellon International Appreciation Fund, | ||||||||||
| BNY Mellon International Equity Income Fund | ||||||||||
| and BNY Mellon Asset Allocation Fund, | ||||||||||
| respectively): | ||||||||||
| Unaffiliated issuers | 20,247,962 | 47,801,088 | 4,064,355 | 14,643,430 | 2,099,771 | |||||
| Affiliated issuers | 11,698 | 14,899 | 1,558 | 3,245 | 3,825,981 | |||||
| Interest | 4,945 | 191,069 | 51 | 40 | 1,864,664 | |||||
| Income from securities lending—Note 2(c) | — | — | — | — | 4,529 | |||||
| Total Income | 20,264,605 | 48,007,056 | 4,065,964 | 14,646,715 | 7,794,945 | |||||
| Expenses: | ||||||||||
| Investment advisory fees—Note 4(a) | 6,459,395 | 22,428,003 | 565,982 | 2,006,171 | 1,270,026 | |||||
| Administration fees—Note 4(a) | 940,158 | 2,413,929 | 140,110 | 291,949 | 178,482 | |||||
| Custodian fees—Note 4(b) | 218,050 | 1,831,775 | 9,008 | 108,878 | 25,340 | |||||
| Trustees’ fees and expenses—Note 4(c) | 45,697 | 123,802 | 4,020 | 15,349 | 28,997 | |||||
| Professional fees | 41,473 | 127,296 | 30,594 | 41,161 | 45,320 | |||||
| Registration fees | 29,777 | 32,152 | 29,731 | 49,094 | 30,959 | |||||
| Shareholder servicing costs—Note 4(b) | 19,423 | 43,828 | 13,325 | 814 | 14,630 | |||||
| Prospectus and shareholders’ reports | 6,430 | 8,884 | 3,658 | 7,178 | 8,352 | |||||
| Loan commitment fees—Note 3 | 5,815 | 18,809 | 715 | 1,763 | 3,846 | |||||
| Interest expense—Note 3 | — | 1,213 | — | 893 | — | |||||
| ADR fees | — | — | 101,893 | — | — | |||||
| Miscellaneous | 56,388 | 662,462 | 32,576 | 28,721 | 36,244 | |||||
| Total Expenses | 7,822,606 | 27,692,153 | 931,612 | 2,551,971 | 1,642,196 | |||||
| Less—reduction in expenses | ||||||||||
| due to undertaking—Note 4(a) | — | — | — | (9 | ) | (411,964 | ) | |||
| Less—reduction in fees | ||||||||||
| due to earnings credits—Note 4(b) | (7 | ) | (11 | ) | (15 | ) | (2 | ) | (2 | ) |
| Net Expenses | 7,822,599 | 27,692,142 | 931,597 | 2,551,960 | 1,230,230 | |||||
| Investment Income—Net | 12,442,006 | 20,314,914 | 3,134,367 | 12,094,755 | 6,564,715 |
114
| BNY Mellon | BNY Mellon | BNY Mellon | BNY Mellon | ||||||
| BNY Mellon | Emerging | International | International | Asset Allocation | |||||
| International Fund | Markets Fund | Appreciation Fund | Equity Income Fund | Fund | |||||
| Realized and Unrealized Gain (Loss) | |||||||||
| on Investments—Note 5 ($): | |||||||||
| Net realized gain (loss) on investments | |||||||||
| and foreign currency transactions | 68,176,684 | 38,608,076 | — | 2,864,963 | — | ||||
| Net realized gain (loss) on forward | |||||||||
| foreign currency exchange contracts | (88,424 | ) | (437,278 | ) | — | (70,661 | ) | — | |
| Net realized gain (loss) on financial futures | — | — | 181,149 | — | — | ||||
| Net realized gain (loss) on investments: | |||||||||
| Unaffiliated issuers | — | — | 198,220 | — | 22,350,193 | ||||
| Affiliated issuers | — | — | — | — | 6,949,486 | ||||
| Capital gain distributions: | |||||||||
| Unaffiliated issuers | — | — | — | — | 1,601,106 | ||||
| Affiliated issuers | — | — | — | — | 6,564,936 | ||||
| Net Realized Gain (Loss) | 68,088,260 | 38,170,798 | 379,369 | 2,794,302 | 37,465,721 | ||||
| Net unrealized appreciation | |||||||||
| (depreciation) on investments | |||||||||
| and foreign currency transactions | 8,436,322 | 324,853,446 | — | 11,110,733 | — | ||||
| Net unrealized appreciation (depreciation) | |||||||||
| on forward foreign currency | |||||||||
| exchange contracts | 2,256 | 12,474 | — | — | — | ||||
| Net unrealized appreciation | |||||||||
| (depreciation) on financial futures | — | — | 53,168 | — | — | ||||
| Net unrealized appreciation | |||||||||
| (depreciation) on investments: | |||||||||
| Unaffiliated issuers | — | — | 11,234,796 | — | (568,152 | ) | |||
| Affiliated issuers | — | — | — | — | 25,124,909 | ||||
| Net Unrealized Appreciation (Depreciation) | 8,438,578 | 324,865,920 | 11,287,964 | 11,110,733 | 24,556,757 | ||||
| Net Realized and Unrealized | |||||||||
| Gain (Loss) on Investments | 76,526,838 | 363,036,718 | 11,667,333 | 13,905,035 | 62,022,478 | ||||
| Net Increase in Net Assets Resulting | |||||||||
| from Operations | 88,968,844 | 383,351,632 | 14,801,700 | 25,999,790 | 68,587,193 | ||||
| See notes to financial statements. | |||||||||
The Funds 115
STATEMENTS OF CHANGES IN NET ASSETS
| BNY Mellon Large Cap | ||||||||
| BNY Mellon Large Cap Stock Fund | Market Opportunities Fund | |||||||
| Year Ended August 31, | Year Ended August 31, | |||||||
| 2014 | 2013 | 2014 | 2013 | |||||
| Operations ($): | ||||||||
| Investment income—net | 6,658,935 | 10,501,420 | 1,451,792 | 1,405,192 | ||||
| Net realized gain (loss) on investments | 240,523,951 | 123,059,384 | 27,709,219 | 17,536,287 | ||||
| Net unrealized appreciation (depreciation) on investments | (104,929,782 | ) | (10,138,306 | ) | 16,774,415 | 10,760,193 | ||
| Net Increase (Decrease) in Net Assets | ||||||||
| Resulting from Operations | 142,253,104 | 123,422,498 | 45,935,426 | 29,701,672 | ||||
| Dividends to Shareholders from ($): | ||||||||
| Investment income—net: | ||||||||
| Class M Shares | (6,578,118 | ) | (10,402,918 | ) | (2,627,874 | ) | (1,053,761 | ) |
| Investor Shares | (129,062 | ) | (132,786 | ) | (2,364 | ) | (178 | ) |
| Net realized gain on investments: | ||||||||
| Class M Shares | (276,682,757 | ) | (41,986,273 | ) | (15,333,111 | ) | — | |
| Investor Shares | (6,356,857 | ) | (546,696 | ) | (15,341 | ) | — | |
| Total Dividends | (289,746,794 | ) | (53,068,673 | ) | (17,978,690 | ) | (1,053,939 | ) |
| Beneficial Interest Transactions ($): | ||||||||
| Net proceeds from shares sold: | ||||||||
| Class M Shares | 102,188,208 | 77,759,660 | 22,641,895 | 70,144,183 | ||||
| Investor Shares | 6,674,853 | 14,649,638 | 1,095,640 | 98,998 | ||||
| Dividends reinvested: | ||||||||
| Class M Shares | 170,863,377 | 30,201,050 | 9,542,067 | 133,186 | ||||
| Investor Shares | 5,699,397 | 557,896 | 7,599 | 100 | ||||
| Cost of shares redeemed: | ||||||||
| Class M Shares | (392,623,979 | ) | (416,800,568 | ) | (84,005,367 | ) | (35,261,770 | ) |
| Investor Shares | (16,968,010 | ) | (8,136,515 | ) | (617,681 | ) | (28,772 | ) |
| Increase (Decrease) in Net Assets from | ||||||||
| Beneficial Interest Transactions | (124,166,154 | ) | (301,768,839 | ) | (51,335,847 | ) | 35,085,925 | |
| Total Increase (Decrease) in Net Assets | (271,659,844 | ) | (231,415,014 | ) | (23,379,111 | ) | 63,733,658 | |
| Net Assets ($): | ||||||||
| Beginning of Period | 752,777,042 | 984,192,056 | 216,219,192 | 152,485,534 | ||||
| End of Period | 481,117,198 | 752,777,042 | 192,840,081 | 216,219,192 | ||||
| Undistributed investment income—net | 102,520 | 154,239 | 562,590 | 783,030 | ||||
| Capital Share Transactions (Shares): | ||||||||
| Class M Shares | ||||||||
| Shares sold | 14,961,103 | 8,219,711 | 1,496,568 | 5,322,811 | ||||
| Shares issued for dividends reinvested | 26,962,119 | 3,394,443 | 644,299 | 10,655 | ||||
| Shares redeemed | (49,885,750 | ) | (44,138,261 | ) | (5,499,352 | ) | (2,658,868 | ) |
| Net Increase (Decrease) in Shares Outstanding | (7,962,528 | ) | (32,524,107 | ) | (3,358,485 | ) | 2,674,598 | |
| Investor Shares | ||||||||
| Shares sold | 879,010 | 1,467,244 | 70,970 | 7,053 | ||||
| Shares issued for dividends reinvested | 897,303 | 61,989 | 510 | 8 | ||||
| Shares redeemed | (2,026,510 | ) | (852,776 | ) | (39,963 | ) | (2,151 | ) |
| Net Increase (Decrease) in Shares Outstanding | (250,197 | ) | 676,457 | 31,517 | 4,910 | |||
| See notes to financial statements. | ||||||||
116
| BNY Mellon Tax-Sensitive | ||||||||
| Large Cap Multi-Strategy Fund | BNY Mellon Income Stock Fund | |||||||
| Year Ended August 31, | Year Ended August 31, | |||||||
| 2014 | 2013 | 2014 | 2013 | |||||
| Operations ($): | ||||||||
| Investment income—net | 5,634,882 | 4,125,294 | 23,924,437 | 21,168,160 | ||||
| Net realized gain (loss) on investments | 58,839,675 | 22,883,887 | 120,348,611 | 25,570,834 | ||||
| Net unrealized appreciation (depreciation) on investments | 67,648,536 | 36,330,755 | 109,277,384 | 92,080,248 | ||||
| Net Increase (Decrease) in Net Assets | ||||||||
| Resulting from Operations | 132,123,093 | 63,339,936 | 253,550,432 | 138,819,242 | ||||
| Dividends to Shareholders from ($): | ||||||||
| Investment income—net: | ||||||||
| Class M Shares | (8,697,498 | ) | (1,087,759 | ) | (23,938,332 | ) | (21,080,259 | ) |
| Investor Shares | (2,065 | ) | — | (108,436 | ) | (53,777 | ) | |
| Net realized gain on investments: | ||||||||
| Class M Shares | (21,406,582 | ) | — | (37,420,387 | ) | (473,022 | ) | |
| Investor Shares | (8,762 | ) | — | (137,721 | ) | (1,451 | ) | |
| Total Dividends | (30,114,907 | ) | (1,087,759 | ) | (61,604,876 | ) | (21,608,509 | ) |
| Beneficial Interest Transactions ($): | ||||||||
| Net proceeds from shares sold: | ||||||||
| Class M Shares | 49,785,143 | 495,682,964 | 251,807,801 | 413,807,788 | ||||
| Investor Shares | 4,592,845 | 3,026,866 | 14,287,359 | 4,038,516 | ||||
| Dividends reinvested: | ||||||||
| Class M Shares | 20,533,885 | 83,182 | 22,677,254 | 4,266,679 | ||||
| Investor Shares | 10,827 | — | 215,737 | 46,170 | ||||
| Cost of shares redeemed: | ||||||||
| Class M Shares | (335,575,104 | ) | (43,118,721 | ) | (192,299,027 | ) | (95,126,887 | ) |
| Investor Shares | (2,282,029 | ) | (1,907,243 | ) | (4,352,989 | ) | (2,828,774 | ) |
| Increase (Decrease) in Net Assets from | ||||||||
| Beneficial Interest Transactions | (262,934,433 | ) | 453,767,048 | 92,336,135 | 324,203,492 | |||
| Total Increase (Decrease) in Net Assets | (160,926,247 | ) | 516,019,225 | 284,281,691 | 441,414,225 | |||
| Net Assets ($): | ||||||||
| Beginning of Period | 639,281,383 | 123,262,158 | 984,253,007 | 542,838,782 | ||||
| End of Period | 478,355,136 | 639,281,383 | 1,268,534,698 | 984,253,007 | ||||
| Undistributed investment income—net | 2,608,730 | 3,549,629 | 53,324 | 175,655 | ||||
| Capital Share Transactions (Shares): | ||||||||
| Class M Shares | ||||||||
| Shares sold | 3,127,442 | 37,436,918 | 27,439,072 | 51,216,956 | ||||
| Shares issued for dividends reinvested | 1,319,658 | 6,504 | 2,518,201 | 554,014 | ||||
| Shares redeemed | (20,893,214 | ) | (3,140,007 | ) | (20,714,936 | ) | (12,338,735 | ) |
| Net Increase (Decrease) in Shares Outstanding | (16,446,114 | ) | 34,303,415 | 9,242,337 | 39,432,235 | |||
| Investor Shares | ||||||||
| Shares sold | 283,402 | 224,259 | 1,499,156 | 512,596 | ||||
| Shares issued for dividends reinvested | 683 | — | 23,465 | 5,965 | ||||
| Shares redeemed | (143,996 | ) | (143,583 | ) | (465,821 | ) | (361,839 | ) |
| Net Increase (Decrease) in Shares Outstanding | 140,089 | 80,676 | 1,056,800 | 156,722 | ||||
| See notes to financial statements. | ||||||||
The Funds 117
STATEMENTS OF CHANGES IN NET ASSETS (continued)
| BNY Mellon Mid Cap Multi-Strategy Fund | BNY Mellon Small Cap Multi-Strategy Fund | |||||||
| Year Ended August 31, | Year Ended August 31, | |||||||
| 2014 | 2013 | 2014 | 2013 | |||||
| Operations ($): | ||||||||
| Investment income (loss)—net | 6,008,535 | 8,207,614 | (767,760 | ) | 212,751 | |||
| Net realized gain (loss) on investments | 110,864,828 | 131,965,095 | 53,222,106 | 40,620,725 | ||||
| Net unrealized appreciation (depreciation) on investments | 253,946,236 | 160,374,845 | (2,358,237 | ) | 26,653,309 | |||
| Net Increase (Decrease) in Net Assets | ||||||||
| Resulting from Operations | 370,819,599 | 300,547,554 | 50,096,109 | 67,486,785 | ||||
| Dividends to Shareholders from ($): | ||||||||
| Investment income—net: | ||||||||
| Class M Shares | (6,436,066 | ) | (2,758,781 | ) | — | (580,713 | ) | |
| Investor Shares | (68,259 | ) | — | — | — | |||
| Net realized gain on investments: | ||||||||
| Class M Shares | (82,167,114 | ) | (97,703,444 | ) | — | — | ||
| Investor Shares | (1,816,907 | ) | (2,035,528 | ) | — | — | ||
| Total Dividends | (90,488,346 | ) | (102,497,753 | ) | — | (580,713 | ) | |
| Beneficial Interest Transactions ($): | ||||||||
| Net proceeds from shares sold: | ||||||||
| Class M Shares | 281,797,689 | 335,912,212 | 44,258,327 | 45,917,357 | ||||
| Investor Shares | 32,357,068 | 9,448,413 | 4,797,347 | 2,962,065 | ||||
| Dividends reinvested: | ||||||||
| Class M Shares | 48,034,957 | 57,479,998 | — | 129,939 | ||||
| Investor Shares | 1,594,057 | 1,690,809 | — | — | ||||
| Cost of shares redeemed: | ||||||||
| Class M Shares | (254,700,059 | ) | (203,744,439 | ) | (44,682,812 | ) | (44,862,742 | ) |
| Investor Shares | (17,095,449 | ) | (10,243,456 | ) | (3,258,381 | ) | (2,514,418 | ) |
| Increase (Decrease) in Net Assets from | ||||||||
| Beneficial Interest Transactions | 91,988,263 | 190,543,537 | 1,114,481 | 1,632,201 | ||||
| Total Increase (Decrease) in Net Assets | 372,319,516 | 388,593,338 | 51,210,590 | 68,538,273 | ||||
| Net Assets ($): | ||||||||
| Beginning of Period | 1,602,200,923 | 1,213,607,585 | 307,887,243 | 239,348,970 | ||||
| End of Period | 1,974,520,439 | 1,602,200,923 | 359,097,833 | 307,887,243 | ||||
| Undistributed investment | ||||||||
| (distribution in excess of) income (loss)—net | 3,410,763 | 4,972,064 | (592,232 | ) | (423,571 | ) | ||
| Capital Share Transactions (Shares): | ||||||||
| Class M Shares | ||||||||
| Shares sold | 19,308,828 | 27,543,848 | 2,641,544 | 3,557,454 | ||||
| Shares issued for dividends reinvested | 3,431,069 | 5,234,972 | — | 11,192 | ||||
| Shares redeemed | (17,347,675 | ) | (16,777,547 | ) | (2,668,257 | ) | (3,510,292 | ) |
| Net Increase (Decrease) in Shares Outstanding | 5,392,222 | 16,001,273 | (26,713 | ) | 58,354 | |||
| Investor Shares | ||||||||
| Shares sold | 2,229,933 | 765,173 | 298,427 | 223,795 | ||||
| Shares issued for dividends reinvested | 115,178 | 155,548 | — | — | ||||
| Shares redeemed | (1,184,000 | ) | (864,387 | ) | (198,568 | ) | (204,693 | ) |
| Net Increase (Decrease) in Shares Outstanding | 1,161,111 | 56,334 | 99,859 | 19,102 | ||||
| See notes to financial statements. | ||||||||
118
| BNY Mellon Focused Equity | BNY Mellon Small/Mid Cap | |||||||
| Opportunities Fund | Multi-Strategy Fund | |||||||
| Year Ended August 31, | Year Ended August 31, | |||||||
| 2014 | 2013 | 2014 | 2013 | |||||
| Operations ($): | ||||||||
| Investment income—net | 3,960,020 | 5,518,027 | 2,049,420 | 4,004,123 | ||||
| Net realized gain (loss) on investments | 107,670,666 | 44,441,315 | 107,737,911 | 59,865,850 | ||||
| Net unrealized appreciation (depreciation) on investments | 49,308,976 | 28,992,705 | (25,461,563 | ) | 13,695,989 | |||
| Net Increase (Decrease) in Net Assets | ||||||||
| Resulting from Operations | 160,939,662 | 78,952,047 | 84,325,768 | 77,565,962 | ||||
| Dividends to Shareholders from ($): | ||||||||
| Investment income—net: | ||||||||
| Class M Shares | (4,990,326 | ) | (4,210,323 | ) | (2,444,709 | ) | (7,566,379 | ) |
| Investor Shares | (10,658 | ) | (1,896 | ) | (3,840 | ) | (10,362 | ) |
| Net realized gain on investments: | ||||||||
| Class M Shares | (43,201,156 | ) | — | (26,997,201 | ) | — | ||
| Investor Shares | (111,275 | ) | — | (60,634 | ) | — | ||
| Total Dividends | (48,313,415 | ) | (4,212,219 | ) | (29,506,384 | ) | (7,576,741 | ) |
| Beneficial Interest Transactions ($): | ||||||||
| Net proceeds from shares sold: | ||||||||
| Class M Shares | 134,940,084 | 178,147,579 | 20,968,147 | 56,761,726 | ||||
| Investor Shares | 5,384,521 | 1,593,152 | 4,320,253 | 1,655,396 | ||||
| Dividends reinvested: | ||||||||
| Class M Shares | 26,641,196 | 769,049 | 18,111,234 | 1,058,234 | ||||
| Investor Shares | 112,908 | 1,861 | 55,878 | 10,104 | ||||
| Cost of shares redeemed: | ||||||||
| Class M Shares | (138,547,390 | ) | (182,464,987 | ) | (146,438,338 | ) | (190,139,885 | ) |
| Investor Shares | (3,364,762 | ) | (894,288 | ) | (1,884,562 | ) | (2,305,372 | ) |
| Increase (Decrease) in Net Assets from | ||||||||
| Beneficial Interest Transactions | 25,166,557 | (2,847,634 | ) | (104,867,388 | ) | (132,959,797 | ) | |
| Total Increase (Decrease) in Net Assets | 137,792,804 | 71,892,194 | (50,048,004 | ) | (62,970,576 | ) | ||
| Net Assets ($): | ||||||||
| Beginning of Period | 539,997,948 | 468,105,754 | 464,470,007 | 527,440,583 | ||||
| End of Period | 677,790,752 | 539,997,948 | 414,422,003 | 464,470,007 | ||||
| Undistributed investment income—net | 2,717,811 | 3,758,775 | 5,503 | 437,489 | ||||
| Capital Share Transactions (Shares): | ||||||||
| Class M Shares | ||||||||
| Shares sold | 8,119,093 | 12,698,505 | 1,280,357 | 4,110,875 | ||||
| Shares issued for dividends reinvested | 1,702,313 | 58,483 | 1,170,732 | 81,907 | ||||
| Shares redeemed | (8,349,038 | ) | (13,143,120 | ) | (8,971,607 | ) | (13,975,928 | ) |
| Net Increase (Decrease) in Shares Outstanding | 1,472,368 | (386,132 | ) | (6,520,518 | ) | (9,783,146 | ) | |
| Investor Shares | ||||||||
| Shares sold | 326,470 | 111,122 | 266,756 | 119,537 | ||||
| Shares issued for dividends reinvested | 7,238 | 142 | 3,626 | 784 | ||||
| Shares redeemed | (202,095 | ) | (62,345 | ) | (116,668 | ) | (165,048 | ) |
| Net Increase (Decrease) in Shares Outstanding | 131,613 | 48,919 | 153,714 | (44,727 | ) | |||
| See notes to financial statements. | ||||||||
The Funds 119
STATEMENTS OF CHANGES IN NET ASSETS (continued)
| BNY Mellon International Fund | BNY Mellon Emerging Markets Fund | |||||||
| Year Ended August 31, | Year Ended August 31, | |||||||
| 2014 | 2013 | 2014 | 2013 | |||||
| Operations ($): | ||||||||
| Investment income—net | 12,442,006 | 9,569,650 | 20,314,914 | 25,590,495 | ||||
| Net realized gain (loss) on investments | 68,088,260 | 38,452,929 | 38,170,798 | (34,982,641 | ) | |||
| Net unrealized appreciation (depreciation) on investments | 8,438,578 | 67,380,146 | 324,865,920 | 23,320,974 | ||||
| Net Increase (Decrease) in Net Assets | ||||||||
| Resulting from Operations | 88,968,844 | 115,402,725 | 383,351,632 | 13,928,828 | ||||
| Dividends to Shareholders from ($): | ||||||||
| Investment income—net: | ||||||||
| Class M Shares | (9,398,282 | ) | (16,766,463 | ) | (21,077,630 | ) | (21,707,909 | ) |
| Investor Shares | (94,457 | ) | (109,039 | ) | (134,594 | ) | (115,068 | ) |
| Total Dividends | (9,492,739 | ) | (16,875,502 | ) | (21,212,224 | ) | (21,822,977 | ) |
| Beneficial Interest Transactions ($): | ||||||||
| Net proceeds from shares sold: | ||||||||
| Class M Shares | 466,602,462 | 46,553,758 | 380,383,384 | 426,526,076 | ||||
| Investor Shares | 9,925,009 | 3,227,291 | 25,557,631 | 12,387,403 | ||||
| Dividends reinvested: | ||||||||
| Class M Shares | 1,980,309 | 3,256,938 | 4,429,908 | 4,437,020 | ||||
| Investor Shares | 78,661 | 93,855 | 104,032 | 86,532 | ||||
| Cost of shares redeemed: | ||||||||
| Class M Shares | (77,103,607 | ) | (177,223,174 | ) | (528,279,852 | ) | (730,431,847 | ) |
| Investor Shares | (6,284,913 | ) | (3,756,896 | ) | (16,688,711 | ) | (18,129,975 | ) |
| Increase (Decrease) in Net Assets from | ||||||||
| Beneficial Interest Transactions | 395,197,921 | (127,848,228 | ) | (134,493,608 | ) | (305,124,791 | ) | |
| Total Increase (Decrease) in Net Assets | 474,674,026 | (29,321,005 | ) | 227,645,800 | (313,018,940 | ) | ||
| Net Assets ($): | ||||||||
| Beginning of Period | 524,396,356 | 553,717,361 | 1,841,618,097 | 2,154,637,037 | ||||
| End of Period | 999,070,382 | 524,396,356 | 2,069,263,897 | 1,841,618,097 | ||||
| Undistributed investment income—net | 12,852,542 | 9,338,567 | 19,989,036 | 21,173,888 | ||||
| Capital Share Transactions (Shares): | ||||||||
| Class M Shares | ||||||||
| Shares sold | 37,197,981 | 4,373,736 | 38,809,061 | 43,117,963 | ||||
| Shares issued for dividends reinvested | 166,413 | 326,020 | 448,371 | 438,441 | ||||
| Shares redeemed | (6,210,847 | ) | (17,177,788 | ) | (53,935,438 | ) | (75,161,840 | ) |
| Net Increase (Decrease) in Shares Outstanding | 31,153,547 | (12,478,032 | ) | (14,678,006 | ) | (31,605,436 | ) | |
| Investor Shares | ||||||||
| Shares sold | 752,109 | 288,218 | 2,499,311 | 1,237,791 | ||||
| Shares issued for dividends reinvested | 6,213 | 8,829 | 10,260 | 8,328 | ||||
| Shares redeemed | (470,168 | ) | (340,516 | ) | (1,633,928 | ) | (1,816,084 | ) |
| Net Increase (Decrease) in Shares Outstanding | 288,154 | (43,469 | ) | 875,643 | (569,965 | ) | ||
| See notes to financial statements. | ||||||||
120
| BNY Mellon | BNY Mellon International | |||||||
| International Appreciation Fund | Equity Income Fund | |||||||
| Year Ended August 31, | Year Ended August 31, | |||||||
| 2014 | 2013 | 2014 | 2013 | |||||
| Operations ($): | ||||||||
| Investment income—net | 3,134,367 | 2,553,655 | 12,094,755 | 5,942,737 | ||||
| Net realized gain (loss) on investments | 379,369 | (3,130,483 | ) | 2,794,302 | (5,824,995 | ) | ||
| Net unrealized appreciation (depreciation) on investments | 11,287,964 | 20,407,123 | 11,110,733 | 10,065,227 | ||||
| Net Increase (Decrease) in Net Assets | ||||||||
| Resulting from Operations | 14,801,700 | 19,830,295 | 25,999,790 | 10,182,969 | ||||
| Dividends to Shareholders from ($): | ||||||||
| Investment income—net: | ||||||||
| Class M Shares | (2,202,471 | ) | (3,637,873 | ) | (10,136,788 | ) | (4,924,144 | ) |
| Investor Shares | (97,873 | ) | (133,114 | ) | (14,404 | ) | (1,414 | ) |
| Total Dividends | (2,300,344 | ) | (3,770,987 | ) | (10,151,192 | ) | (4,925,558 | ) |
| Beneficial Interest Transactions ($): | ||||||||
| Net proceeds from shares sold: | ||||||||
| Class M Shares | 13,738,275 | 1,777,503 | 202,314,910 | 108,163,369 | ||||
| Investor Shares | 173,521 | 843,940 | 2,094,589 | 320,785 | ||||
| Dividends reinvested: | ||||||||
| Class M Shares | 152,529 | 169,947 | 2,697,636 | 1,337,922 | ||||
| Investor Shares | 96,784 | 131,579 | 10,915 | 1,043 | ||||
| Cost of shares redeemed: | ||||||||
| Class M Shares | (12,943,567 | ) | (38,790,868 | ) | (44,350,921 | ) | (30,656,835 | ) |
| Investor Shares | (318,481 | ) | (818,947 | ) | (1,235,314 | ) | (284,973 | ) |
| Increase (Decrease) in Net Assets from | ||||||||
| Beneficial Interest Transactions | 899,061 | (36,686,846 | ) | 161,531,815 | 78,881,311 | |||
| Total Increase (Decrease) in Net Assets | 13,400,417 | (20,627,538 | ) | 177,380,413 | 84,138,722 | |||
| Net Assets ($): | ||||||||
| Beginning of Period | 103,134,103 | 123,761,641 | 165,183,358 | 81,044,636 | ||||
| End of Period | 116,534,520 | 103,134,103 | 342,563,771 | 165,183,358 | ||||
| Undistributed investment income—net | 2,855,923 | 1,827,550 | 4,184,813 | 2,236,471 | ||||
| Capital Share Transactions (Shares): | ||||||||
| Class M Shares | ||||||||
| Shares sold | 999,329 | 149,651 | 13,965,897 | 7,738,685 | ||||
| Shares issued for dividends reinvested | 11,538 | 14,727 | 186,008 | 97,599 | ||||
| Shares redeemed | (950,808 | ) | (3,308,031 | ) | (3,058,624 | ) | (2,181,574 | ) |
| Net Increase (Decrease) in Shares Outstanding | 60,059 | (3,143,653 | ) | 11,093,281 | 5,654,710 | |||
| Investor Shares | ||||||||
| Shares sold | 13,069 | 72,626 | 140,397 | 24,109 | ||||
| Shares issued for dividends reinvested | 7,400 | 11,512 | 738 | 74 | ||||
| Shares redeemed | (23,680 | ) | (71,746 | ) | (83,100 | ) | (21,304 | ) |
| Net Increase (Decrease) in Shares Outstanding | (3,211 | ) | 12,392 | 58,035 | 2,879 | |||
| See notes to financial statements. | ||||||||
The Funds 121
STATEMENTS OF CHANGES IN NET ASSETS (continued)
| BNY Mellon Asset Allocation Fund | ||||
| Year Ended August 31, | ||||
| 2014 | 2013 | |||
| Operations ($): | ||||
| Investment income—net | 6,564,715 | 6,919,542 | ||
| Net realized gain (loss) on investments | 37,465,721 | 9,717,443 | ||
| Net unrealized appreciation (depreciation) on investments | 24,556,757 | 19,197,595 | ||
| Net Increase (Decrease) in Net Assets | ||||
| Resulting from Operations | 68,587,193 | 35,834,580 | ||
| Dividends to Shareholders from ($): | ||||
| Investment income—net: | ||||
| Class M Shares | (9,401,580 | ) | (9,168,546 | ) |
| Investor Shares | (103,512 | ) | (102,392 | ) |
| Net realized gain on investments: | ||||
| Class M Shares | (23,978,914 | ) | (939,855 | ) |
| Investor Shares | (292,104 | ) | (11,962 | ) |
| Total Dividends | (33,776,110 | ) | (10,222,755 | ) |
| Beneficial Interest Transactions ($): | ||||
| Net proceeds from shares sold: | ||||
| Class M Shares | 74,623,554 | 36,319,448 | ||
| Investor Shares | 4,044,875 | 1,672,893 | ||
| Dividends reinvested: | ||||
| Class M Shares | 19,364,809 | 1,363,476 | ||
| Investor Shares | 361,969 | 103,441 | ||
| Cost of shares redeemed: | ||||
| Class M Shares | (45,909,198 | ) | (44,707,793 | ) |
| Investor Shares | (1,452,314 | ) | (2,248,956 | ) |
| Increase (Decrease) in Net Assets from | ||||
| Beneficial Interest Transactions | 51,033,695 | (7,497,491 | ) | |
| Total Increase (Decrease) in Net Assets | 85,844,778 | 18,114,334 | ||
| Net Assets ($): | ||||
| Beginning of Period | 416,152,833 | 398,038,499 | ||
| End of Period | 501,997,611 | 416,152,833 | ||
| Undistributed investment income—net | 432,191 | 672,651 | ||
| Capital Share Transactions (Shares): | ||||
| Class M Shares | ||||
| Shares sold | 6,212,862 | 3,154,967 | ||
| Shares issued for dividends reinvested | 1,623,930 | 121,436 | ||
| Shares redeemed | (3,766,568 | ) | (3,896,907 | ) |
| Net Increase (Decrease) in Shares Outstanding | 4,070,224 | (620,504 | ) | |
| Investor Shares | ||||
| Shares sold | 328,225 | 143,907 | ||
| Shares issued for dividends reinvested | 30,108 | 9,131 | ||
| Shares redeemed | (119,378 | ) | (194,197 | ) |
| Net Increase (Decrease) in Shares Outstanding | 238,955 | (41,159 | ) | |
| See notes to financial statements. | ||||
122
FINANCIAL HIGHLIGHTS
The following tables describe the performance for each share class of each BNY Mellon equity fund for the fiscal periods indicated. All information (except portfolio turnover rate) reflects financial results for a single fund share. Total return shows how much your investment in each fund would have increased (or decreased) during each period, assuming you had reinvested all dividends and distributions.These figures have been derived from each fund’s financial statements.
| Class M Shares | ||||||||||
| Year Ended August 31, | ||||||||||
| BNY Mellon Large Cap Stock Fund | 2014 | 2013 | 2012 | 2011 | 2010 | |||||
| Per Share Data ($): | ||||||||||
| Net asset value, beginning of period | 9.97 | 9.17 | 8.14 | 7.16 | 6.77 | |||||
| Investment Operations: | ||||||||||
| Investment income—neta | .09 | .12 | .08 | .09 | .06 | |||||
| Net realized and unrealized | ||||||||||
| gain (loss) on investments | 1.88 | 1.21 | 1.03 | .98 | .39 | |||||
| Total from Investment Operations | 1.97 | 1.33 | 1.11 | 1.07 | .45 | |||||
| Distributions: | ||||||||||
| Dividends from investment income—net | (.10 | ) | (.12 | ) | (.08 | ) | (.09 | ) | (.06 | ) |
| Dividends from net realized gain on investments | (4.69 | ) | (.41 | ) | — | — | — | |||
| Total Distributions | (4.79 | ) | (.53 | ) | (.08 | ) | (.09 | ) | (.06 | ) |
| Net asset value, end of period | 7.15 | 9.97 | 9.17 | 8.14 | 7.16 | |||||
| Total Return (%) | 26.27 | 15.16 | 13.73 | 14.86 | 6.62 | |||||
| Ratios/Supplemental Data (%): | ||||||||||
| Ratio of total expenses to average net assets | .81 | .80 | .81 | .80 | .80 | |||||
| Ratio of net expenses to average net assets | .81 | .80 | .81 | .80 | .80 | |||||
| Ratio of net investment income | ||||||||||
| to average net assets | 1.20 | 1.23 | .95 | .98 | .81 | |||||
| Portfolio Turnover Rate | 142.41 | 50.96 | 76.82 | 86.71 | 71.61 | |||||
| Net Assets, end of period ($ x 1,000) | 468,446 | 732,612 | 971,849 | 1,093,037 | 1,178,235 | |||||
| a Based on average shares outstanding. | ||||||||||
| See notes to financial statements. | ||||||||||
The Funds 123
FINANCIAL HIGHLIGHTS (continued)
| Investor Shares | ||||||||||
| Year Ended August 31, | ||||||||||
| BNY Mellon Large Cap Stock Fund | 2014 | 2013 | 2012 | 2011 | 2010 | |||||
| Per Share Data ($): | ||||||||||
| Net asset value, beginning of period | 9.97 | 9.17 | 8.15 | 7.16 | 6.78 | |||||
| Investment Operations: | ||||||||||
| Investment income—neta | .07 | .09 | .06 | .06 | .04 | |||||
| Net realized and unrealized | ||||||||||
| gain (loss) on investments | 1.88 | 1.21 | 1.02 | 1.00 | .38 | |||||
| Total from Investment Operations | 1.95 | 1.30 | 1.08 | 1.06 | .42 | |||||
| Distributions: | ||||||||||
| Dividends from investment income—net | (.08 | ) | (.09 | ) | (.06 | ) | (.07 | ) | (.04 | ) |
| Dividends from net realized gain on investments | (4.69 | ) | (.41 | ) | — | — | — | |||
| Total Distributions | (4.77 | ) | (.50 | ) | (.06 | ) | (.07 | ) | (.04 | ) |
| Net asset value, end of period | 7.15 | 9.97 | 9.17 | 8.15 | 7.16 | |||||
| Total Return (%) | 25.96 | 14.87 | 13.33 | 14.78 | 6.21 | |||||
| Ratios/Supplemental Data (%): | ||||||||||
| Ratio of total expenses to average net assets | 1.06 | 1.06 | 1.06 | 1.05 | 1.05 | |||||
| Ratio of net expenses to average net assets | 1.06 | 1.06 | 1.06 | 1.05 | 1.05 | |||||
| Ratio of net investment income | ||||||||||
| to average net assets | .93 | .99 | .71 | .68 | .56 | |||||
| Portfolio Turnover Rate | 142.41 | 50.96 | 76.82 | 86.71 | 71.61 | |||||
| Net Assets, end of period ($ x 1,000) | 12,672 | 20,165 | 12,344 | 12,986 | 7,473 | |||||
| a Based on average shares outstanding. | ||||||||||
| See notes to financial statements. | ||||||||||
124
| Class M Shares | ||||||||||
| Year Ended August 31, | ||||||||||
| BNY Mellon Large Cap Market Opportunities Fund | 2014 | 2013 | 2012 | 2011 | 2010 | a | ||||
| Per Share Data ($): | ||||||||||
| Net asset value, beginning of period | 14.21 | 12.16 | 11.00 | 9.48 | 10.00 | |||||
| Investment Operations: | ||||||||||
| Investment income—netb | .11 | .10 | .06 | .02 | .00 | c | ||||
| Net realized and unrealized | ||||||||||
| gain (loss) on investments | 3.13 | 2.03 | 1.13 | 1.55 | (.52 | ) | ||||
| Total from Investment Operations | 3.24 | 2.13 | 1.19 | 1.57 | (.52 | ) | ||||
| Distributions: | ||||||||||
| Dividends from investment income—net | (.18 | ) | (.08 | ) | (.03 | ) | (.02 | ) | — | |
| Dividends from net realized gain on investments | (1.06 | ) | — | — | (.03 | ) | — | |||
| Total Distributions | (1.24 | ) | (.08 | ) | (.03 | ) | (.05 | ) | — | |
| Net asset value, end of period | 16.21 | 14.21 | 12.16 | 11.00 | 9.48 | |||||
| Total Return (%) | 23.67 | 17.64 | 10.89 | 16.48 | (5.20 | )d | ||||
| Ratios/Supplemental Data (%): | ||||||||||
| Ratio of total expenses to average net assetse | .53 | .79 | .78 | .94 | 15.54 | f | ||||
| Ratio of net expenses to average net assetse | .53 | .79 | .78 | .75 | .98 | f | ||||
| Ratio of net investment income | ||||||||||
| to average net assetse | .69 | .76 | .55 | .21 | .48 | f | ||||
| Portfolio Turnover Rate | 26.42 | 78.41 | 43.61 | 22.06 | 2.12 | d | ||||
| Net Assets, end of period ($ x 1,000) | 192,209 | 216,116 | 152,458 | 117,994 | 5,074 | |||||
| a | From July 30, 2010 (commencement of operations) to August 31, 2010. |
| b | Based on average shares outstanding. |
| c | Amount represents less than $.01 per share. |
| d | Not annualized. |
| e | Amount does not include the expenses of the underlying funds. |
| f | Annualized. |
See notes to financial statements.
The Funds 125
FINANCIAL HIGHLIGHTS (continued)
| Investor Shares | |||||||||
| Year Ended August 31, | |||||||||
| BNY Mellon Large Cap Market Opportunities Fund | 2014 | 2013 | 2012 | 2011 | 2010 | a | |||
| Per Share Data ($): | |||||||||
| Net asset value, beginning of period | 14.28 | 12.25 | 10.98 | 9.48 | 10.00 | ||||
| Investment Operations: | |||||||||
| Investment income—netb | .06 | .07 | .13 | .00 | c | .00 | c | ||
| Net realized and unrealized | |||||||||
| gain (loss) on investments | 3.17 | 2.04 | 1.14 | 1.54 | (.52 | ) | |||
| Total from Investment Operations | 3.23 | 2.11 | 1.27 | 1.54 | (.52 | ) | |||
| Distributions: | |||||||||
| Dividends from investment income—net | (.16 | ) | (.08 | ) | — | (.01 | ) | — | |
| Dividends from net realized gain on investments | (1.06 | ) | — | — | (.03 | ) | — | ||
| Total Distributions | (1.22 | ) | (.08 | ) | — | (.04 | ) | — | |
| Net asset value, end of period | 16.29 | 14.28 | 12.25 | 10.98 | 9.48 | ||||
| Total Return (%) | 23.54 | 17.29 | 11.57 | 16.16 | (5.20 | )d | |||
| Ratios/Supplemental Data (%): | |||||||||
| Ratio of total expenses to average net assetse | .81 | 1.05 | 1.02 | 1.24 | 9.38 | f | |||
| Ratio of net expenses to average net assetse | .81 | 1.05 | 1.02 | 1.00 | 1.23 | f | |||
| Ratio of net investment income | |||||||||
| to average net assetse | .45 | .48 | .95 | .03 | .16 | f | |||
| Portfolio Turnover Rate | 26.42 | 78.41 | 43.61 | 22.06 | 2.12 | d | |||
| Net Assets, end of period ($ x 1,000) | 631 | 103 | 28 | 11 | 9 |
| a | From July 30, 2010 (commencement of operations) to August 31, 2010. |
| b | Based on average shares outstanding. |
| c | Amount represents less than $.01 per share. |
| d | Not annualized. |
| e | Amount does not include the expenses of the underlying funds. |
| f | Annualized. |
See notes to financial statements.
126
| Class M Shares | ||||||||||
| Year Ended August 31, | ||||||||||
| BNY Mellon Tax-Sensitive Large Cap Multi-Strategy Fund | 2014 | 2013 | 2012 | 2011 | 2010 | a | ||||
| Per Share Data ($): | ||||||||||
| Net asset value, beginning of period | 14.45 | 12.50 | 11.14 | 9.52 | 10.00 | |||||
| Investment Operations: | ||||||||||
| Investment income—netb | .15 | .13 | .09 | .06 | .01 | |||||
| Net realized and unrealized | ||||||||||
| gain (loss) on investments | 3.22 | 1.93 | 1.32 | 1.61 | (.49 | ) | ||||
| Total from Investment Operations | 3.37 | 2.06 | 1.41 | 1.67 | (.48 | ) | ||||
| Distributions: | ||||||||||
| Dividends from investment income—net | (.20 | ) | (.11 | ) | (.05 | ) | (.02 | ) | — | |
| Dividends from net realized gain on investments | (.50 | ) | — | — | (.03 | ) | — | |||
| Total Distributions | (.70 | ) | (.11 | ) | (.05 | ) | (.05 | ) | — | |
| Net asset value, end of period | 17.12 | 14.45 | 12.50 | 11.14 | 9.52 | |||||
| Total Return (%) | 23.82 | 16.60 | 12.75 | 17.54 | (4.80 | )c | ||||
| Ratios/Supplemental Data (%): | ||||||||||
| Ratio of total expenses to average net assetsd | .61 | .79 | .87 | 1.28 | 8.12 | e | ||||
| Ratio of net expenses to average net assetsd | .61 | .79 | .87 | .88 | .99 | e | ||||
| Ratio of net investment income | ||||||||||
| to average net assetsd | .95 | .97 | .78 | .51 | .91 | e | ||||
| Portfolio Turnover Rate | 13.01 | 82.04 | 32.62 | 29.24 | 1.53 | c | ||||
| Net Assets, end of period ($ x 1,000) | 474,496 | 638,085 | 123,250 | 75,326 | 10,337 | |||||
| a | From July 30, 2010 (commencement of operations) to August 31, 2010. |
| b | Based on average shares outstanding. |
| c | Not annualized. |
| d | Amount does not include the expenses of the underlying funds. |
| e | Annualized. |
See notes to financial statements.
The Funds 127
FINANCIAL HIGHLIGHTS (continued)
| Investor Shares | ||||||||
| Year Ended August 31, | ||||||||
| BNY Mellon Tax-Sensitive Large Cap Multi-Strategy Fund | 2014 | 2013 | 2012 | 2011 | 2010 | a | ||
| Per Share Data ($): | ||||||||
| Net asset value, beginning of period | 14.64 | 12.41 | 11.04 | 9.52 | 10.00 | |||
| Investment Operations: | ||||||||
| Investment income—netb | .08 | .13 | .06 | .03 | .01 | |||
| Net realized and unrealized | ||||||||
| gain (loss) on investments | 3.30 | 2.10 | 1.31 | 1.54 | (.49 | ) | ||
| Total from Investment Operations | 3.38 | 2.23 | 1.37 | 1.57 | (.48 | ) | ||
| Distributions: | ||||||||
| Dividends from investment income—net | (.12 | ) | — | — | (.02 | ) | — | |
| Dividends from net realized gain on investments | (.50 | ) | — | — | (.03 | ) | — | |
| Total Distributions | (.62 | ) | — | — | (.05 | ) | — | |
| Net asset value, end of period | 17.40 | 14.64 | 12.41 | 11.04 | 9.52 | |||
| Total Return (%) | 23.47 | 17.97 | 12.51 | 16.31 | (4.80 | )c | ||
| Ratios/Supplemental Data (%): | ||||||||
| Ratio of total expenses to average net assetsd | .87 | 1.05 | 1.11 | 1.77 | 5.88 | e | ||
| Ratio of net expenses to average net assetsd | .87 | 1.03 | 1.11 | 1.13 | 1.24 | e | ||
| Ratio of net investment income | ||||||||
| to average net assetsd | .53 | .89 | .46 | .26 | .65 | e | ||
| Portfolio Turnover Rate | 13.01 | 82.04 | 32.62 | 29.24 | 1.53 | c | ||
| Net Assets, end of period ($ x 1,000) | 3,859 | 1,196 | 12 | 11 | 10 |
| a | From July 30, 2010 (commencement of operations) to August 31, 2010. |
| b | Based on average shares outstanding. |
| c | Not annualized. |
| d | Amount does not include the expenses of the underlying funds. |
| e | Annualized. |
See notes to financial statements.
128
| Class M Shares | ||||||||||
| Year Ended August 31, | ||||||||||
| BNY Mellon Income Stock Fund | 2014 | 2013 | 2012 | 2011 | 2010 | |||||
| Per Share Data ($): | ||||||||||
| Net asset value, beginning of period | 8.39 | 6.99 | 6.28 | 5.49 | 5.39 | |||||
| Investment Operations: | ||||||||||
| Investment income—neta | .19 | .24 | .21 | .17 | .09 | |||||
| Net realized and unrealized | ||||||||||
| gain (loss) on investments | 1.86 | 1.41 | .70 | .79 | .10 | |||||
| Total from Investment Operations | 2.05 | 1.65 | .91 | .96 | .19 | |||||
| Distributions: | ||||||||||
| Dividends from investment income—net | (.19 | ) | (.24 | ) | (.20 | ) | (.17 | ) | (.09 | ) |
| Dividends from net realized gain on investments | (.31 | ) | (.01 | ) | — | — | — | |||
| Total Distributions | (.50 | ) | (.25 | ) | (.20 | ) | (.17 | ) | (.09 | ) |
| Net asset value, end of period | 9.94 | 8.39 | 6.99 | 6.28 | 5.49 | |||||
| Total Return (%) | 25.17 | 24.01 | 14.80 | 17.41 | 3.44 | |||||
| Ratios/Supplemental Data (%): | ||||||||||
| Ratio of total expenses to average net assets | .80 | .81 | .82 | .86 | .86 | |||||
| Ratio of net expenses to average net assets | .80 | .81 | .82 | .86 | .86 | |||||
| Ratio of net investment income | ||||||||||
| to average net assets | 2.08 | 3.03 | 3.17 | 2.71 | 1.55 | |||||
| Portfolio Turnover Rate | 57.74 | 41.79 | 35.60 | 72.27 | 66.78 | |||||
| Net Assets, end of period ($ x 1,000) | 1,254,622 | 981,444 | 541,604 | 204,785 | 90,645 | |||||
| a Based on average shares outstanding. | ||||||||||
| See notes to financial statements. | ||||||||||
The Funds 129
FINANCIAL HIGHLIGHTS (continued)
| Investor Shares | ||||||||||
| Year Ended August 31, | ||||||||||
| BNY Mellon Income Stock Fund | 2014 | 2013 | 2012 | 2011 | 2010 | |||||
| Per Share Data ($): | ||||||||||
| Net asset value, beginning of period | 8.45 | 7.04 | 6.33 | 5.54 | 5.44 | |||||
| Investment Operations: | ||||||||||
| Investment income—neta | .16 | .22 | .19 | .15 | .08 | |||||
| Net realized and unrealized | ||||||||||
| gain (loss) on investments | 1.89 | 1.43 | .71 | .80 | .10 | |||||
| Total from Investment Operations | 2.05 | 1.65 | .90 | .95 | .18 | |||||
| Distributions: | ||||||||||
| Dividends from investment income—net | (.17 | ) | (.23 | ) | (.19 | ) | (.16 | ) | (.08 | ) |
| Dividends from net realized gain on investments | (.31 | ) | (.01 | ) | — | — | — | |||
| Total Distributions | (.48 | ) | (.24 | ) | (.19 | ) | (.16 | ) | (.08 | ) |
| Net asset value, end of period | 10.02 | 8.45 | 7.04 | 6.33 | 5.54 | |||||
| Total Return (%) | 24.75 | 23.84 | 14.45 | 17.02 | 3.19 | |||||
| Ratios/Supplemental Data (%): | ||||||||||
| Ratio of total expenses to average net assets | 1.07 | 1.06 | 1.06 | 1.12 | 1.11 | |||||
| Ratio of net expenses to average net assets | 1.07 | 1.06 | 1.06 | 1.12 | 1.11 | |||||
| Ratio of net investment income | ||||||||||
| to average net assets | 1.74 | 2.80 | 2.91 | 2.32 | 1.29 | |||||
| Portfolio Turnover Rate | 57.74 | 41.79 | 35.60 | 72.27 | 66.78 | |||||
| Net Assets, end of period ($ x 1,000) | 13,913 | 2,809 | 1,235 | 1,056 | 988 | |||||
| a Based on average shares outstanding. | ||||||||||
| See notes to financial statements. | ||||||||||
130
| Class M Shares | ||||||||||
| Year Ended August 31, | ||||||||||
| BNY Mellon Mid Cap Multi-Strategy Fund | 2014 | 2013 | 2012 | 2011 | 2010 | |||||
| Per Share Data ($): | ||||||||||
| Net asset value, beginning of period | 13.33 | 11.65 | 11.41 | 9.31 | 8.64 | |||||
| Investment Operations: | ||||||||||
| Investment income (loss)—net a | .05 | .07 | .01 | (.00 | )b | .05 | ||||
| Net realized and unrealized | ||||||||||
| gain (loss) on investments | 2.94 | 2.60 | .60 | 2.10 | .68 | |||||
| Total from Investment Operations | 2.99 | 2.67 | .61 | 2.10 | .73 | |||||
| Distributions: | ||||||||||
| Dividends from investment income—net | (.05 | ) | (.03 | ) | (.04 | ) | (.00 | )b | (.06 | ) |
| Dividends from net realized gain on investments | (.69 | ) | (.96 | ) | (.33 | ) | — | — | ||
| Total Distributions | (.74 | ) | (.99 | ) | (.37 | ) | (.00 | )b | (.06 | ) |
| Net asset value, end of period | 15.58 | 13.33 | 11.65 | 11.41 | 9.31 | |||||
| Total Return (%) | 23.09 | 24.74 | 5.66 | 22.59 | 8.49 | |||||
| Ratios/Supplemental Data (%): | ||||||||||
| Ratio of total expenses to average net assets | .90 | .92 | .90 | .90 | .90 | |||||
| Ratio of net expenses to average net assets | .90 | .92 | .90 | .90 | .90 | |||||
| Ratio of net investment income | ||||||||||
| (loss) to average net assets | .33 | .59 | .09 | (.01 | ) | .53 | ||||
| Portfolio Turnover Rate | 53.63 | 106.59 | 156.98 | 132.20 | 123.41 | |||||
| Net Assets, end of period ($ x 1,000) | 1,922,073 | 1,572,562 | 1,188,324 | 1,280,742 | 1,162,906 | |||||
| a | Based on average shares outstanding. |
| b | Amount represents less than $.01 per share. |
See notes to financial statements.
The Funds 131
FINANCIAL HIGHLIGHTS (continued)
| Investor Shares | ||||||||||
| Year Ended August 31, | ||||||||||
| BNY Mellon Mid Cap Multi-Strategy Fund | 2014 | 2013 | 2012 | 2011 | 2010 | |||||
| Per Share Data ($): | ||||||||||
| Net asset value, beginning of period | 13.17 | 11.52 | 11.29 | 9.24 | 8.57 | |||||
| Investment Operations: | ||||||||||
| Investment income (loss)—neta | .01 | .04 | (.02 | ) | (.03 | ) | .03 | |||
| Net realized and unrealized | ||||||||||
| gain (loss) on investments | 2.91 | 2.57 | .60 | 2.08 | .68 | |||||
| Total from Investment Operations | 2.92 | 2.61 | .58 | 2.05 | .71 | |||||
| Distributions: | ||||||||||
| Dividends from investment income—net | (.03 | ) | — | (.02 | ) | — | (.04 | ) | ||
| Dividends from net realized gain on investments | (.69 | ) | (.96 | ) | (.33 | ) | — | — | ||
| Total Distributions | (.72 | ) | (.96 | ) | (.35 | ) | — | (.04 | ) | |
| Net asset value, end of period | 15.37 | 13.17 | 11.52 | 11.29 | 9.24 | |||||
| Total Return (%) | 22.74 | 24.46 | 5.36 | 22.19 | 8.30 | |||||
| Ratios/Supplemental Data (%): | ||||||||||
| Ratio of total expenses to average net assets | 1.15 | 1.17 | 1.15 | 1.15 | 1.15 | |||||
| Ratio of net expenses to average net assets | 1.15 | 1.17 | 1.15 | 1.15 | 1.15 | |||||
| Ratio of net investment income | ||||||||||
| (loss) to average net assets | .08 | .37 | (.16 | ) | (.26 | ) | .27 | |||
| Portfolio Turnover Rate | 53.63 | 106.59 | 156.98 | 132.20 | 123.41 | |||||
| Net Assets, end of period ($ x 1,000) | 52,447 | 29,639 | 25,283 | 28,098 | 20,733 | |||||
| a Based on average shares outstanding. | ||||||||||
| See notes to financial statements. | ||||||||||
132
| Class M Shares | ||||||||||
| Year Ended August 31, | ||||||||||
| BNY Mellon Small Cap Multi-Strategy Fund | 2014 | 2013 | 2012 | 2011 | 2010 | |||||
| Per Share Data ($): | ||||||||||
| Net asset value, beginning of period | 14.78 | 11.53 | 10.78 | 8.94 | 8.57 | |||||
| Investment Operations: | ||||||||||
| Investment income (loss)—neta | (.04 | ) | .01 | (.00 | )b | (.02 | ) | .00 | b | |
| Net realized and unrealized | ||||||||||
| gain (loss) on investments | 2.44 | 3.27 | 1.05 | 1.86 | .38 | |||||
| Total from Investment Operations | 2.40 | 3.28 | 1.05 | 1.84 | .38 | |||||
| Distributions: | ||||||||||
| Dividends from investment income—net | — | (.03 | ) | (.30 | ) | — | (.01 | ) | ||
| Net asset value, end of period | 17.18 | 14.78 | 11.53 | 10.78 | 8.94 | |||||
| Total Return (%) | 16.24 | 28.51 | 10.05 | 20.58 | 4.45 | |||||
| Ratios/Supplemental Data (%): | ||||||||||
| Ratio of total expenses to average net assets | 1.03 | 1.05 | 1.04 | 1.01 | 1.00 | |||||
| Ratio of net expenses to average net assets | 1.03 | 1.05 | 1.04 | 1.01 | .98 | |||||
| Ratio of net investment income | ||||||||||
| (loss) to average net assets | (.21 | ) | .09 | (.01 | ) | (.16 | ) | .01 | ||
| Portfolio Turnover Rate | 92.86 | 128.11 | 148.75 | 161.05 | 183.41 | |||||
| Net Assets, end of period ($ x 1,000) | 347,613 | 299,415 | 232,952 | 351,122 | 412,824 | |||||
| a | Based on average shares outstanding. |
| b | Amount represents less than $.01 per share. |
See notes to financial statements.
The Funds 133
FINANCIAL HIGHLIGHTS (continued)
| Investor Shares | ||||||||||
| Year Ended August 31, | ||||||||||
| BNY Mellon Small Cap Multi-Strategy Fund | 2014 | 2013 | 2012 | 2011 | 2010 | |||||
| Per Share Data ($): | ||||||||||
| Net asset value, beginning of period | 14.36 | 11.21 | 10.49 | 8.72 | 8.36 | |||||
| Investment Operations: | ||||||||||
| Investment (loss)—neta | (.07 | ) | (.02 | ) | (.03 | ) | (.04 | ) | (.02 | ) |
| Net realized and unrealized | ||||||||||
| gain (loss) on investments | 2.36 | 3.17 | 1.03 | 1.81 | .38 | |||||
| Total from Investment Operations | 2.29 | 3.15 | 1.00 | 1.77 | .36 | |||||
| Distributions: | ||||||||||
| Dividends from investment income—net | — | — | (.28 | ) | — | — | ||||
| Net asset value, end of period | 16.65 | 14.36 | 11.21 | 10.49 | 8.72 | |||||
| Total Return (%) | 15.95 | 28.10 | 9.76 | 20.30 | 4.31 | |||||
| Ratios/Supplemental Data (%): | ||||||||||
| Ratio of total expenses to average net assets | 1.28 | 1.30 | 1.29 | 1.26 | 1.25 | |||||
| Ratio of net expenses to average net assets | 1.28 | 1.30 | 1.29 | 1.26 | 1.23 | |||||
| Ratio of net investment (loss) | ||||||||||
| to average net assets | (.46 | ) | (.16 | ) | (.26 | ) | (.39 | ) | (.24 | ) |
| Portfolio Turnover Rate | 92.86 | 128.11 | 148.75 | 161.05 | 183.41 | |||||
| Net Assets, end of period ($ x 1,000) | 11,485 | 8,472 | 6,397 | 7,815 | 6,022 | |||||
| a Based on average shares outstanding. | ||||||||||
| See notes to financial statements. | ||||||||||
134
| Class M Shares | ||||||||||
| Year Ended August 31, | ||||||||||
| BNY Mellon Focused Equity Opportunities Fund | 2014 | 2013 | 2012 | 2011 | 2010 | a | ||||
| Per Share Data ($): | ||||||||||
| Net asset value, beginning of period | 15.24 | 13.08 | 12.04 | 10.09 | 10.00 | |||||
| Investment Operations: | ||||||||||
| Investment income—netb | .11 | .16 | .08 | .04 | .06 | |||||
| Net realized and unrealized | ||||||||||
| gain (loss) on investments | 4.31 | 2.12 | 1.01 | 1.96 | .04 | |||||
| Total from Investment Operations | 4.42 | 2.28 | 1.09 | 2.00 | .10 | |||||
| Distributions: | ||||||||||
| Dividends from investment income—net | (.14 | ) | (.12 | ) | (.02 | ) | (.05 | ) | (.01 | ) |
| Dividends from net realized gain on investments | (1.22 | ) | — | (.03 | ) | — | (.00 | )c | ||
| Total Distributions | (1.36 | ) | (.12 | ) | (.05 | ) | (.05 | ) | (.01 | ) |
| Net asset value, end of period | 18.30 | 15.24 | 13.08 | 12.04 | 10.09 | |||||
| Total Return (%) | 30.54 | 17.54 | 9.07 | 19.82 | 1.01 | d | ||||
| Ratios/Supplemental Data (%): | ||||||||||
| Ratio of total expenses to average net assets | .85 | .86 | .87 | .87 | .98 | e | ||||
| Ratio of net expenses to average net assets | .85 | .86 | .87 | .87 | .89 | e | ||||
| Ratio of net investment income | ||||||||||
| to average net assets | .65 | 1.12 | .62 | .29 | .59 | e | ||||
| Portfolio Turnover Rate | 76.48 | 77.03 | 59.71 | 58.98 | 64.75 | d | ||||
| Net Assets, end of period ($ x 1,000) | 674,222 | 539,019 | 467,903 | 425,016 | 238,332 | |||||
| a | From September 30, 2009 (commencement of operations) to August 31, 2010. |
| b | Based on average shares outstanding. |
| c | Amount represents less than $.01 per share. |
| d | Not annualized. |
| e | Annualized. |
See notes to financial statements.
The Funds 135
FINANCIAL HIGHLIGHTS (continued)
| Investor Shares | ||||||||||
| Year Ended August 31, | ||||||||||
| BNY Mellon Focused Equity Opportunities Fund | 2014 | 2013 | 2012 | 2011 | 2010 | a | ||||
| Per Share Data ($): | ||||||||||
| Net asset value, beginning of period | 15.18 | 13.05 | 12.04 | 10.07 | 10.00 | |||||
| Investment Operations: | ||||||||||
| Investment income—netb | .06 | .12 | .06 | .00 | c | .02 | ||||
| Net realized and unrealized | ||||||||||
| gain (loss) on investments | 4.30 | 2.10 | .99 | 1.99 | .06 | |||||
| Total from Investment Operations | 4.36 | 2.22 | 1.05 | 1.99 | .08 | |||||
| Distributions: | ||||||||||
| Dividends from investment income—net | (.12 | ) | (.09 | ) | (.01 | ) | (.02 | ) | (.01 | ) |
| Dividends from net realized gain on investments | (1.22 | ) | — | (.03 | ) | — | (.00 | )c | ||
| Total Distributions | (1.34 | ) | (.09 | ) | (.04 | ) | (.02 | ) | (.01 | ) |
| Net asset value, end of period | 18.20 | 15.18 | 13.05 | 12.04 | 10.07 | |||||
| Total Return (%) | 30.18 | 17.12 | 8.73 | 19.80 | .75 | d | ||||
| Ratios/Supplemental Data (%): | ||||||||||
| Ratio of total expenses to average net assets | 1.11 | 1.13 | 1.13 | 1.12 | 1.53 | e | ||||
| Ratio of net expenses to average net assets | 1.11 | 1.13 | 1.13 | 1.12 | 1.14 | e | ||||
| Ratio of net investment income | ||||||||||
| to average net assets | .36 | .90 | .52 | .00 | f | .23 | e | |||
| Portfolio Turnover Rate | 76.48 | 77.03 | 59.71 | 58.98 | 64.75 | d | ||||
| Net Assets, end of period ($ x 1,000) | 3,569 | 979 | 203 | 26 | 13 |
| a | From September 30, 2009 (commencement of operations) to August 31, 2010. |
| b | Based on average shares outstanding. |
| c | Amount represents less than $.01 per share. |
| d | Not annualized. |
| e | Annualized. |
| f | Amount represents less than .01%. |
See notes to financial statements.
136
| Class M Shares | ||||||||||
| Year Ended August 31, | ||||||||||
| BNY Mellon Small/Mid Cap Multi-Strategy Fund | 2014 | 2013 | 2012 | 2011 | 2010 | a | ||||
| Per Share Data ($): | ||||||||||
| Net asset value, beginning of period | 15.09 | 12.99 | 13.14 | 10.92 | 10.00 | |||||
| Investment Operations: | ||||||||||
| Investment income—netb | .07 | .12 | .05 | .04 | .01 | |||||
| Net realized and unrealized | ||||||||||
| gain (loss) on investments | 2.82 | 2.19 | (.02 | ) | 2.31 | .95 | ||||
| Total from Investment Operations | 2.89 | 2.31 | .03 | 2.35 | .96 | |||||
| Distributions: | ||||||||||
| Dividends from investment income—net | (.08 | ) | (.21 | ) | (.18 | ) | (.04 | ) | (.01 | ) |
| Dividends from net realized gain on investments | (.92 | ) | — | — | (.09 | ) | (.03 | ) | ||
| Total Distributions | (1.00 | ) | (.21 | ) | (.18 | ) | (.13 | ) | (.04 | ) |
| Net asset value, end of period | 16.98 | 15.09 | 12.99 | 13.14 | 10.92 | |||||
| Total Return (%) | 19.84 | 18.07 | .34 | 21.41 | 9.65 | c | ||||
| Ratios/Supplemental Data (%): | ||||||||||
| Ratio of total expenses to average net assets | .91 | .92 | .92 | .92 | 1.07 | d | ||||
| Ratio of net expenses to average net assets | .91 | .92 | .92 | .92 | .92 | d | ||||
| Ratio of net investment income | ||||||||||
| to average net assets | .46 | .83 | .38 | .29 | .06 | d | ||||
| Portfolio Turnover Rate | 144.87 | 169.30 | 149.30 | 107.81 | 109.25 | c | ||||
| Net Assets, end of period ($ x 1,000) | 411,334 | 464,031 | 526,484 | 510,512 | 222,034 | |||||
| a | From September 30, 2009 (commencement of operations) to August 31, 2010. |
| b | Based on average shares outstanding. |
| c | Not annualized. |
| d Annualized. | |
See notes to financial statements.
The Funds 137
FINANCIAL HIGHLIGHTS (continued)
| Investor Shares | ||||||||||
| Year Ended August 31, | ||||||||||
| BNY Mellon Small/Mid Cap Multi-Strategy Fund | 2014 | 2013 | 2012 | 2011 | 2010 | a | ||||
| Per Share Data ($): | ||||||||||
| Net asset value, beginning of period | 15.02 | 12.94 | 13.11 | 10.89 | 10.00 | |||||
| Investment Operations: | ||||||||||
| Investment income (loss)—netb | (.00 | )c | .09 | .00 | c | .01 | .01 | |||
| Net realized and unrealized | ||||||||||
| gain (loss) on investments | 2.84 | 2.17 | (.01 | ) | 2.30 | .92 | ||||
| Total from Investment Operations | 2.84 | 2.26 | (.01 | ) | 2.31 | .93 | ||||
| Distributions: | ||||||||||
| Dividends from investment income—net | (.06 | ) | (.18 | ) | (.16 | ) | — | (.01 | ) | |
| Dividends from net realized gain on investments | (.92 | ) | — | — | (.09 | ) | (.03 | ) | ||
| Total Distributions | (.98 | ) | (.18 | ) | (.16 | ) | (.09 | ) | (.04 | ) |
| Net asset value, end of period | 16.88 | 15.02 | 12.94 | 13.11 | 10.89 | |||||
| Total Return (%) | 19.53 | 17.65 | .08 | 21.14 | 9.34 | d | ||||
| Ratios/Supplemental Data (%): | ||||||||||
| Ratio of total expenses to average net assets | 1.17 | 1.17 | 1.17 | 1.20 | 2.35 | e | ||||
| Ratio of net expenses to average net assets | 1.17 | 1.17 | 1.17 | 1.20 | 1.20 | e | ||||
| Ratio of net investment income | ||||||||||
| (loss) to average net assets | (.03 | ) | .64 | .04 | .06 | .08 | e | |||
| Portfolio Turnover Rate | 144.87 | 169.30 | 149.30 | 107.81 | 109.25 | d | ||||
| Net Assets, end of period ($ x 1,000) | 3,088 | 439 | 957 | 507 | 16 | |||||
| a | From September 30, 2009 (commencement of operations) to August 31, 2010. |
| b | Based on average shares outstanding. |
| c | Amount represents less than $.01 per share. |
| d | Not annualized. |
| e | Annualized. |
See notes to financial statements.
138
| Class M Shares | ||||||||||
| Year Ended August 31, | ||||||||||
| BNY Mellon International Fund | 2014 | 2013 | 2012 | 2011 | 2010 | |||||
| Per Share Data ($): | ||||||||||
| Net asset value, beginning of period | 11.14 | 9.29 | 9.94 | 9.38 | 10.12 | |||||
| Investment Operations: | ||||||||||
| Investment income—neta | .21 | .19 | .22 | .22 | .18 | |||||
| Net realized and unrealized | ||||||||||
| gain (loss) on investments | 1.57 | 1.98 | (.54 | ) | .55 | (.67 | ) | |||
| Total from Investment Operations | 1.78 | 2.17 | (.32 | ) | .77 | (.49 | ) | |||
| Distributions: | ||||||||||
| Dividends from investment income—net | (.20 | ) | (.32 | ) | (.33 | ) | (.21 | ) | (.25 | ) |
| Net asset value, end of period | 12.72 | 11.14 | 9.29 | 9.94 | 9.38 | |||||
| Total Return (%) | 16.11 | 23.74 | (2.98 | ) | 8.05 | (5.07 | ) | |||
| Ratios/Supplemental Data (%): | ||||||||||
| Ratio of total expenses to average net assets | 1.03 | 1.05 | 1.04 | 1.02 | 1.09 | |||||
| Ratio of net expenses to average net assets | 1.03 | 1.05 | 1.04 | 1.02 | 1.09 | |||||
| Ratio of net investment income | ||||||||||
| to average net assets | 1.64 | 1.77 | 2.35 | 2.07 | 1.79 | |||||
| Portfolio Turnover Rate | 92.94 | 55.78 | 44.62 | 57.38 | 67.16 | |||||
| Net Assets, end of period ($ x 1,000) | 990,119 | 519,964 | 549,601 | 879,450 | 996,647 | |||||
| a Based on average shares outstanding. | ||||||||||
| See notes to financial statements. | ||||||||||
The Funds 139
FINANCIAL HIGHLIGHTS (continued)
| Investor Shares | ||||||||||
| Year Ended August 31, | ||||||||||
| BNY Mellon International Fund | 2014 | 2013 | 2012 | 2011 | 2010 | |||||
| Per Share Data ($): | ||||||||||
| Net asset value, beginning of period | 11.82 | 9.84 | 10.51 | 9.92 | 10.69 | |||||
| Investment Operations: | ||||||||||
| Investment income—neta | .19 | .17 | .18 | .21 | .16 | |||||
| Net realized and unrealized | ||||||||||
| gain (loss) on investments | 1.67 | 2.10 | (.54 | ) | .56 | (.70 | ) | |||
| Total from Investment Operations | 1.86 | 2.27 | (.36 | ) | .77 | (.54 | ) | |||
| Distributions: | ||||||||||
| Dividends from investment income—net | (.18 | ) | (.29 | ) | (.31 | ) | (.18 | ) | (.23 | ) |
| Net asset value, end of period | 13.50 | 11.82 | 9.84 | 10.51 | 9.92 | |||||
| Total Return (%) | 15.85 | 23.36 | (3.20 | ) | 7.67 | (5.26 | ) | |||
| Ratios/Supplemental Data (%): | ||||||||||
| Ratio of total expenses to average net assets | 1.28 | 1.30 | 1.29 | 1.27 | 1.34 | |||||
| Ratio of net expenses to average net assets | 1.28 | 1.30 | 1.29 | 1.27 | 1.34 | |||||
| Ratio of net investment income | ||||||||||
| to average net assets | 1.38 | 1.51 | 1.85 | 1.79 | 1.46 | |||||
| Portfolio Turnover Rate | 92.94 | 55.78 | 44.62 | 57.38 | 67.16 | |||||
| Net Assets, end of period ($ x 1,000) | 8,952 | 4,432 | 4,116 | 6,157 | 4,319 | |||||
| a Based on average shares outstanding. | ||||||||||
| See notes to financial statements. | ||||||||||
140
| Class M Shares | ||||||||||
| Year Ended August 31, | ||||||||||
| BNY Mellon Emerging Markets Fund | 2014 | 2013 | 2012 | 2011 | 2010 | |||||
| Per Share Data ($): | ||||||||||
| Net asset value, beginning of period | 9.11 | 9.19 | 10.65 | 10.02 | 8.71 | |||||
| Investment Operations: | ||||||||||
| Investment income—neta | .10 | .12 | .12 | .14 | .08 | |||||
| Net realized and unrealized | ||||||||||
| gain (loss) on investments | 1.88 | (.10 | ) | (1.16 | ) | .54 | 1.31 | |||
| Total from Investment Operations | 1.98 | .02 | (1.04 | ) | .68 | 1.39 | ||||
| Distributions: | ||||||||||
| Dividends from investment income—net | (.11 | ) | (.10 | ) | (.11 | ) | (.05 | ) | (.08 | ) |
| Dividends from net realized gain on investments | — | — | (.31 | ) | — | — | ||||
| Total Distributions | (.11 | ) | (.10 | ) | (.42 | ) | (.05 | ) | (.08 | ) |
| Net asset value, end of period | 10.98 | 9.11 | 9.19 | 10.65 | 10.02 | |||||
| Total Return (%) | 21.82 | .09 | (9.55 | ) | 6.77 | 15.92 | ||||
| Ratios/Supplemental Data (%): | ||||||||||
| Ratio of total expenses to average net assets | 1.42 | 1.41 | 1.40 | 1.41 | 1.54 | |||||
| Ratio of net expenses to average net assets | 1.42 | 1.41 | 1.40 | 1.41 | 1.54 | |||||
| Ratio of net investment income | ||||||||||
| to average net assets | 1.04 | 1.19 | 1.21 | 1.20 | .85 | |||||
| Portfolio Turnover Rate | 70.89 | 53.25 | 67.21 | 77.45 | 76.34 | |||||
| Net Assets, end of period ($ x 1,000) | 2,046,317 | 1,830,754 | 2,138,311 | 2,352,233 | 1,796,274 | |||||
| a Based on average shares outstanding. | ||||||||||
| See notes to financial statements. | ||||||||||
The Funds 141
FINANCIAL HIGHLIGHTS (continued)
| Investor Shares | ||||||||||
| Year Ended August 31, | ||||||||||
| BNY Mellon Emerging Markets Fund | 2014 | 2013 | 2012 | 2011 | 2010 | |||||
| Per Share Data ($): | ||||||||||
| Net asset value, beginning of period | 9.33 | 9.41 | 10.91 | 10.27 | 8.94 | |||||
| Investment Operations: | ||||||||||
| Investment income—neta | .09 | .09 | .09 | .13 | .06 | |||||
| Net realized and unrealized | ||||||||||
| gain (loss) on investments | 1.91 | (.10 | ) | (1.19 | ) | .55 | 1.33 | |||
| Total from Investment Operations | 2.00 | (.01 | ) | (1.10 | ) | .68 | 1.39 | |||
| Distributions: | ||||||||||
| Dividends from investment income—net | (.08 | ) | (.07 | ) | (.09 | ) | (.04 | ) | (.06 | ) |
| Dividends from net realized gain on investments | — | — | (.31 | ) | — | — | ||||
| Total Distributions | (.08 | ) | (.07 | ) | (.40 | ) | (.04 | ) | (.06 | ) |
| Net asset value, end of period | 11.25 | 9.33 | 9.41 | 10.91 | 10.27 | |||||
| Total Return (%) | 21.57 | (.19 | ) | (9.86 | ) | 6.59 | 15.56 | |||
| Ratios/Supplemental Data (%): | ||||||||||
| Ratio of total expenses to average net assets | 1.67 | 1.65 | 1.65 | 1.67 | 1.77 | |||||
| Ratio of net expenses to average net assets | 1.67 | 1.65 | 1.65 | 1.67 | 1.77 | |||||
| Ratio of net investment income | ||||||||||
| to average net assets | .90 | .90 | .87 | 1.10 | .54 | |||||
| Portfolio Turnover Rate | 70.89 | 53.25 | 67.21 | 77.45 | 76.34 | |||||
| Net Assets, end of period ($ x 1,000) | 22,947 | 10,864 | 16,326 | 22,027 | 7,091 | |||||
| a Based on average shares outstanding. | ||||||||||
| See notes to financial statements. | ||||||||||
142
| Class M Shares | ||||||||||
| Year Ended August 31, | ||||||||||
| BNY Mellon International Appreciation Fund | 2014 | 2013 | 2012 | 2011 | 2010 | |||||
| Per Share Data ($): | ||||||||||
| Net asset value, beginning of period | 12.38 | 10.80 | 11.31 | 10.54 | 11.35 | |||||
| Investment Operations: | ||||||||||
| Investment income—neta | .38 | .27 | .28 | .36 | .26 | |||||
| Net realized and unrealized | ||||||||||
| gain (loss) on investments | 1.42 | 1.69 | (.39 | ) | .68 | (.73 | ) | |||
| Total from Investment Operations | 1.80 | 1.96 | (.11 | ) | 1.04 | (.47 | ) | |||
| Distributions: | ||||||||||
| Dividends from investment income—net | (.28 | ) | (.38 | ) | (.40 | ) | (.27 | ) | (.34 | ) |
| Net asset value, end of period | 13.90 | 12.38 | 10.80 | 11.31 | 10.54 | |||||
| Total Return (%) | 14.65 | 18.39 | (.55 | ) | 9.75 | (4.35 | ) | |||
| Ratios/Supplemental Data (%): | ||||||||||
| Ratio of total expenses to average net assets | .81 | .83 | .83 | .70 | .68 | |||||
| Ratio of net expenses to average net assets | .81 | .83 | .83 | .70 | .66 | |||||
| Ratio of net investment income | ||||||||||
| to average net assets | 2.78 | 2.27 | 2.66 | 2.94 | 2.29 | |||||
| Portfolio Turnover Rate | 4.41 | 1.24 | 1.49 | 9.39 | 2.71 | |||||
| Net Assets, end of period ($ x 1,000) | 111,225 | 98,361 | 119,730 | 198,122 | 218,067 | |||||
| a Based on average shares outstanding. | ||||||||||
| See notes to financial statements. | ||||||||||
The Funds 143
FINANCIAL HIGHLIGHTS (continued)
| Investor Shares | ||||||||||
| Year Ended August 31, | ||||||||||
| BNY Mellon International Appreciation Fund | 2014 | 2013 | 2012 | 2011 | 2010 | |||||
| Per Share Data ($): | ||||||||||
| Net asset value, beginning of period | 12.24 | 10.68 | 11.19 | 10.43 | 11.24 | |||||
| Investment Operations: | ||||||||||
| Investment income—neta | .34 | .25 | .27 | .33 | .23 | |||||
| Net realized and unrealized | ||||||||||
| gain (loss) on investments | 1.41 | 1.66 | (.41 | ) | .67 | (.72 | ) | |||
| Total from Investment Operations | 1.75 | 1.91 | (.14 | ) | 1.00 | (.49 | ) | |||
| Distributions: | ||||||||||
| Dividends from investment income—net | (.25 | ) | (.35 | ) | (.37 | ) | (.24 | ) | (.32 | ) |
| Net asset value, end of period | 13.74 | 12.24 | 10.68 | 11.19 | 10.43 | |||||
| Total Return (%) | 14.39 | 18.13 | (.85 | ) | 9.50 | (4.60 | ) | |||
| Ratios/Supplemental Data (%): | ||||||||||
| Ratio of total expenses to average net assets | 1.06 | 1.08 | 1.09 | .95 | .93 | |||||
| Ratio of net expenses to average net assets | 1.06 | 1.08 | 1.09 | .95 | .90 | |||||
| Ratio of net investment income | ||||||||||
| to average net assets | 2.52 | 2.08 | 2.52 | 2.75 | 2.08 | |||||
| Portfolio Turnover Rate | 4.41 | 1.24 | 1.49 | 9.39 | 2.71 | |||||
| Net Assets, end of period ($ x 1,000) | 5,310 | 4,773 | 4,032 | 4,019 | 3,462 | |||||
| a Based on average shares outstanding. | ||||||||||
| See notes to financial statements. | ||||||||||
144
| Class M Shares | ||||||
| Year Ended August 31, | ||||||
| BNY Mellon International Equity Income Fund | 2014 | 2013 | 2012 | a | ||
| Per Share Data ($): | ||||||
| Net asset value, beginning of period | 13.81 | 12.87 | 12.50 | |||
| Investment Operations: | ||||||
| Investment income—netb | .75 | .64 | .65 | |||
| Net realized and unrealized | ||||||
| gain (loss) on investments | .90 | .87 | (.02 | ) | ||
| Total from Investment Operations | 1.65 | 1.51 | .63 | |||
| Distributions: | ||||||
| Dividends from investment income—net | (.64 | ) | (.57 | ) | (.26 | ) |
| Net asset value, end of period | 14.82 | 13.81 | 12.87 | |||
| Total Return (%) | 12.08 | 11.96 | 5.28 | c | ||
| Ratios/Supplemental Data (%): | ||||||
| Ratio of total expenses to average net assets | 1.08 | 1.15 | 1.62 | d | ||
| Ratio of net expenses to average net assets | 1.08 | 1.15 | 1.20 | d | ||
| Ratio of net investment income | ||||||
| to average net assets | 5.13 | 4.57 | 7.38 | d | ||
| Portfolio Turnover Rate | 83.07 | 74.80 | 95.27 | c | ||
| Net Assets, end of period ($ x 1,000) | 341,645 | 165,132 | 81,034 |
| a | From December 15, 2011 (commencement of operations) to August 31, 2012. |
| b | Based on average shares outstanding. |
| c | Not annualized. |
| d Annualized. | |
See notes to financial statements.
The Funds 145
FINANCIAL HIGHLIGHTS (continued)
| Investor Shares | ||||||
| Year Ended August 31, | ||||||
| BNY Mellon International Equity Income Fund | 2014 | 2013 | 2012 | a | ||
| Per Share Data ($): | ||||||
| Net asset value, beginning of period | 13.89 | 12.88 | 12.50 | |||
| Investment Operations: | ||||||
| Investment income—netb | .50 | .98 | .65 | |||
| Net realized and unrealized | ||||||
| gain (loss) on investments | 1.11 | .49 | (.04 | ) | ||
| Total from Investment Operations | 1.61 | 1.47 | .61 | |||
| Distributions: | ||||||
| Dividends from investment income—net | (.61 | ) | (.46 | ) | (.23 | ) |
| Net asset value, end of period | 14.89 | 13.89 | 12.88 | |||
| Total Return (%) | 11.79 | 11.56 | 5.10 | c | ||
| Ratios/Supplemental Data (%): | ||||||
| Ratio of total expenses to average net assets | 1.36 | 1.42 | 2.10 | d | ||
| Ratio of net expenses to average net assets | 1.36 | 1.42 | 1.45 | d | ||
| Ratio of net investment income | ||||||
| to average net assets | 3.81 | 5.34 | 7.14 | d | ||
| Portfolio Turnover Rate | 83.07 | 74.80 | 95.27 | c | ||
| Net Assets, end of period ($ x 1,000) | 919 | 51 | 10 |
| a | From December 15, 2011 (commencement of operations) to August 31, 2012. |
| b | Based on average shares outstanding. |
| c | Not annualized. |
| d Annualized. | |
See notes to financial statements.
146
| Class M Shares | ||||||||||
| Year Ended August 31, | ||||||||||
| BNY Mellon Asset Allocation Fund | 2014 | 2013 | 2012 | 2011 | 2010 | |||||
| Per Share Data ($): | ||||||||||
| Net asset value, beginning of period | 11.68 | 10.97 | 10.63 | 9.85 | 9.44 | |||||
| Investment Operations: | ||||||||||
| Investment income—neta | .17 | .19 | .17 | .16 | .19 | |||||
| Net realized and unrealized | ||||||||||
| gain (loss) on investments | 1.67 | .81 | .43 | .83 | .46 | |||||
| Total from Investment Operations | 1.84 | 1.00 | .60 | .99 | .65 | |||||
| Distributions: | ||||||||||
| Dividends from investment income—net | (.26 | ) | (.26 | ) | (.21 | ) | (.21 | ) | (.24 | ) |
| Dividends from net realized gain on investments | (.69 | ) | (.03 | ) | (.05 | ) | — | — | ||
| Total Distributions | (.95 | ) | (.29 | ) | (.26 | ) | (.21 | ) | (.24 | ) |
| Net asset value, end of period | 12.57 | 11.68 | 10.97 | 10.63 | 9.85 | |||||
| Total Return (%) | 16.25 | 9.20 | 5.72 | 10.00 | 6.84 | |||||
| Ratios/Supplemental Data (%): | ||||||||||
| Ratio of total expenses to average net assetsb | .35 | .37 | .37 | .53 | .57 | |||||
| Ratio of net expenses to average net assetsb | .26 | .25 | .27 | .53 | .57 | |||||
| Ratio of net investment income | ||||||||||
| to average net assetsb | 1.43 | 1.69 | 1.59 | 1.49 | 1.78 | |||||
| Portfolio Turnover Rate | 48.28 | 27.39 | c | 81.55 | 71.08 | 69.81 | ||||
| Net Assets, end of period ($ x 1,000) | 493,660 | 411,214 | 392,948 | 365,661 | 335,138 | |||||
| a Based on average shares outstanding. |
| b Amount does not include the expenses of the underlying funds. |
| c The portfolio turnover rates excluding mortgage dollar roll transactions for the period ended August 31, 2013 was 27.03% . |
See notes to financial statements.
The Funds 147
FINANCIAL HIGHLIGHTS (continued)
| Investor Shares | ||||||||||
| Year Ended August 31, | ||||||||||
| BNY Mellon Asset Allocation Fund | 2014 | 2013 | 2012 | 2011 | 2010 | |||||
| Per Share Data ($): | ||||||||||
| Net asset value, beginning of period | 11.74 | 11.03 | 10.69 | 9.90 | 9.50 | |||||
| Investment Operations: | ||||||||||
| Investment income—neta | .14 | .17 | .14 | .14 | .17 | |||||
| Net realized and unrealized | ||||||||||
| gain (loss) on investments | 1.68 | .80 | .43 | .83 | .44 | |||||
| Total from Investment Operations | 1.82 | .97 | .57 | .97 | .61 | |||||
| Distributions: | ||||||||||
| Dividends from investment income—net | (.23 | ) | (.23 | ) | (.18 | ) | (.18 | ) | (.21 | ) |
| Dividends from net realized gain on investments | (.69 | ) | (.03 | ) | (.05 | ) | — | — | ||
| Total Distributions | (.92 | ) | (.26 | ) | (.23 | ) | (.18 | ) | (.21 | ) |
| Net asset value, end of period | 12.64 | 11.74 | 11.03 | 10.69 | 9.90 | |||||
| Total Return (%) | 15.96 | 8.86 | 5.44 | 9.77 | 6.44 | |||||
| Ratios/Supplemental Data (%): | ||||||||||
| Ratio of total expenses to average net assetsb | .61 | .62 | .62 | .78 | .82 | |||||
| Ratio of net expenses to average net assetsb | .52 | .50 | .53 | .78 | .82 | |||||
| Ratio of net investment income | ||||||||||
| to average net assetsb | 1.17 | 1.45 | 1.28 | 1.23 | 1.54 | |||||
| Portfolio Turnover Rate | 48.28 | 27.39 | c | 81.55 | 71.08 | 69.81 | ||||
| Net Assets, end of period ($ x 1,000) | 8,338 | 4,939 | 5,091 | 4,265 | 4,015 |
| a Based on average shares outstanding. |
| b Amount does not include the expenses of the underlying funds. |
| c The portfolio turnover rates excluding mortgage dollar roll transactions for the period ended August 31, 2013 was 27.03% . |
See notes to financial statements.
148
NOTES TO FINANCIAL STATEMENTS
NOTE 1—General:
BNY Mellon Funds Trust (the “Trust”) was organized as a Massachusetts business trust that is registered under the Investment Company Act of 1940, as amended (the “Act”), as an open-end management investment company and operates as a series company currently consisting of twenty-five series, including the following diversified equity funds: BNY Mellon Large Cap Stock Fund, BNY Mellon Large Cap Market Opportunities Fund, BNY Mellon Tax-Sensitive Large Cap Multi-Strategy Fund, BNY Mellon Income Stock Fund, BNY Mellon Mid Cap Multi-Strategy Fund, BNY Mellon Small Cap Multi-Strategy Fund, BNY Mellon Small/Mid Cap Multi-Strategy Fund, BNY Mellon International Fund, BNY Mellon Emerging Markets Fund, BNY Mellon International Appreciation Fund, BNY Mellon International Equity Income Fund and BNY Mellon Asset Allocation Fund; and the following non-diversified equity fund: BNY Mellon Focused Equity Opportunities Fund (each, a “fund” and together, the “funds”). The objectives of the funds are as follows: BNY Mellon Large Cap Stock Fund, BNY Mellon Mid Cap Multi-Strategy Fund, BNY Mellon Small Cap Multi-Strategy Fund, BNY Mellon Focused Equity Opportunities Fund and BNY Mellon Small/Mid Cap Multi-Strategy Fund seek capital appreciation. BNY Mellon Income Stock Fund and BNY Mellon International Equity Income Fund seek total return (consisting of capital appreciation and income). BNY Mellon International Fund and BNY Mellon Emerging Markets Fund seek long-term capital growth. BNY Mellon Large Cap Market Opportunities Fund, BNY Mellon Tax-Sensitive Large Cap Multi-Strategy Fund and BNY Mellon International Appreciation Fund seek long-term capital appreciation. BNY Mellon Asset Allocation Fund seeks long-term growth of principal in conjunction with current income.
At a meeting of the Trust’s Board of Trustees (the “Board”) held on March 11-12, 2014, the Board approved proposals, effective April 28, 2014, to change the name of “BNY Mellon Small/Mid Cap Fund” to “BNY Mellon Small/Mid Cap Multi-Strategy Fund” and to modify the fund’s investment strategy.
BNY Mellon Fund Advisers, a division of The Dreyfus Corporation (the “Manager” or “Dreyfus”), a wholly-owned subsidiary of The Bank of New York Mellon Corporation (“BNY Mellon”), serves as each fund’s investment adviser (the “Investment Adviser”).The Bank of NewYork Mellon, a subsidiary of BNY Mellon and an affiliate of Dreyfus, serves as administrator for the funds pursuant to an Administration Agreement with the Trust (the “Administration Agreement”). The Bank of New York Mellon has entered into a Sub-Administration Agreement with Dreyfus pursuant to which The Bank of New York Mellon pays Dreyfus for performing certain administrative services. Walter Scott & Partners Limited (“Walter Scott”), also a subsidiary of BNY Mellon and an affiliate of Dreyfus, serves as the BNY Mellon Large Cap Market Opportunities Fund’s and BNY Mellon Tax-Sensitive Large Cap Multi-Strategy Fund’s sub-investment adviser with respect to the U.S. Large Cap Equity Strategy of each fund. Robeco Investment Management, Inc. (“Robeco”) and Geneva Capital Management Ltd. (“Geneva”) serve as BNY Mellon Mid Cap Multi-Strategy Fund’s sub-investment adviser with respect to the Robeco Mid CapValue Strategy and the Geneva Mid Cap Growth Strategy, respectively. MBSC Securities Corporation (the “Distributor”), a wholly-owned subsidiary of Dreyfus, is the distributor of each fund’s shares, which are sold without a sales charge.
Each fund is authorized to issue an unlimited number of $.001 par value shares of Beneficial Interest in each of the following classes of shares: Class M and Investor. Other differences between the classes include the services offered to and the expenses borne by each class, the allocation of certain transfer agency costs, and certain voting rights. Income, expenses (other than expenses attributable to a specific class), and realized and unrealized gains or losses on investments are allocated to each class of shares based on its relative net assets.
The Funds 149
NOTES TO FINANCIAL STATEMENTS (continued)
The Trust accounts separately for the assets, liabilities and operations of each series. Expenses directly attributable to each series are charged to that series’ operations; expenses which are applicable to all series are allocated among them on a pro rata basis.
The Financial Accounting Standards Board (“FASB”) Accounting Standards Codification is the exclusive reference of authoritative U.S. generally accepted accounting principles (“GAAP”) recognized by the FASB to be applied by nongovernmental entities. Rules and interpretive releases of the Securities and Exchange Commission (“SEC”) under authority of federal laws are also sources of authoritative GAAP for SEC registrants. Each fund’s financial statements are prepared in accordance with GAAP, which may require the use of management estimates and assumptions. Actual results could differ from those estimates.
NOTE 2—Significant Accounting Policies:
(a) Portfolio valuation: The fair value of a financial instrument is the amount that would be received to sell an asset or paid to transfer a liability in an orderly transaction between market participants at the measurement date (i.e., the exit price). GAAP establishes a fair value hierarchy that prioritizes the inputs of valuation techniques used to measure fair value.This hierarchy gives the highest priority to unadjusted quoted prices in active markets for identical assets or liabilities (Level 1 measurements) and the lowest priority to unobservable inputs (Level 3 measurements).
Additionally, GAAP provides guidance on determining whether the volume and activity in a market has decreased significantly and whether such a decrease in activity results in transactions that are not orderly. GAAP requires enhanced disclosures around valuation inputs and techniques used during annual and interim periods.
Various inputs are used in determining the value of the funds’ investments relating to fair value measurements.
These inputs are summarized in the three broad levels listed below:
Level 1—unadjusted quoted prices in active markets for identical investments.
Level 2—other significant observable inputs (including quoted prices for similar investments, interest rates, prepayment speeds, credit risk, etc.).
Level 3—significant unobservable inputs (including the funds’ own assumptions in determining the fair value of investments).
The inputs or methodology used for valuing securities are not necessarily an indication of the risk associated with investing in those securities.
Changes in valuation techniques may result in transfers in or out of an assigned level within the disclosure hierarchy. Valuation techniques used to value the funds’ investments are as follows:
Investments in equity securities are valued at the last sales price on the securities exchange or national securities market on which such securities are primarily traded. Securities listed on the National Market System for which market quotations are available are valued at the official closing price or, if there is no official closing price that day, at the last sales price. Securities not listed on an exchange or the national securities market, or securities for which there were no transactions, are valued at the average of the most recent bid and asked prices, except for open short positions, where the asked price is used for valuation purposes. Bid price is used when no asked price is available. Registered investment companies that are not traded on an exchange are valued at their net asset value.All of the preceding securities are generally categorized within Level 1 of the fair value hierarchy.
BNY Mellon Asset Allocation Fund: Investments in debt securities, excluding short-term investments (other than U.S.Treasury Bills) are valued each business day by an independent pricing service (the “Service”) approved by
150
the Board. Investments for which quoted bid prices are readily available and are representative of the bid side of the market in the judgment of the Service are valued at the mean between the quoted bid prices (as obtained by the Service from dealers in such securities) and asked prices (as calculated by the Service based upon its evaluation of the market for such securities). Other investments are valued as determined by the Service, based on methods which include consideration of the following: yields or prices of securities of comparable quality, coupon, maturity and type; indications as to values from dealers; and general market conditions. These securities are generally categorized within Level 2 of the fair value hierarchy.
U.S.Treasury Bills are valued at the mean price between quoted bid prices and asked prices by the Service.These securities are generally categorized within Level 2 of the fair value hierarchy.
The Service’s procedures are reviewed by Dreyfus under the general supervision of the Board.
Fair valuing of securities may be determined with the assistance of a pricing service using calculations based on indices of domestic securities and other appropriate indicators, such as prices of relevant ADRs and financial futures. Utilizing these techniques may result in transfers between Level 1 and Level 2 of the fair value hierarchy.
When market quotations or official closing prices are not readily available, or are determined not to reflect accurately fair value, such as when the value of the security has been significantly affected by events after the close of the exchange or market on which the security is principally traded (for example, a foreign exchange or market), but before the funds calculate their net asset values, the funds may value these investments at fair value as determined in accordance with the procedures approved by the Board. Certain factors may be considered when fair valuing investments such as: fundamental analytical data, the nature and duration of restrictions on disposition, an evaluation of the forces that influence the market in which the securities are purchased and sold, and public trading in similar securities of the issuer or comparable issuers. These securities are either categorized within Level 2 or 3 of the fair value hierarchy depending on the relevant inputs used.
For restricted securities where observable inputs are limited, assumptions about market activity and risk are used and are generally categorized within Level 3 of the fair value hierarchy.
Investments denominated in foreign currencies are translated to U.S. dollars at the prevailing rates of exchange.
Financial futures and options, which are traded on an exchange, are valued at the last sales price on the securities exchange on which such securities are primarily traded or at the last sales price on the national securities market on each business day and are generally categorized within Level 1 of the fair value hierarchy. Options traded over the-counter (“OTC”) are valued at the mean between the bid and asked price and are generally categorized within Level 2 of the fair value hierarchy. Forward foreign currency exchange contracts (“forward contracts”) are valued at the forward rate and are generally categorized within Level 2 of the fair value hierarchy.
Table 1 summarizes the inputs used as of August 31, 2014 in valuing each fund’s investments.
At August 31, 2014, there were no transfers between Level 1 and Level 2 of the fair value hierarchy for any of the funds.
(b) Foreign currency transactions: BNY Mellon International Fund, BNY Mellon Emerging Markets Fund and BNY Mellon International Equity Income Fund do not isolate that portion of the results of operations resulting from changes in foreign exchange rates on investments from the fluctuations arising from changes in the market prices of securities held. Such fluctuations are
The Funds 151
NOTES TO FINANCIAL STATEMENTS (continued)
| Table 1—Fair Value Measurements | |||||||||
| Investments in Securities | |||||||||
| Level 2—Other | Level 3— Significant | ||||||||
| Level 1—Unadjusted | Significant | Unobservable | |||||||
| Quoted Prices | Observable Inputs | Inputs | |||||||
| Assets ($) | Liabilities ($) | Assets ($) | Liabilities ($) | Assets ($) | Liabilities ($) | Total ($) | |||
| BNY Mellon Large Cap | |||||||||
| Stock Fund | |||||||||
| Equity Securities—Domestic | |||||||||
| Common Stocks† | 477,024,756 | — | — | — | — | — | 477,024,756 | ||
| Equity Securities—Foreign | |||||||||
| Common Stocks† | 2,399,340 | — | — | — | — | — | 2,399,340 | ||
| Mutual Funds | 1,762,927 | — | — | — | — | — | 1,762,927 | ||
| BNY Mellon Large Cap | |||||||||
| Market Opportunities Fund | |||||||||
| Equity Securities—Domestic | |||||||||
| Common Stocks† | 87,042,573 | — | — | — | — | — | 87,042,573 | ||
| Equity Securities—Foreign | |||||||||
| Common Stocks† | 1,963,593 | — | — | — | — | — | 1,963,593 | ||
| Mutual Funds | 105,698,836 | — | — | — | — | — | 105,698,836 | ||
| BNY Mellon | |||||||||
| Tax-Sensitive Large Cap | |||||||||
| Multi-Strategy Fund | |||||||||
| Equity Securities—Domestic | |||||||||
| Common Stocks† | 292,321,681 | — | — | — | — | — | 292,321,681 | ||
| Equity Securities—Foreign | |||||||||
| Common Stocks† | 2,518,521 | — | — | — | — | — | 2,518,521 | ||
| Mutual Funds | 180,517,405 | — | — | — | — | — | 180,517,405 | ||
| BNY Mellon | |||||||||
| Income Stock Fund | |||||||||
| Equity Securities— | |||||||||
| Domestic | |||||||||
| Common Stocks† | 1,180,587,635 | — | — | — | — | — | 1,180,587,635 | ||
| Equity Securities— | |||||||||
| Domestic | |||||||||
| Preferred Stocks† | 12,107,123 | — | — | — | — | — | 12,107,123 | ||
| Equity Securities—Foreign | |||||||||
| Common Stocks† | 31,561,650 | — | — | — | — | — | 31,561,650 | ||
| Mutual Funds | 22,923,853 | — | — | — | — | — | 22,923,853 | ||
| Other Financial Instruments: | |||||||||
| Options Written | — | (314,636 | ) | — | — | — | — | (314,636 | ) |
| BNY Mellon Mid Cap | |||||||||
| Multi-Strategy Fund | |||||||||
| Equity Securities— | |||||||||
| Domestic | |||||||||
| Common Stocks† | 1,902,221,632 | — | — | — | — | — | 1,902,221,632 | ||
| Equity Securities—Foreign | |||||||||
| Common Stocks† | 33,786,121 | — | — | — | — | — | 33,786,121 | ||
| Exchange-Traded Funds | 10,173,090 | — | — | — | — | — | 10,173,090 | ||
| Mutual Funds | 53,173,766 | — | — | — | — | — | 53,173,766 | ||
| Rights† | 1,299 | — | — | — | — | — | 1,299 | ||
152
| Table 1—Fair Value Measurements (continued) | ||||||||||
| Investments in Securities | ||||||||||
| Level 2—Other | Level 3— Significant | |||||||||
| Level 1—Unadjusted | Significant | Unobservable | ||||||||
| Quoted Prices | Observable Inputs | Inputs | ||||||||
| Assets ($) | Liabilities ($) | Assets ($) | Liabilities ($) | Assets ($) | Liabilities ($) | Total ($) | ||||
| BNY Mellon Small Cap | ||||||||||
| Multi-Strategy Fund | ||||||||||
| Equity Securities—Domestic | ||||||||||
| Common Stocks† | 341,270,465 | — | — | — | — | — | 341,270,465 | |||
| Equity Securities—Foreign | ||||||||||
| Common Stocks† | 13,149,021 | — | — | — | — | — | 13,149,021 | |||
| Exchange-Traded Funds | 1,464,547 | — | — | — | — | — | 1,464,547 | |||
| Mutual Funds | 25,519,432 | — | — | — | — | — | 25,519,432 | |||
| BNY Mellon Focused Equity | ||||||||||
| Opportunities Fund | ||||||||||
| Equity Securities—Domestic | ||||||||||
| Common Stocks† | 648,535,248 | — | — | — | — | — | 648,535,248 | |||
| Equity Securities—Foreign | ||||||||||
| Common Stocks† | 24,885,584 | — | — | — | — | — | 24,885,584 | |||
| Mutual Funds | 2,904,985 | — | — | — | — | — | 2,904,985 | |||
| BNY Mellon Small/Mid Cap | ||||||||||
| Multi-Strategy Fund | ||||||||||
| Equity Securities—Domestic | ||||||||||
| Common Stocks† | 389,698,160 | — | — | — | — | — | 389,698,160 | |||
| Equity Securities—Foreign | ||||||||||
| Common Stocks† | 12,431,971 | — | — | — | — | — | 12,431,971 | |||
| Exchange-Traded Funds | 6,805,249 | — | — | — | — | — | 6,805,249 | |||
| Mutual Funds | 21,436,368 | — | — | — | — | — | 21,436,368 | |||
| BNY Mellon International Fund | ||||||||||
| Equity Securities—Foreign | ||||||||||
| Common Stocks† | 949,660,624 | — | — | — | — | — | 949,660,624 | |||
| Equity Securities—Foreign | ||||||||||
| Preferred Stocks† | 12,782,434 | — | — | — | — | — | 12,782,434 | |||
| Exchange-Traded Funds | 12,967,090 | — | — | — | — | — | 12,967,090 | |||
| Mutual Funds | 14,680,791 | — | — | — | — | — | 14,680,791 | |||
| Other Financial Instruments: | ||||||||||
| Forward Foreign Currency | ||||||||||
| Exchange Contracts†† | — | — | 2,301 | (377 | ) | — | — | 1,924 | ||
| BNY Mellon | ||||||||||
| Emerging Markets Fund | ||||||||||
| Equity Securities—Foreign | ||||||||||
| Common Stocks† | 1,860,566,357 | — | 12,986,203 | — | — | — | 1,873,552,560 | |||
| Equity Securities—Foreign | ||||||||||
| Preferred Stocks† | 100,104,662 | — | — | — | — | — | 100,104,662 | |||
| Exchange-Traded Funds | 50,925,853 | — | — | — | — | — | 50,925,853 | |||
| Mutual Funds | 19,099,791 | — | — | — | — | — | 19,099,791 | |||
| Other Financial Instruments: | ||||||||||
| Forward Foreign Currency | ||||||||||
| Exchange Contracts†† | — | — | 1,911 | (54,237 | ) | — | — | (52,326 | ) | |
The Funds 153
NOTES TO FINANCIAL STATEMENTS (continued)
| Table 1—Fair Value Measurements (continued) | |||||||||
| Investments in Securities | |||||||||
| Level 2—Other | Level 3— Significant | ||||||||
| Level 1—Unadjusted | Significant | Unobservable | |||||||
| Quoted Prices | Observable Inputs | Inputs | |||||||
| Assets ($) | Liabilities ($) | Assets ($) | Liabilities ($) | Assets ($) | Liabilities ($) | Total ($) | |||
| BNY Mellon International | |||||||||
| Appreciation Fund | |||||||||
| Equity Securities—Foreign | |||||||||
| Common Stocks† | 113,609,696 | — | — | — | — | — | 113,609,696 | ||
| Mutual Funds | 2,288,421 | — | — | — | — | — | 2,288,421 | ||
| U.S. Treasury | — | — | 135,000 | — | — | — | 135,000 | ||
| Other Financial Instruments: | |||||||||
| Financial Futures†† | — | (29,624 | ) | — | — | — | — | (29,624 | ) |
| BNY Mellon International | |||||||||
| Equity Income Fund | |||||||||
| Equity Securities—Foreign | |||||||||
| Common Stocks† | 320,026,173 | — | — | — | — | — | 320,026,173 | ||
| Equity Securities—Foreign | |||||||||
| Preferred Stocks† | 5,480,981 | — | — | — | — | — | 5,480,981 | ||
| Exchange-Traded Funds | 9,588,700 | — | — | — | — | — | 9,588,700 | ||
| Mutual Funds | 3,435,128 | — | — | — | — | — | 3,435,128 | ||
| BNY Mellon | |||||||||
| Asset Allocation Fund | |||||||||
| Asset—Backed | — | — | 375,074 | — | — | — | 375,074 | ||
| Commercial | |||||||||
| Mortgage—Backed | — | — | 619,216 | — | — | — | 619,216 | ||
| Corporate Bonds† | — | — | 22,891,671 | — | — | — | 22,891,671 | ||
| Equity Securities—Domestic | |||||||||
| Common Stocks† | 89,999,249 | — | — | — | — | — | 89,999,249 | ||
| Equity Securities—Foreign | |||||||||
| Common Stocks† | 447,647 | — | — | — | — | — | 447,647 | ||
| Exchange-Traded Funds | 647,290 | — | — | — | — | — | 647,290 | ||
| Foreign Government | — | — | 1,261,096 | — | — | — | 1,261,096 | ||
| Municipal Bonds | — | — | 3,667,771 | — | — | — | 3,667,771 | ||
| Mutual Funds | 346,166,445 | — | — | — | — | — | 346,166,445 | ||
| U.S. Government | |||||||||
| Agencies/ | |||||||||
| Mortgage—Backed | — | — | 19,110,785 | — | — | — | 19,110,785 | ||
| U.S. Treasury | — | — | 17,078,929 | — | — | — | 17,078,929 | ||
| † See Statement of Investments for additional detailed categorizations. |
| †† Amount shown represents unrealized appreciation (depreciation) at period end. |
154
included with the net realized and unrealized gain or loss on investments.
Net realized foreign exchange gains or losses arise from sales of foreign currencies, currency gains or losses realized on securities transactions between trade and settlement date, and the difference between the amounts of dividends, interest and foreign withholding taxes recorded on the funds’ books and the U.S. dollar equivalent of the amounts actually received or paid. Net unrealized foreign exchange gains and losses arise from changes in the value of assets and liabilities other than investments resulting from changes in exchange rates. Foreign currency gains and losses on foreign currency transactions are also included with net realized and unrealized gain or loss on investments.
(c) Securities transactions and investment income:
Securities transactions are recorded on a trade date basis. Realized gains and losses from securities transactions are recorded on the identified cost basis. Dividend income is recognized on the ex-dividend date and interest income, including, where applicable, accretion of discount and amortization of premium on investments, is recognized on the accrual basis.
Pursuant to a securities lending agreement with The Bank of New York Mellon, the funds may lend securities to qualified institutions. It is the funds’ policy that, at origination, all loans are secured by collateral of at least 102% of the value of U.S. securities loaned and 105% of the value of foreign securities loaned. Collateral equivalent to at least 100% of the market value of securities on loan is maintained at all times. Collateral is either in the form of cash, which can be invested in certain money market mutual funds managed by Dreyfus or U.S. Government and Agency securities. The funds are entitled to receive all dividends, interest and distributions on securities loaned, in addition to income earned as a result of the lending trans-
action. Should a borrower fail to return the securities in a timely manner, The Bank of New York Mellon is required to replace the securities for the benefit of the funds or credit the funds with the market value of the unreturned securities and is subrogated to the funds’ rights against the borrower and the collateral. Table 2 summarizes the amount The Bank of NewYork Mellon earned from each relevant fund from lending portfolio securities, pursuant to the securities lending agreement during the period ended August 31, 2014.
| Table 2—Securities Lending Agreement | ||
| BNY Mellon Large Cap Stock Fund | $ | 1,286 |
| BNY Mellon Large Cap | ||
| Market Opportunities Fund | 4,705 | |
| BNY Mellon Tax—Sensitive | ||
| Large Cap Multi—Strategy Fund | 2,210 | |
| BNY Mellon Income Stock Fund | 47,632 | |
| BNY Mellon Mid Cap Multi-Strategy Fund | 65,585 | |
| BNY Mellon Small Cap | ||
| Multi-Strategy Fund | 56,234 | |
| BNY Mellon Focused | ||
| Equity Opportunities Fund | 678 | |
| BNY Mellon Small/Mid Cap | ||
| Multi-Strategy Fund | 38,795 | |
| BNY Mellon Asset Allocation Fund | 1,148 |
(d) Affiliated issuers: Investments in other investment companies advised by Dreyfus are defined as “affiliated” under the Act. Table 3 summarizes each fund’s investments in affiliated investment companies during the period ended August 31, 2014.
(e) Risk: BNY Mellon Asset Allocation Fund invests in debt securities. Failure of an issuer of the debt securities to make timely interest or principal payments, or a decline or the perception of a decline in the credit quality of a debt security, can cause the debt security’s price to fall, potentially lowering the fund’s share price. In addition, the value of debt securities may decline due to
The Funds 155
NOTES TO FINANCIAL STATEMENTS (continued)
| Table 3—Affiliated Investment Companies | ||||||||||
| Net Unrealized | ||||||||||
| Affiliated | Value | Net Realized | Appreciation | Value | Net | Dividends/ | ||||
| Investment Companies | 8/31/2013 | ($) | Purchases ($)† | Sales ($) | Gain (Loss) ($) | (Depreciation) ($) | 8/31/2014 | ($) | Assets (%) | Distributions ($) |
| BNY Mellon Large Cap | ||||||||||
| Stock Fund | ||||||||||
| Dreyfus Institutional Preferred | ||||||||||
| Plus Money Market Fund | — | 122,355,256 | 120,592,329 | — | — | 1,762,927 | .4 | — | ||
| Dreyfus Institutional Cash | ||||||||||
| Advantage Fund | — | 22,113,614 | 22,113,614 | — | — | — | — | — | ||
| Total | — | 144,468,870 | 142,705,943 | — | — | 1,762,927 | .4 | — | ||
| BNY Mellon | ||||||||||
| Large Cap Market | ||||||||||
| Opportunities Fund | ||||||||||
| BNY Mellon Income | ||||||||||
| Stock Fund, CI. M | 29,840,748 | 103,194 | 8,214,921 | 547,884 | 4,432,414 | 26,709,319 | 13.9 | 1,673,105 | ||
| Dreyfus Institutional Cash | ||||||||||
| Advantage Fund | — | 9,644,715 | 8,425,867 | — | — | 1,218,848 | .6 | — | ||
| Dreyfus Institutional | ||||||||||
| Preferred Plus | ||||||||||
| Money Market Fund | 3,004,055 | 41,875,159 | 43,692,834 | — | — | 1,186,380 | .6 | 719 | ||
| Dreyfus Research | ||||||||||
| Growth Fund, Cl. Y†††† | 38,896,803 | 8,700,000 | 13,117,646 | 1,209,550 | 6,059,258 | 41,747,965 | 21.6 | 1,532,835 | ||
| Dreyfus Strategic | ||||||||||
| Value Fund, Cl. Y††† | 38,403,151 | — | 9,256,847 | 490,249 | 5,199,771 | 34,836,324 | 18.1 | 2,393,026 | ||
| Total | 110,144,757 | 60,323,068 | 82,708,115 | 2,247,683 | 15,691,443 | 105,698,836 | 54.8 | 5,599,685 | ||
| BNY Mellon | ||||||||||
| Tax-Sensitive Large Cap | ||||||||||
| Multi-Strategy Fund | ||||||||||
| BNY Mellon Income | ||||||||||
| Stock Fund, Cl. M | 76,368,616 | 264,095 | 31,828,013 | 2,499,899 | 9,772,144 | 57,076,741 | 11.9 | 4,299,071 | ||
| Dreyfus Institutional Cash | ||||||||||
| Advantage Fund | — | 4,581,788 | 4,581,788 | — | — | — | — | — | ||
| Dreyfus Institutional | ||||||||||
| Preferred Plus | ||||||||||
| Money Market Fund | 4,353,026 | 63,368,952 | 66,413,094 | — | — | 1,308,884 | .3 | 2,485 | ||
| Dreyfus Research | ||||||||||
| Growth Fund, Cl. Y†††† | 77,259,705 | — | 27,548,002 | 5,635,705 | 9,190,776 | 64,538,184 | 13.5 | 2,439,471 | ||
| Dreyfus Strategic | ||||||||||
| Value, Cl. Y††† | 76,275,820 | — | 29,657,628 | 2,040,426 | 8,934,978 | 57,593,596 | 12.0 | 4,837,763 | ||
| Total | 234,257,167 | 68,214,835 | 160,028,525 | 10,176,030 | 27,897,898 | 180,517,405 | 37.7 | 11,578,790 | ||
| BNY Mellon | ||||||||||
| Income Stock Fund | ||||||||||
| Dreyfus Institutional | ||||||||||
| Preferred Plus | ||||||||||
| Money Market Fund | 13,968,966 | 368,660,124 | 359,705,237 | — | — | 22,923,853 | 1.8 | — | ||
| Dreyfus Institutional Cash | ||||||||||
| Advantage Fund | — | 208,558,131 | 208,558,131 | — | — | — | — | — | ||
| Total | 13,968,966 | 577,218,255 | 568,263,368 | — | — | 22,923,853 | 1.8 | — | ||
156
| Table 3—Affiliated Investment Companies (continued) | ||||||||||
| Net Unrealized | ||||||||||
| Affiliated | Value | Net Realized | Appreciation | Value | Net | Dividends/ | ||||
| Investment Companies | 8/31/2013 | ($) | Purchases ($)† | Sales ($) | Gain (Loss) ($) | (Depreciation) ($) | 8/31/2014 | ($) | Assets (%) | Distributions ($) |
| BNY Mellon Mid Cap | ||||||||||
| Multi-Strategy Fund | ||||||||||
| Dreyfus Institutional | ||||||||||
| Preferred Plus Money | ||||||||||
| Market Fund | 24,835,543 | 205,264,342 | 203,785,029 | — | — | 26,314,856 | 1.3 | — | ||
| Dreyfus Institutional Cash | ||||||||||
| Advantage Fund | — | 309,811,671 | 282,952,761 | — | — | 26,858,910 | 1.4 | — | ||
| Total | 24,835,543 | 515,076,013 | 486,737,790 | — | — | 53,173,766 | 2.7 | — | ||
| BNY Mellon Small Cap | ||||||||||
| Multi-Strategy Fund | ||||||||||
| Dreyfus Institutional | ||||||||||
| Preferred Plus | ||||||||||
| Money Market Fund | 5,055,595 | 75,582,265 | 77,214,582 | — | — | 3,423,278 | 1.0 | — | ||
| Dreyfus Institutional Cash | ||||||||||
| Advantage Fund | 19,981,865 | 168,558,087 | 166,443,798 | — | — | 22,096,154 | 6.1 | — | ||
| Total | 25,037,460 | 244,140,352 | 243,658,380 | — | — | 25,519,432 | 7.1 | — | ||
| BNY Mellon Focused | ||||||||||
| Equity Opportunities Fund | ||||||||||
| Dreyfus Institutional | ||||||||||
| Preferred Plus | ||||||||||
| Money Market Fund | 4,505,312 | 74,246,963 | 75,847,290 | — | — | 2,904,985 | .4 | — | ||
| Dreyfus Institutional Cash | ||||||||||
| Advantage Fund | 686,688 | 28,481,329 | 29,168,017 | — | — | — | — | — | ||
| Total | 5,192,000 | 102,728,292 | 105,015,307 | — | — | 2,904,985 | .4 | — | ||
| BNY Mellon Small/Mid Cap | ||||||||||
| Multi-Strategy Fund | ||||||||||
| Dreyfus Institutional Preferred | ||||||||||
| Plus Money Market Fund | 1,647,363 | 86,164,033 | 82,204,622 | — | — | 5,606,774 | 1.3 | — | ||
| Dreyfus Institutional Cash | ||||||||||
| Advantage Fund | 37,289,322 | 222,178,903 | 243,638,631 | — | — | 15,829,594 | 3.8 | — | ||
| Total | 38,936,685 | 308,342,936 | 325,843,253 | — | — | 21,436,368 | 5.1 | — | ||
| BNY Mellon | ||||||||||
| International Fund | ||||||||||
| Dreyfus Institutional | ||||||||||
| Preferred Plus | ||||||||||
| Money Market Fund | 8,318,742 | 264,850,712 | 258,488,663 | — | — | 14,680,791 | 1.5 | — | ||
| BNY Mellon | ||||||||||
| Emerging Markets Fund | ||||||||||
| Dreyfus Institutional | ||||||||||
| Preferred Plus | ||||||||||
| Money Market Fund | 3,563,342 | 523,381,139 | 507,844,690 | — | — | 19,099,791 | .9 | — | ||
| BNY Mellon International | ||||||||||
| Appreciation Fund | ||||||||||
| Dreyfus Institutional | ||||||||||
| Preferred Plus | ||||||||||
| Money Market Fund | 1,761,341 | 15,276,502 | 14,749,422 | — | — | 2,288,421 | 2.0 | — | ||
| BNY Mellon International | ||||||||||
| Equity Income Fund | ||||||||||
| Dreyfus Institutional | ||||||||||
| Preferred Plus | ||||||||||
| Money Market Fund | 3,045,924 | 215,237,217 | 214,848,013 | — | — | 3,435,128 | 1.0 | — | ||
The Funds 157
NOTES TO FINANCIAL STATEMENTS (continued)
| Table 3—Affiliated Investment Companies (continued) | ||||||||||||
| Net Unrealized | ||||||||||||
| Affiliated | Value | Net Realized | Appreciation | Value | Net | Dividends/ | ||||||
| Investment Companies | 8/31/2013 | ($) | Purchases ($)† | Sales ($) | Gain (Loss) ($) | (Depreciation) ($) | 8/31/2014 | ($) | Assets (%) | Distributions ($) | ||
| BNY Mellon | ||||||||||||
| Asset Allocation Fund | ||||||||||||
| BNY Mellon Corporate | ||||||||||||
| Bond Fund, CI. M | — | 11,221,312 | — | — | 77,218 | 11,298,530 | 2.3 | 91,313 | ||||
| BNY Mellon Emerging | ||||||||||||
| Markets Fund, CI. M | 34,357,539 | 3,373,279 | 4,173,000 | 86,640 | 6,648,136 | 40,292,594 | 8.0 | 401,278 | ||||
| BNY Mellon Focused | ||||||||||||
| Equity Opportunities | ||||||||||||
| Fund, CI. M | 31,293,167 | 2,797,905 | 1,311,000 | 42,944 | 6,542,321 | 39,365,337 | 7.8 | 2,797,905 | ||||
| BNY Mellon Income | ||||||||||||
| Stock Fund, CI. M | 19,787,936 | 1,181,547 | 2,185,000 | 74,976 | 3,501,636 | 22,361,095 | 4.5 | 1,181,548 | ||||
| BNY Mellon Intermediate | ||||||||||||
| Bond Fund, CI. M | 13,545,156 | 9,642,302 | — | — | 43,320 | 23,230,778 | 4.6 | 481,302 | ||||
| BNY Mellon International | ||||||||||||
| Fund, CI. M | 10,157,412 | 12,284,906 | — | — | 1,666,717 | 24,109,035 | 4.8 | 182,906 | ||||
| BNY Mellon Mid Cap | ||||||||||||
| Multi-Strategy | ||||||||||||
| Fund, CI. M | 23,089,380 | 1,287,671 | 4,231,000 | 685,950 | 3,094,426 | 23,926,427 | 4.8 | 1,287,670 | ||||
| BNY Mellon Short-Term | ||||||||||||
| U.S. Government | ||||||||||||
| Securities Fund, CI. M | 8,613,124 | 12,124,437 | 10,728,000 | (120,676 | ) | 53,996 | 9,942,881 | 2.0 | 109,438 | |||
| BNY Mellon Small/Mid Cap | ||||||||||||
| Multi-Strategy | ||||||||||||
| Fund, CI. M†† | 10,776,945 | 1,827,465 | 5,818,000 | 812,332 | 333,410 | 7,932,152 | 1.6 | 50,690 | ||||
| Dreyfus Emerging Markets | ||||||||||||
| Debt Local Currency | ||||||||||||
| Fund, CI. I | 3,673,205 | 41,594 | 3,664,011 | (196,946 | ) | 146,158 | — | — | 41,594 | |||
| Dreyfus Floating Rate | ||||||||||||
| Income Fund, CI. Y | — | 9,586,970 | — | — | 22,784 | 9,609,754 | 1.9 | 86,970 | ||||
| Dreyfus Global Real Estate | ||||||||||||
| Securities Fund, CI. Y††† | 9,022,527 | 5,743,447 | 8,418,744 | 337,235 | 763,286 | 7,447,751 | 1.5 | 230,703 | ||||
| Dreyfus High Yield | ||||||||||||
| Fund, CI. I | 11,918,784 | 7,129,768 | 12,621,000 | 396,733 | 134,664 | 6,958,949 | 1.4 | 862,768 | ||||
| Dreyfus Inflation Adjusted | ||||||||||||
| Securities Fund, Cl. Y††† | 8,629,098 | 6,035,437 | 9,243,990 | (315,924 | ) | 437,380 | 5,542,001 | 1.1 | 124,448 | |||
| Dreyfus Institutional Cash | ||||||||||||
| Advantage Fund | — | 7,545,832 | 7,259,632 | — | — | 286,200 | .1 | — | ||||
| Dreyfus Institutional | ||||||||||||
| Preferred Plus | ||||||||||||
| Money Market Fund | 4,543,384 | 73,663,471 | 69,663,092 | — | — | 8,543,763 | 1.7 | 5,657 | ||||
| Dreyfus Research | ||||||||||||
| Growth Fund, CI. Y†††† | — | 14,526,238 | 7,155,000 | — | 141,197 | 7,512,435 | 1.5 | 216,238 | ||||
| Dreyfus Select Managers | ||||||||||||
| Small Cap Growth | ||||||||||||
| Fund, CI. Y††† | 10,024,093 | 19,075,628 | 17,258,260 | 400,463 | (649,555 | ) | 11,592,369 | 2.3 | 549,367 | |||
| Dreyfus Select Managers | ||||||||||||
| Small Cap Value | ||||||||||||
| Fund, CI. Y††† | 13,499,890 | 10,611,431 | 14,990,543 | 1,038,991 | 203,191 | 10,362,960 | 2.1 | 1,248,887 | ||||
| Dreyfus U.S. Equity | ||||||||||||
| und, CI. Y††† | 18,009,791 | 11,657,135 | 22,217,889 | 3,385,016 | (1,064,241 | ) | 9,769,812 | 1.9 | 202,245 | |||
| Dreyfus/Newton International | ||||||||||||
| Equity Fund, CI. Y††† | 4,825,670 | 16,201,429 | 10,126,076 | — | 719,029 | 11,620,052 | 2.3 | 93,352 | ||||
| Dynamic Total Return | ||||||||||||
| Fund, CI. Y | — | 7,278,000 | — | — | 289,657 | 7,567,657 | 1.5 | — | ||||
| Global Stock | ||||||||||||
| Fund, CI. Y††† | 15,891,193 | 12,056,305 | 13,128,667 | 321,752 | 2,020,179 | 17,160,762 | 3.4 | 144,638 | ||||
| Total | 251,658,294 | 256,893,509 | 224,192,904 | 6,949,486 | 25,124,909 | 316,433,294 | 63.1 | 10,390,917 | ||||
| † | Includes reinvested dividends/distributions. |
| †† | Formerly, BNY Mellon Small/Mid Cap Fund. |
| ††† | During the period ended August 31, 2014, investments were exchanged in the same fund from Class I shares to ClassY shares. |
| †††† | During the period ended August 31, 2014, investments were exchanged in the same fund from Class I shares and Class Z shares to ClassY shares. |
158
general market conditions that are not specifically related to a particular issuer, such as real or perceived adverse economic conditions, changes in outlook for corporate earnings, changes in interest or currency rates or adverse investor sentiment. They may also decline because of factors that affect a particular industry.
BNY Mellon Focused Equity Opportunities Fund is non-diversified, which means that a relatively high percentage of the fund’s assets may be invested in a limited number of issuers. Therefore, the fund’s performance may be vulnerable to changes in market value of a single issuer or group of issuers and more susceptible to risks associated with a single economic, political or regulatory occurrence than a diversified fund.
BNY Mellon International Fund, BNY Mellon Emerging Markets Fund and BNY Mellon International Equity Income Fund:
Investing in foreign markets may involve special risks and considerations not typically associated with investing in the U.S. These risks include revaluation of currencies, high rates of inflation, repatriation restrictions on income and capital, and adverse political and economic developments. Moreover, securities issued in these markets may be less liquid, subject to government ownership controls and delayed settlements, and their prices may be more volatile than those of comparable securities in the U.S.
(f) Dividends to shareholders: Dividends payable to shareholders are recorded by the funds on the ex-dividend date. BNY Mellon Large Cap Stock Fund, BNY Mellon Income Stock Fund and BNY Mellon Asset Allocation Fund normally declare and pay dividends from investment income-net monthly. BNY Mellon International Equity Income Fund normally declares and pays dividends from investment income-net quarterly. BNY Mellon Large Cap Market Opportunities Fund, BNY Mellon Tax-Sensitive Large Cap Multi-Strategy Fund, BNY Mellon Mid Cap Multi-Strategy Fund, BNY Mellon Small Cap Multi-Strategy Fund, BNY Mellon Focused Equity Opportunities Fund, BNY Mellon Small/Mid Cap
Multi-Strategy Fund, BNY Mellon International Fund, BNY Mellon Emerging Markets Fund and BNY Mellon International Appreciation Fund normally declare and pay dividends from investment income-net annually. With respect to each fund, dividends from net realized capital gains, if any, are normally declared and paid annually, but the funds may make distributions on a more frequent basis to comply with the distribution requirements of the Internal Revenue Code of 1986, as amended (the “Code”).To the extent that net realized capital gains can be offset by capital loss carryovers of a fund, it is the policy of the funds not to distribute such gains. Income and capital gain distributions are determined in accordance with income tax regulations, which may differ from GAAP.
(g) Federal income taxes: It is the policy of each fund to continue to qualify as a regulated investment company, if such qualification is in the best interests of its shareholders, by complying with the applicable provisions of the Code, and to make distributions of taxable income sufficient to relieve it from substantially all federal income and excise taxes. For federal income tax purposes, each series is treated as a single entity for the purpose of determining such qualification.
As of and during the period ended August 31, 2014, the funds did not have any liabilities for any uncertain tax positions. The funds recognize interest and penalties, if any, related to uncertain tax positions as income tax expense in the Statements of Operations. During the period ended August 31, 2014, the funds did not incur any interest or penalties.
Except for BNY Mellon International Equity Income Fund, each tax year in the four-year period ended August 31, 2014 remains subject to examination by the Internal Revenue Service and state taxing authorities. For BNY Mellon International Equity Income Fund, each tax year in the three-year period ended August 31, 2014 remains subject to examination by the Internal Revenue Service and state taxing authorities.
The Funds 159
NOTES TO FINANCIAL STATEMENTS (continued)
Table 4 summarizes each fund’s components of accumulated earnings on a tax basis at August 31, 2014.
Under the Regulated Investment Company Modernization Act of 2010 (the “2010 Act”), each relevant fund is permitted to carry forward capital losses incurred in taxable years beginning after December 22, 2010 (“post-enactment losses”) for an unlimited period. Furthermore, post-enactment capital loss carryovers retain their character as either short-term or long-term capital losses rather than short-term as they were under previous statute.The 2010 Act requires post-enactment losses to be utilized before the utilization of losses incurred in taxable years prior to the effective date of the 2010 Act (“pre-enactment losses”). As a result of this ordering rule, pre-enactment losses may be more likely to expire unused.
Table 5 summarizes each relevant fund’s accumulated capital loss carryover available for federal income tax purposes to be applied against future net realized capital gains, if any, realized subsequent to August 31, 2014.
| Table 4—Components of Accumulated Earnings | |||||||||||||||
| Undistributed | Accumulated | Undistributed | Unrealized | Capital (Losses) | |||||||||||
| Ordinary | Capital | Capital | Appreciation | Realized After | |||||||||||
| Income ($) | (Losses) ($) | Gains ($) | (Depreciation) ($) | October 31, 2013 ($)† | |||||||||||
| BNY Mellon Large Cap Stock Fund | 25,140,910 | — | 49,987,947 | 85,839,351 | — | ||||||||||
| BNY Mellon Large Cap | |||||||||||||||
| Market Opportunities Fund | 3,919,613 | — | 21,755,417 | 42,101,065 | — | ||||||||||
| BNY Mellon Tax-Sensitive | |||||||||||||||
| Large Cap Multi-Strategy Fund | 12,544,195 | — | 45,218,411 | 118,802,694 | — | ||||||||||
| BNY Mellon Income Stock Fund | 39,891,884 | — | 67,581,415 | 235,610,544 | — | ||||||||||
| BNY Mellon Mid Cap Multi-Strategy Fund | 28,657,518 | — | 63,473,858 | 519,250,269 | — | ||||||||||
| BNY Mellon Small Cap Multi-Strategy Fund | — | — | 16,380,300 | 40,725,781 | (618,078 | )†† | |||||||||
| BNY Mellon Focused Equity Opportunities Fund | 21,947,303 | — | 73,392,077 | 149,122,398 | — | ||||||||||
| BNY Mellon Small/Mid Cap Multi-Strategy Fund | 29,293,755 | — | 72,366,080 | 30,090,722 | — | ||||||||||
| BNY Mellon International Fund | 14,591,880 | (553,889,090 | ) | — | (25,020,809 | ) | — | ||||||||
| BNY Mellon Emerging Markets Fund | 22,578,913 | (177,548,149 | ) | — | 219,534,642 | — | |||||||||
| BNY Mellon International Appreciation Fund | 2,862,705 | (41,833,077 | ) | — | (15,548,997 | ) | — | ||||||||
| BNY Mellon International Equity Income Fund | 4,191,179 | (3,755,809 | ) | — | 18,956,645 | — | |||||||||
| BNY Mellon Asset Allocation Fund | 3,718,795 | — | 15,163,851 | 75,386,530 | — | ||||||||||
| † These losses were deferred for tax purposes to the first day of the following fiscal year. | |||||||||||||||
| †† Late year ordinary losses deferred for tax purposes to the first day of the following fiscal year. | |||||||||||||||
| Table 5—Capital Loss Carryover | |||||||||||||||
| Post-Enactment | Post-Enactment | ||||||||||||||
| Expiring in fiscal year | Short-Term | Long-Term | |||||||||||||
| 2017 ($)† | 2018($)† | Losses ($)†† | Losses ($)††† | Total ($) | |||||||||||
| BNY Mellon International Fund | 91,594,920 | 462,294,170 | — | — | 553,889,090 | ||||||||||
| BNY Mellon Emerging Markets Fund | — | — | 46,790,492 | 130,757,657 | 177,548,149 | ||||||||||
| BNY Mellon International | |||||||||||||||
| Appreciation Fund | 15,657,135 | — | 603,312 | 25,572,630 | 41,833,077 | ||||||||||
| BNY Mellon International | |||||||||||||||
| Equity Income Fund | — | — | 3,755,809 | — | 3,755,809 | ||||||||||
| † | If not applied, the carryovers expire in the above fiscal years. | ||||||||||||||
| †† | Post-enactment short-term losses which can be carried forward for an unlimited period. | ||||||||||||||
| ††† Post-enactment long-term losses which can be carried forward for an unlimited period. | |||||||||||||||
160
Table 6 summarizes each fund’s tax character of distributions paid to shareholders during the fiscal periods ended August 31, 2014 and August 31, 2013, respectively.
During the period ended August 31, 2014, as a result of permanent book to tax differences, where indicated, each identified fund increased (decreased) accumulated undistributed investment income-net, increased (decreased) accumulated net realized gain (loss) on investments and increased (decreased) paid in capital as summarized in Table 7.These permanent book to tax differences are primarily due to the tax treatment for real estate investment trusts for BNY Mellon Large Cap Stock Fund, short-term capital gain distributions from regulated investment company holdings for BNY Mellon Large Cap Market Opportunities Fund, real estate investment trusts and short-term capital gain distributions from regulated investment company holdings for BNY Mellon Tax-Sensitive Large Cap Multi-Strategy Fund, real estate investment
| Table 6—Tax Character of Distributions Paid | ||||||||
| Long-Term | ||||||||
| Ordinary Income ($) | Capital Gains ($) | |||||||
| 2014 | 2013 | 2014 | 2013 | |||||
| BNY Mellon Large Cap Stock Fund | 44,455,863 | 11,137,684 | 245,290,931 | 41,930,989 | ||||
| BNY Mellon Large Cap Market Opportunities Fund | 3,336,229 | 1,053,939 | 14,642,461 | — | ||||
| BNY Mellon Tax-Sensitive Large Cap Multi-Strategy Fund | 27,437,989 | 1,087,759 | 2,676,918 | — | ||||
| BNY Mellon Income Stock Fund | 38,828,091 | 21,134,036 | 22,776,785 | 474,473 | ||||
| BNY Mellon Mid Cap Multi-Strategy Fund | 58,619,743 | 27,846,244 | 31,868,603 | 74,651,509 | ||||
| BNY Mellon Small Cap Multi-Strategy Fund | — | 580,713 | — | — | ||||
| BNY Mellon Focused Equity Opportunities Fund | 7,358,968 | 4,212,219 | 40,954,447 | — | ||||
| BNY Mellon Small/Mid Cap Multi-Strategy Fund | 4,047,781 | 7,576,741 | 25,458,603 | — | ||||
| BNY Mellon International Fund | 9,492,739 | 16,875,502 | — | — | ||||
| BNY Mellon Emerging Markets Fund | 21,212,224 | 21,822,977 | — | — | ||||
| BNY Mellon International Appreciation Fund | 2,300,344 | 3,770,987 | — | — | ||||
| BNY Mellon International Equity Income Fund | 10,151,192 | 4,925,558 | — | — | ||||
| BNY Mellon Asset Allocation Fund | 12,044,550 | 9,449,181 | 21,731,560 | 773,574 | ||||
| Table 7—Return of Capital Statement of Position | ||||||||
| Accumulated | Accumulated | |||||||
| Undistributed | Net Realized | Paid-in | ||||||
| Investment Income—Net ($) | Gain (Loss) ($) | Capital ($) | ||||||
| BNY Mellon Large Cap Stock Fund | (3,474 | ) | 3,474 | — | ||||
| BNY Mellon Large Cap Market Opportunities Fund | 958,006 | (958,006 | ) | — | ||||
| BNY Mellon Tax-Sensitive Large Cap Multi-Strategy Fund | 2,123,782 | (2,123,782 | ) | — | ||||
| BNY Mellon Mid Cap Multi-Strategy Fund | (1,065,511 | ) | 1,065,511 | — | ||||
| BNY Mellon Small Cap Multi-Strategy Fund | 599,099 | 63,487 | (662,586 | ) | ||||
| BNY Mellon Small/Mid Cap Multi-Strategy Fund | (32,857 | ) | 32,857 | — | ||||
| BNY Mellon International Fund | 564,708 | (564,708 | ) | — | ||||
| BNY Mellon Emerging Markets Fund | (287,542 | ) | 287,542 | — | ||||
| BNY Mellon International Appreciation Fund | 194,350 | (194,350 | ) | — | ||||
| BNY Mellon International Equity Income Fund | 4,779 | (4,779 | ) | — | ||||
| BNY Mellon Asset Allocation Fund | 2,699,917 | (2,699,917 | ) | — | ||||
The Funds 161
NOTES TO FINANCIAL STATEMENTS (continued)
trusts and limited partnership for BNY Mellon Mid Cap Multi-Strategy Fund, real estate investment trusts and net operating losses for BNY Mellon Small Cap Multi-Strategy Fund, real estate investment trusts, passive foreign investment companies and dividend reclassification for BNY Mellon Small/Mid Cap Multi-Strategy Fund, foreign exchange gains and losses and passive foreign investment companies for BNY Mellon International Fund and BNY Mellon Emerging Markets Fund, passive foreign investment companies for BNY Mellon International Appreciation Fund, foreign exchange gains and losses for BNY Mellon International Equity Income Fund and amortization adjustments, paydown gains and losses on mortgage backed securities, short-term capital gain distributions from regulated investment company holdings and consent fees for BNY Mellon Asset Allocation Fund. Net assets and net asset values per share were not affected by these reclassifications.
NOTE 3—Bank Lines of Credit:
The funds participate with other Dreyfus-managed funds in a $265 million unsecured credit facility led by Citibank, N.A. and a $300 million unsecured credit facility provided by The Bank of New York Mellon (each, a “Facility”), each to be utilized primarily for temporary or emergency purposes, including the financing of redemptions. Prior to October 9, 2013, the unsecured credit facility with Citibank, N.A. was $210 million. In connection therewith, each fund has agreed to pay its pro rata portion of commitment fees for each Facility. Interest is charged to the funds based on rates determined pursuant to the terms of the respective Facility at the time of borrowing. During the period ended August 31, 2014, BNY Mellon Mid Cap Multi-Strategy Fund, BNY Mellon Small Cap Multi-Strategy Fund, BNY Mellon International Fund, BNY Mellon International Appreciation Fund and BNY Mellon Asset Allocation Fund did not borrow under the Facilities.
The average amount of borrowings outstanding under the Facilities during the period ended August 31, 2014 for BNY Mellon Large Cap Stock Fund was approxi-
mately $609,000, with a related weighted average annualized interest rate of 1.14%.
The average amount of borrowings outstanding under the Facilities during the period ended August 31, 2014 for BNY Mellon Large Cap Market Opportunities Fund was approximately $12,600, with a related weighted average annualized interest rate of 1.10%.
The average amount of borrowings outstanding under the Facilities during the period ended August 31, 2014 for BNY Mellon Tax-Sensitive Large Cap Multi-Strategy Fund was approximately $24,400, with a related weighted average annualized interest rate of 1.11%.
The average amount of borrowings outstanding under the Facilities during the period ended August 31, 2014 for BNY Mellon Income Stock Fund was approximately $11,500, with a related weighted average annualized interest rate of 1.09%.
The average amount of borrowings outstanding under the Facilities during the period ended August 31, 2014 for BNY Mellon Focused Equity Opportunities Fund was approximately $20,500, with a related weighted average annualized interest rate of 1.09%.
The average amount of borrowings outstanding under the Facilities during the period ended August 31, 2014 for BNY Mellon Small/Mid Cap Multi-Strategy Fund was approximately $429,000, with a related weighted average annualized interest rate of 1.09%.
The average amount of borrowings outstanding under the Facilities during the period ended August 31, 2014 for BNY Mellon Emerging Markets Fund was approximately $111,200, with a related weighted average annualized interest rate of 1.09%.
The average amount of borrowings outstanding under the Facilities during the period ended August 31, 2014 for BNY Mellon International Equity Income Fund was approximately $80,300, with a related weighted average annualized interest rate of 1.11%.
162
NOTE 4—Investment Advisory Fee, Administration Fee, Sub-Investment Advisory Fee and Other Transactions with Affiliates:
(a) Fees payable by the funds pursuant to the provisions of an investment advisory agreement with the Investment Adviser are payable monthly, computed on the average daily value of each fund’s net assets at the following annual rates: .65% of BNY Mellon Large Cap Stock Fund, .70% (direct investment in securities) and .15% (other underlying funds, which may consist of affiliated funds, mutual funds and exchange traded funds) of BNY Mellon Large Cap Market Opportunities Fund, .70% (direct investment in securities) and .15% (other underlying funds, which may consist of affiliated funds, mutual funds and exchange traded funds) of BNY Mellon Tax-Sensitive Large Cap Multi-Strategy Fund, .65% of BNY Mellon Income Stock Fund, .75% of BNY Mellon Mid Cap Multi-Strategy Fund, .85% of BNY Mellon Small Cap Multi-Strategy Fund, .70% of BNY Mellon Focused Equity Opportunities Fund, .75% of BNY Mellon Small/Mid Cap Multi-Strategy Fund, .85% of BNY Mellon International Fund, 1.15% of BNY Mellon Emerging Markets Fund, .50% of BNY Mellon International Appreciation Fund, .85% of BNY Mellon International Equity Income Fund and .65% (equity investments), .40% (debt securities) and .15% (money market investments and other underlying funds, which may consist of affiliated funds, mutual funds and exchange traded funds) of BNY Mellon Asset Allocation Fund.
For BNY Mellon International Equity Income Fund, the Investment Adviser had contractually agreed, from September 1, 2013 through December 31, 2013, to waive receipt of its fees and/or assume the direct expenses of the fund, so that the fund’s total annual operating expenses (excluding Shareholder Services Plan fees, taxes, interest expense, brokerage commissions, commitment fees on borrowings and extraordinary expenses) did not exceed 1.20% of the value of the average daily net assets of their respective class. The reduction in expenses, pursuant to the undertaking, amounted to $9 during the period ended August 31, 2014.
For BNY Mellon Asset Allocation Fund, the Investment Adviser has contractually agreed, from September 1, 2013 through December 31, 2014, to waive receipt of its fees and/or assume the direct expenses of the fund, so that the fund’s total annual fund operating expenses (including indirect fees and expenses of the underlying funds, but excluding Shareholder Services Plan fees, taxes, interest expense, brokerage commissions, commitment fees on borrowings and extraordinary expenses) do not exceed .87% of the value of the average daily net assets of their respective class.The reduction in expenses, pursuant to the undertaking, amounted to $411,964 during the period ended August 31, 2014.
Pursuant to the Administration Agreement,The Bank of New York Mellon provides or arranges for fund accounting, transfer agency and other fund administration services and receives a fee based on the total net assets of the Trust based on the following rates:
| 0 up to $6 billion | .15 | % |
| $6 billion up to $12 billion | .12 | % |
| In excess of $12 billion | .10 | % |
No administration fee is applied to assets held by BNY Mellon Large Cap Market Opportunities Fund and BNY Mellon Tax-Sensitive Large Cap Multi-Strategy Fund which are invested in shares of other underlying funds.
No administration fee is applied to assets held by BNY Mellon Asset Allocation Fund which are invested in cash or money market instruments or shares of other underlying funds.
Pursuant to a Sub-Investment Advisory Agreement between Dreyfus and Walter Scott, Dreyfus pays Walter Scott a monthly fee at an annual rate of .41% of BNY Mellon Large Cap Market Opportunities Fund’s and BNY Mellon Tax-Sensitive Large Cap Multi-Strategy Fund’s average daily net assets allocated to the U.S. Large Cap Equity Strategy.
Pursuant to separate Sub-Investment Advisory Agreements between Dreyfus and Robeco and Geneva, each serves as the fund’s sub-adviser responsible for the day-to–day man-
The Funds 163
NOTES TO FINANCIAL STATEMENTS (continued)
agement of a portion of BNY Mellon Mid Cap Multi-Strategy Fund’s portfolio, Dreyfus pays Robeco and Geneva separate monthly fees at an annual percentage of BNY Mellon Mid Cap Multi-Strategy Fund’s average daily net assets allocated to the Robeco Mid Cap Value Strategy and Geneva Mid Cap Growth Strategy, respectively. Dreyfus has obtained an exemptive order from the SEC, upon which the fund may rely, to use a manager of managers approach that permits Dreyfus, subject to certain conditions and approval by the Board, to enter into and materially amend sub-investment advisory agreements with one or more subadvisers who are either unaffiliated with Dreyfus or are wholly-owned subsidiaries (as defined under the Act) of Dreyfus’ ultimate parent company, BNY Mellon, without obtaining shareholder approval.The order also relieves the fund from disclosing the sub-investment advisory fee paid by Dreyfus to an unaffiliated subadviser in documents filed with the SEC and provided to shareholders. In addition, pursuant to the order, it is not necessary to disclose the sub-investment advisory fee payable by Dreyfus separately to a subadviser that is a wholly-owned subsidiary of BNY Mellon in documents filed with the SEC and provided to shareholders; such fees are to be aggregated with fees payable to Dreyfus. Dreyfus has ultimate responsibility (subject to oversight by the Board) to supervise any subadviser and recommend the hiring, termination, and replacement of any subadviser to the Board.
(b) The funds have adopted a Shareholder Services Plan with respect to their Investor shares. Each fund pays the Distributor for the provision of certain services to holders of Investor shares a fee at an annual rate of .25% of the value of the average daily net assets attributable to Investor shares.The services provided may include personal services relating to shareholder accounts, such as answering shareholder inquiries regarding a fund and providing reports and other information, and services related to the maintenance of such shareholder accounts. The Shareholder Services Plan allows the Distributor to make payments from the shareholder services fees it collects from each fund to compensate service agents (certain banks, securities brokers or dealers and other financial institutions) with respect to these services. Table 8 summarizes the amounts Investor shares were charged during the period ended August 31, 2014, pursuant to the Shareholder Services Plan. Additional fees included in Shareholder servicing costs in the Statements of Operations primarily include fees paid for cash management charges.
| Table 8—Shareholder Services Plan Fees | ||
| BNY Mellon Large Cap Stock Fund | $ | 35,609 |
| BNY Mellon Large Cap | ||
| Market Opportunities Fund | 640 | |
| BNY Mellon Tax-Sensitive | ||
| Large Cap Multi-Strategy Fund | 4,994 | |
| BNY Mellon Income Stock Fund | 14,947 | |
| BNY Mellon Mid Cap | ||
| Multi-Strategy Fund | 102,118 | |
| BNY Mellon Small Cap | ||
| Multi-Strategy Fund | 26,233 | |
| BNY Mellon Focused Equity | ||
| Opportunities Fund | 5,700 | |
| BNY Mellon Small/Mid Cap | ||
| Multi-Strategy Fund | 4,360 | |
| BNY Mellon International Fund | 19,299 | |
| BNY Mellon Emerging Markets Fund | 43,675 | |
| BNY Mellon International | ||
| Appreciation Fund | 13,104 | |
| BNY Mellon International | ||
| Equity Income Fund | 788 | |
| BNY Mellon Asset Allocation Fund | 14,606 |
The funds have arrangements with the transfer agent and the custodian whereby the funds may receive earnings credits when positive cash balances are maintained, which are used to offset transfer agency and custody fees. For financial reporting purposes, the funds include net earnings credits as an expense offset in the Statements of Operations.
The funds compensate Dreyfus Transfer, Inc., a wholly-owned subsidiary of Dreyfus, under a transfer agency agreement for providing cash management services for the funds.The cash management fees are related to fund subscriptions and redemptions. The Bank of New York Mellon pays each fund’s transfer agent fees, which are comprised of amounts paid on a per-account basis out of the administration fee it receives from the Trust. The
164
funds also compensated The Bank of New York Mellon under a cash management agreement that was in effect until September 30, 2013 for performing certain cash management services related to fund subscriptions and redemptions. Table 9 summarizes the amount each fund was charged during the period ended August 31, 2014, pursuant to the cash management agreement, which is included in Shareholder servicing costs in the Statements of Operations. Cash management fees were partially offset by earnings credits for each fund, also summarized in Table 9.
The funds compensate The Bank of New York Mellon under a custody agreement for providing custodial services for the funds. These fees are determined based on net assets, geographic region and transaction activity. Table 10 summarizes the amount each fund was charged during the period ended August 31, 2014, pursuant to the custody agreement.These fees were partially offset by earnings credits for each relevant fund, also summarized in Table 10.
| Table 9—Cash Management Agreement Fees | ||||
| The Bank of New York | ||||
| Dreyfus Transfer, Inc. | Dreyfus Transfer, Inc. | Mellon Cash | ||
| Cash Management Fees ($) | Earnings Credits ($) | Management Fees ($) | ||
| BNY Mellon Large Cap Stock Fund | 81 | (6 | ) | 2 |
| BNY Mellon Large Cap Market Opportunities Fund | 13 | (1 | ) | — |
| BNY Mellon Tax-Sensitive Large Cap Multi-Strategy Fund | 16 | (1 | ) | — |
| BNY Mellon Income Stock Fund | 71 | (5 | ) | 2 |
| BNY Mellon Mid Cap Multi-Strategy Fund | 1,231 | (91 | ) | 33 |
| BNY Mellon Small Cap Multi-Strategy Fund | 482 | (36 | ) | 12 |
| BNY Mellon Focused Equity Opportunities Fund | 28 | (2 | ) | 1 |
| BNY Mellon Small/Mid Cap Multi-Strategy Fund | 43 | (3 | ) | 1 |
| BNY Mellon International Fund | 89 | (7 | ) | 2 |
| BNY Mellon Emerging Markets Fund | 152 | (11 | ) | 4 |
| BNY Mellon International Appreciation Fund | 204 | (15 | ) | 6 |
| BNY Mellon International Equity Income Fund | 23 | (2 | ) | — |
| BNY Mellon Asset Allocation Fund | 24 | (2 | ) | — |
| Table 10—Custody Agreement Fees | |||
| Custody Fees ($) | Earnings Credits ($) | ||
| BNY Mellon Large Cap Stock Fund | 77,712 | — | |
| BNY Mellon Large Cap Market Opportunities Fund | 20,457 | — | |
| BNY Mellon Tax-Sensitive Large Cap Multi-Strategy Fund | 35,872 | — | |
| BNY Mellon Income Stock Fund | 79,220 | (3 | ) |
| BNY Mellon Mid Cap Multi-Strategy Fund | 118,620 | — | |
| BNY Mellon Small Cap Multi-Strategy Fund | 79,869 | — | |
| BNY Mellon Focused Equity Opportunities Fund | 45,942 | — | |
| BNY Mellon Small/Mid Cap Multi-Strategy Fund | 35,368 | — | |
| BNY Mellon International Fund | 218,050 | — | |
| BNY Mellon Emerging Markets Fund | 1,831,775 | — | |
| BNY Mellon International Appreciation Fund | 9,008 | — | |
| BNY Mellon International Equity Income Fund | 108,878 | — | |
| BNY Mellon Asset Allocation Fund | 25,340 | — | |
The Funds 165
NOTES TO FINANCIAL STATEMENTS (continued)
Table 11 summarizes the amount each fund was charged for services performed by the Chief Compliance Officer and his staff during the period ended August 31, 2014.
| Table 11—Chief Compliance Officer Fees | ||
| BNY Mellon Large Cap Stock Fund | $ | 8,296 |
| BNY Mellon Large Cap | ||
| Market Opportunities Fund | 9,450 | |
| BNY Mellon Tax-Sensitive | ||
| Large Cap Multi-Strategy Fund | 9,450 | |
| BNY Mellon Income Stock Fund | 8,296 | |
| BNY Mellon Mid Cap Multi-Strategy Fund | 10,027 | |
| BNY Mellon Small Cap | ||
| Multi-Strategy Fund | 8,296 | |
| BNY Mellon Focused Equity | ||
| Opportunities Fund | 8,296 | |
| BNY Mellon Small/Mid Cap | ||
| Multi-Strategy Fund | 8,296 | |
| BNY Mellon International Fund | 8,296 | |
| BNY Mellon Emerging Markets Fund | 8,296 | |
| BNY Mellon International | ||
| Appreciation Fund | 8,296 | |
| BNY Mellon International | ||
| Equity Income Fund | 8,296 | |
| BNY Mellon Asset Allocation Fund | 8,873 |
Table 12 summarizes the components of “Due to The Dreyfus Corporation and affiliates” in the Statements of Assets and Liabilities for each fund.
(c) Each Board member also serves as a Board member of other funds within the Trust. Annual retainer fees and attendance fees are allocated to each fund based on net assets.
NOTE 5—Securities Transactions:
Table 13 summarizes each fund’s aggregate amount of purchases and sales (including paydowns) of investment securities, excluding short-term securities, forward contracts, financial futures and options transactions, during the period ended August 31, 2014.
Derivatives: A derivative is a financial instrument whose performance is derived from the performance of another asset. Each type of derivative instrument that was held by each relevant fund during the period ended August 31, 2014 is discussed below.
Financial Futures: In the normal course of pursuing its investment objective, BNY Mellon International Appreciation Fund is exposed to market risk, including equity price risk as a result of changes in value of underlying financial instruments. The fund invests in financial futures in order to manage its exposure to or protect against changes in the market.A financial futures contract
| Table 12—Due to The Dreyfus Corporation and Affiliates | ||||||
| Investment | Shareholder | Chief | ||||
| Advisory | Services | Custodian | Compliance | Less Expense | ||
| Fees ($) | Plan Fees ($) | Fees ($) | Officer Fees ($) | Reimbursement ($) | ||
| BNY Mellon Large Cap Stock Fund | 260,490 | 2,611 | 31,378 | 1,154 | — | |
| BNY Mellon Large Cap Market Opportunities Fund | 65,478 | 88 | 13,186 | 1,615 | — | |
| BNY Mellon Tax-Sensitive | ||||||
| Large Cap Multi-Strategy Fund | 196,645 | 763 | 16,512 | 1,615 | — | |
| BNY Mellon Income Stock Fund | 685,226 | 2,793 | 30,398 | 1,154 | — | |
| BNY Mellon Mid Cap Multi-Strategy Fund | 1,229,202 | 10,674 | 44,815 | 1,846 | — | |
| BNY Mellon Small Cap Multi-Strategy Fund | 252,787 | 2,358 | 33,686 | 1,154 | — | |
| BNY Mellon Focused Equity Opportunities Fund | 392,697 | 741 | 17,653 | 1,154 | — | |
| BNY Mellon Small/Mid Cap Multi-Strategy Fund | 258,620 | 608 | 13,955 | 1,154 | — | |
| BNY Mellon International Fund | 711,472 | 1,880 | 100,050 | 1,154 | — | |
| BNY Mellon Emerging Markets Fund | 1,992,028 | 4,676 | 790,406 | 1,154 | — | |
| BNY Mellon International Appreciation Fund | 49,060 | 1,113 | 4,854 | 1,154 | — | |
| BNY Mellon International Equity Income Fund | 240,128 | 169 | 53,427 | 1,154 | — | |
| BNY Mellon Asset Allocation Fund | 114,344 | 1,596 | 10,500 | 1,384 | (8,929 | ) |
166
represents a commitment for the future purchase or a sale of an asset at a specified date. Upon entering into such contracts, these investments require initial margin deposits with a counterparty, which consist of cash or cash equivalents. The amount of these deposits is determined by the exchange or Board of Trade on which the contract is traded and is subject to change. Accordingly, variation margin payments are received or made to reflect daily unrealized gains or losses which are recorded in the Statements of Operations.When the contracts are closed, the fund recognizes a realized gain or loss which is reflected in the Statements of Operations. There is minimal counterparty credit risk to the fund with financial futures since they are exchange traded, and the exchange guarantees the financial futures against default. Financial futures open at August 31, 2014 are set forth in the Statements of Financial Futures.
Options Transactions: BNY Mellon Income Stock Fund purchases and writes (sells) put and call options to hedge against changes in the values of equities, or as a substitute for an investment.The fund is subject to market risk in the course of pursuing its investment objectives through its investments in options contracts. A call option gives the purchaser of the option the right (but not the obligation) to buy, and obligates the writer to sell, the underlying security or securities at the exercise price at any time during the option period, or at a specified date. Conversely, a put option gives the purchaser of the option the right (but not the obligation) to sell, and obligates the writer to buy the underlying security or securities at the exercise price at any time during the option period, or at a specified date.
As a writer of call options, the fund receives a premium at the outset and then bears the market risk of unfavorable changes in the price of the financial instrument underlying the option. Generally, the fund realizes a gain, to the extent of the premium, if the price of the underlying financial instrument decreases between the date the option is written and the date on which the option is terminated. Generally, the fund incurs a loss if the price of the financial instrument increases between those dates.
As a writer of put options, the fund receives a premium at the outset and then bears the market risk of unfavorable changes in the price of the financial instrument underlying the option. Generally, the fund realizes a gain, to the extent of the premium, if the price of the underlying financial instrument increases between the date the option is written and the date on which the option is ter-
| Table 13—Purchases and Sales | ||
| Purchases ($) | Sales ($) | |
| BNY Mellon Large Cap Stock Fund | 806,028,424 | 1,210,976,085 |
| BNY Mellon Large Cap Market Opportunities Fund | 55,380,959 | 115,787,335 |
| BNY Mellon Tax-Sensitive Large Cap Multi-Strategy Fund | 77,226,067 | 354,558,528 |
| BNY Mellon Income Stock Fund | 671,736,727 | 645,768,279 |
| BNY Mellon Mid Cap Multi-Strategy Fund | 970,940,009 | 965,121,764 |
| BNY Mellon Small Cap Multi-Strategy Fund | 320,787,474 | 319,774,172 |
| BNY Mellon Focused Equity Opportunities Fund | 465,413,244 | 482,912,192 |
| BNY Mellon Small/Mid Cap Multi-Strategy Fund | 650,110,018 | 786,427,880 |
| BNY Mellon International Fund | 1,078,116,120 | 689,253,063 |
| BNY Mellon Emerging Markets Fund | 1,353,875,142 | 1,458,213,796 |
| BNY Mellon International Appreciation Fund | 6,680,424 | 4,858,883 |
| BNY Mellon International Equity Income Fund | 354,459,431 | 192,896,484 |
| BNY Mellon Asset Allocation Fund | 246,229,248 | 217,983,596 |
The Funds 167
NOTES TO FINANCIAL STATEMENTS (continued)
minated. Generally, the fund incurs a loss if the price of the financial instrument decreases between those dates.
As a writer of an option, the fund has no control over whether the underlying securities may be sold (call) or purchased (put) and as a result bears the market risk of an unfavorable change in the price of the security underlying the written option. There is a risk of loss from a change in value of such options which may exceed the related premiums received.The Statement of Operations reflects any unrealized gains or losses which occurred during the period as well as any realized gains or losses which occurred upon the expiration or closing of the option transaction.
Table 14 summarizes BNY Mellon Income Stock Fund’s call/put options written during the period ended August 31, 2014.
Forward Foreign Currency Exchange Contracts: BNY Mellon International Fund, BNY Mellon Emerging Markets Fund and BNY Mellon International Equity Income Fund enter into forward contracts in order to hedge their exposure to changes in foreign currency exchange rates on its foreign portfolio holdings, to settle foreign currency transactions or as a part of their invest-
ment strategies. When executing forward contracts, each fund is obligated to buy or sell a foreign currency at a specified rate on a certain date in the future. With respect to sales of forward contracts, each fund incurs a loss if the value of the contract increases between the date the forward contract is opened and the date the forward contract is closed. Each fund realizes a gain if the value of the contract decreases between those dates. With respect to purchases of forward contracts, each fund incurs a loss if the value of the contract decreases between the date the forward contract is opened and the date the forward contract is closed. Each fund realizes a gain if the value of the contract increases between those dates. Any realized or unrealized gains or losses which occurred during the period are reflected in the Statements of Operations. Each fund is exposed to foreign currency risk as a result of changes in value of underlying financial instruments. Each fund is also exposed to credit risk associated with counter-party non-performance on these forward contracts, which is generally limited to the unrealized gain on each open contract. At August 31, 2014, there were no forward contracts outstanding for BNY Mellon International Equity Income Fund. Table 15 summarizes open forward contracts for each relevant fund at August 31, 2014.
Table 14—Options Written
| BNY Mellon Income Stock Fund | Options Terminated | |||
| Number of | Premiums | Net Realized | ||
| Options Written | Contracts | Received ($) | Cost ($) | Gain ($) |
| Contracts outstanding August 31, 2013 | 1,740 | 145,548 | ||
| Contracts written | 28,801 | 1,677,596 | ||
| Contracts terminated: | ||||
| Contracts closed | 10,121 | 450,625 | 316,455 | 134,170 |
| Contracts expired | 12,368 | 903,515 | — | 903,515 |
| Contracts exercised | 4,572 | 372,516 | ||
| Total contracts terminated | 27,061 | 1,726,656 | 316,455 | 1,037,685 |
| Contracts outstanding August 31, 2014 | 3,480 | 96,488 | ||
168
| Table 15—Forward Foreign Currency Exchange Contracts | |||||
| BNY Mellon International Fund | |||||
| Foreign | Unrealized | ||||
| Currency | Appreciation | ||||
| Forward Foreign Currency Exchange Contracts | Amounts | Cost ($) | Value ($) | (Depreciation) ($) | |
| Purchases: | |||||
| British Pound, Expiring 9/2/2014a | 93,496 | 155,291 | 155,216 | (75 | ) |
| Danish Krone, Expiring 9/2/2014b | 557,223 | 98,597 | 98,295 | (302 | ) |
| Sales: | Proceeds ($) | ||||
| Japanese Yen, Expiring: 9/2/2014c | 136,647,186 | 1,315,648 | 1,313,347 | 2,301 | |
| Gross Unrealized Appreciation | 2,301 | ||||
| Gross Unrealized Depreciation | (377 | ) | |||
| Counterparties: | |
| a | Northern Trust |
| b | Citigroup |
| c | Goldman Sachs International |
| Table 15—Forward Foreign Currency Exchange Contracts (continued) | ||||||
| BNY Mellon Emerging Markets Fund | ||||||
| Foreign | Unrealized | |||||
| Currency | Appreciation | |||||
| Forward Foreign Currency Exchange Contracts | Amounts | Cost ($) | Value ($) | (Depreciation) ($) | ||
| Purchases: | ||||||
| Brazilian Real, Expiring: | ||||||
| 9/2/2014 a | 355,353 | 157,759 | 158,746 | 987 | ||
| 9/3/2014 a | 1,648,820 | 737,562 | 736,574 | (988 | ) | |
| Chilean Peso, Expiring | ||||||
| 9/2/2014 b | 37,264,128 | 63,466 | 63,508 | 42 | ||
| Sales: | Proceeds ($) | |||||
| Brazilian Real, Expiring: | ||||||
| 9/2/2014 a | 10,477,865 | 4,647,328 | 4,680,753 | (33,425 | ) | |
| 9/3/2014 a | 1,470,144 | 657,636 | 656,754 | 882 | ||
| Hong Kong Dollar, Expiring | ||||||
| 9/2/2014 c | 22,352,613 | 2,884,150 | 2,884,190 | (40 | ) | |
| Indonesian Rupiah, Expiring: | ||||||
| 9/2/2014 d | 38,609,789,020 | 3,291,759 | 3,300,687 | (8,928 | ) | |
| 9/3/2014 d | 2,975,715,684 | 252,179 | 254,389 | (2,210 | ) | |
| Philippine Peso, Expiring: | ||||||
| 9/2/2014 d | 80,790,127 | 1,852,560 | 1,852,985 | (425 | ) | |
| 9/3/2014 d | 169,113,263 | 3,870,754 | 3,878,745 | (7,991 | ) | |
| Thai Baht, Expiring 9/2/2014e | 31,899,319 | 998,496 | 998,726 | (230 | ) | |
| Gross Unrealized Appreciation | 1,911 | |||||
| Gross Unrealized Depreciation | (54,237 | ) | ||||
Counterparties:
| a | Citibank |
| b | Banco Itau Chile |
| c | Morgan Stanley Capital Services |
| d | Deutsche Bank |
| e | HSBC |
The Funds 169
NOTES TO FINANCIAL STATEMENTS (continued)
In December 2011, with clarification in January 2013, FASB issued guidance that expands disclosure requirements with respect to the offsetting of certain assets and liabilities. The funds adopted these disclosure provisions during the current reporting period. These disclosures are required for certain investments, including derivative financial instruments subject to master netting arrangements (“MNA”) or similar agreements which are eligible for offsetting in the Statement of Assets and Liabilities and require each relevant fund to disclose both gross and net information with respect to such investments. For financial reporting purposes, the funds do not offset derivative assets and derivative liabilities that are subject to MNA in the Statement of Assets and Liabilities.
Table 16 summarizes each relevant fund’s derivatives assets and liabilities (by type) on a gross basis, and net of amounts available for offsetting under MNA and net of related collateral received or pledged, if any, as of August 31, 2014.
| Table 16—Derivatives of Assets and Liabilities subject to MNA offsetting | |||
| BNY Mellon International Fund | |||
| Derivative Financial Instruments: | Assets ($) | Liabilities ($) | |
| Forward contracts | 2,301 | (377 | ) |
| Total gross amount of derivative assets and liabilities | |||
| in the Statement of Assets and Liabilities | 2,301 | (377 | ) |
| Derivatives not subject to MNA or similar agreements | — | — | |
| Total gross amount of assets and liabilities | |||
| subject to MNA or similar agreements | 2,301 | (377 | ) |
| Financial | ||||||
| Instruments | ||||||
| Gross Amount of | and Derivatives | Collateral | Net Amount of | |||
| Counterparty | Assets ($)1 | Available for Offset ($) | Received ($) | Assets ($) | ||
| Goldman Sachs International | 2,301 | — | — | 2,301 | ||
| Financial | ||||||
| Instruments | ||||||
| Gross Amount of | and Derivatives | Collateral | Net Amount of | |||
| Counterparties | Liabilities ($)1 | Available for Offset ($) | Pledged ($) | Liabilities ($) | ||
| Citigroup | (302 | ) | — | — | (302 | ) |
| Northern Trust | (75 | ) | — | — | (75 | ) |
| Total | (377 | ) | — | — | (377 | ) |
| 1 Absent a default event or early termination, OTC derivative assets and liabilities are presented at gross amounts and are not offset in the Statement of Assets and Liabilities. |
170
| Table 16—Derivatives of Assets and Liabilities subject to MNA offsetting (continued) | |||
| BNY Mellon Emerging Markets Fund | |||
| Derivative Financial Instruments: | Assets ($) | Liabilities ($) | |
| Forward contracts | 1,911 | (54,237 | ) |
| Total gross amount of derivative assets and liabilities | |||
| in the Statement of Assets and Liabilities | 1,911 | (54,237 | ) |
| Derivatives not subject to MNA or similar agreements | — | — | |
| Total gross amount of assets and liabilities | |||
| subject to MNA or similar agreements | 1,911 | (54,237 | ) |
| Financial | |||||||
| Instruments | |||||||
| Gross Amount of | and Derivatives | Collateral | Net Amount of | ||||
| Counterparties | Assets ($)1 | Available for Offset ($) | Received ($) | Assets ($) | |||
| Banco Itau Chile | 42 | — | — | 42 | |||
| Citibank | 1,869 | (1,869 | ) | — | — | ||
| Total | 1,911 | (1,869 | ) | — | 42 | ||
| Financial | |||||||
| Instruments | |||||||
| Gross Amount of | and Derivatives | Collateral | Net Amount of | ||||
| Counterparties | Liabilities ($)1 | Available for Offset ($) | Pledged ($) | Liabilities ($) | |||
| Citibank | (34,413 | ) | 1,869 | — | (32,544 | ) | |
| Deutsche Bank | (19,554 | ) | — | — | (19,554 | ) | |
| Morgan Stanley Capital Services | (40 | ) | — | — | (40 | ) | |
| HSBC | (230 | ) | — | — | (230 | ) | |
| Total | (54,237 | ) | 1,869 | — | (52,368 | ) | |
| 1 Absent a default event or early termination, OTC derivative assets and liabilities are presented at gross amounts and are not offset in the Statement of Assets and Liabilities. |
The Funds 171
NOTES TO FINANCIAL STATEMENTS (continued)
Table 17 summarizes each relevant fund’s average market value of derivatives outstanding during the period ended August 31, 2014.
Table 18 summarizes the cost of investments for federal income tax purposes, gross appreciation, gross depreciation and accumulated net unrealized appreciation (depreciation) on investments for each fund at August 31, 2014.
| Table 17—Average Market Value of Derivatives | |
| Average | |
| Market Value ($) | |
| BNY Mellon Income Stock Fund | |
| Equity options contracts | 241,863 |
| BNY Mellon International Fund | |
| Forward contracts | 4,585,550 |
| BNY Mellon Emerging Markets Fund | |
| Forward contracts | 10,398,277 |
| BNY Mellon International Appreciation Fund | |
| Equity financial futures | 2,385,921 |
| BNY Mellon International Equity Income Fund | |
| Forward contracts | 3,744,189 |
| Table 18—Accumulated Net Unrealized Appreciation (Depreciation) | |||||
| Cost of | Gross | Gross | |||
| Investments ($) | Appreciation ($) | Depreciation ($) | Net ($) | ||
| BNY Mellon Large Cap Stock Fund | 395,347,672 | 88,692,215 | 2,852,864 | 85,839,351 | |
| BNY Mellon Large Cap Market Opportunities Fund | 152,603,937 | 42,482,084 | 381,019 | 42,101,065 | |
| BNY Mellon Tax-Sensitive Large Cap Multi-Strategy Fund | 356,554,913 | 119,090,078 | 287,384 | 118,802,694 | |
| BNY Mellon Income Stock Fund | 1,011,351,569 | 240,407,888 | 4,579,196 | 235,828,692 | |
| BNY Mellon Mid Cap Multi-Strategy Fund | 1,480,105,639 | 532,120,060 | 12,869,791 | 519,250,269 | |
| BNY Mellon Small Cap Multi-Strategy Fund | 340,677,684 | 50,340,017 | 9,614,236 | 40,725,781 | |
| BNY Mellon Focused Equity Opportunities Fund | 527,203,419 | 152,725,441 | 3,603,043 | 149,122,398 | |
| BNY Mellon Small/Mid Cap Multi-Strategy Fund | 400,281,026 | 39,709,932 | 9,619,210 | 30,090,722 | |
| BNY Mellon International Fund | 1,015,073,852 | 48,347,614 | 73,330,527 | (24,982,913 | ) |
| BNY Mellon Emerging Markets Fund | 1,824,086,471 | 329,573,671 | 109,977,276 | 219,596,395 | |
| BNY Mellon International Appreciation Fund | 131,582,114 | 19,986,590 | 35,535,587 | (15,548,997 | ) |
| BNY Mellon International Equity Income Fund | 319,561,543 | 32,571,705 | 13,602,266 | 18,969,439 | |
| BNY Mellon Asset Allocation Fund | 426,878,643 | 77,252,947 | 1,866,417 | 75,386,530 | |
172
REPORT OF INDEPENDENT REGISTERED PUBLIC ACCOUNTING FIRM
The Board of Trustees and Shareholders BNY Mellon Funds Trust
We have audited the accompanying statements of assets and liabilities of BNY Mellon Large Cap Stock Fund, BNY Mellon Large Cap Market Opportunities Fund, BNY Mellon Tax-Sensitive Large Cap Multi-Strategy Fund, BNY Mellon Income Stock Fund, BNY Mellon Mid Cap Multi-Strategy Fund, BNY Mellon Small Cap Multi-Strategy Fund, BNY Mellon Focused Equity Opportunities Fund, BNY Mellon Small/Mid Cap Multi-Strategy Fund (formerly, BNY Mellon Small/Mid Cap Fund), BNY Mellon International Fund, BNY Mellon Emerging Markets Fund, BNY Mellon International Appreciation Fund, BNY Mellon International Equity Income Fund and BNY Mellon Asset Allocation Fund (collectively the “Funds”), each a series of BNY Mellon Funds Trust, including the statements of investments, statement of options written (with respect to BNY Mellon Income Stock Fund) and statement of financial futures (with respect to BNY Mellon International Appreciation Fund) as of August 31, 2014, and the related statements of operations for the year then ended, the statements of changes in net assets for each of the years in the two-year period then ended and the financial highlights for each of the years or periods in the five-year period then ended. These financial statements and financial highlights are the responsibility of the Funds’ management. Our responsibility is to express an opinion on these financial statements and financial highlights based on our audits.
We conducted our audits in accordance with the standards of the Public Company Accounting Oversight Board (United States). Those standards require that we plan and perform the audit to obtain reasonable assurance about whether the financial statements and financial highlights are free of material misstatement. An audit includes examining, on a test basis, evidence supporting the amounts and disclosures in the financial statements. Our procedures included confirmation of securities owned as of August 31, 2014, by correspondence with the custodian and brokers or by other appropriate auditing procedures. An audit also includes assessing the accounting principles used and significant estimates made by management, as well as evaluating the overall financial statement presenta-tion.We believe that our audits provide a reasonable basis for our opinion.
In our opinion, the financial statements and financial highlights referred to above present fairly, in all material respects, the financial position of the aforementioned funds, as of August 31, 2014, the results of their operations for the year then ended, the changes in their net assets for each of the years in the two-year period then ended and the financial highlights for each of the years or periods in the five-year period then ended, in conformity with U.S. generally accepted accounting principles.

New York, New York
October 29, 2014
The Funds 173
IMPORTANT TAX INFORMATION (Unaudited)
BNY Mellon Large Cap Stock Fund
For federal tax purposes the fund reports the maximum amount allowable but not less than 30.64% of ordinary income dividends paid during the fiscal year ended August 31, 2014 as eligible for the corporate dividends received deduction provided under Section 243 of the Internal Revenue Code in accordance with Section 854(b)(1)(A) of the Internal Revenue Code. Also, the fund reports the maximum amount allowable but not less than $15,112,384 as ordinary income dividends paid during the fiscal year ended August 31, 2014 as qualified dividend income in accordance with Section 854(b)(1)(B) of the Internal Revenue Code. Shareholders will receive notification in early 2015 of the percentage applicable to the preparation of their 2014 income tax returns. Also, the fund reports the maximum amount allowable but not less than $4.0606 per share as a capital gain dividend paid on December 9, 2013 in accordance with Section 852(b)(3)(C) of the Internal Revenue Code. Also, the fund reports the maximum amount allowable but not less than $.6249 as a short-term capital gain dividend paid on December 9, 2013 in accordance with Sections 871(k)(2) and 881(e) of the Internal Revenue Code.
BNY Mellon Large Cap Market Opportunities Fund
For federal tax purposes the fund reports the maximum amount allowable but not less than 62.20% of ordinary income dividends paid during the fiscal year ended August 31, 2014 as eligible for the corporate dividends received deduction provided under Section 243 of the Internal Revenue Code in accordance with Section 854(b)(1)(A) of the Internal Revenue Code. Also, the fund reports the maximum amount allowable but not less than $3,336,229 as ordinary income dividends paid during the fiscal year ended August 31, 2014 as qualified dividend income in accordance with Section 854(b)(1)(B) of the Internal Revenue Code. Shareholders will receive notification in early 2015 of the percentage applicable to the preparation of their 2014 income tax returns. Also, the fund reports the maximum amount allowable but not less than $1.0142 per share as a capital gain dividend paid on December 20, 2013 in accordance with Section 852(b)(3)(C) of the Internal Revenue Code. Also, the fund reports the maximum amount allowable but not less than $.0489 as a short-term capital gain dividend paid on December 20, 2013 in accordance with Sections 871(k)(2) and 881(e) of the Internal Revenue Code.
BNY Mellon Tax-Sensitive Large Cap Multi-Strategy Fund
For federal tax purposes the fund reports the maximum amount allowable but not less than 34.62% of ordinary income dividends paid during the fiscal year ended August 31, 2014 as eligible for the corporate dividends received deduction provided under Section 243 of the Internal Revenue Code in accordance with Section 854(b)(1)(A) of the Internal Revenue Code. Also, the fund reports the maximum amount allowable but not less than $13,073,167 as ordinary income dividends paid during the fiscal year ended August 31, 2014 as qualified dividend income in accordance with Section 854(b)(1)(B) of the Internal Revenue Code. Shareholders will receive notification in early 2015 of the percentage applicable to the preparation of their 2014 income tax returns. Also, the fund reports the maximum amount allowable but not less than $.0623 per share as a capital gain dividend paid on December 20, 2013 in accordance with Section 852(b)(3)(C) of the Internal Revenue Code. Also, the fund reports the maximum amount allowable but not less than $.4361 as a short-term capital gain dividend paid on December 20, 2013 in accordance with Sections 871(k)(2) and 881(e) of the Internal Revenue Code.
174
BNY Mellon Income Stock Fund
For federal tax purposes the fund reports the maximum amount allowable but not less than 46.22% of ordinary income dividends paid during the fiscal year ended August 31, 2014 as eligible for the corporate dividends received deduction provided under Section 243 of the Internal Revenue Code in accordance with Section 854(b)(1)(A) of the Internal Revenue Code. Also, the fund reports the maximum amount allowable but not less than $30,075,157 as ordinary income dividends paid during the fiscal year ended August 31, 2014 as qualified dividend income in accordance with Section 854(b)(1)(B) of the Internal Revenue Code. Shareholders will receive notification in early 2015 of the percentage applicable to the preparation of their 2014 income tax returns. Also, the fund reports the maximum amount allowable but not less than $.1883 per share as a capital gain dividend paid on December 9, 2013 in accordance with Section 852(b)(3)(C) of the Internal Revenue Code. Also, the fund reports the maximum amount allowable but not less than $.1222 as a short-term capital gain dividend paid on December 9, 2013 in accordance with Sections 871(k)(2) and 881(e) of the Internal Revenue Code.
BNY Mellon Mid Cap Multi-Strategy Fund
For federal tax purposes the fund reports the maximum amount allowable but not less than 28.09% of ordinary income dividends paid during the fiscal year ended August 31, 2014 as eligible for the corporate dividends received deduction provided under Section 243 of the Internal Revenue Code in accordance with Section 854(b)(1)(A) of the Internal Revenue Code. Also, the fund reports the maximum amount allowable but not less than $11,531,725 as ordinary income dividends paid during the fiscal year ended August 31, 2014 as qualified dividend income in accordance with Section 854(b)(1)(B) of the Internal Revenue Code. Shareholders will receive notification in early 2015 of the percentage applicable to the preparation of their 2014 income tax returns. Also, the fund reports the maximum amount allowable but not less than $.2616 per share as a capital gain dividend paid on December 16, 2013 in accordance with Section 852(b)(3)(C) of the Internal Revenue Code. Also, the fund reports the maximum amount allowable but not less than $.4278 as a short-term capital gain dividend paid on December 16, 2013 in accordance with Sections 871(k)(2) and 881(e) of the Internal Revenue Code.
BNY Mellon Focused Equity Opportunities Fund
For federal tax purposes the fund reports the maximum amount allowable but not less than 65.25% of ordinary income dividends paid during the fiscal year ended August 31, 2014 as eligible for the corporate dividends received deduction provided under Section 243 of the Internal Revenue Code in accordance with Section 854(b)(1)(A) of the Internal Revenue Code. Also, the fund reports the maximum amount allowable but not less than $7,358,968 as ordinary income dividends paid during the fiscal year ended August 31, 2014 as qualified dividend income in accordance with Section 854(b)(1)(B) of the Internal Revenue Code. Shareholders will receive notification in early 2015 of the percentage applicable to the preparation of their 2014 income tax returns. Also, the fund reports the maximum amount allowable but not less than $1.1550 per share as a capital gain dividend paid on December 11, 2013 in accordance with Section 852(b)(3)(C) of the Internal Revenue Code. Also, the fund reports the maximum amount allowable but not less than $.0665 as a short-term capital gain dividend paid on December 11, 2013 in accordance with Sections 871(k)(2) and 881(e) of the Internal Revenue Code.
The Funds 175
IMPORTANT TAX INFORMATION (Unaudited) (continued)
BNY Mellon Small/Mid Cap Multi-Strategy Fund
For federal tax purposes the fund reports the maximum amount allowable but not less than 30.23% of ordinary income dividends paid during the fiscal year ended August 31, 2014 as eligible for the corporate dividends received deduction provided under Section 243 of the Internal Revenue Code in accordance with Section 854(b)(1)(A) of the Internal Revenue Code. Also, the fund reports the maximum amount allowable but not less than $4,047,782 as ordinary income dividends paid during the fiscal year ended August 31, 2014 as qualified dividend income in accordance with Section 854(b)(1)(B) of the Internal Revenue Code. Shareholders will receive notification in early 2015 of the percentage applicable to the preparation of their 2014 income tax returns.Also, the fund reports the maximum amount allowable but not less than $.8676 per share as a capital gain dividend paid on December 16, 2013 in accordance with Section 852(b)(3)(C) of the Internal Revenue Code. Also, the fund reports the maximum amount allowable but not less than $.0545 as a short-term capital gain dividend paid on December 16, 2013 in accordance with Sections 871(k)(2) and 881(e) of the Internal Revenue Code.
BNY Mellon International Fund
For federal tax purposes, the fund elects to provide each shareholder with their portion of the fund’s income sourced from foreign countries and taxes paid from foreign countries. The fund reports the maximum amount allowable but not less than $21,529,562 as income sourced from foreign countries for the fiscal year ended August 31, 2014 in accordance with Section 853(c)(2) of the Internal Revenue Code and also the fund reports the maximum amount allowable but not less than $1,526,640 as taxes paid from foreign countries for the fiscal year ended August 31, 2014 in accordance with Section 853(a) of the Internal Revenue Code. Where required by federal tax rules, shareholders will receive notification of their proportionate share of foreign sourced income and foreign taxes paid for the 2014 calendar year with Form 1099-DIV which will be mailed in early 2015. Also, the fund reports the maximum amount allowable, but not less than $9,492,739 as ordinary income dividends paid during the fiscal year ended August 31, 2014 as qualified dividend income in accordance with Section 854(b)(1)(B) of the Internal Revenue Code.
BNY Mellon Emerging Markets Fund
For federal tax purposes, the fund elects to provide each shareholder with their portion of the fund’s income sourced from foreign countries and taxes paid from foreign countries. The fund reports the maximum amount allowable but not less than $53,731,165 as income sourced from foreign countries for the fiscal year ended August 31, 2014 in accordance with Section 853(c)(2) of the Internal Revenue Code and also the fund reports the maximum amount allowable but not less than $5,518,673 as taxes paid from foreign countries for the fiscal year ended August 31, 2014 in accordance with Section 853(a) of the Internal Revenue Code. Where required by federal tax rules, shareholders will receive notification of their proportionate share of foreign sourced income and foreign taxes paid for the 2014 calendar year with Form 1099-DIV which will be mailed in early 2015. Also, the fund reports the maximum amount allowable, but not less than $21,212,224 as ordinary income dividends paid during the fiscal year ended August 31, 2014 as qualified dividend income in accordance with Section 854(b)(1)(B) of the Internal Revenue Code.
BNY Mellon International Appreciation Fund
For federal tax purposes, the fund elects to provide each shareholder with their portion of the fund’s income sourced from foreign countries and taxes paid from for-
176
eign countries. The fund reports the maximum amount allowable but not less than $4,321,921 as income sourced from foreign countries for the fiscal year ended August 31, 2014 in accordance with Section 853(c)(2) of the Internal Revenue Code and also the fund reports the maximum amount allowable but not less than $256,164 as taxes paid from foreign countries for the fiscal year ended August 31, 2014 in accordance with Section 853(a) of the Internal Revenue Code. Where required by federal tax rules, shareholders will receive notification of their proportionate share of foreign sourced income and foreign taxes paid for the 2014 calendar year with Form 1099-DIV which will be mailed in early 2015. Also the fund reports the maximum amount allowable, but not less than $2,300,344 as ordinary income dividends paid during the fiscal year ended August 31, 2014 as qualified dividend income in accordance with Section 854(b)(1)(B) of the Internal Revenue Code.
BNY Mellon International Equity Income Fund
For federal tax purposes, the fund elects to provide each shareholder with their portion of the fund’s income sourced from foreign countries and taxes paid from foreign countries. The fund reports the maximum amount allowable but not less than $15,456,412 as income sourced from foreign countries for the fiscal year ended August 31, 2014 in accordance with Section 853(c)(2) of the Internal Revenue Code and also the fund reports the maximum amount allowable but not less than $717,031 as taxes paid from foreign countries for the fiscal year ended August 31, 2014 in accordance with Section 853(a) of the Internal Revenue Code. Where required by federal tax rules, shareholders will receive notification of their proportionate share of foreign sourced income and foreign taxes paid for the 2014 calendar year with Form 1099-DIV which will be mailed in early 2015. Also, the fund reports the maximum amount allowable, but not less than $10,151,192 as ordinary income dividends paid during the fiscal year ended August 31, 2014 as qualified dividend income in accordance with Section 854(b)(1)(B) of the Internal Revenue Code.
BNY Mellon Asset Allocation Fund
For federal tax purposes the fund reports the maximum amount allowable but not less than 41.77% of ordinary income dividends paid during the fiscal year ended August 31, 2014 as eligible for the corporate dividends received deduction provided under Section 243 of the Internal Revenue Code in accordance with Section 854(b)(1)(A) of the Internal Revenue Code. Also, the fund reports the maximum amount allowable but not less than $5,869,554 as ordinary income dividends paid during the fiscal year ended August 31, 2014 as qualified dividend income in accordance with Section 854(b)(1)(B) of the Internal Revenue Code. Shareholders will receive notification in early 2015 of the percentage applicable to the preparation of their 2014 income tax returns. Also, the fund reports the maximum amount allowable but not less than $.6170 per share as a capital gain dividend paid on December 31, 2013 in accordance with Section 852(b)(3)(C) of the Internal Revenue Code. Also, the fund reports the maximum amount allowable but not less than $.0721 as a short-term capital gain dividend paid on December 31, 2013 in accordance with Sections 871(k)(2) and 881(e) of the Internal Revenue Code.
The Funds 177
| INFORMATION ABOUT THE RENEWAL OF EACH FUND’S |
| INVESTMENT ADVISORY AGREEMENT, ADMINISTRATION |
| AGREEMENT AND BNY MELLON MID CAP MULTI-STRATEGY |
| FUND’S SUB-ADVISORY AGREEMENTS (Unaudited) |
At a meeting of the Trust’s Board of Trustees held on March 11-12, 2014, the Board considered the renewal of (i) the Trust’s Investment Advisory Agreement and Administration Agreement (together, the “Agreement”), pursuant to which BNY Mellon Fund Advisers, a division of Dreyfus, provides the funds with investment advisory services and The Bank of NewYork Mellon provides the funds with administrative services, (ii) the Sub-Investment Advisory Agreement with respect to BNY Mellon Large Cap Market Opportunities Fund and BNY Mellon Tax-Sensitive Large Cap Multi-Strategy Fund, pursuant to which Walter Scott & Partners Limited (“Walter Scott”) provides day-to-day management of the portion of each fund’s investments allocated to the U.S. Large Cap Equity Strategy, (iii) the Sub-Investment Advisory Agreement with respect to BNY Mellon Mid Cap Multi-Strategy Fund, pursuant to which Robeco Investment Management, Inc. (“Robeco”) provides day-to-day management of the portion of the fund’s investments allocated to the Robeco Mid Cap Value Strategy, and (iv) the Sub-Investment Advisory Agreement with respect to BNY Mellon Mid Cap Multi-Strategy Fund, pursuant to which Geneva Capital Management Ltd. (“Geneva”) provides day-to-day management of the portion of the fund’s investments allocated to the Geneva Mid Cap Growth Strategy (Walter Scott, Robeco and Geneva, collectively, the “Sub-Advisers”).The Agreement and each Sub-Investment Advisory Agreement are collectively referred to herein as the “Agreements”. The Bank of New York Mellon has entered into a Sub-Administration Agreement with Dreyfus pursuant to which The Bank of New York Mellon pays Dreyfus for performing certain of the administrative services referenced above. The Board members, none of whom are “interested persons” (as defined in the Investment Company Act of 1940, as amended) of the Trust, were assisted in their review by independent legal counsel and met with counsel in executive session separate from representatives of Dreyfus and the Sub-Advisers. In considering the renewal of the Agreements, the Board considered all factors that it believed to be relevant, including those discussed below. The Board did not identify any one factor as dispositive, and each Board member may have attributed different weights to the factors considered.
Analysis of Nature, Extent, and Quality of Services Provided to the Funds. The Board considered information provided to them at the meeting and in previous presentations from Dreyfus representatives regarding the nature, extent, and quality of the services provided to the funds. Dreyfus provided the number of open accounts in each fund, the fund’s asset size and the allocation of fund assets among distribution channels. Dreyfus also had previously provided information regarding the diverse intermediary relationships and distribution channels of the funds (such as intermediary, in which intermediaries typically are paid by the fund and/or Dreyfus) and Dreyfus’ corresponding need for broad, deep, and diverse resources to be able to provide ongoing shareholder services to each intermediary or distribution channel, as applicable to each fund.
The Board also considered research support available to, and portfolio management capabilities of, each fund’s portfolio management personnel and that Dreyfus also provides oversight of day-to-day fund operations, including fund accounting and administration and assistance in meeting legal and regulatory requirements.The Board also considered Dreyfus’ extensive administrative, accounting, and compliance infrastructures, as well as Dreyfus’ supervisory activities over the Sub-Advisers. The Board also considered portfolio management’s brokerage policies and practices (including policies and practices regarding soft dollars) and the standards applied in seeking best execution.
Comparative Analysis of the Funds’ Performance and Management Fees and Expense Ratios. The Board reviewed reports prepared by Lipper, Inc. (“Lipper”), an independent provider of investment company data, which included information comparing (1) each fund’s performance with the performance of a group of com-
178
parable funds (the “Performance Group”) and with a broader group of funds (the “Performance Universe”), all for various periods ended December 31, 2013, and (2) each fund’s actual and contractual management fees and total expenses with those of a group of comparable funds (the “Expense Group”) and with a broader group of funds (the “Expense Universe”), the information for which was derived in part from fund financial statements available to Lipper as of the date of its analysis. Dreyfus previously had furnished the Board with a description of the methodology Lipper used to select the Performance Group and Performance Universe and the Expense Group and Expense Universe.
Dreyfus representatives stated that the usefulness of performance comparisons may be affected by a number of factors, including different investment limitations that may be applicable to each fund and comparison funds. They also noted that performance generally should be considered over longer periods of time, although it is possible that long-term performance can be adversely affected by even one period of significant underperformance so that a single investment decision or theme has the ability to affect disproportionately long-term performance.
As applicable to each fund, Dreyfus representatives reviewed with the Board the management or investment advisory fees (1) paid by funds advised or administered by Dreyfus that are in the same Lipper category as the fund and (2) paid to Dreyfus, the Sub-Advisers or the Dreyfus-affiliated primary employer of each fund’s primary portfolio manager(s) for advising any separate accounts and/or other types of client portfolios that are considered to have similar investment strategies and policies as the fund (the “Similar Clients”), and explained the nature of the Similar Clients. They discussed differences in fees paid and the relationship of the fees paid in light of any differences in the services provided and other relevant factors. The Board considered the relevance of the fee information provided for the Similar Clients to evaluate the appropriateness and reasonableness of the fund’s management fee.
The Board considered the fee to each Sub-Adviser in relation to the fee paid to Dreyfus by the relevant fund and the respective services provided by the Sub-Adviser and Dreyfus. The Board also noted each Sub-Adviser’s fee is paid by Dreyfus (out of its fee from the relevant fund) and not the fund.
BNY Mellon Large Cap Market Opportunities Fund
The Board discussed the results of the comparisons and noted that the fund’s total return performance was below the Performance Group and Performance Universe medians for the one-, two- and three-year periods, except for the two-year period when the fund’s performance was at the Performance Group median. Dreyfus also provided a comparison of the fund’s calendar year total returns to the returns of the fund’s benchmark index.
The Board also reviewed the range of actual and contractual management fees and total expenses of the Expense Group and Expense Universe funds and discussed the results of the comparisons. The Board noted that the fund’s contractual management fee was below the Expense Group median, the fund’s actual management fee was below the Expense Group median and above the Expense Universe median and total expenses were below the Expense Group and Expense Universe medians.
BNY Mellon Tax-Sensitive Large Cap Multi-Strategy Fund
The Board discussed the results of the comparisons and noted that the fund’s total return performance was below the Performance Group and Performance Universe medians (lowest in the Performance Group) for the one-, two- and three-year periods. Dreyfus also provided a comparison of the fund’s calendar year total returns to the returns of the fund’s benchmark index.
The Board also reviewed the range of actual and contractual management fees and total expenses of the Expense Group and Expense Universe funds and discussed the results of the comparisons. The Board noted that the
The Funds 179
| INFORMATION ABOUT THE RENEWAL OF EACH FUND’S INVESTMENT ADVISORY AGREEMENT, |
| ADMINISTRATION AGREEMENT AND BNY MELLON MID CAP MULTI-STRATEGY FUND’S |
| SUB-ADVISORY AGREEMENTS (Unaudited) (continued) |
fund’s contractual management fee was above the Expense Group median, the fund’s actual management fee was above the Expense Group and Expense Universe medians and the fund’s total expenses were below the Expense Group and Expense Universe medians.
BNY Mellon Mid Cap Multi-Strategy Fund
The Board discussed the results of the comparisons and noted that the fund’s total return performance was below the Performance Group and Performance Universe medians for the various periods, except for the one-year period when the fund’s performance was above Performance Group and Performance Universe medians and for the ten-year period when the fund’s performance was above the Performance Universe median. Dreyfus also provided a comparison of the fund’s calendar year total returns to the returns of the fund’s benchmark index. The Board noted that, effective March 21, 2013, Geneva became an additional sub-adviser for the fund as part of the efforts by the fund’s investment adviser begun on August 20, 2012 to provide the fund with exposure to various mid cap equity portfolio managers and investment strategies and styles.
The Board also reviewed the range of actual and contractual management fees and total expenses of the Expense Group and Expense Universe funds and discussed the results of the comparisons. The Board noted that the fund’s contractual management fee was above the Expense Group median, the fund’s actual management fee was above the Expense Group and Expense Universe medians and the fund’s total expenses were above the Expense Group median and below the Expense Universe median.
BNY Mellon Small Cap Multi-Strategy Fund
The Board discussed the results of the comparisons and noted that the fund’s total return performance was variously above, at and below the Performance Group and Performance Universe medians, ranking in the first quartile of the Performance Group and Performance Universe for the one- and two-year periods. Dreyfus also
provided a comparison of the fund’s calendar year total returns to the returns of the fund’s benchmark index.
The Board also reviewed the range of actual and contractual management fees and total expenses of the Expense Group and Expense Universe funds and discussed the results of the comparisons. The Board noted that the fund’s contractual management fee was above the Expense Group median, the fund’s actual management fee was above the Expense Group and Expense Universe medians and the fund’s total expenses were below the Expense Group and Expense Universe medians.
BNY Mellon Asset Allocation Fund
The Board discussed the results of the comparisons and noted that the fund’s total return performance was below the Performance Group and Performance Universe medians for all periods (lowest in the Performance Group and ranking in the fourth quartile of the Performance Universe for all periods except the ten-year period). Dreyfus also provided a comparison of the fund’s calendar year total returns to the returns of the fund’s benchmark index and noted that the fund’s performance was above the performance of the benchmark index in six of the ten years.
The Board also reviewed the range of actual and contractual management fees and total expenses of the Expense Group and Expense Universe funds and discussed the results of the comparisons. The Board noted that the fund’s contractual management fee was below the Expense Group median and the fund’s actual management fee and total expenses were below the Expense Group and Expense Universe medians (lowest fees and expenses in the Expense Group).
Dreyfus representatives noted that the investment adviser has contractually agreed to waive receipt of its fees and/or assume the expenses of the fund, until December 31, 2014, so that annual direct fund operating expenses (including indirect fees and expenses of the underlying funds in which the fund may invest, but excluding shareholder services fees, taxes, interest, brokerage commis-
180
sions, commitment fees on borrowings and extraordinary expenses) do not exceed 0.87% of the fund’s average daily net assets.
BNY Mellon Income Stock Fund
The Board discussed the results of the comparisons and noted that the fund’s total return performance was above the Performance Group and Performance Universe medians for all periods (highest in the Performance Group and ranking in the first quartile of the Performance Universe for all periods), except for the ten-year period when the fund’s performance was ranked third of the three funds in the Performance Group. Dreyfus also provided a comparison of the fund’s calendar year total returns to the returns of the fund’s benchmark indexes.
The Board also reviewed the range of actual and contractual management fees and total expenses of the Expense Group and Expense Universe funds and discussed the results of the comparisons. The Board noted that the fund’s contractual management fee was above the Expense Group median, the fund’s actual management fee was above the Expense Group and Expense Universe medians and the fund’s total expenses were below the Expense Group and Expense Universe medians.
BNY Mellon Small/Mid Cap Multi-Strategy Fund (formerly, BNY Mellon Small/Mid Cap Fund)
The Board discussed the results of the comparisons and noted that the fund’s total return performance was below the Performance Group and Performance Universe medians for all periods, ranking in the fourth quartile in the Performance Group and the Performance Universe for all periods. Dreyfus also provided a comparison of the fund’s calendar year total returns to the returns of the fund’s benchmark index and noted that the fund’s performance was above the index’s performance in one of the four years. The Board noted that on or about April 28, 2014, the fund’s investment adviser will implement changes to the fund’s investment strategy.
The Board also reviewed the range of actual and contractual management fees and total expenses of the Expense Group and Expense Universe funds and discussed the results of the comparisons. The Board noted that the fund’s contractual management fee was above the Expense Group median, the fund’s actual management fee was above the Expense Group and Expense Universe medians and the fund’s total expenses were below the Expense Group and Expense Universe medians.
BNY Mellon International Fund
The Board discussed the results of the comparisons and noted that the fund’s total return performance was variously above, at and below the Performance Group and Performance Universe medians, ranking first in the Performance Group and in the first quartile of the Performance Universe for the one-year period. Dreyfus also provided a comparison of the fund’s calendar year total returns to the returns of the fund’s benchmark index.
The Board also reviewed the range of actual and contractual management fees and total expenses of the Expense Group and Expense Universe funds and discussed the results of the comparisons. The Board noted that the fund’s contractual management fee was above the Expense Group median (highest in the Expense Group), the fund’s actual management fee was above the Expense Group and Expense Universe medians (highest in the Expense Group) and the fund’s total expenses were below the Expense Group and Expense Universe medians.
BNY Mellon Emerging Markets Fund
The Board discussed the results of the comparisons and noted that the fund’s total return performance was below the Performance Group and Performance Universe medians for the various periods (ranking in the fourth quartile of the Performance Group), except for the one-year period when the fund’s performance was at the Performance Group median. Dreyfus also provided a comparison of the fund’s calendar year total returns to the returns of the fund’s benchmark index.
The Funds 181
| INFORMATION ABOUT THE RENEWAL OF EACH FUND’S INVESTMENT ADVISORY AGREEMENT, |
| ADMINISTRATION AGREEMENT AND BNY MELLON MID CAP MULTI-STRATEGY FUND’S |
| SUB-ADVISORY AGREEMENTS (Unaudited) (continued) |
The Board also reviewed the range of actual and contractual management fees and total expenses of the Expense Group and Expense Universe funds and discussed the results of the comparisons. The Board noted that the fund’s contractual management fee was above the Expense Group median (highest in the Expense Group) and the fund’s actual management fee and total expenses were above the Expense Group and Expense Universe medians (fee was highest in the Expense Group).
BNY Mellon Large Cap Stock Fund
The Board discussed the results of the comparisons and noted that the fund’s total return performance was below the Performance Group and Performance Universe medians for all periods. Dreyfus also provided a comparison of the fund’s calendar year total returns to the returns of the fund’s benchmark index. The Board noted that, since October 21, 2013, the fund’s investment adviser has implemented changes to the fund’s investment strategy.
The Board also reviewed the range of actual and contractual management fees and total expenses of the Expense Group and Expense Universe funds and discussed the results of the comparisons. The Board noted that the fund’s contractual management fee was above the Expense Group median, the fund’s actual management fee was above the Expense Group and Expense Universe medians and the fund’s total expenses were above the Expense Group median and below the Expense Universe median.
BNY Mellon International Equity Income Fund
The Board discussed the results of the comparisons and noted that the fund’s total return performance was below the Performance Group and Performance Universe medians (lowest in the Performance Group and ranking in the fourth quartile of the Performance Universe) for the one- and two-year periods since commencement of the fund’s operations. Dreyfus also provided a comparison of the fund’s calendar year total return to the return of the fund’s benchmark index.
The Board also reviewed the range of actual and contractual management fees and total expenses of the Expense Group and Expense Universe funds and discussed the results of the comparisons. The Board noted that the fund’s contractual management fee was above the Expense Group median and the fund’s actual management fee and total expenses were above the Expense Group and Expense Universe medians (fees and expenses were the highest in the Expense Group).
BNY Mellon International Appreciation Fund
The Board discussed the results of the comparisons and noted that the fund’s total return performance was variously above, at and below the Performance Group and Performance Universe medians. Dreyfus also provided a comparison of the fund’s calendar year total returns to the returns of the fund’s benchmark index.
The Board also reviewed the range of actual and contractual management fees and total expenses of the Expense Group and Expense Universe funds and discussed the results of the comparisons. The Board noted that the fund’s contractual management fee was below the Expense Group median (lowest in the Expense Group) and the fund’s actual management fee and total expenses were below the Expense Group and Expense Universe medians.
BNY Mellon Focused Equity Opportunities Fund
The Board discussed the results of the comparisons and noted that the fund’s total return performance was variously above, at and below the Performance Group and Performance Universe medians for all periods. Dreyfus also provided a comparison of the fund’s calendar year total returns to the returns of the fund’s benchmark index.
The Board also reviewed the range of actual and contractual management fees and total expenses of the Expense Group and Expense Universe funds and discussed the results of the comparisons. The Board noted that the fund’s contractual management fee was above the
182
Expense Group median, the fund’s actual management fee was above the Expense Group and Expense Universe medians and the fund’s total expenses were below the Expense Group and Expense Universe medians.
Analysis of Profitability and Economies of Scale.
Dreyfus representatives reviewed the expenses allocated and profit received by Dreyfus and its affiliates and the resulting profitability percentage for managing each fund and the aggregate profitability percentage to Dreyfus and its affiliates of managing each fund, and the method used to determine the expenses and profit. The Board concluded that the profitability results were not unreasonable, given the services rendered and service levels provided by Dreyfus to each fund. The Board also noted the expense limitation arrangement for BNY Mellon Asset Allocation Fund and its effect on the profitability of Dreyfus and its affiliates. The Board also had been provided with information prepared by an independent consulting firm regarding Dreyfus’ approach to allocating costs to, and determining the profitability of, individual funds and the entire Dreyfus fund complex. The consulting firm also had analyzed where any economies of scale might emerge in connection with the management of the funds.
The Board considered on the advice of its counsel the profitability analysis with respect to each fund (1) as part of its evaluation of whether the fees under the Agreements bear a reasonable relationship to the mix of services provided by Dreyfus and the Sub-Advisers, including the nature, extent, and quality of such services, and (2) in light of the relevant circumstances for the fund and the extent to which economies of scale would be realized if the fund grows and whether fee levels reflect these economies of scale for the benefit of fund shareholders. Since Dreyfus, and not the relevant fund, pays each Sub-Adviser pursuant to its corresponding Sub-Investment Advisory Agreement, the Board did not consider the Sub-Adviser’s profitability to be relevant to its deliberations. Dreyfus representatives noted that a discussion of economies of scale is predicated on a fund having achieved a substantial size with increasing assets and that, if a fund’s assets had been stable or decreasing, the possibility that Dreyfus may have realized any economies of scale would be less. Dreyfus representatives also noted that, as a result of shared and allocated costs among the funds and the funds in the Dreyfus fund complex, the extent of economies of scale could depend substantially on the level of assets in the complex as a whole, so that increases and decreases in complex-wide assets can affect potential economies of scale in a manner that is disproportionate to, or even in the opposite direction from, changes in a fund’s asset level. The Board also considered potential benefits to Dreyfus and the Sub-Advisers from acting as investment adviser and sub-investment advisers, respectively, and noted the soft dollar arrangements in effect for trading each fund’s investments.
At the conclusion of these discussions, the Board agreed that it had been furnished with sufficient information to make an informed business decision with respect to the renewal of the Agreements. Based on the discussions and considerations as described above, the Board concluded and determined as follows.
The Board concluded that the nature, extent, and qual- ity of the services provided by Dreyfus to each fund, by Walter Scott to BNY Mellon Large Cap Market Opportunities Fund and BNY Mellon Tax-Sensitive Large Cap Multi-Strategy Fund and by Robeco and Geneva to BNY Mellon Mid Cap Multi-Strategy Fund, are adequate and appropriate.
With respect to BNY Mellon Income Stock Fund, the Board was satisfied with the fund’s performance.
With respect to BNY Mellon Small Cap Multi- Strategy Fund, BNY Mellon International Fund, BNY Mellon International Appreciation Fund and BNY Mellon Focused Equity Opportunities Fund, the Board generally was satisfied with each fund’s overall performance.
The Funds 183
| INFORMATION ABOUT THE RENEWAL OF EACH FUND’S INVESTMENT ADVISORY AGREEMENT, |
| ADMINISTRATION AGREEMENT AND BNY MELLON MID CAP MULTI-STRATEGY FUND’S |
| SUB-ADVISORY AGREEMENTS (Unaudited) (continued) |
With respect to BNY Mellon Large Cap Market Opportunities Fund, BNY Mellon Tax-Sensitive Large Cap Multi-Strategy Fund, BNY Mellon Asset Allocation Fund, BNY Mellon Emerging Markets Fund and BNY Mellon International Equity Income Fund, while the Board was concerned with the funds’ performance, the Board expressed confidence in the funds’ strategies and portfolio managers and agreed to closely monitor performance.
With respect to BNY Mellon Mid Cap Multi- Strategy Fund, BNY Mellon Large Cap Stock Fund and BNY Mellon Small/Mid Cap Multi-Strategy Fund, the Board noted Dreyfus’ efforts to improve each fund’s performance and agreed to closely moni- tor performance (and, with respect to BNY Mellon Mid Cap Multi-Strategy Fund, improvement in the fund’s recent performance).
The Board concluded that the fee paid to Dreyfus by each fund (and the Sub-Advisers, as applicable) was rea- sonable in light of the considerations described above.
The Board determined that the fees charged by Dreyfus under the Agreement with respect to BNY Mellon Tax-Sensitive Large Cap Multi-Strategy Fund and BNY Mellon Asset Allocation Fund, were for services in addition to, and not duplicative of, services provided under the advisory contracts of the underlying funds in which those funds invested.
The Board determined that the economies of scale which may accrue to Dreyfus and its affiliates in connection with the management of the funds had been adequately considered by Dreyfus in connection with the fee rate charged to each fund pursuant to the Agreement and that, to the extent in the future it were determined that material economies of scale had not been shared with a fund, the Board would seek to have those economies of scale shared with the fund.
In evaluating the Agreements, the Board considered these conclusions and determinations and also relied on its previous knowledge, gained through meetings and other interactions with Dreyfus and its affiliates and the Sub-Advisers, of each fund and the services provided to the funds by Dreyfus and, as applicable, the Sub-Advisers.The Board also relied on information received on a routine and regular basis throughout the year relating to the operations of each fund and the investment management and other services provided under the Agreements, including information on the investment performance of each fund in comparison to similar mutual funds and benchmark performance indices; general market outlook as applicable to each fund; and compliance reports. In addition, the Board’s consideration of the contractual fee arrangements for each fund had the benefit of a number of years of reviews of prior or similar agreements during which lengthy discussions took place between the Board and Dreyfus representatives. Certain aspects of the arrangements may receive greater scrutiny in some years than in others, and the Board’s conclusions may be based, in part, on their consideration of the same or similar arrangements in prior years. The Board determined that renewal of the Agreements was in the best interests of each fund and its respective shareholders.
184
| BOARD MEMBERS INFORMATION (Unaudited) |
| INDEPENDENT BOARD MEMBERS |
The Funds 185
BOARD MEMBERS INFORMATION (Unaudited) (continued)
INDEPENDENT BOARD MEMBERS (continued)

Once elected all Board Members serve for an indefinite term.The address of the Board Members and Officers is c/o The Dreyfus Corporation, 200 Park Avenue, New York, New York 10166. Additional information about the Board Members is available in the fund’s Statement of Additional Information which can be obtained from Dreyfus free of charge by calling this toll free number: 1-800-DREYFUS. For individual account holders for Private Wealth Management clients, please contact your account officer or call 1-888-281-7350.
186
OFFICERS OF THE FUND (Unaudited)
DAVID K. MOSSMAN, President since October 2011.
As Director of Investment Administration for BNY Mellon Wealth Management's Investments Group (the "Investments Group") since January 2006, Mr. Mossman's responsibilities include oversight of securities trading and portfolio management systems administration and mutual fund product management. Mr. Mossman also serves as chief administrative officer of the Investments Group. He is 61 years old and has served in various capacities with BNY Mellon since 1982, including positions in the management of investment, mutual fund and brokerage businesses that encompassed financial, systems, product management, internal distribution and marketing responsibilities, and has been an employee of Dreyfus since September 2000.
JOHN PAK, Chief Legal Officer since March 2013.
Deputy General Counsel, Investment Management, of BNY Mellon since August 2014; Chief Legal Officer of the Manager since August 2012; from March 2005 to July 2012, Managing Director of Deutsche Bank, Deputy Global Head of Deutsche Asset Management Legal and Regional Head of Deutsche Asset Management Americas Legal. He is an officer of 70 investment companies (comprised of 167 portfolios) managed by the Manager. He is 45 years old and has been an employee of the Manager since August 2012.
JANETTE E. FARRAGHER, Vice President and Secretary since December 2011.
Assistant General Counsel of BNY Mellon, and an officer of 70 investment companies (comprised of 167 portfolios) managed by the Manager. She is 51 years old and has been an employee of the Manager since February 1984.
KIESHA ASTWOOD, Vice President and Assistant Secretary since January 2010.
Counsel of BNY Mellon, and an officer of 70 investment companies (comprised of 167 portfolios) managed by the Manager. She is 41 years old and has been an employee of the Manager since July 1995.
JAMES BITETTO, Vice President and Assistant Secretary since August 2005.
Managing Counsel of BNY Mellon and Secretary of the Manager, and an officer of 70 investment companies (comprised of 167 portfolios) managed by the Manager. He is 48 years old and has been an employee of the Manager since December 1996.
JONI LACKS CHARATAN, Vice President and Assistant Secretary since August 2005.
Managing Counsel of BNY Mellon, and an officer of 70 investment companies (comprised of 167 portfolios) managed by the Manager. She is 58 years old and has been an employee of the Manager since October 1988.
JOSEPH M. CHIOFFI, Vice President and Assistant Secretary since August 2005.
Managing Counsel of BNY Mellon, and an officer of 70 investment companies (comprised of 167 portfolios) managed by the Manager. He is 52 years old and has been an employee of the Manager since June 2000.
JOHN B. HAMMALIAN, Vice President and Assistant Secretary since August 2005.
Senior Managing Counsel of BNY Mellon, and an officer of 70 investment companies (comprised of 167 portfolios) managed by the Manager. He is 51 years old and has been an employee of the Manager since February 1991.
SARAH S. KELLEHER, Vice President and Assistant Secretary since April 2014.
Senior Counsel of BNY Mellon, and an officer of 70 investment companies (comprised of 167 portfolios) managed by the Manager; from August 2005 to March 2013, Associate General Counsel of Third Avenue Management. She is 38 years old and has been an employee of the Manager since March 2013.
JEFF PRUSNOFSKY, Vice President and Assistant Secretary since August 2005.
Senior Managing Counsel of BNY Mellon, and an officer of 70 investment companies (comprised of 167 portfolios) managed by the Manager. He is 49 years old and has been an employee of the Manager since October 1990.
JAMES WINDELS, Treasurer since November 2001.
Director – Mutual Fund Accounting of the Manager, and an officer of 70 investment companies (comprised of 167 portfolios) managed by the Manager. He is 55 years old and has been an employee of the Manager since April 1985.
RICHARD CASSARO, Assistant Treasurer since January 2008.
Senior Accounting Manager – Money Market and Municipal Bond Funds of the Manager, and an officer of 70 investment companies (comprised of 167 portfolios) managed by the Manager. He is 55 years old and has been an employee of the Manager since September 1982.
GAVIN C. REILLY, Assistant Treasurer since December 2005.
Tax Manager of the Investment Accounting and Support Department of the Manager, and an officer of 70 investment companies (comprised of 167 portfolios) managed by the Manager. He is 46 years old and has been an employee of the Manager since April 1991.
The Funds 187
OFFICERS OF THE FUND (Unaudited) (continued)
ROBERT S. ROBOL, Assistant Treasurer since December 2002.
Senior Accounting Manager – Fixed Income Funds of the Manager, and an officer of 70 investment companies (comprised of 167 portfolios) managed by the Manager. He is 50 years old and has been an employee of the Manager since October 1988.
ROBERT SALVIOLO, Assistant Treasurer since July 2007.
Senior Accounting Manager – Equity Funds of the Manager, and an officer of 70 investment companies (comprised of 167 portfolios) managed by the Manager. He is 47 years old and has been an employee of the Manager since June 1989.
ROBERT SVAGNA, Assistant Treasurer since December 2002.
Senior Accounting Manager – Equity Funds of the Manager, and an officer of 70 investment companies (comprised of 167 portfolios) managed by the Manager. He is 47 years old and has been an employee of the Manager since November 1990.
JOSEPH W. CONNOLLY, Chief Compliance Officer since October 2004.
Chief Compliance Officer of the Manager and The Dreyfus Family of Funds (70 investment companies, comprised of 167 portfolios). He is 57 years old and has served in various capacities with the Manager since 1980, including manager of the firm’s Fund Accounting Department from 1997 through October 2001.
MATTHEW D. CONNOLLY, Anti-Money Laundering Compliance Officer since April 2012.
Anti-Money Laundering Compliance Officer of the Distributor since October 2011; from March 2010 to September 2011, Global Head, KYC Reviews and Director of UBS Investment Bank; until March 2010, AML Compliance Officer and Senior Vice President of Citi Global Wealth Management. He is an officer of 65 investment companies (comprised of 162 portfolios) managed by the Manager. He is 42 years old and has been an employee of the Distributor since October 2011.
188
NOTES
| Ticker Symbols: | ||
| BNY Mellon Large Cap Stock Fund | Class M: MPLCX | Investor: MILCX |
| BNY Mellon Large Cap Market Opportunities Fund | Class M: MMOMX | Investor: MMOIX |
| BNY Mellon Tax-Sensitive Large Cap Multi-Strategy Fund | Class M: MTSMX | Investor: MTSIX |
| BNY Mellon Income Stock Fund | Class M: MPISX | Investor: MIISX |
| BNY Mellon Mid Cap Multi-Strategy Fund | Class M: MPMCX | Investor: MIMSX |
| BNY Mellon Small Cap Multi-Strategy Fund | Class M: MPSSX | Investor: MISCX |
| BNY Mellon Focused Equity Opportunities Fund | Class M: MFOMX | Investor: MFOIX |
| BNY Mellon Small/Mid Cap Multi-Strategy Fund | Class M: MMCMX | Investor: MMCIX |
| BNY Mellon International Fund | Class M: MPITX | Investor: MIINX |
| BNY Mellon Emerging Markets Fund | Class M: MEMKX | Investor: MIEGX |
| BNY Mellon International Appreciation Fund | Class M: MPPMX | Investor: MARIX |
| BNY Mellon International Equity Income Fund | Class M: MLIMX | Investor: MLIIX |
| BNY Mellon Asset Allocation Fund | Class M: MPBLX | Investor: MIBLX |
Telephone Wealth Management (WM) Clients, please contact your Account Officer or call 1-888-281-7350. Brokerage Clients of BNY Mellon Wealth Advisors (BNYMWA), please contact your financial representative or call 1-800-830-0549, Option 2. Individual Account holders, please call Dreyfus at 1-800-DREYFUS.
Mail WM Clients, write to your Account Officer, c/o The Bank of New York Mellon, One Mellon Bank Center, Pittsburgh, PA 15258 BNYMWA Brokerage Clients, write to your financial representative, P.O. Box 9012, Hicksville, NY 11802–9012 Individual Account Holders, write to: BNY Mellon Funds, P.O. Box 55268, Boston, MA 02205–8502
The funds file their complete schedule of portfolio holdings with the Securities and Exchange Commission (“SEC”) for the first and third quarters of each fiscal year on Form N-Q. The funds’ Forms N-Q are available on the SEC’s website at http://www.sec.gov and may be reviewed and copied at the SEC’s Public Reference Room in Washington, DC. Information on the operation of the Public Reference Room may be obtained by calling 1-800-SEC-0330.
A description of the policies and procedures that the funds use to determine how to vote proxies relating to portfolio securities, and information regarding how the funds voted these proxies for the most recent 12-month period ended June 30 is available at http://www.dreyfus.com and on the SEC’s website at http://www.sec.gov. The description of the policies and procedures is also available without charge, upon request, by calling 1-800-DREYFUS.

The BNY Mellon Funds
| BNY Mellon Bond Fund | |
| BNY Mellon Intermediate Bond Fund | |
| BNY Mellon Corporate Bond Fund | |
| BNY Mellon Short-Term U.S. Government Securities Fund | |
| ANNUAL REPORT | August 31, 2014 |


DISCUSSION OF
FUND PERFORMANCE
For the period of September 1, 2013, through August 31, 2014, as provided by John F. Flahive, CFA, Portfolio Manager
Fund and Market Performance Overview
For the 12-month period ended August 31, 2014, BNY Mellon Bond Fund’s Class M shares produced a total return of 5.19%, and Investor shares produced a total return of 4.95%.1 In comparison, the fund’s benchmark, the Barclays U.S. Aggregate Bond Index (the “Index”), produced a total return of 5.66% for the same period.2
A recovering U.S. economy and rising long-term interest rates caused bond prices to fall during the final months of 2013, but renewed economic uncertainties and favorable supply-and-demand dynamics sent long-term interest rates lower and bond prices higher over the first eight months of 2014. The fund produced lower returns than its benchmark, mainly due to a relatively short average duration and fund fees and expenses that are not reflected in the Index’s results.
The Fund’s Investment Approach
The fund seeks total return (consisting of capital appreciation and current income). To pursue its goal, the fund actively manages bond market and maturity exposure and invests at least 80% of its assets in bonds, such as U.S. Treasury and government agency bonds, corporate bonds, mortgage-related securities, and foreign corporate and government bonds. The fund’s investments in bonds must be rated investment-grade quality at the time of purchase3 or, if unrated, deemed of comparable quality by the investment adviser. Generally, the average effective duration of the fund’s portfolio will not exceed eight years.
Economic Developments Drove Bond Market Performance
By the end of 2013, recovering labor markets, higher housing prices, increased manufacturing activity, and a decision by the Federal Reserve Board (the “Fed”) to begin reducing its quantitative easing program drove yields of 10-year U.S.Treasury securities above 3% for the first time in more than two years. However, renewed global economic concerns at the start of 2014 caused yields to moderate, and the Fed made clear that short-term interest rates were likely to remain near historically low levels for some time to come. Meanwhile, harsh winter weather in much of the U.S. dampened domestic economic activity; U.S. GDP contracted at a 2.1% annualized rate during the first quarter of 2014, despite continued declines in the unemployment rate.
In contrast, government officials estimated that economic growth rebounded at a 4.2% annualized rate during the second quarter. Labor markets continued to strengthen, inflation accelerated mildly, and the Fed continued to taper its bond purchases. Nonetheless, robust demand for a relatively limited supply of U.S. government securities kept yields low as global investors sought alternatives to even lower yielding European sovereign bonds. By the reporting period’s end, yields of 10-year U.S.Treasury securities remained well below their year-end 2013 levels, while short-term yields continued to be anchored by an unchanged overnight federal funds rate. As a result, yield differences generally narrowed along the market’s maturity spectrum over the first eight months of 2014.
Higher yielding bond market sectors, such as corporate-backed bonds and asset-backed securities, generally outperformed U.S. government securities when underlying business conditions improved and income-oriented investors resumed their reach for competitive yields during the reporting period.
Duration Management Strategy Dampened Results
Although a modestly short average duration helped cushion the fund against the damaging effects of rising long-term interest rates in late 2013, the same strategy
The Funds 3
DISCUSSION OF FUND PERFORMANCE (continued)
proved counterproductive in 2014, when rates fell and yield spreads narrowed along the market’s maturity range. The fund’s underweighted exposure to bonds with long-term maturities and an emphasis on maturities in the three-to-seven year range proved particularly counterproductive.To a lesser degree, the fund’s holdings of Treasury Inflation Protected Securities (“TIPS”) also weighed on its relative performance when inflationary pressures remained subdued.
The fund achieved better relative results through underweighted exposure to lower yielding U.S. Treasury securities and overweighted exposure to higher yielding corporate-backed bonds. Heavier-than-average positions among corporate securities from the financials sector helped bolster the fund’s returns. Finally, an overweighted position in taxable municipal bonds added value to the fund’s performance compared to its benchmark over the reporting period.
Strategies for an Improving Economic Environment
As of the reporting period’s end, the U.S. economic recovery apparently is back on track. Moreover, we believe above-trend U.S. GDP growth seems likely to persist over the remainder of the year and into 2015.This development raises the risk of rising interest rates, and could spark heightened market volatility. In addition, corporate-backed bonds and other higher yielding market sectors have reached richer valuations.
Therefore, we have maintained the fund’s relatively short duration posture, which we believe should help address the potential risks of rising interest rates. We have also maintained overweighted exposure to corporate securities, but in light of the prospects of persistently muted inflation, we recently reduced the fund’s exposure to TIPS. In our judgment, these are prudent strategies for today’s changing market environment.
September 15, 2014
Bond funds are subject generally to interest rate, credit, liquidity, and market risks, to varying degrees, all of which are more fully described in the fund’s prospectus. Generally, all other factors being equal, bond prices are inversely related to interest-rate changes, and rate increases can cause price declines.The fund may use derivative instruments, such as options, futures and options on futures, forward contracts, and swaps. A small investment in derivatives could have a potentially large impact on the fund’s performance.The use of derivatives involves risks different from, or possibly greater than, the risks associated with investing directly in the underlying assets.
| 1 | Total return includes reinvestment of dividends and any capital gains paid. |
| Past performance is no guarantee of future results. Share price, yield, and | |
| investment return fluctuate such that upon redemption, fund shares may be | |
| worth more or less than their original cost. | |
| 2 | SOURCE: LIPPER INC. — Reflects reinvestment of dividends and, where |
| applicable, capital gain distributions.The Barclays U.S.Aggregate Bond Index | |
| is a widely accepted, unmanaged total return index of corporate, U.S. | |
| government and U.S. government agency debt instruments, mortgage-backed | |
| securities, and asset-backed securities with an average maturity of 1-10 years. | |
| Investors cannot invest directly in any index. | |
| 3 | The fund may continue to own investment-grade bonds (at the time of |
| purchase), which are subsequently downgraded to below investment grade. |
4
FUND PERFORMANCE
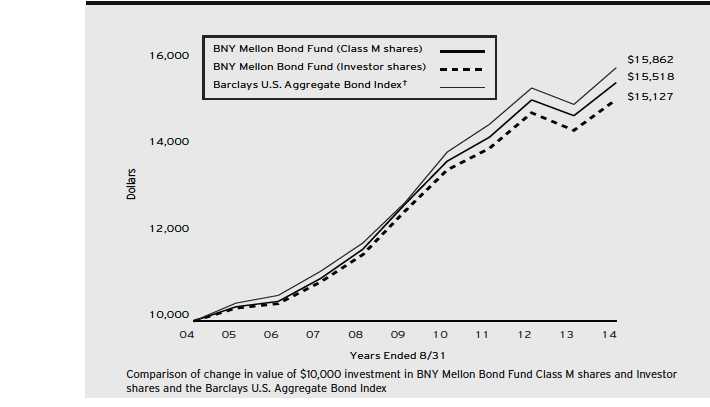
| Average Annual Total Returns as of 8/31/14 | ||||||
| 1 Year | 5 Years | 10 Years | ||||
| Class M shares | 5.19 | % | 4.08 | % | 4.49 | % |
| Investor shares | 4.95 | % | 3.82 | % | 4.23 | % |
| Barclays U.S. Aggregate Bond Index | 5.66 | % | 4.48 | % | 4.72 | % |
† Source: Lipper Inc.
Past performance is not predictive of future performance.The fund’s performance shown in the graph and table does not reflect the deduction of taxes that a shareholder would pay on fund distributions or the redemption of fund shares.
The above graph compares a $10,000 investment made in Class M shares and Investor shares of BNY Mellon Bond Fund on 8/31/04 to a $10,000 investment made in the Barclays U.S. Aggregate Bond Index (the “Index”) on that date. All dividends and capital gain distributions are reinvested.
The fund’s performance shown in the line graph above takes into account all applicable fees and expenses for Class M and Investor shares.The Index is a widely accepted, unmanaged index of corporate, government and government agency debt instruments, mortgage-backed securities, and asset-backed securities with an average maturity of 1-10 years. Unlike a mutual fund, the Index is not subject to charges, fees and other expenses. Investors cannot invest directly in any index. Further information relating to fund performance, including expense reimbursements, if applicable, is contained in the Financial Highlights section of the prospectus and elsewhere in this report.
The Funds 5

DISCUSSION OF
FUND PERFORMANCE
For the period of September 1, 2013, through August 31, 2014, as provided by John F. Flahive, CFA, Portfolio Manager
Fund and Market Performance Overview
For the 12-month period ended August 31, 2014, BNY Mellon Intermediate Bond Fund’s Class M shares produced a total return of 2.87%, and Investor shares produced a total return of 2.69%.1 In comparison, the fund’s benchmark, the Barclays Intermediate Government/Credit Bond Index (the “Index”), produced a total return of 3.55%.2
A recovering U.S. economy and rising long-term interest rates caused bond prices to fall during the final months of 2013, but renewed economic uncertainties and favorable supply-and-demand dynamics sent long-term interest rates lower and bond prices higher over the first eight months of 2014.The fund lagged its benchmark, mainly due to a relatively short average duration and fund fees and expenses that are not reflected in the Index’s results.
The Fund’s Investment Approach
The fund seeks total return (consisting of capital appreciation and current income). To pursue its goal, the fund actively manages bond market and maturity exposure and invests at least 80% of its assets in bonds, such as U.S. government and agency bonds, corporate bonds, mortgage-related securities, foreign corporate and government bonds, and municipal bonds. The fund’s investments in bonds must be rated investment grade at the time of purchase3 or, if unrated, deemed of comparable quality by the investment adviser. Generally, the fund’s average effective portfolio maturity will be between three and 10 years, and the average effective duration of the fund’s portfolio will be between 2.5 and 5.5 years. When managing the fund, we use a disciplined process to select securities and manage risk.We generally choose bonds based on yield, credit quality, the level of interest rates and inflation, general economic and financial trends, and our outlook for the securities markets. Our management process also includes computer modeling and scenario testing of possible changes in market conditions.
Economic Developments Drove Bond Market Performance
By the end of 2013, a sustained economic recovery and a decision by the Federal Reserve Board (the “Fed”) to begin reducing its quantitative easing program drove yields of 10-year U.S. Treasury securities above 3% for the first time in more than two years. However, renewed global economic concerns at the start of 2014 caused yields to moderate, and the Fed made clear that short-term interest rates were likely to remain near historically low levels for some time. Meanwhile, harsh winter weather in much of the U.S. dampened domestic economic activity; U.S. GDP contracted at a 2.1% annualized rate during the first quarter of 2014, despite declines in the unemployment rate.
In contrast, government officials estimated that economic growth rebounded at a 4.2% annualized rate during the second quarter. Labor markets continued to strengthen, inflation accelerated mildly, and the Fed continued to taper its bond purchases. Nonetheless, robust demand for a relatively limited supply of U.S. government securities kept yields low. By the reporting period’s end, yields of 10-year U.S.Treasury securities remained well below their year-end 2013 levels, while short-term yields continued to be anchored by an unchanged federal funds rate. As a result, yield differences generally narrowed along the market’s maturity spectrum over the first eight months of 2014.
Higher yielding bond market sectors, such as corporate-backed bonds and asset-backed securities, generally outperformed U.S. government securities when under-
6
lying business conditions improved and income-oriented investors resumed their reach for competitive yields during the reporting period.
Duration Management Strategy Dampened Results
Although a modestly short average duration helped cushion the fund against the damaging effects of rising long-term interest rates in 2013, the same strategy proved counterproductive in 2014, when rates fell and yield spreads narrowed along the market’s maturity range. The fund’s underweighted exposure to bonds with eight- to 10-year maturities and an emphasis on maturities in the three- to five-year range proved particularly counterproductive. To a lesser degree, the fund’s holdings of Treasury Inflation Protected Securities (“TIPS”) also weighed on its relative performance when inflation remained subdued.
The fund achieved better relative results through underweighted exposure to U.S. Treasury securities and overweighted exposure to higher yielding corporate-backed bonds. Heavier-than-average positions among corporate securities from the financials and industrials sectors helped bolster returns. Finally, an overweighted position in taxable municipal bonds added value.
Strategies for an Improving Economic Environment
The U.S. economic recovery apparently is back on track, and we believe above-trend growth seems likely to persist into 2015. This development raises the risk of rising interest rates, and could spark heightened market volatility. In addition, corporate-backed bonds and other higher yielding market sectors have reached richer valuations.
Therefore, we have maintained the fund’s relatively short duration posture, which we believe should help address the potential risk of rising interest rates.We have also maintained overweighted exposure to corporate securities, but in light of the prospects of persistently muted inflation, we recently reduced the fund’s exposure to TIPS. In our judgment, these are prudent strategies for today’s changing market environment.
September 15, 2014
Bond funds are subject generally to interest rate, credit, liquidity, and market risks, to varying degrees, all of which are more fully described in the fund’s prospectus. Generally, all other factors being equal, bond prices are inversely related to interest-rate changes, and rate increases can cause price declines. The fund may use derivative instruments, such as options, futures and options on futures, forward contracts, and swaps. A small investment in derivatives could have a potentially large impact on the fund’s performance. The use of derivatives involves risks different from, or possibly greater than, the risks associated with investing directly in the underlying assets.
| 1 | Total return includes reinvestment of dividends and any capital gains paid. Past performance is no guarantee of future results. Share price, yield, and investment return fluctuate such that upon redemption, fund shares may be worth more or less than their original cost. |
| 2 | SOURCE: LIPPER INC. — Reflects reinvestment of dividends and, where applicable, capital gain distributions.The Barclays Intermediate Government/Credit Bond Index is a widely accepted, unmanaged index of government and credit bond market performance composed of U.S. government,Treasury and agency securities, fixed-income securities, and nonconvertible investment-grade credit debt, with an average maturity of 1- 10 years. Index return does not reflect the fees and expenses associated with operating a mutual fund. Investors cannot invest directly in any index. |
| 3 | The fund may continue to own investment-grade bonds (at the time of purchase), which are subsequently downgraded to below investment grade. |
The Funds 7
FUND PERFORMANCE
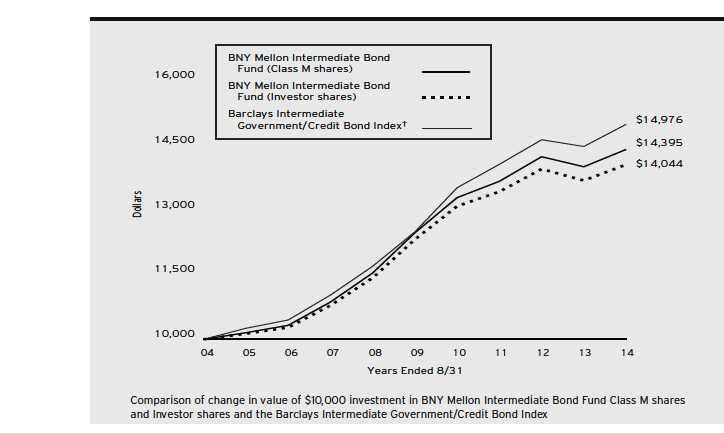
| Average Annual Total Returns as of 8/31/14 | ||||||
| 1 Year | 5 Years | 10 Years | ||||
| Class M shares | 2.87 | % | 2.92 | % | 3.71 | % |
| Investor shares | 2.69 | % | 2.67 | % | 3.45 | % |
| Barclays Intermediate | ||||||
| Government/Credit Bond Index | 3.55 | % | 3.70 | % | 4.12 | % |
† Source: Lipper Inc.
Past performance is not predictive of future performance.The fund’s performance shown in the graph and table does not reflect the deduction of taxes that a shareholder would pay on fund distributions or the redemption of fund shares.
The above graph compares a $10,000 investment made in Class M shares and Investor shares of BNY Mellon Intermediate Bond Fund on 8/31/04 to a $10,000 investment made in the Barclays Intermediate Government/Credit Bond Index (the “Index”) on that date. All dividends and capital gain distributions are reinvested. The fund’s performance shown in the line graph above takes into account all applicable fees and expenses for Class M and Investor shares.The Index is a widely accepted, unmanaged index of Government and credit bond market performance composed of U.S. Government,Treasury and Agency securities, fixed-income securities and nonconvertible investment-grade credit debt, with an average maturity of 1-10 years. Unlike a mutual fund, the Index is not subject to charges, fees and other expenses. Investors cannot invest directly in any index. Further information relating to fund performance, including expense reimbursements, if applicable, is contained in the Financial Highlights section of the prospectus and elsewhere in this report.
8

DISCUSSION OF
FUND PERFORMANCE
For the period of September 1, 2013, through August 31, 2014, as provided by John F. Flahive, CFA, Portfolio Manager
Fund and Market Performance Overview
For the 12-month period ended August 31, 2014, BNY Mellon Corporate Bond Fund’s Class M shares produced a total return of 7.21%, and Investor shares produced a total return of 6.92%.1 In comparison, the fund’s benchmark, the Barclays U.S. Intermediate Credit Bond Index (the “Index”), produced a 3.55% total return and the Barclays U.S. Credit Index produced a 9.06% total return for the same period.2
A recovering U.S. economy and robust demand for higher yielding securities helped support corporate bond prices over the reporting period. The fund produced higher returns than its benchmark, mainly due to overweighted exposure to bonds with credit ratings toward the bottom of the investment-grade range.
The Fund’s Investment Approach
The fund seeks total return (consisting of capital appreciation and current income). To pursue its goal, the fund normally invests at least 80% of its net assets in corporate bonds, which include U.S. dollar-denominated bonds issued by U.S. and foreign corporations.The remainder of the fund’s assets may be invested in U.S. government and agency bonds, mortgage-related securities, including commercial mortgage-backed securities, asset-backed securities, foreign corporate bonds denominated in foreign currencies, foreign government bonds, municipal bonds and commercial paper, and other money market instruments. For additional yield, the fund may invest up to 20% of its assets in fixed-income securities rated below investment grade (“high yield” or “junk” bonds) or the unrated equivalent as determined by the investment adviser.
We employ a disciplined process to select bonds and manage risk, choosing bonds based on yield, credit quality, the level of interest rates and inflation, general economic and financial trends, and our outlook for the securities markets. In selecting corporate bonds for investment, we analyze fundamental metrics, including the issuer’s cash flow, leverage and operating margins, as well as its business strategy and operating performance, and macroeconomic factors.
Economic Developments Drove Bond Market Performance
By the end of 2013, a sustained economic recovery and a decision by the Federal Reserve Board (the “Fed”) to begin reducing its quantitative easing program drove yields of 10-year U.S. Treasury securities above 3% for the first time in more than two years. However, renewed global economic concerns at the start of 2014 caused Treasury yields to moderate, and the Fed reiterated that short-term interest rates were likely to remain near historically low levels for some time to come. Meanwhile, harsh winter weather in much of the U.S. dampened domestic economic activity; U.S. GDP contracted at a 2.1% annualized rate during the first quarter of 2014, despite continued declines in the unemployment rate.
In contrast, government officials estimated that economic growth rebounded at a 4.2% annualized rate during the second quarter. Labor markets continued to strengthen, inflation accelerated mildly, and the Fed continued to taper its bond purchases. Nonetheless, robust demand for a relatively limited supply of U.S. government securities kept yields low. By the reporting period’s end, yields of 10-year U.S. Treasury securities remained well below year-end 2013 levels, while short-term yields continued to be anchored by an unchanged federal funds rate.As a result, yield differences generally narrowed along the market’s maturity spectrum over the first eight months of 2014.
The Funds 9
DISCUSSION OF FUND PERFORMANCE (continued)
Corporate-backed bonds generally outperformed U.S. government securities as underlying business conditions improved. In addition, corporate bond prices were bolstered by robust demand from income-oriented investors, who resumed their reach for competitive yields.
Security Selection Strategy Boosted Fund Performance
The fund participated more than fully in the corporate bond market’s gains over the reporting period. An emphasis on bonds with BBB credit ratings, which are at the bottom of the investment-grade spectrum, proved especially helpful. Positive contributions to performance were particularly significant among bonds from the financials and industrials sectors.
The fund also benefited from its holdings of international fixed-income securities, including sovereign bonds from Spain and Bermuda. Supranational bonds, which are issued by state-supported companies, also fared well. In addition, an overweighted position in taxable municipal bonds added a degree of value to the fund’s relative performance.
Finally, over most of the reporting period we set the fund’s average duration in a position that was slightly longer than market averages.This strategy enabled the fund to participate more fully in gains stemming from narrowing yield differences along the market’s maturity range.
Strategies for an Improving Economic Environment
The U.S. economic recovery apparently is back on track, and we believe above-trend growth seems likely to persist into 2015. This development raises the risks of higher interest rates, which could spark heightened bond market volatility. In addition, we recognize that corporate bonds have reached richer valuations.
As of the reporting period’s end, we have maintained a relatively constructive investment posture. We have continued to identify what we believe are attractive opportunities throughout the investment-grade corporate bond market, and we have also maintained overweighted positions in the financials and industrials sectors. In our judgment, these strategies position the fund well for further improvement in U.S. economic conditions.
September 15, 2014
Bond funds are subject generally to interest rate, credit, liquidity, and market risks, to varying degrees, all of which are more fully described in the fund’s prospectus. Generally, all other factors being equal, bond prices are inversely related to interest-rate changes, and rate increases can cause price declines. The fund may use derivative instruments, such as options, futures and options on futures, forward contracts, and swaps. A small investment in derivatives could have a potentially large impact on the fund’s performance.The use of derivatives involves risks different from, or possibly greater than, the risks associated with investing directly in the underlying assets.
| 1 | Total return includes reinvestment of dividends and any capital gains paid. Past performance is no guarantee of future results. Share price, yield, and investment return fluctuate such that upon redemption, fund shares may be worth more or less than their original cost. |
| 2 | Source: LIPPER INC. – The Barclays U.S. Intermediate Credit Bond Index is an unmanaged index that consists of dollar denominated, investment grade, publicly issued securities with a maturity of between one and ten years and that are issued by both corporate issuers and non-corporate issuers. Unlike a mutual fund, the Index is not subject to charges, fees, and other expenses.The Barclays U.S. Credit Index is an unmanaged index designed to measure the performance of investment grade securities with a maturity of at least one year, issued by U.S. and foreign industrial, utility and financial issuers and by non- corporate issuers. Investors cannot invest directly in any index. |
10
FUND PERFORMANCE
| Average Annual Total Returns as of 8/31/14 | |||||
| Inception | From | ||||
| Date | 1 Year | Inception | |||
| Class M shares | 3/2/12 | 7.21 | % | 4.62 | % |
| Investor shares | 3/2/12 | 6.92 | % | 4.36 | % |
| Barclays U.S. Intermediate Credit Index | 2/29/12 | 3.55 | % | 1.89 | %†† |
| Barclays U.S. Credit Index | 2/29/12 | 9.06 | % | 4.52 | %†† |
| † Source: Lipper Inc. |
| Past performance is not predictive of future performance.The fund’s performance shown in the graph and table does not reflect the deduction of taxes that a shareholder |
| would pay on fund distributions or the redemption of fund shares. |
| The above graph compares a $10,000 investment made in Class M shares and Investor shares of BNY Mellon Corporate Bond Fund on 3/2/12 (inception date) to |
| a $10,000 investment made in each of the Barclays U.S. Intermediate Credit Index and the Barclays U.S. Credit Index on that date.All dividends and capital gain |
| distributions are reinvested. |
| The fund’s performance shown in the line graph above takes into account all applicable fees and expenses for Class M and Investor shares.The Barclays U.S. |
| Intermediate Credit Index is an unmanaged index that consists of dollar denominated, investment grade, publicly issued securities with a maturity of between one and |
| ten years and that are issued by both corporate issuers and non-corporate issuers. The Barclays U.S. Credit Index is an unmanaged index designed to measure the |
| performance of investment grade securities with a maturity of at least one year, issued by U.S. and foreign industrial, utility and financial issuers and by non-corporate |
| issuers. Unlike a mutual fund, the indices are not subject to charges, fees and other expenses. Investors cannot invest directly in any index. Further information relating |
| to fund performance, including expense reimbursements, if applicable, is contained in the Financial Highlights section of the prospectus and elsewhere in this report. |
| †† For comparative purposes, the value of the indices as of 02/29/12 is used as the beginning value on 3/2/12. |
The Funds 11
DISCUSSION OF FUND PERFORMANCE (continued)

DISCUSSION OF
FUND PERFORMANCE
For the period of September 1, 2013, through August 31, 2014, as provided by Lawrence R. Dunn, CFA, Portfolio Manager
Fund and Market Performance Overview
For the 12-month period ended August 31, 2014, BNY Mellon Short-Term U.S. Government Securities Fund’s Class M shares produced a total return of 0.44%, and Investor shares produced a total return of 0.18%.1 In comparison, the Barclays 1-3 Year U.S. Government Index (the “Index”), the fund’s benchmark, achieved a total return of 0.81%.2
Despite heightened volatility among long-term bonds stemming from changing economic conditions and supply-and-demand dynamics, short-term bonds remained relatively stable as the Federal Reserve Board (the “Fed”) left the overnight federal funds rate unchanged.The fund lagged its benchmark, mainly due to a relatively conservative investment posture as well as the impact of fund fees and expenses that are not reflected in the Index’s results.
The Fund’s Investment Approach
The fund seeks to provide as high a level of current income as is consistent with the preservation of capital. To pursue this goal, the fund invests at least 80% of its assets in securities issued or guaranteed by the U.S. government or its agencies or instrumentalities and in repurchase agreements.The fund may invest up to 35% of its net assets in mortgage-related securities issued by U.S. government agencies or instrumentalities, such as mortgage pass-through securities issued by the Government National Mortgage Association (“Ginnie Mae”), the Federal National Mortgage Association (“Fannie Mae”), and the Federal Home Loan Mortgage Corporation (“Freddie Mac”).The fund may also invest in collateralized mortgage obligations (“CMOs”), including stripped mortgage-backed securities. Generally, the fund’s average effective portfolio maturity and the average effective duration of the fund’s portfolio will be less than three years.
When choosing securities, we typically first examine U.S. and global economic conditions and other market factors to estimate long- and short-term interest rates. Using a research-driven investment process, we then seek to identify what we believe are potentially profitable sectors before they are widely perceived by the market.We also seek to identify underpriced or mispriced securities that appear likely to perform well over time.
Economic Developments Drove Bond Market Performance
By the end of 2013, a sustained economic recovery and the Fed’s decision to begin reducing its quantitative easing program drove yields of 10-year U.S. Treasury securities above 3% for the first time in more than two years. However, renewed global economic concerns at the start of 2014 caused yields to moderate, and the Fed made clear that short-term interest rates were likely to remain near historically low levels. Meanwhile, harsh winter weather dampened domestic economic activity: U.S. GDP contracted at a 2.1% annualized rate during the first quarter of 2014.
In contrast, government officials estimated that economic growth rebounded at a 4.2% annualized rate during the second quarter. Labor markets continued to strengthen, inflation accelerated mildly, and the Fed continued to taper its bond purchases. Nonetheless, robust demand for U.S. government securities kept yields low. By the reporting period’s end, yields of 10-year U.S. Treasury securities remained well below their year-end 2013 levels, while short-term yields continued to be anchored by
12
an unchanged federal funds rate.As a result, yield differences generally narrowed along the market’s maturity spectrum.These developments had a far greater impact on long-term U.S. government securities than on their short-term counterparts, which remained relatively stable due to the Fed’s unchanged target for short-term interest rates.
Conservative Investment Posture Dampened Relative Results
In light of stable short-term rates and heightened volatility among longer term bonds, we maintained the fund’s average duration in a position we considered to be roughly in line with market averages. Consequently, the fund did not benefit as much as it might have when yield differences narrowed across the maturity spectrum.
The fund achieved better results from its security selection strategy. In an effort to capture higher yields, we maintained overweighted positions in residential and commercial mortgage-backed securities. Most of the fund’s mortgage-backed securities holdings were backed by U.S. government agencies and featured maturities between three and five years, which we believed would provide protection from rising interest rates and potential increases in mortgage prepayment rates. In addition, an overweighted position in taxable municipal bonds added value to the fund’s relative performance.
Strategies for an Improving Economic Environment
The U.S. economic recovery apparently is back on track, and above-trend growth seems likely to persist into 2015. This development raises the risk of rising longer term interest rates, which could spark heightened market volatility. However, the Fed recently confirmed that it intends to maintain its historically low target for the federal funds rate for “a considerable time” after its quantitative easing program ends.
Therefore, we have maintained the fund’s neutral duration posture, and its focus on higher yielding alternatives to U.S.Treasury securities. In our judgment, these are prudent strategies for today’s changing market environment.
September 15, 2014
Bond funds are subject generally to interest rate, credit, liquidity, and market risks, to varying degrees, all of which are more fully described in the fund’s prospectus. Generally, all other factors being equal, bond prices are inversely related to interest-rate changes, and rate increases can cause price declines. The fund may use derivative instruments, such as options, futures and options on futures, forward contracts, and swaps. A small investment in derivatives could have a potentially large impact on the fund’s performance. The use of derivatives involves risks different from, or possibly greater than, the risks associated with investing directly in the underlying assets.
| 1 | Total return includes reinvestment of dividends and any capital gains paid. |
| Past performance is no guarantee of future results. Share price, yield, and | |
| investment return fluctuate such that upon redemption, fund shares may be | |
| worth more or less than their original cost. | |
| 2 | SOURCE: LIPPER INC. – Reflects reinvestment of dividends and, |
| where applicable, capital gain distributions.The Barclays 1-3Year U.S. | |
| Government Index is a widely accepted, unmanaged index of government | |
| and credit bond market performance composed of U.S. government,Treasury | |
| and agency securities, fixed-income securities, and nonconvertible investment- | |
| grade credit debt, with an average maturity of 1-10 years. Index return | |
| does not reflect the fees and expenses associated with operating a mutual | |
| fund. Investors cannot invest directly in any index. |
The Funds 13
FUND PERFORMANCE
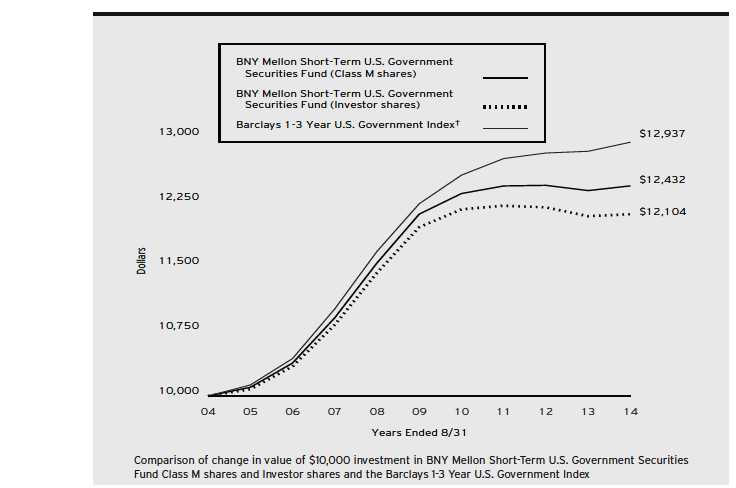
| Average Annual Total Returns as of 8/31/14 | ||||||
| 1 Year | 5 Years | 10 Years | ||||
| Class M shares | 0.44 | % | 0.53 | % | 2.20 | % |
| Investor shares | 0.18 | % | 0.25 | % | 1.93 | % |
| Barclays 1-3 Year U.S. Government Index | 0.81 | % | 1.14 | % | 2.61 | % |
† Source: Lipper Inc.
Past performance is not predictive of future performance.The fund’s performance shown in the graph and table does not reflect the deduction of taxes that a shareholder would pay on fund distributions or the redemption of fund shares.
The above graph compares a $10,000 investment made in Class M shares and Investor shares of BNY Mellon Short-Term U.S. Government Securities Fund on 8/31/04 to a $10,000 investment made in the Barclays 1-3 Year U.S. Government Index (the “Index”) on that date. All dividends and capital gain distributions are reinvested.
The fund’s performance shown in the line graph above takes into account all applicable fees and expenses for Class M and Investor shares.The Index is a widely accepted, unmanaged index of government bond market performance composed of U.S.Treasury and agency securities with maturities of 1-3 years. Unlike a mutual fund, the Index is not subject to charges, fees and other expenses. Investors cannot invest directly in any index. Further information relating to fund performance, including expense reimbursements, if applicable, is contained in the Financial Highlights section of the prospectus and elsewhere in this report.
14
UNDERSTANDING YOUR FUND’S EXPENSES (Unaudited)
As a mutual fund investor, you pay ongoing expenses, such as management fees and other expenses. Using the information below, you can estimate how these expenses affect your investment and compare them with the expenses of other funds.You also may pay one-time transaction expenses, including sales charges (loads) and redemption fees, which are not shown in this section and would have resulted in higher total expenses. For more information, see your fund’s prospectus or talk to your financial adviser.
Review your fund’s expenses
The table below shows the expenses you would have paid on a $1,000 investment in each class of each BNY Mellon fixed income fund from March 1, 2014 to August 31, 2014. It also shows how much as $1,000 investment would be worth at the close of the period, assuming actual returns and expenses.
| Expenses and Value of a $1,000 Investment | ||
| assuming actual returns for the six months ended August 31, 2014 | ||
| Class M Shares | Investor Shares | |
| BNY Mellon Bond Fund | ||
| Expenses paid per $1,000† | $2.80 | $4.07 |
| Ending value (after expenses) | $1,021.20 | $1,020.10 |
| Annualized expense ratio (%) | .55 | .80 |
| BNY Mellon Intermediate Bond Fund | ||
| Expenses paid per $1,000† | $2.79 | $4.10 |
| Ending value (after expenses) | $1,009.00 | $1,008.30 |
| Annualized expense ratio (%) | .55 | .81 |
| BNY Mellon Corporate Bond Fund | ||
| Expenses paid per $1,000† | $2.87 | $4.19 |
| Ending value (after expenses) | $1,030.00 | $1,028.70 |
| Annualized expense ratio (%) | .56 | .82 |
| BNY Mellon Short-Term U.S. Government Securities Fund | ||
| Expenses paid per $1,000† | $2.62 | $3.93 |
| Ending value (after expenses) | $1,000.70 | $999.30 |
| Annualized expense ratio (%) | .52 | .78 |
| † Expenses are equal to each fund’s annualized expense ratios as shown above, multiplied by the average account value over the period, multiplied by 184/365 (to reflect the one-half |
| year period). |
The Funds 15
COMPARING YOUR FUND’S EXPENSES WITH THOSE OF OTHER FUNDS (Unaudited)
Using the SEC’s method to compare expenses
The Securities and Exchange Commission (SEC) has established guidelines to help investors assess fund expenses. Per these guidelines, the table below shows your fund’s expenses based on a $1,000 investment, assuming a hypothetical 5% annualized return.You can use this information to compare the ongoing expenses (but not transaction expenses or total cost) of investing in the fund with those of other funds. All mutual fund shareholder reports will provide this information to help you make this comparison. Please note that you cannot use this information to estimate your actual ending account balance and expenses paid during the period.
| Expenses and Value of a $1,000 Investment | ||
| assuming a hypothetical 5% annualized return for the six months ended August 31, 2014 | ||
| Class M Shares | Investor Shares | |
| BNY Mellon Bond Fund | ||
| Expenses paid per $1,000† | $2.80 | $4.08 |
| Ending value (after expenses) | $1,022.43 | $1,021.17 |
| Annualized expense ratio (%) | .55 | .80 |
| BNY Mellon Intermediate Bond Fund | ||
| Expenses paid per $1,000† | $2.80 | $4.13 |
| Ending value (after expenses) | $1,022.43 | $1,021.12 |
| Annualized expense ratio (%) | .55 | .81 |
| BNY Mellon Corporate Bond Fund | ||
| Expenses paid per $1,000† | $2.85 | $4.18 |
| Ending value (after expenses) | $1,022.38 | $1,021.07 |
| Annualized expense ratio (%) | .56 | .82 |
| BNY Mellon Short-Term U.S. Government Securities Fund | ||
| Expenses paid per $1,000† | $2.65 | $3.97 |
| Ending value (after expenses) | $1,022.58 | $1,021.27 |
| Annualized expense ratio (%) | .52 | .78 |
| † Expenses are equal to each fund’s annualized expense ratios as shown above, multiplied by the average account value over the period, multiplied by 184/365 (to reflect the one-half |
| year period). |
16
STATEMENT OF INVESTMENTS
August 31, 2014
| BNY Mellon Bond Fund | |||||
| Coupon | Maturity | Principal | |||
| Bonds and Notes—98.9% | Rate (%) | Date | Amount ($) | Value ($) | |
| Asset-Backed Ctfs./Auto Receivables—.7% | |||||
| AmeriCredit Automobile Receivables Trust, Ser. 2013-2, Cl. A3 | 0.65 | 12/8/17 | 7,160,000 | 7,161,414 | |
| Casinos—.3% | |||||
| Agua Caliente Band of Cahuilla Indians, Sr. Scd. Notes | 6.08 | 10/1/16 | 1,043,000 | a | 1,056,862 |
| Agua Caliente Band of Cahuilla Indians, Sr. Scd. Notes | 6.35 | 10/1/15 | 753,000 | a | 744,039 |
| Agua Caliente Band of Cahuilla Indians, Sr. Scd. Notes | 6.44 | 10/1/16 | 1,243,000 | a | 1,224,628 |
| 3,025,529 | |||||
| Commercial Mortgage Pass-Through Ctfs.—1.1% | |||||
| Commercial Mortgage Asset Trust, Ser. 1999-C1, Cl. D | 7.30 | 1/17/32 | 222,228 | b | 222,243 |
| UBS Commercial Mortgage Trust, Ser. 2012-C1, Cl. A3 | 3.40 | 5/10/45 | 730,000 | 752,107 | |
| WFRBS Commercial Mortgage Trust, Ser. 2011-C5, Cl. A2 | 2.68 | 11/15/44 | 1,110,000 | 1,144,762 | |
| WFRBS Commerical Mortgage Trust, Ser. 2013-C13, Cl. A4 | 3.00 | 5/15/45 | 9,045,000 | 8,989,902 | |
| 11,109,014 | |||||
| Consumer Discretionary—4.9% | |||||
| 21st Century Fox America, Gtd. Notes | 6.15 | 3/1/37 | 5,054,000 | 6,150,238 | |
| Amazon.com, Sr. Unscd. Notes | 2.50 | 11/29/22 | 6,675,000 | 6,392,814 | |
| Comcast, Gtd. Notes | 3.13 | 7/15/22 | 11,887,000 | 12,191,711 | |
| Discovery Communications, Gtd. Notes | 3.70 | 6/1/15 | 7,050,000 | 7,218,953 | |
| eBay, Sr. Unscd. Notes | 2.88 | 8/1/21 | 5,245,000 | 5,263,583 | |
| Time Warner, Gtd. Notes | 4.00 | 1/15/22 | 7,570,000 | 7,989,893 | |
| Time Warner Cable, Gtd. Notes | 4.13 | 2/15/21 | 5,220,000 | 5,654,226 | |
| 50,861,418 | |||||
| Consumer Staples—2.9% | |||||
| Anheuser-Busch InBev Worldwide, Gtd. Notes | 2.50 | 7/15/22 | 6,160,000 | 6,047,438 | |
| ConAgra Foods, Sr. Unscd. Notes | 3.20 | 1/25/23 | 2,022,000 | 1,996,304 | |
| PepsiCo, Sr. Unscd. Notes | 4.50 | 1/15/20 | 7,040,000 | 7,870,636 | |
| Pernod Ricard, Sr. Unscd. Notes | 4.45 | 1/15/22 | 5,610,000 | a | 6,039,978 |
| Walgreen, Sr. Unscd. Notes | 3.10 | 9/15/22 | 8,355,000 | 8,290,424 | |
| 30,244,780 | |||||
| Energy—1.0% | |||||
| BP Capital Markets, Gtd. Notes | 3.20 | 3/11/16 | 4,990,000 | 5,189,715 | |
| Petrobras International Finance, Gtd. Notes | 5.38 | 1/27/21 | 5,355,000 | 5,672,552 | |
| 10,862,267 | |||||
| Financial—18.6% | |||||
| American International Group, Sr. Unscd. Notes | 5.85 | 1/16/18 | 8,300,000 | 9,419,853 | |
| Bank of America, Sr. Unscd. Notes | 2.60 | 1/15/19 | 18,500,000 | 18,699,523 | |
| BlackRock, Sr. Unscd. Notes | 6.25 | 9/15/17 | 7,860,000 | 8,981,213 | |
| Boston Properties, Sr. Unscd. Notes | 4.13 | 5/15/21 | 7,185,000 | 7,737,577 | |
| Citigroup, Sr. Unscd. Notes | 2.50 | 9/26/18 | 7,075,000 | 7,189,205 | |
| Citigroup, Sr. Unscd. Notes | 6.13 | 11/21/17 | 3,135,000 | 3,559,219 |
The Funds 17
STATEMENT OF INVESTMENTS (continued)
| BNY Mellon Bond Fund (continued) | |||||
| Coupon | Maturity | Principal | |||
| Bonds and Notes (continued) | Rate (%) | Date | Amount ($) | Value ($) | |
| Financial (continued) | |||||
| Citizens Financial Group, Sub. Notes | 4.15 | 9/28/22 | 8,555,000 | a | 8,701,333 |
| Ford Motor Credit, Sr. Unscd. Notes | 3.00 | 6/12/17 | 6,225,000 | 6,460,517 | |
| General Electric Capital, Jr. Sub. Cap. Secs., Ser. C | 5.25 | 6/29/49 | 4,930,000 | b,c | 5,047,088 |
| General Electric Capital, Sub. Notes | 5.30 | 2/11/21 | 8,285,000 | 9,512,820 | |
| Goldman Sachs Group, Sub. Notes | 6.75 | 10/1/37 | 8,270,000 | 10,220,843 | |
| HSBC Finance, Sr. Sub. Notes | 6.68 | 1/15/21 | 10,510,000 | 12,631,507 | |
| JPMorgan Chase & Co., Sub. Notes | 3.38 | 5/1/23 | 5,770,000 | 5,688,822 | |
| MetLife, Sr. Unscd. Notes | 7.72 | 2/15/19 | 6,865,000 | 8,502,783 | |
| Morgan Stanley, Sub. Notes | 4.88 | 11/1/22 | 11,490,000 | 12,432,858 | |
| NYSE Euronext, Gtd. Notes | 2.00 | 10/5/17 | 7,340,000 | 7,460,530 | |
| Prudential Financial, Sr. Unscd. Notes | 4.75 | 9/17/15 | 7,135,000 | 7,435,334 | |
| Rabobank Nederland, Gtd. Notes | 4.50 | 1/11/21 | 8,060,000 | 8,971,256 | |
| Royal Bank of Canada, Sr. Unscd. Notes | 1.25 | 6/16/17 | 8,385,000 | 8,397,829 | |
| Simon Property Group, Sr. Unscd. Notes | 5.65 | 2/1/20 | 8,782,000 | 10,248,085 | |
| TD Ameritrade Holding, Gtd. Notes | 4.15 | 12/1/14 | 6,630,000 | 6,690,061 | |
| Toyota Motor Credit, Sr. Unscd. Notes | 1.13 | 5/16/17 | 5,615,000 | 5,615,163 | |
| Wachovia, Sub. Notes | 5.63 | 10/15/16 | 5,545,000 | 6,068,248 | |
| 195,671,667 | |||||
| Foreign/Governmental—2.0% | |||||
| Mexican Government, Sr. Unscd. Notes | 5.63 | 1/15/17 | 5,975,000 | 6,617,313 | |
| Mexican Government, Sr. Unscd. Notes | 6.63 | 3/3/15 | 1,480,000 | 1,524,237 | |
| Petroleos Mexicanos, Gtd. Notes | 4.88 | 1/24/22 | 5,345,000 | 5,820,705 | |
| Province of Ontario Canada, Sr. Unscd. Bonds | 4.00 | 10/7/19 | 6,500,000 | 7,136,883 | |
| 21,099,138 | |||||
| Health Care—.9% | |||||
| Amgen, Sr. Unscd. Notes | 5.65 | 6/15/42 | 7,955,000 | 9,477,881 | |
| Industrial—1.7% | |||||
| ABB Finance USA, Gtd. Notes | 2.88 | 5/8/22 | 11,060,000 | 11,086,389 | |
| Burlington Northern Santa Fe, Sr. Unscd. Debs | 3.45 | 9/15/21 | 6,415,000 | 6,703,361 | |
| 17,789,750 | |||||
| Information Technology—2.2% | |||||
| Intel, Sr. Unscd. Notes | 2.70 | 12/15/22 | 10,900,000 | 10,732,500 | |
| Oracle, Sr. Unscd. Notes | 5.75 | 4/15/18 | 10,410,000 | 11,921,594 | |
| 22,654,094 | |||||
| Materials—.7% | |||||
| Eastman Chemical, Sr. Unscd. Notes | 3.60 | 8/15/22 | 7,075,000 | 7,281,526 | |
| Municipal Bonds—5.9% | |||||
| Chicago, GO | 7.78 | 1/1/35 | 6,460,000 | 7,776,031 | |
| Florida Hurricane Catastrophe Fund | |||||
| Finance Corporation, Revenue | 3.00 | 7/1/20 | 14,000,000 | 14,251,860 |
18
| BNY Mellon Bond Fund (continued) | |||||
| Coupon | Maturity | Principal | |||
| Bonds and Notes (continued) | Rate (%) | Date | Amount ($) | Value ($) | |
| Municipal Bonds (continued) | |||||
| Illinois, GO | 4.42 | 1/1/15 | 4,935,000 | 4,999,994 | |
| Massachusetts, GO (Build America Bonds) | 4.20 | 12/1/21 | 3,985,000 | 4,362,180 | |
| Metropolitan Transportation Authority, | |||||
| Special Obligation Taxable Bonds | 3.02 | 7/1/24 | 9,700,000 | 9,763,438 | |
| New Jersey Economic Development Authority, | |||||
| School Facilities Construction Revenue | 1.10 | 6/15/16 | 7,425,000 | 7,409,185 | |
| New York City Municipal Water Finance Authority, | |||||
| Water and Sewer System Second General Resolution | |||||
| Revenue (Build America Bonds) | 6.28 | 6/15/42 | 5,430,000 | 6,281,424 | |
| Oakland Unified School District, GO (Build America Bonds) | 9.50 | 8/1/34 | 3,550,000 | 4,219,601 | |
| University of California Regents, Medical Center | |||||
| Pooled Revenue (Build America Bonds) | 5.44 | 5/15/23 | 2,715,000 | 3,163,491 | |
| 62,227,204 | |||||
| Telecommunications—2.8% | |||||
| AT&T, Sr. Unscd. Notes | 4.45 | 5/15/21 | 7,980,000 | 8,855,965 | |
| Telefonica Emisiones, Gtd. Notes | 5.13 | 4/27/20 | 9,395,000 | 10,479,033 | |
| Verizon Communications, Sr. Unscd. Notes | 5.15 | 9/15/23 | 8,490,000 | 9,619,340 | |
| 28,954,338 | |||||
| U.S. Government Agencies/Mortgage-Backed—30.2% | |||||
| Federal Home Loan Mortgage Corp.: | |||||
| 3.00%, 9/1/27—11/1/28 | 21,325,481 | d | 22,095,819 | ||
| 3.50%, 12/1/28—6/1/43 | 18,800,647 | d | 19,461,075 | ||
| 4.00%, 6/1/26—4/1/44 | 16,459,454 | d | 17,566,568 | ||
| 4.50%, 5/1/39—11/1/41 | 37,864,196 | d | 41,258,482 | ||
| 5.00%, 12/1/39—7/1/40 | 11,280,628 | d | 12,485,549 | ||
| 5.50%, 12/1/37—12/1/38 | 7,240,454 | d | 8,037,056 | ||
| Federal National Mortgage Association: | |||||
| 2.50%, 3/1/28—7/1/28 | 29,291,179 | d | 29,799,637 | ||
| 3.00%, 10/1/32—5/1/43 | 18,116,812 | d | 18,318,222 | ||
| 3.35%, 4/1/41 | 4,598,324 | b,d | 4,869,137 | ||
| 3.50%, 9/1/26—8/1/44 | 45,783,066 | d | 47,564,355 | ||
| 4.00%, 2/1/41—4/1/42 | 19,098,186 | d | 20,280,336 | ||
| 4.50%, 3/1/23—4/1/44 | 5,852,131 | d | 6,305,718 | ||
| 5.00%, 12/1/21—11/1/43 | 12,914,517 | d | 14,208,132 | ||
| 5.50%, 2/1/38—1/1/39 | 20,128,057 | d | 22,500,798 | ||
| 6.00%, 4/1/33—9/1/36 | 2,548,378 | d | 2,891,947 | ||
| REMIC, Ser. 2014-28, Cl. ND 3.00%, 3/25/40 | 7,314,264 | d | 7,496,931 | ||
| REMIC, Ser. 2011-8, Cl. PV, 4.00%, 1/25/30 | 3,777,000 | d | 3,971,385 | ||
| Government National Mortgage Association I; | |||||
| 5.00%, 11/15/34—3/15/36 | 7,015,364 | 7,739,968 | |||
| Government National Mortgage Association II; | |||||
| 3.00%, 1/20/44 | 10,217,742 | 10,386,744 | |||
| 317,237,859 | |||||
The Funds 19
STATEMENT OF INVESTMENTS (continued)
| BNY Mellon Bond Fund (continued) | |||||
| Coupon | Maturity | Principal | |||
| Bonds and Notes (continued) | Rate (%) | Date | Amount ($) | Value ($) | |
| U.S. Government Securities—22.5% | |||||
| U.S. Treasury Inflation Protected Securities: | |||||
| Notes, 0.13%, 4/15/18 | 12,052,507 | e | 12,308,623 | ||
| Notes, 0.13%, 1/15/23 | 12,457,354 | e | 12,382,410 | ||
| Notes, 0.63%, 7/15/21 | 8,903,561 | c,e | 9,306,304 | ||
| Notes, 1.38%, 7/15/18 | 13,793,146 | e | 14,869,121 | ||
| Notes, 1.38%, 1/15/20 | 11,026,711 | c,e | 11,954,509 | ||
| U.S. Treasury Notes: | |||||
| 0.25%, 4/15/16 | 6,250,000 | 6,240,113 | |||
| 0.63%, 9/30/17 | 24,750,000 | c | 24,458,990 | ||
| 0.88%, 9/15/16 | 21,000,000 | 21,144,375 | |||
| 0.88%, 12/31/16 | 21,500,000 | 21,599,932 | |||
| 0.88%, 1/31/17 | 20,250,000 | 20,334,645 | |||
| 0.88%, 5/15/17 | 33,000,000 | c | 33,037,389 | ||
| 1.25%, 4/30/19 | 2,415,000 | c | 2,380,661 | ||
| 1.38%, 9/30/18 | 16,470,000 | c | 16,446,201 | ||
| 2.00%, 11/30/20 | 12,890,000 | 12,943,880 | |||
| 2.63%, 1/31/18 | 16,250,000 | 17,039,653 | |||
| 236,446,806 | |||||
| Utilities—.5% | |||||
| Hydro-Quebec, Gov’t Gtd. Notes | 2.00 | 6/30/16 | 5,130,000 | 5,253,679 | |
| Total Bonds and Notes | |||||
| (cost $1,005,845,748) | 1,037,358,364 | ||||
| Other Investment—.7% | Shares | Value ($) | |||
| Registered Investment Company; | |||||
| Dreyfus Institutional Preferred Plus Money Market Fund | |||||
| (cost $7,816,922) | 7,816,922 | f | 7,816,922 | ||
20
| BNY Mellon Bond Fund (continued) | |||
| Investment of Cash Collateral for Securities Loaned—.2% | Shares | Value ($) | |
| Registered Investment Company; | |||
| Dreyfus Institutional Cash Advantage Fund | |||
| (cost $2,385,000) | 2,385,000 | f | 2,385,000 |
| Total Investments (cost $1,016,047,670) | 99.8 | % | 1,047,560,286 |
| Cash and Receivables (Net) | .2 | % | 1,889,570 |
| Net Assets | 100.0 | % | 1,049,449,856 |
GO—General Obligation
REMIC—Real Estate Mortgage Investment Conduit
| a Securities exempt from registration pursuant to Rule 144A under the Securities Act of 1933.These securities may be resold in transactions exempt from registration, normally to |
| qualified institutional buyers.At August 31, 2014, these securities were valued at $17,766,840 or 1.7% of net assets. |
| b Variable rate security—interest rate subject to periodic change. |
| c Security, or portion thereof, on loan.At August 31, 2014, the value of the fund’s securities on loan was $78,407,395 and the value of the collateral held by the fund was |
| $81,263,834, consisting of cash collateral of $2,385,000 and U.S. Government & Agency securities valued at $78,878,834. |
| d The Federal Housing Finance Agency (“FHFA”) placed the Federal Home Loan Mortgage Corporation and Federal National Mortgage Association into conservatorship with |
| FHFA as the conservator.As such, the FHFA oversees the continuing affairs of these companies. |
| e Principal amount for accrual purposes is periodically adjusted based on changes in the Consumer Price Index. |
| f Investment in affiliated money market mutual fund. |
| Portfolio Summary (Unaudited)† | |||
| Value (%) | Value (%) | ||
| U.S. Government Agencies/Mortgage-Backed | 52.7 | Commercial Mortgage-Backed | 1.1 |
| Corporate Bonds | 36.5 | Money Market Investments | .9 |
| Municipal Bonds | 5.9 | Asset-Backed | .7 |
| Foreign/Governmental | 2.0 | 99.8 | |
| † Based on net assets. | |||
| See notes to financial statements. | |||
The Funds 21
| STATEMENT OF INVESTMENTS |
| August 31, 2014 |
| BNY Mellon Intermediate Bond Fund | |||||
| Coupon | Maturity | Principal | |||
| Bonds and Notes—98.3% | Rate (%) | Date | Amount ($) | Value ($) | |
| Asset—Backed Ctfs./Auto Receivables—.5% | |||||
| Santander Drive Auto Receivables Trust, Ser. 2011-1, Cl. D | 4.01 | 2/15/17 | 4,321,000 | 4,436,187 | |
| Casinos—.2% | |||||
| Agua Caliente Band of Cahuilla Indians, Sr. Scd. Notes | 6.08 | 10/1/16 | 777,000 | a | 787,326 |
| Agua Caliente Band of Cahuilla Indians, Scd. Notes | 6.35 | 10/1/15 | 370,000 | a | 365,597 |
| Agua Caliente Band of Cahuilla Indians, Sr. Scd. Notes | 6.44 | 10/1/16 | 949,000 | a | 934,974 |
| 2,087,897 | |||||
| Commercial Mortgage Pass-Through Ctfs.—2.7% | |||||
| Banc of America Commerical Mortgage Trust, Ser. 2005-4, Cl. A5A | 4.93 | 7/10/45 | 10,470,000 | 10,728,672 | |
| GCCFC Commercial Mortgage Trust, Ser. 2005-GG3, Cl. A4 | 4.80 | 8/10/42 | 3,452,069 | b | 3,469,238 |
| GE Capital Commercial Mortgage, Ser. 2005-C2, Cl. AJ | 5.06 | 5/10/43 | 2,290,000 | b | 2,347,218 |
| GE Capital Commercial Mortgage | |||||
| Corporation Trust, Ser. 2006-C1, Cl. A4 | 5.45 | 3/10/44 | 2,908,524 | b | 3,043,691 |
| Morgan Stanley Capital I Trust, Ser. 2006-HQ10, Cl. A4FX | 5.33 | 11/12/41 | 4,814,195 | 5,163,619 | |
| 24,752,438 | |||||
| Consumer Discretionary—5.8% | |||||
| 21st Century Fox America, Gtd. Notes | 3.00 | 9/15/22 | 7,200,000 | 7,131,492 | |
| Amazon.com, Sr. Unscd. Notes | 1.20 | 11/29/17 | 6,345,000 | c | 6,312,184 |
| Discovery Communications, Gtd. Notes | 3.70 | 6/1/15 | 4,800,000 | 4,915,032 | |
| Grupo Televisa, Sr. Unscd. Notes | 6.00 | 5/15/18 | 6,120,000 | 6,945,588 | |
| Johnson Controls, Sr. Unscd. Notes | 5.50 | 1/15/16 | 1,760,000 | 1,873,182 | |
| NBCUniversal Media, Gtd. Notes | 4.38 | 4/1/21 | 7,050,000 | 7,801,763 | |
| Stanford University, Unscd. Bonds | 4.75 | 5/1/19 | 5,000,000 | 5,623,055 | |
| Time Warner Cable, Gtd. Notes | 4.13 | 2/15/21 | 4,455,000 | 4,825,589 | |
| Time Warner, Gtd. Notes | 4.00 | 1/15/22 | 7,400,000 | 7,810,463 | |
| 53,238,348 | |||||
| Consumer Staples—7.0% | |||||
| Anheuser-Busch InBev Worldwide, Gtd. Notes | 1.38 | 7/15/17 | 3,430,000 | 3,453,238 | |
| Coca-Cola, Sr. Unscd. Notes | 0.75 | 11/1/16 | 3,345,000 | 3,345,268 | |
| ConAgra Foods, Sr. Unscd. Notes | 3.20 | 1/25/23 | 3,536,000 | 3,491,065 | |
| CVS Caremark, Sr. Unscd. Notes | 2.25 | 8/12/19 | 4,340,000 | 4,344,366 | |
| Diageo Capital, Gtd. Notes | 1.50 | 5/11/17 | 5,300,000 | 5,358,221 | |
| Dr. Pepper Snapple Group, Gtd. Notes | 2.60 | 1/15/19 | 6,145,000 | 6,247,111 | |
| Kroger, Sr. Unscd. Notes | 2.30 | 1/15/19 | 4,570,000 | 4,605,673 | |
| McDonald’s, Sr. Unscd. Notes | 5.80 | 10/15/17 | 4,460,000 | 5,064,049 | |
| Mondelez International, Sr. Unscd. Notes | 4.13 | 2/9/16 | 6,930,000 | 7,256,438 | |
| Pernod Ricard, Sr. Unscd. Notes | 4.45 | 1/15/22 | 4,520,000 | a | 4,866,435 |
| Walgreen, Sr. Unscd. Notes | 1.80 | 9/15/17 | 7,280,000 | 7,337,163 | |
| Wal-Mart Stores, Sr. Unscd. Notes | 3.63 | 7/8/20 | 7,920,000 | 8,518,396 | |
| 63,887,423 |
22
| BNY Mellon Intermediate Bond Fund (continued) | |||||
| Coupon | Maturity | Principal | |||
| Bonds and Notes (continued) | Rate (%) | Date | Amount ($) | Value ($) | |
| Energy—1.6% | |||||
| BP Capital Markets, Gtd. Notes | 3.20 | 3/11/16 | 6,250,000 | 6,500,144 | |
| Occidental Petroleum, Sr. Unscd. Notes | 4.13 | 6/1/16 | 3,005,000 | 3,181,418 | |
| Petrobras International Finance, Gtd. Notes | 3.88 | 1/27/16 | 5,000,000 | 5,152,480 | |
| 14,834,042 | |||||
| Financial—17.4% | |||||
| American Express Credit, Sr. Unscd. Notes | 2.75 | 9/15/15 | 5,010,000 | 5,131,693 | |
| American Honda Finance, Unscd. Notes | 1.20 | 7/14/17 | 3,450,000 | 3,451,076 | |
| American International Group, Sr. Unscd. Notes | 5.85 | 1/16/18 | 5,925,000 | 6,724,413 | |
| Bank of America, Sr. Unscd. Notes | 2.60 | 1/15/19 | 14,500,000 | 14,656,383 | |
| Boston Properties, Sr. Unscd. Notes | 3.70 | 11/15/18 | 6,948,000 | 7,408,263 | |
| Citigroup, Sr. Unscd. Notes | 2.50 | 9/26/18 | 7,780,000 | 7,905,585 | |
| Citigroup, Sr. Unscd. Notes | 6.13 | 11/21/17 | 3,590,000 | 4,075,788 | |
| Fidelity National Inform, Gtd. Notes | 3.88 | 6/5/24 | 5,470,000 | 5,581,304 | |
| Ford Motor Credit, Sr. Unscd. Notes | 3.00 | 6/12/17 | 5,035,000 | 5,225,494 | |
| General Electric Capital, Jr. Sub. Cap. Secs., Ser. C | 5.25 | 6/29/49 | 3,550,000 | b,c | 3,634,313 |
| General Electric Capital, Sub. Notes | 5.30 | 2/11/21 | 2,765,000 | 3,174,767 | |
| Goldman Sachs Group, Sr. Unscd. Notes | 3.30 | 5/3/15 | 7,780,000 | 7,928,240 | |
| HSBC Finance, Sr. Sub. Notes | 6.68 | 1/15/21 | 9,502,000 | 11,420,036 | |
| John Deere Capital, Sr. Unscd. Notes | 1.25 | 12/2/14 | 3,000,000 | 3,007,665 | |
| JPMorgan Chase & Co., Sub. Notes | 3.38 | 5/1/23 | 7,895,000 | 7,783,925 | |
| MetLife, Sr. Unscd. Notes | 6.75 | 6/1/16 | 4,450,000 | 4,910,152 | |
| Morgan Stanley, Sub. Notes | 4.88 | 11/1/22 | 7,610,000 | 8,234,469 | |
| NYSE Euronext, Gtd. Notes | 2.00 | 10/5/17 | 6,660,000 | 6,769,364 | |
| Private Export Funding, Gov’t Gtd. Notes, Ser. Z | 4.38 | 3/15/19 | 1,065,000 | 1,184,605 | |
| Prudential Financial, Sr. Unscd. Notes | 4.75 | 9/17/15 | 4,735,000 | 4,934,310 | |
| Rabobank Nederland, Sr. Unscd. Notes | 1.70 | 3/19/18 | 6,820,000 | 6,862,570 | |
| Royal Bank of Canada, Covered Bonds | 1.20 | 9/19/18 | 3,330,000 | 3,321,702 | |
| Royal Bank of Scotland Group, Sr. Unscd. Notes | 2.55 | 9/18/15 | 5,920,000 | 6,025,761 | |
| Simon Property Group, Sr. Unscd. Notes | 4.20 | 2/1/15 | 6,682,000 | 6,720,649 | |
| Societe Generale, Gtd. Notes | 2.63 | 10/1/18 | 4,145,000 | 4,246,084 | |
| TD Ameritrade Holding, Gtd. Notes | 4.15 | 12/1/14 | 3,650,000 | 3,683,065 | |
| Toyota Motor Credit, Sr. Unscd. Notes | 2.10 | 1/17/19 | 5,640,000 | 5,692,181 | |
| 159,693,857 | |||||
| Foreign/Governmental—1.6% | |||||
| Mexican Government, Sr. Unscd. Notes | 6.63 | 3/3/15 | 1,064,000 | 1,095,803 | |
| Province of Nova Scotia Canada, Sr. Unscd. Bonds | 5.13 | 1/26/17 | 5,430,000 | c | 5,981,976 |
| Province of Ontario Canada, Sr. Unscd. Bonds | 4.00 | 10/7/19 | 6,515,000 | 7,153,353 | |
| 14,231,132 |
The Funds 23
STATEMENT OF INVESTMENTS (continued)
| BNY Mellon Intermediate Bond Fund (continued) | |||||
| Coupon | Maturity | Principal | |||
| Bonds and Notes (continued) | Rate (%) | Date | Amount ($) | Value ($) | |
| Health Care—3.5% | |||||
| AbbVie, Sr. Unscd. Notes | 1.20 | 11/6/15 | 6,440,000 | 6,477,043 | |
| Amgen, Sr. Unscd. Notes | 5.70 | 2/1/19 | 2,905,000 | 3,337,360 | |
| AstraZeneca, Sr. Unscd. Notes | 5.90 | 9/15/17 | 6,090,000 | 6,899,404 | |
| GlaxoSmithKline Capital, Gtd. Bonds | 5.65 | 5/15/18 | 5,853,000 | 6,705,489 | |
| Pfizer, Sr. Unscd. Notes | 6.20 | 3/15/19 | 4,050,000 | 4,780,681 | |
| Thermo Fisher Scientific, Sr. Unscd. Notes | 3.20 | 3/1/16 | 4,220,000 | 4,370,443 | |
| 32,570,420 | |||||
| Industrial—1.6% | |||||
| ABB Finance USA, Gtd. Notes | 1.63 | 5/8/17 | 6,107,000 | c | 6,168,284 |
| Caterpillar Financial Services, Sr. Unscd. Notes | 2.10 | 6/9/19 | 6,590,000 | 6,623,233 | |
| United Technologies, Sr. Unscd. Notes | 6.13 | 2/1/19 | 1,860,000 | 2,188,338 | |
| 14,979,855 | |||||
| Information Technology—4.6% | |||||
| Adobe Systems, Sr. Unscd. Notes | 4.75 | 2/1/20 | 6,414,000 | 7,119,251 | |
| Apple, Sr. Unscd. Notes | 1.00 | 5/3/18 | 5,915,000 | 5,801,976 | |
| Cisco Systems, Sr. Unscd. Notes | 2.13 | 3/1/19 | 7,265,000 | 7,319,967 | |
| EMC, Sr. Unscd. Notes | 1.88 | 6/1/18 | 5,710,000 | 5,729,854 | |
| Intel, Sr. Unscd. Notes | 1.35 | 12/15/17 | 7,930,000 | 7,931,538 | |
| Oracle, Sr. Unscd. Notes | 5.75 | 4/15/18 | 7,000,000 | 8,016,442 | |
| 41,919,028 | |||||
| Materials—.8% | |||||
| Dow Chemical, Sr. Unscd. Notes | 4.25 | 11/15/20 | 6,545,000 | 7,154,038 | |
| Municipal Bonds—5.5% | |||||
| California, GO (Various Purpose) | 5.95 | 4/1/16 | 3,255,000 | 3,531,317 | |
| Florida Hurricane Catastrophe Fund | |||||
| Finance Corporation, Revenue Bonds | 3.00 | 7/1/20 | 11,000,000 | 11,197,890 | |
| Illinois, GO | 4.42 | 1/1/15 | 4,750,000 | 4,812,558 | |
| Massachusetts, GO (Build America Bonds) | 4.20 | 12/1/21 | 9,625,000 | 10,536,006 | |
| Metropolitan Transportation Authority, | |||||
| Special Obligation Taxable Bonds | 3.02 | 7/1/24 | 8,400,000 | 8,454,936 | |
| New Jersey Economic Development Authority, | |||||
| School Facilities Construction Revenue | 1.10 | 6/15/16 | 6,450,000 | 6,436,262 | |
| University of California Regents, General Revenue | 1.80 | 7/1/19 | 5,675,000 | 5,620,520 | |
| 50,589,489 | |||||
| Telecommunication Services—3.4% | |||||
| AT&T, Sr. Unscd. Notes | 4.45 | 5/15/21 | 6,960,000 | 7,723,999 | |
| British Telecommunications, Sr. Unscd. Notes | 1.25 | 2/14/17 | 4,900,000 | 4,902,489 | |
| Telefonica Emisiones, Gtd. Notes | 3.99 | 2/16/16 | 6,635,000 | 6,928,758 | |
| Verizon Communications, Sr. Unscd. Notes | 5.15 | 9/15/23 | 10,515,000 | 11,913,705 | |
| 31,468,951 |
24
| BNY Mellon Intermediate Bond Fund (continued) | |||||
| Coupon | Maturity | Principal | |||
| Bonds and Notes (continued) | Rate (%) | Date | Amount ($) | Value ($) | |
| U.S. Government Agencies—1.0% | |||||
| Federal Home Loan Bank, Bonds | 1.38 | 3/9/18 | 5,500,000 | 5,517,908 | |
| Federal National Mortgage Association, Notes | 2.00 | 4/30/20 | 3,610,000 | d | 3,616,852 |
| 9,134,760 | |||||
| U.S. Government Agencies/Mortgage-Backed—2.6% | |||||
| Federal Home Loan Mortgage Corp.: | |||||
| REMIC, Ser. 3977, Cl. GA, 1.50%, 7/15/19 | 5,603,850 | d | 5,646,997 | ||
| Federal National Mortgage Association: | |||||
| 3.69%, 6/1/17 | 4,826,561 | d | 5,141,306 | ||
| Ser. 2010-9, Cl. A, 4.00%, 11/25/23 | 106,624 | d | 107,043 | ||
| Government National Mortgage Association I: | |||||
| Ser. 2013-17, Cl. AB, 2.30%, 1/16/49 | 3,332,633 | 3,324,196 | |||
| Ser. 2009-119, Cl. B, 4.29%, 2/16/41 | 701,013 | 712,488 | |||
| Ser. 2005-59, Cl. C, 4.98%, 2/16/37 | 8,662,137 | b | 9,086,495 | ||
| 24,018,525 | |||||
| U.S. Government Securities—37.8% | |||||
| U.S. Treasury Bonds; | |||||
| 7.25%, 5/15/16 | 1,500,000 | 1,674,024 | |||
| U.S. Treasury Inflation Protected Securities: | |||||
| Notes, 0.13%, 4/15/17 | 18,504,406 | e | 18,940,277 | ||
| Notes, 0.13%, 4/15/18 | 22,934,817 | e | 23,422,182 | ||
| Notes, 0.63%, 7/15/21 | 7,486,604 | c,e | 7,825,253 | ||
| Notes, 1.38%, 7/15/18 | 8,620,716 | e | 9,293,201 | ||
| U.S. Treasury Notes: | |||||
| 0.25%, 9/15/15 | 11,375,000 | c | 11,390,550 | ||
| 0.25%, 12/15/15 | 26,655,000 | 26,666,968 | |||
| 0.25%, 12/31/15 | 8,000,000 | c | 8,003,752 | ||
| 0.38%, 8/31/15 | 10,390,000 | 10,417,398 | |||
| 0.50%, 6/15/16 | 16,450,000 | 16,473,458 | |||
| 0.63%, 7/15/16 | 32,500,000 | 32,602,213 | |||
| 0.63%, 2/15/17 | 4,500,000 | 4,489,979 | |||
| 0.63%, 5/31/17 | 7,325,000 | c | 7,278,647 | ||
| 0.63%, 9/30/17 | 19,500,000 | c | 19,270,719 | ||
| 0.75%, 1/15/17 | 5,000,000 | 5,007,225 | |||
| 0.88%, 12/31/16 | 15,750,000 | 15,823,206 | |||
| 0.88%, 1/31/17 | 40,220,000 | 40,388,120 | |||
| 0.88%, 2/28/17 | 15,750,000 | c | 15,802,290 | ||
| 1.00%, 9/30/16 | 3,610,000 | c | 3,642,999 | ||
| 1.50%, 6/30/16 | 12,150,000 | 12,382,320 | |||
| 2.00%, 11/30/20 | 4,590,000 | 4,609,186 | |||
| 2.13%, 2/29/16 | 27,995,000 | 28,755,008 | |||
| 2.63%, 1/31/18 | 5,765,000 | 6,045,144 | |||
| 2.75%, 2/15/24 | 3,100,000 | 3,215,766 | |||
| 3.25%, 7/31/16 | 7,135,000 | c | 7,510,701 | ||
| 4.50%, 11/15/15 | 6,070,000 | 6,383,813 | |||
| 347,314,399 | |||||
The Funds 25
STATEMENT OF INVESTMENTS (continued)
| BNY Mellon Intermediate Bond Fund (continued) | |||||
| Coupon | Maturity | Principal | |||
| Bonds and Notes (continued) | Rate (%) | Date | Amount ($) | Value ($) | |
| Utilities—.7% | |||||
| Duke Energy Carolinas, First Mortgage Bonds | 1.75 | 12/15/16 | 3,010,000 | 3,073,023 | |
| Hydro-Quebec, Gov’t Gtd. Notes | 2.00 | 6/30/16 | 3,655,000 | 3,743,118 | |
| 6,816,141 | |||||
| Total Bonds and Notes | |||||
| (cost $885,037,595) | 903,126,930 | ||||
| Other Investment—1.1% | Shares | Value ($) | |||
| Registered Investment Company; | |||||
| Dreyfus Institutional Preferred Plus Money Market Fund | |||||
| (cost $10,090,672) | 10,090,672 | f | 10,090,672 | ||
| Investment of Cash Collateral for | |||||
| Securities Loaned—.5% | |||||
| Registered Investment Company; | |||||
| Dreyfus Institutional Cash Advantage Fund | |||||
| (cost $4,090,700) | 4,090,700 | f | 4,090,700 | ||
| Total Investments (cost $899,218,967) | 99.9 | % | 917,308,302 | ||
| Cash and Receivables (Net) | .1 | % | 1,353,914 | ||
| Net Assets | 100.0 | % | 918,662,216 | ||
GO—General Obligation
REMIC—Real Estate Mortgage Investment Conduit
| a Securities exempt from registration pursuant to Rule 144A under the Securities Act of 1933.These securities may be resold in transactions exempt from registration, normally to |
| qualified institutional buyers.At August 31, 2014, these securities were valued at $6,954,332 or .8% of net assets. |
| b Variable rate security—interest rate subject to periodic change. |
| c Security, or portion thereof, on loan.At August 31, 2014, the value of the fund’s securities on loan was $70,600,092 and the value of the collateral held by the fund was |
| $72,502,228, consisting of cash collateral of $4,090,700 and U.S. Government & Agency securities valued at $68,411,528. |
| d The Federal Housing Finance Agency (“FHFA”) placed the Federal Home Loan Mortgage Corporation and Federal National Mortgage Association into conservatorship with |
| FHFA as the conservator.As such, the FHFA oversees the continuing affairs of these companies. |
| e Principal amount for accrual purposes is periodically adjusted based on changes in the Consumer Price Index. |
| f Investment in affiliated money market mutual fund. |
| Portfolio Summary (Unaudited)† | |||
| Value (%) | Value (%) | ||
| Corporate Bonds | 46.6 | Foreign/Governmental | 1.6 |
| U.S. Government Agencies/Mortgage-Backed | 41.4 | Money Market Investments | 1.6 |
| Municipal Bonds | 5.5 | Asset-Backed | .5 |
| Commercial Mortgage-Baked | 2.7 | 99.9 | |
| † Based on net assets. | |||
| See notes to financial statements. | |||
26
STATEMENT OF INVESTMENTS
August 31, 2014
| BNY Mellon Corporate Bond Fund | |||||
| Coupon | Maturity | Principal | |||
| Bonds and Notes—98.9% | Rate (%) | Date | Amount ($) | Value ($) | |
| Automobiles & Components—2.4% | |||||
| Hyundai Capital America, Sr. Unscd. Notes | 1.88 | 8/9/16 | 3,000,000 | a | 3,042,771 |
| Johnson Controls, Sr. Unscd. Notes | 3.75 | 12/1/21 | 4,500,000 | 4,714,407 | |
| Nissan Motor Acceptance, Unscd. Notes | 0.93 | 9/26/16 | 5,000,000 | a,b | 5,033,290 |
| Volkswagen Group of America Finance, Gtd. Notes | 2.13 | 5/23/19 | 5,000,000 | a | 4,999,210 |
| 17,789,678 | |||||
| Banks—11.9% | |||||
| American Express Centurion Bank, Sr. Unscd. Notes | 0.68 | 11/13/15 | 2,375,000 | b | 2,385,970 |
| BAC Capital Trust XIV, Gtd. Notes, Ser. G | 4.00 | 9/29/49 | 3,000,000 | b,c | 2,467,500 |
| Bank of America, Sub. Notes | 4.20 | 8/26/24 | 5,000,000 | 5,081,630 | |
| Bank of America, Sub. Notes | 5.49 | 3/15/19 | 2,000,000 | 2,249,768 | |
| Barclays Bank, Sub. Notes | 6.05 | 12/4/17 | 6,500,000 | a | 7,331,688 |
| BBVA Bancomer SA Texas, Sr. Unscd. Notes | 4.38 | 4/10/24 | 4,000,000 | a | 4,120,000 |
| BPCE, Gtd. Notes | 4.00 | 4/15/24 | 5,000,000 | 5,183,300 | |
| Citigroup, Sub. Notes | 4.05 | 7/30/22 | 7,000,000 | 7,227,108 | |
| Goldman Sachs Group, Sub. Notes | 5.63 | 1/15/17 | 2,000,000 | 2,185,782 | |
| Goldman Sachs Group, Sr. Unscd. Notes | 6.15 | 4/1/18 | 4,000,000 | 4,559,772 | |
| JPMorgan Chase & Co., Sub. Notes | 3.38 | 5/1/23 | 1,250,000 | 1,232,414 | |
| Morgan Stanley, Sub. Notes | 4.88 | 11/1/22 | 7,000,000 | 7,574,413 | |
| Rabobank Nederland, Sr. Unscd. Notes | 1.70 | 3/19/18 | 5,210,000 | 5,242,521 | |
| RBS Citizens Financial Group, Sub. Notes | 4.15 | 9/28/22 | 6,000,000 | a | 6,102,630 |
| Royal Bank of Scotland Group, Sub Notes | 5.13 | 5/28/24 | 5,000,000 | 5,109,255 | |
| Santander Issuances, Gtd. Notes | 5.91 | 6/20/16 | 5,750,000 | a | 6,125,854 |
| Societe Generale, Gtd. Notes | 2.75 | 10/12/17 | 6,000,000 | 6,195,930 | |
| Wells Fargo & Co., Sub. Notes | 5.13 | 9/15/16 | 1,000,000 | 1,080,681 | |
| Wells Fargo Bank, Sub. Notes | 5.75 | 5/16/16 | 2,465,000 | 2,668,562 | |
| Westpac Banking, Sub. Notes | 4.63 | 6/1/18 | 4,750,000 | 5,160,994 | |
| 89,285,772 | |||||
| Capital Goods—2.5% | |||||
| ABB Finance USA, Gtd. Notes | 2.88 | 5/8/22 | 2,000,000 | 2,004,772 | |
| CRH America, Gtd. Notes | 4.13 | 1/15/16 | 250,000 | 260,741 | |
| CRH America, Gtd. Notes | 6.00 | 9/30/16 | 5,500,000 | 6,037,927 | |
| Pentair Finance, Gtd. Notes | 2.65 | 12/1/19 | 4,500,000 | 4,506,863 | |
| Valmont Industries, Gtd. Notes | 6.63 | 4/20/20 | 5,000,000 | 5,949,315 | |
| 18,759,618 | |||||
| Commercial & Professional Services—.8% | |||||
| Waste Management, Gtd. Notes | 3.50 | 5/15/24 | 2,000,000 | 2,038,760 | |
| Waste Management, Gtd. Notes | 4.75 | 6/30/20 | 3,853,000 | 4,302,576 | |
| 6,341,336 |
The Funds 27
STATEMENT OF INVESTMENTS (continued)
| BNY Mellon Corporate Bond Fund (continued) | |||||
| Coupon | Maturity | Principal | |||
| Bonds and Notes (continued) | Rate (%) | Date | Amount ($) | Value ($) | |
| Consumer Durables & Apparel—1.9% | |||||
| Hasbro, Sr. Unscd. Notes | 3.15 | 5/15/21 | 3,000,000 | 3,043,023 | |
| Mattel, Sr. Unscd. Notes | 1.70 | 3/15/18 | 2,000,000 | 1,993,644 | |
| Mattel, Sr. Unscd. Notes | 2.35 | 5/6/19 | 2,000,000 | 2,002,768 | |
| NVR, Sr. Unscd. Notes | 3.95 | 9/15/22 | 6,775,000 | 6,939,524 | |
| 13,978,959 | |||||
| Consumer Services—.9% | |||||
| Brinker International, Sr. Unscd. Notes | 2.60 | 5/15/18 | 3,650,000 | 3,669,400 | |
| George Washington University, Unscd. Notes | 1.83 | 9/15/17 | 3,000,000 | 3,043,011 | |
| 6,712,411 | |||||
| Diversified Financials—11.2% | |||||
| American Express, Sr. Unscd. Notes | 7.00 | 3/19/18 | 3,250,000 | 3,829,979 | |
| Apollo Management Holding, Gtd. Notes | 4.00 | 5/30/24 | 7,000,000 | a | 7,130,291 |
| Bear Stearns, Sub. Notes | 5.55 | 1/22/17 | 4,800,000 | 5,258,861 | |
| Blackstone Holdings Finance, Gtd. Notes | 4.75 | 2/15/23 | 3,000,000 | a | 3,340,968 |
| Blackstone Holdings Finance, Gtd. Notes | 6.63 | 8/15/19 | 2,000,000 | a | 2,396,242 |
| Carlyle Holdings Finance, Gtd. Notes | 3.88 | 2/1/23 | 5,736,000 | a | 5,984,960 |
| Caterpillar Financial Services, Sr. Unscd. Notes, Ser. G | 1.25 | 11/6/17 | 2,000,000 | 1,994,804 | |
| Ford Motor Credit, Sr. Unscd. Notes | 4.25 | 2/3/17 | 5,500,000 | 5,871,569 | |
| General Electric Capital, Jr. Sub. Cap. Secs., Ser. C | 5.25 | 6/29/49 | 6,250,000 | b,c | 6,398,437 |
| HSBC Finance, Sr. Sub. Notes | 6.68 | 1/15/21 | 6,000,000 | 7,211,136 | |
| Jefferies Group, Sr. Unscd. Notes | 6.88 | 4/15/21 | 2,000,000 | 2,373,000 | |
| Jefferies Group, Sr. Unscd. Bonds | 8.50 | 7/15/19 | 800,000 | 1,002,600 | |
| John Deere Capital, Sr. Unscd. Notes | 2.80 | 9/18/17 | 4,000,000 | 4,182,620 | |
| Moody’s, Sr. Unscd. Notes | 2.75 | 7/15/19 | 2,000,000 | 2,031,164 | |
| Moody’s, Sr. Unscd. Notes | 4.50 | 9/1/22 | 5,000,000 | 5,333,310 | |
| Nomura Holdings, Sr. Unscd. Bonds | 2.00 | 9/13/16 | 3,107,000 | 3,154,938 | |
| NYSE Euronext, Gtd. Notes | 2.00 | 10/5/17 | 4,500,000 | 4,573,895 | |
| Stifel Financial, Sr. Unscd. Notes | 4.25 | 7/18/24 | 7,000,000 | 7,135,653 | |
| Synchrony Financial, Sr. Unscd. Notes | 3.75 | 8/15/21 | 3,000,000 | 3,064,485 | |
| TD Ameritrade Holding, Gtd. Notes | 4.15 | 12/1/14 | 1,750,000 | 1,765,853 | |
| 84,034,765 | |||||
| Energy—6.1% | |||||
| Continental Resources, Gtd. Notes | 5.00 | 9/15/22 | 6,000,000 | 6,480,000 | |
| Devon Energy, Sr. Unscd. Notes | 1.88 | 5/15/17 | 3,250,000 | 3,302,592 | |
| Energy Transfer Partners, Sr. Unscd. Notes | 4.65 | 6/1/21 | 2,500,000 | 2,718,170 | |
| EQT Midstream Partners, Gtd. Notes | 4.00 | 8/1/24 | 5,000,000 | 5,052,050 | |
| Petrobras International Finance, Gtd. Notes | 5.38 | 1/27/21 | 6,500,000 | 6,885,450 | |
| Pioneer Natural Resource, Sr. Unscd. Notes | 3.95 | 7/15/22 | 5,000,000 | 5,249,950 | |
| Rowan Companies, Gtd. Notes | 4.75 | 1/15/24 | 1,000,000 | 1,056,817 | |
| Rowan Companies, Gtd. Notes | 5.00 | 9/1/17 | 1,050,000 | 1,141,548 | |
| Rowan Companies, Gtd. Notes | 7.88 | 8/1/19 | 3,000,000 | 3,693,081 |
28
| BNY Mellon Corporate Bond Fund (continued) | |||||
| Coupon | Maturity | Principal | |||
| Bonds and Notes (continued) | Rate (%) | Date | Amount ($) | Value ($) | |
| Energy (continued) | |||||
| Schlumberger Investment, Gtd. Notes | 1.25 | 8/1/17 | 3,000,000 | a | 3,003,189 |
| Sunoco Logistics Partners Operations, Gtd. Notes | 3.45 | 1/15/23 | 3,000,000 | 2,957,028 | |
| Sunoco Logistics Partners Operations, Gtd. Notes | 4.25 | 4/1/24 | 1,250,000 | 1,299,329 | |
| Weatherford International, Gtd. Notes | 5.13 | 9/15/20 | 2,252,000 | 2,509,151 | |
| 45,348,355 | |||||
| Food & Staples Retailing—.9% | |||||
| CVS Caremark, Sr. Unscd. Notes | 2.25 | 12/5/18 | 2,000,000 | 2,022,438 | |
| Walgreen, Sr. Unscd. Notes | 3.10 | 9/15/22 | 4,500,000 | 4,465,220 | |
| 6,487,658 | |||||
| Food, Beverage & Tobacco—3.6% | |||||
| Anheuser-Busch InBev Finance, Gtd. Notes | 1.25 | 1/17/18 | 5,000,000 | 4,970,650 | |
| Anheuser-Busch InBev Worldwide, Gtd. Notes | 1.38 | 7/15/17 | 1,000,000 | 1,006,775 | |
| ConAgra Foods, Sr. Unscd. Notes | 1.90 | 1/25/18 | 1,500,000 | 1,501,056 | |
| ConAgra Foods, Sr. Unscd. Notes | 3.20 | 1/25/23 | 3,075,000 | 3,035,923 | |
| Flowers Foods, Sr. Unscd. Notes | 4.38 | 4/1/22 | 2,850,000 | 3,040,334 | |
| General Mills, Sr. Unscd. Notes | 0.53 | 1/29/16 | 2,000,000 | b | 2,005,402 |
| Grupo Bimbo, Gtd. Notes | 3.88 | 6/27/24 | 3,000,000 | a | 3,033,570 |
| Kraft Foods Group, Sr. Unscd. Notes | 1.63 | 6/4/15 | 3,500,000 | 3,531,133 | |
| Pernod-Ricard, Sr. Unscd. Notes | 5.75 | 4/7/21 | 4,000,000 | a | 4,630,068 |
| 26,754,911 | |||||
| Foreign/Governmental—3.6% | |||||
| Bermudian Government, Sr. Unscd. Notes | 5.60 | 7/20/20 | 5,102,000 | a | 5,663,220 |
| Commonwealth of Bahamas, Sr. Unscd. Notes | 5.75 | 1/16/24 | 4,000,000 | a | 4,260,000 |
| North American Development Bank, Sr. Unscd. Notes | 2.30 | 10/10/18 | 3,000,000 | 3,049,218 | |
| Petroleos Mexicanos, Gtd. Notes | 2.25 | 7/18/18 | 5,000,000 | b | 5,257,500 |
| Petroleos Mexicanos, Gtd. Notes | 5.50 | 1/21/21 | 2,000,000 | 2,260,000 | |
| Spanish Government, Sr. Unscd. Notes | 4.00 | 3/6/18 | 6,000,000 | a | 6,424,380 |
| 26,914,318 | |||||
| Health Care Equipment & Services—2.2% | |||||
| Aetna, Sr. Unscd. Notes | 2.20 | 3/15/19 | 4,000,000 | 4,013,828 | |
| Dignity Health, Unscd. Notes | 3.13 | 11/1/22 | 5,000,000 | 4,775,205 | |
| UnitedHealth Group, Sr. Unscd. Notes | 1.40 | 10/15/17 | 3,000,000 | 3,004,203 | |
| WellPoint, Sr. Unscd. Notes | 1.25 | 9/10/15 | 5,000,000 | 5,032,215 | |
| 16,825,451 | |||||
| Insurance—4.9% | |||||
| American International Group, Sr. Unscd. Notes | 5.85 | 1/16/18 | 4,750,000 | 5,390,879 | |
| Assured Guaranty U.S. Holdings, Gtd. Notes | 5.00 | 7/1/24 | 7,000,000 | c | 7,289,079 |
| Fairfax, Gtd. Notes | 4.88 | 8/13/24 | 7,000,000 | a | 6,988,163 |
| Five Corners Funding Trust, Sr. Unscd. Bonds | 4.42 | 11/15/23 | 2,500,000 | a | 2,673,170 |
| Genworth Holdings, Gtd. Notes | 7.70 | 6/15/20 | 4,000,000 | 4,854,908 | |
| MetLife, Sr. Unscd. Notes | 1.76 | 12/15/17 | 5,000,000 | b | 5,045,105 |
The Funds 29
STATEMENT OF INVESTMENTS (continued)
| BNY Mellon Corporate Bond Fund (continued) | |||||
| Coupon | Maturity | Principal | |||
| Bonds and Notes (continued) | Rate (%) | Date | Amount ($) | Value ($) | |
| Insurance (continued) | |||||
| Prudential Financial, Sr. Unscd. Notes | 4.75 | 9/17/15 | 4,250,000 | 4,428,895 | |
| 36,670,199 | |||||
| Materials—2.7% | |||||
| Allegheny Technologies, Sr. Unscd. Notes | 5.88 | 8/15/23 | 5,000,000 | 5,524,580 | |
| Anglo American Capital, Gtd. Notes | 1.18 | 4/15/16 | 3,000,000 | a,b | 3,019,005 |
| Dow Chemical, Sr. Unscd. Notes | 4.13 | 11/15/21 | 5,500,000 | 5,899,724 | |
| Eastman Chemical, Sr. Unscd. Notes | 2.40 | 6/1/17 | 2,000,000 | 2,050,118 | |
| Eastman Chemical, Sr. Unscd. Notes | 3.60 | 8/15/22 | 4,000,000 | 4,116,764 | |
| 20,610,191 | |||||
| Media—4.7% | |||||
| 21st Century Fox America, Gtd. Notes | 3.00 | 9/15/22 | 4,250,000 | 4,209,561 | |
| Comcast, Gtd. Notes | 3.13 | 7/15/22 | 5,000,000 | 5,128,170 | |
| Grupo Televisa, Sr. Unscd. Notes | 6.00 | 5/15/18 | 5,982,000 | 6,788,972 | |
| Thomson Reuters, Gtd. Notes | 4.70 | 10/15/19 | 5,750,000 | 6,342,474 | |
| Time Warner, Gtd. Notes | 4.00 | 1/15/22 | 6,250,000 | 6,596,675 | |
| Time Warner Cable, Gtd. Notes | 4.13 | 2/15/21 | 5,500,000 | 5,957,518 | |
| 35,023,370 | |||||
| Municipal Bonds—6.5% | |||||
| Florida Hurricane Catastrophe Fund Finance Corporation, Revenue | 3.00 | 7/1/20 | 7,500,000 | 7,634,925 | |
| Illinois, GO | 4.42 | 1/1/15 | 5,000,000 | 5,065,850 | |
| JobsOhio Beverage System, | |||||
| Statewide Senior Lien Liquor Profits Revenue | 1.82 | 1/1/18 | 5,000,000 | 5,074,100 | |
| Kentucky Public Transportation Infrastructure Authority, | |||||
| Subordinate Toll Revenue, BAN (Downtown Crossing Project) | 3.22 | 7/1/17 | 2,500,000 | 2,527,075 | |
| New Jersey Economic Development Authority, | |||||
| School Facilities Construction Revenue | 1.06 | 3/1/16 | 4,500,000 | 4,518,315 | |
| New Jersey Economic Development Authority, | |||||
| School Facilities Construction Revenue | 1.10 | 6/15/16 | 5,215,000 | 5,203,892 | |
| New Jersey Transportation Trust Fund | |||||
| Authority (Transportation System) | 1.76 | 12/15/18 | 5,000,000 | 4,937,150 | |
| Oakland Unified School District, GO (Build America Bonds) | 9.50 | 8/1/34 | 2,500,000 | 2,971,550 | |
| University of California Regents, General Revenue | 0.66 | 7/1/17 | 2,000,000 | b | 2,008,840 |
| University of California Regents, General Revenue | 1.80 | 7/1/19 | 2,905,000 | 2,877,112 | |
| West Contra Costa Unified School District, | |||||
| GO (Build America Bonds) | 8.46 | 8/1/34 | 5,000,000 | 6,143,950 | |
| 48,962,759 | |||||
| Pharmaceuticals, Biotech & Life Sciences—2.0% | |||||
| AbbVie, Sr. Unscd. Notes | 1.75 | 11/6/17 | 5,000,000 | 5,030,215 | |
| Amgen, Sr. Unscd. Notes | 3.88 | 11/15/21 | 3,500,000 | 3,733,786 | |
| AstraZeneca, Sr. Unscd. Notes | 5.90 | 9/15/17 | 1,750,000 | 1,982,587 | |
| Teva Pharmaceutical Finance IV, Gtd. Notes | 2.25 | 3/18/20 | 4,500,000 | 4,417,335 | |
| 15,163,923 |
30
| BNY Mellon Corporate Bond Fund (continued) | |||||
| Coupon | Maturity | Principal | |||
| Bonds and Notes (continued) | Rate (%) | Date | Amount ($) | Value ($) | |
| Real Estate—7.7% | |||||
| Boston Properties, Sr. Unscd. Notes | 3.70 | 11/15/18 | 5,000,000 | 5,331,220 | |
| Camden Property Trust, Sr. Unscd. Notes | 5.00 | 6/15/15 | 1,170,000 | 1,209,601 | |
| Corporate Office Properties, Gtd. Notes | 3.60 | 5/15/23 | 5,500,000 | 5,331,760 | |
| CubeSmart, Gtd. Notes | 4.80 | 7/15/22 | 6,400,000 | 6,938,675 | |
| DDR, Sr. Unscd. Notes | 3.50 | 1/15/21 | 5,500,000 | 5,602,542 | |
| Essex Portfolio, Gtd. Notes | 3.25 | 5/1/23 | 2,000,000 | 1,977,654 | |
| First Industrial, Sr. Unscd. Notes | 5.95 | 5/15/17 | 1,500,000 | 1,639,437 | |
| Lexington Realty Trust, Gtd. Notes | 4.40 | 6/15/24 | 4,350,000 | 4,434,712 | |
| Liberty Property, Sr. Unscd. Notes | 5.50 | 12/15/16 | 2,000,000 | 2,178,830 | |
| Liberty Property, Sr. Unscd. Notes | 6.63 | 10/1/17 | 2,500,000 | 2,850,053 | |
| National Retail Properties, Sr. Unscd. Notes | 3.90 | 6/15/24 | 4,000,000 | 4,073,348 | |
| Prologis, Gtd. Notes | 2.75 | 2/15/19 | 3,000,000 | 3,059,736 | |
| Prologis, Gtd. Notes | 7.38 | 10/30/19 | 2,100,000 | 2,570,772 | |
| Realty Income, Sr. Unscd. Notes | 3.88 | 7/15/24 | 500,000 | 510,265 | |
| Realty Income, Sr. Unscd. Notes | 4.65 | 8/1/23 | 3,000,000 | 3,253,551 | |
| Retail Opportunity Investments Partnership, Gtd. Notes | 5.00 | 12/15/23 | 3,500,000 | 3,774,036 | |
| Weingarten Realty Investors, Sr. Unscd. Notes | 3.50 | 4/15/23 | 3,000,000 | 2,982,333 | |
| 57,718,525 | |||||
| Retailing—2.0% | |||||
| AutoNation, Gtd. Notes | 5.50 | 2/1/20 | 6,000,000 | 6,600,000 | |
| Staples, Sr. Unscd. Notes | 4.38 | 1/12/23 | 6,000,000 | c | 6,022,404 |
| TJX, Sr. Unscd. Notes | 2.75 | 6/15/21 | 2,000,000 | 2,017,258 | |
| 14,639,662 | |||||
| Semiconductors & Semiconductor Equipment—1.1% | |||||
| Intel, Sr. Unscd. Notes | 1.35 | 12/15/17 | 3,000,000 | 3,000,582 | |
| Maxim Integrated Products, Sr. Unscd. Notes | 2.50 | 11/15/18 | 5,000,000 | 5,066,130 | |
| 8,066,712 | |||||
| Software & Services—6.2% | |||||
| Adobe Systems, Sr. Unscd. Notes | 4.75 | 2/1/20 | 5,000,000 | 5,549,775 | |
| Broadridge Financial Solution, Sr. Unscd. Notes | 3.95 | 9/1/20 | 4,000,000 | 4,201,760 | |
| CA, Sr. Unscd. Notes | 2.88 | 8/15/18 | 3,750,000 | 3,826,159 | |
| eBay, Sr. Unscd. Notes | 1.35 | 7/15/17 | 2,000,000 | 2,007,638 | |
| eBay, Sr. Unscd. Notes | 2.88 | 8/1/21 | 2,000,000 | 2,007,086 | |
| Fidelity National Information Services, Gtd. Notes | 3.50 | 4/15/23 | 2,000,000 | 1,999,970 | |
| Fidelity National Information Services, Gtd. Notes | 5.00 | 3/15/22 | 4,000,000 | 4,240,204 | |
| Fiserv, Gtd. Notes | 3.50 | 10/1/22 | 7,000,000 | 7,115,437 | |
| Oracle, Sr. Unscd. Notes | 5.75 | 4/15/18 | 2,000,000 | 2,290,412 | |
| Symantec, Sr. Unscd. Notes | 2.75 | 6/15/17 | 3,500,000 | 3,590,153 | |
| Symantec, Sr. Unscd. Notes | 4.20 | 9/15/20 | 2,830,000 | 2,930,875 | |
| Total System Services, Sr. Unscd. Notes | 2.38 | 6/1/18 | 6,500,000 | 6,492,200 | |
| 46,251,669 |
The Funds 31
STATEMENT OF INVESTMENTS (continued)
| BNY Mellon Corporate Bond Fund (continued) | |||||
| Coupon | Maturity | Principal | |||
| Bonds and Notes (continued) | Rate (%) | Date | Amount ($) | Value ($) | |
| Technology Hardware & Equipment—3.7% | |||||
| Arrow Electronics, Sr. Unscd. Notes | 3.00 | 3/1/18 | 3,500,000 | 3,611,695 | |
| Arrow Electronics, Sr. Unscd. Notes | 5.13 | 3/1/21 | 3,000,000 | 3,268,233 | |
| Avnet, Sr. Unscd. Notes | 4.88 | 12/1/22 | 5,500,000 | 5,882,690 | |
| Jabil Circuit, Sr. Unscd. Bonds | 5.63 | 12/15/20 | 4,737,000 | 5,156,840 | |
| NetApp, Sr. Unscd. Notes | 2.00 | 12/15/17 | 4,000,000 | 4,045,436 | |
| Seagate HDD Cayman, Gtd. Bonds | 4.75 | 1/1/25 | 5,500,000 | a | 5,637,500 |
| 27,602,394 | |||||
| Telecommunication Services—4.5% | |||||
| America Movil Sab de CV, Gtd. Notes | 5.00 | 3/30/20 | 3,980,000 | 4,424,248 | |
| AT&T, Sr. Unscd. Notes | 1.70 | 6/1/17 | 1,750,000 | 1,772,865 | |
| AT&T, Sr. Unscd. Notes | 4.45 | 5/15/21 | 3,000,000 | 3,329,310 | |
| British Telecommunications, Sr. Unscd. Notes | 2.00 | 6/22/15 | 3,000,000 | 3,034,296 | |
| CenturyLink, Sr. Unscd. Notes, Ser. T | 5.80 | 3/15/22 | 3,000,000 | 3,180,000 | |
| CenturyLink, Sr. Unscd. Notes, Ser. W | 6.75 | 12/1/23 | 500,000 | c | 555,312 |
| Telefonica Emisiones, Gtd. Notes | 4.57 | 4/27/23 | 6,500,000 | c | 6,979,752 |
| Telefonos de Mexico, Gtd. Notes | 5.50 | 11/15/19 | 3,000,000 | 3,449,940 | |
| Verizon Communications, Sr. Unscd. Notes | 5.15 | 9/15/23 | 6,500,000 | 7,364,630 | |
| 34,090,353 | |||||
| Transportation—1.9% | |||||
| Burlington North Santa Fe, Sr. Unscd. Debs. | 3.40 | 9/1/24 | 5,000,000 | 5,056,020 | |
| ERAC USA Finance, Gtd. Notes | 1.40 | 4/15/16 | 2,000,000 | a | 2,017,872 |
| GATX, Sr. Unscd. Notes | 4.75 | 6/15/22 | 3,000,000 | 3,294,216 | |
| Union Pacific, Sr. Unscd. Notes | 2.25 | 2/15/19 | 4,000,000 | 4,059,716 | |
| 14,427,824 | |||||
| Utilities—3.0% | |||||
| Black Hills, Sr. Unscd. Notes | 4.25 | 11/30/23 | 5,000,000 | 5,400,360 | |
| CMS Energy, Sr. Unscd. Notes | 4.25 | 9/30/15 | 1,400,000 | 1,451,834 | |
| CMS Energy, Sr. Unscd. Notes | 5.05 | 3/15/22 | 1,500,000 | 1,704,816 | |
| Dominion Resources, Sr. Unscd. Notes | 2.25 | 9/1/15 | 2,050,000 | 2,080,904 | |
| Duke Energy, Sr. Unscd. Notes | 1.63 | 8/15/17 | 2,000,000 | 2,015,616 | |
| Georgia Power, Sr. Unscd. Notes | 0.75 | 8/10/15 | 2,500,000 | 2,508,513 | |
| NextEra Energy Capital Holdings, Gtd. Debs. | 2.70 | 9/15/19 | 3,000,000 | 3,061,239 | |
| PPL Capital Funding, Gtd. Notes | 1.90 | 6/1/18 | 2,000,000 | 2,002,984 | |
| PPL Capital Funding, Gtd. Notes | 3.95 | 3/15/24 | 2,000,000 | 2,092,262 | |
| 22,318,528 | |||||
| Total Bonds and Notes | |||||
| (cost $724,082,282) | 740,779,341 |
32
| BNY Mellon Corporate Bond Fund (continued) | ||||
| Other Investment—.2% | Shares | Value ($) | ||
| Registered Investment Company; | ||||
| Dreyfus Institutional Preferred Plus Money Market Fund | ||||
| (cost $1,556,274) | 1,556,274 | d | 1,556,274 | |
| Investment of Cash Collateral for | ||||
| Securities Loaned—2.2% | ||||
| Registered Investment Company; | ||||
| Dreyfus Institutional Cash Advantage Fund | ||||
| (cost $16,427,220) | 16,427,220 | d | 16,427,220 | |
| Total Investments (cost $742,065,776) | 101.3 | % | 758,762,835 | |
| Liabilities, Less Cash and Receivables | (1.3 | %) | (9,969,908 | ) |
| Net Assets | 100.0 | % | 748,792,927 | |
BAN—Bond Anticipation Notes
GO—General Obligation
| a Securities exempt from registration pursuant to Rule 144A under the Securities Act of 1933.These securities may be resold in transactions exempt from registration, normally to |
| qualified institutional buyers.At August 31, 2014, these securities were valued at $102,958,041 or 13.7% of net assets. |
| b Variable rate security—interest rate subject to periodic change. |
| c Security, or portion thereof, on loan.At August 31, 2014, the value of the fund’s securities on loan was $18,363,750 and the value of the collateral held by the fund was |
| $18,987,746, consisting of cash collateral of $16,427,220 and U.S. Government & Agency securities valued at $2,560,526. |
| d Investment in affiliated money market mutual fund. |
| Portfolio Summary (Unaudited)† | |||
| Value (%) | Value (%) | ||
| Corporate Bonds | 88.8 | Money Market Investments | 2.4 |
| Municipal Bonds | 6.5 | ||
| Foreign/Governmental | 3.6 | 101.3 | |
| † Based on net assets. | |||
| See notes to financial statements. | |||
The Funds 33
| STATEMENT OF INVESTMENTS |
| August 31, 2014 |
| BNY Mellon Short-Term U.S. Government Securities Fund | |||||
| Coupon | Maturity | Principal | |||
| Bonds and Notes—102.8% | Rate (%) | Date | Amount ($) | Value ($) | |
| Commercial Mortgage Pass-Through Ctfs.—1.5% | |||||
| GE Capital Commercial Mortgage Corporation Trust, | |||||
| Ser. 2006-C1, Cl. A4 | 5.45 | 3/10/44 | 2,908,524 | a | 3,043,691 |
| JP Morgan Chase Commericial Mortgage Securities Trust, | |||||
| Ser. 2013-FL3, Cl. A2 | 0.86 | 4/15/28 | 787,391 | a,b | 787,008 |
| 3,830,699 | |||||
| Municipal Bonds—5.2% | |||||
| California, GO (Various Purpose) | 1.05 | 2/1/16 | 1,000,000 | 1,008,140 | |
| California, GO (Various Purpose) | 1.25 | 11/1/16 | 1,000,000 | 1,007,970 | |
| Florida Hurricane Catastrophe Fund | |||||
| Finance Corporation, Revenue | 1.30 | 7/1/16 | 2,745,000 | 2,775,689 | |
| Illinois, GO | 4.42 | 1/1/15 | 1,700,000 | 1,722,389 | |
| Nassau County Interim Finance Authority, | |||||
| Sales Tax Secured Revenue | 0.86 | 11/15/15 | 2,500,000 | 2,514,675 | |
| New York City, GO | 5.13 | 12/1/15 | 1,100,000 | 1,162,535 | |
| University of California Regents, | |||||
| General Revenue | 0.66 | 7/1/17 | 3,000,000 | a | 3,013,260 |
| 13,204,658 | |||||
| U.S. Government Agencies—16.7% | |||||
| Federal Farm Credit Bank, Bonds | 0.69 | 5/16/17 | 1,380,000 | 1,374,625 | |
| Federal Home Loan Bank, Bonds | 1.30 | 2/26/18 | 5,930,000 | 5,956,910 | |
| Federal Home Loan Bank, Bonds | 1.38 | 3/9/18 | 750,000 | 752,442 | |
| Federal Home Loan Mortgage Corp., Notes | 0.75 | 10/5/16 | 3,000,000 | c | 3,000,525 |
| Federal Home Loan Mortgage Corp., Notes | 1.13 | 5/19/17 | 6,500,000 | c | 6,509,861 |
| Federal Home Loan Mortgage Corp., Notes | 1.15 | 7/28/17 | 4,495,000 | c | 4,481,695 |
| Federal Home Loan Mortgage Corp., Notes | 1.25 | 8/14/17 | 7,500,000 | c | 7,503,053 |
| Federal National Mortgage Association, Notes | 0.50 | 4/25/16 | 4,500,000 | c | 4,500,671 |
| Federal National Mortgage Association, Notes | 0.65 | 2/27/17 | 2,000,000 | c | 1,991,088 |
| Federal National Mortgage Association, Notes, Ser. 2 | 0.70 | 1/30/18 | 2,715,000 | a,c | 2,705,454 |
| Federal National Mortgage Association, Notes | 0.75 | 11/22/17 | 2,500,000 | a,c | 2,501,657 |
| Federal National Mortgage Association, Notes, Ser. 1 | 1.00 | 4/30/18 | 1,310,000 | c | 1,296,261 |
| 42,574,242 | |||||
34
| BNY Mellon Short-Term U.S. Government Securities Fund (continued) | |||||||
| Principal | Principal | ||||||
| Bonds and Notes (continued) | Amount ($) | Value ($) | Amount ($) | Value ($) | |||
| U.S. Government Agencies/ | U.S. Government Agencies/ | ||||||
| Mortgage-Backed—32.5% | Mortgage-Backed (continued) | ||||||
| Federal Home Loan Mortgage Corp.: | Federal National Mortgage | ||||||
| 4.50%, 12/1/19—9/1/26 | 8,604,771 | c | 9,080,278 | Association (continued): | |||
| REMIC, Ser. 3565, Cl. XA, | REMIC, Ser. 2009-111, | ||||||
| 4.00%, 8/15/22 | 334,434 | c | 338,028 | Cl. JB, 3.00%, 4/25/39 | 669,606 | c | 680,810 |
| REMIC, Ser. 3846, Cl. CK, | REMIC, Ser. 2011-7, Cl. DA, | ||||||
| 1.50%, 9/15/20 | 2,059,146 | c | 2,080,528 | 3.50%, 5/25/24 | 365,128 | c | 371,577 |
| REMIC, Ser. 3689, Cl. AB, | REMIC, Ser. 2003-122, | ||||||
| 2.00%, 12/15/27 | 50,819 | c | 50,857 | Cl. OL, 4.00%, 12/25/18 | 1,698,621 | c | 1,779,613 |
| REMIC, Ser. 4079, Cl. WA, | REMIC, Ser. 2008-23, Cl. A, | ||||||
| 2.00%, 8/15/40 | 3,975,884 | c | 3,916,546 | 4.50%, 10/25/22 | 276,223 | c | 283,192 |
| REMIC, Ser. 2675, Cl. CK, | REMIC, Ser. 2003-67, | ||||||
| 4.00%, 9/15/18 | 161,949 | c | 169,683 | Cl. TJ, 4.75%, 7/25/18 | 918,355 | c | 966,390 |
| REMIC, Ser. 3829, Cl. CA, | REMIC, Ser. 2003-49, | ||||||
| 4.00%, 8/15/24 | 3,848,311 | c | 3,962,216 | Cl. YD, 5.50%, 6/25/23 | 560,000 | c | 580,745 |
| REMIC, Ser. 3986, Cl. P, | REMIC, Ser. 2004-53, Cl. P, | ||||||
| 4.00%, 3/15/39 | 1,130,879 | c | 1,166,374 | 5.50%, 7/25/33 | 467,202 | c | 483,346 |
| REMIC, Ser. 3578, Cl. AM, | Government National | ||||||
| 4.50%, 9/15/16 | 489,650 | c | 503,622 | Mortgage Association I: | |||
| REMIC, Ser. 3835, Cl. CC, | Ser. 2003-4, Cl. LD, 5.50%, | ||||||
| 4.50%, 12/15/40 | 146,000 | c | 146,322 | 3/16/32 | 356,364 | 357,849 | |
| REMIC, Ser. 2495, Cl. UC, | Ser. 2013-101, Cl. A, | ||||||
| 5.00%, 7/15/32 | 14,702 | c | 15,428 | 0.51%, 5/16/35 | 4,763,666 | 4,673,087 | |
| Federal National | Ser. 2013-73, Cl. A, 0.98%, | ||||||
| Mortgage Association: | 12/16/35 | 4,988,860 | 4,929,235 | ||||
| 2.50%, 3/1/22 | 1,664,028 | c | 1,716,244 | Ser. 2012-22, Cl. AB, | |||
| 2.59%, 3/1/16 | 714,185 | c | 728,514 | 1.66%, 3/16/33 | 866,422 | 867,636 | |
| 3.63%, 7/1/18 | 898,887 | c | 963,845 | Ser. 2013-105, Cl. A, | |||
| 4.50%, 11/1/22 | 6,846,500 | c | 7,292,162 | 1.71%, 2/16/37 | 3,822,983 | 3,812,883 | |
| REMIC, Ser. 2010-13, | Ser. 2010-159, Cl. A, | ||||||
| Cl. KA, 2.00%, 12/25/18 | 1,703,666 | c | 1,727,681 | 2.16%, 1/16/33 | 251,888 | 252,380 | |
| REMIC, Ser. 2011-23, | Ser. 2011-49, Cl. A, 2.45%, | ||||||
| Cl. AB, 2.75%, 6/25/20 | 3,378,839 | c | 3,477,258 | 7/16/38 | 4,686,324 | 4,745,733 | |
| REMIC, Ser. 2012-94, Cl. E, | Ser. 2010-122, Cl. AB, | ||||||
| 3.00%, 6/25/22 | 3,290,701 | c | 3,421,478 | 3.31%, 11/16/37 | 1,002,827 | 1,022,328 | |
The Funds 35
STATEMENT OF INVESTMENTS (continued)
| BNY Mellon Short-Term U.S. Government Securities Fund (continued) | ||||||||
| Principal | Principal | |||||||
| Bonds and Notes (continued) | Amount ($) | Value ($) | Amount ($) | Value ($) | ||||
| U.S. Government Agencies/ | U.S. Government Securities (continued) | |||||||
| Mortgage-Backed (continued) | U.S. Treasury Notes (continued): | |||||||
| Government National | 0.63%, 7/15/16 | 5,000,000 | 5,015,725 | |||||
| Mortgage Association I (continued): | 0.63%, 8/15/16 | 10,000,000 | 10,025,590 | |||||
| Ser. 2010-52, Cl. AD, | 0.63%, 10/15/16 | 10,500,000 | 10,511,077 | |||||
| 3.61%, 6/16/36 | 560,388 | 567,098 | 0.63%, 2/15/17 | 10,500,000 | 10,476,616 | |||
| Ser. 2010-100, Cl. D, | 0.63%, 9/30/17 | 11,750,000 | 11,611,844 | |||||
| 4.07%, 1/16/51 | 1,988,129 | a | 2,078,013 | 0.75%, 1/15/17 | 10,500,000 | 10,515,172 | ||
| Ser. 2009-119, Cl. B, | 0.88%, 12/31/16 | 10,500,000 | 10,548,804 | |||||
| 4.29%, 2/16/41 | 2,663,851 | 2,707,455 | 0.88%, 1/31/17 | 10,500,000 | 10,543,890 | |||
| Ser. 2006-31, Cl. E, 4.70%, | 0.88%, 4/15/17 | 11,750,000 | d | 11,776,625 | ||||
| 5/16/39 | 2,753,690 | a | 2,802,716 | 0.88%, 5/15/17 | 11,750,000 | d | 11,763,313 | |
| Ser. 2003-48, Cl. C, 4.89%, | 1.00%, 3/31/17 | 10,500,000 | 10,557,425 | |||||
| 7/16/34 | 907,783 | 928,922 | 119,353,815 | |||||
| Ser. 2005-76, Cl. B, 4.89%, | Total Bonds and Notes | |||||||
| 10/16/38 | 4,564,251 | a | 4,783,057 | (cost $262,178,073) | 261,815,624 | |||
| Ser. 2007-12, Cl. B, 5.14%, | ||||||||
| 12/16/36 | 1,120,444 | a | 1,150,855 | |||||
| Ser. 2007-69, Cl. C, 5.20%, | Other Investment—3.1% | Shares | Value ($) | |||||
| 10/16/37 | 1,111,531 | a | 1,137,036 | Registered Investment Company; | ||||
| Ser. 2003-109, Cl. D, | Dreyfus Institutional Preferred | |||||||
| 5.23%, 1/16/34 | 63,482 | a | 63,465 | Plus Money Market Fund | ||||
| Ser. 2006-32, Cl. B, 5.35%, | (cost $7,926,224) | 7,926,224 | e | 7,926,224 | ||||
| 7/16/36 | 69,582 | a | 69,725 | |||||
| 82,852,210 | Total Investments (cost $270,104,297) | 105.9% | 269,741,848 | |||||
| U.S. Government Securities—46.9% | Liabilities, Less Cash and Receivables | (5.9 | %) | (14,980,064 | ) | |||
| U.S. Treasury Notes: | ||||||||
| 0.38%, 2/15/16 | 6,000,000 | 6,007,734 | Net Assets | 100.0 | % | 254,761,784 | ||
GO—General Obligation
REMIC—Real Mortagage Investment Conduit
| a Variable rate security—interest rate subject to periodic change. |
| b Security exempt from registration pursuant to Rule 144A under the Securities Act of 1933.This security may be resold in transactions exempt from registration, normally to |
| qualified institutional buyers.At August 31, 2014, this security was valued at $787,008 or .3% of net assets. |
| c The Federal Housing Finance Agency (“FHFA”) placed the Federal Home Loan Mortgage Corporation and Federal National Mortgage Association into conservatorship with |
| FHFA as the conservator.As such, the FHFA oversees the continuing affairs of these companies. |
| d Security, or portion thereof, on loan.At August 31, 2014, the value of the fund’s securities on loan was $9,284,952 and the value of the collateral held by the fund was |
| $9,793,539, consisting of U.S. Government & Agency securities. |
| e Investment in affiliated money market mutual fund. |
| Portfolio Summary (Unaudited)† | |||
| Value (%) | Value (%) | ||
| U.S. Government Agencies/Mortgage-Backed | 96.1 | Commercial Mortgage-Backed | 1.5 |
| Municipal Bonds | 5.2 | ||
| Money Market Investment | 3.1 | 105.9 | |
| † Based on net assets. | |||
| See notes to financial statements. | |||
36
STATEMENTS OF ASSETS AND LIABILITIES
August 31, 2014
| BNY Mellon | ||||||||
| BNY Mellon | BNY Mellon | Short-Term | ||||||
| BNY Mellon | Intermediate | Corporate | U.S. Government | |||||
| Bond Fund | Bond Fund | Bond Fund | Securities Fund | |||||
| Assets ($): | ||||||||
| Investments in securities—See Statement of Investments† | ||||||||
| (including securities on loan)††—Note 2(b): | ||||||||
| Unaffiliated issuers | 1,037,358,364 | 903,126,930 | 740,779,341 | 261,815,624 | ||||
| Affiliated issuers | 10,201,922 | 14,181,372 | 17,983,494 | 7,926,224 | ||||
| Cash | — | — | — | 19,067 | ||||
| Dividends, interest and securities lending income receivable | 6,057,179 | 5,427,085 | 7,071,610 | 535,662 | ||||
| Receivable for shares of Beneficial Interest subscribed | 650,632 | 1,009,595 | 487,891 | 144,216 | ||||
| Prepaid expenses | 20,493 | 20,060 | 12,536 | 18,167 | ||||
| 1,054,288,590 | 923,765,042 | 766,334,872 | 270,458,960 | |||||
| Liabilities ($): | ||||||||
| Due to The Dreyfus Corporation and affiliates—Note 4(b) | 391,254 | 342,617 | 270,977 | 83,885 | ||||
| Due to Administrator—Note 4(a) | 109,568 | 95,855 | 77,685 | 25,846 | ||||
| Cash overdraft due to Custodian | 1,546,536 | 420,689 | 590,639 | — | ||||
| Liability for securities on loan—Note 2(b) | 2,385,000 | 4,090,700 | 16,427,220 | — | ||||
| Payable for shares of Beneficial Interest redeemed | 350,043 | 81,510 | 110,146 | 190,847 | ||||
| Payable for investment securities purchased | — | — | — | 15,358,006 | ||||
| Accrued expenses | 56,333 | 71,455 | 65,278 | 38,592 | ||||
| 4,838,734 | 5,102,826 | 17,541,945 | 15,697,176 | |||||
| Net Assets ($) | 1,049,449,856 | 918,662,216 | 748,792,927 | 254,761,784 | ||||
| Composition of Net Assets ($): | ||||||||
| Paid-in capital | 1,017,845,229 | 909,028,364 | 738,965,906 | 268,828,735 | ||||
| Accumulated investment income—net | 392,272 | 246,964 | 155,867 | 60,727 | ||||
| Accumulated net realized gain (loss) on investments | (300,261 | ) | (8,702,447 | ) | (7,025,905 | ) | (13,765,229 | ) |
| Accumulated net unrealized appreciation | ||||||||
| (depreciation) on investments | 31,512,616 | 18,089,335 | 16,697,059 | (362,449 | ) | |||
| Net Assets ($) | 1,049,449,856 | 918,662,216 | 748,792,927 | 254,761,784 | ||||
| Net Asset Value Per Share | ||||||||
| Class M Shares | ||||||||
| Net Assets ($) | 1,040,203,861 | 912,247,400 | 747,274,263 | 253,960,988 | ||||
| Shares Outstanding | 80,006,577 | 71,572,901 | 57,644,510 | 21,258,379 | ||||
| Net Asset Value Per Share ($) | 13.00 | 12.75 | 12.96 | 11.95 | ||||
| Investor Shares | ||||||||
| Net Assets ($) | 9,245,995 | 6,414,816 | 1,518,664 | 800,796 | ||||
| Shares Outstanding | 712,764 | 503,136 | 117,143 | 67,116 | ||||
| Net Asset Value Per Share ($) | 12.97 | 12.75 | 12.96 | 11.93 | ||||
| † Investments at cost ($): | ||||||||
| Unaffiliated issuers | 1,005,845,748 | 885,037,595 | 724,082,282 | 262,178,073 | ||||
| Affiliated issuers | 10,201,922 | 14,181,372 | 17,983,494 | 7,926,224 | ||||
| ††Value of securities on loan ($) | 78,407,395 | 70,600,092 | 18,363,750 | 9,284,952 | ||||
| See notes to financial statements. | ||||||||
The Funds 37
| STATEMENTS OF OPERATIONS |
| Year Ended August 31, 2014 |
| BNY Mellon | ||||||||
| BNY Mellon | BNY Mellon | Short-Term | ||||||
| BNY Mellon | Intermediate | Corporate | U.S. Government | |||||
| Bond Fund | Bond Fund | Bond Fund | Securities Fund | |||||
| Investment Income ($): | ||||||||
| Income: | ||||||||
| Interest | 32,376,509 | 20,652,955 | 18,979,341 | 1,871,724 | ||||
| Income from securities lending—Note 2(b) | 57,971 | 65,722 | 115,102 | 22,874 | ||||
| Cash dividends; | ||||||||
| Affiliated issuers | 7,704 | 6,693 | 8,435 | 3,345 | ||||
| Total Income | 32,442,184 | 20,725,370 | 19,102,878 | 1,897,943 | ||||
| Expenses: | ||||||||
| Investment advisory fee—Note 4(a) | 4,387,134 | 3,741,274 | 2,513,578 | 924,179 | ||||
| Administration fee—Note 4(a) | 1,357,739 | 1,157,816 | 777,623 | 326,900 | ||||
| Custodian fees—Note 4(b) | 75,799 | 66,183 | 41,511 | 22,173 | ||||
| Professional fees | 69,430 | 37,199 | 43,973 | 36,372 | ||||
| Trustees’ fees and expenses—Note 4(c) | 45,516 | 58,694 | 38,054 | 14,412 | ||||
| Registration fees | 27,640 | 28,697 | 48,530 | 27,464 | ||||
| Shareholder servicing costs—Note 4(b) | 22,652 | 20,024 | 2,512 | 2,240 | ||||
| Prospectus and shareholders’ reports | 9,051 | 11,736 | 5,243 | 6,859 | ||||
| Loan commitment fees—Note 3 | 4,607 | 7,310 | 5,386 | 1,705 | ||||
| Miscellaneous | 51,857 | 44,652 | 37,175 | 32,521 | ||||
| Total Expenses | 6,051,425 | 5,173,585 | 3,513,585 | 1,394,825 | ||||
| Less—reduction in fees due to | ||||||||
| earnings credits—Note 4(b) | (16 | ) | (14 | ) | (2 | ) | (3 | ) |
| Net Expenses | 6,051,409 | 5,173,571 | 3,513,583 | 1,394,822 | ||||
| Investment Income—Net | 26,390,775 | 15,551,799 | 15,589,295 | 503,121 | ||||
| Realized and Unrealized Gain (Loss) | ||||||||
| on Investments—Note 5 ($): | ||||||||
| Net realized gain (loss) on investments | 12,833,246 | 3,250,287 | 1,247,039 | 62,069 | ||||
| Net unrealized appreciation (depreciation) on investments | 16,427,599 | 8,171,646 | 26,849,704 | 482,972 | ||||
| Net Realized and Unrealized Gain (Loss) on Investments | 29,260,845 | 11,421,933 | 28,096,743 | 545,041 | ||||
| Net Increase in Net Assets Resulting from Operations | 55,651,620 | 26,973,732 | 43,686,038 | 1,048,162 | ||||
| See notes to financial statements. | ||||||||
38
STATEMENTS OF CHANGES IN NET ASSETS
| BNY Mellon Bond Fund | BNY Mellon Intermediate Bond Fund | |||||||
| Year Ended August 31, | Year Ended August 31, | |||||||
| 2014 | 2013 | 2014 | 2013 | |||||
| Operations ($): | ||||||||
| Investment income—net | 26,390,775 | 30,351,318 | 15,551,799 | 17,111,446 | ||||
| Net realized gain (loss) on investments | 12,833,246 | 15,818,003 | 3,250,287 | 11,874,965 | ||||
| Net unrealized appreciation (depreciation) on investments | 16,427,599 | (75,665,848 | ) | 8,171,646 | (45,403,973 | ) | ||
| Net Increase (Decrease) in Net Assets | ||||||||
| Resulting from Operations | 55,651,620 | (29,496,527 | ) | 26,973,732 | (16,417,562 | ) | ||
| Dividends to Shareholders from ($): | ||||||||
| Investment income—net: | ||||||||
| Class M Shares | (30,493,389 | ) | (36,591,932 | ) | (19,216,433 | ) | (21,686,175 | ) |
| Investor Shares | (230,990 | ) | (263,362 | ) | (140,635 | ) | (135,126 | ) |
| Net realized gain on investments: | ||||||||
| Class M Shares | (15,528,378 | ) | (10,432,257 | ) | (6,357,401 | ) | (1,640,163 | ) |
| Investor Shares | (122,988 | ) | (81,840 | ) | (56,520 | ) | (8,152 | ) |
| Total Dividends | (46,375,745 | ) | (47,369,391 | ) | (25,770,989 | ) | (23,469,616 | ) |
| Beneficial Interest Transactions ($): | ||||||||
| Net proceeds from shares sold: | ||||||||
| Class M Shares | 139,739,656 | 177,159,834 | 190,158,009 | 205,882,674 | ||||
| Investor Shares | 7,978,609 | 9,156,676 | 10,164,564 | 8,031,994 | ||||
| Net assets received in connection | ||||||||
| with reorganization—Note 1 | — | — | — | 41,803,155 | ||||
| Dividends reinvested: | ||||||||
| Class M Shares | 14,743,821 | 11,754,220 | 7,360,340 | 4,613,966 | ||||
| Investor Shares | 330,590 | 316,118 | 181,504 | 130,516 | ||||
| Cost of shares redeemed: | ||||||||
| Class M Shares | (271,511,953 | ) | (291,087,372 | ) | (235,558,817 | ) | (218,287,829 | ) |
| Investor Shares | (7,526,215 | ) | (9,725,407 | ) | (12,338,621 | ) | (7,584,448 | ) |
| Increase (Decrease) in Net Assets from | ||||||||
| Beneficial Interest Transactions | (116,245,492 | ) | (102,425,931 | ) | (40,033,021 | ) | 34,590,028 | |
| Total Increase (Decrease) in Net Assets | (106,969,617 | ) | (179,291,849 | ) | (38,830,278 | ) | (5,297,150 | ) |
| Net Assets ($): | ||||||||
| Beginning of Period | 1,156,419,473 | 1,335,711,322 | 957,492,494 | 962,789,644 | ||||
| End of Period | 1,049,449,856 | 1,156,419,473 | 918,662,216 | 957,492,494 | ||||
| Undistributed investment income—net | 392,272 | 654,694 | 246,964 | 132,194 | ||||
| Capital Share Transactions (Shares): | ||||||||
| Class M Shares | ||||||||
| Shares sold | 10,819,071 | 13,126,571 | 14,905,973 | 15,694,611 | ||||
| Shares received in connection with reorganization—Note 1 | — | — | — | 2,936,786 | ||||
| Shares issued for dividends reinvested | 1,151,700 | 871,263 | 578,435 | 352,062 | ||||
| Shares redeemed | (21,046,850 | ) | (21,635,993 | ) | (18,475,803 | ) | (16,647,387 | ) |
| Net Increase (Decrease) in Shares Outstanding | (9,076,079 | ) | (7,638,159 | ) | (2,991,395 | ) | 2,336,072 | |
| Investor Shares | ||||||||
| Shares sold | 619,028 | 679,405 | 796,117 | 616,052 | ||||
| Shares received in connection with reorganization—Note 1 | — | — | — | 238,458 | ||||
| Shares issued for dividends reinvested | 25,734 | 23,525 | 14,237 | 9,989 | ||||
| Shares redeemed | (584,147 | ) | (725,716 | ) | (966,716 | ) | (582,853 | ) |
| Net Increase (Decrease) in Shares Outstanding | 60,615 | (22,786 | ) | (156,362 | ) | 281,646 | ||
| See notes to financial statements. | ||||||||
The Funds 39
STATEMENTS OF CHANGES IN NET ASSETS (continued)
| BNY Mellon | BNY Mellon Short-Term | |||||||
| Corporate Bond Fund | U.S. Government Securities Fund | |||||||
| Year Ended August 31, | Year Ended August 31, | |||||||
| 2014 | 2013 | 2014 | 2013 | |||||
| Operations ($): | ||||||||
| Investment income (loss)—net | 15,589,295 | 11,090,501 | 503,121 | (365,838 | ) | |||
| Net realized gain (loss) on investments | 1,247,039 | 1,662,231 | 62,069 | 378,855 | ||||
| Net unrealized appreciation (depreciation) on investments | 26,849,704 | (17,491,893 | ) | 482,972 | (1,336,409 | ) | ||
| Net Increase (Decrease) in Net Assets | ||||||||
| Resulting from Operations | 43,686,038 | (4,739,161 | ) | 1,048,162 | (1,323,392 | ) | ||
| Dividends to Shareholders from ($): | ||||||||
| Investment income—net: | ||||||||
| Class M Shares | (20,462,536 | ) | (14,502,105 | ) | (2,917,601 | ) | (3,007,148 | ) |
| Investor Shares | (29,704 | ) | (9,627 | ) | (7,017 | ) | (7,068 | ) |
| Net realized gain on investments: | ||||||||
| Class M Shares | (138,471 | ) | (1,451,053 | ) | — | — | ||
| Investor Shares | (218 | ) | (504 | ) | — | — | ||
| Total Dividends | (20,630,929 | ) | (15,963,289 | ) | (2,924,618 | ) | (3,014,216 | ) |
| Beneficial Interest Transactions ($): | ||||||||
| Net proceeds from shares sold: | ||||||||
| Class M Shares | 313,078,676 | 349,530,512 | 133,824,915 | 142,068,306 | ||||
| Investor Shares | 2,685,439 | 1,150,432 | 1,582,308 | 1,686,738 | ||||
| Dividends reinvested: | ||||||||
| Class M Shares | 5,561,663 | 3,805,589 | 704,409 | 622,803 | ||||
| Investor Shares | 25,818 | 9,126 | 6,915 | 6,982 | ||||
| Cost of shares redeemed: | ||||||||
| Class M Shares | (148,537,331 | ) | (90,737,308 | ) | (157,888,755 | ) | (161,931,227 | ) |
| Investor Shares | (1,804,216 | ) | (600,040 | ) | (1,677,132 | ) | (1,929,155 | ) |
| Increase (Decrease) in Net Assets from | ||||||||
| Beneficial Interest Transactions | 171,010,049 | 263,158,311 | (23,447,340 | ) | (19,475,553 | ) | ||
| Total Increase (Decrease) in Net Assets | 194,065,158 | 242,455,861 | (25,323,796 | ) | (23,813,161 | ) | ||
| Net Assets ($): | ||||||||
| Beginning of Period | 554,727,769 | 312,271,908 | 280,085,580 | 303,898,741 | ||||
| End of Period | 748,792,927 | 554,727,769 | 254,761,784 | 280,085,580 | ||||
| Undistributed investment income—net | 155,867 | 477,272 | 60,727 | 61,578 | ||||
| Capital Share Transactions (Shares): | ||||||||
| Class M Shares | ||||||||
| Shares sold | 24,525,732 | 26,939,469 | 11,150,819 | 11,707,053 | ||||
| Shares issued for dividends reinvested | 434,815 | 295,195 | 58,691 | 51,361 | ||||
| Shares redeemed | (11,676,338 | ) | (7,056,632 | ) | (13,152,428 | ) | (13,330,341 | ) |
| Net Increase (Decrease) in Shares Outstanding | 13,284,209 | 20,178,032 | (1,942,918 | ) | (1,571,927 | ) | ||
| Investor Shares | ||||||||
| Shares sold | 210,491 | 89,203 | 131,951 | 139,586 | ||||
| Shares issued for dividends reinvested | 2,018 | 711 | 577 | 576 | ||||
| Shares redeemed | (141,425 | ) | (46,990 | ) | (139,823 | ) | (159,351 | ) |
| Net Increase (Decrease) in Shares Outstanding | 71,084 | 42,924 | (7,295 | ) | (19,189 | ) | ||
| See notes to financial statements. | ||||||||
40
FINANCIAL HIGHLIGHTS
The following tables describe the performance for each share class of each BNY Mellon fixed income fund for the fiscal periods indicated. All information (except portfolio turnover rate) reflects financial results for a single fund share. Total return shows how much your investment in each fund would have increased (or decreased) during the period, assuming you had reinvested all dividends and distributions.These figures have been derived from each fund’s financial statements.
| Class M Shares | ||||||||||
| Year Ended August 31, | ||||||||||
| BNY Mellon Bond Fund | 2014 | 2013 | 2012 | 2011 | 2010 | |||||
| Per Share Data ($): | ||||||||||
| Net asset value, beginning of period | 12.89 | 13.71 | 13.38 | 13.36 | 12.90 | |||||
| Investment Operations: | ||||||||||
| Investment income—neta | .31 | .32 | .38 | .39 | .43 | |||||
| Net realized and unrealized | ||||||||||
| gain (loss) on investments | .34 | (.64 | ) | .42 | .14 | .56 | ||||
| Total from Investment Operations | .65 | (.32 | ) | .80 | .53 | .99 | ||||
| Distributions: | ||||||||||
| Dividends from investment income—net | (.36 | ) | (.39 | ) | (.44 | ) | (.49 | ) | (.53 | ) |
| Dividends from net realized gain on investments | (.18 | ) | (.11 | ) | (.03 | ) | (.02 | ) | — | |
| Total Distributions | (.54 | ) | (.50 | ) | (.47 | ) | (.51 | ) | (.53 | ) |
| Net asset value, end of period | 13.00 | 12.89 | 13.71 | 13.38 | 13.36 | |||||
| Total Return (%) | 5.19 | (2.41 | ) | 6.05 | 4.06 | 7.84 | ||||
| Ratios/Supplemental Data (%): | ||||||||||
| Ratio of total expenses to average net assets | .55 | .55 | .55 | .55 | .55 | |||||
| Ratio of net expenses to average net assets | .55 | .55 | .55 | .55 | .55 | |||||
| Ratio of net investment income | ||||||||||
| to average net assets | 2.41 | 2.40 | 2.80 | 2.98 | 3.29 | |||||
| Portfolio Turnover Rate | 43.62 | 66.14 | b | 76.43 | 86.75 | b | 99.66 | |||
| Net Assets, end of period ($ x 1,000) | 1,040,204 | 1,148,032 | 1,326,472 | 1,353,593 | 1,455,913 | |||||
| a Based on average shares outstanding. |
| b The portfolio turnover rates excluding mortgage dollar roll transactions for the periods ended August 31, 2013 and 2011 were 65.03% and 79.13%, respectively. |
See notes to financial statements.
The Funds 41
FINANCIAL HIGHLIGHTS (continued)
| Investor Shares | ||||||||||
| Year Ended August 31, | ||||||||||
| BNY Mellon Bond Fund | 2014 | 2013 | 2012 | 2011 | 2010 | |||||
| Per Share Data ($): | ||||||||||
| Net asset value, beginning of period | 12.86 | 13.69 | 13.35 | 13.34 | 12.88 | |||||
| Investment Operations: | ||||||||||
| Investment income—neta | .28 | .29 | .34 | .35 | .39 | |||||
| Net realized and unrealized | ||||||||||
| gain (loss) on investments | .34 | (.65 | ) | .43 | .13 | .57 | ||||
| Total from Investment Operations | .62 | (.36 | ) | .77 | .48 | .96 | ||||
| Distributions: | ||||||||||
| Dividends from investment income—net | (.33 | ) | (.36 | ) | (.40 | ) | (.45 | ) | (.50 | ) |
| Dividends from net realized gain on investments | (.18 | ) | (.11 | ) | (.03 | ) | (.02 | ) | — | |
| Total Distributions | (.51 | ) | (.47 | ) | (.43 | ) | (.47 | ) | (.50 | ) |
| Net asset value, end of period | 12.97 | 12.86 | 13.69 | 13.35 | 13.34 | |||||
| Total Return (%) | 4.95 | (2.74 | ) | 5.87 | 3.72 | 7.60 | ||||
| Ratios/Supplemental Data (%): | ||||||||||
| Ratio of total expenses to average net assets | .80 | .80 | .80 | .80 | .81 | |||||
| Ratio of net expenses to average net assets | .80 | .80 | .80 | .80 | .81 | |||||
| Ratio of net investment income | ||||||||||
| to average net assets | 2.16 | 2.16 | 2.55 | 2.73 | 3.03 | |||||
| Portfolio Turnover Rate | 43.62 | 66.14 | b | 76.43 | 86.75 | b | 99.66 | |||
| Net Assets, end of period ($ x 1,000) | 9,246 | 8,387 | 9,240 | 11,083 | 12,971 |
| a Based on average shares outstanding. |
| b The portfolio turnover rates excluding mortgage dollar roll transactions for the period endeds August 31, 2013 and 2011 were 65.03% and 79.13%, respectively. |
See notes to financial statements.
42
| Class M Shares | ||||||||||
| Year Ended August 31, | ||||||||||
| BNY Mellon Intermediate Bond Fund | 2014 | 2013 | 2012 | 2011 | 2010 | |||||
| Per Share Data ($): | ||||||||||
| Net asset value, beginning of period | 12.73 | 13.26 | 13.09 | 13.15 | 12.81 | |||||
| Investment Operations: | ||||||||||
| Investment income—neta | .21 | .23 | .29 | .32 | .35 | |||||
| Net realized and unrealized | ||||||||||
| gain (loss) on investments | .17 | (.44 | ) | .25 | .04 | .47 | ||||
| Total from Investment Operations | .38 | (.21 | ) | .54 | .36 | .82 | ||||
| Distributions: | ||||||||||
| Dividends from investment income—net | (.27 | ) | (.30 | ) | (.37 | ) | (.42 | ) | (.48 | ) |
| Dividends from net realized gain on investments | (.09 | ) | (.02 | ) | (.00 | )b | — | — | ||
| Total Distributions | (.36 | ) | (.32 | ) | (.37 | ) | (.42 | ) | (.48 | ) |
| Net asset value, end of period | 12.75 | 12.73 | 13.26 | 13.09 | 13.15 | |||||
| Total Return (%) | 2.87 | (1.64 | ) | 4.18 | 2.84 | 6.52 | ||||
| Ratios/Supplemental Data (%): | ||||||||||
| Ratio of total expenses to average net assets | .55 | .56 | .55 | .55 | .55 | |||||
| Ratio of net expenses to average net assets | .55 | .56 | .55 | .55 | .55 | |||||
| Ratio of net investment income | ||||||||||
| to average net assets | 1.66 | 1.77 | 2.23 | 2.42 | 2.72 | |||||
| Portfolio Turnover Rate | 42.45 | 44.76 | 39.00 | 45.15 | 44.58 | |||||
| Net Assets, end of period ($ x 1,000) | 912,247 | 949,095 | 957,778 | 980,237 | 988,555 | |||||
| a | Based on average shares outstanding. |
| b | Amount represents less than $.01 per share. |
See notes to financial statements.
The Funds 43
FINANCIAL HIGHLIGHTS (continued)
| Investor Shares | ||||||||||
| Year Ended August 31, | ||||||||||
| BNY Mellon Intermediate Bond Fund | 2014 | 2013 | 2012 | 2011 | 2010 | |||||
| Per Share Data ($): | ||||||||||
| Net asset value, beginning of period | 12.73 | 13.26 | 13.09 | 13.15 | 12.81 | |||||
| Investment Operations: | ||||||||||
| Investment income—neta | .18 | .20 | .26 | .29 | .31 | |||||
| Net realized and unrealized | ||||||||||
| gain (loss) on investments | .16 | (.45 | ) | .24 | .04 | .48 | ||||
| Total from Investment Operations | .34 | (.25 | ) | .50 | .33 | .79 | ||||
| Distributions: | ||||||||||
| Dividends from investment income—net | (.23 | ) | (.26 | ) | (.33 | ) | (.39 | ) | (.45 | ) |
| Dividends from net realized gain on investments | (.09 | ) | (.02 | ) | (.00 | )b | — | — | ||
| Total Distributions | (.32 | ) | (.28 | ) | (.33 | ) | (.39 | ) | (.45 | ) |
| Net asset value, end of period | 12.75 | 12.73 | 13.26 | 13.09 | 13.15 | |||||
| Total Return (%) | 2.69 | (1.91 | ) | 3.91 | 2.57 | 6.26 | ||||
| Ratios/Supplemental Data (%): | ||||||||||
| Ratio of total expenses to average net assets | .80 | .82 | .81 | .80 | .81 | |||||
| Ratio of net expenses to average net assets | .80 | .82 | .81 | .80 | .81 | |||||
| Ratio of net investment income | ||||||||||
| to average net assets | 1.40 | 1.51 | 1.98 | 2.18 | 2.44 | |||||
| Portfolio Turnover Rate | 42.45 | 44.76 | 39.00 | 45.15 | 44.58 | |||||
| Net Assets, end of period ($ x 1,000) | 6,415 | 8,397 | 5,012 | 4,260 | 4,768 |
| a | Based on average shares outstanding. |
| b | Amount represents less than $.01 per share. |
See notes to financial statements.
44
| Class M Shares | ||||||
| Year Ended August 31, | ||||||
| BNY Mellon Corporate Bond Fund | 2014 | 2013 | 2012 | a | ||
| Per Share Data ($): | ||||||
| Net asset value, beginning of period | 12.49 | 12.91 | 12.50 | |||
| Investment Operations: | ||||||
| Investment income—netb | .32 | .30 | .12 | |||
| Net realized and unrealized | ||||||
| gain (loss) on investments | .56 | (.29 | ) | .43 | ||
| Total from Investment Operations | .88 | .01 | .55 | |||
| Distributions: | ||||||
| Dividends from investment income—net | (.41 | ) | (.39 | ) | (.14 | ) |
| Dividends from net realized gain on investments | (.00 | )c | (.04 | ) | — | |
| Total Distributions | (.41 | ) | (.43 | ) | (.14 | ) |
| Net asset value, end of period | 12.96 | 12.49 | 12.91 | |||
| Total Return (%) | 7.21 | .02 | 4.40 | d | ||
| Ratios/Supplemental Data (%): | ||||||
| Ratio of total expenses to average net assets | .56 | .58 | .70 | e | ||
| Ratio of net expenses to average net assets | .56 | .58 | .60 | e | ||
| Ratio of net investment income | ||||||
| to average net assets | 2.48 | 2.31 | 2.25 | e | ||
| Portfolio Turnover Rate | 33.17 | 36.99 | 34.08 | d | ||
| Net Assets, end of period ($ x 1,000) | 747,274 | 554,152 | 312,231 |
| a | From March 2, 2012 (commencement of operations) to August 31, 2012. |
| b | Based on average shares outstanding. |
| c | Amount represents less than $.01 per share. |
| d | Not annualized. |
| e | Annualized. |
See notes to financial statements.
The Funds 45
FINANCIAL HIGHLIGHTS (continued)
| Investor Shares | ||||||
| Year Ended August 31, | ||||||
| BNY Mellon Corporate Bond Fund | 2014 | 2013 | 2012 | a | ||
| Per Share Data ($): | ||||||
| Net asset value, beginning of period | 12.49 | 12.91 | 12.50 | |||
| Investment Operations: | ||||||
| Investment income—netb | .28 | .26 | .07 | |||
| Net realized and unrealized | ||||||
| gain (loss) on investments | .57 | (.29 | ) | .46 | ||
| Total from Investment Operations | .85 | (.03 | ) | .53 | ||
| Distributions: | ||||||
| Dividends from investment income—net | (.38 | ) | (.35 | ) | (.12 | ) |
| Dividends from net realized gain on investments | (.00 | )c | (.04 | ) | — | |
| Total Distributions | (.38 | ) | (.39 | ) | (.12 | ) |
| Net asset value, end of period | 12.96 | 12.49 | 12.91 | |||
| Total Return (%) | 6.92 | (.24 | ) | 4.29 | d | |
| Ratios/Supplemental Data (%): | ||||||
| Ratio of total expenses to average net assets | .82 | .85 | 1.12 | e | ||
| Ratio of net expenses to average net assets | .82 | .85 | .85 | e | ||
| Ratio of net investment income | ||||||
| to average net assets | 2.21 | 2.05 | 1.67 | e | ||
| Portfolio Turnover Rate | 33.17 | 36.99 | 34.08 | d | ||
| Net Assets, end of period ($ x 1,000) | 1,519 | 575 | 40 |
| a | From March 2, 2012 (commencement of operations) to August 31, 2012. |
| b | Based on average shares outstanding. |
| c | Amount represents less than $.01 per share. |
| d | Not annualized. |
| e | Annualized. |
See notes to financial statements.
46
| Class M Shares | ||||||||||
| Year Ended August 31, | ||||||||||
| BNY Mellon Short-Term U.S. Government Securities Fund | 2014 | 2013 | 2012 | 2011 | 2010 | |||||
| Per Share Data ($): | ||||||||||
| Net asset value, beginning of period | 12.03 | 12.22 | 12.30 | 12.40 | 12.39 | |||||
| Investment Operations: | ||||||||||
| Investment income (loss)—neta | .02 | (.02 | ) | (.00 | )b | .07 | .13 | |||
| Net realized and unrealized | ||||||||||
| gain (loss) on investments | .03 | (.04 | ) | .01 | .02 | .11 | ||||
| Total from Investment Operations | .05 | (.06 | ) | .01 | .09 | .24 | ||||
| Distributions: | ||||||||||
| Dividends from investment income—net | (.13 | ) | (.13 | ) | (.09 | ) | (.19 | ) | (.23 | ) |
| Net asset value, end of period | 11.95 | 12.03 | 12.22 | 12.30 | 12.40 | |||||
| Total Return (%) | .44 | (.49 | ) | .07 | .71 | 1.96 | ||||
| Ratios/Supplemental Data (%): | ||||||||||
| Ratio of total expenses to average net assets | .53 | .53 | .52 | .52 | .53 | |||||
| Ratio of net expenses to average net assets | .53 | .53 | .52 | .52 | .53 | |||||
| Ratio of net investment income | ||||||||||
| (loss) to average net assets | .19 | (.13 | ) | (.00 | )c�� | .56 | 1.07 | |||
| Portfolio Turnover Rate | 116.19 | 125.01 | 152.13 | 143.65 | 59.58 | |||||
| Net Assets, end of period ($ x 1,000) | 253,961 | 279,192 | 302,756 | 349,975 | 304,707 | |||||
| a | Based on average shares outstanding. |
| b | Amount represents less than $.01 per share. |
| c | Amount represents less than .01%. |
See notes to financial statements.
The Funds 47
FINANCIAL HIGHLIGHTS (continued)
| Investor Shares | ||||||||||
| Year Ended August 31, | ||||||||||
| BNY Mellon Short-Term U.S. Government Securities Fund | 2014 | 2013 | 2012 | 2011 | 2010 | |||||
| Per Share Data ($): | ||||||||||
| Net asset value, beginning of period | 12.01 | 12.21 | 12.29 | 12.40 | 12.39 | |||||
| Investment Operations: | ||||||||||
| Investment income (loss)—neta | (.01 | ) | (.05 | ) | (.04 | ) | .04 | .11 | ||
| Net realized and unrealized | ||||||||||
| gain (loss) on investments | .03 | (.05 | ) | .02 | .00 | b | .10 | |||
| Total from Investment Operations | .02 | (.10 | ) | (.02 | ) | .04 | .21 | |||
| Distributions: | ||||||||||
| Dividends from investment income—net | (.10 | ) | (.10 | ) | (.06 | ) | (.15 | ) | (.20 | ) |
| Net asset value, end of period | 11.93 | 12.01 | 12.21 | 12.29 | 12.40 | |||||
| Total Return (%) | .18 | (.84 | ) | (.15 | ) | .34 | 1.73 | |||
| Ratios/Supplemental Data (%): | ||||||||||
| Ratio of total expenses to average net assets | .78 | .78 | .78 | .78 | .78 | |||||
| Ratio of net expenses to average net assets | .78 | .78 | .78 | .78 | .78 | |||||
| Ratio of net investment income | ||||||||||
| (loss) to average net assets | (.06 | ) | (.40 | ) | (.29 | ) | .34 | .84 | ||
| Portfolio Turnover Rate | 116.19 | 125.01 | 152.13 | 143.65 | 59.58 | |||||
| Net Assets, end of period ($ x 1,000) | 801 | 894 | 1,142 | 1,171 | 987 |
| a | Based on average shares outstanding. |
| b | Amount represents less than $.01 per share. |
See notes to financial statements.
48
NOTES TO FINANCIAL STATEMENTS
NOTE 1—General:
BNY Mellon Funds Trust (the “Trust”) was organized as a Massachusetts business trust that is registered under the Investment Company Act of 1940, as amended (the “Act”), as an open-end management investment company and operates as a series company currently consisting of twenty-five series, including the following diversified fixed income funds: BNY Mellon Bond Fund, BNY Mellon Intermediate Bond Fund, BNY Mellon Corporate Bond Fund and BNY Mellon Short-Term U.S. Government Securities Fund (each, a “fund” and together, the “funds”). The objectives of the funds are as follows: BNY Mellon Bond Fund, BNY Mellon Intermediate Bond Fund and BNY Mellon Corporate Bond Fund seek total return (consisting of capital appreciation and current income). BNY Mellon Short-Term U.S. Government Securities Fund seeks as high a level of current income as is consistent with the preservation of capital.
BNY Mellon Fund Advisers, a division of The Dreyfus Corporation (the “Manager” or “Dreyfus”), a wholly-owned subsidiary of The Bank of New York Mellon Corporation (“BNY Mellon”), serves as each fund’s investment adviser (the “Investment Adviser”).The Bank of NewYork Mellon, a subsidiary of BNY Mellon and an affiliate of Dreyfus, serves as administrator for the funds pursuant to an Administration Agreement with the Trust (the “Administration Agreement”). The Bank of New York Mellon has entered into a Sub-Administration Agreement with Dreyfus pursuant to which The Bank of New York Mellon pays Dreyfus for performing certain administrative services. MBSC Securities Corporation (the “Distributor”), a wholly-owned subsidiary of Dreyfus, is the distributor of each fund’s shares, which are sold without a sales charge.
As of the close of business on February 22, 2013, pursuant to an Agreement and Plan of Reorganization previously approved by the Trust’s Board of Trustees (the “Board”), all of the assets, subject to the liabilities, of BNY Mellon Intermediate U.S. Government Fund (“Intermediate U.S. Government Fund”) were transferred to BNY Mellon Intermediate Bond Fund in exchange for corresponding classes of shares of Beneficial Interest of BNY Mellon Intermediate Bond Fund of equal value. The purpose of the transaction was to combine two funds with comparable investment objectives and strategies. Shareholders of Class M and Investor shares of Intermediate U.S. Government Fund received Class M and Investor shares of BNY Mellon Intermediate Bond Fund, in an amount equal to the aggregate net asset value of their investment in Intermediate U.S. Government Fund at the time of the exchange.The exchange ratio for each class was as follows: Class M—.77 to 1 and Investor shares—.77 to 1.The net asset value of BNY Mellon Intermediate Bond Fund’s shares as of the close of business on February 22, 2013, after the reorganization, was $13.16 for Class M and $13.16 for Investor shares, and a total of 2,936,786 Class M shares and 238,458 Investor shares were issued to shareholders of Intermediate U.S. Government Fund in the exchange. Net assets acquired of $41,803,155 included unrealized appreciation of $1,250,668.
Each fund is authorized to issue an unlimited number of $.001 par value shares of Beneficial Interest in each of the following classes of shares: Class M and Investor. Other differences between the classes include the services offered to and the expenses borne by each class, the allocation of certain transfer agency costs, and certain voting rights. Income, expenses (other than expenses attributable to a specific class), and realized and unrealized gains or losses on investments are allocated to each class of shares based on its relative net assets.
The Trust accounts separately for the assets, liabilities and operations of each series. Expenses directly attributable
The Funds 49
NOTES TO FINANCIAL STATEMENTS (continued)
to each series are charged to that series’ operations; expenses that are applicable to all series are allocated among them on a pro rata basis.
The Financial Accounting Standards Board (“FASB”) Accounting Standards Codification is the exclusive reference of authoritative U.S. generally accepted accounting principles (“GAAP”) recognized by the FASB to be applied by nongovernmental entities. Rules and interpretive releases of the Securities and Exchange Commission (“SEC”) under authority of federal laws are also sources of authoritative GAAP for SEC registrants. Each fund’s financial statements are prepared in accordance with GAAP, which may require the use of management estimates and assumptions. Actual results could differ from those estimates.
NOTE 2—Significant Accounting Policies:
(a) Portfolio valuation: The fair value of a financial instrument is the amount that would be received to sell an asset or paid to transfer a liability in an orderly transaction between market participants at the measurement date (i.e., the exit price). GAAP establishes a fair value hierarchy that prioritizes the inputs of valuation techniques used to measure fair value. This hierarchy gives the highest priority to unadjusted quoted prices in active markets for identical assets or liabilities (Level 1 measurements) and the lowest priority to unobservable inputs (Level 3 measurements).
Additionally, GAAP provides guidance on determining whether the volume and activity in a market has decreased significantly and whether such a decrease in activity results in transactions that are not orderly. GAAP requires enhanced disclosures around valuation inputs and techniques used during annual and interim periods.
Various inputs are used in determining the value of the funds’ investments relating to fair value measurements. These inputs are summarized in the three broad levels listed below:
Level 1—unadjusted quoted prices in active markets for identical investments.
Level 2—other significant observable inputs (including quoted prices for similar investments, interest rates, prepayment speeds, credit risk, etc.).
Level 3—significant unobservable inputs (including the funds’ own assumptions in determining the fair value of investments).
The inputs or methodology used for valuing securities are not necessarily an indication of the risk associated with investing in those securities.
Changes in valuation techniques may result in transfers in or out of an assigned level within the disclosure hierarchy. Valuation techniques used to value the funds’ investments are as follows:
Registered investment companies that are not traded on an exchange are valued at their net asset value and are generally categorized within Level 1 of the fair value hierarchy.
Investments in securities, excluding short-term investments (other than U.S. Treasury Bills) are valued each business day by an independent pricing service (the “Service”) approved by the Board. Investments for which quoted bid prices are readily available and are representative of the bid side of the market in the judgment of the Service are valued at the mean between the quoted bid prices (as obtained by the Service from dealers in such securities) and asked prices (as calculated by the Service based upon its evaluation of the market for such securi-
50
ties). Other investments (which constitute a majority of the portfolio securities) are valued as determined by the Service, based on methods which include consideration of the following: yields or prices of securities of comparable quality, coupon, maturity and type; indications as to values from dealers; and general market conditions. These securities are generally categorized within Level 2 of the fair value hierarchy.
The Service’s procedures are reviewed by Dreyfus under the general supervision of the Board.
When market quotations or official closing prices are not readily available, or are determined not to reflect accurately fair value, such as when the value of a security has been significantly affected by events after the close of the exchange or market on which the security is principally traded (for example, a foreign exchange or market), but before the funds calculate their net asset value, the funds may value these investments at fair value as determined in accordance with the procedures approved by the Board. Certain factors may be considered when fair valuing investments such as: fundamental analytical data, the nature and duration of restrictions on disposition, an evaluation of the forces that influence the market in which the securities are purchased and sold, and public trading in similar securities of the issuer or comparable issuers. These securities are either categorized within Level 2 or 3 of the fair value hierarchy depending on the relevant inputs used.
For restricted securities where observable inputs are limited, assumptions about market activity and risk are used and are generally categorized within Level 3 of the fair value hierarchy.
Table 1 summarizes the inputs used as of August 31, 2014 in valuing each fund’s investments.
At August 31, 2014, there were no transfers between Level 1 and Level 2 of the fair value hierarchy for any of the funds.
(b) Securities transactions and investment income:
Securities transactions are recorded on a trade date basis. Realized gains and losses from securities transactions are recorded on the identified cost basis. Dividend income is recognized on the ex-dividend date and interest income, including, where applicable, accretion of discount and amortization of premium on investments, is recognized on the accrual basis.
Pursuant to a securities lending agreement with The Bank of NewYork Mellon, the funds may lend securities to qualified institutions. It is the funds’ policy that, at origination, all loans are secured by collateral of at least 102% of the value of U.S. securities loaned and 105% of the value of foreign securities loaned. Collateral equivalent to at least 100% of the market value of securities on loan is maintained at all times. Collateral is either in the form of cash, which can be invested in certain money market mutual funds managed by Dreyfus or U.S. Government and Agency securities. The funds are entitled to receive all dividends, interest and distributions on securities loaned, in addition to income earned as a result of the lending transaction. Should a borrower fail to return the securities in a timely manner,The Bank of NewYork Mellon is required to replace the securities for the benefit of the funds or credit the funds with the market value of the unreturned securities and is subrogated to the funds’ rights against the borrower and the
The Funds 51
NOTES TO FINANCIAL STATEMENTS (continued)
| Table 1—Fair Value Measurements | ||||||||
| Investments in Securities | ||||||||
| Level 2—Other | ||||||||
| Level 1—Unadjusted | Significant | Level 3—Significant | ||||||
| Quoted Prices | Observable Inputs | Unobservable Inputs | ||||||
| Assets ($) | Liabilities ($) | Assets ($) | Liabilities ($) | Assets ($) | Liabilities ($) | Total ($) | ||
| BNY Mellon Bond Fund | ||||||||
| Asset-Backed | — | — | 7,161,414 | — | — | — | 7,161,414 | |
| Commercial Mortgage-Backed | — | — | 11,109,014 | — | — | — | 11,109,014 | |
| Corporate Bonds† | — | — | 382,076,929 | — | — | — | 382,076,929 | |
| Foreign Government | — | — | 21,099,138 | — | — | — | 21,099,138 | |
| Municipal Bonds† | — | — | 62,227,204 | — | — | — | 62,227,204 | |
| Mutual Funds | 10,201,922 | — | — | — | — | — | 10,201,922 | |
| U.S. Government Agencies/ | ||||||||
| Mortgage-Backed | — | — | 317,237,859 | — | — | — | 317,237,859 | |
| U.S. Treasury | — | — | 236,446,806 | — | — | — | 236,446,806 | |
| BNY Mellon | ||||||||
| Intermediate Bond Fund | ||||||||
| Asset-Backed | — | — | 4,436,187 | — | — | — | 4,436,187 | |
| Commercial Mortgage-Backed | — | — | 24,752,438 | — | — | — | 24,752,438 | |
| Corporate Bonds† | — | — | 428,650,000 | — | — | — | 428,650,000 | |
| Foreign Government | — | — | 14,231,132 | — | — | — | 14,231,132 | |
| Municipal Bonds† | — | — | 50,589,489 | — | — | — | 50,589,489 | |
| Mutual Funds | 14,181,372 | — | — | — | — | — | 14,181,372 | |
| U.S. Government Agencies/ | ||||||||
| Mortgage-Backed | — | — | 33,153,285 | — | — | — | 33,153,285 | |
| U.S. Treasury | — | — | 347,314,399 | — | — | — | 347,314,399 | |
| BNY Mellon | ||||||||
| Corporate Bond Fund | ||||||||
| Corporate Bonds† | — | — | 664,902,264 | — | — | — | 664,902,264 | |
| Foreign Government | — | — | 26,914,318 | — | — | — | 26,914,318 | |
| Municipal Bonds† | — | — | 48,962,759 | — | — | — | 48,962,759 | |
| Mutual Funds | 17,983,494 | — | — | — | — | — | 17,983,494 | |
| BNY Mellon Short-Term U.S. | ||||||||
| Government Securities Fund | ||||||||
| Commercial Mortgage-Backed | — | — | 3,830,699 | — | — | — | 3,830,699 | |
| Municipal Bonds† | — | — | 13,204,658 | — | — | — | 13,204,658 | |
| Mutual Funds | 7,926,224 | — | — | — | — | — | 7,926,224 | |
| U.S. Government Agencies/ | ||||||||
| Mortgage-Backed | — | — | 125,426,452 | — | — | — | 125,426,452 | |
| U.S. Treasury | — | — | 119,353,815 | — | — | — | 119,353,815 | |
| † | See Statements of Investments for additional detailed categorizations. |
52
collateral. Table 2 summarizes the amount The Bank of New York Mellon earned from each fund from lending portfolio securities, pursuant to the securities lending agreement during the period ended August 31, 2014.
| Table 2—Securities Lending Agreement | ||
| BNY Mellon Bond Fund | $14,259 | |
| BNY Mellon Intermediate Bond Fund | 15,553 | |
| BNY Mellon Corporate Bond Fund | 28,854 | |
| BNY Mellon Short-Term U.S. | ||
| Government Securities Fund | 5,829 |
(c) Affiliated issuers: Investments in other investment companies advised by Dreyfus are defined as “affiliated” under the Act. Table 3 summarizes each fund’s investments in affiliated investment companies during the period ended August 31, 2014.
(d) Risk: The funds invest primarily in debt securities. Failure of an issuer of the debt securities to make timely interest or principal payments, or a decline or the perception of a decline in the credit quality of a debt security, can cause the debt security’s price to fall, potentially lowering each fund’s share price. In addition, the value of debt securities may decline due to general market conditions that are not specifically related to a particular issuer, such as real or perceived adverse economic conditions, changes in outlook for corporate earnings, changes in interest or currency rates or adverse investor sentiment. They may also decline because of factors that affect a particular industry.
(e) Dividends to shareholders: Dividends payable to shareholders are recorded by the funds on the ex-dividend date.The funds are normally declared and paid dividends from investment income-net monthly. With respect to each fund, dividends from net realized capital gains, if any, are normally declared and paid annually, but the funds may make distributions on a more frequent basis to comply with the distribution requirements of the Internal Revenue Code of 1986, as amended (the “Code”).To the extent that net realized capital gains can be offset by capital loss carryovers of a fund, it is the policy of the funds not to distribute such gains. Income and capital
| Table 3—Affiliated Investment Companies | |||||||
| Value | Value | Net | |||||
| 8/31/2013 | ($) | Purchases ($) | Sales ($) | 8/31/2014 | ($) | Assets (%) | |
| BNY Mellon Bond Fund | |||||||
| Dreyfus Institutional Preferred | |||||||
| Plus Money Market Fund | 7,366,145 | 230,784,983 | 230,334,206 | 7,816,922 | .7 | ||
| Dreyfus Institutional Cash Advantage Fund | — | 34,558,690 | 32,173,690 | 2,385,000 | .2 | ||
| Total | 7,366,145 | 265,343,673 | 262,507,896 | 10,201,922 | .9 | ||
| BNY Mellon Intermediate Bond Fund | |||||||
| Dreyfus Institutional Preferred | |||||||
| Plus Money Market Fund | 7,922,597 | 168,470,203 | 166,302,128 | 10,090,672 | 1.1 | ||
| Dreyfus Institutional Cash Advantage Fund | — | 54,135,785 | 50,045,085 | 4,090,700 | .5 | ||
| Total | 7,922,597 | 222,605,988 | 216,347,213 | 14,181,372 | 1.6 | ||
| BNY Mellon Corporate Bond Fund | |||||||
| Dreyfus Institutional Preferred | |||||||
| Plus Money Market Fund | 3,067,808 | 221,762,385 | 223,273,919 | 1,556,274 | .2 | ||
| Dreyfus Institutional Cash Advantage Fund | 10,674,810 | 114,337,042 | 108,584,632 | 16,427,220 | 2.2 | ||
| Total | 13,742,618 | 336,099,427 | 331,858,551 | 17,983,494 | 2.4 | ||
| BNY Mellon Short-Term U.S. | |||||||
| Government Securities Fund | |||||||
| Dreyfus Institutional Preferred | |||||||
| Plus Money Market Fund | 1,587,311 | 187,814,980 | 181,476,067 | 7,926,224 | 3.1 | ||
| Dreyfus Institutional CashAdvantage Fund | — | 10,999,973 | 10,999,973 | — | — | ||
| Total | 1,587,311 | 198,814,953 | 192,476,040 | 7,926,224 | 3.1 | ||
The Funds 53
NOTES TO FINANCIAL STATEMENTS (continued)
gain distributions are determined in accordance with income tax regulations, which may differ from GAAP.
(f) Federal income taxes: It is the policy of each fund to continue to qualify as a regulated investment company, if such qualification is in the best interests of its shareholders, by complying with the applicable provisions of the Code, and to make distributions of taxable income sufficient to relieve it from substantially all federal income and excise taxes. For federal income tax purposes, each series is treated as a single entity for the purpose of determining such qualification.
As of and during the period ended August 31, 2014, the funds did not have any liabilities for any uncertain tax positions. The funds recognize interest and penalties, if any, related to uncertain tax positions as income tax expense in the Statements of Operations. During the period ended August 31, 2014, the funds did not incur any interest or penalties.
Except for BNY Mellon Corporate Bond Fund, each tax year in the four-year period ended August 31, 2014 remains subject to examination by the Internal Revenue Service and state taxing authorities. For BNY Mellon Corporate Bond Fund, each tax year in the three-year period ended August 31, 2014 is subject to examination by the Internal Revenue Service and state taxing authorities.
Table 4 summarizes each fund’s components of accumulated earnings on a tax basis at August 31, 2014.
Under the Regulated Investment Company Modernization Act of 2010 (the “2010 Act”), each relevant fund is permitted to carry forward capital losses incurred in taxable years beginning after December 22, 2010 (“post-enactment losses”) for an unlimited period. Furthermore, post-enactment capital loss carryovers retain their character as either short-term or long-term capital losses rather than short-term as they were under previous statute.The 2010 Act requires post-enactment losses to be utilized before the utilization of losses incurred in taxable years prior to the effective date of the 2010 Act (“pre-enactment losses”). As a result of this ordering rule, pre-enactment losses may be more likely to expire unused.
Table 5 summarizes each relevant fund’s accumulated capital loss carryover available for federal income tax purposes to be applied against future net realized capital gains, if any, realized subsequent to August 31, 2014.
Table 6 summarizes each fund’s tax character of distributions paid to shareholders during the fiscal periods ended August 31, 2014 and August 31, 2013, respectively.
During the period ended August 31, 2014, as a result of permanent book to tax differences, where indicated, each identified fund increased (decreased) accumulated undistributed investment income-net, increased (decreased) accumulated net realized gain (loss) on investments and increased (decreased) paid in capital as summarized in Table 7.These permanent book to tax differences are pri-
| Table 4—Components of Accumulated Earnings | ||||||
| Undistributed | Accumulated | Undistributed | Unrealized | |||
| Ordinary | Capital | Capital | Appreciation | |||
| Income ($) | (Losses) ($) | Gains ($) | (Depreciation) ($) | |||
| BNY Mellon Bond Fund | 392,272 | — | 2,406,370 | 28,805,985 | ||
| BNY Mellon Intermediate Bond Fund | 246,964 | (2,926,416 | ) | — | 12,313,304 | |
| BNY Mellon Corporate Bond Fund | 155,867 | (912,804 | ) | — | 10,583,958 | |
| BNY Mellon Short-Term | ||||||
| U.S. Government Securities Fund | 60,727 | (13,527,309 | ) | — | (600,369 | ) |
54
marily due to the tax treatment for amortization of premiums, paydown gains and losses on mortgage-backed securities and consent fees for BNY Mellon Bond Fund, amortization of premiums, paydown gains and losses on mortgage-backed securities, Treasury Inflation Protected Securities and dividend reclassification for BNY Mellon Intermediate Bond Fund, amortization of premiums, con-
sent fees and dividend reclassification for BNY Mellon Corporate Bond Fund, and amortization of premiums, paydown gains and losses on mortgage-backed securities and capital loss carryover expiration for BNY Mellon Short-Term U.S. Government Securities Fund. Net assets and net asset values per share were not affected by these reclassifications.
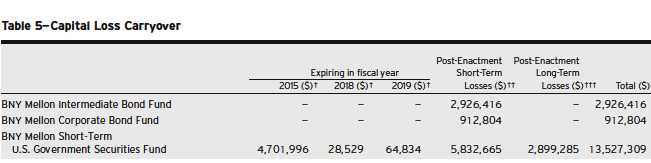
| † | If not applied, the carryovers expire in the above fiscal years. |
| †† | Post-enactment short-term losses which can be carried forward for an unlimited period. |
| ††† Post-enactment long-term losses which can be carried forward for an unlimited period. | |
| Table 6—Tax Character of Distributions Paid | ||||
| Ordinary Income ($) | Long-Term Capital Gains ($) | |||
| 2014 | 2013 | 2014 | 2013 | |
| BNY Mellon Bond Fund | 30,724,379 | 36,855,294 | 15,651,366 | 10,514,097 |
| BNY Mellon Intermediate Bond Fund | 19,361,232 | 22,268,904 | 6,409,757 | 1,200,712 |
| BNY Mellon Corporate Bond Fund | 20,630,929 | 15,963,289 | — | — |
| BNY Mellon Short-Term | ||||
| U.S. Government Securities Fund | 2,924,618 | 3,014,216 | — | — |
| Table 7—Return of Capital Statement of Position | ||||||
| Accumulated | ||||||
| Undistributed | Accumulated | |||||
| Investment | Net Realized | Paid-in | ||||
| Income—Net ($) | Gain (Loss) ($) | Capital ($) | ||||
| BNY Mellon Bond Fund | 4,071,182 | (4,071,182 | ) | — | ||
| BNY Mellon Intermediate Bond Fund | 3,920,039 | (3,920,039 | ) | — | ||
| BNY Mellon Corporate Bond Fund | 4,581,540 | (4,581,540 | ) | — | ||
| BNY Mellon Short-Term U.S. Government Securities Fund | 2,420,646 | 402,074 | (2,822,720 | ) | ||
The Funds 55
NOTES TO FINANCIAL STATEMENTS (continued)
NOTE 3—Bank Lines of Credit:
The funds participate with other Dreyfus-managed funds in a $265 million unsecured credit facility led by Citibank, N.A. and a $300 million unsecured credit facility provided by The Bank of New York Mellon (each, a “Facility”), each to be utilized primarily for temporary or emergency purposes, including the financing of redemptions. Prior to October 9, 2013, the unsecured credit facility with Citibank, N.A. was $210 million. In connection therewith, each fund has agreed to pay its pro rata portion of commitment fees for each Facility. Interest is charged to the fund based on rates determined pursuant to the terms of the respective Facility at the time of borrowing. During the period ended August 31, 2014, the funds did not borrow under the Facilities.
NOTE 4—Investment Advisory Fee, Administration Fee and Other Transactions with Affiliates:
(a) Fees payable by the funds pursuant to the provisions of an investment advisory agreement with the Investment Adviser are payable monthly, computed on the average daily value of each fund’s net assets at the following annual rates: .40% of BNY Mellon Bond Fund, .40% of BNY Mellon Intermediate Bond Fund, .40% of BNY Mellon Corporate Bond Fund and .35% of BNY Mellon Short-Term U.S. Government Securities Fund.
Pursuant to the Administration Agreement, The Bank of New York Mellon provides or arranges for fund accounting, transfer agency and other fund administration services and receives a fee based on the total net assets of the Trust based on the following rates:
| 0 up to $6 billion | .15 | % |
| $6 billion up to $12 billion | .12 | % |
| In excess of $12 billion | .10 | % |
(b) The funds have adopted a Shareholder Services Plan with respect to their Investor shares. Each fund pays the Distributor for the provision of certain services to holders of Investor shares a fee at an annual rate of .25% of the value of the average daily net assets attributable to Investor shares. The services provided may include personal services relating to shareholder accounts, such as answering shareholder inquiries regarding a fund and providing reports and other information and services related to the maintenance of such shareholder accounts. The Shareholder Services Plan allows the Distributor to make payments from the shareholder services fees it collects from each fund to compensate service agents (certain banks, securities brokers or dealers and other financial institutions) with respect to these services. Table 8 summarizes the amounts Investor shares were charged during the period ended August 31, 2014, pursuant to the Shareholder Services Plan. Additional fees included in Shareholder servicing costs in the Statements of Operations primarily include fees paid for cash management charges.
| Table 8—Shareholder Services Plan Fees | ||
| BNY Mellon Bond Fund | $ | 22,372 |
| BNY Mellon Intermediate Bond Fund | 19,746 | |
| BNY Mellon Corporate Bond Fund | 2,467 | |
| BNY Mellon Short-Term | ||
| U.S. Government Securities Fund | 2,192 |
The funds have arrangements with the transfer agent and the custodian whereby the funds may receive earnings credits when positive cash balances are maintained, which are used to offset transfer agency and custody fees. For financial reporting purposes, the funds include net earnings credits as an expense offset in the Statements of Operations.
The funds compensate Dreyfus Transfer, Inc., a wholly-owned subsidiary of Dreyfus, under a transfer agency agreement for providing cash management services for the funds.The cash management fees are related to fund subscriptions and redemptions. The Bank of New York Mellon pays each fund’s transfer agent fees, which are comprised of amounts paid on a per account basis, out of the administration fee it receives from the Trust.The
56
funds also compensated The Bank of New York Mellon for performing certain cash management services related to fund subscriptions and redemptions, including shareholder redemption draft processing, under a cash management agreement that was in effect until September 30, 2013 and, beginning October 1, 2013, compensate The Bank of New York Mellon for processing shareholder redemption drafts under a shareholder draft processing agreement. Table 9 summarizes the amount each fund was charged during the period ended August 31, 2014, pursuant to the cash management agreement, which is included in Shareholder servicing costs in the Statements of Operations. Cash management fees were partially offset by earnings credits for each fund, also summarized in Table 9.
The funds compensate The Bank of New York Mellon under a custody agreement for providing custodial services for the funds. These fees are determined based on net assets, geographic region and transaction activity. Table 10 summarizes the amount each fund was charged
during the period ended August 31, 2014, pursuant to the custody agreement.
| Table 10—Custody Agreement Fees | ||
| BNY Mellon Bond Fund | $ | 75,799 |
| BNY Mellon Intermediate Bond Fund | 66,183 | |
| BNY Mellon Corporate Bond Fund | 41,511 | |
| BNY Mellon Short-Term | ||
| U.S. Government Securities Fund | 22,173 | |
During the period ended August 31, 2014, each fund was charged $8,296 for services performed by the Chief Compliance Officer and his staff.
Table 11 summarizes the components of “Due to The Dreyfus Corporation and affiliates” in the Statement of Assets and Liabilities for each fund.
(c) Each Board member also serves as a Board member of other funds within the Trust. Annual retainer fees and attendance fees are allocated to each fund based on net assets.
| Table 9—Cash Management Agreement Fees | ||||
| The Bank of New York | ||||
| Dreyfus Transfer, Inc. | Dreyfus Transfer, Inc. | Mellon Cash | ||
| Cash Management Fees ($) | Earnings Credits ($) | Management Fees ($) | ||
| BNY Mellon Bond Fund | 212 | (16 | ) | 68 |
| BNY Mellon Intermediate Bond Fund | 186 | (14 | ) | 106 |
| BNY Mellon Corporate Bond Fund | 31 | (2 | ) | 10 |
| BNY Mellon Short-Term U.S. Government Securities Fund | 42 | (3 | ) | 11 |
| Table 11—Due to The Dreyfus Corporation and Affiliates | ||||
| Investment | Shareholder | Chief | ||
| Advisory | Services | Custodian | Compliance | |
| Fees ($) | Plan Fees ($) | Fees ($) | Officer Fees ($) | |
| BNY Mellon Bond Fund | 356,147 | 1,932 | 32,021 | 1,154 |
| BNY Mellon Intermediate Bond Fund | 311,575 | 1,388 | 28,500 | 1,154 |
| BNY Mellon Corporate Bond Fund | 252,512 | 311 | 17,000 | 1,154 |
| BNY Mellon Short-Term | ||||
| U.S. Government Securities Fund | 73,511 | 165 | 9,055 | 1,154 |
The Funds 57
NOTES TO FINANCIAL STATEMENTS (continued)
NOTE 5—Securities Transactions:
Table 12 summarizes each fund’s aggregate amount of purchases and sales (including paydowns) of investment securities, excluding short-term securities, during the period ended August 31, 2014.
Table 13 summarizes the cost of investments for federal income tax purposes, gross appreciation, gross depreciation and accumulated net unrealized appreciation (depreciation) on investments for each fund at August 31, 2014.
| Table 12—Purchases and Sales | |||||
| Purchases ($) | Sales ($) | ||||
| BNY Mellon Bond Fund | 473,661,997 | 608,056,483 | |||
| BNY Mellon Intermediate Bond Fund | 392,544,836 | 450,356,070 | |||
| BNY Mellon Corporate Bond Fund | 375,343,095 | 204,142,183 | |||
| BNY Mellon Short-Term U.S. Government Securities Fund | 304,575,600 | 312,806,694 | |||
| Table 13—Accumulated Net Unrealized Appreciation (Depreciation) | |||||
| Cost of | Gross | Gross | |||
| Investments ($) | Appreciation ($) | Depreciation ($) | Net ($) | ||
| BNY Mellon Bond Fund | 1,018,754,301 | 34,755,486 | 5,949,501 | 28,805,985 | |
| BNY Mellon Intermediate Bond Fund | 904,994,998 | 19,852,849 | 7,539,545 | 12,313,304 | |
| BNY Mellon Corporate Bond Fund | 748,178,877 | 17,408,077 | 6,824,119 | 10,583,958 | |
| BNY Mellon Short-Term U.S. Government Securities Fund | 270,342,217 | 413,713 | 1,014,082 | (600,369 | ) |
58
REPORT OF INDEPENDENT REGISTERED PUBLIC ACCOUNTING FIRM
The Board of Trustees and Shareholders of BNY Mellon Funds Trust
We have audited the accompanying statements of assets and liabilities of BNY Mellon Bond Fund, BNY Mellon Intermediate Bond Fund, BNY Mellon Corporate Bond Fund, and BNY Mellon Short-Term U.S. Government Securities Fund, (collectively the “Funds”), each a series of BNY Mellon Funds Trust, including the statements of investments as of August 31, 2014, and the related statements of operations for the year then ended, the statements of changes in net assets for each of the years in the two-year period then ended, and the financial highlights for each of the periods indicated therein. These financial statements and financial highlights are the responsibility of the Funds’ management. Our responsibility is to express an opinion on these financial statements and financial highlights based on our audits.
We conducted our audits in accordance with the auditing standards of the Public Company Accounting Oversight Board (United States). Those standards require that we plan and perform the audit to obtain reasonable assurance about whether the financial statements and financial highlights are free of material misstatement. An audit also includes examining, on a test basis, evidence supporting the amounts and disclosures in the financial statements.
Our procedures included confirmation of securities owned as of August 31, 2014, by correspondence with the custodian and brokers or by other appropriate procedures. An audit also includes assessing the accounting principles used and significant estimates made by management, as well as evaluating the overall financial statement pre-sentation.We believe that our audits provide a reasonable basis for our opinion.
In our opinion, the financial statements and financial highlights referred to above present fairly, in all material respects, the financial position of BNY Mellon Bond Fund, BNY Mellon Intermediate Bond Fund, BNY Mellon Corporate Bond Fund, and BNY Mellon Short-Term U.S. Government Securities Fund as of August 31, 2014, and the results of their operations for the year then ended, the changes in their net assets for each of the years in the two-year period then ended, and the financial highlights for each of the indicated periods, in conformity with U.S. generally accepted accounting principles.

New York, New York
October 29, 2014
The Funds 59
IMPORTANT TAX INFORMATION (Unaudited)
BNY Mellon Bond Fund
For federal tax purposes, the fund designates the maximum amount allowable but not less than 91.12% as interest-related dividends in accordance with Sections 871(k)(1) and 881(e) of the Internal Revenue Code. Also, the fund reports the maximum amount allowable but not less than $.1800 per share as a capital gain dividend paid on December 16, 2013 in accordance with Section 852(b)(3)(c) of the Internal Revenue Code.
BNY Mellon Intermediate Bond Fund
For federal tax purposes, the fund designates the maximum amount allowable but not less than 87.42% as interest-related dividends in accordance with Sections 871(k)(1) and 881(e) of the Internal Revenue Code. Also, the fund reports the maximum amount allowable but not less than $.0863 per share as a capital gain dividend paid on December 16, 2013 in accordance with Section 852(b)(3)(c) of the Internal Revenue Code.
BNY Mellon Corporate Bond Fund
For federal tax purposes, the fund designates the maximum amount allowable but not less than 90.19% as interest-related dividends in accordance with Sections 871(k)(1) and 881(e) of the Internal Revenue Code. Also, the fund reports the maximum amount allowable but not less than $.0031 per share as a short-term capital gain dividend paid on December 16, 2013 in accordance with Sections 871(k)(2) and 881(e) of the Internal Revenue Code.
BNY Mellon Short-Term U.S. Government Securities Fund
For federal tax purposes, the fund reports the maximum amount allowable but not less than 100% as interest-related dividends in accordance with Sections 871(k)(1) and 881(e) of the Internal Revenue Code.
60
| INFORMATION ABOUT THE RENEWAL OF EACH FUND’S INVESTMENT |
| ADVISORY AGREEMENT AND ADMINISTRATION AGREEMENT (Unaudited) |
At a meeting of the Trust’s Board of Trustees held on March 11-12, 2014, the Board considered the renewal of the Trust’s Investment Advisory Agreement and Administration Agreement (together, the “Agreement”), pursuant to which BNY Mellon Fund Advisers, a division of Dreyfus, provides the funds with investment advisory services and The Bank of New York Mellon provides the funds with administrative services. The Bank of New York Mellon has entered into a Sub-Administration Agreement with Dreyfus pursuant to which The Bank of New York Mellon pays Dreyfus for performing certain of these administrative services. The Board members, none of whom are “interested persons” (as defined in the Investment Company Act of 1940, as amended) of the Trust, were assisted in their review by independent legal counsel and met with counsel in executive session separate from Dreyfus representatives. In considering the renewal of the Agreement, the Board considered all factors that it believed to be relevant, including those discussed below. The Board did not identify any one factor as dispositive, and each Board member may have attributed different weights to the factors considered.
Analysis of Nature, Extent, and Quality of Services Provided to the Funds. The Board considered information provided to them at the meeting and in previous presentations from Dreyfus representatives regarding the nature, extent, and quality of the services provided to the funds. Dreyfus provided the number of open accounts in each fund, the fund’s asset size and the allocation of fund assets among distribution channels. Dreyfus also had previously provided information regarding the diverse intermediary relationships and distribution channels of the funds (such as intermediary, in which intermediaries typically are paid by the fund and/or Dreyfus) and Dreyfus’ corresponding need for broad, deep, and diverse resources to be able to provide ongoing shareholder services to each intermediary or distribution channel, as applicable to each fund.
The Board also considered research support available to, and portfolio management capabilities of, each fund’s portfolio management personnel and that Dreyfus also provides oversight of day-to-day fund operations, including fund accounting and administration and assistance in meeting legal and regulatory requirements.The Board also considered Dreyfus’ extensive administrative, accounting, and compliance infrastructures.
Comparative Analysis of the Funds’ Performance and Management Fees and Expense Ratios. The Board reviewed reports prepared by Lipper, Inc. (“Lipper”), an independent provider of investment company data, which included information comparing (1) each fund’s performance with the performance of a group of comparable funds (the “Performance Group”) and with a broader group of funds (the “Performance Universe”), all for various periods ended December 31, 2013, and (2) each fund’s actual and contractual management fees and total expenses with those of a group of comparable funds (the “Expense Group”) and with a broader group of funds (the “Expense Universe”), the information for which was derived in part from fund financial statements available to Lipper as of the date of its analysis. Dreyfus previously had furnished the Board with a description of the methodology Lipper used to select the Performance Group and Performance Universe and the Expense Group and Expense Universe.
Dreyfus representatives stated that the usefulness of performance comparisons may be affected by a number of factors, including different investment limitations that may be applicable to each fund and comparison funds. They also noted that performance generally should be considered over longer periods of time, although it is possible that long-term performance can be adversely affected by even one period of significant underperformance so that a single investment decision or theme has the ability to affect disproportionately long-term performance.
The Funds 61
| INFORMATION ABOUT THE RENEWAL OF EACH FUND’S INVESTMENT ADVISORY |
| AGREEMENT AND ADMINISTRATION AGREEMENT (Unaudited) (continued) |
As applicable to each fund, Dreyfus representatives reviewed with the Board the management or investment advisory fees (1) paid by funds advised or administered by Dreyfus that are in the same Lipper category as the fund and (2) paid to Dreyfus or the Dreyfus-affiliated primary employer of the fund’s primary portfolio manager(s) for advising any separate accounts and/or other types of client portfolios that are considered to have similar investment strategies and policies as the fund (the “Similar Clients”), and explained the nature of the Similar Clients. They discussed differences in fees paid and the relationship of the fees paid in light of any differences in the services provided and other relevant factors. The Board considered the relevance of the fee information provided for the Similar Clients to evaluate the appropriateness and reasonableness of the fund’s management fee.
BNY Mellon Bond Fund
The Board discussed the results of the comparisons and noted that the fund’s total return performance was below the Performance Group and Performance Universe medians for the various periods, except for the ten-year period when the fund’s performance was above the Performance Universe median. The Board also noted that the fund’s yield performance was at or above the Performance Group medians for seven of the ten one-year periods and above the Performance Universe medians for nine of the ten one-year periods ended December 31st. Dreyfus also provided a comparison of the fund’s calendar year total returns to the returns of the fund’s benchmark index.The Board also received a presentation from the fund’s primary portfolio manager regarding the factors that had influenced the fund’s performance results over the past year, including the fact that the fund’s target duration generally was shorter than those of the funds in the Performance Group and the fund typically held higher quality securities than those held by some of the funds in the Performance Group.
The Board also reviewed the range of actual and contractual management fees and total expenses of the Expense Group and Expense Universe funds and discussed the results of the comparisons. The Board noted that the fund’s contractual management fee was above the Expense Group median, the fund’s actual management fee was above the Expense Group and Expense Universe medians and the fund’s total expenses were above the Expense Group median and below the Expense Universe median.
BNY Mellon Intermediate Bond Fund
The Board discussed the results of the comparisons and noted that the fund’s total return performance was below the Performance Group and Performance Universe medians for all periods (ranking in the fourth quartile of the Performance Group in all periods), except for the ten-year period when the fund’s performance was above the Performance Universe median. The Board also noted that the fund’s yield performance was at or above the Performance Group medians for seven of the ten one-year periods and above the Performance Universe medians for each of the ten one-year periods ended December 31st. Dreyfus also provided a comparison of the fund’s calendar year total returns to the returns of the fund’s benchmark index. The Board also received a presentation from the fund’s primary portfolio manager regarding the factors that had influenced the fund’s performance results over the past year, including the fact that the fund’s target duration generally was shorter than those of the funds in the Performance Group.
The Board also reviewed the range of actual and contractual management fees and total expenses of the Expense Group and Expense Universe funds and discussed the results of the comparisons. The Board noted that the fund’s contractual management fee was above the Expense Group median, the fund’s actual management fee was above the Expense Group and Expense Universe medians (highest in the Expense Group) and the fund’s total expenses were above the Expense Group median and below the Expense Universe median.
62
BNY Mellon Corporate Bond Fund
The Board discussed the results of the comparisons and noted that the fund’s total return performance was below the Performance Group median and above the Performance Universe median for the one-year period (the fund commenced operations in 2012). The Board also noted that the fund’s yield performance was below the Performance Group and Performance Universe medians for the one-year period ended December 31st. Dreyfus also provided a comparison of the fund’s total return to the return of the fund’s benchmark index.
The Board also reviewed the range of actual and contractual management fees and total expenses of the Expense Group and Expense Universe funds and discussed the results of the comparisons. The Board noted that the fund’s contractual management fee was above the Expense Group median, the fund’s actual management fee was above the Expense Group and Expense Universe medians and the fund’s total expenses were below the Expense Group and Expense Universe medians.
BNY Mellon Short-Term U.S. Government Securities Fund
The Board discussed the results of the comparisons and noted that the fund’s total return performance was below the Performance Group and Performance Universe medians for the various periods (ranking in the fourth quartile of the Performance Group), except for the one-year period when the fund’s performance was above the Performance Group and Performance Universe medians. The Board also noted that the fund’s yield performance was at or above the Performance Group medians for six of the ten one-year periods and above the Performance Universe medians for eight of the ten one-year periods ended December 31st. Dreyfus also provided a comparison of the fund’s calendar year total returns to the returns of the fund’s benchmark index. The Board also received a presentation from the fund’s portfolio manager regarding the factors that had influenced the fund’s performance results over the past year, including the fact that the fund’s target duration generally was shorter than those of the funds in the Performance Group.
The Board also reviewed the range of actual and contractual management fees and total expenses of the Expense Group and Expense Universe funds and discussed the results of the comparisons. The Board noted that the fund’s contractual management fee was below the Expense Group median, the fund’s actual management fee was above the Expense Group and Expense Universe medians and the fund’s total expenses were below the Expense Group and Expense Universe medians.
Analysis of Profitability and Economies of Scale. Dreyfus representatives reviewed the expenses allocated and profit received by Dreyfus and its affiliates and the resulting profitability percentage for managing each fund and the aggregate profitability percentage to Dreyfus and its affiliates of managing each fund, and the method used to determine the expenses and profit.The Board concluded that the profitability results were not unreasonable, given the services rendered and service levels provided by Dreyfus to each fund.The Board also had been provided with information prepared by an independent consulting firm regarding Dreyfus’ approach to allocating costs to, and determining the profitability of, individual funds and the entire Dreyfus fund complex.The consulting firm also had analyzed where any economies of scale might emerge in connection with the management of the funds.
The Board considered on the advice of its counsel the profitability analysis with respect to each fund (1) as part of its evaluation of whether the fees under the Agreement bear a reasonable relationship to the mix of services provided by Dreyfus, including the nature, extent, and quality of such services, and (2) in light of the relevant circumstances for the fund and the extent to which economies of scale would be realized if the fund grows and whether fee levels reflect these economies of
The Funds 63
| INFORMATION ABOUT THE RENEWAL OF EACH FUND’S INVESTMENT ADVISORY |
| AGREEMENT AND ADMINISTRATION AGREEMENT (Unaudited) (continued) |
scale for the benefit of fund shareholders. Dreyfus representatives noted that a discussion of economies of scale is predicated on a fund having achieved a substantial size with increasing assets and that, if a fund’s assets had been stable or decreasing, the possibility that Dreyfus may have realized any economies of scale would be less. Dreyfus representatives also noted that, as a result of shared and allocated costs among the funds and the funds in the Dreyfus fund complex, the extent of economies of scale could depend substantially on the level of assets in the complex as a whole, so that increases and decreases in complex-wide assets can affect potential economies of scale in a manner that is disproportionate to, or even in the opposite direction from, changes in a fund’s asset level. The Board also considered potential benefits to Dreyfus from acting as investment adviser and noted that there were no soft dollar arrangements in effect for trading each fund’s investments.
At the conclusion of these discussions, the Board agreed that it had been furnished with sufficient information to make an informed business decision with respect to the renewal of the Agreement. Based on the discussions and considerations as described above, the Board concluded and determined as follows.
The Board concluded that the nature, extent, and quality of the services provided by Dreyfus to each fund are adequate and appropriate.
With respect to BNY Mellon Bond Fund, BNY Mellon Intermediate Bond Fund and BNY Mellon Short-Term U.S. Government Securities Fund, the Board was satisfied with each fund’s yield perfor- mance and noted the considerations described above with respect to total return performance.
With respect to BNY Mellon Corporate Bond Fund, the Board generally was satisfied with the fund’s over- all performance.
The Board concluded that the fee paid to Dreyfus by each fund was reasonable in light of the considerations described above.
The Board determined that the economies of scale which may accrue to Dreyfus and its affiliates in con- nection with the management of the funds had been adequately considered by Dreyfus in connection with the fee rate charged to each fund pursuant to the Agreement and that, to the extent in the future it were determined that material economies of scale had not been shared with a fund, the Board would seek to have those economies of scale shared with the fund.
In evaluating the Agreement, the Board considered these conclusions and determinations and also relied on its previous knowledge, gained through meetings and other interactions with Dreyfus and its affiliates, of each fund and the services provided to the funds by Dreyfus. The Board also relied on information received on a routine and regular basis throughout the year relating to the operations of each fund and the investment management and other services provided under the Agreement, including information on the investment performance of each fund in comparison to similar mutual funds and benchmark performance indices; general market outlook as applicable to each fund; and compliance reports. In addition, the Board’s consideration of the contractual fee arrangements for each fund had the benefit of a number of years of reviews of prior or similar agreements during which lengthy discussions took place between the Board and Dreyfus representatives. Certain aspects of the arrangements may receive greater scrutiny in some years than in others, and the Board’s conclusions may be based, in part, on their consideration of the same or similar arrangements in prior years.The Board determined that renewal of the Agreement was in the best interests of each fund and its respective shareholders.
64
| BOARD MEMBERS INFORMATION (Unaudited) |
| INDEPENDENT BOARD MEMBERS |
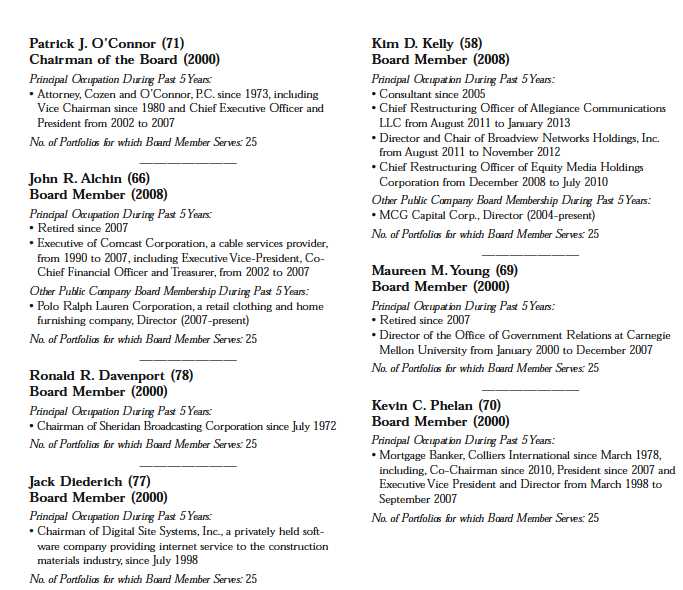
The Funds 65
| BOARD MEMBERS INFORMATION (Unaudited) (continued) |
| INDEPENDENT BOARD MEMBERS (continued) |
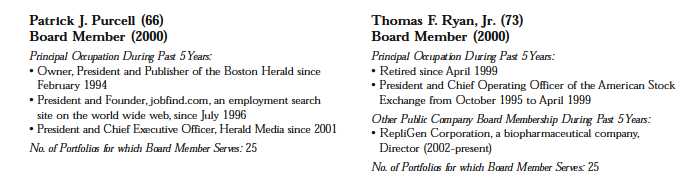
Once elected all Board Members serve for an indefinite term.The address of the Board Members and Officers is c/o The Dreyfus Corporation, 200 Park Avenue, New York, New York 10166. Additional information about the Board Members is available in the fund’s Statement of Additional Information which can be obtained from Dreyfus free of charge by calling this toll free number: 1-800-DREYFUS. For individual account holders for Private Wealth Management clients, please contact your account officer or call 1-888-281-7350.
66
OFFICERS OF THE TRUST (Unaudited)
DAVID K. MOSSMAN, President since October 2011.
As Director of Investment Administration for BNY Mellon Wealth Management's Investments Group (the "Investments Group") since January 2006, Mr. Mossman's responsibilities include oversight of securities trading and portfolio management systems administration and mutual fund product management. Mr. Mossman also serves as chief administrative officer of the Investments Group. He is 61 years old and has served in various capacities with BNY Mellon since 1982, including positions in the management of investment, mutual fund and brokerage businesses that encompassed financial, systems, product management, internal distribution and marketing responsibilities, and has been an employee of Dreyfus since September 2000.
JOHN PAK, Chief Legal Officer since March 2013.
Deputy General Counsel, Investment Management, of BNY Mellon since August 2014; Chief Legal Officer of the Manager since August 2012; from March 2005 to July 2012, Managing Director of Deutsche Bank, Deputy Global Head of Deutsche Asset Management Legal and Regional Head of Deutsche Asset Management Americas Legal. He is an officer of 70 investment companies (comprised of 167 portfolios) managed by the Manager. He is 45 years old and has been an employee of the Manager since August 2012.
JANETTE E. FARRAGHER, Vice President and Secretary since December 2011.
Assistant General Counsel of BNY Mellon, and an officer of 70 investment companies (comprised of 167 portfolios) managed by the Manager. She is 51 years old and has been an employee of the Manager since February 1984.
KIESHA ASTWOOD, Vice President and Assistant Secretary since January 2010.
Counsel of BNY Mellon, and an officer of 70 investment companies (comprised of 167 portfolios) managed by the Manager. She is 41 years old and has been an employee of the Manager since July 1995.
JAMES BITETTO, Vice President and Assistant Secretary since August 2005.
Managing Counsel of BNY Mellon and Secretary of the Manager, and an officer of 70 investment companies (comprised of 167 portfolios) managed by the Manager. He is 48 years old and has been an employee of the Manager since December 1996.
JONI LACKS CHARATAN, Vice President and Assistant Secretary since August 2005.
Managing Counsel of BNY Mellon, and an officer of 70 investment companies (comprised of 167 portfolios) managed by the Manager. She is 58 years old and has been an employee of the Manager since October 1988.
JOSEPH M. CHIOFFI, Vice President and Assistant Secretary since August 2005.
Managing Counsel of BNY Mellon, and an officer of 70 investment companies (comprised of 167 portfolios) managed by the Manager. He is 52 years old and has been an employee of the Manager since June 2000.
JOHN B. HAMMALIAN, Vice President and Assistant Secretary since August 2005.
Senior Managing Counsel of BNY Mellon, and an officer of 70 investment companies (comprised of 167 portfolios) managed by the Manager. He is 51 years old and has been an employee of the Manager since February 1991.
SARAH S. KELLEHER, Vice President and Assistant Secretary since April 2014.
Senior Counsel of BNY Mellon, and an officer of 70 investment companies (comprised of 167 portfolios) managed by the Manager; from August 2005 to March 2013, Associate General Counsel of Third Avenue Management. She is 38 years old and has been an employee of the Manager since March 2013.
The Funds 67
OFFICERS OF THE TRUST (Unaudited) (continued)
JEFF PRUSNOFSKY, Vice President and Assistant Secretary since August 2005.
Senior Managing Counsel of BNY Mellon, and an officer of 70 investment companies (comprised of 167 portfolios) managed by the Manager. He is 49 years old and has been an employee of the Manager since October 1990.
JAMES WINDELS, Treasurer since November 2001.
Director – Mutual Fund Accounting of the Manager, and an officer of 70 investment companies (comprised of 167 portfolios) managed by the Manager. He is 55 years old and has been an employee of the Manager since April 1985.
RICHARD CASSARO, Assistant Treasurer since January 2008.
Senior Accounting Manager – Money Market and Municipal Bond Funds of the Manager, and an officer of 70 investment companies (comprised of 167 portfolios) managed by the Manager. He is 55 years old and has been an employee of the Manager since September 1982.
GAVIN C. REILLY, Assistant Treasurer since December 2005.
Tax Manager of the Investment Accounting and Support Department of the Manager, and an officer of 70 investment companies (comprised of 167 portfolios) managed by the Manager. He is 46 years old and has been an employee of the Manager since April 1991.
ROBERT S. ROBOL, Assistant Treasurer since December 2002.
Senior Accounting Manager – Fixed Income Funds of the Manager, and an officer of 70 investment companies (comprised of 167 portfolios) managed by the Manager. He is 50 years old and has been an employee of the Manager since October 1988.
ROBERT SALVIOLO, Assistant Treasurer since July 2007.
Senior Accounting Manager – Equity Funds of the Manager, and an officer of 70 investment companies (comprised of 167 portfolios) managed by the Manager. He is 47 years old and has been an employee of the Manager since June 1989.
ROBERT SVAGNA, Assistant Treasurer since December 2002.
Senior Accounting Manager – Equity Funds of the Manager, and an officer of 70 investment companies (comprised of 167 portfolios) managed by the Manager. He is 47 years old and has been an employee of the Manager since November 1990.
JOSEPH W. CONNOLLY, Chief Compliance Officer since October 2004.
Chief Compliance Officer of the Manager and The Dreyfus Family of Funds (70 investment companies, comprised of 167 portfolios). He is 57 years old and has served in various capacities with the Manager since 1980, including manager of the firm’s Fund Accounting Department from 1997 through October 2001.
MATTHEW D. CONNOLLY, Anti-Money Laundering Compliance Officer since April 2012.
Anti-Money Laundering Compliance Officer of the Distributor since October 2011; from March 2010 to September 2011, Global Head, KYC Reviews and Director of UBS Investment Bank; until March 2010, AML Compliance Officer and Senior Vice President of Citi Global Wealth Management. He is an officer of 65 investment companies (comprised of 162 portfolios) managed by the Manager. He is 42 years old and has been an employee of the Distributor since October 2011.
68
NOTES
For More Information
Telephone Wealth Management (WM) Clients, please contact your Account Officer or call 1-888-281-7350. Brokerage Clients of BNY Mellon Wealth Advisors (BNYMWA), please contact your financial representative or call 1-800-830-0549, Option 2. Individual Account holders, please call Dreyfus at 1-800-DREYFUS.
Mail WM Clients, write to your Account Officer, c/o The Bank of New York Mellon, One Mellon Bank Center, Pittsburgh, PA 15258 BNYMWA Brokerage Clients, write to your financial representative, P.O. Box 9012, Hicksville, NY 11802–9012 Individual Account Holders, write to: BNY Mellon Funds, P.O. Box 55268, Boston, MA 02205–8502
The funds file their complete schedule of portfolio holdings with the Securities and Exchange Commission (“SEC”) for the first and third quarters of each fiscal year on Form N-Q. The funds’ Forms N-Q are available on the SEC’s website at http://www.sec.gov and may be reviewed and copied at the SEC’s Public Reference Room in Washington, DC. Information on the operation of the Public Reference Room may be obtained by calling 1-800-SEC-0330.
A description of the policies and procedures that the fund uses to determine how to vote proxies relating to portfolio securities, and information regarding how the fund voted these proxies for the most recent 12-month period ended June 30 is available at http://www.dreyfus.com and on the SEC’s website at http://www.sec.gov. The description of the policies and procedures is also available without charge, upon request, by calling 1-800-DREYFUS.
© 2014 MBSC Securities Corporation
MFTAR0814-TB
The BNY Mellon Funds
| BNY Mellon National Intermediate Municipal Bond Fund | |
| BNY Mellon National Short-Term Municipal Bond Fund | |
| BNY Mellon Pennsylvania Intermediate Municipal Bond Fund | |
| BNY Mellon Massachusetts Intermediate Municipal Bond Fund | |
| BNY Mellon New York Intermediate Tax-Exempt Bond Fund | |
| BNY Mellon Municipal Opportunities Fund | |
| ANNUAL REPORT | August 31, 2014 |


DISCUSSION OF
FUND PERFORMANCE
For the period of September 1, 2013, through August 31, 2014, as provided by John F. Flahive and Mary Collette O’Brien, Portfolio Managers
Fund and Market Performance Overview
For the 12-month period ended August 31, 2014, BNY Mellon National Intermediate Municipal Bond Fund’s Class M shares produced a total return of 7.18%, and its Investor shares returned 6.92%.1 In comparison, the fund’s benchmark index, the S&P Municipal Bond Investment Grade Intermediate Index (the “Index”), produced a total return of 8.46%,2 and the fund’s former benchmark, the S&P Municipal Bond Intermediate Index, achieved a total return of 8.58% for the same period.
Municipal bonds rallied over the reporting period as long-term interest rates moderated, investor demand rebounded, the supply of newly issued securities declined, and national credit conditions improved.The fund lagged its benchmark, mainly due to a relatively short average duration.
The Fund’s Investment Approach
The fund seeks to maximize current income exempt from federal income tax to the extent consistent with the preservation of capital. To pursue its goal, the fund normally invests at least 80% of its net assets in municipal bonds that provide income exempt from federal income tax.The fund may occasionally, including for temporary defensive purposes, invest in taxable bonds. The fund’s investments in municipal and taxable bonds must be rated investment grade at the time of purchase or, if unrated, deemed of comparable quality by the investment adviser.3 Generally, the fund’s average effective portfolio maturity will be between three and 10 years, and the average effective duration of the fund’s portfolio will not exceed eight years.
Economic and Technical Forces Buoyed Municipal Bonds
Municipal bonds struggled early in the reporting period as fixed-income investors responded negatively to evidence of more robust economic growth and plans by the Federal Reserve Board (the “Fed”) to begin backing away from its massive quantitative easing program. Indeed, by year-end 2013, long-term interest rates had climbed above 3% for the first time in more than two years, and municipal bond prices fell as newly anxious investors withdrew from the market. However, interest rates subsequently moderated and bond prices rebounded when unusually harsh winter weather in much of the U.S. contributed to an economic contraction during the first quarter of 2014.
Although the economic recovery appeared to get back on track during the spring, favorable supply-and-demand dynamics kept long-term interest rates low. Less refinancing activity produced a reduced supply of newly issued tax-exempt securities over the first eight months of 2014, while demand intensified from investors seeking competitive after-tax yields in a low interest rate environment. This constructive market environment enabled municipal bonds to produce highly competitive total returns for the reporting period, with longer term and lower rated securities faring particularly well.
The U.S. economic rebound persisted through the reporting period’s end, resulting in better underlying credit conditions for many issuers. Tax revenues increased, helping most states achieve budget surpluses. Isolated credit problems in Detroit and Puerto Rico proved to be notable exceptions to recovering credit conditions over the reporting period.
The Funds 3
DISCUSSION OF FUND PERFORMANCE (continued)
Short Duration Posture Dampened Relative Performance
Although the fund’s relatively short average duration sheltered it from some of the adverse impact of rising interest rates in late 2013, the same strategy prevented the fund from participating more fully in gains when long-term rates moderated in 2014.To a lesser degree, a small allocation to Puerto Rico municipal bonds also hampered the fund’s relative performance, as did the fund’s positions in highly rated escrowed securities and our security selection strategy among bonds with a “single-A” credit rating.
The fund achieved better relative results through its holdings of bonds with maturities of 25 years and greater. Underweighted exposure to general obligation bonds from states and local governments also supported the fund’s results compared to the benchmark. Instead, we emphasized bonds backed by revenues from municipal services.The fund received especially strong contributions to performance from bonds backed by municipal water and sewer facilities. However, underweighted exposure to bonds issued on behalf of hospitals offset some of those gains.
At times during the reporting period, the fund employed futures contracts to manage its interest rate strategies.
Maintaining a Cautious Investment Posture
The U.S. economic recovery appears to have gained additional momentum, as evidenced by a strengthening labor market and improved investor confidence. In addition, investors have returned their focus to market and issuer fundamentals now that it appears the Fed is close to the end of its quantitative easing program. From a technical standpoint, we currently expect the supply of newly issued municipal bonds to increase as issuers become more comfortable borrowing in a better economic climate.
In light of these developments, we have maintained a generally defensive stance. We have also maintained the fund’s relatively short average duration, and we have reduced its holdings of lower rated securities in favor of their higher quality counterparts. In our view, these are prudent strategies in today’s changing market environment.
September 15, 2014
Bond funds are subject generally to interest rate, credit, liquidity, and market risks, to varying degrees, all of which are more fully described in the fund’s prospectus. Generally, all other factors being equal, bond prices are inversely related to interest-rate changes, and rate increases can cause price declines.
| 1 | Total return includes reinvestment of dividends and any capital gains paid. Past |
| performance is no guarantee of future results. Share price, yield, and investment | |
| return fluctuate such that upon redemption fund shares may be worth more or | |
| less than their original cost. Income may be subject to state and local taxes, and | |
| some income may be subject to the federal alternative minimum tax (AMT) for | |
| certain investors. Capital gains, if any, are fully taxable. | |
| 2 | SOURCE: BLOOMBERG L.P. — The S&P Municipal Bond |
| Investment Grade Intermediate Index and the S&P Municipal Bond | |
| Intermediate Index are unmanaged, market-weighted indexes designed to | |
| measure the performance of municipal bonds with a minimum maturity of | |
| three years and a maximum maturity of up to, but not including, 15 years, | |
| and, in the case of the S&P Municipal Bond Investment Grade Index, that | |
| are rated at least BBB- by Standard & Poor’s Ratings Services, Baa3 by | |
| Moody’s Investor Services, Inc., or BBB- by Fitch Ratings. Unlike a mutual | |
| fund, neither index is subject to charges, fees and other expenses and is not | |
| limited to investments principally in Pennsylvania municipal obligations. | |
| Investors cannot invest directly in any index. | |
| 3 | The fund may continue to own investment-grade bonds. |
| † | The S&P Municipal Bond Investment Grade Intermediate Index was first |
| calculated on March 19, 2013. Accordingly, the fund will continue to report | |
| the performance of the S&P Municipal Bond Intermediate Index until the | |
| S&P Municipal Bond Investment Grade Index has been calculated for a | |
| 10-year period. |
4
FUND PERFORMANCE
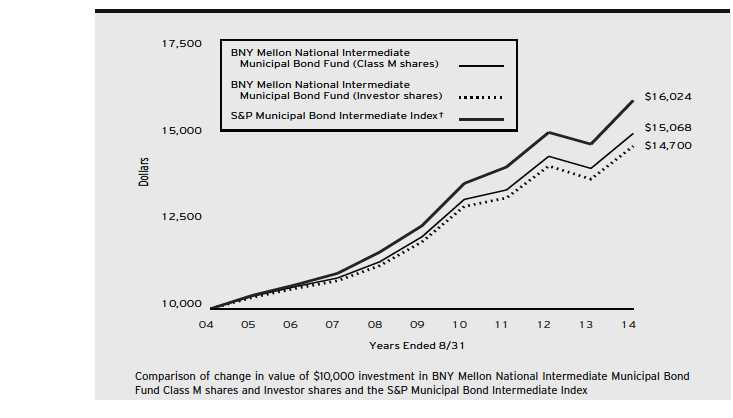
| Average Annual Total Returns as of 8/31/14 | ||||||
| 1 Year | 5 Years | 10 Years | ||||
| Class M shares | 7.18 | % | 4.52 | % | 4.19 | % |
| Investor shares | 6.92 | % | 4.26 | % | 3.93 | % |
| S&P Municipal Bond Intermediate Index | 8.58 | % | 5.27 | % | 4.83 | % |
† Source: Lipper Inc.
Past performance is not predictive of future performance.The fund’s performance shown in the graph and table does not reflect the deduction of taxes that a shareholder would pay on fund distributions or the redemption of fund shares.
The above graph compares a $10,000 investment made in Class M shares and Investor shares of BNY Mellon National Intermediate Municipal Bond Fund on 8/31/04 to a $10,000 investment made in the S&P Municipal Bond Intermediate Index on that date. All dividends and capital gain distributions are reinvested. Effective 7/1/2013, the fund changed its benchmark from the S&P Municipal Bond Intermediate Index to the S&P Municipal Bond Investment Grade Intermediate Index because the new benchmark index is more reflective of the credit quality of the fund’s portfolio holdings. The S&P Municipal Bond Investment Grade Intermediate Index was first calculated on 3/19/13. Accordingly, the fund will continue to report the performance of the S&P Municipal Bond Intermediate Index until the S&P Municipal Bond Investment Grade Intermediate Index has been calculated for a 10-year period. Performance information for the fund versus the S&P Municipal Bond Investment Grade Intermediate Index is included in the graph and table on the next page.
The fund’s performance shown in the line graph above takes into account all applicable fees and expenses for Class M and Investor shares. The S&P Municipal Bond Intermediate Index is comprised of bonds in the S&P Municipal Bond Index with a minimum maturity of 3 years and a maximum maturity of up to, but not including, 15 years as measured from the date on which the Index is rebalanced. Unlike a mutual fund, the S&P Municipal Bond Intermediate Index is not subject to charges, fees and other expenses. Investors cannot invest directly in any index. Further information relating to fund performance, including expense reimbursements, if applicable, is contained in the Financial Highlights section of the prospectus and elsewhere in this report.
The Funds 5
FUND PERFORMANCE

| Average Annual Total Returns as of 8/31/14 | |||||
| Inception | From | ||||
| Date | 1 Year | Inception | |||
| Class M shares | 3/31/13 | 7.18 | % | 2.22 | % |
| Investor shares | 3/31/13 | 6.92 | % | 2.02 | % |
| S&P Municipal Bond Investment Grade | |||||
| Intermediate Index | 3/31/13 | 8.46 | % | 2.96 | %††† |
| †† Source: Bloomberg L.P. |
| Past performance is not predictive of future performance.The fund’s performance shown in the graph and table does not reflect the deduction of taxes that a shareholder |
| would pay on fund distributions or the redemption of fund shares. |
| The above graph compares a $10,000 investment made in Class M shares and Investor shares of BNY Mellon National Intermediate Municipal Bond Fund on |
| 3/31/13 to a $10,000 investment made in the S&P Municipal Bond Investment Grade Intermediate Index on that date.All dividends and capital gain |
| distributions are reinvested. |
| The fund’s performance shown in the line graph above takes into account all applicable fees and expenses for Class M and Investor shares. The S&P Municipal Bond |
| Investment Grade Intermediate Index is comprised of bonds in the S&P Municipal Bond Index that are rated at least BBB- by Standard & Poor’s Ratings Services, |
| Baa3 by Moody’s Investor Services, Inc. or BBB- by Fitch Ratings with a minimum maturity of 3 years and a maximum maturity of up to, but not including, 15 |
| years as measured from the date on which the Index is rebalanced. Unlike a mutual fund, the S&P Municipal Bond Investment Grade Intermediate Index is not |
| subject to charges, fees and other expenses. Investors cannot invest directly in any index. Further information relating to fund performance, including expense |
| reimbursements, if applicable, is contained in the Financial Highlights section of the prospectus and elsewhere in this report. |
| ††† For comparative purposes, the value of the S&P Municipal Bond Investment Grade Intermediate Index on 3/31/13 is used as the beginning value on 3/19/13. |
6

DISCUSSION OF
FUND PERFORMANCE
For the period of September 1, 2013, through August 31, 2014, as provided by Timothy J. Sanville and Jeremy N. Baker, Portfolio Managers
Fund and Market Performance Overview
For the 12-month period ended August 31, 2014, BNY Mellon National Short-Term Municipal Bond Fund’s Class M shares produced a total return of 1.37%, and its Investor shares returned 1.20%.1 In comparison, the fund’s benchmark index, the S&P Municipal Bond Investment Grade Short Index (the “Index”), produced a total return of 1.65%, and the fund’s former benchmark, the S&P Municipal Bond Short Index, achieved a total return of 1.69% for the same period.2
Although long-term municipal bonds rallied strongly amid changing economic conditions, their short-term counterparts remained relatively stable as the Federal Reserve Board (the “Fed”) left the overnight federal funds rate unchanged.The fund lagged its benchmark, mainly due to credit issues affecting its Puerto Rico holdings as well as the impact of fund fees and expenses that are not reflected in the Index’s results.
The Fund’s Investment Approach
The fund seeks to maximize current income exempt from federal income tax to the extent consistent with the preservation of capital. To pursue its goal, the fund normally invests at least 80% of its net assets in municipal bonds that provide income exempt from federal income tax.The fund occasionally may invest in taxable bonds, including for temporary defensive purposes.The fund’s investments in municipal and taxable bonds must be rated investment grade at the time of purchase or, if unrated, deemed of comparable quality by the investment adviser.3 Generally, the average effective portfolio maturity and the average effective portfolio duration of the fund’s portfolio will be less than three years.
Economic and Technical Forces Buoyed Municipal Bonds
Municipal bonds struggled early in the reporting period as fixed-income investors responded negatively to evidence of more robust economic growth and the Fed’s plans to back away from its quantitative easing program. By the end of 2013, long-term interest rates had climbed above 3% for the first time in more than two years, and municipal bond prices fell as anxious investors withdrew from the market. However, interest rates subsequently moderated and bond prices rebounded when unusually harsh winter weather in much of the U.S. triggered an economic contraction during the first quarter of 2014.
Although the recovery got back on track during the spring, favorable supply-and-demand dynamics kept long-term interest rates low. Less refinancing activity produced a reduced supply of newly issued tax-exempt securities over the first eight months of 2014, while demand intensified from investors seeking competitive after-tax yields. This constructive market environment enabled longer term municipal bonds to produce highly competitive total returns, with lower rated securities faring particularly well.These developments had a muted impact on short-term municipal bonds, where yields remained anchored by the historically low federal funds rate.
The U.S. economic rebound persisted through the reporting period’s end, resulting in better underlying credit conditions for many issuers. Tax revenues increased, helping most states achieve budget surpluses. Isolated credit problems in Detroit and Puerto Rico proved to be notable exceptions to recovering credit conditions over the reporting period.
The Funds 7
DISCUSSION OF FUND PERFORMANCE (continued)
Puerto Rico Holdings Dampened Relative Performance
The fund’s holdings of Puerto Rico bonds were relatively modest over the reporting period, but even a light position had a significant impact on the fund’s relative performance when the U.S. territory’s bonds were hurt by media reports detailing its economic and fiscal challenges.
The fund achieved better relative results by maintaining its average duration in a position that was slightly longer than industry averages. This strategy enabled the fund to participate more fully in gains among bonds with maturities of four years or more. Conversely, underweighted exposure to very short maturities helped cushion the impact of their relative weakness. Our security selection strategy also proved effective when “single-A” rated bonds, an area of overweighted exposure, produced higher returns than bonds with “double-A” and “triple-A” credit ratings. Finally, the fund received strong contributions from revenue-backed securities issued on behalf of industrial development projects.
At times during the reporting period, the fund employed futures contracts to establish its interest rate strategies.
Maintaining a Balanced Investment Posture
The U.S. economic recovery appears to have gained additional momentum, as evidenced by strengthening labor markets and improved consumer confidence. In addition, we believe that investors are returning their focus to market and issuer fundamentals now that it appears the Fed is close to ending its quantitative easing program. From a technical standpoint, we currently expect the supply of newly issued municipal bonds to increase as issuers become more comfortable borrowing in a better economic climate.
In light of these potential developments, we have continued to balance our efforts to bolster current tax-advantaged income with the need to preserve investors’ capital.We have maintained the fund’s relatively long average duration to capture higher yields, but we have reduced its holdings of lower-rated securities in favor of their higher quality counterparts.
September 15, 2014
Bond funds are subject generally to interest rate, credit, liquidity, and market risks, to varying degrees, all of which are more fully described in the fund’s prospectus. Generally, all other factors being equal, bond prices are inversely related to interest-rate changes, and rate increases can cause price declines.
| 1 | Total return includes reinvestment of dividends and any capital gains paid. |
| Past performance is no guarantee of future results. Share price, yield, and | |
| investment return fluctuate such that upon redemption fund shares may be | |
| worth more or less than their original cost. Income may be subject to state and | |
| local taxes, and some income may be subject to the federal alternative | |
| minimum tax (AMT) for certain investors. Capital gains, if any, are fully | |
| taxable. | |
| 2 | SOURCE: BLOOMBERG L.P. — Reflects reinvestment of dividends |
| and, where applicable, capital gain distributions.The S&P Municipal Bond | |
| Investment Grade Short Index and the S&P Municipal Bond Short Index | |
| are unmanaged, market-weighted indexes designed to measure the performance | |
| of municipal bonds with a minimum maturity of 6 months and a maximum | |
| maturity of up to, but not including, 4 years, and, in the case of the S&P | |
| Municipal Bond Investment Grade Short Index, that are rated at least BBB- | |
| by Standard & Poor’s Ratings Services, Baa3 by Moody’s Investor Services, | |
| Inc., or BBB- by Fitch Ratings. Unlike a mutual fund, neither index is | |
| subject to charges, fees and other expenses. Investors cannot invest directly in | |
| any index. Further information relating to fund performance, including expense | |
| reimbursements, if applicable, is contained in the Financial Highlights section of | |
| the prospectus and elsewhere in this report.The S&P Municipal Bond | |
| Investment Grade Intermediate Index was first calculated on March 19, | |
| 2013.Accordingly, the fund will continue to report the performance of the | |
| S&P Municipal Bond Intermediate Index until the S&P Municipal Bond | |
| Investment Grade Index has been calculated for a 10-year period. | |
| 3 | The fund may continue to own investment-grade bonds (at the time of |
| purchase), which are subsequently downgraded to below investment grade. |
8
FUND PERFORMANCE

| Average Annual Total Returns as of 8/31/14 | ||||||
| 1 Year | 5 Years | 10 Years | ||||
| Class M shares | 1.37 | % | 1.39 | % | 2.11 | % |
| Investor shares | 1.20 | % | 1.17 | % | 1.87 | % |
| S&P Municipal Bond Short Index | 1.69 | % | 1.87 | % | 2.73 | % |
| † Source: Lipper Inc. |
| Past performance is not predictive of future performance.The fund’s performance shown in the graph and table does not reflect the deduction of taxes that a shareholder |
| would pay on fund distributions or the redemption of fund shares. |
| The above graph compares a $10,000 investment made in Class M shares and Investor shares of BNY Mellon National Short-Term Municipal Bond Fund on |
| 8/31/04 to a $10,000 investment made in the S&P Municipal Bond Short Index on that date.All dividends and capital gain distributions are reinvested. |
| Effective 7/1/2013, the fund changed its benchmark from the S&P Municipal Bond Short Index to the S&P Municipal Bond Investment Grade Short Index |
| because the new benchmark index is more reflective of the credit quality of the fund’s portfolio holdings.The S&P Municipal Bond Investment Grade Short Index was |
| launched on 3/19/13.Accordingly, the fund will continue to report the performance of the S&P Municipal Bond Short Index until the S&P Municipal Bond |
| Investment Grade Short Index has been calculated for a 10-year period. Performance information for the fund versus the S&P Municipal Bond Investment Grade |
| Short Index is included in the graph and table on the next page. |
| The fund’s performance shown in the line graph above takes into account all applicable fees and expenses for Class M and Investor shares.The S&P Municipal Bond |
| Short Index is comprised of bonds in the S&P Municipal Bond Index with a minimum maturity of 6 months and a maximum maturity of up to, but not including, |
| 4 years as measured from the date on which the Index is rebalanced. Unlike a mutual fund, the S&P Municipal Bond Short Index is not subject to charges, fees and |
| other expenses. Investors cannot invest directly in any index. Further information relating to fund performance, including expense reimbursements, if applicable, is |
| contained in the Financial Highlights section of the prospectus and elsewhere in this report. |
The Funds 9
FUND PERFORMANCE
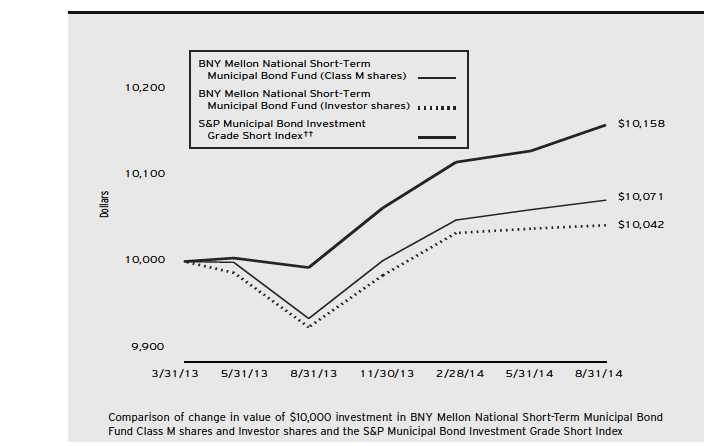
| Average Annual Total Returns as of 8/31/14 | |||||
| Inception | From | ||||
| Date | 1 Year | Inception | |||
| Class M shares | 3/31/13 | 1.37 | % | 0.50 | % |
| Investor shares | 3/31/13 | 1.20 | % | 0.30 | % |
| S&P Municipal Bond Investment Short Index | 3/31/13 | 1.65 | % | 1.11 | %††† |
| †† Source: Bloomberg L.P. |
| Past performance is not predictive of future performance.The fund’s performance shown in the graph and table does not reflect the deduction of taxes that a shareholder |
| would pay on fund distributions or the redemption of fund shares. |
| The above graph compares a $10,000 investment made in Class M shares and Investor shares of BNY Mellon National Short-Term Municipal Bond Fund on |
| 3/31/13 to a $10,000 investment made in the S&P Municipal Bond Investment Grade Short Index on that date.All dividends and capital gain distributions |
| are reinvested. |
| The fund’s performance shown in the line graph above takes into account all applicable fees and expenses for Class M and Investor shares.The S&P Municipal Bond |
| Investment Grade Short Index is comprised of bonds in the S&P Municipal Bond Index that are rated at least BBB- by S&P, Baa3 by Moody’s or BBB- by Fitch |
| with a minimum maturity of 6 months and a maximum maturity of up to, but not including, 4 years as measured from the date on which the Index is rebalanced. |
| Unlike a mutual fund, the S&P Municipal Bond Investment Grade Short Index is not subject to charges, fees and other expenses. Investors cannot invest directly in |
| any index. Further information relating to fund performance, including expense reimbursements, if applicable, is contained in the Financial Highlights section of the |
| prospectus and elsewhere in this report. |
| ††† For comparative purposes, the value of the S&P Municipal Bond Investment Grade Short Index on 3/31/13 is used as the beginning value on 3/19/13. |
10
DISCUSSION OF
FUND PERFORMANCE
For the period of September 1, 2013, through August 31, 2014, as provided by Jeremy N. Baker and Mary Collette O’Brien, Portfolio Managers
Fund and Market Performance Overview
For the 12-month period ended August 31, 2014, BNY Mellon Pennsylvania Intermediate Municipal Bond Fund’s Class M shares produced a total return of 6.31%, and its Investor shares returned 6.04%.1 In comparison, the fund’s benchmark index, the S&P Municipal Bond Investment Grade Intermediate Index (the “Index”), produced a total return of 8.46%, and the fund’s former benchmark, the S&P Municipal Bond Intermediate Index, achieved a total return of 8.58% for the same period.2
Municipal bonds rallied over the reporting period as long-term interest rates moderated, investor demand rebounded, and the supply of newly issued securities declined. The fund lagged its benchmark, mainly due to a relatively short average duration.
The Fund’s Investment Approach
The fund seeks as high a level of income exempt from federal and Pennsylvania state income taxes as is consistent with the preservation of capital. To pursue its goal, the fund normally invests at least 80% of its net assets in municipal bonds, the interest from which is exempt from federal and Pennsylvania state personal income taxes. The fund may also invest in municipal bonds that are exempt from federal income taxes, but not Pennsylvania personal income taxes, and in taxable bonds.The fund’s investments in municipal and taxable bonds must be rated investment grade at the time of purchase or, if unrated, deemed of comparable quality by the investment adviser.3 Generally, the fund’s average effective portfolio maturity will be between three and 10 years, and the average effective duration of the fund’s portfolio will not exceed eight years.
Economic and Technical Forces Buoyed Municipal Bonds
Municipal bonds struggled early in the reporting period when investors responded negatively to evidence of accelerating economic growth and plans by the Federal Reserve Board (the “Fed”) to back away from its massive quantitative easing program. By the end of 2013, long-term interest rates had climbed above 3% for the first time in more than two years, and municipal bond prices fell as anxious investors withdrew from the market. However, interest rates subsequently moderated and bond prices rebounded when unusually harsh winter weather in much of the U.S. contributed to an economic contraction during the first quarter of 2014.
Although the economic recovery got back on track during the spring, favorable supply-and-demand dynamics kept long-term interest rates low. In addition, less refinancing activity produced a reduced supply of newly issued tax-exempt securities over the first eight months of 2014, while demand intensified from investors seeking competitive after-tax yields in a low interest rate environment. This constructive market environment enabled municipal bonds to produce highly competitive total returns for the reporting period, with longer term and lower rated securities faring particularly well.
The Funds 11
DISCUSSION OF FUND PERFORMANCE (continued)
The economic rebound persisted through the reporting period’s end, resulting in better underlying credit conditions for many issuers. Tax revenues increased, helping most states achieve budget surpluses. However, Pennsylvania has continued to struggle with fiscal pressures, which prompted one agency to downgrade its credit rating. Isolated credit problems in Detroit and Puerto Rico also were notable exceptions to recovering national credit conditions over the reporting period.
Short Duration Posture Dampened Relative Performance
Although the fund’s relatively short average duration sheltered it from some of the adverse impact of rising interest rates in late 2013, the same strategy prevented the fund from participating more fully in gains when long-term rates moderated in 2014. An allocation to Puerto Rico municipal bonds also hampered the fund’s relative performance, as did the fund’s positions in highly rated, shorter term escrowed securities.
The fund achieved better relative results through municipal bonds with maturities of 25 years and greater. Underweighted exposure to general obligation bonds also supported the fund’s results compared to the benchmark. Instead, we emphasized bonds backed by revenues from municipal services. The fund received especially strong contributions from bonds issued on behalf of toll roads, airports, and educational institutions.
At times during the reporting period, the fund employed futures contracts to manage its interest rate strategies.
Maintaining a Cautious Investment Posture
The U.S. economic recovery appears to have gained additional momentum, as evidenced by a strengthening labor market and improved consumer confidence. In addition, investors have returned their focus to market and issuer fundamentals now that it appears the Fed is close to ending its quantitative easing program. From a technical standpoint, we currently expect the supply of newly issued municipal bonds to increase as issuers become more comfortable borrowing in a better economic climate.
In light of these potential developments, we have maintained a generally defensive stance. We have also maintained the fund’s relatively short average duration, and we have reduced its holdings of lower rated securities in favor of their higher quality counterparts. In our view, these are prudent strategies in today’s changing market environment.
September 15, 2014
Bond funds are subject generally to interest rate, credit, liquidity, and market risks, to varying degrees, all of which are more fully described in the fund’s prospectus. Generally, all other factors being equal, bond prices are inversely related to interest-rate changes, and rate increases can cause price declines.
| 1 | Total return includes reinvestment of dividends and any capital gains paid. |
| Past performance is no guarantee of future results. Share price, yield, and | |
| investment return fluctuate such that upon redemption fund shares may be | |
| worth more or less than their original cost. Income may be subject to state and | |
| local taxes for non-Pennsylvania residents, and some income may be subject to | |
| the federal alternative minimum tax (AMT) for certain investors. Capital | |
| gains, if any, are fully taxable. | |
| 2 | SOURCE: BLOOMBERG L.P. — The S&P Municipal Bond |
| Investment Grade Intermediate Index and the S&P Municipal Bond | |
| Intermediate Index are unmanaged, market-weighted indexes designed to | |
| measure the performance of municipal bonds with a minimum maturity of | |
| three years and a maximum maturity of up to, but not including, 15 years, | |
| and, in the case of the S&P Municipal Bond Investment Grade Index, that | |
| are rated at least BBB- by Standard & Poor’s Ratings Services, Baa3 by | |
| Moody’s Investor Services, Inc., or BBB- by Fitch Ratings. Unlike a mutual | |
| fund, neither index is subject to charges, fees and other expenses and is not | |
| limited to investments principally in Pennsylvania municipal obligations.The | |
| S&P Municipal Bond Investment Grade Intermediate Index was first | |
| calculated on March 19, 2013.Accordingly, the fund will continue to report | |
| the performance of the S&P Municipal Bond Intermediate Index until the | |
| S&P Municipal Bond Investment Grade Index has been calculated for a 10- | |
| year period. Investors cannot invest directly in any index. | |
| 3 | The fund may continue to own investment-grade bonds (at the time of |
| purchase), which are subsequently downgraded to below investment grade. |
12
FUND PERFORMANCE

| Average Annual Total Returns as of 8/31/14 | ||||||
| 1 Year | 5 Years | 10 Years | ||||
| Class M shares | 6.31 | % | 3.87 | % | 3.51 | % |
| Investor shares | 6.04 | % | 3.64 | % | 3.26 | % |
| S&P Municipal Bond Intermediate Index | 8.58 | % | 5.27 | % | 4.83 | % |
| † Source: Lipper Inc. |
| Past performance is not predictive of future performance.The fund’s performance shown in the graph and table does not reflect the deduction of taxes that a shareholder |
| would pay on fund distributions or the redemption of fund shares. |
| The above graph compares a $10,000 investment made in Class M shares and Investor shares of BNY Mellon Pennsylvania Intermediate Municipal Bond Fund on |
| 8/31/04 to a $10,000 investment made in the S&P Municipal Bond Intermediate Index on that date.All dividends and capital gain distributions are reinvested. |
| Effective 7/1/2013, the fund changed its benchmark from the S&P Municipal Bond Intermediate Index to the S&P Municipal Bond Investment Grade |
| Intermediate Index because the new benchmark index is more reflective of the credit quality of the fund’s portfolio holdings.The S&P Municipal Bond Investment |
| Grade Intermediate Index was first calculated on 3/19/13.Accordingly, the fund will continue to report the performance of the S&P Municipal Bond Intermediate |
| Index until the S&P Municipal Bond Investment Grade Intermediate Index has been calculated for a 10-year period. Performance information for the fund versus the |
| S&P Municipal Bond Investment Grade Intermediate Index is included in the graph and table on the next page. |
| The fund invests primarily in Pennsylvania investment-grade municipal bonds.The fund’s performance shown in the line graph above takes into account all applicable |
| fees and expenses for Class M and Investor shares.The S&P Municipal Bond Intermediate Index is comprised of bonds in the S&P Municipal Bond Index with a |
| minimum maturity of 3 years and a maximum maturity of up to, but not including, 15 years as measured from the date on which the Index is rebalanced. Unlike |
| a mutual fund, the S&P Municipal Bond Intermediate Index is are not subject to charges, fees and other expenses and is not limited to investments principally in |
| Pennsylvania municipal obligations. Investors cannot invest directly in any index. Further information relating to fund performance, including expense reimbursements, |
| if applicable, is contained in the Financial Highlights section of the prospectus and elsewhere in this report. |
The Funds 13
FUND PERFORMANCE
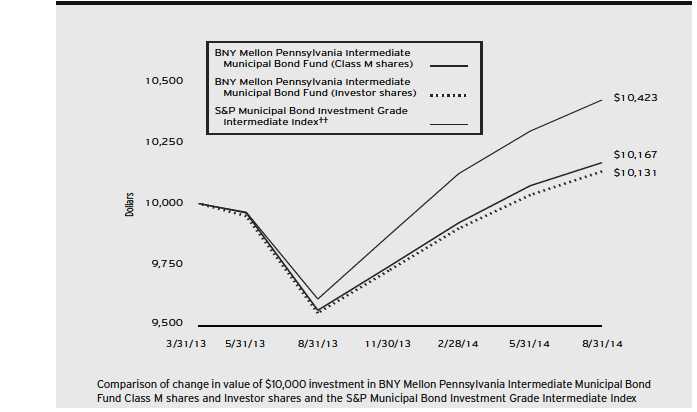
| Average Annual Total Returns as of 8/31/14 | |||||
| Inception | From | ||||
| Date | 1 Year | Inception | |||
| Class M shares | 3/31/13 | 6.31 | % | 1.17 | % |
| Investor shares | 3/31/13 | 6.04 | % | 0.92 | % |
| S&P Municipal Bond Investment Grade | |||||
| Intermediate Index | 3/31/13 | 8.46 | % | 2.96 | %††† |
| †† Source: Bloomberg L.P. |
| Past performance is not predictive of future performance.The fund’s performance shown in the graph and table does not reflect the deduction of taxes that a shareholder |
| would pay on fund distributions or the redemption of fund shares. |
| The above graph compares a $10,000 investment made in Class M shares and Investor shares of BNY Mellon Pennsylvania Intermediate Municipal Bond Fund on |
| 3/31/13 to a $10,000 investment made in the S&P Municipal Bond Investment Grade Intermediate Index on that date.All dividends and capital gain |
| distributions are reinvested. |
| The fund invests primarily in Pennsylvania investment-grade municipal bonds.The fund’s performance shown in the line graph above takes into account all applicable |
| fees and expenses for Class M and Investor shares.The S&P Municipal Bond Investment Grade Intermediate Index is comprised of bonds in the S&P Municipal |
| Bond Index that are rated at least BBB- by Standard & Poor’s Ratings Services, Baa3 by Moody’s Investor Services, Inc. or BBB- by Fitch Ratings with a minimum |
| maturity of 3 years and a maximum maturity of up to, but not including, 15 years as measured from the date on which the Index is rebalanced. Unlike a mutual |
| fund, the S&P Municipal Bond Investment Grade Intermediate Index is not subject to charges, fees and other expenses and is not limited to investments principally in |
| Pennsylvania municipal obligations. Investors cannot invest directly in any index. Further information relating to fund performance, including expense reimbursements, |
| if applicable, is contained in the Financial Highlights section of the prospectus and elsewhere in this report. |
| ††† For comparative purposes, the value of the S&P Municipal Bond Investment Grade Intermediate Index on 3/31/13 is used as the beginning value on 3/19/13. |
14

DISCUSSION OF
FUND PERFORMANCE
For the period of September 1, 2013, through August 31, 2014, as provided by John F. Flahive and Mary Collette O’Brien, Portfolio Managers
Fund and Market Performance Overview
For the 12-month period ended August 31, 2014, BNY Mellon Massachusetts Intermediate Municipal Bond Fund’s Class M shares produced a total return of 6.21%, and its Investor shares returned 5.95%.1 In comparison, the fund’s benchmark index, the S&P Municipal Bond Investment Grade Intermediate Index (the “Index”), produced a total return of 8.46%, and the fund’s former benchmark, the S&P Municipal Bond Intermediate Index, achieved a total return of 8.58% for the same period.2
Municipal bonds rallied over the reporting period as long-term interest rates moderated, investor demand rebounded, the supply of newly issued securities declined, and credit conditions improved. The fund lagged its benchmark, mainly due to a relatively short average duration.
The Fund’s Investment Approach
The fund seeks as high a level of income exempt from federal and Massachusetts state income taxes as is consistent with the preservation of capital. To pursue its goal, the fund normally invests at least 80% of its net assets in municipal bonds, the interest from which is exempt from federal and Massachusetts state personal income taxes. The fund may also invest in municipal bonds that are exempt from federal income taxes, but not Massachusetts personal income taxes, and in taxable bonds.The fund’s investments in municipal and taxable bonds must be rated investment grade at the time of purchase or, if unrated, deemed of comparable quality by the investment adviser.3 Generally, the fund’s average effective portfolio maturity will be between three and 10 years, and the average effective duration of the fund’s portfolio will not exceed eight years.
Economic and Technical Forces Buoyed Municipal Bonds
Municipal bonds struggled early in the reporting period when investors responded negatively to evidence of more robust economic growth and plans by the Federal Reserve Board (the “Fed”) to begin backing away from its massive quantitative easing program. By the end of 2013, long-term interest rates had climbed above 3% for the first time in more than two years, and municipal bond prices fell as anxious investors withdrew from the market. However, interest rates subsequently moderated and bond prices rebounded when unusually harsh winter weather in much of the U.S. contributed to an economic contraction during the first quarter of 2014.
Although the economic recovery appeared to get back on track during the spring, favorable supply-and-demand dynamics kept long-term interest rates low. Less refinancing activity produced a reduced supply of newly issued tax-exempt securities over the first eight months of 2014, while demand intensified from investors seeking competitive after-tax yields in a low interest rate environment. This constructive market environment enabled municipal bonds to produce highly competitive total returns for the reporting period, with longer term and lower rated securities faring particularly well.
The U.S. economic rebound persisted through the reporting period’s end, resulting in better underlying credit conditions for many issuers. Tax revenues increased, helping most states achieve budget surpluses. Massachusetts fared especially well due to its diverse economy and conservative fiscal management. Isolated
The Funds 15
DISCUSSION OF FUND PERFORMANCE (continued)
credit problems in Detroit and Puerto Rico proved to be notable exceptions to recovering national credit conditions over the reporting period.
Short Duration Posture Dampened Relative Performance
Although the fund’s relatively short average duration sheltered it from some of the adverse impact of rising interest rates in late 2013, the same strategy prevented the fund from participating more fully in gains when long-term rates moderated in 2014. An allocation to Puerto Rico municipal bonds also hampered the fund’s relative performance, as did the fund’s positions in highly rated, shorter term escrowed securities.
The fund achieved better relative results through its holdings of bonds with maturities of 25 years and greater. Underweighted exposure to general obligation bonds also supported the fund’s results compared to the benchmark. Instead, we emphasized bonds backed by revenues from municipal services. The fund received especially strong contributions from bonds issued on behalf of Massachusetts educational institutions and hospitals.
At times during the reporting period, the fund employed futures contracts to manage its interest rate strategies.
Maintaining a Cautious Investment Posture
The U.S. economic recovery appears to have gained additional momentum, as evidenced by a strengthening labor market and improved consumer confidence. In addition, investors have returned their focus to market and issuer fundamentals now that it appears the Fed is close to the end of its quantitative easing program. From a technical standpoint, we currently expect the supply of newly issued municipal bonds to increase as issuers become more comfortable borrowing in a better economic climate.
In light of these potential developments, we have maintained a generally defensive stance. We have also maintained the fund’s relatively short average duration, and we have reduced its holdings of lower rated securities in favor of their higher quality counterparts. In our view, these are prudent strategies in today’s changing market environment.
September 15, 2014
Bond funds are subject generally to interest rate, credit, liquidity, and market risks, to varying degrees, all of which are more fully described in the fund’s prospectus. Generally, all other factors being equal, bond prices are inversely related to interest-rate changes, and rate increases can cause price declines.
| 1 | Total return includes reinvestment of dividends and any capital gains paid. |
| Past performance is no guarantee of future results. Share price, yield, and | |
| investment return fluctuate such that upon redemption fund shares may be | |
| worth more or less than their original cost. Income may be subject to state and | |
| local taxes for non-Massachusetts residents, and some income may be subject | |
| to the federal alternative minimum tax (AMT) for certain investors. Capital | |
| gains, if any, are fully taxable. | |
| 2 | SOURCE: BLOOMBERG L.P. — Municipal Bond Investment Grade |
| Intermediate Index and the S&P Municipal Bond Intermediate Index are | |
| unmanaged, market-weighted indexes designed to measure the performance of | |
| municipal bonds is composed of bonds in the S&P Municipal Bond Index | |
| and, in the case of the S&P Municipal Bond Investment Grade Index, with | |
| a minimum maturity of three years and a maximum maturity of up to, but | |
| not including, 15 years. Unlike a mutual fund, neither index is subject to | |
| charges, fees, and other expenses and is not limited to investments principally | |
| in Massachusetts municipal obligations. Investors cannot invest directly in any | |
| index. Further information relating to fund performance, including expense | |
| reimbursements, if applicable, is contained in the Financial Highlights section | |
| of the prospectus and elsewhere in this report. | |
| The S&P Municipal Bond Investment Grade Intermediate Index was first | |
| calculated on March 19, 2013.Accordingly, the fund will continue to report | |
| the performance of the S&P Municipal Bond Intermediate Index until the | |
| S&P Municipal Bond Investment Grade Index has been calculated for a 10- | |
| year period. | |
| 3 | The fund may continue to own investment-grade bonds (at the time of |
| purchase), which are subsequently downgraded to below investment grade. |
16
FUND PERFORMANCE
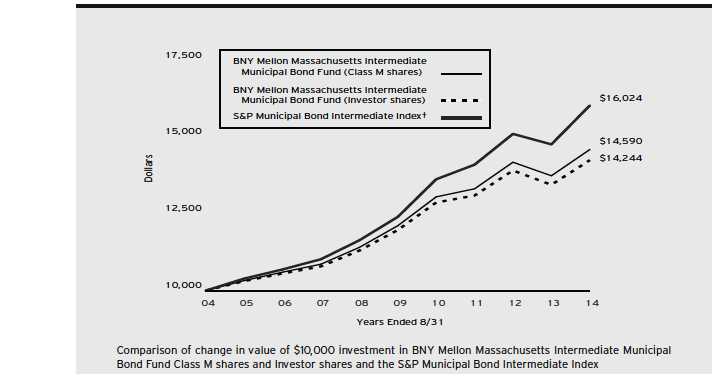
| Average Annual Total Returns as of 8/31/14 | ||||||
| 1 Year | 5 Years | 10 Years | ||||
| Class M shares | 6.21 | % | 3.79 | % | 3.85 | % |
| Investor shares | 5.95 | % | 3.54 | % | 3.60 | % |
| S&P Municipal Bond Intermediate Index | 8.58 | % | 5.27 | % | 4.83 | % |
| † Source: Lipper Inc. |
| Past performance is not predictive of future performance. |
| The above graph compares a $10,000 investment made in Class M shares and Investor shares of BNY Mellon Massachusetts Intermediate Municipal Bond Fund on |
| 8/31/04 to a $10,000 investment made in the S&P Municipal Bond Intermediate Index on that date.All dividends and capital gain distributions are reinvested. |
| Effective 7/1/2013, the fund changed its benchmark from the S&P Municipal Bond Intermediate Index to the S&P Municipal Bond Investment Grade |
| Intermediate Index because the new benchmark index is more reflective of the credit quality of the fund’s portfolio holdings.The S&P Municipal Bond Investment |
| Grade Intermediate Index was first calculated on 3/19/13.Accordingly, the fund will continue to report the performance of the S&P Municipal Bond Intermediate |
| Index until the S&P Municipal Bond Investment Grade Intermediate Index has been calculated for a 10-year period. Performance information for the fund versus the |
| S&P Municipal Bond Investment Grade Intermediate Index is included in the graph and table on the next page. |
| The fund’s performance shown in the line graph above takes into account all applicable fees and expenses for Class M and Investor shares.The S&P Municipal Bond |
| Intermediate Index is comprised of bonds in the S&P Municipal Bond Index with a minimum maturity of 3 years and a maximum maturity of up to, but not |
| including, 15 years as measured from the date on which the Index is rebalanced. Unlike a mutual fund, the S&P Municipal Bond Intermediate Index is not subject to |
| charges, fees and other expenses and is not limited to investments principally in Massachusetts municipal obligations. Investors cannot invest directly in any index. |
| Further information relating to fund performance, including expense reimbursements, if applicable, is contained in the Financial Highlights section of the prospectus |
| and elsewhere in this report. |
The Funds 17
FUND PERFORMANCE

| Average Annual Total Returns as of 8/31/14 | |||||
| Inception | From | ||||
| Date | 1 Year | Inception | |||
| Class M shares | 3/31/13 | 6.21 | % | 1.33 | % |
| Investor shares | 3/31/13 | 5.95 | % | 1.08 | % |
| S&P Municipal Bond Investment Grade | |||||
| Intermediate Index | 3/31/13 | 8.46 | % | 2.96 | %††† |
| †† Source: Bloomberg L.P. |
| Past performance is not predictive of future performance. |
| The above graph compares a $10,000 investment made in Class M shares and Investor shares of BNY Mellon Massachusetts Intermediate Municipal Bond Fund on |
| 3/31/13 to a $10,000 investment made in the S&P Municipal Bond Investment Grade Intermediate Index on that date.All dividends and capital gain |
| distributions are reinvested. |
| The fund’s performance shown in the line graph above takes into account all applicable fees and expenses for Class M and Investor shares.The S&P Municipal Bond |
| Investment Grade Intermediate Index is comprised of bonds in the S&P Municipal Bond Index that are rated at least BBB- by Standard & Poor’s Ratings Services, |
| Baa3 by Moody’s Investor Services, Inc. or BBB- by Fitch Ratings with a minimum maturity of 3 years and a maximum maturity of up to, but not including, |
| 15 years as measured from the date on which the Index is rebalanced. Unlike a mutual fund, the S&P Municipal Bond Investment Grade Intermediate Index is not |
| subject to charges, fees and other expenses and is not limited to investments principally in Massachusetts municipal obligations. Investors cannot invest directly in any |
| index. Further information relating to fund performance, including expense reimbursements, if applicable, is contained in the Financial Highlights section of the |
| prospectus and elsewhere in this report. |
| ††† For comparative purposes, the value of the S&P Municipal Bond Investment Grade Intermediate Index on 3/31/13 is used as the beginning value on 3/19/13. |
18

DISCUSSION OF
FUND PERFORMANCE
For the period of September 1, 2013, through August 31, 2014, as provided by John F. Flahive, Portfolio Manager
Fund and Market Performance Overview
For the 12-month period ended August 31, 2014, BNY Mellon New York Intermediate Tax-Exempt Bond Fund’s Class M shares produced a total return of 7.04%, and its Investor shares returned 6.77%.1 In comparison, the fund’s benchmark index, the S&P Municipal Bond Investment Grade Intermediate Index (the “Index”), produced a total return of 8.46%, and the fund’s former benchmark, the S&P Municipal Bond Intermediate Index, achieved a total return of 8.58% for the same period.2
Municipal bonds rallied over the reporting period as long-term interest rates moderated, investor demand rebounded, the supply of newly issued securities declined, and credit conditions improved. The fund lagged its benchmark, mainly due to a relatively short average duration.
The Fund’s Investment Approach
The fund seeks as high a level of income exempt from federal, New York state, and New York city income taxes as is consistent with the preservation of capital. This objective may be changed without shareholder approval.To pursue its goal, the fund normally invests at least 80% of its net assets in municipal bonds that provide income exempt from federal, New York state, and New York city personal income taxes. These municipal bonds include those issued by New York state and New York city as well as those issued by U.S. territories and possessions.3 Generally, the fund’s average effective portfolio maturity will be between three and 10 years.
Economic and Technical Forces Buoyed Municipal Bonds
Municipal bonds struggled early in the reporting period when investors responded negatively to evidence of more robust economic growth and plans by the Federal Reserve Board (the “Fed”) to begin backing away from its massive quantitative easing program. By the end of 2013, long-term interest rates had climbed above 3% for the first time in more than two years, and municipal bond prices fell as anxious investors withdrew from the market. However, interest rates subsequently moderated and bond prices rebounded when unusually harsh winter weather in much of the U.S. contributed to an economic contraction during the first quarter of 2014.
Although the economic recovery appeared to get back on track during the spring, favorable supply-and-demand dynamics kept long-term interest rates low. Less refinancing activity produced a reduced supply of newly issued tax-exempt securities over the first eight months of 2014, while demand intensified from investors seeking competitive after-tax yields in a low interest rate environment. This constructive market environment enabled municipal bonds to produce highly competitive total returns for the reporting period, with longer term and lower rated securities faring particularly well.
The U.S. economic rebound persisted through the reporting period’s end, resulting in better underlying credit conditions for many issuers. Tax revenues increased, helping most states achieve budget surpluses. New York was no exception to this trend, as the state recently has shored up its finances, resulting in credit rating upgrades from major rating agencies. Isolated credit problems in Detroit and Puerto Rico proved to
The Funds 19
DISCUSSION OF FUND PERFORMANCE (continued)
be notable exceptions to recovering national credit conditions over the reporting period.
Short Duration Posture Dampened Relative Performance
Although the fund’s relatively short average duration sheltered it from some of the adverse impact of rising interest rates in late 2013, the same strategy prevented the fund from participating more fully in gains when long-term rates moderated in 2014. To a lesser degree, an allocation to Puerto Rico municipal bonds also hampered the fund’s relative performance.
The fund achieved better relative results through its holdings of bonds with maturities of 25 years and greater. Underweighted exposure to general obligation bonds also supported the fund’s results compared to the benchmark. Instead, we emphasized bonds backed by revenues from municipal services. The fund received especially strong contributions from bonds issued on behalf of industrial development projects. Underweighted exposure to high-quality escrowed bonds also bolstered the fund’s relative performance.
At times during the reporting period, the fund employed futures contracts to manage its interest rate strategies.
Maintaining a Cautious Investment Posture
The U.S. economic recovery appears to have gained additional momentum, as evidenced by a strengthening labor market and improved consumer confidence. In addition, investors have returned their focus to market and issuer fundamentals now that it appears the Fed is close to the end of its quantitative easing program. From a technical standpoint, we currently expect the supply of newly issued municipal bonds to increase as issuers become more comfortable borrowing in a better economic climate.
In light of these potential developments, we have maintained a generally defensive stance. We have also maintained the fund’s relatively short average duration, and we have reduced its holdings of lower rated securities in favor of their higher quality counterparts. In our view, these are prudent strategies in today’s changing market environment.
September 15, 2014
Bond funds are subject generally to interest rate, credit, liquidity, and market risks, to varying degrees, all of which are more fully described in the fund’s prospectus. Generally, all other factors being equal, bond prices are inversely related to interest-rate changes and rate increases can cause price declines.
| 1 | Total return includes reinvestment of dividends and any capital gains paid. |
| Past performance is no guarantee of future results. Share price, yield, and | |
| investment return fluctuate such that upon redemption fund shares may be | |
| worth more or less than their original cost. Income may be subject to state and | |
| local taxes for non-NewYork residents, and some income may be subject to | |
| the federal alternative minimum tax (AMT) for certain investors. Capital | |
| gains, if any, are fully taxable. Return figures provided reflect the absorption of | |
| certain fund expenses by BNY Mellon Fund Advisors pursuant to an | |
| agreement in effect through December 31, 2014, at which time it may be | |
| extended, modified, or terminated. Had these expenses not been absorbed, the | |
| fund’s returns would have been lower. | |
| 2 | SOURCE: BLOOMBERG L.P. — The S&P Municipal Bond |
| Investment Grade Intermediate Index and the S&P Municipal Bond | |
| Intermediate Index are unmanaged, market-weighted indexes designed to | |
| measure the performance of municipal bonds with a minimum maturity of | |
| three years and a maximum maturity of up to, but not including, 15 years, | |
| and, in the case of the S&P Municipal Bond Investment Grade Index, that | |
| are rated at least BBB- by Standard & Poor’s Ratings Services, Baa3 by | |
| Moody’s Investor Services, Inc., or BBB- by Fitch Ratings. Unlike a mutual | |
| fund, neither index is subject to charges, fees and other expenses and is not | |
| limited to investments principally in NewYork municipal obligations.The | |
| S&P Municipal Bond Investment Grade Intermediate Index was first | |
| calculated on March 19, 2013.Accordingly, the fund will continue to report | |
| the performance of the S&P Municipal Bond Intermediate Index until the | |
| S&P Municipal Bond Investment Grade Index has been calculated for a | |
| 10-year period. Investors cannot invest directly in any index. | |
| 3 | The fund may continue to own investment-grade bonds (at the time of |
| purchase), which are subsequently downgraded to below investment grade. |
20
FUND PERFORMANCE
| Average Annual Total Returns as of 8/31/14 | ||||||
| 1 Year | 5 Years | 10 Years | ||||
| Class M shares | 7.04 | % | 4.09 | % | 4.04 | % |
| Investor shares | 6.77 | % | 3.82 | % | 3.79 | % |
| S&P Municipal Bond Intermediate Index | 8.58 | % | 4.87 | % | 4.66 | % |
| † Source: Lipper Inc. |
| Past performance is not predictive of future performance.The fund’s performance shown in the graph and table does not reflect the deduction of taxes that a shareholder |
| would pay on fund distributions or the redemption of fund shares. |
| The above graph compares a $10,000 investment made in Class M shares and Investor shares of BNY Mellon NewYork Intermediate Tax-Exempt Bond Fund on |
| 8/31/04 to a $10,000 investment made in the S&P Municipal Bond Intermediate Index on that date.All dividends and capital gain distributions are reinvested. |
| Effective 7/1/2013, the fund changed its benchmark from the S&P Municipal Bond Intermediate Index to the S&P Municipal Bond Investment Grade |
| Intermediate Index because the new benchmark index is more reflective of the credit quality of the fund’s portfolio holdings.The S&P Municipal Bond Investment |
| Grade Intermediate Index was first calculated on 3/19/13.Accordingly, the fund will continue to report the performance of the S&P Municipal Bond Intermediate |
| Index until the S&P Municipal Bond Investment Grade Intermediate Index has been calculated for a 10-year period. Performance information for the fund versus the |
| S&P Municipal Bond Investment Grade Intermediate Index is included in the graph and table on the next page. |
| As of the close of business on September 12, 2008, substantially all of the assets of another investment company advised by an affiliate of the fund’s investment |
| adviser, BNY Hamilton NewYork Intermediate Tax-Exempt Fund (the “predecessor fund”), a series of BNY Hamilton Funds, Inc., were transferred to the fund in a |
| tax-free reorganization and the fund commenced operations.The performance figures for the fund’s Class M shares represent the performance of the predecessor fund’s |
| Institutional shares prior to the commencement of operations for the fund and the performance of the fund’s Class M shares thereafter.The performance figures for |
| Investor shares represent the performance of the predecessor fund’s Class A shares prior to the commencement of operations for the fund and the performance of the |
| fund’s Investor shares thereafter. |
| The fund’s performance shown in the line graph above takes into account all applicable fees and expenses for Class M and Investor shares.The S&P Municipal Bond |
| Intermediate Index is comprised of bonds in the S&P Municipal Bond Index with a minimum maturity of 3 years and a maximum maturity of up to, but not |
| including, 15 years as measured from the date on which the Index is rebalanced. Unlike a mutual fund, the S&P Municipal Bond Intermediate Index is not subject to |
| charges, fees and other expenses and is not limited to investments principally in NewYork municipal obligations. Investors cannot invest directly in any index. Further |
| information relating to fund performance, including expense reimbursements, if applicable, is contained in the Financial Highlights section of the prospectus and |
| elsewhere in this report. |
The Funds 21
FUND PERFORMANCE
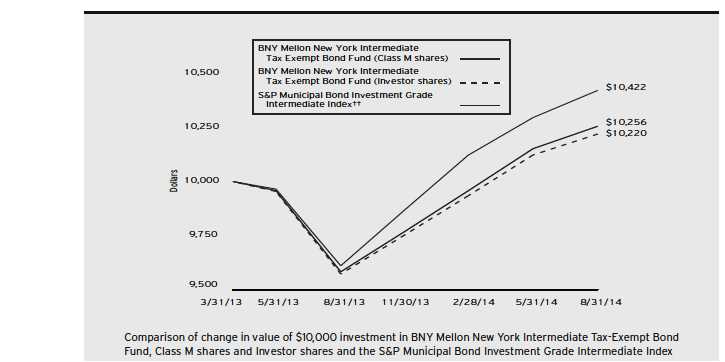
| Average Annual Total Returns as of 8/31/14 | |||||
| Inception | From | ||||
| Date | 1 Year | Inception | |||
| Class M shares | 3/31/13 | 7.04 | % | 1.80 | % |
| Investor shares | 3/31/13 | 6.77 | % | 1.54 | % |
| S&P Municipal Bond Investment Grade | |||||
| Intermediate Index | 3/31/13 | 8.46 | % | 2.96 | %††† |
| †† Source: Bloomberg L.P. |
| Past performance is not predictive of future performance.The fund’s performance shown in the graph and table does not reflect the deduction of taxes that a shareholder |
| would pay on fund distributions or the redemption of fund shares. |
| The above graph compares a $10,000 investment made in Class M shares and Investor shares of BNY Mellon NewYork Intermediate Tax-Exempt Bond Fund on |
| 3/31/13 to a $10,000 investment made in the S&P Municipal Bond Investment Grade Intermediate Index on that date.All dividends and capital gain |
| distributions are reinvested. |
| The fund’s performance shown in the line graph above takes into account all applicable fees and expenses for Class M and Investor shares.The S&P Municipal Bond |
| Investment Grade Intermediate Index is comprised of bonds in the S&P Municipal Bond Index that are rated at least BBB- by Standard & Poor’s Ratings Services, |
| Baa3 by Moody’s Investor Services, Inc. or BBB- by Fitch Ratings with a minimum maturity of 3 years and a maximum maturity of up to, but not including, |
| 15 years as measured from the date on which the Index is rebalanced. Unlike a mutual fund, the S&P Municipal Bond Investment Grade Intermediate Index is |
| not subject to charges, fees and other expenses and is not limited to investments principally in NewYork municipal obligations. Investors cannot invest directly in any |
| index. Further information relating to fund performance, including expense reimbursements, if applicable, is contained in the Financial Highlights section of the |
| prospectus and elsewhere in this report. |
| ††† For comparative purposes, the value of the S&P Municipal Bond Investment Grade Intermediate Index on 3/31/13 is used as the beginning value on 3/19/13. |
22

DISCUSSION OF
FUND PERFORMANCE
For the period of September 1, 2013, through August 31, 2014, as provided by John F. Flahive, Portfolio Manager and Director of Fixed Income
Fund and Market Performance Overview
For the 12-month period ended August 31, 2014, BNY Mellon Municipal Opportunities Fund’s Class M shares produced a total return of 12.88%, and its Investor shares returned 12.54%.1 In comparison, the fund’s benchmark, the Barclays Municipal Bond Index (the “Index”), produced a total return of 10.14%.2
The municipal bond market rallied over the reporting period as long-term interest rates moderated, investor demand rebounded, the supply of newly issued securities declined, and national credit conditions improved. The fund outperformed its benchmark, mainly due to an emphasis on longer term and lower rated securities.
The Fund’s Investment Approach
The fund seeks to maximize total return consisting of high current income exempt from federal income tax and capital appreciation.This objective may be changed without shareholder approval. To pursue its goal, the fund normally invests at least 80% of its net assets in U.S. dollar-denominated fixed-income securities that provide income exempt from federal income tax (municipal bonds).While the fund typically invests in a diversified portfolio of municipal bonds, it may invest up to 20% of its assets in taxable fixed-income securities, including taxable municipal bonds and non-U.S. dollar-denominated foreign debt securities, such as Brady bonds and sovereign debt obligations.
We seek to deliver value-added excess returns (“alpha”) by applying an investment approach designed to identify and exploit relative value opportunities within the municipal bond market. Although the fund seeks to be diversified by geography and sector, the fund may at times invest a significant portion of its assets in a particular state or region or in a particular sector due to market conditions.
Economic and Technical Forces Buoyed Municipal Bonds
Municipal bonds struggled early in the reporting period as fixed-income investors responded negatively to evidence of more robust economic growth. Indeed, by year-end 2013, long-term interest rates had climbed above 3% for the first time in more than two years, and municipal bond prices fell as anxious investors withdrew from the market. However, interest rates soon moderated and bond prices rebounded when harsh winter weather in much of the U.S. contributed to an economic contraction during the first quarter of 2014.
Although the recovery appeared to get back on track during the spring, favorable supply-and-demand dynamics kept long-term interest rates low. Less refinancing activity produced a reduced supply of newly issued tax-exempt securities over the first eight months of 2014, while demand intensified from investors seeking competitive after-tax yields. This constructive environment enabled municipal bonds to produce highly competitive total returns for the reporting period, with longer term and lower rated securities faring particularly well.
The U.S. economic rebound persisted through the reporting period’s end, resulting in better underlying credit conditions.Tax revenues increased, helping most states achieve budget surpluses. Isolated credit problems in Detroit and Puerto Rico were notable exceptions to recovering credit conditions.
The Funds 23
DISCUSSION OF FUND PERFORMANCE (continued)
Constructive Investment Posture Buoyed Fund Results
Constructive positioning helped the fund participate more than fully in the market’s gains over the reporting period. A relatively long average duration, including an emphasis on municipal bonds with maturities of 15 years and more, enhanced the fund’s exposure to a particularly strong segment of the market’s maturity spectrum.The fund also held overweighted exposure to investment-grade bonds with “single-A” and “triple-B” credit ratings, which fared well when yield differences narrowed along the market’s credit quality range.
Our security selection strategy also produced positive results for the fund. California bonds gained value as the state’s fiscal condition improved, and bonds issued on behalf of Texas transportation facilities and charter schools produced strong results. More generally, the fund received positive contributions from revenue-backed bonds from hospitals, airports, and toll roads.
Although disappointments over the reporting period proved mild, the fund’s cash holdings dampened its relative performance to a degree, as did a small allocation to struggling Puerto Rico bonds. At times, the fund employed futures contracts to establish some of its strategies, but these derivative instruments weighed on returns. The fund achieved more positive results through the use of inverse floaters, which helped enhance the fund’s overall yield.
A More Cautious Investment Posture
The U.S. economic recovery has gained additional momentum, as evidenced by a strengthening labor market and improved consumer confidence. In addition, we believe that investors are returning their focus to market and issuer fundamentals now that it appears the Federal Reserve Board is close to ending its quantitative easing program. From a technical standpoint, we currently expect the supply of newly issued municipal bonds to increase as issuers become more comfortable borrowing in a better economic climate.
In light of these factors, we have adopted a more defensive stance.We have reduced the fund’s average duration toward the neutral range, and we have trimmed its holdings of lower-rated securities in favor of their higher quality counterparts. In our view, these are prudent strategies in today’s changing market environment.
September 15, 2014
Bond funds are subject generally to interest rate, credit, liquidity, and market risks, to varying degrees, all of which are more fully described in the fund’s prospectus. Generally, all other factors being equal, bond prices are inversely related to interest-rate changes, and rate increases can cause price declines.
| 1 | Total return includes reinvestment of dividends and any capital gains paid. Past |
| performance is no guarantee of future results. Share price, yield, and investment | |
| return fluctuate such that upon redemption, fund shares may be worth more or | |
| less than their original cost. Income may be subject to state and local taxes, and | |
| some income may be subject to the federal alternative minimum tax (AMT) for | |
| certain investors. Capital gains, if any, are fully taxable. | |
| 2 | SOURCE: LIPPER INC. — Reflects reinvestment of dividends and, |
| where applicable, capital gain distributions.The Barclays Municipal Bond | |
| Index is an unmanaged total return performance benchmark for the | |
| investment-grade, geographically unrestricted tax-exempt bond market. Index | |
| return does not reflect the fees and expenses associated with operating a | |
| mutual fund. Investors cannot invest directly in any index. |
24
FUND PERFORMANCE
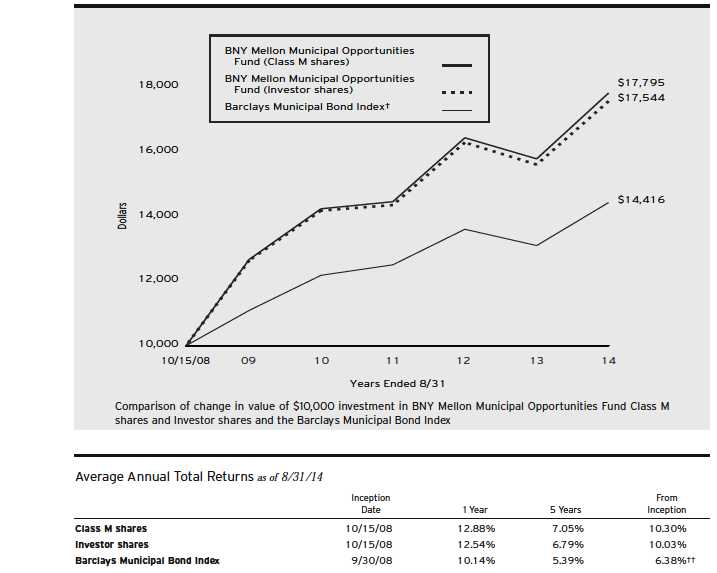
| † Source: Lipper Inc. |
| Past performance is not predictive of future performance.The fund’s performance shown in the graph and table does not reflect the deduction of taxes that a shareholder |
| would pay on fund distributions or the redemption of fund shares. |
| The above graph compares a $10,000 investment made in Class M shares and Investor shares of BNY Mellon Municipal Opportunities Fund on 10/15/08 (inception |
| date) to a $10,000 investment made in the Barclays Municipal Bond Index (the “Index”) on that date.All dividends and capital gain distributions are reinvested. |
| The fund’s performance shown in the line graph above takes into account all applicable fees and expenses for Class M and Investor shares.The Index is an unmanaged |
| total return performance benchmark for the long-term, investment-grade, tax-exempt bond market. Unlike a mutual fund, the Index is not subject to charges, fees and |
| other expenses. Investors cannot invest directly in any index. Further information relating to fund performance, including expense reimbursements, if applicable, is |
| contained in the Financial Highlights section of the prospectus and elsewhere in this report. |
| †† For comparative purposes, the value of the Index as of 9/30/08 is used as the beginning value on 10/15/08. |
The Funds 25
UNDERSTANDING YOUR FUND’S EXPENSES (Unaudited)
As a mutual fund investor, you pay ongoing expenses, such as management fees and other expenses. Using the information below, you can estimate how these expenses affect your investment and compare them with the expenses of other funds.You also may pay one-time transaction expenses, including sales charges (loads) and redemptions fees, which are not shown in this section and would have resulted in higher total expenses. For more information, see your fund’s prospectus or talk to your financial adviser.
Review your fund’s expenses
The table below shows the expenses you would have paid on a $1,000 investment in each class of each BNY Mellon municipal bond fund from March 1, 2014 to August 31, 2014. It also shows how much a $1,000 investment would be worth at the close of the period, assuming actual returns and expenses.
| Expenses and Value of a $1,000 Investment | ||
| assuming actual returns for the six months ended August 31, 2014 | ||
| Class M Shares | Investor Shares | |
| BNY Mellon National Intermediate | ||
| Municipal Bond Fund | ||
| Expenses paid per $1,000† | $2.55 | $3.83 |
| Ending value (after expenses) | $1,026.00 | $1,025.60 |
| Annualized expense ratio (%) | .50 | .75 |
| BNY Mellon National Short-Term | ||
| Municipal Bond Fund | ||
| Expenses paid per $1,000† | $2.52 | $3.83 |
| Ending value (after expenses) | $1,002.20 | $1,001.00 |
| Annualized expense ratio (%) | .50 | .76 |
| BNY Mellon Pennsylvania | ||
| Intermediate Municipal Bond Fund | ||
| Expenses paid per $1,000† | $3.47 | $4.74 |
| Ending value (after expenses) | $1,024.80 | $1,023.60 |
| Annualized expense ratio (%) | .68 | .93 |
| BNY Mellon Massachusetts | ||
| Intermediate Municipal Bond Fund | ||
| Expenses paid per $1,000† | $2.70 | $3.97 |
| Ending value (after expenses) | $1,022.00 | $1,020.80 |
| Annualized expense ratio (%) | .53 | .78 |
| BNY Mellon New York | ||
| Intermediate Tax-Exempt Bond Fund | ||
| Expenses paid per $1,000† | $3.02 | $4.30 |
| Ending value (after expenses) | $1,030.00 | $1,028.70 |
| Annualized expense ratio (%) | .59 | .84 |
| BNY Mellon Municipal | ||
| Opportunities Fund | ||
| Expenses paid per $1,000† | $3.63 | $5.18 |
| Ending value (after expenses) | $1,056.90 | $1,054.80 |
| Annualized expense ratio (%) | .70 | 1.00 |
| † Expenses are equal to each fund’s annualized expense ratio as shown above, multiplied by the average account value over the period, multiplied by 184/365 (to reflect the |
| one-half year period). |
26
COMPARING YOUR FUND’S EXPENSES WITH THOSE OF OTHER FUNDS (Unaudited)
Using the SEC’s method to compare expenses
The Securities and Exchange Commission (SEC) has established guidelines to help investors assess fund expenses. Per these guidelines, the table below shows your fund’s expenses based on a $1,000 investment, assuming a hypothetical 5% annualized return.You can use this information to compare the ongoing expenses (but not transaction expenses or total cost) of investing in the fund with those of other funds. All mutual fund shareholder reports will provide this information to help you make this comparison. Please note that you cannot use this information to estimate your actual ending account balance and expenses paid during the period.
| Expenses and Value of a $1,000 Investment | ||
| assuming a hypothetical 5% annualized return for the six months ended August 31, 2014 | ||
| Class M Shares | Investor Shares | |
| BNY Mellon National Intermediate | ||
| Municipal Bond Fund | ||
| Expenses paid per $1,000† | $2.55 | $3.82 |
| Ending value (after expenses) | $1,022.68 | $1,021.42 |
| Annualized expense ratio (%) | .50 | .75 |
| BNY Mellon National Short-Term | ||
| Municipal Bond Fund | ||
| Expenses paid per $1,000† | $2.55 | $3.87 |
| Ending value (after expenses) | $1,022.68 | $1,021.37 |
| Annualized expense ratio (%) | .50 | .76 |
| BNY Mellon Pennsylvania | ||
| Intermediate Municipal Bond Fund | ||
| Expenses paid per $1,000† | $3.47 | $4.74 |
| Ending value (after expenses) | $1,021.78 | $1,020.52 |
| Annualized expense ratio (%) | .68 | .93 |
| BNY Mellon Massachusetts | ||
| Intermediate Municipal Bond Fund | ||
| Expenses paid per $1,000† | $2.70 | $3.97 |
| Ending value (after expenses) | $1,022.53 | $1,021.27 |
| Annualized expense ratio (%) | .53 | .78 |
| BNY Mellon New York | ||
| Intermediate Tax-Exempt Bond Fund | ||
| Expenses paid per $1,000† | $3.01 | $4.28 |
| Ending value (after expenses) | $1,022.23 | $1,020.97 |
| Annualized expense ratio (%) | .59 | .84 |
| BNY Mellon Municipal | ||
| Opportunities Fund | ||
| Expenses paid per $1,000† | $3.57 | $5.09 |
| Ending value (after expenses) | $1,021.68 | $1,020.16 |
| Annualized expense ratio (%) | .70 | 1.00 |
| † Expenses are equal to each fund’s annualized expense ratio as shown above, multiplied by the average account value over the period, multiplied by 184/365 (to reflect the |
| one-half year period). |
The Funds 27
| STATEMENT OF INVESTMENTS |
| August 31, 2014 |
| BNY Mellon National Intermediate Municipal Bond Fund | |||||
| Long-Term Municipal | Coupon | Maturity | Principal | ||
| Investments—99.1% | Rate (%) | Date | Amount ($) | Value ($) | |
| Alabama—1.7% | |||||
| Alabama 21st Century Authority, Tobacco Settlement Revenue | 5.00 | 6/1/20 | 1,500,000 | 1,753,170 | |
| Alabama 21st Century Authority, Tobacco Settlement Revenue | 5.00 | 6/1/21 | 1,240,000 | 1,455,847 | |
| Birmingham Special Care Facilities Financing Authority-Baptist | |||||
| Medical Centers, Revenue (Baptist Health System, Inc.) | 5.00 | 11/15/15 | 5,000,000 | 5,235,600 | |
| Jefferson County, Limited Obligation School Warrants | 5.25 | 1/1/15 | 1,815,000 | 1,827,705 | |
| Jefferson County, Limited Obligation School Warrants | 5.25 | 1/1/16 | 4,810,000 | 4,843,670 | |
| Jefferson County, Limited Obligation School Warrants | |||||
| (Insured; Assured Guaranty Municipal Corp.) | 5.00 | 1/1/24 | 13,325,000 | 13,331,263 | |
| Montgomery BMC Special Care Facilities Financing | |||||
| Authority, Revenue (Baptist Health) | |||||
| (Insured; National Public Finance Guarantee Corp.) | 5.00 | 11/15/14 | 2,500,000 | 2,525,650 | |
| Alaska—.5% | |||||
| Valdez, Marine Terminal Revenue (BP Pipelines (Alaska) Inc. Project) | 5.00 | 1/1/18 | 8,000,000 | 9,038,240 | |
| Arizona—2.5% | |||||
| Arizona Board of Regents, Arizona State University System | |||||
| Revenue (Polytechnic Campus Project) | 6.00 | 7/1/25 | 2,500,000 | 2,936,425 | |
| Arizona Board of Regents, Arizona State University System | |||||
| Revenue (Polytechnic Campus Project) | 6.00 | 7/1/26 | 1,000,000 | 1,171,700 | |
| Arizona Board of Regents, Arizona State University System | |||||
| Revenue (Polytechnic Campus Project) | 6.00 | 7/1/28 | 1,100,000 | 1,279,498 | |
| Arizona Transportation Board, Highway Revenue | 5.00 | 7/1/26 | 5,000,000 | 5,702,400 | |
| Arizona Transportation Board, Highway Revenue (Prerefunded) | 5.00 | 7/1/16 | 15,000,000 | a | 16,287,450 |
| Arizona Transportation Board, Subordinated Highway Revenue | 5.00 | 7/1/31 | 4,335,000 | 5,036,663 | |
| Glendale, Senior Lien Water and Sewer Revenue Obligations | 5.00 | 7/1/26 | 4,425,000 | 5,180,480 | |
| Phoenix, GO | 6.25 | 7/1/16 | 1,250,000 | 1,386,162 | |
| Salt River Project Agricultural Improvement and Power District, | |||||
| Salt River Project Electric System Revenue | 5.00 | 12/1/26 | 2,000,000 | 2,366,340 | |
| University Medical Center Corporation, HR | 5.25 | 7/1/16 | 2,310,000 | 2,319,194 | |
| University of Arizona Board of Regents, System Revenue | 6.20 | 6/1/16 | 3,570,000 | 3,770,420 | |
| California—18.1% | |||||
| Alameda Corridor Transportation Authority, | |||||
| Subordinate Lien Revenue (Insured; AMBAC) | 5.25 | 10/1/21 | 5,000,000 | 5,485,100 | |
| Bay Area Toll Authority, | |||||
| San Francisco Bay Area Toll Bridge Revenue | 1.88 | 4/1/19 | 10,000,000 | 10,230,300 | |
| California, Economic Recovery Bonds | 5.00 | 7/1/15 | 2,950,000 | 2,951,770 | |
| California, GO (Various Purpose) | 5.00 | 2/1/21 | 4,000,000 | 4,835,840 | |
| California, GO (Various Purpose) | 5.00 | 9/1/21 | 11,200,000 | 13,673,856 | |
| California, GO (Various Purpose) | 5.00 | 9/1/21 | 5,000,000 | 6,104,400 | |
| California, GO (Various Purpose) | 5.25 | 10/1/23 | 5,000,000 | 6,133,800 | |
| California, GO (Various Purpose) | 5.00 | 12/1/23 | 12,500,000 | 15,479,875 | |
| California, GO (Various Purpose) | 5.00 | 12/1/23 | 2,500,000 | 3,095,975 | |
| California, GO (Various Purpose) | 5.25 | 9/1/29 | 10,000,000 | 12,066,400 | |
| California, GO (Various Purpose) | 6.00 | 3/1/33 | 11,445,000 | 13,883,586 | |
28
| BNY Mellon National Intermediate Municipal Bond Fund (continued) | |||||
| Long-Term Municipal | Coupon | Maturity | Principal | ||
| Investments (continued) | Rate (%) | Date | Amount ($) | Value ($) | |
| California (continued) | |||||
| California, GO (Various Purpose) | 6.50 | 4/1/33 | 8,750,000 | 10,702,562 | |
| California, GO (Various Purpose) | 5.50 | 3/1/40 | 7,950,000 | 9,198,389 | |
| California Department of Water Resources, | |||||
| Power Supply Revenue | 5.00 | 5/1/22 | 5,000,000 | 5,956,800 | |
| California Department of Water Resources, Power Supply | |||||
| Revenue (Insured; Assured Guaranty Municipal Corp.) | 5.00 | 5/1/21 | 11,985,000 | 13,852,263 | |
| California Department of Water Resources, | |||||
| Water System Revenue (Central Valley Project) | 5.00 | 12/1/19 | 5,000,000 | 6,005,700 | |
| California Health Facilities Financing Authority, | |||||
| Revenue (City of Hope) | 5.00 | 11/15/23 | 1,500,000 | 1,782,135 | |
| California Health Facilities Financing Authority, | |||||
| Revenue (City of Hope) | 5.00 | 11/15/24 | 1,600,000 | 1,884,496 | |
| California Health Facilities Financing Authority, | |||||
| Revenue (Providence Health and Services) (Prerefunded) | 6.25 | 10/1/18 | 8,500,000 | a | 10,396,180 |
| California Health Facilities Financing Authority, Revenue | |||||
| (Providence Health and Services) (Prerefunded) | 6.25 | 10/1/18 | 4,000,000 | a | 4,892,320 |
| California Health Facilities Financing Authority, Revenue | |||||
| (Providence Health and Services) (Prerefunded) | 6.50 | 10/1/18 | 60,000 | a | 73,934 |
| California Health Facilities Financing Authority, Revenue | |||||
| (Providence Health and Services) (Prerefunded) | 6.50 | 10/1/18 | 3,440,000 | a | 4,234,193 |
| California Health Facilities Financing Authority, | |||||
| Revenue (Saint Joseph Health System) | 5.00 | 10/17/17 | 5,000,000 | 5,685,900 | |
| California Pollution Control Financing Authority, | |||||
| SWDR (Waste Management, Inc. Project) | 5.00 | 1/1/22 | 2,250,000 | 2,403,540 | |
| California Pollution Control Financing Authority, | |||||
| SWDR (Waste Management, Inc. Project) | 5.00 | 7/1/27 | 2,000,000 | 2,063,920 | |
| California State Public Works Board, LR (Department of | |||||
| General Services) (Capitol East End Complex—Blocks | |||||
| 171-174 and 225) (Insured; AMBAC) | 5.25 | 12/1/19 | 5,000,000 | 5,019,850 | |
| California State Public Works Board, LR (Department of | |||||
| General Services) (Capitol East End Complex—Blocks | |||||
| 171-174 and 225) (Insured; AMBAC) | 5.00 | 12/1/23 | 4,000,000 | 4,015,040 | |
| California State Public Works Board, LR (Various Capital Projects) | 5.00 | 4/1/19 | 8,760,000 | 10,295,540 | |
| California State Public Works Board, LR (Various Capital Projects) | 5.00 | 10/1/20 | 2,000,000 | 2,416,200 | |
| California State Public Works Board, LR (Various Capital Projects) | 5.00 | 11/1/20 | 1,350,000 | 1,633,243 | |
| California Statewide Communities Development Authority, | |||||
| Mortgage Revenue (Methodist Hospital of | |||||
| Southern California Project) (Collateralized; FHA) | 6.25 | 8/1/24 | 4,285,000 | 5,144,228 | |
| California Statewide Communities Development Authority, | |||||
| Revenue (Saint Joseph Health System) | |||||
| (Insured; Assured Guaranty Municipal Corp.) | 4.50 | 7/1/18 | 2,200,000 | 2,364,142 | |
| Los Angeles County Metropolitan Transportation Authority, | |||||
| Proposition A First Tier Senior Sales Tax Revenue | 5.00 | 7/1/20 | 7,165,000 | 8,702,681 | |
| Los Angeles Department of Airports, Senior Revenue | |||||
| (Los Angeles International Airport) | 5.25 | 5/15/26 | 15,520,000 | 18,287,061 | |
The Funds 29
STATEMENT OF INVESTMENTS (continued)
| BNY Mellon National Intermediate Municipal Bond Fund (continued) | |||||
| Long-Term Municipal | Coupon | Maturity | Principal | ||
| Investments (continued) | Rate (%) | Date | Amount ($) | Value ($) | |
| California (continued) | |||||
| Los Angeles Unified School District, GO | 5.00 | 7/1/24 | 15,000,000 | 18,848,250 | |
| Los Angeles Unified School District, GO (Insured; | |||||
| Assured Guaranty Municipal Corp.) (Prerefunded) | 5.00 | 7/1/17 | 2,395,000 | a | 2,701,680 |
| Los Angeles Unified School District, GO | |||||
| (Insured; National Public Finance Guarantee Corp.) | 5.75 | 7/1/16 | 2,000,000 | 2,201,880 | |
| New Haven Unified School District, GO | |||||
| (Insured; Assured Guaranty Corp.) | 0.00 | 8/1/33 | 4,000,000 | b | 1,788,280 |
| Port of Oakland, Revenue | 5.00 | 5/1/18 | 1,835,000 | 2,111,571 | |
| Port of Oakland, Revenue | 5.00 | 5/1/19 | 2,250,000 | 2,639,430 | |
| Port of Oakland, Revenue | 5.00 | 5/1/23 | 1,875,000 | 2,174,512 | |
| Riverside County Transportation Commission, Sales Tax Revenue | 5.25 | 6/1/25 | 4,635,000 | 5,750,969 | |
| Riverside County Transportation Commission, Sales Tax Revenue | 5.25 | 6/1/28 | 5,000,000 | 6,101,800 | |
| Sacramento County Sanitation Districts Financing Authority, | |||||
| Subordinate Lien Revenue (Sacramento Regional | |||||
| County Sanitation District) (Insured; FGIC) | 0.69 | 12/1/35 | 10,000,000 | c | 8,831,700 |
| Sacramento County Water Financing Authority, Revenue | |||||
| (Sacramento County Water Agency Zones 40 and 41 Water | |||||
| System Project) (Insured; National Public Finance Guarantee Corp.) | 0.70 | 6/1/34 | 8,000,000 | c | 7,124,720 |
| San Francisco City and County Airport Commission, | |||||
| Second Series Revenue (San Francisco International Airport) | 5.00 | 5/1/25 | 5,000,000 | 5,887,600 | |
| San Francisco City and County Airport Commission, | |||||
| Second Series Revenue (San Francisco International Airport) | 5.00 | 5/1/26 | 5,000,000 | 5,863,850 | |
| San Francisco City and County Public Utilities Commission, | |||||
| San Francisco Water Revenue | 5.00 | 11/1/37 | 11,000,000 | 12,490,280 | |
| Southern California Public Power Authority, | |||||
| Gas Project Revenue (Project Number 1) | 5.25 | 11/1/20 | 4,000,000 | 4,605,640 | |
| Southern California Public Power Authority, | |||||
| Revenue (Apex Power Project) | 5.00 | 7/1/30 | 1,000,000 | 1,189,440 | |
| Southern California Public Power Authority, | |||||
| Revenue (Apex Power Project) | 5.00 | 7/1/31 | 3,855,000 | 4,559,810 | |
| Southern California Public Power Authority, | |||||
| Revenue (Apex Power Project) | 5.00 | 7/1/32 | 8,000,000 | 9,447,600 | |
| Southern California Public Power Authority, | |||||
| Revenue (Apex Power Project) | 5.00 | 7/1/33 | 3,380,000 | 3,972,582 | |
| Colorado—4.0% | |||||
| City and County of Denver, Airport System Revenue | |||||
| (Insured: Assured Guaranty Corp. and | |||||
| National Public Finance Guarantee Corp.) | 5.25 | 11/15/19 | 4,445,000 | 4,990,135 | |
| Colorado Health Facilities Authority, | |||||
| Revenue (Catholic Health Initiatives) | 6.00 | 10/1/23 | 2,000,000 | 2,341,780 | |
| Colorado Health Facilities Authority, | |||||
| Revenue (Catholic Health Initiatives) | 6.25 | 10/1/33 | 1,600,000 | 1,847,792 | |
| Colorado Health Facilities Authority, Revenue | |||||
| (Vail Valley Medical Center Project) | 5.00 | 1/15/20 | 280,000 | 283,206 | |
30
| BNY Mellon National Intermediate Municipal Bond Fund (continued) | |||||
| Long-Term Municipal | Coupon | Maturity | Principal | ||
| Investments (continued) | Rate (%) | Date | Amount ($) | Value ($) | |
| Colorado (continued) | |||||
| Colorado Health Facilities Authority, Revenue | |||||
| (Vail Valley Medical Center Project) (Prerefunded) | 5.00 | 1/15/15 | 970,000 | a | 987,848 |
| E-470 Public Highway Authority, Senior Revenue | |||||
| (Insured; National Public Finance Guarantee Corp.) | 5.00 | 9/1/16 | 3,565,000 | 3,843,213 | |
| E-470 Public Highway Authority, Senior Revenue | |||||
| (Insured; National Public Finance Guarantee Corp.) | 5.25 | 9/1/16 | 5,000,000 | 5,414,950 | |
| E-470 Public Highway Authority, Senior Revenue | |||||
| (Insured; National Public Finance Guarantee Corp.) | 1.80 | 9/1/17 | 5,000,000 | c | 5,037,500 |
| E-470 Public Highway Authority, Senior Revenue | |||||
| (Insured; National Public Finance Guarantee Corp.) | 5.00 | 9/1/17 | 3,500,000 | 3,873,520 | |
| Northwest Parkway Public Highway Authority, | |||||
| Revenue (Insured; AMBAC) (Prerefunded) | 5.45 | 6/15/16 | 7,690,000 | a | 8,379,178 |
| Northwest Parkway Public Highway Authority, | |||||
| Revenue (Insured; AMBAC) (Prerefunded) | 5.70 | 6/15/16 | 7,345,000 | a | 8,036,018 |
| Northwest Parkway Public Highway Authority, Revenue | |||||
| (Insured; Assured Guaranty Municipal Corp.) (Prerefunded) | 5.55 | 6/15/16 | 10,960,000 | a | 11,961,854 |
| Public Authority for Colorado Energy, Natural Gas Purchase Revenue | 5.75 | 11/15/18 | 2,220,000 | 2,485,845 | |
| Public Authority for Colorado Energy, Natural Gas Purchase Revenue | 6.13 | 11/15/23 | 5,350,000 | 6,691,459 | |
| Regional Transportation District, COP | 5.00 | 6/1/19 | 1,750,000 | 2,034,882 | |
| Regional Transportation District, COP | 5.00 | 6/1/20 | 2,700,000 | 3,151,818 | |
| Regional Transportation District, COP | 5.50 | 6/1/22 | 2,200,000 | 2,579,918 | |
| Connecticut—1.1% | |||||
| Connecticut, GO | 5.00 | 4/15/22 | 5,000,000 | 6,065,450 | |
| Connecticut, GO | 5.00 | 5/15/23 | 10,000,000 | 11,885,800 | |
| Connecticut, GO (Insured; AMBAC) | 5.25 | 6/1/18 | 1,500,000 | 1,742,805 | |
| Delaware—1.1% | |||||
| Delaware, GO | 5.00 | 2/1/23 | 5,000,000 | 5,985,700 | |
| Delaware River and Bay Authority, Revenue | 5.00 | 1/1/21 | 2,000,000 | 2,353,520 | |
| Delaware River and Bay Authority, Revenue | 5.00 | 1/1/22 | 2,710,000 | 3,212,434 | |
| Delaware River and Bay Authority, Revenue | 5.00 | 1/1/23 | 1,500,000 | 1,782,105 | |
| Delaware River and Bay Authority, Revenue | 5.00 | 1/1/24 | 1,000,000 | 1,199,470 | |
| University of Delaware, Revenue | 5.00 | 11/1/27 | 5,440,000 | 6,522,397 | |
| District of Columbia—.7% | |||||
| District of Columbia, GO (Insured; | |||||
| Assured Guaranty Municipal Corp.) | 3.30 | 6/1/16 | 5,000,000 | c | 5,187,100 |
| Metropolitan Washington Airports Authority, | |||||
| Airport System Revenue | 5.00 | 10/1/23 | 4,250,000 | 4,959,495 | |
| Metropolitan Washington Airports Authority, | |||||
| Airport System Revenue | 5.00 | 10/1/24 | 2,500,000 | 2,916,900 | |
| Florida—4.9% | |||||
| Florida Department of Transportation, | |||||
| State Infrastructure Bank Revenue | 5.00 | 7/1/19 | 4,220,000 | 4,706,355 | |
The Funds 31
STATEMENT OF INVESTMENTS (continued)
| BNY Mellon National Intermediate Municipal Bond Fund (continued) | |||||
| Long-Term Municipal | Coupon | Maturity | Principal | ||
| Investments (continued) | Rate (%) | Date | Amount ($) | Value ($) | |
| Florida (continued) | |||||
| Florida Department of Transportation, | |||||
| State Infrastructure Bank Revenue | 5.00 | 7/1/20 | 2,500,000 | 2,789,325 | |
| Hillsborough County Aviation Authority, Revenue | |||||
| (Tampa International Airport) (Insured; AMBAC) | 5.13 | 10/1/20 | 3,540,000 | 3,727,018 | |
| Hillsborough County Aviation Authority, Revenue | |||||
| (Tampa International Airport) (Insured; AMBAC) | 5.13 | 10/1/21 | 3,675,000 | 3,867,386 | |
| Jacksonville, Better Jacksonville Sales Tax Revenue | 5.00 | 10/1/17 | 2,000,000 | 2,263,960 | |
| Jacksonville, Better Jacksonville Sales Tax Revenue | 5.00 | 10/1/21 | 2,500,000 | 2,999,750 | |
| Jacksonville Electric Authority, Revenue | |||||
| (Saint Johns River Power Park System) | 5.00 | 10/1/18 | 8,500,000 | 9,866,035 | |
| Jacksonville Electric Authority, Revenue | |||||
| (Saint Johns River Power Park System) | 5.00 | 10/1/21 | 2,000,000 | 2,308,800 | |
| Jacksonville Electric Authority, Revenue | |||||
| (Saint Johns River Power Park System) | 5.00 | 10/1/22 | 1,625,000 | 1,875,412 | |
| Jacksonville Electric Authority, Revenue | |||||
| (Saint Johns River Power Park System) | 5.00 | 10/1/24 | 1,000,000 | 1,154,100 | |
| Lee County, Airport Revenue | 5.50 | 10/1/23 | 2,500,000 | 2,987,450 | |
| Lee County, Airport Revenue | 5.50 | 10/1/24 | 5,000,000 | 5,910,800 | |
| Miami-Dade County, Aviation Revenue (Miami International Airport) | 5.50 | 10/1/25 | 4,175,000 | 4,965,202 | |
| Miami-Dade County, Subordinate Special Obligation Bonds | |||||
| (Insured; National Public Finance Guarantee Corp.) | 5.00 | 10/1/22 | 2,000,000 | 2,195,440 | |
| Orlando Utilities Commission, Utility System Revenue | 3.12 | 10/1/16 | 13,400,000 | c | 13,955,162 |
| Port Saint Lucie, Utility System Revenue | |||||
| (Insured; National Public Finance Guarantee Corp.) | 5.00 | 9/1/29 | 5,000,000 | 5,334,700 | |
| Sarasota County, Revenue (Environmentally | |||||
| Sensitive Lands and Parkland Program) | 5.25 | 10/1/24 | 1,790,000 | 1,954,644 | |
| Sarasota County, Revenue (Environmentally | |||||
| Sensitive Lands and Parkland Program) | 5.25 | 10/1/25 | 6,170,000 | 6,712,096 | |
| Sarasota County, Revenue (Environmentally | |||||
| Sensitive Lands and Parkland Program) | 5.25 | 10/1/28 | 2,105,000 | 2,267,843 | |
| Sarasota County, Revenue (Environmentally | |||||
| Sensitive Lands and Parkland Program) | 5.25 | 10/1/29 | 1,085,000 | 1,165,496 | |
| Sarasota County, Revenue (Environmentally | |||||
| Sensitive Lands and Parkland Program) (Prerefunded) | 5.25 | 10/1/18 | 245,000 | a | 288,495 |
| Sarasota County, Revenue (Environmentally Sensitive | |||||
| Lands and Parkland Program) (Prerefunded) | 5.25 | 10/1/18 | 240,000 | a | 282,607 |
| Sarasota County, Revenue (Environmentally Sensitive | |||||
| Lands and Parkland Program) (Prerefunded) | 5.25 | 10/1/18 | 210,000 | a | 247,281 |
| Sarasota County, Revenue (Environmentally Sensitive | |||||
| Lands and Parkland Program) (Prerefunded) | 5.25 | 10/1/18 | 725,000 | a | 853,709 |
| Tampa Bay Water, A Regional Water Supply Authority, | |||||
| Utility System Revenue | 5.00 | 10/1/20 | 5,000,000 | 6,004,950 | |
| Georgia—1.5% | |||||
| Burke County Development Authority, PCR | |||||
| (Oglethorpe Power Corporation Vogtle Project) | 7.00 | 1/1/23 | 6,000,000 | 6,996,900 | |
32
| BNY Mellon National Intermediate Municipal Bond Fund (continued) | |||||
| Long-Term Municipal | Coupon | Maturity | Principal | ||
| Investments (continued) | Rate (%) | Date | Amount ($) | Value ($) | |
| Georgia (continued) | |||||
| Crisp County Development Authority, EIR | |||||
| (International Paper Company Project) | 5.55 | 2/1/15 | 1,000,000 | 1,019,260 | |
| DeKalb County, Water and Sewerage Revenue | 5.25 | 10/1/36 | 3,500,000 | 4,025,945 | |
| Main Street Natural Gas Inc., Gas Project Revenue | 6.38 | 7/15/38 | 1,335,000 | d | 215,002 |
| Municipal Electric Authority of Georgia, GO | |||||
| (Project One Subordinated Bonds) | 5.75 | 1/1/20 | 5,000,000 | 5,887,850 | |
| Private Colleges and Universities Authority, | |||||
| Revenue (Emory University) | 5.00 | 9/1/18 | 2,000,000 | 2,096,280 | |
| Private Colleges and Universities Authority, | |||||
| Revenue (Emory University) | 5.00 | 9/1/41 | 6,990,000 | 7,832,225 | |
| Hawaii—.7% | |||||
| Hawaii Department of Budget and Finance, Special Purpose | |||||
| Revenue (The Queen’s Health Systems) (Insured; AMBAC) | 0.22 | 7/1/24 | 14,250,000 | c | 13,555,313 |
| Idaho—.6% | |||||
| University of Idaho Regents, General Revenue | 5.25 | 4/1/21 | 10,025,000 | 11,776,769 | |
| Illinois—5.5% | |||||
| Chicago, General Airport Senior Lien Revenue | |||||
| (Chicago O’Hare International Airport) | 5.00 | 1/1/22 | 4,615,000 | 5,501,680 | |
| Chicago, General Airport Senior Lien Revenue | |||||
| (Chicago O’Hare International Airport) | 5.00 | 1/1/25 | 7,055,000 | 8,221,897 | |
| Chicago, GO | 5.00 | 1/1/22 | 5,000,000 | 5,517,200 | |
| Chicago, GO (Modern Schools Across Chicago | |||||
| Program) (Insured; AMBAC) | 5.00 | 12/1/17 | 1,110,000 | 1,204,028 | |
| Chicago, GO (Project and Refunding Series) | |||||
| (Insured; Assured Guaranty Municipal Corp.) | 5.00 | 1/1/26 | 6,940,000 | 7,092,541 | |
| Illinois, GO | 5.00 | 8/1/18 | 19,900,000 | 22,131,387 | |
| Illinois, GO | 5.00 | 8/1/19 | 10,000,000 | 11,232,100 | |
| Illinois, GO | 5.00 | 9/1/19 | 7,500,000 | 7,529,325 | |
| Illinois, GO | 5.00 | 2/1/26 | 5,000,000 | 5,475,100 | |
| Illinois, GO | 5.25 | 2/1/28 | 6,000,000 | 6,527,820 | |
| Illinois, GO (Insured; Assured Guaranty Municipal Corp.) | 5.00 | 1/1/20 | 5,000,000 | 5,673,100 | |
| Illinois Finance Authority, Gas Supply Revenue (The Peoples | |||||
| Gas Light and Coke Company Project) (Insured; AMBAC) | 4.30 | 6/1/16 | 2,500,000 | 2,651,600 | |
| Railsplitter Tobacco Settlement Authority, | |||||
| Tobacco Settlement Revenue | 5.00 | 6/1/15 | 3,500,000 | 3,613,890 | |
| Railsplitter Tobacco Settlement Authority, | |||||
| Tobacco Settlement Revenue | 6.25 | 6/1/24 | 10,000,000 | 10,951,200 | |
| Indiana—.1% | |||||
| Indiana Finance Authority, Acquisition Revenue | |||||
| (National Collegiate Athletic Association Project) | 5.00 | 5/1/15 | 1,000,000 | 1,032,490 | |
| Kansas—2.4% | |||||
| Harvey County Unified School District Number 373, | |||||
| GO Improvement Bonds (Insured; National Public | |||||
| Finance Guarantee Corp.) | 5.00 | 9/1/21 | 1,700,000 | 1,924,315 | |
The Funds 33
STATEMENT OF INVESTMENTS (continued)
| BNY Mellon National Intermediate Municipal Bond Fund (continued) | |||||
| Long-Term Municipal | Coupon | Maturity | Principal | ||
| Investments (continued) | Rate (%) | Date | Amount ($) | Value ($) | |
| Kansas (continued) | |||||
| Kansas Department of Transportation, Highway Revenue | 5.00 | 9/1/27 | 10,000,000 | 12,335,500 | |
| Kansas Department of Transportation, Highway Revenue | 5.00 | 9/1/28 | 6,000,000 | 7,355,340 | |
| Kansas Development Finance Authority, Revenue | |||||
| (University of Kansas Projects) | 4.00 | 5/1/21 | 3,370,000 | 3,772,985 | |
| Wichita, Water and Sewer Utility Revenue | 5.00 | 10/1/21 | 7,990,000 | 9,684,359 | |
| Wichita, Water and Sewer Utility Revenue | 5.00 | 10/1/22 | 8,390,000 | 10,070,265 | |
| Kentucky—.2% | |||||
| Kentucky Housing Corporation, Housing Revenue | 4.80 | 7/1/20 | 1,580,000 | 1,591,408 | |
| Kentucky Property and Buildings Commission, | |||||
| Revenue (Project Number 100) | 5.00 | 8/1/21 | 1,785,000 | 2,123,418 | |
| Louisiana—1.9% | |||||
| Jefferson Sales Tax District, Special Sales Tax | |||||
| Revenue (Insured; AMBAC) | 5.25 | 12/1/21 | 4,000,000 | 4,525,920 | |
| Louisiana Citizens Property Insurance Corporation, | |||||
| Assessment Revenue (Insured; AMBAC) | 5.00 | 6/1/21 | 5,500,000 | 5,876,530 | |
| Louisiana Citizens Property Insurance Corporation, | |||||
| Assessment Revenue (Insured; Assured Guaranty Corp.) | 6.13 | 6/1/25 | 14,500,000 | 16,929,040 | |
| Louisiana Local Government Environmental Facilities and | |||||
| Community Development Authority, Revenue (Louisiana Community | |||||
| and Technical College System Facilities Corporation Project) | 5.00 | 10/1/22 | 5,000,000 | 5,736,850 | |
| Louisiana Public Facilities Authority, Revenue | |||||
| (CHRISTUS Health Obligated Group) | 6.00 | 7/1/29 | 2,000,000 | 2,231,060 | |
| Maryland—1.2% | |||||
| Anne Arundel County, Consolidated General Improvements GO | 5.00 | 4/1/28 | 2,480,000 | 2,961,269 | |
| Anne Arundel County, Consolidated General Improvements GO | 5.00 | 4/1/29 | 4,640,000 | 5,509,814 | |
| Anne Arundel County, Consolidated General Improvements GO | 5.00 | 4/1/30 | 4,640,000 | 5,482,346 | |
| Maryland Department of Transportation, | |||||
| Consolidated Transportation Revenue | 5.00 | 12/1/21 | 6,300,000 | 7,727,706 | |
| Massachusetts—1.7% | |||||
| Massachusetts, GO | 0.62 | 11/1/18 | 2,000,000 | c | 2,036,820 |
| Massachusetts, GO (Consolidated Loan) | 5.00 | 7/1/25 | 7,000,000 | 8,462,860 | |
| Massachusetts, GO (Insured; National Public Finance Guarantee Corp.) | 5.50 | 10/1/20 | 3,285,000 | 4,067,848 | |
| Massachusetts Development Finance Agency, Revenue | |||||
| (Combined Jewish Philanthropies of Greater Boston, Inc. Project) | 4.75 | 2/1/15 | 675,000 | 684,970 | |
| Massachusetts Health and Educational Facilities Authority, | |||||
| Revenue (Simmons College Issue) | 7.50 | 10/1/22 | 2,000,000 | 2,459,900 | |
| Massachusetts Health and Educational Facilities Authority, | |||||
| Revenue (Simmons College Issue) | 8.00 | 10/1/29 | 2,950,000 | 3,183,493 | |
| Massachusetts Health and Educational Facilities Authority, | |||||
| Revenue (Simmons College Issue) | 8.00 | 10/1/39 | 885,000 | 953,402 | |
| Massachusetts Health and Educational Facilities Authority, | |||||
| Revenue (Simmons College Issue) (Prerefunded) | 8.00 | 10/1/15 | 2,050,000 | a | 2,225,255 |
| Massachusetts Health and Educational Facilities Authority, | |||||
| Revenue (Simmons College Issue) (Prerefunded) | 8.00 | 10/1/15 | 615,000 | a | 667,576 |
34
| BNY Mellon National Intermediate Municipal Bond Fund (continued) | |||||
| Long-Term Municipal | Coupon | Maturity | Principal | ||
| Investments (continued) | Rate (%) | Date | Amount ($) | Value ($) | |
| Massachusetts (continued) | |||||
| Massachusetts School Building Authority, | |||||
| Dedicated Sales Tax Revenue (Insured; AMBAC) | 5.00 | 8/15/20 | 6,000,000 | 6,745,920 | |
| Massachusetts School Building Authority, Dedicated Sales Tax | |||||
| Revenue (Insured; Assured Guaranty Municipal Corp.) | 5.00 | 8/15/30 | 60,000 | 62,469 | |
| Massachusetts School Building Authority, | |||||
| Dedicated Sales Tax Revenue (Insured; Assured | |||||
| Guaranty Municipal Corp.) (Prerefunded) | 5.00 | 8/15/15 | 190,000 | a | 198,909 |
| Massachusetts Water Pollution Abatement Trust, | |||||
| Water Pollution Abatement Revenue (MWRA Program) | 5.75 | 8/1/29 | 380,000 | 381,664 | |
| Michigan—1.7% | |||||
| Detroit, Water Supply System Second Lien | |||||
| Revenue (Insured; FGIC) | 5.75 | 7/1/22 | 7,000,000 | 7,972,090 | |
| Michigan, Grant Anticipation Bonds | |||||
| (Insured; Assured Guaranty Municipal Corp.) | 5.25 | 9/15/23 | 7,500,000 | 8,459,775 | |
| Michigan Building Authority, Revenue (Facilities Program) | 5.00 | 10/15/22 | 2,400,000 | 2,853,984 | |
| Michigan Finance Authority, Local Government Loan Program | |||||
| Revenue (Detroit Water and Sewerage Department, | |||||
| Sewage Disposal System Revenue Senior Lien Local Project | |||||
| Bonds) (Insured; Assured Guaranty Municipal Corp.) | 5.00 | 7/1/26 | 1,875,000 | 2,070,337 | |
| Michigan Finance Authority, Local Government Loan Program | |||||
| Revenue (Detroit Water and Sewerage Department, | |||||
| Sewage Disposal System Revenue Senior Lien Local Project | |||||
| Bonds) (Insured; Assured Guaranty Municipal Corp.) | 5.00 | 7/1/27 | 3,000,000 | 3,299,550 | |
| Michigan Finance Authority, Local Government Loan Program | |||||
| Revenue (Detroit Water and Sewerage Department, | |||||
| Sewage Disposal System Revenue Senior Lien Local Project | |||||
| Bonds) (Insured; Assured Guaranty Municipal Corp.) | 5.00 | 7/1/28 | 2,500,000 | 2,732,425 | |
| Michigan Finance Authority, Local Government Loan Program | |||||
| Revenue (Detroit Water and Sewerage Department, | |||||
| Water Supply System Revenue Senior Lien Local Project | |||||
| Bonds) (Insured; Assured Guaranty Municipal Corp.) | 5.00 | 7/1/26 | 2,500,000 | 2,760,450 | |
| Michigan Municipal Bond Authority, | |||||
| Drinking Water Revolving Fund Revenue | 5.50 | 10/1/15 | 1,000,000 | 1,058,350 | |
| Minnesota—1.5% | |||||
| Minneapolis, Health Care System | |||||
| Revenue (Fairview Health Services) | 6.63 | 11/15/28 | 12,000,000 | 14,272,560 | |
| University of Minnesota Regents, Special Purpose | |||||
| Revenue (State Supported Stadium Debt) | 5.00 | 8/1/19 | 6,300,000 | 6,846,525 | |
| Western Minnesota Municipal Power Agency, Power Supply Revenue | 5.00 | 1/1/20 | 3,725,000 | 4,424,071 | |
| Western Minnesota Municipal Power Agency, Power Supply Revenue | 5.00 | 1/1/22 | 1,500,000 | 1,817,670 | |
| Mississippi—.1% | |||||
| Mississippi Home Corporation, SFMR | |||||
| (Collateralized: FHLMC, FNMA and GNMA) | 4.38 | 12/1/18 | 685,000 | 732,875 | |
| Mississippi State University Educational Building Corporation, | |||||
| Revenue (Insured; National Public Finance Guarantee Corp.) | 5.25 | 8/1/16 | 400,000 | 437,704 | |
The Funds 35
STATEMENT OF INVESTMENTS (continued)
| BNY Mellon National Intermediate Municipal Bond Fund (continued) | |||||
| Long-Term Municipal | Coupon | Maturity | Principal | ||
| Investments (continued) | Rate (%) | Date | Amount ($) | Value ($) | |
| Missouri—2.1% | |||||
| Missouri Environmental Improvement and Energy Resources | |||||
| Authority, Water Pollution Control and Drinking | |||||
| Water Revenue (State Revolving Funds Programs) | 5.00 | 7/1/21 | 1,550,000 | 1,895,185 | |
| Missouri Environmental Improvement and Energy Resources | |||||
| Authority, Water Pollution Control and Drinking | |||||
| Water Revenue (State Revolving Funds Programs) | 5.00 | 7/1/22 | 1,750,000 | 2,162,037 | |
| Missouri Environmental Improvement and Energy Resources | |||||
| Authority, Water Pollution Control and Drinking | |||||
| Water Revenue (State Revolving Funds Programs) | 5.00 | 7/1/23 | 2,200,000 | 2,747,426 | |
| Missouri Environmental Improvement and Energy Resources | |||||
| Authority, Water Pollution Control and Drinking | |||||
| Water Revenue (State Revolving Funds Programs) | 5.00 | 1/1/26 | 750,000 | 916,815 | |
| Missouri Highways and Transportation Commission, | |||||
| First Lien State Road Revenue | 5.00 | 5/1/23 | 25,625,000 | 31,921,831 | |
| Nebraska—.1% | |||||
| Omaha City, GO (City of Omaha Convention | |||||
| Center/Arena Project) (Escrowed to Maturity) | 6.50 | 12/1/16 | 1,000,000 | 1,137,470 | |
| Nevada—1.4% | |||||
| Clark County, Highway Revenue (Motor Vehicle Fuel Tax) | 5.00 | 7/1/28 | 10,000,000 | 11,429,200 | |
| Clark County School District, GO (Insured; | |||||
| National Public Finance Guarantee Corp.) | 5.00 | 6/15/20 | 12,930,000 | 14,819,202 | |
| New Jersey—5.4% | |||||
| Garden State Preservation Trust, Open Space and Farmland | |||||
| Preservation Revenue (Insured; Assured Guaranty Municipal Corp.) | 5.13 | 11/1/16 | 1,000,000 | 1,104,650 | |
| Garden State Preservation Trust, Open Space and | |||||
| Farmland Preservation Revenue (Insured; | |||||
| Assured Guaranty Municipal Corp.) (Prerefunded) | 5.80 | 11/1/15 | 5,000,000 | a | 5,328,350 |
| Garden State Preservation Trust, Open Space and | |||||
| Farmland Preservation Revenue (Insured; | |||||
| Assured Guaranty Municipal Corp.) (Prerefunded) | 5.80 | 11/1/15 | 5,000,000 | a | 5,328,350 |
| Garden State Preservation Trust, Open Space and | |||||
| Farmland Preservation Revenue (Insured; | |||||
| Assured Guaranty Municipal Corp.) (Prerefunded) | 5.80 | 11/1/15 | 5,000,000 | a | 5,328,350 |
| Garden State Preservation Trust, Open Space and | |||||
| Farmland Preservation Revenue (Insured; | |||||
| Assured Guaranty Municipal Corp.) (Prerefunded) | 5.80 | 11/1/15 | 2,500,000 | a | 2,664,175 |
| New Jersey Economic Development Authority, | |||||
| School Facilities Construction Revenue | 5.00 | 6/15/19 | 10,000,000 | 11,446,300 | |
| New Jersey Economic Development Authority, | |||||
| School Facilities Construction Revenue | 5.00 | 9/1/20 | 5,555,000 | 6,418,080 | |
| New Jersey Economic Development Authority, | |||||
| School Facilities Construction Revenue | 5.00 | 3/1/25 | 13,000,000 | 14,876,550 | |
| New Jersey Economic Development Authority, | |||||
| School Facilities Construction Revenue (Insured; AMBAC) | 5.25 | 12/15/20 | 5,000,000 | 5,864,250 | |
36
| BNY Mellon National Intermediate Municipal Bond Fund (continued) | |||||
| Long-Term Municipal | Coupon | Maturity | Principal | ||
| Investments (continued) | Rate (%) | Date | Amount ($) | Value ($) | |
| New Jersey (continued) | |||||
| New Jersey Economic Development Authority, | |||||
| School Facilities Construction Revenue | |||||
| (Insured; National Public Finance Guarantee Corp.) | 5.50 | 9/1/23 | 10,000,000 | 12,202,700 | |
| New Jersey Educational Facilities Authority, | |||||
| Revenue (University of Medicine and Dentistry of | |||||
| New Jersey Issue) (Prerefunded) | 7.50 | 6/1/19 | 3,750,000 | a | 4,884,263 |
| New Jersey Health Care Facilities Financing Authority, | |||||
| Revenue (Barnabas Health Issue) | 5.00 | 7/1/22 | 1,830,000 | 2,148,127 | |
| New Jersey Health Care Facilities Financing Authority, | |||||
| Revenue (Barnabas Health Issue) | 5.00 | 7/1/24 | 1,000,000 | 1,152,330 | |
| New Jersey Health Care Facilities Financing Authority, | |||||
| Revenue (Meridian Health System Obligated Group Issue) | 5.00 | 7/1/19 | 2,000,000 | 2,321,440 | |
| New Jersey Transportation Trust Fund | |||||
| Authority (Transportation System) | 0.00 | 12/15/29 | 10,000,000 | b | 5,147,000 |
| New Jersey Transportation Trust Fund | |||||
| Authority (Transportation System) | 5.50 | 6/15/31 | 5,000,000 | 5,794,600 | |
| New Jersey Turnpike Authority, Turnpike Revenue | 5.00 | 1/1/33 | 5,000,000 | 5,765,700 | |
| Rutgers, The State University, GO | 5.00 | 5/1/21 | 2,000,000 | 2,414,000 | |
| New Mexico—.6% | |||||
| New Mexico Finance Authority, | |||||
| State Transportation Senior Lien Revenue | 5.00 | 6/15/18 | 5,000,000 | 5,790,150 | |
| New Mexico Municipal Energy Acquisition Authority, | |||||
| Gas Supply Revenue | 5.00 | 8/1/19 | 5,000,000 | 5,808,700 | |
| New York—12.6% | |||||
| Albany Industrial Development Agency, Civic Facility | |||||
| Revenue (Saint Peter’s Hospital of the City of Albany Project) | 5.75 | 11/15/22 | 1,000,000 | 1,137,290 | |
| Greece Central School District, GO (Insured; FGIC) | 6.00 | 6/15/15 | 950,000 | 994,546 | |
| Metropolitan Transportation Authority, Dedicated Tax Fund | |||||
| Revenue (Insured; National Public Finance Guarantee Corp.) | 5.00 | 11/15/28 | 2,880,000 | 3,133,757 | |
| Metropolitan Transportation Authority, | |||||
| State Service Contract Revenue | 5.75 | 1/1/18 | 1,500,000 | 1,744,395 | |
| Metropolitan Transportation Authority, Transportation Revenue | 5.00 | 11/15/24 | 5,000,000 | 5,621,100 | |
| Metropolitan Transportation Authority, Transportation Revenue | 6.50 | 11/15/28 | 12,000,000 | 14,625,360 | |
| Metropolitan Transportation Authority, Transportation | |||||
| Revenue (Insured; Assured Guaranty Municipal Corp.) | 0.32 | 11/1/22 | 9,175,000 | c | 8,876,813 |
| New York City, GO | 5.00 | 8/1/18 | 5,000,000 | 5,796,600 | |
| New York City, GO | 5.00 | 8/1/20 | 18,505,000 | 22,052,038 | |
| New York City, GO | 5.00 | 8/1/23 | 5,000,000 | 6,075,400 | |
| New York City, GO | 5.13 | 12/1/24 | 5,000,000 | 5,649,500 | |
| New York City, GO | 5.00 | 10/1/25 | 2,500,000 | 2,967,475 | |
| New York City, GO | 5.00 | 8/1/26 | 5,660,000 | 6,692,327 | |
| New York City, GO | 5.00 | 8/1/28 | 16,000,000 | 18,711,680 | |
The Funds 37
STATEMENT OF INVESTMENTS (continued)
| BNY Mellon National Intermediate Municipal Bond Fund (continued) | |||||
| Long-Term Municipal | Coupon | Maturity | Principal | ||
| Investments (continued) | Rate (%) | Date | Amount ($) | Value ($) | |
| New York (continued) | |||||
| New York City Transitional Finance Authority, | |||||
| Future Tax Secured Subordinate Revenue | 5.00 | 2/1/23 | 13,000,000 | 15,452,580 | |
| New York City Transitional Finance Authority, | |||||
| Future Tax Secured Subordinate Revenue | 5.00 | 11/1/25 | 15,000,000 | 17,990,700 | |
| New York Liberty Development Corporation, | |||||
| Revenue (Goldman Sachs Headquarters Issue) | 5.00 | 10/1/15 | 1,000,000 | 1,042,810 | |
| New York State Dormitory Authority, Revenue (Columbia University) | 5.00 | 10/1/41 | 7,500,000 | 8,609,775 | |
| New York State Dormitory Authority, Revenue | |||||
| (Consolidated City University System) | |||||
| (Insured; Assured Guaranty Municipal Corp.) | 5.75 | 7/1/18 | 165,000 | 180,465 | |
| New York State Dormitory Authority, | |||||
| Revenue (The Rockefeller University) | 5.00 | 7/1/40 | 10,000,000 | 11,320,200 | |
| New York State Dormitory Authority, | |||||
| State Personal Income Tax Revenue (Education) | 5.00 | 3/15/35 | 4,190,000 | 4,284,568 | |
| New York State Dormitory Authority, | |||||
| State Personal Income Tax Revenue (General Purpose) | 5.00 | 3/15/20 | 20,000,000 | 23,859,000 | |
| New York State Thruway Authority, | |||||
| General Revenue Junior Indebtedness Obligations | 5.00 | 5/1/19 | 8,000,000 | 9,338,240 | |
| New York State Thruway Authority, | |||||
| Second General Highway and Bridge Trust Fund Bonds | 5.00 | 4/1/16 | 5,000,000 | 5,370,550 | |
| New York State Thruway Authority, | |||||
| Second General Highway and Bridge Trust Fund Bonds | 5.00 | 4/1/21 | 5,000,000 | 5,626,900 | |
| New York State Thruway Authority, Second General | |||||
| Highway and Bridge Trust Fund Bonds | |||||
| (Insured; Assured Guaranty Municipal Corp.) | 5.00 | 4/1/24 | 4,500,000 | 4,987,980 | |
| Port Authority of New York and New Jersey | |||||
| (Consolidated Bonds, 139th Series) | |||||
| (Insured; National Public Finance Guarantee Corp. ) | 5.00 | 10/1/16 | 5,440,000 | �� | 5,646,176 |
| Port Authority of New York and New Jersey | |||||
| (Consolidated Bonds, 184th Series) | 5.00 | 9/1/31 | 1,145,000 | 1,355,256 | |
| Port Authority of New York and New Jersey | |||||
| (Consolidated Bonds, 184th Series) | 5.00 | 9/1/32 | 2,500,000 | 2,942,425 | |
| Tobacco Settlement Financing Corporation of New York, | |||||
| Asset-Backed Revenue (State Contingency Contract Secured) | 5.00 | 6/1/20 | 5,000,000 | 5,398,300 | |
| Triborough Bridge and Tunnel Authority, | |||||
| Subordinate Revenue (MTA Bridges and Tunnels) | 0.00 | 11/15/29 | 10,000,000 | b | 5,783,900 |
| Utility Debt Securitization Authority of New York, | |||||
| Restructuring Bonds | 5.00 | 12/15/26 | 2,500,000 | 3,042,825 | |
| North Carolina—3.1% | |||||
| North Carolina, GO | 5.00 | 5/1/21 | 1,500,000 | 1,830,585 | |
| North Carolina Eastern Municipal Power Agency, | |||||
| Power System Revenue | 5.00 | 1/1/17 | 8,000,000 | 8,813,280 | |
| North Carolina Eastern Municipal Power Agency, | |||||
| Power System Revenue | 5.25 | 1/1/20 | 5,000,000 | 5,635,300 | |
38
| BNY Mellon National Intermediate Municipal Bond Fund (continued) | ||||
| Long-Term Municipal | Coupon | Maturity | Principal | |
| Investments (continued) | Rate (%) | Date | Amount ($) | Value ($) |
| North Carolina (continued) | ||||
| North Carolina Eastern Municipal Power Agency, | ||||
| Power System Revenue | 5.00 | 1/1/26 | 18,000,000 | 20,260,980 |
| North Carolina Eastern Municipal Power Agency, | ||||
| Power System Revenue (Escrowed to Maturity) | 5.00 | 1/1/17 | 8,050,000 | 8,547,007 |
| North Carolina Municipal Power Agency Number 1, | ||||
| Catawba Electric Revenue | 5.00 | 1/1/24 | 5,500,000 | 6,316,860 |
| Wake County, LOR | 5.00 | 1/1/24 | 5,955,000 | 6,962,050 |
| Ohio—.7% | ||||
| Columbus, GO (Various Purpose Limited Tax) | 5.00 | 7/1/21 | 3,005,000 | 3,656,815 |
| Hamilton County, Sewer System Improvement Revenue | ||||
| (The Metropolitan Sewer District of Greater Cincinnati) | 5.00 | 12/1/26 | 3,500,000 | 4,247,600 |
| Montgomery County, Revenue (Catholic Health Initiatives) | 6.00 | 10/1/23 | 3,055,000 | 3,574,442 |
| Ohio Housing Finance Agency, MFHR (Uptown Towers | ||||
| Apartments Project) (Collateralized; GNMA) | 4.75 | 10/20/15 | 280,000 | 285,743 |
| Toledo-Lucas County Port Authority, Port Facilities | ||||
| Revenue (Cargill, Inc. Project) | 4.50 | 12/1/15 | 900,000 | 936,270 |
| Oregon—1.1% | ||||
| Oregon, GO | 5.00 | 11/1/18 | 5,000,000 | 5,854,950 |
| Oregon, GO | 5.00 | 11/1/19 | 5,000,000 | 5,976,150 |
| Oregon, GO | 5.00 | 11/1/20 | 3,100,000 | 3,761,633 |
| Tri-County Metropolitan Transportation District, | ||||
| Payroll Tax and Grant Receipt Revenue | 5.00 | 11/1/18 | 5,000,000 | 5,576,550 |
| Pennsylvania—2.3% | ||||
| Allegheny County Hospital Development Authority, | ||||
| Revenue (University of Pittsburgh Medical Center) | 5.25 | 6/15/15 | 1,620,000 | 1,684,994 |
| Pennsylvania, GO | 5.00 | 6/15/22 | 12,470,000 | 15,118,628 |
| Pennsylvania Turnpike Commission, Turnpike Revenue | 5.00 | 12/1/31 | 5,110,000 | 5,742,873 |
| Pennsylvania Turnpike Commission, | ||||
| Turnpike Subordinate Revenue | 5.00 | 6/1/18 | 5,000,000 | 5,704,800 |
| Pennsylvania Turnpike Commission, Turnpike Subordinate Revenue | 5.00 | 12/1/20 | 3,675,000 | 4,335,067 |
| Pennsylvania Turnpike Commission, Turnpike Subordinate Revenue | 5.00 | 12/1/21 | 3,740,000 | 4,410,619 |
| Philadelphia School District, GO (Insured; AMBAC) | 5.00 | 4/1/17 | 2,165,000 | 2,223,845 |
| State Public School Building Authority, School Lease | ||||
| Revenue (The School District of Philadelphia Project) | 5.00 | 4/1/22 | 1,000,000 | 1,153,160 |
| State Public School Building Authority, School Lease | ||||
| Revenue (The School District of Philadelphia Project) | 5.00 | 4/1/25 | 2,750,000 | 3,145,367 |
| South Carolina—.2% | ||||
| Greenville County School District, Installment Purchase | ||||
| Revenue (Building Equity Sooner for Tomorrow) | 5.50 | 12/1/18 | 3,000,000 | 3,554,790 |
| Newberry Investing in Children’s Education, | ||||
| Installment Purchase Revenue (School District of | ||||
| Newberry County, South Carolina Project) | 5.25 | 12/1/20 | 1,000,000 | 1,054,880 |
The Funds 39
STATEMENT OF INVESTMENTS (continued)
| BNY Mellon National Intermediate Municipal Bond Fund (continued) | |||||
| Long-Term Municipal | Coupon | Maturity | Principal | ||
| Investments (continued) | Rate (%) | Date | Amount ($) | Value ($) | |
| South Dakota—.1% | |||||
| South Dakota Educational Enhancement Funding | |||||
| Corporation, Tobacco Settlement Revenue | 5.00 | 6/1/25 | 1,800,000 | 2,024,784 | |
| South Dakota Educational Enhancement Funding | |||||
| Corporation, Tobacco Settlement Revenue | 5.00 | 6/1/27 | 500,000 | 554,925 | |
| Tennessee—.6% | |||||
| Metropolitan Government of Nashville and | |||||
| Davidson County, GO Improvement Bonds | 5.00 | 7/1/25 | 10,000,000 | 11,817,700 | |
| Texas—6.5% | |||||
| Clifton Higher Education Finance Corporation, | |||||
| Education Revenue (IDEA Public Schools) | 5.00 | 8/15/23 | 1,100,000 | 1,240,679 | |
| Dallas and Fort Worth, Joint Revenue | |||||
| (Dallas/Fort Worth International Airport) | 5.00 | 11/1/26 | 3,000,000 | 3,485,010 | |
| Dallas and Fort Worth, Joint Revenue | |||||
| (Dallas/Fort Worth International Airport) | 5.00 | 11/1/27 | 3,400,000 | 3,924,892 | |
| Forney Independent School District, Unlimited Tax School | |||||
| Building Bonds (Permanent School Fund Guarantee Program) | 5.75 | 8/15/33 | 1,000,000 | 1,161,350 | |
| Harris County, Toll Road Senior Lien Revenue | 5.00 | 8/15/23 | 12,500,000 | 14,614,625 | |
| Harris County, Unlimited Tax Road Bonds | 5.00 | 10/1/21 | 13,705,000 | 16,123,247 | |
| Harris County Health Facilities Development Corporation, HR | |||||
| (Memorial Hermann Healthcare System) (Prerefunded) | 7.00 | 12/1/18 | 5,000,000 | a | 6,269,250 |
| Houston, Combined Utility System First Lien Revenue | 5.00 | 5/15/21 | 5,000,000 | 6,048,800 | |
| Houston, Public Improvement GO | 5.00 | 3/1/18 | 5,000,000 | 5,738,100 | |
| Houston Community College System, Limited Tax Bonds | 5.00 | 2/15/21 | 2,250,000 | 2,713,612 | |
| Katy Independent School District, Unlimited Tax | |||||
| Refunding Bonds (Permanent School Fund Guarantee Program) | 0.00 | 2/15/16 | 1,505,000 | b | 1,496,738 |
| Lower Colorado River Authority, Revenue (Escrowed to Maturity) | 5.00 | 5/15/16 | 15,000 | 16,202 | |
| Lower Colorado River Authority, Revenue (Escrowed to Maturity) | 5.00 | 5/15/16 | 35,000 | 37,804 | |
| San Antonio, Electric and Gas Systems Revenue | 5.00 | 2/1/17 | 5,000,000 | 5,547,800 | |
| Texas Public Finance Authority, GO | 5.00 | 10/1/23 | 9,385,000 | 11,309,300 | |
| Texas Transportation Commission, Highway Improvement GO | 5.00 | 4/1/27 | 5,000,000 | 5,976,400 | |
| Texas Transportation Commission, | |||||
| State Highway Fund First Tier Revenue | 5.00 | 4/1/20 | 15,000,000 | 16,675,800 | |
| Texas Transportation Commission, | |||||
| State Highway Fund First Tier Revenue | 5.00 | 4/1/21 | 12,500,000 | 15,191,500 | |
| Texas Water Development Board, | |||||
| State Revolving Fund Subordinate Lien Revenue | 5.00 | 7/15/24 | 3,650,000 | 4,061,172 | |
| Utah—1.6% | |||||
| Utah, GO | 5.00 | 7/1/20 | 20,000,000 | 24,135,400 | |
| Utah Associated Municipal Power Systems, | |||||
| Revenue (Payson Power Project) | 5.00 | 4/1/22 | 5,675,000 | 6,637,650 | |
| Virginia—2.6% | |||||
| Virginia, GO | 5.00 | 6/1/23 | 5,490,000 | 6,652,672 | |
40
| BNY Mellon National Intermediate Municipal Bond Fund (continued) | ||||
| Long-Term Municipal | Coupon | Maturity | Principal | |
| Investments (continued) | Rate (%) | Date | Amount ($) | Value ($) |
| Virginia (continued) | ||||
| Virginia College Building Authority, Educational Facilities | ||||
| Revenue (21st Century College and Equipment Programs) | 5.00 | 2/1/19 | 7,000,000 | 8,203,650 |
| Virginia College Building Authority, Educational Facilities | ||||
| Revenue (21st Century College and Equipment Programs) | 5.00 | 2/1/21 | 2,235,000 | 2,698,472 |
| Virginia College Building Authority, Educational Facilities | ||||
| Revenue (21st Century College and Equipment Programs) | 5.00 | 2/1/23 | 11,285,000 | 13,476,434 |
| Virginia Public Building Authority, Public Facilities Revenue | 5.00 | 8/1/18 | 8,370,000 | 9,712,213 |
| Virginia Public Building Authority, Public Facilities Revenue | 5.00 | 8/1/19 | 6,950,000 | 8,228,592 |
| Washington—2.3% | ||||
| Energy Northwest, Electric Revenue (Columbia Generating Station) | 5.00 | 7/1/20 | 10,955,000 | 13,094,292 |
| FYI Properties, LR (State of Washington | ||||
| Department of Information Services Project) | 5.25 | 6/1/29 | 5,625,000 | 6,395,963 |
| Washington, Federal Highway Grant Anticipation | ||||
| Revenue (State Road 520 Corridor Program) | 5.00 | 9/1/22 | 5,000,000 | 6,021,750 |
| Washington, Federal Highway Grant Anticipation | ||||
| Revenue (State Road 520 Corridor Program) | 5.00 | 9/1/23 | 5,000,000 | 6,058,450 |
| Washington, Motor Vehicle Fuel Tax GO | 5.00 | 8/1/23 | 3,570,000 | 4,292,782 |
| Washington Health Care Facilities Authority, | ||||
| Revenue (Providence Health and Services) | 5.00 | 10/1/21 | 5,550,000 | 6,640,187 |
| West Virginia—.1% | ||||
| Monongalia County Building Commission, HR | ||||
| (Monongalia General Hospital) | 5.25 | 7/1/20 | 2,575,000 | 2,629,333 |
| Wisconsin—.7% | ||||
| Wisconsin, GO | 5.00 | 5/1/20 | 5,800,000 | 6,669,420 |
| Wisconsin, GO | 5.00 | 5/1/25 | 5,000,000 | 5,841,900 |
| U.S. Related—1.3% | ||||
| A.B. Won International Airport Authority of Guam, | ||||
| General Revenue (Insured; Assured Guaranty Municipal Corp.) | 5.50 | 10/1/33 | 1,000,000 | 1,134,930 |
| Puerto Rico Electric Power Authority, Power Revenue | 5.25 | 7/1/18 | 5,000,000 | 2,754,750 |
| Puerto Rico Electric Power Authority, Power Revenue | 5.25 | 7/1/23 | 5,000,000 | 2,749,750 |
| Puerto Rico Electric Power Authority, Power Revenue | ||||
| (Insured; National Public Finance Guarantee Corp.) | 5.00 | 7/1/17 | 3,940,000 | 3,966,122 |
| Puerto Rico Public Buildings Authority, | ||||
| Government Facilities Revenue | 5.50 | 7/1/15 | 995,000 | 967,230 |
| Puerto Rico Public Buildings Authority, | ||||
| Government Facilities Revenue | 5.50 | 7/1/16 | 1,995,000 | 1,803,600 |
| Puerto Rico Public Buildings Authority, | ||||
| Government Facilities Revenue (Escrowed to Maturity) | 5.50 | 7/1/15 | 5,000 | 5,216 |
| Puerto Rico Public Buildings Authority, | ||||
| Government Facilities Revenue (Escrowed to Maturity) | 5.50 | 7/1/16 | 5,000 | 5,455 |
| Puerto Rico Public Buildings Authority, | ||||
| Government Facilities Revenue (Escrowed to Maturity) | 5.75 | 7/1/17 | 5,000 | 5,699 |
The Funds 41
STATEMENT OF INVESTMENTS (continued)
| BNY Mellon National Intermediate Municipal Bond Fund (continued) | |||||
| Long-Term Municipal | Coupon | Maturity | Principal | ||
| Investments (continued) | Rate (%) | Date | Amount ($) | Value ($) | |
| U.S. Related (continued) | |||||
| Puerto Rico Sales Tax Financing Corporation, | |||||
| Sales Tax Revenue (First Subordinate Series) | 0/6.75 | 8/1/32 | 11,000,000 | e | 8,674,600 |
| Puerto Rico Sales Tax Financing Corporation, | |||||
| Sales Tax Revenue (First Subordinate Series) | 0/6.25 | 8/1/33 | 2,500,000 | e | 1,465,075 |
| Total Long-Term Municipal Investments | |||||
| (cost $1,742,850,139) | 1,853,041,954 | ||||
| Short-Term Municipal Investments—.1% | |||||
| Colorado—.0% | |||||
| Colorado Educational and Cultural Facilities Authority, | |||||
| Revenue (National Jewish Federation Bond Program) | |||||
| (LOC; JPMorgan Chase Bank) | 0.04 | 9/2/14 | 700,000 | f | 700,000 |
| Illinois—.0% | |||||
| Romeoville, Revenue (Lewis University) (LOC; Wells Fargo Bank) | 0.03 | 9/2/14 | 100,000 | f | 100,000 |
| New York—.1% | |||||
| New York City, GO Notes (LOC; JPMorgan Chase Bank) | 0.04 | 9/2/14 | 800,000 | f | 800,000 |
| Total Short-Term Municipal Investments | |||||
| (cost $1,600,000) | 1,600,000 | ||||
| Total Investments (cost $1,744,450,139) | 99.2 | % | 1,854,641,954 | ||
| Cash and Receivables (Net) | .8 | % | 14,975,176 | ||
| Net Assets | 100.0 | % | 1,869,617,130 | ||
| a These securities are prerefunded; the date shown represents the prerefunded date. Bonds which are prerefunded are collateralized by U.S. Government securities which are held in |
| escrow and are used to pay principal and interest on the municipal issue and to retire the bonds in full at the earliest refunding date. |
| b Security issued with a zero coupon. Income is recognized through the accretion of discount. |
| c Variable rate security—interest rate subject to periodic change. |
| d Non-income producing—security in default. |
| e Zero coupon until a specified date at which time the stated coupon rate becomes effective until maturity. |
| f Variable rate demand note—rate shown is the interest rate in effect at August 31, 2014. Maturity date represents the next demand date, or the ultimate maturity date if earlier. |
| Portfolio Summary (Unaudited) † | |||
| Value (%) | Value (%) | ||
| Transportation Services | 18.5 | Lease | 4.0 |
| State/Territory | 14.6 | County | 3.2 |
| Special Tax | 12.7 | Housing | .7 |
| Utility-Electric | 9.9 | Industrial | .5 |
| Education | 8.3 | Pollution Control | .3 |
| Utility-Water and Sewer | 6.9 | Resource Recovery | .1 |
| Prerefunded | 5.6 | Other | 5.1 |
| Health Care | 4.7 | ||
| City | 4.1 | 99.2 | |
| † | Based on net assets. |
42
| Summary of Abbreviations | |||
| ABAG | Association of Bay Area Governments | ACA | American Capital Access |
| AGC | ACE Guaranty Corporation | AGIC | Asset Guaranty Insurance Company |
| AMBAC | American Municipal Bond Assurance Corporation | ARRN | Adjustable Rate Receipt Notes |
| BAN | Bond Anticipation Notes | BPA | Bond Purchase Agreement |
| CIFG | CDC Ixis Financial Guaranty | COP | Certificate of Participation |
| CP | Commercial Paper | DRIVERS | Derivative Inverse Tax-Exempt Receipts |
| EDR | Economic Development Revenue | EIR | Environmental Improvement Revenue |
| FGIC | Financial Guaranty Insurance Company | FHA | Federal Housing Administration |
| FHLB | Federal Home Loan Bank | FHLMC | Federal Home Loan Mortgage Corporation |
| FNMA | Federal National Mortgage Association | GAN | Grant Anticipation Notes |
| GIC | Guaranteed Investment Contract | GNMA | Government National Mortgage Association |
| GO | General Obligation | HR | Hospital Revenue |
| IDB | Industrial Development Board | IDC | Industrial Development Corporation |
| IDR | Industrial Development Revenue | LIFERS | Long Inverse Floating Exempt Receipts |
| LOC | Letter of Credit | LOR | Limited Obligation Revenue |
| LR | Lease Revenue | MERLOTS | Municipal Exempt Receipts Liquidity Option Tender |
| MFHR | Multi-Family Housing Revenue | MFMR | Multi-Family Mortgage Revenue |
| PCR | Pollution Control Revenue | P-FLOATS | Puttable Floating Option Tax-Exempt Receipts |
| PILOT | Payment in Lieu of Taxes | PUTTERS | Puttable Tax-Exempt Receipts |
| RAC | Revenue Anticipation Certificates | RAN | Revenue Anticipation Notes |
| RAW | Revenue Anticipation Warrants | RIB | Residual Interest Bonds |
| ROCS | Reset Options Certificates | RRR | Resources Recovery Revenue |
| SAAN | State Aid Anticipation Notes | SBPA | Standby Bond Purchase Agreement |
| SFHR | Single Family Housing Revenue | SFMR | Single Family Mortgage Revenue |
| SONYMA | State of New York Mortgage Agency | SPEARS | Short Puttable Exempt Adjustable Receipts |
| SWDR | Solid Waste Disposal Revenue | TAN | Tax Anticipation Notes |
| TAW | Tax Anticipation Warrants | TRAN | Tax and Revenue Anticipation Notes |
| XLCA | XL Capital Assurance | ||
| See notes to financial statements. | |||
The Funds 43
STATEMENT OF FINANCIAL FUTURES
August 31, 2014
| Market Value | Unrealized | |||||
| BNY Mellon National | Covered by | (Depreciation) | ||||
| Intermediate Municipal Bond Fund | Contracts | Contracts ($) | Expiration | at 8/31/2014 | ($) | |
| Financial Futures Short | ||||||
| U.S. Treasury 5 Year Notes | 345 | (40,998,398 | ) | December 2014 | (95,692 | ) |
| U.S. Treasury 10 Year Notes | 340 | (42,765,625 | ) | December 2014 | (146,094 | ) |
| (241,786 | ) |
| See notes to financial statements. |
44
| STATEMENT OF INVESTMENTS |
| August 31, 2014 |
| BNY Mellon National Short-Term Municipal Bond Fund | |||||
| Long-Term Municipal | Coupon | Maturity | Principal | ||
| Investments—97.6% | Rate (%) | Date | Amount ($) | Value ($) | |
| Alabama—.1% | |||||
| Alabama 21st Century Authority, Tobacco Settlement Revenue | 4.00 | 6/1/16 | 1,000,000 | 1,059,670 | |
| Jefferson County, Limited Obligation School Warrants | |||||
| (Insured; Assured Guaranty Municipal Corp.) | 5.50 | 2/15/16 | 720,000 | 723,168 | |
| Alaska—.5% | |||||
| Valdez, Marine Terminal Revenue (BP Pipelines (Alaska) Inc. Project) | 5.00 | 1/1/16 | 2,525,000 | 2,684,328 | |
| Valdez, Marine Terminal Revenue (BP Pipelines (Alaska) Inc. Project) | 5.00 | 1/1/18 | 3,000,000 | 3,389,340 | |
| Arizona—.9% | |||||
| Arizona Transportation Board, Subordinated Highway Revenue | 5.00 | 7/1/16 | 5,000,000 | 5,433,050 | |
| Arizona Transportation Board, Transportation Excise Tax | |||||
| Revenue (Maricopa County Regional Area Road Fund) | 5.00 | 7/1/16 | 2,300,000 | 2,497,409 | |
| University of Arizona Board of Regents, System Revenue | 6.20 | 6/1/16 | 1,785,000 | 1,885,210 | |
| Yavapai County Industrial Development Authority, | |||||
| SWDR (Waste Management, Inc. Project) | 0.63 | 3/2/15 | 1,250,000 | 1,250,150 | |
| California—10.3% | |||||
| Bay Area Toll Authority, San Francisco Bay Area Toll Bridge Revenue | 1.00 | 4/3/17 | 20,000,000 | 20,132,000 | |
| Bay Area Toll Authority, San Francisco Bay Area Toll Bridge Revenue | 1.50 | 4/2/18 | 6,000,000 | 6,086,340 | |
| California, GO | 0.94 | 12/3/18 | 2,000,000 | a | 2,030,520 |
| California, GO (Various Purpose) | 5.00 | 9/1/16 | 10,000,000 | 10,937,200 | |
| California Health Facilities Financing Authority, | |||||
| Revenue (Cedars-Sinai Medical Center) | 5.00 | 8/15/15 | 1,000,000 | 1,047,060 | |
| California Health Facilities Financing Authority, Revenue | |||||
| (Lucile Salter Packard Children’s Hospital at Stanford) | 1.45 | 3/15/17 | 3,000,000 | 3,069,210 | |
| California Infrastructure and Economic Development Bank, | |||||
| Revenue (The J. Paul Getty Trust) | 0.33 | 4/1/16 | 5,000,000 | a | 5,000,500 |
| California Municipal Finance Authority, | |||||
| SWDR (Waste Management, Inc. Project) | 2.00 | 9/2/14 | 4,000,000 | 4,000,000 | |
| California Municipal Finance Authority, | |||||
| SWDR (Waste Management, Inc. Project) | 1.13 | 2/1/17 | 5,000,000 | 5,056,100 | |
| California Pollution Control Finance Authority, | |||||
| SWDR (USA Waste Services, Inc. Project) | 1.50 | 6/1/18 | 1,500,000 | 1,503,540 | |
| California Statewide Communities Development Authority, | |||||
| Revenue (Kaiser Permanente) | 5.00 | 5/1/17 | 3,500,000 | 3,920,735 | |
| California Statewide Communities Development Authority, | |||||
| Student Housing Revenue (University of California, Irvine East | |||||
| Campus Apartments, Phase 1 Refunding—CHF—Irvine, L.L.C.) | 4.00 | 5/15/15 | 1,150,000 | 1,178,428 | |
| California Statewide Communities Development Authority, | |||||
| Student Housing Revenue (University of California, Irvine East | |||||
| Campus Apartments, Phase 1 Refunding—CHF—Irvine, L.L.C.) | 4.00 | 5/15/16 | 1,450,000 | 1,531,620 | |
| Chula Vista, IDR (San Diego Gas and Electric Company) | 1.65 | 7/1/18 | 9,045,000 | 9,120,797 | |
| Contra Costa Transportation Authority, | |||||
| Sales Tax Revenue (Limited Tax Bonds) | 0.47 | 12/15/15 | 4,000,000 | a | 4,008,440 |
The Funds 45
STATEMENT OF INVESTMENTS (continued)
| BNY Mellon National Short-Term Municipal Bond Fund (continued) | |||||
| Long-Term Municipal | Coupon | Maturity | Principal | ||
| Investments (continued) | Rate (%) | Date | Amount ($) | Value ($) | |
| California (continued) | |||||
| Irvine Reassessment District Number 12-1, | |||||
| Limited Obligation Improvement Bonds | 3.00 | 9/2/16 | 2,000,000 | 2,089,420 | |
| Long Beach, Harbor Revenue Short-Term Notes | 5.00 | 11/15/18 | 7,500,000 | 8,806,950 | |
| Los Angeles Department of Water and Power, Power System Revenue | 5.00 | 1/1/16 | 10,000,000 | 10,532,600 | |
| Los Angeles Unified School District, GO | 4.00 | 7/1/16 | 4,000,000 | 4,273,880 | |
| Los Angeles Unified School District, GO | 5.00 | 7/1/18 | 10,500,000 | 12,183,255 | |
| Metropolitan Water District of Southern California, Water Revenue | 3.50 | 10/1/16 | 5,900,000 | 6,233,586 | |
| South San Francisco Unified School District, GO, BAN (Measure J) | 4.00 | 6/15/18 | 6,000,000 | 6,711,540 | |
| Colorado—1.9% | |||||
| City and County of Denver, Airport System Revenue | 4.00 | 11/15/14 | 1,310,000 | 1,320,912 | |
| City and County of Denver, Airport System Revenue | 4.00 | 11/15/15 | 1,000,000 | 1,046,570 | |
| City and County of Denver, Airport System Revenue | 5.00 | 11/15/16 | 1,000,000 | 1,101,280 | |
| Denver Urban Renewal Authority, | |||||
| Stapleton Senior Tax Increment Revenue | 5.00 | 12/1/16 | 1,850,000 | 2,027,896 | |
| Denver Urban Renewal Authority, | |||||
| Stapleton Senior Tax Increment Revenue | 5.00 | 12/1/17 | 4,005,000 | 4,523,447 | |
| E-470 Public Highway Authority, Senior Revenue | |||||
| (Insured; National Public Finance Guarantee Corp.) | 1.80 | 9/1/17 | 8,000,000 | a | 8,060,000 |
| Regional Transportation District of Colorado, | |||||
| COP (Lease Purchase Agreement) | 5.00 | 6/1/18 | 5,000,000 | 5,737,950 | |
| Connecticut—3.9% | |||||
| Bridgeport, GO | 4.00 | 8/15/18 | 2,000,000 | 2,223,820 | |
| Connecticut, GO | 5.00 | 9/1/17 | 7,875,000 | 8,908,357 | |
| Connecticut, GO (Insured; AMBAC) | 5.25 | 6/1/18 | 10,000,000 | 11,618,700 | |
| Connecticut, Special Tax Obligation Revenue | |||||
| (Transportation Infrastructure Purposes) | 5.00 | 12/1/16 | 2,900,000 | 3,202,209 | |
| Connecticut Health and Educational Facilities Authority, | |||||
| Revenue (Yale University Issue) | 1.35 | 7/21/16 | 10,000,000 | 10,183,400 | |
| Connecticut Health and Educational Facilities | |||||
| Authority, Revenue (Yale University Issue) | 0.80 | 7/26/17 | 10,000,000 | 10,034,900 | |
| New Haven, GO | 4.00 | 11/1/15 | 3,000,000 | 3,118,140 | |
| Florida—7.1% | |||||
| Citizens Property Insurance Corporation, | |||||
| High-Risk Account Senior Secured Revenue | 5.50 | 6/1/17 | 5,000,000 | 5,650,850 | |
| Citizens Property Insurance Corporation, Personal Lines | |||||
| Account/Commercial Lines Account Senior Secured Revenue | 1.30 | 6/1/15 | 5,000,000 | a | 5,033,800 |
| Citizens Property Insurance Corporation, Personal Lines | |||||
| Account/Commercial Lines Account Senior Secured Revenue | 5.00 | 6/1/16 | 10,000,000 | 10,788,200 | |
| Florida Department of Environmental Protection, | |||||
| Florida Forever Revenue | 5.00 | 7/1/18 | 3,960,000 | 4,560,692 | |
| Florida Hurricane Catastrophe Fund Finance Corporation, | |||||
| Revenue, (Escrowed to Maturity) | 5.00 | 7/1/15 | 10,000,000 | 10,401,700 | |
46
| BNY Mellon National Short-Term Municipal Bond Fund (continued) | ||||
| Long-Term Municipal | Coupon | Maturity | Principal | |
| Investments (continued) | Rate (%) | Date | Amount ($) | Value ($) |
| Florida (continued) | ||||
| Florida State Board of Education, | ||||
| Public Education Capital Outlay Bonds | 5.00 | 6/1/16 | 10,000,000 | 10,832,400 |
| Florida State Board of Education, | ||||
| Public Education Capital Outlay Bonds | 5.00 | 6/1/16 | 6,065,000 | 6,569,851 |
| Florida State Board of Education, | ||||
| Public Education Capital Outlay Bonds | 5.00 | 6/1/18 | 6,930,000 | 8,014,822 |
| Hillsborough County Aviation Authority, | ||||
| Subordinated Revenue (Tampa International Airport) | 4.00 | 10/1/15 | 1,500,000 | 1,562,550 |
| Hillsborough County Aviation Authority, | ||||
| Subordinated Revenue (Tampa International Airport) | 5.00 | 10/1/16 | 1,520,000 | 1,661,284 |
| Jacksonville, Special Revenue | 5.00 | 10/1/16 | 3,000,000 | 3,290,400 |
| Jacksonville Electric Authority, Revenue | ||||
| (Saint Johns River Power Park System) | 5.00 | 10/1/16 | 5,000,000 | 5,478,500 |
| Kissimmee Utility Authority, Electric System Revenue | 4.00 | 10/1/14 | 1,250,000 | 1,254,125 |
| Miami-Dade County, Aviation Revenue | 5.00 | 10/1/18 | 3,700,000 | 4,256,073 |
| Orange County School Board, COP | ||||
| (Master Lease Purchase Agreement) | 5.00 | 8/1/15 | 1,500,000 | 1,565,295 |
| Palm Beach County School Board, COP | ||||
| (Master Lease Purchase Agreement) | ||||
| (Insured; Assured Guaranty Municipal Corp.) | 5.00 | 8/1/17 | 5,000,000 | 5,220,150 |
| Putnam County Development Authority, PCR | ||||
| (Seminole Electric Cooperative, Inc. Project) | ||||
| (Insured; AMBAC) | 5.35 | 5/1/18 | 2,250,000 | 2,564,010 |
| Georgia—3.8% | ||||
| Atlanta, Airport General Revenue | 5.00 | 1/1/17 | 1,000,000 | 1,103,390 |
| Atlanta, Airport General Revenue | 5.00 | 1/1/18 | 1,000,000 | 1,135,790 |
| Atlanta, Water and Wastewater Revenue | 5.00 | 11/1/15 | 5,000,000 | 5,283,550 |
| Burke County Development Authority, PCR | ||||
| (Georgia Power Company Plant Vogtle Project) | 1.40 | 4/1/15 | 5,000,000 | 5,029,250 |
| Burke County Development Authority, PCR | ||||
| (Georgia Power Company Plant Vogtle Project) | 1.80 | 4/3/18 | 3,900,000 | 3,957,057 |
| Floyd County Development Authority, PCR | ||||
| (Georgia Power Company Plant Hammond Project) | 0.85 | 11/19/15 | 5,000,000 | 5,019,600 |
| Fulton County, Water and Sewerage Revenue | 5.00 | 1/1/16 | 1,550,000 | 1,648,239 |
| Fulton County Development Authority, Revenue | ||||
| (Robert W. Woodruff Arts Center, Inc. Project) | 5.00 | 3/15/16 | 12,895,000 | 13,787,850 |
| Monroe County Development Authority, PCR | ||||
| (Georgia Power Company Plant Scherer Project) | 2.00 | 6/13/19 | 2,000,000 | 2,033,200 |
| Monroe County Development Authority, PCR | ||||
| (Gulf Power Company Plant Scherer Project) | 2.00 | 6/21/18 | 7,000,000 | 7,150,920 |
| Municipal Electric Authority of Georgia, Revenue | ||||
| (Project One Subordinated Bonds) | 5.00 | 1/1/17 | 1,000,000 | 1,106,600 |
The Funds 47
STATEMENT OF INVESTMENTS (continued)
| BNY Mellon National Short-Term Municipal Bond Fund (continued) | |||||
| Long-Term Municipal | Coupon | Maturity | Principal | ||
| Investments (continued) | Rate (%) | Date | Amount ($) | Value ($) | |
| Hawaii—1.1% | |||||
| Hawaii Department of Budget and Finance, Special Purpose | |||||
| Revenue (The Queen’s Health Systems) (Insured; AMBAC) | 0.22 | 7/1/24 | 13,850,000 | a | 13,174,813 |
| Illinois—11.0% | |||||
| Central Lake County Joint Action Water Agency, Water Revenue | 4.00 | 5/1/17 | 5,430,000 | 5,912,401 | |
| Chicago, General Airport Senior Lien Revenue | |||||
| (Chicago O’Hare International Airport) | 5.00 | 1/1/17 | 4,000,000 | 4,399,760 | |
| Chicago, General Airport Senior Lien Revenue | |||||
| (Chicago O’Hare International Airport) | 5.00 | 1/1/17 | 4,000,000 | 4,399,760 | |
| Chicago, General Airport Senior Lien Revenue | |||||
| (Chicago O’Hare International Airport) | 5.00 | 1/1/17 | 1,435,000 | 1,578,414 | |
| Chicago, General Airport Senior Lien Revenue | |||||
| (Chicago O’Hare International Airport) | 5.00 | 1/1/18 | 6,000,000 | 6,785,040 | |
| Chicago, Second Lien Revenue | |||||
| (Chicago Midway Airport) (Insured; AMBAC) | 5.00 | 1/1/17 | 4,110,000 | 4,176,418 | |
| Chicago Board of Education, Unlimited Tax GO (Dedicated Revenues) | 5.00 | 12/1/17 | 2,345,000 | 2,571,011 | |
| Chicago Board of Education, Unlimited Tax GO (Dedicated Revenues) | 4.25 | 12/1/18 | 5,020,000 | 5,426,469 | |
| Chicago Board of Education, Unlimited Tax GO | |||||
| (Dedicated Revenues) (Insured; AMBAC) | 5.25 | 12/1/15 | 1,425,000 | 1,498,715 | |
| Chicago Board of Education, Unlimited Tax GO (Dedicated Revenues) | |||||
| (Insured; National Public Finance Guarantee Corp.) | 5.00 | 12/1/14 | 2,000,000 | 2,022,520 | |
| Chicago Board of Education, Unlimited Tax GO (Dedicated Revenues) | |||||
| (Insured; National Public Finance Guarantee Corp.) | 5.00 | 12/1/16 | 17,000,000 | 17,202,640 | |
| Cook County, GO | 5.00 | 11/15/15 | 1,500,000 | 1,583,985 | |
| Cook County, GO | 5.00 | 11/15/16 | 5,400,000 | 5,912,622 | |
| Cook County, GO (Capital Equipment Bonds) | 5.00 | 11/15/15 | 1,000,000 | 1,055,990 | |
| Illinois, GO | 4.00 | 7/1/16 | 3,000,000 | 3,161,580 | |
| Illinois, GO | 5.00 | 7/1/17 | 3,150,000 | 3,459,393 | |
| Illinois, GO | 4.00 | 7/1/18 | 5,000,000 | 5,370,500 | |
| Illinois, GO (Insured; Assured Guaranty Municipal Corp.) | 5.00 | 1/1/16 | 7,500,000 | 7,922,250 | |
| Illinois, GO (Insured; Assured Guaranty Municipal Corp.) | 5.00 | 1/1/19 | 10,000,000 | 11,287,200 | |
| Illinois, GO (Insured; National Public Finance Guarantee Corp.) | 5.38 | 4/1/16 | 4,465,000 | 4,772,103 | |
| Illinois Department of Employment Security, | |||||
| Unemployment Insurance Fund Building Receipts Revenue | 5.00 | 6/15/17 | 2,000,000 | 2,208,500 | |
| Illinois Department of Employment Security, | |||||
| Unemployment Insurance Fund Building Receipts Revenue | 5.00 | 6/15/18 | 9,000,000 | 9,908,730 | |
| Illinois Development Finance Authority, | |||||
| Revenue (Saint Vincent de Paul Center Project) | 1.88 | 3/1/19 | 3,500,000 | 3,560,445 | |
| Illinois Finance Authority, | |||||
| Clean Water Initiative Revolving Fund Revenue | 5.00 | 1/1/17 | 2,175,000 | 2,401,483 | |
| Illinois Finance Authority, | |||||
| Clean Water Initiative Revolving Fund Revenue | 5.00 | 7/1/17 | 2,000,000 | 2,244,000 | |
| Illinois Toll Highway Authority, Toll Highway Senior Revenue | 5.00 | 12/1/18 | 2,000,000 | 2,333,180 | |
48
| BNY Mellon National Short-Term Municipal Bond Fund (continued) | |||||
| Long-Term Municipal | Coupon | Maturity | Principal | ||
| Investments (continued) | Rate (%) | Date | Amount ($) | Value ($) | |
| Illinois (continued) | |||||
| Kane, McHenry, Cook and DeKalb Counties Community Unit | |||||
| School District Number 300, GO (Insured; XLCA) | 5.00 | 12/1/17 | 3,145,000 | 3,301,055 | |
| Railsplitter Tobacco Settlement Authority, | |||||
| Tobacco Settlement Revenue | 5.00 | 6/1/15 | 8,330,000 | 8,601,058 | |
| Springfield, Senior Lien Electric Revenue | 5.00 | 3/1/17 | 3,040,000 | 3,346,979 | |
| Indiana—.7% | |||||
| Indiana Finance Authority, EIR (Southern Indiana Gas | |||||
| and Electric Company Project) | 1.96 | 9/14/17 | 2,500,000 | 2,544,850 | |
| Indiana Health Facility Financing Authority, Revenue | |||||
| (Ascension Health Credit Group) | 1.60 | 2/1/17 | 2,500,000 | 2,557,475 | |
| Indiana Health Facility Financing Authority, Revenue | |||||
| (Ascension Health Subordinate Credit Group) | 1.70 | 9/1/14 | 1,500,000 | 1,500,120 | |
| Indiana Health Facility Financing Authority, Revenue | |||||
| (Ascension Health Subordinate Credit Group) | 5.00 | 7/28/16 | 2,000,000 | 2,172,480 | |
| Kansas—.6% | |||||
| Wichita, GO Temporary Notes | 0.50 | 4/15/15 | 7,500,000 | 7,503,375 | |
| Kentucky—1.7% | |||||
| Kentucky Property and Buildings Commission, | |||||
| Revenue (Project Number 99) | 5.00 | 11/1/17 | 4,200,000 | 4,767,168 | |
| Kentucky Public Transportation Infrastructure Authority, | |||||
| Subordinate Toll Revenue, BAN (Downtown Crossing Project) | 5.00 | 7/1/17 | 10,000,000 | 11,106,300 | |
| Louisville/Jefferson County Metro Government, PCR | |||||
| (Louisville Gas and Electric Company Project) | 1.65 | 4/3/17 | 4,940,000 | 5,028,278 | |
| Louisiana—1.6% | |||||
| East Baton Rouge Sewerage Commission, Revenue | 0.61 | 8/1/18 | 7,500,000 | a | 7,503,000 |
| England District Sub-District Number 1, Revenue | |||||
| (State of Louisiana—Economic Development Project) | 5.00 | 8/15/17 | 3,055,000 | 3,424,747 | |
| Louisiana Public Facilities Authority, Revenue (Loyola University | |||||
| Project) (Insured; National Public Finance Guarantee Corp.) | 5.25 | 10/1/16 | 8,425,000 | 9,234,137 | |
| Maryland—.6% | |||||
| Maryland Health and Higher Educational Facilities | |||||
| Authority, Revenue (The Johns Hopkins Health | |||||
| System Obligated Group Issue) | 1.25 | 11/15/16 | 2,245,000 | a | 2,269,246 |
| University System of Maryland, Revolving Loan Program Bonds | 1.25 | 6/1/18 | 5,000,000 | 5,047,750 | |
| Massachusetts—1.1% | |||||
| Massachusetts Development Finance Agency, | |||||
| Recovery Zone Facility Revenue (Dominion Energy | |||||
| Brayton Point Issue) (Prerefunded) | 2.25 | 9/1/16 | 5,000,000 | b | 5,187,000 |
| Massachusetts Health and Educational Facilities Authority, | |||||
| Revenue (Amherst College Issue) | 1.70 | 11/1/16 | 2,820,000 | 2,882,181 | |
| Massachusetts Health and Educational Facilities Authority, | |||||
| Revenue (Simmons College Issue) | 6.13 | 10/1/14 | 1,000,000 | 1,004,910 | |
The Funds 49
STATEMENT OF INVESTMENTS (continued)
| BNY Mellon National Short-Term Municipal Bond Fund (continued) | ||||
| Long-Term Municipal | Coupon | Maturity | Principal | |
| Investments (continued) | Rate (%) | Date | Amount ($) | Value ($) |
| Massachusetts (continued) | ||||
| Massachusetts Municipal Wholesale Electric Company, | ||||
| Power Supply Project Revenue (Project Number 6 Issue) | 5.00 | 7/1/16 | 4,160,000 | 4,506,611 |
| Michigan—4.6% | ||||
| Detroit School District, School Building and | ||||
| Site Improvement Bonds (GO— Unlimited Tax) | 5.00 | 5/1/16 | 1,490,000 | 1,586,135 |
| Michigan, State Trunk Line Revenue | 5.00 | 11/15/17 | 6,000,000 | 6,820,320 |
| Michigan, State Trunk Line Revenue | 4.00 | 11/15/18 | 4,170,000 | 4,694,711 |
| Michigan, State Trunk Line Revenue | 5.00 | 11/15/18 | 3,450,000 | 4,026,185 |
| Michigan, State Trunk Line Revenue | 5.00 | 11/15/19 | 1,300,000 | 1,544,829 |
| Michigan Finance Authority, Local Government Loan Program | ||||
| Revenue (Detroit Water and Sewerage Department, | ||||
| Sewage Disposal System Revenue Senior Lien Local Project | ||||
| Bonds) (Insured; National Public Finance Guarantee Corp.) | 5.00 | 7/1/18 | 1,500,000 | 1,696,605 |
| Michigan Finance Authority, Local Government Loan Program | ||||
| Revenue (Detroit Water and Sewerage Department, Water Supply | ||||
| System Revenue Senior Lien Local Project Bonds) | ||||
| (Insured; National Public Finance Guarantee Corp.) | 5.00 | 7/1/18 | 1,000,000 | 1,131,070 |
| Michigan Finance Authority, State Aid Revenue | ||||
| (School District of the City of Detroit) | 2.85 | 8/20/15 | 5,100,000 | 5,101,581 |
| Michigan Finance Authority, Unemployment | ||||
| Obligation Assessment Revenue | 5.00 | 7/1/17 | 10,000,000 | 11,247,200 |
| Michigan Hospital Finance Authority, Project Revenue | ||||
| (Ascension Health Senior Credit Group) | 1.50 | 3/1/17 | 12,000,000 | 12,246,840 |
| Michigan State Building Authority, Revenue (Facilities Program) | 5.00 | 10/15/16 | 3,500,000 | 3,831,695 |
| Wayne County Airport Authority, Airport Revenue (Detroit Metropolitan | ||||
| Wayne County Airport) (Insured; Assured Guaranty Corp.) | 4.75 | 12/1/18 | 4,000,000 | 4,207,760 |
| Minnesota—.4% | ||||
| Minnesota, GO | 5.00 | 8/1/16 | 5,200,000 | 5,670,496 |
| Mississippi—.1% | ||||
| Mississippi Business Finance Corporation, | ||||
| SWDR (Waste Management, Inc. Project) | 1.38 | 3/1/17 | 800,000 | 799,368 |
| Missouri—.5% | ||||
| Missouri Environmental Improvement and Energy Resources | ||||
| Authority, Water Pollution Control and Drinking | ||||
| Water Revenue (State Revolving Funds Programs) | 5.00 | 1/1/18 | 1,965,000 | 2,248,608 |
| Missouri State Environmental Improvement and Energy Resources | ||||
| Authority, EIR (Kansas City Power and Light Company Project) | 2.88 | 7/2/18 | 3,400,000 | 3,520,224 |
| Nebraska—.2% | ||||
| Lincoln, GO | 4.00 | 12/1/15 | 2,035,000 | 2,132,924 |
| Nevada—2.7% | ||||
| Clark County School District, Limited Tax GO | 5.00 | 6/15/16 | 10,000,000 | 10,835,500 |
50
| BNY Mellon National Short-Term Municipal Bond Fund (continued) | |||||
| Long-Term Municipal | Coupon | Maturity | Principal | ||
| Investments (continued) | Rate (%) | Date | Amount ($) | Value ($) | |
| Nevada (continued) | |||||
| Las Vegas Convention and Visitors Authority, | |||||
| Revenue (Insured; AMBAC) | 5.00 | 7/1/16 | 3,500,000 | 3,639,965 | |
| Las Vegas Valley Water District, GO | |||||
| (Additionally Secured by Pledged Revenues) | 5.00 | 6/1/17 | 13,640,000 | 14,139,770 | |
| Nevada, Unemployment Compensation Fund Special Revenue | 4.00 | 12/1/15 | 2,800,000 | 2,935,940 | |
| Nevada, Unemployment Compensation Fund Special Revenue | 5.00 | 12/1/17 | 2,200,000 | 2,511,322 | |
| New Hampshire—.6% | |||||
| New Hampshire, Turnpike System Revenue | 5.00 | 2/1/17 | 6,000,000 | 6,644,040 | |
| New Hampshire Business Finance Authority, | |||||
| SWDR (Waste Management, Inc. Project) | 2.13 | 6/1/18 | 1,000,000 | 1,034,230 | |
| New Jersey—5.6% | |||||
| Hudson County Improvement Authority, | |||||
| County-Guaranteed Pooled Notes (Local Unit Loan Program) | 1.00 | 12/10/14 | 5,000,000 | 5,010,400 | |
| New Jersey, GO | 5.00 | 8/15/15 | 10,000,000 | 10,459,900 | |
| New Jersey Economic Development Authority, | |||||
| Cigarette Tax Revenue | 5.00 | 6/15/15 | 4,385,000 | 4,540,360 | |
| New Jersey Economic Development Authority, | |||||
| Cigarette Tax Revenue | 5.00 | 6/15/18 | 6,500,000 | 7,357,740 | |
| New Jersey Economic Development Authority, | |||||
| School Facilities Construction Revenue | 5.00 | 3/1/17 | 4,475,000 | 4,909,701 | |
| New Jersey Economic Development Authority, | |||||
| School Facilities Construction Revenue | 5.00 | 6/15/19 | 7,500,000 | 8,584,725 | |
| New Jersey Economic Development Authority, SWDR | |||||
| (Waste Management of New Jersey, Inc. Project) | 0.55 | 6/1/15 | 1,300,000 | 1,300,468 | |
| New Jersey Sports and Exposition Authority, State Contract Bonds | 5.00 | 9/1/16 | 1,665,000 | 1,807,158 | |
| New Jersey Sports and Exposition Authority, State Contract Bonds | 5.00 | 9/1/18 | 3,950,000 | 4,519,353 | |
| New Jersey Transportation Trust Fund | |||||
| Authority (Transportation System) | 5.00 | 6/15/15 | 1,800,000 | 1,867,014 | |
| New Jersey Transportation Trust Fund | |||||
| Authority (Transportation System) | 5.00 | 6/15/16 | 2,000,000 | 2,156,980 | |
| New Jersey Transportation Trust Fund | |||||
| Authority (Transportation System) | 5.00 | 6/15/18 | 1,380,000 | 1,564,340 | |
| New Jersey Transportation Trust Fund Authority (Transportation | |||||
| System) (Insured; Assured Guaranty Municipal Corp.) | 5.75 | 12/15/14 | 2,820,000 | 2,866,615 | |
| New Jersey Turnpike Authority, Turnpike Revenue | 5.00 | 1/1/19 | 11,985,000 | 13,924,053 | |
| New Mexico—.4% | |||||
| New Mexico Educational Assistance Foundation, | |||||
| Education Loan Revenue | 0.93 | 12/1/20 | 1,705,000 | a | 1,697,055 |
| New Mexico Finance Authority, Subordinate Lien Public | |||||
| Project Revolving Fund Revenue (Insured; | |||||
| National Public Finance Guarantee Corp.) | 5.25 | 6/15/18 | 2,605,000 | 2,932,136 | |
The Funds 51
STATEMENT OF INVESTMENTS (continued)
| BNY Mellon National Short-Term Municipal Bond Fund (continued) | |||||
| Long-Term Municipal | Coupon | Maturity | Principal | ||
| Investments (continued) | Rate (%) | Date | Amount ($) | Value ($) | |
| New York—9.8% | |||||
| Binghamton, GO (Public Improvement) | 1.13 | 1/30/15 | 10,000,000 | 10,036,700 | |
| Nassau County, GO (Insured; Assured Guaranty Municipal Corp.) | 5.00 | 7/1/16 | 4,595,000 | 4,970,779 | |
| Nassau County Interim Finance Authority, | |||||
| Sales Tax Secured Revenue | 4.00 | 11/15/15 | 7,820,000 | 8,186,602 | |
| New York City, GO | 5.25 | 8/1/16 | 40,000 | 40,170 | |
| New York City, GO | 5.00 | 8/1/17 | 10,000,000 | 11,275,100 | |
| New York City, GO | 5.00 | 8/1/17 | 9,545,000 | 10,762,083 | |
| New York City, GO | 0.63 | 8/1/27 | 7,000,000 | a | 7,017,220 |
| New York City, GO (Insured; Assured Guaranty Municipal Corp) | 1.89 | 8/1/17 | 5,000,000 | a | 5,238,050 |
| New York City Transitional Finance Authority, Future Tax Secured | |||||
| Revenue (Insured; National Public Finance Guarantee Corp.) | 5.50 | 11/1/14 | 240,000 | 241,094 | |
| New York City Transitional Finance Authority, | |||||
| Future Tax Secured Subordinate Revenue | 5.00 | 11/1/16 | 2,590,000 | 2,852,238 | |
| New York City Transitional Finance Authority, | |||||
| Future Tax Secured Subordinate Revenue | 5.00 | 11/1/18 | 5,000,000 | 5,848,250 | |
| New York City Transitional Finance Authority, | |||||
| Future Tax Secured Subordinate Revenue | 5.00 | 11/1/19 | 4,115,000 | 4,890,225 | |
| New York City Transitional Finance Authority, | |||||
| Future Tax Secured Subordinate Revenue (Escrowed to Maturity) | 5.00 | 11/1/16 | 765,000 | 840,995 | |
| New York State Dormitory Authority, Revenue | |||||
| (Mental Health Services Facilities Improvement) | 5.00 | 8/15/15 | 995,000 | 1,041,188 | |
| New York State Dormitory Authority, Revenue (Mental Health | |||||
| Services Facilities Improvement) (Escrowed to Maturity) | 5.00 | 8/15/15 | 5,000 | 5,235 | |
| New York State Dormitory Authority, | |||||
| State Personal Income Tax Revenue (General Purpose) | 5.00 | 3/15/18 | 10,000,000 | 11,493,800 | |
| New York State Dormitory Authority, Third General Resolution | |||||
| Revenue (State University Educational Facilities Issue) | 4.00 | 5/15/17 | 4,825,000 | 5,278,261 | |
| New York State Environmental Facilities Corporation, | |||||
| SWDR (Waste Management, Inc. Project) | 2.75 | 7/1/17 | 2,000,000 | 2,108,960 | |
| New York State Thruway Authority, | |||||
| General Revenue Junior Indebtedness Obligations | 5.00 | 5/1/19 | 10,000,000 | 11,672,800 | |
| Port Authority of New York and New Jersey (Consolidated Bonds, | |||||
| 139th Series) (Insured; National Public Finance Guarantee Corp. ) | 5.00 | 10/1/16 | 5,000,000 | 5,189,500 | |
| Port Authority of New York and New Jersey | |||||
| (Consolidated Bonds, 185th Series) | 5.00 | 9/1/17 | 2,000,000 | 2,251,780 | |
| Tobacco Settlement Financing Corporation of New York, | |||||
| Asset-Backed Revenue (State Contingency Contract Secured) | 5.00 | 6/1/19 | 3,000,000 | 3,107,580 | |
| Triborough Bridge and Tunnel Authority, | |||||
| General Revenue (MTA Bridges and Tunnels) | 4.00 | 11/15/16 | 2,500,000 | 2,695,900 | |
| Triborough Bridge and Tunnel Authority, | |||||
| General Revenue (MTA Bridges and Tunnels) | 5.00 | 11/15/16 | 1,900,000 | 2,092,432 | |
52
| BNY Mellon National Short-Term Municipal Bond Fund (continued) | |||||
| Long-Term Municipal | Coupon | Maturity | Principal | ||
| Investments (continued) | Rate (%) | Date | Amount ($) | Value ($) | |
| New York (continued) | |||||
| Triborough Bridge and Tunnel Authority, | |||||
| General Revenue (MTA Bridges and Tunnels) | 4.00 | 11/15/17 | 3,500,000 | 3,870,230 | |
| North Carolina—1.9% | |||||
| North Carolina Medical Care Commission, Health Care | |||||
| Facilities Revenue (Wake Forest Baptist Obligated Group) | 0.79 | 12/1/17 | 2,400,000 | a | 2,393,016 |
| University of North Carolina Board of Governers, | |||||
| General Revenue (The University of North Carolina at Chapel Hill) | 0.55 | 12/1/15 | 11,000,000 | a | 11,016,720 |
| University of North Carolina Board of Governers, | |||||
| General Revenue (The University of North Carolina at Chapel Hill) | 0.85 | 12/1/17 | 10,100,000 | a | 10,215,645 |
| Ohio—2.6% | |||||
| Akron, Income Tax Revenue (Community Learning Centers) | 4.00 | 12/1/16 | 4,090,000 | 4,413,846 | |
| Cleveland, Water Revenue | 5.00 | 1/1/16 | 3,000,000 | 3,192,240 | |
| Ohio, Common Schools GO Bonds | 5.00 | 9/15/16 | 5,780,000 | 6,333,782 | |
| Ohio, GO Highway Capital Improvements Bonds (Full Faith and | |||||
| Credit/Highway User Receipts) (Buckeye Savers Bond Program) | 5.00 | 5/1/16 | 4,650,000 | 5,014,653 | |
| Ohio Building Authority, State Facilities Revenue | |||||
| (Administrative Building Fund Projects) | |||||
| (Insured; National Public Finance Guarantee Corp.) | 5.00 | 10/1/16 | 3,585,000 | 3,929,662 | |
| Ohio Water Development Authority, | |||||
| Drinking Water Assistance Fund Revenue | 5.00 | 12/1/17 | 1,925,000 | 2,198,081 | |
| Ohio Water Development Authority, | |||||
| Solid Waste Revenue (Waste Management, Inc. Project) | 2.25 | 11/2/15 | 6,000,000 | 6,147,480 | |
| Ohio Water Development Authority, | |||||
| SWDR (Waste Management Project) | 2.25 | 7/1/16 | 1,000,000 | 1,031,900 | |
| Oklahoma—.2% | |||||
| Oklahoma Capitol Improvement Authority, | |||||
| State Highway Capital Improvement Revenue | 4.00 | 10/1/16 | 2,960,000 | 3,182,385 | |
| Pennsylvania—5.8% | |||||
| Allegheny County Sanitary Authority, Sewer Revenue | |||||
| (Insured; Assured Guaranty Municipal Corp.) | 5.00 | 6/1/17 | 4,670,000 | 5,221,574 | |
| Chester County Industrial Development Authority, | |||||
| Student Housing Revenue, BAN (University Student | |||||
| Housing, LLC Project at West Chester University of Pennsylvania) | 1.60 | 2/1/15 | 2,600,000 | 2,603,614 | |
| Jim Thorpe Area School District, GO | |||||
| (Insured; National Public Finance Guarantee Corp.) | 5.30 | 3/15/16 | 580,000 | 595,701 | |
| Monroeville Finance Authority, Revenue | |||||
| (University of Pittsburgh Medical Center) | 4.00 | 2/15/16 | 1,000,000 | 1,051,040 | |
| Pennsylvania, GO | 5.00 | 9/1/16 | 5,000,000 | 5,020,600 | |
| Pennsylvania, GO | 5.00 | 10/15/17 | 6,450,000 | 7,320,363 | |
| Pennsylvania, GO (Insured; | |||||
| National Public Finance Guarantee Corp.) | 5.38 | 7/1/19 | 6,500,000 | 7,780,370 | |
The Funds 53
STATEMENT OF INVESTMENTS (continued)
| BNY Mellon National Short-Term Municipal Bond Fund (continued) | |||||
| Long-Term Municipal | Coupon | Maturity | Principal | ||
| Investments (continued) | Rate (%) | Date | Amount ($) | Value ($) | |
| Pennsylvania (continued) | |||||
| Pennsylvania Economic Development Financing | |||||
| Authority, SWDR (Waste Management, Inc. Project) | 1.75 | 12/1/15 | 2,000,000 | 2,035,280 | |
| Pennsylvania Economic Development Financing Authority, | |||||
| SWDR (Waste Management, Inc. Project) | 2.25 | 7/1/19 | 5,000,000 | 5,051,550 | |
| Pennsylvania Economic Development Financing Authority, | |||||
| Unemployment Compensation Revenue | 5.00 | 7/1/16 | 10,000,000 | 10,869,900 | |
| Pennsylvania Turnpike Commission, Turnpike Revenue | 0.65 | 12/1/18 | 4,000,000 | a | 4,002,160 |
| Pennsylvania Turnpike Commission, Turnpike Revenue | 0.75 | 12/1/19 | 2,150,000 | a | 2,151,140 |
| Philadelphia, Airport Revenue | 5.00 | 6/15/15 | 1,000,000 | 1,038,460 | |
| Philadelphia, Water and Wastewater Revenue | |||||
| (Insured; Assured Guaranty Municipal Corp.) | 5.00 | 8/1/17 | 3,690,000 | 4,158,630 | |
| Pittsburgh and Allegheny County Sports and Exhibition | |||||
| Authority, Regional Asset District Sales Tax Revenue | |||||
| (Insured; Assured Guaranty Municipal Corp.) | 5.00 | 2/1/18 | 2,540,000 | 2,880,131 | |
| State Public School Building Authority, Revenue | |||||
| (Albert Gallatin Area School District Project) | 0.90 | 9/1/18 | 3,160,000 | a | 3,161,169 |
| State Public School Building Authority, School Revenue | |||||
| (Chester Upland School District Project) | |||||
| (Insured; Assured Guaranty Municipal Corp.) | 4.00 | 9/15/14 | 1,810,000 | 1,812,914 | |
| Woodland Hills School District, GO | 5.00 | 9/1/17 | 5,010,000 | 5,598,374 | |
| South Carolina—.4% | |||||
| Piedmont Municipal Power Agency, Electric Revenue | 5.00 | 1/1/15 | 2,000,000 | 2,032,600 | |
| Piedmont Municipal Power Agency, Electric Revenue | 5.00 | 1/1/17 | 1,060,000 | 1,167,240 | |
| South Carolina Jobs-Economic Development Authority, | |||||
| EDR (Waste Management of South Carolina, Inc. Project) | 2.88 | 2/1/15 | 2,100,000 | 2,124,087 | |
| Tennessee—3.5% | |||||
| Memphis-Shelby County Airport Authority, Airport Revenue | 5.00 | 7/1/16 | 4,105,000 | 4,432,045 | |
| Memphis-Shelby County Airport Authority, Airport Revenue | 5.00 | 7/1/17 | 4,905,000 | 5,433,072 | |
| Memphis-Shelby County Airport Authority, Airport Revenue | 5.38 | 7/1/18 | 3,175,000 | 3,632,867 | |
| Metropolitan Government of Nashville and | |||||
| Davidson County, GO Improvement Bonds | 5.00 | 7/1/16 | 5,750,000 | 6,250,192 | |
| Metropolitan Government of Nashville and | |||||
| Davidson County, Subordinate Lien Water and Sewer Revenue | 5.00 | 7/1/16 | 1,250,000 | 1,357,287 | |
| Tennessee, GO | 5.00 | 8/1/16 | 3,100,000 | 3,380,488 | |
| Tennessee, GO | 4.00 | 8/1/17 | 17,935,000 | 19,747,152 | |
| Texas—6.5% | |||||
| Frisco Independent School District, Unlimited Tax School | |||||
| Building Bonds (Permanent School Fund Guarantee Program) | 5.00 | 8/15/15 | 1,000,000 | 1,047,360 | |
| Grand Parkway Transportation Corporation, | |||||
| Grand Parkway System Subordinate Tier Toll Revenue, BAN | 3.00 | 12/15/16 | 10,000,000 | 10,567,900 | |
54
| BNY Mellon National Short-Term Municipal Bond Fund (continued) | |||||
| Long-Term Municipal | Coupon | Maturity | Principal | ||
| Investments (continued) | Rate (%) | Date | Amount ($) | Value ($) | |
| Texas (continued) | |||||
| Houston, Combined Utility System First Lien Revenue | 4.00 | 5/15/16 | 3,140,000 | 3,338,448 | |
| Houston, Combined Utility System First Lien Revenue | 5.00 | 11/15/16 | 3,750,000 | 4,132,200 | |
| Houston Convention and Entertainment Facilities Department, | |||||
| Hotel Occupancy Tax and Special Revenue | 4.88 | 9/1/17 | 5,000,000 | 5,411,650 | |
| Houston Independent School District, Limited Tax Schoolhouse | |||||
| Bonds (Permament School Fund Guarantee Program) | 2.00 | 6/1/16 | 6,000,000 | 6,160,980 | |
| Katy Independent School District, Unlimited Tax Bonds | |||||
| (Permament School Fund Guarantee Program) | 1.60 | 8/15/17 | 1,465,000 | 1,465,762 | |
| Katy Independent School District, Unlimited Tax Bonds | |||||
| (Permament School Fund Guarantee Program) | 5.00 | 8/15/17 | 4,000,000 | 4,494,760 | |
| Lower Colorado River Authority, Revenue | |||||
| (Insured; Assured Guaranty Municipal Corp.) | 5.88 | 5/15/15 | 1,070,000 | 1,075,072 | |
| North Central Texas Health Facilities Development Corporation, | |||||
| HR (Children’s Medical Center of Dallas Project) | 5.00 | 8/15/17 | 1,000,000 | 1,123,930 | |
| Northside Independent School District, Unlimited Tax School | |||||
| Building Bonds (Permanent School Fund Guarantee Program) | 1.35 | 6/1/18 | 10,215,000 | 10,301,112 | |
| Sam Rayburn Municipal Power Agency, | |||||
| Power Supply System Revenue | 5.00 | 10/1/16 | 2,320,000 | 2,518,638 | |
| San Antonio, Electric and Gas Systems Junior Lien Revenue | 2.00 | 12/1/16 | 3,000,000 | 3,098,730 | |
| San Antonio Independent School District, Unlimited Tax Bonds | |||||
| (Permament School Fund Guarantee Program) | 2.00 | 8/1/17 | 6,000,000 | 6,199,200 | |
| San Antonio Independent School District, Unlimited Tax Bonds | |||||
| (Permament School Fund Guarantee Program) | 2.00 | 8/1/18 | 2,880,000 | 2,975,990 | |
| Tarrant Regional Water District, A Water Control and | |||||
| Improvement District, Water Revenue | 5.00 | 3/1/16 | 1,500,000 | 1,607,835 | |
| Texas Municipal Power Agency, Revenue | |||||
| (Insured; National Public Finance Guarantee Corp.) | 0.00 | 9/1/14 | 5,000,000 | c | 4,999,950 |
| Texas Public Finance Authority, Unemployment | |||||
| Compensation Obligation Assessment Revenue | 4.00 | 7/1/17 | 3,000,000 | 3,249,060 | |
| Texas Transportation Commission, | |||||
| State Highway Fund First Tier Revenue | 0.40 | 4/1/17 | 2,000,000 | a | 2,005,580 |
| Texas Transportation Commission, | |||||
| State Highway Fund First Tier Revenue | 5.00 | 4/1/19 | 5,000,000 | 5,898,600 | |
| Virginia—1.8% | |||||
| Roanoke Economic Development Authority, HR | |||||
| (Carilion Clinic Obligated Group) | 5.00 | 7/1/15 | 2,000,000 | 2,080,860 | |
| Virginia College Building Authority, Educational Facilities | |||||
| Revenue (21st Century College and Equipment Programs) | 5.00 | 2/1/18 | 10,000,000 | 11,456,200 | |
| Virginia College Building Authority, Educational Facilities | |||||
| Revenue (Public Higher Education Financing Program) | 5.00 | 9/1/16 | 5,000,000 | 5,470,400 | |
The Funds 55
STATEMENT OF INVESTMENTS (continued)
| BNY Mellon National Short-Term Municipal Bond Fund (continued) | |||||
| Long-Term Municipal | Coupon | Maturity | Principal | ||
| Investments (continued) | Rate (%) | Date | Amount ($) | Value ($) | |
| Virginia (continued) | |||||
| Virginia Commonwealth Transportation Board, | |||||
| Federal Transportation Grant Anticipation Revenue Notes | 5.00 | 9/15/16 | 1,000,000 | 1,094,770 | |
| York County Economic Development Authority, PCR | |||||
| (Virginia Electric and Power Company Project) | 1.88 | 5/16/19 | 2,500,000 | 2,552,000 | |
| Washington—1.5% | |||||
| Energy Northwest, Electric Revenue (Project 3) | 5.00 | 7/1/18 | 10,000,000 | 11,578,400 | |
| Port of Seattle, Intermediate Lien Revenue | 5.00 | 2/1/19 | 5,875,000 | 6,825,693 | |
| Wisconsin—.6% | |||||
| Wisconsin, GO (Insured; National Public Finance Guarantee Corp.) | 5.00 | 5/1/16 | 5,000,000 | 5,395,650 | |
| Wisconsin Health and Educational Facilities Authority, | |||||
| Revenue (Ascension Health Alliance Senior Credit Group) | 4.00 | 3/1/18 | 1,500,000 | 1,665,570 | |
| U.S. Related—1.0% | |||||
| A.B. Won International Airport Authority of Guam, General Revenue | 3.00 | 10/1/14 | 2,000,000 | 2,003,940 | |
| A.B. Won International Airport Authority of Guam, General Revenue | 5.00 | 10/1/16 | 2,500,000 | 2,675,500 | |
| Puerto Rico Government Development Bank, Senior Notes | 5.00 | 12/1/14 | 5,520,000 | 5,423,952 | |
| Puerto Rico Highways and Transportation Authority, | |||||
| Transportation Revenue | 5.00 | 7/1/17 | 5,385,000 | 2,718,402 | |
| Total Long-Term Municipal Investments | |||||
| (cost $1,214,043,038) | 1,223,608,409 | ||||
| Short-Term Municipal Investments—2.9% | |||||
| Connecticut—.8% | |||||
| Connecticut, GO Notes, Refunding (Economic Recovery Notes) | 0.35 | 9/2/14 | 10,000,000 | d | 10,000,000 |
| Illinois—.1% | |||||
| Chicago, GO Notes, Refunding (LOC; Barclays Bank PLC) | 0.04 | 9/2/14 | 1,200,000 | d | 1,200,000 |
| New York—1.5% | |||||
| Nassau County, GO Notes, BAN | 2.00 | 2/2/15 | 3,750,000 | 3,777,863 | |
| Nassau County, GO Notes, RAN | 2.00 | 4/15/15 | 3,485,000 | 3,521,070 | |
| Nassau County, GO Notes, TAN | 2.00 | 9/15/14 | 11,000,000 | 11,008,690 | |
| South Dakota—.1% | |||||
| South Dakota Health and Educational Facilities Authority, | |||||
| Revenue (Regional Health) (LOC; U.S. Bank NA) | 0.05 | 9/2/14 | 900,000 | d | 900,000 |
56
| BNY Mellon National Short-Term Municipal Bond Fund (continued) | ||||||
| Short-Term Municipal | Coupon | Maturity | Principal | |||
| Investments (continued) | Rate (%) | Date | Amount ($) | Value ($) | ||
| Vermont—.4% | ||||||
| Vermont Educational and Health Buildings Financing Agency, HR | ||||||
| (Northeastern Vermont Regional Hospital Project) (LOC; TD Bank) | 0.03 | 9/2/14 | 2,800,000 | d | 2,800,000 | |
| Vermont Educational and Health Buildings Financing Agency, | ||||||
| Revenue (Brattleboro Memorial Hospital Project) (LOC; TD Bank) | 0.03 | 9/2/14 | 700,000 | d | 700,000 | |
| Vermont Educational and Health Buildings Financing Agency, | ||||||
| Revenue (North Country Hospital Project) (LOC; TD Bank) | 0.03 | 9/2/14 | 2,100,000 | d | 2,100,000 | |
| Total Short-Term Municipal Investments | ||||||
| (cost $35,999,505) | 36,007,623 | |||||
| Total Investments (cost $1,250,042,543) | 100.5 | % | 1,259,616,032 | |||
| Liabilities, Less Cash and Receivables | (.5 | %) | (5,733,666 | ) | ||
| Net Assets | 100.0 | % | 1,253,882,366 | |||
| a Variable rate security—interest rate subject to periodic change. |
| b This security is prerefunded; the date shown represents the prerefunded date. Bonds which are prerefunded are collateralized by U.S. Government securities which are held in escrow |
| and are used to pay principal and interest on the municipal issue and to retire the bonds in full at the earliest refunding date. |
| c Security issued with a zero coupon. Income is recognized through the accretion of discount. |
| d Variable rate demand note—rate shown is the interest rate in effect at August 31, 2014. Maturity date represents the next demand date, or the ultimate maturity date if earlier. |
| Portfolio Summary (Unaudited) † | |||
| Value (%) | Value (%) | ||
| Transportation Services | 18.0 | Resource Recovery | 2.7 |
| State/Territory | 13.1 | Industrial | 1.5 |
| Special Tax | 10.9 | Lease | 1.5 |
| Education | 9.7 | Prerefunded | .5 |
| City | 8.7 | Pollution Control | .4 |
| Utility-Electric | 6.3 | Housing | .2 |
| Health Care | 5.7 | Other | 12.9 |
| Utility-Water and Sewer | 4.5 | ||
| County | 3.9 | 100.5 | |
| † | Based on net assets. |
The Funds 57
STATEMENT OF INVESTMENTS (continued)
| Summary of Abbreviations | |||
| ABAG | Association of Bay Area Governments | ACA | American Capital Access |
| AGC | ACE Guaranty Corporation | AGIC | Asset Guaranty Insurance Company |
| AMBAC | American Municipal Bond Assurance Corporation | ARRN | Adjustable Rate Receipt Notes |
| BAN | Bond Anticipation Notes | BPA | Bond Purchase Agreement |
| CIFG | CDC Ixis Financial Guaranty | COP | Certificate of Participation |
| CP | Commercial Paper | DRIVERS | Derivative Inverse Tax-Exempt Receipts |
| EDR | Economic Development Revenue | EIR | Environmental Improvement Revenue |
| FGIC | Financial Guaranty Insurance Company | FHA | Federal Housing Administration |
| FHLB | Federal Home Loan Bank | FHLMC | Federal Home Loan Mortgage Corporation |
| FNMA | Federal National Mortgage Association | GAN | Grant Anticipation Notes |
| GIC | Guaranteed Investment Contract | GNMA | Government National Mortgage Association |
| GO | General Obligation | HR | Hospital Revenue |
| IDB | Industrial Development Board | IDC | Industrial Development Corporation |
| IDR | Industrial Development Revenue | LIFERS | Long Inverse Floating Exempt Receipts |
| LOC | Letter of Credit | LOR | Limited Obligation Revenue |
| LR | Lease Revenue | MERLOTS | Municipal Exempt Receipts Liquidity Option Tender |
| MFHR | Multi-Family Housing Revenue | MFMR | Multi-Family Mortgage Revenue |
| PCR | Pollution Control Revenue | P-FLOATS | Puttable Floating Option Tax-Exempt Receipts |
| PILOT | Payment in Lieu of Taxes | PUTTERS | Puttable Tax-Exempt Receipts |
| RAC | Revenue Anticipation Certificates | RAN | Revenue Anticipation Notes |
| RAW | Revenue Anticipation Warrants | RIB | Residual Interest Bonds |
| ROCS | Reset Options Certificates | RRR | Resources Recovery Revenue |
| SAAN | State Aid Anticipation Notes | SBPA | Standby Bond Purchase Agreement |
| SFHR | Single Family Housing Revenue | SFMR | Single Family Mortgage Revenue |
| SONYMA | State of New York Mortgage Agency | SPEARS | Short Puttable Exempt Adjustable Receipts |
| SWDR | Solid Waste Disposal Revenue | TAN | Tax Anticipation Notes |
| TAW | Tax Anticipation Warrants | TRAN | Tax and Revenue Anticipation Notes |
| XLCA | XL Capital Assurance | ||
| See notes to financial statements. | |||
58
| STATEMENT OF FINANCIAL FUTURES |
| August 31, 2014 |
| Market Value | Unrealized | ||||
| BNY Mellon National | Covered by | (Depreciation) | |||
| Short-Term Municipal Bond Fund | Contracts | Contracts ($) | Expiration | at 8/31/2014 | ($) |
| Financial Futures Short | |||||
| U.S. Treasury 5 Year Notes | 300 | (35,650,781) | December 2014 | (83,211 | ) |
| See notes to financial statements. | |||||
The Funds 59
| STATEMENT OF INVESTMENTS |
| August 31, 2014 |
| BNY Mellon Pennsylvania Intermediate Municipal Bond Fund | |||||
| Long-Term Municipal | Coupon | Maturity | Principal | ||
| Investments—98.5% | Rate (%) | Date | Amount ($) | Value ($) | |
| Alabama—1.9% | |||||
| Jefferson County, Limited Obligation School Warrants | 5.25 | 1/1/15 | 2,500,000 | 2,517,500 | |
| Jefferson County, Limited Obligation School Warrants | |||||
| (Insured; Assured Guaranty Municipal Corp.) | 5.50 | 1/1/21 | 3,500,000 | 3,504,410 | |
| California—1.5% | |||||
| Agua Caliente Band, Cahuilla Indians Revenue | 6.00 | 7/1/18 | 1,200,000 | a | 1,183,968 |
| Alameda Corridor Transportation Authority, | |||||
| Subordinate Lien Revenue (Insured; AMBAC) | 5.25 | 10/1/21 | 2,000,000 | 2,194,040 | |
| California, GO (Various Purpose) | 6.50 | 4/1/33 | 1,000,000 | 1,223,150 | |
| District of Columbia—1.7% | |||||
| Metropolitan Washington Airports Authority, Airport System | |||||
| Revenue (Insured; Berkshire Hathaway Assurance Corp.) | 5.00 | 10/1/36 | 5,050,000 | 5,377,897 | |
| Florida—1.6% | |||||
| Lake County School Board, COP (Master Lease Purchase Agreement) | 5.00 | 6/1/27 | 1,620,000 | 1,830,681 | |
| Miami-Dade County School Board, COP | |||||
| (Master Lease Purchase Agreement) | |||||
| (Insured; National Public Finance Guarantee Corp.) | 5.00 | 5/1/25 | 3,000,000 | 3,262,380 | |
| Illinois—1.1% | |||||
| Illinois, GO | 5.25 | 2/1/29 | 2,000,000 | 2,190,480 | |
| Illinois, GO (Insured; National Public Finance Guarantee Corp.) | 5.50 | 8/1/17 | 1,000,000 | 1,114,270 | |
| Michigan—.7% | |||||
| Detroit City School District, School Buildings and | |||||
| Site Improvement Bonds (Insured; FGIC) | 5.25 | 5/1/17 | 2,000,000 | 2,195,620 | |
| New Jersey—1.4% | |||||
| New Jersey Economic Development Authority, | |||||
| School Facilities Construction Revenue | 5.00 | 3/1/27 | 2,000,000 | 2,240,680 | |
| New Jersey Economic Development Authority, | |||||
| School Facilities Construction Revenue | 5.00 | 6/15/29 | 2,000,000 | 2,253,040 | |
| New York—3.9% | |||||
| New York City Municipal Water Finance Authority, | |||||
| Water and Sewer System Second General Resolution Revenue | 5.00 | 6/15/40 | 1,750,000 | 1,972,653 | |
| New York City Transitional Finance Authority, | |||||
| Future Tax Secured Subordinate Revenue | 5.00 | 2/1/35 | 3,505,000 | 3,991,073 | |
| New York State Dormitory Authority, Revenue (Columbia University) | 5.00 | 10/1/41 | 3,500,000 | 4,017,895 | |
| New York State Dormitory Authority, | |||||
| State Personal Income Tax Revenue (General Purpose) | 5.00 | 3/15/30 | 1,890,000 | 2,175,844 | |
| Pennsylvania—80.3% | |||||
| Allegheny County Airport Authority, Airport Revenue (Pittsburgh | |||||
| International Airport) (Insured; Assured Guaranty Municipal Corp.) | 5.00 | 1/1/17 | 1,000,000 | 1,102,400 | |
| Allegheny County Hospital Development Authority, | |||||
| Revenue (University of Pittsburgh Medical Center) | 5.00 | 10/15/22 | 1,250,000 | 1,501,112 | |
60
| BNY Mellon Pennsylvania Intermediate Municipal Bond Fund (continued) | |||||
| Long-Term Municipal | Coupon | Maturity | Principal | ||
| Investments (continued) | Rate (%) | Date | Amount ($) | Value ($) | |
| Pennsylvania (continued) | |||||
| Allegheny County Port Authority, Special Transportation Revenue | 5.25 | 3/1/24 | 5,000,000 | 5,890,400 | |
| Allegheny County Sanitary Authority, Sewer Revenue | |||||
| (Insured; Assured Guaranty Municipal Corp.) | 5.00 | 6/1/26 | 3,000,000 | 3,449,790 | |
| Allegheny County Sanitary Authority, Sewer Revenue | |||||
| (Insured; National Public Finance Guarantee Corp.) | 5.00 | 12/1/21 | 4,815,000 | 5,088,781 | |
| Allentown School District, GO | 5.00 | 2/15/22 | 5,875,000 | 6,624,532 | |
| Beaver County Hospital Authority, Revenue | |||||
| (Heritage Valley Health System, Inc.) | 5.00 | 5/15/19 | 1,205,000 | 1,385,244 | |
| Beaver County Hospital Authority, Revenue | |||||
| (Heritage Valley Health System, Inc.) | 5.00 | 5/15/23 | 1,370,000 | 1,553,676 | |
| Beaver County Hospital Authority, Revenue | |||||
| (Heritage Valley Health System, Inc.) | 5.00 | 5/15/25 | 1,250,000 | 1,396,163 | |
| Berks County Municipal Authority, Revenue | |||||
| (The Reading Hospital and Medical Center Project) | 5.00 | 11/1/19 | 2,000,000 | 2,336,680 | |
| Bucks County, GO | 4.00 | 12/1/19 | 1,000,000 | 1,144,640 | |
| Bucks County, GO | 5.00 | 6/1/23 | 1,955,000 | 2,350,946 | |
| Central Bucks School District, GO (Prerefunded) | 5.00 | 5/15/18 | 5,000,000 | b | 5,785,450 |
| Central Dauphin School District, GO (Insured; | |||||
| National Public Finance Guarantee Corp.) (Prerefunded) | 6.75 | 2/1/16 | 5,000,000 | b | 5,460,850 |
| Chester County, GO | 5.00 | 7/15/25 | 3,060,000 | 3,554,312 | |
| Chester County, GO (Prerefunded) | 5.00 | 7/15/19 | 1,940,000 | b | 2,298,861 |
| Downingtown Area School District, GO | 5.00 | 11/1/18 | 2,010,000 | 2,349,770 | |
| Easton Area School District, GO | |||||
| (Insured; Assured Guaranty Municipal Corp.) | 5.50 | 4/1/23 | 2,260,000 | 2,606,142 | |
| Erie County, GO (Insured; National Public Finance Guarantee Corp.) | 5.50 | 9/1/22 | 1,640,000 | 2,052,788 | |
| Lancaster County Solid Waste Management Authority, | |||||
| Solid Waste Disposal System Revenue | 5.00 | 12/15/19 | 1,000,000 | 1,179,050 | |
| Lower Merion School District, GO | 5.00 | 9/1/22 | 2,980,000 | 3,354,973 | |
| Montgomery County, GO | 5.00 | 12/15/24 | 2,545,000 | 2,976,581 | |
| Montgomery County, GO (Escrowed to Maturity) | 5.00 | 12/15/17 | 245,000 | 280,231 | |
| Montgomery County, GO (Escrowed to Maturity) | 5.00 | 12/15/17 | 95,000 | 108,661 | |
| Montgomery County, GO (Prerefunded) | 5.00 | 12/15/19 | 245,000 | b | 292,981 |
| Montgomery County, GO (Prerefunded) | 5.00 | 12/15/19 | 100,000 | b | 119,584 |
| Montgomery County Industrial Development Authority, FHA | |||||
| Insured Mortgage Revenue (New Regional Medical Center Project) | 5.50 | 8/1/25 | 995,000 | 1,152,956 | |
| Pennsylvania, GO | 5.00 | 7/1/20 | 10,000,000 | 11,940,400 | |
| Pennsylvania, GO | 5.00 | 7/1/21 | 2,520,000 | 3,037,633 | |
| Pennsylvania, GO | 5.00 | 4/1/28 | 3,000,000 | 3,523,830 | |
| Pennsylvania, GO | 5.00 | 10/15/29 | 2,400,000 | 2,823,672 | |
The Funds 61
STATEMENT OF INVESTMENTS (continued)
| BNY Mellon Pennsylvania Intermediate Municipal Bond Fund (continued) | ||||
| Long-Term Municipal | Coupon | Maturity | Principal | |
| Investments (continued) | Rate (%) | Date | Amount ($) | Value ($) |
| Pennsylvania (continued) | ||||
| Pennsylvania Economic Development Financing Authority, | ||||
| Exempt Facilities Revenue (Amtrak Project) | 5.00 | 11/1/26 | 1,000,000 | 1,111,640 |
| Pennsylvania Economic Development Financing Authority, | ||||
| Exempt Facilities Revenue (Amtrak Project) | 5.00 | 11/1/27 | 1,535,000 | 1,701,363 |
| Pennsylvania Economic Development Financing Authority, | ||||
| Governmental LR (Forum Place Project) | 5.00 | 3/1/25 | 1,000,000 | 1,137,870 |
| Pennsylvania Economic Development Financing Authority, | ||||
| SWDR (Waste Management, Inc. Project) | 2.25 | 7/1/19 | 5,000,000 | 5,051,550 |
| Pennsylvania Economic Development Financing Authority, | ||||
| Unemployment Compensation Revenue | 5.00 | 7/1/20 | 5,000,000 | 5,876,250 |
| Pennsylvania Economic Development Financing Authority, | ||||
| Unemployment Compensation Revenue | 5.00 | 1/1/22 | 5,000,000 | 5,601,900 |
| Pennsylvania Higher Educational Facilities Authority, | ||||
| Revenue (Bryn Mawr College) | 5.00 | 12/1/23 | 1,170,000 | 1,444,225 |
| Pennsylvania Higher Educational Facilities Authority, | ||||
| Revenue (Saint Joseph’s University) | 5.00 | 11/1/25 | 2,010,000 | 2,264,024 |
| Pennsylvania Higher Educational Facilities Authority, | ||||
| Revenue (State System of Higher Education) | 5.25 | 6/15/24 | 5,000,000 | 5,984,150 |
| Pennsylvania Higher Educational Facilities Authority, | ||||
| Revenue (State System of Higher Education) | 5.00 | 6/15/26 | 1,000,000 | 1,163,420 |
| Pennsylvania Higher Educational Facilities Authority, | ||||
| Revenue (State System of Higher Education) | 5.00 | 6/15/30 | 1,875,000 | 2,115,544 |
| Pennsylvania Higher Educational Facilities Authority, | ||||
| Revenue (Temple University) | 5.00 | 4/1/26 | 1,000,000 | 1,159,470 |
| Pennsylvania Higher Educational Facilities Authority, | ||||
| Revenue (Temple University) | 5.00 | 4/1/42 | 2,000,000 | 2,193,480 |
| Pennsylvania Higher Educational Facilities Authority, | ||||
| Revenue (The Trustees of the University of Pennsylvania) | 5.00 | 9/1/19 | 10,140,000 | 12,068,628 |
| Pennsylvania Higher Educational Facilities Authority, | ||||
| Revenue (Thomas Jefferson University) (Insured; AMBAC) | 5.25 | 9/1/17 | 1,700,000 | 1,907,366 |
| Pennsylvania Higher Educational Facilities Authority, | ||||
| Revenue (Thomas Jefferson University) (Insured; AMBAC) | 5.25 | 9/1/18 | 1,485,000 | 1,705,552 |
| Pennsylvania Industrial Development Authority, EDR | 5.00 | 7/1/19 | 3,000,000 | 3,490,530 |
| Pennsylvania Industrial Development Authority, EDR | 5.00 | 7/1/21 | 3,450,000 | 4,071,035 |
| Pennsylvania Intergovernmental Cooperation Authority, | ||||
| Special Tax Revenue (City of Philadelphia Funding Program) | 5.00 | 6/15/21 | 2,000,000 | 2,360,120 |
| Pennsylvania Intergovernmental Cooperation Authority, | ||||
| Special Tax Revenue (City of Philadelphia Funding Program) | 5.00 | 6/15/22 | 3,395,000 | 3,966,243 |
| Pennsylvania State University, GO | 5.00 | 3/1/28 | 2,980,000 | 3,458,260 |
| Pennsylvania State University, GO | 5.00 | 3/1/40 | 5,710,000 | 6,480,393 |
62
| BNY Mellon Pennsylvania Intermediate Municipal Bond Fund (continued) | |||||
| Long-Term Municipal | Coupon | Maturity | Principal | ||
| Investments (continued) | Rate (%) | Date | Amount ($) | Value ($) | |
| Pennsylvania (continued) | |||||
| Pennsylvania Turnpike Commission, Motor License Fund- | |||||
| Enhanced Turnpike Subordinate Special Revenue | 5.00 | 12/1/24 | 1,165,000 | 1,367,931 | |
| Pennsylvania Turnpike Commission, Registration Fee | |||||
| Revenue (Insured; Assured Guaranty Municipal Corp.) | 5.25 | 7/15/25 | 2,500,000 | 3,074,250 | |
| Pennsylvania Turnpike Commission, Turnpike Revenue | 1.20 | 12/1/19 | 2,000,000 | c | 2,054,760 |
| Pennsylvania Turnpike Commission, | |||||
| Turnpike Revenue (Insured; AMBAC) | 5.00 | 12/1/29 | 5,000,000 | 5,052,600 | |
| Pennsylvania Turnpike Commission, Turnpike Subordinate Revenue | 5.00 | 12/1/19 | 2,195,000 | 2,572,869 | |
| Pennsylvania Turnpike Commission, Turnpike Subordinate Revenue | 5.00 | 6/1/26 | 5,000,000 | 5,596,100 | |
| Pennsylvania Turnpike Commission, Turnpike Subordinate | |||||
| Revenue (Insured; Assured Guaranty Corp.) | 6.00 | 6/1/28 | 1,500,000 | 1,729,470 | |
| Philadelphia, Airport Revenue | 5.00 | 6/15/20 | 1,750,000 | 2,050,038 | |
| Philadelphia, Airport Revenue | |||||
| (Insured; Assured Guaranty Municipal Corp.) | 5.00 | 6/15/18 | 1,370,000 | 1,559,498 | |
| Philadelphia, Water and Wastewater Revenue | 5.00 | 11/1/26 | 2,000,000 | 2,322,740 | |
| Philadelphia, Water and Wastewater Revenue | 5.00 | 11/1/27 | 2,840,000 | 3,278,496 | |
| Philadelphia, Water and Wastewater Revenue | 5.00 | 1/1/36 | 2,830,000 | 3,108,981 | |
| Philadelphia School District, GO | 5.00 | 9/1/18 | 2,500,000 | 2,858,950 | |
| Philadelphia School District, GO | 5.00 | 9/1/20 | 1,805,000 | 2,094,973 | |
| Pittsburgh, GO | 5.00 | 9/1/25 | 2,000,000 | 2,347,240 | |
| Pittsburgh, GO | 5.00 | 9/1/26 | 5,000,000 | 5,817,050 | |
| Pittsburgh School District, GO | |||||
| (Insured; Assured Guaranty Municipal Corp.) | 5.50 | 9/1/16 | 4,000,000 | 4,393,080 | |
| Pittsburgh School District, GO | |||||
| (Insured; Assured Guaranty Municipal Corp.) | 5.50 | 9/1/18 | 1,000,000 | 1,170,710 | |
| Pittsburgh School District, GO (Insured; Build | |||||
| America Mutual Assurance Company) | 5.00 | 9/1/25 | 1,000,000 | 1,170,730 | |
| Pittsburgh Water and Sewer Authority, Water and Sewer System | |||||
| First Lien Revenue (Insured; Assured Guaranty Municipal Corp.) | 5.00 | 9/1/25 | 2,580,000 | 3,044,400 | |
| Pocono Mountain School District, GO (Insured; | |||||
| Assured Guaranty Municipal Corp.) | 5.00 | 9/1/22 | 5,270,000 | 5,708,042 | |
| Saint Mary Hospital Authority, Health System | |||||
| Revenue (Catholic Health East Issue) | 5.00 | 11/15/17 | 2,085,000 | 2,354,257 | |
| Saint Mary Hospital Authority, Health System | |||||
| Revenue (Catholic Health East Issue) | 5.00 | 11/15/21 | 1,000,000 | 1,009,560 | |
| Saint Mary Hospital Authority, Health System | |||||
| Revenue (Catholic Health East Issue) | 5.00 | 11/15/22 | 1,500,000 | 1,717,710 | |
| Saint Mary Hospital Authority, Health System | |||||
| Revenue (Catholic Health East Issue) | 5.25 | 11/15/23 | 2,000,000 | 2,314,440 | |
The Funds 63
STATEMENT OF INVESTMENTS (continued)
| BNY Mellon Pennsylvania Intermediate Municipal Bond Fund (continued) | |||||
| Long-Term Municipal | Coupon | Maturity | Principal | ||
| Investments (continued) | Rate (%) | Date | Amount ($) | Value ($) | |
| Pennsylvania (continued) | |||||
| Southeastern Pennsylvania Transportation Authority, | |||||
| Capital Grant Receipts Bonds (Federal Transit Administration | |||||
| Section 5309 Fixed Guideway Modernization Formula Funds) | 5.00 | 6/1/23 | 2,000,000 | 2,330,260 | |
| Southeastern Pennsylvania Transportation Authority, Revenue | 5.00 | 3/1/26 | 1,850,000 | 2,142,356 | |
| State Public School Building Authority, School Lease | |||||
| Revenue (The School District of Philadelphia Project) | 5.00 | 4/1/21 | 1,000,000 | 1,147,250 | |
| Susquehanna Area Regional Airport Authority, | |||||
| Airport System Revenue | 5.00 | 1/1/23 | 1,500,000 | 1,674,075 | |
| University of Pittsburgh—of the Commonwealth System of | |||||
| Higher Education, University Capital Project Bonds | 5.50 | 9/15/21 | 2,500,000 | 2,961,875 | |
| University of Pittsburgh—of the Commonwealth System of | |||||
| Higher Education, University Capital Project Bonds | 5.00 | 9/15/28 | 1,580,000 | 1,811,170 | |
| West Mifflin Area School District, GO | |||||
| (Insured; Assured Guaranty Municipal Corp.) | 5.50 | 4/1/24 | 1,060,000 | 1,224,364 | |
| Westmoreland County, GO (Insured; | |||||
| National Public Finance Guarantee Corp.) | 0.00 | 12/1/15 | 1,500,000 | d | 1,481,595 |
| Texas—.3% | |||||
| Centerville Independent School District, Unlimited Tax School | |||||
| Building Bonds (Permanent School Fund Guarantee Program) | 5.00 | 8/15/39 | 780,000 | 869,131 | |
| U.S. Related—4.1% | |||||
| Guam, Business Privilege Tax Revenue | 5.00 | 1/1/24 | 1,500,000 | 1,699,935 | |
| Guam, LOR (Section 30) | 5.63 | 12/1/29 | 1,000,000 | 1,105,950 | |
| Puerto Rico Commonwealth, | |||||
| Public Improvement GO (Insured; AMBAC) | 5.50 | 7/1/19 | 3,000,000 | 3,039,120 | |
| Puerto Rico Electric Power Authority, Power Revenue | 5.38 | 7/1/24 | 2,000,000 | 1,099,740 | |
| Puerto Rico Infrastructure Financing Authority, | |||||
| Revenue (Ports Authority Project) | 6.00 | 12/15/26 | 2,500,000 | 1,553,825 | |
| Puerto Rico Infrastructure Financing Authority, Special Tax Revenue | 5.00 | 7/1/21 | 5,000,000 | 3,162,700 | |
| Puerto Rico Sales Tax Financing Corporation, | |||||
| Sales Tax Revenue (First Subordinate Series) | 0/6.75 | 8/1/32 | 1,000,000 | e | 788,600 |
| Puerto Rico Sales Tax Financing Corporation, | |||||
| Sales Tax Revenue (First Subordinate Series) | 0/6.25 | 8/1/33 | 500,000 | e | 293,015 |
| Total Long-Term Municipal Investments | |||||
| (cost $292,738,368) | 306,435,519 | ||||
64
| BNY Mellon Pennsylvania Intermediate Municipal Bond Fund (continued) | |||||
| Short-Term Municipal | Coupon | Maturity | Principal | ||
| Investments—.6% | Rate (%) | Date | Amount ($) | Value ($) | |
| Illinois—.1% | |||||
| Chicago, GO Notes, Refunding (LOC; Bank of Montreal) | 0.04 | 9/2/14 | 200,000 | f | 200,000 |
| Missouri—.1% | |||||
| Missouri Health and Educational Facilities Authority, | |||||
| Educational Facilities Revenue (The Washington | |||||
| University) (SBPA; JPMorgan Chase Bank) | 0.02 | 9/2/14 | 300,000 | f | 300,000 |
| South Dakota—.4% | |||||
| South Dakota Health and Educational Facilities Authority, | |||||
| Revenue (Regional Health) (LOC; U.S. Bank NA) | 0.05 | 9/2/14 | 1,300,000 | f | 1,300,000 |
| Total Short-Term Municipal Investments | |||||
| (cost $1,800,000) | 1,800,000 | ||||
| Total Investments (cost $294,538,368) | 99.1 | % | 308,235,519 | ||
| Cash and Receivables (Net) | .9 | % | 2,874,951 | ||
| Net Assets | 100.0 | % | 311,110,470 | ||
| a Security exempt from registration pursuant to Rule 144A under the Securities Act of 1933.This security may be resold in transactions exempt from registration, normally to |
| qualified institutional buyers.At August 31, 2014, this security was valued at $1,183,968 or .4% of net assets. |
| b These securities are prerefunded; the date shown represents the prerefunded date. Bonds which are prerefunded are collateralized by U.S. Government securities which are held in |
| escrow and are used to pay principal and interest on the municipal issue and to retire the bonds in full at the earliest refunding date. |
| c Variable rate security—interest rate subject to periodic change. |
| d Security issued with a zero coupon. Income is recognized through the accretion of discount. |
| e Zero coupon until a specified date at which time the stated coupon rate becomes effective until maturity. |
| f Variable rate demand note—rate shown is the interest rate in effect at August 31, 2014. Maturity date represents the next demand date, or the ultimate maturity date if earlier. |
| Portfolio Summary (Unaudited) † | |||
| Value (%) | Value (%) | ||
| Education | 17.0 | Lease | 2.7 |
| Transportation Services | 15.4 | Industrial | 2.4 |
| City | 15.3 | County | 2.0 |
| State/Territory | 8.3 | Resource Recovery | 2.0 |
| Special Tax | 7.4 | Utility-Electric | .4 |
| Utility-Water and Sewer | 7.2 | Other | 8.6 |
| Health Care | 5.8 | ||
| Prerefunded | 4.6 | 99.1 | |
| † | Based on net assets. |
The Funds 65
STATEMENT OF INVESTMENTS (continued)
| Summary of Abbreviations | |||
| ABAG | Association of Bay Area Governments | ACA | American Capital Access |
| AGC | ACE Guaranty Corporation | AGIC | Asset Guaranty Insurance Company |
| AMBAC | American Municipal Bond Assurance Corporation | ARRN | Adjustable Rate Receipt Notes |
| BAN | Bond Anticipation Notes | BPA | Bond Purchase Agreement |
| CIFG | CDC Ixis Financial Guaranty | COP | Certificate of Participation |
| CP | Commercial Paper | DRIVERS | Derivative Inverse Tax-Exempt Receipts |
| EDR | Economic Development Revenue | EIR | Environmental Improvement Revenue |
| FGIC | Financial Guaranty Insurance Company | FHA | Federal Housing Administration |
| FHLB | Federal Home Loan Bank | FHLMC | Federal Home Loan Mortgage Corporation |
| FNMA | Federal National Mortgage Association | GAN | Grant Anticipation Notes |
| GIC | Guaranteed Investment Contract | GNMA | Government National Mortgage Association |
| GO | General Obligation | HR | Hospital Revenue |
| IDB | Industrial Development Board | IDC | Industrial Development Corporation |
| IDR | Industrial Development Revenue | LIFERS | Long Inverse Floating Exempt Receipts |
| LOC | Letter of Credit | LOR | Limited Obligation Revenue |
| LR | Lease Revenue | MERLOTS | Municipal Exempt Receipts Liquidity Option Tender |
| MFHR | Multi-Family Housing Revenue | MFMR | Multi-Family Mortgage Revenue |
| PCR | Pollution Control Revenue | P-FLOATS | Puttable Floating Option Tax-Exempt Receipts |
| PILOT | Payment in Lieu of Taxes | PUTTERS | Puttable Tax-Exempt Receipts |
| RAC | Revenue Anticipation Certificates | RAN | Revenue Anticipation Notes |
| RAW | Revenue Anticipation Warrants | RIB | Residual Interest Bonds |
| ROCS | Reset Options Certificates | RRR | Resources Recovery Revenue |
| SAAN | State Aid Anticipation Notes | SBPA | Standby Bond Purchase Agreement |
| SFHR | Single Family Housing Revenue | SFMR | Single Family Mortgage Revenue |
| SONYMA | State of New York Mortgage Agency | SPEARS | Short Puttable Exempt Adjustable Receipts |
| SWDR | Solid Waste Disposal Revenue | TAN | Tax Anticipation Notes |
| TAW | Tax Anticipation Warrants | TRAN | Tax and Revenue Anticipation Notes |
| XLCA | XL Capital Assurance | ||
| See notes to financial statements. | |||
66
| STATEMENT OF FINANCIAL FUTURES |
| August 31, 2014 |
| Market Value | Unrealized | ||||
| BNY Mellon Pennsylvania | Covered by | (Depreciation) | |||
| Intermediate Municipal Bond Fund | Contracts | Contracts ($) | Expiration | at 8/31/2014 | ($) |
| Financial Futures Short | |||||
| U.S. Treasury 5 Year Notes | 50 | (5,941,797) | December 2014 | (13,868 | ) |
| U.S. Treasury 10 Year Notes | 90 | (11,320,313) | December 2014 | (38,672 | ) |
| (52,540 | ) |
See notes to financial statements.
The Funds 67
| STATEMENT OF INVESTMENTS |
| August 31, 2014 |
| BNY Mellon Massachusetts Intermediate Municipal Bond Fund | |||||
| Long-Term Municipal | Coupon | Maturity | Principal | ||
| Investments—98.8% | Rate (%) | Date | Amount ($) | Value ($) | |
| Massachusetts—94.5% | |||||
| Barnstable, GO | 4.00 | 9/15/21 | 580,000 | 673,131 | |
| Bellingham, GO (Municipal Purpose Loan) | 4.00 | 9/1/19 | 460,000 | 526,107 | |
| Bellingham, GO (Municipal Purpose Loan) | 5.00 | 9/1/23 | 305,000 | 379,826 | |
| Boston, GO | 4.00 | 4/1/18 | 3,000,000 | 3,351,990 | |
| Boston, GO | 5.00 | 4/1/20 | 5,000,000 | 6,006,850 | |
| Boston, GO | 5.00 | 3/1/21 | 2,000,000 | 2,216,280 | |
| Boston Water and Sewer Commission, General Revenue | 5.00 | 11/1/17 | 2,000,000 | 2,275,940 | |
| Boston Water and Sewer Commission, General Revenue | 5.00 | 11/1/18 | 1,500,000 | 1,753,560 | |
| Boston Water and Sewer Commission, General Revenue | 5.00 | 11/1/25 | 2,500,000 | 2,921,550 | |
| Boston Water and Sewer Commission, General Revenue | 5.00 | 11/1/26 | 2,480,000 | 2,842,130 | |
| Brockton, GO (Municipal Purpose Loan) (Insured; AMBAC) | 5.00 | 6/1/19 | 1,430,000 | 1,480,336 | |
| Canton, GO (Municipal Purpose Loan) | 5.00 | 3/15/21 | 1,250,000 | 1,518,163 | |
| Falmouth, GO (Municipal Purpose Loan) | 4.00 | 11/15/19 | 625,000 | 712,631 | |
| Falmouth, GO (Municipal Purpose Loan) | 4.00 | 11/15/20 | 605,000 | 692,931 | |
| Groton-Dunstable Regional School District, GO | 5.00 | 9/1/20 | 725,000 | 867,811 | |
| Haverhill, GO (State Qualified Municipal Purpose Loan) | |||||
| (Insured; National Public Finance Guarantee Corp.) | 5.00 | 6/1/16 | 1,580,000 | 1,706,858 | |
| Haverhill, GO (State Qualified Municipal Purpose Loan) | |||||
| (Insured; National Public Finance Guarantee Corp.) | 5.00 | 6/1/18 | 505,000 | 545,365 | |
| Hopedale, GO (Insured; AMBAC) | 5.00 | 11/15/19 | 650,000 | 663,188 | |
| Massachusetts, Federal Highway GAN (Accelerated Bridge Program) | 5.00 | 6/15/22 | 3,000,000 | 3,688,170 | |
| Massachusetts, GO | 0.62 | 11/1/18 | 2,500,000 | a | 2,546,025 |
| Massachusetts, GO | 5.25 | 8/1/21 | 1,975,000 | 2,445,583 | |
| Massachusetts, GO | 5.25 | 8/1/23 | 1,000,000 | 1,265,440 | |
| Massachusetts, GO (Consolidated Loan) | 4.00 | 7/1/18 | 2,000,000 | 2,241,860 | |
| Massachusetts, GO (Consolidated Loan) | 5.00 | 8/1/20 | 4,000,000 | 4,633,320 | |
| Massachusetts, GO (Consolidated Loan) | 5.00 | 7/1/23 | 2,500,000 | 3,103,675 | |
| Massachusetts, GO (Consolidated Loan) | 5.00 | 8/1/23 | 310,000 | 369,935 | |
| Massachusetts, GO (Consolidated Loan) | 5.00 | 7/1/25 | 5,575,000 | 6,740,063 | |
| Massachusetts, GO (Consolidated Loan) | 5.00 | 8/1/26 | 5,000,000 | 5,976,450 | |
| Massachusetts, GO (Consolidated Loan) | |||||
| (Insured; Assured Guaranty Municipal Corp.) (Prerefunded) | 5.25 | 8/1/17 | 5,825,000 | b | 6,626,287 |
| Massachusetts, GO (Consolidated Loan) (Insured; FGIC) | 5.50 | 8/1/18 | 1,035,000 | 1,221,859 | |
| Massachusetts, GO (Consolidated Loan) (Prerefunded) | 5.00 | 8/1/16 | 1,000,000 | b | 1,090,080 |
| Massachusetts, GO (Insured; AMBAC) | 5.50 | 10/1/18 | 225,000 | 266,953 | |
| Massachusetts, Special Obligation Dedicated Tax Revenue | |||||
| (Insured; National Public Finance Guarantee Corp.) | 2.74 | 1/1/16 | 3,540,000 | a | 3,663,971 |
68
| BNY Mellon Massachusetts Intermediate Municipal Bond Fund (continued) | ||||
| Long-Term Municipal | Coupon | Maturity | Principal | |
| Investments (continued) | Rate (%) | Date | Amount ($) | Value ($) |
| Massachusetts (continued) | ||||
| Massachusetts, Transportation Fund Revenue | ||||
| (Accelerated Bridge Program) | 5.00 | 6/1/20 | 1,680,000 | 2,024,383 |
| Massachusetts, Transportation Fund Revenue | ||||
| (Accelerated Bridge Program) | 5.00 | 6/1/21 | 2,100,000 | 2,566,011 |
| Massachusetts, Transportation Fund Revenue | ||||
| (Accelerated Bridge Program) | 5.00 | 6/1/22 | 3,350,000 | 4,043,383 |
| Massachusetts Bay Transportation Authority, Assessment Revenue | 4.00 | 7/1/17 | 1,805,000 | 1,982,576 |
| Massachusetts Bay Transportation Authority, Assessment Revenue | 5.00 | 7/1/18 | 4,000,000 | 4,647,840 |
| Massachusetts Bay Transportation Authority, | ||||
| Senior Sales Tax Revenue | 5.25 | 7/1/18 | 1,250,000 | 1,462,187 |
| Massachusetts Bay Transportation Authority, | ||||
| Senior Sales Tax Revenue | 5.00 | 7/1/20 | 2,500,000 | 3,006,800 |
| Massachusetts Bay Transportation Authority, | ||||
| Senior Sales Tax Revenue | 5.25 | 7/1/20 | 1,500,000 | 1,825,050 |
| Massachusetts Bay Transportation Authority, | ||||
| Senior Sales Tax Revenue | 5.25 | 7/1/21 | 2,500,000 | 3,088,025 |
| Massachusetts Bay Transportation Authority, | ||||
| Senior Sales Tax Revenue | 5.25 | 7/1/21 | 2,000,000 | 2,470,420 |
| Massachusetts Bay Transportation Authority, | ||||
| Senior Sales Tax Revenue | 5.25 | 7/1/22 | 2,430,000 | 3,033,320 |
| Massachusetts College Building Authority, Project Revenue | 5.00 | 5/1/23 | 1,000,000 | 1,153,800 |
| Massachusetts College Building Authority, Project Revenue | 5.00 | 5/1/27 | 3,000,000 | 3,587,880 |
| Massachusetts Department of Transportation, | ||||
| Metropolitan Highway System Subordinated Revenue | ||||
| (Commonwealth Contract Assistance Secured) | 5.00 | 1/1/35 | 1,460,000 | 1,643,259 |
| Massachusetts Development Finance Agency, | ||||
| Higher Education Revenue (Emerson College Issue) | 5.00 | 1/1/16 | 1,000,000 | 1,052,980 |
| Massachusetts Development Finance Agency, | ||||
| Higher Education Revenue (Emerson College Issue) | 5.00 | 1/1/19 | 1,055,000 | 1,145,508 |
| Massachusetts Development Finance Agency, | ||||
| Higher Education Revenue (Emerson College Issue) | 5.00 | 1/1/22 | 2,000,000 | 2,162,900 |
| Massachusetts Development Finance Agency, | ||||
| Revenue (Boston College Issue) | 5.00 | 7/1/19 | 900,000 | 1,065,645 |
| Massachusetts Development Finance Agency, | ||||
| Revenue (Boston College Issue) | 5.00 | 7/1/19 | 950,000 | 1,124,847 |
| Massachusetts Development Finance Agency, | ||||
| Revenue (Boston College Issue) | 5.00 | 7/1/20 | 1,000,000 | 1,115,290 |
| Massachusetts Development Finance Agency, | ||||
| Revenue (Children’s Hospital Issue) | 5.00 | 10/1/46 | 5,000,000 | 5,671,400 |
The Funds 69
STATEMENT OF INVESTMENTS (continued)
| BNY Mellon Massachusetts Intermediate Municipal Bond Fund (continued) | |||||
| Long-Term Municipal | Coupon | Maturity | Principal | ||
| Investments (continued) | Rate (%) | Date | Amount ($) | Value ($) | |
| Massachusetts (continued) | |||||
| Massachusetts Development Finance Agency, | |||||
| Revenue (College of the Holy Cross Issue) | 5.00 | 9/1/21 | 1,800,000 | 2,071,530 | |
| Massachusetts Development Finance Agency, | |||||
| Revenue (Curry College Issue) (Insured; ACA) | 4.75 | 3/1/20 | 530,000 | 556,102 | |
| Massachusetts Development Finance Agency, | |||||
| Revenue (Curry College Issue) (Insured; ACA) | 5.25 | 3/1/26 | 1,000,000 | 1,056,510 | |
| Massachusetts Development Finance Agency, | |||||
| Revenue (Partners HealthCare System Issue) | 5.00 | 7/1/25 | 1,825,000 | 2,125,085 | |
| Massachusetts Development Finance Agency | |||||
| Revenue (Partners HealthCare System Issue) | 5.00 | 7/1/31 | 675,000 | 772,922 | |
| Massachusetts Development Finance Agency, | |||||
| Revenue (Southcoast Health System Obligated Group Issue) | 4.00 | 7/1/20 | 530,000 | 583,069 | |
| Massachusetts Development Finance Agency, | |||||
| Revenue (Southcoast Health System Obligated Group Issue) | 5.00 | 7/1/27 | 500,000 | 580,065 | |
| Massachusetts Development Finance Agency, | |||||
| Revenue (The Broad Institute Issue) | 5.25 | 4/1/23 | 3,675,000 | 4,407,685 | |
| Massachusetts Development Finance Agency, | |||||
| Revenue (The Broad Institute Issue) | 5.25 | 4/1/24 | 2,500,000 | 2,984,350 | |
| Massachusetts Development Finance Agency, | |||||
| Revenue (The Park School Issue) | 5.00 | 9/1/21 | 300,000 | 352,308 | |
| Massachusetts Development Finance Agency, | |||||
| Revenue (Tufts Medical Center Issue) | 5.00 | 1/1/15 | 600,000 | 608,046 | |
| Massachusetts Development Finance Agency, Revenue | |||||
| (Worcester City Campus Corporation Issue) | |||||
| (University of Massachusetts Project) | 4.00 | 10/1/17 | 730,000 | 804,891 | |
| Massachusetts Development Finance Agency, Revenue | |||||
| (Worcester City Campus Corporation Issue) | |||||
| (University of Massachusetts Project) | 5.00 | 10/1/19 | 910,000 | 1,079,442 | |
| Massachusetts Development Finance Agency, Revenue | |||||
| (Worcester City Campus Corporation Issue) | |||||
| (University of Massachusetts Project) | 5.00 | 10/1/20 | 905,000 | 1,085,728 | |
| Massachusetts Development Finance Agency, Revenue | |||||
| (Worcester City Campus Corporation Issue) | |||||
| (University of Massachusetts Project) | 5.00 | 10/1/21 | 830,000 | 1,007,238 | |
| Massachusetts Development Finance Agency, | |||||
| RRR (Waste Management, Inc. Project) | 2.13 | 12/1/15 | 1,250,000 | 1,280,875 | |
| Massachusetts Development Finance Agency, SWDR | |||||
| (Dominion Energy Brayton Point Issue) (Prerefunded) | 5.75 | 5/1/19 | 2,000,000 | b | 2,429,720 |
| Massachusetts Educational Financing Authority, | |||||
| Education Loan Revenue (Issue I) | 4.00 | 1/1/18 | 2,500,000 | 2,709,150 | |
| Massachusetts Health and Educational Facilities Authority, | |||||
| Revenue (Berklee College of Music Issue) | 5.00 | 10/1/24 | 2,155,000 | 2,395,153 | |
70
| BNY Mellon Massachusetts Intermediate Municipal Bond Fund (continued) | ||||
| Long-Term Municipal | Coupon | Maturity | Principal | |
| Investments (continued) | Rate (%) | Date | Amount ($) | Value ($) |
| Massachusetts (continued) | ||||
| Massachusetts Health and Educational Facilities Authority, | ||||
| Revenue (Berklee College of Music Issue) | 5.00 | 10/1/32 | 2,000,000 | 2,197,600 |
| Massachusetts Health and Educational Facilities Authority, | ||||
| Revenue (Berklee College of Music Issue) | 5.00 | 10/1/37 | 3,250,000 | 3,566,972 |
| Massachusetts Health and Educational Facilities Authority, | ||||
| Revenue (Cape Cod Healthcare Obligated Group Issue) | ||||
| (Insured; Assured Guaranty Corp.) | 5.13 | 11/15/35 | 1,000,000 | 1,115,820 |
| Massachusetts Health and Educational Facilities Authority, | ||||
| Revenue (CareGroup Issue) | 5.00 | 7/1/18 | 690,000 | 794,245 |
| Massachusetts Health and Educational Facilities Authority, | ||||
| Revenue (CareGroup Issue) (Capital Asset Program) | ||||
| (Insured; National Public Finance Guarantee Corp.) | 5.38 | 2/1/27 | 1,650,000 | 1,860,771 |
| Massachusetts Health and Educational Facilities Authority, | ||||
| Revenue (CareGroup Issue) (Insured; National | ||||
| Public Finance Guarantee Corp.) | 5.25 | 7/1/20 | 1,000,000 | 1,139,730 |
| Massachusetts Health and Educational Facilities Authority, | ||||
| Revenue (CareGroup Issue) (Insured; National | ||||
| Public Finance Guarantee Corp.) | 5.25 | 7/1/23 | 1,325,000 | 1,501,649 |
| Massachusetts Health and Educational Facilities Authority, | ||||
| Revenue (Dana-Farber Cancer Institute Issue) | 5.25 | 12/1/22 | 2,750,000 | 3,166,790 |
| Massachusetts Health and Educational Facilities Authority, | ||||
| Revenue (Dana-Farber Cancer Institute Issue) | 5.25 | 12/1/27 | 2,000,000 | 2,288,900 |
| Massachusetts Health and Educational Facilities Authority, | ||||
| Revenue (Harvard University Issue) | 5.00 | 12/15/21 | 500,000 | 615,545 |
| Massachusetts Health and Educational Facilities Authority, | ||||
| Revenue (Harvard University Issue) | 5.00 | 12/15/25 | 2,500,000 | 2,980,675 |
| Massachusetts Health and Educational Facilities Authority, | ||||
| Revenue (Harvard University Issue) | 5.00 | 12/15/27 | 3,230,000 | 3,833,655 |
| Massachusetts Health and Educational Facilities Authority, | ||||
| Revenue (Isabella Stewart Gardner Museum Issue) | 5.00 | 5/1/21 | 1,400,000 | 1,615,320 |
| Massachusetts Health and Educational Facilities Authority, | ||||
| Revenue (Isabella Stewart Gardner Museum Issue) | 5.00 | 5/1/26 | 2,525,000 | 2,893,701 |
| Massachusetts Health and Educational Facilities Authority, | ||||
| Revenue (Isabella Stewart Gardner Museum Issue) | 5.00 | 5/1/27 | 1,000,000 | 1,146,020 |
| Massachusetts Health and Educational Facilities Authority, | ||||
| Revenue (Massachusetts Institute of Technology Issue) | 5.50 | 7/1/22 | 1,800,000 | 2,295,468 |
| Massachusetts Health and Educational Facilities Authority, | ||||
| Revenue (Massachusetts Institute of Technology Issue) | 5.00 | 7/1/23 | 3,335,000 | 4,170,984 |
| Massachusetts Health and Educational Facilities Authority, | ||||
| Revenue (Northeastern University Issue) | 5.00 | 10/1/24 | 2,495,000 | 2,929,055 |
| Massachusetts Health and Educational Facilities Authority, | ||||
| Revenue (Northeastern University Issue) | 5.00 | 10/1/24 | 1,000,000 | 1,179,430 |
The Funds 71
STATEMENT OF INVESTMENTS (continued)
| BNY Mellon Massachusetts Intermediate Municipal Bond Fund (continued) | |||||
| Long-Term Municipal | Coupon | Maturity | Principal | ||
| Investments (continued) | Rate (%) | Date | Amount ($) | Value ($) | |
| Massachusetts (continued) | |||||
| Massachusetts Health and Educational Facilities Authority, | |||||
| Revenue (Northeastern University Issue) | 5.63 | 10/1/29 | 3,000,000 | 3,527,610 | |
| Massachusetts Health and Educational Facilities Authority, | |||||
| Revenue (Northeastern University Issue) | 5.00 | 10/1/30 | 3,000,000 | 3,426,930 | |
| Massachusetts Health and Educational Facilities Authority, | |||||
| Revenue (Partners HealthCare System Issue) | 5.00 | 7/1/16 | 95,000 | 95,258 | |
| Massachusetts Health and Educational Facilities Authority, | |||||
| Revenue (Partners HealthCare System Issue) | 5.00 | 7/1/18 | 1,500,000 | 1,680,120 | |
| Massachusetts Health and Educational Facilities Authority, | |||||
| Revenue (Partners HealthCare System Issue) | 5.00 | 7/1/21 | 1,235,000 | 1,375,531 | |
| Massachusetts Health and Educational Facilities Authority, | |||||
| Revenue (Partners HealthCare System Issue) | 5.00 | 7/1/22 | 250,000 | 278,075 | |
| Massachusetts Health and Educational Facilities Authority, | |||||
| Revenue (Simmons College Issue) | 7.50 | 10/1/22 | 1,000,000 | 1,229,950 | |
| Massachusetts Health and Educational Facilities Authority, | |||||
| Revenue (Simmons College Issue) | 8.00 | 10/1/29 | 1,060,000 | 1,143,899 | |
| Massachusetts Health and Educational Facilities Authority, | |||||
| Revenue (Simmons College Issue) | 8.00 | 10/1/39 | 885,000 | 953,402 | |
| Massachusetts Health and Educational Facilities Authority, | |||||
| Revenue (Simmons College Issue) (Prerefunded) | 8.00 | 10/1/15 | 740,000 | b | 803,263 |
| Massachusetts Health and Educational Facilities Authority, | |||||
| Revenue (Simmons College Issue) (Prerefunded) | 8.00 | 10/1/15 | 615,000 | b | 667,576 |
| Massachusetts Health and Educational Facilities Authority, | |||||
| Revenue (Suffolk University Issue) | 6.25 | 7/1/30 | 2,100,000 | 2,476,194 | |
| Massachusetts Health and Educational Facilities Authority, | |||||
| Revenue (Tufts University Issue) | 5.25 | 8/15/23 | 1,000,000 | 1,156,640 | |
| Massachusetts Health and Educational Facilities Authority, | |||||
| Revenue (Tufts University Issue) | 5.38 | 8/15/38 | 2,000,000 | 2,279,920 | |
| Massachusetts Housing Finance Agency, Housing Revenue | 4.00 | 6/1/19 | 3,170,000 | 3,490,297 | |
| Massachusetts Port Authority, Revenue | 5.00 | 7/1/19 | 400,000 | 472,380 | |
| Massachusetts Port Authority, Revenue | 4.00 | 7/1/20 | 1,000,000 | 1,135,970 | |
| Massachusetts Port Authority, Revenue | 5.00 | 7/1/21 | 525,000 | 635,476 | |
| Massachusetts Port Authority, Revenue | 5.00 | 7/1/27 | 1,345,000 | 1,545,297 | |
| Massachusetts Port Authority, Revenue | 5.00 | 7/1/28 | 2,500,000 | 2,906,100 | |
| Massachusetts Port Authority, Revenue | 5.00 | 7/1/33 | 2,000,000 | 2,324,640 | |
| Massachusetts School Building Authority, | |||||
| Dedicated Sales Tax Revenue (Insured; AMBAC) | 5.00 | 8/15/20 | 4,000,000 | 4,497,280 | |
| Massachusetts School Building Authority, | |||||
| Senior Dedicated Sales Tax Revenue | 5.00 | 8/15/26 | 4,000,000 | 4,837,360 | |
| Massachusetts School Building Authority, | |||||
| Senior Dedicated Sales Tax Revenue | 5.00 | 8/15/29 | 4,700,000 | 5,545,295 | |
72
| BNY Mellon Massachusetts Intermediate Municipal Bond Fund (continued) | |||||
| Long-Term Municipal | Coupon | Maturity | Principal | ||
| Investments (continued) | Rate (%) | Date | Amount ($) | Value ($) | |
| Massachusetts (continued) | |||||
| Massachusetts School Building Authority, | |||||
| Senior Dedicated Sales Tax Revenue | 5.00 | 8/15/30 | 2,000,000 | 2,345,500 | |
| Massachusetts Turnpike Authority, Turnpike Revenue (Insured; | |||||
| National Public Finance Guarantee Corp.) (Escrowed to Maturity) | 5.00 | 1/1/20 | 4,395,000 | 4,928,421 | |
| Massachusetts Water Pollution Abatement Trust (Pool Program) | 5.00 | 8/1/18 | 75,000 | 75,305 | |
| Massachusetts Water Pollution Abatement Trust (Pool Program) | 5.25 | 8/1/20 | 1,700,000 | 2,078,556 | |
| Massachusetts Water Pollution Abatement Trust (Pool Program) | 5.25 | 8/1/22 | 2,350,000 | 2,953,833 | |
| Massachusetts Water Pollution Abatement Trust (Pool Program) | 5.25 | 8/1/23 | 1,500,000 | 1,914,600 | |
| Massachusetts Water Pollution Abatement Trust | |||||
| (Pool Program) (Prerefunded) | 5.00 | 8/1/17 | 2,625,000 | b | 2,967,090 |
| Massachusetts Water Pollution Abatement Trust, | |||||
| State Revolving Fund Revenue | 5.00 | 8/1/19 | 5,000,000 | 5,946,200 | |
| Massachusetts Water Pollution Abatement Trust, | |||||
| State Revolving Fund Revenue | 5.00 | 8/1/21 | 1,500,000 | 1,837,335 | |
| Massachusetts Water Pollution Abatement Trust, | |||||
| State Revolving Fund Revenue | 5.00 | 8/1/24 | 1,000,000 | 1,268,760 | |
| Massachusetts Water Pollution Abatement Trust, | |||||
| Water Pollution Abatement Revenue (MWRA Program) | 5.75 | 8/1/29 | 155,000 | 155,679 | |
| Massachusetts Water Resources Authority, General Revenue | 5.00 | 8/1/19 | 2,475,000 | 2,939,459 | |
| Massachusetts Water Resources Authority, General Revenue | 5.00 | 8/1/27 | 5,000,000 | 5,870,100 | |
| Massachusetts Water Resources Authority, General Revenue | 5.00 | 8/1/28 | 500,000 | 588,695 | |
| Massachusetts Water Resources Authority, General Revenue | |||||
| (Insured; National Public Finance Guarantee Corp.) | 5.25 | 8/1/24 | 2,340,000 | 2,633,038 | |
| Massachusetts Water Resources Authority, General Revenue | |||||
| (Insured; National Public Finance Guarantee Corp.) (Prerefunded) | 5.25 | 8/1/17 | 95,000 | b | 108,128 |
| Massachusetts Water Resources Authority, General Revenue | |||||
| (Insured; National Public Finance Guarantee Corp.) (Prerefunded) | 5.25 | 8/1/17 | 65,000 | b | 73,982 |
| Massachusetts Water Resources Authority, General Revenue | |||||
| (Insured; National Public Finance Guarantee Corp.) (Prerefunded) | 5.25 | 8/1/17 | 160,000 | b | 182,110 |
| Metropolitan Boston Transit Parking Corporation, | |||||
| Systemwide Senior Lien Parking Revenue | 5.00 | 7/1/25 | 1,000,000 | 1,187,000 | |
| Middleborough, GO | |||||
| (Insured; National Public Finance Guarantee Corp.) | 5.00 | 12/15/16 | 1,000,000 | 1,103,960 | |
| Middleborough, GO | |||||
| (Insured; National Public Finance Guarantee Corp.) | 5.00 | 12/15/18 | 1,275,000 | 1,398,382 | |
| Newton, GO | 5.00 | 4/1/39 | 2,500,000 | 2,843,150 | |
| Northbridge, GO (Insured; AMBAC) | 5.25 | 2/15/17 | 60,000 | 60,255 | |
| Pembroke, GO (Insured; National Public Finance Guarantee Corp.) | 5.00 | 8/1/20 | 960,000 | 1,039,440 | |
| Springfield Water and Sewer Commission, | |||||
| General Revenue (Insured; AMBAC) | 5.00 | 7/15/22 | 1,175,000 | 1,265,804 | |
The Funds 73
STATEMENT OF INVESTMENTS (continued)
| BNY Mellon Massachusetts Intermediate Municipal Bond Fund (continued) | |||||
| Long-Term Municipal | Coupon | Maturity | Principal | ||
| Investments (continued) | Rate (%) | Date | Amount ($) | Value ($) | |
| Massachusetts (continued) | |||||
| Springfield Water and Sewer Commission, | |||||
| General Revenue (Insured; AMBAC) | 5.00 | 7/15/23 | 1,235,000 | 1,328,749 | |
| University of Massachusetts Building Authority, Project Revenue | 5.00 | 11/1/18 | 1,370,000 | 1,598,530 | |
| Westwood, GO | 4.00 | 6/1/18 | 1,105,000 | 1,235,622 | |
| Worcester, GO (Insured; National Public Finance Guarantee Corp.) | 5.00 | 4/1/18 | 625,000 | 642,506 | |
| Texas—.5% | |||||
| Centerville Independent School District, Unlimited Tax School | |||||
| Building Bonds (Permanent School Fund Guarantee Program) | 5.00 | 8/15/44 | 1,315,000 | 1,456,599 | |
| U.S. Related—3.8% | |||||
| Guam, Business Privilege Tax Revenue | 5.00 | 1/1/25 | 1,500,000 | 1,676,850 | |
| Guam, Hotel Occupancy Tax Revenue | 6.00 | 11/1/26 | 500,000 | 590,340 | |
| Guam, LOR (Section 30) | 5.63 | 12/1/29 | 1,000,000 | 1,105,950 | |
| Puerto Rico Commonwealth, Public Improvement GO | |||||
| (Insured; National Public Finance Guarantee Corp.) | 5.50 | 7/1/15 | 1,135,000 | 1,136,476 | |
| Puerto Rico Commonwealth, Public Improvement GO | |||||
| (Insured; National Public Finance Guarantee Corp.) | 5.50 | 7/1/19 | 1,000,000 | 1,029,750 | |
| Puerto Rico Electric Power Authority, Power Revenue | 5.25 | 7/1/23 | 1,750,000 | 962,413 | |
| Puerto Rico Electric Power Authority, Power Revenue | |||||
| (Insured; National Public Finance Guarantee Corp.) | 5.00 | 7/1/17 | 1,000,000 | 1,006,630 | |
| Puerto Rico Highways and Transportation Authority, | |||||
| Transportation Revenue (Insured; FGIC) | 5.25 | 7/1/15 | 305,000 | 212,954 | |
| Puerto Rico Highways and Transportation Authority, | |||||
| Transportation Revenue (Insured; FGIC) | 5.25 | 7/1/16 | 330,000 | 221,100 | |
| Puerto Rico Infrastructure Financing Authority, | |||||
| Revenue (Ports Authority Project) | 6.00 | 12/15/26 | 2,500,000 | 1,553,825 | |
| Puerto Rico Infrastructure Financing Authority, Special Tax Revenue | 5.00 | 7/1/20 | 2,000,000 | 1,307,160 | |
| Puerto Rico Sales Tax Financing Corporation, | |||||
| Sales Tax Revenue (First Subordinate Series) | 0/6.75 | 8/1/32 | 1,000,000 | c | 788,600 |
| Puerto Rico Sales Tax Financing Corporation, | |||||
| Sales Tax Revenue (First Subordinate Series) | 0/6.25 | 8/1/33 | 750,000 | c | 439,523 |
| Total Long-Term Municipal Investments | |||||
| (cost $294,191,856) | 311,612,843 | ||||
74
| BNY Mellon Massachusetts Intermediate Municipal Bond Fund (continued) | ||||||
| Short-Term Municipal | Coupon | Maturity | Principal | |||
| Investments—1.4% | Rate (%) | Date | Amount ($) | Value ($) | ||
| Massachusetts; | ||||||
| Massachusetts, GO Notes (Central Artery/Ted Williams Tunnel | ||||||
| Infrastructure Loan Act of 2000) (Liquidity Facility; U.S. Bank NA) | 0.03 | 9/2/14 | 800,000 | d | 800,000 | |
| Massachusetts, GO Notes (Consolidated Loan) | 0.48 | 9/7/14 | 1,500,000 | d | 1,505,760 | |
| Massachusetts Health and Educational Facilities Authority, Revenue | ||||||
| (Children’s Hospital Issue) (LOC; JPMorgan Chase Bank) | 0.03 | 9/2/14 | 500,000 | d | 500,000 | |
| Massachusetts Health and Educational Facilities Authority, Revenue | ||||||
| (Museum of Fine Arts Issue) (Liquidity Facility; Bank of America) | 0.03 | 9/2/14 | 100,000 | d | 100,000 | |
| Massachusetts Health and Educational Facilities Authority, Revenue | ||||||
| (Tufts University Issue) (Liquidity Facility; Wells Fargo Bank) | 0.03 | 9/2/14 | 1,100,000 | d | 1,100,000 | |
| Massachusetts Health and Educational Facilities Authority, | ||||||
| Revenue (Wellesley College Issue) | 0.03 | 9/2/14 | 475,000 | d | 475,000 | |
| Total Short-Term Municipal Investments | ||||||
| (cost $4,475,000) | 4,480,760 | |||||
| Total Investments (cost $298,666,856) | 100.2 | % | 316,093,603 | |||
| Liabilities, Less Cash and Receivables | (.2 | %) | (670,649 | ) | ||
| Net Assets | 100.0 | % | 315,422,954 | |||
| a Variable rate security—interest rate subject to periodic change. |
| b These securities are prerefunded; the date shown represents the prerefunded date. Bonds which are prerefunded are collateralized by U.S. Government securities which are held in |
| escrow and are used to pay principal and interest on the municipal issue and to retire the bonds in full at the earliest refunding date. |
| c Zero coupon until a specified date at which time the stated coupon rate becomes effective until maturity. |
| d Variable rate demand note—rate shown is the interest rate in effect at August 31, 2014. Maturity date represents the next demand date, or the ultimate maturity date if earlier. |
| Portfolio Summary (Unaudited) † | |||
| Value (%) | Value (%) | ||
| Education | 24.0 | Housing | 3.3 |
| Special Tax | 13.2 | City | 2.4 |
| State/Territory | 12.4 | County | .8 |
| Utility-Water and Sewer | 12.2 | Utility-Electric | .6 |
| Transportation Services | 10.7 | Pollution Control | .5 |
| Health Care | 9.1 | Other | 4.7 |
| Prerefunded | 6.3 | 100.2 | |
| † | Based on net assets. |
The Funds 75
STATEMENT OF INVESTMENTS (continued)
| Summary of Abbreviations | |||
| ABAG | Association of Bay Area Governments | ACA | American Capital Access |
| AGC | ACE Guaranty Corporation | AGIC | Asset Guaranty Insurance Company |
| AMBAC | American Municipal Bond Assurance Corporation | ARRN | Adjustable Rate Receipt Notes |
| BAN | Bond Anticipation Notes | BPA | Bond Purchase Agreement |
| CIFG | CDC Ixis Financial Guaranty | COP | Certificate of Participation |
| CP | Commercial Paper | DRIVERS | Derivative Inverse Tax-Exempt Receipts |
| EDR | Economic Development Revenue | EIR | Environmental Improvement Revenue |
| FGIC | Financial Guaranty Insurance Company | FHA | Federal Housing Administration |
| FHLB | Federal Home Loan Bank | FHLMC | Federal Home Loan Mortgage Corporation |
| FNMA | Federal National Mortgage Association | GAN | Grant Anticipation Notes |
| GIC | Guaranteed Investment Contract | GNMA | Government National Mortgage Association |
| GO | General Obligation | HR | Hospital Revenue |
| IDB | Industrial Development Board | IDC | Industrial Development Corporation |
| IDR | Industrial Development Revenue | LIFERS | Long Inverse Floating Exempt Receipts |
| LOC | Letter of Credit | LOR | Limited Obligation Revenue |
| LR | Lease Revenue | MERLOTS | Municipal Exempt Receipts Liquidity Option Tender |
| MFHR | Multi-Family Housing Revenue | MFMR | Multi-Family Mortgage Revenue |
| PCR | Pollution Control Revenue | P-FLOATS | Puttable Floating Option Tax-Exempt Receipts |
| PILOT | Payment in Lieu of Taxes | PUTTERS | Puttable Tax-Exempt Receipts |
| RAC | Revenue Anticipation Certificates | RAN | Revenue Anticipation Notes |
| RAW | Revenue Anticipation Warrants | RIB | Residual Interest Bonds |
| ROCS | Reset Options Certificates | RRR | Resources Recovery Revenue |
| SAAN | State Aid Anticipation Notes | SBPA | Standby Bond Purchase Agreement |
| SFHR | Single Family Housing Revenue | SFMR | Single Family Mortgage Revenue |
| SONYMA | State of New York Mortgage Agency | SPEARS | Short Puttable Exempt Adjustable Receipts |
| SWDR | Solid Waste Disposal Revenue | TAN | Tax Anticipation Notes |
| TAW | Tax Anticipation Warrants | TRAN | Tax and Revenue Anticipation Notes |
| XLCA | XL Capital Assurance | ||
| See notes to financial statements. | |||
76
| STATEMENT OF FINANCIAL FUTURES |
| August 31, 2014 |
| Market Value | Unrealized | ||||
| BNY Mellon Massachusetts | Covered by | (Depreciation) | |||
| Intermediate Municipal Bond Fund | Contracts | Contracts ($) | Expiration | at 8/31/2014 | ($) |
| Financial Futures Short | |||||
| U.S. Treasury 5 Year Notes | 50 | (5,941,797) | December 2014 | (13,869 | ) |
| U.S. Treasury 10 Year Notes | 70 | (8,804,688) | December 2014 | (30,078 | ) |
| (43,947 | ) |
| See notes to financial statements. |
The Funds 77
| STATEMENT OF INVESTMENTS |
| August 31, 2014 |
| BNY Mellon New York Intermediate Tax-Exempt Bond Fund | |||||
| Long-Term Municipal | Coupon | Maturity | Principal | ||
| Investments—98.2% | Rate (%) | Date | Amount ($) | Value ($) | |
| New York—94.4% | |||||
| Albany County Airport Authority, Airport Revenue | |||||
| (Insured; Assured Guaranty Municipal Corp.) | 5.00 | 12/15/23 | 1,500,000 | 1,700,970 | |
| Albany Industrial Development Agency, Civic Facility Revenue | |||||
| (Saint Peter’s Hospital of the City of Albany Project) | 5.75 | 11/15/22 | 2,500,000 | 2,843,225 | |
| Buffalo, General Improvement GO | 4.00 | 4/1/21 | 2,175,000 | 2,453,422 | |
| Build New York City Resource Corporation, Revenue, City University | |||||
| of New York—Queens College (Q Student Residences, LLC Project) | 5.00 | 6/1/33 | 660,000 | 764,544 | |
| Build New York City Resource Corporation, Revenue, City University | |||||
| of New York—Queens College (Q Student Residences, LLC Project) | 5.00 | 6/1/34 | 525,000 | 605,766 | |
| Erie County Fiscal Stability Authority, | |||||
| Sales Tax and State Aid Secured Revenue | 5.00 | 12/1/24 | 1,000,000 | 1,206,010 | |
| Erie County Industrial Development Agency, | |||||
| Revenue (City School District of the City of Buffalo Project) | 5.00 | 5/1/17 | 2,500,000 | 2,792,700 | |
| Hempstead, Public Improvement GO | 5.00 | 8/15/20 | 1,255,000 | 1,508,209 | |
| Long Island Power Authority, Electric System General Revenue | 5.00 | 5/1/20 | 1,000,000 | 1,164,490 | |
| Long Island Power Authority, Electric System General Revenue | 5.00 | 5/1/21 | 1,000,000 | 1,162,210 | |
| Long Island Power Authority, Electric System General Revenue | |||||
| (Insured; National Public Finance Guarantee Corp.) | 5.00 | 12/1/17 | 2,780,000 | 3,046,018 | |
| Metropolitan Transportation Authority, Dedicated Tax Fund Revenue | |||||
| (Insured; National Public Finance Guarantee Corp.) | 5.00 | 11/15/28 | 5,000,000 | 5,440,550 | |
| Metropolitan Transportation Authority, Transportation Revenue | 6.25 | 11/15/23 | 300,000 | 362,187 | |
| Metropolitan Transportation Authority, Transportation Revenue | 5.00 | 11/15/28 | 2,375,000 | 2,751,105 | |
| Metropolitan Transportation Authority, Transportation Revenue | 5.00 | 11/15/30 | 1,190,000 | 1,331,289 | |
| Metropolitan Transportation Authority, Transportation | |||||
| Revenue (Insured; Assured Guaranty Municipal Corp.) | 0.32 | 11/1/22 | 2,300,000 | a | 2,225,250 |
| Monroe County Industrial Development Corporation, | |||||
| Revenue (Saint John Fisher College Project) | 5.00 | 6/1/17 | 1,740,000 | 1,897,992 | |
| Nassau County, General Improvement GO | 4.00 | 10/1/16 | 1,545,000 | 1,653,366 | |
| Nassau County, General Improvement GO | 5.00 | 10/1/18 | 1,310,000 | 1,500,959 | |
| Nassau County, GO | 5.00 | 10/1/20 | 2,000,000 | 2,295,140 | |
| Nassau County, GO (Insured; Assured Guaranty Municipal Corp.) | 5.00 | 7/1/22 | 1,000,000 | 1,139,270 | |
| Nassau County Sewer and Storm Water Finance | |||||
| Authority, System Revenue (Insured; | |||||
| Berkshire Hathaway Assurance Corporation) | 5.38 | 11/1/28 | 1,000,000 | 1,153,640 | |
| New York City, GO | 5.13 | 12/1/22 | 1,000,000 | 1,133,340 | |
| New York City, GO | 5.00 | 8/1/23 | 2,625,000 | 3,141,390 | |
| New York City, GO | 5.25 | 9/1/23 | 1,000,000 | 1,157,630 | |
| New York City, GO | 5.00 | 10/1/28 | 1,725,000 | 2,024,529 | |
| New York City, GO (Prerefunded) | 5.00 | 8/1/16 | 15,000 | b | 16,348 |
78
| BNY Mellon New York Intermediate Tax-Exempt Bond Fund (continued) | ||||
| Long-Term Municipal | Coupon | Maturity | Principal | |
| Investments (continued) | Rate (%) | Date | Amount ($) | Value ($) |
| New York (continued) | ||||
| New York City Industrial Development Agency, | ||||
| Civic Facility Revenue (United Jewish Appeal—Federation | ||||
| of Jewish Philanthropies of New York, Inc. Project) | 5.00 | 7/1/27 | 1,250,000 | 1,250,850 |
| New York City Industrial Development Agency, | ||||
| PILOT Revenue (Queens Baseball Stadium Project) | ||||
| (Insured; Assured Guaranty Corp.) | 6.50 | 1/1/46 | 325,000 | 379,073 |
| New York City Industrial Development Agency, | ||||
| PILOT Revenue (Yankee Stadium Project) | ||||
| (Insured; Assured Guaranty Corp.) | 7.00 | 3/1/49 | 1,000,000 | 1,220,460 |
| New York City Industrial Development Agency, Special Revenue | ||||
| (New York City—New York Stock Exchange Project) | 5.00 | 5/1/21 | 1,000,000 | 1,151,850 |
| New York City Municipal Water Finance Authority, | ||||
| Water and Sewer System Second General Resolution Revenue | 5.00 | 6/15/20 | 2,500,000 | 2,893,250 |
| New York City Municipal Water Finance Authority, | ||||
| Water and Sewer System Second General Resolution Revenue | 5.00 | 6/15/40 | 1,000,000 | 1,127,230 |
| New York City Transitional Finance Authority, Building Aid Revenue | 5.25 | 1/15/25 | 1,545,000 | 1,800,867 |
| New York City Transitional Finance Authority, Building Aid Revenue | 5.25 | 1/15/27 | 1,650,000 | 1,915,633 |
| New York City Transitional Finance Authority, Building Aid Revenue | 5.00 | 7/15/33 | 1,000,000 | 1,148,060 |
| New York City Transitional Finance Authority, | ||||
| Future Tax Secured Subordinate Revenue | 5.00 | 11/1/18 | 1,750,000 | 2,046,887 |
| New York City Transitional Finance Authority, | ||||
| Future Tax Secured Subordinate Revenue | 5.00 | 5/1/21 | 1,100,000 | 1,330,274 |
| New York City Transitional Finance Authority, | ||||
| Future Tax Secured Subordinate Revenue | 5.00 | 5/1/29 | 2,000,000 | 2,322,040 |
| New York City Transitional Finance Authority, | ||||
| Future Tax Secured Subordinate Revenue | 5.00 | 11/1/31 | 1,980,000 | 2,267,694 |
| New York City Trust for Cultural Resources, | ||||
| Revenue (Lincoln Center for the Performing Arts, Inc.) | 5.75 | 12/1/16 | 1,000,000 | 1,108,230 |
| New York City Trust for Cultural Resources, | ||||
| Revenue (The Juilliard School) | 5.00 | 1/1/34 | 2,000,000 | 2,245,020 |
| New York City Trust for Cultural Resources, | ||||
| Revenue (The Juilliard School) | 5.00 | 1/1/39 | 2,500,000 | 2,810,700 |
| New York City Trust for Cultural Resources, | ||||
| Revenue (Whitney Museum of American Art) | 5.00 | 7/1/21 | 2,000,000 | 2,357,500 |
| New York City Trust for Cultural Resources, | ||||
| Revenue (Wildlife Conservation Society) | 5.00 | 8/1/27 | 1,120,000 | 1,317,758 |
| New York City Trust for Cultural Resources, | ||||
| Revenue (Wildlife Conservation Society) | 5.00 | 8/1/31 | 1,480,000 | 1,705,789 |
| New York Liberty Development Corporation, | ||||
| Liberty Revenue (7 World Trade Center Project) | 5.00 | 9/15/29 | 1,000,000 | 1,169,040 |
The Funds 79
STATEMENT OF INVESTMENTS (continued)
| BNY Mellon New York Intermediate Tax-Exempt Bond Fund (continued) | ||||
| Long-Term Municipal | Coupon | Maturity | Principal | |
| Investments (continued) | Rate (%) | Date | Amount ($) | Value ($) |
| New York (continued) | ||||
| New York Liberty Development Corporation, | ||||
| Revenue (Goldman Sachs Headquarters Issue) | 5.00 | 10/1/15 | 3,175,000 | 3,310,922 |
| New York Local Government Assistance Corporation, | ||||
| Subordinate Lien Revenue | 5.00 | 4/1/21 | 2,560,000 | 3,057,562 |
| New York Local Government Assistance Corporation, | ||||
| Subordinate Lien Revenue | 5.00 | 4/1/23 | 1,395,000 | 1,657,037 |
| New York State, GO | 5.00 | 3/1/19 | 1,000,000 | 1,111,590 |
| New York State, GO | 5.00 | 3/1/22 | 1,000,000 | 1,222,860 |
| New York State, GO | 5.00 | 2/15/26 | 2,600,000 | 3,009,916 |
| New York State Dormitory Authority, Consolidated | ||||
| Revenue (City University System) (Insured; | ||||
| National Public Finance Guarantee Corp.) | 5.75 | 7/1/18 | 1,310,000 | 1,432,930 |
| New York State Dormitory Authority, Mental Health Services | ||||
| Facilities Improvement Revenue (Insured; Assured Guaranty | ||||
| Municipal Corp.) (Escrowed to Maturity) | 5.00 | 2/15/17 | 5,000 | 5,559 |
| New York State Dormitory Authority, Revenue (Columbia University) | 5.00 | 7/1/18 | 1,500,000 | 1,627,065 |
| New York State Dormitory Authority, Revenue (Columbia University) | 5.00 | 10/1/41 | 2,500,000 | 2,869,925 |
| New York State Dormitory Authority, Revenue (Convent of the | ||||
| Sacred Heart) (Insured; Assured Guaranty Municipal Corp.) | 5.63 | 11/1/35 | 1,000,000 | 1,166,960 |
| New York State Dormitory Authority, Revenue | ||||
| (Mount Sinai Hospital Obligated Group) | 5.00 | 7/1/26 | 3,000,000 | 3,367,770 |
| New York State Dormitory Authority, | ||||
| Revenue (New York State Dormitory Facilities) | 5.00 | 7/1/19 | 1,500,000 | 1,759,065 |
| New York State Dormitory Authority, Revenue (New York University) | 5.00 | 7/1/37 | 2,155,000 | 2,441,917 |
| New York State Dormitory Authority, Revenue (New York University) | ||||
| (Insured; National Public Finance Guarantee Corp.) | 5.00 | 7/1/21 | 1,500,000 | 1,505,835 |
| New York State Dormitory Authority, | ||||
| Revenue (Rochester Institute of Technology) | 5.00 | 7/1/23 | 1,000,000 | 1,133,850 |
| New York State Dormitory Authority, Revenue | ||||
| (School Districts Revenue Financing Program) | 5.00 | 10/1/18 | 3,040,000 | 3,514,666 |
| New York State Dormitory Authority, | ||||
| Revenue (The Rockefeller University) | 5.00 | 7/1/25 | 1,000,000 | 1,171,340 |
| New York State Dormitory Authority, | ||||
| Revenue (The Rockefeller University) | 5.00 | 7/1/40 | 3,000,000 | 3,396,060 |
| New York State Dormitory Authority, | ||||
| Revenue (Yeshiva University) | 5.00 | 11/1/20 | 3,190,000 | 3,501,950 |
| New York State Dormitory Authority, | ||||
| State Personal Income Tax Revenue (Education) | 5.75 | 3/15/36 | 1,000,000 | 1,167,370 |
| New York State Dormitory Authority, | ||||
| State Personal Income Tax Revenue (General Purpose) | 5.00 | 2/15/20 | 1,000,000 | 1,191,270 |
80
| BNY Mellon New York Intermediate Tax-Exempt Bond Fund (continued) | ||||
| Long-Term Municipal | Coupon | Maturity | Principal | |
| Investments (continued) | Rate (%) | Date | Amount ($) | Value ($) |
| New York (continued) | ||||
| New York State Dormitory Authority, | ||||
| State Personal Income Tax Revenue (General Purpose) | 5.00 | 3/15/20 | 1,000,000 | 1,192,950 |
| New York State Dormitory Authority, | ||||
| State Personal Income Tax Revenue (General Purpose) | 5.00 | 6/15/22 | 1,000,000 | 1,215,690 |
| New York State Dormitory Authority, | ||||
| State Personal Income Tax Revenue (General Purpose) | 5.00 | 3/15/30 | 1,000,000 | 1,151,240 |
| New York State Dormitory Authority, State Sales Tax Revenue | 4.00 | 3/15/20 | 1,000,000 | 1,141,460 |
| New York State Dormitory Authority, State Sales Tax Revenue | 5.00 | 3/15/21 | 1,000,000 | 1,213,560 |
| New York State Medical Care Facilities Finance Agency, | ||||
| Secured Mortgage Revenue (Collateralized; SONYMA) | 6.38 | 11/15/20 | 190,000 | 190,960 |
| New York State Thruway Authority, General Revenue | 5.00 | 1/1/20 | 1,500,000 | 1,767,945 |
| New York State Thruway Authority, | ||||
| General Revenue Junior Indebtedness Obligations | 5.00 | 5/1/19 | 2,000,000 | 2,334,560 |
| New York State Thruway Authority, | ||||
| General Revenue Junior Indebtedness Obligations | ||||
| (Insured; Assured Guaranty Municipal Corp.) | 5.00 | 5/1/19 | 1,000,000 | 1,171,250 |
| New York State Thruway Authority, Second General | ||||
| Highway and Bridge Trust Fund Bonds (Insured; AMBAC) | 5.00 | 4/1/25 | 2,000,000 | 2,135,780 |
| New York State Thruway Authority, | ||||
| State Personal Income Tax Revenue (Transportation) | 5.00 | 3/15/25 | 1,325,000 | 1,562,255 |
| New York State Urban Development Corporation, | ||||
| Revenue (Insured; Assured Guaranty Corp.) | 5.50 | 1/1/19 | 1,140,000 | 1,351,139 |
| New York State Urban Development Corporation, | ||||
| Service Contract Revenue | 5.00 | 1/1/20 | 2,075,000 | 2,449,164 |
| New York State Urban Development Corporation, | ||||
| Service Contract Revenue | 5.25 | 1/1/24 | 2,375,000 | 2,714,506 |
| New York State Urban Development Corporation, | ||||
| State Personal Income Tax Revenue (General Purpose) | 5.00 | 3/15/28 | 1,000,000 | 1,172,020 |
| Onondaga County Trust for Cultural Resources, | ||||
| Revenue (Syracuse University Project) | 5.00 | 12/1/19 | 2,500,000 | 2,981,900 |
| Oyster Bay, Public Improvement GO | 5.00 | 2/15/16 | 1,000,000 | 1,061,420 |
| Oyster Bay, Public Improvement GO | ||||
| (Insured; Assured Guaranty Municipal Corp.) | 4.00 | 11/1/19 | 2,000,000 | 2,254,740 |
| Oyster Bay, Public Improvement GO | ||||
| (Insured; Assured Guaranty Municipal Corp.) | 5.00 | 3/15/21 | 1,330,000 | 1,550,780 |
| Oyster Bay, Public Improvement GO | ||||
| (Insured; Build America Mutual Assurance Company) | 5.00 | 8/15/22 | 1,715,000 | 2,033,047 |
| Port Authority of New York and New Jersey | ||||
| (Consolidated Bonds, 184th Series) | 5.00 | 9/1/28 | 750,000 | 905,355 |
The Funds 81
STATEMENT OF INVESTMENTS (continued)
| BNY Mellon New York Intermediate Tax-Exempt Bond Fund (continued) | |||||
| Long-Term Municipal | Coupon | Maturity | Principal | ||
| Investments (continued) | Rate (%) | Date | Amount ($) | Value ($) | |
| New York (continued) | |||||
| Port Authority of New York and New Jersey | |||||
| (Consolidated Bonds, 184th Series) | 5.00 | 9/1/30 | 1,000,000 | 1,188,420 | |
| Suffolk County, GO | 5.00 | 4/1/19 | 1,400,000 | 1,624,280 | |
| Suffolk County, GO (Insured; Assured Guaranty Municipal Corp.) | 5.00 | 2/1/22 | 1,000,000 | 1,196,920 | |
| Suffolk County, GO (Insured; Assured Guaranty Municipal Corp.) | 5.25 | 5/1/17 | 1,545,000 | 1,731,729 | |
| Suffolk County Industrial Development Agency, Civic Facility | |||||
| Revenue (New York Institute of Technology Project) | 5.00 | 3/1/26 | 750,000 | 759,750 | |
| Tobacco Settlement Financing Corporation of New York, | |||||
| Asset-Backed Revenue (State Contingency Contract Secured) | 5.00 | 6/1/22 | 1,500,000 | 1,676,145 | |
| Triborough Bridge and Tunnel Authority, | |||||
| General Purpose Revenue (Prerefunded) | 5.25 | 1/1/22 | 1,000,000 | b | 1,241,990 |
| Triborough Bridge and Tunnel Authority, | |||||
| General Revenue (MTA Bridges and Tunnels) | 5.00 | 1/1/27 | 1,500,000 | 1,773,675 | |
| Triborough Bridge and Tunnel Authority, | |||||
| General Revenue (MTA Bridges and Tunnels) | 5.00 | 1/1/28 | 1,000,000 | 1,167,740 | |
| Utility Debt Securitization Authority of New York, Restructing Bonds | 5.00 | 6/15/26 | 2,000,000 | 2,441,780 | |
| Westchester County Health Care Corporation, Senior Lien Revenue | 5.00 | 11/1/20 | 1,400,000 | 1,623,706 | |
| Westchester County Health Care Corporation, Senior Lien Revenue | 5.00 | 11/1/24 | 1,500,000 | 1,691,190 | |
| U.S. Related—3.8% | |||||
| Guam, Business Privilege Tax Revenue | 5.00 | 1/1/24 | 1,000,000 | 1,133,290 | |
| Guam, Hotel Occupancy Tax Revenue | 5.00 | 11/1/16 | 1,000,000 | 1,077,810 | |
| Puerto Rico Commonwealth, Public Improvement GO | |||||
| (Insured; National Public Finance Guarantee Corp.) | 5.50 | 7/1/19 | 2,500,000 | 2,574,375 | |
| Puerto Rico Electric Power Authority, Power Revenue | 5.38 | 7/1/24 | 1,000,000 | 549,870 | |
| Puerto Rico Housing Finance Authority, Capital Fund Program | |||||
| Revenue (Puerto Rico Housing Administration Projects) | 5.00 | 12/1/18 | 260,000 | 260,785 | |
| Puerto Rico Housing Finance Authority, Capital Fund Program | |||||
| Revenue (Puerto Rico Housing Administration Projects) | 5.00 | 12/1/19 | 270,000 | 270,794 | |
| Puerto Rico Sales Tax Financing Corporation, | |||||
| Sales Tax Revenue (First Subordinate Series) | 0/6.75 | 8/1/32 | 1,200,000 | c | 946,320 |
| Puerto Rico Sales Tax Financing Corporation, | |||||
| Sales Tax Revenue (First Subordinate Series) | 0/6.25 | 8/1/33 | 500,000 | c | 293,015 |
| Total Long-Term Municipal Investments | |||||
| (cost $174,942,504) | 185,438,478 | ||||
82
| BNY Mellon New York Intermediate Tax-Exempt Bond Fund (continued) | |||||
| Short-Term Municipal | Coupon | Maturity | Principal | ||
| Investments—1.2% | Rate (%) | Date | Amount ($) | Value ($) | |
| New York; | |||||
| New York City, GO Notes (LOC; JPMorgan Chase Bank) | 0.04 | 9/2/14 | 2,000,000 | d | 2,000,000 |
| New York City Trust for Cultural Resources, Revenue, | |||||
| Refunding (Lincoln Center for the Performing Arts, Inc.) | |||||
| (LOC; Bank of America) | 0.04 | 9/2/14 | 300,000 | d | 300,000 |
| Total Short-Term Municipal Investments | |||||
| (cost $2,300,000) | 2,300,000 | ||||
| Total Investments (cost $177,242,504) | 99.4 | % | 187,738,478 | ||
| Cash and Receivables (Net) | .6 | % | 1,096,552 | ||
| Net Assets | 100.0 | % | 188,835,030 | ||
| a Variable rate security—interest rate subject to periodic change. |
| b These securities are prerefunded; the date shown represents the prerefunded date. Bonds which are prerefunded are collateralized by U.S. Government securities which are held in |
| escrow and are used to pay principal and interest on the municipal issue and to retire the bonds in full at the earliest refunding date. |
| c Zero coupon until a specified date at which time the stated coupon rate becomes effective until maturity. |
| d Variable rate demand note—rate shown is the interest rate in effect at August 31, 2014. Maturity date represents the next demand date, or the ultimate maturity date if earlier. |
| Portfolio Summary (Unaudited) † | |||
| Value (%) | Value (%) | ||
| Education | 23.5 | City | 4.2 |
| Special Tax | 18.2 | State/Territory | 3.6 |
| Transportation Services | 12.1 | Industrial | 3.0 |
| County | 8.5 | Housing | 2.3 |
| Health Care | 5.2 | Prerefunded | .7 |
| Utility-Electric | 4.4 | Other | 9.4 |
| Utility-Water and Sewer | 4.3 | 99.4 | |
| † | Based on net assets. |
The Funds 83
STATEMENT OF INVESTMENTS (continued)
| Summary of Abbreviations | |||
| ABAG | Association of Bay Area Governments | ACA | American Capital Access |
| AGC | ACE Guaranty Corporation | AGIC | Asset Guaranty Insurance Company |
| AMBAC | American Municipal Bond Assurance Corporation | ARRN | Adjustable Rate Receipt Notes |
| BAN | Bond Anticipation Notes | BPA | Bond Purchase Agreement |
| CIFG | CDC Ixis Financial Guaranty | COP | Certificate of Participation |
| CP | Commercial Paper | DRIVERS | Derivative Inverse Tax-Exempt Receipts |
| EDR | Economic Development Revenue | EIR | Environmental Improvement Revenue |
| FGIC | Financial Guaranty Insurance Company | FHA | Federal Housing Administration |
| FHLB | Federal Home Loan Bank | FHLMC | Federal Home Loan Mortgage Corporation |
| FNMA | Federal National Mortgage Association | GAN | Grant Anticipation Notes |
| GIC | Guaranteed Investment Contract | GNMA | Government National Mortgage Association |
| GO | General Obligation | HR | Hospital Revenue |
| IDB | Industrial Development Board | IDC | Industrial Development Corporation |
| IDR | Industrial Development Revenue | LIFERS | Long Inverse Floating Exempt Receipts |
| LOC | Letter of Credit | LOR | Limited Obligation Revenue |
| LR | Lease Revenue | MERLOTS | Municipal Exempt Receipts Liquidity Option Tender |
| MFHR | Multi-Family Housing Revenue | MFMR | Multi-Family Mortgage Revenue |
| PCR | Pollution Control Revenue | P-FLOATS | Puttable Floating Option Tax-Exempt Receipts |
| PILOT | Payment in Lieu of Taxes | PUTTERS | Puttable Tax-Exempt Receipts |
| RAC | Revenue Anticipation Certificates | RAN | Revenue Anticipation Notes |
| RAW | Revenue Anticipation Warrants | RIB | Residual Interest Bonds |
| ROCS | Reset Options Certificates | RRR | Resources Recovery Revenue |
| SAAN | State Aid Anticipation Notes | SBPA | Standby Bond Purchase Agreement |
| SFHR | Single Family Housing Revenue | SFMR | Single Family Mortgage Revenue |
| SONYMA | State of New York Mortgage Agency | SPEARS | Short Puttable Exempt Adjustable Receipts |
| SWDR | Solid Waste Disposal Revenue | TAN | Tax Anticipation Notes |
| TAW | Tax Anticipation Warrants | TRAN | Tax and Revenue Anticipation Notes |
| XLCA | XL Capital Assurance | ||
| See notes to financial statements. | |||
84
| STATEMENT OF FINANCIAL FUTURES |
| August 31, 2014 |
| Market Value | Unrealized | ||||
| BNY Mellon New York | Covered by | (Depreciation) | |||
| Intermediate Tax-Exempt Bond Fund | Contracts | Contracts ($) | Expiration | at 8/31/2014 | ($) |
| Financial Futures Short | |||||
| U.S. Treasury 5 Year Notes | 30 | (3,565,078) | December 2014 | (8,321 | ) |
| U.S. Treasury 10 Year Notes | 40 | (5,031,250) | December 2014 | (17,188 | ) |
| (25,509 | ) |
See notes to financial statements.
The Funds 85
| STATEMENT OF INVESTMENTS |
| August 31, 2014 |
| BNY Mellon Municipal Opportunities Fund | |||||
| Long-Term Municipal | Coupon | Maturity | Principal | ||
| Investments—104.7% | Rate (%) | Date | Amount ($) | Value ($) | |
| Alabama—1.5% | |||||
| Jefferson County, Limited Obligation School Warrants | |||||
| (Insured; Assured Guaranty Municipal Corp.) | 5.50 | 2/15/16 | 2,640,000 | 2,651,616 | |
| Jefferson County, Limited Obligation School Warrants | |||||
| (Insured; Assured Guaranty Municipal Corp.) | 5.25 | 1/1/18 | 5,000,000 | 5,010,750 | |
| Jefferson County, Senior Lien Sewer Revenue Warrants | |||||
| (Insured; Assured Guaranty Municipal Corp.) | 5.00 | 10/1/44 | 1,000,000 | 1,068,930 | |
| Jefferson County, Subordinate Lien Sewer Revenue Warrants | 6.00 | 10/1/42 | 5,000,000 | 5,569,300 | |
| Tuscaloosa Public Educational Building Authority, | |||||
| Student Housing Revenue (Ridgecrest Student Housing, LLC | |||||
| University of Alabama Ridgecrest Residential Project) | |||||
| (Insured; Assured Guaranty Corp.) | 6.75 | 7/1/33 | 1,100,000 | 1,276,649 | |
| Arizona—1.0% | |||||
| Arizona Board of Regents, Arizona State University | |||||
| System Revenue (Polytechnic Campus Project) | 6.00 | 7/1/27 | 750,000 | 878,775 | |
| Arizona Health Facilities Authority, HR (Phoenix Children’s Hospital) | 5.00 | 2/1/42 | 6,000,000 | 6,393,720 | |
| University Medical Center Corporation, HR | 6.00 | 7/1/39 | 2,500,000 | 2,868,875 | |
| Arkansas—.4% | |||||
| Pulaski County Public Facilities Board, | |||||
| Health Facilities Revenue (Carti Project) | 5.50 | 7/1/43 | 3,500,000 | 3,843,700 | |
| California—18.2% | |||||
| California, GO (Various Purpose) | 6.50 | 4/1/33 | 6,700,000 | 8,195,105 | |
| California, GO (Various Purpose) | 5.50 | 3/1/40 | 7,950,000 | 9,198,389 | |
| California Health Facilities Financing Authority, | |||||
| Revenue (Providence Health and Services) (Prerefunded) | 6.50 | 10/1/18 | 10,000 | a | 12,322 |
| California Health Facilities Financing Authority, | |||||
| Revenue (Providence Health and Services) (Prerefunded) | 6.50 | 10/1/18 | 490,000 | a | 603,126 |
| California Health Facilities Financing Authority, | |||||
| Revenue (Saint Joseph Health System) | 5.00 | 7/1/37 | 2,270,000 | 2,513,185 | |
| California Infrastructure and Economic Development Bank, | |||||
| Revenue (The J. David Gladstone Institutes Project) | 5.25 | 10/1/34 | 900,000 | 987,723 | |
| California Municipal Finance Authority, | |||||
| Revenue (Emerson College Issue) | 6.00 | 1/1/42 | 6,000,000 | 6,999,000 | |
| California Municipal Finance Authority, | |||||
| Revenue (Southwestern Law School) | 6.50 | 11/1/31 | 300,000 | 356,736 | |
| California Pollution Control Financing Authority, | |||||
| Water Furnishing Revenue (San Diego County | |||||
| Water Authority Desalination Project Pipeline) | 5.00 | 11/21/45 | 6,000,000 | 6,146,220 | |
| California State Public Works Board, LR (Judicial Council of | |||||
| California) (Various Judicial Council Projects) | 5.00 | 12/1/31 | 2,000,000 | 2,283,480 | |
| California Statewide Communities Development Authority, | |||||
| Mortgage Revenue (Methodist Hospital of | |||||
| Southern California Project) (Collateralized; FHA) | 6.75 | 2/1/38 | 2,230,000 | 2,703,764 | |
| California Statewide Communities Development Authority, | |||||
| Revenue (Sutter Health) | 6.00 | 8/15/42 | 6,000,000 | 7,231,860 |
86
| BNY Mellon Municipal Opportunities Fund (continued) | |||||
| Long-Term Municipal | Coupon | Maturity | Principal | ||
| Investments (continued) | Rate (%) | Date | Amount ($) | Value ($) | |
| California (continued) | |||||
| California Statewide Communities Development Authority, | |||||
| Student Housing Revenue (University of California, Irvine East | |||||
| Campus Apartments, Phase 1 Refunding—CHF—Irvine, L.L.C.) | 5.38 | 5/15/38 | 1,900,000 | 2,058,707 | |
| Capistrano Unified School District Community Facilities District | |||||
| Number 90-2, Special Tax Bonds (Improvement Area | |||||
| Number 2002-1) (Insured; Assured Guaranty Municipal Corp.) | 5.00 | 9/1/32 | 4,000,000 | 4,393,560 | |
| Clovis Unified School District, GO | 5.00 | 8/1/38 | 5,000,000 | 5,641,900 | |
| Desert Community College District, GO | |||||
| (Insured; Assured Guaranty Municipal Corp.) | 5.00 | 8/1/37 | 6,800,000 | 7,439,540 | |
| Galt Redevelopment Agency, Tax Allocation | |||||
| Revenue (Galt Redevelopment Project) | 7.38 | 9/1/33 | 2,000,000 | 2,545,540 | |
| Golden State Tobacco Securitization Corporation, | |||||
| Enhanced Tobacco Settlement Asset-Backed Bonds | 5.00 | 6/1/29 | 2,000,000 | 2,260,680 | |
| Golden State Tobacco Securitization Corporation, | |||||
| Enhanced Tobacco Settlement Asset-Backed Bonds | 5.00 | 6/1/30 | 2,000,000 | 2,247,720 | |
| Grant Joint Union High School District, GO | |||||
| (Insured; Assured Guaranty Municipal Corp.) | 0.00 | 8/1/29 | 2,080,000 | b | 1,108,890 |
| Grant Joint Union High School District, GO | |||||
| (Insured; Assured Guaranty Municipal Corp.) | 0.00 | 2/1/33 | 4,380,000 | b | 1,929,434 |
| Irvine Reassessment District Number 12-1, | |||||
| Limited Obligation Improvement Bonds | 4.00 | 9/2/29 | 1,000,000 | 1,031,480 | |
| JPMorgan Chase Putters/Drivers Trust (Series 3847) | |||||
| Non-recourse (Los Angeles Department of Airports, | |||||
| Senior Revenue (Los Angeles International Airport)) | 5.25 | 5/15/18 | 10,000,000 | c,d | 11,782,900 |
| Los Angeles Department of Airports, | |||||
| Senior Revenue (Los Angeles International Airport) | 5.00 | 5/15/28 | 2,800,000 | 3,261,104 | |
| Los Angeles Unified School District, GO | 5.00 | 1/1/34 | 1,000,000 | 1,133,990 | |
| Metropolitan Water District of Southern California, | |||||
| Water Revenue (Build America Bonds) | 6.54 | 7/1/39 | 4,600,000 | 5,381,494 | |
| New Haven Unified School District, GO | |||||
| (Insured; Assured Guaranty Corp.) | 0.00 | 8/1/32 | 2,500,000 | b | 1,180,675 |
| Newport Beach, Revenue (Hoag Memorial | |||||
| Hospital Presbyterian) (Prerefunded) | 6.00 | 12/1/21 | 4,630,000 | a | 5,968,764 |
| Northern California Gas Authority Number 1, | |||||
| Gas Project Revenue | 0.88 | 7/1/27 | 660,000 | e | 597,274 |
| Oakland Unified School District, GO (Build America Bonds) | 9.50 | 8/1/34 | 10,000,000 | 11,886,200 | |
| Peralta Community College District, GO | 5.00 | 8/1/21 | 1,750,000 | f | 2,092,457 |
| Peralta Community College District, GO | 5.00 | 8/1/22 | 1,845,000 | f | 2,217,542 |
| Peralta Community College District, GO | 5.00 | 8/1/24 | 2,040,000 | f | 2,475,744 |
| Riverside County Transportation Commission, Sales Tax Revenue | 5.25 | 6/1/30 | 2,000,000 | 2,409,940 | |
| Riverside County Transportation Commission, Sales Tax Revenue | 5.25 | 6/1/31 | 2,000,000 | 2,397,820 | |
| Riverside County Transportation Commission, Sales Tax Revenue | 5.25 | 6/1/33 | 3,500,000 | 4,154,115 | |
| Riverside County Transportation Commission, Senior Lien Toll Revenue | 5.75 | 6/1/44 | 2,000,000 | 2,280,840 | |
The Funds 87
STATEMENT OF INVESTMENTS (continued)
| BNY Mellon Municipal Opportunities Fund (continued) | |||||
| Long-Term Municipal | Coupon | Maturity | Principal | ||
| Investments (continued) | Rate (%) | Date | Amount ($) | Value ($) | |
| California (continued) | |||||
| Riverside County Transportation Commission, | |||||
| Senior Lien Toll Revenue | 5.75 | 6/1/48 | 5,000,000 | 5,683,750 | |
| San Diego Regional Building Authority, LR | |||||
| (County Operations Center and Annex Redevelopment Project) | 5.38 | 2/1/36 | 2,000,000 | 2,294,780 | |
| San Diego Unified School District, GO | 0.00 | 7/1/25 | 4,000,000 | b | 2,864,400 |
| San Francisco City and County Redevelopment Agency | |||||
| Community Facilities District Number 6, Special Tax | |||||
| Revenue (Mission Bay South Public Improvements) | 0.00 | 8/1/38 | 2,000,000 | b | 512,780 |
| San Francisco City and County Redevelopment Agency | |||||
| Community Facilities District Number 6, Special Tax | |||||
| Revenue (Mission Bay South Public Improvements) | 0.00 | 8/1/43 | 2,835,000 | b | 536,070 |
| San Francisco City and County Redevelopment Financing Authority, | |||||
| Tax Allocation Revenue (San Francisco Redevelopment Projects) | 6.63 | 8/1/41 | 1,250,000 | 1,444,500 | |
| South Bayside Waste Management Authority, Solid Waste | |||||
| Enterprise Revenue (Shoreway Environmental Center) | 6.00 | 9/1/36 | 1,000,000 | 1,120,460 | |
| University of California Regents, General Revenue | 5.00 | 5/15/44 | 5,000,000 | 5,725,700 | |
| University of California Regents, Limited Project Revenue | 5.00 | 5/15/37 | 14,605,000 | 16,425,367 | |
| West Contra Costa Unified School District, GO (Build America Bonds) | 8.46 | 8/1/34 | 10,000,000 | 12,287,900 | |
| Colorado—.3% | |||||
| City and County of Denver, Airport System Revenue | 5.00 | 11/15/21 | 1,500,000 | 1,794,105 | |
| City and County of Denver, Airport System Revenue | |||||
| (Insured: Assured Guaranty Corp. and National | |||||
| Public Finance Guarantee Corp.) | 5.25 | 11/15/19 | 1,000,000 | 1,122,640 | |
| Colorado Health Facilities Authority, | |||||
| Revenue (Catholic Health Initiatives) | 6.00 | 10/1/23 | 500,000 | 585,445 | |
| Connecticut—.5% | |||||
| Connecticut Health and Educational Facilities Authority, | |||||
| Revenue (Yale University Issue) | 5.05 | 7/1/42 | 5,000,000 | 5,479,750 | |
| Delaware—1.4% | |||||
| JPMorgan Chase Putters/Drivers Trust (Series 4359) | |||||
| Non-recourse (University of Delaware, Revenue) | 5.00 | 5/1/21 | 12,230,000 | c,d | 13,899,995 |
| District of Columbia—.8% | |||||
| District of Columbia, Revenue | |||||
| (Friendship Public Charter School, Inc. Issue) | 5.00 | 6/1/32 | 3,500,000 | 3,684,730 | |
| District of Columbia, Revenue (Knowledge is | |||||
| Power Program, District of Columbia Issue) | 6.00 | 7/1/33 | 1,100,000 | 1,276,913 | |
| District of Columbia, Revenue (Knowledge is | |||||
| Power Program, District of Columbia Issue) | 6.00 | 7/1/43 | 1,700,000 | 1,944,613 | |
| District of Columbia, Revenue (Knowledge is | |||||
| Power Program, District of Columbia Issue) | 6.00 | 7/1/48 | 1,450,000 | 1,647,099 | |
| Florida—4.3% | |||||
| Brevard County Health Facilities Authority, | |||||
| Health Facilities Revenue (Health First, Inc. Project) | 7.00 | 4/1/39 | 1,675,000 | 1,946,920 | |
| Florida Municipal Power Agency, | |||||
| All-Requirements Power Supply Project Revenue | 6.25 | 10/1/31 | 1,000,000 | 1,190,500 | |
88
| BNY Mellon Municipal Opportunities Fund (continued) | |||||
| Long-Term Municipal | Coupon | Maturity | Principal | ||
| Investments (continued) | Rate (%) | Date | Amount ($) | Value ($) | |
| Florida (continued) | |||||
| Higher Educational Facilities Financing Authority, | |||||
| Revenue (The University of Tampa Project) | 5.25 | 4/1/42 | 1,100,000 | 1,182,115 | |
| Jacksonville, Better Jacksonville Sales Tax Revenue | 5.00 | 10/1/30 | 750,000 | 852,675 | |
| Miami Beach Health Facilities Authority, | |||||
| HR (Mount Sinai Medical Center of Florida) | 5.00 | 11/15/39 | 1,500,000 | 1,631,205 | |
| Miami Beach Health Facilities Authority, | |||||
| HR (Mount Sinai Medical Center of Florida) | 5.00 | 11/15/44 | 1,500,000 | 1,628,580 | |
| Miami-Dade County, Aviation Revenue (Miami International Airport) | 5.50 | 10/1/41 | 1,200,000 | 1,378,740 | |
| Miami-Dade County, Seaport Revenue | 5.50 | 10/1/42 | 14,145,000 | 16,018,647 | |
| Miami-Dade County Educational Facilities Authority, | |||||
| Revenue (University of Miami Issue) (Insured; | |||||
| Berkshire Hathaway Assurance Corporation) | 5.50 | 4/1/38 | 600,000 | 638,172 | |
| Miami-Dade County Expressway Authority, Toll System Revenue | 5.00 | 7/1/40 | 1,050,000 | 1,123,605 | |
| Orange County Industrial Development Authority, | |||||
| IDR (VitAG Florida LLC Project) | 8.00 | 7/1/36 | 4,500,000 | 4,455,270 | |
| Sarasota County Public Hospital District, HR | |||||
| (Sarasota Memorial Hospital Project) | 5.63 | 7/1/39 | 2,000,000 | 2,147,040 | |
| Southeast Overtown/Park West Community | |||||
| Redevelopment Agency, Tax Increment Revenue | 5.00 | 3/1/20 | 1,325,000 | 1,484,411 | |
| Southeast Overtown/Park West Community | |||||
| Redevelopment Agency, Tax Increment Revenue | 5.00 | 3/1/21 | 1,000,000 | 1,124,870 | |
| Southeast Overtown/Park West Community | |||||
| Redevelopment Agency, Tax Increment Revenue | 5.00 | 3/1/24 | 1,000,000 | 1,132,940 | |
| Southeast Overtown/Park West Community | |||||
| Redevelopment Agency, Tax Increment Revenue | 5.00 | 3/1/30 | 6,000,000 | 6,520,020 | |
| Georgia—.2% | |||||
| Burke County Development Authority, PCR | |||||
| (Oglethorpe Power Corporation Vogtle Project) | 7.00 | 1/1/23 | 1,000,000 | 1,166,150 | |
| DeKalb County, GO (Special Transportation, | |||||
| Parks and Greenspace and Libraries Tax District) | 5.00 | 12/1/18 | 750,000 | 792,645 | |
| Hawaii—3.2% | |||||
| Hawaii Department of Budget and Finance, Special Purpose | |||||
| Revenue (Hawaiian Electric Company, Inc. and Subsidiary Projects) | 6.50 | 7/1/39 | 6,000,000 | 6,986,040 | |
| Hawaii Department of Budget and Finance, | |||||
| Special Purpose Senior Living Revenue (Kahala Nui) | 5.13 | 11/15/32 | 1,000,000 | 1,080,200 | |
| Hawaii Department of Budget and Finance, | |||||
| Special Purpose Senior Living Revenue (Kahala Nui) | 5.25 | 11/15/37 | 1,000,000 | 1,083,780 | |
| JPMorgan Chase Putters/Drivers Trust | |||||
| (Series 4007) Non-recourse (Hawaii, GO) | 5.00 | 12/1/19 | 20,000,000 | c,d | 24,144,271 |
| Illinois—4.9% | |||||
| Chicago, Customer Facility Charge Senior Lien Revenue | |||||
| (Chicago O’Hare International Airport) | |||||
| (Insured; Assured Guaranty Municial Corp.) | 5.50 | 1/1/43 | 4,000,000 | 4,450,160 | |
| Chicago, General Airport Third Lien Revenue | |||||
| (Chicago O’Hare International Airport) | 5.75 | 1/1/39 | 2,500,000 | 2,854,550 | |
The Funds 89
STATEMENT OF INVESTMENTS (continued)
| BNY Mellon Municipal Opportunities Fund (continued) | ||||
| Long-Term Municipal | Coupon | Maturity | Principal | |
| Investments (continued) | Rate (%) | Date | Amount ($) | Value ($) |
| Illinois (continued) | ||||
| Chicago, General Airport Third Lien Revenue | ||||
| (Chicago O’Hare International Airport) | 6.50 | 1/1/41 | 5,000,000 | 6,043,100 |
| Chicago, GO (Project and Refunding Series) | 5.00 | 1/1/35 | 5,000,000 | 5,194,400 |
| Illinois, GO | 5.50 | 7/1/33 | 2,500,000 | 2,725,225 |
| Illinois, GO | 5.50 | 7/1/38 | 2,500,000 | 2,709,900 |
| Illinois, GO | 5.00 | 2/1/39 | 5,000,000 | 5,195,950 |
| Illinois Finance Authority, Revenue (Benedictine University Project) | 6.25 | 10/1/33 | 2,760,000 | 3,191,719 |
| Illinois Finance Authority, Revenue (Franciscan Communities, Inc.) | 5.25 | 5/15/47 | 4,250,000 | 4,280,090 |
| Illinois Finance Authority, Revenue | ||||
| (Lutheran Home and Services Obligated Group) | 5.63 | 5/15/42 | 3,000,000 | 3,077,490 |
| Illinois Finance Authority, Revenue | ||||
| (Rehabilitation Institute of Chicago) | 5.50 | 7/1/28 | 1,560,000 | 1,748,729 |
| Illinois Finance Authority, Revenue | ||||
| (Rehabilitation Institute of Chicago) | 6.50 | 7/1/34 | 2,140,000 | 2,340,454 |
| Illinois Finance Authority, Revenue | ||||
| (Rehabilitation Institute of Chicago) | 6.00 | 7/1/43 | 5,000,000 | 5,638,800 |
| Illinois Finance Authority, Revenue (The Art Institute of Chicago) | 6.00 | 3/1/38 | 1,000,000 | 1,124,880 |
| Indiana—1.0% | ||||
| Indiana Finance Authority, Private Activity | ||||
| Revenue (I-69 Section 5 Project) | 5.25 | 9/1/34 | 1,245,000 | 1,343,504 |
| Indiana Finance Authority, Private Activity | ||||
| Revenue (I-69 Section 5 Project) | 5.25 | 9/1/40 | 2,000,000 | 2,153,180 |
| Indiana Municipal Power Agency, Power Supply System Revenue | 5.25 | 1/1/31 | 6,000,000 | 6,892,860 |
| Kentucky—.5% | ||||
| Kentucky Property and Buildings Commission, | ||||
| Revenue (Project Number 90) | 5.38 | 11/1/23 | 1,500,000 | 1,750,590 |
| Kentucky Public Transportation Infrastructure Authority, | ||||
| First Tier Toll Revenue (Downtown Crossing Project) | 5.75 | 7/1/49 | 3,000,000 | 3,417,720 |
| Louisiana—1.7% | ||||
| Jefferson Parish Hospital Service District Number 2, HR | ||||
| (East Jefferson General Hospital) | 6.25 | 7/1/31 | 5,000,000 | 5,482,100 |
| Louisiana Citizens Property Insurance Corporation, | ||||
| Assessment Revenue (Insured; Assured Guaranty Corp.) | 6.13 | 6/1/25 | 5,000,000 | 5,837,600 |
| Louisiana Public Facilities Authority, Revenue | ||||
| (CHRISTUS Health Obligated Group) | 6.00 | 7/1/29 | 1,000,000 | 1,115,530 |
| New Orleans, Sewerage Service Revenue | 5.00 | 6/1/44 | 2,000,000 | 2,203,420 |
| New Orleans, Water Revenue | 5.00 | 12/1/34 | 500,000 | 554,800 |
| New Orleans Aviation Board, Revenue | ||||
| (Insured; Assured Guaranty Corp.) | 6.00 | 1/1/23 | 2,000,000 | 2,309,660 |
| Maine—.8% | ||||
| Maine Health and Higher Educational Facilities Authority, | ||||
| Revenue (MaineGeneral Medical Center Issue) | 6.00 | 7/1/26 | 825,000 | 907,797 |
| Maine Health and Higher Educational Facilities Authority, | ||||
| Revenue (MaineGeneral Medical Center Issue) | 6.75 | 7/1/41 | 2,725,000 | 3,016,384 |
90
| BNY Mellon Municipal Opportunities Fund (continued) | |||||
| Long-Term Municipal | Coupon | Maturity | Principal | ||
| Investments (continued) | Rate (%) | Date | Amount ($) | Value ($) | |
| Maine (continued) | |||||
| Maine Health and Higher Educational Facilities Authority, | |||||
| Revenue (MaineGeneral Medical Center Issue) | 7.00 | 7/1/41 | 4,240,000 | 4,759,612 | |
| Maryland—3.7% | |||||
| Maryland, GO (State and Local Facilities Loan) | 4.00 | 3/15/25 | 27,810,000 | 30,627,431 | |
| Maryland Economic Development Corporation, EDR (Terminal Project) | 5.75 | 6/1/35 | 3,500,000 | 3,760,680 | |
| Maryland Economic Development Corporation, Port Facilities | |||||
| Revenue (CNX Marine Terminals Inc. Port of Baltimore Facility) | 5.75 | 9/1/25 | 1,000,000 | 1,102,980 | |
| Maryland Health and Higher Educational Facilities Authority, | |||||
| Revenue (Anne Arundel Health System Issue) | 6.75 | 7/1/29 | 2,000,000 | 2,419,100 | |
| Maryland Health and Higher Educational Facilities Authority, | |||||
| Revenue (University of Maryland Medical System Issue) | 5.13 | 7/1/39 | 250,000 | 266,210 | |
| Massachusetts—4.8% | |||||
| JPMorgan Chase Putters/Drivers Trust (Series 3896) | |||||
| Non-recourse (Massachusetts, GO (Consolidated Loan)) | 5.00 | 4/1/19 | 15,000,000 | c,d | 17,973,525 |
| JPMorgan Chase Putters/Drivers Trust (Series 4357) | |||||
| Non-recourse (Massachusetts School Building Authority, | |||||
| Senior Dedicated Sales Tax Revenue) | 5.00 | 8/15/20 | 10,000,000 | c,d | 11,727,497 |
| Massachusetts, GO (Consolidated Loan) | 5.00 | 7/1/25 | 5,000,000 | 6,044,900 | |
| Massachusetts Development Finance Agency, HR | |||||
| (Cape Cod Healthcare Obligated Group Issue) | 5.25 | 11/15/41 | 4,370,000 | 4,844,014 | |
| Massachusetts Development Finance Agency, | |||||
| Revenue (Tufts Medical Center Issue) | 7.25 | 1/1/32 | 3,090,000 | 3,776,876 | |
| Massachusetts Development Finance Agency, | |||||
| Revenue (Tufts Medical Center Issue) | 6.75 | 1/1/36 | 1,165,000 | 1,381,422 | |
| Massachusetts Development Finance Agency, | |||||
| Revenue (Tufts Medical Center Issue) | 6.88 | 1/1/41 | 1,000,000 | 1,185,950 | |
| Massachusetts Health and Educational Facilities Authority, | |||||
| Revenue (Simmons College Issue) | 7.50 | 10/1/22 | 500,000 | 614,975 | |
| Massachusetts Health and Educational Facilities Authority, | |||||
| Revenue (Simmons College Issue) | 8.00 | 10/1/39 | 1,180,000 | 1,271,202 | |
| Massachusetts Health and Educational Facilities Authority, | |||||
| Revenue (Simmons College Issue) (Prerefunded) | 8.00 | 10/1/15 | 820,000 | a | 890,102 |
| Massachusetts Water Pollution Abatement Trust, | |||||
| Water Pollution Abatement Revenue (MWRA Program) | 5.75 | 8/1/29 | 50,000 | 50,219 | |
| Michigan—2.0% | |||||
| Detroit, Water Supply System Second Lien Revenue | |||||
| (Insured; Assured Guaranty Municipal Corp.) | 5.00 | 7/1/22 | 950,000 | 992,836 | |
| Michigan Building Authority, Revenue (Facilities Program) | 5.00 | 10/15/33 | 6,760,000 | 7,610,881 | |
| Michigan Building Authority, Revenue (Facilities Program) | 5.38 | 10/15/41 | 3,000,000 | 3,391,380 | |
| Michigan Finance Authority, Local Government Loan Program | |||||
| Revenue (Detroit Water and Sewerage Department, | |||||
| Sewage Disposal System Revenue Senior Lien Local Project Bonds) | 5.00 | 7/1/44 | 1,000,000 | 1,030,990 | |
| Michigan Finance Authority, Revenue | |||||
| (School District of the City of Detroit) | 5.00 | 6/1/19 | 1,000,000 | 1,136,220 | |
The Funds 91
STATEMENT OF INVESTMENTS (continued)
| BNY Mellon Municipal Opportunities Fund (continued) | |||||
| Long-Term Municipal | Coupon | Maturity | Principal | ||
| Investments (continued) | Rate (%) | Date | Amount ($) | Value ($) | |
| Michigan (continued) | |||||
| Michigan Finance Authority, Revenue | |||||
| (School District of the City of Detroit) | 5.00 | 6/1/20 | 500,000 | 569,670 | |
| Wayne County Airport Authority, Airport Revenue | |||||
| (Detroit Metropolitan Wayne County Airport) | 5.00 | 12/1/21 | 700,000 | 800,408 | |
| Wayne County Airport Authority, Airport Revenue | |||||
| (Detroit Metropolitan Wayne County Airport) | 5.00 | 12/1/44 | 2,000,000 | 2,181,740 | |
| Wayne County Airport Authority, Airport Revenue | |||||
| (Detroit Metropolitan Wayne County Airport) | |||||
| (Insured; Build America Mutual Assurance Company) | 5.00 | 12/1/39 | 2,500,000 | 2,771,750 | |
| Minnesota—3.7% | |||||
| JPMorgan Chase Putters/Drivers Trust (Series 3844) | |||||
| Non-recourse (Minnesota, GO (Various Purpose)) | 5.00 | 8/1/18 | 17,125,000 | c,d | 20,478,711 |
| JPMorgan Chase Putters/Drivers Trust (Series 3845) | |||||
| Non-recourse (Minnesota, GO (Various Purpose)) | 5.00 | 8/1/18 | 10,000,000 | c,d | 12,060,600 |
| Minneapolis, Health Care System Revenue (Fairview Health Services) | 6.63 | 11/15/28 | 1,000,000 | 1,189,380 | |
| Western Minnesota Municipal Power Agency, Power Supply Revenue | 5.00 | 1/1/46 | 4,000,000 | 4,568,440 | |
| Mississippi—.4% | |||||
| Mississippi Development Bank, Special Obligation Revenue | |||||
| (Jackson, Water and Sewer System Revenue Bond Project) | |||||
| (Insured; Assured Guaranty Municipal Corp.) | 6.88 | 12/1/40 | 1,625,000 | 2,152,946 | |
| Warren County, Gulf Opportunity Zone Revenue | |||||
| (International Paper Company Projects) | 5.80 | 5/1/34 | 1,500,000 | 1,673,970 | |
| Nevada—1.1% | |||||
| Clark County, Airport System Revenue (Build America Bonds) | 6.88 | 7/1/42 | 10,000,000 | 11,366,300 | |
| New Hampshire—1.1% | |||||
| New Hampshire Business Finance Authority, PCR (Public Service | |||||
| Company of New Hampshire Project) (Insured; National | |||||
| Public Finance Guarantee Corp.) | 0.12 | 5/1/21 | 12,250,000 | e | 11,331,250 |
| New Jersey—4.4% | |||||
| New Jersey, COP (Equipment Lease Purchase Agreement) | 5.25 | 6/15/28 | 1,000,000 | 1,106,560 | |
| New Jersey Economic Development Authority, Cigarette Tax Revenue | 5.00 | 6/15/26 | 2,500,000 | 2,804,250 | |
| New Jersey Economic Development Authority, Private Activity | |||||
| Revenue (The Goethals Bridge Replacement Project) | 5.13 | 1/1/34 | 5,325,000 | 5,801,587 | |
| New Jersey Economic Development Authority, Private Activity | |||||
| Revenue (The Goethals Bridge Replacement Project) | 5.38 | 1/1/43 | 5,500,000 | 5,981,360 | |
| New Jersey Economic Development Authority, | |||||
| School Facilities Construction Revenue | 5.00 | 3/1/26 | 7,000,000 | 7,944,020 | |
| New Jersey Economic Development Authority, | |||||
| School Facilities Construction Revenue | 5.00 | 6/15/29 | 13,000,000 | 14,644,760 | |
| New Jersey Educational Facilities Authority, Revenue (University of | |||||
| Medicine and Dentistry of New Jersey Issue) (Prerefunded) | 7.50 | 6/1/19 | 2,000,000 | a | 2,604,940 |
| New Jersey Health Care Facilities Financing Authority, | |||||
| Revenue (Saint Peter’s University Hospital Obligated Group Issue) | 6.25 | 7/1/35 | 1,500,000 | 1,631,790 | |
| New Jersey Transportation Trust Fund | |||||
| Authority (Transportation System) | 0.00 | 12/15/29 | 5,000,000 | b | 2,573,500 |
92
| BNY Mellon Municipal Opportunities Fund (continued) | |||||
| Long-Term Municipal | Coupon | Maturity | Principal | ||
| Investments (continued) | Rate (%) | Date | Amount ($) | Value ($) | |
| New York—15.6% | |||||
| Brooklyn Arena Local Development Corporation, | |||||
| PILOT Revenue (Barclays Center Project) | 6.00 | 7/15/30 | 9,500,000 | 10,642,280 | |
| Brooklyn Arena Local Development Corporation, | |||||
| PILOT Revenue (Barclays Center Project) | 6.25 | 7/15/40 | 6,000,000 | 6,792,720 | |
| Brooklyn Arena Local Development Corporation, | |||||
| PILOT Revenue (Barclays Center Project) | 6.38 | 7/15/43 | 4,000,000 | 4,534,360 | |
| Build New York City Resource Corporation, | |||||
| City University of New York—Queens College, | |||||
| Revenue (Q Student Residences, LLC Project) | 5.00 | 6/1/38 | 1,000,000 | 1,138,530 | |
| Build New York City Resource Corporation, | |||||
| City University of New York—Queens College, | |||||
| Revenue (Q Student Residences, LLC Project) | 5.00 | 6/1/43 | 1,250,000 | 1,416,475 | |
| Hudson Yards Infrastructure Corporation, | |||||
| Hudson Yards Senior Revenue | 5.75 | 2/15/47 | 5,000,000 | 5,773,300 | |
| Metropolitan Transportation Authority, Transportation Revenue | 6.50 | 11/15/28 | 665,000 | 810,489 | |
| Metropolitan Transportation Authority, Transportation Revenue ( | |||||
| Insured; Assured Guaranty Municipal Corp.) | 0.32 | 11/1/22 | 11,475,000 | e | 11,102,062 |
| New York City, GO | 6.00 | 10/15/23 | 500,000 | 596,470 | |
| New York City, GO | 5.00 | 8/1/29 | 15,000,000 | 17,471,400 | |
| New York City Industrial Development Agency, | |||||
| PILOT Revenue (Queens Baseball Stadium Project) | |||||
| (Insured; Assured Guaranty Corp.) | 6.50 | 1/1/46 | 325,000 | 379,073 | |
| New York City Industrial Development Agency, PILOT Revenue | |||||
| (Yankee Stadium Project) (Insured; Assured Guaranty Corp.) | 7.00 | 3/1/49 | 1,300,000 | 1,586,598 | |
| New York City Industrial Development Agency, PILOT Revenue | |||||
| (Yankee Stadium Project) (Insured; FGIC) | 2.86 | 3/1/20 | 5,000,000 | e | 4,841,850 |
| New York City Municipal Water Finance Authority, Water and Sewer | |||||
| System Revenue (Citigroup Series RR II R-11931) Recourse | 5.75 | 12/15/16 | 9,000,000 | c,d | 10,382,490 |
| New York City Municipal Water Finance Authority, Water and Sewer | |||||
| System Revenue (Citigroup Series RR II R-11931-1) Recourse | 5.75 | 12/15/16 | 5,090,000 | c,d | 5,871,868 |
| New York City Municipal Water Finance Authority, Water and | |||||
| Sewer System Second General Resolution Revenue | 5.00 | 6/15/34 | 10,000,000 | 11,489,600 | |
| New York Liberty Development Corporation, | |||||
| Liberty Revenue (4 World Trade Center Project) | 5.75 | 11/15/51 | 5,000,000 | 5,799,300 | |
| New York Liberty Development Corporation, | |||||
| Liberty Revenue (7 World Trade Center Project) | 5.00 | 3/15/44 | 2,000,000 | 2,184,200 | |
| New York State Dormitory Authority, Revenue (Pace University) | 5.00 | 5/1/38 | 500,000 | 522,650 | |
| New York State Dormitory Authority, Revenue (Yeshiva University) | 5.00 | 11/1/40 | 1,000,000 | 1,001,480 | |
| New York State Dormitory Authority, | |||||
| State Personal Income Tax Revenue (Education) | 5.75 | 3/15/36 | 1,000,000 | 1,167,370 | |
| New York State Dormitory Authority, | |||||
| State Personal Income Tax Revenue (General Purpose) | 5.00 | 2/15/30 | 20,000,000 | 23,552,800 | |
| New York State Energy Research and Development Authority, | |||||
| PCR (New York State Electric and Gas Corporation Project) | |||||
| (Insured; National Public Finance Guarantee Corp.) | 0.43 | 4/1/34 | 17,410,000 | e | 16,626,550 |
The Funds 93
STATEMENT OF INVESTMENTS (continued)
| BNY Mellon Municipal Opportunities Fund (continued) | |||||
| Long-Term Municipal | Coupon | Maturity | Principal | ||
| Investments (continued) | Rate (%) | Date | Amount ($) | Value ($) | |
| New York (continued) | |||||
| Port Authority of New York and New Jersey, Special Project | |||||
| Revenue (JFK International Air Terminal LLC Project) | 6.00 | 12/1/42 | 5,000,000 | 5,793,850 | |
| Triborough Bridge and Tunnel Authority, | |||||
| General Revenue (MTA Bridges and Tunnels) | 0.00 | 11/15/27 | 2,000,000 | b | 1,321,560 |
| Triborough Bridge and Tunnel Authority, | |||||
| General Revenue (MTA Bridges and Tunnels) | 0.00 | 11/15/28 | 4,715,000 | b | 2,949,657 |
| Triborough Bridge and Tunnel Authority, | |||||
| Subordinate Revenue (MTA Bridges and Tunnels) | 0.00 | 11/15/31 | 5,000,000 | b | 2,630,800 |
| Triborough Bridge and Tunnel Authority, | |||||
| Subordinate Revenue (MTA Bridges and Tunnels) | 0.00 | 11/15/32 | 3,000,000 | b | 1,506,630 |
| North Carolina—1.3% | |||||
| North Carolina Eastern Municipal Power Agency, | |||||
| Power System Revenue | 5.00 | 1/1/26 | 11,415,000 | 12,848,838 | |
| North Carolina Eastern Municipal Power Agency, | |||||
| Power System Revenue (Insured; Assured Guaranty Corp.) | 6.00 | 1/1/19 | 215,000 | 235,049 | |
| Ohio—.3% | |||||
| Montgomery County, Revenue (Catholic Health Initiatives) | 6.25 | 10/1/33 | 1,000,000 | 1,154,870 | |
| Ohio Turnpike and Infrastructure Commission, | |||||
| Turnpike Junior Lien Revenue (Infrastructure Projects) | 0/5.70 | 2/15/34 | 3,000,000 | g | 2,355,840 |
| Oregon—1.4% | |||||
| Oregon Health and Science University, Revenue | 5.75 | 7/1/39 | 2,000,000 | 2,335,700 | |
| Washington and Multnomah Counties, | |||||
| GO (Beaverton School District 48J) | 5.00 | 6/15/27 | 5,000,000 | 6,075,650 | |
| Washington and Multnomah Counties, | |||||
| GO (Beaverton School District 48J) | 5.00 | 6/15/28 | 5,000,000 | 6,036,550 | |
| Pennsylvania—2.3% | |||||
| Pennsylvania, GO | 5.00 | 10/15/26 | 6,770,000 | 8,116,282 | |
| Pennsylvania Economic Development Financing Authority, | |||||
| Water Facilities Revenue (Aqua Pennsylvania, Inc. Project) | 5.00 | 12/1/43 | 4,425,000 | 4,811,612 | |
| Pennsylvania Higher Educational Facilities Authority, Revenue | |||||
| (The Foundation for Indiana University of Pennsylvania | |||||
| Student Housing Project at Indiana University of Pennsylvania) | 5.00 | 7/1/32 | 1,000,000 | 1,073,280 | |
| Pennsylvania Higher Educational Facilities Authority, | |||||
| Revenue (University of Pennsylvania Health System) | 5.75 | 8/15/41 | 2,550,000 | 2,928,012 | |
| Philadelphia, GO | 5.25 | 7/15/27 | 5,350,000 | 6,324,021 | |
| Texas—16.0% | |||||
| Austin, Water and Wastewater System Revenue | 5.00 | 11/15/39 | 20,055,000 | 23,019,731 | |
| Central Texas Regional Mobility Authority, Senior Lien Revenue | 6.00 | 1/1/41 | 5,000,000 | 5,683,550 | |
| Clifton Higher Education Finance Corporation, | |||||
| Education Revenue (IDEA Public Schools) | 5.50 | 8/15/31 | 1,250,000 | 1,377,213 | |
| Clifton Higher Education Finance Corporation, | |||||
| Education Revenue (IDEA Public Schools) | 5.00 | 8/15/32 | 2,745,000 | 2,988,317 | |
| Clifton Higher Education Finance Corporation, | |||||
| Education Revenue (IDEA Public Schools) | 6.00 | 8/15/33 | 1,500,000 | 1,768,980 | |
94
| BNY Mellon Municipal Opportunities Fund (continued) | |||||
| Long-Term Municipal | Coupon | Maturity | Principal | ||
| Investments (continued) | Rate (%) | Date | Amount ($) | Value ($) | |
| Texas (continued) | |||||
| Clifton Higher Education Finance Corporation, | |||||
| Education Revenue (IDEA Public Schools) | 5.75 | 8/15/41 | 1,000,000 | 1,111,760 | |
| Clifton Higher Education Finance Corporation, | |||||
| Education Revenue (IDEA Public Schools) | 5.00 | 8/15/42 | 2,750,000 | 2,950,640 | |
| Clifton Higher Education Finance Corporation, | |||||
| Education Revenue (IDEA Public Schools) | 6.00 | 8/15/43 | 2,770,000 | 3,227,549 | |
| Dallas and Fort Worth, Joint Improvement | |||||
| Revenue (Dallas/Fort Worth International Airport) | 5.00 | 11/1/32 | 7,500,000 | 8,121,150 | |
| Decatur Hospital Authority, HR (Wise Regional Health System) | 5.00 | 9/1/34 | 1,000,000 | 1,034,710 | |
| Dripping Springs Independent School District, Unlimited Tax School | |||||
| Building Bonds (Permanent School Fund Guarantee Program) | 4.00 | 2/15/39 | 1,500,000 | 1,551,990 | |
| Dripping Springs Independent School District, Unlimited Tax School | |||||
| Building Bonds (Permanent School Fund Guarantee Program) | 4.00 | 2/15/44 | 2,750,000 | 2,834,178 | |
| Forney Independent School District, Unlimited Tax School Building | |||||
| Bonds (Permanent School Fund Guarantee Program) | 5.75 | 8/15/33 | 1,000,000 | 1,161,350 | |
| Grand Parkway Transportation Corporation, | |||||
| Grand Parkway System First Tier Toll Revenue | 5.50 | 4/1/53 | 4,500,000 | 5,051,880 | |
| Grand Parkway Transportation Corporation, | |||||
| Grand Parkway System Subordinate Tier Toll | |||||
| Revenue (Toll Equity Loan Agreement Supported) | 0/5.20 | 10/1/31 | 2,000,000 | g | 1,509,280 |
| Grand Parkway Transportation Corporation, | |||||
| Grand Parkway System Subordinate Tier Toll | |||||
| Revenue (Toll Equity Loan Agreement Supported) | 0/5.40 | 10/1/33 | 2,500,000 | g | 1,877,500 |
| Grand Parkway Transportation Corporation, | |||||
| Grand Parkway System Subordinate Tier Toll | |||||
| Revenue (Toll Equity Loan Agreement Supported) | 0/5.45 | 10/1/34 | 2,235,000 | g | 1,673,121 |
| Harris County Health Facilities Development Corporation, | |||||
| HR (Memorial Hermann Healthcare System) (Prerefunded) | 7.00 | 12/1/18 | 1,000,000 | a | 1,253,850 |
| Houston, Airport System Subordinate Lien Revenue | 5.00 | 7/1/32 | 500,000 | 544,745 | |
| Houston, Airport System Subordinate Lien Revenue | |||||
| (Insured; Assured Guaranty Municipal Corp.) | 0.24 | 7/1/30 | 11,100,000 | e | 10,101,000 |
| Houston, Airport System Subordinate Lien Revenue | |||||
| (Insured; Assured Guaranty Municipal Corp.) | 0.24 | 7/1/30 | 3,800,000 | e | 3,458,000 |
| Houston, Combined Utility System First Lien Revenue | 5.00 | 11/15/30 | 5,350,000 | 6,244,253 | |
| Houston Higher Education Finance Corporation, | |||||
| Higher Education Revenue (Cosmos Foundation, Inc.) | 5.88 | 5/15/21 | 825,000 | 943,891 | |
| Houston Higher Education Finance Corporation, | |||||
| Higher Education Revenue (Cosmos Foundation, Inc.) | 6.50 | 5/15/31 | 2,800,000 | 3,318,588 | |
| Houston Higher Education Finance Corporation, | |||||
| Higher Education Revenue (Cosmos Foundation, Inc.) | 6.88 | 5/15/41 | 3,000,000 | 3,620,640 | |
| North Texas Education Finance Corporation, | |||||
| Education Revenue (Uplift Education) | 4.88 | 12/1/32 | 1,630,000 | 1,722,731 | |
| North Texas Tollway Authority, First Tier System Revenue | 6.00 | 1/1/38 | 7,000,000 | 8,197,140 | |
| North Texas Tollway Authority, Special Projects System Revenue | 5.50 | 9/1/41 | 20,000,000 | 23,117,600 | |
The Funds 95
STATEMENT OF INVESTMENTS (continued)
| BNY Mellon Municipal Opportunities Fund (continued) | |||||
| Long-Term Municipal | Coupon | Maturity | Principal | ||
| Investments (continued) | Rate (%) | Date | Amount ($) | Value ($) | |
| Texas (continued) | |||||
| Texas Private Activity Bond Surface Transportation Corporation, | |||||
| Senior Lien Revenue (LBJ Infrastructure | |||||
| Group LLC IH-635 Managed Lanes Project) | 7.00 | 6/30/40 | 7,500,000 | 9,045,750 | |
| Texas Private Activity Bond Surface Transportation Corporation, | |||||
| Senior Lien Revenue (North Tarrant Express Mobility | |||||
| Partners Segments 3 LLC Segments 3A and 3B Facility) | 7.00 | 12/31/38 | 10,000,000 | 12,352,300 | |
| Texas Private Activity Bond Surface Transportation Corporation, | |||||
| Senior Lien Revenue (North Tarrant Express Mobility | |||||
| Partners Segments 3 LLC Segments 3A and 3B Facility) | 6.75 | 6/30/43 | 5,000,000 | 6,029,100 | |
| Texas Private Activity Bond Surface Transportation Corporation, | |||||
| Senior Lien Revenue (NTE Mobility Partners LLC | |||||
| North Tarrant Express Managed Lanes Project) | 7.50 | 12/31/31 | 2,500,000 | 3,061,150 | |
| Texas Transportation Commission, | |||||
| Central Texas Turnpike System First Tier Revenue | 5.00 | 8/15/41 | 3,500,000 | 3,797,395 | |
| Virginia—1.5% | |||||
| Chesapeake, Transportation System Senior Toll Road Revenue | 0/4.88 | 7/15/40 | 2,000,000 | g | 1,272,360 |
| Virginia Small Business Financing Authority, | |||||
| Senior Lien Revenue (95 Express Lanes LLC Project) | 5.00 | 1/1/40 | 7,510,000 | 7,796,281 | |
| Virginia Small Business Financing Authority, | |||||
| Senior Lien Revenue (Elizabeth River Crossing Opco, LLC Project) | 5.25 | 1/1/32 | 4,000,000 | 4,342,080 | |
| Virginia Small Business Financing Authority, | |||||
| Senior Lien Revenue (Elizabeth River Crossing Opco, LLC Project) | 6.00 | 1/1/37 | 2,000,000 | 2,262,460 | |
| Wisconsin—.5% | |||||
| Oneida Tribe of Indians, Retail Sales Revenue | 6.50 | 2/1/31 | 1,325,000 | d | 1,488,001 |
| Wisconsin, General Fund Annual Appropriation Bonds | 5.38 | 5/1/25 | 1,000,000 | 1,175,380 | |
| Wisconsin, General Fund Annual Appropriation Bonds | 5.75 | 5/1/33 | 1,500,000 | 1,771,365 | |
| Wisconsin, General Fund Annual Appropriation Bonds | 6.00 | 5/1/33 | 1,000,000 | 1,195,080 | |
| U.S. Related—3.9% | |||||
| A.B. Won International Airport Authority of Guam, General Revenue | 6.25 | 10/1/34 | 1,000,000 | 1,132,510 | |
| A.B. Won International Airport Authority of Guam, General Revenue | 6.38 | 10/1/43 | 1,000,000 | 1,125,840 | |
| A.B. Won International Airport Authority of Guam, | |||||
| General Revenue (Insured; Assured Guaranty Municipal Corp.) | 6.00 | 10/1/34 | 2,000,000 | 2,344,220 | |
| A.B. Won International Airport Authority of Guam, | |||||
| General Revenue (Insured; Assured Guaranty Municipal Corp.) | 6.13 | 10/1/43 | 2,000,000 | 2,358,680 | |
| Guam, Hotel Occupancy Tax Revenue | 6.00 | 11/1/26 | 2,500,000 | 2,951,700 | |
| Guam, Hotel Occupancy Tax Revenue | 6.13 | 11/1/31 | 5,000,000 | 5,808,600 | |
| Guam, Hotel Occupancy Tax Revenue | 6.50 | 11/1/40 | 2,000,000 | 2,278,200 | |
| Guam Government Department of Education, | |||||
| COP (John F. Kennedy High School Project) | 6.63 | 12/1/30 | 1,000,000 | 1,118,190 | |
| Puerto Rico Electric Power Authority, Power Revenue | 5.00 | 7/1/21 | 500,000 | 500,860 | |
| Puerto Rico Electric Power Authority, Power Revenue | 5.00 | 7/1/22 | 2,000,000 | 1,100,140 | |
| Puerto Rico Electric Power Authority, Power Revenue | 6.75 | 7/1/36 | 10,000,000 | 5,495,400 | |
| Puerto Rico Electric Power Authority, Power Revenue | |||||
| (Insured; National Public Finance Guarantee Corp.) | 5.00 | 7/1/17 | 750,000 | 754,972 | |
96
| BNY Mellon Municipal Opportunities Fund (continued) | |||||
| Long-Term Municipal | Coupon | Maturity | Principal | ||
| Investments (continued) | Rate (%) | Date | Amount ($) | Value ($) | |
| U.S. Related (continued) | |||||
| Puerto Rico Sales Tax Financing Corporation, | |||||
| Sales Tax Revenue (First Subordinate Series) | 0/6.75 | 8/1/32 | 10,000,000 | g | 7,886,000 |
| Puerto Rico Sales Tax Financing Corporation, | |||||
| Sales Tax Revenue (First Subordinate Series) | 0/6.25 | 8/1/33 | 750,000 | g | 439,522 |
| Virgin Islands Public Finance Authority, | |||||
| Revenue (Virgin Islands Gross Receipts Taxes Loan Note) | 5.00 | 10/1/29 | 1,250,000 | 1,377,450 | |
| Virgin Islands Public Finance Authority, | |||||
| Revenue (Virgin Islands Gross Receipts Taxes Loan Note) | 5.00 | 10/1/34 | 1,500,000 | 1,620,240 | |
| Virgin Islands Public Finance Authority, Subordinated Revenue | |||||
| (Virgin Islands Matching Fund Loan Note— Diageo Project) | 6.75 | 10/1/37 | 2,000,000 | 2,300,620 | |
| Total Long-Term Municipal Investments | |||||
| (cost $998,265,896) | 1,077,198,153 | ||||
| Short-Term Municipal Investments—3.5% | |||||
| Colorado—.7% | |||||
| Colorado Educational and Cultural Facilities Authority, Revenue | |||||
| (National Jewish Federation Bond Program) (LOC; TD Bank) | 0.04 | 9/2/14 | 2,500,000 | h | 2,500,000 |
| Colorado Educational and Cultural Facilities Authority, Revenue | |||||
| (National Jewish Federation Bond Program) (LOC; U.S. Bank NA) | 0.04 | 9/2/14 | 5,000,000 | h | 5,000,000 |
| Florida—.3% | |||||
| University of North Florida Foundation Inc., | |||||
| Parking System Revenue (LOC; Wachovia Bank) | 0.05 | 9/2/14 | 3,200,000 | h | 3,200,000 |
| Minnesota—.2% | |||||
| Minnesota Higher Education Facilities Authority, | |||||
| Revenue (Saint Olaf College) (LOC; Bank of Montreal) | 0.05 | 9/2/14 | 2,100,000 | h | 2,100,000 |
| Mississippi—.2% | |||||
| Jackson County, Port Facility Revenue, | |||||
| Refunding (Chevron U.S.A. Inc. Project) | 0.02 | 9/2/14 | 2,200,000 | h | 2,200,000 |
| Missouri—.4% | |||||
| Missouri Development Finance Board, | |||||
| Cultural Facilities Revenue (The Nelson Gallery | |||||
| Foundation) (Liquidity Facility; Northern Trust Company) | 0.03 | 9/2/14 | 2,400,000 | h | 2,400,000 |
| Missouri Health and Educational Facilities Authority, | |||||
| Educational Facilities Revenue (Saint Louis University) | |||||
| (LOC; Wells Fargo Bank) | 0.04 | 9/2/14 | 2,000,000 | h | 2,000,000 |
| New Hampshire—.7% | |||||
| New Hampshire Business Finance Authority, | |||||
| Revenue (Huggins Hospital Issue) (LOC; TD Bank) | 0.05 | 9/2/14 | 2,400,000 | h | 2,400,000 |
| New Hampshire Health and Education Facilities Authority, | |||||
| Revenue (Dartmouth College Issue) | |||||
| (Liquidity Facility; JPMorgan Chase Bank) | 0.04 | 9/2/14 | 4,600,000 | h | 4,600,000 |
| New York—.2% | |||||
| New York City, GO Notes (LOC; JPMorgan Chase Bank) | 0.04 | 9/2/14 | 1,700,000 | h | 1,700,000 |
The Funds 97
STATEMENT OF INVESTMENTS (continued)
| BNY Mellon Municipal Opportunities Fund (continued) | ||||||
| Short-Term Municipal | Coupon | Maturity | Principal | |||
| Investments (continued) | Rate (%) | Date | Amount ($) | Value ($) | ||
| Ohio—.3% | ||||||
| Cleveland-Cuyahoga County Port Authority, Educational Facility | ||||||
| Revenue (Laurel School Project) (LOC; JPMorgan Chase Bank) | 0.06 | 9/2/14 | 2,550,000 | h | 2,550,000 | |
| Pennsylvania—.0% | ||||||
| Pennsylvania Higher Educational Facilities Authority, | ||||||
| Revenue (Drexel University) (LOC; TD Bank) | 0.03 | 9/2/14 | 255,000 | h | 255,000 | |
| Vermont—.3% | ||||||
| Vermont Educational and Health Buildings Financing Agency, | ||||||
| Revenue (Northeastern Vermont Regional | ||||||
| Hospital Project) (LOC; TD Bank) | 0.03 | 9/2/14 | 1,600,000 | h | 1,600,000 | |
| Vermont Educational and Health Buildings Financing Agency, | ||||||
| Revenue (Southwestern Vermont Medical | ||||||
| Center Project) (LOC; TD Bank) | 0.03 | 9/2/14 | 1,800,000 | h | 1,800,000 | |
| Washington—.2% | ||||||
| Washington Housing Finance Commission, Nonprofit Revenue | ||||||
| (Pioneer Human Services Projects) (LOC; U.S. Bank NA) | 0.06 | 9/2/14 | 1,600,000 | h | 1,600,000 | |
| Total Short-Term Municipal Investments | ||||||
| (cost $35,905,000) | 35,905,000 | |||||
| Total Investments (cost $1,034,170,896) | 108.2 | % | 1,113,103,153 | |||
| Liabilities, Less Cash and Receivables | (8.2 | %) | (84,317,105 | ) | ||
| Net Assets | 100.0 | % | 1,028,786,048 | |||
| a These securities are prerefunded; the date shown represents the prerefunded date. Bonds which are prerefunded are collateralized by U.S. Government securities which are held in |
| escrow and are used to pay principal and interest on the municipal issue and to retire the bonds in full at the earliest refunding date. |
| b Security issued with a zero coupon. Income is recognized through the accretion of discount. |
| c Collateral for floating rate borrowings. |
| d Securities exempt from registration pursuant to Rule 144A under the Securities Act of 1933.These securities may be resold in transactions exempt from registration, normally to |
| qualified institutional buyers.At August 31, 2014, these securities were valued at $129,809,858 or 12.6% of net assets. |
| e Variable rate security—interest rate subject to periodic change. |
| f Purchased on a delayed delivery basis. |
| g Zero coupon until a specified date at which time the stated coupon rate becomes effective until maturity. |
| h Variable rate demand note—rate shown is the interest rate in effect at August 31, 2014. Maturity date represents the next demand date, or the ultimate maturity date if earlier. |
| Portfolio Summary (Unaudited) † | |||
| Value (%) | Value (%) | ||
| Transportation Services | 24.0 | Lease | 3.2 |
| Education | 17.9 | County | 1.2 |
| Special Tax | 12.0 | Prerefunded | 1.1 |
| Health Care | 8.4 | Housing | .7 |
| State/Territory | 8.4 | Resource Recovery | .2 |
| Utility-Water and Sewer | 7.8 | Pollution Control | .1 |
| Industrial | 5.8 | Other | 7.0 |
| Utility-Electric | 5.5 | ||
| City | 4.9 | 108.2 | |
| † | Based on net assets. |
98
| Summary of Abbreviations | |||
| ABAG | Association of Bay Area Governments | ACA | American Capital Access |
| AGC | ACE Guaranty Corporation | AGIC | Asset Guaranty Insurance Company |
| AMBAC | American Municipal Bond Assurance Corporation | ARRN | Adjustable Rate Receipt Notes |
| BAN | Bond Anticipation Notes | BPA | Bond Purchase Agreement |
| CIFG | CDC Ixis Financial Guaranty | COP | Certificate of Participation |
| CP | Commercial Paper | DRIVERS | Derivative Inverse Tax-Exempt Receipts |
| EDR | Economic Development Revenue | EIR | Environmental Improvement Revenue |
| FGIC | Financial Guaranty Insurance Company | FHA | Federal Housing Administration |
| FHLB | Federal Home Loan Bank | FHLMC | Federal Home Loan Mortgage Corporation |
| FNMA | Federal National Mortgage Association | GAN | Grant Anticipation Notes |
| GIC | Guaranteed Investment Contract | GNMA | Government National Mortgage Association |
| GO | General Obligation | HR | Hospital Revenue |
| IDB | Industrial Development Board | IDC | Industrial Development Corporation |
| IDR | Industrial Development Revenue | LIFERS | Long Inverse Floating Exempt Receipts |
| LOC | Letter of Credit | LOR | Limited Obligation Revenue |
| LR | Lease Revenue | MERLOTS | Municipal Exempt Receipts Liquidity Option Tender |
| MFHR | Multi-Family Housing Revenue | MFMR | Multi-Family Mortgage Revenue |
| PCR | Pollution Control Revenue | P-FLOATS | Puttable Floating Option Tax-Exempt Receipts |
| PILOT | Payment in Lieu of Taxes | PUTTERS | Puttable Tax-Exempt Receipts |
| RAC | Revenue Anticipation Certificates | RAN | Revenue Anticipation Notes |
| RAW | Revenue Anticipation Warrants | RIB | Residual Interest Bonds |
| ROCS | Reset Options Certificates | RRR | Resources Recovery Revenue |
| SAAN | State Aid Anticipation Notes | SBPA | Standby Bond Purchase Agreement |
| SFHR | Single Family Housing Revenue | SFMR | Single Family Mortgage Revenue |
| SONYMA | State of New York Mortgage Agency | SPEARS | Short Puttable Exempt Adjustable Receipts |
| SWDR | Solid Waste Disposal Revenue | TAN | Tax Anticipation Notes |
| TAW | Tax Anticipation Warrants | TRAN | Tax and Revenue Anticipation Notes |
| XLCA | XL Capital Assurance | ||
| See notes to financial statements. | |||
The Funds 99
| STATEMENT OF FINANCIAL FUTURES |
| August 31, 2014 |
| Market Value | Unrealized | ||||
| BNY Mellon | Covered by | (Depreciation) | |||
| Municipal Opportunities Fund | Contracts | Contracts ($) | Expiration | at 8/31/2014 | ($) |
| Financial Futures Short | |||||
| U.S. Treasury 5 Year Notes | 900 | (106,952,344) | December 2014 | (249,632 | ) |
| U.S. Treasury 10 Year Notes | 1700 | (213,828,125) | December 2014 | (730,468 | ) |
| U.S. Treasury Long Bonds | 200 | (28,018,750) | December 2014 | (200,000 | ) |
| (1,180,100 | ) |
| See notes to financial statements. |
100
| STATEMENTS OF ASSETS AND LIABILITIES |
| August 31, 2014 |
| BNY Mellon | BNY Mellon | BNY Mellon | BNY Mellon | ||
| National | National | Pennsylvania | Massachusetts | ||
| Intermediate | Short-Term | Intermediate | Intermediate | ||
| Municipal Bond Fund | Municipal Bond Fund | Municipal Bond Fund | Municipal Bond Fund | ||
| Assets ($): | |||||
| Investments in securities— | |||||
| See Statement of Investments+ | 1,854,641,954 | 1,259,616,032 | 308,235,519 | 316,093,603 | |
| Cash | — | 3,018,369 | — | — | |
| Cash on Initial Margin—Note 5 | 752,500 | 270,000 | 162,000 | 136,000 | |
| Interest receivable | 21,277,104 | 10,469,207 | 4,084,446 | 2,993,523 | |
| Receivable for investment securites sold | 12,152,826 | 24,017,142 | — | 5,206 | |
| Receivable for shares of Beneficial Interest subscribed | 1,195,500 | 3,747,200 | 327,000 | 2,723,581 | |
| Receivable for futures variation margin—Note 5 | 10,469 | — | 4,063 | 2,812 | |
| Prepaid expenses | 21,511 | 20,905 | 17,493 | 16,781 | |
| 1,890,051,864 | 1,301,158,855 | 312,830,521 | 321,971,506 | ||
| Liabilities ($): | |||||
| Due to The Dreyfus Corporation and affiliates—Note 4(b) | 598,635 | 408,685 | 144,643 | 106,389 | |
| Due to Administrator—Note 4(a) | 193,424 | 131,089 | 32,417 | 32,691 | |
| Cash overdraft due to Custodian | 249,591 | — | 573,017 | 336,923 | |
| Payable for investment securities purchased | 19,083,798 | 45,280,464 | 860,129 | 6,002,754 | |
| Payable for shares of Beneficial Interest redeemed | 228,229 | 1,380,087 | 58,649 | 8,065 | |
| Payable for futures variation margin—Note 5 | — | 9,375 | — | — | |
| Accrued expenses | 81,057 | 66,789 | 51,196 | 61,730 | |
| 20,434,734 | 47,276,489 | 1,720,051 | 6,548,552 | ||
| Net Assets ($) | 1,869,617,130 | 1,253,882,366 | 311,110,470 | 315,422,954 | |
| Composition of Net Assets ($): | |||||
| Paid—in capital | 1,758,678,980 | 1,243,198,412 | 297,315,794 | 299,663,081 | |
| Accumulated undistributed investment income—net | 278,344 | 49,051 | 45,693 | 44,814 | |
| Accumulated net realized gain (loss) on investments | 709,777 | 1,144,625 | 104,372 | (1,667,741 | ) |
| Accumulated net unrealized appreciation (depreciation) | |||||
| on investments [including ($241,786) depreciation on | |||||
| financial futures for BNY Mellon National Intermediate | |||||
| Municipal Bond Fund, ($83,211) depreciation on | |||||
| financial futures for BNY Mellon Short-Term Municipal | |||||
| Bond Fund, ($52,540) depreciation on financial futures | |||||
| for BNY Mellon Pennsylvania Intermediate Municipal | |||||
| Bond Fund and ($43,947) depreciation on financial | |||||
| futures for BNY Mellon Massachusetts | |||||
| Intermediate Municipal Bond Fund] | 109,950,029 | 9,490,278 | 13,644,611 | 17,382,800 | |
| Net Assets ($) | 1,869,617,130 | 1,253,882,366 | 311,110,470 | 315,422,954 | |
| Net Asset Value Per Share | |||||
| Class M Shares | |||||
| Net Assets ($) | 1,827,575,157 | 1,244,186,684 | 306,673,338 | 305,512,785 | |
| Shares Outstanding | 132,744,130 | 96,180,066 | 24,423,548 | 23,597,736 | |
| Net Asset Value Per Share ($) | 13.77 | 12.94 | 12.56 | 12.95 | |
| Investor Shares | |||||
| Net Assets ($) | 42,041,973 | 9,695,682 | 4,437,132 | 9,910,169 | |
| Shares Outstanding | 3,057,065 | 749,943 | 353,738 | 765,591 | |
| Net Asset Value Per Share ($) | 13.75 | 12.93 | 12.54 | 12.94 | |
| † Investments at cost ($) | 1,744,450,139 | 1,250,042,543 | 294,538,368 | 298,666,856 |
See notes to financial statements.
The Funds 101
STATEMENTS OF ASSETS AND LIABILITIES (continued)
| BNY Mellon | BNY Mellon | |||
| New York Intermediate | Municipal | |||
| Tax-Exempt Bond Fund | Opportunities Fund | |||
| Assets ($): | ||||
| Investments in securities—See Statement of Investments† | 187,738,478 | 1,113,103,153 | ||
| Cash on Initial Margin—Note 5 | 79,000 | 3,440,000 | ||
| Receivable for investment securites sold | 2,412,743 | — | ||
| Interest receivable | 2,171,279 | 10,661,491 | ||
| Receivable for shares of Beneficial Interest subscribed | 20,000 | — | ||
| Receivable for futures variation margin—Note 5 | 1,562 | 115,625 | ||
| Prepaid expenses | 17,953 | 23,356 | ||
| 192,441,015 | 1,127,343,625 | |||
| Liabilities ($): | ||||
| Due to The Dreyfus Corporation and affiliates—Note 4(b) | 69,669 | 463,249 | ||
| Due to Administrator—Note 4(a) | 19,477 | 106,529 | ||
| Cash overdraft due to Custodian | 326,466 | 1,490,311 | ||
| Payable for floating rate notes issued—Note 5 | — | 69,540,000 | ||
| Payable for investment securities purchased | 3,130,231 | 26,655,211 | ||
| Payable for shares of Beneficial Interest redeemed | 6,550 | 136,156 | ||
| Interest and expense payable related to floating rate notes issued—Note 5 | — | 122,024 | ||
| Accrued expenses | 53,592 | 44,097 | ||
| 3,605,985 | 98,557,577 | |||
| Net Assets ($) | 188,835,030 | 1,028,786,048 | ||
| Composition of Net Assets ($): | ||||
| Paid—in capital | 178,857,591 | 984,323,169 | ||
| Accumulated undistributed investment income—net | 26,601 | 53,308 | ||
| Accumulated net realized gain (loss) on investments | (519,627 | ) | (33,342,586 | ) |
| Accumulated net unrealized appreciation (depreciation) on investments | ||||
| [including ($25,509) depreciation on financial futures for BNY Mellon | ||||
| New York Intermediate Tax-Exempt Bond Fund and ($1,180,100) depreciation | ||||
| on financial futures for BNY Mellon Municipal Opportunities Fund] | 10,470,465 | 77,752,157 | ||
| Net Assets ($) | 188,835,030 | 1,028,786,048 | ||
| Net Asset Value Per Share | ||||
| Class M Shares | ||||
| Net Assets ($) | 172,407,397 | 1,023,659,813 | ||
| Shares Outstanding | 15,129,197 | 77,785,927 | ||
| Net Asset Value Per Share ($) | 11.40 | 13.16 | ||
| Investor Shares | ||||
| Net Assets ($) | 16,427,633 | 5,126,235 | ||
| Shares Outstanding | 1,440,755 | 389,519 | ||
| Net Asset Value Per Share ($) | 11.40 | 13.16 | ||
| † Investments at cost ($) | 177,242,504 | 1,034,170,896 | ||
| See notes to financial statements. | ||||
102
| STATEMENT OF OPERATIONS |
| Year Ended August 31, 2014 |
| BNY Mellon | BNY Mellon | BNY Mellon | BNY Mellon | |||||
| National | National | Pennsylvania | Massachusetts | |||||
| Intermediate | Short-Term | Intermediate | Intermediate | |||||
| Municipal Bond Fund | Municipal Bond Fund | Municipal Bond Fund | Municipal Bond Fund | |||||
| Investment Income ($): | ||||||||
| Interest Income | 60,196,296 | 15,958,439 | 11,862,848 | 10,434,897 | ||||
| Expenses: | ||||||||
| Investment advisory fee—Note 4(a) | 6,203,960 | 4,384,450 | 1,662,889 | 1,079,318 | ||||
| Administration fee—Note 4(a) | 2,193,992 | 1,550,636 | 411,723 | 381,710 | ||||
| Trustees’ fees and expenses—Note 4(c) | 110,600 | 78,661 | 24,689 | 19,315 | ||||
| Shareholder servicing costs—Note 4(b) | 98,436 | 20,006 | 12,131 | 22,991 | ||||
| Custodian fees—Note 4(b) | 92,641 | 79,251 | 25,662 | 23,894 | ||||
| Professional fees | 83,197 | 74,519 | 49,545 | 47,931 | ||||
| Registration fees | 36,650 | 30,316 | 29,036 | 28,628 | ||||
| Loan commitment fees—Note 3 | 15,937 | 10,228 | 3,060 | 2,754 | ||||
| Prospectus and shareholders’ reports | 12,935 | 6,727 | 7,016 | 4,870 | ||||
| Miscellaneous | 99,819 | 82,718 | 43,071 | 50,324 | ||||
| Total Expenses | 8,948,167 | 6,317,512 | 2,268,822 | 1,661,735 | ||||
| Less—reduction in fees | ||||||||
| due to earnings credits—Note 4(b) | (24 | ) | (4 | ) | (3 | ) | (8 | ) |
| Net Expenses | 8,948,143 | 6,317,508 | 2,268,819 | 1,661,727 | ||||
| Investment Income—Net | 51,248,153 | 9,640,931 | 9,594,029 | 8,773,170 | ||||
| Realized and Unrealized Gain (Loss) | ||||||||
| on Investments—Note 5 ($): | ||||||||
| Net realized gain (loss) on investments | 751,119 | 1,199,538 | 2,733,302 | (162,126 | ) | |||
| Net realized gain (loss) on financial futures | (501,619 | ) | (190,248 | ) | (125,640 | ) | (99,640 | ) |
| Net Realized Gain (Loss) | 249,500 | 1,009,290 | 2,607,662 | (261,766 | ) | |||
| Net unrealized appreciation | ||||||||
| (depreciation) on investments | 73,087,074 | 6,418,571 | 8,527,874 | 10,420,427 | ||||
| Net unrealized appreciation | ||||||||
| (depreciation) on financial futures | (1,670,849 | ) | (83,211 | ) | (430,821 | ) | (338,166 | ) |
| Net Unrealized Appreciation (Depreciation) | 71,416,225 | 6,335,360 | 8,097,053 | 10,082,261 | ||||
| Net Realized and Unrealized | ||||||||
| Gain (Loss) on Investments | 71,665,725 | 7,344,650 | 10,704,715 | 9,820,495 | ||||
| Net Increase in Net Assets | ||||||||
| Resulting from Operations | 122,913,878 | 16,985,581 | 20,298,744 | 18,593,665 | ||||
| See notes to financial statements. | ||||||||
The Funds 103
STATEMENT OF OPERATIONS (continued)
| BNY Mellon | BNY Mellon | |||
| New York Intermediate | Municipal | |||
| Tax-Exempt Bond Fund | Opportunities Fund | |||
| Investment Income ($): | ||||
| Interest Income | 6,391,365 | 42,695,763 | ||
| Expenses: | ||||
| Investment advisory fee—Note 4(a) | 945,500 | 4,651,971 | ||
| Administration fee—Note 4(a) | 234,080 | 1,151,488 | ||
| Interest and expense related to floating rate notes issued—Note 5 | — | 478,825 | ||
| Shareholder servicing costs—Note 4(b) | 42,687 | 8,664 | ||
| Professional fees | 40,851 | 56,638 | ||
| Registration fees | 29,864 | 32,724 | ||
| Custodian fees—Note 4(b) | 15,462 | 67,279 | ||
| Prospectus and shareholders’ reports | 13,471 | 7,735 | ||
| Trustees’ fees and expenses—Note 4(c) | 12,146 | 56,893 | ||
| Loan commitment fees—Note 3 | 1,903 | 9,117 | ||
| Miscellaneous | 44,988 | 72,174 | ||
| Total Expenses | 1,380,952 | 6,593,508 | ||
| Less—reduction in expenses due to undertaking—Note 4(a) | (220,796 | ) | — | |
| Less—reduction in fees due to earnings credits—Note 4(b) | (31 | ) | (3 | )�� |
| Net Expenses | 1,160,125 | 6,593,505 | ||
| Investment Income—Net | 5,231,240 | 36,102,258 | ||
| Realized and Unrealized Gain (Loss) on Investments—Note 5 ($): | ||||
| Net realized gain (loss) on investments | 994,052 | (11,854,907 | ) | |
| Net realized gain (loss) on financial futures | (57,184 | ) | (7,963,797 | ) |
| Net Realized Gain (Loss) | 936,868 | (19,818,704 | ) | |
| Net unrealized appreciation (depreciation) on investments | 6,837,248 | 101,118,411 | ||
| Net unrealized appreciation (depreciation) on financial futures | (193,634 | ) | (5,648,850 | ) |
| Net Unrealized Appreciation (Depreciation) | 6,643,614 | 95,469,561 | ||
| Net Realized and Unrealized Gain (Loss) on Investments | 7,580,482 | 75,650,857 | ||
| Net Increase in Net Assets Resulting from Operations | 12,811,722 | 111,753,115 | ||
| See notes to financial statements. |
104
| STATEMENT OF CASH FLOWS |
| August 31, 2014 |
| BNY Mellon Municipal Opportunities Fund | ||||
| Cash Flows from Operating Activities ($): | ||||
| Purchases of portfolio securities | (557,004,614 | ) | ||
| Proceeds from sales of portfolio securities | 571,156,022 | |||
| Repayment of floating notes issued | (12,500,000 | ) | ||
| Financial futures transactions | (13,938,897 | ) | ||
| Net sales of short-term portfolio securities | 7,245,000 | |||
| Interest received | 44,352,005 | |||
| Operating expenses paid | (1,959,587 | ) | ||
| Cash paid to The Dreyfus Corporation for investment advisory fee | (4,634,910 | ) | ||
| Net Cash Provided by Operating Activities | 32,715,019 | |||
| Cash Flows from Financing Activities ($): | ||||
| Net Benefical Interest transactions | (626,567 | ) | ||
| Dividends paid | (31,849,897 | ) | ||
| Net Cash Used in Financing Activities | (32,476,464 | ) | ||
| Increase in cash | 238,555 | |||
| Cash overdraft due to custodian at beginning of period | (1,728,866 | ) | ||
| Cash overdraft due to custodian at end of period | (1,490,311 | ) | ||
| Reconciliation of Net Increase in Net Assets Resulting from | ||||
| Operations to Net Cash Provided by Operating Activities ($): | ||||
| Net Increase in Net Assets Resulting From Operations | 111,753,115 | |||
| Adjustments to reconcile net increase in net assets resulting | ||||
| from operations to net cash provided by operating activities ($): | ||||
| Purchases of portfolio securities | (557,004,614 | ) | ||
| Proceeds from sales of portfolio securities | 571,156,022 | |||
| Repayment of floating notes issued | (12,500,000 | ) | ||
| Financial futures transactions | (13,938,897 | ) | ||
| Net sales of short-term portfolio securities | 7,245,000 | |||
| Increase in interest receivable | (240,272 | ) | ||
| Decrease in accrued operating expenses | (6,090 | ) | ||
| Increase in prepaid expenses | (17,470 | ) | ||
| Increase in Due to The Dreyfus Corporation and affiliates | 17,061 | |||
| Increase in Due to Administrator | 5,506 | |||
| Decrease in interest and expense payable related to floating rate notes issued | (3,472 | ) | ||
| Net realized gain on investments and financial futures | 19,818,704 | |||
| Net unrealized appreciation on investments and financial futures | (95,469,561 | ) | ||
| Net amortization of premiums on investments | 1,899,987 | |||
| Net Cash Provided by Operating Activities | 32,715,019 | |||
| Supplemental non-cash financing disclosure | ||||
| Reinvestment of dividends | 21,937,507 |
The Funds 105
STATEMENT OF CHANGES IN NET ASSETS
| BNY Mellon National Intermediate | BNY Mellon National Short-Term | |||||||
| Municipal Bond Fund | Municipal Bond Fund | |||||||
| Year Ended August 31, | Year Ended August 31, | |||||||
| 2014 | 2013 | 2014 | 2013 | |||||
| Operations ($): | ||||||||
| Investment income—net | 51,248,153 | 53,150,271 | 9,640,931 | 11,069,807 | ||||
| Net realized gain (loss) on investments | 249,500 | (2,955,901 | ) | 1,009,290 | 790,103 | |||
| Net unrealized appreciation (depreciation) on investments | 71,416,225 | (95,547,790 | ) | 6,335,360 | (14,689,097 | ) | ||
| Net Increase (Decrease) in Net Assets | ||||||||
| Resulting from Operations | 122,913,878 | (45,353,420 | ) | 16,985,581 | (2,829,187 | ) | ||
| Dividends to Shareholders from ($): | ||||||||
| Investment income—net: | ||||||||
| Class M Shares | (49,608,387 | ) | (49,834,763 | ) | (9,530,882 | ) | (10,983,597 | ) |
| Investor Shares | (1,025,498 | ) | (1,041,900 | ) | (41,223 | ) | (28,813 | ) |
| Net realized gain on investments: | ||||||||
| Class M Shares | — | (6,792,322 | ) | (652,036 | ) | — | ||
| Investor Shares | — | (168,134 | ) | (4,310 | ) | — | ||
| Total Dividends | (50,633,885 | ) | (57,837,119 | ) | (10,228,451 | ) | (11,012,410 | ) |
| Beneficial Interest Transactions ($): | ||||||||
| Net proceeds from shares sold: | ||||||||
| Class M Shares | 437,503,341 | 485,500,300 | 741,808,917 | 902,337,667 | ||||
| Investor Shares | 23,291,580 | 18,989,323 | 19,585,740 | 10,907,456 | ||||
| Dividends reinvested: | ||||||||
| Class M Shares | 7,426,245 | 10,289,542 | 2,760,306 | 2,626,274 | ||||
| Investor Shares | 732,176 | 817,405 | 42,467 | 24,109 | ||||
| Cost of shares redeemed: | ||||||||
| Class M Shares | (380,832,569 | ) | (399,600,859 | ) | (689,082,964 | ) | (950,340,471 | ) |
| Investor Shares | (20,664,727 | ) | (18,513,418 | ) | (14,456,070 | ) | (10,385,328 | ) |
| Increase (Decrease) in Net Assets from | ||||||||
| Beneficial Interest Transactions | 67,456,046 | 97,482,293 | 60,658,396 | (44,830,293 | ) | |||
| Total Increase (Decrease) in Net Assets | 139,736,039 | (5,708,246 | ) | 67,415,526 | (58,671,890 | ) | ||
| Net Assets ($): | ||||||||
| Beginning of Period | 1,729,881,091 | 1,735,589,337 | 1,186,466,840 | 1,245,138,730 | ||||
| End of Period | 1,869,617,130 | 1,729,881,091 | 1,253,882,366 | 1,186,466,840 | ||||
| Undistributed investment income—net | 278,344 | 141,449 | 49,051 | 26,376 | ||||
| Capital Share Transactions (Shares): | ||||||||
| Class M Shares | ||||||||
| Shares sold | 32,377,766 | 34,944,891 | 57,416,501 | 69,552,896 | ||||
| Shares issued for dividends reinvested | 548,028 | 741,039 | 213,664 | 202,542 | ||||
| Shares redeemed | (28,277,377 | ) | (29,008,348 | ) | (53,330,158 | ) | (73,268,112 | ) |
| Net Increase (Decrease) in Shares Outstanding | 4,648,417 | 6,677,582 | 4,300,007 | (3,512,674 | ) | |||
| Investor Shares | ||||||||
| Shares sold | 1,725,631 | 1,381,566 | 1,518,674 | 841,370 | ||||
| Shares issued for dividends reinvested | 54,089 | 59,050 | 3,289 | 1,863 | ||||
| Shares redeemed | (1,532,756 | ) | (1,356,254 | ) | (1,120,541 | ) | (803,237 | ) |
| Net Increase (Decrease) in Shares Outstanding | 246,964 | 84,362 | 401,422 | 39,996 | ||||
| See notes to financial statements. | ||||||||
106
| BNY Mellon Pennsylvania Intermediate Municipal Bond Fund | ||||
| Year Ended August 31, | ||||
| 2014 | 2013 | |||
| Operations ($): | ||||
| Investment income—net | 9,594,029 | 11,071,020 | ||
| Net realized gain (loss) on investments | 2,607,662 | 1,115,685 | ||
| Net unrealized appreciation (depreciation) on investments | 8,097,053 | (25,193,478 | ) | |
| Net Increase (Decrease) in Net Assets Resulting from Operations | 20,298,744 | (13,006,773 | ) | |
| Dividends to Shareholders from ($): | ||||
| Investment income—net: | ||||
| Class M Shares | (9,422,346 | ) | (10,874,551 | ) |
| Investor Shares | (126,873 | ) | (141,559 | ) |
| Net realized gain on investments: | ||||
| Class M Shares | (3,103,111 | ) | (2,706,194 | ) |
| Investor Shares | (47,276 | ) | (34,536 | ) |
| Total Dividends | (12,699,606 | ) | (13,756,840 | ) |
| Beneficial Interest Transactions ($): | ||||
| Net proceeds from shares sold: | ||||
| Class M Shares | 32,561,040 | 36,503,372 | ||
| Investor Shares | 3,270,052 | 1,446,499 | ||
| Dividends reinvested: | ||||
| Class M Shares | 2,396,725 | 2,201,734 | ||
| Investor Shares | 132,551 | 110,542 | ||
| Cost of shares redeemed: | ||||
| Class M Shares | (93,213,074 | ) | (58,186,969 | ) |
| Investor Shares | (3,266,695 | ) | (5,572,056 | ) |
| Increase (Decrease) in Net Assets from | ||||
| Beneficial Interest Transactions | (58,119,401 | ) | (23,496,878 | ) |
| Total Increase (Decrease) in Net Assets | (50,520,263 | ) | (50,260,491 | ) |
| Net Assets ($): | ||||
| Beginning of Period | 361,630,733 | 411,891,224 | ||
| End of Period | 311,110,470 | 361,630,733 | ||
| Undistributed investment income—net | 45,693 | 28,962 | ||
| Capital Share Transactions (Shares): | ||||
| Class M Shares | ||||
| Shares sold | 2,629,222 | 2,800,978 | ||
| Shares issued for dividends reinvested | 195,253 | 168,469 | ||
| Shares redeemed | (7,540,335 | ) | (4,495,344 | ) |
| Net Increase (Decrease) in Shares Outstanding | (4,715,860 | ) | (1,525,897 | ) |
| Investor Shares | ||||
| Shares sold | 263,866 | 112,024 | ||
| Shares issued for dividends reinvested | 10,730 | 8,540 | ||
| Shares redeemed | (263,648 | ) | (426,206 | ) |
| Net Increase (Decrease) in Shares Outstanding | 10,948 | (305,642 | ) | |
| See notes to financial statements. | ||||
The Funds 107
STATEMENT OF CHANGES IN NET ASSETS (continued)
| BNY Mellon Massachusetts Intermediate Municipal Bond Fund | ||||
| Year Ended August 31, | ||||
| 2014 | 2013 | |||
| Operations ($): | ||||
| Investment income—net | 8,773,170 | 9,659,275 | ||
| Net realized gain (loss) on investments | (261,766 | ) | 651,128 | |
| Net unrealized appreciation (depreciation) on investments | 10,082,261 | (20,747,063 | ) | |
| Net Increase (Decrease) in Net Assets Resulting from Operations | 18,593,665 | (10,436,660 | ) | |
| Dividends to Shareholders from ($): | ||||
| Investment income—net: | ||||
| Class M Shares | (8,516,368 | ) | (9,398,874 | ) |
| Investor Shares | (236,628 | ) | (235,761 | ) |
| Net realized gain on investments: | ||||
| Class M Shares | (1,993,315 | ) | (3,698,997 | ) |
| Investor Shares | (55,854 | ) | (104,182 | ) |
| Total Dividends | (10,802,165 | ) | (13,437,814 | ) |
| Beneficial Interest Transactions ($): | ||||
| Net proceeds from shares sold: | ||||
| Class M Shares | 55,897,319 | 51,508,436 | ||
| Investor Shares | 3,322,991 | 4,144,022 | ||
| Dividends reinvested: | ||||
| Class M Shares | 2,884,754 | 4,119,877 | ||
| Investor Shares | 235,018 | 261,386 | ||
| Cost of shares redeemed: | ||||
| Class M Shares | (73,467,182 | ) | (66,422,157 | ) |
| Investor Shares | (2,142,654 | ) | (4,589,879 | ) |
| Increase (Decrease) in Net Assets from | ||||
| Beneficial Interest Transactions | (13,269,754 | ) | (10,978,315 | ) |
| Total Increase (Decrease) in Net Assets | (5,478,254 | ) | (34,852,789 | ) |
| Net Assets ($): | ||||
| Beginning of Period | 320,901,208 | 355,753,997 | ||
| End of Period | 315,422,954 | 320,901,208 | ||
| Undistributed investment income—net | 44,814 | 24,640 | ||
| Capital Share Transactions (Shares): | ||||
| Class M Shares | ||||
| Shares sold | 4,375,049 | 3,859,357 | ||
| Shares issued for dividends reinvested | 226,488 | 308,262 | ||
| Shares redeemed | (5,767,654 | ) | (5,001,396 | ) |
| Net Increase (Decrease) in Shares Outstanding | (1,166,117 | ) | (833,777 | ) |
| Investor Shares | ||||
| Shares sold | 259,624 | 311,223 | ||
| Shares issued for dividends reinvested | 18,409 | 19,592 | ||
| Shares redeemed | (166,882 | ) | (348,961 | ) |
| Net Increase (Decrease) in Shares Outstanding | 111,151 | (18,146 | ) | |
| See notes to financial statements. | ||||
108
| BNY Mellon New York Intermediate Tax-Exempt Bond Fund | ||||
| Year Ended August 31, | ||||
| 2014 | 2013 | |||
| Operations ($): | ||||
| Investment income—net | 5,231,240 | 5,579,289 | ||
| Net realized gain (loss) on investments | 936,868 | 1,525,940 | ||
| Net unrealized appreciation (depreciation) on investments | 6,643,614 | (14,276,408 | ) | |
| Net Increase (Decrease) in Net Assets Resulting from Operations | 12,811,722 | (7,171,179 | ) | |
| Dividends to Shareholders from ($): | ||||
| Investment income—net: | ||||
| Class M Shares | (4,767,007 | ) | (5,104,571 | ) |
| Investor Shares | (424,326 | ) | (436,856 | ) |
| Net realized gain on investments: | ||||
| Class M Shares | (2,663,858 | ) | (2,118,837 | ) |
| Investor Shares | (258,819 | ) | (198,769 | ) |
| Total Dividends | (8,114,010 | ) | (7,859,033 | ) |
| Beneficial Interest Transactions ($): | ||||
| Net proceeds from shares sold: | ||||
| Class M Shares | 24,239,748 | 30,937,709 | ||
| Investor Shares | 1,869,840 | 3,170,548 | ||
| Dividends reinvested: | ||||
| Class M Shares | 1,870,192 | 1,787,615 | ||
| Investor Shares | 600,225 | 510,973 | ||
| Cost of shares redeemed: | ||||
| Class M Shares | (42,631,907 | ) | (38,115,417 | ) |
| Investor Shares | (4,398,201 | ) | (3,539,017 | ) |
| Increase (Decrease) in Net Assets from | ||||
| Beneficial Interest Transactions | (18,450,103 | ) | (5,247,589 | ) |
| Total Increase (Decrease) in Net Assets | (13,752,391 | ) | (20,277,801 | ) |
| Net Assets ($): | ||||
| Beginning of Period | 202,587,421 | 222,865,222 | ||
| End of Period | 188,835,030 | 202,587,421 | ||
| Undistributed investment income—net | 26,601 | 14,594 | ||
| Capital Share Transactions (Shares): | ||||
| Class M Shares | ||||
| Shares sold | 2,159,114 | 2,629,856 | ||
| Shares issued for dividends reinvested | 168,661 | 151,302 | ||
| Shares redeemed | (3,811,993 | ) | (3,262,649 | ) |
| Net Increase (Decrease) in Shares Outstanding | (1,484,218 | ) | (481,491 | ) |
| Investor Shares | ||||
| Shares sold | 166,975 | 269,998 | ||
| Shares issued for dividends reinvested | 53,755 | 43,524 | ||
| Shares redeemed | (392,159 | ) | (302,528 | ) |
| Net Increase (Decrease) in Shares Outstanding | (171,429 | ) | 10,994 | |
| See notes to financial statements. | ||||
The Funds 109
STATEMENT OF CHANGES IN NET ASSETS (continued)
| BNY Mellon Municipal Opportunities Fund | ||||
| Year Ended August 31, | ||||
| 2014 | 2013 | |||
| Operations ($): | ||||
| Investment income—net | 36,102,258 | 28,972,464 | ||
| Net realized gain (loss) on investments | (19,818,704 | ) | 10,488,346 | |
| Net unrealized appreciation (depreciation) on investments | 95,469,561 | (87,679,540 | ) | |
| Net Increase (Decrease) in Net Assets Resulting from Operations | 111,753,115 | (48,218,730 | ) | |
| Dividends to Shareholders from ($): | ||||
| Investment income—net: | ||||
| Class M Shares | (35,048,637 | ) | (28,517,581 | ) |
| Investor Shares | (121,615 | ) | (83,551 | ) |
| Net realized gain on investments: | ||||
| Class M Shares | (18,547,570 | ) | (6,451,408 | ) |
| Investor Shares | (69,583 | ) | (19,941 | ) |
| Total Dividends | (53,787,405 | ) | (35,072,481 | ) |
| Beneficial Interest Transactions ($): | ||||
| Net proceeds from shares sold: | ||||
| Class M Shares | 290,851,089 | 414,934,700 | ||
| Investor Shares | 7,296,804 | 3,786,582 | ||
| Dividends reinvested: | ||||
| Class M Shares | 21,766,382 | 11,827,421 | ||
| Investor Shares | 171,125 | 86,338 | ||
| Cost of shares redeemed: | ||||
| Class M Shares | (293,432,679 | ) | (118,973,112 | ) |
| Investor Shares | (5,518,729 | ) | (2,954,766 | ) |
| Increase (Decrease) in Net Assets from | ||||
| Beneficial Interest Transactions | 21,133,992 | 308,707,163 | ||
| Total Increase (Decrease) in Net Assets | 79,099,702 | 225,415,952 | ||
| Net Assets ($): | ||||
| Beginning of Period | 949,686,346 | 724,270,394 | ||
| End of Period | 1,028,786,048 | 949,686,346 | ||
| Undistributed (distributions in excess of) investment income—net | 53,308 | (5,976 | ) | |
| Capital Share Transactions (Shares): | ||||
| Class M Shares | ||||
| Shares sold | 22,817,791 | 30,815,706 | ||
| Shares issued for dividends reinvested | 1,729,813 | 886,429 | ||
| Shares redeemed | (23,260,103 | ) | (8,980,195 | ) |
| Net Increase (Decrease) in Shares Outstanding | 1,287,501 | 22,721,940 | ||
| Investor Shares | ||||
| Shares sold | 573,356 | 284,075 | ||
| Shares issued for dividends reinvested | 13,554 | 6,477 | ||
| Shares redeemed | (435,459 | ) | (225,877 | ) |
| Net Increase (Decrease) in Shares Outstanding | 151,451 | 64,675 | ||
| See notes to financial statements. | ||||
110
FINANCIAL HIGHLIGHTS
The following tables describe the performance for each share class of each BNY Mellon municipal bond fund for the fiscal periods indicated. All information (except portfolio turnover rate) reflects financial results for a single fund share.Total return shows how much your investment in each fund would have increased (or decreased) during the period, assuming you had reinvested all dividends and distributions.These figures have been derived from each fund’s financial statements.
| Class M Shares | ||||||||||
| Year Ended August 31, | ||||||||||
| BNY Mellon National Intermediate Municipal Bond Fund | 2014 | 2013 | 2012 | 2011 | 2010 | |||||
| Per Share Data ($): | ||||||||||
| Net asset value, beginning of period | 13.22 | 13.98 | 13.45 | 13.75 | 13.10 | |||||
| Investment Operations: | ||||||||||
| Investment income—neta | .39 | .41 | .43 | .48 | .50 | |||||
| Net realized and unrealized | ||||||||||
| gain (loss) on investments | .55 | (.73 | ) | .53 | (.22 | ) | .65 | |||
| Total from Investment Operations | .94 | (.32 | ) | .96 | .26 | 1.15 | ||||
| Distributions: | ||||||||||
| Dividends from investment income—net | (.39 | ) | (.39 | ) | (.43 | ) | (.48 | ) | (.50 | ) |
| Dividends from net realized gain on investments | — | (.05 | ) | (.00 | )b | (.08 | ) | — | ||
| Total Distributions | (.39 | ) | (.44 | ) | (.43 | ) | (.56 | ) | (.50 | ) |
| Net asset value, end of period | 13.77 | 13.22 | 13.98 | 13.45 | 13.75 | |||||
| Total Return (%) | 7.18 | (2.43 | ) | 7.25 | 2.07 | 8.96 | ||||
| Ratios/Supplemental Data (%): | ||||||||||
| Ratio of total expenses to average net assets | .50 | .50 | .50 | .50 | .50 | |||||
| Ratio of net expenses to average net assets | .50 | .50 | .50 | .50 | .50 | |||||
| Ratio of net investment income | ||||||||||
| to average net assets | 2.90 | 2.94 | 3.16 | 3.65 | 3.76 | |||||
| Portfolio Turnover Rate | 24.65 | 24.05 | 25.31 | 39.88 | 42.75 | |||||
| Net Assets, end of period ($ x 1,000) | 1,827,575 | 1,692,786 | 1,697,522 | 1,535,563 | 1,638,004 | |||||
| a | Based on average shares outstanding. |
| b | Amount represents less than $.01 per share. |
See notes to financial statements.
The Funds 111
FINANCIAL HIGHLIGHTS (continued)
| Investor Shares | ||||||||||
| Year Ended August 31, | ||||||||||
| BNY Mellon National Intermediate Municipal Bond Fund | 2014 | 2013 | 2012 | 2011 | 2010 | |||||
| Per Share Data ($): | ||||||||||
| Net asset value, beginning of period | 13.20 | 13.97 | 13.44 | 13.73 | 13.09 | |||||
| Investment Operations: | ||||||||||
| Investment income—neta | .36 | .37 | .40 | .45 | .47 | |||||
| Net realized and unrealized | ||||||||||
| gain (loss) on investments | .54 | (.74 | ) | .53 | (.21 | ) | .64 | |||
| Total from Investment Operations | .90 | (.37 | ) | .93 | .24 | 1.11 | ||||
| Distributions: | ||||||||||
| Dividends from investment income—net | (.35 | ) | (.35 | ) | (.40 | ) | (.45 | ) | (.47 | ) |
| Dividends from net realized gain on investments | — | (.05 | ) | (.00 | )b | (.08 | ) | — | ||
| Total Distributions | (.35 | ) | (.40 | ) | (.40 | ) | (.53 | ) | (.47 | ) |
| Net asset value, end of period | 13.75 | 13.20 | 13.97 | 13.44 | 13.73 | |||||
| Total Return (%) | 6.92 | (2.68 | ) | 6.99 | 1.90 | 8.61 | ||||
| Ratios/Supplemental Data (%): | ||||||||||
| Ratio of total expenses to average net assets | .75 | .75 | .75 | .75 | .75 | |||||
| Ratio of net expenses to average net assets | .75 | .75 | .75 | .75 | .75 | |||||
| Ratio of net investment income | ||||||||||
| to average net assets | 2.65 | 2.68 | 2.92 | 3.41 | 3.51 | |||||
| Portfolio Turnover Rate | 24.65 | 24.05 | 25.31 | 39.88 | 42.75 | |||||
| Net Assets, end of period ($ x 1,000) | 42,042 | 37,095 | 38,067 | 41,237 | 33,931 | |||||
| a | Based on average shares outstanding. |
| b | Amount represents less than $.01 per share. |
See notes to financial statements.
112
| Class M Shares | ||||||||||
| Year Ended August 31, | ||||||||||
| BNY Mellon National Short-Term Municipal Bond Fund | 2014 | 2013 | 2012 | 2011 | 2010 | |||||
| Per Share Data ($): | ||||||||||
| Net asset value, beginning of period | 12.86 | 13.01 | 12.99 | 13.01 | 12.80 | |||||
| Investment Operations: | ||||||||||
| Investment income—neta | .10 | .12 | .15 | .18 | .21 | |||||
| Net realized and unrealized | ||||||||||
| gain (loss) on investments | .09 | (.15 | ) | .02 | (.02 | ) | .21 | |||
| Total from Investment Operations | .19 | (.03 | ) | .17 | .16 | .42 | ||||
| Distributions: | ||||||||||
| Dividends from investment income—net | (.10 | ) | (.12 | ) | (.15 | ) | (.18 | ) | (.21 | ) |
| Dividends from net realized gain on investments | (.01 | ) | — | — | — | — | ||||
| Total Distributions | (.11 | ) | (.12 | ) | (.15 | ) | (.18 | ) | (.21 | ) |
| Net asset value, end of period | 12.94 | 12.86 | 13.01 | 12.99 | 13.01 | |||||
| Total Return (%) | 1.37 | (.27 | ) | 1.34 | 1.31 | 3.22 | ||||
| Ratios/Supplemental Data (%): | ||||||||||
| Ratio of total expenses to average net assets | .50 | .50 | .51 | .51 | .51 | |||||
| Ratio of net expenses to average net assets | .50 | .50 | .51 | .51 | .51 | |||||
| Ratio of net investment income | ||||||||||
| to average net assets | .77 | .89 | 1.18 | 1.38 | 1.60 | |||||
| Portfolio Turnover Rate | 39.43 | 41.94 | 34.17 | 24.33 | 16.46 | |||||
| Net Assets, end of period ($ x 1,000) | 1,244,187 | 1,181,988 | 1,241,129 | 1,088,334 | 1,060,685 | |||||
| a Based on average shares outstanding. | ||||||||||
| See notes to financial statements. | ||||||||||
The Funds 113
FINANCIAL HIGHLIGHTS (continued)
| Investor Shares | ||||||||||
| Year Ended August 31, | ||||||||||
| BNY Mellon National Short-Term Municipal Bond Fund | 2014 | 2013 | 2012 | 2011 | 2010 | |||||
| Per Share Data ($): | ||||||||||
| Net asset value, beginning of period | 12.85 | 13.00 | 12.97 | 12.99 | 12.78 | |||||
| Investment Operations: | ||||||||||
| Investment income—neta | .07 | .08 | .12 | .15 | .19 | |||||
| Net realized and unrealized | ||||||||||
| gain (loss) on investments | .09 | (.15 | ) | .03 | (.02 | ) | .20 | |||
| Total from Investment Operations | .16 | (.07 | ) | .15 | .13 | .39 | ||||
| Distributions: | ||||||||||
| Dividends from investment income—net | (.07 | ) | (.08 | ) | (.12 | ) | (.15 | ) | (.18 | ) |
| Dividends from net realized gain on investments | (.01 | ) | — | — | — | — | ||||
| Total Distributions | (.08 | ) | (.08 | ) | (.12 | ) | (.15 | ) | (.18 | ) |
| Net asset value, end of period | 12.93 | 12.85 | 13.00 | 12.97 | 12.99 | |||||
| Total Return (%) | 1.20 | (.52 | ) | 1.17 | .98 | 3.05 | ||||
| Ratios/Supplemental Data (%): | ||||||||||
| Ratio of total expenses to average net assets | .76 | .76 | .76 | .77 | .77 | |||||
| Ratio of net expenses to average net assets | .76 | .76 | .76 | .77 | .77 | |||||
| Ratio of net investment income | ||||||||||
| to average net assets | .52 | .63 | .92 | 1.15 | 1.39 | |||||
| Portfolio Turnover Rate | 39.43 | 41.94 | 34.17 | 24.33 | 16.46 | |||||
| Net Assets, end of period ($ x 1,000) | 9,696 | 4,479 | 4,009 | 4,021 | 2,356 | |||||
| a Based on average shares outstanding. | ||||||||||
| See notes to financial statements. |
114
| Class M Shares | ||||||||||
| Year Ended August 31, | ||||||||||
| BNY Mellon Pennsylvania Intermediate Municipal Bond Fund | 2014 | 2013 | 2012 | 2011 | 2010 | |||||
| Per Share Data ($): | ||||||||||
| Net asset value, beginning of period | 12.27 | 13.15 | 12.77 | 12.96 | 12.40 | |||||
| Investment Operations: | ||||||||||
| Investment income—neta | .36 | .36 | .42 | .46 | .46 | |||||
| Net realized and unrealized | ||||||||||
| gain (loss) on investments | .40 | (.79 | ) | .38 | (.19 | ) | .56 | |||
| Total from Investment Operations | .76 | (.43 | ) | .80 | .27 | 1.02 | ||||
| Distributions: | ||||||||||
| Dividends from investment income—net | (.36 | ) | (.36 | ) | (.42 | ) | (.46 | ) | (.46 | ) |
| Dividends from net realized gain on investments | (.11 | ) | (.09 | ) | — | — | (.00 | )b | ||
| Total Distributions | (.47 | ) | (.45 | ) | (.42 | ) | (.46 | ) | (.46 | ) |
| Net asset value, end of period | 12.56 | 12.27 | 13.15 | 12.77 | 12.96 | |||||
| Total Return (%) | 6.31 | (3.47 | ) | 6.34 | 2.21 | 8.44 | ||||
| Ratios/Supplemental Data (%): | ||||||||||
| Ratio of total expenses to average net assets | .68 | .67 | .67 | .66 | .66 | |||||
| Ratio of net expenses to average net assets | .68 | .67 | .67 | .66 | .66 | |||||
| Ratio of net investment income | ||||||||||
| to average net assets | 2.89 | 2.80 | 3.23 | 3.67 | 3.68 | |||||
| Portfolio Turnover Rate | 25.84 | 29.10 | 27.16 | 9.72 | 7.11 | |||||
| Net Assets, end of period ($ x 1,000) | 306,673 | 357,431 | 403,371 | 420,586 | 500,892 | |||||
| a | Based on average shares outstanding. |
| b | Amount represents less than $.01 per share. |
See notes to financial statements.
The Funds 115
FINANCIAL HIGHLIGHTS (continued)
| Investor Shares | ||||||||||
| Year Ended August 31, | ||||||||||
| BNY Mellon Pennsylvania Intermediate Municipal Bond Fund | 2014 | 2013 | 2012 | 2011 | 2010 | |||||
| Per Share Data ($): | ||||||||||
| Net asset value, beginning of period | 12.25 | 13.14 | 12.75 | 12.94 | 12.39 | |||||
| Investment Operations: | ||||||||||
| Investment income—neta | .33 | .33 | .38 | .43 | .44 | |||||
| Net realized and unrealized | ||||||||||
| gain (loss) on investments | .39 | (.80 | ) | .41 | (.19 | ) | .54 | |||
| Total from Investment Operations | .72 | (.47 | ) | .79 | .24 | .98 | ||||
| Distributions: | ||||||||||
| Dividends from investment income—net | (.32 | ) | (.33 | ) | (.40 | ) | (.43 | ) | (.43 | ) |
| Dividends from net realized gain on investments | (.11 | ) | (.09 | ) | — | — | (.00 | )b | ||
| Total Distributions | (.43 | ) | (.42 | ) | (.40 | ) | (.43 | ) | (.43 | ) |
| Net asset value, end of period | 12.54 | 12.25 | 13.14 | 12.75 | 12.94 | |||||
| Total Return (%) | 6.04 | (3.71 | ) | 6.28 | 1.95 | 8.08 | ||||
| Ratios/Supplemental Data (%): | ||||||||||
| Ratio of total expenses to average net assets | .93 | .92 | .92 | .91 | .92 | |||||
| Ratio of net expenses to average net assets | .93 | .92 | .92 | .91 | .92 | |||||
| Ratio of net investment income | ||||||||||
| to average net assets | 2.64 | 2.58 | 2.97 | 3.42 | 3.42 | |||||
| Portfolio Turnover Rate | 25.84 | 29.10 | 27.16 | 9.72 | 7.11 | |||||
| Net Assets, end of period ($ x 1,000) | 4,437 | 4,200 | 8,520 | 9,153 | 9,385 |
| a | Based on average shares outstanding. |
| b | Amount represents less than $.01 per share. |
See notes to financial statements.
116
| Class M Shares | ||||||||||
| Year Ended August 31, | ||||||||||
| BNY Mellon Massachusetts Intermediate Municipal Bond Fund | 2014 | 2013 | 2012 | 2011 | 2010 | |||||
| Per Share Data ($): | ||||||||||
| Net asset value, beginning of period | 12.62 | 13.54 | 13.12 | 13.39 | 12.86 | |||||
| Investment Operations: | ||||||||||
| Investment income—neta | .36 | .37 | .41 | .45 | .45 | |||||
| Net realized and unrealized | ||||||||||
| gain (loss) on investments | .42 | (.77 | ) | .44 | (.20 | ) | .53 | |||
| Total from Investment Operations | .78 | (.40 | ) | .85 | .25 | .98 | ||||
| Distributions: | ||||||||||
| Dividends from investment income—net | (.36 | ) | (.37 | ) | (.42 | ) | (.45 | ) | (.45 | ) |
| Dividends from net realized gain on investments | (.09 | ) | (.15 | ) | (.01 | ) | (.07 | ) | — | |
| Total Distributions | (.45 | ) | (.52 | ) | (.43 | ) | (.52 | ) | (.45 | ) |
| Net asset value, end of period | 12.95 | 12.62 | 13.54 | 13.12 | 13.39 | |||||
| Total Return (%) | 6.21 | (3.11 | ) | 6.50 | 2.02 | 7.75 | ||||
| Ratios/Supplemental Data (%): | ||||||||||
| Ratio of total expenses to average net assets | .53 | .53 | .53 | .53 | .52 | |||||
| Ratio of net expenses to average net assets | .53 | .53 | .53 | .52 | .52 | |||||
| Ratio of net investment income | ||||||||||
| to average net assets | 2.85 | 2.79 | 3.11 | 3.49 | 3.44 | |||||
| Portfolio Turnover Rate | 32.80 | 21.16 | 29.39 | 10.43 | 21.44 | |||||
| Net Assets, end of period ($ x 1,000) | 305,513 | 312,640 | 346,647 | 349,768 | 407,667 | |||||
| a Based on average shares outstanding. | ||||||||||
| See notes to financial statements. | ||||||||||
The Funds 117
FINANCIAL HIGHLIGHTS (continued)
| Investor Shares | ||||||||||
| Year Ended August 31, | ||||||||||
| BNY Mellon Massachusetts Intermediate Municipal Bond Fund | 2014 | 2013 | 2012 | 2011 | 2010 | |||||
| Per Share Data ($): | ||||||||||
| Net asset value, beginning of period | 12.62 | 13.54 | 13.12 | 13.39 | 12.86 | |||||
| Investment Operations: | ||||||||||
| Investment income—neta | .34 | .34 | .38 | .42 | .42 | |||||
| Net realized and unrealized | ||||||||||
| gain (loss) on investments | .40 | (.77 | ) | .43 | (.20 | ) | .53 | |||
| Total from Investment Operations | .74 | (.43 | ) | .81 | .22 | .95 | ||||
| Distributions: | ||||||||||
| Dividends from investment income—net | (.33 | ) | (.34 | ) | (.38 | ) | (.42 | ) | (.42 | ) |
| Dividends from net realized gain on investments | (.09 | ) | (.15 | ) | (.01 | ) | (.07 | ) | — | |
| Total Distributions | (.42 | ) | (.49 | ) | (.39 | ) | (.49 | ) | (.42 | ) |
| Net asset value, end of period | 12.94 | 12.62 | 13.54 | 13.12 | 13.39 | |||||
| Total Return (%) | 5.95 | (3.35 | ) | 6.23 | 1.77 | 7.49 | ||||
| Ratios/Supplemental Data (%): | ||||||||||
| Ratio of total expenses to average net assets | .78 | .78 | .78 | .78 | .77 | |||||
| Ratio of net expenses to average net assets | .78 | .78 | .78 | .77 | .77 | |||||
| Ratio of net investment income | ||||||||||
| to average net assets | 2.60 | 2.55 | 2.86 | 3.24 | 3.20 | |||||
| Portfolio Turnover Rate | 32.80 | 21.16 | 29.39 | 10.43 | 21.44 | |||||
| Net Assets, end of period ($ x 1,000) | 9,910 | 8,261 | 9,107 | 8,430 | 8,143 | |||||
| a Based on average shares outstanding. | ||||||||||
| See notes to financial statements. | ||||||||||
118
| Class M Shares | ||||||||||
| Year Ended August 31, | ||||||||||
| BNY Mellon New York Intermediate Tax-Exempt Bond Fund | 2014 | 2013 | 2012 | 2011 | 2010 | |||||
| Per Share Data ($): | ||||||||||
| Net asset value, beginning of period | 11.11 | 11.92 | 11.46 | 11.60 | 11.16 | |||||
| Investment Operations: | ||||||||||
| Investment income—neta | .31 | .30 | .36 | .38 | .38 | |||||
| Net realized and unrealized | ||||||||||
| gain (loss) on investments | .46 | (.69 | ) | .49 | (.13 | ) | .44 | |||
| Total from Investment Operations | .77 | (.39 | ) | .85 | .25 | .82 | ||||
| Distributions: | ||||||||||
| Dividends from investment income—net | (.31 | ) | (.30 | ) | (.36 | ) | (.38 | ) | (.38 | ) |
| Dividends from net realized gain on investments | (.17 | ) | (.12 | ) | (.03 | ) | (.01 | ) | (.00 | )b |
| Total Distributions | (.48 | ) | (.42 | ) | (.39 | ) | (.39 | ) | (.38 | ) |
| Net asset value, end of period | 11.40 | 11.11 | 11.92 | 11.46 | 11.60 | |||||
| Total Return (%) | 7.04 | (3.40 | ) | 7.48 | 2.31 | 7.45 | ||||
| Ratios/Supplemental Data (%): | ||||||||||
| Ratio of total expenses to average net assets | .71 | .70 | .71 | .70 | .72 | |||||
| Ratio of net expenses to average net assets | .59 | .59 | .59 | .59 | .59 | |||||
| Ratio of net investment income | ||||||||||
| to average net assets | 2.79 | 2.57 | 3.06 | 3.41 | 3.33 | |||||
| Portfolio Turnover Rate | 36.42 | 39.32 | 30.96 | 21.91 | 4.80 | |||||
| Net Assets, end of period ($ x 1,000) | 172,407 | 184,657 | 203,768 | 182,547 | 196,795 | |||||
| a | Based on average shares outstanding. |
| b | Amount represents less than $.01 per share. |
See notes to financial statements.
The Funds 119
FINANCIAL HIGHLIGHTS (continued)
| Investor Shares | ||||||||||
| Year Ended August 31, | ||||||||||
| BNY Mellon New York Intermediate Tax-Exempt Bond Fund | 2014 | 2013 | 2012 | 2011 | 2010 | |||||
| Per Share Data ($): | ||||||||||
| Net asset value, beginning of period | 11.12 | 11.93 | 11.47 | 11.61 | 11.17 | |||||
| Investment Operations: | ||||||||||
| Investment income—neta | .29 | .27 | .33 | .36 | .35 | |||||
| Net realized and unrealized | ||||||||||
| gain (loss) on investments | .44 | (.69 | ) | .49 | (.14 | ) | .44 | |||
| Total from Investment Operations | .73 | (.42 | ) | .82 | .22 | .79 | ||||
| Distributions: | ||||||||||
| Dividends from investment income—net | (.28 | ) | (.27 | ) | (.33 | ) | (.35 | ) | (.35 | ) |
| Dividends from net realized gain on investments | (.17 | ) | (.12 | ) | (.03 | ) | (.01 | ) | (.00 | )b |
| Total Distributions | (.45 | ) | (.39 | ) | (.36 | ) | (.36 | ) | (.35 | ) |
| Net asset value, end of period | 11.40 | 11.12 | 11.93 | 11.47 | 11.61 | |||||
| Total Return (%) | 6.77 | (3.63 | ) | 7.20 | 2.05 | 7.17 | ||||
| Ratios/Supplemental Data (%): | ||||||||||
| Ratio of total expenses to average net assets | .96 | .95 | .96 | .95 | .97 | |||||
| Ratio of net expenses to average net assets | .84 | .84 | .84 | .84 | .84 | |||||
| Ratio of net investment income | ||||||||||
| to average net assets | 2.54 | 2.32 | 2.81 | 3.16 | 3.08 | |||||
| Portfolio Turnover Rate | 36.42 | 39.32 | 30.96 | 21.91 | 4.80 | |||||
| Net Assets, end of period ($ x 1,000) | 16,428 | 17,930 | 19,097 | 17,177 | 17,352 | |||||
| a | Based on average shares outstanding. |
| b | Amount represents less than $.01 per share. |
See notes to financial statements.
120
| Class M Shares | ||||||||||
| Year Ended August 31, | ||||||||||
| BNY Mellon Municipal Opportunities Fund | 2014 | 2013 | 2012 | 2011 | 2010 | |||||
| Per Share Data ($): | ||||||||||
| Net asset value, beginning of period | 12.38 | 13.42 | 12.27 | 12.78 | 12.22 | |||||
| Investment Operations: | ||||||||||
| Investment income—neta | .49 | .43 | .50 | .52 | .50 | |||||
| Net realized and unrealized | ||||||||||
| gain (loss) on investments | 1.04 | (.92 | ) | 1.15 | (.35 | ) | .95 | |||
| Total from Investment Operations | 1.53 | (.49 | ) | 1.65 | .17 | 1.45 | ||||
| Distributions: | ||||||||||
| Dividends from investment income—net | (.48 | ) | (.43 | ) | (.50 | ) | (.50 | ) | (.52 | ) |
| Dividends from net realized gain on investments | (.27 | ) | (.12 | ) | — | (.18 | ) | (.37 | ) | |
| Total Distributions | (.75 | ) | (.55 | ) | (.50 | ) | (.68 | ) | (.89 | ) |
| Net asset value, end of period | 13.16 | 12.38 | 13.42 | 12.27 | 12.78 | |||||
| Total Return (%) | 12.88 | (3.95 | ) | 13.65 | 1.54 | 12.38 | ||||
| Ratios/Supplemental Data (%): | ||||||||||
| Ratio of total expenses to average net assets | .71 | .71 | .73 | .73 | .71 | |||||
| Ratio of net expenses to average net assets | .71 | .71 | .73 | .73 | .71 | |||||
| Ratio of interest and expense related | ||||||||||
| to floating rate notes issued to average net assets | .05 | .05 | .06 | .06 | .01 | |||||
| Ratio of net investment income | ||||||||||
| to average net assets | 3.88 | 3.22 | 3.84 | 4.22 | 4.12 | |||||
| Portfolio Turnover Rate | 58.87 | 93.04 | 119.90 | 129.00 | 145.57 | |||||
| Net Assets, end of period ($ x 1,000) | 1,023,660 | 946,739 | 721,943 | 505,035 | 384,933 | |||||
| a Based on average shares outstanding . | ||||||||||
| See notes to financial statements. | ||||||||||
The Funds 121
FINANCIAL HIGHLIGHTS (continued)
| Investor Shares | ||||||||||
| Year Ended August 31, | ||||||||||
| BNY Mellon Municipal Opportunities Fund | 2014 | 2013 | 2012 | 2011 | 2010 | |||||
| Per Share Data ($): | ||||||||||
| Net asset value, beginning of period | 12.38 | 13.43 | 12.27 | 12.79 | 12.22 | |||||
| Investment Operations: | ||||||||||
| Investment income—neta | .46 | .40 | .47 | .48 | .50 | |||||
| Net realized and unrealized | ||||||||||
| gain (loss) on investments | 1.05 | (.93 | ) | 1.16 | (.35 | ) | .93 | |||
| Total from Investment Operations | 1.51 | (.53 | ) | 1.63 | .13 | 1.43 | ||||
| Distributions: | ||||||||||
| Dividends from investment income—net | (.46 | ) | (.40 | ) | (.47 | ) | (.47 | ) | (.49 | ) |
| Dividends from net realized gain on investments | (.27 | ) | (.12 | ) | — | (.18 | ) | (.37 | ) | |
| Total Distributions | (.73 | ) | (.52 | ) | (.47 | ) | (.65 | ) | (.86 | ) |
| Net asset value, end of period | 13.16 | 12.38 | 13.43 | 12.27 | 12.79 | |||||
| Total Return (%) | 12.54 | (4.19 | ) | 13.46 | 1.21 | 12.19 | ||||
| Ratios/Supplemental Data (%): | ||||||||||
| Ratio of total expenses to average net assets | .98 | .96 | .99 | .98 | .96 | |||||
| Ratio of net expenses to average net assets | .98 | .96 | .99 | .98 | .95 | |||||
| Ratio of interest and expense related to | ||||||||||
| floating rate notes issued to average net assets | .05 | .05 | .06 | .06 | .01 | |||||
| Ratio of net investment income | ||||||||||
| to average net assets | 3.67 | 2.98 | 3.63 | 3.93 | 4.00 | |||||
| Portfolio Turnover Rate | 58.87 | 93.04 | 119.90 | 129.00 | 145.57 | |||||
| Net Assets, end of period ($ x 1,000) | 5,126 | 2,947 | 2,328 | 1,152 | 1,157 | |||||
| a Based on average shares outstanding. | ||||||||||
| See notes to financial statements. | ||||||||||
122
NOTES TO FINANCIAL STATEMENTS
NOTE 1—General:
BNY Mellon Funds Trust (the “Trust”) was organized as a Massachusetts business trust that is registered under the Investment Company Act of 1940, as amended (the “Act”), as an open-end management investment company and operates as a series company currently comprised of twenty-five series, including the following non-diversified municipal bond funds: BNY Mellon National Intermediate Municipal Bond Fund, BNY Mellon National Short-Term Municipal Bond Fund, BNY Mellon Pennsylvania Intermediate Municipal Bond Fund, BNY Mellon Massachusetts Intermediate Municipal Bond Fund, BNY Mellon New York Intermediate Tax-Exempt Bond Fund and BNY Mellon Municipal Opportunities Fund (each, a “fund” and together, the “funds”). The objectives of the funds are as follows: BNY Mellon National Intermediate Municipal Bond Fund, BNY Mellon National Short-Term Municipal Bond Fund and BNY Mellon Municipal Opportunities Fund seek to maximize current income exempt from federal income tax to the extent consistent with the preservation of capital. BNY Mellon Pennsylvania Intermediate Municipal Bond Fund seeks as high a level of income exempt from federal and Pennsylvania state income taxes as is consistent with the preservation of capital. BNY Mellon Massachusetts Intermediate Municipal Bond Fund seeks as high a level of income exempt from federal and Massachusetts state income taxes as is consistent with the preservation of capital. BNY Mellon New York Intermediate Tax-Exempt Bond Fund seeks as high a level of current income exempt from federal, New York state and New York city income taxes as is consistent with the preservation of capital.
BNY Mellon Fund Advisers, a division of The Dreyfus Corporation (the “Manager” or “Dreyfus”), a wholly-owned subsidiary of The Bank of New York Mellon Corporation (“BNY Mellon”), serves as each fund’s investment adviser (the “Investment Adviser”).The Bank of NewYork Mellon, a subsidiary of BNY Mellon and an affiliate of Dreyfus, serves as administrator for the funds pursuant to an Administration Agreement with the Trust (the “Administration Agreement”). The Bank of New York Mellon has entered into a Sub-Administration Agreement with Dreyfus pursuant to which The Bank of New York Mellon pays Dreyfus for performing certain administrative services. MBSC Securities Corporation (the “Distributor”), a wholly-owned subsidiary of Dreyfus, is the distributor of each fund’s shares.
Each fund is authorized to issue an unlimited number of $.001 par value share of Beneficial Interest in each of the following classes of shares: Class M and Investor. Other differences between the classes include the services offered to and the expenses borne by each class, the allocation of certain transfer agency costs, and certain voting rights. Income, expenses (other than expenses attributable to a specific class), and realized and unrealized gains or losses on investments are allocated to each class of shares based on its relative net assets.
The Trust accounts separately for the assets, liabilities and operations of each series. Expenses directly attributable to each series are charged to that series’ operations; expenses which are applicable to all series are allocated among them on a pro rata basis.
The Financial Accounting Standards Board (“FASB”) Accounting Standards Codification is the exclusive reference of authoritative U.S. generally accepted accounting principles (“GAAP”) recognized by the FASB to be applied by nongovernmental entities. Rules and interpretive releases of the Securities and Exchange Commission (“SEC”) under authority of federal laws are also sources of authoritative GAAP for SEC registrants. Each fund’s financial statements are prepared in accordance with GAAP, which may require the use of management estimates and assumptions. Actual results could differ from those estimates.
The Funds 123
NOTES TO FINANCIAL STATEMENTS (continued)
NOTE 2—Significant Accounting Policies:
(a) Portfolio valuation: The fair value of a financial instrument is the amount that would be received to sell an asset or paid to transfer a liability in an orderly transaction between market participants at the measurement date (i.e., the exit price). GAAP establishes a fair value hierarchy that prioritizes the inputs of valuation techniques used to measure fair value. This hierarchy gives the highest priority to unadjusted quoted prices in active markets for identical assets or liabilities (Level 1 measurements) and the lowest priority to unobservable inputs (Level 3 measurements).
Additionally, GAAP provides guidance on determining whether the volume and activity in a market has decreased significantly and whether such a decrease in activity results in transactions that are not orderly. GAAP requires enhanced disclosures around valuation inputs and techniques used during annual and interim periods.
Various inputs are used in determining the value of the fund’s investments relating to fair value measurements. These inputs are summarized in the three broad levels listed below:
Level 1—unadjusted quoted prices in active markets for identical investments.
Level 2—other significant observable inputs (including quoted prices for similar investments, interest rates, prepayment speeds, credit risk, etc.).
Level 3—significant unobservable inputs (including the funds’ own assumptions in determining the fair value of investments).
The inputs or methodology used for valuing securities are not necessarily an indication of the risk associated with investing in those securities.
Changes in valuation techniques may result in transfers in or out of an assigned level within the disclosure hierarchy. Valuation techniques used to value the fund’s investments are as follows:
Investments in securities are valued each business day by an independent pricing service (the “Service”) approved by the Trust’s Board of Trustees (the “Board”). Investments for which quoted bid prices are readily available and are representative of the bid side of the market in the judgment of the Service are valued at the mean between the quoted bid prices (as obtained by the Service from dealers in such securities) and asked prices (as calculated by the Service based upon its evaluation of the market for such securities). Other investments (which constitute a majority of the portfolio securities) are carried at fair value as determined by the Service, based on methods which include consideration of the following: yields or prices of municipal securities of comparable quality, coupon, maturity and type; indications as to values from dealers; and general market conditions. All of the preceding securities are generally categorized within Level 2 of the fair value hierarchy. Financial futures on municipal and U.S.Treasury securities are valued at the last sales price on the securities exchange on which such securities are primarily traded or at the last sales price on the national securities market on each business day and are generally categorized within Level 1 of the fair value hierarchy.
The Service’s procedures are reviewed by Dreyfus under the general supervision of the Board.
When market quotations or official closing prices are not readily available, or are determined not to reflect accurately fair value, such as when the value of a security has been significantly affected by events after the close of the exchange or market on which the security is principally traded, but before the fund calculates its net asset value, the fund may value these investments at fair value as determined in accordance with the procedures approved by the Board. Certain factors may be considered when fair valuing investments such as: fundamental analytical data, the nature and duration of restrictions on disposition, an evaluation of the forces that influence the market in which the securities are purchased and sold, and public trading in similar securities of the issuer or comparable issuers. These securities are either categorized within Level 2 or 3 of the fair value hierarchy depending on the relevant inputs used.
124
For restricted securities where observable inputs are limited, assumptions about market activity and risk are used and are generally categorized within Level 3 of the fair value hierarchy.
Table 1 summarizes the inputs used as of August 31, 2014 in valuing each fund’s investments.
At August 31, 2014, there were no transfers between Level 1 and Level 2 of the fair value hierarchy for any of the funds.
(b) Securities transactions and investment income:
Securities transactions are recorded on a trade date basis. Realized gain and loss from securities transactions are recorded on the identified cost basis. Interest income, adjusted for accretion of discount and amortization of premium on investments, is earned from settlement date and recognized on the accrual basis. Securities purchased or sold on a when issued or delayed-delivery basis may be settled a month or more after the trade date.
| Table 1—Fair Value Measurements | ||||||||||
| Investments in Securities | ||||||||||
| Level 2—Other | Level 3— | |||||||||
| Level 1—Unadjusted | Significant | Significant | ||||||||
| Quoted Prices | Observable Inputs | Unobservable Inputs | ||||||||
| Assets ($) | Liabilities ($) | Assets ($) | Liabilities ($) | Assets ($) | Liabilities ($) | Total | ||||
| BNY Mellon National | ||||||||||
| Intermediate Municipal | ||||||||||
| Bond Fund | ||||||||||
| Municipal Bonds† | — | — | 1,854,641,954 | — | — | — | 1,854,641,954 | |||
| Other Financial Instruments: | ||||||||||
| Financial Futures†† | — | (241,786 | ) | — | — | — | — | (241,786 | ) | |
| BNY Mellon National | ||||||||||
| Short-Term Municipal Bond Fund | ||||||||||
| Municipal Bonds† | — | — | 1,259,616,032 | — | — | — | 1,259,616,032 | |||
| Other Financial Instruments: | ||||||||||
| Financial Futures†† | — | (83,211 | ) | — | — | — | — | (83,211 | ) | |
| BNY Mellon Pennsylvania | ||||||||||
| Intermediate Municipal Bond Fund | ||||||||||
| Municipal Bonds† | — | — | 308,235,519 | — | — | — | 308,235,519 | |||
| Other Financial Instruments: | ||||||||||
| Financial Futures†† | — | (52,540 | ) | — | — | — | — | (52,540 | ) | |
| BNY Mellon Massachusetts | ||||||||||
| Intermediate Municipal Bond Fund | ||||||||||
| Municipal Bonds† | — | — | 316,093,603 | — | — | — | 316,093,603 | |||
| Other Financial Instruments: | ||||||||||
| Financial Futures†† | — | (43,947 | ) | — | — | — | — | (43,947 | ) | |
| BNY Mellon New York | ||||||||||
| Intermediate Tax-Exempt | ||||||||||
| Bond Fund | ||||||||||
| Municipal Bonds† | — | — | 187,738,478 | — | — | — | 187,738,478 | |||
| Other Financial Instruments: | ||||||||||
| Financial Futures†† | — | (25,509 | ) | — | — | — | — | (25,509 | ) | |
| BNY Mellon Municipal | ||||||||||
| Opportunities Fund | ||||||||||
| Municipal Bonds† | — | — | 1,113,103,153 | — | — | — | 1,113,103,153 | |||
| Floating Rate Notes††† | — | — | — | (69,540,000 | ) | — | — | (69,540,000 | ) | |
| Other Financial Instruments: | ||||||||||
| Financial Futures†† | — | (1,180,100 | ) | — | — | — | — | (1,180,100 | ) | |
| † | See Statement of Investments for additional detailed categorizations. |
| †† | Amount shown represents unrealized (depreciation) at period end. |
| ††† Certain of the fund's liabilities are held at carrying amount, which approximates fair value for financial reporting purposes. | |
The Funds 125
NOTES TO FINANCIAL STATEMENTS (continued)
BNY Mellon Pennsylvania Intermediate Municipal Bond Fund, BNY Mellon Massachusetts Intermediate Municipal Bond Fund and BNY Mellon New York Intermediate Tax-Exempt Bond Fund each follow an investment policy of investing primarily in municipal obligations of one state. Economic changes affecting the state and certain of its public bodies and municipalities may affect the ability of issuers within the state to pay interest on, or repay principal of, municipal obligations held by the fund.
(c) Dividends to shareholders: The funds declare dividends daily from investment income-net; such dividends are paid monthly. With respect to each fund, dividends from net realized capital gains, if any, are normally declared and paid annually, but the funds may make distributions on a more frequent basis to comply with the distribution requirements of the Internal Revenue Code of 1986, as amended (the “Code”). To the extent that net realized capital gains can be offset by capital loss carryovers of a fund, it is the policy of each fund not to distribute such gains. Income and capital gain distributions are determined in accordance with income tax regulations, which may differ from GAAP.
(d) Federal income taxes: It is the policy of each fund to continue to qualify as a regulated investment company, which can distribute tax-exempt dividends, by complying with the applicable provisions of the Code, and to make distributions of income and net realized capital gain sufficient to relieve it from substantially all federal income and excise taxes. For federal income tax purposes, each series is treated as a single entity for the purpose of determining such qualification.
As of and during the period ended August 31, 2014, the funds did not have any liabilities for any uncertain tax positions. The funds recognize interest and penalties, if any, related to uncertain tax positions as income tax expense in the Statements of Operations. During the period ended August 31, 2014, the funds did not incur any interest or penalties.
Each tax year in the four-year period ended August 31, 2014 remains subject to examination by the Internal Revenue Service and state taxing authorities.
Table 2 summarizes each fund’s components of accumulated earnings on a tax basis at August 31, 2014.
Under the Regulated Investment Company Modernization Act of 2010 (the “2010 Act”), funds are permitted to carry forward capital losses incurred in taxable years beginning after December 22, 2010 (“post-enactment losses”) for an unlimited period. Furthermore, post-enactment capital loss carryovers retain their character as either short-term or long-term capital losses rather than short-term as they were under previous statute.
| Table 2—Components of Accumulated Earnings | |||||
| Undistributed | Undistributed | Accumulated | Undistributed | ||
| Tax-Exempt | Ordinary | Capital | Capital | Unrealized | |
| Income ($) | Income ($) | Losses ($) | Gains ($) | Appreciation ($) | |
| BNY Mellon National Intermediate | |||||
| Municipal Bond Fund | 772,392 | — | (1,445,944) | — | 112,105,750 |
| BNY Mellon National Short-Term | |||||
| Municipal Bond Fund | 134,188 | 27,270 | — | 922,568 | 9,685,065 |
| BNY Mellon Pennsylvania Intermediate | |||||
| Municipal Bond Fund | 193,935 | — | (100,877) | — | 13,849,860 |
| BNY Mellon Massachusetts Intermediate | |||||
| Municipal Bond Fund | 57,838 | — | (1,701,688) | — | 17,416,747 |
| BNY Mellon New York Intermediate | |||||
| Tax-Exempt Bond Fund | 27,924 | — | (650,171) | — | 10,601,009 |
| BNY Mellon Municipal Opportunities Fund | 365,663 | — | (35,964,729) | — | 80,374,300 |
126
Table 3 summarizes each relevant fund’s accumulated capital loss carryover available for federal income tax purposes to be applied against future net realized capital gains, if any, realized subsequent to August 31, 2014.
Table 4 summarizes each fund’s tax character of distributions paid to shareholders during the fiscal periods ended August 31, 2014 and August 31, 2013, respectively.
During the period ended August 31, 2014, as a result of permanent book to tax differences, primarily due to the tax treatment for amortization of premiums/discounts, and dividend reclassification, each fund decreased accumulated undistributed investment income–net, increased accumulated net realized gain (loss) on investments and increased (decreased) paid-in capital as summarized in Table 5. Net assets and net asset value per share were not affected by these reclassifications.
| Table 3—Capital Loss Carryover | |||
| Post-Enactment | Post-Enactment | ||
| Short-Term | Long-Term | ||
| Losses ($)† | Losses ($)†† | Total ($) | |
| BNY Mellon National Intermediate Municipal Bond Fund | 609,046 | 836,898 | 1,445,944 |
| BNY Mellon Pennsylvania Intermediate Municipal Bond Fund | 100,877 | — | 100,877 |
| BNY Mellon Massachusetts Intermediate Municipal Bond Fund | 1,300,203 | 401,485 | 1,701,688 |
| BNY Mellon New York Intermediate Tax-Exempt Bond Fund | 650,171 | — | 650,171 |
| BNY Mellon Municipal Opportunities Fund | 25,403,972 | 10,560,757 | 35,964,729 |
| † Post-enactment short-term losses which can be carried forward for an unlimited period. |
| †† Post-enactment long-term losses which can be carried forward for an unlimited period. |
| Table 4—Tax Character of Distributions Paid | ||||||
| Ordinary | Long-Term | |||||
| Tax-Exempt Income ($) | Income ($) | Capital Gains ($) | ||||
| 2014 | 2013 | 2014 | 2013 | 2014 | 2013 | |
| BNY Mellon National Intermediate | ||||||
| Municipal Bond Fund | 50,517,652 | 50,845,315 | 116,233 | 37,809 | — | 6,953,995 |
| BNY Mellon National Short-Term | ||||||
| Municipal Bond Fund | 9,572,105 | 11,012,410 | 28,129 | — | 628,217 | — |
| BNY Mellon Pennsylvania Intermediate | ||||||
| Municipal Bond Fund | 9,549,338 | 11,016,110 | — | 176,204 | 3,150,268 | 2,564,526 |
| BNY Mellon Massachusetts Intermediate | ||||||
| Municipal Bond Fund | 8,754,200 | 9,634,635 | — | 19,250 | 2,047,965 | 3,783,929 |
| BNY Mellon New York Intermediate | ||||||
| Tax-Exempt Bond Fund | 5,190,776 | 5,541,427 | 593 | 521,643 | 2,922,641 | 1,795,963 |
| BNY Mellon Municipal Opportunities Fund | 33,499,604 | 26,669,978 | 1,827,503 | 6,779,359 | 18,460,298 | 1,623,144 |
| Table 5—Return of Capital Statement of Position | |||||
| Accumulated | Accumulated | ||||
| Undistributed | Net Realized | Paid-in | |||
| Investment Income—Net ($) | Gain (Loss) ($) | Capital ($) | |||
| BNY Mellon National Intermediate Municipal Bond Fund | (477,373) | 346,033 | 131,340 | ||
| BNY Mellon National Short-Term Municipal Bond Fund | (46,151) | 40,797 | 5,354 | ||
| BNY Mellon Pennsylvania Intermediate Municipal Bond Fund | (28,079) | 28,199 | (120 | ) | |
| BNY Mellon Massachusetts Intermediate Municipal Bond Fund | — | 1,204 | (1,204 | ) | |
| BNY Mellon New York Intermediate Tax-Exempt Bond Fund | (27,900) | 27,246 | 654 | ||
| BNY Mellon Municipal Opportunities Fund | (872,722) | 663,343 | 209,379 | ||
The Funds 127
NOTES TO FINANCIAL STATEMENTS (continued)
NOTE 3—Bank Lines of Credit:
The fund participates with other Dreyfus-managed funds in a $265 million unsecured credit facility led by Citibank, N.A. and a $300 million unsecured credit facility provided by The Bank of New York Mellon (each, a “Facility”), each to be utilized primarily for temporary or emergency purposes, including the financing of redemptions. Prior to October 9, 2013, the unsecured credit facility with Citibank, N.A. was $210 million. In connection therewith, the fund has agreed to pay its pro rata portion of commitment fees for each Facility. Interest is charged to the fund based on rates determined pursuant to the terms of the respective Facility at the time of borrowing. During the period ended August 31, 2014, the funds did not borrow under the Facilities.
NOTE 4—Investment Advisory Fee, Administration Fee and Other Transactions with Affiliates:
(a) Fees payable by the funds pursuant to the provisions of an Investment Advisory Agreement with the Investment Adviser are payable monthly, computed on the average daily value of each fund’s net assets at the following annual rates: .35% of BNY Mellon National Intermediate Municipal Bond Fund, .35% of BNY Mellon National Short-Term Municipal Bond Fund, .50% of BNY Mellon Pennsylvania Intermediate Municipal Bond Fund, .35% of BNY Mellon Massachusetts Intermediate Municipal Bond Fund, .50% of BNY Mellon New York Intermediate Tax- Exempt Bond Fund and .50% of BNY Mellon Municipal Opportunities Fund.
Pursuant to the Administration Agreement,The Bank of New York Mellon provides or arranges for fund accounting, transfer agency and other fund administration services and receives a fee based on the total net assets of the Trust based on the following rates:
| 0 up to $6 billion | .15 | % |
| $6 billion up to $12 billion | .12 | % |
| In excess of $12 billion | .10 | % |
For BNY Mellon New York Intermediate Tax-Exempt Bond Fund, the Investment Adviser has contractually agreed from September 1, 2013 through December 31, 2014, to waive receipt of its fees and/or assume the expenses of the fund so that the direct expenses of neither class (excluding Shareholder Services Plan fees, taxes, interest expense, brokerage commissions, commitment fees on borrowings and extraordinary expenses) exceed .59% of the value of the fund’s average daily net assets.The reduction in expenses, pursuant to the undertaking, amounted to $220,796 during the period ended August 31, 2014.
(b) Each fund has adopted a Shareholder Services Plan with respect to its Investor shares. Each fund pays the Distributor for the provision of certain services to holders of Investor shares a fee at an annual rate of .25% of the value of the average daily net assets attributable to Investor shares.The services provided may include personal services relating to shareholder accounts, such as answering shareholder inquiries regarding a fund, and providing reports and other information and services related to the maintenance of such shareholder accounts. The Shareholder Services Plan allows the Distributor to make payments from the shareholder services fees it collects from each fund to compensate service agents (securities dealers, financial institutions or other industry professionals) with respect to these services. Table 6 summarizes the amount Investor shares of each fund was charged during the period ended August 31, 2014, pursuant to the Shareholder Services Plan. Additional fees included in Shareholder servicing costs in the Statements of Operations primarily include fees paid for cash management charges.
| Table 6—Shareholder Services Plan Fees | ||
| BNY Mellon National Intermediate | ||
| Municipal Bond Fund | $ | 97,872 |
| BNY Mellon National Short-Term | ||
| Municipal Bond Fund | 19,920 | |
| BNY Mellon Pennsylvania Intermediate | ||
| Municipal Bond Fund | 12,058 | |
| BNY Mellon Massachusetts Intermediate | ||
| Municipal Bond Fund | 22,779 | |
| BNY Mellon New York Intermediate | ||
| Tax-Exempt Bond Fund | 42,078 | |
| BNY Mellon Municipal | ||
| Opportunities Fund | 8,600 | |
128
The funds have arrangements with the transfer agent and the custodian whereby the funds may receive earnings credits when positive cash balances are maintained, which are used to offset transfer agency and custody fees. For financial reporting purposes, the funds include net earnings credits as expense offsets in the Statements of Operations.
The funds compensate Dreyfus Transfer, Inc., a wholly-owned subsidiary of Dreyfus, under a transfer agency agreement for providing cash management services for the funds.The cash management fees are related to fund subscriptions and redemptions. The Bank of New York Mellon pays each fund’s transfer agent fees, which are comprised of amounts paid on a per account basis, out of the administration fee it receives from the Trust.The funds also compensated The Bank of NewYork Mellon for performing certain cash management services related to fund subscriptions and redemptions, including shareholder redemption draft processing, under a cash management agreement that was in effect until September 30, 2013 and, beginning October 1, 2013, compensates The Bank of New York Mellon for processing shareholder redemption drafts under a shareholder draft processing agreement. Table 7 summarizes the amount each fund was charged during the period ended August 31, 2014, pursuant to the cash management agreements, which is included in Shareholder servicing costs in the Statements of Operations. Cash management fees were partially offset by earnings credits for each fund, also summarized in Table 7.
The funds compensate The Bank of New York Mellon under a custody agreement for providing custodial services for the funds.These fees are based on net assets, geographic region and transaction activity. Table 8 summarizes the amount each fund was charged during the period ended August 31, 2014, pursuant to the custody agreement.
| Table 8—Custody Agreement Fees | ||
| BNY Mellon National Intermediate | ||
| Municipal Bond Fund | $ | 92,641 |
| BNY Mellon National Short-Term | ||
| Municipal Bond Fund | 79,251 | |
| BNY Mellon Pennsylvania Intermediate | ||
| Municipal Bond Fund | 25,662 | |
| BNY Mellon Massachusetts Intermediate | ||
| Municipal Bond Fund | 23,894 | |
| BNY Mellon New York Intermediate | ||
| Tax-Exempt Bond Fund | 15,462 | |
| BNY Mellon Municipal | ||
| Opportunities Fund | 67,279 | |
During the period ended August 31, 2014, each fund was charged $8,296 for services performed by the Chief Compliance Officer and his staff.
| Table 7—Cash Management Agreement Fees | |||
| The Bank of New York | |||
| Dreyfus Transfer, Inc. | Dreyfus Transfer, Inc. | Mellon Cash | |
| Cash Management Fees ($) | Earnings Credits ($) | Management Fees ($) | |
| BNY Mellon National Intermediate | |||
| Municipal Bond Fund | 336 | 24 | 167 |
| BNY Mellon National Short-Term | |||
| Municipal Bond Fund | 59 | 4 | 23 |
| BNY Mellon Pennsylvania Intermediate | |||
| Municipal Bond Fund | 38 | 3 | 15 |
| BNY Mellon Massachusetts Intermediate | |||
| Municipal Bond Fund | 117 | 8 | 69 |
| BNY Mellon New York Intermediate | |||
| Tax-Exempt Bond Fund | 424 | 31 | 234 |
| BNY Mellon Municipal Opportunities Fund | 40 | 3 | 13 |
The Funds 129
NOTES TO FINANCIAL STATEMENTS (continued)
Table 9 summarizes the components of “Due to The Dreyfus Corporation and affiliates” in the Statement of Assets and Liabilities for each fund.
(c) Each Board member also serves as a Board member of other funds within the Trust. Annual retainer fees and attendance fees are allocated to each fund based on net assets.
NOTE 5—Securities Transactions:
Table 10 summarizes each fund’s aggregate amount of purchases and sales of investment securities, excluding short-term securities and financial futures, during the period ended August 31, 2014.
Inverse Floater Securities: BNY Mellon Municipal Opportunities Fund participates in secondary inverse floater structures in which fixed-rate, tax-exempt municipal bonds are transferred to a trust. The trust typically issues two variable rate securities that are collateralized by the cash flows of the fixed-rate, tax-exempt municipal bonds. One of these variable rate securities pays interest based on a short-term floating rate set by a remarketing agent at predetermined intervals (“trust certificates”). A residual interest tax-exempt security is also created by the trust, which is transferred to the fund, and is paid interest based on the remaining cash flow of the trust, after payment of interest on the other securities
| Table 9—Due to The Dreyfus Corporation and Affiliates | ||||||
| Investment | Shareholder | Chief | ||||
| Advisory | Services | Custodian | Compliance | Less Expense | ||
| Fees ($) | Plan Fees ($) | Fees ($) | Officer Fees ($) | Reimbursement ($) | ||
| BNY Mellon National Intermediate | ||||||
| Municipal Bond Fund | 550,129 | 8,788 | 38,564 | 1,154 | — | |
| BNY Mellon National Short-Term | ||||||
| Municipal Bond Fund | 372,839 | 1,985 | 32,707 | 1,154 | — | |
| BNY Mellon Pennsylvania Intermediate | ||||||
| Municipal Bond Fund | 131,714 | 948 | 10,827 | 1,154 | — | |
| BNY Mellon Massachusetts Intermediate | ||||||
| Municipal Bond Fund | 92,977 | 2,098 | 10,160 | 1,154 | — | |
| BNY Mellon New York Intermediate | ||||||
| Tax-Exempt Bond Fund | 79,137 | 3,456 | 6,631 | 1,154 | (20,709 | ) |
| BNY Mellon Municipal Opportunities Fund | 432,839 | 1,053 | 28,203 | 1,154 | — | |
| Table 10—Purchases and Sales | ||||||
| Purchases ($) | Sales ($) | |||||
| BNY Mellon National Intermediate Municipal Bond Fund | 553,359,109 | 426,994,455 | ||||
| BNY Mellon National Short-Term Municipal Bond Fund | 586,662,379 | 463,317,922 | ||||
| BNY Mellon Pennsylvania Intermediate Municipal Bond Fund | 83,797,287 | 129,767,831 | ||||
| BNY Mellon Massachusetts Intermediate Municipal Bond Fund | 101,795,265 | 97,121,628 | ||||
| BNY Mellon New York Intermediate Tax-Exempt Bond Fund | 67,249,582 | 76,097,217 | ||||
| BNY Mellon Municipal Opportunities Fund | 562,568,099 | 522,259,598 | ||||
130
and various expenses of the trust. An inverse floater security may be collapsed without the consent of the fund due to certain termination events such as bankruptcy, default or other credit event.
The fund accounts for the transfer of bonds to the trust as secured borrowings, with the securities transferred remaining in the fund’s investments, and the related floating rate certificate securities reflected as fund liabilities in the fund’s Statement of Assets and Liabilities.
The fund may invest in inverse floater securities on either a non-recourse or recourse basis. These securities are typically supported by a liquidity facility provided by a bank or other financial institution (the “Liquidity Provider”) that allows the holders of the trust certificates to tender their certificates in exchange for payment from the Liquidity Provider of par plus accrued interest on any business day prior to a termination event.When the fund invests in inverse floater securities on a non-recourse basis, the Liquidity Provider is required to make a payment under the liquidity facility due to a termination event to the holders of the trust certificates. When this occurs, the Liquidity Provider typically liquidates all or a portion of the municipal securities held in the trust. A liquidation shortfall occurs if the trust certificates exceed the proceeds of the sale of the bonds in the trust (“Liquidation Shortfall”).When a fund invests in inverse floater securities on a recourse basis, the fund typically enters into a reimbursement agreement with the Liquidity Provider where the fund is required to repay the Liquidity Provider the amount of any Liquidation Shortfall. As a result, the fund investing in a recourse inverse floater security bears the risk of loss with respect to any Liquidation Shortfall.
The average amount of borrowings outstanding under the inverse floater structure during the period ended August 31, 2014, was approximately $73,706,700 with a related weighted average annualized interest rate of .65%.
Derivatives: A derivative is a financial instrument whose performance is derived from the performance of another asset. Each type of derivative instrument that was held by the fund during the period ended August 31, 2014 is discussed below.
Financial Futures: In the normal course of pursuing their investment objectives, the funds are exposed to market risk, including interest rate risk, as a result of changes in value of underlying financial instruments. The funds invest in financial futures in order to manage its exposure to or protect against changes in the market. A financial futures contract represents a commitment for the future purchase or a sale of an asset at a specified date. Upon entering into such contracts, these investments require initial margin deposits with a counterparty, which consist of cash or cash equivalents. The amount of these deposits is determined by the exchange or Board of Trade on which the contract is traded and is subject to change. Accordingly, variation margin payments are received or made to reflect daily unrealized gains or losses which are recorded in the Statements of Operations. When the contracts are closed, the funds recognize a realized gain or loss which is reflected in the Statements of Operations. There is minimal counter-party credit risk to the funds with financial futures since they are exchange traded, and the exchange guarantees the financial futures against default. Financial futures open at August 31, 2014 are set forth in the Statements of Financial Futures.
The Funds 131
NOTES TO FINANCIAL STATEMENTS (continued)
Table 11 summarizes each fund’s average market value of derivatives outstanding, during the period ended August 31, 2014.
Table 12 summarizes the cost of investments for federal income tax purposes, gross appreciation, gross depreciation and accumulated net unrealized appreciation on investments for each fund at August 31, 2014.
| Table 11—Average Market Value of Derivatives | ||
| BNY Mellon National Intermediate | ||
| Municipal Bond Fund | ||
| Interest rate financial futures | $ | 48,862,638 |
| BNY Mellon National Short-Term | ||
| Municipal Bond Fund | ||
| Interest rate financial futures | 13,087,560 | |
| BNY Mellon Pennsylvania | ||
| Intermediate Municipal Bond Fund | ||
| Interest rate financial futures | 12,190,950 | |
| BNY Mellon Massachusetts Intermediate | ||
| Municipal Bond Fund | ||
| Interest rate financial futures | 9,684,988 | |
| BNY Mellon New York Intermediate | ||
| Tax-Exempt Bond Fund | ||
| Interest rate financial futures | 5,560,397 | |
| BNY Mellon Municipal | ||
| Opportunities Fund | ||
| Interest rate financial futures | 303,821,274 | |
| Table 12—Accumulated Net Unrealized Appreciation | ||||
| Cost of | Gross | Gross | ||
| Investments ($) | Appreciation ($) | Depreciation ($) | Net ($) | |
| BNY Mellon National Intermediate Municipal Bond Fund | 1,742,536,204 | 119,864,530 | 7,758,780 | 112,105,750 |
| BNY Mellon National Short-Term Municipal Bond Fund | 1,249,930,967 | 12,673,666 | 2,988,601 | 9,685,065 |
| BNY Mellon Pennsylvania Intermediate Municipal Bond Fund | 294,385,659 | 18,116,617 | 4,266,757 | 13,849,860 |
| BNY Mellon Massachusetts Intermediate Municipal Bond Fund | 298,676,856 | 20,552,966 | 3,136,219 | 17,416,747 |
| BNY Mellon New York Intermediate Tax-Exempt Bond Fund | 177,137,469 | 11,303,679 | 702,670 | 10,601,009 |
| BNY Mellon Municipal Opportunities Fund | 963,188,853 | 90,235,354 | 9,861,054 | 80,374,300 |
132
REPORT OF INDEPENDENT REGISTERED PUBLIC ACCOUNTING FIRM
The Board of Trustees and Shareholders BNY Mellon Funds Trust
We have audited the accompanying statements of assets and liabilities of BNY Mellon National Intermediate Municipal Bond Fund, BNY Mellon National Short-Term Municipal Bond Fund, BNY Mellon Pennsylvania Intermediate Municipal Bond Fund, BNY Mellon Massachusetts Intermediate Municipal Bond Fund, BNY Mellon New York Intermediate Tax-Exempt Bond Fund, and BNY Mellon Municipal Opportunities Fund, (collectively the “Funds”), each a series of BNY Mellon Funds Trust, including the statements of investments and statements of financial futures as of August 31, 2014, and the related statements of operations and statement of cash flows (with respect to BNY Mellon Municipal Opportunities Fund) for the year then ended, the statements of changes in net assets for each of the years in the two-year period then ended and the financial highlights for each of the years in the five-year period then ended.These financial statements and financial highlights are the responsibility of the Funds’ management. Our responsibility is to express an opinion on these financial statements and financial highlights based on our audits.
We conducted our audits in accordance with the standards of the Public Company Accounting Oversight Board (United States). Those standards require that we plan and perform the audit to obtain reasonable assurance about whether the financial statements and financial highlights are free of material misstatement. An audit includes examining, on a test basis, evidence supporting the amounts and disclosures in the financial statements. Our procedures included confirmation of securities owned as of August 31, 2014, by correspondence with the custodian and brokers or by other appropriate auditing procedures. An audit also includes assessing the accounting principles used and significant estimates made by management, as well as evaluating the overall financial statement presentation.We believe that our audits provide a reasonable basis for our opinion.
In our opinion, the financial statements and financial highlights referred to above present fairly, in all material respects, the financial position of the aforementioned funds, as of August 31, 2014, the results of their operations and its cash flows (with respect to BNY Mellon Municipal Opportunities Fund) for the year then ended, the changes in their net assets for each of the years in the two-year period then ended and the financial highlights for each of the years in the five-year period then ended, in conformity with U.S. generally accepted accounting principles.

New York, New York
October 29, 2014
The Funds 133
IMPORTANT TAX INFORMATION (Unaudited)
BNY Mellon National Intermediate Municipal Bond Fund
In accordance with federal tax law, the fund hereby reports all the dividends paid from investment income-net during its fiscal year ended August 31, 2014 as “exempt-interest dividends” (not generally subject to regular federal income tax), except $116,233 that is being reported as an ordinary income distribution for reporting purposes. Where required by federal tax law rules, shareholders will receive notification of their portion of the fund’s taxable ordinary dividends (if any), capital gains distributions (if any) and tax-exempt dividends paid for the 2014 calendar year on Form 1099-DIV, which will be mailed in early 2015.
BNY Mellon National Short-Term Municipal Bond Fund
In accordance with federal tax law, the fund hereby reports all the dividends paid from investment income-net during its fiscal year ended August 31, 2014 as “exempt-interest dividends” (not generally subject to regular federal income tax). Also, the fund reports the maximum amount allowable but not less than $.0067 per share as a capital gain dividend paid on December 19, 2013 in accordance with Section 852(b)(3)(C) of the Internal Revenue Code. Also, the fund reports the maximum amount allowable but not less than $.0003 as a short-term capital gain dividend paid on December 19, 2013 in accordance with Sections 871(k)(2) and 881(e) of the Internal Revenue Code. Where required by fed-
eral tax law rules, shareholders will receive notification of their portion of the fund’s taxable ordinary dividends (if any), capital gains distributions (if any) and tax-exempt dividends paid for the 2014 calendar year on Form 1099-DIV, which will be mailed in early 2015.
BNY Mellon Pennsylvania Intermediate Municipal Bond Fund
In accordance with federal tax law, the fund hereby reports all the dividends paid from investment income-net during its fiscal year ended August 31, 2014 as “exempt-interest dividends” (not generally subject to regular federal income tax). Also, the fund reports the maximum amount allowable but not less than $.1121 per share as a capital gain dividend paid on December 19, 2013 in accordance with Section 852(b)(3)(C) of the Internal Revenue Code. Where required by federal tax law rules, shareholders will receive notification of their portion of the fund’s taxable ordinary dividends (if any), capital gains distributions (if any) and tax-exempt dividends paid for the 2014 calendar year on Form 1099-DIV, which will be mailed in early 2015.
BNY Mellon Massachusetts Intermediate Municipal Bond Fund
In accordance with federal tax law, the fund hereby reports all the dividends paid from investment income-net during its fiscal year ended August 31, 2014 as “exempt-interest dividends” (not generally subject to regular federal income tax).Also, the fund reports the maximum amount allowable but not less than $.0860 per share as a capital
134
gain dividend paid on December 19, 2013 in accordance with Section 852(b)(3)(C) of the Internal Revenue Code. Where required by federal tax law rules, shareholders will receive notification of their portion of the fund’s taxable ordinary dividends (if any), capital gains distributions (if any) and tax-exempt dividends paid for the 2014 calendar year on Form 1099-DIV, which will be mailed in early 2015.
BNY Mellon New York Intermediate Tax Exempt Fund
In accordance with federal tax law, the fund hereby reports all the dividends paid from investment income-net during its fiscal year ended August 31, 2014 as “exempt-interest dividends” (not generally subject to regular federal income tax), except $558 that is being reported as an ordinary income distribution for reporting purposes.Also, the fund reports the maximum amount allowable but not less than $.1723 per share as a capital gain dividend paid on December 19, 2013 in accordance with Section 852(b)(3)(C) of the Internal Revenue Code. Where required by federal tax law rules, shareholders will receive notification of their portion of the fund’s taxable ordinary dividends (if any), capital gains distributions (if any) and tax-exempt dividends paid for the 2014 calendar year on Form 1099-DIV, which will be mailed in early 2015.
BNY Mellon Municipal Opportunities Fund
In accordance with federal tax law, the fund hereby reports all the dividends paid from investment income-net during its fiscal year ended August 31, 2014 as “exempt-interest dividends” (not generally subject to regular federal income tax), except $1,670,649 that is being reported as an ordinary income distribution for reporting purposes. Also, the fund reports the maximum amount allowable but not less than $.2651 per share as a capital gain dividend paid on December 19, 2013 in accordance with Section 852(b)(3)(C) of the Internal Revenue Code. Also, the fund reports the maximum amount allowable but not less than $.0022 as a short-term capital gain dividend paid on December 19, 2013 in accordance with Sections 871(k)(2) and 881(e) of the Internal Revenue Code. Where required by federal tax law rules, shareholders will receive notification of their portion of the fund’s taxable ordinary dividends (if any), capital gains distributions (if any) and tax-exempt dividends paid for the 2014 calendar year on Form 1099-DIV, which will be mailed in early 2015.
The Funds 135
| INFORMATION ABOUT THE RENEWAL OF EACH FUND’S INVESTMENT |
| ADVISORY AGREEMENT AND ADMINISTRATION AGREEMENT (Unaudited) |
At a meeting of the Trust’s Board of Trustees held on March 11-12, 2014, the Board considered the renewal of the Trust’s Investment Advisory Agreement and Administration Agreement (together, the “Agreement”), pursuant to which BNY Mellon Fund Advisers, a division of Dreyfus, provides the funds with investment advisory services and The Bank of New York Mellon provides the funds with administrative services. The Bank of New York Mellon has entered into a Sub-Administration Agreement with Dreyfus pursuant to which The Bank of New York Mellon pays Dreyfus for performing certain of these administrative services. The Board members, none of whom are “interested persons” (as defined in the Investment Company Act of 1940, as amended) of the Trust, were assisted in their review by independent legal counsel and met with counsel in executive session separate from Dreyfus representatives. In considering the renewal of the Agreement, the Board considered all factors that it believed to be relevant, including those discussed below. The Board did not identify any one factor as dispositive, and each Board member may have attributed different weights to the factors considered.
Analysis of Nature, Extent, and Quality of Services Provided to the Funds. The Board considered information provided to them at the meeting and in previous presentations from Dreyfus representatives regarding the nature, extent, and quality of the services provided to the funds. Dreyfus provided the number of open accounts in each fund, the fund’s asset size and the allocation of fund assets among distribution channels. Dreyfus also had previously provided information regarding the diverse intermediary relationships and distribution channels of the funds (such as intermediary, in which intermediaries typically are paid by the fund and/or Dreyfus) and Dreyfus’ corresponding need for broad, deep, and diverse resources to be able to provide ongoing shareholder services to each intermediary or distribution channel, as applicable to each fund.
The Board also considered research support available to, and portfolio management capabilities of, each fund’s portfolio management personnel and that Dreyfus also provides oversight of day-to-day fund operations, including fund accounting and administration and assistance in meeting legal and regulatory requirements.The Board also considered Dreyfus’ extensive administrative, accounting, and compliance infrastructures.
Comparative Analysis of the Funds’ Performance and Management Fees and Expense Ratios. The Board reviewed reports prepared by Lipper, Inc. (“Lipper”), an independent provider of investment company data, which included information comparing (1) each fund’s performance with the performance of a group of comparable funds (the “Performance Group”) and with a broader group of funds (the “Performance Universe”), all for various periods ended December 31, 2013, and (2) each fund’s actual and contractual management fees and total expenses with those of a group of comparable funds (the “Expense Group”) and with a broader group of funds (the “Expense Universe”), the information for which was derived in part from fund financial statements available to Lipper as of the date of its analysis. Dreyfus previously had furnished the Board with a description of the methodology Lipper used to select the Performance Group and Performance Universe and the Expense Group and Expense Universe.
Dreyfus representatives stated that the usefulness of performance comparisons may be affected by a number of factors, including different investment limitations that may be applicable to each fund and comparison funds. They also noted that performance generally should be considered over longer periods of time, although it is possible that long-term performance can be adversely affected by even one period of significant underperformance so that a single investment decision or theme has the ability to affect disproportionately long-term performance.
136
As applicable to each fund, Dreyfus representatives reviewed with the Board the management or investment advisory fees (1) paid by funds advised or administered by Dreyfus that are in the same Lipper category as the fund and (2) paid to Dreyfus or the Dreyfus-affiliated primary employer of the fund’s primary portfolio manager(s) for advising any separate accounts and/or other types of client portfolios that are considered to have similar investment strategies and policies as the fund (the “Similar Clients”), and explained the nature of the Similar Clients. They discussed differences in fees paid and the relationship of the fees paid in light of any differences in the services provided and other relevant factors. The Board considered the relevance of the fee information provided for the Similar Clients to evaluate the appropriateness and reasonableness of the fund’s management fee.
BNY Mellon National Intermediate Municipal Bond Fund
The Board discussed the results of the comparisons and noted that the fund’s total return performance was variously above, at and below the Performance Group median and above the Performance Universe medians for the various periods (including ranking in the first quartile of the Performance Universe for most periods). The Board also noted that the fund’s yield performance was at or above the Performance Group medians for six of the ten one-year periods and above the Performance Universe medians for each of the ten one-year periods ended December 31st. Dreyfus also provided a comparison of the fund’s calendar year total returns to the returns of the fund’s benchmark index.
The Board also reviewed the range of actual and contractual management fees and total expenses of the Expense Group and Expense Universe funds and discussed the results of the comparisons. The Board noted that the fund’s contractual management fee was above the Expense Group median, the fund’s actual management fee was above the Expense Group and Expense Universe medians and the fund’s total expenses were below the Expense Group and Expense Universe medians.
BNY Mellon National Short-Term Municipal Bond Fund
The Board discussed the results of the comparisons and noted that the fund’s total return performance was below the Performance Group and Performance Universe medians for the various periods, except for the four- and ten-year periods when the fund’s performance was at and above the Performance Universe median, respectively. The Board also noted that the fund’s yield performance was below the Performance Group medians for eight of the ten one-year periods and below the Performance Universe medians for seven of the ten one-year periods ended December 31st. Dreyfus also provided a comparison of the fund’s calendar year total returns to the returns of the fund’s benchmark index. The Board also received a presentation from the fund’s primary portfolio manager regarding the factors that had influenced the fund’s performance results over the past year, including the fact that the fund’s target duration generally was shorter than those of the funds in the Performance Group and the fund typically held higher quality securities than those held by some of the funds in the Performance Group.
The Board also reviewed the range of actual and contractual management fees and total expenses of the Expense Group and Expense Universe funds and discussed the results of the comparisons. The Board noted that the fund’s contractual management fee was above the Expense Group median, the fund’s actual management fee was above the Expense Group and Expense Universe medians (highest in the Expense Group) and the fund’s total expenses were above the Expense Group median and below the Expense Universe median.
The Funds 137
| INFORMATION ABOUT THE RENEWAL OF EACH FUND’S INVESTMENT ADVISORY |
| AGREEMENT AND ADMINISTRATION AGREEMENT (Unaudited) (continued) |
BNY Mellon Pennsylvania Intermediate Municipal Bond Fund
The Board discussed the results of the comparisons and noted that the fund’s total return performance ranked first or second of the two or three funds in the Performance Group for the various periods and was at or above the Performance Universe medians for various periods, except the one- and two-year periods when the fund’s performance was below the Performance Universe medians.The Board also noted that the fund’s yield performance ranked first or second of the two or three funds in the Performance Group and was above the Performance Universe medians for each of the ten one-year periods ended December 31st. Dreyfus also provided a comparison of the fund’s calendar year total returns to the returns of the fund’s benchmark index.
The Board also reviewed the range of actual and contractual management fees and total expenses of the Expense Group and Expense Universe funds and discussed the results of the comparisons. The Board noted that the fund’s contractual management fee was ranked second (was the highest) of the two funds in the Expense Group, the fund’s actual management fee was the highest in the Expense Group and Expense Universe and the fund’s total expenses were ranked second of the three funds in the Expense Group and above the Expense Universe median.
BNY Mellon Massachusetts Intermediate Municipal Bond Fund
The Board discussed the results of the comparisons and noted that the fund’s total return performance ranked first or second of the two or three funds in the Performance Group for the various periods and was above the Performance Universe medians for all periods except for the one-year period when the fund’s performance was below the Performance Universe median. The Board also noted that the fund’s yield performance ranked first or second of the two or three funds in the Performance Group and was above the Performance Universe medians for each of the ten one-year periods ended December 31st. Dreyfus also provided a comparison of the fund’s calendar year total returns to the returns of the fund’s benchmark index.
The Board also reviewed the range of actual and contractual management fees and total expenses of the Expense Group and Expense Universe funds and discussed the results of the comparisons. The Board noted that the fund’s contractual management fee was ranked first (was the lowest) of the two funds in the Expense Group, the fund’s actual management fee was ranked second of the three funds in the Expense Group and below the Expense Universe median and the fund’s total expenses were ranked first of the three funds in the Expense Group and below the Expense Universe median.
BNY Mellon New York Intermediate Tax-Exempt Bond Fund
The Board discussed the results of the comparisons and noted that the fund’s total return performance was variously above, at and below the Performance Group medians (with only three or four funds in the Performance Group), except for the ten-year period for which the fund was the only fund in the Performance Group, and above the Performance Universe medians for all periods, except for the one-year period when the fund’s performance was below the Performance Universe median. The Board also noted that the fund’s yield performance was below the Performance Group medians for the five most recent one-year periods ended December 31st (with only three or four funds in the Performance Group) and that the fund was the only fund in the Performance Group for the remaining five one-year periods and was at or above the Performance Universe medians for each of the ten one-year periods ended December 31st. Dreyfus also provided a comparison of the fund’s calendar year total returns to the returns of the fund’s benchmark index.
138
The Board also reviewed the range of actual and contractual management fees and total expenses of the Expense Group and Expense Universe funds and discussed the results of the comparisons.The Board noted that the fund’s contractual management fee was the highest of the four funds in the Expense Group, the fund’s actual management fee was the highest of the funds in the Expense Group and Expense Universe and the fund’s total expenses ranked second of the four funds in the Expense Group and were slightly below the Expense Universe median.
Dreyfus representatives noted that the investment adviser has contractually agreed to waive receipt of its fees and/or assume the expenses of the fund, until December 31, 2014, so that annual direct fund operating expenses (excluding shareholder services fees, taxes, interest, brokerage commissions, commitment fees on borrowings and extraordinary expenses) do not exceed 0.59% of the fund’s average daily net assets.
BNY Mellon Municipal Opportunities Fund
The Board discussed the results of the comparisons and noted that the fund’s total return performance was above the Performance Group and Performance Universe medians, ranking in the first quartile of the Performance Universe for all periods. The Board also noted that the fund’s yield performance was below the Performance Group medians for each of the five one-year periods, ranking in the fourth quartile for all periods, and at or above the Performance Universe medians for three of the five one-year periods ended December 31st. Dreyfus also provided a comparison of the fund’s calendar year total returns to the returns of the fund’s benchmark index.
The Board also reviewed the range of actual and contractual management fees and total expenses of the Expense Group and Expense Universe funds and discussed the results of the comparisons.The Board noted that the fund’s contractual management fee was above the Expense Group median, ranking as the highest in the Expense Group, and the fund’s actual management fee and total expenses were above the Expense Group and Expense Universe medians, ranking as the highest in the Expense Group and in the fourth quartile of Expense Universe.
Analysis of Profitability and Economies of Scale. Dreyfus representatives reviewed the expenses allocated and profit received by Dreyfus and its affiliates and the resulting profitability percentage for managing each fund and the aggregate profitability percentage to Dreyfus and its affiliates of managing each fund, and the method used to determine the expenses and profit.The Board concluded that the profitability results were not unreasonable, given the services rendered and service levels provided by Dreyfus to each fund.The Board also noted the expense limitation arrangement for BNY Mellon New York Intermediate Tax-Exempt Bond Fund and its effect on the profitability of Dreyfus and its affiliates. The Board also had been provided with information prepared by an independent consulting firm regarding Dreyfus’ approach to allocating costs to, and determining the profitability of, individual funds and the entire Dreyfus fund complex. The consulting firm also had analyzed where any economies of scale might emerge in connection with the management of the funds.
The Board considered on the advice of its counsel the profitability analysis with respect to each fund (1) as part of its evaluation of whether the fees under the Agreement bear a reasonable relationship to the mix of services provided by Dreyfus, including the nature, extent and quality of such services, and (2) in light of the relevant circumstances for the fund and the extent to which economies of scale would be realized if the fund grows and whether fee levels reflect these economies of scale for the benefit of fund shareholders. Dreyfus representatives noted that a discussion of economies of scale is predicated on a fund having achieved a substantial size with increasing assets and that, if a fund’s assets had been
The Funds 139
| INFORMATION ABOUT THE RENEWAL OF EACH FUND’S INVESTMENT ADVISORY |
| AGREEMENT AND ADMINISTRATION AGREEMENT (Unaudited) (continued) |
stable or decreasing, the possibility that Dreyfus may have realized any economies of scale would be less. Dreyfus representatives also noted that, as a result of shared and allocated costs among the funds and the funds in the Dreyfus fund complex, the extent of economies of scale could depend substantially on the level of assets in the complex as a whole, so that increases and decreases in complex-wide assets can affect potential economies of scale in a manner that is disproportionate to, or even in the opposite direction from, changes in a fund’s asset level. The Board also considered potential benefits to Dreyfus from acting as investment adviser and noted that there were no soft dollar arrangements in effect for trading each fund’s investments.
At the conclusion of these discussions, the Board agreed that it had been furnished with sufficient information to make an informed business decision with respect to the renewal of the Agreement. Based on the discussions and considerations as described above, the Board concluded and determined as follows.
The Board concluded that the nature, extent, and quality of the services provided by Dreyfus to each fund are adequate and appropriate.
With respect to BNY Mellon National Intermediate Municipal Bond Fund, BNY Mellon Pennsylvania Intermediate Municipal Bond Fund, BNY Mellon Massachusetts Intermediate Municipal Bond Fund, BNY Mellon New York Intermediate Tax-Exempt Bond Fund and BNY Mellon Municipal Opportunities Fund, the Board was satisfied with each fund’s overall performance.
With respect to BNY Mellon National Short-Term Municipal Bond Fund, the Board generally was satis- fied with the fund’s overall performance, in light of the considerations discussed above.
The Board concluded that the fee paid to Dreyfus by each fund was reasonable in light of the considerations described above.
The Board determined that the economies of scale which may accrue to Dreyfus and its affiliates in con- nection with the management of the funds had been adequately considered by Dreyfus in connection with the fee rate charged to each fund pursuant to the Agreement and that, to the extent in the future it were determined that material economies of scale had not been shared with a fund, the Board would seek to have those economies of scale shared with the fund.
In evaluating the Agreement, the Board considered these conclusions and determinations and also relied on its previous knowledge, gained through meetings and other interactions with Dreyfus and its affiliates, of each fund and the services provided to the funds by Dreyfus. The Board also relied on information received on a routine and regular basis throughout the year relating to the operations of each fund and the investment management and other services provided under the Agreement, including information on the investment performance of each fund in comparison to similar mutual funds and benchmark performance indices; general market outlook as applicable to each fund; and compliance reports. In addition, the Board’s consideration of the contractual fee arrangements for each fund had the benefit of a number of years of reviews of prior or similar agreements during which lengthy discussions took place between the Board and Dreyfus representatives. Certain aspects of the arrangements may receive greater scrutiny in some years than in others, and the Board’s conclusions may be based, in part, on their consideration of the same or similar arrangements in prior years.The Board determined that renewal of the Agreement was in the best interests of each fund and its respective shareholders.
140
| BOARD MEMBERS INFORMATION (Unaudited) |
| INDEPENDENT BOARD MEMBERS |
The Funds 141
BOARD MEMBERS INFORMATION (Unaudited) (continued)
INDEPENDENT BOARD MEMBERS

Once elected all Board Members serve for an indefinite term.The address of the Board Members and Officers is c/o The Dreyfus Corporation, 200 Park Avenue, New York, New York 10166. Additional information about the Board Members is available in the fund’s Statement of Additional Information which can be obtained from Dreyfus free of charge by calling this toll free number: 1-800-DREYFUS. For individual account holders for Private Wealth Management clients, please contact your account officer or call 1-888-281-7350.
142
OFFICERS OF THE FUND (Unaudited)
DAVID K. MOSSMAN, President since October 2011.
As Director of Investment Administration for BNY Mellon Wealth Management's Investments Group (the "Investments Group") since January 2006, Mr. Mossman's responsibilities include oversight of securities trading and portfolio management systems administration and mutual fund product management. Mr. Mossman also serves as chief administrative officer of the Investments Group. He is 61 years old and has served in various capacities with BNY Mellon since 1982, including positions in the management of investment, mutual fund and brokerage businesses that encompassed financial, systems, product management, internal distribution and marketing responsibilities, and has been an employee of Dreyfus since September 2000.
JOHN PAK, Chief Legal Officer since March 2013.
Deputy General Counsel, Investment Management, of BNY Mellon since August 2014; Chief Legal Officer of the Manager since August 2012; from March 2005 to July 2012, Managing Director of Deutsche Bank, Deputy Global Head of Deutsche Asset Management Legal and Regional Head of Deutsche Asset Management Americas Legal. He is an officer of 70 investment companies (comprised of 167 portfolios) managed by the Manager. He is 45 years old and has been an employee of the Manager since August 2012.
JANETTE E. FARRAGHER, Vice President and Secretary since December 2011.
Assistant General Counsel of BNY Mellon, and an officer of 70 investment companies (comprised of 167 portfolios) managed by the Manager. She is 51 years old and has been an employee of the Manager since February 1984.
KIESHA ASTWOOD, Vice President and Assistant Secretary since January 2010.
Counsel of BNY Mellon, and an officer of 70 investment companies (comprised of 167 portfolios) managed by the Manager. She is 41 years old and has been an employee of the Manager since July 1995.
JAMES BITETTO, Vice President and Assistant Secretary since August 2005.
Managing Counsel of BNY Mellon and Secretary of the Manager, and an officer of 70 investment companies (comprised of 167 portfolios) managed by the Manager. He is 48 years old and has been an employee of the Manager since December 1996.
JONI LACKS CHARATAN, Vice President and Assistant Secretary since August 2005.
Managing Counsel of BNY Mellon, and an officer of 70 investment companies (comprised of 167 portfolios) managed by the Manager. She is 58 years old and has been an employee of the Manager since October 1988.
JOSEPH M. CHIOFFI, Vice President and Assistant Secretary since August 2005.
Managing Counsel of BNY Mellon, and an officer of 70 investment companies (comprised of 167 portfolios) managed by the Manager. He is 52 years old and has been an employee of the Manager since June 2000.
JOHN B. HAMMALIAN, Vice President and Assistant Secretary since August 2005.
Senior Managing Counsel of BNY Mellon, and an officer of 70 investment companies (comprised of 167 portfolios) managed by the Manager. He is 51 years old and has been an employee of the Manager since February 1991.
SARAH S. KELLEHER, Vice President and Assistant Secretary since April 2014.
Senior Counsel of BNY Mellon, and an officer of 70 investment companies (comprised of 167 portfolios) managed by the Manager; from August 2005 to March 2013, Associate General Counsel of Third Avenue Management. She is 38 years old and has been an employee of the Manager since March 2013.
JEFF PRUSNOFSKY, Vice President and Assistant Secretary since August 2005.
Senior Managing Counsel of BNY Mellon, and an officer of 70 investment companies (comprised of 167 portfolios) managed by the Manager. He is 49 years old and has been an employee of the Manager since October 1990.
JAMES WINDELS, Treasurer since November 2001.
Director – Mutual Fund Accounting of the Manager, and an officer of 70 investment companies (comprised of 167 portfolios) managed by the Manager. He is 55 years old and has been an employee of the Manager since April 1985.
The Funds 143
OFFICERS OF THE FUND (Unaudited) (continued)
RICHARD CASSARO, Assistant Treasurer since January 2008.
Senior Accounting Manager – Money Market and Municipal Bond Funds of the Manager, and an officer of 70 investment companies (comprised of 167 portfolios) managed by the Manager. He is 55 years old and has been an employee of the Manager since September 1982.
GAVIN C. REILLY, Assistant Treasurer since December 2005.
Tax Manager of the Investment Accounting and Support Department of the Manager, and an officer of 70 investment companies (comprised of 167 portfolios) managed by the Manager. He is 46 years old and has been an employee of the Manager since April 1991.
ROBERT S. ROBOL, Assistant Treasurer since December 2002.
Senior Accounting Manager – Fixed Income Funds of the Manager, and an officer of 70 investment companies (comprised of 167 portfolios) managed by the Manager. He is 50 years old and has been an employee of the Manager since October 1988.
ROBERT SALVIOLO, Assistant Treasurer since July 2007.
Senior Accounting Manager – Equity Funds of the Manager, and an officer of 70 investment companies (comprised of 167 portfolios) managed by the Manager. He is 47 years old and has been an employee of the Manager since June 1989.
ROBERT SVAGNA, Assistant Treasurer since December 2002.
Senior Accounting Manager – Equity Funds of the Manager, and an officer of 70 investment companies (comprised of 167 portfolios) managed by the Manager. He is 47 years old and has been an employee of the Manager since November 1990.
JOSEPH W. CONNOLLY, Chief Compliance Officer since October 2004.
Chief Compliance Officer of the Manager and The Dreyfus Family of Funds (70 investment companies, comprised of 167 portfolios). He is 57 years old and has served in various capacities with the Manager since 1980, including manager of the firm’s Fund Accounting Department from 1997 through October 2001.
MATTHEW D. CONNOLLY, Anti-Money Laundering Compliance Officer since April 2012.
Anti-Money Laundering Compliance Officer of the Distributor since October 2011; from March 2010 to September 2011, Global Head, KYC Reviews and Director of UBS Investment Bank; until March 2010, AML Compliance Officer and Senior Vice President of Citi Global Wealth Management. He is an officer of 65 investment companies (comprised of 162 portfolios) managed by the Manager. He is 42 years old and has been an employee of the Distributor since October 2011.
144
NOTES
For More Information

Telephone Wealth Management (WM) Clients, please contact your Account Officer or call 1-888-281-7350. Brokerage Clients of BNY Mellon Wealth Advisors (BNYMWA), please contact your financial representative or call 1-800-830-0549, Option 2. Individual Account holders, please call Dreyfus at 1-800-DREYFUS.
Mail WM Clients, write to your Account Officer, c/o The Bank of New York Mellon, One Mellon Bank Center, Pittsburgh, PA 15258 BNYMWA Brokerage Clients, write to your financial representative, P.O. Box 9012, Hicksville, NY 11802–9012 Individual Account Holders, write to: BNY Mellon Funds, P.O. Box 55268, Boston, MA 02205–8502
The funds file their complete schedule of portfolio holdings with the Securities and Exchange Commission (“SEC”) for the first and third quarters of each fiscal year on Form N-Q. The funds’ Forms N-Q are available on the SEC’s website at http://www.sec.gov and may be reviewed and copied at the SEC’s Public Reference Room in Washington, DC. Information on the operation of the Public Reference Room may be obtained by calling 1-800-SEC-0330.
Information regarding how the funds voted proxies relating to portfolio securities for the most recent 12-month period ended June 30 is available on the SEC’s website at http://www.sec.gov and without charge, upon request, by calling 1-800-DREYFUS.
© 2014 MBSC Securities Corporation
MFTAR0814-MB
The BNY Mellon Funds
| BNY Mellon Money Market Fund | |
| BNY Mellon National Municipal Money Market Fund | |
| ANNUAL REPORT | August 31, 2014 |

DISCUSSION OF
FUND PERFORMANCE
For the period of September 1, 2013, through August 31, 2014, as provided by Patricia A. Larkin, Portfolio Manager
Fund and Market Performance Overview
For the 12-month period ended August 31, 2014, BNY Mellon Money Market Fund’s Class M shares produced a yield of 0.00%, and its Investor shares produced a yield of 0.00%. Taking into account the effects of compounding, the fund’s Class M shares and Investor shares produced effective yields of 0.00% and 0.00%, respectively.1
Despite occasional bouts of volatility over the reporting period, longer term bonds rallied amid an accelerating economic recovery. Nonetheless, money market yields remained steady near historical lows, anchored by an unchanged overnight federal funds rate between 0% and 0.25%.
The Fund’s Investment Approach
The fund seeks as high a level of current income as is consistent with the preservation of capital and the maintenance of liquidity. To pursue its goal, the fund invests in a diversified portfolio of high-quality, short-term debt securities, including U.S. government securities; certificates of deposit, time deposits, bankers’ acceptances and other short-term domestic or foreign bank obligations; repurchase agreements; high-grade commercial paper and other short-term corporate obligations; and taxable municipal obligations. Normally, the fund invests at least 25% of its net assets in bank obligations.
U.S. Economy Rebounded after Soft Patch
The reporting period began after a time of uncertainty as investors reacted to indications that the Federal Reserve Board (the “Fed”) would begin to taper its massive quantitative easing program. Although the Fed refrained from doing so until December, long-term rates climbed over the fourth quarter of 2013 as U.S. GDP grew at a 3.5% annualized rate. By year-end, the unemployment rate fell to 7.0% and yields on 10-year U.S.Treasury securities rose above 3%. In contrast, the Fed left its target for short-term interest rates unchanged, and yields of money market instruments remained steady.
Investors worried in January 2014 that global economic and political instability could derail the U.S. recovery, and long-term rates moderated.Yet, corporate earnings growth remained strong, the unemployment rate declined to 6.6% with the addition of 144,000 jobs, and the Fed announced its second reduction in quantitative easing. The economy regained strength in February when the manufacturing and service sectors posted gains. Although the unemployment rate ticked upward to 6.7%, 222,000 new jobs were created. Labor markets remained robust in March with the addition of 203,000 positions while the unemployment rate was unchanged. Nonetheless, U.S. GDP contracted at a 2.1% annualized rate over the first quarter. Economists attributed the downturn to reduced export activity, slowing inventory accumulation by businesses, and the dampening effects of severe winter weather on corporate spending and housing markets.
Housing starts and home sales rebounded in April, suggesting that the recovery would resume in warmer weather.There were 304,000 new jobs created during the month, and the unemployment rate fell sharply to 6.3%. The Fed again tapered quantitative easing at its April meeting. In May, nonfarm payroll employment rose by 229,000, and the unemployment rate held steady. Meanwhile, manufacturing activity accelerated for the fourth consecutive month and personal incomes posted a healthy gain.
The Funds 3
DISCUSSION OF FUND PERFORMANCE (continued)
The U.S. economy strengthened further in June, when 267,000 jobs were created and the unemployment rate dipped to 6.1%. Manufacturing activity, personal incomes, and home sales continued to grow. Perhaps most notably, inflation began to accelerate as the Consumer Price Index climbed 2.1% compared to one year earlier. It later was estimated that the U.S. economy rebounded at a robust 4.6% annualized rate during the second quarter.
In July, the unemployment rate ticked slightly higher to 6.2%, but 212,000 new jobs were created during the month and new claims for unemployment insurance fell to their lowest level since 2006. The Fed implemented additional reductions in its bond purchasing program in June and July, putting the quantitative easing program on track for elimination this fall.August saw further economic improvement when retail sales and new home sales moved sharply higher. In contrast, new job creation fell to 142,000 in August even as the unemployment rate inched lower to 6.1%. Moreover, inflation moderated during the month due to declining fuel prices.
Fed Remains Committed to Low Short-Term Rates
Despite turbulence among intermediate- and long-term interest rates over the reporting period, money market yields remained steady near zero percent. In addition, yield differences along the market’s maturity spectrum stayed relatively narrow.
Monetary policymakers at the Fed reiterated that they are unlikely to raise short-term interest rates for “a considerable time.” Although regulators recently issued changes to the rules governing prime money market funds, the new regulations will not become effective until mid-2016.Therefore, the industry’s operations and asset flows have so far been relatively unaffected.
In this environment, and as we have for some time, we have maintained the fund’s weighted average maturity in a market-neutral position, and we have remained focused on well-established issuers with good quality and liquidity characteristics.
September 15, 2014
An investment in the fund is not insured or guaranteed by the Federal Deposit Insurance Corporation (FDIC) or any other government agency. Although the fund seeks to preserve the value of your investment at $1.00 per share, it is possible to lose money by investing in the fund.
Short-term corporate, asset-backed securities holdings and municipal securities holdings (as applicable), while rated in the highest rating category by one or more Nationally Recognized Statistical Ratings Organization (NRSRO) (or unrated, if deemed of comparable quality by the investment adviser), involve credit and liquidity risks and risk of principal loss.
| 1 | Effective yield is based upon dividends declared daily and reinvested monthly. |
| Past performance is no guarantee of future results.Yields fluctuate.Yields | |
| provided reflect the absorption of certain fund expenses by the investment | |
| adviser pursuant to an undertaking, which is voluntary and temporary, not | |
| contractual, and can be terminated at any time without notice. Had these | |
| expenses not been absorbed, fund yields would have been lower, and in some | |
| cases, 7-day yields during the reporting period would have been negative | |
| absent the expense absorption. |
4

DISCUSSION OF
FUND PERFORMANCE
For the period of September 1, 2013, through August 31, 2014, as provided by Joseph Irace, Senior Portfolio Manager
Fund and Market Performance Overview
For the 12-month period ended August 31, 2014, BNY Mellon National Municipal Money Market Fund’s Class M shares produced a yield of 0.00%, and Investor shares produced a yield of 0.00%.Taking into account the effects of compounding, the fund’s Class M and Investor shares also produced effective yields of 0.00% and 0.00%, respectively.1
Despite mounting evidence of a sustained U.S. economic recovery and an ongoing shift by the Federal Reserve Board (the “Fed”) to a more moderately accommodative monetary policy, the overnight federal funds rate was left unchanged near historical lows. As a result, tax-exempt money market yields also remained low throughout the reporting period.
The Fund’s Investment Approach
The fund seeks as high a level of current income exempt from federal income tax as is consistent with the preservation of capital and maintenance of liquidity. To pursue its goal, the fund invests at least 80% of its assets in short-term municipal obligations that provide income exempt from federal income tax. Among these are municipal notes, short-term municipal bonds, tax-exempt commercial paper, and municipal leases. The fund may invest up to 20% of its total assets in taxable money market securities, such as U.S. government obligations, bank and corporate obligations, and commercial paper.The fund also may invest in custodial receipts.
Yields Stayed Low Despite Accelerating Economic Recovery
While yields of municipal money market securities remained anchored throughout the reporting period by an unchanged federal funds rate between 0% and 0.25%, evidence of an accelerating economic recovery over the fall of 2013 and the Fed’s decision in December to begin reducing its quantitative easing program drove yields of 10-year U.S.Treasury securities above 3% by the start of 2014. However, unusually severe winter weather throughout much of the country caused U.S. GDP to contract at an annualized 2.1% rate during the first quarter of 2014 even as the unemployment rate continued to decline. Investors also grew concerned about economic and political instability in the world’s emerging markets. As a result, longer term bond yields fell significantly over the opening months of the reporting period.
The economic recovery got back on track in the spring, as evidenced by a 4.6% annualized GDP growth rate amid stronger labor markets and improving consumer confidence. However, changing supply-and-demand dynamics continued to put downward pressure on municipal money market yields. Demand remained strong for short-term tax-exempt municipal securities, including from nontraditional buyers, such as taxable intermediate bond funds and taxable money market funds, seeking attractive tax-exempt yields compared to taxable securities with similar maturities. However, individual investors seeking more competitive levels of current income focused mainly on longer term municipal bonds with higher yields. Consequently, yields of high-quality, one-year municipal notes remained low.
The Funds 5
DISCUSSION OF FUND PERFORMANCE (continued)
Robust investor demand and an increasingly limited supply of new instruments also kept yields on variable rate demand notes (“VRDNs”) near historical lows.
Municipal credit quality has continued to improve as most states and local governments recovered from the recession. Most notably, state general funds have shown consecutive quarters of growth in personal income tax and sales tax revenue. Consequently, most states achieved balanced budgets and replenished reserves during the reporting period.
Credit Selection Remained Paramount
Most municipal money market funds have maintained short-weighted average maturities compared to historical averages due to narrow yield differences along the tax-exempt money market’s maturity range. The fund was no exception, as we continued to maintain its weighted average maturity in a position that was consistent with industry averages. Changes to the regulations governing some money market funds - which were announced in July but are not effective until 2016 - also contributed to relatively cautious investment postures throughout the industry.
As always, well-researched credit selection remained paramount. We have continued to favor state general obligation bonds; essential service revenue bonds backed by water, sewer, and electric facilities; certain local credits with strong financial positions and stable tax bases; and health care and education issuers with stable credit characteristics.
Fed Remains Committed to Low Short-Term Rates
The Fed made a number of cuts in its monthly bond purchases over the reporting period, and its quantitative easing program is on track for elimination this fall. However, the Fed also has made clear that short-term interest rates are likely to remain near current levels “for a considerable time.” In determining how long to maintain its current target for the federal funds rate, the Fed reiterated that it will continue to monitor progress toward its objectives of full employment and a 2% inflation rate. Therefore, in our judgment, the prudent course continues to be an emphasis on preservation of capital and liquidity.
September 15, 2014
An investment in the fund is not insured or guaranteed by the FDIC or any other government agency. Although the fund seeks to preserve the value of your investment at $1.00 per share, it is possible to lose money by investing in the fund.
Short-term corporate and asset-backed securities holdings, while rated in the highest rating category by one or more NRSRO (or unrated, if deemed of comparable quality by the investment adviser), involve credit and liquidity risks and risk of principal loss.
| 1 | Effective yield is based upon dividends declared daily and reinvested monthly. Past performance is no guarantee of future results.Yields fluctuate.Yields provided reflect the absorption of certain fund expenses by the investment advisor pursuant to an undertaking, which is voluntary and temporary, not contractual, and can be terminated at any time without notice. Had these expenses not been absorbed, fund yields would have been lower, and in some cases, 7-day yields during the reporting period would have been negative absent the expense absorption. |
6
UNDERSTANDING YOUR FUND’S EXPENSES (Unaudited)
As a mutual fund investor, you pay ongoing expenses, such as management fees and other expenses. Using the information below, you can estimate how these expenses affect your investment and compare them with the expenses of other funds.You also may pay one-time transaction expenses, including sales charges (loads) and redemption fees, which are not shown in this section and would have resulted in higher total expenses. For more information, see your fund’s prospectus or talk to your financial adviser.
Review your fund’s expenses
The table below shows the expenses you would have paid on a $1,000 investment in each class of each BNY Mellon money market fund from March 1, 2014 to August 31, 2014. It also shows how much a $1,000 investment would be worth at the close of the period, assuming actual returns and expenses.
| Expenses and Value of a $1,000 Investment | ||
| assuming actual returns for the six months ended August 31, 2014 | ||
| Class M Shares | Investor Shares | |
| BNY Mellon Money Market Fund | ||
| Expenses paid per $1,000† | $.76 | $.71 |
| Ending value (after expenses) | $1,000.00 | $1,000.00 |
| Annualized expense ratio (%) | .15 | .14 |
| BNY Mellon National Municipal Money Market Fund | ||
| Expenses paid per $1,000† | $.66 | $.66 |
| Ending value (after expenses) | $1,000.00 | $1,000.00 |
| Annualized expense ratio (%) | .13 | .13 |
COMPARING YOUR FUND’S EXPENSES WITH THOSE OF OTHER FUNDS (Unaudited)
Using the SEC’s method to compare expenses
The Securities and Exchange Commission (SEC) has established guidelines to help investors assess fund expenses. Per these guidelines, the table below shows your fund’s expenses based on a $1,000 investment, assuming a hypothetical 5% annualized return.You can use this information to compare the ongoing expenses (but not transaction expenses or total cost) of investing in each fund with those of other funds. All mutual fund shareholder reports will provide this information to help you make this comparison. Please note that you cannot use this information to estimate your actual ending account balance and expenses paid during the period.
| Expenses and Value of a $1,000 Investment | ||||
| assuming a hypothetical 5% annualized return for the six months ended August 31, 2014 | ||||
| Class M Shares | Investor Shares | |||
| BNY Mellon Money Market Fund | ||||
| Expenses paid per $1,000† | $ | .77 | $ | .71 |
| Ending value (after expenses) | $ | 1,024.45 | $ | 1,024.50 |
| Annualized expense ratio (%) | .15 | .14 | ||
| BNY Mellon National Municipal Money Market Fund | ||||
| Expenses paid per $1,000† | $ | .66 | $ | .66 |
| Ending value (after expenses) | $ | 1,024.55 | $ | 1,024.55 |
| Annualized expense ratio (%) | .13 | .13 |
| † Expenses are equal to each fund’s annualized expense ratios as shown above, multiplied by the average account value over the period, multiplied by 184/365 (to reflect the one-half |
| year period). |
The Funds 7
| STATEMENT OF INVESTMENTS |
| August 31, 2014 |
| BNY Mellon Money Market Fund | |||||||
| Negotiable Bank | Principal | Principal | |||||
| Certificates of Deposit—34.1% | Amount ($) | Value ($) | Commercial Paper—26.1% | Amount ($) | Value ($) | ||
| Bank of Tokyo-Mitsubishi | Barclays U.S. Funding | ||||||
| Ltd. (Yankee) | 0.08%, 9/2/14 | 15,000,000 | 14,999,967 | ||||
| 0.25%, 2/17/15 | 18,000,000 | 18,000,000 | Credit Agricole NA | ||||
| BNP Paribas (Yankee) | 0.08%, 9/2/14 | 15,000,000 | 14,999,967 | ||||
| 0.23%, 10/16/14 | 13,000,000 | 13,000,000 | Credit Suisse New York | ||||
| Citibank N.A. | 0.22%, 10/20/14 | 10,000,000 | 9,997,005 | ||||
| 0.17%, 9/4/14 | 15,000,000 | 15,000,000 | Nestle Capital Corporation | ||||
| Credit Industriel et | 0.10%, 11/4/14 | 4,600,000 | a | 4,599,182 | |||
| Commercial (Yankee) | NRW Bank | ||||||
| 0.15%, 9/4/14 | 10,000,000 | 10,000,000 | 0.13%, 9/12/14 | 12,000,000 | a | 11,999,542 | |
| Mizuho Bank Ltd/NY (Yankee) | Sumitomo Mitsui Trust Bank | ||||||
| 0.21%, 11/3/14 | 15,000,000 | 15,000,000 | 0.20%, 9/2/14 | 15,000,000 | 14,999,917 | ||
| Rabobank Nederland (Yankee) | Swedbank | ||||||
| 0.22%, 11/3/14 | 15,000,000 | 15,000,000 | 0.23%, 1/15/15 | 10,000,000 | 9,991,311 | ||
| Skandinaviska Enskilda Banken | Toyota Motor Credit Corp. | ||||||
| NY (Yankee) | 0.22%, 2/18/15 | 10,000,000 | 9,989,611 | ||||
| 0.25%, 1/16/15 | 10,000,000 | 10,000,000 | Westpac Banking Corp. | ||||
| State Street Bank and Trust Co. | 0.23%, 10/1/14 | 10,000,000 | a,b | 10,000,000 | |||
| 0.20%, 12/15/14 | 7,000,000 | 7,000,000 | Total Commercial Paper | ||||
| Sumitomo Mitsui | (cost $101,576,502) | 101,576,502 | |||||
| Banking Corp. (Yankee) | |||||||
| 0.25%, 9/12/14 | 15,000,000 | a | 15,000,000 | ||||
| Asset-Backed | |||||||
| Wells Fargo Bank, NA | |||||||
| Commercial Paper—10.3% | |||||||
| 0.21%, 12/5/14 | 15,000,000 | 15,000,000 | |||||
| Total Negotiable Bank | Antalis U.S. Funding Corp. | ||||||
| Certificates of Deposit | 0.16%, 9/3/14 | 10,000,000 | a | 9,999,911 | |||
| (cost $133,000,000) | 133,000,000 | ||||||
8
| BNY Mellon Money Market Fund (continued) | ||||||||
| Asset-Backed | Principal | Principal | ||||||
| Commercial Paper (continued) | Amount ($) | Value ($) | Time Deposits (continued) | Amount ($) | Value ($) | |||
| Collateralized Commercial Paper | Swedbank (Grand Cayman) | |||||||
| Program Co., LLC | 0.05%, 9/2/14 | 7,000,000 | 7,000,000 | |||||
| 0.30%, 3/17/15 | 15,000,000 | 14,975,375 | Total Time Deposits | |||||
| Regency Markets No. 1 LLC | (cost $80,000,000) | 80,000,000 | ||||||
| 0.14%, 9/15/14 | 15,000,000 | a | 14,999,183 | |||||
| Total Asset-Backed | U.S. Treasury Bills—5.1% | |||||||
| Commercial Paper | ||||||||
| 0.08%, 9/11/14 | ||||||||
| (cost $39,974,469) | 39,974,469 | |||||||
| (cost $19,999,583) | 20,000,000 | 19,999,583 | ||||||
| Time Deposits—20.5% | ||||||||
| Repurchase Agreement—3.8% | ||||||||
| Australia and | ||||||||
| Citigroup Global Markets Holdings Inc. | ||||||||
| New Zealand Banking | ||||||||
| 0.05%, dated 8/29/14, due 9/2/14 | ||||||||
| Group Ltd. (Grand Cayman) | ||||||||
| in the amount of $15,000,083 (fully | ||||||||
| 0.06%, 9/2/14 | 15,000,000 | 15,000,000 | ||||||
| collateralized by $15,585,100 U.S. | ||||||||
| DZ Bank AG (Grand Cayman) | Treasury Notes, 1.38%, due | |||||||
| 0.05%, 9/2/14 | 15,000,000 | 15,000,000 | 1/31/20, value $15,300,026) | |||||
| Lloyds Bank (London) | (cost $15,000,000) | 15,000,000 | 15,000,000 | |||||
| 0.05%, 9/2/14 | 15,000,000 | 15,000,000 | ||||||
| Natixis New York | Total Investments | |||||||
| (Grand Cayman) | (cost $389,550,554) | 99.9 | % | 389,550,554 | ||||
| 0.06%, 9/2/14 | 13,000,000 | 13,000,000 | Cash and Receivables (Net) | .1 | % | 369,203 | ||
| Royal Bank of Canada (Toronto) | ||||||||
| Net Assets | 100.0 | % | 389,919,757 | |||||
| 0.05%, 9/2/14 | 15,000,000 | 15,000,000 | ||||||
| a Securities exempt from registration pursuant to Rule 144A under the Securities Act of 1933.These securities may be resold in transactions exempt from registration, normally to |
| qualified institutional buyers.At August 31, 2014, these securities amounted to $66,597,818 or 17.1% of net assets. |
| b Variable rate security—interest rate subject to periodic change. |
| Portfolio Summary (Unaudited) † | |||
| Value (%) | Value (%) | ||
| Banking | 76.9 | Asset-Backed/Special Purpose Entity | 2.6 |
| U.S. Government | 5.1 | Finance | 2.6 |
| Asset-Backed/Multi-Seller Programs | 3.9 | Food and Beverages | 1.2 |
| Asset-Backed/Banking | 3.8 | ||
| Repurchase Agreement | 3.8 | 99.9 | |
| † Based on net assets. | |||
| See notes to financial statements. | |||
The Funds 9
| STATEMENT OF INVESTMENTS |
| August 31, 2014 |
| BNY Mellon National Municipal Money Market Fund | |||||
| Coupon | Maturity | Principal | |||
| Short-Term Investments—100.0% | Rate (%) | Date | Amount ($) | Value ($) | |
| Alabama—1.1% | |||||
| Mobile County Industrial Development Authority, | |||||
| Gulf Opportunity Zone Revenue | |||||
| (SSAB Alabama Inc.) (LOC; Swedbank) | 0.08 | 9/7/14 | 7,000,000 | a | 7,000,000 |
| Mobile Industrial Development Board, Dock and Wharf Revenue, | |||||
| Refunding (Holnam Inc. Project) (LOC; Bayerische Landesbank) | 0.09 | 9/7/14 | 2,610,000 | a | 2,610,000 |
| Arizona—.8% | |||||
| Yavapai County Industrial Development Authority, Revenue | |||||
| (Skanon Investments, Inc.—Drake Cement Project) | |||||
| (LOC; Citibank NA) | 0.06 | 9/7/14 | 7,000,000 | a | 7,000,000 |
| California—4.6% | |||||
| California Health Facilities Financing Authority, Revenue, CP | |||||
| (Kaiser Permanente) | 0.06 | 9/4/14 | 39,565,000 | 39,564,842 | |
| Colorado—7.1% | |||||
| Colorado Educational and Cultural Facilities Authority, Revenue, | |||||
| Refunding (The Nature Conservancy Project) | 0.06 | 9/7/14 | 34,215,000 | a,b | 34,215,000 |
| Parker Automotive Metropolitan District, GO Notes | |||||
| (LOC; U.S. Bank NA) | 0.06 | 9/7/14 | 850,000 | a | 850,000 |
| Sheridan Redevelopment Agency, Tax Increment Revenue, | |||||
| Refunding (South Santa Fe Drive Corridor Redevelopment | |||||
| Project) (LOC; JPMorgan Chase Bank) | 0.09 | 9/7/14 | 5,000,000 | a | 5,000,000 |
| Southern Ute Indian Tribe of the Southern Ute Indian | |||||
| Reservation, Revenue | 0.06 | 9/7/14 | 20,300,000 | a | 20,300,000 |
| Connecticut—.3% | |||||
| Connecticut Health and Educational Facilities Authority, Revenue | |||||
| (Westminster School Issue) (LOC; Bank of America) | 0.12 | 9/7/14 | 2,100,000 | a,b | 2,100,000 |
| District of Columbia—.4% | |||||
| District of Columbia, Revenue (American Geophysical Union Issue) | |||||
| (LOC; Bank of America) | 0.10 | 9/7/14 | 2,970,000 | a | 2,970,000 |
| Florida—.7% | |||||
| Gainesville, IDR (Gainesville Hillel, Inc. Project) | |||||
| (LOC; Northern Trust Company) | 0.06 | 9/7/14 | 3,250,000 | a | 3,250,000 |
| Jacksonville, IDR (University of Florida Health Sciences Center Clinic) | |||||
| (LOC; Branch Banking and Trust Co.) | 0.05 | 9/7/14 | 2,800,000 | a | 2,800,000 |
| Georgia—.3% | |||||
| Fayette County Hospital Authority, RAC (Fayette Community | |||||
| Hospital Project) (LOC; FHLB) | 0.04 | 9/7/14 | 2,300,000 | a | 2,300,000 |
| Idaho—1.2% | |||||
| Idaho Housing and Finance Association, MFHR (Traditions | |||||
| at Boise Apartments Project) (LOC; FHLB) | 0.07 | 9/7/14 | 10,350,000 | a | 10,350,000 |
10
| BNY Mellon National Municipal Money Market Fund (continued) | |||||
| Coupon | Maturity | Principal | |||
| Short-Term Investments (continued) | Rate (%) | Date | Amount ($) | Value ($) | |
| Illinois—11.2% | |||||
| Brookfield, Revenue (Brookfield Zoo Project) | |||||
| (LOC; Northern Trust Company) | 0.06 | 9/7/14 | 1,920,000 | a,b | 1,920,000 |
| Galesburg, Revenue (Knox College Project) (LOC; PNC Bank NA) | 0.06 | 9/7/14 | 3,100,000 | a,b | 3,100,000 |
| Illinois Development Finance Authority, Revenue (American | |||||
| College of Surgeons Project) (LOC; Northern Trust Company) | 0.06 | 9/7/14 | 3,040,000 | a,b | 3,040,000 |
| Illinois Development Finance Authority, Revenue (Evanston | |||||
| Northwestern Healthcare Corporation) (Liquidity Facility; | |||||
| Wells Fargo Bank) | 0.02 | 9/2/14 | 3,000,000 | a,b | 3,000,000 |
| Illinois Development Finance Authority, Revenue (McCormick | |||||
| Theological Seminary Project) (LOC; Northern Trust Company) | 0.06 | 9/7/14 | 17,935,000 | a,b | 17,935,000 |
| Illinois Development Finance Authority, Revenue (McCormick | |||||
| Theological Seminary Project) (LOC; Northern Trust Company) | 0.06 | 9/7/14 | 4,615,000 | a,b | 4,615,000 |
| Illinois Development Finance Authority, Revenue (Saint | |||||
| Ignatius College Preparatory School) (LOC; PNC Bank NA) | 0.05 | 9/7/14 | 12,000,000 | a,b | 12,000,000 |
| Illinois Educational Facilities Authority, Revenue (The | |||||
| Lincoln Park Society) (LOC; Citibank NA) | 0.11 | 9/7/14 | 500,000 | a | 500,000 |
| Illinois Finance Authority, Revenue (Joan W. and Irving B. Harris | |||||
| Theater for Music and Dance Project) (LOC; PNC Bank NA) | 0.05 | 9/7/14 | 14,000,000 | a | 14,000,000 |
| Illinois Finance Authority, Revenue (Kohl Children’s Museum of | |||||
| Greater Chicago Inc. Project) (LOC; Northern Trust Company) | 0.05 | 9/7/14 | 1,675,000 | a | 1,675,000 |
| Illinois Finance Authority, Revenue (Saint Ignatius College | |||||
| Preparatory Project) (LOC; PNC Bank NA) | 0.06 | 9/7/14 | 13,000,000 | a,b | 13,000,000 |
| Illinois Finance Authority, Revenue (Village of Oak Park | |||||
| Residence Corporation Project) (LOC; PNC Bank NA) | 0.05 | 9/7/14 | 4,300,000 | a | 4,300,000 |
| Illinois Housing Development Authority, MFHR (Woodlawn Six | |||||
| Apartments) (LOC; FHLMC) | 0.07 | 9/7/14 | 8,270,000 | a | 8,270,000 |
| Romeoville, Revenue (Lewis University) (LOC; Wells Fargo Bank) | 0.03 | 9/2/14 | 7,810,000 | a,b | 7,810,000 |
| Indiana—3.8% | |||||
| Deutsche Bank Spears/Lifers Trust (Series DBE-565) (Indiana Bond | |||||
| Bank, Special Program Revenue) (Liquidity Facility; Deutsche | |||||
| Bank AG and LOC; Deutsche Bank AG) | 0.18 | 9/7/14 | 5,760,000 a,c,d | 5,760,000 | |
| Goshen, EDR (Goshen College Project) (LOC; JPMorgan Chase Bank) | 0.07 | 9/7/14 | 26,705,000 | a,b | 26,705,000 |
| Kentucky—.2% | |||||
| Mason County National Rural Utilities Cooperative Finance Corporation, | |||||
| PCR (East Kentucky Power Cooperative, Inc. Project) (Liquidity Facility; | |||||
| National Rural Utilities Cooperative Finance Corporation) | 0.24 | 9/7/14 | 1,125,000 | a | 1,125,000 |
| Mason County National Rural Utilities Cooperative Finance Corporation, | |||||
| PCR (East Kentucky Power Cooperative, Inc. Project) (Liquidity Facility; | |||||
| National Rural Utilities Cooperative Finance Corporation) | 0.24 | 9/7/14 | 450,000 | a | 450,000 |
The Funds 11
STATEMENT OF INVESTMENTS (continued)
| BNY Mellon National Municipal Money Market Fund (continued) | |||||
| Coupon | Maturity | Principal | |||
| Short-Term Investments (continued) | Rate (%) | Date | Amount ($) | Value ($) | |
| Louisiana—3.8% | |||||
| Louisiana Public Facilities Authority, Revenue (Air | |||||
| Products and Chemicals Project) | 0.02 | 9/2/14 | 32,400,000 | a | 32,400,000 |
| Maryland—4.6% | |||||
| Baltimore County, Revenue (Cross Creek Apartments Facility) | |||||
| (LOC; PNC Bank NA) | 0.07 | 9/7/14 | 4,375,000 | a | 4,375,000 |
| Baltimore Mayor and City Council Industrial Development | |||||
| Authority, Revenue (City of Baltimore Capital Acquisition | |||||
| Program) (LOC; Bayerische Landesbank) | 0.08 | 9/7/14 | 11,100,000 | a | 11,100,000 |
| Maryland Economic Development Corporation, EDR (Catholic | |||||
| Relief Services Facility) (LOC; Bank of America) | 0.08 | 9/7/14 | 15,075,000 | a | 15,075,000 |
| Maryland Health and Higher Educational Facilities | |||||
| Authority, Revenue (Stella Maris Issue) (LOC; M&T Trust) | 0.07 | 9/7/14 | 8,680,000 | a | 8,680,000 |
| Massachusetts—7.3% | |||||
| Massachusetts Health and Educational Facilities Authority, Revenue | |||||
| (Hillcrest Extended Care Services Issue) (LOC; Bank of America) | 0.08 | 9/7/14 | 15,410,000 | a | 15,410,000 |
| Massachusetts Water Resource Authority, CP | |||||
| (LOC; State Street Bank and Trust Co.) | 0.10 | 10/31/14 | 6,000,000 | 6,000,000 | |
| University of Massachusetts Building Authority, Project | |||||
| Revenue (Liquidity Facility; JPMorgan Chase Bank) | 0.07 | 9/7/14 | 41,100,000 | a,b | 41,100,000 |
| Michigan—.9% | |||||
| Lenawee County Economic Development Corporation, Revenue, | |||||
| Refunding (Siena Heights University Project) (LOC; FHLB) | 0.05 | 9/7/14 | 7,290,000 | a,b | 7,290,000 |
| Minnesota—1.0% | |||||
| Minnesota Higher Education Facilities Authority, Revenue | |||||
| (Macalester College) | 0.09 | 9/7/14 | 8,565,000 | a,b | 8,565,000 |
| Mississippi—5.1% | |||||
| Jackson County, Port Facility Revenue, Refunding | |||||
| (Chevron U.S.A. Inc. Project) | 0.02 | 9/2/14 | 13,100,000 | a | 13,100,000 |
| Mississippi Business Finance Corporation, Gulf Opportunity | |||||
| Zone IDR (Chevron U.S.A. Inc. Project) | 0.02 | 9/2/14 | 12,420,000 | a | 12,420,000 |
| Mississippi Business Finance Corporation, Gulf Opportunity | |||||
| Zone IDR (Chevron U.S.A. Inc. Project) | 0.02 | 9/2/14 | 16,225,000 | a | 16,225,000 |
| Mississippi Development Bank, Special Obligation Revenue, | |||||
| Refunding (Harrison County GO Bonds Refunding Project) | |||||
| (LOC; Bank of America) | 0.07 | 9/7/14 | 2,110,000 | a | 2,110,000 |
| Missouri—2.0% | |||||
| Saint Charles County Public Water Supply District Number 2, COP | |||||
| (Project Lease Agreement) (LOC; Bank of America) | 0.07 | 9/7/14 | 14,250,000 | a | 14,250,000 |
| Saint Louis Industrial Development Authority, MFHR (Kingsbury | |||||
| Place Apartments) (LOC; FHLB) | 0.09 | 9/7/14 | 3,125,000 | a | 3,125,000 |
12
| BNY Mellon National Municipal Money Market Fund (continued) | |||||
| Coupon | Maturity | Principal | |||
| Short-Term Investments (continued) | Rate (%) | Date | Amount ($) | Value ($) | |
| Nevada—2.1% | |||||
| Deutsche Bank Spears/Lifers Trust (Series DBE-668) (Clark County | |||||
| School District, Limited Tax Building Bonds GO) (Liquidity | |||||
| Facility; Deutsche Bank AG and LOC; Deutsche Bank AG) | 0.20 | 9/7/14 | 17,975,000 | a,b,c,d | 17,975,000 |
| New Hampshire—.7% | |||||
| New Hampshire Health and Education Facilities Authority, Revenue | |||||
| (University System of New Hampshire Issue) (Liquidity | |||||
| Facility; Wells Fargo Bank) | 0.10 | 9/2/14 | 5,735,000 | a,b | 5,735,000 |
| New Jersey—6.3% | |||||
| Deutsche Bank Spears/Lifers Trust (Series DBE-343) (Newark | |||||
| Housing Authority, Marine Terminal Additional Rent-Backed | |||||
| Revenue, Refunding (City of Newark Redevelopment Projects)) | |||||
| (Liquidity Facility; Deutsche Bank AG and LOC; Deutsche Bank AG) | 0.16 | 9/7/14 | 7,785,000 | a,c,d | 7,785,000 |
| Deutsche Bank Spears/Lifers Trust (Series DBE-511) (Newark | |||||
| Housing Authority, Marine Terminal Additional Rent-Backed Revenue, | |||||
| Refunding (City of Newark Redevelopment Projects)) (Liquidity | |||||
| Facility; Deutsche Bank AG and LOC; Deutsche Bank AG) | 0.17 | 9/7/14 | 12,000,000 | a,c,d | 12,000,000 |
| East Orange, GO Notes (BAN, Special Emergency Notes | |||||
| and Tax Appea Refunding Notes) | 1.25 | 9/24/14 | 4,899,000 | 4,900,531 | |
| Garfield, GO Notes, BAN | 1.25 | 2/27/15 | 4,460,000 | 4,476,098 | |
| Little Egg Harbor Township, GO Notes, BAN | 1.00 | 2/3/15 | 8,509,690 | 8,522,228 | |
| Little Falls Township, GO Notes (BAN, Special | |||||
| Emergency Note and Tax Appeal Refunding BAN) | 1.00 | 12/19/14 | 5,170,000 | 5,173,204 | |
| Margate, Special Emergency Notes | 1.00 | 12/22/14 | 3,000,000 | 3,003,194 | |
| Seaside Heights Borough, GO Notes, BAN | 1.00 | 1/30/15 | 5,000,000 | 5,003,277 | |
| Sussex County Municipal Utilities Authority, GO Notes (Paulins | |||||
| Kill Basin Water Reclamation System Project) | 1.50 | 2/13/15 | 2,750,000 | 2,763,613 | |
| New York—9.5% | |||||
| Albany Industrial Development Agency, Civic Facility Revenue | |||||
| (Renaissance Corporation of Albany Project) (LOC; M&T Trust) | 0.10 | 9/7/14 | 2,700,000 | a | 2,700,000 |
| Amherst Industrial Development Agency, Civic Facility Revenue | |||||
| (Daemen College Project) (LOC; M&T Trust) | 0.10 | 9/7/14 | 11,700,000 | a,b | 11,700,000 |
| Deutsche Bank Spears/Lifers Trust (Series DBE-1152) (TSASC, | |||||
| Inc., Tobacco Settlement Asset-Backed Bonds) (Liquidity | |||||
| Facility: Deutsche Bank AG and LOC; Deutsche Bank AG) | 0.15 | 9/7/14 | 6,500,000 a,c,d | 6,500,000 | |
| Dutchess County Industrial Development Agency, Civic | |||||
| Facility Revenue (Brookview, Inc. Project) | |||||
| (LOC; M&T Trust) | 0.10 | 9/7/14 | 8,050,000 | a | 8,050,000 |
| Erie County Industrial Development Agency, Civic Facility | |||||
| Revenue (The Canisius High School of Buffalo, N.Y. Project) | |||||
| (LOC; M&T Trust) | 0.10 | 9/7/14 | 18,360,000 | a,b | 18,360,000 |
The Funds 13
STATEMENT OF INVESTMENTS (continued)
| BNY Mellon National Municipal Money Market Fund (continued) | |||||
| Coupon | Maturity | Principal | |||
| Short-Term Investments (continued) | Rate (%) | Date | Amount ($) | Value ($) | |
| New York (continued) | |||||
| New York City Capital Resource Corporation, Recovery Zone | |||||
| Facility Revenue (WytheHotel Project) (LOC; M&T Trust) | 0.11 | 9/7/14 | 3,700,000 | a | 3,700,000 |
| New York City Municipal Water Finance Authority, Water and | |||||
| Sewer System Revenue (Liquidity Facility; Mizuho Bank, Ltd.) | 0.02 | 9/2/14 | 5,910,000 | a | 5,910,000 |
| New York State Housing Finance Agency, Housing Revenue (25 | |||||
| Washington Street) (LOC; M&T Trust) | 0.09 | 9/7/14 | 6,900,000 | a | 6,900,000 |
| Oneida County Industrial Development Agency, Civic | |||||
| Facility Revenue (Mohawk Valley Community College | |||||
| Dormitory Corporation Project) (LOC; Citibank NA) | 0.07 | 9/7/14 | 3,000,000 | a | 3,000,000 |
| Onondaga County Industrial Development Agency, Civic | |||||
| Facility Revenue (Syracuse Research Corporation Facility) | |||||
| (LOC; M&T Trust) | 0.10 | 9/7/14 | 3,340,000 | a | 3,340,000 |
| Oswego County Industrial Development Agency, Civic | |||||
| Facility Revenue (Oswego College Foundation, Inc. | |||||
| Project) (LOC; M&T Trust) | 0.10 | 9/7/14 | 890,000 | a,b | 890,000 |
| Rockland County Industrial Development Authority, Revenue | |||||
| (Northern Manor Multicare Center, Inc. Project) | |||||
| (LOC; M&T Trust) | 0.15 | 9/7/14 | 2,900,000 | a | 2,900,000 |
| Syracuse Industrial Development Agency, Civic Facility Revenue | |||||
| (Community Development Properties—Vanderbilt/Larned | |||||
| Project) (LOC; M&T Trust) | 0.10 | 9/7/14 | 1,300,000 | a | 1,300,000 |
| Tompkins County Industrial Development Agency, Civic | |||||
| Facility Revenue (Community Development Properties | |||||
| Ithaca, Inc. Project) (LOC; M&T Trust) | 0.15 | 9/7/14 | 5,800,000 | a | 5,800,000 |
| North Carolina—1.8% | |||||
| Charlotte-Mecklenburg Hospital Authority, Health Care Revenue | |||||
| (Carolinas HealthCare System) (LOC; Wells Fargo Bank) | 0.02 | 9/2/14 | 15,070,000 | a | 15,070,000 |
| Ohio—.9% | |||||
| Hamilton County, Hospital Facilities Revenue (Beechwood Home | |||||
| Project) (LOC; PNC Bank NA) | 0.07 | 9/7/14 | 3,015,000 | a | 3,015,000 |
| Summit County Port Authority, Port Facilities Revenue (Summa | |||||
| Wellness Institute-Hudson Project) (LOC; PNC Bank NA) | 0.05 | 9/7/14 | 4,355,000 | a | 4,355,000 |
| Pennsylvania—.9% | |||||
| Allegheny County Industrial Development Authority, Revenue | |||||
| (Sewickley Academy) (LOC; PNC Bank NA) | 0.07 | 9/7/14 | 1,695,000 | a,b | 1,695,000 |
| Butler County Industrial Development Authority, IDR, Refunding | |||||
| (Wetterau Finance Company Project) (LOC; U.S. Bank NA) | 0.07 | 9/7/14 | 1,940,000 | a | 1,940,000 |
| Jackson Township Industrial Development Authority, Revenue | |||||
| (StoneRidge Retirement Living Project) (LOC; PNC Bank NA) | 0.05 | 9/7/14 | 4,350,000 | a | 4,350,000 |
14
| BNY Mellon National Municipal Money Market Fund (continued) | |||||
| Coupon | Maturity | Principal | |||
| Short-Term Investments (continued) | Rate (%) | Date | Amount ($) | Value ($) | |
| South Carolina—2.7% | |||||
| South Carolina Jobs-Economic Development Authority, EDR | |||||
| (Ashley Hall Project) (LOC; Branch Banking and Trust Co.) | 0.06 | 9/7/14 | 18,895,000 | a,b | 18,895,000 |
| South Carolina Jobs-Economic Development Authority, EDR | |||||
| (Lexington-Richland Alcohol and Drug Abuse Council, Inc. | |||||
| Project) (LOC; Branch Banking and Trust Co.) | 0.06 | 9/7/14 | 4,125,000 | a | 4,125,000 |
| Tennessee—2.3% | |||||
| Metropolitan Government of Nashville and Davidson County, | |||||
| CP (Liquidity Facility; Sumitomo Mitsui Trust Bank, Ltd.) | 0.10 | 11/6/14 | 20,000,000 | 20,000,000 | |
| Texas—8.6% | |||||
| Atascosa County Industrial Development Corporation, PCR, | |||||
| Refunding (San Miguel Electric Cooperative, Inc. Project) (LOC; | |||||
| National Rural Utilities Cooperative Finance Corporation) | 0.10 | 9/7/14 | 36,200,000 | a | 36,200,000 |
| Jefferson County Industrial Development Corporation, Hurricane | |||||
| Ike Disaster Area Revenue (Jefferson Refinery, L.L.C. Project) | |||||
| (LOC; Branch Banking and Trust Co.) | 0.60 | 10/15/14 | 15,900,000 | 15,900,000 | |
| Red River Education Finance Corporation, Higher Education | |||||
| Revenue (Texas Christian University Project) (Liquidity | |||||
| Facility; Northern Trust Company) | 0.06 | 9/7/14 | 21,700,000 | a,b | 21,700,000 |
| Utah—.4% | |||||
| Utah Housing Corporation, MFHR (Timbergate Apartments | |||||
| Project) (LOC; FHLMC) | 0.10 | 9/7/14 | 3,125,000 | a | 3,125,000 |
| Virginia—2.4% | |||||
| Alexandria Industrial Development Authority, Revenue (Institute for | |||||
| Defense Analyses Project) (LOC; Branch Banking and Trust Co.) | 0.06 | 9/7/14 | 9,875,000 | a | 9,875,000 |
| Fairfax County Industrial Development Authority, | |||||
| Health Care Revenue (Inova Health System | |||||
| Project) (LOC; Northern Trust Company) | 0.06 | 9/7/14 | 3,600,000 | a | 3,600,000 |
| Fairfax County Industrial Development Authority, Revenue | |||||
| (Fairfax Hospital System, Inc.) (LOC; Northern Trust Company) | 0.06 | 9/7/14 | 1,600,000 | a | 1,600,000 |
| Fairfax County Industrial Development Authority, Revenue (Fairfax | |||||
| Hospital System, Inc.) (LOC; Northern Trust Company) | 0.06 | 9/7/14 | 2,800,000 | a | 2,800,000 |
| Fairfax County Industrial Development Authority, Revenue | |||||
| (Fairfax Hospital System, Inc.) (LOC; Northern Trust Company) | 0.06 | 9/7/14 | 2,900,000 | a | 2,900,000 |
| Washington—5.0% | |||||
| Squaxin Island Tribe, Tribal Infrastructure Revenue | |||||
| (LOC; Bank of America) | 0.13 | 9/7/14 | 4,825,000 | a | 4,825,000 |
| Washington Health Care Facilities Authority, Revenue (Providence | |||||
| Health and Services) (Liquidity Facility; U.S. Bank NA) | 0.07 | 9/7/14 | 22,200,000 | a | 22,200,000 |
The Funds 15
STATEMENT OF INVESTMENTS (continued)
| BNY Mellon National Municipal Money Market Fund (continued) | |||||
| Coupon | Maturity | Principal | |||
| Short-Term Investments (continued) | Rate (%) | Date | Amount ($) | Value ($) | |
| Washington (continued) | |||||
| Washington Health Care Facilities Authority, Revenue (Providence | |||||
| Health and Services) (Liquidity Facility; U.S. Bank NA) | 0.07 | 9/7/14 | 6,550,000 | a | 6,550,000 |
| Washington Housing Finance Commission, MFHR (Affinity at | |||||
| Southridge Apartments Project) (LOC; FHLB) | 0.07 | 9/7/14 | 6,350,000 | a | 6,350,000 |
| Washington Housing Finance Commission, Nonprofit Revenue | |||||
| (District Council Number Five Apprenticeship and Training | |||||
| Trust Fund Project) (LOC; Wells Fargo Bank) | 0.15 | 9/7/14 | 3,155,000 | a | 3,155,000 |
| Wisconsin—.0% | |||||
| Pleasant Prairie, IDR (Muskie Enterprises, Inc. | |||||
| Project) (LOC; Northern Trust Company) | 0.33 | 9/7/14 | 300,000 | a | 300,000 |
| Total Investments (cost $853,651,354) | 100.0 | % | 853,651,987 | ||
| Cash and Receivables (Net) | .0 | % | 233,589 | ||
| Net Assets | 100.0 | % | 853,885,576 | ||
| a Variable rate demand note—rate shown is the interest rate in effect at August 31, 2014. Maturity date represents the next demand date, or the ultimate maturity date if earlier. |
| b At August 31, 2014, the fund had $283,345,000 or 33.2% of net assets invested in securities whose payment of principal and interest is dependent upon revenues generated from |
| education. |
| c Securities exempt from registration pursuant to Rule 144A under the Securities Act of 1933.These securities may be resold in transactions exempt from registration, normally to |
| qualified institutional buyers.At August 31, 2014, these securities amounted to $50,020,000 or 5.9% of net assets. |
| d The fund does not directly own the municipal security indicated; the fund owns an interest in a special purpose entity that, in turn, owns the underlying municipal security.The |
| special purpose entity permits the fund to own interests in underlying assets, but in a manner structured to provide certain advantages not inherent in the underlying bonds (e.g., |
| enhanced liquidity, yields linked to short-term rates). |
| Portfolio Summary (Unaudited) † | |||
| Value (%) | Value (%) | ||
| Education | 33.2 | Lease | 1.9 |
| Industrial | 14.5 | Resource Recovery | 1.9 |
| Health Care | 11.0 | Special Tax | .8 |
| Housing | 8.8 | Transportation Services | .5 |
| Utility-Water and Sewer | 5.7 | Pollution Control | .1 |
| Utility-Electric | 4.2 | Other | 11.3 |
| City | 3.7 | ||
| State/Territory | 2.4 | 100.0 | |
| † Based on net assets. | |||
16
| Summary of Abbreviations | |||
| ABAG | Association of Bay Area Governments | ACA | American Capital Access |
| AGC | ACE Guaranty Corporation | AGIC | Asset Guaranty Insurance Company |
| AMBAC | American Municipal Bond Assurance Corporation | ARRN | Adjustable Rate Receipt Notes |
| BAN | Bond Anticipation Notes | BPA | Bond Purchase Agreement |
| CIFG | CDC Ixis Financial Guaranty | COP | Certificate of Participation |
| CP | Commercial Paper | DRIVERS | Derivative Inverse Tax-Exempt Receipts |
| EDR | Economic Development Revenue | EIR | Environmental Improvement Revenue |
| FGIC | Financial Guaranty Insurance Company | FHA | Federal Housing Administration |
| FHLB | Federal Home Loan Bank | FHLMC | Federal Home Loan Mortgage Corporation |
| FNMA | Federal National Mortgage Association | GAN | Grant Anticipation Notes |
| GIC | Guaranteed Investment Contract | GNMA | Government National Mortgage Association |
| GO | General Obligation | HR | Hospital Revenue |
| IDB | Industrial Development Board | IDC | Industrial Development Corporation |
| IDR | Industrial Development Revenue | LIFERS | Long Inverse Floating Exempt Receipts |
| LOC | Letter of Credit | LOR | Limited Obligation Revenue |
| LR | Lease Revenue | MERLOTS | Municipal Exempt Receipts Liquidity Option Tender |
| MFHR | Multi-Family Housing Revenue | MFMR | Multi-Family Mortgage Revenue |
| PCR | Pollution Control Revenue | P-FLOATS | Puttable Floating Option Tax-Exempt Receipts |
| PILOT | Payment in Lieu of Taxes | PUTTERS | Puttable Tax-Exempt Receipts |
| RAC | Revenue Anticipation Certificates | RAN | Revenue Anticipation Notes |
| RAW | Revenue Anticipation Warrants | RIB | Residual Interest Bonds |
| ROCS | Reset Option Certificates | RRR | Resources Recovery Revenue |
| SAAN | State Aid Anticipation Notes | SBPA | Standby Bond Purchase Agreement |
| SFHR | Single Family Housing Revenue | SFMR | Single Family Mortgage Revenue |
| SONYMA | State of New York Mortgage Agency | SPEARS | Short Puttable Exempt Adjustable Receipts |
| SWDR | Solid Waste Disposal Revenue | TAN | Tax Anticipation Notes |
| TAW | Tax Anticipation Warrants | TRAN | Tax and Revenue Anticipation Notes |
| XLCA | XL Capital Assurance | ||
| See notes to financial statements. | |||
The Funds 17
| STATEMENTS OF ASSETS AND LIABILITIES |
| August 31, 2014 |
| BNY Mellon | BNY Mellon | ||
| Money Market | National Municipal | ||
| Fund | Money Market Fund | ||
| Assets ($): | |||
| Investments in securities—See Statement of Investments† | |||
| (including a Repurchase Agreement of $15,000,000 | |||
| for BNY Mellon Money Market Fund)—Note 2(c) | 389,550,554 | 853,651,987 | |
| Cash | 424,605 | 60,230 | |
| Interest receivable | 64,094 | 328,938 | |
| Prepaid expenses | 7,574 | 8,470 | |
| 390,046,827 | 854,049,625 | ||
| Liabilities ($): | |||
| Due to The Dreyfus Corporation and affiliates—Note 3(b) | 27,717 | 27,681 | |
| Due to Administrator—Note 3(a) | 35,425 | 64,839 | |
| Accrued expenses | 63,928 | 71,529 | |
| 127,070 | 164,049 | ||
| Net Assets ($) | 389,919,757 | 853,885,576 | |
| Composition of Net Assets ($): | |||
| Paid-in capital | 389,916,457 | 855,188,238 | |
| Accumulated net realized gain (loss) on investments | 3,300 | (1,303,295 | ) |
| Accumulated gross unrealized appreciation on investments | — | 633 | |
| Net Assets ($) | 389,919,757 | 853,885,576 | |
| Net Asset Value Per Share | |||
| Class M Shares | |||
| Net Assets ($) | 381,864,009 | 851,238,038 | |
| Shares Outstanding | 381,863,547 | 852,537,529 | |
| Net Asset Value Per Share ($) | 1.00 | 1.00 | |
| Investor Shares | |||
| Net Assets ($) | 8,055,748 | 2,647,538 | |
| Shares Outstanding | 8,055,704 | 2,651,624 | |
| Net Asset Value Per Share ($) | 1.00 | 1.00 | |
| † Investments at cost ($) | 389,550,554 | 853,651,354 | |
| See notes to financial statements. | |||
18
| STATEMENTS OF OPERATIONS |
| Year Ended August 31, 2014 |
| BNY Mellon | BNY Mellon | |||
| Money Market | National Municipal | |||
| Fund | Money Market Fund | |||
| Investment Income ($): | ||||
| Interest Income | 568,606 | 1,163,464 | ||
| Expenses: | ||||
| Investment advisory fee—Note 3(a) | 602,059 | 1,370,118 | ||
| Administration fee—Note 3(a) | 496,920 | 1,130,703 | ||
| Custodian fees—Note 3(b) | 58,928 | 66,753 | ||
| Professional fees | 34,965 | 49,075 | ||
| Registration fees | 26,742 | 26,142 | ||
| Trustees’ fees and expenses—Note 3(c) | 24,781 | 56,163 | ||
| Shareholder servicing costs—Note 3(b) | 17,463 | 8,010 | ||
| Prospectus and shareholders’ reports | 7,314 | 7,820 | ||
| Miscellaneous | 31,407 | 38,804 | ||
| Total Expenses | 1,300,579 | 2,753,588 | ||
| Less—reduction in expenses due to undertakings—Note 3(a) | (602,059 | ) | (1,364,793 | ) |
| Less—reduction in administration fees—Note 3(a) | (129,376 | ) | (225,664 | ) |
| Less—reduction in fees due to earnings credits—Note 3(b) | (688 | ) | — | |
| Net Expenses | 568,456 | 1,163,131 | ||
| Investment Income—Net | 150 | 333 | ||
| Realized and Unrealized Gain (Loss) on Investments—Note 2(b) ($) | ||||
| Net realized gain (loss) on investments | 3,300 | 113,193 | ||
| Net unrealized appreciation (depreciation) on investments | — | 633 | ||
| Net Increase in Net Assets Resulting from Operations | 3,450 | 114,159 | ||
| See notes to financial statements. |
The Funds 19
STATEMENTS OF CHANGES IN NET ASSETS
| BNY Mellon National Municipal | ||||||||
| BNY Mellon Money Market Fund | Money Market Fund | |||||||
| Year Ended August 31, | Year Ended August 31, | |||||||
| 2014 | 2013 | 2014 | 2013 | |||||
| Operations ($): | ||||||||
| Investment income—net | 150 | 254 | 333 | 1,791 | ||||
| Net realized gain (loss) from investments | 3,300 | 5,547 | 113,193 | 43,129 | ||||
| Net unrealized appreciation (depreciation) on investments | — | — | 633 | — | ||||
| Net Increase (Decrease) in Net Assets | ||||||||
| Resulting from Operations | 3,450 | 5,801 | 114,159 | 44,920 | ||||
| Dividends to Shareholders from ($): | ||||||||
| Investment income—net: | ||||||||
| Class M Shares | (3,621 | ) | (849 | ) | (332 | ) | (1,791 | ) |
| Investor Shares | (43 | ) | (5 | ) | (1 | ) | — | |
| Total Dividends | (3,664 | ) | (854 | ) | (333 | ) | (1,791 | ) |
| Beneficial Interest Transactions ($1.00 per share): | ||||||||
| Net proceeds from shares sold: | ||||||||
| Class M Shares | 613,427,576 | 933,333,326 | 1,114,080,175 | 2,093,516,866 | ||||
| Investor Shares | 10,822,069 | 12,316,323 | 6,467,210 | 7,122,756 | ||||
| Dividends reinvested: | ||||||||
| Investor Shares | 43 | 4 | 1 | — | ||||
| Cost of shares redeemed: | ||||||||
| Class M Shares | (619,026,158 | ) | (1,403,475,897 | ) | (1,272,929,316 | ) | (2,400,255,910 | ) |
| Investor Shares | (7,406,843 | ) | (18,015,562 | ) | (6,684,412 | ) | (5,276,615 | ) |
| Increase (Decrease) in Net Assets from | ||||||||
| Beneficial Interest Transactions | (2,183,313 | ) | (475,841,806 | ) | (159,066,342 | ) | (304,892,903 | ) |
| Total Increase (Decrease) In Net Assets | (2,183,527 | ) | (475,836,859 | ) | (158,952,516 | ) | (304,849,774 | ) |
| Net Assets ($): | ||||||||
| Beginning of Period | 392,103,284 | 867,940,143 | 1,012,838,092 | 1,317,687,866 | ||||
| End of Period | 389,919,757 | 392,103,284 | 853,885,576 | 1,012,838,092 | ||||
| See notes to financial statements. | ||||||||
20
FINANCIAL HIGHLIGHTS
The following tables describe the performance for each share class of each BNY Mellon money market fund for the fiscal periods indicated. All information reflects financial results for a single fund share.Total return shows how much your investment in each fund would have increased (or decreased) during each period, assuming you had reinvested all dividends and distributions.These figures have been derived from the funds’ financial statements.
| Class M Shares | ||||||||||
| Year Ended August 31, | ||||||||||
| BNY Mellon Money Market Fund | 2014 | 2013 | 2012 | 2011 | 2010 | |||||
| Per Share Data ($): | ||||||||||
| Net asset value, beginning of period | 1.00 | 1.00 | 1.00 | 1.00 | 1.00 | |||||
| Investment Operations: | ||||||||||
| Investment income—net | .000 | a | .000 | a | .000 | a | .000 | a | .001 | |
| Distributions: | ||||||||||
| Dividends from investment income—net | (.000 | )a | (.000 | )a | (.000 | )a | (.000 | )a | (.001 | ) |
| Net asset value, end of period | 1.00 | 1.00 | 1.00 | 1.00 | 1.00 | |||||
| Total Return (%) | .00 | b | .00 | b | .00 | b | .02 | .07 | ||
| Ratios/Supplemental Data (%): | ||||||||||
| Ratio of total expenses to average net assets | .32 | .31 | .30 | .30 | .30 | |||||
| Ratio of net expenses to average net assets | .14 | .20 | .21 | .26 | .29 | |||||
| Ratio of net investment income to average net assets | .00 | b | .00 | b | .00 | b | .02 | .07 | ||
| Net Assets, end of period ($ x 1,000) | 381,864 | 387,463 | 857,600 | 1,006,111 | 1,092,771 | |||||
| a | Amount represents less than $.001 per share. |
| b | Amount represents less than .01%. |
See notes to financial statements.
The Funds 21
FINANCIAL HIGHLIGHTS (continued)
| Investor Shares | ||||||||||
| Year Ended August 31, | ||||||||||
| BNY Mellon Money Market Fund | 2014 | 2013 | 2012 | 2011 | 2010 | |||||
| Per Share Data ($): | ||||||||||
| Net asset value, beginning of period | 1.00 | 1.00 | 1.00 | 1.00 | 1.00 | |||||
| Investment Operations: | ||||||||||
| Investment income—net | .000 | a | .000 | a | .000 | a | .000 | a | .000 | a |
| Distributions: | ||||||||||
| Dividends from investment income—net | (.000 | )a | (.000 | )a | (.000 | )a | (.000 | )a | (.000 | )a |
| Net asset value, end of period | 1.00 | 1.00 | 1.00 | 1.00 | 1.00 | |||||
| Total Return (%) | .00 | b | .00 | b | .00 | b | .00 | b | .00 | b |
| Ratios/Supplemental Data (%): | ||||||||||
| Ratio of total expenses to average net assets | .57 | .56 | .58 | .55 | .55 | |||||
| Ratio of net expenses to average net assets | .14 | .19 | .22 | .26 | .38 | |||||
| Ratio of net investment income to average net assets | .00 | b | .00 | b | .00 | b | .00 | b | .00 | b |
| Net Assets, end of period ($ x 1,000) | 8,056 | 4,640 | 10,340 | 1,522 | 312 | |||||
| a | Amount represents less than $.001 per share. |
| b | Amount represents less than .01%. |
See notes to financial statements.
22
| Class M Shares | ||||||||||
| Year Ended August 31, | ||||||||||
| BNY Mellon National Municipal Money Market Fund | 2014 | 2013 | 2012 | 2011 | 2010 | |||||
| Per Share Data ($): | ||||||||||
| Net asset value, beginning of period | 1.00 | 1.00 | 1.00 | 1.00 | 1.00 | |||||
| Investment Operations: | ||||||||||
| Investment income—net | .000 | a | .000 | a | .000 | a | .000 | a | .000 | a |
| Distributions: | ||||||||||
| Dividends from investment income—net | (.000 | )a | (.000 | )a | (.000 | )a | (.000 | )a | (.000 | )a |
| Net asset value, end of period | 1.00 | 1.00 | 1.00 | 1.00 | 1.00 | |||||
| Total Return (%) | .00 | b | .00 | b | .00 | b | .03 | .05 | ||
| Ratios/Supplemental Data (%): | ||||||||||
| Ratio of total expenses to average net assets | .30 | .30 | .30 | .29 | .30 | |||||
| Ratio of net expenses to average net assets | .13 | .23 | .22 | .26 | .28 | |||||
| Ratio of net investment income to average net assets | .00 | b | .00 | b | .00 | b | .03 | .04 | ||
| Net Assets, end of period ($ x 1,000) | 851,238 | 1,009,973 | 1,316,666 | 1,352,760 | 1,551,274 | |||||
| a | Amount represents less than $.001 per share. |
| b | Amount represents less than .01%. |
See notes to financial statements.
The Funds 23
FINANCIAL HIGHLIGHTS (continued)
| Investor Shares | ||||||||||
| Year Ended August 31, | ||||||||||
| BNY Mellon National Municipal Money Market Fund | 2014 | 2013 | 2012 | 2011 | 2010 | |||||
| Per Share Data ($): | ||||||||||
| Net asset value, beginning of period | 1.00 | 1.00 | 1.00 | 1.00 | 1.00 | |||||
| Investment Operations: | ||||||||||
| Investment income—net | .000 | a | .000 | a | .000 | a | .000 | a | .000 | a |
| Distributions: | ||||||||||
| Dividends from investment income—net | (.000 | )a | (.000 | )a | (.000 | )a | (.000 | )a | (.000 | )a |
| Net asset value, end of period | 1.00 | 1.00 | 1.00 | 1.00 | 1.00 | |||||
| Total Return (%) | .00 | b | .00 | b | .00 | b | .00 | b | .00 | b |
| Ratios/Supplemental Data (%): | ||||||||||
| Ratio of total expenses to average net assets | .55 | .57 | .56 | .54 | .55 | |||||
| Ratio of net expenses to average net assets | .13 | .24 | .23 | .29 | .33 | |||||
| Ratio of net investment income to average net assets | .00 | b | .00 | b | .00 | b | .00 | b | .00 | b |
| Net Assets, end of period ($ x 1,000) | 2,648 | 2,865 | 1,022 | 272 | 1 | |||||
| a | Amount represents less than $.001 per share. |
| b | Amount represents less than .01%. |
See notes to financial statements.
24
NOTES TO FINANCIAL STATEMENTS
NOTE 1—General:
BNY Mellon Funds Trust (the “Trust”) was organized as a Massachusetts business trust that is registered under the Investment Company Act of 1940, as amended (the “Act”), as an open-end management investment company and operates as a series company currently consisting of twenty-five series, including the following diversified money market funds: BNY Mellon Money Market Fund and BNY Mellon National Municipal Money Market Fund (each, a “fund” and together, the “funds”). BNY Mellon Money Market Fund’s investment objective is to seek as high a level of current income as is consistent with the preservation of capital and the maintenance of liquidity. BNY Mellon National Municipal Money Market Fund’s investment objective is to provide investors with as high a level of current income exempt from federal income tax as is consistent with the preservation of capital and the maintenance of liquidity.
BNY Mellon Fund Advisers, a division of The Dreyfus Corporation (the “Manager” or “Dreyfus), a wholly-owned subsidiary of The Bank of New York Mellon Corporation (“BNY Mellon”), serves as each fund’s investment adviser (the “Investment Adviser”).The Bank of New York Mellon, a subsidiary of BNY Mellon and an affiliate of Dreyfus, serves as administrator for the funds pursuant to an Administration Agreement with the Trust (the “Administration Agreement”). The Bank of New York Mellon has entered into a Sub-Administration Agreement with Dreyfus pursuant to which The Bank of New York Mellon pays Dreyfus for performing certain administrative services. MBSC Securities Corporation (the “Distributor”), a wholly-owned subsidiary of Dreyfus, is the distributor of each fund’s shares, which are sold without a sales charge.
Each fund is authorized to issue an unlimited number of $.001 par value shares of Beneficial Interest in each of the following classes: Class M and Investor. Other differences between the classes include the services offered to and the expenses borne by each class, the allocation of certain transfer agency costs, and certain voting rights. Income, expenses (other than expenses attributable to a specific class), and realized and unrealized gains or losses on investments are allocated to each class of shares based on its relative net assets.
It is each fund’s policy to maintain a continuous net asset value per share of $1.00; each fund has adopted certain investment, portfolio valuation and dividend and distribution policies to enable it to do so. There is no assurance, however, that either fund will be able to maintain a stable net asset value per share of $1.00.
The Trust accounts separately for the assets, liabilities and operations of each series. Expenses directly attributable to each series are charged to that series’ operations; expenses which are applicable to all series are allocated among them on a pro rata basis.
The Financial Accounting Standards Board (“FASB”) Accounting Standards Codification is the exclusive reference of authoritative U.S. generally accepted accounting principles (“GAAP”) recognized by the FASB to be applied by nongovernmental entities. Rules and interpretive releases of the Securities and Exchange Commission (“SEC”) under authority of federal laws are also sources of authoritative GAAP for SEC registrants. Each fund’s financial statements are prepared in accordance with GAAP, which may require the use of management estimates and assumptions. Actual results could differ from those estimates.
NOTE 2—Significant Accounting Policies:
(a) Portfolio valuation: Investments in securities are valued at amortized cost in accordance with Rule 2a-7 under the Act. If amortized cost is determined not to approximate market value, the fair value of the portfolio securities will be determined by procedures established by and under the general supervision of the Trust’s Board of Trustees (the “Board”).
The Funds 25
NOTES TO FINANCIAL STATEMENTS (continued)
The fair value of a financial instrument is the amount that would be received to sell an asset or paid to transfer a liability in an orderly transaction between market participants at the measurement date (i.e., the exit price). GAAP establishes a fair value hierarchy that prioritizes the inputs of valuation techniques used to measure fair value.This hierarchy gives the highest priority to unadjusted quoted prices in active markets for identical assets or liabilities (Level 1 measurements) and the lowest priority to unobservable inputs (Level 3 measurements).
Additionally, GAAP provides guidance on determining whether the volume and activity in a market has decreased significantly and whether such a decrease in activity results in transactions that are not orderly. GAAP requires enhanced disclosures around valuation inputs and techniques used during annual and interim periods.
Various inputs are used in determining the value of each fund’s investments relating to fair value measurements. These inputs are summarized in the three broad levels listed below:
Level 1—unadjusted quoted prices in active markets for identical investments.
Level 2—other significant observable inputs (including quoted prices for similar investments, interest rates, prepayment speeds, credit risk, etc.).
Level 3—significant unobservable inputs (including the funds’ own assumptions in determining the fair value of investments).
The inputs or methodology used for valuing securities are not necessarily an indication of the risk associated with investing in those securities. For example, money market securities are valued using amortized cost, in accordance with rules under the Act. Generally, amortized cost approximates the current fair value of a security, but since the value is not obtained from a quoted price in an active market, such securities are reflected within Level 2 of the fair value hierarchy.
At August 31, 2014, all of the securities in each fund were considered Level 2 of the fair value hierarchy.
At August 31, 2014, there were no transfers between Level 1 and Level 2 of the fair value hierarchy for any of the funds.
(b) Securities transactions and investment income:
Securities transactions are recorded on a trade date basis. Interest income, adjusted for accretion of discount and amortization of premium on investments, is earned from settlement date and recognized on the accrual basis. Realized gains and losses from securities transactions are recorded on the identified cost basis. Cost of investments represents amortized cost.
(c) Repurchase agreements: BNY Mellon Money Market Fund may enter into repurchase agreements with financial institutions, deemed to be creditworthy by Dreyfus, subject to the seller’s agreement to repurchase and the fund’s agreement to resell such securities at a mutually agreed upon price. Pursuant to the terms of the repurchase agreement, such securities must have an aggregate market value greater than or equal to the terms of the repurchase price plus accrued interest at all times. If the value of the underlying securities falls below the value of the repurchase price plus accrued interest, the fund will require the seller to deposit additional collateral by the next business day. If the request for additional collateral is not met, or the seller defaults on its repurchase obligation, the fund maintains its right to sell the underlying securities at market value and may claim any resulting loss against the seller.
(d) Dividends to shareholders: Dividends payable to shareholders are recorded by the funds on the ex-dividend date.The funds declare dividends daily from investment income-net; such dividends are paid monthly.With respect to each series, dividends from net realized capital gains, if any, are normally declared and paid annually, but the funds may make distributions on a more frequent basis to comply with the distribution requirements of the Internal Revenue Code of 1986, as amended (the “Code”).To the extent that net realized capital gains can be offset by capital loss carryovers of a fund, it is the policy of the funds not to distribute such gains.
26
(e) Federal income taxes: It is the policy of BNY Mellon Money Market Fund to continue to qualify as a regulated investment company, if such qualification is in the best interests of its shareholders, by complying with the applicable provisions of the Code, and to make distributions of taxable income sufficient to relieve it from substantially all federal income and excise taxes. It is the policy of BNY Mellon National Municipal Market Fund to continue to qualify as a regulated investment company, which can distribute tax-exempt dividends, by complying with the applicable provisions of the Code, and to make distributions of income and net realized capital gain sufficient to relieve it from substantially all federal income and excise taxes. For federal income tax purposes, each series is treated as a single entity for the purpose of determining such qualification.
As of and during the period ended August 31, 2014, the funds did not have any liabilities for any uncertain tax positions. The funds recognizes interest and penalties, if any, related to uncertain tax positions as income tax expense in the Statement of Operations. During the period ended August 31, 2014, the funds did not incur any interest or penalties.
Each tax year in the four-year period ended August 31, 2014 remains subject to examination by the Internal Revenue Service and state taxing authorities.
At August 31, 2014, the components of accumulated earnings on a tax basis were substantially the same as for financial reporting purposes.
Under the Regulated Investment Company Modernization Act of 2010 (the “2010 Act”), BNY Mellon National Municipal Money Market Fund is permitted to carry forward capital losses incurred in taxable years beginning after December 22, 2010 (“post-enactment losses”) for an unlimited period. Furthermore, post-enactment capital loss carryovers retain their character as either short-term or long-term capital losses rather than short-term as they were under previous statute.The 2010 Act requires post-enactment losses to be utilized before the utilization of losses incurred in taxable years prior to the effective date of the 2010 Act (“pre-enactment losses”). As a result of this ordering rule, pre-enactment losses may be more likely to expire unused.
BNY Mellon National Municipal Money Market Fund has an accumulated capital loss carryover of $1,303,295 available for federal income tax purposes to be applied against future net realized capital gains, if any, realized subsequent to August 31, 2014. If not applied, the carryover expires in fiscal year 2017.
The tax character of distributions paid to shareholders during the fiscal periods ended August 31, 2014 and August 31, 2013 was all ordinary income for BNY Mellon Money Market Fund and all tax-exempt income for BNY Mellon National Municipal Money Market Fund.
During the period ended August 31, 2014, as a result of permanent book to tax differences, primarily due to dividend reclassification, BNY Mellon Money Market Fund increased accumulated undistributed investment income-net by $3,514 and decreased accumulated net realized gain (loss) on investments by the same amount. Net assets and net asset value per share were not affected by this reclassification.
At August 31, 2014, BNY Mellon National Municipal Money Market Fund had accumulated gross unrealized appreciation on investments of $633.
At August 31, 2014, the cost of investments for federal income tax purposes was substantially the same as the cost for financial reporting purposes (see the Statements of Investments).
NOTE 3—Investment Advisory Fee, Administration Fee and Other Transactions with Affiliates:
(a) Fees payable by the funds pursuant to the provisions of an investment advisory agreement with the Investment Adviser are payable monthly, computed on the average daily value of each fund’s net assets at the following annual rates: .15% of BNY Mellon Money
The Funds 27
NOTES TO FINANCIAL STATEMENTS (continued)
Market Fund and .15% of BNY Mellon National Municipal Money Market Fund.
Pursuant to the Administration Agreement,The Bank of New York Mellon provides or arranges for fund accounting, transfer agency and other fund administration services and receives a fee based on the total net assets of the Trust based on the following rates:
| 0 up to $6 billion | .15 | % |
| $6 billion up to $12 billion | .12 | % |
| In excess of $12 billion | .10 | % |
The Investment Adviser has undertaken to waive receipt of the management/administration fees and/or reimburse operating expenses in order to facilitate a daily yield at or above a certain level which may change from time to time. The undertakings are voluntary and not contractual, and may be terminated at any time. Table 1 summarizes the reduction in expenses for each class of shares of each fund, pursuant to these undertakings, during the period ended August 31, 2014.
| Table 1—Expense Reductions | ||
| Class M | Investor | |
| Shares ($) | Shares ($) | |
| BNY Mellon | ||
| Money Market Fund | ||
| Management fee waiver | 591,589 | 10,470 |
| Administration fee waiver | 109,708 | 19,668 |
| BNY Mellon National Municipal | ||
| Money Market Fund | ||
| Management fee waiver | 1,359,992 | 4,801 |
| Administration fee waiver | 216,812 | 8,852 |
(b) The funds have adopted a Shareholder Services Plan with respect to their Investor shares. Each fund pays the Distributor for the provision of certain services to holders of Investor shares a fee at an annual rate of .25% of the value of the average daily net assets attributable to Investor shares. The services provided may include personal services relating to shareholder accounts, such as answering shareholder inquiries regarding a fund and providing reports and other information, and services related to the maintenance of such shareholder accounts. The Shareholder Services Plan allows the Distributor to make payments from the shareholder services fees it collects from each fund to compensate service agents (certain banks, securities brokers or dealers and other financial institutions) with respect to these services. Table 2 summarizes the amounts Investor shares of each fund were charged during the period ended August 31, 2014, pursuant to the Shareholder Services Plan. Additional fees included in shareholder servicing costs in the Statements of Operations primarily include fees paid for cash management charges.
| Table 2—Shareholder Services Plan Fees | ||
| BNY Mellon Money Market Fund | $ | 17,451 |
| BNY Mellon National Municipal | ||
| Money Market Fund | 8,001 |
The funds have arrangements with the transfer agent and the custodian whereby the funds may receive earnings credits when positive cash balances are maintained, which are used to offset transfer agency and custody fees. For financial reporting purposes, the funds include net earnings credits as expense offsets in the Statements of Operations.
The funds compensate Dreyfus Transfer, Inc., a wholly-owned subsidiary of Dreyfus, under a transfer agency agreement for providing cash management services for the funds.The cash management fees are related to fund subscriptions and redemptions. The Bank of New York Mellon pays each fund’s transfer agent fees, which are comprised of amounts paid on a per account basis out of the administration fee it receives from the Trust. The funds also compensated The Bank of New York Mellon for performing certain cash management services related to fund subscriptions and redemptions, including share-
28
holder redemption draft processing, under a cash management agreement that was in effect until September 30, 2013 and, beginning October 1, 2013, compensates The Bank of New York Mellon for processing shareholder redemption drafts under a shareholder draft processing agreement. Table 3 summarizes the amount each fund was charged during the period ended August 31, 2014, pursuant to the cash management agreement, which is included in Shareholder servicing costs in the Statements of Operations.These fees were partially offset by earnings credits for BNY Mellon Money Market Fund, also summarized in Table 3.
The funds compensate The Bank of New York Mellon under a custody agreement for providing custodial services for the funds. These fees are determined based on net assets, geographic region and transaction activity. Table 4 summarizes the amount each fund was charged during the period ended August 31, 2014, pursuant to the custody agreement. These fees were partially offset by earnings credits for BNY Mellon Money Market Fund, also summarized in Table 4.
| Table 4—Custody Agreement Fees | |||
| Custody | Earnings | ||
| Fees ($) | Credits ($) | ||
| BNY Mellon Money Market Fund | 58,928 | (687 | ) |
| BNY Mellon National Municipal | |||
| Money Market Fund | 66,753 | — |
During the period ended August 31, 2014, each fund was charged $8,296 for services performed by the Chief Compliance Officer and his staff.
Table 5 summarizes the components of “Due to The Dreyfus Corporation and affiliates” in the Statements of Assets and Liabilities for each fund.
(c) Each Board member also serves as a Board member of other funds within the Trust. Annual retainer fees and attendance fees are allocated to each fund based on net assets.
| Table 3—Cash Management Agreement Fees | ||||||||
| Dreyfus Transfer, Inc. | The Bank of New York | |||||||
| Cash Management | Dreyfus Transfer, Inc. | Mellon Cash | ||||||
| Fees ($) | Earnings Credits ($) | Management Fees ($) | ||||||
| BNY Mellon Money Market Fund | 8 | (1 | ) | 2 | ||||
| BNY Mellon National Municipal Money Market Fund | 6 | — | 2 | |||||
| Table 5—Due to The Dreyfus Corporation and Affiliates | ||||||||
| Investment | Shareholder | Chief | ||||||
| Advisory | Services | Custody | Compliance | Less Expense | ||||
| Fees ($) | Plan Fees ($) | Fees ($) | Officer Fees ($) | Reimbursement ($) | ||||
| BNY Mellon Money Market Fund | 47,991 | 1,670 | 24,893 | 1,154 | (47,991 | ) | ||
| BNY Mellon National Municipal Money Market Fund | 112,198 | 527 | 26,000 | 1,154 | (112,198 | ) | ||
The Funds 29
NOTES TO FINANCIAL STATEMENTS (continued)
NOTE 4—Securities Transactions:
BNY Mellon National Municipal Money Market Fund is permitted to purchase or sell securities from or to certain affiliated funds under specified conditions outlined in procedures adopted by the Board. The procedures have been designed to ensure that any purchase or sale of securities by the fund from or to another fund or portfolio that are, or could be, considered an affiliate by virtue of having a common investment adviser (or affiliated investment adviser), common board members and/or common officers, complies with Rule 17a-7 under the Act. During the period ended August 31, 2014, the fund engaged in purchases and sales of securities pursuant to Rule 17a-7 under the Act amounting to $303,935,000 and $367,900,000, respectively.
NOTE 5—Regulatory Developments:
On July 23, 2014, the SEC adopted amendments to the rules that govern money market mutual funds. In part, the amendments will require structural changes to most types of money market funds to one extent or another; however, the SEC provided for an extended two-year transition period to comply with such structural require-ments.At this time, management is evaluating the reforms adopted and the manner for implementing these reforms over time and its impact on the financial statements.
30
REPORT OF INDEPENDENT REGISTERED PUBLIC ACCOUNTING FIRM
The Board of Trustees and Shareholders BNY Mellon Funds Trust
We have audited the accompanying statements of assets and liabilities of BNY Mellon Money Market Fund and BNY Mellon National Municipal Money Market Fund, (collectively the “Funds”), each a series of BNY Mellon Funds Trust, including the statements of investments as of August 31, 2014, and the related statements of operations for the year then ended, the statements of changes in net assets for each of the years in the two-year period then ended and the financial highlights for each of the years in the five-year period then ended.These financial statements and financial highlights are the responsibility of the Funds’ management. Our responsibility is to express an opinion on these financial statements and financial highlights based on our audits.
We conducted our audits in accordance with the standards of the Public Company Accounting Oversight Board (United States). Those standards require that we plan and perform the audit to obtain reasonable assurance about whether the financial statements and financial highlights are free of material misstatement.An audit includes examining, on a test basis, evidence supporting the amounts and disclosures in the financial statements.
Our procedures included confirmation of securities owned as of August 31, 2014, by correspondence with the custodian and brokers or by other appropriate auditing procedures. An audit also includes assessing the accounting principles used and significant estimates made by management, as well as evaluating the overall financial statement presentation. We believe that our audits provide a reasonable basis for our opinion.
In our opinion, the financial statements and financial highlights referred to above present fairly, in all material respects, the financial position of BNY Mellon Money Market Fund and BNY Mellon National Municipal Money Market Fund, as of August 31, 2014, the results of their operations for the year then ended, the changes in their net assets for each of the years in the two-year period then ended and the financial highlights for each of the years in the five-year period then ended, in conformity with U.S. generally accepted accounting principles.
![]()
October 29, 2014
The Funds 31
IMPORTANT TAX INFORMATION (Unaudited)
BNY Mellon Money Market Fund
For federal tax purposes, the fund reports the maximum amount allowable but not less than 91.08% as intertest-related dividends in accordance with Sections 871(k)(1) and 881(e) of the Internal Revenue Code.
BNY Mellon National Municipal Money Market Fund
In accordance with federal tax law, the fund hereby reports all the dividends paid from investment income-net during its fiscal year ended August 31, 2014 as
“exempt-interest dividends” (not generally subject to regular federal income tax).
Where required by federal tax law rules, shareholders will receive notification of their portion of the fund’s taxable ordinary dividends (if any), capital gains distributions (if any) and tax-exempt dividends paid for the 2014 calendar year on Form 1099-DIV, which will be mailed in early 2015.
32
| INFORMATION ABOUT THE RENEWAL OF EACH FUND’S INVESTMENT |
| ADVISORY AGREEMENT AND ADMINISTRATION AGREEMENT (Unaudited) |
At a meeting of the Trust’s Board of Trustees held on March 11-12, 2014, the Board considered the renewal of the Trust’s Investment Advisory Agreement and Administration Agreement (together, the “Agreement”), pursuant to which BNY Mellon Fund Advisers, a division of Dreyfus, provides the funds with investment advisory services and The Bank of New York Mellon provides the funds with administrative services.The Bank of NewYork Mellon has entered into a Sub-Administration Agreement with Dreyfus pursuant to which The Bank of New York Mellon pays Dreyfus for performing certain of these administrative services. The Board members, none of whom are “interested persons” (as defined in the Investment Company Act of 1940, as amended) of the Trust, were assisted in their review by independent legal counsel and met with counsel in executive session separate from Dreyfus representatives. In considering the renewal of the Agreement, the Board considered all factors that it believed to be relevant, including those discussed below. The Board did not identify any one factor as dispositive, and each Board member may have attributed different weights to the factors considered.
Analysis of Nature, Extent, and Quality of Services Provided to the Funds. The Board considered information provided to them at the meeting and in previous presentations from Dreyfus representatives regarding the nature, extent, and quality of the services provided to the funds. Dreyfus provided the number of open accounts in each fund, the fund’s asset size and the allocation of fund assets among distribution channels. Dreyfus also had previously provided information regarding the diverse intermediary relationships and distribution channels of the funds (such as intermediary, in which intermediaries typically are paid by the fund and/or Dreyfus) and Dreyfus’ corresponding need for broad, deep, and diverse resources to be able to provide ongoing shareholder services to each intermediary or distribution channel, as applicable to each fund.
The Board also considered research support available to, and portfolio management capabilities of, each fund’s portfolio management personnel and that Dreyfus also provides oversight of day-to-day fund operations, including fund accounting and administration and assistance in meeting legal and regulatory requirements.The Board also considered Dreyfus’ extensive administrative, accounting, and compliance infrastructures.
Comparative Analysis of the Funds’ Performance and Management Fees and Expense Ratios. The Board reviewed reports prepared by Lipper, Inc. (“Lipper”), an independent provider of investment company data, which included information comparing (1) each fund’s performance with the performance of a group of comparable funds (the “Performance Group”) and with a broader group of funds (the “Performance Universe”), all for various periods ended December 31, 2013, and (2) each fund’s actual and contractual management fees and total expenses with those of a group of comparable funds (the “Expense Group”) and with a broader group of funds (the “Expense Universe”), the information for which was derived in part from fund financial statements available to Lipper as of the date of its analysis. Dreyfus previously had furnished the Board with a description of the methodology Lipper used to select the Performance Group and Performance Universe and the Expense Group and Expense Universe.
Dreyfus representatives stated that the usefulness of performance comparisons may be affected by a number of factors, including different investment limitations that may be applicable to each fund and comparison funds.
As applicable to each fund, Dreyfus representatives reviewed with the Board the management or investment advisory fees paid by funds advised or administered by Dreyfus that are in the same Lipper category as the fund (the “Similar Clients”), and explained the nature of the Similar Clients.They discussed differences in fees paid and the relationship of the fees paid in light of any differences in the services provided and other relevant factors. The Board considered the relevance of the fee information provided for the Similar Clients to evaluate the appropriateness and reasonableness of the fund’s management fee.
The Funds 33
| INFORMATION ABOUT THE RENEWAL OF EACH FUND’S INVESTMENT ADVISORY AGREEMENT |
| AND ADMINISTRATION AGREEMENT (Unaudited) (continued) |
BNY Mellon Money Market Fund
The Board discussed the results of the comparisons and noted that the fund’s total return performance was below the Performance Group and Performance Universe medians for the various periods (fourth quartile in half of the periods), except for the five-year period when the fund’s performance was above the Performance Group and Performance Universe medians and the ten-year period when the fund’s performance was above the Performance Universe median. The Board noted the relatively narrow spreads between the fund’s returns and the Performance Group medians (one to four basis points) when the fund’s performance was below the median.
The Board also reviewed the range of actual and contractual management fees and total expenses of the Expense Group and Expense Universe funds and discussed the results of the comparisons.The Board noted that the fund’s contractual management fee was at the Expense Group median, the fund’s actual management fee was above the Expense Group and Expense Universe medians and the fund’s total expenses were above the Expense Group median and below the Expense Universe median. The Board also considered the current fee waiver and expense reimbursement arrangement undertaken by Dreyfus.
BNY Mellon National Municipal Money Market Fund
The Board discussed the results of the comparisons and noted that the fund’s total return performance was below the Performance Group and Performance Universe medians for the various periods, except for the four-year period when the fund’s performance was at the Performance Universe median, ranking in the fourth quartile of the Performance Group in all periods and in the fourth quartile of the Performance Universe for half of the periods.
The Board also reviewed the range of actual and contractual management fees and total expenses of the Expense Group and Expense Universe funds and discussed the results of the comparisons. The Board noted that the fund’s contractual management fee was above the Expense Group median and the fund’s actual management fee and total expenses were above the Expense Group and Expense Universe medians. The Board also considered the current fee waiver and expense reimbursement arrangement undertaken by Dreyfus.
Both Funds
Dreyfus advised the Board that relative underperfor-mance was the result of Dreyfus’ conservative investment approach, including its credit standards and the maintenance of short average portfolio maturities, which Dreyfus employed to seek to reduce risk.
Analysis of Profitability and Economies of Scale. Dreyfus representatives reviewed the expenses allocated and profit received by Dreyfus and its affiliates and the resulting profitability percentage for managing each fund and the aggregate profitability percentage to Dreyfus and its affiliates of managing each fund, and the method used to determine the expenses and profit.The Board concluded that the profitability results were not unreasonable, given the services rendered and service levels provided by Dreyfus to each fund.The Board also noted the fee waiver and expense reimbursement arrangement for each fund and its effect on the profitability of Dreyfus and its affili-ates.The Board also had been provided with information prepared by an independent consulting firm regarding Dreyfus’ approach to allocating costs to, and determining the profitability of, individual funds and the entire Dreyfus fund complex. The consulting firm also had analyzed where any economies of scale might emerge in connection with the management of the funds.
The Board considered on the advice of its counsel the profitability analysis with respect to each fund (1) as part of its evaluation of whether the fees under the Agreement bear a reasonable relationship to the mix of services provided by Dreyfus, including the nature, extent and quality of such services, and (2) in light of the
34
relevant circumstances for the fund and the extent to which economies of scale would be realized if the fund grows and whether fee levels reflect these economies of scale for the benefit of fund shareholders. Dreyfus representatives noted that a discussion of economies of scale is predicated on a fund having achieved a substantial size with increasing assets and that, if a fund’s assets had been stable or decreasing, the possibility that Dreyfus may have realized any economies of scale would be less. Dreyfus representatives also noted that, as a result of shared and allocated costs among the funds and the funds in the Dreyfus fund complex, the extent of economies of scale could depend substantially on the level of assets in the complex as a whole, so that increases and decreases in complex-wide assets can affect potential economies of scale in a manner that is disproportionate to, or even in the opposite direction from, changes in a fund’s asset level. The Board also considered potential benefits to Dreyfus from acting as investment adviser and noted that there were no soft dollar arrangements in effect for trading each fund’s investments.
At the conclusion of these discussions, the Board agreed that it had been furnished with sufficient information to make an informed business decision with respect to the renewal of the Agreement. Based on the discussions and considerations as described above, the Board concluded and determined as follows.
The Board concluded that the nature, extent, and quality of the services provided by Dreyfus to each fund are adequate and appropriate.
The Board generally was satisfied with the funds’ relative performance in light of the considerations described above.
The Board concluded that the fee paid to Dreyfus by each fund was reasonable in light of the considerations described above.
The Board determined that the economies of scale which may accrue to Dreyfus and its affiliates in con- nection with the management of the funds had been adequately considered by Dreyfus in connection with the fee rate charged to each fund pursuant to the Agreement and that, to the extent in the future it were determined that material economies of scale had not been shared with a fund, the Board would seek to have those economies of scale shared with the fund.
In evaluating the Agreement, the Board considered these conclusions and determinations and also relied on its previous knowledge, gained through meetings and other interactions with Dreyfus and its affiliates, of each fund and the services provided to the funds by Dreyfus. The Board also relied on information received on a routine and regular basis throughout the year relating to the operations of each fund and the investment management and other services provided under the Agreement, including information on the investment performance of each fund in comparison to similar mutual funds and benchmark performance indices; general market outlook as applicable to each fund; and compliance reports. In addition, the Board’s consideration of the contractual fee arrangements for each fund had the benefit of a number of years of reviews of prior or similar agreements during which lengthy discussions took place between the Board and Dreyfus representatives. Certain aspects of the arrangements may receive greater scrutiny in some years than in others, and the Board’s conclusions may be based, in part, on their consideration of the same or similar arrangements in prior years. The Board determined that renewal of the Agreement was in the best interests of each fund and its respective shareholders.
The Funds 35
| BOARD MEMBERS INFORMATION (Unaudited) |
| INDEPENDENT BOARD MEMBERS |
36
Once elected all Board Members serve for an indefinite term.The address of the Board Members and Officers is c/o The Dreyfus Corporation, 200 Park Avenue, New York, New York 10166. Additional information about the Board Members is available in the fund’s Statement of Additional Information which can be obtained from Dreyfus free of charge by calling this toll free number: 1-800-DREYFUS. For individual account holders for Private Wealth Management clients, please contact your account officer or call 1-888-281-7350.
The Funds 37
OFFICERS OF THE FUND (Unaudited)
DAVID K. MOSSMAN, President since October 2011.
As Director of Investment Administration for BNY Mellon Wealth Management’s Investments Group (the “Investments Group”) since January 2006, Mr. Mossman’s responsibilities include oversight of securities trading and portfolio management systems administration and mutual fund product management. Mr. Mossman also serves as chief administrative officer of the Investments Group. He is 61 years old and has served in various capacities with BNY Mellon since 1982, including positions in the management of investment, mutual fund and brokerage businesses that encompassed financial, systems, product management, internal distribution and marketing responsibilities, and has been an employee of Dreyfus since September 2000.
JOHN PAK, Chief Legal Officer since March 2013.
Deputy General Counsel, Investment Management, of BNY Mellon since August 2014; Chief Legal Officer of the Manager since August 2012; from March 2005 to July 2012, Managing Director of Deutsche Bank, Deputy Global Head of Deutsche Asset Management Legal and Regional Head of Deutsche Asset Management Americas Legal. He is an officer of 70 investment companies (comprised of 167 portfolios) managed by the Manager. He is 45 years old and has been an employee of the Manager since August 2012.
JANETTE E. FARRAGHER, Vice President and Secretary since December 2011.
Assistant General Counsel of BNY Mellon, and an officer of 70 investment companies (comprised of 167 portfolios) managed by the Manager. She is 51 years old and has been an employee of the Manager since February 1984.
KIESHA ASTWOOD, Vice President and Assistant Secretary since January 2010.
Counsel of BNY Mellon, and an officer of 70 investment companies (comprised of 167 portfolios) managed by the Manager. She is 41 years old and has been an employee of the Manager since July 1995.
JAMES BITETTO, Vice President and Assistant Secretary since August 2005.
Managing Counsel of BNY Mellon and Secretary of the Manager, and an officer of 70 investment companies (comprised of 167 portfolios) managed by the Manager. He is 48 years old and has been an employee of the Manager since December 1996.
JONI LACKS CHARATAN, Vice President and Assistant Secretary since August 2005.
Managing Counsel of BNY Mellon, and an officer of 70 investment companies (comprised of 167 portfolios) managed by the Manager. She is 58 years old and has been an employee of the Manager since October 1988.
JOSEPH M. CHIOFFI, Vice President and Assistant Secretary since August 2005.
Managing Counsel of BNY Mellon, and an officer of 70 investment companies (comprised of 167 portfolios) managed by the Manager. He is 52 years old and has been an employee of the Manager since June 2000.
JOHN B. HAMMALIAN, Vice President and Assistant Secretary since August 2005.
Senior Managing Counsel of BNY Mellon, and an officer of 70 investment companies (comprised of 167 portfolios) managed by the Manager. He is 51 years old and has been an employee of the Manager since February 1991.
SARAH S. KELLEHER, Vice President and Assistant Secretary since April 2014.
Senior Counsel of BNY Mellon, and an officer of 70 investment companies (comprised of 167 portfolios) managed by the Manager; from August 2005 to March 2013, Associate General Counsel of Third Avenue Management. She is 38 years old and has been an employee of the Manager since March 2013.
38
JEFF PRUSNOFSKY, Vice President and Assistant Secretary since August 2005.
Senior Managing Counsel of BNY Mellon, and an officer of 70 investment companies (comprised of 167 portfolios) managed by the Manager. He is 49 years old and has been an employee of the Manager since October 1990.
JAMES WINDELS, Treasurer since November 2001.
Director – Mutual Fund Accounting of the Manager, and an officer of 70 investment companies (comprised of 167 portfolios) managed by the Manager. He is 55 years old and has been an employee of the Manager since April 1985.
RICHARD CASSARO, Assistant Treasurer since January 2007.
Senior Accounting Manager – Money Market and Municipal Bond Funds of the Manager, and an officer of 70 investment companies (comprised of 167 portfolios) managed by the Manager. He is 55 years old and has been an employee of the Manager since September 1982.
GAVIN C. REILLY, Assistant Treasurer since December 2005.
Tax Manager of the Investment Accounting and Support Department of the Manager, and an officer of 70 investment companies (comprised of 167 portfolios) managed by the Manager. He is 46 years old and has been an employee of the Manager since April 1991.
ROBERT S. ROBOL, Assistant Treasurer since December 2002.
Senior Accounting Manager – Fixed Income Funds of the Manager, and an officer of 70 investment companies (comprised of 167 portfolios) managed by the Manager. He is 50 years old and has been an employee of the Manager since October 1988.
ROBERT SALVIOLO, Assistant Treasurer since July 2007.
Senior Accounting Manager – Equity Funds of the Manager, and an officer of 70 investment companies (comprised of 167 portfolios) managed by the Manager. He is 47 years old and has been an employee of the Manager since June 1989.
ROBERT SVAGNA, Assistant Treasurer since December 2002.
Senior Accounting Manager – Equity Funds of the Manager, and an officer of 70 investment companies (comprised of 167 portfolios) managed by the Manager. He is 47 years old and has been an employee of the Manager since November 1990.
JOSEPH W. CONNOLLY, Chief Compliance Officer since October 2004.
Chief Compliance Officer of the Manager and The Dreyfus Family of Funds (70 investment companies, comprised of 167 portfolios). He is 57 years old and has served in various capacities with the Manager since 1980, including manager of the firm’s Fund Accounting Department from 1997 through October 2001.
MATTHEW D. CONNOLLY, Anti-Money Laundering Compliance Officer since April 2012.
Anti-Money Laundering Compliance Officer of the Distributor since October 2011; from March 2010 to September 2011, Global Head, KYC Reviews and Director of UBS Investment Bank; until March 2010, AML Compliance Officer and Senior Vice President of Citi Global Wealth Management. He is an officer of 65 investment companies (comprised of 162 portfolios) managed by the Manager. He is 42 years old and has been an employee of the Distributor since October 2011.
The Funds 39
For More Information
Telephone Wealth Management (WM) Clients, please contact your Account Officer or call 1-888-281-7350. Brokerage Clients of BNY Mellon Wealth Advisors (BNYMWA), please contact your financial representative or call 1-800-830-0549, Option 2. Individual Account holders, please call Dreyfus at 1-800-DREYFUS.
Mail WM Clients, write to your Account Officer, c/o The Bank of New York Mellon, One Mellon Bank Center, Pittsburgh, PA 15258 BNYMWA Brokerage Clients, write to your financial representative, P.O. Box 9012, Hicksville, NY 11802–9012 Individual Account Holders, write to: BNY Mellon Funds, P.O. Box 55268, Boston, MA 02205–8502
Each fund will disclose daily, on http://www.dreyfus.com, the fund’s complete schedule of holdings as of the end of the previous business day. The schedule of holdings will remain on the website until the fund files its Form N-Q or Form N-CSR for the period that includes the date of the posted holdings.
The funds file their complete schedule of portfolio holdings with the Securities and Exchange Commission (“SEC”) for the first and third quarters of each fiscal year on Form N-Q. The funds’ Forms N-Q are available on the SEC’s website at http://www.sec.gov and may be reviewed and copied at the SEC’s Public Reference Room in Washington, DC. Information on the operation of the Public Reference Room may be obtained by calling 1-800-SEC-0330.
Information regarding how the funds voted proxies relating to portfolio securities for the most recent 12-month period ended June 30 is available on the SEC’s website at http://www.sec.gov and without charge, upon request, by calling 1-800-DREYFUS.
© 2014 MBSC Securities Corporation
MFTAR0814-MM
Item 2. Code of Ethics.
The Registrant has adopted a code of ethics that applies to the Registrant's principal executive officer, principal financial officer, principal accounting officer or controller, or persons performing similar functions. There have been no amendments to, or waivers in connection with, the Code of Ethics during the period covered by this Report.
Item 3. Audit Committee Financial Expert.
The Registrant's Board has determined that Thomas F. Ryan, a member of the Audit Committee of the Board, is an audit committee financial expert as defined by the Securities and Exchange Commission (the "SEC"). Mr. Ryan is "independent" as defined by the SEC for purposes of audit committee financial expert determinations.
Item 4. Principal Accountant Fees and Services.
(a) Audit Fees. The aggregate fees billed for each of the last two fiscal years (the "Reporting Periods") for professional services rendered by the Registrant's principal accountant (the "Auditor") for the audit of the Registrant's annual financial statements or services that are normally provided by the Auditor in connection with the statutory and regulatory filings or engagements for the Reporting Periods, were $606,600 in 2013 and $618,300 in 2014.
(b) Audit-Related Fees. The aggregate fees billed in the Reporting Periods for assurance and related services by the Auditor that are reasonably related to the performance of the audit of the Registrant's financial statements and are not reported under paragraph (a) of this Item 4 were $93,980 in 2013 and $98,100 in 2014. These services consisted of one or more of the following: (i) agreed upon procedures related to compliance with Internal Revenue Code section 817(h), (ii) security counts required by Rule 17f-2 under the Investment Company Act of 1940, as amended, (iii) advisory services as to the accounting or disclosure treatment of Registrant transactions or events and (iv) advisory services to the accounting or disclosure treatment of the actual or potential impact to the Registrant of final or proposed rules, standards or interpretations by the Securities and Exchange Commission, the Financial Accounting Standards Boards or other regulatory or standard-setting bodies.
The aggregate fees billed in the Reporting Periods for non-audit assurance and related services by the Auditor to the Registrant's investment adviser (not including any sub-investment adviser whose role is primarily portfolio management and is subcontracted with or overseen by another investment adviser), and any entity controlling, controlled by or under common control with the investment adviser that provides ongoing services to the Registrant ("Service Affiliates"), that were reasonably related to the performance of the annual audit of the Service Affiliate, which required pre-approval by the Audit Committee were $0 in 2013 and $0 in 2014.
(c) Tax Fees. The aggregate fees billed in the Reporting Periods for professional services rendered by the Auditor for tax compliance, tax advice, and tax planning ("Tax Services") were $62,640 in 2013 and $64,900 in 2014. These services consisted of the review or preparation of U.S. federal, state, local and excise tax returns. The aggregate fees billed in the Reporting Periods for Tax Services by the Auditor to Service Affiliates, which required pre-approval by the Audit Committee were $0 in 2013 and $0 in 2014.
(d) All Other Fees. The aggregate fees billed in the Reporting Periods for products and services provided by the Auditor, other than the services reported in paragraphs (a) through (c) of this Item, were $0 in 2013 and $0 in 2014.
The aggregate fees billed in the Reporting Periods for Non-Audit Services by the Auditor to Service Affiliates, other than the services reported in paragraphs (b) through (c) of this Item, which required pre-approval by the Audit Committee, were $0 in 2013 and $0 in 2014.
(e)(1) Audit Committee Pre-Approval Policies and Procedures. The Registrant’s Audit Committee has established policies and procedures (the Policy”) for pre-approval (within specified fee limits) of the Auditor’s engagements for non-audit services to the Registrant and Service Affiliates without specific case-by-case consideration. The pre-approved services in the Policy can include pre-approved audit services, pre-approved audit-related services, pre-approved tax services and pre-approved all other services. Pre-approval considerations include whether the proposed services are compatible with maintaining the Auditor’s independence. Pre-approvals pursuant to the Policy are considered annually.
(e)(2)None of the services described in paragraphs (b) through (d) of this Item 4 were approved by the Audit Committee pursuant to paragraph (c)(7)(i)(C) of Rule 2-01 of Regulation S-X.
(f) None of the hours expended on the principal accountant’s engagement to audit the registrant’s financial statements for the most recent fiscal year were attributed to work performed by persons other than the principal account’s full-time, permanent employees.
Non-Audit Fees. The aggregate non-audit fees billed by the Auditor for services rendered to the Registrant, and rendered to Service Affiliates, for the Reporting Periods were $13,902,636 in 2013 and $15,801,381 in 2014.
Auditor Independence. The Registrant's Audit Committee has considered whether the provision of non-audit services that were rendered to Service Affiliates, which were not pre-approved (not requiring pre-approval), is compatible with maintaining the Auditor's independence.
Item 5. Audit Committee of Listed Registrants.
Not applicable.
Item 6. Investments.
(a) Not applicable.
Item 7. Disclosure of Proxy Voting Policies and Procedures for Closed-End Management Investment Companies.
Not applicable.
Item 8. Portfolio Managers of Closed-End Management Investment Companies.
Not applicable.
Item 9. Purchases of Equity Securities by Closed-End Management Investment Companies and Affiliated Purchasers.
Not applicable.
Item 10. Submission of Matters to a Vote of Security Holders.
There have been no material changes to the procedures applicable to Item 10.
Item 11. Controls and Procedures.
(a) The Registrant's principal executive and principal financial officers have concluded, based on their evaluation of the Registrant's disclosure controls and procedures as of a date within 90 days of the filing date of this report, that the Registrant's disclosure controls and procedures are reasonably designed to ensure that information required to be disclosed by the Registrant on Form N-CSR is recorded, processed, summarized and reported within the required time periods and that information required to be disclosed by the Registrant in the reports that it files or submits on Form N-CSR is accumulated and communicated to the Registrant's management, including its principal executive and principal financial officers, as appropriate to allow timely decisions regarding required disclosure.
(b) There were no changes to the Registrant's internal control over financial reporting that occurred during the second fiscal quarter of the period covered by this report that have materially affected, or are reasonably likely to materially affect, the Registrant's internal control over financial reporting.
Item 12. Exhibits.
(a)(1) Code of ethics referred to in Item 2.
(a)(2) Certifications of principal executive and principal financial officers as required by Rule 30a-2(a) under the Investment Company Act of 1940.
(a)(3) Not applicable.
(b) Certification of principal executive and principal financial officers as required by Rule 30a-2(b) under the Investment Company Act of 1940.
SIGNATURES
Pursuant to the requirements of the Securities Exchange Act of 1934 and the Investment Company Act of 1940, the Registrant has duly caused this Report to be signed on its behalf by the undersigned, thereunto duly authorized.
BNY Mellon Funds Trust
By: /s/ David K. Mossman
David K. Mossman,
President
Date: October 23, 2014
Pursuant to the requirements of the Securities Exchange Act of 1934 and the Investment Company Act of 1940, this Report has been signed below by the following persons on behalf of the Registrant and in the capacities and on the dates indicated.
By: /s/ David K. Mossman
David K. Mossman,
President
Date: October 23, 2014
By: /s/ James Windels
James Windels,
Treasurer
Date: October 23, 2014
EXHIBIT INDEX
(a)(1) Code of ethics referred to in Item 2.
(a)(2) Certifications of principal executive and principal financial officers as required by Rule 30a-2(a) under the Investment Company Act of 1940. (EX-99.CERT)
(b) Certification of principal executive and principal financial officers as required by Rule 30a-2(b) under the Investment Company Act of 1940. (EX-99.906CERT)