UNITED STATES
SECURITIES AND EXCHANGE COMMISSION
Washington, D.C. 20549
FORM N-CSR
CERTIFIED SHAREHOLDER REPORT OF REGISTERED MANAGEMENT
INVESTMENT COMPANIES
Investment Company Act file number | 811-09903 | |||||
|
| |||||
| BNY Mellon Funds Trust |
| ||||
| (Exact name of Registrant as specified in charter) |
| ||||
|
|
| ||||
|
c/o The Dreyfus Corporation 200 Park Avenue New York, New York 10166 |
| ||||
| (Address of principal executive offices) (Zip code) |
| ||||
|
|
| ||||
| Bennett A. MacDougall, Esq. 200 Park Avenue New York, New York 10166 |
| ||||
| (Name and address of agent for service) |
| ||||
| ||||||
Registrant's telephone number, including area code: | (212) 922-6400 | |||||
|
| |||||
Date of fiscal year end:
| 08/31 |
| ||||
Date of reporting period: | 08/31/2017 |
| ||||
FORM N-CSR
Item 1. Reports to Stockholders.
The BNY Mellon Funds
BNY Mellon Large Cap Stock Fund
BNY Mellon Large Cap Market Opportunities Fund
BNY Mellon Tax-Sensitive Large Cap Multi-Strategy Fund
BNY Mellon Income Stock Fund
BNY Mellon Mid Cap Multi-Strategy Fund
BNY Mellon Small Cap Multi-Strategy Fund
BNY Mellon Focused Equity Opportunities Fund
BNY Mellon Small/Mid Cap Multi-Strategy Fund
BNY Mellon International Fund
BNY Mellon Emerging Markets Fund
BNY Mellon International Appreciation Fund
BNY Mellon International Equity Income Fund
BNY Mellon Asset Allocation Fund
ANNUAL REPORT August 31, 2017 | |
| |

Contents
THE FUNDS
Advisory Agreement, Administration Agreement and BNY Mellon | |
Mid Cap Multi-Strategy Fund’s Sub-Advisory Agreements | |
FOR MORE INFORMATION
Back Cover
The views expressed herein are current to the date of this report. These views and the composition of the funds’ portfolios are subject to change at any time based on market and other conditions. |
Not FDIC-Insured • Not Bank-Guaranteed • May Lose Value |
The Funds |
Dear Shareholder:
We are pleased to present this annual report for BNY Mellon Funds Trust, covering the 12-month period from September 1, 2016 through August 31, 2017. For information about how the fund performed during the reporting period, as well as general market perspectives, we provide a Discussion of Fund Performance on the pages that follow.
Stocks set a series of new record highs and bonds produced mixed results over the past year in response to changing economic and political conditions. Financial markets during the final months of 2016 were dominated by the election of a new U.S. presidential administration. Equities surged higher in anticipation of more business-friendly regulatory, tax, and fiscal policies, but high-quality bonds generally lost value due to expectations of rising interest rates and accelerating inflation in a stronger economy. Despite a series of short-term interest-rate hikes, bonds recovered over the first eight months of 2017 when it became clearer that major tax and fiscal reforms would take time and political capital to enact. Stocks continued to rally, led by large growth-oriented companies, as corporate earnings grew and global economic conditions improved.
The markets’ recent strong performance has been supported by solid underlying fundamentals. While we currently expect these favorable conditions to persist, we remain watchful for economic and political developments that could derail the rallies. As always, we encourage you to discuss the risks and opportunities of today’s investment environment with your financial advisor.
Sincerely,

Patrick T. Crowe
President
BNY Mellon Funds Trust
September 15, 2017
3
DISCUSSION OF FUND PERFORMANCE
For the period from September 1, 2016 through August 31, 2017, as provided by C. Wesley Boggs, William S. Cazalet, CAIA, Ronald P. Gala, CFA, Peter D. Goslin, CFA, and Syed A. Zamil, CFA, Portfolio Managers
Market and Fund Performance Overview
For the 12-month period ended August 31, 2017, BNY Mellon Large Cap Stock Fund’s Class M shares produced a total return of 16.12%, and Investor shares produced a total return of 16.02%.1 In comparison, the S&P 500® Index (the “Index”), the fund’s benchmark, produced a total return of 16.22% for the same period.2
Large-cap stocks gained ground amid better-than-expected corporate earnings, improving economic prospects, and positive investor sentiment in the wake of the U.S. presidential election. The fund produced returns that were roughly in line with its benchmark.
The Fund’s Investment Approach
The fund seeks capital appreciation. To pursue its goal, the fund normally invests at least 80% of its net assets, plus any borrowings for investment purposes, in stocks of large-capitalization companies (those with market capitalizations of $5 billion or more at the time of purchase).
We apply a systematic, quantitative investment approach designed to identify and exploit relative misvaluations primarily within large-cap U.S. stocks. We use a proprietary valuation model that identifies and ranks stocks to construct the fund’s portfolio. We construct the fund’s portfolio through a systematic structured approach, focusing on stock selection as opposed to making proactive decisions as to industry or sector exposure. Within each sector and style subset, the fund overweights the most attractive stocks and underweights or zero weights the stocks that have been ranked least attractive. The fund typically will hold between 100 and 175 securities.
Rising Corporate Earnings Drove Markets Higher
While political uncertainties caused U.S. stocks to dip in the weeks before the 2016 presidential election, equity markets were reenergized in November and December when investors began to anticipate lower corporate taxes, reduced regulatory constraints on business, and increased infrastructure spending from the new administration.
Stocks in 2017 generally continued to build on gains achieved during the final months of 2016. Consecutive quarters of better-than-expected corporate earnings and encouraging global economic developments drove the Index to a series of new highs in February and early March. While concerns about the new administration’s ability to implement its business-friendly policy proposals slowed the pace of the market’s advance in the early spring, most broad measures of stock market performance quickly erased those losses and reached new all-time highs over the summer. However, market leadership shifted from smaller, value-oriented stocks to larger, more growth-oriented industry leaders, including multinational corporations with a strong presence in international markets. Although all capitalization ranges produced double-digit returns in this environment, large-cap stocks generally produced higher returns than their small- and mid-cap counterparts, and growth stocks substantially outperformed value-oriented stocks for the reporting period overall. Indeed, the Index saw positive absolute returns in 9 of 11 economic sectors.
Security Selection Strategy Supported Fund Results
The fund’s performance compared to the Index was supported during the reporting period by our security selection process in several industry groups. Results in the consumer discretionary sector were bolstered by a variety of strong stock selections, none of which ranked among the fund’s top individual performers. In addition, the fund did not own some of the consumer discretionary sector’s weaker components. The fund also fared well in the financials sector, where large banks such as Bank of America benefited from strong earnings momentum and expectations of reduced regulatory burdens. Among industrial holdings, aircraft manufacturer Boeing ranked as the fund’s top individual performer for the reporting period as investors responded positively to several quarters of strong earnings. Another top industrial holding, aircraft equipment maker Spirit AeroSystems Holdings, saw higher earnings after the positive resolution of a supply agreement with Boeing, a major customer.
Disappointments during the reporting period included individual holdings such as pharmacy chain CVS Health, which lost value during the fourth quarter of 2016 after issuing an earnings warning stemming from lower profit margins from drug sales. In the real estate sector, retail developer GGP (formerly General Growth Properties) reported good financial results, but the stock’s price declined due to the company’s exposure to the struggling brick-and-mortar retailing industry. While stock selection was neutral in the energy sector, exploration and production company Cimarex Energy fared relatively poorly as the energy sector was one of only two sectors to have a negative absolute return for the period.
Focusing on Individual Large-Cap Companies
Looking forward, we expect to continue to choose investments one company at a time through our disciplined, bottom-up investment process. Indeed, we have continued to identify ample opportunities across the market’s full range of industry groups among businesses that meet our valuation, earnings, and behavioral criteria. When holdings reach fuller valuations, we seek to replace them with highly ranked alternatives with what we believe are more attractive valuation characteristics. Moreover, we seek to manage risks through broad portfolio diversification.
September 15, 2017
1 Total return includes reinvestment of dividends and any capital gains paid. Past performance is no guarantee of future results. Share price and investment return fluctuate such that upon redemption, fund shares may be worth more or less than their original cost.
2 Source: Lipper Inc. — The S&P 500® Index is widely regarded as the best single gauge of large-cap U.S. equities. The index includes 500 leading companies and captures approximately 80% coverage of available market capitalization. Investors cannot invest directly in any index.
Please note: the position in any security highlighted with italicized typeface was sold during the reporting period.
Equities are subject generally to market, market sector, market liquidity, issuer, and investment style risks, among other factors, to varying degrees, all of which are more fully described in the fund’s prospectus.
4
For the period from September 1, 2016 through August 31, 2017, as provided by Caroline Lee Tsao, Primary Portfolio Manager responsible for investment allocation decisions
Market and Fund Performance Overview
For the 12-month period ended August 31, 2017, BNY Mellon Large Cap Market Opportunities Fund’s Class M shares produced a total return of 18.68%, and Investor shares produced a total return of 18.41%.1 In comparison, the S&P 500® Index (the “Index”), the fund’s benchmark, produced a total return of 16.22% for the same period.2
Large-cap stocks gained ground amid better-than-expected corporate earnings and improving global economic prospects. The fund outperformed its benchmark as four of five underlying strategies produced above-average returns.
The Fund’s Investment Approach
The fund seeks long-term capital appreciation. To pursue its goal, the fund normally invests at least 80% of its assets in equity securities of large-cap companies, currently defined to be those companies with total market capitalizations of $5 billion or more at the time of purchase. The fund normally allocates its assets among multiple investment strategies, each employed by the fund’s investment adviser or its affiliates that invest primarily in equity securities issued by large-cap companies. The fund is designed to provide exposure to various large-cap equity portfolio managers and investment strategies and styles, including some or all of the following: the Focused Equity Strategy, U.S. Large Cap Equity Strategy, Dynamic Large Cap Value Strategy, Large Cap Growth Strategy, U.S. Large Cap Growth Strategy, Income Stock Strategy, Appreciation Strategy, and Large Cap Dividend Strategy, all as more particularly described in the fund’s prospectus. The fund invests directly in securities or in other mutual funds advised by the fund’s investment adviser or its affiliates.
The investment adviser has the discretion to change the investment strategies, including whether to implement a strategy by investing directly in securities or through an underlying fund, and the target allocations and ranges when the investment adviser deems it appropriate.
Rising Corporate Earnings Drove Markets Higher
While political uncertainties caused U.S. stocks to dip in the weeks before the 2016 presidential election, equity markets were reenergized in November and December when investors began to anticipate lower corporate taxes, reduced regulatory constraints on business, and increased infrastructure spending from the new administration.
Consecutive quarters of better-than-expected corporate earnings and encouraging global economic developments drove the Index to a series of new highs in early 2017. While concerns about the new administration’s ability to implement its business-friendly policy proposals slowed the pace of the market’s advance in the spring, most broad measures of stock market performance quickly erased those losses and reached new all-time highs over the summer. However, market leadership shifted from smaller, value-oriented stocks to larger, more growth-oriented industry leaders, including multinational corporations with a strong presence in international markets. Large-cap stocks generally produced higher returns than their small- and mid-cap counterparts in this environment, and growth stocks substantially outperformed value-oriented stocks for the reporting period overall.
Selection and Allocation Strategies Supported Fund Results
Our portfolio allocation strategy added value during the reporting period, and favorable security selection decisions within the fund’s strategies further bolstered its relative performance. The Focused Equity Strategy fared best through an emphasis on the information technology sector and favorable stock picks among technology, consumer staples, and energy companies. The Income Stock Strategy also fared well, as strong stock selections in the financials, information technology, and consumer discretionary sectors more than offset weakness stemming from underweighted exposure to utilities. The Dynamic Large Cap Value Strategy achieved relative success through favorable allocation decisions and good stock picks in the financials, industrials, and health care sectors. The U.S. Large Cap Equity Strategy benefited from underweighted exposure to the consumer staples sector, an overweighted position among information technology stocks, and strong stock selections in the health care sector.
Only one active strategy, the U.S. Large Cap Growth Strategy, lagged the Index over the reporting period. Results were dampened by disappointing security selections in the information technology and health care sectors, as well as sector allocation shortfalls in the information technology, consumer discretionary, and energy sectors.
In December 2016, we shifted assets from the Income Stock Strategy to the Dynamic Large Cap Value Strategy to place greater emphasis on value-oriented stocks. We changed the fund’s value-oriented tilt in August 2017, when we reduced allocations to the Dynamic Large Cap Value Strategy and the Income Stock Strategy in favor of the U.S. Large Cap Growth Strategy.
Balanced Exposure to Large-Cap Companies
We believe that market fundamentals remain sound for large-cap stocks in an environment of strong corporate earnings, muted inflation, accelerating global economic growth, and still-accommodative monetary policies in most regions of the world. As of the reporting period’s end, we have maintained the fund’s balanced exposure to growth- and value-oriented stocks as we seek to have the fund participate in whatever investment style ranks as the market leader in the months ahead.
September 15, 2017
1 Total return includes reinvestment of dividends and any capital gains paid. Past performance is no guarantee of future results. Share price and investment return fluctuate such that upon redemption, fund shares may be worth more or less than their original cost.
2 Source: Lipper Inc. — The S&P 500® Index is widely regarded as the best single gauge of large-cap U.S. equities. The index includes 500 leading companies and captures approximately 80% coverage of available market capitalization. Investors cannot invest directly in any index.
Equities are subject generally to market, market sector, market liquidity, issuer, and investment style risks, among other factors, to varying degrees, all of which are more fully described in the fund’s prospectus.
The fund may use derivative instruments, such as options, futures, options on futures, and swaps. A small investment in derivatives could have a potentially large impact on the fund’s performance. The use of derivatives involves risks different from, or possibly greater than, the risks associated with investing directly in the underlying assets.
5
DISCUSSION OF FUND PERFORMANCE (continued)
For the period from September 1, 2016 through August 31, 2017, as provided by Caroline Lee Tsao, Primary Portfolio Manager responsible for investment allocation decisions
Market and Fund Performance Overview
For the 12-month period ended August 31, 2017, BNY Mellon Tax-Sensitive Large Cap Multi-Strategy Fund’s Class M shares produced a total return of 17.13%, and Investor shares produced a total return of 16.87%.1 In comparison, the S&P 500® Index (the “Index”), the fund’s benchmark, produced a total return of 16.22% for the same period.2
Large-cap stocks gained ground amid better-than-expected corporate earnings and improving global economic prospects. The fund outperformed its benchmark as five of six underlying strategies produced above-average returns.
The Fund’s Investment Approach
The fund seeks long-term capital appreciation. To pursue its goal, the fund normally invests at least 80% of its net assets in equity securities of large-cap companies, currently defined to be those companies with total market capitalizations of $5 billion or more at the time of purchase. The fund normally allocates its assets among multiple investment strategies, each employed by the fund’s investment adviser or its affiliates that invest primarily in equity securities issued by large-cap companies. The fund is designed to provide exposure to various large-cap equity portfolio managers and investment strategies and styles, and uses tax-sensitive strategies to reduce the impact of federal and state income taxes on its after-tax returns. The fund allocates its assets among some or all of the following: the Large Cap Core Strategy, Large Cap Tax-Sensitive Strategy, Focused Equity Strategy, U.S. Large Cap Equity Strategy, Dynamic Large Cap Value Strategy, Large Cap Growth Strategy, U.S. Large Cap Growth Strategy, Income Stock Strategy, Appreciation Strategy, and Large Cap Dividend Strategy, all as more particularly described in the fund’s prospectus. The fund invests directly in securities or in other mutual funds advised by the fund’s investment adviser or its affiliates.
The investment adviser has the discretion to change the investment strategies, including whether to implement a strategy by investing directly in securities or through an underlying fund, and the target allocations and ranges when the investment adviser deems it appropriate.
Rising Corporate Earnings Drove Markets Higher
While political uncertainties caused stocks to dip before the 2016 presidential election, equity markets were reenergized in November and December when investors began to anticipate lower corporate taxes, reduced regulatory constraints, and increased infrastructure spending from the new administration.
Consecutive quarters of better-than-expected corporate earnings and encouraging global economic developments drove the Index to new highs in early 2017. While concerns about the new administration’s ability to implement its business-friendly policy proposals slowed the market’s advance in the spring, the Index quickly erased those losses and reached new highs over the summer. However, market leadership shifted from smaller, value-oriented stocks to larger, more growth-oriented industry leaders, including multinational corporations. Large-cap stocks generally produced higher returns than their small- and mid-cap counterparts in this environment, and growth stocks substantially outperformed value-oriented stocks.
Selection and Allocation Strategies Supported Fund Results
During the reporting period, favorable security selection decisions within the fund’s strategies further bolstered relative performance. The Focused Equity Strategy fared best through an emphasis on the information technology sector and favorable stock picks among information technology, consumer staples, and energy companies. The Income Stock Strategy also fared well, as strong stock selections in the financials, information technology, and consumer discretionary sectors more than offset weakness stemming from underweighted exposure to utilities. The Dynamic Large Cap Value Strategy achieved relative success through favorable allocation decisions and good stock picks in the financials, industrials, and health care sectors.
The U.S. Large Cap Equity Strategy benefited from underweighted exposure to the consumer staples sector, an overweighted position among information technology stocks, and strong stock selections in the health care sector. Finally, the passively managed Large Cap Tax-Sensitive Strategy mildly outperformed the Index.
Only one active strategy, the U.S. Large Cap Growth Strategy, lagged the Index over the reporting period. Results were dampened by disappointing security selections in the information technology and health care sectors, as well as by sector allocation shortfalls in the information technology, consumer discretionary, and energy sectors.
In December 2016, we shifted assets from the Income Stock Strategy to the Dynamic Large Cap Value Strategy to place greater emphasis on value-oriented stocks. We changed the fund’s value-oriented tilt in August 2017, when we reduced allocations to the Dynamic Large Cap Value Strategy and the Income Stock Strategy in favor of the U.S. Large Cap Growth Strategy.
Balanced Exposure to Large-Cap Companies
We believe that market fundamentals remain strong for large-cap stocks in an environment of strong corporate earnings, muted inflation, accelerating global economic growth, and still-accommodative monetary policies in most regions of the world. As of the reporting period’s end, we have maintained the fund’s balanced exposure to growth- and value-oriented stocks as we seek to have the fund participate in whatever investment style ranks as the market leader in the months ahead.
September 15, 2017
1 Total return includes reinvestment of dividends and any capital gains paid. Past performance is no guarantee of future results. Share price and investment return fluctuate such that upon redemption, fund shares may be worth more or less than their original cost.
2 Source: Lipper Inc. — The S&P 500® Index is widely regarded as the best single gauge of large-cap U.S. equities. The index includes 500 leading companies and captures approximately 80% coverage of available market capitalization. Investors cannot invest directly in any index.
Equities are subject generally to market, market sector, market liquidity, issuer, and investment style risks, among other factors, to varying degrees, all of which are more fully described in the fund’s prospectus.
The fund may use derivative instruments, such as options, futures, options on futures, and swaps. A small investment in derivatives could have a potentially large impact on the fund’s performance. The use of derivatives involves risks different from, or possibly greater than, the risks associated with investing directly in the underlying assets.
6
For the period from September 1, 2016 through August 31, 2017, as provided by John C. Bailer, Brian C. Ferguson, and David S. Intoppa, Portfolio Managers
Market and Fund Performance Overview
For the 12-month period ended August 31, 2017, BNY Mellon Income Stock Fund’s Class M shares produced a total return of 12.33%, Investor shares produced a total return of 12.02%, Class A shares produced a total return of 12.18%, Class C shares produced a total return of 11.22%, Class I shares produced a total return of 12.44%, and Class Y shares produced a total return of 12.33%.1 In comparison, the fund’s benchmark, the Dow Jones U.S. Select Dividend™ Index (the “Index”), produced a total return of 10.85% for the same period.2
Stocks gained ground over the reporting period amid better-than-expected corporate earnings, improving economic prospects, and positive investor sentiment in the wake of the U.S. presidential election. The fund’s sector allocation and security selection strategies enabled it to outperform its benchmark.
The Fund’s Investment Approach
The fund seeks total return (consisting of capital appreciation and income). To pursue its goal, the fund normally invests at least 80% of its assets in stocks. The fund seeks to focus on dividend-paying stocks and other investment techniques that produce income. We choose stocks through a disciplined investment process that combines quantitative modeling techniques, fundamental analysis, and risk management. The fund emphasizes those stocks with value characteristics, although it may also purchase growth stocks. The fund may invest in the stocks of companies of any size, although it focuses on large-cap companies. The fund’s investment process is designed to provide investors with investment exposure to sector weightings and risk characteristics generally similar to those of the Index.
Rising Corporate Earnings Drove Markets Higher
While political uncertainties caused U.S. stocks to dip in the weeks before the 2016 presidential election, equity markets were reenergized in November and December when investors began to anticipate lower corporate taxes, reduced regulatory constraints, and fiscal stimulus from the new administration.
The market’s advance slowed in the spring when it became clearer that tax and fiscal reforms were far from certain in a contentious political environment, but the rally soon resumed in the midst of strong corporate earnings growth and encouraging global economic data. As a result, the Index advanced to a series of record highs. However, market leadership shifted in the spring from smaller, more attractively valued stocks to industry leaders with a robust international presence, and growth stocks outperformed value-oriented stocks and higher-yielding dividend payers.
Allocation and Selection Strategies Buoyed Fund Results
The fund outperformed the Index over the reporting period in part due to the success of our sector allocation strategy. Most notably, overweighted exposure to the financials sector enabled the fund to participate more fully in its gains. Our security selection strategy also fared well in the financials sector, particularly among banks such as JPMorgan Chase & Co. and Bank of America, insurers such as Prudential Financial, and capital markets companies including Goldman Sachs Group and Morgan Stanley. These companies benefited from attractive valuations, strong earnings momentum, and expectations of reduced regulatory burdens.
Overweighted exposure and favorable stock selections among utilities also helped support the fund’s relative performance. We focused mainly on independent power producers and renewable energy providers such as NextEra Energy Partners, which reported higher earnings amid robust demand for electricity from renewable sources. In the materials sector, Packaging Corporation of America gained value amid rising demand for shipping containers from online retailers, and chemical company DowDuPont advanced as investors recognized the potential for the newly merged company to unlock shareholder value.
Disappointments during the reporting period included the information technology sector, where we did not own some of the richly valued software and hardware companies that led the sector’s gains. Instead, we focused on communications equipment providers, such as Cisco Systems, which lagged sector averages. In the real estate sector, communications infrastructure specialist Uniti Group lost value due to its relatively heavy exposure to one struggling wireless carrier. In the lagging energy sector, Occidental Petroleum, Hess, and Schlumberger were hurt by low oil prices. Finally, in the consumer staples sector, food companies such as Kellogg and Kraft Heinz Foods encountered sluggish sales due to changing consumer preferences.
At times during the reporting period, the fund employed put and call options to enhance its income returns.
Focusing on Value-Oriented, Dividend-Paying Businesses
The valuation disparity between growth- and value-oriented stocks has grown wider than historical norms, and value stocks with strong underlying fundamentals seem poised to reduce the gap in an environment of strong corporate earnings and improving domestic and global economic growth. As of the reporting period’s end, we have found an ample number of opportunities meeting our income-oriented criteria in the financials, telecommunication services, utilities, materials, energy, and real estate sectors, but relatively few in the lower-yielding information technology, consumer discretionary, health care, and industrials sectors.
September 15, 2017
1 Total return includes reinvestment of dividends and any capital gains paid. Past performance is no guarantee of future results. Share price and investment return fluctuate such that upon redemption, fund shares may be worth more or less than their original cost. The fund’s returns reflect the absorption of certain fund expenses by The Dreyfus Corporation pursuant to an agreement in effect through June 1, 2018, for Class A, Class C, Class I, and Class Y, at which time it may be extended, terminated, or modified. Had these expenses not been absorbed, the fund’s returns for those share classes would have been lower.
2 Source: Lipper Inc. – The Dow Jones U.S. Select Dividend™ Index is defined as all dividend-paying companies in the Dow Jones U.S. Index, excluding REITs, that have a non-negative historical five-year dividend-per-share growth rate, a five-year average dividend coverage ratio of greater than or equal to 167%, paid dividends in each of the previous five years, non-negative trailing 12-month earnings-per-share (EPS), a float-adjusted market capitalization of at least US $1 billion, and a three-month average daily trading volume of 200,000 shares. Investors cannot invest directly in any index.
Please note: the position in any security highlighted with italicized typeface was sold during the reporting period.
Equities are subject generally to market, market sector, market liquidity, issuer, and investment style risks, among other factors, to varying degrees, all of which are more fully described in the fund’s prospectus.
7
DISCUSSION OF FUND PERFORMANCE (continued)
For the period from September 1, 2016 through August 31, 2017, as provided by Caroline Lee Tsao, Primary Portfolio Manager responsible for investment allocation decisions
Market and Fund Performance Overview
For the 12-month period ended August 31, 2017, BNY Mellon Mid Cap Multi-Strategy Fund’s Class M shares produced a total return of 13.12%, and Investor shares produced a total return of 12.89%.1 In comparison, the fund’s benchmark, the Russell Midcap® Index, produced a total return of 12.44% for the reporting period.2 The Russell Midcap® Value Index and Russell Midcap® Growth Index, the fund’s secondary benchmarks, produced total returns of 10.82% and 14.52%, respectively, for the same period.3,4
Mid-cap stocks gained ground amid better-than-expected corporate earnings and improving global economic prospects. The fund outperformed its benchmark as four of five underlying strategies produced above-average returns.
The Fund’s Investment Approach
The fund seeks capital appreciation. The fund pursues its goal by normally investing at least 80% of its net assets in equity securities of mid-cap companies. The fund considers mid-cap companies to be those companies with market capitalizations that are within the market-capitalization range of companies comprising the Index. Furthermore, the fund normally allocates assets across multiple investment strategies employed by the investment adviser and unaffiliated sub-investment advisers that invest primarily in equity securities issued by mid-cap companies. The investment adviser determines the investment strategies and sets target allocations and ranges. The fund is designed to provide exposure to various investment strategies and styles, including the Mid Cap Tax-Sensitive Core Strategy, Opportunistic Mid Cap Value Strategy, Mid Cap Growth Strategy, Boston Partners Mid Cap Value Strategy, and Henderson Geneva Mid Cap Growth Strategy, all as more particularly described in the fund’s prospectus.
Rising Corporate Earnings Drove Markets Higher
While political uncertainties caused U.S. stocks to dip in the weeks before the 2016 presidential election, equity markets were reenergized in November and December when investors began to anticipate lower corporate taxes, reduced regulatory constraints on business, and increased infrastructure spending from the new administration.
Consecutive quarters of better-than-expected corporate earnings and encouraging global economic developments drove the Index to a series of new highs in early 2017. While concerns about the new administration’s ability to implement its business-friendly policy proposals slowed the pace of the market’s advance in the spring, most broad measures of stock market performance quickly erased those losses and reached new all-time highs over the summer. However, market leadership shifted from smaller, value-oriented stocks to larger, more growth-oriented industry leaders, including multinational corporations with a strong presence in international markets. All three capitalization ranges produced double-digit returns in this environment, but mid-cap stocks generally lagged their large- and small-cap counterparts, and growth stocks substantially outperformed value-oriented stocks for the reporting period overall.
Selection and Allocation Strategies Supported Fund Results
Our portfolio allocation strategy added value during the reporting period, and favorable security selection and sector allocation decisions within the fund’s strategies further bolstered relative performance.
The Opportunistic Mid Cap Value Strategy fared best through overweighted exposure to the financials and information technology sectors and relatively light holdings of real estate stocks, which more than offset disappointing stock picks in the industrials, health care, and information technology sectors. The Mid Cap Growth Strategy benefited from strong stock selections in the information technology, industrials, and consumer discretionary sectors, as well as favorable sector allocations in the information technology, consumer discretionary, and consumer staples sectors. The Boston Partners Mid Cap Value Strategy overcame shortfalls among stock selections in the real estate, materials, and energy sectors with overweighted exposure to the information technology and financials sectors. Finally, the passively managed Mid Cap Tax-Sensitive Core Strategy mildly outperformed the Index.
Only the Henderson Geneva Mid Cap Growth Strategy lagged the Index over the reporting period. Results were dampened by disappointing security selections in the information technology, industrials, and consumer discretionary sectors. Those shortfalls were only partially offset by overweighted sector allocations in the information technology and financials sectors and underweighted exposure to the consumer discretionary and consumer staples sectors.
In August 2017, we changed the fund’s previous value-oriented tilt by reducing allocations to the Opportunistic Mid Cap Value Strategy and Boston Partners Mid Cap Value Strategy, and increasing its investment in the Henderson Geneva Mid Cap Growth Strategy.
Balanced Exposure to Mid-Cap Companies
We believe that market fundamentals remain strong for mid-cap stocks in an environment of strong corporate earnings, muted inflation, accelerating global economic growth, and still-accommodative monetary policies in most regions of the world. As of the reporting period’s end, we have established more balanced exposure to growth- and value-oriented stocks as we seek to have the fund participate in whatever investment style ranks as the market leader in the months ahead.
September 15, 2017
1 Total return includes reinvestment of dividends and any capital gains paid. Past performance is no guarantee of future results. Share price and investment return fluctuate such that upon redemption, fund shares may be worth more or less than their original cost.
2 Source: Lipper Inc. — The Russell Midcap® Index measures the performance of the mid-cap segment of the U.S. equity universe. The Russell Midcap Index is a subset of the Russell 1000® Index. It includes approximately 800 of the smallest securities based on a combination of their market cap and current index membership. The Russell Midcap® Index represents approximately 31% of the total market capitalization of the Russell 1000 companies. The Russell Midcap® Index is constructed to provide a comprehensive and unbiased barometer for the mid-cap segment. The Index is completely reconstituted annually to ensure larger stocks do not distort the performance and characteristics of the true mid-cap opportunity set. Investors cannot invest directly in any index.
3 Source: Lipper Inc. — The Russell Midcap® Value Index measures the performance of the mid-cap value segment of the U.S. equity universe. It includes those Russell Midcap® Index companies that are considered more value-oriented relative to the overall market as defined by Russell’s leading style methodology. The Russell Midcap Value Index is constructed to provide a comprehensive and unbiased barometer of the mid-cap value market. The Russell Midcap® Value Index is completely reconstituted annually to ensure larger stocks do not distort the performance and characteristics of the true mid-cap value market. Investors cannot invest directly in any index.
4 Source: Lipper Inc. — The Russell Midcap® Growth Index measures the performance of the mid-cap growth segment of the U.S. equity universe. It includes those Russell Midcap® Index companies with higher growth earning potential as defined by Russell’s leading style methodology. The Russell Midcap® Growth Index is constructed to provide a comprehensive and unbiased barometer of the mid-cap growth market. The Russell Midcap® Growth Index is completely reconstituted annually to ensure larger stocks do not distort the performance and characteristics of the true mid-cap growth market. Investors cannot invest directly in any index.
Equities are subject generally to market, market sector, market liquidity, issuer, and investment style risks, among other factors, to varying degrees, all of which are more fully described in the fund’s prospectus.
Stocks of small- and/or mid-cap companies often experience sharper price fluctuations than stocks of large-cap companies.
8
For the period from September 1, 2016 through August 31, 2017, as provided by Caroline Lee Tsao, Primary Portfolio Manager responsible for investment allocation decisions
Market and Fund Performance Overview
For the 12-month period ended August 31, 2017, BNY Mellon Small Cap Multi-Strategy Fund’s Class M shares produced a total return of 17.19%, and Investor shares produced a total return of 16.94%.1 In comparison, the fund’s primary benchmark, the Russell 2000® Index, produced a total return of 14.91% for the same period. 2 The Russell 2000® Growth Index and Russell 2000® Value Index, the fund’s secondary benchmarks, produced total returns of 16.39% and 13.47%, respectively, for the same period.3,4
Small-cap stocks gained ground amid better-than-expected corporate earnings and positive investor sentiment in the wake of the U.S. presidential election. The fund outperformed its benchmark as the Opportunistic Small Cap Strategy and the Small Cap Growth Strategy produced above-average returns.
The Fund’s Investment Approach
The fund seeks capital appreciation. The fund pursues its goal by normally investing at least 80% of its net assets, plus any borrowings for investment purposes, in equity securities of small-cap companies. The fund currently considers small-cap companies to be those companies with market capitalizations that are equal to or less than the market capitalization of the largest company included in the Index. Furthermore, the fund normally allocates assets across multiple investment strategies employed by the investment adviser that invest primarily in equity securities issued by small-cap companies. The investment adviser determines the investment strategies and sets target allocations and ranges. The fund is designed to provide exposure to various investment strategies and styles, including the Opportunistic Small Cap Strategy, the Small Cap Value Strategy, and the Small Cap Growth Strategy, all as more particularly described in the fund’s prospectus.
Rising Corporate Earnings Drove Markets Higher
While political uncertainties caused U.S. stocks to dip in the weeks before the 2016 presidential election, equity markets were reenergized in November and December when investors began to anticipate lower corporate taxes, reduced regulatory constraints on business, and increased infrastructure spending from the presidential administration.
Consecutive quarters of better-than-expected corporate earnings and encouraging global economic developments drove the Index to a series of new highs in February and early March 2017. While concerns about the new administration’s ability to implement its business-friendly policy proposals slowed the pace of the market’s advance in the spring, most broad measures of stock market performance quickly erased those losses and reached new all-time highs over the summer. However, market leadership shifted from smaller, value-oriented stocks to larger, more growth-oriented industry leaders, including multinational corporations. Although all three major capitalization ranges produced double-digit returns in this environment, small-cap stocks generally lagged their large-cap counterparts, and growth stocks substantially outperformed value-oriented stocks for the reporting period overall.
Selection and Allocation Strategies Supported Fund Results
During the reporting period, favorable security selection and sector allocation decisions within the fund’s strategies further bolstered relative performance as two of the fund’s three underlying strategies produced higher returns than the Index.
The Opportunistic Small Cap Strategy fared best through particularly strong stock picks in the information technology, financials, and consumer discretionary sectors. Overweighted exposure to the rising information technology sector and underweighted positions in the lagging real estate and consumer staples sectors also supported the strategy’s relative performance. The Small Cap Growth Strategy benefited from favorable security selections in the information technology, consumer staples, and industrials sectors, which more than offset weaker results stemming from a relatively light position in the health care sector and overweighted exposure to the energy and consumer staples sectors.
The Small Cap Value Strategy lagged the Index during the reporting period due to disappointing results from its security selection and sector allocation decisions. Most notably, individual underperformers in the information technology, consumer staples, and industrials sectors dampened results, as did an underweighted allocation to the financials sector and overweighted positions in the energy and consumer discretionary sectors.
In January 2017, we increased the fund’s exposure to value-oriented stocks by reducing its investment in the Small Cap Growth Strategy. In February, we further reduced the allocation to the Small Cap Growth Strategy in favor of the Small Cap Value Strategy. In August, we changed the fund’s value-oriented tilt by reducing the allocation to the Small Cap Value Strategy and increasing its investment in the Small Cap Growth Strategy.
Balanced Exposure to Small-Cap Companies
We believe that market fundamentals remain constructive for small-cap stocks in an environment of strong corporate earnings, muted inflation, accelerating global economic growth, and still-accommodative monetary policies in most regions of the world. As of the reporting period’s end, we have established more balanced exposure to growth- and value-oriented stocks as we seek to have the fund participate in whatever investment style ranks as the market leader in the months ahead.
September 15, 2017
1 Total return includes reinvestment of dividends and any capital gains paid. Past performance is no guarantee of future results. Share price and investment return fluctuate such that upon redemption, fund shares may be worth more or less than their original cost.
2 Source: Lipper Inc. — The Russell 2000® Index measures the performance of the small-cap segment of the U.S. equity universe. The Russell 2000® Index is a subset of the Russell 3000® Index representing approximately 10% of the total market capitalization of that index. It includes approximately 2,000 of the smallest securities based on a combination of their market cap and current index membership. The Russell 2000 is constructed to provide a comprehensive and unbiased small-cap barometer and is completely reconstituted annually to ensure larger stocks do not distort the performance and characteristics of the true small-cap opportunity set. Investors cannot invest directly in any index.
3 Source: Lipper Inc. — The Russell 2000® Growth Index measures the performance of the small-cap growth segment of the U.S. equity universe. It includes those Russell 2000 companies with higher growth earning potential as defined by Russell’s leading style methodology. The Russell 2000® Growth Index is constructed to provide a comprehensive and unbiased barometer for the small-cap growth segment. The Russell 2000® Growth Index is completely reconstituted annually to ensure larger stocks do not distort the performance and characteristics of the true small-cap opportunity set and that the represented companies continue to reflect growth characteristics. Investors cannot invest directly in any index.
4 Source: Lipper Inc. — The Russell 2000® Value Index measures the performance of the small-cap value segment of the U.S. equity universe. It includes those Russell 2000 companies that are considered more value-oriented relative to the overall market as defined by Russell’s leading style methodology. The Russell 2000 ®Value Index is constructed to provide a comprehensive and unbiased barometer for the small-cap value segment. The Russell 2000 ®Value Index is completely reconstituted annually to ensure larger stocks do not distort the performance and characteristics of the true small-cap opportunity set and that the represented companies continue to reflect value characteristics. Investors cannot invest directly in any index.
Equities are subject generally to market, market sector, market liquidity, issuer, and investment style risks, among other factors, to varying degrees, all of which are more fully described in the fund’s prospectus.
Stocks of small- and/or mid-cap companies often experience sharper price fluctuations than stocks of large-cap companies.
9
DISCUSSION OF FUND PERFORMANCE (continued)
For the period from September 1, 2016 through August 31, 2017, as provided by Irene D. O’Neill, Portfolio Manager
Market and Fund Performance Overview
For the 12-month period ended August 31, 2017, BNY Mellon Focused Equity Opportunities Fund’s Class M shares produced a total return of 27.04%, and Investor shares produced a total return of 26.75%.1 In comparison, the S&P 500® Index (the “Index”), the fund’s benchmark, produced a total return of 16.22% for the same period.2
Stocks gained ground over the reporting period amid better-than-expected corporate earnings, improving economic prospects, and positive investor sentiment in the wake of the U.S. presidential election. The fund produced higher returns than its benchmark due to successful security selections in 10 of the Index’s 11 economic sectors.
The Fund’s Investment Approach
The fund seeks capital appreciation. To pursue its goal, the fund normally invests at least 80% of its net assets in equity securities. The fund invests, under normal circumstances, in approximately 25-30 companies that are considered by the investment adviser to be positioned for long-term earnings growth. The fund may hold growth or value stocks or a blend of both. The fund may invest in the stocks of companies of any size, although it focuses on large-cap companies. The fund invests primarily in equity securities of U.S. issuers, but may invest up to 25% of its assets in the equity securities of foreign issuers, including those in emerging market countries.
The portfolio manager monitors sector and security weightings and regularly evaluates the fund’s risk-adjusted returns to manage the risk profile of the fund’s portfolio. The portfolio manager adjusts exposure limits as necessary.
Rising Corporate Earnings Drove Markets Higher
While political uncertainties caused U.S. stocks to dip in the weeks before the 2016 presidential election, equity markets were reenergized in November and December when investors began to anticipate lower corporate taxes, reduced regulatory constraints, and increased infrastructure spending from the new administration.
In 2017, consecutive quarters of better-than-expected corporate earnings and encouraging global economic developments drove the Index to a series of new highs in February and early March. While concerns about the new administration’s ability to implement its business-friendly policy proposals slowed the pace of the market’s advance in the early spring, mid-cap stocks quickly rebounded and reached new highs over the summer. In addition, broader market leadership shifted from smaller, value-oriented stocks to larger, more growth-oriented industry leaders. Consequently, large-cap stocks generally produced higher returns than their small- and mid-cap counterparts, and growth stocks substantially outperformed value-oriented stocks.
Security Selection Strategy Buoyed Fund Results
The fund outperformed the Index over the reporting period due to the success of our security selection strategy. In the information technology sector, several semiconductor companies posted robust gains. NXP Semiconductors received an acquisition offer at a premium to its stock price at the time, NVIDIA boosted earnings by expanding beyond graphics and into artificial intelligence, Micron Technology benefited from industry consolidation and greater pricing discipline, and Broadcom diversified its end markets while the use of its wireless chips in smartphones increased. Among software developers, Adobe Systems and Electronic Arts continued to transition successfully to cloud-based subscription models.
The fund also fared well in the struggling energy sector, where refiners Valero Energy, Andeavor (formerly Tesoro), and Marathon Petroleum demonstrated greater capital discipline that led to higher cash flows and greater shareholder value. In the consumer staples sector, lack of exposure to packaged food and household products companies helped the fund avoid their weakness. Instead, we focused on holdings such as tobacco producer Philip Morris International, which saw greater adoption of new e-cigarette technology in international markets, and spirits producer Constellation Brands, which increased distribution of its Mexican beers. Top performers in the health care sector included insurer United Health Group, which reported higher earnings as utilization of medical services declined. Laboratory products provider Agilent Technologies achieved recoveries in its chemicals and energy divisions. Abbott Laboratories acquired a medical devices manufacturer with a strong new product pipeline.
While disappointments proved relatively mild, results from the industrials sector were constrained by a weaker-than-expected earnings report from agricultural equipment maker Deere & Co. due to higher warranty and raw materials costs.
Focusing on Growing Businesses
While potential still exists for the enactment of more stimulative fiscal and tax policies by the federal government, even in the absence of new legislation we believe that the U.S. and global economies remain poised for moderate-but-steady expansion. Therefore, we have maintained the fund’s focus on companies with track records of strong earnings growth, particularly those participating in secular industry trends or self-help activities that we believe can support growth independent of economic developments. As of the reporting period’s end, we have found an ample number of opportunities meeting our criteria in the information technology, consumer discretionary, energy, and consumer staples sectors, but relatively few in the traditionally defensive telecommunication services, utilities, and real estate sectors.
September 15, 2017
1 Total return includes reinvestment of dividends and any capital gains paid. Past performance is no guarantee of future results. Share price and investment return fluctuate such that upon redemption, fund shares may be worth more or less than their original cost.
2 Source: Lipper Inc. — The S&P 500® Index is widely regarded as the best single gauge of large-cap U.S. equities. The index includes 500 leading companies and captures approximately 80% coverage of available market capitalization. Investors cannot invest directly in any index.
Please note: the position in any security highlighted with italicized typeface was sold during the reporting period.
Equities are subject generally to market, market sector, market liquidity, issuer, and investment style risks, among other factors, to varying degrees, all of which are more fully described in the fund’s prospectus.
The fund is non-diversified, which means that a relatively high percentage of the fund’s assets may be invested in a limited number of issuers. Therefore, the fund’s performance may be more vulnerable to changes in the market value of a single issuer or group of issuers and more susceptible to risks associated with a single economic, political, or regulatory occurrence than a diversified fund.
10
For the period from September 1, 2016 through August 31, 2017, as provided by Caroline Lee Tsao, Primary Portfolio Manager responsible for investment allocation decisions
Market and Fund Performance Overview
For the 12-month period ended August 31, 2017, BNY Mellon Small/Mid Cap Multi-Strategy Fund’s Class M shares produced a total return of 16.94%, and Investor shares produced a total return of 16.55%.1 In comparison, the Russell 2500™ Index, the fund’s primary benchmark, produced a total return of 13.22% for the same period. 2 The Russell 2500™ Growth Index and Russell 2500™ Value Index, the fund’s secondary benchmarks, produced total returns of 15.57% and 11.12%, respectively, for the same period. 3,4
Small- and mid-cap stocks gained ground amid better-than-expected corporate earnings, improving global economic prospects, and positive investor sentiment in the wake of the U.S. presidential election. The fund outperformed its benchmark as all three of its underlying strategies produced above-average returns.
The Fund’s Investment Approach
The fund seeks capital appreciation. The fund pursues its goal by normally investing at least 80% of its net assets in equity securities of small- and mid-cap companies. The fund currently considers small- and mid-cap companies to be those companies with total market capitalizations that are within the market-capitalization range of the smallest company included in the Russell 2000® Index and the largest company included in the Russell Midcap® Index.
The fund normally allocates assets across multiple investment strategies employed by the investment adviser that invest primarily in equity securities issued by small- and mid-cap companies. The investment adviser determines the investment strategies and sets target allocations and ranges. The fund is designed to provide exposure to various investment strategies and styles, including the Opportunistic Small/Mid Cap Strategy, the Small/Mid Cap Value Strategy, and the Small/Mid Cap Growth Strategy, all as more particularly described in the fund’s prospectus.
Rising Corporate Earnings Drove Markets Higher
While political uncertainties caused U.S. stocks to dip in the weeks before the 2016 presidential election, equity markets were reenergized in November and December when investors began to anticipate lower corporate taxes, reduced regulatory constraints on business, and increased infrastructure spending from the new administration.
Small- and mid-cap stocks in 2017 generally continued to build on gains achieved during the final months of 2016. Consecutive quarters of better-than-expected corporate earnings and encouraging global economic developments drove the Index to a series of new highs in February and early March. While concerns about the new administration’s ability to implement its business-friendly policy proposals slowed the pace of the market’s advance in the spring, most broad measures of stock market performance quickly erased those losses and reached new all-time highs over the summer. However, market leadership shifted from smaller, value-oriented stocks to larger, more growth-oriented industry leaders, including multinational corporations with a strong presence in international markets. All three major capitalization ranges produced double-digit returns in this environment, but small- and mid-cap stocks generally lagged their large-cap counterparts, and growth stocks substantially outperformed value-oriented stocks for the reporting period overall.
Selection and Allocation Strategies Supported Fund Results
During the reporting period, favorable security selection and sector allocation decisions within the fund’s strategies further bolstered relative performance. Indeed, all three of the fund’s underlying strategies produced higher returns than their respective benchmarks.
The Opportunistic Small/Mid Cap Strategy fared best through overweighted exposure to the information technology sector and underweighted positions in the energy and real estate sectors, as well as favorable security selections in the information technology, financials, and materials sectors. The Small/Mid Cap Growth Strategy benefited from strong stock selections in the information technology, consumer staples, and industrials sectors, more than offsetting relatively weak results stemming from relatively light exposure to the telecommunication services sector and overweighted positions in the energy and consumer staples sectors. The Small/Mid Cap Value Strategy overcame shortfalls in its sector allocation strategy—including underweighted exposure to utilities and financial stocks and overweighted positions among consumer staples—through favorable stock selections in the financials, industrials, and energy sectors.
In January 2017, we effectively increased the fund’s exposure to value-oriented stocks by reducing its investment in the Small/Mid Cap Growth Strategy. In February, we further reduced the allocation to the Small/Mid Cap Growth Strategy in favor of the Small/Mid Cap Value Strategy. In August, we changed the fund’s value-oriented tilt by reducing the allocation to the Small/Mid Cap Value Strategy and increasing its investment in the Small/Mid Cap Growth Strategy.
Balanced Exposure to Small- and Mid-Cap Companies
We believe that market fundamentals remain constructive for small- and mid-cap stocks in an environment of strong corporate earnings, muted inflation, accelerating global economic growth, and still-accommodative monetary policies in most regions of the world. As of the reporting period’s end, we have established more balanced exposure to growth- and value-oriented stocks as we seek to have the fund participate in whatever investment style ranks as the market leader in the months ahead.
September 15, 2017
1 Total return includes reinvestment of dividends and any capital gains paid. Past performance is no guarantee of future results. Share price and investment return fluctuate such that upon redemption, fund shares may be worth more or less than their original cost.
2 Source: Lipper Inc. — The Russell 2500™ Index measures the performance of the small- to mid-cap segment of the U.S. equity universe, commonly referred to as “smid” cap. The Russell 2500™ Index is a subset of the Russell 3000® Index. It includes approximately 2,500 of the smallest securities based on a combination of their market cap and current index membership. The Russell 2500™ Index is constructed to provide a comprehensive and unbiased barometer for the small- to mid-cap segment. The Russell 2500™ Index is completely reconstituted annually to ensure larger stocks do not distort the performance and characteristics of the true small- to mid-cap opportunity set. Investors cannot invest directly in any index.
3 Source: Lipper Inc. — The Russell 2500™ Growth Index measures the performance of the small- to mid-cap growth segment of the U.S. equity universe. It includes those Russell 2500 companies with higher growth earning potential as defined by Russell’s leading style methodology. The Russell 2500™ Growth Index is constructed to provide a comprehensive and unbiased barometer of the small- to mid-cap growth market. The Russell 2500™ Growth Index is completely reconstituted annually to ensure larger stocks do not distort the performance and characteristics of the true small- to mid-cap opportunity set and that the represented companies continue to reflect growth characteristics. Investors cannot invest directly in any index.
4 Source: Lipper Inc. — The Russell 2500™ Value Index measures the performance of the small- to mid-cap value segment of the U.S. equity universe. It includes those Russell 2500 companies that are considered more value-oriented relative to the overall market as defined by Russell’s leading style methodology. The Russell 2500™ Value Index is constructed to provide a comprehensive and unbiased barometer of the small- to mid-cap value market. The Russell 2500™ Value Index is completely reconstituted annually to ensure larger stocks do not distort the performance and characteristics of the true small- to mid-cap opportunity set and that the represented companies continue to reflect value characteristics. Investors cannot invest directly in any index.
Equities are subject generally to market, market sector, market liquidity, issuer, and investment style risks, among other factors, to varying degrees, all of which are more fully described in the fund’s prospectus. Stocks of small- and/or mid-cap companies often experience sharper price fluctuations than stocks of large-cap companies.
Part of the fund’s recent performance is attributable to positive returns from its initial public offering (IPO) investments. There can be no guarantee that IPOs will have or continue to have a positive effect on fund performance.
11
DISCUSSION OF FUND PERFORMANCE (continued)
For the period from September 1, 2016 through August 31, 2017, as provided by Mark A. Bogar, Andrew R. Leger, and James A. Lydotes, Portfolio Managers
Market and Fund Performance Overview
For the 12-month period ended August 31, 2017, BNY Mellon International Fund’s Class M shares produced a total return of 19.80%, and Investor shares produced a total return of 19.59%.1 In comparison, the fund’s benchmark, the MSCI EAFE Index (the “Index”), produced a total return of 17.64% for the same period.2
International equity markets gained ground during the reporting period, supported by improving economic data and better-than-expected corporate earnings. The fund outperformed its benchmark, largely due to strong individual security selections in the Japanese, German, and Swiss markets.
The Fund’s Investment Approach
The fund seeks long-term capital growth. To pursue this goal, the fund normally invests at least 65% of its total assets in equity securities of foreign issuers. The fund may invest in companies of any size. Though not specifically limited, the fund ordinarily will invest in a broad range of (and in any case at least five different) countries.
The stocks purchased may have value and/or growth characteristics. The portfolio managers employ a “bottom-up” investment approach, which emphasizes individual stock selection. The stock selection process is designed to produce a diversified portfolio that, relative to the Index, has a below-average price/earnings ratio and an above-average earnings growth trend.
Political Stability and Improving Economics Buoyed Markets
During the early months of the reporting period, most developed international markets lost ground or drifted sideways in volatile trading due to concerns regarding global economic growth and uncertainties in advance of the U.S. presidential election in November 2016.
The presidential election in the U.S. marked a turning point for most global stock markets. International equities turned generally positive in response to prospects for accelerating U.S. growth as well as improving local and regional economic fundamentals. By early 2017, the Index and most individual country stock indices had recouped previous losses and advanced into positive territory.
The second half of the reporting period saw steady gains across most international markets, supported by continuing economic recoveries in Europe and Asia. In the European Union (EU), political worries receded as anti-EU candidates for national office were rejected by voters in favor of more centrist, pro-EU figures, first in The Netherlands in March 2017 and then three months later in France. The U.K. market shrugged off concerns regarding the Brexit vote amid robust corporate earnings and improving economic forecasts. In Japan, the central bank revised its growth estimate upwards amid a slew of unexpectedly strong corporate earnings reports.
Individual Holdings Bolstered Relative Results
The fund’s performance compared to the Index benefited from several individual holdings in the Japanese, German, and Swiss markets. In Japan, a broad group of holdings performed relatively well, particularly in the consumer discretionary and materials sectors. Top performers included car maker Suzuki Motor, which rose due to positive sales trends in Europe, Japan, and India; electronic products maker Panasonic, which increased profit margins by reinvesting in high-growth housing and auto-related areas; and game maker Nintendo, which reported strong sales of new gaming hardware and the release of popular new mobile games. In Germany, electric utility E.ON received a favorable court ruling likely to reduce future costs, while life insurer Allianz saw increased business, declining costs, and an improving solvency position. In Switzerland, wealth management firm Julius Baer Group reported strong financial results, and contract pharmaceutical manufacturer Lonza Group delivered better-than-expected earnings while noting improving business trends. Another notably strong performer, Italian energy utility Enel, acquired a complementary business while meeting earnings expectations.
On the other hand, a few holdings detracted from the fund’s relative performance. Israeli pharmaceutical company Teva Pharmaceutical Industries was negatively affected by pricing issues and a heavy debt burden. In Singapore, Ascendas Real Estate Investment Trust, which focuses on industrial properties, lagged sector averages. In France, underweighted exposure to financial stocks, which surged in the wake of the country’s June 2017 presidential election, detracted from the fund’s returns, as did grocery chain Carrefour, which missed quarterly earnings expectations. Finally, Belgium-based global brewing company Anheuser-Busch InBev underperformed largely due to unfavorable currency fluctuations.
Positioned for Further Growth
We believe the environment for international equities remains supported by increasingly widespread economic growth in the developed and developing worlds, and by growing investor confidence in global political stability. While some challenges continue to loom, most notably in North Korea and the Middle East, as of the end of the reporting period, most of the developed world appears positioned for additional, perhaps accelerating, economic growth. Although stock valuations have risen, we believe that they remain in line with earnings expectations.
In light of the constructive investment environment, we currently see what we believe are attractive investment opportunities in several countries and market sectors. We have increased the fund’s holdings in Italy and Switzerland, while trimming exposure to German and Australian stocks. Among industry groups, we have taken some profits among consumer discretionary stocks and reduced the fund’s health care holdings, while increasing its exposure to the financials and telecommunication services sectors.
September 15, 2017
1 Total return includes reinvestment of dividends and any capital gains paid. Past performance is no guarantee of future results. Share price and investment return fluctuate such that upon redemption, fund shares may be worth more or less than their original cost.
2 Source: Lipper Inc. — Reflects reinvestment of net dividends and, where applicable, capital gain distributions. The MSCI EAFE Index (Europe, Australasia, Far East) is a free float-adjusted market capitalization-weighted index that is designed to measure the equity market performance of developed markets, excluding the U.S. and Canada. Investors cannot invest directly in any index.
Please note: the position in any security highlighted with italicized typeface was sold during the reporting period.
Equities are subject generally to market, market sector, market liquidity, issuer, and investment style risks, among other factors, to varying degrees, all of which are more fully described in the fund’s prospectus.
The fund’s performance will be influenced by political, social, and economic factors affecting investments in foreign companies. Special risks associated with investments in foreign companies include exposure to currency fluctuations, less liquidity, less developed or less efficient trading markets, lack of comprehensive company information, political instability, and differing auditing and legal standards. These risks are enhanced in emerging market countries.
12
For the period from September 1, 2016 through August 31, 2017, as provided by George E. DeFina, Sean P. Fitzgibbon, and Jay Malikowski, Portfolio Managers
Market and Fund Performance Overview
For the 12-month period ended August 31, 2017, BNY Mellon Emerging Markets Fund’s Class M shares produced a total return of 26.36%, and Investor shares produced a total return of 26.05%.1 In comparison, the fund’s benchmark, the MSCI Emerging Markets Index (the “Index”), produced a total return of 24.53% for the same period.2
Emerging market equities rose sharply during the reporting period, largely in response to improving commodity prices, favorable currency movements, and accelerating corporate earnings growth. The fund outperformed the Index, mainly due to relatively strong returns from its security selection strategy in China and, to a lesser degree, India and Malaysia.
The Fund’s Investment Approach
The fund seeks long-term capital growth. To pursue its goal, the fund invests at least 80% of its assets in equity securities of companies organized, or with a majority of assets or operations, in countries considered to be emerging markets. Emerging market countries generally include all countries represented by the Index. The fund may invest in companies of any size.
Normally, the fund will invest in a broad range of (and in any case at least five different) emerging market countries. The stocks purchased may have value and/or growth characteristics. The portfolio managers employ a “bottom-up” investment approach, which emphasizes individual stock selection. The stock selection process is designed to produce a diversified portfolio that, relative to the Index, has a below-average price/earnings ratio and an above-average earnings growth trend.
Emerging Markets Rebounded to Lead Global Equities
The reporting period began with lackluster market performance due to uncertainties regarding the impact of the upcoming U.S. presidential election on global trade and the U.S. dollar. However, in the wake of the outcome of the presidential election in November, many emerging markets responded positively to modestly rebounding energy and commodity prices. While stocks in Mexico and China initially lagged market averages amid concerns regarding possible U.S. trade policy shifts by the new administration, those markets recovered when doubts arose regarding the administration’s determination and ability to enact changes.
The second half of the reporting period saw significant gains for most emerging market equities, with rising valuations supported by corporate earnings growth, a weakening U.S. dollar, and broadly improving global and local economic conditions. Most notably, China experienced explosive growth in the value of Internet-related stocks, while markets in India, which briefly suffered in response to a surprise demonetization in November 2016, normalized in early 2017 and rose sharply in the ensuing months. Consequently, after lagging their developed market counterparts during the first half of the reporting period, emerging markets significantly outpaced global market averages over the second half.
Asian Investments Led Gains
The fund’s holdings of Chinese companies, which constrained the fund’s relative returns during the first half of the reporting period, produced robust second-half gains. Top performers included three fast-growing Internet-related holdings—e-commerce giant Alibaba Group Holding, mobile gaming company Tencent Holdings, and social media platform Weibo—as well as hotel owner China Lodging Group, which more than doubled in value as the company increased operating efficiencies and raised its brand profile. In India, returns compared to the benchmark were bolstered by the fund’s exposure to diversified mining group Vedanta, which sharply increased earnings and revenues from previously depressed levels while issuing a positive pricing outlook, and auto maker Maruti Suzuki India, which gained market share and improved its mix of selling prices. Other leading performers included Malaysian airline AirAsia Berhad, which reported improving profits, and materials producers Vale (Brazil) and POSCO (South Korea), both of which benefited from strengthening global demand and effective operational execution.
On the other hand, a few holdings detracted from the fund’s relative performance. Lack of exposure to fast-growing South African technology firms undermined returns compared to the benchmark, as did financial services provider Barclays Africa Group, which lagged its peers due to challenges in winning new business. In Brazil, underweighted exposure to financial firms rebounding from recession detracted from the fund’s relative performance, as did an investment in meat producer JBS, which became embroiled in a government bribery scandal. In Colombia, oil producer Gran Tierra Energy declined due to operational difficulties and weak oil prices. Other notable disappointments included South Korean grocery chain GS Retail and Chinese telecommunications provider China Mobile.
Emerging Market Valuations Remain Attractive
Despite the recent gains posted by many emerging market stocks, market valuations across the region have remained attractive compared to developed markets, particularly in light of forecasts of stronger economic growth. As of the end of the reporting period, we have found a relatively large number of what we believe are attractive investment opportunities in China and Brazil. Conversely, we have trimmed the fund’s exposure to India and Mexico. Among industry groups, we have increased investments in the materials and utilities sectors, while reducing exposure to the consumer staples and real estate sectors.
September 15, 2017
1 Total return includes reinvestment of dividends and any capital gains paid. Past performance is no guarantee of future results. Share price and investment return fluctuate such that upon redemption, fund shares may be worth more or less than their original cost.
2 Source: Lipper Inc. — Reflects reinvestment of net dividends and, where applicable, capital gain distributions. The MSCI Emerging Markets Index is a free float-adjusted market capitalization-weighted index that is designed to measure equity market performance of emerging markets. Investors cannot invest directly in any index.
Please note: the position in any security highlighted with italicized typeface was sold during the reporting period.
Equities are subject generally to market, market sector, market liquidity, issuer, and investment style risks, among other factors, to varying degrees, all of which are more fully described in the fund’s prospectus.
The fund’s performance will be influenced by political, social, and economic factors affecting investments in foreign companies. Special risks associated with investments in foreign companies include exposure to currency fluctuations, less liquidity, less developed or less efficient trading markets, lack of comprehensive company information, political instability, and differing auditing and legal standards. These risks are enhanced in emerging market countries.
13
DISCUSSION OF FUND PERFORMANCE (continued)
For the period from September 1, 2016 through August 31, 2017, as provided by Richard A. Brown, William S. Cazalet, Thomas J. Durante, Karen Q. Wong, and Syed A. Zamil, Portfolio Managers
Market and Fund Performance Overview
For the 12-month period ended August 31, 2017, BNY Mellon International Appreciation Fund’s Class M shares produced a total return of 16.76%, and Investor shares produced a total return of 16.47%.1 In comparison, the fund’s benchmark, the MSCI EAFE Index (the “Index”), produced a total return of 17.64% for the same period.2
International equity markets gained ground during the reporting period, supported by improving economic data and better-than-expected corporate earnings. The fund lagged its benchmark largely due to security selection shortfalls stemming from disparities between the fund's holdings of American Depositary Receipts (ADRs) and the performance of securities in the Index that were not available as ADRs but which generally performed well during the reporting period.
The Fund’s Investment Approach
The fund seeks long-term capital appreciation. To pursue its goal, the fund normally invests at least 80% of its net assets in equity securities. The fund invests primarily in Depositary Receipts (DRs) representing the local shares of non-U.S. companies, in particular, ADRs.
In selecting securities, we screen the Index universe of approximately 1,000 issuers for the availability of issuers with a DR facility. The investment adviser then uses a proprietary mathematical algorithm to reflect the characteristics of the developed markets that takes into consideration risk characteristics, including country weights and sector weights within each country. As a result of this process, we expect to hold ADRs representing 200 to 300 foreign issuers. The fund’s country allocation is expected to be within 5% of that of the Index, and under normal circumstances, the fund will invest in at least 10 different countries.
Political Stability and Improving Economics Buoyed Markets
Investors over the final months of 2016 responded cautiously to political uncertainty in the United States, which culminated in the election of a new president. As a result, the Index began the reporting period with mild declines. However, investor sentiment changed dramatically in early 2017 when international markets were cheered by encouraging global economic data.
Eurozone stocks were bolstered by an improving regional economy, better-than-expected corporate earnings, and encouraging statements from the European Central Bank, which upgraded growth forecasts while pledging to keep stimulus programs in place in the near term. At the same time, Dutch and French election results reaffirmed regional unity by rejecting nationalist candidates opposed to membership in the European Union (EU). The United Kingdom participated in the market’s rise but lagged its neighbors as the country began the process of exiting the EU, and local political turmoil continued when elections in June resulted in a hung parliament. In Japan, solid corporate financial results bolstered returns, and the Bank of Japan issued a positive revision to its economic forecast. However, Japanese equities rose at a more modest pace than those in Europe when a strengthening yen threatened to dampen export activity.
The Index produced higher returns over the reporting period than most broad-based measures of U.S. stock market performance.
Financial Stocks Led Global Markets Higher
The fund participated substantially in the global equity market’s gains, which were led by a rebounding financials sector. Banks, insurance companies, and capital markets firms in France, Italy, and Spain benefited from rising lending margins, waning regional political concerns, and accelerating economic growth. Industrial stocks fared quite well across a wide range of countries, boosted by rising demand for engineering and construction services in the recovering economy. Positive economic developments in Asia helped spark gains in the materials sector, where recovering prices of industrial metals boosted the earnings of metals-and-mining companies in Australia.
Although all 11 of the industry groups represented in the Index produced positive absolute returns over the reporting period, the health care sector lagged market averages when large pharmaceutical companies encountered pricing pressures and challenges to regulatory approvals of new products. The telecommunication services and real estate sectors were laggards when rising bond yields proved more competitive with dividend-paying stocks.
From a geographic perspective, smaller markets generally outpaced larger ones when Brexit concerns constrained stocks in the United Kingdom and a stronger yen dampened export activity in Japan. Instead, countries in Southern Europe and Scandinavia posted particularly impressive gains, as did Singapore. Ireland and Israel lost some value due to weakness among locally based health care companies.
Maintaining a Disciplined Approach
Encouraging economic and political developments recently have supported higher stock prices in developed international markets, and current evidence suggests that these positive trends could continue over the foreseeable future. However, we remain aware that unexpected reversals in economic data or geopolitical relations could derail the market rally. As always, we have continued to monitor the factors considered by the fund’s investment model in light of current market conditions and will make adjustments as we deem necessary.
September 15, 2017
1 Total return includes reinvestment of dividends and any capital gains paid. Past performance is no guarantee of future results. Share price and investment return fluctuate such that upon redemption, fund shares may be worth more or less than their original cost.
2 Source: Lipper Inc. — Reflects reinvestment of net dividends and, where applicable, capital gain distributions. The MSCI EAFE Index (Europe, Australasia, Far East) is a free float-adjusted market capitalization-weighted index that is designed to measure the equity market performance of developed markets, excluding the U.S. and Canada. Investors cannot invest directly in any index.
Equities are subject generally to market, market sector, market liquidity, issuer, and investment style risks, among other factors, to varying degrees, all of which are more fully described in the fund’s prospectus.
The fund’s performance will be influenced by political, social, and economic factors affecting investments in foreign companies. Special risks associated with investments in foreign companies include exposure to currency fluctuations, less liquidity, less developed or less efficient trading markets, lack of comprehensive company information, political instability, and differing auditing and legal standards. These risks are enhanced in emerging market countries.
14
For the period from September 1, 2016 through August 31, 2017, as provided by C. Wesley Boggs, William S. Cazalet, CAIA, Ronald P. Gala, CFA, Peter D. Goslin, CFA, and Syed A. Zamil, CFA, Primary Portfolio Managers
Market and Fund Performance Overview
For the 12-month period ended August 31, 2017, BNY Mellon International Equity Income Fund’s Class M shares produced a total return of 18.72%, and Investor shares produced a total return of 17.87%.1 In comparison, the fund’s benchmark, the MSCI ACWI ex USA Index (the “Index”), produced a total return of 18.88% for the same period.2
International stocks gained ground amid improving global economic conditions, waning political concerns, and strong corporate earnings. The fund produced returns that were roughly in line with those of its benchmark.
The Fund’s Investment Approach
The fund seeks total return (consisting of capital appreciation and income). To pursue its goal, the fund normally invests at least 80% of its net assets, plus any borrowings for investment purposes, in equity securities. The fund normally invests substantially all of its assets in the equity securities of issuers located outside the United States and diversifies broadly among developed and emerging market countries. The fund focuses on dividend-paying stocks of foreign companies, including those of emerging-market countries. The fund may invest in the stocks of companies of any market capitalization.
We select stocks through a disciplined investment process using proprietary quantitative computer models that analyze a diverse set of characteristics to identify and rank stocks according to earnings quality. Based on this analysis, we generally select from the higher-ranked dividend-paying securities those stocks that we believe will continue to pay above-average dividends. We seek to overweight higher-dividend-paying stocks, while maintaining country and sector weights generally similar to those of the Index.
Improving Fundamentals Drove Markets Higher
Investors responded cautiously over the final months of 2016 to political uncertainty in the United States, which culminated in the election of a new president. As a result, the Index began the reporting period with mild declines. However, investor sentiment changed dramatically in early 2017 when international markets were cheered by the release of encouraging global economic data.
Eurozone stocks were bolstered by an improving regional economy, better-than-expected corporate earnings, and encouraging statements from the European Central Bank, which upgraded growth forecasts while pledging to keep stimulus programs in place in the near term. At the same time, Dutch and French election results reaffirmed regional unity by rejecting nationalist candidates opposed to membership in the European Union (EU). The United Kingdom participated in the market’s rise but lagged its neighbors as the country began the process of exiting the EU, and local political turmoil continued when elections in June resulted in a hung parliament. In Japan, solid corporate financial results bolstered returns, and the Bank of Japan issued a positive revision to its economic forecast. However, Japanese equities rose at a more modest pace than those in Europe when a weakening yen threatened to dampen export activity. The emerging markets fared especially well as fears of protectionist U.S. trade policies abated and local economic data improved.
In this environment, income-oriented investors continued to reach for the higher yields provided by dividend-paying stocks, enabling them to outpace market averages.
Security Selections Supported Fund Results
The fund’s performance compared to the Index was supported during the reporting period by our quantitative security selection process in several sectors. In the real estate sector, developer Guangzhou R&F Properties rallied after reporting strong earnings and raising its future sales targets. The fund also fared well in the industrials sector, where Japanese trading company Sumitomo reported higher quarterly earnings driven by improved business conditions in Australia. In other areas, Swiss technology company STMicroelectronics more than doubled in value after announcing better-than-expected earnings stemming from solid sales of smartphone components. Turkish chemical company Petkim Petrokimya Holding gained value after reporting higher levels of net income. From a regional perspective, the fund’s better-performing countries over the reporting period included Japan, Hong Kong, and Turkey.
Disappointments during the reporting period included the telecommunication services sector, where Bezeq the Israeli Telecommunication Corp. became embroiled in a regulatory investigation. In the struggling energy sector, Canadian petroleum transporter Inter Pipeline missed analysts’ earnings estimates in an environment of low oil prices. Among individual stocks, German broadcaster ProSiebenSat.1 Media declined late in the reporting period due to a slowdown in advertising spending, and UK tobacco company Imperial Tobacco Group was hurt by a U.S. regulatory proposal to reduce cigarette nicotine levels. Among countries, the fund’s results lagged the Index in the United Kingdom, Taiwan, and Germany.
Focusing on Dividend-Paying Companies
Looking forward, we expect to continue to choose investments one company at a time through our disciplined, bottom-up investment process. Indeed, we have continued to identify ample opportunities across the market’s full range of industry groups among businesses that meet our valuation, earnings, behavioral, and dividend-coverage criteria. When holdings reach fuller valuations, we seek to replace them with highly ranked alternatives with what we believe are more attractive valuation characteristics. Moreover, we seek to manage risks through broad portfolio diversification.
September 15, 2017
1 Total return includes reinvestment of dividends and any capital gains paid. Past performance is no guarantee of future results. Share price and investment return fluctuate such that upon redemption, fund shares may be worth more or less than their original cost.
2 Source: Lipper Inc. — Reflects reinvestment of net dividends and, where applicable, capital gain distributions. The MSCI ACWI ex USA Index captures large- and mid-cap representation across developed market (DM) countries (excluding the U.S.) and emerging market (EM) countries. Investors cannot invest directly in any index.
Equities are subject generally to market, market sector, market liquidity, issuer, and investment style risks, among other factors, to varying degrees, all of which are more fully described in the fund’s prospectus.
15
DISCUSSION OF FUND PERFORMANCE (continued)
For the period from September 1, 2016 through August 31, 2017, as provided by Jeffrey M. Mortimer, Primary Portfolio Manager responsible for investment allocation decisions
Market and Fund Performance Overview
For the 12-month period ended August 31, 2017, BNY Mellon Asset Allocation Fund’s Class M shares produced a total return of 11.73%, and Investor shares produced a total return of 11.49%.1 In comparison, the fund’s benchmark, the Morningstar Moderate Target Risk Index (the “Index”), produced a total return of 10.09% for the same period.2
Stocks rallied strongly and bonds produced more moderately positive returns, on average, amid improving economic prospects and positive investor sentiment in the wake of the U.S. presidential election. The fund outperformed the Index, in part due to overweighted exposure to equities.
The Fund’s Investment Approach
The fund seeks long-term growth of principal in conjunction with current income. The fund may invest in both individual securities and other investment companies, including other BNY Mellon funds, funds in the Dreyfus Family of Funds and unaffiliated open-end funds, closed-end funds, and exchange-traded funds (collectively, the “underlying funds”). To pursue its goal, the fund currently intends to allocate its assets, directly and/or through investment in the underlying funds, to gain investment exposure to the following asset classes: Large-Cap Equities, Small-Cap and Mid-Cap Equities, Developed International and Global Equities, Emerging Market Equities, Investment Grade Bonds, High Yield Bonds, Emerging Markets Debt, Diversifying Strategies and Money Market Instruments.
The fund’s investment adviser allocates the fund’s investments among these asset classes using fundamental and quantitative analysis, and its outlook for the economy and financial markets. The underlying funds are selected by the fund’s investment adviser based on their investment objectives and management policies, portfolio holdings, risk/reward profiles, historical performance, and other factors, including the correlation and covariance among the underlying funds.
Economic and Political Developments Drove Markets Higher
While political uncertainties caused U.S. stocks to dip in the weeks before the 2016 presidential election, equity markets were reenergized in November and December when investors began to anticipate lower corporate taxes, reduced regulatory constraints on business, and increased infrastructure spending from the new administration. In early 2017, better-than-expected corporate earnings and encouraging global economic developments drove broad measures of stock market performance to new highs. While concerns about the new administration’s ability to implement its business-friendly policy proposals slowed the market’s advance in the early spring, the stock market quickly erased those losses and set new highs over the summer. However, U.S. market leadership shifted from smaller, value-oriented stocks to larger, more growth-oriented industry leaders, including multinational corporations with a strong presence in international markets. In this environment, large-cap stocks generally produced higher returns than their small- and mid-cap counterparts.
International stocks generally outpaced the U.S. market when global investors responded positively to encouraging economic data in Europe and Japan. Election wins by mainstream candidates over nationalist challengers in some European nations further bolstered international investor sentiment. The emerging markets fared especially well as local economic conditions improved and fears of isolationist U.S. trade policies waned.
U.S. bonds produced more mildly positive returns over the reporting period when moderating long-term interest rates and muted inflation offset earlier market weakness stemming from expectations of greater economic growth after the presidential election. Corporate-backed bonds performed particularly strongly amid improving business fundamentals.
Equity Investments Supported Fund Results
The fund’s performance compared to the Index was supported during the reporting period by our asset allocation strategy, which maintained overweighted exposure to stocks and underweighted exposure to bonds. This positioning enabled the fund to participate more fully in the equity markets’ gains.
Several of the fund’s underlying equity investments produced especially strong results. Most notably, BNY Mellon Focused Equity Opportunities Fund outpaced large-cap stock market averages due to successful security selections in 10 of its benchmark’s 11 economic sectors. Security selections in the information technology, energy, and consumer staples sectors proved particularly advantageous. BNY Mellon Emerging Markets Fund also outperformed its benchmark in a strong asset class, as results were boosted by favorable security selections in China and, to a lesser degree, India and Malaysia. Although the fund’s fixed-income investments produced more moderate returns, Dreyfus High Yield Fund avoided weakness among retailers and participated in the relative strength of the performance of financial institutions and packaging companies.
Disappointments during the reporting period included the fund’s Diversifying Strategies, where a managed futures fund run by an unaffiliated investment company struggled with reversals in the fixed-income and commodities sectors early in the reporting period.
We made several changes to the fund’s allocations over the reporting period. In December 2016, we eliminated positions in Global Stock Fund and Dreyfus U.S. Equity Fund, and we redeployed those assets to BNY Mellon Small Cap Multi-Strategy Fund. In March 2017, we sold an unaffiliated diversifying-strategy fund in favor of BNY Mellon Emerging Markets Fund. Late in the reporting period, we also reduced exposure to a few domestic equity funds in order to build a small cash buffer within the fund with the aim of meeting small redemptions and distributions.
A Constructive Investment Posture
We believe that U.S. and international market fundamentals remain sound in an environment of strong corporate earnings, muted inflation, and accelerating economic growth. We are more cautious regarding bonds in anticipation of rising interest rates and less accommodative monetary policies. Therefore, we have maintained the fund’s emphasis on equities, including our recent increases in exposure to small-cap U.S. stocks and emerging-markets stocks.
September 15, 2017
1 Total return includes reinvestment of dividends and any capital gains paid. Past performance is no guarantee of future results. Share price and investment return fluctuate such that upon redemption, fund shares may be worth more or less than their original cost. The fund’s returns reflect the absorption of certain fund expenses by the fund’s investment adviser pursuant to an agreement in effect through December 31, 2017, at which time it may be extended, terminated, or modified. Had these expenses not been absorbed, the fund’s returns would have been lower.
2 Source: Morningstar Inc. — The Morningstar Moderate Target Risk Index series consists of five asset allocation indices that span the risk spectrum from conservative to aggressive. Investors cannot invest directly in any index.
Equities are subject generally to market, market sector, market liquidity, issuer, and investment style risks, among other factors, to varying degrees, all of which are more fully described in the fund’s prospectus.
Bonds are subject generally to interest-rate, credit, liquidity, and market risks, to varying degrees, all of which are more fully described in the fund’s prospectus. Generally, all other factors being equal, bond prices are inversely related to interest-rate changes, and rate increases can cause price declines.
16
FUND PERFORMANCE
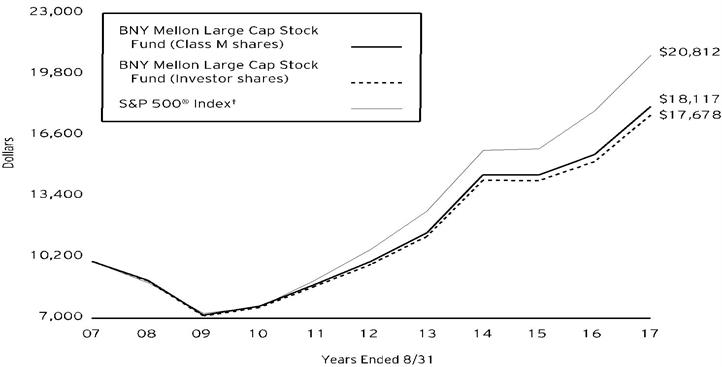
Comparison of change in value of $10,000 investment in BNY Mellon Large Cap Stock Fund Class M shares and Investor shares and the S&P 500® Index (the “Index”)
Average Annual Total Returns as of 8/31/17 |
|
|
| |
| 1 Year | 5 Years | 10 Years | |
Class M shares | 16.12% | 12.65% | 6.12% | |
Investor shares | 16.02% | 12.41% | 5.86% | |
S&P 500® Index | 16.22% | 14.33% | 7.60% | |
† Source: Lipper Inc.
Past performance is not predictive of future performance. The fund’s performance shown in the graph and table does not reflect the deduction of taxes that a shareholder would pay on fund distributions or the redemption of fund shares.
The above graph compares a $10,000 investment made in Class M and Investor shares of BNY Mellon Large Cap Stock Fund on 8/31/07 to a $10,000 investment made in the Index on that date. All dividends and capital gain distributions are reinvested.
The fund’s performance shown in the line graph above takes into account all applicable fees and expenses for Class M and Investor shares. The Index is widely regarded as the best single gauge of large-cap U.S. equities. The Index includes 500 leading companies and captures approximately 80% coverage of available market capitalization. Unlike a mutual fund, the Index is not subject to charges, fees and other expenses. Investors cannot invest directly in any index. Further information relating to fund performance, including expense reimbursements, if applicable, is contained in the Financial Highlights section of the prospectus and elsewhere in this report.
The performance data quoted represents past performance, which is no guarantee of future results. Share price and investment return fluctuate and an investor’s shares may be worth more or less than original cost upon redemption. Current performance may be lower or higher than the performance quoted. Go to Dreyfus.com for the fund’s most recent month-end returns.
17
FUND PERFORMANCE (continued)
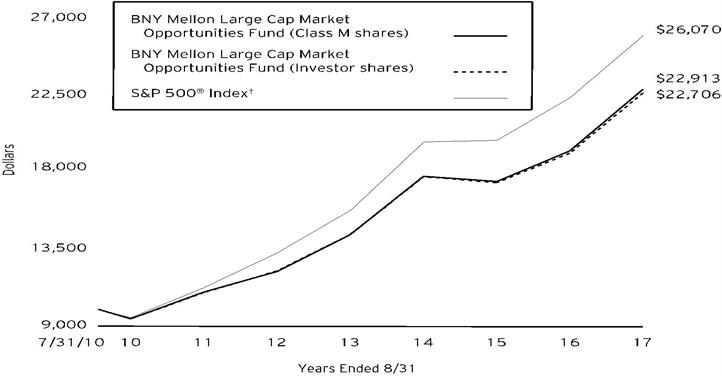
Comparison of change in value of $10,000 investment in BNY Mellon Large Cap Market Opportunities Fund Class M shares and Investor shares and the S&P 500® Index (the “Index”)
Average Annual Total Returns as of 8/31/17 |
|
|
| |
| Inception Date | 1 Year | 5 Years | From Inception |
Class M shares | 7/30/10 | 18.68% | 13.35% | 12.41% |
Investor shares | 7/30/10 | 18.41% | 13.07% | 12.26% |
S&P 500® Index | 7/31/10 | 16.22% | 14.33% | 14.49% |
† Source: Lipper Inc.
Past performance is not predictive of future performance. The fund’s performance shown in the graph and table does not reflect the deduction of taxes that a shareholder would pay on fund distributions or the redemption of fund shares.
The above graph compares a $10,000 investment made in Class M and Investor shares of BNY Mellon Large Cap Market Opportunities Fund on 7/30/10 (inception date) to a $10,000 investment made in the Index. All dividends and capital gain distributions are reinvested.
The fund’s performance shown in the line graph above takes into account all applicable fees and expenses for Class M shares and Investor shares. The Index is widely regarded as the best single gauge of large-cap U.S. equities. The Index includes 500 leading companies and captures approximately 80% coverage of available market capitalization. Investors cannot invest directly in any index. Unlike a mutual fund, the Index is not subject to charges, fees and other expenses. Investors cannot invest directly in any index. Further information relating to fund performance, including expense reimbursements, if applicable, is contained in the Financial Highlights section of the prospectus and elsewhere in this report.
The performance data quoted represents past performance, which is no guarantee of future results. Share price and investment return fluctuate and an investor’s shares may be worth more or less than original cost upon redemption. Current performance may be lower or higher than the performance quoted. Go to Dreyfus.com for the fund’s most recent month-end returns.
18
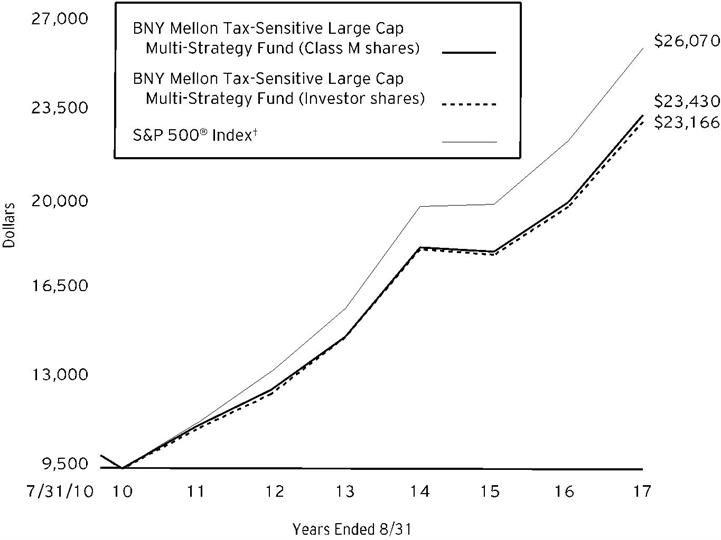
Comparison of change in value of $10,000 investment in BNY Mellon Tax-Sensitive Large Cap Multi-Strategy Fund Class M shares and Investor shares and the S&P 500® Index (the “Index”)
Average Annual Total Returns as of 8/31/17 |
|
|
| |
| Inception Date | 1 Year | 5 Years | From Inception |
Class M shares | 7/30/10 | 17.13% | 13.18% | 12.76% |
Investor shares | 7/30/10 | 16.87% | 13.21% | 12.58% |
S&P 500® Index | 7/31/10 | 16.22% | 14.33% | 14.49% |
† Source: Lipper Inc.
Past performance is not predictive of future performance. The fund’s performance shown in the graph and table does not reflect the deduction of taxes that a shareholder would pay on fund distributions or the redemption of fund shares.
The above graph compares a $10,000 investment made in Class M and Investor shares of BNY Mellon Tax-Sensitive Large Cap Multi-Strategy Fund on 7/30/10 (inception date) to a $10,000 investment made in the Index on that date. All dividends and capital gain distributions are reinvested.
The fund’s performance shown in the line graph above takes into account all applicable fees and expenses for Class M and Investor shares. The Index is widely regarded as the best single gauge of large-cap U.S. equities. The Index includes 500 leading companies and captures approximately 80% coverage of available market capitalization. Unlike a mutual fund, the Index is not subject to charges, fees and other expenses. Investors cannot invest directly in any index. Further information relating to fund performance, including expense reimbursements, if applicable, is contained in the Financial Highlights section of the prospectus and elsewhere in this report.
The performance data quoted represents past performance, which is no guarantee of future results. Share price and investment return fluctuate and an investor’s shares may be worth more or less than original cost upon redemption. Current performance may be lower or higher than the performance quoted. Go to Dreyfus.com for the fund’s most recent month-end returns.
19
FUND PERFORMANCE (continued)
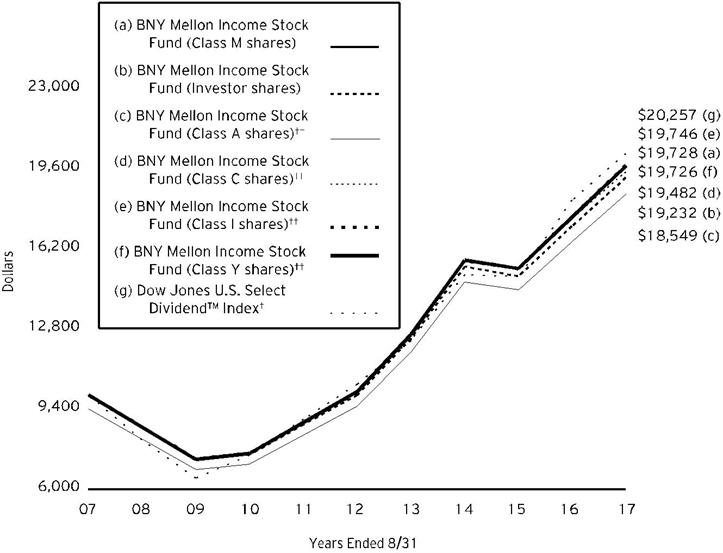
Comparison of change in value of $10,000 investment in BNY Mellon Income Stock Fund Class M shares, Investor shares, Class A shares, Class C shares, Class I shares and Class Y shares and the Dow Jones U.S. Select DividendTM Index (the “Index”)
† Source: Lipper Inc.
†† The total return figures presented for Class A, Class C, Class I and Class Y shares of the fund reflect the performance of the fund’s Class M shares for the period prior to 5/31/16 (the inception date for Class A, Class C, Class I and Class Y shares) adjusted to reflect each share class’ applicable sales charges, and the performance for the fund’s Class A, Class C, Class I and Class Y shares thereafter.
Past performance is not predictive of future performance. The fund's performance shown in the graph and table does not reflect the deduction of taxes that a shareholder would pay on fund distributions or the redemption of fund shares.
The above graph compares a $10,000 investment made in Class M, Investor, Class A, Class C, Class I and Class Y shares of BNY Mellon Income Stock Fund on 8/31/07 to a $10,000 investment made in the Index on that date. All dividends and capital gain distributions are reinvested.
The fund's performance shown in the line graph above takes into account all applicable fees and expenses on all classes. The Index is defined as all dividend-paying companies in the Dow Jones U.S. Index, excluding REITs, that have a non-negative historical five-year dividend-per-share growth rate, a five-year average dividend coverage ratio of greater than or equal to 167%, paid dividends in each of the previous five years, non-negative trailing 12-month earnings-per-share (EPS), a float-adjusted market capitalization of at least US$1 billion, and three-month average daily trading volume of 200,000 shares. Unlike a mutual fund, the Index is not subject to charges, fees and other expenses. Investors cannot invest directly in any index. Further information relating to fund performance, including expense reimbursements, if applicable, is contained in the Financial Highlights section of the prospectus and elsewhere in this report.
20
Average Annual Total Returns as of 8/31/17 |
|
|
| |
| Inception Date | 1 Year | 5 Years | 10 Years |
Class M shares | 1/1/85 | 12.33% | 14.26% | 7.03% |
Investor shares | 7/11/01 | 12.02% | 13.98% | 6.76% |
Class A shares | ||||
with maximum sales charge (5.75%) | 5/31/16 | 5.75% | 12.86%†† | 6.37%†† |
without sales charge | 5/31/16 | 12.18% | 14.21%†† | 7.01%†† |
Class C shares | ||||
with applicable redemption charge† | 5/31/16 | 10.22% | 13.98%†† | 6.90%†† |
without redemption | 5/31/16 | 11.22% | 13.98%†† | 6.90%†† |
Class I shares | 5/31/16 | 12.44% | 14.28%†† | 7.04%†† |
Class Y shares | 5/31/16 | 12.33% | 14.26%†† | 7.03%†† |
Dow Jones U.S. Select Dividend TM Index | 10.85% | 14.13% | 7.31% | |
† The maximum contingent deferred sales charge for Class C shares is 1% for shares redeemed within one year of the date of purchase.
†† The total return figures presented for Class A, Class C, Class I and Class Y shares of the fund reflect the performance of the fund’s Class M shares for the period prior to 5/31/16 (the inception date for Class A, Class C, Class I and Class Y shares) adjusted to reflect each share class’ applicable sales charges, and the performance for the fund’s Class A, Class C, Class I and Class Y shares thereafter.
The performance data quoted represents past performance, which is no guarantee of future results. Share price and investment return fluctuate and an investor’s shares may be worth more or less than original cost upon redemption. Current performance may be lower or higher than the performance quoted. Go to Dreyfus.com for the fund’s most recent month-end returns.
The fund’s performance shown in the graph and table does not reflect the deduction of taxes that a shareholder would pay on fund distributions or the redemption of fund shares. In addition to the performance of Class A shares shown with and without a maximum sales charge, the fund’s performance shown in the table takes into account all other applicable fees and expenses on all classes.
21
FUND PERFORMANCE (continued)
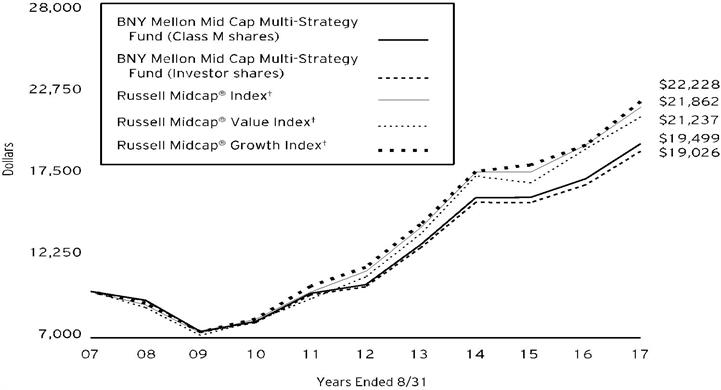
Comparison of change in value of $10,000 investment in BNY Mellon Mid Cap Multi-Strategy Fund Class M shares and Investor shares with the Russell Midcap® Index, Russell Midcap® Value Index and Russell Midcap® Growth Index
Average Annual Total Returns as of 8/31/17 |
|
|
| |
| 1 Year | 5 Years | 10 Years | |
Class M shares | 13.12% | 13.33% | 6.91% | |
Investor shares | 12.89% | 13.07% | 6.64% | |
Russell Midcap® Index | 12.44% | 14.11% | 8.14% | |
Russell Midcap® Value Index | 10.82% | 14.22% | 7.82% | |
Russell Midcap® Growth Index | 14.52% | 13.99% | 8.32% | |
† Source: Lipper Inc.
Past performance is not predictive of future performance. The fund’s performance shown in the graph and table does not reflect the deduction of taxes that a shareholder would pay on fund distributions or the redemption of fund shares.
The above graph compares a $10,000 investment made in Class M and Investor shares of BNY Mellon Mid Cap Multi-Strategy Fund on 8/31/07 to a $10,000 investment made in each of the (1) the Russell Midcap® Index, (2) the Russell Midcap® Value Index and (3) the Russell Midcap® Growth Index on that date. All dividends and capital gain distributions are reinvested.
The fund changed its investment strategy on August 20, 2012. Prior to that date, the fund generally had a single primary portfolio manager and investment strategy – selecting stocks of mid cap domestic companies through a disciplined investment process that combined computer modeling techniques, fundamental analysis and risk management. Different investment strategies may lead to different performance results. The fund’s performance for periods prior to August 20, 2012 reflects the fund’s investment strategy in effect prior to that date.
The fund’s performance shown in the line graph above takes into account all applicable fees and expenses for Class M and Investor shares. The Russell Midcap® Index measures the performance of the mid-cap segment of the U.S. equity universe. The Russell Midcap® Index is a subset of the Russell 1000® Index. It includes approximately 800 of the smallest securities based on a combination of their market cap and current index membership. The Russell Midcap® Index represents approximately 31% of the total market capitalization of the Russell 1000 companies. The Russell Midcap® Index is constructed to provide a comprehensive and unbiased barometer for the mid-cap segment. The index is completely reconstituted annually to ensure larger stocks do not distort the performance and characteristics of the true mid-cap opportunity set. The Russell Midcap® Value Index measures the performance of the mid-cap value segment of the U.S. equity universe. It includes those Russell Midcap® Index companies that are considered more value-oriented relative to the overall market as defined by Russell’s leading style methodology. The Russell Midcap® Value Index is constructed to provide a comprehensive and unbiased barometer of the mid-cap value market. The index is completely reconstituted annually to ensure larger stocks do not distort the performance and characteristics of the true mid-cap value market. The Russell Midcap® Growth Index measures the performance of the mid-cap growth segment of the U.S. equity universe. It includes those Russell Midcap® Index companies with higher growth earning potential as defined by Russell's leading style methodology. The Russell Midcap® Growth Index is constructed to provide a comprehensive and unbiased barometer of the mid-cap growth market. The index is completely reconstituted annually to ensure larger stocks do not distort the performance and characteristics of the true mid-cap growth market. Unlike a mutual fund, the indices are not subject to charges, fees and other expenses. Investors cannot invest directly in any index. Further information relating to fund performance, including expense reimbursements, if applicable, is contained in the Financial Highlights section of the prospectus and elsewhere in this report.
The performance data quoted represents past performance, which is no guarantee of future results. Share price and investment return fluctuate and an investor’s shares may be worth more or less than original cost upon redemption. Current performance may be lower or higher than the performance quoted. Go to Dreyfus.com for the fund’s most recent month-end returns.
22
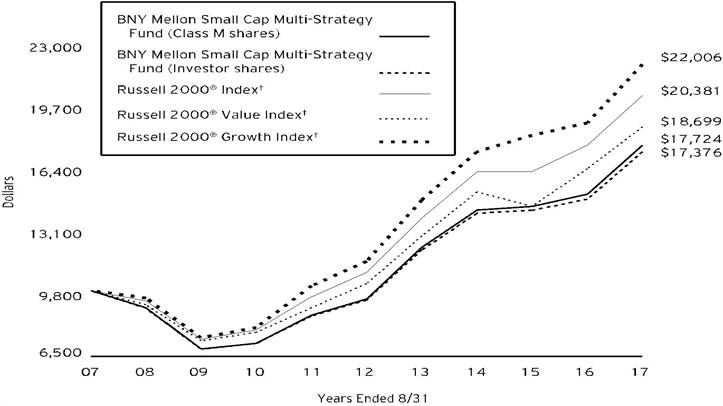
Comparison of change in value of $10,000 investment in BNY Mellon Small Cap Multi-Strategy Fund Class M shares and Investor shares with the Russell 2000® Index, Russell 2000® Value Index and Russell 2000® Growth Index
Average Annual Total Returns as of 8/31/17 |
|
|
| |
| 1 Year | 5 Years | 10 Years | |
Class M shares | 17.19% | 13.13% | 5.89% | |
Investor shares | 16.94% | 12.84% | 5.68% | |
Russell 2000® Index | 14.91% | 13.15% | 7.38% | |
Russell 2000® Value Index | 13.47% | 12.51% | 6.46% | |
Russell 2000® Growth Index | 16.39% | 13.75% | 8.21% | |
† Source: Lipper Inc.
Past performance is not predictive of future performance. The fund’s performance shown in the graph and table does not reflect the deduction of taxes that a shareholder would pay on fund distributions or the redemption of fund shares.
The above graph compares a $10,000 investment made in Class M and Investor shares of BNY Mellon Small Cap Multi-Strategy Fund on 8/31/07 to a $10,000 investment made in each of the (1) the Russell 2000® Index, (2) the Russell 2000® Value Index and (3) the Russell 2000® Growth Index on that date. All dividends and capital gain distributions are reinvested.
The fund changed its investment strategy on August 20, 2012. Prior to that date, the fund generally had a single primary portfolio manager and investment strategy – selecting stocks of small cap domestic companies through a disciplined investment process that combined computer modeling techniques, fundamental analysis and risk management. Different investment strategies may lead to different performance results. The fund’s performance for periods prior to August 20, 2012 reflects the fund’s investment strategy in effect prior to that date.
The fund’s performance shown in the line graph above takes into account all applicable fees and expenses for Class M and Investor shares.
The Russell 2000® Index measures the performance of the small-cap segment of the U.S. equity universe. The Russell 2000® Index is a subset of the Russell 3000® Index representing approximately 10% of the total market capitalization of that index. It includes approximately 2,000 of the smallest securities based on a combination of their market cap and current index membership. The Russell 2000 is constructed to provide a comprehensive and unbiased small-cap barometer and is completely reconstituted annually to ensure larger stocks do not distort the performance and characteristics of the true small-cap opportunity set. The Russell 2000® Value Index measures the performance of the small-cap value segment of the U.S. equity universe. It includes those Russell 2000 companies that are considered more value-oriented relative to the overall market as defined by Russell’s leading style methodology. The Russell 2000® Value Index is constructed to provide a comprehensive and unbiased barometer for the small-cap value segment. The index is completely reconstituted annually to ensure larger stocks do not distort the performance and characteristics of the true small-cap opportunity set and that the represented companies continue to reflect value characteristics. The Russell 2000® Growth Index measures the performance of the small-cap growth segment of the U.S. equity universe. It includes those Russell 2000 companies with higher growth earning potential as defined by Russell's leading style methodology. The Russell 2000® Growth Index is constructed to provide a comprehensive and unbiased barometer for the small-cap growth segment. The index is completely reconstituted annually to ensure larger stocks do not distort the performance and characteristics of the true small-cap opportunity set and that the represented companies continue to reflect growth characteristics. Unlike a mutual fund, the indices are not subject to charges, fees and other expenses. Investors cannot invest directly in any index. Further information relating to fund performance, including expense reimbursements, if applicable, is contained in the Financial Highlights section of the prospectus and elsewhere in this report.
The performance data quoted represents past performance, which is no guarantee of future results. Share price and investment return fluctuate and an investor’s shares may be worth more or less than original cost upon redemption. Current performance may be lower or higher than the performance quoted. Go to Dreyfus.com for the fund’s most recent month-end returns.
23
FUND PERFORMANCE (continued)

Comparison of change in value of $10,000 investment in BNY Mellon Focused Equity Opportunities Fund Class M shares and Investor shares and the S&P 500® Index (the “Index”)
Average Annual Total Returns as of 8/31/17 |
|
|
| ||
| Inception Date | 1 Year | 5 Years | From Inception | |
Class M shares | 9/30/09 | 27.04% | 15.45% | 13.40% | |
Investor shares | 9/30/09 | 26.75% | 15.14% | 13.13% | |
S&P 500® Index | 9/30/09 | 16.22% | 14.33% | 13.69% | |
† Source: Lipper Inc.
Past performance is not predictive of future performance. The fund’s performance shown in the graph and table does not reflect the deduction of taxes that a shareholder would pay on fund distributions or the redemption of fund shares.
The above graph compares a $10,000 investment made in Class M and Investor shares of BNY Mellon Focused Equity Opportunities Fund on 9/30/09 (inception date) to a $10,000 investment made in the Index on that date. All dividends and capital gain distributions are reinvested.
The fund’s performance shown in the line graph above takes into account all applicable fees and expenses for Class M and Investor shares. The Index is widely regarded as the best single gauge of large-cap U.S. equities. The Index includes 500 leading companies and captures approximately 80% coverage of available market capitalization. Unlike a mutual fund, the Index is not subject to charges, fees and other expenses. Investors cannot invest directly in any index. Further information relating to fund performance, including expense reimbursements, if applicable, is contained in the Financial Highlights section of the prospectus and elsewhere in this report.
The performance data quoted represents past performance, which is no guarantee of future results. Share price and investment return fluctuate and an investor’s shares may be worth more or less than original cost upon redemption. Current performance may be lower or higher than the performance quoted. Go to Dreyfus.com for the fund’s most recent month-end returns.
24

Comparison of change in value of $10,000 investment in BNY Mellon Small/Mid Cap Multi-Strategy Fund Class M shares and Investor shares and the Russell 2500™ Index, Russell 2500™ Value Index and Russell 2500™ Growth Index
Average Annual Total Returns as of 8/31/17 |
|
|
| |
| Inception Date | 1 Year | 5 Years | From Inception |
Class M shares | 9/30/09 | 16.94% | 11.92% | 11.37% |
Investor shares | 9/30/09 | 16.55% | 11.60% | 11.06% |
Russell 2500™ Index | 9/30/09 | 13.22% | 13.44% | 13.46% |
Russell 2500™ Value Index | 9/30/09 | 11.12% | 12.81% | 12.65% |
Russell 2500™ Growth Index | 9/30/09 | 15.57% | 14.04% | 14.30% |
† Source: Lipper Inc.
Past performance is not predictive of future performance. The fund’s performance shown in the graph and table does not reflect the deduction of taxes that a shareholder would pay on fund distributions or the redemption of fund shares.
The above graph compares a $10,000 investment made in Class M and Investor shares of BNY Mellon Small/Mid Cap Multi-Strategy Fund on 9/30/09 (inception date) to a $10,000 investment made in each of (1) the Russell 2500™ Index, (2) the Russell 2500™ Value Index and (3) the Russell 2500™ Growth Index on that date. All dividends and capital gain distributions are reinvested.
On April 28, 2014, the fund’s investment strategy changed. From August 20, 2012 through April 27, 2014, the investment adviser selected securities for the fund using a disciplined investment process that combined quantitative modeling techniques, fundamental analysis and risk management. Prior to August 20, 2012, the investment adviser selected securities for the fund using proprietary computer models, along with fundamental analysis to identify and rank stocks within industries or sectors, based on several characteristics, including value, growth and financial profile. Different investment strategies may lead to different performance results. The fund’s performance for the period August 20, 2012 through April 27, 2014 and for the periods prior to August 20, 2012 reflects the fund’s investment strategy in effect during those periods.
The fund’s performance shown in the line graph above takes into account all applicable fees and expenses for Class M and Investor shares. The Russell 2500™ Index measures the performance of the small- to mid-cap segment of the U.S. equity universe, commonly referred to as “smid” cap. The Russell 2500 Index is a subset of the Russell 3000® Index. It includes approximately 2,500 of the smallest securities based on a combination of their market cap and current index membership. The Russell 2500™ Index is constructed to provide a comprehensive and unbiased barometer for the small- to mid-cap segment. The index is completely reconstituted annually to ensure larger stocks do not distort the performance and characteristics of the true small- to mid-cap opportunity set. The Russell 2500™ Value Index measures the performance of the small- to mid-cap value segment of the U.S. equity universe. It includes those Russell 2500 companies that are considered more value-oriented relative to the overall market as defined by Russell’s leading style methodology. The Russell 2500™ Value Index is constructed to provide a comprehensive and unbiased barometer of the small- to mid-cap growth market. The index is completely reconstituted annually to ensure larger stocks do not distort the performance and characteristics of the true small- to mid-cap opportunity set and that the represented companies continue to reflect value characteristics. The Russell 2500™ Growth Index measures the performance of the small- to mid-cap growth segment of the U.S. equity universe. It includes those Russell 2500 companies with higher growth earning potential as defined by Russell's leading style methodology. The Russell 2500™ Growth Index is constructed to provide a comprehensive and unbiased barometer of the small- to mid-cap growth market. The index is completely reconstituted annually to ensure larger stocks do not distort the performance and characteristics of the true small- to mid-cap opportunity set and that the represented companies continue to reflect growth characteristics. Unlike a mutual fund, the indices are not subject to charges, fees and other expenses. Investors cannot invest directly in any index. Further information relating to fund performance, including expense reimbursements, if applicable, is contained in the Financial Highlights section of the prospectus and elsewhere in this report.
The performance data quoted represents past performance, which is no guarantee of future results. Share price and investment return fluctuate and an investor’s shares may be worth more or less than original cost upon redemption. Current performance may be lower or higher than the performance quoted. Go to Dreyfus.com for the fund’s most recent month-end returns.
25
FUND PERFORMANCE (continued)
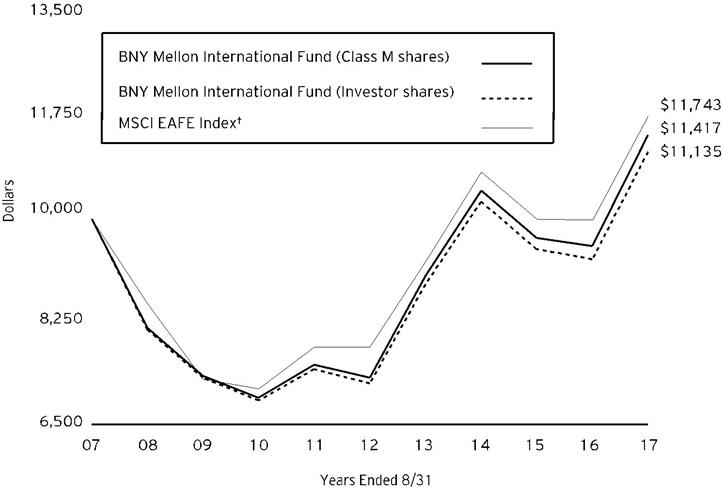
Comparison of change in value of $10,000 investment in BNY Mellon International Fund Class M shares and Investor shares and the MSCI EAFE Index (the “Index”)
Average Annual Total Returns as of 8/31/17 |
|
|
| |
| 1 Year | 5 Years | 10 Years | |
Class M shares | 19.80% | 9.38% | 1.33% | |
Investor shares | 19.59% | 9.11% | 1.08% | |
MSCI EAFE Index | 17.64% | 8.48% | 1.62% | |
† Source: Lipper Inc.
Past performance is not predictive of future performance. The fund’s performance shown in the graph and table does not reflect the deduction of taxes that a shareholder would pay on fund distributions or the redemption of fund shares.
The above graph compares a $10,000 investment made in Class M and Investor shares of BNY Mellon International Fund on 8/31/07 to a $10,000 investment made in the Index on that date. All dividends and capital gain distributions are reinvested. Effective 8/6/2016, the BNY Mellon International Fund investment strategy changed.
The fund’s performance shown in the line graph above takes into account all applicable fees and expenses for Class M and Investor shares. The Index is a free float-adjusted market capitalization-weighted index that is designed to measure the equity market performance of developed markets, excluding the U.S. and Canada. Unlike a mutual fund, the Index is not subject to charges, fees and other expenses. Investors cannot invest directly in any index. Further information relating to fund performance, including expense reimbursements, if applicable, is contained in the Financial Highlights section of the prospectus and elsewhere in this report.
The performance data quoted represents past performance, which is no guarantee of future results. Share price and investment return fluctuate and an investor’s shares may be worth more or less than original cost upon redemption. Current performance may be lower or higher than the performance quoted. Go to Dreyfus.com for the fund’s most recent month-end returns.
26
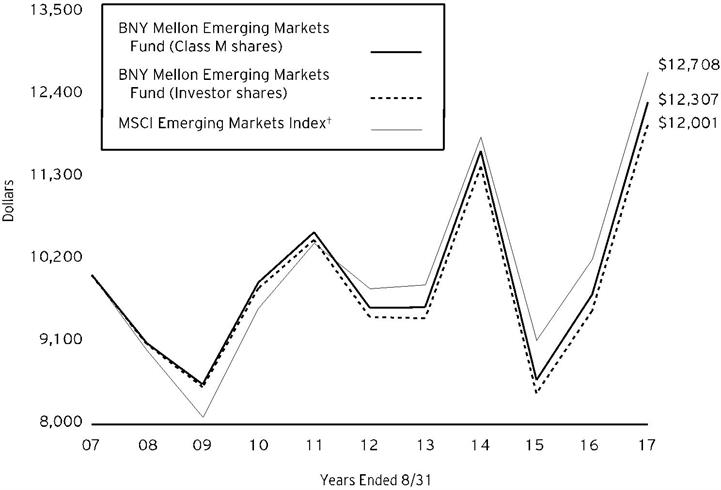
Comparison of change in value of $10,000 investment in BNY Mellon Emerging Markets Fund Class M shares and Investor shares and the MSCI Emerging Markets Index (the “Index”)
Average Annual Total Returns as of 8/31/17 |
|
|
| |
| 1 Year | 5 Years | 10 Years | |
Class M shares | 26.36% | 5.19% | 2.10% | |
Investor shares | 26.05% | 4.93% | 1.84% | |
MSCI Emerging Markets Index | 24.53% | 5.30% | 2.43% | |
† Source: Lipper Inc.
Past performance is not predictive of future performance. The fund’s performance shown in the graph and table does not reflect the deduction of taxes that a shareholder would pay on fund distributions or the redemption of fund shares.
The above graph compares a $10,000 investment made in Class M and Investor shares of BNY Mellon Emerging Markets Fund on 8/31/07 to a $10,000 investment made in the Index on that date. All dividends and capital gain distributions are reinvested. Effective 8/6/2016, the BNY Mellon Emerging Markets Fund investment strategy changed.
The fund’s performance shown in the line graph above takes into account all applicable fees and expenses for Class M and Investor shares. The Index is a free float-adjusted market capitalization-weighted index that is designed to measure equity market performance of emerging markets. Unlike a mutual fund, the Index is not subject to charges, fees and other expenses. Investors cannot invest directly in any index. Further information relating to fund performance, including expense reimbursements, if applicable, is contained in the Financial Highlights section of the prospectus and elsewhere in this report.
The performance data quoted represents past performance, which is no guarantee of future results. Share price and investment return fluctuate and an investor’s shares may be worth more or less than original cost upon redemption. Current performance may be lower or higher than the performance quoted. Go to Dreyfus.com for the fund’s most recent month-end returns.
27
FUND PERFORMANCE (continued)
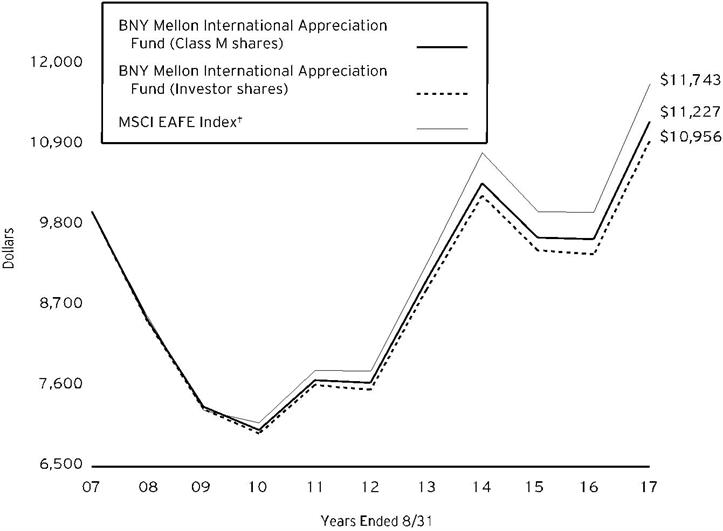
Comparison of change in value of $10,000 investment in BNY Mellon International Appreciation Fund Class M shares and Investor shares and the MSCI EAFE Index (the “Index”)
Average Annual Total Returns as of 8/31/17 |
|
|
| |
| 1 Year | 5 Years | 10 Years | |
Class M shares | 16.76% | 7.99% | 1.16% | |
Investor shares | 16.47% | 7.72% | 0.92% | |
MSCI EAFE Index | 17.64% | 8.48% | 1.62% | |
† Source: Lipper Inc.
Past performance is not predictive of future performance. The fund’s performance shown in the graph and table does not reflect the deduction of taxes that a shareholder would pay on fund distributions or the redemption of fund shares.
The above graph compares a $10,000 investment made in Class M and Investor shares of BNY Mellon International Appreciation Fund on 8/31/07 to a $10,000 investment made in the Index on that date. All dividends and capital gain distributions are reinvested.
As of the close of business on September 12, 2008, substantially all of the assets of another investment company advised by an affiliate of the fund’s investment adviser, BNY Hamilton International Equity Fund (the “predecessor fund”), a series of BNY Hamilton Funds, Inc., were transferred to BNY Mellon International Appreciation Fund in a tax-free reorganization and the fund commenced operations. The performance figures for the fund’s Class M shares represent the performance of the predecessor fund’s Institutional shares prior to the commencement of operations for BNY Mellon International Appreciation Fund and the performance of BNY Mellon International Appreciation Fund’s Class M shares thereafter. The performance figures for Investor shares represent the performance of the predecessor fund’s Class A shares prior to the commencement of operations for BNY Mellon International Appreciation Fund and the performance of BNY Mellon International Appreciation Fund’s Investor shares thereafter. Investor shares are subject to a Shareholder Services Plan.
The fund’s performance shown in the line graph above takes into account all applicable fees and expenses for Class M and Investor shares. The MSCI EAFE Index (Europe, Australasia, Far East) is a free float-adjusted market capitalization-weighted index that is designed to measure the equity market performance of developed markets, excluding the U.S. and Canada. Unlike a mutual fund, the Index is not subject to charges, fees and other expenses. Investors cannot invest directly in any index. Further information relating to fund performance, including expense reimbursements, if applicable, is contained in the Financial Highlights section of the prospectus and elsewhere in this report.
The performance data quoted represents past performance, which is no guarantee of future results. Share price and investment return fluctuate and an investor’s shares may be worth more or less than original cost upon redemption. Current performance may be lower or higher than the performance quoted. Go to Dreyfus.com for the fund’s most recent month-end returns.
28
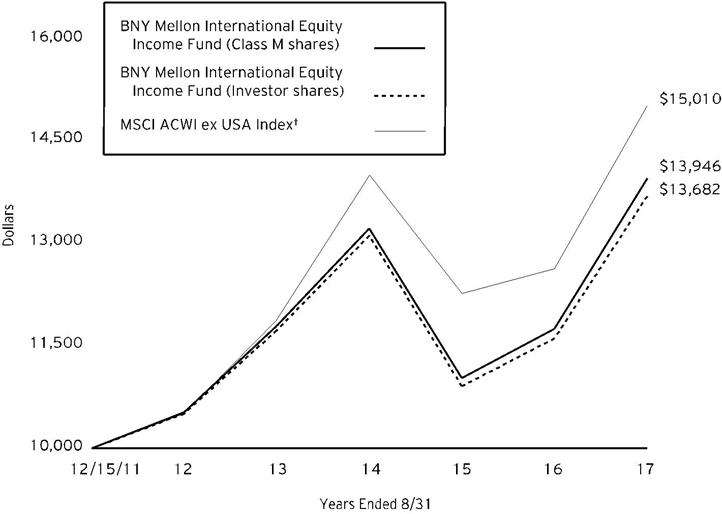
Comparison of change in value of $10,000 investment in BNY Mellon International Equity Income Fund Class M shares and Investor shares and the MSCI ACWI ex-USA Index (“the Index”)
Average Annual Total Returns as of 8/31/17 |
|
|
| |
| Inception Date | 1 Year | 5 Year | From Inception |
Class M shares | 12/15/11 | 18.72% | 5.79% | 6.00% |
Investor shares | 12/15/11 | 17.87% | 5.42% | 5.64% |
MSCI ACWI ex-USA Index | 11/30/11 | 18.88% | 7.36% | 7.32%†† |
† Source: Lipper Inc.
†† For comparative purposes, the value of the Index on 11/30/11 is used as the beginning value on 12/15/11.
Past performance is not predictive of future performance. The fund’s performance shown in the graph and table does not reflect the deduction of taxes that a shareholder would pay on fund distributions or the redemption of fund shares.
The above graph compares a $10,000 investment made in Class M and Investor shares of BNY Mellon International Equity Income Fund on 12/15/11 (inception date) to a $10,000 investment made in the Index on that date. All dividends and capital gain distributions are reinvested.
The fund’s performance shown in the line graph above takes into account all applicable fees and expenses for Class M and Investor shares. The Index captures large- and mid-cap representation across Developed Market (DM) countries (excluding the U.S.) and Emerging Market (EM) countries. Unlike a mutual fund, the Index is not subject to charges, fees and other expenses. Investors cannot invest directly in any index. Further information relating to fund performance, including expense reimbursements, if applicable, is contained in the Financial Highlights section of the prospectus and elsewhere in this report.
The performance data quoted represents past performance, which is no guarantee of future results. Share price and investment return fluctuate and an investor’s shares may be worth more or less than original cost upon redemption. Current performance may be lower or higher than the performance quoted. Go to Dreyfus.com for the fund’s most recent month-end returns.
29
FUND PERFORMANCE (continued)

Comparison of change in value of $10,000 investment in BNY Mellon Asset Allocation Fund Class M shares and Investor shares with the Morningstar Target Risk Index (the “Index”)
Average Annual Total Returns as of 8/31/17 |
|
|
| |
| 1 Year | 5 Years | 10 Years | |
Class M shares | 11.73% | 7.78% | 5.01% | |
Investor shares | 11.49% | 7.53% | 4.76% | |
Morningstar Target Risk Index | 10.09% | 7.60% | 5.58% | |
† Source: Morningstar Inc.
Past performance is not predictive of future performance. The fund’s performance shown in the graph and table does not reflect the deduction of taxes that a shareholder would pay on fund distributions or the redemption of fund shares.
The above graph compares a $10,000 investment made in Class M and Investor shares of BNY Mellon Asset Allocation Fund on 8/31/07 to a $10,000 investment made in the Index on that date. All dividends and capital gain distributions are reinvested.
The fund changed its investment strategy on September 15, 2011. Prior to that date, the fund invested in individual securities and BNY Mellon funds only and its target allocation was 60% of its assets invested in equity securities (directly and through underlying funds) and 40% of its assets invested in bonds and money market instruments (directly), with a range of 15% above or below such target amount. Different investment strategies may lead to different performance results. The fund's performance for periods prior to September 15, 2011 reflects the investment strategy in effect prior to that date.
The fund’s performance shown in the line graph above takes into account all applicable fees and expenses for Class M and Investor shares. The Index series consists of five asset allocation indices that span the risk spectrum from conservative to aggressive. Unlike a mutual fund, the index is not subject to charges, fees and other expenses. Investors cannot invest directly in any index. Further information relating to fund performance, including expense reimbursements, if applicable, is contained in the Financial Highlights section of the prospectus and elsewhere in this report.
The performance data quoted represents past performance, which is no guarantee of future results. Share price and investment return fluctuate and an investor’s shares may be worth more or less than original cost upon redemption. Current performance may be lower or higher than the performance quoted. Go to Dreyfus.com for the fund’s most recent month-end returns.
30
UNDERSTANDING YOUR FUND’S EXPENSES (Unaudited)
As a mutual fund investor, you pay ongoing expenses, such as management fees and other expenses. Using the information below, you can estimate how these expenses affect your investment and compare them with the expenses of other funds. You also may pay one-time transaction expenses, including sales charges (loads) and redemption fees, which are not shown in this section and would have resulted in higher total expenses. For more information, see your fund’s prospectus or talk to your financial adviser.
Review your fund’s expenses
The table below shows the expenses you would have paid on a $1,000 investment in each class of each fund from March 1, 2017 to August 31, 2017. It also shows how much a $1,000 investment would be worth at the close of the period, assuming actual returns and expenses.
Expenses and Value of a $1,000 Investment | ||||||||||||||
assuming actual returns for the six months ended August 31, 2017 | ||||||||||||||
|
|
| Class M | Investor | Class A |
| Class C |
Class I |
| Class Y | ||||
BNY Mellon Large Cap Stock Fund | ||||||||||||||
Expenses paid per $1,000† | $4.34 | $5.62 | – | – | – | – | ||||||||
Ending value (after expenses) | $1,047.50 | $1,046.20 | – | – | – | – | ||||||||
Annualized expense ratio (%) | .84 | 1.09 | – | – | – | – | ||||||||
BNY Mellon Large Cap Market | ||||||||||||||
Expenses paid per $1,000† | $3.44 | $4.73 | – | – | – | – | ||||||||
Ending value (after expenses) | $1,065.90 | $1,064.30 | – | – | – | – | ||||||||
Annualized expense ratio (%) | .66 | .91 | – | – | – | – | ||||||||
BNY Mellon Tax-Sensitive | ||||||||||||||
Expenses paid per $1,000† | $3.37 | $4.67 | – | – | – | – | ||||||||
Ending value (after expenses) | $1,058.40 | $1,057.10 | – | – | – | – | ||||||||
Annualized expense ratio (%) | .65 | .90 | – | – | – | – | ||||||||
BNY Mellon Income Stock Fund | ||||||||||||||
Expenses paid per $1,000† | $4.09 | $5.35 | $5.61 | $9.07 | $4.30 | $4.09 | ||||||||
Ending value (after expenses) | $1,003.80 | $1,002.50 | $1,003.80 | $999.00 | $1,004.90 | $1,003.80 | ||||||||
Annualized expense ratio (%) | .81 | 1.06 | 1.11 | 1.80 | .85 | .81 | ||||||||
BNY Mellon Mid Cap Multi-Strategy Fund | ||||||||||||||
Expenses paid per $1,000† | $4.62 | $5.89 | – | – | – | – | ||||||||
Ending value (after expenses) | $1,034.70 | $1,033.30 | – | – | – | – | ||||||||
Annualized expense ratio (%) | .90 | 1.15 | – | – | – | – | ||||||||
BNY Mellon Small Cap Multi-Strategy Fund | ||||||||||||||
Expenses paid per $1,000† | $5.14 | $6.40 | – | – | – | – | ||||||||
Ending value (after expenses) | $1,017.80 | $1,016.30 | – | – | – | – | ||||||||
Annualized expense ratio (%) | 1.01 | 1.26 | – | – | – | – | ||||||||
BNY Mellon Focused | ||||||||||||||
Expenses paid per $1,000† | $4.60 | $5.94 | – | – | – | – | ||||||||
Ending value (after expenses) | $1,122.40 | $1,121.40 | – | – | – | – | ||||||||
Annualized expense ratio (%) | .86 | 1.11 | – | – | – | – | ||||||||
31
UNDERSTANDING YOUR FUND’S EXPENSES (Unaudited) (continued)
Expenses and Value of a $1,000 Investment (continued) | |||||||||||||||||
assuming actual returns for the six months ended August 31, 2017 | |||||||||||||||||
|
|
|
|
|
| Class M |
|
| Investor Shares |
| |||||||
BNY Mellon Small/Mid Cap Multi-Strategy Fund | |||||||||||||||||
Expenses paid per $1,000† | $4.75 | $6.02 | |||||||||||||||
Ending value (after expenses) | $1,026.20 | $1,025.10 | |||||||||||||||
Annualized expense ratio (%) | .93 | 1.18 | |||||||||||||||
BNY Mellon International Fund | |||||||||||||||||
Expenses paid per $1,000† | $5.62 | $6.96 | |||||||||||||||
Ending value (after expenses) | $1,142.20 | $1,040.80 | |||||||||||||||
Annualized expense ratio (%) | 1.04 | 1.29 | |||||||||||||||
BNY Mellon Emerging Markets Fund | |||||||||||||||||
Expenses paid per $1,000† | $7.93 | $9.32 | |||||||||||||||
Ending value (after expenses) | $1,216.70 | $1,215.00 | |||||||||||||||
Annualized expense ratio (%) | 1.42 | 1.67 | |||||||||||||||
BNY Mellon International Appreciation Fund | |||||||||||||||||
Expenses paid per $1,000† | $4.90 | $6.23 | |||||||||||||||
Ending value (after expenses) | $1,112.50 | $1,111.80 | |||||||||||||||
Annualized expense ratio (%) | .92 | 1.17 | |||||||||||||||
BNY Mellon International Equity Income Fund | |||||||||||||||||
Expenses paid per $1,000† | $5.84 | $7.37 | |||||||||||||||
Ending value (after expenses) | $1,125.30 | $1,118.50 | |||||||||||||||
Annualized expense ratio (%) | 1.09 | 1.38 | |||||||||||||||
BNY Mellon Asset Allocation Fund | |||||||||||||||||
Expenses paid per $1,000† | $1.55 | $2.85 | |||||||||||||||
Ending value (after expenses) | $1,055.60 | $1,054.70 | |||||||||||||||
Annualized expense ratio (%) | .30 | .55 | |||||||||||||||
† Expenses are equal to each fund’s annualized expense ratios as shown above, multiplied by the average account value over the period, multiplied by 184/365 (to reflect the one-half year period).
32
COMPARING YOUR FUND’S EXPENSES
WITH THOSE OF OTHER FUNDS (Unaudited)
Using the SEC’s method to compare expenses
The Securities and Exchange Commission (SEC) has established guidelines to help investors assess fund expenses. Per these guidelines, the table below shows your fund’s expenses based on a $1,000 investment, assuming a hypothetical 5% annualized return. You can use this information to compare the ongoing expenses (but not transaction expenses or total cost) of investing in the fund with those of other funds. All mutual fund shareholder reports will provide this information to help you make this comparison. Please note that you cannot use this information to estimate your actual ending account balance and expenses paid during the period.
Expenses and Value of a $1,000 Investment | ||||||||||||||||
assuming a hypothetical 5% annualized return for the six months ended August 31, 2017 | ||||||||||||||||
|
|
|
|
| Class M | Investor |
| Class A |
| Class C |
Class I |
| Class Y | |||
BNY Mellon Large Cap Stock Fund | ||||||||||||||||
Expenses paid per $1,000† | $4.28 | $5.55 | – | – | – | – | ||||||||||
Ending value (after expenses) | $1,020.97 | $1,019.71 | – | – | – | – | ||||||||||
Annualized expense ratio (%) | .84 | 1.09 | – | – | – | – | ||||||||||
BNY Mellon Large Cap Market | ||||||||||||||||
Expenses paid per $1,000† | $3.36 | $4.63 | – | – | – | – | ||||||||||
Ending value (after expenses) | $1,021.88 | $1,020.62 | – | – | – | – | ||||||||||
Annualized expense ratio (%) | .66 | .91 | – | – | – | – | ||||||||||
BNY Mellon Tax-Sensitive | ||||||||||||||||
Expenses paid per $1,000† | $3.31 | $4.58 | – | – | – | – | ||||||||||
Ending value (after expenses) | $1,021.93 | $1,020.62 | – | – | – | – | ||||||||||
Annualized expense ratio (%) | .65 | .90 | – | – | – | – | ||||||||||
BNY Mellon Income Stock Fund | ||||||||||||||||
Expenses paid per $1,000† | $4.13 | $5.40 | $5.65 | $9.15 | $4.33 | $$4.13 | ||||||||||
Ending value (after expenses) | $1,021.12 | $1,019.86 | $1,019.61 | $1,016.13 | $1,020.92 | $1,021.12 | ||||||||||
Annualized expense ratio (%) | .81 | 1.06 | 1.11 | 1.80 | .85 | .81 | ||||||||||
BNY Mellon Mid Cap Multi-Strategy Fund | ||||||||||||||||
Expenses paid per $1,000† | $4.58 | $5.85 | – | – | – | – | ||||||||||
Ending value (after expenses) | $1,020.67 | $1,019.41 | – | – | – | – | ||||||||||
Annualized expense ratio (%) | .90 | 1.15 | – | – | – | – | ||||||||||
BNY Mellon Small Cap Multi-Strategy Fund | ||||||||||||||||
Expenses paid per $1,000† | $5.14 | $6.41 | – | – | – | – | ||||||||||
Ending value (after expenses) | $1,020.11 | $1,018.85 | – | – | – | – | ||||||||||
Annualized expense ratio (%) | 1.01 | 1.26 | – | – | – | – | ||||||||||
BNY Mellon Focused | ||||||||||||||||
Expenses paid per $1,000† | $4.38 | $5.65 | – | – | – | – | ||||||||||
Ending value (after expenses) | $1,020.87 | $1,019.61 | – | – | – | – | ||||||||||
Annualized expense ratio (%) | .86 | 1.11 | – | – | – | – | ||||||||||
33
COMPARING YOUR FUND’S EXPENSES WITH THOSE OF OTHER FUND’S (Unaudited) (continued)
Expenses and Value of a $1,000 Investment (continued) | |||||||||||||||||
assuming a hypothetical 5% annualized return for the six months ended August 31, 2017 | |||||||||||||||||
|
|
|
|
|
Class M |
|
|
Investor Shares |
| ||||||||
BNY Mellon Small/Mid Cap Multi-Strategy Fund | |||||||||||||||||
Expenses paid per $1,000† | $4.74 | $6.01 | |||||||||||||||
Ending value (after expenses) | $1,020.52 | $1,019.26 | |||||||||||||||
Annualized expense ratio (%) | .93 | 1.18 | |||||||||||||||
BNY Mellon International Fund | |||||||||||||||||
Expenses paid per $1,000† | $5.20 | $6.56 | |||||||||||||||
Ending value (after expenses) | $1,019.96 | $1,018.70 | |||||||||||||||
Annualized expense ratio (%) | 1.04 | 1.29 | |||||||||||||||
BNY Mellon Emerging Markets Fund | |||||||||||||||||
Expenses paid per $1,000† | $7.22 | $8.49 | |||||||||||||||
Ending value (after expenses) | $1,018.05 | $1,016.79 | |||||||||||||||
Annualized expense ratio (%) | 1.42 | 1.67 | |||||||||||||||
BNY Mellon International Appreciation Fund | |||||||||||||||||
Expenses paid per $1,000† | $4.69 | $5.96 | |||||||||||||||
Ending value (after expenses) | $1,020.57 | $1,019.31 | |||||||||||||||
Annualized expense ratio (%) | .92 | 1.17 | |||||||||||||||
BNY Mellon International Equity Income Fund | |||||||||||||||||
Expenses paid per $1,000† | $$5.55 | $7.02 | |||||||||||||||
Ending value (after expenses) | $$1,019.71 | $1,018.25 | |||||||||||||||
Annualized expense ratio (%) | 1.09 | 1.38 | |||||||||||||||
BNY Mellon Asset Allocation Fund | |||||||||||||||||
Expenses paid per $1,000† | $$1.53 | $2.80 | |||||||||||||||
Ending value (after expenses) | $$1,023.69 | $1,022.43 | |||||||||||||||
Annualized expense ratio (%) | .30 | .55 | |||||||||||||||
† Expenses are equal to each fund’s annualized expense ratio as shown above, multiplied by the average account value over the period, multiplied by 184/365 (to reflect the one-half year period).
34
STATEMENT OF INVESTMENTS
August 31, 2017
BNY Mellon Large Cap Stock Fund | |||||
Description | Shares | Value ($) | |||
Common Stocks - 99.6% | |||||
Automobiles & Components - .9% | |||||
Lear | 14,470 | 2,163,844 | |||
Visteon | 4,805 | a | 554,689 | ||
2,718,533 | |||||
Banks - 5.7% | |||||
Bank of America | 247,985 | 5,924,362 | |||
Comerica | 6,405 | 437,141 | |||
JPMorgan Chase & Co. | 77,519 | 7,045,702 | |||
Wells Fargo & Co. | 60,649 | 3,097,344 | |||
16,504,549 | |||||
Capital Goods - 6.2% | |||||
Boeing | 19,440 | 4,658,990 | |||
General Electric | 143,294 | 3,517,868 | |||
Hexcel | 11,070 | 595,234 | |||
Ingersoll-Rand | 27,950 | 2,386,651 | |||
Lennox International | 3,905 | 647,176 | |||
Lockheed Martin | 3,045 | 929,913 | |||
Oshkosh | 32,680 | 2,437,928 | |||
Spirit AeroSystems Holdings, Cl. A | 35,497 | 2,644,527 | |||
17,818,287 | |||||
Consumer Services - 2.8% | |||||
Carnival | 41,090 | 2,854,933 | |||
Darden Restaurants | 32,071 | 2,632,708 | |||
Royal Caribbean Cruises | 20,210 | 2,515,337 | |||
8,002,978 | |||||
Diversified Financials - 5.7% | |||||
American Express | 40,901 | 3,521,576 | |||
Ameriprise Financial | 3,135 | 434,229 | |||
Berkshire Hathaway, Cl. B | 8,395 | a | 1,520,838 | ||
Discover Financial Services | 38,665 | 2,279,302 | |||
Eaton Vance | 45,365 | 2,158,467 | |||
S&P Global | 19,375 | 2,990,144 | |||
State Street | 32,520 | 3,007,775 | |||
Synchrony Financial | 13,330 | 410,431 | |||
16,322,762 | |||||
Energy - 5.8% | |||||
Chevron | 43,805 | 4,714,294 | |||
Exxon Mobil | 86,862 | 6,630,176 | |||
Halliburton | 24,300 | 946,971 | |||
TechnipFMC | 62,805 | a | 1,622,253 | ||
Valero Energy | 39,602 | 2,696,896 | |||
16,610,590 | |||||
Food & Staples Retailing - 3.7% | |||||
CVS Health | 40,850 | 3,159,339 | |||
Sysco | 8,920 | 469,816 | |||
Walgreens Boots Alliance | 39,250 | 3,198,875 | |||
Wal-Mart Stores | 50,378 | 3,933,010 | |||
10,761,040 | |||||
BNY Mellon Large Cap Stock Fund (continued) | |||||
Description | Shares | Value ($) | |||
Common Stocks - 99.6% (continued) | |||||
Food, Beverage & Tobacco - 3.0% | |||||
Altria Group | 6,387 | 404,936 | |||
Campbell Soup | 32,660 | 1,508,892 | |||
Conagra Brands | 62,490 | 2,028,425 | |||
PepsiCo | 39,725 | 4,597,374 | |||
8,539,627 | |||||
Health Care Equipment & Services - 5.5% | |||||
Baxter International | 49,555 | 3,074,392 | |||
Cigna | 9,716 | 1,768,895 | |||
Danaher | 34,375 | 2,867,562 | |||
Express Scripts Holding | 32,350 | a | 2,032,227 | ||
Humana | 10,910 | 2,810,634 | |||
UnitedHealth Group | 16,105 | 3,203,284 | |||
15,756,994 | |||||
Household & Personal Products - 2.0% | |||||
Church & Dwight | 10,880 | 545,850 | |||
Kimberly-Clark | 20,850 | 2,570,596 | |||
Procter & Gamble | 10,999 | 1,014,878 | |||
Spectrum Brands Holdings | 15,390 | 1,692,284 | |||
5,823,608 | |||||
Insurance - 4.1% | |||||
Allstate | 26,165 | 2,367,933 | |||
Aon | 21,335 | 2,968,979 | |||
Everest Re Group | 5,150 | 1,300,272 | |||
Marsh & McLennan Cos. | 36,810 | 2,874,125 | |||
Prudential Financial | 3,711 | 378,819 | |||
Travelers | 11,511 | 1,394,903 | |||
Unum Group | 8,990 | 433,138 | |||
11,718,169 | |||||
Materials - 1.9% | |||||
Air Products & Chemicals | 15,970 | 2,321,559 | |||
Celanese, Ser. A | 28,070 | 2,723,351 | |||
Owens-Illinois | 21,900 | a | 539,616 | ||
5,584,526 | |||||
Media - 2.5% | |||||
Omnicom Group | 4,330 | 313,405 | |||
Time Warner | 30,451 | 3,078,596 | |||
Walt Disney | 38,719 | 3,918,363 | |||
7,310,364 | |||||
Pharmaceuticals, Biotechnology & Life Sciences - 11.1% | |||||
AbbVie | 14,895 | 1,121,594 | |||
Agilent Technologies | 34,595 | 2,238,988 | |||
Amgen | 23,749 | 4,221,860 | |||
Biogen | 1,490 | a | 471,674 | ||
Celgene | 27,385 | a | 3,804,598 | ||
Eli Lilly & Co. | 6,470 | 525,946 | |||
Johnson & Johnson | 51,543 | 6,822,747 | |||
35
STATEMENT OF INVESTMENTS (continued)
BNY Mellon Large Cap Stock Fund (continued) | ||||||
Description | Shares | Value ($) | ||||
Common Stocks - 99.6% (continued) | ||||||
Pharmaceuticals, Biotechnology & Life Sciences - 11.1% (continued) | ||||||
Merck & Co. | 74,001 | 4,725,704 | ||||
Pfizer | 145,806 | 4,945,740 | ||||
Thermo Fisher Scientific | 17,025 | 3,186,058 | ||||
32,064,909 | ||||||
Real Estate - 1.1% | ||||||
Public Storage | 13,380 | b | 2,747,449 | |||
Vornado Realty Trust | 6,605 | b | 492,006 | |||
3,239,455 | ||||||
Retailing - 4.8% | ||||||
Amazon.com | 4,485 | a | 4,397,991 | |||
Best Buy | 50,065 | 2,716,527 | ||||
Burlington Stores | 12,080 | a | 1,052,530 | |||
Home Depot | 7,409 | 1,110,387 | ||||
Lowe's | 21,344 | 1,577,108 | ||||
Ross Stores | 45,605 | 2,665,612 | ||||
The TJX Companies | 6,470 | 467,781 | ||||
13,987,936 | ||||||
Semiconductors & Semiconductor Equipment - 4.5% | ||||||
Applied Materials | 71,765 | 3,238,037 | ||||
Intel | 34,620 | 1,214,123 | ||||
Lam Research | 16,120 | 2,675,598 | ||||
Skyworks Solutions | 23,710 | 2,498,086 | ||||
Texas Instruments | 40,566 | 3,359,676 | ||||
12,985,520 | ||||||
Software & Services - 12.0% | ||||||
Accenture, Cl. A | 14,565 | 1,904,519 | ||||
Alphabet, Cl. A | 5,782 | a | 5,523,198 | |||
Alphabet, Cl. C | 5,781 | a | 5,430,267 | |||
CDK Global | 24,090 | 1,553,805 | ||||
Citrix Systems | 4,330 | a | 338,649 | |||
Facebook, Cl. A | 32,981 | a | 5,671,743 | |||
Fiserv | 7,830 | a | 968,649 | |||
International Business Machines | 24,166 | 3,456,463 | ||||
Microsoft | 61,470 | 4,596,112 | ||||
Red Hat | 6,590 | a | 708,425 | |||
VeriSign | 19,358 | a | 2,008,393 | |||
VMware, Cl. A | 23,905 | a | 2,584,130 | |||
34,744,353 | ||||||
Technology Hardware & Equipment - 8.7% | ||||||
Apple | 71,151 | 11,668,764 | ||||
Cisco Systems | 132,405 | 4,264,765 | ||||
F5 Networks | 11,045 | a | 1,318,552 | |||
HP | 146,470 | 2,794,648 | ||||
Juniper Networks | 34,685 | 961,815 | ||||
NCR | 47,660 | a | 1,741,020 | |||
BNY Mellon Large Cap Stock Fund (continued) | ||||||
Description | Shares | Value ($) | ||||
Common Stocks - 99.6% (continued) | ||||||
Technology Hardware & Equipment - 8.7% (continued) | ||||||
Western Digital | 28,235 | 2,492,303 | ||||
25,241,867 | ||||||
Telecommunication Services - 4.2% | ||||||
AT&T | 152,122 | 5,698,490 | ||||
TE Connectivity | 6,595 | 524,962 | ||||
T-Mobile US | 32,470 | a | 2,101,134 | |||
Verizon Communications | 78,244 | 3,753,365 | ||||
12,077,951 | ||||||
Transportation - 2.0% | ||||||
Delta Air Lines | 49,587 | 2,340,011 | ||||
Union Pacific | 32,030 | 3,372,759 | ||||
5,712,770 | ||||||
Utilities - 1.4% | ||||||
DTE Energy | 4,340 | 487,469 | ||||
FirstEnergy | 12,885 | 419,793 | ||||
Hawaiian Electric Industries | 12,980 | 433,792 | ||||
MDU Resources Group | 76,880 | 2,078,835 | ||||
Sempra Energy | 5,540 | 653,332 | ||||
4,073,221 | ||||||
Total Common Stocks (cost $219,913,179) | 287,600,009 | |||||
Other Investment - .4% | ||||||
Registered Investment Company; | ||||||
Dreyfus Institutional Preferred Government Plus Money Market Fund | 1,096,205 | c | 1,096,205 | |||
Total Investments (cost $221,009,384) | 100.0% | 288,696,214 | ||||
Liabilities, Less Cash and Receivables | .0% | (67,267) | ||||
Net Assets | 100.0% | 288,628,947 | ||||
aNon-income producing security.
bInvestment in real estate investment trust.
cInvestment in affiliated money market mutual fund.
36
Portfolio Summary (Unaudited) † | Value (%) |
Software & Services | 12.0 |
Pharmaceuticals, Biotechnology & Life Sciences | 11.1 |
Technology Hardware & Equipment | 8.7 |
Capital Goods | 6.2 |
Energy | 5.8 |
Banks | 5.7 |
Diversified Financials | 5.7 |
Health Care Equipment & Services | 5.5 |
Retailing | 4.8 |
Semiconductors & Semiconductor Equipment | 4.5 |
Telecommunication Services | 4.2 |
Insurance | 4.1 |
Food & Staples Retailing | 3.7 |
Food, Beverage & Tobacco | 3.0 |
Consumer Services | 2.8 |
Media | 2.5 |
Household & Personal Products | 2.0 |
Transportation | 2.0 |
Materials | 1.9 |
Utilities | 1.4 |
Real Estate | 1.1 |
Automobiles & Components | .9 |
Money Market Investment | .4 |
100.0 |
† Based on net assets.
See notes to financial statements.
37
STATEMENT OF INVESTMENTS (continued)
BNY Mellon Large Cap Market Opportunities Fund | |||||
Description | Shares | Value ($) | |||
Common Stocks - 47.7% | |||||
Capital Goods - 4.6% | |||||
3M | 3,475 | 710,012 | |||
Acuity Brands | 400 | 70,716 | |||
Deere & Co. | 5,610 | 650,367 | |||
Donaldson | 1,399 | 66,103 | |||
Emerson Electric | 1,550 | 91,512 | |||
Fastenal | 2,510 | 107,102 | |||
Flowserve | 2,055 | 80,720 | |||
Honeywell International | 5,052 | 698,540 | |||
Illinois Tool Works | 4,783 | 657,710 | |||
Toro | 990 | 61,063 | |||
3,193,845 | |||||
Consumer Durables & Apparel - .2% | |||||
NIKE, Cl. B | 2,781 | 146,865 | |||
Consumer Services - 1.5% | |||||
McDonald's | 950 | 151,972 | |||
Starbucks | 2,667 | 146,312 | |||
Yum! Brands | 9,370 | 719,803 | |||
1,018,087 | |||||
Diversified Financials - 4.0% | |||||
Ally Financial | 42,640 | 963,664 | |||
Charles Schwab | 22,905 | 913,909 | |||
Invesco | 27,418 | 898,762 | |||
2,776,335 | |||||
Energy - 3.2% | |||||
Andeavor | 7,070 | 708,061 | |||
EOG Resources | 1,656 | 140,743 | |||
Halliburton | 780 | 30,397 | |||
Occidental Petroleum | 2,176 | 129,907 | |||
Pioneer Natural Resources | 385 | 49,915 | |||
Schlumberger | 2,111 | 134,070 | |||
Superior Energy Services | 43,740 | a | 360,418 | ||
Valero Energy | 10,485 | 714,028 | |||
2,267,539 | |||||
Food & Staples Retailing - 1.1% | |||||
Costco Wholesale | 4,705 | 737,462 | |||
Food, Beverage & Tobacco - 2.3% | |||||
Constellation Brands, Cl. A | 3,760 | 752,376 | |||
Philip Morris International | 7,004 | 818,978 | |||
1,571,354 | |||||
Health Care Equipment & Services - 4.2% | |||||
Abbott Laboratories | 20,465 | 1,042,487 | |||
Cerner | 2,400 | a | 162,672 | ||
Edwards Lifesciences | 702 | a | 79,789 | ||
Henry Schein | 782 | a | 135,818 | ||
Intuitive Surgical | 172 | a | 172,803 | ||
ResMed | 1,385 | 107,448 | |||
Stryker | 974 | 137,694 | |||
UnitedHealth Group | 4,932 | 980,975 | |||
BNY Mellon Large Cap Market Opportunities Fund (continued) | |||||
Description | Shares | Value ($) | |||
Common Stocks - 47.7% (continued) | |||||
Health Care Equipment & Services - 4.2% (continued) | |||||
Varian Medical Systems | 1,201 | a | 127,606 | ||
2,947,292 | |||||
Household & Personal Products - .5% | |||||
Colgate-Palmolive | 1,691 | 121,143 | |||
Estee Lauder, Cl. A | 1,985 | 212,375 | |||
333,518 | |||||
Insurance - 1.3% | |||||
Hartford Financial Services Group | 16,430 | 888,370 | |||
Materials - 2.1% | |||||
Dow Chemical | 11,970 | 797,800 | |||
Ecolab | 1,005 | 133,967 | |||
FMC | 1,975 | 170,285 | |||
International Flavors & Fragrances | 780 | 106,743 | |||
Monsanto | 1,139 | 133,491 | |||
Praxair | 1,023 | 134,565 | |||
1,476,851 | |||||
Media - 2.8% | |||||
Comcast, Cl. A | 28,180 | 1,144,390 | |||
Twenty-First Century Fox, Cl. A | 22,760 | 627,948 | |||
Walt Disney | 1,513 | 153,116 | |||
1,925,454 | |||||
Pharmaceuticals, Biotechnology & Life Sciences - 3.5% | |||||
Agilent Technologies | 13,460 | 871,131 | |||
Allergan | 3,972 | 911,495 | |||
Biogen | 492 | a | 155,748 | ||
Celgene | 934 | a | 129,761 | ||
Gilead Sciences | 1,080 | 90,407 | |||
Johnson & Johnson | 1,140 | 150,902 | |||
Mettler-Toledo International | 229 | a | 138,566 | ||
2,448,010 | |||||
Retailing - 1.9% | |||||
Amazon.com | 937 | a | 918,822 | ||
O'Reilly Automotive | 518 | a | 101,595 | ||
The TJX Companies | 2,576 | 186,245 | |||
Tractor Supply | 2,379 | 141,574 | |||
1,348,236 | |||||
Semiconductors & Semiconductor Equipment - 3.7% | |||||
Broadcom | 4,564 | 1,150,447 | |||
NVIDIA | 8,429 | 1,428,210 | |||
2,578,657 | |||||
Software & Services - 9.7% | |||||
Adobe Systems | 8,102 | a | 1,257,106 | ||
Alphabet, Cl. A | 1,440 | a | 1,375,546 | ||
Alphabet, Cl. C | 135 | a | 126,810 | ||
Automatic Data Processing | 990 | 105,405 | |||
Cognizant Technology Solutions, Cl. A | 1,925 | 136,232 | |||
38
BNY Mellon Large Cap Market Opportunities Fund (continued) | |||||
Description | Shares | Value ($) | |||
Common Stocks - 47.7% (continued) | |||||
Software & Services - 9.7% (continued) | |||||
Electronic Arts | 9,884 | a | 1,200,906 | ||
Jack Henry & Associates | 1,505 | 155,120 | |||
Manhattan Associates | 1,465 | a | 61,603 | ||
Mastercard, Cl. A | 1,923 | 256,336 | |||
Microsoft | 12,104 | 905,016 | |||
Oracle | 2,781 | 139,968 | |||
Paychex | 2,521 | 143,773 | |||
Visa, Cl. A | 9,005 | 932,198 | |||
6,796,019 | |||||
Technology Hardware & Equipment - .9% | |||||
Amphenol, Cl. A | 2,943 | 238,206 | |||
Cisco Systems | 4,408 | 141,982 | |||
IPG Photonics | 1,028 | a | 180,712 | ||
TE Connectivity | 1,250 | 99,500 | |||
660,400 | |||||
Transportation - .2% | |||||
Expeditors International of Washington | 2,480 | 139,128 | |||
Total Common Stocks (cost $23,301,740) | 33,253,422 | ||||
Other Investment - 52.3% | |||||
Registered Investment Company; | |||||
BNY Mellon Income Stock Fund, Cl. M | 796,845 | b | 7,402,691 | ||
Dreyfus Institutional Preferred Government Plus Money Market Fund | 775,093 | c | 775,093 | ||
Dreyfus Research Growth Fund, Cl. Y | 1,187,918 | b | 18,056,350 | ||
Dreyfus Strategic Value Fund, Cl. Y | 252,738 | b | 10,172,719 | ||
Total Other Investment (cost $30,534,268) | 36,406,853 | ||||
Total Investments (cost $53,836,008) | 100.0% | 69,660,275 | |||
Cash and Receivables (Net) | .0% | 26,686 | |||
Net Assets | 100.0% | 69,686,961 | |||
aNon-income producing security.
bInvestment in affiliated mutual fund.
cInvestment in affiliated money market mutual fund.
Portfolio Summary (Unaudited) † | Value (%) |
Mutual Funds: Domestic | 51.2 |
Software & Services | 9.7 |
Capital Goods | 4.6 |
Health Care Equipment & Services | 4.2 |
Diversified Financials | 4.0 |
Semiconductors & Semiconductor Equipment | 3.7 |
Pharmaceuticals, Biotechnology & Life Sciences | 3.5 |
Energy | 3.2 |
Media | 2.8 |
Food, Beverage & Tobacco | 2.3 |
Materials | 2.1 |
Retailing | 1.9 |
Consumer Services | 1.5 |
Insurance | 1.3 |
Money Market Investment | 1.1 |
Food & Staples Retailing | 1.1 |
Technology Hardware & Equipment | .9 |
Household & Personal Products | .5 |
Consumer Durables & Apparel | .2 |
Transportation | .2 |
100.0 |
† Based on net assets.
See notes to financial statements.
39
STATEMENT OF INVESTMENTS (continued)
BNY Mellon Tax-Sensitive Large Cap Multi-Strategy Fund | |||||
Description | Shares | Value ($) | |||
Common Stocks - 66.5% | |||||
Automobiles & Components - .2% | |||||
Delphi Automotive | 1,380 | 133,032 | |||
Ford Motor | 7,213 | 79,559 | |||
General Motors | 1,835 | 67,051 | |||
Goodyear Tire & Rubber | 3,325 | 100,748 | |||
Harley-Davidson | 3,444 | 161,902 | |||
542,292 | |||||
Banks - 2.6% | |||||
Bank of America | 70,799 | 1,691,388 | |||
BB&T | 10,767 | 496,251 | |||
Citigroup | 13,705 | 932,351 | |||
Citizens Financial Group | 6,935 | 229,757 | |||
Fifth Third Bancorp | 3,234 | 84,504 | |||
JPMorgan Chase & Co. | 24,169 | 2,196,720 | |||
KeyCorp | 10,500 | 180,705 | |||
M&T Bank | 630 | 93,152 | |||
PNC Financial Services Group | 5,881 | 737,536 | |||
SunTrust Banks | 1,700 | 93,670 | |||
U.S. Bancorp | 5,242 | 268,652 | |||
Wells Fargo & Co. | 32,632 | 1,666,516 | |||
Zions Bancorporation | 2,665 | 116,354 | |||
8,787,556 | |||||
Capital Goods - 5.6% | |||||
3M | 14,976 | 3,059,896 | |||
Acuity Brands | 1,040 | 183,862 | |||
Allegion | 2,996 | 235,815 | |||
Arconic | 4,565 | 116,271 | |||
Boeing | 5,599 | 1,341,856 | |||
Caterpillar | 4,600 | 540,454 | |||
Deere & Co. | 15,841 | 1,836,447 | |||
Donaldson | 3,630 | 171,518 | |||
Dover | 4,704 | 399,276 | |||
Eaton | 4,989 | 358,011 | |||
Emerson Electric | 6,115 | 361,030 | |||
Fastenal | 6,520 | 278,208 | |||
Flowserve | 6,865 | 269,657 | |||
Fortive | 2,056 | 133,578 | |||
General Dynamics | 741 | 149,200 | |||
General Electric | 48,310 | 1,186,010 | |||
Honeywell International | 21,220 | 2,934,089 | |||
Illinois Tool Works | 15,018 | 2,065,125 | |||
Ingersoll-Rand | 5,740 | 490,139 | |||
Johnson Controls International | 1,141 | 45,172 | |||
Lockheed Martin | 1,377 | 420,522 | |||
Masco | 815 | 29,968 | |||
Northrop Grumman | 1,146 | 311,953 | |||
Parker-Hannifin | 612 | 98,465 | |||
Raytheon | 4,125 | 750,791 | |||
Rockwell Collins | 1,753 | 229,731 | |||
Stanley Black & Decker | 653 | 94,032 | |||
BNY Mellon Tax-Sensitive Large Cap Multi-Strategy Fund (continued) | |||||
Description | Shares | Value ($) | |||
Common Stocks - 66.5% (continued) | |||||
Capital Goods - 5.6% (continued) | |||||
Toro | 2,580 | 159,134 | |||
TransDigm Group | 745 | 194,192 | |||
United Rentals | 875 | a | 103,303 | ||
United Technologies | 2,681 | 320,969 | |||
W.W. Grainger | 358 | 58,200 | |||
Xylem | 2,698 | 167,465 | |||
19,094,339 | |||||
Commercial & Professional Services - .1% | |||||
Robert Half International | 2,005 | 90,827 | |||
Stericycle | 656 | a | 47,160 | ||
Waste Management | 2,644 | 203,879 | |||
341,866 | |||||
Consumer Durables & Apparel - .6% | |||||
Hanesbrands | 970 | 23,532 | |||
Leggett & Platt | 5,590 | 256,972 | |||
Lennar, Cl. A | 6,550 | 339,028 | |||
Mattel | 2,505 | 40,631 | |||
NIKE, Cl. B | 21,640 | 1,142,808 | |||
VF | 3,480 | 218,788 | |||
2,021,759 | |||||
Consumer Services - 1.5% | |||||
Carnival | 2,398 | 166,613 | |||
Chipotle Mexican Grill | 285 | a | 90,262 | ||
Marriott International, Cl. A | 608 | 62,977 | |||
McDonald's | 7,831 | 1,252,725 | |||
Starbucks | 22,158 | 1,215,588 | |||
Wyndham Worldwide | 840 | 83,731 | |||
Wynn Resorts | 1,145 | 159,144 | |||
Yum! Brands | 28,767 | 2,209,881 | |||
5,240,921 | |||||
Diversified Financials - 4.3% | |||||
Ally Financial | 114,460 | 2,586,796 | |||
American Express | 1,959 | 168,670 | |||
Ameriprise Financial | 2,408 | 333,532 | |||
Berkshire Hathaway, Cl. B | 10,842 | a | 1,964,137 | ||
BlackRock | 749 | 313,838 | |||
Capital One Financial | 4,908 | 390,726 | |||
Charles Schwab | 73,726 | 2,941,667 | |||
CME Group | 3,750 | 471,750 | |||
Discover Financial Services | 5,797 | 341,733 | |||
Goldman Sachs Group | 2,240 | 501,178 | |||
H&R Block | 3,780 | 101,077 | |||
Intercontinental Exchange | 8,028 | 519,171 | |||
Invesco | 81,425 | 2,669,111 | |||
Moody's | 720 | 96,502 | |||
Morgan Stanley | 6,300 | 286,650 | |||
Navient | 13,675 | 180,510 | |||
40
BNY Mellon Tax-Sensitive Large Cap Multi-Strategy Fund (continued) | |||||
Description | Shares | Value ($) | |||
Common Stocks - 66.5% (continued) | |||||
Diversified Financials - 4.3% (continued) | |||||
S&P Global | 1,858 | 286,745 | |||
State Street | 5,811 | 537,459 | |||
Synchrony Financial | 2,795 | 86,058 | |||
T. Rowe Price Group | 31 | 2,615 | |||
14,779,925 | |||||
Energy - 4.0% | |||||
Anadarko Petroleum | 4,930 | 201,785 | |||
Andeavor | 21,110 | 2,114,167 | |||
Apache | 4,250 | 165,070 | |||
Baker Hughes | 1,160 | 39,324 | |||
Cabot Oil & Gas | 5,290 | 135,160 | |||
Chevron | 9,964 | 1,072,326 | |||
Cimarex Energy | 937 | 93,410 | |||
ConocoPhillips | 2,706 | 118,144 | |||
Devon Energy | 6,515 | 204,571 | |||
EOG Resources | 9,932 | 844,121 | |||
EQT | 390 | 24,313 | |||
Exxon Mobil | 23,949 | 1,828,027 | |||
Halliburton | 5,272 | 205,450 | |||
Helmerich & Payne | 3,515 | 148,825 | |||
Hess | 3,350 | 130,315 | |||
Kinder Morgan | 13,195 | 255,059 | |||
Marathon Oil | 15,500 | 172,360 | |||
Marathon Petroleum | 3,221 | 168,941 | |||
Murphy Oil | 5,355 | 121,344 | |||
National Oilwell Varco | 570 | 17,482 | |||
Newfield Exploration | 3,375 | a | 88,189 | ||
Occidental Petroleum | 6,584 | 393,065 | |||
ONEOK | 1,865 | 101,008 | |||
Phillips 66 | 3,963 | 332,139 | |||
Pioneer Natural Resources | 2,003 | 259,689 | |||
Range Resources | 1,780 | 30,901 | |||
Schlumberger | 12,802 | 813,055 | |||
Superior Energy Services | 117,430 | a | 967,623 | ||
TechnipFMC | 1,640 | a | 42,361 | ||
Transocean | 11,080 | a | 90,413 | ||
Valero Energy | 34,223 | 2,330,586 | |||
Williams Cos. | 4,239 | 126,025 | |||
13,635,248 | |||||
Food & Staples Retailing - 1.3% | |||||
Costco Wholesale | 16,410 | 2,572,103 | |||
CVS Health | 7,141 | 552,285 | |||
Kroger | 13,152 | 287,634 | |||
Sysco | 1,650 | 86,906 | |||
Walgreens Boots Alliance | 7,587 | 618,340 | |||
Wal-Mart Stores | 6,167 | 481,458 | |||
4,598,726 | |||||
BNY Mellon Tax-Sensitive Large Cap Multi-Strategy Fund (continued) | |||||
Description | Shares | Value ($) | |||
Common Stocks - 66.5% (continued) | |||||
Food, Beverage & Tobacco - 3.3% | |||||
Altria Group | 15,089 | 956,643 | |||
Archer-Daniels-Midland | 4,910 | 202,881 | |||
British American Tobacco, ADR | 3,586 | 222,762 | |||
Coca-Cola | 19,090 | 869,549 | |||
Constellation Brands, Cl. A | 13,257 | 2,652,726 | |||
General Mills | 5,075 | 270,294 | |||
Hershey | 281 | 29,483 | |||
Kraft Heinz | 4,451 | 359,418 | |||
McCormick & Co. | 2,837 | 269,884 | |||
Molson Coors Brewing, Cl. B | 4,105 | 368,424 | |||
Mondelez International, Cl. A | 16,565 | 673,533 | |||
Monster Beverage | 2,265 | a | 126,432 | ||
PepsiCo | 10,796 | 1,249,421 | |||
Philip Morris International | 26,638 | 3,114,781 | |||
Tyson Foods, Cl. A | 1,390 | 87,987 | |||
11,454,218 | |||||
Health Care Equipment & Services - 4.6% | |||||
Abbott Laboratories | 60,433 | 3,078,457 | |||
Aetna | 3,693 | 582,386 | |||
AmerisourceBergen | 2,378 | 190,834 | |||
Anthem | 2,774 | 543,815 | |||
Baxter International | 1,555 | 96,472 | |||
Becton Dickinson & Co. | 3,199 | 638,009 | |||
Boston Scientific | 21,064 | a | 580,313 | ||
C.R. Bard | 1,801 | 577,779 | |||
Cardinal Health | 1,135 | 76,567 | |||
Cerner | 6,940 | a | 470,393 | ||
Cigna | 2,998 | 545,816 | |||
Danaher | 4,112 | 343,023 | |||
Edwards Lifesciences | 1,820 | a | 206,861 | ||
Envision Healthcare | 500 | a | 26,205 | ||
Express Scripts Holding | 213 | a | 13,381 | ||
Henry Schein | 2,028 | a | 352,223 | ||
Humana | 1,673 | 430,998 | |||
Intuitive Surgical | 872 | a | 876,072 | ||
McKesson | 1,422 | 212,319 | |||
Medtronic | 8,775 | 707,440 | |||
ResMed | 3,597 | 279,055 | |||
Stryker | 3,526 | 498,471 | |||
UnitedHealth Group | 21,534 | 4,283,113 | |||
Varian Medical Systems | 3,119 | a | 331,394 | ||
15,941,396 | |||||
Household & Personal Products - 1.0% | |||||
Clorox | 2,630 | 364,334 | |||
Colgate-Palmolive | 11,218 | 803,658 | |||
Estee Lauder, Cl. A | 6,255 | 669,222 | |||
41
STATEMENT OF INVESTMENTS (continued)
BNY Mellon Tax-Sensitive Large Cap Multi-Strategy Fund (continued) | |||||
Description | Shares | Value ($) | |||
Common Stocks - 66.5% (continued) | |||||
Household & Personal Products - 1.0% (continued) | |||||
Kimberly-Clark | 1,345 | 165,825 | |||
Procter & Gamble | 13,801 | 1,273,418 | |||
3,276,457 | |||||
Insurance - 1.9% | |||||
Aflac | 250 | 20,638 | |||
Allstate | 4,925 | 445,712 | |||
American International Group | 8,685 | 525,269 | |||
Aon | 4,496 | 625,663 | |||
Brighthouse Financial | 614 | 35,041 | |||
Chubb | 1,116 | 157,825 | |||
Cincinnati Financial | 1,410 | 108,344 | |||
Hartford Financial Services Group | 53,495 | 2,892,475 | |||
Lincoln National | 2,076 | 140,877 | |||
Marsh & McLennan Cos. | 5,996 | 468,168 | |||
MetLife | 6,757 | 316,430 | |||
Prudential Financial | 1,076 | 109,838 | |||
Travelers | 4,531 | 549,067 | |||
6,395,347 | |||||
Materials - 2.3% | |||||
Air Products & Chemicals | 3,487 | 506,905 | |||
CF Industries Holdings | 2,605 | 75,519 | |||
Dow Chemical | 41,456 | 2,763,042 | |||
E.I. du Pont de Nemours & Co. | 7,741 | 649,702 | |||
Ecolab | 2,610 | 347,913 | |||
FMC | 5,130 | 442,309 | |||
Freeport-McMoRan | 25,405 | a | 375,486 | ||
International Flavors & Fragrances | 2,020 | 276,437 | |||
International Paper | 2,004 | 107,955 | |||
LyondellBasell Industries, Cl. A | 3,186 | 288,620 | |||
Monsanto | 6,002 | 703,434 | |||
Mosaic | 1,530 | 30,569 | |||
Newmont Mining | 4,165 | 159,686 | |||
Nucor | 1,060 | 58,417 | |||
PPG Industries | 3,746 | 390,783 | |||
Praxair | 3,057 | 402,118 | |||
Sealed Air | 1,150 | 51,037 | |||
Sherwin-Williams | 186 | 63,104 | |||
Vulcan Materials | 2,949 | 357,596 | |||
8,050,632 | |||||
Media - 2.7% | |||||
CBS, Cl. B | 1,149 | 73,605 | |||
Charter Communications, Cl. A | 612 | a | 243,906 | ||
Comcast, Cl. A | 115,567 | 4,693,176 | |||
Discovery Communications, Cl. A | 1,070 | a | 23,765 | ||
Nielsen Holdings | 1,250 | 48,563 | |||
Omnicom Group | 820 | 59,352 | |||
TEGNA | 1,085 | 13,693 | |||
BNY Mellon Tax-Sensitive Large Cap Multi-Strategy Fund (continued) | |||||
Description | Shares | Value ($) | |||
Common Stocks - 66.5% (continued) | |||||
Media - 2.7% (continued) | |||||
Time Warner | 6,747 | 682,122 | |||
Twenty-First Century Fox, Cl. A | 66,006 | 1,821,106 | |||
Viacom, Cl. B | 675 | 19,305 | |||
Walt Disney | 16,380 | 1,657,656 | |||
9,336,249 | |||||
Pharmaceuticals, Biotechnology & Life Sciences - 5.4% | |||||
AbbVie | 8,413 | 633,499 | |||
Agilent Technologies | 36,130 | 2,338,334 | |||
Alexion Pharmaceuticals | 1,150 | a | 163,772 | ||
Allergan | 12,699 | 2,914,167 | |||
Amgen | 5,181 | 921,026 | |||
Biogen | 2,821 | a | 893,016 | ||
Bristol-Myers Squibb | 12,402 | 750,073 | |||
Celgene | 10,175 | a | 1,413,613 | ||
Eli Lilly & Co. | 9,386 | 762,988 | |||
Gilead Sciences | 14,356 | 1,201,741 | |||
Incyte | 202 | a | 27,757 | ||
Johnson & Johnson | 20,631 | 2,730,925 | |||
Mallinckrodt | 1,409 | a | 57,882 | ||
Merck & Co. | 15,701 | 1,002,666 | |||
Mettler-Toledo International | 595 | a | 360,029 | ||
Pfizer | 36,658 | 1,243,439 | |||
Regeneron Pharmaceuticals | 252 | a | 125,219 | ||
Thermo Fisher Scientific | 4,722 | 883,675 | |||
Vertex Pharmaceuticals | 471 | a | 75,614 | ||
18,499,435 | |||||
Real Estate - 1.1% | |||||
American Tower | 2,360 | b | 349,398 | ||
Apartment Investment & Management, Cl. A | 955 | b | 43,290 | ||
AvalonBay Communities | 2,636 | b | 494,856 | ||
Crown Castle International | 2,870 | b | 311,223 | ||
Equinix | 373 | b | 174,717 | ||
Equity Residential | 5,022 | b | 337,227 | ||
Extra Space Storage | 1,205 | b | 93,544 | ||
GGP | 10,575 | b | 219,431 | ||
HCP | 3,075 | b | 91,666 | ||
Host Hotels & Resorts | 990 | b | 17,939 | ||
Iron Mountain | 7,405 | b | 291,905 | ||
Kimco Realty | 12,020 | b | 235,832 | ||
Macerich | 1,470 | b | 77,572 | ||
Simon Property Group | 1,672 | b | 262,253 | ||
SL Green Realty | 2,005 | b | 193,242 | ||
Ventas | 3,150 | b | 215,586 | ||
Weyerhaeuser | 8,085 | b | 263,652 | ||
3,673,333 | |||||
42
BNY Mellon Tax-Sensitive Large Cap Multi-Strategy Fund (continued) | |||||
Description | Shares | Value ($) | |||
Common Stocks - 66.5% (continued) | |||||
Retailing - 3.4% | |||||
Amazon.com | 5,281 | a | 5,178,549 | ||
Dollar Tree | 3,454 | a | 275,077 | ||
eBay | 2,742 | a | 99,068 | ||
Genuine Parts | 414 | 34,292 | |||
Home Depot | 10,234 | 1,533,770 | |||
Kohl's | 2,060 | 81,947 | |||
L Brands | 289 | 10,468 | |||
Lowe's | 9,727 | 718,728 | |||
Macy's | 414 | 8,599 | |||
Netflix | 3,234 | a | 565,012 | ||
Nordstrom | 255 | 11,378 | |||
O'Reilly Automotive | 2,811 | a | 551,321 | ||
Priceline Group | 435 | a | 805,655 | ||
Ross Stores | 2,388 | 139,579 | |||
Signet Jewelers | 29 | 1,829 | |||
Staples | 1,975 | 20,175 | |||
Target | 50 | 2,727 | |||
The TJX Companies | 14,927 | 1,079,222 | |||
Tractor Supply | 6,186 | 368,129 | |||
11,485,525 | |||||
Semiconductors & Semiconductor Equipment - 3.5% | |||||
Advanced Micro Devices | 4,170 | a | 54,210 | ||
Analog Devices | 1,503 | 125,756 | |||
Applied Materials | 5,935 | 267,787 | |||
Broadcom | 13,846 | 3,490,161 | |||
Intel | 34,362 | 1,205,075 | |||
Lam Research | 3,655 | 606,657 | |||
Micron Technology | 9,220 | a | 294,763 | ||
NVIDIA | 27,817 | 4,713,312 | |||
QUALCOMM | 5,757 | 300,918 | |||
Texas Instruments | 10,679 | 884,435 | |||
Xilinx | 1,834 | 121,154 | |||
12,064,228 | |||||
Software & Services - 11.0% | |||||
Accenture, Cl. A | 4,575 | 598,227 | |||
Adobe Systems | 27,442 | a | 4,257,901 | ||
Alliance Data Systems | 172 | 38,786 | |||
Alphabet, Cl. A | 5,820 | a | 5,559,497 | ||
Alphabet, Cl. C | 2,322 | a | 2,181,124 | ||
Altaba Inc | 11,407 | a | 730,961 | ||
Autodesk | 1,980 | a | 226,631 | ||
Automatic Data Processing | 7,847 | 835,470 | |||
Cars.com Inc | 361 | 9,335 | |||
Cognizant Technology Solutions, Cl. A | 9,227 | 652,995 | |||
DXC Technology | 1,729 | 146,965 | |||
Electronic Arts | 26,539 | a | 3,224,488 | ||
Facebook, Cl. A | 15,070 | a | 2,591,588 | ||
BNY Mellon Tax-Sensitive Large Cap Multi-Strategy Fund (continued) | |||||
Description | Shares | Value ($) | |||
Common Stocks - 66.5% (continued) | |||||
Software & Services - 11.0% (continued) | |||||
Fiserv | 4,267 | a | 527,871 | ||
International Business Machines | 4,091 | 585,136 | |||
Intuit | 929 | 131,407 | |||
Jack Henry & Associates | 3,915 | 403,519 | |||
Manhattan Associates | 3,820 | a | 160,631 | ||
Mastercard, Cl. A | 13,653 | 1,819,945 | |||
Microsoft | 87,898 | 6,572,133 | |||
Oracle | 20,905 | 1,052,149 | |||
Paychex | 11,844 | 675,463 | |||
PayPal Holdings | 2,742 | a | 169,127 | ||
salesforce.com | 7,734 | a | 738,520 | ||
Visa, Cl. A | 37,980 | 3,931,690 | |||
Western Union | 4,157 | 78,650 | |||
37,900,209 | |||||
Technology Hardware & Equipment - 2.9% | |||||
Amphenol, Cl. A | 11,544 | 934,371 | |||
Apple | 34,944 | 5,730,816 | |||
Cisco Systems | 45,742 | 1,473,350 | |||
Corning | 14,950 | 429,962 | |||
Hewlett Packard Enterprise | 20,128 | 363,512 | |||
HP | 20,128 | 384,042 | |||
IPG Photonics | 2,670 | a | 469,359 | ||
Motorola Solutions | 768 | 67,676 | |||
Seagate Technology | 1,350 | 42,566 | |||
Western Digital | 1,496 | 132,052 | |||
10,027,706 | |||||
Telecommunication Services - .8% | |||||
AT&T | 34,068 | 1,276,187 | |||
CenturyLink | 13,250 | 261,290 | |||
TE Connectivity | 3,240 | 257,904 | |||
Verizon Communications | 22,655 | 1,086,760 | |||
2,882,141 | |||||
Transportation - 1.0% | |||||
CSX | 7,713 | 387,193 | |||
Delta Air Lines | 3,995 | 188,524 | |||
Expeditors International of Washington | 6,440 | 361,284 | |||
FedEx | 2,533 | 543,025 | |||
Kansas City Southern | 325 | 33,615 | |||
Norfolk Southern | 757 | 91,234 | |||
Ryder System | 1,780 | 138,128 | |||
Southwest Airlines | 10,010 | 521,921 | |||
Union Pacific | 6,826 | 718,778 | |||
United Parcel Service, Cl. B | 2,638 | 301,682 | |||
3,285,384 | |||||
Utilities - 1.4% | |||||
AES | 11,440 | 126,298 | |||
43
STATEMENT OF INVESTMENTS (continued)
BNY Mellon Tax-Sensitive Large Cap Multi-Strategy Fund (continued) | |||||
Description | Shares | Value ($) | |||
Common Stocks - 66.5% (continued) | |||||
Utilities - 1.4% (continued) | |||||
American Electric Power | 2,915 | 214,631 | |||
CenterPoint Energy | 5,755 | 170,463 | |||
CMS Energy | 8,781 | 426,230 | |||
Dominion Energy | 3,673 | 289,322 | |||
DTE Energy | 660 | 74,131 | |||
Duke Energy | 1,647 | 143,783 | |||
Eversource Energy | 7,290 | 459,270 | |||
Exelon | 5,575 | 211,125 | |||
NextEra Energy | 5,595 | 842,103 | |||
NiSource | 10,190 | 273,805 | |||
NRG Energy | 7,975 | 198,657 | |||
Pinnacle West Capital | 1,425 | 128,207 | |||
SCANA | 1,330 | 80,305 | |||
Sempra Energy | 4,585 | 540,709 | |||
Southern | 1,243 | 59,987 | |||
Xcel Energy | 10,635 | 526,432 | |||
4,765,458 | |||||
Total Common Stocks (cost $125,994,855) | 228,080,350 | ||||
Other Investment - 33.4% | |||||
Registered Investment Company; | |||||
BNY Mellon Income Stock Fund, Cl. M | 2,322,965 | c | 21,580,349 | ||
Dreyfus Institutional Preferred Government Plus Money Market Fund | 1,232,934 | d | 1,232,934 | ||
Dreyfus Research Growth Fund, Cl. Y | 3,967,604 | c | 60,307,580 | ||
Dreyfus Strategic Value Fund, Cl. Y | 787,812 | c | 31,709,431 | ||
Total Other Investment (cost $101,170,669) | 114,830,294 | ||||
Total Investments (cost $227,165,524) | 99.9% | 342,910,644 | |||
Cash and Receivables (Net) | .1% | 258,754 | |||
Net Assets | 100.0% | 343,169,398 | |||
ADR—American Depository Receipt
aNon-income producing security.
bInvestment in real estate investment trust.
cInvestment in affiliated mutual fund.
dInvestment in affiliated money market mutual fund.
Portfolio Summary (Unaudited) † | Value (%) |
Mutual Funds: Domestic | 33.1 |
Software & Services | 11.0 |
Capital Goods | 5.6 |
Pharmaceuticals, Biotechnology & Life Sciences | 5.4 |
Health Care Equipment & Services | 4.6 |
Diversified Financials | 4.3 |
Energy | 4.0 |
Semiconductors & Semiconductor Equipment | 3.5 |
Retailing | 3.4 |
Food, Beverage & Tobacco | 3.3 |
Technology Hardware & Equipment | 2.9 |
Media | 2.7 |
Banks | 2.6 |
Materials | 2.3 |
Insurance | 1.9 |
Consumer Services | 1.5 |
Utilities | 1.4 |
Food & Staples Retailing | 1.3 |
Real Estate | 1.1 |
Transportation | 1.0 |
Household & Personal Products | 1.0 |
Telecommunication Services | .8 |
Consumer Durables & Apparel | .6 |
Money Market Investment | .3 |
Automobiles & Components | .2 |
Commercial & Professional Services | .1 |
99.9 |
† Based on net assets.
See notes to financial statements.
44
BNY Mellon Income Stock Fund | |||||
Description | Shares | Value ($) | |||
Common Stocks - 95.4% | |||||
Banks - 19.4% | |||||
Bank of America | 1,028,119 | 24,561,763 | |||
BB&T | 586,077 | 27,012,289 | |||
Citigroup | 414,792 | 28,218,300 | |||
JPMorgan Chase & Co. | 644,685 | 58,595,420 | |||
PNC Financial Services Group | 192,465 | 24,137,036 | |||
SunTrust Banks | 476,203 | 26,238,785 | |||
U.S. Bancorp | 961,024 | 49,252,480 | |||
238,016,073 | |||||
Capital Goods - 5.8% | |||||
Honeywell International | 137,445 | 19,004,520 | |||
Raytheon | 137,520 | 25,030,015 | |||
United Technologies | 231,202 | 27,679,503 | |||
71,714,038 | |||||
Consumer Services - 1.5% | |||||
Las Vegas Sands | 289,362 | 18,001,210 | |||
Diversified Financials - 2.6% | |||||
Ameriprise Financial | 128,791 | 17,838,841 | |||
Goldman Sachs Group | 62,848 | 14,061,612 | |||
31,900,453 | |||||
Energy - 7.1% | |||||
Occidental Petroleum | 787,282 | 47,000,735 | |||
Phillips 66 | 302,477 | 25,350,597 | |||
Schlumberger | 229,183 | 14,555,412 | |||
86,906,744 | |||||
Food, Beverage & Tobacco - 7.9% | |||||
Coca-Cola | 844,392 | 38,462,056 | |||
Conagra Brands | 301,372 | 9,782,535 | |||
Kellogg | 357,900 | 23,428,134 | |||
Kraft Heinz | 163,844 | 13,230,403 | |||
Molson Coors Brewing, Cl. B | 135,844 | 12,191,999 | |||
97,095,127 | |||||
Health Care Equipment & Services - 1.2% | |||||
UnitedHealth Group | 73,008 | 14,521,291 | |||
Insurance - 4.3% | |||||
American International Group | 192,930 | 11,668,406 | |||
Chubb | 102,643 | 14,515,773 | |||
Prudential Financial | 255,639 | 26,095,629 | |||
52,279,808 | |||||
Materials - 5.7% | |||||
Dow Chemical | 471,680 | 31,437,472 | |||
Packaging Corporation of America | 231,398 | 26,011,449 | |||
Vulcan Materials | 101,591 | 12,318,925 | |||
69,767,846 | |||||
Media - 2.6% | |||||
Comcast, Cl. A | 367,183 | 14,911,302 | |||
Omnicom Group | 240,670 | 17,419,695 | |||
32,330,997 | |||||
BNY Mellon Income Stock Fund (continued) | |||||
Description | Shares | Value ($) | |||
Common Stocks - 95.4% (continued) | |||||
Pharmaceuticals, Biotechnology & Life Sciences - 7.9% | |||||
Bristol-Myers Squibb | 192,927 | 11,668,225 | |||
Eli Lilly & Co. | 149,693 | 12,168,544 | |||
Gilead Sciences | 171,130 | 14,325,292 | |||
Johnson & Johnson | 277,395 | 36,718,776 | |||
Merck & Co. | 339,927 | 21,707,738 | |||
96,588,575 | |||||
Real Estate - 4.0% | |||||
Lamar Advertising, Cl. A | 370,479 | a | 24,659,082 | ||
Uniti Group | 1,261,469 | 24,295,893 | |||
48,954,975 | |||||
Retailing - .5% | |||||
Nordstrom | 128,654 | 5,740,542 | |||
Semiconductors & Semiconductor Equipment - 3.2% | |||||
Microchip Technology | 165,919 | 14,401,769 | |||
Texas Instruments | 300,659 | 24,900,578 | |||
39,302,347 | |||||
Software & Services - 1.0% | |||||
Oracle | 245,329 | 12,347,409 | |||
Technology Hardware & Equipment - 8.3% | |||||
Apple | 246,008 | 40,345,312 | |||
Cisco Systems | 1,423,862 | 45,862,595 | |||
Corning | 553,029 | 15,905,114 | |||
102,113,021 | |||||
Telecommunication Services - 6.1% | |||||
AT&T | 1,335,649 | 50,033,412 | |||
Vodafone Group, ADR | 843,307 | 24,481,202 | |||
74,514,614 | |||||
Utilities - 6.3% | |||||
FirstEnergy | 1,022,020 | 33,297,412 | |||
NextEra Energy Partners | 673,276 | 27,914,023 | |||
NRG Yield, Cl. C | 903,426 | 16,713,381 | |||
77,924,816 | |||||
Total Common Stocks (cost $964,386,273) | 1,170,019,886 | ||||
Description | Preferred Dividend | Shares | Value ($) | ||
Preferred Stocks - 1.1% | |||||
Energy - 1.1% | |||||
Hess | 4.00 | 273,668 | 13,669,717 | ||
45
STATEMENT OF INVESTMENTS (continued)
BNY Mellon Income Stock Fund (continued) | |||||
Description | Shares | Value ($) | |||
Other Investment - 1.0% | |||||
Registered Investment Company; | |||||
Dreyfus Institutional Preferred Government Plus Money Market Fund | 11,627,088 | b | 11,627,088 | ||
Total Investments (cost $993,425,579) | 97.5% | 1,195,316,691 | |||
Cash and Receivables (Net) | 2.5% | 30,945,484 | |||
Net Assets | 100.0% | 1,226,262,175 | |||
ADR—American Depository Receipt
a Investment in real estate investment trust.
b Investment in affiliated money market mutual fund.
Portfolio Summary (Unaudited) † | Value (%) |
Banks | 19.4 |
Technology Hardware & Equipment | 8.3 |
Energy | 8.2 |
Food, Beverage & Tobacco | 7.9 |
Pharmaceuticals, Biotechnology & Life Sciences | 7.9 |
Utilities | 6.3 |
Telecommunication Services | 6.1 |
Capital Goods | 5.8 |
Materials | 5.7 |
Insurance | 4.3 |
Real Estate | 4.0 |
Semiconductors & Semiconductor Equipment | 3.2 |
Media | 2.6 |
Diversified Financials | 2.6 |
Consumer Services | 1.5 |
Health Care Equipment & Services | 1.2 |
Software & Services | 1.0 |
Money Market Investment | 1.0 |
Retailing | .5 |
97.5 |
† Based on net assets.
See notes to financial statements.
46
BNY Mellon Mid Cap Multi-Strategy Fund | |||||
Description | Shares | Value ($) | |||
Common Stocks - 98.3% | |||||
Automobiles & Components - .8% | |||||
Adient | 9,732 | 687,858 | |||
BorgWarner | 117,491 | 5,452,757 | |||
Delphi Automotive | 29,680 | 2,861,152 | |||
Gentex | 84,095 | 1,536,416 | |||
Goodyear Tire & Rubber | 53,335 | 1,616,050 | |||
Harley-Davidson | 28,450 | a | 1,337,435 | ||
Lear | 9,972 | 1,491,213 | |||
Tenneco | 27,478 | 1,489,308 | |||
Thor Industries | 12,105 | 1,315,087 | |||
Visteon | 44,749 | b | 5,165,825 | ||
22,953,101 | |||||
Banks - 4.0% | |||||
Bank of the Ozarks | 7,940 | 341,102 | |||
BB&T | 52,318 | 2,411,337 | |||
BOK Financial | 11,415 | 918,679 | |||
CIT Group | 50,255 | a | 2,253,937 | ||
Citizens Financial Group | 14,660 | 485,686 | |||
Comerica | 30,315 | 2,068,999 | |||
Cullen/Frost Bankers | 15,365 | 1,293,733 | |||
East West Bancorp | 264,852 | 14,664,855 | |||
Fifth Third Bancorp | 287,289 | 7,506,862 | |||
First Horizon National | 95,155 | 1,637,618 | |||
First Republic Bank | 118,024 | 11,454,229 | |||
Huntington Bancshares | 958,020 | 12,061,472 | |||
KeyCorp | 710,626 | 12,229,873 | |||
M&T Bank | 18,002 | 2,661,776 | |||
New York Community Bancorp | 71,520 | 861,816 | |||
PacWest Bancorp | 27,855 | 1,257,653 | |||
People's United Financial | 76,030 | a | 1,269,701 | ||
Popular | 33,565 | 1,339,579 | |||
Regions Financial | 398,862 | 5,627,943 | |||
Signature Bank | 68,523 | b | 8,794,242 | ||
SunTrust Banks | 180,256 | 9,932,106 | |||
SVB Financial Group | 55,622 | b | 9,419,029 | ||
TCF Financial | 78,080 | 1,212,582 | |||
Zions Bancorporation | 64,130 | 2,799,916 | |||
114,504,725 | |||||
Capital Goods - 9.5% | |||||
Acuity Brands | 42,075 | a | 7,438,439 | ||
AECOM | 54,270 | b | 1,818,045 | ||
Air Lease | 86,016 | a | 3,495,690 | ||
Allegion | 116,093 | 9,137,680 | |||
AMETEK | 264,608 | 16,736,456 | |||
Arconic | 40,568 | 1,033,267 | |||
Beacon Roofing Supply | 113,478 | b | 5,344,814 | ||
BWX Technologies | 145,175 | 7,943,976 | |||
Carlisle | 3,379 | 319,958 | |||
Cummins | 14,262 | 2,273,078 | |||
Curtiss-Wright | 26,317 | 2,548,012 | |||
BNY Mellon Mid Cap Multi-Strategy Fund (continued) | |||||
Description | Shares | Value ($) | |||
Common Stocks - 98.3% (continued) | |||||
Capital Goods - 9.5% (continued) | |||||
Donaldson | 47,180 | 2,229,255 | |||
Dover | 24,330 | 2,065,130 | |||
Eaton | 50,874 | 3,650,718 | |||
EnerSys | 25,284 | 1,620,704 | |||
Fastenal | 152,325 | 6,499,708 | |||
Flowserve | 1,025 | a | 40,262 | ||
Fluor | 81,502 | 3,143,532 | |||
Fortune Brands Home & Security | 150,076 | 9,384,252 | |||
Graco | 59,219 | 6,840,387 | |||
Hubbell | 90,027 | 10,154,145 | |||
Huntington Ingalls Industries | 12,311 | 2,634,062 | |||
IDEX | 105,389 | 12,391,639 | |||
Ingersoll-Rand | 77,555 | 6,622,421 | |||
Jacobs Engineering Group | 9,215 | 502,125 | |||
L3 Technologies | 24,899 | 4,518,671 | |||
Lincoln Electric Holdings | 13,780 | 1,196,655 | |||
Masco | 223,718 | 8,226,111 | |||
Middleby | 74,862 | a,b | 9,110,705 | ||
MSC Industrial Direct, Cl. A | 8,765 | 603,733 | |||
Nordson | 20,995 | 2,294,753 | |||
Orbital ATK | 12,445 | 1,388,613 | |||
Owens Corning | 28,985 | 2,148,658 | |||
PACCAR | 188,849 | 12,526,354 | |||
Parker-Hannifin | 13,345 | 2,147,077 | |||
Pentair | 26,730 | 1,658,596 | |||
Quanta Services | 227,772 | b | 8,183,848 | ||
Rockwell Automation | 12,719 | 2,086,679 | |||
Rockwell Collins | 23,475 | 3,076,399 | |||
Roper Technologies | 79,301 | 18,291,569 | |||
Snap-on | 85,870 | a | 12,671,836 | ||
Spirit AeroSystems Holdings, Cl. A | 71,006 | 5,289,947 | |||
Stanley Black & Decker | 62,314 | 8,973,216 | |||
Terex | 26,455 | 1,019,840 | |||
Textron | 106,970 | 5,251,157 | |||
Timken | 100,485 | 4,506,752 | |||
TransDigm Group | 8,180 | a | 2,132,199 | ||
United Rentals | 18,545 | b | 2,189,423 | ||
W.W. Grainger | 7,602 | 1,235,857 | |||
WABCO Holdings | 41,664 | b | 5,983,784 | ||
Wabtec | 19,895 | a | 1,403,990 | ||
Watsco | 44,080 | a | 6,495,629 | ||
WESCO International | 45,113 | b | 2,275,951 | ||
Xylem | 176,660 | 10,965,286 | |||
273,721,043 | |||||
Commercial & Professional Services - 2.0% | |||||
Avery Dennison | 17,365 | 1,636,825 | |||
Cintas | 17,005 | 2,295,845 | |||
Copart | 387,102 | a,b | 12,654,364 | ||
47
STATEMENT OF INVESTMENTS (continued)
BNY Mellon Mid Cap Multi-Strategy Fund (continued) | |||||
Description | Shares | Value ($) | |||
Common Stocks - 98.3% (continued) | |||||
Commercial & Professional Services - 2.0% (continued) | |||||
IHS Markit | 38,186 | b | 1,788,632 | ||
KAR Auction Services | 11,520 | 519,437 | |||
ManpowerGroup | 65,930 | 7,351,854 | |||
Republic Services | 43,970 | 2,868,603 | |||
Robert Half International | 114,896 | 5,204,789 | |||
Stericycle | 18,825 | b | 1,353,329 | ||
Verisk Analytics | 119,747 | b | 9,705,494 | ||
Waste Connections | 159,760 | 10,654,394 | |||
56,033,566 | |||||
Consumer Durables & Apparel - 2.5% | |||||
Brunswick | 110,464 | 5,797,151 | |||
Carter's | 77,391 | 6,710,574 | |||
Coach | 33,095 | 1,380,062 | |||
D.R. Horton | 26,010 | 940,262 | |||
Garmin | 22,545 | a | 1,161,068 | ||
Hanesbrands | 82,610 | a | 2,004,119 | ||
Hasbro | 86,120 | 8,461,290 | |||
Leggett & Platt | 25,880 | 1,189,704 | |||
Lennar, Cl. A | 16,500 | 854,040 | |||
Lululemon Athletica | 125,659 | b | 7,231,675 | ||
Mattel | 73,225 | a | 1,187,710 | ||
Michael Kors Holdings | 22,195 | b | 937,073 | ||
Mohawk Industries | 3,807 | b | 963,628 | ||
Newell Brands | 271,315 | 13,099,088 | |||
NVR | 780 | b | 2,122,263 | ||
Polaris Industries | 12,611 | a | 1,175,724 | ||
PulteGroup | 55,720 | 1,438,690 | |||
PVH | 72,532 | 9,131,053 | |||
Ralph Lauren | 10,939 | 961,429 | |||
Skechers USA, Cl. A | 22,611 | b | 597,609 | ||
Toll Brothers | 45,290 | 1,764,498 | |||
TopBuild | 6,003 | b | 356,278 | ||
Tupperware Brands | 9,295 | 537,902 | |||
Under Armour, Cl. A | 52,450 | a,b | 847,068 | ||
Under Armour, Cl. C | 24,910 | a,b | 376,141 | ||
Whirlpool | 8,340 | 1,431,311 | |||
72,657,410 | |||||
Consumer Services - 1.4% | |||||
Aramark | 54,045 | 2,199,091 | |||
Caesars Entertainment | 202,906 | a,b | 2,353,710 | ||
Chipotle Mexican Grill | 2,787 | b | 882,671 | ||
Darden Restaurants | 22,040 | 1,809,264 | |||
Dunkin' Brands Group | 15,355 | 791,704 | |||
Grand Canyon Education | 50,247 | b | 4,122,766 | ||
Hilton Grand Vacations | 13,786 | 499,743 | |||
Hilton Worldwide Holdings | 19,703 | 1,267,494 | |||
Hyatt Hotels, Cl. A | 9,770 | b | 581,413 | ||
BNY Mellon Mid Cap Multi-Strategy Fund (continued) | |||||
Description | Shares | Value ($) | |||
Common Stocks - 98.3% (continued) | |||||
Consumer Services - 1.4% (continued) | |||||
ILG | 8,080 | 213,312 | |||
Marriott International, Cl. A | 28,440 | 2,945,815 | |||
MGM Resorts International | 60,420 | 1,991,443 | |||
Norwegian Cruise Line Holdings | 20,300 | b | 1,207,038 | ||
Royal Caribbean Cruises | 20,180 | 2,511,603 | |||
Service Corporation International | 52,230 | 1,845,808 | |||
Texas Roadhouse | 101,229 | 4,803,316 | |||
Wyndham Worldwide | 22,890 | 2,281,675 | |||
Wynn Resorts | 58,312 | a | 8,104,785 | ||
40,412,651 | |||||
Diversified Financials - 8.3% | |||||
Affiliated Managers Group | 48,018 | 8,484,300 | |||
AGNC Investment | 61,310 | a | 1,320,617 | ||
Ally Financial | 56,190 | 1,269,894 | |||
Ameriprise Financial | 22,290 | 3,087,388 | |||
Capital One Financial | 225,945 | 17,987,481 | |||
CBOE Holdings | 74,586 | 7,524,982 | |||
Credit Acceptance | 2,099 | b | 571,558 | ||
Discover Financial Services | 116,261 | 6,853,586 | |||
Dun & Bradstreet | 13,119 | 1,461,981 | |||
E*TRADE Financial | 563,984 | b | 23,128,984 | ||
Eaton Vance | 95,233 | 4,531,186 | |||
Equifax | 17,235 | 2,455,470 | |||
Franklin Resources | 231,665 | 10,014,878 | |||
H&R Block | 37,435 | 1,001,012 | |||
Intercontinental Exchange | 198,477 | 12,835,508 | |||
Invesco | 158,731 | 5,203,202 | |||
Legg Mason | 42,355 | a | 1,617,537 | ||
Leucadia National | 782,691 | 18,534,123 | |||
LPL Financial Holdings | 22,080 | 1,034,227 | |||
MFA Financial | 185,725 | c | 1,630,665 | ||
Moody's | 36,882 | 4,943,294 | |||
Nasdaq | 23,680 | 1,784,998 | |||
Navient | 279,333 | 3,687,196 | |||
Northern Trust | 19,900 | 1,761,150 | |||
Principal Financial Group | 32,030 | 2,002,516 | |||
Raymond James Financial | 389,739 | 30,524,358 | |||
SLM | 2,191,421 | b | 22,286,752 | ||
Starwood Property Trust | 35,825 | c | 795,673 | ||
State Street | 37,400 | 3,459,126 | |||
Synchrony Financial | 674,312 | 20,762,066 | |||
T. Rowe Price Group | 28,625 | 2,414,805 | |||
TD Ameritrade Holding | 288,909 | 12,515,538 | |||
Two Harbors Investment | 155,860 | c | 1,594,448 | ||
239,080,499 | |||||
Energy - 3.9% | |||||
Anadarko Petroleum | 51,259 | 2,098,031 | |||
Andeavor | 175,567 | 17,583,035 | |||
48
BNY Mellon Mid Cap Multi-Strategy Fund (continued) | |||||
Description | Shares | Value ($) | |||
Common Stocks - 98.3% (continued) | |||||
Energy - 3.9% (continued) | |||||
Antero Resources | 75,100 | a,b | 1,478,719 | ||
Apache | 42,560 | 1,653,030 | |||
Baker Hughes | 31,250 | 1,059,375 | |||
Cabot Oil & Gas | 55,605 | 1,420,708 | |||
Cheniere Energy | 233,188 | b | 9,978,115 | ||
Chesapeake Energy | 203,335 | b | 740,139 | ||
Cimarex Energy | 29,625 | 2,953,316 | |||
Concho Resources | 17,823 | b | 1,977,818 | ||
CONSOL Energy | 75,810 | a,b | 1,103,036 | ||
Devon Energy | 13,620 | 427,668 | |||
Diamondback Energy | 153,564 | a,b | 13,942,076 | ||
Energen | 121,086 | a,b | 6,209,290 | ||
EQT | 101,607 | 6,334,180 | |||
Gulfport Energy | 41,400 | b | 518,742 | ||
Helmerich & Payne | 45,515 | a | 1,927,105 | ||
HollyFrontier | 30,210 | a | 945,875 | ||
Marathon Oil | 170,985 | 1,901,353 | |||
Marathon Petroleum | 126,304 | 6,624,645 | |||
Murphy Oil | 38,930 | 882,154 | |||
Nabors Industries | 108,520 | a | 710,806 | ||
National Oilwell Varco | 21,315 | a | 653,731 | ||
Newfield Exploration | 122,057 | b | 3,189,349 | ||
Noble Energy | 5,970 | 141,907 | |||
Oceaneering International | 12,525 | 282,439 | |||
ONEOK | 24,750 | 1,340,460 | |||
Parsley Energy, Cl. A | 158,517 | a,b | 3,970,851 | ||
Patterson-UTI Energy | 3,005 | 47,990 | |||
PBF Energy, Cl. A | 24,435 | 578,621 | |||
PDC Energy | 140,969 | a,b | 5,544,311 | ||
Pioneer Natural Resources | 15,677 | 2,032,523 | |||
QEP Resources | 22,965 | b | 173,386 | ||
Range Resources | 67,835 | 1,177,616 | |||
Rice Energy | 26,440 | b | 723,398 | ||
RSP Permian | 81,651 | a,b | 2,562,208 | ||
Southwestern Energy | 193,980 | b | 1,057,191 | ||
Targa Resources | 37,780 | 1,683,855 | |||
Transocean | 134,575 | b | 1,098,132 | ||
Weatherford International | 27,125 | a,b | 103,889 | ||
Williams Cos. | 79,385 | 2,360,116 | |||
World Fuel Services | 15,140 | 522,936 | |||
WPX Energy | 118,225 | b | 1,181,068 | ||
112,895,193 | |||||
Exchange-Traded Funds - .8% | |||||
iShares Russell Mid-Cap Growth ETF | 158,095 | a | 17,444,202 | ||
SPDR S&P MidCap 400 ETF Trust | 13,085 | 4,129,364 | |||
21,573,566 | |||||
Food & Staples Retailing - .3% | |||||
Rite Aid | 34,100 | a,b | 82,522 | ||
Sprouts Farmers Market | 174,354 | a,b | 3,476,619 | ||
BNY Mellon Mid Cap Multi-Strategy Fund (continued) | |||||
Description | Shares | Value ($) | |||
Common Stocks - 98.3% (continued) | |||||
Food & Staples Retailing - .3% (continued) | |||||
Sysco | 6,140 | 323,394 | |||
US Foods Holding | 196,146 | b | 5,384,208 | ||
9,266,743 | |||||
Food, Beverage & Tobacco - 2.2% | |||||
Archer-Daniels-Midland | 389,583 | 16,097,570 | |||
Brown-Forman, Cl. B | 17,330 | 919,183 | |||
Bunge | 7,155 | 533,978 | |||
Campbell Soup | 16,265 | 751,443 | |||
Coca-Cola European Partners | 108,516 | 4,666,188 | |||
Conagra Brands | 51,890 | 1,684,349 | |||
Constellation Brands, Cl. A | 7,293 | 1,459,329 | |||
Dr. Pepper Snapple Group | 11,415 | 1,039,336 | |||
Hershey | 12,140 | 1,273,729 | |||
Ingredion | 19,837 | 2,456,217 | |||
J.M. Smucker | 62,119 | 6,507,586 | |||
Kellogg | 6,395 | 418,617 | |||
Lamb Weston Holdings | 32,136 | 1,461,545 | |||
McCormick & Co. | 19,335 | 1,839,339 | |||
Molson Coors Brewing, Cl. B | 112,704 | 10,115,184 | |||
Monster Beverage | 17,622 | b | 983,660 | ||
Pilgrim's Pride | 18,420 | a,b | 542,469 | ||
Pinnacle Foods | 21,605 | 1,281,393 | |||
Post Holdings | 12,985 | b | 1,105,413 | ||
TreeHouse Foods | 68,148 | a,b | 4,565,235 | ||
Tyson Foods, Cl. A | 39,385 | 2,493,070 | |||
62,194,833 | |||||
Health Care Equipment & Services - 8.8% | |||||
Abbott Laboratories | 30,756 | 1,566,711 | |||
ABIOMED | 88,437 | b | 13,336,300 | ||
Acadia Healthcare | 15,785 | a,b | 740,948 | ||
Alere | 16,305 | a,b | 806,445 | ||
Align Technology | 113,787 | b | 20,110,714 | ||
Allscripts Healthcare Solutions | 20,770 | a,b | 272,918 | ||
AmerisourceBergen | 28,230 | 2,265,457 | |||
athenahealth | 46,111 | b | 6,498,423 | ||
Boston Scientific | 955,780 | b | 26,331,739 | ||
Brookdale Senior Living | 400,084 | b | 4,853,019 | ||
C.R. Bard | 10,692 | 3,430,101 | |||
Cardinal Health | 39,151 | 2,641,127 | |||
Centene | 79,646 | b | 7,076,547 | ||
Cerner | 172,279 | b | 11,677,071 | ||
Cooper | 38,055 | 9,545,336 | |||
DaVita | 59,755 | b | 3,499,253 | ||
DENTSPLY SIRONA | 234,495 | 13,265,382 | |||
DexCom | 145,304 | a,b | 10,841,131 | ||
Edwards Lifesciences | 23,983 | b | 2,725,908 | ||
Envision Healthcare | 19,851 | b | 1,040,391 | ||
49
STATEMENT OF INVESTMENTS (continued)
BNY Mellon Mid Cap Multi-Strategy Fund (continued) | |||||
Description | Shares | Value ($) | |||
Common Stocks - 98.3% (continued) | |||||
Health Care Equipment & Services - 8.8% (continued) | |||||
Henry Schein | 53,533 | b | 9,297,611 | ||
Hill-Rom Holdings | 14,955 | 1,150,937 | |||
Hologic | 23,175 | b | 894,555 | ||
Humana | 33,465 | 8,621,253 | |||
IDEXX Laboratories | 42,748 | b | 6,644,322 | ||
Intuitive Surgical | 3,569 | b | 3,585,667 | ||
Laboratory Corporation of America Holdings | 127,239 | b | 19,959,982 | ||
Medidata Solutions | 69,803 | b | 5,232,433 | ||
MEDNAX | 5,710 | a,b | 256,094 | ||
NuVasive | 84,446 | a,b | 5,276,186 | ||
Quest Diagnostics | 25,140 | 2,723,919 | |||
ResMed | 23,420 | a | 1,816,924 | ||
STERIS | 99,163 | 8,643,047 | |||
Universal Health Services, Cl. B | 42,411 | 4,585,901 | |||
Varex Imaging | 8,468 | 258,528 | |||
Varian Medical Systems | 86,341 | b | 9,173,731 | ||
Veeva Systems, Cl. A | 16,395 | b | 975,503 | ||
WellCare Health Plans | 5,460 | b | 953,753 | ||
Zimmer Biomet Holdings | 169,504 | 19,369,222 | |||
251,944,489 | |||||
Household & Personal Products - .6% | |||||
Church & Dwight | 233,703 | 11,724,880 | |||
Clorox | 9,230 | 1,278,632 | |||
Edgewell Personal Care | 13,645 | b | 1,036,201 | ||
Energizer Holdings | 17,164 | 757,791 | |||
Herbalife | 7,145 | a,b | 493,076 | ||
Nu Skin Enterprises, Cl. A | 13,635 | a | 829,417 | ||
16,119,997 | |||||
Insurance - 3.1% | |||||
Alleghany | 10,932 | b | 6,152,202 | ||
Allstate | 56,488 | 5,112,164 | |||
Aon | 73,475 | 10,224,781 | |||
Assurant | 20,175 | 1,910,371 | |||
Assured Guaranty | 26,870 | 1,143,050 | |||
Athene Holding, Cl. A | 94,917 | 5,079,009 | |||
Cincinnati Financial | 30,550 | 2,347,462 | |||
Everest Re Group | 8,640 | 2,181,427 | |||
FNF Group | 48,465 | 2,337,952 | |||
Hartford Financial Services Group | 53,110 | 2,871,658 | |||
Lincoln National | 36,155 | 2,453,478 | |||
Loews | 126,661 | 5,899,869 | |||
Markel | 1,474 | b | 1,550,633 | ||
Marsh & McLennan Cos. | 57,079 | 4,456,728 | |||
Old Republic International | 86,890 | 1,658,730 | |||
Progressive | 61,690 | 2,867,351 | |||
Reinsurance Group of America | 67,091 | 9,020,385 | |||
BNY Mellon Mid Cap Multi-Strategy Fund (continued) | |||||
Description | Shares | Value ($) | |||
Common Stocks - 98.3% (continued) | |||||
Insurance - 3.1% (continued) | |||||
Torchmark | 26,362 | 2,029,083 | |||
Unum Group | 199,016 | 9,588,591 | |||
Validus Holdings | 27,605 | 1,384,391 | |||
W.R. Berkley | 85,309 | 5,684,992 | |||
XL Group | 78,548 | 3,217,326 | |||
89,171,633 | |||||
Materials - 5.8% | |||||
Albemarle | 19,155 | 2,226,960 | |||
Alcoa | 8,822 | b | 387,109 | ||
Ashland Global Holdings | 9,861 | 611,875 | |||
Axalta Coating Systems | 31,520 | b | 930,470 | ||
Ball | 34,470 | a | 1,378,455 | ||
Bemis | 25,965 | a | 1,106,369 | ||
Berry Plastics Group | 86,787 | b | 4,880,901 | ||
Celanese, Ser. A | 22,210 | 2,154,814 | |||
Cemex SAB de CV | 207,392 | b | 1,930,820 | ||
CF Industries Holdings | 21,630 | 627,054 | |||
Crown Holdings | 92,060 | a,b | 5,434,302 | ||
Eagle Materials | 124,630 | 12,120,267 | |||
Eastman Chemical | 6,350 | 547,370 | |||
FMC | 47,024 | 4,054,409 | |||
Freeport-McMoRan | 1,242,909 | b | 18,370,195 | ||
GCP Applied Technologies | 8,515 | b | 240,549 | ||
Graphic Packaging Holding | 247,784 | 3,233,581 | |||
Huntsman | 13,500 | 358,695 | |||
Ingevity | 3,558 | b | 224,047 | ||
International Flavors & Fragrances | 15,023 | 2,055,898 | |||
International Paper | 318,465 | 17,155,710 | |||
LyondellBasell Industries, Cl. A | 132,210 | 11,976,904 | |||
Martin Marietta Materials | 8,904 | 1,887,559 | |||
Methanex | 119,124 | a | 6,087,236 | ||
Mosaic | 12,015 | 240,060 | |||
Newmont Mining | 450,283 | 17,263,850 | |||
Nucor | 40,615 | 2,238,293 | |||
Packaging Corporation of America | 122,576 | 13,778,768 | |||
PPG Industries | 13,132 | 1,369,930 | |||
Reliance Steel & Aluminum | 23,920 | 1,732,286 | |||
Royal Gold | 11,570 | 1,079,250 | |||
RPM International | 8,255 | 404,247 | |||
Sealed Air | 29,410 | 1,305,216 | |||
Sherwin-Williams | 2,924 | 992,025 | |||
Sonoco Products | 32,050 | 1,546,733 | |||
Steel Dynamics | 196,214 | 6,759,572 | |||
Valvoline | 155,825 | 3,317,514 | |||
Vulcan Materials | 76,904 | 9,325,379 | |||
W.R. Grace & Co. | 15,161 | 1,083,708 | |||
WestRock | 98,700 | 5,617,017 | |||
168,035,397 | |||||
50
BNY Mellon Mid Cap Multi-Strategy Fund (continued) | |||||
Description | Shares | Value ($) | |||
Common Stocks - 98.3% (continued) | |||||
Media - 1.7% | |||||
AMC Networks, Cl. A | 10,100 | a,b | 613,878 | ||
CBS, Cl. B | 60,188 | 3,855,643 | |||
Charter Communications, Cl. A | 1,958 | b | 780,341 | ||
Cinemark Holdings | 36,750 | a | 1,223,408 | ||
Gannett | 15,382 | a | 130,593 | ||
Interpublic Group of Companies | 181,972 | 3,664,916 | |||
John Wiley & Sons, Cl. A | 18,805 | 1,014,530 | |||
Liberty Broadband, Cl. A | 2,552 | b | 258,849 | ||
Liberty Broadband, Cl. C | 12,465 | b | 1,265,571 | ||
Liberty Media Corp-Liberty Braves, Cl. C | 2,745 | a,b | 67,170 | ||
Liberty Media Corp-Liberty Formula One, Cl. A | 2,552 | b | 96,797 | ||
Liberty Media Corp-Liberty Formula One, Cl. C | 120,160 | a,b | 4,722,288 | ||
Liberty Media Corp-Liberty SiriusXM, Cl. A | 10,210 | b | 456,387 | ||
Liberty Media Corp-Liberty SiriusXM, Cl. C | 45,890 | b | 2,047,153 | ||
Lions Gate Entertainment, Cl. B | 18,798 | b | 527,660 | ||
News Corp., Cl. A | 103,150 | 1,379,116 | |||
Nielsen Holdings | 284,976 | a | 11,071,318 | ||
Omnicom Group | 41,710 | 3,018,970 | |||
Scripps Networks Interactive, Cl. A | 17,350 | 1,486,027 | |||
Sinclair Broadcast Group, Cl. A | 392,366 | a | 11,869,071 | ||
TEGNA | 50,955 | 643,052 | |||
50,192,738 | |||||
Pharmaceuticals, Biotechnology & Life Sciences - 4.4% | |||||
ACADIA Pharmaceuticals | 14,670 | b | 522,399 | ||
Agilent Technologies | 141,558 | 9,161,634 | |||
Agios Pharmaceuticals | 8,136 | a,b | 514,683 | ||
Alexion Pharmaceuticals | 122,230 | b | 17,406,774 | ||
Alkermes | 204,144 | a,b | 10,366,432 | ||
Alnylam Pharmaceuticals | 14,030 | a,b | 1,202,792 | ||
BioMarin Pharmaceutical | 102,360 | b | 9,231,848 | ||
Bio-Techne | 11,230 | 1,390,049 | |||
Bruker | 63,406 | 1,844,481 | |||
Charles River Laboratories International | 11,800 | b | 1,283,840 | ||
Exelixis | 22,405 | b | 655,122 | ||
ICON | 16,409 | a,b | 1,860,617 | ||
Illumina | 17,607 | b | 3,599,927 | ||
Incyte | 19,545 | b | 2,685,678 | ||
Intercept Pharmaceuticals | 4,035 | a,b | 470,521 | ||
Ionis Pharmaceuticals | 17,325 | a,b | 928,967 | ||
Jazz Pharmaceuticals | 180,661 | b | 26,983,527 | ||
Juno Therapeutics | 12,740 | a,b | 525,780 | ||
Mallinckrodt | 24,256 | a,b | 996,436 | ||
Mettler-Toledo International | 4,135 | b | 2,502,047 | ||
Mylan | 54,805 | b | 1,725,261 | ||
BNY Mellon Mid Cap Multi-Strategy Fund (continued) | |||||
Description | Shares | Value ($) | |||
Common Stocks - 98.3% (continued) | |||||
Pharmaceuticals, Biotechnology & Life Sciences - 4.4% (continued) | |||||
Neurocrine Biosciences | 200,778 | b | 11,364,035 | ||
Perrigo | 11,406 | a | 900,618 | ||
QIAGEN | 31,496 | b | 1,013,226 | ||
Quintiles IMS Holdings | 13,985 | b | 1,342,980 | ||
Sage Therapeutics | 49,824 | a,b | 4,098,024 | ||
Seattle Genetics | 10,440 | b | 548,413 | ||
TESARO | 39,854 | a,b | 5,146,746 | ||
United Therapeutics | 4,758 | b | 622,346 | ||
Waters | 14,140 | b | 2,594,407 | ||
Zoetis | 46,430 | 2,911,161 | |||
126,400,771 | |||||
Real Estate - 4.5% | |||||
American Assets Trust | 51,568 | c | 2,094,692 | ||
American Homes 4 Rent, Cl. A | 77,856 | c | 1,725,289 | ||
Apartment Investment & Management, Cl. A | 36,320 | c | 1,646,386 | ||
Apple Hospitality REIT | 25,600 | a,c | 465,408 | ||
AvalonBay Communities | 8,634 | c | 1,620,861 | ||
Boston Properties | 80,401 | c | 9,696,361 | ||
Brixmor Property Group | 34,265 | c | 641,441 | ||
Camden Property Trust | 21,145 | c | 1,892,055 | ||
CBRE Group, Cl. A | 63,290 | b,c | 2,283,503 | ||
Colony NorthStar, Cl. A | 105,690 | 1,385,596 | |||
CoreCivic | 5,709 | 153,001 | |||
Crown Castle International | 17,445 | c | 1,891,736 | ||
CyrusOne | 23,600 | a,c | 1,487,508 | ||
DDR | 108,715 | c | 1,052,361 | ||
Digital Realty Trust | 25,055 | c | 2,965,009 | ||
Douglas Emmett | 93,056 | c | 3,625,462 | ||
Duke Realty | 74,956 | c | 2,227,692 | ||
Equinix | 24,081 | c | 11,279,781 | ||
Equity Commonwealth | 50,205 | b,c | 1,553,343 | ||
Equity Lifestyle Properties | 30,160 | a,c | 2,688,764 | ||
Equity Residential | 43,941 | c | 2,950,638 | ||
Essex Property Trust | 18,011 | c | 4,790,386 | ||
Extra Space Storage | 28,165 | c | 2,186,449 | ||
Federal Realty Investment Trust | 16,186 | c | 2,054,489 | ||
Forest City Realty Trust, Cl. A | 67,420 | c | 1,615,383 | ||
Four Corners Property Trust | 8,576 | c | 217,916 | ||
Gaming and Leisure Properties | 31,015 | c | 1,215,478 | ||
GGP | 68,320 | c | 1,417,640 | ||
HCP | 39,135 | c | 1,166,614 | ||
Healthcare Trust of America, Cl. A | 45,315 | c | 1,407,937 | ||
Hospitality Properties Trust | 52,830 | c | 1,445,429 | ||
Host Hotels & Resorts | 105,409 | c | 1,910,011 | ||
Iron Mountain | 59,418 | c | 2,342,258 | ||
JBG SMITH Properties | 7,355 | b | 240,729 | ||
Jones Lang LaSalle | 8,438 | 1,028,677 | |||
51
STATEMENT OF INVESTMENTS (continued)
BNY Mellon Mid Cap Multi-Strategy Fund (continued) | |||||
Description | Shares | Value ($) | |||
Common Stocks - 98.3% (continued) | |||||
Real Estate - 4.5% (continued) | |||||
Kilroy Realty | 21,885 | c | 1,515,099 | ||
Kimco Realty | 185,811 | c | 3,645,612 | ||
Macerich | 32,355 | c | 1,707,373 | ||
Omega Healthcare Investors | 50,660 | a,c | 1,614,534 | ||
Park Hotels & Resorts | 8,506 | 227,025 | |||
Prologis | 57,060 | c | 3,615,322 | ||
Quality Care Properties | 6,719 | 92,185 | |||
Rayonier | 41,074 | c | 1,191,557 | ||
Realty Income | 44,600 | c | 2,567,176 | ||
Regency Centers | 83,670 | c | 5,381,654 | ||
SBA Communications | 17,347 | b | 2,663,632 | ||
SL Green Realty | 88,760 | c | 8,554,689 | ||
Spirit Realty Capital | 138,410 | c | 1,204,167 | ||
Taubman Centers | 1,380 | c | 72,091 | ||
UDR | 63,425 | c | 2,462,158 | ||
Uniti Group | 33,665 | 648,388 | |||
Ventas | 46,020 | c | 3,149,609 | ||
VEREIT | 212,970 | c | 1,797,467 | ||
Vornado Realty Trust | 14,720 | c | 1,096,493 | ||
Weingarten Realty Investors | 45,180 | c | 1,447,567 | ||
Welltower | 41,575 | c | 3,044,121 | ||
Weyerhaeuser | 75,927 | c | 2,475,979 | ||
WP Carey | 16,020 | a,c | 1,102,977 | ||
129,643,158 | |||||
Retailing - 4.4% | |||||
Advance Auto Parts | 29,836 | 2,920,944 | |||
AutoNation | 17,970 | b | 815,299 | ||
AutoZone | 3,700 | b | 1,955,228 | ||
Best Buy | 57,235 | 3,105,571 | |||
CarMax | 25,000 | a,b | 1,678,750 | ||
Dillard's, Cl. A | 8,883 | a | 540,086 | ||
Dollar General | 29,430 | 2,135,441 | |||
Dollar Tree | 192,254 | b | 15,311,109 | ||
eBay | 316,361 | b | 11,430,123 | ||
Expedia | 86,429 | a | 12,822,606 | ||
Foot Locker | 30,885 | 1,088,079 | |||
Gap | 33,285 | 786,192 | |||
Genuine Parts | 13,330 | 1,104,124 | |||
Kohl's | 27,880 | 1,109,066 | |||
L Brands | 32,100 | a | 1,162,662 | ||
Liberty Expedia Holdings, Cl. A | 9,251 | b | 505,937 | ||
Liberty Interactive Corp. QVC Group, Cl. A | 67,655 | b | 1,496,529 | ||
Liberty Ventures, Ser. A | 12,684 | b | 780,827 | ||
LKQ | 510,152 | b | 17,676,767 | ||
Macy's | 64,175 | 1,332,915 | |||
Murphy USA | 14,322 | a,b | 923,196 | ||
Nordstrom | 39,400 | a | 1,758,028 | ||
O'Reilly Automotive | 45,614 | b | 8,946,274 | ||
BNY Mellon Mid Cap Multi-Strategy Fund (continued) | |||||
Description | Shares | Value ($) | |||
Common Stocks - 98.3% (continued) | |||||
Retailing - 4.4% (continued) | |||||
Pool | 50,631 | 5,047,404 | |||
Ross Stores | 162,801 | 9,515,718 | |||
Signet Jewelers | 11,891 | 749,965 | |||
Staples | 122,410 | 1,250,418 | |||
Tiffany & Co. | 16,960 | 1,550,144 | |||
Tractor Supply | 94,994 | a | 5,653,093 | ||
TripAdvisor | 9,380 | a,b | 400,807 | ||
Ulta Beauty | 44,282 | b | 9,786,765 | ||
Williams-Sonoma | 20,935 | a | 963,010 | ||
126,303,077 | |||||
Semiconductors & Semiconductor Equipment - 3.3% | |||||
Analog Devices | 30,871 | 2,582,977 | |||
Applied Materials | 37,675 | 1,699,896 | |||
Cypress Semiconductor | 71,745 | a | 982,189 | ||
KLA-Tencor | 10,620 | 994,988 | |||
Lam Research | 21,200 | 3,518,776 | |||
Marvell Technology Group | 229,722 | 4,114,321 | |||
Maxim Integrated Products | 314,140 | 14,657,772 | |||
Mellanox Technologies | 96,881 | a,b | 4,548,563 | ||
Microchip Technology | 10,689 | a | 927,805 | ||
Micron Technology | 61,645 | b | 1,970,791 | ||
Microsemi | 211,724 | b | 10,666,655 | ||
NVIDIA | 81,262 | 13,769,033 | |||
ON Semiconductor | 212,742 | b | 3,633,633 | ||
Qorvo | 23,885 | a,b | 1,748,860 | ||
Skyworks Solutions | 148,948 | 15,693,161 | |||
Teradyne | 271,875 | 9,681,469 | |||
United Microelectronics, ADR | 735,049 | a | 1,837,622 | ||
Xilinx | 30,960 | 2,045,218 | |||
95,073,729 | |||||
Software & Services - 14.5% | |||||
Activision Blizzard | 181,869 | 11,923,332 | |||
Akamai Technologies | 16,890 | b | 796,364 | ||
Alliance Data Systems | 8,320 | 1,876,160 | |||
Amdocs | 124,499 | 8,066,290 | |||
ANSYS | 93,581 | b | 12,055,104 | ||
Autodesk | 28,790 | b | 3,295,303 | ||
Booz Allen Hamilton Holdings | 206,659 | 7,049,138 | |||
Broadridge Financial Solutions | 201,409 | 15,736,085 | |||
CA | 31,425 | 1,042,682 | |||
Cars.com | 10,255 | a | 265,194 | ||
CDK Global | 14,640 | 944,280 | |||
Citrix Systems | 11,990 | b | 937,738 | ||
Cognizant Technology Solutions, Cl. A | 127,648 | 9,033,649 | |||
CommerceHub, Ser. C | 4,948 | b | 105,046 | ||
Conduent | 39,424 | a | 650,890 | ||
CoreLogic | 25,605 | b | 1,202,667 | ||
CoStar Group | 61,119 | a,b | 17,517,928 | ||
52
BNY Mellon Mid Cap Multi-Strategy Fund (continued) | |||||
Description | Shares | Value ($) | |||
Common Stocks - 98.3% (continued) | |||||
Software & Services - 14.5% (continued) | |||||
CSRA | 30,780 | 969,878 | |||
DXC Technology | 170,532 | 14,495,220 | |||
Electronic Arts | 46,965 | b | 5,706,247 | ||
Fidelity National Information Services | 256,097 | 23,796,533 | |||
First Data, Cl. A | 1,072,886 | b | 19,751,831 | ||
Fiserv | 127,328 | b | 15,751,747 | ||
FleetCor Technologies | 10,138 | b | 1,457,540 | ||
Gartner | 101,805 | b | 12,276,665 | ||
Global Payments | 29,990 | 2,863,745 | |||
HubSpot | 211,337 | a,b | 15,501,569 | ||
IAC/InterActiveCorp | 68,250 | b | 7,747,057 | ||
Intuit | 138,870 | 19,643,161 | |||
j2 Global | 64,675 | a | 4,868,734 | ||
Jack Henry & Associates | 24,220 | a | 2,496,355 | ||
Leidos Holdings | 47,228 | 2,754,337 | |||
LogMeIn | 6,168 | 705,619 | |||
Manhattan Associates | 97,885 | a,b | 4,116,064 | ||
MAXIMUS | 80,913 | 4,917,892 | |||
NetEase, ADR | 12,258 | 3,381,247 | |||
New Relic | 200,241 | b | 9,591,544 | ||
Nuance Communications | 680,530 | b | 10,936,117 | ||
Paychex | 94,906 | 5,412,489 | |||
Proofpoint | 85,371 | a,b | 7,833,643 | ||
RealPage | 76,534 | b | 3,298,615 | ||
Red Hat | 119,736 | b | 12,871,620 | ||
Sabre | 7,425 | 136,917 | |||
ServiceNow | 141,457 | b | 16,435,889 | ||
Shopify, Cl. A | 126,223 | b | 14,000,655 | ||
Splunk | 138,172 | a,b | 9,269,959 | ||
Square, Cl. A | 623,824 | b | 16,288,045 | ||
SS&C Technologies Holdings | 440,102 | 17,036,348 | |||
Symantec | 35,785 | 1,072,834 | |||
Tableau Software, Cl. A | 13,962 | a,b | 1,011,966 | ||
Total System Services | 37,190 | 2,570,573 | |||
Twilio, Cl. A | 400,134 | a,b | 11,715,924 | ||
Tyler Technologies | 55,636 | a,b | 9,613,901 | ||
Ultimate Software Group | 32,389 | a,b | 6,506,950 | ||
VeriSign | 22,480 | a,b | 2,332,300 | ||
Western Union | 98,915 | 1,871,472 | |||
WEX | 4,062 | b | 443,327 | ||
Workday, Cl. A | 13,895 | a,b | 1,524,143 | ||
417,474,522 | |||||
Technology Hardware & Equipment - 5.8% | |||||
3D Systems | 30,440 | a,b | 382,326 | ||
Amphenol, Cl. A | 350,017 | 28,330,376 | |||
ARRIS International | 29,675 | b | 826,746 | ||
Arrow Electronics | 90,507 | b | 7,188,971 | ||
BNY Mellon Mid Cap Multi-Strategy Fund (continued) | |||||
Description | Shares | Value ($) | |||
Common Stocks - 98.3% (continued) | |||||
Technology Hardware & Equipment - 5.8% (continued) | |||||
Avnet | 10,815 | 417,135 | |||
Belden | 2,465 | 189,978 | |||
Brocade Communications Systems | 94,935 | 1,175,295 | |||
CDW | 7,325 | 464,552 | |||
Ciena | 353,644 | a,b | 7,642,247 | ||
Cognex | 7,835 | 853,780 | |||
CommScope Holding | 36,792 | a,b | 1,216,344 | ||
EchoStar, Cl. A | 15,595 | b | 940,379 | ||
F5 Networks | 9,231 | b | 1,101,997 | ||
Flex | 334,129 | b | 5,436,279 | ||
FLIR Systems | 172,670 | 6,561,460 | |||
Harris | 75,049 | 9,223,522 | |||
Hewlett Packard Enterprise | 692,696 | 12,510,090 | |||
HP | 205,433 | 3,919,662 | |||
Jabil Circuit | 80,494 | 2,523,487 | |||
Juniper Networks | 55,900 | 1,550,107 | |||
Keysight Technologies | 46,000 | b | 1,879,560 | ||
Motorola Solutions | 25,235 | 2,223,708 | |||
National Instruments | 91,112 | a | 3,680,014 | ||
NCR | 23,405 | b | 854,985 | ||
NetApp | 22,755 | 879,708 | |||
Palo Alto Networks | 12,380 | b | 1,642,702 | ||
Teradata | 473,334 | a,b | 15,108,821 | ||
Trimble | 393,162 | b | 15,207,506 | ||
Viavi Solutions | 1,013,564 | b | 10,176,183 | ||
Western Digital | 59,974 | 5,293,905 | |||
Xerox | 345,685 | 11,155,255 | |||
Zebra Technologies, Cl. A | 68,709 | b | 7,083,211 | ||
167,640,291 | |||||
Telecommunication Services - .3% | |||||
Level 3 Communications | 17,467 | b | 950,729 | ||
Sprint | 116,415 | a,b | 960,424 | ||
TE Connectivity | 58,811 | 4,681,356 | |||
Telephone & Data Systems | 34,375 | a | 1,007,531 | ||
Zayo Group Holdings | 49,100 | b | 1,677,747 | ||
9,277,787 | |||||
Transportation - 2.3% | |||||
American Airlines Group | 111,218 | 4,975,893 | |||
CH Robinson Worldwide | 25,380 | a | 1,792,589 | ||
Copa Holdings, Cl. A | 8,535 | 1,058,937 | |||
Delta Air Lines | 44,881 | 2,117,934 | |||
Expeditors International of Washington | 27,280 | 1,530,408 | |||
Genesee & Wyoming, Cl. A | 9,120 | a,b | 625,267 | ||
J.B. Hunt Transport Services | 245,683 | 24,295,592 | |||
JetBlue Airways | 48,500 | b | 960,785 | ||
Kansas City Southern | 18,870 | 1,951,724 | |||
Landstar System | 15,410 | 1,438,523 | |||
Macquarie Infrastructure | 15,950 | 1,187,956 | |||
53
STATEMENT OF INVESTMENTS (continued)
BNY Mellon Mid Cap Multi-Strategy Fund (continued) | |||||
Description | Shares | Value ($) | |||
Common Stocks - 98.3% (continued) | |||||
Transportation - 2.3% (continued) | |||||
Norfolk Southern | 36,212 | 4,364,270 | |||
Southwest Airlines | 74,569 | 3,888,028 | |||
Swift Transportation | 402,954 | a,b | 11,302,860 | ||
United Continental Holdings | 73,483 | b | 4,553,007 | ||
66,043,773 | |||||
Utilities - 3.1% | |||||
AES | 168,470 | 1,859,909 | |||
Alliant Energy | 127,395 | 5,444,862 | |||
Ameren | 53,545 | 3,212,165 | |||
American Water Works | 27,465 | 2,221,918 | |||
Aqua America | 55,970 | a | 1,869,398 | ||
Atmos Energy | 16,455 | 1,448,698 | |||
Calpine | 207,305 | b | 3,047,383 | ||
CenterPoint Energy | 32,965 | 976,423 | |||
CMS Energy | 57,200 | 2,776,488 | |||
Consolidated Edison | 22,755 | 1,917,564 | |||
DTE Energy | 22,480 | 2,524,954 | |||
Edison International | 104,859 | 8,407,595 | |||
Entergy | 25,085 | 1,985,979 | |||
Eversource Energy | 56,275 | 3,545,325 | |||
First Solar | 16,565 | b | 777,892 | ||
Great Plains Energy | 54,469 | 1,671,654 | |||
National Fuel Gas | 11,530 | 668,509 | |||
NiSource | 104,185 | 2,799,451 | |||
NRG Energy | 65,635 | 1,634,968 | |||
OGE Energy | 23,710 | 846,921 | |||
PG&E | 84,126 | 5,920,788 | |||
Pinnacle West Capital | 99,392 | 8,942,298 | |||
Portland General Electric | 64,495 | 3,064,157 | |||
PPL | 83,210 | 3,265,160 | |||
Public Service Enterprise Group | 47,975 | 2,247,149 | |||
SCANA | 32,040 | 1,934,575 | |||
Sempra Energy | 22,455 | 2,648,118 | |||
Vectren | 34,775 | 2,281,588 | |||
WEC Energy Group | 22,830 | 1,488,973 | |||
Westar Energy | 23,865 | 1,224,513 | |||
Xcel Energy | 149,826 | 7,416,387 | |||
90,071,762 | |||||
Total Common Stocks (cost $2,081,812,570) | 2,828,686,454 | ||||
Master Limited Partnerships - .1% | |||||
Diversified Financials - .1% | |||||
Blackstone Group LP | 78,930 | 2,583,379 | |||
Description | Number of | Value ($) | |||
Rights - .0% | |||||
Food & Staples Retailing - .0% | |||||
Safeway CVR--Casa Ley | 30,090 | b | 0 | ||
BNY Mellon Mid Cap Multi-Strategy Fund (continued) | |||||
Description | Number of | Value ($) | |||
Rights - .0% (continued) | |||||
Health Care Equipment & Services - .0% | |||||
Community Health Systems | 33,320 | b | 470 | ||
Total Rights (cost $2,051) | 470 | ||||
Description | Shares | Value ($) | |||
Other Investment - 1.5% | |||||
Registered Investment Company; | |||||
Dreyfus Institutional Preferred Government Plus Money Market Fund | 44,284,328 | d | 44,284,328 | ||
Investment of Cash Collateral for Securities Loaned - 3.1% | |||||
Registered Investment Company; | |||||
Dreyfus Institutional Preferred Government Money Market Fund, Institutional Shares | 89,017,908 | d | 89,017,908 | ||
Total Investments (cost $2,216,719,778) | 103.0% | 2,964,572,539 | |||
Liabilities, Less Cash and Receivables | (3.0%) | (87,742,895) | |||
Net Assets | 100.0% | 2,876,829,644 | |||
ADR—American Depository Receipt
ETF—Exchange-Traded Fund
LP—Limited Partnership
aSecurity, or portion thereof, on loan. At August 31, 2017, the value of the fund’s securities on loan was $230,288,385 and the value of the collateral held by the fund was $247,151,754, consisting of cash collateral of $89,017,908 and U.S. Government & Agency securities valued at $158,133,846.
bNon-income producing security.
cInvestment in real estate investment trust.
dInvestment in affiliated money market mutual fund.
54
Portfolio Summary (Unaudited) † | Value (%) |
Software & Services | 14.5 |
Capital Goods | 9.5 |
Health Care Equipment & Services | 8.8 |
Diversified Financials | 8.4 |
Materials | 5.8 |
Technology Hardware & Equipment | 5.8 |
Money Market Investments | 4.6 |
Real Estate | 4.5 |
Pharmaceuticals, Biotechnology & Life Sciences | 4.4 |
Retailing | 4.4 |
Banks | 4.0 |
Energy | 3.9 |
Semiconductors & Semiconductor Equipment | 3.3 |
Utilities | 3.1 |
Insurance | 3.1 |
Consumer Durables & Apparel | 2.5 |
Transportation | 2.3 |
Food, Beverage & Tobacco | 2.2 |
Commercial & Professional Services | 2.0 |
Media | 1.7 |
Consumer Services | 1.4 |
Automobiles & Components | .8 |
Exchange-Traded Funds | .8 |
Household & Personal Products | .6 |
Telecommunication Services | .3 |
Food & Staples Retailing | .3 |
103.0 |
† Based on net assets.
See notes to financial statements.
55
STATEMENT OF INVESTMENTS (continued)
BNY Mellon Small Cap Multi-Strategy Fund | |||||
Description | Shares | Value ($) | |||
Common Stocks - 97.9% | |||||
Automobiles & Components - .8% | |||||
Dana | 45,688 | 1,099,710 | |||
Gentherm | 39,268 | a,b | 1,223,198 | ||
Visteon | 18,354 | b | 2,118,786 | ||
4,441,694 | |||||
Banks - 11.8% | |||||
Ameris Bancorp | 23,899 | a | 1,052,751 | ||
Associated Banc-Corp | 75,746 | 1,658,837 | |||
Atlantic Capital Bancshares | 99,561 | b | 1,787,120 | ||
Banner | 86,372 | 4,760,825 | |||
Brookline Bancorp | 28,111 | 403,393 | |||
Bryn Mawr Bank | 18,136 | a | 742,669 | ||
Capital Bank Financial, Cl. A | 18,590 | 698,984 | |||
Central Pacific Financial | 34,805 | 1,009,345 | |||
CoBiz Financial | 31,822 | 542,565 | |||
Columbia Banking System | 39,907 | 1,483,343 | |||
CVB Financial | 46,828 | 969,340 | |||
FCB Financial Holdings, Cl. A | 78,699 | b | 3,431,276 | ||
First Hawaiian | 33,332 | 902,964 | |||
First Interstate BancSystem, Cl. A | 90,108 | 3,171,802 | |||
First Merchants | 29,657 | 1,164,630 | |||
First Midwest Bancorp | 7,426 | 156,540 | |||
Fulton Financial | 87,122 | 1,520,279 | |||
Great Western Bancorp | 91,476 | 3,285,818 | |||
Hancock Holding | 35,463 | 1,558,599 | |||
Heritage Financial | 23,972 | 626,868 | |||
MGIC Investment | 437,146 | b | 5,005,322 | ||
Midland States Bancorp | 32,902 | 1,004,827 | |||
National Bank Holdings, Cl. A | 67,179 | 2,161,820 | |||
Old National Bancorp | 84,144 | 1,375,754 | |||
Seacoast Banking Corporation of Florida | 31,090 | b | 711,028 | ||
South State | 30,030 | 2,469,968 | |||
SVB Financial Group | 22,206 | b | 3,760,364 | ||
Texas Capital Bancshares | 10,256 | b | 761,508 | ||
TriState Capital Holdings | 37,547 | b | 784,732 | ||
UMB Financial | 23,779 | 1,596,045 | |||
Umpqua Holdings | 122,554 | 2,144,695 | |||
Union Bankshares | 109,630 | 3,434,708 | |||
United Community Banks | 54,037 | 1,410,906 | |||
Univest Corporation of Pennsylvania | 42,680 | a | 1,244,122 | ||
Webster Financial | 62,489 | 2,916,987 | |||
Westamerica Bancorporation | 12,161 | a | 626,900 | ||
62,337,634 | |||||
Capital Goods - 7.0% | |||||
Aerojet Rocketdyne Holdings | 32,724 | b | 969,612 | ||
Aerovironment | 37,857 | b | 1,855,750 | ||
Astec Industries | 17,996 | 894,041 | |||
Beacon Roofing Supply | 53,351 | b | 2,512,832 | ||
Chart Industries | 28,687 | b | 967,899 | ||
BNY Mellon Small Cap Multi-Strategy Fund (continued) | |||||
Description | Shares | Value ($) | |||
Common Stocks - 97.9% (continued) | |||||
Capital Goods - 7.0% (continued) | |||||
Comfort Systems USA | 17,901 | 609,529 | |||
Curtiss-Wright | 12,955 | 1,254,303 | |||
EMCOR Group | 21,778 | 1,438,219 | |||
EnerSys | 18,939 | 1,213,990 | |||
Granite Construction | 58,790 | 3,246,972 | |||
Kaman | 14,863 | a | 728,882 | ||
KeyW Holding | 132,310 | a,b | 946,017 | ||
Lindsay | 15,279 | a | 1,322,703 | ||
Mercury Systems | 70,357 | b | 3,394,725 | ||
Proto Labs | 23,079 | b | 1,657,072 | ||
Simpson Manufacturing | 50,270 | 2,200,821 | |||
Sun Hydraulics | 56,396 | 2,701,932 | |||
Tennant | 31,935 | a | 1,946,438 | �� | |
TPI Composites | 21,698 | b | 441,337 | ||
Trinity Industries | 38,647 | 1,114,579 | |||
Universal Forest Products | 20,660 | 1,801,759 | |||
Valmont Industries | 7,813 | 1,121,556 | |||
Watsco | 8,681 | 1,279,232 | |||
Woodward | 16,828 | 1,181,494 | |||
36,801,694 | |||||
Commercial & Professional Services - 1.7% | |||||
Aqua Metals | 66,930 | a,b | 495,951 | ||
Deluxe | 30,685 | 2,128,005 | |||
Interface | 57,944 | 1,100,936 | |||
Knoll | 84,608 | 1,527,174 | |||
Korn/Ferry International | 44,973 | 1,498,500 | |||
LSC Communications | 50,130 | 807,594 | |||
WageWorks | 26,204 | b | 1,544,726 | ||
9,102,886 | |||||
Consumer Durables & Apparel - 2.2% | |||||
Cavco Industries | 5,869 | b | 789,674 | ||
Deckers Outdoor | 25,118 | b | 1,605,040 | ||
Ethan Allen Interiors | 25,089 | 733,853 | |||
G-III Apparel Group | 209,811 | b | 5,769,803 | ||
Oxford Industries | 15,837 | 915,537 | |||
TRI Pointe Group | 57,087 | a,b | 727,288 | ||
Vera Bradley | 17,137 | b | 154,918 | ||
William Lyon Homes, Cl. A | 33,915 | a,b | 813,621 | ||
11,509,734 | |||||
Consumer Services - 4.0% | |||||
Belmond, Cl. A | 104,920 | b | 1,337,730 | ||
Bright Horizons Family Solutions | 10,649 | b | 851,175 | ||
Buffalo Wild Wings | 12,358 | a,b | 1,269,785 | ||
Cheesecake Factory | 31,624 | 1,310,182 | |||
Houghton Mifflin Harcourt | 310,328 | b | 3,165,346 | ||
Pinnacle Entertainment | 72,742 | b | 1,418,469 | ||
Planet Fitness, Cl. A | 402,921 | 10,222,106 | |||
56
BNY Mellon Small Cap Multi-Strategy Fund (continued) | |||||
Description | Shares | Value ($) | |||
Common Stocks - 97.9% (continued) | |||||
Consumer Services - 4.0% (continued) | |||||
Texas Roadhouse | 23,007 | 1,091,682 | |||
Zoe's Kitchen | 44,814 | b | 576,756 | ||
21,243,231 | |||||
Diversified Financials - 5.2% | |||||
Capitol Investment Corp. IV | 143,065 | 1,452,110 | |||
Cohen & Steers | 30,010 | a | 1,135,578 | ||
Donnelley Financial Solutions | 130,230 | 2,788,224 | |||
Federated Investors, Cl. B | 55,875 | a | 1,525,946 | ||
FNFV Group | 110,222 | b | 1,857,241 | ||
Green Dot, Cl. A | 61,952 | b | 2,984,847 | ||
Investment Technology Group | 124,209 | 2,495,359 | |||
Landcadia Holdings | 60,686 | b | 651,161 | ||
Morningstar | 13,320 | 1,101,564 | |||
Raymond James Financial | 48,305 | 3,783,248 | |||
SLM | 533,315 | b | 5,423,814 | ||
TPG Pace Holdings | 98,446 | 1,013,994 | |||
WisdomTree Investments | 139,531 | a | 1,279,499 | ||
27,492,585 | |||||
Energy - 3.8% | |||||
Arch Coal, Cl. A | 34,585 | a | 2,762,304 | ||
Ardmore Shipping | 8,253 | b | 66,849 | ||
Callon Petroleum | 92,804 | a,b | 961,449 | ||
Dril-Quip | 20,934 | a,b | 786,072 | ||
GasLog | 55,392 | a | 930,586 | ||
Geospace Technologies | 20,625 | b | 311,231 | ||
Laredo Petroleum | 122,266 | b | 1,518,544 | ||
Natural Gas Services Group | 23,510 | b | 554,836 | ||
Newpark Resources | 97,652 | b | 786,099 | ||
Oasis Petroleum | 232,045 | b | 1,693,929 | ||
Oceaneering International | 34,970 | 788,574 | |||
Patterson-UTI Energy | 72,317 | 1,154,903 | |||
PDC Energy | 71,120 | b | 2,797,150 | ||
RPC | 49,553 | a | 961,824 | ||
Scorpio Tankers | 127,362 | 518,363 | |||
Select Energy Services, Cl. A | 173,914 | 2,452,187 | |||
SRC Energy | 97,217 | a,b | 767,042 | ||
19,811,942 | |||||
Exchange-Traded Funds - .7% | |||||
iShares Russell 2000 ETF | 7,882 | a | 1,101,352 | ||
iShares Russell 2000 Growth ETF | 14,558 | a | 2,474,278 | ||
3,575,630 | |||||
Food & Staples Retailing - 1.4% | |||||
Performance Food Group | 59,557 | b | 1,655,685 | ||
SpartanNash | 27,825 | 685,608 | |||
Sprouts Farmers Market | 82,461 | b | 1,644,272 | ||
United Natural Foods | 74,168 | b | 2,577,338 | ||
US Foods Holding | 37,335 | b | 1,024,846 | ||
7,587,749 | |||||
BNY Mellon Small Cap Multi-Strategy Fund (continued) | |||||
Description | Shares | Value ($) | |||
Common Stocks - 97.9% (continued) | |||||
Food, Beverage & Tobacco - 2.1% | |||||
Boston Beer, Cl. A | 14,559 | a,b | 2,169,291 | ||
Calavo Growers | 46,193 | a | 3,101,860 | ||
Fresh Del Monte Produce | 8,041 | 377,847 | |||
Freshpet | 153,732 | a,b | 2,436,652 | ||
Hain Celestial Group | 43,637 | b | 1,755,080 | ||
Snyder's-Lance | 27,450 | a | 975,024 | ||
10,815,754 | |||||
Health Care Equipment & Services - 4.5% | |||||
Align Technology | 15,341 | b | 2,711,368 | ||
Allscripts Healthcare Solutions | 65,347 | b | 858,660 | ||
Amedisys | 20,872 | b | 1,090,353 | ||
AMN Healthcare Services | 31,075 | b | 1,160,651 | ||
Analogic | 9,929 | 710,420 | |||
Anika Therapeutics | 12,910 | b | 693,267 | ||
Brookdale Senior Living | 272,600 | b | 3,306,638 | ||
Globus Medical, Cl. A | 53,311 | a,b | 1,611,592 | ||
iRhythm Technologies | 21,707 | 1,036,292 | |||
K2M Group Holdings | 51,312 | b | 1,199,675 | ||
LifePoint Health | 13,735 | b | 795,943 | ||
Nevro | 22,945 | a,b | 1,977,400 | ||
NxStage Medical | 83,223 | b | 2,330,244 | ||
Omnicell | 31,988 | b | 1,640,984 | ||
Tivity Health | 29,965 | a,b | 1,174,628 | ||
WellCare Health Plans | 7,791 | b | 1,360,932 | ||
23,659,047 | |||||
Household & Personal Products - .8% | |||||
Avon Products | 451,154 | b | 1,123,373 | ||
Inter Parfums | 73,207 | a | 2,888,016 | ||
4,011,389 | |||||
Insurance - .3% | |||||
Safety Insurance Group | 8,760 | 625,464 | |||
Selective Insurance Group | 21,791 | 1,098,266 | |||
1,723,730 | |||||
Materials - 4.2% | |||||
Carpenter Technology | 79,966 | 3,241,022 | |||
Commercial Metals | 62,132 | a | 1,173,673 | ||
Ferroglobe | 50,610 | 682,729 | |||
Hecla Mining | 154,033 | 813,294 | |||
Louisiana-Pacific | 61,642 | b | 1,570,638 | ||
Methanex | 121,668 | 6,217,235 | |||
OMNOVA Solutions | 202,089 | b | 1,758,174 | ||
Summit Materials, Cl. A | 98,048 | a,b | 2,896,338 | ||
US Concrete | 46,314 | a,b | 3,707,436 | ||
22,060,539 | |||||
Media - 3.2% | |||||
E.W. Scripps, Cl. A | 91,311 | a,b | 1,632,641 | ||
Gray Television | 69,489 | b | 993,693 | ||
57
STATEMENT OF INVESTMENTS (continued)
BNY Mellon Small Cap Multi-Strategy Fund (continued) | |||||
Description | Shares | Value ($) | |||
Common Stocks - 97.9% (continued) | |||||
Media - 3.2% (continued) | |||||
IMAX | 86,162 | a,b | 1,606,921 | ||
New York Times, Cl. A | 95,335 | a | 1,777,998 | ||
Nexstar Media Group, Cl. A | 70,988 | a | 4,273,478 | ||
Scholastic | 22,561 | 889,580 | |||
Sinclair Broadcast Group, Cl. A | 181,818 | a | 5,499,995 | ||
16,674,306 | |||||
Pharmaceuticals, Biotechnology & Life Sciences - 8.3% | |||||
Aerie Pharmaceuticals | 30,798 | a,b | 1,766,265 | ||
Cambrex | 62,660 | b | 3,264,586 | ||
Flexion Therapeutics | 237,392 | a,b | 6,100,974 | ||
Foamix Pharmaceuticals | 173,846 | a,b | 897,045 | ||
Galapagos, ADR | 16,997 | b | 1,572,053 | ||
Halozyme Therapeutics | 124,653 | a,b | 1,621,736 | ||
Ligand Pharmaceuticals | 21,556 | a,b | 2,777,922 | ||
Natera | 158,727 | b | 1,960,278 | ||
NeoGenomics | 181,458 | a,b | 1,834,540 | ||
Otonomy | 68,960 | b | 248,256 | ||
Radius Health | 46,148 | a,b | 1,736,549 | ||
Retrophin | 75,673 | a,b | 1,846,421 | ||
Revance Therapeutics | 160,862 | a,b | 3,949,162 | ||
Sage Therapeutics | 76,825 | a,b | 6,318,856 | ||
Supernus Pharmaceuticals | 28,633 | b | 1,311,391 | ||
TherapeuticsMD | 1,080,104 | b | 6,480,624 | ||
43,686,658 | |||||
Real Estate - 2.8% | |||||
Agree Realty | 17,579 | c | 881,059 | ||
DuPont Fabros Technology | 25,020 | c | 1,610,287 | ||
Education Realty Trust | 5,319 | c | 205,526 | ||
LaSalle Hotel Properties | 40,516 | a,c | 1,149,844 | ||
Monmouth Real Estate Investment | 52,461 | c | 852,491 | ||
Outfront Media | 31,188 | a,c | 686,136 | ||
Pebblebrook Hotel Trust | 56,571 | a,c | 1,900,220 | ||
Physicians Realty Trust | 71,827 | c | 1,345,320 | ||
QTS Realty Trust, Cl. A | 21,691 | c | 1,175,218 | ||
STAG Industrial | 48,469 | c | 1,356,647 | ||
STORE Capital | 38,651 | c | 980,962 | ||
Tanger Factory Outlet Centers | 42,432 | a,c | 992,909 | ||
Washington Prime Group | 159,444 | a,c | 1,331,357 | ||
14,467,976 | |||||
Retailing - 3.6% | |||||
Carvana | 55,203 | a | 985,374 | ||
Core-Mark Holding | 24,841 | 672,197 | |||
Dick's Sporting Goods | 11,470 | 302,349 | |||
Dillard's, Cl. A | 37,046 | a | 2,252,397 | ||
Duluth Holdings, Cl. B | 68,474 | a,b | 1,341,406 | ||
Guess? | 92,561 | a | 1,442,100 | ||
Lithia Motors, Cl. A | 39,579 | a | 4,274,532 | ||
Office Depot | 549,101 | 2,355,643 | |||
BNY Mellon Small Cap Multi-Strategy Fund (continued) | |||||
Description | Shares | Value ($) | |||
Common Stocks - 97.9% (continued) | |||||
Retailing - 3.6% (continued) | |||||
Ollie's Bargain Outlet Holdings | 41,670 | a,b | 1,743,890 | ||
Shutterfly | 25,058 | b | 1,142,144 | ||
Urban Outfitters | 60,215 | a,b | 1,230,795 | ||
Williams-Sonoma | 21,516 | a | 989,736 | ||
18,732,563 | |||||
Semiconductors & Semiconductor Equipment - 4.2% | |||||
Ambarella | 14,887 | a,b | 809,853 | ||
Brooks Automation | 37,964 | 989,721 | |||
Cirrus Logic | 15,404 | b | 893,124 | ||
First Solar | 24,237 | b | 1,138,170 | ||
Impinj | 58,827 | a,b | 2,249,545 | ||
Inphi | 34,101 | a,b | 1,305,727 | ||
MaxLinear | 60,795 | a,b | 1,313,172 | ||
Mellanox Technologies | 26,239 | b | 1,231,921 | ||
Microsemi | 56,976 | b | 2,870,451 | ||
Photronics | 87,823 | b | 693,802 | ||
Power Integrations | 52,042 | 3,791,260 | |||
Semtech | 30,745 | b | 1,156,012 | ||
Teradyne | 110,399 | 3,931,308 | |||
22,374,066 | |||||
Software & Services - 11.0% | |||||
2U | 29,552 | a,b | 1,480,555 | ||
Acxiom | 182,803 | b | 4,257,482 | ||
CACI International, Cl. A | 17,291 | b | 2,244,372 | ||
CommVault Systems | 72,764 | b | 4,442,242 | ||
CSG Systems International | 29,203 | 1,130,448 | |||
DST Systems | 29,854 | 1,532,406 | |||
Envestnet | 24,290 | b | 1,079,691 | ||
HubSpot | 59,637 | b | 4,374,374 | ||
LogMeIn | 31,198 | 3,569,051 | |||
MicroStrategy, Cl. A | 7,480 | b | 964,920 | ||
Mimecast | 100,737 | b | 2,724,936 | ||
New Relic | 82,110 | b | 3,933,069 | ||
NIC | 38,020 | 621,627 | |||
Proofpoint | 33,843 | a,b | 3,105,434 | ||
Shopify, Cl. A | 34,734 | a,b | 3,852,695 | ||
Shutterstock | 27,421 | a,b | 920,797 | ||
Silver Spring Networks | 174,729 | b | 2,212,069 | ||
Square, Cl. A | 132,425 | b | 3,457,617 | ||
Teradata | 74,274 | b | 2,370,826 | ||
Twilio, Cl. A | 118,286 | a,b | 3,463,414 | ||
Varonis Systems | 76,911 | b | 2,984,147 | ||
Verint Systems | 37,693 | b | 1,496,412 | ||
Zendesk | 68,916 | a,b | 1,888,298 | ||
58,106,882 | |||||
Technology Hardware & Equipment - 7.9% | |||||
Airgain | 68,897 | a | 756,489 | ||
58
BNY Mellon Small Cap Multi-Strategy Fund (continued) | |||||
Description | Shares | Value ($) | |||
Common Stocks - 97.9% (continued) | |||||
Technology Hardware & Equipment - 7.9% (continued) | |||||
Ciena | 332,254 | a,b | 7,180,009 | ||
Cray | 46,015 | b | 867,383 | ||
FARO Technologies | 9,191 | a,b | 316,630 | ||
II-VI | 8,683 | b | 311,286 | ||
Infinera | 495,712 | a,b | 4,193,724 | ||
Lumentum Holdings | 33,806 | a,b | 1,921,871 | ||
Methode Electronics | 82,699 | 3,382,389 | |||
NETGEAR | 54,423 | b | 2,612,304 | ||
NetScout Systems | 41,925 | a,b | 1,373,044 | ||
Novanta | 56,966 | b | 2,227,371 | ||
Plantronics | 17,835 | 760,306 | |||
Sierra Wireless | 151,217 | b | 3,349,457 | ||
Tech Data | 13,114 | a,b | 1,446,343 | ||
Universal Display | 8,458 | a | 1,075,012 | ||
VeriFone Systems | 178,537 | b | 3,529,677 | ||
Viavi Solutions | 635,229 | b | 6,377,699 | ||
41,680,994 | |||||
Transportation - 4.4% | |||||
Avis Budget Group | 151,744 | a,b | 5,497,685 | ||
Covenant Transport Group, Cl. A | 40,364 | b | 969,140 | ||
Hub Group, Cl. A | 39,465 | b | 1,517,429 | ||
Knight Transportation | 147,427 | a | 5,757,024 | ||
Marten Transport | 106,388 | 1,824,554 | |||
Swift Transportation | 81,284 | a,b | 2,280,016 | ||
Werner Enterprises | 166,291 | 5,504,232 | |||
23,350,080 | |||||
Utilities - 2.0% | |||||
American States Water | 17,992 | a | 887,006 | ||
Calpine | 34,953 | b | 513,809 | ||
Chesapeake Utilities | 18,356 | 1,458,384 | |||
Dynegy | 229,117 | b | 2,158,282 | ||
Hawaiian Electric Industries | 39,345 | a | 1,314,910 | ||
Portland General Electric | 25,330 | 1,203,428 | |||
Vectren | 19,420 | 1,274,146 | |||
WGL Holdings | 22,245 | 1,874,364 | |||
10,684,329 | |||||
Total Common Stocks (cost $432,205,426) | 515,933,092 | ||||
Other Investment - 2.1% | |||||
Registered Investment Company; | |||||
Dreyfus Institutional Preferred Government Plus Money Market Fund | 11,224,713 | d | 11,224,713 | ||
BNY Mellon Small Cap Multi-Strategy Fund (continued) | |||||
Description | Shares | Value ($) | |||
Investment of Cash Collateral for Securities Loaned - 11.6% | |||||
Registered Investment Company; | |||||
Dreyfus Institutional Preferred Government Money Market Fund, Institutional Shares | 61,260,053 | d | 61,260,053 | ||
Total Investments (cost $504,690,192) | 111.6% | 588,417,858 | |||
Liabilities, Less Cash and Receivables | (11.6%) | (61,074,121) | |||
Net Assets | 100.0% | 527,343,737 | |||
ADR—American Depository Receipt
ETF—Exchange-Traded Fund
aSecurity, or portion thereof, on loan. At August 31, 2017, the value of the fund’s securities on loan was $116,705,981 and the value of the collateral held by the fund was $119,277,917, consisting of cash collateral of $61,260,053 and U.S. Government & Agency securities valued at $58,017,864.
bNon-income producing security.
cInvestment in real estate investment trust.
dInvestment in affiliated money market mutual fund.
Portfolio Summary (Unaudited) † | Value (%) |
Money Market Investments | 13.7 |
Banks | 11.8 |
Software & Services | 11.0 |
Pharmaceuticals, Biotechnology & Life Sciences | 8.3 |
Technology Hardware & Equipment | 7.9 |
Capital Goods | 7.2 |
Diversified Financials | 5.0 |
Health Care Equipment & Services | 4.5 |
Transportation | 4.4 |
Semiconductors & Semiconductor Equipment | 4.2 |
Materials | 4.2 |
Consumer Services | 4.0 |
Energy | 3.8 |
Retailing | 3.6 |
Media | 3.2 |
Real Estate | 2.8 |
Consumer Durables & Apparel | 2.2 |
Food, Beverage & Tobacco | 2.1 |
Utilities | 2.0 |
Commercial & Professional Services | 1.7 |
Food & Staples Retailing | 1.4 |
Automobiles & Components | .8 |
Household & Personal Products | .8 |
Exchange-Traded Funds | .7 |
Insurance | .3 |
111.6 |
† Based on net assets.
See notes to financial statements.
59
STATEMENT OF INVESTMENTS (continued)
BNY Mellon Focused Equity Opportunities Fund | |||||
Description | Shares | Value ($) | |||
Common Stocks - 99.4% | |||||
Capital Goods - 9.5% | |||||
3M | 59,041 | 12,063,257 | |||
Deere & Co. | 96,013 | 11,130,787 | |||
Honeywell International | 87,632 | 12,116,877 | |||
Illinois Tool Works | 81,429 | 11,197,302 | |||
46,508,223 | |||||
Consumer Services - 2.8% | |||||
Yum! Brands | 181,400 | 13,935,148 | |||
Diversified Financials - 10.2% | |||||
Ally Financial | 781,870 | 17,670,262 | |||
Charles Schwab | 413,690 | 16,506,231 | |||
Invesco | 481,210 | 15,774,064 | |||
49,950,557 | |||||
Energy - 6.6% | |||||
Andeavor | 121,740 | 12,192,261 | |||
Superior Energy Services | 858,890 | a | 7,077,254 | ||
Valero Energy | 194,690 | 13,258,389 | |||
32,527,904 | |||||
Food & Staples Retailing - 2.8% | |||||
Costco Wholesale | 85,912 | 13,465,847 | |||
Food, Beverage & Tobacco - 6.2% | |||||
Constellation Brands, Cl. A | 75,532 | 15,113,953 | |||
Philip Morris International | 131,943 | 15,428,095 | |||
30,542,048 | |||||
Health Care Equipment & Services - 8.2% | |||||
Abbott Laboratories | 430,130 | 21,910,822 | |||
UnitedHealth Group | 92,279 | 18,354,293 | |||
40,265,115 | |||||
Insurance - 3.4% | |||||
Hartford Financial Services Group | 305,540 | 16,520,548 | |||
Materials - 2.9% | |||||
Dow Chemical | 213,270 | 14,214,445 | |||
Media - 6.8% | |||||
Comcast, Cl. A | 528,170 | 21,448,984 | |||
Twenty-First Century Fox, Cl. A | 436,100 | 12,031,999 | |||
33,480,983 | |||||
Pharmaceuticals, Biotechnology & Life Sciences - 6.8% | |||||
Agilent Technologies | 243,880 | 15,783,913 | |||
Allergan | 76,187 | 17,483,393 | |||
33,267,306 | |||||
Retailing - 3.2% | |||||
Amazon.com | 15,962 | a | 15,652,337 | ||
Semiconductors & Semiconductor Equipment - 9.5% | |||||
Broadcom | 83,788 | 21,120,441 | |||
NVIDIA | 151,375 | 25,648,980 | |||
46,769,421 | |||||
BNY Mellon Focused Equity Opportunities Fund (continued) | |||||
Description | Shares | Value ($) | |||
Common Stocks - 99.4% (continued) | |||||
Software & Services - 20.5% | |||||
Adobe Systems | 135,470 | a | 21,019,525 | ||
Alphabet, Cl. A | 25,770 | a | 24,616,535 | ||
Electronic Arts | 198,462 | a | 24,113,133 | ||
Microsoft | 176,700 | 13,211,859 | |||
Visa, Cl. A | 170,950 | b | 17,696,744 | ||
100,657,796 | |||||
Total Common Stocks (cost $367,587,071) | 487,757,678 | ||||
Other Investment - .3% | |||||
Registered Investment Company; | |||||
Dreyfus Institutional Preferred Government Plus Money Market Fund | 1,622,984 | c | 1,622,984 | ||
Total Investments (cost $369,210,055) | 99.7% | 489,380,662 | |||
Cash and Receivables (Net) | .3% | 1,605,707 | |||
Net Assets | 100.0% | 490,986,369 | |||
aNon-income producing security.
bSecurity, or portion thereof, on loan. At August 31, 2017, the value of the fund’s securities on loan was $17,481,836 and the value of the collateral held by the fund was $17,867,984, consisting of U.S. Government & Agency securities.
cInvestment in affiliated money market mutual fund.
Portfolio Summary (Unaudited) † | Value (%) |
Software & Services | 20.5 |
Diversified Financials | 10.2 |
Semiconductors & Semiconductor Equipment | 9.5 |
Capital Goods | 9.5 |
Health Care Equipment & Services | 8.2 |
Media | 6.8 |
Pharmaceuticals, Biotechnology & Life Sciences | 6.8 |
Energy | 6.6 |
Food, Beverage & Tobacco | 6.2 |
Insurance | 3.4 |
Retailing | 3.2 |
Materials | 2.9 |
Consumer Services | 2.8 |
Food & Staples Retailing | 2.8 |
Money Market Investment | .3 |
99.7 |
† Based on net assets.
See notes to financial statements.
60
BNY Mellon Small/Mid Cap Multi-Strategy Fund | |||||
Description | Shares | Value ($) | |||
Common Stocks - 97.9% | |||||
Automobiles & Components - .4% | |||||
Visteon | 11,445 | a | 1,321,211 | ||
Banks - 7.3% | |||||
Banner | 39,337 | 2,168,255 | |||
Columbia Banking System | 14,539 | 540,415 | |||
Cullen/Frost Bankers | 31,355 | 2,640,091 | |||
First Interstate BancSystem, Cl. A | 34,810 | 1,225,312 | |||
First Republic Bank | 35,095 | 3,405,970 | |||
Great Western Bancorp | 62,396 | 2,241,264 | |||
Huntington Bancshares | 101,906 | 1,282,997 | |||
KeyCorp | 177,894 | 3,061,556 | |||
National Bank Holdings, Cl. A | 24,474 | 787,573 | |||
SVB Financial Group | 19,846 | a | 3,360,722 | ||
TriState Capital Holdings | 13,679 | a | 285,891 | ||
Webster Financial | 70,521 | 3,291,920 | |||
24,291,966 | |||||
Capital Goods - 5.4% | |||||
AGCO | 23,699 | 1,622,197 | |||
Allegion | 6,548 | 515,393 | |||
AMETEK | 10,012 | 633,259 | |||
Beacon Roofing Supply | 19,437 | a | 915,483 | ||
BWX Technologies | 10,323 | 564,875 | |||
Curtiss-Wright | 4,720 | 456,990 | |||
Graco | 4,211 | 486,413 | |||
Granite Construction | 10,490 | 579,363 | |||
Hubbell | 11,719 | 1,321,786 | |||
Mercury Systems | 25,632 | a | 1,236,744 | ||
Proto Labs | 8,408 | a,b | 603,694 | ||
Quanta Services | 16,182 | a | 581,419 | ||
Roper Technologies | 2,234 | 515,294 | |||
Snap-on | 15,900 | 2,346,363 | |||
Sun Hydraulics | 20,546 | 984,359 | |||
Universal Forest Products | 7,532 | 656,866 | |||
Valmont Industries | 17,086 | 2,452,695 | |||
Watsco | 3,163 | 466,100 | |||
Woodward | 6,131 | 430,457 | |||
Xylem | 9,488 | 588,920 | |||
17,958,670 | |||||
Commercial & Professional Services - 2.7% | |||||
Aqua Metals | 24,383 | a,b | 180,678 | ||
Clean Harbors | 51,507 | a | 2,786,014 | ||
Copart | 13,117 | a | 428,795 | ||
Deluxe | 19,130 | 1,326,665 | |||
Korn/Ferry International | 47,678 | 1,588,631 | |||
Nielsen Holdings | 32,168 | 1,249,727 | |||
WageWorks | 9,546 | a | 562,737 | ||
Waste Connections | 11,358 | 757,465 | |||
8,880,712 | |||||
BNY Mellon Small/Mid Cap Multi-Strategy Fund (continued) | |||||
Description | Shares | Value ($) | |||
Common Stocks - 97.9% (continued) | |||||
Consumer Durables & Apparel - 1.6% | |||||
G-III Apparel Group | 129,723 | a | 3,567,382 | ||
Lululemon Athletica | 7,913 | a | 455,393 | ||
Newell Brands | 15,716 | 758,768 | |||
PVH | 4,189 | 527,353 | |||
5,308,896 | |||||
Consumer Services - 5.2% | |||||
Bright Horizons Family Solutions | 3,880 | a | 310,128 | ||
Buffalo Wild Wings | 4,502 | a | 462,580 | ||
Cheesecake Factory | 61,317 | 2,540,363 | |||
Grand Canyon Education | 39,133 | a | 3,210,863 | ||
Penn National Gaming | 90,427 | a | 2,006,575 | ||
Planet Fitness, Cl. A | 159,545 | 4,047,657 | |||
Service Corporation International | 103,740 | 3,666,172 | |||
Texas Roadhouse | 8,382 | 397,726 | |||
Wynn Resorts | 3,318 | b | 461,169 | ||
17,103,233 | |||||
Diversified Financials - 5.6% | |||||
CBOE Holdings | 5,304 | 535,121 | |||
E*TRADE Financial | 133,658 | a | 5,481,315 | ||
Eaton Vance | 33,209 | 1,580,084 | |||
FNFV Group | 53,301 | a | 898,122 | ||
Green Dot, Cl. A | 20,100 | a | 968,418 | ||
Invesco | 11,287 | 369,988 | |||
Leucadia National | 117,050 | 2,771,744 | |||
Raymond James Financial | 22,703 | 1,778,099 | |||
SLM | 367,462 | a | 3,737,089 | ||
WisdomTree Investments | 50,833 | b | 466,139 | ||
18,586,119 | |||||
Energy - 3.1% | |||||
Arch Coal, Cl. A | 21,610 | b | 1,725,991 | ||
Diamondback Energy | 5,250 | a,b | 476,647 | ||
Dril-Quip | 53,088 | a,b | 1,993,454 | ||
Laredo Petroleum | 44,544 | a | 553,236 | ||
Oasis Petroleum | 78,355 | a | 571,991 | ||
PDC Energy | 27,409 | a | 1,077,996 | ||
RPC | 106,253 | b | 2,062,371 | ||
RSP Permian | 54,351 | a | 1,705,534 | ||
10,167,220 | |||||
Exchange-Traded Funds - .7% | |||||
iShares Russell 2000 Growth ETF | 5,304 | b | 901,468 | ||
iShares Russell 2000 Value ETF | 12,819 | b | 1,489,311 | ||
2,390,779 | |||||
Food & Staples Retailing - 2.3% | |||||
Casey's General Stores | 29,226 | b | 3,081,005 | ||
Performance Food Group | 21,698 | a | 603,204 | ||
Sprouts Farmers Market | 12,393 | a | 247,116 | ||
United Natural Foods | 68,755 | a | 2,389,236 | ||
61
STATEMENT OF INVESTMENTS (continued)
BNY Mellon Small/Mid Cap Multi-Strategy Fund (continued) | |||||
Description | Shares | Value ($) | |||
Common Stocks - 97.9% (continued) | |||||
Food & Staples Retailing - 2.3% (continued) | |||||
US Foods Holding | 49,539 | a | 1,359,846 | ||
7,680,407 | |||||
Food, Beverage & Tobacco - 1.7% | |||||
Boston Beer, Cl. A | 16,205 | a,b | 2,414,545 | ||
Calavo Growers | 16,829 | b | 1,130,067 | ||
Freshpet | 56,007 | a,b | 887,711 | ||
Molson Coors Brewing, Cl. B | 6,805 | 610,749 | |||
Snyder's-Lance | 10,001 | 355,235 | |||
TreeHouse Foods | 3,922 | a,b | 262,735 | ||
5,661,042 | |||||
Health Care Equipment & Services - 5.7% | |||||
ABIOMED | 2,825 | a | 426,010 | ||
Align Technology | 10,413 | a | 1,840,394 | ||
Amedisys | 42,765 | a | 2,234,044 | ||
athenahealth | 2,719 | a | 383,189 | ||
Boston Scientific | 28,420 | a | 782,971 | ||
Brookdale Senior Living | 195,201 | a | 2,367,788 | ||
Centene | 3,705 | a | 329,189 | ||
Dentsply Sirona | 5,388 | 304,799 | |||
DexCom | 9,364 | a,b | 698,648 | ||
Globus Medical, Cl. A | 49,518 | a,b | 1,496,929 | ||
iRhythm Technologies | 7,908 | 377,528 | |||
K2M Group Holdings | 18,694 | a | 437,066 | ||
Laboratory Corporation of America Holdings | 5,481 | a | 859,804 | ||
Nevro | 8,359 | a,b | 720,379 | ||
NxStage Medical | 30,320 | a | 848,960 | ||
Omnicell | 39,181 | a | 2,009,985 | ||
Premier, Cl. A | 64,926 | a | 2,175,021 | ||
WellCare Health Plans | 2,838 | a | 495,742 | ||
18,788,446 | |||||
Household & Personal Products - .5% | |||||
Avon Products | 215,180 | a | 535,798 | ||
Inter Parfums | 26,670 | b | 1,052,131 | ||
1,587,929 | |||||
Insurance - 1.1% | |||||
MGIC Investment | 309,731 | a | 3,546,420 | ||
Materials - 4.0% | |||||
Carpenter Technology | 18,305 | 741,902 | |||
Compass Minerals International | 33,699 | b | 2,251,093 | ||
Eagle Materials | 8,857 | 861,343 | |||
Ferroglobe | 18,451 | 248,904 | |||
Methanex | 68,415 | 3,496,006 | |||
Packaging Corporation of America | 26,740 | 3,005,843 | |||
Summit Materials, Cl. A | 35,720 | a,b | 1,055,169 | ||
US Concrete | 13,961 | a,b | 1,117,578 | ||
BNY Mellon Small/Mid Cap Multi-Strategy Fund (continued) | |||||
Description | Shares | Value ($) | |||
Common Stocks - 97.9% (continued) | |||||
Materials - 4.0% (continued) | |||||
Vulcan Materials | 4,140 | 502,016 | |||
13,279,854 | |||||
Media - 2.2% | |||||
IMAX | 31,390 | a,b | 585,423 | ||
Liberty Media, Cl. C | 8,515 | a,b | 334,639 | ||
Nexstar Media Group, Cl. A | 54,856 | b | 3,302,331 | ||
Sinclair Broadcast Group, Cl. A | 104,200 | 3,152,050 | |||
7,374,443 | |||||
Pharmaceuticals, Biotechnology & Life Sciences - 7.3% | |||||
Aerie Pharmaceuticals | 11,220 | a | 643,467 | ||
Agilent Technologies | 7,161 | 463,460 | |||
Alkermes | 12,500 | a | 634,750 | ||
BioMarin Pharmaceutical | 5,273 | a | 475,572 | ||
Cambrex | 54,751 | a | 2,852,527 | ||
Flexion Therapeutics | 38,977 | a,b | 1,001,709 | ||
Foamix Pharmaceuticals | 63,335 | a,b | 326,809 | ||
Galapagos, ADR | 6,192 | a | 572,698 | ||
Halozyme Therapeutics | 45,413 | a,b | 590,823 | ||
Jazz Pharmaceuticals | 21,038 | a | 3,142,236 | ||
Ligand Pharmaceuticals | 7,853 | a,b | 1,012,016 | ||
Natera | 57,827 | a | 714,163 | ||
NeoGenomics | 66,108 | a | 668,352 | ||
Neurocrine Biosciences | 13,619 | a | 770,835 | ||
Otonomy | 25,123 | a | 90,443 | ||
Radius Health | 16,812 | a,b | 632,636 | ||
Retrophin | 27,569 | a | 672,684 | ||
Sage Therapeutics | 51,630 | a,b | 4,246,567 | ||
TESARO | 2,825 | a,b | 364,820 | ||
TherapeuticsMD | 703,687 | a | 4,222,122 | ||
24,098,689 | |||||
Real Estate - 4.6% | |||||
DuPont Fabros Technology | 9,115 | c | 586,641 | ||
Empire State Realty Trust, Cl. A | 125,305 | c | 2,549,957 | ||
Equinix | 1,199 | c | 561,624 | ||
Healthcare Trust of America, Cl. A | 83,122 | c | 2,582,601 | ||
Jones Lang LaSalle | 19,700 | 2,401,627 | |||
Monmouth Real Estate Investment | 19,112 | c | 310,570 | ||
Pebblebrook Hotel Trust | 85,620 | b,c | 2,875,976 | ||
Physicians Realty Trust | 26,168 | c | 490,127 | ||
STORE Capital | 110,184 | c | 2,796,470 | ||
15,155,593 | |||||
Retailing - 3.9% | |||||
Carvana | 20,111 | b | 358,981 | ||
Core-Mark Holding | 9,050 | 244,893 | |||
Dick's Sporting Goods | 56,961 | b | 1,501,492 | ||
Dollar Tree | 11,611 | a | 924,700 | ||
Duluth Holdings, Cl. B | 24,971 | a,b | 489,182 | ||
Expedia | 3,349 | 496,858 | |||
62
BNY Mellon Small/Mid Cap Multi-Strategy Fund (continued) | |||||
Description | Shares | Value ($) | |||
Common Stocks - 97.9% (continued) | |||||
Retailing - 3.9% (continued) | |||||
Lithia Motors, Cl. A | 27,291 | b | 2,947,428 | ||
LKQ | 13,237 | a | 458,662 | ||
Office Depot | 233,980 | 1,003,774 | |||
Ollie's Bargain Outlet Holdings | 15,181 | a,b | 635,325 | ||
Ross Stores | 8,715 | 509,392 | |||
Ulta Beauty | 2,514 | a | 555,619 | ||
Williams-Sonoma | 58,049 | b | 2,670,254 | ||
12,796,560 | |||||
Semiconductors & Semiconductor Equipment - 3.4% | |||||
Impinj | 21,432 | a,b | 819,560 | ||
Inphi | 12,424 | a,b | 475,715 | ||
Marvell Technology Group | 41,696 | 746,775 | |||
Maxim Integrated Products | 18,897 | 881,734 | |||
MaxLinear | 22,148 | a,b | 478,397 | ||
Mellanox Technologies | 16,444 | a | 772,046 | ||
Microsemi | 23,677 | a | 1,192,847 | ||
NVIDIA | 1,466 | 248,399 | |||
Power Integrations | 18,960 | 1,381,236 | |||
Semtech | 11,201 | a | 421,158 | ||
Skyworks Solutions | 7,405 | 780,191 | |||
Teradyne | 73,486 | 2,616,836 | |||
United Microelectronics, ADR | 247,638 | b | 619,095 | ||
11,433,989 | |||||
Software & Services - 15.2% | |||||
2U | 10,766 | a,b | 539,377 | ||
Acxiom | 157,351 | a | 3,664,705 | ||
Akamai Technologies | 39,483 | a | 1,861,624 | ||
Amdocs | 39,866 | 2,582,918 | |||
Booz Allen Hamilton Holdings | 14,645 | 499,541 | |||
Broadridge Financial Solutions | 15,748 | 1,230,391 | |||
CACI International, Cl. A | 6,299 | a | 817,610 | ||
Cognizant Technology Solutions, Cl. A | 7,263 | 514,002 | |||
CommVault Systems | 21,423 | a | 1,307,874 | ||
CoreLogic | 71,642 | a | 3,365,025 | ||
CoStar Group | 1,910 | a | 547,444 | ||
Envestnet | 14,968 | a | 665,328 | ||
Fidelity National Information Services | 10,381 | 964,602 | |||
First Data, Cl. A | 156,930 | a | 2,889,081 | ||
HubSpot | 36,746 | a,b | 2,695,319 | ||
Intuit | 2,918 | 412,751 | |||
Jack Henry & Associates | 19,538 | b | 2,013,782 | ||
KeyW Holding | 48,202 | a,b | 344,644 | ||
LogMeIn | 11,370 | 1,300,728 | |||
Mimecast | 36,700 | a | 992,735 | ||
New Relic | 44,146 | a | 2,114,593 | ||
Nuance Communications | 91,669 | a | 1,473,121 | ||
Paychex | 4,629 | 263,992 | |||
Proofpoint | 18,380 | a,b | 1,686,549 | ||
BNY Mellon Small/Mid Cap Multi-Strategy Fund (continued) | |||||
Description | Shares | Value ($) | |||
Common Stocks - 97.9% (continued) | |||||
Software & Services - 15.2% (continued) | |||||
ServiceNow | 8,724 | a | 1,013,642 | ||
Shopify, Cl. A | 21,600 | a | 2,395,872 | ||
Splunk | 8,195 | a | 549,803 | ||
Square, Cl. A | 127,234 | a | 3,322,080 | ||
SS&C Technologies Holdings | 16,849 | 652,225 | |||
Teradata | 119,079 | a,b | 3,801,002 | ||
Twilio, Cl. A | 71,527 | a,b | 2,094,311 | ||
Varonis Systems | 28,020 | a | 1,087,176 | ||
Zendesk | 25,125 | a,b | 688,425 | ||
50,352,272 | |||||
Technology Hardware & Equipment - 7.7% | |||||
Airgain | 25,100 | b | 275,598 | ||
Amphenol, Cl. A | 10,923 | 884,108 | |||
Ciena | 169,565 | a,b | 3,664,300 | ||
Dolby Laboratories, Cl. A | 40,772 | 2,057,355 | |||
FLIR Systems | 8,480 | 322,240 | |||
Infinera | 148,068 | a,b | 1,252,655 | ||
Lumentum Holdings | 22,220 | a,b | 1,263,207 | ||
Methode Electronics | 45,839 | 1,874,815 | |||
NETGEAR | 13,218 | a | 634,464 | ||
Novanta | 20,754 | a | 811,481 | ||
Trimble | 12,149 | a | 469,923 | ||
Universal Display | 5,055 | b | 642,490 | ||
VeriFone Systems | 112,254 | a,b | 2,219,262 | ||
Viavi Solutions | 411,899 | a | 4,135,466 | ||
Xerox | 111,918 | 3,611,594 | |||
Zebra Technologies, Cl. A | 12,024 | a | 1,239,554 | ||
25,358,512 | |||||
Transportation - 5.9% | |||||
Avis Budget Group | 107,638 | a | 3,899,725 | ||
Hub Group, Cl. A | 51,649 | a | 1,985,904 | ||
J.B. Hunt Transport Services | 21,290 | 2,105,368 | |||
Kirby | 24,244 | a,b | 1,517,674 | ||
Knight Transportation | 114,931 | b | 4,488,056 | ||
Marten Transport | 19,164 | 328,663 | |||
Ryder System | 35,553 | 2,758,913 | |||
Werner Enterprises | 70,777 | 2,342,719 | |||
19,427,022 | |||||
Utilities - .4% | |||||
Calpine | 43,948 | a | 646,036 | ||
Dynegy | 79,093 | a | 745,056 | ||
1,391,092 | |||||
Total Common Stocks (cost $269,457,527) | 323,941,076 | ||||
63
STATEMENT OF INVESTMENTS (continued)
BNY Mellon Small/Mid Cap Multi-Strategy Fund (continued) | |||||
Description | Shares | Value ($) | |||
Other Investment - 2.1% | |||||
Registered Investment Company; | |||||
Dreyfus Institutional Preferred Government Plus Money Market Fund | 6,871,312 | d | 6,871,312 | ||
Investment of Cash Collateral for Securities Loaned - 7.9% | |||||
Registered Investment Company; | |||||
Dreyfus Institutional Preferred Government Money Market Fund, Institutional Shares | 26,312,751 | d | 26,312,751 | ||
Total Investments (cost $302,641,590) | 107.9% | 357,125,139 | |||
Liabilities, Less Cash and Receivables | (7.9%) | (26,294,087) | |||
Net Assets | 100.0% | 330,831,052 | |||
ADR—American Depository Receipt
ETF—Exchange-Traded Fund
aNon-income producing security.
bSecurity, or portion thereof, on loan. At August 31, 2017, the value of the fund’s securities on loan was $58,197,127 and the value of the collateral held by the fund was $59,605,101, consisting of cash collateral of $26,312,751 and U.S. Government & Agency securities valued at $33,292,350.
cInvestment in real estate investment trust.
dInvestment in affiliated money market mutual fund.
Portfolio Summary (Unaudited) † | Value (%) |
Software & Services | 15.2 |
Money Market Investments | 10.0 |
Technology Hardware & Equipment | 7.7 |
Banks | 7.3 |
Pharmaceuticals, Biotechnology & Life Sciences | 7.3 |
Transportation | 5.9 |
Health Care Equipment & Services | 5.7 |
Diversified Financials | 5.6 |
Capital Goods | 5.4 |
Consumer Services | 5.2 |
Real Estate | 4.6 |
Materials | 4.0 |
Retailing | 3.9 |
Semiconductors & Semiconductor Equipment | 3.4 |
Energy | 3.1 |
Commercial & Professional Services | 2.7 |
Food & Staples Retailing | 2.3 |
Media | 2.2 |
Food, Beverage & Tobacco | 1.7 |
Consumer Durables & Apparel | 1.6 |
Insurance | 1.1 |
Exchange-Traded Funds | .7 |
Household & Personal Products | .5 |
Utilities | .4 |
Automobiles & Components | .4 |
107.9 |
† Based on net assets.
See notes to financial statements.
64
BNY Mellon International Fund | |||||
Description | Shares | Value ($) | |||
Common Stocks - 98.1% | |||||
Australia - 5.1% | |||||
Australia & New Zealand Banking Group | 465,796 | 10,943,612 | |||
BHP Billiton | 420,626 | 9,151,603 | |||
Macquarie Group | 247,444 | 17,173,530 | |||
Woodside Petroleum | 376,742 | 8,675,535 | |||
Woolworths | 470,117 | 9,726,906 | |||
55,671,186 | |||||
Belgium - .7% | |||||
bpost | 267,343 | 7,466,805 | |||
Brazil - 1.2% | |||||
Aperam | 242,047 | 12,790,886 | |||
Denmark - 1.3% | |||||
Chr. Hansen Holding | 160,936 | 13,851,573 | |||
Finland - .7% | |||||
UPM-Kymmene | 296,033 | 7,707,105 | |||
France - 10.6% | |||||
Arkema | 98,628 | 10,732,100 | |||
Atos | 76,816 | 11,866,795 | |||
BNP Paribas | 305,356 | 23,258,945 | |||
Carrefour | 144,935 | 2,924,280 | |||
Cie de Saint-Gobain | 141,196 | 7,749,502 | |||
Cie Generale des Etablissements Michelin | 72,013 | 9,825,237 | |||
Orange | 1,143,800 | 19,455,308 | |||
Renault | 123,572 | 10,947,275 | |||
Thales | 44,816 | 4,965,697 | |||
Vinci | 159,679 | 14,716,334 | |||
116,441,473 | |||||
Germany - 7.8% | |||||
Allianz | 95,100 | 20,349,742 | |||
Continental | 36,097 | 8,144,614 | |||
Deutsche Post | 130,194 | 5,401,435 | |||
E.ON | 1,199,148 | 13,560,215 | |||
Evonik Industries | 276,528 | 8,969,586 | |||
Fresenius & Co. | 231,647 | 19,607,921 | |||
Infineon Technologies | 385,939 | 8,902,908 | |||
84,936,421 | |||||
Hong Kong - 3.0% | |||||
AIA Group | 2,643,400 | 20,299,569 | |||
Sun Hung Kai Properties | 725,000 | 12,106,093 | |||
32,405,662 | |||||
Italy - 6.5% | |||||
Enel | 2,295,634 | 13,893,271 | |||
Fiat Chrysler Automobiles | 702,219 | a | 10,604,082 | ||
Leonardo | 846,125 | 14,337,678 | |||
Moncler | 364,278 | 10,365,305 | |||
Prysmian | 182,150 | 5,735,039 | |||
Telecom Italia | 17,169,279 | a | 16,470,084 | ||
71,405,459 | |||||
BNY Mellon International Fund (continued) | |||||
Description | Shares | Value ($) | |||
Common Stocks - 98.1% (continued) | |||||
Japan - 23.2% | |||||
Aisin Seiki | 231,600 | 11,676,889 | |||
Alps Electric | 468,200 | 12,904,905 | |||
Astellas Pharma | 872,600 | 10,989,730 | |||
Chubu Electric Power | 599,300 | 7,848,707 | |||
Daiwa Securities Group | 947,000 | 5,194,994 | |||
Hitachi | 3,150,000 | 21,732,624 | |||
ITOCHU | 468,400 | 7,666,947 | |||
Japan Airlines | 250,500 | 8,617,964 | |||
JTEKT | 309,800 | 4,158,212 | |||
Kandenko | 434,000 | 4,662,854 | |||
KDDI | 470,900 | 12,724,231 | |||
MINEBEA MITSUMI | 398,600 | 6,574,648 | |||
Mitsubishi Electric | 749,300 | 11,120,620 | |||
Nintendo | 47,700 | 16,033,852 | |||
Panasonic | 328,300 | 4,387,488 | |||
Park24 | 147,700 | 3,556,221 | |||
Seven & i Holdings | 359,000 | 14,272,327 | |||
Shionogi & Co. | 152,000 | 8,023,708 | |||
Showa Shell Sekiyu | 1,168,300 | 12,833,321 | |||
Sony | 513,100 | 20,297,437 | |||
Sumitomo Mitsui Financial Group | 592,300 | 22,069,253 | |||
Suzuki Motor | 325,800 | 16,413,827 | |||
Zeon Corp | 808,000 | 10,213,621 | |||
253,974,380 | |||||
Macau - .9% | |||||
Sands China | 2,145,600 | 9,615,295 | |||
Netherlands - 5.2% | |||||
ABN AMRO Group | 748,484 | b | 21,004,511 | ||
Heineken | 156,020 | 16,380,298 | |||
NN Group | 495,229 | 19,665,410 | |||
57,050,219 | |||||
Norway - .8% | |||||
Telenor | 452,762 | 9,170,719 | |||
Portugal - 1.3% | |||||
Galp Energia | 864,629 | 14,325,965 | |||
Singapore - .6% | |||||
Ascendas Real Estate Investment Trust | 3,545,400 | 6,964,014 | |||
Spain - 3.5% | |||||
ACS Actividades de Construccion y Servicios | 325,876 | 12,326,911 | |||
Banco Santander | 3,924,625 | 25,542,479 | |||
37,869,390 | |||||
Sweden - .5% | |||||
Volvo, Cl. B | 303,529 | 5,193,607 | |||
Switzerland - 9.0% | |||||
ABB | 384,745 | 8,914,559 | |||
Adecco Group | 171,216 | 12,416,851 | |||
Julius Baer Group | 294,340 | a | 16,470,157 | ||
Lonza Group | 55,351 | a | 14,028,099 | ||
65
STATEMENT OF INVESTMENTS (continued)
BNY Mellon International Fund (continued) | ||||||
Description | Shares | Value ($) | ||||
Common Stocks - 98.1% (continued) | ||||||
Switzerland - 9.0% (continued) | ||||||
Novartis | 280,243 | 23,635,692 | ||||
Roche Holding | 92,572 | 23,594,901 | ||||
99,060,259 | ||||||
United Kingdom - 15.1% | ||||||
Anglo American | 417,551 | 7,566,511 | ||||
Diageo | 670,909 | 22,475,222 | ||||
Ferguson | 109,774 | 6,530,628 | ||||
Imperial Brands | 397,020 | 16,419,337 | ||||
Prudential | 738,141 | 17,340,067 | ||||
Royal Dutch Shell, Cl. B | 444,060 | 12,410,471 | ||||
Shire | 260,221 | 12,954,557 | ||||
Smiths Group | 265,950 | 5,316,947 | ||||
SSE | 529,190 | 9,748,151 | ||||
Standard Chartered | 1,744,118 | a | 17,352,724 | |||
Unilever | 344,966 | 20,169,725 | ||||
WPP | 934,879 | 17,157,015 | ||||
165,441,355 | ||||||
United States - 1.1% | ||||||
iShares MSCI EAFE ETF | 185,122 | 12,384,662 | ||||
Total Common Stocks (cost $967,528,744) | 1,073,726,435 | |||||
Other Investment - .8% | ||||||
Registered Investment Company; | ||||||
Dreyfus Institutional Preferred Government Plus Money Market Fund | 8,972,288 | c | 8,972,288 | |||
Total Investments (cost $976,501,032) | 98.9% | 1,082,698,723 | ||||
Cash and Receivables (Net) | 1.1% | 11,890,431 | ||||
Net Assets | 100.0% | 1,094,589,154 | ||||
ETF—Exchange-Traded Fund
aNon-income producing security.
bSecurity exempt from registration pursuant to Rule 144A under the Securities Act of 1933. These securities may be resold in transactions exempt from registration, normally to qualified institutional buyers. At August 31, 2017, these securities were valued at $21,004,511 or 1.92% of net assets.
cInvestment in affiliated money market mutual fund.
Portfolio Summary (Unaudited) † | Value (%) |
Financials | 21.6 |
Industrials | 14.4 |
Consumer Discretionary | 11.8 |
Health Care | 10.3 |
Consumer Staples | 9.4 |
Materials | 7.4 |
Information Technology | 6.5 |
Telecommunications | 5.3 |
Energy | 4.4 |
Utilities | 4.1 |
Real Estate | 1.8 |
Exchange-Traded Funds | 1.1 |
Money Market Investment | .8 |
98.9 |
† Based on net assets.
See notes to financial statements.
66
BNY Mellon Emerging Markets Fund | |||||
Description | Shares | Value ($) | |||
Common Stocks - 93.5% | |||||
Brazil - 4.2% | |||||
Ambev, ADR | 488,143 | 3,055,775 | |||
Cia de Saneamento Basico do Estado de Sao Paulo | 411,400 | 4,201,760 | |||
Kroton Educacional | 1,342,500 | 7,663,874 | |||
Localiza Rent a Car | 296,220 | 5,603,793 | |||
MRV Engenharia e Participacoes | 761,200 | 3,262,096 | |||
Qualicorp | 417,600 | 4,623,270 | |||
Tim Participacoes | 2,747,000 | 9,843,595 | |||
38,254,163 | |||||
Canada - .3% | |||||
Gran Tierra Energy | 1,265,015 | a,b | 2,567,980 | ||
China - 30.4% | |||||
Alibaba Group Holding, ADR | 292,850 | b | 50,294,059 | ||
Anhui Conch Cement, Cl. H | 2,295,000 | 8,569,083 | |||
ANTA Sports Products | 574,000 | 2,259,038 | |||
Beijing Capital International Airport, Cl. H | 3,952,000 | 6,393,773 | |||
China Construction Bank, Cl. H | 29,246,939 | 25,656,181 | |||
China Lodging Group, ADR | 109,270 | b | 12,403,238 | ||
China Shenhua Energy, Cl. H | 2,255,000 | 5,820,271 | |||
Guangzhou Automobile Group, Cl. H | 2,238,000 | 4,433,818 | |||
JD.com, ADR | 275,465 | b | 11,544,738 | ||
Jiangsu Expressway, Cl. H | 2,490,000 | 3,824,052 | |||
PICC Property & Casualty, Cl. H | 7,856,000 | 14,815,274 | |||
Ping An Insurance Group Company of China, Cl. H | 2,429,500 | 19,311,105 | |||
Shanghai Pharmaceuticals Holding, Cl. H | 4,242,000 | 10,447,121 | |||
Sunny Optical Technology Group | 549,000 | 7,966,890 | |||
TAL Education Group, ADR | 300,468 | 9,143,241 | |||
Tencent Holdings | 1,647,900 | 70,021,676 | |||
Weibo, ADR | 87,961 | b | 8,892,857 | ||
ZTE, Cl. H | 3,115,800 | b | 8,541,558 | ||
280,337,973 | |||||
Colombia - .3% | |||||
Bancolombia, ADR | 58,803 | 2,670,244 | |||
Hong Kong - 3.9% | |||||
China Everbright International | 7,849,000 | 10,377,160 | |||
China Mobile | 936,500 | 9,929,769 | |||
ENN Energy Holdings | 618,000 | 4,005,133 | |||
Galaxy Entertainment Group | 1,041,000 | 6,546,095 | |||
Haier Electronics Group | 1,950,000 | b | 5,215,148 | ||
36,073,305 | |||||
Hungary - 2.0% | |||||
MOL Hungarian Oil & Gas | 73,540 | 6,821,984 | |||
Richter Gedeon | 447,210 | 11,637,151 | |||
18,459,135 | |||||
India - 5.7% | |||||
Bharat Electronics | 1,547,861 | 4,475,188 | |||
Engineers India | 1,619,052 | 3,923,148 | |||
BNY Mellon Emerging Markets Fund (continued) | |||||
Description | Shares | Value ($) | |||
Common Stocks - 93.5% (continued) | |||||
India - 5.7% (continued) | |||||
ICICI Bank | 301,241 | 1,409,614 | |||
Indiabulls Housing Finance | 337,630 | 6,394,008 | |||
IRB Infrastructure Developers | 795,759 | 2,668,508 | |||
ITC | 1,471,784 | 6,492,775 | |||
Jubilant Life Sciences | 262,842 | 2,900,567 | |||
Maruti Suzuki India | 65,675 | 7,789,354 | |||
Power Finance | 3,341,983 | 6,358,300 | |||
Reliance Industries | 163,590 | 4,067,172 | |||
UPL | 464,295 | 6,003,207 | |||
52,481,841 | |||||
Indonesia - 2.6% | |||||
Bank Negara Indonesia | 17,306,900 | 9,543,470 | |||
Bank Rakyat Indonesia | 2,006,500 | 2,278,851 | |||
Telekomunikasi Indonesia | 34,770,900 | 12,246,615 | |||
24,068,936 | |||||
Malaysia - .4% | |||||
AirAsia | 5,212,100 | 4,063,330 | |||
Mexico - 2.2% | |||||
Arca Continental | 1,052,358 | 7,679,946 | |||
Grupo Aeroportuario del Centro Norte | 1,274,400 | 7,709,446 | |||
Wal-Mart de Mexico | 2,075,700 | 5,050,153 | |||
20,439,545 | |||||
Panama - .6% | |||||
Copa Holdings, Cl. A | 40,962 | 5,082,155 | |||
Peru - 1.0% | |||||
Credicorp | 46,687 | 9,469,991 | |||
Philippines - .1% | |||||
Puregold Price Club | 1,112,300 | 1,044,945 | |||
Poland - 1.4% | |||||
Alior Bank | 215,117 | b | 3,979,625 | ||
KGHM Polska Miedz | 131,444 | 4,651,307 | |||
Powszechny Zaklad Ubezpieczen | 312,303 | 4,248,442 | |||
12,879,374 | |||||
Russia - 3.7% | |||||
LUKOIL, ADR | 308,349 | 15,500,704 | |||
Sberbank of Russia, ADR | 1,374,099 | 18,646,523 | |||
34,147,227 | |||||
South Africa - 3.2% | |||||
Barloworld | 400,449 | 3,959,146 | |||
Clicks Group | 759,390 | 8,689,653 | |||
Exxaro Resources | 747,363 | 7,506,150 | |||
Shoprite Holdings | 379,708 | 6,581,701 | |||
Telkom | 648,649 | 3,129,866 | |||
29,866,516 | |||||
South Korea - 15.8% | |||||
BGF Retail | 18,012 | 1,455,205 | |||
Coway | 34,231 | 3,002,379 | |||
Hana Financial Group | 134,550 | 5,844,244 | |||
Hankook Tire | 74,926 | 3,918,938 | |||
67
STATEMENT OF INVESTMENTS (continued)
BNY Mellon Emerging Markets Fund (continued) | |||||
Description | Shares | Value ($) | |||
Common Stocks - 93.5% (continued) | |||||
South Korea - 15.8% (continued) | |||||
Hugel | 18,265 | b | 9,453,233 | ||
Hyundai Mobis | 16,539 | 3,460,691 | |||
KB Financial Group | 79,239 | 3,893,737 | |||
Korea Electric Power | 283,327 | 10,834,718 | |||
Korea Investment Holdings | 97,613 | 5,674,539 | |||
KT | 55,886 | 1,548,943 | |||
KT, ADR | 30,572 | 504,132 | |||
LG Chem | 31,616 | 10,612,536 | |||
POSCO | 41,546 | 12,612,377 | |||
Samsung Card | 195,796 | 6,435,864 | |||
Samsung Electronics | 18,251 | 37,687,504 | |||
Samsung SDI | 46,412 | 8,133,432 | |||
SK Hynix | 188,530 | 11,599,905 | |||
SK Innovation | 52,448 | 8,776,730 | |||
145,449,107 | |||||
Taiwan - 8.5% | |||||
Accton Technology | 1,522,000 | 3,998,739 | |||
Airtac International Group | 650,839 | 9,087,286 | |||
Catcher Technology | 820,000 | 10,477,807 | |||
Chailease Holding | 1,592,000 | 4,352,321 | |||
Fubon Financial Holding | 4,161,000 | 6,706,958 | |||
Hon Hai Precision Industry | 3,531,000 | 13,841,316 | |||
Largan Precision | 14,000 | 2,713,087 | |||
Merry Electronics | 678,000 | 5,379,864 | |||
Taiwan Semiconductor Manufacturing | 3,079,000 | 22,165,146 | |||
78,722,524 | |||||
Thailand - .6% | |||||
Thai Beverage | 2,856,000 | 1,960,396 | |||
Thanachart Capital | 2,452,300 | 3,453,182 | |||
5,413,578 | |||||
Turkey - 2.1% | |||||
Tupras Turkiye Petrol Rafinerileri | 122,209 | 4,156,100 | |||
Turk Telekomunikasyon | 1,897,852 | b | 3,948,689 | ||
Turkiye Garanti Bankasi | 3,487,045 | 10,862,973 | |||
18,967,762 | |||||
United Arab Emirates - 1.4% | |||||
Abu Dhabi Commercial Bank | 3,877,351 | 7,735,745 | |||
Emaar Properties | 2,254,425 | 5,234,974 | |||
12,970,719 | |||||
United States - 3.1% | |||||
iShares MSCI Emerging Markets ETF | 645,647 | 28,944,355 | |||
Total Common Stocks (cost $612,090,295) | 862,374,705 | ||||
BNY Mellon Emerging Markets Fund (continued) | |||||
Description | Shares | Value ($) | |||
Preferred Stocks - 5.3% | |||||
Brazil - 5.3% | |||||
Cia Energetica de Minas Gerais | 2,858,000 | 7,608,380 | |||
Cia Paranaense de Energia, Cl. B | 409,800 | 3,741,491 | |||
Itausa - Investimentos Itau | 2,591,100 | 8,395,959 | |||
Petroleo Brasileiro | 3,011,500 | b | 13,058,747 | ||
Suzano Papel e Celulose, Cl. A | 992,900 | 5,519,879 | |||
Vale | 970,260 | 10,812,689 | |||
Total Preferred Stocks (cost $41,904,280) | 49,137,145 | ||||
Other Investment - .6% | |||||
Registered Investment Company; | |||||
Dreyfus Institutional Preferred Government Plus Money Market Fund | 5,959,053 | c | 5,959,053 | ||
Investment of Cash Collateral for Securities Loaned - .1% | |||||
Registered Investment Company; | |||||
Dreyfus Institutional Preferred Government Money Market Fund, Institutional Shares | 425,984 | c | 425,984 | ||
Total Investments (cost $660,379,612) | 99.5% | 917,896,887 | |||
Cash and Receivables (Net) | .5% | 4,846,767 | |||
Net Assets | 100.0% | 922,743,654 | |||
ADR—American Depository Receipt
ETF—Exchange-Traded Fund
aSecurity, or portion thereof, on loan. At August 31, 2017, the value of the fund’s securities on loan was $384,332 and the value of the collateral held by the fund was $425,984.
bNon-income producing security.
cInvestment in affiliated money market mutual fund.
Portfolio Summary (Unaudited) † | Value (%) |
Information Technology | 22.9 |
Financials | 20.4 |
Consumer Discretionary | 14.2 |
Energy | 7.4 |
Industrials | 7.3 |
Materials | 6.4 |
Consumer Staples | 4.5 |
Telecommunication Services | 4.5 |
Health Care | 4.2 |
Utilities | 3.3 |
Exchange-Traded Funds | 3.1 |
Money Market Investments | .7 |
Real Estate | .6 |
99.5 |
† Based on net assets.
See notes to financial statements.
68
BNY Mellon International Appreciation Fund | |||||
Description | Shares | Value ($) | |||
Common Stocks - 98.7% | |||||
Automobiles & Components - 4.3% | |||||
Bridgestone, ADR | 14,448 | 309,476 | |||
Daimler | 6,357 | 463,362 | |||
Denso, ADR | 16,138 | 393,122 | |||
Ferrari | 2,939 | 336,486 | |||
Fiat Chrysler Automobiles | 10,295 | 155,763 | |||
Honda Motor, ADR | 8,948 | 251,439 | |||
Nissan Motor, ADR | 8,962 | 179,150 | |||
Sumitomo Electric Industries, ADR | 13,020 | 201,940 | |||
Toyota Motor, ADR | 7,048 | 796,283 | |||
Volkswagen, ADR | 7,750 | 239,785 | |||
3,326,806 | |||||
Banks - 13.1% | |||||
Australia & New Zealand Banking Group, ADR | 22,898 | 536,958 | |||
Banco Bilbao Vizcaya Argentaria, ADR | 52,559 | 464,622 | |||
Banco Santander, ADR | 106,669 | 694,415 | |||
Barclays, ADR | 26,340 | 259,976 | |||
BNP Paribas, ADR | 14,661 | 559,390 | |||
Commerzbank, ADR | 20,092 | a | 248,739 | ||
Commonwealth Bank of Australia, ADR | 3,423 | b | 617,378 | ||
Credit Agricole, ADR | 35,091 | 308,450 | |||
Danske Bank, ADR | 22,808 | 443,844 | |||
Erste Group Bank, ADR | 12,733 | 270,576 | |||
Hachijuni Bank, ADR | 2,799 | 170,739 | |||
Hang Seng Bank, ADR | 12,669 | 291,373 | |||
HSBC Holdings, ADR | 21,528 | 1,041,955 | |||
ING Groep, ADR | 30,369 | 539,961 | |||
Intesa Sanpaolo, ADR | 16,734 | 342,210 | |||
Lloyds Banking Group, ADR | 90,723 | 301,200 | |||
Mitsubishi UFJ Financial Group, ADR | 70,092 | 426,159 | |||
Mizuho Financial Group, ADR | 63,000 | 214,830 | |||
National Australia Bank, ADR | 43,206 | 520,848 | |||
Nordea Bank, ADR | 9,100 | 122,987 | |||
Shinsei Bank, ADR | 35,546 | 114,103 | |||
Societe Generale, ADR | 28,045 | 315,506 | |||
Sumitomo Mitsui Financial Group, ADR | 35,296 | 264,014 | |||
Sumitomo Mitsui Trust Holdings, ADR | 44,240 | 154,840 | |||
United Overseas Bank, ADR | 8,700 | 308,415 | |||
Westpac Banking, ADR | 22,315 | 556,090 | |||
10,089,578 | |||||
Capital Goods - 10.3% | |||||
ABB, ADR | 21,572 | 500,039 | |||
Airbus, ADR | 22,772 | 479,806 | |||
Asahi Glass, ADR | 24,076 | 187,071 | |||
Atlas Copco, Cl. A, ADR | 8,647 | 340,173 | |||
Atlas Copco, Cl. B, ADR | 5,620 | 199,201 | |||
BAE Systems, ADR | 7,289 | 232,884 | |||
CK Hutchison Holdings, ADR | 14,471 | 187,689 | |||
FANUC, ADR | 16,000 | 311,200 | |||
BNY Mellon International Appreciation Fund (continued) | |||||
Description | Shares | Value ($) | |||
Common Stocks - 98.7% (continued) | |||||
Capital Goods - 10.3% (continued) | |||||
ITOCHU, ADR | 5,705 | 186,439 | |||
Kajima, ADR | 3,417 | 320,583 | |||
Kawasaki Heavy Industries, ADR | 11,754 | 145,985 | |||
Keppel, ADR | 13,187 | 121,848 | |||
Komatsu, ADR | 9,788 | 264,765 | |||
Kubota, ADR | 3,271 | 284,642 | |||
Marubeni, ADR | 1,423 | 92,552 | |||
Metso, ADR | 30,248 | 246,521 | |||
Mitsubishi Electric, ADR | 9,575 | 284,856 | |||
Mitsubishi, ADR | 5,957 | 276,000 | |||
Mitsui & Co., ADR | 811 | 243,462 | |||
Nidec, ADR | 11,562 | 328,939 | |||
NSK, ADR | 7,210 | 171,814 | |||
Rolls-Royce Holdings, ADR | 18,030 | 212,213 | |||
Sandvik, ADR | 23,276 | 385,451 | |||
Schneider Electric, ADR | 2,150 | 34,615 | |||
Siemens, ADR | 11,472 | 752,334 | |||
SKF, ADR | 10,990 | 219,690 | |||
Sumitomo, ADR | 17,536 | 249,537 | |||
Teijin, ADR | 8,848 | 179,436 | |||
TOTO, ADR | 5,445 | 207,046 | |||
Volvo AB, Cl. B, ADR | 19,952 | 339,783 | |||
7,986,574 | |||||
Commercial & Professional Services - 2.5% | |||||
Dai Nippon Printing, ADR | 22,828 | 270,968 | |||
Experian, ADR | 13,373 | 268,797 | |||
RELX, ADR | 16,624 | 368,554 | |||
Secom, ADR | 20,620 | 382,707 | |||
Toppan Printing, ADR | 30,905 | 314,304 | |||
Wolters Kluwer, ADR | 8,172 | 357,362 | |||
1,962,692 | |||||
Consumer Durables & Apparel - 3.9% | |||||
adidas, ADR | 4,525 | 507,230 | |||
Casio Computer, ADR | 1,290 | 183,077 | |||
Cie Financiere Richemont, ADR | 40,900 | 363,397 | |||
Electrolux, Cl. B, ADR | 3,767 | 274,576 | |||
LVMH Moet Hennessy Louis Vuitton, ADR | 11,669 | 613,556 | |||
Panasonic, ADR | 21,520 | 288,153 | |||
Pandora A/S | 9,200 | 244,628 | |||
Sega Sammy Holdings, ADR | 44,384 | 157,785 | |||
Sony, ADR | 10,522 | 416,987 | |||
3,049,389 | |||||
Consumer Services - 1.3% | |||||
Compass Group, ADR | 19,831 | 431,324 | |||
InterContinental Hotels Group, ADR | 5,028 | 252,406 | |||
69
STATEMENT OF INVESTMENTS (continued)
BNY Mellon International Appreciation Fund (continued) | |||||
Description | Shares | Value ($) | |||
Common Stocks - 98.7% (continued) | |||||
Consumer Services - 1.3% (continued) | |||||
Sodexo, ADR | 14,960 | 349,316 | |||
1,033,046 | |||||
Diversified Financials - 2.1% | |||||
Credit Suisse Group, ADR | 17,222 | 252,130 | |||
Daiwa Securities Group, ADR | 42,790 | 231,922 | |||
Deutsche Bank | 15,506 | 247,941 | |||
Nomura Holdings, ADR | 31,857 | 177,125 | |||
ORIX, ADR | 3,179 | 255,941 | |||
UBS Group | 27,651 | a | 454,582 | ||
1,619,641 | |||||
Energy - 4.5% | |||||
BP, ADR | 17,666 | 613,540 | |||
Eni, ADR | 11,575 | 364,381 | |||
Repsol, ADR | 15,992 | 275,062 | |||
Royal Dutch Shell, Cl. A, ADR | 10,097 | 557,152 | |||
Royal Dutch Shell, Cl. B, ADR | 8,593 | 486,622 | |||
Statoil, ADR | 10,155 | 191,422 | |||
Total, ADR | 14,372 | 747,919 | |||
Woodside Petroleum, ADR | 10,215 | 237,397 | |||
3,473,495 | |||||
Food & Staples Retailing - 1.0% | |||||
Aeon, ADR | 15,968 | 235,327 | |||
J Sainsbury, ADR | 5,618 | 69,719 | |||
Koninklijke Ahold, ADR | 15,426 | 277,359 | |||
Tesco, ADR | 21,655 | a | 153,751 | ||
736,156 | |||||
Food, Beverage & Tobacco - 7.5% | |||||
Ajinomoto, ADR | 10,230 | 199,383 | |||
Anheuser-Busch InBev, ADR | 4,685 | 554,563 | |||
British American Tobacco, ADR | 10,408 | 646,545 | |||
Coca-Cola Amatil, ADR | 19,462 | 125,141 | |||
Coca-Cola HBC, ADR | 7,462 | a | 253,708 | ||
Danone, ADR | 29,659 | 466,833 | |||
Diageo, ADR | 3,298 | 443,284 | |||
Heineken, ADR | 7,309 | 384,380 | |||
Imperial Brands, ADR | 5,274 | 220,717 | |||
Japan Tobacco, ADR | 15,000 | 255,750 | |||
Kirin Holdings, ADR | 11,382 | 260,420 | |||
Nestle, ADR | 17,855 | 1,513,390 | |||
Orkla, ADR | 25,307 | 261,168 | |||
Yamazaki Baking, ADR | 1,023 | 193,706 | |||
5,778,988 | |||||
Health Care Equipment & Services - 1.7% | |||||
Essilor International, ADR | 6,934 | 438,784 | |||
Fresenius Medical Care & Co., ADR | 7,800 | 366,678 | |||
Olympus, ADR | 6,140 | 212,106 | |||
BNY Mellon International Appreciation Fund (continued) | |||||
Description | Shares | Value ($) | |||
Common Stocks - 98.7% (continued) | |||||
Health Care Equipment & Services - 1.7% (continued) | |||||
Smith & Nephew, ADR | 8,103 | 294,949 | |||
1,312,517 | |||||
Household & Personal Products - 3.1% | |||||
Henkel AG & Co., ADR | 2,322 | 311,729 | |||
Kao, ADR | 4,988 | 312,648 | |||
L'Oreal, ADR | 9,964 | 421,477 | |||
Reckitt Benckiser Group, ADR | 14,141 | 273,275 | |||
Unilever (NY Shares) | 10,103 | 601,129 | |||
Unilever, ADR | 7,838 | 456,250 | |||
2,376,508 | |||||
Insurance - 5.6% | |||||
Aegon (NY Shares) | 26,227 | 149,494 | |||
Ageas, ADR | 6,836 | 316,302 | |||
AIA Group, ADR | 26,000 | 800,800 | |||
Allianz, ADR | 37,220 | 796,508 | |||
AXA, ADR | 14,800 | 428,016 | |||
Legal & General Group, ADR | 18,467 | 317,448 | |||
MS&AD Insurance Group Holdings, ADR | 16,902 | 279,221 | |||
Prudential, ADR | 10,632 | 498,960 | |||
Tokio Marine Holdings, ADR | 8,055 | 321,958 | |||
Zurich Insurance Group, ADR | 14,447 | 431,965 | |||
4,340,672 | |||||
Materials - 7.4% | |||||
Air Liquide, ADR | 16,867 | 412,229 | |||
Akzo Nobel, ADR | 11,115 | 337,674 | |||
Alumina, ADR | 30,320 | 203,750 | |||
Amcor, ADR | 5,596 | 282,318 | |||
Anglo American, ADR | 12,623 | 113,986 | |||
ArcelorMittal | 8,151 | a | 217,550 | ||
Asahi Kasei, ADR | 10,985 | 264,189 | |||
BASF, ADR | 7,596 | 736,584 | |||
BHP Billiton, ADR | 2,445 | 93,228 | |||
BHP Billiton, ADR | 9,104 | 396,024 | |||
Boral, ADR | 7,621 | 161,270 | |||
Glencore, ADR | 38,136 | a | 352,758 | ||
James Hardie Industries, ADR | 16,620 | 235,505 | |||
Johnson Matthey, ADR | 1,892 | 134,521 | |||
Kobe Steel, ADR | 5,450 | a | 32,781 | ||
Nippon Steel & Sumitomo Metal, ADR | 8,082 | 192,724 | |||
Nitto Denko, ADR | 5,620 | 248,123 | |||
Norsk Hydro, ADR | 20,133 | 144,152 | |||
OJI Holdings, ADR | 3,200 | 167,763 | |||
Rio Tinto, ADR | 6,824 | 334,922 | |||
South32, ADR | 13,639 | 159,304 | |||
Toray Industries, ADR | 15,040 | 286,813 | |||
70
BNY Mellon International Appreciation Fund (continued) | |||||
Description | Shares | Value ($) | |||
Common Stocks - 98.7% (continued) | |||||
Materials - 7.4% (continued) | |||||
UPM-Kymmene, ADR | 8,622 | 223,913 | |||
5,732,081 | |||||
Media - 1.2% | |||||
Pearson, ADR | 12,033 | 93,857 | |||
Publicis Groupe, ADR | 14,714 | 248,225 | |||
Sky, ADR | 5,057 | 250,018 | |||
WPP, ADR | 3,596 | 330,077 | |||
922,177 | |||||
Pharmaceuticals, Biotechnology & Life Sciences - 8.8% | |||||
AstraZeneca, ADR | 16,886 | 503,709 | |||
Bayer, ADR | 5,480 | 702,481 | |||
CSL, ADR | 5,200 | 267,020 | |||
Eisai, ADR | 4,123 | 214,272 | |||
GlaxoSmithKline, ADR | 15,840 | 637,243 | |||
H Lundeck, ADR | 2,400 | 153,168 | |||
Novartis, ADR | 15,237 | 1,284,327 | |||
Novo Nordisk, ADR | 13,975 | 665,490 | |||
Roche Holding, ADR | 38,182 | 1,212,278 | |||
Sanofi, ADR | 16,289 | 795,555 | |||
Shire, ADR | 1,985 | 296,539 | |||
Takeda Pharmaceutical, ADR | 1,000 | 27,770 | |||
Teva Pharmaceutical Industries, ADR | 2,900 | 45,994 | |||
6,805,846 | |||||
Real Estate - 3.5% | |||||
British Land, ADR | 9,094 | 71,588 | |||
CapitaLand, ADR | 56,796 | 312,378 | |||
City Developments, ADR | 32,591 | 278,653 | |||
Daiwa House Industry, ADR | 7,610 | 265,513 | |||
Hysan Development, ADR | 27,301 | 252,553 | |||
LendLease Group, ADR | 21,216 | 281,324 | |||
Mitsubishi Estate, ADR | 15,000 | 257,250 | |||
Sino Land, ADR | 21,641 | 187,199 | |||
Sun Hung Kai Properties, ADR | 18,037 | 303,022 | |||
Swire Pacific, Cl. A, ADR | 18,906 | 194,165 | |||
Westfield, ADR | 24,214 | 285,725 | |||
2,689,370 | |||||
Retailing - 1.1% | |||||
Hennes & Mauritz, ADR | 53,006 | 266,620 | |||
INDITEX, ADR | 1,600 | 30,496 | |||
Kingfisher, ADR | 20,001 | 155,008 | |||
Marui Group, ADR | 5,401 | 153,064 | |||
Nintendo, ADR | 6,000 | 249,780 | |||
854,968 | |||||
Semiconductors & Semiconductor Equipment - .4% | |||||
ASML Holding | 1,900 | 296,989 | |||
Tokyo Electron | 1,000 | 35,290 | |||
332,279 | |||||
BNY Mellon International Appreciation Fund (continued) | |||||
Description | Shares | Value ($) | |||
Common Stocks - 98.7% (continued) | |||||
Software & Services - 2.8% | |||||
Computershare, ADR | 16,642 | 185,059 | |||
Dassault Systemes, ADR | 3,770 | 370,591 | |||
Fujitsu, ADR | 5,602 | 208,618 | |||
Nice, ADR | 3,000 | 234,660 | |||
Sage Group, ADR | 8,164 | 294,026 | |||
SAP, ADR | 8,462 | 888,087 | |||
2,181,041 | |||||
Technology Hardware & Equipment - 2.8% | |||||
Canon, ADR | 8,097 | 284,286 | |||
Ericsson, ADR | 28,504 | 166,178 | |||
FUJIFILM Holdings, ADR | 6,819 | 268,259 | |||
Hitachi, ADR | 3,435 | 237,839 | |||
Kyocera, ADR | 5,424 | 327,067 | |||
Nokia, ADR | 39,630 | 244,913 | |||
Omron, ADR | 4,660 | 232,068 | |||
Ricoh, ADR | 15,155 | 150,868 | |||
TDK, ADR | 3,571 | 239,257 | |||
2,150,735 | |||||
Telecommunication Services - 4.5% | |||||
BT Group, ADR | 10,368 | 198,029 | |||
Deutsche Telekom, ADR | 25,034 | 452,865 | |||
KDDI, ADR | 22,000 | 296,560 | |||
Nippon Telegraph & Telephone, ADR | 4,682 | 232,883 | |||
Orange, ADR | 15,952 | 271,344 | |||
Singapore Telecommunications, ADR | 1,960 | 53,508 | |||
SoftBank Group, ADR | 11,000 | 448,030 | |||
Swisscom, ADR | 5,286 | 266,097 | |||
Telecom Italia, ADR | 16,796 | a | 162,921 | ||
Telefonica, ADR | 30,412 | 327,537 | |||
Telenor, ADR | 7,588 | 153,505 | |||
Telstra, ADR | 12,648 | 183,649 | |||
Vodafone Group, ADR | 13,664 | 396,666 | |||
3,443,594 | |||||
Transportation - 1.6% | |||||
ANA Holdings, ADR | 31,722 | 238,867 | |||
Deutsche Lufthansa, ADR | 3,566 | 89,293 | |||
International Consolidated Airlines Group, ADR | 9,655 | 152,646 | |||
MTR, ADR | 6,662 | a | 389,461 | ||
Nippon Yusen, ADR | 34,373 | a | 136,169 | ||
Ryanair Holdings, ADR | 1,745 | a | 198,407 | ||
1,204,843 | |||||
Utilities - 3.7% | |||||
Centrica, ADR | 10,470 | 108,993 | |||
CLP Holdings, ADR | 12,613 | 133,193 | |||
E.ON, ADR | 24,594 | 278,896 | |||
EDP - Energias de Portugal, ADR | 3,830 | 147,532 | |||
Enel, ADR | 60,207 | 363,048 | |||
71
STATEMENT OF INVESTMENTS (continued)
BNY Mellon International Appreciation Fund (continued) | |||||
Description | Shares | Value ($) | |||
Common Stocks - 98.7% (continued) | |||||
Utilities - 3.7% (continued) | |||||
Engie, ADR | 7,886 | 132,169 | |||
Hong Kong & China Gas, ADR | 128,060 | 240,753 | |||
Iberdrola, ADR | 16,048 | 525,893 | |||
National Grid, ADR | 4,340 | 277,022 | |||
RWE, ADR | 6,730 | a | 167,712 | ||
SSE, ADR | 7,960 | 148,534 | |||
United Utilities Group, ADR | 6,047 | 142,952 | |||
Veolia Environnement, ADR | 9,077 | 212,129 | |||
2,878,826 | |||||
Total Common Stocks (cost $91,736,160) | 76,281,822 | ||||
Description | Principal Amount ($) | Value ($) | |||
Short-Term Investments - .1% | |||||
U.S. Treasury Bills | |||||
1.08%, 12/7/17 | 54,000 | c | 53,859 | ||
Description | Shares | Value ($) | |||
Other Investment - .8% | |||||
Registered Investment Company; | |||||
Dreyfus Institutional Preferred Government Plus Money Market Fund | 643,374 | d | 643,374 | ||
Total Investments (cost $92,433,376) | 99.6% | 76,979,055 | |||
Cash and Receivables (Net) | .4% | 333,153 | |||
Net Assets | 100.0% | 77,312,208 | |||
ADR—American Depository Receipt
aNon-income producing security.
bSecurity exempt from registration pursuant to Rule 144A under the Securities Act of 1933. These securities may be resold in transactions exempt from registration, normally to qualified institutional buyers. At August 31, 2017, these securities were valued at $617,378 or .8% of net assets.
cHeld by or on behalf of a counterparty for open futures contracts.
dInvestment in affiliated money market mutual fund.
Portfolio Summary (Unaudited) † | Value (%) |
Banks | 13.1 |
Capital Goods | 10.3 |
Pharmaceuticals, Biotechnology & Life Sciences | 8.8 |
Food, Beverage & Tobacco | 7.5 |
Materials | 7.4 |
Insurance | 5.6 |
Energy | 4.5 |
Telecommunication Services | 4.5 |
Automobiles & Components | 4.3 |
Consumer Durables & Apparel | 3.9 |
Utilities | 3.7 |
Real Estate | 3.5 |
Household & Personal Products | 3.1 |
Software & Services | 2.8 |
Technology Hardware & Equipment | 2.8 |
Commercial & Professional Services | 2.5 |
Diversified Financials | 2.1 |
Health Care Equipment & Services | 1.7 |
Transportation | 1.6 |
Consumer Services | 1.3 |
Media | 1.2 |
Retailing | 1.1 |
Food & Staples Retailing | 1.0 |
Short-Term/Money Market Investments | .9 |
Semiconductors & Semiconductor Equipment | .4 |
99.6 |
† Based on net assets.
See notes to financial statements.
72
BNY Mellon International Equity Income Fund | |||||
Description | Shares | Value ($) | |||
Common Stocks - 97.1% | |||||
Australia - 7.0% | |||||
Australia & New Zealand Banking Group | 323,225 | 7,593,988 | |||
Bank of Queensland | 330,000 | 3,309,819 | |||
Commonwealth Bank of Australia | 89,240 | 5,403,007 | |||
National Australia Bank | 185,400 | 4,474,239 | |||
Telstra | 506,634 | 1,479,302 | |||
Westpac Banking | 146,467 | 3,644,554 | |||
25,904,909 | |||||
Canada - 4.8% | |||||
BCE | 42,800 | 2,037,263 | |||
CI Financial | 68,800 | 1,506,300 | |||
Inter Pipeline | 137,500 | 2,518,218 | |||
National Bank of Canada | 93,000 | 4,280,793 | |||
Royal Bank of Canada | 28,600 | 2,122,641 | |||
Shaw Communications, Cl. B | 78,800 | 1,758,052 | |||
Toronto-Dominion Bank | 68,600 | 3,683,937 | |||
17,907,204 | |||||
China - 8.8% | |||||
Bank of China, Cl. H | 5,382,500 | 2,846,461 | |||
Chongqing Changan Automobile, Cl. B | 3,095,886 | 4,052,051 | |||
CNOOC | 1,957,400 | 2,363,563 | |||
Guangzhou R&F Properties, Cl. H | 6,125,000 | 14,323,265 | |||
Industrial & Commercial Bank of China, Cl. H | 4,942,000 | 3,717,083 | |||
Jiangsu Expressway, Cl. H | 1,111,300 | 1,706,694 | |||
Zhejiang Expressway, Cl. H | 2,802,700 | 3,507,141 | |||
32,516,258 | |||||
Czech Republic - 2.6% | |||||
CEZ | 431,500 | 8,185,596 | |||
Komercni banka | 30,800 | 1,356,721 | |||
9,542,317 | |||||
Finland - 2.0% | |||||
Fortum | 415,400 | 7,458,696 | |||
France - 2.7% | |||||
Electricite de France | 200,000 | 2,120,394 | |||
Renault | 51,750 | 4,584,546 | |||
TOTAL | 66,254 | 3,428,044 | |||
10,132,984 | |||||
Germany - 3.2% | |||||
Deutsche Post | 30,000 | 1,244,628 | |||
HUGO BOSS | 25,200 | 2,133,761 | |||
Muenchener Rueckversicherungs | 18,523 | 3,824,197 | |||
ProSiebenSat.1 Media | 139,367 | 4,675,768 | |||
11,878,354 | |||||
Hong Kong - 2.5% | |||||
Li & Fung | 18,512,000 | 8,352,454 | |||
WH Group | 790,000 | a | 826,038 | ||
9,178,492 | |||||
BNY Mellon International Equity Income Fund (continued) | |||||
Description | Shares | Value ($) | |||
Common Stocks - 97.1% (continued) | |||||
Israel - 1.4% | |||||
Bezeq The Israeli Telecommunication Corporation | 3,534,229 | 5,207,874 | |||
Italy - 3.3% | |||||
Eni | 38,005 | 596,107 | |||
Intesa Sanpaolo | 3,010,000 | 10,175,942 | |||
Snam | 278,140 | 1,354,474 | |||
12,126,523 | |||||
Japan - 13.5% | |||||
Asahi Glass | 23,600 | 924,932 | |||
Bridgestone | 42,000 | 1,805,849 | |||
Daito Trust Construction | 34,900 | 6,204,556 | |||
Honda Motor | 68,000 | 1,909,701 | |||
ITOCHU | 567,200 | 9,284,142 | |||
JFE Holdings | 57,300 | 1,134,581 | |||
Marubeni | 548,800 | 3,578,234 | |||
NTT DOCOMO | 58,600 | 1,362,755 | |||
Sumitomo | 706,300 | 10,020,004 | |||
Takeda Pharmaceutical | 112,400 | 6,230,863 | |||
Tokyo Electron | 53,000 | 7,535,031 | |||
49,990,648 | |||||
Luxembourg - .6% | |||||
RTL Group | 27,200 | 2,062,869 | |||
Macau - 2.3% | |||||
Sands China | 1,873,500 | 8,395,906 | |||
Malaysia - .6% | |||||
British American Tobacco Malaysia | 216,600 | 2,240,991 | |||
New Zealand - 2.4% | |||||
Auckland International Airport | 583,100 | 2,843,469 | |||
Spark New Zealand | 2,195,200 | 6,172,643 | |||
9,016,112 | |||||
Norway - 3.2% | |||||
Marine Harvest | 588,000 | b | 11,680,763 | ||
Qatar - .0% | |||||
Commercial Bank PQSC | 12,314 | b | 100,621 | ||
Russia - 3.2% | |||||
MMC Norilsk Nickel | 13,400 | 2,263,014 | |||
Severstal | 600,000 | 9,413,302 | |||
11,676,316 | |||||
South Africa - .8% | |||||
Fortress Income Fund, Cl. A | 238,700 | 321,825 | |||
MMI Holdings | 1,079,801 | 1,727,906 | |||
MTN Group | 100,000 | 993,855 | |||
3,043,586 | |||||
South Korea - .1% | |||||
Korea Electric Power | 8,200 | 313,576 | |||
Spain - 3.0% | |||||
Banco Santander | 690,700 | 4,495,255 | |||
Telefonica | 606,100 | 6,540,462 | |||
11,035,717 | |||||
73
STATEMENT OF INVESTMENTS (continued)
BNY Mellon International Equity Income Fund (continued) | ||||||
Description | Shares | Value ($) | ||||
Common Stocks - 97.1% (continued) | ||||||
Sweden - .3% | ||||||
Skanska, Cl. B | 50,500 | 1,141,271 | ||||
Switzerland - 5.6% | ||||||
Novartis | 79,436 | 6,699,631 | ||||
Roche Holding | 10,971 | 2,796,306 | ||||
STMicroelectronics | 397,573 | 6,915,339 | ||||
Zurich Insurance Group | 13,785 | 4,127,008 | ||||
20,538,284 | ||||||
Taiwan - 5.1% | ||||||
Asustek Computer | 236,000 | 1,955,039 | ||||
Chicony Electronics | 394,192 | 992,440 | ||||
Compal Electronics | 1,093,900 | 787,528 | ||||
Highwealth Construction | 2,091,000 | 3,330,742 | ||||
MediaTek | 216,000 | 1,944,699 | ||||
Novatek Microelectronics | 660,000 | 2,577,513 | ||||
Siliconware Precision Industries | 2,242,000 | 3,552,472 | ||||
Taiwan Semiconductor Manufacturing | 420,000 | 3,023,502 | ||||
Transcend Information | 264,400 | 789,047 | ||||
18,952,982 | ||||||
Turkey - 2.6% | ||||||
Petkim Petrokimya Holding | 5,418,000 | 9,799,401 | ||||
United Arab Emirates - 1.0% | ||||||
Dubai Islamic Bank | 2,208,000 | 3,666,013 | ||||
United Kingdom - 13.6% | ||||||
AstraZeneca | 56,940 | 3,346,651 | ||||
BP | 1,845,051 | 10,655,690 | ||||
British American Tobacco | 130,712 | 8,150,698 | ||||
GlaxoSmithKline | 181,124 | 3,592,872 | ||||
HSBC Holdings | 238,773 | 2,320,447 | ||||
Imperial Brands | 82,355 | 3,405,910 | ||||
Legal & General Group | 959,709 | 3,227,877 | ||||
Persimmon | 41,800 | 1,437,904 | ||||
Petrofac | 69,000 | 373,514 | ||||
Royal Dutch Shell, Cl. A | 347,945 | 9,576,661 | ||||
Royal Dutch Shell, Cl. B | 28,000 | 782,537 | ||||
SSE | 161,452 | 2,974,089 | ||||
Vodafone Group | 174,795 | 499,990 | ||||
50,344,840 | ||||||
United States - .9% | ||||||
iShares MSCI EAFE ETF | 50,000 | 3,345,000 | ||||
Total Common Stocks (cost $312,690,237) | 359,198,507 | |||||
Preferred Stocks - 1.0% | ||||||
South Korea - 1.0% | ||||||
Hyundai Motor | 40,900 | 3,506,927 | ||||
BNY Mellon International Equity Income Fund (continued) | ||||||
Description | Shares | Value ($) | ||||
Other Investment - 1.3% | ||||||
Registered Investment Company; | ||||||
Dreyfus Institutional Preferred Government Plus Money Market Fund | 4,877,078 | c | 4,877,078 | |||
Total Investments (cost $321,195,366) | 99.4% | 367,582,512 | ||||
Cash and Receivables (Net) | .6% | 2,381,655 | ||||
Net Assets | 100.0% | 369,964,167 | ||||
ETF—Exchange-Traded Fund
aSecurity exempt from registration pursuant to Rule 144A under the Securities Act of 1933. These securities may be resold in transactions exempt from registration, normally to qualified institutional buyers. At August 31, 2017, these securities were valued at $826,038 or .22% of net assets.
bNon-income producing security.
cInvestment in affiliated money market mutual fund.
Portfolio Summary (Unaudited) † | Value (%) |
Financials | 21.0 |
Consumer Discretionary | 17.8 |
Energy | 8.2 |
Information Technology | 8.1 |
Consumer Staples | 7.1 |
Telecommunications | 7.1 |
Real Estate | 6.5 |
Health Care | 6.1 |
Materials | 6.1 |
Utilities | 6.1 |
Industrials | 3.1 |
Money Market Investment | 1.3 |
Exchange-Traded Funds | .9 |
99.4 |
† Based on net assets.
See notes to financial statements.
74
BNY Mellon Asset Allocation Fund | |||||
Description | Principal | Value ($) | |||
Bonds and Notes - 14.2% | |||||
Commercial Mortgage Pass-Through Ctfs. - .2% | |||||
UBS Commercial Mortgage Trust, Ser. 2012-C1, Cl. A3, 3.40%, 5/10/45 | 274,817 | 288,025 | |||
WFRBS Commercial Mortgage Trust, Ser. 2013-C13, Cl. A4, 3.00%, 5/15/45 | 540,000 | 556,391 | |||
844,416 | |||||
Consumer Discretionary - .7% | |||||
21st Century Fox America, Gtd. Notes, 6.15%, 3/1/37 | 265,000 | 338,249 | |||
Amazon.com, Sr. Unscd. Notes, 2.50%, 11/29/22 | 435,000 | 440,800 | |||
Comcast, Gtd. Notes, 2.75%, 3/1/23 | 625,000 | 635,275 | |||
eBay, Sr. Unscd. Notes, 2.60%, 7/15/22 | 385,000 | 386,226 | |||
Ford Motor Credit, Sr. Unscd. Notes, 3.22%, 1/9/22 | 325,000 | 330,505 | |||
Scripps Networks Interactive, Sr. Unscd. Notes, 2.80%, 6/15/20 | 345,000 | 347,778 | |||
Time Warner, Gtd. Notes, 4.00%, 1/15/22 | 470,000 | 497,582 | |||
Toyota Motor Credit, Sr. Unscd. Notes, 2.15%, 3/12/20 | 300,000 | 303,158 | |||
3,279,573 | |||||
Consumer Staples - .4% | |||||
Anheuser-Busch InBev Finance, Gtd. Notes, 4.90%, 2/1/46 | 375,000 | 429,002 | |||
BAT Capital, Gtd. Notes, 3.56%, 8/15/27 | 345,000 | a | 350,634 | ||
CVS Health, Sr. Unscd. Notes, 4.88%, 7/20/35 | 340,000 | 381,743 | |||
Kroger, Sr. Unscd. Notes, 2.60%, 2/1/21 | 235,000 | 236,952 | |||
PepsiCo, Sr. Unscd. Notes, 4.50%, 1/15/20 | 375,000 | 400,398 | |||
1,798,729 | |||||
Energy - .3% | |||||
Apache, Sr. Unscd. Notes, 3.25%, 4/15/22 | 265,000 | 269,946 | |||
BP Capital Markets, Gtd. Notes, 4.75%, 3/10/19 | 255,000 | 266,789 | |||
Enterprise Products Operating, Gtd. Notes, 2.55%, 10/15/19 | 200,000 | 201,778 | |||
Exxon Mobil, Sr. Unscd. Notes, 1.71%, 3/1/19 | 260,000 | 260,639 | |||
Sabine Pass Liquefaction, Sr. Scd. Notes, 5.75%, 5/15/24 | 200,000 | 222,729 | |||
Spectra Energy Partners, Sr. Unscd. Notes, 3.50%, 3/15/25 | 195,000 | 198,824 | |||
Williams Partners, Sr. Unscd. Notes, 4.30%, 3/4/24 | 225,000 | 238,841 | |||
1,659,546 | |||||
Financials - 2.2% | |||||
AerCap Ireland Capital, Gtd. Notes, 4.50%, 5/15/21 | 680,000 | 723,346 | |||
Bank of America, Sr. Unscd. Notes, Ser. L, 2.60%, 1/15/19 | 645,000 | 651,628 | |||
Bank of America, Sub. Notes, Ser. L, 3.95%, 4/21/25 | 590,000 | 609,880 | |||
Barclays, Sub. Notes, 5.20%, 5/12/26 | 255,000 | 273,206 | |||
Citigroup, Sub. Notes, 4.45%, 9/29/27 | 800,000 | 846,869 | |||
Citizens Financial Group, Sub. Notes, 4.15%, 9/28/22 | 545,000 | a | 574,722 | ||
Cooperatieve Rabobank, Gtd. Notes, 4.50%, 1/11/21 | 530,000 | 569,455 | |||
Deutsche Bank, Sr. Unscd. Notes, 6.00%, 9/1/17 | 350,000 | 350,000 | |||
GE Capital International Funding, Gtd. Notes, 2.34%, 11/15/20 | 410,000 | 415,212 | |||
General Electric, Sub. Notes, 5.30%, 2/11/21 | 142,000 | 157,456 | |||
General Motors Financial, Gtd. Notes, 3.20%, 7/6/21 | 210,000 | 213,889 | |||
Goldman Sachs Group, Sub. Notes, 6.75%, 10/1/37 | 530,000 | 699,069 | |||
HSBC Finance, Sub. Notes, 6.68%, 1/15/21 | 642,000 | 731,855 | |||
BNY Mellon Asset Allocation Fund (continued) | |||||
Description | Principal | Value ($) | |||
Bonds and Notes - 14.2% (continued) | |||||
Financials - 2.2% (continued) | |||||
Intercontinental Exchange, Gtd. Notes, 2.75%, 12/1/20 | 410,000 | 421,613 | |||
JPMorgan Chase & Co., Sub. Notes, 3.38%, 5/1/23 | 425,000 | 436,649 | |||
MetLife, Sr. Unscd. Notes, 7.72%, 2/15/19 | 345,000 | 374,530 | |||
Morgan Stanley, Sub. Notes, 4.88%, 11/1/22 | 735,000 | 801,383 | |||
Societe Generale, Sub. Notes, 4.75%, 11/24/25 | 510,000 | a | 543,476 | ||
Total System Services, Sr. Unscd. Notes, 4.80%, 4/1/26 | 350,000 | 389,235 | |||
Wells Fargo & Co., Sr. Unscd. Notes, 2.60%, 7/22/20 | 210,000 | 213,552 | |||
Wells Fargo & Co., Sub. Notes, 4.90%, 11/17/45 | 405,000 | 447,808 | |||
10,444,833 | |||||
Foreign/Governmental - .2% | |||||
Petroleos Mexicanos, Gtd. Notes, 4.88%, 1/24/22 | 550,000 | 581,020 | |||
Province of Ontario Canada, Sr. Unscd. Bonds, 4.00%, 10/7/19 | 330,000 | 345,459 | |||
926,479 | |||||
Health Care - .3% | |||||
AbbVie, Sr. Unscd. Notes, 2.90%, 11/6/22 | 325,000 | 330,114 | |||
Amgen, Sr. Unscd. Notes, 5.65%, 6/15/42 | 325,000 | 396,877 | |||
Biogen, Sr. Unscd. Notes, 2.90%, 9/15/20 | 345,000 | 353,336 | |||
Celgene, Sr. Unscd. Notes, 2.88%, 8/15/20 | 265,000 | 271,848 | |||
1,352,175 | |||||
Industrials - .3% | |||||
ABB Finance USA, Gtd. Notes, 2.88%, 5/8/22 | 505,000 | 521,252 | |||
American Airlines Pass Through Trust, Bonds, Ser. 2015-1 Cl. A, 3.38%, 11/1/28 | 316,374 | 323,688 | |||
Burlington North Santa Fe, Sr. Unscd. Debs., 3.45%, 9/15/21 | 430,000 | 450,120 | |||
General Electric, Jr. Sub. Debs., Ser. D, 3 Month LIBOR + 3.33%, 5.00%, 12/31/49 | 295,000 | b | 311,963 | ||
1,607,023 | |||||
Information Technology - .8% | |||||
Adobe Systems, Sr. Unscd. Notes, 3.25%, 2/1/25 | 305,000 | 315,753 | |||
Apple, Sr. Unscd. Notes, 4.38%, 5/13/45 | 300,000 | 331,648 | |||
Arrow Electronics, Sr. Unscd. Notes, 3.50%, 4/1/22 | 385,000 | 396,892 | |||
Dell International, Sr. Scd. Notes, 6.02%, 6/15/26 | 375,000 | a | 419,331 | ||
Fidelity National Information Services, Gtd. Notes, 3.88%, 6/5/24 | 126,000 | 133,448 | |||
Intel, Sr. Unscd. Notes, 2.70%, 12/15/22 | 290,000 | 297,190 | |||
Intel, Sr. Unscd. Notes, 4.90%, 7/29/45 | 415,000 | 491,791 | |||
Microsoft, Sr. Unscd. Notes, 3.75%, 2/12/45 | 440,000 | 447,907 | |||
Oracle, Sr. Unscd. Notes, 2.50%, 5/15/22 | 570,000 | 579,008 | |||
Seagate HDD Cayman, Gtd. Bonds, 4.75%, 1/1/25 | 170,000 | 165,749 | |||
3,578,717 | |||||
Materials - .0% | |||||
Eastman Chemical, Sr. Unscd. Notes, 3.60%, 8/15/22 | 224,000 | 233,511 | |||
Municipal Bonds - 1.0% | |||||
California Earthquake Authority, Revenue, 2.81%, 7/1/19 | 294,000 | 296,543 | |||
California Educational Facilities Authority, Revenue (Stanford University), 5.00%, 10/1/32 | 375,000 | 489,986 | |||
Chicago, GO, 7.38%, 1/1/33 | 290,000 | 336,464 | |||
Commonwealth of Massachusetts, GO (Build America Bonds), 4.91%, 5/1/29 | 325,000 | 387,780 | |||
Florida Hurricane Catastrophe Fund Finance Corporation, Revenue Bonds, Ser. A, 3.00%, 7/1/20 | 900,000 | 925,542 | |||
75
STATEMENT OF INVESTMENTS (continued)
BNY Mellon Asset Allocation Fund (continued) | |||||
Description | PrincipalAmount ($) | Value ($) | |||
Bonds and Notes - 14.2% (continued) | |||||
Municipal Bonds - 1.0% (continued) | |||||
New York City, GO (Build America Bonds), 6.25%, 6/1/35 | 345,000 | 382,522 | |||
New York City Municipal Water Finance Authority, Water and Sewer System Second General Resolution Revenue (Build America Bonds), 6.28%, 6/15/42 | 530,000 | 594,490 | |||
Oakland Unified School District, GO (Build America Bonds), 9.50%, 8/1/34 | 180,000 | 204,788 | |||
South Carolina Public Service Authority, Revenue Obligations, 2.39%, 12/1/23 | 260,000 | 245,531 | |||
Texas Public Finance Authority, Windstorm Insurance Association Premium Revenue, 8.25%, 7/1/24 | 310,000 | 328,349 | |||
University of California Regents, Limited Project Revenue, 4.13%, 5/15/45 | 340,000 | 361,094 | |||
4,553,089 | |||||
Real Estate - .4% | |||||
Alexandria Real Estate Equities, Gtd. Notes, 4.30%, 1/15/26 | 265,000 | 282,314 | |||
Boston Properties, Sr. Unscd. Notes, 4.13%, 5/15/21 | 215,000 | 228,513 | |||
CubeSmart, Gtd. Notes, 4.80%, 7/15/22 | 335,000 | 364,825 | |||
Essex Portfolio, Gtd. Notes, 3.38%, 1/15/23 | 265,000 | 271,306 | |||
Kimco Realty, Sr. Unscd. Notes, 3.40%, 11/1/22 | 340,000 | 351,983 | |||
Tanger Properties, Sr. Unscd. Notes, 3.13%, 9/1/26 | 235,000 | 223,922 | |||
1,722,863 | |||||
Telecommunications - .5% | |||||
AT&T, Sr. Unscd. Notes, 4.45%, 5/15/21 | 525,000 | 562,425 | |||
AT&T, Sr. Unscd. Notes, 3.90%, 8/14/27 | 335,000 | 339,196 | |||
Telefonica Emisiones, Gtd. Notes, 4.10%, 3/8/27 | 590,000 | 617,685 | |||
Verizon Communications, Sr. Unscd. Bonds, 5.50%, 3/16/47 | 570,000 | 618,288 | |||
2,137,594 | |||||
U.S. Government Agencies - .1% | |||||
Federal Farm Credit Bank, Bonds, 2.50%, 8/28/24 | 330,000 | 329,773 | |||
U.S. Government Agencies Mortgage-Backed - 3.8% | |||||
Federal Home Loan Mortgage Corp.: | |||||
3.00%, 8/1/47 | 159,556 | c | 161,495 | ||
3.50%, 12/1/28-8/1/47 | 1,026,616 | c | 1,063,117 | ||
4.00%, 6/1/26-8/1/47 | 818,501 | c | 869,298 | ||
4.50%, 2/1/47 | 429,911 | c | 462,074 | ||
5.00%, 7/1/40 | 218,597 | c | 239,789 | ||
Federal National Mortgage Association: | |||||
2.50%, 9/1/31 | 901,100 | c | 914,741 | ||
3.00%, 2/1/32-8/1/47 | 4,193,441 | c | 4,266,862 | ||
3.50%, 1/1/28-7/1/47 | 3,738,445 | c | 3,879,254 | ||
4.00%, 3/1/46-7/1/47 | 1,718,321 | c | 1,818,225 | ||
4.50%, 2/1/47-6/1/47 | 1,063,803 | c | 1,144,797 | ||
5.00%, 11/1/43 | 144,872 | c | 159,107 | ||
Government National Mortgage Association II: | |||||
3.00%, 1/20/47 | 862,448 | 881,291 | |||
3.50%, 2/20/47 | 494,659 | 516,561 | |||
4.00%, 6/20/47 | 850,296 | 900,755 | |||
4.50%, 7/20/47 | 279,210 | 298,120 | |||
17,575,486 | |||||
U.S. Government Securities - 2.9% | |||||
U.S. Treasury Bonds, 2.50%, 5/15/46 | 460,000 | 438,725 | |||
U.S. Treasury Bonds, 2.25%, 8/15/46 | 420,000 | d | 379,165 | ||
U.S. Treasury Bonds, 3.00%, 2/15/47 | 895,000 | 944,645 | |||
U.S. Treasury Inflation Protected Securities, Notes, 0.13%, 4/15/20 | 319,024 | d,e | 320,708 | ||
BNY Mellon Asset Allocation Fund (continued) | |||||
Description | Principal | Value ($) | |||
Bonds and Notes - 14.2% (continued) | |||||
U.S. Government Securities - 2.9% (continued) | |||||
U.S. Treasury Inflation Protected Securities, Notes, 0.63%, 7/15/21 | 972,686 | e | 1,002,232 | ||
U.S. Treasury Inflation Protected Securities, Notes, 0.13%, 1/15/22 | 768,390 | e | 773,308 | ||
U.S. Treasury Inflation Protected Securities, Notes, 0.38%, 7/15/25 | 666,227 | d,e | 672,275 | ||
U.S. Treasury Inflation Protected Securities, Notes, 0.38%, 1/15/27 | 324,490 | e | 324,325 | ||
U.S. Treasury Inflation Protected Securities, Notes, 1.00%, 2/15/46 | 635,775 | e | 655,028 | ||
U.S. Treasury Notes, 1.13%, 1/15/19 | 65,000 | d | 64,873 | ||
U.S. Treasury Notes, 1.13%, 2/28/19 | 485,000 | 483,892 | |||
U.S. Treasury Notes, 1.25%, 3/31/19 | 2,300,000 | 2,298,068 | |||
U.S. Treasury Notes, 1.38%, 2/15/20 | 940,000 | d | 940,129 | ||
U.S. Treasury Notes, 1.50%, 4/15/20 | 480,000 | 481,387 | |||
U.S. Treasury Notes, 1.13%, 2/28/21 | 2,750,000 | 2,712,563 | |||
U.S. Treasury Notes, 2.13%, 9/30/21 | 705,000 | 719,196 | |||
U.S. Treasury Notes, 1.88%, 4/30/22 | 120,000 | 120,968 | |||
U.S. Treasury Notes, 2.38%, 5/15/27 | 90,000 | d | 91,969 | ||
13,423,456 | |||||
Utilities - .1% | |||||
Consumers Energy, First Mortgage Bonds, 3.25%, 8/15/46 | 180,000 | 170,024 | |||
Exelon, Sr. Unscd. Notes, 3.40%, 4/15/26 | 280,000 | 285,049 | |||
Public Service Enterprise Group, Sr. Unscd. Notes, 1.60%, 11/15/19 | 170,000 | 168,735 | |||
623,808 | |||||
Total Bonds and Notes | 66,091,071 | ||||
Description | Shares | Value ($) | |||
Common Stocks - 21.0% | |||||
Consumer Discretionary - 2.4% | |||||
Amazon.com | 1,544 | f | 1,514,046 | ||
Best Buy | 17,020 | 923,505 | |||
Burlington Stores | 4,095 | f | 356,797 | ||
Carnival | 14,063 | 977,097 | |||
Darden Restaurants | 11,035 | 905,863 | |||
Home Depot | 2,540 | 380,670 | |||
Lear | 4,940 | 738,728 | |||
Lowe's | 7,312 | 540,284 | |||
Omnicom Group | 1,470 | 106,399 | |||
Ross Stores | 15,565 | 909,774 | |||
Royal Caribbean Cruises | 6,845 | 851,929 | |||
The TJX Companies | 2,190 | 158,337 | |||
Time Warner | 10,440 | 1,055,484 | |||
Visteon | 1,625 | 187,590 | |||
Walt Disney | 13,334 | 1,349,401 | |||
10,955,904 | |||||
Consumer Staples - 1.8% | |||||
Altria Group | 2,190 | 138,846 | |||
Campbell Soup | 11,179 | �� | 516,470 | ||
Church & Dwight | 3,695 | 185,378 | |||
Conagra Brands | 21,297 | 691,301 | |||
CVS Health | 13,874 | 1,073,015 | |||
Kimberly-Clark | 7,070 | 871,660 | |||
PepsiCo | 13,619 | 1,576,127 | |||
Procter & Gamble | 3,783 | 349,057 | |||
Spectrum Brands Holdings | 5,260 | 578,390 | |||
Sysco | 3,020 | 159,063 | |||
Walgreens Boots Alliance | 13,370 | 1,089,655 | |||
Wal-Mart Stores | 17,342 | 1,353,890 | |||
8,582,852 | |||||
Energy - 1.2% | |||||
Chevron | 14,913 | 1,604,937 | |||
Exxon Mobil | 29,492 | 2,251,124 | |||
Halliburton | 8,235 | 320,918 | |||
76
BNY Mellon Asset Allocation Fund (continued) | |||||
Description | Shares | Value ($) | |||
Common Stocks - 21.0% (continued) | |||||
Energy - 1.2% (continued) | |||||
TechnipFMC | 21,270 | 549,404 | |||
Valero Energy | 13,669 | 930,859 | |||
5,657,242 | |||||
Financials - 3.0% | |||||
Allstate | 8,850 | 800,925 | |||
American Express | 14,028 | 1,207,811 | |||
Ameriprise Financial | 1,072 | 148,483 | |||
Aon | 7,260 | 1,010,302 | |||
Bank of America | 84,826 | 2,026,493 | |||
Berkshire Hathaway, Cl. B | 2,844 | f | 515,219 | ||
Comerica | 2,170 | 148,103 | |||
Discover Financial Services | 13,239 | 780,439 | |||
Eaton Vance | 15,410 | 733,208 | |||
Everest Re Group | 1,755 | 443,102 | |||
JPMorgan Chase & Co. | 26,699 | 2,426,672 | |||
Marsh & McLennan Co. | 12,535 | 978,733 | |||
Prudential Financial | 1,285 | 131,173 | |||
State Street | 11,055 | 1,022,477 | |||
Synchrony Financial | 4,535 | 139,633 | |||
Travelers | 3,921 | 475,147 | |||
Unum Group | 3,045 | 146,708 | |||
Wells Fargo & Co. | 20,950 | 1,069,916 | |||
14,204,544 | |||||
Health Care - 3.5% | |||||
AbbVie | 5,103 | 384,256 | |||
Agilent Technologies | 11,744 | 760,072 | |||
Amgen | 8,206 | 1,458,781 | |||
Baxter International | 16,982 | 1,053,563 | |||
Biogen | 510 | f | 161,446 | ||
Celgene | 9,350 | f | 1,298,996 | ||
Cigna | 3,389 | 617,001 | |||
Danaher | 11,655 | 972,260 | |||
Eli Lilly & Co. | 2,190 | 178,025 | |||
Express Scripts Holding | 11,080 | f | 696,046 | ||
Humana | 3,695 | 951,906 | |||
Johnson & Johnson | 17,597 | 2,329,315 | |||
Merck & Co. | 25,043 | 1,599,246 | |||
Pfizer | 49,796 | 1,689,080 | |||
Thermo Fisher Scientific | 5,802 | 1,085,786 | |||
UnitedHealth Group | 5,485 | 1,090,966 | |||
16,326,745 | |||||
Industrials - 2.1% | |||||
Boeing | 6,601 | 1,581,996 | |||
CDK Global | 8,190 | 528,255 | |||
Delta Air Lines | 16,987 | 801,617 | |||
General Electric | 48,954 | 1,201,821 | |||
Hexcel | 3,755 | 201,906 | |||
Ingersoll-Rand | 9,510 | 812,059 | |||
Lennox International | 1,335 | 221,250 | |||
Lockheed Martin | 1,035 | 316,079 | |||
Oshkosh | 11,110 | 828,806 | |||
S&P Global | 6,590 | 1,017,035 | |||
Spirit AeroSystems Holdings, Cl. A | 12,224 | 910,688 | |||
Union Pacific | 10,845 | 1,141,978 | |||
9,563,490 | |||||
Information Technology - 5.3% | |||||
Accenture, Cl. A | 4,960 | 648,570 | |||
Alphabet, Cl. A | 1,989 | f | 1,899,972 | ||
Alphabet, Cl. C | 1,989 | f | 1,868,327 | ||
Apple | 24,309 | 3,986,676 | |||
Applied Materials | 24,503 | 1,105,575 | |||
Cisco Systems | 45,151 | 1,454,314 | |||
Citrix Systems | 1,475 | f | 115,360 | ||
F5 Networks | 3,770 | f | 450,063 | ||
Facebook, Cl. A | 11,266 | f | 1,937,414 | ||
Fiserv | 2,679 | f | 331,419 | ||
HP | 49,987 | 953,752 | |||
Intel | 11,775 | 412,949 | |||
International Business Machines | 8,336 | 1,192,298 | |||
BNY Mellon Asset Allocation Fund (continued) | |||||
Description | Shares | Value ($) | |||
Common Stocks - 21.0% (continued) | |||||
Information Technology - 5.3% (continued) | |||||
Juniper Networks | 11,760 | 326,105 | |||
Lam Research | 5,500 | 912,890 | |||
Microsoft | 20,980 | 1,568,675 | |||
NCR | 16,270 | f | 594,343 | ||
Red Hat | 2,247 | f | 241,553 | ||
Skyworks Solutions | 8,050 | 848,148 | |||
TE Connectivity | 2,255 | 179,498 | |||
Texas Instruments | 13,763 | 1,139,852 | |||
VeriSign | 6,607 | f | 685,476 | ||
VMware, Cl. A | 8,135 | f | 879,394 | ||
Western Digital | 9,565 | 844,303 | |||
24,576,926 | |||||
Materials - .4% | |||||
Air Products & Chemicals | 5,450 | 792,267 | |||
Celanese, Ser. A | 9,585 | 929,937 | |||
Owens-Illinois | 7,455 | f | 183,691 | ||
1,905,895 | |||||
Real Estate - .2% | |||||
Public Storage | 4,533 | g | 930,806 | ||
Vornado Realty Trust | 2,240 | g | 166,858 | ||
1,097,664 | |||||
Telecommunications - .8% | |||||
AT&T | 51,626 | 1,933,910 | |||
T-Mobile US | 11,005 | 712,134 | |||
Verizon Communications | 26,495 | 1,270,965 | |||
3,917,009 | |||||
Utilities - .3% | |||||
DTE Energy | 1,470 | 165,110 | |||
FirstEnergy | 4,425 | 144,167 | |||
Hawaiian Electric Industries | 4,395 | 146,881 | |||
MDU Resources Group | 26,260 | 710,070 | |||
Sempra Energy | 1,875 | 221,119 | |||
1,387,347 | |||||
Total Common Stocks | 98,175,618 | ||||
Description | Shares | Value ($) | |||
Other Investments - 64.8% | |||||
Registered Investment Company; | |||||
ASG Managed Futures Strategy Fund, Cl. Y | 1,032,164 | 10,331,965 | |||
BNY Mellon Corporate Bond Fund, Cl. M | 967,685 | h | 12,637,970 | ||
BNY Mellon Emerging Markets Fund, Cl. M | 2,084,721 | h | 23,411,412 | ||
BNY Mellon Focused Equity Opportunities Fund, Cl. M | 2,332,169 | h | 39,553,593 | ||
BNY Mellon Income Stock Fund, Cl. M | 1,535,874 | h | 14,268,270 | ||
BNY Mellon Intermediate Bond Fund, Cl. M | 1,919,691 | h | 24,188,103 | ||
BNY Mellon International Fund, Cl. M | 1,015,926 | h | 13,379,750 | ||
BNY Mellon Mid Cap Multi-Strategy Fund, Cl. M | 2,419,469 | h | 40,453,519 | ||
BNY Mellon Small Cap Multi-Strategy Fund, Cl. M | 270,270 | f,h | 5,264,865 | ||
BNY Mellon Small/Mid Cap Multi-Strategy Fund, Cl. M | 679,407 | h | 9,844,609 | ||
Dreyfus Floating Rate Income Fund, Cl. Y | 863,642 | h | 10,450,069 | ||
Dreyfus Global Real Estate Securities Fund, Cl. Y | 935,558 | h | 8,522,929 | ||
Dreyfus High Yield Fund, Cl. I | 1,608,800 | h | 10,167,618 | ||
Dreyfus Institutional Preferred Government Plus Money Market Fund | 6,504,032 | i | 6,504,032 | ||
Dreyfus International Small Cap Fund, Cl. Y | 741,307 | h | 11,816,435 | ||
Dreyfus Research Growth Fund, Cl. Y | 566,872 | h | 8,616,451 | ||
Dreyfus Select Managers Small Cap Growth Fund, Cl. Y | 677,347 | f,h | 17,638,127 | ||
Dreyfus Select Managers Small Cap Value Fund, Cl. Y | 622,545 | h | 15,121,619 | ||
Dreyfus/Newton International Equity Fund, Cl. Y | 602,528 | h | 12,538,600 | ||
77
STATEMENT OF INVESTMENTS (continued)
BNY Mellon Asset Allocation Fund (continued) | |||||
Description | Shares | Value ($) | |||
Other Investments - 64.8% (continued) | |||||
Registered Investment Company; (continued) | |||||
Dynamic Total Return Fund, Cl. Y | 487,575 | f,h | 8,064,491 | ||
Total Other Investments | 302,774,427 | ||||
Total Investments (cost $396,086,004) | 100.0% | 467,041,116 | |||
Liabilities, Less Cash and Receivables | 0.0% | (153,971) | |||
Net Assets | 100.0% | 466,887,145 | |||
GO—General Obligation
LIBOR—London Interbank Offered Rate (3 Month)
a Security exempt from registration pursuant to Rule 144A under the Securities Act of 1933. These securities may be resold in transactions exempt from registration, normally to qualified institutional buyers. At August 31, 2017, these securities were valued at $1,888,163 or .4% of net assets.
b Variable rate security—rate shown is the interest rate in effect at period end.
c The Federal Housing Finance Agency (“FHFA”) placed the Federal Home Loan Mortgage Corporation and Federal National Mortgage Association into conservatorship with FHFA as the conservator. As such, the FHFA oversees the continuing affairs of these companies.
d Security, or portion thereof, on loan. At August 31, 2017, the value of the fund’s securities on loan was $2,469,119 and the value of the collateral held by the fund was $2,527,975, consisting of U.S. Government & Agency securities.
e Principal amount for accrual purposes is periodically adjusted based on changes in the Consumer Price Index.
f Non-income producing security.
g Investment in real estate investment trust.
h Investment in affiliated mutual fund.
i Investment in affiliated money market mutual fund.
Portfolio Summary (Unaudited) † | Value (%) |
Mutual Funds: Domestic | 48.5 |
Common Stocks | 21.0 |
Mutual Funds: Foreign | 14.9 |
U.S. Government Agencies/Mortgage-Backed | 6.7 |
Corporate Bonds | 6.0 |
Money Market Investment | 1.4 |
Municipal Bonds | 1.0 |
Foreign/Governmental | .2 |
Commercial Mortgage-Backed | .2 |
U.S. Government & Agencies | .1 |
100.0 |
† Based on net assets.
See notes to financial statements.
78
STATEMENTS OF INVESTMENTS IN AFFILIATED ISSUERS
Registered Investment Companies | Value | Purchases ($) | Sales ($) | Net Realized | Net Unrealized | Value | Net | Dividends/ | |||||
BNY Mellon Large Cap | |||||||||||||
Dreyfus Institutional Cash Advantage Fund, Institutional Shares | 4,718,547 | 7,393,348 | 12,111,895 | – | – | – | – | – | |||||
Dreyfus Institutional | 1,504,500 | 67,805,929 | 68,214,224 | – | – | 1,096,205 | .4 | 7,952 | |||||
Dreyfus Institutional | – | 28,343,968 | 28,343,968 | – | – | – | – | – | |||||
Total | 6,223,047 | 103,543,245 | 108,670,087 | – | – | 1,096,205 | .4 | 7,952 | |||||
BNY Mellon | |||||||||||||
BNY Mellon Income | 11,553,775 | – | 4,743,681 | 233,459 | 359,138 | 7,402,691 | 10.7 | 545,225 | |||||
Dreyfus Institutional Cash Advantage Fund, Institutional Shares | 173,853 | 403,904 | 577,757 | – | – | – | – | – | |||||
Dreyfus Institutional | 637,948 | 16,672,445 | 16,535,300 | – | – | 775,093 | 1.1 | 3,419 | |||||
Dreyfus Institutional | – | 1,775,399 | 1,775,399 | – | – | – | – | – | |||||
Dreyfus Research | 16,328,934 | 3,800,000 | 2,852,209 | 402,110 | 377,515 | 18,056,350 | 25.9 | 1,189,336 | |||||
Dreyfus Strategic | 15,070,157 | – | 6,390,128 | 155,544 | 1,337,146 | 10,172,719 | 14.6 | 413,571 | |||||
Total | 43,764,667 | 22,651,748 | 32,874,474 | 791,113 | 2,073,799 | 36,406,853 | 52.3 | 2,151,551 | |||||
BNY Mellon | |||||||||||||
BNY Mellon Income | 37,992,839 | – | 18,736,189 | 1,365,731 | 957,968 | 21,580,349 | 6.3 | 1,879,474 | |||||
Dreyfus Institutional Cash Advantage Fund, Institutional Shares | 2,232,376 | 3,731,776 | 5,964,152 | – | – | – | – | – | |||||
Dreyfus Institutional | 1,056,039 | 31,313,997 | 31,137,102 | – | – | 1,232,934 | .4 | 14,494 | |||||
Dreyfus Institutional | – | 15,360,493 | 15,360,493 | – | – | – | – | – | |||||
Dreyfus Research | 37,371,737 | 24,500,000 | 4,175,355 | 776,637 | 1,834,561 | 60,307,580 | 17.5 | 2,854,542 | |||||
Dreyfus Strategic | 38,381,360 | 8,500,030 | 19,099,592 | 199,286 | 3,728,347 | 31,709,431 | 9.2 | 1,161,848 | |||||
Total | 117,034,351 | 83,406,296 | 94,472,883 | 2,341,654 | 6,520,876 | 114,830,294 | 33.4 | 5,910,358 | |||||
BNY Mellon | |||||||||||||
Dreyfus Institutional Cash Advantage Fund, Institutional Shares | – | 84,508,090 | 84,508,090 | – | – | – | – | – | |||||
Dreyfus Institutional | 38,468,816 | 416,474,027 | 443,315,755 | – | – | 11,627,088 | 1.0 | 132,393 | |||||
Dreyfus Institutional | – | 186,691,779 | 186,691,779 | – | – | – | – | – | |||||
Total | 38,468,816 | 687,673,896 | 714,515,624 | – | – | 11,627,088 | 1.0 | 132,393 |
79
STATEMENTS OF INVESTMENTS IN AFFILIATED ISSUERS (continued)
Registered Investment Companies | Value | Purchases ($) | Sales ($) | Net Realized | Net Unrealized | Value | Net | Dividends/ | |||||
BNY Mellon Mid Cap | |||||||||||||
Dreyfus Institutional Cash Advantage Fund, Institutional Shares | 54,977,193 | 46,789,146 | 101,766,339 | – | – | – | – | – | |||||
Dreyfus Institutional | 26,052,381 | 377,141,153 | 358,909,206 | – | – | 44,284,328 | 1.5 | 265,090 | |||||
Dreyfus Institutional | – | 691,941,741 | 602,923,833 | – | – | 89,017,908 | 3.1 | – | |||||
Total | 81,029,574 | 1,115,872,040 | 1,063,599,378 | – | – | 133,302,236 | 4.6 | 265,090 | |||||
BNY Mellon Small Cap | |||||||||||||
Dreyfus Institutional Cash Advantage Fund, Institutional Shares | 35,676,403 | 28,397,835 | 64,074,238 | – | – | – | – | – | |||||
Dreyfus Institutional | 6,748,382 | 109,316,212 | 104,839,881 | – | – | 11,224,713 | 2.1 | 55,935 | |||||
Dreyfus Institutional | – | 309,794,094 | 248,534,041 | – | – | 61,260,053 | 11.6 | – | |||||
Total | 42,424,785 | 447,508,141 | 417,448,160 | – | – | 72,484,766 | 13.7 | 55,935 | |||||
BNY Mellon Focused | |||||||||||||
Dreyfus Institutional | – | 45,720,064 | 44,097,080 | – | – | 1,622,984 | .3 | 9,214 | |||||
Dreyfus Institutional | – | 28,219,187 | 28,219,187 | – | – | – | – | – | |||||
Total | – | 73,939,251 | 72,316,267 | – | – | 1,622,984 | .3 | 9,214 | |||||
BNY Mellon Small/ | |||||||||||||
Dreyfus Institutional Cash Advantage Fund, Institutional Shares | 16,425,833 | 19,285,053 | 35,710,886 | – | – | – | – | – | |||||
Dreyfus Institutional | 4,590,205 | 62,884,620 | 60,603,513 | – | – | 6,871,312 | 2.1 | 27,816 | |||||
Dreyfus Institutional | – | 225,394,465 | 199,081,714 | – | – | 26,312,751 | 7.9 | – | |||||
Total | 21,016,038 | 307,564,138 | 295,396,113 | – | – | 33,184,063 | 10.0 | 27,816 | |||||
BNY Mellon | |||||||||||||
Dreyfus Institutional | 6,769,193 | 287,023,454 | 284,820,359 | – | – | 8,972,288 | .8 | 40,178 | |||||
BNY Mellon | |||||||||||||
Dreyfus Institutional | 2,740,735 | 293,451,564 | 290,233,246 | – | – | 5,959,053 | .6 | 39,692 | |||||
Dreyfus Institutional | – | 80,158,547 | 79,732,563 | – | – | 425,984 | .1 | – | |||||
Total | 2,740,735 | 373,610,111 | 369,965,809 | – | – | 6,385,037 | .7 | 39,692 | |||||
BNY Mellon International | |||||||||||||
Dreyfus Institutional | 672,923 | 12,792,206 | 12,821,755 | – | – | 643,374 | .8 | 3,963 |
80
Registered Investment Companies | Value | Purchases ($) | Sales ($) | Net Realized | Net Unrealized | Value | Net | Dividends/ | |||||
BNY Mellon International | |||||||||||||
Dreyfus Institutional | 3,566,489 | 99,493,239 | 98,182,650 | – | – | 4,877,078 | 1.3 | 19,948 | |||||
BNY Mellon | |||||||||||||
BNY Mellon Corporate | 12,190,973 | 450,627 | – | – | (3,630) | 12,637,970 | 2.7 | 450,627 | |||||
BNY Mellon Emerging | 10,013,307 | 9,192,782 | – | – | 4,205,323 | 23,411,412 | 5.0 | 77,782 | |||||
BNY Mellon Focused Equity | 31,874,148 | 2,914,643 | 932,911 | 157,052 | 5,540,661 | 39,553,593 | 8.5 | 2,914,643 | |||||
BNY Mellon Income | 13,114,016 | 719,892 | 464,198 | 20,315 | 878,245 | 14,268,270 | 3.1 | 719,892 | |||||
BNY Mellon Intermediate | 23,946,952 | 502,380 | – | – | (261,229) | 24,188,103 | 5.2 | 502,381 | |||||
BNY Mellon International | 11,168,773 | 223,773 | – | – | 1,987,204 | 13,379,750 | 2.9 | 223,774 | |||||
BNY Mellon Mid Cap | 36,592,119 | 636,162 | 928,455 | 46,002 | 4,107,691 | 40,453,519 | 8.7 | 636,163 | |||||
BNY Mellon Small Cap | – | 5,000,000 | – | – | 264,865 | 5,264,865 | 1.1 | – | |||||
BNY Mellon Small/Mid Cap | 8,418,520 | 36,544 | – | – | 1,389,545 | 9,844,609 | 2.1 | 36,543 | |||||
Dreyfus Floating Rate | 9,999,226 | 391,689 | – | – | 59,154 | 10,450,069 | 2.2 | 391,689 | |||||
Dreyfus Global Real Estate | 8,465,494 | 473,280 | – | – | (415,845) | 8,522,929 | 1.8 | 473,280 | |||||
Dreyfus High Yield | 13,755,572 | 711,869 | 4,601,910 | (68,782) | 370,869 | 10,167,618 | 2.2 | 711,869 | |||||
Dreyfus Institutional Cash Advantage Fund, Institutional Shares | 1,417,190 | 295,310 | 1,712,500 | – | – | – | – | – | |||||
Dreyfus Institutional | 15,993,029 | 40,471,470 | 49,960,467 | – | – | 6,504,032 | 1.4 | 25,025 | |||||
Dreyfus Institutional Preferred Government Money Market Fund, Institutional Shares | – | 3,540,561 | 3,540,561 | – | – | – | – | – | |||||
Dreyfus International | 9,610,881 | 167,900 | – | – | 2,037,654 | 11,816,435 | 2.5 | 167,899 | |||||
Dreyfus Research | 7,947,699 | 652,869 | 464,690 | 7,115 | 473,458 | 8,616,451 | 1.8 | 444,225 | |||||
Dreyfus Select | 15,125,168 | – | – | – | 2,512,959 | 17,638,127 | 3.8 | – | |||||
Dreyfus Select | 13,195,172 | 86,029 | – | – | 1,840,418 | 15,121,619 | 3.2 | 86,029 | |||||
Dreyfus U.S. Equity | 2,731,184 | – | 2,802,900 | 710,919 | (639,203) | – | – | – | |||||
Dreyfus/Newton | 10,995,886 | 153,777 | – | – | 1,388,937 | 12,538,600 | 2.7 | 153,776 | |||||
Dynamic Total Return | 7,733,123 | 14,308 | – | – | 317,060 | 8,064,491 | 1.7 | 14,309 | |||||
Global Stock Fund, Cl. Y | 7,718,686 | – | 7,633,631 | 1,816,662 | (1,901,717) | – | – | – | |||||
Total | 272,007,118 | 66,635,865 | 73,042,223 | 2,689,283 | 24,152,419 | 292,442,462 | 62.6 | 8,029,906 |
See notes to financial statements
81
STATEMENT OF FUTURES
August 31, 2017
BNY Mellon International Appreciation Fund | |||||||||||
Description | Number of | Expiration | Notional | Value ($) | Unrealized | ||||||
Futures Long | |||||||||||
MSCI EAFE Index | 9 | 9/2017 | 860,101 | 870,660 | 10,559 | ||||||
Gross Unrealized Appreciation | 10,559 | ||||||||||
See notes to financial statements.
82
STATEMENT OF OPTIONS WRITTEN
August 31, 2017
BNY Mellon Income Stock Fund | ||||||
Description/ Expiration Date/ Exercise Price | Counterparty | Number of Contracts | Notional Amount ($) | Value ($) | ||
Call Options: | ||||||
Ameriprise Financial | Goldman Sachs International | 838 | 12,570,000 | (1,676) | ||
Apple | Goldman Sachs International | 378 | 6,615,000 | (63,125) | ||
Dow Chemical | Goldman Sachs International | 914 | 6,078,100 | (59,410) | ||
Texas Instruments | Goldman Sachs International | 738 | 6,273,000 | (16,974) | ||
Put Options: | ||||||
American International Group | Goldman Sachs International | 160 | 968,000 | (5,280) | ||
Apple | Goldman Sachs International | 107 | 1,658,500 | (6,099) | ||
AT&T | Goldman Sachs International | 200 | 750,000 | (7,200) | ||
AT&T | Goldman Sachs International | 208 | 748,800 | (9,360) | ||
Bank of America | Goldman Sachs International | 435 | 1,044,000 | (19,140) | ||
Cisco Systems | Goldman Sachs International | 484 | 1,452,000 | (9,196) | ||
Citigroup | Goldman Sachs International | 147 | 992,250 | (1,911) | ||
Coca-Cola | Goldman Sachs International | 222 | 999,000 | (5,328) | ||
Comcast, Cl. A | Goldman Sachs International | 250 | 1,000,000 | (21,500) | ||
Corning | Goldman Sachs International | 351 | 1,000,350 | (8,775) | ||
Dow Chemical | Goldman Sachs International | 160 | 1,000,000 | (1,600) | ||
FirstEnergy | Goldman Sachs International | 43 | 137,600 | (688) | ||
FirstEnergy | Goldman Sachs International | 169 | 540,800 | (8,873) | ||
Goldman Sachs Group | Goldman Sachs International | 41 | 881,500 | (3,280) | ||
Hess | Goldman Sachs International | 111 | 388,500 | (999) | ||
Johnson & Johnson | Goldman Sachs International | 72 | 950,400 | (1,440) | ||
JPMorgan Chase & Co. | Goldman Sachs International | 111 | 999,000 | (8,325) | ||
Lamar Advertising, Cl. A | Goldman Sachs International | 109 | 681,250 | (1,908) | ||
Las Vegas Sands | Goldman Sachs International | 146 | 876,000 | (4,964) | ||
Merck & Co. | Goldman Sachs International | 80 | 480,000 | (560) | ||
Occidental Petroleum | Goldman Sachs International | 177 | 1,000,050 | (2,832) | ||
Omnicom Group | Goldman Sachs International | 71 | 497,000 | (9,940) | ||
Oracle | Goldman Sachs International | 275 | 1,320,000 | (2,475) | ||
Phillips 66 | Goldman Sachs International | 124 | 998,200 | (2,790) | ||
83
STATEMENT OF OPTIONS WRITTEN (continued)
BNY Mellon Income Stock Fund | ||||||
Description/ Expiration Date/ Exercise Price | Counterparty | Number of Contracts | Notional Amount ($) | Value ($) | ||
Put Options: (continued) | ||||||
Prudential Financial | Goldman Sachs International | 48 | 480,000 | (3,168) | ||
Prudential Financial | Goldman Sachs International | 48 | 504,000 | (14,592) | ||
Raytheon | Goldman Sachs International | 63 | 1,008,000 | (756) | ||
United Technologies | Goldman Sachs International | 83 | 996,000 | (14,940) | ||
UnitedHealth Group | Goldman Sachs International | 79 | 1,501,000 | (2,291) | ||
Uniti Group | Goldman Sachs International | 537 | 1,208,250 | (177,210) | ||
Vulcan Materials | Goldman Sachs International | 91 | 1,001,000 | (2,184) | ||
Total Options Written (premiums received $579,741) | (500,789) | |||||
See notes to financial statements.
84
STATEMENT OF FORWARD FOREIGN CURRENCY EXCHANGE CONTRACTS August 31, 2017
BNY Mellon Emerging Markets Fund | |||||
Counterparty/ Purchased | Purchased Currency | Currency | Sold | Settlement Date | Unrealized (Depreciation)($) |
Northern Trust Bank | |||||
Hong Kong Dollars | 10,165,592 | United States Dollar | 1,299,057 | 9/1/17 | (64) |
Gross Unrealized Depreciation | (64) | ||||
See notes to financial statements.
85
STATEMENTS OF ASSETS AND LIABILITIES
August 31, 2017
|
|
|
|
|
|
|
|
|
|
|
| |
|
|
|
| BNY Mellon Large Cap Stock Fund |
| BNY Mellon Large Cap Market Opportunities Fund |
| BNY Mellon Tax-Sensitive Large Cap Multi-Strategy Fund |
| BNY Mellon Income Stock Fund |
| |
Assets ($): |
|
|
|
|
|
|
|
|
|
|
| |
Investments in securities—See Statements |
|
|
|
|
|
|
|
|
|
|
| |
Unaffiliated issuers |
|
|
| 287,600,009 |
| 33,253,422 |
| 228,080,350 |
| 1,183,689,603 |
| |
Affiliated issuers |
|
|
| 1,096,205 |
| 36,406,853 |
| 114,830,294 |
| 11,627,088 |
| |
Cash |
|
|
| - |
| 20,000 |
| 34,064 |
| 582,521 |
| |
Dividends receivable |
|
|
| 637,631 |
| 67,037 |
| 500,723 |
| 2,918,983 |
| |
Receivable for shares of Beneficial |
|
|
| 27,700 |
| 15,000 |
| 2,971 |
| 246,046 |
| |
Receivable for investment securities sold |
|
|
| - |
| 73,905 |
| 191,984 |
| - |
| |
Cash collateral held by broker—Note 4 |
|
|
| - |
| - |
| - |
| 29,464,523 |
| |
Prepaid expenses |
|
|
| 19,821 |
| 17,646 |
| 19,608 |
| 44,516 |
| |
|
|
|
| 289,381,366 |
| 69,853,863 |
| 343,659,994 |
| 1,228,573,280 |
|
|
Liabilities ($): |
|
|
|
|
|
|
|
|
|
|
| |
Due to The Dreyfus Corporation |
|
|
| 186,426 |
| 37,405 |
| 166,710 |
| 718,464 |
| |
Due to Administrator—Note 3(a) |
|
|
| 30,356 |
| 3,557 |
| 24,377 |
| 129,456 |
| |
Cash overdraft due to Custodian |
|
|
| 321,179 |
| - |
| - |
| - |
| |
Payable for shares of Beneficial |
|
|
| 172,979 |
| 32,453 |
| 107,590 |
| 891,537 |
| |
Payable for investment securities purchased |
|
|
| - |
| 56,323 |
| 147,198 |
| - |
| |
Outstanding options written, at value†† |
|
|
| - |
| - |
| - |
| 500,789 |
| |
Accrued expenses |
|
|
| 41,479 |
| 37,164 |
| 44,721 |
| 70,859 |
| |
|
|
|
| 752,419 |
| 166,902 |
| 490,596 |
| 2,311,105 |
|
|
Net Assets ($) |
|
|
| 288,628,947 |
| 69,686,961 |
| 343,169,398 |
| 1,226,262,175 |
|
|
Composition of Net Assets ($): |
|
|
|
|
|
|
|
|
|
|
| |
Paid-in capital |
|
|
| 190,942,695 |
| 45,236,554 |
| 196,467,837 |
| 962,043,643 |
| |
Accumulated undistributed investment |
|
|
| - |
| 137,607 |
| 1,602,702 |
| 2,349,664 |
| |
Accumulated net realized gain (loss) |
|
|
| 29,999,422 |
| 8,488,533 |
| 29,353,739 |
| 59,898,804 |
| |
Accumulated net unrealized appreciation |
|
|
| 67,686,830 |
| 15,824,267 |
| 115,745,120 |
| 201,891,112 |
| |
Accumulated net unrealized appreciation |
|
|
| - |
| - |
| - |
| 78,952 |
| |
Net Assets ($) |
|
|
| 288,628,947 |
| 69,686,961 |
| 343,169,398 |
| 1,226,262,175 |
|
|
† Investments at cost ($) |
|
|
|
|
|
|
|
|
|
|
|
|
Unaffiliated issuers |
|
|
| 219,913,179 |
| 23,301,740 |
| 125,994,855 |
| 981,798,491 |
|
|
Affiliated issuers |
|
|
| 1,096,205 |
| 30,534,268 |
| 101,170,669 |
| 11,627,088 |
|
|
†† Outstanding options premiums received ($) |
|
|
| - |
| - |
| - |
| 579,741 |
| |
Net Asset Value Per Share |
|
|
|
|
|
|
|
|
|
|
| |
Class M |
|
|
|
|
|
|
|
|
|
|
| |
Net Assets ($) |
|
|
| 278,535,819 |
| 68,786,232 |
| 336,658,515 |
| 1,185,723,123 |
| |
Shares Outstanding |
|
|
| 44,544,315 |
| 5,450,293 |
| 20,405,386 |
| 127,594,006 |
| |
Net Asset Value Per Share ($) |
|
|
| 6.25 |
| 12.62 |
| 16.50 |
| 9.29 |
| |
Investor Shares |
|
|
|
|
|
|
|
|
|
|
|
|
Net Assets ($) |
|
|
| 10,093,128 |
| 900,729 |
| 6,510,883 |
| 28,204,431 |
| |
Shares Outstanding |
|
|
| 1,613,070 |
| 70,667 |
| 386,627 |
| 3,003,465 |
| |
Net Asset Value Per Share ($) |
|
|
| 6.26 |
| 12.75 |
| 16.84 |
| 9.39 |
| |
Class A |
|
|
|
|
|
|
|
|
|
|
|
|
Net Assets ($) |
|
|
| - |
| - |
| - |
| 5,112,027 |
| |
Shares Outstanding |
|
|
| - |
| - |
| - |
| 549,802 |
| |
Net Asset Value Per Share ($) |
|
|
| - |
| - |
| - |
| 9.30 |
| |
Class C |
|
|
|
|
|
|
|
|
|
|
|
|
Net Assets ($) |
|
|
| - |
| - |
| - |
| 1,143,094 |
| |
Shares Outstanding |
|
|
| - |
| - |
| - |
| 123,123 |
| |
Net Asset Value Per Share ($) |
|
|
| - |
| - |
| - |
| 9.28 |
| |
Class I |
|
|
|
|
|
|
|
|
|
|
|
|
Net Assets ($) |
|
|
| - |
| - |
| - |
| 6,068,466 |
| |
Shares Outstanding |
|
|
| - |
| - |
| - |
| 652,837 |
| |
Net Asset Value Per Share ($) |
|
|
| - |
| - |
| - |
| 9.30 |
| |
Class Y |
|
|
|
|
|
|
|
|
|
|
|
|
Net Assets ($) |
|
|
| - |
| - |
| - |
| 11,034 |
| |
Shares Outstanding |
|
|
| - |
| - |
| - |
| 1,188 |
| |
Net Asset Value Per Share ($) |
|
|
| - |
| - |
| - |
| 9.29 |
| |
| ||||||||||||
See notes to financial statements. |
|
86
|
|
|
|
|
|
|
|
|
|
|
| |
|
|
|
| BNY Mellon Mid Cap Multi-Strategy Fund |
| BNY Mellon Small Cap Multi-Strategy Fund |
| BNY Mellon Focused Equity Opportunities Fund |
| BNY Mellon Small/Mid Cap Multi-Strategy Fund |
| |
Assets ($): |
|
|
|
|
|
|
|
|
|
|
| |
Investments in securities—See Statements |
|
|
|
|
|
|
|
|
|
|
| |
Unaffiliated issuers |
|
|
| 2,831,270,303 |
| 515,933,092 |
| 487,757,678 |
| 323,941,076 |
| |
Affiliated issuers |
|
|
| 133,302,236 |
| 72,484,766 |
| 1,622,984 |
| 33,184,063 |
| |
Cash |
|
|
| 1,090,025 |
| 367,501 |
| 677,500 |
| 272,597 |
| |
Receivable for investment securities sold |
|
|
| 63,494,533 |
| 1,791,788 |
| - |
| 817,677 |
| |
Dividends receivable |
|
|
| 3,178,241 |
| 323,403 |
| 860,499 |
| 210,195 |
| |
Receivable for shares of Beneficial |
|
|
| 852,633 |
| 203,672 |
| 522,500 |
| 18,077 |
| |
Securities lending receivable |
|
|
| 21,849 |
| 68,889 |
| 2,000 |
| 29,673 |
| |
Prepaid expenses |
|
|
| 34,217 |
| 22,097 |
| 24,326 |
| 26,759 |
| |
|
|
|
| 3,033,244,037 |
| 591,195,208 |
| 491,467,487 |
| 358,500,117 |
|
|
Liabilities ($): |
|
|
|
|
|
|
|
|
|
|
| |
Due to The Dreyfus Corporation |
|
|
| 1,893,283 |
| 417,343 |
| 306,264 |
| 234,153 |
| |
Due to Administrator—Note 3(a) |
|
|
| 298,572 |
| 54,805 |
| 50,919 |
| 34,421 |
| |
Liability for securities on loan—Note 1(c) |
|
|
| 89,017,908 |
| 61,260,053 |
| - |
| 26,312,751 |
| |
Payable for investment securities purchased |
|
|
| 64,817,723 |
| 2,041,948 |
| - |
| 848,940 |
| |
Payable for shares of Beneficial |
|
|
| 281,709 |
| 22,075 |
| 66,303 |
| 179,953 |
| |
Accrued expenses |
|
|
| 105,198 |
| 55,247 |
| 57,632 |
| 58,847 |
| |
|
|
|
| 156,414,393 |
| 63,851,471 |
| 481,118 |
| 27,669,065 |
|
|
Net Assets ($) |
|
|
| 2,876,829,644 |
| 527,343,737 |
| 490,986,369 |
| 330,831,052 |
|
|
Composition of Net Assets ($): |
|
|
|
|
|
|
|
|
|
|
| |
Paid-in capital |
|
|
| 2,035,330,834 |
| 409,147,954 |
| 316,539,658 |
| 253,470,453 |
| |
Accumulated undistributed investment |
|
|
| 5,505,432 |
| 130,188 |
| 1,961,462 |
| 121,745 |
| |
Accumulated net realized gain (loss) |
|
|
| 88,140,617 |
| 34,337,929 |
| 52,314,642 |
| 22,755,305 |
| |
Accumulated net unrealized appreciation |
|
|
| 747,852,761 |
| 83,727,666 |
| 120,170,607 |
| 54,483,549 |
| |
Net Assets ($) |
|
|
| 2,876,829,644 |
| 527,343,737 |
| 490,986,369 |
| 330,831,052 |
|
|
† Investments at cost ($) |
|
|
|
|
|
|
|
|
|
|
|
|
Unaffiliated issuers |
|
|
| 2,083,417,542 |
| 432,205,426 |
| 367,587,071 |
| 269,457,527 |
|
|
Affiliated issuers |
|
|
| 133,302,236 |
| 72,484,766 |
| 1,622,984 |
| 33,184,063 |
|
|
†† Value of securities on loan ($) |
|
|
| 230,288,385 |
| 116,705,981 |
| 17,481,836 |
| 58,197,127 |
|
|
Net Asset Value Per Share |
|
|
|
|
|
|
|
|
|
|
| |
Class M |
|
|
|
|
|
|
|
|
|
|
| |
Net Assets ($) |
|
|
| 2,788,132,906 |
| 507,702,500 |
| 485,039,803 |
| 327,603,681 |
| |
Shares Outstanding |
|
|
| 166,748,247 |
| 26,057,731 |
| 28,596,815 |
| 22,602,472 |
| |
Net Asset Value Per Share ($) |
|
|
| 16.72 |
| 19.48 |
| 16.96 |
| 14.49 |
| |
Investor Shares |
|
|
|
|
|
|
|
|
|
|
|
|
Net Assets ($) |
|
|
| 88,696,738 |
| 19,641,237 |
| 5,946,566 |
| 3,227,371 |
| |
Shares Outstanding |
|
|
| 5,393,172 |
| 1,050,889 |
| 353,844 |
| 225,674 |
| |
Net Asset Value Per Share ($) |
|
|
| 16.45 |
| 18.69 |
| 16.81 |
| 14.30 |
| |
| ||||||||||||
See notes to financial statements. |
|
87
STATEMENTS OF ASSETS AND LIABILITIES (continued)
|
|
|
|
|
|
|
|
|
|
|
|
|
| |
|
|
|
| BNY Mellon International Fund |
| BNY Mellon Emerging Markets Fund |
| BNY Mellon International Appreciation Fund |
| BNY Mellon International Equity Income Fund |
| BNY Mellon Asset Allocation Fund |
| |
Assets ($): |
|
|
|
|
|
|
|
|
|
|
|
|
| |
Investments in securities—See Statements |
|
|
|
|
|
|
|
|
|
|
|
|
| |
Unaffiliated issuers |
|
|
| 1,073,726,435 |
| 911,511,850 |
| 76,335,681 |
| 362,705,434 |
| 174,598,654 |
| |
Affiliated issuers |
|
|
| 8,972,288 |
| 6,385,037 |
| 643,374 |
| 4,877,078 |
| 292,442,462 |
| |
Cash |
|
|
| 571,501 |
| 557,061 |
| - |
| 647,314 |
| - |
| |
Cash denominated in foreign currency††† |
|
|
| 2,735,487 |
| 4,590,589 |
| - |
| 761,092 |
| - |
| |
Receivable for investment securities sold |
|
|
| 5,423,093 |
| 1,159,520 |
| 248,232 |
| - |
| 663,602 |
| |
Dividends receivable |
|
|
| 4,327,175 |
| 1,169,703 |
| 226,008 |
| 1,889,405 |
| 216,113 |
| |
Receivable for shares of Beneficial |
|
|
| 683,016 |
| 472,080 |
| - |
| 29,053 |
| 89,000 |
| |
Securities lending receivable |
|
|
| - |
| 469 |
| - |
| - |
| 208 |
| |
Receivable for futures |
|
|
| - |
| - |
| 6,615 |
| - |
| - |
| |
Interest receivable |
|
|
| - |
| - |
| - |
| - |
| 440,239 |
| |
Prepaid expenses and other assets |
|
|
| 35,995 |
| 23,774 |
| 211,174 |
| 7,846 |
| 22,679 |
| |
|
|
|
| 1,096,474,990 |
| 925,870,083 |
| 77,671,084 |
| 370,917,222 |
| 468,472,957 |
|
|
Liabilities ($): |
|
|
|
|
|
|
|
|
|
|
|
|
| |
Due to The Dreyfus Corporation |
|
|
| 896,266 |
| 1,146,283 |
| 40,583 |
| 353,564 |
| 78,544 |
| |
Due to Administrator—Note 3(a) |
|
|
| 114,588 |
| 93,996 |
| 8,061 |
| 38,161 |
| 17,130 |
| |
Cash overdraft due to Custodian |
|
|
| - |
| - |
| 8,730 |
| - |
| 394,518 |
| |
Payable for shares of Beneficial |
|
|
| 807,029 |
| 103,132 |
| 10,000 |
| 509,502 |
| 217,323 |
| |
Payable for investment securities purchased |
|
|
| - |
| 1,298,992 |
| 250,435 |
| - |
| 823,832 |
| |
Liability for securities on loan—Note 1(c) |
|
|
| - |
| 425,984 |
| - |
| - |
| - |
| |
Unrealized depreciation on forward foreign |
|
|
| - |
| 64 |
| - |
| - |
| - |
| |
Accrued expenses |
|
|
| 67,953 |
| 57,978 |
| 41,067 |
| 51,828 |
| 54,465 |
| |
|
|
|
| 1,885,836 |
| 3,126,429 |
| 358,876 |
| 953,055 |
| 1,585,812 |
|
|
Net Assets ($) |
|
|
| 1,094,589,154 |
| 922,743,654 |
| 77,312,208 |
| 369,964,167 |
| 466,887,145 |
|
|
Composition of Net Assets ($): |
|
|
|
|
|
|
|
|
|
|
|
|
| |
Paid-in capital |
|
|
| 1,539,761,916 |
| 1,106,807,155 |
| 121,760,781 |
| 361,868,315 |
| 384,524,072 |
| |
Accumulated undistributed investment |
|
|
| 15,505,542 |
| 5,241,896 |
| 1,114,984 |
| 4,550,128 |
| 125,245 |
| |
Accumulated net realized gain (loss) |
|
|
| (567,003,965) |
| (446,915,751) |
| (30,119,795) |
| (42,862,445) |
| 11,282,716 |
| |
Accumulated net unrealized appreciation |
|
|
| 106,197,691 |
| 257,517,275 |
| (15,454,321) |
| 46,387,146 |
| 70,955,112 |
| |
Accumulated net unrealized appreciation |
|
|
| 127,970 |
| 93,079 |
| - |
| 21,023 |
| - |
| |
Accumulated net unrealized appreciation |
|
|
| - |
| - |
| 10,559 |
| - |
| - |
| |
Net Assets ($) |
|
|
| 1,094,589,154 |
| 922,743,654 |
| 77,312,208 |
| 369,964,167 |
| 466,887,145 |
|
|
† Investments at cost ($) |
|
|
|
|
|
|
|
|
|
|
|
|
|
|
Unaffiliated issuers |
|
|
| 967,528,744 |
| 653,994,575 |
| 91,790,002 |
| 316,318,288 |
| 152,152,369 |
|
|
Affiliated issuers |
|
|
| 8,972,288 |
| 6,385,037 |
| 643,374 |
| 4,877,078 |
| 243,933,635 |
|
|
†† Value of securities on loan ($) |
|
|
| - |
| 384,332 |
| - |
| - |
| 2,469,119 |
|
|
††† Cash denominated in foreign |
|
|
| 2,671,608 |
| 4,496,165 |
| - |
| 771,264 |
| - |
| |
Net Asset Value Per Share |
|
|
|
|
|
|
|
|
|
|
|
|
| |
Class M |
|
|
|
|
|
|
|
|
|
|
|
|
| |
Net Assets ($) |
|
|
| 1,076,444,094 |
| 904,774,115 |
| 75,884,718 |
| 367,829,336 |
| 460,142,304 |
| |
Shares Outstanding |
|
|
| 81,736,938 |
| 80,589,878 |
| 5,479,502 |
| 25,895,148 |
| 37,403,761 |
| |
Net Asset Value Per Share ($) |
|
|
| 13.17 |
| 11.23 |
| 13.85 |
| 14.20 |
| 12.30 |
| |
Investor Shares |
|
|
|
|
|
|
|
|
|
|
|
|
|
|
Net Assets ($) |
|
|
| 18,145,060 |
| 17,969,539 |
| 1,427,490 |
| 2,134,831 |
| 6,744,841 |
| |
Shares Outstanding |
|
|
| 1,294,512 |
| 1,558,730 |
| 103,996 |
| 148,694 |
| 544,425 |
| |
Net Asset Value Per Share ($) |
|
|
| 14.02 |
| 11.53 |
| 13.73 |
| 14.36 |
| 12.39 |
| |
| ||||||||||||||
See notes to financial statements. |
|
88
STATEMENTS OF OPERATIONS
Year Ended August 31, 2017
|
|
|
|
|
|
|
|
|
|
|
|
|
|
|
|
|
| BNY Mellon Large Cap Stock Fund |
| BNY Mellon Large Cap Market Opportunities Fund |
| BNY Mellon Tax-Sensitive Large Cap Multi-Strategy Fund |
| BNY Mellon Income Stock Fund |
|
Investment Income ($): |
|
|
|
|
|
|
|
|
|
| ||
Income: |
|
|
|
|
|
|
|
|
|
| ||
Cash dividends: |
|
|
|
|
|
|
|
|
|
| ||
Unaffiliated issuers |
|
| 6,389,746 |
| 539,344 |
| 4,368,185 |
| 36,045,271 |
| ||
Affiliated issuers |
|
| 7,952 |
| 503,703 |
| 1,514,842 |
| 132,393 |
| ||
Income from securities lending—Note 1(c) |
|
| 15,984 |
| 566 |
| 5,371 |
| 50,354 |
| ||
Total Income |
|
| 6,413,682 |
| 1,043,613 |
| 5,888,398 |
| 36,228,018 |
| ||
Expenses: |
|
|
|
|
|
|
|
|
|
| ||
Investment advisory fee—Note 3(a) |
|
| 1,976,411 |
| 305,269 |
| 1,803,932 |
| 7,633,376 |
| ||
Administration fee—Note 3(a) |
|
| 378,500 |
| 44,310 |
| 290,520 |
| 1,461,649 |
| ||
Custodian fees—Note 3(b) |
|
| 54,308 |
| 16,634 |
| 20,848 |
| 75,881 |
| ||
Professional fees |
|
| 34,805 |
| 32,718 |
| 38,521 |
| 60,064 |
| ||
Registration fees |
|
| 34,514 |
| 31,992 |
| 35,904 |
| 119,479 |
| ||
Shareholder servicing costs—Note 3(b) |
|
| 25,057 |
| 2,111 |
| 14,843 |
| 59,083 |
| ||
Trustees’ fees and expenses—Note 3(c) |
|
| 20,576 |
| 5,121 |
| 25,810 |
| 79,094 |
| ||
Prospectus and shareholders’ reports |
|
| 15,893 |
| 12,277 |
| 12,369 |
| 14,348 |
| ||
Loan commitment fees—Note 2 |
|
| 7,651 |
| 1,907 |
| 6,320 |
| 27,748 |
| ||
Interest expense—Note 2 |
|
| 649 |
| - |
| 80 |
| - |
| ||
Distribution fees—Note 3(b) |
|
| - |
| - |
| - |
| 4,796 |
| ||
Miscellaneous |
|
| 25,992 |
| 26,247 |
| 28,546 |
| 30,902 |
| ||
Total Expenses |
|
| 2,574,356 |
| 478,586 |
| 2,277,693 |
| 9,566,420 |
| ||
Less—reduction in expenses due to undertakings—Note 3(a) |
|
| - |
| - |
| - |
| (388) |
| ||
Less—reduction in fees due to earnings credits—Note 3(b) |
|
| (88) |
| (19) |
| (67) |
| (772) |
| ||
Net Expenses |
|
| 2,574,268 |
| 478,567 |
| 2,277,626 |
| 9,565,260 |
| ||
Investment Income—Net |
|
| 3,839,414 |
| 565,046 |
| 3,610,772 |
| 26,662,758 |
| ||
Realized and Unrealized Gain (Loss) |
|
|
|
|
|
|
|
| ||||
Net realized gain (loss) on investments: |
|
|
|
|
|
|
|
| ||||
Unaffiliated issuers |
|
|
| 32,594,373 |
| 7,799,433 |
| 25,691,576 |
| 77,413,044 |
| |
Affiliated issuers |
|
|
| - |
| 791,113 |
| 2,341,654 |
| - |
| |
Net realized gain (loss) on options transactions |
|
| - |
| - |
| - |
| (1,014,733) |
| ||
Capital gain distributions from affiliated issuers |
|
| - |
| 1,647,848 |
| 4,395,516 |
| - |
| ||
Net Realized Gain (Loss) |
|
| 32,594,373 |
| 10,238,394 |
| 32,428,746 |
| 76,398,311 |
| ||
Net unrealized appreciation (depreciation) on investments: |
|
|
|
|
|
|
|
|
|
| ||
Unaffiliated issuers |
|
|
| 8,923,695 |
| (419,144) |
| 13,073,513 |
| 28,259,521 |
| |
Affiliated issuers |
|
|
| - |
| 2,073,799 |
| 6,520,876 |
| - |
| |
Net unrealized appreciation (depreciation) on options transactions |
|
| - |
| - |
| - |
| 135,882 |
| ||
Net Unrealized Appreciation (Depreciation) |
|
| 8,923,695 |
| 1,654,655 |
| 19,594,389 |
| 28,395,403 |
| ||
Net Realized and Unrealized Gain (Loss) on Investments |
|
| 41,518,068 |
| 11,893,049 |
| 52,023,135 |
| 104,793,714 |
| ||
Net Increase in Net Assets Resulting from Operations |
| 45,357,482 |
| 12,458,095 |
| 55,633,907 |
| 131,456,472 |
| |||
See notes to financial statements. | ||||||||||||
89
STATEMENTS OF OPERATIONS (continued)
|
|
|
|
|
|
|
|
|
|
|
|
|
|
|
|
|
| BNY Mellon Mid Cap Multi-Strategy Fund |
| BNY Mellon Small Cap Multi-Strategy Fund |
| BNY Mellon Focused Equity Opportunities Fund |
| BNY Mellon Small/Mid Cap Multi-Strategy Fund |
|
Investment Income ($): |
|
|
|
|
|
|
|
|
|
| ||
Income: |
|
|
|
|
|
|
|
|
|
| ||
Cash dividends: |
|
|
|
|
|
|
|
|
|
| ||
Unaffiliated issuers |
|
| 34,634,422 | † | 4,529,326 | † | 7,069,498 |
| 3,064,037 | † | ||
Affiliated issuers |
|
| 265,090 |
| 55,935 |
| 9,214 |
| 27,816 |
| ||
Income from securities lending—Note 1(c) |
|
| 727,519 |
| 552,412 |
| 9,702 |
| 236,098 |
| ||
Total Income |
|
| 35,627,031 |
| 5,137,673 |
| 7,088,414 |
| 3,327,951 |
| ||
Expenses: |
|
|
|
|
|
|
|
|
|
| ||
Investment advisory fee—Note 3(a) |
|
| 19,870,024 |
| 4,060,675 |
| 3,116,084 |
| 2,407,608 |
| ||
Administration fee—Note 3(a) |
|
| 3,297,320 |
| 594,565 |
| 554,011 |
| 399,565 |
| ||
Trustees’ fees and expenses—Note 3(c) |
|
| 187,752 |
| 34,365 |
| 32,308 |
| 23,332 |
| ||
Shareholder servicing costs—Note 3(b) |
|
| 185,999 |
| 44,550 |
| 13,005 |
| 4,387 |
| ||
Custodian fees—Note 3(b) |
|
| 165,831 |
| 81,440 |
| 35,038 |
| 50,600 |
| ||
Professional fees |
|
| 68,365 |
| 41,645 |
| 40,880 |
| 36,349 |
| ||
Loan commitment fees—Note 2 |
|
| 65,033 |
| 11,100 |
| 10,799 |
| 8,088 |
| ||
Registration fees |
|
| 59,544 |
| 35,466 |
| 36,829 |
| 36,205 |
| ||
Prospectus and shareholders’ reports |
|
| 30,944 |
| 17,014 |
| 12,940 |
| 20,010 |
| ||
Interest expense—Note 2 |
|
| - |
| - |
| 2,693 |
| 260 |
| ||
Miscellaneous |
|
| 54,412 |
| 24,136 |
| 24,976 |
| 22,628 |
| ||
Total Expenses |
|
| 23,985,224 |
| 4,944,956 |
| 3,879,563 |
| 3,009,032 |
| ||
Less—reduction in fees due to earnings credits—Note 3(b) |
|
| (1,645) |
| (685) |
| (57) |
| (175) |
| ||
Net Expenses |
|
| 23,983,579 |
| 4,944,271 |
| 3,879,506 |
| 3,008,857 |
| ||
Investment Income—Net |
|
| 11,643,452 |
| 193,402 |
| 3,208,908 |
| 319,094 |
| ||
Realized and Unrealized Gain (Loss) |
|
|
|
|
|
|
|
| ||||
Net realized gain (loss) on investments | 118,148,460 |
| 43,027,917 |
| 72,662,640 |
| 30,724,500 |
| ||||
Net unrealized appreciation (depreciation) on investments |
|
| 193,029,893 |
| 27,837,466 |
| 29,720,961 |
| 18,808,799 |
| ||
Net Realized and Unrealized Gain (Loss) on Investments |
|
| 311,178,353 |
| 70,865,383 |
| 102,383,601 |
| 49,533,299 |
| ||
Net Increase in Net Assets Resulting from Operations |
| 322,821,805 |
| 71,058,785 |
| 105,592,509 |
| 49,852,393 |
| |||
† Net of foreign taxes withheld at source ($) |
|
| 43,555 |
| 24,553 |
| - |
| 20,801 |
| ||
See notes to financial statements. | ||||||||||||
90
|
|
|
|
|
|
|
|
|
|
|
|
|
|
|
|
|
|
|
| BNY Mellon International Fund |
| BNY Mellon Emerging Markets Fund |
| BNY Mellon International Appreciation Fund |
| BNY Mellon International Equity Income Fund |
| BNY Mellon Asset Allocation Fund |
|
Investment Income ($): |
|
|
|
|
|
|
|
|
|
|
|
| ||
Income: |
|
|
|
|
|
|
|
|
|
|
|
| ||
Cash dividends: |
|
|
|
|
|
|
|
|
|
|
|
| ||
Unaffiliated issuers |
|
| 26,766,677 | † | 16,439,767 | † | 2,165,086 | † | 13,782,354 | † | 2,104,091 |
| ||
Affiliated issuers |
|
| 40,178 |
| 39,692 |
| 3,963 |
| 19,948 |
| 4,157,353 |
| ||
Interest |
|
| - |
| - |
| 519 |
| - |
| 1,950,278 |
| ||
Income from securities lending—Note 1(c) |
|
| - |
| 10,333 |
| - |
| - |
| 3,480 |
| ||
Total Income |
|
| 26,806,855 |
| 16,489,792 |
| 2,169,568 |
| 13,802,302 |
| 8,215,202 |
| ||
Expenses: |
|
|
|
|
|
|
|
|
|
|
|
| ||
Investment advisory fee—Note 3(a) |
|
| 8,505,647 |
| 8,464,544 |
| 370,809 |
| 2,684,680 |
| 1,338,791 |
| ||
Administration fee—Note 3(a) |
|
| 1,245,350 |
| 915,867 |
| 92,304 |
| 393,052 |
| 204,478 |
| ||
Custodian fees—Note 3(b) |
|
| 344,349 |
| 655,556 |
| 14,465 |
| 198,337 |
| 22,505 |
| ||
Trustees’ fees and expenses—Note 3(c) |
|
| 73,511 |
| 49,696 |
| 3,127 |
| 22,307 |
| 35,769 |
| ||
Professional fees |
|
| 54,171 |
| 77,583 |
| 38,908 |
| 44,166 |
| 43,361 |
| ||
Registration fees |
|
| 46,283 |
| 39,637 |
| 33,438 |
| 49,266 |
| 34,832 |
| ||
Shareholder servicing costs—Note 3(b) |
|
| 37,307 |
| 37,545 |
| 4,299 |
| 5,038 |
| 15,093 |
| ||
Loan commitment fees—Note 2 |
|
| 26,267 |
| 17,738 |
| 1,626 |
| 6,810 |
| 7,687 |
| ||
Prospectus and shareholders’ reports |
|
| 13,208 |
| 14,475 |
| 12,247 |
| 12,556 |
| 11,876 |
| ||
Interest expense—Note 2 |
|
| 2,351 |
| 1,669 |
| 376 |
| 96 |
| 58 |
| ||
ADR fees |
|
| - |
| - |
| 90,302 |
| - |
| - |
| ||
Miscellaneous |
|
| 51,801 |
| 47,819 |
| 27,524 |
| 40,502 |
| 42,387 |
| ||
Total Expenses |
|
| 10,400,245 |
| 10,322,129 |
| 689,425 |
| 3,456,810 |
| 1,756,837 |
| ||
Less—reduction in expenses due to undertakings—Note 3(a) |
|
| - |
| - |
| - |
| - |
| (355,507) |
| ||
Less—reduction in fees due to earnings credits—Note 3(b) |
|
| (139) |
| (345) |
| (787) |
| (40) |
| (40) |
| ||
Net Expenses |
|
| 10,400,106 |
| 10,321,784 |
| 688,638 |
| 3,456,770 |
| 1,401,290 |
| ||
Investment Income—Net |
|
| 16,406,749 |
| 6,168,008 |
| 1,480,930 |
| 10,345,532 |
| 6,813,912 |
| ||
Realized and Unrealized Gain (Loss) |
|
|
|
|
|
|
|
|
|
| ||||
Net realized gain (loss) on investments |
|
|
|
|
|
|
|
|
|
| ||||
Unaffiliated issuers |
|
|
| 15,401,203 |
| 47,527,630 |
| (542,467) |
| 11,691,890 |
| 6,364,458 |
| |
Affiliated issuers |
|
|
| - |
| - |
| - |
| - |
| 2,689,283 |
| |
Net realized gain (loss) on futures |
|
| - |
| - |
| 110,932 |
| - |
| - |
| ||
Net realized gain (loss) on forward foreign | 776,957 |
| (299,864) |
| - |
| (166,979) |
| - |
| ||||
Capital gain distributions from affiliated issuers |
|
| - |
| - |
| - |
| - |
| 3,872,553 |
| ||
Net Realized Gain (Loss) |
|
| 16,178,160 |
| 47,227,766 |
| (431,535) |
| 11,524,911 |
| 12,926,294 |
| ||
Net unrealized appreciation (depreciation) on investments |
|
|
|
|
|
|
|
|
|
|
|
| ||
Unaffiliated issuers |
|
|
| 147,143,057 |
| 128,400,974 |
| 10,301,831 |
| 34,649,956 |
| 6,393,024 |
| |
Affiliated issuers |
|
|
| - |
| - |
| - |
| - |
| 24,152,419 |
| |
Net unrealized appreciation (depreciation) on futures |
|
| - |
| - |
| 4,805 |
| - |
| - |
| ||
Net unrealized appreciation (depreciation) on |
|
| (14,546) |
| (64) |
| - |
| - |
| - |
| ||
Net Unrealized Appreciation (Depreciation) |
|
| 147,128,511 |
| 128,400,910 |
| 10,306,636 |
| 34,649,956 |
| 30,545,443 |
| ||
Net Realized and Unrealized Gain (Loss) on Investments |
|
| 163,306,671 |
| 175,628,676 |
| 9,875,101 |
| 46,174,867 |
| 43,471,737 |
| ||
Net Increase in Net Assets Resulting from Operations |
| 179,713,420 |
| 181,796,684 |
| 11,356,031 |
| 56,520,399 |
| 50,285,649 |
| |||
† Net of foreign taxes withheld at source ($) |
|
| 2,757,559 |
| 2,000,466 |
| 217,619 |
| 1,727,776 |
| - |
| ||
See notes to financial statements. | ||||||||||||||
91
STATEMENTS OF CHANGES IN NET ASSETS
|
|
|
| BNY Mellon Large Cap Stock Fund |
| BNY Mellon Large Cap Market Opportunities Fund |
| ||||||||
|
|
|
| Year Ended August 31, | Year Ended August 31, | ||||||||||
|
|
|
| 2017 |
|
|
| 2016 |
| 2017 |
|
|
| 2016 |
|
Operations ($): |
|
|
|
|
|
|
|
|
|
|
|
|
|
| |
Investment income—net |
|
| 3,839,414 |
|
|
| 5,115,523 |
| 565,046 |
|
|
| 958,944 |
| |
Net realized gain (loss) on investments |
| 32,594,373 |
|
|
| 10,190,516 |
| 10,238,394 |
|
|
| 9,494,738 |
| ||
Net unrealized appreciation (depreciation) |
| 8,923,695 |
|
|
| 12,033,907 |
| 1,654,655 |
|
|
| (1,037,847) |
| ||
Net Increase (Decrease) in Net Assets | 45,357,482 |
|
|
| 27,339,946 |
| 12,458,095 |
|
|
| 9,415,835 |
| |||
Distributions to Shareholders from ($): |
|
|
|
|
|
|
|
|
|
|
|
|
|
| |
Investment income—net: |
|
|
|
|
|
|
|
|
|
|
|
|
|
| |
Class M |
|
| (3,551,397) |
|
|
| (5,038,864) |
| (1,152,978) |
|
|
| (993,839) |
| |
Investor Shares |
|
| (97,932) |
|
|
| (118,371) |
| (7,124) |
|
|
| (6,507) |
| |
Net realized gain on investments: |
|
|
|
|
|
|
|
|
|
|
|
|
|
| |
Class M |
|
| (11,731,752) |
|
|
| (35,063,742) |
| (8,206,774) |
|
|
| (20,163,560) |
| |
Investor Shares |
|
| (397,965) |
|
|
| (1,058,366) |
| (83,930) |
|
|
| (191,924) |
| |
Total Distributions |
|
| (15,779,046) |
|
|
| (41,279,343) |
| (9,450,806) |
|
|
| (21,355,830) |
| |
Beneficial Interest Transactions ($): |
|
|
|
|
|
|
|
|
|
|
|
|
|
| |
Net proceeds from shares sold: |
|
|
|
|
|
|
|
|
|
|
|
|
|
| |
Class M |
|
| 18,032,405 |
|
|
| 72,557,074 |
| 3,142,900 |
|
|
| 9,388,484 |
| |
Investor Shares |
|
| 3,203,491 |
|
|
| 3,846,259 |
| 422,266 |
|
|
| 1,039,757 |
| |
Distributions reinvested: |
|
|
|
|
|
|
|
|
|
|
|
|
|
| |
Class M |
|
| 8,301,936 |
|
|
| 25,934,770 |
| 4,541,413 |
|
|
| 11,656,466 |
| |
Investor Shares |
|
| 477,188 |
|
|
| 1,037,543 |
| 59,851 |
|
|
| 73,976 |
| |
Cost of shares redeemed: |
|
|
|
|
|
|
|
|
|
|
|
|
|
| |
Class M |
|
| (104,524,357) |
|
|
| (155,481,485) |
| (25,281,654) |
|
|
| (56,086,712) |
| |
Investor Shares |
|
| (4,354,112) |
|
|
| (4,424,986) |
| (300,399) |
|
|
| (1,412,753) |
| |
Increase (Decrease) in Net Assets | (78,863,449) |
|
|
| (56,530,825) |
| (17,415,623) |
|
|
| (35,340,782) |
| |||
Total Increase (Decrease) in Net Assets | (49,285,013) |
|
|
| (70,470,222) |
| (14,408,334) |
|
|
| (47,280,777) |
| |||
Net Assets ($): |
|
|
|
|
|
|
|
|
|
|
|
|
|
| |
Beginning of Period |
|
| 337,913,960 |
|
|
| 408,384,182 |
| 84,095,295 |
|
|
| 131,376,072 |
| |
End of Period |
|
| 288,628,947 |
|
|
| 337,913,960 |
| 69,686,961 |
|
|
| 84,095,295 |
| |
| - |
|
|
| 17,929 |
| 137,607 |
|
|
| 703,655 |
| |||
Capital Share Transactions (Shares): |
|
|
|
|
|
|
|
|
|
|
|
|
|
| |
Class Ma |
|
|
|
|
|
|
|
|
|
|
|
|
|
| |
Shares sold |
|
| 3,082,461 |
|
|
| 13,199,296 |
| 266,829 |
|
|
| 783,965 |
| |
Shares issued for distributions reinvested |
|
| 1,490,525 |
|
|
| 4,590,390 |
| 403,323 |
|
|
| 1,036,130 |
| |
Shares redeemed |
|
| (17,925,467) |
|
|
| (27,226,111) |
| (2,121,253) |
|
|
| (4,747,498) |
| |
Net Increase (Decrease) in Shares Outstanding | (13,352,481) |
|
|
| (9,436,425) |
| (1,451,101) |
|
|
| (2,927,403) |
| |||
Investor Sharesa |
|
|
|
|
|
|
|
|
|
|
|
|
|
| |
Shares sold |
|
| 549,469 |
|
|
| 673,728 |
| 34,826 |
|
|
| 85,223 |
| |
Shares issued for distributions reinvested |
|
| 85,149 |
|
|
| 183,641 |
| 5,273 |
|
|
| 6,524 |
| |
Shares redeemed |
|
| (749,857) |
|
|
| (800,878) |
| (24,508) |
|
|
| (120,678) |
| |
Net Increase (Decrease) in Shares Outstanding | (115,239) |
|
|
| 56,491 |
| 15,591 |
|
|
| (28,931) |
| |||
|
| ||||||||||||||
aDuring the period ended August 31, 2017, 519,256 Class M shares representing $3,023,178 were exchanged for 518,985 Investor shares for BNY Mellon Large Cap Stock Fund and 23,925 Class M shares representing $290,411 were exchanged for 23,802 Investor shares for BNY Mellon Large Cap Market Opportunities Fund. During the period ended August 31, 2016, 636,777 Class M shares representing $3,652,970 were exchanged for 636,737 Investor shares for BNY Mellon Large Cap Stock Fund and 85,779 Class M shares representing $1,039,758 were exchanged for 85,223 Investor shares for BNY Mellon Large Cap Market Opportunities Fund. | |||||||||||||||
See notes to financial statements. | |||||||||||||||
92
|
|
|
| BNY Mellon Tax-Sensitive Large Cap Multi-Strategy Fund |
| BNY Mellon Income Stock Fund |
| ||||||||
|
|
|
| Year Ended August 31, | Year Ended August 31, | ||||||||||
|
|
|
| 2017 |
|
|
| 2016 |
| 2017 |
|
|
| 2016 |
|
Operations ($): |
|
|
|
|
|
|
|
|
|
|
|
|
|
| |
Investment income—net |
|
| 3,610,772 |
|
|
| 4,420,418 |
| 26,662,758 |
|
|
| 25,977,403 |
| |
Net realized gain (loss) on investments |
| 32,428,746 |
|
|
| 14,410,535 |
| 76,398,311 |
|
|
| 32,390,508 |
| ||
Net unrealized appreciation (depreciation) |
| 19,594,389 |
|
|
| 16,401,411 |
| 28,395,403 |
|
|
| 85,478,472 |
| ||
Net Increase (Decrease) in Net Assets | 55,633,907 |
|
|
| 35,232,364 |
| 131,456,472 |
|
|
| 143,846,383 |
| |||
Distributions to Shareholders from ($): |
|
|
|
|
|
|
|
|
|
|
|
|
|
| |
Investment income—net: |
|
|
|
|
|
|
|
|
|
|
|
|
|
| |
Class M |
|
| (5,084,395) |
|
|
| (3,971,525) |
| (24,231,708) |
|
|
| (25,629,571) |
| |
Investor Shares |
|
| (95,138) |
|
|
| (29,776) |
| (389,454) |
|
|
| (322,008) |
| |
Class A |
|
| - |
|
|
| - |
| (33,515) |
|
|
| (730) |
| |
Class C |
|
| - |
|
|
| - |
| (7,791) |
|
|
| (42) |
| |
Class I |
|
| - |
|
|
| - |
| (52,116) |
|
|
| (68) |
| |
Class Y |
|
| - |
|
|
| - |
| (227) |
|
|
| (68) |
| |
Net realized gain on investments: |
|
|
|
|
|
|
|
|
|
|
|
|
|
| |
Class M |
|
| (16,161,275) |
|
|
| (28,802,216) |
| (34,379,484) |
|
|
| (92,555,876) |
| |
Investor Shares |
|
| (340,491) |
|
|
| (294,305) |
| (575,328) |
|
|
| (1,309,191) |
| |
Class A |
|
| - |
|
|
| - |
| (12,719) |
|
|
| - |
| |
Class C |
|
| - |
|
|
| - |
| (8,853) |
|
|
| - |
| |
Class I |
|
| - |
|
|
| - |
| (640) |
|
|
| - |
| |
Class Y |
|
| - |
|
|
| - |
| (334) |
|
|
| - |
| |
Total Distributions |
|
| (21,681,299) |
|
|
| (33,097,822) |
| (59,692,169) |
|
|
| (119,817,554) |
| |
Beneficial Interest Transactions ($): |
|
|
|
|
|
|
|
|
|
|
|
|
|
| |
Net proceeds from shares sold: |
|
|
|
|
|
|
|
|
|
|
|
|
|
| |
Class M |
|
| 13,793,845 |
|
|
| 20,063,224 |
| 222,593,274 |
|
|
| 190,055,326 |
| |
Investor Shares |
|
| 4,543,884 |
|
|
| 3,813,536 |
| 22,859,011 |
|
|
| 12,965,028 |
| |
Class A |
|
| - |
|
|
| - |
| 5,389,041 |
|
|
| 309,740 |
| |
Class C |
|
| - |
|
|
| - |
| 1,382,623 |
|
|
| 10,000 |
| |
Class I |
|
| - |
|
|
| - |
| 6,471,234 |
|
|
| 10,000 |
| |
Class Y |
|
| - |
|
|
| - |
| - |
|
|
| 10,000 |
| |
Distributions reinvested: |
|
|
|
|
|
|
|
|
|
|
|
|
|
| |
Class M |
|
| 14,463,851 |
|
|
| 26,042,120 |
| 20,256,708 |
|
|
| 48,835,055 |
| |
Investor Shares |
|
| 346,837 |
|
|
| 190,229 |
| 790,208 |
|
|
| 1,256,712 |
| |
Class A |
|
| - |
|
|
| - |
| 45,390 |
|
|
| 668 |
| |
Class C |
|
| - |
|
|
| - |
| 16,179 |
|
|
| - |
| |
Class I |
|
| - |
|
|
| - |
| 52,196 |
|
|
| - |
| |
Cost of shares redeemed: |
|
|
|
|
|
|
|
|
|
|
|
|
|
| |
Class M |
|
| (69,907,179) |
|
|
| (105,105,070) |
| (195,706,156) |
|
|
| (271,832,105) |
| |
Investor Shares |
|
| (4,973,148) |
|
|
| (2,281,014) |
| (12,852,062) |
|
|
| (12,889,914) |
| |
Class A |
|
| - |
|
|
| - |
| (698,411) |
|
|
| (593) |
| |
Class C |
|
| - |
|
|
| - |
| (288,341) |
|
|
| - |
| |
Class I |
|
| - |
|
|
| - |
| (546,828) |
|
|
| - |
| |
Increase (Decrease) in Net Assets | (41,731,910) |
|
|
| (57,276,975) |
| 69,764,066 |
|
|
| (31,270,083) |
| |||
Total Increase (Decrease) in Net Assets | (7,779,302) |
|
|
| (55,142,433) |
| 141,528,369 |
|
|
| (7,241,254) |
| |||
Net Assets ($): |
|
|
|
|
|
|
|
|
|
|
|
|
|
| |
Beginning of Period |
|
| 350,948,700 |
|
|
| 406,091,133 |
| 1,084,733,806 |
|
|
| 1,091,975,060 |
| |
End of Period |
|
| 343,169,398 |
|
|
| 350,948,700 |
| 1,226,262,175 |
|
|
| 1,084,733,806 |
| |
Undistributed investment income—net | 1,602,702 |
|
|
| 3,174,531 |
| 2,349,664 |
|
|
| 426,403 |
| |||
93
STATEMENTS OF CHANGES IN NET ASSETS (continued)
|
|
|
| BNY Mellon Tax-Sensitive Large Cap Multi-Strategy Fund |
| BNY Mellon Income Stock Fund |
| ||||||||
|
|
|
| Year Ended August 31, | Year Ended August 31, | ||||||||||
|
|
|
| 2017 |
|
|
| 2016 |
| 2017 |
|
|
| 2016 |
|
Capital Share Transactions (Shares): |
|
|
|
|
|
|
|
|
|
|
|
|
|
| |
Class Ma |
|
|
|
|
|
|
|
|
|
|
|
|
|
| |
Shares sold |
|
| 897,855 |
|
|
| 1,421,130 |
| 24,391,573 |
|
|
| 23,224,898 |
| |
Shares issued for distributions reinvested |
|
| 970,728 |
|
|
| 1,874,883 |
| 2,317,614 |
|
|
| 5,950,165 |
| |
Shares redeemed |
|
| (4,486,873) |
|
|
| (7,597,018) |
| (21,563,169) |
|
|
| (32,488,848) |
| |
Net Increase (Decrease) in Shares Outstanding | (2,618,290) |
|
|
| (4,301,005) |
| 5,146,018 |
|
|
| (3,313,785) |
| |||
Investor Sharesa |
|
|
|
|
|
|
|
|
|
|
|
|
|
| |
Shares sold |
|
| 282,595 |
|
|
| 263,036 |
| 2,493,510 |
|
|
| 1,541,996 |
| |
Shares issued for distributions reinvested |
|
| 22,773 |
|
|
| 13,406 |
| 88,605 |
|
|
| 151,361 |
| |
Shares redeemed |
|
| (316,679) |
|
|
| (161,334) |
| (1,405,460) |
|
|
| (1,543,556) |
| |
Net Increase (Decrease) in Shares Outstanding | (11,311) |
|
|
| 115,108 |
| 1,176,655 |
|
|
| 149,801 |
| |||
Class A |
|
|
|
|
|
|
|
|
|
|
|
|
|
| |
Shares sold |
|
| - |
|
|
| - |
| 586,479 |
|
|
| 36,222 |
| |
Shares issued for distributions reinvested |
|
| - |
|
|
| - |
| 5,012 |
|
|
| 77 |
| |
Shares redeemed |
|
| - |
|
|
| - |
| (77,920) |
|
|
| (68) |
| |
Net Increase (Decrease) in Shares Outstanding | - |
|
|
| - |
| 513,571 |
|
|
| 36,231 |
| |||
Class C |
|
|
|
|
|
|
|
|
|
|
|
|
|
| |
Shares sold |
|
| - |
|
|
| - |
| 151,491 |
|
|
| 1,188 |
| |
Shares issued for distributions reinvested |
|
| - |
|
|
| - |
| 1,817 |
|
|
| - |
| |
Shares redeemed |
|
| - |
|
|
| - |
| (31,373) |
|
|
| - |
| |
Net Increase (Decrease) in Shares Outstanding | - |
|
|
| - |
| 121,935 |
|
|
| 1,188 |
| |||
Class I |
|
|
|
|
|
|
|
|
|
|
|
|
|
| |
Shares sold |
|
| - |
|
|
| - |
| 705,068 |
|
|
| 1,188 |
| |
Shares issued for distributions reinvested |
|
| - |
|
|
| - |
| 5,639 |
|
|
| - |
| |
Shares redeemed |
|
| - |
|
|
| - |
| (59,058) |
|
|
| - |
| |
Net Increase (Decrease) in Shares Outstanding | - |
|
|
| - |
| 651,649 |
|
|
| 1,188 |
| |||
Class Y |
|
|
|
|
|
|
|
|
|
|
|
|
|
| |
Shares sold |
|
| - |
|
|
| - |
| - |
|
|
| 1,188 |
| |
Net Increase (Decrease) in Shares Outstanding | - |
|
|
| - |
| - |
|
|
| 1,188 |
| |||
|
| ||||||||||||||
a During the period ended August 31, 2017, 318,522 Class M shares representing $4,977,043 were exchanged for 311,900 Investor shares for BNY Mellon Tax-Sensitive Large Cap Multi-Strategy Fund and 1,715,659 Class M shares representing $15,610,562 were exchanged for 1,698,369 Investor shares for BNY Mellon Income Stock Fund. During the period ended August 31, 2016, 268,510 Class M shares representing $3,813,537 were exchanged for 263,036 Investor shares for BNY Mellon Tax-Sensitive Large Cap Multi-Strategy Fund and 1,315,916 Class M shares representing $10,984,096 were exchanged for 1,303,790 Investor shares for BNY Mellon Income Stock Fund. | |||||||||||||||
See notes to financial statements. | |||||||||||||||
94
|
|
|
| BNY Mellon Mid Cap Multi-Strategy Fund |
| BNY Mellon Small Cap Multi-Strategy Fund |
| ||||||||
|
|
|
| Year Ended August 31, | Year Ended August 31, | ||||||||||
|
|
|
| 2017 |
|
|
| 2016 |
| 2017 |
|
|
| 2016 |
|
Operations ($): |
|
|
|
|
|
|
|
|
|
|
|
|
|
| |
Investment income—net |
|
| 11,643,452 |
|
|
| 13,789,659 |
| 193,402 |
|
|
| 130,234 |
| |
Net realized gain (loss) on investments |
| 118,148,460 |
|
|
| (2,304,821) |
| 43,027,917 |
|
|
| (1,214,105) |
| ||
Net unrealized appreciation (depreciation) |
| 193,029,893 |
|
|
| 171,394,229 |
| 27,837,466 |
|
|
| 19,086,467 |
| ||
Net Increase (Decrease) in Net Assets | 322,821,805 |
|
|
| 182,879,067 |
| 71,058,785 |
|
|
| 18,002,596 |
| |||
Distributions to Shareholders from ($): |
|
|
|
|
|
|
|
|
|
|
|
|
|
| |
Investment income—net: |
|
|
|
|
|
|
|
|
|
|
|
|
|
| |
Class M |
|
| (16,464,161) |
|
|
| (2,822,168) |
| - |
|
|
| - |
| |
Investor Shares |
|
| (331,178) |
|
|
| - |
| - |
|
|
| - |
| |
Net realized gain on investments: |
|
|
|
|
|
|
|
|
|
|
|
|
|
| |
Class M |
|
| (24,664,762) |
|
|
| (99,762,868) |
| (2,279,213) |
|
|
| (13,981,459) |
| |
Investor Shares |
|
| (718,775) |
|
|
| (2,536,473) |
| (91,392) |
|
|
| (530,824) |
| |
Total Distributions |
|
| (42,178,876) |
|
|
| (105,121,509) |
| (2,370,605) |
|
|
| (14,512,283) |
| |
Beneficial Interest Transactions ($): |
|
|
|
|
|
|
|
|
|
|
|
|
|
| |
Net proceeds from shares sold: |
|
|
|
|
|
|
|
|
|
|
|
|
|
| |
Class M |
|
| 380,656,004 |
|
|
| 577,209,414 |
| 93,296,638 |
|
|
| 67,461,797 |
| |
Investor Shares |
|
| 53,158,637 |
|
|
| 31,216,038 |
| 8,529,859 |
|
|
| 5,682,428 |
| |
Distributions reinvested: |
|
|
|
|
|
|
|
|
|
|
|
|
|
| |
Class M |
|
| 15,655,601 |
|
|
| 53,692,955 |
| 1,304,414 |
|
|
| 8,441,422 |
| |
Investor Shares |
|
| 850,935 |
|
|
| 2,166,218 |
| 73,462 |
|
|
| 418,602 |
| |
Cost of shares redeemed: |
|
|
|
|
|
|
|
|
|
|
|
|
|
| |
Class M |
|
| (313,953,735) |
|
|
| (473,433,640) |
| (42,999,303) |
|
|
| (57,867,164) |
| |
Investor Shares |
|
| (33,415,145) |
|
|
| (31,887,118) |
| (5,724,662) |
|
|
| (4,625,390) |
| |
Increase (Decrease) in Net Assets | 102,952,297 |
|
|
| 158,963,867 |
| 54,480,408 |
|
|
| 19,511,695 |
| |||
Total Increase (Decrease) in Net Assets | 383,595,226 |
|
|
| 236,721,425 |
| 123,168,588 |
|
|
| 23,002,008 |
| |||
Net Assets ($): |
|
|
|
|
|
|
|
|
|
|
|
|
|
| |
Beginning of Period |
|
| 2,493,234,418 |
|
|
| 2,256,512,993 |
| 404,175,149 |
|
|
| 381,173,141 |
| |
End of Period |
|
| 2,876,829,644 |
|
|
| 2,493,234,418 |
| 527,343,737 |
|
|
| 404,175,149 |
| |
Undistributed (distributions in excess of) | 5,505,432 |
|
|
| 12,297,344 |
| 130,188 |
|
|
| (155,182) |
| |||
Capital Share Transactions (Shares): |
|
|
|
|
|
|
|
|
|
|
|
|
|
| |
Class Ma |
|
|
|
|
|
|
|
|
|
|
|
|
|
| |
Shares sold |
|
| 23,907,927 |
|
|
| 41,588,266 |
| 4,974,843 |
|
|
| 4,430,097 |
| |
Shares issued for distributions reinvested |
|
| 1,008,088 |
|
|
| 3,922,057 |
| 70,054 |
|
|
| 550,647 |
| |
Shares redeemed |
|
| (20,075,659) |
|
|
| (33,628,797) |
| (2,319,640) |
|
|
| (3,780,833) |
| |
Net Increase (Decrease) in Shares Outstanding | 4,840,356 |
|
|
| 11,881,526 |
| 2,725,257 |
|
|
| 1,199,911 |
| |||
Investor Sharesa |
|
|
|
|
|
|
|
|
|
|
|
|
|
| |
Shares sold |
|
| 3,401,149 |
|
|
| 2,230,885 |
| 477,419 |
|
|
| 378,301 |
| |
Shares issued for distributions reinvested |
|
| 55,617 |
|
|
| 160,579 |
| 4,106 |
|
|
| 28,322 |
| |
Shares redeemed |
|
| (2,135,663) |
|
|
| (2,270,938) |
| (319,385) |
|
|
| (310,626) |
| |
Net Increase (Decrease) in Shares Outstanding | 1,321,103 |
|
|
| 120,526 |
| 162,140 |
|
|
| 95,997 |
| |||
|
| ||||||||||||||
a During the period ended August 31, 2017, 2,973,607 Class M shares representing $47,210,458 were exchanged for 3,021,358 Investor shares for BNY Mellon Mid Cap Multi-Strategy Fund and 402,709 Class M shares representing $7,470,648 were exchanged for 419,262 Investor shares for BNY Mellon Small Cap Multi-Strategy Fund. During the period ended August 31, 2016, 2,123,400 Class M shares representing $30,168,012 were exchanged for 2,155,326 Investor shares for BNY Mellon Mid Cap Multi-Strategy Fund and 292,734 Class M shares representing $4,524,411 were exchanged for 303,807 Investor shares for BNY Mellon Small Cap Multi-Strategy Fund. | |||||||||||||||
| |||||||||||||||
95
STATEMENTS OF CHANGES IN NET ASSETS (continued)
|
|
|
| BNY Mellon Focused Equity Opportunities Fund |
| BNY Mellon Small/Mid Cap Multi-Strategy Fund |
| ||||||||
|
|
|
| Year Ended August 31, | Year Ended August 31, | ||||||||||
|
|
|
| 2017 |
|
|
| 2016 |
| 2017 |
|
|
| 2016 |
|
Operations ($): |
|
|
|
|
|
|
|
|
|
|
|
|
|
| |
Investment income—net |
|
| 3,208,908 |
|
|
| 4,005,009 |
| 319,094 |
|
|
| 310,188 |
| |
Net realized gain (loss) on investments |
| 72,662,640 |
|
|
| 12,719,051 |
| 30,724,500 |
|
|
| (4,171,001) |
| ||
Net unrealized appreciation (depreciation) |
| 29,720,961 |
|
|
| 26,296,923 |
| 18,808,799 |
|
|
| 16,107,868 |
| ||
Net Increase (Decrease) in Net Assets | 105,592,509 |
|
|
| 43,020,983 |
| 49,852,393 |
|
|
| 12,247,055 |
| |||
Distributions to Shareholders from ($): |
|
|
|
|
|
|
|
|
|
|
|
|
|
| |
Investment income—net: |
|
|
|
|
|
|
|
|
|
|
|
|
|
| |
Class M |
|
| (5,192,351) |
|
|
| (3,773,879) |
| (240,001) |
|
|
| (882,016) |
| |
Investor Shares |
|
| (57,844) |
|
|
| (44,480) |
| - |
|
|
| - |
| |
Net realized gain on investments: |
|
|
|
|
|
|
|
|
|
|
|
|
|
| |
Class M |
|
| (32,053,374) |
|
|
| (43,223,639) |
| (1,043,174) |
|
|
| (18,614,519) |
| |
Investor Shares |
|
| (434,697) |
|
|
| (741,578) |
| (3,739) |
|
|
| (99,692) |
| |
Total Distributions |
|
| (37,738,266) |
|
|
| (47,783,576) |
| (1,286,914) |
|
|
| (19,596,227) |
| |
Beneficial Interest Transactions ($): |
|
|
|
|
|
|
|
|
|
|
|
|
|
| |
Net proceeds from shares sold: |
|
|
|
|
|
|
|
|
|
|
|
|
|
| |
Class M |
|
| 51,356,160 |
|
|
| 52,043,353 |
| 23,584,515 |
|
|
| 46,469,399 |
| |
Investor Shares |
|
| 4,965,899 |
|
|
| 5,906,819 |
| 3,740,966 |
|
|
| 4,776,272 |
| |
Distributions reinvested: |
|
|
|
|
|
|
|
|
|
|
|
|
|
| |
Class M |
|
| 20,715,198 |
|
|
| 27,138,539 |
| 783,850 |
|
|
| 13,917,271 |
| |
Investor Shares |
|
| 360,140 |
|
|
| 583,461 |
| 3,425 |
|
|
| 92,905 |
| |
Cost of shares redeemed: |
|
|
|
|
|
|
|
|
|
|
|
|
|
| |
Class M |
|
| (88,313,144) |
|
|
| (202,413,999) |
| (45,763,907) |
|
|
| (92,311,040) |
| |
Investor Shares |
|
| (4,329,680) |
|
|
| (10,109,483) |
| (2,337,406) |
|
|
| (4,713,819) |
| |
Increase (Decrease) in Net Assets | (15,245,427) |
|
|
| (126,851,310) |
| (19,988,557) |
|
|
| (31,769,012) |
| |||
Total Increase (Decrease) in Net Assets | 52,608,816 |
|
|
| (131,613,903) |
| 28,576,922 |
|
|
| (39,118,184) |
| |||
Net Assets ($): |
|
|
|
|
|
|
|
|
|
|
|
|
|
| |
Beginning of Period |
|
| 438,377,553 |
|
|
| 569,991,456 |
| 302,254,130 |
|
|
| 341,372,314 |
| |
End of Period |
|
| 490,986,369 |
|
|
| 438,377,553 |
| 330,831,052 |
|
|
| 302,254,130 |
| |
Undistributed (distributions in excess of) | 1,961,462 |
|
|
| 4,002,749 |
| 121,745 |
|
|
| (54,449) |
| |||
Capital Share Transactions (Shares): |
|
|
|
|
|
|
|
|
|
|
|
|
|
| |
Class Ma |
|
|
|
|
|
|
|
|
|
|
|
|
|
| |
Shares sold |
|
| 3,293,535 |
|
|
| 3,795,449 |
| 1,727,137 |
|
|
| 4,037,895 |
| |
Shares issued for distributions reinvested |
|
| 1,483,897 |
|
|
| 1,934,322 |
| 57,425 |
|
|
| 1,191,547 |
| |
Shares redeemed |
|
| (5,861,544) |
|
|
| (14,333,540) |
| (3,350,090) |
|
|
| (7,782,695) |
| |
Net Increase (Decrease) in Shares Outstanding | (1,084,112) |
|
|
| (8,603,769) |
| (1,565,528) |
|
|
| (2,553,253) |
| |||
Investor Sharesa |
|
|
|
|
|
|
|
|
|
|
|
|
|
| |
Shares sold |
|
| 331,171 |
|
|
| 422,614 |
| 264,995 |
|
|
| 412,467 |
| |
Shares issued for distributions reinvested |
|
| 25,984 |
|
|
| 41,855 |
| 254 |
|
|
| 8,023 |
| |
Shares redeemed |
|
| (293,241) |
|
|
| (764,929) |
| (177,477) |
|
|
| (404,619) |
| |
Net Increase (Decrease) in Shares Outstanding | 63,914 |
|
|
| (300,460) |
| 87,772 |
|
|
| 15,871 |
| |||
|
| ||||||||||||||
aDuring the period ended August 31, 2017, 324,024 Class M shares representing $4,898,429 were exchanged for 326,762 Investor shares for BNY Mellon Focused Equity Opportunities Fund and 240,045 Class M shares representing $3,420,916 were exchanged for 243,131 Investor shares for BNY Mellon Small/Mid Cap Multi-Strategy Fund. During the period ended August 31, 2016, 391,755 Class M shares representing $5,502,987 were exchanged for 394,747 Investor shares for BNY Mellon Focused Equity Opportunities Fund and 169,567 Class M shares representing $2,033,714 were exchanged for 171,228 Investor shares for BNY Mellon Small/Mid Cap Multi-Strategy Fund. | |||||||||||||||
| |||||||||||||||
96
|
|
|
| BNY Mellon International Fund |
| BNY Mellon Emerging Markets Fund |
| ||||||||
|
|
|
| Year Ended August 31, | Year Ended August 31, | ||||||||||
|
|
|
| 2017 |
|
|
| 2016 |
| 2017 |
|
|
| 2016 |
|
Operations ($): |
|
|
|
|
|
|
|
|
|
|
|
|
|
| |
Investment income—net |
|
| 16,406,749 |
|
|
| 16,614,498 |
| 6,168,008 |
|
|
| 8,520,792 |
| |
Net realized gain (loss) on investments |
| 16,178,160 |
|
|
| (53,693,892) |
| 47,227,766 |
|
|
| (110,700,968) |
| ||
Net unrealized appreciation (depreciation) |
| 147,128,511 |
|
|
| 20,246,908 |
| 128,400,910 |
|
|
| 182,867,352 |
| ||
Net Increase (Decrease) in Net Assets | 179,713,420 |
|
|
| (16,832,486) |
| 181,796,684 |
|
|
| 80,687,176 |
| |||
Distributions to Shareholders from ($): |
|
|
|
|
|
|
|
|
|
|
|
|
|
| |
Investment income—net: |
|
|
|
|
|
|
|
|
|
|
|
|
|
| |
Class M |
|
| (18,946,155) |
|
|
| (14,863,929) |
| (5,176,429) |
|
|
| (7,819,971) |
| |
Investor Shares |
|
| (189,658) |
|
|
| (121,406) |
| (73,944) |
|
|
| (55,653) |
| |
Total Distributions |
|
| (19,135,813) |
|
|
| (14,985,335) |
| (5,250,373) |
|
|
| (7,875,624) |
| |
Beneficial Interest Transactions ($): |
|
|
|
|
|
|
|
|
|
|
|
|
|
| |
Net proceeds from shares sold: |
|
|
|
|
|
|
|
|
|
|
|
|
|
| |
Class M |
|
| 151,215,147 |
|
|
| 380,266,326 |
| 167,463,648 |
|
|
| 147,194,029 |
| |
Investor Shares |
|
| 26,987,645 |
|
|
| 12,900,286 |
| 23,745,116 |
|
|
| 8,661,487 |
| |
Distributions reinvested: |
|
|
|
|
|
|
|
|
|
|
|
|
|
| |
Class M |
|
| 3,602,325 |
|
|
| 3,494,971 |
| 1,034,878 |
|
|
| 1,547,745 |
| |
Investor Shares |
|
| 152,750 |
|
|
| 95,702 |
| 68,623 |
|
|
| 49,972 |
| |
Cost of shares redeemed: |
|
|
|
|
|
|
|
|
|
|
|
|
|
| |
Class M |
|
| (243,709,088) |
|
|
| (350,168,168) |
| (130,130,682) |
|
|
| (635,316,728) |
| |
Investor Shares |
|
| (23,542,043) |
|
|
| (15,143,480) |
| (20,898,496) |
|
|
| (15,682,704) |
| |
Increase (Decrease) in Net Assets | (85,293,264) |
|
|
| 31,445,637 |
| 41,283,087 |
|
|
| (493,546,199) |
| |||
Total Increase (Decrease) in Net Assets | 75,284,343 |
|
|
| (372,184) |
| 217,829,398 |
|
|
| (420,734,647) |
| |||
Net Assets ($): |
|
|
|
|
|
|
|
|
|
|
|
|
|
| |
Beginning of Period |
|
| 1,019,304,811 |
|
|
| 1,019,676,995 |
| 704,914,256 |
|
|
| 1,125,648,903 |
| |
End of Period |
|
| 1,094,589,154 |
|
|
| 1,019,304,811 |
| 922,743,654 |
|
|
| 704,914,256 |
| |
Undistributed investment income—net | 15,505,542 |
|
|
| 16,013,632 |
| 5,241,896 |
|
|
| 5,002,369 |
| |||
Capital Share Transactions (Shares): |
|
|
|
|
|
|
|
|
|
|
|
|
|
| |
Class Ma |
|
|
|
|
|
|
|
|
|
|
|
|
|
| |
Shares sold |
|
| 12,825,198 |
|
|
| 34,356,918 |
| 17,330,357 |
|
|
| 18,947,324 |
| |
Shares issued for distributions reinvested |
|
| 329,884 |
|
|
| 309,563 |
| 122,181 |
|
|
| 198,429 |
| |
Shares redeemed |
|
| (21,256,636) |
|
|
| (31,873,355) |
| (14,245,310) |
|
|
| (80,717,669) |
| |
Net Increase (Decrease) in Shares Outstanding | (8,101,554) |
|
|
| 2,793,126 |
| 3,207,228 |
|
|
| (61,571,916) |
| |||
Investor Sharesa |
|
|
|
|
|
|
|
|
|
|
|
|
|
| |
Shares sold |
|
| 2,148,295 |
|
|
| 1,096,410 |
| 2,432,256 |
|
|
| 1,046,704 |
| |
Shares issued for distributions reinvested |
|
| 13,123 |
|
|
| 7,962 |
| 7,879 |
|
|
| 6,231 |
| |
Shares redeemed |
|
| (1,835,955) |
|
|
| (1,280,320) |
| (2,105,403) |
|
|
| (1,914,124) |
| |
Net Increase (Decrease) in Shares Outstanding | 325,463 |
|
|
| (175,948) |
| 334,732 |
|
|
| (861,189) |
| |||
|
| ||||||||||||||
a During the period ended August 31, 2017, 1,245,106 Class M shares representing $14,769,885 were exchanged for 1,169,756 Investor shares for BNY Mellon International Fund and 1,373,819 Class M shares representing $13,052,484 were exchanged for 1,337,426 Investor shares for BNY Mellon Emerging Markets Fund. During the period ended August 31, 2016, 1,092,642 Class M shares representing $12,065,116 were exchanged for 1,027,945 Investor shares for BNY Mellon International Fund and 1,029,819 Class M shares representing $8,297,400 were exchanged for 1,003,808 Investor shares for BNY Mellon Emerging Markets Fund. | |||||||||||||||
| |||||||||||||||
97
STATEMENTS OF CHANGES IN NET ASSETS (continued)
|
|
|
| BNY Mellon International Appreciation Fund |
| BNY Mellon International Equity Income Fund |
| ||||||||
|
|
|
| Year Ended August 31, | Year Ended August 31, | ||||||||||
|
|
|
| 2017 |
|
|
| 2016 |
| 2017 |
|
|
| 2016 |
|
Operations ($): |
|
|
|
|
|
|
|
|
|
|
|
|
|
| |
Investment income—net |
|
| 1,480,930 |
|
|
| 1,915,822 |
| 10,345,532 |
|
|
| 7,336,840 |
| |
Net realized gain (loss) on investments |
| (431,535) |
|
|
| (2,268,175) |
| 11,524,911 |
|
|
| (16,180,279) |
| ||
Net unrealized appreciation (depreciation) |
| 10,306,636 |
|
|
| (757,479) |
| 34,649,956 |
|
|
| 27,137,709 |
| ||
Net Increase (Decrease) in Net Assets | 11,356,031 |
|
|
| (1,109,832) |
| 56,520,399 |
|
|
| 18,294,270 |
| |||
Distributions to Shareholders from ($): |
|
|
|
|
|
|
|
|
|
|
|
|
|
| |
Investment income—net: |
|
|
|
|
|
|
|
|
|
|
|
|
|
| |
Class M |
|
| (1,926,533) |
|
|
| (2,143,484) |
| (9,852,699) |
|
|
| (6,886,640) |
| |
Investor Shares |
|
| (28,462) |
|
|
| (101,316) |
| (15,224) |
|
|
| (29,990) |
| |
Total Distributions |
|
| (1,954,995) |
|
|
| (2,244,800) |
| (9,867,923) |
|
|
| (6,916,630) |
| |
Beneficial Interest Transactions ($): |
|
|
|
|
|
|
|
|
|
|
|
|
|
| |
Net proceeds from shares sold: |
|
|
|
|
|
|
|
|
|
|
|
|
|
| |
Class M |
|
| 4,948,545 |
|
|
| 4,846,450 |
| 92,375,228 |
|
|
| 139,885,306 |
| |
Investor Shares |
|
| 221,820 |
|
|
| 125,002 |
| 13,395,013 |
|
|
| 1,225,206 |
| |
Distributions reinvested: |
|
|
|
|
|
|
|
|
|
|
|
|
|
| |
Class M |
|
| 130,124 |
|
|
| 137,561 |
| 2,615,445 |
|
|
| 1,942,320 |
| |
Investor Shares |
|
| 27,294 |
|
|
| 100,982 |
| 8,911 |
|
|
| 6,578 |
| |
Cost of shares redeemed: |
|
|
|
|
|
|
|
|
|
|
|
|
|
| |
Class M |
|
| (12,276,860) |
|
|
| (28,911,787) |
| (55,937,132) |
|
|
| (153,655,524) |
| |
Investor Shares |
|
| (3,395,282) |
|
|
| (677,068) |
| (12,519,547) |
|
|
| (3,430,287) |
| |
Increase (Decrease) in Net Assets | (10,344,359) |
|
|
| (24,378,860) |
| 39,937,918 |
|
|
| (14,026,401) |
| |||
Total Increase (Decrease) in Net Assets | (943,323) |
|
|
| (27,733,492) |
| 86,590,394 |
|
|
| (2,648,761) |
| |||
Net Assets ($): |
|
|
|
|
|
|
|
|
|
|
|
|
|
| |
Beginning of Period |
|
| 78,255,531 |
|
|
| 105,989,023 |
| 283,373,773 |
|
|
| 286,022,534 |
| |
End of Period |
|
| 77,312,208 |
|
|
| 78,255,531 |
| 369,964,167 |
|
|
| 283,373,773 |
| |
Undistributed investment income—net | 1,114,984 |
|
|
| 1,572,619 |
| 4,550,128 |
|
|
| 2,689,974 |
| |||
Capital Share Transactions (Shares): |
|
|
|
|
|
|
|
|
|
|
|
|
|
| |
Class Ma |
|
|
|
|
|
|
|
|
|
|
|
|
|
| |
Shares sold |
|
| 389,152 |
|
|
| 404,809 |
| 7,185,399 |
|
|
| 11,929,496 |
| |
Shares issued for distributions reinvested |
|
| 10,962 |
|
|
| 11,570 |
| 204,949 |
|
|
| 166,343 |
| |
Shares redeemed |
|
| (982,512) |
|
|
| (2,427,127) |
| (4,378,738) |
|
|
| (12,952,594) |
| |
Net Increase (Decrease) in Shares Outstanding | (582,398) |
|
|
| (2,010,748) |
| 3,011,610 |
|
|
| (856,755) |
| |||
Investor Sharesa |
|
|
|
|
|
|
|
|
|
|
|
|
|
| |
Shares sold |
|
| 18,186 |
|
|
| 11,046 |
| 1,013,608 |
|
|
| 102,872 |
| |
Shares issued for distributions reinvested |
|
| 2,315 |
|
|
| 8,579 |
| 700 |
|
|
| 555 |
| |
Shares redeemed |
|
| (278,469) |
|
|
| (59,284) |
| (926,932) |
|
|
| (286,295) |
| |
Net Increase (Decrease) in Shares Outstanding | (257,968) |
|
|
| (39,659) |
| 87,376 |
|
|
| (182,868) |
| |||
|
| ||||||||||||||
aDuring the period ended August 31, 2017, 17,879 Class M shares representing $220,375 were exchanged for 18,066 Investor shares for BNY Mellon International Appreciation Fund and 225,273 Class M shares representing $2,972,782 were exchanged for 222,915 Investor shares for BNY Mellon International Equity Income Fund. During the period ended August 31, 2016, 103,388 Class M shares representing $1,221,348 were exchanged for 102,528 Investor shares for NY Mellon International Equity Income Fund. | |||||||||||||||
| |||||||||||||||
98
|
|
|
| BNY Mellon Asset Allocation Fund |
| ||||
|
|
|
| Year Ended August 31, | |||||
|
|
|
| 2017 |
|
|
| 2016 |
|
Operations ($): |
|
|
|
|
|
|
|
| |
Investment income—net |
|
| 6,813,912 |
|
|
| 6,847,325 |
| |
Net realized gain (loss) on investments |
| 12,926,294 |
|
|
| 4,476,666 |
| ||
Net unrealized appreciation (depreciation) |
| 30,545,443 |
|
|
| 11,159,883 |
| ||
Net Increase (Decrease) in Net Assets | 50,285,649 |
|
|
| 22,483,874 |
| |||
Distributions to Shareholders from ($): |
|
|
|
|
|
|
|
| |
Investment income—net: |
|
|
|
|
|
|
|
| |
Class M |
|
| (7,721,467) |
|
|
| (7,375,237) |
| |
Investor Shares |
|
| (88,101) |
|
|
| (88,615) |
| |
Net realized gain on investments: |
|
|
|
|
|
|
|
| |
Class M |
|
| (3,794,493) |
|
|
| (22,663,275) |
| |
Investor Shares |
|
| (47,678) |
|
|
| (306,583) |
| |
Total Distributions |
|
| (11,651,739) |
|
|
| (30,433,710) |
| |
Beneficial Interest Transactions ($): |
|
|
|
|
|
|
|
| |
Net proceeds from shares sold: |
|
|
|
|
|
|
|
| |
Class M |
|
| 24,788,099 |
|
|
| 40,469,197 |
| |
Investor Shares |
|
| 5,291,045 |
|
|
| 2,117,131 |
| |
Distributions reinvested: |
|
|
|
|
|
|
|
| |
Class M |
|
| 3,609,322 |
|
|
| 18,961,989 |
| |
Investor Shares |
|
| 126,112 |
|
|
| 365,940 |
| |
Cost of shares redeemed: |
|
|
|
|
|
|
|
| |
Class M |
|
| (50,789,034) |
|
|
| (74,573,494) |
| |
Investor Shares |
|
| (4,302,297) |
|
|
| (3,684,506) |
| |
Increase (Decrease) in Net Assets | (21,276,753) |
|
|
| (16,343,743) |
| |||
Total Increase (Decrease) in Net Assets | 17,357,157 |
|
|
| (24,293,579) |
| |||
Net Assets ($): |
|
|
|
|
|
|
|
| |
Beginning of Period |
|
| 449,529,988 |
|
|
| 473,823,567 |
| |
End of Period |
|
| 466,887,145 |
|
|
| 449,529,988 |
| |
Undistributed investment income—net | 125,245 |
|
|
| 429,889 |
| |||
Capital Share Transactions (Shares): |
|
|
|
|
|
|
|
| |
Class Ma |
|
|
|
|
|
|
|
| |
Shares sold |
|
| 2,119,243 |
|
|
| 3,665,671 |
| |
Shares issued for distributions reinvested |
|
| 319,341 |
|
|
| 1,737,267 |
| |
Shares redeemed |
|
| (4,348,773) |
|
|
| (6,706,655) |
| |
Net Increase (Decrease) in Shares Outstanding | (1,910,189) |
|
|
| (1,303,717) |
| |||
Investor Sharesa |
|
|
|
|
|
|
|
| |
Shares sold |
|
| 450,242 |
|
|
| 192,637 |
| |
Shares issued for distributions reinvested |
|
| 10,946 |
|
|
| 33,220 |
| |
Shares redeemed |
|
| (367,506) |
|
|
| (326,994) |
| |
Net Increase (Decrease) in Shares Outstanding | 93,682 |
|
|
| (101,137) |
| |||
| |||||||||
aDuring the period ended August 31, 2017, 430,765 Class M shares representing $5,025,248 were exchanged for 427,759 Investor shares for BNY Mellon Asset Allocation Fund. | |||||||||
| |||||||||
99
FINANCIAL HIGHLIGHTS
The following tables describe the performance for each share class of each fund for the fiscal periods indicated. All information (except portfolio turnover rate) reflects financial results for a single fund share. Total return shows how much your investment in each fund would have increased (or decreased) during each period, assuming you had reinvested all dividends and distributions. These figures have been derived from the funds’ financial statements.
Class M | ||||||
Year Ended August 31, | ||||||
BNY Mellon Large Cap Stock Fund | 2017 | 2016 | 2015 | 2014 | 2013 | |
Per Share Data ($): | ||||||
Net asset value, beginning of period | 5.67 | 5.92 | 7.15 | 9.97 | 9.17 | |
Investment Operations: | ||||||
Investment income—net a | .07 | .08 | .09 | .09 | .12 | |
Net realized and unrealized | .81 | .34 | (.04) | 1.88 | 1.21 | |
Total from Investment Operations | .88 | .42 | .05 | 1.97 | 1.33 | |
Distributions: | ||||||
Dividends from investment income—net | (.07) | (.08) | (.08) | (.10) | (.12) | |
Dividends from net realized gain on investments | (.23) | (.59) | (1.20) | (4.69) | (.41) | |
Total Distributions | (.30) | (.67) | (1.28) | (4.79) | (.53) | |
Net asset value, end of period | 6.25 | 5.67 | 5.92 | 7.15 | 9.97 | |
Total Return (%) | 16.12 | 7.31 | .12 | 26.27 | 15.16 | |
Ratios/Supplemental Data (%) | ||||||
Ratio of total expenses to average net assets | .84 | .83 | .81 | .81 | .80 | |
Ratio of net expenses to average net assets | .84 | .83 | .81 | .81 | .80 | |
Ratio of net investment income | 1.27 | 1.44 | 1.32 | 1.20 | 1.23 | |
Portfolio Turnover | 46.36 | 49.82 | 52.80 | 142.41 | 50.96 | |
Net Assets, end of period ($ x 1,000) | 278,536 | 328,113 | 398,485 | 468,446 | 732,612 | |
a Based on average shares outstanding.
See notes to financial statements.
100
Investor Shares | ||||||
Year Ended August 31, | ||||||
BNY Mellon Large Cap Stock Fund | 2017 | 2016 | 2015 | 2014 | 2013 | |
Per Share Data ($): | ||||||
Net asset value, beginning of period | 5.67 | 5.92 | 7.15 | 9.97 | 9.17 | |
Investment Operations: | ||||||
Investment income—net a | .06 | .07 | .07 | .07 | .09 | |
Net realized and unrealized | .82 | .34 | (.03) | 1.88 | 1.21 | |
Total from Investment Operations | .88 | .41 | .04 | 1.95 | 1.30 | |
Distributions: | ||||||
Dividends from investment income—net | (.06) | (.07) | (.07) | (.08) | (.09) | |
Dividends from net realized gain on investments | (.23) | (.59) | (1.20) | (4.69) | (.41) | |
Total Distributions | (.29) | (.66) | (1.27) | (4.77) | (.50) | |
Net asset value, end of period | 6.26 | 5.67 | 5.92 | 7.15 | 9.97 | |
Total Return (%) | 16.02 | 7.04 | (.13) | 25.96 | 14.87 | |
Ratios/Supplemental Data (%): | ||||||
Ratio of total expenses to average net assets | 1.09 | 1.08 | 1.06 | 1.06 | 1.06 | |
Ratio of net expenses to average net assets | 1.09 | 1.08 | 1.06 | 1.06 | 1.06 | |
Ratio of net investment income | 1.02 | 1.18 | 1.08 | .93 | .99 | |
Portfolio Turnover Rate | 46.36 | 49.82 | 52.80 | 142.41 | 50.96 | |
Net Assets, end of period ($ x 1,000) | 10,093 | 9,801 | 9,900 | 12,672 | 20,165 | |
a Based on average shares outstanding.
See notes to financial statements.
101
FINANCIAL HIGHLIGHTS (continued)
Class M | ||||||
Year Ended August 31, | ||||||
BNY Mellon Large Cap | 2017 | 2016 | 2015 | 2014 | 2013 | |
Per Share Data ($): | ||||||
Net asset value, beginning of period | 12.09 | 13.25 | 16.21 | 14.21 | 12.16 | |
Investment Operations: | ||||||
Investment income—net a | .09 | .11 | .11 | .11 | .10 | |
Net realized and unrealized | 1.98 | 1.08 | (.28) | 3.13 | 2.03 | |
Total from Investment Operations | 2.07 | 1.19 | (.17) | 3.24 | 2.13 | |
Distributions: | ||||||
Dividends from investment income—net | (.19) | (.11) | (.25) | (.18) | (.08) | |
Dividends from net realized gain on investments | (1.35) | (2.24) | (2.54) | (1.06) | - | |
Total Distributions | (1.54) | (2.35) | (2.79) | (1.24) | (.08) | |
Net asset value, end of period | 12.62 | 12.09 | 13.25 | 16.21 | 14.21 | |
Total Return (%) | 18.68 | 10.27 | (1.72) | 23.67 | 17.64 | |
Ratios/Supplemental Data (%): | ||||||
Ratio of total expenses to average net assets b | .66 | .60 | .53 | .53 | .79 | |
Ratio of net expenses to average net assets b | .66 | .60 | .53 | .53 | .79 | |
Ratio of net investment income | .78 | .92 | .78 | .69 | .76 | |
Portfolio Turnover | 30.26 | 19.43 | 30.75 | 26.42 | 78.41 | |
Net Assets, end of period ($ x 1,000) | 68,786 | 83,425 | 130,257 | 192,209 | 216,116 | |
a Based on average shares outstanding.
b Amount does not include the expenses of the underlying funds.
See notes to financial statements.
102
Investor Shares | ||||||
Year Ended August 31, | ||||||
BNY Mellon Large Cap | 2017 | 2016 | 2015 | 2014 | 2013 | |
Per Share Data ($): | ||||||
Net asset value, beginning of period | 12.16 | 13.32 | 16.29 | 14.28 | 12.25 | |
Investment Operations: | ||||||
Investment income—net a | .05 | .09 | .07 | .06 | .07 | |
Net realized and unrealized | 2.00 | 1.07 | (.28) | 3.17 | 2.04 | |
Total from Investment Operations | 2.05 | 1.16 | (.21) | 3.23 | 2.11 | |
Distributions: | ||||||
Dividends from investment income—net | (.11) | (.08) | (.22) | (.16) | (.08) | |
Dividends from net realized gain on investments | (1.35) | (2.24) | (2.54) | (1.06) | - | |
Total Distributions | (1.46) | (2.32) | (2.76) | (1.22) | (.08) | |
Net asset value, end of period | 12.75 | 12.16 | 13.32 | 16.29 | 14.28 | |
Total Return (%) | 18.41 | 9.90 | (1.99) | 23.54 | 17.29 | |
Ratios/Supplemental Data (%): | ||||||
Ratio of total expenses to average net assets b | .91 | .84 | .79 | .81 | 1.05 | |
Ratio of net expenses to average net assets b | .91 | .84 | .79 | .81 | 1.05 | |
Ratio of net investment income | .44 | .76 | .50 | .45 | .48 | |
Portfolio Turnover | 30.26 | 19.43 | 30.75 | 26.42 | 78.41 | |
Net Assets, end of period ($ x 1,000) | 901 | 670 | 1,119 | 631 | 103 | |
a Based on average shares outstanding.
b Amount does not include the expenses of the underlying funds.
See notes to financial statements.
103
FINANCIAL HIGHLIGHTS (continued)
Class M | ||||||||||
Year Ended August 31, | ||||||||||
BNY Mellon Tax-Sensitive Large Cap | 2017 | 2016 |
| 2015 |
| 2014 |
| 2013 |
| |
Per Share Data ($): | ||||||||||
Net asset value, beginning of period | 14.98 | 14.71 | 17.12 | 14.45 | 12.50 | |||||
Investment Operations: | ||||||||||
Investment income—net a | .16 | .17 | .16 | .15 | .13 | |||||
Net realized and unrealized | 2.31 | 1.33 | (.23) | 3.22 | 1.93 | |||||
Total from Investment Operations | 2.47 | 1.50 | (.07) | 3.37 | 2.06 | |||||
Distributions: | ||||||||||
Dividends from investment income—net | (.23) | (.15) | (.26) | (.20) | (.11) | |||||
Dividends from net realized gain on investments | (.72) | (1.08) | (2.08) | (.50) | — | |||||
Total Distributions | (.95) | (1.23) | (2.34) | (.70) | (.11) | |||||
Net asset value, end of period | 16.50 | 14.98 | 14.71 | 17.12 | 14.45 | |||||
Total Return (%) | 17.13 | 10.86 | (.94) | 23.82 | 16.60 | |||||
Ratios/Supplemental Data (%): | ||||||||||
Ratio of total expenses to average net assets b | .65 | .64 | .61 | .61 | .79 | |||||
Ratio of net expenses to average net assets b | .65 | .64 | .61 | .61 | .79 | |||||
Ratio of net investment income | 1.05 | 1.19 | .99 | .95 | .97 | |||||
Portfolio Turnover | 24.05 | 13.81 | 20.63 | 13.01 | 82.04 | |||||
Net Assets, end of period ($ x 1,000) | 336,659 | 344,867 | 401,855 | 474,496 | 638,085 | |||||
a Based on average shares outstanding.
b Amount does not include the expenses of the underlying funds.
See notes to financial statements.
104
Investor Shares | ||||||||||
Year Ended August 31, | ||||||||||
BNY Mellon Tax-Sensitive Large Cap | 2017 | 2016 |
| 2015 |
| 2014 |
| 2013 |
| |
Per Share Data ($): | ||||||||||
Net asset value, beginning of period | 15.28 | 14.98 | 17.40 | 14.64 | 12.41 | |||||
Investment Operations: | ||||||||||
Investment income—net a | .13 | .14 | .12 | .08 | .13 | |||||
Net realized and unrealized | 2.35 | 1.35 | (.23) | 3.30 | 2.10 | |||||
Total from Investment Operations | 2.48 | 1.49 | (.11) | 3.38 | 2.23 | |||||
Distributions: | ||||||||||
Dividends from investment income—net | (.20) | (.11) | (.23) | (.12) | — | |||||
Dividends from net realized gain on investments | (.72) | (1.08) | (2.08) | (.50) | — | |||||
Total Distributions | (.92) | (1.19) | (2.31) | (.62) | — | |||||
Net asset value, end of period | 16.84 | 15.28 | 14.98 | 17.40 | 14.64 | |||||
Total Return (%) | 16.87 | 10.56 | (1.19) | 23.47 | 17.97 | |||||
Ratios/Supplemental Data (%): | ||||||||||
Ratio of total expenses to average net assets b | .90 | .89 | .86 | .87 | 1.05 | |||||
Ratio of net expenses to average net assets b | .90 | .89 | .86 | .87 | 1.03 | |||||
Ratio of net investment income | .81 | .97 | .74 | .53 | .89 | |||||
Portfolio Turnover Rate | 24.05 | 13.81 | 20.63 | 13.01 | 82.04 | |||||
Net Assets, end of period ($ x 1,000) | 6,511 | 6,081 | 4,237 | 3,859 | 1,196 | |||||
a Based on average shares outstanding.
b Amount does not include the expenses of the underlying funds.
See notes to financial statements.
105
FINANCIAL HIGHLIGHTS (continued)
Class M | ||||||||||
Year Ended August 31, | ||||||||||
BNY Mellon Income Stock Fund | 2017 | 2016 |
| 2015 |
| 2014 |
| 2013 |
| |
Per Share Data ($): | ||||||||||
Net asset value, beginning of period | 8.72 | 8.57 | 9.94 | 8.39 | 6.99 | |||||
Investment Operations: | ||||||||||
Investment income—net a | .21 | .21 | .19 | .19 | .24 | |||||
Net realized and unrealized | .83 | .94 | (.38) | 1.86 | 1.41 | |||||
Total From Investment Operations | 1.04 | 1.15 | (.19) | 2.05 | 1.65 | |||||
Distributions: | ||||||||||
Dividends from investment income—net | (.19) | (.21) | (.19) | (.19) | (.24) | |||||
Dividends from net realized gain on investments | (.28) | (.79) | (.99) | (.31) | (.01) | |||||
Total Distributions | (.47) | (1.00) | (1.18) | (.50) | (.25) | |||||
Net asset value, end of period | 9.29 | 8.72 | 8.57 | 9.94 | 8.39 | |||||
Total Return (%) | 12.33 | 14.33 | (2.28) | 25.17 | 24.01 | |||||
Ratios/Supplemental Data (%): | ||||||||||
Ratio of total expenses to average net assets | .81 | .81 | .80 | .80 | .81 | |||||
Ratio of net expenses to average net assets | .81 | .81 | .80 | .80 | .81 | |||||
Ratio of net investment income | 2.28 | 2.54 | 2.06 | 2.08 | 3.03 | |||||
Portfolio Turnover | 52.66 | 54.31 | 65.75 | 57.74 | 41.79 | |||||
Net Assets, end of period ($ x 1,000) | 1,185,723 | 1,068,292 | 1,077,496 | 1,254,622 | 981,444 | |||||
a Based on average shares outstanding.
See notes to financial statements.
106
Investor Shares | ||||||||||
Year Ended August 31, | ||||||||||
BNY Mellon Income Stock Fund | 2017 | 2016 |
| 2015 |
| 2014 |
| 2013 |
| |
Per Share Data ($): | ||||||||||
Net asset value, beginning of period | 8.81 | 8.63 | 10.02 | 8.45 | 7.04 | |||||
Investment Operations: | ||||||||||
Investment income—net a | .19 | .19 | .17 | .16 | .22 | |||||
Net realized and unrealized | .84 | .97 | (.40) | 1.89 | 1.43 | |||||
Total from Investment Operations | 1.03 | 1.16 | (.23) | 2.05 | 1.65 | |||||
Distributions: | ||||||||||
Dividends from investment income—net | (.17) | (.19) | (.17) | (.17) | (.23) | |||||
Dividends from net realized gain on investments | (.28) | (.79) | (.99) | (.31) | (.01) | |||||
Total Distributions | (.45) | (.98) | (1.16) | (.48) | (.24) | |||||
Net asset value, end of period | 9.39 | 8.81 | 8.63 | 10.02 | 8.45 | |||||
Total Return (%) | 12.02 | 14.14 | (2.64) | 24.75 | 23.84 | |||||
Ratios/Supplemental Data (%): | ||||||||||
Ratio of total expenses to average net assets | 1.06 | 1.06 | 1.05 | 1.07 | 1.06 | |||||
Ratio of net expenses to average net assets | 1.06 | 1.06 | 1.05 | 1.07 | 1.06 | |||||
Ratio of net investment income | 2.03 | 2.27 | 1.81 | 1.74 | 2.80 | |||||
Portfolio Turnover Rate | 52.66 | 54.31 | 65.75 | 57.74 | 41.79 | |||||
Net Assets, end of period ($ x 1,000) | 28,204 | 16,094 | 14,479 | 13,913 | 2,809 | |||||
a Based on average shares outstanding.
See notes to financial statements.
107
FINANCIAL HIGHLIGHTS (continued)
Class A | ||||||||||
Year Ended August 31, | ||||||||||
BNY Mellon Income Stock Fund | 2017 | 2016 | a | |||||||
Per Share Data ($): | ||||||||||
Net asset value, beginning of period | 8.72 | 8.42 | ||||||||
Investment Operations: | ||||||||||
Investment income—net b | .17 | .05 | ||||||||
Net realized and unrealized gain (loss) on investments | .86 | .30 | ||||||||
Total from Investment Operations | 1.03 | .35 | ||||||||
Distributions: | ||||||||||
Dividends from investment income—net | (.17) | (.05) | ||||||||
Dividends from net realized gain on investments | (.28) | — | ||||||||
Total Distributions | (.45) | (.05) | ||||||||
Net asset value, end of period | 9.30 | 8.72 | ||||||||
Total Return (%) c | 12.18 | 4.19 | d | |||||||
Ratios/Supplemental Data (%): | ||||||||||
Ratio of total expenses to average net assets | 1.11 | 1.15 | e | |||||||
Ratio of net expenses to average net assets | 1.10 | 1.15 | e | |||||||
Ratio of net investment income to average net assets | 2.01 | 1.96 | e | |||||||
Portfolio Turnover Rate | 52.66 | 54.31 | ||||||||
Net Assets, end of period ($ x 1,000) | 5,112 | 316 | ||||||||
a From May 31, 2016 (commencement of initial offering) to August 31, 2016.
b Based on average shares outstanding.
c Exclusive of sales charge.
d Not annualized.
e Annualized.
See notes to financial statements.
108
Class C | ||||||||||
Year Ended August 31, | ||||||||||
BNY Mellon Income Stock Fund | 2017 | 2016 | a | |||||||
Per Share Data ($): | ||||||||||
Net asset value, beginning of period | 8.72 | 8.42 | ||||||||
Investment Operations: | ||||||||||
Investment income—net b | .12 | .04 | ||||||||
Net realized and unrealized gain (loss) on investments | .83 | .30 | ||||||||
Total from Investment Operations | .95 | .34 | ||||||||
Distributions: | ||||||||||
Dividends from investment income—net | (.11) | (.04) | ||||||||
Dividends from net realized gain on investments | (.28) | — | ||||||||
Total Distributions | (.39) | (.04) | ||||||||
Net asset value, end of period | 9.28 | 8.72 | ||||||||
Total Return (%) c | 11.22 | 4.00 | d | |||||||
Ratios/Supplemental Data (%): | ||||||||||
Ratio of total expenses to average net assets | 1.85 | 1.85 | e | |||||||
Ratio of net expenses to average net assets | 1.81 | 1.85 | e | |||||||
Ratio of net investment income to average net assets | 1.30 | 1.69 | e | |||||||
Portfolio Turnover Rate | 52.66 | 54.31 | ||||||||
Net Assets, end of period ($ x 1,000) | 1,143 | 10 | ||||||||
a From May 31, 2016 (commencement of initial offering) to August 31, 2016.
b Based on average shares outstanding.
c Exclusive of sales charge.
d Not annualized.
e Annualized.
See notes to financial statements.
109
FINANCIAL HIGHLIGHTS (continued)
Class I | ||||||||||
Year Ended August 31, | ||||||||||
BNY Mellon Income Stock Fund | 2017 | 2016 | a | |||||||
Per Share Data ($): | ||||||||||
Net asset value, beginning of period | 8.72 | 8.42 | ||||||||
Investment Operations: | ||||||||||
Investment income—net b | .21 | .06 | ||||||||
Net realized and unrealized gain (loss) on investments | .84 | .30 | ||||||||
Total from Investment Operations | 1.05 | .36 | ||||||||
Distributions: | ||||||||||
Dividends from investment income—net | (.19) | (.06) | ||||||||
Dividends from net realized gain on investments | (.28) | — | ||||||||
Total Distributions | (.47) | (.06) | ||||||||
Net asset value, end of period | 9.30 | 8.72 | ||||||||
Total Return (%) | 12.44 | 4.26 | c | |||||||
Ratios/Supplemental Data (%): | ||||||||||
Ratio of total expenses to average net assets | .85 | .86 | d | |||||||
Ratio of net expenses to average net assets | .85 | .86 | d | |||||||
Ratio of net investment income to average net assets | 2.30 | 2.71 | d | |||||||
Portfolio Turnover Rate | 52.66 | 54.31 | ||||||||
Net Assets, end of period ($ x 1,000) | 6,068 | 10 | ||||||||
a From May 31, 2016 (commencement of initial offering) to August 31, 2016.
b Based on average shares outstanding.
c Not annualized.
d Annualized.
See notes to financial statements.
110
Class Y | ||||||||||
Year Ended August 31, | ||||||||||
BNY Mellon Income Stock Fund | 2017 | 2016 | a | |||||||
Per Share Data ($): | ||||||||||
Net asset value, beginning of period | 8.72 | 8.42 | ||||||||
Investment Operations: | ||||||||||
Investment income—net b | .21 | .06 | ||||||||
Net realized and unrealized gain (loss) on investments | .83 | .30 | ||||||||
Total from Investment Operations | 1.04 | .36 | ||||||||
Distributions: | ||||||||||
Dividends from investment income—net | (.19) | (.06) | ||||||||
Dividends from net realized gain on investments | (.28) | — | ||||||||
Total Distributions | (.47) | (.06) | ||||||||
Net asset value, end of period | 9.29 | 8.72 | ||||||||
Total Return (%) | 12.33 | 4.26 | c | |||||||
Ratios/Supplemental Data (%): | ||||||||||
Ratio of total expenses to average net assets | .81 | .86 | d | |||||||
Ratio of net expenses to average net assets | .81 | .86 | d | |||||||
Ratio of net investment income to average net assets | 2.27 | 2.71 | d | |||||||
Portfolio Turnover Rate | 52.66 | 54.31 | ||||||||
Net Assets, end of period ($ x 1,000) | 11 | 10 | ||||||||
a From May 31, 2016 (commencement of initial offering) to August 31, 2016.
b Based on average shares outstanding.
c Not annualized.
d Annualized.
See notes to financial statements.
111
FINANCIAL HIGHLIGHTS (continued)
Class M | ||||||||||
Year Ended August 31, | ||||||||||
BNY Mellon Mid Cap Multi-Strategy Fund | 2017 | 2016 |
| 2015 |
| 2014 |
| 2013 |
| |
Per Share Data ($): | ||||||||||
Net asset value, beginning of period | 15.03 | 14.66 | 15.58 | 13.33 | 11.65 | |||||
Investment Operations: | ||||||||||
Investment income—net a | .07 | .08 | .05 | .05 | .07 | |||||
Net realized and unrealized | 1.88 | .96 | (.04) | 2.94 | 2.60 | |||||
Total from Investment Operations | 1.95 | 1.04 | .01 | 2.99 | 2.67 | |||||
Distributions: | ||||||||||
Dividends from investment income—net | (.10) | (.02) | (.04) | (.05) | (.03) | |||||
Dividends from net realized gain on investments | (.16) | (.65) | (.89) | (.69) | (.96) | |||||
Total Distributions | (.26) | (.67) | (.93) | (.74) | (.99) | |||||
Net asset value, end of period | 16.72 | 15.03 | 14.66 | 15.58 | 13.33 | |||||
Total Return (%) | 13.12 | 7.51 | .15 | 23.09 | 24.74 | |||||
Ratios/Supplemental Data (%): | ||||||||||
Ratio of total expenses to average net assets | .90 | .90 | .90 | .90 | .92 | |||||
Ratio of net expenses to average net assets | .90 | .90 | .90 | .90 | .92 | |||||
Ratio of net investment income | .45 | .60 | .29 | .33 | .59 | |||||
Portfolio Turnover | 62.81 | 74.68 | 73.87 | 53.63 | 106.59 | |||||
Net Assets, end of period ($ x 1,000) | 2,788,133 | 2,433,012 | 2,199,395 | 1,922,073 | 1,572,562 | |||||
a Based on average shares outstanding.
See notes to financial statements.
112
Investor Shares | ||||||||||
Year Ended August 31, | ||||||||||
BNY Mellon Mid Cap Multi-Strategy Fund | 2017 | 2016 |
| 2015 |
| 2014 |
| 2013 |
| |
Per Share Data ($): | ||||||||||
Net asset value, beginning of period | 14.79 | 14.45 | 15.37 | 13.17 | 11.52 | |||||
Investment Operations: | ||||||||||
Investment income—net a | .03 | .05 | .01 | .01 | .04 | |||||
Net realized and unrealized | 1.86 | .94 | (.03) | 2.91 | 2.57 | |||||
Total from Investment Operations | 1.89 | .99 | (.02) | 2.92 | 2.61 | |||||
Distributions: | ||||||||||
Dividends from investment income—net | (.07) | — | (.01) | (.03) | — | |||||
Dividends from net realized gain on investments | (.16) | (.65) | (.89) | (.69) | (.96) | |||||
Total Distributions | (.23) | (.65) | (.90) | (.72) | (.96) | |||||
Net asset value, end of period | 16.45 | 14.79 | 14.45 | 15.37 | 13.17 | |||||
Total Return (%) | 12.89 | 7.26 | (.08) | 22.74 | 24.46 | |||||
Ratios/Supplemental Data (%): | ||||||||||
Ratio of total expenses to average net assets | 1.15 | 1.15 | 1.15 | 1.15 | 1.17 | |||||
Ratio of net expenses to average net assets | 1.15 | 1.15 | 1.15 | 1.15 | 1.17 | |||||
Ratio of net investment income | .20 | .34 | .04 | .08 | .37 | |||||
Portfolio Turnover Rate | 62.81 | 74.68 | 73.87 | 53.63 | 106.59 | |||||
Net Assets, end of period ($ x 1,000) | 88,697 | 60,222 | 57,118 | 52,447 | 29,639 | |||||
a Based on average shares outstanding.
See notes to financial statements.
113
FINANCIAL HIGHLIGHTS (continued)
Class M | ||||||||||
Year Ended August 31, | ||||||||||
BNY Mellon Small Cap Multi-Strategy Fund | 2017 | 2016 |
| 2015 |
| 2014 |
| 2013 |
| |
Per Share Data ($): | ||||||||||
Net asset value, beginning of period | 16.71 | 16.65 | 17.18 | 14.78 | 11.53 | |||||
Investment Operations: | ||||||||||
Investment income (loss)—net a | .01 | .01 | (.02) | (.04) | .01 | |||||
Net realized and unrealized | 2.86 | .68 | .25 | 2.44 | 3.27 | |||||
Total from Investment Operations | 2.87 | .69 | .23 | 2.40 | 3.28 | |||||
Distributions: | ||||||||||
Dividends from investment income—net | — | — | — | — | (.03) | |||||
Dividends from net realized gain on investments | (.10) | (.63) | (.76) | — | — | |||||
Total Distributions | (.10) | (.63) | (.76) | — | (.03) | |||||
Net asset value, end of period | 19.48 | 16.71 | 16.65 | 17.18 | 14.78 | |||||
Total Return (%) | 17.19 | 4.46 | 1.33 | 16.24 | 28.51 | |||||
Ratios/Supplemental Data (%): | ||||||||||
Ratio of total expenses to average net assets | 1.03 | 1.05 | 1.03 | 1.03 | 1.05 | |||||
Ratio of net expenses to average net assets | 1.03 | 1.05 | 1.03 | 1.03 | 1.05 | |||||
Ratio of net investment income | .05 | .04 | (.14) | (.21) | .09 | |||||
Portfolio Turnover | 75.82 | 101.40 | 90.30 | 92.86 | 128.11 | |||||
Net Assets, end of period ($ x 1,000) | 507,703 | 389,890 | 368,428 | 347,613 | 299,415 | |||||
a Based on average shares outstanding.
See notes to financial statements.
114
Investor Shares | ||||||||||
Year Ended August 31, | ||||||||||
BNY Mellon Small Cap Multi-Strategy Fund | 2017 | 2016 |
| 2015 |
| 2014 |
| 2013 |
| |
Per Share Data ($): | ||||||||||
Net asset value, beginning of period | 16.07 | 16.08 | 16.65 | 14.36 | 11.21 | |||||
Investment Operations: | ||||||||||
Investment (loss)—net a | (.04) | (.03) | (.06) | (.07) | (.02) | |||||
Net realized and unrealized | 2.76 | .65 | .25 | 2.36 | 3.17 | |||||
Total from Investment Operations | 2.72 | .62 | .19 | 2.29 | 3.15 | |||||
Distributions: | ||||||||||
Dividends from investment income—net | — | — | — | — | — | |||||
Dividends from net realized gain on investments | (.10) | (.63) | (.76) | — | — | |||||
Total Distributions | (.10) | (.63) | (.76) | — | — | |||||
Net asset value, end of period | 18.69 | 16.07 | 16.08 | 16.65 | 14.36 | |||||
Total Return (%) | 16.94 | 4.17 | 1.13 | 15.95 | 28.10 | |||||
Ratios/Supplemental Data (%): | ||||||||||
Ratio of total expenses to average net assets | 1.28 | 1.30 | 1.28 | 1.28 | 1.30 | |||||
Ratio of net expenses to average net assets | 1.28 | 1.30 | 1.28 | 1.28 | 1.30 | |||||
Ratio of net investment (loss) | (.20) | (.21) | (.39) | (.46) | (.16) | |||||
Portfolio Turnover Rate | 75.82 | 101.40 | 90.30 | 92.86 | 128.11 | |||||
Net Assets, end of period ($ x 1,000) | 19,641 | 14,285 | 12,745 | 11,485 | 8,472 | |||||
a Based on average shares outstanding.
See notes to financial statements.
115
FINANCIAL HIGHLIGHTS (continued)
Class M | ||||||
Year Ended August 31, | ||||||
BNY Mellon Focused Equity Opportunities Fund | 2017 | 2016 | 2015 | 2014 | 2013 | |
Per Share Data ($): | ||||||
Net asset value, beginning of period | 14.63 | 14.66 | 18.30 | 15.24 | 13.08 | |
Investment Operations: | ||||||
Investment income—net a | .11 | .12 | .12 | .11 | .16 | |
Net realized and unrealized | 3.56 | 1.20 | (.69) | 4.31 | 2.12 | |
Total from Investment Operations | 3.67 | 1.32 | (.57) | 4.42 | 2.28 | |
Distributions: | ||||||
Dividends from investment income—net | (.19) | (.11) | (.10) | (.14) | (.12) | |
Dividends from net realized gain on investments | (1.15) | (1.24) | (2.97) | (1.22) | - | |
Total Distributions | (1.34) | (1.35) | (3.07) | (1.36) | (.12) | |
Net asset value, end of period | 16.96 | 14.63 | 14.66 | 18.30 | 15.24 | |
Total Return (%) | 27.04 | 9.39 | (3.82) | 30.54 | 17.54 | |
Ratios/Supplemental Data (%): | ||||||
Ratio of total expenses to average net assets | .87 | .87 | .85 | .85 | .86 | |
Ratio of net expenses to average net assets | .87 | .87 | .85 | .85 | .86 | |
Ratio of net investment income | .72 | .83 | .73 | .65 | 1.12 | |
Portfolio Turnover | 62.39 | 48.25 | 74.72 | 76.48 | 77.03 | |
Net Assets, end of period ($ x 1,000) | 485,040 | 434,171 | 561,399 | 674,222 | 539,019 | |
a Based on average shares outstanding.
See notes to financial statements.
116
Investor Shares | ||||||
Year Ended August 31, | ||||||
BNY Mellon Focused Equity Opportunities Fund | 2017 | 2016 | 2015 | 2014 | 2013 | |
Per Share Data ($): | ||||||
Net asset value, beginning of period | 14.51 | 14.55 | 18.20 | 15.18 | 13.05 | |
Investment Operations: | ||||||
Investment income—net a | .07 | .08 | .08 | .06 | .12 | |
Net realized and unrealized | 3.53 | 1.19 | (.69) | 4.30 | 2.10 | |
Total from Investment Operations | 3.60 | 1.27 | (.61) | 4.36 | 2.22 | |
Distributions: | ||||||
Dividends from investment income—net | (.15) | (.07) | (.07) | (.12) | (.09) | |
Dividends from net realized gain on investments | (1.15) | (1.24) | (2.97) | (1.22) | - | |
Total Distributions | (1.30) | (1.31) | (3.04) | (1.34) | (.09) | |
Net asset value, end of period | 16.81 | 14.51 | 14.55 | 18.20 | 15.18 | |
Total Return (%) | 26.75 | 9.13 | (4.05) | 30.18 | 17.12 | |
Ratios/Supplemental Data (%): | ||||||
Ratio of total expenses to average net assets | 1.12 | 1.12 | 1.11 | 1.11 | 1.13 | |
Ratio of net expenses to average net assets | 1.12 | 1.12 | 1.11 | 1.11 | 1.13 | |
Ratio of net investment income | .49 | .59 | .47 | .36 | .90 | |
Portfolio Turnover | 62.39 | 48.25 | 74.72 | 76.48 | 77.03 | |
Net Assets, end of period ($ x 1,000) | 5,947 | 4,206 | 8,593 | 3,569 | 979 | |
a Based on average shares outstanding.
See notes to financial statements.
117
FINANCIAL HIGHLIGHTS (continued)
Class M | ||||||
Year Ended August 31, | ||||||
BNY Mellon Small/Mid Cap Multi-Strategy Fund | 2017 | 2016 | 2015 | 2014 | 2013 | |
Per Share Data ($): | ||||||
Net asset value, beginning of period | 12.44 | 12.72 | 16.98 | 15.09 | 12.99 | |
Investment Operations: | ||||||
Investment income (loss)—net a | .01 | .01 | (.01) | .07 | .12 | |
Net realized and unrealized | 2.09 | .50 | .10 | 2.82 | 2.19 | |
Total from Investment Operations | 2.10 | .51 | .09 | 2.89 | 2.31 | |
Distributions: | ||||||
Dividends from investment income—net | (.01) | (.04) | - | (.08) | (.21) | |
Dividends from net realized gain on investments | (.04) | (.75) | (4.35) | (.92) | - | |
Total Distributions | (.05) | (.79) | (4.35) | (1.00) | (.21) | |
Net asset value, end of period | 14.49 | 12.44 | 12.72 | 16.98 | 15.09 | |
Total Return (%) | 16.94 | 4.35 | 1.71 | 19.84 | 18.07 | |
Ratios/Supplemental Data (%): | ||||||
Ratio of total expenses to average net assets | .94 | .95 | .94 | .91 | .92 | |
Ratio of net expenses to average net assets | .94 | .95 | .94 | .91 | .92 | |
Ratio of net investment income (loss) | .10 | .10 | (.08) | .46 | .83 | |
Portfolio Turnover | 79.45 | 99.45 | 110.79 | 144.87 | 169.30 | |
Net Assets, end of period ($ x 1,000) | 327,604 | 300,557 | 339,836 | 411,334 | 464,031 | |
a Based on average shares outstanding.
See notes to financial statements.
118
Investor Shares | ||||||
Year Ended August 31, | ||||||
BNY Mellon Small/Mid Cap Multi-Strategy Fund | 2017 | 2016 | 2015 | 2014 | 2013 | |
Per Share Data ($): | ||||||
Net asset value, beginning of period | 12.31 | 12.59 | 16.88 | 15.02 | 12.94 | |
Investment Operations: | ||||||
Investment income (loss)—net a | (.02) | (.01) | (.04) | (.00)b | .09 | |
Net realized and unrealized | 2.05 | .48 | .10 | 2.84 | 2.17 | |
Total from Investment Operations | 2.03 | .47 | .06 | 2.84 | 2.26 | |
Distributions: | ||||||
Dividends from investment income—net | - | - | - | (.06) | (.18) | |
Dividends from net realized gain on investments | (.04) | (.75) | (4.35) | (.92) | - | |
Total Distributions | (.04) | (.75) | (4.35) | (.98) | (.18) | |
Net asset value, end of period | 14.30 | 12.31 | 12.59 | 16.88 | 15.02 | |
Total Return (%) | 16.55 | 4.08 | 1.48 | 19.53 | 17.65 | |
Ratios/Supplemental Data (%): | ||||||
Ratio of total expenses to average net assets | 1.19 | 1.20 | 1.19 | 1.17 | 1.17 | |
Ratio of net expenses to average net assets | 1.19 | 1.20 | 1.19 | 1.17 | 1.17 | |
Ratio of net investment income (loss) | (.17) | (.11) | (.32) | (.03) | .64 | |
Portfolio Turnover | 79.45 | 99.45 | 110.79 | 144.87 | 169.30 | |
Net Assets, end of period ($ x 1,000) | 3,227 | 1,697 | 1,536 | 3,088 | 439 | |
a Based on average shares outstanding.
b Amount represents less than $.01 per share.
See notes to financial statements.
119
FINANCIAL HIGHLIGHTS (continued)
Class M | ||||||||||
Year Ended August 31, | ||||||||||
BNY Mellon International Fund | 2017 | 2016 |
| 2015 |
| 2014 |
| 2013 |
| |
Per Share Data ($): | ||||||||||
Net asset value, beginning of period | 11.22 | 11.55 | 12.72 | 11.14 | 9.29 | |||||
Investment Operations: | ||||||||||
Investment income—net a | .19 | .18 | .18 | .21 | .19 | |||||
Net realized and unrealized | 1.98 | (.35) | (1.16) | 1.57 | 1.98 | |||||
Total from Investment Operations | 2.17 | (.17) | (.98) | 1.78 | 2.17 | |||||
Distributions: | ||||||||||
Dividends from investment income—net | (.22) | (.16) | (.19) | (.20) | (.32) | |||||
Net asset value, end of period | 13.17 | 11.22 | 11.55 | 12.72 | 11.14 | |||||
Total Return (%) | 19.80 | (1.49) | (7.68) | 16.11 | 23.74 | |||||
Ratios/Supplemental Data (%): | ||||||||||
Ratio of total expenses to average net assets | 1.04 | 1.03 | 1.03 | 1.03 | 1.05 | |||||
Ratio of net expenses to average net assets | 1.04 | 1.03 | 1.03 | 1.03 | 1.05 | |||||
Ratio of net investment income | 1.64 | 1.59 | 1.49 | 1.64 | 1.77 | |||||
Portfolio Turnover | 81.88 | 86.83 | 112.69 | 92.94 | 55.78 | |||||
Net Assets, end of period ($ x 1,000) | 1,076,444 | 1,007,752 | 1,005,637 | 990,119 | 519,964 | |||||
a Based on average shares outstanding.
See notes to financial statements.
120
Investor Shares | ||||||||||
Year Ended August 31, | ||||||||||
BNY Mellon International Fund | 2017 | 2016 |
| 2015 |
| 2014 |
| 2013 |
| |
Per Share Data ($): | ||||||||||
Net asset value, beginning of period | 11.92 | 12.26 | 13.50 | 11.82 | 9.84 | |||||
Investment Operations: | ||||||||||
Investment income—net a | .20 | .15 | .15 | .19 | .17 | |||||
Net realized and unrealized | 2.10 | (.37) | (1.22) | 1.67 | 2.10 | |||||
Total from Investment Operations | 2.30 | (.22) | (1.07) | 1.86 | 2.27 | |||||
Distributions: | ||||||||||
Dividends from investment income—net | (.20) | (.12) | (.17) | (.18) | (.29) | |||||
Net asset value, end of period | 14.02 | 11.92 | 12.26 | 13.50 | 11.82 | |||||
Total Return (%) | 19.59 | (1.78) | (7.88) | 15.85 | 23.36 | |||||
Ratios/Supplemental Data (%): | ||||||||||
Ratio of total expenses to average net assets | 1.29 | 1.28 | 1.28 | 1.28 | 1.30 | |||||
Ratio of net expenses to average net assets | 1.29 | 1.28 | 1.28 | 1.28 | 1.30 | |||||
Ratio of net investment income | 1.53 | 1.25 | 1.17 | 1.38 | 1.51 | |||||
Portfolio Turnover Rate | 81.88 | 86.83 | 112.69 | 92.94 | 55.78 | |||||
Net Assets, end of period ($ x 1,000) | 18,145 | 11,553 | 14,040 | 8,952 | 4,432 | |||||
a Based on average shares outstanding.
See notes to financial statements.
121
FINANCIAL HIGHLIGHTS (continued)
Class M | ||||||||||
Year Ended August 31, | ||||||||||
BNY Mellon Emerging Markets Fund | 2017 | 2016 |
| 2015 |
| 2014 |
| 2013 |
| |
Per Share Data ($): | ||||||||||
Net asset value, beginning of period | 8.96 | 7.98 | 10.98 | 9.11 | 9.19 | |||||
Investment Operations: | ||||||||||
Investment income—net a | .08 | .09 | .09 | .10 | .12 | |||||
Net realized and unrealized | 2.26 | .96 | (2.96) | 1.88 | (.10) | |||||
Total from Investment Operations | 2.34 | 1.05 | (2.87) | 1.98 | .02 | |||||
Distributions: | ||||||||||
Dividends from investment income—net | (.07) | (.07) | (.13) | (.11) | (.10) | |||||
Dividends from net realized gain on investments | — | — | — | — | — | |||||
Total Distributions | (.07) | (.07) | (.13) | (.11) | (.10) | |||||
Net asset value, end of period | 11.23 | 8.96 | 7.98 | 10.98 | 9.11 | |||||
Total Return (%) | 26.36 | 13.35 | (26.28) | 21.82 | .09 | |||||
Ratios/Supplemental Data (%): | ||||||||||
Ratio of total expenses to average net assets | 1.40 | 1.44 | 1.42 | 1.42 | 1.41 | |||||
Ratio of net expenses to average net assets | 1.40 | 1.44 | 1.42 | 1.42 | 1.41 | |||||
Ratio of net investment income | .84 | 1.10 | .98 | 1.04 | 1.19 | |||||
Portfolio Turnover | 91.81 | 103.60 | 107.27 | 70.89 | 53.25 | |||||
Net Assets, end of period ($ x 1,000) | 904,774 | 693,652 | 1,108,616 | 2,046,317 | 1,830,754 | |||||
a Based on average shares outstanding.
See notes to financial statements.
122
Investor Shares | ||||||||||
Year Ended August 31, | ||||||||||
BNY Mellon Emerging Markets Fund | 2017 | 2016 | 2015 | 2014 |
| 2013 |
| |||
Per Share Data ($): | ||||||||||
Net asset value, beginning of period | 9.20 | 8.17 | 11.25 | 9.33 | 9.41 | |||||
Investment Operations: | ||||||||||
Investment income—net a | .07 | .07 | .08 | .09 | .09 | |||||
Net realized and unrealized | 2.31 | 1.00 | (3.04) | 1.91 | (.10) | |||||
Total from Investment Operations | 2.38 | 1.07 | (2.96) | 2.00 | (.01) | |||||
Distributions: | ||||||||||
Dividends from investment income—net | (.05) | (.04) | (.12) | (.08) | (.07) | |||||
Dividends from net realized gain on investments | — | — | — | — | — | |||||
Total Distributions | (.05) | (.04) | (.12) | (.08) | (.07) | |||||
Net asset value, end of period | 11.53 | 9.20 | 8.17 | 11.25 | 9.33 | |||||
Total Return (%) | 26.05 | 13.13 | (26.49) | 21.57 | (.19) | |||||
Ratios/Supplemental Data (%): | ||||||||||
Ratio of total expenses to average net assets | 1.65 | 1.69 | 1.67 | 1.67 | 1.65 | |||||
Ratio of net expenses to average net assets | 1.65 | 1.69 | 1.67 | 1.67 | 1.65 | |||||
Ratio of net investment income | .69 | .85 | .76 | .90 | .90 | |||||
Portfolio Turnover Rate | 91.81 | 103.60 | 107.27 | 70.89 | 53.25 | |||||
Net Assets, end of period ($ x 1,000) | 17,970 | 11,263 | 17,033 | 22,947 | 10,864 | |||||
a Based on average shares outstanding.
See notes to financial statements.
123
FINANCIAL HIGHLIGHTS (continued)
Class M | ||||||
Year Ended August 31, | ||||||
BNY Mellon International Appreciation Fund | 2017 | 2016 | 2015 | 2014 | 2013 | |
Per Share Data ($): | ||||||
Net asset value, beginning of period | 12.19 | 12.51 | 13.90 | 12.38 | 10.80 | |
Investment Operations: | ||||||
Investment income—net a | .26 | .26 | .27 | .38 | .27 | |
Net realized and unrealized | 1.73 | (.29) | (1.26) | 1.42 | 1.69 | |
Total from Investment Operations | 1.99 | (.03) | (.99) | 1.80 | 1.96 | |
Distributions: | ||||||
Dividends from investment income—net | (.33) | (.29) | (.40) | (.28) | (.38) | |
Net asset value, end of period | 13.85 | 12.19 | 12.51 | 13.90 | 12.38 | |
Total Return (%) | 16.76 | (.22) | (7.14) | 14.65 | 18.39 | |
Ratios/Supplemental Data (%): | ||||||
Ratio of total expenses to average net assets | .92 | .92 | .83 | .81 | .83 | |
Ratio of net expenses to average net assets | .92 | .92 | .83 | .81 | .83 | |
Ratio of net investment income | 2.01 | 2.21 | 2.02 | 2.78 | 2.27 | |
Portfolio Turnover | 4.49 | 3.04 | 12.51 | 4.41 | 1.24 | |
Net Assets, end of period ($ x 1,000) | 75,885 | 73,896 | 101,023 | 111,225 | 98,361 | |
a Based on average shares outstanding.
See notes to financial statements.
124
Investor Shares | ||||||
Year Ended August 31, | ||||||
BNY Mellon International Appreciation Fund | 2017 | 2016 | 2015 | 2014 | 2013 | |
Per Share Data ($): | ||||||
Net asset value, beginning of period | 12.04 | 12.37 | 13.74 | 12.24 | 10.68 | |
Investment Operations: | ||||||
Investment income—net a | .18 | .23 | .23 | .34 | .25 | |
Net realized and unrealized | 1.76 | (.31) | (1.24) | 1.41 | 1.66 | |
Total from Investment Operations | 1.94 | (.08) | (1.01) | 1.75 | 1.91 | |
Distributions: | ||||||
Dividends from investment income—net | (.25) | (.25) | (.36) | (.25) | (.35) | |
Net asset value, end of period | 13.73 | 12.04 | 12.37 | 13.74 | 12.24 | |
Total Return (%) | 16.47 | (.57) | (7.32) | 14.39 | 18.13 | |
Ratios/Supplemental Data (%): | ||||||
Ratio of total expenses to average net assets | 1.17 | 1.17 | 1.08 | 1.06 | 1.08 | |
Ratio of net expenses to average net assets | 1.17 | 1.17 | 1.08 | 1.06 | 1.08 | |
Ratio of net investment income | 1.50 | 1.96 | 1.77 | 2.52 | 2.08 | |
Portfolio Turnover | 4.49 | 3.04 | 12.51 | 4.41 | 1.24 | |
Net Assets, end of period ($ x 1,000) | 1,427 | 4,360 | 4,966 | 5,310 | 4,773 | |
a Based on average shares outstanding.
See notes to financial statements.
125
FINANCIAL HIGHLIGHTS (continued)
Class M | ||||||||||
Year Ended August 31, | ||||||||||
BNY Mellon International Equity Income Fund | 2017 | 2016 |
| 2015 |
| 2014 |
| 2013 |
| |
Per Share Data ($): | ||||||||||
Net asset value, beginning of period | 12.35 | 11.92 | 14.82 | 13.81 | 12.87 | |||||
Investment Operations: | ||||||||||
Investment income—net a | .42 | .34 | .43 | .75 | .64 | |||||
Net realized and unrealized | 1.84 | .41 | (2.82) | .90 | .87 | |||||
Total from Investment Operations | 2.26 | .75 | (2.39) | 1.65 | 1.51 | |||||
Distributions: | ||||||||||
Dividends from investment income—net | (.41) | (.32) | (.51) | (.64) | (.57) | |||||
Net asset value, end of period | 14.20 | 12.35 | 11.92 | 14.82 | 13.81 | |||||
Total Return (%) | 18.72 | 6.51 | (16.51) | 12.08 | 11.96 | |||||
Ratios/Supplemental Data (%): | ||||||||||
Ratio of total expenses to average net assets | 1.09 | 1.09 | 1.07 | 1.08 | 1.15 | |||||
Ratio of net expenses to average net assets | 1.09 | 1.09 | 1.07 | 1.08 | 1.15 | |||||
Ratio of net investment income | 3.27 | 2.85 | 3.25 | 5.13 | 4.57 | |||||
Portfolio Turnover | 46.42 | 78.17 | 88.45 | 83.07 | 74.80 | |||||
Net Assets, end of period ($ x 1,000) | 367,829 | 282,609 | 283,099 | 341,645 | 165,132 | |||||
a Based on average shares outstanding.
See notes to financial statements.
126
Investor Shares | ||||||||||
Year Ended August 31, | ||||||||||
BNY Mellon International Equity Income Fund | 2017 | 2016 |
| 2015 |
| 2014 |
| 2013 | ||
Per Share Data ($): | ||||||||||
Net asset value, beginning of period | 12.47 | 11.97 | 14.89 | 13.89 | 12.88 | |||||
Investment Operations: | ||||||||||
Investment income—net a | .62 | .23 | .39 | .50 | .98 | |||||
Net realized and unrealized | 1.57 | .52 | (2.83) | 1.11 | .49 | |||||
Total from Investment Operations | 2.19 | .75 | (2.44) | 1.61 | 1.47 | |||||
Distributions: | ||||||||||
Dividends from investment income—net | (.30) | (.25) | (.48) | (.61) | (.46) | |||||
Net asset value, end of period | 14.36 | 12.47 | 11.97 | 14.89 | 13.89 | |||||
Total Return (%) | 17.87 | 6.40 | (16.77) | 11.79 | 11.56 | |||||
Ratios/Supplemental Data (%): | ||||||||||
Ratio of total expenses to average net assets | 1.37 | 1.34 | 1.33 | 1.36 | 1.42 | |||||
Ratio of net expenses to average net assets | 1.37 | 1.34 | 1.33 | 1.36 | 1.42 | |||||
Ratio of net investment income | 4.13 | 1.92 | 2.84 | 3.81 | 5.34 | |||||
Portfolio Turnover Rate | 46.42 | 78.17 | 88.45 | 83.07 | 74.80 | |||||
Net Assets, end of period ($ x 1,000) | 2,135 | 765 | 2,924 | 919 | 51 | |||||
a Based on average shares outstanding.
See notes to financial statements.
127
FINANCIAL HIGHLIGHTS (continued)
Class M | ||||||
Year Ended August 31, | ||||||
BNY Mellon Asset Allocation Fund | 2017 | 2016 | 2015 | 2014 | 2013 | |
Per Share Data ($): | ||||||
Net asset value, beginning of period | 11.30 | 11.51 | 12.57 | 11.68 | 10.97 | |
Investment Operations: | ||||||
Investment income—net a | .18 | .17 | .18 | .17 | .19 | |
Net realized and unrealized | 1.12 | .39 | (.46) | 1.67 | .81 | |
Total from Investment Operations | 1.30 | .56 | (.28) | 1.84 | 1.00 | |
Distributions: | ||||||
Dividends from investment income—net | (.20) | (.19) | (.32) | (.26) | (.26) | |
Dividends from net realized gain on investments | (.10) | (.58) | (.46) | (.69) | (.03) | |
Total Distributions | (.30) | (.77) | (.78) | (.95) | (.29) | |
Net asset value, end of period | 12.30 | 11.30 | 11.51 | 12.57 | 11.68 | |
Total Return (%) | 11.73 | 5.08 | (2.39) | 16.25 | 9.20 | |
Ratios/Supplemental Data (%): | ||||||
Ratio of total expenses to average net assets b | .38 | .37 | .35 | .35 | .37 | |
Ratio of net expenses to average net assets b | .30 | .27 | .26 | .26 | .25 | |
Ratio of net investment income | 1.51 | 1.52 | 1.48 | 1.43 | 1.69 | |
Portfolio Turnover | 27.34 | 23.99 | 30.31 | 48.28 | 27.39c | |
Net Assets, end of period ($ x 1,000) | 460,142 | 444,399 | 467,431 | 493,660 | 411,214 | |
a Based on average shares outstanding.
b Amount does not include the expenses of the underlying funds.
c The portfolio turnover rate excluding mortgage dollar roll transactions for the period ended August 31, 2013 was 27.03%.
See notes to financial statements.
128
Investor Shares | ||||||
Year Ended August 31, | ||||||
BNY Mellon Asset Allocation Fund | 2017 | 2016 | 2015 | 2014 | 2013 | |
Per Share Data ($): | ||||||
Net asset value, beginning of period | 11.38 | 11.58 | 12.64 | 11.74 | 11.03 | |
Investment Operations: | ||||||
Investment income—net a | .15 | .14 | .15 | .14 | .17 | |
Net realized and unrealized | 1.14 | .40 | (.46) | 1.68 | .80 | |
Total from Investment Operations | 1.29 | .54 | (.31) | 1.82 | .97 | |
Distributions: | ||||||
Dividends from investment income—net | (.18) | (.16) | (.29) | (.23) | (.23) | |
Dividends from net realized gain on investments | (.10) | (.58) | (.46) | (.69) | (.03) | |
Total Distributions | (.28) | (.74) | (.75) | (.92) | (.26) | |
Net asset value, end of period | 12.39 | 11.38 | 11.58 | 12.64 | 11.74 | |
Total Return (%) | 11.49 | 4.89 | (2.62) | 15.96 | 8.86 | |
Ratios/Supplemental Data (%): | ||||||
Ratio of total expenses to average net assets b | .63 | .62 | .60 | .61 | .62 | |
Ratio of net expenses to average net assets b | .55 | .52 | .51 | .52 | .50 | |
Ratio of net investment income | 1.22 | 1.25 | 1.25 | 1.17 | 1.45 | |
Portfolio Turnover | 27.34 | 23.99 | 30.31 | 48.28 | 27.39c | |
Net Assets, end of period ($ x 1,000) | 6,745 | 5,131 | 6,393 | 8,338 | 4,939 | |
a Based on average shares outstanding.
b Amount does not include the expenses of the underlying funds.
c The portfolio turnover rate excluding mortgage dollar roll transactions for the period ended August 31, 2013 was 27.03%.
See notes to financial statements.
129
NOTES TO FINANCIAL STATEMENTS
NOTE 1—Significant Accounting Policies:
BNY Mellon Funds Trust (the “Trust”), a Massachusetts business trust that is registered under the Investment Company Act of 1940, as amended (the “Act”), as an open-end management investment company, operates as a series company currently consisting of twenty-five series, including the following diversified funds: BNY Mellon Large Cap Stock Fund, BNY Mellon Large Cap Market Opportunities Fund, BNY Mellon Tax-Sensitive Large Cap Multi-Strategy Fund, BNY Mellon Income Stock Fund, BNY Mellon Mid Cap Multi-Strategy Fund, BNY Mellon Small Cap Multi-Strategy Fund, BNY Mellon Small/Mid Cap Multi-Strategy Fund, BNY Mellon International Fund, BNY Mellon Emerging Markets Fund, BNY Mellon International Appreciation Fund, BNY Mellon International Equity Income Fund and BNY Mellon Asset Allocation Fund and the following non-diversified fund: BNY Mellon Focused Equity Opportunities Fund (each, a “fund” and collectively, the “funds”). The objectives of the funds are as follows: BNY Mellon Large Cap Stock Fund, BNY Mellon Mid Cap Multi-Strategy Fund, BNY Mellon Small Cap Multi-Strategy Fund, BNY Mellon Focused Equity Opportunities Fund and BNY Mellon Small/Mid Cap Multi-Strategy Fund seek capital appreciation. BNY Mellon Income Stock Fund and BNY Mellon International Equity Income Fund seek total return (consisting of capital appreciation and income). BNY Mellon International Fund and BNY Mellon Emerging Markets Fund seek long-term capital growth. BNY Mellon Large Cap Market Opportunities Fund, BNY Mellon Tax-Sensitive Large Cap Multi-Strategy Fund and BNY Mellon International Appreciation Fund seek long-term capital appreciation. BNY Mellon Asset Allocation Fund seeks long-term growth of principal in conjunction with current income.
BNY Mellon Fund Advisers, a division of The Dreyfus Corporation (the “Manager” or “Dreyfus”), a wholly-owned subsidiary of The Bank of New York Mellon Corporation (“BNY Mellon”), serves as each fund’s investment adviser (the “Investment Adviser”). The Bank of New York Mellon, a subsidiary of BNY Mellon and an affiliate of Dreyfus, serves as administrator for the funds pursuant to an Administration Agreement with the Trust (the “Administration Agreement”). The Bank of New York Mellon has entered into a Sub-Administration Agreement with Dreyfus pursuant to which The Bank of New York Mellon pays Dreyfus for performing certain administrative services. Walter Scott & Partners Limited (“Walter Scott”), also a wholly-owned subsidiary of BNY Mellon and an affiliate of Dreyfus, serves as the BNY Mellon Large Cap Market Opportunities Fund’s and BNY Mellon Tax-Sensitive Large Cap Multi-Strategy Fund’s sub-investment adviser with respect to the U.S. Large Cap Equity Strategy of each fund. Boston Partners Global Investors, Inc. (“Boston Partners”), and Geneva Capital Management LLC (“Geneva”), formerly doing business as Henderson Geneva Capital Management LLC, serve as BNY Mellon Mid Cap Multi-Strategy Fund’s sub-investment adviser with respect to the Boston Partners Mid Cap Value Strategy and the Geneva Mid Cap Growth Strategy, formerly, known as the Henderson Geneva Mid Cap Growth Strategy of the fund, respectively. MBSC Securities Corporation (the “Distributor”), a wholly-owned subsidiary of Dreyfus, is the distributor of each fund’s shares.
Effective March 31, 2017, BNY Mellon Income Stock Fund authorized the issuance of Class T shares, but, as of the date of this report, the fund did not offer Class T shares for purchase.
Each fund is authorized to issue an unlimited number of $.001 par value shares of Beneficial Interest in each of the following classes of shares: Class M and Investor and for BNY Mellon Income Stock Fund only Class A, Class C, Class I, Class T and Class Y. Class A and Class T shares generally are subject to a sales charge imposed at the time of purchase. Class C shares are subject to a contingent deferred sales charge (“CDSC”) imposed on Class C shares redeemed within one year of purchase. Class I and Class Y shares are sold at net asset value per share generally to institutional investors. Other differences between the classes include the services offered to and the expenses borne by each class, the allocation of certain transfer agency costs, and certain voting rights. Income, expenses (other than expenses attributable to a specific class), and realized and unrealized gains or losses on investments are allocated to each class of shares based on its relative net assets.
As of August 31, 2017, MBC Investments Corp., an indirect subsidiary of BNY Mellon, held all of the outstanding Class Y shares of BNY Mellon Income Stock Fund.
The Trust accounts separately for the assets, liabilities and operations of each series. Expenses directly attributable to each series are charged to that series’ operations; expenses which are applicable to all series are allocated among them on a pro rata basis.
The Financial Accounting Standards Board (“FASB”) Accounting Standards Codification (“ASC”) is the exclusive reference of authoritative U.S. generally accepted accounting principles (“GAAP”) recognized by the FASB to be applied by nongovernmental entities. Rules and interpretive releases of the Securities and Exchange Commission (“SEC”) under authority of federal laws are also sources of authoritative GAAP for SEC registrants. The fund’s financial statements are prepared in accordance with GAAP, which may require the use of management estimates and assumptions. Actual results could differ from those estimates.
130
(a) Portfolio valuation: The fair value of a financial instrument is the amount that would be received to sell an asset or paid to transfer a liability in an orderly transaction between market participants at the measurement date (i.e., the exit price). GAAP establishes a fair value hierarchy that prioritizes the inputs of valuation techniques used to measure fair value. This hierarchy gives the highest priority to unadjusted quoted prices in active markets for identical assets or liabilities (Level 1 measurements) and the lowest priority to unobservable inputs (Level 3 measurements).
Additionally, GAAP provides guidance on determining whether the volume and activity in a market has decreased significantly and whether such a decrease in activity results in transactions that are not orderly. GAAP requires enhanced disclosures around valuation inputs and techniques used during annual and interim periods.
Various inputs are used in determining the value of each fund’s investments relating to fair value measurements. These inputs are summarized in the three broad levels listed below:
Level 1—unadjusted quoted prices in active markets for identical investments.
Level 2—other significant observable inputs (including quoted prices for similar investments, interest rates, prepayment speeds, credit risk, etc.).
Level 3—significant unobservable inputs (including the funds’ own assumptions in determining the fair value of investments).
The inputs or methodology used for valuing securities are not necessarily an indication of the risk associated with investing in those securities.
Changes in valuation techniques may result in transfers in or out of an assigned level within the disclosure hierarchy. Valuation techniques used to value each fund’s investments are as follows:
BNY Mellon Asset Allocation Fund: Investments in debt securities, excluding short-term investments (other than U.S. Treasury Bills), are valued each business day by an independent pricing service (the “Service”) approved by the Trust’s Board of Trustees (the “Board”). Investments for which quoted bid prices are readily available and are representative of the bid side of the market in the judgment of the Service are valued at the mean between the quoted bid prices (as obtained by the Service from dealers in such securities) and asked prices (as calculated by the Service based upon its evaluation of the market for such securities). Other investments are valued as determined by the Service, based on methods which include consideration of the following: yields or prices of securities of comparable quality, coupon, maturity and type; indications as to values from dealers; and general market conditions. These securities are generally categorized within Level 2 of the fair value hierarchy.
Investments in equity securities are valued at the last sales price on the securities exchange or national securities market on which such securities are primarily traded. Securities listed on the National Market System for which market quotations are available are valued at the official closing price or, if there is no official closing price that day, at the last sales price. For open short positions, asked prices are used for valuation purposes. Bid price is used when no asked price is available. Registered investment companies that are not traded on an exchange are valued at their net asset value. All of the preceding securities are generally categorized within Level 1 of the fair value hierarchy.
Securities not listed on an exchange or the national securities market, or securities for which there were no transactions, are valued at the average of the most recent bid and asked prices. U.S Treasury Bills are valued at the mean price between quoted prices and asked prices by the Service. These securities are generally categorized within Level 2 of the fair value hierarchy.
The Service is engaged under the general supervision of the Board.
Fair valuing of securities may be determined with the assistance of a pricing service using calculations based on indices of domestic securities and other appropriate indicators, such as prices of relevant ADRs and futures. Utilizing these techniques may result in transfers between Level 1 and Level 2 of the fair value hierarchy.
When market quotations or official closing prices are not readily available, or are determined not to reflect accurately fair value, such as when the value of a security has been significantly affected by events after the close of the exchange or market on which the security is principally traded (for example, a foreign exchange or market), but before the funds calculate their net asset value, the funds may value these investments at fair value as determined in accordance with the procedures approved by the Board. Certain factors may be considered when fair valuing investments such as: fundamental analytical data, the nature and duration of restrictions on disposition, an evaluation of the forces that influence the market in which the securities are purchased and sold, and public trading in similar securities of the issuer or comparable issuers. These securities are either categorized within Level 2 or 3 of the fair value hierarchy depending on the relevant inputs used.
131
NOTES TO FINANCIAL STATEMENTS (continued)
For restricted securities where observable inputs are limited, assumptions about market activity and risk are used and are generally categorized within Level 3 of the fair value hierarchy.
Investments denominated in foreign currencies are translated to U.S. dollars at the prevailing rates of exchange.
Futures and options, which are traded on an exchange, are valued at the last sales price on the securities exchange on which such securities are primarily traded or at the last sales price on the national securities market on each business day and are generally categorized within Level 1 of the fair value hierarchy. Options traded over-the-counter (“OTC”) are valued at the mean between the bid and asked price and are generally categorized within Level 2 of the fair value hierarchy. Forward foreign currency exchange contracts (“forward contracts”) are valued at the forward rate and are generally categorized within Level 2 of the fair value hierarchy.
Table 1 summarizes the inputs used as of August 31, 2017 in valuing each fund’s investments:
At August 31, 2017, there were no transfers between levels of the fair value hierarchy, except for BNY Mellon International Fund, BNY Mellon Emerging Markets Fund and BNY Mellon International Equity Income Fund which had transfers between Level 1 and Level 2 at period end.
(b) Foreign currency transactions: BNY Mellon International Fund, BNY Mellon Emerging Markets Fund and BNY Mellon International Equity Income Fund do not isolate that portion of the results of operations resulting from changes in foreign exchange rates on investments from the fluctuations arising from changes in the market prices of securities held. Such fluctuations are included with the net realized and unrealized gain or loss on investments.
Net realized foreign exchange gains or losses arise from sales of foreign currencies, currency gains or losses realized on securities transactions between trade and settlement date, and the difference between the amounts of dividends, interest and foreign withholding taxes recorded on the funds’ books and the U.S. dollar equivalent of the amounts actually received or paid. Net unrealized foreign exchange gains and losses arise from changes in the value of assets and liabilities other than investments resulting from changes in exchange rates. Foreign currency gains and losses on foreign currency transactions are also included with net realized and unrealized gain or loss on investments.
(c) Securities transactions and investment income: Securities transactions are recorded on a trade date basis. Realized gains and losses from securities transactions are recorded on the identified cost basis. Dividend income is recognized on the ex-dividend date and interest income, including, where applicable, accretion of discount and amortization of premium on investments, is recognized on the accrual basis.
Table 1—Fair Value Measurements | |||||||||||||||||
Investments in Securities | |||||||||||||||||
Level 1—Unadjusted |
| Level 2—Other |
| Level 3-Significant Unobservable Inputs |
|
| |||||||||||
|
| Assets ($) | Liabilities ($) | Assets ($) | Liabilities ($) | Assets ($) | Liabilities ($) | Total | |||||||||
BNY Mellon Large Cap | |||||||||||||||||
Equity Securities—Domestic | 285,977,756 | - | - | - | - | - | 285,977,756 | ||||||||||
Equity Securities—Foreign | 1,622,253 | - | - | - | - | - | 1,622,253 | ||||||||||
Registered Investment Companies | 1,096,205 | - | - | - | - | - | 1,096,205 | ||||||||||
BNY Mellon Large Cap Market | |||||||||||||||||
Equity Securities—Domestic | 32,102,975 | - | - | - | - | - | 32,102,975 | ||||||||||
Equity Securities—Foreign | 1,150,447 | - | - | - | - | - | 1,150,447 | ||||||||||
Registered Investment Companies | 36,406,853 | - | - | - | - | - | 36,406,853 | ||||||||||
132
Table 1—Fair Value Measurements (continued) | |||||||||||||||||
Investments in Securities | |||||||||||||||||
Level 1—Unadjusted |
| Level 2—Other |
| Level 3-Significant |
|
| |||||||||||
|
| Assets ($) | Liabilities ($) | Assets ($) | Liabilities ($) | Assets ($) | Liabilities ($) | Total | |||||||||
BNY Mellon Tax-Sensitive | |||||||||||||||||
Equity Securities—Domestic | 224,232,824 | - | - | - | - | - | 224,232,824 | ||||||||||
Equity Securities—Foreign | 3,847,526 | - | - | - | - | - | 3,847,526 | ||||||||||
Registered Investment Companies | 114,830,294 | - | - | - | - | - | 114,830,294 | ||||||||||
BNY Mellon Income Stock Fund | |||||||||||||||||
Equity Securities—Domestic | 1,145,538,684 | - | - | - | - | - | 1,145,538,684 | ||||||||||
Equity Securities—Domestic | 13,669,717 | - | - | - | - | - | 13,669,717 | ||||||||||
Equity Securities—Foreign | 24,481,202 | - | - | - | - | - | 24,481,202 | ||||||||||
Registered Investment Companies | 11,627,088 | - | - | - | - | - | 11,627,088 | ||||||||||
Other Financial Instruments: | |||||||||||||||||
Options Written | - | (500,789) | - | - | - | - | (500,789) | ||||||||||
BNY Mellon Mid Cap | |||||||||||||||||
Equity Securities—Domestic | 2,758,836,436 | - | - | - | - | - | 2,758,836,436 | ||||||||||
Equity Securities—Foreign | 48,276,452 | - | - | - | - | - | 48,276,452 | ||||||||||
Exchange-Traded Funds | 21,573,566 | - | - | - | - | - | 21,573,566 | ||||||||||
Master Limited Partnership† | 2,583,379 | - | - | - | - | - | 2,583,379 | ||||||||||
Registered Investment Companies | 133,302,236 | - | - | - | - | - | 133,302,236 | ||||||||||
Rights† | 470 | - | - | - | - | - | 470 | ||||||||||
BNY Mellon Small Cap | |||||||||||||||||
Equity Securities—Domestic | 491,844,162 | - | - | - | - | - | 491,844,162 | ||||||||||
Equity Securities—Foreign | 20,513,300 | - | - | - | - | - | 20,513,300 | ||||||||||
Exchange-Traded Funds | 3,575,630 | - | - | - | - | - | 3,575,630 | ||||||||||
Registered Investment Companies | 72,484,766 | - | - | - | - | - | 72,484,766 | ||||||||||
BNY Mellon Focused Equity | |||||||||||||||||
Equity Securities—Domestic | 466,637,237 | - | - | - | - | - | 466,637,237 | ||||||||||
Equity Securities—Foreign | 21,120,441 | - | - | - | - | - | 21,120,441 | ||||||||||
Registered Investment Companies | 1,622,984 | - | - | - | - | - | 1,622,984 | ||||||||||
133
NOTES TO FINANCIAL STATEMENTS (continued)
Table 1—Fair Value Measurements (continued) | |||||||||||||||||||
Investments in Securities | |||||||||||||||||||
Level 1—Unadjusted |
| Level 2—Other |
| Level 3-Significant |
|
| |||||||||||||
|
| Assets ($) | Liabilities ($) | Assets ($) | Liabilities ($) | Assets ($) | Liabilities ($) | Total | |||||||||||
BNY Mellon Small/Mid Cap | |||||||||||||||||||
Equity Securities—Domestic | 311,857,362 | - | - | - | - | - | 311,857,362 | ||||||||||||
Equity Securities—Foreign | 9,692,935 | - | - | - | - | - | 9,692,935 | ||||||||||||
Exchange-Traded Funds | 2,390,779 | - | - | - | - | - | 2,390,779 | ||||||||||||
Registered Investment Companies | 33,184,063 | - | - | - | - | - | 33,184,063 | ||||||||||||
BNY Mellon International Fund | |||||||||||||||||||
Equity Securities—Foreign | - | - | 1,061,341,773 | †† | - | - | - | 1,061,341,773 | |||||||||||
Exchange-Traded Funds | 12,384,662 | - | - | - | - | - | 12,384,662 | ||||||||||||
Registered Investment Company | 8,972,288 | - | - | - | - | - | 8,972,288 | ||||||||||||
BNY Mellon | |||||||||||||||||||
Equity Securities—Foreign | 149,775,638 | - | 683,654,712 | †† | - | - | - | 833,430,350 | |||||||||||
Equity Securities—Foreign | - | - | 49,137,145 | †† | - | - | - | 49,137,145 | |||||||||||
Exchange-Traded Funds | 28,944,355 | - | - | - | - | - | 28,944,355 | ||||||||||||
Registered Investment Companies | 6,385,037 | - | - | - | - | - | 6,385,037 | ||||||||||||
Forward Foreign Currency | - | - | - | (64) | - | - | (64) | ||||||||||||
BNY Mellon International | |||||||||||||||||||
Equity Securities—Foreign | 76,281,822 | - | - | - | - | - | 76,281,822 | ||||||||||||
Registered Investment Companies | 643,374 | - | - | - | - | - | 643,374 | ||||||||||||
U.S. Treasury | - | - | 53,859 | - | - | - | 53,859 | ||||||||||||
Other Financial Instruments: | |||||||||||||||||||
Futures††† | 10,559 | - | - | - | - | - | 10,559 | ||||||||||||
BNY Mellon International | |||||||||||||||||||
Equity Securities—Foreign | - | - | 355,853,507 | †† | - | - | - | 355,853,507 | |||||||||||
Equity Securities—Foreign | - | - | 3,506,927 | †† | - | - | - | 3,506,927 | |||||||||||
Exchange-Traded Fund | 3,345,000 | - | - | - | - | - | 3,345,000 | ||||||||||||
Registered Investment Company | 4,877,078 | - | - | - | - | - | 4,877,078 | ||||||||||||
134
Table 1—Fair Value Measurements (continued) | |||||||||||||||||||
Investments in Securities | |||||||||||||||||||
Level 1—Unadjusted |
| Level 2—Other |
| Level 3-Significant |
|
| |||||||||||||
|
| Assets ($) | Liabilities ($) | Assets ($) | Liabilities ($) | Assets ($) | Liabilities ($) | Total | |||||||||||
BNY Mellon Asset | |||||||||||||||||||
Commercial Mortgage-Backed | - | - | 844,416 | - | - | - | 844,416 | ||||||||||||
Corporate Bonds† | - | - | 28,438,371 | - | - | - | 28,438,371 | ||||||||||||
Equity Securities—Domestic | 98,175,619 | - | - | - | - | - | 98,175,619 | ||||||||||||
Foreign Government | - | - | 926,479 | - | - | - | 926,479 | ||||||||||||
Municipal Bonds† | - | - | 4,553,089 | - | - | - | 4,553,089 | ||||||||||||
Registered Investment Companies | 302,774,427 | - | - | - | - | - | 302,774,427 | ||||||||||||
U.S. Government | - | - | 17,905,259 | - | - | - | 17,905,259 | ||||||||||||
U.S. Treasury | - | - | 13,423,456 | - | - | - | 13,423,456 | ||||||||||||
† See Statement of Investments for additional detailed categorizations.
†† Securities classified within Level 2 at period end as the values were determined pursuant to the fund’s fair valuation procedures.
††† Amount shown represents unrealized appreciation (depreciation) at period end.
Pursuant to a securities lending agreement with The Bank of New York Mellon, the funds may lend securities to qualified institutions. It is the funds’ policy that, at origination, all loans are secured by collateral of at least 102% of the value of U.S. securities loaned and 105% of the value of foreign securities loaned. Collateral equivalent to at least 100% of the market value of securities on loan is maintained at all times. Collateral is either in the form of cash, which can be invested in certain money market mutual funds managed by Dreyfus, or U.S. Government and Agency securities. The funds are entitled to receive all dividends, interest and distributions on securities loaned, in addition to income earned as a result of the lending transaction. Should a borrower fail to return the securities in a timely manner, The Bank of New York Mellon is required to replace the securities for the benefit of the funds or credit the funds with the market value of the unreturned securities and is subrogated to the funds’ rights against the borrower and the collateral. Additionally, the contractual maturity of security lending transactions are on an overnight and continuous basis. Table 2 summarizes the amount The Bank of New York Mellon earned from each relevant fund from lending portfolio securities, pursuant to the securities lending agreement during the period ended August 31, 2017.
Table 2—Securities Lending Agreement |
|
BNY Mellon Large Cap Stock Fund | $3,223 |
BNY Mellon Large Cap Market Opportunities Fund | 112 |
BNY Mellon Tax-Sensitive Large Cap Multi-Strategy Fund | 1,040 |
BNY Mellon Income Stock Fund | 10,504 |
BNY Mellon Mid Cap Multi-Strategy Fund | 142,895 |
BNY Mellon Small Cap Multi-Strategy Fund | 105,558 |
BNY Mellon Focused Equity Opportunities Fund | 1,776 |
BNY Mellon Small/Mid Cap Multi-Strategy Fund | 44,315 |
BNY Mellon Emerging Markets Fund | 1,844 |
BNY Mellon Asset Allocation Fund | 721 |
(d) Affiliated issuers: Investments in other investment companies advised by Dreyfus are defined as “affiliated” under the Act.
(e) Risk: BNY Mellon International Fund, BNY Mellon Emerging Markets Fund and BNY Mellon International Equity Income Fund invest in foreign markets which may involve special risks and considerations not typically associated with investing in the U.S. These risks include revaluation of currencies, high rates of inflation, repatriation restrictions on income and capital, and adverse political and economic developments. Moreover, securities issued in these markets may be less liquid, subject to government ownership controls and delayed settlements, and their prices may be more volatile than those of comparable securities in the U.S.
135
NOTES TO FINANCIAL STATEMENTS (continued)
BNY Mellon Asset Allocation Fund invests in debt securities. Failure of an issuer of the debt securities to make timely interest or principal payments, or a decline or the perception of a decline in the credit quality of a debt security, can cause the debt security’s price to fall, potentially lowering the fund’s share price. In addition, the value of debt securities may decline due to general market conditions that are not specifically related to a particular issuer, such as real or perceived adverse economic conditions, changes in outlook for corporate earnings, changes in interest or currency rates or adverse investor sentiment. They may also decline because of factors that affect a particular industry.
BNY Mellon Focused Equity Opportunities Fund is non-diversified, which means that a relatively high percentage of the fund’s assets may be invested in a limited number of issuers. Therefore, the fund’s performance may be vulnerable to changes in market value of a single issuer or group of issuers and more susceptible to risks associated with a single economic, political or regulatory occurrence than a diversified fund.
(f) Dividends and distributions to shareholders: Dividends and distributions payable to shareholders are recorded by each fund on the ex-dividend date. BNY Mellon Large Cap Stock Fund, BNY Mellon Income Stock Fund and BNY Mellon Asset Allocation Fund normally declare and pay dividends from investment income-net monthly. BNY Mellon International Equity Income Fund normally declares and pays dividends from investment income-net quarterly. BNY Mellon Large Cap Market Opportunities Fund, BNY Mellon Tax-Sensitive Large Cap Multi-Strategy Fund, BNY Mellon Mid Cap Multi-Strategy Fund, BNY Mellon Small Cap Multi-Strategy Fund, BNY Mellon Focused Equity Opportunities Fund, BNY Mellon Small/Mid Cap Multi-Strategy Fund, BNY Mellon International Fund, BNY Mellon Emerging Markets Fund and BNY Mellon International Appreciation Fund normally declare and pay dividends from investment income-net annually. Dividends from net realized capital gains, if any, are normally declared and paid annually, but each fund may make distributions on a more frequent basis to comply with the distribution requirements of the Internal Revenue Code of 1986, as amended (the “Code”). To the extent that net realized capital gains can be offset by capital loss carryovers of a fund, it is the policy of each fund not to distribute such gains. Income and capital gain distributions are determined in accordance with income tax regulations, which may differ from GAAP.
(g) Federal income taxes: It is the policy of each fund to continue to qualify as a regulated investment company, if such qualification is in the best interests of its shareholders, by complying with the applicable provisions of the Code, and to make distributions of taxable income sufficient to relieve it from substantially all federal income and excise taxes. For federal income tax purposes, each fund is treated as a separate entity for the purpose of determining such qualification.
As of and during the period ended August 31, 2017, the funds did not have any liabilities for any uncertain tax positions. Each fund recognizes interest and penalties, if any, related to uncertain tax positions as income tax expense in the Statements of Operations. During the period ended August 31, 2017, the funds did not incur any interest or penalties.
Each tax year in the four-year period ended August 31, 2017 remains subject to examination by the Internal Revenue Service and state taxing authorities.
Table 3 summarizes each fund’s components of accumulated earnings on a tax basis at August 31, 2017.
Under the Regulated Investment Company Modernization Act of 2010 (the “2010 Act”), each fund is permitted to carry forward capital losses incurred in taxable years beginning after December 22, 2010 (“post-enactment losses”) for an unlimited period. Furthermore, post-enactment capital loss carryovers retain their character as either short-term or long-term capital losses rather than short-term as they were under previous statute. The 2010 Act requires post-enactment losses to be utilized before the utilization of losses incurred in taxable years prior to the effective date of the 2010 Act (“pre-enactment losses”). As a result of this ordering rule, pre-enactment losses may be more likely to expire unused.
136
Table 3—Components of Accumulated Earnings | ||||||
Undistributed | Accumulated | Undistributed | Unrealized | Capital (Losses) | ||
BNY Mellon Large Cap Stock Fund | 1,451,355 | – | 29,257,223 | 66,977,674 | – | |
BNY Mellon Large Cap Market Opportunities Fund | 811,389 | – | 7,971,947 | 15,667,071 | – | |
BNY Mellon Tax-Sensitive Large Cap Multi-Strategy Fund | 3,017,339 | – | 28,141,518 | 115,542,704 | – | |
BNY Mellon Income Stock Fund | 26,553,496 | – | 37,843,522 | 199,821,514 | – | |
BNY Mellon Mid Cap Multi-Strategy Fund | 4,616,859 | – | 101,943,231 | 737,518,935 | (2,580,215) | |
BNY Mellon Small Cap Multi-Strategy Fund | 7,092,152 | – | 31,082,214 | 80,021,417 | - | |
BNY Mellon Focus Equity Opportunities Fund | 7,657,273 | – | 47,890,152 | 118,899,286 | – | |
BNY Mellon Small/Mid Cap Multi-Strategy Fund | 6,815,241 | - | 18,731,298 | 51,814,060 | – | |
BNY Mellon International Fund | 17,180,528 | (566,110,581) | – | 103,757,291 | – | |
BNY Mellon Emerging Markets Fund | 7,831,331 | (436,307,249) | – | 244,412,417 | – | |
BNY Mellon International Appreciation Fund | 1,252,828 | (29,586,195) | – | (16,115,206) | – | |
BNY Mellon International Equity Income Fund | 4,573,657 | (41,830,840) | – | 45,353,035 | – | |
BNY Mellon Asset Allocation Fund | 125,245 | – | 12,019,722 | 70,218,106 | – | |
† These losses were deferred for tax purposes to the first day of the following fiscal year.
Table 4 summarizes each relevant fund’s accumulated capital loss carryover available for federal income tax purposes to be applied against future net realized capital gains, if any, realized subsequent to August 31, 2017.
Table 5 summarizes each fund’s tax character of distributions paid to shareholders during the fiscal periods ended August 31, 2017 and August 31, 2016.
During the period ended August 31, 2017, as a result of permanent book to tax differences, where indicated each identified fund increased (decreased) accumulated undistributed investment income-net, increased (decreased) accumulated net realized gain (loss) on investments and increased (decreased) paid-in capital as summarized in Table 6. These permanent book to tax differences are primarily due to the tax treatment for real estate investment trusts and dividend reclassification for BNY Mellon Large Cap Stock Fund, short-term capital gain distributions from regulated investment company holdings and treating portion of the proceeds from redemptions as a distribution for tax purposes for BNY Mellon Large Cap Market Opportunities Fund, real estate investment trusts and short-term capital gain distributions from regulated investment company holdings for BNY Mellon Tax-Sensitive Large Cap Multi-Strategy Fund, real estate investment trusts and dividend reclassification for BNY Mellon Income Stock Fund, real estate investment trusts, dividend reclassification and a limited partnership for BNY Mellon Mid Cap Multi-Strategy Fund, real estate investment trusts, net operating losses and passive foreign investment companies for BNY Mellon Small Cap Multi-Strategy Fund, real estate investment trusts and passive foreign investment companies for BNY Mellon Small/Mid Cap Multi-Strategy Fund, foreign exchange gains and losses, passive foreign investment companies and expiration of capital loss carryover for BNY Mellon International Fund, foreign exchange gains and losses, passive foreign investment companies and foreign capital gain taxes for BNY Mellon Emerging Markets Fund, passive foreign investment companies and expiration of capital loss carryover for BNY Mellon International Appreciation Fund, foreign exchange gains and losses and passive foreign investment companies for BNY Mellon International Equity Income Fund and real estate investment trusts, amortization adjustments, paydown gains and losses on mortgage-backed securities and short-term capital gain distribution from regulated investment company holdings for BNY Mellon Asset Allocation Fund. Net assets and net asset value per share were not affected by these reclassifications.
Table 4—Capital Loss Carryover | ||||||||
Expiring in fiscal year | Post-Enactment Losses ($)†† | Post-Enactment Losses ($)††† | ||||||
2018 ($)† | Total ($) | |||||||
BNY Mellon International Fund | 462,294,170 | 2,030,988 | 101,785,423 | 566,110,581 | ||||
BNY Mellon Emerging Markets Fund | - | 201,359,124 | 234,948,125 | 436,307,249 | ||||
BNY Mellon International Appreciation Fund | - | 383,070 | 29,203,125 | 29,586,195 | ||||
BNY Mellon International Equity Income Fund | - | 33,126,045 | 8,704,795 | 41,830,840 | ||||
† If not applied, the carryovers expire in the above fiscal years.
†† Post-enactment short-term capital losses which can be carried forward for an unlimited period.
††† Post-enactment long-term capital losses which can be carried forward for an unlimited period.
137
NOTES TO FINANCIAL STATEMENTS (continued)
Table 5— Tax Character of Distributions Paid | |||||||||||||
2017 | 2016 | ||||||||||||
| Ordinary Income ($) | Long-Term |
| Ordinary | Long-Term | ||||||||
BNY Mellon Large Cap Stock Fund | 3,649,329 | 12,129,717 | 6,198,924 | 35,080,419 | |||||||||
BNY Mellon Large Cap Market Opportunities Fund | 1,470,911 | 7,979,895 | 1,000,346 | 20,355,484 | |||||||||
BNY Mellon Tax-Sensitive Large Cap Multi-Strategy Fund | 5,840,522 | 15,840,777 | 4,001,301 | 29,096,521 | |||||||||
BNY Mellon Income Stock Fund | 27,616,101 | 32,076,068 | 40,861,818 | 78,955,736 | |||||||||
BNY Mellon Mid Cap Multi-Strategy Fund | 20,569,662 | 21,609,214 | 3,707,741 | 101,413,768 | |||||||||
BNY Mellon Small Cap Multi-Strategy Fund | – | 2,370,605 | – | 14,512,283 | |||||||||
BNY Mellon Focused Equity Opportunities Fund | 9,861,114 | 27,877,152 | 3,924,693 | 43,858,883 | |||||||||
BNY Mellon Small/Mid Cap Multi-Strategy Fund | 240,001 | 1,046,913 | 2,398,472 | 17,197,755 | |||||||||
BNY Mellon International Fund | 19,135,813 | – | 14,985,335 | – | |||||||||
BNY Mellon Emerging Markets Fund | 5,250,373 | – | 7,875,624 | – | |||||||||
BNY Mellon International Appreciation Fund | 1,954,995 | – | 2,244,800 | – | |||||||||
BNY Mellon International Equity Income Fund | 9,867,923 | – | 6,916,630 | – | |||||||||
BNY Mellon Asset Allocation Fund | 7,809,568 | 3,842,171 | 8,125,141 | 22,308,569 | |||||||||
Table 6—Return of Capital Statement of Position | |||||
| Accumulated | Accumulated | Paid-in | ||
BNY Mellon Large Cap Stock Fund | (208,014) | 208,014 | – | ||
BNY Mellon Large Cap Market Opportunities Fund | 29,008 | (2,556,421) | 2,527,413 | ||
BNY Mellon Tax-Sensitive Large Cap Multi-Strategy Fund | (3,068) | 3,068 | – | ||
BNY Mellon Income Stock Fund | (24,686) | 24,686 | – | ||
BNY Mellon Mid Cap Multi-Strategy Fund | (1,640,025) | 1,640,025 | – | ||
BNY Mellon Small Cap Multi-Strategy Fund | 91,968 | (91,968) | - | ||
BNY Mellon Small/Mid Cap Multi-Strategy Fund | 97,101 | (97,101) | – | ||
BNY Mellon International Fund | 2,220,974 | 85,512,799 | (87,733,773) | ||
BNY Mellon Emerging Markets Fund | (678,108) | 678,108 | – | ||
BNY Mellon International Appreciation Fund | 16,430 | 15,640,705 | (15,657,135) | ||
BNY Mellon International Equity Income Fund | 1,382,545 | (1,382,545) | – | ||
BNY Mellon Asset Allocation Fund | 691,012 | (691,012) | – | ||
NOTE 2—Bank Lines of Credit:
The funds participate with other Dreyfus-managed funds in an $810 million unsecured credit facility led by Citibank, N.A. and a $300 million unsecured credit facility provided by The Bank of New York Mellon (each, a “Facility”), each to be utilized primarily for temporary or emergency purposes, including the financing of redemptions. Prior to October 5, 2016, the unsecured credit facility with Citibank, N.A. was $555 million. In connection therewith, each fund has agreed to pay its pro rata portion of commitment fees for each Facility. Interest is charged to the funds based on rates determined pursuant to the terms of the respective Facility at the time of borrowing. During the period ended August 31, 2017, BNY Mellon Large Cap Market Opportunities Fund, BNY Mellon Income Stock Fund, BNY Mellon Mid Cap Multi-Strategy Fund and BNY Mellon Small Cap Multi-Strategy Fund did not borrow under the Facilities.
The average amount of borrowings outstanding under the Facilities during the period ended August 31, 2017 for BNY Mellon Large Cap Stock Fund was approximately $43,600, with a related weighted average annualized interest rate of 1.49%.
The average amount of borrowings outstanding under the Facilities during the period ended August 31, 2017 for BNY Mellon Tax-Sensitive Large Cap Multi-Strategy Fund was approximately $4,700, with a related weighted average annualized interest rate of 1.73%.
The average amount of borrowings outstanding under the Facilities during the period ended August 31, 2017 for BNY Mellon Focused Equity Opportunities Fund was
138
approximately $181,900, with a related weighted average annualized interest rate of 1.48%.
The average amount of borrowings outstanding under the Facilities during the period ended August 31, 2017 for BNY Mellon Small/Mid Cap Multi-Strategy Fund was approximately $16,200, with a related weighted average annualized interest rate of 1.61%.
The average amount of borrowings outstanding under the Facilities during the period ended August 31, 2017 for BNY Mellon International Fund was approximately $148,800, with a related weighted average annualized interest rate of 1.58%.
The average amount of borrowings outstanding under the Facilities during the period ended August 31, 2017 for BNY Mellon Emerging Markets Fund was approximately $113,400, with a related weighted average annualized interest rate of 1.47%.
The average amount of borrowings outstanding under the Facilities during the period ended August 31, 2017 for BNY Mellon International Appreciation Fund was approximately $24,100, with a related weighted average annualized interest rate of 1.56%.
The average amount of borrowings outstanding under the Facilities during the period ended August 31, 2017 for BNY Mellon International Equity Income Fund was approximately $6,600, with a related weighted average annualized interest rate of 1.46%.
The average amount of borrowings outstanding under the Facilities during the period ended August 31, 2017 for BNY Mellon Asset Allocation Fund was approximately $3,000, with a related weighted average annualized interest rate of 1.91%.
NOTE 3—Investment Advisory Fee, Administration Fee, Sub-Investment Advisory Fee and Other Transactions with Affiliates:
(a) Fees payable by the funds pursuant to the provisions of an investment advisory agreement with the Investment Adviser are payable monthly, computed on the average daily value of each fund’s net assets at the following annual rates: .65% of BNY Mellon Large Cap Stock Fund, .70% (direct investment in securities) and .15% (other underlying funds, which may consist of affiliated funds, mutual funds and exchange traded funds) of BNY Mellon Large Cap Market Opportunities Fund, .70% (direct investment in securities) and .15% (other underlying funds, which may consist of affiliated funds, mutual funds and exchange traded funds) of BNY Mellon Tax-Sensitive Large Cap Multi-Strategy Fund, .65% of BNY Mellon Income Stock Fund, .75% of BNY Mellon Mid Cap Multi-Strategy Fund, .85% of BNY Mellon Small Cap Multi-Strategy Fund, .70% of BNY Mellon Focused Equity Opportunities Fund, .75% of BNY Mellon Small/Mid Cap Multi-Strategy Fund, .85% of BNY Mellon International Fund, 1.15% of BNY Mellon Emerging Markets Fund, .50% of BNY Mellon International Appreciation Fund, .85% of BNY Mellon International Equity Income Fund and .65% (equity investments), .40% (debt securities) and .15% (money market investments and other underlying funds, which may consist of affiliated funds, mutual funds and exchange traded funds) of BNY Mellon Asset Allocation Fund.
For BNY Mellon Income Stock Fund, the Investment Adviser has contractually agreed, from September 1, 2016 through June 1, 2018, to waive receipt of its fees and/or assume the direct expenses of the fund, so that the total expenses of Class A, Class C, Class I and Class Y shares (excluding Rule 12b-1 Distribution Plan fees, Shareholder Services Plan fees, taxes, interest expense, brokerage commissions, commitment fees on borrowings and extraordinary expenses) do not exceed .90% of the value of the fund’s average daily net assets. The reduction in expenses, pursuant to the undertaking, amounted to $388 during the period ended August 31, 2017.
For BNY Mellon Asset Allocation Fund, the Investment Adviser has contractually agreed, from September 1, 2016 through December 31, 2017, to waive receipt of its fees and/or assume the direct expenses of the fund, so that the total annual fund operating expenses of neither class (including indirect fees, and expense of the underlying funds, but excluding Shareholder Services Plan fees, taxes, interest expense, brokerage commissions, commitment fees on borrowings and extraordinary expenses) do not exceed .87% of the value of the fund’s average daily net assets. The reduction in expenses, pursuant to the undertaking, amounted to $355,507 during the period ended August 31, 2017.
During the period ended August 31, 2017, the Distributor retained $307 from commissions earned on sales of BNY Mellon Income Stock Fund’s Class A shares.
Pursuant to the Administration Agreement, The Bank of New York Mellon provides or arranges for fund accounting, transfer agency and other fund administration services and receives a fee based on the total net assets of the Trust based on the following rates:
0 up to $6 billion .15%
$6 billion up to $12 billion .12%
In excess of $12 billion .10%
139
NOTES TO FINANCIAL STATEMENTS (continued)
No administration fee is applied to assets held by BNY Mellon Large Cap Market Opportunities Fund and BNY Mellon Tax-Sensitive Large Cap Multi-Strategy Fund which are invested in shares of other underlying funds.
No administration fee is applied to assets held by BNY Mellon Asset Allocation Fund which are invested in cash or money market instruments or shares of other underlying funds.
Pursuant to a sub-investment advisory agreement between Dreyfus and Walter Scott, Dreyfus pays Walter Scott a monthly fee at an annual rate of .41% of BNY Mellon Large Cap Market Opportunities Fund’s and BNY Mellon Tax-Sensitive Large Cap Multi-Strategy Fund’s average daily net assets allocated to the U.S. Large Cap Equity Strategy.
Pursuant to separate sub-investment advisory agreements, Geneva and Boston Partners serve as a sub-investment adviser responsible for the day-to-day management of their respective portion of BNY Mellon Mid Cap Multi-Strategy Fund’s portfolio. Dreyfus pays Boston Partners and Geneva separate monthly fees at an annual percentage of BNY Mellon Mid Cap Multi-Strategy Fund’s average daily net assets allocated to the Boston Partners Mid Cap Value Strategy and the Geneva Mid Cap Growth Strategy, respectively. Dreyfus has obtained an exemptive order from the SEC (the “Order”), upon which the funds may rely, to use a manager of managers approach that permits Dreyfus, subject to certain conditions and approval by the Board, to enter into and materially amend sub-investment advisory agreements with one or more sub-investment advisers who are either unaffiliated with Dreyfus or are wholly-owned subsidiaries (as defined under the Act) of Dreyfus’ ultimate parent company, BNY Mellon, without obtaining shareholder approval. The Order also allows the funds to disclose the sub-investment advisory fee paid by Dreyfus to any unaffiliated sub-investment adviser in the aggregate with other unaffiliated sub-investment advisers in documents filed with the SEC and provided to shareholders. In addition, pursuant to the Order, it is not necessary to disclose the sub-investment advisory fee payable by Dreyfus separately to a sub-investment adviser that is a wholly-owned subsidiary of BNY Mellon in documents filed with the SEC and provided to shareholders; such fees are to be aggregated with fees payable to Dreyfus. Dreyfus has ultimate responsibility (subject to oversight by the Board) to supervise any sub-investment adviser and recommend the hiring, termination, and replacement of any sub-investment adviser to the Board.
(b) Under the Distribution Plan adopted pursuant to Rule 12b-1 under the Act, Class C shares of BNY Mellon Income Stock Fund pay the Distributor for distributing its shares at an annual rate of .75% of the value of its average daily net assets. During the period ended August 31, 2017, Class C shares were charged $4,796 pursuant to the Distribution Plan.
Each fund has adopted a Shareholder Services Plan with respect to its Investor shares. BNY Mellon Income Stock Fund has also adopted a Shareholder Services Plan with respect to its Class A and Class C shares. Each fund pays the Distributor at an annual rate of .25% of the value of its Investor shares, and BNY Mellon Income Stock Fund pays the Distributor at an annual rate of .25% of the value of its Class A and Class C shares, based on the respective fund’s average daily net assets for the provision of certain services. The services provided may include personal services relating to shareholder accounts, such as answering shareholder inquiries regarding a fund and providing reports and other information, and services related to the maintenance of such shareholder accounts. The Shareholder Services Plan allows the Distributor to make payments from the shareholder services fees it collects from each fund to compensate service agents (certain banks, securities brokers or dealers and other financial institutions) with respect to these services. Table 7 summarizes the amounts Investor, Class A and Class C shares were charged during the period ended August 31, 2017, pursuant to the Shareholder Services Plan. Additional fees included in Shareholder servicing costs in the Statements of Operations primarily include fees paid for cash management charges.
Table 7—Shareholder Services Plan Fees |
|
BNY Mellon Large Cap Stock Fund | $24,880 |
BNY Mellon Large Cap Market Opportunities Fund | 2,068 |
BNY Mellon Tax-Sensitive Large Cap Multi-Strategy Fund | 14,773 |
BNY Mellon Income Stock Fund | |
Investor Shares | 52,237 |
Class A | 4,058 |
Class C | 1,599 |
BNY Mellon Mid Cap Multi-Strategy Fund | 183,254 |
BNY Mellon Small Cap Multi-Strategy Fund | 43,437 |
BNY Mellon Focused Equity Opportunities Fund | 12,891 |
BNY Mellon Small/Mid Cap Multi-Strategy Fund | 4,283 |
BNY Mellon International Fund | 36,410 |
BNY Mellon Emerging Markets Fund | 37,227 |
BNY Mellon International Appreciation Fund | 3,779 |
BNY Mellon International Equity Income Fund | 4,958 |
BNY Mellon Asset Allocation Fund | 15,013 |
The funds have arrangements with the transfer agent and the custodian whereby the funds may receive earnings credits when positive cash balances are maintained, which are used to offset transfer agency and custody fees. For financial
140
reporting purposes, the funds include net earnings credits as expense offsets in the Statements of Operations.
Each fund compensates Dreyfus Transfer, Inc., a wholly-owned subsidiary of Dreyfus, under a transfer agency agreement for providing transfer agency and cash management services for the funds. The majority of transfer agency fees are comprised of amounts paid on a per account basis, while cash management fees are related to fund subscriptions and redemptions. The Bank of New York Mellon pays each fund’s transfer agent fees out of the administration fee it receives from the Trust. Table 8 summarizes the amount each fund was charged during the period ended August 31, 2017 for cash management services, which is included in Shareholder servicing costs in the Statements of Operations. Cash management fees were partially offset by earnings credits, also summarized in Table 8.
Each fund compensates The Bank of New York Mellon, under a custody agreement for providing custodial services for each fund. These fees are determined based on net assets, geographic region and transaction activity. Table 9 summarizes the amount each fund was charged during the period ended August 31, 2017 pursuant to the custody agreement.
Table 8—Cash Management Agreement Fees | ||||
| Dreyfus Transfer, Inc. | Dreyfus Transfer, Inc. | ||
BNY Mellon Large Cap Stock Fund | 89 | (88) | ||
BNY Mellon Large Cap Market Opportunities Fund | 19 | (19) | ||
BNY Mellon Tax-Sensitive Large Cap Multi-Strategy Fund | 35 | (35) | ||
BNY Mellon Income Stock Fund | 180 | (180) | ||
BNY Mellon Mid Cap Multi-Strategy Fund | 1,381 | (1,364) | ||
BNY Mellon Small Cap Multi-Strategy Fund | 559 | (554) | ||
BNY Mellon Focused Equity Opportunities Fund | 57 | (57) | ||
BNY Mellon Small/Mid Cap Multi-Strategy Fund | 52 | (52) | ||
BNY Mellon International Fund | 139 | (139) | ||
BNY Mellon Emerging Markets Fund | 159 | (159) | ||
BNY Mellon International Appreciation Fund | 228 | (225) | ||
BNY Mellon International Equity Income Fund | 40 | (40) | ||
BNY Mellon Asset Allocation Fund | 40 | (40) | ||
Table 9—Custody Agreement Fees | ||||
| Custody Fees ($) | Earnings Credits ($) | ||
BNY Mellon Large Cap Stock Fund | 54,308 | – | ||
BNY Mellon Large Cap Market Opportunities Fund | 16,634 | – | ||
BNY Mellon Tax-Sensitive Large Cap Multi-Strategy Fund | 20,848 | (32) | ||
BNY Mellon Income Stock Fund | 75,881 | (592) | ||
BNY Mellon Mid Cap Multi-Strategy Fund | 165,831 | (281) | ||
BNY Mellon Small Cap Multi-Strategy Fund | 81,440 | (131) | ||
BNY Mellon Focused Equity Opportunities Fund | 35,038 | – | ||
BNY Mellon Small/Mid Cap Multi-Strategy Fund | 50,600 | (123) | ||
BNY Mellon International Fund | 344,349 | – | ||
BNY Mellon Emerging Markets Fund | 655,556 | (186) | ||
BNY Mellon International Appreciation Fund | 14,465 | (562) | ||
BNY Mellon International Equity Income Fund | 198,337 | – | ||
BNY Mellon Asset Allocation Fund | 22,505 | – | ||
141
NOTES TO FINANCIAL STATEMENTS (continued)
Table 10 summarizes the amount each fund was charged for services performed by the Chief Compliance Officer and his staff, during the period ended August 31, 2017.
Table 10—Chief Compliance Officer Fees |
|
BNY Mellon Large Cap Stock Fund | 11,281 |
BNY Mellon Large Cap Market Opportunities Fund | 15,793 |
BNY Mellon Tax-Sensitive Large Cap Multi-Strategy Fund | 15,793 |
BNY Mellon Income Stock Fund | 11,281 |
BNY Mellon Mid Cap Multi-Strategy Fund | 18,050 |
BNY Mellon Small Cap Multi-Strategy Fund | 11,281 |
BNY Mellon Focused Equity Opportunities Fund | 11,281 |
BNY Mellon Small/Mid Cap Multi-Strategy Fund | 11,281 |
BNY Mellon International Fund | 11,281 |
BNY Mellon Emerging Markets Fund | 11,281 |
BNY Mellon International Appreciation Fund | 11,281 |
BNY Mellon International Equity Income Fund | 11,281 |
BNY Mellon Asset Allocation Fund | 13,537 |
Table 11 summarizes the components of “Due to The Dreyfus Corporation and affiliates” in the Statements of Assets and Liabilities for each fund.
(c) Each Board member also serves as a Board member of other funds within the Trust. Annual retainer fees and attendance fees are allocated to each fund based on net assets.
NOTE 4—Securities Transactions:
Table 12 summarizes each fund’s aggregate amount of purchases and sales (including paydowns) of investment securities, excluding short-term securities, forward contracts, futures and options transactions, during the period ended August 31, 2017.
Derivatives: A derivative is a financial instrument whose performance is derived from the performance of another asset. Each relevant fund enters into International Swaps and Derivatives Association, Inc. Master Agreements or similar agreements (collectively, “Master Agreements”) with its OTC derivative contract counterparties in order to, among other things, reduce its credit risk to counterparties. Master Agreements include provisions for general obligations, representations, collateral and events of default or termination. Under a Master Agreement, the fund may offset with the counterparty certain derivative financial instrument’s payables and/or receivables with collateral held and/or posted and create one single net payment in the event of default or termination.
Each type of derivative instrument that was held by each relevant fund during the period ended August 31, 2017 is discussed below.
Table 11—Due to The Dreyfus Corporation and Affiliates | ||||||||||
| Investment | Distribution | Shareholder | Custodian | Chief Compliance | Dreyfus Transfer, Inc. Cash Management Fees ($) | Less Expense | |||
BNY Mellon Large Cap Stock Fund | 159,609 | – | 2,147 | 20,000 | 4,670 | - | – | |||
BNY Mellon Large Cap Market Opportunities Fund | 24,678 | – | 189 | 6,000 | 6,538 | - | – | |||
BNY Mellon Tax-Sensitive Large Cap Multi-Strategy Fund | 152,418 | – | 1,362 | 6,392 | 6,538 | - | – | |||
BNY Mellon Income Stock Fund | 680,677 | 735 | 7,110 | 25,272 | 4,670 | - | – | |||
BNY Mellon Mid Cap Multi-Strategy Fund | 1,811,402 | – | 18,409 | 56,000 | 7,472 | - | – | |||
BNY Mellon Small Cap Multi-Strategy Fund | 376,828 | — | 4,199 | 31,496 | 4,670 | 150 | – | |||
BNY Mellon Focused Equity Opportunities Fund | 288,323 | – | 1,178 | 12,093 | 4,670 | - | – | |||
BNY Mellon Small/Mid Cap Multi-Strategy Fund | 208,829 | – | 654 | 20,000 | 4,670 | - | – | |||
BNY Mellon International Fund | 787,883 | – | 3,714 | 99,999 | 4,670 | - | – | |||
BNY Mellon Emerging Markets Fund | 874,400 | – | 3,630 | 263,583 | 4,670 | - | – | |||
BNY Mellon International Appreciation Fund | 32,603 | – | 303 | 3,007 | 4,670 | - | – | |||
BNY Mellon International Equity Income Fund | 262,391 | – | 461 | 86,025 | 4,670 | 17 | – | |||
BNY Mellon Asset Allocation Fund | 114,350 | – | 1,435 | 7,285 | 5,604 | - | (50,130) | |||
142
Table 12—Purchases and Sales | ||||||||
| Purchases ($) | Sales ($) | ||||||
BNY Mellon Large Cap Stock Fund | 140,337,285 | 230,123,069 | ||||||
BNY Mellon Large Cap Market Opportunities Fund | 21,984,638 | 46,481,098 | ||||||
BNY Mellon Tax-Sensitive Large Cap Multi-Strategy Fund | 82,415,987 | 135,615,101 | ||||||
BNY Mellon Income Stock Fund | 620,269,734 | 597,834,896 | ||||||
BNY Mellon Mid Cap Multi-Strategy Fund | 1,690,490,884 | 1,637,689,616 | ||||||
BNY Mellon Small Cap Multi-Strategy Fund | 401,332,571 | 354,648,895 | ||||||
BNY Mellon Focused Equity Opportunities Fund | 277,555,255 | 328,960,720 | ||||||
BNY Mellon Small/Mid Cap Multi-Strategy Fund | 250,345,237 | 271,601,129 | ||||||
BNY Mellon International Fund | 812,664,544 | 911,593,606 | ||||||
BNY Mellon Emerging Markets Fund | 706,637,790 | 671,517,942 | ||||||
BNY Mellon International Appreciation Fund | 3,289,338 | 13,829,546 | ||||||
BNY Mellon International Equity Income Fund | 183,573,921 | 144,260,119 | ||||||
BNY Mellon Asset Allocation Fund | 122,253,807 | 136,810,347 | ||||||
Futures: In the normal course of pursuing their investment objective, BNY Mellon International Appreciation Fund is exposed to market risk, including equity price risk, as a result of changes in value of underlying financial instruments. The fund invests in futures in order to manage their exposure to or protect against changes in the market. A futures contract represents a commitment for the future purchase or a sale of an asset at a specified date. Upon entering into such contracts, these investments require initial margin deposits with a counterparty, which consist of cash or cash equivalents. The amount of these deposits is determined by the exchange or Board of Trade on which the contract is traded and is subject to change. Accordingly, variation margin payments are received or made to reflect daily unrealized gains or losses which are recorded in the Statements of Operations. When the contracts are closed, the fund recognizes a realized gain or loss which is reflected in the Statements of Operations. There is minimal counterparty credit risk to the fund with futures since they are exchange traded, and the exchange guarantees the futures against default. Futures open at August 31, 2017 are set forth in the Statements of Futures.
Options Transactions: BNY Mellon Income Stock Fund purchases and writes (sells) put and call options to hedge against changes in the values of equities or as a substitute for an investment. The fund is subject to market risk, in the course of pursuing its investment objectives through its investments in options contracts. A call option gives the purchaser of the option the right (but not the obligation) to buy, and obligates the writer to sell, the underlying financial instrument at the exercise price at any time during the option period, or at a specified date. Conversely, a put option gives the purchaser of the option the right (but not the obligation) to sell, and obligates the writer to buy the underlying financial instrument at the exercise price at any time during the option period, or at a specified date.
As a writer of call options, the fund receives a premium at the outset and then bears the market risk of unfavorable changes in the price of the financial instrument underlying the option. Generally, the fund realizes a gain, to the extent of the premium, if the price of the underlying financial instrument decreases between the date the option is written and the date on which the option is terminated. Generally, the fund incurs a loss if the price of the financial instrument increases between those dates.
As a writer of put options, the fund receives a premium at the outset and then bears the market risk of unfavorable changes in the price of the financial instrument underlying the option. Generally, the fund realizes a gain, to the extent of the premium, if the price of the underlying financial instrument increases between the date the option is written and the date on which the option is terminated. Generally, the fund incurs a loss if the price of the financial instrument decreases between those dates.
As a writer of an option, the fund has no control over whether the underlying financial instrument may be sold (call) or purchased (put) and as a result bears the market risk of an unfavorable change in the price of the financial instrument underlying the written option. There is a risk of loss from a change in value of such options which may exceed the related premiums received. The Statement of Operations reflects any unrealized gains or losses which occurred during the period as well as any realized gains or losses which occurred upon the expiration or closing of the option transaction. Options written open at August 31, 2017 are set forth in the Statement of Option Written.
Forward Foreign Currency Exchange Contracts: BNY Mellon International Fund, BNY Mellon Emerging Markets
143
NOTES TO FINANCIAL STATEMENTS (continued)
Fund and BNY Mellon International Equity Income Fund enter into forward contracts in order to hedge their exposure to changes in foreign currency exchange rates on its foreign portfolio holdings, to settle foreign currency transactions or as a part of their investment strategies. When executing forward contracts, each fund is obligated to buy or sell a foreign currency at a specified rate on a certain date in the future. With respect to sales of forward contracts, each fund incurs a loss if the value of the contract increases between the date the forward contract is opened and the date the forward contract is closed. Each fund realizes a gain if the value of the contract decreases between those dates. With respect to purchases of forward contracts, each fund incurs a loss if the value of the contract decreases between the date the forward contract is opened and the date the forward contract is closed. Each fund realizes a gain if the value of the contract increases between those dates. Any realized or unrealized gains or losses which occurred during the period are reflected in the Statements of Operations. Each fund is exposed to foreign currency risk as a result of changes in value of underlying financial instruments. Each fund is also exposed to credit risk associated with counterparty non-performance on these forward contracts, which is generally limited to the unrealized gain on each open contract. This risk may be mitigated by Master Agreements, if any, between each fund and the counterparty and the posting of collateral, if any, by the counterparty to each fund to cover the funds’ exposure to the counterparty. At August 31, 2017, there were no forward contracts outstanding for BNY Mellon International Fund and BNY Mellon International Equity Income Fund. Forward contracts open at August 31, 2017 for BNY Mellon Emerging Markets Fund are set forth in the Statement of Forward Foreign Currency Exchange Contracts.
The provisions of ASC Topic 210 “Disclosures about Offsetting Assets and Liabilities” require disclosure on the offsetting of financial assets and liabilities. These disclosures are required for certain investments, including derivative financial instruments subject to Master Agreements which are eligible for offsetting in the Statement of Assets and Liabilities and require each relevant fund to disclose both gross and net information with respect to such investments. For financial reporting purposes, each relevant fund does not offset derivative assets and derivative liabilities that are subject to Master Agreements in the Statement of Assets and Liabilities.
Table 13 summarizes each relevant fund’s derivatives assets and liabilities (by type) on a gross basis, and net of amounts available for offsetting under Master Agreements and net of related collateral received or pledged, if any, as of August 31, 2017.
Table 13—Derivative of Assets and Liabilities subject to Master Netting Agreements
BNY Mellon Emerging Markets Fund |
|
|
| ||
|
|
|
|
|
|
Derivative Financial Instruments: |
| Assets ($) |
| Liabilities ($) |
|
Forward contracts |
| - |
| (64) |
|
Total gross amount of derivative |
|
|
|
|
|
assets and liabilities in the |
|
|
|
|
|
Statement of Assets and Liabilities |
| - |
| (64) |
|
Derivatives not subject to |
|
|
|
|
|
Master Agreements |
| - |
| - |
|
Total gross amount of assets |
|
|
|
|
|
and liabilities subject to |
|
|
|
|
|
Master Agreements |
| - |
| (64) |
|
|
|
|
|
|
|
|
|
|
| Financial |
|
|
|
|
|
| Instruments |
|
|
|
|
|
| and Derivatives |
|
|
|
| Gross Amount of |
| Available | Collateral |
| Net Amount of |
Counterparty | Liabilities ($) | 1 | for Offset ($) | Pledged ($) |
| Liabilities ($) |
Northern Trust | (64) |
| - | - |
| (64) |
1 Absent a default event or early termination, OTC derivative assets and liabilities are presented at gross amounts and are not offset in the Statements of Assets and Liabilities. | ||||||
144
Table 14 summarizes each relevant fund’s average market value of derivatives outstanding during the period ended August 31, 2017.
Table 14—Average Market Value of Derivatives | |
Average Market Value ($) | |
BNY Mellon Income Stock Fund | 998,263 |
BNY Mellon International Fund | 8,515,493 |
BNY Mellon Emerging Markets Fund | 2,901,332 |
BNY Mellon International Appreciation Fund | 872,411 |
BNY Mellon International Equity Income Fund | 702,653 |
Table 15 summarizes the cost of investments inclusive of derivative contracts for federal income tax purposes, gross appreciation, gross depreciation and accumulated net unrealized appreciation (depreciation) on investments inclusive of derivative contracts for each fund at August 31, 2017.
Table 15—Accumulated Net Unrealized Appreciation (Depreciation) | ||||||||
| Cost of | Gross | Gross | Net ($) | ||||
BNY Mellon Large Cap Stock Fund | 221,718,540 | 71,005,170 | 4,027,496 | 66,977,674 | ||||
BNY Mellon Large Cap Market Opportunities Fund | 53,993,204 | 16,270,057 | 602,986 | 15,667,071 | ||||
BNY Mellon Tax-Sensitive Large Cap Multi-Strategy Fund | 227,367,940 | 116,798,525 | 1,255,821 | 115,542,704 | ||||
BNY Mellon Income Stock Fund | 995,574,129 | 237,277,551 | 37,456,037 | 199,821,514 | ||||
BNY Mellon Mid Cap Multi-Strategy Fund | 2,227,053,604 | 770,697,245 | 33,178,310 | 737,518,935 | ||||
BNY Mellon Small Cap Multi-Strategy Fund | 508,396,441 | 100,528,746 | 20,507,329 | 80,021,417 | ||||
BNY Mellon Focused Equity Opportunities Fund | 370,481,376 | 128,228,703 | 9,329,417 | 118,899,286 | ||||
BNY Mellon Small/Mid Cap Multi-Strategy Fund | 305,311,079 | 64,149,821 | 12,335,761 | 51,814,060 | ||||
BNY Mellon International Fund | 979,069,402 | 141,377,765 | 37,748,444 | 103,629,321 | ||||
BNY Mellon Emerging Markets Fund | 673,577,549 | 265,042,310 | 20,723,036 | 244,319,274 | ||||
BNY Mellon International Appreciation Fund | 93,094,261 | 13,832,043 | 29,936,690 | (16,104,647) | ||||
BNY Mellon International Equity Income Fund | 322,250,500 | 55,149,423 | 9,817,411 | 45,332,012 | ||||
BNY Mellon Asset Allocation Fund | 396,823,010 | 74,302,996 | 4,084,890 | 70,218,106 | ||||
145
REPORT OF INDEPENDENT REGISTERED
PUBLIC ACCOUNTING FIRM
The Board of Trustees and Shareholders
BNY Mellon Funds Trust
We have audited the accompanying statements of assets and liabilities of BNY Mellon Large Cap Stock Fund, BNY Mellon Large Cap Market Opportunities Fund, BNY Mellon Tax-Sensitive Large Cap Multi-Strategy Fund, BNY Mellon Income Stock Fund, BNY Mellon Mid Cap Multi-Strategy Fund, BNY Mellon Small Cap Multi-Strategy Fund, BNY Mellon Focused Equity Opportunities Fund, BNY Mellon Small/Mid Cap Multi-Strategy Fund, BNY Mellon International Fund, BNY Mellon Emerging Markets Fund, BNY Mellon International Appreciation Fund, BNY Mellon International Equity Income Fund and BNY Mellon Asset Allocation Fund (collectively the “Funds”), each a series of BNY Mellon Funds Trust, including the statements of investments, and investments in affiliated issuers, statement of options written (with respect to BNY Mellon Income Stock Fund), statement of forward foreign currency exchange contracts (with respect to BNY Mellon Emerging Markets Fund) and statement of futures (with respect to BNY Mellon International Appreciation Fund), as of August 31, 2017, and the related statements of operations for the year then ended, the statements of changes in net assets for each of the years or periods in the two-year period then ended and the financial highlights for each of the years or periods in the five-year period then ended. These financial statements and financial highlights are the responsibility of the Funds’ management. Our responsibility is to express an opinion on these financial statements and financial highlights based on our audits.
We conducted our audits in accordance with the standards of the Public Company Accounting Oversight Board (United States). Those standards require that we plan and perform the audit to obtain reasonable assurance about whether the financial statements and financial highlights are free of material misstatement. An audit includes examining, on a test basis, evidence supporting the amounts and disclosures in the financial statements. Our procedures included confirmation of securities owned as of August 31, 2017, by correspondence with the custodian and brokers or by other appropriate auditing procedures. An audit also includes assessing the accounting principles used and significant estimates made by management, as well as evaluating the overall financial statement presentation. We believe that our audits provide a reasonable basis for our opinion.
In our opinion, the financial statements and financial highlights referred to above present fairly, in all material respects, the financial position of the aforementioned funds, as of August 31, 2017, the results of their operations for the year then ended, the changes in their net assets for each of the years or periods in the two-year period then ended and the financial highlights for each of the years or periods in the five-year period then ended, in conformity with U.S. generally accepted accounting principles.

New York, New York
October 27, 2017
146
IMPORTANT TAX INFORMATION (Unaudited)
BNY Mellon Large Cap Stock Fund
For federal tax purposes, the fund reports the maximum amount allowable but not less than 100% of ordinary income dividends paid during the fiscal year ended August 31, 2017 as eligible for the corporate dividends received deduction provided under Section 243 of the Internal Revenue Code in accordance with Section 854(b)(1)(A) of the Internal Revenue Code. Also, the fund reports the maximum amount allowable but not less than $3,649,329 as ordinary income dividends paid during the fiscal year ended August 31, 2017 as qualified dividend income in accordance with Section 854(b)(1)(B) of the Internal Revenue Code. Shareholders will receive notification in early 2018 of the percentage applicable to the preparation of their 2017 income tax returns. Also, the fund reports the maximum amount allowable but not less than $.2254 per share as a capital gain dividend paid on December 2, 2016 in accordance with Section 852(b)(3)(C) of the Internal Revenue Code.
BNY Mellon Large Cap Market Opportunities Fund
For federal tax purposes, the fund reports the maximum amount allowable but not less than 79.91% of ordinary income dividends paid during the fiscal year ended August 31, 2017 as eligible for the corporate dividends received deduction provided under Section 243 of the Internal Revenue Code in accordance with Section 854(b)(1)(A) of the Internal Revenue Code. Also, the fund reports the maximum amount allowable but not less than $1,470,911 as ordinary income dividends paid during the fiscal year ended August 31, 2017 as qualified dividend income in accordance with Section 854(b)(1)(B) of the Internal Revenue Code. Shareholders will receive notification in early 2018 of the percentage applicable to the preparation of their 2017 income tax returns. Also, the fund reports the maximum amount allowable but not less than $1.3017 per share as a capital gain dividend paid on December 20, 2016 in accordance with Section 852(b)(3)(C) of the Internal Revenue Code. Also, the fund reports the maximum amount allowable but not less than $.0507 as a short-term capital gain dividend paid on December 20, 2016 in accordance with Sections 871(k)(2) and 881(e) of the Internal Revenue Code.
BNY Mellon Tax-Sensitive Large Cap Multi-Strategy Fund
For federal tax purposes, the fund reports the maximum amount allowable but not less than 98.84% of ordinary income dividends paid during the fiscal year ended August 31, 2017 as eligible for the corporate dividends received deduction provided under Section 243 of the Internal Revenue Code in accordance with Section 854(b)(1)(A) of the Internal Revenue Code. Also, the fund reports the maximum amount allowable but not less than $5,840,522 as ordinary income dividends paid during the fiscal year ended August 31, 2017 as qualified dividend income in accordance with Section 854(b)(1)(B) of the Internal Revenue Code. Shareholders will receive notification in early 2018 of the percentage applicable to the preparation of their 2017 income tax returns. Also, the fund reports the maximum amount allowable but not less than $.6902 per share as a capital gain dividend paid on December 20, 2016 in accordance with Section 852(b)(3)(C) of the Internal Revenue Code. Also, the fund reports the maximum amount allowable but not less than $.0288 as a short-term capital gain dividend paid on December 20, 2016 in accordance with Sections 871(k)(2) and 881(e) of the Internal Revenue Code.
BNY Mellon Income Stock Fund
For federal tax purposes, the fund reports the maximum amount allowable but not less than 61.63% of ordinary income dividends paid during the fiscal year ended August 31, 2017 as eligible for the corporate dividends received deduction provided under Section 243 of the Internal Revenue Code in accordance with Section 854(b)(1)(A) of the Internal Revenue Code. Also, the fund reports the maximum amount allowable but not less than $27,616,101 as ordinary income dividends paid during the fiscal year ended August 31, 2017 as qualified dividend income in accordance with Section 854(b)(1)(B) of the Internal Revenue Code. Shareholders will receive notification in early 2018 of the percentage applicable to the preparation of their 2017 income tax returns. Also, the fund reports the maximum amount allowable but not less than $.2576 per share as a capital gain dividend paid on December 2, 2016 in accordance with Section 852(b)(3)(C) of the Internal Revenue Code. Also, the fund reports the maximum amount allowable but not less than $.0233 as a short-term capital gain dividend paid on December 2, 2016 in accordance with Sections 871(k)(2) and 881(e) of the Internal Revenue Code.
BNY Mellon Mid Cap Multi-Strategy Fund
For federal tax purposes, the fund reports the maximum amount allowable but not less than 100% of ordinary income dividends paid during the fiscal year ended August 31, 2017 as eligible for the corporate dividends received deduction provided under Section 243 of the Internal Revenue Code in accordance with Section 854(b)(1)(A). of the Internal Revenue Code. Also, the fund reports the maximum amount allowable but not less than $20,569,662 as ordinary income dividends paid during the fiscal year ended August 31, 2017 as qualified dividend income in accordance with Section 854(b)(1)(B) of the Internal Revenue Code. Shareholders will
147
IMPORTANT TAX INFORMATION (Unaudited) (continued)
receive notification in early 2018 of the percentage applicable to the preparation of their 2017 income tax returns. Also, the fund reports the maximum amount allowable but not less than $.1334 per share as a capital gain dividend paid on December 20, 2016 in accordance with Section 852(b)(3)(C) of the Internal Revenue Code. Also, the fund reports the maximum amount allowable but not less than $.0233 as a short-term capital gain dividend paid on December 20, 2016 in accordance with Sections 871(k)(2) and 881(e) of the Internal Revenue Code.
BNY Mellon Small Cap Multi-Strategy Fund
The fund reports the maximum amount allowable but not less than $.0973 per share as a capital gain dividend paid on December 19, 2016 in accordance with Section 852(b)(3)(C) of the Internal Revenue Code.
Mellon Focused Equity Opportunities Fund
For federal tax purposes, the fund reports the maximum amount allowable but not less than 68.06% of ordinary income dividends paid during the fiscal year ended August 31, 2017 as eligible for the corporate dividends received deduction provided under Section 243 of the Internal Revenue Code in accordance with Section 854(b)(1)(A) of the Internal Revenue Code. Also, the fund reports the maximum amount allowable but not less than $9,861,114 as ordinary income dividends paid during the fiscal year ended August 31, 2017 as qualified dividend income in accordance with Section 854(b)(1)(B) of the Internal Revenue Code. Shareholders will receive notification in early 2018 of the percentage applicable to the preparation of their 2017 income tax returns. Also, the fund reports the maximum amount allowable but not less than $.9879 per share as a capital gain dividend paid on December 7, 2016 in accordance with Section 852(b)(3)(C) of the Internal Revenue Code. Also, the fund reports the maximum amount allowable but not less than $.1634 as a short-term capital gain dividend paid on December 7, 2016 in accordance with Sections 871(k)(2) and 881(e) of the Internal Revenue Code.
BNY Mellon Small/Mid Cap Multi-Strategy Fund
For federal tax purposes, the fund reports the maximum amount allowable but not less than 71.28% of ordinary income dividends paid during the fiscal year ended August 31, 2017 as eligible for the corporate dividends received deduction provided under Section 243 of the Internal Revenue Code in accordance with Section 854(b)(1)(A) of the Internal Revenue Code. Also, the fund reports the maximum amount allowable but not less than $240,001 as ordinary income dividends paid during the fiscal year ended August 31, 2017 as qualified dividend income in accordance with Section 854(b)(1)(B) of the Internal Revenue Code. Shareholders will receive notification in early 2018 of the percentage applicable to the preparation of their 2017 income tax returns. Also, the fund reports the maximum amount allowable but not less than $.0439 per share as a capital gain dividend paid on December 7, 2016 in accordance with Section 852(b)(3)(C) of the Internal Revenue Code.
BNY Mellon International Fund
For federal tax purposes, the fund elects to provide each shareholder with their portion of the fund's income sourced from foreign countries and taxes paid from foreign countries. The fund reports the maximum amount allowable but not less than $29,376,132 as income sourced from foreign countries for the fiscal year ended August 31, 2017 in accordance with Section 853(c)(2) of the Internal Revenue Code and also the fund reports the maximum amount allowable but not less than $2,605,602 as taxes paid from foreign countries for the fiscal year ended August 31, 2017 in accordance with Section 853(a) of the Internal Revenue Code. Where required by federal tax rules, shareholders will receive notification of their proportionate share of foreign sourced income and foreign taxes paid for the 2017 calendar year with Form 1099-DIV which will be mailed in early 2018. Also the fund reports the maximum amount allowable, but not less than $19,135,813 as ordinary income dividends paid during the fiscal year ended August 31, 2017 as qualified dividend income in accordance with Section 854(b)(1)(B) of the Internal Revenue Code.
BNY Mellon Emerging Markets Fund
For federal tax purposes, the fund elects to provide each shareholder with their portion of the fund's income sourced from foreign countries and taxes paid from foreign countries. The fund reports the maximum amount allowable but not less than $18,423,482 as income sourced from foreign countries for the fiscal year ended August 31, 2017 in accordance with Section 853(c)(2) of the Internal Revenue Code and also the fund reports the maximum amount allowable but not less than $2,861,193 as taxes paid from foreign countries for the fiscal year ended August 31, 2017 in accordance with Section 853(a) of the Internal Revenue Code. Where required by federal tax rules, shareholders will receive notification of their proportionate share of foreign sourced income and foreign taxes paid for the 2017 calendar year with Form 1099-DIV which will be mailed in early 2018. Also the fund reports the maximum amount allowable, but not less than $5,250,373 as ordinary income dividends paid during the fiscal year ended August 31, 2017 as qualified dividend income in accordance with Section 854(b)(1)(B) of the Internal Revenue Code.
148
BNY Mellon International Appreciation Fund
For federal tax purposes, the fund elects to provide each shareholder with their portion of the fund's income sourced from foreign countries and taxes paid from foreign countries. The fund reports the maximum amount allowable but not less than $2,387,341 as income sourced from foreign countries for the fiscal year ended August 31, 2017 in accordance with Section 853(c)(2) of the Internal Revenue Code and also the fund reports the maximum amount allowable but not less than $211,047 as taxes paid from foreign countries for the fiscal year ended August 31, 2017 in accordance with Section 853(a) of the Internal Revenue Code. Where required by federal tax rules, shareholders will receive notification of their proportionate share of foreign sourced income and foreign taxes paid for the 2017 calendar year with Form 1099-DIV which will be mailed in early 2018. Also the fund reports the maximum amount allowable, but not less than $1,954,995 as ordinary income dividends paid during the fiscal year ended August 31, 2017 as qualified dividend income in accordance with Section 854(b)(1)(B) of the Internal Revenue Code.
BNY Mellon International Equity Income Fund
For federal tax purposes, the fund elects to provide each shareholder with their portion of the fund's income sourced from foreign countries and taxes paid from foreign countries. The fund reports the maximum amount allowable but not less than $15,548,127 as income sourced from foreign countries for the fiscal year ended August 31, 2017 in accordance with Section 853(c)(2) of the Internal Revenue Code and also the fund reports the maximum amount allowable but not less than $1,638,094 as taxes paid from foreign countries for the fiscal year ended August 31, 2017 in accordance with Section 853(a) of the Internal Revenue Code. Where required by federal tax rules, shareholders will receive notification of their proportionate share of foreign sourced income and foreign taxes paid for the 2017 calendar year with Form 1099-DIV which will be mailed in early 2018. Also the fund reports the maximum amount allowable, but not less than $9,867,923 as ordinary income dividends paid during the fiscal year ended August 31, 2017 as qualified dividend income in accordance with Section 854(b)(1)(B) of the Internal Revenue Code.
BNY Mellon Asset Allocation Fund
For federal tax purposes the fund reports the maximum amount allowable but not less than 82.67% of ordinary income dividends paid during the fiscal year ended August 31, 2017 as eligible for the corporate dividends received deduction provided under Section 243 of the Internal Revenue Code in accordance with Section 854(b)(1)(A) of the Internal Revenue Code. Also, the fund reports the maximum amount allowable but not less than $6,105,060 as ordinary income dividends paid during the fiscal year ended August 31, 2017 as qualified dividend income in accordance with Section 854(b)(1)(B) of the Internal Revenue Code. Shareholders will receive notification in early 2018 of the percentage applicable to the preparation of their 2017 income tax returns. Also, the fund reports the maximum amount allowable but not less than $.0987 per share as a capital gain dividend paid on December 30, 2016 in accordance with Section 852(b)(3)(C) of the Internal Revenue Code.
149
INFORMATION ABOUT THE RENEWAL OF EACH FUND’S INVESTMENT ADVISORY AGREEMENT, ADMINISTRATION AGREEMENT AND BNY MELLON MID CAP MULTI-STRATEGY FUND’S SUB-ADVISORY AGREEMENTS (Unaudited)
At a meeting of the Trust’s Board of Trustees held on March 6-7, 2017, the Board considered the renewal of (i) the Trust’s Investment Advisory Agreement and Administration Agreement (together, the “Agreement”), pursuant to which BNY Mellon Fund Advisers, a division of Dreyfus, provides the funds with investment advisory services and The Bank of New York Mellon provides the funds with administrative services, (ii) the Sub-Investment Advisory Agreement with respect to BNY Mellon Large Cap Market Opportunities Fund and BNY Mellon Tax-Sensitive Large Cap Multi-Strategy Fund, pursuant to which Walter Scott & Partners Limited (“Walter Scott”) provides day-to-day management of the portion of each fund’s investments allocated to the U.S. Large Cap Equity Strategy, (iii) the Sub-Investment Advisory Agreement with respect to BNY Mellon Mid Cap Multi-Strategy Fund, pursuant to which Boston Partners Global Investors, Inc. (“Boston Partners”) provides day-to-day management of the fund’s investments allocated to the Boston Partners Mid Cap Value Strategy, and (iv) the Sub-Investment Advisory Agreement with respect to BNY Mellon Mid Cap Multi-Strategy Fund, pursuant to which Geneva Capital Management LLC, doing business as Henderson Geneva Capital Management LLC (“HGCM”), provides day-to-day management of the portion of the fund’s investments allocated to the Henderson Geneva Mid Cap Growth Strategy (Walter Scott, Boston Partners and HGCM, collectively, the “Sub-Advisers”). The Agreement and each Sub-Investment Advisory Agreement are collectively referred to as the “Agreements”. The Bank of New York Mellon has entered into a Sub-Administration Agreement with Dreyfus pursuant to which The Bank of New York Mellon pays Dreyfus for performing certain of the administrative services referenced above. The Board members, none of whom are “interested persons” (as defined in the Investment Company Act of 1940, as amended) of the Trust, were assisted in their review by independent legal counsel and met with counsel in executive session separate from representatives of Dreyfus and the Sub-Advisers. In considering the renewal of the Agreements, the Board considered all factors that it believed to be relevant, including those discussed below. The Board did not identify any one factor as dispositive, and each Board member may have attributed different weights to the factors considered.
Analysis of Nature, Extent, and Quality of Services Provided to the Funds. The Board considered information provided to them at the meeting and in previous presentations from Dreyfus representatives regarding the nature, extent, and quality of the services provided to the funds. Dreyfus provided the number of open accounts in each fund, the fund’s asset size and the allocation of fund assets among distribution channels. Dreyfus also had previously provided information regarding the diverse intermediary relationships and distribution channels of the funds (such as retail direct or intermediary, in which intermediaries typically are paid by the fund and/or Dreyfus) and Dreyfus’ corresponding need for broad, deep, and diverse resources to be able to provide ongoing shareholder services to each intermediary or distribution channel, as applicable to each fund.
The Board also considered research support available to, and portfolio management capabilities of, each fund’s portfolio management personnel and that Dreyfus also provides oversight of day-to-day fund operations, including fund accounting and administration and assistance in meeting legal and regulatory requirements. The Board also considered Dreyfus’ extensive administrative, accounting and compliance infrastructures, as well as Dreyfus’ supervisory activities over the Sub-Advisers. The Board also considered portfolio management’s brokerage policies and practices (including policies and practices regarding soft dollars) and the standards applied in seeking best execution.
Comparative Analysis of the Funds’ Performance and Management Fees and Expense Ratios. The Board reviewed reports prepared by Broadridge Financial Solutions, Inc. (“Broadridge”), an independent provider of investment company data, which included information comparing (1) each fund’s performance with the performance of a group of comparable funds (the “Performance Group”) and with a broader group of funds (the “Performance Universe”), all for various periods ended December 31, 2016, and (2) each fund’s actual and contractual management fees and total expenses with those of a group of comparable funds (the “Expense Group”) and with a broader group of funds (the “Expense Universe”). At Dreyfus’ request, the Board also reviewed reports prepared by Broadridge with respect to BNY Mellon Large Cap Market Opportunities Fund and BNY Mellon Asset Allocation Fund (each, a “Fund of Funds”) which included information comparing (1) each fund’s performance with the performance of a group of funds of funds from various Broadridge categories (the “Funds of Funds Performance Group”) for various periods ended December 31, 2016, and (2) each fund’s actual and contractual management fees and total expenses with those of a group of funds of funds (the “Funds of Funds Expense Group”) and with a broader group of funds of funds (the “Funds of Funds Expense Universe”). The information for each comparison was derived in part from fund financial statements available to Broadridge as of the date of its analysis. With respect to each Fund of Funds, it was noted that the fund’s performance universe (the “Funds of Funds Performance Universe”) was identical to each fund’s respective Performance Universe, and so a separate
150
comparison of the performance of each Fund of Funds to its Funds of Funds Performance Universe was not discussed. Dreyfus previously had furnished the Board with a description of the methodology Broadridge used to select the Performance Group and Performance Universe and the Expense Group and Expense Universe, and Dreyfus representatives informed the Board of the methodology Broadridge used to select the funds in the Funds of Funds Performance Group and the Funds of Funds Expense Group and Funds of Funds Expense Universe.
Dreyfus representatives stated that the usefulness of performance comparisons may be affected by a number of factors, including different investment limitations that may be applicable to each fund and comparison funds. They also considered that performance generally should be considered over longer periods of time, although it is possible that long-term performance can be adversely affected by even one period of significant underperformance so that a single investment decision or theme has the ability to affect disproportionately long-term performance.
As applicable to each fund, Dreyfus representatives reviewed with the Board the management or investment advisory fees (1) paid by funds advised or administered by Dreyfus that are in the same Broadridge category as each fund and (2) paid to Dreyfus, the Sub-Advisers or the Dreyfus-affiliated primary employer of each fund’s primary portfolio manager(s) for advising any separate accounts and/or other types of client portfolios that are considered to have similar investment strategies and policies as the fund (the “Similar Clients”), and explained the nature of the Similar Clients. They discussed differences in fees paid and the relationship of the fees paid in light of any differences in the services provided and other relevant factors. The Board considered the relevance of the fee information provided for the Similar Clients to evaluate the appropriateness of the fund’s management fee.
The Board considered the fee to each Sub-Adviser in relation to the fee paid to Dreyfus by the relevant fund and the respective services provided by the Sub-Adviser and Dreyfus. The Board also considered each Sub-Adviser’s fee is paid by Dreyfus (out of its fee from the relevant fund) and not the fund.
BNY Mellon Large Cap Market Opportunities Fund
The Board discussed the results of the comparisons and considered that the fund’s total return performance was above the Performance Group and Performance Universe medians (highest in the Performance Group for the one-year period), and at or above the Funds of Funds Performance Group medians (highest in the Funds of Funds Performance Group for the one-, two-, and three-year periods), for all periods. Dreyfus also provided a comparison of the fund’s calendar year total returns to the returns of the fund’s benchmark index.
The Board also reviewed the range of actual and contractual management fees and total expenses of the Expense Group and Expense Universe funds and the Funds of Funds Expense Group and Funds of Funds Expense Universe funds and discussed the results of the comparisons. The Board considered that the fund’s contractual management fee was below the Expense Group median and above the Funds of Funds Expense Group median, the fund’s actual management fee was below the Expense Group and Expense Universe medians and above the Funds of Funds Expense Group and Funds of Funds Expense Universe medians and the fund’s total expenses were above the Expense Group, Expense Universe, Funds of Funds Expense Group and Fund of Funds Expense Universe medians. The Board considered that the fund invests a portion of its assets in underlying mutual funds (“Acquired Funds”) and that the fund’s pro rata share of the expenses of the Acquired Funds (the “Acquired Fund Expenses”) were included in the fund’s actual total expense rankings in the Expense Group and Expense Universe and the Funds of Funds Expense Group and Funds of Funds Expense Universe and that the other funds of funds in the Funds of Funds Expense Group and Funds of Funds Expense Group Universe also included Acquired Fund Expenses.
BNY Mellon Tax-Sensitive Large Cap Multi-Strategy Fund
The Board discussed the results of the comparisons and considered that the fund’s total return performance was above the Performance Group median for the one-, two- and three-year periods (highest in the Performance Group for the one- and two-year periods) and at or above the Performance Universe median for all periods except the five-year period. Dreyfus also provided a comparison of the fund’s calendar year total returns to the returns of the fund’s benchmark index.
The Board also reviewed the range of actual and contractual management fees and total expenses of the Expense Group and Expense Universe funds and discussed the results of the comparisons. The Board considered that the fund’s contractual management fee was above the Expense Group median, the fund’s actual management fee was below the Expense Group median and above the Expense Universe median and the fund’s total expenses were above the Expense Group and Expense Universe medians. The Board considered that the fund invests a portion of its assets in Acquired Funds and that the fund’s pro rata share of the
151
INFORMATION ABOUT THE RENEWAL OF EACH FUND’S INVESTMENT ADVISORY AGREEMENT, ADMINISTRATION AGREEMENT AND BNY MELLON MID CAP MULTI-STRATEGY FUND’S SUB-ADVISORY AGREEMENTS (Unaudited) (continued)
Acquired Fund Expenses was included in the fund’s actual total expense rankings in the Expense Group and Expense Universe.
BNY Mellon Mid Cap Multi-Strategy Fund
The Board discussed the results of the comparisons and considered that the fund’s total return performance was below the Performance Group and Performance Universe medians for all periods, except for the four-year period when the fund’s performance was above the Performance Group and Performance Universe medians. The Board considered the proximity of the fund’s total return to the Performance Group and/or Performance Universe median for certain periods in which the fund’s performance was below median. Dreyfus also provided a comparison of the fund’s calendar year total returns to the returns of the fund’s benchmark index and the Board considered that the fund had outperformed its benchmark index in four of the past ten calendar years.
The Board also reviewed the range of actual and contractual management fees and total expenses of the Expense Group and Expense Universe funds and discussed the results of the comparisons. The Board considered that the fund’s contractual management fee was above the Expense Group median, the fund’s actual management fee was above the Expense Group and Expense Universe medians and the fund’s total expenses were slightly above the Expense Group median and below the Expense Universe median.
BNY Mellon Small Cap Multi-Strategy Fund
The Board discussed the results of the comparisons and considered that the fund’s total return performance was below the Performance Group and Performance Universe medians for all periods except the four- and five-year periods, when the fund’s performance was at the Performance Group medians and above the Performance Universe medians. Dreyfus also provided a comparison of the fund’s calendar year total returns to the returns of the fund’s benchmark index.
The Board also reviewed the range of actual and contractual management fees and total expenses of the Expense Group and Expense Universe funds and discussed the results of the comparisons. The Board considered that the fund’s contractual management fee was above the Expense Group median, the fund’s actual management fee was above the Expense Group and Expense Universe medians and the fund’s total expenses were above the Expense Group median and slightly below the Expense Universe median.
BNY Mellon Small/Mid Cap Multi-Strategy Fund
The Board discussed the results of the comparisons and considered that the fund’s total return performance was below the Performance Group medians for all periods except the one-year period, when the fund’s performance was at the Performance Group median, and above the Performance Universe medians for all periods except for the four- and five-year periods, when the fund’s performance was below the Performance Universe medians. The Board considered the proximity of the fund’s total return to the Performance Group and/or Performance Universe median for certain periods in which the fund’s performance was below median. Dreyfus also provided a comparison of the fund’s calendar year total returns to the returns of the fund’s benchmark index.
The Board also reviewed the range of actual and contractual management fees and total expenses of the Expense Group and Expense Universe funds and discussed the results of the comparisons. The Board considered that the fund’s contractual management fee was above the Expense Group median, the fund’s actual management fee was above the Expense Group and Expense Universe medians and the fund’s total expenses were above the Expense Group and Expense Universe medians.
BNY Mellon Income Stock Fund
The Board discussed the results of the comparisons and considered that the fund’s total return performance was above the Performance Group and Performance Universe medians for all periods (highest in the Performance Group for the five-year period and ranking in the first quartile of the Performance Group and Performance Universe for most periods), except for the ten-year period when the fund’s performance was at the Performance Group median. Dreyfus also provided a comparison of the fund’s calendar year total returns to the returns of the fund’s benchmark index.
The Board also reviewed the range of actual and contractual management fees and total expenses of the Expense Group and Expense Universe funds and discussed the results of the comparisons. The Board considered that the fund’s contractual management fee was above the Expense Group median, the fund’s actual management fee was above the Expense Group and Expense Universe medians and the fund’s total expenses were above the Expense Group median and below the Expense Universe median.
Dreyfus representatives stated that the investment adviser has contractually agreed to waive receipt of its fees and/or assume the expenses of the fund until June 1, 2017, so that annual direct operating expenses of Class A, C, I or Y shares of the fund (excluding Rule 12b-1 fees. shareholder services fees, taxes, interest, brokerage commissions, commitment
152
fees on borrowings and extraordinary expenses) do not exceed 0.90% of the fund’s average daily net assets.
BNY Mellon Focused Equity Opportunities Fund
The Board discussed the results of the comparisons and considered that the fund’s total return performance was above the Performance Group and Performance Universe medians for all periods (highest in the Performance Group for the five-year period). Dreyfus also provided a comparison of the fund’s calendar year total returns to the returns of the fund’s benchmark index and considered that the fund’s performance was above the return of the index in three of the seven years.
The Board also reviewed the range of actual and contractual management fees and total expenses of the Expense Group and Expense Universe funds and discussed the results of the comparisons. The Board considered that the fund’s contractual management fee was below the Expense Group median, the fund’s actual management fee was above the Expense Group and Expense Universe medians and the fund’s total expenses were below the Expense Group median and above the Expense Universe median.
BNY Mellon Asset Allocation Fund
The Board discussed the results of the comparisons and considered that the fund’s total return performance was below the Performance Group and Performance Universe medians for all periods and below the Funds of Funds Performance Group medians for all periods except the three- and ten-year periods, when the fund’s performance was at and above, respectively, the Funds of Funds Performance Group medians. Dreyfus also provided a comparison of the fund’s calendar year total returns to the returns of the fund’s benchmark index and the Board considered that the fund had outperformed its benchmark index in six of the past ten calendar years.
The Board also reviewed the range of actual and contractual management fees and total expenses of the Expense Group and Expense Universe funds and the Funds of Funds Expense Group and Funds of Funds Expense Universe funds and discussed the results of the comparisons. The Board considered that the fund’s contractual management fee was below the Expense Group median and above the Funds of Funds Expense Group median, the fund’s actual management fee was below the Expense Group and Expense Universe medians and above the Funds of Funds Expense Group and Funds of Funds Expense Universe medians and the fund’s total expenses were above the Expense Group median and below the Expense Universe, Funds of Funds Expense Group and Funds of Funds Expense Universe medians. The Board considered that the fund invests a portion of its assets in Acquired Funds and that the fund’s pro rata share of the Acquired Fund Expenses was included in the fund’s actual total expense rankings in the Expense Group and Expense Universe and the Funds of Funds Expense Group and Funds of Funds Expense Universe and that the other funds of funds in the Funds of Funds Expense Group and Funds of Funds Expense Group Universe also included Acquired Fund Expenses.
Dreyfus representatives stated that the investment adviser has contractually agreed to waive receipt of its fees and/or assume the expenses of the fund, until December 31, 2017, so that annual direct fund operating expenses (including indirect fees and expenses of the underlying funds in which the fund may invest, but excluding shareholder services fees, taxes, interest, brokerage commissions, commitment fees on borrowings and extraordinary expenses) do not exceed 0.87% of the fund’s average daily net assets.
BNY Mellon International Fund
The Board discussed the results of the comparisons and considered that the fund’s total return performance was below the Performance Group medians for the one-, two- and three-year periods and at the Performance Group medians for the four-, five- and ten-year periods, and below the Performance Universe medians for all periods except the four- and five-year periods, when the fund’s performance was above the Performance Universe medians. Dreyfus also provided a comparison of the fund’s calendar year total returns to the returns of the fund’s benchmark index. The Board considered that, on August 6, 2015, the fund changed its investment strategy and, prior to that date, the fund allocated its assets between a core investment style and a value investment style.
The Board also reviewed the range of actual and contractual management fees and total expenses of the Expense Group and Expense Universe funds and discussed the results of the comparisons. The Board considered that the fund’s contractual management fee was above the Expense Group median, the fund’s actual management fee was above the Expense Group and Expense Universe medians and the fund’s total expenses were above the Expense Group median and below the Expense Universe median.
BNY Mellon Emerging Markets Fund
The Board discussed the results of the comparisons and considered that the fund’s total return performance was at or below the Performance Group and Performance Universe medians for all periods except the one-year period, when the fund’s performance was above the Performance Group and
153
INFORMATION ABOUT THE RENEWAL OF EACH FUND’S INVESTMENT ADVISORY AGREEMENT, ADMINISTRATION AGREEMENT AND BNY MELLON MID CAP MULTI-STRATEGY FUND’S SUB-ADVISORY AGREEMENTS (Unaudited) (continued)
Performance Universe medians. Dreyfus also provided a comparison of the fund’s calendar year total returns to the returns of the fund’s benchmark index. The Board considered that, on August 6, 2015, the fund changed its investment strategy and, prior to that date, the fund allocated its assets between a core investment style and a value investment style.
The Board also reviewed the range of actual and contractual management fees and total expenses of the Expense Group and Expense Universe funds and discussed the results of the comparisons. The Board considered that the fund’s contractual management fee was above the Expense Group median, the fund’s actual management fee was above the Expense Group and Expense Universe medians and the fund’s total expenses were above the Expense Group and Expense Universe medians.
BNY Mellon Large Cap Stock Fund
The Board discussed the results of the comparisons and considered that the fund’s total return performance was at or below the Performance Group and Performance Universe medians for all periods except the three-year period, when the fund’s performance was above the Performance Group and Performance Universe medians. Dreyfus also provided a comparison of the fund’s calendar year total returns to the returns of the fund’s benchmark index and the Board considered that the fund had outperformed its benchmark index in five of the past ten calendar years.
The Board also reviewed the range of actual and contractual management fees and total expenses of the Expense Group and Expense Universe funds and discussed the results of the comparisons. The Board considered that the fund’s contractual management fee was above the Expense Group median, the fund’s actual management fee was above the Expense Group and Expense Universe medians and the fund’s total expenses were above the Expense Group and Expense Universe medians.
BNY Mellon International Appreciation Fund
The Board discussed the results of the comparisons and considered that the fund’s total return performance was above the Performance Group medians for all periods (highest in the Performance Group for the three-year period) except for the one-year and ten-year periods, when the fund’s performance was below the Performance Group median, and above the Performance Universe medians for all periods except for the one-year period, when the fund’s performance was below the Performance Universe median. Dreyfus also provided a comparison of the fund’s calendar year total returns to the returns of the fund’s benchmark index.
The Board also reviewed the range of actual and contractual management fees and total expenses of the Expense Group and Expense Universe funds and discussed the results of the comparisons. The Board considered that the fund’s contractual management fee was below the Expense Group median, the fund’s actual management fee was below the Expense Group and Expense Universe medians and the fund’s total expenses were below the Expense Group and Expense Universe medians.
BNY Mellon International Equity Income Fund
The Board discussed the results of the comparisons and considered that the fund’s total return performance was above the Performance Group and Performance Universe medians for all periods (highest in the Performance Group for the one-, two- and three-year periods) except for the four- and five-year periods, when the fund’s performance was below the Performance Group and Performance Universe medians (lowest in the Performance Group for the four-year period). Dreyfus also provided a comparison of the fund’s calendar year total returns to the returns of the fund’s benchmark index.
The Board also reviewed the range of actual and contractual management fees and total expenses of the Expense Group and Expense Universe funds and discussed the results of the comparisons. The Board considered that the fund’s contractual management fee was above the Expense Group median, the fund’s actual management fee was above the Expense Group and Expense Universe medians and the fund’s total expenses were above the Expense Group and Expense Universe medians.
Analysis of Profitability and Economies of Scale. Dreyfus representatives reviewed the expenses allocated and profit received by Dreyfus and its affiliates and the resulting profitability percentage for managing each fund and the aggregate profitability percentage to Dreyfus and its affiliates for managing the fund complex, and the method used to determine the expenses and profit. The Board concluded that the profitability results were not unreasonable, given the services rendered and service levels provided by Dreyfus. The Board also considered the expense limitation arrangements for BNY Mellon Asset Allocation Fund and Class A, C, I and Y shares of BNY Mellon Income Stock Fund and its effect on the profitability of Dreyfus and its affiliates. The Board also had been provided with information prepared by an independent consulting firm regarding Dreyfus’ approach to allocating costs to, and determining the profitability of, individual funds and the entire Dreyfus fund complex. The consulting firm also had analyzed where any economies of
154
scale might emerge in connection with the management of the funds.
The Board considered, on the advice of its counsel, the profitability analysis (1) as part of its evaluation of whether the fees under the Agreements, considered in relation to the mix of services provided by Dreyfus and the Sub-Advisers, including the nature, extent and quality of such services, supported the renewal of the Agreements and (2) in light of the relevant circumstances for each fund and the extent to which economies of scale would be realized if each fund grows and whether fee levels reflect these economies of scale for the benefit of fund shareholders. Since Dreyfus, and not the relevant fund, pays each Sub-Adviser pursuant to its corresponding Sub-Investment Advisory Agreement, the Board did not consider the Sub-Adviser’s profitability to be relevant to its deliberations. Dreyfus representatives stated that a discussion of economies of scale is predicated on a fund having achieved a substantial size with increasing assets and that, if a fund’s assets had been stable or decreasing, the possibility that Dreyfus may have realized any economies of scale would be less. Dreyfus representatives also stated that, as a result of shared and allocated costs among the funds and the funds in the Dreyfus fund complex, the extent of economies of scale could depend substantially on the level of assets in the complex as a whole, so that increases and decreases in complex-wide assets can affect potential economies of scale in a manner that is disproportionate to, or even in the opposite direction from, changes in a fund’s asset level. The Board also considered potential benefits to Dreyfus and the Sub-Advisers from acting as investment adviser and sub-investment advisers, respectively, and took into consideration the soft dollar arrangements in effect for trading each fund’s investments.
At the conclusion of these discussions, the Board agreed that it had been furnished with sufficient information to make an informed business decision with respect to the renewal of the Agreements. Based on the discussions and considerations as described above, the Board concluded and determined as follows.
· The Board concluded that the nature, extent and quality of the services provided by Dreyfus to each fund, by Walter Scott to BNY Mellon Large Cap Market Opportunities Fund and BNY Mellon Tax-Sensitive Large Cap Multi-Strategy Fund and by Boston Partners and HGCM to BNY Mellon Mid Cap Multi-Strategy Fund are adequate and appropriate.
· With respect to BNY Mellon Large Cap Market Opportunities Fund, BNY Mellon Income Stock Fund and BNY Mellon Focused Opportunities Fund, the Board was satisfied with each fund’s performance.
· With respect to BNY Mellon Tax-Sensitive Large Cap Multi-Strategy Fund, BNY Mellon International Appreciation Fund and BNY Mellon International Equity Income Fund, the Board generally was satisfied with each fund’s overall performance.
· With respect to BNY Mellon Mid Cap Multi-Strategy Fund, BNY Mellon Small Cap Multi-Strategy Fund, BNY Mellon Small/Mid Cap Multi-Strategy Fund, BNY Mellon Asset Allocation Fund, BNY Mellon International Fund and BNY Mellon Large Cap Stock Fund, while the Board was concerned with the funds’ performance, the Board expressed confidence in the funds’ strategies and portfolio managers and agreed to closely monitor performance.
· With respect to BNY Mellon Emerging Markets Fund, the Board considered Dreyfus’ efforts to improve fund performance and agreed to closely monitor performance.
· The Board concluded that the fee paid to Dreyfus by each fund (and the Sub-Advisers, as applicable) supported the renewal of the Agreements in light of the considerations described above.
· The Board determined that the fees charged by Dreyfus under the Agreement with respect to BNY Mellon Large Cap Market Opportunities Fund, BNY Mellon Tax-Sensitive Large Cap Multi-Strategy Fund and BNY Mellon Asset Allocation Fund were for services in addition to, and not duplicative of, services provided under the advisory contracts of the underlying funds in which those funds invested.
· The Board determined that the economies of scale which may accrue to Dreyfus and its affiliates in connection with the management of the funds had been adequately considered by Dreyfus in connection with the fee rate charged to each fund pursuant to the Agreement and that, to the extent in the future it were determined that material economies of scale had not been shared with a fund, the Board would seek to have those economies of scale shared with the fund.
In evaluating the Agreements, the Board considered these conclusions and determinations and also relied on its previous knowledge, gained through meetings and other interactions with Dreyfus and its affiliates and the Sub-
155
INFORMATION ABOUT THE RENEWAL OF EACH FUND’S INVESTMENT ADVISORY AGREEMENT, ADMINISTRATION AGREEMENT AND BNY MELLON MID CAP MULTI-STRATEGY FUND’S SUB-ADVISORY AGREEMENTS (Unaudited) (continued)
Advisers, of each fund and the services provided to the funds by Dreyfus and, as applicable, the Sub-Advisers. The Board also relied on information received on a routine and regular basis throughout the year relating to the operations of each fund and the investment management and other services provided under the Agreements, including information on the investment performance of each fund in comparison to similar mutual funds and benchmark performance indices; general market outlook as applicable to each fund; and compliance reports. In addition, the Board’s consideration of the contractual fee arrangements for each fund had the benefit of a number of years of reviews of prior or similar agreements during which lengthy discussions took place between the Board and Dreyfus representatives. Certain aspects of the arrangements may receive greater scrutiny in some years than in others, and the Board’s conclusions may be based, in part, on their consideration of the same or similar arrangements in prior years. The Board determined to renew the Agreements.
156
BOARD MEMBERS INFORMATION (Unaudited)
INDEPENDENT BOARD MEMBERS
Chairman of the Board (2000)
Principal Occupation During Past 5 Years:
Attorney, Cozen and O’Connor, P.C. since 1973, including Vice Chairman since 1980 and Chief Executive Officer and President from 2002 to 2007
No. of Portfolios for which Board Member Serves: 25
———————
John R. Alchin (69)
Board Member (2008)
Principal Occupation During Past 5 Years:
· Retired since 2007
· Executive of Comcast Corporation, a cable services provider, from 1990 to 2007, including Executive Vice-President, Co-Chief Financial Officer and Treasurer, from 2002 to 2007
Other Public Company Board Memberships During Past 5 Years:
· Polo Ralph Lauren Corporation, a retail clothing and home furnishing company, Director (2007-present)
No. of Portfolios for which Board Member Serves: 25
———————
Ronald R. Davenport (81)
Board Member (2000)
Principal Occupation During Past 5 Years:
· Chairman of Sheridan Broadcasting Corporation since July 1972
No. of Portfolios for which Board Member Serves: 25
———————
Jack Diederich (80)
Board Member (2000)
Principal Occupation During Past 5 Years:
· Retired; Executive Vice President—Chairman’s Counsel of Alcoa Inc. from 1991 to 1997
No. of Portfolios for which Board Member Serves: 25
———————
Kim D. Kelly (61)
Board Member (2008)
Principal Occupation During Past 5 Years:
· Consultant since 2005
· Chief Restructuring Officer of Allegiance Communications LLC from August 2011 to January 2013
Other Public Company Board Memberships During Past 5 Years:
· MCG Capital Corporation, a business development company, Director (2004-2015)
· Broadview Network Holdings, Inc.-Director and Chair (2011-2012)
No. of Portfolios for which Board Member Serves: 25
———————
Kevin C. Phelan (73)
Board Member (2000)
Principal Occupation During Past 5 Years:
· Mortgage Banker, Colliers International since March 1978, including,
Co-Chairman since 2010, President since 2007 and Executive Vice President and Director from March 1998 to September 2007
No. of Portfolios for which Board Member Serves: 25
———————
Patrick J. Purcell (69)
Board Member (2000)
Principal Occupation During Past 5 Years:
· Owner, President and Publisher of the Boston Herald since February 1994
President and Founder, jobfind.com, an employment search site on the world wide web, since July 1996
· President and Chief Executive Officer, Herald Media since 2001
No. of Portfolios for which Board Member Serves: 25
———————
Thomas F. Ryan, Jr. (76)
Board Member (2000)
Principal Occupation During Past 5 Years:
· Retired since April 1999
President and Chief Operating Officer of the American Stock Exchange from October 1995 to April 1999
Other Public Company Board Memberships During Past 5 Years:
· RepliGen Corporation, a biopharmaceutical company, Director (2002-present)
No. of Portfolios for which Board Member Serves: 25
———————
Maureen M. Young (72)
Board Member (2000)
Principal Occupation During Past 5 Years:
· Retired since 2007
Director of the Office of Government Relations at Carnegie Mellon University from January 2000 to December 2007
No. of Portfolios for which Board Member Serves: 25
———————
Once elected all Board Members serve for an indefinite term. The address of the Board Members and Officers is c/o The Dreyfus Corporation, 200 Park Avenue, New York, New York 10166. Additional information about the Board Members is available in the fund’s Statement of Additional Information which can be obtained from Dreyfus free of charge by calling this toll free number: 1-800-DREYFUS. For individual account holders for Private Wealth Management clients, please contact your account officer or call 1-866-804-5023.
157
OFFICERS OF THE TRUST (Unaudited)
PATRICK T. CROWE, President since July 2015.
National Director of Investment Advisory, Analytics and Solutions for BNY Mellon Wealth Management since July 2014; from July 2007 to July 2014, Managing Director for BNY Mellon Wealth Management's Tri-State region, comprising New York, New Jersey and Southern Connecticut. He is 53 years old and has served in various capacities with BNY Mellon since 1993.
BENNETT A. MACDOUGALL, Chief Legal Officer since October 2015.
Chief Legal Officer of the Manager and Associate General Counsel and Managing Director of BNY Mellon since June 2015; from June 2005 to June 2015, he served in various capacities with Deutsche Bank – Asset & Wealth Management Division, including as Director and Associate General Counsel, and Chief Legal Officer of Deutsche Investment Management Americas Inc. from June 2012 to May 2015. He is an officer of 64 investment companies (comprised of 155 portfolios) managed by the Manager. He is 44 years old and has been an employee of the Manager since June 2015.
JANETTE E. FARRAGHER, Vice President and Secretary since December 2011.
Associate General Counsel of BNY Mellon, and an officer of 64 investment companies (comprised of 155 portfolios) managed by the Manager. She is 54 years old and has been an employee of the Manager since February 1984.
JAMES BITETTO, Vice President and Assistant Secretary since August 2005.
Managing Counsel of BNY Mellon and Secretary of the Manager, and an officer of 64 investment companies (comprised of 155 portfolios) managed by the Manager. He is 51 years old and has been an employee of the Manager since December 1996.
JOSEPH M. CHIOFFI, Vice President and Assistant Secretary since August 2005.
Managing Counsel of BNY Mellon, and an officer of 64 investment companies (comprised of 155 portfolios) managed by the Manager. He is 55 years old and has been an employee of the Manager since June 2000.
MAUREEN E. KANE, Vice President and Assistant Secretary since April 2015.
Managing Counsel of BNY Mellon since July 2014; from October 2004 until July 2014, General Counsel, and from May 2009 until July 2014, Chief Compliance Officer of Century Capital Management. She is an officer of 64 investment companies (comprised of 155 portfolios) managed by the Manager. She is 55 years old and has been an employee of the Manager since July 2014.
SARAH S. KELLEHER, Vice President and Assistant Secretary since April 2014.
Senior Counsel of BNY Mellon, since March 2013 from August 2005 to March 2013, Associate General Counsel of Third Avenue Management. She is an officer of 64 investment companies (comprised of 155 portfolios) managed by the Manager. She is 40 years old and has been an employee of the Manager since March 2013.
JEFF PRUSNOFSKY, Vice President and Assistant Secretary since August 2015.
Senior Managing Counsel of BNY Mellon, and an officer of 64 investment companies (comprised of 155 portfolios) managed by the Manager. He is 52 years old and has been an employee of the Manager since October 1990.
NATALYA ZELENSKY, Vice President and Assistant Secretary since March 2017.
Counsel and Vice President of BNY Mellon since May 2016; Attorney at Wildermuth Endowment Strategy Fund/Wildermuth Advisory, LLC from November 2015 until May 2016; Assistant General Counsel at RCS Advisory Services from July 2014 until November 2015; Associate at Sutherland, Asbill & Brennan from January 2013 until January 2014; Associate at K&L Gates from October 2011 until January 2013. She is an officer of 64 investment companies (comprised of 155 portfolios) managed by Dreyfus. She is 32 years old and has been an employee of the Manager since May 2016.
JAMES WINDELS, Treasurer since November 2001.
Director – Mutual Fund Accounting of the Manager, and an officer of 64 investment companies (comprised of 155 portfolios) managed by the Manager. He is 58 years old and has been an employee of the Manager since April 1985.
RICHARD CASSARO, Assistant Treasurer since January 2008.
Senior Accounting Manager – Money Market, Municipal Bond and Equity Funds of the Manager, and an officer of 64 investment companies (comprised of 155 portfolios) managed by the Manager. He is 58 years old and has been an employee of the Manager since September 1982.
GAVIN C. REILLY, Assistant Treasurer since December 2005.
Tax Manager of the Investment Accounting and Support Department of the Manager, and an officer of 64 investment companies (comprised of 155 portfolios) managed by the Manager. He is 49 years old and has been an employee of the Manager since April 1991.
ROBERT S. ROBOL, Assistant Treasurer since December 2002.
Senior Accounting Manager Dreyfus Financial Reporting of the Manager, and an officer of 64 investment companies (comprised of 155 portfolios) managed by the Manager. He is 53 years old and has been an employee of the Manager since October 1988.
ROBERT SALVIOLO, Assistant Treasurer since July 2007.
Senior Accounting Manager – Equity Funds of the Manager, and an officer of 64 investment companies (comprised of 155 portfolios) managed by the Manager. He is 50 years old and has been an employee of the Manager since June 1989.
ROBERT SVAGNA, Assistant Treasurer since December 2002.
Senior Accounting Manager – Fixed Income and Equity Funds of the Manager, and an officer of 64 investment companies (comprised of 155 portfolios) managed by the Manager. He is 50 years old and has been an employee of the Manager since November 1990.
JOSEPH W. CONNOLLY, Chief Compliance Officer since October 2004.
Chief Compliance Officer of the Manager and The Dreyfus Family of Funds (64 investment companies, comprised of 155 portfolios). He is 60 years old and has served in various capacities with the Manager since 1980, including manager of the firm’s Fund Accounting Department from 1997 through October 2001.
CARIDAD M. CAROSELLA, Ant-Money Laudering Compliance Officer January 2016.
Anti-Money Laundering Compliance Officer of the Dreyfus Family of Funds and BNY Mellon Funds Trust since January 2016; from May 2015 to December 2015, Interim Anti-Money Laundering Compliance Officer of the Dreyfus Family of Funds and BNY Mellon Funds Trust and the Distributor; from January 2012 to May 2015, AML Surveillance Officer of the Distributor and from 2007 to December 2011, Financial Processing Manager of the Distributor. She is an officer of 59 investment companies (comprised of 150 portfolios) managed by the Manager. She is 49 years old and has been an employee of the Distributor since 1997.
158
NOTES
159
The BNY Mellon Funds
c/o The Dreyfus Corporation
200 Park Avenue
New York, NY 10166
Investment Adviser
BNY Mellon Fund Advisers, a division of
The Dreyfus Corporation
200 Park Avenue
New York, NY 10166
Sub-Investment Adviser
Walter Scott & Partners Limited
One Charlotte Square
Edinburgh, Scotland, UK
Geneva Capital Management LLC
100 East Wisconsin Avenue
Suite 2550,
Milwaukee, WI 53202
Boston Partners Global Investors, Inc.
909 Third Avenue
New York, NY 10022
Administrator
The Bank of New York Mellon
225 Liberty Street
New York, NY 10286
Sub-Administrator
The Dreyfus Corporation
200 Park Avenue
New York, NY 10166
Custodian
The Bank of New York Mellon
225 Liberty Street
New York, NY 10286
Transfer Agent &
Dividend Disbursing Agent
Dreyfus Transfer, Inc.
200 Park Avenue
New York, NY 10166
Distributor
MBSC Securities Corporation
200 Park Avenue
New York, NY 10166
Ticker Symbols: | ||||||
BNY Mellon Large Cap Stock Fund | Class M: MPLCX | Investor: MILCX | ||||
BNY Mellon Large Cap Market Opportunities Fund | Class M: MMOMX | Investor: MMOIX | ||||
BNY Mellon Tax-Sensitive Large Cap Multi-Strategy Fund | Class M: MTSMX | Investor: MTSIX | ||||
BNY Mellon Income Stock Fund | Class M: MPISX | Investor: MIISX | Class A: BMIAX | Class C: BMISX | Class I: BMIIX | Class Y: BMIYX |
BNY Mellon Mid Cap Multi-Strategy Fund | Class M: MPMCX | Investor: MIMSX | ||||
BNY Mellon Small Cap Multi-Strategy Fund | Class M: MPSSX | Investor: MISCX | ||||
BNY Mellon Focused Equity Opportunities Fund | Class M: MFOMX | Investor: MFOIX | ||||
BNY Mellon Small/Mid Cap Multi-Strategy Fund | Class M: MMCMX | Investor: MMCIX | ||||
BNY Mellon International Fund | Class M: MPITX | Investor: MIINX | ||||
BNY Mellon Emerging Markets Fund | Class M: MEMKX | Investor: MIEGX | ||||
BNY Mellon International Appreciation Fund | Class M: MPPMX | Investor: MARIX | ||||
BNY Mellon International Equity Income Fund | Class M: MLIMX | Investor: MLIIX | ||||
BNY Mellon Asset Allocation Fund | Class M: MPBLX | Investor: MIBLX |
Telephone Wealth Management (WM) Clients, please contact your Account Officer or call 1-866-804-5023. Brokerage Clients of BNY Mellon Wealth Advisors (BNYMWA), please contact your financial representative or call 1-800-830-0549, Option 2 for BNY Mellon Wealth Management Direct or 1-800-843-5466 for former brokerage clients of BNY Mellon Wealth Advisors whose accounts are now held by Dreyfus Brokerage Services. Individual Account holders, please call Dreyfus at 1-800-DREYFUS.
Mail WM clients, write to your Account Officer, c/o The Bank of New York Mellon, One Mellon Bank Center, Pittsburgh, PA 15258
BNYMWA Brokerage Clients, write to your financial representative, P.O. Box 9012, Hicksville, NY 11802-9012
Individual Account Holders, write to: BNY Mellon Funds, P.O. Box 9879, Providence, RI 02940-8079
Each fund files its complete schedule of portfolio holdings with the Securities and Exchange Commission (“SEC”) for the first and third quarters of each fiscal year on Form N-Q. The fund’s Forms N-Q are available on the SEC’s website at http://www.sec.gov and may be reviewed and copied at the SEC’s Public Reference Room in Washington, DC. Information on the operation of the Public Reference Room may be obtained by calling 1-800-SEC-0330.
A description of the policies and procedures that the fund uses to determine how to vote proxies relating to portfolio securities, and information regarding how the fund voted these proxies for the most recent 12-month period ended June 30 is available at http://www.dreyfus.com and on the SEC’s website at http://www.sec.gov. The description of the policies and procedures is also available without charge, upon request, by calling 1-800-DREYFUS.
© 2017 MBSC Securities Corporation | MFTAR0817-EQ |
The BNY Mellon Funds
BNY Mellon Bond Fund
BNY Mellon Intermediate Bond Fund
BNY Mellon Corporate Bond Fund
BNY Mellon Short-Term U.S. Government Securities Fund
ANNUAL REPORT August 31, 2017 | |
| |

Contents
THE FUNDS
Advisory Agreement and Administration Agreement | |
FOR MORE INFORMATION
Back Cover
The views expressed herein are current to the date of this report. These views and the composition of the funds’ portfolios are subject to change at any time based on market and other conditions. |
Not FDIC-Insured • Not Bank-Guaranteed • May Lose Value |
The Funds |
Dear Shareholder:
We are pleased to present this annual report for BNY Mellon Funds Trust, covering the 12-month period from September 1, 2016 through August 31, 2017. For information about how the fund performed during the reporting period, as well as general market perspectives, we provide a Discussion of Fund Performance on the pages that follow.
Stocks set a series of new record highs and bonds produced mixed results over the past year in response to changing economic and political conditions. Financial markets during the final months of 2016 were dominated by the election of a new U.S. presidential administration. Equities surged higher in anticipation of more business-friendly regulatory, tax, and fiscal policies, but high-quality bonds generally lost value due to expectations of rising interest rates and accelerating inflation in a stronger economy. Despite a series of short-term interest-rate hikes, bonds recovered over the first eight months of 2017 when it became clearer that major tax and fiscal reforms would take time and political capital to enact. Stocks continued to rally, led by large growth-oriented companies, as corporate earnings grew and global economic conditions improved.
The markets’ recent strong performance has been supported by solid underlying fundamentals. While we currently expect these favorable conditions to persist, we remain watchful for economic and political developments that could derail the rallies. As always, we encourage you to discuss the risks and opportunities of today’s investment environment with your financial advisor.
Sincerely,

Patrick T. Crowe
President
BNY Mellon Funds Trust
September 15, 2017
3
DISCUSSION OF FUND PERFORMANCE
For the period from September 1, 2016 through August 31, 2017, as provided by John F. Flahive, CFA, and Timothy J. Sanville, CFA, Portfolio Managers
Market and Fund Performance Overview
For the 12-month period ended August 31, 2017, BNY Mellon Bond Fund’s Class M shares produced a total return of 0.87%, and Investor shares produced a total return of 0.63%.1 In comparison, the fund’s benchmark, the Bloomberg Barclays U.S. Aggregate Bond Index (the “Index”), produced a total return of 0.49% for the same period.2
U.S. bonds produced modestly positive returns over the reporting period when moderating long-term interest rates and muted inflation offset earlier market weakness stemming from expectations of greater economic growth. The fund outperformed the Index, primarily due to its overweighted exposure to corporate-backed bonds.
The Fund’s Investment Approach
The fund seeks total return (consisting of capital appreciation and current income). To pursue its goal, the fund actively manages bond market and maturity exposure and invests at least 80% of its net assets in bonds, such as U.S. government and agency bonds, corporate bonds, municipal bonds, mortgage-related securities, and foreign corporate and government bonds. The fund’s investments in bonds must be rated investment grade at the time of purchase or, if unrated, deemed of comparable quality by the investment adviser.3 Generally, the average effective duration of the fund’s portfolio will not exceed eight years.
Economic and Political Developments Drove Bond Markets
Longer-term interest rates rose sharply in the weeks following the U.S. presidential election in November 2016, causing prices of U.S. government securities to decline. Rates moved higher in response to expectations that the new administration’s more business-friendly regulatory, tax, and fiscal policies would boost U.S. economic growth and inflationary pressures. In addition, the Federal Reserve Board (the “Fed”) implemented a long-awaited increase in short-term interest rates in December 2016.
Meanwhile, evidence of stronger global economic growth in overseas markets prompted a gradual move among central banks away from the aggressively accommodative monetary policies of the past few years. In the United States, short-term interest rates continued to rise when the Fed implemented two more increases in short-term rates over the first half of 2017. In contrast, long-term U.S. interest rates moderated, giving back some, but not all, of the post-election spike when inflationary pressures remained muted and investors came to realize that some government policy reforms were far from certain. Meanwhile, corporate-backed bonds generally continued to produce robust returns in an environment of growing corporate earnings.
Allocation Strategy Bolstered Relative Results
The fund’s performance compared to the Index benefited over the reporting period from our sector allocation strategy. Most notably, overweighted exposure to corporate-backed bonds, and a commensurately underweighted position in U.S. Treasury securities, helped the fund participate more fully in the higher yields and narrowing credit spreads of corporate securities. The fund’s relative performance was further enhanced by an emphasis on corporate bonds with BBB credit ratings, which are at the lower end of the investment-grade range. Bonds issued on behalf of companies in the industrial, communications, financial, and technology industry groups fared especially well. Among government-issued securities, the fund added a degree of value through its holdings of Treasury Inflation Protected Securities (“TIPS”) and taxable municipal bonds.
We maintained the fund’s average duration in a range that was slightly shorter than the Index. This positioning helped cushion the negative impact of rising long-term interest rates over the final weeks of 2016, but it mildly constrained the benefits of moderating rates in 2017.
Disappointments proved to be relatively mild during the reporting period. The fund’s holdings of short-term bonds with maturities of one to two years trailed broader market averages. Corporate-backed bonds from the energy and utilities sectors also generally lagged. The fund held no exposure to sovereign bonds in overseas markets, missing out on their relatively strong results during the reporting period.
Positioned for Continued Economic Growth
The U.S. economy has continued to expand, and many analysts expect slow-to-moderate growth to persist over the months ahead. Inflationary pressures may increase in this environment, and most analysts anticipate additional short-term interest-rate hikes and balance-sheet normalization from the Fed as it moves toward a less stimulative monetary policy. On the other hand, we believe that technical conditions in the bond market remain favorable, as a limited supply of new bond issuance has been met with generally robust investor demand.
Therefore, we currently are cautiously optimistic regarding the prospects for the U.S. bond market. As of the reporting period’s end, we have maintained the fund’s overweighted exposure to corporate bonds that historically have been more sensitive to business conditions than interest rates, and we have continued to hold inflation-adjusted securities and taxable municipal bonds. On a more cautious note, we have maintained a modestly shorter-than-average duration posture to guard against the possibility of rising long-term interest rates.
September 15, 2017
1 Total return includes reinvestment of dividends and any capital gains paid. Past performance is no guarantee of future results. Share price, yield, and investment return fluctuate such that upon redemption, fund shares may be worth more or less than their original cost.
2 Source: Lipper Inc. — The Bloomberg Barclays U.S. Aggregate Bond Index is a broad-based flagship benchmark that measures the investment-grade, U.S. dollar-denominated, fixed-rate taxable bond market. The index includes Treasuries, government-related and corporate securities, MBS (agency fixed-rate and hybrid ARM pass-throughs), ABS and CMBS (agency and nonagency). Investors cannot invest directly in any index.
3 The fund may continue to own investment-grade bonds (at the time of purchase), which are subsequently downgraded to below investment grade.
Bond funds are subject generally to interest-rate, credit, liquidity, and market risks, to varying degrees, all of which are more fully described in the fund’s prospectus. Generally, all other factors being equal, bond prices are inversely related to interest-rate changes, and rate increases can cause price declines. The fund may use derivative instruments, such as options, futures, options on futures, forward contracts, and swaps. A small investment in derivatives could have a potentially large impact on the fund’s performance. The use of derivatives involves risks different from, or possibly greater than, the risks associated with investing directly in the underlying assets.
4
For the period from September 1, 2016 through August 31, 2017, as provided by John F. Flahive, CFA, and Timothy J. Sanville, CFA, Portfolio Managers
Market and Fund Performance Overview
For the 12-month period ended August 31, 2017, BNY Mellon Intermediate Bond Fund’s Class M shares produced a total return of 1.01%, and Investor shares produced a total return of 0.75%.1 In comparison, the fund’s benchmark, the Bloomberg Barclays U.S. Intermediate Government/Credit Index (the “Index”), produced a total return of 0.82% for the same period.2
U.S. bonds produced modestly positive returns over the reporting period when moderating long-term interest rates offset earlier market weakness. The fund’s Class M shares outperformed the Index, primarily due to overweighted exposure to corporate-backed bonds.
The Fund’s Investment Approach
The fund seeks total return (consisting of capital appreciation and current income). To pursue its goal, the fund actively manages bond market and maturity exposure and invests at least 80% of its net assets in bonds, such as U.S. government and agency bonds, corporate bonds, mortgage-related securities, foreign corporate and government bonds, and municipal bonds. The fund’s investments in bonds must be rated investment grade at the time of purchase or, if unrated, deemed of comparable quality by the investment adviser.3 Generally, the fund’s average effective portfolio maturity will be between 3 and 10 years, and the average effective duration of the fund’s portfolio will be between 2.5 and 5.5 years. When managing the fund, we use a disciplined process to select bonds and manage risk. We generally choose bonds based on yield, credit quality, the level of interest rates and inflation, general economic and financial trends, and our outlook for the securities markets. Our management process also includes computer modeling and scenario testing of possible changes in market conditions.
Economic and Political Developments Drove Bond Markets
Longer-term interest rates rose sharply in the weeks following the U.S. presidential election in November 2016, causing prices of U.S. government securities to decline. Rates moved higher in response to expectations that the new administration’s more business-friendly regulatory, tax, and fiscal policies would boost U.S. economic growth and inflationary pressures. In addition, the Federal Reserve Board (the “Fed”) implemented a long-awaited increase in short-term interest rates in December 2016.
Meanwhile, evidence of stronger global economic growth in overseas markets prompted a gradual move among central banks away from the aggressively accommodative monetary policies of the past few years. In the United States, short-term interest rates continued to rise when the Fed implemented two more short-term rate hikes over the first half of 2017. In contrast, long-term U.S. interest rates moderated, giving back some, but not all, of the post-election spike when inflationary pressures remained muted and investors came to realize that some government policy reforms were far from certain. Meanwhile, corporate-backed bonds generally continued to produce robust returns in an environment of growing corporate earnings.
Allocation Strategy Bolstered Relative Results
The fund’s performance compared to the Index benefited over the reporting period from our sector allocation strategy. Most notably, overweighted exposure to corporate-backed bonds, and a commensurately underweighted position in U.S. Treasury securities, helped the fund participate more fully in the higher yields and narrowing credit spreads of corporate securities. The fund’s relative performance was further enhanced by an emphasis on corporate bonds with BBB credit ratings, which are at the lower end of the investment-grade range. Bonds issued on behalf of companies in the industrial, technology, and financial industry groups fared especially well. Among government-issued securities, the fund added a degree of value through Treasury Inflation Protected Securities (“TIPS”), taxable municipal bonds, and securities backed by U.S. government agencies.
We maintained the fund’s average duration in a range that was slightly shorter than the Index. This positioning helped cushion the negative impact of rising long-term interest rates over the final weeks of 2016.
Disappointments proved to be relatively mild during the reporting period. The fund’s holdings of short-term bonds with maturities of one to two years trailed broader market averages. Corporate bonds from the energy and utilities sectors also generally lagged.
Positioned for Continued Economic Growth
The U.S. economy has continued to expand, and many analysts expect slow-to-moderate growth to persist over the months ahead. Inflationary pressures may increase in this environment, and most analysts anticipate additional short-term interest-rate hikes from the Fed. On the other hand, we believe that technical conditions in the bond market remain favorable, as a limited supply of new bond issuance has been met with generally robust investor demand.
Therefore, we currently are cautiously optimistic regarding the prospects for the U.S. bond market. As of the reporting period’s end, we have maintained the fund’s overweighted exposure to corporate bonds that historically have been more sensitive to business conditions than interest rates, and we have continued to hold inflation-adjusted securities and taxable municipal bonds. On a more cautious note, we have maintained a modestly shorter-than-average duration posture to guard against the possibility of rising long-term interest rates.
September 15, 2017
1 Total return includes reinvestment of dividends and any capital gains paid. Past performance is no guarantee of future results. Share price, yield, and investment return fluctuate such that upon redemption, fund shares may be worth more or less than their original cost.
2 Source: Lipper Inc. – The Bloomberg Barclays U.S. Intermediate Government/Credit Index is a broad-based flagship benchmark that measures the non-securitized component of the Bloomberg Barclays U.S. Aggregate Bond Index. Investors cannot invest directly in any index.
3 The fund may continue to own investment-grade bonds (at the time of purchase), which are subsequently downgraded to below investment grade.
Bonds are subject generally to interest-rate, credit, liquidity, and market risks, to varying degrees, all of which are more fully described in the fund’s prospectus. Generally, all other factors being equal, bond prices are inversely related to interest-rate changes, and rate increases can cause price declines.
The fund may use derivative instruments, such as options, futures, options on futures, forward contracts, and swaps. A small investment in derivatives could have a potentially large impact on the fund’s performance. The use of derivatives involves risks different from, or possibly greater than, the risks associated with investing directly in the underlying assets.
5
DISCUSSION OF FUND PERFORMANCE (continued)
For the period from September 1, 2016 through August 31, 2017, as provided by John F. Flahive, CFA, and Timothy J. Sanville, CFA, Portfolio Managers
Market and Fund Performance Overview
For the 12-month period ended August 31, 2017, BNY Mellon Corporate Bond Fund’s Class M shares produced a total return of 3.67%, and Investor shares produced a total return of 3.53%.1 In comparison, the fund’s benchmark, the Bloomberg Barclays U.S. Intermediate Credit Index (the “Index”), produced a total return of 1.92%, and the Bloomberg Barclays U.S. Credit Index, the fund’s secondary benchmark, produced a total return of 1.90% for the same period.2,3
U.S. corporate bonds produced moderately positive returns over the reporting period in an environment of improving business conditions. The fund’s security selection, sector allocation, and duration management strategies enabled it to outperform the Index.
The Fund’s Investment Approach
The fund seeks total return (consisting of capital appreciation and current income). To pursue its goal, the fund normally invests at least 80% of its net assets in corporate bonds, which include U.S. dollar-denominated bonds issued by U.S. and foreign corporations. The remainder of the fund’s assets may be invested in U.S. government and agency bonds, mortgage-related securities, including commercial mortgage-backed securities, asset-backed securities, foreign corporate bonds denominated in foreign currencies, foreign government bonds, municipal bonds and commercial paper, and other money market instruments. For additional yield, the fund may invest up to 20% of its assets in fixed-income securities rated below investment grade (“high yield” or “junk” bonds) or the unrated equivalent as determined by the investment adviser.
We employ a disciplined process to select bonds and manage risk. We choose bonds based on yield, credit quality, the level of interest rates and inflation, general economic and financial trends, and our outlook for the securities markets. In selecting corporate bonds for investment, we analyze fundamental metrics, including the issuer’s cash flow, leverage and operating margins, as well as its business strategy and operating performance, and macroeconomic factors.
Economic and Political Developments Drove Bond Markets
Longer-term interest rates rose sharply in the weeks following the U.S. presidential election in November 2016, causing prices of U.S. government securities to decline. Rates moved higher in response to expectations that the new administration’s more business-friendly regulatory, tax, and fiscal policies would boost U.S. economic growth and inflationary pressures. In addition, the Federal Reserve Board (the “Fed”) implemented a long-awaited increase in short-term interest rates in December 2016.
In 2017, short-term interest rates continued to rise when the Fed implemented two more short-term rate hikes over the first half of the year. In contrast, long-term U.S. interest rates moderated, giving back some, but not all, of the post-election spike when inflationary pressures remained muted and investors came to realize that some government policy reforms were far from certain.
Corporate-backed bonds generally produced higher returns than their government-issued counterparts in this environment. Lower-rated corporate bonds fared especially well in light of growing corporate earnings and improving global economic conditions.
Fund Strategies Bolstered Relative Results
The fund’s performance compared to the Index benefited over the reporting period from our security selection strategy among corporate-backed bonds. Most notably, the fund achieved strong results from its holdings of longer-term securities issued on behalf of companies in the industrials and financials sectors, which provided highly competitive yields. The fund’s exposure to lower-rated securities, including those with BBB and high yield credit ratings, also enhanced relative performance, as did underweighted exposure to more highly rated corporate bonds. In other areas of the bond market, the fund added a degree of value through its exposure to taxable municipal bonds and U.S. dollar-denominated sovereigns.
We maintained the fund’s average duration among corporate bonds in a range that was longer than the Index. This positioning helped the fund capture incrementally higher yields and benefit more fully as yield differences narrowed along the market’s credit-quality spectrum.
Disappointments proved to be relatively mild during the reporting period. The fund’s holdings of corporate bonds from the consumer cyclical sector generally lagged broader market averages due to security selection shortfalls.
Positioned for Continued Economic Growth
The U.S. economy has continued to expand, and many analysts expect slow-to-moderate growth to persist over the months ahead. Corporate earnings and inflationary pressures may increase in this environment, and most analysts anticipate additional short-term interest-rate hikes from the Fed. Among corporate bonds, credit spreads have narrowed significantly in the wake of the recent rally. On the other hand, we believe that technical conditions in the bond market generally remain favorable, as a limited supply of new bond issuance has been met with generally robust investor demand.
Therefore, we currently are cautiously optimistic regarding the prospects for corporate bonds. As of the reporting period’s end, we have maintained the fund’s overweighted exposure to lower-rated corporate bonds that historically have been more sensitive to business conditions than interest rates. We have also maintained a modestly longer-than-average duration posture as we seek to capture higher yields.
September 15, 2017
1 Total return includes reinvestment of dividends and any capital gains paid. Past performance is no guarantee of future results. Share price, yield, and investment return fluctuate such that upon redemption, fund shares may be worth more or less than their original cost.
2 Source: Lipper Inc. – The Bloomberg Barclays U.S. Intermediate Credit Index measures the investment-grade, U.S. dollar-denominated, fixed-rate, taxable corporate and government-related bond markets with a maturity greater than 1 year and less than 10 years. It is composed of the U.S. Corporate Index and a non-corporate component that includes non-U.S. agencies, sovereigns, supranationals and local authorities constrained by maturity. The U.S. Intermediate Credit Index is a subset of the U.S. Credit Index, which feeds into the U.S. Government/Credit Index and U.S. Aggregate Index. Investors cannot invest directly in any index.
3 Source: Lipper Inc. – The Bloomberg Barclays U.S. Credit Index measures the investment-grade, U.S. dollar-denominated, fixed-rate, taxable corporate and government-related bond markets. It is composed of the U.S. Corporate Index and a non-corporate component that includes non-U.S. agencies sovereigns, supranationals and local authorities. Investors cannot invest directly in any index.
Bonds are subject generally to interest-rate, credit, liquidity, and market risks, to varying degrees, all of which are more fully described in the fund’s prospectus. Generally, all other factors being equal, bond prices are inversely related to interest-rate changes, and rate increases can cause price declines.
The fund may use derivative instruments, such as options, futures, options on futures, forward contracts, and swaps. A small investment in derivatives could have a potentially large impact on the fund’s performance. The use of derivatives involves risks different from, or possibly greater than, the risks associated with investing directly in the underlying assets.
6
For the period from September 1, 2016 through August 31, 2017, as provided by Lawrence R. Dunn, CFA, and Timothy J. Sanville, CFA, Portfolio Managers
Market and Fund Performance Overview
For the 12-month period ended August 31, 2017, BNY Mellon Short-Term U.S. Government Securities Fund’s Class M shares produced a total return of 0.26%, and Investor shares produced a total return of 0.10%.1 In comparison, the Bloomberg Barclays U.S. Government 1-3 Year Bond Index (the “Index”), the fund’s benchmark, produced a total return of 0.56% for the same period.2
Short-term U.S. government securities produced modestly positive total returns over the reporting period as short-term rates increased and longer-term interest rates moderated. The fund underperformed the Index, primarily due to its focus on short-term securities during the final months of 2016, when longer-term bonds fared better.
The Fund’s Investment Approach
The fund seeks to provide as high a level of current income as is consistent with the preservation of capital. To pursue this goal, the fund invests at least 80% of its net assets in securities issued or guaranteed by the U.S. government or its agencies or instrumentalities and in repurchase agreements. The fund may invest up to 35% of its net assets in mortgage-related securities issued by U.S. government agencies or instrumentalities, such as mortgage pass-through securities issued by the Government National Mortgage Association (“Ginnie Mae”), the Federal National Mortgage Association (“Fannie Mae”), and the Federal Home Loan Mortgage Corporation (“Freddie Mac”). The fund may also invest in collateralized mortgage obligations (“CMOs”), including stripped mortgage-backed securities. Generally, the fund’s average effective portfolio maturity and the average effective duration of the fund’s portfolio will be less than three years.
When choosing securities, we typically first examine U.S. and global economic conditions and other market factors to estimate long- and short-term interest rates. Using a research-driven investment process, we then seek to identify what we believe are potentially profitable sectors before they are widely perceived as such by the market. We also seek to identify underpriced or mispriced securities that appear likely to perform well over time.
Short-Term Rates Climbed in Anticipation of Greater Growth
Longer-term interest rates rose sharply in the weeks following the U.S. presidential election in November 2016, causing prices of U.S. government securities and other high-quality bonds to decline. Rates moved higher in response to expectations that the new administration’s more business-friendly regulatory, tax, and fiscal policies would boost U.S. economic growth and inflationary pressures. In addition, the Federal Reserve Board (the “Fed”) implemented a long-awaited increase in the overnight federal funds rate in December 2017, driving short-term rates higher.
Short-term interest rates continued to rise when the Fed implemented two more increases in the federal funds rate over the first half of 2017, sending the target for overnight rates to between 1.00% and 1.25%. Yields of bonds in the two- to five-year maturity range also rose. In contrast, long-term U.S. interest rates moderated, giving back some, but not all, of the post-election spike as investors came to realize that some government policy reforms were far from certain in a contentious political environment.
Meanwhile, mortgage-backed securities and asset-backed securities from U.S. government agencies generally continued to provide yield advantages over nominal U.S. Treasury securities with comparable maturities.
Conservative Posture in a Rising Rate Environment
The fund’s performance compared to the Index was dampened to a degree by a relatively conservative investment posture, including an emphasis on short-term securities, in an environment of rising short-term interest rates in the wake of the November 2016 presidential election.
On the other hand, the fund benefited over the reporting period from its sector allocation strategy, most notably significant positions in higher-yielding mortgage-backed and asset-backed securities backed by U.S. government agencies. These holdings performed well amid low market volatility throughout the reporting period. We focused mainly on mortgage-related securities backed by pools of 10-year amortizing loans, which tend to be less sensitive to the risks of duration extension when rates rise. A relatively small allocation to taxable municipal bonds also helped support relative results.
Positioned for Continued Economic Growth
The U.S. economy has continued to expand moderately, and some analysts expect growth to gain momentum over the months ahead. Inflationary pressures have remained muted, but they may be poised to increase. Therefore, many analysts currently believe that higher short-term rates are more likely than lower rates, and the Fed is expected to begin to reduce its holdings of U.S. government securities in an effort to normalize monetary policy in the months ahead.
These developments could cause yield differences to widen across the market’s maturity spectrum, particularly at the longer end of its range. As of the reporting period’s end, we have maintained a relatively cautious investment posture, but we have maintained overweighted exposure to mortgage-backed securities and asset-backed securities that we believe provide yield advantages over U.S. Treasury securities. In our judgment, these are prudent strategies in an environment of expanding economic activity and rising interest rates.
September 15, 2017
1 Total return includes reinvestment of dividends and any capital gains paid. Past performance is no guarantee of future results. Share price, yield, and investment return fluctuate such that upon redemption, fund shares may be worth more or less than their original cost.
2 Source: Lipper Inc. – The Bloomberg Barclays U.S. Government 1-3 Year Bond Index comprises the U.S. Treasury and U.S. Agency Indices. The index includes U.S. dollar-denominated, fixed-rate, nominal U.S. Treasuries and U.S. agency debentures, which reach maturity in 1-3 years. Investors cannot invest directly in any index.
Bonds are subject generally to interest-rate, credit, liquidity, and market risks, to varying degrees, all of which are more fully described in the fund’s prospectus. Generally, all other factors being equal, bond prices are inversely related to interest-rate changes, and rate increases can cause price declines.
The fund may use derivative instruments, such as options, futures, options on futures, forward contracts, and swaps. A small investment in derivatives could have a potentially large impact on the fund’s performance. The use of derivatives involves risks different from, or possibly greater than, the risks associated with investing directly in the underlying assets.
7
FUND PERFORMANCE
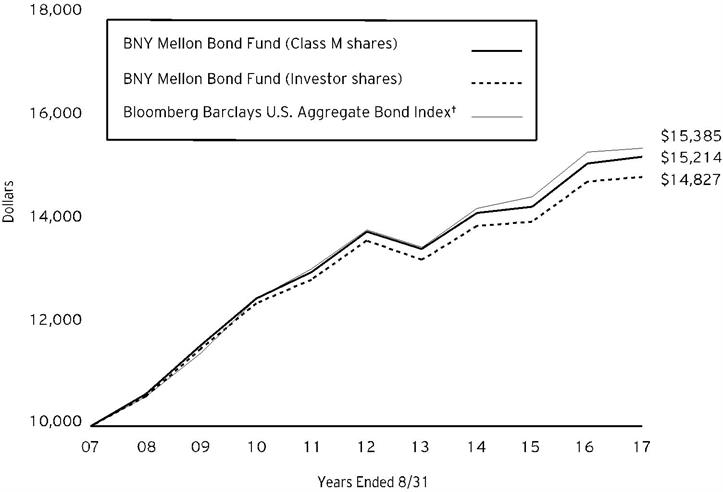
Comparison of change in value of $10,000 investment in BNY Mellon Bond Fund Class M shares and Investor shares and the Bloomberg Barclays U.S. Aggregate Bond Index (the “Index”)
Average Annual Total Returns as of 8/31/17 | |||
| 1 Year | 5 Years | 10 Years |
Class M shares | 0.87% | 2.02% | 4.29% |
Investor shares | 0.63% | 1.75% | 4.02% |
Bloomberg Barclays U.S. Aggregate Bond Index | 0.49% | 2.19% | 4.40% |
† Source: Lipper Inc.
Past performance is not predictive of future performance. The fund’s performance shown in the graph and table does not reflect the deduction of taxes that a shareholder would pay on fund distributions or the redemption of fund shares.
The above graph compares a $10,000 investment made in Class M and Investor shares of BNY Mellon Bond Fund on 8/31/07 to a $10,000 investment made in the Index on that date. All dividends and capital gain distributions are reinvested.
The fund’s performance shown in the line graph above takes into account all applicable fees and expenses for Class M and Investor shares. The Index is a broad-based flagship benchmark that measures the investment-grade, U.S. dollar-denominated, fixed-rate taxable bond market. The Index includes Treasuries, government-related and corporate securities, MBS (agency fixed-rate and hybrid ARM pass-throughs), ABS and CMBS (agency and nonagency). Investors cannot invest directly in any index. Unlike a mutual fund, the Index is not subject to charges, fees and other expenses. Investors cannot invest directly in any index. Further information relating to fund performance, including expense reimbursements, if applicable, is contained in the Financial Highlights section of the prospectus and elsewhere in this report.
The performance data quoted represents past performance, which is no guarantee of future results. Share price and investment return fluctuate and an investor’s shares may be worth more or less than original cost upon redemption. Current performance may be lower or higher than the performance quoted. Go to Dreyfus.com for the fund’s most recent month-end returns.
8
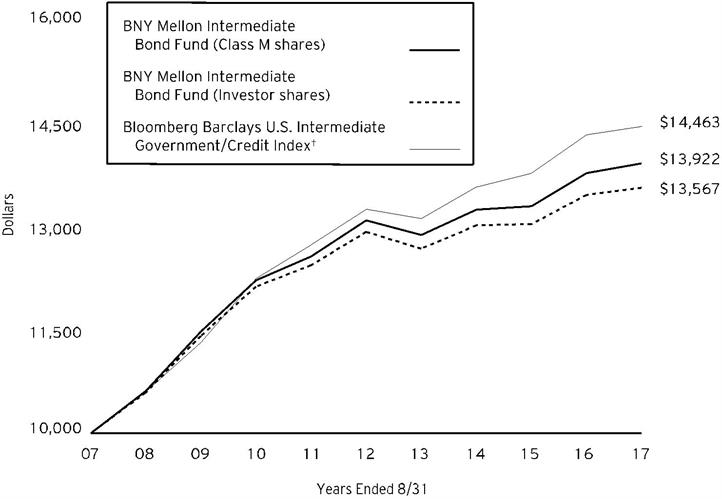
Comparison of change in value of $10,000 investment in BNY Mellon Intermediate Bond Fund Class M shares and Investor shares and the Bloomberg Barclays U.S. Intermediate Government/Credit Index (the “Index”)
Average Annual Total Returns as of 8/31/17 | |||
| 1 Year | 5 Years | 10 Years |
Class M shares | 1.01% | 1.23% | 3.36% |
Investor shares | 0.75% | 0.97% | 3.10% |
Bloomberg Barclays U.S. Intermediate | 0.82% | 1.75% | 3.76% |
† Source: Lipper Inc.
Past performance is not predictive of future performance. The fund’s performance shown in the graph and table does not reflect the deduction of taxes that a shareholder would pay on fund distributions or the redemption of fund shares.
The above graph compares a $10,000 investment made in Class M shares and Investor shares of BNY Mellon Intermediate Bond Fund on 8/31/07 to a $10,000 investment made in the Index on that date. All dividends and capital gain distributions are reinvested.
The fund’s performance shown in the line graph above takes into account all applicable fees and expenses for Class M and Investor shares. The Index is a broad-based flagship benchmark that measures the non-securitized component of the Bloomberg Barclays U.S. Aggregate Bond Index. Unlike a mutual fund, the Index is not subject to charges, fees and other expenses. Investors cannot invest directly in any index. Further information relating to fund performance, including expense reimbursements, if applicable, is contained in the Financial Highlights section of the prospectus and elsewhere in this report.
The performance data quoted represents past performance, which is no guarantee of future results. Share price and investment return fluctuate and an investor’s shares may be worth more or less than original cost upon redemption. Current performance may be lower or higher than the performance quoted. Go to Dreyfus.com for the fund’s most recent month-end returns.
9
FUND PERFORMANCE (continued)
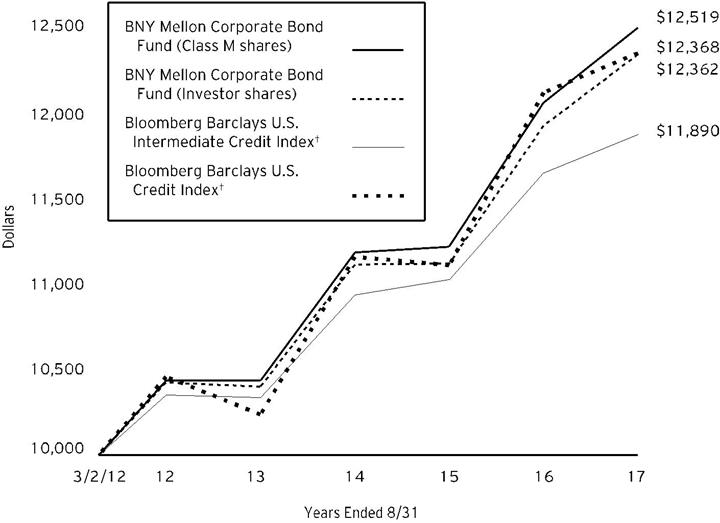
Comparison of change in value of $10,000 investment in BNY Mellon Corporate Bond Fund Class M shares and Investor shares and the Bloomberg Barclays U.S. Intermediate Credit Index and the Bloomberg Barclays U.S. Credit Index
Average Annual Total Returns as of 8/31/17 | ||||
| Inception | 1 Year | 5 Year | From |
Class M shares | 3/2/12 | 3.67% | 3.70% | 4.17% |
Investor shares | 3/2/12 | 3.53% | 3.46% | 3.93% |
Bloomberg Barclays U.S. Intermediate Credit Index | 2/29/12 | 1.92% | 2.80% | 3.20%†† |
Bloomberg Barclays U.S. Credit Index | 2/29/12 | 1.90% | 3.40% | 3.94%†† |
† Source: Lipper Inc.
†† For comparative purposes, the value of the indices as of 02/29/12 is used as the beginning value on 3/2/12.
Past performance is not predictive of future performance. The fund’s performance shown in the graph and table does not reflect the deduction of taxes that a shareholder would pay on fund distributions or the redemption of fund shares.
The above graph compares a $10,000 investment made in Class M shares and Investor shares of BNY Mellon Corporate Bond Fund on 3/2/12 (inception date) to a $10,000 investment made in each of the Bloomberg Barclays U.S. Intermediate Credit Index and the Bloomberg Barclays U.S. Credit Index on that date. All dividends and capital gain distributions are reinvested.
The fund’s performance shown in the line graph above takes into account all applicable fees and expenses for Class M and Investor shares. The Bloomberg Barclays U.S. Intermediate Credit Index measures the investment-grade, U.S. dollar-denominated, fixed-rate, taxable corporate and government-related bond markets with a maturity greater than 1 year and less than 10 years. It is composed of the U.S. Corporate Index and a non-corporate component that includes non-U.S. agencies, sovereigns, supranationals and local authorities constrained by maturity. The U.S. Intermediate Credit Index is a subset of the U.S. Credit Index which feeds into the U.S. Government/Credit Index and U.S. Aggregate Index. Bloomberg Barclays U.S. Credit Index measures the investment-grade, U.S. dollar-denominated, fixed-rate, taxable corporate and government-related bond markets. It is composed of the U.S. Corporate Index and a non-corporate component that includes non-U.S. agencies sovereigns, supranationals and local authorities. Unlike a mutual fund, the indices are not subject to charges, fees and other expenses. Investors cannot invest directly in any index. Further information relating to fund performance, including expense reimbursements, if applicable, is contained in the Financial Highlights section of the prospectus and elsewhere in this report.
The performance data quoted represents past performance, which is no guarantee of future results. Share price and investment return fluctuate and an investor’s shares may be worth more or less than original cost upon redemption. Current performance may be lower or higher than the performance quoted. Go to Dreyfus.com for the fund’s most recent month-end returns.
10
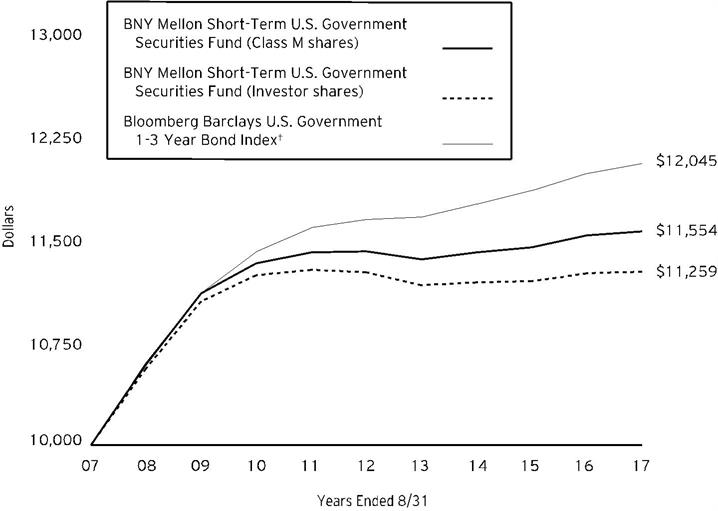
Comparison of change in value of $10,000 investment in BNY Mellon Short-Term U.S. Government Securities Fund Class M shares and Investor shares and the Bloomberg Barclays U.S. Government 1-3 Year Bond Index (the “Index”)
Average Annual Total Returns as of 8/31/17 | |||
| 1 Year | 5 Years | 10 Years |
Class M shares | 0.26% | 0.26% | 1.46% |
Investor shares | 0.10% | 0.01% | 1.19% |
Bloomberg Barclays U.S. Government | 0.56% | 0.68% | 1.88% |
† Source: Lipper Inc.
Past performance is not predictive of future performance. The fund’s performance shown in the graph and table does not reflect the deduction of taxes that a shareholder would pay on fund distributions or the redemption of fund shares.
The above graph compares a $10,000 investment made in Class M shares and Investor shares of BNY Mellon Short-Term U.S. Government Securities Fund on 8/31/07 to a $10,000 investment made in the Index on that date. All dividends and capital gain distributions are reinvested.
The fund’s performance shown in the line graph above takes into account all applicable fees and expenses for Class M and Investor shares. The Index comprises the U.S. Treasury and U.S. Agency Indices. The Index includes U.S. dollar-denominated, fixed-rate, nominal U.S. Treasuries and U.S. agency debentures, which reach maturity in 1-3 years. Unlike a mutual fund, the Index is not subject to charges, fees and other expenses. Investors cannot invest directly in any index. Further information relating to fund performance, including expense reimbursements, if applicable, is contained in the Financial Highlights section of the prospectus and elsewhere in this report.
The performance data quoted represents past performance, which is no guarantee of future results. Share price and investment return fluctuate and an investor’s shares may be worth more or less than original cost upon redemption. Current performance may be lower or higher than the performance quoted. Go to Dreyfus.com for the fund’s most recent month-end returns.
11
UNDERSTANDING YOUR FUND’S EXPENSES (Unaudited)
As a mutual fund investor, you pay ongoing expenses, such as management fees and other expenses. Using the information below, you can estimate how these expenses affect your investment and compare them with the expenses of other funds. You also may pay one-time transaction expenses, including sales charges (loads) and redemption fees, which are not shown in this section and would have resulted in higher total expenses. For more information, see your fund’s prospectus or talk to your financial adviser.
Review your fund’s expenses
The table below shows the expenses you would have paid on a $1,000 investment in each class of each fund from March 1, 2017 to August 31, 2017. It also shows how much a $1,000 investment would be worth at the close of the period, assuming actual returns and expenses.
Expenses and Value of a $1,000 Investment | |||||||||||||||||
assuming actual returns for the six months ended August 31, 2017 | |||||||||||||||||
|
|
|
|
|
| Class M |
|
|
| Investor Shares |
| ||||||
BNY Mellon Bond Fund | |||||||||||||||||
Expenses paid per $1,000† | $2.86 | $4.14 | |||||||||||||||
Ending value (after expenses) | $1,028.40 | $1,026.60 | |||||||||||||||
Annualized expense ratio (%) | .56 | .81 | |||||||||||||||
BNY Mellon Intermediate Bond Fund | |||||||||||||||||
Expenses paid per $1,000† | $2.85 | $4.12 | |||||||||||||||
Ending value (after expenses) | $1,017.50 | $1,015.60 | |||||||||||||||
Annualized expense ratio (%) | .56 | .81 | |||||||||||||||
BNY Mellon Corporate Bond Fund | |||||||||||||||||
Expenses paid per $1,000† | $2.87 | $4.16 | |||||||||||||||
Ending value (after expenses) | $1,036.00 | $1,036.70 | |||||||||||||||
Annualized expense ratio (%) | .56 | .81 | |||||||||||||||
BNY Mellon Short-Term U.S. Government Securities Fund | |||||||||||||||||
Expenses paid per $1,000† | $2.83 | $4.09 | |||||||||||||||
Ending value (after expenses) | $1,006.10 |
| $1,005.60 | ||||||||||||||
Annualized expense ratio (%) | .56 | .81 | |||||||||||||||
† Expenses are equal to each fund’s annualized expense ratios as shown above, multiplied by the average account value over the period, multiplied by 184/365 (to reflect the one-half year period).
12
COMPARING YOUR FUND’S EXPENSES
WITH THOSE OF OTHER FUNDS (Unaudited)
Using the SEC’s method to compare expenses
The Securities and Exchange Commission (SEC) has established guidelines to help investors assess fund expenses. Per these guidelines, the table below shows your fund’s expenses based on a $1,000 investment, assuming a hypothetical 5% annualized return. You can use this information to compare the ongoing expenses (but not transaction expenses or total cost) of investing in the fund with those of other funds. All mutual fund shareholder reports will provide this information to help you make this comparison. Please note that you cannot use this information to estimate your actual ending account balance and expenses paid during the period.
Expenses and Value of a $1,000 Investment | |||||||||||||||||
assuming a hypothetical 5% annualized return for the six months ended August 31, 2017 | |||||||||||||||||
|
|
|
|
|
| Class M |
|
|
| Investor Shares |
| ||||||
BNY Mellon Bond Fund | |||||||||||||||||
Expenses paid per $1,000† | $2.85 | $4.13 | |||||||||||||||
Ending value (after expenses) | $1,022.38 | $1,021.12 | |||||||||||||||
Annualized expense ratio (%) | .56 | .81 | |||||||||||||||
BNY Mellon Intermediate Bond Fund | |||||||||||||||||
Expenses paid per $1,000† | $2.85 | $4.13 | |||||||||||||||
Ending value (after expenses) | $1,022.38 | $1,021.12 | |||||||||||||||
Annualized expense ratio (%) | .56 | .81 | |||||||||||||||
BNY Mellon Corporate Bond Fund | |||||||||||||||||
Expenses paid per $1,000† | $2.85 | $4.13 | |||||||||||||||
Ending value (after expenses) | $1,022.38 | $1,021.12 | |||||||||||||||
Annualized expense ratio (%) | .56 | .81 | |||||||||||||||
BNY Mellon Short-Term U.S. Government Securities Fund | |||||||||||||||||
Expenses paid per $1,000† | $2.85 | $4.13 | |||||||||||||||
Ending value (after expenses) |
| $1,022.38 | $1,021.12 | ||||||||||||||
Annualized expense ratio (%) | .56 | .81 | |||||||||||||||
† Expenses are equal to each fund’s annualized expense ratios as shown above, multiplied by the average account value over the period, multiplied by 184/365 (to reflect the one-half year period).
13
STATEMENT OF INVESTMENTS
August 31, 2017
BNY Mellon Bond Fund | |||||||||
Description | Coupon | Maturity | Principal | Value ($) | |||||
Bonds and Notes - 98.5% | |||||||||
Commercial Mortgage Pass-Through Ctfs. - 1.4% | |||||||||
UBS Commercial Mortgage Trust, | 3.40 | 5/10/45 | 4,225,307 | 4,428,386 | |||||
WFRBS Commercial Mortgage Trust, | 3.00 | 5/15/45 | 9,045,000 | 9,319,552 | |||||
13,747,938 | |||||||||
Consumer Discretionary - 3.7% | |||||||||
21st Century Fox America, | 6.15 | 3/1/37 | 4,365,000 | 5,571,538 | |||||
Comcast, | 2.75 | 3/1/23 | 9,400,000 | 9,554,536 | |||||
General Motors Financial, | 3.20 | 7/6/21 | 3,240,000 | 3,300,007 | |||||
Scripps Networks Interactive, | 2.80 | 6/15/20 | 5,465,000 | 5,508,999 | |||||
Time Warner, | 4.00 | 1/15/22 | 7,570,000 | 8,014,247 | |||||
Toyota Motor Credit, | 2.15 | 3/12/20 | 5,145,000 | 5,199,167 | |||||
37,148,494 | |||||||||
Consumer Staples - 2.9% | |||||||||
Anheuser-Busch InBev Finance, | 4.90 | 2/1/46 | 5,935,000 | 6,789,676 | |||||
BAT Capital, | 3.56 | 8/15/27 | 5,230,000 | a | 5,315,404 | ||||
CVS Health, | 4.88 | 7/20/35 | 5,540,000 | 6,220,162 | |||||
Kroger, | 2.60 | 2/1/21 | 3,735,000 | 3,766,032 | |||||
PepsiCo, | 4.50 | 1/15/20 | 7,040,000 | 7,516,812 | |||||
29,608,086 | |||||||||
Energy - 2.7% | |||||||||
Apache, | 3.25 | 4/15/22 | 4,120,000 | 4,196,896 | |||||
BP Capital Markets, | 4.75 | 3/10/19 | 4,640,000 | 4,854,503 | |||||
Enterprise Products Operating, | 2.55 | 10/15/19 | 3,235,000 | 3,263,754 | |||||
Exxon Mobil, | 1.71 | 3/1/19 | 4,425,000 | 4,435,874 | |||||
Sabine Pass Liquefaction, | 5.75 | 5/15/24 | 3,300,000 | 3,675,035 | |||||
Spectra Energy Partners, | 3.50 | 3/15/25 | 3,145,000 | 3,206,667 | |||||
Williams Partners, | 4.30 | 3/4/24 | 3,516,000 | 3,732,288 | |||||
27,365,017 | |||||||||
Financials - 15.9% | |||||||||
AerCap Ireland Capital, | 4.50 | 5/15/21 | 10,430,000 | 11,094,856 | |||||
Bank of America, | 2.60 | 1/15/19 | 9,330,000 | 9,425,878 | |||||
Bank of America, | 3.95 | 4/21/25 | 9,170,000 | 9,478,981 | |||||
Barclays, | 5.20 | 5/12/26 | 4,055,000 | 4,344,511 | |||||
Citigroup, | 4.45 | 9/29/27 | 10,200,000 | 10,797,584 | |||||
Citizens Financial Group, | 4.15 | 9/28/22 | 8,555,000 | a | 9,021,552 | ||||
Cooperatieve Rabobank, | 4.50 | 1/11/21 | 8,060,000 | 8,660,010 | |||||
Deutsche Bank , | 6.00 | 9/1/17 | 5,485,000 | 5,485,000 | |||||
Ford Motor Credit, | 3.22 | 1/9/22 | 4,995,000 | 5,079,615 | |||||
14
BNY Mellon Bond Fund (continued) | |||||||||
Description | Coupon | Maturity | Principal | Value ($) | |||||
Bonds and Notes - 98.5% (continued) | |||||||||
Financials - 15.9% (continued) | |||||||||
GE Capital International Funding, | 2.34 | 11/15/20 | 6,873,000 | 6,960,367 | |||||
Goldman Sachs Group, | 6.75 | 10/1/37 | 8,270,000 | 10,908,122 | |||||
HSBC Finance, | 6.68 | 1/15/21 | 10,510,000 | 11,980,997 | |||||
Intercontinental Exchange, | 2.75 | 12/1/20 | 6,035,000 | 6,205,935 | |||||
JPMorgan Chase & Co., | 3.38 | 5/1/23 | 5,770,000 | 5,928,146 | |||||
MetLife, | 7.72 | 2/15/19 | 6,865,000 | 7,452,604 | |||||
Morgan Stanley, | 4.88 | 11/1/22 | 11,490,000 | 12,527,739 | |||||
Societe Generale, | 4.75 | 11/24/25 | 8,355,000 | a,b | 8,903,411 | ||||
Total System Services, | 4.80 | 4/1/26 | 5,765,000 | 6,411,255 | |||||
Wells Fargo & Co., | 2.60 | 7/22/20 | 3,415,000 | 3,472,770 | |||||
Wells Fargo & Co., | 4.90 | 11/17/45 | 6,265,000 | 6,927,196 | |||||
161,066,529 | |||||||||
Foreign/Governmental - 1.6% | |||||||||
Petroleos Mexicanos, | 4.88 | 1/24/22 | 8,605,000 | 9,090,322 | |||||
Province of Ontario Canada, | 4.00 | 10/7/19 | 6,500,000 | 6,804,494 | |||||
15,894,816 | |||||||||
Health Care - 2.1% | |||||||||
AbbVie, | 2.90 | 11/6/22 | 5,090,000 | 5,170,090 | |||||
Amgen, | 5.65 | 6/15/42 | 4,955,000 | 6,050,854 | |||||
Biogen, | 2.90 | 9/15/20 | 5,600,000 | 5,735,304 | |||||
Celgene, | 2.88 | 8/15/20 | 4,305,000 | 4,416,253 | |||||
21,372,501 | |||||||||
Industrials - 2.7% | |||||||||
ABB Finance USA, | 2.88 | 5/8/22 | 7,215,000 | 7,447,192 | |||||
American Airlines , | 3.38 | 11/1/28 | 4,926,391 | 5,040,289 | |||||
Burlington Northern Santa Fe, | 3.45 | 9/15/21 | 6,415,000 | 6,715,157 | |||||
General Electric, | 5.00 | 12/31/49 | 5,393,000 | c | 5,703,098 | ||||
General Electric, | 5.30 | 2/11/21 | 2,373,000 | 2,631,287 | |||||
27,537,023 | |||||||||
Information Technology - 6.8% | |||||||||
Adobe Systems, | 3.25 | 2/1/25 | 4,895,000 | 5,067,579 | |||||
Amazon.com, | 2.50 | 11/29/22 | 6,675,000 | 6,764,005 | |||||
Apple, | 4.38 | 5/13/45 | 4,895,000 | 5,411,392 | |||||
Arrow Electronics, | 3.50 | 4/1/22 | 5,620,000 | 5,793,596 | |||||
Dell International, | 6.02 | 6/15/26 | 5,775,000 | a | 6,457,701 | ||||
eBay, | 2.60 | 7/15/22 | 5,295,000 | 5,311,858 | |||||
Fidelity National Information Services, | 3.88 | 6/5/24 | 2,016,000 | 2,135,170 | |||||
Intel, | 2.70 | 12/15/22 | 4,020,000 | 4,119,674 | |||||
15
STATEMENT OF INVESTMENTS (continued)
BNY Mellon Bond Fund (continued) | |||||||||
Description | Coupon | Maturity | Principal | Value ($) | |||||
Bonds and Notes - 98.5% (continued) | |||||||||
Information Technology - 6.8% (continued) | |||||||||
Intel, | 4.90 | 7/29/45 | 7,250,000 | 8,591,537 | |||||
Microsoft, | 3.75 | 2/12/45 | 7,035,000 | 7,161,420 | |||||
Oracle, | 2.50 | 5/15/22 | 9,660,000 | 9,812,655 | |||||
Seagate HDD Cayman, | 4.75 | 1/1/25 | 2,725,000 | 2,656,860 | |||||
69,283,447 | |||||||||
Materials - .4% | |||||||||
Eastman Chemical, | 3.60 | 8/15/22 | 3,440,000 | 3,586,056 | |||||
Municipal Bonds - 7.3% | |||||||||
California Earthquake Authority, | 2.81 | 7/1/19 | 4,788,000 | 4,829,416 | |||||
California Educational Facilities Authority, | 5.00 | 10/1/32 | 6,125,000 | 8,003,109 | |||||
Chicago, | 7.38 | 1/1/33 | 4,710,000 | 5,464,636 | |||||
Commonwealth of Massachusetts, | 4.91 | 5/1/29 | 4,990,000 | 5,953,918 | |||||
Commonwealth of Massachusetts, | 4.20 | 12/1/21 | 335,000 | 360,189 | |||||
Florida Hurricane Catastrophe Fund Finance Corporation, | 3.00 | 7/1/20 | 14,000,000 | 14,397,320 | |||||
New York City, | 6.25 | 6/1/35 | 5,470,000 | 6,064,917 | |||||
New York City Municipal Water Finance Authority, | 6.28 | 6/15/42 | 8,440,000 | 9,466,979 | |||||
Oakland Unified School District, | 9.50 | 8/1/34 | 3,550,000 | 4,038,871 | |||||
South Carolina Public Service Authority, | 2.39 | 12/1/23 | 3,950,000 | 3,730,183 | |||||
Texas Public Finance Authority, | 8.25 | 7/1/24 | 4,890,000 | 5,179,439 | |||||
University of California Regents, | 4.13 | 5/15/45 | 5,530,000 | 5,873,081 | |||||
73,362,058 | |||||||||
Real Estate - 2.6% | |||||||||
Alexandria Real Estate Equities, | 4.30 | 1/15/26 | 4,180,000 | 4,453,105 | |||||
Boston Properties, | 4.13 | 5/15/21 | 3,005,000 | 3,193,870 | |||||
CubeSmart, | 4.80 | 7/15/22 | 5,173,000 | 5,633,552 | |||||
Essex Portfolio, | 3.38 | 1/15/23 | 4,081,000 | 4,178,113 | |||||
Kimco Realty, | 3.40 | 11/1/22 | 5,595,000 | 5,792,198 | |||||
Tanger Properties, | 3.13 | 9/1/26 | 3,605,000 | 3,435,065 | |||||
26,685,903 | |||||||||
Telecommunications - 3.5% | |||||||||
AT&T, | 4.45 | 5/15/21 | 7,980,000 | 8,548,861 | |||||
AT&T, | 3.90 | 8/14/27 | 5,205,000 | 5,270,188 | |||||
Telefonica Emisiones, | 4.10 | 3/8/27 | 9,675,000 | 10,128,984 | |||||
Verizon Communications, | 5.50 | 3/16/47 | 10,605,000 | 11,503,418 | |||||
35,451,451 | |||||||||
U.S. Government Agencies - .5% | |||||||||
Federal Farm Credit Bank, | 2.50 | 8/28/24 | 5,235,000 | 5,231,398 | |||||
16
BNY Mellon Bond Fund (continued) | |||||||||
Description | Coupon | Maturity | Principal | Value ($) | |||||
Bonds and Notes - 98.5% (continued) | |||||||||
U.S. Government Agencies Mortgage-Backed - 26.3% | |||||||||
Federal Home Loan Mortgage Corp. | |||||||||
3.00%, 8/1/47 | 2,543,761 | d | 2,574,661 | ||||||
3.50%, 12/1/28-8/1/47 | 15,935,537 | d | 16,500,821 | ||||||
4.00%, 6/1/26-8/1/47 | 11,754,190 | d | 12,478,365 | ||||||
4.50%, 2/1/47 | 6,525,944 | d | 7,014,187 | ||||||
5.00%, 12/1/39-7/1/40 | 6,103,822 | d | 6,708,162 | ||||||
Federal National Mortgage Association | |||||||||
2.50%, 10/1/31 | 13,625,727 | d | 13,831,991 | ||||||
3.00%, 2/1/32-8/1/47 | 61,832,747 | d | 62,923,111 | ||||||
3.50%, 1/1/28-7/1/47 | 57,177,390 | d | 59,330,257 | ||||||
4.00%, 3/1/46-7/1/47 | 26,064,928 | d | 27,580,683 | ||||||
4.50%, 2/1/47-6/1/47 | 15,352,554 | d | 16,521,394 | ||||||
5.00%, 11/1/43 | 1,395,863 | d | 1,533,022 | ||||||
Government National Mortgage Association I | |||||||||
5.00%, 11/15/34 | 11,201 | 12,320 | |||||||
Government National Mortgage Association II | |||||||||
3.00%, 1/20/47 | 13,125,689 | 13,412,454 | |||||||
3.50%, 2/20/47 | 7,512,023 | 7,844,635 | |||||||
4.00%, 6/20/47 | 12,829,031 | 13,590,344 | |||||||
4.50%, 7/20/47 | 4,238,008 | 4,525,038 | |||||||
266,381,445 | |||||||||
U.S. Government Securities - 17.1% | |||||||||
U.S. Treasury Bonds | 2.88 | 8/15/45 | 115,000 | 118,481 | |||||
U.S. Treasury Bonds | 2.50 | 5/15/46 | 2,340,000 | 2,231,776 | |||||
U.S. Treasury Bonds | 2.25 | 8/15/46 | 5,500,000 | b | 4,965,256 | ||||
U.S. Treasury Bonds | 3.00 | 2/15/47 | 15,800,000 | b | 16,676,407 | ||||
U.S. Treasury Inflation Protected Securities, | 1.00 | 2/15/46 | 9,691,688 | e | 9,985,178 | ||||
U.S. Treasury Inflation Protected Securities, | 0.13 | 4/15/20 | 4,916,106 | e | 4,942,062 | ||||
U.S. Treasury Inflation Protected Securities, | 0.63 | 7/15/21 | 14,410,968 | e | 14,848,711 | ||||
U.S. Treasury Inflation Protected Securities, | 0.13 | 1/15/22 | 11,774,771 | e | 11,850,122 | ||||
U.S. Treasury Inflation Protected Securities, | 0.38 | 7/15/25 | 12,611,831 | b,e | 12,726,328 | ||||
U.S. Treasury Inflation Protected Securities, | 0.38 | 1/15/27 | 5,070,150 | b,e | 5,067,584 | ||||
U.S. Treasury Notes | 1.13 | 1/15/19 | 18,440,000 | b | 18,403,985 | ||||
U.S. Treasury Notes | 1.13 | 2/28/19 | 13,750,000 | 13,718,579 | |||||
U.S. Treasury Notes | 1.38 | 2/15/20 | 14,500,000 | b | 14,501,982 | ||||
U.S. Treasury Notes | 1.50 | 4/15/20 | 4,000,000 | 4,011,562 | |||||
U.S. Treasury Notes | 1.50 | 7/15/20 | 7,750,000 | 7,767,558 | |||||
U.S. Treasury Notes | 1.13 | 2/28/21 | 13,080,000 | 12,901,938 | |||||
U.S. Treasury Notes | 2.13 | 9/30/21 | 13,750,000 | 14,026,880 | |||||
U.S. Treasury Notes | 1.88 | 4/30/22 | 2,000,000 | 2,016,133 | |||||
U.S. Treasury Notes | 2.38 | 5/15/27 | 1,605,000 | 1,640,109 | |||||
172,400,631 | |||||||||
Utilities - 1.0% | |||||||||
Consumers Energy, | 3.25 | 8/15/46 | 2,720,000 | 2,569,252 | |||||
Exelon, | 3.40 | 4/15/26 | 4,400,000 | 4,479,339 | |||||
Public Service Enterprise Group, | 1.60 | 11/15/19 | 2,670,000 | 2,650,125 | |||||
9,698,716 | |||||||||
Total Bonds and Notes | 995,821,509 | ||||||||
17
STATEMENT OF INVESTMENTS (continued)
BNY Mellon Bond Fund (continued) | |||||||||
Description | Shares | Value ($) | |||||||
Other Investment - 1.3% | |||||||||
Registered Investment Company; | |||||||||
Dreyfus Institutional Preferred Government Plus Money Market Fund | 12,777,129 | f | 12,777,129 | ||||||
Investment of Cash Collateral for Securities Loaned - .1% | |||||||||
Registered Investment Company; | |||||||||
Dreyfus Institutional Preferred Government Money Market Fund, Institutional Shares | 1,199,000 | f | 1,199,000 | ||||||
Total Investments (cost $983,828,073) | 99.9% | 1,009,797,638 | |||||||
Cash and Receivables (Net) | 0.1% | 1,105,161 | |||||||
Net Assets | 100.0% | 1,010,902,799 | |||||||
GO—General Obligation
LIBOR—London Interbank Offered Rate
a Security exempt from registration pursuant to Rule 144A under the Securities Act of 1933. These securities may be resold in transactions exempt from registration, normally to qualified institutional buyers. At August 31, 2017, these securities were valued at $29,698,068 or 2.94% of net assets.
b Security, or portion thereof, on loan. At August 31, 2017, the value of the fund’s securities on loan was $42,740,647 and the value of the collateral held by the fund was $43,787,537, consisting of cash collateral of $1,199,000 and U.S. Government & Agency securities valued at $42,588,537.
c Variable rate security—rate shown is the interest rate in effect at period end.
d The Federal Housing Finance Agency (“FHFA”) placed the Federal Home Loan Mortgage Corporation and Federal National Mortgage Association into conservatorship with FHFA as the conservator. As such, the FHFA oversees the continuing affairs of these companies.
e Principal amount for accrual purposes is periodically adjusted based on changes in the Consumer Price Index.
f Investment in affiliated money market mutual fund.
Portfolio Summary (Unaudited) † | Value (%) |
Corporate Bonds | 44.3 |
U.S. Government Agencies/Mortgage-Backed | 26.8 |
U.S. Government Securities | 17.1 |
Municipal Bonds | 7.3 |
Foreign/Governmental | 1.6 |
Money Market Investments | 1.4 |
Commercial Mortgage-Backed | 1.4 |
99.9 |
† Based on net assets.
See notes to financial statements.
18
BNY Mellon Intermediate Bond Fund | |||||||||
Description | Coupon | Maturity | Principal | Value ($) | |||||
Bonds and Notes - 98.3% | |||||||||
Consumer Discretionary - 6.0% | |||||||||
American Honda Finance, | 1.70 | 9/9/21 | 4,260,000 | 4,207,397 | |||||
BMW US Capital, | 1.68 | 4/6/20 | 2,000,000 | a,b | 2,011,164 | ||||
General Motors Financial, | 3.20 | 7/6/21 | 2,805,000 | 2,856,951 | |||||
Grupo Televisa, | 6.00 | 5/15/18 | 6,120,000 | 6,301,590 | |||||
NBCUniversal Media, | 4.38 | 4/1/21 | 7,050,000 | 7,633,584 | |||||
Stanford University, | 4.75 | 5/1/19 | 5,000,000 | 5,260,419 | |||||
Time Warner, | 4.00 | 1/15/22 | 7,400,000 | 7,834,271 | |||||
Toyota Motor Credit, | 2.15 | 3/12/20 | 5,960,000 | 6,022,747 | |||||
Wal-Mart Stores, | 3.25 | 10/25/20 | 7,925,000 | 8,302,592 | |||||
50,430,715 | |||||||||
Consumer Staples - 3.1% | |||||||||
Anheuser-Busch InBev Finance, | 2.65 | 2/1/21 | 6,635,000 | 6,765,167 | |||||
BAT Capital, | 3.56 | 8/15/27 | 4,425,000 | b | 4,497,258 | ||||
CVS Health, | 2.80 | 7/20/20 | 4,340,000 | 4,436,203 | |||||
Dr. Pepper Snapple Group, | 2.60 | 1/15/19 | 6,145,000 | 6,203,555 | |||||
Kroger, | 2.30 | 1/15/19 | 4,570,000 | 4,595,202 | |||||
26,497,385 | |||||||||
Energy - 2.6% | |||||||||
BP Capital Markets, | 4.75 | 3/10/19 | 5,813,000 | 6,081,730 | |||||
Enterprise Products Operating, | 2.55 | 10/15/19 | 3,330,000 | 3,359,598 | |||||
Noble Energy, | 3.85 | 1/15/28 | 3,575,000 | 3,592,318 | |||||
ONEOK, | 4.00 | 7/13/27 | 3,400,000 | 3,446,450 | |||||
Sabine Pass Liquefaction, | 5.75 | 5/15/24 | 2,500,000 | 2,784,117 | |||||
Spectra Energy Partners, | 3.50 | 3/15/25 | 2,760,000 | 2,814,118 | |||||
22,078,331 | |||||||||
Financials - 17.5% | |||||||||
AerCap Ireland Capital, | 4.50 | 5/15/21 | 4,435,000 | 4,717,707 | |||||
American Express Credit, | 1.80 | 7/31/18 | 6,735,000 | 6,745,301 | |||||
Bank of America, | 2.60 | 1/15/19 | 7,325,000 | 7,400,274 | |||||
Bank of America, | 3.95 | 4/21/25 | 7,175,000 | 7,416,760 | |||||
Bank of Montreal, | 2.10 | 12/12/19 | 8,250,000 | 8,309,538 | |||||
Berkshire Hathaway Finance, | 1.70 | 3/15/19 | 3,225,000 | 3,234,923 | |||||
Citigroup, | 2.50 | 7/29/19 | 5,565,000 | 5,626,361 | |||||
Citigroup, | 4.40 | 6/10/25 | 5,500,000 | 5,821,942 | |||||
Citizens Financial Group, | 4.30 | 12/3/25 | 6,885,000 | 7,304,181 | |||||
Cooperatieve Rabobank, | 3.75 | 7/21/26 | 6,785,000 | 6,941,587 | |||||
19
STATEMENT OF INVESTMENTS (continued)
BNY Mellon Intermediate Bond Fund (continued) | |||||||||
Description | Coupon | Maturity | Principal | Value ($) | |||||
Bonds and Notes - 98.3% (continued) | |||||||||
Financials - 17.5% (continued) | |||||||||
Credit Suisse Group Funding Guernsey, | 3.45 | 4/16/21 | 4,315,000 | 4,457,004 | |||||
Deutsche Bank, | 3.38 | 5/12/21 | 4,420,000 | 4,526,787 | |||||
Fidelity National Information Services, | 3.88 | 6/5/24 | 1,481,000 | 1,568,545 | |||||
Ford Motor Credit, | 3.81 | 1/9/24 | 4,270,000 | 4,366,542 | |||||
GE Capital International Funding, | 2.34 | 11/15/20 | 2,293,000 | 2,322,148 | |||||
Goldman Sachs Group, | 2.63 | 1/31/19 | 7,790,000 | 7,873,160 | |||||
HSBC Finance, | 6.68 | 1/15/21 | 9,502,000 | 10,831,916 | |||||
Intercontinental Exchange, | 2.75 | 12/1/20 | 6,195,000 | 6,370,467 | |||||
JPMorgan Chase & Co., | 3.38 | 5/1/23 | 7,895,000 | 8,111,389 | |||||
Morgan Stanley, | 4.88 | 11/1/22 | 7,610,000 | 8,297,310 | |||||
Royal Bank of Canada, | 4.65 | 1/27/26 | 6,510,000 | 7,054,757 | |||||
Santander Holdings USA, | 2.65 | 4/17/20 | 4,615,000 | 4,637,711 | |||||
Societe Generale, | 2.63 | 10/1/18 | 2,000,000 | 2,020,864 | |||||
Societe Generale, | 4.75 | 11/24/25 | 7,335,000 | b,c | 7,816,459 | ||||
Sumitomo Mitsui Banking, | 1.76 | 10/19/18 | 4,725,000 | 4,727,769 | |||||
148,501,402 | |||||||||
Foreign/Governmental - 1.6% | |||||||||
Petroleos Mexicanos, | 4.88 | 1/24/22 | 6,390,000 | 6,750,396 | |||||
Province of Ontario Canada, | 4.00 | 10/7/19 | 6,515,000 | 6,820,196 | |||||
13,570,592 | |||||||||
Health Care - 4.2% | |||||||||
Abbott Laboratories, | 2.35 | 11/22/19 | 3,925,000 | 3,961,686 | |||||
Abbvie, | 2.85 | 5/14/23 | 4,235,000 | 4,282,581 | |||||
Actavis Funding, | 3.45 | 3/15/22 | 4,560,000 | 4,742,415 | |||||
Amgen, | 5.70 | 2/1/19 | 2,905,000 | 3,065,755 | |||||
GlaxoSmithKline Capital, | 5.65 | 5/15/18 | 5,853,000 | 6,025,400 | |||||
Providence St Joseph Health Obligated Group, | 2.75 | 10/1/26 | 4,095,000 | 4,004,417 | |||||
Shire Acquisitions Investments Ireland, | 3.20 | 9/23/26 | 5,005,000 | 4,935,279 | |||||
UnitedHealth Group, | 1.90 | 7/16/18 | 4,335,000 | 4,348,555 | |||||
35,366,088 | |||||||||
Industrials - 3.9% | |||||||||
American Airlines, | 3.38 | 11/1/28 | 4,248,447 | 4,346,671 | |||||
Caterpillar Financial Services, | 2.10 | 6/9/19 | 6,590,000 | 6,640,415 | |||||
General Electric, | 5.00 | 12/29/49 | 3,884,000 | a | 4,107,330 | ||||
General Electric, | 5.30 | 2/11/21 | 792,000 | 878,205 | |||||
John Deere Capital, | 1.95 | 1/8/19 | 4,915,000 | 4,944,436 | |||||
Snap-on, | 3.25 | 3/1/27 | 3,890,000 | 4,010,010 | |||||
20
BNY Mellon Intermediate Bond Fund (continued) | |||||||||
Description | Coupon | Maturity | Principal | Value ($) | |||||
Bonds and Notes - 98.3% (continued) | |||||||||
Industrials - 3.9% (continued) | |||||||||
Vulcan Materials, | 1.92 | 6/15/20 | 3,600,000 | a | 3,599,584 | ||||
Waste Management, | 3.13 | 3/1/25 | 4,775,000 | 4,892,602 | |||||
33,419,253 | |||||||||
Information Technology - 9.7% | |||||||||
Adobe Systems, | 4.75 | 2/1/20 | 6,414,000 | 6,876,044 | |||||
Amazon.com, | 2.60 | 12/5/19 | 6,345,000 | 6,472,064 | |||||
Apple, | 2.25 | 2/23/21 | 5,915,000 | 5,984,479 | |||||
Automatic Data Processing, | 2.25 | 9/15/20 | 4,135,000 | 4,193,274 | |||||
Cisco Systems, | 2.13 | 3/1/19 | 7,265,000 | 7,325,882 | |||||
Dell International, | 6.02 | 6/15/26 | 4,850,000 | b | 5,423,351 | ||||
eBay, | 2.15 | 6/5/20 | 3,855,000 | 3,871,866 | |||||
EMC, | 1.88 | 6/1/18 | 5,710,000 | 5,690,420 | |||||
Fiserv, | 3.85 | 6/1/25 | 6,035,000 | 6,348,622 | |||||
Intel, | 2.45 | 7/29/20 | 7,930,000 | 8,109,621 | |||||
Microsoft, | 3.13 | 11/3/25 | 6,550,000 | 6,783,177 | |||||
Oracle, | 2.50 | 5/15/22 | 7,000,000 | 7,110,620 | |||||
QUALCOMM, | 1.85 | 5/20/19 | 5,340,000 | 5,364,355 | |||||
Seagate HDD Cayman, | 4.75 | 1/1/25 | 2,390,000 | 2,330,237 | |||||
81,884,012 | |||||||||
Materials - .5% | |||||||||
Dow Chemical, | 4.25 | 11/15/20 | 4,053,000 | 4,306,579 | |||||
Municipal Bonds - 5.1% | |||||||||
California Earthquake Authority, | 2.81 | 7/1/19 | 4,032,000 | 4,066,877 | |||||
Chicago, | 7.05 | 1/1/29 | 4,000,000 | 4,448,280 | |||||
Florida Hurricane Catastrophe Fund Finance Corporation, | 3.00 | 7/1/20 | 7,375,000 | 7,584,303 | |||||
Massachusetts, | 4.20 | 12/1/21 | 6,495,000 | 6,983,359 | |||||
South Carolina Public Service Authority, | 2.39 | 12/1/23 | 3,380,000 | 3,191,903 | |||||
State of California, | 2.37 | 4/1/22 | 2,850,000 | 2,889,330 | |||||
Texas Public Finance Authority, | 8.25 | 7/1/24 | 4,305,000 | 4,559,813 | |||||
University of California, | 3.06 | 7/1/25 | 9,140,000 | 9,432,846 | |||||
43,156,711 | |||||||||
Real Estate - 1.1% | |||||||||
Boston Properties, | 3.70 | 11/15/18 | 3,473,000 | 3,538,971 | |||||
UDR, | 2.95 | 9/1/26 | 3,620,000 | 3,504,092 | |||||
Weingarten Realty Investors, | 3.25 | 8/15/26 | 2,135,000 | 2,077,050 | |||||
9,120,113 | |||||||||
Telecommunications - 2.9% | |||||||||
AT&T, | 4.45 | 5/15/21 | 6,960,000 | 7,456,150 | |||||
21
STATEMENT OF INVESTMENTS (continued)
BNY Mellon Intermediate Bond Fund (continued) | |||||||||
Description | Coupon | Maturity | Principal | Value ($) | |||||
Bonds and Notes - 98.3% (continued) | |||||||||
Telecommunications - 2.9% (continued) | |||||||||
Telefonica Emisiones, | 4.57 | 4/27/23 | 4,460,000 | 4,913,702 | |||||
Verizon Communications, | 5.15 | 9/15/23 | 10,515,000 | 11,765,841 | |||||
24,135,693 | |||||||||
U.S. Government Agencies - .4% | |||||||||
Federal National Mortgage Association, | 2.00 | 4/30/20 | 3,610,000 | d | 3,652,331 | ||||
U.S. Government Agencies Mortgage-Backed - .4% | |||||||||
Government National Mortgage Association, | 2.30 | 1/16/49 | 3,359,962 | 3,327,297 | |||||
U.S. Government Securities - 37.9% | |||||||||
U.S. Treasury Inflation Protected Securities, | 0.13 | 4/15/20 | 4,204,839 | c,e | 4,227,040 | ||||
U.S. Treasury Inflation Protected Securities, | 0.63 | 7/15/21 | 11,835,252 | e | 12,194,756 | ||||
U.S. Treasury Inflation Protected Securities, | 0.13 | 1/15/22 | 10,037,776 | e | 10,102,011 | ||||
U.S. Treasury Inflation Protected Securities, | 0.38 | 1/15/27 | 13,141,829 | e | 13,135,176 | ||||
U.S. Treasury Notes | 2.63 | 1/31/18 | 12,000,000 | 12,074,126 | |||||
U.S. Treasury Notes | 1.00 | 5/31/18 | 15,000,000 | 14,975,684 | |||||
U.S. Treasury Notes | 1.38 | 9/30/18 | 22,000,000 | c | 22,028,360 | ||||
U.S. Treasury Notes | 1.38 | 11/30/18 | 22,000,000 | 22,030,078 | |||||
U.S. Treasury Notes | 1.13 | 1/31/19 | 20,900,000 | 20,853,057 | |||||
U.S. Treasury Notes | 1.25 | 3/31/19 | 21,500,000 | 21,481,944 | |||||
U.S. Treasury Notes | 0.88 | 5/15/19 | 23,000,000 | 22,833,788 | |||||
U.S. Treasury Notes | 0.88 | 6/15/19 | 13,500,000 | c | 13,397,431 | ||||
U.S. Treasury Notes | 1.38 | 7/31/19 | 14,750,000 | 14,765,269 | |||||
U.S. Treasury Notes | 0.75 | 8/15/19 | 21,500,000 | 21,263,584 | |||||
U.S. Treasury Notes | 1.75 | 9/30/19 | 18,500,000 | 18,653,204 | |||||
U.S. Treasury Notes | 1.50 | 7/15/20 | 4,500,000 | 4,510,195 | |||||
U.S. Treasury Notes | 2.00 | 11/30/20 | 5,955,000 | 6,051,304 | |||||
U.S. Treasury Notes | 1.13 | 2/28/21 | 9,680,000 | 9,548,223 | |||||
U.S. Treasury Notes | 1.13 | 6/30/21 | 8,990,000 | 8,838,469 | |||||
U.S. Treasury Notes | 1.88 | 1/31/22 | 10,250,000 | 10,343,491 | |||||
U.S. Treasury Notes | 1.88 | 2/28/22 | 7,200,000 | 7,265,390 | |||||
U.S. Treasury Notes | 2.00 | 7/31/22 | 3,340,000 | 3,384,098 | |||||
U.S. Treasury Notes | 1.75 | 9/30/22 | 11,400,000 | 11,407,125 | |||||
U.S. Treasury Notes | 1.38 | 8/31/23 | 4,000,000 | 3,892,502 | |||||
U.S. Treasury Notes | 2.25 | 11/15/24 | 7,750,000 | 7,898,340 | |||||
U.S. Treasury Notes | 1.63 | 5/15/26 | 4,000,000 | 3,855,469 | |||||
321,010,114 | |||||||||
Utilities - 1.4% | |||||||||
Edison International, | 2.40 | 9/15/22 | 3,035,000 | 3,047,630 | |||||
NiSource Finance, | 3.49 | 5/15/27 | 3,600,000 | 3,694,616 | |||||
Southern, | 1.55 | 7/1/18 | 4,990,000 | 4,983,796 | |||||
11,726,042 | |||||||||
Total Bonds and Notes | 832,182,658 | ||||||||
Description | Shares | Value ($) | |||||||
Other Investment - 1.1% | |||||||||
Registered Investment Company; | |||||||||
Dreyfus Institutional Preferred Government Plus Money Market Fund | 9,460,867 | f | 9,460,867 | ||||||
22
BNY Mellon Intermediate Bond Fund (continued) | |||||||||
Description | Shares | Value ($) | |||||||
Investment of Cash Collateral for Securities Loaned - .4% | |||||||||
Registered Investment Company; | |||||||||
Dreyfus Institutional Preferred Government Money Market Fund, Institutional Shares | 3,164,700 | f | 3,164,700 | ||||||
Total Investments (cost $831,608,037) | 99.8% | 844,808,225 | |||||||
Cash and Receivables (Net) | 0.2% | 1,495,873 | |||||||
Net Assets | 100.0% | 846,304,098 | |||||||
GO—General Obligation
LIBOR—London Interbank Offered Rate
a Variable rate security—rate shown is the interest rate in effect at period end.
b Security exempt from registration pursuant to Rule 144A under the Securities Act of 1933. These securities may be resold in transactions exempt from registration, normally to qualified institutional buyers. At August 31, 2017, these securities were valued at $19,748,232 or 2.33% of net assets.
c Security, or portion thereof, on loan. At August 31, 2017, the value of the fund’s securities on loan was $15,659,277 and the value of the collateral held by the fund was $16,174,050, consisting of cash collateral of $3,164,700 and U.S. Government & Agency securities valued at $13,009,350.
d The Federal Housing Finance Agency (“FHFA”) placed the Federal Home Loan Mortgage Corporation and Federal National Mortgage Association into conservatorship with FHFA as the conservator. As such, the FHFA oversees the continuing affairs of these companies.
e Principal amount for accrual purposes is periodically adjusted based on changes in the Consumer Price Index.
f Investment in affiliated money market mutual fund.
Portfolio Summary (Unaudited) † | Value (%) |
Corporate Bonds | 52.9 |
U.S. Government Securities | 37.9 |
Municipal Bonds | 5.1 |
Foreign/Governmental | 1.6 |
Money Market Investments | 1.5 |
U.S. Government Agencies/Mortgage-Backed | .8 |
99.8 |
† Based on net assets.
See notes to financial statements.
23
STATEMENT OF INVESTMENTS (continued)
BNY Mellon Corporate Bond Fund | |||||||||
Description | Coupon | Maturity | Principal | Value ($) | |||||
Bonds and Notes - 97.8% | |||||||||
Consumer Discretionary - 11.7% | |||||||||
BorgWarner, | 4.63 | 9/15/20 | 3,000,000 | 3,207,840 | |||||
Brinker International, | 3.88 | 5/15/23 | 2,000,000 | 1,952,500 | |||||
Coach, | 3.00 | 7/15/22 | 3,000,000 | 3,001,234 | |||||
Daimler Finance North America, | 2.25 | 7/31/19 | 4,000,000 | a,b | 4,020,837 | ||||
Ford Motor Credit, | 4.39 | 1/8/26 | 3,750,000 | 3,896,686 | |||||
General Motors Financial, | 3.95 | 4/13/24 | 2,000,000 | 2,050,693 | |||||
General Motors Financial, | 4.00 | 1/15/25 | 2,000,000 | 2,029,092 | |||||
Grupo Televisa, | 6.00 | 5/15/18 | 5,000,000 | 5,148,358 | |||||
Grupo Televisa, | 4.63 | 1/30/26 | 2,000,000 | 2,166,031 | |||||
Harley-Davidson Financial Services, | 2.15 | 2/26/20 | 5,000,000 | a,b | 5,004,797 | ||||
Hasbro, | 3.15 | 5/15/21 | 6,000,000 | 6,175,927 | |||||
Macy's Retail Holdings, | 3.63 | 6/1/24 | 3,000,000 | b | 2,854,698 | ||||
Marriott International, | 2.88 | 3/1/21 | 3,000,000 | 3,057,076 | |||||
NBCUniversal Media, | 4.38 | 4/1/21 | 5,000,000 | 5,413,889 | |||||
Newell Brands, | 4.20 | 4/1/26 | 2,500,000 | 2,668,102 | |||||
Nordstorm, | 4.00 | 3/15/27 | 4,000,000 | 4,007,726 | |||||
NVR, | 3.95 | 9/15/22 | 6,750,000 | 7,128,459 | |||||
Scripps Networks Interactive, | 2.80 | 6/15/20 | 5,500,000 | 5,544,281 | |||||
Sky, | 2.63 | 9/16/19 | 4,000,000 | a | 4,041,811 | ||||
Thomson Reuters, | 4.70 | 10/15/19 | 5,000,000 | 5,268,751 | |||||
Time Warner, | 4.00 | 1/15/22 | 2,000,000 | 2,117,370 | |||||
Time Warner, | 3.80 | 2/15/27 | 3,000,000 | 3,026,150 | |||||
Volkswagen Group of America Finance, | 2.13 | 5/23/19 | 5,000,000 | a | 5,010,964 | ||||
Wyndham Worldwide, | 5.10 | 10/1/25 | 3,000,000 | 3,178,561 | |||||
91,971,833 | |||||||||
Consumer Staples - 4.4% | |||||||||
Alimentation Couche-Tard, | 3.55 | 7/26/27 | 3,000,000 | a | 3,041,503 | ||||
Anheuser-Busch InBev Finance, | 3.65 | 2/1/26 | 4,000,000 | 4,174,592 | |||||
BAT Capital, | 3.56 | 8/15/27 | 5,000,000 | a | 5,081,648 | ||||
Becle, | 3.75 | 5/13/25 | 6,000,000 | a | 6,119,902 | ||||
Flowers Foods, | 4.38 | 4/1/22 | 5,500,000 | b | 5,906,470 | ||||
Flowers Foods, | 3.50 | 10/1/26 | 2,000,000 | 2,000,631 | |||||
Grupo Bimbo, | 3.88 | 6/27/24 | 3,000,000 | a | 3,141,068 | ||||
Kraft Heinz Foods, | 4.88 | 2/15/25 | 3,000,000 | a | 3,224,840 | ||||
24
BNY Mellon Corporate Bond Fund (continued) | |||||||||
Description | Coupon | Maturity | Principal | Value ($) | |||||
Bonds and Notes - 97.8% (continued) | |||||||||
Consumer Staples - 4.4% (continued) | |||||||||
McCormick & Co., | 3.15 | 8/15/24 | 2,000,000 | 2,039,553 | |||||
34,730,207 | |||||||||
Energy - 8.3% | |||||||||
Anadarko Petroleum, | 5.55 | 3/15/26 | 2,750,000 | b | 3,074,866 | ||||
Andeavor, | 4.75 | 12/15/23 | 4,000,000 | a | 4,301,745 | ||||
Antero Resources, | 5.13 | 12/1/22 | 3,000,000 | 3,022,500 | |||||
Boardwalk Pipelines, | 4.95 | 12/15/24 | 2,500,000 | 2,666,389 | |||||
Continental Resources, | 5.00 | 9/15/22 | 3,750,000 | 3,782,813 | |||||
Enbridge, | 4.25 | 12/1/26 | 4,000,000 | 4,220,814 | |||||
EQT Midstream Partners, | 4.13 | 12/1/26 | 3,000,000 | 3,046,694 | |||||
Marathon Oil, | 2.80 | 11/1/22 | 5,000,000 | 4,893,920 | |||||
Newfield Exploration, | 5.63 | 7/1/24 | 1,500,000 | 1,603,050 | |||||
Newfield Exploration, | 5.38 | 1/1/26 | 2,000,000 | 2,100,000 | |||||
Noble Energy, | 3.90 | 11/15/24 | 3,000,000 | 3,081,555 | |||||
Petrobras Global Finance, | 5.38 | 1/27/21 | 7,500,000 | 7,792,500 | |||||
Pioneer Natural Resources, | 3.95 | 7/15/22 | 5,855,000 | 6,183,902 | |||||
Regency Energy Partners, | 5.88 | 3/1/22 | 2,500,000 | 2,774,490 | |||||
Sabine Pass Liquefaction, | 4.20 | 3/15/28 | 6,000,000 | 6,035,929 | |||||
Sunoco Logistics Partners Operations, | 3.45 | 1/15/23 | 3,100,000 | 3,126,270 | |||||
Valero Energy Partners, | 4.38 | 12/15/26 | 1,000,000 | 1,036,012 | |||||
Williams Partners, | 3.75 | 6/15/27 | 3,000,000 | 3,007,733 | |||||
65,751,182 | |||||||||
Financials - 26.9% | |||||||||
Apollo Management Holdings, | 4.00 | 5/30/24 | 7,000,000 | a | 7,226,019 | ||||
Assured Guaranty U.S. Holdings, | 5.00 | 7/1/24 | 7,000,000 | b | 7,692,112 | ||||
BAC Capital Trust XIV, | 4.00 | 3/15/43 | 3,000,000 | c | 2,658,750 | ||||
Bank of America, | 4.20 | 8/26/24 | 5,000,000 | 5,270,479 | |||||
Barclays, | 5.20 | 5/12/26 | 7,000,000 | 7,499,772 | |||||
BBVA Bancomer, | 4.38 | 4/10/24 | 5,000,000 | a | 5,262,500 | ||||
Blackstone Holdings Finance, | 6.63 | 8/15/19 | 2,000,000 | a | 2,174,361 | ||||
Blackstone Holdings Finance, | 4.75 | 2/15/23 | 3,000,000 | a | 3,328,351 | ||||
BNP Paribas, | 4.38 | 5/12/26 | 5,000,000 | a | 5,223,800 | ||||
Carlyle Holdings Finance, | 3.88 | 2/1/23 | 5,921,000 | a | 6,146,309 | ||||
Citigroup, | 5.95 | 12/31/49 | 5,000,000 | c | 5,287,500 | ||||
Citigroup, | 4.40 | 6/10/25 | 4,000,000 | 4,234,140 | |||||
Citizens Financial Group, | 3.75 | 7/1/24 | 6,000,000 | 6,085,925 | |||||
25
STATEMENT OF INVESTMENTS (continued)
BNY Mellon Corporate Bond Fund (continued) | |||||||||
Description | Coupon | Maturity | Principal | Value ($) | |||||
Bonds and Notes - 97.8% (continued) | |||||||||
Financials - 26.9% (continued) | |||||||||
Cooperatieve Rabobank, | 4.38 | 8/4/25 | 5,500,000 | 5,848,632 | |||||
Credit Suisse Group Funding Guernsey, | 3.80 | 9/15/22 | 7,000,000 | 7,326,145 | |||||
Deutsche Bank, | 4.50 | 4/1/25 | 9,000,000 | b | 9,101,988 | ||||
E*Trade Financial, | 3.80 | 8/24/27 | 2,000,000 | 2,034,852 | |||||
Five Corners Funding Trust, | 4.42 | 11/15/23 | 6,500,000 | a | 7,104,837 | ||||
Goldman Sachs Group, | 6.15 | 4/1/18 | 2,000,000 | 2,050,446 | |||||
Goldman Sachs Group, | 4.25 | 10/21/25 | 6,000,000 | 6,295,003 | |||||
HSBC Finance, | 6.68 | 1/15/21 | 7,000,000 | 7,979,732 | |||||
International Lease Finance, | 5.88 | 8/15/22 | 7,000,000 | 7,933,477 | |||||
JPMorgan Chase & Co., | 3.38 | 5/1/23 | 4,500,000 | 4,623,338 | |||||
JPMorgan Chase & Co., | 3.63 | 12/1/27 | 2,500,000 | 2,529,316 | |||||
Legg Mason, | 4.75 | 3/15/26 | 6,000,000 | 6,480,815 | |||||
Lloyds Banking Group, | 4.65 | 3/24/26 | 7,000,000 | 7,453,494 | |||||
Moody's, | 2.75 | 7/15/19 | 2,000,000 | 2,031,784 | |||||
Moody's, | 4.50 | 9/1/22 | 5,000,000 | 5,436,978 | |||||
Morgan Stanley, | 4.88 | 11/1/22 | 7,000,000 | 7,632,217 | |||||
Nasdaq, | 3.85 | 6/30/26 | 2,000,000 | 2,081,845 | |||||
Nuveen Finance, | 2.95 | 11/1/19 | 5,000,000 | a | 5,087,082 | ||||
Royal Bank of Canada, | 4.65 | 1/27/26 | 6,000,000 | 6,502,080 | |||||
Royal Bank of Scotland Group, | 8.63 | 12/29/49 | 3,000,000 | 3,330,000 | |||||
Royal Bank of Scotland Group, | 6.13 | 12/15/22 | 5,000,000 | 5,512,516 | |||||
Santander Holdings USA, | 3.70 | 3/28/22 | 5,000,000 | a | 5,103,797 | ||||
Santander UK Group Holdings, | 2.88 | 8/5/21 | 2,500,000 | 2,522,330 | |||||
Societe Generale, | 4.75 | 11/24/25 | 7,250,000 | a,b | 7,725,880 | ||||
Stifel Financial, | 4.25 | 7/18/24 | 7,000,000 | 7,232,321 | |||||
Toronto-Dominion Bank, | 3.63 | 9/15/31 | 1,500,000 | 1,504,671 | |||||
Westpac Banking, | 4.32 | 11/23/31 | 5,000,000 | 5,204,422 | |||||
211,760,016 | |||||||||
Foreign/Governmental - 2.3% | |||||||||
Bermuda Government, | 5.60 | 7/20/20 | 6,102,000 | a | 6,655,634 | ||||
Petroleos Mexicanos, | 5.50 | 1/21/21 | 3,000,000 | 3,219,750 | |||||
Petroleos Mexicanos, | 4.63 | 9/21/23 | 5,000,000 | 5,217,500 | |||||
Saudi Arabian Government, | 2.38 | 10/26/21 | 2,700,000 | a | 2,676,240 | ||||
17,769,124 | |||||||||
Health Care - 4.1% | |||||||||
AbbVie, | 3.60 | 5/14/25 | 5,000,000 | 5,176,760 | |||||
26
BNY Mellon Corporate Bond Fund (continued) | |||||||||
Description | Coupon | Maturity | Principal | Value ($) | |||||
Bonds and Notes - 97.8% (continued) | |||||||||
Health Care - 4.1% (continued) | |||||||||
Aetna, | 2.20 | 3/15/19 | 4,000,000 | 4,025,133 | |||||
Amgen, | 3.88 | 11/15/21 | 3,500,000 | 3,713,823 | |||||
Dignity Health, | 3.13 | 11/1/22 | 5,000,000 | 5,063,040 | |||||
Express Scripts Holdings, | 3.00 | 7/15/23 | 3,000,000 | 3,024,642 | |||||
Teva Pharmaceutical Finance IV, | 2.25 | 3/18/20 | 4,000,000 | b | 3,916,939 | ||||
Teva Pharmaceutical Finance Netherlands III, | 3.15 | 10/1/26 | 5,000,000 | b | 4,584,196 | ||||
UnitedHealth Group, | 2.88 | 3/15/22 | 3,000,000 | 3,080,865 | |||||
32,585,398 | |||||||||
Industrials - 5.6% | |||||||||
Air Canada Pass Through Trust, | 3.60 | 9/15/28 | 2,808,357 | a | 2,864,524 | ||||
American Airlines Pass Through Trust, | 3.38 | 11/1/28 | 4,067,662 | 4,161,707 | |||||
CRH America Finance, | 3.40 | 5/9/27 | 1,000,000 | a | 1,023,096 | ||||
GATX, | 4.75 | 6/15/22 | 3,000,000 | 3,280,589 | |||||
GATX, | 3.25 | 3/30/25 | 2,000,000 | 2,006,803 | |||||
General Electric, | 5.00 | 12/31/49 | 6,838,000 | c | 7,231,185 | ||||
Pentair Finance, | 2.65 | 12/1/19 | 4,500,000 | 4,538,733 | |||||
Stanley Black & Decker, | 1.62 | 11/17/18 | 3,000,000 | 2,997,082 | |||||
Tech Data, | 4.95 | 2/15/27 | 6,250,000 | b | 6,727,899 | ||||
United Airlines Pass Through Trust, | 3.10 | 4/7/30 | 5,000,000 | 4,962,500 | |||||
Waste Management, | 4.75 | 6/30/20 | 3,853,000 | 4,152,382 | |||||
43,946,500 | |||||||||
Information Technology - 11.3% | |||||||||
Arrow Electronics, | 5.13 | 3/1/21 | 3,000,000 | 3,241,434 | |||||
Arrow Electronics, | 3.50 | 4/1/22 | 2,000,000 | 2,061,778 | |||||
Arrow Electronics, | 4.00 | 4/1/25 | 3,000,000 | 3,100,218 | |||||
Avnet, | 4.88 | 12/1/22 | 3,000,000 | 3,211,816 | |||||
Broadridge Financial Solutions, | 3.95 | 9/1/20 | 4,850,000 | 5,113,272 | |||||
CA, | 3.60 | 8/1/20 | 5,000,000 | 5,163,542 | |||||
Cadence Design Systems, | 4.38 | 10/15/24 | 5,250,000 | 5,515,666 | |||||
Dell International, | 7.13 | 6/15/24 | 1,500,000 | a,b | 1,662,345 | ||||
Dell International, | 6.02 | 6/15/26 | 1,750,000 | a | 1,956,879 | ||||
Dell International, | 8.10 | 7/15/36 | 3,000,000 | a | 3,785,190 | ||||
eBay, | 2.60 | 7/15/22 | 2,000,000 | 2,006,368 | |||||
eBay , | 3.80 | 3/9/22 | 2,500,000 | 2,636,313 | |||||
Electronic Arts, | 4.80 | 3/1/26 | 3,000,000 | 3,354,991 | |||||
Fidelity National Information Services, | 3.50 | 4/15/23 | 1,055,000 | 1,100,676 | |||||
27
STATEMENT OF INVESTMENTS (continued)
BNY Mellon Corporate Bond Fund (continued) | |||||||||
Description | Coupon | Maturity | Principal | Value ($) | |||||
Bonds and Notes - 97.8% (continued) | |||||||||
Information Technology - 11.3% (continued) | |||||||||
Fiserv, | 3.50 | 10/1/22 | 6,500,000 | 6,744,940 | |||||
Flex , | 4.75 | 6/15/25 | 7,000,000 | 7,683,586 | |||||
Jabil, | 5.63 | 12/15/20 | 3,737,000 | 4,066,230 | |||||
Lam Research, | 3.80 | 3/15/25 | 8,000,000 | 8,370,303 | |||||
Maxim Integrated Products, | 2.50 | 11/15/18 | 5,000,000 | 5,039,832 | |||||
Seagate HDD Cayman, | 4.88 | 6/1/27 | 4,000,000 | 3,783,186 | |||||
Total System Services, | 4.80 | 4/1/26 | 7,500,000 | 8,340,748 | |||||
VMware, | 2.95 | 8/21/22 | 1,000,000 | 1,003,697 | |||||
88,943,010 | |||||||||
Materials - 5.3% | |||||||||
Allegheny Technologies, | 7.88 | 8/15/23 | 4,000,000 | b | 4,305,000 | ||||
CRH America, | 3.88 | 5/18/25 | 3,000,000 | a | 3,159,861 | ||||
Dow Chemical, | 4.13 | 11/15/21 | 5,500,000 | 5,881,493 | |||||
Georgia-Pacific, | 3.16 | 11/15/21 | 6,000,000 | a | 6,192,589 | ||||
Glencore Funding, | 4.63 | 4/29/24 | 3,000,000 | a | 3,193,851 | ||||
Glencore Funding, | 4.00 | 3/27/27 | 5,000,000 | a,b | 5,073,000 | ||||
International Paper, | 3.00 | 2/15/27 | 5,000,000 | 4,865,952 | |||||
Valmont Industries, | 6.63 | 4/20/20 | 1,667,000 | 1,840,487 | |||||
Vulcan Materials, | 7.50 | 6/15/21 | 5,846,000 | 6,903,693 | |||||
41,415,926 | |||||||||
Municipal Bonds - 6.2% | |||||||||
Chicago, | 7.05 | 1/1/29 | 4,000,000 | 4,448,280 | |||||
Illinois, | 5.88 | 3/1/19 | 2,205,000 | 2,296,309 | |||||
Illinois, | 6.20 | 7/1/21 | 880,000 | 933,662 | |||||
Las Vegas Valley Water District, | 7.10 | 6/1/39 | 5,000,000 | 5,438,500 | |||||
Massachusetts Development Finance Agency, | 2.96 | 1/1/19 | 4,000,000 | 4,008,760 | |||||
New Jersey Transportation Trust Fund Authority, | 1.76 | 12/15/18 | 5,000,000 | 5,002,350 | |||||
North Texas Tollway Authority, | 8.91 | 2/1/30 | 5,000,000 | 5,723,200 | |||||
Texas Public Finance Authority, | 8.25 | 7/1/24 | 7,500,000 | 7,943,925 | |||||
The Medical Center Hospital Authority, | 4.88 | 8/1/22 | 5,000,000 | 5,245,050 | |||||
Wayne County, | 4.25 | 12/1/18 | 2,155,000 | 2,171,464 | |||||
West Contra Costa Unified School District, | 8.46 | 8/1/34 | 5,000,000 | 5,621,600 | |||||
48,833,100 | |||||||||
Real Estate - 6.6% | |||||||||
Alexandria Real Estate Equities, | 4.30 | 1/15/26 | 2,000,000 | 2,130,672 | |||||
Alexandria Real Estate Equities, | 3.95 | 1/15/27 | 3,327,000 | 3,459,653 | |||||
CBRE Services, | 4.88 | 3/1/26 | 6,000,000 | 6,542,524 | |||||
28
BNY Mellon Corporate Bond Fund (continued) | |||||||||
Description | Coupon | Maturity | Principal | Value ($) | |||||
Bonds and Notes - 97.8% (continued) | |||||||||
Real Estate - 6.6% (continued) | |||||||||
CubeSmart, | 4.80 | 7/15/22 | 6,000,000 | 6,534,180 | |||||
DDR, | 3.90 | 8/15/24 | 2,000,000 | 2,027,571 | |||||
Duke Realty, | 3.25 | 6/30/26 | 1,000,000 | 1,005,194 | |||||
EPR Properties, | 4.75 | 12/15/26 | 2,500,000 | 2,603,097 | |||||
EPR Properties, | 4.50 | 6/1/27 | 2,000,000 | 2,036,055 | |||||
Essex Portfolio, | 3.25 | 5/1/23 | 2,500,000 | 2,540,850 | |||||
Healthcare Trust of America, | 3.75 | 7/1/27 | 4,000,000 | 4,052,652 | |||||
Kilroy Realty, | 4.38 | 10/1/25 | 5,000,000 | 5,319,037 | |||||
Liberty Property, | 3.25 | 10/1/26 | 4,000,000 | 3,966,506 | |||||
Retail Opportunity Investments Partnership, | 5.00 | 12/15/23 | 3,750,000 | 3,940,596 | |||||
Retail Opportunity Investments Partnership, | 4.00 | 12/15/24 | 3,000,000 | 2,939,051 | |||||
Weingarten Realty Investors, | 4.45 | 1/15/24 | 3,000,000 | 3,179,625 | |||||
52,277,263 | |||||||||
Telecommunications - 3.1% | |||||||||
AT&T, | 3.60 | 2/17/23 | 7,500,000 | 7,737,344 | |||||
Telefonica Emisiones, | 4.57 | 4/27/23 | 6,500,000 | 7,161,224 | |||||
Verizon Communications, | 5.15 | 9/15/23 | 5,500,000 | 6,154,268 | |||||
Verizon Communications, | 4.50 | 8/10/33 | 3,000,000 | 3,060,086 | |||||
24,112,922 | |||||||||
Utilities - 2.0% | |||||||||
Black Hills, | 4.25 | 11/30/23 | 5,000,000 | 5,388,181 | |||||
Entergy, | 2.95 | 9/1/26 | 2,000,000 | 1,961,053 | |||||
Exelon, | 3.50 | 6/1/22 | 3,000,000 | 3,113,237 | |||||
NextEra Energy Capital Holdings, | 2.70 | 9/15/19 | 3,000,000 | 3,042,682 | |||||
PPL Capital Funding, | 3.95 | 3/15/24 | 2,000,000 | 2,120,183 | |||||
15,625,336 | |||||||||
Total Bonds and Notes | 769,721,817 | ||||||||
Description | Shares | Value ($) | |||||||
Other Investment - 1.3% | |||||||||
Registered Investment Company; | |||||||||
Dreyfus Institutional Preferred Government Plus Money Market Fund | 10,207,722 | d | 10,207,722 | ||||||
29
STATEMENT OF INVESTMENTS (continued)
BNY Mellon Corporate Bond Fund (continued) | |||||||||
Description | Shares | Value ($) | |||||||
Investment of Cash Collateral for Securities Loaned - 4.1% | |||||||||
Registered Investment Company; | |||||||||
Dreyfus Institutional Preferred Government Money Market Fund, Institutional Shares | 32,008,032 | d | 32,008,032 | ||||||
Total Investments (cost $781,253,459) | 103.2% | 811,937,571 | |||||||
Liabilities, Less Cash and Receivables | (3.2%) | (24,893,677) | |||||||
Net Assets | 100.0% | 787,043,894 | |||||||
GO—General Obligation
LIBOR—London Interbank Offered Rate
a Security exempt from registration pursuant to Rule 144A under the Securities Act of 1933. These securities may be resold in transactions exempt from registration, normally to qualified institutional buyers. At August 31, 2017, these securities were valued at $135,615,260 or 17.23% of net assets.
b Security, or portion thereof, on loan. At August 31, 2017, the value of the fund’s securities on loan was $42,079,971 and the value of the collateral held by the fund was $43,493,798, consisting of cash collateral of $32,008,032 and U.S. Government & Agency securities valued at $11,485,766.
c Variable rate security—rate shown is the interest rate in effect at period end.
d Investment in affiliated money market mutual fund.
Portfolio Summary (Unaudited) † | Value (%) |
Corporate Bonds | 89.3 |
Municipal Bonds | 6.2 |
Money Market Investments | 5.4 |
Foreign/Governmental | 2.3 |
103.2 |
† Based on net assets.
See notes to financial statements.
30
BNY Mellon Short-Term U.S. Government Securities Fund | |||||||||
Description | Coupon | Maturity | Principal | Value ($) | |||||
Bonds and Notes - 98.7% | |||||||||
Municipal Bonds - 2.8% | |||||||||
California Earthquake Authority, | 2.81 | 7/1/19 | 1,071,000 | 1,080,264 | |||||
Florida Hurricane Catastrophe Fund Finance Corporation, | 2.11 | 7/1/18 | 2,850,000 | 2,864,022 | |||||
Kansas Development Finance Authority, | 1.88 | 4/15/18 | 1,000,000 | 1,001,280 | |||||
4,945,566 | |||||||||
U.S. Government Agencies - 36.2% | |||||||||
Federal Farm Credit Bank, | 1.10 | 10/15/18 | 6,500,000 | 6,483,432 | |||||
Federal Farm Credit Bank, | 1.23 | 1/25/19 | 7,660,000 | 7,640,092 | |||||
Federal Farm Credit Bank, | 1.11 | 1/28/19 | 3,050,000 | 3,037,199 | |||||
Federal Farm Credit Bank, | 1.25 | 3/4/19 | 2,775,000 | 2,766,361 | |||||
Federal Farm Credit Bank, | 1.18 | 8/1/19 | 2,000,000 | 1,989,496 | |||||
Federal Farm Credit Bank, | 1.16 | 9/26/19 | 1,000,000 | 992,513 | |||||
Federal Farm Credit Bank, | 1.17 | 1/13/20 | 3,000,000 | 2,980,401 | |||||
Federal Home Loan Bank, | 1.75 | 7/13/20 | 3,630,000 | 3,630,791 | |||||
Federal Home Loan Mortgage Corp., | 1.30 | 5/24/19 | 2,000,000 | a | 1,998,258 | ||||
Federal Home Loan Mortgage Corp., | 1.25 | 8/15/19 | 2,105,000 | a | 2,098,369 | ||||
Federal Home Loan Mortgage Corp., | 1.30 | 9/20/19 | 4,000,000 | a | 3,981,520 | ||||
Federal Home Loan Mortgage Corp., | 1.05 | 2/26/18 | 3,000,000 | a | 2,998,554 | ||||
Federal National Mortgage Association, | 1.25 | 2/26/19 | 1,810,000 | a | 1,807,692 | ||||
Federal National Mortgage Association, | 1.27 | 2/26/19 | 1,710,000 | a | 1,705,150 | ||||
Federal National Mortgage Association, | 1.38 | 6/21/19 | 6,000,000 | a | 5,992,116 | ||||
Federal National Mortgage Association, | 1.15 | 7/26/19 | 1,815,000 | a | 1,805,420 | ||||
Federal National Mortgage Association, | 1.25 | 7/26/19 | 2,180,000 | a | 2,168,219 | ||||
Federal National Mortgage Association, | 1.20 | 8/16/19 | 1,800,000 | a | 1,789,823 | ||||
Federal National Mortgage Association, | 1.54 | 7/6/21 | 2,965,000 | a | 2,901,169 | ||||
Federal National Mortgage Association, | 1.00 | 4/30/18 | 3,310,000 | a | 3,305,214 | ||||
Federal National Mortgage Association, | 1.15 | 8/23/19 | 1,000,000 | a | 989,006 | ||||
63,060,795 | |||||||||
U.S. Government Agencies Mortgage-Backed - 33.3% | |||||||||
Federal Home Loan Mortgage Corp.: | |||||||||
REMIC, Ser. 3846, Cl. CK, 1.50%, 9/15/20 | 20,492 | a | 20,473 | ||||||
REMIC, Ser. 4020, Cl. PC, 1.75%, 3/15/27 | 1,083,561 | a | 1,072,089 | ||||||
2.00%, 5/1/23-7/1/23 | 1,517,631 | a | 1,533,562 | ||||||
REMIC, Ser. 3942, Cl. AC, 2.00%, 10/15/21 | 4,662,282 | a | 4,680,057 | ||||||
Multifamily Structured Pass Through Certificates, Ser. K709, Cl. A2, 2.09%, 3/25/19 | 2,000,000 | a | 2,012,347 | ||||||
REMIC, Ser. 3684, Cl. CM, 2.50%, 8/15/24 | 654,915 | a | 660,126 | ||||||
2.50%, 8/1/25 | 1,237,647 | a | 1,261,224 | ||||||
REMIC, Ser. 3928, Cl. A, 3.00%, 9/15/25 | 1,196,749 | a | 1,217,913 | ||||||
31
STATEMENT OF INVESTMENTS (continued)
BNY Mellon Short-Term U.S. Government Securities Fund (continued) | |||||||||
Description | Coupon | Maturity | Principal | Value ($) | |||||
Bonds and Notes - 98.7% (continued) | |||||||||
U.S. Government Agencies Mortgage-Backed - 33.3% (continued) | |||||||||
3.50%, 10/1/26-5/1/27 | 2,958,800 | a | 3,042,102 | ||||||
REMIC, Ser. 2675, Cl. CK, 4.00%, 9/15/18 | 19,759 | a | 19,935 | ||||||
4.50%, 9/1/26 | 240,588 | a | 246,220 | ||||||
Federal National Mortgage Association: | |||||||||
REMIC, Ser. 2012-78, Cl. KB, 1.75%, 11/25/20 | 2,463,663 | a | 2,445,445 | ||||||
2.00%, 4/1/23-2/1/27 | 12,103,863 | a | 12,254,830 | ||||||
REMIC, Ser. 2010-13, Cl. KA, 2.00%, 12/25/18 | 135,388 | a | 135,299 | ||||||
2.50%, 12/1/23-7/1/27 | 10,990,215 | a | 11,193,856 | ||||||
REMIC, Ser. 2013-138, Cl. BE, 2.50%, 1/25/29 | 1,182,267 | a | 1,190,009 | ||||||
REMIC, Ser. 2011-23, Cl. AB, 2.75%, 6/25/20 | 460,744 | a | 462,215 | ||||||
REMIC, Ser. 2012-94, Cl. E, 3.00%, 6/25/22 | 747,148 | a | 756,012 | ||||||
4.50%, 11/1/22 | 1,745,821 | a | 1,794,921 | ||||||
REMIC, Ser. 2003-67, Cl. TJ, 4.75%, 7/25/18 | 81,253 | a | 81,696 | ||||||
Government National Mortgage Association I: | |||||||||
Ser. 2013-101, Cl. A, 0.51%, 5/16/35 | 2,528,311 | 2,481,497 | |||||||
Ser. 2013-73, Cl. A, 0.98%, 12/16/35 | 3,918,336 | 3,857,513 | |||||||
Ser. 2012-55, Cl. A, 1.70%, 8/16/33 | 1,809,565 | 1,805,453 | |||||||
Ser. 2013-105, Cl. A, 1.71%, 2/16/37 | 3,387,367 | 3,351,215 | |||||||
Ser. 2011-20, Cl. A, 1.88%, 4/16/32 | 400,450 | 400,036 | |||||||
57,976,045 | |||||||||
U.S. Government Securities - 26.4% | |||||||||
U.S. Treasury Notes | 1.00 | 8/15/18 | 1,000,000 | 997,793 | |||||
U.S. Treasury Notes | 1.13 | 1/15/19 | 2,000,000 | b | 1,996,094 | ||||
U.S. Treasury Notes | 0.88 | 4/15/19 | 3,250,000 | 3,227,339 | |||||
U.S. Treasury Notes | 0.88 | 6/15/19 | 5,000,000 | b | 4,962,012 | ||||
U.S. Treasury Notes | 0.75 | 7/15/19 | 4,000,000 | b | 3,958,281 | ||||
U.S. Treasury Notes | 0.88 | 9/15/19 | 1,500,000 | b | 1,486,348 | ||||
U.S. Treasury Notes | 1.00 | 10/15/19 | 4,750,000 | b | 4,716,880 | ||||
U.S. Treasury Notes | 1.00 | 11/15/19 | 5,000,000 | 4,962,696 | |||||
U.S. Treasury Notes | 1.38 | 1/15/20 | 5,000,000 | 5,001,465 | |||||
U.S. Treasury Notes | 1.38 | 2/15/20 | 4,000,000 | b | 4,000,547 | ||||
U.S. Treasury Notes | 1.63 | 3/15/20 | 5,000,000 | 5,030,957 | |||||
U.S. Treasury Notes | 1.50 | 7/15/20 | 1,500,000 | 1,503,398 | |||||
U.S. Treasury Notes | 1.50 | 8/15/20 | 4,250,000 | 4,258,550 | |||||
46,102,360 | |||||||||
Total Bonds and Notes | 172,084,766 | ||||||||
Description | Shares | Value ($) | |||||||
Other Investment - .5% | |||||||||
Registered Investment Company; | |||||||||
Dreyfus Institutional Preferred Government Plus Money Market Fund | 867,636 | c | 867,636 | ||||||
Total Investments (cost $173,700,984) | 99.2% | 172,952,402 | |||||||
Cash and Receivables (Net) | 0.8% | 1,403,108 | |||||||
Net Assets | 100.0% | 174,355,510 | |||||||
REMIC—Real Estate Mortgage Investment Conduit
a The Federal Housing Finance Agency (“FHFA”) placed the Federal Home Loan Mortgage Corporation and Federal National Mortgage Association into conservatorship with FHFA as the conservator. As such, the FHFA oversees the continuing affairs of these companies.
b Security, or portion thereof, on loan. At August 31, 2017, the value of the fund’s securities on loan was $15,583,839 and the value of the collateral held by the fund was $16,062,269, consisting of U.S. Government & Agency securities.
c Investment in affiliated money market mutual fund.
32
Portfolio Summary (Unaudited) † | Value (%) |
U.S. Government Agencies/Mortgage-Backed | 69.4 |
U.S. Government Securities | 26.5 |
Municipal Bonds | 2.8 |
Money Market Investment | .5 |
99.2 |
† Based on net assets.
See notes to financial statements.
33
STATEMENTS OF INVESTMENTS IN AFFILIATED ISSUERS
Registered Investment Companies | Value | Purchases ($) | Sales ($) | Value | Net | Dividends/ |
BNY Mellon Bond Fund | ||||||
Dreyfus Institutional Cash Advantage Fund, | 5,312,290 | 1,990,050 | 7,302,340 | - | - | - |
Dreyfus Institutional Preferred | 32,727,374 | 197,952,053 | 217,902,298 | 12,777,129 | 1.3 | 69,376 |
Dreyfus Institutional Preferred | - | 39,686,895 | 38,487,895 | 1,199,000 | .1 | - |
Total | 38,039,664 | 239,628,998 | 263,692,533 | 13,976,129 | 1.4 | 69,376 |
BNY Mellon Intermediate Bond Fund | ||||||
Dreyfus Institutional Cash Advantage Fund, | 8,656,030 | 183,090 | 8,839,120 | - | - | - |
Dreyfus Institutional Preferred | 10,324,571 | 204,751,370 | 205,615,074 | 9,460,867 | 1.1 | 47,262 |
Dreyfus Institutional Preferred | - | 21,496,761 | 18,332,061 | 3,164,700 | .4 | - |
Total | 18,980,601 | 226,431,221 | 232,786,255 | 12,625,567 | 1.5 | 47,262 |
BNY Mellon Corporate Bond Fund | ||||||
Dreyfus Institutional Cash Advantage Fund, | 26,115,869 | 17,048,360 | 43,164,229 | - | - | - |
Dreyfus Institutional Preferred | 3,826,896 | 180,476,966 | 174,096,140 | 10,207,722 | 1.3 | 41,099 |
Dreyfus Institutional Preferred | - | 149,981,005 | 117,972,973 | 32,008,032 | 4.1 | - |
Total | 29,942,765 | 347,506,331 | 335,233,342 | 42,215,754 | 5.4 | 41,099 |
BNY Mellon Short-Term U.S. | ||||||
Dreyfus Institutional Preferred | 2,814,000 | 144,835,995 | 146,782,359 | 867,636 | .5 | 13,371 |
Dreyfus Institutional Preferred | - | 18,654,256 | 18,654,256 | - | - | - |
Total | 2,814,000 | 163,490,251 | 165,436,615 | 867,636 | .5 | 13,371 |
See notes to financial statements.
34
STATEMENTS OF ASSETS AND LIABILITIES
August 31, 2017
|
|
|
|
|
|
|
|
|
|
|
| |
|
|
|
| BNY Mellon Bond Fund |
| BNY Mellon Intermediate Bond Fund |
| BNY Mellon Corporate Bond Fund |
| BNY Mellon Short-Term U.S. Government Securities Fund |
| |
Assets ($): |
|
|
|
|
|
|
|
|
|
|
| |
Investments in securities—See Statements |
|
|
|
|
|
|
|
|
|
|
| |
Unaffiliated issuers |
|
|
| 995,821,509 |
| 832,182,658 |
| 769,721,817 |
| 172,084,766 |
| |
Affiliated issuers |
|
|
| 13,976,129 |
| 12,625,567 |
| 42,215,754 |
| 867,636 |
| |
Cash |
|
|
| - |
| 309,432 |
| - |
| 3,510,910 |
| |
Receivable for investment securities sold |
|
|
| 9,820,826 |
| - |
| - |
| - | ||
Interest receivable |
|
|
| 6,704,802 |
| 5,288,412 |
| 8,318,058 |
| 398,401 |
| |
Receivable for shares of Beneficial |
|
|
| 3,269,505 |
| 2,248,093 |
| 877,854 |
| 1,024,407 |
| |
Dividends receivable |
|
|
| 11,101 |
| - |
| 7,856 |
| 1,508 |
| |
Securities lending receivable |
|
|
| 2,946 |
| 5,241 |
| 15,828 |
| 947 |
| |
Prepaid expenses |
|
|
| 27,108 |
| 24,700 |
| 14,341 |
| 21,241 |
| |
|
|
|
| 1,029,633,926 |
| 852,684,103 |
| 821,171,508 |
| 177,909,816 |
|
|
Liabilities ($): |
|
|
|
|
|
|
|
|
|
|
| |
Due to The Dreyfus Corporation |
|
|
| 372,505 |
| 312,672 |
| 290,826 |
| 61,491 |
| |
Due to Administrator—Note 3(a) |
|
|
| 105,579 |
| 88,425 |
| 82,069 |
| 17,953 |
| |
Cash overdraft due to Custodian |
|
|
| 282,539 |
| - |
| 646,841 |
| - |
| |
Payable for investment securities purchased |
|
|
| 12,732,595 |
| - |
| - |
| 2,757,940 | ||
Payable for shares of Beneficial |
|
|
| 3,967,159 |
| 2,745,627 |
| 1,043,437 |
| 680,231 |
| |
Liability for securities on loan—Note 1(b) |
|
|
| 1,199,000 |
| 3,164,700 |
| 32,008,032 |
| - |
| |
Accrued expenses |
|
|
| 71,750 |
| 68,581 |
| 56,409 |
| 36,691 |
| |
|
|
|
| 18,731,127 |
| 6,380,005 |
| 34,127,614 |
| 3,554,306 |
|
|
Net Assets ($) |
|
|
| 1,010,902,799 |
| 846,304,098 |
| 787,043,894 |
| 174,355,510 |
|
|
Composition of Net Assets ($): |
|
|
|
|
|
|
|
|
|
|
| |
Paid-in capital |
|
|
| 995,241,236 |
| 847,721,029 |
| 773,886,901 |
| 187,706,622 |
| |
Accumulated undistributed investment |
|
|
| 336,907 |
| 263,079 |
| 618,905 |
| 88,388 |
| |
Accumulated net realized gain (loss) |
|
|
| (10,644,909) |
| (14,880,198) |
| (18,146,024) |
| (12,690,918) |
| |
Accumulated net unrealized appreciation |
|
|
| 25,969,565 |
| 13,200,188 |
| 30,684,112 |
| (748,582) |
| |
Net Assets ($) |
|
|
| 1,010,902,799 |
| 846,304,098 |
| 787,043,894 |
| 174,355,510 |
|
|
† Investments at cost ($) |
|
|
|
|
|
|
|
|
|
|
|
|
Unaffiliated issuers |
|
|
| 969,851,944 |
| 818,982,470 |
| 739,037,705 |
| 172,833,348 |
|
|
Affiliated issuers |
|
|
| 13,976,129 |
| 12,625,567 |
| 42,215,754 |
| 867,636 |
|
|
†† Value of securities on loan ($) |
|
|
| 42,740,647 |
| 15,659,277 |
| 42,079,971 |
| 15,583,839 |
|
|
Net Asset Value Per Share |
|
|
|
|
|
|
|
|
|
|
| |
Class M |
|
|
|
|
|
|
|
|
|
|
| |
Net Assets ($) |
|
|
| 1,001,289,990 |
| 838,741,220 |
| 784,236,555 |
| 172,602,961 |
| |
Shares Outstanding |
|
|
| 78,126,529 |
| 66,591,119 |
| 60,028,497 |
| 14,722,695 |
| |
Net Asset Value Per Share ($) |
|
|
| 12.82 |
| 12.60 |
| 13.06 |
| 11.72 |
| |
Investor Shares |
|
|
|
|
|
|
|
|
|
|
|
|
Net Assets ($) |
|
|
| 9,612,809 |
| 7,562,878 |
| 2,807,339 |
| 1,752,549 |
| |
Shares Outstanding |
|
|
| 751,780 |
| 600,214 |
| 214,805 |
| 149,665 |
| |
Net Asset Value Per Share ($) |
|
|
| 12.79 |
| 12.60 |
| 13.07 |
| 11.71 |
| |
| ||||||||||||
See notes to financial statements. |
|
35
STATEMENTS OF OPERATIONS
Year Ended August 31, 2017
|
|
|
|
|
|
|
|
|
|
|
|
|
|
|
|
|
| BNY Mellon Bond Fund |
| BNY Mellon Intermediate Bond Fund |
| BNY Mellon Corporate Bond Fund |
| BNY Mellon Short-Term U.S. Government Securities Fund |
|
Investment Income ($): |
|
|
|
|
|
|
|
|
|
| ||
Income: |
|
|
|
|
|
|
|
|
|
| ||
Interest |
|
| 30,630,374 |
| 19,915,095 |
| 30,723,836 |
| 2,418,613 |
| ||
Dividends from affiliated issuers |
|
| 69,376 |
| 47,262 |
| 41,099 |
| 13,371 |
| ||
Income from securities lending—Note 1(b) |
|
| 38,635 |
| 74,057 |
| 211,268 |
| 21,021 |
| ||
Total Income |
|
| 30,738,385 |
| 20,036,414 |
| 30,976,203 |
| 2,453,005 |
| ||
Expenses: |
|
|
|
|
|
|
|
|
|
| ||
Investment advisory fee—Note 3(a) |
|
| 4,026,369 |
| 3,441,275 |
| 3,215,579 |
| 698,768 |
| ||
Administration fee—Note 3(a) |
|
| 1,252,931 |
| 1,070,910 |
| 1,000,689 |
| 248,580 |
| ||
Custodian fees—Note 3(b) |
|
| 75,702 |
| 64,232 |
| 61,513 |
| 18,603 |
| ||
Trustees’ fees and expenses—Note 3(c) |
|
| 73,956 |
| 71,377 |
| 57,578 |
| 13,577 | |||
Professional fees |
|
| 62,318 |
| 58,396 |
| 57,338 |
| 35,572 | |||
Registration fees |
|
| 37,588 |
| 37,426 |
| 42,813 |
| 35,225 | |||
Shareholder servicing costs—Note 3(b) |
|
| 22,065 |
| 17,755 |
| 6,875 |
| 4,678 | |||
Loan commitment fees—Note 2 |
|
| 21,250 |
| 21,718 |
| 18,645 |
| 5,682 | |||
Prospectus and shareholders’ reports |
|
| 12,511 |
| 15,360 |
| 10,722 |
| 12,446 |
| ||
Interest expense—Note 2 |
|
| - |
| - |
| 59 |
| - |
| ||
Miscellaneous |
|
| 51,547 |
| 46,706 |
| 57,305 |
| 30,503 |
| ||
Total Expenses |
|
| 5,636,237 |
| 4,845,155 |
| 4,529,116 |
| 1,103,634 |
| ||
Less—reduction in fees due to earnings credits—Note 3(b) |
|
| (265) |
| (836) |
| (275) |
| (132) |
| ||
Net Expenses |
|
| 5,635,972 |
| 4,844,319 |
| 4,528,841 |
| 1,103,502 |
| ||
Investment Income—Net |
|
| 25,102,413 |
| 15,192,095 |
| 26,447,362 |
| 1,349,503 |
| ||
Realized and Unrealized Gain (Loss) |
|
|
|
|
|
|
|
| ||||
Net realized gain (loss) on investments | (2,405,730) |
| 769,919 |
| 3,894,619 |
| (352,790) |
| ||||
Net unrealized appreciation (depreciation) on investments |
|
| (15,291,612) |
| (7,681,641) |
| (3,450,234) |
| (417,376) |
| ||
Net Realized and Unrealized Gain (Loss) on Investments |
|
| (17,697,342) |
| (6,911,722) |
| 444,385 |
| (770,166) |
| ||
Net Increase in Net Assets Resulting from Operations |
| 7,405,071 |
| 8,280,373 |
| 26,891,747 |
| 579,337 |
| |||
See notes to financial statements. | ||||||||||||
36
STATEMENTS OF CHANGES IN NET ASSETS
|
|
|
| BNY Mellon Bond Fund |
| BNY Mellon Intermediate Bond Fund |
| ||||||||
|
|
|
| Year Ended August 31, | Year Ended August 31, | ||||||||||
|
|
|
| 2017 |
|
|
| 2016 |
| 2017 |
|
|
| 2016 |
|
Operations ($): |
|
|
|
|
|
|
|
|
|
|
|
|
|
| |
Investment income—net |
|
| 25,102,413 |
|
|
| 24,158,082 |
| 15,192,095 |
|
|
| 14,004,644 |
| |
Net realized gain (loss) on investments |
| (2,405,730) |
|
|
| 6,515,181 |
| 769,919 |
|
|
| 158,106 |
| ||
Net unrealized appreciation (depreciation) |
| (15,291,612) |
|
|
| 26,968,596 |
| (7,681,641) |
|
|
| 15,914,271 |
| ||
Net Increase (Decrease) in Net Assets | 7,405,071 |
|
|
| 57,641,859 |
| 8,280,373 |
|
|
| 30,077,021 |
| |||
Distributions to Shareholders from ($): |
|
|
|
|
|
|
|
|
|
|
|
|
|
| |
Investment income—net: |
|
|
|
|
|
|
|
|
|
|
|
|
|
| |
Class M |
|
| (28,638,017) |
|
|
| (28,195,330) |
| (17,926,346) |
|
|
| (17,610,181) |
| |
Investor Shares |
|
| (226,317) |
|
|
| (221,091) |
| (127,446) |
|
|
| (127,578) |
| |
Net realized gain on investments: |
|
|
|
|
|
|
|
|
|
|
|
|
|
| |
Class M |
|
| (2,338,221) |
|
|
| - |
| - |
|
|
| - |
| |
Investor Shares |
|
| (20,354) |
|
|
| - |
| - |
|
|
| - |
| |
Total Distributions |
|
| (31,222,909) |
|
|
| (28,416,421) |
| (18,053,792) |
|
|
| (17,737,759) |
| |
Beneficial Interest Transactions ($): |
|
|
|
|
|
|
|
|
|
|
|
|
|
| |
Net proceeds from shares sold: |
|
|
|
|
|
|
|
|
|
|
|
|
|
| |
Class M |
|
| 157,399,563 |
|
|
| 135,302,949 |
| 149,116,716 |
|
|
| 121,361,604 |
| |
Investor Shares |
|
| 9,227,669 |
|
|
| 8,842,498 |
| 8,605,753 |
|
|
| 9,093,845 |
| |
Distributions reinvested: |
|
|
|
|
|
|
|
|
|
|
|
|
|
| |
Class M |
|
| 6,520,913 |
|
|
| 4,861,827 |
| 3,865,056 |
|
|
| 3,762,278 |
| |
Investor Shares |
|
| 226,047 |
|
|
| 195,680 |
| 119,914 |
|
|
| 120,111 |
| |
Cost of shares redeemed: |
|
|
|
|
|
|
|
|
|
|
|
|
|
| |
Class M |
|
| (169,728,840) |
|
|
| (148,837,129) |
| (173,981,449) |
|
|
| (145,270,631) |
| |
Investor Shares |
|
| (9,228,455) |
|
|
| (7,895,083) |
| (9,315,196) |
|
|
| (8,529,880) |
| |
Increase (Decrease) in Net Assets | (5,583,103) |
|
|
| (7,529,258) |
| (21,589,206) |
|
|
| (19,462,673) |
| |||
Total Increase (Decrease) in Net Assets | (29,400,941) |
|
|
| 21,696,180 |
| (31,362,625) |
|
|
| (7,123,411) |
| |||
Net Assets ($): |
|
|
|
|
|
|
|
|
|
|
|
|
|
| |
Beginning of Period |
|
| 1,040,303,740 |
|
|
| 1,018,607,560 |
| 877,666,723 |
|
|
| 884,790,134 |
| |
End of Period |
|
| 1,010,902,799 |
|
|
| 1,040,303,740 |
| 846,304,098 |
|
|
| 877,666,723 |
| |
Undistributed investment income—net | 336,907 |
|
|
| 501,814 |
| 263,079 |
|
|
| 237,005 |
| |||
Capital Share Transactions (Shares): |
|
|
|
|
|
|
|
|
|
|
|
|
|
| |
Class Ma |
|
|
|
|
|
|
|
|
|
|
|
|
|
| |
Shares sold |
|
| 12,353,358 |
|
|
| 10,496,743 |
| 11,892,867 |
|
|
| 9,608,380 |
| |
Shares issued for distributions reinvested |
|
| 513,521 |
|
|
| 377,002 |
| 307,921 |
|
|
| 297,744 |
| |
Shares redeemed |
|
| (13,360,693) |
|
|
| (11,582,419) |
| (13,876,208) |
|
|
| (11,519,147) |
| |
Net Increase (Decrease) in Shares Outstanding | (493,814) |
|
|
| (708,674) |
| (1,675,420) |
|
|
| (1,613,023) |
| |||
Investor Sharesa |
|
|
|
|
|
|
|
|
|
|
|
|
|
| |
Shares sold |
|
| 722,680 |
|
|
| 685,758 |
| 684,836 |
|
|
| 718,365 |
| |
Shares issued for distributions reinvested |
|
| 17,811 |
|
|
| 15,197 |
| 9,547 |
|
|
| 9,500 |
| |
Shares redeemed |
|
| (724,064) |
|
|
| (612,572) |
| (741,492) |
|
|
| (675,154) |
| |
Net Increase (Decrease) in Shares Outstanding | 16,427 |
|
|
| 88,383 |
| (47,109) |
|
|
| 52,711 |
| |||
|
| ||||||||||||||
a During the period ended August 31, 2017, 634,208 Class M Shares representing $8,113,155 were exchanged for 635,580 Investor Shares for BNY Mellon Bond Fund and 597,818 Class M Shares representing $7,510,190 were exchanged for 597,627 Investor Shares for BNY Mellon Intermediate Bond Fund and during the period ended August 31, 2016, 681,282 Class M Shares representing $8,804,999 were exchanged for 682,875 Investor shares for BNY Mellon Bond Fund and 708,806 Class M Shares representing $8,971,016 were exchanged for 708,561 Investor Shares for BNY Mellon Intermediate Bond Fund. | |||||||||||||||
See notes to financial statements. | |||||||||||||||
37
STATEMENTS OF CHANGES IN NET ASSETS (continued)
|
|
|
| BNY Mellon Corporate Bond Fund |
| BNY Mellon Short-Term U.S. Government Securities Fund |
| ||||||||
|
|
|
| Year Ended August 31, | Year Ended August 31, | ||||||||||
|
|
|
| 2017 |
|
|
| 2016 |
| 2017 |
|
|
| 2016 |
|
Operations ($): |
|
|
|
|
|
|
|
|
|
|
|
|
|
| |
Investment income—net |
|
| 26,447,362 |
|
|
| 24,423,382 |
| 1,349,503 |
|
|
| 739,478 |
| |
Net realized gain (loss) on investments |
| 3,894,619 |
|
|
| (2,483,138) |
| (352,790) |
|
|
| (27,501) |
| ||
Net unrealized appreciation (depreciation) |
| (3,450,234) |
|
|
| 35,559,289 |
| (417,376) |
|
|
| 672,612 |
| ||
Net Increase (Decrease) in Net Assets | 26,891,747 |
|
|
| 57,499,533 |
| 579,337 |
|
|
| 1,384,589 |
| |||
Distributions to Shareholders from ($): |
|
|
|
|
|
|
|
|
|
|
|
|
|
| |
Investment income—net: |
|
|
|
|
|
|
|
|
|
|
|
|
|
| |
Class M |
|
| (29,448,184) |
|
|
| (27,952,207) |
| (1,975,337) |
|
|
| (2,050,626) |
| |
Investor Shares |
|
| (89,761) |
|
|
| (105,956) |
| (13,983) |
|
|
| (12,314) |
| |
Total Distributions |
|
| (29,537,945) |
|
|
| (28,058,163) |
| (1,989,320) |
|
|
| (2,062,940) |
| |
Beneficial Interest Transactions ($): |
|
|
|
|
|
|
|
|
|
|
|
|
|
| |
Net proceeds from shares sold: |
|
|
|
|
|
|
|
|
|
|
|
|
|
| |
Class M |
|
| 166,856,298 |
|
|
| 200,332,812 |
| 137,551,952 |
|
|
| 115,776,155 |
| |
Investor Shares |
|
| 13,928,758 |
|
|
| 3,830,590 |
| 1,945,189 |
|
|
| 1,396,436 |
| |
Distributions reinvested: |
|
|
|
|
|
|
|
|
|
|
|
|
|
| |
Class M |
|
| 8,221,541 |
|
|
| 8,733,097 |
| 494,054 |
|
|
| 505,001 |
| |
Investor Shares |
|
| 64,950 |
|
|
| 36,078 |
| 12,669 |
|
|
| 11,133 |
| |
Cost of shares redeemed: |
|
|
|
|
|
|
|
|
|
|
|
|
|
| |
Class M |
|
| (238,094,978) |
|
|
| (174,562,705) |
| (178,801,248) |
|
|
| (96,504,648) |
| |
Investor Shares |
|
| (13,097,169) |
|
|
| (7,400,689) |
| (2,097,052) |
|
|
| (1,070,230) |
| |
Increase (Decrease) in Net Assets | (62,120,600) |
|
|
| 30,969,183 |
| (40,894,436) |
|
|
| 20,113,847 |
| |||
Total Increase (Decrease) in Net Assets | (64,766,798) |
|
|
| 60,410,553 |
| (42,304,419) |
|
|
| 19,435,496 |
| |||
Net Assets ($): |
|
|
|
|
|
|
|
|
|
|
|
|
|
| |
Beginning of Period |
|
| 851,810,692 |
|
|
| 791,400,139 |
| 216,659,929 |
|
|
| 197,224,433 |
| |
End of Period |
|
| 787,043,894 |
|
|
| 851,810,692 |
| 174,355,510 |
|
|
| 216,659,929 |
| |
Undistributed investment income—net | 618,905 |
|
|
| 539,335 |
| 88,388 |
|
|
| 71,368 |
| |||
Capital Share Transactions (Shares): |
|
|
|
|
|
|
|
|
|
|
|
|
|
| |
Class Ma |
|
|
|
|
|
|
|
|
|
|
|
|
|
| |
Shares sold |
|
| 12,932,113 |
|
|
| 15,773,365 |
| 11,746,685 |
|
|
| 9,784,196 |
| |
Shares issued for distributions reinvested |
|
| 637,719 |
|
|
| 687,925 |
| 42,133 |
|
|
| 42,689 |
| |
Shares redeemed |
|
| (18,553,332) |
|
|
| (13,882,122) |
| (15,256,386) |
|
|
| (8,159,136) |
| |
Net Increase (Decrease) in Shares Outstanding | (4,983,500) |
|
|
| 2,579,168 |
| (3,467,568) |
|
|
| 1,667,749 |
| |||
Investor Sharesa |
|
|
|
|
|
|
|
|
|
|
|
|
|
| |
Shares sold |
|
| 1,083,503 |
|
|
| 301,786 |
| 165,703 |
|
|
| 118,090 |
| |
Shares issued for distributions reinvested |
|
| 5,036 |
|
|
| 2,849 |
| 1,082 |
|
|
| 942 |
| |
Shares redeemed |
|
| (1,010,979) |
|
|
| (589,556) |
| (178,818) |
|
|
| (90,655) |
| |
Net Increase (Decrease) in Shares Outstanding | 77,560 |
|
|
| (284,921) |
| (12,033) |
|
|
| 28,377 |
| |||
|
| ||||||||||||||
a During the period ended August 31, 2017, 429,818 Class M Shares representing $5,546,314 were exchanged for 429,906 Investor Shares for BNY Mellon Corporate Bond Fund and 162,475 Class M Shares representing $1,909,863 were exchanged for 162,678 Investor Shares for BNY Mellon Short-Term U.S. Government Securities Fund and during the period ended August 31, 2016, 327,051 Class M Shares representing $4,148,556 were exchanged for 327,245 Investor Shares for BNY Mellon Corporate Bond Fund and 93,604 Class M Shares representing $1,108,424 were exchanged for 93,733 Investor Shares for BNY Mellon Short-Term U.S. Government Securities Fund. | |||||||||||||||
See notes to financial statements. | |||||||||||||||
38
FINANCIAL HIGHLIGHTS
The following tables describe the performance for each share class of each fund for the fiscal periods indicated. All information (except portfolio turnover) reflects financial results for a single fund share. Total return shows how much your investment in each fund would have increased (or decreased) during each period, assuming you had reinvested all dividends and distributions. These figures have been derived from the funds’ financial statements.
Class M Shares | |||||||||||||||
Year Ended August 31, | |||||||||||||||
BNY Mellon Bond Fund | 2017 |
| 2016 |
| 2015 |
| 2014 |
| 2013 |
| |||||
Per Share Data ($): | |||||||||||||||
Net asset value, beginning of period | 13.11 | 12.74 | 13.00 | 12.89 | 13.71 | ||||||||||
Investment Operations: | |||||||||||||||
Investment income—net a | .32 | .31 | .29 | .31 | .32 | ||||||||||
Net realized and unrealized | (.21) | .42 | (.18) | .34 | (.64) | ||||||||||
Total from Investment Operations | .11 | .73 | .11 | .65 | (.32) | ||||||||||
Distributions: | |||||||||||||||
Dividends from investment income—net | (.37) | (.36) | (.34) | (.36) | (.39) | ||||||||||
Dividends from net realized gain on investments | (.03) | - | (.03) | (.18) | (.11) | ||||||||||
Total Distributions | (.40) | (.36) | (.37) | (.54) | (.50) | ||||||||||
Net asset value, end of period | 12.82 | 13.11 | 12.74 | 13.00 | 12.89 | ||||||||||
Total Return (%) | .87 | 5.82 | .87 | 5.19 | (2.41) | ||||||||||
Ratios/Supplemental Data (%): | |||||||||||||||
Ratio of total expenses to average net assets | .56 | .56 | .55 | .55 | .55 | ||||||||||
Ratio of net expenses to average net assets | .56 | .56 | .55 | .55 | .55 | ||||||||||
Ratio of net investment income | 2.50 | 2.38 | 2.21 | 2.41 | 2.40 | ||||||||||
Portfolio Turnover Rate | 72.85 | 72.21 | 59.94 | 43.62 | 66.14 | b | |||||||||
Net Assets, end of period ($ x 1,000) | 1,001,290 | 1,030,685 | 1,010,387 | 1,040,204 | 1,148,032 | ||||||||||
a Based on average shares outstanding.
b The portfolio turnover rate excluding mortgage dollar roll transactions for the period ended August 31, 2013 was 65.03%.
See notes to financial statements.
39
FINANCIAL HIGHLIGHTS (continued)
Investor Shares | |||||||||||||||
Year Ended August 31, | |||||||||||||||
BNY Mellon Bond Fund | 2017 |
| 2016 |
| 2015 |
| 2014 |
| 2013 |
| |||||
Per Share Data ($): | |||||||||||||||
Net asset value, beginning of period | 13.08 | 12.71 | 12.97 | 12.86 | 13.69 | ||||||||||
Investment Operations: | |||||||||||||||
Investment income—net a | .28 | .27 | .26 | .28 | .29 | ||||||||||
Net realized and unrealized | (.21) | .43 | (.18) | .34 | (.65) | ||||||||||
Total from Investment Operations | .07 | .70 | .08 | .62 | (.36) | ||||||||||
Distributions: | |||||||||||||||
Dividends from investment income—net | (.33) | (.33) | (.31) | (.33) | (.36) | ||||||||||
Dividends from net realized gain on investments | (.03) | - | (.03) | (.18) | (.11) | ||||||||||
Total Distributions | (.36) | (.33) | (.34) | (.51) | (.47) | ||||||||||
Net asset value, end of period | 12.79 | 13.08 | 12.71 | 12.97 | 12.86 | ||||||||||
Total Return (%) | .63 | 5.55 | .62 | 4.95 | (2.74) | ||||||||||
Ratios/Supplemental Data (%): | |||||||||||||||
Ratio of total expenses to average net assets | .81 | .81 | .80 | .80 | .80 | ||||||||||
Ratio of net expenses to average net assets | .81 | .81 | .80 | .80 | .80 | ||||||||||
Ratio of net investment income | 2.24 | 2.14 | 1.95 | 2.16 | 2.16 | ||||||||||
Portfolio Turnover Rate | 72.85 | 72.21 | 59.94 | 43.62 | 66.14 | b | |||||||||
Net Assets, end of period ($ x 1,000) | 9,613 | 9,619 | 8,221 | 9,246 | 8,387 | ||||||||||
a Based on average shares outstanding.
b The portfolio turnover rate excluding mortgage dollar roll transactions for the period ended August 31, 2013 was 65.03%.
See notes to financial statements.
40
Class M Shares | |||||||||||||||
Year Ended August 31, | |||||||||||||||
BNY Mellon Intermediate Bond Fund | 2017 |
| 2016 |
| 2015 |
| 2014 |
| 2013 |
| |||||
Per Share Data ($): | |||||||||||||||
Net asset value, beginning of period | 12.74 | 12.55 | 12.75 | 12.73 | 13.26 | ||||||||||
Investment Operations: | |||||||||||||||
Investment income—net a | .22 | .20 | .19 | .21 | .23 | ||||||||||
Net realized and unrealized | (.10) | .25 | (.15) | .17 | (.44) | ||||||||||
Total from Investment Operations | .12 | .45 | .04 | .38 | (.21) | ||||||||||
Distributions: | |||||||||||||||
Dividends from investment income—net | (.26) | (.26) | (.24) | (.27) | (.30) | ||||||||||
Dividends from net realized gain on investments | - | - | - | (.09) | (.02) | ||||||||||
Total Distributions | (.26) | (.26) | (.24) | (.36) | (.32) | ||||||||||
Net asset value, end of period | 12.60 | 12.74 | 12.55 | 12.75 | 12.73 | ||||||||||
Total Return (%) | 1.01 | 3.60 | .39 | 2.87 | (1.64) | ||||||||||
Ratios/Supplemental Data (%): | |||||||||||||||
Ratio of total expenses to average net assets | .56 | .56 | .55 | .55 | .56 | ||||||||||
Ratio of net expenses to average net assets | .56 | .56 | .55 | .55 | .56 | ||||||||||
Ratio of net investment income | 1.77 | 1.61 | 1.46 | 1.66 | 1.77 | ||||||||||
Portfolio Turnover Rate | 48.97 | 32.99 | 50.80 | 42.45 | 44.76 | ||||||||||
Net Assets, end of period ($ x 1,000) | 838,741 | 869,419 | 877,322 | 912,247 | 949,095 | ||||||||||
a Based on average shares outstanding.
See notes to financial statements.
41
FINANCIAL HIGHLIGHTS (continued)
Investor Shares | |||||||||||||||
Year Ended August 31, | |||||||||||||||
BNY Mellon Intermediate Bond Fund | 2017 |
| 2016 |
| 2015 |
| 2014 |
| 2013 |
| |||||
Per Share Data ($): | |||||||||||||||
Net asset value, beginning of period | 12.74 | 12.56 | 12.75 | 12.73 | 13.26 | ||||||||||
Investment Operations: | |||||||||||||||
Investment income—net a | .19 | .17 | .15 | .18 | .20 | ||||||||||
Net realized and unrealized | (.10) | .24 | (.13) | .16 | (.45) | ||||||||||
Total from Investment Operations | .09 | .41 | .02 | .34 | (.25) | ||||||||||
Distributions: | |||||||||||||||
Dividends from investment income—net | (.23) | (.23) | (.21) | (.23) | (.26) | ||||||||||
Dividends from net realized gain on investments | - | - | - | (.09) | (.02) | ||||||||||
Total Distributions | (.23) | (.23) | (.21) | (.32) | (.28) | ||||||||||
Net asset value, end of period | 12.60 | 12.74 | 12.56 | 12.75 | 12.73 | ||||||||||
Total Return (%) | .75 | 3.26 | .14 | 2.69 | (1.91) | ||||||||||
Ratios/Supplemental Data (%): | |||||||||||||||
Ratio of total expenses to average net assets | .81 | .81 | .80 | .80 | .82 | ||||||||||
Ratio of net expenses to average net assets | .81 | .81 | .80 | .80 | .82 | ||||||||||
Ratio of net investment income | 1.52 | 1.36 | 1.21 | 1.40 | 1.51 | ||||||||||
Portfolio Turnover Rate | 48.97 | 32.99 | 50.80 | 42.45 | 44.76 | ||||||||||
Net Assets, end of period ($ x 1,000) | 7,563 | 8,247 | 7,468 | 6,415 | 8,397 | ||||||||||
a Based on average shares outstanding.
See notes to financial statements.
42
Class M Shares | |||||||||||||||
Year Ended August 31, | |||||||||||||||
BNY Mellon Corporate Bond Fund | 2017 | 2016 | 2015 |
| 2014 |
| 2013 |
| |||||||
Per Share Data ($): | |||||||||||||||
Net asset value, beginning of period | 13.07 | 12.59 | 12.96 | 12.49 | 12.91 | ||||||||||
Investment Operations: | |||||||||||||||
Investment income—net a | .42 | .39 | .35 | .32 | .30 | ||||||||||
Net realized and unrealized | .05 | .54 | (.31) | .56 | (.29) | ||||||||||
Total from Investment Operations | .47 | .93 | .04 | .88 | .01 | ||||||||||
Distributions: | |||||||||||||||
Dividends from investment income—net | (.48) | (.45) | (.41) | (.41) | (.39) | ||||||||||
Dividends from net realized gain on investments | - | - | - | (.00) | b | (.04) | |||||||||
Total Distributions | (.48) | (.45) | (.41) | (.41) | (.43) | ||||||||||
Net asset value, end of period | 13.06 | 13.07 | 12.59 | 12.96 | 12.49 | ||||||||||
Total Return (%) | 3.67 | 7.55 | .31 | 7.21 | .02 | ||||||||||
Ratios/Supplemental Data (%): | |||||||||||||||
Ratio of total expenses to average net assets | .56 | .56 | .56 | .56 | .58 | ||||||||||
Ratio of net expenses to average net assets | .56 | .56 | .56 | .56 | .58 | ||||||||||
Ratio of net investment income | 3.29 | 3.10 | 2.71 | 2.48 | 2.31 | ||||||||||
Portfolio Turnover Rate | 33.05 | 34.99 | 34.56 | 33.17 | 36.99 | ||||||||||
Net Assets, end of period ($ x 1,000) | 784,237 | 850,017 | 786,085 | 747,274 | 554,152 | ||||||||||
a Based on average shares outstanding.
b Amount represents less than $.01 per share.
See notes to financial statements.
43
FINANCIAL HIGHLIGHTS (continued)
Investor Shares | |||||||||||||||
Year Ended August 31, | |||||||||||||||
BNY Mellon Corporate Bond Fund | 2017 | 2016 | 2015 |
| 2014 |
| 2013 |
| |||||||
Per Share Data ($): | |||||||||||||||
Net asset value, beginning of period | 13.07 | 12.59 | 12.96 | 12.49 | 12.91 | ||||||||||
Investment Operations: | |||||||||||||||
Investment income—net a | .42 | .35 | .33 | .28 | .26 | ||||||||||
Net realized and unrealized | .03 | .55 | (.32) | .57 | (.29) | ||||||||||
Total from Investment Operations | .45 | .90 | .01 | .85 | (.03) | ||||||||||
Distributions: | |||||||||||||||
Dividends from investment income—net | (.45) | (.42) | (.38) | (.38) | (.35) | ||||||||||
Dividends from net realized gain on investments | - | - | - | (.00) | b | (.04) | |||||||||
Total Distributions | (.45) | (.42) | (.38) | (.38) | (.39) | ||||||||||
Net asset value, end of period | 13.07 | 13.07 | 12.59 | 12.96 | 12.49 | ||||||||||
Total Return (%) | 3.53 | 7.29 | .04 | 6.92 | (.24) | ||||||||||
Ratios/Supplemental Data (%): | |||||||||||||||
Ratio of total expenses to average net assets | .81 | .81 | .81 | .82 | .85 | ||||||||||
Ratio of net expenses to average net assets | .81 | .81 | .81 | .82 | .85 | ||||||||||
Ratio of net investment income | 3.02 | 2.83 | 2.46 | 2.21 | 2.05 | ||||||||||
Portfolio Turnover Rate | 33.05 | 34.99 | 34.56 | 33.17 | 36.99 | ||||||||||
Net Assets, end of period ($ x 1,000) | 2,807 | 1,793 | 5,315 | 1,519 | 575 | ||||||||||
a Based on average shares outstanding.
b Amount represents less than $.01 per share.
See notes to financial statements.
44
Class M Shares | |||||||||||||||
Year Ended August 31, | |||||||||||||||
BNY Mellon Short-Term | 2017 |
| 2016 |
| 2015 |
| 2014 |
| 2013 |
| |||||
Per Share Data ($): | |||||||||||||||
Net asset value, beginning of period | 11.81 | 11.84 | 11.95 | 12.03 | 12.22 | ||||||||||
Investment Operations: | |||||||||||||||
Investment income (loss)—net a | .08 | .04 | .06 | .02 | (.02) | ||||||||||
Net realized and unrealized | (.05) | .05 | (.02) | .03 | (.04) | ||||||||||
Total from Investment Operations | .03 | .09 | .04 | .05 | (.06) | ||||||||||
Distributions: | |||||||||||||||
Dividends from investment income—net | (.12) | (.12) | (.15) | (.13) | (.13) | ||||||||||
Net asset value, end of period | 11.72 | 11.81 | 11.84 | 11.95 | 12.03 | ||||||||||
Total Return (%) | .26 | .77 | .31 | .44 | (.49) | ||||||||||
Ratios/Supplemental Data (%): | |||||||||||||||
Ratio of total expenses to average net assets | .55 | .55 | .54 | .53 | .53 | ||||||||||
Ratio of net expenses to average net assets | .55 | .55 | .54 | .53 | .53 | ||||||||||
Ratio of net investment income | .68 | .37 | .47 | .19 | (.13) | ||||||||||
Portfolio Turnover Rate | 65.98 | 100.46 | 105.49 | 116.19 | 125.01 | ||||||||||
Net Assets, end of period ($ x 1,000) | 172,603 | 214,754 | 195,648 | 253,961 | 279,192 | ||||||||||
a Based on average shares outstanding.
See notes to financial statements.
45
FINANCIAL HIGHLIGHTS (continued)
Investor Shares | |||||||||||||||
Year Ended August 31, | |||||||||||||||
BNY Mellon Short-Term | 2017 |
| 2016 |
| 2015 |
| 2014 |
| 2013 |
| |||||
Per Share Data ($): | |||||||||||||||
Net asset value, beginning of period | 11.79 | 11.82 | 11.93 | 12.01 | 12.21 | ||||||||||
Investment Operations: | |||||||||||||||
Investment income (loss)—net a | .05 | .01 | .03 | (.01) | (.05) | ||||||||||
Net realized and unrealized | (.04) | .05 | (.02) | .03 | (.05) | ||||||||||
Total from Investment Operations | .01 | .06 | .01 | .02 | (.10) | ||||||||||
Distributions: | |||||||||||||||
Dividends from investment income—net | (.09) | (.09) | (.12) | (.10) | (.10) | ||||||||||
Net asset value, end of period | 11.71 | 11.79 | 11.82 | 11.93 | 12.01 | ||||||||||
Total Return (%) | .10 | .51 | .07 | .18 | (.84) | ||||||||||
Ratios/Supplemental Data (%): | |||||||||||||||
Ratio of total expenses to average net assets | .80 | .80 | .79 | .78 | .78 | ||||||||||
Ratio of net expenses to average net assets | .80 | .80 | .79 | .78 | .78 | ||||||||||
Ratio of net investment income | .43 | .12 | .22 | (.06) | (.40) | ||||||||||
Portfolio Turnover Rate | 65.98 | 100.46 | 105.49 | 116.19 | 125.01 | ||||||||||
Net Assets, end of period ($ x 1,000) | 1,753 | 1,906 | 1,576 | 801 | 894 | ||||||||||
a Based on average shares outstanding.
See notes to financial statements.
46
NOTES TO FINANCIAL STATEMENTS
NOTE 1—Significant Accounting Policies:
BNY Mellon Funds Trust (the “Trust”), a Massachusetts business trust that is registered under the Investment Company Act of 1940, as amended (the “Act”), as an open-end management investment company, operates as a series company currently consisting of twenty-five series, including the following diversified funds: BNY Mellon Bond Fund, BNY Mellon Intermediate Bond Fund, BNY Mellon Corporate Bond Fund and BNY Mellon Short-Term U.S. Government Securities Fund (each, a “fund” and collectively, the “funds”). The objectives of the funds are as follows: BNY Mellon Bond Fund, BNY Mellon Intermediate Bond Fund and BNY Mellon Corporate Bond Fund seek total return (consisting of capital appreciation and current income). BNY Mellon Short-Term U.S. Government Securities Fund seeks to provide as high a level of current income as is consistent with the preservation of capital.
BNY Mellon Fund Advisers, a division of The Dreyfus Corporation (the “Manager” or “Dreyfus”), a wholly-owned subsidiary of The Bank of New York Mellon Corporation (“BNY Mellon”), serves as each fund’s investment adviser (the “Investment Adviser”). The Bank of New York Mellon, a subsidiary of BNY Mellon and an affiliate of Dreyfus, serves as administrator for the funds pursuant to an Administration Agreement with the Trust (the “Administration Agreement”). The Bank of New York Mellon has entered into a Sub-Administration Agreement with Dreyfus pursuant to which The Bank of New York Mellon pays Dreyfus for performing certain administrative services. MBSC Securities Corporation (the “Distributor”), a wholly-owned subsidiary of Dreyfus, is the distributor of each fund’s shares, which are sold without a sales charge.
Each fund is authorized to issue an unlimited number of $.001 par value shares of Beneficial Interest in each of the following classes of shares: Class M and Investor. Each class of shares has identical rights and privileges, except with respect to the Shareholder Service Plan and the expenses borne by each class, the allocation of certain transfer agency costs, and certain voting rights. Income, expenses (other than expenses attributable to a specific class), and realized and unrealized gains or losses on investments are allocated to each class of shares based on its relative net assets.
The Trust accounts separately for the assets, liabilities and operations of each series. Expenses directly attributable to each series are charged to that series’ operations; expenses which are applicable to all series are allocated among them on a pro rata basis.
The Financial Accounting Standards Board (“FASB”) Accounting Standards Codification is the exclusive reference of authoritative U.S. generally accepted accounting principles (“GAAP”) recognized by the FASB to be applied by nongovernmental entities. Rules and interpretive releases of the Securities and Exchange Commission (“SEC”) under authority of federal laws are also sources of authoritative GAAP for SEC registrants. The fund’s financial statements are prepared in accordance with GAAP, which may require the use of management estimates and assumptions. Actual results could differ from those estimates.
(a) Portfolio valuation: The fair value of a financial instrument is the amount that would be received to sell an asset or paid to transfer a liability in an orderly transaction between market participants at the measurement date (i.e., the exit price). GAAP establishes a fair value hierarchy that prioritizes the inputs of valuation techniques used to measure fair value. This hierarchy gives the highest priority to unadjusted quoted prices in active markets for identical assets or liabilities (Level 1 measurements) and the lowest priority to unobservable inputs (Level 3 measurements).
Additionally, GAAP provides guidance on determining whether the volume and activity in a market has decreased significantly and whether such a decrease in activity results in transactions that are not orderly. GAAP requires enhanced disclosures around valuation inputs and techniques used during annual and interim periods.
Various inputs are used in determining the value of each fund’s investments relating to fair value measurements. These inputs are summarized in the three broad levels listed below:
Level 1—unadjusted quoted prices in active markets for identical investments.
Level 2—other significant observable inputs (including quoted prices for similar investments, interest rates, prepayment speeds, credit risk, etc.).
Level 3—significant unobservable inputs (including the funds’ own assumptions in determining the fair value of investments).
The inputs or methodology used for valuing securities are not necessarily an indication of the risk associated with investing in those securities.
Changes in valuation techniques may result in transfers in or out of an assigned level within the disclosure hierarchy. Valuation techniques used to value each fund’s investments are as follows:
Registered investment companies that are not traded on an exchange are valued at their net asset value and are generally categorized within Level 1 of the fair value hierarchy.
Investments in securities, excluding short-term investments (other than U.S. Treasury Bills), are valued each business day by an independent pricing service (the “Service”) approved by the Trust’s Board of Trustees (the “Board”). Investments
47
NOTES TO FINANCIAL STATEMENTS (continued)
for which quoted bid prices are readily available and are representative of the bid side of the market in the judgment of the Service are valued at the mean between the quoted bid prices (as obtained by the Service from dealers in such securities) and asked prices (as calculated by the Service based upon its evaluation of the market for such securities). Other investments (which constitute a majority of the portfolio securities) are valued as determined by the Service, based on methods which include consideration of the following: yields or prices of securities of comparable quality, coupon, maturity and type; indications as to values from dealers; and general market conditions. These securities are generally categorized within Level 2 of the fair value hierarchy.
The Service is engaged under the general supervision of the Board.
When market quotations or official closing prices are not readily available, or are determined not to reflect accurately fair value, such as when the value of a security has been significantly affected by events after the close of the exchange or market on which the security is principally traded (for example, a foreign exchange or market), but before the funds calculate their net asset value, the funds may value these investments at fair value as determined in accordance with the procedures approved by the Board. Certain factors may be considered when fair valuing investments such as: fundamental analytical data, the nature and duration of restrictions on disposition, an evaluation of the forces that influence the market in which the securities are purchased and sold, and public trading in similar securities of the issuer or comparable issuers. These securities are either categorized within Level 2 or 3 of the fair value hierarchy depending on the relevant inputs used.
For restricted securities where observable inputs are limited, assumptions about market activity and risk are used and are generally categorized within Level 3 of the fair value hierarchy.
Table 1 summarizes the inputs used as of August 31, 2017 in valuing each fund’s investments:
At August 31, 2017, there were no transfers between levels of the fair value hierarchy.
Table 1—Fair Value Measurements | |||||||||||||||||
Investments in Securities | |||||||||||||||||
Level 1—Unadjusted |
| Level 2—Other |
| Level 3—Significant Unobservable Inputs |
|
| |||||||||||
|
| Assets ($) | Liabilities ($) | Assets ($) | Liabilities ($) | Assets ($) | Liabilities ($) | Total | |||||||||
BNY Mellon Bond Fund | |||||||||||||||||
Commercial Mortgage-Backed | - | - | 13,747,938 | - | - | - | 13,747,938 | ||||||||||
Corporate Bonds† | - | - | 448,803,223 | - | - | - | 448,803,223 | ||||||||||
Foreign Government | - | - | 15,894,816 | - | - | - | 15,894,816 | ||||||||||
Municipal Bonds† | - | - | 73,362,058 | - | - | - | 73,362,058 | ||||||||||
Registered Investment | 13,976,129 | - | - | - | - | - | 13,976,129 | ||||||||||
U.S. Government Agencies/ | - | - | 271,612,843 | - | - | - | 271,612,843 | ||||||||||
U.S. Treasury | - | - | 172,400,631 | - | - | - | 172,400,631 | ||||||||||
BNY Mellon | |||||||||||||||||
Corporate Bonds† | - | - | 447,465,613 | - | - | - | 447,465,613 | ||||||||||
Foreign Government | - | - | 13,570,592 | - | - | - | 13,570,592 | ||||||||||
Municipal Bonds† | - | - | 43,156,711 | - | - | - | 43,156,711 | ||||||||||
Registered Investment | 12,625,567 | - | - | - | - | - | 12,625,567 | ||||||||||
U.S. Government Agencies/ | - | - | 6,979,628 | - | - | - | 6,979,628 | ||||||||||
U.S. Treasury | - | - | 321,010,114 | - | - | - | 321,010,114 | ||||||||||
48
Table 1—Fair Value Measurements (contibued) | |||||||||||||||||
Investments in Securities | |||||||||||||||||
Level 1—Unadjusted |
| Level 2—Other |
| Level 3—Significant Unobservable Inputs |
|
| |||||||||||
|
| Assets ($) | Liabilities ($) | Assets ($) | Liabilities ($) | Assets ($) | Liabilities ($) | Total | |||||||||
BNY Mellon | |||||||||||||||||
Corporate Bonds† | - | - | 703,119,593 | - | - | - | 703,119,593 | ||||||||||
Foreign Government | - | - | 17,769,124 | - | - | - | 17,769,124 | ||||||||||
Municipal Bonds† | - | - | 48,833,100 | - | - | - | 48,833,100 | ||||||||||
Registered Investment | 42,215,754 | - | - | - | - | - | 42,215,754 | ||||||||||
BNY Mellon Short-Term U.S. | |||||||||||||||||
Municipal Bonds† | - | - | 4,945,566 | - | - | - | 4,945,566 | ||||||||||
Registered Investment | 867,636 | - | - | - | - | - | 867,636 | ||||||||||
U.S. Government Agencies/ | - | - | 121,036,840 | - | - | - | 121,036,840 | ||||||||||
U.S. Treasury | - | - | 46,102,360 | - | - | - | 46,102,360 | ||||||||||
† See Statement of Investments for additional detailed categorizations.
(b) Securities transactions and investment income: Securities transactions are recorded on a trade date basis. Realized gains and losses from securities transactions are recorded on the identified cost basis. Dividend income is recognized on the ex-dividend date and interest income, including, where applicable, accretion of discount and amortization of premium on investments, is recognized on the accrual basis.
Pursuant to a securities lending agreement with The Bank of New York Mellon, the funds may lend securities to qualified institutions. It is the funds’ policy that, at origination, all loans are secured by collateral of at least 102% of the value of U.S. securities loaned and 105% of the value of foreign securities loaned. Collateral equivalent to at least 100% of the market value of securities on loan is maintained at all times. Collateral is either in the form of cash, which can be invested in certain money market mutual funds managed by Dreyfus, or U.S. Government and Agency securities. The funds are entitled to receive all dividends, interest and distributions on securities loaned, in addition to income earned as a result of the lending transaction. Should a borrower fail to return the securities in a timely manner, The Bank of New York Mellon is required to replace the securities for the benefit of the funds or credit the funds with the market value of the unreturned securities and is subrogated to the funds’ rights against the borrower and the collateral. Additionally, the contractual maturity of security lending transactions are on an overnight and continuous basis. Table 2 summarizes the amount The Bank of New York Mellon earned from each fund from lending portfolio securities, pursuant to the securities lending agreement during the period ended August 31, 2017.
Table 2—Securities Lending Agreement |
|
BNY Mellon Bond Fund | $ 7,798 |
BNY Mellon Intermediate Bond Fund | 14,821 |
BNY Mellon Corporate Bond Fund | 42,767 |
BNY Mellon Short-Term U.S. | 4,213 |
(c) Affiliated issuers: Investments in other investment companies advised by Dreyfus are defined as “affiliated” under the Act.
(d) Risk: The funds invests primarily in debt securities. Failure of an issuer of the debt securities to make timely interest or principal payments, or a decline or the perception of a decline in the credit quality of a debt security, can cause the debt security’s price to fall, potentially lowering each fund’s share price. In addition, the value of debt securities may decline due to general market conditions that are not specifically related to a particular issuer, such as real or perceived adverse economic conditions, changes in outlook
49
NOTES TO FINANCIAL STATEMENTS (continued)
for corporate earnings, changes in interest or currency rates or adverse investor sentiment. They may also decline because of factors that affect a particular industry.
(e) Dividends and distributions to shareholders: Dividends and distributions payable to shareholders are recorded by each fund on the ex-dividend date. The funds normally declare and pay dividends from investment income-net monthly. Dividends from net realized capital gains, if any, are normally declared and paid annually, but each fund may make distributions on a more frequent basis to comply with the distribution requirements of the Internal Revenue Code of 1986, as amended (the “Code”). To the extent that net realized capital gains can be offset by capital loss carryovers of a fund, it is the policy of each fund not to distribute such gains. Income and capital gain distributions are determined in accordance with income tax regulations, which may differ from GAAP.
(f) Federal income taxes: It is the policy of each fund to continue to qualify as a regulated investment company, if such qualification is in the best interests of its shareholders, by complying with the applicable provisions of the Code, and to make distributions of taxable income sufficient to relieve it from substantially all federal income and excise taxes. For federal income tax purposes, each fund is treated as a separate entity for the purpose of determining such qualification.
As of and during the period ended August 31, 2017, the funds did not have any liabilities for any uncertain tax positions. Each fund recognizes interest and penalties, if any, related to uncertain tax positions as income tax expense in the Statements of Operations. During the period ended August 31, 2017, the funds did not incur any interest or penalties.
Each tax year in the four-year period ended August 31, 2017 remains subject to examination by the Internal Revenue Service and state taxing authorities.
Table 3 summarizes each fund’s components of accumulated earnings on a tax basis at August 31, 2017.
Under the Regulated Investment Company Modernization Act of 2010 (the “2010 Act”), each fund is permitted to carry forward capital losses incurred in taxable years beginning after December 22, 2010 (“post-enactment losses”) for an unlimited period. Furthermore, post-enactment capital loss carryovers retain their character as either short-term or long-term capital losses rather than short-term as they were under previous statute. The 2010 Act requires post-enactment losses to be utilized before the utilization of losses incurred in taxable years prior to the effective date of the 2010 Act (“pre-enactment losses”). As a result of this ordering rule, pre-enactment losses may be more likely to expire unused.
Table 4 summarizes each relevant fund’s accumulated capital loss carryover available for federal income tax purposes to be applied against future net realized capital gains, if any, realized subsequent to August 31, 2017.
Table 5 summarizes each fund’s tax character of distributions paid to shareholders during the fiscal periods ended August 31, 2017 and August 31, 2016.
During the period ended August 31, 2017, as a result of permanent book to tax differences, each fund increased accumulated undistributed investment income–net and decreased accumulated net realized gain (loss) on investments as summarized in Table 6. These permanent book to tax differences are primarily due to the tax treatment for dividend reclassification, amortization of premiums and paydown gains and losses on mortgage-backed securities for BNY Mellon Bond Fund and BNY Mellon Intermediate Bond Fund, amortization of premiums for BNY Mellon Corporate Bond Fund and amortization of premiums and paydown gains and losses on mortgage-backed securities for BNY Mellon Short–Term U.S. Government Securities Fund. Net assets and net asset value per share were not affected by these reclassifications.
Table 3—Components of Accumulated Earnings | |||||||
Undistributed | Accumulated | Unrealized | Capital (Losses) | ||||
BNY Mellon Bond Fund | 336,907 | - | 21,893,442 | (6,568,786) | |||
BNY Mellon Intermediate Bond Fund | 263,079 | (9,898,015) | 8,218,005 | - | |||
BNY Mellon Corporate Bond Fund | 618,905 | (11,167,321) | 23,705,409 | - | |||
BNY Mellon Short-Term U.S. Government Securities Fund | 88,388 | (12,611,252) | (828,248) | - | |||
† These losses were deferred for tax purposes to the first day of the following fiscal year.
50
Table 4—Capital Loss Carryover | ||||||||||
Expiring in fiscal year | Post-Enactment | †† | Post-Enactment | |||||||
2018 ($) | † | 2019 ($) | † | ††† | Total($) | |||||
BNY Mellon Intermediate Bond Fund | - | - | 5,167,502 | 4,730,513 | 9,898,015 | |||||
BNY Mellon Corporate Bond Fund | - | - | 3,261,008 | 7,906,313 | 11,167,321 | |||||
BNY Mellon Short-Term U.S. Government Securities Fund | 28,528 | 64,834 | 7,051,956 | 5,465,934 | 12,611,252 | |||||
† If not applied, the carryovers expire in the above fiscal years.
†† Post-enactment short-term losses which can be carried forward for an unlimited period.
††† Post-enactment long-term losses which can be carried forward for an unlimited period.
Table 5—Tax Character of Distributions Paid | |||||||||||||
2017 | 2016 | ||||||||||||
| Ordinary Income ($) | Long-Term |
| Ordinary Income ($) | Long-Term | ||||||||
BNY Mellon Bond Fund | 29,026,163 | 2,196,746 | 28,416,421 | - | |||||||||
BNY Mellon Intermediate Bond Fund | 18,053,792 | - | 17,737,759 | - | |||||||||
BNY Mellon Corporate Bond Fund | 29,537,945 | - | 28,058,163 | - | |||||||||
BNY Mellon Short-Term U.S. Government Securities Fund | 1,989,320 | - | 2,062,940 | - | |||||||||
Table 6—Return of Capital Statement of Position | |||||
| Accumulated | Accumulated | |||
BNY Mellon Bond Fund | 3,597,014 | (3,597,014) | |||
BNY Mellon Intermediate Bond Fund | 2,887,771 | (2,887,771) | |||
BNY Mellon Corporate Bond Fund | 3,170,153 | (3,170,153) | |||
BNY Mellon Short-Term U.S. Government Securities Fund | 656,837 | (656,837) | |||
NOTE 2—Bank Lines of Credit:
The funds participate with other Dreyfus-managed funds in an $810 million unsecured credit facility led by Citibank, N.A. and a $300 million unsecured credit facility provided by The Bank of New York Mellon (each, a “Facility”), each to be utilized primarily for temporary or emergency purposes, including the financing of redemptions. Prior to October 5, 2016, the unsecured credit facility with Citibank, N.A. was $555 million. In connection therewith, each fund has agreed to pay its pro rata portion of commitment fees for each Facility. Interest is charged to the funds based on rates determined pursuant to the terms of the respective Facility at the time of borrowing. During the period ended August 31, 2017, BNY Mellon Bond Fund, BNY Mellon Intermediate Bond Fund and BNY Mellon Short-Term U.S. Government Securities Fund did not borrow under the Facilities.
The average amount of borrowings outstanding under the Facilities during the period ended August 31, 2017 for BNY Mellon Corporate Bond Fund was approximately $3,600, with a related weighted average annualized interest rate of 1.64%.
NOTE 3—Investment Advisory Fee, Administration Fee and Other Transactions with Affiliates:
(a) Fees payable by the funds pursuant to the provisions of an investment advisory agreement with the Investment Adviser are payable monthly, computed on the average daily value of each fund’s net assets at the following annual rates: .40% of BNY Mellon Bond Fund, .40% of BNY Mellon Intermediate Bond Fund, .40% of BNY Mellon Corporate Bond Fund and .35% of BNY Mellon Short-Term U.S. Government Securities Fund.
51
NOTES TO FINANCIAL STATEMENTS (continued)
Pursuant to the Administration Agreement, The Bank of New York Mellon provides or arranges for fund accounting, transfer agency and other fund administration services and receives a fee based on the total net assets of the Trust based on the following rates:
0 up to $6 billion .15%
$6 billion up to $12 billion .12%
In excess of $12 billion .10%
(b) Each fund has adopted a Shareholder Services Plan with respect to its Investor shares. Each fund pays the Distributor at an annual rate of .25% of the value of its Investor shares average daily net assets for the provision of certain services. The services provided may include personal services relating to shareholder accounts, such as answering shareholder inquiries regarding a fund and providing reports and other information, and services related to the maintenance of such shareholder accounts. The Shareholder Services Plan allows the Distributor to make payments from the shareholder services fees it collects from each fund to compensate service agents (certain banks, securities brokers or dealers and other financial institutions) with respect to these services. Table 7 summarizes the amounts Investor shares were charged during the period ended August 31, 2017, pursuant to the Shareholder Services Plan. Additional fees included in Shareholder servicing costs in the Statements of Operations primarily include fees paid for cash management charges.
Table 7—Shareholder Services Plan Fees |
|
BNY Mellon Bond Fund | $21,453 |
BNY Mellon Intermediate Bond Fund | 17,184 |
BNY Mellon Corporate Bond Fund | 6,735 |
BNY Mellon Short-Term | 4,540 |
The funds have arrangements with the transfer agent and the custodian whereby the funds may receive earnings credits when positive cash balances are maintained, which are used to offset transfer agency and custody fees. For financial reporting purposes, the funds include net earnings credits as expense offsets in the Statements of Operations.
Each fund compensates Dreyfus Transfer, Inc., a wholly-owned subsidiary of Dreyfus, under a transfer agency agreement for providing transfer agency and cash management services for the funds. The majority of transfer agency fees are comprised of amounts paid on a per account basis, while cash management fees are related to fund subscriptions and redemptions. The Bank of New York Mellon pays each fund’s transfer agent fees out of the administration fee it receives from the Trust. Table 8 summarizes the amount each fund was charged during the period ended August 31, 2017 for cash management services, which is included in Shareholder servicing costs in the Statements of Operations. Cash management fees were partially offset by earnings credits, also summarized in Table 8.
Each fund compensates The Bank of New York Mellon, under a custody agreement for providing custodial services for each fund. These fees are determined based on net assets, geographic region and transaction activity. Table 9 summarizes the amount each fund was charged during the period ended August 31, 2017 pursuant to the custody agreement. These fees were offset by earnings credits for each relevant fund, also summarized in Table 9.
Table 8—Cash Management Agreement Fees | ||||
| Dreyfus Transfer, Inc. | Dreyfus Transfer, Inc. | ||
BNY Mellon Bond Fund | 269 | (265) | ||
BNY Mellon Intermediate Bond Fund | 224 | (220) | ||
BNY Mellon Corporate Bond Fund | 58 | (58) | ||
BNY Mellon Short-Term U.S. Government Securities Fund | 60 | (59) | ||
52
Table 9—Custody Agreement Fees |
| |
Custody fees ($) | Earnings Credits ($) | |
BNY Mellon Bond Fund | 75,702 | - |
BNY Mellon Intermediate Bond Fund | 64,232 | (616) |
BNY Mellon Corporate Bond Fund | 61,513 | (217) |
BNY Mellon Short-Term U.S. Government Securities Fund | 18,603 | (73) |
Each fund compensates The Bank of New York Mellon under a shareholder redemptions draft processing agreement for providing certain services related to the funds’ check writing privilege. Table 10 summarizes the amount each fund was charged during the period ended August 31, 2017 for cash management services, which is included in Shareholder servicing costs in the Statements of Operations.
Table 10—The Bank of New York Mellon Cash Management Fees |
|
BNY Mellon Bond Fund | $89 |
BNY Mellon Intermediate Bond Fund | 127 |
BNY Mellon Corporate Bond Fund | 24 |
BNY Mellon Short-Term | 19 |
During the period ended August 31, 2017, each fund was charged $11,281 for services performed by the Chief Compliance Officer and his staff.
Table 11 summarizes the components of “Due to The Dreyfus Corporation and affiliates” in the Statements of Assets and Liabilities for each fund.
(c) Each Board member also serves as a Board member of other funds within the Trust. Annual retainer fees and attendance fees are allocated to each fund based on net assets.
NOTE 4—Securities Transactions:
Table 12 summarizes each fund’s aggregate amount of purchases and sales (including paydowns) of investment securities, excluding short-term securities during the period ended August 31, 2017.
Table 13 summarizes the cost of investments for federal income tax purposes, gross appreciation, gross depreciation and accumulated net unrealized appreciation (depreciation) on investments for each fund at August 31, 2017.
Table 11—Due to The Dreyfus Corporation and Affiliates | ||||||||
| Investment | Shareholder | Custodian | Chief | ||||
BNY Mellon Bond Fund | 341,618 | 1,817 | 24,400 | 4,670 | ||||
BNY Mellon Intermediate Bond Fund | 286,116 | 1,486 | 20,400 | 4,670 | ||||
BNY Mellon Corporate Bond Fund | 265,548 | 608 | 20,000 | 4,670 | ||||
BNY Mellon Short-Term U.S. Government Securities Fund | 50,829 | 392 | 5,600 | 4,670 | ||||
Table 12—Purchases and Sales | ||||||||
| Purchases ($) | Sales ($) | ||||||
BNY Mellon Bond Fund | 725,255,725 | 737,682,622 | ||||||
BNY Mellon Intermediate Bond Fund | 415,210,986 | 436,919,634 | ||||||
BNY Mellon Corporate Bond Fund | 261,990,025 | 330,455,638 | ||||||
BNY Mellon Short-Term U.S. Government Securities Fund | 129,071,447 | 169,427,329 | ||||||
53
NOTES TO FINANCIAL STATEMENTS (continued)
Table 13—Accumulated Net Unrealized Appreciation (Depreciation) | ||||||||
| Cost of | Gross | Gross | Net ($) | ||||
BNY Mellon Bond Fund | 987,904,196 | 28,995,214 | 7,101,772 | 21,893,442 | ||||
BNY Mellon Intermediate Bond Fund | 836,590,220 | 14,607,032 | 6,389,027 | 8,218,005 | ||||
BNY Mellon Corporate Bond Fund | 788,232,162 | 31,640,073 | 7,934,664 | 23,705,409 | ||||
BNY Mellon Short-Term U.S. Government Securities Fund | 173,780,650 | 143,350 | 971,598 | (828,248) | ||||
54
REPORT OF INDEPENDENT REGISTERED
PUBLIC ACCOUNTING FIRM
The Board of Trustees and Shareholders
BNY Mellon Funds Trust
We have audited the accompanying statements of assets and liabilities of BNY Mellon Bond Fund, BNY Mellon Intermediate Bond Fund, BNY Mellon Corporate Bond Fund and BNY Mellon Short-Term U.S. Government Securities Fund (collectively the “Funds”), each a series of BNY Mellon Funds Trust, including the statements of investments and investments in affiliated issuers, as of August 31, 2017, and the related statements of operations for the year then ended, the statements of changes in net assets for each of the years in the two-year period then ended and the financial highlights for each of the years in the five-year period then ended. These financial statements and financial highlights are the responsibility of the Funds’ management. Our responsibility is to express an opinion on these financial statements and financial highlights based on our audits.
We conducted our audits in accordance with the standards of the Public Company Accounting Oversight Board (United States). Those standards require that we plan and perform the audit to obtain reasonable assurance about whether the financial statements and financial highlights are free of material misstatement. An audit includes examining, on a test basis, evidence supporting the amounts and disclosures in the financial statements. Our procedures included confirmation of securities
owned as of August 31, 2017, by correspondence with the custodian and brokers or by other appropriate auditing procedures. An audit also includes assessing the accounting principles used and significant estimates made by management, as well as evaluating the overall financial statement presentation. We believe that our audits provide a reasonable basis for our opinion.
In our opinion, the financial statements and financial highlights referred to above present fairly, in all material respects, the financial position of the aforementioned funds, as of August 31, 2017, the results of their operations for the year then ended, the changes in their net assets for each of the years in the two-year period then ended and the financial highlights for each of the years in the five-year period then ended, in conformity with U.S. generally accepted accounting principles.

New York, New York
October 27, 2017
55
IMPORTANT TAX INFORMATION (Unaudited)
BNY Mellon Bond Fund
For federal tax purposes, the fund designates the maximum amount allowable but not less than 88.29% as interest-related dividends in accordance with Sections 871(k)(1) and 881(e) of the Internal Revenue Code. Also, the fund reports the maximum amount allowable but not less than $.0277 per share as a capital gain dividend paid on December 8, 2016 in accordance with Section 852(b)(3)(C) of the Internal Revenue Code. Also, the fund reports the maximum amount allowable but not less than $.0020 as a short-term capital gain dividend paid on December 8, 2016 in accordance with Sections 871(k)(2) and 881(e) of the Internal Revenue Code.
BNY Mellon Intermediate Bond Fund
For federal tax purposes, the fund designates the maximum amount allowable but not less than 81.26% as interest-related dividends in accordance with Sections 871(k)(1) and 881(e) of the Internal Revenue Code.
BNY Mellon Corporate Bond Fund
For federal tax purposes, the fund reports the maximum amount allowable but not less than 76.92% as interest-related dividends in accordance with Sections 871(k)(1) and 881(e) of the Internal Revenue Code.
BNY Mellon Short-Term U.S. Government Securities Fund
For federal tax purposes, the fund reports the maximum amount allowable but not less than 100% as interest-related dividends in accordance with Sections 871(k)(1) and 881(e) of the Internal Revenue Code.
56
INFORMATION ABOUT THE RENEWAL OF EACH FUND’S INVESTMENT ADVISORY AGREEMENT AND ADMINISTRATION AGREEMENT (Unaudited)
At a meeting of the Trust’s Board of Trustees held on March 6-7, 2017, the Board considered the renewal of the Trust’s Investment Advisory Agreement and Administration Agreement (together, the “Agreement”), pursuant to which BNY Mellon Fund Advisers, a division of Dreyfus, provides the funds with investment advisory services and The Bank of New York Mellon provides the funds with administrative services. The Bank of New York Mellon has entered into a Sub-Administration Agreement with Dreyfus pursuant to which The Bank of New York Mellon pays Dreyfus for performing certain of these administrative services. The Board members, none of whom are “interested persons” (as defined in the Investment Company Act of 1940, as amended) of the Trust, were assisted in their review by independent legal counsel and met with counsel in executive session separate from Dreyfus representatives. In considering the renewal of the Agreement, the Board considered all factors that it believed to be relevant, including those discussed below. The Board did not identify any one factor as dispositive, and each Board member may have attributed different weights to the factors considered.
Analysis of Nature, Extent, and Quality of Services Provided to the Funds. The Board considered information provided to them at the meeting and in previous presentations from Dreyfus representatives regarding the nature, extent, and quality of the services provided to the funds. Dreyfus provided the number of open accounts in each fund, each fund’s asset size and the allocation of fund assets among distribution channels. Dreyfus also had previously provided information regarding the diverse intermediary relationships and distribution channels of the funds (such as retail direct or intermediary, in which intermediaries typically are paid by the fund and/or Dreyfus) and Dreyfus’ corresponding need for broad, deep, and diverse resources to be able to provide ongoing shareholder services to each intermediary or distribution channel, as applicable to each fund.
The Board also considered research support available to, and portfolio management capabilities of, each fund’s portfolio management personnel and that Dreyfus also provides oversight of day-to-day fund operations, including fund accounting and administration and assistance in meeting legal and regulatory requirements. The Board also considered Dreyfus’ extensive administrative, accounting and compliance infrastructures.
Comparative Analysis of the Funds’ Performance and Management Fees and Expense Ratios. The Board reviewed reports prepared by Broadridge Financial Solutions, Inc. (“Broadridge”), an independent provider of investment company data, which included information comparing (1) each fund’s performance with the performance of a group of comparable funds (the “Performance Group”) and with a broader group of funds (the “Performance Universe”), all for various periods ended December 31, 2016, and (2) each fund’s actual and contractual management fees and total expenses with those of a group of comparable funds (the “Expense Group”) and with a broader group of funds (the “Expense Universe”), the information for which was derived in part from fund financial statements available to Broadridge as of the date of its analysis. Dreyfus previously had furnished the Board with a description of the methodology Broadridge used to select the Performance Group and Performance Universe and the Expense Group and Expense Universe.
Dreyfus representatives stated that the usefulness of performance comparisons may be affected by a number of factors, including different investment limitations that may be applicable to each fund and comparison funds. They also considered that performance generally should be considered over longer periods of time, although it is possible that long-term performance can be adversely affected by even one period of significant underperformance so that a single investment decision or theme has the ability to affect disproportionately long-term performance.
As applicable to each fund, Dreyfus representatives reviewed with the Board the management or investment advisory fees (1) paid by funds advised or administered by Dreyfus that are in the same Broadridge category as the fund and (2) paid to Dreyfus or the Dreyfus-affiliated primary employer of the fund’s primary portfolio manager(s) for advising any separate accounts and/or other types of client portfolios that are considered to have similar investment strategies and policies as the fund (the “Similar Clients”), and explained the nature of the Similar Clients. They discussed differences in fees paid and the relationship of the fees paid in light of any differences in the services provided and other relevant factors. The Board considered the relevance of the fee information provided for the Similar Clients to evaluate the appropriateness of the fund’s management fee.
BNY Mellon Bond Fund
The Board discussed the results of the comparisons and considered that the fund’s total return performance was below the Performance Group medians for all periods , except for the two- and ten-year periods, when the fund’s performance was above the Performance Universe medians. The Board also considered that the fund’s yield performance was at or above the Performance Group medians for nine of the ten one-year periods and above the Performance Universe medians for nine of the ten one-year periods ended December 31st. Dreyfus also provided a comparison of the fund’s calendar year total returns to the returns of the fund’s
57
INFORMATION ABOUT THE RENEWAL OF EACH FUND’S INVESTMENT ADVISORY AGREEMENT AND ADMINISTRATION AGREEMENT (Unaudited) (continued)
benchmark index and the Board considered that the fund had outperformed its benchmark index in four of the past ten calendar years. The Board also received a presentation from a primary portfolio manager of the fund regarding the factors that had influenced the fund’s performance results, including the fact that the fund typically held higher quality securities than those held by some of the funds in the Performance Group. The Board also received a presentation from a primary portfolio manager of the fund regarding the factors that had influenced the fund’s performance results, including the fact that the fund typically held higher quality securities than those held by some of the funds in the Performance Group.
The Board also reviewed the range of actual and contractual management fees and total expenses of the Expense Group and Expense Universe funds and discussed the results of the comparisons. The Board considered that the fund’s contractual management fee was above the Expense Group median, the fund’s actual management fee was above the Expense Group and Expense Universe medians and the fund’s total expenses were above the Expense Group median and below the Expense Universe median.
BNY Mellon Intermediate Bond Fund
The Board discussed the results of the comparisons and considered that the fund’s total return performance was below the Performance Group and Performance Universe medians for all periods, except for the three- and ten-year periods, when the fund’s performance was above the Performance Universe medians. The Board also considered that the fund’s yield performance was at or above the Performance Group medians for eight of the ten one-year periods and above the Performance Universe medians for each of the ten one-year periods ended December 31st. The Board considered the proximity of the fund’s total return to the Performance Group and/or Performance Universe median for certain periods in which the fund’s performance was below median. Dreyfus also provided a comparison of the fund’s calendar year total returns to the returns of the fund’s benchmark index and the Board considered that the fund had outperformed its benchmark index in five of the past ten calendar years.
The Board also reviewed the range of actual and contractual management fees and total expenses of the Expense Group and Expense Universe funds and discussed the results of the comparisons. The Board considered that the fund’s contractual management fee was above the Expense Group median, the fund’s actual management fee was above the Expense Group and Expense Universe medians and the fund’s total expenses were above the Expense Group and Expense Universe medians.
BNY Mellon Corporate Bond Fund
The Board discussed the results of the comparisons and considered that the fund’s total return performance was above the Performance Group and Performance Universe medians for all periods since the fund commenced operations except the three- and four-year periods, when the fund’s performance was below the Performance Group medians. The Board also considered that the fund’s yield performance was below the Performance Group medians for three of the past four one-year periods and above the Performance Universe medians for two of the past four one-year periods ended December 31st. Dreyfus also provided a comparison of the fund’s calendar year total returns to the returns of the fund’s benchmark index and the Board considered that the fund had outperformed its benchmark index in two of the past four calendar years.
The Board also reviewed the range of actual and contractual management fees and total expenses of the Expense Group and Expense Universe funds and discussed the results of the comparisons. The Board considered that the fund’s contractual management fee was above the Expense Group median, the fund’s actual management fee was above the Expense Group and Expense Universe medians and the fund’s total expenses were slightly above the Expense Group median and below the Expense Universe median.
BNY Mellon Short-Term U.S. Government Securities Fund
The Board discussed the results of the comparisons and considered that the fund’s total return performance was at or below the Performance Group and Performance Universe medians for all periods. The Board also considered that the fund’s yield performance was at or above the Performance Group medians for four of the ten one-year periods and above the Performance Universe medians for each of the ten one-year periods ended December 31st. Dreyfus also provided a comparison of the fund’s calendar year total returns to the returns of the fund’s benchmark index.
The Board also reviewed the range of actual and contractual management fees and total expenses of the Expense Group and Expense Universe funds and discussed the results of the comparisons. The Board considered that the fund’s contractual management fee was at the Expense Group median, the fund’s actual management fee was above the Expense Group and Expense Universe medians and the fund’s total expenses were at the Expense Group median and below the Expense Universe median.
58
Analysis of Profitability and Economies of Scale. Dreyfus representatives reviewed the expenses allocated and profit received by Dreyfus and its affiliates and the resulting profitability percentage for managing each fund and the aggregate profitability percentage to Dreyfus and its affiliates for managing the fund complex, and the method used to determine the expenses and profit. The Board concluded that the profitability results were not unreasonable, given the services rendered and service levels provided by Dreyfus. The Board also had been provided with information prepared by an independent consulting firm regarding Dreyfus’ approach to allocating costs to, and determining the profitability of, individual funds and the entire Dreyfus fund complex. The consulting firm also had analyzed where any economies of scale might emerge in connection with the management of the funds.
The Board considered, on the advice of its counsel, the profitability analysis (1) as part of its evaluation of whether the fees under the Agreement, considered in relation to the mix of services provided by Dreyfus, including the nature, extent and quality of such services, supported the renewal of the Agreement and (2) in light of the relevant circumstances for the fund and the extent to which economies of scale would be realized if the fund grows and whether fee levels reflect these economies of scale for the benefit of fund shareholders. Dreyfus representatives stated that a discussion of economies of scale is predicated on a fund having achieved a substantial size with increasing assets and that, if a fund’s assets had been stable or decreasing, the possibility that Dreyfus may have realized any economies of scale would be less. Dreyfus representatives also stated that, as a result of shared and allocated costs among funds in the Dreyfus fund complex, the extent of economies of scale could depend substantially on the level of assets in the complex as a whole, so that increases and decreases in complex-wide assets can affect potential economies of scale in a manner that is disproportionate to, or even in the opposite direction from, changes in a fund’s asset level. The Board also considered potential benefits to Dreyfus from acting as investment adviser and took into consideration that there were no soft dollar arrangements in effect for trading each fund’s investments.
At the conclusion of these discussions, the Board agreed that it had been furnished with sufficient information to make an informed business decision with respect to the renewal of the Agreement. Based on the discussions and considerations as described above, the Board concluded and determined as follows.
· The Board concluded that the nature, extent and quality of the services provided by Dreyfus to each fund are adequate and appropriate.
· With respect to BNY Mellon Bond Fund and BNY Mellon Intermediate Bond Fund, the Board generally was satisfied with each fund’s yield performance in light of the considerations described above with respect to total return performance.
· With respect to BNY Mellon Corporate Bond Fund, the Board generally was satisfied with the fund’s overall performance.
· With respect to BNY Mellon Short-Term U.S. Government Securities Fund, while the Board was concerned with the fund’s performance, the Board expressed confidence in the fund’s strategy and portfolio managers and agreed to closely monitor performance.
· The Board concluded that the fee paid to Dreyfus by each fund supported the renewal of the Agreement in light of the considerations described above.
· The Board determined that the economies of scale which may accrue to Dreyfus and its affiliates in connection with the management of the funds had been adequately considered by Dreyfus in connection with the fee rate charged to each fund pursuant to the Agreement and that, to the extent in the future it were determined that material economies of scale had not been shared with a fund, the Board would seek to have those economies of scale shared with the fund.
In evaluating the Agreement, the Board considered these conclusions and determinations and also relied on its previous knowledge, gained through meetings and other interactions with Dreyfus and its affiliates, of Dreyfus and the services provided to the funds by Dreyfus. The Board also relied on information received on a routine and regular basis throughout the year relating to the operations of each fund and the investment management and other services provided under the Agreement, including information on the investment performance of each fund in comparison to similar mutual funds and benchmark performance indices; general market outlook as applicable to each fund; and compliance reports. In addition, the Board’s consideration of the contractual fee arrangements for each fund had the benefit of a number of years of reviews of prior or similar agreements during which lengthy discussions took place between the Board and Dreyfus representatives. Certain
59
INFORMATION ABOUT THE RENEWAL OF EACH FUND’S INVESTMENT ADVISORY AGREEMENT AND ADMINISTRATION AGREEMENT (Unaudited) (continued)
aspects of the arrangements may receive greater scrutiny in some years than in others, and the Board’s conclusions may be based, in part, on their consideration of the same or similar arrangements in prior years. The Board determined to renew the Agreement.
60
BOARD MEMBERS INFORMATION (Unaudited)
INDEPENDENT BOARD MEMBERS
Chairman of the Board (2000)
Principal Occupation During Past 5 Years:
Attorney, Cozen and O’Connor, P.C. since 1973, including Vice Chairman since 1980 and Chief Executive Officer and President from 2002 to 2007
No. of Portfolios for which Board Member Serves: 25
———————
John R. Alchin (69)
Board Member (2008)
Principal Occupation During Past 5 Years:
· Retired since 2007
· Executive of Comcast Corporation, a cable services provider, from 1990 to 2007, including Executive Vice-President, Co-Chief Financial Officer and Treasurer, from 2002 to 2007
Other Public Company Board Memberships During Past 5 Years:
· Polo Ralph Lauren Corporation, a retail clothing and home furnishing company, Director (2007-present)
No. of Portfolios for which Board Member Serves: 25
———————
Ronald R. Davenport (81)
Board Member (2000)
Principal Occupation During Past 5 Years:
· Chairman of Sheridan Broadcasting Corporation since July 1972
No. of Portfolios for which Board Member Serves: 25
———————
Jack Diederich (80)
Board Member (2000)
Principal Occupation During Past 5 Years:
· Retired; Executive Vice President—Chairman’s Counsel of Alcoa Inc. from 1991 to 1997
No. of Portfolios for which Board Member Serves: 25
———————
Kim D. Kelly (61)
Board Member (2008)
Principal Occupation During Past 5 Years:
· Consultant since 2005
· Chief Restructuring Officer of Allegiance Communications LLC from August 2011 to January 2013
Other Public Company Board Memberships During Past 5 Years:
· MCG Capital Corporation, a business development company, Director (2004-2015)
· Broadview Network Holdings, Inc.-Director and Chair (2011-2012)
No. of Portfolios for which Board Member Serves: 25
———————
Kevin C. Phelan (73)
Board Member (2000)
Principal Occupation During Past 5 Years:
· Mortgage Banker, Colliers International since March 1978, including,
Co-Chairman since 2010, President since 2007 and Executive Vice President and Director from March 1998 to September 2007
No. of Portfolios for which Board Member Serves: 25
———————
Patrick J. Purcell (69)
Board Member (2000)
Principal Occupation During Past 5 Years:
· Owner, President and Publisher of the Boston Herald since February 1994
President and Founder, jobfind.com, an employment search site on the world wide web, since July 1996
· President and Chief Executive Officer, Herald Media since 2001
No. of Portfolios for which Board Member Serves: 25
———————
Thomas F. Ryan, Jr. (76)
Board Member (2000)
Principal Occupation During Past 5 Years:
· Retired since April 1999
President and Chief Operating Officer of the American Stock Exchange from October 1995 to April 1999
Other Public Company Board Memberships During Past 5 Years:
· RepliGen Corporation, a biopharmaceutical company, Director (2002-present)
No. of Portfolios for which Board Member Serves: 25
———————
Maureen M. Young (72)
Board Member (2000)
Principal Occupation During Past 5 Years:
· Retired since 2007
Director of the Office of Government Relations at Carnegie Mellon University from January 2000 to December 2007
No. of Portfolios for which Board Member Serves: 25
———————
Once elected all Board Members serve for an indefinite term. The address of the Board Members and Officers is c/o The Dreyfus Corporation, 200 Park Avenue, New York, New York 10166. Additional information about the Board Members is available in the fund’s Statement of Additional Information which can be obtained from Dreyfus free of charge by calling this toll free number: 1-800-DREYFUS. For individual account holders for Private Wealth Management clients, please contact your account officer or call 1-866-804-5023.
61
OFFICERS OF THE TRUST (Unaudited)
PATRICK T. CROWE, President since July 2015.
National Director of Investment Advisory, Analytics and Solutions for BNY Mellon Wealth Management since July 2014; from July 2007 to July 2014, Managing Director for BNY Mellon Wealth Management's Tri-State region, comprising New York, New Jersey and Southern Connecticut. He is 53 years old and has served in various capacities with BNY Mellon since 1993.
BENNETT A. MACDOUGALL, Chief Legal Officer since October 2015.
Chief Legal Officer of the Manager and Associate General Counsel and Managing Director of BNY Mellon since June 2015; from June 2005 to June 2015, he served in various capacities with Deutsche Bank – Asset & Wealth Management Division, including as Director and Associate General Counsel, and Chief Legal Officer of Deutsche Investment Management Americas Inc. from June 2012 to May 2015. He is an officer of 64 investment companies (comprised of 155 portfolios) managed by the Manager. He is 44 years old and has been an employee of the Manager since June 2015.
JANETTE E. FARRAGHER, Vice President and Secretary since December 2011.
Associate General Counsel of BNY Mellon, and an officer of 64 investment companies (comprised of 155 portfolios) managed by the Manager. She is 54 years old and has been an employee of the Manager since February 1984.
JAMES BITETTO, Vice President and Assistant Secretary since August 2005.
Managing Counsel of BNY Mellon and Secretary of the Manager, and an officer of 64 investment companies (comprised of 155 portfolios) managed by the Manager. He is 51 years old and has been an employee of the Manager since December 1996.
JOSEPH M. CHIOFFI, Vice President and Assistant Secretary since August 2005.
Managing Counsel of BNY Mellon, and an officer of 64 investment companies (comprised of 155 portfolios) managed by the Manager. He is 55 years old and has been an employee of the Manager since June 2000.
MAUREEN E. KANE, Vice President and Assistant Secretary since April 2015.
Managing Counsel of BNY Mellon since July 2014; from October 2004 until July 2014, General Counsel, and from May 2009 until July 2014, Chief Compliance Officer of Century Capital Management. She is an officer of 64 investment companies (comprised of 155 portfolios) managed by the Manager. She is 55 years old and has been an employee of the Manager since July 2014.
SARAH S. KELLEHER, Vice President and Assistant Secretary since April 2014.
Senior Counsel of BNY Mellon, since March 2013 from August 2005 to March 2013, Associate General Counsel of Third Avenue Management. She is an officer of 64 investment companies (comprised of 155 portfolios) managed by the Manager. She is 40 years old and has been an employee of the Manager since March 2013.
JEFF PRUSNOFSKY, Vice President and Assistant Secretary since August 2015.
Senior Managing Counsel of BNY Mellon, and an officer of 64 investment companies (comprised of 155 portfolios) managed by the Manager. He is 52 years old and has been an employee of the Manager since October 1990.
NATALYA ZELENSKY, Vice President and Assistant Secretary since May 2016.
Counsel and Vice President of BNY Mellon since May 2016; Attorney at Wildermuth Endowment Strategy Fund/Wildermuth Advisory, LLC from November 2015 until May 2016; Assistant General Counsel at RCS Advisory Services from July 2014 until November 2015; Associate at Sutherland, Asbill & Brennan from January 2013 until January 2014; Associate at K&L Gates from October 2011 until January 2013. She is an officer of 64 investment companies (comprised of 155 portfolios) managed by Dreyfus. She is 32 years old and has been an employee of the Manager since May 2016.
JAMES WINDELS, Treasurer since November 2001.
Director – Mutual Fund Accounting of the Manager, and an officer of 64 investment companies (comprised of 155 portfolios) managed by the Manager. He is 58 years old and has been an employee of the Manager since April 1985.
RICHARD CASSARO, Assistant Treasurer since January 2008.
Senior Accounting Manager – Money Market, Municipal Bond and Equity Funds of the Manager, and an officer of 64 investment companies (comprised of 155 portfolios) managed by the Manager. He is 58 years old and has been an employee of the Manager since September 1982.
GAVIN C. REILLY, Assistant Treasurer since December 2005.
Tax Manager of the Investment Accounting and Support Department of the Manager, and an officer of 64 investment companies (comprised of 155 portfolios) managed by the Manager. He is 49 years old and has been an employee of the Manager since April 1991.
ROBERT S. ROBOL, Assistant Treasurer since December 2002.
Senior Accounting Manager Dreyfus Financial Reporting of the Manager, and an officer of 64 investment companies (comprised of 155 portfolios) managed by the Manager. He is 53 years old and has been an employee of the Manager since October 1988.
ROBERT SALVIOLO, Assistant Treasurer since July 2007.
Senior Accounting Manager – Equity Funds of the Manager, and an officer of 64 investment companies (comprised of 155 portfolios) managed by the Manager. He is 50 years old and has been an employee of the Manager since June 1989.
ROBERT SVAGNA, Assistant Treasurer since December 2002.
Senior Accounting Manager – Fixed Income and Equity Funds of the Manager, and an officer of 64 investment companies (comprised of 155 portfolios) managed by the Manager. He is 50 years old and has been an employee of the Manager since November 1990.
JOSEPH W. CONNOLLY, Chief Compliance Officer since October 2004.
Chief Compliance Officer of the Manager and The Dreyfus Family of Funds (64 investment companies, comprised of 155 portfolios). He is 60 years old and has served in various capacities with the Manager since 1980, including manager of the firm’s Fund Accounting Department from 1997 through October 2001.
CARIDAD M. CAROSELLA, Ant-Money Laudering Compliance Officer January 2016.
Anti-Money Laundering Compliance Officer of the Dreyfus Family of Funds and BNY Mellon Funds Trust since January 2016; from May 2015 to December 2015, Interim Anti-Money Laundering Compliance Officer of the Dreyfus Family of Funds and BNY Mellon Funds Trust and the Distributor; from January 2012 to May 2015, AML Surveillance Officer of the Distributor and from 2007 to December 2011, Financial Processing Manager of the Distributor. She is an officer of 59 investment companies (comprised of 150 portfolios) managed by the Manager. She is 49 years old and has been an employee of the Distributor since 1997.
62
NOTES
63
The BNY Mellon Funds
c/o The Dreyfus Corporation
200 Park Avenue
New York, NY 10166
Investment Adviser
BNY Mellon Fund Advisers, a division of
The Dreyfus Corporation
200 Park Avenue
New York, NY 10166
Administrator
The Bank of New York Mellon
225 Liberty Street
New York, NY 10286
Sub-Administrator
The Dreyfus Corporation
200 Park Avenue
New York, NY 10166
Custodian
The Bank of New York Mellon
225 Liberty Street
New York, NY 10286
Transfer Agent &
Dividend Disbursing Agent
Dreyfus Transfer, Inc.
200 Park Avenue
New York, NY 10166
Distributor
MBSC Securities Corporation
200 Park Avenue
New York, NY 10166
Ticker Symbols: | |||||||
BNY Mellon Bond Fund | Class M: MPBFX | Investor: MIBDX | |||||
BNY Mellon Intermediate Bond Fund | Class M: MPIBX | Investor: MIIDX | |||||
BNY Mellon Corporate Bond Fund | Class M: BYMMX | Investor: BYMIX | |||||
BNY Mellon Short-Term U.S. Government Securities Fund | Class M: MPSUX | Investor: MISTX |
Telephone Wealth Management (WM) Clients, please contact your Account Officer or call 1-866-804-5023. Brokerage Clients of BNY Mellon Wealth Advisors (BNYMWA), please contact your financial representative or call 1-800-830-0549, Option 2 for BNY Mellon Wealth Management Direct or 1-800-843-5466 for former brokerage clients of BNY Mellon Wealth Advisors whose accounts are now held by Dreyfus Brokerage Services. Individual Account holders, please call Dreyfus at 1-800-DREYFUS.
Mail WM clients, write to your Account Officer, c/o The Bank of New York Mellon, One Mellon Bank Center, Pittsburgh, PA 15258
BNYMWA Brokerage Clients, write to your financial representative, P.O. Box 9012, Hicksville, NY 11802-9012
Individual Account Holders, write to: BNY Mellon Funds, P.O. Box 9879, Providence, RI 02940-8079
Each fund files its complete schedule of portfolio holdings with the Securities and Exchange Commission (“SEC”) for the first and third quarters of each fiscal year on Form N-Q. The fund’s Forms N-Q are available on the SEC’s website at http://www.sec.gov and may be reviewed and copied at the SEC’s Public Reference Room in Washington, DC. Information on the operation of the Public Reference Room may be obtained by calling 1-800-SEC-0330.
A description of the policies and procedures that the fund uses to determine how to vote proxies relating to portfolio securities, and information regarding how the fund voted these proxies for the most recent 12-month period ended June 30 is available at http://www.dreyfus.com and on the SEC’s website at http://www.sec.gov. The description of the policies and procedures is also available without charge, upon request, by calling 1-800-DREYFUS.
© 2017 MBSC Securities Corporation | MFTAR0817-TB |
The BNY Mellon Funds
BNY Mellon National Intermediate Municipal Bond Fund
BNY Mellon National Short-Term Municipal Bond Fund
BNY Mellon Pennsylvania Intermediate Municipal Bond Fund
BNY Mellon Massachusetts Intermediate Municipal Bond Fund
BNY Mellon New York Intermediate Tax-Exempt Bond Fund
BNY Mellon Municipal Opportunities Fund
ANNUAL REPORT August 31, 2017 | |
| |

Contents
THE FUNDS
Advisory Agreement and Administration Agreement | |
FOR MORE INFORMATION
Back Cover
The views expressed herein are current to the date of this report. These views and the composition of the funds’ portfolios are subject to change at any time based on market and other conditions. |
Not FDIC-Insured • Not Bank-Guaranteed • May Lose Value |
The Funds |
Dear Shareholder:
We are pleased to present this annual report for BNY Mellon Funds Trust, covering the 12-month period from September 1, 2016 through August 31, 2017. For information about how the fund performed during the reporting period, as well as general market perspectives, we provide a Discussion of Fund Performance on the pages that follow.
Stocks set a series of new record highs and bonds produced mixed results over the past year in response to changing economic and political conditions. Financial markets during the final months of 2016 were dominated by the election of a new U.S. presidential administration. Equities surged higher in anticipation of more business-friendly regulatory, tax, and fiscal policies, but high-quality bonds generally lost value due to expectations of rising interest rates and accelerating inflation in a stronger economy. Despite a series of short-term interest-rate hikes, bonds recovered over the first eight months of 2017 when it became clearer that major tax and fiscal reforms would take time and political capital to enact. Stocks continued to rally, led by large growth-oriented companies, as corporate earnings grew and global economic conditions improved.
The markets’ recent strong performance has been supported by solid underlying fundamentals. While we currently expect these favorable conditions to persist, we remain watchful for economic and political developments that could derail the rallies. As always, we encourage you to discuss the risks and opportunities of today’s investment environment with your financial advisor.
Sincerely,

Patrick T. Crowe
President
BNY Mellon Funds Trust
September 15, 2017
3
DISCUSSION OF FUND PERFORMANCE
For the period from September 1, 2016 through August 31, 2017, as provided by John F. Flahive and Mary Collette O’Brien, Portfolio Managers
Market and Fund Performance Overview
For the 12-month period ended August 31, 2017, BNY Mellon National Intermediate Municipal Bond Fund’s Class M shares produced a total return of 0.60%, and Investor shares produced a total return of 0.35%.1 In comparison, the fund’s benchmark index, the S&P Municipal Bond Investment Grade Intermediate Index (the “Index”), produced a total return of 1.11%,2 and the fund’s former benchmark, the S&P Municipal Bond Intermediate Index, produced a total return of 1.16% for the same period.3,4
Municipal bonds produced modestly positive returns over the reporting period when moderating long-term interest rates and improving supply-and-demand dynamics offset earlier market weakness. The fund underperformed the Index, in part due to overweighted exposure to securities with shorter maturities.
The Fund’s Investment Approach
The fund seeks to maximize current income exempt from federal income tax to the extent consistent with the preservation of capital. To pursue its goal, the fund normally invests at least 80% of its net assets in municipal bonds that provide income exempt from federal income tax. The fund’s investments in municipal and taxable bonds must be rated investment grade at the time of purchase or, if unrated, deemed of comparable quality by the investment adviser.5 Generally, the fund’s average effective portfolio maturity will be between 3 and 10 years, and the average effective duration of the fund’s portfolio will not exceed 8 years.
Supply-and-Demand Dynamics Buoyed Municipal Bonds
The reporting period began in the midst of heightened market volatility stemming from a flood of new securities as issuers sought to lock in low financing rates in advance of expected short-term interest-rate hikes from the Federal Reserve Board (the “Fed”). In addition, the outcome of the presidential election in November sparked uncertainty regarding potential changes in tax policy.
These negative market trends reversed in early 2017, and municipal bonds rebounded steadily from low valuations as the supply of newly issued securities moderated, demand increased, and investors realized that tax reform was far from certain. As a result, the Index produced a positive total return for the reporting period overall.
Although growth in tax revenues has slowed and several states are facing pressure from underfunded pension systems, credit conditions have remained stable for most municipal bond issuers. Solid credit fundamentals helped lower-rated municipal bonds outperform their higher-quality counterparts over the reporting period.
Shorter-Term Securities Dampened Fund Results
The fund’s performance compared to the Index was hindered to a degree by its “barbell” yield curve strategy, in which we emphasized securities at the short and long ends of the market’s maturity range in order to establish an average duration in the intermediate-term range. However, rising short-term interest rates put downward pressure on the value of municipal bonds with maturities of less than three years. Because these short-term bonds are not represented in the Index, the fund mildly trailed the Index for the reporting period.
The fund achieved better relative results through other strategies. We set our duration management strategy in a position that was modestly shorter than that of the Index, which helped cushion the negative impact of rising long-term interest rates over the final weeks of 2016. Our sector allocation strategy added value through overweighted exposure to higher-yielding revenue-backed bonds and commensurately underweighted positions in lower-yielding general obligation bonds. The fund received especially strong contributions to relative performance from bonds issued on behalf of hospitals and other health care facilities.
From a credit quality perspective, the fund benefited from its holdings of BBB-rated municipal bonds, which are at the lower end of the investment-grade range. Although holdings from the state of Illinois fared well after rebounding from previous weakness, a small position in Puerto Rico securities hurt the fund’s relative results among the fund’s high yield holdings as the U.S. territory’s fiscal issues continued.
At times, the fund employed futures contracts to set its duration posture.
Positioned for Continued Economic Growth
The U.S. economy has continued to expand, and many analysts expect slow-to-moderate growth to persist over the months ahead. Inflationary pressures may increase in this environment, and most analysts anticipate additional short-term interest-rate hikes and balance-sheet normalization from the Fed as it moves toward a less stimulative monetary policy. On the other hand, we believe that technical conditions in the municipal bond market remain favorable, as a limited supply of new issuance has been met with robust investor demand.
Therefore, we currently are cautiously optimistic regarding the prospects for municipal bonds. As of the reporting period’s end, we have maintained the fund’s overweighted exposure to higher-yielding revenue bonds. On a more cautious note, we have maintained a modestly shorter-than-average duration posture to guard against the possibility of rising long-term interest rates.
September 15, 2017
1 Total return includes reinvestment of dividends and any capital gains paid. Past performance is no guarantee of future results. Share price, yield, and investment return fluctuate such that upon redemption, fund shares may be worth more or less than their original cost. Income may be subject to state and local taxes, and some income may be subject to the federal alternative minimum tax (AMT) for certain investors. Capital gains, if any, are fully taxable.
2 Source: Bloomberg L.P. — The S&P Municipal Bond Investment Grade Intermediate Index consists of bonds in the S&P Municipal Bond Index that are rated at least BBB- by Standard & Poor’s, Baa3 by Moody’s or BBB- by Fitch Ratings. All bonds must also have a minimum maturity of 3 years and a maximum maturity of up to, but not including, 15 years as measured from the rebalancing date. Investors cannot invest directly in any index.
3 Source: Lipper Inc.— The S&P Municipal Bond Intermediate Index consists of bonds in the S&P Municipal Bond Index with a minimum maturity of 3 years and a maximum maturity of up to, but not including, 15 years as measured from the rebalancing date. Investors cannot invest directly in any index.
4 The S&P Municipal Bond Investment Grade Intermediate Index was first calculated on March 19, 2013. Accordingly, the fund will continue to report the performance of the S&P Municipal Bond Intermediate Index until the S&P Municipal Bond Investment Grade Intermediate Index has been calculated for a 10-year period.
5 The fund may continue to own investment-grade bonds (at the time of purchase), which are subsequently downgraded to below investment grade.
Bonds are subject generally to interest-rate, credit, liquidity, and market risks, to varying degrees, all of which are more fully described in the fund’s prospectus. Generally, all other factors being equal, bond prices are inversely related to interest-rate changes, and rate increases can cause price declines.
4
For the period from September 1, 2016 through August 31, 2017, as provided by John F. Flahive, Portfolio Manager
Market and Fund Performance Overview
For the 12-month period ended August 31, 2017, BNY Mellon National Short-Term Municipal Bond Fund’s Class M shares produced a total return of 0.76%, and Investor shares produced a total return of 0.52%.1 In comparison, the fund’s benchmark index, the S&P Municipal Bond Investment Grade Short Index (the “Index”), produced a total return of 1.01%,2 and the fund’s former benchmark, the S&P Municipal Bond Short Index, produced a total return of 1.01% for the same period.3,4
Short-term municipal bonds produced modestly positive returns over the reporting period, as favorable supply-and-demand dynamics offset the impact of three short-term interest-rate hikes from the Federal Reserve Board (the “Fed”). The fund underperformed the Index, in part due to overweighted exposure to securities with shorter maturities.
The Fund’s Investment Approach
The fund seeks to maximize current income exempt from federal income tax to the extent consistent with the preservation of capital. To pursue its goal, the fund normally invests at least 80% of its net assets in municipal bonds that provide income exempt from federal income tax. The fund’s investments in municipal and taxable bonds must be rated investment grade at the time of purchase or, if unrated, deemed of comparable quality by the investment adviser.5 Generally, the average effective portfolio maturity and the average effective portfolio duration of the fund’s portfolio will be less than three years.
Supply-and-Demand Dynamics Buoyed Municipal Bonds
The reporting period began in the midst of heightened market volatility stemming from a flood of new securities as issuers sought to lock in low financing rates in advance of expected short-term interest-rate hikes from the Fed. In addition, the outcome of the presidential election in November sparked uncertainty regarding potential changes in tax policy.
These negative market trends reversed in early 2017, and municipal bonds rebounded steadily from low valuations as the supply of newly issued securities moderated, demand increased, and investors realized that tax reform was far from certain. As a result, the Index produced a positive total return for the reporting period overall.
Although growth in tax revenues has slowed and several states are facing pressure from underfunded pension systems, credit conditions have remained stable for most municipal bond issuers. Solid credit fundamentals helped lower-rated municipal bonds outperform their higher-quality counterparts over the reporting period.
Longer-Term Securities Dampened Fund Results
The fund’s performance compared to the Index was hindered to a degree by its yield-curve strategy, in which we emphasized securities at the short and long ends of the market’s maturity range. However, rising long-term interest rates early in the reporting period put downward pressure on the value of municipal bonds with intermediate-term maturities. Because these longer-term bonds are not represented in the Index, the fund mildly trailed the Index for the reporting period.
The fund achieved better relative results through other strategies. An emphasis on municipal bonds with maturities of up to two years fared particularly well. We set our duration management strategy in a position that was modestly shorter than that of the Index, which helped cushion the negative impact of rising long-term interest rates over the final weeks of 2016. Our sector allocation strategy proved effective through overweighted exposure to higher-yielding revenue-backed bonds, while general obligation bonds from state and local issuers also added a degree of value. The fund received especially strong contributions to relative performance from bonds from Illinois and New York, as well as securities backed by dedicated tax receipts and revenues from transportation infrastructure. From a credit-quality perspective, the fund benefited from its holdings of AA-rated municipal bonds and, to a lesser extent, A-rated bonds.
Positioned for Continued Economic Growth
The U.S. economy has continued to expand, and many analysts expect slow-to-moderate growth to persist over the months ahead. Inflationary pressures may increase in this environment, and most analysts anticipate additional short-term interest-rate hikes and balance-sheet normalization from the Fed as it moves toward a less stimulative monetary policy. On the other hand, we believe that technical conditions in the municipal bond market remain favorable, as a limited supply of new issuance has been met with robust investor demand.
Therefore, we currently are cautiously optimistic regarding the prospects for municipal bonds. As of the reporting period’s end, we have maintained the fund’s overweighted exposure to higher-yielding revenue bonds, including lower-rated securities. On a more cautious note, we have maintained a modestly shorter-than-average duration posture to guard against the possibility of rising long-term interest rates.
September 15, 2017
1 Total return includes reinvestment of dividends and any capital gains paid. Past performance is no guarantee of future results. Share price, yield, and investment return fluctuate such that upon redemption, fund shares may be worth more or less than their original cost. Income may be subject to state and local taxes, and some income may be subject to the federal alternative minimum tax (AMT) for certain investors. Capital gains, if any, are fully taxable.
2 Source: Bloomberg L.P. — The S&P Municipal Bond Investment Grade Short Index consists of bonds in the S&P Municipal Bond Index that are rated at least BBB- by Standard & Poor’s, Baa3 by Moody’s or BBB- by Fitch Ratings. All bonds must also have a minimum maturity of six months and a maximum maturity of up to, but not including, four years as measured from the rebalancing date. Investors cannot invest directly in any index.
3 Source: Lipper Inc. — The S&P Municipal Bond Short Indexconsists of bonds in the S&P Municipal Bond Index with a minimum maturity of six months and a maximum maturity of up to, but not including, four years as measured from the rebalancing date. Investors cannot invest directly in any index.
4 The S&P Municipal Bond Investment Grade Short Index was first calculated on March 19, 2013. Accordingly, the fund will continue to report the performance of the S&P Municipal Bond Short Index until the S&P Municipal Bond Investment Grade Short Index has been calculated for a 10-year period.
5 The fund may continue to own investment-grade bonds (at the time of purchase), which are subsequently downgraded to below investment grade.
Bonds are subject generally to interest-rate, credit, liquidity, and market risks, to varying degrees, all of which are more fully described in the fund’s prospectus. Generally, all other factors being equal, bond prices are inversely related to interest-rate changes, and rate increases can cause price declines.
5
DISCUSSION OF FUND PERFORMANCE (continued)
For the period from September 1, 2016 through August 31, 2017, as provided by Gregory J. Conant and Mary Collette O’Brien, Portfolio Managers
Market and Fund Performance Overview
For the 12-month period ended August 31, 2017, BNY Mellon Pennsylvania Intermediate Municipal Bond Fund’s Class M shares produced a total return of 0.55%, and Investor shares produced a total return of 0.30%.1 In comparison, the fund’s benchmark index, the S&P Municipal Bond Investment Grade Intermediate Index (the “Index”), produced a total return of 1.11%,2 and the fund’s former benchmark, the S&P Municipal Bond Intermediate Index, produced a total return of 1.16% for the same period.3,4
Municipal bonds produced modestly positive returns over the reporting period when moderating long-term interest rates and improving supply-and-demand dynamics offset earlier market weakness. The fund underperformed the Index, in part due to our yield curve strategy.
The Fund’s Investment Approach
The fund seeks as high a level of income exempt from federal and Pennsylvania state income taxes as is consistent with the preservation of capital. To pursue its goal, the fund normally invests at least 80% of its net assets in municipal bonds that provide income exempt from federal and Pennsylvania state personal income taxes. The fund’s investments in municipal and taxable bonds must be rated investment grade at the time of purchase or, if unrated, deemed of comparable quality by the investment adviser.5 Generally, the fund’s average effective portfolio maturity will be between 3 and 10 years, and the average effective duration of the fund’s portfolio will not exceed 8 years.
Supply-and-Demand Dynamics Buoyed Municipal Bonds
The reporting period began in the midst of heightened market volatility stemming from a flood of new securities as issuers sought to lock in low financing rates in advance of expected short-term interest-rate hikes from the Federal Reserve Board (the “Fed”). In addition, the outcome of the presidential election in November sparked uncertainty regarding potential changes in tax policy.
These negative market trends reversed in early 2017, and municipal bonds rebounded steadily from low valuations as the supply of newly issued securities moderated, demand increased, and investors realized that tax reform was far from certain. As a result, the Index produced a positive total return for the reporting period overall.
Like several other states, Pennsylvania is facing fiscal pressure from an underfunded pension system and structural budget issues. These issues are creating a legislative deadlock impairing the passage of a balanced budget for the current fiscal year. Nonetheless, the state’s sound and diverse economy will support a sound credit risk profile.
Out-of-Index Securities Dampened Fund Results
The fund’s performance compared to the Index was hindered to a degree by our “barbell” yield curve strategy, in which we emphasized securities at the short and long ends of the market’s maturity range in order to establish an average duration in the intermediate-term range. However, rising short-term interest rates put downward pressure on the value of municipal bonds with maturities of less than three years, and long-term securities underperformed their intermediate-term counterparts. These bonds are not represented in the Index, weighing on the fund’s returns relative to the Index for the reporting period overall. The fund’s relative performance also was undermined by its small position in Puerto Rico bonds, which remained under pressure due to the U.S. territory’s ongoing fiscal issues.
The fund achieved better relative results through a modestly shorter average duration than that of the Index, which helped cushion the negative impact of rising long-term interest rates over the final weeks of 2016. Our sector allocation strategy added significant value through overweighted exposure to higher-yielding revenue-backed bonds and a commensurately underweighted position in state-issued general obligation bonds. The fund also received positive contributions to relative performance from Pennsylvania bonds, which generally produced higher returns than national averages, as well as from underweighted exposure to lower-yielding escrowed bonds. From a credit-quality perspective, the fund benefited significantly from its holdings of AA-rated municipal bonds and, to a lesser extent, BBB-rated securities.
At times, the fund employed futures contracts to establish its duration posture.
Positioned for Continued Economic Growth
The U.S. and Pennsylvania economies have continued to expand, and many analysts expect slow-to-moderate growth to persist over the months ahead. Inflationary pressures may increase in this environment, and most analysts anticipate additional short-term interest-rate hikes and balance-sheet normalization from the Fed as it moves toward a less stimulative monetary policy. On the other hand, we believe that technical conditions in the municipal bond market remain favorable, as a limited supply of new issuance has been met with robust investor demand.
Therefore, we currently are cautiously optimistic regarding the prospects for municipal bonds. As of the reporting period’s end, we have maintained the fund’s overweighted exposure to higher-yielding revenue bonds, including lower-rated securities. On a more cautious note, we have maintained a modestly shorter-than-average duration posture to guard against the possibility of rising long-term interest rates.
September 15, 2017
1 Total return includes reinvestment of dividends and any capital gains paid. Past performance is no guarantee of future results. Share price, yield, and investment return fluctuate such that upon redemption, fund shares may be worth more or less than their original cost. Income may be subject to state and local taxes for non-Pennsylvania residents, and some income may be subject to the federal alternative minimum tax (AMT) for certain investors. Capital gains, if any, are fully taxable.
2 Source: Bloomberg L.P. — The S&P Municipal Bond Investment Grade Intermediate Index consists of bonds in the S&P Municipal Bond Index that are rated at least BBB- by Standard & Poor’s, Baa3 by Moody’s or BBB- by Fitch Ratings. All bonds must also have a minimum maturity of 3 years and a maximum maturity of up to, but not including, 15 years as measured from the rebalancing date. Unlike a mutual fund, the index is not subject to charges, fees, and other expenses and is not limited to investments principally in Pennsylvania municipal obligations. Investors cannot invest directly in any index.
3 Source: Lipper Inc.— The S&P Municipal Bond Intermediate Index consists of bonds in the S&P Municipal Bond Index with a minimum maturity of 3 years and a maximum maturity of up to, but not including, 15 years as measured from the rebalancing date. Investors cannot invest directly in any index.
4 The S&P Municipal Bond Investment Grade Intermediate Index was first calculated on March 19, 2013. Accordingly, the fund will continue to report the performance of the S&P Municipal Bond Intermediate Index until the S&P Municipal Bond Investment Grade Intermediate Index has been calculated for a 10-year period.
5 The fund may continue to own investment-grade bonds (at the time of purchase), which are subsequently downgraded to below investment grade.
Bonds are subject generally to interest-rate, credit, liquidity, and market risks, to varying degrees, all of which are more fully described in the fund’s prospectus. Generally, all other factors being equal, bond prices are inversely related to interest-rate changes, and rate increases can cause price declines.
6
For the period from September 1, 2016 through August 31, 2017, as provided by Mary Collette O’Brien and Stephen J. O’Brien, Portfolio Managers
Market and Fund Performance Overview
For the 12-month period ended August 31, 2017, BNY Mellon Massachusetts Intermediate Municipal Bond Fund’s Class M shares produced a total return of 0.24%, and Investor shares produced a total return of 0.06%.1 In comparison, the fund’s benchmark index, the S&P Municipal Bond Investment Grade Intermediate Index (the “Index”), produced a total return of 1.11%,2 and the fund’s former benchmark, the S&P Municipal Bond Intermediate Index, produced a total return of 1.16% for the same period.3,4
Municipal bonds produced modestly positive returns over the reporting period when moderating long-term interest rates and improving supply-and-demand dynamics offset earlier market weakness. The fund underperformed the Index, in part due to the underperformance of Massachusetts bonds compared to national averages.
The Fund’s Investment Approach
The fund seeks as high a level of income exempt from federal and Massachusetts state income taxes as is consistent with the preservation of capital. To pursue its goal, the fund normally invests at least 80% of its net assets in municipal bonds that provide income exempt from federal and Massachusetts state personal income taxes. The fund’s investments in municipal and taxable bonds must be rated investment grade at the time of purchase or, if unrated, deemed of comparable quality by the investment adviser.5 Generally, the fund’s average effective portfolio maturity will be between 3 and 10 years, and the average effective duration of the fund’s portfolio will not exceed 8 years.
Supply-and-Demand Dynamics Buoyed Municipal Bonds
The reporting period began in the midst of heightened market volatility stemming from a flood of new securities as issuers sought to lock in low financing rates in advance of expected short-term interest-rate hikes from the Federal Reserve Board (the “Fed”). In addition, the outcome of the presidential election in November sparked uncertainty regarding potential changes in tax policy.
These negative market trends reversed in early 2017, and municipal bonds rebounded steadily from low valuations as the supply of newly issued securities moderated, demand increased, and investors realized that tax reform was far from certain. As a result, the Index produced a positive total return for the reporting period overall.
Although growth in tax revenues has slowed and several states are facing pressure from underfunded pension systems, credit conditions have remained stable for most municipal bond issuers, including Massachusetts. Solid credit fundamentals helped lower-rated municipal bonds outperform their higher-quality counterparts over the reporting period.
Out-of-Index Securities Dampened Fund Results
The fund’s performance compared to the Index was constrained to a degree by its focus on Massachusetts securities, which lagged national averages during the market selloff at the end of 2016. In addition, relative performance was hindered by our “barbell” yield curve strategy, in which we emphasized securities at the short and long ends of the market’s maturity range in order to establish an average duration in the intermediate-term range. However, rising short-term interest rates put downward pressure on the value of municipal bonds with maturities of less than three years, and long-term securities underperformed their intermediate-term counterparts. These bonds are not represented in the Index, weighing on the fund’s returns relative to the Index for the reporting period overall.
Over the final weeks of 2016, the fund achieved better relative results through a modestly shorter average duration than that of the Index, which helped cushion the negative impact of rising long-term interest rates. Our sector allocation strategy added significant value through overweighted exposure to higher-yielding revenue-backed bonds. The fund also received positive contributions to relative performance from overweighted exposure to local general obligation bonds. From a credit quality perspective, the fund benefited from its holdings of BBB-rated municipal bonds, which are at the lower end of the investment-grade range.
At times, the fund employed futures contracts to establish its duration posture.
Positioned for Continued Economic Growth
The U.S. and Massachusetts economies have continued to expand, and many analysts expect slow-to-moderate growth to persist over the months ahead. Inflationary pressures may increase in this environment, and most analysts anticipate additional short-term interest-rate hikes and balance-sheet normalization from the Fed as it moves toward a less stimulative monetary policy. On the other hand, we believe that technical conditions in the municipal bond market remain favorable, as a limited supply of new issuance has been met with robust investor demand.
Therefore, we currently are cautiously optimistic regarding the prospects for municipal bonds. As of the reporting period’s end, we have maintained the fund’s overweighted exposure to higher-yielding revenue bonds. On a more cautious note, we have maintained a modestly shorter-than-average duration posture to guard against the possibility of rising long-term interest rates.
September 15, 2017
1 Total return includes reinvestment of dividends and any capital gains paid. Past performance is no guarantee of future results. Share price, yield, and investment return fluctuate such that upon redemption, fund shares may be worth more or less than their original cost. Income may be subject to state and local taxes for non-Massachusetts residents, and some income may be subject to the federal alternative minimum tax (AMT) for certain investors. Capital gains, if any, are taxable.
2 Source: Bloomberg L.P. — The S&P Municipal Bond Investment Grade Intermediate Index consists of bonds in the S&P Municipal Bond Index that are rated at least BBB- by Standard & Poor’s, Baa3 by Moody’s or BBB- by Fitch Ratings. All bonds must also have a minimum maturity of 3 years and a maximum maturity of up to, but not including, 15 years as measured from the rebalancing date. Investors cannot invest directly in any index.
3 Source: Lipper Inc. — The S&P Municipal Bond Intermediate Index consists of bonds in the S&P Municipal Bond Index with a minimum maturity of 3 years and a maximum maturity of up to, but not including, 15 years as measured from the rebalancing date. Investors cannot invest directly in any index.
4 The S&P Municipal Bond Investment Grade Intermediate Index was first calculated on March 19, 2013. Accordingly, the fund will continue to report the performance of the S&P Municipal Bond Intermediate Index until the S&P Municipal Bond Investment Grade Intermediate Index has been calculated for a 10-year period.
5 The fund may continue to own investment-grade bonds (at the time of purchase), which are subsequently downgraded to below investment grade.
Bonds are subject generally to interest-rate, credit, liquidity, and market risks, to varying degrees, all of which are more fully described in the fund’s prospectus. Generally, all other factors being equal, bond prices are inversely related to interest-rate changes, and rate increases can cause price declines. The amount of public information available about municipal bonds is generally less than that for corporate equities or bonds. Special factors, such as legislative changes, and state and local economic and business developments, may adversely affect the yield and/or value of the fund’s investments in municipal bonds. Other factors include the general conditions of the municipal bond market, the size of the particular offering, the maturity of the obligation, and the rating of the issue. Changes in economic, business, or political conditions relating to a particular municipal project, municipality, or state in which the fund invests may have an impact on the fund’s share price.
7
DISCUSSION OF FUND PERFORMANCE (continued)
For the period from September 1, 2016 through August 31, 2017, as provided by John F. Flahive and Gregory J. Conant, Portfolio Managers
Market and Fund Performance Overview
For the 12-month period ended August 31, 2017, BNY Mellon New York Intermediate Tax-Exempt Bond Fund’s Class M shares produced a total return of 0.31%, and Investor shares produced a total return of 0.07%.1 In comparison, the fund’s benchmark index, the S&P Municipal Bond Investment Grade Intermediate Index (the “Index”), produced a total return of 1.11%,2 and the fund’s former benchmark, the S&P Municipal Bond Intermediate Index, produced a total return of 1.16% for the same period.3,4
Municipal bonds produced modestly positive returns over the reporting period when moderating long-term interest rates and improving supply-and-demand dynamics offset earlier market weakness. The fund underperformed the Index, in part due to our yield curve strategy.
The Fund’s Investment Approach
The fund seeks as high a level of income exempt from federal, New York state, and New York City income taxes as is consistent with the preservation of capital. This objective may be changed without shareholder approval. To pursue its goal, the fund normally invests at least 80% of its net assets in municipal bonds that provide income exempt from federal, New York state, and New York City personal income taxes. These municipal bonds include those issued by New York state and New York City as well as those issued by U.S. territories and possessions. Generally, the fund’s average effective portfolio maturity will be between 3 and 10 years.
Supply-and-Demand Dynamics Buoyed Municipal Bonds
The reporting period began in the midst of heightened market volatility stemming from a flood of new securities as issuers sought to lock in low financing rates in advance of expected short-term interest-rate hikes from the Federal Reserve Board (the “Fed”). In addition, the outcome of the presidential election in November sparked uncertainty regarding potential changes in tax policy.
These negative market trends reversed in early 2017, and municipal bonds rebounded steadily from low valuations as the supply of newly issued securities moderated, demand increased, and investors realized that tax reform was far from certain. As a result, the Index produced a positive total return for the reporting period overall.
Although growth in tax revenues has slowed and several states are facing pressure from underfunded pension systems, credit conditions have remained stable for most municipal bond issuers, including New York. Solid credit fundamentals helped lower-rated municipal bonds outperform their higher-quality counterparts over the reporting period.
Out-of-Index Securities Dampened Fund Results
The fund’s performance compared to the Index was constrained to a degree by our “barbell” yield curve strategy, in which we emphasized securities at the short and long ends of the market’s maturity range in order to establish an average duration in the intermediate-term range. However, rising short-term interest rates put downward pressure on the value of municipal bonds with maturities of less than three years, and long-term securities underperformed their intermediate-term counterparts. These bonds are not represented in the Index, weighing on the fund’s returns relative to the Index for the reporting period overall. The fund’s relative performance also was undermined by its small position in Puerto Rico bonds, which remained under pressure due to the U.S. territory’s ongoing fiscal issues.
The fund achieved better relative results through a modestly shorter average duration than that of the Index, which helped cushion the negative impact of rising long-term interest rates over the final weeks of 2016. Our sector allocation strategy added significant value through overweighted exposure to higher-yielding revenue-backed bonds and a commensurately underweighted position in state-issued general obligation bonds. The fund also received positive contributions to relative performance from overweighted exposure to general obligation bonds from local issuers. From a credit-quality perspective, the fund benefited from its holdings of AA-rated municipal bonds.
At times, the fund employed futures contracts to establish its duration posture.
Positioned for Continued Economic Growth
The U.S. and New York economies have continued to expand, and many analysts expect slow-to-moderate growth to persist over the months ahead. Inflationary pressures may increase in this environment, and most analysts anticipate additional short-term interest-rate hikes and balance-sheet normalization from the Fed as it moves toward a less stimulative monetary policy. On the other hand, we believe that technical conditions in the municipal bond market remain favorable, as a limited supply of new issuance has been met with robust investor demand.
Therefore, we currently are cautiously optimistic regarding the prospects for municipal bonds. As of the reporting period’s end, we have maintained the fund’s overweighted exposure to higher-yielding revenue bonds, including lower-rated securities. On a more cautious note, we have maintained a modestly shorter-than-average duration posture to guard against the possibility of rising long-term interest rates.
September 15, 2017
1 Total return includes reinvestment of dividends and any capital gains paid. Past performance is no guarantee of future results. Share price, yield, and investment return fluctuate such that upon redemption, fund shares may be worth more or less than their original cost. Income may be subject to state and local taxes for non-New York residents, and some income may be subject to the federal alternative minimum tax (AMT) for certain investors. Capital gains, if any, are fully taxable. The fund’s returns reflect the absorption of certain fund expenses by BNY Mellon Fund Advisers pursuant to an agreement in effect through December 31, 2017, at which time it may be extended, terminated, or modified. Had these expenses not been absorbed, the fund’s returns would have been lower.
2 Source: Bloomberg L.P. — The S&P Municipal Bond Investment Grade Intermediate Index consists of bonds in the S&P Municipal Bond Index that are rated at least BBB- by Standard & Poor’s, Baa3 by Moody’s or BBB- by Fitch Ratings. All bonds must also have a minimum maturity of 3 years and a maximum maturity of up to, but not including, 15 years as measured from the rebalancing date. Investors cannot invest directly in any index.
3 Source: Lipper Inc. — The S&P Municipal Bond Intermediate Index consists of bonds in the S&P Municipal Bond Index with a minimum maturity of 3 years and a maximum maturity of up to, but not including, 15 years as measured from the rebalancing date. Unlike a mutual fund, neither index is subject to charges, fees, and other expenses and is not limited to investments principally in New York municipal obligations. Investors cannot invest directly in any index.
4 The S&P Municipal Bond Investment Grade Intermediate Index was first calculated on March 19, 2013. Accordingly, the fund will continue to report the performance of the S&P Municipal Bond Intermediate Index until the S&P Municipal Bond Investment Grade Intermediate Index has been calculated for a 10-year period.
Bonds are subject generally to interest-rate, credit, liquidity, and market risks, to varying degrees, all of which are more fully described in the fund’s prospectus. Generally, all other factors being equal, bond prices are inversely related to interest-rate changes, and rate increases can cause price declines.
8
For the period from September 1, 2016 through August 31, 2017, as provided by John F. Flahive, Portfolio Manager
Market and Fund Performance Overview
For the 12-month period ended August 31, 2017, BNY Mellon Municipal Opportunities Fund’s Class M shares produced a total return of 1.11%, and Investor shares produced a total return of 0.95%.1 In comparison, the fund’s benchmark, the Bloomberg Barclays U.S. Municipal Bond Index (the “Index”), produced a total return of 0.88% for the same period.2
Municipal bonds produced modestly positive returns over the reporting period when moderating long-term interest rates and improving supply-and-demand dynamics offset earlier market weakness. The fund outperformed the Index, in part due to overweighted exposure to securities with longer maturities.
As of June 30, 2017, the fund was closed to new and existing investors.
The Fund’s Investment Approach
The fund seeks to maximize total return consisting of high current income exempt from federal income tax and capital appreciation. This objective may be changed without shareholder approval. To pursue its goal, the fund normally invests at least 80% of its net assets in U.S. dollar-denominated fixed-income securities that provide income exempt from federal income tax (municipal bonds). While the fund typically invests in a diversified portfolio of municipal bonds, it may invest up to 20% of its assets in taxable fixed-income securities, including taxable municipal bonds and non-U.S. dollar-denominated foreign debt securities, such as Brady bonds and sovereign debt obligations.
We seek to deliver value-added excess returns (“alpha”) by applying an investment approach designed to identify and exploit relative value opportunities within the municipal bond market. Although the fund seeks to be diversified by geography and sector, it may at times invest a significant portion of its assets in a particular state or region or in a particular sector due to market conditions.
Supply-and-Demand Dynamics Buoyed Municipal Bonds
The reporting period began in the midst of heightened market volatility stemming from a flood of new securities as issuers sought to lock in low financing rates in advance of expected short-term interest-rate hikes from the Federal Reserve Board (the “Fed”). In addition, the outcome of the presidential election in November sparked uncertainty regarding potential changes in tax policy.
These negative market trends reversed in early 2017, and municipal bonds rebounded steadily from low valuations as the supply of newly issued securities moderated, demand increased, and investors realized that tax reform was far from certain. As a result, the Index produced a positive total return for the reporting period overall.
Although growth in tax revenues has slowed and several states are facing pressure from underfunded pension systems, credit conditions have remained stable for most municipal bond issuers. Solid credit fundamentals helped lower-rated municipal bonds outperform their higher-quality counterparts over the reporting period.
Several Fund Strategies Bolstered Relative Results
The fund achieved better results than the Index partly through our emphasis on longer-term municipal bonds that benefited from moderating long-term rates in 2017. Meanwhile, the fund’s relatively short average duration helped cushion the negative impact of rising long-term interest rates over the final weeks of 2016. Our sector allocation strategy added value through overweighted exposure to higher-yielding revenue-backed bonds and commensurately underweighted positions in lower-yielding general obligation bonds. The fund received especially strong contributions from bonds issued on behalf of transportation infrastructure and health care facilities.
From a security selection perspective, holdings from the states of New York and Illinois fared well, but small positions in Puerto Rico and Virgin Islands securities hurt the fund’s relative results as the U.S. territories’ fiscal issues continued.
The fund’s performance compared to the Index was constrained by its holdings at the short end of the market’s maturity range, which were hurt by rising short-term interest rates. The fund’s cash reserves also were a drag on relative results over much of the reporting period.
At times, the fund employed futures contracts to set its duration posture.
Positioned for Continued Economic Growth
The U.S. economy has continued to expand, and many analysts expect slow-to-moderate growth to persist over the months ahead. Inflationary pressures may increase in this environment, and most analysts anticipate additional short-term interest-rate hikes and balance-sheet normalization from the Fed as it moves toward a less stimulative monetary policy. On the other hand, we believe that technical conditions in the municipal bond market remain favorable, as a limited supply of new issuance has been met with robust investor demand.
Therefore, we currently are cautiously optimistic regarding the prospects for municipal bonds. As of the reporting period’s end, we have maintained the fund’s overweighted exposure to higher-yielding revenue bonds, including lower-rated securities. On a more cautious note, we have maintained a modestly shorter-than-average duration posture to guard against the possibility of rising long-term interest rates.
September 15, 2017
1 Total return includes reinvestment of dividends and any capital gains paid. Past performance is no guarantee of future results. Share price, yield, and investment return fluctuate such that upon redemption, fund shares may be worth more or less than their original cost. Income may be subject to state and local taxes, and some income may be subject to the federal alternative minimum tax (AMT) for certain investors. Capital gains, if any, are fully taxable.
2 Source: Lipper Inc. — The Bloomberg Barclays U.S. Municipal Bond Index covers the U.S. dollar-denominated long-term tax-exempt bond market. Investors cannot invest directly in any index.
Bonds are subject generally to interest-rate, credit, liquidity, and market risks, to varying degrees, all of which are more fully described in the fund’s prospectus. Generally, all other factors being equal, bond prices are inversely related to interest-rate changes, and rate increases can cause price declines.
9
FUND PERFORMANCE
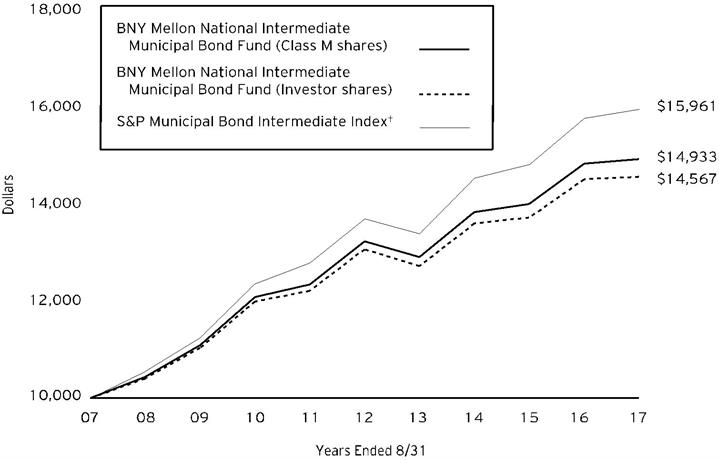
Comparison of change in value of $10,000 investment in BNY Mellon National Intermediate Municipal Bond Fund Class M shares and Investor shares and the S&P Municipal Bond Intermediate Index (the “Index”)
Average Annual Total Returns as of 8/31/17 | |||
1 Year | 5 Years | 10 Years | |
Class M shares | 0.60% | 2.44% | 4.09% |
Investor shares | 0.35% | 2.19% | 3.83% |
S&P Municipal Bond Intermediate Index | 1.16% | 3.10% | 4.79% |
† Source: Lipper Inc.
Past performance is not predictive of future performance. The fund’s performance shown in the graph and table does not reflect the deduction of taxes that a shareholder would pay on fund distributions or the redemption of fund shares.
The above graph compares a $10,000 investment made in Class M and Investor shares of BNY Mellon National Intermediate Municipal Bond Fund on 8/31/07 to a $10,000 investment made in the Index on that date. All dividends and capital gain distributions are reinvested.
Effective 7/1/2013, the fund changed its benchmark from the S&P Municipal Bond Intermediate Index to the S&P Municipal Bond Investment Grade Intermediate Index because the new benchmark index is more reflective of the credit quality of the fund’s portfolio holdings. The S&P Municipal Bond Investment Grade Intermediate Index was launched on 3/19/13. Accordingly, the fund will continue to report the performance of the S&P Municipal Bond Intermediate Index until the S&P Municipal Bond Investment Grade Intermediate Index has been calculated for a 10-year period. Performance information for the fund versus the S&P Municipal Bond Investment Grade Intermediate Index is included in the graph and table on the next page.
The fund’s performance shown in the line graph above takes into account all applicable fees and expenses for Class M and Investor shares. The Index consists of bonds in the S&P Municipal Bond Index with a minimum maturity of three years and a maximum maturity of up to, but not including, 15 years as measured from the rebalancing date. Unlike a mutual fund, the Index is not subject to charges, fees and other expenses. Investors cannot invest directly in any index. Further information relating to fund performance, including expense reimbursements, if applicable, is contained in the Financial Highlights section of the prospectus and elsewhere in this report.
The performance data quoted represents past performance, which is no guarantee of future results. Share price and investment return fluctuate and an investor's shares may be worth more or less than original cost upon redemption. Current performance may be lower or higher than the performance quoted. Go to Dreyfus.com for the fund's most recent month-end returns.
10
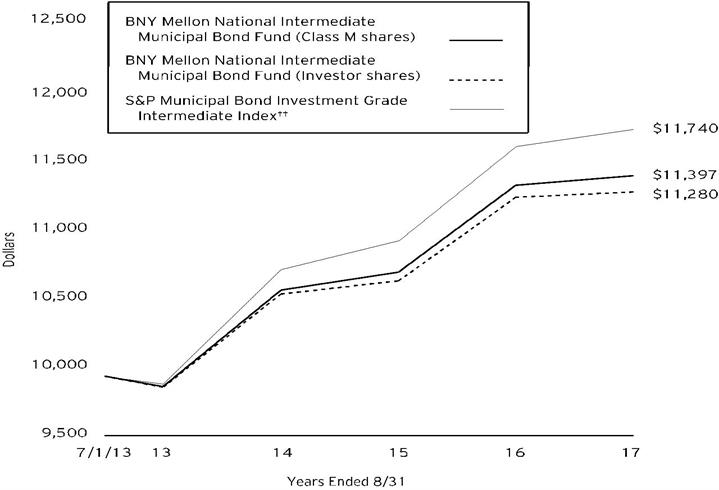
Comparison of change in value of $10,000 investment in BNY Mellon National Intermediate Municipal Bond Fund Class M shares and Investor shares and the S&P Municipal Bond Investment Grade Intermediate Index (the “Index”)
Average Annual Total Returns as of 8/31/17 | |||
Inception Date | 1 Year | From Inception | |
Class M shares | 7/1/13 | 0.60% | 3.19% |
Investor shares | 7/1/13 | 0.35% | 2.93% |
S&P Municipal Bond Investment Grade Intermediate Index | 7/1/13 | 1.11% | 3.91%††† |
†† Source: Bloomberg L.P.
Past performance is not predictive of future performance. The fund’s performance shown in the graph and table does not reflect the deduction of taxes that a shareholder would pay on fund distributions or the redemption of fund shares.
The above graph compares a $10,000 investment made in Class M and Investor shares of BNY Mellon National Intermediate Municipal Bond Fund on 7/1/13 to a $10,000 investment made in the Index on that date. All dividends and capital gain distributions are reinvested.
The fund’s performance shown in the line graph above takes into account all applicable fees and expenses for Class M and Investor shares. The Index consists of bonds in the S&P Municipal Bond Index that are rated at least BBB- by Standard & Poor’s, Baa3 by Moody’s or BBB- by Fitch Ratings. All bonds must also have a minimum maturity of 3 years and a maximum maturity of up to, but not including, 15 years as measured from the rebalancing date. Unlike a mutual fund, the Index is not subject to charges, fees and other expenses. Investors cannot invest directly in any index. Further information relating to fund performance, including expense reimbursements, if applicable, is contained in the Financial Highlights section of the prospectus and elsewhere in this report.
††† For comparative purposes, the value of the Index on 6/30/13 is used as the beginning value on 7/1/13.
The performance data quoted represents past performance, which is no guarantee of future results. Share price and investment return fluctuate and an investor's shares may be worth more or less than original cost upon redemption. Current performance may be lower or higher than the performance quoted. Go to Dreyfus.com for the fund's most recent month-end returns.
11
FUND PERFORMANCE (continued)
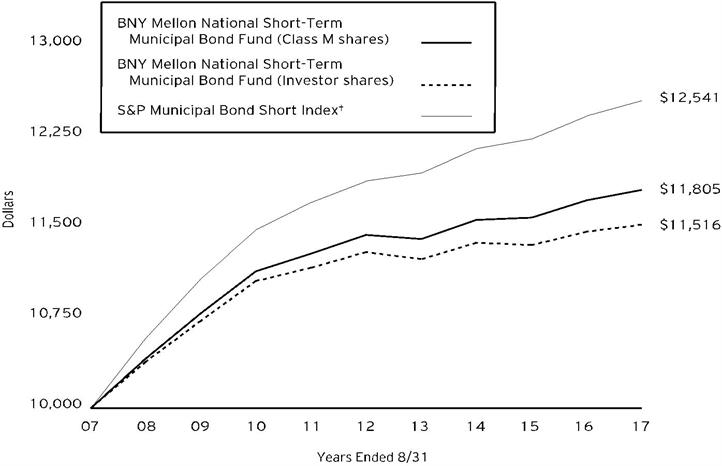
Comparison of change in value of $10,000 investment in BNY Mellon National Short-Term Municipal Bond Fund Class M shares and Investor shares and the S&P Municipal Bond Short Index (the “Index”)
Average Annual Total Returns as of 8/31/17 | |||
1 Year | 5 Years | 10 Years | |
Class M shares | 0.76% | 0.65% | 1.67% |
Investor shares | 0.52% | 0.40% | 1.42% |
S&P Municipal Bond Short Index | 1.01% | 1.09% | 2.29% |
† Source: Lipper Inc.
Past performance is not predictive of future performance. The fund’s performance shown in the graph and table does not reflect the deduction of taxes that a shareholder would pay on fund distributions or the redemption of fund shares.
The above graph compares a $10,000 investment made in Class M and Investor shares of BNY Mellon National Short-Term Municipal Bond Fund on 8/31/07 to a $10,000 investment made in the Index on that date. All dividends and capital gain distributions are reinvested.
Effective 7/1/2013, the fund changed its benchmark from the S&P Municipal Bond Short Index to the S&P Municipal Bond Investment Grade Short Index because the new benchmark index is more reflective of the credit quality of the fund’s portfolio holdings. The S&P Municipal Bond Investment Grade Short Index was launched on 3/19/13. Accordingly, the fund will continue to report the performance of the S&P Municipal Bond Short Index until the S&P Municipal Bond Investment Grade Short Index has been calculated for a 10-year period. Performance information for the fund versus the S&P Municipal Bond Investment Grade Short Index is included in the graph and table on the next page.
The fund’s performance shown in the line graph above takes into account all applicable fees and expenses for Class M and Investor shares. The Index consists of bonds in the S&P Municipal Bond Index with a minimum maturity of six months and a maximum maturity of up to, but not including, four years as measured from the rebalancing date. Unlike a mutual fund, the Index is not subject to charges, fees and other expenses. Investors cannot invest directly in any index. Further information relating to fund performance, including expense reimbursements, if applicable, is contained in the Financial Highlights section of the prospectus and elsewhere in this report.
The performance data quoted represents past performance, which is no guarantee of future results. Share price and investment return fluctuate and an investor's shares may be worth more or less than original cost upon redemption. Current performance may be lower or higher than the performance quoted. Go to Dreyfus.com for the fund's most recent month-end returns.
12
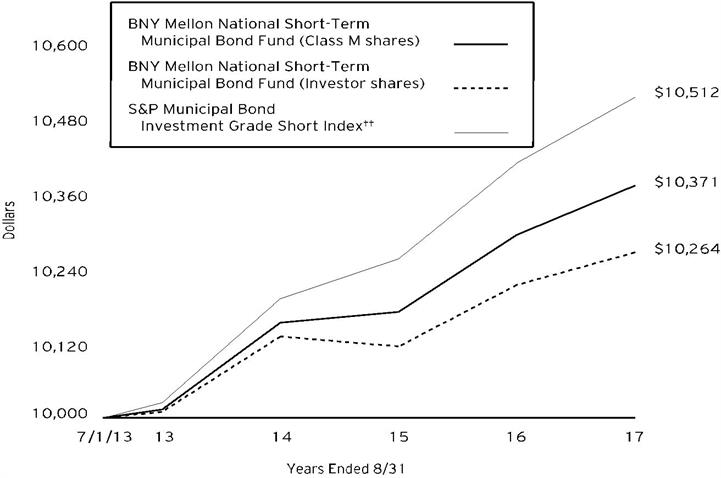
Comparison of change in value of $10,000 investment in BNY Mellon National Short-Term Municipal Bond Fund Class M shares and Investor shares and the S&P Municipal Bond Investment Grade Short Index (the “Index”)
Average Annual Total Returns as of 8/31/17 | |||
Inception Date | 1 Year | From Inception | |
Class M shares | 7/1/13 | 0.76% | 0.88% |
Investor shares | 7/1/13 | 0.52% | 0.63% |
S&P Municipal Bond Investment Grade Short Index | 7/1/13 | 1.01% | 1.20%††† |
†† Source: Bloomberg L.P.
Past performance is not predictive of future performance. The fund’s performance shown in the graph and table does not reflect the deduction of taxes that a shareholder would pay on fund distributions or the redemption of fund shares.
The above graph compares a $10,000 investment made in Class M and Investor shares of BNY Mellon National Short-Term Municipal Bond Fund on 7/1/13 to a $10,000 investment made in the Index. All dividends and capital gain distributions are reinvested.
The fund’s performance shown in the line graph above takes into account all applicable fees and expenses for Class M and Investor shares. The Index consists of bonds in the S&P Municipal Bond Index that are rated at least BBB- by Standard & Poor’s, Baa3 by Moody’s or BBB- by Fitch Ratings. For the avoidance of doubt, the lowest rating is used in determining if a bond is eligible for the index. S&P Dow Jones Indices looks at the long term rating, either insured or uninsured, and the underlying rating for index inclusion. Bonds that are pre-refunded or escrowed to maturity are included in this index. All bonds must also have a minimum maturity of six months and a maximum maturity of up to, but not including, four years as measured from the rebalancing date. Unlike a mutual fund, the Index is not subject to charges, fees and other expenses. Investors cannot invest directly in any index. Further information relating to fund performance, including expense reimbursements, if applicable, is contained in the Financial Highlights section of the prospectus and elsewhere in this report
††† For comparative purposes, the value of the Index on 6/30/13 is used as the beginning value on 7/1/13.
The performance data quoted represents past performance, which is no guarantee of future results. Share price and investment return fluctuate and an investor's shares may be worth more or less than original cost upon redemption. Current performance may be lower or higher than the performance quoted. Go to Dreyfus.com for the fund's most recent month-end returns.
13
FUND PERFORMANCE (continued)
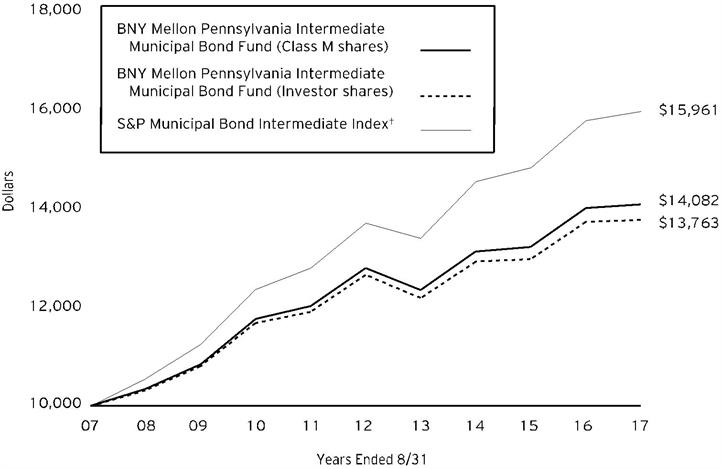
Comparison of change in value of $10,000 investment in BNY Mellon Pennsylvania Intermediate Municipal Bond Fund Class M shares and Investor shares and the S&P Municipal Bond Intermediate Index (the “Index”)
Average Annual Total Returns as of 8/31/17 | |||
1 Year | 5 Years | 10 Years | |
Class M shares | 0.55% | 1.95% | 3.48% |
Investor shares | 0.30% | 1.70% | 3.25% |
S&P Municipal Bond Intermediate Index | 1.16% | 3.10% | 4.79% |
† Source: Lipper Inc.
Past performance is not predictive of future performance. The fund’s performance shown in the graph and table does not reflect the deduction of taxes that a shareholder would pay on fund distributions or the redemption of fund shares.
The above graph compares a $10,000 investment made in Class M and Investor shares of BNY Mellon Pennsylvania Intermediate Municipal Bond Fund on 8/31/07 to a $10,000 investment made in the Index on that date. All dividends and capital gain distributions are reinvested.
Effective 7/1/2013, the fund changed its benchmark from the S&P Municipal Bond Intermediate Index to the S&P Municipal Bond Investment Grade Intermediate Index because the new benchmark index is more reflective of the credit quality of the fund’s portfolio holdings. The S&P Municipal Bond Investment Grade Intermediate Index was launched on 3/19/13. Accordingly, the fund will continue to report the performance of the S&P Municipal Bond Intermediate Index until the S&P Municipal Bond Investment Grade Intermediate Index has been calculated for a 10-year period. Performance information for the fund versus the S&P Municipal Bond Investment Grade Intermediate Index is included in the graph and table on the next page.
Unlike the Index, the fund invests primarily in Pennsylvania investment-grade municipal bonds. The fund’s performance shown in the line graph above takes into account all applicable fees and expenses for Class M and Investor shares. The Index consists of bonds in the S&P Municipal Bond Index with a minimum maturity of three years and a maximum maturity of up to, but not including, 15 years as measured from the rebalancing date. Unlike a mutual fund, the Index is not subject to charges, fees and other expenses. Investors cannot invest directly in any index. Further information relating to fund performance, including expense reimbursements, if applicable, is contained in the Financial Highlights section of the prospectus and elsewhere in this report.
The performance data quoted represents past performance, which is no guarantee of future results. Share price and investment return fluctuate and an investor's shares may be worth more or less than original cost upon redemption. Current performance may be lower or higher than the performance quoted. Go to Dreyfus.com for the fund's most recent month-end returns.
14
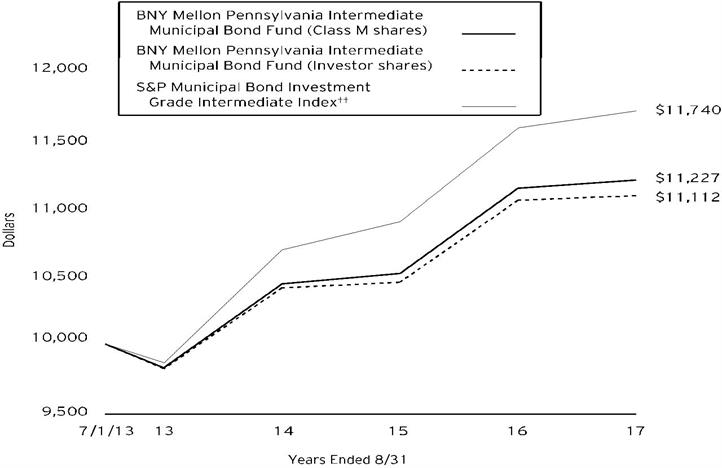
Comparison of change in value of $10,000 investment in BNY Mellon Pennsylvania Intermediate Municipal Bond Fund Class M shares and Investor shares and the S&P Municipal Bond Investment Grade Intermediate Index (the “Index”)
Average Annual Total Returns as of 8/31/17 | |||
Inception Date | 1 Year | From Inception | |
Class M shares | 7/1/13 | 0.55% | 2.82% |
Investor shares | 7/1/13 | 0.30% | 2.56% |
S&P Municipal Bond Investment Grade Intermediate Index | 7/1/13 | 1.11% | 3.91%††† |
†† Source: Bloomberg L.P.
Past performance is not predictive of future performance. The fund’s performance shown in the graph and table does not reflect the deduction of taxes that a shareholder would pay on fund distributions or the redemption of fund shares.
The above graph compares a $10,000 investment made in Class M and Investor shares of BNY Mellon Pennsylvania Intermediate Municipal Bond Fund on 7/1/13 to a $10,000 investment made in the Index. All dividends and capital gain distributions are reinvested.
Unlike the Index, the fund invests primarily in Pennsylvania investment-grade municipal bonds. The fund’s performance shown in the line graph above takes into account all applicable fees and expenses for Class M and Investor shares. The Index consists of bonds in the S&P Municipal Bond Index that are rated at least BBB- by Standard & Poor’s, Baa3 by Moody’s or BBB- by Fitch Ratings. All bonds must also have a minimum maturity of 3 years and a maximum maturity of up to, but not including, 15 years as measured from the rebalancing date. Unlike a mutual fund, the Index is not subject to charges, fees and other expenses. Investors cannot invest directly in any index. Further information relating to fund performance, including expense reimbursements, if applicable, is contained in the Financial Highlights section of the prospectus and elsewhere in this report.
††† For comparative purposes, the value of the Index on 6/30/13 is used as the beginning value on 7/1/13.
The performance data quoted represents past performance, which is no guarantee of future results. Share price and investment return fluctuate and an investor's shares may be worth more or less than original cost upon redemption. Current performance may be lower or higher than the performance quoted. Go to Dreyfus.com for the fund's most recent month-end returns.
15
FUND PERFORMANCE (continued)
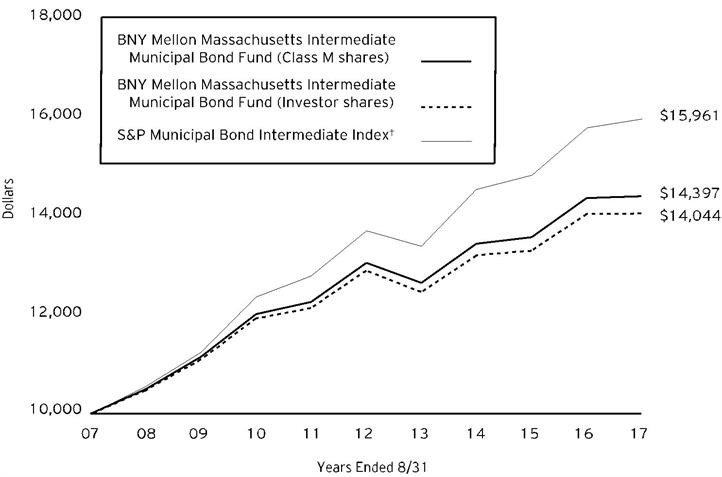
Comparison of change in value of $10,000 investment in BNY Mellon Massachusetts Intermediate Municipal Bond Fund Class M shares and Investor shares and the S&P Municipal Bond Intermediate Index (the “Index”)
Average Annual Total Returns as of 8/31/17 | |||
1 Year | 5 Years | 10 Years | |
Class M shares | 0.24% | 1.98% | 3.71% |
Investor shares | 0.06% | 1.72% | 3.45% |
S&P Municipal Bond Intermediate Index | 1.16% | 3.10% | 4.79% |
† Source: Lipper Inc.
Past performance is not predictive of future performance.
The above graph compares a $10,000 investment made in Class M and Investor shares of BNY Mellon Massachusetts Intermediate Municipal Bond Fund on 8/31/07 to a $10,000 investment made in the Index on that date. All dividends and capital gain distributions are reinvested.
Effective 7/1/2013, the fund changed its benchmark from the S&P Municipal Bond Intermediate Index to the S&P Municipal Bond Investment Grade Intermediate Index because the new benchmark index is more reflective of the credit quality of the fund’s portfolio holdings. The S&P Municipal Bond Investment Grade Intermediate Index was first calculated on 3/19/13. Accordingly, the fund will continue to report the performance of the S&P Municipal Bond Intermediate Index until the S&P Municipal Bond Investment Grade Intermediate Index has been calculated for a 10-year period. Performance information for the fund versus the S&P Municipal Bond Investment Grade Intermediate Index is included in the graph and table on the next page.
Unlike the Index, the fund invests primarily in Massachusetts investment-grade municipal bonds. The fund’s performance shown in the line graph above takes into account all applicable fees and expenses for Class M and Investor shares. The Index consists of bonds in the S&P Municipal Bond Index with a minimum maturity of three years and a maximum maturity of up to, but not including, 15 years as measured from the rebalancing date. Unlike a mutual fund, the Index is not subject to charges, fees and other expenses. Investors cannot invest directly in any index. Further information relating to fund performance, including expense reimbursements, if applicable, is contained in the Financial Highlights section of the prospectus and elsewhere in this report.
The performance data quoted represents past performance, which is no guarantee of future results. Share price and investment return fluctuate and an investor's shares may be worth more or less than original cost upon redemption. Current performance may be lower or higher than the performance quoted. Go to Dreyfus.com for the fund's most recent month-end returns.
16

Comparison of change in value of $10,000 investment in BNY Mellon Massachusetts Intermediate Municipal Bond Fund Class M shares and Investor shares and the S&P Municipal Bond Investment Grade Intermediate Index (the “Index”)
Average Annual Total Returns as of 8/31/17 | |||
Inception Date | 1 Year | From Inception | |
Class M shares | 7/1/13 | 0.24% | 2.77% |
Investor shares | 7/1/13 | 0.06% | 2.53% |
S&P Municipal Bond Investment Grade Intermediate Index | 7/1/13 | 1.11% | 3.91%††† |
†† Source: Bloomberg L.P.
Past performance is not predictive of future performance.
The above graph compares a $10,000 investment made in Class M and Investor shares of BNY Mellon Massachusetts Intermediate Municipal Bond Fund on 7/1/13 to a $10,000 investment made in the Index on that date. All dividends and capital gain distributions are reinvested.
Unlike the Index, the fund invests primarily in Massachusetts investment-grade municipal bonds. The fund’s performance shown in the line graph above takes into account all applicable fees and expenses for Class M and Investor shares. The Index consists of bonds in the S&P Municipal Bond Index that are rated at least BBB- by Standard & Poor’s, Baa3 by Moody’s or BBB- by Fitch Ratings. All bonds must also have a minimum maturity of 3 years and a maximum maturity of up to, but not including, 15 years as measured from the rebalancing date. Unlike a mutual fund, the Index is not subject to charges, fees and other expenses. Investors cannot invest directly in any index. Further information relating to fund performance, including expense reimbursements, if applicable, is contained in the Financial Highlights section of the prospectus and elsewhere in this report.
††† For comparative purposes, the value of the Index on 6/30/13 is used as the beginning value on 7/1/13.
The performance data quoted represents past performance, which is no guarantee of future results. Share price and investment return fluctuate and an investor's shares may be worth more or less than original cost upon redemption. Current performance may be lower or higher than the performance quoted. Go to Dreyfus.com for the fund's most recent month-end returns.
17
FUND PERFORMANCE (continued)
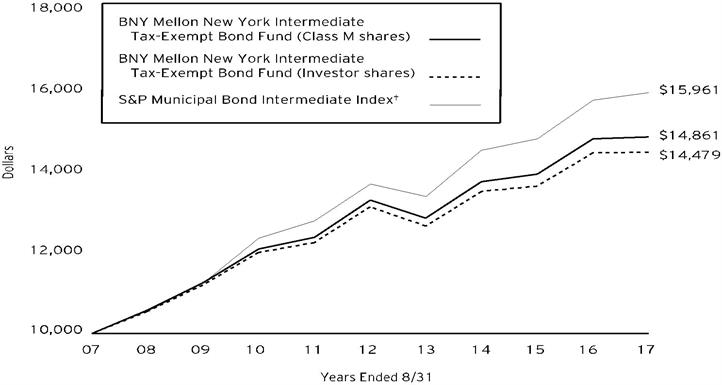
Comparison of change in value of $10,000 investment in BNY Mellon New York Intermediate Tax-Exempt Bond Fund Class M shares and Investor shares and the S&P Municipal Bond Intermediate Index (the “Index”)
Average Annual Total Returns as of 8/31/17 | |||
1 Year | 5 Years | 10 Years | |
Class M shares | 0.31% | 2.24% | 4.04% |
Investor shares | 0.07% | 1.97% | 3.77% |
S&P Municipal Bond Intermediate Index | 1.16% | 3.10% | 4.79% |
† Source: Lipper Inc.
Past performance is not predictive of future performance. The fund’s performance shown in the graph and table does not reflect the deduction of taxes that a shareholder would pay on fund distributions or the redemption of fund shares.
The above graph compares a $10,000 investment made in Class M and Investor shares of BNY Mellon New York Intermediate Tax-Exempt Bond Fund on 8/31/07 to a $10,000 investment made in the Index on that date. All dividends and capital gain distributions are reinvested.
Effective 7/1/2013, the fund changed its benchmark from the S&P Municipal Bond Intermediate Index to the S&P Municipal Bond Investment Grade Intermediate Index because the new benchmark index is more reflective of the credit quality of the fund’s portfolio holdings. The S&P Municipal Bond Investment Grade Intermediate Index was launched on 3/19/13. Accordingly, the fund will continue to report the performance of the S&P Municipal Bond Intermediate Index until the S&P Municipal Bond Investment Grade Intermediate Index has been calculated for a 10-year period. Performance information for the fund versus the S&P Municipal Bond Investment Grade Intermediate Index is included in the graph and table on the next page.
As of the close of business on September 12, 2008, substantially all of the assets of another investment company advised by an affiliate of the fund’s investment adviser, BNY Hamilton New York Intermediate Tax-Exempt Fund (the “predecessor fund”), a series of BNY Hamilton Funds, Inc., were transferred to BNY Mellon New York Intermediate Tax-Exempt Bond Fund in a tax-free reorganization and the fund commenced operations. The performance figures for the fund’s Class M shares represent the performance of the predecessor fund’s Institutional shares prior to the commencement of operations for BNY Mellon New York Intermediate Tax-Exempt Bond Fund and the performance of BNY Mellon New York Intermediate Tax-Exempt Bond Fund’s Class M shares thereafter. Unlike the Index, the fund invests primarily in New York municipal obligations. The performance figures for Investor shares represent the performance of the predecessor fund’s Class A shares prior to the commencement of operations for BNY Mellon New York Intermediate Tax-Exempt Bond Fund and the performance of BNY Mellon New York Intermediate Tax-Exempt Bond Fund’s Investor shares thereafter. Investor shares are subject to a Shareholder Services Plan.
The fund’s performance shown in the line graph above takes into account all applicable fees and expenses for Class M and Investor shares. The Index consists of bonds in the S&P Municipal Bond Index with a minimum maturity of three years and a maximum maturity of up to, but not including, 15 years as measured from the rebalancing date. Unlike a mutual fund, the Index is not subject to charges, fees and other expenses. Investors cannot invest directly in any index. Further information relating to fund performance, including expense reimbursements, if applicable, is contained in the Financial Highlights section of the prospectus and elsewhere in this report.
The performance data quoted represents past performance, which is no guarantee of future results. Share price and investment return fluctuate and an investor's shares may be worth more or less than original cost upon redemption. Current performance may be lower or higher than the performance quoted. Go to Dreyfus.com for the fund's most recent month-end returns.
18
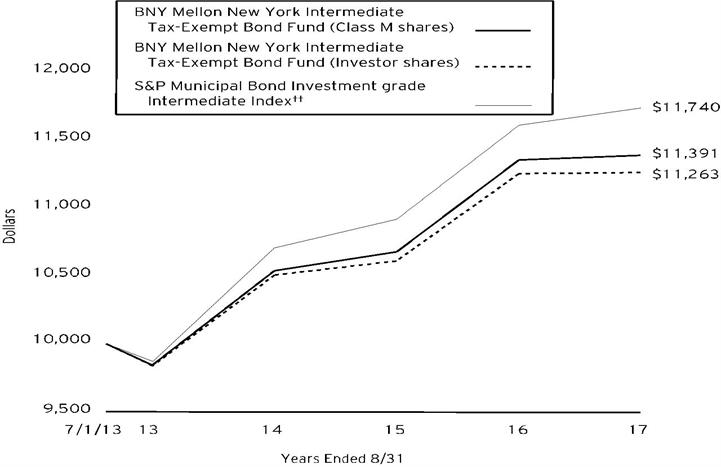
Comparison of change in value of $10,000 investment in BNY Mellon New York Intermediate Tax-Exempt Bond Fund Class M shares and Investor shares and the S&P Municipal Bond Investment Grade Intermediate Index (the “Index”)
Average Annual Total Returns as of 8/31/17 | |||
Inception Date | 1 Year | From Inception | |
Class M shares | 7/1/13 | 0.31% | 3.17% |
Investor shares | 7/1/13 | 0.07% | 2.89% |
S&P Municipal Bond Investment Grade Intermediate Index | 7/1/13 | 1.11% | 3.91%††† |
†† Source: Bloomberg L.P.
Past performance is not predictive of future performance. The fund’s performance shown in the graph and table does not reflect the deduction of taxes that a shareholder would pay on fund distributions or the redemption of fund shares.
The above graph compares a $10,000 investment made in Class M and Investor shares of BNY Mellon New York Intermediate Tax-Exempt Bond Fund on 7/1/13 to a $10,000 investment made in the Index on that date. All dividends and capital gain distributions are reinvested.
Unlike the Index, the fund invests primarily in New York municipal obligations. The fund’s performance shown in the line graph above takes into account all applicable fees and expenses for Class M and Investor shares. The Index consists of bonds in the S&P Municipal Bond Index that are rated at least BBB- by Standard & Poor’s, Baa3 by Moody’s or BBB- by Fitch Ratings. All bonds must also have a minimum maturity of 3 years and a maximum maturity of up to, but not including, 15 years as measured from the rebalancing date. Unlike a mutual fund, the Index is not subject to charges, fees and other expenses. Investors cannot invest directly in any index. Further information relating to fund performance, including expense reimbursements, if applicable, is contained in the Financial Highlights section of the prospectus and elsewhere in this report.
††† For comparative purposes, the value of the Index on 6/30/13 is used as the beginning value on 7/1/13.
The performance data quoted represents past performance, which is no guarantee of future results. Share price and investment return fluctuate and an investor's shares may be worth more or less than original cost upon redemption. Current performance may be lower or higher than the performance quoted. Go to Dreyfus.com for the fund's most recent month-end returns.
19
FUND PERFORMANCE (continued)
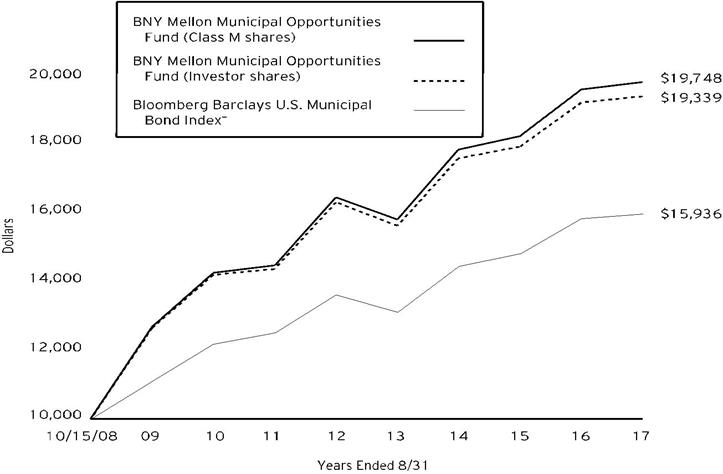
Comparison of change in value of $10,000 investment in BNY Mellon Municipal Opportunities Fund Class M shares and Investor shares and the Bloomberg Barclays U.S. Municipal Bond Index (the “Index”)
Average Annual Total Returns as of 8/31/17 | ||||
Inception Date | 1 Year | 5 Year | From Inception | |
Class M shares | 10/15/08 | 1.11% | 3.77% | 7.96% |
Investor shares | 10/15/08 | 0.95% | 3.52% | 7.71% |
Bloomberg Barclays U.S. Municipal Bond Index | 9/30/08 | 0.88% | 3.23% | 5.37%†† |
† Source: Lipper Inc.
Past performance is not predictive of future performance. The fund’s performance shown in the graph and table does not reflect the deduction of taxes that a shareholder would pay on fund distributions or the redemption of fund shares.
The above graph compares a $10,000 investment made in Class M and Investor shares of BNY Mellon Municipal Opportunities Fund on 10/15/08 (inception date) to a $10,000 investment made in the Index. All dividends and capital gain distributions are reinvested.
The fund’s performance shown in the line graph above takes into account all applicable fees and expenses for Class M and Investor shares. The Index covers the USD-denominated long-term tax-exempt bond market. Unlike a mutual fund, the Index is not subject to charges, fees and other expenses. Investors cannot invest directly in any index. Further information relating to fund performance, including expense reimbursements, if applicable, is contained in the Financial Highlights section of the prospectus and elsewhere in this report.
†† For comparative purposes, the value of the Index as of 9/30/08 is used as the beginning value on 10/15/08.
The performance data quoted represents past performance, which is no guarantee of future results. Share price and investment return fluctuate and an investor's shares may be worth more or less than original cost upon redemption. Current performance may be lower or higher than the performance quoted. Go to Dreyfus.com for the fund's most recent month-end returns.
20
UNDERSTANDING YOUR FUND’S EXPENSES (Unaudited)
As a mutual fund investor, you pay ongoing expenses, such as management fees and other expenses. Using the information below, you can estimate how these expenses affect your investment and compare them with the expenses of other funds. You also may pay one-time transaction expenses, including sales charges (loads) and redemption fees, which are not shown in this section and would have resulted in higher total expenses. For more information, see your fund’s prospectus or talk to your financial adviser.
Review your fund’s expenses
The table below shows the expenses you would have paid on a $1,000 investment in each class of each fund from March 1, 2017 to August 31, 2017. It also shows how much a $1,000 investment would be worth at the close of the period, assuming actual returns and expenses.
Expenses and Value of a $1,000 Investment |
|
|
|
|
|
|
|
|
|
| |||||||
assuming actual returns for the six months ended August 31, 2017 | |||||||||||||||||
|
|
|
|
|
| Class M |
|
|
| Investor Shares |
| ||||||
BNY Mellon National Intermediate | |||||||||||||||||
Expenses paid per $1,000† |
| $2.56 | $3.84 | ||||||||||||||
Ending value (after expenses) | $1,033.10 | $1,031.90 | |||||||||||||||
Annualized expense ratio (%) | .50 | .75 | |||||||||||||||
BNY Mellon National Short-Term | |||||||||||||||||
Expenses paid per $1,000† | $2.58 | $3.85 | |||||||||||||||
Ending value (after expenses) | $1,010.50 | $1,008.40 | |||||||||||||||
Annualized expense ratio (%) | .51 | .76 | |||||||||||||||
BNY Mellon Pennsylvania | |||||||||||||||||
Expenses paid per $1,000† | $3.59 | $4.87 | |||||||||||||||
Ending value (after expenses) | $1,032.60 | $1,032.20 | |||||||||||||||
Annualized expense ratio (%) | .70 | .95 | |||||||||||||||
BNY Mellon Massachusetts | |||||||||||||||||
Expenses paid per $1,000† | $2.82 | $4.09 | |||||||||||||||
Ending value (after expenses) | $1,030.60 | $1,030.10 | |||||||||||||||
Annualized expense ratio (%) | .55 | .80 | |||||||||||||||
BNY Mellon New York | |||||||||||||||||
Expenses paid per $1,000† | $3.02 | $4.30 | |||||||||||||||
Ending value (after expenses) | $1,032.30 | $1,030.00 | |||||||||||||||
Annualized expense ratio (%) | .59 | .84 | |||||||||||||||
BNY Mellon Municipal | |||||||||||||||||
Expenses paid per $1,000† | $3.75 | $5.04 | |||||||||||||||
Ending value (after expenses) | $1,040.40 | $1,040.00 | |||||||||||||||
Annualized expense ratio (%) | .73 | .98 | |||||||||||||||
† Expenses are equal to each fund’s annualized expense ratios as shown above, multiplied by the average account value over the period, multiplied by 184/365 (to reflect the one-half year period).
21
UNDERSTANDING YOUR FUND’S EXPENSES (Unaudited) (continued)
COMPARING YOUR FUND’S EXPENSES
WITH THOSE OF OTHER FUNDS (Unaudited)
Using the SEC’s method to compare expenses
The Securities and Exchange Commission (SEC) has established guidelines to help investors assess fund expenses. Per these guidelines, the table below shows your fund’s expenses based on a $1,000 investment, assuming a hypothetical 5% annualized return. You can use this information to compare the ongoing expenses (but not transaction expenses or total cost) of investing in the fund with those of other funds. All mutual fund shareholder reports will provide this information to help you make this comparison. Please note that you cannot use this information to estimate your actual ending account balance and expenses paid during the period.
Expenses and Value of a $1,000 Investment |
|
|
|
|
|
|
|
| |||||||||
assuming a hypothetical 5% annualized return for the six months ended August 31, 2017 | |||||||||||||||||
|
|
|
|
|
| Class M |
|
|
| Investor Shares |
| ||||||
BNY Mellon National Intermediate | |||||||||||||||||
Expenses paid per $1,000† | $2.55 | $3.82 | |||||||||||||||
Ending value (after expenses) | $1,022.68 | $1,021.42 | |||||||||||||||
Annualized expense ratio (%) | .50 | .75 | |||||||||||||||
BNY Mellon National Short-Term | |||||||||||||||||
Expenses paid per $1,000† | $2.60 | $3.87 | |||||||||||||||
Ending value (after expenses) | $1,022.63 | $1,021.37 | |||||||||||||||
Annualized expense ratio (%) | .51 | .76 | |||||||||||||||
BNY Mellon Pennsylvania | |||||||||||||||||
Expenses paid per $1,000† | $3.57 | $4.84 | |||||||||||||||
Ending value (after expenses) | $1,021.68 | $1,020.42 | |||||||||||||||
Annualized expense ratio (%) | .70 | .95 | |||||||||||||||
BNY Mellon Massachusetts | |||||||||||||||||
Expenses paid per $1,000† | $2.80 | $4.08 | |||||||||||||||
Ending value (after expenses) | $1,022.43 | $1,021.17 | |||||||||||||||
Annualized expense ratio (%) | .55 | .80 | |||||||||||||||
BNY Mellon New York | |||||||||||||||||
Expenses paid per $1,000† | $3.01 | $4.28 | |||||||||||||||
Ending value (after expenses) | $1,022.23 | $1,020.97 | |||||||||||||||
Annualized expense ratio (%) | .59 | .84 | |||||||||||||||
BNY Mellon Municipal | |||||||||||||||||
Expenses paid per $1,000† | $3.72 | $4.99 | |||||||||||||||
Ending value (after expenses) | $1,021.53 | $1,020.27 | |||||||||||||||
Annualized expense ratio (%) | .73 | .98 | |||||||||||||||
† Expenses are equal to each fund’s annualized expense ratios as shown above, multiplied by the average account value over the period, multiplied by 184/365 (to reflect the one-half year period).
22
STATEMENT OF INVESTMENTS
August 31, 2017
BNY Mellon National Intermediate Municipal Bond Fund | |||||||||
Description | Coupon | Maturity | Principal | Value ($) | |||||
Long-Term Municipal Investments - 98.7% | |||||||||
Alabama - .1% | |||||||||
Alabama 21st Century Authority, | 5.00 | 6/1/20 | 1,500,000 | 1,648,140 | |||||
Alabama 21st Century Authority, | 5.00 | 6/1/21 | 1,240,000 | 1,398,782 | |||||
3,046,922 | |||||||||
Alaska - .3% | |||||||||
Alaska, | 5.00 | 10/1/32 | 5,000,000 | 5,814,250 | |||||
Arizona - .3% | |||||||||
Maricopa County Industrial Development Authority, | 5.00 | 1/1/27 | 5,000,000 | 6,213,450 | |||||
Arkansas - .2% | |||||||||
University of Arkansas, | 5.00 | 11/1/33 | 500,000 | 606,585 | |||||
University of Arkansas, | 5.00 | 11/1/34 | 1,100,000 | 1,327,931 | |||||
University of Arkansas, | 5.00 | 11/1/36 | 580,000 | 695,037 | |||||
University of Arkansas, | 5.00 | 11/1/37 | 900,000 | 1,077,624 | |||||
University of Arkansas, | 5.00 | 11/1/38 | 800,000 | 955,536 | |||||
4,662,713 | |||||||||
California - 16.5% | |||||||||
Alameda Corridor Transportation Authority, | 5.00 | 10/1/34 | 1,500,000 | 1,740,825 | |||||
Alameda Corridor Transportation Authority, | 5.00 | 10/1/35 | 2,050,000 | 2,407,663 | |||||
Bay Area Toll Authority, | 2.00 | 4/1/21 | 5,000,000 | 5,121,500 | |||||
Bay Area Toll Authority, | 4.00 | 4/1/35 | 10,000,000 | 10,818,700 | |||||
California, | 5.00 | 8/1/22 | 5,000,000 | 5,897,700 | |||||
California, | 5.00 | 12/1/23 | 2,500,000 | 3,031,725 | |||||
California, | 5.00 | 12/1/23 | 12,500,000 | 15,158,625 | |||||
California, | 5.25 | 9/1/29 | 10,000,000 | 12,114,200 | |||||
California, | 4.00 | 9/1/31 | 10,000,000 | 11,049,400 | |||||
California, | 5.00 | 9/1/31 | 20,000,000 | 23,018,800 | |||||
California, | 6.00 | 3/1/33 | 11,445,000 | 12,864,638 | |||||
California, | 6.50 | 4/1/33 | 8,750,000 | 9,550,275 | |||||
California, | 5.50 | 3/1/40 | 7,950,000 | 8,798,503 | |||||
California, | 5.00 | 11/1/24 | 3,000,000 | 3,685,920 | |||||
California, | 5.00 | 11/1/25 | 5,000,000 | 6,219,950 | |||||
California Department of Water Resources, | 5.00 | 12/1/19 | 115,000 | 125,761 | |||||
California Health Facilities Financing Authority, | 4.00 | 3/1/33 | 7,500,000 | 8,015,025 | |||||
California Health Facilities Financing Authority, | 5.00 | 11/15/23 | 1,500,000 | 1,770,690 | |||||
California Health Facilities Financing Authority, | 5.00 | 11/15/24 | 1,600,000 | 1,890,608 | |||||
California Health Facilities Financing Authority, | 5.00 | 11/15/42 | 825,000 | 975,464 | |||||
23
STATEMENT OF INVESTMENTS (continued)
BNY Mellon National Intermediate Municipal Bond Fund (continued) | |||||||||
Description | Coupon | Maturity | Principal | Value ($) | |||||
Long-Term Municipal Investments - 98.7% (continued) | |||||||||
California - 16.5% (continued) | |||||||||
California Health Facilities Financing Authority, | 4.00 | 11/15/47 | 1,120,000 | 1,181,454 | |||||
California Health Facilities Financing Authority, | 6.25 | 10/1/18 | 8,500,000 | a | 9,011,020 | ||||
California Health Facilities Financing Authority, | 6.25 | 10/1/18 | 4,000,000 | a | 4,240,480 | ||||
California Health Facilities Financing Authority, | 6.50 | 10/1/18 | 60,000 | a | 63,732 | ||||
California Health Facilities Financing Authority, | 6.50 | 10/1/18 | 3,440,000 | a | 3,653,968 | ||||
California Infrastructure and Economic Development Bank, | 4.00 | 10/1/45 | 8,275,000 | 8,887,598 | |||||
California State Public Works Board, | 5.00 | 10/1/20 | 2,000,000 | 2,238,720 | |||||
California Statewide Communities Development Authority, | 6.25 | 8/1/19 | 4,140,000 | a | 4,566,172 | ||||
California Statewide Communities Development Authority, | 4.50 | 7/1/18 | 590,000 | 606,485 | |||||
Escondido Union School District, | 5.00 | 8/1/23 | 1,105,000 | 1,343,724 | |||||
Escondido Union School District, | 5.00 | 8/1/25 | 1,320,000 | 1,656,930 | |||||
Evergreen School District, | 4.00 | 8/1/41 | 5,000,000 | 5,270,500 | |||||
Golden State Tobacco Securitization Corporation, | 5.00 | 6/1/29 | 10,680,000 | 12,482,036 | |||||
Golden State Tobacco Securitization Corporation, | 5.00 | 6/1/32 | 2,000,000 | 2,345,600 | |||||
Long Beach Unified School District, | 4.00 | 8/1/38 | 10,300,000 | 11,037,171 | |||||
Los Angeles Department of Airports, | 5.25 | 5/15/26 | 15,520,000 | 17,313,181 | |||||
Los Angeles Unified School District, | 5.00 | 7/1/32 | 10,000,000 | 11,421,500 | |||||
New Haven Unified School District, | 0.00 | 8/1/33 | 4,000,000 | b | 2,336,320 | ||||
Port of Oakland, | 5.00 | 5/1/23 | 1,875,000 | 2,112,806 | |||||
Riverside County Transportation Commission, | 5.25 | 6/1/28 | 5,000,000 | 6,063,950 | |||||
Sacramento County Sanitation Districts Financing Authority, | 1.34 | 12/1/35 | 10,000,000 | c | 9,100,200 | ||||
Sacramento County Water Financing Authority, | 1.36 | 6/1/34 | 8,000,000 | c | 7,085,600 | ||||
San Francisco City and County, | 5.00 | 4/1/27 | 3,555,000 | 4,217,972 | |||||
San Francisco City and County, | 4.00 | 4/1/37 | 11,000,000 | 11,759,660 | |||||
San Francisco City and County Public Utilities Commission, | 5.00 | 11/1/37 | 11,000,000 | 12,613,920 | |||||
San Francisco Community College District, | 5.00 | 6/15/29 | 5,000,000 | 6,021,900 | |||||
San Jose Airport, | 5.00 | 3/1/42 | 1,000,000 | 1,171,480 | |||||
San Jose Airport, | 5.00 | 3/1/47 | 1,750,000 | 2,034,323 | |||||
Southern California Public Power Authority, | 5.25 | 11/1/20 | 4,000,000 | 4,443,720 | |||||
Southern California Public Power Authority, | 5.00 | 7/1/30 | 1,000,000 | 1,201,660 | |||||
Southern California Public Power Authority, | 5.00 | 7/1/31 | 3,855,000 | 4,602,369 | |||||
Southern California Public Power Authority, | 5.00 | 7/1/33 | 3,380,000 | 4,015,034 | |||||
24
BNY Mellon National Intermediate Municipal Bond Fund (continued) | |||||||||
Description | Coupon | Maturity | Principal | Value ($) | |||||
Long-Term Municipal Investments - 98.7% (continued) | |||||||||
California - 16.5% (continued) | |||||||||
Successor Agency to the Redevelopment Agency of the City of Pittsburg, | 5.00 | 9/1/21 | 1,325,000 | 1,522,915 | |||||
Successor Agency to the Redevelopment Agency of the City of Pittsburg, | 5.00 | 9/1/26 | 6,610,000 | 8,131,820 | |||||
University of California Regents, | 5.00 | 5/15/31 | 9,000,000 | 10,826,370 | |||||
University of California Regents, | 5.00 | 5/15/30 | 11,000,000 | 13,309,560 | |||||
354,147,822 | |||||||||
Colorado - 1.2% | |||||||||
City and County of Denver, | 5.25 | 11/15/19 | 4,445,000 | 4,484,427 | |||||
Colorado Department of Transportation, | 5.00 | 6/15/41 | 3,000,000 | 3,171,960 | |||||
Colorado Health Facilities Authority, | 6.00 | 10/1/23 | 2,000,000 | 2,106,180 | |||||
Colorado Health Facilities Authority, | 6.25 | 10/1/33 | 1,600,000 | 1,676,368 | |||||
Public Authority for Colorado Energy, | 5.75 | 11/15/18 | 995,000 | 1,024,243 | |||||
Public Authority for Colorado Energy, | 6.13 | 11/15/23 | 5,350,000 | 6,478,689 | |||||
Regional Transportation District, | 5.50 | 6/1/22 | 450,000 | 504,482 | |||||
Regional Transportation District, | 5.50 | 6/1/20 | 1,750,000 | a | 1,965,250 | ||||
Regional Transportation District of Colorado, | 5.00 | 6/1/19 | 1,750,000 | 1,873,165 | |||||
Regional Transportation District of Colorado, | 5.00 | 6/1/20 | 2,700,000 | 2,987,145 | |||||
26,271,909 | |||||||||
Connecticut - 1.0% | |||||||||
Connecticut, | 5.00 | 11/15/21 | 9,430,000 | 10,688,716 | |||||
Connecticut, | 5.00 | 4/15/22 | 5,000,000 | 5,704,450 | |||||
Connecticut, | 4.00 | 6/15/30 | 3,000,000 | 3,189,150 | |||||
Connecticut Housing Finance Authority, | 4.00 | 11/15/47 | 2,500,000 | 2,753,375 | |||||
22,335,691 | |||||||||
Delaware - .7% | |||||||||
Delaware River and Bay Authority, | 5.00 | 1/1/21 | 2,000,000 | 2,246,880 | |||||
Delaware River and Bay Authority, | 5.00 | 1/1/22 | 2,710,000 | 3,126,175 | |||||
Delaware River and Bay Authority, | 5.00 | 1/1/23 | 1,500,000 | 1,763,895 | |||||
Delaware River and Bay Authority, | 5.00 | 1/1/24 | 1,000,000 | 1,196,000 | |||||
University of Delaware, | 5.00 | 11/1/27 | 5,440,000 | 6,438,022 | |||||
14,770,972 | |||||||||
District of Columbia - .4% | |||||||||
Metropolitan Washington Airports Authority, | 5.00 | 10/1/23 | 4,250,000 | 4,854,222 | |||||
Metropolitan Washington Airports Authority, | 5.00 | 10/1/24 | 2,500,000 | 2,849,525 | |||||
7,703,747 | |||||||||
25
STATEMENT OF INVESTMENTS (continued)
BNY Mellon National Intermediate Municipal Bond Fund (continued) | |||||||||
Description | Coupon | Maturity | Principal | Value ($) | |||||
Long-Term Municipal Investments - 98.7% (continued) | |||||||||
Florida - 3.2% | |||||||||
Citizens Property Insurance Corporation, | 5.00 | 6/1/20 | 10,000,000 | 10,872,400 | |||||
Florida Department of Transportation, | 5.00 | 7/1/19 | 4,220,000 | 4,336,345 | |||||
Florida State Board of Education, | 5.00 | 6/1/26 | 10,000,000 | 12,150,400 | |||||
Jacksonville, | 5.00 | 10/1/21 | 2,500,000 | 2,872,025 | |||||
Lee County, | 5.50 | 10/1/23 | 3,565,000 | 4,123,671 | |||||
Lee County, | 5.50 | 10/1/24 | 5,000,000 | 5,760,650 | |||||
Miami-Dade County, | 5.50 | 10/1/25 | 3,165,000 | 3,584,204 | |||||
Miami-Dade County School Board, | 5.00 | 5/1/26 | 5,600,000 | 6,738,648 | |||||
Palm Beach County School Board, | 5.00 | 8/1/27 | 4,595,000 | 5,531,553 | |||||
Sarasota County, | 5.25 | 10/1/18 | 240,000 | a | 251,522 | ||||
Sarasota County, | 5.25 | 10/1/18 | 245,000 | a | 256,762 | ||||
Sarasota County, | 5.25 | 10/1/18 | 210,000 | a | 220,082 | ||||
Sarasota County, | 5.25 | 10/1/18 | 1,790,000 | a | 1,875,938 | ||||
Sarasota County, | 5.25 | 10/1/18 | 1,085,000 | a | 1,137,091 | ||||
Tampa Bay Water A Regional Water Supply Authority, | 5.00 | 10/1/20 | 5,000,000 | 5,611,400 | |||||
Tampa Sports Authority, | 5.00 | 1/1/24 | 90,000 | 109,084 | |||||
Tampa Sports Authority, | 5.00 | 1/1/25 | 2,865,000 | 3,516,415 | |||||
68,948,190 | |||||||||
Georgia - 1.8% | |||||||||
Atlanta Water and Wastewater, | 5.00 | 11/1/37 | 3,375,000 | 4,064,344 | |||||
Burke County Development Authority, | 2.35 | 12/11/20 | 7,500,000 | 7,626,600 | |||||
Burke County Development Authority, | 7.00 | 1/1/23 | 6,000,000 | 6,120,180 | |||||
Cobb County Kennestone Hospital Authority, | 5.00 | 4/1/35 | 2,000,000 | 2,307,540 | |||||
Cobb County Kennestone Hospital Authority, | 5.00 | 4/1/36 | 2,710,000 | 3,119,454 | |||||
Cobb County Kennestone Hospital Authority, | 5.00 | 4/1/37 | 2,845,000 | 3,267,226 | |||||
DeKalb County, | 5.25 | 10/1/36 | 3,500,000 | 4,003,335 | |||||
Main Street Natural Gas Inc., | 6.38 | 7/15/38 | 1,335,000 | d | 13,951 | ||||
Private Colleges and Universities Authority, | 5.00 | 9/1/41 | 6,990,000 | 7,895,694 | |||||
38,418,324 | |||||||||
Hawaii - .9% | |||||||||
Hawaii, | 5.00 | 5/1/25 | 10,750,000 | 13,295,815 | |||||
Hawaii, | 5.00 | 10/1/28 | 5,000,000 | 6,192,150 | |||||
19,487,965 | |||||||||
26
BNY Mellon National Intermediate Municipal Bond Fund (continued) | |||||||||
Description | Coupon | Maturity | Principal | Value ($) | |||||
Long-Term Municipal Investments - 98.7% (continued) | |||||||||
Idaho - .8% | |||||||||
Idaho Health Facilities Authority, | 5.00 | 12/1/33 | 5,000,000 | 5,628,000 | |||||
University of Idaho Regents, | 5.25 | 4/1/21 | 9,515,000 | 10,732,159 | |||||
16,360,159 | |||||||||
Illinois - 5.6% | |||||||||
Chicago, | 5.00 | 1/1/22 | 4,615,000 | 5,340,570 | |||||
Chicago, | 5.00 | 1/1/23 | 2,000,000 | 2,368,740 | |||||
Chicago, | 5.00 | 1/1/24 | 5,000,000 | 6,013,250 | |||||
Chicago, | 5.00 | 1/1/25 | 4,450,000 | 5,413,825 | |||||
Chicago, | 5.00 | 1/1/25 | 7,055,000 | 8,197,981 | |||||
Chicago, | 5.00 | 1/1/26 | 2,000,000 | 2,451,520 | |||||
Chicago, | 5.00 | 1/1/27 | 2,500,000 | 3,036,625 | |||||
Chicago, | 5.00 | 1/1/24 | 4,500,000 | 5,007,195 | |||||
Chicago, | 5.00 | 1/1/26 | 3,000,000 | 3,309,090 | |||||
Chicago, | 5.50 | 1/1/35 | 3,750,000 | 4,091,775 | |||||
Chicago, | 5.50 | 1/1/37 | 3,500,000 | 3,795,890 | |||||
Chicago, | 5.00 | 12/1/17 | 1,110,000 | 1,113,719 | |||||
Chicago, | 5.25 | 1/1/22 | 1,000,000 | 1,103,150 | |||||
Chicago, | 5.00 | 1/1/26 | 2,270,000 | 2,287,229 | |||||
Chicago, | 5.00 | 1/1/24 | 3,000,000 | 3,523,050 | |||||
Chicago, | 5.00 | 1/1/25 | 2,110,000 | 2,497,058 | |||||
Chicago Board of Education, | 5.50 | 12/1/18 | 1,605,000 | 1,651,385 | |||||
Illinois, | 5.00 | 8/1/18 | 19,900,000 | 20,474,513 | |||||
Illinois, | 5.00 | 8/1/19 | 10,000,000 | 10,511,900 | |||||
Illinois, | 5.00 | 9/1/19 | 185,000 | 185,414 | |||||
Illinois, | 5.00 | 8/1/23 | 5,000,000 | 5,528,100 | |||||
Illinois, | 5.25 | 2/1/28 | 6,000,000 | 6,147,900 | |||||
Illinois, | 5.00 | 1/1/20 | 5,000,000 | 5,334,250 | |||||
Railsplitter Tobacco Settlement Authority, | 6.25 | 6/1/24 | 10,000,000 | 10,207,200 | |||||
119,591,329 | |||||||||
Kansas - 1.3% | |||||||||
Kansas Department of Transportation, | 5.00 | 9/1/27 | 5,000,000 | 6,080,900 | |||||
Kansas Department of Transportation, | 5.00 | 9/1/28 | 6,000,000 | 7,267,680 | |||||
27
STATEMENT OF INVESTMENTS (continued)
BNY Mellon National Intermediate Municipal Bond Fund (continued) | |||||||||
Description | Coupon | Maturity | Principal | Value ($) | |||||
Long-Term Municipal Investments - 98.7% (continued) | |||||||||
Kansas - 1.3% (continued) | |||||||||
Kansas Department of Transportation, | 5.00 | 9/1/29 | 1,300,000 | 1,565,174 | |||||
Kansas Development Finance Authority, | 4.00 | 5/1/21 | 3,370,000 | 3,620,863 | |||||
Wichita, | 5.00 | 10/1/21 | 7,990,000 | 9,232,525 | |||||
27,767,142 | |||||||||
Kentucky - .7% | |||||||||
Kentucky Property and Buildings Commission, | 5.00 | 11/1/22 | 5,000,000 | 5,836,900 | |||||
Kentucky State Property and Buildings Commission, | 5.00 | 8/1/21 | 1,785,000 | 2,021,870 | |||||
Kentucky State Property and Buildings Commission, | 5.00 | 2/1/28 | 5,150,000 | 6,157,958 | |||||
14,016,728 | |||||||||
Louisiana - 1.9% | |||||||||
Jefferson Sales Tax District, | 5.25 | 12/1/17 | 4,000,000 | a | 4,039,640 | ||||
Louisiana, | 5.00 | 8/1/26 | 5,000,000 | 6,021,700 | |||||
Louisiana Citizens Property Insurance Corporation, | 6.13 | 6/1/18 | 9,500,000 | a | 9,879,810 | ||||
Louisiana Citizens Property Insurance Corporation, | 5.00 | 6/1/21 | 5,000,000 | 5,694,250 | |||||
Louisiana Local Government Environmental Facilities and Community Development Authority, | 5.00 | 10/1/22 | 5,000,000 | 5,573,800 | |||||
Louisiana Public Facilities Authority, | 6.00 | 7/1/29 | 2,000,000 | 2,172,200 | |||||
Louisiana Public Facilities Authority, | 5.00 | 10/1/41 | 6,000,000 | 6,330,180 | |||||
39,711,580 | |||||||||
Maryland - 3.4% | |||||||||
Anne Arundel County, | 5.00 | 4/1/28 | 2,480,000 | 2,946,116 | |||||
Anne Arundel County, | 5.00 | 4/1/29 | 4,640,000 | 5,497,797 | |||||
Anne Arundel County, | 5.00 | 4/1/30 | 4,640,000 | 5,486,893 | |||||
Maryland, | 4.00 | 6/1/27 | 10,000,000 | 11,441,900 | |||||
Maryland Department of Transportation, | 4.00 | 11/1/27 | 10,000,000 | 11,432,900 | |||||
Maryland Economic Development Corporation, | 5.00 | 3/31/24 | 6,000,000 | 6,813,120 | |||||
Maryland Health and Higher Educational Facilities Authority, | 5.00 | 5/15/42 | 2,500,000 | 2,861,550 | |||||
Montgomery County, | 5.00 | 11/1/26 | 10,000,000 | 12,383,500 | |||||
Montgomery County, | 4.00 | 12/1/30 | 12,000,000 | 13,309,440 | |||||
72,173,216 | |||||||||
Massachusetts - 2.5% | |||||||||
Massachusetts, | 4.00 | 6/1/46 | 10,000,000 | 10,582,400 | |||||
Massachusetts, | 4.50 | 12/1/43 | 15,000,000 | 16,360,200 | |||||
Massachusetts, | 5.50 | 10/1/20 | 3,285,000 | 3,739,677 | |||||
Massachusetts, | 1.34 | 11/1/18 | 2,000,000 | c | 2,000,880 | ||||
28
BNY Mellon National Intermediate Municipal Bond Fund (continued) | |||||||||
Description | Coupon | Maturity | Principal | Value ($) | |||||
Long-Term Municipal Investments - 98.7% (continued) | |||||||||
Massachusetts - 2.5% (continued) | |||||||||
Massachusetts Development Finance Agency, | 5.00 | 10/1/33 | 5,000,000 | 5,798,450 | |||||
Massachusetts Development Finance Agency, | 5.00 | 7/1/34 | 1,000,000 | 1,160,860 | |||||
Massachusetts Development Finance Agency, | 5.00 | 7/1/35 | 1,000,000 | 1,157,190 | |||||
Massachusetts Development Finance Agency, | 5.00 | 7/1/36 | 850,000 | 982,048 | |||||
Massachusetts Development Finance Agency, | 5.00 | 5/1/44 | 2,505,000 | 2,842,599 | |||||
Massachusetts Health and Educational Facilities Authority, | 7.50 | 10/1/18 | 820,000 | a | 878,482 | ||||
Massachusetts Health and Educational Facilities Authority, | 7.50 | 10/1/18 | 1,180,000 | a | 1,264,158 | ||||
Massachusetts Water Pollution Abatement Trust, | 5.75 | 8/1/29 | 380,000 | 381,478 | |||||
The Commonwealth of Massachusetts, | 4.00 | 2/1/29 | 5,000,000 | 5,576,150 | |||||
52,724,572 | |||||||||
Michigan - 3.0% | |||||||||
Detroit, | 5.75 | 7/1/22 | 7,000,000 | 7,282,660 | |||||
Michigan Building Authority, | 5.00 | 10/15/22 | 2,400,000 | 2,836,728 | |||||
Michigan Building Authority, | 5.00 | 10/15/29 | 10,000,000 | 11,654,400 | |||||
Michigan Building Authority, | 5.00 | 10/15/33 | 5,000,000 | 5,751,300 | |||||
Michigan Finance Authority, | 5.00 | 12/1/31 | 10,000,000 | 11,260,800 | |||||
Michigan Finance Authority, | 5.00 | 12/1/35 | 5,000,000 | 5,594,450 | |||||
Michigan Finance Authority, | 5.00 | 12/1/39 | 7,095,000 | 8,010,397 | |||||
Michigan Finance Authority, | 5.00 | 7/1/26 | 1,875,000 | 2,202,488 | |||||
Michigan Finance Authority, | 5.00 | 7/1/27 | 3,000,000 | 3,498,090 | |||||
Michigan Finance Authority, | 5.00 | 7/1/28 | 2,500,000 | 2,893,700 | |||||
Michigan Finance Authority, | 5.00 | 7/1/26 | 2,500,000 | 2,936,650 | |||||
63,921,663 | |||||||||
Minnesota - .8% | |||||||||
Minneapolis, | 6.63 | 11/15/18 | 12,000,000 | a | 12,832,680 | ||||
Minnesota Housing Finance Agency Residential Housing Finance, | 4.00 | 7/1/47 | 2,000,000 | 2,185,020 | |||||
Western Minnesota Municipal Power Agency, | 5.00 | 1/1/22 | 1,500,000 | 1,744,095 | |||||
16,761,795 | |||||||||
Mississippi - .1% | |||||||||
Mississippi Home Corporation, | 4.38 | 12/1/18 | 305,000 | 307,184 | |||||
29
STATEMENT OF INVESTMENTS (continued)
BNY Mellon National Intermediate Municipal Bond Fund (continued) | |||||||||
Description | Coupon | Maturity | Principal | Value ($) | |||||
Long-Term Municipal Investments - 98.7% (continued) | |||||||||
Mississippi - .1% (continued) | |||||||||
Southern Mississippi Educational Building Corporation, | 5.00 | 9/1/24 | 450,000 | 545,841 | |||||
Southern Mississippi Educational Building Corporation, | 5.00 | 9/1/25 | 250,000 | 306,848 | |||||
Southern Mississippi Educational Building Corporation, | 5.00 | 9/1/26 | 550,000 | 681,874 | |||||
1,841,747 | |||||||||
Missouri - 1.8% | |||||||||
Missouri Environmental Improvement and Energy Resources Authority, | 5.00 | 7/1/21 | 1,505,000 | 1,731,442 | |||||
Missouri Environmental Improvement and Energy Resources Authority, | 5.00 | 7/1/23 | 2,125,000 | 2,573,970 | |||||
Missouri Environmental Improvement and Energy Resources Authority, | 5.00 | 1/1/26 | 750,000 | 900,720 | |||||
Missouri Environmental Improvement and Energy Resources Authority, | 5.00 | 7/1/21 | 45,000 | 51,679 | |||||
Missouri Environmental Improvement and Energy Resources Authority, | 5.00 | 7/1/22 | 65,000 | 76,749 | |||||
Missouri Environmental Improvement and Energy Resources Authority, | 5.00 | 7/1/23 | 75,000 | 90,728 | |||||
Missouri Health and Educational Facilities Authority, | 5.00 | 10/1/38 | 2,000,000 | 2,319,400 | |||||
Missouri Highways and Transportation Commission, | 5.00 | 5/1/23 | 25,625,000 | 30,923,481 | |||||
38,668,169 | |||||||||
Montana - .2% | |||||||||
Montana Board of Housing, | 3.50 | 6/1/44 | 4,710,000 | 5,081,242 | |||||
Nebraska - .5% | |||||||||
Central Plains Energy Project, | 5.00 | 12/1/19 | 10,000,000 | 10,801,400 | |||||
Nevada - .8% | |||||||||
Clark County, | 5.00 | 7/1/19 | 10,000,000 | a | 10,753,200 | ||||
Clark County School District, | 5.00 | 6/15/20 | 6,330,000 | 6,541,675 | |||||
17,294,875 | |||||||||
New Jersey - 5.5% | |||||||||
New Jersey Economic Development Authority, | 5.00 | 6/15/21 | 10,000,000 | 11,006,200 | |||||
New Jersey Economic Development Authority, | 5.00 | 6/15/24 | 5,000,000 | 5,513,350 | |||||
New Jersey Economic Development Authority, | 5.00 | 6/15/20 | 5,000,000 | 5,387,400 | |||||
New Jersey Economic Development Authority, | 5.50 | 12/15/19 | 1,410,000 | 1,517,231 | |||||
New Jersey Economic Development Authority, | 5.25 | 12/15/20 | 5,000,000 | 5,486,250 | |||||
New Jersey Economic Development Authority, | 5.00 | 3/1/25 | 13,000,000 | 14,719,250 | |||||
New Jersey Economic Development Authority, | 5.50 | 9/1/23 | 10,000,000 | 11,747,000 | |||||
30
BNY Mellon National Intermediate Municipal Bond Fund (continued) | |||||||||
Description | Coupon | Maturity | Principal | Value ($) | |||||
Long-Term Municipal Investments - 98.7% (continued) | |||||||||
New Jersey - 5.5% (continued) | |||||||||
New Jersey Educational Facilities Authority, | 7.50 | 6/1/19 | 3,750,000 | a | 4,181,625 | ||||
New Jersey Health Care Facilities Financing Authority, | 5.00 | 7/1/22 | 1,830,000 | 2,131,712 | |||||
New Jersey Health Care Facilities Financing Authority, | 5.00 | 7/1/24 | 3,005,000 | 3,454,187 | |||||
New Jersey Health Care Facilities Financing Authority, | 5.00 | 7/1/19 | 2,000,000 | 2,140,400 | |||||
New Jersey Health Care Facilities Financing Authority, | 5.00 | 7/1/24 | 1,000,000 | 1,175,340 | |||||
New Jersey Health Care Facilities Financing Authority, | 5.00 | 7/1/25 | 1,060,000 | 1,253,249 | |||||
New Jersey Health Care Facilities Financing Authority, | 5.00 | 7/1/26 | 1,000,000 | 1,186,590 | |||||
New Jersey Transportation Trust Fund Authority, | 5.25 | 12/15/21 | 7,000,000 | 7,825,230 | |||||
New Jersey Transportation Trust Fund Authority, | 5.50 | 6/15/31 | 5,000,000 | 5,436,800 | |||||
New Jersey Transportation Trust Fund Authority, | 5.50 | 12/15/21 | 10,000,000 | 11,383,900 | |||||
New Jersey Transportation Trust Fund Authority, | 5.00 | 6/15/24 | 10,000,000 | 10,268,400 | |||||
New Jersey Transportation Trust Fund Authority, | 5.00 | 6/15/19 | 10,000,000 | 10,562,800 | |||||
Rutgers The State University, | 5.00 | 5/1/21 | 2,000,000 | 2,278,240 | |||||
118,655,154 | |||||||||
New Mexico - .2% | |||||||||
New Mexico Municipal Energy Acquisition Authority, | 5.00 | 8/1/19 | 5,000,000 | 5,344,100 | |||||
New York - 14.7% | |||||||||
Brooklyn Arena Local Development Corporation, | 4.00 | 7/15/32 | 750,000 | 815,333 | |||||
Brooklyn Arena Local Development Corporation, | 4.00 | 7/15/33 | 900,000 | 973,791 | |||||
Brooklyn Arena Local Development Corporation, | 4.00 | 7/15/34 | 1,000,000 | 1,078,600 | |||||
Hudson Yards Infrastructure Corporation Second Indenture, | 5.00 | 2/15/32 | 7,000,000 | 8,465,520 | |||||
Metropolitan Transportation Authority, | 5.25 | 11/15/33 | 5,000,000 | 6,262,350 | |||||
Metropolitan Transportation Authority, | 6.50 | 11/15/28 | 2,250,000 | 2,406,330 | |||||
Metropolitan Transportation Authority, | 5.00 | 11/15/31 | 10,000,000 | 12,016,700 | |||||
Metropolitan Transportation Authority, | 6.50 | 11/15/18 | 720,000 | a | 769,896 | ||||
Metropolitan Transportation Authority, | 6.50 | 11/15/18 | 9,030,000 | a | 9,655,779 | ||||
Metropolitan Transportation Authority Hudson Rail Yards Trust, | 5.00 | 11/15/46 | 10,000,000 | 10,713,700 | |||||
Metropolitan Transportation Authority Hudson Rail Yards Trust, | 5.00 | 11/15/51 | 5,000,000 | 5,512,600 | |||||
Monroe County Industrial Development Corporation, | 5.00 | 7/1/30 | 2,000,000 | 2,463,860 | |||||
Nassau County, | 5.00 | 4/1/35 | 4,845,000 | 5,677,565 | |||||
New York City, | 5.00 | 8/1/23 | 5,000,000 | 6,032,600 | |||||
31
STATEMENT OF INVESTMENTS (continued)
BNY Mellon National Intermediate Municipal Bond Fund (continued) | |||||||||
Description | Coupon | Maturity | Principal | Value ($) | |||||
Long-Term Municipal Investments - 98.7% (continued) | |||||||||
New York - 14.7% (continued) | |||||||||
New York City, | 5.00 | 8/1/24 | 5,000,000 | 6,122,900 | |||||
New York City, | 5.00 | 10/1/25 | 2,500,000 | 2,884,450 | |||||
New York City, | 5.00 | 8/1/26 | 5,660,000 | 6,655,990 | |||||
New York City, | 5.00 | 8/1/28 | 16,000,000 | 18,346,720 | |||||
New York City Transitional Finance Authority, | 5.00 | 7/15/30 | 5,000,000 | 6,128,250 | |||||
New York City Transitional Finance Authority, | 5.00 | 11/1/38 | 4,015,000 | 4,657,360 | |||||
New York City Transitional Finance Authority, | 5.00 | 2/1/23 | 8,325,000 | 9,437,886 | |||||
New York City Transitional Finance Authority, | 5.00 | 11/1/25 | 20,000,000 | 24,111,400 | |||||
New York Counties Tobacco Trust VI, | 5.00 | 6/1/45 | 2,000,000 | 2,116,780 | |||||
New York Liberty Development Corporation, | 5.15 | 11/15/34 | 3,500,000 | e | 3,855,425 | ||||
New York Liberty Development Corporation, | 5.00 | 11/15/44 | 8,000,000 | e | 8,716,000 | ||||
New York State Dormitory Authority, | 5.00 | 10/1/41 | 7,500,000 | 8,450,925 | |||||
New York State Dormitory Authority, | 5.75 | 7/1/18 | 45,000 | 46,831 | |||||
New York State Dormitory Authority, | 5.00 | 3/15/31 | 5,165,000 | 6,141,650 | |||||
New York State Dormitory Authority, | 5.00 | 2/15/33 | 25,000,000 | 29,469,000 | |||||
New York State Dormitory Authority, | 5.00 | 3/15/34 | 2,500,000 | 2,947,475 | |||||
New York State Thruway Authority, | 5.00 | 1/1/32 | 3,000,000 | 3,530,370 | |||||
New York State Urban Development Corporation, | 5.00 | 3/15/23 | 10,845,000 | 12,991,659 | |||||
New York State Urban Development Corporation, | 5.00 | 3/15/25 | 5,000,000 | 6,187,550 | |||||
New York State Urban Development Corporation, | 5.00 | 3/15/29 | 10,000,000 | 11,762,700 | |||||
New York Transportation Development Corporation, | 5.00 | 7/1/41 | 2,000,000 | 2,214,140 | |||||
New York Transportation Development Corporation, | 5.00 | 7/1/46 | 2,500,000 | 2,759,600 | |||||
Port Authority of New York and New Jersey, | 5.00 | 5/1/36 | 3,000,000 | 3,289,680 | |||||
Port Authority of New York and New Jersey, | 5.00 | 5/1/37 | 3,400,000 | 3,725,482 | |||||
Port Authority of New York and New Jersey, | 5.00 | 5/1/38 | 1,375,000 | 1,506,629 | |||||
Port Authority of New York and New Jersey, | 5.00 | 11/15/31 | 4,205,000 | 5,184,975 | |||||
Port Authority of New York and New Jersey, | 5.00 | 11/15/32 | 3,845,000 | 4,717,661 | |||||
Port Authority of New York and New Jersey, | 5.25 | 11/15/39 | 12,340,000 | 15,192,021 | |||||
Sales Tax Asset Receivable Corporation, | 5.00 | 10/15/29 | 6,370,000 | 7,762,291 | |||||
Suffolk County, | 4.00 | 2/1/24 | 5,000,000 | 5,659,850 | |||||
Triborough Bridge and Tunnel Authority, | 0.00 | 11/15/29 | 10,000,000 | b | 7,060,300 | ||||
TSASC, Inc. of New York, | 5.00 | 6/1/23 | 5,000,000 | 5,796,050 | |||||
Utility Debt Securitization Authority of New York, | 5.00 | 12/15/26 | 2,500,000 | 3,045,425 | |||||
315,320,049 | |||||||||
32
BNY Mellon National Intermediate Municipal Bond Fund (continued) | |||||||||
Description | Coupon | Maturity | Principal | Value ($) | |||||
Long-Term Municipal Investments - 98.7% (continued) | |||||||||
North Carolina - .9% | |||||||||
North Carolina Eastern Municipal Power Agency, | 5.00 | 1/1/19 | 11,000,000 | a | 11,608,410 | ||||
North Carolina Medical Care Commission, | 5.00 | 10/1/26 | 1,000,000 | 1,242,400 | |||||
North Carolina Medical Care Commission, | 5.00 | 10/1/28 | 1,030,000 | 1,281,866 | |||||
North Carolina Medical Care Commission, | 5.00 | 10/1/29 | 1,725,000 | 2,127,563 | |||||
North Carolina Medical Care Commission, | 5.00 | 10/1/30 | 780,000 | 951,475 | |||||
North Carolina Municipal Power Agency Number 1, | 5.00 | 1/1/24 | 1,585,000 | 1,670,923 | |||||
18,882,637 | |||||||||
Ohio - 1.7% | |||||||||
Board of Education of the Winton Woods City School District, | 5.00 | 11/1/42 | 1,750,000 | 2,001,230 | |||||
Board of Education of the Winton Woods City School District, | 5.00 | 11/1/47 | 2,590,000 | 2,954,335 | |||||
Columbus, | 5.00 | 7/1/21 | 3,005,000 | 3,454,668 | |||||
Hamilton County, | 5.00 | 12/1/26 | 3,500,000 | 4,222,925 | |||||
Montgomery County, | 6.00 | 10/1/23 | 3,055,000 | 3,219,237 | |||||
Ohio, | 5.00 | 3/15/36 | 5,000,000 | 5,861,550 | |||||
Ohio Housing Finance Agency, | 4.00 | 3/1/47 | 7,000,000 | 7,560,700 | |||||
Ohio Housing Finance Agency, | 4.50 | 3/1/47 | 2,500,000 | 2,776,550 | |||||
Revere Local School District, | 5.00 | 12/1/42 | 2,500,000 | 2,816,400 | |||||
Revere Local School District, | 5.00 | 12/1/45 | 2,100,000 | 2,361,744 | |||||
37,229,339 | |||||||||
Oregon - .2% | |||||||||
Oregon Housing and Community Services Department, | 4.00 | 1/1/47 | 4,740,000 | 5,142,853 | |||||
Pennsylvania - 5.9% | |||||||||
Chester County Health and Education Facilities Authority Health System, | 4.00 | 10/1/37 | 2,105,000 | 2,232,331 | |||||
Geisinger Authority, | 5.00 | 2/15/34 | 2,000,000 | 2,357,820 | |||||
Montgomery County Industrial Development Authority, | 5.00 | 11/15/36 | 5,000,000 | 5,678,350 | |||||
Pennsylvania, | 5.00 | 8/15/21 | 7,210,000 | 8,246,582 | |||||
Pennsylvania, | 5.00 | 6/15/22 | 5,220,000 | 6,078,325 | |||||
Pennsylvania, | 5.00 | 11/15/22 | 5,000,000 | 5,753,600 | |||||
Pennsylvania, | 5.00 | 3/15/31 | 5,000,000 | 5,816,650 | |||||
Pennsylvania, | 5.00 | 4/1/26 | 11,520,000 | 13,496,602 | |||||
Pennsylvania, | 5.00 | 6/1/28 | 7,540,000 | 8,723,177 | |||||
Pennsylvania Higher Educational Facilities Authority, | 5.00 | 8/15/24 | 5,000,000 | 6,076,850 | |||||
Pennsylvania Higher Educational Facilities Authority, | 5.00 | 6/15/29 | 5,000,000 | 5,953,800 | |||||
33
STATEMENT OF INVESTMENTS (continued)
BNY Mellon National Intermediate Municipal Bond Fund (continued) | |||||||||
Description | Coupon | Maturity | Principal | Value ($) | |||||
Long-Term Municipal Investments - 98.7% (continued) | |||||||||
Pennsylvania - 5.9% (continued) | |||||||||
Pennsylvania Housing Finance Agency, | 4.00 | 10/1/46 | 2,880,000 | 3,120,365 | |||||
Pennsylvania Turnpike Commission, | 5.00 | 12/1/31 | 5,110,000 | 5,850,592 | |||||
Pennsylvania Turnpike Commission, | 5.00 | 6/1/33 | 10,000,000 | 11,744,100 | |||||
Pennsylvania Turnpike Commission, | 5.00 | 12/1/20 | 3,675,000 | 4,094,428 | |||||
Pennsylvania Turnpike Commission, | 5.00 | 12/1/21 | 3,740,000 | 4,277,999 | |||||
Philadelphia Authority for Industrial Development Hospital, | 4.00 | 7/1/35 | 1,575,000 | 1,688,778 | |||||
Philadelphia Authority for Industrial Development Hospital, | 4.00 | 7/1/36 | 3,750,000 | 4,011,075 | |||||
Philadelphia Authority for Industrial Development Hospital, | 4.00 | 7/1/37 | 3,500,000 | 3,734,500 | |||||
State Public School Building Authority, | 5.00 | 4/1/22 | 1,000,000 | 1,110,130 | |||||
State Public School Building Authority, | 5.00 | 4/1/25 | 2,750,000 | 2,992,137 | |||||
State Public School Building Authority, | 5.00 | 6/1/25 | 5,000,000 | 5,898,500 | |||||
State Public School Building Authority, | 5.00 | 6/1/31 | 5,000,000 | 5,758,700 | |||||
West Mifflin Area School District, | 5.00 | 4/1/27 | 1,140,000 | 1,341,176 | |||||
West Mifflin Area School District, | 5.00 | 4/1/28 | 1,000,000 | 1,165,100 | |||||
127,201,667 | |||||||||
South Carolina - .9% | |||||||||
Greenville County School District, | 5.50 | 12/1/18 | 3,000,000 | 3,171,300 | |||||
Growth Remedy Opportunity Without Tax Hike, | 5.00 | 12/1/28 | 1,750,000 | 2,053,100 | |||||
Growth Remedy Opportunity Without Tax Hike, | 5.00 | 12/1/29 | 2,000,000 | 2,333,620 | |||||
South Carolina Public Service Authority, | 5.00 | 12/1/30 | 3,315,000 | 3,853,356 | |||||
South Carolina Public Service Authority, | 5.00 | 12/1/22 | 7,500,000 | 8,720,400 | |||||
20,131,776 | |||||||||
South Dakota - .1% | |||||||||
South Dakota Educational Enhancement Funding Corporation, | 5.00 | 6/1/25 | 1,800,000 | 2,053,566 | |||||
South Dakota Educational Enhancement Funding Corporation, | 5.00 | 6/1/27 | 500,000 | 561,940 | |||||
2,615,506 | |||||||||
Tennessee - .3% | |||||||||
Clarksville Natural Gas Acquisition Corporation, | 5.00 | 12/15/20 | 1,690,000 | 1,852,815 | |||||
Tennessee Housing Development Agency, | 3.50 | 1/1/47 | 2,810,000 | 2,991,357 | |||||
Tennessee Housing Development Agency, | 4.00 | 1/1/42 | 2,000,000 | 2,196,020 | |||||
7,040,192 | |||||||||
Texas - 10.1% | |||||||||
Arlington Higher Education Finance Corporation, | 4.00 | 12/1/42 | 2,760,000 | 2,922,205 | |||||
Arlington Higher Education Finance Corporation, | 5.00 | 2/15/42 | 1,000,000 | 1,169,860 | |||||
34
BNY Mellon National Intermediate Municipal Bond Fund (continued) | |||||||||
Description | Coupon | Maturity | Principal | Value ($) | |||||
Long-Term Municipal Investments - 98.7% (continued) | |||||||||
Texas - 10.1% (continued) | |||||||||
Clifton Higher Education Finance Corporation, | 5.00 | 8/15/23 | 1,100,000 | 1,238,952 | |||||
Culberson County-Allamoore Independent School District, | 4.00 | 2/15/41 | 1,300,000 | 1,333,683 | |||||
Dallas and Fort Worth, | 5.00 | 11/1/31 | 5,000,000 | 5,651,150 | |||||
Dallas and Fort Worth, | 5.00 | 11/1/26 | 3,000,000 | 3,357,930 | |||||
Dallas and Fort Worth, | 5.00 | 11/1/27 | 3,400,000 | 3,803,410 | |||||
Dallas Area Rapid Transit, | 5.00 | 12/1/22 | 5,700,000 | 6,792,348 | |||||
Dallas Area Rapid Transit Senior Lien Sales Tax, | 5.00 | 12/1/41 | 5,305,000 | 6,171,943 | |||||
El Paso, | 5.00 | 3/1/22 | 1,000,000 | 1,167,440 | |||||
Forney Independent School District, | 5.00 | 8/15/27 | 2,200,000 | 2,716,450 | |||||
Forney Independent School District, | 5.75 | 8/15/18 | 1,000,000 | a | 1,046,830 | ||||
Harris County, | 5.00 | 10/1/21 | 10,000,000 | 10,858,900 | |||||
Harris County Flood Control District, | 5.00 | 10/1/26 | 10,000,000 | 12,230,700 | |||||
Harris County Health Facilities Development Corporation, | 7.00 | 12/1/18 | 5,000,000 | a | 5,385,700 | ||||
Harris County-Houston Sports Authority, | 5.00 | 11/15/22 | 6,500,000 | 7,695,870 | |||||
Houston, | 5.00 | 5/15/21 | 5,000,000 | 5,704,200 | |||||
Houston Community College System, | 5.00 | 2/15/32 | 8,200,000 | 9,511,344 | |||||
Houston Community College System, | 5.00 | 2/15/21 | 2,250,000 | 2,553,300 | |||||
North Texas Tollway Authority, | 5.00 | 1/1/26 | 10,000,000 | 11,913,700 | |||||
North Texas Tollway Authority, | 5.00 | 1/1/29 | 2,885,000 | 3,477,406 | |||||
North Texas Tollway Authority, | 5.00 | 1/1/40 | 5,000,000 | 5,599,150 | |||||
North Texas Tollway Authority, | 5.00 | 1/1/30 | 3,000,000 | 3,565,920 | |||||
North Texas Tollway Authority, | 5.00 | 1/1/31 | 11,415,000 | 13,290,941 | |||||
San Antonio, | 3.00 | 12/1/19 | 5,800,000 | 6,011,294 | |||||
San Antonio Independent School District, | 5.00 | 2/15/23 | 9,535,000 | 11,405,958 | |||||
Schertz-Cibolo-Universal City Independent School District, | 4.00 | 2/1/46 | 3,000,000 | 3,198,600 | |||||
Texas Public Finance Authority, | 5.00 | 10/1/23 | 4,220,000 | 4,873,973 | |||||
Texas Public Finance Authority, | 5.00 | 10/1/24 | 5,000,000 | 6,174,600 | |||||
Texas Public Finance Authority, | 5.00 | 10/1/21 | 5,165,000 | a | 5,978,281 | ||||
Texas Transportation Commission, | 5.00 | 10/1/24 | 5,900,000 | 7,286,028 | |||||
Texas Transportation Commission, | 5.00 | 10/1/24 | 4,000,000 | 4,896,200 | |||||
Texas Transportation Commission, | 5.00 | 4/1/24 | 10,000,000 | 12,244,100 | |||||
35
STATEMENT OF INVESTMENTS (continued)
BNY Mellon National Intermediate Municipal Bond Fund (continued) | |||||||||
Description | Coupon | Maturity | Principal | Value ($) | |||||
Long-Term Municipal Investments - 98.7% (continued) | |||||||||
Texas - 10.1% (continued) | |||||||||
Texas Water Development Board, | 5.00 | 10/15/45 | 21,165,000 | 24,760,722 | |||||
215,989,088 | |||||||||
Utah - .7% | |||||||||
Salt Lake City, | 5.00 | 7/1/29 | 2,500,000 | 3,029,700 | |||||
Salt Lake City, | 5.00 | 7/1/30 | 2,000,000 | 2,406,400 | |||||
Salt Lake City, | 5.00 | 7/1/31 | 2,400,000 | 2,869,272 | |||||
Utah Associated Municipal Power Systems, | 5.00 | 4/1/22 | 5,675,000 | 6,504,969 | |||||
14,810,341 | |||||||||
Vermont - .5% | |||||||||
Vermont Educational & Health Buildings Financing Agency, | 5.00 | 12/1/32 | 10,000,000 | 11,537,000 | |||||
Virginia - .6% | |||||||||
Virginia College Building Authority, | 5.00 | 2/1/21 | 2,235,000 | 2,536,412 | |||||
Virginia Small Business Financing Authority, | 5.00 | 7/1/34 | 9,500,000 | 10,330,775 | |||||
12,867,187 | |||||||||
Washington - 3.8% | |||||||||
Energy Northwest, | 5.00 | 7/1/20 | 10,955,000 | 12,198,831 | |||||
Energy Northwest, | 5.00 | 7/1/31 | 7,500,000 | 8,249,550 | |||||
FYI Properties, | 5.25 | 6/1/29 | 5,625,000 | 6,039,450 | |||||
King County, | 5.00 | 7/1/39 | 15,000,000 | 17,322,600 | |||||
Port of Seattle, | 5.00 | 3/1/28 | 1,750,000 | 2,074,835 | |||||
Port of Seattle, | 5.00 | 4/1/29 | 1,000,000 | 1,179,310 | |||||
Port of Seattle, | 5.00 | 4/1/30 | 2,840,000 | 3,331,973 | |||||
Washington, | 5.00 | 9/1/22 | 5,000,000 | 5,892,750 | |||||
Washington, | 5.00 | 9/1/23 | 5,000,000 | 6,007,950 | |||||
Washington, | 5.00 | 2/1/23 | 5,315,000 | 6,364,606 | |||||
Washington Health Care Facilities Authority, | 5.00 | 10/1/21 | 5,550,000 | 6,350,865 | |||||
Washington Health Care Facilities Authority, | 5.00 | 8/15/25 | 1,700,000 | 2,018,767 | |||||
Washington Health Care Facilities Authority, | 5.00 | 8/15/26 | 2,000,000 | 2,384,000 | |||||
Washington Health Care Facilities Authority, | 5.00 | 8/15/27 | 2,175,000 | 2,594,035 | |||||
82,009,522 | |||||||||
West Virginia - 1.1% | |||||||||
West Virginia Economic Development Authority, | 5.00 | 6/1/28 | 10,000,000 | 11,648,700 | |||||
West Virginia Economic Development Authority, | 5.00 | 6/1/29 | 10,000,000 | 11,638,700 | |||||
23,287,400 | |||||||||
Wisconsin - 1.0% | |||||||||
Wisconsin Health and Educational Facilities Authority, | 4.00 | 11/15/34 | 10,000,000 | 10,494,600 | |||||
Wisconsin Transportation, | 5.00 | 7/1/36 | 1,800,000 | 2,123,100 | |||||
36
BNY Mellon National Intermediate Municipal Bond Fund (continued) | |||||||||
Description | Coupon | Maturity | Principal | Value ($) | |||||
Long-Term Municipal Investments - 98.7% (continued) | |||||||||
Wisconsin - 1.0% (continued) | |||||||||
Wisconsin Transportation, | 5.00 | 7/1/37 | 1,600,000 | 1,883,856 | |||||
WPPI Energy, | 5.00 | 7/1/29 | 1,000,000 | 1,161,920 | |||||
WPPI Energy, | 5.00 | 7/1/30 | 1,000,000 | 1,155,780 | |||||
WPPI Energy, | 5.00 | 7/1/31 | 1,000,000 | 1,151,360 | |||||
WPPI Energy, | 5.00 | 7/1/32 | 500,000 | 573,995 | |||||
WPPI Energy, | 5.00 | 7/1/33 | 2,000,000 | 2,286,560 | |||||
20,831,171 | |||||||||
U.S. Related - .5% | |||||||||
A.B. Won International Airport Authority of Guam, | 5.50 | 10/1/33 | 1,000,000 | 1,177,570 | |||||
Guam, | 5.00 | 12/1/28 | 2,000,000 | 2,331,000 | |||||
Guam, | 5.00 | 12/1/29 | 2,000,000 | 2,313,180 | |||||
Puerto Rico Electric Power Authority, | 5.25 | 7/1/18 | 5,000,000 | d | 2,950,000 | ||||
Puerto Rico Sales Tax Financing Corporation, | 6.75 | 8/1/32 | 5,000,000 | d | 1,267,500 | ||||
Puerto Rico Sales Tax Financing Corporation, | 0/6.25 | 8/1/33 | 2,500,000 | f | 492,150 | ||||
10,531,400 | |||||||||
Total Long-Term Municipal Investments | 2,117,963,954 | ||||||||
Short-Term Municipal Investments - .1% | |||||||||
New York - .0% | |||||||||
New York State Housing Finance Agency, | 0.85 | 9/1/17 | 1,100,000 | g,h | 1,100,000 | ||||
Tennessee - .1% | |||||||||
Montgomery County Public Building Authority, | 0.90 | 9/1/17 | 1,900,000 | g,h | 1,900,000 | ||||
Total Short-Term Municipal Investments | 3,000,000 | ||||||||
Total Investments (cost $2,033,703,769) | 98.8% | 2,120,963,954 | |||||||
Cash and Receivables (Net) | 1.2% | 24,911,724 | |||||||
Net Assets | 100.0% | 2,145,875,678 | |||||||
a These securities are prerefunded; the date shown represents the prerefunded date. Bonds which are prerefunded are collateralized by U.S. Government securities which are held in escrow and are used to pay principal and interest on the municipal issue and to retire the bonds in full at the earliest refunding date.
b Security issued with a zero coupon. Income is recognized through the accretion of discount.
c Variable rate security—rate shown is the interest rate in effect at period end.
d Non-income producing—security in default.
e Security exempt from registration pursuant to Rule 144A under the Securities Act of 1933. These securities may be resold in transactions exempt from registration, normally to qualified institutional buyers. At August 31, 2017, these securities were valued at $12,571,425 or .59% of net assets.
f Zero coupon until a specified date at which time the stated coupon rate becomes effective until maturity.
g Variable rate demand note—rate shown is the interest rate in effect at August 31, 2017. Maturity date represents the next demand date, or the ultimate maturity date if earlier.
h The Variable Rate shall be determined by the Remarketing Agent in its sole discretion based on prevailing market conditions and may, but need not, be established by reference to one or more financial indices.
37
STATEMENT OF INVESTMENTS (continued)
Portfolio Summary (Unaudited) † | Value (%) |
Transportation Services | 19.7 |
State/Territory | 16.0 |
Education | 10.1 |
Special Tax | 9.2 |
Utility-Water and Sewer | 6.5 |
Health Care | 6.4 |
Prerefunded | 5.0 |
Lease | 4.5 |
County | 3.5 |
City | 3.3 |
Utility-Electric | 3.1 |
Housing | 1.9 |
Industrial | 1.0 |
Pollution Control | .0 |
Other | 8.6 |
98.8 |
† Based on net assets.
See notes to financial statements.
38
BNY Mellon National Short-Term Municipal Bond Fund | |||||||||
Description | Coupon | Maturity | Principal | Value ($) | |||||
Long-Term Municipal Investments - 99.7% | |||||||||
Alabama - .4% | |||||||||
Black Belt Energy Gas District, | 4.00 | 6/1/21 | 3,500,000 | 3,801,770 | |||||
Alaska - .3% | |||||||||
Valdez, | 5.00 | 1/1/18 | 3,000,000 | 3,040,290 | |||||
Arizona - 2.2% | |||||||||
Arizona, | 5.00 | 10/1/19 | 7,000,000 | 7,569,730 | |||||
Coconino County Pollution Control, | 1.60 | 5/21/20 | 1,100,000 | 1,106,468 | |||||
Maricopa County, | 5.00 | 7/1/18 | 5,000,000 | 5,175,700 | |||||
Maricopa County Pollution Control Corporation, | 1.75 | 5/30/18 | 5,000,000 | 5,026,000 | |||||
Phoenix Union High School District Number 210, | 5.00 | 7/1/20 | 1,000,000 | 1,112,940 | |||||
19,990,838 | |||||||||
Arkansas - .6% | |||||||||
Arkansas, | 5.00 | 4/1/20 | 5,000,000 | 5,524,300 | |||||
California - 8.9% | |||||||||
Bay Area Toll Authority, | 1.50 | 4/2/18 | 8,160,000 | 8,165,059 | |||||
Bay Area Toll Authority, | 1.38 | 4/1/53 | 6,750,000 | 6,779,092 | |||||
California, | 5.00 | 8/1/20 | 8,000,000 | 8,926,080 | |||||
California Health Facilities Financing Authority, | 1.25 | 10/1/20 | 5,000,000 | 5,014,300 | |||||
California Municipal Finance Authority, | 5.00 | 2/1/18 | 500,000 | 508,235 | |||||
California Municipal Finance Authority, | 5.00 | 2/1/19 | 1,000,000 | 1,053,550 | |||||
California Pollution Control Finance Authority, | 1.50 | 6/1/18 | 1,500,000 | 1,504,410 | |||||
California State University Trustees, | 3.00 | 11/1/19 | 1,690,000 | 1,749,894 | |||||
Chula Vista, | 1.65 | 7/1/18 | 20,130,000 | 20,145,299 | |||||
Escondido Union School District, | 4.00 | 8/1/18 | 1,000,000 | 1,030,130 | |||||
Escondido Union School District, | 4.00 | 8/1/20 | 1,250,000 | 1,363,063 | |||||
Golden State Tobacco Securitization Corporation, | 5.00 | 6/1/19 | 7,000,000 | 7,505,330 | |||||
Golden State Tobacco Securitization Corporation, | 5.00 | 6/1/20 | 3,000,000 | 3,321,060 | |||||
Simi Valley Unified School District, | 5.00 | 8/1/19 | 1,000,000 | 1,080,620 | |||||
Simi Valley Unified School District, | 5.00 | 8/1/20 | 1,000,000 | 1,119,190 | |||||
Simi Valley Unified School District, | 5.00 | 8/1/21 | 1,000,000 | 1,155,060 | |||||
South Monterey County Joint Union High School District, | 5.00 | 8/1/19 | 1,665,000 | 1,796,069 | |||||
Successor Agency to the Redevelopment Agency of the City of Pittsburg, | 5.00 | 9/1/18 | 2,750,000 | 2,865,170 | |||||
Sulphur Springs Union School District, | 0.00 | 7/1/19 | 5,000,000 | a | 4,916,550 | ||||
79,998,161 | |||||||||
39
STATEMENT OF INVESTMENTS (continued)
BNY Mellon National Short-Term Municipal Bond Fund (continued) | |||||||||
Description | Coupon | Maturity | Principal | Value ($) | |||||
Long-Term Municipal Investments - 99.7% (continued) | |||||||||
Colorado - 2.0% | |||||||||
Colorado Educational and Cultural Facilities Authority, | 5.00 | 4/1/20 | 1,300,000 | 1,420,926 | |||||
Colorado Health Facilities Authority, | 1.88 | 11/6/19 | 5,000,000 | 5,029,200 | |||||
Denver Urban Renewal Authority, | 5.00 | 12/1/17 | 4,005,000 | 4,045,170 | |||||
Regional Transportation District of Colorado, | 5.00 | 6/1/18 | 5,000,000 | 5,153,850 | |||||
University of Colorado Hospital Authority, | 4.00 | 3/1/20 | 2,000,000 | 2,114,980 | |||||
17,764,126 | |||||||||
Connecticut - 4.1% | |||||||||
Bridgeport, | 4.00 | 8/15/18 | 2,000,000 | 2,053,180 | |||||
Connecticut, | 1.54 | 6/15/18 | 11,495,000 | b | 11,504,541 | ||||
Connecticut Health and Educational Facilities Authority, | 1.38 | 7/11/18 | 7,500,000 | 7,535,475 | |||||
Connecticut Health and Educational Facilities Authority, | 1.20 | 2/1/19 | 5,000,000 | 5,020,250 | |||||
Connecticut Health and Educational Facilities Authority, | 5.00 | 7/1/20 | 10,000,000 | 11,108,600 | |||||
37,222,046 | |||||||||
Delaware - .4% | |||||||||
Delaware, | 5.00 | 3/1/20 | 3,650,000 | 4,022,337 | |||||
Florida - 5.0% | |||||||||
Citizens Property Insurance Corporation, | 5.00 | 6/1/19 | 3,685,000 | 3,946,340 | |||||
Citizens Property Insurance Corporation, | 5.00 | 6/1/20 | 3,000,000 | 3,321,630 | |||||
Miami-Dade County, | 5.00 | 10/1/18 | 3,700,000 | 3,858,841 | |||||
Miami-Dade County, | 5.00 | 10/1/20 | 4,000,000 | 4,477,440 | |||||
Miami-Dade County Industrial Development Authority, | 1.45 | 8/1/18 | 5,000,000 | 5,004,200 | |||||
Miami-Dade County School Board, | 5.00 | 5/1/18 | 5,000,000 | 5,136,600 | |||||
Orange County Health Facilities Authority, | 5.25 | 10/1/20 | 5,000,000 | 5,436,450 | |||||
Orlando Utilities Commission, | 5.00 | 10/1/20 | 2,000,000 | 2,232,900 | |||||
Orlando-Orange County Expressway Authority, | 5.00 | 7/1/21 | 5,000,000 | 5,576,650 | |||||
Palm Beach County Health Facilities Authority, | 4.00 | 11/15/19 | 2,000,000 | 2,111,500 | |||||
Palm Beach County Health Facilities Authority, | 4.00 | 11/15/20 | 2,000,000 | 2,153,760 | |||||
Putnam County Development Authority, | 5.35 | 5/1/18 | 2,250,000 | 2,312,843 | |||||
45,569,154 | |||||||||
Georgia - 2.3% | |||||||||
Atlanta, | 5.00 | 1/1/18 | 1,000,000 | 1,013,600 | |||||
Burke County Development Authority, | 2.35 | 12/11/20 | 5,000,000 | 5,084,400 | |||||
Georgia Municipal Association, Inc., | 5.00 | 12/1/19 | 2,270,000 | 2,463,881 | |||||
40
BNY Mellon National Short-Term Municipal Bond Fund (continued) | |||||||||
Description | Coupon | Maturity | Principal | Value ($) | |||||
Long-Term Municipal Investments - 99.7% (continued) | |||||||||
Georgia - 2.3% (continued) | |||||||||
Monroe County Development Authority, | 2.00 | 6/21/18 | 7,000,000 | 7,049,350 | |||||
Muscogee County School District, | 4.00 | 10/1/19 | 2,000,000 | 2,126,580 | |||||
Richmond County Board of Education, | 5.00 | 10/1/20 | 3,000,000 | 3,366,840 | |||||
21,104,651 | |||||||||
Illinois - 5.7% | |||||||||
Chicago, | 5.00 | 1/1/18 | 6,000,000 | 6,082,200 | |||||
Chicago, | 5.25 | 1/1/18 | 7,540,000 | 7,629,651 | |||||
Chicago, | 5.00 | 11/1/19 | 3,250,000 | 3,503,825 | |||||
Chicago Board of Education, | 9.00 | 3/1/32 | 2,200,000 | b | 2,221,560 | ||||
Chicago Board of Education, | 5.00 | 12/1/17 | 1,455,000 | 1,457,764 | |||||
Chicago Board of Education, | 4.25 | 12/1/18 | 3,115,000 | 3,117,461 | |||||
Chicago Board of Education, | 5.00 | 12/1/17 | 890,000 | 899,309 | |||||
Chicago Board of Education, | 4.25 | 12/1/18 | 1,905,000 | 1,983,276 | |||||
Chicago Board of Education, | 5.00 | 12/1/17 | 1,455,000 | c | 1,470,219 | ||||
Illinois, | 4.00 | 7/1/18 | 5,000,000 | 5,091,300 | |||||
Illinois, | 5.00 | 6/1/18 | 1,960,000 | 1,976,111 | |||||
Illinois, | 5.00 | 1/1/19 | 10,000,000 | 10,412,700 | |||||
Illinois Development Finance Authority, | 1.88 | 3/1/19 | 3,500,000 | 3,535,210 | |||||
Illinois Toll Highway Authority, | 5.00 | 12/1/18 | 2,000,000 | 2,101,840 | |||||
51,482,426 | |||||||||
Indiana - 2.1% | |||||||||
Indiana Finance Authority, | 1.95 | 9/14/17 | 2,500,000 | 2,501,000 | |||||
Indiana Health Facility Financing Authority, | 2.80 | 8/1/19 | 1,720,000 | 1,771,806 | |||||
Whiting, | 1.85 | 10/1/19 | 10,000,000 | 10,082,700 | |||||
Whiting, | 1.54 | 12/1/44 | 5,000,000 | b | 4,999,600 | ||||
19,355,106 | |||||||||
Kentucky - 1.5% | |||||||||
Kentucky, | 5.00 | 5/1/20 | 2,000,000 | 2,192,760 | |||||
Kentucky Property and Buildings Commission, | 5.00 | 11/1/20 | 10,000,000 | 11,127,500 | |||||
13,320,260 | |||||||||
Louisiana - 1.7% | |||||||||
East Baton Rouge Sewerage Commission, | 1.36 | 2/1/46 | 7,055,000 | b | 7,043,783 | ||||
Louisiana Citizens Property Insurance Corporation, | 5.00 | 6/1/18 | 5,000,000 | 5,150,850 | |||||
41
STATEMENT OF INVESTMENTS (continued)
BNY Mellon National Short-Term Municipal Bond Fund (continued) | |||||||||
Description | Coupon | Maturity | Principal | Value ($) | |||||
Long-Term Municipal Investments - 99.7% (continued) | |||||||||
Louisiana - 1.7% (continued) | |||||||||
Louisiana Public Facilities Authority, | 5.00 | 6/1/20 | 2,800,000 | 3,082,912 | |||||
15,277,545 | |||||||||
Maryland - .6% | |||||||||
University System of Maryland, | 1.25 | 6/1/18 | 5,000,000 | 5,017,100 | |||||
Massachusetts - .9% | |||||||||
Massachusetts Educational Financing Authority, | 4.00 | 7/1/18 | 2,780,000 | 2,845,247 | |||||
Massachusetts Educational Financing Authority, | 4.00 | 7/1/20 | 375,000 | 400,796 | |||||
Massachusetts Educational Financing Authority, | 4.00 | 7/1/21 | 1,000,000 | 1,088,480 | |||||
Massachusetts Health and Educational Facilities Authority, | 1.15 | 4/1/19 | 4,000,000 | 4,012,120 | |||||
8,346,643 | |||||||||
Michigan - 3.7% | |||||||||
Michigan, | 5.00 | 3/15/20 | 3,700,000 | 4,069,482 | |||||
Michigan Building Authority, | 5.00 | 10/15/20 | 2,250,000 | 2,523,195 | |||||
Michigan Finance Authority, | 1.10 | 8/15/19 | 3,000,000 | 3,001,320 | |||||
Michigan Finance Authority, | 4.00 | 10/1/17 | 1,155,000 | 1,158,107 | |||||
Michigan Finance Authority, | 5.00 | 10/1/18 | 2,280,000 | 2,376,991 | |||||
Michigan Finance Authority, | 5.00 | 7/1/18 | 1,500,000 | 1,548,885 | |||||
Michigan Finance Authority, | 5.00 | 7/1/18 | 1,000,000 | 1,032,590 | |||||
Michigan Finance Authority, | 5.00 | 1/1/20 | 5,525,000 | 5,949,596 | |||||
Michigan Finance Authority, | 5.00 | 7/1/21 | 10,000,000 | 10,357,000 | |||||
Michigan Strategic Fund, | 1.45 | 9/1/21 | 1,000,000 | 993,430 | |||||
33,010,596 | |||||||||
Mississippi - .7% | |||||||||
Mississippi, | 1.16 | 9/1/27 | 6,000,000 | b | 6,003,180 | ||||
Missouri - .4% | |||||||||
Missouri State Environmental Improvement and Energy Resources Authority, | 2.88 | 7/2/18 | 3,400,000 | 3,436,958 | |||||
Nebraska - 1.7% | |||||||||
Central Plains Energy Project, | 5.00 | 12/1/19 | 14,625,000 | 15,797,047 | |||||
Nevada - 1.7% | |||||||||
Clark County Nevada Airport System, | 4.00 | 7/1/19 | 3,000,000 | 3,160,260 | |||||
Clark County Nevada Airport System, | 5.00 | 7/1/20 | 3,010,000 | 3,332,100 | |||||
Clark County Pollution Control, | 1.60 | 5/21/20 | 3,000,000 | 3,022,470 | |||||
Washoe County, | 1.50 | 6/3/19 | 5,500,000 | 5,485,370 | |||||
15,000,200 | |||||||||
42
BNY Mellon National Short-Term Municipal Bond Fund (continued) | |||||||||
Description | Coupon | Maturity | Principal | Value ($) | |||||
Long-Term Municipal Investments - 99.7% (continued) | |||||||||
New Hampshire - .1% | |||||||||
New Hampshire Business Finance Authority, | 2.13 | 6/1/18 | 1,000,000 | 1,007,160 | |||||
New Jersey - 4.1% | |||||||||
New Jersey Economic Development Authority, | 5.00 | 6/15/18 | 6,500,000 | 6,663,215 | |||||
New Jersey Economic Development Authority, | 5.00 | 6/15/20 | 3,000,000 | 3,229,680 | |||||
New Jersey Economic Development Authority, | 5.00 | 12/15/18 | 1,500,000 | 1,566,855 | |||||
New Jersey Economic Development Authority, | 5.00 | 6/15/19 | 10,700,000 | 11,291,924 | |||||
New Jersey Sports and Exposition Authority, | 5.00 | 9/1/18 | 3,950,000 | 4,091,094 | |||||
New Jersey Transportation Trust Fund Authority, | 5.00 | 12/15/17 | 2,500,000 | 2,529,600 | |||||
New Jersey Transportation Trust Fund Authority, | 5.00 | 6/15/21 | 5,000,000 | 5,150,150 | |||||
New Jersey Water Supply Authority, | 5.00 | 8/1/19 | 2,670,000 | 2,877,619 | |||||
37,400,137 | |||||||||
New York - 13.5% | |||||||||
Lancaster, | 2.25 | 7/26/18 | 4,900,000 | 4,948,755 | |||||
Long Island Power Authority, | 1.51 | 5/1/33 | 10,000,000 | b | 10,012,900 | ||||
Metropolitan Transportation Authority, | 5.00 | 2/15/20 | 10,000,000 | 10,934,000 | |||||
Monroe County Industrial Development Corporation, | 5.00 | 7/1/20 | 1,000,000 | 1,112,940 | |||||
Nassau County, | 5.00 | 4/1/19 | 10,000,000 | 10,643,100 | |||||
New York City Housing Development Corp., | 1.70 | 7/1/21 | 12,150,000 | 12,273,565 | |||||
New York City Housing Development Corporation, | 1.38 | 5/1/20 | 5,000,000 | 5,010,800 | |||||
New York City Industrial Development Agency, | 2.58 | 3/1/23 | 2,000,000 | 2,005,380 | |||||
New York City Transitional Finance Authority Future Tax Secured Bonds, | 4.44 | 8/1/21 | 13,870,000 | 15,062,959 | |||||
New York State Housing Finance Agency, | 1.00 | 11/1/19 | 3,465,000 | 3,465,347 | |||||
New York State Urban Development Corporation, | 5.00 | 1/1/21 | 5,005,000 | 5,475,270 | |||||
North Syracuse Central School District, | 2.25 | 6/28/18 | 2,000,000 | 2,019,920 | |||||
School District of the Corning Steuben, Schuyler and Chemung Counties, | 2.00 | 6/21/18 | 7,500,000 | 7,567,125 | |||||
Skaneateles Central School District, | 2.25 | 7/6/18 | 2,000,000 | 2,018,880 | |||||
Tompkins County, | 2.25 | 2/21/18 | 3,949,000 | 3,971,509 | |||||
Triborough Bridge and Tunnel Authority, | 1.41 | 1/1/31 | 15,000,000 | b | 15,023,850 | ||||
Triborough Bridge and Tunnel Authority, | 1.23 | 1/1/19 | 250,000 | b | 249,925 | ||||
TSASC, Inc. of New York, | 4.00 | 6/1/19 | 3,000,000 | 3,129,540 | |||||
TSASC, Inc. of New York, | 5.00 | 6/1/20 | 2,500,000 | 2,729,150 | |||||
Yonkers, | 4.00 | 8/1/18 | 3,130,000 | 3,217,327 | |||||
43
STATEMENT OF INVESTMENTS (continued)
BNY Mellon National Short-Term Municipal Bond Fund (continued) | |||||||||
Description | Coupon | Maturity | Principal | Value ($) | |||||
Long-Term Municipal Investments - 99.7% (continued) | |||||||||
New York - 13.5% (continued) | |||||||||
Yonkers, | 4.00 | 9/1/18 | 1,230,000 | 1,267,367 | |||||
122,139,609 | |||||||||
North Carolina - .4% | |||||||||
North Carolina Medical Care Commission, | 1.53 | 12/1/33 | 2,300,000 | b | 2,300,874 | ||||
North Carolina Medical Care Commission, | 5.00 | 10/1/20 | 890,000 | 991,487 | |||||
3,292,361 | |||||||||
Ohio - .6% | |||||||||
Hamilton County, | 4.00 | 12/1/20 | 1,280,000 | 1,400,960 | |||||
Miami University (A State University of Ohio), | 5.00 | 9/1/19 | 4,015,000 | 4,338,328 | |||||
5,739,288 | |||||||||
Oklahoma - .8% | |||||||||
Oklahoma County Independent School, | 5.00 | 7/1/20 | 3,625,000 | 4,011,824 | |||||
Oklahoma County Independent School District Number 12, | 2.00 | 8/1/19 | 3,020,000 | 3,080,732 | |||||
7,092,556 | |||||||||
Pennsylvania - 10.5% | |||||||||
Delaware River Port Authority, | 5.00 | 1/1/18 | 1,080,000 | 1,092,528 | |||||
Lehigh County Industrial Development Authority, | 1.80 | 8/15/22 | 7,000,000 | 7,010,430 | |||||
Lehigh County Industrial Development Authority, | 1.80 | 9/1/22 | 5,000,000 | 5,013,500 | |||||
Norwin School District, | 4.00 | 11/15/20 | 1,325,000 | 1,447,337 | |||||
Pennsylvania, | 5.00 | 8/15/19 | 4,995,000 | 5,387,807 | |||||
Pennsylvania Economic Development Financing Authority, | 4.00 | 6/30/18 | 4,000,000 | 4,097,280 | |||||
Pennsylvania Economic Development Financing Authority, | 5.00 | 6/30/19 | 2,500,000 | 2,668,875 | |||||
Pennsylvania Economic Development Financing Authority, | 5.00 | 12/31/19 | 2,000,000 | 2,167,080 | |||||
Pennsylvania Economic Development Financing Authority, | 5.00 | 6/30/20 | 2,000,000 | 2,191,700 | |||||
Pennsylvania Economic Development Financing Authority, | 1.70 | 8/3/20 | 3,000,000 | 3,004,650 | |||||
Pennsylvania Economic Development Financing Authority, | 2.25 | 7/1/19 | 5,000,000 | 5,063,900 | |||||
Pennsylvania Economic Development Financing Authority, | 5.00 | 7/1/20 | 3,720,000 | 4,004,468 | |||||
Pennsylvania Higher Educational Facilities Authority, | 5.00 | 6/15/20 | 11,030,000 | 12,222,343 | |||||
Pennsylvania Turnpike Commission, | 1.59 | 12/1/45 | 5,000,000 | b | 4,999,750 | ||||
Philadelphia, | 5.00 | 8/1/21 | 4,000,000 | 4,542,520 | |||||
Philadelphia, | 5.00 | 1/1/20 | 6,150,000 | 6,718,875 | |||||
Philadelphia School District, | 5.00 | 9/1/18 | 5,350,000 | 5,527,031 | |||||
Pittsburgh, | 5.00 | 9/1/18 | 7,000,000 | 7,286,510 | |||||
Pittsburgh and Allegheny County Sports and Exhibition Authority, | 5.00 | 2/1/18 | 2,540,000 | 2,583,180 | |||||
44
BNY Mellon National Short-Term Municipal Bond Fund (continued) | |||||||||
Description | Coupon | Maturity | Principal | Value ($) | |||||
Long-Term Municipal Investments - 99.7% (continued) | |||||||||
Pennsylvania - 10.5% (continued) | |||||||||
State Public School Building Authority, | 1.63 | 9/1/24 | 2,665,000 | b | 2,665,346 | ||||
Woodland Hills School District, | 5.00 | 9/1/17 | 5,010,000 | 5,010,000 | |||||
94,705,110 | |||||||||
Rhode Island - .7% | |||||||||
Rhode Island Commerce Corporation, | 5.00 | 6/15/19 | 2,000,000 | 2,142,400 | |||||
Rhode Island Health and Educational Building Corporation, | 5.00 | 5/15/18 | 1,250,000 | 1,283,225 | |||||
Rhode Island Health and Educational Building Corporation, | 5.00 | 5/15/19 | 1,500,000 | 1,591,980 | |||||
Rhode Island Health and Educational Building Corporation, | 5.00 | 5/15/20 | 1,500,000 | 1,640,445 | |||||
6,658,050 | |||||||||
South Carolina - 1.5% | |||||||||
South Carolina Public Service Authority, | 5.00 | 12/1/18 | 5,000,000 | 5,243,150 | |||||
South Carolina Public Service Authority, | 5.00 | 12/1/19 | 7,500,000 | 8,126,250 | |||||
13,369,400 | |||||||||
Tennessee - 1.2% | |||||||||
Memphis-Shelby County Airport Authority, | 5.38 | 7/1/18 | 3,175,000 | 3,289,141 | |||||
Metropolitan Government of Nashville and Davidson County Health and Educational Facilities Board, | 1.55 | 11/3/20 | 7,500,000 | 7,564,950 | |||||
10,854,091 | |||||||||
Texas - 13.1% | |||||||||
Alvin Independent School District, | 3.00 | 8/14/19 | 4,000,000 | 4,140,760 | |||||
Clear Creek Independent School District, | 1.35 | 8/15/18 | 2,000,000 | 2,008,120 | |||||
Corpus Christi, | 4.00 | 3/1/19 | 2,000,000 | 2,090,340 | |||||
Corpus Christi Independent School District, | 2.00 | 8/15/19 | 5,000,000 | 5,077,800 | |||||
Cypress-Fairbanks Independent School District, | 1.40 | 8/17/20 | 4,125,000 | 4,125,247 | |||||
Dallas Independent School District, | 1.50 | 8/15/18 | 4,050,000 | 4,066,402 | |||||
Dallas Independent School District, | 5.00 | 2/15/21 | 3,000,000 | 3,368,190 | |||||
Denton Independent School District, | 2.00 | 8/1/20 | 1,000,000 | 1,021,550 | |||||
Eagle Mountain-Saginaw Independent School District, | 2.00 | 8/1/19 | 9,925,000 | 10,097,993 | |||||
Fort Bend Independent School District, | 0.90 | 8/1/18 | 5,375,000 | 5,370,646 | |||||
Harris County Cultural Education Facilities Finance Corporation, | 5.00 | 11/15/18 | 1,550,000 | 1,626,291 | |||||
Houston Convention and Entertainment Facilities Department, | 4.88 | 9/1/17 | 5,000,000 | 5,000,000 | |||||
Houston Independent School District, | 3.00 | 6/1/19 | 5,000,000 | 5,161,950 | |||||
45
STATEMENT OF INVESTMENTS (continued)
BNY Mellon National Short-Term Municipal Bond Fund (continued) | |||||||||
Description | Coupon | Maturity | Principal | Value ($) | |||||
Long-Term Municipal Investments - 99.7% (continued) | |||||||||
Texas - 13.1% (continued) | |||||||||
Lamar Consolidated Independent School District, | 1.05 | 8/15/18 | 9,300,000 | 9,307,440 | |||||
Mansfield Independent School District, | 2.50 | 8/1/21 | 3,500,000 | 3,657,570 | |||||
Matagorda County, | 1.75 | 9/1/20 | 5,000,000 | 5,005,800 | |||||
New Hope Cultural Education Facilities Finance Corporation, | 1.00 | 2/1/18 | 1,460,000 | 1,460,015 | |||||
North Harris County Regional Water Authority, | 5.00 | 12/15/19 | 1,150,000 | 1,252,270 | |||||
Northside Independent School District, | 1.35 | 6/1/18 | 9,185,000 | 9,201,257 | |||||
Northside Independent School District, | 2.00 | 6/1/21 | 5,000,000 | 5,123,650 | |||||
Plano, | 5.00 | 9/1/20 | 2,125,000 | 2,375,814 | |||||
Round Rock Independent School District, | 1.50 | 8/1/21 | 9,545,000 | 9,554,545 | |||||
San Antonio Electric & Gas, | 2.00 | 12/1/21 | 5,000,000 | 5,097,200 | |||||
San Antonio Independent School District, | 2.00 | 8/1/18 | 2,770,000 | 2,796,260 | |||||
Texas, | 4.00 | 10/1/20 | 5,845,000 | 6,393,787 | |||||
Texas Municipal Gas Acquisition and Supply Corporation I, | 5.25 | 12/15/18 | 3,325,000 | 3,505,016 | |||||
117,885,913 | |||||||||
Virginia - 1.9% | |||||||||
Greater Richmond Convention Center Authority, | 5.00 | 6/15/18 | 1,750,000 | 1,806,875 | |||||
Peninsula Ports Authority of Virginia, | 1.55 | 10/1/19 | 2,750,000 | 2,752,503 | |||||
York County Economic Development Authority, | 1.88 | 5/16/19 | 12,075,000 | 12,220,021 | |||||
16,779,399 | |||||||||
Washington - 2.7% | |||||||||
Port of Seattle, | 5.00 | 2/1/19 | 5,875,000 | 6,209,229 | |||||
Port of Seattle, | 5.00 | 12/1/21 | 5,000,000 | 5,622,200 | |||||
Seattle, | 1.47 | 5/1/45 | 7,500,000 | b | 7,499,925 | ||||
Washington, | 4.00 | 7/1/20 | 1,000,000 | 1,081,540 | |||||
Washington, | 5.00 | 7/1/20 | 3,345,000 | 3,710,876 | |||||
24,123,770 | |||||||||
West Virginia - .3% | |||||||||
West Virginia Economic Development Authority, | 1.70 | 9/1/20 | 2,500,000 | 2,494,175 | |||||
Wisconsin - 1.3% | |||||||||
La Crosse County, | 1.00 | 10/15/17 | 6,200,000 | 6,200,558 | |||||
Muskego, | 2.25 | 9/1/18 | 1,500,000 | 1,501,635 | |||||
Wisconsin, | 4.00 | 3/1/19 | 2,340,000 | 2,442,492 | |||||
46
BNY Mellon National Short-Term Municipal Bond Fund (continued) | |||||||||
Description | Coupon | Maturity | Principal | Value ($) | |||||
Long-Term Municipal Investments - 99.7% (continued) | |||||||||
Wisconsin - 1.3% (continued) | |||||||||
Wisconsin Health and Educational Facilities Authority, | 4.00 | 3/1/18 | 1,500,000 | 1,523,685 | |||||
11,668,370 | |||||||||
U.S. Related - .1% | |||||||||
Puerto Rico Highways and Transportation Authority, | 5.00 | 10/27/17 | 2,885,000 | d | 692,400 | ||||
Total Long-Term Municipal Investments | 899,986,523 | ||||||||
Short-Term Municipal Investments - .6% | |||||||||
Nebraska - .0% | |||||||||
Douglas County Hospital Authority Number 2, | 0.85 | 9/1/17 | 100,000 | e,f | 100,000 | ||||
New York - .6% | |||||||||
New York City, | 0.86 | 9/1/17 | 1,700,000 | e,f | 1,700,000 | ||||
New York State Housing Finance Agency, | 0.85 | 9/1/17 | 4,000,000 | e,f | 4,000,000 | ||||
5,700,000 | |||||||||
Total Short-Term Municipal Investments | 5,800,000 | ||||||||
Total Investments (cost $904,018,365) | 100.3% | 905,786,523 | |||||||
Liabilities, Less Cash and Receivables | (0.3%) | (3,023,458) | |||||||
Net Assets | 100.0% | 902,763,065 | |||||||
a Security issued with a zero coupon. Income is recognized through the accretion of discount.
b Variable rate security—rate shown is the interest rate in effect at period end.
c These securities are prerefunded; the date shown represents the prerefunded date. Bonds which are prerefunded are collateralized by U.S. Government securities which are held in escrow and are used to pay principal and interest on the municipal issue and to retire the bonds in full at the earliest refunding date.
d Non-income producing—security in default.
e Variable rate demand note—rate shown is the interest rate in effect at August 31, 2017. Maturity date represents the next demand date, or the ultimate maturity date if earlier.
f The Variable Rate shall be determined by the Remarketing Agent in its sole discretion based on prevailing market conditions and may, but need not, be established by reference to one or more financial indices.
Portfolio Summary (Unaudited) † | Value (%) |
Education | 17.1 |
Transportation Services | 11.2 |
Utility-Electric | 10.0 |
City | 8.7 |
State/Territory | 7.2 |
Health Care | 4.9 |
Special Tax | 4.7 |
Utility-Water and Sewer | 4.3 |
Lease | 3.7 |
Housing | 3.4 |
County | 3.2 |
Industrial | 3.0 |
Resource Recovery | 2.3 |
Pollution Control | .9 |
Prerefunded | .5 |
Other | 15.2 |
100.3 |
† Based on net assets.
See notes to financial statements.
47
STATEMENT OF INVESTMENTS (continued)
BNY Mellon Pennsylvania Intermediate Municipal Bond Fund | |||||||||
Description | Coupon | Maturity | Principal | Value ($) | |||||
Long-Term Municipal Investments - 98.6% | |||||||||
Florida - .8% | |||||||||
Lake County School Board, | 5.00 | 6/1/27 | 1,620,000 | 1,858,156 | |||||
Illinois - 1.9% | |||||||||
Chicago, | 5.00 | 1/1/24 | 500,000 | 556,355 | |||||
Chicago, | 5.25 | 1/1/22 | 1,285,000 | 1,417,548 | |||||
Illinois, | 5.25 | 2/1/29 | 2,000,000 | 2,186,320 | |||||
4,160,223 | |||||||||
Michigan - 1.0% | |||||||||
Michigan Finance Authority, | 5.00 | 12/1/33 | 1,850,000 | 2,077,032 | |||||
New Jersey - 3.3% | |||||||||
New Jersey Economic Development Authority, | 5.00 | 3/1/27 | 2,000,000 | 2,165,960 | |||||
New Jersey Economic Development Authority, | 5.25 | 12/15/20 | 1,250,000 | 1,371,563 | |||||
New Jersey Economic Development Authority, | 5.25 | 12/15/21 | 2,000,000 | 2,256,380 | |||||
New Jersey Transportation Trust Fund Authority, | 5.00 | 6/15/24 | 1,250,000 | 1,283,550 | |||||
7,077,453 | |||||||||
New York - 1.9% | |||||||||
Metropolitan Transportation Authority Hudson Rail Yards Trust, | 5.00 | 11/15/46 | 1,550,000 | 1,660,623 | |||||
New York Liberty Development Corporation, | 5.00 | 11/15/44 | 1,750,000 | a | 1,906,625 | ||||
TSASC, Inc. of New York, | 5.00 | 6/1/22 | 450,000 | 513,720 | |||||
4,080,968 | |||||||||
Pennsylvania - 86.8% | |||||||||
Allegheny County Higher Education Building Authority, | 5.00 | 3/1/26 | 750,000 | 909,758 | |||||
Allegheny County Port Authority, | 5.25 | 3/1/24 | 2,000,000 | 2,282,020 | |||||
Beaver County Hospital Authority, | 5.00 | 5/15/23 | 1,345,000 | 1,517,254 | |||||
Beaver County Hospital Authority, | 5.00 | 5/15/25 | 1,250,000 | 1,394,563 | |||||
Berks County Municipal Authority, | 5.00 | 11/1/19 | 2,000,000 | 2,168,760 | |||||
Boyertown Area School District, | 5.00 | 10/1/34 | 1,060,000 | 1,219,223 | |||||
Boyertown Area School District, | 5.00 | 10/1/35 | 1,425,000 | 1,636,256 | |||||
Canonsburg-Houston Joint Authority, | 5.00 | 12/1/23 | 1,260,000 | 1,496,540 | |||||
Chester County Health and Education Facilities Authority, | 4.00 | 10/1/36 | 1,000,000 | 1,063,140 | |||||
Dallastown Area School District York County, | 5.00 | 4/15/31 | 1,400,000 | 1,653,204 | |||||
Dallastown Area School District York County, | 5.00 | 4/15/32 | 1,000,000 | 1,176,290 | |||||
Dauphin County General Authority, | 5.00 | 6/1/29 | 1,000,000 | 1,175,660 | |||||
Delaware County Authority, | 5.00 | 8/1/30 | 1,000,000 | 1,169,990 | |||||
Easton Area School District, | 5.50 | 4/1/23 | 2,260,000 | 2,322,082 | |||||
Erie County, | 5.50 | 9/1/22 | 1,640,000 | 1,965,360 | |||||
Fox Chapel Area School District, | 5.00 | 8/1/34 | 3,190,000 | 3,652,454 | |||||
48
BNY Mellon Pennsylvania Intermediate Municipal Bond Fund (continued) | |||||||||
Description | Coupon | Maturity | Principal | Value ($) | |||||
Long-Term Municipal Investments - 98.6% (continued) | |||||||||
Pennsylvania - 86.8% (continued) | |||||||||
Geisinger Authority, | 5.00 | 2/15/34 | 1,000,000 | 1,178,910 | |||||
Lancaster County Hospital Authority, | 5.00 | 8/15/31 | 1,250,000 | 1,485,000 | |||||
Lancaster County Solid Waste Management Authority, | 5.00 | 12/15/33 | 1,895,000 | 2,190,525 | |||||
Lower Paxton Township, | 5.00 | 4/1/42 | 1,000,000 | 1,130,770 | |||||
Monroeville Finance Authority, | 5.00 | 2/15/25 | 1,000,000 | 1,233,420 | |||||
Montgomery County, | 5.00 | 12/15/19 | 100,000 | b | 109,253 | ||||
Montgomery County Industrial Development Authority, | 5.50 | 8/1/20 | 995,000 | b | 1,124,867 | ||||
Montgomery County Industrial Development Authority, | 5.00 | 1/15/20 | 1,000,000 | 1,072,910 | |||||
Montgomery County Industrial Development Authority, | 5.00 | 11/15/36 | 1,000,000 | 1,135,670 | |||||
Northampton County General Purpose Authority, | 4.00 | 11/1/34 | 1,000,000 | 1,087,040 | |||||
Northhampton County General Purpose Authority, | 5.00 | 11/1/43 | 3,500,000 | 4,034,835 | |||||
Pennsylvania, | 5.00 | 7/1/20 | 5,000,000 | 5,538,000 | |||||
Pennsylvania, | 5.00 | 9/15/23 | 1,000,000 | 1,192,310 | |||||
Pennsylvania, | 5.00 | 3/15/28 | 2,200,000 | 2,611,620 | |||||
Pennsylvania, | 5.00 | 8/15/22 | 3,060,000 | 3,589,686 | |||||
Pennsylvania Economic Development Financing Authority, | 5.00 | 11/1/26 | 1,000,000 | 1,139,590 | |||||
Pennsylvania Economic Development Financing Authority, | 5.00 | 3/1/25 | 1,000,000 | 1,143,650 | |||||
Pennsylvania Economic Development Financing Authority, | 5.00 | 2/1/26 | 2,455,000 | 2,944,257 | |||||
Pennsylvania Economic Development Financing Authority, | 2.25 | 7/1/19 | 5,000,000 | 5,063,900 | |||||
Pennsylvania Economic Development Financing Authority, | 5.00 | 7/1/20 | 1,500,000 | 1,614,705 | |||||
Pennsylvania Higher Educational Facilities Authority, | 5.00 | 8/15/24 | 1,310,000 | 1,592,135 | |||||
Pennsylvania Higher Educational Facilities Authority, | 5.00 | 8/15/40 | 2,000,000 | 2,291,860 | |||||
Pennsylvania Higher Educational Facilities Authority, | 5.00 | 5/1/31 | 775,000 | 909,277 | |||||
Pennsylvania Higher Educational Facilities Authority, | 5.00 | 11/1/25 | 2,010,000 | 2,243,823 | |||||
Pennsylvania Higher Educational Facilities Authority, | 5.00 | 6/15/22 | 1,500,000 | 1,743,210 | |||||
Pennsylvania Higher Educational Facilities Authority, | 5.25 | 6/15/24 | 5,000,000 | 5,748,850 | |||||
Pennsylvania Higher Educational Facilities Authority, | 5.00 | 6/15/26 | 1,000,000 | 1,104,450 | |||||
Pennsylvania Higher Educational Facilities Authority, | 5.00 | 6/15/30 | 1,875,000 | 2,124,619 | |||||
Pennsylvania Higher Educational Facilities Authority, | 5.00 | 4/1/26 | 1,000,000 | 1,145,030 | |||||
Pennsylvania Higher Educational Facilities Authority, | 5.00 | 8/15/32 | 2,240,000 | 2,719,472 | |||||
Pennsylvania Higher Educational Facilities Authority, | 5.25 | 9/1/18 | 1,485,000 | 1,546,479 | |||||
Pennsylvania Industrial Development Authority, | 5.00 | 7/1/21 | 5,000,000 | 5,689,500 | |||||
49
STATEMENT OF INVESTMENTS (continued)
BNY Mellon Pennsylvania Intermediate Municipal Bond Fund (continued) | |||||||||
Description | Coupon | Maturity | Principal | Value ($) | |||||
Long-Term Municipal Investments - 98.6% (continued) | |||||||||
Pennsylvania - 86.8% (continued) | |||||||||
Pennsylvania Infrastructure Investment Authority, | 5.00 | 5/15/22 | 2,155,000 | 2,534,560 | |||||
Pennsylvania Intergovernmental Cooperation Authority, | 5.00 | 6/15/21 | 1,000,000 | 1,112,490 | |||||
Pennsylvania Intergovernmental Cooperation Authority, | 5.00 | 6/15/22 | 3,395,000 | 3,771,845 | |||||
Pennsylvania State University, | 5.00 | 9/1/33 | 1,010,000 | 1,209,677 | |||||
Pennsylvania Turnpike Commission, | 5.00 | 12/1/32 | 1,190,000 | 1,371,535 | |||||
Pennsylvania Turnpike Commission, | 5.00 | 12/1/38 | 2,415,000 | 2,753,607 | |||||
Pennsylvania Turnpike Commission, | 5.00 | 12/1/30 | 1,325,000 | 1,597,499 | |||||
Pennsylvania Turnpike Commission, | 5.25 | 7/15/25 | 2,500,000 | 3,110,800 | |||||
Pennsylvania Turnpike Commission, | 5.00 | 12/1/40 | 2,000,000 | 2,184,400 | |||||
Pennsylvania Turnpike Commission, | 5.00 | 6/1/34 | 1,000,000 | 1,172,560 | |||||
Pennsylvania Turnpike Commission, | 5.25 | 12/1/35 | 2,280,000 | 2,634,312 | |||||
Perkiomen Valley School District, | 4.00 | 3/1/28 | 3,345,000 | 3,675,586 | |||||
Philadelphia, | 5.00 | 6/15/20 | 1,750,000 | 1,930,110 | |||||
Philadelphia, | 5.00 | 8/1/29 | 1,000,000 | 1,188,300 | |||||
Philadelphia, | 5.00 | 8/1/29 | 1,000,000 | 1,188,300 | |||||
Philadelphia, | 5.00 | 8/1/30 | 1,275,000 | 1,534,870 | |||||
Philadelphia, | 5.00 | 11/1/27 | 355,000 | 412,634 | |||||
Philadelphia, | 5.00 | 11/1/22 | 2,485,000 | b | 2,956,404 | ||||
Philadelphia, | 5.00 | 10/1/33 | 1,250,000 | 1,496,175 | |||||
Philadelphia, | 5.00 | 7/1/31 | 2,000,000 | 2,333,500 | |||||
Philadelphia, | 5.00 | 1/1/36 | 2,830,000 | 3,123,584 | |||||
Philadelphia Authority for Industrial Development, | 5.00 | 4/1/25 | 2,500,000 | 3,038,075 | |||||
Philadelphia Authority for Industrial Development, | 5.00 | 4/1/31 | 2,000,000 | 2,334,380 | |||||
Philadelphia Authority for Industrial Development, | 5.00 | 9/1/35 | 2,000,000 | 2,317,760 | |||||
Philadelphia Authority for Industrial Development Hospital, | 4.00 | 7/1/35 | 2,000,000 | 2,144,480 | |||||
Philadelphia School District, | 5.00 | 9/1/20 | 1,805,000 | 1,957,685 | |||||
Pittsburgh, | 5.00 | 9/1/25 | 2,000,000 | 2,333,180 | |||||
Pittsburgh, | 5.00 | 9/1/26 | 5,000,000 | 5,820,700 | |||||
Pittsburgh, | 5.00 | 9/1/36 | 700,000 | 822,829 | |||||
Pittsburgh Water and Sewer Authority, | 5.00 | 9/1/25 | 2,580,000 | 3,059,906 | |||||
Saint Mary Hospital Authority, | 5.00 | 11/15/40 | 915,000 | 992,958 | |||||
Saint Mary Hospital Authority, | 5.25 | 11/15/23 | 2,000,000 | 2,228,300 | |||||
50
BNY Mellon Pennsylvania Intermediate Municipal Bond Fund (continued) | |||||||||
Description | Coupon | Maturity | Principal | Value ($) | |||||
Long-Term Municipal Investments - 98.6% (continued) | |||||||||
Pennsylvania - 86.8% (continued) | |||||||||
Southcentral Pennsylvania General Authority, | 5.00 | 6/1/27 | 2,085,000 | 2,449,646 | |||||
Southeastern Pennsylvania Transportation Authority, | 5.00 | 6/1/23 | 2,000,000 | 2,272,300 | |||||
State Public School Building Authority, | 5.00 | 6/1/24 | 2,000,000 | 2,357,900 | |||||
State Public School Building Authority, | 5.00 | 4/1/31 | 2,490,000 | 2,733,024 | |||||
Upper Merion Area School District, | 5.00 | 1/15/34 | 620,000 | 724,656 | |||||
Upper Merion Area School District, | 5.00 | 1/15/35 | 650,000 | 757,816 | |||||
Upper Merion Area School District, | 5.00 | 1/15/37 | 400,000 | 464,596 | |||||
West Mifflin Area School District, | 5.00 | 4/1/26 | 1,000,000 | 1,177,460 | |||||
West View Borough Municipal Authority, | 5.00 | 11/15/32 | 3,000,000 | 3,572,220 | |||||
Westmoreland County Municipal Authority, | 5.00 | 8/15/27 | 1,500,000 | 1,795,050 | |||||
Westmoreland County Municipal Authority, | 5.00 | 8/15/28 | 1,000,000 | 1,186,990 | |||||
186,116,836 | |||||||||
U.S. Related - 2.9% | |||||||||
Guam, | 5.00 | 1/1/24 | 1,500,000 | 1,660,860 | |||||
Guam, | 5.63 | 12/1/19 | 1,000,000 | b | 1,104,950 | ||||
Puerto Rico Commonwealth, | 5.50 | 7/1/19 | 3,000,000 | 3,100,620 | |||||
Puerto Rico Infrastructure Financing Authority, | 5.00 | 7/1/21 | 3,500,000 | c | 225,330 | ||||
Puerto Rico Sales Tax Financing Corporation, | 0/6.25 | 8/1/33 | 500,000 | d | 98,430 | ||||
6,190,190 | |||||||||
Total Long-Term Municipal Investments | 211,560,858 | ||||||||
Short-Term Municipal Investments - .4% | |||||||||
New York - .4% | |||||||||
New York City, | 0.86 | 9/1/17 | 900,000 | e,f | 900,000 | ||||
Total Investments (cost $205,598,047) | 99.0% | 212,460,858 | |||||||
Cash and Receivables (Net) | 1.0% | 2,039,166 | |||||||
Net Assets | 100.0% | 214,500,024 | |||||||
a Security exempt from registration pursuant to Rule 144A under the Securities Act of 1933. These securities may be resold in transactions exempt from registration, normally to qualified institutional buyers. At August 31, 2017, these securities were valued at $1,906,625 or .89% of net assets.
b These securities are prerefunded; the date shown represents the prerefunded date. Bonds which are prerefunded are collateralized by U.S. Government securities which are held in escrow and are used to pay principal and interest on the municipal issue and to retire the bonds in full at the earliest refunding date.
c Non-income producing—security in default.
d Zero coupon until a specified date at which time the stated coupon rate becomes effective until maturity.
e Variable rate demand note—rate shown is the interest rate in effect at August 31, 2017. Maturity date represents the next demand date, or the ultimate maturity date if earlier.
f The Variable Rate shall be determined by the Remarketing Agent in its sole discretion based on prevailing market conditions and may, but need not, be established by reference to one or more financial indices.
51
STATEMENT OF INVESTMENTS (continued)
Portfolio Summary (Unaudited) † | Value (%) |
Education | 22.9 |
Health Care | 12.5 |
Transportation Services | 11.8 |
City | 9.2 |
Utility-Water and Sewer | 9.1 |
State/Territory | 7.6 |
Lease | 3.8 |
Industrial | 3.5 |
County | 3.3 |
Special Tax | 3.1 |
Prerefunded | 2.5 |
Resource Recovery | 2.4 |
Other | 7.3 |
99.0 |
† Based on net assets.
See notes to financial statements.
52
BNY Mellon Massachusetts Intermediate Municipal Bond Fund | |||||||||
Description | Coupon | Maturity | Principal | Value ($) | |||||
Long-Term Municipal Investments - 99.2% | |||||||||
Illinois - .7% | |||||||||
Chicago, | 5.00 | 1/1/23 | 1,970,000 | 2,176,062 | |||||
Massachusetts - 90.8% | |||||||||
Mansfield, | 4.00 | 5/15/29 | 815,000 | 918,081 | |||||
Mansfield, | 4.00 | 5/15/30 | 845,000 | 945,986 | |||||
Barnstable, | 4.00 | 9/15/21 | 580,000 | 648,933 | |||||
Berkshire Wind Power Cooperative Corporation, | 5.25 | 7/1/23 | 750,000 | 822,593 | |||||
Boston Water and Sewer Commission, | 5.00 | 11/1/28 | 500,000 | 602,585 | |||||
Boston Water and Sewer Commission, | 5.00 | 11/1/29 | 1,000,000 | 1,201,370 | |||||
Boston Water and Sewer Commission, | 5.00 | 11/1/30 | 1,000,000 | 1,198,760 | |||||
Boston Water and Sewer Commission, | 5.00 | 11/1/31 | 600,000 | 717,768 | |||||
Brookline, | 5.00 | 3/15/25 | 1,360,000 | 1,693,921 | |||||
Canton, | 5.00 | 3/15/21 | 1,250,000 | 1,423,875 | |||||
Dedham, | 4.00 | 6/15/26 | 555,000 | 645,154 | |||||
Dedham, | 4.00 | 6/15/29 | 495,000 | 559,513 | |||||
Dedham, | 4.00 | 6/15/30 | 495,000 | 556,459 | |||||
Groton-Dunstable Regional School District, | 5.00 | 9/1/20 | 725,000 | 809,883 | |||||
Massachusetts, | 4.00 | 6/1/46 | 2,500,000 | 2,645,600 | |||||
Massachusetts, | 5.00 | 6/15/25 | 5,060,000 | 6,184,737 | |||||
Massachusetts, | 5.00 | 6/15/27 | 2,000,000 | 2,419,900 | |||||
Massachusetts, | 5.00 | 2/1/33 | 2,000,000 | 2,419,040 | |||||
Massachusetts, | 5.00 | 4/1/37 | 3,015,000 | 3,611,126 | |||||
Massachusetts, | 4.50 | 12/1/43 | 5,000,000 | 5,453,400 | |||||
Massachusetts, | 5.00 | 3/1/31 | 2,250,000 | 2,671,582 | |||||
Massachusetts, | 5.00 | 8/1/21 | 920,000 | a | 1,060,153 | ||||
Massachusetts, | 5.00 | 8/1/21 | 5,000,000 | a | 5,761,700 | ||||
Massachusetts, | 5.00 | 7/1/22 | 2,500,000 | a | 2,953,200 | ||||
Massachusetts, | 1.34 | 11/1/18 | 2,500,000 | b | 2,501,100 | ||||
Massachusetts, | 5.00 | 6/1/21 | 2,100,000 | 2,407,398 | |||||
Massachusetts Bay Transportation Authority, | 5.25 | 7/1/21 | 3,085,000 | 3,573,047 | |||||
Massachusetts Bay Transportation Authority, | 5.25 | 7/1/21 | 2,000,000 | 2,316,400 | |||||
Massachusetts Bay Transportation Authority, | 5.25 | 7/1/22 | 2,430,000 | 2,898,358 | |||||
Massachusetts Bay Transportation Authority, | 0.00 | 7/1/32 | 2,500,000 | c | 1,560,800 | ||||
Massachusetts Clean Energy Cooperative Corporation, | 5.00 | 7/1/28 | 1,250,000 | 1,461,850 | |||||
53
STATEMENT OF INVESTMENTS (continued)
BNY Mellon Massachusetts Intermediate Municipal Bond Fund (continued) | |||||||||
Description | Coupon | Maturity | Principal | Value ($) | |||||
Long-Term Municipal Investments - 99.2% (continued) | |||||||||
Massachusetts - 90.8% (continued) | |||||||||
Massachusetts Clean Water Trust, | 5.00 | 2/1/35 | 990,000 | 1,166,111 | |||||
Massachusetts College Building Authority, | 5.00 | 5/1/27 | 3,000,000 | 3,572,520 | |||||
Massachusetts Department of Transportation, | 5.00 | 1/1/32 | 1,530,000 | 1,660,769 | |||||
Massachusetts Department of Transportation, | 5.00 | 1/1/35 | 3,045,000 | 3,310,402 | |||||
Massachusetts Development Finance Agency, | 5.00 | 10/1/25 | 545,000 | 665,325 | |||||
Massachusetts Development Finance Agency, | 5.00 | 7/1/24 | 350,000 | 421,456 | |||||
Massachusetts Development Finance Agency, | 5.00 | 7/1/40 | 1,500,000 | 1,728,705 | |||||
Massachusetts Development Finance Agency, | 5.00 | 10/1/29 | 1,000,000 | 1,201,780 | |||||
Massachusetts Development Finance Agency, | 5.00 | 10/1/37 | 1,750,000 | 2,044,630 | |||||
Massachusetts Development Finance Agency, | 5.00 | 10/1/23 | 400,000 | 477,060 | |||||
Massachusetts Development Finance Agency, | 5.00 | 7/1/23 | 765,000 | 892,373 | |||||
Massachusetts Development Finance Agency, | 5.00 | 7/1/24 | 475,000 | 558,287 | |||||
Massachusetts Development Finance Agency, | 5.00 | 7/1/25 | 500,000 | 591,155 | |||||
Massachusetts Development Finance Agency, | 5.00 | 7/1/26 | 500,000 | 593,295 | |||||
Massachusetts Development Finance Agency, | 5.00 | 7/1/44 | 2,000,000 | 2,198,140 | |||||
Massachusetts Development Finance Agency, | 4.00 | 10/1/32 | 1,000,000 | 1,093,120 | |||||
Massachusetts Development Finance Agency, | 5.00 | 10/1/46 | 2,000,000 | 2,312,480 | |||||
Massachusetts Development Finance Agency, | 5.00 | 7/1/22 | 1,000,000 | 1,167,420 | |||||
Massachusetts Development Finance Agency, | 5.00 | 7/1/24 | 1,000,000 | 1,204,160 | |||||
Massachusetts Development Finance Agency, | 5.00 | 7/1/26 | 1,000,000 | 1,228,180 | |||||
Massachusetts Development Finance Agency, | 5.00 | 7/1/29 | 1,000,000 | 1,192,230 | |||||
Massachusetts Development Finance Agency, | 5.00 | 7/1/30 | 1,000,000 | 1,184,410 | |||||
Massachusetts Development Finance Agency, | 5.00 | 12/1/32 | 1,565,000 | 1,853,602 | |||||
Massachusetts Development Finance Agency, | 5.00 | 12/1/33 | 1,500,000 | 1,764,555 | |||||
Massachusetts Development Finance Agency, | 5.00 | 1/1/19 | 2,000,000 | 2,099,380 | |||||
Massachusetts Development Finance Agency, | 5.00 | 1/1/22 | 565,000 | 645,868 | |||||
Massachusetts Development Finance Agency, | 5.00 | 1/1/23 | 400,000 | 467,244 | |||||
Massachusetts Development Finance Agency, | 5.00 | 1/1/25 | 1,000,000 | 1,197,620 | |||||
Massachusetts Development Finance Agency, | 5.00 | 10/1/30 | 1,000,000 | 1,173,810 | |||||
Massachusetts Development Finance Agency, | 4.00 | 10/1/46 | 1,000,000 | 1,016,760 | |||||
Massachusetts Development Finance Agency, | 5.00 | 8/15/27 | 1,000,000 | 1,113,660 | |||||
Massachusetts Development Finance Agency, | 5.00 | 8/15/28 | 1,000,000 | 1,110,210 | |||||
Massachusetts Development Finance Agency, | 5.00 | 7/1/28 | 1,550,000 | 1,854,032 | |||||
Massachusetts Development Finance Agency, | 5.00 | 7/1/31 | 1,000,000 | 1,175,350 | |||||
54
BNY Mellon Massachusetts Intermediate Municipal Bond Fund (continued) | |||||||||
Description | Coupon | Maturity | Principal | Value ($) | |||||
Long-Term Municipal Investments - 99.2% (continued) | |||||||||
Massachusetts - 90.8% (continued) | |||||||||
Massachusetts Development Finance Agency, | 5.00 | 7/1/37 | 465,000 | 535,433 | |||||
Massachusetts Development Finance Agency, | 5.00 | 11/1/38 | 5,000,000 | 5,737,800 | |||||
Massachusetts Development Finance Agency, | 5.00 | 7/1/25 | 1,825,000 | 2,081,485 | |||||
Massachusetts Development Finance Agency, | 4.00 | 7/1/32 | 2,000,000 | 2,152,520 | |||||
Massachusetts Development Finance Agency, | 5.00 | 4/15/33 | 3,410,000 | 3,720,890 | |||||
Massachusetts Development Finance Agency, | 5.00 | 4/15/40 | 1,230,000 | 1,326,826 | |||||
Massachusetts Development Finance Agency, | 5.25 | 10/1/24 | 465,000 | 552,025 | |||||
Massachusetts Development Finance Agency, | 5.00 | 10/1/25 | 700,000 | 847,581 | |||||
Massachusetts Development Finance Agency, | 5.00 | 10/1/29 | 2,820,000 | 3,305,435 | |||||
Massachusetts Development Finance Agency, | 5.00 | 7/1/24 | 530,000 | 635,194 | |||||
Massachusetts Development Finance Agency, | 5.00 | 7/1/25 | 500,000 | 604,635 | |||||
Massachusetts Development Finance Agency, | 5.00 | 7/1/28 | 750,000 | 890,250 | |||||
Massachusetts Development Finance Agency, | 5.00 | 7/1/41 | 2,000,000 | 2,235,840 | |||||
Massachusetts Development Finance Agency, | 4.00 | 7/1/20 | 530,000 | 569,830 | |||||
Massachusetts Development Finance Agency, | 5.00 | 7/1/28 | 1,000,000 | 1,240,310 | |||||
Massachusetts Development Finance Agency, | 5.00 | 7/1/32 | 1,910,000 | 2,255,175 | |||||
Massachusetts Development Finance Agency, | 5.13 | 7/1/40 | 210,000 | 224,179 | |||||
Massachusetts Development Finance Agency, | 5.00 | 7/1/23 | 1,250,000 | 1,473,975 | |||||
Massachusetts Development Finance Agency, | 5.00 | 7/1/25 | 1,340,000 | 1,616,134 | |||||
Massachusetts Development Finance Agency, | 5.25 | 4/1/23 | 3,675,000 | 4,216,768 | |||||
Massachusetts Development Finance Agency, | 5.25 | 4/1/24 | 4,500,000 | 5,159,970 | |||||
Massachusetts Development Finance Agency, | 5.00 | 9/1/21 | 300,000 | 339,201 | |||||
Massachusetts Development Finance Agency, | 5.00 | 7/1/24 | 1,000,000 | 1,184,390 | |||||
Massachusetts Development Finance Agency, | 5.00 | 7/1/25 | 2,375,000 | 2,841,664 | |||||
Massachusetts Development Finance Agency, | 5.00 | 7/1/28 | 1,000,000 | 1,183,540 | |||||
Massachusetts Development Finance Agency, | 5.00 | 10/1/20 | 705,000 | 781,429 | |||||
Massachusetts Development Finance Agency, | 5.00 | 10/1/24 | 550,000 | 661,881 | |||||
Massachusetts Development Finance Agency, | 5.00 | 9/1/35 | 1,000,000 | 1,123,160 | |||||
Massachusetts Development Finance Agency, | 5.00 | 9/1/40 | 2,650,000 | 2,952,656 | |||||
Massachusetts Development Finance Agency, | 4.00 | 1/1/19 | 170,000 | 176,829 | |||||
Massachusetts Development Finance Agency, | 5.00 | 1/1/20 | 200,000 | 217,916 | |||||
Massachusetts Development Finance Agency, | 5.00 | 1/1/21 | 100,000 | 112,309 | |||||
Massachusetts Development Finance Agency, | 5.00 | 1/1/22 | 200,000 | 230,622 | |||||
Massachusetts Development Finance Agency, | 5.00 | 1/1/23 | 250,000 | 293,843 | |||||
Massachusetts Development Finance Agency, | 3.00 | 1/1/25 | 190,000 | 202,897 | |||||
55
STATEMENT OF INVESTMENTS (continued)
BNY Mellon Massachusetts Intermediate Municipal Bond Fund (continued) | |||||||||
Description | Coupon | Maturity | Principal | Value ($) | |||||
Long-Term Municipal Investments - 99.2% (continued) | |||||||||
Massachusetts - 90.8% (continued) | |||||||||
Massachusetts Development Finance Agency, | 4.00 | 1/1/26 | 130,000 | 148,790 | |||||
Massachusetts Development Finance Agency, | 5.00 | 1/1/27 | 310,000 | 378,216 | |||||
Massachusetts Development Finance Agency, | 5.00 | 1/1/28 | 140,000 | 168,938 | |||||
Massachusetts Development Finance Agency, | 5.00 | 1/1/29 | 200,000 | 239,578 | |||||
Massachusetts Development Finance Agency, | 5.00 | 1/1/30 | 410,000 | 487,912 | |||||
Massachusetts Development Finance Agency, | 5.00 | 1/1/31 | 415,000 | 490,625 | |||||
Massachusetts Development Finance Agency, | 5.00 | 7/1/28 | 1,375,000 | 1,740,846 | |||||
Massachusetts Development Finance Agency, | 5.00 | 7/1/29 | 620,000 | 777,418 | |||||
Massachusetts Development Finance Agency, | 5.00 | 7/1/30 | 1,000,000 | 1,244,850 | |||||
Massachusetts Development Finance Agency, | 5.00 | 10/1/20 | 905,000 | 1,016,252 | |||||
Massachusetts Development Finance Agency, | 5.00 | 10/1/21 | 830,000 | 961,414 | |||||
Massachusetts Development Finance Agency, | 5.00 | 7/1/30 | 525,000 | 623,873 | |||||
Massachusetts Development Finance Agency, | 5.00 | 5/1/34 | 1,000,000 | 1,141,970 | |||||
Massachusetts Development Finance Agency, | 5.00 | 5/1/39 | 1,460,000 | 1,663,758 | |||||
Massachusetts Development Finance Agency, | 5.75 | 5/1/19 | 2,000,000 | a | 2,161,000 | ||||
Massachusetts Educational Financing Authority, | 4.00 | 1/1/18 | 2,500,000 | 2,523,675 | |||||
Massachusetts Educational Financing Authority, | 5.00 | 1/1/20 | 1,400,000 | 1,514,268 | |||||
Massachusetts Educational Financing Authority, | 5.00 | 7/1/21 | 2,350,000 | 2,631,929 | |||||
Massachusetts Educational Financing Authority, | 5.00 | 7/1/24 | 2,000,000 | 2,364,600 | |||||
Massachusetts Health and Educational Facilities Authority, | 5.00 | 10/1/32 | 125,000 | 125,421 | |||||
Massachusetts Health and Educational Facilities Authority, | 5.00 | 10/1/37 | 360,000 | 361,184 | |||||
Massachusetts Health and Educational Facilities Authority, | 5.13 | 11/15/19 | 1,000,000 | a | 1,092,340 | ||||
Massachusetts Health and Educational Facilities Authority, | 5.00 | 7/1/18 | 690,000 | 713,012 | |||||
Massachusetts Health and Educational Facilities Authority, | 5.25 | 7/1/18 | 1,000,000 | a | 1,037,560 | ||||
Massachusetts Health and Educational Facilities Authority, | 5.25 | 12/1/22 | 2,750,000 | 2,915,357 | |||||
Massachusetts Health and Educational Facilities Authority, | 5.25 | 12/1/27 | 2,000,000 | 2,114,540 | |||||
Massachusetts Health and Educational Facilities Authority, | 5.00 | 5/1/19 | 2,525,000 | a | 2,698,316 | ||||
Massachusetts Health and Educational Facilities Authority, | 5.50 | 7/1/22 | 1,800,000 | 2,171,808 | |||||
Massachusetts Health and Educational Facilities Authority, | 5.00 | 7/1/23 | 3,335,000 | 4,043,788 | |||||
Massachusetts Health and Educational Facilities Authority, | 5.00 | 10/1/24 | 2,000,000 | 2,226,940 | |||||
Massachusetts Health and Educational Facilities Authority, | 5.00 | 10/1/24 | 1,000,000 | 1,172,810 | |||||
56
BNY Mellon Massachusetts Intermediate Municipal Bond Fund (continued) | |||||||||
Description | Coupon | Maturity | Principal | Value ($) | |||||
Long-Term Municipal Investments - 99.2% (continued) | |||||||||
Massachusetts - 90.8% (continued) | |||||||||
Massachusetts Health and Educational Facilities Authority, | 5.63 | 10/1/29 | 3,000,000 | 3,282,240 | |||||
Massachusetts Health and Educational Facilities Authority, | 5.00 | 10/1/30 | 3,000,000 | 3,314,220 | |||||
Massachusetts Health and Educational Facilities Authority, | 5.00 | 7/1/22 | 115,000 | 115,398 | |||||
Massachusetts Health and Educational Facilities Authority, | 7.50 | 10/1/18 | 410,000 | a | 439,241 | ||||
Massachusetts Health and Educational Facilities Authority, | 7.50 | 10/1/18 | 590,000 | a | 632,079 | ||||
Massachusetts Health and Educational Facilities Authority, | 5.00 | 7/1/20 | 4,640,000 | a | 5,168,218 | ||||
Massachusetts Health and Educational Facilities Authority, | 6.25 | 7/1/30 | 840,000 | 914,029 | |||||
Massachusetts Health and Educational Facilities Authority, | 5.25 | 2/15/26 | 3,130,000 | 3,980,515 | |||||
Massachusetts Housing Finance Agency, | 4.00 | 6/1/19 | 815,000 | 851,447 | |||||
Massachusetts Housing Finance Agency, | 2.95 | 12/1/32 | 1,000,000 | 974,710 | |||||
Massachusetts Housing Finance Agency, | 3.50 | 12/1/46 | 1,435,000 | 1,539,899 | |||||
Massachusetts Port Authority, | 5.00 | 7/1/24 | 315,000 | 378,639 | |||||
Massachusetts Port Authority, | 5.00 | 7/1/27 | 1,345,000 | 1,545,042 | |||||
Massachusetts Port Authority, | 5.00 | 7/1/28 | 200,000 | 236,928 | |||||
Massachusetts Port Authority, | 5.00 | 7/1/28 | 2,500,000 | 2,774,925 | |||||
Massachusetts Port Authority, | 5.00 | 7/1/29 | 200,000 | 235,134 | |||||
Massachusetts Port Authority, | 5.00 | 7/1/31 | 1,500,000 | 1,744,620 | |||||
Massachusetts Port Authority, | 5.00 | 7/1/32 | 750,000 | 892,493 | |||||
Massachusetts Port Authority, | 5.00 | 7/1/33 | 2,000,000 | 2,371,560 | |||||
Massachusetts Port Authority, | 5.00 | 7/1/40 | 2,000,000 | 2,188,180 | |||||
Massachusetts School Building Authority, | 5.00 | 8/15/26 | 4,000,000 | 4,710,720 | |||||
Massachusetts School Building Authority, | 5.00 | 8/15/29 | 2,700,000 | 3,160,053 | |||||
Massachusetts School Building Authority, | 5.00 | 8/15/30 | 2,000,000 | 2,339,500 | |||||
Massachusetts School Building Authority, | 4.00 | 8/15/32 | 2,500,000 | 2,723,775 | |||||
Massachusetts State College Building Authority, | 4.00 | 5/1/20 | 715,000 | 772,543 | |||||
Massachusetts Turnpike Authority, | 5.00 | 1/1/20 | 2,295,000 | 2,415,740 | |||||
Massachusetts Water Pollution Abatement Trust, | 5.00 | 8/1/18 | 75,000 | 75,269 | |||||
Massachusetts Water Pollution Abatement Trust, | 5.00 | 8/1/23 | 3,000,000 | 3,636,660 | |||||
Massachusetts Water Pollution Abatement Trust, | 5.75 | 8/1/29 | 155,000 | 155,603 | |||||
Massachusetts Water Resources Authority, | 5.00 | 8/1/27 | 2,570,000 | 3,060,587 | |||||
Massachusetts Water Resources Authority, | 5.00 | 8/1/21 | 500,000 | a | 575,965 | ||||
Metropolitan Boston Transit Parking Corporation, | 5.00 | 7/1/25 | 1,000,000 | 1,144,770 | |||||
Metropolitan Boston Transit Parking Corporation, | 5.00 | 7/1/41 | 4,090,000 | 4,599,328 | |||||
Mount Greylock Regional School District, | 4.00 | 6/15/27 | 640,000 | 720,832 | |||||
57
STATEMENT OF INVESTMENTS (continued)
BNY Mellon Massachusetts Intermediate Municipal Bond Fund (continued) | |||||||||
Description | Coupon | Maturity | Principal | Value ($) | |||||
Long-Term Municipal Investments - 99.2% (continued) | |||||||||
Massachusetts - 90.8% (continued) | |||||||||
Mount Greylock Regional School District, | 4.00 | 6/15/28 | 420,000 | 467,090 | |||||
Mount Greylock Regional School District, | 4.00 | 6/15/29 | 745,000 | 821,616 | |||||
Mount Greylock Regional School District, | 4.00 | 6/15/30 | 315,000 | 344,664 | |||||
The Commonwealth of Massachusetts, | 4.00 | 2/1/29 | 2,500,000 | 2,788,075 | |||||
Waltham Massachusetts, | 4.00 | 6/15/25 | 845,000 | 992,706 | |||||
Waltham Massachusetts, | 4.00 | 6/15/27 | 1,210,000 | 1,437,069 | |||||
Weston, | 4.00 | 12/1/23 | 530,000 | 618,770 | |||||
278,358,803 | |||||||||
Michigan - .7% | |||||||||
Michigan Finance Authority, | 5.00 | 12/1/33 | 2,000,000 | 2,245,440 | |||||
New Jersey - 2.8% | |||||||||
New Jersey Economic Development Authority, | 5.25 | 12/15/20 | 1,760,000 | 1,931,160 | |||||
New Jersey Economic Development Authority, | 5.00 | 6/15/25 | 2,000,000 | 2,305,220 | |||||
New Jersey Economic Development Authority, | 5.25 | 12/15/21 | 2,160,000 | 2,436,890 | |||||
New Jersey Transportation Trust Fund Authority, | 5.00 | 6/15/24 | 1,750,000 | 1,796,970 | |||||
8,470,240 | |||||||||
New Mexico - .4% | |||||||||
New Mexico Finance Authority, | 5.00 | 6/1/24 | 1,100,000 | 1,348,435 | |||||
New York - 2.3% | |||||||||
Metropolitan Transportation Authority Hudson Rail Yards Trust, | 5.00 | 11/15/46 | 2,250,000 | 2,410,582 | |||||
New York Liberty Development Corporation, | 5.00 | 11/15/44 | 1,750,000 | d | 1,906,625 | ||||
New York State Energy Research and Development Authority, | 2.00 | 5/1/20 | 2,000,000 | 2,032,180 | |||||
TSASC, Inc. of New York, | 5.00 | 6/1/22 | 550,000 | 627,880 | |||||
6,977,267 | |||||||||
U.S. Related - 1.5% | |||||||||
Guam, | 5.00 | 1/1/25 | 1,500,000 | 1,647,870 | |||||
Guam, | 6.00 | 11/1/26 | 500,000 | 571,655 | |||||
Guam, | 5.63 | 12/1/19 | 1,000,000 | a | 1,104,950 | ||||
Puerto Rico Commonwealth, | 5.50 | 7/1/19 | 1,000,000 | 1,056,350 | |||||
Puerto Rico Infrastructure Financing Authority, | 5.00 | 7/1/20 | 2,000,000 | e | 128,760 | ||||
Puerto Rico Sales Tax Financing Corporation, | 0/6.25 | 8/1/33 | 750,000 | f | 147,645 | ||||
4,657,230 | |||||||||
Total Long-Term Municipal Investments | 304,233,477 | ||||||||
58
BNY Mellon Massachusetts Intermediate Municipal Bond Fund (continued) | |||||||||
Description | Coupon | Maturity | Principal | a | Value ($) | ||||
Short-Term Municipal Investments - 1.9% | |||||||||
Massachusetts - 1.9% | |||||||||
Massachusetts Health and Educational Facilities Authority, | 0.83 | 9/1/17 | 5,700,000 | g,h | 5,700,000 | ||||
Total Investments (cost $300,245,461) | 101.1% | 309,933,477 | |||||||
Liabilities, Less Cash and Receivables | (1.1%) | (3,295,600) | |||||||
Net Assets | 100.0% | 306,637,877 | |||||||
a These securities are prerefunded; the date shown represents the prerefunded date. Bonds which are prerefunded are collateralized by U.S. Government securities which are held in escrow and are used to pay principal and interest on the municipal issue and to retire the bonds in full at the earliest refunding date.
b Variable rate security—rate shown is the interest rate in effect at period end.
c Security issued with a zero coupon. Income is recognized through the accretion of discount.
d Security exempt from registration pursuant to Rule 144A under the Securities Act of 1933. These securities may be resold in transactions exempt from registration, normally to qualified institutional buyers. At August 31, 2017, these securities were valued at $1,906,625 or .62% of net assets.
e Non-income producing—security in default.
f Zero coupon until a specified date at which time the stated coupon rate becomes effective until maturity.
g Variable rate demand note—rate shown is the interest rate in effect at August 31, 2017. Maturity date represents the next demand date, or the ultimate maturity date if earlier.
h The Variable Rate shall be determined by the Remarketing Agent in its sole discretion based on prevailing market conditions and may, but need not, be established by reference to one or more financial indices.
Portfolio Summary (Unaudited) † | Value (%) |
Education | 34.8 |
Transportation Services | 14.3 |
Health Care | 12.0 |
Prerefunded | 8.8 |
State/Territory | 6.6 |
City | 4.7 |
Special Tax | 4.0 |
Utility-Water and Sewer | 2.6 |
Housing | 2.0 |
Industrial | 1.3 |
Utility-Electric | .7 |
Pollution Control | .1 |
Other | 9.2 |
101.1 |
† Based on net assets.
See notes to financial statements.
59
STATEMENT OF INVESTMENTS (continued)
BNY Mellon New York Intermediate Tax-Exempt Bond Fund | |||||||||
Description | Coupon | Maturity | Principal | Value ($) | |||||
Long-Term Municipal Investments - 98.0% | |||||||||
Illinois - .8% | |||||||||
Chicago, | 5.25 | 1/1/22 | 1,150,000 | 1,268,623 | |||||
Michigan - .8% | |||||||||
Michigan Finance Authority, | 5.00 | 12/1/33 | 1,150,000 | 1,291,128 | |||||
New Jersey - 2.1% | |||||||||
New Jersey Economic Development Authority, | 5.25 | 12/15/20 | 1,000,000 | 1,097,250 | |||||
New Jersey Economic Development Authority, | 5.25 | 12/15/21 | 1,265,000 | 1,427,160 | |||||
New Jersey Transportation Trust Fund Authority, | 5.00 | 6/15/24 | 1,000,000 | 1,026,840 | |||||
3,551,250 | |||||||||
New York - 92.0% | |||||||||
Albany County Airport Authority, | 5.00 | 12/15/23 | 1,500,000 | 1,656,675 | |||||
Battery Park City Authority, | 5.00 | 11/1/23 | 1,065,000 | 1,309,215 | |||||
Dutchess County Local Development Corporation, | 5.00 | 7/1/27 | 1,000,000 | 1,204,960 | |||||
Erie County Fiscal Stability Authority, | 5.00 | 12/1/21 | 1,000,000 | a | 1,160,500 | ||||
Haverstraw-Stony Point Central School District, | 5.00 | 10/15/33 | 725,000 | 849,272 | |||||
Haverstraw-Stony Point Central School District, | 5.00 | 10/15/34 | 730,000 | 852,377 | |||||
Hudson Yards Infrastructure Corporation Second Indenture, | 5.00 | 2/15/32 | 1,500,000 | 1,814,040 | |||||
Long Island Power Authority, | 5.00 | 5/1/20 | 1,000,000 | 1,103,410 | |||||
Long Island Power Authority, | 5.00 | 5/1/21 | 1,000,000 | 1,137,320 | |||||
Long Island Power Authority, | 5.00 | 9/1/24 | 1,270,000 | 1,547,952 | |||||
Metropolitan Transortation Authority, | 5.00 | 11/15/39 | 2,000,000 | 2,333,500 | |||||
Metropolitan Transportation Authority, | 5.25 | 11/15/28 | 1,000,000 | 1,268,020 | |||||
Metropolitan Transportation Authority, | 4.00 | 11/15/33 | 1,000,000 | 1,110,540 | |||||
Metropolitan Transportation Authority, | 6.25 | 11/15/23 | 60,000 | 63,997 | |||||
Metropolitan Transportation Authority, | 5.00 | 11/15/24 | 1,465,000 | 1,790,142 | |||||
Metropolitan Transportation Authority, | 5.00 | 11/15/28 | 2,375,000 | 2,785,162 | |||||
Metropolitan Transportation Authority, | 6.25 | 11/15/18 | 5,000 | a | 5,332 | ||||
Metropolitan Transportation Authority Hudson Rail Yards Trust, | 5.00 | 11/15/46 | 2,200,000 | 2,357,014 | |||||
Monroe County Industrial Development Corporation, | 5.00 | 12/1/28 | 1,095,000 | 1,305,393 | |||||
Monroe County Industrial Development Corporation, | 5.00 | 12/1/32 | 1,000,000 | 1,163,970 | |||||
Monroe County Industrial Development Corporation, | 5.00 | 7/1/30 | 1,000,000 | 1,231,930 | |||||
Monroe County Industrial Development Corporation, | 5.00 | 7/1/33 | 1,335,000 | 1,612,680 | |||||
Nassau County, | 5.00 | 10/1/20 | 1,000,000 | 1,079,340 | |||||
Nassau County, | 5.00 | 4/1/35 | 1,000,000 | 1,171,840 | |||||
Nassau County, | 5.00 | 4/1/29 | 1,500,000 | 1,735,440 | |||||
60
BNY Mellon New York Intermediate Tax-Exempt Bond Fund (continued) | |||||||||
Description | Coupon | Maturity | Principal | Value ($) | |||||
Long-Term Municipal Investments - 98.0% (continued) | |||||||||
New York - 92.0% (continued) | |||||||||
Nassau County, | 5.00 | 10/1/23 | 1,100,000 | 1,317,547 | |||||
Nassau County Sewer and Storm Water Finance Authority, | 5.38 | 11/1/18 | 1,000,000 | a | 1,054,050 | ||||
New York City, | 5.00 | 8/1/20 | 750,000 | 836,363 | |||||
New York City, | 5.00 | 8/1/25 | 1,255,000 | 1,555,133 | |||||
New York City Industrial Development Agency, | 7.00 | 3/1/49 | 1,000,000 | 1,090,350 | |||||
New York City Municipal Water Finance Authority, | 5.00 | 6/15/44 | 2,110,000 | 2,347,903 | |||||
New York City Transitional Finance Authority, | 5.00 | 7/15/29 | 1,000,000 | 1,237,460 | |||||
New York City Transitional Finance Authority, | 5.00 | 7/15/30 | 1,000,000 | 1,225,650 | |||||
New York City Transitional Finance Authority, | 5.00 | 11/1/18 | 1,750,000 | 1,835,785 | |||||
New York City Transitional Finance Authority, | 5.00 | 11/1/25 | 1,000,000 | 1,250,880 | |||||
New York City Transitional Finance Authority, | 5.00 | 5/1/29 | 2,000,000 | 2,324,800 | |||||
New York City Transitional Finance Authority, | 5.00 | 11/1/31 | 1,980,000 | 2,216,570 | |||||
New York City Trust for Cultural Resources, | 5.00 | 7/1/37 | 1,000,000 | 1,164,990 | |||||
New York City Trust for Cultural Resources, | 5.00 | 12/1/26 | 1,075,000 | 1,322,605 | |||||
New York City Trust for Cultural Resources, | 5.00 | 1/1/34 | 2,000,000 | 2,104,580 | |||||
New York City Trust for Cultural Resources, | 5.00 | 1/1/39 | 2,500,000 | 2,629,700 | |||||
New York City Trust for Cultural Resources, | 5.00 | 8/1/31 | 1,480,000 | 1,738,304 | |||||
New York Counties Tobacco Trust VI, | 5.00 | 6/1/45 | 1,000,000 | 1,058,390 | |||||
New York Liberty Development Corporation, | 5.00 | 9/15/29 | 1,000,000 | 1,156,340 | |||||
New York Liberty Development Corporation, | 5.00 | 12/15/41 | 1,205,000 | 1,365,036 | |||||
New York Liberty Development Corporation, | 5.15 | 11/15/34 | 1,500,000 | b | 1,652,325 | ||||
New York Liberty Development Corporation, | 5.00 | 11/15/44 | 1,500,000 | b | 1,634,250 | ||||
New York Local Government Assistance Corporation, | 5.00 | 4/1/21 | 1,000,000 | 1,105,410 | |||||
New York State Dormitory Authority, | 5.75 | 7/1/18 | 360,000 | 373,626 | |||||
New York State Dormitory Authority, | 5.00 | 2/15/32 | 1,000,000 | 1,210,290 | |||||
New York State Dormitory Authority, | 5.00 | 10/1/41 | 2,500,000 | 2,816,975 | |||||
New York State Dormitory Authority, | 5.63 | 11/1/35 | 1,000,000 | 1,145,460 | |||||
New York State Dormitory Authority, | 5.00 | 7/1/23 | 1,000,000 | 1,185,880 | |||||
New York State Dormitory Authority, | 4.00 | 7/1/26 | 1,200,000 | 1,380,348 | |||||
New York State Dormitory Authority, | 5.00 | 7/1/26 | 2,500,000 | 2,765,325 | |||||
New York State Dormitory Authority, | 5.00 | 7/1/25 | 1,000,000 | 1,237,770 | |||||
New York State Dormitory Authority, | 5.00 | 7/1/31 | 2,000,000 | 2,391,340 | |||||
61
STATEMENT OF INVESTMENTS (continued)
BNY Mellon New York Intermediate Tax-Exempt Bond Fund (continued) | |||||||||
Description | Coupon | Maturity | Principal | Value ($) | |||||
Long-Term Municipal Investments - 98.0% (continued) | |||||||||
New York - 92.0% (continued) | |||||||||
New York State Dormitory Authority, | 5.00 | 7/1/37 | 650,000 | 749,879 | |||||
New York State Dormitory Authority, | 5.00 | 7/1/37 | 2,155,000 | 2,460,988 | |||||
New York State Dormitory Authority, | 5.00 | 7/1/43 | 2,400,000 | 2,750,376 | |||||
New York State Dormitory Authority, | 5.00 | 10/1/28 | 1,805,000 | 2,241,323 | |||||
New York State Dormitory Authority, | 5.00 | 7/1/23 | 1,000,000 | 1,108,930 | |||||
New York State Dormitory Authority, | 5.00 | 10/1/26 | 1,000,000 | 1,247,330 | |||||
New York State Dormitory Authority, | 5.00 | 7/1/32 | 1,530,000 | 1,783,949 | |||||
New York State Dormitory Authority, | 5.00 | 3/15/35 | 1,100,000 | 1,306,184 | |||||
New York State Dormitory Authority, | 5.00 | 2/15/20 | 1,000,000 | 1,099,540 | |||||
New York State Dormitory Authority, | 5.00 | 3/15/20 | 1,000,000 | 1,102,670 | |||||
New York State Dormitory Authority, | 5.00 | 3/15/21 | 1,000,000 | 1,141,350 | |||||
New York State Dormitory Authority, | 5.00 | 3/15/30 | 1,275,000 | 1,563,826 | |||||
New York State Energy Research and Development Authority, | 2.00 | 5/1/20 | 2,000,000 | 2,032,180 | |||||
New York State Environmental Facilities Corporation, | 4.00 | 6/15/46 | 1,475,000 | 1,572,881 | |||||
New York State Thruway Authority, | 5.00 | 1/1/32 | 1,000,000 | 1,176,790 | |||||
New York State Thruway Authority, | 5.00 | 1/1/31 | 2,000,000 | 2,360,960 | |||||
New York State Urban Development Corporation, | 5.00 | 1/1/20 | 2,075,000 | 2,268,950 | |||||
New York State Urban Development Corporation, | 5.00 | 3/15/25 | 1,000,000 | 1,237,510 | |||||
New York State Urban Development Corporation, | 5.00 | 3/15/23 | 1,410,000 | 1,689,096 | |||||
New York State Urban Development Corporation, | 5.00 | 3/15/29 | 1,000,000 | 1,176,270 | |||||
Onondaga County Trust for Cultural Resources, | 5.00 | 12/1/19 | 1,500,000 | 1,638,300 | |||||
Oyster Bay, | 4.00 | 11/1/19 | 2,000,000 | 2,099,740 | |||||
Oyster Bay, | 5.00 | 3/15/21 | 1,330,000 | 1,481,846 | |||||
Oyster Bay, | 5.00 | 8/15/22 | 1,715,000 | 1,971,993 | |||||
Port Authority of New York and New Jersey, | 5.00 | 5/1/30 | 1,000,000 | 1,202,000 | |||||
Port Authority of New York and New Jersey, | 5.25 | 11/15/39 | 1,000,000 | 1,231,120 | |||||
Port Authority of New York and New Jersey, | 5.00 | 10/15/41 | 1,000,000 | 1,166,710 | |||||
Rockland County, | 5.00 | 6/1/23 | 575,000 | 676,994 | |||||
Sales Tax Asset Receivable Corporation, | 5.00 | 10/15/21 | 1,000,000 | 1,160,740 | |||||
Sales Tax Asset Receivable Corporation, | 5.00 | 10/15/31 | 1,060,000 | 1,282,611 | |||||
St. Lawrence County New York Development Agency, | 5.00 | 9/1/29 | 1,000,000 | 1,195,600 | |||||
62
BNY Mellon New York Intermediate Tax-Exempt Bond Fund (continued) | |||||||||
Description | Coupon | Maturity | Principal | Value ($) | |||||
Long-Term Municipal Investments - 98.0% (continued) | |||||||||
New York - 92.0% (continued) | |||||||||
Suffolk County, | 5.00 | 2/1/22 | 1,000,000 | 1,154,140 | |||||
Suffolk County, | 4.00 | 2/1/24 | 2,115,000 | 2,394,117 | |||||
Suffolk County Water Authority, | 4.00 | 6/1/38 | 1,000,000 | 1,082,830 | |||||
Suffolk County Water Authority, | 4.00 | 6/1/30 | 1,895,000 | 2,115,407 | |||||
Triborough Bridge and Tunnel Authority, | 5.00 | 11/15/23 | 1,000,000 | 1,219,650 | |||||
Triborough Bridge and Tunnel Authority, | 5.00 | 11/15/30 | 1,645,000 | 1,948,091 | |||||
TSASC, Inc. of New York, | 5.00 | 6/1/22 | 1,000,000 | 1,141,600 | |||||
Utility Debt Securitization Authority of New York, | 5.00 | 6/15/26 | 2,000,000 | 2,440,400 | |||||
Westchester County Health Care Corporation, | 5.00 | 11/1/20 | 1,400,000 | 1,556,002 | |||||
Westchester County Health Care Corporation, | 5.00 | 11/1/24 | 1,500,000 | 1,688,160 | |||||
Westchester County Local Development Corporation, | 5.00 | 11/1/28 | 1,000,000 | 1,158,900 | |||||
Yonkers, | 5.00 | 9/1/21 | 2,640,000 | 3,016,174 | |||||
Yonkers, | 5.00 | 11/15/26 | 1,000,000 | 1,230,520 | |||||
152,706,083 | |||||||||
U.S. Related - 2.3% | |||||||||
Guam, | 5.00 | 1/1/24 | 1,000,000 | 1,107,240 | |||||
Puerto Rico Commonwealth, | 5.50 | 7/1/19 | 2,500,000 | 2,640,875 | |||||
Puerto Rico Sales Tax Financing Corporation, | 0/6.25 | 8/1/33 | 500,000 | c | 98,430 | ||||
3,846,545 | |||||||||
Total Long-Term Municipal Investments | 162,663,629 | ||||||||
Short-Term Municipal Investments - 1.0% | |||||||||
New York - 1.0% | |||||||||
New York City, | 0.85 | 9/1/17 | 200,000 | d,e | 200,000 | ||||
New York City Municipal Water Finance Authority, | 0.83 | 9/1/17 | 100,000 | d,e | 100,000 | ||||
New York State Housing Finance Agency, | 0.85 | 9/1/17 | 300,000 | d,e | 300,000 | ||||
New York State Housing Finance Agency, | 0.85 | 9/1/17 | 1,100,000 | d,e | 1,100,000 | ||||
Total Short-Term Municipal Investments | 1,700,000 | ||||||||
Total Investments (cost $157,654,117) | 99.0% | 164,363,629 | |||||||
Cash and Receivables (Net) | 1.0% | 1,651,557 | |||||||
Net Assets | 100.0% | 166,015,186 | |||||||
a These securities are prerefunded; the date shown represents the prerefunded date. Bonds which are prerefunded are collateralized by U.S. Government securities which are held in escrow and are used to pay principal and interest on the municipal issue and to retire the bonds in full at the earliest refunding date.
b Security exempt from registration pursuant to Rule 144A under the Securities Act of 1933. These securities may be resold in transactions exempt from registration, normally to qualified institutional buyers. At August 31, 2017, these securities were valued at $3,286,575 or 1.98% of net assets.
c Zero coupon until a specified date at which time the stated coupon rate becomes effective until maturity.
d Variable rate demand note—rate shown is the interest rate in effect at August 31, 2017. Maturity date represents the next demand date, or the ultimate maturity date if earlier.
e The Variable Rate shall be determined by the Remarketing Agent in its sole discretion based on prevailing market conditions and may, but need not, be established by reference to one or more financial indices.
63
STATEMENT OF INVESTMENTS (continued)
Portfolio Summary (Unaudited) † | Value (%) |
Education | 20.2 |
Transportation Services | 16.4 |
Special Tax | 13.4 |
Health Care | 8.1 |
County | 7.9 |
City | 6.1 |
Industrial | 4.6 |
Utility-Water and Sewer | 4.3 |
Utility-Electric | 3.7 |
Lease | .8 |
Housing | .7 |
Prerefunded | .6 |
Multi Family Housing | .2 |
Other | 12.0 |
99.0 |
† Based on net assets.
See notes to financial statements.
64
BNY Mellon Municipal Opportunities Fund | |||||||||
Description | Coupon | Maturity | Principal | Value ($) | |||||
Long-Term Municipal Investments - 100.8% | |||||||||
Alabama - .6% | |||||||||
Lower Alabama Gas District, | 5.00 | 9/1/46 | 5,170,000 | 6,423,053 | |||||
Tuscaloosa Public Educational Building Authority, | 6.75 | 7/1/18 | 1,100,000 | a | 1,154,615 | ||||
7,577,668 | |||||||||
Arizona - .9% | |||||||||
Arizona Board of Regents, | 6.00 | 7/1/18 | 750,000 | a | 781,350 | ||||
Arizona Health Facilities Authority, | 5.00 | 2/1/42 | 6,000,000 | 6,405,660 | |||||
Salt River Project Agricultural Improvement and Power District, | 5.00 | 1/1/38 | 1,130,000 | 1,355,503 | |||||
University Medical Center Corporation, | 6.00 | 7/1/21 | 2,500,000 | a | 2,960,600 | ||||
11,503,113 | |||||||||
Arkansas - .5% | |||||||||
University of Arkansas, | 5.00 | 11/1/42 | 5,990,000 | 7,107,914 | |||||
California - 18.6% | |||||||||
Alameda Corridor Transportation Authority, | 5.00 | 10/1/35 | 2,500,000 | 2,892,750 | |||||
Alameda Corridor Transportation Authority, | 4.00 | 10/1/35 | 1,500,000 | 1,613,520 | |||||
Alameda Corridor Transportation Authority, | 5.00 | 10/1/36 | 1,000,000 | 1,171,840 | |||||
Alameda Corridor Transportation Authority, | 4.00 | 10/1/37 | 1,000,000 | 1,069,120 | |||||
Alameda Corridor Transportation Authority, | 5.00 | 10/1/37 | 1,325,000 | 1,550,382 | |||||
Anaheim Public Financing Authority, | 5.00 | 5/1/46 | 2,000,000 | 2,318,520 | |||||
Bay Area Toll Authority, | 4.00 | 4/1/47 | 5,000,000 | 5,285,450 | |||||
California, | 5.50 | 3/1/40 | 7,950,000 | 8,798,503 | |||||
California, | 5.00 | 9/1/46 | 4,430,000 | 5,204,453 | |||||
California, | 5.00 | 11/1/47 | 7,000,000 | 8,303,050 | |||||
California Communities Development Authority, | 4.00 | 4/1/42 | 1,600,000 | 1,646,160 | |||||
California Communities Development Authority, | 4.00 | 4/1/47 | 1,500,000 | 1,537,080 | |||||
California Communities Development Authority, | 5.00 | 4/1/47 | 1,500,000 | 1,715,700 | |||||
California Education Facilities Authority, | 5.00 | 4/1/42 | 2,000,000 | 2,289,720 | |||||
California Education Facilities Authority, | 5.00 | 4/1/47 | 2,500,000 | 2,848,875 | |||||
California Health Facilities Financing Authority, | 5.00 | 8/15/47 | 1,000,000 | 1,129,480 | |||||
California Health Facilities Financing Authority, | 4.00 | 11/1/44 | 17,000,000 | 17,914,770 | |||||
California Health Facilities Financing Authority, | 5.00 | 7/1/37 | 590,000 | b | 677,355 | ||||
California Health Facilities Financing Authority, | 5.00 | 7/1/47 | 870,000 | b | 985,484 | ||||
65
STATEMENT OF INVESTMENTS (continued)
BNY Mellon Municipal Opportunities Fund (continued) | |||||||||
Description | Coupon | Maturity | Principal | Value ($) | |||||
Long-Term Municipal Investments - 100.8% (continued) | |||||||||
California - 18.6% (continued) | |||||||||
California Health Facilities Financing Authority, | 5.00 | 11/15/56 | 7,500,000 | 8,715,900 | |||||
California Health Facilities Financing Authority, | 6.50 | 10/1/18 | 10,000 | a | 10,622 | ||||
California Health Facilities Financing Authority, | 5.00 | 7/1/37 | 2,270,000 | 2,586,756 | |||||
California Health Facilities Financing Authority, | 4.00 | 11/15/48 | 5,000,000 | 5,254,750 | |||||
California Infrastructure and Economic Development Bank, | 5.25 | 10/1/34 | 900,000 | 1,021,797 | |||||
California Municipal Finance Authority, | 5.00 | 2/1/42 | 1,000,000 | 1,135,740 | |||||
California Municipal Finance Authority, | 6.00 | 1/1/42 | 6,000,000 | 6,875,700 | |||||
California Municipal Finance Authority, | 5.25 | 11/1/41 | 1,200,000 | 1,376,580 | |||||
California Municipal Finance Authority, | 5.00 | 11/1/47 | 2,000,000 | 2,226,380 | |||||
California Municipal Finance Authority, | 5.25 | 11/1/47 | 700,000 | 795,760 | |||||
California Municipal Finance Authority, | 6.50 | 11/1/31 | 300,000 | 355,614 | |||||
California Municipal Finance Authority, | 5.00 | 6/1/35 | 600,000 | 652,104 | |||||
California Municipal Finance Authority, | 5.00 | 6/1/50 | 2,750,000 | 2,946,680 | |||||
California Pollution Control Financing Authority, | 5.00 | 11/21/45 | 6,000,000 | b | 6,011,760 | ||||
California State Public Works Board, | 5.00 | 12/1/31 | 2,000,000 | 2,271,220 | |||||
California State University Trustees, | 4.00 | 11/1/45 | 500,000 | 531,215 | |||||
California Statewide Communities Development Authority, | 6.75 | 8/1/19 | 2,230,000 | a | 2,480,251 | ||||
California Statewide Communities Development Authority, | 2.63 | 12/1/23 | 3,000,000 | 3,131,310 | |||||
California Statewide Communities Development Authority, | 5.00 | 12/1/36 | 2,500,000 | b | 2,750,725 | ||||
California Statewide Communities Development Authority, | 5.00 | 12/1/41 | 2,500,000 | b | 2,731,125 | ||||
California Statewide Communities Development Authority, | 5.25 | 12/1/44 | 2,000,000 | 2,179,500 | |||||
California Statewide Communities Development Authority, | 5.00 | 12/1/46 | 3,500,000 | b | 3,809,960 | ||||
California Statewide Communities Development Authority, | 6.00 | 8/15/42 | 6,000,000 | 6,803,760 | |||||
California Statewide Communities Development Authority, | 5.00 | 5/15/40 | 2,000,000 | 2,294,480 | |||||
California Statewide Communities Development Authority, | 5.38 | 5/15/38 | 1,900,000 | 2,121,027 | |||||
Capistrano Unified School District Community Facilities District Number 90-2, | 5.00 | 9/1/32 | 4,000,000 | 4,638,520 | |||||
Foothill Eastern Transportation Corridor Agency, | 3.95 | 1/15/53 | 1,250,000 | 1,260,088 | |||||
Galt Redevelopment Agency, | 7.38 | 9/1/33 | 2,000,000 | 2,397,620 | |||||
Golden State Tobacco Securitization Corporation, | 5.00 | 6/1/27 | 3,000,000 | 3,626,340 | |||||
Golden State Tobacco Securitization Corporation, | 5.00 | 6/1/28 | 3,000,000 | 3,590,970 | |||||
Golden State Tobacco Securitization Corporation, | 5.00 | 6/1/29 | 3,000,000 | 3,559,890 | |||||
66
BNY Mellon Municipal Opportunities Fund (continued) | |||||||||
Description | Coupon | Maturity | Principal | Value ($) | |||||
Long-Term Municipal Investments - 100.8% (continued) | |||||||||
California - 18.6% (continued) | |||||||||
Grant Joint Union High School District, | 0.00 | 8/1/29 | 2,080,000 | c | 1,461,970 | ||||
Grant Joint Union High School District, | 0.00 | 2/1/33 | 4,380,000 | c | 2,584,945 | ||||
Irvine Reassessment District Number 12-1, | 4.00 | 9/2/29 | 1,000,000 | 1,062,050 | |||||
Long Beach, | 5.00 | 5/15/40 | 2,500,000 | 2,763,675 | |||||
Long Beach, | 5.00 | 5/15/45 | 2,000,000 | 2,199,560 | |||||
Los Angeles County Public Works Financing Authority, | 5.00 | 12/1/34 | 1,000,000 | 1,183,720 | |||||
Los Angeles County Public Works Financing Authority, | 5.00 | 12/1/39 | 1,000,000 | 1,174,940 | |||||
New Haven Unified School District, | 0.00 | 8/1/32 | 2,500,000 | c | 1,534,725 | ||||
Northern California Gas Authority Number 1, | 1.59 | 7/1/27 | 660,000 | d | 633,336 | ||||
Palomar Health, | 5.00 | 11/1/39 | 1,000,000 | 1,117,540 | |||||
Riverside County Transportation Commission, | 5.25 | 6/1/30 | 2,000,000 | 2,387,020 | |||||
Riverside County Transportation Commission, | 5.25 | 6/1/31 | 2,000,000 | 2,377,660 | |||||
Riverside County Transportation Commission, | 5.25 | 6/1/33 | 3,500,000 | 4,139,905 | |||||
Riverside County Transportation Commission, | 5.75 | 6/1/44 | 2,000,000 | 2,273,680 | |||||
Riverside County Transportation Commission, | 5.75 | 6/1/48 | 5,000,000 | 5,678,000 | |||||
San Diego County Regional Airport Authority, | 5.00 | 7/1/42 | 1,000,000 | 1,162,710 | |||||
San Diego Unified School District, | 0.00 | 7/1/25 | 4,000,000 | c | 3,406,840 | ||||
San Diego Unified School District, | 4.00 | 7/1/35 | 2,205,000 | 2,377,012 | |||||
San Francisco City and County Redevelopment Agency Community Facilities District Number 6, | 0.00 | 8/1/38 | 2,000,000 | c | 664,180 | ||||
San Francisco City and County Redevelopment Agency Community Facilities District Number 6, | 0.00 | 8/1/43 | 7,835,000 | c | 1,922,396 | ||||
San Francisco City and County Redevelopment Financing Authority, | 6.63 | 8/1/41 | 1,250,000 | 1,469,075 | |||||
San Joaquin Hills Transportation Corridor Agency, | 5.00 | 1/15/50 | 5,000,000 | 5,512,800 | |||||
San Jose Airport, | 5.00 | 3/1/47 | 1,500,000 | 1,728,975 | |||||
Sierra Joint Community College District School Facilities Improvement District #2, | 0.00 | 8/1/30 | 3,020,000 | c | 2,061,210 | ||||
Sierra Joint Community College District School Facilities Improvement District #2, | 0.00 | 8/1/31 | 5,330,000 | c | 3,478,571 | ||||
South Bayside Waste Management Authority, | 6.00 | 9/1/36 | 1,000,000 | 1,093,390 | |||||
Tender Option Bond Trust Receipts (Series 2016-XM0427) Non-recourse, | 5.25 | 5/15/18 | 10,000,000 | b,e | 11,155,400 | ||||
University of California Regents, | 5.00 | 5/15/37 | 14,605,000 | 16,692,201 | |||||
244,393,842 | |||||||||
67
STATEMENT OF INVESTMENTS (continued)
BNY Mellon Municipal Opportunities Fund (continued) | |||||||||
Description | Coupon | Maturity | Principal | Value ($) | |||||
Long-Term Municipal Investments - 100.8% (continued) | |||||||||
Colorado - .3% | |||||||||
City and County of Denver, | 5.25 | 11/15/19 | 1,000,000 | 1,008,870 | |||||
Colorado Health Facilities Authority, | 5.00 | 6/1/47 | 2,500,000 | 2,760,200 | |||||
Colorado Health Facilities Authority, | 6.00 | 10/1/23 | 500,000 | 526,545 | |||||
4,295,615 | |||||||||
Delaware - 1.1% | |||||||||
Tender Option Bond Trust Receipts (Series 2016-XM0431) Non-recourse, | 5.00 | 5/1/21 | 12,230,000 | b,e | 14,016,550 | ||||
District of Columbia - .9% | |||||||||
District of Columbia, | 5.00 | 6/1/32 | 3,500,000 | 3,754,800 | |||||
District of Columbia, | 6.00 | 7/1/33 | 1,100,000 | 1,290,124 | |||||
District of Columbia, | 6.00 | 7/1/43 | 1,700,000 | 1,973,938 | |||||
District of Columbia, | 6.00 | 7/1/48 | 1,450,000 | 1,679,448 | |||||
Metropolitan Washington Airports Authority, | 0.00 | 10/1/36 | 6,275,000 | c | 3,107,631 | ||||
11,805,941 | |||||||||
Florida - 3.8% | |||||||||
Brevard County Health Facilities Authority, | 7.00 | 4/1/19 | 1,675,000 | a | 1,836,369 | ||||
Collier County Health Facilities Authority, | 5.00 | 5/1/45 | 2,500,000 | 2,791,075 | |||||
Higher Educational Facilities Financing Authority, | 5.25 | 4/1/42 | 1,100,000 | 1,234,255 | |||||
Jacksonville, | 5.00 | 10/1/30 | 750,000 | 852,593 | |||||
Miami Beach Redevelopment Agency, | 5.00 | 2/1/40 | 7,545,000 | 8,575,270 | |||||
Miami-Dade County, | 5.50 | 10/1/41 | 1,200,000 | 1,332,000 | |||||
Miami-Dade County, | 5.50 | 10/1/42 | 14,145,000 | 16,577,940 | |||||
Miami-Dade County Expressway Authority, | 5.00 | 7/1/40 | 1,050,000 | 1,147,566 | |||||
Miami-Dade County Health Facilities Authority, | 4.00 | 8/1/42 | 2,650,000 | 2,748,898 | |||||
Miami-Dade County Health Facilities Authority, | 5.00 | 8/1/42 | 4,000,000 | 4,600,240 | |||||
Miami-Dade County Health Facilities Authority, | 5.00 | 8/1/47 | 1,125,000 | 1,287,653 | |||||
Orange County Health Facilities Authority, | 5.00 | 10/1/42 | 5,000,000 | 5,438,550 | |||||
Sarasota County Public Hospital District, | 5.63 | 7/1/39 | 2,000,000 | 2,124,960 | |||||
50,547,369 | |||||||||
Georgia - .8% | |||||||||
Atlanta Development Authority, | 5.25 | 7/1/44 | 1,500,000 | 1,746,510 | |||||
Atlanta Development Authority Senior Health Care Facilities, | 6.75 | 1/1/35 | 5,000,000 | 5,210,450 | |||||
Atlanta Development Authority Senior Health Care Facilities, | 7.00 | 1/1/40 | 2,500,000 | 2,627,275 | |||||
68
BNY Mellon Municipal Opportunities Fund (continued) | |||||||||
Description | Coupon | Maturity | Principal | Value ($) | |||||
Long-Term Municipal Investments - 100.8% (continued) | |||||||||
Georgia - .8% (continued) | |||||||||
Burke County Development Authority, | 7.00 | 1/1/23 | 1,000,000 | 1,020,030 | |||||
10,604,265 | |||||||||
Hawaii - 3.0% | |||||||||
Hawaii Department of Budget and Finance, | 6.50 | 7/1/39 | 6,000,000 | 6,489,420 | |||||
Hawaii Department of Budget and Finance, | 5.00 | 7/1/35 | 7,000,000 | 8,070,860 | |||||
Hawaii Department of Budget and Finance, | 5.13 | 11/15/32 | 1,000,000 | 1,103,190 | |||||
Hawaii Department of Budget and Finance, | 5.25 | 11/15/37 | 1,000,000 | 1,100,050 | |||||
Tender Option Bond Trust Receipts (Series 2016-XM0429) Non-recourse, | 5.00 | 12/1/19 | 20,000,000 | b,e | 23,244,555 | ||||
40,008,075 | |||||||||
Idaho - .3% | |||||||||
Idaho Health Facilities Authority, | 5.00 | 12/1/32 | 3,900,000 | 4,395,456 | |||||
Illinois - 13.2% | |||||||||
Board of Education of Chicago Unlimited Tax, | 6.75 | 12/1/30 | 7,500,000 | b | 8,791,950 | ||||
Board of Education of Chicago Unlimited Tax, | 7.00 | 12/1/42 | 10,000,000 | b | 11,772,600 | ||||
Board of Education of Chicago Unlimited Tax, | 7.00 | 12/1/46 | 5,000,000 | b | 5,873,000 | ||||
Chicago, | 5.50 | 1/1/43 | 4,000,000 | 4,565,480 | |||||
Chicago, | 5.00 | 1/1/31 | 15,000,000 | 17,552,700 | |||||
Chicago, | 5.00 | 1/1/41 | 6,800,000 | 7,779,744 | |||||
Chicago, | 6.50 | 1/1/21 | 5,000,000 | a | 5,890,250 | ||||
Chicago, | 5.50 | 1/1/40 | 5,000,000 | 5,406,300 | |||||
Chicago, | 5.50 | 1/1/42 | 1,750,000 | 1,889,912 | |||||
Chicago, | 5.50 | 1/1/42 | 1,250,000 | 1,349,937 | |||||
Chicago, | 7.75 | 1/1/42 | 7,480,000 | 8,094,033 | |||||
Chicago, | 5.00 | 1/1/35 | 5,000,000 | 5,248,500 | |||||
Chicago Board of Education, | 6.00 | 4/1/46 | 1,500,000 | 1,745,895 | |||||
Chicago Board of Education, | 6.50 | 12/1/46 | 4,500,000 | 5,058,450 | |||||
Chicago Board of Education, | 5.25 | 12/1/39 | 8,500,000 | 8,477,135 | |||||
Chicago Board of Education, | 7.00 | 12/1/44 | 2,500,000 | 2,867,125 | |||||
Chicago O'Hare International Airport, | 5.75 | 1/1/39 | 415,000 | 471,257 | |||||
Chicago O'Hare International Airport, | 5.75 | 1/1/21 | 2,085,000 | a | 2,405,131 | ||||
Chicago O'Hare International Airport, | 5.00 | 1/1/32 | 10,000,000 | 11,665,300 | |||||
Chicago Transit Authority, | 5.00 | 12/1/51 | 9,000,000 | 9,975,600 | |||||
Illinois, | 5.50 | 7/1/33 | 2,500,000 | 2,710,825 | |||||
69
STATEMENT OF INVESTMENTS (continued)
BNY Mellon Municipal Opportunities Fund (continued) | |||||||||
Description | Coupon | Maturity | Principal | Value ($) | |||||
Long-Term Municipal Investments - 100.8% (continued) | |||||||||
Illinois - 13.2% (continued) | |||||||||
Illinois, | 5.50 | 7/1/38 | 12,500,000 | 13,513,500 | |||||
Illinois, | 5.00 | 2/1/39 | 5,000,000 | 5,182,900 | |||||
Illinois Finance Authority, | 6.25 | 10/1/33 | 2,760,000 | 3,040,195 | |||||
Illinois Finance Authority, | 5.25 | 5/15/47 | 4,250,000 | 4,449,877 | |||||
Illinois Finance Authority, | 5.00 | 5/15/37 | 3,000,000 | 3,206,040 | |||||
Illinois Finance Authority, | 5.63 | 5/15/42 | 3,000,000 | 3,135,660 | |||||
Illinois Finance Authority, | 5.50 | 7/1/28 | 1,560,000 | 1,805,638 | |||||
Illinois Finance Authority, | 6.50 | 7/1/34 | 2,140,000 | 2,224,573 | |||||
Illinois Finance Authority, | 6.00 | 7/1/43 | 5,000,000 | 5,776,750 | |||||
Illinois Finance Authority, | 6.00 | 3/1/19 | 1,000,000 | a | 1,076,710 | ||||
173,002,967 | |||||||||
Indiana - .8% | |||||||||
Allen County, | 6.75 | 1/15/43 | 750,000 | b | 794,498 | ||||
Allen County, | 6.88 | 1/15/52 | 1,250,000 | b | 1,323,838 | ||||
Indiana Finance Authority, | 5.25 | 2/1/35 | 5,000,000 | 5,922,800 | |||||
Indiana Finance Authority, | 5.25 | 9/1/40 | 2,000,000 | 2,101,880 | |||||
10,143,016 | |||||||||
Kentucky - .3% | |||||||||
Kentucky Public Transportation Infrastructure Authority, | 5.75 | 7/1/49 | 3,000,000 | 3,372,570 | |||||
Kentucky State Property and Buildings Commission, | 5.38 | 11/1/23 | 165,000 | 173,613 | |||||
3,546,183 | |||||||||
Louisiana - .9% | |||||||||
Jefferson Parish Hospital Service District Number 2, | 6.25 | 7/1/31 | 5,000,000 | 5,351,800 | |||||
Louisiana Public Facilities Authority, | 6.00 | 7/1/29 | 1,000,000 | 1,086,100 | |||||
Louisiana Public Facilities Authority, | 0/5.70 | 10/1/46 | 2,500,000 | f | 2,089,725 | ||||
New Orleans, | 5.00 | 12/1/34 | 500,000 | 571,350 | |||||
New Orleans Aviation Board, | 6.00 | 1/1/19 | 2,000,000 | a | 2,136,520 | ||||
11,235,495 | |||||||||
Maine - .6% | |||||||||
Maine Health and Higher Educational Facilities Authority, | 6.00 | 7/1/26 | 825,000 | 896,800 | |||||
Maine Health and Higher Educational Facilities Authority, | 6.75 | 7/1/41 | 2,725,000 | 2,978,561 | |||||
Maine Health and Higher Educational Facilities Authority, | 7.00 | 7/1/41 | 4,240,000 | 4,671,759 | |||||
8,547,120 | |||||||||
Maryland - 2.1% | |||||||||
Maryland, | 4.00 | 3/15/25 | 20,000,000 | 21,460,600 | |||||
Maryland Economic Development Corporation, | 5.75 | 6/1/35 | 3,500,000 | 3,754,450 | |||||
Maryland Health and Higher Educational Facilities Authority, | 6.75 | 7/1/19 | 2,000,000 | a | 2,214,960 | ||||
Maryland Health and Higher Educational Facilities Authority, | 5.13 | 7/1/19 | 250,000 | a | 269,540 | ||||
27,699,550 | |||||||||
70
BNY Mellon Municipal Opportunities Fund (continued) | |||||||||
Description | Coupon | Maturity | Principal | Value ($) | |||||
Long-Term Municipal Investments - 100.8% (continued) | |||||||||
Massachusetts - 5.7% | |||||||||
Massachusetts Development Finance Agency, | 5.25 | 11/15/41 | 4,370,000 | 4,943,912 | |||||
Massachusetts Development Finance Agency, | 5.00 | 7/1/40 | 5,500,000 | 6,338,585 | |||||
Massachusetts Development Finance Agency, | 5.00 | 10/1/39 | 5,000,000 | 5,815,750 | |||||
Massachusetts Development Finance Agency, | 5.00 | 12/1/41 | 3,000,000 | 3,463,050 | |||||
Massachusetts Development Finance Agency, | 5.25 | 1/1/42 | 5,500,000 | 6,345,680 | |||||
Massachusetts Development Finance Agency, | 5.00 | 10/1/43 | 4,260,000 | 4,767,494 | |||||
Massachusetts Development Finance Agency, | 5.00 | 4/15/40 | 1,500,000 | 1,618,080 | |||||
Massachusetts Development Finance Agency, | 5.00 | 10/1/36 | 2,115,000 | 2,416,578 | |||||
Massachusetts Development Finance Agency, | 7.25 | 1/1/32 | 3,090,000 | 3,600,684 | |||||
Massachusetts Development Finance Agency, | 6.75 | 1/1/36 | 1,165,000 | 1,328,368 | |||||
Massachusetts Development Finance Agency, | 6.88 | 1/1/41 | 1,000,000 | 1,141,800 | |||||
Massachusetts Development Finance Agency, | 5.00 | 10/1/46 | 2,015,000 | 2,271,792 | |||||
Massachusetts Development Finance Agency, | 5.00 | 1/1/40 | 1,000,000 | 1,149,230 | |||||
Massachusetts Health and Educational Facilities Authority, | 7.50 | 10/1/18 | 205,000 | a | 219,621 | ||||
Massachusetts Health and Educational Facilities Authority, | 7.50 | 10/1/18 | 295,000 | a | 316,039 | ||||
Massachusetts Water Pollution Abatement Trust, | 5.75 | 8/1/29 | 50,000 | 50,195 | |||||
Tender Option Bond Trust Receipts (Series 2016-XM0428) Non-recourse, | 5.00 | 4/1/19 | 15,000,000 | b,e | 17,118,150 | ||||
Tender Option Bond Trust Receipts (Series 2016-XM0430) Non-recourse, | 5.00 | 8/15/20 | 10,000,000 | b,e | 11,697,482 | ||||
74,602,490 | |||||||||
Michigan - 1.5% | |||||||||
Michigan Building Authority, | 5.38 | 10/15/41 | 3,000,000 | 3,412,560 | |||||
Michigan Finance Authority, | 5.00 | 8/1/32 | 2,000,000 | 2,278,940 | |||||
Michigan Finance Authority, | 5.00 | 12/1/38 | 6,475,000 | 7,213,927 | |||||
Michigan Finance Authority, | 5.00 | 5/1/25 | 1,250,000 | 1,495,712 | |||||
Wayne County Building Authority, | 10.00 | 12/1/40 | 5,000,000 | 5,925,350 | |||||
20,326,489 | |||||||||
Minnesota - 2.3% | |||||||||
Tender Option Bond Trust Receipts (Series 2016-XM0425) Non-recourse, | 5.00 | 8/1/18 | 17,125,000 | b,e | 19,113,536 | ||||
Tender Option Bond Trust Receipts (Series 2016-XM0426) Non-recourse, | 5.00 | 8/1/18 | 10,000,000 | b,e | 11,163,700 | ||||
30,277,236 | |||||||||
Mississippi - .3% | |||||||||
Mississippi Development Bank, | 6.88 | 12/1/40 | 1,625,000 | 2,089,181 | |||||
71
STATEMENT OF INVESTMENTS (continued)
BNY Mellon Municipal Opportunities Fund (continued) | |||||||||
Description | Coupon | Maturity | Principal | Value ($) | |||||
Long-Term Municipal Investments - 100.8% (continued) | |||||||||
Mississippi - .3% (continued) | |||||||||
Warren County, | 5.80 | 5/1/34 | 1,500,000 | 1,651,575 | |||||
3,740,756 | |||||||||
Missouri - .1% | |||||||||
Stoddard County Industrial Development Authority, | 4.25 | 3/1/42 | 1,000,000 | 1,003,880 | |||||
New Hampshire - .9% | |||||||||
New Hampshire Business Finance Authority, | 1.91 | 5/1/21 | 12,250,000 | g | 12,188,750 | ||||
New Jersey - 2.8% | |||||||||
New Jersey, | 5.25 | 6/15/19 | 1,000,000 | a | 1,077,020 | ||||
New Jersey Economic Development Authority, | 5.00 | 6/15/26 | 2,500,000 | 2,714,325 | |||||
New Jersey Economic Development Authority, | 5.13 | 1/1/34 | 5,325,000 | 5,806,167 | |||||
New Jersey Economic Development Authority, | 5.38 | 1/1/43 | 5,500,000 | 6,154,225 | |||||
New Jersey Economic Development Authority, | 5.00 | 6/15/29 | 13,000,000 | 14,584,180 | |||||
New Jersey Health Care Facilities Financing Authority, | 6.25 | 7/1/35 | 1,500,000 | 1,646,520 | |||||
New Jersey Transportation Trust Fund Authority, | 5.00 | 6/15/30 | 1,500,000 | 1,651,875 | |||||
New Jersey Transportation Trust Fund Authority, | 5.00 | 6/15/31 | 3,000,000 | 3,069,300 | |||||
36,703,612 | |||||||||
New York - 8.2% | |||||||||
Brooklyn Arena Local Development Corporation, | 6.00 | 1/15/20 | 9,500,000 | a | 10,650,830 | ||||
Brooklyn Arena Local Development Corporation, | 6.25 | 1/15/20 | 6,000,000 | a | 6,762,000 | ||||
Hudson Yards Infrastructure Corporation, | 5.75 | 2/15/47 | 2,020,000 | 2,325,646 | |||||
Hudson Yards Infrastructure Corporation, | 5.75 | 2/15/21 | 2,980,000 | a | 3,455,727 | ||||
Metropolitan Transportation Authority, | 6.50 | 11/15/28 | 140,000 | 149,727 | |||||
Metropolitan Transportation Authority, | 6.50 | 11/15/18 | 55,000 | a | 58,812 | ||||
Metropolitan Transportation Authority Hudson Rail Yards Trust, | 5.00 | 11/15/56 | 5,000,000 | 5,664,200 | |||||
New York City, | 6.00 | 10/15/23 | 245,000 | 259,563 | |||||
New York City, | 5.00 | 12/1/34 | 2,000,000 | 2,397,780 | |||||
New York City, | 5.00 | 12/1/35 | 2,000,000 | 2,388,680 | |||||
New York City, | 5.00 | 12/1/37 | 3,150,000 | 3,739,396 | |||||
New York City, | 5.00 | 12/1/41 | 4,000,000 | 4,691,240 | |||||
New York City, | 6.00 | 10/15/18 | 255,000 | a | 269,984 | ||||
New York City Industrial Development Agency, | 6.50 | 1/1/46 | 325,000 | 348,657 | |||||
New York City Industrial Development Agency, | 7.00 | 3/1/49 | 1,300,000 | 1,417,455 | |||||
72
BNY Mellon Municipal Opportunities Fund (continued) | |||||||||
Description | Coupon | Maturity | Principal | Value ($) | |||||
Long-Term Municipal Investments - 100.8% (continued) | |||||||||
New York - 8.2% (continued) | |||||||||
New York City Industrial Development Agency, | 2.52 | 3/1/20 | 6,100,000 | d | 6,126,962 | ||||
New York City Municipal Water Finance Authority, | 5.75 | 6/15/40 | 10,840,000 | 11,275,768 | |||||
New York City Municipal Water Finance Authority, | 5.75 | 6/15/18 | 3,250,000 | a | 3,378,862 | ||||
New York Counties Tobacco Trust VI, | 5.00 | 6/1/51 | 4,585,000 | 4,733,600 | |||||
New York Liberty Development Corporation, | 5.75 | 11/15/51 | 5,000,000 | 5,825,050 | |||||
New York Liberty Development Corporation, | 5.00 | 3/15/44 | 2,000,000 | 2,187,180 | |||||
New York Liberty Development Corporation, | 5.00 | 11/15/44 | 10,000,000 | b | 10,895,000 | ||||
New York State Dormitory Authority, | 5.00 | 5/1/38 | 500,000 | 539,560 | |||||
New York State Environmental Facilities Corporation, | 1.18 | 11/1/17 | 3,000,000 | 3,000,000 | |||||
Port Authority of New York and New Jersey, | 6.00 | 12/1/42 | 5,000,000 | 5,600,950 | |||||
Triborough Bridge and Tunnel Authority, | 0.00 | 11/15/27 | 2,000,000 | c | 1,555,420 | ||||
Triborough Bridge and Tunnel Authority, | 0.00 | 11/15/28 | 4,715,000 | c | 3,509,516 | ||||
Triborough Bridge and Tunnel Authority, | 0.00 | 11/15/31 | 5,000,000 | c | 3,266,250 | ||||
Triborough Bridge and Tunnel Authority, | 0.00 | 11/15/32 | 3,000,000 | c | 1,886,670 | ||||
108,360,485 | |||||||||
North Carolina - .7% | |||||||||
North Carolina Eastern Municipal Power Agency, | 6.00 | 1/1/19 | 105,000 | 109,216 | |||||
North Carolina Medical Care Commission, | 5.00 | 10/1/33 | 1,550,000 | 1,859,798 | |||||
North Carolina Medical Care Commission, | 5.00 | 10/1/34 | 1,000,000 | 1,194,990 | |||||
North Carolina Medical Care Commission, | 5.00 | 10/1/35 | 1,000,000 | 1,191,110 | |||||
North Carolina Turnpike Authority, | 5.00 | 7/1/47 | 4,000,000 | 4,442,720 | |||||
8,797,834 | |||||||||
Ohio - 1.0% | |||||||||
Butler County, | 6.38 | 1/15/43 | 1,500,000 | b | 1,550,610 | ||||
Cuyahoga County Hospital, | 5.00 | 2/15/57 | 2,000,000 | 2,126,920 | |||||
Montgomery County, | 6.25 | 10/1/33 | 1,115,000 | 1,168,843 | |||||
Ohio, | 5.00 | 12/31/35 | 3,000,000 | 3,373,620 | |||||
Ohio, | 5.00 | 12/31/39 | 2,000,000 | 2,232,920 | |||||
Ohio Turnpike and Infrastructure Commission, | 0/5.70 | 2/15/34 | 3,000,000 | f | 2,940,990 | ||||
13,393,903 | |||||||||
Pennsylvania - 1.0% | |||||||||
Beaver County Industrial Development Authority, | 4.38 | 7/1/22 | 2,500,000 | 2,461,800 | |||||
Chester County Health and Education Facilities Authority Health System, | 4.00 | 10/1/42 | 2,000,000 | 2,101,660 | |||||
73
STATEMENT OF INVESTMENTS (continued)
BNY Mellon Municipal Opportunities Fund (continued) | |||||||||
Description | Coupon | Maturity | Principal | Value ($) | |||||
Long-Term Municipal Investments - 100.8% (continued) | |||||||||
Pennsylvania - 1.0% (continued) | |||||||||
Pennsylvania Economic Development Financing Authority, | 5.00 | 12/1/43 | 4,425,000 | 4,888,873 | |||||
Pennsylvania Higher Educational Facilities Authority, | 5.00 | 7/1/32 | 1,000,000 | 1,099,720 | |||||
Pennsylvania Higher Educational Facilities Authority, | 5.75 | 8/15/21 | 2,550,000 | a | 3,016,446 | ||||
13,568,499 | |||||||||
Rhode Island - .6% | |||||||||
Rhode Island Health and Educational Building Corporation, | 5.00 | 11/1/45 | 7,000,000 | 7,909,650 | |||||
South Carolina - .7% | |||||||||
South Carolina Public Service Authority, | 5.00 | 12/1/36 | 2,000,000 | 2,277,660 | |||||
Spartanburg South Carolina Waterworks, | 5.00 | 6/1/39 | 5,740,000 | 6,832,322 | |||||
9,109,982 | |||||||||
Texas - 17.0% | |||||||||
Arlington Higher Education Finance Corporation, | 5.00 | 12/1/36 | 1,315,000 | 1,448,893 | |||||
Arlington Higher Education Finance Corporation, | 5.00 | 12/1/46 | 1,100,000 | 1,198,043 | |||||
Austin, | 5.00 | 11/15/46 | 13,120,000 | 15,205,030 | |||||
Bexar County Health Facilities Development Corporation, | 5.00 | 7/15/41 | 1,750,000 | 1,912,347 | |||||
Bexar County Health Facilities Development Corporation, | 4.00 | 7/15/45 | 3,750,000 | 3,794,625 | |||||
Central Texas Regional Mobility Authority, | 5.00 | 1/1/40 | 7,300,000 | 8,279,514 | |||||
Central Texas Regional Mobility Authority, | 5.00 | 1/1/46 | 2,000,000 | 2,261,420 | |||||
Central Texas Regional Mobility Authority, | 6.00 | 1/1/21 | 5,000,000 | a | 5,803,200 | ||||
Clifton Higher Education Finance Corporation, | 5.00 | 8/15/32 | 2,745,000 | 2,984,144 | |||||
Clifton Higher Education Finance Corporation, | 6.00 | 8/15/33 | 1,500,000 | 1,765,200 | |||||
Clifton Higher Education Finance Corporation, | 5.00 | 8/15/42 | 6,135,000 | 6,581,996 | |||||
Clifton Higher Education Finance Corporation, | 6.00 | 8/15/43 | 2,770,000 | 3,251,260 | |||||
Clifton Higher Education Finance Corporation, | 5.50 | 8/15/21 | 1,250,000 | a | 1,457,037 | ||||
Clifton Higher Education Finance Corporation, | 5.75 | 8/15/21 | 1,000,000 | a | 1,175,260 | ||||
Clifton Higher Education Finance Corporation, | 5.00 | 12/1/45 | 3,855,000 | 4,152,066 | |||||
Clint Independent School District, | 5.00 | 8/15/45 | 5,000,000 | 5,760,300 | |||||
Dallas and Fort Worth, | 5.00 | 11/1/32 | 7,500,000 | 8,451,000 | |||||
El Paso Independent School District, | 5.00 | 8/15/42 | 6,000,000 | 7,023,540 | |||||
Grand Parkway Transportation Corporation, | 5.50 | 4/1/53 | 4,500,000 | 5,153,490 | |||||
Grand Parkway Transportation Corporation, | 0/5.20 | 10/1/31 | 2,000,000 | f | 1,922,620 | ||||
Grand Parkway Transportation Corporation, | 0/5.40 | 10/1/33 | 2,500,000 | f | 2,398,300 | ||||
74
BNY Mellon Municipal Opportunities Fund (continued) | |||||||||
Description | Coupon | Maturity | Principal | Value ($) | |||||
Long-Term Municipal Investments - 100.8% (continued) | |||||||||
Texas - 17.0% (continued) | |||||||||
Grand Parkway Transportation Corporation, | 0/5.45 | 10/1/34 | 2,235,000 | f | 2,136,325 | ||||
Harris County Health Facilities Development Corporation, | 7.00 | 12/1/18 | 1,000,000 | a | 1,077,140 | ||||
Houston, | 5.00 | 7/1/32 | 500,000 | 557,525 | |||||
Houston, | 2.44 | 7/1/30 | 9,825,000 | d | 9,137,250 | ||||
Houston, | 2.46 | 7/1/30 | 3,400,000 | d | 3,162,000 | ||||
Houston Higher Education Finance Corporation, | 6.50 | 5/15/21 | 1,530,000 | a | 1,831,349 | ||||
Houston Higher Education Finance Corporation, | 6.50 | 5/15/21 | 1,270,000 | a | 1,514,513 | ||||
Houston Higher Education Finance Corporation, | 5.88 | 5/15/21 | 500,000 | 542,525 | |||||
Houston Higher Education Finance Corporation, | 6.88 | 5/15/21 | 4,400,000 | a | 5,323,736 | ||||
Mission Economic Development Corporation, | 5.75 | 10/1/31 | 1,000,000 | b | 1,046,570 | ||||
Newark Higher Education Finance Corporation, | 5.50 | 8/15/35 | 750,000 | b | 765,953 | ||||
Newark Higher Education Finance Corporation, | 5.75 | 8/15/45 | 1,000,000 | b | 1,026,920 | ||||
North Texas Education Finance Corporation, | 4.88 | 12/1/32 | 1,630,000 | 1,714,092 | |||||
North Texas Tollway Authority, | 6.00 | 1/1/38 | 7,000,000 | 8,025,220 | |||||
North Texas Tollway Authority, | 5.50 | 9/1/41 | 20,000,000 | 23,280,800 | |||||
Pottsboro Higher Education Finance Corporation, | 5.00 | 8/15/46 | 1,000,000 | 1,014,620 | |||||
Schertz-Cibolo-Universal City Independent School District, | 4.00 | 2/1/46 | 4,000,000 | 4,264,800 | |||||
Texas Private Activity Bond Surface Transportation Corporation, | 5.00 | 12/31/45 | 1,000,000 | 1,103,760 | |||||
Texas Private Activity Bond Surface Transportation Corporation, | 7.00 | 6/30/40 | 11,175,000 | 12,683,401 | |||||
Texas Private Activity Bond Surface Transportation Corporation, | 7.00 | 12/31/38 | 10,000,000 | 11,603,100 | |||||
Texas Private Activity Bond Surface Transportation Corporation, | 6.75 | 6/30/43 | 5,000,000 | 5,800,750 | |||||
Texas Private Activity Bond Surface Transportation Corporation, | 7.50 | 12/31/31 | 2,500,000 | 2,821,950 | |||||
Texas Transportation Commission, | 5.00 | 8/15/37 | 15,950,000 | 18,088,895 | |||||
Texas Transportation Commission, | 5.00 | 8/15/41 | 6,000,000 | 6,730,680 | |||||
Ysleta Independent School District, | 5.00 | 8/15/47 | 5,000,000 | 5,833,050 | |||||
223,066,209 | |||||||||
Utah - 2.0% | |||||||||
Salt Lake City, | 5.00 | 7/1/42 | 1,000,000 | 1,178,510 | |||||
Salt Lake City, | 5.00 | 7/1/42 | 4,000,000 | 4,636,080 | |||||
75
STATEMENT OF INVESTMENTS (continued)
BNY Mellon Municipal Opportunities Fund (continued) | |||||||||
Description | Coupon | Maturity | Principal | Value ($) | |||||
Long-Term Municipal Investments - 100.8% (continued) | |||||||||
Utah - 2.0% (continued) | |||||||||
Salt Lake County, | 2.00 | 12/28/17 | 20,000,000 | 20,083,600 | |||||
25,898,190 | |||||||||
Vermont - .1% | |||||||||
Burlington, | 5.00 | 7/1/30 | 1,000,000 | 1,132,610 | |||||
Virginia - 2.2% | |||||||||
Chesapeake, | 0/4.87 | 7/15/40 | 2,000,000 | f | 1,658,060 | ||||
Virginia Small Business Financing Authority, | 5.00 | 1/1/40 | 12,395,000 | 13,442,006 | |||||
Virginia Small Business Financing Authority, | 5.00 | 1/1/40 | 7,510,000 | 8,142,192 | |||||
Virginia Small Business Financing Authority, | 5.25 | 1/1/32 | 4,000,000 | 4,428,520 | |||||
Virginia Small Business Financing Authority, | 6.00 | 1/1/37 | 1,665,000 | 1,896,951 | |||||
29,567,729 | |||||||||
Washington - .3% | |||||||||
Washington Economic Development Finance Authority, | 7.50 | 1/1/32 | 3,500,000 | b | 3,843,770 | ||||
Wisconsin - 1.2% | |||||||||
Oneida Tribe of Indians, | 6.50 | 2/1/31 | 1,325,000 | b | 1,436,008 | ||||
Public Finance Authority, | 5.00 | 12/1/27 | 2,000,000 | b | 2,101,560 | ||||
Wisconsin, | 5.75 | 5/1/19 | 130,000 | a | 140,654 | ||||
Wisconsin, | 5.75 | 5/1/19 | 1,370,000 | a | 1,482,271 | ||||
Wisconsin, | 6.00 | 5/1/19 | 930,000 | a | 1,010,054 | ||||
Wisconsin, | 6.00 | 5/1/19 | 70,000 | a | 76,026 | ||||
Wisconsin Center District, | 0.00 | 12/15/44 | 8,735,000 | c | 3,114,377 | ||||
Wisconsin Center District, | 0.00 | 12/15/46 | 3,990,000 | c | 1,312,670 | ||||
Wisconsin Health & Educational Facilities Authority, | 5.00 | 2/15/47 | 5,000,000 | 5,601,500 | |||||
16,275,120 | |||||||||
U.S. Related - 3.5% | |||||||||
A.B. Won International Airport Authority of Guam, | 6.25 | 10/1/34 | 1,000,000 | 1,132,730 | |||||
A.B. Won International Airport Authority of Guam, | 6.38 | 10/1/43 | 1,000,000 | 1,141,560 | |||||
A.B. Won International Airport Authority of Guam, | 6.00 | 10/1/34 | 2,000,000 | 2,350,760 | |||||
A.B. Won International Airport Authority of Guam, | 6.13 | 10/1/43 | 2,000,000 | 2,354,840 | |||||
Guam, | 6.00 | 11/1/26 | 2,500,000 | 2,858,275 | |||||
Guam, | 6.13 | 11/1/31 | 5,000,000 | 5,702,700 | |||||
Guam, | 6.50 | 11/1/40 | 2,000,000 | 2,302,040 | |||||
Guam, | 5.00 | 12/1/46 | 1,500,000 | 1,651,485 | |||||
Guam Government Department of Education, | 6.63 | 12/1/30 | 1,000,000 | 1,048,090 | |||||
Puerto Rico Commonwealth, | 8.00 | 7/1/35 | 5,000,000 | h | 2,893,750 | ||||
76
BNY Mellon Municipal Opportunities Fund (continued) | |||||||||
Description | Coupon | Maturity | Principal | Value ($) | |||||
Long-Term Municipal Investments - 100.8% (continued) | |||||||||
U.S. Related - 3.5% (continued) | |||||||||
Puerto Rico Electric Power Authority, | 5.00 | 7/1/22 | 2,000,000 | h | 1,180,000 | ||||
Puerto Rico Electric Power Authority, | 6.75 | 7/1/36 | 10,000,000 | h | 5,900,000 | ||||
Puerto Rico Electric Power Authority, | 5.00 | 7/1/21 | 500,000 | 505,995 | |||||
Puerto Rico Infrastructure Financing Authority, | 5.00 | 7/1/21 | 500,000 | h | 32,190 | ||||
Puerto Rico Sales Tax Financing Corporation, | 5.00 | 8/1/22 | 4,585,000 | h | 2,905,744 | ||||
Puerto Rico Sales Tax Financing Corporation, | 0/6.25 | 8/1/33 | 750,000 | f | 147,645 | ||||
Puerto Rico Sales Tax Financing Corporation, | 6.75 | 8/1/32 | 15,000,000 | h | 3,802,500 | ||||
Virgin Islands Public Finance Authority, | 5.00 | 10/1/29 | 2,250,000 | 1,697,040 | |||||
Virgin Islands Public Finance Authority, | 5.00 | 10/1/30 | 5,000,000 | 3,746,700 | |||||
Virgin Islands Public Finance Authority, | 5.00 | 10/1/34 | 1,500,000 | 1,087,125 | |||||
Virgin Islands Public Finance Authority, | 6.75 | 10/1/37 | 1,250,000 | 955,638 | |||||
45,396,807 | |||||||||
Total Long-Term Municipal Investments | 1,325,594,140 | ||||||||
Description | |||||||||
Short-Term Municipal Investments - 2.0% | |||||||||
Indiana - .1% | |||||||||
Indiana Finance Authority, | 0.81 | 9/1/17 | 2,000,000 | i,j | 2,000,000 | ||||
Iowa - .3% | |||||||||
Iowa Higher Education Loan Authority, | 0.85 | 9/1/17 | 3,500,000 | i,j | 3,500,000 | ||||
Missouri - .1% | |||||||||
Missouri Health and Educational Facilities Authority, | 0.85 | 9/1/17 | 2,000,000 | i,j | 2,000,000 | ||||
New York - 1.0% | |||||||||
New York State Housing Finance Agency, | 0.86 | 9/1/17 | 3,800,000 | i,j | 3,800,000 | ||||
New York State Housing Finance Agency, | 0.82 | 9/7/17 | 3,500,000 | i,j | 3,500,000 | ||||
Triborough Bridge and Tunnel Authority, | 0.81 | 9/1/17 | 1,500,000 | i,j | 1,500,000 | ||||
Yonkers Industrial Development Agency Civic Facility, | 0.82 | 9/7/17 | 5,000,000 | i,j | 5,000,000 | ||||
13,800,000 | |||||||||
Pennsylvania - .0% | |||||||||
Luzerne County Convention Center Authority, | 0.78 | 9/7/17 | 90,000 | i,j | 90,000 | ||||
Tennessee - .2% | |||||||||
Clarksville Public Building Authority, | 0.90 | 9/1/17 | 1,400,000 | i,j | 1,400,000 | ||||
Montgomery County Public Building Authority, | 0.90 | 9/1/17 | 900,000 | i,j | 900,000 | ||||
2,300,000 | |||||||||
77
STATEMENT OF INVESTMENTS (continued)
BNY Mellon Municipal Opportunities Fund (continued) | |||||||||
Description | Coupon | Maturity Date | Principal Amount ($) | a | Value ($) | ||||
Short-Term Municipal Investments - 2.0% (continued) | |||||||||
Texas - .3% | |||||||||
Austin Hotel Occupancy Tax Subordinate, | 0.81 | 9/7/17 | 3,450,000 | i,j | 3,450,000 | ||||
Total Short-Term Municipal Investments | 27,140,000 | ||||||||
Total Investments (cost $1,277,946,453) | 102.8% | 1,352,734,140 | |||||||
Liabilities, Less Cash and Receivables | (2.8%) | (37,371,685) | |||||||
Net Assets | 100.0% | 1,315,362,455 | |||||||
a These securities are prerefunded; the date shown represents the prerefunded date. Bonds which are prerefunded are collateralized by U.S. Government securities which are held in escrow and are used to pay principal and interest on the municipal issue and to retire the bonds in full at the earliest refunding date.
b Security exempt from registration pursuant to Rule 144A under the Securities Act of 1933. These securities may be resold in transactions exempt from registration, normally to qualified institutional buyers. At August 31, 2017, these securities were valued at $175,698,059 or 13.36% of net assets.
c Security issued with a zero coupon. Income is recognized through the accretion of discount.
d Variable rate security—rate shown is the interest rate in effect at period end.
e Collateral for floating rate borrowings.
f Zero coupon until a specified date at which time the stated coupon rate becomes effective until maturity.
g Auction Rate Security—interest rate is reset periodically under an auction process that is conducted by an auction agent. Rate shown is the interest rate in effect at period end.
h Non-income producing—security in default.
i Variable rate demand note—rate shown is the interest rate in effect at August 31, 2017. Maturity date represents the next demand date, or the ultimate maturity date if earlier.
j The Variable Rate shall be determined by the Remarketing Agent in its sole discretion based on prevailing market conditions and may, but need not, be established by reference to one or more financial indices.
Portfolio Summary (Unaudited) † | Value (%) |
Transportation Services | 26.5 |
Education | 19.5 |
Health Care | 15.4 |
Special Tax | 7.9 |
Prerefunded | 5.9 |
Industrial | 4.0 |
State/Territory | 3.3 |
Lease | 3.0 |
Utility-Water and Sewer | 2.4 |
City | 2.3 |
Utility-Electric | 1.9 |
County | 1.1 |
Housing | .9 |
Resource Recovery | .7 |
Pollution Control | .1 |
Other | 7.9 |
102.8 |
† Based on net assets.
See notes to financial statements.
78
STATEMENTS OF FUTURES
August 31, 2017
BNY Mellon National Intermediate Municipal Bond Fund | |||||||||||
Description | Number of | Expiration | Notional | Value ($) | Unrealized | ||||||
Futures Short | |||||||||||
U.S. Treasury 10 Year Notes | 169 | 12/2017 | (21,412,782) | (21,460,360) | (47,578) | ||||||
U.S. Treasury 5 Year Notes | 226 | 12/2017 | (26,752,633) | (26,781,000) | (28,367) | ||||||
Ultra 10 Year U.S. Treasury Notes | 509 | 12/2017 | (69,271,718) | (69,494,406) | (222,688) | ||||||
Gross Unrealized Depreciation | (298,633) | ||||||||||
See notes to financial statements.
BNY Mellon Pennsylvania Intermediate Municipal Bond Fund | |||||||||||
Description | Number of | Expiration | Notional | Value ($) | Unrealized | ||||||
Futures Short | |||||||||||
U.S. Treasury 10 Year Notes | 17 | 12/2017 | (2,153,953) | (2,158,734) | (4,781) | ||||||
U.S. Treasury 5 Year Notes | 23 | 12/2017 | (2,722,625) | (2,725,500) | (2,875) | ||||||
Ultra 10 Year U.S. Treasury Notes | 51 | 12/2017 | (6,940,781) | (6,963,094) | (22,313) | ||||||
Gross Unrealized Depreciation | (29,969) | ||||||||||
See notes to financial statements.
BNY Mellon Massachusetts Intermediate Municipal Bond Fund | |||||||||||
Description | Number of | Expiration | Notional | Value ($) | Unrealized | ||||||
Futures Short | |||||||||||
U.S. Treasury 10 Year Notes | 24 | 12/2017 | (3,040,875) | (3,047,625) | (6,750) | ||||||
U.S. Treasury 5 Year Notes | 32 | 12/2017 | (3,788,000) | (3,792,000) | (4,000) | ||||||
Ultra 10 Year U.S. Treasury Notes | 73 | 12/2017 | (9,934,843) | (9,966,781) | (31,938) | ||||||
Gross Unrealized Depreciation | (42,688) | ||||||||||
See notes to financial statements.
BNY Mellon New York Intermediate Tax-Exempt Bond Fund | |||||||||||
Description | Number of | Expiration | Notional | Value ($) | Unrealized | ||||||
Futures Short | |||||||||||
U.S. Treasury 10 Year Notes | 13 | 12/2017 | (1,647,141) | (1,650,797) | (3,656) | ||||||
U.S. Treasury 5 Year Notes | 17 | 12/2017 | (2,012,375) | (2,014,500) | (2,125) | ||||||
Ultra 10 Year U.S. Treasury Notes | 39 | 12/2017 | (5,307,656) | (5,324,719) | (17,063) | ||||||
Gross Unrealized Depreciation | (22,844) | ||||||||||
See notes to financial statements.
BNY Mellon Municipal Opportunities Fund | |||||||||||
Description | Number of | Expiration | Notional | Value ($) | Unrealized | ||||||
Futures Short | |||||||||||
U.S. Treasury 10 Year Notes | 213 | 12/2017 | (26,987,766) | (27,047,672) | (59,906) | ||||||
U.S. Treasury 5 Year Notes | 630 | 12/2017 | (74,576,250) | (74,655,000) | (78,750) | ||||||
U.S. Treasury Ultra Long Bond | 300 | 12/2017 | (50,418,750) | (50,718,750) | (300,000) | ||||||
Ultra 10 Year U.S. Treasury Notes | 933 | 12/2017 | (127,109,843) | (127,383,656) | (273,813) | ||||||
Gross Unrealized Depreciation | (712,469) | ||||||||||
See notes to financial statements.
79
Summary of Abbreviations (Unaudited) | |||
ABAG | Association of Bay Area | ACA | American Capital Access |
AGC | ACE Guaranty Corporation | AGIC | Asset Guaranty Insurance Company |
AMBAC | American Municipal Bond | ARRN | Adjustable Rate |
BAN | Bond Anticipation Notes | BPA | Bond Purchase Agreement |
CIFG | CDC Ixis Financial Guaranty | COP | Certificate of Participation |
CP | Commercial Paper | DRIVERS | Derivative Inverse |
EDR | Economic Development | EIR | Environmental Improvement |
FGIC | Financial Guaranty | FHA | Federal Housing Administration |
FHLB | Federal Home | FHLMC | Federal Home Loan Mortgage |
FNMA | Federal National | GAN | Grant Anticipation Notes |
GIC | Guaranteed Investment | GNMA | Government National Mortgage |
GO | General Obligation | HR | Hospital Revenue |
IDB | Industrial Development Board | IDC | Industrial Development Corporation |
IDR | Industrial Development | LIFERS | Long Inverse Floating |
LOC | Letter of Credit | LOR | Limited Obligation Revenue |
LR | Lease Revenue | MERLOTS | Municipal Exempt Receipts |
MFHR | Multi-Family Housing Revenue | MFMR | Multi-Family Mortgage Revenue |
PCR | Pollution Control Revenue | PILOT | Payment in Lieu of Taxes |
P-FLOATS | Puttable Floating Option | PUTTERS | Puttable Tax-Exempt Receipts |
RAC | Revenue Anticipation Certificates | RAN | Revenue Anticipation Notes |
RAW | Revenue Anticipation Warrants | RIB | Residual Interest Bonds |
ROCS | Reset Options Certificates | RRR | Resources Recovery Revenue |
SAAN | State Aid Anticipation Notes | SBPA | Standby Bond Purchase Agreement |
SFHR | Single Family Housing Revenue | SFMR | Single Family Mortgage Revenue |
SONYMA | State of New York | SPEARS | Short Puttable Exempt |
SWDR | Solid Waste Disposal Revenue | TAN | Tax Anticipation Notes |
TAW | Tax Anticipation Warrants | TRAN | Tax and Revenue Anticipation Notes |
XLCA | XL Capital Assurance | ||
See notes to financial statements.
80
STATEMENTS OF ASSETS AND LIABILITIES
August 31, 2017
|
|
|
|
|
|
|
|
|
|
|
| |
|
|
|
| BNY Mellon National Intermediate Municipal Bond Fund |
| BNY Mellon National Short-Term Municipal Bond Fund |
| BNY Mellon Pennsylvania Intermediate Municipal Bond Fund |
| BNY Mellon Massachusetts Intermediate Municipal Bond Fund |
| |
Assets ($): |
|
|
|
|
|
|
|
|
|
|
| |
Investments in securities—See Statements |
|
|
| 2,120,963,954 |
| 905,786,523 |
| 212,460,858 |
| 309,933,477 |
| |
Cash collateral held by broker—Note 4 |
|
|
| 1,099,100 |
| - |
| 110,425 |
| 157,100 |
| |
Interest receivable |
|
|
| 24,732,000 |
| 7,390,529 |
| 2,457,675 |
| 3,073,813 |
| |
Receivable for investment securities sold | 27,376,980 |
| - |
| 31,940 |
| - | |||||
Receivable for shares of Beneficial |
|
|
| 2,744,348 |
| 1,153,637 |
| 1,200 |
| 22,300 |
| |
Prepaid expenses |
|
|
| 28,376 |
| 25,794 |
| 17,900 |
| 19,738 |
| |
|
|
|
| 2,176,944,758 |
| 914,356,483 |
| 215,079,998 |
| 313,206,428 |
|
|
Liabilities ($): |
|
|
|
|
|
|
|
|
|
|
| |
Due to The Dreyfus Corporation |
|
|
| 684,214 |
| 298,331 |
| 104,027 |
| 105,875 |
| |
Due to Administrator—Note 3(a) |
|
|
| 224,056 |
| 94,405 |
| 22,604 |
| 32,124 |
| |
Cash overdraft due to Custodian |
|
|
| 2,323,328 |
| 390,660 |
| 369,906 |
| 415,924 |
| |
Payable for investment securities purchased | 26,342,410 |
| 10,093,550 |
| - |
| 5,496,200 |
| ||||
Payable for shares of Beneficial |
|
|
| 1,229,645 |
| 655,099 |
| 10,018 |
| 432,042 |
| |
Payable for futures |
|
|
| 164,234 |
| - |
| 16,492 |
| 23,484 |
| |
Accrued expenses |
|
|
| 101,193 |
| 61,373 |
| 56,927 |
| 62,902 |
| |
|
|
|
| 31,069,080 |
| 11,593,418 |
| 579,974 |
| 6,568,551 |
|
|
Net Assets ($) |
|
|
| 2,145,875,678 |
| 902,763,065 |
| 214,500,024 |
| 306,637,877 |
|
|
Composition of Net Assets ($): |
|
|
|
|
|
|
|
|
|
|
| |
Paid-in capital |
|
|
| 2,060,012,433 |
| 903,412,623 |
| 207,844,854 |
| 297,495,114 |
| |
Accumulated net realized gain (loss) |
|
|
| (1,098,307) |
| (2,417,716) |
| (177,672) |
| (502,565) |
| |
Accumulated net unrealized appreciation |
|
|
| 87,260,185 |
| 1,768,158 |
| 6,862,811 |
| 9,688,016 |
| |
Accumulated net unrealized appreciation |
|
|
| (298,633) |
| - |
| (29,969) |
| (42,688) |
| |
Net Assets ($) |
|
|
| 2,145,875,678 |
| 902,763,065 |
| 214,500,024 |
| 306,637,877 |
|
|
† Investments at cost ($) |
|
|
| 2,033,703,769 |
| 904,018,365 |
| 205,598,047 |
| 300,245,461 |
|
|
Net Asset Value Per Share |
|
|
|
|
|
|
|
|
|
|
| |
Class M |
|
|
|
|
|
|
|
|
|
|
| |
Net Assets ($) |
|
|
| 2,093,660,050 |
| 889,236,672 |
| 209,456,819 |
| 297,242,798 |
| |
Shares Outstanding |
|
|
| 153,443,043 |
| 69,319,574 |
| 17,112,289 |
| 23,305,446 |
| |
Net Asset Value Per Share ($) |
|
|
| 13.64 |
| 12.83 |
| 12.24 |
| 12.75 |
| |
Investor Shares |
|
|
|
|
|
|
|
|
|
|
|
|
Net Assets ($) |
|
|
| 52,215,628 |
| 13,526,393 |
| 5,043,205 |
| 9,395,079 |
| |
Shares Outstanding |
|
|
| 3,831,051 |
| 1,055,021 |
| 412,519 |
| 736,798 |
| |
Net Asset Value Per Share ($) |
|
|
| 13.63 |
| 12.82 |
| 12.23 |
| 12.75 |
| |
| ||||||||||||
See notes to financial statements. |
|
81
STATEMENTS OF ASSETS AND LIABILITIES (continued)
|
|
|
|
|
|
|
| |
|
|
|
| BNY Mellon New York Intermediate Tax-Exempt Bond Fund |
| BNY Mellon Municipal Opportunities Fund |
| |
Assets ($): |
|
|
|
|
|
|
| |
Investments in securities—See Statements |
|
|
| 164,363,629 |
| 1,352,734,140 |
| |
Cash collateral held by broker—Note 4 |
|
|
| 84,075 |
| 3,148,200 |
| |
Interest receivable |
|
|
| 1,866,220 |
| 13,552,073 |
| |
Receivable for shares of Beneficial |
|
|
| 9,441 |
| - |
| |
Receivable for investment securities sold |
|
|
| - |
| 31,420,955 |
| |
Prepaid expenses and other assets |
|
|
| 19,358 |
| 141,680 |
| |
|
|
|
| 166,342,723 |
| 1,400,997,048 |
|
|
Liabilities ($): |
|
|
|
|
|
|
| |
Due to The Dreyfus Corporation |
|
|
| 66,062 |
| 609,327 |
| |
Due to Administrator—Note 3(a) |
|
|
| 17,375 |
| 139,138 |
| |
Cash overdraft due to Custodian |
|
|
| 180,304 |
| 2,142,811 |
| |
Payable for futures | 12,570 |
| 524,578 |
| ||||
Payable for shares of Beneficial |
|
|
| 3,326 |
| 335,923 |
| |
Payable for floating rate notes issued—Note 4 |
|
|
| - |
| 58,975,000 |
| |
Payable for investment securities purchased |
|
|
| - |
| 22,594,290 |
| |
Interest and expense payable related to |
|
|
| - |
| 218,759 |
| |
Accrued expenses |
|
|
| 47,900 |
| 94,767 |
| |
|
|
|
| 327,537 |
| 85,634,593 |
|
|
Net Assets ($) |
|
|
| 166,015,186 |
| 1,315,362,455 |
|
|
Composition of Net Assets ($): |
|
|
|
|
|
|
| |
Paid-in capital |
|
|
| 159,638,511 |
| 1,267,814,264 |
| |
Accumulated net realized gain (loss) |
|
|
| (309,993) |
| (26,527,027) |
| |
Accumulated net unrealized appreciation |
|
|
| 6,709,512 |
| 74,787,687 |
| |
Accumulated net unrealized appreciation |
|
|
| (22,844) |
| (712,469) |
| |
Net Assets ($) |
|
|
| 166,015,186 |
| 1,315,362,455 |
|
|
† Investments at cost ($) |
|
|
| 157,654,117 |
| 1,277,946,453 |
|
|
Net Asset Value Per Share |
|
|
|
|
|
|
| |
Class M |
|
|
|
|
|
|
| |
Net Assets ($) |
|
|
| 152,922,591 |
| 1,257,497,676 |
| |
Shares Outstanding |
|
|
| 13,657,029 |
| 95,615,144 |
| |
Net Asset Value Per Share ($) |
|
|
| 11.20 |
| 13.15 |
| |
Investor Shares |
|
|
|
|
|
|
|
|
Net Assets ($) |
|
|
| 13,092,595 |
| 57,864,779 |
| |
Shares Outstanding |
|
|
| 1,168,547 |
| 4,398,032 |
| |
Net Asset Value Per Share ($) |
|
|
| 11.20 |
| 13.16 |
| |
| ||||||||
See notes to financial statements. |
|
82
STATEMENTS OF OPERATIONS
Year Ended August 31, 2017
|
|
|
|
|
|
|
|
|
|
|
|
|
|
|
|
|
| BNY Mellon |
| BNY Mellon |
| BNY Mellon Pennsylvania Intermediate Municipal Bond Fund |
| BNY Mellon Massachusetts Intermediate Municipal Bond Fund |
|
Investment Income ($): |
|
|
|
|
|
|
|
|
|
| ||
Interest Income |
|
| 64,630,622 |
| 13,906,536 |
| 7,276,096 |
| 9,143,338 |
| ||
Expenses: |
|
|
|
|
|
|
|
|
|
| ||
Investment advisory fee—Note 3(a) |
|
| 7,496,313 |
| 3,358,514 |
| 1,157,076 |
| 1,104,295 |
| ||
Administration fee—Note 3(a) |
|
| 2,665,977 |
| 1,194,503 |
| 288,076 |
| 392,731 |
| ||
Trustees’ fees and expenses—Note 3(c) |
|
| 154,167 |
| 70,066 |
| 17,188 |
| 21,875 |
| ||
Shareholder servicing costs—Note 3(b) |
|
| 130,305 |
| 26,207 |
| 13,702 |
| 24,678 |
| ||
Custodian fees—Note 3(b) |
|
| 110,195 |
| 75,194 |
| 20,435 |
| 27,825 |
| ||
Professional fees |
|
| 99,722 |
| 59,140 |
| 48,348 |
| 53,352 |
| ||
Loan commitment fees—Note 2 |
|
| 50,356 |
| 22,790 |
| 6,437 |
| 7,622 |
| ||
Registration fees |
|
| 47,949 |
| 51,751 |
| 33,572 |
| 32,626 |
| ||
Prospectus and shareholders’ reports |
|
| 16,562 |
| 14,850 |
| 10,437 |
| 14,374 |
| ||
Miscellaneous |
|
| 118,914 |
| 68,812 |
| 42,396 |
| 57,997 |
| ||
Total Expenses |
|
| 10,890,460 |
| 4,941,827 |
| 1,637,667 |
| 1,737,375 |
| ||
Less—reduction in fees due to earnings credits—Note 3(b) |
|
| (398) |
| (109) |
| (189) |
| (152) |
| ||
Net Expenses |
|
| 10,890,062 |
| 4,941,718 |
| 1,637,478 |
| 1,737,223 |
| ||
Investment Income—Net |
|
| 53,740,560 |
| 8,964,818 |
| 5,638,618 |
| 7,406,115 |
| ||
Realized and Unrealized Gain (Loss) |
|
|
|
|
|
|
|
| ||||
Net realized gain (loss) on investments | (479,519) |
| (2,372,606) |
| 367,131 |
| 637,340 |
| ||||
Net realized gain (loss) on futures |
|
| 2,271,276 |
| - |
| 276,471 |
| 416,028 |
| ||
Net Realized Gain (Loss) |
|
| 1,791,757 |
| (2,372,606) |
| 643,602 |
| 1,053,368 |
| ||
Net unrealized appreciation (depreciation) on investments |
|
| (49,991,476) |
| (1,534,285) |
| (6,361,528) |
| (10,309,220) |
| ||
Net unrealized appreciation (depreciation) on futures |
|
| (274,821) |
| - |
| (27,266) |
| (38,875) |
| ||
Net Unrealized Appreciation (Depreciation) |
|
| (50,266,297) |
| (1,534,285) |
| (6,388,794) |
| (10,348,095) |
| ||
Net Realized and Unrealized Gain (Loss) on Investments |
|
| (48,474,540) |
| (3,906,891) |
| (5,745,192) |
| (9,294,727) |
| ||
Net Increase (Decrease) in Net Assets Resulting from Operations | 5,266,020 |
| 5,057,927 |
| (106,574) |
| (1,888,612) |
| ||||
See notes to financial statements. | ||||||||||||
83
STATEMENTS OF OPERATIONS (continued)
|
|
|
|
|
|
|
|
|
|
|
|
|
| BNY Mellon New York Intermediate Tax-Exempt Bond Fund |
| BNY Mellon Municipal Opportunities Fund |
|
Investment Income ($): |
|
|
|
|
|
| ||
Interest Income |
|
| 5,080,754 |
| 49,980,152 |
| ||
Expenses: |
|
|
|
|
|
| ||
Investment advisory fee—Note 3(a) |
|
| 855,809 |
| 5,992,419 |
| ||
Administration fee—Note 3(a) |
|
| 213,059 |
| 1,491,512 |
| ||
Professional fees |
|
| 43,380 |
| 80,046 |
| ||
Shareholder servicing costs—Note 3(b) |
|
| 34,084 |
| 86,212 |
| ||
Registration fees |
|
| 34,067 |
| 62,494 |
| ||
Prospectus and shareholders’ reports |
|
| 17,914 |
| 12,778 |
| ||
Custodian fees—Note 3(b) |
|
| 17,155 |
| 83,243 |
| ||
Trustees’ fees and expenses—Note 3(c) |
|
| 14,480 |
| 82,335 |
| ||
Loan commitment fees—Note 2 |
|
| 3,985 |
| 25,955 |
| ||
Interest and expense related to floating rate notes issued—Note 4 |
|
| - |
| 857,829 |
| ||
Miscellaneous |
|
| 43,957 |
| 88,435 |
| ||
Total Expenses |
|
| 1,277,890 |
| 8,863,258 |
| ||
Less—reduction in expenses due to undertakings—Note 3(a) |
|
| (230,644) |
| - |
| ||
Less—reduction in fees due to earnings credits—Note 3(b) |
|
| (534) |
| (196) |
| ||
Net Expenses |
|
| 1,046,712 |
| 8,863,062 |
| ||
Investment Income—Net |
|
| 4,034,042 |
| 41,117,090 |
| ||
Realized and Unrealized Gain (Loss) |
|
|
|
| ||||
Net realized gain (loss) on investments | 224,278 |
| 11,307,754 |
| ||||
Net realized gain (loss) on futures |
|
| 196,830 |
| 5,480,110 |
| ||
Net Realized Gain (Loss) |
|
| 421,108 |
| 16,787,864 |
| ||
Net unrealized appreciation (depreciation) on investments |
|
| (4,649,762) |
| (34,656,018) |
| ||
Net unrealized appreciation (depreciation) on futures |
|
| (20,875) |
| (632,586) |
| ||
Net Unrealized Appreciation (Depreciation) |
|
| (4,670,637) |
| (35,288,604) |
| ||
Net Realized and Unrealized Gain (Loss) on Investments |
|
| (4,249,529) |
| (18,500,740) |
| ||
Net Increase (Decrease) in Net Assets Resulting from Operations |
| (215,487) |
| 22,616,350 |
| |||
See notes to financial statements. | ||||||||
84
STATEMENT OF CASH FLOWS
Year Ended August 31, 2017
BNY Mellon Municipal Opportunities Fund |
|
|
Cash Flows from Operating Activities ($): | ||
Purchases of portfolio securities | (584,105,202) | |
Proceeds from sales of portfolio securities | 371,733,355 | |
Futures transactions | 5,601,011 | |
Net purchase of short-term portfolio securities | (20,815,000) | |
Interest received | 52,951,261 | |
Operating expenses paid | (2,839,777) | |
Cash paid to The Dreyfus Corporation for investment advisory fee | (5,905,215) | |
Net Cash provided by Operating Activities | (183,379,567) | |
Cash Flows from Financing Activities ($): | ||
Net Beneficial Interest transactions | 208,054,227 | |
Dividends paid | (25,418,447) | |
Net increase (decrease) in cash | 743,787 | |
Net Cash Used in Financing Activities | 183,379,567 | |
Cash at beginning of period | - | |
Cash at end of period | - | |
Reconciliation of Net Decrease in Net Assets Resulting | ||
Net Increase in Net Assets Resulting from Operations | 22,616,350 | |
Adjustments to reconcile net increase in net assets resulting | ||
Purchases of portfolio securities | (584,105,202) | |
Proceeds from sales of portfolio securities | 371,733,355 | |
Futures transactions | 5,601,011 | |
Net purchases of short-term portfolio securities | (20,815,000) | |
Increase in interest receivable | (1,801,487) | |
Increase in accrued expenses | 18,303 | |
Increase in prepaid expenses and other assets | (9,567) | |
Increase in Due to The Dreyfus Corporation and affiliates | 87,204 | |
Increase in Due to Administrator | 22,130 | |
Decrease in interest and expense payable related to floating rate notes issued | (19,619) | |
Net realized gain on investments and futures transactions | (16,787,864) | |
Net unrealized depreciation on investments and futures | 35,288,604 | |
Net amortization of premiums on investments | 4,792,215 | |
Net Cash Provided by Operating Activities | (183,379,567) | |
Supplemental non-cash financing disclosure: | ||
Reinvestment of dividends | 15,448,225 |
See notes to financial statements.
85
STATEMENTS OF CHANGES IN NET ASSETS
|
|
|
| BNY Mellon National Intermediate |
| BNY Mellon National Short-Term |
| ||||||||
|
|
|
| Year Ended August 31, | Year Ended August 31, | ||||||||||
|
|
|
| 2017 |
|
|
| 2016 |
| 2017 |
|
|
| 2016 |
|
Operations ($): |
|
|
|
|
|
|
|
|
|
|
|
|
|
| |
Investment income—net |
|
| 53,740,560 |
|
|
| 55,074,682 |
| 8,964,818 |
|
|
| 8,593,002 |
| |
Net realized gain (loss) on investments |
| 1,791,757 |
|
|
| 8,381,167 |
| (2,372,606) |
|
|
| 1,414,237 |
| ||
Net unrealized appreciation (depreciation) |
| (50,266,297) |
|
|
| 60,585,704 |
| (1,534,285) |
|
|
| 2,131,577 |
| ||
Net Increase (Decrease) in Net Assets | 5,266,020 |
|
|
| 124,041,553 |
| 5,057,927 |
|
|
| 12,138,816 |
| |||
Distributions to Shareholders from ($): |
|
|
|
|
|
|
|
|
|
|
|
|
|
| |
Investment income—net: |
|
|
|
|
|
|
|
|
|
|
|
|
|
| |
Class M |
|
| (52,338,335) |
|
|
| (53,472,330) |
| (8,877,598) |
|
|
| (8,533,801) |
| |
Investor Shares |
|
| (1,168,985) |
|
|
| (1,201,131) |
| (74,272) |
|
|
| (51,886) |
| |
Net realized gain on investments: |
|
|
|
|
|
|
|
|
|
|
|
|
|
| |
Class M |
|
| (14,139,955) |
|
|
| (311,121) |
| (1,195,000) |
|
|
| (564,699) |
| |
Investor Shares |
|
| (353,740) |
|
|
| (7,743) |
| (8,660) |
|
|
| (4,219) |
| |
Total Distributions |
|
| (68,001,015) |
|
|
| (54,992,325) |
| (10,155,530) |
|
|
| (9,154,605) |
| |
Beneficial Interest Transactions ($): |
|
|
|
|
|
|
|
|
|
|
|
|
|
| |
Net proceeds from shares sold: |
|
|
|
|
|
|
|
|
|
|
|
|
|
| |
Class M |
|
| 464,961,765 |
|
|
| 446,910,370 |
| 351,029,658 |
|
|
| 510,854,039 |
| |
Investor Shares |
|
| 39,289,745 |
|
|
| 22,844,489 |
| 20,423,368 |
|
|
| 13,119,723 |
| |
Distributions reinvested: |
|
|
|
|
|
|
|
|
|
|
|
|
|
| |
Class M |
|
| 14,329,916 |
|
|
| 8,175,890 |
| 2,217,207 |
|
|
| 2,160,503 |
| |
Investor Shares |
|
| 1,160,740 |
|
|
| 913,677 |
| 64,988 |
|
|
| 41,803 |
| |
Cost of shares redeemed: |
|
|
|
|
|
|
|
|
|
|
|
|
|
| |
Class M |
|
| (548,178,549) |
|
|
| (269,483,160) |
| (563,035,625) |
|
|
| (419,336,843) |
| |
Investor Shares |
|
| (41,884,372) |
|
|
| (20,370,559) |
| (12,880,518) |
|
|
| (19,480,019) |
| |
Increase (Decrease) in Net Assets | (70,320,755) |
|
|
| 188,990,707 |
| (202,180,922) |
|
|
| 87,359,206 |
| |||
Total Increase (Decrease) in Net Assets | (133,055,750) |
|
|
| 258,039,935 |
| (207,278,525) |
|
|
| 90,343,417 |
| |||
Net Assets ($): |
|
|
|
|
|
|
|
|
|
|
|
|
|
| |
Beginning of Period |
|
| 2,278,931,428 |
|
|
| 2,020,891,493 |
| 1,110,041,590 |
|
|
| 1,019,698,173 |
| |
End of Period |
|
| 2,145,875,678 |
|
|
| 2,278,931,428 |
| 902,763,065 |
|
|
| 1,110,041,590 |
| |
Capital Share Transactions (Shares): |
|
|
|
|
|
|
|
|
|
|
|
|
|
| |
Class Ma |
|
|
|
|
|
|
|
|
|
|
|
|
|
| |
Shares sold |
|
| 34,444,410 |
|
|
| 32,344,857 |
| 27,512,365 |
|
|
| 39,780,572 |
| |
Shares issued for distributions reinvested |
|
| 1,071,958 |
|
|
| 591,223 |
| 173,928 |
|
|
| 168,311 |
| |
Shares redeemed |
|
| (40,856,606) |
|
|
| (19,527,706) |
| (44,177,739) |
|
|
| (32,660,748) |
| |
Net Increase (Decrease) in Shares Outstanding | (5,340,238) |
|
|
| 13,408,374 |
| (16,491,446) |
|
|
| 7,288,135 |
| |||
Investor Sharesa |
|
|
|
|
|
|
|
|
|
|
|
|
|
| |
Shares sold |
|
| 2,904,127 |
|
|
| 1,656,631 |
| 1,600,474 |
|
|
| 1,022,248 |
| |
Shares issued for distributions reinvested |
|
| 86,441 |
|
|
| 66,122 |
| 5,092 |
|
|
| 3,258 |
| |
Shares redeemed |
|
| (3,110,518) |
|
|
| (1,478,831) |
| (1,007,809) |
|
|
| (1,516,993) |
| |
Net Increase (Decrease) in Shares Outstanding | (119,950) |
|
|
| 243,922 |
| 597,757 |
|
|
| (491,487) |
| |||
|
| ||||||||||||||
a During the period ended August 31, 2017, 2,722,998 Class M shares representing $36,899,982 were exchanged for 2,726,012 Investor shares for BNY Mellon National Intermediate Municipal Bond Fund and 1,231,437 Class M shares representing $15,723,475 were exchanged for 1,232,157 Investor shares for BNY Mellon National Short-Term Municipal Bond Fund. During the period ended August 31, 2016, 1,615,596 Class M shares representing $22,300,611 were exchanged for 1,617,313 Investor shares for BNY Mellon National Intermediate Municipal Bond Fund and 1,019,730 Class M shares representing $13,095,762 were exchanged for 1,020,395 Investor shares for BNY Mellon National Short-Term Municipal Bond Fund. | |||||||||||||||
| |||||||||||||||
86
|
|
|
| BNY Mellon Pennsylvania |
| BNY Mellon Massachusetts |
| ||||||||
|
|
|
| Year Ended August 31, | Year Ended August 31, | ||||||||||
|
|
|
| 2017 |
|
|
| 2016 |
| 2017 |
|
|
| 2016 |
|
Operations ($): |
|
|
|
|
|
|
|
|
|
|
|
|
|
| |
Investment income—net |
|
| 5,638,618 |
|
|
| 6,910,537 |
| 7,406,115 |
|
|
| 8,180,432 |
| |
Net realized gain (loss) on investments |
| 643,602 |
|
|
| 3,033,976 |
| 1,053,368 |
|
|
| 2,527,957 |
| ||
Net unrealized appreciation (depreciation) |
| (6,388,794) |
|
|
| 6,166,564 |
| (10,348,095) |
|
|
| 8,616,605 |
| ||
Net Increase (Decrease) in Net Assets | (106,574) |
|
|
| 16,111,077 |
| (1,888,612) |
|
|
| 19,324,994 |
| |||
Distributions to Shareholders from ($): |
|
|
|
|
|
|
|
|
|
|
|
|
|
| |
Investment income—net: |
|
|
|
|
|
|
|
|
|
|
|
|
|
| |
Class M |
|
| (5,519,051) |
|
|
| (6,770,211) |
| (7,200,296) |
|
|
| (7,991,350) |
| |
Investor Shares |
|
| (119,567) |
|
|
| (138,974) |
| (205,819) |
|
|
| (187,729) |
| |
Net realized gain on investments: |
|
|
|
|
|
|
|
|
|
|
|
|
|
| |
Class M |
|
| (3,691,537) |
|
|
| (848,376) |
| (2,949,849) |
|
|
| - |
| |
Investor Shares |
|
| (86,542) |
|
|
| (20,018) |
| (92,935) |
|
|
| - |
| |
Total Distributions |
|
| (9,416,697) |
|
|
| (7,777,579) |
| (10,448,899) |
|
|
| (8,179,079) |
| |
Beneficial Interest Transactions ($): |
|
|
|
|
|
|
|
|
|
|
|
|
|
| |
Net proceeds from shares sold: |
|
|
|
|
|
|
|
|
|
|
|
|
|
| |
Class M |
|
| 24,449,460 |
|
|
| 14,446,424 |
| 71,259,007 |
|
|
| 72,373,497 |
| |
Investor Shares |
|
| 2,708,628 |
|
|
| 6,992,631 |
| 5,566,606 |
|
|
| 2,551,555 |
| |
Distributions reinvested: |
|
|
|
|
|
|
|
|
|
|
|
|
|
| |
Class M |
|
| 2,397,494 |
|
|
| 867,070 |
| 2,530,486 |
|
|
| 1,577,519 |
| |
Investor Shares |
|
| 181,526 |
|
|
| 117,564 |
| 235,740 |
|
|
| 156,147 |
| |
Cost of shares redeemed: |
|
|
|
|
|
|
|
|
|
|
|
|
|
| |
Class M |
|
| (63,118,005) |
|
|
| (45,185,314) |
| (124,543,987) |
|
|
| (35,329,243) |
| |
Investor Shares |
|
| (3,593,488) |
|
|
| (6,862,020) |
| (4,590,867) |
|
|
| (3,223,400) |
| |
Increase (Decrease) in Net Assets | (36,974,385) |
|
|
| (29,623,645) |
| (49,543,015) |
|
|
| 38,106,075 |
| |||
Total Increase (Decrease) in Net Assets | (46,497,656) |
|
|
| (21,290,147) |
| (61,880,526) |
|
|
| 49,251,990 |
| |||
Net Assets ($): |
|
|
|
|
|
|
|
|
|
|
|
|
|
| |
Beginning of Period |
|
| 260,997,680 |
|
|
| 282,287,827 |
| 368,518,403 |
|
|
| 319,266,413 |
| |
End of Period |
|
| 214,500,024 |
|
|
| 260,997,680 |
| 306,637,877 |
|
|
| 368,518,403 |
| |
Capital Share Transactions (Shares): |
|
|
|
|
|
|
|
|
|
|
|
|
|
| |
Class Ma |
|
|
|
|
|
|
|
|
|
|
|
|
|
| |
Shares sold |
|
| 2,025,605 |
|
|
| 1,157,054 |
| 5,661,003 |
|
|
| 5,580,704 |
| |
Shares issued for distributions reinvested |
|
| 200,854 |
|
|
| 69,588 |
| 201,893 |
|
|
| 121,414 |
| |
Shares redeemed |
|
| (5,219,093) |
|
|
| (3,607,100) |
| (9,929,865) |
|
|
| (2,728,472) |
| |
Net Increase (Decrease) in Shares Outstanding | (2,992,634) |
|
|
| (2,380,458) |
| (4,066,969) |
|
|
| 2,973,646 |
| |||
Investor Sharesa |
|
|
|
|
|
|
|
|
|
|
|
|
|
| |
Shares sold |
|
| 223,741 |
|
|
| 558,093 |
| 442,792 |
|
|
| 196,148 |
| |
Shares issued for distributions reinvested |
|
| 15,096 |
|
|
| 9,395 |
| 18,765 |
|
|
| 12,025 |
| |
Shares redeemed |
|
| (298,376) |
|
|
| (547,547) |
| (364,170) |
|
|
| (246,900) |
| |
Net Increase (Decrease) in Shares Outstanding | (59,539) |
|
|
| 19,941 |
| 97,387 |
|
|
| (38,727) |
| |||
|
| ||||||||||||||
a During the period ended August 31, 2017, 219,175 Class M shares representing $2,656,057 were exchanged for 219,383 Investor shares for BNY Mellon Pennsylvania Intermediate Municipal Bond Fund and 424,713 Class M shares representing $5,338,623 were exchanged for 424,751 Investor shares for BNY Mellon Massachusetts Intermediate Municipal Bond Fund. During the period ended August 31, 2016, 557,431 Class M shares representing $6,992,789 were exchanged for 558,106 Investor shares for BNY Mellon Pennsylvania Intermediate Municipal Bond Fund and 134,145 Class M shares representing $1,755,584 were exchanged for 134,223 Investor shares for BNY Mellon Massachusetts Intermediate Municipal Bond Fund. | |||||||||||||||
See notes to financial statements. | |||||||||||||||
87
STATEMENTS OF CHANGES IN NET ASSETS (continued)
|
|
|
| BNY Mellon New York Intermediate |
| BNY Mellon Municipal |
| ||||||||
|
|
|
| Year Ended August 31, | Year Ended August 31, | ||||||||||
|
|
|
| 2017 |
|
|
| 2016 |
| 2017 |
|
|
| 2016 |
|
Operations ($): |
|
|
|
|
|
|
|
|
|
|
|
|
|
| |
Investment income—net |
|
| 4,034,042 |
|
|
| 4,593,092 |
| 41,117,090 |
|
|
| 42,709,644 |
| |
Net realized gain (loss) on investments |
| 421,108 |
|
|
| 1,954,231 |
| 16,787,864 |
|
|
| (9,838,513) |
| ||
Net unrealized appreciation (depreciation) |
| (4,670,637) |
|
|
| 4,557,161 |
| (35,288,604) |
|
|
| 47,606,727 |
| ||
Net Increase (Decrease) in Net Assets | (215,487) |
|
|
| 11,104,484 |
| 22,616,350 |
|
|
| 80,477,858 |
| |||
Distributions to Shareholders from ($): |
|
|
|
|
|
|
|
|
|
|
|
|
|
| |
Investment income—net: |
|
|
|
|
|
|
|
|
|
|
|
|
|
| |
Class M |
|
| (3,745,574) |
|
|
| (4,219,342) |
| (39,572,767) |
|
|
| (39,846,368) |
| |
Investor Shares |
|
| (279,994) |
|
|
| (343,142) |
| (1,067,663) |
|
|
| (623,308) |
| |
Net realized gain on investments: |
|
|
|
|
|
|
|
|
|
|
|
|
|
| |
Class M |
|
| (2,556,555) |
|
|
| (452,142) |
| (223,073) |
|
|
| - |
| |
Investor Shares |
|
| (209,342) |
|
|
| (43,068) |
| (3,169) |
|
|
| - |
| |
Total Distributions |
|
| (6,791,465) |
|
|
| (5,057,694) |
| (40,866,672) |
|
|
| (40,469,676) |
| |
Beneficial Interest Transactions ($): |
|
|
|
|
|
|
|
|
|
|
|
|
|
| |
Net proceeds from shares sold: |
|
|
|
|
|
|
|
|
|
|
|
|
|
| |
Class M |
|
| 22,229,807 |
|
|
| 22,940,063 |
| 365,448,364 |
|
|
| 10,802,969 |
| |
Investor Shares |
|
| 1,876,931 |
|
|
| 993,077 |
| 66,921,405 |
|
|
| 20,503,815 |
| |
Distributions reinvested: |
|
|
|
|
|
|
|
|
|
|
|
|
|
| |
Class M |
|
| 1,838,885 |
|
|
| 718,050 |
| 14,506,224 |
|
|
| 16,389,949 |
| |
Investor Shares |
|
| 419,414 |
|
|
| 339,400 |
| 942,001 |
|
|
| 396,563 |
| |
Cost of shares redeemed: |
|
|
|
|
|
|
|
|
|
|
|
|
|
| |
Class M |
|
| (39,701,418) |
|
|
| (23,482,588) |
| (188,436,751) |
|
|
| (123,224,652) |
| |
Investor Shares |
|
| (3,016,640) |
|
|
| (3,011,738) |
| (35,881,226) |
|
|
| (12,904,709) |
| |
Increase (Decrease) in Net Assets | (16,353,021) |
|
|
| (1,503,736) |
| 223,500,017 |
|
|
| (88,036,065) |
| |||
Total Increase (Decrease) in Net Assets | (23,359,973) |
|
|
| 4,543,054 |
| 205,249,695 |
|
|
| (48,027,883) |
| |||
Net Assets ($): |
|
|
|
|
|
|
|
|
|
|
|
|
|
| |
Beginning of Period |
|
| 189,375,159 |
|
|
| 184,832,105 |
| 1,110,112,760 |
|
|
| 1,158,140,643 |
| |
End of Period |
|
| 166,015,186 |
|
|
| 189,375,159 |
| 1,315,362,455 |
|
|
| 1,110,112,760 |
| |
Capital Share Transactions (Shares): |
|
|
|
|
|
|
|
|
|
|
|
|
|
| |
Class Ma |
|
|
|
|
|
|
|
|
|
|
|
|
|
| |
Shares sold |
|
| 2,005,486 |
|
|
| 2,002,590 |
| 28,499,079 |
|
|
| 812,230 |
| |
Shares issued for distributions reinvested |
|
| 167,853 |
|
|
| 62,831 |
| 1,118,271 |
|
|
| 1,238,379 |
| |
Shares redeemed |
|
| (3,584,901) |
|
|
| (2,065,435) |
| (14,607,840) |
|
|
| (9,329,500) |
| |
Net Increase (Decrease) in Shares Outstanding | (1,411,562) |
|
|
| (14) |
| 15,009,510 |
|
|
| (7,278,891) |
| |||
Investor Sharesa |
|
|
|
|
|
|
|
|
|
|
|
|
|
| |
Shares sold |
|
| 168,471 |
|
|
| 86,483 |
| 5,171,811 |
|
|
| 1,539,987 |
| |
Shares issued for distributions reinvested |
|
| 38,019 |
|
|
| 29,638 |
| 72,316 |
|
|
| 29,889 |
| |
Shares redeemed |
|
| (270,033) |
|
|
| (262,083) |
| (2,738,110) |
|
|
| (973,681) |
| |
Net Increase (Decrease) in Shares Outstanding | (63,543) |
|
|
| (145,962) |
| 2,506,017 |
|
|
| 596,195 |
| |||
|
| ||||||||||||||
a During the period ended August 31, 2017, 75,328 Class M shares representing $834,807 were exchanged for 75,294 Investor shares for BNY Mellon New York Intermediate Tax-Exempt Bond Fund and 2,139,351 Class M shares representing $27,790,102 were exchanged for 2,138,157 Investor shares for BNY Mellon Municipal Opportunities Fund. During the period ended August 31, 2016, 71,936 Class M shares representing $824,338 were exchanged for 71,891 Investor shares for BNY Mellon New York Intermediate Tax-Exempt Bond Fund and 1,544,688 Class M shares representing $20,563,879 were exchanged for 1,544,529 Investor shares for BNY Mellon Municipal Opportunities Fund. | |||||||||||||||
See notes to financial statements. | |||||||||||||||
88
FINANCIAL HIGHLIGHTS
The following tables describe the performance for each share class of each fund for the fiscal periods indicated. All information (except portfolio turnover rate) reflects financial results for a single fund share. Total return shows how much your investment in each fund would have increased (or decreased) during each period, assuming you had reinvested all dividends and distributions. These figures have been derived from the funds’ financial statements.
Class M Shares | |||||||||||||||
Year Ended August 31, | |||||||||||||||
BNY Mellon National Intermediate Municipal Bond Fund | 2017 |
| 2016 |
| 2015 |
| 2014 |
| 2013 |
| |||||
Per Share Data ($): | |||||||||||||||
Net asset value, beginning of period | 14.00 | 13.56 | 13.77 | 13.22 | 13.98 | ||||||||||
Investment Operations: | |||||||||||||||
Investment income—net a | .34 | .36 | .37 | .39 | .41 | ||||||||||
Net realized and unrealized gain (loss) on investments | (.27) | .43 | (.21) | .55 | (.73) | ||||||||||
Total from Investment Operations | .07 | .79 | .16 | .94 | (.32) | ||||||||||
Distributions: | |||||||||||||||
Dividends from investment income—net | (.34) | (.35) | (.37) | (.39) | (.39) | ||||||||||
Dividends from net realized gain on investments | (.09) | (.00) | b | - | - | (.05) | |||||||||
Total Distributions | (.43) | (.35) | (.37) | (.39) | (.44) | ||||||||||
Net asset value, end of period | 13.64 | 14.00 | 13.56 | 13.77 | 13.22 | ||||||||||
Total Return (%) | .60 | 5.94 | 1.23 | 7.18 | (2.43) | ||||||||||
Ratios/Supplemental Data (%): | |||||||||||||||
Ratio of total expenses to average net assets | .50 | .50 | .50 | .50 | .50 | ||||||||||
Ratio of net expenses to average net assets | .50 | .50 | .50 | .50 | .50 | ||||||||||
Ratio of net investment income to average net assets | 2.52 | 2.58 | 2.70 | 2.90 | 2.94 | ||||||||||
Portfolio Turnover Rate | 32.14 | 18.61 | 35.65 | 24.65 | 24.05 | ||||||||||
Net Assets, end of period ($ x 1,000) | 2,093,660 | 2,223,660 | 1,970,693 | 1,827,575 | 1,692,786 | ||||||||||
a Based on average shares outstanding.
b Amount represents less than $.01 per share.
See notes to financial statements.
89
FINANCIAL HIGHLIGHTS (continued)
Investor Shares | |||||||||||||||
Year Ended August 31, | |||||||||||||||
BNY Mellon National Intermediate Municipal Bond Fund | 2017 |
| 2016 |
| 2015 |
| 2014 |
| 2013 |
| |||||
Per Share Data ($): | |||||||||||||||
Net asset value, beginning of period | 13.99 | 13.54 | 13.75 | 13.20 | 13.97 | ||||||||||
Investment Operations: | |||||||||||||||
Investment income—net a | .31 | .32 | .34 | .36 | .37 | ||||||||||
Net realized and unrealized gain (loss) on investments | (.27) | .45 | (.22) | .54 | (.74) | ||||||||||
Total from Investment Operations | .04 | .77 | .12 | .90 | (.37) | ||||||||||
Distributions: | |||||||||||||||
Dividends from investment income—net | (.31) | (.32) | (.33) | (.35) | (.35) | ||||||||||
Dividends from net realized gain on investments | (.09) | (.00) | b | - | - | (.05) | |||||||||
Total Distributions | (.40) | (.32) | (.33) | (.35) | (.40) | ||||||||||
Net asset value, end of period | 13.63 | 13.99 | 13.54 | 13.75 | 13.20 | ||||||||||
Total Return (%) | .35 | 5.76 | .90 | 6.92 | (2.68) | ||||||||||
Ratios/Supplemental Data (%): | |||||||||||||||
Ratio of total expenses to average net assets | .75 | .75 | .75 | .75 | .75 | ||||||||||
Ratio of net expenses to average net assets | .75 | .75 | .75 | .75 | .75 | ||||||||||
Ratio of net investment income to average net assets | 2.27 | 2.33 | 2.45 | 2.65 | 2.68 | ||||||||||
Portfolio Turnover Rate | 32.14 | 18.61 | 35.65 | 24.65 | 24.05 | ||||||||||
Net Assets, end of period ($ x 1,000) | 52,216 | 55,272 | 50,199 | 42,042 | 37,095 | ||||||||||
a Based on average shares outstanding.
b Amount represents less than $.01 per share.
See notes to financial statements.
90
Class M Shares | |||||||||||||||
Year Ended August 31, | |||||||||||||||
BNY Mellon National Short-Term Municipal Bond Fund | 2017 |
| 2016 |
| 2015 |
| 2014 |
| 2013 |
| |||||
Per Share Data ($): | |||||||||||||||
Net asset value, beginning of period | 12.87 | 12.83 | 12.94 | 12.86 | 13.01 | ||||||||||
Investment Operations: | |||||||||||||||
Investment income—net a | .12 | .11 | .11 | .10 | .12 | ||||||||||
Net realized and unrealized gain (loss) on investments | (.02) | .05 | (.09) | .09 | (.15) | ||||||||||
Total from Investment Operations | .10 | .16 | .02 | .19 | (.03) | ||||||||||
Distributions: | |||||||||||||||
Dividends from investment income—net | (.12) | (.11) | (.11) | (.10) | (.12) | ||||||||||
Dividends from net realized gain on investments | (.02) | (.01) | (.02) | (.01) | - | ||||||||||
Total Distributions | (.14) | (.12) | (.13) | (.11) | (.12) | ||||||||||
Net asset value, end of period | 12.83 | 12.87 | 12.83 | 12.94 | 12.86 | ||||||||||
Total Return (%) | .76 | 1.21 | .17 | 1.37 | (.27) | ||||||||||
Ratios/Supplemental Data (%): | |||||||||||||||
Ratio of total expenses to average net assets | .51 | .51 | .50 | .50 | .50 | ||||||||||
Ratio of net expenses to average net assets | .51 | .51 | .50 | .50 | .50 | ||||||||||
Ratio of net investment income to average net assets | .94 | .84 | .82 | .77 | .89 | ||||||||||
Portfolio Turnover Rate | 35.60 | 51.47 | 34.24 | 39.43 | 41.94 | ||||||||||
Net Assets, end of period ($ x 1,000) | 889,237 | 1,104,162 | 1,007,532 | 1,244,187 | 1,181,988 | ||||||||||
a Based on average shares outstanding.
See notes to financial statements.
91
FINANCIAL HIGHLIGHTS (continued)
Investor Shares | |||||||||||||||
Year Ended August 31, | |||||||||||||||
BNY Mellon National Short-Term Municipal Bond Fund | 2017 |
| 2016 |
| 2015 |
| 2014 |
| 2013 |
| |||||
Per Share Data ($): | |||||||||||||||
Net asset value, beginning of period | 12.86 | 12.82 | 12.93 | 12.85 | 13.00 | ||||||||||
Investment Operations: | |||||||||||||||
Investment income—net a | .09 | .08 | .08 | .07 | .08 | ||||||||||
Net realized and unrealized gain (loss) on investments | (.02) | .05 | (.10) | .09 | (.15) | ||||||||||
Total from Investment Operations | .07 | .13 | (.02) | .16 | (.07) | ||||||||||
Distributions: | |||||||||||||||
Dividends from investment income—net | (.09) | (.08) | (.07) | (.07) | (.08) | ||||||||||
Dividends from net realized gain on investments | (.02) | (.01) | (.02) | (.01) | - | ||||||||||
Total Distributions | (.11) | (.09) | (.09) | (.08) | (.08) | ||||||||||
Net asset value, end of period | 12.82 | 12.86 | 12.82 | 12.93 | 12.85 | ||||||||||
Total Return (%) | .52 | .97 | (.15) | 1.20 | (.52) | ||||||||||
Ratios/Supplemental Data (%): | |||||||||||||||
Ratio of total expenses to average net assets | .76 | .76 | .76 | .76 | .76 | ||||||||||
Ratio of net expenses to average net assets | .76 | .76 | .76 | .76 | .76 | ||||||||||
Ratio of net investment income to average net assets | .72 | .60 | .59 | .52 | .63 | ||||||||||
Portfolio Turnover Rate | 35.60 | 51.47 | 34.24 | 39.43 | 41.94 | ||||||||||
Net Assets, end of period ($ x 1,000) | 13,526 | 5,880 | 12,166 | 9,696 | 4,479 | ||||||||||
a Based on average shares outstanding.
See notes to financial statements.
92
Class M Shares | |||||||||||||||
Year Ended August 31, | |||||||||||||||
BNY Mellon Pennsylvania Intermediate Municipal Bond Fund | 2017 |
| 2016 |
| 2015 |
| 2014 |
| 2013 |
| |||||
Per Share Data ($): | |||||||||||||||
Net asset value, beginning of period | 12.68 | 12.31 | 12.56 | 12.27 | 13.15 | ||||||||||
Investment Operations: | |||||||||||||||
Investment income—net a | .30 | .32 | .33 | .36 | .36 | ||||||||||
Net realized and unrealized gain (loss) on investments | (.24) | .41 | (.25) | .40 | (.79) | ||||||||||
Total from Investment Operations | .06 | .73 | .08 | .76 | (.43) | ||||||||||
Distributions: | |||||||||||||||
Dividends from investment income—net | (.30) | (.32) | (.33) | (.36) | (.36) | ||||||||||
Dividends from net realized gain on investments | (.20) | (.04) | - | (.11) | (.09) | ||||||||||
Total Distributions | (.50) | (.36) | (.33) | (.47) | (.45) | ||||||||||
Net asset value, end of period | 12.24 | 12.68 | 12.31 | 12.56 | 12.27 | ||||||||||
Total Return (%) | .55 | 5.96 | .74 | 6.31 | (3.47) | ||||||||||
Ratios/Supplemental Data (%): | |||||||||||||||
Ratio of total expenses to average net assets | .70 | .69 | .68 | .68 | .67 | ||||||||||
Ratio of net expenses to average net assets | .70 | .69 | .68 | .68 | .67 | ||||||||||
Ratio of net investment income to average net assets | 2.44 | 2.52 | 2.65 | 2.89 | 2.80 | ||||||||||
Portfolio Turnover Rate | 20.07 | 25.94 | 35.96 | 25.84 | 29.10 | ||||||||||
Net Assets, end of period ($ x 1,000) | 209,457 | 255,017 | 276,729 | 306,673 | 357,431 | ||||||||||
a Based on average shares outstanding.
See notes to financial statements.
93
FINANCIAL HIGHLIGHTS (continued)
Investor Shares | |||||||||||||||
Year Ended August 31, | |||||||||||||||
BNY Mellon Pennsylvania Intermediate Municipal Bond Fund | 2017 |
| 2016 |
| 2015 |
| 2014 |
| 2013 |
| |||||
Per Share Data ($): | |||||||||||||||
Net asset value, beginning of period | 12.67 | 12.29 | 12.54 | 12.25 | 13.14 | ||||||||||
Investment Operations: | |||||||||||||||
Investment income—net a | .27 | .28 | .30 | .33 | .33 | ||||||||||
Net realized and unrealized gain (loss) on investments | (.24) | .42 | (.25) | .39 | (.80) | ||||||||||
Total from Investment Operations | .03 | .70 | .05 | .72 | (.47) | ||||||||||
Distributions: | |||||||||||||||
Dividends from investment income—net | (.27) | (.28) | (.30) | (.32) | (.33) | ||||||||||
Dividends from net realized gain on investments | (.20) | (.04) | - | (.11) | (.09) | ||||||||||
Total Distributions | (.47) | (.32) | (.30) | (.43) | (.42) | ||||||||||
Net asset value, end of period | 12.23 | 12.67 | 12.29 | 12.54 | 12.25 | ||||||||||
Total Return (%) | .30 | 5.79 | .40 | 6.04 | (3.71) | ||||||||||
Ratios/Supplemental Data (%): | |||||||||||||||
Ratio of total expenses to average net assets | .95 | .94 | .93 | .93 | .92 | ||||||||||
Ratio of net expenses to average net assets | .95 | .94 | .93 | .93 | .92 | ||||||||||
Ratio of net investment income to average net assets | 2.20 | 2.27 | 2.41 | 2.64 | 2.58 | ||||||||||
Portfolio Turnover Rate | 20.07 | 25.94 | 35.96 | 25.84 | 29.10 | ||||||||||
Net Assets, end of period ($ x 1,000) | 5,043 | 5,981 | 5,558 | 4,437 | 4,200 | ||||||||||
a Based on average shares outstanding.
See notes to financial statements.
94
Class M Shares | |||||||||||||||
Year Ended August 31, | |||||||||||||||
BNY Mellon Massachusetts Intermediate Municipal Bond Fund | 2017 |
| 2016 |
| 2015 |
| 2014 |
| 2013 |
| |||||
Per Share Data ($): | |||||||||||||||
Net asset value, beginning of period | 13.16 | 12.73 | 12.95 | 12.62 | 13.54 | ||||||||||
Investment Operations: | |||||||||||||||
Investment income—net a | .30 | .31 | .33 | .36 | .37 | ||||||||||
Net realized and unrealized gain (loss) on investments | (.28) | .43 | (.21) | .42 | (.77) | ||||||||||
Total from Investment Operations | .02 | .74 | .12 | .78 | (.40) | ||||||||||
Distributions: | |||||||||||||||
Dividends from investment income—net | (.30) | (.31) | (.34) | (.36) | (.37) | ||||||||||
Dividends from net realized gain on investments | (.13) | - | - | (.09) | (.15) | ||||||||||
Total Distributions | (.43) | (.31) | (.34) | (.45) | (.52) | ||||||||||
Net asset value, end of period | 12.75 | 13.16 | 12.73 | 12.95 | 12.62 | ||||||||||
Total Return (%) | .24 | 5.88 | .98 | 6.21 | (3.11) | ||||||||||
Ratios/Supplemental Data (%): | |||||||||||||||
Ratio of total expenses to average net assets | .54 | .54 | .53 | .53 | .53 | ||||||||||
Ratio of net expenses to average net assets | .54 | .54 | .53 | .53 | .53 | ||||||||||
Ratio of net investment income to average net assets | 2.35 | 2.39 | 2.60 | 2.85 | 2.79 | ||||||||||
Portfolio Turnover Rate | 31.61 | 28.71 | 41.79 | 32.80 | 21.16 | ||||||||||
Net Assets, end of period ($ x 1,000) | 297,243 | 360,108 | 310,635 | 305,513 | 312,640 | ||||||||||
a Based on average shares outstanding.
See notes to financial statements.
95
FINANCIAL HIGHLIGHTS (continued)
Investor Shares | |||||||||||||||
Year Ended August 31, | |||||||||||||||
BNY Mellon Massachusetts Intermediate Municipal Bond Fund | 2017 |
| 2016 |
| 2015 |
| 2014 |
| 2013 |
| |||||
Per Share Data ($): | |||||||||||||||
Net asset value, beginning of period | 13.15 | 12.73 | 12.94 | 12.62 | 13.54 | ||||||||||
Investment Operations: | |||||||||||||||
Investment income—net a | .27 | .28 | .31 | .34 | .34 | ||||||||||
Net realized and unrealized gain (loss) on investments | (.27) | .42 | (.22) | .40 | (.77) | ||||||||||
Total from Investment Operations | - | .70 | .09 | .74 | (.43) | ||||||||||
Distributions: | |||||||||||||||
Dividends from investment income—net | (.27) | (.28) | (.30) | (.33) | (.34) | ||||||||||
Dividends from net realized gain on investments | (.13) | - | - | (.09) | (.15) | ||||||||||
Total Distributions | (.40) | (.28) | (.30) | (.42) | (.49) | ||||||||||
Net asset value, end of period | 12.75 | 13.15 | 12.73 | 12.94 | 12.62 | ||||||||||
Total Return (%) | .06 | 5.54 | .73 | 5.95 | (3.35) | ||||||||||
Ratios/Supplemental Data (%): | |||||||||||||||
Ratio of total expenses to average net assets | .79 | .79 | .78 | .78 | .78 | ||||||||||
Ratio of net expenses to average net assets | .79 | .79 | .78 | .78 | .78 | ||||||||||
Ratio of net investment income to average net assets | 2.12 | 2.15 | 2.35 | 2.60 | 2.55 | ||||||||||
Portfolio Turnover Rate | 31.61 | 28.71 | 41.79 | 32.80 | 21.16 | ||||||||||
Net Assets, end of period ($ x 1,000) | 9,395 | 8,410 | 8,632 | 9,910 | 8,261 | ||||||||||
a Based on average shares outstanding.
See notes to financial statements.
96
Class M Shares | |||||||||||||||
Year Ended August 31, | |||||||||||||||
BNY Mellon New York Intermediate Tax-Exempt Bond Fund | 2017 |
| 2016 |
| 2015 |
| 2014 |
| 2013 |
| |||||
Per Share Data ($): | |||||||||||||||
Net asset value, beginning of period | 11.62 | 11.24 | 11.40 | 11.11 | 11.92 | ||||||||||
Investment Operations: | |||||||||||||||
Investment income—net a | .26 | .29 | .30 | .31 | .30 | ||||||||||
Net realized and unrealized gain (loss) on investments | (.24) | .41 | (.16) | .46 | (.69) | ||||||||||
Total from Investment Operations | .02 | .70 | .14 | .77 | (.39) | ||||||||||
Distributions: | |||||||||||||||
Dividends from investment income—net | (.26) | (.29) | (.30) | (.31) | (.30) | ||||||||||
Dividends from net realized gain on investments | (.18) | (.03) | - | (.17) | (.12) | ||||||||||
Total Distributions | (.44) | (.32) | (.30) | (.48) | (.42) | ||||||||||
Net asset value, end of period | 11.20 | 11.62 | 11.24 | 11.40 | 11.11 | ||||||||||
Total Return (%) | .31 | 6.30 | 1.33 | 7.04 | (3.40) | ||||||||||
Ratios/Supplemental Data (%): | |||||||||||||||
Ratio of total expenses to average net assets | .73 | .72 | .71 | .71 | .70 | ||||||||||
Ratio of net expenses to average net assets | .59 | .59 | .59 | .59 | .59 | ||||||||||
Ratio of net investment income to average net assets | 2.38 | 2.53 | 2.64 | 2.79 | 2.57 | ||||||||||
Portfolio Turnover Rate | 37.78 | 36.53 | 52.79 | 36.42 | 39.32 | ||||||||||
Net Assets, end of period ($ x 1,000) | 152,923 | 175,053 | 169,337 | 172,407 | 184,657 | ||||||||||
a Based on average shares outstanding.
See notes to financial statements.
97
FINANCIAL HIGHLIGHTS (continued)
Investor Shares | |||||||||||||||
Year Ended August 31, | |||||||||||||||
BNY Mellon New York Intermediate Tax-Exempt Bond Fund | 2017 |
| 2016 |
| 2015 |
| 2014 |
| 2013 |
| |||||
Per Share Data ($): | |||||||||||||||
Net asset value, beginning of period | 11.62 | 11.24 | 11.40 | 11.12 | 11.93 | ||||||||||
Investment Operations: | |||||||||||||||
Investment income—net a | .24 | .26 | .27 | .29 | .27 | ||||||||||
Net realized and unrealized gain (loss) on investments | (.24) | .41 | (.16) | .44 | (.69) | ||||||||||
Total from Investment Operations | - | .67 | .11 | .73 | (.42) | ||||||||||
Distributions: | |||||||||||||||
Dividends from investment income—net | (.24) | (.26) | (.27) | (.28) | (.27) | ||||||||||
Dividends from net realized gain on investments | (.18) | (.03) | - | (.17) | (.12) | ||||||||||
Total Distributions | (.42) | (.29) | (.27) | (.45) | (.39) | ||||||||||
Net asset value, end of period | 11.20 | 11.62 | 11.24 | 11.40 | 11.12 | ||||||||||
Total Return (%) | .07 | 6.03 | .98 | 6.77 | (3.63) | ||||||||||
Ratios/Supplemental Data (%): | |||||||||||||||
Ratio of total expenses to average net assets | .98 | .97 | .96 | .96 | .95 | ||||||||||
Ratio of net expenses to average net assets | .84 | .84 | .84 | .84 | .84 | ||||||||||
Ratio of net investment income to average net assets | 2.13 | 2.28 | 2.39 | 2.54 | 2.32 | ||||||||||
Portfolio Turnover Rate | 37.78 | 36.53 | 52.79 | 36.42 | 39.32 | ||||||||||
Net Assets, end of period ($ x 1,000) | 13,093 | 14,322 | 15,495 | 16,428 | 17,930 | ||||||||||
a Based on average shares outstanding.
See notes to financial statements.
98
Class M Shares | |||||||||||||||
Year Ended August 31, | |||||||||||||||
BNY Mellon Municipal Opportunities Fund | 2017 |
| 2016 |
| 2015 |
| 2014 |
| 2013 |
| |||||
Per Share Data ($): | |||||||||||||||
Net asset value, beginning of period | 13.46 | 12.99 | 13.16 | 12.38 | 13.42 | ||||||||||
Investment Operations: | |||||||||||||||
Investment income—net a | .45 | .50 | .47 | .49 | .43 | ||||||||||
Net realized and unrealized gain (loss) on investments | (.32) | .45 | (.18) | 1.04 | (.92) | ||||||||||
Total from Investment Operations | .13 | .95 | .29 | 1.53 | (.49) | ||||||||||
Distributions: | |||||||||||||||
Dividends from investment income—net | (.44) | (.48) | (.46) | (.48) | (.43) | ||||||||||
Dividends from net realized gain on investments | (.00) | b | - | - | (.27) | (.12) | |||||||||
Total Distributions | (.44) | (.48) | (.46) | (.75) | (.55) | ||||||||||
Net asset value, end of period | 13.15 | 13.46 | 12.99 | 13.16 | 12.38 | ||||||||||
Total Return (%) | 1.11 | 7.40 | 2.20 | 12.88 | (3.95) | ||||||||||
Ratios/Supplemental Data (%): | |||||||||||||||
Ratio of total expenses to average net assets | .73 | .71 | .69 | .71 | .71 | ||||||||||
Ratio of net expenses to average net assets | .73 | .71 | .69 | .71 | .71 | ||||||||||
Ratio of interest and expense related to floating | .07 | .05 | .04 | .05 | .05 | ||||||||||
Ratio of net investment income to average net assets | 3.44 | 3.79 | 3.57 | 3.88 | 3.22 | ||||||||||
Portfolio Turnover Rate | 34.78 | 31.92 | 41.90 | 58.87 | 93.04 | ||||||||||
Net Assets, end of period ($ x 1,000) | 1,257,498 | 1,084,650 | 1,141,309 | 1,023,660 | 946,739 | ||||||||||
a Based on average shares outstanding.
b Amount represents less than $.01 per share.
See notes to financial statements.
99
FINANCIAL HIGHLIGHTS (continued)
Investor Shares | |||||||||||||||
Year Ended August 31, | |||||||||||||||
BNY Mellon Municipal Opportunities Fund | 2017 |
| 2016 |
| 2015 |
| 2014 |
| 2013 |
| |||||
Per Share Data ($): | |||||||||||||||
Net asset value, beginning of period | 13.46 | 12.99 | 13.16 | 12.38 | 13.43 | ||||||||||
Investment Operations: | |||||||||||||||
Investment income—net a | .41 | .47 | .43 | .46 | .40 | ||||||||||
Net realized and unrealized gain (loss) on investments | (.30) | .44 | (.18) | 1.05 | (.93) | ||||||||||
Total from Investment Operations | .11 | .91 | .25 | 1.51 | (.53) | ||||||||||
Distributions: | |||||||||||||||
Dividends from investment income—net | (.41) | (.44) | (.42) | (.46) | (.40) | ||||||||||
Dividends from net realized gain on investments | (.00) | b | - | - | (.27) | (.12) | |||||||||
Total Distributions | (.41) | (.44) | (.42) | (.73) | (.52) | ||||||||||
Net asset value, end of period | 13.16 | 13.46 | 12.99 | 13.16 | 12.38 | ||||||||||
Total Return (%) | .95 | 7.13 | 1.93 | 12.54 | (4.19) | ||||||||||
Ratios/Supplemental Data (%): | |||||||||||||||
Ratio of total expenses to average net assets | .99 | .96 | .96 | .98 | .96 | ||||||||||
Ratio of net expenses to average net assets | .99 | .96 | .96 | .98 | .96 | ||||||||||
Ratio of interest and expense related to floating | .07 | .05 | .04 | .05 | .05 | ||||||||||
Ratio of net investment income to average net assets | 3.14 | 3.55 | 3.30 | 3.67 | 2.98 | ||||||||||
Portfolio Turnover Rate | 34.78 | 31.92 | 41.90 | 58.87 | 93.04 | ||||||||||
Net Assets, end of period ($ x 1,000) | 57,865 | 25,463 | 16,832 | 5,126 | 2,947 | ||||||||||
a Based on average shares outstanding.
b Amount represents less than $.01 per share.
See notes to financial statements.
100
NOTES TO FINANCIAL STATEMENTS
NOTE 1—Significant Accounting Policies:
BNY Mellon Funds Trust (the “Trust”), a Massachusetts business trust that is registered under the Investment Company Act of 1940, as amended (the “Act”), as an open-end management investment company, operates as a series company currently consisting of twenty-five series, including the following non-diversified funds: BNY Mellon National Intermediate Municipal Bond Fund, BNY Mellon National Short-Term Municipal Bond Fund, BNY Mellon Pennsylvania Intermediate Municipal Bond Fund, BNY Mellon Massachusetts Intermediate Municipal Bond Fund, BNY Mellon New York Intermediate Tax-Exempt Bond Fund and BNY Mellon Municipal Opportunities Fund (each, a “fund” and collectively, the “funds”). The objectives of the funds are as follows: BNY Mellon National Intermediate Municipal Bond Fund and BNY Mellon National Short-Term Municipal Bond Fund seek to maximize current income exempt from federal income tax to the extent consistent with the preservation of capital. BNY Mellon Pennsylvania Intermediate Municipal Bond Fund seeks as high a level of income exempt from federal and Pennsylvania state income taxes as is consistent with the preservation of capital. BNY Mellon Massachusetts Intermediate Municipal Bond Fund seeks as high a level of income exempt from federal and Massachusetts state income taxes as is consistent with the preservation of capital. BNY Mellon New York Intermediate Tax-Exempt Bond Fund seeks as high a level of current income exempt from federal, New York state and New York city income taxes as is consistent with the preservation of capital. BNY Mellon Municipal Opportunities Fund seeks to maximize total return consisting of high current income exempt from federal income tax and capital appreciation. On December 15, 2016, BNY Mellon Municipal Opportunities Fund was reopened to new and existing investors and subsequently closed on June 30, 2017 to new and existing investors.
BNY Mellon Fund Advisers, a division of The Dreyfus Corporation (the “Manager” or “Dreyfus”), a wholly-owned subsidiary of The Bank of New York Mellon Corporation (“BNY Mellon”), serves as each fund’s investment adviser (the “Investment Adviser”). The Bank of New York Mellon, a subsidiary of BNY Mellon and an affiliate of Dreyfus, serves as administrator for the funds pursuant to an Administration Agreement with the Trust (the “Administration Agreement”). The Bank of New York Mellon has entered into a Sub-Administration Agreement with Dreyfus pursuant to which The Bank of New York Mellon pays Dreyfus for performing certain administrative services. MBSC Securities Corporation (the “Distributor”), a wholly-owned subsidiary of Dreyfus, is the distributor of each fund’s shares, which are sold without a sales charge.
Each fund is authorized to issue an unlimited number of $.001 par value shares of Beneficial Interest in each of the following classes of shares: Class M and Investor. Each class of shares has identical rights and privileges, except with respect to the Shareholder Service Plan and the expenses borne by each class, the allocation of certain transfer agency costs and certain voting rights. Income, expenses (other than expenses attributable to a specific class), and realized and unrealized gains or losses on investments are allocated to each class of shares based on its relative net assets.
The Trust accounts separately for the assets, liabilities and operations of each series. Expenses directly attributable to each series are charged to that series’ operations; expenses which are applicable to all series are allocated among them on a pro rata basis.
The Financial Accounting Standards Board (“FASB”) Accounting Standards Codification is the exclusive reference of authoritative U.S. generally accepted accounting principles (“GAAP”) recognized by the FASB to be applied by nongovernmental entities. Rules and interpretive releases of the Securities and Exchange Commission (“SEC”) under authority of federal laws are also sources of authoritative GAAP for SEC registrants. The fund’s financial statements are prepared in accordance with GAAP, which may require the use of management estimates and assumptions. Actual results could differ from those estimates.
(a) Portfolio valuation: The fair value of a financial instrument is the amount that would be received to sell an asset or paid to transfer a liability in an orderly transaction between market participants at the measurement date (i.e., the exit price). GAAP establishes a fair value hierarchy that prioritizes the inputs of valuation techniques used to measure fair value. This hierarchy gives the highest priority to unadjusted quoted prices in active markets for identical assets or liabilities (Level 1 measurements) and the lowest priority to unobservable inputs (Level 3 measurements).
Additionally, GAAP provides guidance on determining whether the volume and activity in a market has decreased significantly and whether such a decrease in activity results in transactions that are not orderly. GAAP requires enhanced disclosures around valuation inputs and techniques used during annual and interim periods.
Various inputs are used in determining the value of each fund’s investments relating to fair value measurements. These inputs are summarized in the three broad levels listed below:
Level 1—unadjusted quoted prices in active markets for identical investments.
101
NOTES TO FINANCIAL STATEMENTS (continued)
Level 2—other significant observable inputs (including quoted prices for similar investments, interest rates, prepayment speeds, credit risk, etc.).
Level 3—significant unobservable inputs (including the funds’ own assumptions in determining the fair value of investments).
The inputs or methodology used for valuing securities are not necessarily an indication of the risk associated with investing in those securities.
Changes in valuation techniques may result in transfers in or out of an assigned level within the disclosure hierarchy. Valuation techniques used to value each fund’s investments are as follows:
Investments in securities are valued each business day by an independent pricing service (the “Service”) approved by the Trust’s Board of Trustees (the “Board”). Investments for which quoted bid prices are readily available and are representative of the bid side of the market in the judgment of the Service are valued at the mean between the quoted bid prices (as obtained by the Service from dealers in such securities) and asked prices (as calculated by the Service based upon its evaluation of the market for such securities). Other investments (which constitute a majority of the portfolio securities) are carried at fair value as determined by the Service, based on methods which include consideration of the following: yields or prices of municipal securities of comparable quality, coupon, maturity and type; indications as to values from dealers; and general market conditions. All of the preceding securities are generally categorized within Level 2 of the fair value hierarchy.
The Service is engaged under the general supervision of the Board.
When market quotations or official closing prices are not readily available, or are determined not to reflect accurately fair value, such as when the value of a security has been significantly affected by events after the close of the exchange or market on which the security is principally traded, but before the funds calculate their net asset value, the funds may value these investments at fair value as determined in accordance with the procedures approved by the Board. Certain factors may be considered when fair valuing investments such as: fundamental analytical data, the nature and duration of restrictions on disposition, an evaluation of the forces that influence the market in which the securities are purchased and sold, and public trading in similar securities of the issuer or comparable issuers. These securities are either categorized within Level 2 or 3 of the fair value hierarchy depending on the relevant inputs used.
For restricted securities where observable inputs are limited, assumptions about market activity and risk are used and are generally categorized within Level 3 of the fair value hierarchy.
Futures on municipal and U.S. Treasury securities are valued at the last sales price on the securities exchange on which such securities are primarily traded or at the last sales price on the national securities market on each business day and are generally categorized within Level 1 of the fair value hierarchy.
Table 1 summarizes the inputs used as of August 31, 2017 in valuing each fund’s investments:
At August 31, 2017, there were no transfers between levels of the fair value hierarchy.
Table 1—Fair Value Measurements | |||||||||||||||||
Investments in Securities | |||||||||||||||||
Level 1—Unadjusted |
| Level 2—Other |
| Level 3—Significant Unobservable Inputs |
|
| |||||||||||
|
| Assets ($) | Liabilities ($) | Assets ($) | Liabilities ($) | Assets ($) | Liabilities ($) | Total | |||||||||
BNY Mellon National | |||||||||||||||||
Municipal Bonds† | - | - | 2,120,963,954 | - | - | - | 2,120,963,954 | ||||||||||
Other Financial Instruments: | |||||||||||||||||
Futures†† | - | (298,633) | - | - | - | - | (298,633) | ||||||||||
BNY Mellon National | |||||||||||||||||
Municipal Bonds† | - | - | 905,786,523 | - | - | - | 905,786,523 | ||||||||||
102
Table 1—Fair Value Measurements (continued) | |||||||||||||||||
Investments in Securities | |||||||||||||||||
Level 1—Unadjusted |
| Level 2—Other |
| Level 3—Significant Unobservable Inputs |
|
| |||||||||||
|
| Assets ($) | Liabilities ($) | Assets ($) | Liabilities ($) | Assets ($) | Liabilities ($) | Total | |||||||||
BNY Mellon Pennsylvania | |||||||||||||||||
Municipal Bonds† | - | - | 212,460,858 | - | - | - | 212,460,858 | ||||||||||
Other Financial Instruments: | |||||||||||||||||
Futures†† | - | (29,969) | - | - | - | - | (29,969) | ||||||||||
BNY Mellon Massachusetts | |||||||||||||||||
Municipal Bonds† | - | - | 309,933,477 | - | - | - | 309,933,477 | ||||||||||
Other Financial Instruments: | |||||||||||||||||
Futures†† | - | (42,688) | - | - | - | - | (42,688) | ||||||||||
BNY Mellon New York | |||||||||||||||||
Municipal Bonds† | - | - | 164,363,629 | - | - | - | 164,363,629 | ||||||||||
Other Financial Instruments: | |||||||||||||||||
Futures†† | - | (22,844) | - | - | - | - | (22,844) | ||||||||||
BNY Mellon Municipal | |||||||||||||||||
Municipal Bonds† | - | - | 1,352,734,140 | - | - | - | 1,352,734,140 | ||||||||||
Other Financial Instruments: | |||||||||||||||||
Futures†† | - | (712,469) | - | - | - | - | (712,469) | ||||||||||
Floating Rate Notes††† | - | - | - | (58,975,000) | - | - | (58,975,000) | ||||||||||
† See Statement of Investments for additional detailed categorizations.
†† Amount shown represents unrealized depreciation at period end.
††† Certain of the fund’s liabilities are held at carrying amount, which approximates fair value for financial reporting purposes.
(b) Securities transactions and investment income: Securities transactions are recorded on a trade date basis. Realized gains and losses from securities transactions are recorded on the identified cost basis. Interest income, adjusted for accretion of discount and amortization of premium on investments, is earned from settlement date and recognized on the accrual basis. Securities purchased or sold on a when issued or delayed delivery basis may be settled a month or more after the trade date.
BNY Mellon Pennsylvania Intermediate Municipal Bond Fund, BNY Mellon Massachusetts Intermediate Municipal Bond Fund and BNY Mellon New York Intermediate Tax-Exempt Bond Fund each follow an investment policy of investing primarily in municipal obligations of one state. Economic changes affecting the state and certain of its public bodies and municipalities may affect the ability of issuers within the state to pay interest on, or repay principal of, municipal obligations held by the funds.
(c) Dividends and distributions to shareholders: It is the policy of each fund to declare dividends daily from investment income-net. Such dividends are paid monthly. Dividends from net realized capital gains, if any, are normally declared and paid annually, but each fund may make distributions on a more frequent basis to comply with the distribution requirements of the Internal Revenue Code of 1986, as amended (the “Code”). To the extent that net realized capital gains can be offset by capital loss carryovers, it is the policy of each fund not to distribute such gains. Income and capital gain distributions are determined in accordance with income tax regulations, which may differ from GAAP.
(d) Federal income taxes: It is the policy of each fund to continue to qualify as a regulated investment company, which can distribute tax-exempt dividends, by complying with the applicable provisions of the Code, and to make distributions of income and net realized capital gain sufficient
103
NOTES TO FINANCIAL STATEMENTS (continued)
to relieve it from substantially all federal income and excise taxes. For federal income tax purposes, each fund is treated as a separate entity for the purpose of determining such qualification.
As of and during the period ended August 31, 2017, the funds did not have any liabilities for any uncertain tax positions. Each fund recognizes interest and penalties, if any, related to uncertain tax positions as income tax expense in the Statements of Operations. During the period ended August 31, 2017, the funds did not incur any interest or penalties.
Each tax year in the four-year period ended August 31, 2017 remains subject to examination by the Internal Revenue Service and state taxing authorities.
Table 2 summarizes each fund’s components of accumulated earnings on a tax basis at August 31, 2017.
Under the Regulated Investment Company Modernization Act of 2010, each fund is permitted to carry forward capital losses for an unlimited period. Furthermore, capital loss carryovers retain their character as either short-term or long-term capital losses.
Table 3 summarizes each fund’s accumulated capital loss carryover available for federal income tax purposes to be applied against future net realized capital gains, if any, realized subsequent to August 31, 2017.
Table 4 summarizes each fund’s tax character of distributions paid to shareholders during the fiscal periods ended August 31, 2017 and August 31, 2016.
Table 2—Components of Accumulated Earnings | |||||
| Undistributed | Undistributed | Accumulated | Unrealized | Capital (Losses) |
BNY Mellon National Intermediate Municipal Bond Fund | 669,489 | - | - | 88,790,482 | (2,927,237) |
BNY Mellon National Short-Term Municipal Bond Fund | 100,286 | - | (2,372,606) | 1,723,048 | - |
BNY Mellon Pennsylvania Intermediate Municipal Bond Fund | 172,466 | - | - | 6,862,811 | (207,641) |
BNY Mellon Massachusetts Intermediate Municipal Bond Fund | 10,311 | - | - | 9,672,238 | (529,475) |
BNY Mellon New York Intermediate Tax-Exempt Bond Fund | 25,262 | 53,323 | - | 6,709,512 | (386,160) |
BNY Mellon Municipal Opportunities Fund | 632,902 | 456,913 | (29,692,226) | 76,783,504 | - |
† These losses were deferred for tax purposes to the first day of the following fiscal year.
Table 3—Capital Loss Carryover | ||||||
Short-Term | Long-Term | Total($) | ||||
BNY Mellon National Short-Term Municipal Bond Fund | 2,273,704 | 98,902 | 2,372,606 | |||
BNY Mellon Municipal Opportunities Fund | 24,617,013 | 5,075,213 | 29,692,226 |
† Short-term capital losses which can be carried forward for an unlimited period.
†† Long-term capital losses which can be carried forward for an unlimited period.
Table 4—Tax Character of Distributions Paid | ||||||||
2017 | 2016 | |||||||
| Tax-Exempt | Ordinary | Long-Term |
| Tax-Exempt Income ($) | Ordinary | Long-Term | |
BNY Mellon National Intermediate Municipal Bond Fund | 53,509,362 | 3,193,470 | 11,298,183 | 54,673,461 | 121,472 | 197,392 | ||
BNY Mellon National Short-Term Municipal Bond Fund | 8,960,424 | 405,623 | 789,483 | 8,585,687 | 296,479 | 272,439 | ||
BNY Mellon Pennsylvania Intermediate Municipal Bond Fund | 5,639,243 | 263,264 | 3,514,190 | 6,909,186 | 139,845 | 728,548 | ||
BNY Mellon Massachusetts Intermediate Municipal Bond Fund | 7,408,903 | 137,940 | 2,902,056 | 8,179,079 | - | - | ||
BNY Mellon New York Intermediate Tax-Exempt Bond Fund | 4,025,568 | 712,073 | 2,053,824 | 4,562,484 | - | 495,210 | ||
BNY Mellon Municipal Opportunities Fund | 40,279,302 | 587,370 | - | 39,326,061 | 1,143,615 | - | ||
104
During the period ended August 31, 2017, as a result of permanent book to tax differences, each fund decreased accumulated undistributed investment income-net, increased (decreased) accumulated net realized gain (loss) on investments and increased paid-in capital as summarized in Table 5. These permanent book to tax differences are primarily due to the tax treatment for amortization of premiums/discounts and dividend reclassification. Net assets and net asset value per share were not affected by these reclassifications.
NOTE 2—Bank Lines of Credit:
The funds participate with other Dreyfus-managed funds in an $810 million unsecured credit facility led by Citibank, N.A. and a $300 million unsecured credit facility provided by The Bank of New York Mellon (each, a “Facility”), each to be utilized primarily for temporary or emergency purposes, including the financing of redemptions. Prior to October 5, 2016, the unsecured credit facility with Citibank, N.A. was $555 million. In connection therewith, each fund has agreed to pay its pro rata portion of commitment fees for each Facility. Interest is charged to the funds based on rates determined pursuant to the terms of the respective Facility at the time of borrowing. During the period ended August 31, 2017, the funds did not borrow under the Facilities.
NOTE 3—Investment Advisory Fee, Administration Fee and Other Transactions with Affiliates:
(a) Fees payable by the funds pursuant to the provisions of an Investment Advisory Agreement with the Investment Adviser are payable monthly, computed on the average daily value of each fund’s net assets at the following annual rates: .35% of BNY Mellon National Intermediate Municipal Bond Fund, .35% of BNY Mellon National Short-Term Municipal Bond Fund, .50% of BNY Mellon Pennsylvania Intermediate Municipal Bond Fund, .35% of BNY Mellon Massachusetts Intermediate Municipal Bond Fund, .50% of BNY Mellon New York Intermediate Tax-Exempt Bond Fund and .50% of BNY Mellon Municipal Opportunities Fund.
For BNY Mellon New York Intermediate Tax-Exempt Bond Fund, the Investment Adviser has contractually agreed from September 1, 2016 through December 31, 2017, to waive receipt of its fees and/or assume the expense of the fund so that the direct expense of neither class (excluding Shareholder Services Plan fees, taxes, interest expense, brokerage commissions, commitment fees on borrowings and extraordinary expenses) exceed .59% of the value of the fund’s average daily net assets. The reduction in expenses, pursuant to the undertaking, amounted to $230,644 during the period ended August 31, 2017.
Pursuant to the Administration Agreement, The Bank of New York Mellon provides or arranges for fund accounting, transfer agency and other fund administration services and receives a fee based on the total net assets of the Trust based on the following rates:
0 up to $6 billion .15%
$6 billion up to $12 billion .12%
In excess of $12 billion .10%
Table 5—Return of Capital Statement of Position |
|
|
|
Accumulated | Accumulated | Paid-in | |
BNY Mellon National Intermediate Municipal Bond Fund | (233,240) | 120,633 | 112,607 |
BNY Mellon National Short-Term Municipal Bond Fund | (12,948) | 21,504 | (8,556) |
BNY Mellon Pennsylvania Intermediate Municipal Bond Fund | - | 625 | (625) |
BNY Mellon Massachusetts Intermediate Municipal Bond Fund | - | 2,788 | (2,788) |
BNY Mellon New York Intermediate Tax-Exempt Bond Fund | (8,474) | (15,220) | 23,694 |
BNY Mellon Municipal Opportunities Fund | (476,660) | 399,802 | 76,858 |
105
NOTES TO FINANCIAL STATEMENTS (continued)
(b) Each fund has adopted a Shareholder Services Plan with respect to its Investor shares. Each fund pays the Distributor at an annual rate of .25% of the value of its Investor shares average daily net assets for the provision of certain services. The services provided may include personal services relating to shareholder accounts, such as answering shareholder inquiries regarding a fund and providing reports and other information, and services related to the maintenance of such shareholder accounts. The Shareholder Services Plan allows the Distributor to make payments from the shareholder services fees it collects from each fund to compensate service agents (certain banks, securities brokers or dealers and other financial institutions) with respect to these services. Table 6 summarizes the amounts Investor shares were charged during the period ended August 31, 2017, pursuant to the Shareholder Services Plan. Additional fees included in Shareholder servicing costs in the Statements of Operations primarily include fees paid for cash management charges.
Table 6—Shareholder Services Plan Fees |
|
BNY Mellon National Intermediate | $129,309 |
BNY Mellon National Short-Term | 25,944 |
BNY Mellon Pennsylvania Intermediate | 13,583 |
BNY Mellon Massachusetts Intermediate | 24,252 |
BNY Mellon New York Intermediate | 32,982 |
BNY Mellon Municipal | 85,987 |
The funds have arrangements with the transfer agent and the custodian whereby the funds may receive earnings credits when positive cash balances are maintained, which are used to offset transfer agency and custody fees. For financial reporting purposes, the funds include net earnings credits as expense offsets in the Statements of Operations.
Each fund compensates Dreyfus Transfer, Inc., a wholly-owned subsidiary of Dreyfus, under a transfer agency agreement for providing transfer agency and cash management services for the funds. The majority of transfer agency fees are comprised of amounts paid on a per account basis, while cash management fees are related to fund subscriptions and redemptions. The Bank of New York Mellon pays each fund’s transfer agent fees out of the administration fee it receives from the Trust. Table 7 summarizes the amount each fund was charged during the period ended August 31, 2017 for cash management services, which is included in Shareholder servicing costs in the Statements of Operations. Cash management fees were partially offset by earnings credits, also summarized in Table 7.
Each fund compensates The Bank of New York Mellon, under a custody agreement for providing custodial services for each fund. These fees are determined based on net assets, geographic region and transaction activity. Table 8 summarizes the amount each fund was charged during the period ended August 31, 2017 pursuant to the custody agreement.
Table 7—Cash Management Agreement Fees | |||
| Dreyfus Transfer, Inc. | Dreyfus Transfer, Inc. | |
BNY Mellon National Intermediate Municipal Bond Fund | 405 | (398) | |
BNY Mellon National Short-Term Municipal Bond Fund | 109 | (109) | |
BNY Mellon Pennsylvania Intermediate Municipal Bond Fund | 49 | (48) | |
BNY Mellon Massachusetts Intermediate Municipal Bond Fund | 154 | (152) | |
BNY Mellon New York Intermediate Tax-Exempt Bond Fund | 431 | (423) | |
BNY Mellon Municipal Opportunities Fund | 93 | (93) | |
Table 8—Custody Agreement Fees | |||
| Custody Fees ($) | Custody | |
BNY Mellon National Intermediate Municipal Bond Fund | 110,195 | - | |
BNY Mellon National Short-Term Municipal Bond Fund | 75,194 | - | |
BNY Mellon Pennsylvania Intermediate Municipal Bond Fund | 20,435 | (141) | |
BNY Mellon Massachusetts Intermediate Municipal Bond Fund | 27,825 | - | |
BNY Mellon New York Intermediate Tax-Exempt Bond Fund | 17,155 | (111) | |
BNY Mellon Municipal Opportunities Fund | 83,243 | (103) | |
106
Each fund compensates The Bank of New York Mellon under a shareholder redemptions draft processing agreement for providing certain services related to the funds’ check writing privilege. Table 9 summarizes the amount each fund was charged during the period ended August 31, 2017 for cash management services, which is included in Shareholder servicing costs in the Statements of Operations.
Table 9—The Bank of New York Mellon Cash Management Fees | |
BNY Mellon National Intermediate | $193 |
BNY Mellon National Short-Term | 45 |
BNY Mellon Pennsylvania Intermediate | 22 |
BNY Mellon Massachusetts Intermediate | 89 |
BNY Mellon New York Intermediate | 248 |
BNY Mellon Municipal | 39 |
During the period ended August 31, 2017, each fund was charged $11,281 for services performed by the Chief Compliance Officer and his staff.
Table 10 summarizes the components of “Due to The Dreyfus Corporation and affiliates” in the Statements of Assets and Liabilities for each fund.
(c) Each Board member also serves as a Board member of other funds within the Trust. Annual retainer fees and attendance fees are allocated to each fund based on net assets.
NOTE 4—Securities Transactions:
Table 11 summarizes each fund’s aggregate amount of purchases and sales of investment securities, excluding short-term securities and futures, during the period ended August 31, 2017.
Table 10—Due to The Dreyfus Corporation and Affiliates | |||||
| Investment | Shareholder | Custodian | Chief | Less Expense |
BNY Mellon National Intermediate Municipal Bond Fund | 634,350 | 11,206 | 33,988 | 4,670 | - |
BNY Mellon National Short-Term Municipal Bond Fund | 267,332 | 3,308 | 23,021 | 4,670 | - |
BNY Mellon Pennsylvania Intermediate Municipal Bond Fund | 91,419 | 1,069 | 6,869 | 4,670 | - |
BNY Mellon Massachusetts Intermediate Municipal Bond Fund | 90,950 | 2,108 | 8,147 | 4,670 | - |
BNY Mellon New York Intermediate Tax-Exempt Bond Fund | 70,276 | 2,767 | 5,889 | 4,670 | (17,540) |
BNY Mellon Municipal Opportunities Fund | 562,757 | 14,803 | 27,097 | 4,670 | - |
Table 11—Purchases and Sales | ||
| Purchases ($) | Sales ($) |
BNY Mellon National Intermediate Municipal Bond Fund | 688,558,299 | 773,328,298 |
BNY Mellon National Short-Term Municipal Bond Fund | 339,587,467 | 513,490,478 |
BNY Mellon Pennsylvania Intermediate Municipal Bond Fund | 46,117,033 | 85,141,274 |
BNY Mellon Massachusetts Intermediate Municipal Bond Fund | 97,760,541 | 135,532,186 |
BNY Mellon New York Intermediate Tax-Exempt Bond Fund | 63,995,516 | 81,289,887 |
BNY Mellon Municipal Opportunities Fund | 577,708,344 | 394,133,235 |
107
NOTES TO FINANCIAL STATEMENTS (continued)
Inverse Floater Securities: BNY Mellon Municipal Opportunities Fund participates in secondary inverse floater structures in which fixed-rate, tax-exempt municipal bonds are transferred to a trust (the “Inverse Floater Trust”). The Inverse Floater Trust typically issues two variable rate securities that are collateralized by the cash flows of the fixed-rate, tax-exempt municipal bonds. One of these variable rate securities pays interest based on a short-term floating rate set by a remarketing agent at predetermined intervals (“Trust Certificates”). A residual interest tax-exempt security is also created by the Inverse Floater Trust, which is transferred to the fund, and is paid interest based on the remaining cash flows of the Inverse Floater Trust, after payment of interest on the other securities and various expenses of the Inverse Floater Trust. An Inverse Floater Trust may be collapsed without the consent of the fund due to certain termination events such as bankruptcy, default or other credit event.
The fund accounts for the transfer of bonds to the Inverse Floater Trust as secured borrowings, with the securities transferred remaining in the fund’s investments, and the related floating rate certificate securities reflected as fund liabilities in the Statement of Assets and Liabilities.
The fund may invest in inverse floater securities on either a non-recourse or recourse basis. These securities are typically supported by a liquidity facility provided by a bank or other financial institution (the “Liquidity Provider”) that allows the holders of the Trust Certificates to tender their certificates in exchange for payment from the Liquidity Provider of par plus accrued interest on any business day prior to a termination event. When the fund invests in inverse floater securities on a non-recourse basis, the Liquidity Provider is required to make a payment under the liquidity facility due to a termination event to the holders of the Trust Certificates. When this occurs, the Liquidity Provider typically liquidates all or a portion of the municipal securities held in the Inverse Floater Trust. A liquidation shortfall occurs if the Trust Certificates exceed the proceeds of the sale of the bonds in the Inverse Floater Trust (“Liquidation Shortfall”). When a fund invests in inverse floater securities on a recourse basis, the fund typically enters into a reimbursement agreement with the Liquidity Provider where the fund is required to repay the Liquidity Provider the amount of any Liquidation Shortfall. As a result, a fund investing in a recourse inverse floater security bears the risk of loss with respect to any Liquidation Shortfall.
The average amount of borrowings outstanding under the inverse floater structure during the period ended August 31, 2017, was approximately $61,616,300 with a related weighted average annualized interest rate of 1.39%.
Derivatives: A derivative is a financial instrument whose performance is derived from the performance of another asset. Each type of derivative instrument that was held by each fund during the period ended August 31, 2017 is discussed below.
Futures: In the normal course of pursuing their investment objective, BNY Mellon National Intermediate Municipal Bond Fund, BNY Mellon Pennsylvania Intermediate Municipal Bond Fund, BNY Mellon Massachusetts Intermediate Municipal Bond Fund, BNY Mellon New York Intermediate Tax-Exempt Bond Fund and BNY Mellon Municipal Opportunities Fund are exposed to market risk, including interest rate risk, as a result of changes in value of underlying financial instruments. The funds invest in futures in order to manage their exposure to or protect against changes in the market. A futures contract represents a commitment for the future purchase or a sale of an asset at a specified date. Upon entering into such contracts, these investments require initial margin deposits with a counterparty, which consist of cash or cash equivalents. The amount of these deposits is determined by the exchange or Board of Trade on which the contract is traded and is subject to change. Accordingly, variation margin payments are received or made to reflect daily unrealized gains or losses which are recorded in the Statements of Operations. When the contracts are closed, the funds recognize a realized gain or loss which is reflected in the Statements of Operations. There is minimal counterparty credit risk to the funds with futures since they are exchange traded, and the exchange guarantees the futures against default. Futures open at August 31, 2017 are set forth in the Statements of Futures.
108
Table 12 summarizes each fund’s average market value of derivatives outstanding during the period ended August 31, 2017.
Table 12—Average Market Value of Derivatives |
|
Average | |
BNY Mellon National Intermediate | 96,743,244 |
BNY Mellon Pennsylvania Intermediate | 10,483,931 |
BNY Mellon Massachusetts Intermediate | 14,322,686 |
BNY Mellon New York Intermediate | 7,769,904 |
BNY Mellon Municipal | 258,701,736 |
Table 13 summarizes the cost of investments inclusive of derivative contracts for federal income tax purposes, gross appreciation, gross depreciation and accumulated net unrealized appreciation (depreciation) on investments inclusive of derivative contracts for each fund at August 31, 2017.
Table 13—Accumulated Net Unrealized Appreciation (Depreciation) | |||||||
| Cost of | Gross | Gross | Net ($) | |||
BNY Mellon National Intermediate Municipal Bond Fund | 2,032,173,472 | 97,601,324 | 9,109,475 | 88,491,849 | |||
BNY Mellon National Short-Term Municipal Bond Fund | 904,063,475 | 4,238,723 | 2,515,675 | 1,723,048 | |||
BNY Mellon Pennsylvania Intermediate Municipal Bond Fund | 205,598,047 | 10,600,504 | 3,767,662 | 6,832,842 | |||
BNY Mellon Massachusetts Intermediate Municipal Bond Fund | 300,261,239 | 12,660,260 | 3,030,710 | 9,629,550 | |||
BNY Mellon New York Intermediate Tax-Exempt Bond Fund | 157,654,117 | 7,143,178 | 456,510 | 6,686,668 | |||
BNY Mellon Municipal Opportunities Fund | 1,216,975,636 | 99,408,182 | 23,337,147 | 76,071,035 | |||
109
REPORT OF INDEPENDENT REGISTERED
PUBLIC ACCOUNTING FIRM
The Board of Trustees and Shareholders
BNY Mellon Funds Trust
We have audited the accompanying statements of assets and liabilities of BNY Mellon National Intermediate Municipal Bond Fund, BNY Mellon National Short-Term Municipal Bond Fund, BNY Mellon Pennsylvania Intermediate Municipal Bond Fund, BNY Mellon Massachusetts Intermediate Municipal Bond Fund, BNY Mellon New York Intermediate Tax-Exempt Bond Fund, and BNY Mellon Municipal Opportunities Fund (collectively the “Funds”), each a series of BNY Mellon Funds Trust, including the statements of investments and statements of futures (with respect to BNY Mellon National Intermediate Municipal Bond Fund, BNY Mellon Pennsylvania Intermediate Municipal Bond Fund, BNY Mellon Massachusetts Intermediate Municipal Bond Fund, BNY Mellon New York Intermediate Tax-Exempt Bond Fund, and BNY Mellon Municipal Opportunities Fund), as of August 31, 2017, and the related statements of operations and statement of cash flows (with respect to BNY Mellon Municipal Opportunities Fund) for the year then ended, the statements of changes in net assets for each of the years in the two-year period then ended and the financial highlights for each of the years in the five-year period then ended. These financial statements and financial highlights are the responsibility of the Funds’ management. Our responsibility is to express an opinion on these financial statements and financial highlights based on our audits.
We conducted our audits in accordance with the standards of the Public Company Accounting Oversight Board (United States). Those standards require that we plan and perform the audit to obtain reasonable assurance about whether the financial statements and financial highlights are free of material misstatement. An audit includes examining, on a test basis, evidence supporting the amounts and disclosures in the financial
statements. Our procedures included confirmation of securities owned as of August 31, 2017, by correspondence with the custodian and brokers or by other appropriate auditing procedures. An audit also includes assessing the accounting principles used and significant estimates made by management, as well as evaluating the overall financial statement presentation. We believe that our audits provide a reasonable basis for our opinion.
In our opinion, the financial statements and financial highlights referred to above present fairly, in all material respects, the financial position of the aforementioned funds, as of August 31, 2017, the results of their operations and cash flows (with respect to BNY Mellon Municipal Opportunities Fund) for the year then ended, the changes in their net assets for each of the years in the two-year period then ended and the financial highlights for each of the years in the five-year period then ended, in conformity with U.S. generally accepted accounting principles.

New York, New York
October 27, 2017
110
IMPORTANT TAX INFORMATION (Unaudited)
BNY Mellon National Intermediate Municipal Bond Fund
In accordance with federal tax law, the fund hereby reports all the dividends paid from investment income-net during its fiscal year ended August 31, 2017 as “exempt-interest dividends” (not generally subject to regular Federal income tax). Also, the fund reports the maximum amount allowable but not less than $.0718 per share as a capital gain dividend paid on December 29, 2016 in accordance with Section 852(b)(3)(C) of the Internal Revenue Code. Also, the fund reports the maximum amount allowable but not less than $.0203 as a short-term capital gain dividend paid on December 29, 2016 in accordance with Sections 871(k)(2) and 881(e) of the Internal Revenue Code. Where required by federal tax law rules, shareholders will receive notification of their portion of the fund’s taxable ordinary dividends (if any), capital gains distributions (if any) and tax-exempt dividends paid for the 2017 calendar year on Form 1099-DIV, which will be mailed in early 2018.
BNY Mellon National Short-Term Municipal Bond Fund
In accordance with federal tax law, the fund hereby reports all the dividends paid from investment income-net during its fiscal year ended August 31, 2017 as “exempt-interest dividends” (not generally subject to regular Federal income tax). Also, the fund reports the maximum amount allowable but not less than $.0108 per share as a capital gain dividend paid on December 29, 2016 in accordance with Section 852(b)(3)(C) of the Internal Revenue Code. Also, the fund reports the maximum amount allowable but not less than $.0056 as a short-term capital gain dividend paid on December 29, 2016 in accordance with Sections 871(k)(2) and 881(e) of the Internal Revenue Code. Where required by federal tax law rules, shareholders will receive notification of their portion of the fund’s taxable ordinary dividends (if any), capital gains distributions (if any) and tax-exempt dividends paid for the 2017 calendar year on Form 1099-DIV, which will be mailed in early 2018.
BNY Mellon Pennsylvania Intermediate Municipal Bond Fund
In accordance with federal tax law, the fund hereby reports all the dividends paid from investment income-net during its fiscal year ended August 31, 2017 as “exempt-interest dividends” (not generally subject to regular Federal income tax). Also, the fund reports the maximum amount allowable but not less than $.1826 per share as a capital gain dividend paid on December 29, 2016 in accordance with Section 852(b)(3)(C) of the Internal Revenue Code. Also, the fund reports the maximum amount allowable but not less than $.0137 as a short-term capital gain dividend paid on December 29, 2016 in accordance with Sections 871(k)(2) and 881(e) of the Internal Revenue Code. Where required by federal tax law rules, shareholders will receive notification of their portion of the fund’s taxable ordinary dividends (if any), capital gains distributions (if any) and tax-exempt dividends paid for the 2017 calendar year on Form 1099-DIV, which will be mailed in early 2018.
BNY Mellon Massachusetts Intermediate Municipal Bond Fund
In accordance with federal tax law, the fund hereby reports all the dividends paid from investment income-net during its fiscal year ended August 31, 2017 as “exempt-interest dividends” (not generally subject to regular Federal income tax). Also, the fund reports the maximum amount allowable but not less than $.1234 per share as a capital gain dividend paid on December 29, 2016 in accordance with Section 852(b)(3)(C) of the Internal Revenue Code. Also, the fund reports the maximum amount allowable but not less than $.0059 as a short-term capital gain dividend paid on December 29, 2016 in accordance with Sections 871(k)(2) and 881(e) of the Internal Revenue Code. Where required by federal tax law rules, shareholders will receive notification of their portion of the fund’s taxable ordinary dividends (if any), capital gains distributions (if any) and tax-exempt dividends paid for the 2017 calendar year on Form 1099-DIV, which will be mailed in early 2018.
BNY Mellon New York Intermediate Tax-Exempt Bond Fund
In accordance with federal tax law, the fund hereby reports all the dividends paid from investment income-net during its fiscal year ended August 31, 2017 as “exempt-interest dividends” (not generally subject to regular Federal income tax). Also, the fund reports the maximum amount allowable but not less than $.1324 per share as a capital gain dividend paid on December 29, 2016 in accordance with Section 852(b)(3)(C) of the Internal Revenue Code. Also, the fund reports the maximum amount allowable but not less than $.0458 as a short-term capital gain dividend paid on December 29, 2016 in accordance with Sections 871(k)(2) and 881(e) of the Internal Revenue Code. Where required by federal tax law rules, shareholders will receive notification of their portion of the fund’s taxable ordinary dividends (if any), capital gains distributions (if any) and tax-exempt dividends paid for the 2017 calendar year on Form 1099-DIV, which will be mailed in early 2018.
BNY Mellon Municipal Opportunities Fund
In accordance with federal tax law, the fund hereby reports all the dividends paid from investment income-net during its fiscal year ended August 31, 2017 as “exempt-interest dividends” (not generally subject to regular Federal income tax), except $361,128 that is being reported as an ordinary income distribution for reporting purposes. Also, the fund reports the maximum amount allowable but not less than $.0026 as a short-term capital gain dividend paid on December 29, 2016 in accordance with Sections 871(k)(2) and 881(e) of the Internal Revenue Code. Where required by federal tax law rules, shareholders will receive notification of their portion of the fund’s taxable ordinary dividends (if any), capital gains distributions (if any) and tax-exempt dividends paid for the 2017 calendar year on Form 1099-DIV, which will be mailed in early 2018.
111
INFORMATION ABOUT THE INFORMATION ABOUT RENEWAL OF EACH FUND’S
INVESTMENT ADVISORY AGREEMENT AND ADMINISTRATION AGREEMENT (Unaudited)
At a meeting of the Trust’s Board of Trustees held on March 6-7, 2017, the Board considered the renewal of the Trust’s Investment Advisory Agreement and Administration Agreement (together, the “Agreement”), pursuant to which BNY Mellon Fund Advisers, a division of Dreyfus, provides the funds with investment advisory services and The Bank of New York Mellon provides the funds with administrative services. The Bank of New York Mellon has entered into a Sub-Administration Agreement with Dreyfus pursuant to which The Bank of New York Mellon pays Dreyfus for performing certain of these administrative services. The Board members, none of whom are “interested persons” (as defined in the Investment Company Act of 1940, as amended) of the Trust, were assisted in their review by independent legal counsel and met with counsel in executive session separate from Dreyfus representatives. In considering the renewal of the Agreement, the Board considered all factors that it believed to be relevant, including those discussed below. The Board did not identify any one factor as dispositive, and each Board member may have attributed different weights to the factors considered.
Analysis of Nature, Extent, and Quality of Services Provided to the Funds. The Board considered information provided to them at the meeting and in previous presentations from Dreyfus representatives regarding the nature, extent, and quality of the services provided to the funds. Dreyfus provided the number of open accounts in each fund, each fund’s asset size and the allocation of fund assets among distribution channels. Dreyfus also had previously provided information regarding the diverse intermediary relationships and distribution channels of the funds (such as retail direct or intermediary, in which intermediaries typically are paid by the fund and/or Dreyfus) and Dreyfus’ corresponding need for broad, deep, and diverse resources to be able to provide ongoing shareholder services to each intermediary or distribution channel, as applicable to each fund.
The Board also considered research support available to, and portfolio management capabilities of, each fund’s portfolio management personnel and that Dreyfus also provides oversight of day-to-day fund operations, including fund accounting and administration and assistance in meeting legal and regulatory requirements. The Board also considered Dreyfus’ extensive administrative, accounting and compliance infrastructures.
Comparative Analysis of the Funds’ Performance and Management Fees and Expense Ratios. The Board reviewed reports prepared by Broadridge Financial Solutions, Inc. (“Broadridge”), an independent provider of investment company data, which included information comparing (1) the fund’s performance with the performance of a group of comparable funds (the “Performance Group”) and with a broader group of funds (the “Performance Universe”), all for various periods ended December 31, 2016, and (2) the fund’s actual and contractual management fees and total expenses with those of a group of comparable funds (the “Expense Group”) and with a broader group of funds (the “Expense Universe”), the information for which was derived in part from fund financial statements available to Broadridge as of the date of its analysis. Dreyfus previously had furnished the Board with a description of the methodology Broadridge used to select the Performance Group and Performance Universe and the Expense Group and Expense Universe.
Dreyfus representatives stated that the usefulness of performance comparisons may be affected by a number of factors, including different investment limitations that may be applicable to each fund and comparison funds. They also considered that performance generally should be considered over longer periods of time, although it is possible that long-term performance can be adversely affected by even one period of significant underperformance so that a single investment decision or theme has the ability to affect disproportionately long-term performance.
Dreyfus representatives reviewed with the Board the management or investment advisory fees (1) paid by funds advised or administered by Dreyfus that are in the same Broadridge category as the fund and (2) paid to Dreyfus or the Dreyfus-affiliated primary employer of the fund’s primary portfolio manager(s) for advising any separate accounts and/or other types of client portfolios that are considered to have similar investment strategies and policies as the fund (the “Similar Clients”), and explained the nature of the Similar Clients. They discussed differences in fees paid and the relationship of the fees paid in light of any differences in the services provided and other relevant factors. The Board considered the relevance of the fee information provided for the Similar Clients to evaluate the appropriateness of the fund’s management fee.
BNY Mellon National Intermediate Municipal Bond Fund
The Board discussed the results of the comparisons and considered that the fund’s total return performance was at or below the Performance Group medians for all periods and was above the Performance Universe medians for all periods except for the one- and three-year periods, when the fund’s performance was below the Performance Universe median. The Board also considered that the fund’s yield performance was at the Performance Group medians for eight of the ten one-year periods and above the Performance Universe medians for each of the ten one-year periods ended
112
December 31st. The Board considered the proximity of the fund’s total return to the Performance Group and/or Performance Universe median for certain periods in which the fund’s performance was below median. Dreyfus also provided a comparison of the fund’s calendar year total returns to the returns of the fund’s benchmark index.
The Board also reviewed the range of actual and contractual management fees and total expenses of the Expense Group and Expense Universe funds and discussed the results of the comparisons. The Board considered that the fund’s contractual management fee was at the Expense Group median, the fund’s actual management fee was above the Expense Group and Expense Universe medians and the fund’s total expenses were approximately equal to the Expense Group median and below the Expense Universe median.
BNY Mellon National Short-Term Municipal Bond Fund
The Board discussed the results of the comparisons and considered that the fund’s total return performance was below the Performance Group medians for all periods except for the ten-year period, when the fund’s performance was at the Performance Group median, and below the Performance Universe medians for all periods except for the one- and ten-year periods, when the fund’s performance was above the Performance Universe medians. The Board also considered that the fund’s yield performance was below the Performance Group medians for nine of the ten one-year periods and at or below the Performance Universe medians for seven of the ten one-year periods ended December 31st. The Board considered the proximity of the fund’s yield performance to the Performance Group and/or Performance Universe median for certain periods in which the fund’s performance was below median. Dreyfus also provided a comparison of the fund’s calendar year total returns to the returns of the fund’s benchmark index. The Board also received a presentation from the fund’s primary portfolio manager regarding the factors that influenced the fund’s performance results over the past year (which also impacted results for longer-term periods), including the fact that the fund’s target duration generally was shorter than those of the funds in the Performance Group and the fund typically held higher quality securities than those held by some of the funds in the Performance Group.
The Board also reviewed the range of actual and contractual management fees and total expenses of the Expense Group and Expense Universe funds and discussed the results of the comparisons. The Board considered that the fund’s contractual management fee was slightly above the Expense Group median, the fund’s actual management fee was above the Expense Group and Expense Universe medians and the fund’s total expenses were slightly above the Expense Group and Expense Universe medians.
BNY Mellon Pennsylvania Intermediate Municipal Bond Fund
The Board discussed the results of the comparisons and considered that the fund’s total return performance was below the Performance Group medians for all periods and variously above, at and below the Performance Universe medians. The Board also considered that the fund’s yield performance was at or below the Performance Group medians for seven of the ten one-year periods and above the Performance Universe medians for each of the ten one-year periods ended on December 31st. The Board also considered that there were no other funds that invested primarily in Pennsylvania municipal securities in the Performance Group and Performance Universe. Dreyfus also provided a comparison of the fund’s calendar year total returns to the returns of the fund’s benchmark index.
The Board also reviewed the range of actual and contractual management fees and total expenses of the Expense Group and Expense Universe funds and discussed the results of the comparisons. The Board considered that the fund’s contractual management fee was above the Expense Group median, the fund’s actual management fee was above the Expense Group and Expense Universe medians and the fund’s total expenses were above the Expense Group and Expense Universe medians.
BNY Mellon Massachusetts Intermediate Municipal Bond Fund
The Board discussed the results of the comparisons and considered that the fund’s total return performance was variously above, at and below the Performance Group medians (with only three or four funds in the Performance Group) and was at or above the Performance Universe medians for all periods. The Board also considered that the fund’s yield performance was above the Performance Group and Performance Universe medians for each of the ten one-year periods ended December 31st. The Board considered that the Performance Universe was comprised of funds that invested primarily in municipal securities other than Massachusetts municipal securities. Dreyfus also provided a comparison of the fund’s calendar year total returns to the returns of the fund’s benchmark index.
The Board also reviewed the range of actual and contractual management fees and total expenses of the Expense Group and Expense Universe funds and discussed the results of the
113
INFORMATION ABOUT THE INFORMATION ABOUT RENEWAL OF EACH FUND’S
INVESTMENT ADVISORY AGREEMENT AND ADMINISTRATION AGREEMENT (Unaudited) (continued)
comparisons. The Board considered that the fund’s contractual management fee was ranked second of the four funds in the Expense Group, the fund’s actual management fee was ranked fourth of the four funds (the highest) in the Expense Group and above the Expense Universe median and the fund’s total expenses were ranked first of the four funds (the lowest) in the Expense Group and below the Expense Universe median.
BNY Mellon New York Intermediate Tax-Exempt Bond Fund
The Board discussed the results of the comparisons and considered that the fund’s total return performance was at or above the Performance Group medians for all periods (with only four or five funds in the Performance Group, except for the ten-year period during which the fund was the only fund in the Performance Group), and was above the Performance Universe medians for all periods (ranking in the first quartile for all periods). The Board also considered that the fund’s yield performance was at or below the Performance Group medians for the ten most recent one-year periods ended December 31st (with only one fund in the Performance Group for the two earliest periods) and that the fund was at or above the Performance Universe medians for nine of the ten one-year periods December 31st. Dreyfus also provided a comparison of the fund’s calendar year total returns to the returns of the fund’s benchmark index.
The Board also reviewed the range of actual and contractual management fees and total expenses of the Expense Group and Expense Universe funds and discussed the results of the comparisons. The Board considered that the fund’s contractual management fee was slightly above the Expense Group median, the fund’s actual management fee was above the Expense Group and Expense Universe medians and the fund’s total expenses were slightly below the Expense Group median and at the Expense Universe median.
Dreyfus representatives stated that the investment adviser has contractually agreed to waive receipt of its fees and/or assume the expenses of the fund until December 31, 2017 so that annual direct fund operating expenses (excluding shareholder services fees, taxes, interest, brokerage commissions, commitment fees on borrowings and extraordinary expenses) do not exceed 0.59% of the fund’s average daily net assets.
BNY Mellon Municipal Opportunities Fund
The Board discussed the results of the comparisons and considered that the fund’s total return performance was above the Performance Group medians for all periods except for the one- and two-year periods, when the fund’s performance was below the Performance Group median, and at or above the Performance Universe medians for all periods except the one-year period, when the fund’s performance was below the Performance Universe median. The Board also considered that the fund’s yield performance was below the Performance Group medians for seven of the past eight one-year periods and above the Performance Universe medians for five of the past eight one-year periods ended December 31st. Dreyfus also provided a comparison of the fund’s calendar year total returns to the returns of the fund’s benchmark index and the Board considered that the fund’s performance was higher than the return of the index in five of the eight years shown.
The Board also reviewed the range of actual and contractual management fees and total expenses of the Expense Group and Expense Universe funds and discussed the results of the comparisons. The Board considered that the fund’s contractual management fee was above the Expense Group median, the fund’s actual management fee was above the Expense Group and Expense Universe medians and the fund’s total expenses were above the Expense Group and Expense Universe medians.
Analysis of Profitability and Economies of Scale. Dreyfus representatives reviewed the expenses allocated and profit received by Dreyfus and its affiliates and the resulting profitability percentage for managing each fund and the aggregate profitability percentage to Dreyfus and its affiliates for managing the fund complex, and the method used to determine the expenses and profit. The Board concluded that the profitability results were not unreasonable, given the services rendered and service levels provided by Dreyfus to each fund. The Board also considered the expense limitation arrangement for BNY Mellon New York Intermediate Tax-Exempt Bond Fund and its effect on the profitability of Dreyfus and its affiliates. The Board also had been provided with information prepared by an independent consulting firm regarding Dreyfus’ approach to allocating costs to, and determining the profitability of, individual funds and the entire Dreyfus fund complex. The consulting firm also had analyzed where any economies of scale might emerge in connection with the management of the funds.
The Board considered, on the advice of its counsel, the profitability analysis (1) as part of its evaluation of whether the fees under the Agreement, considered in relation to the mix of services provided by Dreyfus, including the nature, extent and quality of such services, supported the renewal of the Agreement and (2) in light of the relevant circumstances for the fund and the extent to which economies of scale would be realized if the fund grows and whether fee levels reflect these economies of scale for the benefit of fund
114
shareholders. Dreyfus representatives stated that a discussion of economies of scale is predicated on a fund having achieved a substantial size with increasing assets and that, if a fund’s assets had been stable or decreasing, the possibility that Dreyfus may have realized any economies of scale would be less. Dreyfus representatives also stated that, as a result of shared and allocated costs among funds in the Dreyfus fund complex, the extent of economies of scale could depend substantially on the level of assets in the complex as a whole, so that increases and decreases in complex-wide assets can affect potential economies of scale in a manner that is disproportionate to, or even in the opposite direction from, changes in a fund’s asset level. The Board also considered potential benefits to Dreyfus from acting as investment adviser and took into consideration that there were no soft dollar arrangements in effect for trading each fund’s investments.
At the conclusion of these discussions, the Board agreed that it had been furnished with sufficient information to make an informed business decision with respect to the renewal of the Agreement. Based on the discussions and considerations as described above, the Board concluded and determined as follows.
· The Board concluded that the nature, extent and quality of the services provided by Dreyfus to each fund are adequate and appropriate.
· With respect to BNY Mellon National Intermediate Municipal Bond Fund, BNY Mellon Massachusetts Intermediate Municipal Bond Fund, BNY Mellon New York Intermediate Tax-Exempt Bond Fund and BNY Mellon Municipal Opportunities Fund, the Board generally was satisfied with each fund’s overall performance.
· With respect to BNY Mellon National Short-Term Municipal Bond Fund and BNY Mellon Pennsylvania Intermediate Municipal Bond Fund, the Board accepted the performance shown in light of the considerations discussed above.
· The Board concluded that the fee paid to Dreyfus by each fund supported the renewal of the Agreement in light of the considerations described above.
· The Board determined that the economies of scale which may accrue to Dreyfus and its affiliates in connection with the management of the funds had been adequately considered by Dreyfus in connection with the fee rate charged to each fund pursuant to the Agreement and that, to the extent in the future it were determined that material economies of scale had not been shared with a fund, the Board would seek to have those economies of scale shared with the fund.
In evaluating the Agreement, the Board considered these conclusions and determinations and also relied on its previous knowledge, gained through meetings and other interactions with Dreyfus and its affiliates, of Dreyfus and the services provided to the funds by Dreyfus. The Board also relied on information received on a routine and regular basis throughout the year relating to the operations of each fund and the investment management and other services provided under the Agreement, including information on the investment performance of each fund in comparison to similar mutual funds and benchmark performance indices; general market outlook as applicable to each fund; and compliance reports. In addition, the Board’s consideration of the contractual fee arrangements for each fund had the benefit of a number of years of reviews of prior or similar agreements during which lengthy discussions took place between the Board and Dreyfus representatives. Certain aspects of the arrangements may receive greater scrutiny in some years than in others, and the Board’s conclusions may be based, in part, on their consideration of the same or similar arrangements in prior years. The Board determined to renew the Agreement.
115
BOARD MEMBERS INFORMATION (Unaudited)
INDEPENDENT BOARD MEMBERS
Patrick J. O’Connor (74)
Chairman of the Board (2000)
Principal Occupation During Past 5 Years:
Attorney, Cozen and O’Connor, P.C. since 1973, including Vice Chairman since 1980 and Chief Executive Officer and President from 2002 to 2007
No. of Portfolios for which Board Member Serves: 25
———————
John R. Alchin (69)
Board Member (2008)
Principal Occupation During Past 5 Years:
· Retired since 2007
· Executive of Comcast Corporation, a cable services provider, from 1990 to 2007, including Executive Vice-President, Co-Chief Financial Officer and Treasurer, from 2002 to 2007
Other Public Company Board Memberships During Past 5 Years:
· Polo Ralph Lauren Corporation, a retail clothing and home furnishing company, Director (2007-present)
No. of Portfolios for which Board Member Serves: 25
———————
Ronald R. Davenport (81)
Board Member (2000)
Principal Occupation During Past 5 Years:
· Chairman of Sheridan Broadcasting Corporation since July 1972
No. of Portfolios for which Board Member Serves: 25
———————
Jack Diederich (80)
Board Member (2000)
Principal Occupation During Past 5 Years:
· Retired; Executive Vice President—Chairman’s Counsel of Alcoa Inc. from 1991 to 1997
No. of Portfolios for which Board Member Serves: 25
———————
Kim D. Kelly (61)
Board Member (2008)
Principal Occupation During Past 5 Years:
· Consultant since 2005
· Chief Restructuring Officer of Allegiance Communications LLC from August 2011 to January 2013
Other Public Company Board Memberships During Past 5 Years:
· MCG Capital Corporation, a business development company, Director (2004-2015)
· Broadview Network Holdings, Inc.-Director and Chair (2011-2012)
No. of Portfolios for which Board Member Serves: 25
———————
Kevin C. Phelan (73)
Board Member (2000)
Principal Occupation During Past 5 Years:
· Mortgage Banker, Colliers International since March 1978, including,
Co-Chairman since 2010, President since 2007 and Executive Vice President and Director from March 1998 to September 2007
No. of Portfolios for which Board Member Serves: 25
———————
Patrick J. Purcell (69)
Board Member (2000)
Principal Occupation During Past 5 Years:
· Owner, President and Publisher of the Boston Herald since February 1994
President and Founder, jobfind.com, an employment search site on the world wide web, since July 1996
· President and Chief Executive Officer, Herald Media since 2001
No. of Portfolios for which Board Member Serves: 25
———————
Thomas F. Ryan, Jr. (76)
Board Member (2000)
Principal Occupation During Past 5 Years:
· Retired since April 1999
President and Chief Operating Officer of the American Stock Exchange from October 1995 to April 1999
Other Public Company Board Memberships During Past 5 Years:
· RepliGen Corporation, a biopharmaceutical company, Director (2002-present)
No. of Portfolios for which Board Member Serves: 25
———————
116
Maureen M. Young (72)
Board Member (2000)
Principal Occupation During Past 5 Years:
· Retired since 2007
Director of the Office of Government Relations at Carnegie Mellon University from January 2000 to December 2007
No. of Portfolios for which Board Member Serves: 25
———————
Once elected all Board Members serve for an indefinite term. The address of the Board Members and Officers is c/o The Dreyfus Corporation, 200 Park Avenue, New York, New York 10166. Additional information about the Board Members is available in the fund’s Statement of Additional Information which can be obtained from Dreyfus free of charge by calling this toll free number: 1-800-DREYFUS. For individual account holders for Private Wealth Management clients, please contact your account officer or call 1-866-804-5023.
117
OFFICERS OF THE TRUST (Unaudited)
PATRICK T. CROWE, President since July 2015.
National Director of Investment Advisory, Analytics and Solutions for BNY Mellon Wealth Management since July 2014; from July 2007 to July 2014, Managing Director for BNY Mellon Wealth Management's Tri-State region, comprising New York, New Jersey and Southern Connecticut. He is 53 years old and has served in various capacities with BNY Mellon since 1993.
BENNETT A. MACDOUGALL, Chief Legal Officer since October 2015.
Chief Legal Officer of the Manager and Associate General Counsel and Managing Director of BNY Mellon since June 2015; from June 2005 to June 2015, he served in various capacities with Deutsche Bank – Asset & Wealth Management Division, including as Director and Associate General Counsel, and Chief Legal Officer of Deutsche Investment Management Americas Inc. from June 2012 to May 2015. He is an officer of 64 investment companies (comprised of 155 portfolios) managed by the Manager. He is 44 years old and has been an employee of the Manager since June 2015.
JANETTE E. FARRAGHER, Vice President and Secretary since December 2011.
Associate General Counsel of BNY Mellon, and an officer of 64 investment companies (comprised of 155 portfolios) managed by the Manager. She is 54 years old and has been an employee of the Manager since February 1984.
JAMES BITETTO, Vice President and Assistant Secretary since August 2005.
Managing Counsel of BNY Mellon and Secretary of the Manager, and an officer of 64 investment companies (comprised of 155 portfolios) managed by the Manager. He is 51 years old and has been an employee of the Manager since December 1996.
JOSEPH M. CHIOFFI, Vice President and Assistant Secretary since August 2005.
Managing Counsel of BNY Mellon, and an officer of 64 investment companies (comprised of 155 portfolios) managed by the Manager. He is 55 years old and has been an employee of the Manager since June 2000.
MAUREEN E. KANE, Vice President and Assistant Secretary since April 2015.
Managing Counsel of BNY Mellon since July 2014; from October 2004 until July 2014, General Counsel, and from May 2009 until July 2014, Chief Compliance Officer of Century Capital Management. She is an officer of 64 investment companies (comprised of 155 portfolios) managed by the Manager. She is 55 years old and has been an employee of the Manager since July 2014.
SARAH S. KELLEHER, Vice President and Assistant Secretary since April 2014.
Senior Counsel of BNY Mellon, since March 2013 from August 2005 to March 2013, Associate General Counsel of Third Avenue Management. She is an officer of 64 investment companies (comprised of 155 portfolios) managed by the Manager. She is 40 years old and has been an employee of the Manager since March 2013.
JEFF PRUSNOFSKY, Vice President and Assistant Secretary since August 2015.
Senior Managing Counsel of BNY Mellon, and an officer of 64 investment companies (comprised of 155 portfolios) managed by the Manager. He is 52 years old and has been an employee of the Manager since October 1990.
NATALYA ZELENSKY, Vice President and Assistant Secretary since March 2017.
Counsel and Vice President of BNY Mellon since May 2016; Attorney at Wildermuth Endowment Strategy Fund/Wildermuth Advisory, LLC from November 2015 until May 2016; Assistant General Counsel at RCS Advisory Services from July 2014 until November 2015; Associate at Sutherland, Asbill & Brennan from January 2013 until January 2014; Associate at K&L Gates from October 2011 until January 2013. She is an officer of 64 investment companies (comprised of 155 portfolios) managed by Dreyfus. She is 32 years old and has been an employee of the Manager since May 2016.
JAMES WINDELS, Treasurer since November 2001.
Director – Mutual Fund Accounting of the Manager, and an officer of 64 investment companies (comprised of 155 portfolios) managed by the Manager. He is 58 years old and has been an employee of the Manager since April 1985.
RICHARD CASSARO, Assistant Treasurer since January 2008.
Senior Accounting Manager – Money Market, Municipal Bond and Equity Funds of the Manager, and an officer of 64 investment companies (comprised of 155 portfolios) managed by the Manager. He is 58 years old and has been an employee of the Manager since September 1982.
GAVIN C. REILLY, Assistant Treasurer since December 2005.
Tax Manager of the Investment Accounting and Support Department of the Manager, and an officer of 64 investment companies (comprised of 155 portfolios) managed by the Manager. He is 49 years old and has been an employee of the Manager since April 1991.
ROBERT S. ROBOL, Assistant Treasurer since December 2002.
Senior Accounting Manager Dreyfus Financial Reporting of the Manager, and an officer of 64 investment companies (comprised of 155 portfolios) managed by the Manager. He is 53 years old and has been an employee of the Manager since October 1988.
ROBERT SALVIOLO, Assistant Treasurer since July 2007.
Senior Accounting Manager – Equity Funds of the Manager, and an officer of 64 investment companies (comprised of 155 portfolios) managed by the Manager. He is 50 years old and has been an employee of the Manager since June 1989.
ROBERT SVAGNA, Assistant Treasurer since December 2002.
Senior Accounting Manager – Fixed Income and Equity Funds of the Manager, and an officer of 64 investment companies (comprised of 155 portfolios) managed by the Manager. He is 50 years old and has been an employee of the Manager since November 1990.
JOSEPH W. CONNOLLY, Chief Compliance Officer since October 2004.
Chief Compliance Officer of the Manager and The Dreyfus Family of Funds (64 investment companies, comprised of 155 portfolios). He is 60 years old and has served in various capacities with the Manager since 1980, including manager of the firm’s Fund Accounting Department from 1997 through October 2001.
CARIDAD M. CAROSELLA, Ant-Money Laudering Compliance Officer January 2016.
Anti-Money Laundering Compliance Officer of the Dreyfus Family of Funds and BNY Mellon Funds Trust since January 2016; from May 2015 to December 2015, Interim Anti-Money Laundering Compliance Officer of the Dreyfus Family of Funds and BNY Mellon Funds Trust and the Distributor; from January 2012 to May 2015, AML Surveillance Officer of the Distributor and from 2007 to December 2011, Financial Processing Manager of the Distributor. She is an officer of 59 investment companies (comprised of 150 portfolios) managed by the Manager. She is 49 years old and has been an employee of the Distributor since 1997.
118
NOTES
119
The BNY Mellon Funds
c/o The Dreyfus Corporation
200 Park Avenue
New York, NY 10166
Investment Adviser
BNY Mellon Fund Advisers, a division of
The Dreyfus Corporation
200 Park Avenue
New York, NY 10166
Administrator
The Bank of New York Mellon
225 Liberty Street
New York, NY 10286
Sub-Administrator
The Dreyfus Corporation
200 Park Avenue
New York, NY 10166
Custodian
The Bank of New York Mellon
225 Liberty Street
New York, NY 10286
Transfer Agent &
Dividend Disbursing Agent
Dreyfus Transfer, Inc.
200 Park Avenue
New York, NY 10166
Distributor
MBSC Securities Corporation
200 Park Avenue
New York, NY 10166
Ticker Symbols: | ||||||||
BNY Mellon National Intermediate Municipal Bond Fund | Class M: MPNIX | Investor: MINMX | ||||||
BNY Mellon National Short-Term Municipal Bond Fund | Class M: MPSTX | Investor: MINSX | ||||||
BNY Mellon Pennsylvania Intermediate Municipal Bond Fund | Class M: MPPIX | Investor: MIPAX | ||||||
BNY Mellon Massachusetts Intermediate Municipal Bond Fund | Class M: MMBMX | Investor: MMBIX | ||||||
BNY Mellon New York Intermediate Tax-Exempt Bond Fund | Class M: MNYMX | Investor: MNYIX | ||||||
BNY Mellon Municipal Opportunities Fund | Class M: MOTMX | Investor: MOTIX | ||||||
Telephone Wealth Management (WM) Clients, please contact your Account Officer or call 1-866-804-5023. Brokerage Clients of BNY Mellon Wealth Advisors (BNYMWA), please contact your financial representative or call 1-800-830-0549, Option 2 for BNY Mellon Wealth Management Direct or 1-800-843-5466 for former brokerage clients of BNY Mellon Wealth Advisors whose accounts are now held by Dreyfus Brokerage Services. Individual Account holders, please call Dreyfus at 1-800-DREYFUS.
Mail WM clients, write to your Account Officer, c/o The Bank of New York Mellon, One Mellon Bank Center, Pittsburgh, PA 15258
BNYMWA Brokerage Clients, write to your financial representative, P.O. Box 9012, Hicksville, NY 11802-9012
Individual Account Holders, write to: BNY Mellon Funds, P.O. Box 9879, Providence, RI 02940-8079
Each fund files its complete schedule of portfolio holdings with the Securities and Exchange Commission (“SEC”) for the first and third quarters of each fiscal year on Form N-Q. The fund’s Forms N-Q are available on the SEC’s website at http://www.sec.gov and may be reviewed and copied at the SEC’s Public Reference Room in Washington, DC. Information on the operation of the Public Reference Room may be obtained by calling 1-800-SEC-0330.
A description of the policies and procedures that the fund uses to determine how to vote proxies relating to portfolio securities, and information regarding how the fund voted these proxies for the most recent 12-month period ended June 30 is available at http://www.dreyfus.com and on the SEC’s website at http://www.sec.gov. The description of the policies and procedures is also available without charge, upon request, by calling 1-800-DREYFUS.
© 2017 MBSC Securities Corporation | MFTAR0817-MB |
The BNY Mellon Funds
BNY Mellon Government Money Market Fund
BNY Mellon National Municipal Money Market Fund
ANNUAL REPORT August 31, 2017 | |
| |

Contents
THE FUNDS
Investment Advisory Agreement and Administration Agreement | |
FOR MORE INFORMATION
Back Cover
The views expressed herein are current to the date of this report. These views and the composition of the funds’ portfolios are subject to change at any time based on market and other conditions. |
Not FDIC-Insured • Not Bank-Guaranteed • May Lose Value |
The Funds |
Dear Shareholder:
We are pleased to present this annual report for BNY Mellon Funds Trust, covering the 12-month period from September 1, 2016 through August 31, 2017. For information about how the fund performed during the reporting period, as well as general market perspectives, we provide a Discussion of Fund Performance on the pages that follow.
Stocks set a series of new record highs and bonds produced mixed results over the past year in response to changing economic and political conditions. Financial markets during the final months of 2016 were dominated by the election of a new U.S. presidential administration. Equities surged higher in anticipation of more business-friendly regulatory, tax, and fiscal policies, but high-quality bonds generally lost value due to expectations of rising interest rates and accelerating inflation in a stronger economy. Despite a series of short-term interest-rate hikes, bonds recovered over the first eight months of 2017 when it became clearer that major tax and fiscal reforms would take time and political capital to enact. Stocks continued to rally, led by large growth-oriented companies, as corporate earnings grew and global economic conditions improved.
The markets’ recent strong performance has been supported by solid underlying fundamentals. While we currently expect these favorable conditions to persist, we remain watchful for economic and political developments that could derail the rallies. As always, we encourage you to discuss the risks and opportunities of today’s investment environment with your financial advisor.
Sincerely,

Patrick T. Crowe
President
BNY Mellon Funds Trust
September 15, 2017
3
DISCUSSION OF FUND PERFORMANCE
For the period from September 1, 2016 through August 31, 2017, as provided by Patricia A. Larkin, Senior Portfolio Manager
Market and Fund Performance Overview
For the 12-month period ended August 31, 2017, BNY Mellon Government Money Market Fund’s Class M shares produced a yield of 0.38%, and its Investor shares produced a yield of 0.18%. Taking into account the effects of compounding, the fund’s Class M shares and Investor shares produced effective yields of 0.38% and 0.18%, respectively.1
Yields of money market instruments climbed over the reporting period when the Federal Reserve Board (the “Fed”) implemented three increases in short-term interest rates and investors looked forward to higher levels of economic growth.
The Fund’s Investment Approach
The fund seeks as high a level of current income as is consistent with the preservation of capital and the maintenance of liquidity. To pursue its goal, the fund, which is a “government money market fund,” is required to invest at least 99.5% of its total assets in securities issued or guaranteed as to principal and interest by the U.S. government or its agencies or instrumentalities, repurchase agreements collateralized solely by cash and/or government securities, and cash. The securities in which the fund invests include those backed by the full faith and credit of the U.S. government, and those that are neither insured nor guaranteed by the U.S. government. The fund normally invests at least 80% of its net assets, plus any borrowings for investment purposes, in government securities and/or repurchase agreements collateralized solely by government securities.
Three Increases in Short-Term Interest Rates
The reporting period began with positive economic news as U.S. GDP growth and the labor market strengthened, 249,000 new jobs were added in September and the unemployment rate stood at 5.0%. In October, the unemployment rate slid to 4.9% as an estimated 124,000 jobs were created. November saw the election of a new presidential administration, and investors looked forward to more stimulative fiscal, tax, and regulatory policies. Consumer confidence rose, and the unemployment rate slid to 4.6% while 164,000 new jobs were created. The Federal Reserve Board (the “Fed”) implemented a long-awaited short-term interest-rate hike in December, raising the overnight federal funds rate to between 0.50% and 0.75%. In that month, 155,000 jobs were created, and the unemployment rate ticked up to end 2016 at 4.7%. The U.S. economy grew at a 2.1% annualized rate during the fourth quarter of 2016.
In January 2017, the economy added 216,000 new jobs, but the unemployment rate rose to 4.8%. Meanwhile, both manufacturing and non-manufacturing activity continued to expand. February saw the addition of 232,000 jobs and a decrease in the unemployment rate to 4.7%. Corporate earnings exceeded analysts’ expectations, and consumer and business confidence remained strong. March brought another short-term interest-rate hike from the Fed, which sent the federal funds rate to between 0.75% and 1.00%. Although the unemployment rate fell to 4.5%, job creation declined to 50,000 new positions. U.S. economic growth slowed to a 1.2% annualized rate over the first quarter of the year.
In April, consumer confidence moderated as investors realized that proposed legislative reforms from the new administration were far from certain. U.S. manufacturing activity slowed, but corporate earnings continued to exceed forecasts, and the labor market rebounded with 207,000 new jobs and an unemployment rate of 4.4%. In May, only 145,000 new jobs were created, but the unemployment rate slid further to 4.3%, a 16-year low, as older workers retired. Wage growth generally remained steady, increasing at a rate that was roughly in line with inflation. The unemployment rate in June ticked higher to 4.4% and 210,000 new jobs were added. Fifteen of 18 manufacturing industries reported growth, and the services sector also posted gains. Yet, inflation remained muted as energy prices fell. Nonetheless, the Fed again raised short-term interest rates, raising the federal funds rate to between 1.00% and 1.25%. The U.S. economy grew at a 3.0% annualized rate over the second quarter of 2017.
The Fed held interest rates steady at its meeting in July. The economy generated 189,000 new jobs, and the unemployment rate slid to 4.3%. The manufacturing and services sectors continued to grow, but at slower rates than in the previous month. In August, an estimated 156,000 jobs were added, and the unemployment rate returned to 4.4%. Import prices and housing starts exceeded forecasts, but retail sales generally disappointed.
Additional Rate Hikes Expected
Despite signs that fiscal and tax reforms may be more difficult to enact than previously anticipated, investors have continued to respond positively to expectations of greater economic growth. Recent comments from members of its Board of Governors suggest that the Fed will further moderate its accommodative monetary policy by beginning to unwind its balance sheet. In addition, many analysts expect the Fed to implement another interest-rate increase before year-end.
In this environment, we have continued to maintain the fund’s weighted-average maturity in a range that is modestly shorter than industry averages. This strategy seeks to capture higher yields as they become available. As always, we have retained our longstanding focus on quality and liquidity.
September 15, 2017
1 Effective yield is based upon dividends declared daily and reinvested monthly. Past performance is no guarantee of future results. Yields fluctuate. Yields for Investor shares provided reflect the absorption of certain fund expenses by the investment adviser pursuant to an undertaking, which is voluntary and temporary, not contractual, and that can be terminated at any time without notice. Had these expenses not been absorbed, Investor shares’ yields would have been lower, and in some cases, seven-day yields during the reporting period would have been negative absent the expense absorption.
You could lose money by investing in a money market fund. Although the fund seeks to preserve the value of your investment at $1.00 per share, it cannot guarantee it will do so. An investment in the fund is not insured or guaranteed by the Federal Deposit Insurance Corporation or any other government agency. The fund’s sponsor has no legal obligation to provide financial support to the fund, and you should not expect that the sponsor will provide financial support to the fund at any time.
4
For the period from September 1, 2016 through August 31, 2017, as provided by Joseph Irace, Senior Portfolio Manager
Market and Fund Performance Overview
For the 12-month period ended August 31, 2017, BNY Mellon National Municipal Money Market Fund’s Class M shares produced a yield of 0.44%, and Investor shares produced a yield of 0.19%. Taking into account the effects of compounding, the fund’s Class M and Investor shares also produced effective yields of 0.44% and 0.19%, respectively.1
Yields of municipal money market instruments generally rose during the reporting period as the Federal Reserve Board (the “Fed”) implemented three increases in the federal funds rate. Supply-and-demand dynamics also contributed to the performance of tax-exempt money market instruments.
The Fund’s Investment Approach
The fund seeks as high a level of current income exempt from federal income tax as is consistent with the preservation of capital and maintenance of liquidity. To pursue its goal, the fund invests at least 80% of its net assets in short-term, high-quality municipal obligations that provide income exempt from federal income tax. Among these are municipal notes, short-term municipal bonds, tax-exempt commercial paper, and municipal leases. The fund may invest up to 20% of its total assets in taxable money market securities, such as U.S. government obligations, U.S. and foreign bank and corporate obligations, and commercial paper. The fund also may invest in custodial receipts.
Higher Rates and Robust Demand Drove Market
Yields of tax-exempt money market instruments moved higher early in the reporting period when investor demand moderated in anticipation of money market reforms scheduled to take effect in October 2016. At the same time, issuance volumes increased, putting additional upward pressure on short-term yields. Yields continued to climb after investors reacted to the results of the presidential election in November 2016 and anticipated a long-awaited rate hike from the Fed in December.
However, tax-exempt money market yields moderated over the opening months of 2017 in response to steady municipal note issuance and strong investor demand. In the spring, strong asset inflows into short-term bond funds and separately managed accounts further depressed yields of longer-dated notes, while two more short-term interest-rate hikes from the Fed caused yields to rise on shorter-maturity instruments, most notably variable-rate demand notes (“VRDNs”) on which yields are reset weekly. As a result, yield differences narrowed substantially along the market’s maturity spectrum, and yields of one-year notes recently have roughly matched those of seven-day VRDNs.
Over most of the reporting period, short-term tax-exempt instruments provided attractive after-tax yields compared to their taxable counterparts, supporting demand from investors that traditionally have not participated in the municipal money markets.
We have begun to see some deterioration in municipal credit quality after several years of generally sound fiscal conditions. Several states and municipalities have encountered difficulty in balancing their budgets due to stalled growth in tax receipts. States with underfunded pension programs and those whose economies rely on energy production also have faced greater credit pressures.
Maintaining a Prudent Investment Posture
In this environment, most municipal money market funds maintained short weighted-average maturities with a focus on liquidity. The fund was no exception, as we set its weighted-average maturity in a range that is consistent with industry averages.
We have also maintained a careful and well-researched credit selection strategy. We have continued to identify what we believe to be low-credit-risk opportunities among certain state general obligation bonds; essential service revenue bonds issued by water, sewer, and electric enterprises; select local credits with strong financial positions and stable tax bases; and various health care and education issuers.
Additional Rate Hikes Expected
After three interest-rate hikes earlier in the reporting period, the Fed left its target for the federal funds rate unchanged—between 1.00% and 1.25%—at its meetings in July and September. Still, Fed officials indicated that continued economic growth and a robust labor market could lead to an additional interest-rate increase before the end of 2017. The Fed also indicated that it would begin to “normalize” its balance sheet through the sale of U.S. government securities as it continues to back away from an aggressively accommodative monetary policy.
In light of these developments, we intend to emphasize liquidity in seeking to capture higher yields as short-term interest rates rise. In addition, we are aware that persistently subdued inflationary pressures have kept the Consumer Price Index (“CPI”) below the Fed’s target of an annualized 2% rate. Therefore, we believe that interest-rate hikes over the foreseeable future are likely to be gradual, and a focus on preservation of capital and liquidity remains the prudent course for the fund’s management.
September 15, 2017
1 Effective yield is based upon dividends declared daily and reinvested monthly. Past performance is no guarantee of future results. Yields fluctuate.
You could lose money by investing in a money market fund. Although the fund seeks to preserve the value of your investment at $1.00 per share, it cannot guarantee it will do so. The fund may impose a fee upon the sale of your shares or may temporarily suspend your ability to sell shares if the fund’s liquidity falls below required minimums because of market conditions or other factors. An investment in the fund is not insured or guaranteed by the Federal Deposit Insurance Corporation or any other government agency. The fund’s sponsor has no legal obligation to provide financial support to the fund, and you should not expect that the sponsor will provide financial support to the fund at any time.
Short-term corporate, asset-backed securities holdings and municipal securities holdings (as applicable), while rated in the highest rating category by one or more nationally recognized statistical rating organizations (or unrated, if deemed of comparable quality by Dreyfus), involve credit and liquidity risks and risk of principal loss.
5
UNDERSTANDING YOUR FUND’S EXPENSES (Unaudited)
As a mutual fund investor, you pay ongoing expenses, such as management fees and other expenses. Using the information below, you can estimate how these expenses affect your investment and compare them with the expenses of other funds. You also may pay one-time transaction expenses, including sales charges (loads) and redemption fees, which are not shown in this section and would have resulted in higher total expenses. For more information, see your fund’s prospectus or talk to your financial adviser.
Review your fund’s expenses
The table below shows the expenses you would have paid on a $1,000 investment in each class of each fund from March 1, 2017 to August 31, 2017. It also shows how much a $1,000 investment would be worth at the close of the period, assuming actual returns and expenses.
Expenses and Value of a $1,000 Investment |
|
|
|
|
|
|
|
|
|
|
| |||||||
assuming actual returns for the six months ended August 31, 2017 | ||||||||||||||||||
|
|
|
|
|
| Class M |
|
|
| Investor Shares |
| |||||||
BNY Mellon Government Money Market Fund | ||||||||||||||||||
Expenses paid per $1,000† | $1.57 | $2.83 | ||||||||||||||||
Ending value (after expenses) | $1,003.00 | $1,001.70 | ||||||||||||||||
Annualized expense ratio (%) | .31 | .56 | ||||||||||||||||
BNY Mellon National Municipal Money Market Fund | ||||||||||||||||||
Expenses paid per $1,000† | $1.56 | $2.82 | ||||||||||||||||
Ending value (after expenses) | $1,002.50 | $1,001.30 | ||||||||||||||||
Annualized expense ratio (%) | .31 | .56 | ||||||||||||||||
COMPARING YOUR FUND’S EXPENSES
WITH THOSE OF OTHER FUNDS (Unaudited)
Using the SEC’s method to compare expenses
The Securities and Exchange Commission (SEC) has established guidelines to help investors assess fund expenses. Per these guidelines, the table below shows your fund’s expenses based on a $1,000 investment, assuming a hypothetical 5% annualized return. You can use this information to compare the ongoing expenses (but not transaction expenses or total cost) of investing in the fund with those of other funds. All mutual fund shareholder reports will provide this information to help you make this comparison. Please note that you cannot use this information to estimate your actual ending account balance and expenses paid during the period.
Expenses and Value of a $1,000 Investment |
|
|
|
|
|
|
|
|
| |||||||||
assuming a hypothetical 5% annualized return for the six months ended August 31, 2017 | ||||||||||||||||||
|
|
|
|
|
| Class M |
|
|
| Investor Shares |
| |||||||
BNY Mellon Government Money Market Fund | ||||||||||||||||||
Expenses paid per $1,000† |
| $1.58 | $2.85 | |||||||||||||||
Ending value (after expenses) | $1,023.64 | $1,022.38 | ||||||||||||||||
Annualized expense ratio (%) | .31 | .56 | ||||||||||||||||
BNY Mellon National Municipal Money Market Fund | ||||||||||||||||||
Expenses paid per $1,000† | $1.58 | $2.85 | ||||||||||||||||
Ending value (after expenses) | $1,023.64 | $1,022.38 | ||||||||||||||||
Annualized expense ratio (%) | .31 | .56 | ||||||||||||||||
† Expenses are equal to each fund’s annualized expense ratios as shown above, multiplied by the average account value over the period, multiplied by 184/365 (to reflect the one-half year period).
6
STATEMENT OF INVESTMENTS
August 31, 2017
BNY Mellon Government Money Market Fund | |||||||
Description | Annualized Yield on Date of Purchase (%) | Principal Amount($) | Value($) | ||||
U.S. Government Agencies - 45.4% | |||||||
Federal Farm Credit Bank: | |||||||
9/1/17, FFE+1 | 1.15 | 5,000,000 | a | 5,001,234 | |||
9/1/17, PRIME-312 | 1.18 | 15,000,000 | a | 15,002,644 | |||
9/1/17, FFE+17 | 1.33 | 10,000,000 | a | 9,998,304 | |||
9/1/17, 1 LIBOR+15 | 1.38 | 5,000,000 | a | 5,014,472 | |||
9/1/17, PRIME-290 | 1.42 | 20,000,000 | a | 19,987,072 | |||
9/3/17, 1 LIBOR+5 | 1.28 | 10,000,000 | a | 10,000,000 | |||
9/29/17, 1 LIBOR+11.5 | 1.36 | 5,000,000 | a | 5,000,567 | |||
Federal Home Loan Bank: | |||||||
9/1/17, 1 LIBOR+17.6 | 1.06 | 50,000,000 | a | 50,000,000 | |||
9/8/17 | 1.01 | 50,000,000 | 49,990,181 | ||||
9/9/17, 1 LIBOR-4 | 1.19 | 25,000,000 | a | 25,000,006 | |||
9/12/17, 1 LIBOR-7 | 1.16 | 5,000,000 | a | 5,000,000 | |||
9/13/17 | 1.03 | 30,000,000 | 29,989,700 | ||||
9/17/17, 1 LIBOR-12 | 1.11 | 5,000,000 | a | 5,000,000 | |||
9/28/17, 1 LIBOR | 1.23 | 50,000,000 | a | 50,000,000 | |||
11/10/17 | 1.05 | 20,000,000 | 19,959,167 | ||||
2/9/18 | 1.14 | 20,000,000 | 19,898,749 | ||||
Total U.S. Government Agencies (cost $324,842,096) | 324,842,096 | ||||||
Description | |||||||
U.S. Treasury Bills - 9.0% | |||||||
1/2/18 | 1.04 | 15,000,000 | 14,946,700 | ||||
1/11/18 | 1.12 | 50,000,000 | 49,796,500 | ||||
Total U.S. Treasury Bills (cost $64,743,200) | 64,743,200 | ||||||
Description | |||||||
U.S. Treasury Floating Rate Notes - 2.0% | |||||||
9/1/17, 3 MONTH T-BILL+7 | 1.08 | 5,000,000 | a | 5,001,243 | |||
9/1/17, 3 MONTH T-BILL+14 | 1.15 | 9,000,000 | a | 9,001,917 | |||
Total U.S. Treasury Floating Rate Notes (cost $14,003,160) | 14,003,160 | ||||||
Description | |||||||
U.S. Treasury Notes - 3.5% | |||||||
9/30/17 | 0.79 | 25,000,000 | 24,996,004 | ||||
Description | |||||||
Repurchase Agreements - 42.2% | |||||||
ABN AMRO Bank | 1.06 | 50,000,000 | 50,000,000 | ||||
Tri-Party Agreement thru BNY Mellon, 1.06%, dated 8/31/17, due 9/1/17 in the amount of $50,001,472 (fully collateralized by $50,952,340 U.S. Treasuries, 0.88% -2.25%, due 11/30/18-11/15/25, Value $51,000,005) | |||||||
Bank of Nova Scotia | 1.06 | 32,000,000 | 32,000,000 | ||||
Tri-Party Agreement thru BNY Mellon, 1.06%, dated 8/31/17, due 9/1/17 in the amount of $32,000,942 (fully collateralized by $31,169,066 U.S. Treasuries (including strips), 0%-4.38%, due 9/14/17-11/15/43, Value $32,640,001) | |||||||
BNP Paribas | 1.05 | 55,000,000 | 55,000,000 | ||||
Tri-Party Agreement thru BNY Mellon, 1.05%, dated 8/31/17, due 9/1/17 in the amount of $55,001,604 (fully collateralized by $56,329,400 U.S. Treasuries, 1.38%, due 1/31/21, Value $56,100,043) | |||||||
Credit Agricole CIB | 1.05 | 70,000,000 | 70,000,000 | ||||
Tri-Party Agreement thru BNY Mellon, 1.05%, dated 8/31/17, due 9/1/17 in the amount of $70,002,042 (fully collateralized by $68,061,415 U.S. Treasuries, 1.38%-3%, due 1/15/18-5/15/45, Value $71,400,001) | |||||||
7
STATEMENT OF INVESTMENTS (continued)
BNY Mellon Government Money Market Fund (continued) | |||||||
Description | Annualized Yield on Date of Purchase (%) | Principal Amount($) | Value($) | ||||
Repurchase Agreements - 42.2% (continued) | |||||||
TD Securities (USA) LLC | 1.06 | 95,000,000 | 95,000,000 | ||||
Tri-Party Agreement thru BNY Mellon, 1.06%, dated 8/31/17, due 9/1/17 in the amount of $95,002,797 (fully collateralized by $119,136,900 U.S. Treasuries (including strips), 0%-3.63%, due 1/15/18-2/15/44, Value $96,900,034) | |||||||
Total Repurchase Agreements (cost $302,000,000) | 302,000,000 | ||||||
Total Investments (cost $730,584,460) | 102.1% | 730,584,460 | |||||
Liabilities, Less Cash and Receivables | (2.1%) | (14,874,962) | |||||
Net Assets | 100.0% | 715,709,498 | |||||
FFE—Federal Fund Effected
LIBOR—London Interbank Offered Rate
PRIME—Prime Lending Rate
a Variable rate security—rate shown is the interest rate in effect at period end. Date shown represents the earlier of the next interest reset date or ultimate maturity date.
Portfolio Summary (Unaudited) † | Value (%) |
Repurchase Agreements | 42.2 |
Federal Home Loan Bank | 35.6 |
Federal Farm Credit Bank | 9.8 |
U.S Treasury Bills | 9.0 |
U.S. Treasury Notes | 3.5 |
U.S. Treasury Floating Rate Notes | 2.0 |
102.1 |
† Based on net assets.
See notes to financial statements.
8
BNY Mellon National Municipal Money Market Fund | |||||||||||
Description | Coupon | Maturity | Principal | Value ($) | |||||||
Short-Term Investments - 100.8% | |||||||||||
Alabama - 2.8% | |||||||||||
Chatom Industrial Development Board, | 0.91 | 9/7/17 | 17,700,000 | a,b | 17,700,000 | ||||||
Alaska - 1.8% | |||||||||||
Tender Option Bond Trust Receipts (Series 2017-XL0044), | 0.89 | 9/7/17 | 6,750,000 | a,b,c,d | 6,750,000 | ||||||
Tender Option Bond Trust Receipts (Series 2017-XM0532), | 0.89 | 9/7/17 | 4,665,000 | a,b,c,d | 4,665,000 | ||||||
11,415,000 | |||||||||||
Arizona - 3.7% | |||||||||||
Casa Grande Industrial Development Authority, | 0.86 | 9/7/17 | 2,010,000 | a,b | 2,010,000 | ||||||
Phoenix Industrial Development Authority, | 0.89 | 9/7/17 | 1,140,000 | a | 1,140,000 | ||||||
RBC Municipal Products Trust, | 0.82 | 9/7/17 | 20,000,000 | a,c,d | 20,000,000 | ||||||
23,150,000 | |||||||||||
Arkansas - .8% | |||||||||||
Benton County Public Facilities Board, | 0.84 | 9/7/17 | 4,890,000 | a,b | 4,890,000 | ||||||
California - 7.4% | |||||||||||
California Enterprise Development Authority, | 0.84 | 9/7/17 | 6,585,000 | a,b | 6,585,000 | ||||||
California Enterprise Development Authority, | 0.86 | 9/7/17 | 6,340,000 | a,b | 6,340,000 | ||||||
California Enterprise Development Authority, | 0.84 | 9/7/17 | 14,500,000 | a,b | 14,500,000 | ||||||
California Infrastructure and Economic Development Bank, | 0.84 | 9/7/17 | 515,000 | a,b | 515,000 | ||||||
California Pollution Control Financing Authority, | 0.91 | 9/7/17 | 2,900,000 | a,b | 2,900,000 | ||||||
California Statewide Communities Development Authority, | 0.88 | 9/7/17 | 1,000,000 | a,b | 1,000,000 | ||||||
RIB Floater Trust (Series 2017-004), | 0.87 | 9/7/17 | 14,000,000 | a,c,d | 14,000,000 | ||||||
Tender Option Bond Trust Receipts/Certificates Various States, | 0.82 | 9/7/17 | 200,000 | a,b,c,d | 200,000 | ||||||
46,040,000 | |||||||||||
Colorado - 1.0% | |||||||||||
Colorado Educational and Cultural Facilities Authority, | 0.87 | 9/7/17 | 2,315,000 | a,b | 2,315,000 | ||||||
Colorado Educational and Cultural Facilities Authority, | 0.87 | 9/7/17 | 1,915,000 | a,b | 1,915,000 | ||||||
Colorado Health Facilities Authority, | 0.89 | 9/7/17 | 1,835,000 | a,b | 1,835,000 | ||||||
6,065,000 | |||||||||||
Connecticut - 4.1% | |||||||||||
RIB Floater Trust (Series 2017-016), | 0.79 | 9/1/17 | 25,165,000 | a,c,d | 25,165,000 | ||||||
9
STATEMENT OF INVESTMENTS (continued)
BNY Mellon National Municipal Money Market Fund (continued) | |||||||||||
Description | Coupon | Maturity | Principal | Value ($) | |||||||
Short-Term Investments - 100.8% (continued) | |||||||||||
District of Columbia - .6% | |||||||||||
District of Columbia, | 0.88 | 9/7/17 | 4,000,000 | a,b | 4,000,000 | ||||||
Florida - 3.1% | |||||||||||
Brevard County, | 0.94 | 9/7/17 | 445,000 | a,b | 445,000 | ||||||
Florida Development Finance Corporation, | 0.85 | 9/7/17 | 1,490,000 | a,b | 1,490,000 | ||||||
Jacksonville, | 0.89 | 9/7/17 | 2,900,000 | a,b | 2,900,000 | ||||||
Jacksonville, | 0.83 | 9/7/17 | 1,400,000 | a,b | 1,400,000 | ||||||
Kissimmee Utility Authority, | 0.94 | 9/6/17 | 13,200,000 | 13,200,000 | |||||||
19,435,000 | |||||||||||
Illinois - 2.9% | |||||||||||
Illinois Development Finance Authority, | 0.86 | 9/7/17 | 1,225,000 | a,b | 1,225,000 | ||||||
Illinois Finance Authority, | 0.89 | 9/7/17 | 1,900,000 | a,b | 1,900,000 | ||||||
Illinois Finance Authority, | 0.86 | 9/7/17 | 5,080,000 | a,b | 5,080,000 | ||||||
Illinois Housing Development Authority, | 0.84 | 9/7/17 | 7,740,000 | a,b | 7,740,000 | ||||||
Lake Villa, | 0.83 | 9/7/17 | 1,880,000 | a,b | 1,880,000 | ||||||
17,825,000 | |||||||||||
Indiana - 3.2% | |||||||||||
Crawfordsville, | 0.89 | 9/7/17 | 4,000,000 | a,b | 4,000,000 | ||||||
Indiana Development Finance Authority, | 0.82 | 9/7/17 | 5,340,000 | a,b | 5,340,000 | ||||||
Indiana Development Finance Authority, | 0.86 | 9/7/17 | 3,500,000 | a,b | 3,500,000 | ||||||
Indiana Health Facility Financing Authority, | 0.89 | 9/7/17 | 1,900,000 | a,b | 1,900,000 | ||||||
Saint Joseph County, | 0.82 | 9/7/17 | 4,895,000 | a,b | 4,895,000 | ||||||
19,635,000 | |||||||||||
Kentucky - .7% | |||||||||||
Jefferson County, | 0.88 | 9/7/17 | 3,625,000 | a,b | 3,625,000 | ||||||
Lexington-Fayette Urban County Government, | 0.83 | 9/7/17 | 705,000 | a,b | 705,000 | ||||||
4,330,000 | |||||||||||
Louisiana - 4.1% | |||||||||||
Louisiana Public Facilities Authority, | 0.83 | 9/1/17 | 11,000,000 | a,b | 11,000,000 | ||||||
Louisiana Public Facilities Authority, | 0.85 | 9/1/17 | 14,200,000 | a,b | 14,200,000 | ||||||
25,200,000 | |||||||||||
10
BNY Mellon National Municipal Money Market Fund (continued) | |||||||||||
Description | Coupon | Maturity | Principal | Value ($) | |||||||
Short-Term Investments - 100.8% (continued) | |||||||||||
Maryland - 1.7% | |||||||||||
Baltimore County, | 0.88 | 9/7/17 | 970,000 | a,b | 970,000 | ||||||
Maryland Economic Development Corporation, | 0.92 | 9/7/17 | 2,135,000 | a,b | 2,135,000 | ||||||
Montgomery County, | 0.89 | 9/7/17 | 1,100,000 | a | 1,100,000 | ||||||
Tender Option Bond Trust Receipts (Series 2017-XG0146), | 0.82 | 9/7/17 | 6,635,000 | a,b,c,d | 6,635,000 | ||||||
10,840,000 | |||||||||||
Minnesota - .4% | |||||||||||
Minneapolis, | 0.89 | 9/7/17 | 1,140,000 | a,b | 1,140,000 | ||||||
Minnesota Higher Education Facilities Authority, | 0.86 | 9/7/17 | 1,200,000 | a,b | 1,200,000 | ||||||
2,340,000 | |||||||||||
Mississippi - 5.0% | |||||||||||
Mississippi Business Finance Corporation, | 0.84 | 9/1/17 | 30,000,000 | a,b | 30,000,000 | ||||||
Mississippi Business Finance Corporation, | 0.84 | 9/7/17 | 900,000 | a,b | 900,000 | ||||||
30,900,000 | |||||||||||
Missouri - 1.1% | |||||||||||
Kirkwood Industrial Development Authority, | 0.92 | 9/7/17 | 1,440,000 | a,b | 1,440,000 | ||||||
St Charles County Industrial Development Authority, | 0.83 | 9/7/17 | 5,560,000 | a | 5,560,000 | ||||||
7,000,000 | |||||||||||
New Hampshire - .8% | |||||||||||
Merrimack County, | 1.24 | 12/28/17 | 5,000,000 | 5,005,500 | |||||||
New Jersey - 3.3% | |||||||||||
Burlington County Bridge Commission, | 1.95 | 11/16/17 | 1,200,000 | 1,202,747 | |||||||
Fort Lee, | 1.95 | 11/10/17 | 1,200,000 | 1,202,531 | |||||||
Montclair Township, | 2.43 | 11/3/17 | 1,200,000 | 1,203,279 | |||||||
New Jersey Economic Development Authority, | 0.89 | 9/7/17 | 840,000 | a | 840,000 | ||||||
RBC Municipal Products Trust, | 0.82 | 9/7/17 | 5,000,000 | a,c,d | 5,000,000 | ||||||
Tender Option Bond Trust Receipts (Series 2016-XF2370), | 0.82 | 9/7/17 | 2,770,000 | a,b,c,d | 2,770,000 | ||||||
Tender Option Bond Trust Receipts (Series 2016-ZF0468), | 0.84 | 9/7/17 | 6,800,000 | a,b,c,d | 6,800,000 | ||||||
Tender Option Bond Trust Receipts (Series 2016-ZF0470), | 0.84 | 9/7/17 | 1,200,000 | a,b,c,d | 1,200,000 | ||||||
20,218,557 | |||||||||||
New York - 21.2% | |||||||||||
Metropolitan Transportation Authority, | 0.83 | 9/1/17 | 3,600,000 | a,b | 3,600,000 | ||||||
Metropolitan Transportation Authority of New York, | 0.84 | 9/7/17 | 2,590,000 | a,b,c,d | 2,590,000 | ||||||
New York City, | 0.85 | 9/1/17 | 8,700,000 | a | 8,700,000 | ||||||
11
STATEMENT OF INVESTMENTS (continued)
BNY Mellon National Municipal Money Market Fund (continued) | |||||||||||
Description | Coupon | Maturity | Principal | Value ($) | |||||||
Short-Term Investments - 100.8% (continued) | |||||||||||
New York - 21.2% (continued) | |||||||||||
New York City, | 0.87 | 9/1/17 | 20,000,000 | a | 20,000,000 | ||||||
New York City Capital Resource Corporation, | 0.91 | 9/7/17 | 3,700,000 | a | 3,700,000 | ||||||
New York City Municipal Water Finance Authority, | 0.86 | 9/1/17 | 23,440,000 | a | 23,440,000 | ||||||
New York City Transitional Finance Authority, | 0.86 | 9/1/17 | 22,200,000 | a | 22,200,000 | ||||||
New York State Housing Finance Agency, | 0.86 | 9/1/17 | 11,500,000 | a | 11,500,000 | ||||||
Tender Option Bond Trust Receipts (Series 2015-ZF0275), | 0.84 | 9/7/17 | 2,385,000 | a,b,c,d | 2,385,000 | ||||||
Tompkins County Industrial Development Agency, | 0.88 | 9/7/17 | 5,300,000 | a,b | 5,300,000 | ||||||
Triborough Bridge and Tunnel Authority, | 0.86 | 9/1/17 | 28,385,000 | a,b | 28,385,000 | ||||||
131,800,000 | |||||||||||
North Carolina - .4% | |||||||||||
North Carolina Capital Facilities Finance Agency, | 0.85 | 9/7/17 | 1,520,000 | a | 1,520,000 | ||||||
North Carolina Medical Care Commission, | 0.82 | 9/7/17 | 1,050,000 | a | 1,050,000 | ||||||
2,570,000 | |||||||||||
North Dakota - 1.1% | |||||||||||
Grand Forks, | 0.94 | 9/1/17 | 6,600,000 | a,b | 6,600,000 | ||||||
Ohio - 3.5% | |||||||||||
Butler County, | 0.83 | 9/7/17 | 1,500,000 | a,b | 1,500,000 | ||||||
Hamilton County, | 0.82 | 9/7/17 | 2,750,000 | a,b | 2,750,000 | ||||||
RIB Floater Trust (Series 2017-003), | 0.94 | 9/7/17 | 10,200,000 | a,c,d | 10,200,000 | ||||||
Salem, | 0.82 | 9/7/17 | 5,370,000 | a | 5,370,000 | ||||||
Stark County Port Authority, | 0.90 | 9/7/17 | 635,000 | a,b | 635,000 | ||||||
Stark County Port Authority, | 0.86 | 9/7/17 | 1,365,000 | a,b | 1,365,000 | ||||||
21,820,000 | |||||||||||
Pennsylvania - 1.6% | |||||||||||
JPMorgan Chase Putters/Drivers Trust (Series 2017-5015), | 0.90 | 9/1/17 | 7,630,000 | a,b,c,d | 7,630,000 | ||||||
Pennsylvania Economic Development Financing Authority, | 0.98 | 9/7/17 | 400,000 | a | 400,000 | ||||||
12
BNY Mellon National Municipal Money Market Fund (continued) | |||||||||||
Description | Coupon | Maturity | Principal | Value ($) | |||||||
Short-Term Investments - 100.8% (continued) | |||||||||||
Pennsylvania - 1.6% (continued) | |||||||||||
Pennsylvania Higher Educational Facilities Authority, | 0.83 | 9/7/17 | 1,800,000 | a | 1,800,000 | ||||||
9,830,000 | |||||||||||
South Carolina - 1.4% | |||||||||||
South Carolina Jobs-Economic Development Authority, | 0.82 | 9/7/17 | 1,210,000 | a | 1,210,000 | ||||||
South Carolina Jobs-Economic Development Authority, | 0.89 | 9/7/17 | 2,290,000 | a,b | 2,290,000 | ||||||
Tender Option Bond Trust Receipts (Series 2017-XG0149), | 0.86 | 9/7/17 | 5,315,000 | a,b,c,d | 5,315,000 | ||||||
8,815,000 | |||||||||||
Tennessee - 9.4% | |||||||||||
Clarksville Public Building Authority, | 0.90 | 9/1/17 | 5,350,000 | a,b | 5,350,000 | ||||||
Clarksville Public Building Authority, | 0.90 | 9/1/17 | 17,500,000 | a,b | 17,500,000 | ||||||
Clarksville Public Building Authority, | 0.85 | 9/7/17 | 8,220,000 | a,b | 8,220,000 | ||||||
Cleveland Health and Educational Facilities Board, | 0.84 | 9/7/17 | 800,000 | a,b | 800,000 | ||||||
Hawkins County Industrial Development Board, | 1.03 | 9/7/17 | 1,750,000 | a,b | 1,750,000 | ||||||
Montgomery County Public Building Authority, | 0.90 | 9/1/17 | 6,960,000 | a | 6,960,000 | ||||||
Montgomery County Public Building Authority, | 0.90 | 9/1/17 | 14,625,000 | a | 14,625,000 | ||||||
Tender Option Bond Trust Receipts/Certificates Ser. 2017-XG0145, | 0.84 | 9/7/17 | 3,485,000 | a,b,c,d | 3,485,000 | ||||||
58,690,000 | |||||||||||
Texas - 6.8% | |||||||||||
Atascosa County Industrial Development Corporation, | 0.84 | 9/7/17 | 24,000,000 | a,b | 24,000,000 | ||||||
Gulf Coast Industrial Development Authority, | 0.87 | 9/7/17 | 2,350,000 | a,b | 2,350,000 | ||||||
Midlothian Industrial Development Corporation, | 0.80 | 9/7/17 | 12,000,000 | a,b | 12,000,000 | ||||||
Mission Economic Development Corporation, | 0.84 | 9/7/17 | 3,600,000 | a,b | 3,600,000 | ||||||
41,950,000 | |||||||||||
Utah - .4% | |||||||||||
Ogden City Redevelopment Agency, | 0.89 | 9/7/17 | 2,185,000 | a | 2,185,000 | ||||||
Vermont - .1% | |||||||||||
Vermont Educational and Health Buildings Financing Agency, | 1.00 | 9/7/17 | 800,000 | a,b | 800,000 | ||||||
Washington - 4.0% | |||||||||||
JPMorgan Chase Putters/Drivers Trust (Series 5002), | 0.90 | 9/1/17 | 13,600,000 | a,b,c,d | 13,600,000 | ||||||
Squaxin Island Tribe, | 0.86 | 9/7/17 | 7,530,000 | a,b | 7,530,000 | ||||||
13
STATEMENT OF INVESTMENTS (continued)
BNY Mellon National Municipal Money Market Fund (continued) | |||||||||||
Description | Coupon | Maturity | Principal | Value ($) | |||||||
Short-Term Investments - 100.8% (continued) | |||||||||||
Washington - 4.0% (continued) | |||||||||||
Washington Housing Finance Commission, | 0.89 | 9/7/17 | 495,000 | a,b | 495,000 | ||||||
Washington Housing Finance Commission, | 0.82 | 9/7/17 | 3,200,000 | a,b | 3,200,000 | ||||||
24,825,000 | |||||||||||
West Virginia - .3% | |||||||||||
Cabell County Commission, | 0.86 | 9/7/17 | 2,050,000 | a,b | 2,050,000 | ||||||
Wisconsin - 2.1% | |||||||||||
Byron, | 0.89 | 9/7/17 | 6,500,000 | a,b | 6,500,000 | ||||||
Wisconsin Health and Educational Facilities Authority, | 0.89 | 9/7/17 | 5,335,000 | a,b | 5,335,000 | ||||||
Wisconsin Health and Educational Facilities Authority, | 0.86 | 9/7/17 | 1,215,000 | a,b | 1,215,000 | ||||||
Wisconsin Health and Educational Facilities Authority, | 0.86 | 9/7/17 | 155,000 | a,b | 155,000 | ||||||
13,205,000 | |||||||||||
Total Investments (cost $626,294,057) | 100.8% | 626,294,057 | |||||||||
Liabilities, Less Cash and Receivables | (0.8%) | (4,819,171) | |||||||||
Net Assets | 100.0% | 621,474,886 | |||||||||
a Variable rate demand note—rate shown is the interest rate in effect at August 31, 2017. Maturity date represents the next demand date, or the ultimate maturity date if earlier.
b The Variable Rate shall be determined by the Remarketing Agent in its sole discretion based on prevailing market conditions and may, but need not, be established by reference to one or more financial indices.
c Security exempt from registration pursuant to Rule 144A under the Securities Act of 1933. These securities may be resold in transactions exempt from registration, normally to qualified institutional buyers. At August 31, 2017, these securities amounted to $138,390,000 or 22.27% of net assets.
d The fund does not directly own the municipal security indicated; the fund owns an interest in a special purpose entity that, in turn, owns the underlying municipal security. The special purpose entity permits the fund to own interests in underlying assets, but in a manner structured to provide certain advantages not inherent in the underlying bonds (e.g., enhanced liquidity, yields linked to short-term rates).
Portfolio Summary (Unaudited) † | Value (%) |
Industrial | 18.9 |
Health Care | 11.2 |
Transportation Services | 9.7 |
Utility-Electric | 9.7 |
Special Tax | 7.2 |
Housing | 5.4 |
State/Territory | 5.2 |
City | 5.0 |
Education | 4.9 |
Pollution Control | 4.0 |
Utility-Water & Sewer | 3.8 |
County | 2.1 |
Resource Recovery | .6 |
Other | 13.1 |
100.8 |
† Based on net assets.
See notes to financial statements.
14
Summary of Abbreviations (Unaudited) | |||
ABAG | Association of Bay Area | ACA | American Capital Access |
AGC | ACE Guaranty Corporation | AGIC | Asset Guaranty Insurance Company |
AMBAC | American Municipal Bond | ARRN | Adjustable Rate |
BAN | Bond Anticipation Notes | BPA | Bond Purchase Agreement |
CIFG | CDC Ixis Financial Guaranty | COP | Certificate of Participation |
CP | Commercial Paper | DRIVERS | Derivative Inverse |
EDR | Economic Development | EIR | Environmental Improvement |
FGIC | Financial Guaranty | FHA | Federal Housing Administration |
FHLB | Federal Home | FHLMC | Federal Home Loan Mortgage |
FNMA | Federal National | GAN | Grant Anticipation Notes |
GIC | Guaranteed Investment | GNMA | Government National Mortgage |
GO | General Obligation | HR | Hospital Revenue |
IDB | Industrial Development Board | IDC | Industrial Development Corporation |
IDR | Industrial Development | LIFERS | Long Inverse Floating |
LOC | Letter of Credit | LOR | Limited Obligation Revenue |
LR | Lease Revenue | MERLOTS | Municipal Exempt Receipts |
MFHR | Multi-Family Housing Revenue | MFMR | Multi-Family Mortgage Revenue |
PCR | Pollution Control Revenue | PILOT | Payment in Lieu of Taxes |
P-FLOATS | Puttable Floating Option | PUTTERS | Puttable Tax-Exempt Receipts |
RAC | Revenue Anticipation Certificates | RAN | Revenue Anticipation Notes |
RAW | Revenue Anticipation Warrants | RIB | Residual Interest Bonds |
ROCS | Reset Options Certificates | RRR | Resources Recovery Revenue |
SAAN | State Aid Anticipation Notes | SBPA | Standby Bond Purchase Agreement |
SFHR | Single Family Housing Revenue | SFMR | Single Family Mortgage Revenue |
SONYMA | State of New York | SPEARS | Short Puttable Exempt |
SWDR | Solid Waste Disposal Revenue | TAN | Tax Anticipation Notes |
TAW | Tax Anticipation Warrants | TRAN | Tax and Revenue Anticipation Notes |
XLCA | XL Capital Assurance | ||
See notes to financial statements.
15
STATEMENTS OF ASSETS AND LIABILITIES
August 31, 2017
|
|
|
|
|
|
|
| |
|
|
|
| BNY Mellon Government Money Market Fund |
| BNY Mellon National Municipal Money Market Fund |
| |
Assets ($): |
|
|
|
|
|
|
| |
Investments in securities—See Statements |
|
|
| 730,584,460 | †† | 626,294,057 |
| |
Cash |
|
|
| 77,994 |
| - |
| |
Interest receivable |
|
|
| 250,763 |
| 634,192 |
| |
Prepaid expenses |
|
|
| 10,649 |
| 10,974 |
| |
|
|
|
| 730,923,866 |
| 626,939,223 |
|
|
Liabilities ($): |
|
|
|
|
|
|
| |
Due to The Dreyfus Corporation |
|
|
| 126,664 |
| 99,695 |
| |
Due to Administrator—Note 2(a) |
|
|
| 77,942 |
| 66,720 |
| |
Cash overdraft due to Custodian |
|
|
| - |
| 229,225 |
| |
Payable for investment securities purchased |
|
|
| 14,946,700 |
| 5,005,500 |
| |
Accrued expenses |
|
|
| 63,062 |
| 63,197 |
| |
|
|
|
| 15,214,368 |
| 5,464,337 |
|
|
Net Assets ($) |
|
|
| 715,709,498 |
| 621,474,886 |
|
|
Composition of Net Assets ($): |
|
|
|
|
|
|
| |
Paid-in capital |
|
|
| 715,712,787 |
| 621,474,886 |
| |
Accumulated net realized gain (loss) |
|
|
| (3,289) |
| - |
| |
Net Assets ($) |
|
|
| 715,709,498 |
| 621,474,886 |
|
|
† Investments at cost ($) |
|
|
| 730,584,460 |
| 626,294,057 |
|
|
†† Value of repurchase |
|
|
| 302,000,000 |
| - |
|
|
Net Asset Value Per Share |
|
|
|
|
|
|
| |
Class M |
|
|
|
|
|
|
| |
Net Assets ($) |
|
|
| 695,341,778 |
| 621,434,948 |
| |
Shares Outstanding |
|
|
| 695,347,854 |
| 622,260,158 |
| |
Net Asset Value Per Share ($) |
|
|
| 1.00 |
| 1.00 |
| |
Investor Shares |
|
|
|
|
|
|
|
|
Net Assets ($) |
|
|
| 20,367,720 |
| 39,938 |
| |
Shares Outstanding |
|
|
| 20,367,727 |
| 40,000 |
| |
Net Asset Value Per Share ($) |
|
|
| 1.00 |
| 1.00 |
| |
| ||||||||
See notes to financial statements. |
|
16
STATEMENTS OF OPERATIONS
Year Ended August 31, 2017
|
|
|
|
|
|
|
|
|
|
|
|
|
| BNY Mellon Government Money Market Fund |
| BNY Mellon National Municipal Money Market Fund |
|
Investment Income ($): |
|
|
|
|
|
| ||
Interest Income |
|
| 5,338,882 |
| 4,105,416 |
| ||
Expenses: |
|
|
|
|
|
| ||
Investment advisory fee—Note 2(a) |
|
| 1,200,801 |
| 818,832 |
| ||
Administration fee—Note 2(a) |
|
| 996,591 |
| 679,410 |
| ||
Custodian fees—Note 2(b) |
|
| 76,983 |
| 48,985 |
| ||
Trustees’ fees and expenses—Note 2(c) |
|
| 65,322 |
| 29,273 |
| ||
Professional fees |
|
| 62,180 |
| 47,749 |
| ||
Shareholder servicing costs—Note 2(b) |
|
| 38,143 |
| 218 |
| ||
Registration fees |
|
| 32,855 |
| 36,197 |
| ||
Prospectus and shareholders’ reports |
|
| 24,823 |
| 18,147 |
| ||
Miscellaneous |
|
| 25,683 |
| 37,293 |
| ||
Total Expenses |
|
| 2,523,381 |
| 1,716,104 |
| ||
Less—reduction in expenses due to undertakings—Note 2(a) |
|
| (6,338) |
| - |
| ||
Less—reduction in administration fees due to undertakings—Note 2(a) |
|
| (1,279) |
| - |
| ||
Less—reduction in fees due to earnings credits—Note 2(b) |
|
| (17,064) |
| (2,477) |
| ||
Net Expenses |
|
| 2,498,700 |
| 1,713,627 |
| ||
Investment Income—Net |
|
| 2,840,182 |
| 2,391,789 |
| ||
Realized and Unrealized Gain (Loss) |
|
|
|
| ||||
Net realized gain (loss) on investments | (3,289) |
| 94,244 |
| ||||
Net unrealized appreciation (depreciation) on investments |
|
| - |
| (9,775) |
| ||
Net Realized and Unrealized Gain (Loss) on Investments |
|
| (3,289) |
| 84,469 |
| ||
Net Increase in Net Assets Resulting from Operations |
| 2,836,893 |
| 2,476,258 |
| |||
See notes to financial statements. | ||||||||
17
STATEMENTS OF CHANGES IN NET ASSETS
|
|
|
| BNY Mellon Government Money Market Fund |
| BNY Mellon National Municipal Money Market Fund |
| ||||||||
|
|
|
| Year Ended August 31, | Year Ended August 31, | ||||||||||
|
|
|
| 2017 |
|
|
| 2016 |
| 2017 |
|
|
| 2016 |
|
Operations ($): |
|
|
|
|
|
|
|
|
|
|
|
|
|
| |
Investment income—net |
|
| 2,840,182 |
|
|
| 152,519 |
| 2,391,789 |
|
|
| 322,855 |
| |
Net realized gain (loss) on investments |
| (3,289) |
|
|
| 7,620 |
| 94,244 |
|
|
| 290,055 |
| ||
Net unrealized appreciation (depreciation) |
| - |
|
|
| - |
| (9,775) |
|
|
| 8,154 |
| ||
Net Increase (Decrease) in Net Assets | 2,836,893 |
|
|
| 160,139 |
| 2,476,258 |
|
|
| 621,064 |
| |||
Distributions to Shareholders from ($): |
|
|
|
|
|
|
|
|
|
|
|
|
|
| |
Investment income—net: |
|
|
|
|
|
|
|
|
|
|
|
|
|
| |
Class M |
|
| (2,816,846) |
|
|
| (152,052) |
| (2,391,695) |
|
|
| (322,615) |
| |
Investor Shares |
|
| (30,956) |
|
|
| (705) |
| (94) |
|
|
| (240) |
| |
Total Distributions |
|
| (2,847,802) |
|
|
| (152,757) |
| (2,391,789) |
|
|
| (322,855) |
| |
Beneficial Interest Transactions ($1.00 per share): |
|
|
|
|
|
|
|
|
|
|
| ||||
Net proceeds from shares sold: |
|
|
|
|
|
|
|
|
|
|
|
|
|
| |
Class M |
|
| 1,099,083,546 |
|
|
| 1,044,715,703 |
| 1,112,006,777 |
|
|
| 1,340,898,174 |
| |
Investor Shares |
|
| 25,709,856 |
|
|
| 13,246,904 |
| 71,063 |
|
|
| 1,940,243 |
| |
Distributions reinvested: |
|
|
|
|
|
|
|
|
|
|
|
|
|
| |
Class M |
|
| 4,229 |
|
|
| 2 |
| 86,364 |
|
|
| 11,125 |
| |
Investor Shares |
|
| 30,796 |
|
|
| 703 |
| 1 |
|
|
| 240 |
| |
Cost of shares redeemed: |
|
|
|
|
|
|
|
|
|
|
|
|
|
| |
Class M |
|
| (1,243,212,154) |
|
|
| (534,359,610) |
| (1,062,025,863) |
|
|
| (1,550,891,069) |
| |
Investor Shares |
|
| (14,171,816) |
|
|
| (12,483,499) |
| (2,365,959) |
|
|
| (6,403,884) |
| |
Increase (Decrease) in Net Assets | (132,555,543) |
|
|
| 511,120,203 |
| 47,772,383 |
|
|
| (214,445,171) |
| |||
Total Increase (Decrease) in Net Assets | (132,566,452) |
|
|
| 511,127,585 |
| 47,856,852 |
|
|
| (214,146,962) |
| |||
Net Assets ($): |
|
|
|
|
|
|
|
|
|
|
|
|
|
| |
Beginning of Period |
|
| 848,275,950 |
|
|
| 337,148,365 |
| 573,618,034 |
|
|
| 787,764,996 |
| |
End of Period |
|
| 715,709,498 |
|
|
| 848,275,950 |
| 621,474,886 |
|
|
| 573,618,034 |
| |
|
| ||||||||||||||
See notes to financial statements. | |||||||||||||||
18
FINANCIAL HIGHLIGHTS
The following tables describe the performance for each share class of each fund for the fiscal periods indicated. All information reflects financial results for a single fund share. Total return shows how much your investment in each fund would have increased (or decreased) during each period, assuming you had reinvested all dividends and distributions. These figures have been derived from the funds’ financial statements.
Class M Shares | |||||||||||||||
Year Ended August 31, | |||||||||||||||
BNY Mellon Government Money Market Fund | 2017 |
| 2016 |
| 2015 |
| 2014 |
| 2013 |
| |||||
Per Share Data ($): | |||||||||||||||
Net asset value, beginning of period | 1.00 | 1.00 | 1.00 | 1.00 | 1.00 | ||||||||||
Investment Operations: | |||||||||||||||
Investment income—net | .004 | .000 | a | .000 | a | .000 | a | .000 | a | ||||||
Distributions: | |||||||||||||||
Dividends from investment income—net | (.004) | (.000) | a | (.000) | a | (.000) | a | (.000) | a | ||||||
Net asset value, end of period | 1.00 | 1.00 | 1.00 | 1.00 | 1.00 | ||||||||||
Total Return (%) | .38 | .04 | .00 | b | .00 | b | .00 | b | |||||||
Ratios/Supplemental Data (%): | |||||||||||||||
Ratio of total expenses to average net assets | .31 | .33 | .32 | .32 | .31 | ||||||||||
Ratio of net expenses to average net assets | .31 | .30 | .19 | .14 | .20 | ||||||||||
Ratio of net investment income to average net assets | .36 | .04 | .00 | b | .00 | b | .00 | b | |||||||
Net Assets, end of period ($ x 1,000) | 695,342 | 839,477 | 329,114 | 381,864 | 387,463 | ||||||||||
a Amount represents less than $.001 per share.
b Amount represents less than .01%.
See notes to financial statements
19
FINANCIAL HIGHLIGHTS (continued)
Investor Shares | |||||||||||||||
Year Ended August 31, | |||||||||||||||
BNY Mellon Government Money Market Fund | 2017 |
| 2016 |
| 2015 |
| 2014 |
| 2013 |
| |||||
Per Share Data ($): | |||||||||||||||
Net asset value, beginning of period | 1.00 | 1.00 | 1.00 | 1.00 | 1.00 | ||||||||||
Investment Operations: | |||||||||||||||
Investment income—net | .002 | .000 | a | .000 | a | .000 | a | .000 | a | ||||||
Distributions: | |||||||||||||||
Dividends from investment income—net | (.002) | (.000) | a | (.000) | a | (.000) | a | (.000) | a | ||||||
Net asset value, end of period | 1.00 | 1.00 | 1.00 | 1.00 | 1.00 | ||||||||||
Total Return (%) | .18 | .01 | .00 | b | .00 | b | .00 | b | |||||||
Ratios/Supplemental Data (%): | |||||||||||||||
Ratio of total expenses to average net assets | .56 | .58 | .57 | .57 | .56 | ||||||||||
Ratio of net expenses to average net assets | .52 | .32 | .19 | .14 | .19 | ||||||||||
Ratio of net investment income to average net assets | .20 | .01 | .00 | b | .00 | b | .00 | b | |||||||
Net Assets, end of period ($ x 1,000) | 20,368 | 8,799 | 8,035 | 8,056 | 4,640 | ||||||||||
a Amount represents less than $.001 per share.
b Amount represents less than .01%.
See notes to financial statements
20
Class M Shares | |||||||||||||||
Year Ended August 31, | |||||||||||||||
BNY Mellon National Municipal Money Market Fund | 2017 |
| 2016 |
| 2015 |
| 2014 |
| 2013 |
| |||||
Per Share Data ($): | |||||||||||||||
Net asset value, beginning of period | 1.00 | 1.00 | 1.00 | 1.00 | 1.00 | ||||||||||
Investment Operations: | |||||||||||||||
Investment income—net | .004 | .000 | a | .000 | a | .000 | a | .000 | a | ||||||
Distributions: | |||||||||||||||
Dividends from investment income—net | (.004) | (.000) | a | (.000) | a | (.000) | a | (.000) | a | ||||||
Net asset value, end of period | 1.00 | 1.00 | 1.00 | 1.00 | 1.00 | ||||||||||
Total Return (%) | .44 | .04 | .00 | b | .00 | b | .00 | b | |||||||
Ratios/Supplemental Data (%): | |||||||||||||||
Ratio of total expenses to average net assets | .31 | .31 | .30 | .30 | .30 | ||||||||||
Ratio of net expenses to average net assets | .31 | .16 | .08 | .13 | .23 | ||||||||||
Ratio of net investment income to average net assets | .44 | .04 | .00 | b | .00 | b | .00 | b | |||||||
Net Assets, end of period ($ x 1,000) | 621,435 | 571,287 | 780,977 | 851,238 | 1,009,973 | ||||||||||
a Amount represents less than $.001 per share.
b Amount represents less than .01%.
See notes to financial statements
.
21
FINANCIAL HIGHLIGHTS (continued)
Investor Shares | |||||||||||||||
Year Ended August 31, | |||||||||||||||
BNY Mellon National Municipal Money Market Fund | 2017 |
| 2016 |
| 2015 |
| 2014 |
| 2013 |
| |||||
Per Share Data ($): | |||||||||||||||
Net asset value, beginning of period | 1.00 | 1.00 | 1.00 | 1.00 | 1.00 | ||||||||||
Investment Operations: | |||||||||||||||
Investment income—net | .002 | .000 | a | .000 | a | .000 | a | .000 | a | ||||||
Distributions: | |||||||||||||||
Dividends from investment income—net | (.002) | (.000) | a | (.000) | a | (.000) | a | (.000) | a | ||||||
Net asset value, end of period | 1.00 | 1.00 | 1.00 | 1.00 | 1.00 | ||||||||||
Total Return (%) | .19 | .01 | .00 | b | .00 | b | .00 | b | |||||||
Ratios/Supplemental Data (%): | |||||||||||||||
Ratio of total expenses to average net assets | .57 | .56 | .56 | .55 | .57 | ||||||||||
Ratio of net expenses to average net assets | .57 | .17 | .09 | .13 | .24 | ||||||||||
Ratio of net investment income to average net assets | .12 | .01 | .00 | b | .00 | b | .00 | b | |||||||
Net Assets, end of period ($ x 1,000) | 40 | 2,331 | 6,788 | 2,648 | 2,865 | ||||||||||
a Amount represents less than $.001 per share.
c Amount represents less than .01%.
See notes to financial statements
22
NOTES TO FINANCIAL STATEMENTS
NOTE 1—Significant Accounting Policies:
BNY Mellon Funds Trust (the “Trust”), a Massachusetts business trust that is registered under the Investment Company Act of 1940, as amended (the “Act”), as an open-end management investment company, operates as a series company currently consisting of twenty-five series, including the following diversified funds: BNY Mellon Government Money Market Fund and BNY Mellon National Municipal Money Market Fund (each, a “fund” and collectively, the “funds”). The objectives of the funds are as follows: BNY Mellon Government Money Market Fund’s investment objective is to seek as high a level of current income as is consistent with the preservation of capital and the maintenance of liquidity. BNY Mellon National Municipal Money Market Fund’s investment objective is to provide investors with as high a level of current income exempt from federal income tax as is consistent with the preservation of capital and the maintenance of liquidity.
BNY Mellon Fund Advisers, a division of The Dreyfus Corporation (the “Manager” or “Dreyfus”), a wholly-owned subsidiary of The Bank of New York Mellon Corporation (“BNY Mellon”), serves as each fund’s investment adviser (the “Investment Adviser”). The Bank of New York Mellon, a subsidiary of BNY Mellon and an affiliate of Dreyfus, serves as administrator for the funds pursuant to an Administration Agreement with the Trust (the “Administration Agreement”). The Bank of New York Mellon has entered into a Sub-Administration Agreement with Dreyfus pursuant to which The Bank of New York Mellon pays Dreyfus for performing certain administrative services. MBSC Securities Corporation (the “Distributor”), a wholly-owned subsidiary of Dreyfus, is the distributor of each fund’s shares, which are sold without a sales charge.
Each fund is authorized to issue an unlimited number of $.001 par value shares of Beneficial Interest in each of the following classes of shares: Class M and Investor. Each class of shares has identical rights and privileges, except with respect to the Shareholder Service Plan and the expenses borne by each class, the allocation of certain transfer agency costs, and certain voting rights. Income, expenses (other than expenses attributable to a specific class), and realized and unrealized gains or losses on investments are allocated to each class of shares based on its relative net assets.
It is each fund’s policy to maintain a constant net asset value (NAV) per share of $1.00; the funds have adopted certain investment, portfolio valuation and dividend and distribution policies to enable it to do so. There is no assurance, however, that the funds will be able to maintain a constant NAV per share of $1.00.
BNY Mellon National Municipal Money Market Fund operates as a “retail money market fund” as that term is defined in Rule 2a-7 under the Act, and, such, the fund may, or in certain circumstances, must impose a fee upon the sale of shares or may temporarily suspend redemptions if the fund’s weekly liquid assets fall below required minimums because of market conditions or other factors. BNY Mellon Government Money Market Fund is a “government money market fund” as that term is defined in Rule 2a-7 under the Act, and, as such, the fund is not subject to liquidity fees or temporary suspensions of redemptions due to declines in the fund’s weekly liquid assets.
The Trust accounts separately for the assets, liabilities and operations of each series. Expenses directly attributable to each series are charged to that series’ operations; expenses which are applicable to all series are allocated among them on a pro rata basis.
The Financial Accounting Standards Board (“FASB”) Accounting Standards Codification is the exclusive reference of authoritative U.S. generally accepted accounting principles (“GAAP”) recognized by the FASB to be applied by nongovernmental entities. Rules and interpretive releases of the Securities and Exchange Commission (“SEC”) under authority of federal laws are also sources of authoritative GAAP for SEC registrants. The fund’s financial statements are prepared in accordance with GAAP, which may require the use of management estimates and assumptions. Actual results could differ from those estimates.
(a) Portfolio valuation: Investments in securities are valued at amortized cost in accordance with Rule 2a-7 under the Act. If amortized cost is determined not to approximate market value, the fair value of the portfolio securities will be determined by procedures established by and under the general supervision of the Board.
The fair value of a financial instrument is the amount that would be received to sell an asset or paid to transfer a liability in an orderly transaction between market participants at the measurement date (i.e., the exit price). GAAP establishes a fair value hierarchy that prioritizes the inputs of valuation techniques used to measure fair value. This hierarchy gives the highest priority to unadjusted quoted prices in active markets for identical assets or liabilities (Level 1 measurements) and the lowest priority to unobservable inputs (Level 3 measurements).
Additionally, GAAP provides guidance on determining whether the volume and activity in a market has decreased significantly and whether such a decrease in activity results in transactions that are not orderly. GAAP requires enhanced disclosures around valuation inputs and techniques used during annual and interim periods.
23
NOTES TO FINANCIAL STATEMENTS (continued)
Various inputs are used in determining the value of each fund’s investments relating to fair value measurements. These inputs are summarized in the three broad levels listed below:
Level 1—unadjusted quoted prices in active markets for identical investments.
Level 2—other significant observable inputs (including quoted prices for similar investments, interest rates, prepayment speeds, credit risk, etc.).
Level 3—significant unobservable inputs (including the funds’ own assumptions in determining the fair value of investments).
The inputs or methodology used for valuing securities are not necessarily an indication of the risk associated with investing in those securities. For example, money market securities are valued using amortized cost, in accordance with rules under the Act. Generally, amortized cost approximates the current fair value of a security, but since the value is not obtained from a quoted price in an active market, such securities are reflected within Level 2 of the fair value hierarchy.
At August 31, 2017, all of the securities in each fund were considered Level 2 within the fair value hierarchy.
At August 31, 2017, there were no transfers between levels of the fair value hierarchy.
(b) Securities transactions and investment income: Securities transactions are recorded on a trade date basis. Interest income, adjusted for accretion of discount and amortization of premium on investments, is earned from settlement date and is recognized on the accrual basis. Realized gains and losses from securities transactions are recorded on the identified cost basis.
BNY Mellon Government Money Market Fund may enter into repurchase agreements with financial institutions, deemed to be creditworthy by Dreyfus, subject to the seller’s agreement to repurchase and the fund agreement to resell such securities at a mutually agreed upon price. Pursuant to the terms of the repurchase agreement, such securities must have an aggregate market value greater than or equal to the terms of the repurchase price plus accrued interest at all times. If the value of the underlying securities falls below the value of the repurchase price plus accrued interest, the fund will require the seller to deposit additional collateral by the next business day. If the request for additional collateral is not met, or the seller defaults on its repurchase obligation, the fund maintains its right to sell the underlying securities at market value and may claim any resulting loss against the seller. The collateral is held on behalf of the fund by the tri-party administrator with respect to any tri-party agreement. The fund may also jointly enter into one or more repurchase agreements with other Dreyfus-managed funds in accordance with an exemptive order granted by the SEC pursuant to section 17(d) and Rule 17d-1 under the Act. Any joint repurchase agreements must be collateralized fully by U.S. Government securities.
(c) Dividends and distributions to shareholders: It is the policy of each fund to declare dividends daily from investment income-net. Such dividends are paid monthly. Dividends from net realized capital gains, if any, are normally declared and paid annually, but each fund may make distributions on a more frequent basis to comply with the distribution requirements of the Internal Revenue Code of 1986, as amended (the “Code”). To the extent that net realized capital gains can be offset by capital loss carryovers, it is the policy of each fund not to distribute such gains.
(d) Federal income taxes: It is the policy of BNY Mellon Government Money Market Fund to continue to qualify as a regulated investment company if such qualification is in the best interests of its shareholders, by complying with the applicable provisions of the Code and to make distributions of taxable income sufficient to relieve it from substantially all federal income and excise taxes.
It is the policy of BNY Mellon National Municipal Money Market Fund to continue to qualify as a regulated investment company, which can distribute tax-exempt dividends, by complying with the applicable provisions of the Code and to make distributions of income and net realized capital gain sufficient to relieve it from substantially all federal income and excise taxes.
For federal income tax purposes, each fund is treated as a separate entity for the purpose of determining such qualification.
As of and during the period ended August 31, 2017, the funds did not have any liabilities for any uncertain tax positions. Each fund recognizes interest and penalties, if any, related to uncertain tax positions as income tax expense in the Statements of Operations. During the period ended August 31, 2017, the funds did not incur any interest or penalties.
Each tax year in the four-year period ended August 31, 2017 remains subject to examination by the Internal Revenue Service and state taxing authorities.
At August 31, 2017, the components of accumulated earnings on a tax basis for each fund were substantially the same as for financial reporting purposes.
24
Under the Regulated Investment Company Modernization Act of 2010, each fund is permitted to carry forward capital losses for an unlimited period. Furthermore, capital loss carryovers retain their character as either short-term or long-term capital losses.
BNY Mellon Government Money Market Fund has an accumulated capital loss carryover available for federal income tax purposes to be applied against future net realized capital gains, if any, realized subsequent to August 31, 2017. The fund has $3,289 of short-term capital losses which can be carried forward for an unlimited period..
The tax character of distributions paid to shareholders for each fund during the fiscal periods ended August 31, 2017 and August 31, 2016 was all ordinary income for BNY Mellon Government Money Market Fund and all tax-exempt income for BNY Mellon National Municipal Money Market Fund.
During the period ended August 31, 2017, as a result of permanent book to tax differences, primarily due to dividend reclassification, BNY Mellon Government Money Market Fund increased accumulated undistributed investment income-net by $7,620 and decreased accumulated net realized gain (loss) on investments by the same amount. Net assets and net asset value per share were not affected by this reclassification.
During the period ended August 31, 2017, as a result of permanent book to tax differences, primarily due to capital loss carryover expiration, BNY Mellon National Municipal Money Market Fund decreased paid-in capital by $824,357 and increased accumulated net realized gain (loss) on investments by the same amount. Net assets and net asset value per share were not affected by this reclassification.
At August 31, 2017, the cost of investments for federal income tax purposes for each fund was substantially the same as the cost for financial reporting purposes (see the Statements of Investments).
NOTE 2—Investment Advisory Fee, Administration Fee and Other Transactions with Affiliates:
(a) Fees payable by the funds pursuant to the provisions of an investment advisory agreement with the Investment Adviser are payable monthly, computed on the average daily value of each fund’s net assets at the following annual rates: .15% of BNY Mellon Government Money Market Fund and .15% of BNY Mellon National Municipal Money Market Fund.
Pursuant to the Administration Agreement, The Bank of New York Mellon provides or arranges for fund accounting, transfer agency and other fund administration services and receives a fee based on the total net assets of the Trust based on the following rates:
0 up to $6 billion .15%
$6 billion up to $12 billion .12%
In excess of $12 billion .10%
The Investment Adviser has undertaken to waive receipt of the management/administration fee and/or reimburse operating expenses in order to facilitate a daily yield at or above a certain level which may change from time to time. This undertaking is voluntary and not contractual, and may be terminated at any time. Table 1 summarizes the reduction in expenses for each relevant fund, pursuant to these undertakings, during the period ended August 31, 2017.
Table 1 —Expense Reductions |
|
BNY Mellon Government Money Market Fund | |
Expense waiver | $6,338 |
Administration fee waiver | 1,279 |
(b) Each fund has adopted a Shareholder Services Plan with respect to its Investor shares. Each fund pays the Distributor at an annual rate of .25% of the value of its Investor shares average daily net assets for the provision of certain services. The services provided may include personal services relating to shareholder accounts, such as answering shareholder inquiries regarding a fund and providing reports and other information, and services related to the maintenance of such shareholder accounts. The Shareholder Services Plan allows the Distributor to make payments from the shareholder services fees it collects from each fund to compensate service agents (certain banks, securities brokers or dealers and other financial institutions) with respect to these services. Table 2 summarizes the amounts Investor shares were charged during the period ended August 31, 2017, pursuant to the Shareholder Services Plan. Additional fees included in Shareholder servicing costs in the Statements of Operations primarily include fees paid for cash management charges.
Table 2 —Shareholder Services Plan Fees |
|
BNY Mellon Government Money Market Fund | $38,104 |
BNY Mellon National Municipal | 200 |
The funds have arrangements with the transfer agent and the custodian whereby the funds may receive earnings credits when positive cash balances are maintained, which are used
25
NOTES TO FINANCIAL STATEMENTS (continued)
to offset transfer agency and custody fees. For financial reporting purposes, the funds include net earnings credits as expense offsets in the Statements of Operations.
Each fund compensates Dreyfus Transfer, Inc., a wholly-owned subsidiary of Dreyfus, under a transfer agency agreement for providing transfer agency and cash management services for the funds. The majority of transfer agency fees are comprised of amounts paid on a per account basis, while cash management fees are related to fund subscriptions and redemptions. The Bank of New York Mellon pays each fund’s transfer agent fees out of the administration fee it receives from the Trust. Table 3 summarizes the amount each fund was charged during the period ended August 31, 2017 for cash management services, which is included in Shareholder servicing costs in the Statements of Operations. Cash management fees were partially offset by earnings credits, also summarized in Table 3.
Each fund compensates The Bank of New York Mellon, under a custody agreement for providing custodial services for each fund. These fees are determined based on net assets, geographic region and transaction activity. Table 4 summarizes the amount each fund was charged during the period ended August 31, 2017 pursuant to the custody agreement. These fees were partially offset by earnings credits for each relevant fund, also summarized in Table 4.
Each fund compensates The Bank of New York Mellon under a shareholder redemptions draft processing agreement for providing certain services related to the funds’ check writing privilege. Table 5 summarizes the amount each fund was charged during the period ended August 31, 2017 for cash management services, which is included in Shareholder servicing costs in the Statements of Operations.
Table 5 —The Bank of New York Mellon Cash Management Fees |
|
BNY Mellon Government Money Market Fund | $5 |
BNY Mellon National Municipal | 1 |
During the period ended August 31, 2017, each fund was charged $11,281 for services performed by the Chief Compliance Officer and his staff.
Table 6 summarizes the components of “Due to The Dreyfus Corporation and affiliates” in the Statements of Assets and Liabilities for each fund.
Table 3—Cash Management Agreement Fees | ||||
| Dreyfus Transfer, Inc. | Dreyfus Transfer, Inc. | ||
BNY Mellon Government Money Market Fund | 17 | (17) | ||
BNY Mellon National Municipal Money Market Fund | 9 | (8) | ||
Table 4—Custody Agreement Fees | |||
| Custody Fees ($) | Earnings Credits ($) | |
BNY Mellon Government Money Market Fund | 76,983 | (17,047) | |
BNY Mellon National Municipal Money Market Fund | 48,985 | (2,469) |
Table 6—Due to The Dreyfus Corporation and Affiliates | ||||||
| Investment | Shareholder | Custodian | Chief | ||
BNY Mellon Government Money Market Fund | 94,574 | 4,594 | 22,826 | 4,670 | ||
BNY Mellon National Municipal Money Market Fund | 80,956 | 8 | 14,061 | 4,670 | ||
(c) Each Board member also serves as a Board member of other funds within the Trust. Annual retainer fees and attendance fees are allocated to each fund based on net assets.
NOTE 3—Securities Transactions:
BNY Mellon National Municipal Money Market Fund is permitted to purchase or sell securities from or to certain affiliated funds under specified conditions outlined in procedures adopted by the Board. The procedures have been
26
designed to ensure that any purchase or sale of securities by the fund from or to another fund or portfolio that are, or could be, considered an affiliate by virtue of having a common investment adviser (or affiliated investment adviser), common Trustees and/or common officers, complies with Rule 17a-7 under the Act. During the period ended August 31, 2017, the fund engaged in purchases and sales of securities pursuant to Rule 17a-7 under the Act amounting to $449,835,000 and $273,540,000 respectively.
27
REPORT OF INDEPENDENT REGISTERED
PUBLIC ACCOUNTING FIRM
The Board of Directors and Shareholders
BNY Mellon Funds Trust
We have audited the accompanying statements of assets and liabilities of BNY Mellon Government Money Market Fund and BNY Mellon National Municipal Money Market Fund, (collectively the “Funds”) each a series of BNY Mellon Funds Trust, including the statements of investments, as of August 31, 2017, and the related statements of operations for the year then ended, the statements of changes in net assets for each of the years in the two-year period then ended, and the financial highlights for each of the years in the five-year period then ended. These financial statements and financial highlights are the responsibility of the Funds’ management. Our responsibility is to express an opinion on these financial statements and financial highlights based on our audits.
We conducted our audits in accordance with the standards of the Public Company Accounting Oversight Board (United States). Those standards require that we plan and perform the audit to obtain reasonable assurance about whether the financial statements and financial highlights are free of material misstatement. An audit includes examining, on a test basis, evidence supporting the amounts and disclosures in the financial statements. Our procedures included confirmation of securities owned as of August 31, 2017, by correspondence with the custodian and brokers or by other appropriate auditing procedures. An audit also includes assessing the accounting principles used and significant estimates made by management, as well as evaluating the overall financial statement presentation. We believe that our audits provide a reasonable basis for our opinion.
In our opinion, the financial statements and financial highlights referred to above present fairly, in all material respects, the financial position of BNY Mellon Government Money Market Fund and BNY Mellon National Municipal Money Market Fund, as of August 31, 2017, the results of their operations for the year then ended, the changes in their net assets for each of the years in the two-year period then ended and the financial highlights for each of the years in the five-year period then ended, in conformity with U.S. generally accepted accounting principles.

New York, New York
October 27, 2017
28
IMPORTANT TAX INFORMATION (Unaudited)
BNY Mellon Government Money Market Fund
For federal tax purposes the fund reports the maximum amount allowable but not less than 100% as interest-related dividends in accordance with Sections 871(k)(1) and 881(e) of the Internal Revenue Code.
BNY Mellon National Municipal Money Market Fund
In accordance with federal tax law, the fund hereby reports all the dividends paid from investment income-net during its fiscal year ended August 31, 2017 as “exempt-interest dividends” (not generally subject to regular Federal income tax). Where required by federal tax law rules, shareholders will receive notification of their portion of the fund’s taxable ordinary dividends (if any), capital gains distributions (if any) and tax-exempt dividends paid for the 2017 calendar year on Form 1099-DIV, which will be mailed in early 2018.
29
INFORMATION ABOUT THE INFORMATION ABOUT RENEWAL OF EACH FUND’S MANAGEMENT AGREEMENTS AND ADMINISTRATION AGREEMENT (Unaudited)
At a meeting of the Trust’s Board of Trustees held on March 6-7, 2017, the Board considered the renewal of the Trust’s Investment Advisory Agreement and Administration Agreement (together, the “Agreement”), pursuant to which BNY Mellon Fund Advisers, a division of Dreyfus, provides the funds with investment advisory services and The Bank of New York Mellon provides the funds with administrative services. The Bank of New York Mellon has entered into a Sub-Administration Agreement with Dreyfus pursuant to which The Bank of New York Mellon pays Dreyfus for performing certain of these administrative services. The Board members, none of whom are “interested persons” (as defined in the Investment Company Act of 1940, as amended) of the Trust, were assisted in their review by independent legal counsel and met with counsel in executive session separate from Dreyfus representatives. In considering the renewal of the Agreement, the Board considered all factors that it believed to be relevant, including those discussed below. The Board did not identify any one factor as dispositive, and each Board member may have attributed different weights to the factors considered.
Analysis of Nature, Extent, and Quality of Services Provided to the Funds. The Board considered information provided to them at the meeting and in previous presentations from Dreyfus representatives regarding the nature, extent, and quality of the services provided to the funds. Dreyfus provided the number of open accounts in each fund, each fund’s asset size and the allocation of fund assets among distribution channels. Dreyfus also had previously provided information regarding the diverse intermediary relationships and distribution channels of funds in the Dreyfus fund complex (such as retail direct or intermediary, in which intermediaries typically are paid by the fund and/or Dreyfus) and Dreyfus’ corresponding need for broad, deep, and diverse resources to be able to provide ongoing shareholder services to each intermediary or distribution channel, as applicable to each fund.
The Board also considered research support available to, and portfolio management capabilities of, each fund’s portfolio management personnel and that Dreyfus also provides oversight of day-to-day fund operations, including fund accounting and administration and assistance in meeting legal and regulatory requirements. The Board also considered Dreyfus’ extensive administrative, accounting and compliance infrastructures.
Comparative Analysis of the Funds’ Performance and Management Fees and Expense Ratios. The Board reviewed reports prepared by Broadridge Financial Solutions, Inc. (“Broadridge”), an independent provider of investment company data, which included information comparing (1) the fund’s performance with the performance of a group of comparable funds (the “Performance Group”) and with a broader group of funds (the “Performance Universe”), all for various periods ended December 31, 2016, and (2) the fund’s actual and contractual management fees and total expenses with those of a group of comparable funds (the “Expense Group”) and with a broader group of funds (the “Expense Universe”), the information for which was derived in part from fund financial statements available to Broadridge as of the date of its analysis. Dreyfus previously had furnished the Board with a description of the methodology Broadridge used to select the Performance Group and Performance Universe and the Expense Group and Expense Universe.
Dreyfus representatives stated that the usefulness of performance comparisons may be affected by a number of factors, including different investment limitations that may be applicable to each fund and comparison funds.
As applicable to each fund, Dreyfus representatives reviewed with the Board the management or investment advisory fees paid by funds advised or administered by Dreyfus that are in the same Broadridge category as the fund (the “Similar Funds”), and explained the nature of the Similar Funds. They discussed differences in fees paid and the relationship of the fees paid in light of any differences in the services provided and other relevant factors. The Board considered the relevance of the fee information provided for the Similar Funds to evaluate the appropriateness of the fund’s management fee.
BNY Mellon Government Money Market Fund
The Board discussed the results of the comparisons and considered that the fund’s total return performance was above the Performance Group medians for all periods and variously above, at and below the Performance Universe medians for all periods. The Board took into consideration the relatively narrow spreads between the fund’s returns and the Performance Universe median when the fund’s performance was below the median. The Board considered that, on May 1, 2016, the fund changed its investment strategy and, prior to that date, the fund was not limited to investing its assets exclusively in U.S. government securities.
The Board also reviewed the range of actual and contractual management fees and total expenses of the Expense Group and Expense Universe funds and discussed the results of the comparisons. The Board considered that the fund’s contractual management fee was slightly below the Expense Group median, the fund’s actual management fee was above the Expense Group and Expense Universe medians and the fund’s total expenses were above the Expense Group and Expense Universe medians. The Board also considered the
30
current fee waiver and expense reimbursement arrangement undertaken by Dreyfus.
BNY Mellon National Municipal Money Market Fund
The Board discussed the results of the comparisons and considered that the fund’s total return performance was below the Performance Group medians for all periods and at or above the Performance Universe medians for all periods except for the four- and five-year periods, when the fund’s performance was below the Performance Universe medians by two basis points.
The Board also reviewed the range of actual and contractual management fees and total expenses of the Expense Group and Expense Universe funds and discussed the results of the comparisons. The Board considered that the fund’s contractual management fee was above the Expense Group median, the fund’s actual management fee was above the Expense Group and Expense Universe medians and the fund’s total expenses were above the Expense Group and Expense Universe medians. The Board also considered the current fee waiver and expense reimbursement arrangement undertaken by Dreyfus.
Dreyfus advised the Board that underperformance relative to the Performance Group was the result of Dreyfus’ conservative investment approach, including its credit standards and the maintenance of short average portfolio maturities, which Dreyfus employed to seek to reduce risk.
Analysis of Profitability and Economies of Scale. Dreyfus representatives reviewed the expenses allocated and profit received by Dreyfus and its affiliates and the resulting profitability percentage for managing each fund (which was zero in recent years) and the aggregate profitability percentage to Dreyfus and its affiliates for managing each the fund complex, and the method used to determine the expenses and profit. The Board concluded that the profitability results were not unreasonable, given the services rendered and service levels provided by Dreyfus to each fund. The Board also considered the fee waiver and expense reimbursement arrangement for each fund and its effect on the profitability of Dreyfus and its affiliates. The Board also had been provided with information prepared by an independent consulting firm regarding Dreyfus’ approach to allocating costs to, and determining the profitability of, individual funds and the entire Dreyfus fund complex. The consulting firm also had analyzed where any economies of scale might emerge in connection with the management of the funds.
The Board considered, on the advice of its counsel, the profitability analysis (1) as part of its evaluation of whether the fees under the Agreement, considered in relation to the mix of services provided by Dreyfus, including the nature, extent and quality of such services, supported the renewal of the Agreement and (2) in light of the relevant circumstances for the fund and the extent to which economies of scale would be realized if the fund grows and whether fee levels reflect these economies of scale for the benefit of fund shareholders. Dreyfus representatives stated that a discussion of economies of scale is predicated on a fund having achieved a substantial size with increasing assets and that, if a fund’s assets had been stable or decreasing, the possibility that Dreyfus may have realized any economies of scale would be less. Dreyfus representatives also stated that, as a result of shared and allocated costs among funds in the Dreyfus fund complex, the extent of economies of scale could depend substantially on the level of assets in the complex as a whole, so that increases and decreases in complex-wide assets can affect potential economies of scale in a manner that is disproportionate to, or even in the opposite direction from, changes in a fund’s asset level. The Board also considered potential benefits to Dreyfus from acting as investment adviser and took into consideration that there were no soft dollar arrangements in effect for trading each fund’s investments.
At the conclusion of these discussions, the Board agreed that it had been furnished with sufficient information to make an informed business decision with respect to the renewal of the Agreement. Based on the discussions and considerations as described above, the Board concluded and determined as follows.
· The Board concluded that the nature, extent and quality of the services provided by Dreyfus to each fund are adequate and appropriate.
· The Board generally was satisfied with the funds’ relative performance in light of the considerations described above.
· The Board concluded that the fee paid to Dreyfus by each fund supported the renewal of the Agreement in light of the considerations described above.
· The Board determined that the economies of scale which may accrue to Dreyfus and its affiliates in connection with the management of the funds had been adequately considered by Dreyfus in connection with the fee rate charged to each fund pursuant to the Agreement and that, to the extent in the future it were determined that material economies of scale had not been shared with a fund, the Board would seek to have those economies of scale shared with the fund.
31
INFORMATION ABOUT THE INFORMATION ABOUT RENEWAL OF EACH FUND’S MANAGEMENT AGREEMENTS AND ADMINISTRATION AGREEMENT (Unaudited) (continued)
In evaluating the Agreement, the Board considered these conclusions and determinations and also relied on its previous knowledge, gained through meetings and other interactions with Dreyfus and its affiliates, of Dreyfus and the services provided to the funds by Dreyfus. The Board also relied on information received on a routine and regular basis throughout the year relating to the operations of each fund and the investment management and other services provided under the Agreement, including information on the investment performance of each fund in comparison to similar mutual funds and benchmark performance measures; general market outlook as applicable to each fund; and compliance reports. In addition, the Board’s consideration of the contractual fee arrangements for each fund had the benefit of a number of years of reviews of prior or similar agreements during which lengthy discussions took place between the Board and Dreyfus representatives. Certain aspects of the arrangements may receive greater scrutiny in some years than in others, and the Board’s conclusions may be based, in part, on their consideration of the same or similar arrangements in prior years. The Board determined to renew the Agreement.
32
BOARD MEMBERS INFORMATION (Unaudited)
INDEPENDENT BOARD MEMBERS
Chairman of the Board (2000)
Principal Occupation During Past 5 Years:
Attorney, Cozen and O’Connor, P.C. since 1973, including Vice Chairman since 1980 and Chief Executive Officer and President from 2002 to 2007
No. of Portfolios for which Board Member Serves: 25
———————
John R. Alchin (69)
Board Member (2008)
Principal Occupation During Past 5 Years:
· Retired since 2007
· Executive of Comcast Corporation, a cable services provider, from 1990 to 2007, including Executive Vice-President, Co-Chief Financial Officer and Treasurer, from 2002 to 2007
Other Public Company Board Memberships During Past 5 Years:
· Polo Ralph Lauren Corporation, a retail clothing and home furnishing company, Director (2007-present)
No. of Portfolios for which Board Member Serves: 25
———————
Ronald R. Davenport (81)
Board Member (2000)
Principal Occupation During Past 5 Years:
· Chairman of Sheridan Broadcasting Corporation since July 1972
No. of Portfolios for which Board Member Serves: 25
———————
Jack Diederich (80)
Board Member (2000)
Principal Occupation During Past 5 Years:
· Retired; Executive Vice President—Chairman’s Counsel of Alcoa Inc. from 1991 to 1997
No. of Portfolios for which Board Member Serves: 25
———————
Kim D. Kelly (61)
Board Member (2008)
Principal Occupation During Past 5 Years:
· Consultant since 2005
· Chief Restructuring Officer of Allegiance Communications LLC from August 2011 to January 2013
Other Public Company Board Memberships During Past 5 Years:
· MCG Capital Corporation, a business development company, Director (2004-2015)
· Broadview Network Holdings, Inc.-Director and Chair (2011-2012)
No. of Portfolios for which Board Member Serves: 25
———————
Kevin C. Phelan (73)
Board Member (2000)
Principal Occupation During Past 5 Years:
· Mortgage Banker, Colliers International since March 1978, including,
Co-Chairman since 2010, President since 2007 and Executive Vice President and Director from March 1998 to September 2007
No. of Portfolios for which Board Member Serves: 25
———————
Patrick J. Purcell (69)
Board Member (2000)
Principal Occupation During Past 5 Years:
· Owner, President and Publisher of the Boston Herald since February 1994
President and Founder, jobfind.com, an employment search site on the world wide web, since July 1996
· President and Chief Executive Officer, Herald Media since 2001
No. of Portfolios for which Board Member Serves: 25
———————
Thomas F. Ryan, Jr. (76)
Board Member (2000)
Principal Occupation During Past 5 Years:
· Retired since April 1999
President and Chief Operating Officer of the American Stock Exchange from October 1995 to April 1999
Other Public Company Board Memberships During Past 5 Years:
· RepliGen Corporation, a biopharmaceutical company, Director (2002-present)
No. of Portfolios for which Board Member Serves: 25
———————
Maureen M. Young (72)
Board Member (2000)
Principal Occupation During Past 5 Years:
· Retired since 2007
Director of the Office of Government Relations at Carnegie Mellon University from January 2000 to December 2007
No. of Portfolios for which Board Member Serves: 25
———————
Once elected all Board Members serve for an indefinite term. The address of the Board Members and Officers is c/o The Dreyfus Corporation, 200 Park Avenue, New York, New York 10166. Additional information about the Board Members is available in the fund’s Statement of Additional Information which can be obtained from Dreyfus free of charge by calling this toll free number: 1-800-DREYFUS. For individual account holders for Private Wealth Management clients, please contact your account officer or call 1-866-804-5023.
33
OFFICERS OF THE TRUST (Unaudited)
PATRICK T. CROWE, President since July 2015.
National Director of Investment Advisory, Analytics and Solutions for BNY Mellon Wealth Management since July 2014; from July 2007 to July 2014, Managing Director for BNY Mellon Wealth Management's Tri-State region, comprising New York, New Jersey and Southern Connecticut. He is 53 years old and has served in various capacities with BNY Mellon since 1993.
BENNETT A. MACDOUGALL, Chief Legal Officer since October 2015.
Chief Legal Officer of the Manager and Associate General Counsel and Managing Director of BNY Mellon since June 2015; from June 2005 to June 2015, he served in various capacities with Deutsche Bank – Asset & Wealth Management Division, including as Director and Associate General Counsel, and Chief Legal Officer of Deutsche Investment Management Americas Inc. from June 2012 to May 2015. He is an officer of 64 investment companies (comprised of 155 portfolios) managed by the Manager. He is 44 years old and has been an employee of the Manager since June 2015.
JANETTE E. FARRAGHER, Vice President and Secretary since December 2011.
Associate General Counsel of BNY Mellon, and an officer of 64 investment companies (comprised of 155 portfolios) managed by the Manager. She is 54 years old and has been an employee of the Manager since February 1984.
JAMES BITETTO, Vice President and Assistant Secretary since August 2005.
Managing Counsel of BNY Mellon and Secretary of the Manager, and an officer of 64 investment companies (comprised of 155 portfolios) managed by the Manager. He is 51 years old and has been an employee of the Manager since December 1996.
JOSEPH M. CHIOFFI, Vice President and Assistant Secretary since August 2005.
Managing Counsel of BNY Mellon, and an officer of 64 investment companies (comprised of 155 portfolios) managed by the Manager. He is 55 years old and has been an employee of the Manager since June 2000.
MAUREEN E. KANE, Vice President and Assistant Secretary since April 2015.
Managing Counsel of BNY Mellon since July 2014; from October 2004 until July 2014, General Counsel, and from May 2009 until July 2014, Chief Compliance Officer of Century Capital Management. She is an officer of 64 investment companies (comprised of 155 portfolios) managed by the Manager. She is 55 years old and has been an employee of the Manager since July 2014.
SARAH S. KELLEHER, Vice President and Assistant Secretary since April 2014.
Senior Counsel of BNY Mellon, since March 2013 from August 2005 to March 2013, Associate General Counsel of Third Avenue Management. She is an officer of 64 investment companies (comprised of 155 portfolios) managed by the Manager. She is 40 years old and has been an employee of the Manager since March 2013.
JEFF PRUSNOFSKY, Vice President and Assistant Secretary since August 2015.
Senior Managing Counsel of BNY Mellon, and an officer of 64 investment companies (comprised of 155 portfolios) managed by the Manager. He is 52 years old and has been an employee of the Manager since October 1990.
NATALYA ZELENSKY, Vice President and Assistant Secretary since March 2017.
Counsel and Vice President of BNY Mellon since May 2016; Attorney at Wildermuth Endowment Strategy Fund/Wildermuth Advisory, LLC from November 2015 until May 2016; Assistant General Counsel at RCS Advisory Services from July 2014 until November 2015; Associate at Sutherland, Asbill & Brennan from January 2013 until January 2014; Associate at K&L Gates from October 2011 until January 2013. She is an officer of 64 investment companies (comprised of 155 portfolios) managed by Dreyfus. She is 32 years old and has been an employee of the Manager since May 2016.
JAMES WINDELS, Treasurer since November 2001.
Director – Mutual Fund Accounting of the Manager, and an officer of 64 investment companies (comprised of 155 portfolios) managed by the Manager. He is 58 years old and has been an employee of the Manager since April 1985.
RICHARD CASSARO, Assistant Treasurer since January 2008.
Senior Accounting Manager – Money Market, Municipal Bond and Equity Funds of the Manager, and an officer of 64 investment companies (comprised of 155 portfolios) managed by the Manager. He is 58 years old and has been an employee of the Manager since September 1982.
GAVIN C. REILLY, Assistant Treasurer since December 2005.
Tax Manager of the Investment Accounting and Support Department of the Manager, and an officer of 64 investment companies (comprised of 155 portfolios) managed by the Manager. He is 49 years old and has been an employee of the Manager since April 1991.
ROBERT S. ROBOL, Assistant Treasurer since December 2002.
Senior Accounting Manager Dreyfus Financial Reporting of the Manager, and an officer of 64 investment companies (comprised of 155 portfolios) managed by the Manager. He is 53 years old and has been an employee of the Manager since October 1988.
ROBERT SALVIOLO, Assistant Treasurer since July 2007.
Senior Accounting Manager – Equity Funds of the Manager, and an officer of 64 investment companies (comprised of 155 portfolios) managed by the Manager. He is 50 years old and has been an employee of the Manager since June 1989.
ROBERT SVAGNA, Assistant Treasurer since December 2002.
Senior Accounting Manager – Fixed Income and Equity Funds of the Manager, and an officer of 64 investment companies (comprised of 155 portfolios) managed by the Manager. He is 50 years old and has been an employee of the Manager since November 1990.
JOSEPH W. CONNOLLY, Chief Compliance Officer since October 2004.
Chief Compliance Officer of the Manager and The Dreyfus Family of Funds (64 investment companies, comprised of 155 portfolios). He is 60 years old and has served in various capacities with the Manager since 1980, including manager of the firm’s Fund Accounting Department from 1997 through October 2001.
CARIDAD M. CAROSELLA, Ant-Money Laudering Compliance Officer January 2016.
Anti-Money Laundering Compliance Officer of the Dreyfus Family of Funds and BNY Mellon Funds Trust since January 2016; from May 2015 to December 2015, Interim Anti-Money Laundering Compliance Officer of the Dreyfus Family of Funds and BNY Mellon Funds Trust and the Distributor; from January 2012 to May 2015, AML Surveillance Officer of the Distributor and from 2007 to December 2011, Financial Processing Manager of the Distributor. She is an officer of 59 investment companies (comprised of 150 portfolios) managed by the Manager. She is 49 years old and has been an employee of the Distributor since 1997.
34
NOTES
35
The BNY Mellon Funds
c/o The Dreyfus Corporation
200 Park Avenue
New York, NY 10166
Investment Adviser
BNY Mellon Fund Advisers, a division of
The Dreyfus Corporation
200 Park Avenue
New York, NY 10166
Administrator
The Bank of New York Mellon
225 Liberty Street
New York, NY 10286
Sub-Administrator
The Dreyfus Corporation
200 Park Avenue
New York, NY 10166
Custodian
The Bank of New York Mellon
225 Liberty Street
New York, NY 10286
Transfer Agent &
Dividend Disbursing Agent
Dreyfus Transfer, Inc.
200 Park Avenue
New York, NY 10166
Distributor
MBSC Securities Corporation
200 Park Avenue
New York, NY 10166
Ticker Symbols: | ||||||||
BNY Mellon Government Money Market Fund | Class M: MLMXX | Investor: MLOXX | ||||||
BNY Mellon National Municipal Money Market Fund | Class M: MOMXX | Investor: MNTXX |
Telephone Wealth Management (WM) Clients, please contact your Account Officer or call 1-866-804-5023. Brokerage Clients of BNY Mellon Wealth Advisors (BNYMWA), please contact your financial representative or call 1-800-830-0549, Option 2 for BNY Mellon Wealth Management Direct or 1-800-843-5466 for former brokerage clients of BNY Mellon Wealth Advisors whose accounts are now held by Dreyfus Brokerage Services. Individual Account holders, please call Dreyfus at 1-800-DREYFUS.
Mail WM clients, write to your Account Officer, c/o The Bank of New York Mellon, One Mellon Bank Center, Pittsburgh, PA 15258
BNYMWA Brokerage Clients, write to your financial representative, P.O. Box 9012, Hicksville, NY 11802-9012
Individual Account Holders, write to: BNY Mellon Funds, P.O. Box 9879, Providence, RI 02940-8079
Each fund will disclose daily, on www.dreyfus.com, the fund’s complete schedule of holdings as of the end of the previous business day. The schedule of holdings will remain on the website until the fund files its Form N-Q or Form N-CSR for the period that includes the date of the posted holdings.
Each fund files its complete schedule of portfolio holdings with the Securities and Exchange Commission (“SEC”) for the first and third quarters of each fiscal year on Form N-Q. The fund’s Forms N-Q are available on the SEC’s website at http://www.sec.gov and may be reviewed and copied at the SEC’s Public Reference Room in Washington, DC. Information on the operation of the Public Reference Room may be obtained by calling 1-800-SEC-0330.
A description of the policies and procedures that the fund uses to determine how to vote proxies relating to portfolio securities, and information regarding how the fund voted these proxies for the most recent 12-month period ended June 30 is available at http://www.dreyfus.com and on the SEC’s website at http://www.sec.gov. The description of the policies and procedures is also available without charge, upon request, by calling 1-800-DREYFUS.
© 2017 MBSC Securities Corporation | MFTAR0817-MM |
Item 2. Code of Ethics.
The Registrant has adopted a code of ethics that applies to the Registrant's principal executive officer, principal financial officer, principal accounting officer or controller, or persons performing similar functions. There have been no amendments to, or waivers in connection with, the Code of Ethics during the period covered by this Report.
Item 3. Audit Committee Financial Expert.
The Registrant's Board has determined that Thomas F. Ryan, a member of the Audit Committee of the Board, is an audit committee financial expert as defined by the Securities and Exchange Commission (the "SEC"). Thomas F. Ryan is "independent" as defined by the SEC for purposes of audit committee financial expert determinations.
Item 4. Principal Accountant Fees and Services.
(a) Audit Fees. The aggregate fees billed for each of the last two fiscal years (the "Reporting Periods") for professional services rendered by the Registrant's principal accountant (the "Auditor") for the audit of the Registrant's annual financial statements or services that are normally provided by the Auditor in connection with the statutory and regulatory filings or engagements for the Reporting Periods, were $655,440 in 2016 and $668,570 in 2017.
(b) Audit-Related Fees. The aggregate fees billed in the Reporting Periods for assurance and related services by the Auditor that are reasonably related to the performance of the audit of the Registrant's financial statements and are not reported under paragraph (a) of this Item 4 were $107,485 in 2016 and $109,630 in 2017. These services consisted of one or more of the following: (i) agreed upon procedures related to compliance with Internal Revenue Code section 817(h), (ii) security counts required by Rule 17f-2 under the Investment Company Act of 1940, as amended, (iii) advisory services as to the accounting or disclosure treatment of Registrant transactions or events and (iv) advisory services to the accounting or disclosure treatment of the actual or potential impact to the Registrant of final or proposed rules, standards or interpretations by the Securities and Exchange Commission, the Financial Accounting Standards Boards or other regulatory or standard-setting bodies.
The aggregate fees billed in the Reporting Periods for non-audit assurance and related services by the Auditor to the Registrant's investment adviser (not including any sub-investment adviser whose role is primarily portfolio management and is subcontracted with or overseen by another investment adviser), and any entity controlling, controlled by or under common control with the investment adviser that provides ongoing services to the Registrant ("Service Affiliates"), that were reasonably related to the performance of the annual audit of the Service Affiliate, which required pre-approval by the Audit Committee were $0 in 2016 and $0 in 2017.
(c) Tax Fees. The aggregate fees billed in the Reporting Periods for professional services rendered by the Auditor for tax compliance, tax advice, and tax planning ("Tax Services") were $75,400 in 2016 and $80,400 in 2017. These services consisted of: (i) review or preparation of U.S. federal, state, local and excise tax returns. The aggregate fees billed in the Reporting Periods for Tax Services by the Auditor to Service Affiliates, which required pre-approval by the Audit Committee were $0 in 2016 and $0 in 2017.
(d) All Other Fees. The aggregate fees billed in the Reporting Periods for products and services provided by the Auditor, other than the services reported in paragraphs (a) through (c) of this Item, were $0 in 2016 and $0 in 2017.
The aggregate fees billed in the Reporting Periods for Non-Audit Services by the Auditor to Service Affiliates, other than the services reported in paragraphs (b) through (c) of this Item, which required pre-approval by the Audit Committee, were $0 in 2016 and $0 in 2017.
(e)(1) Audit Committee Pre-Approval Policies and Procedures. The Registrant's Audit Committee has established policies and procedures (the "Policy") for pre-approval (within specified fee limits) of the Auditor's engagements for non-audit services to the Registrant and Service Affiliates without specific case-by-case consideration. The pre-approved services in the Policy can include pre-approved audit services, pre-approved audit-related services, pre-approved tax services and pre-approved all other services. Pre-approval considerations include whether the proposed services are compatible with maintaining the Auditor's independence. Pre-approvals pursuant to the Policy are considered annually.
(e)(2) Note. None of the services described in paragraphs (b) through (d) of this Item 4 were approved by the Audit Committee pursuant to paragraph (c)(7)(i)(C) of Rule 2-01 of Regulation S-X.
(f) None of the hours expended on the principal accountant's engagement to audit the registrant's financial statements for the most recent fiscal year were attributed to work performed by persons other than the principal account's full-time, permanent employees.
Non-Audit Fees. The aggregate non-audit fees billed by the Auditor for services rendered to the Registrant, and rendered to Service Affiliates, for the Reporting Periods were $19,018,000 in 2016 and $20,552,000 in 2017.
Auditor Independence. The Registrant's Audit Committee has considered whether the provision of non-audit services that were rendered to Service Affiliates, which were not pre-approved (not requiring pre-approval), is compatible with maintaining the Auditor's independence.
Item 5. Audit Committee of Listed Registrants.
Not applicable.
Item 6. Investments.
(a) Not applicable.
Item 7. Disclosure of Proxy Voting Policies and Procedures for Closed-End Management Investment Companies.
Not applicable.
Item 8. Portfolio Managers of Closed-End Management Investment Companies.
Not applicable.
Item 9. Purchases of Equity Securities by Closed-End Management Investment Companies and Affiliated Purchasers.
Not applicable.
Item 10. Submission of Matters to a Vote of Security Holders.
There have been no material changes to the procedures applicable to Item 10.
Item 11. Controls and Procedures.
(a) The Registrant's principal executive and principal financial officers have concluded, based on their evaluation of the Registrant's disclosure controls and procedures as of a date within 90 days of the filing date of this report, that the Registrant's disclosure controls and procedures are reasonably designed to ensure that information required to be disclosed by the Registrant on Form N-CSR is recorded, processed, summarized and reported within the required time periods and that information required to be disclosed by the Registrant in the reports that it files or submits on Form N-CSR is accumulated and communicated to the Registrant's management, including its principal executive and principal financial officers, as appropriate to allow timely decisions regarding required disclosure.
(b) There were no changes to the Registrant's internal control over financial reporting that occurred during the second fiscal quarter of the period covered by this report that have materially affected, or are reasonably likely to materially affect, the Registrant's internal control over financial reporting.
Item 12. Exhibits.
(a)(1) Code of ethics referred to in Item 2.
(a)(2) Certifications of principal executive and principal financial officers as required by Rule 30a-2(a) under the Investment Company Act of 1940.
(a)(3) Not applicable.
(b) Certification of principal executive and principal financial officers as required by Rule 30a-2(b) under the Investment Company Act of 1940.
SIGNATURES
Pursuant to the requirements of the Securities Exchange Act of 1934 and the Investment Company Act of 1940, the Registrant has duly caused this Report to be signed on its behalf by the undersigned, thereunto duly authorized.
BNY Mellon Funds Trust
By: /s/ Patrick T. Crowe | |
Patrick T. Crowe President
| |
Date: | October 27, 2017 |
| |
Pursuant to the requirements of the Securities Exchange Act of 1934 and the Investment Company Act of 1940, this Report has been signed below by the following persons on behalf of the Registrant and in the capacities and on the dates indicated. | |
| |
By: /s/ Patrick T. Crowe | |
Patrick T. Crowe President
| |
Date: | October 27, 2017 |
| |
By: /s/ James Windels | |
James Windels Treasurer
| |
Date: | October 27, 2017 |
| |
EXHIBIT INDEX
(a)(1) Code of ethics referred to in Item 2.
(a)(2) Certifications of principal executive and principal financial officers as required by Rule 30a-2(a) under the Investment Company Act of 1940. (EX-99.CERT)
(b) Certification of principal executive and principal financial officers as required by Rule 30a-2(b) under the Investment Company Act of 1940. (EX-99.906CERT)