Municipal bonds generally produced positive total returns over the reporting period due to falling interest rates and demand supported by investors’ desire for tax-free income. The fund underperformed the Index, primarily due to hedging activity.
Over the reporting period, several shifts in investor sentiment and behavior occurred. During September 2018, markets were still enjoying momentum from strong summer 2018 returns, despite continued concerns over trade disputes, geopolitical disagreements and the possibility of slowing global growth. In October 2018, the U.S. Federal Reserve (the “Fed”) made comments that led investors to believe it was set to proceed down a hawkish trajectory in terms of 2019 interest-rate hikes. This, along with softness in earnings of cyclical companies, increasing corporate leverage, and continued global political uncertainty unnerved investors and sparked a period of volatility that lasted throughout the fourth quarter of 2018.
Investor sentiment and market performance shifted once again in January 2019 after comments by the Fed, which emphasized its focus on data as a driver for rate-hike decisions and its ability to suspend additional rate increases when the data is not supportive. After the Federal Open Market Committee (FOMC) meeting, spreads narrowed and risk asset valuations recovered. Prices of fixed-income instruments continued to rally throughout much of the latter half of the period, with high yield securities outperforming much of the broader market. Corporate earnings were generally in line with expectations, and the performance of cyclical sector debt, such as automobile, energy and chemical companies, has continued to improve since the end of 2018. At its July 2019 meeting, the Fed continued its accommodative policies by cutting the federal funds rate by 25 basis points. Throughout much of 2019, rates generally fell, and the Treasury and municipal yield curves flattened.
The financial condition of Pennsylvania has stabilized throughout the last several years due to an improved budgetary process. This has reassured investors, and the state spreads have narrowed. Pennsylvania enjoys a diverse economy, which helps to provide steady revenues.
The fund’s performance relative to the Index was hindered during the reporting period due in part to hedging activity, which was one of the largest detractors from relative performance during the 12 months. The fund utilizes interest-rate futures, which had a material effect on performance during the period. An overweight to shorter-maturity bonds also detracted. In addition, positioning within pre-refunded debt provided a headwind to results, as did a small cash position. Shorter duration and maturity positioning within bonds issued by New Jersey, Illinois, and Puerto Rico also detracted relative to the Index.
Conversely, its concentrated exposure to bonds issued by Pennsylvania was beneficial to portfolio performance. Investments in AA, A and AAA rated debt also contributed. An overweight to bonds maturing between 2034 and 2038 bolstered results, along with duration positioning and issue selection within local general obligation, education and health care bonds. Transportation credits also benefited returns.
As we watch economic growth rates moderate, we remain guarded and are keeping an eye on global events and dynamics. We believe that the U.S. continues to be tethered to global interest rates. As non-U.S. sovereign rates stay low, so do rates in the U.S. We think this trend will persist, with the Fed possibly continuing to unwind its previous rate increases throughout the rest of 2019. It is our opinion that rates will stay range-bound, but the yield curve may steepen. In this environment, we feel it is prudent to maintain neutral duration positioning to potentially help mitigate the impact of interest-rate changes on relative performance. In aiming for this goal, we have been reducing our exposure to bonds with zero-to-three-year maturity profiles and 20+ year maturity profiles.
For the period from September 1, 2018 through August 31, 2019, as provided by Mary Collette O’Brien and Stephen J. O’Brien, portfolio managers
Market and Fund Performance Overview
For the 12-month period ended August 31, 2019, BNY Mellon Massachusetts Intermediate Municipal Bond Fund’s Class M shares produced a total return of 8.28%, and Investor shares produced a total return of 7.93%.1 In comparison, the fund’s benchmark index, the S&P Municipal Bond Investment Grade Intermediate Index (the “Index”), produced a total return of 8.42%,2 and the fund’s former benchmark, the S&P Municipal Bond Intermediate Index, produced a total return of 8.41% for the same period.3,4
Municipal bonds generally produced positive total returns over the reporting period due to falling interest rates and demand supported by investors’ desire for tax-free income. The fund underperformed the Index, primarily due to hedging activity.
The Fund’s Investment Approach
The fund seeks as high a level of income exempt from federal and Massachusetts state income taxes as is consistent with the preservation of capital. To pursue its goal, the fund normally invests at least 80% of its net assets, plus any borrowings for investment purposes, in municipal bonds that provide income exempt from federal and Massachusetts state personal income taxes. The fund’s investments in municipal and taxable bonds must be rated investment grade (i.e., Baa/BBB or higher) at the time of purchase or, if unrated, deemed of comparable quality by the investment adviser.5 Generally, the fund’s average effective portfolio maturity will be between three and ten years and the average effective duration of the fund’s portfolio will not exceed eight years.
A Tale of Two Markets
Over the reporting period, several shifts in investor sentiment and behavior occurred. During September 2018, markets were still enjoying momentum from strong summer 2018 returns, despite continued concerns over trade disputes, geopolitical disagreements and the possibility of slowing global growth. In October 2018, the U.S. Federal Reserve (the “Fed”) made comments that led investors to believe it was set to proceed down a hawkish trajectory in terms of 2019 rate hikes. This, along with softness in earnings of cyclical companies, increasing corporate leverage, and continued global political uncertainty unnerved investors and sparked a period of volatility that lasted throughout the fourth quarter of 2018.
Investor sentiment and market performance shifted once again in January 2019 after comments by the Fed, which emphasized its focus on data as a driver for rate-hike decisions and its ability to suspend additional rate increases when the data is not supportive. After the Fed’s meeting, spreads narrowed and risk asset valuations recovered. Prices of fixed income instruments continued to rally throughout much of the latter half of the period, with high yield securities outperforming much of the broader market. Corporate earnings were generally in line with expectations, and the performance of cyclical sector debt such as automobile, energy and chemical companies, has continued to improve since the end of 2018. At its July 2019 meeting, the Fed continued its accommodative policies by cutting the federal funds rate by 25 basis points. Throughout much of 2019, rates generally fell, and the Treasury and municipal yield curves flattened.
Massachusetts is doing well from an economic and credit perspective. Revenue increases have been mitigating budgetary strains. The state benefits from diversified sources of revenue. Challenges remain regarding pension funding, but increased revenue flows have improved funding rates. Fiscal discipline keeps the state in a healthy financial condition.
Hedging Activity Dampens Fund Results
The fund’s performance relative to the Index was hindered during the reporting period due in part to hedging activity, which was one of the largest detractors from relative performance during the 12 months. The fund utilizes interest-rate futures, which had a material effect on performance during the period. An overweight to shorter-maturity bonds also detracted. A small cash position provided a headwind to returns, as did shorter-duration positioning within the transportation sector, bonds issued by New Jersey, and investments in A rated credit.
Conversely, the fund’s concentrated exposure to bonds issued by Massachusetts was beneficial to portfolio performance along with securities in the BBB rating category. An overweight to bonds maturing between 2034 and 2038 bolstered results, along with positioning in education, health care, utility and Industrial Development Revenue/Pollution Control Revenue (IDR/PCR).
Constructively Positioned for Low Rates
As we watch economic growth rates moderate, we remain guarded and are keeping an eye on global events and dynamics. We believe that the U.S. continues to be tethered to global interest rates. As non-U.S. sovereign rates stay low, so do rates in the U.S. We think this trend will persist, with the Fed possibly continuing to unwind its previous rate increases throughout the rest of 2019. It is our opinion that rates will stay range-bound, but the yield curve may steepen. In this environment, we feel it is prudent to maintain neutral duration positioning to potentially help mitigate the impact of interest-rate changes on relative performance. In aiming for this goal, we have been reducing our exposure to bonds with zero-to-three-year maturity profiles and 20+ year maturity profiles.
September 16, 2019
1 Total return includes reinvestment of dividends and any capital gains paid. Past performance is no guarantee of future results. Share price, yield, and investment return fluctuate such that upon redemption, fund shares may be worth more or less than their original cost. Income may be subject to state and local taxes for non-Massachusetts residents, and some income may be subject to the federal alternative minimum tax (AMT) for certain investors. Capital gains, if any, are taxable.
2 Source: Bloomberg L.P. — The S&P Municipal Bond Investment Grade Intermediate Index consists of bonds in the S&P Municipal Bond Index that are rated at least BBB- by Standard & Poor’s, Baa3 by Moody’s or BBB- by Fitch Ratings. All bonds must also have a minimum maturity of 3 years and a maximum maturity of up to, but not including, 15 years as measured from the rebalancing date. Investors cannot invest directly in any index.
3 Source: Lipper Inc. — The S&P Municipal Bond Intermediate Index consists of bonds in the S&P Municipal Bond Index with a minimum maturity of 3 years and a maximum maturity of up to, but not including, 15 years as measured from the rebalancing date. Investors cannot invest directly in any index.
4 The S&P Municipal Bond Investment Grade Intermediate Index was first calculated on March 19, 2013. Accordingly, the fund will continue to report the performance of the S&P Municipal Bond Intermediate Index until the S&P Municipal Bond Investment Grade Intermediate Index has been calculated for a 10-year period.
5 The fund may continue to own investment-grade bonds (at the time of purchase), which are subsequently downgraded to below investment grade.
Bonds are subject generally to interest-rate, credit, liquidity, and market risks, to varying degrees, all of which are more fully described in the fund’s prospectus. Generally, all other factors being equal, bond prices are inversely related to interest-rate changes, and rate increases can cause price declines. The amount of public information available about municipal bonds is generally less than that for corporate equities or bonds. Special factors, such as legislative changes, and state and local economic and business developments, may adversely affect the yield and/or value of the fund’s investments in municipal bonds. Other factors include the general conditions of the municipal bond market, the size of the particular offering, the maturity of the obligation, and the rating of the issue. Changes in economic, business, or political conditions relating to a particular municipal project, municipality, or state in which the fund invests may have an impact on the fund’s share price.
The fund may use derivative instruments, such as options, futures, options on futures, forward contracts, and swaps. A small investment in derivatives could have a potentially large impact on the fund’s performance. The use of derivatives involves risks different from, or possibly greater than, the risks associated with investing directly in the underlying assets.
7
DISCUSSION OF FUND PERFORMANCE(Unaudited) (continued)
For the period from September 1, 2018 through August 31, 2019, as provided by John F. Flahive and Gregory J. Conant, portfolio managers
Market and Fund Performance Overview
For the 12-month period ended August 31, 2019, BNY Mellon New York Intermediate Tax-Exempt Bond Fund’s Class M shares produced a total return of 8.28%, and Investor shares produced a total return of 8.00%.1 In comparison, the fund’s benchmark index, the S&P Municipal Bond Investment Grade Intermediate Index (the “Index”), produced a total return of 8.42%,2 and the fund’s former benchmark, the S&P Municipal Bond Intermediate Index, produced a total return of 8.41% for the same period.3,4
Municipal bonds generally produced positive total returns over the reporting period due to falling interest rates and demand supported by investors’ desire for tax-free income. The fund underperformed the Index, primarily due to hedging activities.
The Fund’s Investment Approach
The fund seeks as high a level of income exempt from federal, New York state and New York city income taxes as is consistent with the preservation of capital. To pursue its goal, the fund normally invests at least 80% of its net assets, plus any borrowings for investment purposes, in municipal bonds that provide income exempt from federal, New York state and New York city personal income taxes. These municipal bonds include those issued by New York state and New York City as well as those issued by territories and possessions of the United States and the District of Columbia and their political subdivisions, agencies and instrumentalities, or multistate agencies and authorities, and certain other specified securities. Generally, the fund’s average effective portfolio maturity will be between three and ten years.
A Tale of Two Markets
Over the reporting period, several shifts in investor sentiment and behavior occurred. During September 2018, markets were still enjoying momentum from strong summer 2018 returns, despite continued concerns over trade disputes, geopolitical disagreements and the possibility of slowing global growth. In October 2018, the U.S. Federal Reserve (the “Fed”) made comments that led investors to believe it was set to proceed down a hawkish trajectory in terms of 2019 interest-rate hikes. This, along with softness in earnings of cyclical companies, increasing corporate leverage, and continued global political uncertainty unnerved investors and sparked a period of volatility that lasted throughout the fourth quarter of 2018.
Investor sentiment and market performance shifted once again in January 2019 after comments by the Fed, which emphasized its focus on data as a driver for rate-hike decisions and its ability to suspend additional rate increases when the data is not supportive. After the Federal Open Market Committee (FOMC) meeting, spreads narrowed and risk asset valuations recovered. Prices of fixed-income instruments continued to rally throughout much of the latter half of the period, with high yield securities outperforming much of the broader market. Corporate earnings were generally in line with expectations, and the performance of cyclical sector debt, such as automobile, energy and chemical companies, has continued to improve since the end of 2018. At its July 2019 meeting, the Fed continued its accommodative policies by cutting the federal funds rate by 25 basis points. Throughout much of 2019, rates generally fell, and the Treasury and municipal yield curves flattened.
New York’s fiscal condition continues to benefit from a diverse economy. The state also employs strong fiscal controls and relatively high funding requirements for public pensions, when compared with other states. New York boasts a long history of being supportive to its bondholders and continues to enjoy an AA rating.
Hedging Activity Dampens Fund Results
The fund’s performance relative to the Index was hindered during the reporting period due in part to hedging activity, which was one of the largest detractors from relative performance during the 12 months. The fund utilizes futures, which had a material effect on performance during the period. An overweight to shorter-maturity bonds also detracted. A small cash position provided a headwind to returns, as did its shorter-duration positioning within transportation and housing debt. Shorter duration and maturity positioning within bonds issued by New Jersey, Illinois, and Puerto Rico also detracted relative to the Index.
Conversely, its concentrated exposure to bonds issued by New York was beneficial to portfolio performance. Investments in AA rated debt were standout contributors, but all credit qualities yielded positive performance for the period. An overweight to bonds maturing between 2034 and 2038 also bolstered results, along with positioning in tax-supported, education and utility debt.
Constructively Positioned for Low Rates
As we watch economic growth rates moderate, we remain guarded and are keeping an eye on global events and dynamics. We believe that the U.S. continues to be tethered to global interest rates. As non-U.S. sovereign rates stay low, so do rates in the U.S. We think this trend will persist, with the Fed possibly continuing to unwind its previous rate increases throughout the rest of 2019. It is our opinion that rates will stay range-bound, but the yield curve may steepen. In this environment, we feel it is prudent to maintain neutral duration positioning to potentially help mitigate the impact of interest-rate changes on relative performance. In aiming for this goal, we have been reducing our exposure to bonds with zero-to-three-year maturity profiles and 20+ year maturity profiles.
September 16, 2019
1 Total return includes reinvestment of dividends and any capital gains paid. Past performance is no guarantee of future results. Share price, yield, and investment return fluctuate such that upon redemption, fund shares may be worth more or less than their original cost. Income may be subject to state and local taxes for non-New York residents, and some income may be subject to the federal alternative minimum tax (AMT) for certain investors. Capital gains, if any, are fully taxable. The fund’s returns reflect the absorption of certain fund expenses by BNY Mellon Fund Advisers pursuant to an agreement in effect through December 31, 2019, at which time it may be extended, terminated, or modified. Had these expenses not been absorbed, the fund’s returns would have been lower.
2 Source: Bloomberg L.P. — The S&P Municipal Bond Investment Grade Intermediate Index consists of bonds in the S&P Municipal Bond Index that are rated at least BBB- by Standard & Poor’s, Baa3 by Moody’s or BBB- by Fitch Ratings. All bonds must also have a minimum maturity of 3 years and a maximum maturity of up to, but not including, 15 years as measured from the rebalancing date. Investors cannot invest directly in any index.
3 Source: Lipper Inc. — The S&P Municipal Bond Intermediate Index consists of bonds in the S&P Municipal Bond Index with a minimum maturity of 3 years and a maximum maturity of up to, but not including, 15 years as measured from the rebalancing date. Unlike a mutual fund, neither index is subject to charges, fees, and other expenses and is not limited to investments principally in New York municipal obligations. Investors cannot invest directly in any index.
4 The S&P Municipal Bond Investment Grade Intermediate Index was first calculated on March 19, 2013. Accordingly, the fund will continue to report the performance of the S&P Municipal Bond Intermediate Index until the S&P Municipal Bond Investment Grade Intermediate Index has been calculated for a 10-year period.
Bonds are subject generally to interest-rate, credit, liquidity, and market risks, to varying degrees, all of which are more fully described in the fund’s prospectus. Generally, all other factors being equal, bond prices are inversely related to interest-rate changes, and rate increases can cause price declines.
The fund may use derivative instruments, such as options, futures, options on futures, forward contracts, and swaps. A small investment in derivatives could have a potentially large impact on the fund’s performance. The use of derivatives involves risks different from, or possibly greater than, the risks associated with investing directly in the underlying assets.
8
For the period from September 1, 2018 through August 31, 2019, as provided by John F. Flahive, portfolio manager
Market and Fund Performance Overview
For the 12-month period ended August 31, 2019, BNY Mellon Municipal Opportunities Fund’s Class M shares produced a total return of 7.77%, and Investor shares produced a total return of 7.50%.1 In comparison, the fund’s benchmark, the Bloomberg Barclays U.S. Municipal Bond Index (the “Index”), produced a total return of 8.72% for the same period.2
Municipal bonds generally produced positive total returns over the reporting period due to falling interest rates and demand supported by investors’ desire for tax-free income. The fund underperformed the Index for the period, partly due to the hedging activity of the fund.
The Fund’s Investment Approach
The fund seeks to maximize total return consisting of high current income exempt from federal income tax and capital appreciation. To pursue its goal, the fund normally invests at least 80% of its net assets, plus any borrowings for investment purposes, in U.S. dollar-denominated, fixed-income securities that provide income exempt from federal income tax (municipal bonds). While the fund typically invests in a diversified portfolio of municipal bonds, it may invest up to 20% of its assets in taxable fixed-income securities, including taxable municipal bonds and non-U.S. dollar-denominated, foreign-debt securities, such as Brady bonds and sovereign debt obligations.
The fund’s portfolio manager seeks to deliver value-added excess returns (“alpha”) by applying an investment approach designed to identify and exploit relative value opportunities within the municipal bond market and other fixed-income markets. Although the fund seeks to be diversified by geography and sector, the fund may at times invest a significant portion of its assets in a particular state or region or in a particular sector due to market conditions.
A Tale of Two Markets
Over the reporting period, several shifts in investor sentiment and behavior occurred. During September 2018, markets were still enjoying momentum from strong summer 2018 returns, despite continued concerns over trade disputes, geopolitical disagreements and the possibility of slowing global growth. In October 2018, the U.S. Federal Reserve (the “Fed”) made comments that led investors to believe it was set to proceed down a hawkish trajectory in terms of 2019 interest-rate hikes. This, along with softness in earnings of cyclical companies, increasing corporate leverage, and continued global political uncertainty, unnerved investors and sparked a period of volatility that lasted throughout the fourth quarter of 2018.
Investor sentiment and market performance shifted once again in January 2019 after comments by the Fed, which emphasized its focus on data as a driver for rate-hike decisions and its ability to suspend additional rate increases when the data is not supportive. After the Fed’s meeting, spreads narrowed, and risk asset valuations recovered. Prices of fixed-income instruments continued to rally throughout much of the latter half of the period, with high yield securities outperforming much of the broader market. Corporate earnings were generally in line with expectations, and the performance of cyclical sector debt, such as automobile, energy and chemical companies, has continued to improve since the end of 2018. At its July 2019 meeting, the Fed continued its accommodative policies by cutting the federal funds rate by 25 basis points. Throughout much of the latter half of the period, rates generally fell, and the Treasury yield curve flattened.
Hedging Activity Dampens Fund Results
The fund’s performance relative to the Index was hindered during the reporting period due in part to hedging activity, which was one of the largest detractors from relative performance during the 12 months. The fund utilizes interest-rate swaps and futures, which had a material effect on performance during the period. In addition, an out-of-index position in bonds that matured in 2018 provided a drag on results, as did a cash position. An overweight to bonds issued by Texas also produced a headwind during the period.
Conversely, investments in AA and A rated debt were beneficial to portfolio performance, due primarily to successful duration positioning and issue selection. A generous overweight to BBB rated securities also provided a tailwind to results. Bonds issued by California, New York, Massachusetts and Puerto Rico also bolstered returns. An overweight to bonds maturing in 2039 and beyond also helped.
Constructively Positioned for Low Rates
As we watch economic growth rates moderate, we remain guarded and are keeping an eye on global events and dynamics. We believe that the U.S. continues to be tethered to global interest rates. As non-U.S. sovereign rates stay low, so do rates in the U.S. We think this trend will persist, with the Fed possibly continuing to unwind its previous rate increases throughout the rest of 2019. It is our opinion that rates will stay range-bound, but the yield curve may steepen. In this environment, we feel it is prudent to maintain neutral duration positioning to potentially help mitigate the impact of interest-rate changes on relative performance.
September 16, 2019
1 Total return includes reinvestment of dividends and any capital gains paid. Past performance is no guarantee of future results. Share price, yield and investment return fluctuate such that upon redemption, fund shares may be worth more or less than their original cost. Income may be subject to state and local taxes, and some income may be subject to the federal alternative minimum tax (AMT) for certain investors. Capital gains, if any, are fully taxable.
2 Source: Lipper Inc. — The Bloomberg Barclays U.S. Municipal Bond Index covers the U.S. dollar-denominated, long-term, tax-exempt bond market. Investors cannot invest directly in any index.
Bonds are subject generally to interest-rate, credit, liquidity and market risks, to varying degrees, all of which are more fully described in the fund’s prospectus. Generally, all other factors being equal, bond prices are inversely related to interest-rate changes, and rate increases can cause price declines.
The fund may use derivative instruments, such as options, futures, options on futures, forward contracts and swaps. A small investment in derivatives could have a potentially large impact on the fund’s performance. The use of derivatives involves risks different from, or possibly greater than, the risks associated with investing directly in the underlying assets
9
FUND PERFORMANCE(Unaudited)

Comparison of change in value of a $10,000 investment in Class M shares and Investor shares of BNY Mellon National Intermediate Municipal Bond Fund with a hypothetical investment of $10,000 in the S&P Municipal Bond Intermediate Index (the “Index”)
| | | | |
Average Annual Total Returnsas of 8/31/19 | | | |
| | 1 Year | 5 Years | 10 Years |
Class M shares | 8.26% | 3.14% | 3.83% |
Investor shares | 7.92% | 2.87% | 3.57% |
S&P Municipal Bond Intermediate Index | 8.41% | 3.50% | 4.38% |
† Source: Lipper Inc.
Past performance is not predictive of future performance.
The above graph compares a hypothetical $10,000 investment made in each of the Class M and Investor shares of BNY Mellon National Intermediate Municipal Bond Fund on 8/31/09 to a hypothetical investment of $10,000 made in the Index on that date.All dividends and capital gain distributions are reinvested.
Effective 7/1/2013, the fund changed its benchmark from the S&P Municipal Bond Intermediate Index to the S&P Municipal Bond Investment Grade Intermediate Index because the new benchmark index is more reflective of the credit quality of the fund’s portfolio holdings. The S&P Municipal Bond Investment Grade Intermediate Index was launched on 3/19/13. Accordingly, the fund will continue to report the performance of the S&P Municipal Bond Intermediate Index until the S&P Municipal Bond Investment Grade Intermediate Index has been calculated for a 10-year period. Performance information for the fund versus the S&P Municipal Bond Investment Grade Intermediate Index is included in the graph and table on the next page.
The fund’s performance shown in the line graph above takes into account all applicable fees and expenses for Class M and Investor shares. The Index consists of bonds in the S&P Municipal Bond Index with a minimum maturity of three years and a maximum maturity of up to, but not including, 15 years as measured from the rebalancing date. Unlike a mutual fund, the Index is not subject to charges, fees and other expenses. Investors cannot invest directly in any index. Further information relating to fund performance, including expense reimbursements, if applicable, is contained in the Financial Highlights section of the prospectus and elsewhere in this report.
The performance data quoted represents past performance, which is no guarantee of future results. Share price and investment return fluctuate and an investor’s shares may be worth more or less than original cost upon redemption. Current performance may be lower or higher than the performance quoted. Go to im.bnymellon.com for the fund’s most recent month-end returns.
The fund’s performance shown in the graph and table does not reflect the deduction of taxes that a shareholder would pay on fund distributions or the redemption of fund shares.
10

Comparison of change in value of a $10,000 investment in Class M shares and Investor shares of BNY Mellon National Intermediate Municipal Bond Fund with a hypothetical investment of $10,000 in the S&P Municipal Bond Investment Grade Intermediate Index (the “Index”)
| | | | | |
Average Annual Total Returnsas of 8/31/19 | | | | |
| | Inception Date | 1 Year | 5 Years | From Inception |
Class M shares | 7/1/13 | 8.26% | 3.14% | 3.46% |
Investor shares | 7/1/13 | 7.92% | 2.87% | 3.19% |
S&P Municipal Bond Investment Grade Intermediate Index | 7/1/13 | 8.42% | 3.43% | 3.93%††† |
†† Source: Bloomberg L.P.
Past performance is not predictive of future performance.
The above graph compares a hypothetical $10,000 investment made in each of the Class M and Investor shares of BNY Mellon National Intermediate Municipal Bond Fund on 7/1/13 to a hypothetical investment of $10,000 made in the Index on that date. All dividends and capital gain distributions are reinvested.
The fund’s performance shown in the line graph above takes into account all applicable fees and expenses for Class M and Investor shares. The Index consists of bonds in the S&P Municipal Bond Index that are rated at least BBB- by Standard& Poor’s, Baa3 by Moody’s or BBB- by Fitch Ratings. All bonds must also have a minimum maturity of 3 years and a maximum maturity of up to, but not including, 15 years as measured from the rebalancing date. Unlike a mutual fund, the Index is not subject to charges, fees and other expenses. Investors cannot invest directly in any index. Further information relating to fund performance, including expense reimbursements, if applicable, is contained in the Financial Highlights section of the prospectus and elsewhere in this report.
††† For comparative purposes, the value of the Index on 6/30/13 is used as the beginning value on 7/1/13.
The performance data quoted represents past performance, which is no guarantee of future results. Share price and investment return fluctuate and an investor’s shares may be worth more or less than original cost upon redemption. Current performance may be lower or higher than the performance quoted. Go to im.bnymellon.com for the fund’s most recent month-end returns.
The fund’s performance shown in the graph and table does not reflect the deduction of taxes that a shareholder would pay on fund distributions or the redemption of fund shares.
11
FUND PERFORMANCE(Unaudited) (continued)
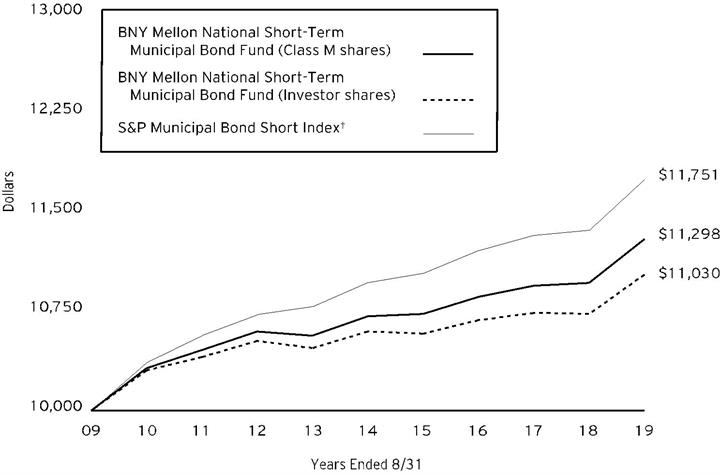
Comparison of change in value of a $10,000 investment in Class M shares and Investor shares of BNY Mellon National Short-Term Municipal Bond Fund with a hypothetical investment of $10,000 in the S&P Municipal Bond Short Index (the “Index”)
| | | | |
Average Annual Total Returnsas of 8/31/19 | | | |
| | 1 Year | 5 Years | 10 Years |
Class M shares | 3.03% | 1.07% | 1.23% |
Investor shares | 2.78% | 0.80% | 0.99% |
S&P Municipal Bond Short Index | 3.39% | 1.38% | 1.63% |
† Source: Lipper Inc.
Past performance is not predictive of future performance.
The above graph compares a hypothetical $10,000 investment made in each of the Class M and Investor shares of BNY Mellon National Short-Term Municipal Bond Fund on 8/31/09 to a hypothetical investment of $10,000 made in the Index on that date. All dividends and capital gain distributions are reinvested.
Effective 7/1/2013, the fund changed its benchmark from the S&P Municipal Bond Short Index to the S&P Municipal Bond Investment Grade Short Index because the new benchmark index is more reflective of the credit quality of the fund’s portfolio holdings. The S&P Municipal Bond Investment Grade Short Index was launched on 3/19/13. Accordingly, the fund will continue to report the performance of the S&P Municipal Bond Short Index until the S&P Municipal Bond Investment Grade Short Index has been calculated for a 10-year period. Performance information for the fund versus the S&P Municipal Bond Investment Grade Short Index is included in the graph and table on the next page.
The fund’s performance shown in the line graph above takes into account all applicable fees and expenses for Class M and Investor shares. The Index consists of bonds in the S&P Municipal Bond Index with a minimum maturity of six months and a maximum maturity of up to, but not including, four years as measured from the rebalancing date. Unlike a mutual fund, the Index is not subject to charges, fees and other expenses. Investors cannot invest directly in any index. Further information relating to fund performance, including expense reimbursements, if applicable, is contained in the Financial Highlights section of the prospectus and elsewhere in this report.
The performance data quoted represents past performance, which is no guarantee of future results. Share price and investment return fluctuate and an investor’s shares may be worth more or less than original cost upon redemption. Current performance may be lower or higher than the performance quoted. Go to im.bnymellon.com for the fund’s most recent month-end returns.
The fund’s performance shown in the graph and table does not reflect the deduction of taxes that a shareholder would pay on fund distributions or the redemption of fund shares.
12

Comparison of change in value of a $10,000 investment in Fund Class M shares and Investor shares of BNY Mellon National Short-Term Municipal Bond with a hypothetical investment of $10,000 in the S&P Municipal Bond Investment Grade Short Index (the “Index”)
| | | | | |
Average Annual Total Returnsas of 8/31/19 | | | | |
| | Inception Date | 1 Year | 5 Years | From Inception |
Class M shares | 7/1/13 | 3.03% | 1.07% | 1.11% |
Investor shares | 7/1/13 | 2.78% | 0.80% | 0.86% |
S&P Municipal Bond Investment Grade Short Index | 7/1/13 | 3.36% | 1.35% | 1.40%††† |
†† Source: Bloomberg L.P.
Past performance is not predictive of future performance.
The above graph compares a hypothetical $10,000 investment made in each of the Class M and Investor shares of BNY Mellon National Short-Term Municipal Bond Fund on 7/1/13 to a hypothetical investment of $10,000 made in the Index on that date. All dividends and capital gain distributions are reinvested.
The fund’s performance shown in the line graph above takes into account all applicable fees and expenses for Class M and Investor shares. The Index consists of bonds in the S&P Municipal Bond Index that are rated at least BBB- by Standard& Poor’s, Baa3 by Moody’s or BBB- by Fitch Ratings. For the avoidance of doubt, the lowest rating is used in determining if a bond is eligible for the index. S&P Dow Jones Indices looks at the long term rating, either insured or uninsured, and the underlying rating for index inclusion. Bonds that are pre-refunded or escrowed to maturity are included in this index. All bonds must also have a minimum maturity of six months and a maximum maturity of up to, but not including, four years as measured from the rebalancing date. Unlike a mutual fund, the Index is not subject to charges, fees and other expenses. Investors cannot invest directly in any index. Further information relating to fund performance, including expense reimbursements, if applicable, is contained in the Financial Highlights section of the prospectus and elsewhere in this report.
††† For comparative purposes, the value of the Index on 6/30/13 is used as the beginning value on 7/1/13.
The performance data quoted represents past performance, which is no guarantee of future results. Share price and investment return fluctuate and an investor’s shares may be worth more or less than original cost upon redemption. Current performance may be lower or higher than the performance quoted. Go to im.bnymellon.com for the fund’s most recent month-end returns.
The fund’s performance shown in the graph and table does not reflect the deduction of taxes that a shareholder would pay on fund distributions or the redemption of fund shares.
13
FUND PERFORMANCE(Unaudited) (continued)

Comparison of change in value of a $10,000 investment in Class M shares and Investor shares of BNY Mellon Pennsylvania Intermediate Municipal Bond Fund with a hypothetical investment of $10,000 in the S&P Municipal Bond Intermediate Index (the “Index”)
| | | | |
Average Annual Total Returnsas of 8/31/19 | | | |
| | 1 Year | 5 Years | 10 Years |
Class M shares | 8.09% | 3.06% | 3.47% |
Investor shares | 7.83% | 2.79% | 3.21% |
S&P Municipal Bond Intermediate Index | 8.41% | 3.50% | 4.38% |
† Source: Lipper Inc.
Past performance is not predictive of future performance.
The above graph compares a hypothetical $10,000 investment made in each of the Class M and Investor shares of BNY Mellon Pennsylvania Intermediate Municipal Bond Fund on 8/31/09 to a hypothetical investment of $10,000 made in the Index on that date. All dividends and capital gain distributions are reinvested.
Effective 7/1/2013, the fund changed its benchmark from theS&P Municipal Bond Intermediate Index to the S&P Municipal Bond Investment Grade Intermediate Index because the new benchmark index is more reflective of the credit quality of the fund’s portfolio holdings. The S&PMunicipal Bond Investment Grade Intermediate Index was launched on 3/19/13. Accordingly, the fund will continue to report the performance of theS&P Municipal Bond Intermediate Index until the S&P Municipal Bond Investment Grade Intermediate Index has been calculated for a 10-year period. Performance information for the fund versus the S&P Municipal Bond Investment Grade Intermediate Index is included in the graph and table on the next page.
Unlike the Index, the fund invests primarily in Pennsylvania investment-grade municipal bonds. The fund’s performance shown in the line graph above takes into account all applicable fees and expenses for Class M and Investor shares. The Index consists of bonds in the S&P Municipal Bond Index with a minimum maturity of three years and a maximum maturity of up to, but not including, 15 years as measured from the rebalancing date. Unlike a mutual fund, the Index is not subject to charges, fees and other expenses. Investors cannot invest directly in any index. Further information relating to fund performance, including expense reimbursements, if applicable, is contained in the Financial Highlights section of the prospectus and elsewhere in this report.
The performance data quoted represents past performance, which is no guarantee of future results. Share price and investment return fluctuate and an investor’s shares may be worth more or less than original cost upon redemption. Current performance may be lower or higher than the performance quoted. Go to im.bnymellon.com for the fund’s most recent month-end returns.
The fund’s performance shown in the graph and table does not reflect the deduction of taxes that a shareholder would pay on fund distributions or the redemption of fund shares.
14
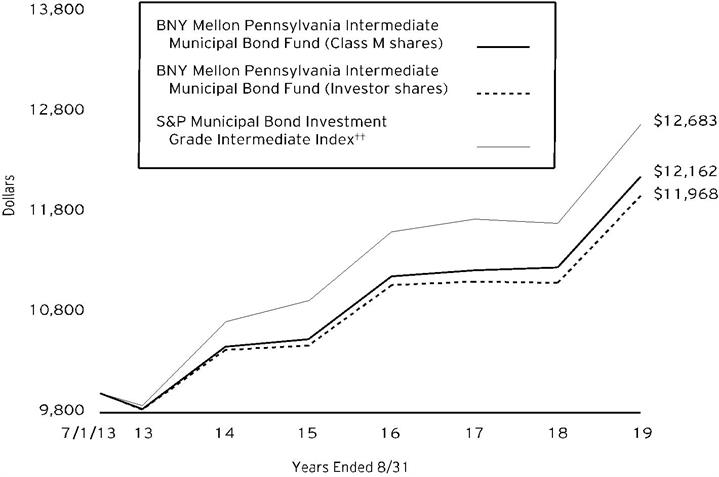
Comparison of change in value of a $10,000 investment in Class M shares and Investor shares of BNY Mellon Pennsylvania Intermediate Municipal Bond Fund with a hypothetical investment of $10,000 in the S&P Municipal Bond Investment Grade Intermediate Index (the “Index”)
| | | | | |
Average Annual Total Returnsas of 8/31/19 | | | | |
| | Inception Date | 1 Year | 5 Years | From Inception |
Class M shares | 7/1/13 | 8.09% | 3.06% | 3.22% |
Investor shares | 7/1/13 | 7.83% | 2.79% | 2.95% |
S&P Municipal Bond Investment Grade Intermediate Index | 7/1/13 | 8.42% | 3.43% | 3.93%††† |
†† Source: Bloomberg L.P.
Past performance is not predictive of future performance.
The above graph compares a hypothetical $10,000 investment made in each of the Class M and Investor shares of BNY Mellon Pennsylvania Intermediate Municipal Bond Fund on 7/1/13 to a hypothetical investment of $10,000 made in the Index on that date.All dividends and capital gain distributions are reinvested.
Unlike the Index, the fund invests primarily in Pennsylvania investment-grade municipal bonds. The fund’s performance shown in the line graph above takes into account all applicable fees and expenses for Class M and Investor shares. The Index consists of bonds in the S&P Municipal Bond Index that are rated at least BBB- by Standard&Poor’s, Baa3 by Moody’s or BBB- by Fitch Ratings. All bonds must also have a minimum maturity of 3 years and a maximum maturity of up to, but not including, 15 years as measured from the rebalancing date. Unlike a mutual fund, the Index is not subject to charges, fees and other expenses. Investors cannot invest directly in any index. Further information relating to fund performance, including expense reimbursements, if applicable, is contained in the Financial Highlights section of the prospectus and elsewhere in this report.
††† For comparative purposes, the value of the Index on 6/30/13 is used as the beginning value on 7/1/13.
The performance data quoted represents past performance, which is no guarantee of future results. Share price and investment return fluctuate and an investor’s shares may be worth more or less than original cost upon redemption. Current performance may be lower or higher than the performance quoted. Go to im.bnymellon.com for the fund’s most recent month-end returns.
The fund’s performance shown in the graph and table does not reflect the deduction of taxes that a shareholder would pay on fund distributions or the redemption of fund shares.
15
FUND PERFORMANCE(Unaudited) (continued)
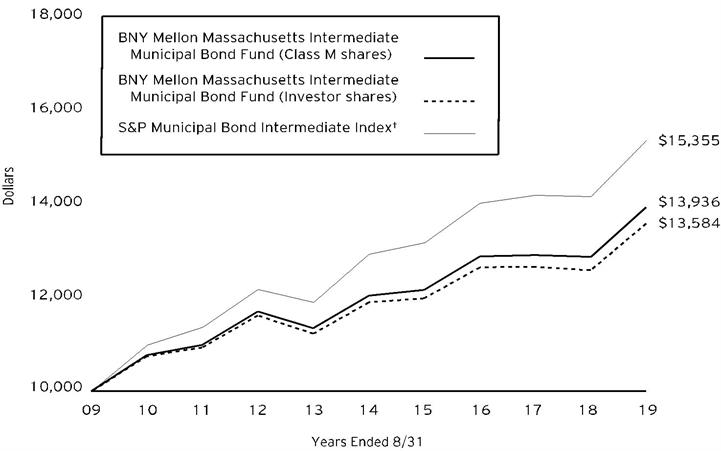
Comparison of change in value of a $10,000 investment in Class M shares and Investor shares of BNY Mellon Massachusetts Intermediate Municipal Bond Fund with a hypothetical investment of $10,000 in the S&P Municipal Bond Intermediate Index (the “Index”)
| | | | |
Average Annual Total Returnsas of 8/31/19 | | | |
| | 1 Year | 5 Years | 10 Years |
Class M shares | 8.28% | 2.96% | 3.38% |
Investor shares | 7.93% | 2.68% | 3.11% |
S&P Municipal Bond Intermediate Index | 8.41% | 3.50% | 4.38% |
† Source: Lipper Inc.
Past performance is not predictive of future performance.
The above graph compares a hypothetical $10,000 investment made in each of the Class M and Investor shares of BNY Mellon Massachusetts Intermediate Municipal Bond Fund on 8/31/09 to a hypothetical investment of $10,000 made in the Index on that date. All dividends and capital gain distributions are reinvested.
Effective 7/1/2013, the fund changed its benchmark from the S&P Municipal Bond Intermediate Index to the S&P Municipal Bond Investment Grade Intermediate Index because the new benchmark index is more reflective of the credit quality of the fund’s portfolio holdings. The S&P Municipal Bond Investment Grade Intermediate Index was first calculated on 3/19/13. Accordingly, the fund will continue to report the performance of the S&P Municipal Bond Intermediate Index until the S&P Municipal Bond Investment Grade Intermediate Index has been calculated for a 10-year period. Performance information for the fund versus the S&P Municipal Bond Investment Grade Intermediate Index is included in the graph and table on the next page.
Unlike the Index, the fund invests primarily in Massachusetts investment-grade municipal bonds. The fund’s performance shown in the line graph above takes into account all applicable fees and expenses for Class M and Investor shares. The Index consists of bonds in the S&P Municipal Bond Index with a minimum maturity of three years and a maximum maturity of up to, but not including, 15 years as measured from the rebalancing date. Unlike a mutual fund, the Index is not subject to charges, fees and other expenses. Investors cannot invest directly in any index. Further information relating to fund performance, including expense reimbursements, if applicable, is contained in the Financial Highlights section of the prospectus and elsewhere in this report.
The performance data quoted represents past performance, which is no guarantee of future results. Share price and investment return fluctuate and an investor’s shares may be worth more or less than original cost upon redemption. Current performance may be lower or higher than the performance quoted. Go to im.bnymellon.com for the fund’s most recent month-end returns.
The fund’s performance shown in the graph and table does not reflect the deduction of taxes that a shareholder would pay on fund distributions or the redemption of fund shares.
16
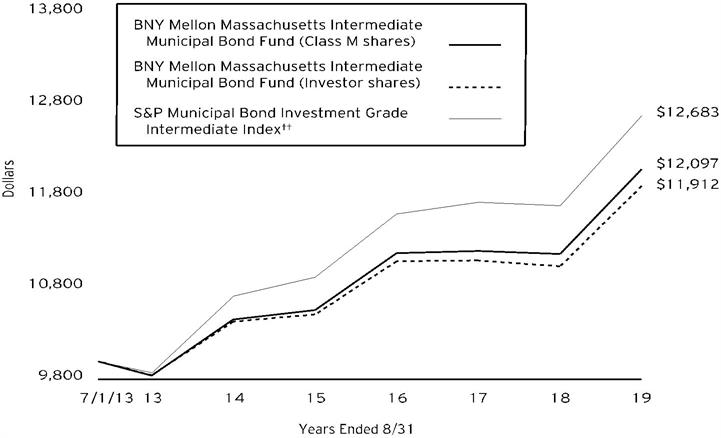
Comparison of change in value of a $10,000 investment in Class M shares and Investor shares of BNY Mellon Massachusetts Intermediate Municipal Bond Fund with a hypothetical investment of $10,000 in the S&P Municipal Bond Investment Grade Intermediate Index (the “Index”)
| | | | | |
Average Annual Total Returnsas of 8/31/19 | | | | |
| | Inception Date | 1 Year | 5 Years | From Inception |
Class M shares | 7/1/13 | 8.28% | 2.96% | 3.13% |
Investor shares | 7/1/13 | 7.93% | 2.68% | 2.88% |
S&P Municipal Bond Investment Grade Intermediate Index | 7/1/13 | 8.42% | 3.43% | 3.93%††† |
†† Source: Bloomberg L.P.
Past performance is not predictive of future performance.
The above graph compares a hypothetical $10,000 investment made in each of the Class M and Investor shares of BNY Mellon Massachusetts Intermediate Municipal Bond Fund on 7/1/13 to a hypothetical investment of $10,000 made in the Index on that date. All dividends and capital gain distributions are reinvested.
Unlike the Index, the fund invests primarily in Massachusetts investment-grade municipal bonds. The fund invests primarily in Massachusetts investment-grade municipal bonds. The fund’s performance shown in the line graph above takes into account all applicable fees and expenses for Class M and Investor shares. The Index consists of bonds in the S&P Municipal Bond Index that are rated at least BBB- by Standard& Poor’s, Baa3 by Moody’s or BBB- by Fitch Ratings. All bonds must also have a minimum maturity of 3 years and a maximum maturity of up to, but not including, 15 years as measured from the rebalancing date. Unlike a mutual fund, the Index is not subject to charges, fees and other expenses. Investors cannot invest directly in any index. Further information relating to fund performance, including expense reimbursements, if applicable, is contained in the Financial Highlights section of the prospectus and elsewhere in this report.
††† For comparative purposes, the value of the Index on 6/30/13 is used as the beginning value on 7/1/13.
The performance data quoted represents past performance, which is no guarantee of future results. Share price and investment return fluctuate and an investor’s shares may be worth more or less than original cost upon redemption. Current performance may be lower or higher than the performance quoted. Go to im.bnymellon.com for the fund’s most recent month-end returns.
The fund’s performance shown in the graph and table does not reflect the deduction of taxes that a shareholder would pay on fund distributions or the redemption of fund shares.
17
FUND PERFORMANCE(Unaudited) (continued)
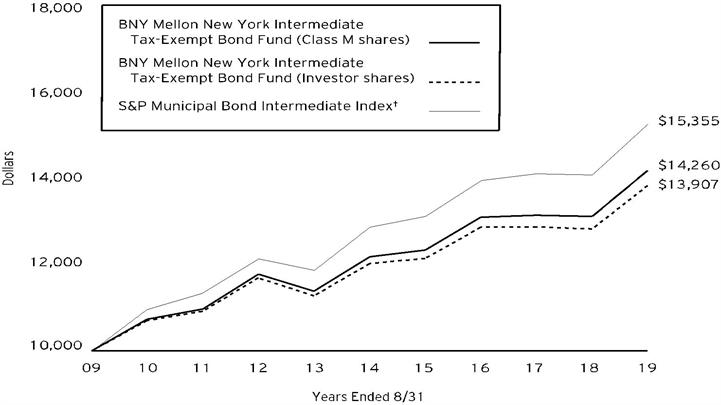
Comparison of change in value of a $10,000 investment in Class M shares and Investor shares of BNY Mellon New York Intermediate Tax-Exempt Bond Fund with a hypothetical investment of $10,000 in the S&P Municipal Bond Intermediate Index (the “Index”)
| | | | | |
Average Annual Total Returnsas of 8/31/19 | | | | |
| | 1 Year | | 5 Years | 10 Years |
Class M shares | 8.28% | | 3.14% | 3.61% |
Investor shares | 8.00% | | 2.88% | 3.35% |
S&P Municipal Bond Intermediate Index | 8.41% | | 3.50% | 4.38% |
† Source: Lipper Inc.
Past performance is not predictive of future performance.
The above graph compares a hypothetical $10,000 investment made in each of the Class M and Investor shares of BNY Mellon New York Intermediate Tax-Exempt Bond Fund on 8/31/09 to a hypothetical investment of $10,000 made in the Index on that date. All dividends and capital gain distributions are reinvested.
Effective 7/1/2013, the fund changed its benchmark from the S&P Municipal Bond Intermediate Index to the S&P Municipal Bond Investment Grade Intermediate Index because the new benchmark index is more reflective of the credit quality of the fund’s portfolio holdings. The S&P Municipal Bond Investment Grade Intermediate Index was launched on 3/19/13. Accordingly, the fund will continue to report the performance of the S&P Municipal Bond Intermediate Index until the S&P Municipal Bond Investment Grade Intermediate Index has been calculated for a 10-year period. Performance information for the fund versus the S&P Municipal Bond Investment Grade Intermediate Index is included in the graph and table on the next page.
As of the close of business on September 12, 2008, substantially all of the assets of another investment company advised by an affiliate of the fund’s investment adviser, BNY Hamilton New York Intermediate Tax-Exempt Fund (the “predecessor fund”), a series of BNY Hamilton Funds, Inc., were transferred to BNY Mellon New York Intermediate Tax-Exempt Bond Fund in a tax-free reorganization and the fund commenced operations. The performance figures for the fund’s Class M shares represent the performance of the predecessor fund’s Institutional shares prior to the commencement of operations for BNY Mellon New York Intermediate Tax-Exempt Bond Fund and the performance of BNY Mellon New York Intermediate Tax-Exempt Bond Fund’s Class M shares thereafter. The performance figures for Investor shares represent the performance of the predecessor fund’s Class A shares prior to the commencement of operations for BNY Mellon New York Intermediate Tax-Exempt Bond Fund and the performance of BNY Mellon New York Intermediate Tax-Exempt Bond Fund’s Investor shares thereafter. Investor shares are subject to a Shareholder Services Plan.
Unlike the Index, the fund invests primarily in New York investment-grade municipal bonds. The fund’s performance shown in the line graph above takes into account all applicable fees and expenses for Class M and Investor shares. The Index consists of bonds in the S&P Municipal Bond Index with a minimum maturity of three years and a maximum maturity of up to, but not including, 15 years as measured from the rebalancing date. Unlike a mutual fund, the Index is not subject to charges, fees and other expenses. Investors cannot invest directly in any index. Further information relating to fund performance, including expense reimbursements, if applicable, is contained in the Financial Highlights section of the prospectus and elsewhere in this report.
The performance data quoted represents past performance, which is no guarantee of future results. Share price and investment return fluctuate and an investor’s shares may be worth more or less than original cost upon redemption. Current performance may be lower or higher than the performance quoted. Go to im.bnymellon.com for the fund’s most recent month-end returns.
The fund’s performance shown in the graph and table does not reflect the deduction of taxes that a shareholder would pay on fund distributions or the redemption of fund shares.
18
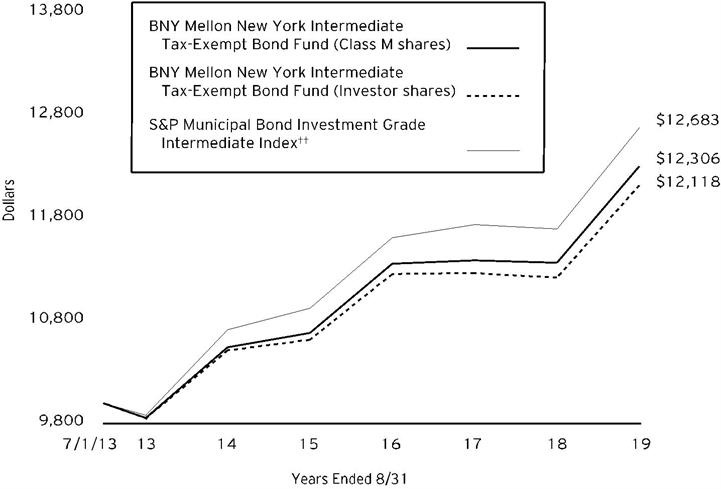
Comparison of change in value of a $10,000 investment in Class M shares and Investor shares of BNY Mellon New York Intermediate Tax-Exempt Bond Fund with a hypothetical investment of $10,000 in the S&P Municipal Bond Investment Grade Intermediate Index (the “Index”)
| | | | | |
Average Annual Total Returnsas of 8/31/19 | | | | |
| | Inception Date | 1 Year | 5 Years | From Inception |
Class M shares | 7/1/13 | 8.28% | 3.14% | 3.42% |
Investor shares | 7/1/13 | 8.00% | 2.88% | 3.16% |
S&P Municipal Bond Investment Grade Intermediate Index | 7/1/13 | 8.42% | 3.43% | 3.93%††† |
†† Source: Bloomberg L.P.
Past performance is not predictive of future performance.
The above graph compares a hypothetical $10,000 investment made in each of the Class M and Investor shares of BNY Mellon New York Intermediate Tax-Exempt Bond Fund on 7/1/13 to a hypothetical investment of $10,000 made in the Index on that date. All dividends and capital gain distributions are reinvested.
Unlike the Index, the fund invests primarily in New York investment-grade municipal bonds. The fund’s performance shown in the line graph above takes into account all applicable fees and expenses for Class M and Investor shares. The Index consists of bonds in the S&P Municipal Bond Index that are rated at least BBB- by Standard&Poor’s, Baa3 by Moody’s or BBB- by Fitch Ratings. All bonds must also have a minimum maturity of 3 years and a maximum maturity of up to, but not including, 15 years as measured from the rebalancing date. Unlike a mutual fund, the Index is not subject to charges, fees and other expenses. Investors cannot invest directly in any index. Further information relating to fund performance, including expense reimbursements, if applicable, is contained in the Financial Highlights section of the prospectus and elsewhere in this report.
††† For comparative purposes, the value of the Index on 6/30/13 is used as the beginning value on 7/1/13.
The performance data quoted represents past performance, which is no guarantee of future results. Share price and investment return fluctuate and an investor’s shares may be worth more or less than original cost upon redemption. Current performance may be lower or higher than the performance quoted. Go to im.bnymellon.com for the fund’s most recent month-end returns.
The fund’s performance shown in the graph and table does not reflect the deduction of taxes that a shareholder would pay on fund distributions or the redemption of fund shares.
19
FUND PERFORMANCE(Unaudited) (continued)

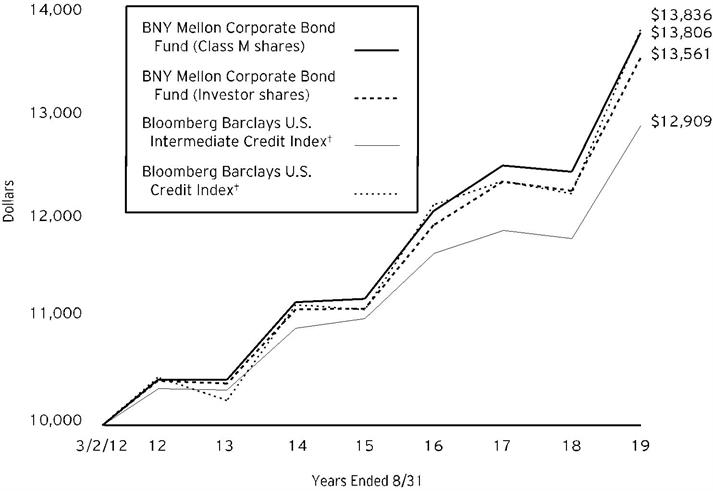
Comparison of change in value of a $10,000 investment in Class M shares and Investor shares of BNY Mellon Municipal Opportunities Fund with a hypothetical investment of $10,000 in the Bloomberg Barclays U.S. Municipal Bond Index (the “Index”)
| | | | | |
Average Annual Total Returnsas of 8/31/19 | | | | |
| | | 1 Year | 5 Year | 10 Years |
Class M shares | | 7.77% | 4.32% | 5.67% |
Investor shares | | 7.50% | 4.07% | 5.42% |
Bloomberg Barclays U.S. Municipal Bond Index | | 8.72% | 3.85% | 4.62% |
† Source: Lipper Inc.
Past performance is not predictive of future performance.
The above graph compares a hypothetical $10,000 investment made in each of the Class M and Investor shares of BNY Mellon Municipal Opportunities Fund on 8/31/09 to a hypothetical investment of $10,000 made in the Index on that date. All dividends and capital gain distributions are reinvested.
The fund’s performance shown in the line graph above takes into account all applicable fees and expenses for Class M and Investor shares. The Index covers the U.S. dollar-denominated long-term tax-exempt bond market. Unlike a mutual fund, the Index is not subject to charges, fees and other expenses. Investors cannot invest directly in any index. Further information relating to fund performance, including expense reimbursements, if applicable, is contained in the Financial Highlights section of the prospectus and elsewhere in this report.
The performance data quoted represents past performance, which is no guarantee of future results. Share price and investment return fluctuate and an investor’s shares may be worth more or less than original cost upon redemption. Current performance may be lower or higher than the performance quoted. Go to im.bnymellon.com for the fund’s most recent month-end returns.
The fund’s performance shown in the graph and table does not reflect the deduction of taxes that a shareholder would pay on fund distributions or the redemption of fund shares.
20
UNDERSTANDING YOUR FUND’S EXPENSES(Unaudited)
As a mutual fund investor, you pay ongoing expenses, such as management fees and other expenses. Using the information below, you can estimate how these expenses affect your investment and compare them with the expenses of other funds. You also may pay one-time transaction expenses, including sales charges (loads) and redemption fees, which are not shown in this section and would have resulted in higher total expenses. For more information, see your fund’s prospectus or talk to your financial adviser.
Review your fund’s expenses
The table below shows the expenses you would have paid on a $1,000 investment in each class of each fund from March 1, 2019 to August 31, 2019. It also shows how much a $1,000 investment would be worth at the close of the period, assuming actual returns and expenses.
| | | | | | | | | | | | | | | | | | |
Expenses and Value of a $1,000 Investment | | | | | | | | | | |
assuming actual returns for the six months ended August 31, 2019 | | | | | | | | | |
| | | | | | | | | Class M | | | | | | Investor Shares | | |
BNY Mellon National Intermediate
Municipal Bond Fund | | | | | | | | | | | | | | | |
Expenses paid per $1,000† | | | | | | | $2.59 | | | | | | $3.89 | | |
Ending value (after expenses) | | | | | | | $1,058.50 | | | | | | $1,056.50 | | |
Annualized expense ratio (%) | | | | | | | .50 | | | | | | .75 | | |
BNY Mellon National Short-Term
Municipal Bond Fund | | | | | | | | | | | | | | | |
Expenses paid per $1,000† | | | | | | | $2.55 | | | | | | $3.82 | | |
Ending value (after expenses) | | | | | | | $1,020.10 | | | | | | $1,018.80 | | |
Annualized expense ratio (%) | | | | | | | .50 | | | | | | .75 | | |
BNY Mellon Pennsylvania
Intermediate Municipal Bond Fund | | | | | | | | | | | | | | | |
Expenses paid per $1,000† | | | | | | | $3.63 | | | | | | $4.92 | | |
Ending value (after expenses) | | | | | | | $1,056.00 | | | | | | $1,054.00 | | |
Annualized expense ratio (%) | | | | | | | .70 | | | | | | .95 | | |
BNY Mellon Massachusetts
Intermediate Municipal Bond Fund | | | | | | | | | | | | | | | |
Expenses paid per $1,000† | | | | | | | $2.75 | | | | | | $4.04 | | |
Ending value (after expenses) | | | | | | | $1,057.10 | | | | | | $1,055.00 | | |
Annualized expense ratio (%) | | | | | | | .53 | | | | | | .78 | | |
BNY Mellon New York
Intermediate Tax-Exempt Bond Fund | | | | | | | | | | | | | | | |
Expenses paid per $1,000† | | | | | | | $3.06 | | | | | | $4.35 | | |
Ending value (after expenses) | | | | | | | $1,058.20 | | | | | | $1,056.80 | | |
Annualized expense ratio (%) | | | | | | | .59 | | | | | | .84 | | |
BNY Mellon Municipal
Opportunities Fund | | | | | | | | | | | | | | | |
Expenses paid per $1,000† | | | | | | | $3.74 | | | | | | $5.03 | | |
Ending value (after expenses) | | | | | | | $1,060.00 | | | | | | $1,058.60 | | |
Annualized expense ratio (%) | | | | | | | .72 | | | | | | .97 | | |
† Expenses are equal to each fund’s annualized expense ratios as shown above, multiplied by the average account value over the period, multiplied by 184/365 (to reflect the one-half year period).
21
UNDERSTANDING YOUR FUND’S EXPENSES (Unaudited)(continued)
COMPARING YOUR FUND’S EXPENSES
WITH THOSE OF OTHER FUNDS(Unaudited)
Using the SEC’s method to compare expenses
The Securities and Exchange Commission (“SEC”) has established guidelines to help investors assess fund expenses. Per these guidelines, the table below shows your fund’s expenses based on a $1,000 investment, assuming a hypothetical 5% annualized return. You can use this information to compare the ongoing expenses (but not transaction expenses or total cost) of investing in the fund with those of other funds. All mutual fund shareholder reports will provide this information to help you make this comparison. Please note that you cannot use this information to estimate your actual ending account balance and expenses paid during the period.
| | | | | | | | | | | | | | | | | | |
Expenses and Value of a $1,000 Investment | | | | | | | | |
assuming a hypothetical 5% annualized return for the six months ended August 31, 2019 | | | |
| | | | | | | | | Class M | | | | | | Investor Shares | | |
BNY Mellon National Intermediate
Municipal Bond Fund | | | | | | | | | | | | | | | |
Expenses paid per $1,000† | | | | | | | $2.55 | | | | | | $3.82 | | |
Ending value (after expenses) | | | | | | | $1,022.68 | | | | | | $1,021.42 | | |
Annualized expense ratio (%) | | | | | | | .50 | | | | | | .75 | | |
BNY Mellon National Short-Term
Municipal Bond Fund | | | | | | | | | | | | | | | |
Expenses paid per $1,000† | | | | | | | $2.55 | | | | | | $3.82 | | |
Ending value (after expenses) | | | | | | | $1,022.68 | | | | | | $1,021.42 | | |
Annualized expense ratio (%) | | | | | | | .50 | | | | | | .75 | | |
BNY Mellon Pennsylvania
Intermediate Municipal Bond Fund | | | | | | | | | | | | | | | |
Expenses paid per $1,000† | | | | | | | $3.57 | | | | | | $4.84 | | |
Ending value (after expenses) | | | | | | | $1,021.68 | | | | | | $1,020.42 | | |
Annualized expense ratio (%) | | | | | | | .70 | | | | | | .95 | | |
BNY Mellon Massachusetts
Intermediate Municipal Bond Fund | | | | | | | | | | | | | | | |
Expenses paid per $1,000† | | | | | | | $2.70 | | | | | | $3.97 | | |
Ending value (after expenses) | | | | | | | $1,022.53 | | | | | | $1,021.27 | | |
Annualized expense ratio (%) | | | | | | | .53 | | | | | | .78 | | |
BNY Mellon New York
Intermediate Tax-Exempt Bond Fund | | | | | | | | | | | | | | | |
Expenses paid per $1,000† | | | | | | | $3.01 | | | | | | $4.28 | | |
Ending value (after expenses) | | | | | | | $1,022.23 | | | | | | $1,020.97 | | |
Annualized expense ratio (%) | | | | | | | .59 | | | | | | .84 | | |
BNY Mellon Municipal
Opportunities Fund | | | | | | | | | | | | | | | |
Expenses paid per $1,000† | | | | | | | $3.67 | | | | | | $4.94 | | |
Ending value (after expenses) | | | | | | | $1,021.58 | | | | | | $1,020.32 | | |
Annualized expense ratio (%) | | | | | | | .72 | | | | | | .97 | | |
† Expenses are equal to each fund’s annualized expense ratios as shown above, multiplied by the average account value over the period, multiplied by 184/365 (to reflect the one-half year period).
22
STATEMENT OF INVESTMENTS
August 31, 2019
| | | | | | | | | | |
| |
BNY Mellon National Intermediate Municipal Bond Fund |
Description | Coupon
Rate (%) | | Maturity
Date | | Principal
Amount ($) | | Value ($) | |
Long-Term Municipal Investments - 101.3% | | | | | |
Alabama - 1.1% | | | | | |
Alabama 21st Century Authority, Revenue Bonds, Refunding, Ser. A | | 5.00 | | 6/1/2021 | | 1,240,000 | | 1,317,624 | |
Alabama 21st Century Authority, Revenue Bonds, Refunding, Ser. A | | 5.00 | | 6/1/2020 | | 1,500,000 | | 1,540,800 | |
Auburn University, Revenue Bonds, Refunding, Ser. A | | 5.00 | | 6/1/2030 | | 5,000,000 | | 5,998,450 | |
Black Belt Energy Gas District, Revenue Bonds, Refunding (Project No. 4) Ser. A1 | | 4.00 | | 12/1/2025 | | 16,500,000 | | 18,710,175 | |
| | 27,567,049 | |
Alaska - .5% | | | | | |
Alaska, GO, Ser. A | | 5.00 | | 8/1/2028 | | 5,560,000 | | 6,741,556 | |
Alaska Industrial Development & Export Authority, Revenue Bonds, Refunding (LOC; Bank of Tokyo-Mitsubishi UFJ) | | 1.39 | | 4/1/2034 | | 100,000 | a | 100,000 | |
Alaska International Airports, Revenue Bonds, Refunding, Ser. B | | 5.00 | | 10/1/2032 | | 5,000,000 | | 5,951,900 | |
| | 12,793,456 | |
Arizona - 2.6% | | | | | |
Arizona, COP, Refunding, Ser. A | | 5.00 | | 10/1/2026 | | 10,450,000 | | 13,150,175 | |
Arizona Industrial Development Authority, Revenue Bonds (Great Lakes Senior Living Community) Ser. A | | 5.00 | | 1/1/2029 | | 675,000 | | 834,077 | |
Arizona Industrial Development Authority, Revenue Bonds (Great Lakes Senior Living Community) Ser. A | | 5.00 | | 1/1/2025 | | 650,000 | | 757,497 | |
Arizona Industrial Development Authority, Revenue Bonds (Great Lakes Senior Living Community) Ser. A | | 5.00 | | 1/1/2028 | | 1,000,000 | | 1,223,680 | |
Arizona Industrial Development Authority, Revenue Bonds (Great Lakes Senior Living Community) Ser. A | | 5.00 | | 1/1/2026 | | 600,000 | | 713,370 | |
Arizona Industrial Development Authority, Revenue Bonds (Great Lakes Senior Living Community) Ser. A | | 5.00 | | 1/1/2027 | | 525,000 | | 635,098 | |
Maricopa County Industrial Development Authority, Revenue Bonds, Refunding (Banner Health Obligated Group) | | 5.00 | | 1/1/2034 | | 10,000,000 | | 12,269,700 | |
Maricopa County Industrial Development Authority, Revenue Bonds, Refunding (Banner Health Obligated Group) | | 5.00 | | 1/1/2027 | | 5,000,000 | | 6,305,550 | |
Maricopa County Special Health Care District, GO | | 5.00 | | 7/1/2035 | | 6,000,000 | | 7,540,500 | |
Maricopa County Special Health Care District, GO | | 5.00 | | 7/1/2029 | | 5,000,000 | | 6,458,750 | |
Mesa Utility System, Revenue Bonds, Refunding, Ser. B | | 4.00 | | 7/1/2033 | | 5,000,000 | | 5,522,650 | |
Phoenix Civic Improvement Corp., Revenue Bonds, Refunding, Ser. B | | 4.00 | | 7/1/2028 | | 10,000,000 | | 11,257,100 | |
| | 66,668,147 | |
California - 13.5% | | | | | |
Alameda Corridor Transportation Authority, Revenue Bonds, Refunding (Insured; Assured Guaranty Municipal Corp.) Ser. B | | 5.00 | | 10/1/2035 | | 2,050,000 | | 2,477,138 | |
Alameda Corridor Transportation Authority, Revenue Bonds, Refunding, Ser. B | | 5.00 | | 10/1/2036 | | 1,500,000 | | 1,783,245 | |
Anaheim Housing & Public Improvement Authority, Revenue Bonds, Refunding, Ser. B | | 5.00 | | 10/1/2036 | | 1,750,000 | | 1,985,813 | |
Anaheim Housing & Public Improvement Authority, Revenue Bonds, Refunding, Ser. B | | 5.00 | | 10/1/2035 | | 2,485,000 | | 2,823,358 | |
Bay Area Toll Authority, Revenue Bonds, Refunding | | 4.00 | | 4/1/2035 | | 10,000,000 | | 11,509,100 | |
Bay Area Toll Authority, Revenue Bonds, Refunding, Ser. A | | 2.63 | | 4/1/2026 | | 10,000,000 | | 10,845,900 | |
California, GO | | 5.25 | | 9/1/2029 | | 10,000,000 | | 11,602,800 | |
California, GO | | 5.25 | | 10/1/2039 | | 5,000,000 | | 6,155,200 | |
California, GO, Refunding | | 4.00 | | 9/1/2031 | | 10,000,000 | | 11,675,100 | |
California, GO, Refunding | | 5.00 | | 12/1/2023 | | 12,500,000 | | 14,558,500 | |
California, GO, Refunding | | 5.00 | | 12/1/2023 | | 2,500,000 | | 2,911,700 | |
California, GO, Refunding | | 5.00 | | 10/1/2029 | | 5,000,000 | | 6,179,700 | |
California, GO, Refunding | | 5.00 | | 10/1/2025 | | 5,000,000 | | 6,163,350 | |
California, GO, Refunding | | 5.00 | | 4/1/2033 | | 5,000,000 | | 5,813,500 | |
23
STATEMENT OF INVESTMENTS (continued)
| | | | | | | | | | |
| |
BNY Mellon National Intermediate Municipal Bond Fund (continued) |
Description | Coupon
Rate (%) | | Maturity
Date | | Principal
Amount ($) | | Value ($) | |
Long-Term Municipal Investments - 101.3% (continued) | | | | | |
California - 13.5% (continued) | | | | | |
California, GO, Refunding | | 5.00 | | 4/1/2031 | | 9,900,000 | | 13,071,762 | |
California Health Facilities Financing Authority, Revenue Bonds | | 4.00 | | 11/15/2047 | | 1,120,000 | | 1,239,862 | |
California Health Facilities Financing Authority, Revenue Bonds, Refunding (Adventist Health System) Ser. A | | 4.00 | | 3/1/2033 | | 7,500,000 | | 8,013,450 | |
California Health Facilities Financing Authority, Revenue Bonds, Refunding (St. Joseph Health System) Ser. A | | 5.00 | | 7/1/2033 | | 10,000,000 | | 11,331,600 | |
California Health Facilities Financing Authority, Revenue Bonds, Refunding, Ser. A | | 5.00 | | 11/15/2035 | | 5,100,000 | | 6,449,664 | |
California Health Facilities Financing Authority, Revenue Bonds, Ser. A | | 5.00 | | 11/15/2024 | | 1,600,000 | | 1,800,944 | |
California Health Facilities Financing Authority, Revenue Bonds, Ser. A | | 5.00 | | 11/15/2023 | | 1,500,000 | | 1,690,410 | |
California Infrastructure & Economic Development Bank, Revenue Bonds, Ser. A | | 4.00 | | 10/1/2045 | | 8,275,000 | | 9,270,979 | |
Evergreen School District, GO | | 4.00 | | 8/1/2041 | | 5,000,000 | | 5,504,250 | |
Fairfield-Suisun Unified School District, GO, Refunding | | 5.00 | | 8/1/2025 | | 1,115,000 | b | 1,309,902 | |
Fairfield-Suisun Unified School District, GO, Refunding | | 5.00 | | 8/1/2026 | | 1,170,000 | b | 1,411,827 | |
Fairfield-Suisun Unified School District, GO, Refunding | | 5.00 | | 8/1/2027 | | 2,460,000 | b | 3,038,469 | |
Fairfield-Suisun Unified School District, GO, Refunding | | 5.00 | | 8/1/2024 | | 1,060,000 | b | 1,211,622 | |
Fairfield-Suisun Unified School District, GO, Refunding | | 5.00 | | 8/1/2021 | | 1,955,000 | b | 2,038,870 | |
Fairfield-Suisun Unified School District, GO, Refunding | | 5.00 | | 8/1/2022 | | 2,055,000 | b | 2,212,392 | |
Fairfield-Suisun Unified School District, GO, Refunding | | 5.00 | | 8/1/2023 | | 2,030,000 | b | 2,252,975 | |
Glendale Unified School District, GO, Refunding | | 5.00 | | 9/1/2024 | | 650,000 | b | 751,433 | |
Glendale Unified School District, GO, Refunding | | 5.00 | | 9/1/2025 | | 500,000 | b | 595,780 | |
Glendale Unified School District, GO, Refunding | | 5.00 | | 9/1/2026 | | 500,000 | b | 612,675 | |
Glendale Unified School District, GO, Refunding | | 5.00 | | 9/1/2021 | | 500,000 | b | 523,330 | |
Glendale Unified School District, GO, Refunding | | 5.00 | | 9/1/2022 | | 715,000 | b | 774,774 | |
Glendale Unified School District, GO, Refunding | | 5.00 | | 9/1/2023 | | 530,000 | b | 593,621 | |
Golden State Tobacco Securitization Corp., Revenue Bonds, Refunding, Ser. A1 | | 5.00 | | 6/1/2032 | | 5,000,000 | | 6,074,650 | |
Golden State Tobacco Securitization Corp., Revenue Bonds, Refunding, Ser. A1 | | 5.00 | | 6/1/2029 | | 3,500,000 | | 4,232,655 | |
Golden State Tobacco Securitization Corp., Revenue Bonds, Refunding, Ser. A1 | | 5.00 | | 6/1/2033 | | 1,000,000 | | 1,211,510 | |
Golden State Tobacco Securitization Corp., Revenue Bonds, Ser. A | | 5.00 | | 6/1/2029 | | 9,080,000 | | 10,403,864 | |
Long Beach Unified School District, GO, Ser. A | | 4.00 | | 8/1/2038 | | 10,300,000 | | 11,720,164 | |
Los Angeles Department of Airports, Revenue Bonds, Refunding, Ser. A | | 5.00 | | 5/15/2024 | | 1,080,000 | | 1,264,540 | |
Los Angeles Department of Airports, Revenue Bonds, Refunding, Ser. A | | 5.00 | | 5/15/2026 | | 1,500,000 | | 1,850,415 | |
Los Angeles Department of Airports, Revenue Bonds, Refunding, Ser. A | | 5.00 | | 5/15/2025 | | 1,240,000 | | 1,492,228 | |
Los Angeles Department of Airports, Revenue Bonds, Refunding, Ser. A | | 5.00 | | 5/15/2023 | | 825,000 | | 937,365 | |
Los Angeles Department of Airports, Revenue Bonds, Refunding, Ser. B | | 5.00 | | 5/15/2026 | | 9,060,000 | | 11,196,167 | |
Los Angeles Unified School District, GO, Refunding, Ser. A | | 5.00 | | 7/1/2026 | | 5,000,000 | | 6,266,200 | |
New Haven Unified School District, GO (Insured; Assured Guaranty Corp.) | | 0.00 | | 8/1/2033 | | 4,000,000 | c | 2,920,400 | |
Newport Mesa Unified School District, GO, Refunding | | 5.00 | | 8/1/2026 | | 1,060,000 | b | 1,288,239 | |
Newport Mesa Unified School District, GO, Refunding | | 5.00 | | 8/1/2025 | | 1,300,000 | b | 1,538,030 | |
Newport Mesa Unified School District, GO, Refunding | | 5.00 | | 8/1/2024 | | 1,000,000 | b | 1,150,590 | |
Pittsburg Successor Agency Redevelopment Agency, Tax Allocation Bonds, Refunding (Insured; Assured Guaranty Municipal Corp.) Ser. A | | 5.00 | | 9/1/2026 | | 6,610,000 | | 8,211,074 | |
Port of Oakland, Revenue Bonds, Refunding, Ser. O | | 5.00 | | 5/1/2023 | | 1,875,000 | | 1,989,769 | |
24
| | | | | | | | | | |
| |
BNY Mellon National Intermediate Municipal Bond Fund (continued) |
Description | Coupon
Rate (%) | | Maturity
Date | | Principal
Amount ($) | | Value ($) | |
Long-Term Municipal Investments - 101.3% (continued) | | | | | |
California - 13.5% (continued) | | | | | |
Redondo Beach Unified School District, GO, Refunding | | 5.00 | | 8/1/2029 | | 875,000 | b | 1,123,570 | |
Redondo Beach Unified School District, GO, Refunding | | 5.00 | | 8/1/2030 | | 930,000 | b | 1,184,615 | |
Redondo Beach Unified School District, GO, Refunding | | 5.00 | | 8/1/2027 | | 805,000 | b | 998,651 | |
Redondo Beach Unified School District, GO, Refunding | | 5.00 | | 8/1/2028 | | 840,000 | b | 1,062,088 | |
Riverside County Transportation Commission, Revenue Bonds, Refunding, Ser. A | | 5.25 | | 6/1/2023 | | 5,000,000 | d | 5,802,450 | |
Sacramento County Sanitation Districts Financing Authority, Revenue Bonds, Refunding (Insured; Assured Guaranty Corp.) Ser. B, 3 Month LIBOR x .67 +.53% | | 2.22 | | 12/1/2035 | | 10,000,000 | e | 9,698,300 | |
Sacramento County Water Financing Authority, Revenue Bonds (Water Agency Zones 40 & 41) (Insured; National Public Finance Guarantee Corp.) Ser. B, 3 Month LIBOR x .67 +.55% | | 2.24 | | 6/1/2034 | | 8,000,000 | e | 7,630,720 | |
San Francisco City & County, COP, Refunding (Moscone Convention Center Expansion Project) | | 4.00 | | 4/1/2037 | | 7,000,000 | | 7,824,810 | |
San Francisco City & County Airport Comm-San Francisco International Airport, Revenue Bonds, Refunding, Ser. D | | 5.00 | | 5/1/2024 | | 4,375,000 | | 5,110,087 | |
San Francisco Community College District, GO, Refunding | | 5.00 | | 6/15/2029 | | 5,000,000 | | 6,065,500 | |
San Francisco Public Utilities Commission, Revenue Bonds, Refunding (Green Bond) Ser. D | | 5.00 | | 11/1/2035 | | 10,025,000 | | 12,799,920 | |
Southern California Public Power Authority, Revenue Bonds (Apex Power Project) Ser. A | | 5.00 | | 7/1/2033 | | 3,380,000 | | 3,969,303 | |
Southern California Public Power Authority, Revenue Bonds (Project No. 1) Ser. A | | 5.25 | | 11/1/2020 | | 4,000,000 | | 4,179,480 | |
University of California, Revenue Bonds, Refunding (Limited Project) Ser. I | | 5.00 | | 5/15/2030 | | 11,000,000 | | 13,325,070 | |
University of California, Revenue Bonds, Refunding (Limited Project) Ser. K | | 4.00 | | 5/15/2037 | | 5,000,000 | | 5,640,450 | |
University of California, Revenue Bonds, Refunding, Ser. AO | | 5.00 | | 5/15/2031 | | 9,000,000 | | 10,880,190 | |
| | 343,228,059 | |
Colorado - 1.5% | | | | | |
Adams & Arapahoe Joint School District 28J Aurora, GO, Refunding (Insured; State Aid Withholding) Ser. A | | 5.00 | | 12/1/2030 | | 5,000,000 | | 6,259,800 | |
Colorado Health Facilities Authority, Revenue Bonds, Refunding (CommonSpirit Health) Ser. A | | 5.00 | | 8/1/2034 | | 4,000,000 | | 5,029,440 | |
Colorado Health Facilities Authority, Revenue Bonds, Refunding (CommonSpirit Health) Ser. B | | 5.00 | | 8/1/2025 | | 3,000,000 | | 3,551,040 | |
Colorado Health Facilities Authority, Revenue Bonds, Refunding (CommonSpirit Health) Ser. B | | 5.00 | | 8/1/2026 | | 5,000,000 | | 6,026,400 | |
Colorado Health Facilities Authority, Revenue Bonds, Refunding, Ser. A | | 5.00 | | 8/1/2033 | | 1,500,000 | | 1,891,155 | |
Colorado Housing & Finance Authority, Revenue Bonds (Insured; Government National Mortgage Association) Ser. F | | 4.25 | | 11/1/2049 | | 5,000,000 | | 5,583,400 | |
Public Authority for Colorado Energy, Revenue Bonds | | 6.13 | | 11/15/2023 | | 5,350,000 | | 5,929,458 | |
Regional Transportation District, COP, Refunding, Ser. A | | 5.00 | | 6/1/2020 | | 2,700,000 | | 2,778,948 | |
Regional Transportation District, COP, Refunding, Ser. A | | 5.50 | | 6/1/2022 | | 450,000 | | 464,166 | |
Regional Transportation District, COP, Refunding, Ser. A | | 5.50 | | 6/1/2020 | | 1,750,000 | d | 1,807,890 | |
| | 39,321,697 | |
Connecticut - .8% | | | | | |
Connecticut, GO, Ser. B | | 4.00 | | 6/15/2030 | | 3,000,000 | | 3,359,970 | |
Connecticut, GO, Ser. B | | 5.00 | | 4/15/2022 | | 5,000,000 | | 5,486,700 | |
Connecticut, Revenue Bonds, Ser. A | | 5.00 | | 9/1/2030 | | 7,055,000 | | 8,630,452 | |
Connecticut, Revenue Bonds, Ser. A | | 5.00 | | 9/1/2028 | | 1,070,000 | | 1,320,883 | |
Connecticut Housing Finance Authority, Revenue Bonds, Refunding (Insured; GNMA, FNMA, FHLMC) Ser. D1 | | 4.00 | | 11/15/2047 | | 2,215,000 | | 2,377,958 | |
| | 21,175,963 | |
Delaware - .3% | | | | | |
Delaware River & Bay Authority, Revenue Bonds, Refunding, Ser. C | | 5.00 | | 1/1/2024 | | 1,000,000 | | 1,160,930 | |
25
STATEMENT OF INVESTMENTS (continued)
| | | | | | | | | | |
| |
BNY Mellon National Intermediate Municipal Bond Fund (continued) |
Description | Coupon
Rate (%) | | Maturity
Date | | Principal
Amount ($) | | Value ($) | |
Long-Term Municipal Investments - 101.3% (continued) | | | | | |
Delaware - .3% (continued) | | | | | |
Delaware River & Bay Authority, Revenue Bonds, Refunding, Ser. C | | 5.00 | | 1/1/2023 | | 1,500,000 | | 1,688,415 | |
University of Delaware, Revenue Bonds, Refunding, Ser. A | | 5.00 | | 5/1/2023 | | 5,440,000 | d | 6,204,918 | |
| | 9,054,263 | |
District of Columbia - 2.2% | | | | | |
District of Columbia, Revenue Bonds, Refunding (Friendship Public Charter School) | | 5.00 | | 6/1/2036 | | 3,200,000 | | 3,715,040 | |
District of Columbia, Revenue Bonds, Refunding (Kipp DC Project) Ser. B | | 5.00 | | 7/1/2037 | | 1,010,000 | | 1,209,111 | |
District of Columbia, Revenue Bonds, Refunding, (KIPP DC) Ser. A | | 5.00 | | 7/1/2042 | | 5,955,000 | | 7,031,545 | |
District of Columbia, Revenue Bonds, Refunding, (KIPP DC) Ser. A | | 5.00 | | 7/1/2037 | | 4,925,000 | | 5,895,914 | |
Metropolitan Washington Airports Authority, Revenue Bonds, Refunding | | 5.00 | | 10/1/2027 | | 15,495,000 | | 19,616,670 | |
Metropolitan Washington Airports Authority, Revenue Bonds, Refunding, Ser. A | | 5.00 | | 10/1/2028 | | 8,500,000 | | 10,968,910 | |
Metropolitan Washington Airports Authority, Revenue Bonds, Refunding, Ser. C | | 5.00 | | 10/1/2023 | | 4,250,000 | | 4,575,210 | |
Metropolitan Washington Airports Authority, Revenue Bonds, Refunding, Ser. C | | 5.00 | | 10/1/2024 | | 2,500,000 | | 2,690,775 | |
| | 55,703,175 | |
Florida - 4.8% | | | | | |
Broward County School District, GO | | 5.00 | | 7/1/2031 | | 5,035,000 | | 6,501,645 | |
Florida Turnpike Authority, Revenue Bonds, Refunding, Ser. C | | 4.50 | | 7/1/2040 | | 8,710,000 | | 9,509,230 | |
Jacksonville, Revenue Bonds, Refunding | | 5.00 | | 10/1/2021 | | 2,500,000 | | 2,695,050 | |
Lee County, Revenue Bonds, Refunding, Ser. A | | 5.50 | | 10/1/2024 | | 5,000,000 | | 5,400,350 | |
Lee County, Revenue Bonds, Refunding, Ser. A | | 5.50 | | 10/1/2023 | | 3,565,000 | | 3,850,450 | |
Miami-Dade County Aviation, Revenue Bonds, Ser. A | | 5.50 | | 10/1/2020 | | 3,165,000 | d | 3,316,540 | |
Miami-Dade County Water & Sewer System, Revenue Bonds, Refunding, Ser. A | | 5.00 | | 10/1/2034 | | 10,110,000 | | 12,088,931 | |
Miami-Dade County Water & Sewer System, Revenue Bonds, Refunding, Ser. A | | 5.00 | | 10/1/2032 | | 5,000,000 | | 6,003,050 | |
Miami-Dade County Water & Sewer System, Revenue Bonds, Refunding, Ser. B | | 5.00 | | 10/1/2031 | | 3,000,000 | | 3,608,790 | |
Miami-Dade County Water & Sewer System, Revenue Bonds, Refunding, Ser. B | | 5.00 | | 10/1/2033 | | 5,150,000 | | 6,172,687 | |
Orange County Convention Center, Revenue Bonds, Refunding | | 4.00 | | 10/1/2031 | | 5,000,000 | | 5,762,350 | |
Orange County Health Facilities Authority, Revenue Bonds, Refunding | | 5.00 | | 10/1/2025 | | 3,000,000 | | 3,666,360 | |
Orange County Health Facilities Authority, Revenue Bonds, Refunding | | 5.00 | | 10/1/2026 | | 3,000,000 | | 3,754,380 | |
Orange County School Board, COP, Refunding, Ser. C | | 5.00 | | 8/1/2031 | | 10,000,000 | | 11,962,800 | |
Palm Beach County School District, COP, Refunding, Ser. C | | 5.00 | | 8/1/2031 | | 10,000,000 | | 11,684,000 | |
Palm Beach County School District, COP, Refunding, Ser. D | | 5.00 | | 8/1/2030 | | 7,840,000 | | 9,428,227 | |
Palm Beach County School District, COP, Refunding, Ser. D | | 5.00 | | 8/1/2031 | | 2,855,000 | | 3,420,718 | |
Tampa Sports Authority, Revenue Bonds, Refunding | | 5.00 | | 1/1/2024 | | 90,000 | | 104,774 | |
The School Board of Miami-Dade County, COP, Refunding, Ser. A | | 5.00 | | 5/1/2032 | | 5,475,000 | | 6,476,596 | |
The School Board of Miami-Dade County, COP, Refunding, Ser. A | | 5.00 | | 5/1/2026 | | 5,600,000 | | 6,718,096 | |
| | 122,125,024 | |
Georgia - 2.0% | | | | | |
Burke County Development Authority, Revenue Bonds (Georgia Power Company Plant Vogtle Project) | | 2.35 | | 12/11/2020 | | 7,500,000 | | 7,591,125 | |
Cobb County Kennestone Hospital Authority, Revenue Bonds, Refunding | | 5.00 | | 4/1/2037 | | 2,845,000 | | 3,412,350 | |
26
| | | | | | | | | | |
| |
BNY Mellon National Intermediate Municipal Bond Fund (continued) |
Description | Coupon
Rate (%) | | Maturity
Date | | Principal
Amount ($) | | Value ($) | |
Long-Term Municipal Investments - 101.3% (continued) | | | | | |
Georgia - 2.0% (continued) | | | | | |
Cobb County Kennestone Hospital Authority, Revenue Bonds, Refunding | | 5.00 | | 4/1/2036 | | 2,710,000 | | 3,259,100 | |
Cobb County Kennestone Hospital Authority, Revenue Bonds, Refunding | | 5.00 | | 4/1/2035 | | 2,000,000 | | 2,411,180 | |
Columbia County Water & Sewerage, Revenue Bonds, Refunding | | 5.00 | | 6/1/2029 | | 1,140,000 | b | 1,478,740 | |
Columbia County Water & Sewerage, Revenue Bonds, Refunding | | 5.00 | | 6/1/2031 | | 1,240,000 | b | 1,628,207 | |
Columbia County Water & Sewerage, Revenue Bonds, Refunding | | 5.00 | | 6/1/2025 | | 300,000 | b | 355,632 | |
Columbia County Water & Sewerage, Revenue Bonds, Refunding | | 5.00 | | 6/1/2026 | | 800,000 | b | 973,584 | |
DeKalb County Water & Sewerage, Revenue Bonds, Ser. A | | 5.25 | | 10/1/2036 | | 3,500,000 | | 3,780,455 | |
Main Street Natural Gas, Revenue Bonds, Ser. A | | 5.00 | | 5/15/2026 | | 3,000,000 | | 3,613,380 | |
Main Street Natural Gas, Revenue Bonds, Ser. A | | 5.00 | | 5/15/2027 | | 2,500,000 | | 3,064,525 | |
Main Street Natural Gas, Revenue Bonds, Ser. A | | 5.00 | | 5/15/2029 | | 4,940,000 | | 6,227,660 | |
Main Street Natural Gas, Revenue Bonds, Ser. A | | 5.00 | | 5/15/2028 | | 2,510,000 | | 3,124,699 | |
Main Street Natural Gas, Revenue Bonds, Ser. A | | 6.38 | | 7/15/2038 | | 1,335,000 | f | 13,350 | |
Main Street Natural Gas, Revenue Bonds, Ser. A | | 4.00 | | 9/1/2023 | | 5,000,000 | | 5,481,050 | |
Main Street Natural Gas, Revenue Bonds, Ser. C | | 4.00 | | 12/1/2023 | | 5,000,000 | | 5,502,550 | |
| | 51,917,587 | |
Idaho - .6% | | | | | |
Idaho Health Facilities Authority, Revenue Bonds, Refunding, Ser. D | | 5.00 | | 12/1/2033 | | 5,000,000 | | 5,460,300 | |
University of Idaho, Revenue Bonds, Refunding | | 5.25 | | 4/1/2021 | | 9,075,000 | | 9,597,538 | |
| | 15,057,838 | |
Illinois - 5.2% | | | | | |
Chicago II, GO, Refunding, Ser. 2005D | | 5.50 | | 1/1/2037 | | 3,500,000 | | 3,954,090 | |
Chicago II, GO, Refunding, Ser. 2007F | | 5.50 | | 1/1/2035 | | 3,750,000 | | 4,253,062 | |
Chicago II, GO, Ser. 2002B | | 5.25 | | 1/1/2022 | | 1,000,000 | | 1,066,600 | |
Chicago II, GO, Ser. A | | 5.00 | | 1/1/2026 | | 3,000,000 | | 3,400,020 | |
Chicago II, GO, Ser. A | | 5.00 | | 1/1/2024 | | 4,500,000 | | 4,988,835 | |
Chicago Il Wastewater Transmission, Revenue Bonds, Refunding, Ser. C | | 5.00 | | 1/1/2025 | | 2,110,000 | | 2,467,160 | |
Chicago Il Wastewater Transmission, Revenue Bonds, Refunding, Ser. C | | 5.00 | | 1/1/2024 | | 3,000,000 | | 3,429,600 | |
Chicago O'Hare International Airport, Revenue Bonds, Refunding, Ser. B | | 5.00 | | 1/1/2033 | | 1,000,000 | | 1,169,700 | |
Chicago O'Hare International Airport, Revenue Bonds, Refunding, Ser. B | | 5.00 | | 1/1/2037 | | 3,000,000 | | 3,775,620 | |
Chicago O'Hare International Airport, Revenue Bonds, Refunding, Ser. B | | 5.00 | | 1/1/2025 | | 7,055,000 | | 7,948,516 | |
Chicago O'Hare International Airport, Revenue Bonds, Refunding, Ser. B | | 5.00 | | 1/1/2025 | | 4,450,000 | | 5,295,722 | |
Chicago O'Hare International Airport, Revenue Bonds, Refunding, Ser. B | | 5.00 | | 1/1/2022 | | 4,615,000 | | 5,016,551 | |
Chicago O'Hare International Airport, Revenue Bonds, Refunding, Ser. B | | 5.00 | | 1/1/2023 | | 2,000,000 | | 2,244,240 | |
Chicago O'Hare International Airport, Revenue Bonds, Refunding, Ser. B | | 5.00 | | 1/1/2024 | | 5,000,000 | | 5,784,050 | |
Chicago O'Hare International Airport, Revenue Bonds, Refunding, Ser. C | | 5.00 | | 1/1/2027 | | 2,500,000 | | 3,048,450 | |
Chicago O'Hare International Airport, Revenue Bonds, Refunding, Ser. C | | 5.00 | | 1/1/2026 | | 2,000,000 | | 2,443,380 | |
Cook County, Revenue Bonds, Refunding | | 5.00 | | 11/15/2033 | | 6,050,000 | | 7,366,540 | |
DuPage & Cook Counties Township High School District No. 86 , GO | | 4.00 | | 1/15/2035 | | 5,205,000 | | 5,987,103 | |
27
STATEMENT OF INVESTMENTS (continued)
| | | | | | | | | | |
| |
BNY Mellon National Intermediate Municipal Bond Fund (continued) |
Description | Coupon
Rate (%) | | Maturity
Date | | Principal
Amount ($) | | Value ($) | |
Long-Term Municipal Investments - 101.3% (continued) | | | | | |
Illinois - 5.2% (continued) | | | | | |
DuPage & Cook Counties Township High School District No. 86 , GO | | 4.00 | | 1/15/2033 | | 2,000,000 | | 2,320,320 | |
Illinois, GO, Refunding | | 5.00 | | 2/1/2026 | | 5,000,000 | | 5,759,850 | |
Illinois, GO, Refunding | | 5.00 | | 2/1/2021 | | 5,000,000 | | 5,224,300 | |
Illinois, GO, Refunding | | 5.00 | | 8/1/2023 | | 5,000,000 | | 5,519,200 | |
Illinois, GO, Refunding | | 5.00 | | 9/1/2019 | | 185,000 | | 185,000 | |
Illinois, GO, Refunding, Ser. A | | 5.00 | | 10/1/2023 | | 1,200,000 | | 1,329,660 | |
Illinois, GO, Refunding, Ser. A | | 5.00 | | 10/1/2022 | | 2,000,000 | | 2,176,280 | |
Illinois, GO, Refunding, Ser. A | | 5.00 | | 10/1/2025 | | 4,000,000 | | 4,580,200 | |
Illinois, GO, Refunding, Ser. A | | 5.00 | | 10/1/2024 | | 2,000,000 | | 2,245,600 | |
Illinois, Revenue Bonds (Insured; National Public Finance Guarantee Corp.) | | 6.00 | | 6/15/2026 | | 4,290,000 | | 5,275,713 | |
Illinois, Revenue Bonds (Insured; National Public Finance Guarantee Corp.) | | 6.00 | | 6/15/2025 | | 2,625,000 | | 3,155,565 | |
Illinois, Revenue Bonds (Insured; National Public Finance Guarantee Corp.) | | 6.00 | | 6/15/2024 | | 5,030,000 | | 5,878,511 | |
Illinois State Toll Highway Authority, Revenue Bonds, Refunding, Ser. A | | 5.00 | | 12/1/2031 | | 5,000,000 | | 5,982,350 | |
Kane Cook & DuPage Counties Community College District No. 509, GO, Refunding | | 3.00 | | 12/15/2032 | | 5,000,000 | | 5,292,150 | |
Kendall County Forest Preserve District, GO, Refunding (Insured; Build America Mutual) | | 4.00 | | 1/1/2027 | | 2,270,000 | | 2,498,521 | |
St. Clair County Community Unit School District No. 19, GO, Refunding, Ser. B | | 5.00 | | 2/1/2029 | | 2,235,000 | | 2,547,677 | |
| | 133,610,136 | |
Indiana - .8% | | | | | |
Indiana Finance Authority, Revenue Bonds (Goshen Health) Ser. B | | 2.10 | | 11/1/2026 | | 2,700,000 | | 2,765,988 | |
Indiana Finance Authority, Revenue Bonds, Refunding (Goshen Health) Ser. A | | 5.00 | | 11/1/2028 | | 775,000 | | 986,451 | |
Indiana Finance Authority, Revenue Bonds, Refunding (Goshen Health) Ser. A | | 5.00 | | 11/1/2027 | | 740,000 | | 927,538 | |
Whiting, Revenue Bonds, Refunding (BP Products North America) | | 5.00 | | 6/5/2026 | | 12,500,000 | | 15,235,250 | |
| | 19,915,227 | |
Iowa - .3% | | | | | |
PEFA, Revenue Bonds (PEFA Inc. Gas Project) | | 5.00 | | 9/1/2026 | | 7,000,000 | | 8,430,870 | |
Kansas - .5% | | | | | |
Kansas Department of Transportation, Revenue Bonds, Refunding, Ser. A | | 5.00 | | 9/1/2028 | | 6,000,000 | | 7,123,860 | |
Kansas Department of Transportation, Revenue Bonds, Refunding, Ser. A | | 5.00 | | 9/1/2027 | | 5,000,000 | | 5,939,850 | |
| | 13,063,710 | |
Kentucky - 1.9% | | | | | |
Kentucky Public Energy Authority, Revenue Bonds, Ser. A1 | | 4.00 | | 6/1/2025 | | 8,000,000 | | 8,986,240 | |
Kentucky State Property & Building Commission, Revenue Bonds (Project No. 112) (Insured; Assured Guaranty Municipal Corp.) Ser. A | | 5.00 | | 2/1/2028 | | 5,150,000 | | 6,220,994 | |
Kentucky State Property & Building Commission, Revenue Bonds (Project No. 112) Ser. A | | 5.00 | | 2/1/2031 | | 3,000,000 | | 3,544,830 | |
Kentucky State Property & Building Commission, Revenue Bonds, Refunding (Project No. 100) Ser. A | | 5.00 | | 8/1/2021 | | 1,785,000 | | 1,912,574 | |
Kentucky State Property & Building Commission, Revenue Bonds, Refunding (Project No. 112) Ser. B | | 5.00 | | 11/1/2025 | | 7,475,000 | | 9,008,496 | |
Kentucky State Property & Building Commission, Revenue Bonds, Refunding (Project No. 112) Ser. B | | 5.00 | | 11/1/2022 | | 5,000,000 | | 5,565,850 | |
Kentucky State Property & Building Commission, Revenue Bonds, Refunding (Project No. 112) Ser. B | | 5.00 | | 11/1/2026 | | 5,000,000 | | 6,127,550 | |
28
| | | | | | | | | | |
| |
BNY Mellon National Intermediate Municipal Bond Fund (continued) |
Description | Coupon
Rate (%) | | Maturity
Date | | Principal
Amount ($) | | Value ($) | |
Long-Term Municipal Investments - 101.3% (continued) | | | | | |
Kentucky - 1.9% (continued) | | | | | |
Kentucky Turnpike Authority, Revenue Bonds, Refunding, Ser. A | | 5.00 | | 7/1/2027 | | 5,000,000 | | 6,121,100 | |
| | 47,487,634 | |
Louisiana - .2% | | | | | |
Louisiana, GO, Refunding, Ser. C | | 5.00 | | 8/1/2026 | | 5,000,000 | | 5,901,600 | |
Maine - .2% | | | | | |
Maine Governmental Facilities Authority, Revenue Bonds, Ser. A | | 4.00 | | 10/1/2034 | | 1,880,000 | | 2,179,597 | |
University of Maine, Revenue Bonds, Refunding | | 5.00 | | 3/1/2027 | | 3,085,000 | | 3,479,078 | |
| | 5,658,675 | |
Maryland - 2.9% | | | | | |
Anne Arundel County, GO | | 5.00 | | 10/1/2025 | | 7,205,000 | | 8,867,049 | |
Anne Arundel County, GO, Refunding | | 5.00 | | 4/1/2030 | | 4,640,000 | | 5,251,645 | |
Maryland, GO | | 4.00 | | 6/1/2027 | | 18,700,000 | | 21,251,802 | |
Maryland Community Development Administration, Revenue Bonds, Refunding, Ser. B | | 4.00 | | 9/1/2049 | | 5,000,000 | | 5,529,800 | |
Maryland Department of Transportation, Revenue Bonds | | 4.00 | | 11/1/2027 | | 1,300,000 | | 1,486,797 | |
Maryland Economic Development Corp., Revenue Bonds (Purple Line Light Rail Project) | | 5.00 | | 3/31/2024 | | 6,000,000 | | 6,454,560 | |
Montgomery County, GO, Refunding, Ser. A | | 5.00 | | 11/1/2024 | | 10,000,000 | d | 11,978,200 | |
Montgomery County, GO, Refunding, Ser. B | | 4.00 | | 12/1/2030 | | 12,000,000 | | 13,323,480 | |
| | 74,143,333 | |
Massachusetts - 2.0% | | | | | |
Massachusetts, GO, Refunding, Ser. A, 3 Month LIBOR x .67 +.55% | | 2.06 | | 11/1/2025 | | 5,000,000 | e | 5,008,350 | |
Massachusetts, GO, Ser. C | | 4.00 | | 2/1/2029 | | 5,000,000 | | 5,579,500 | |
Massachusetts Development Finance Agency, Revenue Bonds, Refunding (Emerson College) | | 5.00 | | 1/1/2035 | | 2,000,000 | | 2,281,500 | |
Massachusetts Development Finance Agency, Revenue Bonds, Refunding (Emmanuel College) Ser. A | | 5.00 | | 10/1/2033 | | 5,000,000 | | 5,901,450 | |
Massachusetts Development Finance Agency, Revenue Bonds, Refunding (Partners Healthcare System) | | 4.00 | | 7/1/2035 | | 5,000,000 | | 5,765,300 | |
Massachusetts Development Finance Agency, Revenue Bonds, Refunding (Partners Healthcare System) | | 5.00 | | 7/1/2033 | | 5,815,000 | | 7,385,399 | |
Massachusetts Development Finance Agency, Revenue Bonds, Refunding (Suffolk University) | | 5.00 | | 7/1/2032 | | 770,000 | | 970,354 | |
Massachusetts Development Finance Agency, Revenue Bonds, Refunding (Suffolk University) | | 5.00 | | 7/1/2031 | | 620,000 | | 784,610 | |
Massachusetts Development Finance Agency, Revenue Bonds, Refunding (Suffolk University) | | 5.00 | | 7/1/2033 | | 800,000 | | 1,005,616 | |
Massachusetts Development Finance Agency, Revenue Bonds, Refunding (Suffolk University) | | 5.00 | | 7/1/2030 | | 700,000 | | 891,653 | |
Massachusetts Development Finance Agency, Revenue Bonds, Refunding (Suffolk University) | | 5.00 | | 7/1/2034 | | 1,000,000 | | 1,205,480 | |
Massachusetts Development Finance Agency, Revenue Bonds, Refunding (Suffolk University) | | 5.00 | | 7/1/2035 | | 1,000,000 | | 1,201,420 | |
Massachusetts Development Finance Agency, Revenue Bonds, Refunding (Suffolk University) | | 5.00 | | 7/1/2036 | | 1,010,000 | | 1,209,637 | |
The Massachusetts Clean Water Trust, Revenue Bonds, Refunding, Ser. A | | 5.75 | | 8/1/2029 | | 380,000 | | 381,307 | |
University of Massachusetts Building Authority, Revenue Bonds, Ser. 1 | | 4.00 | | 11/1/2043 | | 10,000,000 | | 10,671,000 | |
| | 50,242,576 | |
Michigan - 2.0% | | | | | |
Detroit Downtown Development Authority, Tax Allocation Bonds, Refunding (Catalyst Development Project) (Insured; Assured Guaranty Municipal Corp.) Ser. A | | 5.00 | | 7/1/2029 | | 1,350,000 | | 1,550,529 | |
Detroit Downtown Development Authority, Tax Allocation Bonds, Refunding (Catalyst Development Project) Ser. A | | 5.00 | | 7/1/2032 | | 1,000,000 | | 1,139,250 | |
29
STATEMENT OF INVESTMENTS (continued)
| | | | | | | | | | |
| |
BNY Mellon National Intermediate Municipal Bond Fund (continued) |
Description | Coupon
Rate (%) | | Maturity
Date | | Principal
Amount ($) | | Value ($) | |
Long-Term Municipal Investments - 101.3% (continued) | | | | | |
Michigan - 2.0% (continued) | | | | | |
Detroit Downtown Development Authority, Tax Allocation Bonds, Refunding (Catalyst Development Project) Ser. A | | 5.00 | | 7/1/2031 | | 1,000,000 | | 1,141,340 | |
Michigan Finance Authority, Revenue Bonds, Refunding (Insured; Assured Guaranty Municipal Corp.) | | 5.00 | | 7/1/2026 | | 1,875,000 | | 2,209,613 | |
Michigan Finance Authority, Revenue Bonds, Refunding (Insured; Assured Guaranty Municipal Corp.) | | 5.00 | | 7/1/2027 | | 3,000,000 | | 3,527,040 | |
Michigan Finance Authority, Revenue Bonds, Refunding (Insured; Assured Guaranty Municipal Corp.) | | 5.00 | | 7/1/2028 | | 2,500,000 | | 2,933,375 | |
Michigan Finance Authority, Revenue Bonds, Refunding (Insured; Assured Guaranty Municipal Corp.) | | 5.00 | | 7/1/2026 | | 2,500,000 | | 2,946,150 | |
Michigan Finance Authority, Revenue Bonds, Refunding (Trinity Health Corp) | | 5.00 | | 12/1/2035 | | 5,000,000 | | 5,465,950 | |
Michigan Finance Authority, Revenue Bonds, Refunding (Trinity Health Corp) | | 5.00 | | 12/1/2031 | | 10,000,000 | | 10,926,200 | |
Michigan State Building Authority, Revenue Bonds, Refunding, Ser. IA | | 5.00 | | 10/15/2029 | | 10,000,000 | | 11,471,400 | |
Michigan State Building Authority, Revenue Bonds, Refunding, Ser. IA | | 5.00 | | 10/15/2033 | | 5,000,000 | | 5,712,200 | |
Michigan State Building Authority, Revenue Bonds, Refunding, Ser. IA | | 5.00 | | 10/15/2022 | | 2,400,000 | | 2,687,424 | |
| | 51,710,471 | |
Minnesota - .1% | | | | | |
Minnesota Housing Finance Agency, Revenue Bonds, Refunding (Insured; GNMA, FNMA, FHLMC) Ser. B | | 4.00 | | 7/1/2047 | | 1,560,000 | | 1,675,970 | |
Mississippi - .3% | | | | | |
Mississippi Business Finance Corp., Revenue Bonds (Chevron USA Inc. Project) Ser. E | | 1.35 | | 12/1/2030 | | 2,000,000 | a | 2,000,000 | |
The University of Southern Mississippi, Revenue Bonds, Refunding (Facilities Refinancing Project) | | 5.00 | | 9/1/2025 | | 250,000 | | 304,500 | |
West Rankin Utility Authority, Revenue Bonds (Insured; Assured Guaranty Municipal Corp.) | | 5.00 | | 1/1/2033 | | 1,650,000 | | 1,929,098 | |
West Rankin Utility Authority, Revenue Bonds (Insured; Assured Guaranty Municipal Corp.) | | 5.00 | | 1/1/2032 | | 1,000,000 | | 1,171,070 | |
West Rankin Utility Authority, Revenue Bonds (Insured; Assured Guaranty Municipal Corp.) | | 5.00 | | 1/1/2030 | | 1,105,000 | | 1,302,231 | |
| | 6,706,899 | |
Missouri - 1.5% | | | | | |
Missouri Environmental Improvement & Energy Resources Authority, Revenue Bonds, Refunding, Ser. A | | 5.00 | | 7/1/2023 | | 75,000 | | 85,865 | |
Missouri Environmental Improvement & Energy Resources Authority, Revenue Bonds, Refunding, Ser. A | | 5.00 | | 7/1/2022 | | 65,000 | | 72,012 | |
Missouri Environmental Improvement & Energy Resources Authority, Revenue Bonds, Refunding, Ser. A | | 5.00 | | 7/1/2021 | | 45,000 | | 48,153 | |
Missouri Health & Educational Facilities Authority, Revenue Bonds, Refunding (Mercy Health) Ser. A | | 5.00 | | 6/1/2028 | | 6,000,000 | | 7,800,240 | |
Missouri Health & Educational Facilities Authority, Revenue Bonds, Refunding (Mercy Health) Ser. C | | 4.00 | | 11/15/2036 | | 1,300,000 | | 1,469,624 | |
Missouri Highways & Transportation Commission, Revenue Bonds, Refunding, Ser. A | | 5.00 | | 5/1/2023 | | 24,625,000 | | 28,144,405 | |
| | 37,620,299 | |
Montana - .9% | | | | | |
Montana Board of Housing, Revenue Bonds, Ser. A2 | | 3.50 | | 6/1/2044 | | 3,545,000 | | 3,735,934 | |
Montana Facility Finance Authority, Revenue Bonds, Refunding, Ser. A | | 4.00 | | 1/1/2036 | | 3,000,000 | | 3,527,670 | |
Montana Facility Finance Authority, Revenue Bonds, Refunding, Ser. A | | 4.00 | | 1/1/2035 | | 4,000,000 | | 4,719,320 | |
Montana Facility Finance Authority, Revenue Bonds, Refunding, Ser. A | | 5.00 | | 1/1/2027 | | 5,000,000 | | 6,268,250 | |
30
| | | | | | | | | | |
| |
BNY Mellon National Intermediate Municipal Bond Fund (continued) |
Description | Coupon
Rate (%) | | Maturity
Date | | Principal
Amount ($) | | Value ($) | |
Long-Term Municipal Investments - 101.3% (continued) | | | | | |
Montana - .9% (continued) | | | | | |
Montana Facility Finance Authority, Revenue Bonds, Refunding, Ser. A | | 5.00 | | 1/1/2028 | | 3,885,000 | | 4,980,143 | |
| | 23,231,317 | |
Nebraska - .1% | | | | | |
Lincoln Electric System, Revenue Bonds | | 5.00 | | 9/1/2030 | | 1,650,000 | | 2,068,391 | |
Nevada - 1.8% | | | | | |
Clark County School District, GO (Insured; Assured Guaranty Municipal Corp.) Ser. A | | 5.00 | | 6/15/2029 | | 5,280,000 | | 6,583,526 | |
Clark County School District, GO (Insured; Assured Guaranty Municipal Corp.) Ser. B | | 5.00 | | 6/15/2033 | | 5,000,000 | | 6,330,400 | |
Clark County School District, GO, Refunding, Ser. A | | 5.00 | | 6/15/2024 | | 5,000,000 | | 5,866,500 | |
Clark County School District, GO, Refunding, Ser. C | | 5.00 | | 6/15/2027 | | 5,000,000 | | 6,043,400 | |
Clark County School District, GO, Refunding, Ser. C | | 5.00 | | 6/15/2036 | | 5,000,000 | | 5,479,000 | |
Clark County School District, GO, Ser. B | | 5.00 | | 6/15/2028 | | 10,005,000 | | 12,827,010 | |
Nevada Housing Division, Revenue Bonds (Insured; GNMA, FNMA, FHLMC) Ser. A | | 4.00 | | 4/1/2049 | | 3,100,000 | | 3,430,460 | |
| | 46,560,296 | |
New Jersey - 5.9% | | | | | |
Bergen County, GO, Refunding | | 3.00 | | 7/15/2028 | | 3,025,000 | | 3,371,121 | |
Bergen County, GO, Refunding | | 3.00 | | 7/15/2027 | | 3,505,000 | | 3,946,209 | |
New Jersey Economic Development Authority, Revenue Bonds, Refunding | | 5.00 | | 6/15/2023 | | 5,000,000 | | 5,446,000 | |
New Jersey Economic Development Authority, Revenue Bonds, Refunding | | 5.00 | | 6/15/2021 | | 10,000,000 | | 10,605,300 | |
New Jersey Economic Development Authority, Revenue Bonds, Refunding | | 5.00 | | 6/15/2024 | | 5,000,000 | | 5,435,700 | |
New Jersey Economic Development Authority, Revenue Bonds, Refunding (Insured; American Municipal Bond Assurance Corp.) Ser. K | | 5.25 | | 12/15/2020 | | 5,000,000 | | 5,255,150 | |
New Jersey Economic Development Authority, Revenue Bonds, Refunding (Insured; American Municipal Bond Assurance Corp.) Ser. K | | 5.50 | | 12/15/2019 | | 1,410,000 | | 1,426,821 | |
New Jersey Economic Development Authority, Revenue Bonds, Refunding (Insured; Assured Guaranty Municipal Corp.) | | 5.00 | | 3/1/2025 | | 13,000,000 | | 14,478,750 | |
New Jersey Economic Development Authority, Revenue Bonds, Refunding (Insured; National Public Finance Guarantee Corp.) Ser. N1 | | 5.50 | | 9/1/2023 | | 10,000,000 | | 11,447,200 | |
New Jersey Economic Development Authority, Revenue Bonds, Refunding, Ser. PP | | 5.00 | | 6/15/2020 | | 5,000,000 | | 5,146,300 | |
New Jersey Health Care Facilities Financing Authority, Revenue Bonds, Refunding (Barnabas Health) Ser. A | | 5.00 | | 7/1/2022 | | 1,830,000 | | 2,028,134 | |
New Jersey Health Care Facilities Financing Authority, Revenue Bonds, Refunding (Barnabas Health) Ser. A | | 5.00 | | 7/1/2024 | | 3,005,000 | | 3,322,358 | |
New Jersey Health Care Facilities Financing Authority, Revenue Bonds, Refunding (Trinitas Regional Medical Center) | | 5.00 | | 7/1/2024 | | 1,000,000 | | 1,155,560 | |
New Jersey Health Care Facilities Financing Authority, Revenue Bonds, Refunding (Trinitas Regional Medical Center) | | 5.00 | | 7/1/2025 | | 1,060,000 | | 1,254,107 | |
New Jersey Health Care Facilities Financing Authority, Revenue Bonds, Refunding (Trinitas Regional Medical Center) | | 5.00 | | 7/1/2026 | | 1,000,000 | | 1,207,950 | |
New Jersey Tobacco Settlement Financing Corp., Revenue Bonds, Refunding, Ser. A | | 5.00 | | 6/1/2030 | | 5,000,000 | | 6,146,000 | |
New Jersey Tobacco Settlement Financing Corp., Revenue Bonds, Refunding, Ser. A | | 5.00 | | 6/1/2032 | | 6,000,000 | | 7,291,920 | |
New Jersey Tobacco Settlement Financing Corp., Revenue Bonds, Refunding, Ser. A | | 5.00 | | 6/1/2033 | | 12,000,000 | | 14,538,000 | |
New Jersey Tobacco Settlement Financing Corp., Revenue Bonds, Refunding, Ser. A | | 5.00 | | 6/1/2034 | | 8,000,000 | | 9,636,160 | |
31
STATEMENT OF INVESTMENTS (continued)
| | | | | | | | | | |
| |
BNY Mellon National Intermediate Municipal Bond Fund (continued) |
Description | Coupon
Rate (%) | | Maturity
Date | | Principal
Amount ($) | | Value ($) | |
Long-Term Municipal Investments - 101.3% (continued) | | | | | |
New Jersey - 5.9% (continued) | | | | | |
New Jersey Transportation Trust Fund Authority, Revenue Bonds (Insured; National Public Finance Guarantee Corp.) Ser. A | | 5.75 | | 6/15/2025 | | 4,245,000 | | 5,157,420 | |
New Jersey Transportation Trust Fund Authority, Revenue Bonds, Refunding (Insured; National Public Finance Guarantee Corp.) Ser. B | | 5.50 | | 12/15/2021 | | 10,000,000 | | 10,916,100 | |
New Jersey Transportation Trust Fund Authority, Revenue Bonds, Refunding, Ser. A | | 5.00 | | 12/15/2027 | | 10,000,000 | | 12,356,000 | |
New Jersey Transportation Trust Fund Authority, Revenue Bonds, Refunding, Ser. A | | 5.25 | | 12/15/2021 | | 3,000,000 | | 3,258,060 | |
New Jersey Transportation Trust Fund Authority, Revenue Bonds, Ser. B | | 5.50 | | 6/15/2031 | | 5,000,000 | | 5,331,200 | |
| | 150,157,520 | |
New Mexico - .1% | | | | | |
New Mexico Finance Authority, Revenue Bonds, Ser. C | | 5.00 | | 6/1/2029 | | 1,615,000 | | 1,943,717 | |
New York - 14.7% | | | | | |
Brooklyn Arena Local Development Corp., Revenue Bonds, Refunding (Barclays Center Project) (Insured; Assured Guaranty Municipal Corp.) Ser. A | | 4.00 | | 7/15/2034 | | 1,000,000 | | 1,132,180 | |
Brooklyn Arena Local Development Corp., Revenue Bonds, Refunding (Barclays Center Project) (Insured; Assured Guaranty Municipal Corp.) Ser. A | | 4.00 | | 7/15/2033 | | 900,000 | | 1,023,111 | |
Brooklyn Arena Local Development Corp., Revenue Bonds, Refunding (Barclays Center Project) (Insured; Assured Guaranty Municipal Corp.) Ser. A | | 4.00 | | 7/15/2032 | | 750,000 | | 855,413 | |
Hudson Yards Infrastructure Corp., Revenue Bonds, Refunding, Ser. A | | 5.00 | | 2/15/2033 | | 5,000,000 | | 6,268,450 | |
Metropolitan Transportation Authority, Revenue Bonds (Green Bond) Ser. A | | 5.00 | | 11/15/2035 | | 10,000,000 | | 12,436,900 | |
Metropolitan Transportation Authority, Revenue Bonds, Refunding (Green Bond) Ser. A1 | | 5.00 | | 11/15/2024 | | 10,000,000 | | 11,823,400 | |
Metropolitan Transportation Authority, Revenue Bonds, Refunding (Green Bond) Ser. B2 | | 5.25 | | 11/15/2033 | | 5,000,000 | | 6,478,400 | |
Metropolitan Transportation Authority, Revenue Bonds, Refunding (Green Bond) Ser. C1 | | 5.00 | | 11/15/2026 | | 10,185,000 | | 12,726,667 | |
Metropolitan Transportation Authority, Revenue Bonds, Refunding, Ser. D | | 5.00 | | 11/15/2031 | | 10,000,000 | | 12,327,200 | |
Metropolitan Transportation Authority Hudson Rail Yards Trust, Revenue Bonds, Refunding, Ser. A | | 5.00 | | 11/15/2051 | | 5,000,000 | | 5,355,450 | |
Nassau County, GO, Refunding, Ser. B | | 5.00 | | 4/1/2036 | | 4,000,000 | | 4,885,680 | |
Nassau County, GO, Refunding, Ser. C | | 5.00 | | 10/1/2028 | | 10,000,000 | | 12,734,700 | |
New York & New Jersey Port Authority, Revenue Bonds, Refunding, Ser. 207 | | 5.00 | | 9/15/2024 | | 10,000,000 | | 11,804,600 | |
New York City, GO (LOC; Mizuho Bank, Ltd.) Ser. A3 | | 1.52 | | 10/1/2040 | | 4,900,000 | a | 4,900,000 | |
New York City, GO (LOC; Mizuho Bank, Ltd.) Ser. G6 | | 1.40 | | 4/1/2042 | | 3,300,000 | a | 3,300,000 | |
New York City, GO Notes, Ser. A2 | | 1.52 | | 10/1/2038 | | 8,700,000 | a | 8,700,000 | |
New York City, GO, Refunding, Ser. A | | 5.00 | | 8/1/2024 | | 5,000,000 | | 5,930,850 | |
New York City, GO, Refunding, Ser. G | | 5.00 | | 8/1/2023 | | 5,000,000 | | 5,747,750 | |
New York City, GO, Refunding, Ser. I | | 5.00 | | 8/1/2026 | | 5,660,000 | | 6,288,826 | |
New York City Housing Development Corp., Revenue Bonds, Ser. A1 | | 3.38 | | 11/15/2029 | | 3,000,000 | | 3,200,160 | |
New York City Housing Development Corp., Revenue Bonds, Ser. B2 | | 5.25 | | 7/1/2032 | | 10,000,000 | | 11,324,700 | |
New York City Transitional Finance Authority, Revenue Bonds | | 5.25 | | 8/1/2037 | | 10,000,000 | | 12,923,600 | |
New York City Transitional Finance Authority, Revenue Bonds (Insured; State Aid Withholding) Ser. S3 | | 5.25 | | 7/15/2036 | | 10,000,000 | | 12,848,800 | |
New York City Transitional Finance Authority, Revenue Bonds (SPA; State Street Bank and Trust Co.) Ser. A6 | | 1.42 | | 8/1/2039 | | 3,800,000 | a | 3,800,000 | |
32
| | | | | | | | | | |
| |
BNY Mellon National Intermediate Municipal Bond Fund (continued) |
Description | Coupon
Rate (%) | | Maturity
Date | | Principal
Amount ($) | | Value ($) | |
Long-Term Municipal Investments - 101.3% (continued) | | | | | |
New York - 14.7% (continued) | | | | | |
New York City Transitional Finance Authority, Revenue Bonds, Ser. A2 | | 5.00 | | 8/1/2035 | | 5,295,000 | | 6,592,328 | |
New York City Water & Sewer System, Revenue Bonds (LOC; Citibank NA) Ser. F | | 1.42 | | 6/15/2035 | | 2,300,000 | a | 2,300,000 | |
New York City Water & Sewer System, Revenue Bonds, Refunding (SPA; Mizuho Bank Ltd.) Ser. AA5 | | 1.52 | | 6/15/2048 | | 400,000 | a | 400,000 | |
New York City Water & Sewer System, Revenue Bonds, Refunding, Ser. DD | | 4.50 | | 6/15/2039 | | 1,000,000 | | 1,120,110 | |
New York Counties Tobacco Trust VI, Revenue Bonds, Refunding, Ser. A-2B | | 5.00 | | 6/1/2045 | | 1,250,000 | | 1,347,650 | |
New York Liberty Development Corp., Revenue Bonds, Refunding (Class 1-3 World Trade Center Project) | | 5.00 | | 11/15/2044 | | 15,400,000 | g | 17,106,166 | |
New York Liberty Development Corp., Revenue Bonds, Refunding (Class 2-3 World Trade Center Project) | | 5.15 | | 11/15/2034 | | 3,500,000 | g | 3,954,755 | |
New York State Dormitory Authority, Revenue Bonds, Refunding (Insured; State Aid Withholding) Ser. A | | 5.00 | | 10/1/2030 | | 5,000,000 | | 6,371,550 | |
New York State Dormitory Authority, Revenue Bonds, Refunding, Ser. A | | 5.00 | | 3/15/2033 | | 7,000,000 | | 8,643,110 | |
New York State Dormitory Authority, Revenue Bonds, Refunding, Ser. A | | 5.00 | | 3/15/2034 | | 2,500,000 | | 2,894,775 | |
New York State Dormitory Authority, Revenue Bonds, Refunding, Ser. A | | 5.00 | | 7/1/2032 | | 10,000,000 | | 11,877,100 | |
New York State Dormitory Authority, Revenue Bonds, Refunding, Ser. C | | 5.00 | | 3/15/2031 | | 5,165,000 | | 6,013,558 | |
New York State Dormitory Authority, Revenue Bonds, Ser. A | | 5.00 | | 3/15/2033 | | 5,685,000 | | 7,040,816 | |
New York State Dormitory Authority, Revenue Bonds, Ser. B | | 5.00 | | 2/15/2033 | | 20,000,000 | | 23,785,600 | |
New York State Mortgage Agency, Revenue Bonds, Ser. 52 | | 1.65 | | 10/1/2019 | | 1,200,000 | | 1,200,156 | |
New York State Thruway Authority, Revenue Bonds, Refunding, Ser. K | | 5.00 | | 1/1/2032 | | 3,000,000 | | 3,556,950 | |
New York State Urban Development Corp., Revenue Bonds (Insured; National Public Finance Guarantee Corp.) Ser. A2 | | 5.50 | | 3/15/2024 | | 10,000,000 | | 11,962,400 | |
New York State Urban Development Corp., Revenue Bonds, Ser. C | | 5.00 | | 3/15/2029 | | 10,000,000 | | 11,358,000 | |
New York State Urban Development Corp., Revenue Bonds, Ser. E | | 5.00 | | 3/15/2026 | | 5,000,000 | | 5,679,000 | |
New York Transportation Development Corp., Revenue Bonds (Delta Air Lines) | | 5.00 | | 1/1/2025 | | 20,000,000 | | 23,263,400 | |
New York Transportation Development Corp., Revenue Bonds (LaGuardia Airport Terminal B Redevelopment Project) | | 5.00 | | 7/1/2041 | | 2,000,000 | | 2,250,100 | |
New York Transportation Development Corp., Revenue Bonds (LaGuardia Airport Terminal B Redevelopment Project) Ser. A | | 5.00 | | 7/1/2046 | | 2,500,000 | | 2,797,700 | |
Sales Tax Asset Receivable Corp., Revenue Bonds, Refunding, Ser. A | | 5.00 | | 10/15/2029 | | 6,370,000 | | 7,572,592 | |
Suffolk County, GO (Insured; Build America Mutual) Ser. A | | 4.00 | | 4/1/2032 | | 4,780,000 | | 5,488,157 | |
Suffolk County, GO, Refunding (Insured; Build America Mutual) Ser. D | | 4.00 | | 10/15/2028 | | 4,810,000 | | 5,693,886 | |
Triborough Bridge & Tunnel Authority, Revenue Bonds, Refunding, Ser. A | | 0.00 | | 11/15/2029 | | 10,000,000 | c | 8,138,600 | |
TSASC, Revenue Bonds, Refunding, Ser. A | | 5.00 | | 6/1/2023 | | 5,000,000 | | 5,657,400 | |
Utility Debt Securitization Authority, Revenue Bonds, Refunding | | 5.00 | | 12/15/2026 | | 2,500,000 | | 2,910,825 | |
| | 375,793,521 | |
North Carolina - .7% | | | | | |
North Carolina Municipal Power Agency No. 1, Revenue Bonds, Refunding, Ser. A | | 5.00 | | 1/1/2024 | | 1,585,000 | | 1,589,486 | |
North Carolina Turnpike Authority, Revenue Bonds, Refunding (Insured; Assured Guaranty Municipal Corp.) | | 5.00 | | 1/1/2033 | | 3,400,000 | | 4,304,434 | |
33
STATEMENT OF INVESTMENTS (continued)
| | | | | | | | | | |
| |
BNY Mellon National Intermediate Municipal Bond Fund (continued) |
Description | Coupon
Rate (%) | | Maturity
Date | | Principal
Amount ($) | | Value ($) | |
Long-Term Municipal Investments - 101.3% (continued) | | | | | |
North Carolina - .7% (continued) | | | | | |
North Carolina Turnpike Authority, Revenue Bonds, Refunding (Insured; Assured Guaranty Municipal Corp.) | | 5.00 | | 1/1/2032 | | 3,780,000 | | 4,798,294 | |
Wake County, GO, Refunding, Ser. B | | 4.00 | | 5/1/2031 | | 3,245,000 | | 3,553,729 | |
Wake County, GO, Refunding, Ser. B | | 4.00 | | 5/1/2030 | | 3,000,000 | | 3,293,520 | |
| | 17,539,463 | |
Ohio - .6% | | | | | |
Hamilton County Sewer System, Revenue Bonds, Refunding, Ser. A | | 5.00 | | 12/1/2029 | | 2,250,000 | | 2,677,613 | |
Hamilton County Sewer System, Revenue Bonds, Refunding, Ser. A | | 5.00 | | 12/1/2026 | | 3,500,000 | | 4,052,685 | |
Ohio, Revenue Bonds, Refunding (University Hospitals Health System) (LOC; PNC Bank NA) Ser. A | | 1.43 | | 1/15/2046 | | 2,100,000 | a | 2,100,000 | |
Ohio Housing Finance Agency, Revenue Bonds (Insured; GNMA, FNMA, FHLMC) Ser. A | | 4.50 | | 3/1/2047 | | 1,990,000 | | 2,181,995 | |
Ohio Housing Finance Agency, Revenue Bonds, Refunding (Insured; GNMA, FNMA, FHLMC) Ser. D | | 4.00 | | 3/1/2047 | | 4,870,000 | | 5,233,984 | |
| | 16,246,277 | |
Oregon - 1.8% | | | | | |
Multnomah & Clackamas Counties School District No. 10, GO (Insured; School Board Guaranty) Ser. B | | 5.00 | | 6/15/2030 | | 10,000,000 | | 12,641,300 | |
Oregon Housing & Community Services Department, Revenue Bonds, Ser. A | | 4.00 | | 1/1/2047 | | 3,650,000 | | 3,901,157 | |
Portland Sewer System, Revenue Bonds, Ser. A | | 4.50 | | 5/1/2037 | | 13,635,000 | | 15,899,364 | |
Portland Sewer System, Revenue Bonds, Ser. A | | 4.50 | | 5/1/2033 | | 11,435,000 | | 13,468,372 | |
| | 45,910,193 | |
Pennsylvania - 9.6% | | | | | |
Berks County Industrial Development Authority, Revenue Bonds, Refunding (Tower Health Project) | | 4.00 | | 11/1/2032 | | 1,400,000 | | 1,570,352 | |
Chambersburg Area School District, GO, Refunding (Insured; State Aid Withholding) | | 4.00 | | 3/1/2028 | | 2,435,000 | | 2,863,170 | |
Chester County Health & Education Facilities Authority, Revenue Bonds, Refunding (Main Line Health System) Ser. A | | 4.00 | | 10/1/2037 | | 2,105,000 | | 2,384,586 | |
Commonwealth Financing Authority, Revenue Bonds | | 5.00 | | 6/1/2033 | | 3,250,000 | | 4,046,153 | |
Commonwealth Financing Authority, Revenue Bonds | | 5.00 | | 6/1/2031 | | 3,500,000 | | 4,381,965 | |
Commonwealth Financing Authority, Revenue Bonds | | 5.00 | | 6/1/2030 | | 4,000,000 | | 5,034,240 | |
Montgomery County Higher Education & Health Authority, Revenue Bonds, Refunding (Thomas Jefferson University Project) | | 4.00 | | 9/1/2034 | | 1,155,000 | | 1,319,218 | |
Pennsylvania, GO | | 5.00 | | 9/15/2029 | | 7,000,000 | | 8,667,190 | |
Pennsylvania, GO | | 5.00 | | 3/15/2031 | | 5,000,000 | | 5,934,800 | |
Pennsylvania, GO (Insured; Assured Guaranty Municipal Corp.) | | 5.00 | | 6/1/2022 | | 7,540,000 | d | 8,351,379 | |
Pennsylvania, GO (Insured; Assured Guaranty Municipal Corp.) | | 5.00 | | 4/1/2023 | | 11,520,000 | d | 13,125,542 | |
Pennsylvania, GO, Refunding | | 4.00 | | 1/1/2030 | | 5,000,000 | | 5,755,500 | |
Pennsylvania, GO, Refunding | | 5.00 | | 8/15/2023 | | 5,000,000 | | 5,744,550 | |
Pennsylvania, GO, Refunding | | 5.00 | | 7/15/2028 | | 10,000,000 | | 12,899,700 | |
Pennsylvania Economic Development Financing Authority, Revenue Bonds, Refunding (UPMC) | | 4.00 | | 3/15/2032 | | 3,305,000 | | 3,738,847 | |
Pennsylvania Economic Development Financing Authority, Revenue Bonds, Refunding, Ser. A | | 4.00 | | 11/15/2036 | | 3,750,000 | | 4,257,337 | |
Pennsylvania Economic Development Financing Authority, Revenue Bonds, Refunding, Ser. A | | 4.00 | | 11/15/2035 | | 6,000,000 | | 6,830,280 | |
Pennsylvania Higher Educational Facilities Authority, Revenue Bonds, Refunding (St. Joseph's University) Ser. A | | 5.00 | | 11/1/2034 | | 2,240,000 | | 2,322,746 | |
Pennsylvania Higher Educational Facilities Authority, Revenue Bonds, Refunding (University of Pennsylvani Health System) Ser. C | | 5.00 | | 8/15/2024 | | 5,000,000 | | 5,903,650 | |
Pennsylvania Higher Educational Facilities Authority, Revenue Bonds, Refunding, Ser. AV1 | | 4.00 | | 6/15/2031 | | 2,505,000 | | 2,907,528 | |
34
| | | | | | | | | | |
| |
BNY Mellon National Intermediate Municipal Bond Fund (continued) |
Description | Coupon
Rate (%) | | Maturity
Date | | Principal
Amount ($) | | Value ($) | |
Long-Term Municipal Investments - 101.3% (continued) | | | | | |
Pennsylvania - 9.6% (continued) | | | | | |
Pennsylvania Higher Educational Facilities Authority, Revenue Bonds, Refunding, Ser. AV1 | | 4.00 | | 6/15/2032 | | 1,355,000 | | 1,567,586 | |
Pennsylvania Higher Educational Facilities Authority, Revenue Bonds, Ser. AT-1 | | 5.00 | | 6/15/2029 | | 5,000,000 | | 6,087,800 | |
Pennsylvania Housing Finance Agency, Revenue Bonds, Refunding, Ser. 122 | | 3.65 | | 10/1/2032 | | 3,310,000 | | 3,572,946 | |
Pennsylvania Housing Finance Agency, Revenue Bonds, Refunding, Ser. 122 | | 4.00 | | 10/1/2046 | | 2,130,000 | | 2,283,743 | |
Pennsylvania Turnpike Commission, Revenue Bonds, Refunding | | 5.00 | | 12/1/2038 | | 10,000,000 | | 12,180,200 | |
Pennsylvania Turnpike Commission, Revenue Bonds, Refunding | | 5.00 | | 12/1/2035 | | 7,085,000 | | 8,697,829 | |
Pennsylvania Turnpike Commission, Revenue Bonds, Refunding | | 5.00 | | 12/1/2031 | | 5,000,000 | | 6,203,350 | |
Pennsylvania Turnpike Commission, Revenue Bonds, Refunding (Insured; Assured Guaranty Municipal Corporation) Ser. B2 | | 5.00 | | 6/1/2033 | | 10,000,000 | | 12,278,600 | |
Pennsylvania Turnpike Commission, Revenue Bonds, Refunding, Ser. A | | 5.00 | | 12/1/2033 | | 2,525,000 | | 3,186,373 | |
Pennsylvania Turnpike Commission, Revenue Bonds, Refunding, Ser. B | | 5.00 | | 6/1/2029 | | 7,925,000 | | 9,534,567 | |
Pennsylvania Turnpike Commission, Revenue Bonds, Ser. A | | 5.00 | | 12/1/2022 | | 5,110,000 | d | 5,756,824 | |
Pennsylvania Turnpike Commission, Revenue Bonds, Ser. B | | 5.00 | | 12/1/2021 | | 3,740,000 | | 4,051,355 | |
Perkiomen Valley School District, GO (Insured; State Aid Withholding) | | 4.00 | | 2/15/2031 | | 5,000,000 | | 5,573,000 | |
Philadelphia, GO, Refunding, Ser. A | | 5.00 | | 8/1/2026 | | 3,400,000 | | 4,234,904 | |
Philadelphia, GO, Refunding, Ser. A | | 5.00 | | 8/1/2025 | | 3,455,000 | | 4,191,537 | |
Philadelphia, Revenue Bonds, Refunding, Ser. B | | 5.00 | | 7/1/2025 | | 1,125,000 | | 1,351,755 | |
Philadelphia Authority for Industrial Development, Revenue Bonds, Refunding (Children's Hospital of Philadelphia Project) | | 4.00 | | 7/1/2035 | | 1,575,000 | | 1,808,825 | |
Philadelphia Authority for Industrial Development, Revenue Bonds, Refunding (Children's Hospital of Philadelphia Project) | | 4.00 | | 7/1/2036 | | 8,400,000 | | 9,622,620 | |
Pittsburgh Water & Sewer Authority, Revenue Bonds, Refunding (Insured; Assured Guaranty Municipal Corp.) Ser. A | | 5.00 | | 9/1/2026 | | 10,000,000 | | 12,490,200 | |
State Public School Building Authority, Revenue Bonds (The School District of Philadelphia Project) (Insured; State Aid Withholding) | | 5.00 | | 4/1/2025 | | 2,750,000 | | 2,996,923 | |
State Public School Building Authority, Revenue Bonds (The School District of Philadelphia Project) (Insured; State Aid Withholding) | | 5.00 | | 4/1/2022 | | 1,000,000 | | 1,090,590 | |
State Public School Building Authority, Revenue Bonds, Refunding (Insured; Assured Guaranty Municipal Corp.) Ser. A | | 5.00 | | 6/1/2031 | | 5,000,000 | | 6,042,900 | |
State Public School Building Authority, Revenue Bonds, Refunding (Insured; Assured Guaranty Municipal Corp.) Ser. A | | 5.00 | | 6/1/2025 | | 5,000,000 | | 5,978,750 | |
The School District of Philadelphia, GO (Insured; State Aid Withholding) Ser. A | | 5.00 | | 9/1/2025 | | 500,000 | | 600,355 | |
The School District of Philadelphia, GO (Insured; State Aid Withholding) Ser. A | | 5.00 | | 9/1/2024 | | 600,000 | | 701,142 | |
The School District of Philadelphia, GO (Insured; State Aid Withholding) Ser. A | | 5.00 | | 9/1/2027 | | 500,000 | | 621,220 | |
The School District of Philadelphia, GO (Insured; State Aid Withholding) Ser. A | | 5.00 | | 9/1/2026 | | 500,000 | | 612,140 | |
West Mifflin School District, GO, Refunding (Insured; Assured Guaranty Municipal Corp.) | | 5.00 | | 4/1/2028 | | 1,000,000 | | 1,201,920 | |
35
STATEMENT OF INVESTMENTS (continued)
| | | | | | | | | | |
| |
BNY Mellon National Intermediate Municipal Bond Fund (continued) |
Description | Coupon
Rate (%) | | Maturity
Date | | Principal
Amount ($) | | Value ($) | |
Long-Term Municipal Investments - 101.3% (continued) | | | | | |
Pennsylvania - 9.6% (continued) | | | | | |
West Mifflin School District, GO, Refunding (Insured; Assured Guaranty Municipal Corp.) | | 5.00 | | 4/1/2027 | | 1,140,000 | | 1,374,384 | |
| | 243,933,071 | |
Rhode Island - .5% | | | | | |
Rhode Island, GO, Refunding, Ser. B | | 5.00 | | 8/1/2029 | | 5,290,000 | | 6,715,919 | |
Rhode Island Housing & Mortgage Finance Corp., Revenue Bonds (Insured; Government National Mortgage Association) Ser. 70 | | 4.00 | | 10/1/2049 | | 5,000,000 | | 5,533,000 | |
| | 12,248,919 | |
South Carolina - .8% | | | | | |
Dorchester County School District No. 2, Revenue Bonds, Refunding | | 5.00 | | 12/1/2029 | | 2,000,000 | | 2,291,700 | |
Dorchester County School District No. 2, Revenue Bonds, Refunding | | 5.00 | | 12/1/2028 | | 1,750,000 | | 2,008,353 | |
Lexington County Health Services District, Revenue Bonds, Refunding (LexMed Obligated Group) | | 4.00 | | 11/1/2032 | | 750,000 | | 852,593 | |
Lexington County Health Services District, Revenue Bonds, Refunding (LexMed Obligated Group) | | 4.00 | | 11/1/2031 | | 1,000,000 | | 1,141,260 | |
Lexington County Health Services District, Revenue Bonds, Refunding (LexMed Obligated Group) | | 4.00 | | 11/1/2030 | | 1,000,000 | | 1,148,080 | |
South Carolina Public Service Authority, Revenue Bonds, Refunding, Ser. A | | 5.00 | | 12/1/2030 | | 3,315,000 | | 4,014,200 | |
South Carolina Public Service Authority, Revenue Bonds, Refunding, Ser. C | | 5.00 | | 12/1/2022 | | 7,500,000 | | 8,375,700 | |
| | 19,831,886 | |
South Dakota - .3% | | | | | |
Educational Enhancement Funding Corp., Revenue Bonds, Refunding, Ser. B | | 5.00 | | 6/1/2027 | | 500,000 | | 557,775 | |
Educational Enhancement Funding Corp., Revenue Bonds, Refunding, Ser. B | | 5.00 | | 6/1/2025 | | 1,800,000 | | 2,011,932 | |
South Dakota State Building Authority, Revenue Bonds, Refunding, Ser. A | | 4.00 | | 6/1/2032 | | 2,660,000 | | 3,081,583 | |
South Dakota State Building Authority, Revenue Bonds, Refunding, Ser. A | | 4.00 | | 6/1/2031 | | 1,250,000 | | 1,452,513 | |
| | 7,103,803 | |
Tennessee - 1.2% | | | | | |
Clarksville Natural Gas Acquisition Corp., Revenue Bonds | | 5.00 | | 12/15/2020 | | 1,690,000 | | 1,768,382 | |
Clarksville Public Building Authority, Revenue Bonds (Tennessee Municipal Bond Fund) (LOC; Bank of America NA) | | 1.40 | | 11/1/2035 | | 3,900,000 | a | 3,900,000 | |
Memphis-Shelby County Industrial Development Board, Revenue Bonds, Refunding, Ser. B | | 5.00 | | 11/1/2029 | | 5,840,000 | | 7,228,168 | |
Metropolitan Government of Nashville & Davidson County, GO, Refunding | | 5.00 | | 1/1/2030 | | 5,000,000 | | 6,197,200 | |
Tennessee Energy Acquisition Corp., Revenue Bonds, Ser. A | | 4.00 | | 5/1/2023 | | 7,820,000 | | 8,465,854 | |
Tennessee Housing Development Agency, Revenue Bonds, Ser. 2B | | 4.00 | | 1/1/2042 | | 1,670,000 | | 1,801,830 | |
Tennessee Housing Development Agency, Revenue Bonds, Ser. B | | 3.50 | | 1/1/2047 | | 2,005,000 | | 2,115,476 | |
| | 31,476,910 | |
Texas - 8.8% | | | | | |
Arlington, Special Tax Bonds, Refunding (Insured; Assured Guaranty Municipal Corp.) | | 5.00 | | 2/15/2034 | | 4,180,000 | | 4,874,591 | |
Arlington Higher Education Finance Corp., Revenue Bonds, Refunding (Uplift Education) (Insured; Texas Permanent School Fund Guarantee Program) Ser. A | | 4.00 | | 12/1/2042 | | 2,760,000 | | 3,090,262 | |
Bexar County, Revenue Bonds, Refunding (Tax Exempt Venue Project) | | 4.00 | | 8/15/2033 | | 1,000,000 | | 1,161,690 | |
36
| | | | | | | | | | |
| |
BNY Mellon National Intermediate Municipal Bond Fund (continued) |
Description | Coupon
Rate (%) | | Maturity
Date | | Principal
Amount ($) | | Value ($) | |
Long-Term Municipal Investments - 101.3% (continued) | | | | | |
Texas - 8.8% (continued) | | | | | |
Bexar County, Revenue Bonds, Refunding (Tax Exempt Venue Project) | | 4.00 | | 8/15/2034 | | 1,075,000 | | 1,242,722 | |
Bexar County, Revenue Bonds, Refunding (Tax Exempt Venue Project) | | 4.00 | | 8/15/2032 | | 1,000,000 | | 1,166,200 | |
Bexar County, Revenue Bonds, Refunding (Tax Exempt Venue Project) | | 4.00 | | 8/15/2030 | | 1,000,000 | | 1,179,530 | |
Bexar County, Revenue Bonds, Refunding (Tax Exempt Venue Project) | | 5.00 | | 8/15/2027 | | 1,110,000 | | 1,396,702 | |
Clifton Higher Education Finance Corp., Revenue Bonds | | 5.00 | | 8/15/2023 | | 1,100,000 | | 1,188,253 | |
Culberson County-Allamoore Independent School District, GO (Insured; Texas Permanent School Fund Guarantee Program) | | 4.00 | | 2/15/2041 | | 1,300,000 | | 1,302,535 | |
Dallas, GO, Refunding | | 5.00 | | 2/15/2028 | | 5,000,000 | | 6,314,250 | |
Forney Independent School District, GO, Refunding (Insured; Permanent School Fund Guarantee Program) | | 5.00 | | 8/15/2027 | | 2,200,000 | | 2,669,304 | |
Frisco Independent School District, GO (Insured; Permanent School Fund Guarantee Program) | | 4.00 | | 8/15/2027 | | 4,010,000 | | 4,536,353 | |
Grand Parkway Transportation Corp., BAN | | 5.00 | | 2/1/2023 | | 12,500,000 | | 14,019,375 | |
Harris County Flood Control District, Revenue Bonds, Refunding | | 5.00 | | 10/1/2026 | | 10,000,000 | | 11,940,500 | |
Houston, GO, Refunding, Ser. A | | 5.00 | | 3/1/2029 | | 5,000,000 | | 6,250,850 | |
Houston Community College System, GO | | 5.00 | | 2/15/2032 | | 8,200,000 | | 9,146,034 | |
Houston Independent School District, GO, Refunding (Insured; Permanent School Fund Guarantee Program) | | 4.00 | | 2/15/2028 | | 5,000,000 | | 5,605,150 | |
Houston Texas Combined Utility System, Revenue Bonds, Refunding, Ser. B | | 4.50 | | 11/15/2038 | | 16,540,000 | | 19,355,439 | |
Houston Texas Combined Utility System, Revenue Bonds, Refunding, Ser. B | | 5.25 | | 11/15/2033 | | 5,000,000 | | 6,295,350 | |
Houston Texas Hotel Occupancy, Revenue Bonds, Refunding | | 5.00 | | 9/1/2028 | | 1,350,000 | | 1,749,992 | |
Houston Texas Hotel Occupancy, Revenue Bonds, Refunding | | 5.00 | | 9/1/2026 | | 1,750,000 | | 2,180,483 | |
Houston Texas Hotel Occupancy, Revenue Bonds, Refunding | | 5.00 | | 9/1/2027 | | 1,720,000 | | 2,186,963 | |
New Hope Cultural Educational Facilities Finance Corp., Revenue Bonds, Refunding (Children's Health System Project) Ser. A | | 4.00 | | 8/15/2033 | | 2,000,000 | | 2,275,880 | |
North Texas Tollway Authority, Revenue Bonds, Refunding (Insured; Assured Guaranty Municipal Corp.) Ser. B | | 4.00 | | 1/1/2034 | | 5,015,000 | | 5,698,043 | |
North Texas Tollway Authority, Revenue Bonds, Refunding, Ser. A | | 5.00 | | 1/1/2030 | | 8,650,000 | | 10,487,865 | |
North Texas Tollway Authority, Revenue Bonds, Refunding, Ser. A | | 5.00 | | 1/1/2026 | | 10,000,000 | | 11,590,700 | |
North Texas Tollway Authority, Revenue Bonds, Refunding, Ser. A | | 5.00 | | 1/1/2030 | | 3,000,000 | | 3,538,830 | |
North Texas Tollway Authority, Revenue Bonds, Refunding, Ser. A | | 5.00 | | 1/1/2031 | | 11,415,000 | | 13,405,205 | |
North Texas Tollway Authority, Revenue Bonds, Refunding, Ser. B | | 5.00 | | 1/1/2031 | | 1,875,000 | | 2,252,813 | |
North Texas Tollway Authority, Revenue Bonds, Refunding, Ser. B | | 5.00 | | 1/1/2040 | | 5,000,000 | | 5,581,050 | |
North Texas Tollway Authority, Revenue Bonds, Refunding, Ser. B | | 5.00 | | 1/1/2030 | | 1,750,000 | | 2,113,598 | |
Pearland Independent School District, GO, Refunding (Insured; Texas Permanent School Fund Guarantee Program) | | 5.00 | | 2/15/2031 | | 5,000,000 | | 6,084,450 | |
Southwest Higher Education Authority, Revenue Bonds, Refunding | | 5.00 | | 10/1/2029 | | 5,000,000 | | 6,158,900 | |
Southwest Higher Education Authority, Revenue Bonds, Refunding | | 5.00 | | 10/1/2028 | | 4,500,000 | | 5,565,150 | |
Texas, GO, Refunding | | 5.00 | | 10/1/2023 | | 4,220,000 | | 4,563,761 | |
Texas, GO, Refunding | | 5.00 | | 10/1/2024 | | 4,000,000 | | 4,697,240 | |
Texas, GO, Refunding | | 5.00 | | 10/1/2027 | | 8,470,000 | | 10,360,673 | |
37
STATEMENT OF INVESTMENTS (continued)
| | | | | | | | | | |
| |
BNY Mellon National Intermediate Municipal Bond Fund (continued) |
Description | Coupon
Rate (%) | | Maturity
Date | | Principal
Amount ($) | | Value ($) | |
Long-Term Municipal Investments - 101.3% (continued) | | | | | |
Texas - 8.8% (continued) | | | | | |
Texas, GO, Refunding | | 5.00 | | 10/1/2021 | | 5,165,000 | d | 5,564,874 | |
Texas Municipal Power Agency, Revenue Bonds, Refunding | | 5.00 | | 9/1/2047 | | 2,500,000 | | 2,586,275 | |
University of Houston, Revenue Bonds, Refunding, Ser. A | | 5.00 | | 2/15/2033 | | 5,000,000 | | 6,033,750 | |
University of North Texas System, Revenue Bonds, Refunding, Ser. A | | 5.00 | | 4/15/2035 | | 5,000,000 | | 5,877,800 | |
| | 223,289,385 | |
U.S. Related - .3% | | | | | |
Antonio B Won International Airport Authority, Revenue Bonds (Insured; Assured Guaranty Municipal Corp.) Ser. B | | 5.50 | | 10/1/2033 | | 1,000,000 | | 1,161,370 | |
Guam, Revenue Bonds, Refunding, Ser. A | | 5.00 | | 12/1/2029 | | 2,000,000 | | 2,338,880 | |
Guam, Revenue Bonds, Refunding, Ser. A | | 5.00 | | 12/1/2028 | | 2,000,000 | | 2,351,520 | |
Puerto Rico Electric Power Authority, Revenue Bonds, Refunding, Ser. ZZ | | 5.25 | | 7/1/2018 | | 2,500,000 | f | 1,921,875 | |
| | 7,773,645 | |
Utah - .6% | | | | | |
Salt Lake City Airport, Revenue Bonds, Ser. A | | 5.00 | | 7/1/2031 | | 2,400,000 | | 2,948,616 | |
Salt Lake City Airport, Revenue Bonds, Ser. A | | 5.00 | | 7/1/2030 | | 2,000,000 | | 2,468,840 | |
Salt Lake City Airport, Revenue Bonds, Ser. A | | 5.00 | | 7/1/2029 | | 2,500,000 | | 3,103,350 | |
Utah Associated Municipal Power Systems, Revenue Bonds, Refunding (Payson Power Project) | | 5.00 | | 4/1/2022 | | 5,675,000 | | 6,114,131 | |
| | 14,634,937 | |
Vermont - .5% | | | | | |
Vermont Educational & Health Buildings Financing Agency, Revenue Bonds, Refunding (University of Vermont Medical Center) Ser. A | | 5.00 | | 12/1/2032 | | 10,000,000 | | 12,055,000 | |
Virginia - .4% | | | | | |
Virginia Small Business Financing Authority, Revenue Bonds (95 Express Lanes) | | 5.00 | | 7/1/2034 | | 9,500,000 | | 10,218,295 | |
Washington - 3.5% | | | | | |
Energy Northwest, Revenue Bonds, Refunding, Ser. A | | 5.00 | | 7/1/2029 | | 5,745,000 | | 7,319,819 | |
King County School District No. 411, GO, Refunding (Insured; School Board Guaranty) | | 4.50 | | 12/1/2027 | | 6,650,000 | | 7,334,684 | |
Port of Seattle, Revenue Bonds, Refunding, Ser. B | | 5.00 | | 3/1/2028 | | 1,750,000 | | 2,059,295 | |
Port of Seattle, Revenue Bonds, Ser. A | | 5.00 | | 4/1/2030 | | 2,840,000 | | 3,339,386 | |
Port of Seattle, Revenue Bonds, Ser. A | | 5.00 | | 4/1/2029 | | 1,000,000 | | 1,177,500 | |
Washington, GO, Refunding, Ser. B | | 5.00 | | 7/1/2032 | | 5,000,000 | | 6,068,750 | |
Washington, GO, Refunding, Ser. R-2015C | | 5.00 | | 7/1/2031 | | 5,400,000 | | 6,422,058 | |
Washington, GO, Ser. A1 | | 5.00 | | 8/1/2031 | | 5,165,000 | | 6,243,710 | |
Washington, GO, Ser. A1 | | 5.00 | | 8/1/2026 | | 10,000,000 | | 12,221,700 | |
Washington, Revenue Bonds, Ser. C | | 5.00 | | 9/1/2022 | | 5,000,000 | | 5,574,250 | |
Washington, Revenue Bonds, Ser. C | | 5.00 | | 9/1/2023 | | 5,000,000 | | 5,761,200 | |
Washington Health Care Facilities Authority, Revenue Bonds, Refunding (CommonSpirit Health) Ser. B2 | | 5.00 | | 8/1/2025 | | 3,000,000 | | 3,559,620 | |
Washington Health Care Facilities Authority, Revenue Bonds, Refunding (CommonSpirit Health) Ser. B3 | | 5.00 | | 8/1/2026 | | 3,000,000 | | 3,617,880 | |
Washington Health Care Facilities Authority, Revenue Bonds, Refunding (Providence Health & Services) Ser. B | | 5.00 | | 10/1/2021 | | 5,550,000 | | 5,975,907 | |
Washington Health Care Facilities Authority, Revenue Bonds, Refunding (Providence St. Joseph Health) | | 5.00 | | 10/1/2032 | | 2,500,000 | | 3,174,400 | |
Washington Health Care Facilities Authority, Revenue Bonds, Refunding (Virginia Manson Medical Center) | | 5.00 | | 8/15/2025 | | 1,700,000 | | 1,993,335 | |
Washington Health Care Facilities Authority, Revenue Bonds, Refunding (Virginia Manson Medical Center) | | 5.00 | | 8/15/2026 | | 2,000,000 | | 2,393,640 | |
Washington Health Care Facilities Authority, Revenue Bonds, Refunding (Virginia Manson Medical Center) | | 5.00 | | 8/15/2027 | | 2,175,000 | | 2,645,975 | |
Washington State University, Revenue Bonds, Refunding (Green Bond) | | 5.00 | | 10/1/2028 | | 1,000,000 | | 1,306,230 | |
38
| | | | | | | | | | |
| |
BNY Mellon National Intermediate Municipal Bond Fund (continued) |
Description | Coupon
Rate (%) | | Maturity
Date | | Principal
Amount ($) | | Value ($) | |
Long-Term Municipal Investments - 101.3% (continued) | | | | | |
Washington - 3.5% (continued) | | | | | |
Washington State University, Revenue Bonds, Refunding (Green Bond) | | 5.00 | | 10/1/2027 | | 1,000,000 | | 1,280,880 | |
| | 89,470,219 | |
Wisconsin - .4% | | | | | |
Wisconsin, Revenue Bonds, Refunding, Ser. A | | 5.00 | | 5/1/2029 | | 3,140,000 | | 3,986,073 | |
WPPI Energy, Revenue Bonds, Refunding, Ser. A | | 5.00 | | 7/1/2033 | | 2,000,000 | | 2,324,400 | |
WPPI Energy, Revenue Bonds, Refunding, Ser. A | | 5.00 | | 7/1/2029 | | 1,000,000 | | 1,170,760 | |
WPPI Energy, Revenue Bonds, Refunding, Ser. A | | 5.00 | | 7/1/2032 | | 500,000 | | 581,645 | |
WPPI Energy, Revenue Bonds, Refunding, Ser. A | | 5.00 | | 7/1/2030 | | 1,000,000 | | 1,168,020 | |
WPPI Energy, Revenue Bonds, Refunding, Ser. A | | 5.00 | | 7/1/2031 | | 1,000,000 | | 1,164,910 | |
| | 10,395,808 | |
Total Investments(cost $2,426,147,113) | | 101.3% | 2,582,662,231 | |
Liabilities, Less Cash and Receivables | | (1.3%) | (32,565,116) | |
Net Assets | | 100.0% | 2,550,097,115 | |
a The Variable Rate shall be determined by the Remarketing Agent in its sole discretion based on prevailing market conditions and may, but need not, be established by reference to one or more financial indices.
b Security purchased on a when-issued or delayed basis for which the fund has not taken delivery as of August 31, 2019.
c Security issued with a zero coupon. Income is recognized through the accretion of discount.
d These securities are prerefunded; the date shown represents the prerefunded date. Bonds which are prerefunded are collateralized by U.S. Government securities which are held in escrow and are used to pay principal and interest on the municipal issue and to retire the bonds in full at the earliest refunding date.
e Variable rate security—rate shown is the interest rate in effect at period end.
f Non-income producing—security in default.
g Security exempt from registration pursuant to Rule 144A under the Securities Act of 1933. These securities may be resold in transactions exempt from registration, normally to qualified institutional buyers. At August 31, 2019, these securities were valued at $21,060,921 or .83% of net assets.
| | |
Portfolio Summary (Unaudited)† | Value (%) |
General | 18.7 |
General Obligation | 17.8 |
Transportation | 12.6 |
Education | 9.6 |
Medical | 9.4 |
Water | 7.0 |
School District | 6.8 |
Airport | 5.0 |
Tobacco Settlement | 3.3 |
Development | 2.8 |
Prerefunded | 2.4 |
Single Family Housing | 2.0 |
Power | 1.8 |
Multifamily Housing | .6 |
Utilities | .5 |
Bond Bank | .4 |
Facilities | .2 |
Special Tax | .2 |
Nursing Homes | .2 |
| | 101.3 |
† Based on net assets.
See notes to financial statements.
39
STATEMENT OF INVESTMENTS (continued)
| | | | | | | | | | |
| |
BNY Mellon National Short-Term Municipal Bond Fund |
Description | Coupon
Rate (%) | | Maturity
Date | | Principal
Amount ($) | | Value ($) | |
Long-Term Municipal Investments - 98.9% | | | | | |
Alabama - 2.5% | | | | | |
Black Belt Energy Gas District, Revenue Bonds, Ser. A | | 4.00 | | 6/1/2021 | | 18,085,000 | | 18,910,399 | |
Black Belt Energy Gas District, Revenue Bonds, Ser. A | | 4.00 | | 7/1/2022 | | 9,125,000 | | 9,780,449 | |
| | 28,690,848 | |
Arizona - 2.9% | | | | | |
Arizona, COP, Refunding, Ser. A | | 5.00 | | 10/1/2022 | | 8,000,000 | | 8,946,400 | |
Arizona, CP, Refunding, Ser. A | | 5.00 | | 10/1/2021 | | 9,000,000 | | 9,723,420 | |
Chandler Industrial Development Authority, Revenue Bonds (Intel Corp.) | | 5.00 | | 6/3/2024 | | 7,000,000 | | 8,124,200 | |
Coconino County Pollution Control Corp., Revenue Bonds, Refunding, Ser. B | | 1.60 | | 5/21/2020 | | 1,100,000 | | 1,102,013 | |
Maricopa County Industrial Development Authority, Revenue Bonds, Refunding (Honorhealth) Ser. A | | 5.00 | | 9/1/2021 | | 725,000 | | 778,889 | |
Maricopa County Industrial Development Authority, Revenue Bonds, Refunding (Honorhealth) Ser. A | | 5.00 | | 9/1/2020 | | 750,000 | | 778,995 | |
The Yavapai County Industrial Development Authority, Revenue Bonds (Waste Management) Ser. A2 | | 2.20 | | 6/3/2024 | | 3,350,000 | | 3,455,659 | |
| | 32,909,576 | |
California - 2.8% | | | | | |
Bay Area Toll Authority, Revenue Bonds, Refunding, Ser. B | | 2.25 | | 4/1/2022 | | 7,500,000 | | 7,687,050 | |
California Infrastructure & Economic Development Bank, Revenue Bonds, Refunding, (The J Paul Getty Trust) Ser. A, 1 Month LIBOR x .7 +.33% | | 1.89 | | 4/1/2022 | | 5,000,000 | a | 4,996,700 | |
Port of Los Angeles, Revenue Bonds, Refunding, Ser. A | | 5.00 | | 8/1/2023 | | 5,000,000 | | 5,715,900 | |
Port of Los Angeles, Revenue Bonds, Refunding, Ser. A | | 5.00 | | 8/1/2022 | | 3,000,000 | | 3,324,390 | |
San Francisco City & County Airport Comm-San Francisco International Airport, Revenue Bonds, Refunding, Ser. H | | 5.00 | | 5/1/2023 | | 8,580,000 | | 9,718,394 | |
| | 31,442,434 | |
Colorado - 2.7% | | | | | |
Colorado Educational & Cultural Facilities Authority, Revenue Bonds, Refunding, Ser. B | | 5.00 | | 4/1/2020 | | 910,000 | | 928,318 | |
Colorado Health Facilities Authority, Revenue Bonds, Refunding, Ser. A | | 5.00 | | 2/1/2021 | | 4,555,000 | b | 4,795,276 | |
Colorado Health Facilities Authority, Revenue Bonds, Refunding, Ser. B3 | | 1.88 | | 11/6/2019 | | 5,000,000 | | 5,005,500 | |
Colorado Housing & Finance Authority, Revenue Bonds (Multi-Family Project) Ser. B2 | | 1.35 | | 2/1/2022 | | 5,000,000 | | 4,997,150 | |
Colorado Housing & Finance Authority, Revenue Bonds (S Range Crossings Project) | | 2.15 | | 1/1/2020 | | 3,000,000 | | 3,007,200 | |
E-470 Public Highway Authority, Revenue Bonds, Refunding, Ser. C | | 5.25 | | 9/1/2025 | | 3,000,000 | | 3,118,020 | |
Rio Blanco County School District No. Re-1, GO, Ser. B | | 5.00 | | 12/1/2022 | | 1,000,000 | | 1,121,840 | |
Rio Blanco County School District No. Re-1, GO, Ser. B | | 5.00 | | 12/1/2021 | | 2,000,000 | | 2,171,140 | |
Rio Blanco County School District No. Re-1, GO, Ser. B | | 5.00 | | 12/1/2020 | | 1,700,000 | | 1,780,869 | |
University of Colorado Hospital Authority, Revenue Bonds | | 4.00 | | 3/1/2020 | | 4,000,000 | | 4,004,640 | |
| | 30,929,953 | |
Connecticut - 3.0% | | | | | |
Connecticut, GO, Refunding, Ser. F | | 5.00 | | 9/15/2020 | | 1,200,000 | | 1,246,944 | |
Connecticut, GO, Ser. A | | 5.00 | | 4/15/2023 | | 3,075,000 | | 3,483,452 | |
Connecticut, Revenue Bonds, Ser. A | | 5.00 | | 1/1/2021 | | 5,000,000 | | 5,254,350 | |
Connecticut, Revenue Bonds, Ser. A | | 5.00 | | 1/1/2022 | | 5,000,000 | | 5,442,300 | |
Connecticut State Health & Educational Facilities Authority, Revenue Bonds, Refunding (Yale University) Ser. A2 | | 5.00 | | 7/1/2022 | | 11,960,000 | | 13,261,966 | |
Connecticut State Health & Educational Facilities Authority, Revenue Bonds, Refunding (Yale University) Ser. C2 | | 5.00 | | 2/1/2023 | | 5,000,000 | | 5,647,000 | |
| | 34,336,012 | |
40
| | | | | | | | | | |
| |
BNY Mellon National Short-Term Municipal Bond Fund (continued) |
Description | Coupon
Rate (%) | | Maturity
Date | | Principal
Amount ($) | | Value ($) | |
Long-Term Municipal Investments - 98.9% (continued) | | | | | |
District of Columbia - .4% | | | | | |
Metropolitan Washington Airports Authority, Revenue Bonds, Refunding (LOC; TD Bank NA) Ser. D2 | | 1.44 | | 10/1/2039 | | 4,000,000 | c | 4,000,000 | |
Florida - 4.9% | | | | | |
Citizens Property Insurance Corp., Revenue Bonds, Ser. A1 | | 5.00 | | 6/1/2021 | | 5,200,000 | | 5,546,944 | |
Citizens Property Insurance Corp., Revenue Bonds, Ser. A1 | | 5.00 | | 6/1/2020 | | 9,400,000 | | 9,669,216 | |
Florida, GO, Refunding, Ser. D | | 5.00 | | 6/1/2023 | | 1,031,000 | | 1,102,036 | |
Florida Development Finance Corp., Revenue Bonds (Virgin Trains USA) Ser. B | | 1.90 | | 3/17/2020 | | 7,500,000 | | 7,502,400 | |
Florida Lottery, Revenue Bonds, Refunding, Ser. A | | 5.00 | | 7/1/2021 | | 12,575,000 | | 13,456,130 | |
Hillsborough County School Board, COP, Refunding | | 5.00 | | 7/1/2021 | | 7,000,000 | | 7,498,400 | |
Orange County Health Facilities Authority, Revenue Bonds, Refunding (Orlando Health Obligated Group) | | 5.00 | | 10/1/2021 | | 3,890,000 | | 4,199,333 | |
Palm Beach County Airport System, Revenue Bonds, Refunding | | 5.00 | | 10/1/2022 | | 710,000 | | 788,292 | |
Palm Beach County Health Facilities Authority, Revenue Bonds, Refunding (ACTS Retirement-Life Communities) | | 4.00 | | 11/15/2020 | | 2,000,000 | | 2,065,300 | |
Palm Beach County School Board, COP, Refunding, Ser. A | | 5.00 | | 8/1/2022 | | 1,875,000 | | 2,083,875 | |
Palm Beach County School Board, COP, Refunding, Ser. A | | 5.00 | | 8/1/2021 | | 1,525,000 | | 1,638,506 | |
| | 55,550,432 | |
Georgia - 2.8% | | | | | |
Bartow County Development Authority, Revenue Bonds, Refunding (Gerorgia Power) | | 1.55 | | 8/19/2022 | | 2,000,000 | | 1,995,540 | |
Burke County Development Authority, Revenue Bonds (Georgia Power Company Plant Vogtle Project) | | 2.35 | | 12/11/2020 | | 5,000,000 | | 5,060,750 | |
Burke County Development Authority, Revenue Bonds (Georgia Power Company Plant Vogtle Project) | | 2.25 | | 5/25/2023 | | 8,000,000 | | 8,169,520 | |
Burke County Development Authority, Revenue Bonds (Georgia Power Company Plant Vogtle Project) | | 2.25 | | 5/25/2023 | | 5,000,000 | | 5,105,950 | |
DeKalb County School District, GO | | 4.00 | | 10/1/2021 | | 4,045,000 | | 4,292,514 | |
Main Street Natural Gas, Revenue Bonds, Ser. A | | 5.00 | | 5/15/2021 | | 700,000 | | 741,034 | |
Main Street Natural Gas, Revenue Bonds, Ser. A | | 5.00 | | 5/15/2022 | | 1,000,000 | | 1,091,440 | |
Main Street Natural Gas, Revenue Bonds, Ser. A | | 5.00 | | 5/15/2020 | | 500,000 | | 512,470 | |
Main Street Natural Gas, Revenue Bonds, Ser. A | | 4.00 | | 9/1/2023 | | 5,000,000 | | 5,481,050 | |
| | 32,450,268 | |
Hawaii - 1.0% | | | | | |
Honolulu City & County, GO (Honolulu Rail Transit Project) Ser. E | | 5.00 | | 9/1/2023 | | 5,000,000 | | 5,696,850 | |
Honolulu City & County, GO (Honolulu Rail Transit Project) Ser. E | | 5.00 | | 9/1/2023 | | 5,000,000 | | 5,696,850 | |
| | 11,393,700 | |
Illinois - 6.4% | | | | | |
Chicago, Revenue Bonds, Refunding | | 5.00 | | 11/1/2019 | | 3,250,000 | | 3,268,557 | |
Chicago, Revenue Bonds, Refunding, Ser. 2017-2 | | 5.00 | | 11/1/2019 | | 2,500,000 | | 2,514,275 | |
Chicago Board of Education, GO, Refunding (Insured; National Public Finance Guarantee Corp.) Ser. A | | 5.00 | | 12/1/2019 | | 2,020,000 | | 2,035,736 | |
Chicago Board of Education, GO, Refunding (Insured; National Public Finance Guarantee Corp.) Ser. A | | 5.25 | | 12/1/2020 | | 1,175,000 | | 1,225,408 | |
Chicago Board of Education, GO, Refunding (Insured; National Public Finance Guarantee Corp.) Ser. A | | 5.25 | | 12/1/2020 | | 1,275,000 | | 1,329,698 | |
Cook County, GO, Refunding | | 5.00 | | 11/15/2020 | | 890,000 | | 928,421 | |
Greater Chicago Metropolitan Water Reclamation District, GO (Green Bond) Ser. C | | 5.00 | | 12/1/2020 | | 5,000,000 | | 5,234,000 | |
Illinois, GO | | 5.00 | | 4/1/2020 | | 1,865,000 | | 1,900,043 | |
Illinois, GO, Refunding, Ser. A | | 5.00 | | 10/1/2020 | | 3,000,000 | | 3,103,020 | |
Illinois, GO, Ser. A | | 5.00 | | 4/1/2020 | | 4,515,000 | | 4,599,837 | |
Illinois, GO, Ser. D | | 5.00 | | 11/1/2021 | | 5,000,000 | | 5,307,250 | |
Illinois, GO, Ser. D | | 5.00 | | 11/1/2020 | | 17,000,000 | | 17,598,570 | |
Illinois, Revenue Bonds, Refunding (Insured; National Public Finance Guarantee Corp.) | | 5.75 | | 6/15/2020 | | 1,615,000 | | 1,666,228 | |
41
STATEMENT OF INVESTMENTS (continued)
| | | | | | | | | | |
| |
BNY Mellon National Short-Term Municipal Bond Fund (continued) |
Description | Coupon
Rate (%) | | Maturity
Date | | Principal
Amount ($) | | Value ($) | |
Long-Term Municipal Investments - 98.9% (continued) | | | | | |
Illinois - 6.4% (continued) | | | | | |
Illinois Finance Authority, Revenue Bonds (Northwestern Memorial Healthcare) Ser. B | | 5.00 | | 12/15/2022 | | 10,680,000 | | 11,963,522 | |
Illinois Housing Development Authority, Revenue Bonds (Century Woods) (Insured; Government National Mortgage Association Collateral) | | 1.90 | | 10/1/2021 | | 5,000,000 | | 5,055,850 | |
Railsplitter Tobacco Settlement Authority, Revenue Bonds | | 5.00 | | 6/1/2022 | | 5,000,000 | | 5,484,350 | |
| | 73,214,765 | |
Indiana - 1.2% | | | | | |
Center Grove Multi-Facility School Building Corp., BAN | | 2.50 | | 12/15/2020 | | 2,200,000 | | 2,214,124 | |
Hammond Multi-School Building Corp., Revenue Bonds, Refunding | | 4.00 | | 1/15/2021 | | 660,000 | | 683,278 | |
Indiana Finance Authority, Revenue Bonds, Refunding (Indiana University Health Inc.) Ser. C | | 5.00 | | 12/1/2022 | | 3,500,000 | | 3,935,995 | |
Whiting, Revenue Bonds (BP Products North America) | | 5.00 | | 11/1/2022 | | 6,000,000 | | 6,671,220 | |
| | 13,504,617 | |
Kansas - .5% | | | | | |
Johnson County Unified School District No. 512, GO, Refunding, Ser. A | | 2.25 | | 10/1/2023 | | 4,790,000 | | 4,851,695 | |
Lenexa, GO, Ser. B | | 1.63 | | 9/1/2021 | | 1,000,000 | | 1,000,820 | |
| | 5,852,515 | |
Kentucky - 3.5% | | | | | |
Carroll County, Revenue Bonds, Refunding | | 1.20 | | 6/1/2021 | | 6,000,000 | | 5,994,840 | |
Kentucky Property & Building Commission, Revenue Bonds, Refunding (Project Number 112) Ser. B | | 5.00 | | 11/1/2020 | | 10,000,000 | | 10,436,800 | |
Louisville & Jefferson County Metropolitan Government, Revenue Bonds, Refunding (Louisville Gas & Electric) | | 1.85 | | 4/1/2021 | | 13,500,000 | | 13,632,165 | |
Louisville & Jefferson County Metropolitan Government, Revenue Bonds, Refunding (Louisville Gas & Electric) | | 2.55 | | 5/3/2021 | | 1,500,000 | | 1,532,745 | |
Louisville & Jefferson County Metropolitan Sewer District, Revenue Bonds, Refunding | | 5.00 | | 5/15/2022 | | 7,470,000 | | 8,251,287 | |
| | 39,847,837 | |
Louisiana - .3% | | | | | |
East Baton Rouge Parish Industrial Development Board, Revenue Bonds (Exxon Mobil Project) Ser. A | | 1.43 | | 8/1/2035 | | 2,000,000 | d | 2,000,000 | |
East Baton Rouge Parish Industrial Development Board, Revenue Bonds (Exxon Mobil Project) Ser. B | | 1.43 | | 12/1/2040 | | 1,500,000 | d | 1,500,000 | |
| | 3,500,000 | |
Maryland - 1.5% | | | | | |
Cecil County, GO, Refunding | | 5.00 | | 8/1/2022 | | 2,185,000 | | 2,431,730 | |
Maryland, GO, Refunding, Ser. B | | 5.00 | | 8/1/2022 | | 10,000,000 | | 11,129,200 | |
Washington Suburban Sanitary Commission, GO | | 5.00 | | 6/1/2021 | | 3,605,000 | | 3,850,717 | |
| | 17,411,647 | |
Massachusetts - 2.5% | | | | | |
Massachusetts Development Finance Agency, Revenue Bonds, Refunding (Partners Healthcare System) | | 5.00 | | 7/1/2021 | | 3,010,000 | | 3,222,054 | |
Massachusetts Development Finance Agency, Revenue Bonds, Refunding (Partners Healthcare System) Ser. S5,1 Month MUNIPSA +.42% | | 1.77 | | 1/27/2022 | | 5,500,000 | a | 5,500,660 | |
Massachusetts Development Finance Agency, Revenue Bonds, Refunding (Suffolk University) | | 5.00 | | 7/1/2022 | | 550,000 | | 606,150 | |
Massachusetts Development Finance Agency, Revenue Bonds, Refunding (Suffolk University) | | 5.00 | | 7/1/2021 | | 575,000 | | 613,565 | |
Massachusetts Educational Financing Authority, Revenue Bonds, Refunding (Issue J) | | 5.00 | | 7/1/2022 | | 3,000,000 | | 3,308,010 | |
Massachusetts Educational Financing Authority, Revenue Bonds, Refunding (Issue K) Ser. A | | 4.00 | | 7/1/2021 | | 1,000,000 | | 1,048,720 | |
Massachusetts Educational Financing Authority, Revenue Bonds, Refunding (Issue K) Ser. A | | 4.00 | | 7/1/2020 | | 375,000 | | 383,340 | |
42
| | | | | | | | | | |
| |
BNY Mellon National Short-Term Municipal Bond Fund (continued) |
Description | Coupon
Rate (%) | | Maturity
Date | | Principal
Amount ($) | | Value ($) | |
Long-Term Municipal Investments - 98.9% (continued) | | | | | |
Massachusetts - 2.5% (continued) | | | | | |
Massachusetts Educational Financing Authority, Revenue Bonds, Refunding (Issue L) Ser. B | | 5.00 | | 7/1/2022 | | 2,000,000 | | 2,205,340 | |
Massachusetts Educational Financing Authority, Revenue Bonds, Refunding (Issue L) Ser. B | | 5.00 | | 7/1/2021 | | 1,150,000 | | 1,226,694 | |
Massachusetts Health & Educational Facilities Authority, Revenue Bonds (University of Massachusetts) Ser. A | | 1.85 | | 4/1/2022 | | 5,000,000 | | 5,099,850 | |
Massachusetts Transportation Trust Fund Metropolitan Highway, Revenue Bonds, Refunding, Ser. A | | 5.00 | | 1/1/2023 | | 5,000,000 | | 5,610,600 | |
| | 28,824,983 | |
Michigan - 1.4% | | | | | |
Detroit Downtown Development Authority, Tax Allocation Bonds, Refunding (Catalyst Development Project) Ser. A | | 5.00 | | 7/1/2021 | | 500,000 | | 531,565 | |
Detroit Downtown Development Authority, Tax Allocation Bonds, Refunding, Ser. A | | 5.00 | | 7/1/2021 | | 1,000,000 | | 1,063,130 | |
Michigan Finance Authority, Revenue Bonds, Refunding, Ser. B | | 5.00 | | 7/1/2020 | | 12,325,000 | | 12,548,329 | |
Michigan State Housing Development Authority, Revenue Bonds, Ser. A1 | | 1.50 | | 10/1/2022 | | 1,000,000 | | 1,001,630 | |
Michigan Strategic Fund, Revenue Bonds, Refunding, Ser. CC | | 1.45 | | 9/1/2021 | | 1,000,000 | | 998,990 | |
| | 16,143,644 | |
Minnesota - 1.3% | | | | | |
Minneapolis-St. Paul Metropolitan Airports Commission, Revenue Bonds, Refunding, Ser. B | | 5.00 | | 1/1/2023 | | 6,340,000 | | 7,082,921 | |
Minneapolis-St. Paul Metropolitan Airports Commission, Revenue Bonds, Refunding, Ser. B | | 5.00 | | 1/1/2022 | | 4,675,000 | | 5,062,417 | |
Rochester Independent School District No. 535, COP, Ser. B | | 5.00 | | 2/1/2022 | | 1,560,000 | | 1,705,205 | |
Russell Tyler Ruthton Independent School District No. 2902, GO, Ser. A | | 5.00 | | 2/1/2024 | | 1,210,000 | | 1,412,929 | |
| | 15,263,472 | |
Mississippi - .7% | | | | | |
Mississippi, GO, Refunding, Ser. B, 1 Month LIBOR x .67 +.33% | | 1.82 | | 9/1/2020 | | 5,490,000 | a | 5,492,800 | |
Mississippi Business Finance Corp., Revenue Bonds (Chevron U.S.A. Inc. Project) Ser. F | | 1.35 | | 12/1/2030 | | 2,295,000 | d | 2,295,000 | |
| | 7,787,800 | |
Missouri - .6% | | | | | |
Missouri Development Finance Board, Revenue Bonds, Refunding, Ser. A | | 3.00 | | 12/1/2022 | | 3,540,000 | | 3,740,930 | |
Missouri Health & Educational Facilities Authority, Revenue Bonds (Liquidity Facility; U.S. Bank NA) Ser. C | | 1.35 | | 3/1/2040 | | 2,900,000 | d | 2,900,000 | |
| | 6,640,930 | |
Montana - .2% | | | | | |
Montana Board of Investments, Revenue Bonds, Refunding | | 1.87 | | 3/1/2028 | | 2,000,000 | d | 2,004,980 | |
Nebraska - .2% | | | | | |
Central Plains Energy Project, Revenue Bonds, Refunding (Liquidity Facility; Royal Bank of Canada) | | 5.00 | | 12/1/2019 | | 1,975,000 | | 1,991,985 | |
Nevada - 2.6% | | | | | |
Clark County, Revenue Bonds, Refunding (Nevada Power) | | 1.60 | | 5/21/2020 | | 3,000,000 | | 3,005,490 | |
Clark County Department of Aviation, Revenue Bonds, Refunding, Ser. A1 | | 5.00 | | 7/1/2020 | | 3,010,000 | | 3,104,574 | |
Clark County School District, GO, Refunding, Ser. A | | 5.00 | | 6/15/2022 | | 8,220,000 | | 9,081,867 | |
Clark County School District, GO, Refunding, Ser. D | | 5.00 | | 6/15/2021 | | 3,000,000 | | 3,205,140 | |
Las Vegas Valley Water District, GO, Refunding, Ser. C | | 5.00 | | 6/1/2022 | | 4,000,000 | | 4,272,720 | |
Washoe County, Revenue Bonds, Refunding (Sierra Pacific Power) | | 2.05 | | 4/15/2022 | | 7,500,000 | | 7,606,200 | |
| | 30,275,991 | |
New Hampshire - .5% | | | | | |
New Hampshire Business Finance Authority, Revenue Bonds, Refunding (Waste Management) Ser. A3 | | 2.15 | | 7/1/2024 | | 4,000,000 | | 4,105,280 | |
43
STATEMENT OF INVESTMENTS (continued)
| | | | | | | | | | |
| |
BNY Mellon National Short-Term Municipal Bond Fund (continued) |
Description | Coupon
Rate (%) | | Maturity
Date | | Principal
Amount ($) | | Value ($) | |
Long-Term Municipal Investments - 98.9% (continued) | | | | | |
New Hampshire - .5% (continued) | | | | | |
New Hampshire Business Finance Authority, Revenue Bonds, Refunding (Waste Management) Ser. A4 | | 2.15 | | 7/1/2024 | | 2,000,000 | | 2,052,520 | |
| | 6,157,800 | |
New Jersey - 4.4% | | | | | |
New Jersey Economic Development Authority, Revenue Bonds, Refunding | | 5.00 | | 6/15/2023 | | 1,500,000 | | 1,633,800 | |
New Jersey Economic Development Authority, Revenue Bonds, Refunding | | 5.00 | | 6/15/2020 | | 4,500,000 | | 4,623,435 | |
New Jersey Economic Development Authority, Revenue Bonds, Refunding | | 5.00 | | 6/15/2021 | | 1,000,000 | | 1,060,530 | |
New Jersey Economic Development Authority, Revenue Bonds, Refunding (Insured; American Municipal Bond Assurance Corp.) Ser. K | | 5.50 | | 12/15/2019 | | 750,000 | | 758,948 | |
New Jersey Housing & Mortgage Finance Agency, Revenue Bonds, Refunding, Ser. 2 | | 2.45 | | 11/1/2019 | | 2,350,000 | | 2,353,290 | |
New Jersey Tobacco Settlement Financing Corp., Revenue Bonds, Refunding, Ser. A | | 5.00 | | 6/1/2020 | | 4,000,000 | | 4,104,600 | |
New Jersey Tobacco Settlement Financing Corp., Revenue Bonds, Refunding, Ser. A | | 5.00 | | 6/1/2021 | | 5,000,000 | | 5,302,000 | |
New Jersey Transportation Trust Fund Authority, Revenue Bonds, Refunding (Insured; American Municipal Bond Assurance Corp.) Ser. B | | 5.25 | | 12/15/2022 | | 5,000,000 | | 5,601,500 | |
New Jersey Transportation Trust Fund Authority, Revenue Bonds, Refunding, Ser. A | | 5.00 | | 6/15/2021 | | 3,400,000 | | 3,615,050 | |
New Jersey Transportation Trust Fund Authority, Revenue Bonds, Refunding, Ser. A | | 5.00 | | 6/15/2022 | | 10,000,000 | | 10,962,000 | |
New Jersey Transportation Trust Fund Authority, Revenue Bonds, Refunding, Ser. A | | 5.25 | | 12/15/2021 | | 10,000,000 | | 10,860,200 | |
| | 50,875,353 | |
New Mexico - 2.1% | | | | | |
New Mexico, GO, Refunding, Ser. B | | 5.00 | | 3/1/2022 | | 14,365,000 | | 15,755,101 | |
New Mexico Finance Authority, Revenue Bonds, Ser. C | | 5.00 | | 6/1/2022 | | 4,200,000 | | 4,487,112 | |
New Mexico Municipal Energy Acquisition Authority, Revenue Bonds, Refunding, Ser. A | | 4.00 | | 11/1/2021 | | 1,210,000 | | 1,282,419 | |
New Mexico Municipal Energy Acquisition Authority, Revenue Bonds, Refunding, Ser. A | | 4.00 | | 5/1/2022 | | 1,000,000 | | 1,072,330 | |
New Mexico Municipal Energy Acquisition Authority, Revenue Bonds, Refunding, Ser. A | | 4.00 | | 5/1/2021 | | 1,200,000 | | 1,255,440 | |
| | 23,852,402 | |
New York - 9.8% | | | | | |
Metropolitan Transportation Authority, BAN, Ser. A | | 5.00 | | 3/1/2022 | | 10,000,000 | | 10,952,200 | |
Metropolitan Transportation Authority, BAN, Ser. B1 | | 5.00 | | 5/15/2022 | | 10,000,000 | | 10,986,900 | |
Metropolitan Transportation Authority, BAN, Ser. C1 | | 5.00 | | 9/1/2020 | | 10,000,000 | | 10,368,400 | |
Metropolitan Transportation Authority, Revenue Bonds, Refunding, Ser. F | | 5.00 | | 11/15/2024 | | 11,175,000 | | 12,508,736 | |
New York City, GO, Refunding, Ser. C | | 5.00 | | 8/1/2022 | | 3,840,000 | | 3,851,174 | |
New York City, GO, Ser. D3 | | 5.00 | | 2/1/2024 | | 5,000,000 | | 5,730,800 | |
New York City Housing Development Corp., Revenue Bonds, Ser. B2 | | 5.00 | | 7/1/2023 | | 4,100,000 | | 4,654,156 | |
New York City Housing Development Corp., Revenue Bonds, Ser. C2 | | 1.70 | | 7/1/2021 | | 10,000,000 | | 10,012,700 | |
New York City Industrial Development Agency, Revenue Bonds (Yankee Stadium Project) (Insured; National Public Finance Guarantee Corp.) | | 2.50 | | 3/1/2023 | | 2,000,000 | e | 2,072,280 | |
New York City Transitional Finance Authority, Revenue Bonds (Build America Bonds) | | 4.44 | | 8/1/2021 | | 8,870,000 | | 9,324,144 | |
New York City Transitional Finance Authority, Revenue Bonds (SPA; JPMorgan Chase Bank NA) | | 1.39 | | 8/1/2045 | | 4,000,000 | d | 4,000,000 | |
44
| | | | | | | | | | |
| |
BNY Mellon National Short-Term Municipal Bond Fund (continued) |
Description | Coupon
Rate (%) | | Maturity
Date | | Principal
Amount ($) | | Value ($) | |
Long-Term Municipal Investments - 98.9% (continued) | | | | | |
New York - 9.8% (continued) | | | | | |
New York City Transitional Finance Authority, Revenue Bonds, Ser. B4 | | 1.39 | | 8/1/2042 | | 1,100,000 | d | 1,100,000 | |
New York City Water & Sewer System, Revenue Bonds, Refunding (SPA; Landesbank HessenThuringen Girozentrale) Ser. BB1 | | 1.37 | | 6/15/2039 | | 100,000 | c | 100,000 | |
New York Housing Finance Authority, Revenue Bonds (Insured; SONYMA/GNMA/FNMA/FHLMC) Ser. K | | 1.50 | | 5/1/2021 | | 5,000,000 | | 5,017,350 | |
New York State Housing Finance Agency, Revenue Bonds (Green Bond) Ser. I | | 2.55 | | 11/1/2022 | | 2,000,000 | | 2,025,180 | |
New York State Housing Finance Agency, Revenue Bonds (Green Bond) Ser. I | | 2.65 | | 5/1/2023 | | 2,000,000 | | 2,039,100 | |
New York State Housing Finance Agency, Revenue Bonds, Refunding (Insured; State of New York Mortgage Agency) Ser. F | | 1.80 | | 5/1/2020 | | 2,915,000 | | 2,915,641 | |
New York State Housing Finance Agency, Revenue Bonds, Ser. J | | 2.50 | | 5/1/2022 | | 1,500,000 | | 1,513,605 | |
Triborough Bridge & Tunnel Authority, Revenue Bonds, Ser. B, 1 Month SOFRRATE x .67 +.43% | | 1.85 | | 9/26/2019 | | 2,650,000 | a | 2,650,477 | |
Triborough Bridge & Tunnel Authority, Revenue Bonds, Ser. D, 1 Month SOFRRATE x .67 +.50% | | 1.92 | | 10/1/2020 | | 5,000,000 | a | 5,015,300 | |
TSASC, Revenue Bonds, Refunding, Ser. A | | 5.00 | | 6/1/2022 | | 2,790,000 | | 3,064,731 | |
TSASC, Revenue Bonds, Refunding, Ser. A | | 5.00 | | 6/1/2020 | | 2,500,000 | | 2,569,325 | |
| | 112,472,199 | |
North Carolina - .1% | | | | | |
North Carolina Eastern Municipal Power Agency, Revenue Bonds, Refunding (Insured; National Public Finance Guarantee Corp.) (Escrowed to Maturity) Ser. B | | 6.00 | | 1/1/2022 | | 1,250,000 | | 1,391,425 | |
Ohio - 2.1% | | | | | |
Allen County Hospital Facilities, Revenue Bonds (Mercy Health Project) Ser. B | | 5.00 | | 5/5/2022 | | 3,000,000 | | 3,292,260 | |
American Municipal Power, Revenue Bonds (AMP Fremont Energy Center Project) Ser. B | | 5.25 | | 2/15/2022 | | 5,040,000 | b | 5,542,337 | |
American Municipal Power, Revenue Bonds (Combined Hydroelectric Project) Ser. A | | 2.25 | | 8/15/2021 | | 2,500,000 | | 2,531,050 | |
Miami University, Revenue Bonds, Refunding | | 5.00 | | 9/1/2022 | | 1,590,000 | | 1,710,474 | |
Ohio, Revenue Bonds, Refunding (University Hospitals Health System) (LOC; PNC Bank NA) Ser. A | | 1.43 | | 1/15/2046 | | 1,100,000 | c | 1,100,000 | |
Ohio, Revenue Bonds, Ser. A | | 5.00 | | 4/1/2021 | | 1,035,000 | | 1,099,191 | |
Ohio Housing Finance Agency, Revenue Bonds (Neilan Park Apartments) | | 1.75 | | 6/1/2021 | | 3,150,000 | | 3,173,972 | |
Ohio Housing Finance Agency, Revenue Bonds (RAD East Project) | | 2.45 | | 5/1/2021 | | 5,020,000 | | 5,115,531 | |
| | 23,564,815 | |
Oregon - .4% | | | | | |
Gilliam County, Revenue Bonds (Waste Management) Ser. A | | 2.40 | | 5/2/2022 | | 2,375,000 | | 2,439,909 | |
Gilliam County, Revenue Bonds (Waste Management) Ser. A | | 2.40 | | 5/2/2022 | | 2,500,000 | | 2,567,975 | |
| | 5,007,884 | |
Pennsylvania - 7.2% | | | | | |
Allegheny County Hospital Development Authority, Revenue Bonds, Refunding (University of Pittsburgh Medical Center) Ser. A | | 5.00 | | 7/15/2022 | | 1,500,000 | | 1,664,145 | |
Allegheny County Hospital Development Authority, Revenue Bonds, Refunding (University of Pittsburgh Medical Center) Ser. A | | 5.00 | | 7/15/2023 | | 2,200,000 | | 2,518,164 | |
Allegheny County Hospital Development Authority, Revenue Bonds, Refunding (University of Pittsburgh Medical Center) Ser. A | | 5.00 | | 7/15/2020 | | 2,850,000 | | 2,945,276 | |
Allegheny County Hospital Development Authority, Revenue Bonds, Refunding (University of Pittsburgh Medical Center) Ser. A | | 5.00 | | 7/15/2021 | | 2,500,000 | | 2,676,000 | |
45
STATEMENT OF INVESTMENTS (continued)
| | | | | | | | | | |
| |
BNY Mellon National Short-Term Municipal Bond Fund (continued) |
Description | Coupon
Rate (%) | | Maturity
Date | | Principal
Amount ($) | | Value ($) | |
Long-Term Municipal Investments - 98.9% (continued) | | | | | |
Pennsylvania - 7.2% (continued) | | | | | |
Commonwealth Financing Authority, Revenue Bonds | | 5.00 | | 6/1/2022 | | 3,000,000 | | 3,288,060 | |
Delaware River Port Authority, Revenue Bonds, Refunding, Ser. B | | 5.00 | | 1/1/2021 | | 4,000,000 | | 4,206,760 | |
Montgomery County Higher Education & Health Authority, Revenue Bonds, Refunding (AICUP Financing Program Gwynedd Mercy University Project) | | 4.00 | | 5/1/2022 | | 1,000,000 | | 1,056,130 | |
Montgomery County Higher Education & Health Authority, Revenue Bonds, Refunding (Gwynedd Mercy University Project) | | 3.00 | | 5/1/2021 | | 1,100,000 | | 1,117,655 | |
Montgomery County Higher Education & Health Authority, Revenue Bonds, Refunding (Thomas Jefferson University Project) | | 5.00 | | 9/1/2023 | | 500,000 | | 572,535 | |
Montgomery County Higher Education & Health Authority, Revenue Bonds, Refunding (Thomas Jefferson University Project) | | 5.00 | | 9/1/2022 | | 600,000 | | 667,596 | |
Pennsylvania, GO | | 5.00 | | 4/1/2023 | | 12,040,000 | b | 13,718,015 | |
Pennsylvania, GO, Refunding | | 5.00 | | 1/15/2021 | | 5,000,000 | | 5,266,000 | |
Pennsylvania, GO, Refunding | | 5.00 | | 8/15/2022 | | 9,000,000 | | 10,007,460 | |
Pennsylvania Economic Development Financing Authority, Revenue Bonds | | 5.00 | | 12/31/2019 | | 2,000,000 | | 2,020,980 | |
Pennsylvania Economic Development Financing Authority, Revenue Bonds | | 5.00 | | 6/30/2020 | | 2,640,000 | | 2,708,138 | |
Pennsylvania Economic Development Financing Authority, Revenue Bonds (Waste Management Inc. Project) | | 1.75 | | 8/1/2024 | | 5,000,000 | | 5,032,750 | |
Pennsylvania Economic Development Financing Authority, Revenue Bonds (Waste Management Inc. Project) | | 2.15 | | 7/1/2024 | | 4,500,000 | | 4,614,480 | |
Pennsylvania Economic Development Financing Authority, Revenue Bonds (Waste Management Inc. Project) Ser. A | | 1.70 | | 8/3/2020 | | 3,000,000 | | 3,005,970 | |
Pennsylvania Higher Educational Facilities Authority, Revenue Bonds (Shippensburg University of Pennsylvania) | | 6.00 | | 10/1/2021 | | 2,000,000 | b | 2,202,220 | |
Pennsylvania Higher Educational Facilities Authority, Revenue Bonds (Shippensburg University Student Sevices) | | 5.00 | | 10/1/2022 | | 1,000,000 | b | 1,118,560 | |
Pittsburgh Water & Sewer Authority, Revenue Bonds, Refunding (Insured; Assured Guaranty Municipal Corp.) Ser. C, 1 Month LIBOR x .7 +.64% | | 2.20 | | 12/1/2020 | | 2,500,000 | a | 2,500,950 | |
The Philadelphia School District, GO, Refunding, Ser. C | | 5.00 | | 9/1/2021 | | 1,500,000 | | 1,555,995 | |
The Philadelphia School District, GO, Refunding, Ser. D | | 5.00 | | 9/1/2020 | | 6,000,000 | | 6,220,440 | |
The Philadelphia School District, GO, Ser. A | | 5.00 | | 9/1/2019 | | 700,000 | | 700,000 | |
The Philadelphia School District, GO, Ser. A | | 5.00 | | 9/1/2020 | | 500,000 | | 518,370 | |
| | 81,902,649 | |
Rhode Island - .1% | | | | | |
Rhode Island Health & Educational Building Corp., Revenue Bonds, Refunding (Lifespan Obligated Group) | | 5.00 | | 5/15/2020 | | 1,500,000 | | 1,536,135 | |
Tennessee - .7% | | | | | |
Greeneville Health & Educational Facilities Board, Revenue Bonds, Refunding (Ballad Health Obligated Group) | | 5.00 | | 7/1/2020 | | 2,000,000 | | 2,061,160 | |
Knox County Health Educational & Housing Facility Board, Revenue Bonds (Clear Springs Apartments Project) | | 1.80 | | 5/1/2021 | | 1,000,000 | | 1,007,880 | |
Metropolitan Government of Nashville & Davidson County Health & Educational Facilities, Revenue Bonds (Ascension Health Credit Group) | | 1.55 | | 11/3/2020 | | 5,000,000 | | 5,020,150 | |
| | 8,089,190 | |
Texas - 19.5% | | | | | |
Alamo Heights Independent School District, GO (Insured; Permanent School Fund Guarantee Program) Ser. B | | 3.00 | | 2/1/2021 | | 1,500,000 | | 1,536,945 | |
Alvin Independent School District, GO, Refunding (Insured; Permanent School Fund Guarantee Program) | | 5.00 | | 2/15/2025 | | 1,000,000 | | 1,055,610 | |
Austin Airport System, Revenue Bonds, Refunding | | 5.00 | | 11/15/2022 | | 2,000,000 | | 2,231,720 | |
Austin Airport System, Revenue Bonds, Refunding | | 5.00 | | 11/15/2023 | | 3,000,000 | | 3,452,940 | |
46
| | | | | | | | | | |
| |
BNY Mellon National Short-Term Municipal Bond Fund (continued) |
Description | Coupon
Rate (%) | | Maturity
Date | | Principal
Amount ($) | | Value ($) | |
Long-Term Municipal Investments - 98.9% (continued) | | | | | |
Texas - 19.5% (continued) | | | | | |
Austin Airport System, Revenue Bonds, Refunding | | 5.00 | | 11/15/2020 | | 2,500,000 | | 2,614,075 | |
Austin Airport System, Revenue Bonds, Refunding | | 5.00 | | 11/15/2021 | | 2,500,000 | | 2,702,350 | |
Austin Airport System, Revenue Bonds, Refunding, Ser. B | | 5.00 | | 11/15/2024 | | 600,000 | | 710,400 | |
Austin Airport System, Revenue Bonds, Refunding, Ser. B | | 5.00 | | 11/15/2022 | | 1,200,000 | | 1,339,032 | |
Bexar County , GO, Ser. B | | 5.00 | | 6/15/2023 | | 1,000,000 | b | 1,145,210 | |
Brownsville Independent School District, GO, Refunding (Insured; Permanent School Fund Guarantee Program) Ser. A | | 5.00 | | 2/15/2022 | | 2,875,000 | | 3,148,326 | |
Central Texas Regional Mobility Authority, BAN | | 4.00 | | 1/1/2022 | | 4,000,000 | | 4,176,800 | |
Corpus Christi, GO | | 5.00 | | 3/1/2027 | | 2,365,000 | | 2,497,984 | |
Cypress-Fairbanks Independent School District, GO (Insured; Permanent School Fund Guarantee Program) Ser. A3 | | 3.00 | | 8/17/2020 | | 12,000,000 | | 12,197,040 | |
Dallas Independent School District, GO (Insured; Permanent School Fund Guarantee Program) Ser. B5 | | 5.00 | | 2/15/2021 | | 3,000,000 | | 3,163,500 | |
Fort Bend Independent School District, GO, Refunding (Insured; Permanent School Fund Guarantee Program) Ser. A | | 1.95 | | 8/1/2022 | | 1,000,000 | | 1,017,990 | |
Garland, GO, Refunding | | 5.00 | | 2/15/2022 | | 1,750,000 | | 1,915,918 | |
Georgetown Independent School District, GO (Insured; Permanent School Fund Guarantee Program) | | 2.75 | | 8/1/2022 | | 5,000,000 | | 5,205,150 | |
Harris County-Houston Sports Authority, Revenue Bonds, Refunding (Insured; Assured Guaranty Municipal Corp.) Ser. A | | 5.00 | | 11/15/2022 | | 6,500,000 | | 7,261,800 | |
Houston Combined Utility System, Revenue Bonds, Refunding, Ser. C, 1 Month LIBOR x .7 +.36% | | 1.84 | | 8/1/2021 | | 5,000,000 | a | 4,999,450 | |
Houston Independent School District, GO (Insured; Permanent School Fund Guarantee Program) Ser. A1B | | 2.20 | | 6/1/2020 | | 6,270,000 | | 6,317,025 | |
Houston Independent School District, GO (Insured; Permanent School Fund Guarantee Program) Ser. A2 | | 2.25 | | 6/1/2022 | | 3,500,000 | | 3,587,675 | |
Lamar Consolidated Independent School District, GO (Insured; Permanent School Fund Guarantee Program) Ser. A | | 1.95 | | 8/17/2020 | | 3,750,000 | | 3,779,400 | |
Lewisville Independent School District, GO, Refunding (Insured; Permanent School Fund Guarantee Program) Ser. A | | 5.00 | | 8/15/2021 | | 12,700,000 | | 13,666,851 | |
Mansfield Independent School District, GO (Insured; Permanent School Fund Guarantee Program) | | 2.50 | | 8/1/2021 | | 3,500,000 | | 3,578,225 | |
Matagorda County Navigation Distric No. 1, Revenue Bonds, Refunding | | 1.75 | | 9/1/2020 | | 5,000,000 | | 4,993,650 | |
New Caney Independent School District, GO (Insured; Permanent School Fund Guarantee Program) | | 3.00 | | 8/15/2021 | | 6,000,000 | | 6,195,180 | |
North Texas Tollway Authority, Revenue Bonds (Special Project Systems) Ser. D | | 5.00 | | 9/1/2021 | | 10,000,000 | b | 10,764,200 | |
North Texas Tollway Authority, Revenue Bonds (Special Project Systems) Ser. D | | 5.00 | | 9/1/2021 | | 22,540,000 | b | 24,262,507 | |
North Texas Tollway Authority, Revenue Bonds, Refunding, Ser. A | | 5.00 | | 1/1/2022 | | 2,275,000 | | 2,479,545 | |
North Texas Tollway Authority, Revenue Bonds, Refunding, Ser. B | | 5.00 | | 1/1/2023 | | 2,500,000 | | 2,813,150 | |
Northside Independent School District, GO (Insured; Permanent School Fund Guarantee Program) | | 2.00 | | 6/1/2021 | | 5,000,000 | | 5,066,100 | |
Pasadena Independent School District, GO (Insured; Permanent School Fund Guarantee Program) Ser. B | | 1.50 | | 8/15/2024 | | 4,000,000 | | 4,035,560 | |
Pflugerville Independent School District, GO (Insured; Permanent School Fund Guarantee Program) Ser. A | | 2.25 | | 8/15/2022 | | 3,450,000 | | 3,548,739 | |
Pflugerville Independent School District, GO (Insured; Permanent School Fund Guarantee Program) Ser. B | | 2.50 | | 8/15/2023 | | 9,725,000 | | 10,168,071 | |
Round Rock Independent School District, GO (Insured; Permanent School Fund Guarantee Program) | | 1.50 | | 8/1/2021 | | 6,770,000 | | 6,776,838 | |
San Antonio Electric & Gas Systems, Revenue Bonds, Refunding | | 2.75 | | 12/1/2022 | | 2,250,000 | | 2,349,653 | |
47
STATEMENT OF INVESTMENTS (continued)
| | | | | | | | | | |
| |
BNY Mellon National Short-Term Municipal Bond Fund (continued) |
Description | Coupon
Rate (%) | | Maturity
Date | | Principal
Amount ($) | | Value ($) | |
Long-Term Municipal Investments - 98.9% (continued) | | | | | |
Texas - 19.5% (continued) | | | | | |
San Antonio Electric & Gas Systems, Revenue Bonds, Refunding, Ser. B | | 2.00 | | 12/1/2021 | | 5,000,000 | | 5,052,400 | |
Socorro Independent School District, GO (Insured; Permanent School Fund Guarantee Program) | | 5.00 | | 8/15/2021 | | 10,000,000 | b | 10,747,200 | |
Tarrant County Health Facilities Development Corp., Revenue Bonds (Cook Children's Medical Center) Ser. A | | 5.00 | | 12/1/2033 | | 1,010,000 | | 1,018,535 | |
Texas, GO, Refunding, Ser. B3 | | 5.00 | | 8/1/2022 | | 7,500,000 | | 8,340,075 | |
Travis County, GO, Refunding | | 5.00 | | 3/1/2023 | | 3,900,000 | | 4,279,431 | |
University of Houston, Revenue Bonds, Refunding, Ser. A | | 5.00 | | 2/15/2022 | | 15,530,000 | | 17,002,399 | |
| | 223,194,649 | |
U.S. Related - .1% | | | | | |
Puerto Rico Highways & Transportation Authority, TRAN, Ser. K | | 5.00 | | 12/31/2049 | | 2,885,000 | f | 1,110,725 | |
Virginia - 1.2% | | | | | |
Charles City County Economic Development Authority, Revenue Bonds (Waste Management) | | 2.40 | | 5/2/2022 | | 1,750,000 | | 1,797,740 | |
Fairfax County Industrial Development Authority, Revenue Bonds, Refunding (Inova Health System) Ser. B1 | | 5.00 | | 5/15/2021 | | 3,900,000 | | 4,152,252 | |
Gloucester County Economic Development Authority, Revenue Bonds (Waste Management) Ser. A | | 2.40 | | 5/2/2022 | | 1,500,000 | | 1,542,765 | |
King George County Economic Development Authority, Revenue Bonds (Waste Management) Ser. A | | 2.50 | | 6/1/2023 | | 2,000,000 | d | 2,071,680 | |
Peninsula Ports Authority , Revenue Bonds, Refunding (Dominion Terminal Association Project) | | 1.55 | | 10/1/2019 | | 2,750,000 | | 2,749,780 | |
Sussex County Industrial Development Authority, Revenue Bonds (Waste Management) Ser. A | | 2.40 | | 5/2/2022 | | 1,750,000 | | 1,797,408 | |
| | 14,111,625 | |
Washington - 2.4% | | | | | |
King County, GO, Refunding | | 5.00 | | 12/1/2022 | | 2,675,000 | | 3,010,953 | |
King County School District No. 405, GO (Insured; School Board Guaranty) | | 5.00 | | 12/1/2022 | | 4,085,000 | | 4,599,424 | |
University of Washington, Revenue Bonds, Refunding, Ser. A | | 5.00 | | 7/1/2023 | | 2,260,000 | | 2,505,346 | |
University of Washington, Revenue Bonds, Ser. A | | 5.00 | | 5/1/2022 | | 7,575,000 | | 8,180,848 | |
Washington, GO, Ser. D | | 5.00 | | 2/1/2024 | | 660,000 | | 721,928 | |
Washington Health Care Facilities Authority, Revenue Bonds, Refunding (CommonSpirit Health) Ser. B1 | | 5.00 | | 8/1/2024 | | 5,000,000 | | 5,759,250 | |
Whatcom County School District No. 502, GO (Insured; School Board Guaranty) | | 3.00 | | 12/1/2024 | | 1,295,000 | | 1,421,055 | |
Whatcom County School District No. 502, GO (Insured; School Board Guaranty) | | 3.00 | | 12/1/2023 | | 1,015,000 | | 1,096,342 | |
| | 27,295,146 | |
West Virginia - .2% | | | | | |
West Virginia Economic Development Authority, Revenue Bonds (Appalachian Power Company Amos Project) Ser. A | | 1.70 | | 9/1/2020 | | 2,500,000 | | 2,507,350 | |
Wisconsin - 2.2% | | | | | |
Howard, NAN | | 4.00 | | 12/1/2022 | | 5,000,000 | | 5,220,550 | |
Kenosha Unified School District No. 1, GO, Refunding | | 5.00 | | 4/1/2023 | | 1,365,000 | | 1,551,609 | |
Waukesha County, GO, Ser. A | | 3.00 | | 4/1/2023 | | 1,400,000 | | 1,491,966 | |
Wisconsin, GO, Refunding, Ser. 2 | | 5.00 | | 5/1/2024 | | 8,050,000 | | 8,877,781 | |
Wisconsin, GO, Ser. A | | 5.00 | | 5/1/2022 | | 6,300,000 | b | 6,957,594 | |
Wisconsin, GO, Ser. B | | 5.00 | | 5/1/2022 | | 580,000 | b | 640,540 | |
| | 24,740,040 | |
TotalLong-Term Municipal Investments
(cost $1,119,618,688) | | 1,131,777,776 | |
| | | | | | | | | |
Short-Term Municipal Investments - 2.8% | | | | | |
Illinois - .2% | | | | | |
Illinois, GO (Build America Bonds) | | 5.73 | | 4/1/2020 | | 2,475,000 | | 2,518,783 | |
48
| | | | | | | | | | |
| |
BNY Mellon National Short-Term Municipal Bond Fund (continued) |
Description | Coupon
Rate (%) | | Maturity Date | | Principal Amount ($) | | Value ($) | |
Short-Term Municipal Investments - 2.8%(continued) | | | | | |
Massachusetts - .4% | | | | | |
Medford, BAN | | 2.50 | | 6/19/2020 | | 1,585,000 | | 1,599,962 | |
Taunton, BAN | | 2.50 | | 5/21/2020 | | 2,445,000 | | 2,467,421 | |
| | 4,067,383 | |
New Jersey - .1% | | | | | |
New Jersey Sports & Exposition Authority, Revenue Bonds, Refunding, Ser. A | | 4.00 | | 9/1/2019 | | 1,000,000 | | 1,000,000 | |
New York - 1.1% | | | | | |
Hempstead Union Free School District, TAN | | 2.50 | | 6/25/2020 | | 3,000,000 | | 3,022,110 | |
Phoenix Central School District, GO | | 2.25 | | 7/10/2020 | | 10,000,000 | | 10,076,000 | |
| | 13,098,110 | |
Pennsylvania - .1% | | | | | |
Pennsylvania Housing Finance Agency, Revenue Bonds, Refunding, Ser. 109 | | 3.40 | | 4/1/2020 | | 755,000 | | 756,208 | |
Texas - .9% | | | | | |
Texas, TRAN | | 4.00 | | 8/27/2020 | | 10,000,000 | | 10,278,100 | |
TotalShort-Term Municipal Investments
(cost $31,689,692) | | 31,718,584 | |
| | Annualized
Yield (%) | | | | | | | |
Short-Term Investments - .9% | | | | | |
U.S. Treasury Securities | | | | | |
U.S. Treasury Bills
(cost $9,861,742) | | 3.89 | | 5/21/2020 | | 10,000,000 | g | 9,873,294 | |
Total Investments(cost $1,161,170,122) | | 102.6% | 1,173,369,654 | |
Liabilities, Less Cash and Receivables | | (2.6%) | (29,275,673) | |
Net Assets | | 100.0% | 1,144,093,981 | |
a Variable rate security—rate shown is the interest rate in effect at period end.
b These securities are prerefunded; the date shown represents the prerefunded date. Bonds which are prerefunded are collateralized by U.S. Government securities which are held in escrow and are used to pay principal and interest on the municipal issue and to retire the bonds in full at the earliest refunding date.
c Auction Rate Security—interest rate is reset periodically under an auction process that is conducted by an auction agent. Rate shown is the interest rate in effect at period end.
d The Variable Rate shall be determined by the Remarketing Agent in its sole discretion based on prevailing market conditions and may, but need not, be established by reference to one or more financial indices.
e Principal amount for accrual purposes is periodically adjusted based on changes in the Consumer Price Index.
f Non-income producing—security in default.
g Security is a discount security. Income is recognized through the accretion of discount.
49
STATEMENT OF INVESTMENTS (continued)
| | |
Portfolio Summary (Unaudited)† | Value (%) |
General | 18.7 |
School District | 14.3 |
General Obligation | 13.7 |
Transportation | 8.7 |
Prerefunded | 7.2 |
Development | 6.6 |
Medical | 6.5 |
Education | 6.4 |
Multifamily Housing | 4.7 |
Airport | 3.7 |
Power | 3.5 |
Tobacco Settlement | 2.1 |
Water | 1.9 |
Pollution | 1.1 |
Build America Bonds | 1.0 |
U.S. Government | .9 |
Student Loan | .7 |
Utilities | .6 |
Nursing Homes | .2 |
Single Family Housing | .1 |
| | 102.6 |
† Based on net assets.
See notes to financial statements.
50
| | | | | | | | | | |
| |
BNY Mellon Pennsylvania Intermediate Municipal Bond Fund |
Description | Coupon
Rate (%) | | Maturity
Date | | Principal
Amount ($) | | Value ($) | |
Long-Term Municipal Investments - 101.1% | | | | | |
Alabama - 1.1% | | | | | |
Black Belt Energy Gas District, Revenue Bonds, Refunding (Project No. 4) Ser. A1 | | 4.00 | | 12/1/2025 | | 2,000,000 | | 2,267,900 | |
Florida - .9% | | | | | |
Lake County School Board, COP, Refunding, Ser. B | | 5.00 | | 6/1/2027 | | 1,620,000 | | 1,772,960 | |
Illinois - 2.1% | | | | | |
Chicago II, GO, Ser. 2002B | | 5.25 | | 1/1/2022 | | 1,285,000 | | 1,370,581 | |
Chicago II, GO, Ser. A | | 5.00 | | 1/1/2024 | | 500,000 | | 554,315 | |
Illinois, GO | | 5.25 | | 2/1/2029 | | 2,000,000 | | 2,229,340 | |
| | 4,154,236 | |
Michigan - 1.0% | | | | | |
Michigan Finance Authority, Revenue Bonds, Refunding (Trinity Health Corp.) | | 5.00 | | 12/1/2033 | | 1,850,000 | | 2,020,311 | |
New Jersey - 4.3% | | | | | |
New Jersey Economic Development Authority, Revenue Bonds, Refunding | | 5.00 | | 3/1/2027 | | 2,000,000 | | 2,207,260 | |
New Jersey Economic Development Authority, Revenue Bonds, Refunding (Insured; American Municipal Bond Assurance Corp.) Ser. K | | 5.25 | | 12/15/2020 | | 1,250,000 | | 1,313,788 | |
New Jersey Economic Development Authority, Revenue Bonds, Refunding (Insured; National Public Finance Guarantee Corp.) Ser. K | | 5.25 | | 12/15/2021 | | 2,000,000 | | 2,172,040 | |
New Jersey Tobacco Settlement Financing Corp., Revenue Bonds, Refunding, Ser. A | | 5.00 | | 6/1/2031 | | 625,000 | | 763,669 | |
New Jersey Tobacco Settlement Financing Corp., Revenue Bonds, Refunding, Ser. A | | 5.00 | | 6/1/2029 | | 875,000 | | 1,082,568 | |
New Jersey Tobacco Settlement Financing Corp., Revenue Bonds, Refunding, Ser. A | | 5.00 | | 6/1/2028 | | 875,000 | | 1,088,509 | |
| | 8,627,834 | |
New Mexico - 1.2% | | | | | |
New Mexico Municipal Energy Acquisition Authority, Revenue Bonds, Refunding, Ser. A | | 5.00 | | 5/1/2025 | | 2,000,000 | | 2,369,640 | |
New York - 4.8% | | | | | |
Metropolitan Transportation Authority, Revenue Bonds, Refunding (Green Bond) Ser. A1 | | 5.00 | | 11/15/2024 | | 1,625,000 | | 1,921,302 | |
New York City, GO Notes, Ser. A2 | | 1.52 | | 10/1/2038 | | 300,000 | a | 300,000 | |
New York City Housing Development Corp., Revenue Bonds, Ser. B2 | | 5.25 | | 7/1/2032 | | 1,350,000 | | 1,528,834 | |
New York Liberty Development Corp., Revenue Bonds, Refunding (Bank of America Tower at One Bryant Park) | | 2.63 | | 9/15/2069 | | 1,675,000 | | 1,734,194 | |
New York Liberty Development Corp., Revenue Bonds, Refunding (Class 1-3 World Trade Center Project) | | 5.00 | | 11/15/2044 | | 2,250,000 | b | 2,499,277 | |
New York Transportation Development Corp., Revenue Bonds (Delta Air Lines) | | 5.00 | | 1/1/2025 | | 1,350,000 | | 1,570,279 | |
| | 9,553,886 | |
Pennsylvania - 84.7% | | | | | |
Allegheny County Higher Education Building Authority, Revenue Bonds, Refunding (Duquesne University) | | 5.00 | | 3/1/2026 | | 1,000,000 | | 1,221,500 | |
Allegheny County Hospital Development Authority, Revenue Bonds, Refunding, Ser. A | | 5.00 | | 4/1/2030 | | 1,000,000 | | 1,253,340 | |
Allegheny County Port Authority, Revenue Bonds, Refunding | | 5.25 | | 3/1/2024 | | 2,000,000 | | 2,117,080 | |
Armstrong School District, GO, Refunding, Ser. A | | 5.00 | | 3/15/2029 | | 920,000 | | 1,184,482 | |
Beaver County Hospital Authority, Revenue Bonds, Refunding (Heritage Valley Health System) | | 5.00 | | 5/15/2025 | | 1,250,000 | | 1,323,713 | |
Beaver County Hospital Authority, Revenue Bonds, Refunding (Heritage Valley Health System) | | 5.00 | | 5/15/2023 | | 1,345,000 | | 1,428,054 | |
Berks County Industrial Development Authority, Revenue Bonds, Refunding (Tower Health Project) | | 4.00 | | 11/1/2033 | | 1,300,000 | | 1,454,817 | |
51
STATEMENT OF INVESTMENTS (continued)
| | | | | | | | | | |
| |
BNY Mellon Pennsylvania Intermediate Municipal Bond Fund (continued) |
Description | Coupon
Rate (%) | | Maturity
Date | | Principal
Amount ($) | | Value ($) | |
Long-Term Municipal Investments - 101.1% (continued) | | | | | |
Pennsylvania - 84.7% (continued) | | | | | |
Boyertown Area School District, GO | | 5.00 | | 10/1/2034 | | 1,060,000 | | 1,214,580 | |
Canonsburg-Houston Joint Authority, Revenue Bonds, Refunding, Ser. A | | 5.00 | | 12/1/2023 | | 1,260,000 | | 1,436,513 | |
Capital Region Water, Revenue Bonds, Refunding | | 5.00 | | 7/15/2026 | | 750,000 | | 927,525 | |
Chambersburg Area School District, GO, Refunding (Insured; State Aid Withholding) | | 4.00 | | 3/1/2028 | | 1,000,000 | | 1,175,840 | |
Chester County, GO, Refunding | | 4.00 | | 11/15/2032 | | 740,000 | | 873,859 | |
Commonwealth Financing Authority, Revenue Bonds | | 5.00 | | 6/1/2032 | | 2,500,000 | | 3,119,700 | |
Dallastown Area School District, GO, Refunding | | 5.00 | | 4/15/2031 | | 1,400,000 | | 1,652,602 | |
Dauphin County General Authority, Revenue Bonds, Refunding (Pinnacle Health Systems Project), Ser. A | | 5.00 | | 6/1/2029 | | 1,000,000 | | 1,216,570 | |
Downingtown Area School District, GO, Ser. C | | 5.00 | | 8/1/2030 | | 1,455,000 | | 1,808,085 | |
East Pennsboro Township, GO, Refunding | | 5.00 | | 9/1/2031 | | 1,115,000 | | 1,397,374 | |
Easton Area School District, GO, Ser. A | | 5.00 | | 4/1/2029 | | 1,090,000 | | 1,336,613 | |
Erie County, GO (Insured; National Public Finance Guarantee Corp.) Ser. A | | 5.50 | | 9/1/2022 | | 1,640,000 | | 1,846,214 | |
Franklin County, GO, Refunding | | 4.00 | | 11/1/2032 | | 1,205,000 | | 1,376,905 | |
Garnet Valley School District, GO, Refunding | | 4.00 | | 4/1/2027 | | 2,415,000 | | 2,751,651 | |
Lancaster County Solid Waste Management Authority, Revenue Bonds (Insured; County Guaranty) Ser. B | | 5.00 | | 12/15/2033 | | 1,895,000 | | 2,163,863 | |
Lebanon School District, GO, Refunding (Insured; Assured Guaranty Municipal Corp.) Ser. B | | 4.00 | | 6/15/2031 | | 1,500,000 | | 1,723,590 | |
Lower Merion Township, GO, Ser. B | | 4.00 | | 7/15/2033 | | 495,000 | | 552,504 | |
Lower Merion Township, GO, Ser. B | | 4.00 | | 7/15/2034 | | 515,000 | | 573,983 | |
Lower Merion Township, GO, Ser. B | | 4.00 | | 7/15/2031 | | 460,000 | | 515,780 | |
Lower Merion Township, GO, Ser. B | | 4.00 | | 7/15/2029 | | 425,000 | | 478,780 | |
Lower Merion Township, GO, Ser. B | | 4.00 | | 7/15/2030 | | 440,000 | | 494,476 | |
Manheim Township School District, GO, Ser. A | | 5.00 | | 2/1/2030 | | 1,025,000 | | 1,237,677 | |
Montgomery County, GO, Refunding, Ser. C | | 5.00 | | 12/15/2019 | | 100,000 | c | 101,085 | |
Montgomery County Higher Education & Health Authority, Revenue Bonds, Refunding (The Hill School Project) | | 5.00 | | 8/15/2037 | | 500,000 | | 586,425 | |
Montgomery County Higher Education & Health Authority, Revenue Bonds, Refunding (Thomas Jefferson University Project) | | 4.00 | | 9/1/2034 | | 1,000,000 | | 1,142,180 | |
Montgomery County Higher Education & Health Authority, Revenue Bonds, Refunding (Thomas Jefferson University) Ser. A | | 5.00 | | 9/1/2030 | | 1,600,000 | | 2,018,736 | |
Montgomery County Industrial Development Authority, Revenue Bonds (New Regional Medical Center Project) (Insured; Federal Housing Administration) | | 5.50 | | 8/1/2020 | | 995,000 | c | 1,035,288 | |
Montgomery County Industrial Development Authority, Revenue Bonds, Refunding (Albert Einstein Healthcare Network) | | 5.00 | | 1/15/2020 | | 1,000,000 | | 1,011,520 | |
Mount Lebanon Hospital Authority, Revenue Bonds (St. Clair Memorial Hospital Project) | | 5.00 | | 7/1/2036 | | 1,105,000 | | 1,365,647 | |
Mount Lebanon Hospital Authority, Revenue Bonds (St. Clair Memorial Hospital Project) | | 5.00 | | 7/1/2035 | | 1,000,000 | | 1,239,280 | |
Northampton County General Purpose Authority, Revenue Bonds, Refunding (Lafayette College) Ser. A | | 5.00 | | 11/1/2043 | | 2,000,000 | | 2,242,280 | |
Northampton County General Purpose Authority, Revenue Bonds, Refunding (Lehigh University) Ser. A | | 4.00 | | 11/15/2035 | | 1,530,000 | | 1,742,991 | |
Pennsylvania, GO, Ser. 1st | | 5.00 | | 3/15/2028 | | 2,200,000 | | 2,624,578 | |
Pennsylvania, GO, Ser. 2nd | | 5.00 | | 9/15/2024 | | 2,975,000 | | 3,535,847 | |
Pennsylvania Economic Development Financing Authority, Revenue Bonds (UPMC) Ser. A | | 5.00 | | 2/1/2026 | | 2,455,000 | | 2,899,011 | |
Pennsylvania Economic Development Financing Authority, Revenue Bonds (Waste Management Inc. Project) | | 2.15 | | 7/1/2024 | | 2,000,000 | | 2,050,880 | |
Pennsylvania Economic Development Financing Authority, Revenue Bonds (Waste Management Inc. Project) Ser. A | | 2.15 | | 11/1/2021 | | 2,375,000 | | 2,407,514 | |
52
| | | | | | | | | | |
| |
BNY Mellon Pennsylvania Intermediate Municipal Bond Fund (continued) |
Description | Coupon
Rate (%) | | Maturity
Date | | Principal
Amount ($) | | Value ($) | |
Long-Term Municipal Investments - 101.1% (continued) | | | | | |
Pennsylvania - 84.7% (continued) | | | | | |
Pennsylvania Economic Development Financing Authority, Revenue Bonds, Refunding (Amtrak Project) Ser. A | | 5.00 | | 11/1/2026 | | 1,000,000 | | 1,095,950 | |
Pennsylvania Economic Development Financing Authority, Revenue Bonds, Refunding (Forum Place Project) | | 5.00 | | 3/1/2025 | | 1,000,000 | | 1,086,950 | |
Pennsylvania Economic Development Financing Authority, Revenue Bonds, Refunding (UPMC) | | 4.00 | | 3/15/2032 | | 1,690,000 | | 1,911,846 | |
Pennsylvania Economic Development Financing Authority, Revenue Bonds, Refunding (UPMC) | | 5.00 | | 3/15/2031 | | 1,000,000 | | 1,232,110 | |
Pennsylvania Higher Educational Facilities Authority, Revenue Bonds (Insured; Build American Mutual Assurance Company) Ser. AT-1 | | 5.00 | | 6/15/2027 | | 1,000,000 | | 1,233,890 | |
Pennsylvania Higher Educational Facilities Authority, Revenue Bonds (Temple University) | | 5.00 | | 4/1/2026 | | 1,000,000 | | 1,089,790 | |
Pennsylvania Higher Educational Facilities Authority, Revenue Bonds (The Trustees of the University of Pennsylvania) Ser. A | | 5.00 | | 8/15/2032 | | 1,000,000 | | 1,250,930 | |
Pennsylvania Higher Educational Facilities Authority, Revenue Bonds (University of Pennsylvania Health System) Ser. E | | 4.00 | | 8/15/2034 | | 1,000,000 | | 1,142,340 | |
Pennsylvania Higher Educational Facilities Authority, Revenue Bonds, Refunding (Drexel University) | | 5.00 | | 5/1/2028 | | 1,855,000 | | 2,323,295 | |
Pennsylvania Higher Educational Facilities Authority, Revenue Bonds, Refunding (University of Pennsylvani Health System) Ser. C | | 5.00 | | 8/15/2024 | | 1,410,000 | | 1,664,829 | |
Pennsylvania Higher Educational Facilities Authority, Revenue Bonds, Refunding (University of Pennsylvania Health System) | | 5.00 | | 8/15/2035 | | 1,200,000 | | 1,421,580 | |
Pennsylvania Higher Educational Facilities Authority, Revenue Bonds, Refunding (University of Sciences) | | 5.00 | | 11/1/2025 | | 1,000,000 | | 1,169,220 | |
Pennsylvania Higher Educational Facilities Authority, Revenue Bonds, Refunding, Ser. AQ | | 5.00 | | 6/15/2025 | | 1,000,000 | | 1,203,790 | |
Pennsylvania Higher Educational Facilities Authority, Revenue Bonds, Refunding, Ser. AV-1 | | 4.00 | | 6/15/2030 | | 2,220,000 | | 2,590,585 | |
Pennsylvania Housing Finance Agency, Revenue Bonds, Refunding, Ser. 122 | | 3.65 | | 10/1/2032 | | 1,500,000 | | 1,619,160 | |
Pennsylvania Turnpike Commission, Revenue Bonds, Refunding | | 5.00 | | 12/1/2040 | | 1,260,000 | | 1,525,973 | |
Pennsylvania Turnpike Commission, Revenue Bonds, Refunding | | 5.00 | | 12/1/2038 | | 1,230,000 | | 1,498,165 | |
Pennsylvania Turnpike Commission, Revenue Bonds, Refunding (Insured; Assured Guaranty Municipal Corp.) | | 5.25 | | 7/15/2025 | | 2,500,000 | | 3,097,850 | |
Pennsylvania Turnpike Commission, Revenue Bonds, Refunding (Insured; Assured Guaranty Municipal Corp.) Ser. B2 | | 5.00 | | 6/1/2034 | | 1,000,000 | | 1,224,540 | |
Pennsylvania Turnpike Commission, Revenue Bonds, Refunding, Ser. 2nd | | 5.00 | | 12/1/2034 | | 1,000,000 | | 1,230,990 | |
Pennsylvania Turnpike Commission, Revenue Bonds, Refunding, Ser. A | | 5.00 | | 12/1/2030 | | 1,325,000 | | 1,644,378 | |
Pennsylvania Turnpike Commission, Revenue Bonds, Refunding, Ser. A-1 | | 5.25 | | 12/1/2035 | | 2,280,000 | | 2,703,738 | |
Pennsylvania Turnpike Commission, Revenue Bonds, Refunding, Ser. B2 | | 5.00 | | 6/1/2032 | | 1,000,000 | | 1,210,350 | |
Pennsylvania Turnpike Commission, Revenue Bonds, Ser. A | | 5.00 | | 12/1/2038 | | 2,415,000 | | 2,637,711 | |
Pennsylvania Turnpike Commission, Revenue Bonds, Ser. A | | 5.00 | | 12/1/2034 | | 1,000,000 | | 1,257,370 | |
Pennsylvania Turnpike Commission, Revenue Bonds, Ser. B | | 5.00 | | 12/1/2022 | | 1,190,000 | c | 1,340,630 | |
Philadelphia, GO, Refunding | | 5.00 | | 8/1/2029 | | 1,000,000 | | 1,250,860 | |
Philadelphia, GO, Refunding (Insured; Assured Guaranty Municipal Corp.) | | 5.00 | | 8/1/2030 | | 1,275,000 | | 1,596,478 | |
Philadelphia, GO, Refunding, Ser. A | | 5.00 | | 8/1/2029 | | 1,000,000 | | 1,250,860 | |
Philadelphia, Revenue Bonds, Refunding | | 5.00 | | 11/1/2022 | | 355,000 | c | 398,207 | |
Philadelphia, Revenue Bonds, Refunding, Ser. A | | 5.00 | | 6/15/2020 | | 1,750,000 | | 1,799,945 | |
53
STATEMENT OF INVESTMENTS (continued)
| | | | | | | | | | |
| |
BNY Mellon Pennsylvania Intermediate Municipal Bond Fund (continued) |
Description | Coupon
Rate (%) | | Maturity
Date | | Principal
Amount ($) | | Value ($) | |
Long-Term Municipal Investments - 101.1% (continued) | | | | | |
Pennsylvania - 84.7% (continued) | | | | | |
Philadelphia, Revenue Bonds, Refunding, Ser. B | | 5.00 | | 7/1/2025 | | 2,000,000 | | 2,403,120 | |
Philadelphia, Revenue Bonds, Refunding, Ser. B | | 5.00 | | 7/1/2031 | | 2,000,000 | | 2,379,360 | |
Philadelphia, Revenue Bonds, Ser. A | | 5.00 | | 1/1/2036 | | 2,830,000 | | 2,956,586 | |
Philadelphia Authority for Industrial Development, Revenue Bonds (Green Bond) Ser. A | | 5.00 | | 2/15/2034 | | 1,250,000 | | 1,534,912 | |
Philadelphia Authority for Industrial Development, Revenue Bonds, Refunding (Children's Hospital of Philadelphia Project) | | 4.00 | | 7/1/2036 | | 1,000,000 | | 1,145,550 | |
Philadelphia Authority for Industrial Development, Revenue Bonds, Refunding (Temple University) Ser. 2016 | | 5.00 | | 4/1/2031 | | 2,000,000 | | 2,353,000 | |
Philadelphia Authority for Industrial Development, Revenue Bonds, Refunding (Temple University) Ser. 2016 | | 5.00 | | 4/1/2025 | | 1,500,000 | | 1,805,100 | |
Pittsburgh, GO | | 4.00 | | 9/1/2034 | | 325,000 | | 370,698 | |
Pittsburgh, GO | | 4.00 | | 9/1/2035 | | 750,000 | | 854,340 | |
Pittsburgh, GO | | 4.00 | | 9/1/2036 | | 500,000 | | 568,190 | |
Pittsburgh & Allegheny County Sports & Exhibition Authority, Revenue Bonds | | 5.00 | | 12/15/2032 | | 1,000,000 | | 1,216,320 | |
Pittsburgh & Allegheny County Sports & Exhibition Authority, Revenue Bonds | | 5.00 | | 12/15/2023 | | 855,000 | | 979,659 | |
Pittsburgh & Allegheny County Sports & Exhibition Authority, Revenue Bonds | | 5.00 | | 12/15/2024 | | 940,000 | | 1,107,217 | |
Pittsburgh Water & Sewer Authority, Revenue Bonds (Insured; Assured Guaranty Municipal Corp.) Ser. B | | 5.00 | | 9/1/2023 | | 2,580,000 | c | 2,974,069 | |
Pittsburgh Water & Sewer Authority, Revenue Bonds, Refunding (Insured; Assured Guaranty Municipal Corp.) Ser. A | | 5.00 | | 9/1/2027 | | 1,060,000 | | 1,352,380 | |
Pittsburgh Water & Sewer Authority, Revenue Bonds, Refunding (Insured; Assured Guaranty Municipal Corp.) Ser. A | | 5.00 | | 9/1/2026 | | 1,000,000 | | 1,249,020 | |
Selinsgrove Area School District, GO, Refunding, Ser. B | | 3.00 | | 3/1/2026 | | 1,095,000 | | 1,180,936 | |
Southcentral Pennsylvania General Authority, Revenue Bonds, Refunding (Wellspan Health Obligated Group) | | 5.00 | | 6/1/2038 | | 1,000,000 | | 1,261,500 | |
Southcentral Pennsylvania General Authority, Revenue Bonds, Refunding (Wellspan Health Obligated Group) Ser. A | | 5.00 | | 6/1/2027 | | 2,085,000 | | 2,431,006 | |
Southeastern Pennsylvania Transportation Authority, Revenue Bonds | | 5.00 | | 6/1/2021 | | 1,000,000 | c | 1,067,800 | |
State Public School Building Authority, Revenue Bonds (The School District of Philadelphia) (Insured; Assured Guaranty Municipal Corp.) | | 5.00 | | 4/1/2031 | | 2,490,000 | | 2,683,647 | |
State Public School Building Authority, Revenue Bonds, Refunding (The School District of Philadelphia) (Insured; Assured Guaranty Municipal Corp.) Ser. A | | 5.00 | | 6/1/2024 | | 2,000,000 | | 2,312,900 | |
Susquehanna Township School District, GO, Refunding | | 4.00 | | 11/15/2027 | | 1,975,000 | | 2,202,243 | |
The Pennsylvania State University, Revenue Bonds, Ser. A | | 5.00 | | 9/1/2033 | | 1,010,000 | | 1,247,037 | |
The School District of Philadelphia, GO, Ser. A | | 5.00 | | 9/1/2028 | | 500,000 | | 632,270 | |
Township of Whitemarsh, GO, Refunding | | 4.00 | | 11/15/2035 | | 605,000 | | 665,790 | |
Township of Whitemarsh, GO, Refunding | | 4.00 | | 11/15/2039 | | 1,000,000 | | 1,091,690 | |
Tredyffrin Easttown School District, GO | | 5.00 | | 2/15/2032 | | 290,000 | | 361,337 | |
Tredyffrin Easttown School District, GO | | 5.00 | | 2/15/2036 | | 1,365,000 | | 1,675,756 | |
Tredyffrin Easttown School District, GO | | 5.00 | | 2/15/2034 | | 240,000 | | 296,167 | |
Upper Merion Area School District, GO | | 5.00 | | 1/15/2034 | | 350,000 | | 422,811 | |
Upper Merion Area School District, GO | | 5.00 | | 1/15/2037 | | 275,000 | | 329,786 | |
Upper Merion Area School District, GO | | 5.00 | | 1/15/2035 | | 420,000 | | 506,159 | |
Upper Merion Area School District, GO | | 5.00 | | 1/15/2036 | | 250,000 | | 300,635 | |
Upper Moreland Township School District, GO | | 4.00 | | 10/1/2033 | | 780,000 | | 838,562 | |
Upper St. Clair Township School District, GO | | 5.00 | | 10/1/2041 | | 1,000,000 | | 1,149,000 | |
West Mifflin Area School District, GO, Refunding (Insured; Assured Guaranty Municipal Corp.) | | 5.00 | | 4/1/2026 | | 1,000,000 | | 1,197,690 | |
54
| | | | | | | | | | |
| |
BNY Mellon Pennsylvania Intermediate Municipal Bond Fund (continued) |
Description | Coupon
Rate (%) | | Maturity
Date | | Principal
Amount ($) | | Value ($) | |
Long-Term Municipal Investments - 101.1% (continued) | | | | | |
Pennsylvania - 84.7% (continued) | | | | | |
West View Municipal Authority, Revenue Bonds | | 5.00 | | 11/15/2024 | | 3,000,000 | c | 3,597,810 | |
Westmoreland County Municipal Authority, Revenue Bonds, Refunding (Insured; Build America Mutual Assurance Company) | | 5.00 | | 8/15/2027 | | 1,500,000 | | 1,808,415 | |
Westmoreland County Municipal Authority, Revenue Bonds, Refunding (Insured; Build America Mutual Assurance Company) | | 5.00 | | 8/15/2028 | | 1,000,000 | | 1,204,210 | |
| | 169,279,920 | |
Tennessee - .1% | | | | | |
Montgomery County Public Building Authority, Revenue Bonds (LOC; Bank of America NA) | | 1.40 | | 4/1/2032 | | 200,000 | d | 200,000 | |
U.S. Related - .9% | | | | | |
Guam, Revenue Bonds, Ser. A | | 5.00 | | 1/1/2024 | | 1,500,000 | | 1,599,480 | |
Puerto Rico Infrastructure Financing Authority, Revenue Bonds, Ser. B | | 5.00 | | 7/1/2021 | | 800,000 | e | 190,000 | |
| | 1,789,480 | |
Total Investments(cost $189,810,837) | | 101.1% | 202,036,167 | |
Liabilities, Less Cash and Receivables | | (1.1%) | (2,271,837) | |
Net Assets | | 100.0% | 199,764,330 | |
a Auction Rate Security—interest rate is reset periodically under an auction process that is conducted by an auction agent. Rate shown is the interest rate in effect at period end.
b Security exempt from registration pursuant to Rule 144A under the Securities Act of 1933. These securities may be resold in transactions exempt from registration, normally to qualified institutional buyers. At August 31, 2019, these securities were valued at $2,499,277 or 1.25% of net assets.
c These securities are prerefunded; the date shown represents the prerefunded date. Bonds which are prerefunded are collateralized by U.S. Government securities which are held in escrow and are used to pay principal and interest on the municipal issue and to retire the bonds in full at the earliest refunding date.
d The Variable Rate shall be determined by the Remarketing Agent in its sole discretion based on prevailing market conditions and may, but need not, be established by reference to one or more financial indices.
e Non-income producing—security in default.
| | |
Portfolio Summary (Unaudited)† | Value (%) |
Medical | 15.3 |
Education | 15.0 |
General Obligation | 13.2 |
School District | 12.6 |
Transportation | 10.5 |
General | 7.3 |
Water | 6.7 |
Prerefunded | 5.3 |
Development | 4.5 |
Tobacco Settlement | 3.0 |
Pollution | 2.3 |
Airport | 2.1 |
Facilities | 1.7 |
Single Family Housing | .8 |
Multifamily Housing | .8 |
| | 101.1 |
† Based on net assets.
See notes to financial statements.
55
STATEMENT OF INVESTMENTS (continued)
| | | | | | | | | | |
| |
BNY Mellon Massachusetts Intermediate Municipal Bond Fund |
Description | Coupon
Rate (%) | | Maturity
Date | | Principal
Amount ($) | | Value ($) | |
Long-Term Municipal Investments - 101.4% | | | | | |
Alabama - 1.0% | | | | | |
Black Belt Energy Gas District, Revenue Bonds, Refunding (Project No. 4) Ser. A1 | | 4.00 | | 12/1/2025 | | 3,000,000 | | 3,401,850 | |
Florida - .5% | | | | | |
Orange County Health Facilities Authority, Revenue Bonds, Refunding (Orlando Health Obligated Group) | | 5.00 | | 10/1/2024 | | 1,250,000 | | 1,486,975 | |
Illinois - 1.5% | | | | | |
Chicago, GO, Ser. A | | 5.00 | | 1/1/2023 | | 1,970,000 | | 2,136,465 | |
Illinois, GO, Ser. D | | 5.00 | | 11/1/2026 | | 2,500,000 | | 2,898,875 | |
| | 5,035,340 | |
Massachusetts - 88.3% | | | | | |
Berkshire Wind Power Cooperative Corp., Revenue, Refunding (Green Bond) (Berkshire Wind Project) Ser. 2 | | 5.00 | | 7/1/2030 | | 1,000,000 | | 1,244,330 | |
Berkshire Wind Power Cooperative Corp., Revenue, Refunding (Green Bond) (Berkshire Wind Project) Ser. 2 | | 5.00 | | 7/1/2028 | | 1,000,000 | | 1,255,550 | |
Berkshire Wind Power Cooperative Corp., Revenue, Refunding (Green Bond) (Berkshire Wind Project) Ser. 2 | | 5.00 | | 7/1/2026 | | 475,000 | | 588,596 | |
Dedham, GO | | 4.00 | | 6/15/2029 | | 495,000 | | 574,848 | |
Framingham, GO, Refunding | | 5.00 | | 12/1/2029 | | 365,000 | | 473,084 | |
Framingham, GO, Refunding | | 5.00 | | 12/1/2028 | | 420,000 | | 546,937 | |
Manchester Essex Regional School District, GO, (School Project Loan) | | 4.00 | | 2/1/2034 | | 845,000 | | 996,247 | |
Manchester Essex Regional School District, GO, (School Project Loan) | | 4.00 | | 2/1/2033 | | 590,000 | | 704,082 | |
Mansfield, GO (Municipal Purpose Loan) | | 4.00 | | 5/15/2030 | | 845,000 | | 968,488 | |
Mansfield, GO (Municipal Purpose Loan) | | 4.00 | | 5/15/2029 | | 815,000 | | 940,029 | |
Massachusetts, GO, Refunding, Ser. A, 3 Month LIBOR x .67 +.55% | | 2.06 | | 11/1/2025 | | 2,500,000 | a | 2,504,175 | |
Massachusetts, GO, Refunding, Ser. B | | 5.00 | | 7/1/2027 | | 2,500,000 | | 3,210,150 | |
Massachusetts, GO, Refunding, Ser. B | | 5.00 | | 1/1/2021 | | 3,000,000 | | 3,156,690 | |
Massachusetts, GO, Ser. A | | 5.00 | | 3/1/2031 | | 2,250,000 | | 2,619,022 | |
Massachusetts, GO, Ser. C | | 4.00 | | 2/1/2029 | | 2,500,000 | | 2,789,750 | |
Massachusetts Clean Energy Cooperative Corp., Revenue Bonds | | 5.00 | | 7/1/2032 | | 870,000 | | 992,148 | |
Massachusetts Clean Energy Cooperative Corp., Revenue Bonds | | 5.00 | | 7/1/2028 | | 1,250,000 | | 1,432,950 | |
Massachusetts Development Finance Agency, Revenue Bonds (Dana-Farber Cancer Institute) Ser. N | | 5.00 | | 12/1/2033 | | 2,500,000 | | 3,069,700 | |
Massachusetts Development Finance Agency, Revenue Bonds (Emerson College) | | 5.00 | | 1/1/2026 | | 170,000 | | 204,258 | |
Massachusetts Development Finance Agency, Revenue Bonds (Emerson College) | | 5.00 | | 1/1/2028 | | 255,000 | | 318,003 | |
Massachusetts Development Finance Agency, Revenue Bonds (Emerson College) | | 5.00 | | 1/1/2033 | | 305,000 | | 372,048 | |
Massachusetts Development Finance Agency, Revenue Bonds (Emerson College) | | 5.00 | | 1/1/2027 | | 280,000 | | 343,655 | |
Massachusetts Development Finance Agency, Revenue Bonds (Emerson College) | | 5.00 | | 1/1/2031 | | 325,000 | | 399,604 | |
Massachusetts Development Finance Agency, Revenue Bonds (Emerson College) | | 5.00 | | 1/1/2032 | | 340,000 | | 416,038 | |
Massachusetts Development Finance Agency, Revenue Bonds (Emerson College) Ser. A | | 5.00 | | 1/1/2022 | | 565,000 | | 611,714 | |
Massachusetts Development Finance Agency, Revenue Bonds (Emerson College) Ser. A | | 5.00 | | 1/1/2023 | | 400,000 | | 446,076 | |
Massachusetts Development Finance Agency, Revenue Bonds (North Hill Communities) Ser. A | | 6.50 | | 11/15/2023 | | 3,750,000 | b,c | 4,561,087 | |
Massachusetts Development Finance Agency, Revenue Bonds (Partners Healthcare System) (LOC; U.S. BANK N.A.) Ser. M-1 | | 1.40 | | 7/1/2048 | | 700,000 | d | 700,000 | |
56
| | | | | | | | | | |
| |
BNY Mellon Massachusetts Intermediate Municipal Bond Fund (continued) |
Description | Coupon
Rate (%) | | Maturity
Date | | Principal
Amount ($) | | Value ($) | |
Long-Term Municipal Investments - 101.4% (continued) | | | | | |
Massachusetts - 88.3% (continued) | | | | | |
Massachusetts Development Finance Agency, Revenue Bonds (Southcoast Health System Obligated Group) Ser. F | | 4.00 | | 7/1/2020 | | 530,000 | | 541,740 | |
Massachusetts Development Finance Agency, Revenue Bonds (Suffolk University) | | 5.13 | | 7/1/2040 | | 210,000 | | 216,010 | |
Massachusetts Development Finance Agency, Revenue Bonds (Waste Management Inc. Project) | | 2.15 | | 5/1/2020 | | 2,500,000 | b | 2,511,900 | |
Massachusetts Development Finance Agency, Revenue Bonds (Wentworth Institute of Technology) | | 5.00 | | 10/1/2024 | | 550,000 | | 639,804 | |
Massachusetts Development Finance Agency, Revenue Bonds (Wentworth Institute of Technology) | | 5.00 | | 10/1/2020 | | 705,000 | | 732,121 | |
Massachusetts Development Finance Agency, Revenue Bonds (Williams College) Ser. S | | 5.00 | | 7/1/2030 | | 1,000,000 | | 1,284,070 | |
Massachusetts Development Finance Agency, Revenue Bonds, (Boston University Issue) Ser. DD | | 5.00 | | 4/1/2024 | | 1,075,000 | | 1,239,658 | |
Massachusetts Development Finance Agency, Revenue Bonds, (Brandeis University) Ser. S-2 | | 5.00 | | 10/1/2031 | | 1,000,000 | | 1,310,750 | |
Massachusetts Development Finance Agency, Revenue Bonds, (Brandeis University) Ser. S-3 | | 5.00 | | 10/1/2032 | | 1,410,000 | | 1,842,870 | |
Massachusetts Development Finance Agency, Revenue Bonds, Refunding (Babson College) Ser. A | | 5.00 | | 10/1/2025 | | 545,000 | | 668,203 | |
Massachusetts Development Finance Agency, Revenue Bonds, Refunding (Baystate Medical Center) Ser. N | | 5.00 | | 7/1/2024 | | 350,000 | | 409,413 | |
Massachusetts Development Finance Agency, Revenue Bonds, Refunding (Beth Israel Lahey Health) | | 5.00 | | 7/1/2026 | | 1,000,000 | | 1,236,210 | |
Massachusetts Development Finance Agency, Revenue Bonds, Refunding (Boston Medical Center) Ser. E | | 5.00 | | 7/1/2026 | | 500,000 | | 610,090 | |
Massachusetts Development Finance Agency, Revenue Bonds, Refunding (Boston Medical Center) Ser. E | | 5.00 | | 7/1/2025 | | 500,000 | | 596,150 | |
Massachusetts Development Finance Agency, Revenue Bonds, Refunding (Boston Medical Center) Ser. E | | 5.00 | | 7/1/2023 | | 2,060,000 | | 2,327,718 | |
Massachusetts Development Finance Agency, Revenue Bonds, Refunding (Boston University) Ser. BB2 | | 4.00 | | 10/1/2032 | | 1,000,000 | | 1,142,010 | |
Massachusetts Development Finance Agency, Revenue Bonds, Refunding (Caregroup) Ser. H1 | | 5.00 | | 7/1/2025 | | 800,000 | | 965,232 | |
Massachusetts Development Finance Agency, Revenue Bonds, Refunding (Caregroup) Ser. H1 | | 5.00 | | 7/1/2022 | | 1,000,000 | | 1,105,320 | |
Massachusetts Development Finance Agency, Revenue Bonds, Refunding (Caregroup) Ser. I | | 5.00 | | 7/1/2026 | | 1,000,000 | | 1,236,210 | |
Massachusetts Development Finance Agency, Revenue Bonds, Refunding (Caregroup) Ser. I | | 5.00 | | 7/1/2029 | | 2,000,000 | | 2,447,580 | |
Massachusetts Development Finance Agency, Revenue Bonds, Refunding (College of the Holy Cross) | | 5.00 | | 9/1/2026 | | 705,000 | | 886,467 | |
Massachusetts Development Finance Agency, Revenue Bonds, Refunding (Emerson College) | | 5.00 | | 1/1/2035 | | 1,000,000 | | 1,140,750 | |
Massachusetts Development Finance Agency, Revenue Bonds, Refunding (Emerson College) | | 5.00 | | 1/1/2025 | | 1,000,000 | | 1,175,400 | |
Massachusetts Development Finance Agency, Revenue Bonds, Refunding (Emerson College) Ser. A | | 5.00 | | 1/1/2035 | | 1,000,000 | | 1,212,320 | |
Massachusetts Development Finance Agency, Revenue Bonds, Refunding (Emerson College) Ser. A | | 5.00 | | 1/1/2033 | | 1,250,000 | | 1,524,788 | |
Massachusetts Development Finance Agency, Revenue Bonds, Refunding (Emmanuel College) Ser. A | | 5.00 | | 10/1/2043 | | 1,000,000 | | 1,156,770 | |
Massachusetts Development Finance Agency, Revenue Bonds, Refunding (Emmanuel College) Ser. A | | 5.00 | | 10/1/2030 | | 1,000,000 | | 1,195,100 | |
Massachusetts Development Finance Agency, Revenue Bonds, Refunding (Fisher College) | | 4.00 | | 7/1/2022 | | 655,000 | | 688,634 | |
Massachusetts Development Finance Agency, Revenue Bonds, Refunding (Fisher College) | | 4.00 | | 7/1/2021 | | 625,000 | | 646,713 | |
Massachusetts Development Finance Agency, Revenue Bonds, Refunding (Fisher College) | | 5.00 | | 7/1/2037 | | 1,600,000 | | 1,853,584 | |
57
STATEMENT OF INVESTMENTS (continued)
| | | | | | | | | | |
| |
BNY Mellon Massachusetts Intermediate Municipal Bond Fund (continued) |
Description | Coupon
Rate (%) | | Maturity
Date | | Principal
Amount ($) | | Value ($) | |
Long-Term Municipal Investments - 101.4% (continued) | | | | | |
Massachusetts - 88.3% (continued) | | | | | |
Massachusetts Development Finance Agency, Revenue Bonds, Refunding (Fisher College) | | 5.00 | | 4/1/2035 | | 840,000 | | 996,500 | |
Massachusetts Development Finance Agency, Revenue Bonds, Refunding (Fisher College) | | 5.00 | | 4/1/2033 | | 390,000 | | 465,371 | |
Massachusetts Development Finance Agency, Revenue Bonds, Refunding (Fisher College) | | 5.00 | | 4/1/2032 | | 370,000 | | 443,016 | |
Massachusetts Development Finance Agency, Revenue Bonds, Refunding (Fisher College) | | 5.00 | | 4/1/2031 | | 350,000 | | 421,253 | |
Massachusetts Development Finance Agency, Revenue Bonds, Refunding (Fisher College) | | 5.00 | | 4/1/2037 | | 835,000 | | 984,883 | |
Massachusetts Development Finance Agency, Revenue Bonds, Refunding (Harvard University) Ser. A | | 5.00 | | 7/15/2027 | | 3,200,000 | | 4,042,176 | |
Massachusetts Development Finance Agency, Revenue Bonds, Refunding (International Charter School) | | 5.00 | | 4/15/2033 | | 3,410,000 | | 3,777,359 | |
Massachusetts Development Finance Agency, Revenue Bonds, Refunding (International Charter School) | | 5.00 | | 4/15/2040 | | 1,730,000 | | 1,887,966 | |
Massachusetts Development Finance Agency, Revenue Bonds, Refunding (Lesley University) | | 5.00 | | 7/1/2031 | | 1,000,000 | | 1,219,090 | |
Massachusetts Development Finance Agency, Revenue Bonds, Refunding (MCPHS University) Ser. H | | 5.00 | | 7/1/2037 | | 465,000 | | 547,612 | |
Massachusetts Development Finance Agency, Revenue Bonds, Refunding (Northeastern University) Ser. A | | 5.00 | | 10/1/2033 | | 500,000 | | 643,015 | |
Massachusetts Development Finance Agency, Revenue Bonds, Refunding (Northeastern University) Ser. A | | 5.00 | | 10/1/2032 | | 750,000 | | 966,848 | |
Massachusetts Development Finance Agency, Revenue Bonds, Refunding (Park School) | | 5.00 | | 9/1/2021 | | 300,000 | | 321,438 | |
Massachusetts Development Finance Agency, Revenue Bonds, Refunding (Partners Healthcare System) | | 4.00 | | 7/1/2036 | | 2,480,000 | | 2,851,926 | |
Massachusetts Development Finance Agency, Revenue Bonds, Refunding (Partners Healthcare System) | | 4.00 | | 7/1/2032 | | 2,000,000 | | 2,275,760 | |
Massachusetts Development Finance Agency, Revenue Bonds, Refunding (Partners Healthcare System) Ser. S5,1 Month MUNIPSA +.42% | | 1.77 | | 1/27/2022 | | 1,500,000 | a | 1,500,180 | |
Massachusetts Development Finance Agency, Revenue Bonds, Refunding (Simmons College) Ser. K1 | | 5.00 | | 10/1/2029 | | 1,000,000 | | 1,190,930 | |
Massachusetts Development Finance Agency, Revenue Bonds, Refunding (Simmons College) Ser. K1 | | 5.00 | | 10/1/2025 | | 700,000 | | 838,236 | |
Massachusetts Development Finance Agency, Revenue Bonds, Refunding (South Shore Hospital) Ser. I | | 5.00 | | 7/1/2021 | | 500,000 | | 532,130 | |
Massachusetts Development Finance Agency, Revenue Bonds, Refunding (South Shore Hospital) Ser. I | | 5.00 | | 7/1/2028 | | 750,000 | | 908,130 | |
Massachusetts Development Finance Agency, Revenue Bonds, Refunding (South Shore Hospital) Ser. I | | 5.00 | | 7/1/2024 | | 530,000 | | 616,194 | |
Massachusetts Development Finance Agency, Revenue Bonds, Refunding (South Shore Hospital) Ser. I | | 5.00 | | 7/1/2025 | | 500,000 | | 596,765 | |
Massachusetts Development Finance Agency, Revenue Bonds, Refunding (Sterling & Francine Clark) | | 5.00 | | 7/1/2028 | | 1,000,000 | | 1,261,450 | |
Massachusetts Development Finance Agency, Revenue Bonds, Refunding (Sterling & Francine Clark) | | 5.00 | | 7/1/2031 | | 2,050,000 | | 2,552,598 | |
Massachusetts Development Finance Agency, Revenue Bonds, Refunding (Sterling & Francine Clark) | | 5.00 | | 7/1/2032 | | 1,910,000 | | 2,294,426 | |
Massachusetts Development Finance Agency, Revenue Bonds, Refunding (Suffolk University) | | 5.00 | | 7/1/2025 | | 1,340,000 | | 1,610,090 | |
Massachusetts Development Finance Agency, Revenue Bonds, Refunding (Suffolk University) | | 5.00 | | 7/1/2028 | | 1,300,000 | | 1,611,649 | |
Massachusetts Development Finance Agency, Revenue Bonds, Refunding (Suffolk University) | | 5.00 | | 7/1/2027 | | 600,000 | | 746,592 | |
Massachusetts Development Finance Agency, Revenue Bonds, Refunding (Suffolk University) | | 5.00 | | 7/1/2023 | | 2,500,000 | | 2,839,900 | |
58
| | | | | | | | | | |
| |
BNY Mellon Massachusetts Intermediate Municipal Bond Fund (continued) |
Description | Coupon
Rate (%) | | Maturity
Date | | Principal
Amount ($) | | Value ($) | |
Long-Term Municipal Investments - 101.4% (continued) | | | | | |
Massachusetts - 88.3% (continued) | | | | | |
Massachusetts Development Finance Agency, Revenue Bonds, Refunding (Suffolk University) | | 5.00 | | 7/1/2028 | | 525,000 | | 664,781 | |
Massachusetts Development Finance Agency, Revenue Bonds, Refunding (Suffolk University) | | 5.00 | | 7/1/2029 | | 2,250,000 | | 2,770,762 | |
Massachusetts Development Finance Agency, Revenue Bonds, Refunding (The Broad Institute) | | 5.00 | | 4/1/2036 | | 2,000,000 | | 2,505,720 | |
Massachusetts Development Finance Agency, Revenue Bonds, Refunding (Umass Memorial Health Care) Ser. I | | 5.00 | | 7/1/2036 | | 1,340,000 | | 1,584,684 | |
Massachusetts Development Finance Agency, Revenue Bonds, Refunding (Umass Memorial Health Care) Ser. I | | 5.00 | | 7/1/2024 | | 1,000,000 | | 1,163,640 | |
Massachusetts Development Finance Agency, Revenue Bonds, Refunding (Umass Memorial Health Care) Ser. I | | 5.00 | | 7/1/2028 | | 1,000,000 | | 1,218,040 | |
Massachusetts Development Finance Agency, Revenue Bonds, Refunding (Umass Memorial Health Care) Ser. I | | 5.00 | | 7/1/2025 | | 2,375,000 | | 2,837,555 | |
Massachusetts Development Finance Agency, Revenue Bonds, Refunding (Umass Memorial Health Care) Ser. K | | 5.00 | | 7/1/2022 | | 490,000 | | 538,299 | |
Massachusetts Development Finance Agency, Revenue Bonds, Refunding (Umass Memorial Health Care) Ser. K | | 5.00 | | 7/1/2024 | | 815,000 | | 948,367 | |
Massachusetts Development Finance Agency, Revenue Bonds, Refunding (WellsForce) Ser. A | | 5.00 | | 7/1/2031 | | 1,350,000 | | 1,689,228 | |
Massachusetts Development Finance Agency, Revenue Bonds, Refunding (WellsForce) Ser. A | | 5.00 | | 7/1/2030 | | 2,075,000 | | 2,610,661 | |
Massachusetts Development Finance Agency, Revenue Bonds, Refunding (Western New England University) | | 5.00 | | 9/1/2024 | | 1,090,000 | | 1,269,741 | |
Massachusetts Development Finance Agency, Revenue Bonds, Refunding (Western New England University) | | 5.00 | | 9/1/2035 | | 1,000,000 | | 1,150,210 | |
Massachusetts Development Finance Agency, Revenue Bonds, Refunding (Western New England University) | | 5.00 | | 9/1/2026 | | 1,205,000 | | 1,470,799 | |
Massachusetts Development Finance Agency, Revenue Bonds, Refunding (Western New England University) | | 5.00 | | 9/1/2040 | | 2,650,000 | | 3,017,952 | |
Massachusetts Development Finance Agency, Revenue Bonds, Refunding (Western New England University) | | 5.00 | | 9/1/2033 | | 500,000 | | 613,320 | |
Massachusetts Development Finance Agency, Revenue Bonds, Refunding (Western New England University) | | 5.00 | | 9/1/2032 | | 500,000 | | 615,635 | |
Massachusetts Development Finance Agency, Revenue Bonds, Refunding (WGBH Educational Foundation) | | 3.00 | | 1/1/2025 | | 190,000 | | 206,414 | |
Massachusetts Development Finance Agency, Revenue Bonds, Refunding (WGBH Educational Foundation) | | 4.00 | | 1/1/2026 | | 130,000 | | 150,704 | |
Massachusetts Development Finance Agency, Revenue Bonds, Refunding (WGBH Educational Foundation) | | 5.00 | | 1/1/2028 | | 140,000 | | 173,705 | |
Massachusetts Development Finance Agency, Revenue Bonds, Refunding (WGBH Educational Foundation) | | 5.00 | | 1/1/2029 | | 200,000 | | 246,976 | |
Massachusetts Development Finance Agency, Revenue Bonds, Refunding (WGBH Educational Foundation) | | 5.00 | | 1/1/2023 | | 250,000 | | 282,275 | |
Massachusetts Development Finance Agency, Revenue Bonds, Refunding (WGBH Educational Foundation) | | 5.00 | | 1/1/2027 | | 310,000 | | 387,261 | |
Massachusetts Development Finance Agency, Revenue Bonds, Refunding (WGBH Educational Foundation) | | 5.00 | | 1/1/2030 | | 410,000 | | 504,862 | |
Massachusetts Development Finance Agency, Revenue Bonds, Refunding (WGBH Educational Foundation) | | 5.00 | | 1/1/2021 | | 100,000 | | 105,115 | |
Massachusetts Development Finance Agency, Revenue Bonds, Refunding (WGBH Educational Foundation) | | 5.00 | | 1/1/2022 | | 200,000 | | 218,126 | |
Massachusetts Development Finance Agency, Revenue Bonds, Refunding (WGBH Educational Foundation) | | 5.00 | | 1/1/2031 | | 415,000 | | 508,782 | |
Massachusetts Development Finance Agency, Revenue Bonds, Refunding (Wheaton College) Ser. H | | 5.00 | | 1/1/2023 | | 1,935,000 | | 2,174,669 | |
Massachusetts Development Finance Agency, Revenue Bonds, Refunding (Woods Hole Oceanographic Institution) | | 5.00 | | 6/1/2026 | | 850,000 | | 1,061,582 | |
Massachusetts Development Finance Agency, Revenue Bonds, Refunding (Woods Hole Oceanographic Institution) | | 5.00 | | 6/1/2025 | | 450,000 | | 546,944 | |
59
STATEMENT OF INVESTMENTS (continued)
| | | | | | | | | | |
| |
BNY Mellon Massachusetts Intermediate Municipal Bond Fund (continued) |
Description | Coupon
Rate (%) | | Maturity
Date | | Principal
Amount ($) | | Value ($) | |
Long-Term Municipal Investments - 101.4% (continued) | | | | | |
Massachusetts - 88.3% (continued) | | | | | |
Massachusetts Development Finance Agency, Revenue Bonds, Refunding, (Olin College) Ser. E | | 5.00 | | 11/1/2038 | | 4,500,000 | | 5,110,785 | |
Massachusetts Development Finance Agency, Revenue Bonds, Refunding, (Simmons College) Ser. J | | 5.25 | | 10/1/2024 | | 465,000 | | 534,387 | |
Massachusetts Development Finance Agency, Revenue Bonds, Refunding, (Williams College) Ser. P | | 5.00 | | 7/1/2024 | | 3,250,000 | | 3,724,597 | |
Massachusetts Development Finance Agency, Revenue Bonds, Refunding, Ser. A | | 5.00 | | 7/1/2029 | | 1,050,000 | | 1,330,665 | |
Massachusetts Development Finance Agency, Revenue Bonds, Refunding, Ser. O | | 5.00 | | 12/1/2033 | | 160,000 | | 207,717 | |
Massachusetts Development Finance Agency, Revenue Bonds, Refunding, Ser. O | | 5.00 | | 12/1/2034 | | 200,000 | | 258,704 | |
Massachusetts Development Finance Agency, Revenue Bonds, Refunding, Ser. O | | 5.00 | | 12/1/2032 | | 250,000 | | 326,303 | |
Massachusetts Development Finance Agency, Revenue Bonds, Refunding, Ser. O | | 5.00 | | 12/1/2025 | | 1,140,000 | | 1,395,793 | |
Massachusetts Development Finance Agency, Revenue Bonds, Refunding, Ser. O | | 5.00 | | 12/1/2026 | | 1,000,000 | | 1,255,520 | |
Massachusetts Development Finance Agency, Revenue Bonds, Refunding, Ser. O | | 5.00 | | 12/1/2031 | | 250,000 | | 328,085 | |
Massachusetts Development Finance Agency, Revenue Bonds, Refunding, Ser. O | | 5.00 | | 12/1/2035 | | 200,000 | | 257,858 | |
Massachusetts Educational Financing Authority, Revenue Bonds, Refunding (Issue J) | | 5.00 | | 7/1/2021 | | 2,350,000 | | 2,506,721 | |
Massachusetts Educational Financing Authority, Revenue Bonds, Refunding (Issue K) Ser. A | | 5.00 | | 7/1/2024 | | 3,000,000 | | 3,487,890 | |
Massachusetts Educational Financing Authority, Revenue Bonds, Refunding (Issue L) Ser. B | | 5.00 | | 7/1/2023 | | 2,300,000 | | 2,608,085 | |
Massachusetts Educational Financing Authority, Revenue Bonds, Ser. A | | 5.00 | | 1/1/2020 | | 1,400,000 | | 1,416,800 | |
Massachusetts Federal Highway Grant, GAN, Refunding, Ser. A | | 5.00 | | 6/15/2027 | | 2,500,000 | | 3,136,250 | |
Massachusetts Federal Highway Grant, GAN, Ser. A | | 5.00 | | 6/15/2027 | | 2,000,000 | | 2,370,960 | |
Massachusetts Federal Highway Grant, GAN, Ser. A | | 5.00 | | 6/15/2025 | | 4,000,000 | | 4,747,960 | |
Massachusetts Health & Educational Facilities Authority, Revenue Bonds (Dana-Farber Cancer Institute) Ser. K | | 5.25 | | 12/1/2022 | | 2,750,000 | | 2,750,000 | |
Massachusetts Health & Educational Facilities Authority, Revenue Bonds (Museum of Fine Arts) (SPA; Wells Fargo Bank NA) Ser. A1 | | 1.32 | | 12/1/2037 | | 1,100,000 | e | 1,100,000 | |
Massachusetts Health & Educational Facilities Authority, Revenue Bonds (University of Massachusetts) Ser. A | | 1.85 | | 4/1/2022 | | 1,250,000 | | 1,274,963 | |
Massachusetts Health & Educational Facilities Authority, Revenue Bonds, (Massachusetts Institute of Technology) Ser. K | | 5.50 | | 7/1/2022 | | 1,800,000 | | 2,027,898 | |
Massachusetts Health & Educational Facilities Authority, Revenue Bonds, Refunding (Baystate Medical Center) (LOC; TD Bank NA) Ser. G | | 1.37 | | 7/1/2026 | | 1,900,000 | d | 1,900,000 | |
Massachusetts Health & Educational Facilities Authority, Revenue Bonds, Refunding (Berklee College of Music) | | 5.00 | | 10/1/2032 | | 125,000 | | 125,375 | |
Massachusetts Health & Educational Facilities Authority, Revenue Bonds, Refunding (Massachusetts Institute of Technology) Ser. L | | 5.00 | | 7/1/2023 | | 3,335,000 | | 3,838,251 | |
Massachusetts Health & Educational Facilities Authority, Revenue Bonds, Refunding (Northeastern University) Ser. A | | 5.00 | | 10/1/2030 | | 3,000,000 | | 3,111,480 | |
Massachusetts Health & Educational Facilities Authority, Revenue Bonds, Refunding (Tufts University) Ser. M | | 5.25 | | 2/15/2026 | | 3,130,000 | | 3,935,005 | |
Massachusetts Housing Finance Agency, Revenue Bonds, Refunding (Single Family Housing) (Insured: GNMA, FNMA and FHLMC) Ser. 195 | | 4.00 | | 12/1/2048 | | 1,240,000 | | 1,350,422 | |
Massachusetts Housing Finance Agency, Revenue Bonds, Refunding (Single Family Housing) Ser. 183 | | 3.50 | | 12/1/2046 | | 1,255,000 | | 1,312,303 | |
60
| | | | | | | | | | |
| |
BNY Mellon Massachusetts Intermediate Municipal Bond Fund (continued) |
Description | Coupon
Rate (%) | | Maturity
Date | | Principal
Amount ($) | | Value ($) | |
Long-Term Municipal Investments - 101.4% (continued) | | | | | |
Massachusetts - 88.3% (continued) | | | | | |
Massachusetts Housing Finance Agency, Revenue Bonds, Refunding, Ser. 207 | | 4.00 | | 6/1/2049 | | 2,700,000 | | 2,980,368 | |
Massachusetts Housing Finance Agency, Revenue Bonds, Ser. F | | 2.95 | | 12/1/2032 | | 1,000,000 | | 1,029,670 | |
Massachusetts Port Authority, Revenue Bonds, Refunding, Ser. A | | 5.00 | | 7/1/2028 | | 2,000,000 | | 2,570,240 | |
Massachusetts Port Authority, Revenue Bonds, Refunding, Ser. A | | 5.00 | | 7/1/2027 | | 2,000,000 | | 2,523,800 | |
Massachusetts Port Authority, Revenue Bonds, Refunding, Ser. A | | 5.00 | | 7/1/2028 | | 1,330,000 | | 1,573,550 | |
Massachusetts Port Authority, Revenue Bonds, Refunding, Ser. B | | 5.00 | | 7/1/2030 | | 1,375,000 | | 1,515,773 | |
Massachusetts Port Authority, Revenue Bonds, Refunding, Ser. B | | 5.00 | | 7/1/2031 | | 1,500,000 | | 1,652,685 | |
Massachusetts Port Authority, Revenue Bonds, Refunding, Ser. C | | 5.00 | | 7/1/2032 | | 750,000 | | 878,955 | |
Massachusetts Port Authority, Revenue Bonds, Refunding, Ser. C | | 5.00 | | 7/1/2033 | | 2,000,000 | | 2,343,720 | |
Massachusetts Port Authority, Revenue Bonds, Ser. A | | 5.00 | | 7/1/2027 | | 1,345,000 | | 1,479,150 | |
Massachusetts Port Authority, Revenue Bonds, Ser. B | | 5.00 | | 7/1/2024 | | 315,000 | | 370,242 | |
Massachusetts Port Authority, Revenue Bonds, Ser. B | | 5.00 | | 7/1/2028 | | 200,000 | | 239,728 | |
Massachusetts Port Authority, Revenue Bonds, Ser. B | | 5.00 | | 7/1/2029 | | 200,000 | | 239,350 | |
Massachusetts Port Authority, Revenue Bonds, Ser. C | | 5.00 | | 7/1/2030 | | 1,635,000 | | 2,121,707 | |
Massachusetts School Building Authority, Revenue Bonds, Refunding, Ser. A | | 5.00 | | 8/15/2026 | | 2,000,000 | | 2,225,720 | |
Massachusetts School Building Authority, Revenue Bonds, Refunding, Ser. B | | 5.00 | | 8/15/2029 | | 2,700,000 | | 2,998,080 | |
Massachusetts School Building Authority, Revenue Bonds, Refunding, Ser. C | | 4.00 | | 8/15/2032 | | 2,500,000 | | 2,841,350 | |
Massachusetts Transportation Fund, Revenue Bonds Ser. A | | 5.00 | | 6/1/2036 | | 1,000,000 | | 1,165,110 | |
Massachusetts Transportation Trust Fund Metropolitan Highway, Revenue Bonds, Refunding, Ser. A | | 5.00 | | 1/1/2023 | | 5,000,000 | | 5,610,600 | |
Massachusetts Water Resources Authority, Revenue Bonds, Refunding (Green Bond) Ser. B | | 5.00 | | 8/1/2028 | | 1,925,000 | | 2,409,041 | |
Massachusetts Water Resources Authority, Revenue Bonds, Refunding (Green Bond) Ser. B | | 5.00 | | 8/1/2033 | | 2,500,000 | | 3,084,225 | |
Massachusetts Water Resources Authority, Revenue Bonds, Refunding (Green Bond) Ser. B | | 5.00 | | 8/1/2029 | | 2,590,000 | | 3,236,904 | |
Massachusetts Water Resources Authority, Revenue Bonds, Refunding (Insured; Assured Guaranty Municipal Corp.) Ser. B | | 5.25 | | 8/1/2028 | | 2,000,000 | | 2,681,080 | |
Metropolitan Boston Transit Parking Corp., Revenue Bonds, Refunding | | 5.00 | | 7/1/2041 | | 2,000,000 | | 2,125,520 | |
Minuteman Regional Vocational Technical School District, GO (School Bonds) | | 5.00 | | 10/15/2028 | | 1,055,000 | | 1,330,186 | |
Minuteman Regional Vocational Technical School District, GO (School Bonds) | | 5.00 | | 10/15/2026 | | 915,000 | | 1,161,794 | |
Minuteman Regional Vocational Technical School District, GO (School Bonds) | | 5.00 | | 10/15/2027 | | 525,000 | | 663,789 | |
Mount Greylock Regional School District, GO | | 4.00 | | 6/15/2028 | | 420,000 | | 471,950 | |
Mount Greylock Regional School District, GO | | 4.00 | | 6/15/2027 | | 640,000 | | 720,621 | |
Mount Greylock Regional School District, GO | | 4.00 | | 6/15/2030 | | 315,000 | | 351,127 | |
Mount Greylock Regional School District, GO | | 4.00 | | 6/15/2029 | | 745,000 | | 834,586 | |
Natick, GO (Municipal Purpose Loan) | | 4.00 | | 7/15/2033 | | 3,000,000 | | 3,543,780 | |
Natick, GO (Municipal Purpose Loan) | | 5.00 | | 7/15/2029 | | 2,000,000 | | 2,572,800 | |
Plainville, GO (Municipal Purpose Loan) | | 4.00 | | 10/15/2030 | | 1,210,000 | | 1,454,735 | |
Randolph, GO, Refunding | | 5.00 | | 9/15/2031 | | 595,000 | | 760,190 | |
The Massachusetts Clean Water Trust, Revenue Bonds (Green Bond) Ser. 20 | | 5.00 | | 2/1/2035 | | 990,000 | | 1,180,209 | |
61
STATEMENT OF INVESTMENTS (continued)
| | | | | | | | | | |
| |
BNY Mellon Massachusetts Intermediate Municipal Bond Fund (continued) |
Description | Coupon
Rate (%) | | Maturity
Date | | Principal
Amount ($) | | Value ($) | |
Long-Term Municipal Investments - 101.4% (continued) | | | | | |
Massachusetts - 88.3% (continued) | | | | | |
The Massachusetts Clean Water Trust, Revenue Bonds (Green Bond) Ser. 20 | | 5.00 | | 2/1/2033 | | 2,300,000 | | 2,752,410 | |
The Massachusetts Clean Water Trust, Revenue Bonds (Green Bond) Ser. 21 | | 5.00 | | 8/1/2035 | | 2,250,000 | | 2,900,362 | |
The Massachusetts Clean Water Trust, Revenue Bonds, Refunding, Ser. A | | 5.75 | | 8/1/2029 | | 155,000 | | 155,533 | |
University of Massachusetts Building Authority, Revenue Bonds, Refunding (University of Massachusetts) Ser. 3 | | 5.00 | | 11/1/2034 | | 2,200,000 | | 2,777,896 | |
University of Massachusetts Building Authority, Revenue Bonds, Ser. 1 | | 4.00 | | 11/1/2043 | | 3,500,000 | | 3,734,850 | |
Worcester, GO, Refunding | | 4.00 | | 1/15/2031 | | 2,235,000 | | 2,611,888 | |
Worcester, GO, Refunding | | 4.00 | | 1/15/2028 | | 800,000 | | 952,224 | |
Worcester, GO, Refunding, Ser. A | | 5.00 | | 1/15/2029 | | 1,690,000 | | 2,087,674 | |
| | 285,809,085 | |
Michigan - .7% | | | | | |
Michigan Finance Authority, Revenue Bonds, Refunding (Trinity Health Corp.) | | 5.00 | | 12/1/2033 | | 2,000,000 | | 2,184,120 | |
New Jersey - 3.4% | | | | | |
New Jersey Economic Development Authority, Revenue Bonds, (School Facilities Construction) (Insured; Assured Guaranty Municipal Corp.) Ser. UU-A | | 5.00 | | 6/15/2025 | | 2,000,000 | | 2,308,140 | |
New Jersey Economic Development Authority, Revenue Bonds, Refunding (Insured; American Municipal Bond Assurance Corp.) Ser. K | | 5.25 | | 12/15/2020 | | 1,760,000 | | 1,849,813 | |
New Jersey Economic Development Authority, Revenue Bonds, Refunding (Insured; National Public Finance Guarantee Corp.) Ser. K | | 5.25 | | 12/15/2021 | | 2,160,000 | | 2,345,803 | |
New Jersey Tobacco Settlement Financing Corp., Revenue Bonds, Refunding, Ser. A | | 5.00 | | 6/1/2031 | | 875,000 | | 1,069,136 | |
New Jersey Tobacco Settlement Financing Corp., Revenue Bonds, Refunding, Ser. A | | 5.00 | | 6/1/2029 | | 1,375,000 | | 1,701,178 | |
New Jersey Tobacco Settlement Financing Corp., Revenue Bonds, Refunding, Ser. A | | 5.00 | | 6/1/2028 | | 1,375,000 | | 1,710,514 | |
| | 10,984,584 | |
New Mexico - 1.1% | | | | | |
New Mexico Municipal Energy Acquisition Authority, Revenue Bonds, Refunding, Ser. A | | 5.00 | | 5/1/2025 | | 3,000,000 | | 3,554,460 | |
New York - 3.3% | | | | | |
Metropolitan Transportation Authority, Revenue Bonds, Refunding (Green Bond) Ser. A1 | | 5.00 | | 11/15/2024 | | 2,500,000 | | 2,955,850 | |
New York City Housing Development Corp., Revenue Bonds, Ser. B2 | | 5.25 | | 7/1/2032 | | 2,250,000 | | 2,548,057 | |
New York Liberty Development Corp., Revenue Bonds, Refunding (Bank of America Tower at One Bryant Park) | | 2.63 | | 9/15/2069 | | 2,675,000 | | 2,769,534 | |
New York Liberty Development Corp., Revenue Bonds, Refunding (Class 1-3 World Trade Center Project) | | 5.00 | | 11/15/2044 | | 2,250,000 | b | 2,499,278 | |
| | 10,772,719 | |
Texas - .9% | | | | | |
Arlington Higher Education Finance Corp., Revenue Bonds (Insured; Permanent School Fund) Ser. A | | 4.00 | | 8/15/2035 | | 500,000 | | 588,310 | |
Arlington Higher Education Finance Corp., Revenue Bonds (Insured; Permanent School Fund) Ser. A | | 4.00 | | 8/15/2031 | | 510,000 | | 607,308 | |
Houston Independent School District, GO, Refunding, Ser. C | | 4.00 | | 2/15/2030 | | 1,500,000 | | 1,633,485 | |
| | 2,829,103 | |
U.S. Related - .7% | | | | | |
Guam, Revenue Bonds, Ser. A | | 5.00 | | 1/1/2025 | | 1,500,000 | | 1,599,405 | |
Guam, Revenue Bonds, Ser. A | | 6.00 | | 11/1/2026 | | 500,000 | | 535,535 | |
62
| | | | | | | | | | |
| |
BNY Mellon Massachusetts Intermediate Municipal Bond Fund (continued) |
Description | Coupon
Rate (%) | | Maturity
Date | | Principal
Amount ($) | | Value ($) | |
Long-Term Municipal Investments - 101.4% (continued) | | | | | |
U.S. Related - .7% (continued) | | | | | |
Puerto Rico Infrastructure Financing Authority, Revenue Bonds, Ser. B | | 5.00 | | 7/1/2020 | | 650,000 | f | 154,375 | |
| | 2,289,315 | |
Total Investments(cost $310,617,338) | | 101.4% | 328,347,551 | |
Liabilities, Less Cash and Receivables | | (1.4%) | (4,545,841) | |
Net Assets | | 100.0% | 323,801,710 | |
a Variable rate security—rate shown is the interest rate in effect at period end.
b Security exempt from registration pursuant to Rule 144A under the Securities Act of 1933. These securities may be resold in transactions exempt from registration, normally to qualified institutional buyers. At August 31, 2019, these securities were valued at $9,572,265 or 2.96% of net assets.
c These securities are prerefunded; the date shown represents the prerefunded date. Bonds which are prerefunded are collateralized by U.S. Government securities which are held in escrow and are used to pay principal and interest on the municipal issue and to retire the bonds in full at the earliest refunding date.
d The Variable Rate shall be determined by the Remarketing Agent in its sole discretion based on prevailing market conditions and may, but need not, be established by reference to one or more financial indices.
e Auction Rate Security—interest rate is reset periodically under an auction process that is conducted by an auction agent. Rate shown is the interest rate in effect at period end.
f Non-income producing—security in default.
| | |
Portfolio Summary (Unaudited)† | Value (%) |
Education | 32.8 |
Medical | 15.5 |
General Obligation | 11.4 |
Transportation | 10.9 |
General | 6.8 |
Water | 4.8 |
Development | 3.9 |
Student Loan | 3.1 |
School District | 2.7 |
Single Family Housing | 1.7 |
Power | 1.7 |
Prerefunded | 1.4 |
Tobacco Settlement | 1.4 |
Multifamily Housing | 1.1 |
Pollution | .8 |
Facilities | .7 |
Airport | .7 |
| | 101.4 |
† Based on net assets.
See notes to financial statements.
63
STATEMENT OF INVESTMENTS (continued)
| | | | | | | | | | |
| |
BNY Mellon New York Intermediate Tax-Exempt Bond Fund |
Description | Coupon
Rate (%) | | Maturity
Date | | Principal
Amount ($) | | Value ($) | |
Long-Term Municipal Investments - 100.8% | | | | | |
Alabama - 1.1% | | | | | |
Black Belt Energy Gas District, Revenue Bonds, Refunding (Project No. 4) Ser. A1 | | 4.00 | | 12/1/2025 | | 1,500,000 | | 1,700,925 | |
Florida - .5% | | | | | |
Orange County Health Facilities Authority, Revenue Bonds, Refunding (Orlando Health Obligated Group) | | 5.00 | | 10/1/2024 | | 750,000 | | 892,185 | |
Illinois - 1.7% | | | | | |
Chicago II, GO, Ser. 2002B | | 5.25 | | 1/1/2022 | | 1,150,000 | | 1,226,590 | |
Illinois, GO, Ser. D | | 5.00 | | 11/1/2026 | | 1,250,000 | | 1,449,438 | |
| | 2,676,028 | |
Michigan - .8% | | | | | |
Michigan Finance Authority, Revenue Bonds, Refunding (Trinity Health Corp.) | | 5.00 | | 12/1/2033 | | 1,150,000 | | 1,255,869 | |
New Jersey - 3.8% | | | | | |
New Jersey Economic Development Authority, Revenue Bonds, Refunding (Insured; American Municipal Bond Assurance Corp.) Ser. K | | 5.25 | | 12/15/2020 | | 1,000,000 | | 1,051,030 | |
New Jersey Economic Development Authority, Revenue Bonds, Refunding (Insured; National Public Finance Guarantee Corp.) Ser. K | | 5.25 | | 12/15/2021 | | 1,265,000 | | 1,373,815 | |
New Jersey Economic Development Authority, Revenue Bonds, Refunding, Ser. II | | 5.00 | | 3/1/2025 | | 1,070,000 | | 1,157,558 | |
New Jersey Tobacco Settlement Financing Corp., Revenue Bonds, Refunding, Ser. A | | 5.00 | | 6/1/2031 | | 500,000 | | 610,935 | |
New Jersey Tobacco Settlement Financing Corp., Revenue Bonds, Refunding, Ser. A | | 5.00 | | 6/1/2029 | | 750,000 | | 927,915 | |
New Jersey Tobacco Settlement Financing Corp., Revenue Bonds, Refunding, Ser. A | | 5.00 | | 6/1/2028 | | 750,000 | | 933,008 | |
| | 6,054,261 | |
New Mexico - 1.1% | | | | | |
New Mexico Municipal Energy Acquisition Authority, Revenue Bonds, Refunding, Ser. A | | 5.00 | | 5/1/2025 | | 1,500,000 | | 1,777,230 | |
New York - 91.1% | | | | | |
Albany County Airport Authority, Revenue Bonds, Refunding (Insured; Assured Guaranty Municipal Corp.) Ser. A | | 5.00 | | 12/15/2023 | | 1,500,000 | | 1,544,130 | |
Battery Park City Authority, Revenue Bonds, Refunding, Ser. A | | 5.00 | | 11/1/2023 | | 1,065,000 | | 1,240,331 | |
Build NYC Resource Corp., Revenue Bonds, Refunding (YMCA of Greater New York Project) | | 5.00 | | 8/1/2029 | | 200,000 | | 236,098 | |
Build NYC Resource Corp., Revenue Bonds, Refunding (YMCA of Greater New York Project) | | 5.00 | | 8/1/2027 | | 300,000 | | 357,045 | |
Build NYC Resource Corp., Revenue Bonds, Refunding (YMCA of Greater New York Project) | | 5.00 | | 8/1/2026 | | 350,000 | | 417,806 | |
Dutchess County Local Development Corp., Revenue Bonds (Health Quest Systems) Ser. B | | 5.00 | | 7/1/2026 | | 1,000,000 | | 1,240,630 | |
Dutchess County Local Development Corp., Revenue Bonds, Refunding (The Culinary Institute of America Project) | | 5.00 | | 7/1/2028 | | 1,000,000 | | 1,268,130 | |
Dutchess County Local Development Corp., Revenue Bonds, Refunding (The Culinary Institute of America Project) | | 5.00 | | 7/1/2033 | | 920,000 | | 1,139,558 | |
Dutchess County Local Development Corp., Revenue Bonds, Refunding (The Culinary Institute of America Project) | | 5.00 | | 7/1/2026 | | 525,000 | | 640,595 | |
Dutchess County Local Development Corp., Revenue Bonds, Refunding (The Culinary Institute of America Project) | | 5.00 | | 7/1/2027 | | 1,000,000 | | 1,243,490 | |
East Ramapo Central School District, GO, Refunding (Insured; Assured Guaranty Municipal Corp.) | | 5.00 | | 12/15/2024 | | 1,240,000 | | 1,482,866 | |
Haverstraw-Stony Point Central School District, GO, Refunding (Insured; Assured Guaranty Municipal Corp.) | | 5.00 | | 10/15/2034 | | 730,000 | | 836,690 | |
Haverstraw-Stony Point Central School District, GO, Refunding (Insured; Assured Guaranty Municipal Corp.) | | 5.00 | | 10/15/2033 | | 725,000 | | 832,336 | |
64
| | | | | | | | | | |
| |
BNY Mellon New York Intermediate Tax-Exempt Bond Fund (continued) |
Description | Coupon
Rate (%) | | Maturity
Date | | Principal
Amount ($) | | Value ($) | |
Long-Term Municipal Investments - 100.8% (continued) | | | | | |
New York - 91.1% (continued) | | | | | |
Hudson Yards Infrastructure Corp., Revenue Bonds, Refunding, Ser. A | | 5.00 | | 2/15/2033 | | 1,310,000 | | 1,642,334 | |
Island Trees Union Free School District, GO, Refunding | | 3.00 | | 5/15/2030 | | 615,000 | | 673,474 | |
Johnstown City School District, GO, Refunding (Insured; Build America Mutual Assurance Company) | | 3.00 | | 6/15/2028 | | 1,100,000 | | 1,211,276 | |
Metropolitan Transportation Authority, Revenue Bonds (Green Bond) Ser. A | | 5.00 | | 11/15/2035 | | 1,570,000 | | 1,952,593 | |
Metropolitan Transportation Authority, Revenue Bonds (Green Bond) Ser. B2 | | 4.00 | | 11/15/2033 | | 1,000,000 | | 1,160,630 | |
Metropolitan Transportation Authority, Revenue Bonds, Refunding (Green Bond) Ser. A1 | | 5.00 | | 11/15/2024 | | 2,300,000 | | 2,719,382 | |
Metropolitan Transportation Authority, Revenue Bonds, Refunding (Green Bond) Ser. C1 | | 5.00 | | 11/15/2025 | | 1,000,000 | | 1,222,900 | |
Metropolitan Transportation Authority, Revenue Bonds, Refunding, Ser. A | | 5.25 | | 11/15/2035 | | 1,000,000 | | 1,258,840 | |
Metropolitan Transportation Authority, Revenue Bonds, Refunding, Ser. B | | 5.00 | | 11/15/2035 | | 1,215,000 | | 1,481,875 | |
Metropolitan Transportation Authority, Revenue Bonds, Refunding, Ser. C1 | | 5.25 | | 11/15/2030 | | 1,000,000 | | 1,224,110 | |
Metropolitan Transportation Authority, Revenue Bonds, Ser. B | | 5.00 | | 11/15/2038 | | 1,010,000 | | 1,129,190 | |
Nassau County, GO, Refunding, Ser. B | | 5.00 | | 4/1/2036 | | 1,000,000 | | 1,221,420 | |
New York & New Jersey Port Authority, Revenue Bonds, Refunding, Ser. 189 | | 5.00 | | 5/1/2030 | | 1,000,000 | | 1,211,850 | |
New York & New Jersey Port Authority, Revenue Bonds, Refunding, Ser. 207 | | 5.00 | | 9/15/2024 | | 3,000,000 | | 3,541,380 | |
New York City, GO (LOC; Bank of America NA) Ser. L3 | | 1.45 | | 4/1/2036 | | 100,000 | a | 100,000 | |
New York City, GO, Refunding, Ser. E | | 5.00 | | 8/1/2033 | | 1,000,000 | | 1,295,400 | |
New York City, GO, Refunding, Ser. J | | 5.00 | | 8/1/2025 | | 1,335,000 | | 1,532,994 | |
New York City, GO, Ser. E1 | | 5.25 | | 3/1/2031 | | 1,065,000 | | 1,388,717 | |
New York City Housing Development Corp., Revenue Bonds, Refunding, Ser. A | | 4.00 | | 7/1/2024 | | 1,150,000 | | 1,261,251 | |
New York City Housing Development Corp., Revenue Bonds, Ser. A1 | | 3.38 | | 11/15/2029 | | 1,000,000 | | 1,066,720 | |
New York City Housing Development Corp., Revenue Bonds, Ser. B2 | | 5.00 | | 7/1/2025 | | 1,500,000 | | 1,709,070 | |
New York City Housing Development Corp., Revenue Bonds, Ser. B2 | | 5.25 | | 7/1/2032 | | 1,500,000 | | 1,698,705 | |
New York City Industrial Development Agency, Revenue Bonds (Yankee Stadium Project) (Insured; Assured Guaranty Corp.) | | 7.00 | | 3/1/2049 | | 1,000,000 | | 1,004,890 | |
New York City Transitional Finance Authority, Revenue Bonds | | 5.25 | | 8/1/2037 | | 1,000,000 | | 1,292,360 | |
New York City Transitional Finance Authority, Revenue Bonds (Insured; State Aid Withholding) Ser. S3 | | 5.25 | | 7/15/2036 | | 1,000,000 | | 1,284,880 | |
New York City Transitional Finance Authority, Revenue Bonds, Refunding, Ser. F1 | | 5.00 | | 5/1/2029 | | 2,000,000 | | 2,200,120 | |
New York City Transitional Finance Authority, Revenue Bonds, Ser. C2 | | 2.98 | | 11/1/2027 | | 1,050,000 | | 1,128,740 | |
New York City Trust for Cultural Resources, Revenue Bonds (Wildlife Conservation Society) Ser. A | | 5.00 | | 8/1/2031 | | 1,480,000 | | 1,685,912 | |
New York City Trust for Cultural Resources, Revenue Bonds, Refunding (Carnegie Hall) | | 5.00 | | 12/1/2033 | | 1,000,000 | | 1,321,190 | |
New York City Trust for Cultural Resources, Revenue Bonds, Refunding (Lincoln Center Performing Arts) Ser. A | | 5.00 | | 12/1/2026 | | 1,075,000 | | 1,360,724 | |
New York City Trust for Cultural Resources, Revenue Bonds, Refunding (The American Museum of Natural History) Ser. A | | 5.00 | | 7/1/2037 | | 1,000,000 | | 1,163,530 | |
New York City Water & Sewer System, Revenue Bonds, Refunding (SPA; Mizuho Bank Ltd.) Ser. AA5 | | 1.52 | | 6/15/2048 | | 200,000 | a | 200,000 | |
New York City Water & Sewer System, Revenue Bonds, Refunding, Ser. AA | | 5.00 | | 6/15/2027 | | 2,000,000 | | 2,586,100 | |
65
STATEMENT OF INVESTMENTS (continued)
| | | | | | | | | | |
| |
BNY Mellon New York Intermediate Tax-Exempt Bond Fund (continued) |
Description | Coupon
Rate (%) | | Maturity
Date | | Principal
Amount ($) | | Value ($) | |
Long-Term Municipal Investments - 100.8% (continued) | | | | | |
New York - 91.1% (continued) | | | | | |
New York City Water & Sewer System, Revenue Bonds, Refunding, Ser. AA | | 5.00 | | 6/15/2021 | | 2,000,000 | b | 2,142,280 | |
New York City Water & Sewer System, Revenue Bonds, Refunding, Ser. FF2 | | 4.00 | | 6/15/2036 | | 1,000,000 | | 1,187,500 | |
New York City Water & Sewer System, Revenue Bonds, Refunding, Ser. FF2 | | 5.00 | | 6/15/2034 | | 1,000,000 | | 1,307,460 | |
New York City Water & Sewer System, Revenue Bonds, Refunding, Ser. FF2 | | 5.00 | | 6/15/2035 | | 1,000,000 | | 1,302,090 | |
New York Convention Center Development Corp., Revenue Bonds, Refunding | | 5.00 | | 11/15/2029 | | 1,000,000 | | 1,224,270 | |
New York Counties Tobacco Trust VI, Revenue Bonds, Refunding, Ser. A-2B | | 5.00 | | 6/1/2045 | | 750,000 | | 808,590 | |
New York Liberty Development Corp., Revenue Bonds, Refunding (Bank of America Tower at One Bryant Park) | | 2.63 | | 9/15/2069 | | 1,500,000 | | 1,553,010 | |
New York Liberty Development Corp., Revenue Bonds, Refunding (Class 1-3 World Trade Center Project) | | 5.00 | | 11/15/2044 | | 2,000,000 | c | 2,221,580 | |
New York Liberty Development Corp., Revenue Bonds, Refunding (Class 2-3 World Trade Center Project) | | 5.15 | | 11/15/2034 | | 1,500,000 | c | 1,694,895 | |
New York Monroe County Industrial Development Corp., Revenue Bonds (The Rochester General Hospital) | | 5.00 | | 12/1/2028 | | 1,095,000 | | 1,348,065 | |
New York Monroe County Industrial Development Corp., Revenue Bonds (The Rochester General Hospital) | | 5.00 | | 12/1/2032 | | 1,000,000 | | 1,209,210 | |
New York Monroe County Industrial Development Corp., Revenue Bonds, Refunding (University of Rochester Project) Ser. C | | 4.00 | | 7/1/2035 | | 1,000,000 | | 1,146,900 | |
New York Nassau County, GO, Refunding, Ser. A | | 5.00 | | 1/1/2032 | | 1,640,000 | | 1,974,970 | |
New York Nassau County, GO, Ser. A | | 5.00 | | 1/15/2031 | | 500,000 | | 618,960 | |
New York Nassau County, GO, Ser. B | | 5.00 | | 4/1/2029 | | 1,500,000 | | 1,743,000 | |
New York State Dormitory Authority, Revenue Bonds (Insured; Assured Guaranty Municipal Corp.) | | 5.63 | | 11/1/2035 | | 1,000,000 | | 1,073,150 | |
New York State Dormitory Authority, Revenue Bonds (New York University) Ser. A | | 5.00 | | 7/1/2043 | | 2,400,000 | | 2,722,824 | |
New York State Dormitory Authority, Revenue Bonds, Refunding (Catholic Health System) | | 5.00 | | 7/1/2034 | | 550,000 | | 694,579 | |
New York State Dormitory Authority, Revenue Bonds, Refunding (Catholic Health System) | | 5.00 | | 7/1/2032 | | 640,000 | | 812,397 | |
New York State Dormitory Authority, Revenue Bonds, Refunding (Fordham University) | | 4.00 | | 7/1/2034 | | 1,000,000 | | 1,147,740 | |
New York State Dormitory Authority, Revenue Bonds, Refunding (Icahn School of Medicine at Mount Sinai) Ser. A | | 5.00 | | 7/1/2023 | | 1,000,000 | | 1,143,600 | |
New York State Dormitory Authority, Revenue Bonds, Refunding (Insured; State Aid Withholding) Ser. A | | 5.00 | | 10/1/2030 | | 1,045,000 | | 1,331,654 | |
New York State Dormitory Authority, Revenue Bonds, Refunding (New York University) Ser. A | | 5.00 | | 7/1/2031 | | 2,000,000 | | 2,432,780 | |
New York State Dormitory Authority, Revenue Bonds, Refunding (NYU Hospitals Center) | | 5.00 | | 7/1/2030 | | 1,155,000 | | 1,411,479 | |
New York State Dormitory Authority, Revenue Bonds, Refunding (Rochester Institute of Technology) | | 5.00 | | 7/1/2023 | | 1,000,000 | | 1,030,670 | |
New York State Dormitory Authority, Revenue Bonds, Refunding (The New School) Ser. A | | 5.00 | | 7/1/2032 | | 1,530,000 | | 1,821,893 | |
New York State Dormitory Authority, Revenue Bonds, Refunding, Ser. A | | 5.00 | | 10/1/2028 | | 1,400,000 | | 1,761,382 | |
New York State Dormitory Authority, Revenue Bonds, Refunding, Ser. E | | 5.00 | | 3/15/2032 | | 1,325,000 | | 1,610,193 | |
New York State Dormitory Authority, Revenue Bonds, Ser. 2015B-B | | 5.00 | | 3/15/2035 | | 1,100,000 | | 1,325,874 | |
New York State Dormitory Authority, Revenue Bonds, Ser. A | | 5.00 | | 3/15/2030 | | 1,275,000 | | 1,594,349 | |
New York State Dormitory Authority, Revenue Bonds, Ser. B1 | | 4.00 | | 7/1/2026 | | 1,200,000 | | 1,411,500 | |
New York State Environmental Facilities Corp., Revenue Bonds, Refunding (Green Bond) Ser. D | | 3.00 | | 9/15/2030 | | 1,050,000 | | 1,129,643 | |
66
| | | | | | | | | | |
| |
BNY Mellon New York Intermediate Tax-Exempt Bond Fund (continued) |
Description | Coupon
Rate (%) | | Maturity
Date | | Principal
Amount ($) | | Value ($) | |
Long-Term Municipal Investments - 100.8% (continued) | | | | | |
New York - 91.1% (continued) | | | | | |
New York State Environmental Facilities Corp., Revenue Bonds, Refunding, Ser. A | | 4.00 | | 6/15/2026 | | 1,010,000 | | 1,091,356 | |
New York State Housing Finance Agency, Revenue Bonds (Insured; State of New York Mortgage Agency) Ser. E | | 4.13 | | 11/1/2028 | | 1,000,000 | | 1,079,330 | |
New York State Thruway Authority, Revenue Bonds, Refunding (Insured; Assured Guaranty Municipal Corp.) Ser. K | | 5.00 | | 1/1/2031 | | 2,000,000 | | 2,383,640 | |
New York State Urban Development Corp., Revenue Bonds, Refunding, Ser. A | | 5.00 | | 3/15/2033 | | 1,000,000 | | 1,245,670 | |
New York State Urban Development Corp., Revenue Bonds, Refunding, Ser. A | | 5.00 | | 3/15/2031 | | 1,500,000 | | 1,883,700 | |
New York Transportation Development Corp., Revenue Bonds (Delta Air Lines) | | 5.00 | | 1/1/2025 | | 1,575,000 | | 1,831,993 | |
New York Westchester County Health Care Corp., Revenue Bonds, Refunding, Ser. A | | 5.00 | | 11/1/2024 | | 1,500,000 | | 1,609,920 | |
New York Westchester County Health Care Corp., Revenue Bonds, Ser. A | | 5.00 | | 11/1/2020 | | 1,400,000 | | 1,456,168 | |
Niagara Area Development Corp., Revenue Bonds, Refunding (Niagara University Project) Ser. A | | 5.00 | | 5/1/2035 | | 500,000 | | 539,195 | |
Niagara Frontier Transportation Authority, Revenue Bonds, Refunding, Ser. T | | 5.00 | | 4/1/2024 | | 1,750,000 | | 2,008,702 | |
Niagara Frontier Transportation Authority, Revenue Bonds, Refunding, Ser. T | | 5.00 | | 4/1/2026 | | 925,000 | | 1,114,227 | |
Niagara Frontier Transportation Authority, Revenue Bonds, Refunding, Ser. T | | 5.00 | | 4/1/2025 | | 630,000 | | 741,403 | |
Oyster Bay, GO, Refunding (Insured; Build America Mutual Assurance Company) Ser. B | | 5.00 | | 8/15/2022 | | 1,715,000 | | 1,894,869 | |
Sales Tax Asset Receivable Corp., Revenue Bonds, Refunding, Ser. A | | 5.00 | | 10/15/2031 | | 1,060,000 | | 1,256,641 | |
St. Lawrence County Development Agency, Revenue Bonds, Refunding (Clarkson University Project) | | 5.00 | | 9/1/2029 | | 1,000,000 | | 1,226,140 | |
Suffolk County, GO (Insured; Build America Mutual Assurance Company) Ser. A | | 4.00 | | 4/1/2033 | | 1,785,000 | | 2,036,863 | |
Suffolk County, GO, Refunding (Insured; Assured Guaranty Municipal Corp.) | | 5.00 | | 2/1/2022 | | 1,000,000 | | 1,090,830 | |
Suffolk County Water Authority, Revenue Bonds, Refunding, Ser. A | | 4.00 | | 6/1/2030 | | 1,145,000 | | 1,346,245 | |
TSASC, Revenue Bonds, Refunding, Ser. A | | 5.00 | | 6/1/2022 | | 1,750,000 | | 1,922,322 | |
TSASC, Revenue Bonds, Refunding, Ser. A | | 5.00 | | 6/1/2024 | | 500,000 | | 580,450 | |
Utility Debt Securitization Authority, Revenue Bonds, Refunding, Ser. A | | 5.00 | | 6/15/2027 | | 1,600,000 | | 1,954,032 | |
Utility Debt Securitization Authority, Revenue Bonds, Refunding, Ser. TE | | 5.00 | | 6/15/2026 | | 2,000,000 | | 2,328,660 | |
Washingtonville Central School District, GO, Refunding | | 3.00 | | 6/15/2031 | | 1,000,000 | | 1,087,080 | |
Westchester County Local Development Corp., Revenue Bonds (Purchase Housing Corporation II Project) | | 5.00 | | 6/1/2037 | | 1,000,000 | | 1,194,200 | |
Westchester County Local Development Corp., Revenue Bonds, Refunding (Sarah Lawrence College) Ser. A | | 5.00 | | 6/1/2026 | | 1,210,000 | | 1,458,873 | |
Westchester County Local Development Corp., Revenue Bonds, Refunding (Sarah Lawrence College) Ser. A | | 5.00 | | 6/1/2025 | | 1,105,000 | | 1,303,270 | |
Westchester County Local Development Corp., Revenue Bonds, Refunding (Westchester Medical Center Obligated Group Project) | | 5.00 | | 11/1/2028 | | 1,000,000 | | 1,186,310 | |
Yonkers, GO (Insured; Assured Guaranty Municipal Corp.) Ser. A | | 5.00 | | 11/15/2026 | | 1,000,000 | | 1,259,710 | |
| | 145,462,548 | |
67
STATEMENT OF INVESTMENTS (continued)
| | | | | | | | | | |
| |
BNY Mellon New York Intermediate Tax-Exempt Bond Fund (continued) |
Description | Coupon
Rate (%) | | Maturity
Date | | Principal
Amount ($) | | Value ($) | |
Long-Term Municipal Investments - 100.8% (continued) | | | | | |
U.S. Related - .7% | | | | | |
Guam, Revenue Bonds, Ser. A | | 5.00 | | 1/1/2024 | | 1,000,000 | | 1,066,320 | |
Total Investments(cost $151,435,175) | | 100.8% | 160,885,366 | |
Liabilities, Less Cash and Receivables | | (0.8%) | (1,276,817) | |
Net Assets | | 100.0% | 159,608,549 | |
a The Variable Rate shall be determined by the Remarketing Agent in its sole discretion based on prevailing market conditions and may, but need not, be established by reference to one or more financial indices.
b These securities are prerefunded; the date shown represents the prerefunded date. Bonds which are prerefunded are collateralized by U.S. Government securities which are held in escrow and are used to pay principal and interest on the municipal issue and to retire the bonds in full at the earliest refunding date.
c Security exempt from registration pursuant to Rule 144A under the Securities Act of 1933. These securities may be resold in transactions exempt from registration, normally to qualified institutional buyers. At August 31, 2019, these securities were valued at $3,916,475 or 2.45% of net assets.
| | |
Portfolio Summary (Unaudited)† | Value (%) |
General | 21.6 |
Education | 16.8 |
General Obligation | 11.8 |
Transportation | 10.1 |
Medical | 9.1 |
Development | 5.8 |
Water | 5.7 |
Multifamily Housing | 4.3 |
School District | 3.8 |
Tobacco Settlement | 3.6 |
Airport | 3.4 |
Power | 2.7 |
Prerefunded | 1.3 |
Housing | .8 |
| | 100.8 |
† Based on net assets.
See notes to financial statements.
68
| | | | | | | | | | |
| |
BNY Mellon Municipal Opportunities Fund |
Description | Coupon
Rate (%) | | Maturity
Date | | Principal
Amount ($) | | Value ($) | |
Bonds and Notes - 1.2% | | | | | |
Health Care - 1.2% | | | | | |
CommonSpirit Health, Sr. Scd. Bonds | | 3.82 | | 10/1/2049 | | 7,000,000 | | 7,292,800 | |
CommonSpirit Health, Sr. Scd. Bonds | | 4.19 | | 10/1/2049 | | 4,000,000 | | 4,296,344 | |
Montefiore Obligated Group, Unscd. Bonds, Ser. 18-C | | 5.25 | | 11/1/2048 | | 10,000,000 | | 12,019,276 | |
TotalBonds and Notes
(cost $21,000,000) | | 23,608,420 | |
| | | | | | | | | |
Long-Term Municipal Investments - 100.5% | | | | | |
Alabama - 1.1% | | | | | |
Auburn University, Revenue Bonds, Ser. A | | 5.00 | | 6/1/2048 | | 5,000,000 | | 6,177,150 | |
Auburn University, Revenue Bonds, Ser. A | | 5.00 | | 6/1/2043 | | 3,500,000 | | 4,349,170 | |
Black Belt Energy Gas District, Revenue Bonds, Refunding (Project No. 4) Ser. A1 | | 4.00 | | 12/1/2025 | | 10,000,000 | | 11,339,500 | |
| | 21,865,820 | |
Arizona - 2.3% | | | | | |
Arizona Health Facilities Authority, Revenue Bonds, Refunding (Phoenix Children's Hospital) Ser. A | | 5.00 | | 2/1/2042 | | 6,000,000 | | 6,438,180 | |
Arizona Industrial Development Authority, Revenue Bonds (Academies of Math & Science Projects) Ser. B | | 5.50 | | 7/1/2038 | | 1,165,000 | a | 1,283,492 | |
Arizona Industrial Development Authority, Revenue Bonds (Academies of Math & Science Projects) Ser. B | | 5.63 | | 7/1/2048 | | 2,000,000 | a | 2,191,180 | |
Arizona Industrial Development Authority, Revenue Bonds (Academies of Math & Science Projects) Ser. B | | 5.75 | | 7/1/2053 | | 3,260,000 | a | 3,579,871 | |
Arizona Industrial Development Authority, Revenue Bonds (Doral Academy of Nevada) Ser. A | | 5.00 | | 7/15/2049 | | 1,675,000 | a | 1,839,100 | |
Arizona Industrial Development Authority, Revenue Bonds (Doral Academy of Nevada) Ser. A | | 5.00 | | 7/15/2039 | | 1,325,000 | a | 1,472,088 | |
Arizona Industrial Development Authority, Revenue Bonds (Equitable School Revolving Fund) Ser. A | | 4.00 | | 11/1/2049 | | 1,600,000 | | 1,770,608 | |
Arizona Industrial Development Authority, Revenue Bonds (Equitable School Revolving Fund) Ser. A | | 5.00 | | 11/1/2044 | | 1,625,000 | | 1,982,403 | |
Arizona Industrial Development Authority, Revenue Bonds (Great Lakes Senior Living Communities LLC) Ser. A | | 5.00 | | 1/1/2043 | | 1,750,000 | | 2,028,863 | |
Arizona Industrial Development Authority, Revenue Bonds (Great Lakes Senior Living Communities LLC) Ser. B | | 5.00 | | 1/1/2043 | | 1,000,000 | | 1,131,290 | |
Arizona Industrial Development Authority, Revenue Bonds (Great Lakes Senior Living Communities LLC) Ser. B | | 5.00 | | 1/1/2049 | | 1,400,000 | | 1,570,114 | |
Arizona Industrial Development Authority, Revenue Bonds (Insured; Bulid America Mutual) Ser. A | | 4.00 | | 6/1/2044 | | 2,000,000 | | 2,188,440 | |
Arizona Industrial Development Authority, Revenue Bonds (Lone Mountain Campus Project) Ser. A | | 5.00 | | 12/15/2049 | | 700,000 | a | 763,833 | |
Arizona Industrial Development Authority, Revenue Bonds (Lone Mountain Campus Project) Ser. A | | 5.00 | | 12/15/2039 | | 400,000 | a | 442,788 | |
Maricopa County Special Health Care District, GO, Ser. C | | 5.00 | | 7/1/2036 | | 7,500,000 | | 9,378,975 | |
Pinal County Industrial Development Authority, Revenue Bonds (Green Bond) (WOF SW GGP 1) | | 7.25 | | 10/1/2033 | | 4,000,000 | a | 4,428,200 | |
University Medical Center Corp., Revenue Bonds | | 6.00 | | 7/1/2021 | | 2,500,000 | b | 2,717,825 | |
| | 45,207,250 | |
Arkansas - .4% | | | | | |
University of Arkansas, Revenue Bonds | | 5.00 | | 11/1/2042 | | 5,990,000 | | 7,391,600 | |
California - 18.7% | | | | | |
Alameda Corridor Transportation Authority, Revenue Bonds, Refunding (Insured; Assured Guaranty Municipal Corp.) Ser. B | | 4.00 | | 10/1/2035 | | 1,500,000 | | 1,685,940 | |
Alameda Corridor Transportation Authority, Revenue Bonds, Refunding (Insured; Assured Guaranty Municipal Corp.) Ser. B | | 4.00 | | 10/1/2037 | | 1,000,000 | | 1,114,140 | |
69
STATEMENT OF INVESTMENTS (continued)
| | | | | | | | | | |
| |
BNY Mellon Municipal Opportunities Fund (continued) |
Description | Coupon
Rate (%) | | Maturity Date | | Principal Amount ($) | | Value ($) | |
Long-Term Municipal Investments - 100.5%(continued) | | | | | |
California - 18.7% (continued) | | | | | |
Alameda Corridor Transportation Authority, Revenue Bonds, Refunding, Ser. B | | 5.00 | | 10/1/2036 | | 2,500,000 | | 2,972,075 | |
Anaheim Public Financing Authority, Revenue Bonds, Refunding (Anaheim Convention Center Expansion Project) Ser. A | | 5.00 | | 5/1/2046 | | 6,450,000 | | 7,465,359 | |
Bay Area Toll Authority, Revenue Bonds, Refunding | | 4.00 | | 4/1/2042 | | 5,000,000 | | 5,629,450 | |
Bay Area Toll Authority, Revenue Bonds, Refunding, Ser. A | | 2.63 | | 4/1/2026 | | 10,000,000 | | 10,845,900 | |
California, GO | | 5.00 | | 4/1/2031 | | 750,000 | | 990,285 | |
California, GO | | 5.00 | | 4/1/2049 | | 2,500,000 | | 3,170,550 | |
California, GO | | 5.00 | | 4/1/2032 | | 3,000,000 | | 3,945,300 | |
California, GO | | 5.00 | | 4/1/2045 | | 3,500,000 | | 4,464,250 | |
California, GO | | 5.00 | | 4/1/2033 | | 1,205,000 | | 1,580,538 | |
California, GO, Refunding | | 5.00 | | 4/1/2035 | | 9,000,000 | | 10,442,610 | |
California Community College Financing Authority, Revenue Bonds (Orange Coast Properties) | | 5.25 | | 5/1/2048 | | 2,000,000 | | 2,390,780 | |
California Community College Financing Authority, Revenue Bonds (Orange Coast Properties) | | 5.25 | | 5/1/2043 | | 1,250,000 | | 1,501,713 | |
California Community Housing Agency, Revenue Bonds (Annadel Apartments) Ser. A | | 5.00 | | 4/1/2049 | | 7,500,000 | a | 8,434,275 | |
California Community Housing Agency, Revenue Bonds (Verdant At Green Valley Project) | | 5.00 | | 8/1/2049 | | 4,000,000 | a | 4,541,640 | |
California Educational Facilities Authority, Revenue Bonds (Green Bond) (Loyola Marymount University) | | 5.00 | | 10/1/2048 | | 3,000,000 | | 3,684,540 | |
California Educational Facilities Authority, Revenue Bonds, Refunding (Loma Linda University) Ser. A | | 5.00 | | 4/1/2047 | | 2,500,000 | | 2,960,100 | |
California Educational Facilities Authority, Revenue Bonds, Refunding (Loma Linda University) Ser. A | | 5.00 | | 4/1/2042 | | 2,000,000 | | 2,389,160 | |
California Health Facilities Financing Authority, Revenue Bonds, Refunding (Children's Hospital) Ser. A | | 5.00 | | 8/15/2047 | | 1,000,000 | | 1,197,450 | |
California Health Facilities Financing Authority, Revenue Bonds, Refunding, Ser. A | | 5.00 | | 7/1/2037 | | 2,270,000 | | 2,565,917 | |
California Health Facilities Financing Authority, Revenue Bonds, Refunding, Ser. A2 | | 4.00 | | 11/1/2044 | | 12,000,000 | | 13,490,160 | |
California Infrastructure & Economic Development Bank, Revenue Bonds, Refunding (The J. David Gladstone Institutes Project) Ser. A | | 5.25 | | 10/1/2034 | | 900,000 | | 971,343 | |
California Municipal Finance Authority, Revenue Bonds | | 5.00 | | 6/1/2043 | | 5,750,000 | | 7,108,610 | |
California Municipal Finance Authority, Revenue Bonds | | 5.00 | | 5/15/2049 | | 2,000,000 | | 2,449,140 | |
California Municipal Finance Authority, Revenue Bonds (Bowles Hall Foundation) Ser. A | | 5.00 | | 6/1/2035 | | 600,000 | | 689,370 | |
California Municipal Finance Authority, Revenue Bonds (Bowles Hall Foundation) Ser. A | | 5.00 | | 6/1/2050 | | 2,750,000 | | 3,102,192 | |
California Municipal Finance Authority, Revenue Bonds (CHF-Davis I) | | 5.00 | | 5/15/2040 | | 5,000,000 | | 6,098,550 | |
California Municipal Finance Authority, Revenue Bonds (CHF-Davis I) | | 5.00 | | 5/15/2043 | | 5,000,000 | | 6,055,800 | |
California Municipal Finance Authority, Revenue Bonds (CHF-Davis I) | | 5.00 | | 5/15/2048 | | 6,000,000 | | 7,234,200 | |
California Municipal Finance Authority, Revenue Bonds (CHF-Riverside I) | | 5.00 | | 5/15/2039 | | 3,265,000 | | 3,992,148 | |
California Municipal Finance Authority, Revenue Bonds (CHF-Riverside I) | | 5.00 | | 5/15/2052 | | 7,500,000 | | 9,022,050 | |
California Municipal Finance Authority, Revenue Bonds (CHF-Riverside I) | | 5.00 | | 5/15/2043 | | 2,000,000 | | 2,422,320 | |
California Municipal Finance Authority, Revenue Bonds (CHF-Riverside I) | | 5.00 | | 5/15/2037 | | 2,605,000 | | 3,204,358 | |
California Municipal Finance Authority, Revenue Bonds (CHF-Riverside I) | | 5.00 | | 5/15/2034 | | 2,250,000 | | 2,797,605 | |
70
| | | | | | | | | | |
| |
BNY Mellon Municipal Opportunities Fund (continued) |
Description | Coupon
Rate (%) | | Maturity Date | | Principal Amount ($) | | Value ($) | |
Long-Term Municipal Investments - 100.5%(continued) | | | | | |
California - 18.7% (continued) | | | | | |
California Municipal Finance Authority, Revenue Bonds (Emerson College) | | 6.00 | | 1/1/2022 | | 6,000,000 | b | 6,705,360 | |
California Municipal Finance Authority, Revenue Bonds (LAX Integrated Express Solutions LLC Project) Ser. A | | 5.00 | | 12/31/2047 | | 2,250,000 | | 2,709,157 | |
California Municipal Finance Authority, Revenue Bonds (Northbay Healthcare) Ser. A | | 5.25 | | 11/1/2047 | | 700,000 | | 815,752 | |
California Municipal Finance Authority, Revenue Bonds (Northbay Healthcare) Ser. A | | 5.25 | | 11/1/2041 | | 1,200,000 | | 1,408,368 | |
California Municipal Finance Authority, Revenue Bonds (Palmdale Aerospace Academy Project) Ser. A | | 5.00 | | 7/1/2038 | | 1,100,000 | a | 1,259,522 | |
California Municipal Finance Authority, Revenue Bonds (Palmdale Aerospace Academy Project) Ser. A | | 5.00 | | 7/1/2049 | | 1,800,000 | a | 2,031,084 | |
California Municipal Finance Authority, Revenue Bonds (Southwestern Law School) | | 6.50 | | 11/1/2031 | | 300,000 | | 336,678 | |
California Municipal Finance Authority, Revenue Bonds, Refunding (William Jessup University) | | 5.00 | | 8/1/2039 | | 1,500,000 | | 1,738,725 | |
California Municipal Finance Authority, Revenue Bonds, Refunding, Ser. A | | 5.00 | | 2/1/2042 | | 1,000,000 | | 1,193,940 | |
California Pollution Control Financing Authority, Revenue Bonds (Rialto Bioenergy Facility, LLC Project) | | 7.50 | | 12/1/2040 | | 5,000,000 | a | 5,250,450 | |
California Pollution Control Financing Authority, Revenue Bonds (Waste Management Project) Ser. A | | 2.50 | | 5/1/2024 | | 2,870,000 | | 3,004,115 | |
California Pollution Control Financing Authority, Revenue Bonds (Waste Management Project) Ser. A | | 2.50 | | 5/1/2024 | | 4,125,000 | | 4,319,081 | |
California School Finance Authority, Revenue Bonds (Green Dot Public Schools California Projects) Ser. A | | 5.00 | | 8/1/2038 | | 1,000,000 | a | 1,204,420 | |
California School Finance Authority, Revenue Bonds (Green Dot Public Schools California Projects) Ser. A | | 5.00 | | 8/1/2048 | | 2,750,000 | a | 3,269,860 | |
California School Finance Authority, Revenue Bonds (KIPP LA Project) Ser. A | | 5.00 | | 7/1/2037 | | 590,000 | a | 706,466 | |
California School Finance Authority, Revenue Bonds (KIPP LA Project) Ser. A | | 5.00 | | 7/1/2047 | | 870,000 | a | 1,022,433 | |
California School Finance Authority, Revenue Bonds (Summit Public Schools) | | 5.00 | | 6/1/2047 | | 1,500,000 | a | 1,753,515 | |
California State Public Works Board, Revenue Bonds (Various Judicial Council Projects) Ser. D | | 5.00 | | 12/1/2031 | | 2,000,000 | | 2,171,600 | |
California State University, Revenue Bonds, Refunding, Ser. A | | 4.00 | | 11/1/2045 | | 500,000 | | 556,165 | |
California Statewide Communities Development Authority, Revenue Bonds (Loma Linda University Medical Center) | | 5.00 | | 12/1/2033 | | 1,000,000 | a | 1,191,860 | |
California Statewide Communities Development Authority, Revenue Bonds (Loma Linda University Medical Center) Ser. A | | 5.00 | | 12/1/2036 | | 2,500,000 | a | 2,875,450 | |
California Statewide Communities Development Authority, Revenue Bonds (Loma Linda University Medical Center) Ser. A | | 5.00 | | 12/1/2041 | | 2,500,000 | a | 2,840,675 | |
California Statewide Communities Development Authority, Revenue Bonds (Loma Linda University Medical Center) Ser. A | | 5.25 | | 12/1/2043 | | 2,150,000 | a | 2,551,190 | |
California Statewide Communities Development Authority, Revenue Bonds (Loma Linda University Medical Center) Ser. A | | 5.25 | | 12/1/2038 | | 1,500,000 | a | 1,804,515 | |
California Statewide Communities Development Authority, Revenue Bonds (Sutter Health) Ser. A | | 6.00 | | 8/15/2020 | | 6,000,000 | b | 6,289,080 | |
California Statewide Communities Development Authority, Revenue Bonds, Refunding | | 5.38 | | 5/15/2038 | | 1,900,000 | | 2,038,301 | |
California Statewide Communities Development Authority, Revenue Bonds, Refunding (CHF-Irvine) | | 5.00 | | 5/15/2040 | | 2,000,000 | | 2,357,600 | |
California Statewide Communities Development Authority, Revenue Bonds, Refunding (Front Porch Communities & Services) | | 4.00 | | 4/1/2042 | | 1,600,000 | | 1,747,648 | |
71
STATEMENT OF INVESTMENTS (continued)
| | | | | | | | | | |
| |
BNY Mellon Municipal Opportunities Fund (continued) |
Description | Coupon
Rate (%) | | Maturity Date | | Principal Amount ($) | | Value ($) | |
Long-Term Municipal Investments - 100.5%(continued) | | | | | |
California - 18.7% (continued) | | | | | |
California Statewide Communities Development Authority, Revenue Bonds, Refunding (Front Porch Communities & Services) | | 5.00 | | 4/1/2047 | | 1,500,000 | | 1,780,635 | |
Capistrano Unified School District Community Facilities District No. 90-2, Special Tax Bonds, Refunding (Insured; Assured Guaranty Municipal Corp.) | | 5.00 | | 9/1/2032 | | 4,000,000 | | 4,579,480 | |
Desert Sands Unified School District, GO | | 5.00 | | 8/1/2040 | | 7,680,000 | | 9,491,328 | |
Foothill Eastern Transportation Corridor Agency, Revenue Bonds, Refunding, Ser. B1 | | 3.95 | | 1/15/2053 | | 5,000,000 | | 5,399,200 | |
Galt Redevelopment Agency, Tax Allocation Bonds (Galt Redevelopment Project) | | 7.38 | | 9/1/2033 | | 2,000,000 | | 2,245,420 | |
Golden State Tobacco Securitization Corp., Revenue Bonds, Refunding, Ser. A1 | | 5.00 | | 6/1/2047 | | 5,000,000 | | 5,128,300 | |
Golden State Tobacco Securitization Corp., Revenue Bonds, Refunding, Ser. A1 | | 5.00 | | 6/1/2029 | | 3,000,000 | | 3,627,990 | |
Golden State Tobacco Securitization Corp., Revenue Bonds, Refunding, Ser. A1 | | 5.00 | | 6/1/2028 | | 3,000,000 | | 3,646,500 | |
Golden State Tobacco Securitization Corp., Revenue Bonds, Refunding, Ser. A2 | | 5.00 | | 6/1/2047 | | 5,000,000 | | 5,128,300 | |
Grant Joint Union High School District, GO (Insured; Assured Guaranty Municipal Corp.) | | 0.00 | | 2/1/2033 | | 4,380,000 | c | 3,223,592 | |
Grant Joint Union High School District, GO (Insured; Assured Guaranty Municipal Corp.) | | 0.00 | | 8/1/2029 | | 2,080,000 | c | 1,719,723 | |
Irvine, Revenue Bonds | | 4.00 | | 9/2/2029 | | 1,000,000 | | 1,072,490 | |
Long Beach Marina System, Revenue Bonds (Alamitos Bay Marina Project) | | 5.00 | | 5/15/2045 | | 2,000,000 | | 2,273,000 | |
Long Beach Marina System, Revenue Bonds (Alamitos Bay Marina Project) | | 5.00 | | 5/15/2040 | | 2,500,000 | | 2,848,400 | |
Los Angeles County Public Works Financing Authority, Revenue Bonds, Refunding, Ser. A | | 5.00 | | 12/1/2039 | | 1,000,000 | | 1,177,060 | |
Los Angeles County Public Works Financing Authority, Revenue Bonds, Refunding, Ser. A | | 5.00 | | 12/1/2034 | | 1,000,000 | | 1,188,300 | |
New Haven Unified School District, GO (Insured; Assured Guaranty Corp.) | | 0.00 | | 8/1/2032 | | 2,500,000 | c | 1,879,200 | |
Norman Y Mineta San Jose International Airport, Revenue Bonds, Refunding, Ser. A | | 5.00 | | 3/1/2047 | | 8,500,000 | | 10,113,810 | |
Northern California Energy Authority, Revenue Bonds, Ser. A | | 4.00 | | 7/1/2024 | | 5,000,000 | | 5,521,350 | |
Northern California Gas Authority No. 1, Revenue Bonds, Ser. B, 3 Month LIBOR x .67 +.72% | | 2.27 | | 7/1/2027 | | 660,000 | d | 648,549 | |
Oroville, Revenue Bonds (Oroville Hospital) | | 5.25 | | 4/1/2039 | | 1,750,000 | | 2,138,290 | |
Palomar Health, Revenue Bonds, Refunding | | 5.00 | | 11/1/2039 | | 1,000,000 | | 1,157,640 | |
Riverside County Transportation Commission, Revenue Bonds, Refunding, Ser. A | | 5.25 | | 6/1/2023 | | 2,000,000 | b | 2,320,980 | |
Riverside County Transportation Commission, Revenue Bonds, Ser. A | | 5.75 | | 6/1/2048 | | 5,000,000 | | 5,587,250 | |
Riverside County Transportation Commission, Revenue Bonds, Ser. A | | 5.75 | | 6/1/2044 | | 2,000,000 | | 2,238,820 | |
San Diego Unified School District, GO, Ser. A | | 0.00 | | 7/1/2025 | | 4,000,000 | c | 3,705,800 | |
San Diego Unified School District, GO, Ser. F | | 4.00 | | 7/1/2035 | | 2,205,000 | | 2,488,343 | |
San Francisco City & County Airport Comm-San Francisco International Airport, Revenue Bonds, Ser. A | | 5.00 | | 5/1/2044 | | 6,500,000 | | 8,017,100 | |
San Francisco City & County Redevelopment Agency Successor Agency, Special Tax Bonds, Ser. C | | 0.00 | | 8/1/2043 | | 7,835,000 | c | 2,166,142 | |
San Francisco City & County Redevelopment Agency Successor Agency, Special Tax Bonds, Ser. C | | 0.00 | | 8/1/2038 | | 2,000,000 | c | 746,800 | |
San Francisco City & County Redevelopment Financing Authority, Tax Allocation Bonds (San Francisco Redevelopment Projects) Ser. B | | 6.63 | | 2/1/2021 | | 1,250,000 | b | 1,350,838 | |
San Joaquin Hills Transportation Corridor Agency, Revenue Bonds, Refunding, Ser. A | | 5.00 | | 1/15/2050 | | 5,000,000 | | 5,698,850 | |
72
| | | | | | | | | | |
| |
BNY Mellon Municipal Opportunities Fund (continued) |
Description | Coupon
Rate (%) | | Maturity Date | | Principal Amount ($) | | Value ($) | |
Long-Term Municipal Investments - 100.5%(continued) | | | | | |
California - 18.7% (continued) | | | | | |
Sierra Joint Community College District School Facilities District No. 2, GO (Insured; National Public Finance Guarantee Corp.) Ser. B | | 0.00 | | 8/1/2030 | | 3,020,000 | c | 2,464,078 | |
Sierra Joint Community College District School Facilities District No. 2, GO (Insured; National Public Finance Guarantee Corp.) Ser. B | | 0.00 | | 8/1/2031 | | 5,330,000 | c | 4,223,119 | |
South Bayside Waste Management Authority, Revenue Bonds, Ser. A | | 6.00 | | 9/1/2036 | | 1,000,000 | | 1,000,000 | |
Tender Option Bond Trust Receipts (Series 2016-XM0427) Non-recourse, (Los Angeles International Airport, Revenue Bonds) Non-recourse, Underlying Coupon Rate (%) 5.25 | | 12.29 | | 5/15/2026 | | 10,000,000 | a,e,f | 10,294,100 | |
The Morongo Band of Mission Indians, Revenue Bonds, Ser. A | | 5.00 | | 10/1/2042 | | 1,000,000 | a | 1,139,090 | |
University of California, Revenue Bonds, Refunding (Limited Project) Ser. G | | 5.00 | | 5/15/2037 | | 7,325,000 | | 8,061,455 | |
University of California, Revenue Bonds, Refunding (Limited Project) Ser. G | | 5.00 | | 5/15/2022 | | 7,280,000 | b | 8,067,332 | |
University of California, Revenue Bonds, Refunding, Ser. AZ | | 5.00 | | 5/15/2043 | | 4,000,000 | | 4,998,960 | |
University of California, Revenue Bonds, Ser. AV | | 5.00 | | 5/15/2042 | | 2,525,000 | | 3,117,542 | |
| | 371,437,984 | |
Colorado - 2.1% | | | | | |
Board of Governors of Colorado State University System, Revenue Bonds, Refunding, Ser. C | | 5.00 | | 3/1/2043 | | 5,000,000 | | 6,188,450 | |
Colorado Health Facilities Authority, Revenue Bonds, Refunding (Adventist Health System) | | 4.00 | | 11/15/2043 | | 4,000,000 | | 4,581,680 | |
Colorado Health Facilities Authority, Revenue Bonds, Refunding (CommonSpirit Health) Ser. A | | 4.00 | | 8/1/2044 | | 6,000,000 | | 6,648,720 | |
Colorado Health Facilities Authority, Revenue Bonds, Refunding (CommonSpirit Health) Ser. A | | 4.00 | | 8/1/2049 | | 5,000,000 | | 5,504,200 | |
Colorado Health Facilities Authority, Revenue Bonds, Refunding (CommonSpirit Health) Ser. A | | 4.00 | | 8/1/2038 | | 2,750,000 | | 3,096,252 | |
Colorado Health Facilities Authority, Revenue Bonds, Refunding (CommonSpirit Health) Ser. A | | 4.00 | | 8/1/2039 | | 2,250,000 | | 2,524,388 | |
Colorado Health Facilities Authority, Revenue Bonds, Refunding (Evangelical Lutheran Good Samaritan Society Project) | | 5.00 | | 6/1/2027 | | 2,500,000 | b | 3,156,000 | |
Denver City & County Airport System, Revenue Bonds, Refunding, Ser. A | | 4.00 | | 12/1/2048 | | 1,250,000 | | 1,392,488 | |
Denver City & County Airport System, Revenue Bonds, Refunding, Ser. A | | 5.25 | | 12/1/2048 | | 3,500,000 | | 4,367,020 | |
Denver Urban Renewal Authority, Tax Allocation Bonds, Ser. A | | 5.25 | | 12/1/2039 | | 2,000,000 | a | 2,150,520 | |
Denver Urban Renewal Authority, Tax Allocation Bonds, Ser. A | | 5.25 | | 12/1/2039 | | 2,500,000 | a | 2,688,150 | |
| | 42,297,868 | |
Connecticut - .2% | | | | | |
The Metropolitan District, GO, Ser. A | | 4.00 | | 7/15/2037 | | 1,125,000 | | 1,301,771 | |
The Metropolitan District, GO, Ser. A | | 4.00 | | 7/15/2039 | | 500,000 | | 575,355 | |
The Metropolitan District, GO, Ser. A | | 4.00 | | 7/15/2035 | | 500,000 | | 582,450 | |
The Metropolitan District, GO, Ser. A | | 4.00 | | 7/15/2036 | | 1,200,000 | | 1,393,572 | |
| | 3,853,148 | |
Delaware - .8% | | | | | |
Kent County, Revenue Bonds (CHF-Dover LLC University Project) Ser. A | | 5.00 | | 7/1/2048 | | 1,000,000 | | 1,112,820 | |
Kent County, Revenue Bonds (CHF-Dover LLC University Project) Ser. A | | 5.00 | | 7/1/2040 | | 750,000 | | 843,863 | |
Tender Option Bond Trust Receipts (Series 2016-XM0431) Non-recourse, (University of Delaware, Revenue Bonds, Refunding) Non-recourse, Underlying Coupon Rate (%) 5.00 | | 11.09 | | 11/1/2043 | | 12,230,000 | a,e,f | 13,912,357 | |
| | 15,869,040 | |
District of Columbia - 1.3% | | | | | |
Columbia, Revenue Bonds, Refunding (KIPP Charter School) | | 6.00 | | 7/1/2023 | | 1,700,000 | b | 2,013,259 | |
73
STATEMENT OF INVESTMENTS (continued)
| | | | | | | | | | |
| |
BNY Mellon Municipal Opportunities Fund (continued) |
Description | Coupon
Rate (%) | | Maturity Date | | Principal Amount ($) | | Value ($) | |
Long-Term Municipal Investments - 100.5%(continued) | | | | | |
District of Columbia - 1.3% (continued) | | | | | |
District of Columbia, Revenue Bonds (District of Columbia International School) | | 5.00 | | 7/1/2049 | | 1,275,000 | | 1,538,237 | |
District of Columbia, Revenue Bonds (Friendship Public Charter School) | | 5.00 | | 6/1/2032 | | 3,500,000 | | 3,802,890 | |
District of Columbia, Revenue Bonds, Refunding | | 6.00 | | 7/1/2023 | | 1,450,000 | b | 1,717,192 | |
District of Columbia, Revenue Bonds, Refunding | | 6.00 | | 7/1/2023 | | 1,100,000 | b | 1,302,697 | |
District of Columbia, Revenue Bonds, Refunding (Kipp DC Project) Ser. A | | 5.00 | | 7/1/2048 | | 5,000,000 | | 5,861,750 | |
District of Columbia, Revenue Bonds, Refunding (Kipp DC Project) Ser. B | | 5.00 | | 7/1/2042 | | 4,000,000 | | 4,723,120 | |
Metropolitan Washington Airports Authority, Revenue Bonds (Dulles Metrorail & Capital Improvement Projects) (Insured; Assured Guaranty Corp.) | | 0.00 | | 10/1/2036 | | 6,275,000 | c | 3,882,029 | |
| | 24,841,174 | |
Florida - 3.2% | | | | | |
Capital Trust Agency, Revenue Bonds (H-Bay Ministries Inc-Superior Residences Project) Ser. A1 | | 5.00 | | 7/1/2048 | | 750,000 | | 807,360 | |
Capital Trust Agency, Revenue Bonds (H-Bay Ministries Inc-Superior Residences Project) Ser. B | | 5.00 | | 7/1/2053 | | 250,000 | | 266,790 | |
Collier County Health Facilities Authority, Revenue Bonds, Refunding, Ser. A | | 5.00 | | 5/1/2045 | | 2,500,000 | | 2,874,925 | |
Davie, Revenue Bonds, Refunding (Nova Southeastern Univerity Project) | | 5.00 | | 4/1/2048 | | 8,395,000 | | 9,961,675 | |
Florida Development Finance Corp., Revenue Bonds, Refunding (Virgin Trains USA Florida) Ser. A | | 6.25 | | 1/1/2024 | | 2,500,000 | a | 2,398,475 | |
Florida Development Finance Corp., Revenue Bonds, Refunding (Virgin Trains USA Florida) Ser. A | | 6.38 | | 1/1/2026 | | 2,000,000 | a | 1,914,540 | |
Gainesville Utilities System, Revenue Bonds, Refunding, Ser. A | | 5.00 | | 10/1/2044 | | 2,500,000 | | 3,160,750 | |
Higher Educational Facilities Financing Authority, Revenue Bonds, Refunding (The University of Tampa Project) Ser. A | | 5.25 | | 4/1/2042 | | 1,100,000 | | 1,205,633 | |
Jacksonville, Revenue Bonds, Refunding | | 5.00 | | 10/1/2030 | | 750,000 | | 833,715 | |
Miami Beach Redevelopment Agency, Tax Allocation Bonds, Refunding (Insured; Assured Guaranty Municipal Corp.) | | 5.00 | | 2/1/2040 | | 7,545,000 | | 8,663,094 | |
Miami-Dade County Aviation, Revenue Bonds, Ser. A | | 5.50 | | 10/1/2020 | | 1,200,000 | b | 1,257,456 | |
Miami-Dade County Expressway Authority, Revenue Bonds, Ser. A | | 5.00 | | 7/1/2040 | | 1,050,000 | | 1,082,151 | |
Miami-Dade County Health Facilities Authority, Revenue Bonds, Refunding (Nicklaus Children's Hospital) | | 5.00 | | 8/1/2042 | | 4,000,000 | | 4,775,160 | |
Miami-Dade County Seaport Department, Revenue Bonds, Ser. A | | 5.50 | | 10/1/2042 | | 14,145,000 | | 16,156,843 | |
Orange County Health Facilities Authority, Revenue Bonds (Orlando Health Obligated Group) | | 5.00 | | 10/1/2047 | | 3,000,000 | | 3,660,060 | |
Orange County Health Facilities Authority, Revenue Bonds (Orlando Health Obligated Group) Ser. B | | 5.00 | | 10/1/2042 | | 5,000,000 | | 5,371,300 | |
| | 64,389,927 | |
Georgia - .7% | | | | | |
Atlanta Development Authority, Revenue Bonds (Georgia Proton Treatment Center) Ser. A1 | | 7.00 | | 1/1/2040 | | 2,500,000 | | 2,754,650 | |
Atlanta Development Authority, Revenue Bonds, Ser. A1 | | 5.25 | | 7/1/2044 | | 1,500,000 | | 1,786,335 | |
Fulton County Development Authority, Revenue Bonds, Refunding (Robert W Woodruff Arts Center) | | 5.00 | | 3/15/2044 | | 6,000,000 | | 7,419,840 | |
Main Street Natural Gas, Revenue Bonds, Ser. A | | 5.00 | | 5/15/2043 | | 1,500,000 | | 1,813,290 | |
| | 13,774,115 | |
Hawaii - 1.7% | | | | | |
Hawaii Department of Budget & Finance, Revenue Bonds, Refunding (Kahala Senior Living Community) | | 5.13 | | 11/15/2032 | | 2,050,000 | | 2,298,645 | |
Hawaii Department of Budget & Finance, Revenue Bonds, Refunding (Kahala Senior Living Community) | | 5.25 | | 11/15/2037 | | 1,000,000 | | 1,118,280 | |
74
| | | | | | | | | | |
| |
BNY Mellon Municipal Opportunities Fund (continued) |
Description | Coupon
Rate (%) | | Maturity Date | | Principal Amount ($) | | Value ($) | |
Long-Term Municipal Investments - 100.5%(continued) | | | | | |
Hawaii - 1.7% (continued) | | | | | |
Hawaii Department of Budget & Finance, Revenue Bonds, Refunding (Queen's Health Systems) Ser. A | | 5.00 | | 7/1/2035 | | 7,000,000 | | 8,155,280 | |
Tender Option Bond Trust Receipts (Series 2016-XM0429) Non-recourse, (Hawaii, GO) Non-recourse, Ser. DZ, Underlying Coupon Rate (%) 5.00 | | 8.95 | | 12/1/2024 | | 20,000,000 | a,e,f | 21,720,460 | |
| | 33,292,665 | |
Idaho - .2% | | | | | |
Idaho Health Facilities Authority, Revenue Bonds, Refunding (Trinity Health Corp.) Ser. D | | 5.00 | | 12/1/2032 | | 3,900,000 | | 4,260,126 | |
Illinois - 9.6% | | | | | |
Chicago, GO, Ser. A | | 5.50 | | 1/1/2049 | | 4,000,000 | | 4,750,680 | |
Chicago Board of Education, GO, Refunding (Insured; Assured Guaranty Municipal Corp.) Ser. A | | 5.00 | | 12/1/2026 | | 1,170,000 | | 1,405,322 | |
Chicago Board of Education, GO, Refunding, Ser. A | | 7.00 | | 12/1/2044 | | 2,500,000 | | 3,049,525 | |
Chicago Board of Education, GO, Refunding, Ser. B | | 6.75 | | 12/1/2030 | | 7,500,000 | a | 9,704,850 | |
Chicago Board of Education, GO, Refunding, Ser. B | | 7.00 | | 12/1/2042 | | 10,000,000 | a | 12,791,300 | |
Chicago Board of Education, GO, Ser. A | | 7.00 | | 12/1/2046 | | 5,000,000 | a | 6,363,850 | |
Chicago Board of Education, GO, Ser. B | | 6.50 | | 12/1/2046 | | 4,500,000 | | 5,462,550 | |
Chicago Board of Education, Revenue Bonds | | 6.00 | | 4/1/2046 | | 1,500,000 | | 1,818,255 | |
Chicago Board of Education, Special Tax Bonds | | 5.00 | | 4/1/2042 | | 1,700,000 | | 1,924,570 | |
Chicago Board of Education, Special Tax Bonds | | 5.00 | | 4/1/2046 | | 1,600,000 | | 1,802,208 | |
Chicago II, GO, Refunding, Ser. A | | 5.00 | | 1/1/2035 | | 5,000,000 | | 5,443,050 | |
Chicago II, GO, Refunding, Ser. B | | 7.75 | | 1/1/2042 | | 1,272,000 | | 1,472,976 | |
Chicago II, GO, Refunding, Ser. B | | 7.75 | | 1/1/2025 | | 6,208,000 | b | 8,070,772 | |
Chicago II, GO, Refunding, Ser. D | | 5.50 | | 1/1/2040 | | 5,000,000 | | 5,619,250 | |
Chicago II, GO, Refunding, Ser. E | | 5.50 | | 1/1/2042 | | 1,750,000 | | 1,961,715 | |
Chicago II, GO, Refunding, Ser. F | | 5.50 | | 1/1/2042 | | 1,250,000 | | 1,401,225 | |
Chicago Midway International Airport, Revenue Bonds, Refunding, Ser. B | | 5.00 | | 1/1/2046 | | 5,000,000 | | 5,831,350 | |
Chicago O'Hare International Airport, Revenue Bonds | | 5.75 | | 1/1/2039 | | 415,000 | | 438,983 | |
Chicago O'Hare International Airport, Revenue Bonds (Insured; Assured Guaranty Municipal Corp.) | | 5.50 | | 1/1/2043 | | 4,000,000 | | 4,507,360 | |
Chicago O'Hare International Airport, Revenue Bonds, Refunding, Ser. A | | 5.00 | | 1/1/2039 | | 3,710,000 | | 4,554,322 | |
Chicago O'Hare International Airport, Revenue Bonds, Refunding, Ser. A | | 5.00 | | 1/1/2038 | | 3,250,000 | | 3,999,710 | |
Chicago O'Hare International Airport, Revenue Bonds, Refunding, Ser. A | | 5.00 | | 1/1/2036 | | 3,130,000 | | 3,875,816 | |
Chicago O'Hare International Airport, Revenue Bonds, Refunding, Ser. A | | 5.00 | | 1/1/2037 | | 3,000,000 | | 3,703,620 | |
Chicago O'Hare International Airport, Revenue Bonds, Refunding, Ser. B | | 5.00 | | 1/1/2041 | | 6,800,000 | | 8,002,376 | |
Chicago O'Hare International Airport, Revenue Bonds, Refunding, Ser. B | | 5.00 | | 1/1/2033 | | 10,425,000 | | 12,194,122 | |
Chicago O'Hare International Airport, Revenue Bonds, Refunding, Ser. B | | 5.00 | | 1/1/2031 | | 15,000,000 | | 17,632,050 | |
Illinois, GO | | 5.50 | | 7/1/2033 | | 2,500,000 | | 2,749,600 | |
Illinois, GO | | 5.50 | | 7/1/2038 | | 10,000,000 | | 10,979,900 | |
Illinois, GO, Refunding, Ser. B | | 5.00 | | 10/1/2025 | | 15,000,000 | | 17,175,750 | |
Illinois, GO, Ser. A | | 5.00 | | 5/1/2042 | | 2,500,000 | | 2,854,250 | |
Illinois Finance Authority, Revenue Bonds, Refunding (Franciscan Communities) Ser. A | | 5.00 | | 5/15/2037 | | 3,000,000 | | 3,310,470 | |
Illinois Finance Authority, Revenue Bonds, Refunding (Franciscan Communities) Ser. A | | 5.25 | | 5/15/2047 | | 4,250,000 | | 4,520,767 | |
Illinois Finance Authority, Revenue Bonds, Refunding (Lutheran Home & Services) | | 5.63 | | 5/15/2042 | | 3,000,000 | | 3,116,280 | |
Illinois Finance Authority, Revenue Bonds, Refunding, Ser. A | | 6.00 | | 7/1/2043 | | 5,000,000 | | 5,699,600 | |
75
STATEMENT OF INVESTMENTS (continued)
| | | | | | | | | | |
| |
BNY Mellon Municipal Opportunities Fund (continued) |
Description | Coupon
Rate (%) | | Maturity Date | | Principal Amount ($) | | Value ($) | |
Long-Term Municipal Investments - 100.5%(continued) | | | | | |
Illinois - 9.6% (continued) | | | | | |
Illinois Finance Authority, Revenue Bonds, Ser. A | | 5.50 | | 7/1/2028 | | 1,560,000 | | 1,780,896 | |
| | 189,969,320 | |
Indiana - .6% | | | | | |
Allen County, Revenue Bonds (Storypoint Fort Wayne Project) Ser. A1 | | 6.75 | | 1/15/2043 | | 750,000 | a | 828,465 | |
Allen County, Revenue Bonds (Storypoint Fort Wayne Project) Ser. A1 | | 6.88 | | 1/15/2052 | | 1,250,000 | a | 1,378,988 | |
Indiana Finance Authority, Revenue Bonds (Butler University Project) | | 4.00 | | 2/1/2044 | | 2,595,000 | | 2,903,753 | |
Indiana Finance Authority, Revenue Bonds, Refunding (Stadium Project) Ser. A | | 5.25 | | 2/1/2035 | | 5,000,000 | | 6,056,750 | |
| | 11,167,956 | |
Kentucky - 1.1% | | | | | |
Kentucky Economic Development Finance Authority, Revenue Bonds, Refunding (CommonSpirit Health) Ser. A | | 4.00 | | 8/1/2039 | | 1,295,000 | | 1,452,925 | |
Kentucky Economic Development Finance Authority, Revenue Bonds, Refunding (CommonSpirit Health) Ser. A | | 4.00 | | 8/1/2038 | | 1,000,000 | | 1,124,980 | |
Kentucky Economic Development Finance Authority, Revenue Bonds, Refunding (Insured; Assured Guaranty Municipal Corp.) Ser. A | | 5.00 | | 12/1/2047 | | 3,500,000 | | 3,846,920 | |
Kentucky Public Transportation Infrastructure Authority, Revenue Bonds (Downtown Crossing Project) Ser. A | | 5.75 | | 7/1/2049 | | 3,000,000 | | 3,389,730 | |
Kentucky State Property & Building Commission, Revenue Bonds, Refunding, Ser. B | | 5.00 | | 11/1/2027 | | 10,000,000 | | 12,173,900 | |
| | 21,988,455 | |
Louisiana - 1.0% | | | | | |
Jefferson Parish Economic Development & Port District, Revenue Bonds (Kenner Discovery Health Sciences Foundation) | | 5.50 | | 6/15/2038 | | 3,200,000 | a | 3,444,192 | |
Jefferson Parish Economic Development & Port District, Revenue Bonds (Kenner Discovery Health Sciences Foundation) | | 5.63 | | 6/15/2048 | | 4,350,000 | a | 4,688,386 | |
Jefferson Parish Hospital Service District No. 2, Revenue Bonds, Refunding | | 6.25 | | 7/1/2031 | | 5,000,000 | | 5,110,800 | |
Louisiana Public Facilities Authority, Revenue Bonds (Louisiana Children's Medical Center Project) Ser. A1 | | 4.00 | | 6/1/2045 | | 5,000,000 | | 5,515,150 | |
New Orleans Water System, Revenue Bonds, Refunding | | 5.00 | | 12/1/2034 | | 500,000 | | 574,500 | |
| | 19,333,028 | |
Maine - .9% | | | | | |
Maine Finance Authority, Revenue Bonds (Coastal Resources of Maine LLL Project) | | 5.25 | | 6/15/2034 | | 1,000,000 | | 1,022,370 | |
Maine Finance Authority, Revenue Bonds (Coastal Resources of Maine LLL Project) | | 5.38 | | 12/15/2033 | | 4,500,000 | a | 4,821,390 | |
Maine Health & Higher Educational Facilities Authority, Revenue Bonds (MaineGeneral Health Medical Center) | | 6.00 | | 7/1/2026 | | 825,000 | | 881,315 | |
Maine Health & Higher Educational Facilities Authority, Revenue Bonds (MaineGeneral Health Medical Center) | | 7.00 | | 7/1/2041 | | 4,240,000 | | 4,612,314 | |
Maine Health & Higher Educational Facilities Authority, Revenue Bonds, Refunding (Bowdoin College) | | 5.00 | | 7/1/2038 | | 5,000,000 | | 6,166,650 | |
| | 17,504,039 | |
Maryland - 1.1% | | | | | |
Maryland, GO, Ser. B | | 4.00 | | 3/15/2020 | | 20,000,000 | b | 20,315,600 | |
Maryland Economic Development Corp., Revenue Bonds (Seagirt Marine Terminal Project) | | 5.00 | | 6/1/2049 | | 750,000 | | 908,108 | |
Maryland Economic Development Corp., Revenue Bonds (Seagirt Marine Terminal Project) | | 5.00 | | 6/1/2044 | | 200,000 | | 243,696 | |
| | 21,467,404 | |
76
| | | | | | | | | | |
| |
BNY Mellon Municipal Opportunities Fund (continued) |
Description | Coupon
Rate (%) | | Maturity Date | | Principal Amount ($) | | Value ($) | |
Long-Term Municipal Investments - 100.5%(continued) | | | | | |
Massachusetts - 5.0% | | | | | |
Massachusetts Development Finance Agency, Revenue Bonds (Bentley University) | | 5.00 | | 7/1/2040 | | 5,500,000 | | 6,595,875 | |
Massachusetts Development Finance Agency, Revenue Bonds (Dana-Farber Cancer Institute) Ser. N | | 5.00 | | 12/1/2041 | | 3,000,000 | | 3,586,110 | |
Massachusetts Development Finance Agency, Revenue Bonds (Emerson College) Ser. A | | 5.25 | | 1/1/2042 | | 5,500,000 | | 6,530,150 | |
Massachusetts Development Finance Agency, Revenue Bonds (Linden Ponds) | | 5.13 | | 11/15/2046 | | 1,500,000 | a | 1,709,940 | |
Massachusetts Development Finance Agency, Revenue Bonds (Wentworth Institute of Technology) | | 5.00 | | 10/1/2046 | | 2,015,000 | | 2,331,637 | |
Massachusetts Development Finance Agency, Revenue Bonds, Refunding (Berklee College of Music) | | 5.00 | | 10/1/2039 | | 5,000,000 | | 6,046,750 | |
Massachusetts Development Finance Agency, Revenue Bonds, Refunding (Cape Cod Healthcare) | | 5.25 | | 11/15/2041 | | 4,370,000 | | 4,899,163 | |
Massachusetts Development Finance Agency, Revenue Bonds, Refunding (Emerson College) Ser. A | | 5.00 | | 1/1/2040 | | 1,000,000 | | 1,195,990 | |
Massachusetts Development Finance Agency, Revenue Bonds, Refunding (International Charter School) | | 5.00 | | 4/15/2040 | | 1,500,000 | | 1,636,965 | |
Massachusetts Development Finance Agency, Revenue Bonds, Refunding (NewBridge Charles) | | 5.00 | | 10/1/2047 | | 3,000,000 | a | 3,327,000 | |
Massachusetts Development Finance Agency, Revenue Bonds, Refunding (NewBridge Charles) | | 5.00 | | 10/1/2037 | | 1,000,000 | a | 1,117,290 | |
Massachusetts Development Finance Agency, Revenue Bonds, Refunding (NewBridge Charles) | | 5.00 | | 10/1/2057 | | 2,000,000 | a | 2,211,640 | |
Massachusetts Development Finance Agency, Revenue Bonds, Refunding (Simmons College) Ser. K1 | | 5.00 | | 10/1/2036 | | 2,115,000 | | 2,464,081 | |
Massachusetts Development Finance Agency, Revenue Bonds, Refunding (Suffolk University Project) | | 5.00 | | 7/1/2036 | | 445,000 | | 553,099 | |
Massachusetts Development Finance Agency, Revenue Bonds, Refunding (Suffolk University Project) | | 5.00 | | 7/1/2035 | | 470,000 | | 586,396 | |
Massachusetts Development Finance Agency, Revenue Bonds, Refunding (Suffolk University Project) | | 5.00 | | 7/1/2037 | | 605,000 | | 749,359 | |
Massachusetts Development Finance Agency, Revenue Bonds, Refunding (Suffolk University Project) | | 5.00 | | 7/1/2038 | | 340,000 | | 419,611 | |
Massachusetts Development Finance Agency, Revenue Bonds, Refunding, Ser. A | | 5.00 | | 7/1/2044 | | 1,375,000 | | 1,656,174 | |
Massachusetts Development Finance Agency, Revenue Bonds, Refunding, Ser. I | | 6.75 | | 1/1/2021 | | 470,000 | b | 504,695 | |
Massachusetts Development Finance Agency, Revenue Bonds, Refunding, Ser. I | | 6.88 | | 1/1/2021 | | 400,000 | b | 430,184 | |
Massachusetts Development Finance Agency, Revenue Bonds, Refunding, Ser. I | | 7.25 | | 1/1/2021 | | 1,240,000 | b | 1,338,977 | |
Massachusetts School Building Authority, Revenue Bonds, Ser. A | | 5.25 | | 2/15/2048 | | 7,500,000 | | 9,392,700 | |
Massachusetts School Building Authority, Revenue Bonds, Ser. B | | 5.25 | | 2/15/2048 | | 10,000,000 | | 12,523,600 | |
Tender Option Bond Trust Receipts (Series 2016-XM0428) Non-recourse, (Massachusetts, GO (Consolidated Loan)) Non-recourse, Underlying Coupon Rate (%) 5.00 | | 11.27 | | 4/1/2023 | | 15,000,000 | a,e,f | 15,913,687 | |
Tender Option Bond Trust Receipts (Series 2016-XM0430) Non-recourse, (Massachusetts School Building Authority, Senior Dedicated Sales Tax Revenue Bonds, Refunding) Non-recourse, Underlying Coupon Rate (%) 5.00 | | 8.95 | | 8/15/2030 | | 10,000,000 | a,e,f | 11,069,134 | |
The Massachusetts Clean Water Trust, Revenue Bonds, Refunding, Ser. A | | 5.75 | | 8/1/2029 | | 50,000 | | 50,172 | |
| | 98,840,379 | |
Michigan - 3.1% | | | | | |
Detroit, GO | | 5.00 | | 4/1/2034 | | 1,000,000 | | 1,136,180 | |
Detroit, GO | | 5.00 | | 4/1/2033 | | 1,150,000 | | 1,309,275 | |
Detroit, GO | | 5.00 | | 4/1/2035 | | 1,660,000 | | 1,880,481 | |
77
STATEMENT OF INVESTMENTS (continued)
| | | | | | | | | | |
| |
BNY Mellon Municipal Opportunities Fund (continued) |
Description | Coupon
Rate (%) | | Maturity Date | | Principal Amount ($) | | Value ($) | |
Long-Term Municipal Investments - 100.5%(continued) | | | | | |
Michigan - 3.1% (continued) | | | | | |
Detroit, GO | | 5.00 | | 4/1/2038 | | 1,235,000 | | 1,388,461 | |
Detroit, GO | | 5.00 | | 4/1/2036 | | 1,200,000 | | 1,355,724 | |
Detroit, GO | | 5.00 | | 4/1/2029 | | 1,000,000 | | 1,155,310 | |
Detroit, GO | | 5.00 | | 4/1/2028 | | 900,000 | | 1,040,904 | |
Detroit, GO | | 5.00 | | 4/1/2030 | | 700,000 | | 807,520 | |
Detroit, GO | | 5.00 | | 4/1/2032 | | 850,000 | | 968,618 | |
Detroit, GO | | 5.00 | | 4/1/2031 | | 1,000,000 | | 1,145,250 | |
Detroit, GO, Ser. B1 | | 4.00 | | 4/1/2044 | | 3,000,000 | | 2,762,220 | |
Detroit Downtown Development Authority, Tax Allocation Bonds, Refunding (Catalyst Development Project) (Insured; Assured Guaranty Municipal Corp.) Ser. A | | 5.00 | | 7/1/2043 | | 10,000,000 | | 11,256,600 | |
Michigan Finance Authority, Revenue Bonds (Henry Ford Health System) Ser. A | | 4.00 | | 11/15/2050 | | 3,000,000 | | 3,339,030 | |
Michigan Finance Authority, Revenue Bonds (Henry Ford Health System) Ser. A | | 5.00 | | 11/15/2048 | | 2,000,000 | | 2,475,900 | |
Michigan Finance Authority, Revenue Bonds, Refunding (Beaumont Health) | | 5.00 | | 8/1/2032 | | 2,000,000 | | 2,320,400 | |
Michigan Finance Authority, Revenue Bonds, Refunding (Trinity Health Corp.) | | 5.00 | | 12/1/2038 | | 6,475,000 | | 7,051,016 | |
Michigan State Building Authority, Revenue Bonds, Refunding, Ser. IA | | 5.38 | | 10/15/2041 | | 3,000,000 | | 3,249,690 | |
Michigan Strategic Fund, Revenue Bonds (AMT-I-75 Improvement Project) | | 5.00 | | 12/31/2043 | | 10,000,000 | | 12,126,300 | |
Warren County, Revenue Bonds (Insured; County Guaranteed) | | 10.00 | | 12/1/2040 | | 5,000,000 | | 5,443,950 | |
| | 62,212,829 | |
Minnesota - 1.8% | | | | | |
Tender Option Bond Trust Receipts (Series 2016-XM0425) Non-recourse, (Minnesota, GO (Various Purpose)) Non-recourse, Underlying Coupon Rate (%) 5.00 | | 6.63 | | 8/1/2023 | | 17,125,000 | a,e,f | 17,728,319 | |
Tender Option Bond Trust Receipts (Series 2016-XM0426) Non-recourse, (Minnesota, GO (Various Purpose)) Non-recourse, Underlying Coupon Rate (%) 5.00 | | 6.64 | | 8/1/2020 | | 10,000,000 | a,e,f | 10,355,650 | |
Western Minnesota Municipal Power Agency, Revenue Bonds (Red Rock Hydroelectric Project) Ser. A | | 5.00 | | 1/1/2049 | | 5,390,000 | | 6,684,516 | |
| | 34,768,485 | |
Mississippi - .2% | | | | | |
Mississippi Development Bank, Revenue Bonds (Jackson, Water and Sewer System Project) (Insured; Assured Guaranty Municipal Corp.) | | 6.88 | | 12/1/2040 | | 1,625,000 | | 1,949,041 | |
Warren County, Revenue Bonds (International Paper Company Projects) Ser. A | | 5.80 | | 5/1/2034 | | 1,500,000 | | 1,543,800 | |
| | 3,492,841 | |
Nebraska - .6% | | | | | |
Omaha Public Power District, Revenue Bonds, Refunding, Ser. A | | 5.00 | | 2/1/2042 | | 10,000,000 | | 12,282,900 | |
Nevada - .4% | | | | | |
State of Nevada Department of Business & Industry, Revenue Bonds (Fulcrum Sierra Biofuels LLC Project) | | 6.25 | | 12/15/2037 | | 5,000,000 | a | 5,869,550 | |
State of Nevada Department of Business & Industry, Revenue Bonds (Green Bond) (Fulcrum Sierra Biofuels LLC Project) Ser. B | | 5.13 | | 12/15/2037 | | 1,500,000 | a | 1,642,215 | |
| | 7,511,765 | |
New Jersey - 4.3% | | | | | |
New Jersey Economic Development Authority, Revenue Bonds (Beloved Community Charter School Inc. Project) Ser. A | | 5.00 | | 6/15/2049 | | 1,105,000 | a | 1,197,279 | |
New Jersey Economic Development Authority, Revenue Bonds (Beloved Community Charter School Inc. Project) Ser. A | | 5.00 | | 6/15/2054 | | 725,000 | a | 779,672 | |
New Jersey Economic Development Authority, Revenue Bonds (The Goethals Bridge Replacement Project) | | 5.13 | | 1/1/2034 | | 5,325,000 | | 6,039,349 | |
78
| | | | | | | | | | |
| |
BNY Mellon Municipal Opportunities Fund (continued) |
Description | Coupon
Rate (%) | | Maturity Date | | Principal Amount ($) | | Value ($) | |
Long-Term Municipal Investments - 100.5%(continued) | | | | | |
New Jersey - 4.3% (continued) | | | | | |
New Jersey Economic Development Authority, Revenue Bonds (The Goethals Bridge Replacement Project) | | 5.38 | | 1/1/2043 | | 5,500,000 | | 6,214,065 | |
New Jersey Economic Development Authority, Revenue Bonds (University Heights Charter School Project) Ser. A | | 4.70 | | 9/1/2028 | | 325,000 | a | 345,859 | |
New Jersey Economic Development Authority, Revenue Bonds (University Heights Charter School Project) Ser. A | | 5.38 | | 9/1/2033 | | 265,000 | a | 292,714 | |
New Jersey Economic Development Authority, Revenue Bonds (University Heights Charter School Project) Ser. A | | 5.63 | | 9/1/2038 | | 340,000 | a | 375,170 | |
New Jersey Economic Development Authority, Revenue Bonds (University Heights Charter School Project) Ser. A | | 5.75 | | 9/1/2050 | | 1,250,000 | a | 1,367,400 | |
New Jersey Economic Development Authority, Revenue Bonds, Refunding | | 5.00 | | 6/15/2026 | | 2,500,000 | | 2,708,675 | |
New Jersey Economic Development Authority, Revenue Bonds, Refunding (Insured; Assured Guaranty Municipal Corp.) | | 5.00 | | 6/15/2029 | | 13,000,000 | | 14,915,680 | |
New Jersey Economic Development Authority, Revenue Bonds, Refunding, Ser. A | | 5.00 | | 7/1/2033 | | 2,500,000 | | 2,952,900 | |
New Jersey Health Care Facilities Financing Authority, Revenue Bonds, Refunding (St Peter's University Hospital) | | 6.25 | | 7/1/2035 | | 1,500,000 | | 1,605,090 | |
New Jersey Tobacco Settlement Financing Corp., Revenue Bonds, Refunding, Ser. A | | 5.00 | | 6/1/2033 | | 7,000,000 | | 8,480,500 | |
New Jersey Tobacco Settlement Financing Corp., Revenue Bonds, Refunding, Ser. A | | 5.00 | | 6/1/2046 | | 3,000,000 | | 3,445,800 | |
New Jersey Tobacco Settlement Financing Corp., Revenue Bonds, Refunding, Ser. A | | 5.25 | | 6/1/2046 | | 5,000,000 | | 5,859,200 | |
New Jersey Transportation Trust Fund Authority, Revenue Bonds | | 5.00 | | 6/15/2030 | | 1,500,000 | | 1,786,665 | |
New Jersey Transportation Trust Fund Authority, Revenue Bonds, Refunding, Ser. A | | 5.00 | | 6/15/2029 | | 15,000,000 | | 17,964,900 | |
New Jersey Transportation Trust Fund Authority, Revenue Bonds, Refunding, Ser. A | | 5.00 | | 6/15/2031 | | 2,000,000 | | 2,366,720 | |
New Jersey Transportation Trust Fund Authority, Revenue Bonds, Refunding, Ser. A | | 5.00 | | 6/15/2030 | | 3,000,000 | | 3,573,330 | |
South Jersey Port Corp., Revenue Bonds, Ser. B | | 5.00 | | 1/1/2048 | | 1,500,000 | | 1,748,685 | |
South Jersey Port Corp., Revenue Bonds, Ser. B | | 5.00 | | 1/1/2042 | | 1,250,000 | | 1,471,025 | |
| | 85,490,678 | |
New Mexico - .6% | | | | | |
New Mexico Municipal Energy Acquisition Authority, Revenue Bonds, Refunding, Ser. A | | 5.00 | | 5/1/2025 | | 10,000,000 | | 11,848,200 | |
New York - 11.4% | | | | | |
Build New York City Resource Corp., Revenue Bonds (Metropolitan Lighthouse Charter School Project) Ser. A | | 5.00 | | 6/1/2047 | | 1,000,000 | a | 1,093,200 | |
Build New York City Resource Corp., Revenue Bonds (Metropolitan Lighthouse Charter School Project) Ser. A | | 5.00 | | 6/1/2052 | | 1,000,000 | a | 1,090,510 | |
Build New York City Resource Corp., Revenue Bonds (Metropolitan Lighthouse Charter School Project) Ser. A | | 5.00 | | 6/1/2032 | | 500,000 | a | 559,660 | |
Build New York City Resource Corp., Revenue Bonds (Metropolitan Lighthouse Charter School Project) Ser. A | | 5.00 | | 6/1/2037 | | 700,000 | a | 774,900 | |
Hudson Yards Infrastructure Corp., Revenue Bonds, Ser. A | | 5.75 | | 2/15/2047 | | 1,930,000 | | 2,052,285 | |
Metropolitan Transportation Authority, Revenue Bonds, Refunding (Green Bond) Ser. A1 | | 5.00 | | 11/15/2024 | | 20,000,000 | | 23,646,800 | |
Metropolitan Transportation Authority Hudson Rail Yards Trust, Revenue Bonds, Refunding, Ser. A | | 5.00 | | 11/15/2056 | | 5,000,000 | | 5,603,150 | |
New York City, GO, Refunding, Ser. E | | 5.00 | | 8/1/2034 | | 1,250,000 | | 1,612,500 | |
New York City, GO, Refunding, Ser. E | | 5.00 | | 8/1/2032 | | 1,000,000 | | 1,300,560 | |
New York City, GO, Refunding, Ser. F1 | | 5.00 | | 8/1/2032 | | 1,000,000 | | 1,300,560 | |
New York City, GO, Refunding, Ser. F1 | | 5.00 | | 8/1/2033 | | 1,000,000 | | 1,295,400 | |
New York City, GO, Refunding, Ser. F1 | | 5.00 | | 8/1/2034 | | 2,220,000 | | 2,863,800 | |
New York City, GO, Ser. AA1 | | 4.00 | | 8/1/2040 | | 5,000,000 | | 5,831,950 | |
New York City, GO, Ser. AA1 | | 4.00 | | 8/1/2038 | | 5,000,000 | | 5,873,400 | |
79
STATEMENT OF INVESTMENTS (continued)
| | | | | | | | | | |
| |
BNY Mellon Municipal Opportunities Fund (continued) |
Description | Coupon
Rate (%) | | Maturity Date | | Principal Amount ($) | | Value ($) | |
Long-Term Municipal Investments - 100.5%(continued) | | | | | |
New York - 11.4% (continued) | | | | | |
New York City, GO, Ser. AA1 | | 5.00 | | 8/1/2039 | | 4,240,000 | | 5,432,542 | |
New York City, GO, Ser. AA1 | | 5.00 | | 8/1/2035 | | 2,500,000 | | 3,247,100 | |
New York City, GO, Ser. B1 | | 5.00 | | 12/1/2041 | | 14,000,000 | | 16,944,480 | |
New York City, GO, Ser. B1 | | 5.00 | | 12/1/2035 | | 2,000,000 | | 2,459,960 | |
New York City Industrial Development Agency, Revenue Bonds (Queens Baseball Stadium Project) (Insured; Assured Guaranty Corp.) | | 6.50 | | 1/1/2046 | | 325,000 | | 326,225 | |
New York City Industrial Development Agency, Revenue Bonds (Yankee Stadium Project) (Insured; Assured Guaranty Corp.) | | 7.00 | | 3/1/2049 | | 1,300,000 | | 1,306,357 | |
New York City Industrial Development Agency, Revenue Bonds (Yankee Stadium Project) (Insured; Financial Guaranty Insurance Co.) | | 2.44 | | 3/1/2020 | | 6,100,000 | g | 6,136,722 | |
New York City Transitional Finance Authority, Revenue Bonds | | 4.00 | | 8/1/2038 | | 1,250,000 | | 1,452,675 | |
New York City Transitional Finance Authority, Revenue Bonds | | 5.25 | | 8/1/2037 | | 10,000,000 | | 12,923,600 | |
New York City Transitional Finance Authority, Revenue Bonds (SPA; State Street Bank and Trust Co.) Ser. A6 | | 1.42 | | 8/1/2039 | | 1,400,000 | e | 1,400,000 | |
New York City Transitional Finance Authority, Revenue Bonds, Refunding, Ser. S-2A | | 4.00 | | 7/15/2037 | | 2,500,000 | | 2,898,200 | |
New York City Transitional Finance Authority, Revenue Bonds, Refunding, Ser. S-2A | | 5.00 | | 7/15/2033 | | 3,250,000 | | 4,152,557 | |
New York City Transitional Finance Authority, Revenue Bonds, Ser. A1 | | 4.00 | | 8/1/2041 | | 5,000,000 | | 5,762,950 | |
New York City Transitional Finance Authority, Revenue Bonds, Ser. A1 | | 5.00 | | 8/1/2042 | | 10,000,000 | | 12,450,400 | |
New York City Transitional Finance Authority, Revenue Bonds, Ser. S3 | | 5.25 | | 7/15/2035 | | 10,000,000 | | 12,893,500 | |
New York Counties Tobacco Trust VI, Revenue Bonds, Refunding, Ser. A-2B | | 5.00 | | 6/1/2051 | | 4,585,000 | | 4,811,866 | |
New York Liberty Development Corp., Revenue Bonds, Refunding (4 World Trade Center Project) | | 5.75 | | 11/15/2051 | | 5,000,000 | | 5,496,450 | |
New York Liberty Development Corp., Revenue Bonds, Refunding (7 World Trade Center Project) | | 5.00 | | 3/15/2044 | | 2,000,000 | | 2,171,100 | |
New York Liberty Development Corp., Revenue Bonds, Refunding (Bank of America Tower at One Bryant Park) | | 2.80 | | 9/15/2069 | | 4,000,000 | | 4,162,480 | |
New York Liberty Development Corp., Revenue Bonds, Refunding (Class 1-3 World Trade Center Project) | | 5.00 | | 11/15/2044 | | 5,000,000 | a | 5,553,950 | |
New York State Dormitory Authority, Revenue Bonds (Montefiore Obligated Group) (Insured; Assured Guaranty Municipal Corp.) Ser. B | | 4.95 | | 8/1/2048 | | 10,500,000 | | 11,887,155 | |
New York State Dormitory Authority, Revenue Bonds (Pace University) Ser. A | | 5.00 | | 5/1/2038 | | 500,000 | | 543,695 | |
New York State Dormitory Authority, Revenue Bonds, Refunding, Ser. A | | 5.00 | | 3/15/2042 | | 15,000,000 | | 18,892,500 | |
New York State Dormitory Authority, Revenue Bonds, Ser. A | | 5.00 | | 10/1/2048 | | 2,000,000 | | 3,232,900 | |
New York Transportation Development Corp., Revenue Bonds (Delta Air Lines) | | 5.00 | | 1/1/2036 | | 2,500,000 | | 3,020,450 | |
New York Transportation Development Corp., Revenue Bonds (Delta Air Lines) | | 5.00 | | 1/1/2034 | | 4,000,000 | | 4,850,320 | |
Port Authority of New York & New Jersey, Revenue Bonds (JFK International Air Terminal LLC Project) | | 6.00 | | 12/1/2042 | | 5,000,000 | | 5,287,550 | |
Triborough Bridge & Tunnel Authority, Revenue Bonds, Refunding, Ser. A | | 0.00 | | 11/15/2031 | | 5,000,000 | c | 3,806,900 | |
Triborough Bridge & Tunnel Authority, Revenue Bonds, Refunding, Ser. A | | 0.00 | | 11/15/2032 | | 3,000,000 | c | 2,211,810 | |
Triborough Bridge & Tunnel Authority, Revenue Bonds, Refunding, Ser. B | | 0.00 | | 11/15/2027 | | 2,000,000 | c | 1,738,540 | |
Triborough Bridge & Tunnel Authority, Revenue Bonds, Refunding, Ser. B | | 0.00 | | 11/15/2028 | | 4,715,000 | c | 3,986,391 | |
| | 226,340,000 | |
80
| | | | | | | | | | |
| |
BNY Mellon Municipal Opportunities Fund (continued) |
Description | Coupon
Rate (%) | | Maturity Date | | Principal Amount ($) | | Value ($) | |
Long-Term Municipal Investments - 100.5%(continued) | | | | | |
North Carolina - .3% | | | | | |
North Carolina Turnpike Authority, Revenue Bonds, Refunding (Insured; Assured Guaranty Municipal Corp.) | | 5.00 | | 1/1/2038 | | 5,000,000 | | 6,234,450 | |
North Dakota - .2% | | | | | |
Grand Forks County, Revenue Bonds, Refunding (Green Bond) (Red River Biorefinery LLC Project) | | 5.38 | | 9/15/2038 | | 5,000,000 | a | 4,920,700 | |
Ohio - .9% | | | | | |
Butler County Port Authority, Revenue Bonds (Storypoint Fairfield Project) Ser. A1 | | 6.38 | | 1/15/2043 | | 1,500,000 | a | 1,635,075 | |
Cleveland-Cuyahoga County Port Authority, Revenue Bonds, Refunding (Playhouse Square Foundation Project) | | 5.25 | | 12/1/2038 | | 1,170,000 | | 1,373,826 | |
Cleveland-Cuyahoga County Port Authority, Revenue Bonds, Refunding (Playhouse Square Foundation Project) | | 5.50 | | 12/1/2053 | | 1,500,000 | | 1,759,635 | |
Cleveland-Cuyahoga County Port Authority, Revenue Bonds, Refunding (Playhouse Square Foundation Project) | | 5.50 | | 12/1/2043 | | 1,580,000 | | 1,867,276 | |
Ohio, Revenue Bonds (Portsmouth Bypass Project) (Insured; Assured Guaranty Municipal Corp.) | | 5.00 | | 12/31/2039 | | 2,000,000 | | 2,300,920 | |
Ohio, Revenue Bonds (Portsmouth Bypass Project) (Insured; Assured Guaranty Municipal Corp.) | | 5.00 | | 12/31/2035 | | 3,000,000 | | 3,475,410 | |
Ohio Air Quality Development Authority, Revenue Bonds (Pratt Paper LLC Project) | | 4.25 | | 1/15/2038 | | 2,500,000 | a | 2,714,150 | |
Ohio Turnpike & Infrastructure Commission, Revenue Bonds (Infrastructure Projects) | | 0/5.70 | | 2/15/2034 | | 3,000,000 | h | 3,455,130 | |
| | 18,581,422 | |
Oregon - 1.3% | | | | | |
Benton & Linn Counties Consolidated School District No. 509J & 509A, GO (Insured; School Board Guaranty) Ser. A | | 0/5.00 | | 6/15/2025 | | 2,610,000 | h | 3,055,423 | |
Benton & Linn Counties Consolidated School District No. 509J & 509A, GO (Insured; School Board Guaranty) Ser. A | | 0/5.00 | | 6/15/2026 | | 4,300,000 | h | 5,177,888 | |
Benton & Linn Counties Consolidated School District No. 509J & 509A, GO (Insured; School Board Guaranty) Ser. A | | 0/5.00 | | 6/15/2027 | | 1,275,000 | h | 1,573,121 | |
Benton & Linn Counties Consolidated School District No. 509J & 509A, GO (Insured; School Board Guaranty) Ser. A | | 0/5.00 | | 6/15/2024 | | 2,310,000 | h | 2,629,103 | |
Benton & Linn Counties Consolidated School District No. 509J & 509A, GO (Insured; School Board Guaranty) Ser. A | | 0/5.00 | | 6/15/2021 | | 1,800,000 | h | 1,855,638 | |
Benton & Linn Counties Consolidated School District No. 509J & 509A, GO (Insured; School Board Guaranty) Ser. A | | 0/5.00 | | 6/15/2022 | | 1,745,000 | h | 1,862,910 | |
Benton & Linn Counties Consolidated School District No. 509J & 509A, GO (Insured; School Board Guaranty) Ser. A | | 0/5.00 | | 6/15/2023 | | 1,785,000 | h | 1,970,711 | |
Oregon State Business Development Commission, Revenue Bonds, Refunding (RED Rock Biofuels) Ser. 248A | | 6.50 | | 4/1/2031 | | 2,000,000 | a | 1,900,180 | |
Oregon State Business Development Commission, Revenue Bonds, Refunding (RED Rock Biofuels) Ser. 248D | | 6.50 | | 4/1/2031 | | 3,000,000 | a | 2,850,270 | |
Oregon State Business Development Commission, Revenue Bonds, Refunding (RED Rock Biofuels) Ser. 248F | | 11.50 | | 4/1/2031 | | 1,000,000 | | 1,078,820 | |
Warm Springs Reservation Confederated Tribe, Revenue Bonds, Refunding (Green Bond) Ser. B | | 5.00 | | 11/1/2039 | | 700,000 | a | 830,550 | |
Warm Springs Reservation Confederated Tribe, Revenue Bonds, Refunding (Green Bond) Ser. B | | 5.00 | | 11/1/2036 | | 700,000 | a | 837,627 | |
| | 25,622,241 | |
Pennsylvania - 2.0% | | | | | |
Berks County Industrial Development Authority, Revenue Bonds, Refunding (Tower Health Project) | | 4.00 | | 11/1/2038 | | 5,000,000 | | 5,518,550 | |
Commonwealth Financing Authority, Revenue Bonds | | 5.00 | | 6/1/2035 | | 3,500,000 | | 4,315,500 | |
Commonwealth Financing Authority, Revenue Bonds | | 5.00 | | 6/1/2034 | | 4,000,000 | | 4,961,320 | |
Montgomery County Higher Education & Health Authority, Revenue Bonds, Refunding (Thomas Jefferson University Project) | | 4.00 | | 9/1/2044 | | 1,750,000 | | 1,942,045 | |
Pennsylvania Economic Development Financing Authority, Revenue Bonds (Aqua Pennsylvania, Inc. Project) Ser. B | | 5.00 | | 12/1/2043 | | 4,425,000 | | 4,614,965 | |
81
STATEMENT OF INVESTMENTS (continued)
| | | | | | | | | | |
| |
BNY Mellon Municipal Opportunities Fund (continued) |
Description | Coupon
Rate (%) | | Maturity Date | | Principal Amount ($) | | Value ($) | |
Long-Term Municipal Investments - 100.5%(continued) | | | | | |
Pennsylvania - 2.0% (continued) | | | | | |
Pennsylvania Economic Development Financing Authority, Revenue Bonds, Refunding (Tapestry Moon Senior Housing Project) Ser. A | | 6.50 | | 12/1/2038 | | 3,000,000 | a | 3,111,330 | |
Pennsylvania Higher Educational Facilities Authority, Revenue Bonds (University of Pennsylvania Health System) Ser. A | | 5.75 | | 8/15/2021 | | 2,550,000 | b | 2,779,882 | |
Pennsylvania Higher Educational Facilities Authority, Revenue Bonds (University of Pennsylvania Health System) Ser. E | | 4.00 | | 8/15/2042 | | 4,000,000 | | 4,461,720 | |
Pennsylvania Higher Educational Facilities Authority, Revenue Bonds, Refunding, Ser. A | | 5.00 | | 7/1/2022 | | 1,000,000 | b | 1,109,350 | |
Pennsylvania Turnpike Commission, Revenue Bonds, Ser. A | | 5.00 | | 12/1/2044 | | 5,000,000 | | 6,132,450 | |
| | 38,947,112 | |
Rhode Island - .4% | | | | | |
Rhode Island Health & Educational Building Corp., Revenue Bonds, Refunding (Providence College) | | 5.00 | | 11/1/2045 | | 7,000,000 | | 8,233,890 | |
South Carolina - .1% | | | | | |
South Carolina Public Service Authority, Revenue Bonds, Refunding, Ser. A | | 5.00 | | 12/1/2036 | | 2,000,000 | | 2,380,800 | |
Tennessee - .4% | | | | | |
Chattanooga Health Educational & Housing Facility Board, Revenue Bonds, Refunding (CommonSpirit Health) Ser. A | | 4.00 | | 8/1/2044 | | 2,000,000 | | 2,216,240 | |
Chattanooga Health Educational & Housing Facility Board, Revenue Bonds, Refunding (CommonSpirit Health) Ser. A | | 4.00 | | 8/1/2038 | | 1,000,000 | | 1,124,980 | |
Memphis-Shelby County Industrial Development Board, Tax Allocation Bonds, Refunding (Senior Tax Increment-Graceland Project) Ser. A | | 4.75 | | 7/1/2027 | | 560,000 | | 618,419 | |
Memphis-Shelby County Industrial Development Board, Tax Allocation Bonds, Refunding (Senior Tax Increment-Graceland Project) Ser. A | | 5.50 | | 7/1/2037 | | 1,100,000 | | 1,232,605 | |
Memphis-Shelby County Industrial Development Board, Tax Allocation Bonds, Refunding (Senior Tax Increment-Graceland Project) Ser. A | | 5.63 | | 1/1/2046 | | 750,000 | | 835,950 | |
Metropolitan Government Nashville & Davidson County Health & Educational Facilities Board, Revenue Bonds, Refunding (Lipscomb University Project) Ser. S | | 5.25 | | 10/1/2058 | | 1,500,000 | | 1,840,140 | |
| | 7,868,334 | |
Texas - 10.9% | | | | | |
Arlington Higher Education Finance Corp., Revenue Bonds (Fing Corp.) Ser. A | | 5.00 | | 8/15/2048 | | 1,900,000 | | 2,003,075 | |
Arlington Higher Education Finance Corp., Revenue Bonds (Fing Corp.) Ser. A | | 5.00 | | 8/15/2053 | | 925,000 | | 971,990 | |
Arlington Higher Education Finance Corp., Revenue Bonds (Fing Corp.) Ser. A | | 5.00 | | 8/15/2038 | | 1,000,000 | | 1,067,480 | |
Arlington Higher Education Finance Corp., Revenue Bonds, Refunding (Uplift Education) Ser. A | | 5.00 | | 12/1/2046 | | 1,100,000 | | 1,244,496 | |
Arlington Higher Education Finance Corp., Revenue Bonds, Refunding (Uplift Education) Ser. A | | 5.00 | | 12/1/2036 | | 1,315,000 | | 1,509,909 | |
Austin Airport System, Revenue Bonds, Ser. A | | 5.00 | | 11/15/2046 | | 13,120,000 | | 15,736,653 | |
Bexar County Health Facilities Development Corp., Revenue Bonds, Refunding (Army Retirement Residence Foundation Project) | | 5.00 | | 7/15/2041 | | 1,750,000 | | 1,978,253 | |
Central Texas Regional Mobility Authority, Revenue Bonds, Refunding | | 5.00 | | 1/1/2046 | | 2,000,000 | | 2,308,260 | |
Central Texas Regional Mobility Authority, Revenue Bonds, Ser. A | | 5.00 | | 1/1/2040 | | 7,300,000 | | 8,424,711 | |
Central Texas Turnpike System, Revenue Bonds, Refunding, Ser. A | | 5.00 | | 8/15/2041 | | 6,000,000 | | 6,521,100 | |
Central Texas Turnpike System, Revenue Bonds, Refunding, Ser. B | | 5.00 | | 8/15/2037 | | 15,950,000 | | 18,313,630 | |
Clifton Higher Education Finance Corp., Revenue Bonds (IDEA Public Schools) | | 5.00 | | 8/15/2032 | | 2,745,000 | | 2,966,000 | |
82
| | | | | | | | | | |
| |
BNY Mellon Municipal Opportunities Fund (continued) |
Description | Coupon
Rate (%) | | Maturity Date | | Principal Amount ($) | | Value ($) | |
Long-Term Municipal Investments - 100.5%(continued) | | | | | |
Texas - 10.9% (continued) | | | | | |
Clifton Higher Education Finance Corp., Revenue Bonds (IDEA Public Schools) | | 6.00 | | 8/15/2043 | | 2,770,000 | | 3,160,154 | |
Clifton Higher Education Finance Corp., Revenue Bonds (IDEA Public Schools) | | 6.00 | | 8/15/2033 | | 1,500,000 | | 1,734,285 | |
Clifton Higher Education Finance Corp., Revenue Bonds (IDEA Public Schools) | | 5.50 | | 8/15/2021 | | 1,250,000 | b | 1,352,888 | |
Clifton Higher Education Finance Corp., Revenue Bonds (IDEA Public Schools) | | 5.75 | | 8/15/2021 | | 1,000,000 | b | 1,087,100 | |
Clifton Higher Education Finance Corp., Revenue Bonds (International Leadership) Ser. D | | 6.13 | | 8/15/2048 | | 18,000,000 | | 20,290,140 | |
Clifton Higher Education Finance Corp., Revenue Bonds, Ser. A | | 5.00 | | 12/1/2045 | | 3,855,000 | | 4,250,176 | |
Dallas/Fort Worth International Airport, Revenue Bonds, Ser. H | | 5.00 | | 11/1/2032 | | 7,500,000 | | 8,028,375 | |
Grand Parkway Transportation Corp., Revenue Bonds, Ser. A | | 5.00 | | 10/1/2043 | | 5,000,000 | | 6,153,150 | |
Grand Parkway Transportation Corp., Revenue Bonds, Ser. A | | 5.50 | | 4/1/2053 | | 4,500,000 | | 5,110,875 | |
Grand Parkway Transportation Corp., Revenue Bonds, Ser. B | | 0/5.20 | | 10/1/2031 | | 2,000,000 | h | 2,185,440 | |
Grand Parkway Transportation Corp., Revenue Bonds, Ser. B | | 0/5.40 | | 10/1/2033 | | 2,500,000 | h | 2,738,325 | |
Grand Parkway Transportation Corp., Revenue Bonds, Ser. B | | 0/5.45 | | 10/1/2034 | | 2,235,000 | h | 2,443,816 | |
Houston Higher Education Finance Corp., Revenue Bonds (Escrowed to Maturity) Ser. A | | 5.88 | | 5/15/2021 | | 260,000 | | 273,273 | |
Houston Higher Education Finance Corp., Revenue Bonds, Refunding | | 6.50 | | 5/15/2021 | | 1,270,000 | b | 1,381,150 | |
Houston Higher Education Finance Corp., Revenue Bonds, Refunding | | 6.50 | | 5/15/2021 | | 1,530,000 | b | 1,663,906 | |
Houston Higher Education Finance Corp., Revenue Bonds, Ser. A | | 6.88 | | 5/15/2021 | | 4,400,000 | b | 4,812,676 | |
Mission Economic Development Corp., Revenue Bonds, Refunding (Natgasoline Project) | | 4.63 | | 10/1/2031 | | 3,250,000 | a | 3,514,062 | |
Newark Higher Education Finance Corp., Revenue Bonds (A+ Charter Schools) Ser. A | | 5.50 | | 8/15/2035 | | 750,000 | a | 865,095 | |
Newark Higher Education Finance Corp., Revenue Bonds (A+ Charter Schools) Ser. A | | 5.75 | | 8/15/2045 | | 1,000,000 | a | 1,149,710 | |
North Texas Education Finance Corp., Revenue Bonds (Uplift Education) Ser. A | | 4.88 | | 6/1/2022 | | 1,630,000 | b | 1,788,273 | |
North Texas Tollway Authority, Revenue Bonds, Refunding | | 5.00 | | 1/1/2036 | | 2,800,000 | | 3,474,128 | |
North Texas Tollway Authority, Revenue Bonds, Ser. A | | 5.50 | | 9/1/2021 | | 20,000,000 | b | 21,724,800 | |
Pottsboro Higher Education Finance Corp., Revenue Bonds, Ser. A | | 5.00 | | 8/15/2046 | | 1,000,000 | | 1,069,500 | |
San Antonio Independent School District, GO, Refunding (Insured; Permanent School Fund Guarantee Program) Ser. B | | 5.00 | | 8/1/2044 | | 7,140,000 | | 8,465,255 | |
Spring Branch Independent School District, GO (Insured; Permanent School Fund Guarantee Program) | | 1.55 | | 6/15/2021 | | 3,295,000 | | 3,310,124 | |
Texas Private Activity Bond Surface Transportation Corp., Revenue Bonds (Blueridge Transportation Group, State Highway 288 Toll Lanes Project) | | 5.00 | | 12/31/2045 | | 1,000,000 | | 1,130,900 | |
Texas Private Activity Bond Surface Transportation Corp., Revenue Bonds (LBJ Infrastructure Group LLC IH-635 Managed Lanes Project) | | 7.00 | | 6/30/2040 | | 11,175,000 | | 11,730,062 | |
Texas Private Activity Bond Surface Transportation Corp., Revenue Bonds (North Tarrant Express Mobility Partners Segments 3 LLC Segments 3A and 3B Facility) | | 6.75 | | 6/30/2043 | | 5,000,000 | | 5,856,450 | |
Texas Private Activity Bond Surface Transportation Corp., Revenue Bonds (North Tarrant Express Mobility Partners Segments 3 LLC Segments 3A and 3B Facility) | | 7.00 | | 12/31/2038 | | 10,000,000 | | 11,849,900 | |
Texas Private Activity Bond Surface Transportation Corp., Revenue Bonds (NTE Mobility Partners LLC North Tarrant Express Managed Lanes Project) | | 7.50 | | 12/31/2031 | | 2,500,000 | | 2,554,800 | |
Texas Private Activity Bond Surface Transportation Corp., Revenue Bonds (Segment 3C Project) | | 5.00 | | 6/30/2058 | | 5,000,000 | | 5,929,250 | |
83
STATEMENT OF INVESTMENTS (continued)
| | | | | | | | | | |
| |
BNY Mellon Municipal Opportunities Fund (continued) |
Description | Coupon
Rate (%) | | Maturity Date | | Principal Amount ($) | | Value ($) | |
Long-Term Municipal Investments - 100.5%(continued) | | | | | |
Texas - 10.9% (continued) | | | | | |
Texas Transportation Commission, Revenue Bonds | | 5.00 | | 8/1/2057 | | 2,000,000 | | 2,380,560 | |
| | 216,504,155 | |
U.S. Related - 2.8% | | | | | |
Antonio B Won International Airport Authority , Revenue Bonds (Insured; Assured Guaranty Municipal Corp.) Ser. C | | 6.00 | | 10/1/2034 | | 2,000,000 | | 2,360,960 | |
Antonio B Won International Airport Authority , Revenue Bonds (Insured; Assured Guaranty Municipal Corp.) Ser. C | | 6.13 | | 10/1/2043 | | 2,000,000 | | 2,351,920 | |
Antonio B Won International Airport Authority , Revenue Bonds, Ser. C | | 6.25 | | 10/1/2034 | | 1,000,000 | | 1,169,130 | |
Antonio B Won International Airport Authority , Revenue Bonds, Ser. C | | 6.38 | | 10/1/2043 | | 1,000,000 | | 1,172,390 | |
Guam, Revenue Bonds, Refunding, Ser. A | | 5.00 | | 12/1/2046 | | 1,500,000 | | 1,691,820 | |
Guam, Revenue Bonds, Ser. A | | 6.00 | | 11/1/2026 | | 2,500,000 | | 2,677,675 | |
Guam, Revenue Bonds, Ser. A | | 6.13 | | 11/1/2031 | | 5,000,000 | | 5,357,900 | |
Guam, Revenue Bonds, Ser. A | | 6.50 | | 11/1/2040 | | 2,000,000 | | 2,147,220 | |
Puerto Rico, GO, Refunding, Ser. A | | 8.00 | | 7/1/2035 | | 5,000,000 | i | 2,781,250 | |
Puerto Rico Commonwealth Aqueduct & Sewer Authority, Revenue Bonds, Ser. A | | 5.75 | | 7/1/2037 | | 2,500,000 | | 2,656,250 | |
Puerto Rico Commonwealth Aqueduct & Sewer Authority, Revenue Bonds, Ser. A | | 6.00 | | 7/1/2038 | | 2,500,000 | | 2,537,500 | |
Puerto Rico Electric Power Authority, Revenue Bonds, Refunding (Insured; National Public Finance Guarantee Corp.) Ser. SS | | 5.00 | | 7/1/2021 | | 500,000 | | 505,630 | |
Puerto Rico Electric Power Authority, Revenue Bonds, Refunding, Ser. DDD | | 5.00 | | 7/1/2022 | | 2,000,000 | i | 1,530,000 | |
Puerto Rico Electric Power Authority, Revenue Bonds, Ser. A | | 6.75 | | 7/1/2036 | | 10,000,000 | i | 7,987,500 | |
Puerto Rico Highway & Transportation Authority, Revenue Bonds, Refunding, Ser. M | | 5.00 | | 7/1/2032 | | 220,000 | i | 85,250 | |
Puerto Rico Highway & Transportation Authority, Revenue Bonds, Refunding, Ser. M | | 5.00 | | 7/1/2025 | | 110,000 | i | 42,625 | |
Puerto Rico Highway & Transportation Authority, Revenue Bonds, Ser. G | | 5.00 | | 7/1/2042 | | 120,000 | i | 46,500 | |
Puerto Rico Highway & Transportation Authority, Revenue Bonds, Ser. K | | 5.00 | | 7/1/2030 | | 120,000 | i | 46,500 | |
Puerto Rico Infrastructure Financing Authority, Revenue Bonds, Ser. B | | 5.00 | | 7/1/2021 | | 500,000 | i | 118,750 | |
Puerto Rico Sales Tax Financing Corp., Revenue Bonds, Ser. A1 | | 0.00 | | 7/1/2031 | | 498,000 | c | 337,614 | |
Puerto Rico Sales Tax Financing Corp., Revenue Bonds, Ser. A1 | | 0.00 | | 7/1/2029 | | 387,000 | c | 284,673 | |
Puerto Rico Sales Tax Financing Corp., Revenue Bonds, Ser. A1 | | 0.00 | | 7/1/2033 | | 561,000 | c | 347,001 | |
Puerto Rico Sales Tax Financing Corp., Revenue Bonds, Ser. A1 | | 0.00 | | 7/1/2051 | | 4,348,000 | c | 844,990 | |
Puerto Rico Sales Tax Financing Corp., Revenue Bonds, Ser. A1 | | 0.00 | | 7/1/2046 | | 5,338,000 | c | 1,433,467 | |
Puerto Rico Sales Tax Financing Corp., Revenue Bonds, Ser. A1 | | 0.00 | | 7/1/2027 | | 397,000 | c | 314,142 | |
Puerto Rico Sales Tax Financing Corp., Revenue Bonds, Ser. A1 | | 0.00 | | 7/1/2024 | | 207,000 | c | 180,610 | |
Puerto Rico Sales Tax Financing Corp., Revenue Bonds, Ser. A1 | | 4.50 | | 7/1/2034 | | 411,000 | | 439,959 | |
Puerto Rico Sales Tax Financing Corp., Revenue Bonds, Ser. A1 | | 4.55 | | 7/1/2040 | | 208,000 | | 214,696 | |
Puerto Rico Sales Tax Financing Corp., Revenue Bonds, Ser. A1 | | 4.75 | | 7/1/2053 | | 1,526,000 | | 1,568,438 | |
Puerto Rico Sales Tax Financing Corp., Revenue Bonds, Ser. A1 | | 5.00 | | 7/1/2058 | | 3,858,000 | | 4,032,227 | |
Puerto Rico Sales Tax Financing Corp., Revenue Bonds, Ser. A2 | | 4.33 | | 7/1/2040 | | 2,112,000 | | 2,151,600 | |
Puerto Rico Sales Tax Financing Corp., Revenue Bonds, Ser. A2 | | 4.54 | | 7/1/2053 | | 63,000 | | 64,022 | |
Puerto Rico Sales Tax Financing Corp., Revenue Bonds, Ser. A2 | | 4.78 | | 7/1/2058 | | 847,000 | | 871,351 | |
Virgin Islands Public Finance Authority, Revenue Bonds (Virgin Islands Matching Fund Loan Note - Diageo Project) Ser. A | | 6.75 | | 10/1/2037 | | 1,250,000 | | 1,250,413 | |
Virgin Islands Public Finance Authority, Revenue Bonds, Ser. A | | 5.00 | | 10/1/2034 | | 1,500,000 | | 1,432,500 | |
Virgin Islands Public Finance Authority, Revenue Bonds, Ser. A | | 5.00 | | 10/1/2029 | | 2,250,000 | | 2,182,500 | |
| | 55,216,973 | |
84
| | | | | | | | | | |
| |
BNY Mellon Municipal Opportunities Fund (continued) |
Description | Coupon
Rate (%) | | Maturity Date | | Principal Amount ($) | | Value ($) | |
Long-Term Municipal Investments - 100.5%(continued) | | | | | |
Utah - .1% | | | | | |
Utah Charter School Finance Authority, Revenue Bonds, Refunding (Summit Academy) (Insured; UT CSCE) | | 5.00 | | 4/15/2049 | | 1,150,000 | | 1,407,462 | |
Utah Charter School Finance Authority, Revenue Bonds, Refunding (Summit Academy) (Insured; UT CSCE) | | 5.00 | | 4/15/2044 | | 625,000 | | 768,500 | |
| | 2,175,962 | |
Virginia - 2.8% | | | | | |
Chesapeake Expressway, Revenue Bonds, Refunding | | 0/4.87 | | 7/15/2040 | | 2,000,000 | h | 2,005,740 | |
Roanoke County Economic Development Authority, Revenue Bonds, Refunding (Richfield Living) Ser. A | | 5.25 | | 9/1/2049 | | 10,000,000 | | 10,458,900 | |
University of Virginia, Revenue Bonds, Refunding, Ser. A1 | | 4.00 | | 4/1/2045 | | 3,950,000 | | 4,341,247 | |
Virginia Small Business Financing Authority, Revenue Bonds (95 Express Lanes LLC Project) | | 5.00 | | 1/1/2040 | | 7,510,000 | | 8,038,629 | |
Virginia Small Business Financing Authority, Revenue Bonds (95 Express Lanes LLC Project) | | 5.00 | | 1/1/2040 | | 12,395,000 | | 13,267,484 | |
Virginia Small Business Financing Authority, Revenue Bonds (Covanta Project) | | 5.00 | | 7/1/2038 | | 1,000,000 | a | 1,072,470 | |
Virginia Small Business Financing Authority, Revenue Bonds (Elizabeth River Crossing Opco, LLC Project) | | 5.25 | | 1/1/2032 | | 4,000,000 | | 4,391,120 | |
Virginia Small Business Financing Authority, Revenue Bonds (Elizabeth River Crossing Opco, LLC Project) | | 6.00 | | 1/1/2037 | | 1,665,000 | | 1,854,594 | |
Virginia Small Business Financing Authority, Revenue Bonds (Transform 66 P3 Project) | | 5.00 | | 12/31/2056 | | 4,000,000 | | 4,614,200 | |
Virginia Small Business Financing Authority, Revenue Bonds (Transform 66 P3 Project) | | 5.00 | | 12/31/2049 | | 4,500,000 | | 5,225,265 | |
| | 55,269,649 | |
Washington - 1.6% | | | | | |
Washington, Revenue Bonds, Ser. B | | 5.00 | | 6/1/2042 | | 5,950,000 | | 7,417,508 | |
Washington, Revenue Bonds, Ser. B | | 5.00 | | 6/1/2041 | | 5,465,000 | | 6,824,419 | |
Washington, Revenue Bonds, Ser. B | | 5.00 | | 6/1/2040 | | 5,350,000 | | 6,693,064 | |
Washington Health Care Facilities Authority, Revenue Bonds, Refunding (CommonSpirit Health) Ser. A | | 4.00 | | 8/1/2044 | | 2,500,000 | | 2,770,300 | |
Washington Health Care Facilities Authority, Revenue Bonds, Refunding, Ser. C, 1 Month MUNIPSA +1.05% | | 2.40 | | 7/3/2023 | | 7,965,000 | d | 8,080,015 | |
| | 31,785,306 | |
West Virginia - 1.1% | | | | | |
Monongalia County Commission Special District, Revenue Bonds, Refunding, Ser. A | | 5.75 | | 6/1/2043 | | 750,000 | a | 830,280 | |
West Virginia, GO, Ser. B | | 5.00 | | 6/1/2041 | | 13,330,000 | | 16,694,625 | |
West Virginia Hospital Finance Authority, Revenue Bonds, Refunding (Charleston Area Medical Center) | | 5.00 | | 9/1/2039 | | 1,450,000 | | 1,787,705 | |
West Virginia Hospital Finance Authority, Revenue Bonds, Refunding (Charleston Area Medical Center) | | 5.00 | | 9/1/2038 | | 1,500,000 | | 1,854,225 | |
| | 21,166,835 | |
Wisconsin - 1.2% | | | | | |
Public Finance Authority, Revenue Bonds | | 5.00 | | 6/15/2049 | | 3,440,000 | | 4,034,088 | |
Public Finance Authority, Revenue Bonds (Maryland Proton Treatment Center) Ser. A1 | | 6.38 | | 1/1/2048 | | 2,500,000 | a | 2,684,500 | |
Public Finance Authority, Revenue Bonds (Nevada State College) | | 5.00 | | 5/1/2055 | | 5,000,000 | a | 5,434,600 | |
Public Finance Authority, Revenue Bonds (Piedmont Community Charter School) | | 5.00 | | 6/15/2053 | | 1,000,000 | | 1,163,310 | |
Wisconsin Center District, Revenue Bonds (Insured; Assured Guaranty Municipal Corp.) Ser. A | | 0.00 | | 12/15/2046 | | 3,990,000 | c | 1,515,123 | |
Wisconsin Center District, Revenue Bonds (Insured; Assured Guaranty Municipal Corp.) Ser. A | | 0.00 | | 12/15/2044 | | 8,735,000 | c | 3,615,416 | |
85
STATEMENT OF INVESTMENTS (continued)
| | | | | | | | | | |
| |
BNY Mellon Municipal Opportunities Fund (continued) |
Description | Coupon
Rate (%) | | Maturity Date | | Principal Amount ($) | | Value ($) | |
Long-Term Municipal Investments - 100.5%(continued) | | | | | |
Wisconsin - 1.2% (continued) | | | | | |
Wisconsin Health & Educational Facilities Authority, Revenue Bonds, Refunding (Marshfield Clinic Health System) Ser. C | | 5.00 | | 2/15/2047 | | 5,000,000 | | 5,773,600 | |
| | 24,220,637 | |
TotalLong-Term Municipal Investments
(cost $1,826,880,599) | | 1,991,827,462 | |
| | Annualized
Yield (%) | | | | | | | |
Short-Term Investments - .2% | | | | | |
U.S. Treasury Securities | | | | | |
U.S. Treasury Bills
(cost $4,957,891) | | 3.76 | | 2/13/2020 | | 5,000,000 | j | 4,958,420 | |
Total Investments(cost $1,852,838,490) | | 101.9% | 2,020,394,302 | |
Liabilities, Less Cash and Receivables | | (1.9%) | (38,344,539) | |
Net Assets | | 100.0% | 1,982,049,763 | |
a Security exempt from registration pursuant to Rule 144A under the Securities Act of 1933. These securities may be resold in transactions exempt from registration, normally to qualified institutional buyers. At August 31, 2019, these securities were valued at $275,702,358 or 13.91% of net assets.
b These securities are prerefunded; the date shown represents the prerefunded date. Bonds which are prerefunded are collateralized by U.S. Government securities which are held in escrow and are used to pay principal and interest on the municipal issue and to retire the bonds in full at the earliest refunding date.
c Security issued with a zero coupon. Income is recognized through the accretion of discount.
d Variable rate security—rate shown is the interest rate in effect at period end.
e The Variable Rate shall be determined by the Remarketing Agent in its sole discretion based on prevailing market conditions and may, but need not, be established by reference to one or more financial indices.
f Collateral for floating rate borrowings. The coupon rate given represents the current interest rate for the inverse floating rate security.
g Principal amount for accrual purposes is periodically adjusted based on changes in the Consumer Price Index.
h Zero coupon until a specified date at which time the stated coupon rate becomes effective until maturity.
i Non-income producing—security in default.
j Security is a discount security. Income is recognized through the accretion of discount.
| | |
Portfolio Summary (Unaudited)† | Value (%) |
Education | 14.7 |
General | 14.2 |
General Obligation | 13.7 |
Transportation | 13.6 |
Medical | 9.8 |
Airport | 6.7 |
Development | 5.5 |
Prerefunded | 5.3 |
School District | 4.6 |
Housing | 3.3 |
Nursing Homes | 3.1 |
Tobacco Settlement | 2.5 |
Power | 1.7 |
Multifamily Housing | .7 |
Pollution | .6 |
Special Tax | .6 |
Water | .5 |
Build America Bonds | .3 |
Facilities | .3 |
Government | .2 |
Mello-Roos | .0 |
| | 101.9 |
† Based on net assets.
See notes to financial statements.
86
STATEMENTS OF FUTURES
August 31, 2019
| | | | | | | | | | | | |
BNY Mellon National Intermediate Municipal Bond Fund | |
Description | Number of
Contracts | Expiration | Notional
Value($) | Value ($) | Unrealized
(Depreciation) ($) | |
Futures Short | | | | | | |
U.S. Treasury Long Bond | 78 | 9/19 | 11,597,000 | 12,952,875 | (1,355,875) | |
Gross Unrealized Depreciation | | (1,355,875) | |
See notes to financial statements.
| | | | | | | | | | | | |
BNY Mellon Pennsylvania Intermediate Municipal Bond Fund | |
Description | Number of
Contracts | Expiration | Notional
Value($) | Value ($) | Unrealized
(Depreciation) ($) | |
Futures Short | | | | | | |
U.S. Treasury Long Bond | 6 | 9/19 | 892,077 | 996,375 | (104,298) | |
Gross Unrealized Depreciation | | (104,298) | |
See notes to financial statements.
| | | | | | | | | | | | |
BNY Mellon Massachusetts Intermediate Municipal Bond Fund | |
Description | Number of
Contracts | Expiration | Notional
Value($) | Value ($) | Unrealized
(Depreciation) ($) | |
Futures Short | | | | | | |
U.S. Treasury Long Bond | 10 | 9/19 | 1,486,795 | 1,660,625 | (173,830) | |
Gross Unrealized Depreciation | | (173,830) | |
See notes to financial statements.
| | | | | | | | | | | | |
BNY Mellon New York Intermediate Tax-Exempt Bond Fund | |
Description | Number of
Contracts | Expiration | Notional
Value($) | Value ($) | Unrealized
(Depreciation) ($) | |
Futures Short | | | | | | |
U.S. Treasury Long Bond | 5 | 9/19 | 743,398 | 830,313 | (86,915) | |
Gross Unrealized Depreciation | | (86,915) | |
See notes to financial statements.
| | | | | | | | | | | | |
BNY Mellon Municipal Opportunities Fund | |
Description | Number of
Contracts | Expiration | Notional
Value($) | Value ($) | Unrealized
(Depreciation) ($) | |
Futures Short | | | | | | |
U.S. Treasury 10 Year Notes | 65 | 9/19 | 8,088,968 | 8,518,047 | (429,079) | |
U.S. Treasury 5 Year Notes | 69 | 9/19 | 8,004,000 | 8,247,656 | (243,656) | |
U.S. Treasury Long Bond | 93 | 9/19 | 13,827,193 | 15,443,813 | (1,616,620) | |
U.S. Treasury Ultra Long Bond | 188 | 9/19 | 31,587,346 | 36,924,375 | (5,337,029) | |
Ultra 10 Year U.S. Treasury Notes | 113 | 9/19 | 15,070,493 | 16,254,344 | (1,183,851) | |
Gross Unrealized Depreciation | | (8,810,235) | |
See notes to financial statements.
87
STATEMENT OF SWAP AGREEMENTS
August 31, 2019
| | | | | | | |
BNY Mellon Municipal Opportunities Fund | |
OTC Forward Rate Agreement Swaps | | | |
Reference
Obligation | Counterparty | Determination
Date | Notional
Amount ($)1 | Base Index
Value ($) | Unrealized
(Depreciation)($) |
Municipal Market Data General obligation, 2049, 5% Coupon AAA Index | Goldman Sachs | 11/15/19 | 10,000,000 | 2.04 | (237,874) |
Municipal Market Data General obligation, 2049, 5% Coupon AAA Index | Citigroup | 11/11/19 | 10,000,000 | 2.17 | (499,145) |
Municipal Market Data General obligation, 2049, 5% Coupon AAA Index | Citigroup | 11/11/19 | 10,000,000 | 2.15 | (459,292) |
Municipal Market Data General obligation, 2049, 5% Coupon AAA Index | Citigroup | 11/15/19 | 10,000,000 | 2.04 | (237,874) |
Gross Unrealized Depreciation | (1,434,185) |
1 The fund will receive a payment from the counterparty if the value of the reference index is less than the bases index value on the determination date. The fund will make a payment to the counterparty if the value of the reference index is greater than the base index value on the determination date.
See notes to financial statements.
88
| | | | |
| |
Summary of Abbreviations(Unaudited) |
| |
ABAG | Association of Bay Area Governments | ACA | American Capital Access |
AGC | ACE Guaranty Corporation | AGIC | Asset Guaranty Insurance Company |
AMBAC | American Municipal Bond Assurance Corporation | ARRN | Adjustable Rate Receipt Notes |
BAN | Bond Anticipation Notes | BPA | Bond Purchase Agreement |
CIFG | CDC Ixis Financial Guaranty | COP | Certificate of Participation |
CP | Commercial Paper | DRIVERS | Derivative Inverse Tax-Exempt Receipts |
EDR | Economic Development Revenue | EIR | Environmental Improvement Revenue |
EURIBOR | Euro Interbank Offered Rate | FGIC | Financial Guaranty Insurance Company |
FHA | Federal Housing Administration | FHLB | Federal Home Loan Bank |
FHLMC | Federal Home Loan Mortgage Corporation | FNMA | Federal National Mortgage Association |
GAN | Grant Anticipation Notes | GIC | Guaranteed Investment Contract |
GNMA | Government National Mortgage Association | GO | General Obligation |
HR | Hospital Revenue | IDB | Industrial Development Board |
IDC | Industrial Development Corporation | IDR | Industrial Development Revenue |
LIBOR | London Interbank Offered Rate | LIFERS | Long Inverse Floating Exempt Receipts |
LOC | Letter of Credit | LOR | Limited Obligation Revenue |
LR | Lease Revenue | NAN | Note Anticipation Notes |
MERLOTS | Municipal Exempt Receipts Liquidity Option Tender | MFHR | Multi-Family Housing Revenue |
MFMR | Multi-Family Mortgage Revenue | MUNIPSA | Securities Industry and Financial Markets Association Municipal Swap Index Yield |
PCR | Pollution Control Revenue | PILOT | Payment in Lieu of Taxes |
P-FLOATS | Puttable Floating Option Tax-Exempt Receipts | PRIME | Prime Lending Rate |
PUTTERS | Puttable Tax-Exempt Receipts | RAC | Revenue Anticipation Certificates |
RAN | Revenue Anticipation Notes | RAW | Revenue Anticipation Warrants |
RIB | Residual Interest Bonds | ROCS | Reset Options Certificates |
RRR | Resources Recovery Revenue | SAAN | State Aid Anticipation Notes |
SBPA | Standby Bond Purchase Agreement | SFHR | Single Family Housing Revenue |
SFMR | Single Family Mortgage Revenue | SOFRRATE | Secured Overnight Financing Rate |
SONYMA | State of New York Mortgage Agency | SPEARS | Short Puttable Exempt Adjustable Receipts |
SWDR | Solid Waste Disposal Revenue | TAN | Tax Anticipation Notes |
TAW | Tax Anticipation Warrants | TRAN | Tax and Revenue Anticipation Notes |
XLCA | XL Capital Assurance | | |
See notes to financial statements.
89
STATEMENTS OF ASSETS AND LIABILITIES
August 31, 2019
| | | | | | | | | | | | | |
| | | | | | | | | | | | |
| | | | BNY Mellon National Intermediate Municipal Bond Fund | | BNY Mellon National Short-Term Municipal Bond Fund | | BNY Mellon Pennsylvania Intermediate Municipal Bond Fund | | BNY Mellon Massachusetts Intermediate Municipal Bond Fund | | |
Assets ($): | | | | | | | | | | | | |
Investments in securities—See Statements
of Investments† | | | | 2,582,662,231 | | 1,173,369,654 | | 202,036,167 | | 328,347,551 | | |
Cash collateral held by broker—Note 4 | | | | 218,400 | | - | | 16,800 | | 28,000 | | |
Interest receivable | | | | 27,170,797 | | 10,026,055 | | 2,173,460 | | 2,866,766 | | |
Receivable for investment securities sold | | | | 6,160,945 | | 39,210,994 | | - | | - | | |
Receivable for shares of Beneficial
Interest subscribed | | | | 4,137,806 | | 1,468,658 | | 536,867 | | 188,741 | | |
Prepaid expenses | | | | 45,146 | | 32,890 | | 24,507 | | 23,888 | | |
| | | | 2,620,395,325 | | 1,224,108,251 | | 204,787,801 | | 331,454,946 | | |
Liabilities ($): | | | | | | | | | | | | |
Due to BNY Mellon Investment Adviser, Inc.
and affiliates—Note 3(b) | | | | 1,046,150 | | 476,561 | | 112,180 | | 136,373 | | |
Cash overdraft due to Custodian | | | | 3,875,096 | | 1,062,778 | | 310,979 | | 447,772 | | |
Payable for investment securities purchased | | | | 60,869,161 | | 71,823,365 | | 4,041,506 | | 6,697,793 | | |
Payable for shares of Beneficial
Interest redeemed | | | | 4,387,284 | | 6,588,642 | | 532,541 | | 332,874 | | |
Trustees fees and expenses payable | | | | 22,918 | | 10,638 | | 1,981 | | 3,302 | | |
Other accrued expenses | | | | 97,601 | | 52,286 | | 24,284 | | 35,122 | | |
| | | | 70,298,210 | | 80,014,270 | | 5,023,471 | | 7,653,236 | | |
Net Assets ($) | | | | 2,550,097,115 | | 1,144,093,981 | | 199,764,330 | | 323,801,710 | | |
Composition of Net Assets ($): | | | | | | | | | | | | |
Paid-in capital | | | | 2,394,026,196 | | 1,134,956,183 | | 187,659,691 | | 306,342,835 | | |
Total distributable earnings (loss) | | | | 156,070,919 | | 9,137,798 | | 12,104,639 | | 17,458,875 | | |
Net Assets ($) | | | | 2,550,097,115 | | 1,144,093,981 | | 199,764,330 | | 323,801,710 | | |
†Investments at cost ($) | | | | 2,426,147,113 | | 1,161,170,122 | | 189,810,837 | | 310,617,338 | | |
Net Asset Value Per Share | | | | | | | | | | | | |
Class M | | | | | | | | | | | | |
Net Assets ($) | | | | 2,498,912,826 | | 1,129,486,147 | | 191,701,511 | | 316,364,219 | | |
Shares Outstanding | | | | 178,007,529 | | 87,519,815 | | 15,201,761 | | 24,120,453 | | |
Net Asset Value Per Share ($) | | | | 14.04 | | 12.91 | | 12.61 | | 13.12 | | |
Investor Shares | | | | | | | | | | | | |
Net Assets ($) | | | | 51,184,289 | | 14,607,834 | | 8,062,819 | | 7,437,491 | | |
Shares Outstanding | | | | 3,650,292 | | 1,132,723 | | 640,197 | | 567,278 | | |
Net Asset Value Per Share ($) | | | | 14.02 | | 12.90 | | 12.59 | | 13.11 | | |
| | | | | | | | | | | | |
See notes to financial statements. | | | | | | | | | | | | |
90
| | | | | | | | | |
| | | | | | | | |
| | | | BNY Mellon New York Intermediate Tax-Exempt Bond Fund | | BNY Mellon Municipal Opportunities Fund | | |
Assets ($): | | | | | | | | |
Investments in securities—See Statements
of Investments† | | | | 160,885,366 | | 2,020,394,302 | | |
Cash collateral held by broker—Note 4 | | | | 14,000 | | 1,364,850 | | |
Interest receivable | | | | 1,703,845 | | 20,173,696 | | |
Receivable for shares of Beneficial
Interest subscribed | | | | 301,064 | | 530,585 | | |
Receivable for investment securities sold | | | | - | | 11,939,587 | | |
Prepaid expenses | | | | 19,484 | | 38,263 | | |
| | | | 162,923,759 | | 2,054,441,283 | | |
Liabilities ($): | | | | | | | | |
Due to BNY Mellon Investment Adviser, Inc.
and affiliates—Note 3(b) | | | | 75,823 | | 1,079,101 | | |
Cash overdraft due to Custodian | | | | 193,824 | | 3,290,207 | | |
Payable for investment securities purchased | | | | 2,802,320 | | 4,000,000 | | |
Payable for shares of Beneficial
Interest redeemed | | | | 216,947 | | 573,092 | | |
Payable for floating rate notes issued—Note 4 | | | | - | | 61,475,000 | | |
Unrealized depreciation on swap agreements—Note 4 | | | | - | | 1,434,185 | | |
Interest and expense payable related to
floating rate notes issued—Note 4 | | | | - | | 335,540 | | |
Payable for futures
variation margin—Note 4 | | | | - | | 69,039 | | |
Trustees fees and expenses payable | | | | 1,621 | | 18,158 | | |
Other accrued expenses | | | | 24,675 | | 117,198 | | |
| | | | 3,315,210 | | 72,391,520 | | |
Net Assets ($) | | | | 159,608,549 | | 1,982,049,763 | | |
Composition of Net Assets ($): | | | | | | | | |
Paid-in capital | | | | 149,396,931 | | 1,850,718,130 | | |
Total distributable earnings (loss) | | | | 10,211,618 | | 131,331,633 | | |
Net Assets ($) | | | | 159,608,549 | | 1,982,049,763 | | |
†Investments at cost ($) | | | | 151,435,175 | | 1,852,838,490 | | |
Net Asset Value Per Share | | | | | | | | |
Class M | | | | | | | | |
Net Assets ($) | | | | 148,557,554 | | 1,918,498,723 | | |
Shares Outstanding | | | | 12,885,449 | | 140,084,575 | | |
Net Asset Value Per Share ($) | | | | 11.53 | | 13.70 | | |
Investor Shares | | | | | | | | |
Net Assets ($) | | | | 11,050,995 | | 63,551,040 | | |
Shares Outstanding | | | | 957,921 | | 4,637,652 | | |
Net Asset Value Per Share ($) | | | | 11.54 | | 13.70 | | |
| | | | | | | | |
See notes to financial statements. | | | | | | | | |
91
STATEMENTS OF OPERATIONS
Year Ended August 31, 2019
| | | | | | | | | | | | | |
| | | | | | | | | | | | |
| | | | | BNY Mellon National Intermediate Municipal Bond Fund | | BNY Mellon National Short-Term Municipal Bond Fund | | BNY Mellon Pennsylvania Intermediate Municipal Bond Fund | | BNY Mellon Massachusetts Intermediate Municipal Bond Fund | |
Investment Income ($): | | | | | | | | | | |
Interest Income | | | 66,693,704 | | 20,875,863 | | 5,916,653 | | 8,577,261 | |
Expenses: | | | | | | | | | | |
Investment advisory fee—Note 3(a) | | | 7,916,627 | | 3,772,184 | | 951,876 | | 1,052,549 | |
Administration fee—Note 3(a) | | | 2,772,993 | | 1,321,563 | | 233,412 | | 368,678 | |
Trustees’ fees and expenses—Note 3(c) | | | 152,813 | | 69,223 | | 11,899 | | 20,844 | |
Shareholder servicing costs—Note 3(b) | | | 113,863 | | 24,276 | | 14,192 | | 17,730 | |
Professional fees | | | 103,255 | | 65,991 | | 53,540 | | 45,742 | |
Registration fees | | | 62,622 | | 53,461 | | 31,533 | | 33,391 | |
Loan commitment fees—Note 2 | | | 54,503 | | 27,935 | | 4,653 | | 10,276 | |
Custodian fees—Note 3(b) | | | 37,545 | | 27,939 | | 5,421 | | 8,274 | |
Prospectus and shareholders’ reports | | | 20,210 | | 8,678 | | 10,106 | | 13,547 | |
Interest expense—Note 2 | | | - | | - | | - | | 400 | |
Miscellaneous | | | 89,140 | | 62,024 | | 35,423 | | 47,643 | |
Total Expenses | | | 11,323,571 | | 5,433,274 | | 1,352,055 | | 1,619,074 | |
Less—reduction in fees due to earnings credits—Note 3(b) | | | (7,116) | | (14,035) | | (809) | | (4,353) | |
Net Expenses | | | 11,316,455 | | 5,419,239 | | 1,351,246 | | 1,614,721 | |
Investment Income—Net | | | 55,377,249 | | 15,456,624 | | 4,565,407 | | 6,962,540 | |
Realized and Unrealized Gain (Loss)
on Investments—Note 4 ($): | | | | | | | | |
Net realized gain (loss) on investments | 5,674,623 | | 472,183 | | 812,681 | | 551,481 | |
Net realized gain (loss) on futures | | | (4,445,962) | | - | | (381,219) | | (593,852) | |
Net Realized Gain (Loss) | | | 1,228,661 | | 472,183 | | 431,462 | | (42,371) | |
Net change in unrealized appreciation (depreciation) on investments | | | 126,775,552 | | 17,567,621 | | 10,126,711 | | 16,960,376 | |
Net change in unrealized appreciation (depreciation) on futures | | | (1,425,223) | | - | | (110,562) | | (183,450) | |
Net Change in Unrealized Appreciation (Depreciation) | | | 125,350,329 | | 17,567,621 | | 10,016,149 | | 16,776,926 | |
Net Realized and Unrealized Gain (Loss) on Investments | | | 126,578,990 | | 18,039,804 | | 10,447,611 | | 16,734,555 | |
Net Increase in Net Assets Resulting from Operations | | 181,956,239 | | 33,496,428 | | 15,013,018 | | 23,697,095 | |
| | | | | | | | | | | | |
See notes to financial statements. | | | | | | | | | | | |
92
| | | | | | | | | |
| | | | | | | | |
| | | | | BNY Mellon New York Intermediate Tax-Exempt Bond Fund | | BNY Mellon Municipal Opportunities Fund | |
Investment Income ($): | | | | | | |
Interest Income | | | 4,399,218 | | 71,220,421 | |
Expenses: | | | | | | |
Investment advisory fee—Note 3(a) | | | 747,548 | | 9,014,077 | |
Administration fee—Note 3(a) | | | 183,299 | | 2,210,302 | |
Professional fees | | | 43,895 | | 83,910 | |
Registration fees | | | 31,809 | | 123,350 | |
Shareholder servicing costs—Note 3(b) | | | 27,767 | | 133,906 | |
Prospectus and shareholders’ reports | | | 16,605 | | 13,114 | |
Custodian fees—Note 3(b) | | | 6,722 | | 30,357 | |
Trustees’ fees and expenses—Note 3(c) | | | 5,579 | | 121,090 | |
Loan commitment fees—Note 2 | | | 3,458 | | 44,059 | |
Interest and expense related to floating rate notes issued—Note 4 | | | - | | 1,395,892 | |
Miscellaneous | | | 32,103 | | 88,151 | |
Total Expenses | | | 1,098,785 | | 13,258,208 | |
Less—reduction in expenses due to undertakings—Note 3(a) | | | (184,881) | | - | |
Less—reduction in fees due to earnings credits—Note 3(b) | | | (978) | | (11,885) | |
Net Expenses | | | 912,926 | | 13,246,323 | |
Investment Income—Net | | | 3,486,292 | | 57,974,098 | |
Realized and Unrealized Gain (Loss)
on Investments—Note 4 ($): | | | | |
Net realized gain (loss) on investments | 1,133,971 | | 6,201,080 | |
Net realized gain (loss) on futures | | | (288,080) | | (25,432,457) | |
Net Realized Gain (Loss) | | | 845,891 | | (19,231,377) | |
Net change in unrealized appreciation (depreciation) on investments | | | 7,404,165 | | 117,465,064 | |
Net change in unrealized appreciation (depreciation) on futures | | | (92,192) | | (8,985,490) | |
Net change in unrealized appreciation (depreciation) on swap agreements | | | - | | (1,434,185) | |
Net Change in Unrealized Appreciation (Depreciation) | | | 7,311,973 | | 107,045,389 | |
Net Realized and Unrealized Gain (Loss) on Investments | | | 8,157,864 | | 87,814,012 | |
Net Increase in Net Assets Resulting from Operations | | 11,644,156 | | 145,788,110 | |
| | | | | | | | |
See notes to financial statements. | | | | | | | |
93
STATEMENTS OF CHANGES IN NET ASSETS
| | | | | | | | | | | | | | | | |
| | | | BNY Mellon National Intermediate
Municipal Bond Fund | | BNY Mellon National Short-Term
Municipal Bond Fund | |
| | | | Year Ended August 31, | Year Ended August 31, |
| | | | 2019 | | | | 2018 | a | 2019 | | | | 2018 | a |
Operations ($): | | | | | | | | | | | | | | |
Investment income—net | | | 55,377,249 | | | | 54,865,726 | | 15,456,624 | | | | 10,402,284 | |
Net realized gain (loss) on investments | | 1,228,661 | | | | 682,133 | | 472,183 | | | | (1,203,921) | |
Net change in unrealized appreciation (depreciation)
on investments | | 125,350,329 | | | | (57,152,638) | | 17,567,621 | | | | (7,136,247) | |
Net Increase (Decrease) in Net Assets
Resulting from Operations | 181,956,239 | | | | (1,604,779) | | 33,496,428 | | | | 2,062,116 | |
Distributions ($): | | | | | | | | | | | | | | |
Distributions to shareholders: | | | | | | | | | | | | | | |
Class M | | | (54,047,433) | | | | (53,913,268) | | (15,273,026) | | | | (10,300,745) | |
Investor Shares | | | (1,000,031) | | | | (1,078,143) | | (114,913) | | | | (82,504) | |
Total Distributions | | | (55,047,464) | | | | (54,991,411) | | (15,387,939) | | | | (10,383,249) | |
Beneficial Interest Transactions ($): | | | | | | | | | | | | | | |
Net proceeds from shares sold: | | | | | | | | | | | | | | |
Class M | | | 924,564,661 | | | | 541,093,004 | | 662,514,188 | | | | 440,092,102 | |
Investor Shares | | | 30,145,345 | | | | 27,746,089 | | 15,862,712 | | | | 14,896,270 | |
Distributions reinvested: | | | | | | | | | | | | | | |
Class M | | | 7,396,191 | | | | 7,761,103 | | 2,760,357 | | | | 2,229,003 | |
Investor Shares | | | 748,375 | | | | 794,386 | | 76,023 | | | | 63,066 | |
Cost of shares redeemed: | | | | | | | | | | | | | | |
Class M | | | (702,377,279) | | | | (442,308,601) | | (466,572,548) | | | | (410,500,922) | |
Investor Shares | | | (29,452,276) | | | | (32,202,146) | | (10,651,925) | | | | (19,224,766) | |
Increase (Decrease) in Net Assets
from Beneficial Interest Transactions | 231,025,017 | | | | 102,883,835 | | 203,988,807 | | | | 27,554,753 | |
Total Increase (Decrease) in Net Assets | 357,933,792 | | | | 46,287,645 | | 222,097,296 | | | | 19,233,620 | |
Net Assets ($): | | | | | | | | | | | | | | |
Beginning of Period | | | 2,192,163,323 | | | | 2,145,875,678 | | 921,996,685 | | | | 902,763,065 | |
End of Period | | | 2,550,097,115 | | | | 2,192,163,323 | | 1,144,093,981 | | | | 921,996,685 | |
Capital Share Transactions (Shares): | | | | | | | | | | | | | | |
Class Mb | | | | | | | | | | | | | | |
Shares sold | | | 68,809,556 | | | | 40,418,705 | | 52,060,559 | | | | 34,647,488 | |
Shares issued for distributions reinvested | | | 547,710 | | | | 580,735 | | 216,153 | | | | 175,407 | |
Shares redeemed | | | (52,723,996) | | | | (33,068,224) | | (36,601,056) | | | | (32,298,310) | |
Net Increase (Decrease) in Shares Outstanding | 16,633,270 | | | | 7,931,216 | | 15,675,656 | | | | 2,524,585 | |
Investor Sharesb | | | | | | | | | | | | | | |
Shares sold | | | 2,228,820 | | | | 2,077,366 | | 1,240,572 | | | | 1,173,257 | |
Shares issued for distributions reinvested | | | 55,481 | | | | 59,478 | | 5,948 | | | | 4,965 | |
Shares redeemed | | | (2,194,034) | | | | (2,407,870) | | (835,125) | | | | (1,511,915) | |
Net Increase (Decrease) in Shares Outstanding | 90,267 | | | | (271,026) | | 411,395 | | | | (333,693) | |
| | | | | | | | | | | | | | | |
a For BNY Mellon National Intermediate Municipal Bond Fund, distributions to shareholders include $53,538,956 Class M shares and $1,069,679 Investor shares of distributions from net investment income and $374,312 Class M shares and $8,464 Investor shares distributions from net realized gains and for BNY Mellon National Short-Term Municipal Bond Fund, distributions to shareholders include only distributions from net investment income. |
b During the period ended August 31, 2019, 2,239,971 Class M shares representing $30,321,493 were exchanged for 2,242,724 Investor shares for BNY Mellon National Intermediate Municipal Bond Fund and 1,245,318 Class M shares representing $15,936,111 were exchanged for 1,246,081 Investor shares for BNY Mellon National Short-Term Municipal Bond Fund. During the period ended August 31, 2018, 1,985,316 Class M shares representing $26,542,819 were exchanged for 1,987,563 Investor shares for BNY Mellon National Intermediate Municipal Bond Fund and 1,147,283 Class M shares representing $14,575,993 were exchanged for 1,148,115 Investor shares for BNY Mellon National Short-Term Municipal Bond Fund. |
See notes to financial statements.
| | | | | | | | | | | | | | |
94
| | | | | | | | | | | | | | | | |
| | | | BNY Mellon Pennsylvania
Intermediate Municipal Bond Fund | | BNY Mellon Massachusetts
Intermediate Municipal Bond Fund | |
| | | | Year Ended August 31, | Year Ended August 31, |
| | | | 2019 | | | | 2018a | | 2019 | | | | 2018 | a |
Operations ($): | | | | | | | | | | | | | | |
Investment income—net | | | 4,565,407 | | | | 4,872,754 | | 6,962,540 | | | | 7,357,008 | |
Net realized gain (loss) on investments | | 431,462 | | | | 79,221 | | (42,371) | | | | 505,900 | |
Net change in unrealized appreciation (depreciation)
on investments | | 10,016,149 | | | | (4,727,959) | | 16,776,926 | | | | (8,865,871) | |
Net Increase (Decrease) in Net Assets
Resulting from Operations | 15,013,018 | | | | 224,016 | | 23,697,095 | | | | (1,002,963) | |
Distributions ($): | | | | | | | | | | | | | | |
Distributions to shareholders: | | | | | | | | | | | | | | |
Class M | | | (4,439,732) | | | | (5,091,772) | | (6,794,542) | | | | (7,269,509) | |
Investor Shares | | | (121,424) | | | | (134,886) | | (146,121) | | | | (169,645) | |
Total Distributions | | | (4,561,156) | | | | (5,226,658) | | (6,940,663) | | | | (7,439,154) | |
Beneficial Interest Transactions ($): | | | | | | | | | | | | | | |
Net proceeds from shares sold: | | | | | | | | | | | | | | |
Class M | | | 59,394,454 | | | | 15,022,892 | | 140,917,074 | | | | 65,668,049 | |
Investor Shares | | | 5,158,346 | | | | 3,174,709 | | 3,238,437 | | | | 2,498,387 | |
Distributions reinvested: | | | | | | | | | | | | | | |
Class M | | | 136,786 | | | | 391,540 | | 1,214,722 | | | | 1,478,003 | |
Investor Shares | | | 109,549 | | | | 126,859 | | 116,654 | | | | 138,330 | |
Cost of shares redeemed: | | | | | | | | | | | | | | |
Class M | | | (62,177,242) | | | | (35,799,291) | | (139,658,366) | | | | (58,636,443) | |
Investor Shares | | | (2,998,173) | | | | (2,725,343) | | (3,343,700) | | | | (4,781,629) | |
Increase (Decrease) in Net Assets
from Beneficial Interest Transactions | (376,280) | | | | (19,808,634) | | 2,484,821 | | | | 6,364,697 | |
Total Increase (Decrease) in Net Assets | 10,075,582 | | | | (24,811,276) | | 19,241,253 | | | | (2,077,420) | |
Net Assets ($): | | | | | | | | | | | | | | |
Beginning of Period | | | 189,688,748 | | | | 214,500,024 | | 304,560,457 | | | | 306,637,877 | |
End of Period | | | 199,764,330 | | | | 189,688,748 | | 323,801,710 | | | | 304,560,457 | |
Capital Share Transactions (Shares): | | | | | | | | | | | | | | |
Class Mb | | | | | | | | | | | | | | |
Shares sold | | | 4,952,835 | | | | 1,248,516 | | 11,290,812 | | | | 5,248,057 | |
Shares issued for distributions reinvested | | | 11,251 | | | | 32,492 | | 96,492 | | | | 118,419 | |
Shares redeemed | | | (5,178,666) | | | | (2,976,956) | | (11,250,364) | | | | (4,688,409) | |
Net Increase (Decrease) in Shares Outstanding | (214,580) | | | | (1,695,948) | | 136,940 | | | | 678,067 | |
Investor Sharesb | | | | | | | | | | | | | | |
Shares sold | | | 418,317 | | | | 263,105 | | 259,762 | | | | 201,472 | |
Shares issued for distributions reinvested | | | 9,030 | | | | 10,583 | | 9,263 | | | | 11,084 | |
Shares redeemed | | | (245,706) | | | | (227,651) | | (269,848) | | | | (381,253) | |
Net Increase (Decrease) in Shares Outstanding | 181,641 | | | | 46,037 | | (823) | | | | (168,697) | |
| | | | | | | | | | | | | | | |
a For BNY Mellon Pennsylvania Intermediate Municipal Bond Fund, distributions to shareholders include $4,747,819 Class M shares and $123,103 Investor shares of distributions from net investment income and $343,953 Class M shares and $11,783 Investor shares distributions from net realized gains and for BNY Mellon Massachusetts Intermediate Municipal Bond Fund, distributions to shareholders include $7,180,877 Class M shares and $167,392 Investor shares of distributions from net investment income and $88,632 Class M shares and $2,253 Investor shares distributions from net realized gains. |
b During the period ended August 31, 2019, 417,738 Class M shares representing $5,158,014 were exchanged for 418,289 Investor shares for BNY Mellon Pennsylvania Intermediate Municipal Bond Fund and 246,548 Class M shares representing $3,076,110 were exchanged for 246,610 Investor shares for BNY Mellon Massachusetts Intermediate Municipal Bond Fund. During the period ended August 31, 2018, 262,189 Class M shares representing $3,168,278 were exchanged for 262,569 Investor shares for BNY Mellon Pennsylvania Intermediate Municipal Bond Fund and 193,033 Class M shares representing $2,392,295 were exchanged for 193,072 Investor shares for BNY Mellon Massachusetts Intermediate Municipal Bond Fund. |
See notes to financial statements.
| | | | | | | | | | | | | | |
95
STATEMENTS OF CHANGES IN NET ASSETS (continued)
| | | | | | | | | | | | | | | | |
| | | | BNY Mellon New York
Intermediate Tax-Exempt Bond Fund | | BNY Mellon Municipal
Opportunities Fund | |
| | | | Year Ended August 31, | Year Ended August 31, |
| | | | 2019 | | | | 2018 | a | 2019 | | | | 2018 | a |
Operations ($): | | | | | | | | | | | | | | |
Investment income—net | | | 3,486,292 | | | | 3,796,575 | | 57,974,098 | | | | 43,592,890 | |
Net realized gain (loss) on investments | | 845,891 | | | | 470,127 | | (19,231,377) | | | | 20,347,053 | |
Net change in unrealized appreciation (depreciation)
on investments | | 7,311,973 | | | | (4,635,365) | | 107,045,389 | | | | (23,809,215) | |
Net Increase (Decrease) in Net Assets
Resulting from Operations | 11,644,156 | | | | (368,663) | | 145,788,110 | | | | 40,130,728 | |
Distributions ($): | | | | | | | | | | | | | | |
Distributions to shareholders: | | | | | | | | | | | | | | |
Class M | | | (3,350,041) | | | | (3,596,094) | | (56,442,648) | | | | (42,677,125) | |
Investor Shares | | | (240,285) | | | | (254,130) | | (1,589,104) | | | | (1,077,442) | |
Total Distributions | | | (3,590,326) | | | | (3,850,224) | | (58,031,752) | | | | (43,754,567) | |
Beneficial Interest Transactions ($): | | | | | | | | | | | | | | |
Net proceeds from shares sold: | | | | | | | | | | | | | | |
Class M | | | 50,782,643 | | | | 26,703,390 | | 591,544,011 | | | | 247,896,915 | |
Investor Shares | | | 1,724,720 | | | | 729,015 | | 60,863,277 | | | | 20,385,710 | |
Distributions reinvested: | | | | | | | | | | | | | | |
Class M | | | 521,325 | | | | 515,854 | | 16,847,749 | | | | 14,193,605 | |
Investor Shares | | | 216,022 | | | | 221,412 | | 1,290,464 | | | | 920,060 | |
Cost of shares redeemed: | | | | | | | | | | | | | | |
Class M | | | (57,545,613) | | | | (28,891,537) | | (206,989,736) | | | | (83,869,298) | |
Investor Shares | | | (2,821,412) | | | | (2,397,399) | | (34,537,076) | | | | (45,990,892) | |
Increase (Decrease) in Net Assets
from Beneficial Interest Transactions | (7,122,315) | | | | (3,119,265) | | 429,018,689 | | | | 153,536,100 | |
Total Increase (Decrease) in Net Assets | 931,515 | | | | (7,338,152) | | 516,775,047 | | | | 149,912,261 | |
Net Assets ($): | | | | | | | | | | | | | | |
Beginning of Period | | | 158,677,034 | | | | 166,015,186 | | 1,465,274,716 | | | | 1,315,362,455 | |
End of Period | | | 159,608,549 | | | | 158,677,034 | | 1,982,049,763 | | | | 1,465,274,716 | |
Capital Share Transactions (Shares): | | | | | | | | | | | | | | |
Class Mb | | | | | | | | | | | | | | |
Shares sold | | | 4,614,444 | | | | 2,426,877 | | 45,331,585 | | | | 18,906,273 | |
Shares issued for distributions reinvested | | | 47,158 | | | | 47,013 | | 1,273,298 | | | | 1,087,061 | |
Shares redeemed | | | (5,277,280) | | | | (2,629,792) | | (15,711,099) | | | | (6,417,687) | |
Net Increase (Decrease) in Shares Outstanding | (615,678) | | | | (155,902) | | 30,893,784 | | | | 13,575,647 | |
Investor Sharesb | | | | | | | | | | | | | | |
Shares sold | | | 157,588 | | | | 66,757 | | 4,613,967 | | | | 1,557,633 | |
Shares issued for distributions reinvested | | | 19,503 | | | | 20,167 | | 97,159 | | | | 70,408 | |
Shares redeemed | | | (257,126) | | | | (217,515) | | (2,581,794) | | | | (3,517,753) | |
Net Increase (Decrease) in Shares Outstanding | (80,035) | | | | (130,591) | | 2,129,332 | | | | (1,889,712) | |
| | | | | | | | | | | | | | | |
a For BNY Mellon New York Intermediate Tax-Exempt Bond Fund, distributions to shareholders include $3,546,488 Class M shares and $250,069 Investor shares of distributions from net investment income and $49,606 Class M shares and $4,061 Investor shares distributions from net realized gains and for BNY Mellon Municipal Opportunities Fund, distributions to shareholders include $42,226,128 Class M shares and $1,067,817 Investor shares of distributions from net investment income and $450,997 Class M shares and $9,625 Investor shares distributions from net realized gains. |
b During the period ended August 31, 2019, 71,695 Class M shares representing $797,325 were exchanged for 71,637 Investor shares for BNY Mellon New York Intermediate Tax-Exempt Bond Fund and 2,891,943 Class M shares representing $38,378,965 were exchanged for 2,892,570 Investor shares for BNY Mellon Municipal Opportunities Fund. During the period ended August 31, 2018, 53,856 Class M shares representing $587,054 were exchanged for 53,281 Investor shares for BNY Mellon New York Intermediate Tax Exempt Bond Fund and 1,049,031 Class M shares representing $13,699,928 were exchanged for 1,048,357 Investor shares for BNY Mellon Municipal Opportunities Fund. |
See notes to financial statements.
| | | | | | | | | | | | | | |
96
FINANCIAL HIGHLIGHTS
The following tables describe the performance for each share class of each fund for the fiscal periods indicated. All information (except portfolio turnover rate) reflects financial results for a single fund share. Total return shows how much your investment in each fund would have increased (or decreased) during each period, assuming you had reinvested all dividends and distributions. These figures have been derived from the funds’ financial statements.
| | | | | | | | | | | | | | | | |
| | | | | Class M Shares |
| | | | | | | |
| | | | | | | Year Ended August 31, |
BNY Mellon National Intermediate Municipal Bond Fund | | | 2019 | | 2018 | | 2017 | | 2016 | | 2015 | |
Per Share Data ($): | | | | | | | | | | | | |
Net asset value, beginning of period | | | 13.29 | | 13.64 | | 14.00 | | 13.56 | | 13.77 | |
Investment Operations: | | | | | | | | | | | | |
Investment income—neta | | | .33 | | .34 | | .34 | | .36 | | .37 | |
Net realized and unrealized gain (loss) on investments | | | .75 | | (.35) | | (.27) | | .43 | | (.21) | |
Total from Investment Operations | | | 1.08 | | (.01) | | .07 | | .79 | | .16 | |
Distributions: | | | | | | | | | | | | |
Dividends from investment income—net | | | (.33) | | (.34) | | (.34) | | (.35) | | (.37) | |
Dividends from net realized gain on investments | | | - | | (.00) | b | (.09) | | (.00) | b | - | |
Total Distributions | | | (.33) | | (.34) | | (.43) | | (.35) | | (.37) | |
Net asset value, end of period | | | 14.04 | | 13.29 | | 13.64 | | 14.00 | | 13.56 | |
Total Return (%) | | | 8.26 | | (.05) | | .60 | | 5.94 | | 1.23 | |
Ratios/Supplemental Data (%): | | | | | | | | | | | | |
Ratio of total expenses to average net assets | | | .50 | | .50 | | .50 | | .50 | | .50 | |
Ratio of net expenses to average net assets | | | .50 | | .50 | | .50 | | .50 | | .50 | |
Ratio of net investment income to average net assets | | | 2.45 | | 2.54 | | 2.52 | | 2.58 | | 2.70 | |
Portfolio Turnover Rate | | | 61.91 | | 38.75 | | 32.14 | | 18.61 | | 35.65 | |
Net Assets, end of period ($ x 1,000) | | | 2,498,913 | | 2,144,898 | | 2,093,660 | | 2,223,660 | | 1,970,693 | |
a Based on average shares outstanding.
b Amount represents less than $.01 per share.
See notes to financial statements.
97
FINANCIAL HIGHLIGHTS (continued)
| | | | | | | | | | | | | | | | |
| | | | | Investor Shares |
| | | | | | | |
| | | | | | | Year Ended August 31, |
BNY Mellon National Intermediate Municipal Bond Fund | | | 2019 | | 2018 | | 2017 | | 2016 | | 2015 | |
Per Share Data ($): | | | | | | | | | | | | |
Net asset value, beginning of period | | | 13.28 | | 13.63 | | 13.99 | | 13.54 | | 13.75 | |
Investment Operations: | | | | | | | | | | | | |
Investment income—neta | | | .30 | | .31 | | .31 | | .32 | | .34 | |
Net realized and unrealized gain (loss) on investments | | | .74 | | (.36) | | (.27) | | .45 | | (.22) | |
Total from Investment Operations | | | 1.04 | | (.05) | | .04 | | .77 | | .12 | |
Distributions: | | | | | | | | | | | | |
Dividends from investment income—net | | | (.30) | | (.30) | | (.31) | | (.32) | | (.33) | |
Dividends from net realized gain on investments | | | - | | (.00) | b | (.09) | | (.00) | b | - | |
Total Distributions | | | (.30) | | (.30) | | (.40) | | (.32) | | (.33) | |
Net asset value, end of period | | | 14.02 | | 13.28 | | 13.63 | | 13.99 | | 13.54 | |
Total Return (%) | | | 7.92 | | (.30) | | .35 | | 5.76 | | .90 | |
Ratios/Supplemental Data (%): | | | | | | | | | | | | |
Ratio of total expenses to average net assets | | | .75 | | .75 | | .75 | | .75 | | .75 | |
Ratio of net expenses to average net assets | | | .75 | | .75 | | .75 | | .75 | | .75 | |
Ratio of net investment income to average net assets | | | 2.22 | | 2.29 | | 2.27 | | 2.33 | | 2.45 | |
Portfolio Turnover Rate | | | 61.91 | | 38.75 | | 32.14 | | 18.61 | | 35.65 | |
Net Assets, end of period ($ x 1,000) | | | 51,184 | | 47,265 | | 52,216 | | 55,272 | | 50,199 | |
a Based on average shares outstanding.
b Amount represents less than $.01 per share.
See notes to financial statements.
98
| | | | | | | | | | | | | | | | |
| | | | | Class M Shares |
| | | | | | | |
| | | | | | | Year Ended August 31, |
BNY Mellon National Short-Term Municipal Bond Fund | | | 2019 | | 2018 | | 2017 | | 2016 | | 2015 | |
Per Share Data ($): | | | | | | | | | | | | |
Net asset value, beginning of period | | | 12.71 | | 12.83 | | 12.87 | | 12.83 | | 12.94 | |
Investment Operations: | | | | | | | | | | | | |
Investment income—neta | | | .18 | | .14 | | .12 | | .11 | | .11 | |
Net realized and unrealized gain (loss) on investments | | | .20 | | (.12) | | (.02) | | .05 | | (.09) | |
Total from Investment Operations | | | .38 | | .02 | | .10 | | .16 | | .02 | |
Distributions: | | | | | | | | | | | | |
Dividends from investment income—net | | | (.18) | | (.14) | | (.12) | | (.11) | | (.11) | |
Dividends from net realized gain on investments | | | - | | - | | (.02) | | (.01) | | (.02) | |
Total Distributions | | | (.18) | | (.14) | | (.14) | | (.12) | | (.13) | |
Net asset value, end of period | | | 12.91 | | 12.71 | | 12.83 | | 12.87 | | 12.83 | |
Total Return (%) | | | 3.03 | | .18 | | .76 | | 1.21 | | .17 | |
Ratios/Supplemental Data (%): | | | | | | | | | | | | |
Ratio of total expenses to average net assets | | | .50 | | .51 | | .51 | | .51 | | .50 | |
Ratio of net expenses to average net assets | | | .50 | | .51 | | .51 | | .51 | | .50 | |
Ratio of net investment income to average net assets | | | 1.44 | | 1.12 | | .94 | | .84 | | .82 | |
Portfolio Turnover Rate | | | 128.58 | | 58.52 | | 35.60 | | 51.47 | | 34.24 | |
Net Assets, end of period ($ x 1,000) | | | 1,129,486 | | 912,838 | | 889,237 | | 1,104,162 | | 1,007,532 | |
a Based on average shares outstanding.
See notes to financial statements.
99
FINANCIAL HIGHLIGHTS (continued)
| | | | | | | | | | | | | | | | |
| | | | | Investor Shares |
| | | | | | | |
| | | | | | | Year Ended August 31, |
BNY Mellon National Short-Term Municipal Bond Fund | | | 2019 | | 2018 | | 2017 | | 2016 | | 2015 | |
Per Share Data ($): | | | | | | | | | | | | |
Net asset value, beginning of period | | | 12.70 | | 12.82 | | 12.86 | | 12.82 | | 12.93 | |
Investment Operations: | | | | | | | | | | | | |
Investment income—neta | | | .15 | | .11 | | .09 | | .08 | | .08 | |
Net realized and unrealized gain (loss) on investments | | | .20 | | (.12) | | (.02) | | .05 | | (.10) | |
Total from Investment Operations | | | .35 | | (.01) | | .07 | | .13 | | (.02) | |
Distributions: | | | | | | | | | | | | |
Dividends from investment income—net | | | (.15) | | (.11) | | (.09) | | (.08) | | (.07) | |
Dividends from net realized gain on investments | | | - | | - | | (.02) | | (.01) | | (.02) | |
Total Distributions | | | (.15) | | (.11) | | (.11) | | (.09) | | (.09) | |
Net asset value, end of period | | | 12.90 | | 12.70 | | 12.82 | | 12.86 | | 12.82 | |
Total Return (%) | | | 2.78 | | (.07) | | .52 | | .97 | | (.15) | |
Ratios/Supplemental Data (%): | | | | | | | | | | | | |
Ratio of total expenses to average net assets | | | .75 | | .76 | | .76 | | .76 | | .76 | |
Ratio of net expenses to average net assets | | | .75 | | .76 | | .76 | | .76 | | .76 | |
Ratio of net investment income to average net assets | | | 1.20 | | .87 | | .72 | | .60 | | .59 | |
Portfolio Turnover Rate | | | 128.58 | | 58.52 | | 35.60 | | 51.47 | | 34.24 | |
Net Assets, end of period ($ x 1,000) | | | 14,608 | | 9,158 | | 13,526 | | 5,880 | | 12,166 | |
a Based on average shares outstanding.
See notes to financial statements.
100
| | | | | | | | | | | | | | | | |
| | | | | Class M Shares |
| | | | | | | |
| | | | | | | Year Ended August 31, |
BNY Mellon Pennsylvania Intermediate Municipal Bond Fund | | | 2019 | | 2018 | | 2017 | | 2016 | | 2015 | |
Per Share Data ($): | | | | | | | | | | | | |
Net asset value, beginning of period | | | 11.95 | | 12.24 | | 12.68 | | 12.31 | | 12.56 | |
Investment Operations: | | | | | | | | | | | | |
Investment income—neta | | | .29 | | .29 | | .30 | | .32 | | .33 | |
Net realized and unrealized gain (loss) on investments | | | .66 | | (.27) | | (.24) | | .41 | | (.25) | |
Total from Investment Operations | | | .95 | | .02 | | .06 | | .73 | | .08 | |
Distributions: | | | | | | | | | | | | |
Dividends from investment income—net | | | (.29) | | (.29) | | (.30) | | (.32) | | (.33) | |
Dividends from net realized gain on investments | | | - | | (.02) | | (.20) | | (.04) | | - | |
Total Distributions | | | (.29) | | (.31) | | (.50) | | (.36) | | (.33) | |
Net asset value, end of period | | | 12.61 | | 11.95 | | 12.24 | | 12.68 | | 12.31 | |
Total Return (%) | | | 8.09 | | .22 | | .55 | | 5.96 | | .74 | |
Ratios/Supplemental Data (%): | | | | | | | | | | | | |
Ratio of total expenses to average net assets | | | .70 | | .70 | | .70 | | .69 | | .68 | |
Ratio of net expenses to average net assets | | | .70 | | .70 | | .70 | | .69 | | .68 | |
Ratio of net investment income to average net assets | | | 2.41 | | 2.44 | | 2.44 | | 2.52 | | 2.65 | |
Portfolio Turnover Rate | | | 69.91 | | 38.13 | | 20.07 | | 25.94 | | 35.96 | |
Net Assets, end of period ($ x 1,000) | | | 191,702 | | 184,216 | | 209,457 | | 255,017 | | 276,729 | |
a Based on average shares outstanding.
See notes to financial statements.
101
FINANCIAL HIGHLIGHTS (continued)
| | | | | | | | | | | | | | | | |
| | | | | Investor Shares |
| | | | | | | |
| | | | | | | Year Ended August 31, |
BNY Mellon Pennsylvania Intermediate Municipal Bond Fund | | | 2019 | | 2018 | | 2017 | | 2016 | | 2015 | |
Per Share Data ($): | | | | | | | | | | | | |
Net asset value, beginning of period | | | 11.93 | | 12.23 | | 12.67 | | 12.29 | | 12.54 | |
Investment Operations: | | | | | | | | | | | | |
Investment income—neta | | | .26 | | .27 | | .27 | | .28 | | .30 | |
Net realized and unrealized gain (loss) on investments | | | .66 | | (.29) | | (.24) | | .42 | | (.25) | |
Total from Investment Operations | | | .92 | | (.02) | | .03 | | .70 | | .05 | |
Distributions: | | | | | | | | | | | | |
Dividends from investment income—net | | | (.26) | | (.26) | | (.27) | | (.28) | | (.30) | |
Dividends from net realized gain on investments | | | - | | (.02) | | (.20) | | (.04) | | - | |
Total Distributions | | | (.26) | | (.28) | | (.47) | | (.32) | | (.30) | |
Net asset value, end of period | | | 12.59 | | 11.93 | | 12.23 | | 12.67 | | 12.29 | |
Total Return (%) | | | 7.83 | | (.12) | | .30 | | 5.79 | | .40 | |
Ratios/Supplemental Data (%): | | | | | | | | | | | | |
Ratio of total expenses to average net assets | | | .95 | | .95 | | .95 | | .94 | | .93 | |
Ratio of net expenses to average net assets | | | .95 | | .95 | | .95 | | .94 | | .93 | |
Ratio of net investment income to average net assets | | | 2.15 | | 2.19 | | 2.20 | | 2.27 | | 2.41 | |
Portfolio Turnover Rate | | | 69.91 | | 38.13 | | 20.07 | | 25.94 | | 35.96 | |
Net Assets, end of period ($ x 1,000) | | | 8,063 | | 5,473 | | 5,043 | | 5,981 | | 5,558 | |
a Based on average shares outstanding.
See notes to financial statements.
102
| | | | | | | | | | | | | | | | |
| | | | | Class M Shares |
| | | | | | | |
| | | | | | | Year Ended August 31, |
BNY Mellon Massachusetts Intermediate Municipal Bond Fund | | | 2019 | | 2018 | | 2017 | | 2016 | | 2015 | |
Per Share Data ($): | | | | | | | | | | | | |
Net asset value, beginning of period | | | 12.40 | | 12.75 | | 13.16 | | 12.73 | | 12.95 | |
Investment Operations: | | | | | | | | | | | | |
Investment income—neta | | | .29 | | .30 | | .30 | | .31 | | .33 | |
Net realized and unrealized gain (loss) on investments | | | .72 | | (.35) | | (.28) | | .43 | | (.21) | |
Total from Investment Operations | | | 1.01 | | (.05) | | .02 | | .74 | | .12 | |
Distributions: | | | | | | | | | | | | |
Dividends from investment income—net | | | (.29) | | (.30) | | (.30) | | (.31) | | (.34) | |
Dividends from net realized gain on investments | | | - | | (.00) | b | (.13) | | - | | - | |
Total Distributions | | | (.29) | | (.30) | | (.43) | | (.31) | | (.34) | |
Net asset value, end of period | | | 13.12 | | 12.40 | | 12.75 | | 13.16 | | 12.73 | |
Total Return (%) | | | 8.28 | | (.32) | | .24 | | 5.88 | | .98 | |
Ratios/Supplemental Data (%): | | | | | | | | | | | | |
Ratio of total expenses to average net assets | | | .53 | | .54 | | .54 | | .54 | | .53 | |
Ratio of net expenses to average net assets | | | .53 | | .54 | | .54 | | .54 | | .53 | |
Ratio of net investment income to average net assets | | | 2.32 | | 2.43 | | 2.35 | | 2.39 | | 2.60 | |
Portfolio Turnover Rate | | | 80.68 | | 38.51 | | 31.61 | | 28.71 | | 41.79 | |
Net Assets, end of period ($ x 1,000) | | | 316,364 | | 297,515 | | 297,243 | | 360,108 | | 310,635 | |
a Based on average shares outstanding.
b Amount represents less than $.01 per share.
See notes to financial statements.
103
FINANCIAL HIGHLIGHTS (continued)
| | | | | | | | | | | | | | | | |
| | | | | Investor Shares |
| | | | | | | |
| | | | | | | Year Ended August 31, |
BNY Mellon Massachusetts Intermediate Municipal Bond Fund | | | 2019 | | 2018 | | 2017 | | 2016 | | 2015 | |
Per Share Data ($): | | | | | | | | | | | | |
Net asset value, beginning of period | | | 12.40 | | 12.75 | | 13.15 | | 12.73 | | 12.94 | |
Investment Operations: | | | | | | | | | | | | |
Investment income—neta | | | .26 | | .27 | | .27 | | .28 | | .31 | |
Net realized and unrealized gain (loss) on investments | | | .71 | | (.35) | | (.27) | | .42 | | (.22) | |
Total from Investment Operations | | | .97 | | (.08) | | - | | .70 | | .09 | |
Distributions: | | | | | | | | | | | | |
Dividends from investment income—net | | | (.26) | | (.27) | | (.27) | | (.28) | | (.30) | |
Dividends from net realized gain on investments | | | - | | (.00) | b | (.13) | | - | | - | |
Total Distributions | | | (.26) | | (.27) | | (.40) | | (.28) | | (.30) | |
Net asset value, end of period | | | 13.11 | | 12.40 | | 12.75 | | 13.15 | | 12.73 | |
Total Return (%) | | | 7.93 | | (.56) | | .06 | | 5.54 | | .73 | |
Ratios/Supplemental Data (%): | | | | | | | | | | | | |
Ratio of total expenses to average net assets | | | .78 | | .79 | | .79 | | .79 | | .78 | |
Ratio of net expenses to average net assets | | | .78 | | .79 | | .79 | | .79 | | .78 | |
Ratio of net investment income to average net assets | | | 2.08 | | 2.18 | | 2.12 | | 2.15 | | 2.35 | |
Portfolio Turnover Rate | | | 80.68 | | 38.51 | | 31.61 | | 28.71 | | 41.79 | |
Net Assets, end of period ($ x 1,000) | | | 7,437 | | 7,046 | | 9,395 | | 8,410 | | 8,632 | |
a Based on average shares outstanding.
b Amount represents less than $.01 per share.
See notes to financial statements.
104
| | | | | | | | | | | | | | | | |
| | | | | Class M Shares |
| | | | | | | |
| | | | | | | Year Ended August 31, |
BNY Mellon New York Intermediate Tax-Exempt Bond Fund | | | 2019 | | 2018 | | 2017 | | 2016 | | 2015 | |
Per Share Data ($): | | | | | | | | | | | | |
Net asset value, beginning of period | | | 10.91 | | 11.20 | | 11.62 | | 11.24 | | 11.40 | |
Investment Operations: | | | | | | | | | | | | |
Investment income—neta | | | .26 | | .26 | | .26 | | .29 | | .30 | |
Net realized and unrealized gain (loss) on investments | | | .63 | | (.29) | | (.24) | | .41 | | (.16) | |
Total from Investment Operations | | | .89 | | (.03) | | .02 | | .70 | | .14 | |
Distributions: | | | | | | | | | | | | |
Dividends from investment income—net | | | (.26) | | (.26) | | (.26) | | (.29) | | (.30) | |
Dividends from net realized gain on investments | | | (.01) | | (.00) | b | (.18) | | (.03) | | - | |
Total Distributions | | | (.27) | | (.26) | | (.44) | | (.32) | | (.30) | |
Net asset value, end of period | | | 11.53 | | 10.91 | | 11.20 | | 11.62 | | 11.24 | |
Total Return (%) | | | 8.28 | | (.22) | | .31 | | 6.30 | | 1.33 | |
Ratios/Supplemental Data (%): | | | | | | | | | | | | |
Ratio of total expenses to average net assets | | | .72 | | .72 | | .73 | | .72 | | .71 | |
Ratio of net expenses to average net assets | | | .59 | | .59 | | .59 | | .59 | | .59 | |
Ratio of net investment income to average net assets | | | 2.35 | | 2.36 | | 2.38 | | 2.53 | | 2.64 | |
Portfolio Turnover Rate | | | 90.17 | | 45.71 | | 37.78 | | 36.53 | | 52.79 | |
Net Assets, end of period ($ x 1,000) | | | 148,558 | | 147,343 | | 152,923 | | 175,053 | | 169,337 | |
a Based on average shares outstanding.
b Amount represents less than $.01 per share.
See notes to financial statements.
105
FINANCIAL HIGHLIGHTS (continued)
| | | | | | | | | | | | | | | | |
| | | | | Investor Shares |
| | | | | | | |
| | | | | | | Year Ended August 31, |
BNY Mellon New York Intermediate Tax-Exempt Bond Fund | | | 2019 | | 2018 | | 2017 | | 2016 | | 2015 | |
Per Share Data ($): | | | | | | | | | | | | |
Net asset value, beginning of period | | | 10.92 | | 11.20 | | 11.62 | | 11.24 | | 11.40 | |
Investment Operations: | | | | | | | | | | | | |
Investment income—neta | | | .23 | | .23 | | .24 | | .26 | | .27 | |
Net realized and unrealized gain (loss) on investments | | | .63 | | (.28) | | (.24) | | .41 | | (.16) | |
Total from Investment Operations | | | .86 | | (.05) | | - | | .67 | | .11 | |
Distributions: | | | | | | | | | | | | |
Dividends from investment income—net | | | (.23) | | (.23) | | (.24) | | (.26) | | (.27) | |
Dividends from net realized gain on investments | | | (.01) | | (.00) | b | (.18) | | (.03) | | - | |
Total Distributions | | | (.24) | | (.23) | | (.42) | | (.29) | | (.27) | |
Net asset value, end of period | | | 11.54 | | 10.92 | | 11.20 | | 11.62 | | 11.24 | |
Total Return (%) | | | 8.00 | | (.38) | | .07 | | 6.03 | | .98 | |
Ratios/Supplemental Data (%): | | | | | | | | | | | | |
Ratio of total expenses to average net assets | | | .97 | | .97 | | .98 | | .97 | | .96 | |
Ratio of net expenses to average net assets | | | .84 | | .84 | | .84 | | .84 | | .84 | |
Ratio of net investment income to average net assets | | | 2.11 | | 2.11 | | 2.13 | | 2.28 | | 2.39 | |
Portfolio Turnover Rate | | | 90.17 | | 45.71 | | 37.78 | | 36.53 | | 52.79 | |
Net Assets, end of period ($ x 1,000) | | | 11,051 | | 11,334 | | 13,093 | | 14,322 | | 15,495 | |
a Based on average shares outstanding.
b Amount represents less than $.01 per share.
See notes to financial statements.
106
| | | | | | | | | | | | | | | | |
| | | | | Class M Shares |
| | | | | | | |
| | | | | | | Year Ended August 31, |
BNY Mellon Municipal Opportunities Fund | | | 2019 | | 2018 | | 2017 | | 2016 | | 2015 | |
Per Share Data ($): | | | | | | | | | | | | |
Net asset value, beginning of period | | | 13.12 | | 13.15 | | 13.46 | | 12.99 | | 13.16 | |
Investment Operations: | | | | | | | | | | | | |
Investment income—neta | | | .43 | | .44 | | .45 | | .50 | | .47 | |
Net realized and unrealized gain (loss) on investments | | | .57 | | (.02) | | (.32) | | .45 | | (.18) | |
Total from Investment Operations | | | 1.00 | | .42 | | .13 | | .95 | | .29 | |
Distributions: | | | | | | | | | | | | |
Dividends from investment income—net | | | (.42) | | (.45) | | (.44) | | (.48) | | (.46) | |
Dividends from net realized gain on investments | | | (.00) | b | (.00) | b | (.00) | b | - | | - | |
Total Distributions | | | (.42) | | (.45) | | (.44) | | (.48) | | (.46) | |
Net asset value, end of period | | | 13.70 | | 13.12 | | 13.15 | | 13.46 | | 12.99 | |
Total Return (%) | | | 7.77 | | 3.27 | | 1.11 | | 7.40 | | 2.20 | |
Ratios/Supplemental Data (%): | | | | | | | | | | | | |
Ratio of total expenses to average net assets | | | .73 | | .75 | | .73 | | .71 | | .69 | |
Ratio of net expenses to average net assets | | | .73 | | .75 | | .73 | | .71 | | .69 | |
Ratio of interest and expense related to floating
rate notes issued to average net assets | | | .08 | | .10 | | .07 | | .05 | | .04 | |
Ratio of net investment income to average net assets | | | 3.22 | | 3.43 | | 3.44 | | 3.79 | | 3.57 | |
Portfolio Turnover Rate | | | 72.96 | | 41.48 | | 34.78 | | 31.92 | | 41.90 | |
Net Assets, end of period ($ x 1,000) | | | 1,918,499 | | 1,432,351 | | 1,257,498 | | 1,084,650 | | 1,141,309 | |
a Based on average shares outstanding.
b Amount represents less than $.01 per share.
See notes to financial statements.
107
FINANCIAL HIGHLIGHTS (continued)
| | | | | | | | | | | | | | | | |
| | | | | Investor Shares |
| | | | | | | |
| | | | | | | Year Ended August 31, |
BNY Mellon Municipal Opportunities Fund | | | 2019 | | 2018 | | 2017 | | 2016 | | 2015 | |
Per Share Data ($): | | | | | | | | | | | | |
Net asset value, beginning of period | | | 13.13 | | 13.16 | | 13.46 | | 12.99 | | 13.16 | |
Investment Operations: | | | | | | | | | | | | |
Investment income—neta | | | .39 | | .40 | | .41 | | .47 | | .43 | |
Net realized and unrealized gain (loss) on investments | | | .57 | | (.02) | | (.30) | | .44 | | (.18) | |
Total from Investment Operations | | | .96 | | .38 | | .11 | | .91 | | .25 | |
Distributions: | | | | | | | | | | | | |
Dividends from investment income—net | | | (.39) | | (.41) | | (.41) | | (.44) | | (.42) | |
Dividends from net realized gain on investments | | | (.00) | b | (.00) | b | (.00) | b | - | | - | |
Total Distributions | | | (.39) | | (.41) | | (.41) | | (.44) | | (.42) | |
Net asset value, end of period | | | 13.70 | | 13.13 | | 13.16 | | 13.46 | | 12.99 | |
Total Return (%) | | | 7.50 | | 3.01 | | .95 | | 7.13 | | 1.93 | |
Ratios/Supplemental Data (%): | | | | | | | | | | | | |
Ratio of total expenses to average net assets | | | .98 | | 1.00 | | .99 | | .96 | | .96 | |
Ratio of net expenses to average net assets | | | .98 | | 1.00 | | .99 | | .96 | | .96 | |
Ratio of interest and expense related to floating
rate notes issued to average net assets | | | .08 | | .10 | | .07 | | .05 | | .04 | |
Ratio of net investment income to average net assets | | | 2.97 | | 3.12 | | 3.14 | | 3.55 | | 3.30 | |
Portfolio Turnover Rate | | | 72.96 | | 41.48 | | 34.78 | | 31.92 | | 41.90 | |
Net Assets, end of period ($ x 1,000) | | | 63,551 | | 32,924 | | 57,865 | | 25,463 | | 16,832 | |
a Based on average shares outstanding.
b Amount represents less than $.01 per share.
See notes to financial statements.
108
NOTES TO FINANCIAL STATEMENTS
NOTE 1—Significant Accounting Policies:
BNY Mellon Funds Trust (the “Trust”), a Massachusetts business trust that is registered under the Investment Company Act of 1940, as amended (the “Act”), as an open-end management investment company, operates as a series company currently consisting of twenty-three series, including the following non-diversified funds: BNY Mellon National Intermediate Municipal Bond Fund, BNY Mellon National Short-Term Municipal Bond Fund, BNY Mellon Pennsylvania Intermediate Municipal Bond Fund, BNY Mellon Massachusetts Intermediate Municipal Bond Fund, BNY Mellon New York Intermediate Tax-Exempt Bond Fund and BNY Mellon Municipal Opportunities Fund (each, a “fund” and collectively, the “funds”). The objectives of the funds are as follows: BNY Mellon National Intermediate Municipal Bond Fund and BNY Mellon National Short-Term Municipal Bond Fund seek to maximize current income exempt from federal income tax to the extent consistent with the preservation of capital. BNY Mellon Pennsylvania Intermediate Municipal Bond Fund seeks as high a level of income exempt from federal and Pennsylvania state income taxes as is consistent with the preservation of capital. BNY Mellon Massachusetts Intermediate Municipal Bond Fund seeks as high a level of income exempt from federal and Massachusetts state income taxes as is consistent with the preservation of capital. BNY Mellon New York Intermediate Tax-Exempt Bond Fund seeks as high a level of current income exempt from federal, New York state and New York city income taxes as is consistent with the preservation of capital. BNY Mellon Municipal Opportunities Fund seeks to maximize total return consisting of high current income exempt from federal income tax and capital appreciation. Effective March 31, 2019, BNY Mellon Municipal Opportunities Fund is closed to new and existing investors.
BNY Mellon Investment Adviser, Inc. (the “Adviser”), a wholly-owned subsidiary of The Bank of New York Mellon Corporation (“BNY Mellon”), serves as each fund’s investment adviser The Bank of New York Mellon, a subsidiary of BNY Mellon and an affiliate of the Adviser, serves as administrator for the funds pursuant to an Administration Agreement with the Trust (the “Administration Agreement”). The Bank of New York Mellon has entered into a Sub-Administration Agreement with the Adviser pursuant to which The Bank of New York Mellon pays the Adviser for performing certain administrative services.BNY MellonSecurities Corporation (the “Distributor”), a wholly-owned subsidiary of the Adviser, is the distributor of each fund’s shares, which are sold without a sales charge.
Effective June 3, 2019, The Dreyfus Corporation, each fund’s investment adviser, changed its name to “BNY Mellon Investment Adviser, Inc.”, MBSC Securities Corporation, each fund’s distributor, changed its name to “BNY Mellon Securities Corporation” and Dreyfus Transfer, Inc., each fund’s transfer agent, changed its name to “BNY Mellon Transfer, Inc.” In addition, effective June 3, 2019, BNY Mellon Investment Adviser, Inc. serves as the funds’ investment adviser directly and not through BNY Mellon Fund Advisers, formerly a division of BNY Mellon Investment Adviser, Inc.
Each fund is authorized to issue an unlimited number of $.001 par value shares of Beneficial Interest in each of the following classes of shares: Class M and Investor. Each class of shares has identical rights and privileges, except with respect to the Shareholder Service Plan and the expenses borne by each class, the allocation of certain transfer agency costs and certain voting rights. Income, expenses (other than expenses attributable to a specific class), and realized and unrealized gains or losses on investments are allocated to each class of shares based on its relative net assets.
The Trust accounts separately for the assets, liabilities and operations of each series. Expenses directly attributable to each series are charged to that series’ operations; expenses which are applicable to all series are allocated among them on a pro rata basis.
The Financial Accounting Standards Board (“FASB”) Accounting Standards Codification (“ASC”) is the exclusive reference of authoritative U.S. generally accepted accounting principles (“GAAP”) recognized by the FASB to be applied by nongovernmental entities. Rules and interpretive releases of the Securities and Exchange Commission (“SEC”) under authority of federal laws are also sources of authoritative GAAP for SEC registrants. Each fund is an investment company and applies the accounting and reporting guidance of the FASB ASC Topic 946 Financial Services-Investment Companies. Each fund’s financial statements are prepared in accordance with GAAP, which may require the use of management estimates and assumptions. Actual results could differ from those estimates.
(a) Portfolio valuation: The fair value of a financial instrument is the amount that would be received to sell an asset or paid to transfer a liability in an orderly transaction between market participants at the measurement date (i.e., the exit price). GAAP establishes a fair value hierarchy that prioritizes the inputs of valuation techniques used to measure fair value. This hierarchy gives the highest priority to unadjusted quoted prices in active markets for identical assets or liabilities (Level 1 measurements) and the lowest priority to unobservable inputs (Level 3 measurements).
Additionally, GAAP provides guidance on determining whether the volume and activity in a market has decreased
109
NOTES TO FINANCIAL STATEMENTS(continued)
significantly and whether such a decrease in activity results in transactions that are not orderly. GAAP requires enhanced disclosures around valuation inputs and techniques used during annual and interim periods.
Various inputs are used in determining the value of each fund’s investments relating to fair value measurements. These inputs are summarized in the three broad levels listed below:
Level 1—unadjusted quoted prices in active markets for identical investments.
Level 2—other significant observable inputs (including quoted prices for similar investments, interest rates, prepayment speeds, credit risk, etc.).
Level 3—significant unobservable inputs (including the funds’ own assumptions in determining the fair value of investments).
The inputs or methodology used for valuing securities are not necessarily an indication of the risk associated with investing in those securities.
Changes in valuation techniques may result in transfers in or out of an assigned level within the disclosure hierarchy. Valuation techniques used to value each fund’s investments are as follows:
Investments in securities are valued each business day by an independent pricing service (the “Service”) approved by the Board. Investments for which quoted bid prices are readily available and are representative of the bid side of the market in the judgment of the Service are valued at the mean between the quoted bid prices (as obtained by the Service from dealers in such securities) and asked prices (as calculated by the Service based upon its evaluation of the market for such securities). Debt investments (which constitute a majority of the portfolio securities) are carried at fair value as determined by the Service, based on methods which include consideration of the following: yields or prices of municipal securities of comparable quality, coupon, maturity and type; indications as to values from dealers; and general market conditions. All of the preceding securities are generally categorized within Level 2 of the fair value hierarchy.
The Service is engaged under the general oversight of the Board.
When market quotations or official closing prices are not readily available, or are determined not to reflect accurately fair value, such as when the value of a security has been significantly affected by events after the close of the exchange or market on which the security is principally traded, but before the funds calculate their net asset value, the funds may value these investments at fair value as determined in accordance with the procedures approved by the Board. Certain factors may be considered when fair valuing investments such as: fundamental analytical data, the nature and duration of restrictions on disposition, an evaluation of the forces that influence the market in which the securities are purchased and sold, and public trading in similar securities of the issuer or comparable issuers. These securities are either categorized within Level 2 or 3 of the fair value hierarchy depending on the relevant inputs used.
For restricted securities where observable inputs are limited, assumptions about market activity and risk are used and are generally categorized within Level 3 of the fair value hierarchy.
Futures on municipal and U.S. Treasury securities are valued at the last sales price on the securities exchange on which such securities are primarily traded or at the last sales price on the national securities market on each business day and are generally categorized within Level 1 of the fair value hierarchy. Investments in swap agreements are valued each business day by the Service. Swaps are valued by the Service by using a swap pricing model which incorporates among other factors, default probabilities, recovery rates, credit curves of the underlying issuer and swap spreads on interest rates and are generally categorized within Level 2 of the fair value hierarchy.
Table 1 summarizes the inputs used as of August 31, 2019in valuing each fund’s investments:
| | | | | | | | | | | | | | | | | | |
Table 1—Fair Value Measurements | | | | | | |
| | | Investments in Securities |
| | | Level 1—Unadjusted
Quoted Prices | | Level 2—Other Significant
Observable Inputs | | Level 3—Significant Unobservable Inputs | | |
| | Assets ($) | Liabilities ($) | | Assets ($) | Liabilities ($) | | Assets ($) | Liabilities ($) | | Total |
BNY Mellon National Intermediate Municipal Bond Fund | | | | | | | | |
Municipal Securities† | | - | - | | 2,582,662,231 | - | | - | - | | 2,582,662,231 |
Other Financial Instruments: | | | | | | | | | | | |
Futures†† | | (1,355,875) | - | | - | - | | - | - | | (1,355,875) |
110
| | | | | | | | | | | | | | | | | | |
Table 1—Fair Value Measurements(continued) | | | | | | |
| | | Investments in Securities |
| | | Level 1—Unadjusted
Quoted Prices | | Level 2—Other Significant
Observable Inputs | | Level 3—Significant Unobservable Inputs | | |
| | Assets ($) | Liabilities ($) | | Assets ($) | Liabilities ($) | | Assets ($) | Liabilities ($) | | Total |
BNY Mellon National Short-Term
Municipal Bond Fund | | | | | | | | | | | |
Municipal Securities† | | - | - | | 1,163,496,360 | - | | - | - | | 1,163,496,360 |
U.S. Treasury Securities | | - | - | | 9,873,294 | - | | - | - | | 9,873,294 |
BNY Mellon Pennsylvania Intermediate Municipal Bond Fund | | | | | | | | | | | |
Municipal Securities† | | - | - | | 202,036,167 | - | | - | - | | 202,036,167 |
Other Financial Instruments: | | | | | | | | | | | |
Futures†† | | (104,298) | - | | - | - | | - | - | | (104,298) |
BNY Mellon Massachusetts
Intermediate Municipal
Bond Fund | | | | | | | | | | | |
Municipal Securities† | | - | - | | 328,347,551 | - | | - | - | | 328,347,551 |
Other Financial Instruments: | | | | | | | | | | | |
Futures†† | | (173,830) | - | | - | - | | - | - | | (173,830) |
BNY Mellon New York Intermediate
Tax-Exempt Bond Fund | | | | | | | | | | | |
Municipal Securities† | | - | - | | 160,885,366 | - | | - | - | | 160,885,366 |
Other Financial Instruments: | | | | | | | | | | | |
Futures†† | | (86,915) | - | | - | - | | - | - | | (86,915) |
BNY Mellon Municipal
Opportunities Fund | | | | | | | | | | | |
Corporate Bonds† | | - | - | | 23,608,420 | - | | - | - | | 23,608,420 |
Municipal Securities† | | - | - | | 1,991,827,462 | - | | - | - | | 1,991,827,462 |
U.S. Treasury Securities | | - | - | | 4,958,420 | - | | - | - | | 4,958,420 |
Other Financial Instruments: | | | | | | | | | | | |
Futures†† | | - | (8,810,235) | | - | - | | - | - | | (8,810,235) |
Swaps†† | | - | - | | - | (1,434,185) | | - | - | | (1,434,185) |
Floating Rate Notes††† | | - | - | | - | (61,475,000) | | - | - | | (61,475,000) |
† See Statement of Investments for additional detailed categorizations, if any.
†† Amount shown represents unrealized appreciation (depreciation) at period end, but only variation margin on exchanged traded and centrally cleared derivatives, if any, are reported in the Statement of Assets and Liabilities.
††† Certain of the fund’s liabilities are held at carrying amount, which approximates fair value for financial reporting purposes.
(b) Securities transactions and investment income: Securities transactions are recorded on a trade date basis. Realized gains and losses from securities transactions are recorded on the identified cost basis. Interest income, adjusted for accretion of discount and amortization of premium on investments, is earned from settlement date and recognized on the accrual basis. Securities purchased or sold on a when issued or delayed delivery basis may be settled a month or more after the trade date.
BNY Mellon Pennsylvania Intermediate Municipal Bond Fund, BNY Mellon Massachusetts Intermediate Municipal Bond Fund and BNY Mellon New York Intermediate Tax-Exempt Bond Fund each follow an investment policy of investing primarily in municipal obligations of one state. Economic changes affecting the state and certain of its public bodies and municipalities may affect the ability of issuers within the state to pay interest on, or repay principal of, municipal obligations held by the funds.
(c) Dividends and distributions to shareholders:It is the policy of each fund to declare dividends daily from investment income-net. Such dividends are paid monthly. Dividends from net realized capital gains, if any, are normally declared and paid annually, but each fund may make distributions on a more frequent basis to comply with the distribution requirements of the Internal Revenue Code of 1986, as amended (the “Code”). To the extent that net realized capital gains can be offset by capital loss carryovers, it is the policy of each fund not to distribute such gains. Income and capital gain distributions are determined in
111
NOTES TO FINANCIAL STATEMENTS(continued)
accordance with income tax regulations, which may differ from GAAP.
(d) Federal income taxes:It is the policy of each fund to continue to qualify as a regulated investment company, which can distribute tax-exempt dividends, by complying with the applicable provisions of the Code, and to make distributions of income and net realized capital gain sufficient to relieve it from substantially all federal income and excise taxes. For federal income tax purposes, each fund is treated as a separate entity for the purpose of determining such qualification.
As of and during the period ended August 31, 2019, the funds did not have any liabilities for any uncertain tax positions. Each fund recognizes interest and penalties, if any, related to uncertain tax positions as income tax expense in the Statements of Operations. During the period ended August 31, 2019, the funds did not incur any interest or penalties.
Each tax year in the four-year period ended August 31, 2019 remains subject to examination by the Internal Revenue Service and state taxing authorities.
Table 2 summarizes each fund’s components of accumulated earnings on a tax basis at August 31, 2019.
Under the Regulated Investment Company Modernization Act of 2010, each fund is permitted to carry forward capital losses for an unlimited period. Furthermore, capital loss carryovers retain their character as either short-term or long-term capital losses.
Table 3summarizes each fund’s accumulated capital loss carryover available for federal income tax purposes to be applied against future net realized capital gains, if any, realized subsequent to August 31, 2019.
Table 4 summarizes each fund’s tax character of distributions paid to shareholders during the fiscal periods ended August 31, 2019 and August 31, 2018.
| | | | | |
Table 2—Components of Accumulated Earnings | | | | |
| Undistributed
Tax-Exempt
Income ($) | Accumulated
Capital
Gains/Losses ($) | Unrealized (Depreciation)/
Appreciation ($) | Capital (Losses)
Realized After
October 31, 2018 ($)† |
BNY Mellon National Intermediate Municipal Bond Fund | 919,776 | (1,915,903) | 157,841,446 | - |
BNY Mellon National Short-Term Municipal Bond Fund | 141,824 | (3,156,295) | 12,252,555 | - |
BNY Mellon Pennsylvania Intermediate Municipal Bond Fund | 176,486 | (124,988) | 12,225,358 | - |
BNY Mellon Massachusetts Intermediate Municipal Bond Fund | 25,109 | (276,930) | 17,719,211 | - |
BNY Mellon New York Intermediate Tax-Exempt Bond Fund | 33,635 | 753,031 | 9,450,214 | - |
BNY Mellon Municipal Opportunities Fund | 1,116,749 | - | 167,202,689 | 36,005,825 |
† These losses were deferred for tax purposes to the first day of the following fiscal year.
| | | | | | | |
Table 3—Capital Loss Carryover | | | | | | |
| | | | | Short-Term
Losses($)† | Long-Term
Losses($)†† | Total($) |
BNY Mellon National Intermediate Municipal Bond Fund | | | | 1,915,903 | - | 1,915,903 |
BNY Mellon National Short-Term Municipal Bond Fund | | | | 1,376,245 | 1,780,050 | 3,156,295 |
BNY Mellon Pennsylvania Intermediate Municipal Bond Fund | | | | - | 124,988 | 124,988 |
BNY Mellon Massachusetts Intermediate Municipal Bond Fund | | | | 276,930 | - | 276,930 |
† Short-term capital losses which can be carried forward for an unlimited period.
†† Long-term capital losses which can be carried forward for an unlimited period.
| | | | | | | | | | | |
Table 4—Tax Character of Distributions Paid | | | | | | | |
| | 2019 | | 2018 |
| Tax-Exempt
Income ($) | Ordinary
Income ($) | Long-Term
Capital
Gains ($) | | Tax-Exempt Income ($) | Ordinary
Income ($) | Long-Term
Capital
Gains ($) |
BNY Mellon National Intermediate Municipal Bond Fund | 55,005,117 | 42,347 | - | | 54,602,839 | 388,572 | - |
BNY Mellon National Short-Term Municipal Bond Fund | 15,387,939 | - | - | | 10,383,249 | - | - |
BNY Mellon Pennsylvania Intermediate Municipal Bond Fund | 4,561,156 | - | - | | 4,871,171 | - | 355,487 |
BNY Mellon Massachusetts Intermediate Municipal Bond Fund | 6,940,663 | - | - | | 7,350,064 | - | 89,090 |
BNY Mellon New York Intermediate Tax-Exempt Bond Fund | 3,477,899 | - | 112,427 | | 3,796,557 | 53,322 | 345 |
BNY Mellon Municipal Opportunities Fund | 56,447,020 | 1,181,393 | 403,339 | | 42,889,466 | 865,101 | - |
112
During the period ended August 31, 2019, as a result of permanent book to tax differences, each relevant fund decreased total distributable earnings (loss) and increased paid-in capital as summarized inTable 5. These permanent book to tax differences are primarily due to the tax treatment for amortization of premiums/discounts and dividend reclassification. Net assets and net asset value per share were not affected by these reclassifications.
(e) New Accounting Pronouncements: Effective June 1, 2019, the funds adopted Accounting Standards Update 2017-08, Receivables—Nonrefundable Fees and Other Costs (Subtopic 310-20): Premium Amortization On Purchased Callable Debt Securities (“ASU 2017-08”). The update shortens the amortization period for the premium on certain purchased callable debt securities to the earliest call date.
Also effective June 1, 2019, the funds adopted Accounting Standards Update 2018-13, Fair Value Measurement (Topic 820): Disclosure Framework—Changes to the Disclosure Requirements for Fair Value Measurement (“ASU 2018-13”). The update provides guidance that modifies certain disclosure requirements for fair value measurements. The adoption of ASU 2017-08 and ASU 2018-13 had no impact on the operations of the funds for the period ended August 31, 2019.
| | | | |
Table 5—Return of Capital Statement of Position | | | |
| | Total Distributable
Earnings (Loss) ($) | | Paid-in
Capital ($) |
BNY Mellon National Intermediate Municipal Bond Fund | (48,016) | | 48,016 |
BNY Mellon Municipal Opportunities Fund | (156,454) | | 156,454 |
NOTE 2—Bank Lines of Credit:
The funds participate with other long-term open-end funds managed by the Adviser in a $1.030 billion unsecured credit facility led by Citibank, N.A. (the “Citibank Credit Facility”) and a $300 million unsecured credit facility provided by The Bank of New York Mellon (the “BNYM Credit Facility”), each to be utilized primarily for temporary or emergency purposes, including the financing of redemptions (each, a “Facility”). The Citibank Credit Facility is available in two tranches: (i) Tranche A is in an amount equal to $830 million and is available to all long-term open-ended funds, including the funds, and (ii) Tranche B is in amount equal to $200 million and is available only to the BNY Mellon Floating Rate Income Fund, a series of BNY Mellon Investment Funds IV, Inc. Prior to October 3, 2018, the unsecured credit facility with Citibank, N.A. was $830 million. In connection therewith, each fund has agreed to pay its pro rata portion of commitment fees for Tranche A of the Citibank Credit Facility and the BNYM Credit Facility. Interest is charged to the funds based on rates determined pursuant to the terms of the respective Facility at the time of borrowing. During the period ended August 31, 2019, BNY Mellon National Intermediate Municipal Bond Fund, BNY Mellon National Short-Term Municipal Bond Fund, BNY Mellon Pennsylvania Intermediate Municipal Bond Fund, BNY Mellon New York Intermediate Tax-Exempt Bond Fund and BNY Mellon Municipal Opportunities Fund did not borrow under the Facilities.
For BNY Mellon Massachusetts Intermediate Municipal Bond Fund the average amount of borrowings outstanding under the Facilities during the period ended August 31, 2019 was approximately $12,330 with a related weighted average annualized interest rate of 3.24%.
NOTE 3—Investment Advisory Fee, Administration Fee and Other Transactions with Affiliates:
(a)Fees payable by the funds pursuant to the provisions of an Investment Advisory Agreement with the Adviser are payable monthly, computed on the average daily value of each fund’s net assets at the following annual rates: .35% of BNY Mellon National Intermediate Municipal Bond Fund, .35% of BNY Mellon National Short-Term Municipal Bond Fund, .50% of BNY Mellon Pennsylvania Intermediate Municipal Bond Fund, .35% of BNY Mellon Massachusetts Intermediate Municipal Bond Fund, .50% of BNY Mellon New York Intermediate Tax-Exempt Bond Fund and .50% of BNY Mellon Municipal Opportunities Fund. For BNY Mellon New York Intermediate Tax-Exempt Bond Fund, the Adviser has contractually agreed from September 1, 2018 through December 31, 2019, to waive receipt of its fees and/or assume the direct expense of the fund so that the direct expense of neither class (excluding Shareholder Services Plan fees, taxes, interest expense, brokerage commissions, commitment fees on borrowings and extraordinary expenses) exceed .59% of the fund’s average daily net assets. The reduction in expenses, pursuant to the undertaking, amounted to $184,881 during the period ended August 31, 2019.
113
NOTES TO FINANCIAL STATEMENTS(continued)
Pursuant to the Administration Agreement, The Bank of New York Mellon provides or arranges for fund accounting, transfer agency and other fund administration services and receives a fee based on the total net assets of the Trust based on the following rates:
0 up to $6 billion .15%
$6 billion up to $12 billion .12%
In excess of $12 billion .10%
The funds have arrangements with the transfer agent and the custodian whereby the funds may receive earnings credits when positive cash balances are maintained, which are used to offset transfer agency and custody fees. For financial reporting purposes, the funds include net earnings credits, if any, as expense offsets in the Statements of Operations.
(b)Each fund has adopted a Shareholder Services Plan with respect to its Investor shares. Each fund pays the Distributor at an annual rate of .25% of the value of its Investor shares average daily net assets for the provision of certain services. The services provided may include personal services relating to shareholder accounts, such as answering shareholder inquiries regarding a fund and providing reports and other information, and services related to the maintenance of such shareholder accounts. The Shareholder Services Plan allows the Distributor to make payments from the shareholder services fees it collects from each fund to compensate service agents (certain banks, securities brokers or dealers and other financial institutions) with respect to these services.Table 6summarizes the amounts Investor shares were charged during the period ended August 31, 2019, pursuant to the Shareholder Services Plan. Additional fees included in Shareholder servicing costs in the Statements of Operations primarily include fees paid for cash management charges.
| | |
Table 6—Shareholder Services Plan Fees | |
| | |
BNY Mellon National Intermediate
Municipal Bond Fund | $113,625 |
BNY Mellon National Short-Term
Municipal Bond Fund | 24,209 |
BNY Mellon Pennsylvania Intermediate
Municipal Bond Fund | 14,149 |
BNY Mellon Massachusetts Intermediate
Municipal Bond Fund | 17,629 |
BNY Mellon New York Intermediate
Tax-Exempt Bond Fund | 27,503 |
BNY Mellon Municipal
Opportunities Fund | 133,818 |
Each fund compensates The Bank of New York Mellon, under a custody agreement for providing custodial services for each fund. These fees are determined based on net assets, geographic region and transaction activity.Table 7 summarizes the amount each fund was charged during the period ended August 31, 2019 pursuant to the custody agreement.
Each fund compensates The Bank of New York Mellon under a shareholder redemptionsdraft processingagreement for providing certain services related to the funds’ check writing privilege.Table 8 summarizes the amount each fund was charged during the period ended August 31, 2019 for cash management services, which is included in Shareholder servicing costs in the Statements of Operations.
| | | | |
Table 7—Custody Agreement Fees | |
| | Custody Fees ($) | Custody
Earnings Credits ($) |
BNY Mellon National Intermediate Municipal Bond Fund | | 37,545 | (7,116) |
BNY Mellon National Short-Term Municipal Bond Fund | | 27,939 | (14,035) |
BNY Mellon Pennsylvania Intermediate Municipal Bond Fund | | 5,421 | (809) |
BNY Mellon Massachusetts Intermediate Municipal Bond Fund | | 8,274 | (4,353) |
BNY Mellon New York Intermediate Tax-Exempt Bond Fund | | 6,722 | (978) |
BNY Mellon Municipal Opportunities Fund | | 30,357 | (11,885) |
| | |
|
Table 8—The Bank of New York Mellon Cash Management Fees |
| | |
BNY Mellon National Intermediate
Municipal Bond Fund | $219 |
BNY Mellon National Short-Term
Municipal Bond Fund | 64 |
BNY Mellon Pennsylvania Intermediate
Municipal Bond Fund | 42 |
BNY Mellon Massachusetts Intermediate
Municipal Bond Fund | 95 |
BNY Mellon New York Intermediate
Tax-Exempt Bond Fund | 245 |
BNY Mellon Municipal
Opportunities Fund | 84 |
114
During the period ended August 31, 2019, each fund was charged $11,539 for services performed by the Chief Compliance Officer and his staff. These fees are included in Miscellaneous in the Statements of Operations.
Table 9summarizes the components of “Due to BNY Mellon Investment Adviser, Inc. and affiliates” in the Statements of Assets and Liabilities for each fund.
(c) Each Board member also serves as a Board member of other funds within the Trust. Annual retainer fees and attendance fees are allocated to each fund based on net assets.
NOTE 4—Securities Transactions:
Table 10summarizes each fund’s aggregate amount of purchases and sales of investment securities, excluding short-term securities and futures,during the period ended August 31, 2019.
Inverse Floater Securities: BNY Mellon Municipal Opportunities Fund participates in secondary inverse floater structures in which fixed-rate, tax-exempt municipal bonds are transferred to a trust (the “Inverse Floater Trust”). The Inverse Floater Trust typically issues two variable rate securities that are collateralized by the cash flows of the fixed-rate, tax-exempt municipal bonds. One of these variable rate securities pays interest based on a short-term floating rate set by a remarketing agent at predetermined intervals (“Trust Certificates”). A residual interest tax-exempt security is also created by the Inverse Floater Trust, which is transferred to the fund, and is paid interest based on the remaining cash flows of the Inverse Floater Trust, after payment of interest on the other securities and various expenses of the Inverse Floater Trust. An Inverse Floater Trust may be collapsed without the consent of the fund due to certain termination events such as bankruptcy, default or other credit event.
The fund accounts for the transfer of bonds to the Inverse Floater Trust as secured borrowings, with the securities transferred remaining in the fund’s investments, and the related floating rate certificate securities reflected as fund liabilities in the Statement of Assets and Liabilities.
The fund may invest in inverse floater securities on either a non-recourse or recourse basis. These securities are typically supported by a liquidity facility provided by a bank or other financial institution (the “Liquidity Provider”) that allows the holders of the Trust Certificates to tender their certificates in exchange for payment from the Liquidity Provider of par plus accrued interest on any business day prior to a termination event. When the fund invests in inverse floater securities on a non-recourse basis, the Liquidity Provider is required to make a payment under the liquidity facility due to a termination event to the holders of the Trust Certificates. When this occurs, the Liquidity Provider typically liquidates all or a portion of the municipal securities held in the Inverse Floater Trust. A liquidation shortfall occurs if the Trust Certificates exceed the proceeds of the sale of the bonds in the Inverse Floater Trust (“Liquidation Shortfall”). When a fund invests in inverse floater securities on a recourse basis, the fund typically enters into a reimbursement agreement with the Liquidity Provider where the fund is required to repay the Liquidity Provider the amount of any Liquidation Shortfall. As a result, a fund investing in a recourse inverse floater security bears the risk of loss with respect to any Liquidation Shortfall.
The average amount of borrowings outstanding under the inverse floater structure during the period ended August 31, 2019, was approximately $61,475,000 with a related weighted average annualized interest rate of 2.27%.
| | | | | | | | |
Table 9—Due to BNY Mellon Investment Adviser, Inc. and Affiliates | | | | | |
| Investment
Advisory
Fees ($) | Administration
Fees ($) | Shareholder
Services Plan
Fees ($) | Custodian
Fees ($) | The Bank of New York Mellon Cash Management
Fees ($) | Chief
Compliance
Officer
Fees ($) | Less Expense
Reimbursement ($) |
BNY Mellon National Intermediate
Municipal Bond Fund | 754,186 | 263,662 | 10,838 | 15,152 | 60 | 2,252 | - |
BNY Mellon National Short-Term
Municipal Bond Fund | 342,264 | 119,655 | 3,007 | 9,375 | 8 | 2,252 | - |
BNY Mellon Pennsylvania Intermediate
Municipal Bond Fund | 85,187 | 20,847 | 1,671 | 2,219 | 4 | 2,252 | - |
BNY Mellon Massachusetts Intermediate
Municipal Bond Fund | 95,972 | 33,552 | 1,576 | 3,000 | 21 | 2,252 | - |
BNY Mellon New York Intermediate
Tax-Exempt Bond Fund | 67,685 | 16,560 | 2,344 | 2,675 | 41 | 2,252 | (15,734) |
BNY Mellon Municipal Opportunities Fund | 843,157 | 206,312 | 14,042 | 13,320 | 18 | 2,252 | - |
115
NOTES TO FINANCIAL STATEMENTS(continued)
| | | |
Table 10—Purchases and Sales |
| Purchases ($) | Sales ($) |
BNY Mellon National Intermediate Municipal Bond Fund | 1,698,443,401 | 1,406,386,079 |
BNY Mellon National Short-Term Municipal Bond Fund | 1,586,719,090 | 1,324,289,545 |
BNY Mellon Pennsylvania Intermediate Municipal Bond Fund | 134,681,043 | 133,232,390 |
BNY Mellon Massachusetts Intermediate Municipal Bond Fund | 253,578,525 | 243,039,232 |
BNY Mellon New York Intermediate Tax-Exempt Bond Fund | 135,469,532 | 138,058,968 |
BNY Mellon Municipal Opportunities Fund | 1,647,377,631 | 1,275,995,359 |
Derivatives: A derivative is a financial instrument whose performance is derived from the performance of another asset. Each fund enters into International Swaps and Derivatives Association, Inc. Master Agreements or similar agreements (collectively, “Master Agreements”) with its OTC derivative contract counterparties in order to, among other things, reduce its credit risk to counterparties. Master Agreements include provisions for general obligations, representations, collateral and events of default or termination. Under a Master Agreement, the fund may offset with the counterparty certain derivative financial instrument’s payables and/or receivables with collateral held and/or posted and create one single net payment in the event of default or termination.
Each type of derivative instrument that was held by each relevant fund during the period ended August 31, 2019 is discussed below.
Futures:In the normal course of pursuing their investment objective, BNY Mellon National Intermediate Municipal Bond Fund, BNY Mellon Pennsylvania Intermediate Municipal Bond Fund, BNY Mellon Massachusetts Intermediate Municipal Bond Fund, BNY Mellon New York Intermediate Tax-Exempt Bond Fund and BNY Mellon Municipal Opportunities Fund are exposed to market risk, including interest rate risk,as a result of changes in value of underlying financial instruments. The funds invest in futures in order to manage their exposure to or protect against changes in the market. A futures contract represents a commitment for the future purchase or a sale of an asset at a specified date. Upon entering into such contracts, these investments require initial margin deposits with a counterparty, which consist of cash or cash equivalents. The amount of these deposits is determined by the exchange or Board of Trade on which the contract is traded and is subject to change. Accordingly, variation margin payments are received or made to reflect daily unrealized gains or losses which are recorded in the Statements of Operations. When the contracts are closed, the funds recognize a realized gain or loss which is reflected in the Statements of Operations. There is minimal counterparty credit risk to the funds with futures since they are exchange traded, and the exchange guarantees the futures against default. Futures open at August 31, 2019 are set forth in the Statements of Futures.
Swap Agreements:BNY Mellon Municipal Opportunities Fund enters into swap agreements to exchange the interest rate on, or return generated by, one nominal instrument for the return generated by another nominal instrument. Swap agreements are privately negotiated in the OTC market or centrally cleared. The fund enters into these agreements to hedge certain market or interest rate risks, to manage the interest rate sensitivity (sometimes called duration) of fixed income securities, to provide a substitute for purchasing or selling particular securities or to increase potential returns.
For OTC swaps, the fund accrues for the interim payments on a daily basis, with the net amount recorded within unrealized appreciation (depreciation) on swap agreements in the Statement of Assets and Liabilities. Once the interim payments are settled in cash, the net amount is recorded as a realized gain (loss) on swaps, in addition to realized gain (loss) recorded upon the termination of swap agreements in the Statement of Operations. Upfront payments made and/or received by the fund, are recorded as an asset and/or liability in the Statement of Assets and Liabilities and are recorded as a realized gain or loss ratably over the agreement’s term/event with the exception of forward starting interest rate swaps which are recorded as realized gains or losses on the termination date.
Upon entering into centrally cleared swap agreements, an initial margin deposit is required with a counterparty, which consists of cash or cash equivalents. The amount of these deposits is determined by the exchange on which the agreement is traded and is subject to change. The change in valuation of centrally cleared swaps is recorded as a receivable or payable for variation margin in the Statement of Assets and Liabilities. Payments received from (paid to) the counterparty, including upon termination, are recorded as realized gain (loss) in the Statement of Operations.
Fluctuations in the value of swap agreements are recorded for financial statement purposes as unrealized appreciation or depreciation on swap agreements.
116
Forward Rate Swaps Agreements: BNY Mellon Municipal Opportunities Fund accrues for payments on a daily basis based upon the daily difference between the Base Index Value and the Reference Index Value, with the net amount recorded within unrealized appreciation (depreciation) on swap agreements in the Statement of Assets and Liabilities. Once the payments are settled in cash, the net amount is recorded as a realized gain (loss) on Forward Rate Agreement, in addition to realized gain (loss) recorded upon the termination of swap agreements in the Statement of Operations. The settlement of the Forward Rate Agreement is governed by International Swaps and Derivatives Association, Inc. (ISDA) agreement with the counterparty of the positions. Forward rate swap agreements are subject to general market risk, liquidity risk, counterparty risk and interest rate risk. Forward rate swap agreements open at August 31, 2019 are set forth in the Statement of Swap Agreements.
The provisions of ASC Topic 210 “Disclosures about Offsetting Assets and Liabilities” require disclosure on the offsetting of financial assets and liabilities. These disclosures are required for certain investments, including derivative financial instruments subject to Master Agreements which are eligible for offsetting in the Statement of Assets and Liabilities and require each relevant fund to disclose both gross and net information with respect to such investments. For financial reporting purposes, each relevant fund does not offset derivative assets and derivative liabilities that are subject to Master Agreements in the Statement of Assets and Liabilities.
Table 11 summarizes each relevant fund’s derivatives assets and liabilities (by type) on a gross basis, and net of amounts available for offsetting under Master Agreements and net of related collateral received or pledged, if any, as of August 31, 2019.
Table 11—Derivative of Assets and Liabilities subject to Master Netting Agreements
| | | | | | |
BNY Mellon Municipal Opportunities Fund | | | |
| | | | | |
Derivative Financial Instruments: | | Assets ($) | | Liabilities ($) | |
Futures | | - | | (8,810,235) | |
Swaps | | - | | (1,434,185) | |
Total gross amount of derivative | | | | | |
assets and liabilities in the | | | | | |
Statement of Assets and Liabilities | | - | | (10,244,420) | |
Derivatives not subject to | | | | | |
Master Agreements | | - | | 8,810,235 | |
Total gross amount of assets | | | | | |
and liabilities subject to | | | | | |
Master Agreements | | - | | (1,434,185) | |
| | | | | | | |
| | | Financial | | | |
| | | Instruments | | | |
| | | and Derivatives | | | |
| Gross Amount of | | Available | Collateral | | Net Amount of |
Counterparty | Liabilities ($) | 1 | for Offset ($) | Pledged ($) | | Liabilities ($) |
Citigroup | (1,196,311) | | - | - | | (1,196,311) |
Goldman Sachs
International | (237,874) | | - | - | | (237,874) |
Total | (1,434,185) | | - | - | | (1,434,185) |
1Absent a default event or early termination, OTC derivative assets and liabilities are presented at gross amounts and are not offset in the Statement of Assets and Liabilities. |
117
NOTES TO FINANCIAL STATEMENTS(continued)
Table 12 summarizes each fund’s average market value of derivatives outstanding during the period ended August 31, 2019.
| | |
Table 12—Average Market Value of Derivatives |
| | Average
Market Value ($) |
BNY Mellon National Intermediate
Municipal Bond Fund
Interest rate futures | 60,539,310 |
BNY Mellon Pennsylvania Intermediate
Municipal Bond Fund
Interest rate futures | 5,244,944 |
BNY Mellon Massachusetts Intermediate
Municipal Bond Fund
Interest rate futures | 8,252,170 |
BNY Mellon New York Intermediate
Tax-Exempt Bond Fund
Interest rate futures | 4.176,043 |
BNY Mellon Municipal
Opportunities Fund
Interest rate futures | 244,489,229 |
Table 13 summarizes each fund’saverage notional value of swap agreements outstanding during the period ended August 31, 2019.
| | |
Table 13—Average Notional Value of Swap Agreements |
| | Average
Notional Value ($) |
BNY Mellon Municipal
Opportunities Fund
Interest rate swaps | 3,076,923 |
Table 14 summarizes the cost of investments inclusive of derivative contracts for federal income tax purposes, gross appreciation, gross depreciation and accumulated net unrealized appreciation (depreciation) on investments inclusive of derivative contracts for each fund at August 31, 2019.
| | | | | |
Table 14—Accumulated Net Unrealized Appreciation (Depreciation) |
| Cost of
Investments ($) | Gross
Appreciation ($) | Gross
Depreciation ($) | Net ($) |
BNY Mellon National Intermediate Municipal Bond Fund | 2,424,820,785 | 158,688,044 | 846,598 | 157,841,446 |
BNY Mellon National Short-Term Municipal Bond Fund | 1,161,117,099 | 14,140,954 | 1,888,399 | 12,252,555 |
BNY Mellon Pennsylvania Intermediate Municipal Bond Fund | 189,810,809 | 12,839,459 | 614,101 | 12,225,358 |
BNY Mellon Massachusetts Intermediate Municipal Bond Fund | 310,628,340 | 18,237,924 | 518,713 | 17,719,211 |
BNY Mellon New York Intermediate Tax-Exempt Bond Fund | 151,435,152 | 9,460,118 | 9,904 | 9,450,214 |
BNY Mellon Municipal Opportunities Fund | 1,790,282,428 | 172,505,065 | 5,302,376 | 167,202,689 |
118
REPORT OF INDEPENDENT REGISTERED
PUBLIC ACCOUNTING FIRM
To the Shareholders of the Funds and Board of Trustees of
BNY Mellon Funds Trust:
Opinion on the Financial Statements
We have audited the accompanying statements of assets and liabilities of BNY Mellon National Intermediate Municipal Bond Fund, BNY Mellon National Short-Term Municipal Bond Fund, BNY Mellon Pennsylvania Intermediate Municipal Bond Fund, BNY Mellon Massachusetts Intermediate Municipal Bond Fund, BNY Mellon New York Intermediate Tax-Exempt Bond Fund and BNY Mellon Municipal Opportunities Fund (collectively, the “Funds”), each a series of BNY Mellon Funds Trust, including the statements of investments, the statements of futures (with respect to BNY Mellon National Intermediate Municipal Bond Fund, BNY Mellon Pennsylvania Intermediate Municipal Bond Fund, BNY Mellon Massachusetts Intermediate Municipal Bond Fund, BNY Mellon New York Intermediate Tax-Exempt Bond Fund and BNY Mellon Municipal Opportunities Fund), and the statement of swap agreements (with respect to BNY Mellon Municipal Opportunities Fund), as of August 31, 2019, the related statements of operations for the year then ended, the statements of changes in net assets for each of the years in the two-year period then ended, and the related notes (collectively, the financial statements) and the financial highlights for each of the years in the five-year period then ended. In our opinion, the financial statements and financial highlights present fairly, in all material respects, the financial position of the Funds as of August 31, 2019, the results of their operations for the year then ended, the changes in their net assets for each of the years in the two-year period then ended, and the financial highlights for each of the years in the five-year period then ended, in conformity with U.S. generally accepted accounting principles.
Basis for Opinion
These financial statements and financial highlights are the responsibility of the Funds’ management. Our responsibility is to express an opinion on these financial statements and financial highlights based on our audits. We are a public accounting firm registered with the Public Company Accounting Oversight Board (United States) (PCAOB) and are required to be independent with respect to the Funds in accordance with the U.S. federal securities laws and the applicable rules and regulations of the Securities and Exchange Commission and the PCAOB.
We conducted our audits in accordance with the standards of the PCAOB. Those standards require that we plan and perform the audit to obtain reasonable assurance about whether the financial statements and financial highlights are free of material misstatement, whether due to error or fraud. Our audits included performing procedures to assess the risks of material misstatement of the financial statements and financial highlights, whether due to error or fraud, and performing procedures that respond to those risks. Such procedures included examining, on a test basis, evidence regarding the amounts and disclosures in the financial statements and financial highlights. Such procedures also included confirmation of securities owned as of August 31, 2019, by correspondence with the custodian and brokers or by other appropriate auditing procedures when replies from brokers were not received. Our audits also included evaluating the accounting principles used and significant estimates made by management, as well as evaluating the overall presentation of the financial statements and financial highlights. We believe that our audits provide a reasonable basis for our opinion.

We have served as the auditor of one or more BNY Mellon Investment Adviser, Inc. investment companies since 1994.
New York, New York
October 29, 2019
119
IMPORTANT TAX INFORMATION(Unaudited)
BNY Mellon National Intermediate Municipal Bond Fund
In accordance with federal tax law, the fund hereby reports all the dividends paid from investment income-net during its fiscal year ended August 31, 2019 as “exempt-interest dividends” (not generally subject to regular Federal income tax) except $42,347 that is being reported as an ordinary income distribution for reporting purposes. Where required by federal tax law rules, shareholders will receive notification of their portion of the fund’s taxable ordinary dividends (if any), capital gains distributions (if any) and tax-exempt dividends paid for the 2019 calendar year on Form 1099-DIV, which will be mailed in early 2020.
BNY Mellon National Short-Term Municipal Bond Fund
In accordance with federal tax law, the fund hereby reports all the dividends paid from investment income-net during its fiscal year ended August 31, 2019 as “exempt-interest dividends” (not generally subject to regular Federal income tax). Where required by federal tax law rules, shareholders will receive notification of their portion of the fund’s taxable ordinary dividends (if any), capital gains distributions (if any) and tax-exempt dividends paid for the 2019 calendar year on Form 1099-DIV, which will be mailed in early 2020.
BNY Mellon Pennsylvania Intermediate Municipal Bond Fund
In accordance with federal tax law, the fund hereby reports all the dividends paid from investment income-net during its fiscal year ended August 31, 2019 as “exempt-interest dividends” (not generally subject to regular Federal income tax). Where required by federal tax law rules, shareholders will receive notification of their portion of the fund’s taxable ordinary dividends (if any), capital gains distributions (if any) and tax-exempt dividends paid for the 2019 calendar year on Form 1099-DIV, which will be mailed in early 2020.
BNY Mellon Massachusetts Intermediate Municipal Bond Fund
In accordance with federal tax law, the fund hereby reports all the dividends paid from investment income-net during its fiscal year ended August 31, 2019 as “exempt-interest dividends” (not generally subject to regular Federal income tax). Where required by federal tax law rules, shareholders will receive notification of their portion of the fund’s taxable ordinary dividends (if any), capital gains distributions (if any) and tax-exempt dividends paid for the 2019 calendar year on Form 1099-DIV, which will be mailed in early 2020.
BNY Mellon New York Intermediate Tax-Exempt Bond Fund
In accordance with federal tax law, the fund hereby reports all the dividends paid from investment income-net during its fiscal year ended August 31, 2019 as “exempt-interest dividends” (not generally subject to regular Federal income tax). Also, the fund reports the maximum amount allowable but not less than $.0088 per share as a capital gain dividend paid on December 28, 2018 in accordance with Section 852(b)(3)(C) of the Internal Revenue Code. Where required by federal tax law rules, shareholders will receive notification of their portion of the fund’s taxable ordinary dividends (if any), capital gains distributions (if any) and tax-exempt dividends paid for the 2019 calendar year on Form 1099-DIV, which will be mailed in early 2020.
BNY Mellon Municipal Opportunities Fund
In accordance with federal tax law, the fund hereby reports all the dividends paid from investment income-net during its fiscal year ended August 31, 2019 as “exempt-interest dividends” (not generally subject to regular Federal income tax) except $1,181,393 that is being reported as an ordinary income distribution for reporting purposes. Also, the fund reports the maximum amount allowable but not less than $.0031per share as a capital gain dividend paid on December 28, 2018 in accordance with Section 852(b)(3)(C) of the Internal Revenue Code. Where required by federal tax law rules, shareholders will receive notification of their portion of the fund’s taxable ordinary dividends (if any), capital gains distributions (if any) and tax-exempt dividends paid for the 2019 calendar year on Form 1099-DIV, which will be mailed in early 2020.
120
INFORMATION ABOUT THE INFORMATION ABOUT RENEWAL OF EACH FUND’S
INVESTMENT ADVISORY AGREEMENT AND ADMINISTRATION AGREEMENT (Unaudited)
At a meeting of the Trust’s Board of Trustees held on March 18-19, 2019, the Board considered the renewal of the Trust’s Investment Advisory Agreement and Administration Agreement, pursuant to which the Adviser provides the funds with investment advisory services and The Bank of New York Mellon provides the funds with administrative services (together the “Agreement”). The Bank of New York Mellon has entered into a Sub-Administration Agreement with the Adviser pursuant to which The Bank of New York Mellon pays the Adviser for performing certain of these administrative services. The Board members, none of whom are “interested persons” (as defined in the Investment Company Act of 1940, as amended) of the Trust, were assisted in their review by independent legal counsel and met with counsel in executive session separate from representatives of the Adviser. In considering the renewal of the Agreement, the Board considered all factors that it believed to be relevant, including those discussed below. The Board did not identify any one factor as dispositive, and each Board member may have attributed different weights to the factors considered.
Analysis of Nature, Extent, and Quality of Services Provided to the Funds. The Board considered information provided to it at the meeting and in previous presentations from representatives of the Adviser regarding the nature, extent, and quality of the services provided to the funds. The Adviser provided the number of open accounts in each fund, each fund’s asset size and the allocation of fund assets among distribution channels. The Adviser also had previously provided information regarding the diverse intermediary relationships and distribution channels of the funds (such as retail direct or intermediary, in which intermediaries typically are paid by a fund and/or the Adviser) and the Adviser’s corresponding need for broad, deep, and diverse resources to be able to provide ongoing shareholder services to each intermediary or distribution channel, as applicable to each fund.
The Board also considered research support available to, and portfolio management capabilities of, each fund’s portfolio management personnel and that the Adviser also provides oversight of day-to-day fund operations, including fund accounting and administration and assistance in meeting legal and regulatory requirements. The Board also considered the Adviser’s extensive administrative, accounting and compliance infrastructures.
Comparative Analysis of the Funds’ Performance and Management Fees and Expense Ratios. For each fund, the Board reviewed reports prepared by Broadridge Financial Solutions, Inc. (“Broadridge”), an independent provider of investment company data, which included information comparing (1) the fund’s performance with the performance of a group of comparable funds (the “Performance Group”) and with a broader group of funds (the “Performance Universe”), all for various periods ended December 31, 2018, and (2) the fund’s actual and contractual management fees and total expenses with those of a group of comparable funds (the “Expense Group”) and with a broader group of funds (the “Expense Universe”), the information for which was derived in part from fund financial statements available to Broadridge as of the date of its analysis. The Adviser previously had furnished the Board with a description of the methodology Broadridge used to select the Performance Group and Performance Universe and the Expense Group and Expense Universe.
Representatives of the Adviser stated that the usefulness of performance comparisons may be affected by a number of factors, including different investment limitations and policies that may be applicable to each fund and comparison funds.
BNY Mellon National Intermediate Municipal Bond Fund
The Board discussed with representatives of the Adviser and/or its affiliates the results of the comparisons and considered that the fund’s total return performance was at or below the Performance Group median for all periods but was above the Performance Universe median for all periods except for the five-year period, when the fund’s performance was slightly below the Performance Universe median. The Board considered the relative proximity of the fund’s performance to the Performance Group median in certain periods when performance was below median. The Board also considered that the fund’s yield performance was at or above the Performance Group median for four of the ten one-year periods ended December 31st and above the Performance Universe median for each of the ten one-year periods ended December 31st. The Adviser also provided a comparison of the fund’s calendar year total returns to the returns of the fund’s benchmark index.
The Board also reviewed the range of actual and contractual management fees and total expenses of the Expense Group and Expense Universe funds and discussed the results of the comparisons. The Board considered that the fund’s contractual management fee was above the Expense Group median, the fund’s actual management fee was above the Expense Group and Expense Universe medians and the fund’s total expenses were at the Expense Group and Expense Universe medians.
BNY Mellon National Short-Term Municipal Bond Fund
121
INFORMATION ABOUT THE INFORMATION ABOUT RENEWAL OF EACH FUND’S
INVESTMENT ADVISORY AGREEMENT AND ADMINISTRATION AGREEMENT (Unaudited) (continued)
The Board discussed with representatives of the Adviser and/or its affiliates the results of the comparisons and considered that the fund’s total return performance was below the Performance Group and Performance Universe medians for all periods. The Board also considered that the fund’s yield performance was below the Performance Group median for nine of the ten one-year periods ended December 31st and at or below the Performance Universe medians for nine of the ten one-year periods ended December 31st. The Board considered the relative proximity of the fund’s total return performance or yield to the Performance Group and/or Performance Universe median in certain periods when performance or yield, as applicable, was below median. The Adviser also provided a comparison of the fund’s calendar year total returns to the returns of the fund’s benchmark index.
The Board also reviewed the range of actual and contractual management fees and total expenses of the Expense Group and Expense Universe funds and discussed the results of the comparisons. The Board considered that the fund’s contractual management fee was above the Expense Group median and the fund’s actual management fee and total expenses were above the Expense Group and Expense Universe medians.
BNY Mellon Pennsylvania Intermediate Municipal Bond Fund
The Board discussed with representatives of the Adviser and/or its affiliates the results of the comparisons and considered that the fund’s total return performance was above the Performance Group and Performance Universe medians for all periods, except for the five-year period when the fund’s performance was below the Performance Group median. The Board also considered that the fund’s yield performance was below the Performance Group medians for seven of the ten one-year periods ended December 31st but above the Performance Universe medians for each of the ten one-year periods ended December 31st. The Board also considered that there were no other funds that invested primarily in Pennsylvania municipal securities in the Performance Group or Performance Universe. The Adviser also provided a comparison of the fund’s calendar year total returns to the returns of the fund’s benchmark index.
The Board also reviewed the range of actual and contractual management fees and total expenses of the Expense Group and Expense Universe funds and discussed the results of the comparisons. The Board considered that the fund’s contractual management fee was above the Expense Group median and the fund’s actual management fee and total expenses were above the Expense Group and Expense Universe medians.
BNY Mellon Massachusetts Intermediate Municipal Bond Fund
The Board discussed with representatives of the Adviser and/or its affiliates the results of the comparisons and considered that the fund’s total return performance was at or above the Performance Group and Performance Universe medians for all of the periods, except the five-year period where performance was below the Performance Group median. The Board also considered that the fund’s yield performance was below the Performance Group median for each of the ten one-year periods ended December 31st and at or above the Performance Universe median for eight of the ten one-year periods ended December 31st. The Adviser also provided a comparison of the fund’s calendar year total returns to the returns of the fund’s benchmark index.
The Board also reviewed the range of actual and contractual management fees and total expenses of the Expense Group and Expense Universe funds and discussed the results of the comparisons. The Board considered that the fund’s contractual management fee was below the Expense Group median, the fund’s actual management fee was above the Expense Group and Expense Universe medians and the fund’s total expenses were at the Expense Group median and below the Expense Universe median.
BNY Mellon New York Intermediate Tax-Exempt Bond Fund
The Board discussed with representatives of the Adviser and/or its affiliates the results of the comparisons and considered that the fund’s total return performance was at or above the Performance Group and Performance Universe medians for all periods, except the one-year period where the fund’s total return performance was below the Performance Group median and the ten-year period where the total return performance was slightly below the Performance Group median. The Board also considered that the fund’s yield performance was below the Performance Group median for seven of the ten most recent one-year periods ended December 31st and at or above the Performance Universe medians for four of the ten one-year periods December 31st. The Adviser also provided a comparison of the fund’s calendar year total returns to the returns of the fund’s benchmark index.
The Board also reviewed the range of actual and contractual management fees and total expenses of the Expense Group and Expense Universe funds and discussed the results of the comparisons. The Board considered that the fund’s
122
contractual management fee was above the Expense Group median and the fund’s actual management fee and total expenses were above the Expense Group and Expense Universe medians.
Representatives of the Adviser stated that the investment adviser has contractually agreed, until December 31, 2019, to waive receipt of its fees and/or assume the direct expenses of the fund, so that the direct expenses of neither class (excluding shareholder services fees, taxes, interest, brokerage commissions, commitment fees on borrowings and extraordinary expenses) exceed 0.59% of the fund’s average daily net assets.
BNY Mellon Municipal Opportunities Fund
The Board discussed the results of the comparisons and considered that the fund’s total return performance was above the Performance Group and Performance Universe medians for all periods except the three-, four- and five-year periods, when the fund’s total return performance was below the Performance Group median. The Board considered the relative proximity of the fund’s performance to the Performance Group median in certain periods when performance was below median. The Board also considered that the fund’s yield performance was below the Performance Group median for all of the ten one-year periods ended December 31st and above the Performance Universe median for seven of the ten one-year periods ended December 31st. The Adviser also provided a comparison of the fund’s calendar year total returns to the returns of the fund’s benchmark index and the Board considered that the fund’s performance was higher than the return of the index in seven of the ten years shown.
The Board also reviewed the range of actual and contractual management fees and total expenses of the Expense Group and Expense Universe funds and discussed the results of the comparisons. The Board considered that the fund’s contractual management fee was above the Expense Group median and the fund’s actual management fee and total expenses were above the Expense Group and Expense Universe medians.
As applicable to each fund, representatives of the Adviser reviewed with the Board the management or investment advisory fees (1) paid by funds advised or administered by the Adviser that are in the same Lipper category as the fund and (2) paid to the Adviser or the primary employer of the fund’s primary portfolio manager(s) that is affiliated with the Adviser, for advising any separate accounts and/or other types of client portfolios that are considered to have similar investment strategies and policies as the fund (the “Similar Clients”), and explained the nature of the Similar Clients. They discussed differences in fees paid and the relationship of the fees paid in light of any differences in the services provided and other relevant factors. The Board considered the relevance of the fee information provided for the Similar Clients toevaluate the appropriateness of the fund’s management fee.
Analysis of Profitability and Economies of Scale. Representatives of the Adviser reviewed the expenses allocated and profit received by the Adviser and its affiliates and the resulting profitability percentage for managing each fund and the aggregate profitability percentage to the Adviser and its affiliates for managing the funds in the BNY Mellon fund complex, and the method used to determine the expenses and profit. The Board concluded that the profitability results were not unreasonable, given the services rendered and service levels provided by the Adviser to each fund. The Board also considered the expense limitation arrangement forBNY Mellon New York Intermediate Tax-Exempt Bond Fund and its effect on the profitability of the Adviser and its affiliates.The Board also had been provided with information prepared by an independent consulting firm regarding the Adviser’s approach to allocating costs to, and determining the profitability of, individual funds and the entire BNY Mellon fund complex. The consulting firm also had analyzed where any economies of scale might emerge in connection with the management of the funds.
For each fund, the Board considered, on the advice of its counsel, the profitability analysis (1) as part of its evaluation of whether the fees under the Agreement, considered in relation to the mix of services provided by the Adviser, including the nature, extent and quality of such services, supported the renewal of the Agreement and (2) in light of the relevant circumstances for the fund and the extent to which economies of scale would be realized if the fund grows and whether fee levels reflect these economies of scale for the benefit of fund shareholders. Representatives of the Adviser also stated that, as a result of shared and allocated costs among funds in the BNY Mellon fund complex, the extent of economies of scale could depend substantially on the level of assets in the complex as a whole, so that increases and decreases in complex-wide assets can affect potential economies of scale in a manner that is disproportionate to, or even in the opposite direction from, changes in a fund’s asset level. The Board also considered potential benefits to the Adviser from acting as investment adviser and took into consideration that there were no soft dollar arrangements in effect for trading the funds’ investments.
At the conclusion of these discussions, the Board agreed that it had been furnished with sufficient information to make an informed business decision with respect to the renewal of the
123
INFORMATION ABOUT THE INFORMATION ABOUT RENEWAL OF EACH FUND’S
INVESTMENT ADVISORY AGREEMENT AND ADMINISTRATION AGREEMENT (Unaudited) (continued)
Agreement. Based on the discussions and considerations as described above, the Board concluded and determined as follows.
· The Board concluded that the nature, extent and quality of the services provided by the Adviser to each fund are adequate and appropriate.
· With respect to BNY Mellon Pennsylvania Intermediate Municipal Bond Fund, BNY Mellon Massachusetts Intermediate Municipal Bond Fund, BNY Mellon New York Intermediate Tax-Exempt Bond Fund and BNY Mellon Municipal Opportunities Fund, the Board generally was satisfied with each fund’s overall performance.
· With respect to BNY Mellon National Intermediate Municipal Bond Fund and BNY Mellon National Short-Term Municipal Bond Fund, while the Board was concerned with each fund’s performance, the Board expressed confidence in the fund’s strategy and portfolio managers and agreed to closely monitor performance.
· For each fund, the Board concluded that the fee paid to the Adviser continued to be appropriate under the circumstances and in light of the factors and the totality of the services provided as discussed above.
· The Board determined that the economies of scale which may accrue to the Adviser and its affiliates in connection with the management of the funds had been adequately considered by the Adviser in connection with the fee rate charged to each fund pursuant to the Agreements and that, to the extent in the future it were determined that material economies of scale had not been shared with a fund, the Board would seek to have those economies of scale shared with the fund.
In evaluating the Agreement, the Board considered these conclusions and determinations and also relied on its previous knowledge, gained through meetings and other interactions with the Adviser and its affiliates, of the Adviser and the services provided to each fund by the Adviser. The Board also relied on information received on a routine and regular basis throughout the year relating to the operations of each fund and the investment management and other services provided under the Agreement, including information on the investment performance of each fund in comparison to similar mutual funds and benchmark performance indices; general market outlook as applicable to each fund; and compliance reports. In addition, the Board’s consideration of the contractual fee arrangements for each fund had the benefit of a number of years of reviews of the Agreement for the funds, or substantially similar agreements for other funds that the Board oversees, during which lengthy discussions took place between the Board and representatives of the Adviser. Certain aspects of the arrangements may receive greater scrutiny in some years than in others, and the Board’s conclusions may be based, in part, on their consideration of the funds’ arrangements, or substantially similar arrangements, in prior years. The Board determined to renew the Agreement.
124
BOARD MEMBERS INFORMATION(Unaudited)
INDEPENDENT BOARD MEMBERS
Patrick J. O’Connor (76)
Board Member, Chairman of the Board (2000)
Principal Occupation During Past 5 Years:
Attorney, Cozen and O’Connor, P.C. since 1973, including Vice Chairman since 1980
No. of Portfolios for which Board Member Serves:23
———————
John R. Alchin (71)
Board Member (2008)
Principal Occupation During Past 5 Years:
· Retired since 2007
Other Public Company Board Memberships During Past 5 Years:
· Polo Ralph Lauren Corporation, a retail clothing and home furnishing company,Director (2007-present) and Chair of Audit Committee (August 2018-Present)
· The Barnes Foundation, an art collection and educational institution promoting the appreciation of art and horticulture, Director (2017-Present)
No. of Portfolios for which Board Member Serves:23
———————
Ronald R. Davenport (83)
Board Member (2000)
Principal Occupation During Past 5 Years:
· Chairman of Sheridan Broadcasting Corporation since July 1972
No. of Portfolios for which Board Member Serves:23
———————
Jack Diederich (82)
Board Member (2000)
Principal Occupation During Past 5 Years:
· Retired
Other Public Company Board Memberships During Past 5 Years:
· Continental Mills, a dry baking products company, Board Member (1997 - Present)
No. of Portfolios for which Board Member Serves: 23
———————
Kim D. Kelly (63)
Board Member (2008)
Principal Occupation During Past 5 Years:
· Consultant since 2005
Other Public Company Board Memberships During Past 5 Years:
· MCG Capital Corporation, a business development company, Director (2004-2015)
No. of Portfolios for which Board Member Serves:23
———————
Kevin C. Phelan (75)
Board Member (2000)
Principal Occupation During Past 5 Years:
· Mortgage Banker, Colliers International since March 1978, including,
Co-Chairman since 2010 and President since 2007
No. of Portfolios for which Board Member Serves:23
———————
Patrick J. Purcell (71)
Board Member (2000)
Principal Occupation During Past 5 Years:
· Owner of The Boston Herald since February 1994, President and Publisher (from 1994 to 2018)
President and Founder, jobfind.com, an employment search site on the world wide web, since July 1996
· President and Chief Executive Officer, Herald Media from 2001 to 2018
No. of Portfolios for which Board Member Serves: 23
———————
Thomas F. Ryan, Jr. (78)
Board Member (2000)
Principal Occupation During Past 5 Years:
· Retired since April 1999
Other Public Company Board Memberships During Past 5 Years:
· RepliGen Corporation, a biopharmaceutical company, Director (2002-present)
No. of Portfolios for which Board Member Serves: 23
———————
Maureen M. Young (73)
Board Member (2000)
Principal Occupation During Past 5 Years:
· Retired since 2007
No. of Portfolios for which Board Member Serves:23
———————
Once elected all Board Members serve for an indefinite term. The address of the Board Members and Officers is c/o BNY Mellon Investment Adviser, Inc. 240 Greenwich Street, New York, New York 10286. Additional information about the Board Members is available in the fund’s Statement of Additional Information which can be obtained from the Adviser free of charge by calling this toll free number: 1-800-373-9387. For individual account holders for Private Wealth Management clients, please contact your account officer or call 1-866-804-5023.
125
OFFICERS OF THE TRUST(Unaudited)
PATRICK T. CROWE, President since July 2015.
National Director of Investment Advisory, Analytics and Solutions for BNY Mellon Wealth Management since July 2014; from July 2007 to July 2014, Managing Director for BNY Mellon Wealth Management's Tri-State region, comprising New York, New Jersey and Southern Connecticut. He is 55 years old and has served in various capacities with BNY Mellon since 1993.
JAMES WINDELS, Treasurer since November 2001.
Director- BNY Mellon Fund Administration, and an officer of 64 investment companies (comprised of 143 portfolios) managed by the Adviser. He is 61 years old and has been an employee of the Adviser since April 1985.
BENNETT A. MACDOUGALL, Chief Legal Officer since October 2015.
Chief Legal Officer of the Adviser and Associate General Counsel and Managing Director of BNY Mellon since June 2015; Director and Associate General Counsel of Deutsche Bank – Asset & Wealth Management Division from June 2005 to June 2015, and as Chief Legal Officer of Deutsche Investment Management Americas Inc. from June 2012 to May 2015. He is an officer of 64 investment companies (comprised of 143 portfolios) managed by the Adviser. He is 48 years old and has been an employee of the Adviser since June 2015.
JAMES BITETTO, Vice President since August 2005 and Secretary since February 2018.
Managing Counsel of BNY Mellon and Secretary of the Adviser, and an officer of 64 investment companies (comprised of 143 portfolios) managed by the Adviser. He is 53 years old and has been an employee of the Adviser since December 1996.
SONALEE CROSS, Vice President and Assistant Secretary since March 2017.
Counsel of BNY Mellon since October 2016; Associate at Proskauer Rose LLP from April 2016 to September 2016; Attorney at EnTrust Capital from August 2015 to February 2016; Associate at Sidley Austin LLP from September 2013 to August 2015. She is an officer of 64 investment companies (comprised of 143 portfolios) managed by the Adviser. She is 31 years old and has been an employee of the Adviser since October 2016.
DEIRDRE CUNNANE, Vice President and Assistant Secretary since February 2019.
Counsel of BNY Mellon since August 2018; Senior Regulatory Specialist at BNY Mellon Investment Management Services from February 2016 to August 2018; Trustee Associate at BNY Mellon Trust Company (Ireland) Limited from August 2013 to February 2016. She is an officer of 64 investment companies (comprised of 143 portfolios) managed by the Adviser. She is 29 years old and has been an employee of the Adviser since August 2018.
SARAH S. KELLEHER, Vice President and Assistant Secretary since April 2014.
Managing Counsel of BNY Mellon since December 2017, Senior Counsel of BNY Mellon from March 2013 to December 2017. She is an officer of 64 investment companies (comprised of 143 portfolios) managed by the Adviser. She is 44 years old and has been an employee of the Adviser since March 2013.
NATALYA ZELENSKY, Vice President and Assistant Secretary since March 2017.
Counsel of BNY Mellon since May 2016; Attorney at Wildermuth Endowment Strategy Fund/Wildermuth Advisory, LLC from November 2015 to May 2016 and Assistant General Counsel at RCS Advisory Services from July 2014 to November 2015. She is an officer of 64 investment companies (comprised of 143 portfolios) managed by the Adviser. She is 34 years old and has been an employee of the Adviser since May 2016.
JEFF PRUSNOFSKY, Vice President and Assistant Secretary since August 2015.
Senior Managing Counsel of BNY Mellon, and an officer of 64 investment companies (comprised of 143 portfolios) managed by the Adviser. He is 54 years old and has been an employee of the Adviser since October 1990.
PETER M. SULLIVAN, Vice President and Assistant Secretary since March 2019.
Managing Counsel of BNY Mellon, and an officer of 64 investment companies (comprised of 143 portfolios) managed by the Adviser. He is 51 years old and has been an employee of the Adviser since April 2004.
GAVIN C. REILLY, Assistant Treasurer since December 2005.
Tax Manager - BNY Mellon Fund Administration, and an officer of 64 investment companies (comprised of 143 portfolios) managed by the Adviser. He is 51 years old and has been an employee of the Adviser since April 1991.
ROBERT S. ROBOL, Assistant Treasurer since December 2002.
Senior Accounting Manager- BNY Mellon Fund Administration, and an officer of 64 investment companies (comprised of 143 portfolios) managed by the Adviser. He is 55 years old and has been an employee of the Adviser since October 1988.
ROBERT SALVIOLO, Assistant Treasurer since July 2007.
Senior Accounting Manager – BNY Mellon Fund Administration, and an officer of 64 investment companies (comprised of 143 portfolios) managed by the Adviser. He is 52 years old and has been an employee of the Adviser since June 1989.
ROBERT SVAGNA, Assistant Treasurer since December 2002.
Senior Accounting Manager – BNY Mellon Fund Administration, and an officer of 64 investment companies (comprised of 143 portfolios) managed by the Adviser. He is 52 years old and has been an employee of the Adviser since November 1990.
JOSEPH W. CONNOLLY, Chief Compliance Officer since October 2004.
Chief Compliance Officer of the Adviser, the BNY Mellon Family of Funds and BNY Mellon Funds Trust (64 investment companies, comprised of 143 portfolios). He is 62 years old and has served in various capacities with the Adviser since 1980, including manager of the firm’s Fund Accounting Department from 1997 through October 2001.
CARIDAD M. CAROSELLA, Anti-Money Laudering Compliance Officer since January 2016.
Anti-Money Laundering Compliance Officer of the BNY Mellon Family of Funds and BNY Mellon Funds Trust since January 2016; from May 2015 to December 2015, Interim Anti-Money Laundering Compliance Officer of the BNY Mellon Family of Funds and BNY Mellon Funds Trust and the Distributor; from January 2012 to May 2015, AML Surveillance Officer of the Distributor. She is an officer of 57 investment companies (comprised of 136 portfolios) managed by the Adviser. She is 51 years old and has been an employee of the Distributor since 1997.
126
NOTES
127
The BNY Mellon Funds
c/o BNY Mellon Investment Adviser, Inc.
240 Greenwich Street
New York, NY 10286
Adviser
BNY Mellon Investment Adviser, Inc.
240 Greenwich Street
New York, NY 10286
Administrator
The Bank of New York Mellon
240 Greenwich Street
New York, NY 10286
Sub-Administrator
BNY Mellon Investment Adviser, Inc.
240 Greenwich Street
New York, NY 10286
Custodian
The Bank of New York Mellon
240 Greenwich Street
New York, NY 10286
Transfer Agent &
Dividend Disbursing Agent
BNY Mellon Transfer, Inc.
240 Greenwich Street
New York, NY 10286
Distributor
BNY Mellon Securities Corporation
240 Greenwich Street
New York, NY 10286
| | | | | | | | | |
Ticker Symbols: | | | | | | | | |
BNY Mellon National Intermediate Municipal Bond Fund | | | Class M: MPNIX | | Investor: MINMX | | | |
BNY Mellon National Short-Term Municipal Bond Fund | | Class M: MPSTX | | Investor: MINSX | | | |
BNY Mellon Pennsylvania Intermediate Municipal Bond Fund | Class M: MPPIX | | Investor: MIPAX | | | |
BNY Mellon Massachusetts Intermediate Municipal Bond Fund | Class M: MMBMX | | Investor: MMBIX | | | |
BNY Mellon New York Intermediate Tax-Exempt Bond Fund | Class M: MNYMX | | Investor: MNYIX | | | |
BNY Mellon Municipal Opportunities Fund | | | Class M: MOTMX | | Investor: MOTIX | | | |
Telephone Wealth Management (WM) Clients, please contact your Account Officer or call 1-866-804-5023. Brokerage Clients of BNY Mellon Wealth Advisors (BNYMWA), please contact your financial representative or call 1-800-830-0549, Option 2 for BNY Mellon Wealth Management Direct or 1-800-843-5466 for former brokerage clients of BNY Mellon Wealth Advisors whose accounts are now held by BNY Mellon Brokerage Services. Individual Account holders, please call BNY Mellon Investment Advisers at 1-800-373-9387.
Mail WM clients, write to your Account Officer, c/o The Bank of New York Mellon, One Mellon Bank Center, Pittsburgh, PA 15258
BNYMWA Brokerage Clients, write to your financial representative, P.O. Box 9012, Hicksville, NY 11802-9012
Individual Account Holders, write to: BNY Mellon Funds, P.O. Box 9879, Providence, RI 02940-8079
Each fund files its complete schedule of portfolio holdings with the Securities and Exchange Commission (“SEC”) for the first and third quarters of each fiscal year on Form N-PORT. The fund’s Forms N-PORT are available on the SEC’s website at http://www.sec.gov.
A description of the policies and procedures that the fund uses to determine how to vote proxies relating to portfolio securities, and information regarding how the fund voted these proxies for the most recent 12-month period ended June 30 is available at http://www.bnymellonim.com/usand on the SEC’s website at http://www.sec.gov. The description of the policies and procedures is also available without charge, upon request, by calling 1-800-373-9387.
| | |
© 2019 BNY Mellon Securities Corporation | MFTAR0819-MB |