UNITED STATES
SECURITIES AND EXCHANGE COMMISSION
Washington, D.C. 20549
FORM N-CSR
CERTIFIED SHAREHOLDER REPORT OF REGISTERED MANAGEMENT
INVESTMENT COMPANIES
| Investment Company Act file number | 811-09903 |
| | |
| | BNY Mellon Funds Trust | |
| | (Exact name of Registrant as specified in charter) | |
| | | |
| | c/o BNY Mellon Investment Adviser, Inc. 240 Greenwich Street New York, New York 10286 | |
| | (Address of principal executive offices) (Zip code) | |
| | | |
| | Deirdre Cunnane, Esq. 240 Greenwich Street New York, New York 10286 | |
| | (Name and address of agent for service) | |
| |
| Registrant's telephone number, including area code: | (212) 922-6400 |
| | |
Date of fiscal year end: | 08/31 | |
| Date of reporting period: | 08/31/23 | |
| | | | | | | |
FORM N-CSR
Item 1. Reports to Stockholders.
BNY Mellon Funds Trust
| |
BNY Mellon Income Stock Fund |
BNY Mellon Mid Cap Multi-Strategy Fund |
BNY Mellon Small Cap Multi-Strategy Fund |
BNY Mellon International Fund |
BNY Mellon Emerging Markets Fund |
BNY Mellon International Equity Income Fund |
BNY Mellon Asset Allocation Fund |
| | |
ANNUAL REPORT August 31, 2023 |

| |
Contents
THE FUNDS
FOR MORE INFORMATION
Back Cover
| |
| |
Save time. Save paper. View your next shareholder report online as soon as it’s available. Log into www.im.bnymellon.com and sign up for eCommunications. It’s simple and only takes a few minutes. |
| |
The views expressed herein are current to the date of this report. These views and the composition of the funds’ portfolios are subject to change at any time based on market and other conditions. |
| |
Not FDIC-Insured • Not Bank-Guaranteed • May Lose Value |
DISCUSSION OF FUND PERFORMANCE (Unaudited)
For the period of September 1, 2022, through August 31, 2023, as provided by John C. Bailer, Brian C. Ferguson, and Keith Howell, Portfolio Managers of Newton Investment Management North America, LLC (NIMNA), the fund’s sub-adviser.
Market and Fund Performance Overview
For the 12-month period ended August 31, 2023, BNY Mellon Income Stock Fund’s (the “fund”) Class M shares produced a total return of 12.06%, Investor shares produced a total return of 11.93%, Class A shares produced a total return of 11.72%, Class C shares produced a total return of 11.00%, Class I shares produced a total return of 12.16% and Class Y shares produced a total return of 12.09%.1 In comparison, the fund’s benchmark, the Dow Jones U.S. Select Dividend™ Index (the “Index”), produced a total return of −1.56% for the same period.2
Income-oriented stocks lagged as investors favored more growth-oriented shares. But the fund outperformed the Index mostly due to favorable security selection.
The Fund’s Investment Approach
The fund seeks total return (consisting of capital appreciation and income). To pursue its goal, the fund normally invests at least 80% of its assets, plus any borrowings for investment purposes, in stocks. The fund seeks to focus on dividend-paying stocks and other investment techniques that produce income. We choose stocks through a disciplined investment process that combines quantitative modeling techniques, fundamental analysis and risk management. The fund emphasizes those stocks with value characteristics, although it may also purchase growth stocks. The fund may invest in the stocks of companies of any size, although it focuses on large-cap companies. The fund’s investment process is designed to provide investors with investment exposure to sector weightings and risk characteristics generally similar to those of the Index.
Market Supported by Easing Inflation, Economic Resilience
The reporting period was marked by a range of factors that affected returns. Early in the period, the dominant theme was the Federal Reserve’s (the “Fed”) continued monetary tightening policies aimed at curbing inflation. Added to this was the banking crisis that emerged early in 2023. Uncertainty about the outcome of the debt ceiling standoff in the Congress also weighed on markets, as did some weaker-than-expected performance of China’s economy. Easing inflation, continued economic growth, the anticipated end to the Fed’s rate hikes and the emergence of the artificial intelligence (“AI”) theme provided markets with support.
The Fed raised the federal funds rate seven times during the period but reduced the size of the increase from 75 basis points to just 25 basis points for the last four hikes. The smaller rate hikes late in the period disappointed markets somewhat, as many investors were hoping for an end to the hiking cycle, given some signs of economic slowing.
Economic data showed that as pricing pressures continued to weaken from their peak in June 2022, the labor market also began to soften. Though unemployment remained relatively low, some large technology companies announced layoffs or paused hiring amid a more cautious macroeconomic outlook.
The banking crisis that emerged early in 2023 gave investors another reason to believe the Fed’s tightening policy would not continue. Three regional banks—Silicon Valley Bank, Signature Bank and First Republic Bank—faced mounting losses in their long-dated bond holdings as interest rates rose. Uninsured depositors were alarmed by the headlines and lost confidence, choosing to move their money into larger money center banks.
In May 2023, the debate in Congress over the federal debt ceiling reached an apparent standoff, resulting in some market volatility. While an agreement was eventually reached, providing the market with some relief, the run-up caused some turmoil as the prospect of a default was threatened.
In addition to easing inflation and investors’ growing anticipation of the end to the Fed’s tightening cycle, the possibility the economy could avoid recession also provided some support as a widely expected recession failed to arrive. China’s weaker-than-expected rebound from its Zero-COVID policies, however, disappointed investors somewhat.
The market was also supported by the launch of ChatGPT by Open AI, which drew investors’ attention to the promise of artificial intelligence and its likely enhancement of productivity and economic growth. While the most immediate beneficiaries of this news were large-cap growth stocks in the information technology sector, their performance provided support to the market as a whole.
Performance Aided Largely by Stock Selection
The fund’s outperformance versus the Index benefited mainly from stock selection decisions, with asset allocations also contributing somewhat. The fund’s leading sector was utilities, where performance stemmed largely from a position in Constellation Energy Corp. This company is the largest owner and operator of nuclear power plants, and nuclear power will be the beneficiary of financial incentives passed in the 2022 Inflation Reduction Act. The company has also reported less volatile cash flows, resulting in a higher valuation. Stock selection in the information technology sector also added to the fund’s performance. Shares of Cisco Systems, Inc. a network hardware company, gained from the company’s robust backlog, which is twice the normal level, providing some assurance of revenues expected over the next two years. The fund’s position in Applied Materials, Inc. which is a semiconductor equipment manufacturer, also contributed positively. The company will be a beneficiary of the construction of semiconductor fabrication facilities in the U.S., funded in part by the CHIPS Act passed in 2022 to reduce the semiconductor industry’s dependence on China. Positions in the financials sector also boosted performance somewhat. Shares of insurance companies in particular, which benefit from higher interest rates, were advantageous. Shares of J.P.Morgan Chase & Co. also added to relative returns. The large bank was not hurt by the banking crisis early in the year, and it kept more cash on its balance sheet, which bolstered its financial results.
While all sectors generated positive returns, some lagged the Index, resulting in a drag on relative performance. But the fund’s relative returns were hindered most by certain stock selections.
2
In the consumer staples sector, which lagged the Index the most, the fund’s position in British American Tabacco PLC was a leading detractor. Shares slumped on concerns about the company’s exposure to the U.S. vaping market, where rival Philip Morris International will introduce a new product. Shares of Kenvue, Inc., a spin-off from Johnson & Johnson, also hampered relative returns. These shares performed poorly as arbitrageurs bought Johnson & Johnson and shorted Kenvue, Inc. In addition, Kenvue, Inc. is also exposed somewhat to legal liabilities related to a lawsuit regarding Johnson & Johnson’s talcum powder product. A lawsuit related to Tylenol may also have weighed on shares. Finally, two positions in the materials sector also detracted. Shares of two fertilizer companies, The Mosaic Co. and CF Industries Holdings, Inc., hampered performance as both companies were hurt by weak demand for potash.
Focused on Quality
In this uncertain and high interest-rate environment, we remain cautious. We believe inflation will remain relatively high for an extended period, in part due to deglobalization and also due to greater worker negotiating power, which should boost wages and support higher prices. As for interest rates, we believe that while short-term bond yields may come down, longer-term yields will remain steady.
In this environment, we remain focused on high-quality companies with strong balance sheets and less need to refinance existing debt. While some sectors, such as consumer staples, are highly leveraged, we are finding value elsewhere. We see opportunities among insurance companies, which typically benefit from higher interest rates. In addition, we are overweight in the energy sector, where balance sheets are stronger than in the past, and cash flows are strong. We also believe this sector will benefit as China continues to rebound. In addition, energy production in Russia will level off or decline because many oilfield services firms have exited the country as a result of sanctions by the U.S. and Europe. The need in the U.S. to refill the Strategic Petroleum Reserve could also boost demand for this sector.
Finally, we believe that market returns could be muted in the medium term, and that as a result, dividends will account for a larger portion of total returns in the equity market.
September 15, 2023
1 Total return includes reinvestment of dividends and any capital gains paid. Past performance is no guarantee of future results. Share price and investment return fluctuate such that upon redemption, fund shares may be worth more or less than their original cost. The fund’s returns reflect the absorption of certain fund expenses by BNY Mellon Investment Adviser, Inc. pursuant to an agreement in effect through December 30, 2023, for Class A, Class C, Class I and Class Y, at which time it may be extended, terminated or modified. Had these expenses not been absorbed, the fund’s returns for those share classes would have been lower.
2 Source: Lipper Inc. – The Dow Jones U.S. Select Dividend™ Index is defined as all dividend-paying companies in the Dow Jones U.S. Index, excluding REITs, that have a non-negative, historical, five-year dividend-per-share growth rate, a five-year average dividend coverage ratio of greater than or equal to 167%, paid dividends in each of the previous five years, non-negative, trailing 12-month earnings-per-share (EPS), a float-adjusted market capitalization of at least U.S. $1 billion, and a three-month average daily trading volume of 200,000 shares. Investors cannot invest directly in any index.
Please note: the position in any security highlighted with italicized typeface was sold during the reporting period.
Investing in foreign denominated and/or domiciled securities involves special risks, including changes in currency exchange rates, political, economic, and social instability, limited company information, differing auditing and legal standards, and less market liquidity. These risks generally are greater with emerging market countries.
Equities are subject generally to market, market sector, market liquidity, issuer and investment style risks, among other factors, to varying degrees, all of which are more fully described in the fund’s prospectus.
3
DISCUSSION OF FUND PERFORMANCE (Unaudited) (continued)
For the period from September 1, 2022, through August 31, 2023, as provided by Alicia Levine, Primary Portfolio Manager responsible for investment allocation decisions.
Market and Fund Performance Overview
For the 12-month period ended August 31, 2023, BNY Mellon Mid Cap Multi-Strategy Fund’s (the “fund”) Class M shares produced a total return of 10.50%, and Investor shares produced a total return of 10.18%.1 In comparison, the fund’s benchmark, the Russell Midcap® Index (the “Index”), produced a total return of 8.38% for the reporting period.2 The Russell Midcap® Growth Index and Russell Midcap® Value Index, the fund’s secondary benchmarks, produced total returns of 13.00% and 5.65%, respectively, for the same period.3,4
Mid-cap stocks gained ground over the reporting period as investors began to anticipate the end of the Federal Reserve’s (the “Fed”) monetary tightening program. The fund outperformed the Index due to outperformance by three of the underlying strategies.
The Fund’s Investment Approach
The fund seeks capital appreciation. The fund pursues its goal by normally investing at least 80% of its net assets in equity securities of mid-cap companies. The fund considers mid-cap companies to be those companies with market capitalizations that are within the market-capitalization range of companies comprising the Index. Furthermore, the fund normally allocates assets across multiple investment strategies employed by the investment adviser and unaffiliated sub-investment advisers that invest primarily in equity securities issued by mid-cap companies. The investment adviser determines the investment strategies and sets target allocations and ranges. The fund is designed to provide exposure to various investment strategies and styles, including the Mid Cap Tax-Sensitive Core Strategy, Opportunistic Mid Cap Value Strategy, Mid Cap Growth Strategy, Boston Partners Mid Cap Value Strategy and Geneva Mid Cap Growth Strategy, all as more particularly described in the fund’s prospectus.
Market Supported by Easing Inflation, Economic Resilience
The reporting period was marked by a range of factors that affected returns. Early in the period, the dominant theme was the Fed’s continued monetary tightening policies aimed at curbing inflation. Added to this was the banking crisis that emerged early in 2023. Uncertainty about the outcome of the debt ceiling standoff in the Congress also weighed on markets, as did some weaker-than-expected performance of China’s economy. Easing inflation, continued economic growth, the anticipated end to the Fed’s rate hikes and the emergence of the artificial intelligence (“AI”) theme provided markets with support.
The Fed raised the federal funds rate seven times during the period but reduced the size of the increase from 75 basis points to just 25 basis points for the last four hikes. The smaller rate hikes late in the period disappointed markets somewhat, as many investors were hoping for an end to the hiking cycle, given some signs of economic slowing.
Economic data showed that as pricing pressures continued to weaken from their peak in June 2022, the labor market also began to soften. Though unemployment remained relatively low, some large technology companies announced layoffs or paused hiring amid a more cautious macroeconomic outlook.
The banking crisis that emerged early in 2023 gave investors another reason to believe the Fed’s tightening policy would not continue. Three regional banks—Silicon Valley Bank, Signature Bank and First Republic Bank—faced mounting losses in their long-dated bond holdings as interest rates rose. Uninsured depositors were disconcerted by the headlines and lost confidence, choosing to move their money into larger money center banks.
In May 2023, the debate in Congress over the federal debt ceiling reached an apparent standoff, resulting in some market volatility. While an agreement was eventually reached, providing the market with some relief, the run-up caused some turmoil as the prospect of a default was threatened.
In addition to easing inflation and investors’ growing anticipation of the end to the Fed’s tightening cycle, the possibility the economy could avoid recession also provided some support as a widely expected recession failed to arrive. China’s weaker-than-expected rebound from its Zero-COVID policies, however, disappointed investors somewhat.
The market was also supported by the launch of ChatGPT by Open AI, which drew investors’ attention to the promise of artificial intelligence and its likely enhancement of productivity and economic growth. While the most immediate beneficiaries of this news were large-cap growth stocks in the information technology sector, their performance provided support to the market as a whole.
Three Strategies Contributed Positively
The fund’s relative performance was aided by three of the five underlying strategies. The primary contributor was the Boston Partners Mid Cap Value Strategy, which outperformed both the Index and the Russell Midcap Value benchmark. The Opportunistic Mid Cap Value Strategy also contributed positively. In the growth category, the Midcap Growth Strategy added to relative returns, outperforming both the Index and the category benchmark.
On the other hand, an underweight to the value-oriented category hindered returns somewhat, and two underlying strategies in two other categories also detracted from relative performance. In the growth-oriented category, the Geneva Midcap Growth Strategy posted a positive return but fell slightly short of the category benchmark. In the tax-sensitive category, the Mid Cap Tax-Sensitive Core Strategy lagged.
A Positive Outlook
We’ve become more constructive on the forward outlook. There are growing signs that the slowdown in earnings and economic activity is stabilizing, and leading indicators are turning higher. Resilient U.S. growth is diverging from the rest of world, especially China and Europe, leading to a stronger U.S. dollar. The U.S. labor market is cooling but remains strong and continues to support consumer spending. Further disinflation
4
could be more challenging due to sticky inflation in the services sector, higher commodity prices, and resilient U.S. growth. Sentiment and valuations are elevated, which could become a near-term headwind along with higher interest rates. The longer U.S. growth remains resilient, the greater likelihood that interest rates stay higher for longer. Key risks are China’s slowdown, the impact of credit tightening, and another uptick in inflation, especially if inflation in services remains sticky, oil prices continue to increase and growth stays resilient.
September 15, 2023
1 Total return includes reinvestment of dividends and any capital gains paid. Past performance is no guarantee of future results. Share price and investment return fluctuate such that upon redemption, fund shares may be worth more or less than their original cost.
2 Source: Lipper Inc. — The Russell Midcap® Index measures the performance of the mid-cap segment of the U.S. equity universe. The Russell Midcap® Index is a subset of the Russell 1000® Index. It includes approximately 800 of the smallest securities based on a combination of their market cap and current index membership. The Russell Midcap® Index represents approximately 31% of the total market capitalization of the Russell 1000 companies. The Russell Midcap® Index is constructed to provide a comprehensive and unbiased barometer for the mid-cap segment. The Index is completely reconstituted annually to ensure larger stocks do not distort the performance and characteristics of the true midcap opportunity set. Investors cannot invest directly in any index.
3 Source: Lipper Inc. — The Russell Midcap® Value Index measures the performance of the mid-cap value segment of the U.S. equity universe. It includes those Russell Midcap® Index companies that are considered more value-oriented relative to the overall market as defined by Russell’s leading style methodology. The Russell Midcap Value® Index is constructed to provide a comprehensive and unbiased barometer of the mid-cap value market. The Russell Midcap® Value Index is completely reconstituted annually to ensure larger stocks do not distort the performance and characteristics of the true mid-cap value market. Investors cannot invest directly in any index.
4 Source: Lipper Inc. — The Russell Midcap® Growth Index measures the performance of the mid-cap growth segment of the U.S. equity universe. It includes those Russell Midcap® Index companies with higher growth earning potential as defined by Russell’s leading style methodology. The Russell Midcap® Growth Index is constructed to provide a comprehensive and unbiased barometer of the mid-cap growth market. The Russell Midcap® Growth Index is completely reconstituted annually to ensure larger stocks do not distort the performance and characteristics of the true mid-cap growth market. Investors cannot invest directly in any index.
Equities are subject generally to market, market sector, market liquidity, issuer and investment style risks, among other factors, to varying degrees, all of which are more fully described in the fund’s prospectus.
Stocks of small- and/or mid-cap companies often experience sharper price fluctuations than stocks of large-cap companies.
5
DISCUSSION OF FUND PERFORMANCE (Unaudited) (continued)
For the period of September 1, 2022, through August 31, 2023, as provided by Alicia Levine, Primary Portfolio Manager responsible for investment allocation decisions.
Fund and Market Performance Overview
For the 12-month period ended August 31, 2023, BNY Mellon Small Cap Multi-Strategy Fund’s (the “fund”) Class M shares produced a total return of 2.15%, and Investor shares produced a total return of 1.88%.1 In comparison, the fund’s primary benchmark, the Russell 2000® Index (the “Index”), produced a total return of 4.65% for the same period.2 The Russell 2000® Growth Index and Russell 2000® Value Index, the fund’s secondary benchmarks, produced total returns of 6.78% and 2.17%, respectively, for the same period.3,4
Small-cap stocks gained ground over the reporting period as investors began to anticipate the end of the Federal Reserve’s (the “Fed) monetary tightening program. The fund lagged the Index, primarily due to the underperformance of two of the fund’s underlying strategies.
The Fund’s Investment Approach
The fund seeks capital appreciation. The fund pursues its goal by normally investing at least 80% of its net assets, plus any borrowings for investment purposes, in equity securities of small-cap companies. The fund currently considers small-cap companies to be those companies with market capitalizations that are equal to or less than the market capitalization of the largest company included in the Index. Furthermore, the fund normally allocates assets across multiple investment strategies employed by the investment adviser that invest primarily in equity securities issued by small-cap companies. The investment adviser determines the investment strategies and sets target allocations and ranges. The fund is designed to provide exposure to various investment strategies and styles, including the Opportunistic Small Cap Strategy, the Small Cap Value Strategy and the Small Cap Growth Strategy—all of which are more fully described in the fund’s prospectus.
Market Supported by Easing Inflation, Economic Resilience
The reporting period was marked by a range of factors that affected returns. Early in the period, the dominant theme was the Fed’s continued monetary tightening policies aimed at curbing inflation. Added to this was the banking crisis that emerged early in 2023. Uncertainty about the outcome of the debt ceiling standoff in the Congress also weighed on markets, as did some weaker-than-expected performance of China’s economy. Easing inflation, continued economic growth, the anticipated end to the Fed’s rate hikes and the emergence of the artificial intelligence (“AI”) theme provided markets with support.
The Fed raised the federal funds rate seven times during the period but reduced the size of the increase from 75 basis points to just 25 basis points for the last four hikes. The smaller rate hikes late in the period disappointed markets somewhat, as many investors were hoping for an end to the hiking cycle, given some signs of economic slowing.
Economic data showed that as pricing pressures continued to weaken from their peak in June 2022, the labor market also began to soften. Though unemployment remained relatively low, some large technology companies announced layoffs or paused hiring amid a more cautious macroeconomic outlook.
The banking crisis that emerged early in 2023 gave investors another reason to believe the Fed’s tightening policy would not continue. Three regional banks—Silicon Valley Bank, Signature Bank and First Republic Bank—faced mounting losses in their long-dated bond holdings as interest rates rose. Uninsured depositors were disconcerted by the headlines and lost confidence, choosing to move their money into larger money center banks.
In May 2023, the debate in Congress over the federal debt ceiling reached an apparent standoff, resulting in some market volatility. While an agreement was eventually reached, providing the market with some relief, the run-up caused some turmoil as the prospect of a default was threatened.
In addition to easing inflation and investors’ growing anticipation of the end to the Fed’s tightening cycle, the possibility the economy could avoid recession also provided some support as a widely expected recession failed to arrive. China’s weaker-than-expected rebound from its Zero-COVID policies, however, disappointed investors somewhat.
The market was also supported by the launch of ChatGPT by Open AI, which drew investors’ attention to the promise of artificial intelligence and its likely enhancement of productivity and economic growth. While the most immediate beneficiaries of this news were large-cap growth stocks in the information technology sector, their performance provided support to the market as a whole.
Two Underlying Funds Hindered Performance
The primary detractor in the fund’s relative performance was the Small Cap Growth Strategy. The fund’s decision to underweight this underlying strategy partially offset the effect of this lagging performance. An overweight allocation to the small cap value category also hindered relative returns. Although the underlying strategy in this category outperformed the Russell 2000® Value benchmark, it lagged the Index. The Opportunistic Small Cap Strategy also detracted somewhat as it slightly lagged the Index.
On the other hand, the strongest performance came from the underlying strategy in the Small Cap Value category. The underlying fund in this category significantly outperformed the Russell 2000® Value benchmark.
A Positive Outlook
We’ve become more constructive on the forward outlook. There are growing signs that the slowdown in earnings and economic activity is stabilizing, and leading indicators are turning higher. Resilient U.S. growth is diverging from the rest of world, especially China and Europe, leading to a stronger U.S. dollar. The U.S. labor market is cooling but remains strong and continues to support consumer spending. Further disinflation could be more challenging due to sticky inflation in the services sector, higher commodity prices and resilient U.S. growth. Sentiment and valuations are elevated, which could become a
6
near-term headwind along with higher interest rates. The longer U.S. growth remains resilient, the greater likelihood that interest rates stay higher for longer. Key risks are China’s slowdown, the impact of credit tightening and another uptick in inflation, especially if inflation in services remains sticky, oil prices continue to increase and growth stays resilient.
September 15, 2023
1 Total return includes reinvestment of dividends and any capital gains paid. Past performance is no guarantee of future results. Share price and investment return fluctuate such that upon redemption, fund shares may be worth more or less than their original cost.
2 Source: Lipper Inc. — The Russell 2000® Index measures the performance of the small-cap segment of the U.S. equity universe. The Russell 2000® Index is a subset of the Russell 3000® Index representing approximately 10% of the total market capitalization of that index. It includes approximately 2,000 of the smallest securities based on a combination of their market cap and current index membership. The Russell 2000® Index is constructed to provide a comprehensive and unbiased small-cap barometer and is completely reconstituted annually to ensure larger stocks do not distort the performance and characteristics of the true small-cap opportunity set. Investors cannot invest directly in any index.
3 Source: Lipper Inc. — The Russell 2000® Growth Index measures the performance of the small-cap growth segment of the U.S. equity universe. It includes those Russell 2000 companies with higher growth earning potential as defined by Russell’s leading style methodology. The Russell 2000® Growth Index is constructed to provide a comprehensive and unbiased barometer for the small-cap growth segment. The Russell 2000® Growth Index is completely reconstituted annually to ensure larger stocks do not distort the performance and characteristics of the true small-cap opportunity set, and that the represented companies continue to reflect growth characteristics. Investors cannot invest directly in any index.
4 Source: Lipper Inc. — The Russell 2000® Value Index measures the performance of the small-cap value segment of the U.S. equity universe. It includes those Russell 2000 companies that are considered more value-oriented relative to the overall market as defined by Russell’s leading style methodology. The Russell 2000 ®Value Index is constructed to provide a comprehensive and unbiased barometer for the small-cap value segment. The Russell 2000 ®Value Index is completely reconstituted annually to ensure larger stocks do not distort the performance and characteristics of the true small-cap opportunity set, and that the represented companies continue to reflect value characteristics. Investors cannot invest directly in any index.
Equities are subject generally to market, market sector, market liquidity, issuer and investment style risks, among other factors, to varying degrees, all of which are more fully described in the fund’s prospectus.
Stocks of small- and/or mid-cap companies often experience sharper price fluctuations than stocks of large-cap companies.
7
DISCUSSION OF FUND PERFORMANCE (Unaudited) (continued)
For the period of September 1, 2022, through August 31, 2023, as provided by portfolio manager, James A. Lydotes, of Newton Investment Management North America, LLC, sub-adviser.
Market and Fund Performance Overview
For the 12-month period ended August 31, 2023, BNY Mellon International Fund’s (the “fund”) Class M shares produced a total return of 21.91%, and Investor shares produced a total return of 21.64%.1 In comparison, the fund’s benchmark, the MSCI EAFE® Index (the “Index”), produced a total return of 17.92% for the same period.2
International equity markets posted gains as inflation eased, and investors began to anticipate an easing of tight monetary policy. The fund outperformed the Index primarily due to favorable stock selections.
The Fund’s Investment Approach
The fund seeks long-term capital growth. To pursue this goal, the fund normally invests at least 65% of its total assets in equity securities of foreign issuers. Foreign issuers are companies, organized under the laws of a foreign country, whose principal trading market is in a foreign country or with a majority of their assets or business outside the United States. The fund may invest in companies of any size. Though not specifically limited, the fund ordinarily will invest in a broad range of (and in any case at least five different) countries. The fund will limit its investments in any single company to no more than 5% of the fund’s assets at the time of purchase.
The stocks purchased may have value and/or growth characteristics. The portfolio managers employ a “bottom-up” investment approach, which emphasizes individual stock selection. The stock selection process is designed to produce a diversified portfolio that, relative to the Index, has a below-average price/earnings ratio and an above-average earnings growth trend.
Market Supported by Easing Inflation, Economic Resilience
The reporting period was marked by a range of factors that affected returns. Early in the period, the dominant theme was the Federal Reserve’s (the “Fed”) continued monetary tightening policies aimed at curbing inflation. Added to this was the banking crisis that emerged early in 2023. Uncertainty about the outcome of the debt ceiling standoff in the Congress also weighed on markets, as did some weaker-than-expected performance of China’s economy. Easing inflation, continued economic growth, the anticipated end to the Fed’s rate hikes and the emergence of the artificial intelligence (“AI”) theme provided markets with support.
The Fed raised the federal funds rate seven times during the period but reduced the size of the increase from 75 basis points to just 25 basis points for the last four hikes. The smaller rate hikes late in the period disappointed markets somewhat, as many investors were hoping for an end to the hiking cycle, given some signs of economic slowing.
Economic data showed that as pricing pressures continued to weaken from their peak in June 2022, the labor market also began to soften. Though unemployment remained relatively low, some large technology companies announced layoffs or paused hiring amid a more cautious macroeconomic outlook.
The banking crisis that emerged early in 2023 gave investors another reason to believe the Fed’s tightening policy would not continue. Three regional banks—Silicon Valley Bank, Signature Bank and First Republic Bank—faced mounting losses in their long-dated bond holdings as interest rates rose. Uninsured depositors were disconcerted by the headlines and lost confidence, choosing to move their money into larger money center banks.
In May 2023, the debate in Congress over the federal debt ceiling reached an apparent standoff, resulting in some market volatility. While an agreement was eventually reached, providing the market with some relief, the run-up caused some turmoil as the prospect of a default was threatened.
In addition to easing inflation and investors’ growing anticipation of the end to the Fed’s tightening cycle, the possibility the economy could avoid recession also provided some support as a widely expected recession failed to arrive. China’s weaker-than-expected rebound from its Zero-COVID policies, however, disappointed investors somewhat.
The market was also supported by the launch of ChatGPT by OpenAI, which drew investors’ attention to the promise of artificial intelligence and its likely enhancement of productivity and economic growth. While the most immediate beneficiaries of this news were large-cap growth stocks in the information technology sector, their performance provided support to the market as a whole.
Risk factors that drove performance during the period varied. While the dividend and value factors were very strong over the last year, momentum was quite weak. In addition, outside the U.S. market, the “big tech” narrative has played little role in performance as big technology companies make up only a small share of non-U.S. developed markets. As a result, the value/dividend trade continued to work very well during the period.
Finally, markets in Europe benefited from economic activity that was stronger than expected. A year ago, many were concerned that Europe’s dependence on Russian natural gas would result in shortages, causing economic activity to suffer. But these fears failed to materialize as a mild winter reduced natural gas demand.
Stock Selection Drove Results
The fund performed well relative to the Index over the period due primarily to favorable stock selection. Selections in the utilities sector were a key to relative outperformance, with positions in SSE PLC, based in the UK, and Enel SPA, based in Italy, contributing most. Both companies performed better than expected because the worst-case scenario, which included price caps on utilities, failed to materialize. A position in British defense contractor BAE Systems PLC also added to relative returns. Shares moved higher as a result of the conflict between Russia and Ukraine. The fund’s position in Germany’s Deutsche Post AG, a package delivery and logistics company, was also advantageous as the company benefited from better-than-expected economic activity in Europe. Finally, Ashtead Group PLC, UK-based industrial equipment rental company,
8
contributed positively as well. The U.S. market makes up the bulk of the company’s business, and that market segment has performed well.
On a less positive note, the health care sector was the primary laggard. A large position in Roche Holding AG, a Swiss pharmaceutical and diagnostics company, detracted from returns because the company’s drug pipeline proved to be disappointing during the reporting period. In the consumer discretionary sector, the fund’s position in Volkswagen AG also detracted, primarily because of its exposure to China. In the less expensive portion of that auto market, the company has faced increased competition.
Europe, Health Care and Communication Services Are Attractive
We continue to be constructive about the next six to 12 months for non-U.S. developed market equities. Although Europe remains dependent on Russia for natural gas, once this coming winter has passed, investors will find stocks in this region more attractive.
We remain overweight in the health care sector, driven largely by an overweight to the pharmaceutical industry. The sector’s underperformance over the past years stemmed largely from a rotation into more cyclical sectors, but we continue to view our position in health care as appropriate, given its defensive, consumer staples-like nature. In addition, the sector is home to many attractive businesses, and valuations are generally attractive. We are also overweight in the communication services sector. We especially see value in telecommunications companies and advertising agencies.
September 15, 2023
1 Total return includes reinvestment of dividends and any capital gains paid. Past performance is no guarantee of future results. Share price and investment return fluctuate such that upon redemption, fund shares may be worth more or less than their original cost.
2 Source: Lipper Inc. — Reflects reinvestment of net dividends and, where applicable, capital gain distributions. The MSCI EAFE® Index (Europe, Australasia, Far East) is a free float-adjusted, market capitalization-weighted index that is designed to measure the equity market performance of developed markets, excluding the U.S. and Canada. Investors cannot invest directly in any index.
Equities are subject generally to market, market sector, market liquidity, issuer and investment style risks, among other factors, to varying degrees, all of which are more fully described in the fund’s prospectus.
The fund’s performance will be influenced by political, social and economic factors affecting investments in foreign companies. Special risks associated with investments in foreign companies include exposure to currency fluctuations, less liquidity, less developed or less efficient trading markets, lack of comprehensive company information, political instability and differing auditing and legal standards. These risks are enhanced in emerging market countries.
The fund may, but is not required to, use derivative instruments. A small investment in derivatives could have a potentially large impact on the fund’s performance. The use of derivatives involves risks different from, or possibly greater than, the risks associated with investing directly in the underlying assets.
9
DISCUSSION OF FUND PERFORMANCE (Unaudited) (continued)
For the period from September 1, 2022, through August 31, 2023, as provided by Paul Birchenough, Ian Smith and Alex Khosla, portfolio managers, of Newton Investment Management Limited, sub-adviser.
Market and Fund Performance Overview
For the 12-month period ended August 31, 2023, BNY Mellon Emerging Markets Fund’s (the “fund”) Class M shares produced a total return of 1.02%, and Investor shares produced a total return of .87%.1 In comparison, the fund’s benchmark, the MSCI Emerging Markets Index (the “Index”), produced a total return of 1.25% for the same period.2
The reporting period was bookended by two down months for markets, as high inflation, higher-for-longer interest rates, geopolitical tensions and concerns about the strength of the Chinese economy dragged the Index down. This outweighed a period of more positive sentiment that persisted through much of the fourth quarter of 2022 and into the new year. The fund underperformed the Index, mainly due to stock selections in the consumer staples and information technology sectors.
The Fund’s Investment Approach
The fund seeks long-term capital growth. To pursue its goal, the fund invests at least 80% of its assets in equity securities of companies organized, or with a majority of assets or operations, in countries considered to be emerging markets. Emerging-markets countries generally include all countries represented by the Index. The fund may invest in companies of any size.
Normally, the fund will invest in a broad range of (and in any case, at least five different) emerging-markets countries. The stocks purchased may have value and/or growth characteristics. The portfolio managers employ a “bottom-up” investment approach, which emphasizes individual stock selection. The stock selection process is designed to produce a diversified portfolio that, relative to the Index, has a below-average price/earnings ratio and an above-average earnings growth trend.
Inflation, Geopolitical Concerns and the Chinese Economy Hinder Markets
The outlook for inflation and the trajectory of monetary policy continued to dominate the narrative within financial markets. The review period began with a large decline in the Index with the Federal Reserve (the “Fed”) raising interest rates by 75 basis points (bps), with a hawkish statement accompanying the rise, prompting investors to reassess their assumptions that rate hikes might have peaked. Meanwhile, the threat of nuclear escalation by Russia further unsettled markets.
In early October 2022, evidence of decelerating price growth in the U.S. ISM (Institute for Supply Management) manufacturing report raised hopes that inflation had peaked, ensuring risk assets got off to a flying start. Further positive momentum was injected the following month, when it was the turn of U.S. consumer price inflation to come in lower than expected. However, the resilience of the U.S. economy, particularly when viewed in terms of its labor market, necessitated further increases in interest rates through the review period, and also saw expectations for the terminal rate this cycle to move higher.
The other key factor that affected confidence was the initial positive reaction to the lifting of China’s strict COVID-19 restrictions at the beginning of 2023, despite rising infections. Sentiment was also bolstered by a government vaccination drive for the elderly population and the securities regulator’s decision to make raising equity easier for property developers. However, as we moved through the year, a series of weak macroeconomic data releases called into question the strength of the country’s post-COVID-19 recovery.
Meanwhile, U.S.-China relations continued to worsen. Despite well-received indications from the Chinese government that it would provide more support for the troubled real estate sector, pledge to boost consumption and address the market concerns about local government debt, the Chinese market widely underperformed the Index over the review period. An unexpected move by the central bank to reduce interest rates by the greatest amount since 2020 to support an economy facing further pressure from weak consumer spending, also failed to boost the market.
Performance Hindered by Stock Selection
The leading detractor for the period was in the consumer staples sector. Shares of China’s Foshan Haitian Flavouring & Food Co. Ltd. trended downwards after the release of results in which net profits and sales came in lower than the market expected. Investors were also worried that short-term economic headwinds could push retail and catering customers to cheaper non-branded offerings. The second leading detractor was in the information technology sector. Shares of LONGi Green Energy Technology Co. Ltd. declined, with the solar energy product manufacturer being affected by concerns around pricing pressure. Finally, Brazil’s second-largest private bank, Banco Bradesco SA, weakened over the period after reporting a fall in profits and raising its forecast for the amount of money it will set aside to cover bad loans.
The energy sector was a leading contributor to the fund’s outperformance. Having sold the position in October 2022, the fund’s zero weighting in Brazil’s largest oil and gas producer, Petroleo Brasileiro SA, was the top contributor to relative returns. Its share price plunged in December 2022 as Brazilian lawmakers approved changes to a law that shields state-controlled companies from political interference. In the information technology sector, the fund benefited from its holding in Japan-based automatic test equipment manufacturer Advantest Corp., which rode a wave of positive sentiment after U.S. chipmaker Nvidia released guidance that hugely exceeded market expectations, driven by significant demand for chips used in generative artificial intelligence systems. China-based Internet giant Tencent Holdings Ltd. also outperformed over the review period, largely in the latter part of 2022, on optimism that the economic reopening in China would boost economic growth. Another leading contributor was China Resources Sanjiu Medical & Pharmaceutical Co,, which the fund sold in October 2022 following strong performance.
Attractive Opportunities in the Consumer Staples and Industrial Sectors
We believe the longer-term opportunities in emerging markets are attractive. These are based on relatively higher levels of
10
income growth, rapid increases in product penetration and scope for industry consolidation. We believe there is a unique opportunity for emerging-markets companies that are well-exposed to reliable secular-growth trends and that can exploit this opportunity more than their peers, with their differentiated customer offering and execution. Accordingly, we believe that emerging-markets investors who can identify the right growth themes and companies should be rewarded over the long term.
On a sector basis, the fund is most overweight in the consumer staples and industrials sectors. On a country basis, the fund remains most overweight in India, as we believe the country offers many of the best investment cases in emerging markets over five years and beyond.
September 15, 2023
1 Total return includes reinvestment of dividends and any capital gains paid. Past performance is no guarantee of future results. Share price and investment return fluctuate such that upon redemption, fund shares may be worth more or less than their original cost. The fund’s return reflects the absorption of certain fund expenses by BNY Mellon Investment Adviser, Inc. pursuant to an agreement in effect through April 1, 2024, at which time it may be extended, modified or terminated. Had these expenses not been absorbed, returns would have been lower.
2 Source: Lipper Inc. — Reflects reinvestment of net dividends and, where applicable, capital gain distributions. The MSCI Emerging Markets Index is a free float-adjusted, market capitalization-weighted index that is designed to measure equity market performance of emerging markets. Investors cannot invest directly in any index.
Please note: the position in any security highlighted with italicized typeface was sold during the reporting period.
Equities are subject generally to market, market sector, market liquidity, issuer and investment style risks, among other factors, to varying degrees, all of which are more fully described in the fund’s prospectus.
The fund’s performance will be influenced by political, social and economic factors affecting investments in foreign companies. Special risks associated with investments in foreign companies include exposure to currency fluctuations, less liquidity, less developed, or less efficient trading markets, lack of comprehensive company information, political instability and differing auditing and legal standards. These risks are enhanced in emerging market countries.
The fund may, but is not required to, use derivative instruments. A small investment in derivatives could have a potentially large impact on the fund’s performance. The use of derivatives involves risks different from, or possibly greater than, the risks associated with investing directly in the underlying assets.
11
DISCUSSION OF FUND PERFORMANCE (Unaudited) (continued)
For the period from September 1, 2022, through August 31, 2023, as provided by Peter D. Goslin, CFA, of Newton Investment Management North America, LLC, sub-adviser.
Market and Fund Performance Overview
For the 12-month period ended August 31, 2023, BNY Mellon International Equity Income Fund’s (the “fund”) Class M shares produced a total return of 16.79%, and Investor shares produced a total return of 16.54%.1 In comparison, the fund’s benchmark, the MSCI ACWI ex USA Index (the “Index”), produced a total return of 11.89% for the same period.2
International equities generally rose during the period as economic growth and easing inflationary pressures outweighed concerns regarding elevated interest rates, slowing growth in China and heightened geopolitical tensions. The fund outperformed the Index during the period, largely due to its emphasis on high-dividend-paying stocks, which were favored by the market.
The Fund’s Investment Approach
The fund seeks total return (consisting of capital appreciation and income). To pursue its goal, the fund normally invests at least 80% of its net assets, plus any borrowings for investment purposes, in equity securities. The fund normally invests substantially all of its assets in the equity securities of issuers located outside the United States and diversifies broadly among developed- and emerging-markets countries. The fund focuses on dividend-paying stocks of foreign companies, including those of emerging-markets countries. The fund may invest in the stocks of companies of any market capitalization.
We select stocks through a disciplined investment process using proprietary, quantitative computer models that analyze a diverse set of characteristics to identify and rank stocks according to earnings quality. Based on this analysis, we generally select from the higher-ranked, dividend-paying securities that we believe will continue to pay above-average dividends. We seek to overweight higher-dividend-paying stocks, while maintaining country and sector weights generally similar to those of the Index.
High-Yielding, Developed-Markets Equities Outperform
The reporting period began on a negative note, as stocks broadly retreated in September and early October 2022 in the face of elevated rates of inflation, high energy prices and geopolitical concerns regarding the war in Ukraine. In the Eurozone, annual inflation was estimated at 10.0% in September, up from 9.1% a month earlier. While economic growth remained mildly positive, signs of economic weakening raised the specter of a recession. In much of Asia, shares were further hampered by slowing growth in China due to the spread of COVID-19 infections and fears of pandemic-related lockdowns.
Equities recovered broadly beginning in mid-October as inflationary pressures eased, and economic data reassured investors that a recession was not imminent. In Europe, equities showed surprising strength, bolstered by signs of easing global inflation, despite the war in Ukraine. In Asia, shares rose as China eased the pandemic restrictions that had been constraining economic growth, although China’s growth remained subdued through the remainder of the period. Most other emerging markets exhibited mild gains as well, due to lessening inflationary pressures and declining, relative U.S. dollar values, although energy producers were hurt by weak oil prices for much of the period. Over the entire reporting period, traditionally defensive, value-oriented and dividend-paying stocks tended to outperform growth-oriented shares by a wide margin, with high-dividend-paying stocks in the Index returning approximately 18%, while low-dividend-paying stocks gained approximately 2%. The best-performing sectors in the Index included information technology and industrials, while communication services and real estate lagged. Among countries, top performers included Turkey and Greece, while Qatar and Saudi Arabia were hurt by weak oil prices.
Gains Driven by a Focus on Dividend-Paying Stocks
The fund captured the outperformance of high-dividend-paying stocks, in line with its benchmark-driven, risk-controlled focus on maximizing dividend-yield exposure. Returns relative to the Index further benefited from good stock selection in industrials and financials, while disappointing selection in communication services and consumer staples detracted. From a country perspective, the fund saw strong returns from stock selections in Japan and Hong Kong, while positions in the UK and Denmark lagged. While individual holdings played only a minor role in the fund’s outperformance, given its broadly diversified profile, notably strong performers included Japan-based industrial conglomerate Sumitomo Corp., which posted strong earnings with inflation fueling strengthening margins; France-based global property and casualty insurance provider AXA SA, which reported better-than-expected earnings and revenues while exhibiting strong pricing power and repurchasing shares; and Ford Otomotiv Sanayi SA, a Turkey-based manufacturer, importer and distributor of Ford trucks, automobiles and commercial vehicles, which beat earnings expectations on strong domestic performance and issued improved guidance. Notably weak holdings included UK-based British American Tobacco PLC, which came under pressure from the increasing likelihood of a UK ban on disposable vaping products, and wireless telecommunications services provider Spark New Zealand Ltd., which declined after providing disappointing guidance and issuing uncharacteristically soft financial results.
Maintaining a Diversified, Risk-Controlled Portfolio
As of August 31, 2023, with inflation subsiding and economic growth remaining broadly positive despite the pressure from high interest rates, most observers now anticipate a soft landing, in which central banks manage to bring inflation under control without precipitating a global recession. However, risks remain as the impacts of high—and still increasing—interest rates continue to work their way through the real economy. Geopolitical risks remain a cause for concern as well, with Russia’s war in Ukraine ongoing and tensions simmering between the Western world and China over several issues. In this environment, we believe the fund is well positioned to provide investors with diversified access to international, high-dividend-paying stocks that reflect the geographic, sector and market-capitalization characteristics of the Index. While the fund maintains weightings similar to those of the Index, it does hold modest overweights and underweights in some areas. As of the
12
end of the reporting period, sector overweights included communication services and financials, while underweights included materials and industrials. Country overweights included Taiwan and Australia, with underweights in France and Denmark.
September 15, 2023
1 Total return includes reinvestment of dividends and any capital gains paid. Past performance is no guarantee of future results. Share price and investment return fluctuate such that upon redemption, fund shares may be worth more or less than their original cost.
2 Source: Lipper Inc. — Reflects reinvestment of net dividends and, where applicable, capital gain distributions. The MSCI ACWI ex USA Index captures large- and mid-cap representation across developed market (DM) countries (excluding the U.S.) and emerging market (EM) countries. Investors cannot invest directly in any index.
Equities are subject generally to market, market sector, market liquidity, issuer and investment style risks, among other factors, to varying degrees, all of which are more fully described in the fund’s prospectus.
The fund may, but is not required to, use derivative instruments. A small investment in derivatives could have a potentially large impact on the fund’s performance. The use of derivatives involves risks different from, or possibly greater than, the risks associated with investing directly in the underlying assets.
13
DISCUSSION OF FUND PERFORMANCE (Unaudited) (continued)
For the period from September 1, 2022, through August 31, 2023, as provided by Alicia Levine of BNY Mellon Investment Adviser, Inc., Primary Portfolio Manager responsible for investment allocation decisions.
Market and Fund Performance Overview
For the 12-month period ended August 31, 2023, BNY Mellon Asset Allocation Fund (the “fund”) produced a total return of 7.53% for Class M shares, and 7.29% for Investor shares.1 In comparison, the fund’s benchmark, the Morningstar Moderate Target Risk Index (the “Index”), produced a total return of 6.48% for the same period.2
Global equities gained ground during the reporting period as inflationary pressures eased, the U.S. Federal Reserve (the “Fed”) reduced the pace of interest-rate hikes and economic growth remained positive. Bonds produced mixed returns under pressure from rising interest rates. The fund outperformed the Index, largely due to the positive impact from fixed-income allocations and manager selection.
The Fund’s Investment Approach
The fund seeks long-term growth of principal in conjunction with current income. The fund may invest in both individual securities and other investment companies, including other BNY Mellon funds, funds in the BNY Mellon Investment Adviser, Inc. Family of Funds and unaffiliated open-end funds, closed-end funds and exchange-traded funds (collectively, the “underlying funds”). To pursue its goal, the fund currently intends to allocate its assets, directly and/or through investment in the underlying funds, to gain investment exposure to the following asset classes: large-cap equities, small-cap and mid-cap equities, developed international and global equities, emerging-markets equities, investment grade bonds, high yield bonds, emerging-markets debt, diversifying strategies and money market instruments.
BNY Mellon Investment Adviser, Inc. (“BNYM Investment Adviser”) allocates the fund’s investments among these asset classes using fundamental and quantitative analysis and its outlook for the economy and financial markets. The underlying funds are selected by BNYM Investment Adviser based on its investment objectives and management policies, portfolio holdings, risk/reward profiles, historical performance and other factors, including the correlation and covariance among the underlying funds.
Easing Inflation and Strong Economic Conditions Bolster Stocks and Bonds
Stocks and bonds broadly retreated in September and early October 2022 in the face of high levels of inflation and sharply rising interest rates. Although U.S. inflation appeared to peak before the period began, topping at over 9% in June, rates remained over 8% at the start of the period, well above the 2% target adopted by the Fed. The Fed responded with its third consecutive 0.75% increase to the federal funds rate in September, while indicating that additional increases were likely, increasing concerns of a possible recession. In Europe, inflation-related worries were exacerbated by Russia’s ongoing war in Ukraine, which increased energy prices and heightened regional geopolitical instability. In Asia, shares were further hampered by slowing growth in China due to the country’s “zero-COVID-19” lockdowns.
Equities and fixed-income assets began recovering broadly beginning in mid-October as inflationary pressures eased, and economic data reassured investors that a recession was not imminent. In the United States, inflation dropped steadily, dipping below 3% in June 2023 and remaining under 4% through the end of the period. While the Fed continued to hike rates, the scale of increases eased, with a fourth 0.75% increase in November, followed by a 0.50% increase in December and four subsequent 0.25% increases in 2023. At the same time, the U.S. economy continued to grow, bolstered by strong consumer spending, rising wages and robust levels of employment. Although European economic conditions proved less robust than those in the United States, European economies showed surprising strength despite the war in Ukraine, with warmer-than-expected winter temperatures limiting the impact of the conflict on energy prices. In addition, China began to emerge from pandemic-related lockdowns, although economic growth in the world’s second-largest economy remained sluggish. Generally, equity market returns remained positive despite a downturn in February and early March driven by renewed inflationary concerns, rising geopolitical tensions in Asia and concerns regarding a few inflation-driven regional bank failures in the United States. Over the entire reporting period, large-cap growth stocks tended to outperform value-oriented and smaller-capitalization shares. Bond prices improved as well from October through the end of the period, although fixed-income securities generated mixed returns overall. Shorter-duration fixed-income instruments tended to outperform their longer-duration counterparts, and lower-credit-rated securities generally outperformed higher credit ratings.
Fixed-Income Positions Enhance Relative Returns
While most of the fund’s total gains were driven by equity positions, particularly in the large-cap blend category, fixed-income positions provided the greatest contributions to relative performance, with positive attribution split between manager selection and asset allocation. From a manager selection perspective, investment grade fixed-income positions led relative returns, with nearly equal contributions from corporate bond and intermediate bond positions. From an asset allocation point of view, relative returns were bolstered by high yield bond positions.
The most significant detractors from relative performance came from equity positions, led by emerging-markets equity, followed by small-cap blend. Virtually all of the fund’s negative equity contribution resulted from asset allocation, with manager selection having little net effect.
We made several changes to the fund’s composition during the period. In September 2022, we reduced allocations to small-cap value and small-cap growth stocks, while increasing exposure to small-cap multi-strategy and short-term U.S. government securities. In January 2023, we used some of the fund’s cash to increase exposure to investment grade fixed-income direct and international equity, while selling a portion of the fund’s large-cap tax-managed equity to increase positions in income stock and, to a lesser extent, emerging-markets equity. In June, we sold positions in income stock and mid-cap equity multi-strategy,
14
while buying positions in research growth. Finally, in July, we trimmed positions in short-term U.S. government fixed income, small-cap equity multi-strategy and floating-rate income, while increasing large-cap tax-managed equity.
Adopting a More Constructive Outlook
In light of emerging economic developments, we have become more constructive on the market’s near- and mid-term prospects. Specifically, we see growing signs that the slowdown in earnings and economic activity is stabilizing, and leading indicators are turning higher. However, U.S. growth is diverging from the rest of world, leading to a stronger U.S. dollar, which could drive risk-off sentiment. From a monetary policy perspective, we see little likelihood of further substantial Fed rate increases. While rates may remain high for an extended period of time, the potential shock to the system has diminished. Nevertheless, elevated investor sentiment and equity price/earnings ratios could become near-term headwinds in an environment of high rates. Key risks over the coming months include China’s slowdown, the impact of credit tightening (which typically leads to lower earnings and growth) and the potential for another uptick in inflation if service prices remain high, and oil prices continue to increase.
As of the end of the period, the fund has allocated 64.3% of assets to equities and 33.1% to fixed income. The fund’s largest allocations by category are to large-cap blend equity and investment grade fixed income, while its smallest allocations by category are to alternatives and emerging-markets equity. By manager, the fund’s largest allocations are to tax-managed large-cap equity, investment grade fixed-income direct and intermediate bond, while its smallest allocations by manager are to small-cap growth, developed-markets REITs (real estate investment trusts), small-cap value, high yield and floating-rate income.
September 15, 2023
1 Total return includes reinvestment of dividends and any capital gains paid. Past performance is no guarantee of future results. Share price and investment return fluctuate such that upon redemption, fund shares may be worth more or less than their original cost. The fund’s return reflects the absorption of certain fund expenses by BNY Mellon Investment Adviser, Inc. pursuant to an agreement in effect through December 30, 2023, at which time it may be extended, modified or terminated. Had these expenses not been absorbed, returns would have been lower.
2 Source: Morningstar Inc. — Morningstar Moderate Target Risk Index serves as a benchmark to help with target-risk, mutual fund selection and evaluation by offering an objective yardstick for moderate performance comparison. Investors cannot invest directly in any index.
Equities are subject generally to market, market sector, market liquidity, issuer and investment style risks, among other factors, to varying degrees, all of which are more fully described in the fund’s prospectus.
Bonds are subject generally to interest-rate, credit, liquidity and market risks, to varying degrees, all of which are more fully described in the fund’s prospectus. Generally, all other factors being equal, bond prices are inversely related to interest-rate changes, and rate increases can cause price declines.
The underlying funds’ underlying strategies may use derivative instruments. A small investment in derivatives could have a potentially large impact on the fund’s performance. The use of derivatives involves risks different from, or possibly greater than, the risks associated with investing directly in the underlying assets.
15
FUND PERFORMANCE (Unaudited)
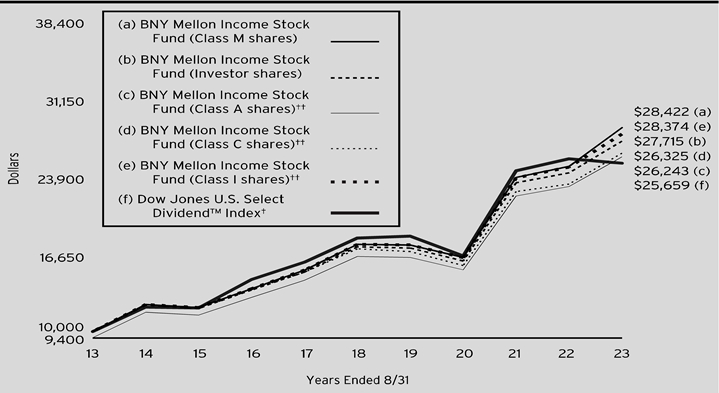
Comparison of change in value of a $10,000 investment in Class M shares, Investor shares, Class A shares, Class C shares and Class I shares of BNY Mellon Income Stock Fund with a hypothetical investment of $10,000 in the Dow Jones U.S. Select DividendTM Index (the “Index”).
† Source: Lipper Inc.
†† The total return figures presented for Class A shares, Class C shares and Class I shares of the fund reflect the performance of the fund’s Class M shares for the period prior to 5/31/16 (the inception date for Class A shares, Class C shares and Class I shares) adjusted to reflect each share class’ applicable sales charges, and the performance for the fund’s Class A shares, Class C shares and Class I shares thereafter.
Past performance is not predictive of future performance.
The above graph compares a hypothetical $10,000 investment made in each of the Class M shares, Investor shares, Class A shares, Class C shares and Class I shares of BNY Mellon Income Stock Fund on 8/31/13 to a hypothetical investment of $10,000 made in the Index on that date. All dividends and capital gain distributions are reinvested.
The fund’s performance shown in the line graph above takes into account all applicable fees and expenses on all classes. The Index is defined as all dividend-paying companies in the Dow Jones U.S. Index, excluding REITs, that have a non-negative historical five-year dividend-per-share growth rate, a five-year average dividend coverage ratio of greater than or equal to 167%, paid dividends in each of the previous five years, non-negative trailing 12-month earnings-per-share (EPS), a float-adjusted market capitalization of at least US$1 billion, and three-month average daily trading volume of 200,000 shares. Unlike a mutual fund, the Index is not subject to charges, fees and other expenses. Investors cannot invest directly in any index. Further information relating to fund performance, including expense reimbursements, if applicable, is contained in the Financial Highlights section of the prospectus and elsewhere in this report.
16

Comparison of change in value of a $1,000,000 investment in Class Y shares of BNY Mellon Income Stock Fund with a hypothetical investment of $1,000,000 in the Dow Jones U.S. Select DividendTM Index (the “Index”).
† Source: Lipper Inc.
†† The total return figures presented for Class Y shares for the period prior to 5/31/16 (the inception date for Class Y shares) adjusted to reflect each share class’ applicable sales charges, and the performance for the fund’s Class Y shares thereafter.
Past performance is not predictive of future performance.
The above graph compares a hypothetical investment of $1,000,000 made in Class Y shares of BNY Mellon Income Stock Fund on 8/31/13 to a hypothetical investment of $1,000,000 made in the Index on that date. All dividends and capital gain distributions are reinvested.
The fund’s performance shown in the line graph above takes into account all applicable fees and expenses on Class Y shares. The Index is defined as all dividend-paying companies in the Dow Jones U.S. Index, excluding REITs, that have a non-negative historical five-year dividend-per-share growth rate, a five-year average dividend coverage ratio of greater than or equal to 167%, paid dividends in each of the previous five years, non-negative trailing 12-month earnings-per-share (EPS), a float-adjusted market capitalization of at least US$1 billion, and three-month average daily trading volume of 200,000 shares. Unlike a mutual fund, the Index is not subject to charges, fees and other expenses. Investors cannot invest directly in any index. Further information relating to fund performance, including expense reimbursements, if applicable, is contained in the Financial Highlights section of the prospectus and elsewhere in this report.
17
FUND PERFORMANCE (Unaudited) (continued)
| | | | | | | | |
Average Annual Total Returns as of 8/31/2023 | | | |
| Inception Date | 1 Year | 5 Years | 10 Years |
Class M shares | 1/1/85 | 12.06% | 9.43% | 11.01% |
Investor shares | 7/11/01 | 11.93% | 9.17% | 10.73% |
Class A shares | | | | |
with maximum sales charge (5.75%) | 5/31/16 | 5.30% | 7.79% | 10.13%†† |
without sales charge | 5/31/16 | 11.72% | 9.08% | 10.78%†† |
Class C shares | | | | |
with applicable redemption charge† | 5/31/16 | 10.12% | 8.27% | 10.16%†† |
without redemption | 5/31/16 | 11.00% | 8.27% | 10.16%†† |
Class I shares | 5/31/16 | 12.16% | 9.40% | 10.99%†† |
Class Y shares | 5/31/16 | 12.09% | 9.41% | 11.00%†† |
Dow Jones U.S. Select Dividend TM Index | | -1.56% | 6.53% | 9.88% |
† The maximum contingent deferred sales charge for Class C shares is 1% for shares redeemed within one year of the date of purchase.
†† The total return performance figures presented for Class A shares, Class C shares, Class I shares and Class Y shares of the fund reflect the performance of the fund’s Class M shares for the period prior to 5/31/16 (the inception date for Class A shares, Class C shares, Class I shares and Class Y shares) adjusted to reflect each share class’ applicable sales charges, and the performance for the fund’s Class A shares, Class C shares, Class I shares and Class Y shares thereafter.
The performance data quoted represents past performance, which is no guarantee of future results. Share price and investment return fluctuate and an investor’s shares may be worth more or less than original cost upon redemption. Current performance may be lower or higher than the performance quoted. Go to www.im.bnymellon.com for the fund’s most recent month-end returns.
The fund’s performance shown in the graphs and table does not reflect the deduction of taxes that a shareholder would pay on fund distributions or the redemption of fund shares.
18
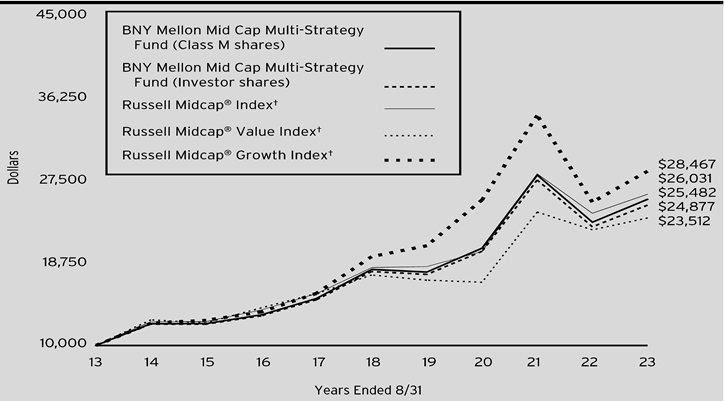
Comparison of change in value of a $10,000 investment in Class M shares and Investor shares of BNY Mellon Mid Cap Multi-Strategy Fund with a hypothetical investment of $10,000 in each of the Russell Midcap® Index, Russell Midcap® Value Index and Russell Midcap® Growth Index.
| | | | | |
Average Annual Total Returns as of 8/31/2023 | | | |
| | 1 Year | 5 Years | 10 Years |
Class M shares | | 10.50% | 7.13% | 9.81% |
Investor shares | | 10.18% | 6.88% | 9.54% |
Russell Midcap® Index | | 8.38% | 7.35% | 10.04% |
Russell Midcap® Value Index | | 5.65% | 6.12% | 8.93% |
Russell Midcap® Growth Index | | 13.00% | 7.95% | 11.03% |
† Source: Lipper Inc.
Past performance is not predictive of future performance.
The above graph compares a $10,000 investment made in Class M shares and Investor shares of BNY Mellon Mid Cap Multi-Strategy Fund on 8/31/13 to a hypothetical investment of $10,000 made in each of the (1) the Russell Midcap® Index, (2) the Russell Midcap® Value Index and (3) the Russell Midcap® Growth Index on that date. All dividends and capital gain distributions are reinvested.
The fund’s performance shown in the line graph above takes into account all applicable fees and expenses for Class M shares and Investor shares. The Russell Midcap® Index measures the performance of the mid-cap segment of the U.S. equity universe. The Russell Midcap® Index is a subset of the Russell 1000® Index. It includes approximately 800 of the smallest securities based on a combination of their market cap and current index membership. The Russell Midcap® Index represents approximately 31% of the total market capitalization of the Russell 1000 companies. The Russell Midcap® Index is constructed to provide a comprehensive and unbiased barometer for the mid-cap segment. The index is completely reconstituted annually to ensure larger stocks do not distort the performance and characteristics of the true mid-cap opportunity set. The Russell Midcap® Value Index measures the performance of the mid-cap value segment of the U.S. equity universe. It includes those Russell Midcap® Index companies that are considered more value-oriented relative to the overall market as defined by Russell’s leading style methodology. The Russell Midcap® Value Index is constructed to provide a comprehensive and unbiased barometer of the mid-cap value market. The index is completely reconstituted annually to ensure larger stocks do not distort the performance and characteristics of the true mid-cap value market. The Russell Midcap® Growth Index measures the performance of the mid-cap growth segment of the U.S. equity universe. It includes those Russell Midcap® Index companies with higher growth earning potential as defined by Russell’s leading style methodology. The Russell Midcap® Growth Index is constructed to provide a comprehensive and unbiased barometer of the mid-cap growth market. The index is completely reconstituted annually to ensure larger stocks do not distort the performance and characteristics of the true mid-cap growth market. Unlike a mutual fund, the indices are not subject to charges, fees and other expenses. Investors cannot invest directly in any index. Further information relating to fund performance, including expense reimbursements, if applicable, is contained in the Financial Highlights section of the prospectus and elsewhere in this report.
The performance data quoted represents past performance, which is no guarantee of future results. Share price and investment return fluctuate and an investor’s shares may be worth more or less than original cost upon redemption. Current performance may be lower or higher than the performance quoted. Go to www.im.bnymellon.com for the fund’s most recent month-end returns.
The fund’s performance shown in the graph and table does not reflect the deduction of taxes that a shareholder would pay on fund distributions or the redemption of fund shares.
19
FUND PERFORMANCE (Unaudited) (continued)
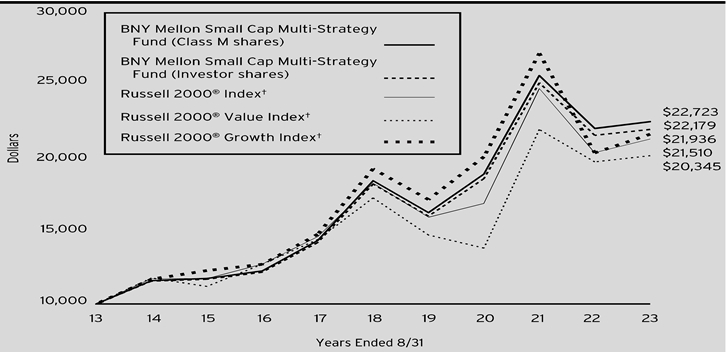
Comparison of change in value of a $10,000 investment in Class M shares and Investor shares of BNY Mellon Small Cap Multi-Strategy Fund with a hypothetical investment of $10,000 in each of the Russell 2000® Index, Russell 2000® Value Index and Russell 2000® Growth Index.
| | | | | |
Average Annual Total Returns as of 8/31/2023 | | | |
| | 1 Year | 5 Years | 10 Years |
Class M shares | | 2.15% | 4.09% | 8.55% |
Investor shares | | 1.88% | 3.84% | 8.29% |
Russell 2000® Index | | 4.65% | 3.14% | 7.96% |
Russell 2000® Value Index | | 2.17% | 3.18% | 7.36% |
Russell 2000® Growth Index | | 6.78% | 2.46% | 8.17% |
† Source: Lipper Inc.
Past performance is not predictive of future performance.
The above graph compares a $10,000 investment made in Class M shares and Investor shares of BNY Mellon Small Cap Multi-Strategy Fund on 8/31/13 to a hypothetical investment of $10,000 made in each of the (1) the Russell 2000® Index, (2) the Russell 2000® Value Index and (3) the Russell 2000® Growth Index on that date. All dividends and capital gain distributions are reinvested.
The fund’s performance shown in the line graph above takes into account all applicable fees and expenses for Class M shares and Investor shares. The Russell 2000® Index measures the performance of the small-cap segment of the U.S. equity universe. The Russell 2000® Index is a subset of the Russell 3000® Index representing approximately 10% of the total market capitalization of that index. It includes approximately 2,000 of the smallest securities based on a combination of their market cap and current index membership. The Russell 2000 is constructed to provide a comprehensive and unbiased small-cap barometer and is completely reconstituted annually to ensure larger stocks do not distort the performance and characteristics of the true small-cap opportunity set. The Russell 2000® Value Index measures the performance of the small-cap value segment of the U.S. equity universe. It includes those Russell 2000 companies that are considered more value-oriented relative to the overall market as defined by Russell’s leading style methodology. The Russell 2000® Value Index is constructed to provide a comprehensive and unbiased barometer for the small-cap value segment. The index is completely reconstituted annually to ensure larger stocks do not distort the performance and characteristics of the true small-cap opportunity set and that the represented companies continue to reflect value characteristics. The Russell 2000® Growth Index measures the performance of the small-cap growth segment of the U.S. equity universe. It includes those Russell 2000 companies with higher growth earning potential as defined by Russell’s leading style methodology. The Russell 2000® Growth Index is constructed to provide a comprehensive and unbiased barometer for the small-cap growth segment. The index is completely reconstituted annually to ensure larger stocks do not distort the performance and characteristics of the true small-cap opportunity set and that the represented companies continue to reflect growth characteristics. Unlike a mutual fund, the indices are not subject to charges, fees and other expenses. Investors cannot invest directly in any index. Further information relating to fund performance, including expense reimbursements, if applicable, is contained in the Financial Highlights section of the prospectus and elsewhere in this report.
The performance data quoted represents past performance, which is no guarantee of future results. Share price and investment return fluctuate and an investor’s shares may be worth more or less than original cost upon redemption. Current performance may be lower or higher than the performance quoted. Go to www.im.bnymellon.com for the fund’s most recent month-end returns.
The fund’s performance shown in the graph and table does not reflect the deduction of taxes that a shareholder would pay on fund distributions or the redemption of fund shares.
20
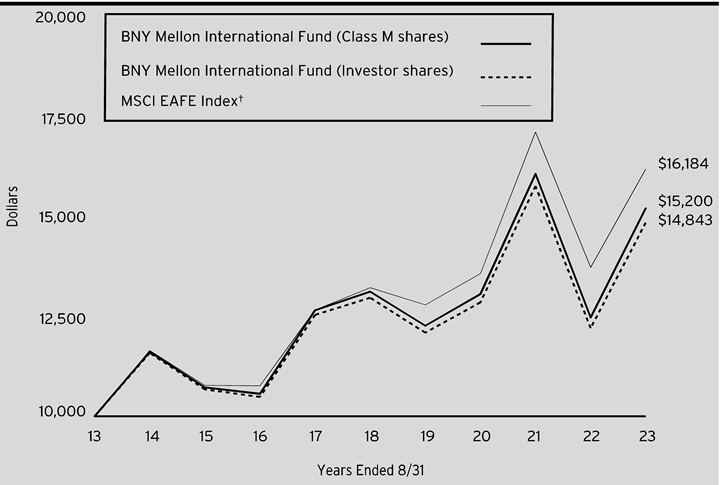
Comparison of change in value of a $10,000 investment in Class M shares and Investor shares of BNY Mellon International Fund with a hypothetical investment of $10,000 in the MSCI EAFE Index (the “Index”).
| | | | | |
Average Annual Total Returns as of 8/31/2023 | | | |
| | 1 Year | 5 Years | 10 Years |
Class M shares | | 21.91% | 2.99% | 4.28% |
Investor shares | | 21.64% | 2.75% | 4.03% |
MSCI EAFE Index | | 17.92% | 4.14% | 4.93% |
† Source: Lipper Inc.
Past performance is not predictive of future performance.
The above graph compares a $10,000 investment made in each of the Class M shares and Investor shares of BNY Mellon International Fund on 8/31/13 to a hypothetical investment of $10,000 made in the Index on that date. All dividends and capital gain distributions are reinvested.
The fund changed its investment strategy on August 6, 2015. Prior to that date, the fund allocated its assets between a core investment style and a value investment style at the discretion of the investment adviser. Different investment strategies may lead to different performance results. The fund’s performance shown in the line chart and table reflects the fund’s investment strategy in effect during those periods. The fund’s performance shown in the line graph above takes into account all applicable fees and expenses for Class M and Investor shares. The Index is a free float‐adjusted market capitalization-weighted index that is designed to measure the equity market performance of developed markets, excluding the U.S. and Canada. Unlike a mutual fund, the Index is not subject to charges, fees and other expenses. Investors cannot invest directly in any Index. Further information relating to fund performance, including expense reimbursements, if applicable, is contained in the Financial Highlights section of the prospectus and elsewhere in this report.
The performance data quoted represents past performance, which is no guarantee of future results. Share price and investment return fluctuate and an investor’s shares may be worth more or less than original cost upon redemption. Current performance may be lower or higher than the performance quoted. Go to www.im.bnymellon.com for the fund’s most recent month-end returns.
The fund’s performance shown in the graph and table does not reflect the deduction of taxes that a shareholder would pay on fund distributions or the redemption of fund shares.
21
FUND PERFORMANCE (Unaudited) (continued)

Comparison of change in value of a $10,000 investment in Class M shares and Investor shares of BNY Mellon Emerging Markets Fund with a hypothetical investment of $10,000 in the MSCI Emerging Markets Index (the “Index”).
| | | | | |
Average Annual Total Returns as of 8/31/2023 | | | |
| | 1 Year | 5 Years | 10 Years |
Class M shares | | 1.02% | 1.34% | 2.84% |
Investor shares | | .87% | 1.09% | 2.60% |
MSCI Emerging Markets Index | | 1.25% | .98% | 2.99% |
† Source: Lipper Inc.
Past performance is not predictive of future performance.
The above graph compares a hypothetical investment of $10,000 made in each of the Class M shares and Investor shares of BNY Mellon Emerging Markets Fund on 8/31/13 to a hypothetical investment of $10,000 made in the Index on that date. All dividends and capital gain distributions are reinvested.
The fund changed its investment strategy on August 6, 2015. Prior to that date, the fund allocated its assets between a core investment style and a value investment style at the discretion of the investment adviser. Different investment strategies may lead to different performance results. The fund’s performance shown in the line chart and table reflects the fund’s investment strategy in effect during those periods. The fund’s performance shown in the line graph above takes into account all applicable fees and expenses for Class M shares and Investor shares. The Index is a free float‐adjusted market capitalization-weighted index that is designed to measure equity market performance of emerging markets. Unlike a mutual fund, the Index is not subject to charges, fees and other expenses. Investors cannot invest directly in any index. Further information relating to fund performance, including expense reimbursements, if applicable, is contained in the Financial Highlights section of the prospectus and elsewhere in this report.
The performance data quoted represents past performance, which is no guarantee of future results. Share price and investment return fluctuate and an investor’s shares may be worth more or less than original cost upon redemption. Current performance may be lower or higher than the performance quoted. Go to www.im.bnymellon.com for the fund’s most recent month-end returns.
The fund’s performance shown in the graph and table does not reflect the deduction of taxes that a shareholder would pay on fund distributions or the redemption of fund shares.
22
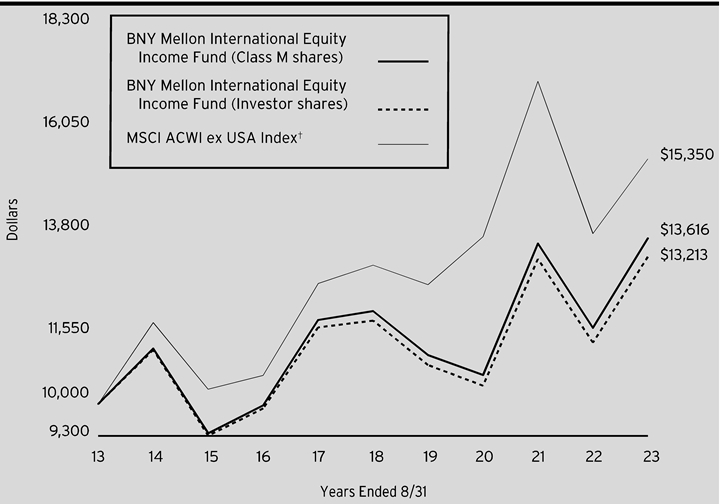
Comparison of change in value of a $10,000 investment in Class M shares and Investor shares of BNY Mellon International Equity Income Fund with a hypothetical investment of $10,000 in the MSCI ACWI ex USA Index (the “Index”).
| | | | | |
Average Annual Total Returns as of 8/31/2023 | | | |
| | 1 Year | 5 Year | 10 Years |
Class M shares | | 16.79% | 2.52% | 3.14% |
Investor shares | | 16.54% | 2.26% | 2.83% |
MSCI ACWI ex USA Index | | 11.89% | 3.33% | 4.38% |
† Source: Lipper Inc.
Past performance is not predictive of future performance.
The above graph compares a hypothetical $10,000 investment made in each of the Class M shares and Investor shares of BNY Mellon International Equity Income Fund on 8/31/13 to a hypothetical investment of $10,000 made in the Index on that date. All dividends and capital gain distributions are reinvested.
The fund’s performance shown in the line graph above takes into account all applicable fees and expenses for Class M shares and Investor shares. The Index captures large- and mid-cap representation across Developed Market (DM) countries (excluding the U.S.) and Emerging Market (EM) countries. Unlike a mutual fund, the Index is not subject to charges, fees and other expenses. Investors cannot invest directly in any index. Further information relating to fund performance, including expense reimbursements, if applicable, is contained in the Financial Highlights section of the prospectus and elsewhere in this report.
The performance data quoted represents past performance, which is no guarantee of future results. Share price and investment return fluctuate and an investor’s shares may be worth more or less than original cost upon redemption. Current performance may be lower or higher than the performance quoted. Go to www.im.bnymellon.com for the fund’s most recent month-end returns.
The fund’s performance shown in the graph and table does not reflect the deduction of taxes that a shareholder would pay on fund distributions or the redemption of fund shares.
23
FUND PERFORMANCE (Unaudited) (continued)
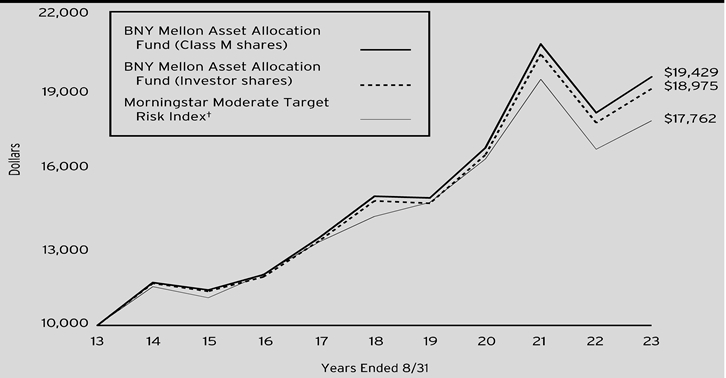
Comparison of change in value of a $10,000 investment in Class M shares and Investor shares of BNY Mellon Asset Allocation Fund with a hypothetical investment of $10,000 in the Morningstar Moderate Target Risk Index (the “Index”)
| | | | | |
Average Annual Total Returns as of 8/31/2023 | | | |
| | 1 Year | 5 Years | 10 Years |
Class M shares | | 7.53% | 5.45% | 6.87% |
Investor shares | | 7.29% | 5.21% | 6.62% |
Morningstar Moderate Target Risk Index | | 6.48% | 4.67% | 5.91% |
† Source: Morningstar Inc.
Past performance is not predictive of future performance.
The above graph compares a hypothetical $10,000 investment made in each of the Class M shares and Investor shares of BNY Mellon Asset Allocation Fund on 8/31/13 to a hypothetical investment of $10,000 made in the Index on that date. All dividends and capital gain distributions are reinvested.
The fund’s performance shown in the line graph above takes into account all applicable fees and expenses for Class M shares and Investor shares. The Index serves as a benchmark to help with target-risk mutual fund selection and evaluation by offering an objective yardstick for moderate performance comparison. Unlike a mutual fund, the index is not subject to charges, fees and other expenses. Investors cannot invest directly in any index. Further information relating to fund performance, including expense reimbursements, if applicable, is contained in the Financial Highlights section of the prospectus and elsewhere in this report.
The performance data quoted represents past performance, which is no guarantee of future results. Share price and investment return fluctuate and an investor’s shares may be worth more or less than original cost upon redemption. Current performance may be lower or higher than the performance quoted. Go to www.im.bnymellon.com for the fund’s most recent month-end returns.
The fund’s performance shown in the graph and table does not reflect the deduction of taxes that a shareholder would pay on fund distributions or the redemption of fund shares.
24
UNDERSTANDING YOUR FUND’S EXPENSES (Unaudited)
As a mutual fund investor, you pay ongoing expenses, such as management fees and other expenses. Using the information below, you can estimate how these expenses affect your investment and compare them with the expenses of other funds. You also may pay one-time transaction expenses, including sales charges (loads) and redemption fees, which are not shown in this section and would have resulted in higher total expenses. For more information, see your fund’s prospectus or talk to your financial adviser.
Review your fund’s expenses
The table below shows the expenses you would have paid on a $1,000 investment in each class of each fund from March 1, 2023 to August 31, 2023. It also shows how much a $1,000 investment would be worth at the close of the period, assuming actual returns and expenses.
| | | | | | | | | |
Expenses and Value of a $1,000 Investment | |
Assume actual returns for the six months ended August 31, 2023 | |
| | | | | | | | |
| | Class M | Investor Shares | Class A | Class C | Class I | Class Y | |
BNY Mellon Income Stock Fund | | | | | |
Expenses paid per $1,000† | $4.42 | $5.70 | $5.90 | $9.73 | $4.62 | $4.42 | |
Ending value (after expenses) | $1,037.60 | $1,036.70 | $1,036.00 | $1,032.50 | $1,038.70 | $1,037.60 | |
Annualized expense ratio (%) | .86 | 1.11 | 1.15 | 1.90 | .90 | .86 | |
BNY Mellon Mid Cap Multi-Strategy Fund | | | | | |
Expenses paid per $1,000† | $4.75 | $6.03 | - | - | - | - | |
Ending value (after expenses) | $1,047.30 | $1,045.60 | - | - | - | - | |
Annualized expense ratio (%) | .92 | 1.17 | - | - | - | - | |
BNY Mellon Small Cap Multi-Strategy Fund | | | | | |
Expenses paid per $1,000† | $5.15 | $6.40 | - | - | - | - | |
Ending value (after expenses) | $985.50 | $984.20 | - | - | - | - | |
Annualized expense ratio (%) | 1.03 | 1.28 | - | - | - | - | |
BNY Mellon International Fund | | | | | |
Expenses paid per $1,000† | $4.69 | $5.98 | - | - | - | - | |
Ending value (after expenses) | $1,046.70 | $1,045.60 | - | - | - | - | |
Annualized expense ratio (%) | .91 | 1.16 | - | - | - | - | |
BNY Mellon Emerging Markets Fund | | | | | |
Expenses paid per $1,000† | $6.16 | $7.44 | - | - | - | - | |
Ending value (after expenses) | $1,021.30 | $1,020.70 | - | - | - | - | |
Annualized expense ratio (%) | 1.21 | 1.46 | - | - | - | - | |
BNY Mellon International Equity Income Fund | | | | | |
Expenses paid per $1,000† | $8.66 | $9.94 | - | - | - | - | |
Ending value (after expenses) | $1,045.10 | $1,043.80 | - | - | - | - | |
Annualized expense ratio (%) | 1.68 | 1.93 | - | - | - | - | |
BNY Mellon Asset Allocation Fund | | | | | |
Expenses paid per $1,000† | $2.18 | $3.48 | - | - | - | - | |
Ending value (after expenses) | $1,062.50 | $1,061.00 | - | - | - | - | |
Annualized expense ratio (%) | .42 | .67 | - | - | - | - | |
† | Expenses are equal to each fund’s annualized expense ratio as shown above, multiplied by the average account value over the period, multiplied by 184/365 (to reflect the one-half year period). |
25
COMPARING YOUR FUND’S EXPENSES WITH THOSE OF OTHER FUNDS (Unaudited)
Using the SEC’s method to compare expenses
The Securities and Exchange Commission (“SEC”) has established guidelines to help investors assess fund expenses. Per these guidelines, the table below shows your fund’s expenses based on a $1,000 investment, assuming a hypothetical 5% annualized return. You can use this information to compare the ongoing expenses (but not transaction expenses or total cost) of investing in the fund with those of other funds. All mutual fund shareholder reports will provide this information to help you make this comparison. Please note that you cannot use this information to estimate your actual ending account balance and expenses paid during the period.
| | | | | | | | | |
Expenses and Value of a $1,000 Investment | |
Assuming a hypothetical 5% annualized return for the six months ended August 31, 2023 | |
| | | | | | | | |
| | Class M | Investor Shares | Class A | Class C | Class I | Class Y | |
BNY Mellon Income Stock Fund | | | | | |
Expenses paid per $1,000† | $4.38 | $5.65 | $5.85 | $9.65 | $4.58 | $4.38 | |
Ending value (after expenses) | $1,020.87 | $1,019.61 | $1,019.41 | $1,015.63 | $1,020.67 | $1,020.87 | |
Annualized expense ratio (%) | .86 | 1.11 | 1.15 | 1.90 | .90 | .86 | |
BNY Mellon Mid Cap Multi-Strategy Fund | | | | | |
Expenses paid per $1,000† | $4.69 | $5.96 | - | - | - | - | |
Ending value (after expenses) | $1,020.57 | $1,019.31 | - | - | - | - | |
Annualized expense ratio (%) | .92 | 1.17 | - | - | - | - | |
BNY Mellon Small Cap Multi-Strategy Fund | | | | | |
Expenses paid per $1,000† | $5.24 | $6.51 | - | - | - | - | |
Ending value (after expenses) | $1,020.01 | $1,018.75 | - | - | - | - | |
Annualized expense ratio (%) | 1.03 | 1.28 | - | - | - | - | |
BNY Mellon International Fund | | | | | |
Expenses paid per $1,000† | $4.63 | $5.90 | - | - | - | - | |
Ending value (after expenses) | $1,020.62 | $1,019.36 | - | - | - | - | |
Annualized expense ratio (%) | .91 | 1.16 | - | - | - | - | |
BNY Mellon Emerging Markets Fund | | | | | |
Expenses paid per $1,000† | $6.16 | $7.43 | - | - | - | - | |
Ending value (after expenses) | $1,019.11 | $1,017.85 | - | - | - | - | |
Annualized expense ratio (%) | 1.21 | 1.46 | - | - | - | - | |
BNY Mellon International Equity Income Fund | | | | | |
Expenses paid per $1,000† | $8.54 | $9.80 | - | - | - | - | |
Ending value (after expenses) | $1,016.74 | $1,015.48 | - | - | - | - | |
Annualized expense ratio (%) | 1.68 | 1.93 | - | - | - | - | |
BNY Mellon Asset Allocation Fund | | | | | |
Expenses paid per $1,000† | $2.14 | $3.41 | - | - | - | - | |
Ending value (after expenses) | $1,023.09 | $1,021.83 | - | - | - | - | |
Annualized expense ratio (%) | .42 | .67 | - | - | - | - | |
† | Expenses are equal to each fund’s annualized expense ratio as shown above, multiplied by the average account value over the period, multiplied by 184/365 (to reflect the one-half year period). |
26
STATEMENT OF INVESTMENTS
August 31, 2023
| | | | | | |
| |
BNY Mellon Income Stock Fund |
Description | | Shares | | Value ($) | |
Common Stocks - 96.4% | | | |
Automobiles & Components - .8% | | | | |
General Motors Co. | | 77,562 | | 2,599,103 | |
Banks - 7.5% | | | | |
JPMorgan Chase & Co. | | 112,558 | | 16,470,612 | |
U.S. Bancorp | | 253,646 | | 9,265,688 | |
| | | | 25,736,300 | |
Capital Goods - 4.3% | | | | |
Eaton Corp. PLC | | 26,391 | | 6,079,695 | |
L3Harris Technologies, Inc. | | 19,168 | | 3,413,629 | |
Northrop Grumman Corp. | | 11,998 | | 5,196,214 | |
| | | | 14,689,538 | |
Consumer Durables & Apparel - .5% | | | | |
Hasbro, Inc. | | 24,597 | | 1,770,984 | |
Consumer Services - 5.0% | | | | |
International Game Technology PLC | | 376,729 | | 12,062,863 | |
Wynn Resorts Ltd. | | 48,616 | | 4,928,690 | |
| | | | 16,991,553 | |
Energy - 14.8% | | | | |
ConocoPhillips | | 32,620 | | 3,882,759 | |
EQT Corp. | | 105,032 | a | 4,539,483 | |
Exxon Mobil Corp. | | 72,514 | | 8,062,832 | |
Hess Corp. | | 42,105 | | 6,505,222 | |
Marathon Petroleum Corp. | | 49,346 | | 7,045,128 | |
Occidental Petroleum Corp. | | 141,565 | | 8,888,866 | |
Schlumberger NV | | 75,887 | | 4,474,298 | |
Shell PLC, ADR | | 116,137 | | 7,210,946 | |
| | | | 50,609,534 | |
Financial Services - 9.8% | | | | |
Ameriprise Financial, Inc. | | 7,609 | | 2,568,646 | |
Ares Management Corp., Cl. A | | 34,121 | | 3,529,476 | |
CME Group, Inc. | | 51,594 | | 10,457,072 | |
Morgan Stanley | | 37,271 | | 3,173,626 | |
The Charles Schwab Corp. | | 77,308 | | 4,572,768 | |
The Goldman Sachs Group, Inc. | | 7,923 | | 2,596,446 | |
Voya Financial, Inc. | | 96,474 | | 6,722,308 | |
| | | | 33,620,342 | |
Food, Beverage & Tobacco - 1.3% | | | | |
Bunge Ltd. | | 39,478 | | 4,513,125 | |
Health Care Equipment & Services - 9.4% | | | | |
Baxter International, Inc. | | 70,178 | | 2,849,227 | |
Becton, Dickinson & Co. | | 49,203 | | 13,749,778 | |
Medtronic PLC | | 149,227 | | 12,162,000 | |
UnitedHealth Group, Inc. | | 7,294 | | 3,476,175 | |
| | | | 32,237,180 | |
Household & Personal Products - 2.2% | | | | |
Kenvue, Inc. | | 329,194 | | 7,587,922 | |
Insurance - 10.4% | | | | |
American International Group, Inc. | | 117,333 | | 6,866,327 | |
Assurant, Inc. | | 71,189 | | 9,918,763 | |
Everest Group Ltd. | | 28,153 | | 10,154,224 | |
The Allstate Corp. | | 32,387 | | 3,491,642 | |
The Progressive Corp. | | 39,007 | | 5,206,264 | |
| | | | 35,637,220 | |
Materials - 3.0% | | | | |
CF Industries Holdings, Inc. | | 33,993 | | 2,619,841 | |
| |
BNY Mellon Income Stock Fund (continued) |
Description | | Shares | | Value ($) | |
Common Stocks - 96.4%(continued) | | | |
Materials - 3.0% (continued) | | | | |
Freeport-McMoRan, Inc. | | 195,010 | | 7,782,849 | |
| | | | 10,402,690 | |
Media & Entertainment - 4.6% | | | | |
Comcast Corp., Cl. A | | 82,650 | | 3,864,714 | |
Omnicom Group, Inc. | | 72,302 | | 5,857,185 | |
The Interpublic Group of Companies, Inc. | | 181,391 | | 5,915,161 | |
| | | | 15,637,060 | |
Pharmaceuticals, Biotechnology & Life Sciences - 9.0% | | | | |
AbbVie, Inc. | | 82,862 | | 12,177,400 | |
Gilead Sciences, Inc. | | 115,110 | | 8,803,613 | |
Sanofi, ADR | | 183,454 | | 9,756,084 | |
| | | | 30,737,097 | |
Semiconductors & Semiconductor Equipment - 3.5% | | | | |
Applied Materials, Inc. | | 54,264 | | 8,289,369 | |
Intel Corp. | | 102,878 | | 3,615,133 | |
| | | | 11,904,502 | |
Software & Services - .8% | | | | |
International Business Machines Corp. | | 19,873 | | 2,917,953 | |
Technology Hardware & Equipment - 4.8% | | | | |
Cisco Systems, Inc. | | 288,158 | | 16,525,861 | |
Transportation - 1.4% | | | | |
FedEx Corp. | | 18,926 | | 4,940,065 | |
Utilities - 3.3% | | | | |
Constellation Energy Corp. | | 76,628 | | 7,981,572 | |
Exelon Corp. | | 78,709 | | 3,157,805 | |
| | | | 11,139,377 | |
Total Common Stocks(cost $277,058,519) | 330,197,406 | |
| | 1-Day
Yield (%) | | | | |
Investment Companies - 3.7% | | | | |
Registered Investment Companies - 3.7% | | | | |
Dreyfus Institutional Preferred Government Plus Money Market Fund, Institutional Shares
(cost $12,657,325) | 5.41 | 12,657,325 | b | 12,657,325 | |
Total Investments (cost $289,715,844) | 100.1% | 342,854,731 | |
Liabilities, Less Cash and Receivables | (.1%) | (394,404) | |
Net Assets | 100.0% | 342,460,327 | |
ADR—American Depositary Receipt
a Security, or portion thereof, on loan. At August 31, 2023, the value of the fund’s securities on loan was $4,494,059 and the value of the collateral was $4,594,452, consisting of U.S. Government & Agency securities. In addition, the value of collateral may include pending sales that are also on loan.
b Investment in affiliated issuer. The investment objective of this investment company is publicly available and can be found within the investment company’s prospectus.
27
STATEMENT OF INVESTMENTS (continued)
| | |
Portfolio Summary (Unaudited) † | Value (%) |
Financials | 27.7 |
Health Care | 18.4 |
Energy | 14.8 |
Information Technology | 9.2 |
Consumer Discretionary | 6.2 |
Industrials | 5.7 |
Communication Services | 4.6 |
Investment Companies | 3.7 |
Consumer Staples | 3.5 |
Utilities | 3.3 |
Materials | 3.0 |
| | 100.1 |
† Based on net assets.
See notes to financial statements.
28
| | | | | | | |
BNY Mellon Income Stock Fund | | |
Affiliated Issuers | | |
Description | Value ($)
8/31/2022 | Purchases ($)† | Sales ($) | Value ($)
8/31/2023 | Dividends/
Distributions ($) | |
Registered Investment Companies - 3.7% | | |
Dreyfus Institutional Preferred Government Plus Money Market Fund, Institutional Shares - 3.7% | 20,109,734 | 228,879,769 | (236,332,178) | 12,657,325 | 729,452 | |
Investment of Cash Collateral for Securities Loaned - .0%†† | | |
Dreyfus Institutional Preferred Government Plus Money Market Fund, Institutional Shares - .0% | - | 8,443,135 | (8,443,135) | - | 78,374 | ††† |
Dreyfus Institutional Preferred Government Plus Money Market Fund, SL Shares - .0% | - | 21,835,554 | (21,835,554) | - | 3,478 | ††† |
Total - 3.7% | 20,109,734 | 259,158,458 | (266,610,867) | 12,657,325 | 811,304 | |
† Includes reinvested dividends/distributions.
†† Effective July 3, 2023, cash collateral for securities lending was transferred from Dreyfus Institutional Preferred Government Plus Money Market Fund, SL Shares to Dreyfus Institutional Preferred Government Plus Money Market Fund, Institutional Shares.
††† Represents securities lending income earned from the reinvestment of cash collateral from loaned securities, net of fees and collateral investment expenses, and other payments to and from borrowers of securities.
See notes to financial statements.
29
STATEMENT OF INVESTMENTS (continued)
| | | | | | |
| |
BNY Mellon Mid Cap Multi-Strategy Fund |
Description | | Shares | | Value ($) | |
Common Stocks - 97.1% | | | |
Automobiles & Components - .7% | | | | |
Aptiv PLC | | 4,059 | a | 411,786 | |
BorgWarner, Inc. | | 9,390 | | 382,642 | |
Gentex Corp. | | 94,484 | | 3,085,847 | |
Harley-Davidson, Inc. | | 56,479 | | 1,906,166 | |
Lear Corp. | | 6,904 | | 994,797 | |
Mobileye Global, Inc., Cl. A | | 53,323 | a,b | 1,893,500 | |
Phinia, Inc. | | 1,878 | | 52,208 | |
QuantumScape Corp. | | 25,140 | a | 179,500 | |
Rivian Automotive, Inc., Cl. A | | 25,340 | a,b | 575,978 | |
Thor Industries, Inc. | | 7,630 | | 799,777 | |
| | | | 10,282,201 | |
Banks - 1.3% | | | | |
Columbia Banking System, Inc. | | 3,160 | | 64,717 | |
Comerica, Inc. | | 4,685 | | 225,395 | |
East West Bancorp, Inc. | | 30,294 | | 1,676,470 | |
F.N.B. Corp. | | 43,090 | | 501,137 | |
Fifth Third Bancorp | | 124,323 | | 3,300,776 | |
First Citizens Bancshares, Inc., Cl. A | | 37 | | 50,335 | |
First Horizon Corp. | | 4,920 | | 61,746 | |
Frost Bankers, Inc. | | 4,574 | | 432,380 | |
Huntington Bancshares, Inc. | | 227,867 | | 2,527,045 | |
KeyCorp | | 10,532 | | 119,328 | |
M&T Bank Corp. | | 3,655 | | 457,058 | |
New York Community Bancorp, Inc. | | 32,375 | | 397,565 | |
NU Holdings Ltd. | | 72,990 | a | 499,981 | |
Popular, Inc. | | 75,249 | | 5,138,002 | |
Regions Financial Corp. | | 107,880 | | 1,978,519 | |
Synovus Financial Corp. | | 29,000 | | 897,840 | |
Webster Financial Corp. | | 26,387 | | 1,119,073 | |
Wintrust Financial Corp. | | 8,355 | | 648,432 | |
Zions Bancorp NA | | 16,875 | | 599,062 | |
| | | | 20,694,861 | |
Capital Goods - 10.9% | | | | |
Advanced Drainage Systems, Inc. | | 54,887 | | 7,034,318 | |
AECOM | | 17,410 | | 1,527,727 | |
Air Lease Corp. | | 6,640 | | 270,646 | |
Allegion PLC | | 34,765 | | 3,956,605 | |
AMETEK, Inc. | | 77,101 | | 12,298,381 | |
Axon Enterprise, Inc. | | 48,822 | a | 10,394,692 | |
Builders FirstSource, Inc. | | 8,083 | a | 1,172,358 | |
BWX Technologies, Inc. | | 34,224 | | 2,524,362 | |
Carrier Global Corp. | | 26,000 | | 1,493,700 | |
ChargePoint Holdings, Inc. | | 4,640 | a,b | 33,222 | |
CNH Industrial NV | | 257,996 | | 3,555,185 | |
Cummins, Inc. | | 4,163 | | 957,657 | |
Curtiss-Wright Corp. | | 17,849 | | 3,712,414 | |
Donaldson Co., Inc. | | 14,855 | | 948,789 | |
Dover Corp. | | 37,357 | | 5,540,043 | |
| |
BNY Mellon Mid Cap Multi-Strategy Fund (continued) |
Description | | Shares | | Value ($) | |
Common Stocks - 97.1%(continued) | | | |
Capital Goods - 10.9% (continued) | | | | |
Eaton Corp. PLC | | 17,388 | | 4,005,674 | |
Fastenal Co. | | 19,190 | | 1,104,960 | |
Ferguson PLC | | 16,920 | | 2,733,595 | |
Flowserve Corp. | | 3,645 | | 144,233 | |
Fortive Corp. | | 24,322 | | 1,917,790 | |
Fortune Brands Innovations, Inc. | | 27,204 | | 1,877,620 | |
Generac Holdings, Inc. | | 8,463 | a | 1,005,489 | |
Graco, Inc. | | 30,099 | | 2,376,015 | |
HEICO Corp., Cl. A | | 51,347 | | 6,953,924 | |
Hexcel Corp. | | 32,312 | | 2,368,470 | |
Howmet Aerospace, Inc. | | 89,937 | | 4,449,183 | |
Huntington Ingalls Industries, Inc. | | 14,527 | | 3,200,589 | |
IDEX Corp. | | 44,982 | | 10,183,925 | |
Ingersoll Rand, Inc. | | 26,105 | | 1,817,169 | |
ITT, Inc. | | 12,580 | | 1,286,682 | |
L3Harris Technologies, Inc. | | 4,579 | | 815,474 | |
Lincoln Electric Holdings, Inc. | | 7,846 | | 1,510,041 | |
Masco Corp. | | 79,484 | | 4,690,351 | |
MasTec, Inc. | | 2,525 | a | 251,212 | |
MDU Resources Group, Inc. | | 8,735 | | 177,845 | |
Nordson Corp. | | 5,253 | | 1,282,467 | |
nVent Electric PLC | | 49,230 | | 2,783,464 | |
Otis Worldwide Corp. | | 30,342 | | 2,595,758 | |
Owens Corning | | 9,915 | | 1,426,868 | |
PACCAR, Inc. | | 26,962 | | 2,218,703 | |
Parker-Hannifin Corp. | | 22,681 | | 9,455,709 | |
Plug Power, Inc. | | 26,170 | a,b | 221,398 | |
Quanta Services, Inc. | | 26,156 | | 5,489,360 | |
Regal Rexnord Corp. | | 1,638 | | 265,667 | |
Resideo Technologies, Inc. | | 64,860 | a | 1,093,540 | |
Rockwell Automation, Inc. | | 8,130 | | 2,537,210 | |
Snap-on, Inc. | | 3,450 | | 926,670 | |
Spirit AeroSystems Holdings, Inc., Cl. A | | 7,775 | | 165,763 | |
Stanley Black & Decker, Inc. | | 3,671 | | 346,469 | |
Sunrun, Inc. | | 6,815 | a,b | 106,518 | |
Textron, Inc. | | 67,254 | | 5,226,308 | |
The Timken Company | | 12,925 | | 987,728 | |
Trane Technologies PLC | | 18,780 | | 3,854,783 | |
TransDigm Group, Inc. | | 5,429 | a | 4,907,002 | |
United Rentals, Inc. | | 6,549 | | 3,120,860 | |
Vertiv Holdings Co. | | 14,395 | | 567,019 | |
W.W. Grainger, Inc. | | 3,197 | | 2,283,106 | |
Watsco, Inc. | | 16,282 | b | 5,935,603 | |
WESCO International, Inc. | | 8,886 | | 1,438,199 | |
Westinghouse Air Brake Technologies Corp. | | 15,160 | | 1,705,803 | |
WillScot Mobile Mini Holdings Corp. | | 3,875 | a | 158,953 | |
30
| | | | | | |
| |
BNY Mellon Mid Cap Multi-Strategy Fund (continued) |
Description | | Shares | | Value ($) | |
Common Stocks - 97.1%(continued) | | | |
Capital Goods - 10.9% (continued) | | | | |
Xylem, Inc. | | 16,498 | | 1,708,203 | |
| | | | 171,099,471 | |
Commercial & Professional Services - 6.4% | | | | |
ASGN, Inc. | | 11,444 | a | 940,239 | |
Broadridge Financial Solutions, Inc. | | 42,657 | | 7,943,160 | |
CACI International, Inc., Cl. A | | 12,506 | a | 4,102,093 | |
Cintas Corp. | | 9,448 | | 4,763,398 | |
Clarivate PLC | | 541,423 | a,b | 4,022,773 | |
Copart, Inc. | | 265,212 | a | 11,889,454 | |
Dun & Bradstreet Holdings, Inc. | | 15,875 | | 173,038 | |
Equifax, Inc. | | 34,127 | | 7,054,051 | |
FTI Consulting, Inc. | | 9,872 | a | 1,834,415 | |
Jacobs Solutions, Inc. | | 9,215 | | 1,242,366 | |
Leidos Holdings, Inc. | | 12,464 | | 1,215,365 | |
Paychex, Inc. | | 23,210 | | 2,836,958 | |
Paycom Software, Inc. | | 10,889 | | 3,210,513 | |
RB Global, Inc. | | 39,157 | | 2,416,770 | |
Rentokil Initial PLC, ADR | | 158,057 | | 5,998,263 | |
Republic Services, Inc. | | 22,682 | | 3,269,157 | |
Robert Half, Inc. | | 16,716 | | 1,236,315 | |
Rollins, Inc. | | 55,452 | | 2,194,236 | |
Science Applications International Corp. | | 18,660 | | 2,195,536 | |
SS&C Technologies Holdings, Inc. | | 129,460 | | 7,433,593 | |
TransUnion | | 21,943 | | 1,782,210 | |
Verisk Analytics, Inc. | | 49,946 | | 12,097,920 | |
Waste Connections, Inc. | | 76,982 | | 10,545,764 | |
| | | | 100,397,587 | |
Consumer Discretionary Distribution - 5.2% | | | | |
Advance Auto Parts, Inc. | | 1,891 | | 130,139 | |
AutoZone, Inc. | | 1,956 | a | 4,951,281 | |
Bath & Body Works, Inc. | | 21,525 | | 793,627 | |
Best Buy Co., Inc. | | 18,641 | | 1,425,104 | |
Burlington Stores, Inc. | | 35,988 | a | 5,839,413 | |
CarMax, Inc. | | 11,440 | a | 934,419 | |
Chewy, Inc., Cl. A | | 66,116 | a | 1,585,462 | |
Coupang, Inc. | | 45,530 | a | 864,159 | |
eBay, Inc. | | 49,935 | | 2,236,089 | |
Etsy, Inc. | | 22,905 | a | 1,685,121 | |
Farfetch Ltd., Cl. A | | 338,435 | a | 964,540 | |
Five Below, Inc. | | 3,867 | a | 664,969 | |
Floor & Decor Holdings, Inc., Cl. A | | 1,850 | a | 184,445 | |
Genuine Parts Co. | | 7,796 | | 1,198,479 | |
Kohl's Corp. | | 15,520 | | 413,453 | |
Lithia Motors, Inc. | | 1,491 | | 459,258 | |
LKQ Corp. | | 24,094 | | 1,265,658 | |
Macy's, Inc. | | 7,725 | | 94,477 | |
Ollie's Bargain Outlet Holdings, Inc. | | 120,284 | a | 9,271,491 | |
O'Reilly Automotive, Inc. | | 12,080 | a | 11,351,576 | |
| |
BNY Mellon Mid Cap Multi-Strategy Fund (continued) |
Description | | Shares | | Value ($) | |
Common Stocks - 97.1%(continued) | | | |
Consumer Discretionary Distribution - 5.2% (continued) | | | | |
Pool Corp. | | 20,861 | | 7,626,782 | |
RH | | 5,728 | a,b | 2,091,808 | |
Ross Stores, Inc. | | 115,467 | | 14,065,035 | |
The Gap, Inc. | | 14,250 | b | 165,015 | |
Tractor Supply Co. | | 9,328 | | 2,038,168 | |
Ulta Beauty, Inc. | | 13,922 | a | 5,778,048 | |
Valvoline, Inc. | | 39,415 | | 1,357,453 | |
Victoria's Secret & Co. | | 12,270 | a,b | 235,339 | |
Wayfair, Inc., Cl. A | | 5,085 | a | 351,424 | |
Williams-Sonoma, Inc. | | 7,545 | b | 1,065,354 | |
| | | | 81,087,586 | |
Consumer Durables & Apparel - 3.1% | | | | |
Capri Holdings Ltd. | | 21,955 | a | 1,152,418 | |
Crocs, Inc. | | 2,277 | a | 221,643 | |
D.R. Horton, Inc. | | 12,075 | | 1,437,166 | |
Deckers Outdoor Corp. | | 145 | a | 76,718 | |
Garmin Ltd. | | 23,780 | | 2,521,156 | |
Hasbro, Inc. | | 79,705 | | 5,738,760 | |
Lululemon Athletica, Inc. | | 31,910 | a | 12,166,007 | |
Mohawk Industries, Inc. | | 9,035 | a | 916,059 | |
NVR, Inc. | | 628 | a | 4,004,963 | |
Peloton Interactive, Inc., Cl. A | | 336,916 | a | 2,149,524 | |
Polaris, Inc. | | 27,242 | | 3,053,556 | |
PulteGroup, Inc. | | 25,990 | | 2,132,739 | |
PVH Corp. | | 4,395 | | 367,422 | |
Ralph Lauren Corp. | | 5,191 | | 605,426 | |
Skechers USA, Inc., Cl. A | | 78,571 | a | 3,952,907 | |
Tapestry, Inc. | | 30,675 | | 1,022,091 | |
Tempur Sealy International, Inc. | | 61,606 | b | 2,878,232 | |
Toll Brothers, Inc. | | 25,915 | | 2,123,216 | |
Whirlpool Corp. | | 18,248 | | 2,553,990 | |
| | | | 49,073,993 | |
Consumer Services - 3.8% | | | | |
ADT, Inc. | | 335,681 | | 2,155,072 | |
Aramark | | 190,301 | | 7,075,391 | |
Boyd Gaming Corp. | | 21,656 | | 1,448,137 | |
Bright Horizons Family Solutions, Inc. | | 205 | a | 19,356 | |
Caesars Entertainment, Inc. | | 11,755 | a | 649,581 | |
Carnival Corp. | | 57,165 | a | 904,350 | |
Darden Restaurants, Inc. | | 22,439 | | 3,489,489 | |
Domino's Pizza, Inc. | | 3,183 | | 1,233,094 | |
Doordash, Inc., Cl. A | | 9,185 | a | 772,734 | |
DraftKings, Inc., Cl. A | | 17,180 | a | 509,387 | |
Expedia Group, Inc. | | 116,055 | a | 12,579,201 | |
Frontdoor, Inc. | | 53,448 | a | 1,754,163 | |
H&R Block, Inc. | | 33,585 | | 1,342,728 | |
Hilton Worldwide Holdings, Inc. | | 19,703 | | 2,928,851 | |
31
STATEMENT OF INVESTMENTS (continued)
| | | | | | |
| |
BNY Mellon Mid Cap Multi-Strategy Fund (continued) |
Description | | Shares | | Value ($) | |
Common Stocks - 97.1%(continued) | | | |
Consumer Services - 3.8% (continued) | | | | |
Hyatt Hotels Corp., Cl. A | | 4,388 | | 493,255 | |
International Game Technology PLC | | 29,468 | | 943,565 | |
Las Vegas Sands Corp. | | 28,631 | | 1,570,697 | |
Marriott International, Inc., Cl. A | | 12,701 | | 2,584,781 | |
Marriott Vacations Worldwide Corp. | | 81 | | 8,804 | |
MGM Resorts International | | 36,220 | | 1,592,956 | |
Norwegian Cruise Line Holdings Ltd. | | 28,425 | a | 471,002 | |
Planet Fitness, Inc., Cl. A | | 104,754 | a,b | 6,369,043 | |
Restaurant Brands International, Inc. | | 36,670 | | 2,546,731 | |
Royal Caribbean Cruises Ltd. | | 15,572 | a | 1,540,694 | |
Service Corp. International | | 20,820 | | 1,313,950 | |
The Wendy's Company | | 14,790 | | 292,694 | |
Travel + Leisure Co. | | 1,960 | | 78,792 | |
Wingstop, Inc. | | 508 | | 81,605 | |
Wyndham Hotels & Resorts, Inc. | | 38,904 | | 2,932,973 | |
Wynn Resorts Ltd. | | 4,135 | | 419,206 | |
| | | | 60,102,282 | |
Consumer Staples Distribution - 1.0% | | | | |
BJ's Wholesale Club Holdings, Inc. | | 2,450 | a | 165,106 | |
Casey's General Stores, Inc. | | 3,018 | | 737,629 | |
Dollar Tree, Inc. | | 49,937 | a | 6,110,291 | |
Grocery Outlet Holding Corp. | | 66,956 | a | 2,065,593 | |
Performance Food Group Co. | | 8,770 | a | 544,880 | |
The Kroger Company | | 25,875 | | 1,200,341 | |
US Foods Holding Corp. | | 99,150 | a | 4,008,634 | |
Walgreens Boots Alliance, Inc. | | 16,335 | | 413,439 | |
| | | | 15,245,913 | |
Energy - 5.2% | | | | |
Antero Midstream Corp. | | 3,020 | | 36,602 | |
Antero Resources Corp. | | 58,693 | a | 1,624,035 | |
Baker Hughes Co. | | 60,845 | | 2,201,981 | |
Cheniere Energy, Inc. | | 15,258 | | 2,490,106 | |
Chesapeake Energy Corp. | | 21,200 | b | 1,870,052 | |
Chevron Corp. | | 711 | | 114,542 | |
Coterra Energy, Inc. | | 20,415 | | 575,499 | |
Devon Energy Corp. | | 79,323 | | 4,052,612 | |
Diamondback Energy, Inc. | | 27,535 | | 4,179,262 | |
DT Midstream, Inc. | | 10,030 | | 524,469 | |
EQT Corp. | | 358,559 | b | 15,496,920 | |
Halliburton Co. | | 246,765 | | 9,530,064 | |
Hess Corp. | | 34,370 | | 5,310,165 | |
HF Sinclair Corp. | | 4,910 | | 270,492 | |
Marathon Oil Corp. | | 79,820 | | 2,103,257 | |
Marathon Petroleum Corp. | | 13,425 | | 1,916,687 | |
New Fortress Energy, Inc. | | 4,410 | b | 136,886 | |
NOV, Inc. | | 252,110 | | 5,327,084 | |
ONEOK, Inc. | | 22,535 | | 1,469,282 | |
Phillips 66 | | 14,881 | | 1,698,815 | |
Pioneer Natural Resources Co. | | 29,283 | | 6,967,304 | |
| |
BNY Mellon Mid Cap Multi-Strategy Fund (continued) |
Description | | Shares | | Value ($) | |
Common Stocks - 97.1%(continued) | | | |
Energy - 5.2% (continued) | | | | |
Range Resources Corp. | | 4,330 | | 140,205 | |
Schlumberger NV | | 45,051 | | 2,656,207 | |
Targa Resources Corp. | | 22,185 | | 1,913,456 | |
TechnipFMC PLC | | 10,825 | | 206,108 | |
The Williams Companies, Inc. | | 24,340 | | 840,460 | |
Valero Energy Corp. | | 52,452 | | 6,813,515 | |
Weatherford International PLC | | 20,121 | a | 1,781,111 | |
| | | | 82,247,178 | |
Equity Real Estate Investment - 4.3% | | | | |
Alexandria Real Estate Equities, Inc. | | 22,109 | c | 2,572,161 | |
American Homes 4 Rent, Cl. A | | 41,898 | c | 1,510,004 | |
Americold Realty Trust, Inc. | | 1,850 | c | 62,253 | |
AvalonBay Communities, Inc. | | 5,361 | c | 985,459 | |
Boston Properties, Inc. | | 6,370 | c | 425,325 | |
Brixmor Property Group, Inc. | | 74,580 | c | 1,639,268 | |
Camden Property Trust | | 19,110 | c | 2,056,618 | |
Cousins Properties, Inc. | | 9,820 | c | 230,770 | |
CubeSmart | | 13,560 | b,c | 565,588 | |
Digital Realty Trust, Inc. | | 52,677 | c | 6,938,614 | |
EastGroup Properties, Inc. | | 6,233 | c | 1,119,634 | |
EPR Properties | | 1,775 | c | 79,485 | |
Equinix, Inc. | | 3,932 | c | 3,072,386 | |
Equity Lifestyle Properties, Inc. | | 53,747 | c | 3,598,899 | |
Equity Residential | | 86,262 | c | 5,592,365 | |
Essex Property Trust, Inc. | | 10,834 | c | 2,582,717 | |
Extra Space Storage, Inc. | | 18,242 | c | 2,347,381 | |
Federal Realty Investment Trust | | 5,455 | c | 534,263 | |
Healthcare Realty Trust, Inc. | | 700 | c | 12,264 | |
Healthpeak Properties, Inc. | | 70,728 | c | 1,455,582 | |
Highwoods Properties, Inc. | | 12,525 | c | 298,471 | |
Host Hotels & Resorts, Inc. | | 61,889 | c | 977,227 | |
Iron Mountain, Inc. | | 6,610 | c | 419,999 | |
Kilroy Realty Corp. | | 11,150 | c | 411,992 | |
Kimco Realty Corp. | | 81,004 | c | 1,534,216 | |
Lamar Advertising Co., Cl. A | | 35,968 | c | 3,281,001 | |
Medical Properties Trust, Inc. | | 50,060 | b,c | 361,433 | |
Mid-America Apartment Communities, Inc. | | 6,670 | c | 968,684 | |
NNN REIT, Inc. | | 11,835 | c | 466,181 | |
Omega Healthcare Investors, Inc. | | 6,270 | b,c | 199,511 | |
Park Hotels & Resorts, Inc. | | 31,625 | c | 405,749 | |
Rayonier, Inc. | | 24,799 | c | 741,490 | |
Realty Income Corp. | | 31,106 | c | 1,743,180 | |
Regency Centers Corp. | | 54,170 | c | 3,369,374 | |
Rexford Industrial Realty, Inc. | | 19,962 | c | 1,067,368 | |
Simon Property Group, Inc. | | 31,357 | c | 3,558,706 | |
Spirit Realty Capital, Inc. | | 23,674 | c | 914,053 | |
UDR, Inc. | | 28,390 | c | 1,132,761 | |
Ventas, Inc. | | 6,545 | c | 285,886 | |
32
| | | | | | |
| |
BNY Mellon Mid Cap Multi-Strategy Fund (continued) |
Description | | Shares | | Value ($) | |
Common Stocks - 97.1%(continued) | | | |
Equity Real Estate Investment - 4.3% (continued) | | | | |
VICI Properties, Inc. | | 97,483 | c | 3,006,376 | |
Vornado Realty Trust | | 9,040 | a,b,c | 217,141 | |
Welltower, Inc. | | 51,542 | c | 4,271,801 | |
Weyerhaeuser Co. | | 27,897 | c | 913,627 | |
| | | | 67,927,263 | |
Financial Services - 7.4% | | | | |
Affirm Holdings, Inc. | | 10,005 | a | 208,204 | |
Ally Financial, Inc. | | 38,090 | | 1,054,712 | |
Ameriprise Financial, Inc. | | 30,332 | | 10,239,477 | |
Apollo Global Management, Inc. | | 17,090 | | 1,492,640 | |
Ares Management Corp., Cl. A | | 111,520 | | 11,535,629 | |
Block, Inc. | | 103,223 | a | 5,950,806 | |
Blue Owl Capital, Inc. | | 22,135 | | 264,513 | |
Coinbase Global, Inc., Cl. A | | 8,690 | a,b | 691,724 | |
Credit Acceptance Corp. | | 593 | a | 297,550 | |
Discover Financial Services | | 47,781 | | 4,303,635 | |
Equitable Holdings, Inc. | | 41,565 | | 1,197,072 | |
Euronet Worldwide, Inc. | | 43,095 | a | 3,764,779 | |
Evercore, Inc., Cl. A | | 21,487 | | 3,009,254 | |
Fidelity National Information Services, Inc. | | 66,630 | | 3,721,952 | |
Fiserv, Inc. | | 58,896 | a | 7,149,385 | |
FLEETCOR Technologies, Inc. | | 7,535 | a | 2,047,486 | |
Franklin Resources, Inc. | | 13,315 | b | 356,043 | |
Global Payments, Inc. | | 98,810 | | 12,518,239 | |
Interactive Brokers Group, Inc., Cl. A | | 745 | | 67,855 | |
Intercontinental Exchange, Inc. | | 47,295 | | 5,580,337 | |
Invesco Ltd. | | 43,145 | | 686,868 | |
Jack Henry & Associates, Inc. | | 8,174 | | 1,281,520 | |
Janus Henderson Group PLC | | 7,975 | | 219,073 | |
Jefferies Financial Group, Inc. | | 5,100 | | 182,019 | |
KKR & Co., Inc. | | 19,560 | | 1,228,564 | |
LPL Financial Holdings, Inc. | | 37,737 | | 8,701,775 | |
MGIC Investment Corp. | | 41,290 | | 725,878 | |
MSCI, Inc. | | 3,382 | | 1,838,523 | |
Nasdaq, Inc. | | 49,192 | | 2,581,596 | |
Northern Trust Corp. | | 12,025 | | 914,742 | |
OneMain Holdings, Inc. | | 2,250 | | 93,398 | |
Raymond James Financial, Inc. | | 48,215 | | 5,042,807 | |
Robinhood Markets, Inc., Cl. A | | 33,875 | a | 368,899 | |
Rocket Cos, Inc., CI. A | | 45,894 | a,b | 490,148 | |
Shift4 Payments, Inc., Cl. A | | 5,415 | a | 307,518 | |
SLM Corp. | | 103,412 | | 1,472,587 | |
SoFi Technologies, Inc. | | 45,520 | a,b | 394,203 | |
Starwood Property Trust, Inc. | | 43,790 | b,c | 894,630 | |
State Street Corp. | | 14,635 | | 1,006,010 | |
Synchrony Financial | | 22,749 | | 734,338 | |
T. Rowe Price Group, Inc. | | 13,812 | | 1,550,121 | |
| |
BNY Mellon Mid Cap Multi-Strategy Fund (continued) |
Description | | Shares | | Value ($) | |
Common Stocks - 97.1%(continued) | | | |
Financial Services - 7.4% (continued) | | | | |
Toast, Inc., Cl. A | | 18,225 | a,b | 404,048 | |
Tradeweb Markets, Inc., Cl. A | | 29,296 | | 2,532,053 | |
Voya Financial, Inc. | | 90,073 | | 6,276,287 | |
WEX, Inc. | | 1,437 | a | 281,911 | |
XP, Inc., Cl. A | | 9,800 | a | 248,332 | |
| | | | 115,909,140 | |
Food, Beverage & Tobacco - 1.4% | | | | |
Brown-Forman Corp., Cl. B | | 15,817 | | 1,045,978 | |
Bunge Ltd. | | 12,935 | | 1,478,729 | |
Celsius Holdings, Inc. | | 988 | a | 193,688 | |
Coca-Cola Europacific Partners PLC | | 30,236 | | 1,938,430 | |
Conagra Brands, Inc. | | 150,638 | | 4,501,063 | |
Darling Ingredients, Inc. | | 1,650 | a | 101,904 | |
Freshpet, Inc. | | 8,991 | a,b | 678,910 | |
Ingredion, Inc. | | 4,980 | | 512,492 | |
Lamb Weston Holdings, Inc. | | 12,021 | | 1,170,966 | |
McCormick & Co., Inc. | | 19,380 | | 1,590,710 | |
Molson Coors Beverage Co., Cl. B | | 61,015 | | 3,873,842 | |
The J.M. Smucker Company | | 1,779 | | 257,866 | |
Tyson Foods, Inc., Cl. A | | 85,392 | | 4,548,832 | |
| | | | 21,893,410 | |
Health Care Equipment & Services - 6.6% | | | | |
Acadia Healthcare Co., Inc. | | 430 | a | 33,153 | |
agilon health, Inc. | | 18,125 | a,b | 321,175 | |
Align Technology, Inc. | | 28,951 | a | 10,715,923 | |
AMN Healthcare Services, Inc. | | 11,755 | a | 1,038,907 | |
Baxter International, Inc. | | 91,657 | | 3,721,274 | |
Cencora, Inc. | | 39,479 | | 6,947,514 | |
Centene Corp. | | 102,750 | a | 6,334,537 | |
Certara, Inc. | | 7,930 | a | 128,149 | |
DaVita, Inc. | | 4,865 | a | 498,273 | |
Dentsply Sirona, Inc. | | 10,956 | | 406,358 | |
DexCom, Inc. | | 85,293 | a | 8,612,887 | |
Doximity, Inc., Cl. A | | 6,740 | a,b | 160,682 | |
Encompass Health Corp. | | 73,119 | | 5,194,374 | |
Enovis Corp. | | 2,475 | a | 138,699 | |
Envista Holdings Corp. | | 10,990 | a | 351,900 | |
HCA Healthcare, Inc. | | 5,540 | | 1,536,242 | |
HealthEquity, Inc. | | 14,532 | a | 981,637 | |
Henry Schein, Inc. | | 13,215 | a | 1,011,476 | |
Humana, Inc. | | 3,071 | | 1,417,666 | |
ICU Medical, Inc. | | 453 | a,b | 65,699 | |
IDEXX Laboratories, Inc. | | 19,113 | a | 9,774,579 | |
Inspire Medical Systems, Inc. | | 15,183 | a | 3,444,719 | |
Insulet Corp. | | 8,822 | a | 1,691,266 | |
Laboratory Corp. of America Holdings | | 24,731 | | 5,146,521 | |
Masimo Corp. | | 1,792 | a,b | 204,790 | |
Molina Healthcare, Inc. | | 11,609 | a | 3,600,183 | |
33
STATEMENT OF INVESTMENTS (continued)
| | | | | | |
| |
BNY Mellon Mid Cap Multi-Strategy Fund (continued) |
Description | | Shares | | Value ($) | |
Common Stocks - 97.1%(continued) | | | |
Health Care Equipment & Services - 6.6% (continued) | | | | |
Penumbra, Inc. | | 1,981 | a | 523,974 | |
Quest Diagnostics, Inc. | | 10,071 | | 1,324,336 | |
QuidelOrtho Corp. | | 2,335 | a | 192,311 | |
R1 RCM, Inc. | | 127,540 | a | 2,198,790 | |
ResMed, Inc. | | 12,592 | | 2,009,557 | |
Shockwave Medical, Inc. | | 12,573 | a | 2,770,963 | |
Steris PLC | | 35,658 | | 8,186,720 | |
Tenet Healthcare Corp. | | 1,680 | a | 130,301 | |
The Cooper Companies, Inc. | | 12,759 | | 4,720,702 | |
Universal Health Services, Inc., Cl. B | | 826 | | 111,262 | |
Veeva Systems, Inc., Cl. A | | 10,500 | a | 2,191,350 | |
Zimmer Biomet Holdings, Inc. | | 51,428 | | 6,126,103 | |
| | | | 103,964,952 | |
Household & Personal Products - .7% | | | | |
Church & Dwight Co., Inc. | | 73,119 | | 7,075,726 | |
Coty, Inc., Cl. A | | 73,520 | a | 849,891 | |
Kenvue, Inc. | | 94,808 | | 2,185,324 | |
Spectrum Brands Holdings, Inc. | | 815 | | 67,784 | |
The Clorox Company | | 4,322 | | 676,177 | |
| | | | 10,854,902 | |
Insurance - 3.9% | | | | |
Aflac, Inc. | | 25,776 | | 1,922,116 | |
American Financial Group, Inc. | | 9,016 | | 1,045,135 | |
Aon PLC, Cl. A | | 6,208 | | 2,069,685 | |
Arch Capital Group Ltd. | | 102,167 | a | 7,852,556 | |
Arthur J. Gallagher & Co. | | 10,541 | | 2,429,490 | |
Assurant, Inc. | | 35,920 | | 5,004,734 | |
Assured Guaranty Ltd. | | 22,525 | | 1,325,371 | |
Brighthouse Financial, Inc. | | 35 | a | 1,738 | |
Cincinnati Financial Corp. | | 14,964 | | 1,583,042 | |
Everest Group Ltd. | | 12,779 | | 4,609,130 | |
Fidelity National Financial, Inc. | | 27,130 | | 1,123,182 | |
First American Financial Corp. | | 42,908 | | 2,646,565 | |
Globe Life, Inc. | | 20,935 | | 2,335,718 | |
Kinsale Capital Group, Inc. | | 247 | | 98,462 | |
Lincoln National Corp. | | 13,920 | | 357,187 | |
Markel Group, Inc. | | 2,940 | a | 4,348,025 | |
Old Republic International Corp. | | 41,500 | | 1,135,025 | |
Principal Financial Group, Inc. | | 22,735 | | 1,766,737 | |
Prudential Financial, Inc. | | 590 | | 55,855 | |
Reinsurance Group of America, Inc. | | 37,463 | | 5,193,121 | |
RenaissanceRe Holdings Ltd. | | 6,990 | | 1,313,351 | |
Ryan Specialty Holdings, Inc. | | 94,321 | a | 4,598,149 | |
The Allstate Corp. | | 624 | | 67,273 | |
The Hanover Insurance Group, Inc. | | 1,750 | | 186,760 | |
The Hartford Financial Services Group, Inc. | | 53,110 | | 3,814,360 | |
The Travelers Companies, Inc. | | 5,334 | | 860,001 | |
| |
BNY Mellon Mid Cap Multi-Strategy Fund (continued) |
Description | | Shares | | Value ($) | |
Common Stocks - 97.1%(continued) | | | |
Insurance - 3.9% (continued) | | | | |
Unum Group | | 25,415 | | 1,250,164 | |
W.R. Berkley Corp. | | 32,492 | | 2,009,955 | |
White Mountains Insurance Group Ltd. | | 28 | | 44,483 | |
| | | | 61,047,370 | |
Materials - 3.9% | | | | |
Albemarle Corp. | | 7,742 | | 1,538,413 | |
Alcoa Corp. | | 55,093 | | 1,657,197 | |
Ashland, Inc. | | 9,860 | | 854,172 | |
Avery Dennison Corp. | | 22,120 | | 4,166,966 | |
Axalta Coating Systems Ltd. | | 63,350 | a | 1,792,805 | |
Ball Corp. | | 13,165 | | 716,834 | |
Celanese Corp. | | 13,008 | | 1,643,691 | |
CF Industries Holdings, Inc. | | 66,299 | | 5,109,664 | |
Cleveland-Cliffs, Inc. | | 13,085 | a | 200,070 | |
Corteva, Inc. | | 98,627 | | 4,981,650 | |
DuPont de Nemours, Inc. | | 45,771 | | 3,519,332 | |
Eastman Chemical Co. | | 5,938 | | 504,789 | |
FMC Corp. | | 27,531 | | 2,373,998 | |
Freeport-McMoRan, Inc. | | 87,256 | | 3,482,387 | |
Huntsman Corp. | | 32,120 | | 895,184 | |
International Flavors & Fragrances, Inc. | | 12,210 | | 860,194 | |
LyondellBasell Industries NV, Cl. A | | 6,330 | | 625,214 | |
Martin Marietta Materials, Inc. | | 5,338 | | 2,382,937 | |
Newmont Corp. | | 142,254 | | 5,607,653 | |
Nucor Corp. | | 4,988 | | 858,435 | |
Olin Corp. | | 17,040 | | 988,661 | |
Packaging Corp. of America | | 18,411 | | 2,745,080 | |
PPG Industries, Inc. | | 23,785 | | 3,371,762 | |
Reliance Steel & Aluminum Co. | | 5,136 | | 1,463,555 | |
Royal Gold, Inc. | | 8,690 | | 974,062 | |
Sealed Air Corp. | | 23,140 | | 857,568 | |
Sonoco Products Co. | | 11,905 | | 683,942 | |
SSR Mining, Inc. | | 14,615 | | 217,033 | |
Steel Dynamics, Inc. | | 14,217 | | 1,515,390 | |
Teck Resources Ltd., Cl. B | | 35,978 | | 1,486,611 | |
The Chemours Company | | 770 | | 26,195 | |
The Mosaic Company | | 27,740 | | 1,077,699 | |
The Scotts Miracle-Gro Company | | 2,440 | b | 138,250 | |
U.S. Steel Corp. | | 10,865 | | 337,793 | |
Vulcan Materials Co. | | 7,685 | | 1,677,251 | |
WestRock Co. | | 12,296 | | 402,202 | |
| | | | 61,734,639 | |
Media & Entertainment - 2.5% | | | | |
Atlanta Braves Holdings, Inc. | | 2,603 | a | 95,894 | |
Cable One, Inc. | | 121 | | 78,719 | |
Electronic Arts, Inc. | | 5,635 | | 676,087 | |
Fox Corp., Cl. A | | 21,295 | | 704,013 | |
34
| | | | | | |
| |
BNY Mellon Mid Cap Multi-Strategy Fund (continued) |
Description | | Shares | | Value ($) | |
Common Stocks - 97.1%(continued) | | | |
Media & Entertainment - 2.5% (continued) | | | | |
IAC, Inc. | | 13,645 | a | 754,978 | |
Liberty Broadband Corp., Cl. A | | 2,552 | a,b | 238,969 | |
Liberty Broadband Corp., Cl. C | | 7,696 | a | 720,038 | |
Liberty Media Corp-Liberty Formula One, Cl. C | | 89,913 | a | 6,185,115 | |
Liberty Media Corp-Liberty Live, Cl. C | | 8,952 | a | 301,235 | |
Liberty Media Corp-Liberty SiriusXM | | 20,420 | a | 499,065 | |
Live Nation Entertainment, Inc. | | 34,877 | a | 2,948,153 | |
Match Group, Inc. | | 24,767 | a | 1,160,829 | |
News Corporation, Cl. A | | 38,225 | | 821,455 | |
Nexstar Media Group, Inc. | | 6,204 | b | 1,010,011 | |
Omnicom Group, Inc. | | 23,400 | | 1,895,634 | |
Paramount Global, Cl. B | | 31,991 | b | 482,744 | |
Pinterest, Inc., Cl. A | | 18,392 | | 505,596 | |
Roblox Corp., CI. A | | 15,860 | a | 448,679 | |
Roku, Inc. | | 3,690 | a | 299,628 | |
Spotify Technology SA | | 20,505 | a | 3,157,155 | |
Take-Two Interactive Software, Inc. | | 21,584 | a | 3,069,245 | |
TEGNA, Inc. | | 57,110 | | 944,028 | |
The Interpublic Group of Companies, Inc. | | 81,992 | | 2,673,759 | |
The Trade Desk, Inc., Cl. A | | 53,189 | a | 4,256,716 | |
Warner Bros Discovery, Inc. | | 86,224 | a | 1,132,983 | |
Warner Music Group Corp., Cl. A | | 124,226 | | 4,136,726 | |
ZoomInfo Technologies, Inc. | | 4,860 | a | 87,577 | |
| | | | 39,285,031 | |
Pharmaceuticals, Biotechnology & Life Sciences - 5.4% | | | | |
10X Genomics, Inc., CI. A | | 35,758 | a | 1,854,052 | |
Agilent Technologies, Inc. | | 22,884 | | 2,770,566 | |
Alnylam Pharmaceuticals, Inc. | | 7,849 | a | 1,552,689 | |
Apellis Pharmaceuticals, Inc. | | 6,030 | a,b | 254,526 | |
Avantor, Inc. | | 104,215 | a | 2,256,255 | |
Biogen, Inc. | | 3,048 | a | 814,913 | |
BioMarin Pharmaceutical, Inc. | | 51,269 | a | 4,684,961 | |
Bio-Rad Laboratories, Inc., Cl. A | | 246 | a | 98,449 | |
Bio-Techne Corp. | | 53,287 | | 4,177,701 | |
Catalent, Inc. | | 8,435 | a | 421,497 | |
Charles River Laboratories International, Inc. | | 8,597 | a | 1,778,032 | |
Elanco Animal Health, Inc. | | 47,987 | a | 585,441 | |
Exact Sciences Corp. | | 8,410 | a | 703,665 | |
Exelixis, Inc. | | 1,630 | a | 36,496 | |
Fortrea Holdings, Inc. | | 49,102 | a | 1,352,760 | |
Horizon Therapeutics PLC | | 69,494 | a | 7,834,754 | |
ICON PLC | | 16,087 | a | 4,181,655 | |
Illumina, Inc. | | 28,304 | a | 4,676,387 | |
Incyte Corp. | | 14,730 | a | 950,527 | |
Ionis Pharmaceuticals, Inc. | | 11,845 | a,b | 476,998 | |
| |
BNY Mellon Mid Cap Multi-Strategy Fund (continued) |
Description | | Shares | | Value ($) | |
Common Stocks - 97.1%(continued) | | | |
Pharmaceuticals, Biotechnology & Life Sciences - 5.4% (continued) | | | | |
IQVIA Holdings, Inc. | | 12,851 | a | 2,861,018 | |
Karuna Therapeutics, Inc. | | 1,235 | a | 231,884 | |
Mettler-Toledo International, Inc. | | 1,752 | a | 2,126,017 | |
Moderna, Inc. | | 5,686 | a | 642,916 | |
Natera, Inc. | | 7,575 | a | 444,880 | |
Neurocrine Biosciences, Inc. | | 64,540 | a | 7,027,761 | |
QIAGEN NV | | 10,641 | a | 484,059 | |
Repligen Corp. | | 42,364 | a | 7,367,523 | |
Roivant Sciences Ltd. | | 19,470 | a | 225,268 | |
Sarepta Therapeutics, Inc. | | 103,345 | a | 12,505,778 | |
Seagen, Inc. | | 6,830 | a | 1,407,458 | |
Sotera Health Co. | | 1,730 | a | 27,922 | |
Syneos Health, Inc. | | 1,130 | a | 48,285 | |
Ultragenyx Pharmaceutical, Inc. | | 5,430 | a | 199,770 | |
United Therapeutics Corp. | | 18,783 | a | 4,214,154 | |
Viatris, Inc. | | 45,179 | | 485,674 | |
Waters Corp. | | 4,032 | a | 1,132,186 | |
West Pharmaceutical Services, Inc. | | 4,337 | | 1,764,725 | |
| | | | 84,659,602 | |
Real Estate Management & Development - 1.9% | | | | |
CBRE Group, Inc., Cl. A | | 74,519 | a | 6,337,841 | |
CoStar Group, Inc. | | 240,075 | a | 19,683,749 | |
Zillow Group, Inc., Cl. C | | 71,995 | a | 3,755,259 | |
| | | | 29,776,849 | |
Semiconductors & Semiconductor Equipment - 2.4% | | | | |
Allegro MicroSystems, Inc. | | 2,635 | a | 100,789 | |
Enphase Energy, Inc. | | 5,729 | a | 724,890 | |
First Solar, Inc. | | 6,921 | a | 1,308,900 | |
KLA Corp. | | 2,320 | | 1,164,338 | |
Lattice Semiconductor Corp. | | 8,295 | a | 806,772 | |
Marvell Technology, Inc. | | 28,730 | | 1,673,522 | |
Microchip Technology, Inc. | | 44,363 | | 3,630,668 | |
MKS Instruments, Inc. | | 46,535 | b | 4,664,203 | |
Monolithic Power Systems, Inc. | | 5,424 | | 2,827,043 | |
NVIDIA Corp. | | 13,020 | | 6,426,021 | |
NXP Semiconductors NV | | 7,214 | | 1,484,064 | |
ON Semiconductor Corp. | | 10,785 | a | 1,061,891 | |
Qorvo, Inc. | | 30,184 | a | 3,241,460 | |
Skyworks Solutions, Inc. | | 46,078 | | 5,010,522 | |
Teradyne, Inc. | | 23,986 | b | 2,587,370 | |
Universal Display Corp. | | 1,947 | | 316,504 | |
Wolfspeed, Inc. | | 7,760 | a,b | 371,083 | |
| | | | 37,400,040 | |
Software & Services - 9.9% | | | | |
Akamai Technologies, Inc. | | 51,342 | a | 5,395,531 | |
Alteryx, Inc., Cl. A | | 65 | a | 1,919 | |
35
STATEMENT OF INVESTMENTS (continued)
| | | | | | |
| |
BNY Mellon Mid Cap Multi-Strategy Fund (continued) |
Description | | Shares | | Value ($) | |
Common Stocks - 97.1%(continued) | | | |
Software & Services - 9.9% (continued) | | | | |
Ansys, Inc. | | 44,489 | a | 14,186,207 | |
AppLovin Corp., Cl. A | | 37,760 | a | 1,631,987 | |
Bill Holdings, Inc. | | 32,500 | a | 3,747,250 | |
Black Knight, Inc. | | 14,860 | a | 1,125,794 | |
BlackLine, Inc. | | 19,464 | a | 1,169,008 | |
Cadence Design Systems, Inc. | | 20,347 | a | 4,892,233 | |
CCC Intelligent Solutions Holdings, Inc. | | 2,685 | a | 28,730 | |
Check Point Software Technologies Ltd. | | 22,210 | a | 2,989,244 | |
Cloudflare, Inc., Cl. A | | 10,200 | a,b | 663,306 | |
Cognizant Technology Solutions Corp., Cl. A | | 31,687 | | 2,269,106 | |
Confluent, Inc., Cl. A | | 10,765 | a | 356,214 | |
CrowdStrike Holdings, Inc., CI. A | | 8,610 | a | 1,403,688 | |
Datadog, Inc., Cl. A | | 10,558 | a | 1,018,636 | |
DocuSign, Inc. | | 4,011 | a | 201,753 | |
Dolby Laboratories, Inc., Cl. A | | 37,659 | | 3,181,056 | |
DoubleVerify Holdings, Inc. | | 2,265 | a | 76,580 | |
DXC Technology Co. | | 14,045 | a | 291,293 | |
Dynatrace, Inc. | | 67,800 | a | 3,267,960 | |
Elastic NV | | 3,075 | a | 190,281 | |
EPAM Systems, Inc. | | 18,195 | a | 4,712,323 | |
Fair Isaac Corp. | | 686 | a | 620,549 | |
Five9, Inc. | | 4,235 | a | 306,487 | |
Gartner, Inc. | | 27,939 | a | 9,769,710 | |
Gen Digital, Inc. | | 116,852 | | 2,366,253 | |
Gitlab, Inc., Cl. A | | 2,195 | a | 103,977 | |
Globant SA | | 1,159 | a,b | 236,981 | |
Guidewire Software, Inc. | | 8,140 | a | 703,540 | |
HashiCorp, Inc., Cl. A | | 815 | a | 23,765 | |
HubSpot, Inc. | | 27,685 | a | 15,130,406 | |
Informatica, Inc., Cl. A | | 1,640 | a | 34,358 | |
Intuit, Inc. | | 17,009 | | 9,215,646 | |
Kyndryl Holdings, Inc. | | 33,080 | a | 558,390 | |
Manhattan Associates, Inc. | | 1,622 | a | 328,650 | |
MongoDB, Inc. | | 3,612 | a | 1,377,256 | |
nCino, Inc. | | 855 | a | 28,104 | |
New Relic, Inc. | | 5,340 | a | 454,487 | |
Nutanix, Inc., Cl. A | | 7,170 | a | 222,987 | |
Okta, Inc. | | 6,807 | a | 568,453 | |
Palantir Technologies, Inc., Cl. A | | 84,685 | a | 1,268,581 | |
Pegasystems, Inc. | | 135 | | 6,704 | |
Procore Technologies, Inc. | | 4,345 | a | 293,505 | |
PTC, Inc. | | 744 | a | 109,494 | |
RingCentral, Inc., Cl. A | | 3,375 | a | 104,389 | |
Roper Technologies, Inc. | | 24,955 | | 12,454,042 | |
SentinelOne, Inc., Cl. A | | 2,075 | a | 34,507 | |
ServiceNow, Inc. | | 14,352 | a | 8,450,888 | |
| |
BNY Mellon Mid Cap Multi-Strategy Fund (continued) |
Description | | Shares | | Value ($) | |
Common Stocks - 97.1%(continued) | | | |
Software & Services - 9.9% (continued) | | | | |
Shopify, Inc., Cl. A | | 143,646 | a | 9,551,023 | |
Smartsheet, Inc., Cl. A | | 6,545 | a | 273,123 | |
Splunk, Inc. | | 74,530 | a | 9,037,508 | |
Teradata Corp. | | 1,775 | a | 82,129 | |
Twilio, Inc., Cl. A | | 103,835 | a | 6,615,328 | |
Tyler Technologies, Inc. | | 19,323 | a | 7,698,863 | |
UiPath, Inc., Cl. A | | 43,165 | a,b | 682,439 | |
Unity Software, Inc. | | 10,417 | a,b | 386,158 | |
Verisign, Inc. | | 7,681 | a | 1,596,035 | |
Zoom Video Communications, Inc., CI. A | | 8,840 | a | 627,905 | |
Zscaler, Inc. | | 6,681 | a | 1,042,570 | |
| | | | 155,165,289 | |
Technology Hardware & Equipment - 3.7% | | | | |
Amphenol Corp., Cl. A | | 204,901 | | 18,109,150 | |
CDW Corp. | | 10,114 | | 2,135,571 | |
Cognex Corp. | | 22,447 | | 1,056,805 | |
Coherent Corp. | | 1,975 | a | 74,319 | |
Corning, Inc. | | 6,635 | | 217,761 | |
Dell Technologies, Inc., Cl. C | | 44,304 | | 2,491,657 | |
F5, Inc. | | 6,103 | a | 998,817 | |
Flex Ltd. | | 53,124 | a | 1,465,691 | |
Hewlett Packard Enterprise Co. | | 20,315 | | 345,152 | |
HP, Inc. | | 10,460 | | 310,767 | |
Jabil, Inc. | | 15,780 | | 1,805,548 | |
Keysight Technologies, Inc. | | 68,484 | a | 9,128,917 | |
Lumentum Holdings, Inc. | | 37,455 | a | 2,027,439 | |
NetApp, Inc. | | 43,987 | | 3,373,803 | |
Pure Storage, Inc., Cl. A | | 27,470 | a | 1,005,127 | |
TE Connectivity Ltd. | | 20,361 | | 2,695,593 | |
Trimble, Inc. | | 77,738 | a | 4,259,265 | |
Viasat, Inc. | | 3,650 | a,b | 101,251 | |
Western Digital Corp. | | 81,662 | a | 3,674,790 | |
Zebra Technologies Corp., Cl. A | | 9,446 | a | 2,597,744 | |
| | | | 57,875,167 | |
Telecommunication Services - .0% | | | | |
Frontier Communications Parent, Inc. | | 15,720 | a | 251,834 | |
Iridium Communications, Inc. | | 4,965 | | 243,037 | |
| | | | 494,871 | |
Transportation - 1.7% | | | | |
Alaska Air Group, Inc. | | 39,805 | a | 1,670,616 | |
American Airlines Group, Inc. | | 12,965 | a | 190,974 | |
Avis Budget Group, Inc. | | 472 | a | 100,720 | |
Expeditors International of Washington, Inc. | | 38,414 | | 4,483,298 | |
GXO Logistics, Inc. | | 4,345 | a | 277,950 | |
J.B. Hunt Transport Services, Inc. | | 19,259 | | 3,618,381 | |
Knight-Swift Transportation Holdings, Inc. | | 48,383 | | 2,652,356 | |
36
| | | | | | |
| |
BNY Mellon Mid Cap Multi-Strategy Fund (continued) |
Description | | Shares | | Value ($) | |
Common Stocks - 97.1%(continued) | | | |
Transportation - 1.7% (continued) | | | | |
Landstar System, Inc. | | 19,722 | | 3,743,433 | |
Lyft, Inc., Cl. A | | 275,686 | a | 3,247,581 | |
Norfolk Southern Corp. | | 13,258 | | 2,718,023 | |
Old Dominion Freight Line, Inc. | | 1,096 | | 468,398 | |
Ryder System, Inc. | | 8,455 | | 851,418 | |
Southwest Airlines Co. | | 6,290 | b | 198,764 | |
United Airlines Holdings, Inc. | | 31,825 | a | 1,585,203 | |
XPO, Inc. | | 735 | a | 54,853 | |
| | | | 25,861,968 | |
Utilities - 3.8% | | | | |
Ameren Corp. | | 38,855 | | 3,080,036 | |
American Electric Power Co., Inc. | | 31,772 | | 2,490,925 | |
American Water Works Co., Inc. | | 19,573 | | 2,715,558 | |
Brookfield Renewable Corp., Cl. A | | 385 | | 10,761 | |
CenterPoint Energy, Inc. | | 197,050 | | 5,495,724 | |
Clearway Energy, Inc., Cl. C | | 3,465 | | 85,828 | |
CMS Energy Corp. | | 30,975 | | 1,740,485 | |
Constellation Energy Corp. | | 93,815 | | 9,771,770 | |
Dominion Energy, Inc. | | 74,608 | | 3,621,472 | |
DTE Energy Co. | | 26,091 | | 2,697,288 | |
Edison International | | 11,110 | | 764,923 | |
Entergy Corp. | | 41,312 | | 3,934,968 | |
Essential Utilities, Inc. | | 1,475 | | 54,428 | |
Eversource Energy | | 37,690 | | 2,405,376 | |
Exelon Corp. | | 97,998 | | 3,931,680 | |
FirstEnergy Corp. | | 52,523 | | 1,894,505 | |
IDACORP, Inc. | | 1,090 | | 104,466 | |
NiSource, Inc. | | 42,260 | | 1,130,878 | |
NRG Energy, Inc. | | 32,600 | | 1,224,130 | |
Pinnacle West Capital Corp. | | 19,345 | | 1,494,788 | |
Public Service Enterprise Group, Inc. | | 7,980 | | 487,418 | |
The AES Corp. | | 51,305 | | 919,899 | |
UGI Corp. | | 7,740 | | 194,893 | |
Vistra Corp. | | 182,278 | | 5,727,175 | |
WEC Energy Group, Inc. | | 11,365 | | 956,024 | |
Xcel Energy, Inc. | | 42,585 | | 2,432,881 | |
| | | | 59,368,279 | |
Total Common Stocks(cost $769,004,941) | 1,523,449,844 | |
| | | | | | |
Exchange-Traded Funds - 1.4% | | | | |
Registered Investment Companies - 1.4% | | | | |
iShares Russell Mid-Cap Growth ETF | | 170,192 | b | 16,374,172 | |
SPDR S&P MidCap 400 ETF Trust | | 10,629 | b | 5,139,866 | |
Total Exchange-Traded Funds(cost $18,511,478) | 21,514,038 | |
| | | | | | |
Escrow Shares - .0% | | | | |
Telecommunication Services - .0% | | | | |
GCI Liberty, Inc.
(cost $0) | | 9,830 | | 8,847 | |
| |
BNY Mellon Mid Cap Multi-Strategy Fund (continued) |
Description | | Number of Rights | | Value ($) | |
Rights - .0% | | | | |
Health Care Equipment & Services - .0% | | | | |
Abiomed, Inc. expiring 12/31/2049
(cost $0) | | 40,585 | d | 41,397 | |
| | 1-Day
Yield (%) | Shares | | | |
Investment Companies - 1.5% | | | | |
Registered Investment Companies - 1.5% | | | | |
Dreyfus Institutional Preferred Government Plus Money Market Fund, Institutional Shares
(cost $23,123,161) | 5.41 | 23,123,161 | e | 23,123,161 | |
| | | | | | |
Investment of Cash Collateral for Securities Loaned - .7% | | | | |
Registered Investment Companies - .7% | | | | |
Dreyfus Institutional Preferred Government Plus Money Market Fund, Institutional Shares
(cost $10,609,780) | 5.41 | 10,609,780 | e | 10,609,780 | |
Total Investments (cost $821,249,360) | 100.7% | 1,578,747,067 | |
Liabilities, Less Cash and Receivables | (.7%) | (10,576,666) | |
Net Assets | 100.0% | 1,568,170,401 | |
ADR—American Depositary Receipt
ETF—Exchange-Traded Fund
REIT—Real Estate Investment Trust
SPDR—Standard & Poor's Depository Receipt
a Non-income producing security.
b Security, or portion thereof, on loan. At August 31, 2023, the value of the fund’s securities on loan was $43,643,130 and the value of the collateral was $44,454,513, consisting of cash collateral of $10,609,780 and U.S. Government & Agency securities valued at $33,844,733. In addition, the value of collateral may include pending sales that are also on loan.
c Investment in real estate investment trust within the United States.
d The fund held Level 3 securities at August 31, 2023. These securities were valued at $41,397 or .0% of net assets.
e Investment in affiliated issuer. The investment objective of this investment company is publicly available and can be found within the investment company’s prospectus.
37
STATEMENT OF INVESTMENTS (continued)
| | |
Portfolio Summary (Unaudited) † | Value (%) |
Industrials | 19.0 |
Information Technology | 16.0 |
Consumer Discretionary | 12.7 |
Financials | 12.6 |
Health Care | 12.0 |
Real Estate | 6.2 |
Energy | 5.3 |
Materials | 3.9 |
Utilities | 3.8 |
Investment Companies | 3.6 |
Consumer Staples | 3.1 |
Communication Services | 2.5 |
Consumer, Non-cyclical | .0 |
Communications | .0 |
| | 100.7 |
† Based on net assets.
See notes to financial statements.
38
| | | | | | | |
BNY Mellon Mid Cap Multi-Strategy Fund | | |
Affiliated Issuers | | |
Description | Value ($)
8/31/2022 | Purchases ($)† | Sales ($) | Value ($)
8/31/2023 | Dividends/
Distributions ($) | |
Registered Investment Companies - 1.5% | | |
Dreyfus Institutional Preferred Government Plus Money Market Fund, Institutional Shares - 1.5% | 32,165,379 | 399,832,183 | (408,874,401) | 23,123,161 | 1,501,733 | |
Investment of Cash Collateral for Securities Loaned - .7%†† | | |
Dreyfus Institutional Preferred Government Plus Money Market Fund, Institutional Shares - .7% | - | 82,064,166 | (71,454,386) | 10,609,780 | 33,335 | ††† |
Dreyfus Institutional Preferred Government Plus Money Market Fund, SL Shares - .0% | 20,829,528 | 325,265,922 | (346,095,450) | - | 186,200 | ††† |
Total - 2.2% | 52,994,907 | 807,162,271 | (826,424,237) | 33,732,941 | 1,721,268 | |
† Includes reinvested dividends/distributions.
†† Effective July 3, 2023, cash collateral for securities lending was transferred from Dreyfus Institutional Preferred Government Plus Money Market Fund, SL Shares to Dreyfus Institutional Preferred Government Plus Money Market Fund, Institutional Shares.
††† Represents securities lending income earned from the reinvestment of cash collateral from loaned securities, net of fees and collateral investment expenses, and other payments to and from borrowers of securities.
See notes to financial statements.
39
STATEMENT OF INVESTMENTS (continued)
| | | | | | |
| |
BNY Mellon Small Cap Multi-Strategy Fund |
Description | | Shares | | Value ($) | |
Common Stocks - 95.8% | | | |
Automobiles & Components - .9% | | | | |
Gentherm, Inc. | | 37,177 | a | 2,238,427 | |
Stoneridge, Inc. | | 86,345 | a | 1,774,390 | |
Visteon Corp. | | 11,406 | a | 1,588,514 | |
| | | | 5,601,331 | |
Banks - 6.6% | | | | |
BankUnited, Inc. | | 109,882 | | 2,884,402 | |
Banner Corp. | | 13,949 | | 607,479 | |
Capstar Financial Holdings, Inc. | | 29,650 | | 387,229 | |
Columbia Banking System, Inc. | | 151,493 | | 3,102,577 | |
CVB Financial Corp. | | 51,758 | | 903,695 | |
First Bancorp | | 24,783 | b | 734,568 | |
First Bancorp / Puerto Rico | | 313,462 | | 4,344,583 | |
First Hawaiian, Inc. | | 49,393 | | 934,022 | |
First Interstate BancSystem, Inc., Cl. A | | 87,681 | | 2,271,815 | |
First Merchants Corp. | | 64,647 | | 1,929,066 | |
HarborOne Bancorp, Inc. | | 43,212 | | 430,824 | |
Heritage Commerce Corp. | | 65,018 | | 563,706 | |
Heritage Financial Corp. | | 48,486 | | 834,929 | |
National Bank Holdings Corp., Cl. A | | 45,747 | | 1,442,860 | |
Seacoast Banking Corp. of Florida | | 103,229 | | 2,437,237 | |
SouthState Corp. | | 27,509 | | 1,988,901 | |
Synovus Financial Corp. | | 88,905 | | 2,752,499 | |
Texas Capital Bancshares, Inc. | | 104,489 | a | 6,524,293 | |
UMB Financial Corp. | | 42,573 | | 2,691,039 | |
United Community Banks, Inc. | | 84,151 | | 2,272,077 | |
Webster Financial Corp. | | 60,258 | | 2,555,542 | |
| | | | 42,593,343 | |
Capital Goods - 12.4% | | | | |
AerCap Holdings NV | | 23,963 | a | 1,474,204 | |
AeroVironment, Inc. | | 18,087 | a | 1,754,982 | |
Armstrong World Industries, Inc. | | 26,463 | | 2,026,801 | |
Astec Industries, Inc. | | 27,346 | | 1,499,108 | |
Boise Cascade Co. | | 7,665 | | 838,321 | |
BWX Technologies, Inc. | | 65,070 | | 4,799,563 | |
Construction Partners, Inc., Cl. A | | 181,598 | a | 6,310,530 | |
Curtiss-Wright Corp. | | 12,716 | | 2,644,801 | |
Dycom Industries, Inc. | | 12,701 | a | 1,269,211 | |
EMCOR Group, Inc. | | 19,232 | | 4,312,776 | |
Energy Recovery, Inc. | | 40,859 | a | 1,110,548 | |
EnerSys | | 54,906 | | 5,764,032 | |
EnPro Industries, Inc. | | 13,389 | | 1,826,126 | |
Flowserve Corp. | | 122,113 | | 4,832,011 | |
Fluor Corp. | | 351,986 | a | 12,315,990 | |
Gibraltar Industries, Inc. | | 25,136 | a | 1,885,954 | |
GrafTech International Ltd. | | 39,091 | | 138,382 | |
Granite Construction, Inc. | | 43,390 | b | 1,791,573 | |
| |
BNY Mellon Small Cap Multi-Strategy Fund (continued) |
Description | | Shares | | Value ($) | |
Common Stocks - 95.8%(continued) | | | |
Capital Goods - 12.4% (continued) | | | | |
Kratos Defense & Security Solutions, Inc. | | 83,994 | a | 1,351,463 | |
Lindsay Corp. | | 9,081 | | 1,126,952 | |
Matrix Service Co. | | 298,529 | a | 2,480,776 | |
MDU Resources Group, Inc. | | 55,240 | | 1,124,686 | |
Mercury Systems, Inc. | | 41,435 | a | 1,626,324 | |
MSC Industrial Direct Co., Inc., Cl. A | | 19,835 | | 2,024,360 | |
Proto Labs, Inc. | | 34,705 | a | 1,023,798 | |
SiteOne Landscape Supply, Inc. | | 23,846 | a | 4,082,197 | |
Spirit AeroSystems Holdings, Inc., Cl. A | | 136,259 | b | 2,905,042 | |
Terex Corp. | | 6,399 | | 387,843 | |
The AZEK Company, Inc. | | 98,838 | a | 3,361,480 | |
Titan Machinery, Inc. | | 32,875 | a | 1,019,783 | |
Zurn Elkay Water Solutions Corp. | | 24,391 | | 722,461 | |
| | | | 79,832,078 | |
Commercial & Professional Services - 2.2% | | | | |
CACI International, Inc., Cl. A | | 13,605 | a | 4,462,576 | |
KBR, Inc. | | 62,472 | | 3,843,277 | |
Korn Ferry | | 29,753 | | 1,516,808 | |
Li-Cycle Holdings Corp. | | 113,415 | a,b | 503,563 | |
The Brink's Company | | 53,754 | | 4,075,091 | |
| | | | 14,401,315 | |
Consumer Discretionary Distribution - 3.9% | | | | |
American Eagle Outfitters, Inc. | | 132,184 | | 2,241,841 | |
Citi Trends, Inc. | | 57,090 | a | 1,234,857 | |
Designer Brands, Inc., Cl. A | | 166,114 | | 1,745,858 | |
Farfetch Ltd., Cl. A | | 314,116 | a,b | 895,231 | |
Leslie's, Inc. | | 123,661 | a,b | 774,118 | |
Ollie's Bargain Outlet Holdings, Inc. | | 167,505 | a | 12,911,285 | |
RH | | 3,769 | a,b | 1,376,401 | |
Urban Outfitters, Inc. | | 60,534 | a | 2,010,334 | |
Warby Parker, Inc., Cl. A | | 198,260 | a,b | 2,381,103 | |
| | | | 25,571,028 | |
Consumer Durables & Apparel - 3.0% | | | | |
Capri Holdings Ltd. | | 22,637 | a | 1,188,216 | |
Carter's, Inc. | | 9,837 | b | 704,034 | |
Cavco Industries, Inc. | | 5,949 | a | 1,662,864 | |
Figs, Inc., Cl. A | | 133,527 | a | 825,197 | |
GoPro, Inc., Cl. A | | 581,644 | a | 2,114,276 | |
Meritage Homes Corp. | | 6,990 | | 971,890 | |
Oxford Industries, Inc. | | 1,362 | | 137,548 | |
Peloton Interactive, Inc., Cl. A | | 324,242 | a | 2,068,664 | |
Skechers USA, Inc., Cl. A | | 26,353 | a | 1,325,819 | |
Sonos, Inc. | | 57,983 | a | 799,006 | |
The Lovesac Company | | 33,167 | a | 760,188 | |
Toll Brothers, Inc. | | 9,061 | | 742,368 | |
Topgolf Callaway Brands Corp. | | 178,531 | a | 3,113,581 | |
40
| | | | | | |
| |
BNY Mellon Small Cap Multi-Strategy Fund (continued) |
Description | | Shares | | Value ($) | |
Common Stocks - 95.8%(continued) | | | |
Consumer Durables & Apparel - 3.0% (continued) | | | | |
YETI Holdings, Inc. | | 60,492 | a | 3,021,575 | |
| | | | 19,435,226 | |
Consumer Services - 3.9% | | | | |
Bloomin' Brands, Inc. | | 137,538 | | 3,859,316 | |
Bright Horizons Family Solutions, Inc. | | 23,950 | a | 2,261,359 | |
Chuy's Holdings, Inc. | | 18,647 | a | 710,451 | |
El Pollo Loco Holdings, Inc. | | 9,984 | a | 94,948 | |
European Wax Center, Inc., Cl. A | | 73,203 | a,b | 1,270,804 | |
Genius Sports Ltd. | | 1,184,430 | a | 7,864,615 | |
Monarch Casino & Resort, Inc. | | 7,652 | | 515,745 | |
Papa John's International, Inc. | | 25,908 | | 1,961,236 | |
Planet Fitness, Inc., Cl. A | | 72,337 | a | 4,398,090 | |
Six Flags Entertainment Corp. | | 91,760 | a | 2,106,810 | |
| | | | 25,043,374 | |
Consumer Staples Distribution - 1.0% | | | | |
Grocery Outlet Holding Corp. | | 149,457 | a | 4,610,748 | |
The Chefs' Warehouse, Inc. | | 58,482 | a | 1,669,076 | |
| | | | 6,279,824 | |
Energy - 9.2% | | | | |
Antero Resources Corp. | | 54,569 | a | 1,509,924 | |
Cactus, Inc., Cl. A | | 157,530 | | 8,402,650 | |
ChampionX Corp. | | 50,807 | | 1,833,625 | |
CNX Resources Corp. | | 291,652 | a | 6,518,422 | |
Comstock Resources, Inc. | | 147,106 | b | 1,803,520 | |
Dril-Quip, Inc. | | 176,751 | a | 4,874,793 | |
EQT Corp. | | 150,343 | | 6,497,824 | |
Expro Group Holdings NV | | 158,706 | a | 3,731,178 | |
Frontline PLC | | 135,008 | | 2,378,841 | |
Helix Energy Solutions Group, Inc. | | 154,979 | a | 1,571,487 | |
Liberty Energy, Inc. | | 59,778 | | 953,459 | |
PBF Energy, Inc., Cl. A | | 200,850 | | 9,417,856 | |
Transocean Ltd. | | 407,869 | a | 3,336,368 | |
Viper Energy Partners LP | | 229,990 | | 6,398,322 | |
| | | | 59,228,269 | |
Equity Real Estate Investment - 3.3% | | | | |
Agree Realty Corp. | | 34,010 | c | 2,102,498 | |
EPR Properties | | 56,597 | c | 2,534,414 | |
Equity Commonwealth | | 106,440 | c | 2,025,553 | |
Highwoods Properties, Inc. | | 38,368 | c | 914,309 | |
Pebblebrook Hotel Trust | | 168,136 | b,c | 2,432,928 | |
Physicians Realty Trust | | 184,715 | c | 2,569,386 | |
Potlatchdeltic Corp. | | 40,162 | b,c | 1,898,056 | |
Rayonier, Inc. | | 34,104 | c | 1,019,710 | |
STAG Industrial, Inc. | | 53,135 | c | 1,941,022 | |
Sunstone Hotel Investors, Inc. | | 163,150 | c | 1,465,087 | |
Terreno Realty Corp. | | 19,248 | c | 1,172,011 | |
| |
BNY Mellon Small Cap Multi-Strategy Fund (continued) |
Description | | Shares | | Value ($) | |
Common Stocks - 95.8%(continued) | | | |
Equity Real Estate Investment - 3.3% (continued) | | | | |
Urban Edge Properties | | 96,357 | c | 1,576,401 | |
| | | | 21,651,375 | |
Financial Services - 4.7% | | | | |
AvidXchange Holdings, Inc. | | 229,470 | a,b | 2,358,952 | |
Bread Financial Holdings, Inc. | | 35,777 | | 1,344,500 | |
Cannae Holdings, Inc. | | 68,815 | a | 1,350,838 | |
Cohen & Steers, Inc. | | 20,729 | | 1,351,116 | |
Essent Group Ltd. | | 160,555 | | 8,063,072 | |
Euronet Worldwide, Inc. | | 16,518 | a | 1,443,012 | |
Federated Hermes, Inc. | | 53,794 | | 1,869,879 | |
Flywire Corp. | | 7,135 | a | 246,728 | |
MarketWise, Inc. | | 121,071 | | 163,446 | |
PJT Partners, Inc., Cl. A | | 51,189 | | 4,043,419 | |
PRA Group, Inc. | | 166,286 | a | 3,239,251 | |
PROG Holdings, Inc. | | 60,531 | a | 2,076,213 | |
StepStone Group, Inc., Cl. A | | 33,182 | | 1,024,328 | |
WisdomTree, Inc. | | 218,905 | | 1,598,007 | |
| | | | 30,172,761 | |
Food, Beverage & Tobacco - 1.4% | | | | |
Fresh Del Monte Produce, Inc. | | 42,278 | | 1,080,203 | |
Freshpet, Inc. | | 61,272 | a,b | 4,626,649 | |
J&J Snack Foods Corp. | | 10,090 | | 1,635,892 | |
Mission Produce, Inc. | | 25,613 | a | 243,836 | |
The Boston Beer Company, Inc., Cl. A | | 4,047 | a,b | 1,478,895 | |
| | | | 9,065,475 | |
Health Care Equipment & Services - 9.8% | | | | |
Acadia Healthcare Co., Inc. | | 60,607 | a | 4,672,800 | |
AtriCure, Inc. | | 39,768 | a | 1,795,525 | |
CONMED Corp. | | 24,582 | | 2,739,910 | |
Encompass Health Corp. | | 36,881 | | 2,620,026 | |
Evolent Health, Inc., Cl. A | | 208,683 | a | 5,323,503 | |
Globus Medical, Inc., Cl. A | | 81,670 | a | 4,418,347 | |
Guardant Health, Inc. | | 39,826 | a | 1,556,400 | |
Health Catalyst, Inc. | | 86,060 | a | 1,006,041 | |
Inspire Medical Systems, Inc. | | 7,751 | a | 1,758,547 | |
iRhythm Technologies, Inc. | | 17,534 | a | 1,812,490 | |
Merit Medical Systems, Inc. | | 5,085 | a | 331,949 | |
ModivCare, Inc. | | 28,424 | a | 912,410 | |
Omnicell, Inc. | | 92,904 | a | 5,282,521 | |
Outset Medical, Inc. | | 79,076 | a | 1,076,224 | |
Privia Health Group, Inc. | | 332,361 | a | 8,724,476 | |
R1 RCM, Inc. | | 594,181 | a | 10,243,680 | |
Select Medical Holdings Corp. | | 135,804 | | 3,966,835 | |
TransMedics Group, Inc. | | 77,290 | a | 5,072,543 | |
| | | | 63,314,227 | |
Household & Personal Products - 1.6% | | | | |
Inter Parfums, Inc. | | 33,175 | | 4,635,543 | |
41
STATEMENT OF INVESTMENTS (continued)
| | | | | | |
| |
BNY Mellon Small Cap Multi-Strategy Fund (continued) |
Description | | Shares | | Value ($) | |
Common Stocks - 95.8%(continued) | | | |
Household & Personal Products - 1.6% (continued) | | | | |
Spectrum Brands Holdings, Inc. | | 66,016 | | 5,490,551 | |
| | | | 10,126,094 | |
Insurance - 1.7% | | | | |
BRP Group, Inc., Cl. A | | 190,699 | a | 5,070,686 | |
Palomar Holdings, Inc. | | 28,050 | a | 1,430,831 | |
Selective Insurance Group, Inc. | | 19,866 | | 1,970,906 | |
The Hanover Insurance Group, Inc. | | 22,731 | | 2,425,852 | |
| | | | 10,898,275 | |
Materials - 5.0% | | | | |
Alamos Gold, Inc., Cl. A | | 745,856 | | 9,576,791 | |
Carpenter Technology Corp. | | 42,064 | | 2,634,468 | |
Constellium SE | | 145,765 | a | 2,623,770 | |
Hecla Mining Co. | | 257,613 | b | 1,130,921 | |
Knife River Corp. | | 25,774 | a | 1,326,330 | |
Largo, Inc. | | 226,681 | a | 759,381 | |
Livent Corp. | | 72,988 | a,b | 1,567,052 | |
Materion Corp. | | 20,684 | | 2,250,212 | |
MP Materials Corp. | | 47,326 | a,b | 991,006 | |
Royal Gold, Inc. | | 14,927 | | 1,673,167 | |
Schnitzer Steel Industries, Inc., Cl. A | | 42,508 | | 1,411,266 | |
The Chemours Company | | 120,632 | | 4,103,901 | |
Tronox Holdings PLC | | 162,152 | | 2,211,753 | |
| | | | 32,260,018 | |
Media & Entertainment - 3.2% | | | | |
Eventbrite, Inc., Cl. A | | 451,358 | a | 4,572,257 | |
IMAX Corp. | | 73,580 | a | 1,407,585 | |
John Wiley & Sons, Inc., Cl. A | | 23,542 | | 874,821 | |
Lions Gate Entertainment Corp., Cl. A | | 169,718 | a | 1,344,167 | |
Lions Gate Entertainment Corp., Cl. B | | 181,806 | a | 1,354,455 | |
Magnite, Inc. | | 442,316 | a | 3,649,107 | |
Manchester United PLC, Cl. A | | 96,232 | a,b | 2,195,052 | |
Scholastic Corp. | | 30,281 | | 1,315,709 | |
Shutterstock, Inc. | | 26,862 | b | 1,131,159 | |
Stagwell, Inc. | | 74,914 | a | 408,281 | |
TEGNA, Inc. | | 112,094 | | 1,852,914 | |
Ziff Davis, Inc. | | 13,205 | a | 880,113 | |
| | | | 20,985,620 | |
Pharmaceuticals, Biotechnology & Life Sciences - 6.3% | | | | |
10X Genomics, Inc., CI. A | | 19,561 | a | 1,014,238 | |
Akero Therapeutics, Inc. | | 21,399 | a | 1,062,032 | |
Alkermes PLC | | 320,699 | a | 9,361,204 | |
Ascendis Pharma A/S, ADR | | 12,754 | a,b | 1,250,147 | |
Beam Therapeutics, Inc. | | 17,394 | a | 403,193 | |
Crinetics Pharmaceuticals, Inc. | | 77,708 | a | 1,345,903 | |
Cytokinetics, Inc. | | 26,280 | a | 918,223 | |
Denali Therapeutics, Inc. | | 163,023 | a | 3,764,201 | |
ImmunoGen, Inc. | | 65,610 | a | 1,039,262 | |
| |
BNY Mellon Small Cap Multi-Strategy Fund (continued) |
Description | | Shares | | Value ($) | |
Common Stocks - 95.8%(continued) | | | |
Pharmaceuticals, Biotechnology & Life Sciences - 6.3% (continued) | | | | |
Insmed, Inc. | | 194,230 | a | 4,251,695 | |
Karuna Therapeutics, Inc. | | 7,158 | a | 1,343,986 | |
Keros Therapeutics, Inc. | | 6,898 | a | 242,189 | |
MeiraGTx Holdings PLC | | 32,520 | a | 204,551 | |
Pacific Biosciences of California, Inc. | | 187,210 | a | 2,111,729 | |
Prothena Corp. PLC | | 16,487 | a | 870,843 | |
PTC Therapeutics, Inc. | | 45,273 | a | 1,788,283 | |
Sarepta Therapeutics, Inc. | | 35,378 | a | 4,281,092 | |
Twist Bioscience Corp. | | 57,173 | a | 1,257,234 | |
Ultragenyx Pharmaceutical, Inc. | | 15,707 | a | 577,861 | |
Xenon Pharmaceuticals, Inc. | | 96,835 | a | 3,774,628 | |
| | | | 40,862,494 | |
Real Estate Management & Development - .5% | | | | |
Colliers International Group, Inc. | | 23,409 | | 2,702,803 | |
Douglas Elliman, Inc. | | 137,918 | | 346,174 | |
Newmark Group, Inc., Cl. A | | 24,142 | | 171,167 | |
| | | | 3,220,144 | |
Semiconductors & Semiconductor Equipment - 2.1% | | | | |
Diodes, Inc. | | 3,606 | a | 295,151 | |
MaxLinear, Inc. | | 138,301 | a | 3,250,073 | |
MKS Instruments, Inc. | | 27,304 | | 2,736,680 | |
Power Integrations, Inc. | | 32,853 | | 2,760,309 | |
SkyWater Technology, Inc. | | 45,165 | a | 302,606 | |
Synaptics, Inc. | | 50,083 | a | 4,384,266 | |
| | | | 13,729,085 | |
Software & Services - 4.8% | | | | |
A10 Networks, Inc. | | 86,146 | | 1,282,714 | |
DoubleVerify Holdings, Inc. | | 174,109 | a | 5,886,625 | |
Edgio, Inc. | | 1,084,584 | a | 937,081 | |
Everbridge, Inc. | | 24,912 | a | 618,067 | |
HubSpot, Inc. | | 11,150 | a | 6,093,698 | |
JFrog Ltd. | | 236,266 | a | 6,778,472 | |
nCino, Inc. | | 19,604 | a,b | 644,383 | |
Progress Software Corp. | | 20,016 | | 1,217,773 | |
Twilio, Inc., Cl. A | | 41,694 | a | 2,656,325 | |
Zuora, Inc., Cl. A | | 534,207 | a | 4,866,626 | |
| | | | 30,981,764 | |
Technology Hardware & Equipment - 3.7% | | | | |
ADTRAN Holdings, Inc. | | 316,761 | | 2,708,307 | |
Belden, Inc. | | 14,187 | | 1,332,159 | |
Calix, Inc. | | 59,976 | a | 2,789,484 | |
Corsair Gaming, Inc. | | 94,281 | a | 1,482,097 | |
Itron, Inc. | | 78,764 | a | 5,388,245 | |
Knowles Corp. | | 148,081 | a | 2,373,738 | |
Lumentum Holdings, Inc. | | 74,497 | a | 4,032,523 | |
nLight, Inc. | | 172,678 | a | 1,970,256 | |
42
| | | | | | |
| |
BNY Mellon Small Cap Multi-Strategy Fund (continued) |
Description | | Shares | | Value ($) | |
Common Stocks - 95.8%(continued) | | | |
Technology Hardware & Equipment - 3.7% (continued) | | | | |
Ondas Holdings, Inc. | | 75,101 | a,b | 75,101 | |
Plexus Corp. | | 14,647 | a | 1,487,403 | |
| | | | 23,639,313 | |
Telecommunication Services - .1% | | | | |
Bandwidth, Inc., Cl. A | | 34,439 | a | 494,888 | |
Transportation - 1.6% | | | | |
Alaska Air Group, Inc. | | 38,028 | a | 1,596,035 | |
Heartland Express, Inc. | | 118,119 | | 1,782,416 | |
SkyWest, Inc. | | 124,251 | a | 5,603,720 | |
Werner Enterprises, Inc. | | 27,113 | | 1,128,172 | |
| | | | 10,110,343 | |
Utilities - 2.9% | | | | |
Atlantica Sustainable Infrastructure PLC | | 49,464 | | 1,110,467 | |
Avista Corp. | | 39,529 | | 1,315,920 | |
Chesapeake Utilities Corp. | | 15,922 | | 1,753,012 | |
Clearway Energy, Inc., Cl. C | | 175,271 | | 4,341,463 | |
NextEra Energy Partners LP | | 95,061 | | 4,741,643 | |
NorthWestern Corp. | | 22,318 | | 1,124,827 | |
PNM Resources, Inc. | | 18,373 | | 814,108 | |
Portland General Electric Co. | | 43,155 | | 1,892,778 | |
Southwest Gas Holdings, Inc. | | 29,620 | | 1,834,367 | |
| | | | 18,928,585 | |
Total Common Stocks(cost $533,000,767) | 618,426,249 | |
| | 1-Day
Yield (%) | | | | |
Investment Companies - 4.0% | | | | |
Registered Investment Companies - 4.0% | | | | |
Dreyfus Institutional Preferred Government Plus Money Market Fund, Institutional Shares
(cost $25,668,861) | 5.41 | 25,668,861 | d | 25,668,861 | |
| |
BNY Mellon Small Cap Multi-Strategy Fund (continued) |
Description | 1-Day
Yield (%) | Shares | | Value ($) | |
Investment of Cash Collateral for Securities Loaned - 1.3% | | | | |
Registered Investment Companies - 1.3% | | | | |
Dreyfus Institutional Preferred Government Plus Money Market Fund, Institutional Shares
(cost $8,407,712) | 5.41 | 8,407,712 | d | 8,407,712 | |
Total Investments (cost $567,077,340) | 101.1% | 652,502,822 | |
Liabilities, Less Cash and Receivables | (1.1%) | (6,818,610) | |
Net Assets | 100.0% | 645,684,212 | |
ADR—American Depositary Receipt
a Non-income producing security.
b Security, or portion thereof, on loan. At August 31, 2023, the value of the fund’s securities on loan was $21,025,115 and the value of the collateral was $21,583,912, consisting of cash collateral of $8,407,712 and U.S. Government & Agency securities valued at $13,176,200. In addition, the value of collateral may include pending sales that are also on loan.
c Investment in real estate investment trust within the United States.
d Investment in affiliated issuer. The investment objective of this investment company is publicly available and can be found within the investment company’s prospectus.
| | |
Portfolio Summary (Unaudited) † | Value (%) |
Industrials | 16.2 |
Health Care | 16.1 |
Financials | 13.0 |
Consumer Discretionary | 11.7 |
Information Technology | 10.6 |
Energy | 9.2 |
Investment Companies | 5.3 |
Materials | 5.0 |
Consumer Staples | 3.9 |
Real Estate | 3.9 |
Communication Services | 3.3 |
Utilities | 2.9 |
| | 101.1 |
† Based on net assets.
See notes to financial statements.
43
STATEMENT OF INVESTMENTS (continued)
| | | | | | | |
BNY Mellon Small Cap Multi-Strategy Fund | | |
Affiliated Issuers | | |
Description | Value ($)
8/31/2022 | Purchases ($)† | Sales ($) | Value ($)
8/31/2023 | Dividends/
Distributions ($) | |
Registered Investment Companies - 4.0% | | |
Dreyfus Institutional Preferred Government Plus Money Market Fund, Institutional Shares - 4.0% | 24,504,649 | 162,996,255 | (161,832,043) | 25,668,861 | 1,061,147 | |
Investment of Cash Collateral for Securities Loaned - 1.3%†† | | |
Dreyfus Institutional Preferred Government Plus Money Market Fund, Institutional Shares - 1.3% | - | 26,234,842 | (17,827,130) | 8,407,712 | 12,464 | ††† |
Dreyfus Institutional Preferred Government Plus Money Market Fund, SL Shares - .0% | 8,610,562 | 117,185,502 | (125,796,064) | - | 111,793 | ††† |
Total - 5.3% | 33,115,211 | 306,416,599 | (305,455,237) | 34,076,573 | 1,185,404 | |
† Includes reinvested dividends/distributions.
†† Effective July 3, 2023, cash collateral for securities lending was transferred from Dreyfus Institutional Preferred Government Plus Money Market Fund, SL Shares to Dreyfus Institutional Preferred Government Plus Money Market Fund, Institutional Shares.
††† Represents securities lending income earned from the reinvestment of cash collateral from loaned securities, net of fees and collateral investment expenses, and other payments to and from borrowers of securities.
See notes to financial statements.
44
| | | | | | |
| |
BNY Mellon International Fund |
Description | | Shares | | Value ($) | |
Common Stocks - 95.6% | | | |
Australia - 3.7% | | | | |
AGL Energy Ltd. | | 95,820 | a | 688,540 | |
Aristocrat Leisure Ltd. | | 27,816 | | 737,156 | |
ASX Ltd. | | 181,085 | a | 6,757,267 | |
Brambles Ltd. | | 137,160 | | 1,330,426 | |
Macquarie Group Ltd. | | 11,864 | | 1,364,723 | |
| | | | 10,878,112 | |
Austria - 1.3% | | | | |
OMV AG | | 82,089 | | 3,807,095 | |
Bermuda - 1.9% | | | | |
Hiscox Ltd. | | 430,899 | | 5,444,982 | |
Denmark - .3% | | | | |
AP Moller - Maersk A/S, Cl. B | | 520 | | 946,094 | |
France - 18.5% | | | | |
AXA SA | | 64,090 | | 1,930,251 | |
BNP Paribas SA | | 155,180 | | 10,047,368 | |
Cie Generale des Etablissements Michelin SCA | | 143,657 | | 4,503,440 | |
Euroapi SA | | 3,255 | b | 44,314 | |
Klepierre SA | | 99,477 | | 2,631,976 | |
LVMH Moet Hennessy Louis Vuitton SE | | 3,631 | | 3,079,736 | |
Orange SA | | 757,236 | | 8,505,046 | |
Publicis Groupe SA | | 98,676 | | 7,710,371 | |
Sanofi | | 93,996 | | 10,053,839 | |
Teleperformance SE | | 14,434 | | 2,001,045 | |
Vinci SA | | 31,137 | | 3,476,280 | |
| | | | 53,983,666 | |
Germany - 11.1% | | | | |
Allianz SE | | 11,404 | | 2,774,296 | |
Bayer AG | | 138,334 | | 7,581,125 | |
Daimler Truck Holding AG | | 42,342 | | 1,491,731 | |
Deutsche Post AG | | 90,946 | | 4,248,926 | |
Evonik Industries AG | | 149,901 | | 2,877,862 | |
Heidelberg Materials AG | | 15,436 | | 1,243,301 | |
Mercedes-Benz Group AG | | 114,475 | | 8,383,805 | |
Muenchener Rueckversicherungs-Gesellschaft AG | | 9,647 | | 3,747,031 | |
| | | | 32,348,077 | |
Hong Kong - .8% | | | | |
Sun Hung Kai Properties Ltd. | | 204,000 | | 2,296,914 | |
Italy - 2.5% | | | | |
Enel SPA | | 440,540 | | 2,966,514 | |
Eni SPA | | 273,698 | | 4,239,269 | |
| | | | 7,205,783 | |
Japan - 16.1% | | | | |
Advantest Corp. | | 11,200 | | 1,409,478 | |
Casio Computer Co. Ltd. | | 343,600 | | 3,049,998 | |
FUJIFILM Holdings Corp. | | 25,700 | | 1,521,563 | |
| |
BNY Mellon International Fund (continued) |
Description | | Shares | | Value ($) | |
Common Stocks - 95.6%(continued) | | | |
Japan - 16.1% (continued) | | | | |
Fujitsu Ltd. | | 27,700 | | 3,465,951 | |
ITOCHU Corp. | | 144,200 | | 5,423,296 | |
Mitsubishi Electric Corp. | | 180,600 | | 2,357,190 | |
Mizuho Financial Group, Inc. | | 84,500 | | 1,399,670 | |
Nippon Telegraph & Telephone Corp. | | 4,938,200 | | 5,712,217 | |
Renesas Electronics Corp. | | 148,500 | b | 2,501,112 | |
Shionogi & Co. Ltd. | | 78,600 | | 3,466,622 | |
Sony Group Corp. | | 50,700 | | 4,232,114 | |
Sumitomo Mitsui Financial Group, Inc. | | 159,500 | | 7,324,097 | |
Tokyo Electron Ltd. | | 26,800 | | 3,974,088 | |
Trend Micro, Inc. | | 30,600 | | 1,301,649 | |
| | | | 47,139,045 | |
Netherlands - 6.1% | | | | |
ASML Holding NV | | 10,056 | | 6,628,678 | |
ING Groep NV | | 375,624 | | 5,335,733 | |
Koninklijke Ahold Delhaize NV | | 176,758 | | 5,783,568 | |
| | | | 17,747,979 | |
Norway - .4% | | | | |
Yara International ASA | | 33,851 | a | 1,238,245 | |
Singapore - 1.4% | | | | |
Singapore Exchange Ltd. | | 390,800 | | 2,784,716 | |
United Overseas Bank Ltd. | | 57,400 | | 1,207,929 | |
| | | | 3,992,645 | |
Spain - .9% | | | | |
ACS Actividades de Construccion y Servicios SA | | 74,412 | | 2,613,505 | |
Switzerland - 7.2% | | | | |
Kuehne + Nagel International AG | | 10,532 | | 3,170,271 | |
Novartis AG | | 38,469 | | 3,889,360 | |
Roche Holding AG | | 34,541 | | 10,178,324 | |
Sonova Holding AG | | 9,686 | | 2,562,538 | |
STMicroelectronics NV | | 24,790 | | 1,173,760 | |
| | | | 20,974,253 | |
United Kingdom - 23.4% | | | | |
Ashtead Group PLC | | 42,778 | | 2,993,520 | |
BAE Systems PLC | | 289,057 | | 3,689,237 | |
BP PLC | | 437,254 | | 2,700,328 | |
Bunzl PLC | | 31,720 | | 1,137,176 | |
Burberry Group PLC | | 159,894 | | 4,423,773 | |
Diageo PLC | | 261,821 | | 10,757,874 | |
Ferguson PLC | | 20,337 | | 3,309,246 | |
GSK PLC | | 466,813 | | 8,212,790 | |
Haleon PLC | | 289,534 | | 1,182,871 | |
Imperial Brands PLC | | 206,380 | | 4,678,508 | |
Legal & General Group PLC | | 592,333 | | 1,641,054 | |
Melrose Industries PLC | | 216,248 | | 1,404,232 | |
Rio Tinto PLC | | 53,387 | | 3,295,303 | |
45
STATEMENT OF INVESTMENTS (continued)
| | | | | | |
| |
BNY Mellon International Fund (continued) |
Description | | Shares | | Value ($) | |
Common Stocks - 95.6%(continued) | | | |
United Kingdom - 23.4% (continued) | | | | |
Shell PLC | | 286,579 | | 8,754,668 | |
SSE PLC | | 171,346 | | 3,530,499 | |
Tate & Lyle PLC | | 606,864 | | 5,431,398 | |
Unilever PLC | | 21,977 | | 1,125,312 | |
| | | | 68,267,789 | |
Total Common Stocks(cost $260,230,582) | 278,884,184 | |
| | | | | | |
Exchange-Traded Funds - 1.0% | | | | |
United States - 1.0% | | | | |
iShares MSCI EAFE ETF
(cost $2,851,125) | | 40,710 | a | 2,911,986 | |
| | Preferred Dividend
Rate (%) | | | | |
Preferred Stocks - 1.7% | | | | |
Germany - 1.7% | | | | |
Volkswagen AG
(cost $9,433,505) | 24.93 | 39,262 | | 4,812,537 | |
| | 1-Day
Yield (%) | | | | |
Investment Companies - .3% | | | | |
Registered Investment Companies - .3% | | | | |
Dreyfus Institutional Preferred Government Plus Money Market Fund, Institutional Shares
(cost $1,009,721) | 5.41 | 1,009,721 | c | 1,009,721 | |
| | | | | | |
Investment of Cash Collateral for Securities Loaned - 1.0% | | | | |
Registered Investment Companies - 1.0% | | | | |
Dreyfus Institutional Preferred Government Plus Money Market Fund, Institutional Shares
(cost $2,981,093) | 5.41 | 2,981,093 | c | 2,981,093 | |
Total Investments (cost $276,506,026) | 99.6% | 290,599,521 | |
Cash and Receivables (Net) | .4% | 1,138,195 | |
Net Assets | 100.0% | 291,737,716 | |
ETF—Exchange-Traded Fund
a Security, or portion thereof, on loan. At August 31, 2023, the value of the fund’s securities on loan was $5,711,092 and the value of the collateral was $5,955,660, consisting of cash collateral of $2,981,093 and U.S. Government & Agency securities valued at $2,974,567. In addition, the value of collateral may include pending sales that are also on loan.
b Non-income producing security.
c Investment in affiliated issuer. The investment objective of this investment company is publicly available and can be found within the investment company’s prospectus.
| | |
Portfolio Summary (Unaudited) † | Value (%) |
Pharmaceuticals, Biotechnology & Life Sciences | 13.8 |
Capital Goods | 9.5 |
Banks | 8.7 |
Food, Beverage & Tobacco | 7.1 |
Energy | 6.7 |
Automobiles & Components | 6.1 |
Semiconductors & Semiconductor Equipment | 5.4 |
Insurance | 5.3 |
Consumer Durables & Apparel | 5.1 |
Telecommunication Services | 4.9 |
Financial Services | 3.7 |
Materials | 3.0 |
Transportation | 2.9 |
Media & Entertainment | 2.6 |
Utilities | 2.5 |
Investment Companies | 2.3 |
Consumer Staples Distribution | 2.0 |
Software & Services | 1.6 |
Pharmaceuticals Biotechnology & Life Sciences | 1.2 |
Commercial & Professional Services | 1.1 |
Equity Real Estate Investment | .9 |
Health Care Equipment & Services | .9 |
Household & Personal Products | .8 |
Real Estate Management & Devel | .8 |
Technology Hardware & Equipment | .5 |
Consumer Services | .2 |
| | 99.6 |
† Based on net assets.
See notes to financial statements.
46
| | | | | | | |
BNY Mellon International Fund | | |
Affiliated Issuers | | |
Description | Value ($)
8/31/2022 | Purchases ($)† | Sales ($) | Value ($)
8/31/2023 | Dividends/
Distributions ($) | |
Registered Investment Companies - .3% | | |
Dreyfus Institutional Preferred Government Plus Money Market Fund, Institutional Shares - .3% | 47,603 | 70,194,157 | (69,232,039) | 1,009,721 | 43,499 | |
Investment of Cash Collateral for Securities Loaned - 1.0%†† | | |
Dreyfus Institutional Preferred Government Plus Money Market Fund, Institutional Shares - 1.0% | - | 16,305,168 | (13,324,075) | 2,981,093 | 1,984 | ††† |
Dreyfus Institutional Preferred Government Plus Money Market Fund, SL Shares - .0% | 4,839,849 | 138,210,394 | (143,050,243) | - | 9,180 | ††† |
Total - 1.3% | 4,887,452 | 224,709,719 | (225,606,357) | 3,990,814 | 54,663 | |
† Includes reinvested dividends/distributions.
†† Effective July 3, 2023, cash collateral for securities lending was transferred from Dreyfus Institutional Preferred Government Plus Money Market Fund, SL Shares to Dreyfus Institutional Preferred Government Plus Money Market Fund, Institutional Shares.
††† Represents securities lending income earned from the reinvestment of cash collateral from loaned securities, net of fees and collateral investment expenses, and other payments to and from borrowers of securities.
See notes to financial statements.
47
STATEMENT OF INVESTMENTS (continued)
| | | | | | |
| |
BNY Mellon Emerging Markets Fund |
Description | | Shares | | Value ($) | |
Common Stocks - 98.1% | | | |
Australia - .6% | | | | |
BHP Group Ltd. | | 70,778 | | 2,038,904 | |
Brazil - 6.6% | | | | |
B3 SA - Brasil Bolsa Balcao | | 1,267,995 | | 3,315,907 | |
Banco Bradesco SA, ADR | | 1,815,368 | | 5,427,950 | |
Raia Drogasil SA | | 626,354 | | 3,517,514 | |
WEG SA | | 600,219 | | 4,337,969 | |
XP, Inc., Cl. A | | 172,716 | a | 4,376,623 | |
| | | | 20,975,963 | |
China - 21.5% | | | | |
Alibaba Group Holding Ltd. | | 344,800 | a | 3,965,770 | |
BY-HEALTH Co. Ltd., Cl. A | | 782,964 | | 2,076,033 | |
China Merchants Bank Co. Ltd., Cl. H | | 501,000 | | 1,980,401 | |
Foshan Haitian Flavouring & Food Co. Ltd., Cl. A | | 727,056 | | 3,899,466 | |
JD.com, Inc., Cl. A | | 143,600 | | 2,358,436 | |
Kingdee International Software Group Co. Ltd. | | 879,000 | | 1,358,455 | |
Meituan, Cl. B | | 521,360 | a,b | 8,542,689 | |
NARI Technology Co. Ltd., Cl. A | | 1,556,337 | | 5,085,176 | |
NetEase, Inc. | | 161,900 | | 3,381,540 | |
Pharmaron Beijing Co. Ltd., Cl. H | | 552,150 | b,c | 1,288,433 | |
Ping An Insurance Group Company of China Ltd., Cl. H | | 793,000 | | 4,747,474 | |
Shenzhen Inovance Technology Co. Ltd., CI. A | | 375,032 | | 3,512,549 | |
Silergy Corp. | | 144,000 | | 1,297,725 | |
Sungrow Power Supply Co. Ltd., CI. A | | 305,206 | | 4,176,058 | |
Tencent Holdings Ltd. | | 374,700 | | 15,528,190 | |
Yum China Holdings, Inc. | | 99,968 | | 5,367,282 | |
| | | | 68,565,677 | |
France - 2.2% | | | | |
TotalEnergies SE | | 112,104 | | 7,058,988 | |
Hong Kong - 3.3% | | | | |
AIA Group Ltd. | | 750,600 | | 6,814,631 | |
Hong Kong Exchanges & Clearing Ltd. | | 49,900 | | 1,934,318 | |
Pacific Basin Shipping Ltd. | | 6,769,000 | | 1,838,476 | |
| | | | 10,587,425 | |
India - 20.5% | | | | |
Dr Lal PathLabs Ltd. | | 81,364 | b | 2,138,519 | |
Godrej Consumer Products Ltd. | | 274,214 | a | 3,329,372 | |
HDFC Bank Ltd. | | 558,720 | | 10,605,633 | |
HDFC Life Insurance Co. Ltd. | | 416,378 | b | 3,242,806 | |
Hindustan Unilever Ltd. | | 129,020 | | 3,904,049 | |
ICICI Bank Ltd. | | 312,104 | | 3,614,486 | |
Info Edge India Ltd. | | 93,428 | | 4,888,292 | |
Infosys Ltd. | | 128,551 | | 2,228,976 | |
Jio Financial Services Ltd. | | 209,092 | a | 589,747 | |
KEI Industries Ltd. | | 97,185 | | 3,178,407 | |
| |
BNY Mellon Emerging Markets Fund (continued) |
Description | | Shares | | Value ($) | |
Common Stocks - 98.1%(continued) | | | |
India - 20.5% (continued) | | | | |
Marico Ltd. | | 654,239 | | 4,504,962 | |
Pidilite Industries Ltd. | | 53,636 | | 1,629,432 | |
Reliance Industries Ltd. | | 203,760 | | 5,924,297 | |
Sona Blw Precision Forgings Ltd. | | 496,521 | b | 3,572,186 | |
Tata Consultancy Services Ltd. | | 104,757 | | 4,247,665 | |
Titan Co. Ltd. | | 122,739 | | 4,602,662 | |
Zomato Ltd. | | 2,750,225 | a | 3,242,350 | |
| | | | 65,443,841 | |
Indonesia - 3.1% | | | | |
Bank Mandiri Persero TBK Pt | | 19,075,900 | | 7,546,441 | |
Bank Rakyat Indonesia Persero TBK Pt | | 6,350,900 | | 2,314,346 | |
| | | | 9,860,787 | |
Japan - .7% | | | | |
Advantest Corp. | | 17,000 | | 2,139,386 | |
Mexico - 5.4% | | | | |
Fomento Economico Mexicano SAB de CV | | 474,162 | | 5,308,790 | |
Grupo Financiero Banorte SAB de CV, Cl. O | | 637,691 | | 5,412,921 | |
Wal-Mart de Mexico SAB de CV | | 1,686,963 | | 6,650,694 | |
| | | | 17,372,405 | |
Netherlands - 2.2% | | | | |
ASM International NV | | 7,595 | | 3,666,506 | |
ASML Holding NV | | 5,224 | | 3,443,537 | |
| | | | 7,110,043 | |
Peru - 1.5% | | | | |
Credicorp Ltd. | | 34,233 | | 4,841,573 | |
Philippines - .6% | | | | |
Ayala Corp. | | 182,540 | | 1,985,953 | |
Poland - .9% | | | | |
Dino Polska SA | | 31,010 | a,b | 2,847,926 | |
Russia - .0% | | | | |
Lukoil PJSC, ADR | | 85,809 | a,d | 0 | |
Sberbank of Russia PJSC, ADR | | 884,047 | a,d | 0 | |
X5 Retail Group NV, GDR | | 198,889 | a,d | 0 | |
Yandex NV, Cl. A | | 34,166 | a,d | 0 | |
Singapore - .3% | | | | |
Sea Ltd., ADR | | 29,915 | a | 1,125,701 | |
South Africa - 1.3% | | | | |
Clicks Group Ltd. | | 278,112 | | 4,027,727 | |
South Korea - 8.4% | | | | |
KT Corp. | | 117,476 | | 2,933,012 | |
LG Energy Solution Ltd. | | 5,899 | a | 2,427,884 | |
Samsung Electronics Co. Ltd. | | 323,283 | | 16,362,877 | |
Samsung SDI Co. Ltd. | | 11,215 | | 5,209,767 | |
| | | | 26,933,540 | |
48
| | | | | | |
| |
BNY Mellon Emerging Markets Fund (continued) |
Description | | Shares | | Value ($) | |
Common Stocks - 98.1%(continued) | | | |
Sweden - 1.3% | | | | |
Epiroc AB, Cl. A | | 209,322 | | 4,026,416 | |
Taiwan - 12.6% | | | | |
Airtac International Group | | 80,575 | | 2,327,697 | |
Chailease Holding Co. Ltd. | | 442,546 | | 2,466,579 | |
Delta Electronics, Inc. | | 248,000 | | 2,694,425 | |
MediaTek, Inc. | | 216,000 | | 4,781,687 | |
Taiwan Semiconductor Manufacturing Co. Ltd. | | 1,208,000 | | 20,824,643 | |
Uni-President Enterprises Corp. | | 2,024,000 | | 4,493,329 | |
Voltronic Power Technology Corp. | | 55,000 | | 2,504,200 | |
| | | | 40,092,560 | |
United States - 2.5% | | | | |
Lam Research Corp. | | 2,455 | | 1,724,392 | |
Livent Corp. | | 92,718 | a,c | 1,990,655 | |
Schlumberger NV | | 72,559 | | 4,278,079 | |
| | | | 7,993,126 | |
Uruguay - 2.6% | | | | |
Globant SA | | 16,924 | a,c | 3,460,450 | |
MercadoLibre, Inc. | | 3,555 | a | 4,878,740 | |
| | | | 8,339,190 | |
Total Common Stocks(cost $273,205,297) | 313,367,131 | |
| | 1-Day
Yield (%) | | | | |
Investment Companies - 1.7% | | | | |
Registered Investment Companies - 1.7% | | | | |
Dreyfus Institutional Preferred Government Plus Money Market Fund, Institutional Shares
(cost $5,362,241) | 5.41 | 5,362,241 | e | 5,362,241 | |
| |
BNY Mellon Emerging Markets Fund (continued) |
Description | 1-Day
Yield (%) | Shares | | Value ($) | |
Investment of Cash Collateral for Securities Loaned - .3% | | | | |
Registered Investment Companies - .3% | | | | |
Dreyfus Institutional Preferred Government Plus Money Market Fund, Institutional Shares
(cost $960,211) | 5.41 | 960,211 | e | 960,211 | |
Total Investments (cost $279,527,749) | 100.1% | 319,689,583 | |
Liabilities, Less Cash and Receivables | (.1%) | (364,595) | |
Net Assets | 100.0% | 319,324,988 | |
ADR—American Depositary Receipt
GDR—Global Depository Receipt
a Non-income producing security.
b Security exempt from registration pursuant to Rule 144A under the Securities Act of 1933. These securities may be resold in transactions exempt from registration, normally to qualified institutional buyers. At August 31, 2023, these securities were valued at $21,632,559 or 6.77% of net assets.
c Security, or portion thereof, on loan. At August 31, 2023, the value of the fund’s securities on loan was $4,163,828 and the value of the collateral was $4,329,051, consisting of cash collateral of $960,211 and U.S. Government & Agency securities valued at $3,368,840. In addition, the value of collateral may include pending sales that are also on loan.
d The fund held Level 3 securities at August 31, 2023. These securities were valued at $0 or .0% of net assets.
e Investment in affiliated issuer. The investment objective of this investment company is publicly available and can be found within the investment company’s prospectus.
| | |
Portfolio Summary (Unaudited) † | Value (%) |
Banks | 13.1 |
Semiconductors & Semiconductor Equipment | 11.9 |
Capital Goods | 10.5 |
Media & Entertainment | 7.8 |
Technology Hardware & Equipment | 7.6 |
Food, Beverage & Tobacco | 5.7 |
Energy | 5.4 |
Consumer Services | 5.4 |
Consumer Staples Distribution | 5.3 |
Insurance | 4.6 |
Financial Services | 3.8 |
Software & Services | 3.5 |
Consumer Discretionary Distribution | 3.5 |
Household & Personal Products | 2.9 |
Investment Companies | 2.0 |
Materials | 1.8 |
Consumer Durables & Apparel | 1.4 |
Automobiles & Components | 1.1 |
Telecommunication Services | .9 |
Health Care Equipment & Services | .7 |
Transportation | .6 |
Pharmaceuticals Biotechnology & Life Sciences | .4 |
Diversified Financials | .2 |
| | 100.1 |
† Based on net assets.
See notes to financial statements.
49
STATEMENT OF INVESTMENTS (continued)
| | | | | | | |
BNY Mellon Emerging Markets Fund | | |
Affiliated Issuers | | |
Description | Value ($)
8/31/2022 | Purchases ($)† | Sales ($) | Value ($)
8/31/2023 | Dividends/
Distributions ($) | |
Registered Investment Companies - 1.7% | | |
Dreyfus Institutional Preferred Government Plus Money Market Fund, Institutional Shares - 1.7% | - | 170,597,503 | (165,235,262) | 5,362,241 | 250,149 | |
Investment of Cash Collateral for Securities Loaned - .3%†† | | |
Dreyfus Institutional Preferred Government Plus Money Market Fund, Institutional Shares - .3% | - | 1,762,929 | (802,718) | 960,211 | 1,806 | ††† |
Dreyfus Institutional Preferred Government Plus Money Market Fund, SL Shares - .0% | 1,883,109 | 21,209,849 | (23,092,958) | - | 6,379 | ††† |
Total - 2.0% | 1,883,109 | 193,570,281 | (189,130,938) | 6,322,452 | 258,334 | |
† Includes reinvested dividends/distributions.
†† Effective July 3, 2023, cash collateral for securities lending was transferred from Dreyfus Institutional Preferred Government Plus Money Market Fund, SL Shares to Dreyfus Institutional Preferred Government Plus Money Market Fund, Institutional Shares.
††† Represents securities lending income earned from the reinvestment of cash collateral from loaned securities, net of fees and collateral investment expenses, and other payments to and from borrowers of securities.
See notes to financial statements.
50
| | | | | | |
| |
BNY Mellon International Equity Income Fund |
Description | | Shares | | Value ($) | |
Common Stocks - 94.0% | | | |
Australia - 6.8% | | | | |
ANZ Group Holdings Ltd. | | 3,966 | | 65,092 | |
Aurizon Holdings Ltd. | | 125,281 | | 296,292 | |
BHP Group Ltd. | | 9,094 | | 264,277 | |
National Australia Bank Ltd. | | 15,238 | | 285,935 | |
SEEK Ltd. | | 7,194 | | 107,724 | |
Sonic Healthcare Ltd. | | 3,076 | | 64,098 | |
Suncorp Group Ltd. | | 4,307 | | 38,038 | |
Wesfarmers Ltd. | | 22,634 | | 790,041 | |
Westpac Banking Corp. | | 6,018 | | 85,591 | |
Woodside Energy Group Ltd. | | 1,656 | | 39,723 | |
| | | | 2,036,811 | |
Belgium - .4% | | | | |
Proximus SADP | | 15,341 | | 116,079 | |
Brazil - .6% | | | | |
Cia Siderurgica Nacional SA | | 79,190 | | 194,295 | |
Canada - 8.6% | | | | |
BCE, Inc. | | 1,379 | | 58,418 | |
Canadian Imperial Bank of Commerce | | 5,022 | | 198,992 | |
Enbridge, Inc. | | 12,163 | | 427,037 | |
Great-West Lifeco, Inc. | | 12,181 | | 350,050 | |
IGM Financial, Inc. | | 10,432 | | 297,395 | |
Keyera Corp. | | 8,651 | | 213,714 | |
Manulife Financial Corp. | | 14,628 | | 270,432 | |
Power Corporation of Canada | | 5,541 | | 151,320 | |
The Bank of Nova Scotia | | 4,284 | | 203,294 | |
The Toronto-Dominion Bank | | 6,590 | | 401,974 | |
| | | | 2,572,626 | |
China - 6.8% | | | | |
Alibaba Group Holding Ltd., ADR | | 2,283 | a,b | 212,091 | |
Bank of China Ltd., Cl. H | | 587,580 | | 199,298 | |
Cosco Shipping Holdings Co. Ltd., Cl. H | | 334,150 | | 342,998 | |
Industrial & Commercial Bank of China Ltd., Cl. H | | 161,860 | | 74,301 | |
JD.com, Inc., Cl. A | | 321 | | 5,272 | |
Lenovo Group Ltd. | | 181,070 | | 204,797 | |
Meituan, Cl. B | | 823 | b,c | 13,485 | |
Ping An Insurance Group Company of China Ltd., Cl. H | | 22,030 | | 131,888 | |
Shenzhou International Group Holdings Ltd. | | 5,600 | | 57,483 | |
Sinopharm Group Co. Ltd., Cl. H | | 55,600 | | 161,291 | |
Tencent Holdings Ltd. | | 9,130 | | 378,362 | |
Zhejiang Expressway Co. Ltd., Cl. H | | 331,050 | | 247,369 | |
| | | | 2,028,635 | |
Czech Republic - 2.0% | | | | |
CEZ AS | | 13,730 | | 584,563 | |
| |
BNY Mellon International Equity Income Fund (continued) |
Description | | Shares | | Value ($) | |
Common Stocks - 94.0%(continued) | | | |
Finland - 2.5% | | | | |
Fortum OYJ | | 12,128 | | 163,072 | |
Nordea Bank Abp | | 42,692 | | 468,624 | |
Orion OYJ, Cl. B | | 1,514 | | 62,040 | |
Sampo OYJ, Cl. A | | 980 | | 43,070 | |
| | | | 736,806 | |
France - 5.5% | | | | |
AXA SA | | 26,784 | | 806,676 | |
Bouygues SA | | 2,171 | | 75,097 | |
Credit Agricole SA | | 3,692 | | 46,664 | |
Engie SA | | 3,004 | | 48,503 | |
Eutelsat Communications SA | | 14,134 | a | 86,133 | |
Orange SA | | 800 | | 8,985 | |
Sanofi | | 2,610 | | 279,166 | |
TotalEnergies SE | | 4,821 | | 303,570 | |
| | | | 1,654,794 | |
Germany - 5.7% | | | | |
Allianz SE | | 1,017 | | 247,410 | |
BASF SE | | 3,881 | | 196,909 | |
Bayer AG | | 2,958 | | 162,107 | |
Bayerische Motoren Werke AG | | 1,230 | | 129,601 | |
Deutsche Post AG | | 11,110 | | 519,051 | |
Mercedes-Benz Group AG | | 3,706 | | 271,416 | |
SAP SE | | 1,244 | | 173,769 | |
| | | | 1,700,263 | |
Hong Kong - 1.1% | | | | |
China Medical System Holdings Ltd. | | 98,250 | | 141,818 | |
New World Development Co. Ltd. | | 24,000 | | 50,985 | |
PCCW Ltd. | | 291,880 | | 138,825 | |
| | | | 331,628 | |
Israel - .5% | | | | |
Bank Leumi Le-Israel BM | | 8,749 | | 68,026 | |
ICL Group Ltd. | | 14,689 | | 88,063 | |
| | | | 156,089 | |
Italy - 2.6% | | | | |
Enel SPA | | 18,968 | | 127,727 | |
Eni SPA | | 35,673 | | 552,534 | |
Poste Italiane SPA | | 8,864 | c | 98,568 | |
| | | | 778,829 | |
Japan - 13.1% | | | | |
AGC, Inc. | | 4,100 | | 144,083 | |
Aisin Corp. | | 5,600 | | 187,327 | |
Canon, Inc. | | 8,490 | | 209,369 | |
Honda Motor Co. Ltd. | | 10,310 | | 333,262 | |
ITOCHU Corp. | | 4,420 | | 166,234 | |
Japan Tobacco, Inc. | | 13,000 | | 285,116 | |
Marubeni Corp. | | 17,700 | | 290,083 | |
Mitsubishi Corp. | | 3,480 | | 172,116 | |
51
STATEMENT OF INVESTMENTS (continued)
| | | | | | |
| |
BNY Mellon International Equity Income Fund (continued) |
Description | | Shares | | Value ($) | |
Common Stocks - 94.0%(continued) | | | |
Japan - 13.1% (continued) | | | | |
MS&AD Insurance Group Holdings, Inc. | | 7,010 | | 252,465 | |
Otsuka Corp. | | 4,460 | | 199,098 | |
Sumco Corp. | | 45,500 | | 608,877 | |
Sumitomo Corp. | | 22,030 | | 454,091 | |
Takeda Pharmaceutical Co. Ltd. | | 20,600 | | 638,268 | |
| | | | 3,940,389 | |
Malaysia - .1% | | | | |
British American Tobacco Malaysia Bhd | | 11,490 | | 24,713 | |
Malta - .0% | | | | |
Lighthouse Properties PLC | | 4,442 | | 1,275 | |
Mexico - 1.1% | | | | |
Grupo Mexico SAB de CV, Ser. B | | 71,700 | | 342,720 | |
Netherlands - 1.3% | | | | |
ASML Holding NV | | 513 | | 338,157 | |
Randstad NV | | 744 | | 43,710 | |
| | | | 381,867 | |
New Zealand - 2.0% | | | | |
Spark New Zealand Ltd. | | 195,054 | | 590,277 | |
Norway - .5% | | | | |
Mowi ASA | | 6,520 | | 118,359 | |
Telenor ASA | | 1,972 | | 21,127 | |
| | | | 139,486 | |
Philippines - .1% | | | | |
Manila Electric Co. | | 5,890 | | 35,744 | |
Poland - .9% | | | | |
Powszechny Zaklad Ubezpieczen SA | | 28,408 | | 284,583 | |
Qatar - .8% | | | | |
Industries Qatar Qsc | | 71,190 | | 241,733 | |
Singapore - .1% | | | | |
DBS Group Holdings Ltd. | | 1,051 | | 25,897 | |
South Africa - .8% | | | | |
Anglo American Platinum Ltd. | | 1,902 | | 66,581 | |
Kumba Iron Ore Ltd. | | 5,639 | | 124,031 | |
Resilient REIT Ltd. | | 9,288 | | 19,491 | |
Vodacom Group Ltd. | | 3,431 | | 19,596 | |
| | | | 229,699 | |
South Korea - 1.3% | | | | |
LG Display Co. Ltd. | | 4,400 | | 44,608 | |
Samsung Electronics Co. Ltd. | | 6,714 | | 339,827 | |
| | | | 384,435 | |
Spain - 1.9% | | | | |
ACS Actividades de Construccion y Servicios SA | | 7,206 | | 253,090 | |
Endesa SA | | 6,030 | | 125,411 | |
Telefonica SA | | 45,589 | | 189,037 | |
| | | | 567,538 | |
| |
BNY Mellon International Equity Income Fund (continued) |
Description | | Shares | | Value ($) | |
Common Stocks - 94.0%(continued) | | | |
Sweden - 1.9% | | | | |
Hennes & Mauritz AB, Cl. B | | 15,268 | | 233,556 | |
Svenska Handelsbanken AB, Cl. A | | 9,465 | | 78,981 | |
Tele2 AB, Cl. B | | 20,065 | | 141,739 | |
Telia Co. AB | | 60,436 | | 122,048 | |
| | | | 576,324 | |
Switzerland - 7.5% | | | | |
Nestle SA | | 3,596 | | 433,140 | |
Novartis AG | | 4,063 | | 410,785 | |
Partners Group Holding AG | | 297 | | 321,157 | |
Roche Holding AG | | 720 | | 212,165 | |
Swiss Re AG | | 5,121 | | 497,984 | |
Zurich Insurance Group AG | | 784 | | 368,325 | |
| | | | 2,243,556 | |
Taiwan - 7.1% | | | | |
ASE Technology Holding Co. Ltd. | | 45,000 | | 166,737 | |
Asia Cement Corp. | | 50,700 | | 63,521 | |
Asustek Computer, Inc. | | 17,550 | | 221,810 | |
Catcher Technology Co. Ltd. | | 27,940 | | 158,359 | |
China Steel Corp. | | 10,300 | | 8,571 | |
MediaTek, Inc. | | 10,000 | | 221,374 | |
Micro-Star International Co. Ltd. | | 22,510 | | 112,739 | |
Nan Ya Plastics Corp. | | 30,750 | | 63,824 | |
Pegatron Corp. | | 40,430 | | 99,023 | |
Quanta Computer, Inc. | | 35,140 | | 279,716 | |
Realtek Semiconductor Corp. | | 13,990 | | 183,625 | |
Taiwan Semiconductor Manufacturing Co. Ltd. | | 26,990 | | 465,279 | |
Uni-President Enterprises Corp. | | 2,020 | | 4,484 | |
United Microelectronics Corp. | | 63,300 | | 90,439 | |
| | | | 2,139,501 | |
Turkey - 1.2% | | | | |
Ford Otomotiv Sanayi AS | | 11,009 | | 355,441 | |
United Arab Emirates - .5% | | | | |
Dubai Islamic Bank PJSC | | 37,475 | | 57,544 | |
Emirates Telecommunications Group Co. PJSC | | 18,483 | | 99,837 | |
| | | | 157,381 | |
United Kingdom - 8.7% | | | | |
abrdn PLC | | 88,956 | | 186,050 | |
Anglo American PLC | | 3,328 | | 88,555 | |
BP PLC | | 56,391 | | 348,251 | |
British American Tobacco PLC | | 14,033 | | 466,202 | |
GSK PLC | | 24,237 | | 426,409 | |
Imperial Brands PLC | | 27,094 | | 614,204 | |
Persimmon PLC | | 20,511 | | 276,982 | |
SSE PLC | | 3,299 | | 67,974 | |
Taylor Wimpey PLC | | 96,528 | | 139,768 | |
| | | | 2,614,395 | |
Total Common Stocks(cost $25,683,784) | 28,168,372 | |
52
| | | | | | |
| |
BNY Mellon International Equity Income Fund (continued) |
Description | | Shares | | Value ($) | |
Exchange-Traded Funds - 1.5% | | | | |
United States - 1.5% | | | | |
iShares MSCI EAFE ETF
(cost $427,584) | | 6,077 | a | 434,688 | |
| | Preferred Dividend
Rate (%) | | | | |
Preferred Stocks - 1.7% | | | | |
Brazil - .6% | | | | |
Gerdau SA | 15.80 | 31,902 | | 166,659 | |
Germany - .9% | | | | |
Volkswagen AG | 25.08 | 2,177 | | 266,846 | |
South Korea - .2% | | | | |
Samsung Electronics Co. Ltd. | 2.00 | 1,462 | | 59,730 | |
Total Preferred Stocks(cost $561,081) | 493,235 | |
| | 1-Day
Yield (%) | | | | |
Investment Companies - .3% | | | | |
Registered Investment Companies - .3% | | | | |
Dreyfus Institutional Preferred Government Plus Money Market Fund, Institutional Shares
(cost $101,957) | 5.41 | 101,957 | d | 101,957 | |
| | | | | | |
Investment of Cash Collateral for Securities Loaned - .2% | | | | |
Registered Investment Companies - .2% | | | | |
Dreyfus Institutional Preferred Government Plus Money Market Fund, Institutional Shares
(cost $72,149) | 5.41 | 72,149 | d | 72,149 | |
Total Investments (cost $26,846,555) | 97.7% | 29,270,401 | |
Cash and Receivables (Net) | 2.3% | 697,574 | |
Net Assets | 100.0% | 29,967,975 | |
ADR—American Depositary Receipt
ETF—Exchange-Traded Fund
REIT—Real Estate Investment Trust
a Security, or portion thereof, on loan. At August 31, 2023, the value of the fund’s securities on loan was $709,519 and the value of the collateral was $733,706, consisting of cash collateral of $72,149 and U.S. Government & Agency securities valued at $661,557. In addition, the value of collateral may include pending sales that are also on loan.
b Non-income producing security.
c Security exempt from registration pursuant to Rule 144A under the Securities Act of 1933. These securities may be resold in transactions exempt from registration, normally to qualified institutional buyers. At August 31, 2023, these securities were valued at $112,053 or .37% of net assets.
d Investment in affiliated issuer. The investment objective of this investment company is publicly available and can be found within the investment company’s prospectus.
| | |
Portfolio Summary (Unaudited) † | Value (%) |
Insurance | 11.8 |
Pharmaceuticals, Biotechnology & Life Sciences | 7.8 |
Banks | 7.5 |
Semiconductors & Semiconductor Equipment | 6.9 |
Food, Beverage & Tobacco | 6.5 |
Energy | 6.3 |
Capital Goods | 6.0 |
Technology Hardware & Equipment | 5.8 |
Materials | 5.6 |
Automobiles & Components | 5.2 |
Telecommunication Services | 5.0 |
Transportation | 4.7 |
Consumer Discretionary Distribution | 4.1 |
Utilities | 3.9 |
Financial Services | 2.7 |
Investment Companies | 2.0 |
Media & Entertainment | 1.9 |
Consumer Durables & Apparel | 1.6 |
Software & Services | 1.2 |
Health Care Equipment & Services | .8 |
Real Estate Management & Development | .2 |
Commercial & Professional Services | .1 |
Equity Real Estate Investment | .1 |
Consumer Services | .0 |
| | 97.7 |
† Based on net assets.
See notes to financial statements.
53
STATEMENT OF INVESTMENTS (continued)
| | | | | | | |
BNY Mellon International Equity Income Fund | | |
Affiliated Issuers | | |
Description | Value ($)
8/31/2022 | Purchases ($)† | Sales ($) | Value ($)
8/31/2023 | Dividends/
Distributions ($) | |
Registered Investment Companies - .3% | | |
Dreyfus Institutional Preferred Government Plus Money Market Fund, Institutional Shares - .3% | 298,075 | 9,113,407 | (9,309,525) | 101,957 | 4,044 | |
Investment of Cash Collateral for Securities Loaned - .2%†† | | |
Dreyfus Institutional Preferred Government Plus Money Market Fund, Institutional Shares - .2% | - | 113,389 | (41,240) | 72,149 | 333 | ††† |
Dreyfus Institutional Preferred Government Plus Money Market Fund, SL Shares - .0% | 1,124,132 | 8,931,247 | (10,055,379) | - | 2,215 | ††† |
Total - .5% | 1,422,207 | 18,158,043 | (19,406,144) | 174,106 | 6,592 | |
† Includes reinvested dividends/distributions.
†† Effective July 3, 2023, cash collateral for securities lending was transferred from Dreyfus Institutional Preferred Government Plus Money Market Fund, SL Shares to Dreyfus Institutional Preferred Government Plus Money Market Fund, Institutional Shares.
††† Represents securities lending income earned from the reinvestment of cash collateral from loaned securities, net of fees and collateral investment expenses, and other payments to and from borrowers of securities.
See notes to financial statements.
54
| | | | | | | | | | |
| |
BNY Mellon Asset Allocation Fund |
Description | Coupon
Rate (%) | | Maturity Date | | Principal Amount ($) | | Value ($) | |
Bonds and Notes - 12.4% | | | | | |
Aerospace & Defense - .0% | | | | | |
The Boeing Company, Sr. Unscd. Notes | | 3.63 | | 2/1/2031 | | 250,000 | | 223,378 | |
Airlines - .1% | | | | | |
American Airlines Pass Through Trust, Ser. 2015-1, Cl. A | | 3.38 | | 5/1/2027 | | 231,191 | | 206,265 | |
Delta Air Lines Pass Through Trust, Ser. 2019-1, Cl. AA | | 3.20 | | 4/25/2024 | | 250,000 | | 245,474 | |
| | 451,739 | |
Automobiles & Components - .0% | | | | | |
General Motors Financial Co., Inc., Sr. Unscd. Notes | | 3.10 | | 1/12/2032 | | 150,000 | | 120,302 | |
Banks - .9% | | | | | |
Bank of America Corp., Jr. Sub. Notes, Ser. TT | | 6.13 | | 4/27/2027 | | 350,000 | a | 340,375 | |
Barclays PLC, Sr. Unscd. Notes | | 7.33 | | 11/2/2026 | | 325,000 | | 332,510 | |
Citigroup, Inc., Sub. Notes | | 4.45 | | 9/29/2027 | | 240,000 | | 229,546 | |
Citigroup, Inc., Sub. Notes | | 6.17 | | 5/25/2034 | | 100,000 | | 99,707 | |
Citizens Bank NA/Providence RI, Sr. Unscd. Notes | | 2.25 | | 4/28/2025 | | 175,000 | | 162,507 | |
Deutsche Bank AG, Sr. Unscd. Notes | | 2.55 | | 1/7/2028 | | 365,000 | | 322,878 | |
HSBC Holdings PLC, Sr. Unscd. Notes | | 4.76 | | 6/9/2028 | | 175,000 | | 167,961 | |
JPMorgan Chase & Co., Jr. Sub. Bonds, Ser. II | | 4.00 | | 4/1/2025 | | 290,000 | a,b | 266,887 | |
Morgan Stanley, Sr. Unscd. Notes | | 1.59 | | 5/4/2027 | | 375,000 | | 336,588 | |
NatWest Group PLC, Sr. Unscd. Notes | | 5.08 | | 1/27/2030 | | 260,000 | | 247,797 | |
Nordea Bank Abp, Jr. Sub. Notes | | 6.63 | | 3/26/2026 | | 255,000 | a,c | 242,248 | |
Societe Generale SA, Sub. Notes | | 6.22 | | 6/15/2033 | | 350,000 | c | 329,157 | |
The Goldman Sachs Group, Inc., Sub. Notes | | 6.75 | | 10/1/2037 | | 385,000 | | 408,466 | |
UBS Group AG, Sr. Unscd. Notes | | 2.59 | | 9/11/2025 | | 175,000 | c | 168,817 | |
| | 3,655,444 | |
Beverage Products - .1% | | | | | |
Anheuser-Busch Companies LLC/Anheuser-Busch Inbev Worldwide, Inc., Gtd. Notes | | 4.90 | | 2/1/2046 | | 300,000 | | 279,310 | |
Chemicals - .0% | | | | | |
Celanese US Holdings LLC, Gtd. Notes | | 5.90 | | 7/5/2024 | | 215,000 | b | 214,803 | |
Consumer Discretionary - .1% | | | | | |
Warnermedia Holdings, Inc., Gtd. Notes | | 3.76 | | 3/15/2027 | | 325,000 | | 304,932 | |
Warnermedia Holdings, Inc., Gtd. Notes | | 4.28 | | 3/15/2032 | | 275,000 | b | 242,785 | |
| | 547,717 | |
Diversified Financials - .4% | | | | | |
Aercap Ireland Capital DAC/AerCap Global Aviation Trust, Gtd. Notes | | 2.45 | | 10/29/2026 | | 300,000 | | 270,095 | |
Aircastle Ltd., Sr. Unscd. Notes | | 2.85 | | 1/26/2028 | | 425,000 | c | 366,286 | |
Ares Capital Corp., Sr. Unscd. Notes | | 2.88 | | 6/15/2028 | | 275,000 | | 232,217 | |
BlackRock TCP Capital Corp., Sr. Unscd. Notes | | 2.85 | | 2/9/2026 | | 200,000 | | 180,896 | |
Blackstone Secured Lending Fund, Sr. Unscd. Notes | | 2.85 | | 9/30/2028 | | 310,000 | | 256,387 | |
Blue Owl Finance LLC, Gtd. Notes | | 4.13 | | 10/7/2051 | | 350,000 | c | 210,160 | |
| | 1,516,041 | |
Electronic Components - .1% | | | | | |
Jabil, Inc., Sr. Unscd. Notes | | 3.60 | | 1/15/2030 | | 275,000 | | 246,186 | |
Energy - .3% | | | | | |
Boardwalk Pipelines LP, Gtd. Notes | | 3.60 | | 9/1/2032 | | 175,000 | | 147,243 | |
Diamondback Energy, Inc., Gtd. Notes | | 3.13 | | 3/24/2031 | | 200,000 | | 172,099 | |
Enterprise Products Operating LLC, Gtd. Notes | | 5.35 | | 1/31/2033 | | 125,000 | | 125,769 | |
Marathon Petroleum Corp., Sr. Unscd. Notes | | 3.80 | | 4/1/2028 | | 175,000 | | 163,615 | |
55
STATEMENT OF INVESTMENTS (continued)
| | | | | | | | | | |
| |
BNY Mellon Asset Allocation Fund (continued) |
Description | Coupon
Rate (%) | | Maturity Date | | Principal Amount ($) | | Value ($) | |
Bonds and Notes - 12.4% (continued) | | | | | |
Energy - .3% (continued) | | | | | |
Sabine Pass Liquefaction LLC, Sr. Scd. Notes | | 4.50 | | 5/15/2030 | | 200,000 | | 188,317 | |
Targa Resources Partners LP/Targa Resources Partners Finance Corp., Gtd. Notes | | 5.00 | | 1/15/2028 | | 250,000 | | 240,794 | |
TransCanada PipeLines Ltd., Sr. Unscd. Notes | | 2.50 | | 10/12/2031 | | 175,000 | | 139,552 | |
| | 1,177,389 | |
Food Products - .1% | | | | | |
The Kroger Company, Sr. Unscd. Notes | | 1.70 | | 1/15/2031 | | 300,000 | | 233,358 | |
Health Care - .3% | | | | | |
AbbVie, Inc., Sr. Unscd. Notes | | 3.20 | | 11/21/2029 | | 285,000 | | 257,057 | |
Amgen, Inc., Sr. Unscd. Notes | | 5.60 | | 3/2/2043 | | 150,000 | | 147,313 | |
Amgen, Inc., Sr. Unscd. Notes | | 5.65 | | 6/15/2042 | | 80,000 | | 78,805 | |
CVS Health Corp., Sr. Unscd. Notes | | 4.78 | | 3/25/2038 | | 360,000 | | 322,590 | |
Pfizer Investment Enterprises Pte Ltd., Gtd. Notes | | 4.65 | | 5/19/2030 | | 300,000 | | 295,420 | |
| | 1,101,185 | |
Information Technology - .1% | | | | | |
Oracle Corp., Sr. Unscd. Notes | | 3.90 | | 5/15/2035 | | 275,000 | | 234,932 | |
Insurance - .1% | | | | | |
MetLife, Inc., Jr. Sub. Bonds, Ser. G | | 3.85 | | 9/15/2025 | | 100,000 | a,b | 92,460 | |
Prudential Financial, Inc., Sr. Unscd. Notes | | 4.35 | | 2/25/2050 | | 275,000 | | 229,103 | |
| | 321,563 | |
Internet Software & Services - .2% | | | | | |
Amazon.com, Inc., Sr. Unscd. Notes | | 1.65 | | 5/12/2028 | | 350,000 | | 306,100 | |
eBay, Inc., Sr. Unscd. Notes | | 1.90 | | 3/11/2025 | | 300,000 | | 284,335 | |
Meta Platforms, Inc., Sr. Unscd. Notes | | 4.45 | | 8/15/2052 | | 380,000 | | 322,741 | |
| | 913,176 | |
Media - .0% | | | | | |
Comcast Corp., Gtd. Notes | | 5.35 | | 11/15/2027 | | 215,000 | | 218,114 | |
Metals & Mining - .1% | | | | | |
Glencore Funding LLC, Gtd. Notes | | 2.63 | | 9/23/2031 | | 225,000 | c | 179,308 | |
Nucor Corp., Sr. Unscd. Notes | | 4.30 | | 5/23/2027 | | 125,000 | | 121,302 | |
| | 300,610 | |
Municipal Securities - .0% | | | | | |
New York City, GO, Refunding, Ser. D | | 1.92 | | 8/1/2031 | | 175,000 | | 139,916 | |
Real Estate - .1% | | | | | |
Alexandria Real Estate Equities, Inc., Gtd. Notes | | 2.95 | | 3/15/2034 | | 225,000 | | 178,278 | |
Prologis LP, Sr. Unscd. Notes | | 2.25 | | 1/15/2032 | | 175,000 | | 140,613 | |
Prologis LP, Sr. Unscd. Notes | | 4.75 | | 6/15/2033 | | 100,000 | | 95,946 | |
Simon Property Group LP, Sr. Unscd. Notes | | 2.65 | | 2/1/2032 | | 200,000 | | 160,790 | |
| | 575,627 | |
Retailing - .1% | | | | | |
McDonald's Corp., Sr. Unscd. Notes | | 4.60 | | 9/9/2032 | | 200,000 | b | 195,784 | |
The Home Depot, Inc., Sr. Unscd. Notes | | 1.38 | | 3/15/2031 | | 280,000 | | 219,392 | |
| | 415,176 | |
Semiconductors & Semiconductor Equipment - .2% | | | | | |
Broadcom, Inc., Gtd. Notes | | 2.45 | | 2/15/2031 | | 175,000 | c | 141,172 | |
Broadcom, Inc., Sr. Unscd. Notes | | 3.19 | | 11/15/2036 | | 300,000 | c | 225,626 | |
Foundry JV Holdco LLC, Sr. Scd. Notes | | 5.88 | | 1/25/2034 | | 225,000 | c | 222,148 | |
Microchip Technology, Inc., Sr. Unscd. Notes | | 0.97 | | 2/15/2024 | | 125,000 | | 122,145 | |
Microchip Technology, Inc., Sr. Unscd. Notes | | 0.98 | | 9/1/2024 | | 100,000 | | 95,269 | |
56
| | | | | | | | | | |
| |
BNY Mellon Asset Allocation Fund (continued) |
Description | Coupon
Rate (%) | | Maturity Date | | Principal Amount ($) | | Value ($) | |
Bonds and Notes - 12.4% (continued) | | | | | |
Semiconductors & Semiconductor Equipment - .2% (continued) | | | | | |
NXP BV/NXP Funding LLC, Gtd. Notes | | 5.35 | | 3/1/2026 | | 210,000 | | 208,770 | |
| | 1,015,130 | |
Technology Hardware & Equipment - .0% | | | | | |
Dell International LLC/EMC Corp., Gtd. Notes | | 3.38 | | 12/15/2041 | | 200,000 | c | 141,012 | |
Telecommunication Services - .1% | | | | | |
AT&T, Inc., Sr. Unscd. Notes | | 4.55 | | 3/9/2049 | | 345,000 | | 276,398 | |
T-Mobile USA, Inc., Gtd. Notes | | 3.00 | | 2/15/2041 | | 325,000 | | 229,773 | |
Verizon Communications, Inc., Sr. Unscd. Notes | | 3.40 | | 3/22/2041 | | 140,000 | | 104,033 | |
| | 610,204 | |
Transportation - .1% | | | | | |
J.B. Hunt Transport Services, Inc., Gtd. Notes | | 3.88 | | 3/1/2026 | | 250,000 | | 242,345 | |
U.S. Government Agencies Collateralized Municipal-Backed Securities - .0% | | | | | |
Government National Mortgage Association, Ser. 2012-135, Cl. AE | | 1.83 | | 12/16/2052 | | 254,821 | | 209,197 | |
U.S. Government Agencies Mortgage-Backed - 3.4% | | | | | |
Federal Home Loan Mortgage Corp.: | | | |
1.50%, 10/1/2050 | | | 266,822 | d | 196,388 | |
2.00%, 8/1/2041-2/1/2052 | | | 1,794,692 | d | 1,420,589 | |
2.50%, 12/1/2035-12/1/2051 | | | 2,332,973 | d | 2,001,257 | |
3.00%, 11/1/2051-1/1/2052 | | | 641,067 | d | 554,285 | |
3.50%, 1/1/2052 | | | 315,589 | d | 282,327 | |
4.00%, 1/1/2052 | | | 429,356 | d | 396,964 | |
5.00%, 11/1/2052-6/1/2053 | | | 666,843 | d | 649,391 | |
5.50%, 1/1/2053-4/1/2053 | | | 941,963 | d | 931,791 | |
Federal National Mortgage Association: | | | |
1.50%, 1/1/2042 | | | 255,298 | d | 205,014 | |
2.00%, 10/1/2050-1/1/2052 | | | 2,198,019 | d | 1,760,015 | |
2.50%, 6/1/2051-11/1/2051 | | | 1,690,907 | d | 1,400,702 | |
3.00%, 1/1/2035-1/1/2052 | | | 816,920 | d | 732,610 | |
3.50%, 3/1/2052 | | | 564,138 | d | 505,261 | |
4.00%, 4/1/2052-6/1/2052 | | | 699,966 | d | 646,789 | |
4.50%, 3/1/2050-10/1/2052 | | | 701,308 | d | 667,393 | |
Government National Mortgage Association II: | | | |
2.00%, 8/20/2051-9/20/2051 | | | 400,746 | | 318,086 | |
2.50%, 5/20/2051 | | | 516,880 | | 424,940 | |
3.00%, 6/20/2050-11/20/2051 | | | 686,990 | | 604,970 | |
3.50%, 1/20/2052 | | | 258,189 | | 234,594 | |
4.00%, 2/20/2051-5/20/2051 | | | 281,281 | | 258,077 | |
4.50%, 7/20/2052 | | | 406,862 | | 388,207 | |
| | 14,579,650 | |
U.S. Treasury Securities - 5.5% | | | | | |
U.S. Treasury Bonds | | 1.88 | | 11/15/2051 | | 100,000 | | 61,465 | |
U.S. Treasury Bonds | | 2.25 | | 2/15/2052 | | 150,000 | | 101,238 | |
U.S. Treasury Bonds | | 3.00 | | 8/15/2052 | | 700,000 | | 558,059 | |
U.S. Treasury Bonds | | 3.63 | | 5/15/2053 | | 575,000 | | 518,713 | |
U.S. Treasury Bonds | | 3.63 | | 2/15/2053 | | 585,000 | | 527,186 | |
U.S. Treasury Bonds | | 3.88 | | 2/15/2043 | | 970,000 | | 902,706 | |
U.S. Treasury Bonds | | 4.00 | | 11/15/2052 | | 1,640,000 | | 1,582,920 | |
57
STATEMENT OF INVESTMENTS (continued)
| | | | | | | | | | |
| |
BNY Mellon Asset Allocation Fund (continued) |
Description | Coupon
Rate (%) | | Maturity Date | | Principal Amount ($) | | Value ($) | |
Bonds and Notes - 12.4% (continued) | | | | | |
U.S. Treasury Securities - 5.5% (continued) | | | | | |
U.S. Treasury Inflation Indexed Notes, US CPI Urban Consumers Not Seasonally Adjusted | | 0.38 | | 1/15/2027 | | 353,662 | e | 331,209 | |
U.S. Treasury Inflation Indexed Notes, US CPI Urban Consumers Not Seasonally Adjusted | | 0.50 | | 1/15/2028 | | 661,758 | e | 616,888 | |
U.S. Treasury Notes | | 0.25 | | 6/15/2024 | | 250,000 | b | 240,165 | |
U.S. Treasury Notes | | 0.50 | | 8/31/2027 | | 515,000 | | 442,578 | |
U.S. Treasury Notes | | 0.63 | | 5/15/2030 | | 375,000 | | 297,583 | |
U.S. Treasury Notes | | 0.75 | | 4/30/2026 | | 100,000 | | 90,453 | |
U.S. Treasury Notes | | 0.88 | | 1/31/2024 | | 460,000 | b | 451,528 | |
U.S. Treasury Notes | | 1.25 | | 11/30/2026 | | 320,000 | | 289,062 | |
U.S. Treasury Notes | | 1.50 | | 2/15/2030 | | 110,000 | | 93,339 | |
U.S. Treasury Notes | | 1.63 | | 8/15/2029 | | 865,000 | | 749,306 | |
U.S. Treasury Notes | | 1.75 | | 12/31/2026 | | 55,000 | | 50,428 | |
U.S. Treasury Notes | | 2.00 | | 11/15/2026 | | 395,000 | | 365,776 | |
U.S. Treasury Notes | | 2.38 | | 5/15/2027 | | 1,280,000 | | 1,191,400 | |
U.S. Treasury Notes | | 2.50 | | 3/31/2027 | | 980,000 | | 918,444 | |
U.S. Treasury Notes | | 2.50 | | 5/31/2024 | | 815,000 | | 797,519 | |
U.S. Treasury Notes | | 2.50 | | 1/31/2024 | | 185,000 | b | 182,778 | |
U.S. Treasury Notes | | 2.63 | | 7/31/2029 | | 505,000 | | 462,608 | |
U.S. Treasury Notes | | 2.63 | | 1/31/2026 | | 300,000 | | 285,926 | |
U.S. Treasury Notes | | 2.75 | | 7/31/2027 | | 145,000 | | 136,521 | |
U.S. Treasury Notes | | 2.75 | | 8/15/2032 | | 535,000 | | 480,309 | |
U.S. Treasury Notes | | 2.88 | | 4/30/2029 | | 1,095,000 | | 1,019,334 | |
U.S. Treasury Notes | | 2.88 | | 5/15/2032 | | 460,000 | | 418,115 | |
U.S. Treasury Notes | | 3.00 | | 7/31/2024 | | 200,000 | | 195,696 | |
U.S. Treasury Notes | | 3.13 | | 11/15/2028 | | 75,000 | | 71,024 | |
U.S. Treasury Notes | | 3.25 | | 6/30/2029 | | 940,000 | | 891,605 | |
U.S. Treasury Notes | | 3.25 | | 6/30/2027 | | 100,000 | | 96,016 | |
U.S. Treasury Notes | | 3.38 | | 5/15/2033 | | 670,000 | b | 631,266 | |
U.S. Treasury Notes | | 3.50 | | 1/31/2028 | | 345,000 | | 333,666 | |
U.S. Treasury Notes | | 3.50 | | 1/31/2030 | | 40,000 | | 38,377 | |
U.S. Treasury Notes | | 3.50 | | 2/15/2033 | | 555,000 | | 528,637 | |
U.S. Treasury Notes | | 3.63 | | 3/31/2030 | | 850,000 | b | 821,180 | |
U.S. Treasury Notes | | 3.75 | | 5/31/2030 | | 145,000 | | 141,109 | |
U.S. Treasury Notes | | 3.88 | | 12/31/2027 | | 1,035,000 | | 1,016,160 | |
U.S. Treasury Notes | | 3.88 | | 1/15/2026 | | 1,050,000 | | 1,030,271 | |
U.S. Treasury Notes | | 4.00 | | 2/29/2028 | | 175,000 | | 172,860 | |
U.S. Treasury Notes | | 4.13 | | 11/15/2032 | | 895,000 | | 894,755 | |
U.S. Treasury Notes | | 4.25 | | 12/31/2024 | | 1,050,000 | | 1,037,265 | |
U.S. Treasury Notes | | 4.50 | | 11/15/2025 | | 200,000 | | 198,812 | |
U.S. Treasury Notes | | 4.63 | | 6/30/2025 | | 410,000 | | 407,758 | |
U.S. Treasury Notes | | 4.63 | | 2/28/2025 | | 690,000 | | 685,283 | |
U.S. Treasury Notes | | 4.75 | | 7/31/2025 | | 160,000 | b | 159,581 | |
| | 23,514,877 | |
Total Bonds and Notes
(cost $57,937,131) | | 53,198,381 | |
58
| | | | | | | | | | |
| |
BNY Mellon Asset Allocation Fund (continued) |
Description | | | | | Shares | | Value ($) | |
Common Stocks - 34.7% | | | | | |
Advertising - .1% | | | | | |
Omnicom Group, Inc. | | | | | | 1,670 | | 135,287 | |
The Interpublic Group of Companies, Inc. | | | | | | 3,450 | | 112,505 | |
| | 247,792 | |
Aerospace & Defense - .5% | | | | | |
Howmet Aerospace, Inc. | | | | | | 2,930 | | 144,947 | |
L3Harris Technologies, Inc. | | | | | | 334 | | 59,482 | |
Lockheed Martin Corp. | | | | | | 1,056 | | 473,458 | |
Northrop Grumman Corp. | | | | | | 603 | | 261,153 | |
RTX Corp. | | | | | | 5,352 | | 460,486 | |
The Boeing Company | | | | | | 2,278 | f | 510,340 | |
TransDigm Group, Inc. | | | | | | 275 | f | 248,559 | |
| | 2,158,425 | |
Agriculture - .3% | | | | | |
Altria Group, Inc. | | | | | | 5,696 | | 251,877 | |
Archer-Daniels-Midland Co. | | | | | | 2,185 | | 173,270 | |
Bunge Ltd. | | | | | | 685 | | 78,309 | |
Philip Morris International, Inc. | | | | | | 6,749 | | 648,309 | |
| | 1,151,765 | |
Airlines - .1% | | | | | |
American Airlines Group, Inc. | | | | | | 7,020 | f | 103,405 | |
Delta Air Lines, Inc. | | | | | | 4,405 | | 188,886 | |
Southwest Airlines Co. | | | | | | 2,715 | | 85,794 | |
| | 378,085 | |
Automobiles & Components - .8% | | | | | |
BorgWarner, Inc. | | | | | | 2,925 | | 119,194 | |
Ford Motor Co. | | | | | | 21,985 | | 266,678 | |
General Motors Co. | | | | | | 4,770 | | 159,843 | |
Tesla, Inc. | | | | | | 10,508 | f | 2,711,905 | |
| | 3,257,620 | |
Banks - 1.0% | | | | | |
Bank of America Corp. | | | | | | 33,963 | | 973,719 | |
Citigroup, Inc. | | | | | | 6,456 | | 266,568 | |
Citizens Financial Group, Inc. | | | | | | 3,970 | | 111,676 | |
Fifth Third Bancorp | | | | | | 3,530 | | 93,722 | |
Huntington Bancshares, Inc. | | | | | | 9,700 | | 107,573 | |
JPMorgan Chase & Co. | | | | | | 10,809 | | 1,581,681 | |
KeyCorp | | | | | | 8,680 | | 98,344 | |
M&T Bank Corp. | | | | | | 874 | | 109,294 | |
Regions Financial Corp. | | | | | | 10,285 | | 188,627 | |
The PNC Financial Services Group, Inc. | | | | | | 1,641 | | 198,118 | |
Truist Financial Corp. | | | | | | 2,398 | | 73,259 | |
Wells Fargo & Co. | | | | | | 13,104 | | 541,064 | |
| | 4,343,645 | |
Beverage Products - .6% | | | | | |
Constellation Brands, Inc., Cl. A | | | | | | 609 | | 158,681 | |
CVS Health Corp. | | | | | | 4,822 | | 314,250 | |
Molson Coors Beverage Co., Cl. B | | | | | | 1,915 | | 121,583 | |
Monster Beverage Corp. | | | | | | 6,138 | f | 352,383 | |
PepsiCo, Inc. | | | | | | 5,365 | | 954,541 | |
59
STATEMENT OF INVESTMENTS (continued)
| | | | | | | | | | |
| |
BNY Mellon Asset Allocation Fund (continued) |
Description | | | | | Shares | | Value ($) | |
Common Stocks - 34.7% (continued) | | | | | |
Beverage Products - .6% (continued) | | | | | |
The Coca-Cola Company | | | | | | 14,658 | | 876,988 | |
| | 2,778,426 | |
Building Materials - .2% | | | | | |
Carrier Global Corp. | | | | | | 4,330 | | 248,758 | |
Johnson Controls International PLC | | | | | | 3,282 | | 193,835 | |
Trane Technologies PLC | | | | | | 1,301 | | 267,043 | |
| | 709,636 | |
Chemicals - .6% | | | | | |
Air Products & Chemicals, Inc. | | | | | | 794 | | 234,619 | |
Albemarle Corp. | | | | | | 661 | | 131,347 | |
Celanese Corp. | | | | | | 800 | | 101,088 | |
CF Industries Holdings, Inc. | | | | | | 1,055 | | 81,309 | |
Dow, Inc. | | | | | | 2,970 | | 162,043 | |
DuPont de Nemours, Inc. | | | | | | 1,960 | | 150,704 | |
Eastman Chemical Co. | | | | | | 1,845 | | 156,843 | |
Ecolab, Inc. | | | | | | 820 | | 150,724 | |
FMC Corp. | | | | | | 803 | | 69,243 | |
Linde PLC | | | | | | 1,879 | | 727,248 | |
LyondellBasell Industries NV, Cl. A | | | | | | 1,520 | | 150,130 | |
PPG Industries, Inc. | | | | | | 836 | | 118,511 | |
The Sherwin-Williams Company | | | | | | 891 | | 242,103 | |
Vulcan Materials Co. | | | | | | 592 | | 129,204 | |
| | 2,605,116 | |
Commercial & Professional Services - .4% | | | | | |
Automatic Data Processing, Inc. | | | | | | 1,922 | | 489,360 | |
Cintas Corp. | | | | | | 478 | | 240,993 | |
Equifax, Inc. | | | | | | 775 | | 160,193 | |
FLEETCOR Technologies, Inc. | | | | | | 399 | f | 108,420 | |
S&P Global, Inc. | | | | | | 1,751 | | 684,396 | |
| | 1,683,362 | |
Consumer Discretionary - .5% | | | | | |
Carnival Corp. | | | | | | 7,535 | f | 119,204 | |
Chipotle Mexican Grill, Inc. | | | | | | 116 | f | 223,490 | |
D.R. Horton, Inc. | | | | | | 1,923 | | 228,875 | |
Darden Restaurants, Inc. | | | | | | 1,052 | | 163,597 | |
Hasbro, Inc. | | | | | | 1,080 | | 77,760 | |
Hilton Worldwide Holdings, Inc. | | | | | | 1,179 | | 175,258 | |
Lennar Corp., Cl. A | | | | | | 1,527 | | 181,850 | |
Marriott International, Inc., Cl. A | | | | | | 1,197 | | 243,601 | |
MGM Resorts International | | | | | | 2,810 | | 123,584 | |
Newell Brands, Inc. | | | | | | 5,430 | | 57,449 | |
Royal Caribbean Cruises Ltd. | | | | | | 930 | f | 92,014 | |
Starbucks Corp. | | | | | | 4,398 | | 428,541 | |
Whirlpool Corp. | | | | | | 695 | | 97,272 | |
Yum! Brands, Inc. | | | | | | 1,106 | | 143,094 | |
| | 2,355,589 | |
Consumer Durables & Apparel - .2% | | | | | |
NIKE, Inc., Cl. B | | | | | | 5,011 | | 509,669 | |
Tapestry, Inc. | | | | | | 3,765 | | 125,450 | |
60
| | | | | | | | | | |
| |
BNY Mellon Asset Allocation Fund (continued) |
Description | | | | | Shares | | Value ($) | |
Common Stocks - 34.7% (continued) | | | | | |
Consumer Durables & Apparel - .2% (continued) | | | | | |
VF Corp. | | | | | | 3,610 | | 71,334 | |
| | 706,453 | |
Consumer Staples - .4% | | | | | |
Church & Dwight Co., Inc. | | | | | | 1,370 | | 132,575 | |
Colgate-Palmolive Co. | | | | | | 4,370 | | 321,064 | |
The Procter & Gamble Company | | | | | | 9,259 | | 1,429,034 | |
| | 1,882,673 | |
Diversified Financials - 1.5% | | | | | |
American Express Co. | | | | | | 3,600 | | 568,764 | |
BlackRock, Inc. | | | | | | 590 | | 413,319 | |
Capital One Financial Corp. | | | | | | 1,550 | | 158,705 | |
CME Group, Inc. | | | | | | 1,364 | | 276,456 | |
Discover Financial Services | | | | | | 1,780 | | 160,325 | |
Intercontinental Exchange, Inc. | | | | | | 2,071 | | 244,357 | |
Invesco Ltd. | | | | | | 7,300 | | 116,216 | |
Mastercard, Inc., Cl. A | | | | | | 3,109 | | 1,282,898 | |
Moody's Corp. | | | | | | 724 | | 243,843 | |
Morgan Stanley | | | | | | 5,650 | | 481,097 | |
Northern Trust Corp. | | | | | | 1,271 | | 96,685 | |
State Street Corp. | | | | | | 2,070 | | 142,292 | |
The Charles Schwab Corp. | | | | | | 5,760 | | 340,704 | |
The Goldman Sachs Group, Inc. | | | | | | 1,394 | | 456,828 | |
Visa, Inc., Cl. A | | | | | | 6,374 | | 1,565,964 | |
| | 6,548,453 | |
Electronic Components - .6% | | | | | |
AMETEK, Inc. | | | | | | 1,268 | | 202,259 | |
Amphenol Corp., Cl. A | | | | | | 2,951 | | 260,809 | |
Emerson Electric Co. | | | | | | 2,740 | | 269,205 | |
Fastenal Co. | | | | | | 3,225 | | 185,695 | |
Fortive Corp. | | | | | | 920 | | 72,542 | |
Generac Holdings, Inc. | | | | | | 395 | f | 46,930 | |
Honeywell International, Inc. | | | | | | 2,616 | | 491,651 | |
PACCAR, Inc. | | | | | | 3,487 | | 286,945 | |
Quanta Services, Inc. | | | | | | 1,610 | | 337,891 | |
TE Connectivity Ltd. | | | | | | 1,528 | | 202,292 | |
United Rentals, Inc. | | | | | | 547 | | 260,667 | |
| | 2,616,886 | |
Energy - 1.5% | | | | | |
Baker Hughes Co. | | | | | | 3,570 | | 129,198 | |
Chevron Corp. | | | | | | 5,410 | | 871,551 | |
ConocoPhillips | | | | | | 6,135 | | 730,249 | |
Coterra Energy, Inc. | | | | | | 3,455 | | 97,396 | |
Devon Energy Corp. | | | | | | 2,410 | | 123,127 | |
Diamondback Energy, Inc. | | | | | | 1,569 | | 238,143 | |
EOG Resources, Inc. | | | | | | 3,708 | | 476,923 | |
EQT Corp. | | | | | | 1,450 | | 62,669 | |
Exxon Mobil Corp. | | | | | | 13,964 | | 1,552,657 | |
Halliburton Co. | | | | | | 4,120 | | 159,114 | |
Hess Corp. | | | | | | 1,707 | | 263,731 | |
61
STATEMENT OF INVESTMENTS (continued)
| | | | | | | | | | |
| |
BNY Mellon Asset Allocation Fund (continued) |
Description | | | | | Shares | | Value ($) | |
Common Stocks - 34.7% (continued) | | | | | |
Energy - 1.5% (continued) | | | | | |
Kinder Morgan, Inc. | | | | | | 5,557 | | 95,692 | |
Marathon Oil Corp. | | | | | | 8,310 | | 218,968 | |
Marathon Petroleum Corp. | | | | | | 1,621 | | 231,430 | |
Occidental Petroleum Corp. | | | | | | 2,870 | | 180,207 | |
ONEOK, Inc. | | | | | | 2,005 | | 130,726 | |
Phillips 66 | | | | | | 1,501 | | 171,354 | |
Pioneer Natural Resources Co. | | | | | | 519 | | 123,486 | |
Schlumberger NV | | | | | | 6,225 | | 367,026 | |
The Williams Companies, Inc. | | | | | | 4,010 | | 138,465 | |
Valero Energy Corp. | | | | | | 1,333 | | 173,157 | |
| | 6,535,269 | |
Environmental Control - .1% | | | | | |
Waste Management, Inc. | | | | | | 1,407 | | 220,589 | |
Food & Staples Retailing - .5% | | | | | |
Costco Wholesale Corp. | | | | | | 1,689 | | 927,734 | |
Sysco Corp. | | | | | | 2,235 | | 155,668 | |
The Kroger Company | | | | | | 3,420 | | 158,654 | |
Walmart, Inc. | | | | | | 6,160 | | 1,001,678 | |
| | 2,243,734 | |
Food Products - .3% | | | | | |
General Mills, Inc. | | | | | | 3,590 | | 242,899 | |
Lamb Weston Holdings, Inc. | | | | | | 1,145 | | 111,534 | |
Mondelez International, Inc., Cl. A | | | | | | 5,715 | | 407,251 | |
The Hershey Company | | | | | | 824 | | 177,045 | |
The J.M. Smucker Company | | | | | | 1,022 | | 148,139 | |
| | 1,086,868 | |
Forest Products & Paper - .0% | | | | | |
International Paper Co. | | | | | | 3,235 | | 112,966 | |
Health Care - 4.6% | | | | | |
Abbott Laboratories | | | | | | 7,279 | | 749,009 | |
AbbVie, Inc. | | | | | | 6,977 | | 1,025,340 | |
Agilent Technologies, Inc. | | | | | | 2,643 | | 319,988 | |
Amgen, Inc. | | | | | | 2,342 | | 600,348 | |
Baxter International, Inc. | | | | | | 2,800 | | 113,680 | |
Becton, Dickinson & Co. | | | | | | 1,315 | | 367,477 | |
Biogen, Inc. | | | | | | 768 | f | 205,332 | |
Boston Scientific Corp. | | | | | | 6,440 | f | 347,374 | |
Bristol-Myers Squibb Co. | | | | | | 8,558 | | 527,601 | |
Cardinal Health, Inc. | | | | | | 2,550 | | 222,691 | |
Centene Corp. | | | | | | 2,495 | f | 153,817 | |
Corteva, Inc. | | | | | | 2,893 | | 146,125 | |
Danaher Corp. | | | | | | 3,287 | | 871,055 | |
Dentsply Sirona, Inc. | | | | | | 1,995 | | 73,995 | |
DexCom, Inc. | | | | | | 1,413 | f | 142,685 | |
Edwards Lifesciences Corp. | | | | | | 1,391 | f | 106,370 | |
Elevance Health, Inc. | | | | | | 911 | | 402,671 | |
Eli Lilly & Co. | | | | | | 3,020 | | 1,673,684 | |
GE HealthCare Technologies, Inc. | | | | | | 1,755 | | 123,640 | |
Gilead Sciences, Inc. | | | | | | 4,645 | | 355,250 | |
62
| | | | | | | | | | |
| |
BNY Mellon Asset Allocation Fund (continued) |
Description | | | | | Shares | | Value ($) | |
Common Stocks - 34.7% (continued) | | | | | |
Health Care - 4.6% (continued) | | | | | |
HCA Healthcare, Inc. | | | | | | 1,049 | | 290,888 | |
Hologic, Inc. | | | | | | 1,510 | f | 112,857 | |
Humana, Inc. | | | | | | 534 | | 246,510 | |
IDEXX Laboratories, Inc. | | | | | | 595 | f | 304,289 | |
Illumina, Inc. | | | | | | 650 | f | 107,393 | |
Intuitive Surgical, Inc. | | | | | | 1,370 | f | 428,372 | |
IQVIA Holdings, Inc. | | | | | | 660 | f | 146,936 | |
Johnson & Johnson | | | | | | 11,018 | | 1,781,390 | |
Laboratory Corp. of America Holdings | | | | | | 611 | | 127,149 | |
McKesson Corp. | | | | | | 551 | | 227,188 | |
Medtronic PLC | | | | | | 1,778 | | 144,907 | |
Merck & Co., Inc. | | | | | | 9,576 | | 1,043,592 | |
Organon & Co. | | | | | | 3,475 | | 76,311 | |
Pfizer, Inc. | | | | | | 24,921 | | 881,705 | |
Quest Diagnostics, Inc. | | | | | | 762 | | 100,203 | |
Regeneron Pharmaceuticals, Inc. | | | | | | 424 | f | 350,432 | |
ResMed, Inc. | | | | | | 786 | | 125,438 | |
Steris PLC | | | | | | 608 | | 139,591 | |
Stryker Corp. | | | | | | 1,481 | | 419,938 | |
The Cigna Group | | | | | | 1,149 | | 317,423 | |
The Cooper Companies, Inc. | | | | | | 261 | | 96,567 | |
Thermo Fisher Scientific, Inc. | | | | | | 1,824 | | 1,016,150 | |
UnitedHealth Group, Inc. | | | | | | 3,658 | | 1,743,330 | |
Vertex Pharmaceuticals, Inc. | | | | | | 1,048 | f | 365,060 | |
Waters Corp. | | | | | | 356 | f | 99,965 | |
Zoetis, Inc. | | | | | | 2,225 | | 423,885 | |
| | 19,645,601 | |
Household & Personal Products - .1% | | | | | |
Kimberly-Clark Corp. | | | | | | 2,269 | | 292,315 | |
Industrial - .9% | | | | | |
Caterpillar, Inc. | | | | | | 1,840 | | 517,279 | |
Copart, Inc. | | | | | | 4,546 | f | 203,797 | |
Deere & Co. | | | | | | 1,207 | | 496,005 | |
Dover Corp. | | | | | | 1,046 | | 155,122 | |
Eaton Corp. PLC | | | | | | 1,647 | | 379,419 | |
General Electric Co. | | | | | | 5,073 | | 580,656 | |
Huntington Ingalls Industries, Inc. | | | | | | 338 | | 74,468 | |
Illinois Tool Works, Inc. | | | | | | 475 | | 117,491 | |
Ingersoll Rand, Inc. | | | | | | 2,470 | | 171,937 | |
Otis Worldwide Corp. | | | | | | 1,444 | | 123,534 | |
Parker-Hannifin Corp. | | | | | | 672 | | 280,157 | |
Rockwell Automation, Inc. | | | | | | 708 | | 220,953 | |
Snap-on, Inc. | | | | | | 705 | | 189,363 | |
Teledyne Technologies, Inc. | | | | | | 244 | f | 102,065 | |
Textron, Inc. | | | | | | 1,610 | | 125,113 | |
Westinghouse Air Brake Technologies Corp. | | | | | | 931 | | 104,756 | |
| | 3,842,115 | |
Information Technology - 4.0% | | | | | |
Activision Blizzard, Inc. | | | | | | 2,985 | | 274,590 | |
63
STATEMENT OF INVESTMENTS (continued)
| | | | | | | | | | |
| |
BNY Mellon Asset Allocation Fund (continued) |
Description | | | | | Shares | | Value ($) | |
Common Stocks - 34.7% (continued) | | | | | |
Information Technology - 4.0% (continued) | | | | | |
Adobe, Inc. | | | | | | 1,790 | f | 1,001,219 | |
Autodesk, Inc. | | | | | | 932 | f | 206,848 | |
Cadence Design Systems, Inc. | | | | | | 1,967 | f | 472,945 | |
Cognizant Technology Solutions Corp., Cl. A | | | | | | 2,355 | | 168,642 | |
eBay, Inc. | | | | | | 2,732 | | 122,339 | |
Electronic Arts, Inc. | | | | | | 1,180 | | 141,576 | |
Fidelity National Information Services, Inc. | | | | | | 2,830 | | 158,084 | |
Fiserv, Inc. | | | | | | 2,511 | f | 304,810 | |
Global Payments, Inc. | | | | | | 1,454 | | 184,207 | |
International Business Machines Corp. | | | | | | 3,243 | | 476,170 | |
Intuit, Inc. | | | | | | 1,207 | | 653,965 | |
Jack Henry & Associates, Inc. | | | | | | 708 | | 111,000 | |
Microsoft Corp. | | | | | | 29,169 | | 9,560,431 | |
MSCI, Inc. | | | | | | 462 | | 251,152 | |
Oracle Corp. | | | | | | 6,013 | | 723,905 | |
Paychex, Inc. | | | | | | 1,826 | | 223,192 | |
PayPal Holdings, Inc. | | | | | | 5,056 | f | 316,051 | |
Roper Technologies, Inc. | | | | | | 411 | | 205,114 | |
Salesforce, Inc. | | | | | | 3,868 | f | 856,607 | |
ServiceNow, Inc. | | | | | | 772 | f | 454,577 | |
Synopsys, Inc. | | | | | | 564 | f | 258,814 | |
| | 17,126,238 | |
Insurance - 1.3% | | | | | |
Aflac, Inc. | | | | | | 3,355 | | 250,182 | |
American International Group, Inc. | | | | | | 4,315 | | 252,514 | |
Aon PLC, Cl. A | | | | | | 1,054 | | 351,393 | |
Berkshire Hathaway, Inc., Cl. B | | | | | | 6,672 | f | 2,403,254 | |
Chubb Ltd. | | | | | | 1,244 | | 249,882 | |
Cincinnati Financial Corp. | | | | | | 1,130 | | 119,543 | |
Lincoln National Corp. | | | | | | 2,560 | | 65,690 | |
Marsh & McLennan Cos., Inc. | | | | | | 1,605 | | 312,959 | |
MetLife, Inc. | | | | | | 2,325 | | 147,266 | |
Prudential Financial, Inc. | | | | | | 2,400 | | 227,208 | |
The Allstate Corp. | | | | | | 1,605 | | 173,035 | |
The Progressive Corp. | | | | | | 4,353 | | 580,995 | |
The Travelers Companies, Inc. | | | | | | 1,277 | | 205,891 | |
Willis Towers Watson PLC | | | | | | 631 | | 130,466 | |
| | 5,470,278 | |
Internet Software & Services - 3.3% | | | | | |
Alphabet, Inc., Cl. A | | | | | | 21,600 | f | 2,941,272 | |
Alphabet, Inc., Cl. C | | | | | | 22,134 | f | 3,040,105 | |
Amazon.com, Inc. | | | | | | 34,988 | f | 4,828,694 | |
Booking Holdings, Inc. | | | | | | 139 | f | 431,599 | |
Etsy, Inc. | | | | | | 940 | f | 69,156 | |
Match Group, Inc. | | | | | | 1,900 | f | 89,053 | |
Meta Platforms, Inc., Cl. A | | | | | | 8,670 | f | 2,565,366 | |
Verisign, Inc. | | | | | | 786 | f | 163,323 | |
| | 14,128,568 | |
64
| | | | | | | | | | |
| |
BNY Mellon Asset Allocation Fund (continued) |
Description | | | | | Shares | | Value ($) | |
Common Stocks - 34.7% (continued) | | | | | |
Materials - .1% | | | | | |
Sealed Air Corp. | | | | | | 2,320 | | 85,979 | |
WestRock Co. | | | | | | 5,065 | | 165,676 | |
| | 251,655 | |
Media - .6% | | | | | |
Charter Communications, Inc., Cl. A | | | | | | 465 | f | 203,726 | |
Comcast Corp., Cl. A | | | | | | 16,206 | | 757,793 | |
Fox Corp., Cl. A | | | | | | 3,125 | | 103,313 | |
Live Nation Entertainment, Inc. | | | | | | 1,125 | f | 95,096 | |
Netflix, Inc. | | | | | | 1,779 | f | 771,517 | |
News Corporation, Cl. A | | | | | | 6,050 | | 130,015 | |
The Walt Disney Company | | | | | | 3,783 | f | 316,561 | |
Warner Bros Discovery, Inc. | | | | | | 9,945 | f | 130,677 | |
| | 2,508,698 | |
Metals & Mining - .1% | | | | | |
Freeport-McMoRan, Inc. | | | | | | 5,745 | | 229,283 | |
Nucor Corp. | | | | | | 1,088 | | 187,245 | |
| | 416,528 | |
Real Estate - .8% | | | | | |
Alexandria Real Estate Equities, Inc. | | | | | | 881 | g | 102,496 | |
American Tower Corp. | | | | | | 288 | g | 52,220 | |
AvalonBay Communities, Inc. | | | | | | 672 | g | 123,527 | |
CBRE Group, Inc., Cl. A | | | | | | 1,925 | f | 163,721 | |
Crown Castle, Inc. | | | | | | 1,709 | g | 171,754 | |
Digital Realty Trust, Inc. | | | | | | 1,366 | g | 179,930 | |
Equinix, Inc. | | | | | | 351 | g | 274,264 | |
Equity Residential | | | | | | 2,210 | g | 143,274 | |
Essex Property Trust, Inc. | | | | | | 495 | g | 118,003 | |
Extra Space Storage, Inc. | | | | | | 852 | g | 109,635 | |
Federal Realty Investment Trust | | | | | | 1,200 | g | 117,528 | |
Healthpeak Properties, Inc. | | | | | | 5,785 | g | 119,055 | |
Invitation Homes, Inc. | | | | | | 3,060 | g | 104,315 | |
Iron Mountain, Inc. | | | | | | 2,770 | g | 176,006 | |
Prologis, Inc. | | | | | | 3,441 | g | 427,372 | |
Public Storage | | | | | | 1,169 | g | 323,088 | |
Regency Centers Corp. | | | | | | 2,065 | g | 128,443 | |
Simon Property Group, Inc. | | | | | | 1,964 | g | 222,894 | |
UDR, Inc. | | | | | | 3,370 | g | 134,463 | |
VICI Properties, Inc. | | | | | | 5,290 | g | 163,144 | |
Welltower, Inc. | | | | | | 2,125 | g | 176,120 | |
Weyerhaeuser Co. | | | | | | 3,105 | g | 101,689 | |
| | 3,632,941 | |
Retailing - 1.0% | | | | | |
AutoZone, Inc. | | | | | | 113 | f | 286,040 | |
CarMax, Inc. | | | | | | 890 | f | 72,695 | |
Dollar General Corp. | | | | | | 1,022 | | 141,547 | |
Dollar Tree, Inc. | | | | | | 1,058 | f | 129,457 | |
Domino's Pizza, Inc. | | | | | | 177 | | 68,570 | |
Lowe's Cos., Inc. | | | | | | 2,524 | | 581,732 | |
McDonald's Corp. | | | | | | 2,617 | | 735,770 | |
65
STATEMENT OF INVESTMENTS (continued)
| | | | | | | | | | |
| |
BNY Mellon Asset Allocation Fund (continued) |
Description | | | | | Shares | | Value ($) | |
Common Stocks - 34.7% (continued) | | | | | |
Retailing - 1.0% (continued) | | | | | |
O'Reilly Automotive, Inc. | | | | | | 305 | f | 286,608 | |
Target Corp. | | | | | | 1,972 | | 249,557 | |
The Home Depot, Inc. | | | | | | 3,913 | | 1,292,464 | |
The TJX Companies, Inc. | | | | | | 4,182 | | 386,751 | |
Tractor Supply Co. | | | | | | 862 | | 188,347 | |
| | 4,419,538 | |
Semiconductors & Semiconductor Equipment - 2.5% | | | | | |
Advanced Micro Devices, Inc. | | | | | | 6,244 | f | 660,116 | |
Analog Devices, Inc. | | | | | | 2,182 | | 396,644 | |
Applied Materials, Inc. | | | | | | 3,442 | | 525,800 | |
Broadcom, Inc. | | | | | | 1,599 | | 1,475,701 | |
Intel Corp. | | | | | | 16,443 | | 577,807 | |
KLA Corp. | | | | | | 783 | | 392,964 | |
Lam Research Corp. | | | | | | 511 | | 358,926 | |
Microchip Technology, Inc. | | | | | | 2,521 | | 206,319 | |
Micron Technology, Inc. | | | | | | 4,440 | | 310,534 | |
Monolithic Power Systems, Inc. | | | | | | 173 | | 90,169 | |
NVIDIA Corp. | | | | | | 9,796 | | 4,834,816 | |
NXP Semiconductors NV | | | | | | 894 | | 183,914 | |
ON Semiconductor Corp. | | | | | | 1,455 | f | 143,259 | |
Teradyne, Inc. | | | | | | 607 | | 65,477 | |
Texas Instruments, Inc. | | | | | | 3,687 | | 619,637 | |
| | 10,842,083 | |
Technology Hardware & Equipment - 3.3% | | | | | |
Accenture PLC, Cl. A | | | | | | 3,173 | | 1,027,322 | |
Apple, Inc. | | | | | | 58,698 | | 11,027,593 | |
Corning, Inc. | | | | | | 3,560 | | 116,839 | |
DXC Technology Co. | | | | | | 2,375 | f | 49,258 | |
F5, Inc. | | | | | | 516 | f | 84,449 | |
Fortinet, Inc. | | | | | | 4,620 | f | 278,170 | |
HP, Inc. | | | | | | 4,506 | | 133,873 | |
Juniper Networks, Inc. | | | | | | 4,985 | | 145,163 | |
Keysight Technologies, Inc. | | | | | | 1,270 | f | 169,291 | |
Leidos Holdings, Inc. | | | | | | 1,525 | | 148,703 | |
Motorola Solutions, Inc. | | | | | | 428 | | 121,368 | |
Palo Alto Networks, Inc. | | | | | | 1,117 | f | 271,766 | |
Qualcomm, Inc. | | | | | | 4,969 | | 569,100 | |
Seagate Technology Holdings PLC | | | | | | 1,240 | | 87,780 | |
Western Digital Corp. | | | | | | 2,040 | f | 91,800 | |
| | 14,322,475 | |
Telecommunication Services - .5% | | | | | |
Arista Networks, Inc. | | | | | | 1,371 | f | 267,660 | |
AT&T, Inc. | | | | | | 7,615 | | 112,626 | |
Cisco Systems, Inc. | | | | | | 14,030 | | 804,620 | |
T-Mobile US, Inc. | | | | | | 3,239 | f | 441,314 | |
Verizon Communications, Inc. | | | | | | 20,738 | | 725,415 | |
| | 2,351,635 | |
Transportation - .5% | | | | | |
CSX Corp. | | | | | | 7,083 | | 213,907 | |
66
| | | | | | | | | | |
| |
BNY Mellon Asset Allocation Fund (continued) |
Description | | | | | Shares | | Value ($) | |
Common Stocks - 34.7% (continued) | | | | | |
Transportation - .5% (continued) | | | | | |
FedEx Corp. | | | | | | 1,061 | | 276,942 | |
Norfolk Southern Corp. | | | | | | 1,474 | | 302,185 | |
Union Pacific Corp. | | | | | | 3,100 | | 683,767 | |
United Parcel Service, Inc., Cl. B | | | | | | 2,995 | | 507,353 | |
| | 1,984,154 | |
Utilities - .9% | | | | | |
Ameren Corp. | | | | | | 1,865 | | 147,839 | |
American Electric Power Co., Inc. | | | | | | 2,538 | | 198,979 | |
American Water Works Co., Inc. | | | | | | 1,539 | | 213,521 | |
CenterPoint Energy, Inc. | | | | | | 5,555 | | 154,929 | |
CMS Energy Corp. | | | | | | 2,315 | | 130,080 | |
Consolidated Edison, Inc. | | | | | | 3,475 | | 309,136 | |
Constellation Energy Corp. | | | | | | 1,723 | | 179,468 | |
Dominion Energy, Inc. | | | | | | 2,575 | | 124,991 | |
DTE Energy Co. | | | | | | 1,447 | | 149,591 | |
Duke Energy Corp. | | | | | | 2,585 | | 229,548 | |
Edison International | | | | | | 3,225 | | 222,041 | |
Entergy Corp. | | | | | | 1,156 | | 110,109 | |
Evergy, Inc. | | | | | | 3,000 | | 164,910 | |
Exelon Corp. | | | | | | 6,320 | | 253,558 | |
FirstEnergy Corp. | | | | | | 4,450 | | 160,511 | |
NextEra Energy, Inc. | | | | | | 8,137 | | 543,552 | |
NiSource, Inc. | | | | | | 3,805 | | 101,822 | |
Public Service Enterprise Group, Inc. | | | | | | 3,125 | | 190,875 | |
The Southern Company | | | | | | 2,945 | | 199,465 | |
| | 3,784,925 | |
Total Common Stocks
(cost $75,570,585) | | 148,643,099 | |
| | Preferred Dividend
Rate (%) | | | | | | | |
Preferred Stocks - .1% | | | | | |
Telecommunication Services - .1% | | | | | |
AT&T, Inc., Ser. A
(cost $375,000) | | 5.00 | | | | 15,000 | | 304,950 | |
| | | | | | Number of Rights | | | |
Rights - .0% | | | | | |
Health Care - .0% | | | | | |
Abiomed, Inc.
(cost $0) | | | | | | 390 | h | 398 | |
67
STATEMENT OF INVESTMENTS (continued)
| | | | | | | | | | |
| |
BNY Mellon Asset Allocation Fund (continued) |
Description | 1-Day
Yield (%) | | | | Shares | | Value ($) | |
Investment Companies - 52.9% | | | | | |
Registered Investment Companies - 52.9% | | | | | |
BNY Mellon Corporate Bond Fund, Cl. M | | | | | | 1,602,586 | i | 18,654,106 | |
BNY Mellon Developed Markets Real Estate Securities Fund, CI. Y | | | | | | 1,246,316 | i | 9,372,297 | |
BNY Mellon Emerging Markets Fund, Cl. M | | | | | | 2,024,158 | i | 19,391,435 | |
BNY Mellon Floating Rate Income Fund, Cl. Y | | | | | | 778,047 | i | 8,589,643 | |
BNY Mellon High Yield Fund, Cl. I | | | | | | 2,267,630 | i | 11,814,352 | |
BNY Mellon Income Stock Fund, Cl. M | | | | | | 2,940,366 | i | 22,934,851 | |
BNY Mellon Intermediate Bond Fund, Cl. M | | | | | | 2,192,593 | i | 25,456,010 | |
BNY Mellon International Equity Fund, Cl. Y | | | | | | 1,091,079 | i | 22,956,302 | |
BNY Mellon International Fund, Cl. M | | | | | | 20,170 | i | 275,522 | |
BNY Mellon Mid Cap Multi-Strategy Fund, Cl. M | | | | | | 1,341,163 | i | 23,456,943 | |
BNY Mellon Research Growth Fund Inc, Cl. Y | | | | | | 1,595,195 | i | 25,108,369 | |
BNY Mellon Select Managers Small Cap Growth Fund, Cl. Y | | | | | | 241,259 | i | 5,310,119 | |
BNY Mellon Select Managers Small Cap Value Fund, Cl. Y | | | | | | 493,011 | i | 10,294,069 | |
BNY Mellon Short-Term U.S. Government Securities Fund, Cl. M | | | | | | 1,146,210 | i | 12,390,529 | |
BNY Mellon Small Cap Multi-Strategy Fund, Cl. M | | | | | | 489,144 | i | 9,606,788 | |
Dreyfus Institutional Preferred Government Plus Money Market Fund, Institutional Shares | | 5.41 | | | | 1,191,576 | i | 1,191,576 | |
Total Investment Companies
(cost $219,178,552) | | 226,802,911 | |
| | | | | | | | | |
Investment of Cash Collateral for Securities Loaned - .1% | | | | | |
Registered Investment Companies - .1% | | | | | |
Dreyfus Institutional Preferred Government Plus Money Market Fund, Institutional Shares
(cost $612,720) | | 5.41 | | | | 612,720 | i | 612,720 | |
Total Investments (cost $353,673,988) | | 100.2% | 429,562,459 | |
Liabilities, Less Cash and Receivables | | (0.2%) | (742,338) | |
Net Assets | | 100.0% | 428,820,121 | |
GO—General Obligation
a Security is a perpetual bond with no specified maturity date. Maturity date shown is next reset date of the bond.
b Security, or portion thereof, on loan. At August 31, 2023, the value of the fund’s securities on loan was $3,428,283 and the value of the collateral was $3,530,423, consisting of cash collateral of $612,720 and U.S. Government & Agency securities valued at $2,917,703. In addition, the value of collateral may include pending sales that are also on loan.
c Security exempt from registration pursuant to Rule 144A under the Securities Act of 1933. These securities may be resold in transactions exempt from registration, normally to qualified institutional buyers. At August 31, 2023, these securities were valued at $2,225,934 or .52% of net assets.
d The Federal Housing Finance Agency (“FHFA”) placed the Federal Home Loan Mortgage Corporation and Federal National Mortgage Association into conservatorship with FHFA as the conservator. As such, the FHFA oversees the continuing affairs of these companies.
e Principal amount for accrual purposes is periodically adjusted based on changes in the Consumer Price Index.
f Non-income producing security.
g Investment in real estate investment trust within the United States.
h The fund held Level 3 securities at August 31, 2023. These securities were valued at $398 or .0% of net assets.
i Investment in affiliated issuer. The investment objective of this investment company is publicly available and can be found within the investment company’s prospectus.
68
| | |
Portfolio Summary (Unaudited) † | Value (%) |
Investment Companies | 53.0 |
Technology | 9.8 |
Consumer, Non-cyclical | 7.3 |
Financial | 6.0 |
Government | 5.5 |
Communications | 5.2 |
Consumer, Cyclical | 3.6 |
Mortgage Securities | 3.5 |
Industrial | 2.8 |
Energy | 1.8 |
Utilities | .9 |
Basic Materials | .8 |
| | 100.2 |
† Based on net assets.
See notes to financial statements.
69
STATEMENT OF INVESTMENTS (continued)
| | | | | | | | | |
BNY Mellon Asset Allocation Fund | | |
Affiliated Issuers | | | |
Description | Value ($) 8/31/2022 | Purchases ($)† | Sales ($) | Net Realized
Gain (Loss) ($) | Net Change in
Unrealized Appreciation (Depreciation) ($) | Value ($) 8/31/2023 | Dividends/
Distributions ($) | |
Registered Investment Companies - 52.9% | | |
BNY Mellon Corporate Bond Fund, Cl. M - 4.3% | 18,101,111 | 703,194 | - | - | (150,199) | 18,654,106 | 703,194 | |
BNY Mellon Developed Markets Real Estate Securities Fund, CI. Y - 2.2% | 9,685,917 | 645,959 | - | - | (959,579) | 9,372,297 | 645,959 | |
BNY Mellon Emerging Markets Fund, Cl. M - 4.5% | 15,169,116 | 5,969,702 | - | - | (1,747,383) | 19,391,435 | 1,800,435 | |
BNY Mellon Floating Rate Income Fund, Cl. Y - 2.0% | 11,919,561 | 964,885 | (4,378,847) | (687,724) | 771,768 | 8,589,643 | 964,884 | |
BNY Mellon High Yield Fund, Cl. I - 2.8% | 11,093,722 | 737,825 | - | - | (17,195) | 11,814,352 | 741,788 | |
BNY Mellon Income Stock Fund, Cl. M - 5.3% | 17,148,000 | 20,634,832 | (12,877,883) | (940,054) | (1,030,044) | 22,934,851 | 4,099,641 | |
BNY Mellon Intermediate Bond Fund, Cl. M - 5.9% | 25,139,781 | 659,350 | - | - | (343,121) | 25,456,010 | 659,350 | |
BNY Mellon International Equity Fund, Cl. Y - 5.4% | 16,274,442 | 4,813,363 | - | - | 1,868,497 | 22,956,302 | 614,384 | |
BNY Mellon International Fund, Cl. M - .1% | 226,000 | 10,887 | - | - | 38,635 | 275,522 | 10,887 | |
BNY Mellon Mid Cap Multi-Strategy Fund, Cl. M - 5.5% | 24,005,465 | 3,012,489 | (3,199,365) | (236,207) | (125,439) | 23,456,943 | 2,835,360 | |
BNY Mellon Research Growth Fund Inc, Cl. Y - 5.9% | 6,273,531 | 17,202,266 | - | - | 1,632,572 | 25,108,369 | 286,842 | |
BNY Mellon Select Managers Small Cap Growth Fund, Cl. Y - 1.2% | 20,529,815 | 401,028 | (14,259,060) | (2,037,441) | 675,777 | 5,310,119 | 401,028 | |
70
| | | | | | | | | |
BNY Mellon Asset Allocation Fund (continued) | | |
Description | Value ($) 8/31/2022 | Purchases ($)† | Sales ($) | Net Realized
Gain (Loss) ($) | Net Change in
Unrealized Appreciation (Depreciation) ($) | Value ($) 8/31/2023 | Dividends/
Distributions ($) | |
Registered Investment Companies - 52.9% (continued) | | |
BNY Mellon Select Managers Small Cap Value Fund, Cl. Y - 2.4% | 25,151,772 | 1,266,075 | (14,259,969) | (4,690,636) | 2,826,827 | 10,294,069 | 1,266,075 | |
BNY Mellon Short-Term U.S. Government Securities Fund, Cl. M - 2.9% | - | 21,190,480 | (8,695,936) | (48,561) | (55,454) | 12,390,529 | 515,147 | |
BNY Mellon Small Cap Multi-Strategy Fund, Cl. M - 2.2% | 4,630,763 | 8,460,327 | (4,318,857) | 256,890 | 577,665 | 9,606,788 | 350,480 | |
Dreyfus Institutional Preferred Government Plus Money Market Fund, Institutional Shares - .3% | 28,211,101 | 28,858,618 | (55,878,143) | - | - | 1,191,576 | 347,530 | |
Investment of Cash Collateral for Securities Loaned - .1%†† | | |
Dreyfus Institutional Preferred Government Plus Money Market Fund, Institutional Shares - .1% | - | 5,923,927 | (5,311,207) | - | - | 612,720 | 898 | ††† |
Dreyfus Institutional Preferred Government Plus Money Market Fund, SL Shares - .0% | 2,420,356 | 34,319,235 | (36,739,591) | - | - | - | 5,465 | ††† |
Total - 53.0% | 235,980,453 | 155,774,442 | (159,918,858) | (8,383,733) | 3,963,327 | 227,415,631 | 16,249,347 | |
† Includes reinvested dividends/distributions.
†† Effective July 3, 2023, cash collateral for securities lending was transferred from Dreyfus Institutional Preferred Government Plus Money Market Fund, SL Shares to Dreyfus Institutional Preferred Government Plus Money Market Fund, Institutional Shares.
††† Represents securities lending income earned from the reinvestment of cash collateral from loaned securities, net of fees and collateral investment expenses, and other payments to and from borrowers of securities.
See notes to financial statements.
71
STATEMENTS OF ASSETS AND LIABILITIES
August 31, 2023
| | | | | | | | | | | | | |
| | | | | | | | | | | | |
| | | | BNY Mellon Income Stock Fund | | BNY Mellon Mid Cap Multi-Strategy Fund | | BNY Mellon Small Cap Multi-Strategy Fund | | BNY Mellon International Fund | | |
Assets ($): | | | | | | | | | | | | |
Investments in securities—See Statements
of Investments† (including securities
on loan)††—Note 1(c): | | | | | | | | | | | | |
Unaffiliated issuers | | | | 330,197,406 | | 1,545,014,126 | | 618,426,249 | | 286,608,707 | | |
Affiliated issuers | | | | 12,657,325 | | 33,732,941 | | 34,076,573 | | 3,990,814 | | |
Cash denominated in foreign currency††† | | | | - | | - | | - | | 537,413 | | |
Receivable for investment securities sold | | | | 2,155,238 | | 736,895 | | 755,292 | | - | | |
Dividends and securities lending
income receivable | | | | 783,320 | | 1,685,306 | | 766,594 | | 809,101 | | |
Receivable for shares of Beneficial
Interest subscribed | | | | 162,027 | | 361,456 | | 1,690,149 | | - | | |
Tax reclaim receivable | | | | 91,755 | | 29,199 | | 7,818 | | 3,264,637 | | |
Prepaid expenses | | | | 64,089 | | 39,748 | | 35,324 | | 28,330 | | |
| | | | 346,111,160 | | 1,581,599,671 | | 655,757,999 | | 295,239,002 | | |
Liabilities ($): | | | | | | | | | | | | |
Due to BNY Mellon Investment Adviser, Inc.
and affiliates—Note 3(c) | | | | 246,970 | | 1,227,264 | | 559,938 | | 232,655 | | |
Cash overdraft due to Custodian | | | | 378,432 | | - | | - | | - | | |
Payable for investment securities purchased | | | | 2,461,272 | | 566,341 | | 697,000 | | - | | |
Payable for shares of Beneficial
Interest redeemed | | | | 495,696 | | 899,047 | | 354,481 | | 234,277 | | |
Trustees’ fees and expenses payable | | | | 10,279 | | 43,969 | | 18,593 | | 9,957 | | |
Liability for securities on loan—Note 1(c) | | | | - | | 10,609,780 | | 8,407,712 | | 2,981,093 | | |
Other accrued expenses | | | | 58,184 | | 82,869 | | 36,063 | | 43,304 | | |
| | | | 3,650,833 | | 13,429,270 | | 10,073,787 | | 3,501,286 | | |
Net Assets ($) | | | | 342,460,327 | | 1,568,170,401 | | 645,684,212 | | 291,737,716 | | |
Composition of Net Assets ($): | | | | | | | | | | | | |
Paid-in capital | | | | 271,361,829 | | 654,888,392 | | 572,299,616 | | 349,876,928 | | |
Total distributable earnings (loss) | | | | 71,098,498 | | 913,282,009 | | 73,384,596 | | (58,139,212) | | |
Net Assets ($) | | | | 342,460,327 | | 1,568,170,401 | | 645,684,212 | | 291,737,716 | | |
† Investments at cost ($) | | | | | | | | | | | | |
Unaffiliated issuers | | | | 277,058,519 | | 787,516,419 | | 533,000,767 | | 272,515,212 | | |
Affiliated issuers | | | | 12,657,325 | | 33,732,941 | | 34,076,573 | | 3,990,814 | | |
†† Value of securities on loan ($) | | | | 4,494,059 | | 43,643,130 | | 21,025,115 | | 5,711,092 | | |
††† Cash denominated in foreign
currency (cost) ($) | | | | - | | - | | - | | 548,139 | | |
72
| | | | | | | | | | | | | |
| | | | | | | | | | | | |
| | | | BNY Mellon Income Stock Fund | | BNY Mellon Mid Cap Multi-Strategy Fund | | BNY Mellon Small Cap Multi-Strategy Fund | | BNY Mellon International Fund | | |
Net Asset Value Per Share | | | | | | | | | | | | |
Class M | | | | | | | | | | | | |
Net Assets ($) | | | | 282,598,264 | | 1,445,233,506 | | 619,375,014 | | 276,642,156 | | |
Shares Outstanding | | | | 36,217,415 | | 82,624,883 | | 31,539,322 | | 20,251,327 | | |
Net Asset Value Per Share ($) | | | | 7.80 | | 17.49 | | 19.64 | | 13.66 | | |
Investor Shares | | | | | | | | | | | | |
Net Assets ($) | | | | 16,305,500 | | 122,936,895 | | 26,309,198 | | 15,095,560 | | |
Shares Outstanding | | | | 2,041,962 | | 7,239,762 | | 1,453,850 | | 1,029,339 | | |
Net Asset Value Per Share ($) | | | | 7.99 | | 16.98 | | 18.10 | | 14.67 | | |
Class A | | | | | | | | | | | | |
Net Assets ($) | | | | 3,081,538 | | - | | - | | - | | |
Shares Outstanding | | | | 394,334 | | - | | - | | - | | |
Net Asset Value Per Share ($) | | | | 7.81 | | - | | - | | - | | |
Class C | | | | | | | | | | | | |
Net Assets ($) | | | | 1,055,051 | | - | | - | | - | | |
Shares Outstanding | | | | 135,973 | | - | | - | | - | | |
Net Asset Value Per Share ($) | | | | 7.76 | | - | | - | | - | | |
Class I | | | | | | | | | | | | |
Net Assets ($) | | | | 39,110,270 | | - | | - | | - | | |
Shares Outstanding | | | | 5,010,233 | | - | | - | | - | | |
Net Asset Value Per Share ($) | | | | 7.81 | | - | | - | | - | | |
Class Y | | | | | | | | | | | | |
Net Assets ($) | | | | 309,704 | | - | | - | | - | | |
Shares Outstanding | | | | 39,770 | | - | | - | | - | | |
Net Asset Value Per Share ($) | | | | 7.79 | | - | | - | | - | | |
| | | | | | | | | | | | |
See notes to financial statements. | | | | | | | | | | | | |
73
STATEMENTS OF ASSETS AND LIABILITIES (continued)
| | | | | | | | | | | |
| | | | | | | | | | |
| | | | BNY Mellon Emerging Markets Fund | | BNY Mellon International Equity Income Fund | | BNY Mellon Asset Allocation Fund | | |
Assets ($): | | | | | | | | | | |
Investments in securities—See Statements
of Investments† (including securities
on loan)††—Note 1(c): | | | | | | | | | | |
Unaffiliated issuers | | | | 313,367,131 | | 29,096,295 | | 202,146,828 | | |
Affiliated issuers | | | | 6,322,452 | | 174,106 | | 227,415,631 | | |
Cash | | | | 59,926 | | - | | - | | |
Cash denominated in foreign currency††† | | | | 1,538,388 | | 94,815 | | - | | |
Dividends, interest and securities lending
income receivable | | | | 307,521 | | 64,265 | | 897,817 | | |
Tax reclaim receivable | | | | 46,938 | | 682,931 | | - | | |
Prepaid expenses | | | | 32,282 | | 12,562 | | 27,238 | | |
Receivable for shares of Beneficial
Interest subscribed | | | | 13,270 | | - | | 42,200 | | |
| | | | 321,687,908 | | 30,124,974 | | 430,529,714 | | |
Liabilities ($): | | | | | | | | | | |
Due to BNY Mellon Investment Adviser, Inc.
and affiliates—Note 3(b) | | | | 486,786 | | 54,590 | | 179,339 | | |
Cash overdraft due to Custodian | | | | - | | - | | 560,366 | | |
Liability for securities on loan—Note 1(c) | | | | 960,211 | | 72,149 | | 612,720 | | |
Foreign capital gains tax payable | | | | 499,489 | | - | | - | | |
Payable for investment securities purchased | | | | 207,187 | | - | | 264,476 | | |
Payable for shares of Beneficial
Interest redeemed | | | | 161,755 | | 25,410 | | 40,161 | | |
Trustees’ fees and expenses payable | | | | 9,618 | | 1,095 | | 12,768 | | |
Other accrued expenses | | | | 37,874 | | 3,755 | | 39,763 | | |
| | | | 2,362,920 | | 156,999 | | 1,709,593 | | |
Net Assets ($) | | | | 319,324,988 | | 29,967,975 | | 428,820,121 | | |
Composition of Net Assets ($): | | | | | | | | | | |
Paid-in capital | | | | 634,268,934 | | 96,366,741 | | 350,748,336 | | |
Total distributable earnings (loss) | | | | (314,943,946) | | (66,398,766) | | 78,071,785 | | |
Net Assets ($) | | | | 319,324,988 | | 29,967,975 | | 428,820,121 | | |
† Investments at cost ($) | | | | | | | | | | |
Unaffiliated issuers | | | | 273,205,297 | | 26,672,449 | | 133,882,716 | | |
Affiliated issuers | | | | 6,322,452 | | 174,106 | | 219,791,272 | | |
†† Value of securities on loan ($) | | | | 4,163,828 | | 709,519 | | 3,428,283 | | |
††† Cash denominated in foreign
currency (cost) ($) | | | | 2,043,583 | | 95,003 | | - | | |
Net Asset Value Per Share | | | | | | | | | | |
Class M | | | | | | | | | | |
Net Assets ($) | | | | 299,278,196 | | 29,325,187 | | 420,930,124 | | |
Shares Outstanding | | | | 31,227,437 | | 2,289,215 | | 34,876,529 | | |
Net Asset Value Per Share ($) | | | | 9.58 | | 12.81 | | 12.07 | | |
Investor Shares | | | | | | | | | | |
Net Assets ($) | | | | 20,046,792 | | 642,788 | | 7,889,997 | | |
Shares Outstanding | | | | 2,029,868 | | 49,471 | | 645,890 | | |
Net Asset Value Per Share ($) | | | | 9.88 | | 12.99 | | 12.22 | | |
| | | | | | | | | | |
See notes to financial statements. | | | | | | | | | | |
74
STATEMENTS OF OPERATIONS
Year Ended August 31, 2023
| | | | | | | | | | | | | |
| | | | | | | | | | | | |
| | | | | BNY Mellon Income Stock Fund | | BNY Mellon Mid Cap Multi-Strategy Fund | | BNY Mellon Small Cap Multi-Strategy Fund | | BNY Mellon International Fund | |
Investment Income ($): | | | | | | | | | | |
Income: | | | | | | | | | | |
Cash dividends: | | | | | | | | | | |
Unaffiliated issuers | | | 11,376,129 | † | 22,532,188 | † | 6,503,019 | † | 13,224,703 | † |
Affiliated issuers | | | 729,452 | | 1,501,733 | | 1,061,147 | | 43,499 | |
Interest | | | - | | 2,597 | | 1,523 | | 3,248 | |
Income from securities lending—Note 1(c) | | | 81,852 | | 219,535 | | 124,257 | | 11,164 | |
Total Income | | | 12,187,433 | | 24,256,053 | | 7,689,946 | | 13,282,614 | |
Expenses: | | | | | | | | | | |
Management fee—Note 3(a) | | | 2,638,584 | | 12,637,196 | | 5,000,720 | | 2,715,061 | |
Administration fee—Note 3(a) | | | 548,672 | | 2,277,985 | | 795,961 | | 432,029 | |
Registration fees | | | 95,677 | | 36,926 | | 41,697 | | 33,643 | |
Shareholder servicing costs—Note 3(c) | | | 86,729 | | 308,997 | | 68,627 | | 38,685 | |
Professional fees | | | 53,246 | | 97,433 | | 58,940 | | 48,670 | |
Trustees’ fees and expenses—Note 3(d) | | | 50,900 | | 192,792 | | 68,637 | | 35,343 | |
Custodian fees—Note 3(c) | | | 22,014 | | 54,204 | | 36,780 | | 80,499 | |
Chief Compliance Officer fees—Note 3(c) | | | 19,899 | | 34,852 | | 24,153 | | 20,177 | |
Prospectus and shareholders’ reports | | | 16,942 | | 31,334 | | 21,621 | | 17,307 | |
Distribution fees—Note 3(b) | | | 8,493 | | - | | - | | - | |
Loan commitment fees—Note 2 | | | 8,027 | | 39,350 | | 11,720 | | 8,024 | |
Interest expense—Note 2 | | | - | | - | | - | | 2,797 | |
Miscellaneous | | | 27,256 | | 80,880 | | 34,256 | | 35,996 | |
Total Expenses | | | 3,576,439 | | 15,791,949 | | 6,163,112 | | 3,468,231 | |
Less—reduction in expenses due to undertakings—Note 3(a) | | | (16,472) | | - | | - | | (259,918) | |
Less—reduction in fees due to earnings credits—Note 3(c) | | | (2,755) | | (6,820) | | (4,497) | | (1,207) | |
Net Expenses | | | 3,557,212 | | 15,785,129 | | 6,158,615 | | 3,207,106 | |
Net Investment Income | | | 8,630,221 | | 8,470,924 | | 1,531,331 | | 10,075,508 | |
Realized and Unrealized Gain (Loss)
on Investments—Note 4 ($): | | | | | | | | |
Net realized gain (loss) on investments
and foreign currency transactions | 29,503,507 | | 228,664,992 | | 2,277,020 | | (11,323,021) | |
Net change in unrealized appreciation (depreciation)
on investments and foreign currency transactions | | | 8,754,579 | | (74,299,868) | | 8,560,854 | | 65,089,352 | |
Net Realized and Unrealized Gain (Loss) on Investments | | | 38,258,086 | | 154,365,124 | | 10,837,874 | | 53,766,331 | |
Net Increase in Net Assets Resulting from Operations | | 46,888,307 | | 162,836,048 | | 12,369,205 | | 63,841,839 | |
† Net of foreign taxes withheld at source ($) | | | 76,578 | | 64,682 | | 30,466 | | 1,584,264 | |
| | | | | | | | | | | | |
See notes to financial statements. | | | | | | | | | | | |
75
STATEMENTS OF OPERATIONS (continued)
| | | | | | | | | | | |
| | | | | | | | | | |
| | | | | BNY Mellon Emerging Markets Fund | | BNY Mellon International Equity Income Fund | | BNY Mellon Asset Allocation Fund | |
Investment Income ($): | | | | | | | | |
Income: | | | | | | | | |
Dividends: | | | | | | | | |
Unaffiliated issuers | | | 7,581,148 | † | 1,979,731 | † | 2,417,993 | † |
Affiliated issuers | | | 250,149 | | 4,044 | | 6,961,899 | |
Interest | | | - | | - | | 1,773,073 | |
Income from securities lending—Note 1(c) | | | 8,185 | | 2,548 | | 6,363 | |
Total Income | | | 7,839,482 | | 1,986,323 | | 11,159,328 | |
Expenses: | | | | | | | | |
Management fee—Note 3(a) | | | 4,559,099 | | 332,017 | | 1,461,767 | |
Administration fee—Note 3(a) | | | 535,604 | | 52,756 | | 259,228 | |
Custodian fees—Note 3(b) | | | 466,904 | | 90,100 | | 11,847 | |
Professional fees | | | 254,611 | | 63,273 | | 52,525 | |
Shareholder servicing costs—Note 3(b) | | | 58,806 | | 2,044 | | 20,664 | |
Registration fees | | | 50,939 | | 30,075 | | 32,758 | |
Trustees’ fees and expenses—Note 3(c) | | | 41,576 | | 4,449 | | 50,570 | |
Chief Compliance Officer fees—Note 3(b) | | | 20,249 | | 20,841 | | 23,636 | |
Prospectus and shareholders’ reports | | | 19,766 | | 11,127 | | 12,369 | |
Interest expense—Note 2 | | | 11,351 | | 6,809 | | 454 | |
Loan commitment fees—Note 2 | | | 7,621 | | 768 | | 9,257 | |
Miscellaneous | | | 39,794 | | 20,343 | | 27,012 | |
Total Expenses | | | 6,066,320 | | 634,602 | | 1,962,087 | |
Less—reduction in expenses due to undertakings—Note 3(a) | | | (602,995) | | - | | (89,511) | |
Less—reduction in fees due to earnings credits—Note 3(b) | | | (1,552) | | (392) | | (504) | |
Net Expenses | | | 5,461,773 | | 634,210 | | 1,872,072 | |
Net Investment Income | | | 2,377,709 | | 1,352,113 | | 9,287,256 | |
Realized and Unrealized Gain (Loss)
on Investments—Note 4 ($): | | | | | | |
Net realized gain (loss) on investments
and foreign currency transactions: | | | | | | |
Unaffiliated issuers | | | | 21,178,639 | | 3,756,451 | | 836,646 | |
Affiliated issuers | | | | - | | - | | (8,383,733) | |
Capital gain distributions from affiliated issuers | | | - | | - | | 9,281,085 | |
Net Realized Gain (Loss) | | | 21,178,639 | | 3,756,451 | | 1,733,998 | |
Net change in unrealized appreciation (depreciation)
on investments and foreign currency transactions: | | | | | | | | |
Unaffiliated issuers | | | | (25,391,354) | | 1,225,629 | | 14,968,997 | |
Affiliated issuers | | | | - | | - | | 3,963,327 | |
Net Change in Unrealized Appreciation (Depreciation) | | | (25,391,354) | | 1,225,629 | | 18,932,324 | |
Net Realized and Unrealized Gain (Loss) on Investments | | | (4,212,715) | | 4,982,080 | | 20,666,322 | |
Net Increase (Decrease) in Net Assets Resulting from Operations | | (1,835,006) | | 6,334,193 | | 29,953,578 | |
† Net of foreign taxes withheld at source ($) | | | 1,138,596 | | 241,258 | | 479 | |
| | | | | | | | | | |
See notes to financial statements. | | | | | | | | | |
76
STATEMENTS OF CHANGES IN NET ASSETS
| | | | | | | | | | | | | | | | |
| | | | BNY Mellon Income Stock Fund | | BNY Mellon Mid Cap Multi-Strategy Fund | |
| | | | Year Ended August 31, | Year Ended August 31, |
| | | | 2023 | | | | 2022 | | 2023 | | | | 2022 | |
Operations ($): | | | | | | | | | | | | | | |
Net investment income | | | 8,630,221 | | | | 9,984,516 | | 8,470,924 | | | | 7,239,499 | |
Net realized gain (loss) on investments | | 29,503,507 | | | | 122,871,363 | | 228,664,992 | | | | 230,322,444 | |
Net change in unrealized appreciation
(depreciation) on investments | | 8,754,579 | | | | (107,737,504) | | (74,299,868) | | | | (714,575,601) | |
Net Increase (Decrease) in Net Assets
Resulting from Operations | 46,888,307 | | | | 25,118,375 | | 162,836,048 | | | | (477,013,658) | |
Distributions ($): | | | | | | | | | | | | | | |
Distributions to shareholders: | | | | | | | | | | | | | | |
Class M | | | (87,444,071) | | | | (93,310,187) | | (196,813,310) | | | | (317,016,965) | |
Investor Shares | | | (4,763,858) | | | | (3,313,325) | | (15,403,777) | | | | (21,460,398) | |
Class A | | | (485,432) | | | | (315,573) | | - | | | | - | |
Class C | | | (263,029) | | | | (116,701) | | - | | | | - | |
Class I | | | (5,665,128) | | | | (1,615,290) | | - | | | | - | |
Class Y | | | (95,500) | | | | (143,557) | | - | | | | - | |
Total Distributions | | | (98,717,018) | | | | (98,814,633) | | (212,217,087) | | | | (338,477,363) | |
Beneficial Interest Transactions ($): | | | | | | | | | | | | | | |
Net proceeds from shares sold: | | | | | | | | | | | | | | |
Class M | | | 57,583,320 | | | | 74,655,179 | | 24,028,695 | | | | 131,500,513 | |
Investor Shares | | | 10,370,344 | | | | 10,656,309 | | 31,682,207 | | | | 53,270,204 | |
Class A | | | 1,564,153 | | | | 857,076 | | - | | | | - | |
Class C | | | 304,483 | | | | 729,804 | | - | | | | - | |
Class I | | | 36,122,103 | | | | 14,293,701 | | - | | | | - | |
Class Y | | | 152,500 | | | | 137,730 | | - | | | | - | |
Distributions reinvested: | | | | | | | | | | | | | | |
Class M | | | 37,719,277 | | | | 36,772,633 | | 83,609,366 | | | | 137,487,779 | |
Investor Shares | | | 3,941,927 | | | | 2,638,670 | | 12,858,168 | | | | 17,357,474 | |
Class A | | | 469,489 | | | | 300,209 | | - | | | | - | |
Class C | | | 263,029 | | | | 116,700 | | - | | | | - | |
Class I | | | 5,462,493 | | | | 1,423,072 | | - | | | | - | |
Class Y | | | 95,418 | | | | 143,558 | | - | | | | - | |
Cost of shares redeemed: | | | | | | | | | | | | | | |
Class M | | | (195,766,769) | | | | (167,054,538) | | (432,608,133) | | | | (521,361,999) | |
Investor Shares | | | (15,108,064) | | | | (7,052,622) | | (51,301,437) | | | | (60,295,702) | |
Class A | | | (752,994) | | | | (602,310) | | - | | | | - | |
Class C | | | (421,895) | | | | (308,796) | | - | | | | - | |
Class I | | | (18,519,236) | | | | (4,743,897) | | - | | | | - | |
Class Y | | | (309,160) | | | | (531,015) | | - | | | | - | |
Increase (Decrease) in Net Assets
from Beneficial Interest Transactions | (76,829,582) | | | | (37,568,537) | | (331,731,134) | | | | (242,041,731) | |
Total Increase (Decrease) in Net Assets | (128,658,293) | | | | (111,264,795) | | (381,112,173) | | | | (1,057,532,752) | |
Net Assets ($): | | | | | | | | | | | | | | |
Beginning of Period | | | 471,118,620 | | | | 582,383,415 | | 1,949,282,574 | | | | 3,006,815,326 | |
End of Period | | | 342,460,327 | | | | 471,118,620 | | 1,568,170,401 | | | | 1,949,282,574 | |
77
STATEMENTS OF CHANGES IN NET ASSETS (continued)
| | | | | | | | | | | | | | | | |
| | | | BNY Mellon Income Stock Fund | | BNY Mellon Mid Cap Multi-Strategy Fund | |
| | | | Year Ended August 31, | Year Ended August 31, |
| | | | 2023 | | | | 2022 | | 2023 | | | | 2022 | |
Capital Share Transactions (Shares): | | | | | | | | | | | | | | |
Class Ma | | | | | | | | | | | | | | |
Shares sold | | | 7,342,643 | | | | 8,206,558 | | 1,425,243 | | | | 6,578,749 | |
Shares issued for distributions reinvested | | | 5,020,059 | | | | 4,122,850 | | 5,088,824 | | | | 6,509,838 | |
Shares redeemed | | | (24,756,998) | | | | (17,260,801) | | (25,544,120) | | | | (26,114,942) | |
Net Increase (Decrease) in
Shares Outstanding | (12,394,296) | | | | (4,931,393) | | (19,030,053) | | | | (13,026,355) | |
Investor Sharesa | | | | | | | | | | | | | | |
Shares sold | | | 1,246,774 | | | | 1,120,882 | | 1,909,515 | | | | 2,653,269 | |
Shares issued for distributions reinvested | | | 512,322 | | | | 289,772 | | 804,641 | | | | 842,187 | |
Shares redeemed | | | (1,910,963) | | | | (750,347) | | (3,132,310) | | | | (3,074,523) | |
Net Increase (Decrease) in
Shares Outstanding | (151,867) | | | | 660,307 | | (418,154) | | | | 420,933 | |
Class A | | | | | | | | | | | | | | |
Shares sold | | | 198,293 | | | | 92,777 | | - | | | | - | |
Shares issued for distributions reinvested | | | 62,317 | | | | 33,516 | | - | | | | - | |
Shares redeemed | | | (93,122) | | | | (65,122) | | - | | | | - | |
Net Increase (Decrease) in
Shares Outstanding | 167,488 | | | | 61,171 | | - | | | | - | |
Class C | | | | | | | | | | | | | | |
Shares sold | | | 36,859 | | | | 80,514 | | - | | | | - | |
Shares issued for distributions reinvested | | | 35,191 | | | | 13,106 | | - | | | | - | |
Shares redeemed | | | (56,462) | | | | (34,126) | | - | | | | - | |
Net Increase (Decrease) in
Shares Outstanding | 15,588 | | | | 59,494 | | - | | | | - | |
Class I | | | | | | | | | | | | | | |
Shares sold | | | 4,579,158 | | | | 1,587,310 | | - | | | | - | |
Shares issued for distributions reinvested | | | 725,766 | | | | 158,997 | | - | | | | - | |
Shares redeemed | | | (2,359,396) | | | | (504,841) | | - | | | | - | |
Net Increase (Decrease) in
Shares Outstanding | 2,945,528 | | | | 1,241,466 | | - | | | | - | |
Class Y | | | | | | | | | | | | | | |
Shares sold | | | 20,075 | | | | 15,185 | | - | | | | - | |
Shares issued for distributions reinvested | | | 12,707 | | | | 16,079 | | - | | | | - | |
Shares redeemed | | | (41,277) | | | | (58,289) | | - | | | | - | |
Net Increase (Decrease) in
Shares Outstanding | (8,495) | | | | (27,025) | | - | | | | - | |
| | | | | | | | | | | | | | | |
a | During the period ended August 31, 2023, 798,427 Class M shares representing $6,603,512 were exchanged for 782,059 Investor shares for BNY Mellon Income Stock Fund and 1,861,521 Class M shares representing $31,747,018 were exchanged for 1,914,614 Investor shares for BNY Mellon Mid Cap Multi-Strategy Fund. During the period ended August 31, 2022, 865,951 Class M shares representing $8,231,963 were exchanged for 851,272 Investor shares for BNY Mellon Income Stock Fund and 2,550,351 class M shares representing $52,469,790 were exchanged for 2,614,151 Investor shares for BNY Mellon Mid Cap Multi-Strategy Fund. |
See notes to financial statements. | | | | | | | | | | | | | | |
78
| | | | | | | | | | | | | | | | |
| | | | BNY Mellon Small Cap Multi-Strategy Fund | | BNY Mellon International Fund | |
| | | | Year Ended August 31, | Year Ended August 31, |
| | | | 2023 | | | | 2022 | | 2023 | | | | 2022 | |
Operations ($): | | | | | | | | | | | | | | |
Net investment income (loss) | | | 1,531,331 | | | | (132,459) | | 10,075,508 | | | | 12,385,807 | |
Net realized gain (loss) on investments | | 2,277,020 | | | | 9,897,545 | | (11,323,021) | | | | (24,320,821) | |
Net change in unrealized appreciation
(depreciation) on investments | | 8,560,854 | | | | (132,545,919) | | 65,089,352 | | | | (113,651,528) | |
Net Increase (Decrease) in Net Assets
Resulting from Operations | 12,369,205 | | | | (122,780,833) | | 63,841,839 | | | | (125,586,542) | |
Distributions ($): | | | | | | | | | | | | | | |
Distributions to shareholders: | | | | | | | | | | | | | | |
Class M | | | (14,102,454) | | | | (105,858,494) | | (14,122,101) | | | | (10,972,686) | |
Investor Shares | | | (788,902) | | | | (4,329,154) | | (614,959) | | | | (328,535) | |
Total Distributions | | | (14,891,356) | | | | (110,187,648) | | (14,737,060) | | | | (11,301,221) | |
Beneficial Interest Transactions ($): | | | | | | | | | | | | | | |
Net proceeds from shares sold: | | | | | | | | | | | | | | |
Class M | | | 169,879,822 | | | | 184,363,598 | | 1,539,915 | | | | 42,310,492 | |
Investor Shares | | | 8,547,597 | | | | 14,479,458 | | 5,922,525 | | | | 10,715,219 | |
Distributions reinvested: | | | | | | | | | | | | | | |
Class M | | | 6,518,743 | | | | 50,813,496 | | 1,951,475 | | | | 1,913,533 | |
Investor Shares | | | 682,264 | | | | 3,704,720 | | 491,619 | | | | 252,819 | |
Cost of shares redeemed: | | | | | | | | | | | | | | |
Class M | | | (138,382,108) | | | | (361,562,211) | | (111,519,603) | | | | (178,260,338) | |
Investor Shares | | | (10,963,920) | | | | (14,661,356) | | (9,102,533) | | | | (10,023,297) | |
Increase (Decrease) in Net Assets
from Beneficial Interest Transactions | 36,282,398 | | | | (122,862,295) | | (110,716,602) | | | | (133,091,572) | |
Total Increase (Decrease) in Net Assets | 33,760,247 | | | | (355,830,776) | | (61,611,823) | | | | (269,979,335) | |
Net Assets ($): | | | | | | | | | | | | | | |
Beginning of Period | | | 611,923,965 | | | | 967,754,741 | | 353,349,539 | | | | 623,328,874 | |
End of Period | | | 645,684,212 | | | | 611,923,965 | | 291,737,716 | | | | 353,349,539 | |
Capital Share Transactions (Shares): | | | | | | | | | | | | | | |
Class Ma | | | | | | | | | | | | | | |
Shares sold | | | 8,893,817 | | | | 8,335,456 | | 119,965 | | | | 2,960,185 | |
Shares issued for distributions reinvested | | | 352,937 | | | | 2,273,534 | | 155,993 | | | | 129,118 | |
Shares redeemed | | | (7,235,651) | | | | (16,893,699) | | (8,895,585) | | | | (13,494,214) | |
Net Increase (Decrease) in
Shares Outstanding | 2,011,103 | | | | (6,284,709) | | (8,619,627) | | | | (10,404,911) | |
Investor Sharesa | | | | | | | | | | | | | | |
Shares sold | | | 482,153 | | | | 700,102 | | 433,884 | | | | 712,127 | |
Shares issued for distributions reinvested | | | 40,016 | | | | 178,713 | | 36,552 | | | | 15,921 | |
Shares redeemed | | | (619,250) | | | | (730,791) | | (666,991) | | | | (681,847) | |
Net Increase (Decrease) in
Shares Outstanding | (97,081) | | | | 148,024 | | (196,555) | | | | 46,201 | |
| | | | | | | | | | | | | | | |
a | During the period ended August 31, 2023, 398,945 Class M shares representing $7,650,485 were exchanged for 431,908 Investor shares for BNY Mellon Small Cap Multi-Strategy Fund and 468,621 Class M shares representing $5,964,188 were exchanged for 436,964 Investor shares for BNY Mellon International Fund. During the period ended August 31, 2022, 626,736 Class M shares representing $13,896,251 were exchanged for 674,698 Investor shares for BNY Mellon Small Cap Multi-Strategy Fund and 746,476 class M shares representing $10,488,986 were exchanged for 697,461 Investor shares for BNY International Fund. |
See notes to financial statements. | | | | | | | | | | | | | | |
79
STATEMENTS OF CHANGES IN NET ASSETS (continued)
| | | | | | | | | | | | | | | | |
| | | | BNY Mellon Emerging Markets Fund | | BNY Mellon International Equity Income Fund | |
| | | | Year Ended August 31, | Year Ended August 31, |
| | | | 2023 | | | | 2022 | | 2023 | | | | 2022 | |
Operations ($): | | | | | | | | | | | | | | |
Net investment income | | | 2,377,709 | | | | 34,678,017 | | 1,352,113 | | | | 2,804,350 | |
Net realized gain (loss) on investments | | 21,178,639 | | | | 61,318,116 | | 3,756,451 | | | | 4,606,067 | |
Net change in unrealized appreciation
(depreciation) on investments | | (25,391,354) | | | | (320,397,241) | | 1,225,629 | | | | (17,590,829) | |
Net Increase (Decrease) in Net Assets
Resulting from Operations | (1,835,006) | | | | (224,401,108) | | 6,334,193 | | | | (10,180,412) | |
Distributions ($): | | | | | | | | | | | | | | |
Distributions to shareholders: | | | | | | | | | | | | | | |
Class M | | | (51,953,342) | | | | (18,779,410) | | (1,691,697) | | | | (3,259,273) | |
Investor Shares | | | (3,129,603) | | | | (615,834) | | (33,747) | | | | (61,322) | |
Total Distributions | | | (55,082,945) | | | | (19,395,244) | | (1,725,444) | | | | (3,320,595) | |
Beneficial Interest Transactions ($): | | | | | | | | | | | | | | |
Net proceeds from shares sold: | | | | | | | | | | | | | | |
Class M | | | 9,128,427 | | | | 119,038,625 | | 36,000 | | | | 3,770,663 | |
Investor Shares | | | 11,434,080 | | | | 20,385,715 | | 233,785 | | | | 1,466,682 | |
Distributions reinvested: | | | | | | | | | | | | | | |
Class M | | | 9,131,665 | | | | 3,324,382 | | 432,680 | | | | 959,726 | |
Investor Shares | | | 2,318,745 | | | | 481,300 | | 28,140 | | | | 47,898 | |
Cost of shares redeemed: | | | | | | | | | | | | | | |
Class M | | | (187,263,379) | | | | (428,652,989) | | (28,512,770) | | | | (28,270,733) | |
Investor Shares | | | (19,454,797) | | | | (16,863,324) | | (1,130,744) | | | | (1,122,709) | |
Increase (Decrease) in Net Assets
from Beneficial Interest Transactions | (174,705,259) | | | | (302,286,291) | | (28,912,909) | | | | (23,148,473) | |
Total Increase (Decrease) in Net Assets | (231,623,210) | | | | (546,082,643) | | (24,304,160) | | | | (36,649,480) | |
Net Assets ($): | | | | | | | | | | | | | | |
Beginning of Period | | | 550,948,198 | | | | 1,097,030,841 | | 54,272,135 | | | | 90,921,615 | |
End of Period | | | 319,324,988 | | | | 550,948,198 | | 29,967,975 | | | | 54,272,135 | |
Capital Share Transactions (Shares): | | | | | | | | | | | | | | |
Class Ma | | | | | | | | | | | | | | |
Shares sold | | | 941,252 | | | | 9,370,815 | | 2,953 | | | | 290,682 | |
Shares issued for distributions reinvested | | | 969,391 | | | | 254,937 | | 37,188 | | | | 72,459 | |
Shares redeemed | | | (19,150,518) | | | | (36,309,720) | | (2,372,351) | | | | (2,237,040) | |
Net Increase (Decrease) in
Shares Outstanding | (17,239,875) | | | | (26,683,968) | | (2,332,210) | | | | (1,873,899) | |
Investor Sharesa | | | | | | | | | | | | | | |
Shares sold | | | 1,126,206 | | | | 1,584,701 | | 19,850 | | | | 111,155 | |
Shares issued for distributions reinvested | | | 238,554 | | | | 35,891 | | 2,357 | | | | 3,573 | |
Shares redeemed | | | (1,946,863) | | | | (1,338,697) | | (98,998) | | | | (85,326) | |
Net Increase (Decrease) in
Shares Outstanding | (582,103) | | | | 281,895 | | (76,791) | | | | 29,402 | |
| | | | | | | | | | | | | | | |
a | During the period ended August 31, 2023, 797,769 Class M shares representing $7,860,887 were exchanged for 775,085 Investor shares for BNY Mellon Emerging Markets Fund and 20,131 Class M shares representing $233,772 were exchanged for 19,849 Investor shares for BNY Mellon International Equity Income Fund. During the period ended August 31, 2022, 1,498,829 Class M shares representing $18,733,686 were exchanged for 1,459,974 Investor shares for BNY Mellon Emerging Markets Fund and 112,677 class M shares representing $1,466,682 were exchanged for 111,155 Investor shares for BNY International Equity Income Fund. |
See notes to financial statements. | | | | | | | | | | | | | | |
80
| | | | | | | | | | |
| | | | BNY Mellon Asset Allocation Fund | |
| | | | Year Ended August 31, |
| | | | 2023 | | | | 2022 | |
Operations ($): | | | | | | | | |
Net investment income | | | 9,287,256 | | | | 7,336,007 | |
Net realized gain (loss) on investments | | 1,733,998 | | | | 43,981,881 | |
Net change in unrealized appreciation
(depreciation) on investments | | 18,932,324 | | | | (115,663,116) | |
Net Increase (Decrease) in Net Assets
Resulting from Operations | 29,953,578 | | | | (64,345,228) | |
Distributions ($): | | | | | | | | |
Distributions to shareholders: | | | | | | | | |
Class M | | | (44,026,923) | | | | (33,007,312) | |
Investor Shares | | | (861,566) | | | | (502,061) | |
Total Distributions | | | (44,888,489) | | | | (33,509,373) | |
Beneficial Interest Transactions ($): | | | | | | | | |
Net proceeds from shares sold: | | | | | | | | |
Class M | | | 27,701,028 | | | | 35,128,163 | |
Investor Shares | | | 1,752,698 | | | | 4,703,594 | |
Distributions reinvested: | | | | | | | | |
Class M | | | 27,922,755 | | | | 16,573,744 | |
Investor Shares | | | 714,831 | | | | 471,584 | |
Cost of shares redeemed: | | | | | | | | |
Class M | | | (52,548,193) | | | | (60,211,965) | |
Investor Shares | | | (3,069,506) | | | | (2,532,696) | |
Increase (Decrease) in Net Assets
from Beneficial Interest Transactions | 2,473,613 | | | | (5,867,576) | |
Total Increase (Decrease) in Net Assets | (12,461,298) | | | | (103,722,177) | |
Net Assets ($): | | | | | | | | |
Beginning of Period | | | 441,281,419 | | | | 545,003,596 | |
End of Period | | | 428,820,121 | | | | 441,281,419 | |
Capital Share Transactions (Shares): | | | | | | | | |
Class Ma | | | | | | | | |
Shares sold | | | 2,363,423 | | | | 2,505,076 | |
Shares issued for distributions reinvested | | | 2,502,740 | | | | 1,123,931 | |
Shares redeemed | | | (4,409,837) | | | | (4,232,492) | |
Net Increase (Decrease) in
Shares Outstanding | 456,326 | | | | (603,485) | |
Investor Sharesa | | | | | | | | |
Shares sold | | | 143,842 | | | | 339,791 | |
Shares issued for distributions reinvested | | | 63,031 | | | | 31,836 | |
Shares redeemed | | | (254,228) | | | | (183,067) | |
Net Increase (Decrease) in
Shares Outstanding | (47,355) | | | | 188,560 | |
| | | | | | | | | |
a | During the period ended August 31, 2023, 143,246 Class M shares representing $1,727,467 were exchanged for 141,676 Investor shares and during the period ended August 31, 2022, 324,018 Class M shares representing $4,437,580 were exchanged for 320,858 Investor shares for BNY Mellon Asset Allocation Fund. |
See notes to financial statements. | | | | | | | | |
81
FINANCIAL HIGHLIGHTS
The following tables describe the performance for each share class of each fund for the fiscal periods indicated. All information (except portfolio turnover rate) reflects financial results for a single fund share. Net asset value total return is calculated assuming an initial investment made at the net asset value at the beginning of the period, reinvestment of all dividends and distributions at net asset value during the period, and redemption at net asset value on the last day of the period. Net asset value total return includes adjustments in accordance with accounting principles generally accepted in the United States of America and as such, the net asset value for financial reporting purposes and the returns based upon those net asset values may differ from the net asset value and returns for shareholder transactions. These figures have been derived from the funds’ financial statements.
| | | | | | | | |
| | | Class M |
| | | Year Ended August 31, |
BNY Mellon Income Stock Fund | | 2023 | 2022 | 2021 | 2020 | 2019 |
Per Share Data ($): | | | | | | |
Net asset value, beginning of period | | 8.84 | 10.36 | 7.34 | 8.70 | 9.78 |
Investment Operations: | | | | | | |
Net investment incomea | | .17 | .19 | .18 | .20 | .22 |
Net realized and unrealized
gain (loss) on investments | | .79 | .24 | 3.02 | (.66) | (.33) |
Total From Investment Operations | | .96 | .43 | 3.20 | (.46) | (.11) |
Distributions: | | | | | | |
Dividends from net investment income | | (.17) | (.19) | (.18) | (.19) | (.21) |
Dividends from net realized gain on investments | | (1.83) | (1.76) | - | (.71) | (.76) |
Total Distributions | | (2.00) | (1.95) | (.18) | (.90) | (.97) |
Net asset value, end of period | | 7.80 | 8.84 | 10.36 | 7.34 | 8.70 |
Total Return (%) | | 12.06 | 4.22 | 44.06 | (6.38) | (.36) |
Ratios/Supplemental Data (%): | | | | | | |
Ratio of total expenses to average net assets | | .86 | .83 | .83 | .81 | .80 |
Ratio of net expenses to average net assets | | .86 | .83 | .83 | .81 | .80 |
Ratio of net investment income
to average net assets | | 2.15 | 1.99 | 2.02 | 2.53 | 2.47 |
Portfolio Turnover Rate | | 83.54 | 83.04 | 69.79 | 78.02 | 59.45 |
Net Assets, end of period ($ x 1,000) | | 282,598 | 429,623 | 554,602 | 578,269 | 930,683 |
a Based on average shares outstanding.
See notes to financial statements.
82
| | | | | | | | | |
| | | Investor Shares |
| | | Year Ended August 31, |
BNY Mellon Income Stock Fund | | 2023 | 2022 | 2021 | 2020 | 2019 |
Per Share Data ($): | | | | | | |
Net asset value, beginning of period | | 9.00 | 10.52 | 7.44 | 8.82 | 9.90 |
Investment Operations: | | | | | | |
Net investment incomea | | .15 | .17 | .16 | .19 | .20 |
Net realized and unrealized
gain (loss) on investments | | .82 | .23 | 3.08 | (.69) | (.33) |
Total from Investment Operations | | .97 | .40 | 3.24 | (.50) | (.13) |
Distributions: | | | | | | |
Dividends from net investment income | | (.15) | (.16) | (.16) | (.17) | (.19) |
Dividends from net realized gain on investments | | (1.83) | (1.76) | - | (.71) | (.76) |
Total Distributions | | (1.98) | (1.92) | (.16) | (.88) | (.95) |
Net asset value, end of period | | 7.99 | 9.00 | 10.52 | 7.44 | 8.82 |
Total Return (%) | | 11.93 | 3.87 | 43.91 | (6.77) | (.60) |
Ratios/Supplemental Data (%): | | | | | | |
Ratio of total expenses to average net assets | | 1.11 | 1.08 | 1.08 | 1.06 | 1.05 |
Ratio of net expenses to average net assets | | 1.11 | 1.08 | 1.08 | 1.06 | 1.05 |
Ratio of net investment income
to average net assets | | 1.90 | 1.76 | 1.77 | 2.26 | 2.24 |
Portfolio Turnover Rate | | 83.54 | 83.04 | 69.79 | 78.02 | 59.45 |
Net Assets, end of period ($ x 1,000) | | 16,305 | 19,747 | 16,125 | 12,282 | 23,913 |
a Based on average shares outstanding.
See notes to financial statements.
83
FINANCIAL HIGHLIGHTS (continued)
| | | | | | | |
| | | Class A |
| | | Year Ended August 31, |
BNY Mellon Income Stock Fund | | 2023 | 2022 | 2021 | 2020 | 2019 |
Per Share Data ($): | | | | | | |
Net asset value, beginning of period | | 8.85 | 10.37 | 7.34 | 8.71 | 9.79 |
Investment Operations: | | | | | | |
Net investment incomea | | .15 | .16 | .15 | .17 | .19 |
Net realized and unrealized gain (loss) on investments | | .79 | .24 | 3.03 | (.66) | (.33) |
Total from Investment Operations | | .94 | .40 | 3.18 | (.49) | (.14) |
Distributions: | | | | | | |
Dividends from net investment income | | (.15) | (.16) | (.15) | (.17) | (.18) |
Dividends from net realized gain on investments | | (1.83) | (1.76) | - | (.71) | (.76) |
Total Distributions | | (1.98) | (1.92) | (.15) | (.88) | (.94) |
Net asset value, end of period | | 7.81 | 8.85 | 10.37 | 7.34 | 8.71 |
Total Return (%)b | | 11.72 | 3.85 | 43.74 | (6.81) | (.64) |
Ratios/Supplemental Data (%): | | | | | | |
Ratio of total expenses to average net assets | | 1.23 | 1.20 | 1.20 | 1.21 | 1.10 |
Ratio of net expenses to average net assets | | 1.15 | 1.15 | 1.15 | 1.15 | 1.10 |
Ratio of net investment income
to average net assets | | 1.84 | 1.68 | 1.68 | 2.18 | 2.20 |
Portfolio Turnover Rate | | 83.54 | 83.04 | 69.79 | 78.02 | 59.45 |
Net Assets, end of period ($ x 1,000) | | 3,082 | 2,007 | 1,718 | 1,193 | 1,506 |
a Based on average shares outstanding.
b Exclusive of sales charge.
See notes to financial statements.
84
| | | | | | | |
| | | Class C |
| | | Year Ended August 31, |
BNY Mellon Income Stock Fund | | 2023 | 2022 | 2021 | 2020 | 2019 |
Per Share Data ($): | | | | | | |
Net asset value, beginning of period | | 8.80 | 10.33 | 7.32 | 8.68 | 9.76 |
Investment Operations: | | | | | | |
Net investment incomea | | .09 | .09 | .09 | .11 | .12 |
Net realized and unrealized gain (loss) on investments | | .79 | .23 | 3.01 | (.65) | (.33) |
Total from Investment Operations | | .88 | .32 | 3.10 | (.54) | (.21) |
Distributions: | | | | | | |
Dividends from net investment income | | (.09) | (.09) | (.09) | (.11) | (.11) |
Dividends from net realized gain on investments | | (1.83) | (1.76) | - | (.71) | (.76) |
Total Distributions | | (1.92) | (1.85) | (.09) | (.82) | (.87) |
Net asset value, end of period | | 7.76 | 8.80 | 10.33 | 7.32 | 8.68 |
Total Return (%)b | | 11.00 | 3.03 | 42.59 | (7.44) | (1.43) |
Ratios/Supplemental Data (%): | | | | | | |
Ratio of total expenses to average net assets | | 1.94 | 1.93 | 1.93 | 1.91 | 1.88 |
Ratio of net expenses to average net assets | | 1.90 | 1.90 | 1.90 | 1.90 | 1.88 |
Ratio of net investment income
to average net assets | | 1.11 | .93 | .96 | 1.43 | 1.36 |
Portfolio Turnover Rate | | 83.54 | 83.04 | 69.79 | 78.02 | 59.45 |
Net Assets, end of period ($ x 1,000) | | 1,055 | 1,060 | 629 | 747 | 1,158 |
a Based on average shares outstanding.
b Exclusive of sales charge.
See notes to financial statements.
85
FINANCIAL HIGHLIGHTS (continued)
| | | | | | | |
| | | Class I |
| | | Year Ended August 31, |
BNY Mellon Income Stock Fund | | 2023 | 2022 | 2021 | 2020 | 2019 |
Per Share Data ($): | | | | | | |
Net asset value, beginning of period | | 8.84 | 10.36 | 7.34 | 8.71 | 9.78 |
Investment Operations: | | | | | | |
Net investment incomea | | .17 | .18 | .17 | .20 | .22 |
Net realized and unrealized gain (loss) on investments | | .80 | .24 | 3.03 | (.67) | (.33) |
Total from Investment Operations | | .97 | .42 | 3.20 | (.47) | (.11) |
Distributions: | | | | | | |
Dividends from net investment income | | (.17) | (.18) | (.18) | (.19) | (.20) |
Dividends from net realized gain on investments | | (1.83) | (1.76) | - | (.71) | (.76) |
Total Distributions | | (2.00) | (1.94) | (.18) | (.90) | (.96) |
Net asset value, end of period | | 7.81 | 8.84 | 10.36 | 7.34 | 8.71 |
Total Return (%) | | 12.16 | 4.13 | 43.96 | (6.54) | (.28) |
Ratios/Supplemental Data (%): | | | | | | |
Ratio of total expenses to average net assets | | .94 | .89 | .89 | .87 | .84 |
Ratio of net expenses to average net assets | | .90 | .89 | .89 | .87 | .84 |
Ratio of net investment income
to average net assets | | 2.11 | 1.96 | 1.96 | 2.51 | 2.41 |
Portfolio Turnover Rate | | 83.54 | 83.04 | 69.79 | 78.02 | 59.45 |
Net Assets, end of period ($ x 1,000) | | 39,110 | 18,255 | 8,530 | 7,887 | 10,135 |
a Based on average shares outstanding.
See notes to financial statements.
86
| | | | | | | | | |
| | | Class Y |
| | | Year Ended August 31, |
BNY Mellon Income Stock Fund | | 2023 | 2022 | 2021 | 2020 | 2019 |
Per Share Data ($): | | | | | | |
Net asset value, beginning of period | | 8.83 | 10.35 | 7.33 | 8.70 | 9.78 |
Investment Operations: | | | | | | |
Net investment incomea | | .19 | .20 | .18 | .20 | .22 |
Net realized and unrealized gain (loss) on investments | | .77 | .23 | 3.02 | (.67) | (.33) |
Total from Investment Operations | | .96 | .43 | 3.20 | (.47) | (.11) |
Distributions: | | | | | | |
Dividends from net investment income | | (.17) | (.19) | (.18) | (.19) | (.21) |
Dividends from net realized gain on investments | | (1.83) | (1.76) | - | (.71) | (.76) |
Total Distributions | | (2.00) | (1.95) | (.18) | (.90) | (.97) |
Net asset value, end of period | | 7.79 | 8.83 | 10.35 | 7.33 | 8.70 |
Total Return (%) | | 12.09 | 4.21 | 44.11 | (6.51) | (.36) |
Ratios/Supplemental Data (%): | | | | | | |
Ratio of total expenses to average net assets | | .87 | .83 | .83 | .83 | .82 |
Ratio of net expenses to average net assets | | .87 | .83 | .83 | .83 | .82 |
Ratio of net investment income
to average net assets | | 2.20 | 2.00 | 2.01 | 2.63 | 2.43 |
Portfolio Turnover Rate | | 83.54 | 83.04 | 69.79 | 78.02 | 59.45 |
Net Assets, end of period ($ x 1,000) | | 310 | 426 | 779 | 541 | 382 |
a Based on average shares outstanding.
See notes to financial statements.
87
FINANCIAL HIGHLIGHTS (continued)
| | | | | | | |
| | | Class M |
| | | Year Ended August 31, |
BNY Mellon Mid Cap Multi-Strategy Fund | | 2023 | 2022 | 2021 | 2020 | 2019 |
Per Share Data ($): | | | | | | |
Net asset value, beginning of period | | 17.86 | 24.69 | 19.28 | 17.45 | 19.24 |
Investment Operations: | | | | | | |
Net investment incomea | | .09 | .06 | .04 | .09 | .08 |
Net realized and unrealized
gain (loss) on investments | | 1.65 | (4.01) | 6.99 | 2.36 | (.63) |
Total from Investment Operations | | 1.74 | (3.95) | 7.03 | 2.45 | (.55) |
Distributions: | | | | | | |
Dividends from net investment income | | (.08) | (.02) | (.08) | (.04) | (.05) |
Dividends from net realized gain on investments | | (2.03) | (2.86) | (1.54) | (.58) | (1.19) |
Total Distributions | | (2.11) | (2.88) | (1.62) | (.62) | (1.24) |
Net asset value, end of period | | 17.49 | 17.86 | 24.69 | 19.28 | 17.45 |
Total Return (%) | | 10.50 | (17.82) | 38.15 | 14.24 | (1.54) |
Ratios/Supplemental Data (%): | | | | | | |
Ratio of total expenses to average net assets | | .92 | .90 | .90 | .90 | .89 |
Ratio of net expenses to average net assets | | .92 | .90 | .90 | .90 | .89 |
Ratio of net investment income
to average net assets | | .52 | .31 | .18 | .50 | .45 |
Portfolio Turnover Rate | | 26.34 | 22.23 | 31.74 | 41.86 | 44.44 |
Net Assets, end of period ($ x 1,000) | | 1,445,234 | 1,816,047 | 2,831,948 | 2,433,885 | 2,610,739 |
a Based on average shares outstanding.
See notes to financial statements.
88
| | | | | | | |
| | | Investor Shares |
| | | Year Ended August 31, |
BNY Mellon Mid Cap Multi-Strategy Fund | | 2023 | 2022 | 2021 | 2020 | 2019 |
Per Share Data ($): | | | | | | |
Net asset value, beginning of period | | 17.40 | 24.16 | 18.90 | 17.13 | 18.90 |
Investment Operations: | | | | | | |
Net investment income (loss)a | | .04 | .01 | (.02) | .04 | .04 |
Net realized and unrealized
gain (loss) on investments | | 1.60 | (3.91) | 6.86 | 2.31 | (.60) |
Total from Investment Operations | | 1.64 | (3.90) | 6.84 | 2.35 | (.56) |
Distributions: | | | | | | |
Dividends from net investment income | | (.03) | - | (.04) | - | (.02) |
Dividends from net realized gain on investments | | (2.03) | (2.86) | (1.54) | (.58) | (1.19) |
Total Distributions | | (2.06) | (2.86) | (1.58) | (.58) | (1.21) |
Net asset value, end of period | | 16.98 | 17.40 | 24.16 | 18.90 | 17.13 |
Total Return (%) | | 10.18 | (18.00) | 37.83 | 13.93 | (1.70) |
Ratios/Supplemental Data (%): | | | | | | |
Ratio of total expenses to average net assets | | 1.17 | 1.15 | 1.15 | 1.15 | 1.14 |
Ratio of net expenses to average net assets | | 1.17 | 1.15 | 1.15 | 1.15 | 1.14 |
Ratio of net investment income (loss)
to average net assets | | .27 | .06 | (.08) | .26 | .21 |
Portfolio Turnover Rate | | 26.34 | 22.23 | 31.74 | 41.86 | 44.44 |
Net Assets, end of period ($ x 1,000) | | 122,937 | 133,236 | 174,867 | 106,907 | 118,579 |
a Based on average shares outstanding.
See notes to financial statements.
89
FINANCIAL HIGHLIGHTS (continued)
| | | | | | | |
| | | Class M |
| | | Year Ended August 31, |
BNY Mellon Small Cap Multi-Strategy Fund | | 2023 | 2022 | 2021 | 2020 | 2019 |
Per Share Data ($): | | | | | | |
Net asset value, beginning of period | | 19.76 | 26.07 | 19.28 | 17.12 | 23.16 |
Investment Operations: | | | | | | |
Net investment income (loss) a | | .05 | (.00)b | (.05) | .00b | .02 |
Net realized and unrealized
gain (loss) on investments | | .34 | (3.37) | 6.99 | 2.77 | (3.16) |
Total from Investment Operations | | .39 | (3.37) | 6.94 | 2.77 | (3.14) |
Distributions: | | | | | | |
Dividends from net investment income | | - | - | - | (.03) | - |
Dividends from net realized gain on investments | | (.51) | (2.94) | (.15) | (.58) | (2.90) |
Total Distributions | | (.51) | (2.94) | (.15) | (.61) | (2.90) |
Net asset value, end of period | | 19.64 | 19.76 | 26.07 | 19.28 | 17.12 |
Total Return (%) | | 2.15 | (14.23) | 36.05 | 16.42 | (11.94) |
Ratios/Supplemental Data (%): | | | | | | |
Ratio of total expenses to average net assets | | 1.04 | 1.01 | 1.01 | 1.03 | 1.02 |
Ratio of net expenses to average net assets | | 1.04 | 1.01 | 1.01 | 1.03 | 1.02 |
Ratio of net investment income (loss)
to average net assets | | .27 | (.01) | (.19) | .02 | .10 |
Portfolio Turnover Rate | | 56.56 | 52.04 | 55.94 | 74.33 | 71.58 |
Net Assets, end of period ($ x 1,000) | | 619,375 | 583,546 | 933,506 | 466,531 | 405,350 |
a Based on average shares outstanding.
b Amount represents less than $.01 per share.
See notes to financial statements.
90
| | | | | | | |
| | | Investor Shares |
| | | Year Ended August 31, |
BNY Mellon Small Cap Multi-Strategy Fund | | 2023 | 2022 | 2021 | 2020 | 2019 |
Per Share Data ($): | | | | | | |
Net asset value, beginning of period | | 18.30 | 24.41 | 18.11 | 16.12 | 22.08 |
Investment Operations: | | | | | | |
Net investment income (loss) a | | .00b | (.05) | (.10) | (.04) | (.02) |
Net realized and unrealized
gain (loss) on investments | | .31 | (3.12) | 6.55 | 2.61 | (3.04) |
Total from Investment Operations | | .31 | (3.17) | 6.45 | 2.57 | (3.06) |
Distributions: | | | | | | |
Dividends from net realized gain on investments | | (.51) | (2.94) | (.15) | (.58) | (2.90) |
Net asset value, end of period | | 18.10 | 18.30 | 24.41 | 18.11 | 16.12 |
Total Return (%) | | 1.88 | (14.40) | 35.68 | 16.20 | (12.20) |
Ratios/Supplemental Data (%): | | | | | | |
Ratio of total expenses to average net assets | | 1.29 | 1.26 | 1.26 | 1.28 | 1.27 |
Ratio of net expenses to average net assets | | 1.29 | 1.26 | 1.26 | 1.28 | 1.27 |
Ratio of net investment income (loss)
to average net assets | | .02 | (.26) | (.44) | (.22) | (.13) |
Portfolio Turnover Rate | | 56.56 | 52.04 | 55.94 | 74.33 | 71.58 |
Net Assets, end of period ($ x 1,000) | | 26,309 | 28,378 | 34,249 | 20,474 | 18,823 |
a Based on average shares outstanding.
b Amount represents less than $.01 per share.
See notes to financial statements.
91
FINANCIAL HIGHLIGHTS (continued)
| | | | | | | |
| | | Class M |
| | | Year Ended August 31, |
BNY Mellon International Fund | | 2023 | 2022 | 2021 | 2020 | 2019 |
Per Share Data ($): | | | | | | |
Net asset value, beginning of period | | 11.71 | 15.38 | 12.78 | 12.31 | 13.45 |
Investment Operations: | | | | | | |
Net investment incomea | | .41 | .33 | .27 | .21 | .31 |
Net realized and unrealized
gain (loss) on investments | | 2.10 | (3.71) | 2.64 | .60 | (1.20) |
Total from Investment Operations | | 2.51 | (3.38) | 2.91 | .81 | (.89) |
Distributions: | | | | | | |
Dividends from net investment income | | (.56) | (.29) | (.31) | (.34) | (.25) |
Net asset value, end of period | | 13.66 | 11.71 | 15.38 | 12.78 | 12.31 |
Total Return (%) | | 21.91 | (22.39) | 23.04 | 6.47 | (6.50) |
Ratios/Supplemental Data (%): | | | | | | |
Ratio of total expenses to average net assets | | 1.07 | 1.03 | 1.03 | 1.03 | 1.02 |
Ratio of net expenses to average net assets | | .99 | 1.03 | 1.03 | 1.03 | 1.02 |
Ratio of net investment income
to average net assets | | 3.17 | 2.33 | 1.86 | 1.67 | 2.47 |
Portfolio Turnover Rate | | 63.06 | 78.04 | 56.01 | 66.41 | 59.03 |
Net Assets, end of period ($ x 1,000) | | 276,642 | 337,994 | 603,937 | 552,883 | 897,080 |
a Based on average shares outstanding.
See notes to financial statements.
92
| | | | | | | |
| | | Investor Shares |
| | | Year Ended August 31, |
BNY Mellon International Fund | | 2023 | 2022 | 2021 | 2020 | 2019 |
Per Share Data ($): | | | | | | |
Net asset value, beginning of period | | 12.53 | 16.44 | 13.65 | 13.12 | 14.32 |
Investment Operations: | | | | | | |
Net investment incomea | | .40 | .31 | .25 | .20 | .29 |
Net realized and unrealized
gain (loss) on investments | | 2.26 | (3.97) | 2.81 | .64 | (1.27) |
Total from Investment Operations | | 2.66 | (3.66) | 3.06 | .84 | (.98) |
Distributions: | | | | | | |
Dividends from net investment income | | (.52) | (.25) | (.27) | (.31) | (.22) |
Net asset value, end of period | | 14.67 | 12.53 | 16.44 | 13.65 | 13.12 |
Total Return (%) | | 21.64 | (22.57) | 22.66 | 6.28 | (6.74) |
Ratios/Supplemental Data (%): | | | | | | |
Ratio of total expenses to average net assets | | 1.32 | 1.28 | 1.28 | 1.28 | 1.27 |
Ratio of net expenses to average net assets | | 1.24 | 1.28 | 1.28 | 1.28 | 1.27 |
Ratio of net investment income
to average net assets | | 2.92 | 2.08 | 1.62 | 1.53 | 2.20 |
Portfolio Turnover Rate | | 63.06 | 78.04 | 56.01 | 66.41 | 59.03 |
Net Assets, end of period ($ x 1,000) | | 15,096 | 15,355 | 19,392 | 14,473 | 16,755 |
a Based on average shares outstanding.
See notes to financial statements.
93
FINANCIAL HIGHLIGHTS (continued)
| | | | | | | |
| | | Class M |
| | | Year Ended August 31, |
BNY Mellon Emerging Markets Fund | | 2023 | 2022 | 2021 | 2020 | 2019 |
Per Share Data ($): | | | | | | |
Net asset value, beginning of period | | 10.77 | 14.15 | 11.35 | 10.14 | 10.72 |
Investment Operations: | | | | | | |
Net investment incomea | | .06 | .50 | .24 | .07 | .14 |
Net realized and unrealized
gain (loss) on investments | | .03 | (3.61) | 2.71 | 1.27 | (.64) |
Total from Investment Operations | | .09 | (3.11) | 2.95 | 1.34 | (.50) |
Distributions: | | | | | | |
Dividends from net investment income | | (1.28) | (.27) | (.15) | (.13) | (.08) |
Net asset value, end of period | | 9.58 | 10.77 | 14.15 | 11.35 | 10.14 |
Total Return (%) | | 1.02 | (22.31) | 26.19 | 13.24 | (4.68) |
Ratios/Supplemental Data (%): | | | | | | |
Ratio of total expenses to average net assets | | 1.52 | 1.43 | 1.39 | 1.39 | 1.39 |
Ratio of net expenses to average net assets | | 1.36 | 1.43 | 1.39 | 1.39 | 1.39 |
Ratio of net investment income
to average net assets | | .61 | 4.00 | 1.78 | .71 | 1.37 |
Portfolio Turnover Rate | | 121.64 | 60.15 | 63.29 | 34.44 | 90.09 |
Net Assets, end of period ($ x 1,000) | | 299,278 | 522,075 | 1,063,203 | 762,408 | 819,164 |
a Based on average shares outstanding.
See notes to financial statements.
94
| | | | | | | |
| | | Investor Shares |
| | | Year Ended August 31, |
BNY Mellon Emerging Markets Fund | | 2023 | 2022 | 2021 | 2020 | 2019 |
Per Share Data ($): | | | | | | |
Net asset value, beginning of period | | 11.05 | 14.52 | 11.64 | 10.41 | 11.01 |
Investment Operations: | | | | | | |
Net investment incomea | | .04 | .48 | .21 | .04 | .12 |
Net realized and unrealized
gain (loss) on investments | | .04 | (3.71) | 2.80 | 1.30 | (.67) |
Total from Investment Operations | | .08 | (3.23) | 3.01 | 1.34 | (.55) |
Distributions: | | | | | | |
Dividends from net investment income | | (1.25) | (.24) | (.13) | (.11) | (.05) |
Net asset value, end of period | | 9.88 | 11.05 | 14.52 | 11.64 | 10.41 |
Total Return (%) | | .87 | (22.52) | 25.97 | 12.85 | (4.99) |
Ratios/Supplemental Data (%): | | | | | | |
Ratio of total expenses to average net assets | | 1.77 | 1.68 | 1.64 | 1.64 | 1.64 |
Ratio of net expenses to average net assets | | 1.61 | 1.68 | 1.64 | 1.64 | 1.64 |
Ratio of net investment income
to average net assets | | .36 | 3.75 | 1.53 | .36 | 1.10 |
Portfolio Turnover Rate | | 121.64 | 60.15 | 63.29 | 34.44 | 90.09 |
Net Assets, end of period ($ x 1,000) | | 20,047 | 28,873 | 33,827 | 20,919 | 20,970 |
a Based on average shares outstanding.
See notes to financial statements.
95
FINANCIAL HIGHLIGHTS (continued)
| | | | | | | | |
| | | Class M |
| | | Year Ended August 31, |
BNY Mellon International Equity Income Fund | | 2023 | 2022 | 2021 | 2020 | 2019 |
Per Share Data ($): | | | | | | |
Net asset value, beginning of period | | 11.43 | 13.79 | 11.27 | 12.20 | 13.86 |
Investment Operations: | | | | | | |
Net investment incomea | | .41 | .47 | .37 | .37 | .59 |
Net realized and unrealized
gain (loss) on investments | | 1.46 | (2.28) | 2.62 | (.82) | (1.69) |
Total from Investment Operations | | 1.87 | (1.81) | 2.99 | (.45) | (1.10) |
Distributions: | | | | | | |
Dividends from net investment income | | (.49) | (.55) | (.47) | (.48) | (.56) |
Net asset value, end of period | | 12.81 | 11.43 | 13.79 | 11.27 | 12.20 |
Total Return (%) | | 16.79 | (13.65) | 27.02 | (3.94) | (7.98) |
Ratios/Supplemental Data (%): | | | | | | |
Ratio of total expenses to average net assets | | 1.62 | 1.25 | 1.20 | 1.14 | 1.07 |
Ratio of net expenses to average net assets | | 1.62 | 1.25 | 1.20 | 1.14 | 1.07 |
Ratio of net investment income
to average net assets | | 3.47 | 3.61 | 2.95 | 3.05 | 4.53 |
Portfolio Turnover Rate | | 56.71 | 45.62 | 44.35 | 55.03 | 45.49 |
Net Assets, end of period ($ x 1,000) | | 29,325 | 52,810 | 89,568 | 111,258 | 282,061 |
a Based on average shares outstanding.
See notes to financial statements.
96
| | | | | | | |
| | | Investor Shares |
| | | Year Ended August 31, |
BNY Mellon International Equity Income Fund | | 2023 | 2022 | 2021 | 2020 | 2019 |
Per Share Data ($): | | | | | | |
Net asset value, beginning of period | | 11.58 | 13.97 | 11.42 | 12.35 | 14.00 |
Investment Operations: | | | | | | |
Net investment incomea | | .38 | .45 | .36 | .36 | .53 |
Net realized and unrealized
gain (loss) on investments | | 1.49 | (2.32) | 2.63 | (.85) | (1.67) |
Total from Investment Operations | | 1.87 | (1.87) | 2.99 | (.49) | (1.14) |
Distributions: | | | | | | |
Dividends from net investment income | | (.46) | (.52) | (.44) | (.44) | (.51) |
Net asset value, end of period | | 12.99 | 11.58 | 13.97 | 11.42 | 12.35 |
Total Return (%) | | 16.54 | (13.88) | 26.62 | (4.15) | (8.21) |
Ratios/Supplemental Data (%): | | | | | | |
Ratio of total expenses to average net assets | | 1.87 | 1.50 | 1.45 | 1.39 | 1.32 |
Ratio of net expenses to average net assets | | 1.87 | 1.50 | 1.45 | 1.39 | 1.32 |
Ratio of net investment income
to average net assets | | 3.22 | 3.36 | 2.80 | 2.97 | 4.09 |
Portfolio Turnover Rate | | 56.71 | 45.62 | 44.35 | 55.03 | 45.49 |
Net Assets, end of period ($ x 1,000) | | 643 | 1,463 | 1,354 | 930 | 2,318 |
a Based on average shares outstanding.
See notes to financial statements.
97
FINANCIAL HIGHLIGHTS (continued)
| | | | | | | | |
| | | | Class M |
| | | | Year Ended August 31, |
BNY Mellon Asset Allocation Fund | | | 2023 | 2022 | 2021 | 2020 | 2019 |
Per Share Data ($): | | | | | | | |
Net asset value, beginning of period | | | 12.56 | 15.34 | 12.88 | 12.27 | 13.16 |
Investment Operations: | | | | | | | |
Net investment incomea | | | .26 | .21 | .16 | .21 | .19 |
Net realized and unrealized
gain (loss) on investments | | | .57 | (2.01) | 2.81 | 1.31 | (.33) |
Total from Investment Operations | | | .83 | (1.80) | 2.97 | 1.52 | (.14) |
Distributions: | | | | | | | |
Dividends from net investment income | | | (.26) | (.35) | (.21) | (.23) | (.26) |
Dividends from net realized gain on investments | | | (1.06) | (.63) | (.30) | (.68) | (.49) |
Total Distributions | | | (1.32) | (.98) | (.51) | (.91) | (.75) |
Net asset value, end of period | | | 12.07 | 12.56 | 15.34 | 12.88 | 12.27 |
Total Return (%) | | | 7.53 | (12.62) | 23.59 | 12.78 | (.44) |
Ratios/Supplemental Data (%): | | | | | | | |
Ratio of total expenses to average net assetsb | | | .46 | .42 | .40 | .39 | .39 |
Ratio of net expenses to average net assetsb | | | .44 | .41 | .32 | .31 | .31 |
Ratio of net investment income
to average net assetsb | | | 2.20 | 1.50 | 1.14 | 1.76 | 1.55 |
Portfolio Turnover Rate | | | 32.54 | 29.76 | 17.71 | 35.71 | 28.14 |
Net Assets, end of period ($ x 1,000) | | | 420,930 | 432,481 | 537,189 | 463,184 | 454,093 |
a Based on average shares outstanding.
b Amount does not include the expenses of the underlying funds.
See notes to financial statements.
98
| | | | | | | | |
| | | | Investor Shares |
| | | | Year Ended August 31, |
BNY Mellon Asset Allocation Fund | | | 2023 | 2022 | 2021 | 2020 | 2019 |
Per Share Data ($): | | | | | | | |
Net asset value, beginning of period | | | 12.69 | 15.48 | 13.00 | 12.37 | 13.25 |
Investment Operations: | | | | | | | |
Net investment incomea | | | .24 | .17 | .12 | .18 | .13 |
Net realized and unrealized
gain (loss) on investments | | | .57 | (2.02) | 2.83 | 1.32 | (.29) |
Total from Investment Operations | | | .81 | (1.85) | 2.95 | 1.50 | (.16) |
Distributions: | | | | | | | |
Dividends from net investment income | | | (.22) | (.31) | (.17) | (.19) | (.23) |
Dividends from net realized gain on investments | | | (1.06) | (.63) | (.30) | (.68) | (.49) |
Total Distributions | | | (1.28) | (.94) | (.47) | (.87) | (.72) |
Net asset value, end of period | | | 12.22 | 12.69 | 15.48 | 13.00 | 12.37 |
Total Return (%) | | | 7.29 | (12.85) | 23.29 | 12.51 | (.63) |
Ratios/Supplemental Data (%): | | | | | | | |
Ratio of total expenses to average net assetsb | | | .71 | .67 | .65 | .64 | .64 |
Ratio of net expenses to average net assetsb | | | .69 | .66 | .57 | .56 | .56 |
Ratio of net investment income
to average net assetsb | | | 1.97 | 1.25 | .86 | 1.52 | 1.09 |
Portfolio Turnover Rate | | | 32.54 | 29.76 | 17.71 | 35.71 | 28.14 |
Net Assets, end of period ($ x 1,000) | | | 7,890 | 8,800 | 7,815 | 6,443 | 7,083 |
a Based on average shares outstanding.
b Amount does not include the expenses of the underlying funds.
See notes to financial statements.
99
NOTES TO FINANCIAL STATEMENTS
NOTE 1—Significant Accounting Policies:
BNY Mellon Funds Trust (the “Trust”), a Massachusetts business trust that is registered under the Investment Company Act of 1940, as amended (the “Act”), as an open-end management investment company, operates as a series company currently consisting of nineteen series, including the following diversified funds: BNY Mellon Income Stock Fund, BNY Mellon Mid Cap Multi-Strategy Fund, BNY Mellon Small Cap Multi-Strategy Fund, BNY Mellon International Fund, BNY Mellon Emerging Markets Fund, BNY Mellon International Equity Income Fund and BNY Mellon Asset Allocation Fund (each, a “fund” and collectively, the “funds”). The objectives of the funds are as follows: BNY Mellon Mid Cap Multi-Strategy Fund and BNY Mellon Small Cap Multi-Strategy Fund seek capital appreciation. BNY Mellon Income Stock Fund and BNY Mellon International Equity Income Fund seek total return (consisting of capital appreciation and income). BNY Mellon International Fund and BNY Mellon Emerging Markets Fund seek long-term capital growth. BNY Mellon Asset Allocation Fund seeks long-term growth of principal in conjunction with current income.
BNY Mellon Investment Adviser, Inc. (the “Adviser”), a wholly-owned subsidiary of The Bank of New York Mellon Corporation (“BNY Mellon”), which serves as each fund’s investment adviser. BNY Mellon serves as administrator for the funds pursuant to an Administration Agreement with the Trust (the “Administration Agreement”). BNY Mellon has entered into a Sub-Administration Agreement with the Adviser pursuant to which BNY Mellon pays the Adviser for performing certain administrative services.
Boston Partners Global Investors, Inc. (“Boston Partners”), and Geneva Capital Management LLC (“Geneva”), serve as BNY Mellon Mid Cap Multi-Strategy Fund’s sub-adviser with respect to the Boston Partners Mid Cap Value Strategy and the Geneva Mid Cap Growth Strategy, respectively. Newton Investment Management North America, LLC (“NIMNA”), also an indirect wholly-owned subsidiary of BNY Mellon and an affiliate of the Adviser serves as a sub-adviser of (i) BNY Mellon Income Stock Fund; (ii) BNY Mellon Mid Cap Multi-Strategy Fund responsible for the portions of the fund’s assets allocated to the Opportunistic Mid Cap Value Strategy and the Mid Cap Growth Strategy; (iii) BNY Mellon Small Cap Multi-Strategy Fund responsible for the portions of the fund’s assets allocated to the Opportunistic Small Cap Strategy, the Small Cap Value Strategy and the Small Cap Growth Strategy; (iv) BNY Mellon International Fund and (v) BNY Mellon International Equity Income Fund. NIMNA, subject to the Adviser’s supervision and approval, provides investment advisory assistance and research and the day-to-day management of the respective fund’s assets or the portion of the respective fund’s assets allocated to the strategies described above. Effective March 31, 2023, NIMNA entered into a sub-sub-investment advisory agreement with its affiliate, Newton Investment Management Limited (“NIM”), to enable NIM to provide certain advisory services to NIMNA for the benefit of the funds, including, but not limited to, portfolio management services. NIM is subject to the supervision of the NIMNA and the Adviser. NIM, also an indirect wholly-owned subsidiary of BNY Mellon and an affiliate of the Adviser, serves as the sub-adviser for BNY Mellon Emerging Markets Fund. Effective March 31, 2023, NIM entered into a sub-sub-investment advisory agreement with its affiliate, NIMNA, to enable NIMNA to provide certain advisory services to NIM for the benefit of the funds, including, but not limited to, portfolio management services. NIMNA is subject to the supervision of the NIM and the Adviser.
BNY Mellon Securities Corporation (the “Distributor”), a wholly-owned subsidiary of the Adviser, is the distributor of each fund’s shares. Each fund is authorized to issue an unlimited number of $.001 par value shares of Beneficial Interest in each of the following classes of shares: Class M and Investor and for BNY Mellon Income Stock Fund only Class A, Class C, Class I and Class Y. Class A and Class C shares are sold primarily to retail investors through financial intermediaries and bear Distribution and/or Shareholder Services Plan fees. Class A shares generally are subject to a sales charge imposed at the time of purchase. Class A shares bought without an initial sales charge as part of an investment of $1 million or more may be charged a contingent deferred sales charge (“CDSC”) of 1.00% if redeemed within one year. Class C shares are subject to a CDSC imposed on Class C shares redeemed within one year of purchase. Class C shares automatically convert to Class A shares eight years after the date of purchase, without the imposition of a sales charge. Class I shares are sold primarily to bank trust departments and other financial service providers (including BNY Mellon and its affiliates), acting on behalf of customers having a qualified trust or an investment account or relationship at such institution, and bear no Distribution or Shareholder Services Plan fees. Class Y shares are sold at net asset value per share generally to institutional investors, and bear no Distribution or Shareholder Services Plan fees. Class I and Class Y shares are offered without a front-end sales charge or CDSC. Other differences between the classes include the services offered to and the expenses borne by each class, the allocation of certain transfer agency costs and certain voting rights. Income, expenses (other than expenses attributable to a specific class), and realized and unrealized gains or losses on investments are allocated to each class of shares based on its relative net assets.
100
The Trust accounts separately for the assets, liabilities and operations of each series. Expenses directly attributable to each series are charged to that series’ operations; expenses which are applicable to all series are allocated among them on a pro rata basis.
The Financial Accounting Standards Board (“FASB”) Accounting Standards Codification (“ASC”) is the exclusive reference of authoritative U.S. generally accepted accounting principles (“GAAP”) recognized by the FASB to be applied by nongovernmental entities. Rules and interpretive releases of the SEC under authority of federal laws are also sources of authoritative GAAP for SEC registrants. Each fund is an investment company and applies the accounting and reporting guidance of the FASB ASC Topic 946 Financial Services-Investment Companies. Each fund’s financial statements are prepared in accordance with GAAP, which may require the use of management estimates and assumptions. Actual results could differ from those estimates.
The Trust enters into contracts that contain a variety of indemnifications. The funds’ maximum exposure under these arrangements is unknown. The funds do not anticipate recognizing any loss related to these arrangements.
(a) Portfolio valuation: The fair value of a financial instrument is the amount that would be received to sell an asset or paid to transfer a liability in an orderly transaction between market participants at the measurement date (i.e., the exit price). GAAP establishes a fair value hierarchy that prioritizes the inputs of valuation techniques used to measure fair value. This hierarchy gives the highest priority to unadjusted quoted prices in active markets for identical assets or liabilities (Level 1 measurements) and the lowest priority to unobservable inputs (Level 3 measurements).
Additionally, GAAP provides guidance on determining whether the volume and activity in a market has decreased significantly and whether such a decrease in activity results in transactions that are not orderly. GAAP requires enhanced disclosures around valuation inputs and techniques used during annual and interim periods.
Various inputs are used in determining the value of each fund’s investments relating to fair value measurements. These inputs are summarized in the three broad levels listed below:
Level 1—unadjusted quoted prices in active markets for identical investments.
Level 2—other significant observable inputs (including quoted prices for similar investments, interest rates, prepayment speeds, credit risk, etc.).
Level 3—significant unobservable inputs (including the funds’ own assumptions in determining the fair value of investments).
The inputs or methodology used for valuing securities are not necessarily an indication of the risk associated with investing in those securities.
Changes in valuation techniques may result in transfers in or out of an assigned level within the disclosure hierarchy. Valuation techniques used to value each fund’s investments are as follows:
The Trust’s Board of Trustees (the “Board”) has designated the Adviser as each fund’s valuation designee, effective September 8, 2022, to make all fair value determinations with respect to each fund’s portfolio investments, subject to the Board’s oversight and pursuant to Rule 2a-5 under the Act.
BNY Mellon Asset Allocation Fund: Investments in debt securities excluding short-term investments (other than U.S. Treasury Bills) are valued each business day by one or more independent pricing services (each, a “Service”) approved by the Board. Investments for which quoted bid prices are readily available and are representative of the bid side of the market in the judgment of a Service are valued at the mean between the quoted bid prices (as obtained by a Service from dealers in such securities) and asked prices (as calculated by a Service based upon its evaluation of the market for such securities). Securities are valued as determined by a Service, based on methods which include consideration of the following: yields or prices of securities of comparable quality, coupon, maturity and type; indications as to values from dealers; and general market conditions. The Services are engaged under the general supervision of the Board. These securities are generally categorized within Level 2 of the fair value hierarchy.
Investments in equity securities are valued at the last sales price on the securities exchange or national securities market on which such securities are primarily traded. Securities listed on the National Market System for which market quotations are available are valued at the official closing price or, if there is no official closing price that day, at the last sales price. For open short positions, asked prices are used for valuation purposes. Bid price is used when no asked price is available. Registered investment companies that are not traded on an exchange are valued at their net asset value. All of the preceding securities are generally categorized within Level 1 of the fair value hierarchy.
Securities not listed on an exchange or the national securities market, or securities for which there were no transactions, are valued at the average of the most recent bid and asked prices.
101
NOTES TO FINANCIAL STATEMENTS (continued)
U.S Treasury Bills are valued at the mean price between quoted prices and asked prices by the Service. These securities are generally categorized within Level 2 of the fair value hierarchy.
Fair valuing of securities may be determined with the assistance of a Service using calculations based on indices of domestic securities and other appropriate indicators, such as prices of relevant ADRs and futures. Utilizing these techniques may result in transfers between Level 1 and Level 2 of the fair value hierarchy.
When market quotations or official closing prices are not readily available, or are determined not to reflect accurately fair value, such as when the value of a security has been significantly affected by events after the close of the exchange or market on which the security is principally traded (for example, a foreign exchange or market), but before the funds calculate their net asset value, the funds may value these investments at fair value as determined in accordance with the procedures approved by the Board. Certain factors may be considered when fair valuing investments such as: fundamental analytical data, the nature and duration of restrictions on disposition, an evaluation of the forces that influence the market in which the securities are purchased and sold, and public trading in similar securities of the issuer or comparable issuers. These securities are either categorized within Level 2 or 3 of the fair value hierarchy depending on the relevant inputs used.
For securities where observable inputs are limited, assumptions about market activity and risk are used and are generally categorized within Level 3 of the fair value hierarchy.
Investments denominated in foreign currencies are translated to U.S. dollars at the prevailing rates of exchange.
The following below summarizes the inputs used as of August 31, 2023 in valuing each fund’s investments:
| | | | | | | |
BNY Mellon Income Stock Fund | |
| | Level 1-Unadjusted Quoted Prices | Level 2- Other Significant Observable Inputs | | Level 3-Significant Unobservable Inputs | Total | |
Assets ($) | | |
Investments in Securities:† | | |
Equity Securities - Common Stocks | 330,197,406 | - | | - | 330,197,406 | |
Investment Companies | 12,657,325 | - | | - | 12,657,325 | |
† See Statement of Investments for additional detailed categorizations, if any.
| | | | | | | |
BNY Mellon Mid Cap Multi-Strategy Fund | |
| | Level 1-Unadjusted Quoted Prices | Level 2- Other Significant Observable Inputs | | Level 3-Significant Unobservable Inputs | Total | |
Assets ($) | | |
Investments in Securities:† | | |
Equity Securities - Common Stocks | 1,523,449,844 | - | | - | 1,523,449,844 | |
Escrow Shares | - | 8,847 | †† | - | 8,847 | |
Exchange-Traded Funds | 21,514,038 | - | | - | 21,514,038 | |
Investment Companies | 33,732,941 | - | | - | 33,732,941 | |
Rights | - | - | | 41,397 | 41,397 | |
† See Statement of Investments for additional detailed categorizations, if any.
†† Securities classified within Level 2 at period end as the values were determined pursuant to the fund’s fair valuation procedures.
102
The following is a reconciliation of Level 3 assets for which significant unobservable inputs were used to determine fair value:
| | |
| | Rights ($) |
Balance as of 8/31/2022 | - |
Purchases/Issuances | 0 |
Sales/Dispositions | - |
Net realized gain (loss) | - |
Change in unrealized appreciation (depreciation) | 41,397 |
Transfers into Level 3 | - |
Transfer out of Level 3 | - |
Balances as of 8/31/2023† | 41,397 |
The amount of total net gains (loss) for the period included in earnings attributable to the change in unrealized appreciation (depreciation) relating to investments still held at 8/31/2023 | 41,397 |
† Securities deemed as Level 3 due to the lack of observable inputs by management assessment.
| | | | | | | |
BNY Mellon Small Cap Multi-Strategy Fund | |
| | Level 1-Unadjusted Quoted Prices | Level 2- Other Significant Observable Inputs | | Level 3-Significant Unobservable Inputs | Total | |
Assets ($) | | |
Investments in Securities:† | | |
Equity Securities - Common Stocks | 618,426,249 | - | | - | 618,426,249 | |
Investment Companies | 34,076,573 | - | | - | 34,076,573 | |
† See Statement of Investments for additional detailed categorizations, if any.
| | | | | | | |
BNY Mellon International Fund | |
| | Level 1-Unadjusted Quoted Prices | Level 2- Other Significant Observable Inputs | | Level 3-Significant Unobservable Inputs | Total | |
Assets ($) | | |
Investments in Securities:† | | |
Equity Securities - Common Stocks | 278,884,184 | - | | - | 278,884,184 | |
Equity Securities - Preferred Stocks | 4,812,537 | - | | - | 4,812,537 | |
Exchange-Traded Funds | 2,911,986 | - | | - | 2,911,986 | |
Investment Companies | 3,990,814 | - | | - | 3,990,814 | |
† See Statement of Investments for additional detailed categorizations, if any.
| | | | | | | |
BNY Mellon Emerging Markets Fund | |
| | Level 1-Unadjusted Quoted Prices | Level 2- Other Significant Observable Inputs | | Level 3-Significant Unobservable Inputs | Total | |
Assets ($) | | |
Investments in Securities:† | | |
Equity Securities - Common Stocks | 313,367,131 | - | | 0 | 313,367,131 | |
Investment Companies | 6,322,452 | - | | - | 6,322,452 | |
† See Statement of Investments for additional detailed categorizations, if any.
103
NOTES TO FINANCIAL STATEMENTS (continued)
The following is a reconciliation of Level 3 assets for which significant unobservable inputs were used to determine fair value:
| | |
| | Equity Securities-Common Stocks ($) |
Balance as of 8/31/2022† | 0 |
Purchases/Issuances | - |
Sales/Dispositions | - |
Net realized gain (loss) | - |
Change in unrealized appreciation (depreciation) | - |
Transfers into Level 3 | - |
Transfer out of Level 3 | - |
Balances as of 8/31/2023† | 0 |
The amount of total net gains (loss) for the period included in earnings attributable to the change in unrealized appreciation (depreciation) relating to investments still held at 8/31/2023 | - |
† Securities deemed as Level 3 due to the lack of observable inputs by management assessment.
| | | | | | | |
BNY Mellon International Equity Income Fund | |
| | Level 1-Unadjusted Quoted Prices | Level 2- Other Significant Observable Inputs | | Level 3-Significant Unobservable Inputs | Total | |
Assets ($) | | |
Investments in Securities:† | | |
Equity Securities - Common Stocks | 28,168,372 | - | | - | 28,168,372 | |
Equity Securities - Preferred Stocks | 493,235 | - | | - | 493,235 | |
Exchange-Traded Funds | 434,688 | - | | - | 434,688 | |
Investment Companies | 174,106 | - | | - | 174,106 | |
† See Statement of Investments for additional detailed categorizations, if any.
| | | | | | | |
BNY Mellon Asset Allocation Fund | |
| | Level 1-Unadjusted Quoted Prices | Level 2- Other Significant Observable Inputs | | Level 3-Significant Unobservable Inputs | Total | |
Assets ($) | | |
Investments in Securities:† | | |
Corporate Bonds | - | 14,754,741 | | - | 14,754,741 | |
Equity Securities - Common Stocks | 148,643,099 | - | | - | 148,643,099 | |
Equity Securities - Preferred Stocks | 304,950 | - | | - | 304,950 | |
Investment Companies | 227,415,631 | - | | - | 227,415,631 | |
Municipal Securities | - | 139,916 | | - | 139,916 | |
Rights | - | - | | 398 | 398 | |
U.S. Government Agencies Collateralized Municipal-Backed Securities | - | 209,197 | | - | 209,197 | |
U.S. Government Agencies Mortgage-Backed | - | 14,579,650 | | - | 14,579,650 | |
U.S. Treasury Securities | - | 23,514,877 | | - | 23,514,877 | |
† See Statement of Investments for additional detailed categorizations, if any.
104
The following is a reconciliation of Level 3 assets for which significant unobservable inputs were used to determine fair value:
| | |
| | Rights ($) |
Balance as of 8/31/2022 | - |
Purchases/Issuances | 0 |
Sales/Dispositions | - |
Net realized gain (loss) | - |
Change in unrealized appreciation (depreciation) | 398 |
Transfers into Level 3 | 0 |
Transfer out of Level 3 | - |
Balances as of 8/31/2023† | 398 |
The amount of total net gains (loss) for the period included in earnings attributable to the change in unrealized appreciation (depreciation) relating to investments still held at 8/31/2023 | 398 |
† Securities deemed as Level 3 due to the lack of observable inputs by management assessment.
(b) Foreign currency transactions: Each relevant fund do not isolate that portion of the results of operations resulting from changes in foreign exchange rates on investments from the fluctuations arising from changes in the market prices of securities held. Such fluctuations are included with the net realized and unrealized gain or loss on investments.
Net realized foreign exchange gains or losses arise from sales of foreign currencies, currency gains or losses realized on securities transactions between trade and settlement date, and the difference between the amounts of dividends, interest and foreign withholding taxes recorded on the funds’ books and the U.S. dollar equivalent of the amounts actually received or paid. Net unrealized foreign exchange gains and losses arise from changes in the value of assets and liabilities other than investments resulting from changes in exchange rates. Foreign currency gains and losses on foreign currency transactions are also included with net realized and unrealized gain or loss on investments.
Foreign taxes: Each relevant fund may be subject to foreign taxes (a portion of which may be reclaimable) on income, stock dividends, realized and unrealized capital gains on investments or certain foreign currency transactions. Foreign taxes are recorded in accordance with the funds’ understanding of the applicable foreign tax regulations and rates that exist in the foreign jurisdictions in which the funds invest. These foreign taxes, if any, are paid by the funds and are reflected in the Statements of Operations, if applicable. Foreign taxes payable or deferred as of August 31, 2023, if any, are disclosed in the funds’ Statements of Assets and Liabilities.
(c) Securities transactions and investment income: Securities transactions are recorded on a trade date basis. Realized gains and losses from securities transactions are recorded on the identified cost basis. Dividend income is recognized on the ex-dividend date and interest income, including, where applicable, accretion of discount and amortization of premium on investments, is recognized on the accrual basis.
Pursuant to a securities lending agreement with BNY Mellon, the funds may lend securities to qualified institutions. It is the funds’ policy that, at origination, all loans are secured by collateral of at least 102% of the value of U.S. securities loaned and 105% of the value of foreign securities loaned. Collateral equivalent to at least 100% of the market value of securities on loan is maintained at all times. Collateral is either in the form of cash, which can be invested in certain money market mutual funds managed by the Adviser, or U.S. Government and Agency securities. The funds are entitled to receive all dividends, interest and distributions on securities loaned, in addition to income earned as a result of the lending transaction. Should a borrower fail to return the securities in a timely manner, BNY Mellon is required to replace the securities for the benefit of the funds or credit the funds with the market value of the unreturned securities and is subrogated to the funds’ rights against the borrower and the collateral. Additionally, the contractual maturity of security lending transactions are on an overnight and continuous basis. Table 1 summarizes the amount BNY Mellon earned from each fund from lending portfolio securities, pursuant to the securities lending agreement during the period ended August 31, 2023.
105
NOTES TO FINANCIAL STATEMENTS (continued)
| | |
Table 1—Securities Lending Agreement ($) | |
| | |
BNY Mellon Income Stock Fund | 11,161 |
BNY Mellon Mid Cap Multi-Strategy Fund | 29,922 |
BNY Mellon Small Cap Multi-Strategy Fund | 16,934 |
BNY Mellon International Fund | 1,521 |
BNY Mellon Emerging Markets Fund | 1,115 |
BNY Mellon International Equity Income Fund | 347 |
BNY Mellon Asset Allocation Fund | 865 |
(d) Affiliated issuers: Investments in other investment companies advised by the Adviser are defined as “affiliated” under the Act.
(e) Market Risk: The value of the securities in which each fund invests may be affected by political, regulatory, economic and social developments, and developments that impact specific economic sectors, industries or segments of the market. The value of a security may also decline due to general market conditions that are not specifically related to a particular company or industry, such as real or perceived adverse economic conditions, changes in the general outlook for corporate earnings, changes in interest or currency rates, changes to inflation, adverse changes to credit markets or adverse investor sentiment generally. In addition, turbulence in financial markets and reduced liquidity in equity, credit and/or fixed-income markets may negatively affect many issuers, which could adversely affect each fund. Global economies and financial markets are becoming increasingly interconnected, and conditions and events in one country, region or financial market may adversely impact issuers in a different country, region or financial market. These risks may be magnified if certain events or developments adversely interrupt the global supply chain; in these and other circumstances, such risks might affect companies world-wide.
Foreign Investment Risk: To the extent each fund invests in foreign securities, each fund’s performance will be influenced by political, social and economic factors affecting investments in foreign issuers. Special risks associated with investments in foreign issuers include exposure to currency fluctuations, less liquidity, less developed or less efficient trading markets, lack of comprehensive company information, political and economic instability and differing auditing and legal standards.
Emerging Market Risk: The securities of issuers located or doing substantial business in emerging market countries tend to be more volatile and less liquid than the securities of issuers located in countries with more mature economies. Emerging markets generally have less diverse and less mature economic structures and less stable political systems than those of developed countries. Investments in these countries may be subject to political, economic, legal, market and currency risks. Special risks associated with investments in emerging market issuers may include a lack of publicly available information, a lack of uniform disclosure, accounting and financial reporting and recordkeeping standards and limited investor protections applicable in developed economies. The risks also may include unpredictable political and economic policies, the imposition of capital controls and/or foreign investment limitations by a country, nationalization of businesses and the imposition of sanctions or restrictions on certain investments by other countries, such as the United States.
ETF And Other Investment Company Risk: To the extent each relevant fund invests in pooled investment vehicles, such as ETFs and other investment companies, each relevant fund will be affected by the investment policies, practices and performance of such entities in direct proportion to the amount of assets each relevant fund has invested therein. The risks of investing in other investment companies, including ETFs, typically reflect the risks associated with the types of instruments in which the investment companies invest. When each relevant fund invests in an ETF or other investment company, shareholders of the fund will bear indirectly their proportionate share of the expenses of the ETF or other investment company (including management fees) in addition to the expenses of each relevant fund. ETFs are exchange-traded investment companies that are, in many cases, designed to provide investment results corresponding to an index. The value of the underlying securities can fluctuate in response to activities of individual companies or in response to general market and/or economic conditions. Additional risks of investments in ETFs include: (i) the market price of an ETF’s shares may trade at a discount to its net asset value; (ii) an active trading market for an ETF’s shares may not develop or be maintained; or (iii) trading may be halted if the listing exchanges’ officials deem such action appropriate, the shares are delisted from the exchange, or the activation of market-wide “circuit breakers” (which are tied to large decreases in stock prices) halts trading generally. The fund will incur brokerage costs when purchasing and selling shares of ETFs.
Debt Risk: Each relevant fund invests in debt securities. Failure of an issuer of the debt securities to make timely interest or principal payments, or a decline or the perception of a decline in the credit quality of a debt security, can cause the debt security’s price to fall, potentially lowering the fund’s share price. In addition, the value of debt securities may decline due to general market conditions that are not specifically related to a particular issuer, such as real or
106
perceived adverse economic conditions, changes in outlook for corporate earnings, changes in interest or currency rates or adverse investor sentiment. They may also decline because of factors that affect a particular industry.
(f) Dividends and distributions to shareholders: Dividends and distributions payable to shareholders are recorded by each fund on the ex-dividend date. BNY Mellon Income Stock Fund and BNY Mellon Asset Allocation Fund normally declare and pay dividends from net investment income monthly. BNY Mellon International Equity Income Fund normally declares and pays dividends from net investment income quarterly. BNY Mellon Mid Cap Multi-Strategy Fund, BNY Mellon Small Cap Multi-Strategy Fund, BNY Mellon International Fund and BNY Mellon Emerging Markets Fund normally declare and pay dividends from net investment income annually. Dividends from net realized capital gains, if any, are normally declared and paid annually, but each fund may make distributions on a more frequent basis to comply with the distribution requirements of the Internal Revenue Code of 1986, as amended (the “Code”). To the extent that net realized capital gains can be offset by capital loss carryovers of a fund, it is the policy of each fund not to distribute such gains. Income and capital gain distributions are determined in accordance with income tax regulations, which may differ from GAAP.
(g) Federal income taxes: It is the policy of each fund to continue to qualify as a regulated investment company, if such qualification is in the best interests of its shareholders, by complying with the applicable provisions of the Code, and to make distributions of taxable income sufficient to relieve it from substantially all federal income and excise taxes. For federal income tax purposes, each fund is treated as a separate entity for the purpose of determining such qualification.
As of and during the period ended August 31, 2023, the funds did not have any liabilities for any uncertain tax positions. Each fund recognizes interest and penalties, if any, related to uncertain tax positions as income tax expense in the Statements of Operations. During the period ended August 31, 2023, the funds did not incur any interest or penalties.
Each tax year in the four-year period ended August 31, 2023 remains subject to examination by the Internal Revenue Service and state taxing authorities.
Under the Regulated Investment Company Modernization Act of 2010, each fund is permitted to carry forward capital losses for an unlimited period. Furthermore, capital loss carryovers retain their character as either short-term or long-term capital losses.
Table 2 summarizes each fund’s components of accumulated earnings on a tax basis at August 31, 2023.
Table 3 summarizes each relevant fund’s accumulated capital loss carryover available for federal income tax purposes to be applied against future net realized capital gains, if any, realized subsequent to August 31, 2023.
Table 4 summarizes each fund’s tax character of distributions paid to shareholders during the fiscal periods ended August 31, 2023 and August 31, 2022.
During the period ended August 31, 2023, as a result of permanent book to tax differences, where indicated each identified fund increased (decreased) total distributable earnings (loss) and increased (decreased) paid-in capital as summarized in Table 5. These permanent book to tax differences are primarily due to the tax treatment for treating a portion of the proceeds from redemptions as a distribution for tax purposes for BNY Mellon Income Stock Fund and BNY Mellon Mid Cap Multi-Strategy Fund. Net assets and net asset value per share were not affected by these reclassifications.
| | | | | | |
Table 2—Components of Accumulated Earnings |
| | Undistributed
Ordinary Income($) | Undistributed
Capital Gains ($) | Accumulated
Capital (Losses) ($) | | Unrealized
Appreciation
(Depreciation) ($) |
BNY Mellon Income Stock Fund | 758,904 | 21,352,668 | - | | 48,986,926 |
BNY Mellon Mid Cap Multi-Strategy Fund | 3,835,511 | 171,890,608 | - | | 737,583,560 |
BNY Mellon Small Cap Multi-Strategy Fund | 890,025 | 2,126,045 | - | | 70,368,526 |
BNY Mellon International Fund | 10,210,068 | - | (78,972,109) | | 10,622,829 |
BNY Mellon Emerging Markets Fund | 4,450,474 | - | (354,425,404) | | 35,030,984 |
BNY Mellon International Equity Income Fund | 646,439 | - | (69,064,926) | | 2,019,721 |
BNY Mellon Asset Allocation Fund | 877,197 | 1,776,311 | - | | 75,418,277 |
107
NOTES TO FINANCIAL STATEMENTS (continued)
| | | | | | | |
Table 3—Capital Loss Carryover | | | | | |
| | | Short-Term
Losses ($)† | Long-Term
Losses ($)† | Total ($) |
BNY Mellon International Fund | | | 74,687,758 | 4,284,351 | 78,972,109 |
BNY Mellon Emerging Markets Fund | | | 340,447,445 | 13,977,959 | 354,425,404 |
BNY Mellon International Equity Income Fund | | | 36,404,842 | 32,660,084 | 69,064,926 |
† These capital losses can be carried forward for an unlimited period.
| | | | | | |
Table 4— Tax Character of Distributions Paid |
| | 2023 | | 2022 |
| Ordinary
Income ($) | Long-Term
Capital Gains ($) | | Ordinary
Income ($) | Long-Term
Capital Gains ($) |
BNY Mellon Income Stock Fund | 24,138,230 | 74,578,788 | | 12,657,456 | 86,157,177 |
BNY Mellon Mid Cap Multi-Strategy Fund | 7,702,473 | 204,514,614 | | 52,286,726 | 286,190,637 |
BNY Mellon Small Cap Multi-Strategy Fund | - | 14,891,356 | | 36,895,850 | 73,291,798 |
BNY Mellon International Fund | 14,737,060 | - | | 11,301,221 | - |
BNY Mellon Emerging Markets Fund | 55,082,945 | - | | 19,395,244 | - |
BNY Mellon International Equity Income Fund | 1,725,444 | - | | 3,320,595 | - |
BNY Mellon Asset Allocation Fund | 8,916,913 | 35,971,576 | | 12,911,973 | 20,597,400 |
| | | | | | |
Table 5—Return of Capital Statement of Position |
| | | Total Distributable
Earnings (Loss) ($) | Paid-in
Capital ($) | |
BNY Mellon Income Stock Fund | | | (5,660,980) | 5,660,980 | |
BNY Mellon Mid Cap Multi-Strategy Fund | | | (21,528,419) | 21,528,419 | |
NOTE 2—Bank Lines of Credit:
The funds participate with other long-term open-end funds managed by the Adviser in a $823.5 million unsecured credit facility led by Citibank, N.A. (the “Citibank Credit Facility”) and a $300 million unsecured credit facility provided by BNY Mellon (the “BNYM Credit Facility”), each to be utilized primarily for temporary or emergency purposes, including the financing of redemptions (each, a “Facility”). The Citibank Credit Facility is available in two tranches: (i) Tranche A is in an amount equal to $688.5 million and is available to all long-term open-ended funds, including the funds, and (ii) Tranche B is in amount equal to $135 million and is available only to the BNY Mellon Floating Rate Income Fund, a series of BNY Mellon Investment Funds IV, Inc. In connection therewith, each fund has agreed to pay its pro rata portion of commitment fees for Tranche A of the Citibank Credit Facility and the BNYM Credit Facility. Interest is charged to the funds based on rates determined pursuant to the terms of the respective Facility at the time of borrowing. During the period ended August 31, 2023, BNY Mellon Income Stock Fund, BNY Mellon Mid Cap Multi-Strategy Fund and BNY Mellon Small Cap Multi-Strategy Fund did not borrow under the Facilities.
During the period ended August 31, 2023, BNY Mellon International Fund was charged $2,797 for interest expense. These fees are included in Interest expense in the Statement of Operations. The average amount of borrowings outstanding under the Facilities during the period ended August 31, 2023 for the fund was approximately $51,233, with a related weighted average annualized interest rate of 5.46%.
During the period ended August 31, 2023, BNY Mellon Emerging Markets Fund was charged $11,351 for interest expense. These fees are included in Interest expense in the Statement of Operations. The average amount of borrowings outstanding under the Facilities during the period ended August 31, 2023 for the fund was approximately $218,356, with a related weighted average annualized interest rate of 5.20%.
During the period ended August 31, 2023, BNY Mellon International Equity Income Fund was charged $6,809 for interest expense. These fees are included in Interest expense in the Statement of Operations. The average amount of borrowings outstanding under the Facilities during the period ended August 31, 2023 for the fund was approximately $127,123, with a related weighted average annualized interest rate of 5.36%.
108
During the period ended August 31, 2023, BNY Mellon Asset Allocation Fund was charged $454 for interest expense. These fees are included in Interest expense in the Statement of Operations. The average amount of borrowings outstanding under the Facilities during the period ended August 31, 2023 for the fund was approximately $7,397, with a related weighted average annualized interest rate of 6.14%.
NOTE 3—Management Fee, Administration Fee, Sub-Advisory Fee and Other Transactions with Affiliates:
(a) Pursuant to an investment advisory agreement with the Adviser, the management fee is payable monthly and computed on the average daily value of each fund’s net assets at the following annual rate: .65% of BNY Mellon Income Stock Fund, .75% of BNY Mellon Mid Cap Multi-Strategy Fund, .85% of BNY Mellon Small Cap Multi-Strategy Fund, .85% of BNY Mellon International Fund, 1.15% of BNY Mellon Emerging Markets Fund, ..85% of BNY Mellon International Equity Income Fund and .65% (equity securities), .40% (debt securities) and .15% (money market instruments and other underlying funds, which may consist of affiliated funds and unaffiliated open-end funds, closed-end funds and exchange traded funds) of BNY Mellon Asset Allocation Fund.
For BNY Mellon Income Stock Fund, the Adviser has contractually agreed, from September 1, 2022 through December 30, 2023, to waive receipt of its fees and/or assume the direct expenses of the fund so that the direct expenses of none of Class A, Class C, Class I and Class Y share classes (excluding Rule 12b-1 Distribution Plan fees, Shareholder Services Plan fees, taxes, interest expense, brokerage commissions, commitment fees on borrowings and extraordinary expenses) do not exceed .90% of the value of the fund’s average daily net assets. On or after December 30, 2023, the Adviser may terminate this expense limitation agreement at any time. The reduction in expenses, pursuant to the undertaking, amounted to $16,472 during the period ended August 31, 2023.
For BNY Mellon International Fund, effective April 1, 2023, the Adviser has contractually agreed to waive receipt of a portion of its management fee in the amount of .20% of the value of the fund’s average daily net assets until April 1, 2024. On or after April 1, 2024, the Adviser may terminate this waiver agreement at any time. The reduction in expenses, pursuant to the undertaking amounted to $259,918 during the period ended August 31, 2023.
For BNY Mellon Emerging Markets Fund, effective January 1, 2023 through March 31, 2023, the Adviser had agreed to waive receipt of a portion of its management fee in the amount of .25% of the value of the fund’s average daily net assets. Effective April 1, 2023, the Adviser has contractually agreed to waive receipt of a portion of its management fee in the amount of .25% of the value of the fund’s average daily net assets until April 1, 2024. On or after April 1, 2024, the Adviser may terminate this waiver agreement at any time. The reduction in expenses, pursuant to the undertakings, amounted to $602,995 during the period ended August 31, 2023.
For BNY Mellon Asset Allocation Fund, the Adviser has contractually agreed, from September 1, 2022 through December 30, 2023, to waive receipt of its fees and/or assume the direct expenses of the fund so that the total annual fund operating expenses of neither class of fund shares (including indirect fees, and expense of the underlying funds, but excluding Shareholder Services Plan fees, taxes, interest expense, brokerage commissions, commitment fees on borrowings and extraordinary expenses) exceed ..87% of the value of the fund’s average daily net assets. On or after December 30, 2023, the Adviser may terminate this expense limitation agreement at any time. The reduction in expenses, pursuant to the undertaking, amounted to $89,511 during the period ended August 31, 2023.
Pursuant to the Administration Agreement, BNY Mellon provides or arranges for fund accounting, transfer agency and other fund administration services and receives a fee based on the total net assets of the Trust based on the following rates:
0 up to $6 billion .15%
$6 billion up to $12 billion .12%
In excess of $12 billion .10%
No administration fee is applied to assets held by BNY Mellon Asset Allocation Fund which are invested in cash or money market instruments or shares of other underlying funds.
Pursuant to a sub-investment advisory agreement between the Adviser and NIMNA and NIM for each relevant fund, the Adviser pays NIMNA and NIM for each relevant fund a monthly fee at an annual rate set forth below in Table 6 of the respective fund’s average daily net assets or the portion of the respective fund’s average daily net assets allocated to the strategies sub-advised by NIMNA and NIM for each relevant fund.
109
NOTES TO FINANCIAL STATEMENTS (continued)
| | |
Table 6—Annual Fee (as a percentage of average daily net assets allocated to the strategies sub-advised by NIMNA and NIM for each relevant fund) | |
| | |
BNY Mellon Income Stock Fund | .195 |
BNY Mellon Mid Cap Multi-Strategy Fund | .40 |
BNY Mellon Small Cap Multi-Strategy Fund | .55 |
BNY Mellon International Fund | .255 |
BNY Mellon Emerging Markets Fund | .345 |
BNY Mellon International Equity Income Fund | .25 |
Pursuant to separate sub-investment advisory agreements, Geneva and Boston Partners serve as a sub-adviser responsible for the day-to-day management of their respective portion of BNY Mellon Mid Cap Multi-Strategy Fund’s portfolio. The Adviser pays Boston Partners and Geneva separate monthly fees at an annual percentage of BNY Mellon Mid Cap Multi-Strategy Fund’s average daily net assets allocated to the Boston Partners Mid Cap Value Strategy and the Geneva Mid Cap Growth Strategy, respectively. The Adviser has obtained an exemptive order from the SEC (the “Order”), upon which the funds may rely, to use a manager of managers approach that permits the Adviser, subject to certain conditions and approval by the Board, to enter into and materially amend sub-investment advisory agreements with one or more sub-advisers who are either unaffiliated with the Adviser or are wholly-owned subsidiaries (as defined under the Act) of the Adviser’s ultimate parent company, BNY Mellon, without obtaining shareholder approval. The Order also allows the funds to disclose the sub-advisory fee paid by the Adviser to any unaffiliated sub-adviser in the aggregate with other unaffiliated sub-advisers in documents filed with the SEC and provided to shareholders. In addition, pursuant to the Order, it is not necessary to disclose the sub-advisory fee payable by the Adviser separately to a sub-adviser that is a wholly-owned subsidiary of BNY Mellon in documents filed with the SEC and provided to shareholders; such fees are to be aggregated with fees payable to the Adviser. The Adviser has ultimate responsibility (subject to oversight by the Board) to supervise any sub-adviser and recommend the hiring, termination, and replacement of any sub-adviser to the Board.
During the period ended August 31, 2023, the Distributor retained $2,107 from commissions earned on sales of BNY Mellon Income Stock Fund Class A shares and $1,089 from CDSC fees on redemptions of the fund’s Class C shares.
(b) Under the Distribution Plan adopted pursuant to Rule 12b-1 under the Act, Class C shares of BNY Mellon Income Stock Fund pay the Distributor for distributing its shares at an annual rate of .75% of the value of its average daily net assets. The Distributor may pay one or more Service Agents in respect of advertising, marketing and other distribution services, and determines the amounts, if any, to be paid to Service Agents and the basis on which such payments are made. During the period ended August 31, 2023, Class C shares were charged $8,493 pursuant to the Distribution Plan.
Each fund has adopted a Shareholder Services Plan with respect to its Investor shares. BNY Mellon Income Stock Fund has also adopted a Shareholder Services Plan with respect to its Class A and Class C shares. Each fund pays the Distributor at an annual rate of .25% of the value of its Investor shares, and BNY Mellon Income Stock Fund pays the Distributor at an annual rate of .25% of the value of its Class A and Class C shares, based on the respective fund’s average daily net assets for the provision of certain services. The services provided may include personal services relating to shareholder accounts, such as answering shareholder inquiries regarding a fund, and services related to the maintenance of such shareholder accounts. The Shareholder Services Plan allows the Distributor to make payments from the shareholder services fees it collects from each fund to compensate service agents (certain banks, securities brokers or dealers and other financial institutions) with respect to these services. Table 7 summarizes the amounts Investor, Class A and Class C shares were charged during the period ended August 31, 2023, pursuant to the Shareholder Services Plan, which is included in Shareholder servicing costs in the Statements of Operations.
| | | |
Table 7—Shareholder Services Plan Fees | |
| | |
BNY Mellon Income Stock Fund | |
Investor Shares | $ | 48,023 |
Class A | 6,495 |
Class C | 2,831 |
BNY Mellon Mid Cap Multi-Strategy Fund | 308,961 |
BNY Mellon Small Cap Multi-Strategy Fund | 68,619 |
BNY Mellon International Fund | 38,611 |
BNY Mellon Emerging Markets Fund | 58,733 |
BNY Mellon International Equity Income Fund | 1,970 |
BNY Mellon Asset Allocation Fund | 20,664 |
The funds have an arrangement with BNY Mellon Transfer, Inc., (the “Transfer Agent”), a subsidiary of BNY Mellon and an affiliate of the Adviser, whereby the funds may receive earnings credits when positive cash balances are maintained, which are used to offset Transfer Agent fees. For financial reporting purposes, the funds include net earnings credits, if any, as an expense offset in the Statements of Operations.
110
The funds have an arrangement with The Bank of New York Mellon (the “Custodian”), a subsidiary of BNY Mellon and an affiliate of the Adviser, whereby the funds will receive interest income or be charged overdraft fees when cash balances are maintained. For financial reporting purposes, the funds include this interest income and overdraft fees, if any, as interest income in the Statements of Operations.
Each fund compensates the Transfer Agent, under a transfer agency agreement, for providing transfer agency services for BNY Mellon Income Stock Fund Class A, Class C, Class I and Class Y shares and cash management services for the funds. The majority of Transfer Agent fees for BNY Mellon Income Stock Fund Class A, Class C, Class I and Class Y shares are comprised of amounts paid on a per account basis, while cash management fees are related to fund subscriptions and redemptions. BNY Mellon pays each fund’s Transfer Agent fees comprised of amounts paid on a per account basis out of the administration fee it receives from the Trust, excluding BNY Mellon Income Stock Fund, Class A, Class C, Class I and Class Y shares. Table 8 summarizes the amount each fund was charged during the period ended August 31, 2023, which is included in Shareholder servicing costs in the Statements of Operations. These fees were partially offset by earnings credits for each relevant fund, also summarized in Table 8.
Each fund compensates the Custodian, under a custody agreement, for providing custodial services for each fund. These fees are determined based on net assets, geographic region and transaction activity. Table 9 summarizes the amount each fund was charged during the period ended August 31, 2023 pursuant to the custody agreement.
| | | |
Table 9—Custody Agreement Fees | |
| | |
BNY Mellon Income Stock Fund | $ | 22,014 |
BNY Mellon Mid Cap Multi-Strategy Fund | 54,204 |
BNY Mellon Small Cap Multi-Strategy Fund | 36,780 |
BNY Mellon International Fund | 80,499 |
BNY Mellon Emerging Markets Fund | 466,904 |
BNY Mellon International Equity Income Fund | 90,100 |
BNY Mellon Asset Allocation Fund | 11,847 |
Table 10 summarizes the amount each fund was charged for services performed by the Chief Compliance Officer and his staff, during the period ended August 31, 2023.
| | | |
Table 10—Chief Compliance Officer Fees | |
| | |
BNY Mellon Income Stock Fund | $ | 19,899 |
BNY Mellon Mid Cap Multi-Strategy Fund | 34,852 |
BNY Mellon Small Cap Multi-Strategy Fund | 24,153 |
BNY Mellon International Fund | 20,177 |
BNY Mellon Emerging Markets Fund | 20,249 |
BNY Mellon International Equity Income Fund | 20,841 |
BNY Mellon Asset Allocation Fund | 23,636 |
| | | | |
Table 8—Transfer Agent Fees | |
| | Transfer
Agent Fees ($) | Transfer Agent
Earnings Credits ($) |
BNY Mellon Income Stock Fund | 4,063 | (2,755) |
BNY Mellon Mid Cap Multi-Strategy Fund | - | (6,820) |
BNY Mellon Small Cap Multi-Strategy Fund | - | (4,497) |
BNY Mellon International Fund | - | (1,207) |
BNY Mellon Emerging Markets Fund | - | (1,552) |
BNY Mellon International Equity Income Fund | - | (392) |
BNY Mellon Asset Allocation Fund | - | (504) |
111
NOTES TO FINANCIAL STATEMENTS (continued)
Table 11 summarizes the components of “Due to BNY Mellon Investment Adviser, Inc. and affiliates” in the Statements of Assets and Liabilities for each fund.
(c) Each Board member also serves as a Board member of other funds within the Trust. Annual retainer fees and attendance fees are allocated to each fund based on net assets.
NOTE 4—Securities Transactions:
Table 12 summarizes each fund’s aggregate amount of purchases and sales (including paydowns) of investment securities, excluding short-term securities during the period ended August 31, 2023.
Table 13 summarizes the cost of investments for federal income tax purposes, gross appreciation, gross depreciation and accumulated net unrealized appreciation (depreciation) on investments for each fund at August 31, 2023.
| | | | | | | | | |
Table 11—Due to BNY Mellon Investment Adviser, Inc. and Affiliates |
| Management
Fee ($) | Administration
Fee ($) | Distribution
Plan
Fees ($) | Shareholder
Services
Plan
Fees ($) | Custodian
Fees ($) | Chief Compliance
Officer
Fees ($) | Transfer Agent
Fees ($) | Less Expense Reimbursement ($) |
BNY Mellon Income Stock Fund | 193,977 | 39,672 | 672 | 4,455 | 4,800 | 3,274 | 852 | (732) |
BNY Mellon Mid Cap Multi-Strategy Fund | 998,970 | 179,142 | - | 25,887 | 16,800 | 6,465 | - | - |
BNY Mellon Small Cap Multi-Strategy Fund | 462,322 | 72,500 | - | 5,669 | 14,000 | 5,447 | - | - |
BNY Mellon International Fund | 214,761 | 34,032 | - | 3,183 | 28,000 | 3,323 | - | (50,644) |
BNY Mellon Emerging Markets Fund | 321,146 | 37,514 | - | 4,354 | 190,000 | 3,586 | - | (69,814) |
BNY Mellon International Equity Income Fund | 21,899 | 3,376 | - | 136 | 25,500 | 3,679 | - | - |
BNY Mellon Asset Allocation Fund | 148,116 | 22,867 | - | 1,652 | 2,800 | 3,904 | - | - |
| | | | | | | | | |
Table 12—Purchases and Sales | | | |
| | Purchases ($) | | Sales ($) | |
BNY Mellon Income Stock Fund | | 322,447,579 | | 484,702,288 | |
BNY Mellon Mid Cap Multi-Strategy Fund | | 437,137,324 | | 966,340,563 | |
BNY Mellon Small Cap Multi-Strategy Fund | | 343,944,985 | | 321,835,008 | |
BNY Mellon International Fund | | 196,978,287 | | 311,500,586 | |
BNY Mellon Emerging Markets Fund | | 474,513,321 | | 691,926,301 | |
BNY Mellon International Equity Income Fund | | 21,726,767 | | 50,496,206 | |
BNY Mellon Asset Allocation Fund | | 138,221,407 | | 134,841,014 | |
| | | | | | | | | |
Table 13—Accumulated Net Unrealized Appreciation (Depreciation) | | | |
| | Cost of
Investments ($) | Gross
Appreciation ($) | Gross
Depreciation ($) | Net ($) |
BNY Mellon Income Stock Fund | | 293,867,805 | 55,571,959 | 6,585,033 | 48,986,926 |
BNY Mellon Mid Cap Multi-Strategy Fund | | 841,163,523 | 782,323,200 | 44,739,656 | 737,583,544 |
BNY Mellon Small Cap Multi-Strategy Fund | | 582,134,296 | 138,737,367 | 68,368,841 | 70,368,526 |
BNY Mellon International Fund | | 279,936,304 | 33,378,641 | 22,715,424 | 10,663,217 |
BNY Mellon Emerging Markets Fund | | 283,653,324 | 63,952,133 | 27,915,874 | 36,036,259 |
BNY Mellon International Equity Income Fund | | 27,223,397 | 4,931,562 | 2,884,558 | 2,047,004 |
BNY Mellon Asset Allocation Fund | | 354,144,182 | 88,607,496 | 13,189,219 | 75,418,277 |
112
REPORT OF INDEPENDENT REGISTERED
PUBLIC ACCOUNTING FIRM
To the Shareholders of the Funds and Board of Trustees of
BNY Mellon Funds Trust:
Opinion on the Financial Statements
We have audited the accompanying statements of assets and liabilities of BNY Mellon Income Stock Fund, BNY Mellon Mid Cap Multi-Strategy Fund, BNY Mellon Small Cap Multi-Strategy Fund, BNY Mellon International Fund, BNY Mellon Emerging Markets Fund, BNY Mellon International Equity Income Fund and BNY Mellon Asset Allocation Fund, (collectively, the “Funds”), each a series of BNY Mellon Funds Trust, including the statements of investments as of August 31, 2023, the related statements of operations for the year then ended, the statements of changes in net assets for each of the years in the two-year period then ended, and the related notes (collectively, the financial statements) and the financial highlights for each of the years in the five-year period then ended. In our opinion, the financial statements and financial highlights present fairly, in all material respects, the financial position of the Funds as of August 31, 2023, the results of their operations for the year then ended, the changes in their net assets for each of the years in the two-year period then ended, and the financial highlights for each of the years in the five-year period then ended, in conformity with U.S. generally accepted accounting principles.
Basis for Opinion
These financial statements and financial highlights are the responsibility of the Funds’ management. Our responsibility is to express an opinion on these financial statements and financial highlights based on our audits. We are a public accounting firm registered with the Public Company Accounting Oversight Board (United States) (PCAOB) and are required to be independent with respect to the Funds in accordance with the U.S. federal securities laws and the applicable rules and regulations of the Securities and Exchange Commission and the PCAOB.
We conducted our audits in accordance with the standards of the PCAOB. Those standards require that we plan and perform the audit to obtain reasonable assurance about whether the financial statements and financial highlights are free of material misstatement, whether due to error or fraud. Our audits included performing procedures to assess the risks of material misstatement of the financial statements and financial highlights, whether due to error or fraud, and performing procedures that respond to those risks. Such procedures included examining, on a test basis, evidence regarding the amounts and disclosures in the financial statements and financial highlights. Such procedures also included confirmation of securities owned as of August 31, 2023, by correspondence with the custodian and brokers or by other appropriate auditing procedures when replies from brokers were not received. Our audits also included evaluating the accounting principles used and significant estimates made by management, as well as evaluating the overall presentation of the financial statements and financial highlights. We believe that our audits provide a reasonable basis for our opinion.

We have served as the auditor of one or more BNY Mellon Investment Adviser, Inc. investment companies since 1994.
New York, New York
October 23, 2023
113
IMPORTANT TAX INFORMATION (Unaudited)
BNY Mellon Income Stock Fund
For federal tax purposes the fund reports the maximum amount allowable but not less than 58.30% of ordinary income dividends paid during the fiscal year ended August 31, 2023 as eligible for the corporate dividends received deduction provided under Section 243 of the Internal Revenue Code in accordance with Section 854(b)(1)(A) of the Internal Revenue Code. Also, the fund reports the maximum amount allowable but not less than $15,429,172 as ordinary income dividends paid during the fiscal year ended August 31, 2023 as qualified dividend income in accordance with Section 854(b)(1)(B) of the Internal Revenue Code. Shareholders will receive notification in early 2024 of the percentage applicable to the preparation of their 2023 income tax returns. Also, the fund reports the maximum amount allowable but not less than $1.5093 per share as a capital gain dividend paid on December 7, 2022 in accordance with Section 852(b)(3)(C) of the Internal Revenue Code. Also, the fund reports the maximum amount allowable but not less than $.3192 as a short-term capital gain dividend paid on December 7, 2022 in accordance with Sections 871(k)(2) and 881(e) of the Internal Revenue Code.
BNY Mellon Mid Cap Multi-Strategy Fund
For federal tax purposes the fund reports the maximum amount allowable but not less than 100% of ordinary income dividends paid during the fiscal year ended August 31, 2023 as eligible for the corporate dividends received deduction provided under Section 243 of the Internal Revenue Code in accordance with Section 854(b)(1)(A) of the Internal Revenue Code. Also, the fund reports the maximum amount allowable but not less than $7,702,473 as ordinary income dividends paid during the fiscal year ended August 31, 2023 as qualified dividend income in accordance with Section 854(b)(1)(B) of the Internal Revenue Code. Shareholders will receive notification in early 2024 of the percentage applicable to the preparation of their 2023 income tax returns. Also, the fund reports the maximum amount allowable but not less than $2.0296 as a long-term capital gain dividend paid on December 13, 2022 in accordance with Sections 871(k)(2) and 881(e) of the Internal Revenue Code.
BNY Mellon Small Cap Multi-Strategy Fund
The fund reports the maximum amount allowable but not less than $.5121 per share as a long-term capital gain dividend paid on December 16, 2022 in accordance with Section 852(b)(3)(C) of the Internal Revenue Code.
BNY Mellon International Fund
For federal tax purposes, the fund elects to provide each shareholder with their portion of the fund’s income sourced from foreign countries and taxes paid from foreign countries. The fund reports the maximum amount allowable but not less than $14,748,358 as income sourced from foreign countries for the fiscal year ended August 31, 2023 in accordance with Section 853(c)(2) of the Internal Revenue Code and also the fund reports the maximum amount allowable but not less than $1,584,264 as taxes paid from foreign countries for the fiscal year ended August 31, 2023 in accordance with Section 853(a) of the Internal Revenue Code. Where required by federal tax rules, shareholders will receive notification of their proportionate share of foreign sourced income and foreign taxes paid for the 2023 calendar year with Form 1099-DIV which will be mailed in early 2023. Also the fund reports the maximum amount allowable, but not less than $16,321,324 as ordinary income dividends paid during the fiscal year ended August 31, 2023 as qualified dividend income in accordance with Section 854(b)(1)(B) of the Internal Revenue Code.
BNY Mellon Emerging Markets Fund
For federal tax purposes, the fund elects to provide each shareholder with their portion of the fund’s income sourced from foreign countries and taxes paid from foreign countries. The fund reports the maximum amount allowable but not less than $10,703,589 as income sourced from foreign countries for the fiscal year ended August 31, 2023 in accordance with Section 853(c)(2) of the Internal Revenue Code and also the fund reports the maximum amount allowable but not less than $1,152,044 as taxes paid from foreign countries for the fiscal year ended August 31, 2023 in accordance with Section 853(a) of the Internal Revenue Code. Where required by federal tax rules, shareholders will receive notification of their proportionate share of foreign sourced income and foreign taxes paid for the 2023 calendar year with Form 1099-DIV which will be mailed in early 2024. Also the fund reports the maximum amount allowable, but not less than $39,495,140 as ordinary income dividends paid during the fiscal year ended August 31, 2023 as qualified dividend income in accordance with Section 854(b)(1)(B) of the Internal Revenue Code.
BNY Mellon International Equity Income Fund
For federal tax purposes, the fund elects to provide each shareholder with their portion of the fund’s income sourced from foreign countries and taxes paid from foreign countries. The fund reports the maximum amount allowable but not less than $2,266,525 as income sourced from foreign countries for the fiscal year ended August 31, 2023 in
114
accordance with Section 853(c)(2) of the Internal Revenue Code and also the fund reports the maximum amount allowable but not less than $232,484 as taxes paid from foreign countries for the fiscal year ended August 31, 2023 in accordance with Section 853(a) of the Internal Revenue Code. Where required by federal tax rules, shareholders will receive notification of their proportionate share of foreign sourced income and foreign taxes paid for the 2023 calendar year with Form 1099-DIV which will be mailed in early 2024. Also, the fund reports the maximum amount allowable, but not less than $1,919,311 as ordinary income dividends paid during the fiscal year ended August 31, 2023 as qualified dividend income in accordance with Section 854(b)(1)(B) of the Internal Revenue Code.
BNY Mellon Asset Allocation Fund
For federal tax purposes the fund reports the maximum amount allowable but not less than 28.53% of ordinary income dividends paid during the fiscal year ended August 31, 2023 as eligible for the corporate dividends received deduction provided under Section 243 of the Internal Revenue Code in accordance with Section 854(b)(1)(A) of the Internal Revenue Code. Also, the fund reports the maximum amount allowable but not less than $4,966,886 as ordinary income dividends paid during the fiscal year ended August 31, 2023 as qualified dividend income in accordance with Section 854(b)(1)(B) of the Internal Revenue Code. Shareholders will receive notification in early 2024 of the percentage applicable to the preparation of their 2023 income tax returns. Also, the fund reports the maximum amount allowable but not less than $1.0634 per share as a capital gain dividend paid on December 30, 2022 n accordance with Section 852(b)(3)(C) of the Internal Revenue Code.
115
INFORMATION ABOUT THE RENEWAL AND APPROVAL OF THE FUND’S INVESTMENT ADVISORY, ADMINISTRATION AND EACH RELEVANT FUND’S SUB-INVESTMENT ADVISORY AGREEMENTS (Unaudited)
At a meeting of the Trust’s Board of Trustees held on March 20-21, 2023, the Board considered the renewal of (i) the Trust’s Investment Advisory Agreement and Administration Agreement, pursuant to which the Adviser provides the funds with investment advisory services and The Bank of New York Mellon is responsible for the provision of administrative services to the funds (together, the “Management Agreement”); (ii) the separate Sub-Investment Advisory Agreements with respect to BNY Mellon Mid Cap Multi-Strategy Fund, pursuant to which (a) Boston Partners Global Investors, Inc. (“Boston Partners”) provides day-to-day management of the fund’s investments allocated to the Boston Partners Mid Cap Value Strategy, (b) Geneva Capital Management, LLC (“Geneva”) provides day-to-day management of the portion of the fund’s investments allocated to the Geneva Mid Cap Growth Strategy, and (c) Newton Investment Management North America, LLC (“NIMNA”) provides day-to-day management of the portion of the fund’s investments allocated to the Opportunistic Mid Cap Value Strategy and Mid Cap Growth Strategy; (iii) the Sub-Investment Advisory Agreement with respect to BNY Mellon Small Cap Multi-Strategy Fund, pursuant to which NIMNA provides day-to-day management of the portion of the fund’s investments allocated to the Opportunistic Small Cap Strategy, the Small Cap Value Strategy and the Small Cap Growth Strategy; (iv) the Sub-Investment Advisory Agreement with respect to BNY Mellon Income Stock Fund, pursuant to which NIMNA provides day-to-day management of the fund’s investments; (v) the Sub-Investment Advisory Agreement with respect to BNY Mellon International Equity Income Fund, pursuant to which NIMNA provides day-to-day management of the fund’s investments; (vi) the Sub-Investment Advisory Agreement with respect to BNY Mellon International Fund, pursuant to which NIMNA provides day-to-day management of the fund’s investments; and (vii) the Sub-Investment Advisory Agreement with respect to BNY Mellon Emerging Markets Fund, pursuant to which Newton Investment Management Limited (“NIM”) provides day-to-day management of the fund’s investments. The Management Agreement, together with the Sub-Investment Advisory Agreements, are referred to as the “Agreements,” Boston Partners, Geneva, NIMNA and NIM are each referred to as a “Sub-Adviser” and collectively as the “Sub-Advisers,” and BNY Mellon Mid Cap Multi-Strategy Fund, BNY Mellon Emerging Markets Fund, BNY Mellon Income Stock Fund, BNY Mellon International Equity Fund, BNY Mellon International Fund, and BNY Mellon Small Cap Multi-Strategy Fund are referred to collectively as the “Sub-Advised Funds.” The Bank of New York Mellon has entered into a Sub-Administration Agreement with the Adviser pursuant to which The Bank of New York Mellon pays the Adviser for performing certain of the administrative services referenced above. The Board members, none of whom are “interested persons” (as defined in the Investment Company Act of 1940, as amended) of the Trust, were assisted in their review by independent legal counsel and met with counsel in executive session separate from representatives of the Adviser and the Sub-Advisers. In considering the renewal of the Agreements, the Board considered several factors that it believed to be relevant, including those discussed below. The Board did not identify any one factor as dispositive, and each Board member may have attributed different weights to the factors considered.
Analysis of Nature, Extent, and Quality of Services Provided to the Funds. The Board considered information provided to it at the meeting and in previous presentations from representatives of the Adviser regarding the nature, extent, and quality of the services provided to the funds in the Trust, including the funds. The Adviser provided the number of open accounts in each fund, each fund’s asset size and the allocation of fund assets among distribution channels. The Adviser also had previously provided information regarding the distribution channel(s) of the funds and the need to be able to provide ongoing shareholder services to each distribution channel, as applicable to each fund.
The Board also considered research support available to, and portfolio management capabilities of, each fund’s portfolio management personnel and that the Adviser also provides oversight of day-to-day fund operations, including fund accounting and administration and assistance in meeting legal and regulatory requirements. The Board also considered the Adviser’s extensive administrative, accounting and compliance infrastructures, as well as, for the Sub-Advised Funds, the Adviser’s supervisory activities over the Sub-Adviser(s). The Board also considered portfolio management’s brokerage policies and practices (including policies and practices regarding soft dollars) and the standards applied in seeking best execution.
Comparative Analysis of the Funds’ Performance and Management Fees and Expense Ratios. For each fund, the Board reviewed reports prepared by Broadridge Financial Solutions, Inc. (“Broadridge”), an independent provider of investment company data based on classifications provided by Thomson Reuters Lipper (“Lipper”), which included information comparing (1) the performance of the fund’s Class M shares with the performance of a group of institutional funds selected by Broadridge as comparable to the fund (the “Performance Group”) and with a broader group of funds consisting of all retail and institutional funds in the particular Lipper classification (the “Performance Universe”), all for various periods ended December 31, 2022,
116
and (2) the fund’s actual and contractual management fees and total expenses with those of the same group of funds in the Performance Group (the “Expense Group”) and with a broader group of all institutional funds in the particular Lipper classification, excluding outliers (the “Expense Universe”). At the Adviser’s request, the Board also reviewed reports prepared by Broadridge with respect to BNY Mellon Asset Allocation Fund, a “fund of funds,” which included information comparing (1) the performance of the fund’s Class M shares with the performance of a group of funds of funds selected by Broadridge as comparable to the fund (the “Funds of Funds Performance Group”), all for various periods ended December 31, 2022, and (2) the fund’s actual and contractual management fees and total expenses with those of the same group of funds in the Funds of Funds Performance Group (the “Funds of Funds Expense Group”) and with a broader group of funds consisting of the funds in the Funds of Funds Expense Group and the fund’s Expense Universe (the “Funds of Funds Expense Universe”). The information for each comparison was derived, in part, from fund financial statements available to Broadridge as of the date of its analysis. The Adviser previously had furnished the Board with a description of the methodology Broadridge used to select the Performance Group and Performance Universe and the Expense Group and Expense Universe and representatives of the Adviser informed the Board of the methodology Broadridge used to select the funds in the Funds of Funds Performance Group and the Funds of Funds Expense Group and the funds in the Funds of Funds Expense Universe.
Performance Comparisons. Representatives of the Adviser stated that the usefulness of performance comparisons may be affected by a number of factors, including different investment limitations and policies that may be applicable to each fund and comparison funds and the end date selected. The Board also considered the funds’ performance in light of overall financial market conditions.
Management Fee and Expense Ratio Comparisons. For each fund, the Board reviewed and considered the contractual management fee rate payable by the fund to the Adviser in light of the nature, extent and quality of the management services provided by the Adviser and the Sub-Advisers, respectively. In addition, the Board reviewed and considered the actual management fee rate paid by the fund over the fund’s last fiscal year. The Board also reviewed the range of actual and contractual management fees and total expenses as a percentage of average net assets of the Expense Group and Expense Universe funds and discussed the results of the comparisons.
For the Sub-Advised Funds, the Board considered the fee payable to the Sub-Adviser(s) in relation to the fee payable to the Adviser by the fund and the respective services provided by the Sub-Adviser(s) and the Adviser. The Board also took into consideration that each Sub-Adviser’s fee is paid by the Adviser, out of its fee from the relevant fund, and not the fund.
For each of BNY Mellon Mid Cap Multi-Strategy Fund, BNY Mellon Small Cap Multi-Strategy Fund, BNY Mellon Asset Allocation Fund and BNY Mellon Emerging Markets Fund, representatives of the Adviser reviewed with the Board the management or advisory fees paid by any funds advised by the Adviser in the same Lipper category as the fund (the “Similar Fund(s)”) and explained the nature of the Similar Fund(s). They discussed differences in fees paid and the relationship of the fees paid in light of any differences in the services provided and other relevant factors. For each such fund, the Board considered the relevance of the fee information provided for the Similar Fund(s) to evaluate the appropriateness of the fund’s management fee. For each such fund, representatives of the Adviser noted that there were no separate accounts and/or other types of client portfolios advised by the Adviser or, for the Sub-Advised Funds, the Sub-Adviser(s), that are considered to have similar investment strategies and policies as the fund.
For each of BNY Mellon Income Stock Fund and BNY Mellon International Fund, representatives of the Adviser reviewed with the Board the management or advisory fees (1) paid by any Similar Fund(s) and (2) paid to the Adviser or its affiliates for advising the one or more separate accounts and/or other types of client portfolios that are considered to have similar investment strategies and policies as the fund (together with the Similar Funds, the “Similar Clients”), and explained the nature of the Similar Clients. They discussed differences in fees paid and the relationship of the fees paid in light of any differences in the services provided and other relevant factors. For each such fund, the Board considered the relevance of the fee information provided for the Similar Clients to evaluate the appropriateness of the fund’s management fee. For BNY Mellon International Equity Income Fund, representatives of the Adviser noted that there were no other funds advised by the Adviser that are in the same Lipper category as the fund or separate accounts and/or other types of client portfolios advised by the Adviser or the Sub-Adviser that are considered to have similar investment strategies and policies as the fund.
117
INFORMATION ABOUT THE RENEWAL AND APPROVAL OF THE FUND’S INVESTMENT ADVISORY, ADMINISTRATION AND EACH RELEVANT FUND’S SUB-INVESTMENT ADVISORY AGREEMENTS (Unaudited) (continued)
BNY Mellon Income Stock Fund
The information comparing the fund’s performance to that of its Performance Group and Performance Universe consisted of funds classified as equity income funds by Lipper.
The Board discussed with representatives of the Adviser and the Sub-Adviser, the results of the comparisons and considered that the fund’s total return performance was above the Performance Group and Performance Universe medians for all periods and was the highest in the Performance Group for all periods. The Adviser also provided a comparison of the fund’s calendar year total returns to the returns of the fund’s benchmark index, and it was noted that the fund’s returns were above the returns of the index in five of the ten calendar years shown. The Board noted that the fund had a four star rating for each of the three-, five- and ten-year periods and a four star overall rating from Morningstar based on Morningstar’s risk-adjusted return measures.
The Board considered that the fund’s contractual management fee was slightly higher than the Expense Group median contractual management fee, the fund’s actual management fee was higher than the Expense Group median and Expense Universe median actual management fee, and the fund’s total expenses were slightly higher than the Expense Group median and higher than the Expense Universe median total expenses.
Representatives of the Adviser stated that the Adviser has contractually agreed, until December 30, 2023, to waive receipt of its fees and/or assume the direct expenses of the fund so that the direct expenses of none of Class A, C, I or Y shares of the fund (excluding Rule 12b-1 fees, shareholder services fees, taxes, interest expense, brokerage commissions, commitment fees on borrowing and extraordinary expenses) exceed .90% of the fund’s average daily net assets.
BNY Mellon Mid Cap Multi-Strategy Fund
The information comparing the fund’s performance to that of its Performance Group and Performance Universe consisted of funds classified as mid-cap growth funds by Lipper.
The Board discussed with representatives of the Adviser and the Sub-Advisers the results of the performance comparisons and considered that the fund’s total return performance was above the Performance Group and Performance Universe medians for all periods, except for the five- and ten-year periods when the fund’s total return performance was slightly below the Performance Group and Performance Universe medians. The Board also reviewed performance attribution information relating to each fund strategy and the managers responsible for the strategy compared to the strategy’s benchmark index for the one-year period ended December 31, 2022, which showed that three out of the fund’s five strategies performed better than the respective benchmark index. The Adviser also provided a comparison of the fund’s calendar year total returns to the returns of the fund’s benchmark index, and it was noted the fund’s returns were at or above the returns of the index in five of the ten calendar years shown. It was noted that the Performance Group and Performance Universe were comprised of institutional mid-cap growth funds, whereas the fund allocates its assets among multiple investment strategies which include mid-cap growth, value and core investment strategies. Management confirmed that the fund continued to apply consistent investment strategies and performed in a manner management expected under then-current market conditions.
The Board considered that the fund’s contractual management fee was higher than the Expense Group median, the fund’s actual management fee was higher than the Expense Group median and Expense Universe median actual management fee, and the fund’s actual total expenses were higher than the Expense Group median and Expense Universe median total expenses.
BNY Mellon Small Cap Multi-Strategy Fund
The information comparing the fund’s performance to that of its Performance Group and Performance Universe consisted of funds classified as small-cap core funds by Lipper.
The Board discussed with representatives of the Adviser and the Sub-Adviser the results of the performance comparisons and considered that the fund’s total return performance was at or above the Performance Group median for all periods, except for the one-, two- and ten-year periods when the fund’s total return performance was below the Performance Group median, and was above the Performance Universe medians for all periods, except for the one- and two-year periods when the fund’s total return performance was below the Performance Universe median. The Board also reviewed performance attribution information relating to each fund strategy and the managers responsible for the strategy compared to the strategy’s benchmark index for the one-year period ended December 31, 2022, which showed that two out of the fund’s three strategies performed better than the respective benchmark index. The Board discussed with representatives of the Adviser and the Sub-Adviser the reasons for the fund’s underperformance versus the Performance Group and Performance Universe during the most recent periods under review and noted that the
118
portfolio managers are very experienced with an impressive long-term track record and continued to apply a consistent investment strategy. The Adviser also provided a comparison of the fund’s calendar year total returns to the returns of the fund’s benchmark index, and it was noted that the fund’s returns were above the returns six out of the ten calendar years shown.
The Board considered that the fund’s contractual management fee was higher than the Expense Group median contractual management fee, the fund’s actual management fee was higher than the Expense Group median and Expense Universe median actual management fee, and the fund’s actual total expenses were higher than the Expense Group median and Expense Universe median total expenses.
BNY Mellon International Fund
The information comparing the fund’s performance to that of its Performance Group and Performance Universe consisted of funds classified as international multi-cap core funds by Lipper.
The Board discussed with representatives of the Adviser and the Sub-Adviser the results of the performance comparisons and considered that the fund’s total return performance was below the Performance Group median and the Performance Universe median for all periods. The Board discussed with representatives of the Adviser and the Sub-Adviser the reasons for the fund’s underperformance versus the Performance Group and Performance Universe and noted that the portfolio manager is very experienced and continued to apply a consistent investment strategy. The Board considered the relative proximity of the fund’s performance to the Performance Group and/or Performance Universe medians in certain periods. The Adviser also provided a comparison of the fund’s calendar year total returns to the returns of the fund’s benchmark index, and it was noted that the fund’s returns were above the returns of the index in four of the ten calendar years shown.
The Board considered that the fund’s contractual management fee was higher than the Expense Group median contractual management fee, the fund’s actual management fee was higher than the Expense Group median and Expense Universe median actual management fee, and the fund’s total expenses were higher than the Expense Group median and Expense Universe median total expenses.
Representatives of the Adviser stated that the Adviser has contractually agreed, until April 1, 2024, to waive receipt of a portion of its management fee in the amount of .20% of the value of the fund’s average daily net assets.
BNY Mellon Emerging Market Fund
The information comparing the fund’s performance to that of its Performance Group and Performance Universe consisted of funds classified as emerging markets funds by Lipper.
The Board discussed with representatives of the Adviser and Sub-Adviser the results of the performance comparisons and considered that the fund’s total return performance was at or above the Performance Group median for all periods, except the four-year period when the fund’s total return performance was just below the Performance Group median, and was above the Performance Universe median for all periods, except the ten-year period when the fund’s total return performance was slightly below the Performance Group median. The Adviser also provided a comparison for the fund’s calendar year total returns to the returns of the fund’s benchmark index, and it was noted that the fund’s returns were above the returns of the index in four of the ten calendar years shown.
The Board considered that the fund’s contractual management fee was higher than the Expense Group median contractual management fee, the fund’s actual management fee was higher than the Expense Group median and Expense Universe median actual management fee, and the fund’s total expenses were higher than the Expense Group median and Expense Universe median total expenses.
Representatives of the Adviser stated that the Adviser has contractually agreed, until April 1, 2024, to waive receipt of a portion of its management fee in the amount of .25% of the value of the fund’s average daily net assets.
BNY Mellon International Equity Income Fund
The information comparing the fund’s performance to that of its Performance Group and Performance Universe consisted of funds classified as international equity income funds by Lipper.
The Board discussed with representatives of the Adviser and Sub-Adviser the results of the performance comparisons and considered that the fund’s total return performance was below the Performance Group and Performance Universe medians for all periods, except the one- and two-year periods when the fund’s total return performance was above and at the Performance Group median, respectively, and above the Performance Universe median. The Board discussed with representatives of the Adviser and the Sub-Adviser the reasons for the fund’s underperformance versus the Performance Group and Performance Universe during certain periods under review and noted that the portfolio manager is very experienced and continued to apply a
119
INFORMATION ABOUT THE RENEWAL AND APPROVAL OF THE FUND’S INVESTMENT ADVISORY, ADMINISTRATION AND EACH RELEVANT FUND’S SUB-INVESTMENT ADVISORY AGREEMENTS (Unaudited) (continued)
consistent investment strategy. The Adviser also provided a comparison of the fund’s calendar year total returns to the returns of the fund’s benchmark index.
The Board considered that the fund’s contractual management fee was higher than the Expense Group median contractual management fee, the fund’s actual management fee was higher than the Expense Group median and Expense Universe median actual management fee, and the fund’s total expenses were higher than the Expense Group median and Expense Universe median total expenses. The Board noted the small asset size of the fund.
BNY Mellon Asset Allocation Fund
The information comparing the fund’s performance to that of its Performance Group and Performance Universe consisted of funds classified as mixed-asset target allocation growth funds by Lipper and to that of its Funds of Funds Performance Group consisted of funds classified as mixed-asset target allocation growth funds of funds.
The Board discussed with representatives of the Adviser the results of the performance comparisons and considered that the fund’s total return performance was below the Performance Group median for all periods, except for the three- and five-year periods when the fund’s total return performance was slightly above the Performance Group median, and was above the Performance Universe median for all periods, except for the ten-year period when the fund’s total return performance was below the Performance Universe median. The Board also considered that the fund’s total return performance was above the Funds of Funds Performance Group median for all periods. The Board also reviewed performance attribution information relating to each fund strategy to which fund assets were allocated and the managers and underlying funds responsible for the strategy compared to the strategy’s benchmark index for the one-year period ended December 31, 2022, which showed that five out of the sixteen managers/underlying funds in the strategies to which fund assets were allocated performed better than the respective benchmark index. The Adviser also provided a comparison of the fund’s calendar year total returns to the returns of the fund’s benchmark index, and it was noted that the fund’s returns were above the returns of the index in seven of the ten calendar years shown.
The Board considered that the fund invests a portion of its assets in underlying mutual funds (“Acquired Funds”) and that the fund’s pro rata share of the expenses of the Acquired Funds was included in the fund’s total expenses used to determine its rankings in the Expense Group, Expense Universe, Funds of Funds Expense Group and Funds of Funds Expense Universe (even though not all other funds in the Expense Group and Expense Universe invest in underlying funds). The Board considered that the fund’s contractual management fee was lower than the Expense Group median and higher than the Funds of Funds Expense Group median contractual management fee; the fund’s actual management fee was lower than the Expense Group median and Expense Universe median actual management fee (lowest in the Expense Group) and higher than the Funds of Funds Expense Group median and the Funds of Funds Expense Universe median actual management fee; and the fund’s total expenses were higher than the Expense Group median and the Expense Universe median total expenses and slightly higher than the Funds of Funds Expense Group median and higher than the Funds of Funds Expense Universe median total expenses (all including Acquired Fund expenses). The Board determined that the fee payable by the fund pursuant to the Management Agreement was based on services provided that were in addition to, rather than duplicative of, the services provided under the advisory contracts of the Acquired Funds in which the fund invested.
Representatives of the Adviser stated that the Adviser has contractually agreed, until December 30, 2023, to waive receipt of its fees and/or assume the expenses of the fund so that the total annual operating expenses of neither share class (including indirect fees and expenses of the underlying funds, but excluding shareholder services fees, taxes, interest expense, brokerage commissions, commitment fees on borrowings and extraordinary expenses) exceed .87% of the fund’s average daily net assets.
Analysis of Profitability and Economies of Scale. Representatives of the Adviser reviewed the expenses allocated and profit received by the Adviser and its affiliates and the resulting profitability percentage for managing each fund and the aggregate profitability percentage to the Adviser and its affiliates for managing the funds in the BNY Mellon fund complex, and the method used to determine the expenses and profit. The Board concluded that the profitability results were not excessive, given the services rendered and service levels provided by the Adviser and its affiliates to each fund. The Board also considered the expense limitation arrangements for certain funds and the effect each such arrangement had on profitability of the Adviser and its affiliates. The Board also had been provided with information prepared by an independent consulting firm regarding the Adviser’s approach to allocating costs to, and determining the profitability of, individual funds and the entire BNY Mellon fund complex. The consulting firm also had analyzed where any economies of scale might emerge in connection with the management of a fund.
120
As to each fund, the Board considered, on the advice of its counsel, the profitability analysis (1) as part of its evaluation of whether the fees under the Agreements, considered in relation to the mix of services provided by the Adviser and the Sub-Adviser(s), including the nature, extent and quality of such services, supported the renewal of the Agreements and (2) in light of the relevant circumstances for the fund and the extent to which economies of scale would be realized if the fund grows and whether fee levels reflect these economies of scale for the benefit of fund shareholders. Since the Adviser, and not the fund, pays each Sub-Adviser pursuant to the respective Sub-Advisory Agreement, the Board did not consider the Sub-Adviser’s profitability to be relevant to its deliberations. Representatives of the Adviser stated that a discussion of economies of scale is predicated on a fund having achieved a substantial size with increasing assets and that, if a fund’s assets had been stable or decreasing, the possibility that the Adviser may have realized any economies of scale would be less. Representatives of the Adviser also stated that, as a result of shared and allocated costs among funds in the BNY Mellon fund complex, the extent of economies of scale could depend substantially on the level of assets in the complex as a whole, so that increases and decreases in complex-wide assets can affect potential economies of scale in a manner that is disproportionate to, or even in the opposite direction from, changes in the fund’s asset level. The Board also considered potential benefits to the Adviser and the Sub-Advisers from acting as investment adviser and sub-investment adviser, respectively, and took into consideration the soft dollar arrangements in effect for trading certain fund’s investments.
At the conclusion of these discussions, the Board agreed that it had been furnished with sufficient information to make an informed business decision with respect to the renewal of the Agreements. Based on the discussions and considerations as described above, the Board concluded and determined as follows.
· The Board concluded that the nature, extent and quality of the services provided by the Adviser to each fund, and by the each Sub-Adviser to the applicable Sub-Advised Fund, are adequate and appropriate.
· With respect to BNY Mellon Asset Allocation Fund, BNY Mellon Mid Cap Multi-Strategy Fund, BNY Mellon Small Cap Multi-Strategy Fund, BNY Mellon International Fund and BNY Mellon International Equity Income Fund, the Board determined each fund’s overall relative performance was satisfactory in light of the totality of the information presented.
· With respect to and BNY Mellon Income Stock Fund, the Board was satisfied with the fund’s performance.
· With respect to BNY Mellon Emerging Markets Fund, the Board generally was satisfied with the fund’s relative performance.
· With respect to each fund, as applicable, the Board concluded that the fees paid to the Adviser and the Sub-Advisers continued to be appropriate under the circumstances and in light of the factors and the totality of the services provided as discussed above.
· The Board determined that the fees charged by the Adviser under the Management Agreement with respect BNY Mellon Asset Allocation Fund were for services in addition to, and not duplicative of, services provided under the advisory contracts of the Acquired Funds in which the fund invested.
· The Board determined that the economies of scale which may accrue to the Adviser and its affiliates in connection with the management of the funds had been adequately considered by the Adviser in connection with the fee rate charged to each fund pursuant to the Management Agreement and that, to the extent in the future it were determined that material economies of scale had not been shared with the fund, the Board would seek to have those economies of scale shared with the fund.
In evaluating the respective Agreement with respect to each fund, the Board considered these conclusions and determinations and also relied on its previous knowledge, gained through meetings and other interactions with the Adviser and its affiliates and the Sub-Advisers, of the Adviser (and, for the Sub-Advised Funds, the Sub-Adviser(s)) and the services provided to the fund pursuant to the respective Agreement. The Board also relied on information received on a routine and regular basis throughout the year relating to the operations of the funds and the investment management and other services provided under the respective Agreement, including information on the investment performance of each fund in comparison to similar mutual funds and benchmark performance indices; general market outlook as applicable to each fund; and compliance reports. In addition, the Board’s consideration of the contractual fee arrangements for each fund had the benefit of a number of years of reviews of the Agreements, during which lengthy discussions took place between the Board and representatives of the Adviser. Certain aspects of the arrangements may receive greater scrutiny in some years than in others, and the Board’s
121
INFORMATION ABOUT THE RENEWAL AND APPROVAL OF THE FUND’S INVESTMENT ADVISORY, ADMINISTRATION AND EACH RELEVANT FUND’S SUB-INVESTMENT ADVISORY AGREEMENTS (Unaudited) (continued)
conclusions may be based, in part, on its consideration of the respective fund’s arrangements, or substantially similar arrangements for the funds in the Trust, in prior years. The Board determined to renew the Agreement(s) for each fund.
*******
At the meeting of the Trust’s Board of Trustees held on March 20-21, 2023, the Board also considered the approval of (i) a delegation arrangement between NIMNA and its affiliate, NIM, which permits NIMNA, as the sub-investment adviser with respect to BNY Mellon Income Stock Fund, BNY Mellon International Equity Income Fund, BNY Mellon International Fund, BNY Mellon Mid Cap Multi-Strategy Fund (Opportunistic Mid Cap Value Strategy and Mid Cap Growth Strategy) and BNY Mellon Small Cap Multi-Strategy Fund (Opportunistic Small Cap Strategy, Small Cap Value Strategy and Small Cap Growth Strategy), to use the investment advisory personnel, resources and capabilities (“Investment Advisory Services”) available at its sister company, NIM, in providing the day-to-day management of such funds’ investments; and (ii) a delegation arrangement between NIM and its affiliate, NIMNA, which permits NIM, as the sub-investment adviser with respect to BNY Mellon Emerging Markets Fund, to use the Investment Advisory Services available at its sister company, NIMNA, in providing the day-to-day management of such fund’s investments. In connection therewith, the Board considered the approval of separate sub-sub-investment advisory agreements (each, the “SSIA Agreement”) with respect to each such fund (the “Newton Sub-Advised Funds”). In considering the approval of the SSIA Agreement, the Board considered several factors that it believed to be relevant, including those discussed below. The Board did not identify any one factor as dispositive, and each Board member may have attributed different weights to the factors considered.
At the meeting, the Adviser and NIMNA and NIM (together, the “Newton Sub-Advisers”) recommended the approval of the SSIA Agreement to enable NIM and NIMNA to each provide Investment Advisory Services for the benefit of the Newton Sub-Advised Funds, as applicable, including, but not limited to, portfolio management services, subject to the supervision of the respective Newton Sub-Adviser and the Adviser. The recommendation for the approval of the SSIA Agreement was based on the following considerations, among others: (i) approval of the SSIA Agreement would permit each Newton Sub-Adviser to use investment personnel employed primarily by its sister company as primary portfolio managers of the Newton Sub-Advised Fund it sub-advises and to use the investment research services of its sister company in the day-to-day management of such Newton Sub-Advised Fund’s investments; and (ii) there would be no material changes to the Newton Sub-Advised Funds’ investment objectives, strategies or policies, no reduction in the nature or level of services provided to the funds, and no increases in the management fee payable by the Newton Sub-Advised Funds or the sub-advisory fee payable by the Adviser to the Newton Sub-Advisers as a result of the delegation arrangements. The Board also considered the fact that the Adviser stated that it believed there were no material changes to the information the Board had previously considered at the meeting in connection with the Board’s re-approval of the Agreements for the ensuing year, other than the information about the delegation arrangements.
In determining whether to approve the SSIA Agreement, the Board considered the materials prepared by the Adviser and each Newton Sub-Adviser received in advance of the meeting and other information presented at the meeting, which included: (i) a form of the SSIA Agreement; (ii) information regarding the delegation arrangements and how it is expected to enhance investment capabilities for the benefit of each Newton Sub-Advised Fund; (iii) information regarding the Newton Sub-Advisers; and (iv) an opinion of counsel that the proposed delegation arrangements would not result in an “assignment” of the respective Sub-Investment Advisory Agreement under the 1940 Act and the Investment Advisers Act of 1940, as amended, and, therefore, did not require the approval of fund shareholders. The Board also considered the substance of discussions with representatives of the Adviser and each Newton Sub-Adviser at the meeting in connection with the Board’s re-approval of the Agreements.
Nature, Extent and Quality of Services to be Provided. In examining the nature, extent and quality of the services that were expected to be provided by the Newton Sub-Advisers under the SSIA Agreement with respect to each Newton Sub-Advised Fund, the Board considered: (i) each Newton Sub-Adviser’s organization, qualification and background, as well as the qualifications of its personnel; (ii) the expertise of the personnel providing portfolio management services; (iii) information regarding each Newton Sub-Adviser’s compliance program; and (iv) the investment strategy for the Newton Sub-Advised Fund, which would remain the same. The Board also considered that enabling each Newton Sub-Adviser to use the proposed Investment Advisory Services provided by its sister company, the Newton Sub-Advisers would provide investment and portfolio management services of at least the same nature, extent and quality that it currently provides to the respective Newton Sub-Advised Fund without the ability to use the Investment Advisory Services of its sister company. Based on the considerations and review of the foregoing information, the Board concluded that the nature, extent and quality of the sub-investment advisory
122
services to be provided by each Newton Sub-Adviser having the ability to use the Investment Advisory Services supported a decision to approve the SSIA Agreement.
Investment Performance. The Board considered each Newton Sub-Advised Fund’s investment performance and that of the investment team managing such fund’s portfolio (including comparative data provided by Broadridge) at the meeting in connection with the Board’s re-approval of the Agreements. The Board considered that the same investment professionals would continue to manage each Newton Sub-Advised Fund’s assets and that enabling the Sub-Advisers to use the Investment Advisory Services pursuant to the SSIA Agreement for the benefit of the respective Newton Sub-Advised Fund supported a decision to approve the SSIA Agreement.
Costs of Services to be Provided and Profitability. The Board considered the contractual management fees payable by each Newton Sub-Advised Fund pursuant to the Investment Advisory Agreement and Administration Agreement and the contractual sub-investment advisory fee payable by the Adviser to each Newton Sub-Adviser pursuant to the respective Sub-Investment Advisory Agreement at the meeting in connection with the Board’s re-approval of the Agreements. The Board noted that the contractual management fees payable by each Newton Sub-Advised Fund to the Adviser and the sub-investment advisory fees payable by the Adviser to each Newton Sub-Adviser, would not change in connection with the proposed delegation arrangements. The Board recognized that, because the fees payable would not change, an analysis of profitability was more appropriate in the context of the Board’s consideration of the Agreements, and that the Board had received and considered a profitability analysis of the Adviser and its affiliates, including NIMNA and NIM, at the meeting in connection with the Board’s re-approval of the Agreements. The Board concluded that the Adviser’s profitability was not excessive in light of the nature, extent and quality of the services to be provided to each Newton Sub-Advised Fund by the Adviser and each Newton Sub-Adviser, as applicable, under the Agreements.
Economies of Scale to be Realized. The Board recognized that, because the fees payable by each Newton Sub-Advised Fund pursuant to the Investment Advisory Agreement and Administration Agreement and the contractual sub-investment advisory fee payable by the Adviser to each Newton Sub-Adviser pursuant to the respective Sub-Investment Advisory Agreement would not change in connection with the proposed delegation arrangement, an analysis of economies of scale was more appropriate in the context of the Board’s consideration of the Agreements, which had been done at the meeting in connection with the Board’s re-approval of the Agreements. At the meeting, the Board determined that the economies of scale which may accrue to the Adviser and its affiliates in connection with the management of each Newton Sub-Advised Fund had been adequately considered by the Adviser in connection with the fee rate charged to the Newton Sub-Advised Fund pursuant to the Agreements and that, to the extent in the future it were determined that material economies of scale had not been shared with such fund, the Board would seek to have those economies of scale shared with the Newton Sub-Advised Fund.
The Board also considered whether there were any ancillary benefits that would accrue to the Newton Sub-Advisers as a result of its relationship with each respective Newton Sub-Advised Fund after the delegation arrangements, and such ancillary benefits, if any, were determined to be reasonable.
After full consideration of the factors discussed above, with no single factor identified as being of paramount importance, the Board, with the assistance of independent legal counsel, approved the delegation arrangements and the SSIA Agreement for each Newton Sub-Advised Fund.
123
LIQUIDITY RISK MANAGEMENT PROGRAM (Unaudited)
Each fund adopted a liquidity risk management program (the “Liquidity Risk Management Program”) pursuant to the requirements of Rule 22e-4 under the Investment Company Act of 1940, as amended. Rule 22e-4 requires registered open-end funds, including mutual funds and exchange-traded funds but not money market funds, to establish liquidity risk management programs in order to effectively manage fund liquidity and shareholder redemptions. The rule is designed to mitigate the risk that a fund could not meet redemption requests without significantly diluting the interests of remaining investors.
The rule requires each fund to assess, manage and review their liquidity risk at least annually considering applicable factors such as investment strategy and liquidity during normal and foreseeable stressed conditions, including whether the strategy is appropriate for an open-end fund and whether the fund has a relatively concentrated portfolio or large positions in particular issuers. The fund must also assess its use of borrowings and derivatives, short-term and long-term cash flow projections in normal and stressed conditions, holdings of cash and cash equivalents, and borrowing arrangements and other funding sources.
The rule also requires each fund to classify its investments as highly liquid, moderately liquid, less liquid or illiquid based on the number of days each fund expects it would take to liquidate the investment, and to review these classifications at least monthly or more often under certain conditions. The periods range from three or fewer business days for a highly liquid investment to greater than seven calendar days for settlement of a less liquid investment. Illiquid investments are those funds do not expect to be able to sell or dispose of within seven calendar days without significantly changing the market value. Each fund is prohibited from acquiring an investment if, after the acquisition, its holdings of illiquid assets will exceed 15% of its net assets. In addition, if a fund permits redemptions in-kind, the rule requires the fund to establish redemption in-kind policies and procedures governing how and when it will engage in such redemptions.
Pursuant to the rule’s requirements, the Liquidity Risk Management Program has been reviewed and approved by the Board. Furthermore, the Board has received a written report prepared by the Program’s Administrator that addresses the operation of the Program, assesses its adequacy and effectiveness and describes any material changes made to the Program.
Assessment of Program
In the opinion of the Program Administrator, the Program approved by the Board continues to be adequate for each fund and the Program has been implemented effectively. The Program Administrator has monitored the funds’ liquidity risk and the liquidity classification of the securities held by each fund and has determined that the Program is operating effectively.
During the period from January 1, 2022 to December 31, 2022, there were no material changes to the Program and no material liquidity events that impacted each fund. During the period, each fund held sufficient highly liquid assets to meet fund redemptions.
Under normal expected foreseeable fund redemption forecasts and foreseeable stressed fund redemption forecasts, the Program Administrator believes that each fund maintains sufficient highly liquid assets to meet expected fund redemptions.
124
BOARD MEMBERS INFORMATION (Unaudited)
INDEPENDENT BOARD MEMBERS
Independent Board Members
Patrick J. O’Connor (80)
Board Member, Chairman of the Board (2000)
Principal Occupation During Past 5 Years:
Attorney, Cozen O’Connor, P.C. (1973-Present), Vice Chairman (1980-2002); and President and Chief Executive Officer (2002-2007)
No. of Portfolios for which Board Member Serves: 19
———————
John R. Alchin (75)
Board Member (2008)
Principal Occupation During Past 5 Years:
· Retired
· The Barnes Foundation, an art museum, Trustee (2017 - Present)
· Metropolitan AIDS Neighborhood Nutrition Alliance, Advisory Board Member (2004 – Present)
· Philadelphia Art Museum, Board Member (2008 - Present)
· Xplornet Communications, Inc., a rural wireless tele-communications provider, Director (2015 –2020)
Other Public Company Board Memberships During Past 5 Years:
· Ralph Lauren Corporation, a retail clothing and home furnishing company, Director (2007-Present), and Chair of Audit Committee (2018-Present)
No. of Portfolios for which Board Member Serves: 19
———————
Ronald R. Davenport (87)
Board Member (2000)
Principal Occupation During Past 5 Years:
· Sheridan Broadcasting Corporation, Chairman (1972-Present)
No. of Portfolios for which Board Member Serves: 19
———————
Kim D. Kelly (67)
Board Member (2008)
Principal Occupation During Past 5 Years:
· Consultant (2005-Present)
Other Public Company Board Memberships During Past 5 Years:
· MCG Capital Corporation, a business development company, Director (2004-2015)
· HITV, broadcasting, President (2015 – 2019)
No. of Portfolios for which Board Member Serves: 19
———————
Kevin C. Phelan (79)
Board Member (2000)
Principal Occupation During Past 5 Years:
· Colliers International Mortgage Banker, (1978-Present) and Co-Chairman (2010-Present)
· A.D. Makepeace Co., cranberry grower and real estate development company, Director (2019-Present)
Other Public Company Board Memberships During Past 5 Years:
· Industrial Logistics Properties Trust, a real estate company, Trustee (2020 - Present)
No. of Portfolios for which Board Member Serves: 19
———————
Patrick J. Purcell (75)
Board Member (2000)
Principal Occupation During Past 5 Years:
· jobfind.com, an employment search site on the world wide web, President and Founder (1996 -– Present)
· The Boston Herald, President and Publisher (1994-2018)
· Herald Media, President and Chief Executive Officer, (2001 – 2018)
No. of Portfolios for which Board Member Serves: 19
———————
Thomas F. Ryan, Jr. (81)
Board Member (2000)
Principal Occupation During Past 5 Years:
· Retired
· Boston College. Trustee Associate (2013 – Present)
· NYISO Independent System Operator, a non-profit organization responsible for managing the state of New York’s electric grid, Director (1998-2021)
Other Public Company Board Memberships During Past 5 Years:
· RepliGen Corporation, a biopharmaceutical company, Director (2002-May 2022)
No. of Portfolios for which Board Member Serves: 19
———————
125
BOARD MEMBERS INFORMATION (Unaudited) (continued)
INDEPENDENT BOARD MEMBERS (continued)
Maureen M. Young (78)
Board Member (2000)
Principal Occupation During Past 5 Years:
· Retired
No. of Portfolios for which Board Member Serves: 19
———————
Once elected all Board Members serve for an indefinite term. The address of the Board Members and Officers is c/o BNY Mellon Investment Adviser, Inc. 240 Greenwich Street, New York, New York 10286. Additional information about each Board Member is available in the fund’s Statement of Additional Information which can be obtained from the Adviser free of charge by calling this toll free number: 1-800-373-9387. For individual account holders for Private Wealth Management clients, please contact your account officer or call 1-866-804-5023.
126
OFFICERS OF THE TRUST (Unaudited)
PATRICK T. CROWE, President since July 2015.
National Director of Investment Advisory, Analytics and Solutions for BNY Mellon Wealth Management since July 2014. He is 59 years old and has served in various capacities with BNY Mellon since 1993.
JAMES WINDELS, Treasurer since November 2001.
Director of the Adviser since February 2023; Vice President of the Adviser since September 2020, and Director- BNY Mellon Fund Administration. He is an officer of 54 investment companies (comprised of 122 portfolios) managed by the Adviser or an affiliate of the Adviser. He is 64 years old and has been an employee of the Adviser since April 1985.
PETER M. SULLIVAN, Chief Legal Officer since July 2021 and Vice President and Assistant Secretary since March 2019.
Chief Legal Officer of the Adviser and Associate General Counsel of BNY Mellon since July 2021; Senior Managing Counsel of BNY Mellon from December 2020 to July 2021; and Managing Counsel of BNY Mellon from March 2009 to December 2020. He is an officer of 54 investment companies (comprised of 122 portfolios) managed by the Adviser or an affiliate of the Adviser. He is 55 years old and has been an employee of BNY Mellon since April 2004.
JAMES BITETTO, Vice President since August 2005 and Secretary since February 2018.
Senior Managing Counsel of BNY Mellon since December 2019; Managing Counsel of BNY Mellon from April 2014 to December 2019; and Secretary of the Adviser. He is an officer of 54 investment companies (comprised of 122 portfolios) managed by the Adviser or an affiliate of the Adviser. He is 57 years old and has been an employee of the Adviser since December 1996.
DEIRDRE CUNNANE, Vice President and Assistant Secretary since February 2019.
Managing Counsel of BNY Mellon since December 2021; and Counsel of BNY Mellon from August 2018 to December 2021. She is an officer of 54 investment companies (comprised of 122 portfolios) managed by BNYM Investment Adviser or an affiliate of BNYM Investment Adviser. She is 33 years old and has been an employee of BNY Mellon since August 2013.
SARAH S. KELLEHER, Vice President and Assistant Secretary since April 2014.
Vice President of BNY Mellon ETF Investment Adviser, LLC since February 2020; Senior Managing Counsel of BNY Mellon since September 2021; and Managing Counsel of BNY Mellon from December 2017 to September 2021. She is an officer of 54 investment companies (comprised of 122 portfolios) managed by the Adviser or an affiliate of the Adviser. She is 47 years old and has been an employee of BNY Mellon since March 2013.
JEFF PRUSNOFSKY, Vice President and Assistant Secretary since August 2015.
Senior Managing Counsel of BNY Mellon. He is an officer of 54 investment companies (comprised of 122 portfolios) managed by the Adviser or an affiliate of the Adviser. He is 58 years old and has been an employee of the Adviser since October 1990.
AMANDA QUINN, Vice President and Assistant Secretary since March 2020.
Counsel of BNY Mellon since June 2019; Regulatory Administration Manager at BNY Mellon Investment Management Services from September 2018 to May 2019; and Senior Regulatory Specialist at BNY Mellon Investment Management Services from April 2015 to August 2018. She is an officer of 54 investment companies (comprised of 122 portfolios) managed by the Adviser or an affiliate of the Adviser. She is 38 years old and has been an employee of BNY Mellon since April 2015.
JOANNE SKERRETT, Vice President and Assistant Secretary since March 2023.
Managing Counsel of BNY Mellon since June 2022; and Senior Counsel with the Mutual Fund Directors Forum, a leading funds industry organization, from 2016 to June 2022. She is an officer of 54 investment companies (comprised of 122 portfolios) managed by BNYM Investment Adviser or an affiliate of BNYM Investment Adviser. She is 51 years old and has been an employee of BNYM Investment Adviser since June 2022.
NATALYA ZELENSKY, Vice President and Assistant Secretary since March 2017.
Chief Compliance Officer since August 2021 and Vice President since February 2020 of BNY Mellon ETF Investment Adviser, LLC; Chief Compliance Officer since August 2021 and Vice President and Assistant Secretary since February 2020 of BNY Mellon ETF Trust; Managing Counsel from December 2019 to August 2021; Counsel of BNY Mellon from May 2016 to December 2019; and Assistant Secretary of the Adviser from April 2018 to August 2021. She is an officer of 54 investment companies (comprised of 122 portfolios) managed by the Adviser or an affiliate of the Adviser. She is 38 years old and has been an employee of BNY Mellon since May 2016.
GAVIN C. REILLY, Assistant Treasurer since December 2005.
Tax Manager - BNY Mellon Fund Administration. He is an officer of 54 investment companies (comprised of 122 portfolios) managed by the Adviser or an affiliate of the Adviser. He is 55 years old and has been an employee of the Adviser since April 1991.
ROBERT SALVIOLO, Assistant Treasurer since July 2007.
Senior Accounting Manager – BNY Mellon Fund Administration. He is an officer of 54 investment companies (comprised of 122 portfolios) managed by the Adviser or an affiliate of the Adviser. He is 56 years old and has been an employee of the Adviser since June 1989.
ROBERT SVAGNA, Assistant Treasurer since December 2002.
Senior Accounting Manager – BNY Mellon Fund Administration. He is an officer of 54 investment companies (comprised of 122 portfolios) managed by the Adviser or an affiliate of the Adviser. He is 56 years old and has been an employee of the Adviser since November 1990.
JOSEPH W. CONNOLLY, Chief Compliance Officer since October 2004.
Chief Compliance Officer of the BNY Mellon Family of Funds and BNY Mellon Funds Trust since 2004; and Chief Compliance Officer of BNYM Investment Adviser from 2004 until June 2021. He is the Chief Compliance Officer of 53 investment companies (comprised of 105 portfolios) managed by BNYM Investment Adviser. He is 66 years old.
CARIDAD M. CAROSELLA, Anti-Money Laundering Compliance Officer since January 2016.
Anti-Money Laundering Compliance Officer of the BNY Mellon Family of Funds and BNY Mellon Funds Trust. She is an officer of 47 investment companies (comprised of 115 portfolios) managed by BNYM Investment Adviser or an affiliate of BNYM Investment Adviser. She is 55 years old and has been an employee of the Distributor since 1997.
127
This page intentionally left blank.
128
This page intentionally left blank.
129
This page intentionally left blank.
130
BNY Mellon Funds Trust
240 Greenwich Street
New York, NY 10286
Adviser
BNY Mellon Investment Adviser, Inc.
240 Greenwich Street
New York, NY 10286
Sub-Adviser
Newton Investment Management
North America, LLC
BNY Mellon Center
201 Washington Street
Boston, MA 02108
Newton Investment
Management Limited
160 Queen Victoria Street
London, EC4V, 4LA. UK
Geneva Capital Management LLC
411 East Wisconsin Avenue
Suite 2320,
Milwaukee, WI 53202
Boston Partners Global Investors, Inc.
One Grand Central Place
60 East 42nd Street – Suite 1550
New York, NY 10165
Administrator
The Bank of New York Mellon
240 Greenwich Street
New York, NY 10286
Sub-Administrator
BNY Mellon Investment Adviser, Inc.
240 Greenwich Street
New York, NY 10286
Custodian
The Bank of New York Mellon
240 Greenwich Street
New York, NY 10286
Transfer Agent &
Dividend Disbursing Agent
BNY Mellon Transfer, Inc.
240 Greenwich Street
New York, NY 10286
Distributor
BNY Mellon Securities Corporation
240 Greenwich Street
New York, NY 10286
| | | | | | | |
Ticker Symbols: | | | | | | |
BNY Mellon Income Stock Fund | Class M: MPISX | Investor: MIISX | Class A: BMIAX | Class C: BMISX | Class I: BMIIX | Class Y: BMIYX |
BNY Mellon Mid Cap Multi-Strategy Fund | Class M: MPMCX | Investor: MIMSX | | | | |
BNY Mellon Small Cap Multi-Strategy Fund | Class M: MPSSX | Investor: MISCX | | | | |
BNY Mellon International Fund | Class M: MPITX | Investor: MIINX | | | | |
BNY Mellon Emerging Markets Fund | Class M: MEMKX | Investor: MIEGX | | | | |
BNY Mellon International Equity Income Fund | Class M: MLIMX | Investor: MLIIX | | | | |
BNY Mellon Asset Allocation Fund | Class M: MPBLX | Investor: MIBLX | | | | |
Telephone Wealth Management (WM) Clients, please contact your Account Officer or call 1-866-804-5023. Brokerage Clients of BNY Mellon Wealth Advisors (BNYMWA), please contact your financial representative or call 1-800-830-0549, Option 2 for BNY Mellon Wealth Management Direct or 1-800-843-5466 for former brokerage clients of BNY Mellon Wealth Advisors whose accounts are now held by BNY Mellon Brokerage Services. Individual Account holders, please call BNY Mellon Investment Advisers at 1-800-373-9387.
Mail WM clients, write to your Account Officer, c/o The Bank of New York Mellon, One Mellon Bank Center, Pittsburgh, PA 15258
BNYMWA Brokerage Clients, write to your financial representative, P.O. Box 9012, Hicksville, NY 11802-9012
Individual Account Holders, write to: BNY Mellon Funds, P.O. Box 534434, Pittsburgh, Pennslylvania 15253-4434
Each fund files its complete schedule of portfolio holdings with the Securities and Exchange Commission (“SEC”) for the first and third quarters of each fiscal year on Form N-PORT. The fund’s Forms N-PORT are available on the SEC’s website at http://www.sec.gov.
A description of the policies and procedures that the fund uses to determine how to vote proxies relating to portfolio securities, and information regarding how the fund voted these proxies for the most recent 12-month period ended June 30 is available at http:// www.im.bnymellon.com and on the SEC’s website at http://www.sec.gov. The description of the policies and procedures is also available without charge, upon request, by calling 1-800-373-9387.
| | |
© 2023 BNY Mellon Securities Corporation | MFTAR0823-EQ |
BNY Mellon Funds Trust
BNY Mellon Bond Fund
BNY Mellon Intermediate Bond Fund
BNY Mellon Corporate Bond Fund
BNY Mellon Short-Term U.S. Government Securities Fund
| | |
ANNUAL REPORT August 31, 2023 |

| |
Contents
THE FUNDS
FOR MORE INFORMATION
Back Cover
| |
| |
Save time. Save paper. View your next shareholder report online as soon as it’s available. Log into www.im.bnymellon.com and sign up for eCommunications. It’s simple and only takes a few minutes. |
| |
The views expressed herein are current to the date of this report. These views and the composition of the funds’ portfolios are subject to change at any time based on market and other conditions. |
| |
Not FDIC-Insured • Not Bank-Guaranteed • May Lose Value |
DISCUSSION OF FUND PERFORMANCE (Unaudited)
For the period from September 1, 2022, through August 31, 2023, as provided by John F. Flahive, CFA, portfolio manager with BNY Mellon Investment Adviser, Inc.
Market and Fund Performance Overview
For the 12-month period ended August 31, 2023, BNY Mellon Bond Fund’s (the “fund”) Class M shares produced a total return of −1.05%, and Investor shares produced a total return of −1.38%.1 In comparison, the fund’s benchmark, the Bloomberg U.S. Aggregate Bond Index (the “Index”), produced a total return of −1.19% for the same period.2
The Index declined due to pressure on bond prices driven by rate hikes implemented by the U.S. Federal Reserve (the “Fed”) in an effort to constrain inflation. The fund produced mixed performance relative to the Index, with positive credit and duration exposure balanced by underperformance in a small number of asset classes.
The Fund’s Investment Approach
The fund seeks total return (consisting of capital appreciation and current income). To pursue its goal, the fund normally invests at least 80% of its net assets, plus any borrowings for investment purposes, in bonds. BNY Mellon Investment Adviser, Inc. (BNY Mellon Investment Adviser) actively manages the fund’s bond market and maturity exposure and credit profile and uses a disciplined process to select bonds and manage risks. The fund’s investments in bonds must be rated investment grade (i.e., Baa/BBB or higher) at the time of purchase or, if unrated, deemed of comparable quality by the investment adviser.3 Investments in bonds may include government securities, corporate bonds, mortgage-related securities and municipal securities. Generally, the average effective duration of the fund’s portfolio will not exceed eight years.
Rising Interest Rates Pressure Bond Prices and Increase Yields
Bond yields generally rose during the reporting period as the Fed sharply increased the federal funds rate in an effort to curb high levels of inflation. At the same time, bond prices, which generally move in the opposite direction of yields, declined. Although inflation appeared to peak before the period began, topping at over 9% in June, it remained over 8% at the start of the period, well above the Fed’s 2% target rate. The Fed responded with its third consecutive 0.75% increase to the federal funds rate in September, while indicating that additional increases were likely, increasing concerns of a possible recession.
The economic backdrop began improving in mid-October as inflationary pressures eased, and economic data reassured investors that a recession was not imminent. U.S. inflation levels dropped steadily, dipping below 3% in June 2023 and remaining under 4% through the end of the period. While the Fed continued to hike rates, the scale of increases eased, with a fourth 0.75% increase in November 2022, followed by a 0.50% increase in December and four subsequent 0.25% increases in 2023. At the same time, the U.S. economy continued to grow, bolstered by strong consumer spending, rising wages and robust levels of employment. Different asset classes within the Index responded to these developments in different ways. Treasury securities, particularly long-term Treasury bonds, underperformed. The Treasury yield curve remained inverted throughout the period, with the two-year Treasury rate exceeding the 10-year Treasury rate. Securitized instruments, most notably mortgage-backed securities, underperformed as well. On the other hand, government-related bonds and investment-grade corporates registered modest gains, while high yield corporates produced still stronger returns. In general, bonds characterized by lower credit quality and shorter duration tended to outperform their higher-credit-quality, longer-duration counterparts. Yields grew increasingly attractive across the bond spectrum.
Seeking Yield Advantage While Adjusting Credit Exposure
Prior to the beginning of the period, we took several steps to position the fund defensively in consideration of the prevailing environment of high inflation, rising rates and potentially slowing economic growth. Specifically, we trimmed the fund’s corporate exposure, while maintaining a mildly overweight position relative to the Index, with an emphasis on higher-yielding, lower-quality corporate bonds. At the same time, in recognition of increased inflationary pressures and the likelihood of further interest-rate increases, the fund maintained relatively short average duration to reduce interest-rate sensitivity. These moves made positive contributions to performance relative to the Index. Within the corporate sector, returns benefited from the fund’s overweight exposure to lower-credit-quality, BBB rated bonds and corresponding underweight exposure to higher-quality, AAA and A rated bonds. As credit outperformed, and relative valuations began to look less attractive, we trimmed the fund’s credit exposure. Within the Treasury sector, relatively short duration proved additive. Conversely, issue selection detracted from returns in the mortgage-backed area, despite the positive impact of the fund’s underweight exposure. Out-of-Index exposure to TIPS (Treasury Inflation-Protected Securities) also had a negative impact on relative returns.
Well Positioned for the Prevailing Environment
While the economy has remained resilient in the face of the Fed’s aggressive efforts to combat inflation, cracks have begun to appear in some areas, including increasing consumer delinquencies and tightening bank credit, with impacts on commercial real estate and commercial and industrial loans. We expect to see further effects if, as expected, the Fed maintains rates at or near current levels for an extended period of time. On the other hand, the level of inflation has declined substantially, and the labor market remains healthy, with the overall economy continuing to benefit from several recent federal programs designed to stimulate growth, including the CHIPS and Science Act, the $1 trillion bipartisan infrastructure bill and the Inflation Reduction Act of 2022. Accordingly, while we expect economic growth to slow modestly in the near term, we do not anticipate a steep recession.
In light of these countervailing forces, we continue to maintain the fund’s yield advantage, while remaining cautious regarding the valuations of positions we add to the portfolio. The fund currently holds a well-diversified portfolio of corporate securities. Average duration stands slightly short but near-neutral relative to the Index, with overweight exposure to the long- and short-end of the yield curve where we find the greatest yield advantage, and underweight exposure to the middle of the curve. From a credit perspective, the fund holds overweight exposure to lower-rated BBB credits, and underweight exposure to higher-rated AA and AAA credits. Treasury exposure is slightly underweight, while securitized exposure remains neutral. The fund also maintains a small, out-of-Index position in TIPS.
September 15, 2023
1 Total return includes reinvestment of dividends and any capital gains paid. Past performance is no guarantee of future results. Share price, yield and investment return fluctuate such that upon redemption, fund shares may be worth more or less than their original cost.
2 Source: Lipper Inc. — The Bloomberg U.S. Aggregate Bond Index is a broad-based flagship benchmark that measures the investment-grade, U.S. dollar-denominated, fixed-rate, taxable bond market. The Index includes Treasuries, government-related and corporate securities, MBS (agency fixed-rate and hybrid ARM pass-throughs), ABS and CMBS (agency and nonagency). Investors cannot invest directly in any index.
3 The fund may continue to own investment-grade bonds (at the time of purchase), which are subsequently downgraded to below investment grade.
Bond funds are subject generally to interest-rate, credit, liquidity and market risks, to varying degrees, all of which are more fully described in the fund’s prospectus. Generally, all other factors being equal, bond prices are inversely related to interest-rate changes, and rate increases can cause price declines.
Investing in foreign denominated and/or domiciled securities involves special risks, including changes in currency exchange rates, political, economic, and social instability, limited company information, differing auditing and legal standards, and less market liquidity. These risks generally are greater with emerging market countries.
2
For the period from September 1, 2022, through August 31, 2023, as provided by John F. Flahive, CFA, Portfolio Manager with BNY Mellon Investment Adviser, Inc.
Market and Fund Performance Overview
For the 12-month period ended August 31, 2023, BNY Mellon Intermediate Bond Fund’s (the “fund”) Class M shares produced a total return of 1.26%, and Investor shares produced a total return of 1.03%.1 In comparison, the fund’s benchmark, the Bloomberg U.S. Intermediate Government/Credit Index (the “Index”), produced a total return of 0.55% for the same period.2
Intermediate-term bonds gained modest ground amid aggressive rate hikes implemented by the U.S. Federal Reserve (the “Fed”) in an effort to constrain inflation. The fund outperformed the Index due primarily to favorable asset-class allocation and credit and duration positioning.
The Fund’s Investment Approach
The fund seeks total return (consisting of capital appreciation and current income). To pursue its goal, the fund normally invests at least 80% of its net assets in bonds. The BNY Mellon Investment Adviser, Inc. (BNY Mellon Investment Adviser) actively manages bond market and maturity exposure and credit profile and uses a disciplined process to select bonds and manage risk.
Investments in bonds may include government securities, corporate bonds and municipal bonds. The fund’s investments in bonds must be rated investment grade at the time of purchase or, if unrated, deemed of comparable quality by the investment adviser.3 Generally, the fund’s average effective portfolio maturity will be between 3 and 10 years, and the average effective duration of the fund’s portfolio will be between 2.5 and 5.5 years. When managing the fund, we use a disciplined process to select bonds and manage risk. We generally choose bonds based on yield, credit quality, the level of interest rates and inflation, general economic and financial trends, and our outlook for the securities markets. Our management process also includes computer modeling and scenario testing of possible changes in market conditions.
Rising Interest Rates Pressure Bond Prices and Increase Yields
Bond yields generally rose during the reporting period as the Fed sharply increased the federal funds rate in an effort to curb high levels of inflation. At the same time, bond prices, which generally move in the opposite direction of yields, declined. Although inflation appeared to peak before the period began, topping at over 9% in June, it remained over 8% at the start of the period, well above the Fed’s 2% target rate. The Fed responded with its third consecutive 0.75% increase to the federal funds rate in September, while indicating that additional increases were likely, increasing concerns of a possible recession.
The economic backdrop began improving in mid-October as inflationary pressures eased, and economic data reassured investors that a recession was not imminent. U.S. inflation levels dropped steadily, dipping below 3% in June 2023 and remaining under 4% through the end of the period. While the Fed continued to hike rates, the scale of increases eased, with a fourth 0.75% increase in November 2022, followed by a 0.50% increase in December and four subsequent 0.25% increases in 2023. At the same time, the U.S. economy continued to grow, bolstered by strong consumer spending, rising wages and robust levels of employment. Different intermediate bond asset classes responded to these developments in different ways. Treasury securities, particularly long-term Treasury bonds, underperformed. The Treasury yield curve remained inverted throughout the period, with the two-year Treasury rate exceeding the 10-year Treasury rate. Securitized instruments, most notably mortgage-backed securities, underperformed as well. On the other hand, government-related bonds, investment-grade corporates and municipal bonds registered modest gains, while high yield corporates produced still stronger returns. In general, bonds characterized by lower credit quality and shorter duration tended to outperform their higher-credit-quality, longer-duration counterparts. Yields grew increasingly attractive across the bond spectrum.
Duration, Allocation and Credit Positioning Bolster Relative Performance
During the reporting period, the fund maintained shorter average duration than the Index at a time when shorter-duration instruments outperformed longer-duration instruments. Much of the fund’s short position was concentrated among Treasury holdings, where performance was further enhanced by the fund’s underweight allocation. Conversely, the fund held overweight exposure to local authority municipal bonds, which added value. The fund also held overweight exposure to corporates, particularly lower-credit-quality BBB bonds, which further bolstered relative returns, as did the short average duration of corporate holdings. Among corporate industry sectors, only real estate detracted slightly from performance due to issue selection. During the period, as municipals and corporates outperformed, and spreads tightened, making them less attractive on a relative basis, we trimmed the fund’s overweight positions in both areas. We also increased the fund’s average duration, moving closer to neutral relative to the Index.
Well Positioned for the Prevailing Environment
While the economy has remained resilient in the face of the Fed’s aggressive efforts to combat inflation, cracks have begun to appear in some areas, including increasing consumer delinquencies and tightening bank credit, with impacts on commercial real estate and commercial and industrial loans. We expect to see further effects if, as expected, the Fed maintains rates at or near current levels for an extended period of time. On the other hand, the level of inflation has declined substantially, and the labor market remains healthy, with the overall economy continuing to benefit from several recent federal programs designed to stimulate growth, including the CHIPS and Science Act, the $1 trillion bipartisan infrastructure bill and the Inflation Reduction Act of 2022. Accordingly, while we expect economic growth to slow modestly in the near term, we do not anticipate a steep recession.
In light of these countervailing forces, we continue to maintain the fund’s yield advantage, while remaining cautious regarding the valuations of positions we add to the portfolio. The fund currently holds a well-diversified portfolio of securities, with underweight exposure to Treasury securities, and overweight exposure to corporates, municipals and, to a slight degree, agencies. Average duration stands slightly short, but near-neutral relative to the Index. From a credit perspective, the fund continues to hold overweight exposure to lower-rated BBB credits, and underweight exposure to higher-rated credits.
September 15, 2023
1 Total return includes reinvestment of dividends and any capital gains paid. Past performance is no guarantee of future results. Share price, yield and investment return fluctuate such that upon redemption, fund shares may be worth more or less than their original cost.
2 Source: Lipper Inc. — The Bloomberg U.S. Intermediate Government/Credit Index is a broad-based flagship benchmark that measures the non-securitized component of the Bloomberg U.S. Aggregate Bond Index. The Index includes Treasuries, government-related and corporate securities, MBS (agency fixed-rate and hybrid ARM pass-throughs), ABS and CMBS (agency and nonagency). Investors cannot invest directly in any index.
3 The fund may continue to own investment-grade bonds (at the time of purchase), which are subsequently downgraded to below investment grade.
Bond funds are subject generally to interest-rate, credit, liquidity and market risks, to varying degrees, all of which are more fully described in the fund’s prospectus. Generally, all other factors being equal, bond prices are inversely related to interest-rate changes, and rate increases can cause price declines.
3
DISCUSSION OF FUND PERFORMANCE (Unaudited) (continued)
For the period from September 1, 2022, through August 31, 2023, as provided by John F. Flahive, CFA, portfolio manager with BNY Mellon Investment Adviser, Inc.
Market and Fund Performance Overview
For the 12-month period ended August 31, 2023, BNY Mellon Corporate Bond Fund’s (the “fund”) Class M shares produced a total return of 3.06%, and Investor shares produced a total return of 2.82%.1 In comparison, the fund’s benchmark, the Bloomberg U.S. Intermediate Credit Index (the “Index”), produced a total return of 1.81%, and the Bloomberg U.S. Credit Index, the fund’s secondary benchmark, produced a total return of 0.85% for the same period.2,3
Corporate bonds gained modest ground amid aggressive rate hikes implemented by the U.S. Federal Reserve (the “Fed”) in an effort to constrain inflation. The fund outperformed the Index due primarily to favorable credit positioning.
The Fund’s Investment Approach
The fund seeks total return (consisting of capital appreciation and current income). To pursue its goal, the fund normally invests at least 80% of its net assets, plus any borrowings for investment purposes, in corporate bonds, which include U.S. dollar-denominated bonds issued by U.S. and foreign corporations. The remainder of the fund’s assets may be invested in U.S. government and agency bonds, mortgage-related securities, including commercial mortgage-backed securities, asset-backed securities, foreign corporate bonds denominated in foreign currencies, foreign government bonds, municipal bonds and commercial paper, and other money market instruments. For additional yield, the fund may invest up to 20% of its assets in fixed-income securities rated below investment grade (“high yield” or “junk” bonds) or the unrated equivalent as determined by the investment adviser, but no lower than Ba/BB (or the unrated equivalent as determined by the investment adviser) in the case of mortgage-related and asset-backed securities.
BNY Mellon Investment Adviser, Inc. uses a disciplined process to select bonds and manage risk. The investment adviser chooses bonds based on yield, credit quality, the level of interest rates and inflation, general economic and financial trends, and its outlook for the securities markets. In selecting corporate bonds for investment, the fund’s portfolio managers analyze fundamental metrics, including the issuer’s cash flow, leverage and operating margins, as well as its business strategy and operating performance, and macroeconomic factors.
Rising Interest Rates Pressure Bond Prices and Increase Yields
Bond yields generally rose during the reporting period as the Fed sharply increased the federal funds rate in an effort to curb high levels of inflation. At the same time, bond prices, which generally move in the opposite direction of yields, declined. Although inflation appeared to peak before the period began, topping at over 9% in June, it remained over 8% at the start of the period, well above the Fed’s 2% target rate. The Fed responded with its third consecutive 0.75% increase to the federal funds rate in September, while indicating that additional increases were likely, increasing concerns of a possible recession.
The economic backdrop began improving in mid-October as inflationary pressures eased, and economic data reassured investors that a recession was not imminent. U.S. inflation levels dropped steadily, dipping below 3% in June 2023 and remaining under 4% through the end of the period. While the Fed continued to hike rates, the scale of increases eased, with a fourth 0.75% increase in November 2022, followed by a 0.50% increase in December and four subsequent 0.25% increases in 2023. At the same time, the U.S. economy continued to grow, bolstered by strong consumer spending, rising wages and robust levels of employment. In this environment, corporate bonds produced modest gains, with lower-credit-quality and shorter-duration instruments tending to outperform their higher-credit-quality, longer-duration counterparts. Yields grew increasingly attractive across the corporate bond spectrum, with the greatest yield advantages in the short end and long end of the yield curve.
Seeking Yield Advantage While Adjusting Credit Exposure
Unlike the Index, which includes a significant allocation to government-related issues, including agencies, local authorities, sovereigns and supranationals, the fund held relatively little exposure outside of corporate bonds. Among corporates, the fund benefited most significantly from heavily overweight exposure to lower-rated BBB credits and underweight exposure to higher-rated AA and A credits. While the fund’s average duration was slightly longer than that of the Index, the timing of the fund’s duration exposure proved additive, with longer duration early in the period and shorter duration later. From a sector perspective, positioning in industrials and finance enhanced returns, while only real estate positioning detracted slightly.
Well Positioned for the Prevailing Environment
While the economy has remained resilient in the face of the Fed’s aggressive efforts to combat inflation, cracks have begun to appear in some areas, including increasing consumer delinquencies and tightening bank credit, with impacts on commercial real estate and commercial and industrial loans. We expect to see further effects if, as expected, the Fed maintains rates at or near current levels for an extended period of time. On the other hand, the level of inflation has declined substantially, and the labor market remains healthy, with the overall economy continuing to benefit from several recent federal programs designed to stimulate growth, including the CHIPS and Science Act, the $1 trillion bipartisan infrastructure bill and the Inflation Reduction Act of 2022. Accordingly, while we expect economic growth to slow modestly in the near term, we do not anticipate a steep recession.
In light of these countervailing forces, we continue to maintain the fund’s yield advantage, while remaining cautious regarding the valuations of positions we add to the portfolio. The fund currently holds a well-diversified portfolio of corporate securities. Average duration stands slightly long but near-neutral relative to the Index, with overweight exposure to the long- and short-end of the yield curve where we find the greatest yield advantage, and underweight exposure to the middle of the curve. From a credit perspective, the fund continues to hold overweight exposure to lower-rated BBB credits, and underweight exposure to higher-rated credits. Among sectors, the fund holds overweight exposure to finance, industrials and energy. The fund also holds overweight exposure to REITs (real estate investment trusts), with an emphasis on specialty REITs rather than bonds in the more troubled office real estate area. Conversely, the fund holds relatively underweight exposure to the utilities sector, which tends to include higher-quality credits.
September 15, 2023
1 Total return includes reinvestment of dividends and any capital gains paid. Past performance is no guarantee of future results. Share price, yield and investment return fluctuate such that upon redemption, fund shares may be worth more or less than their original cost.
2 Source: Lipper Inc. – The Bloomberg U.S. Intermediate Credit Index measures the investment-grade, U.S. dollar-denominated, fixed-rate, taxable corporate and government-related bond markets with a maturity greater than 1 year and less than 10 years. It is composed of the U.S. Corporate Index and a non-corporate component that includes non-U.S. agencies, sovereigns, supranationals and local authorities constrained by maturity. The U.S. Intermediate Credit Index is a subset of the U.S. Credit Index, which feeds into the U.S. Government/Credit Index and U.S. Aggregate Index. Investors cannot invest directly in any index.
3 Source: Lipper Inc. – The Bloomberg U.S. Credit Index measures the investment-grade, U.S. dollar-denominated, fixed-rate, taxable corporate and government-related bond markets. It is composed of the U.S. Corporate Index and a non-corporate component that includes non-U.S. agencies sovereigns, supranationals and local authorities. Investors cannot invest directly in any index.
Bonds are subject generally to interest-rate, credit, liquidity and market risks, to varying degrees, all of which are more fully described in the fund’s prospectus. Generally, all other factors being equal, bond prices are inversely related to interest-rate changes, and rate increases can cause price declines.
4
For the period from September 1, 2022, through August 31, 2023, as provided by Lawrence R. Dunn, CFA, portfolio manager with BNY Mellon Investment Adviser, Inc.
Market and Fund Performance Overview
For the 12-month period ended August 31, 2023, BNY Mellon Short-Term U.S. Government Securities Fund’s (the “fund”) Class M shares produced a total return of 1.33%, and Investor shares produced a total return of 1.09%.1 In comparison, the Bloomberg U.S. Government 1-3 Year Bond Index (the “Index”), the fund’s benchmark, produced a total return of 1.29% for the same period.2
Short-term U.S. government bonds gained modest ground amid aggressive rate hikes implemented by the U.S. Federal Reserve (the “Fed”) in an effort to constrain inflation. The fund generated mixed performance compared to the Index, with relatively strong returns in some areas balanced by relatively weak returns in others.
The Fund’s Investment Approach
The fund seeks to provide as high a level of current income as is consistent with the preservation of capital. To pursue this goal, the fund normally invests at least 80% of its net assets in securities issued or guaranteed by the U.S. government or its agencies or instrumentalities, and in repurchase agreements. The fund may invest in mortgage-related securities issued by U.S. government agencies or instrumentalities, such as mortgage pass-through securities issued by the Government National Mortgage Association (“Ginnie Mae”), the Federal National Mortgage Association (“Fannie Mae”) and the Federal Home Loan Mortgage Corporation (“Freddie Mac”). The fund may also invest in collateralized mortgage obligations (“CMOs”), including stripped mortgage-backed securities. Generally, the fund’s average effective portfolio maturity and the average effective duration of the fund’s portfolio will be less than three years.
When choosing securities, we typically first examine U.S. and global economic conditions and other market factors to estimate long- and short-term interest rates. Using a research-driven investment process, generally we then seek to identify what we believe are potentially profitable sectors before they are widely perceived as such by the market. We also seek to identify underpriced or mispriced securities that appear likely to perform well over time.
Yields Rise as Interest Rates Increase
Bond yields generally rose during the reporting period as the Fed sharply increased the federal funds rate in an effort to curb high levels of inflation. At the same time, bond prices, which tend to move in the opposite direction of yields, declined. Although inflation appeared to peak before the period began, topping at over 9% in June, it remained over 8% at the start of the period, well above the Fed’s 2% target rate. The Fed responded with its third consecutive 0.75% increase to the federal funds rate in September, while indicating that additional increases were likely, increasing concerns of a possible recession.
The economic backdrop began improving in mid-October as inflationary pressures eased, and economic data reassured investors that a recession was not imminent. U.S. inflation levels dropped steadily, dipping below 3% in June 2023 and remaining under 4% through the end of the period. While the Fed continued to hike rates, the scale of increases eased, with a fourth 0.75% increase in November 2022, followed by a 0.50% increase in December and four subsequent 0.25% increases in 2023. At the same time, the U.S. economy continued to grow, bolstered by strong consumer spending, rising wages and robust levels of employment. Yields continued to rise across the maturity spectrum during the period, and the yield curve continued to flatten, with short-term interest rates rising faster than long-term yields. Lower-credit-quality, higher-yielding issues tended to outperform Treasury securities and high-quality, lower-yielding non-Treasury instruments.
Mixed Returns from Allocations
Compared to the Index, the fund’s performance benefited from relatively short duration at a time of rising interest rates. In addition, overweight exposure to non-Treasury bonds bolstered returns by adding yield. Specifically, the fund sought to increase yield relative to the Index by investing a substantial proportion of assets in a variety of short-term agency mortgage instruments, most of them and backed by government-sponsored enterprises, and taxable municipal bonds. The main headwinds to performance arose in March and April 2023, when a few regional bank failures caused mortgage-backed securities (“MBS”) to cheapen sharply amid fears that bank weakness would spread. Contributing to the trend were worries of sudden forced liquidations of MBS securities in connection with resolving those bank failures. MBS spreads later retightened as monetary authorities contained the situation.
Continuing to Seek Yield Advantage While Controlling Risk
While the economy has remained resilient in the face of the Fed’s aggressive efforts to combat inflation, cracks have begun to appear in some areas, including increasing consumer delinquencies and tightening bank credit, with impacts on commercial real estate and commercial and industrial loans. We expect to see further effects if, as expected, the Fed maintains rates at or near current levels for an extended period of time. On the other hand, the level of inflation has declined substantially, and the labor market remains healthy, with the overall economy continuing to benefit from several recent federal programs designed to stimulate growth, including the CHIPS and Science Act, the $1 trillion bipartisan infrastructure bill and the Inflation Reduction Act of 2022. Accordingly, while we expect economic growth to slow modestly in the near term, we do not anticipate a steep recession.
As of August 31, 2023, the fund’s duration position is nearly neutral relative the Index, reflecting our belief that, while short-term rates are not likely to rise significantly from current levels, the Fed does not appear poised to lower rates any time soon. The fund maintains modest exposure to securities with average maturities longer than three years but holds overweight exposure to 0-to-one-year maturities. We have reduced the fund’s exposure to MBS and taxable municipals.
September 15, 2023
1 Total return includes reinvestment of dividends and any capital gains paid. Past performance is no guarantee of future results. Share price, yield and investment return fluctuate such that upon redemption, fund shares may be worth more or less than their original cost. Income may be subject to state and local taxes, and some income may be subject to the federal alternative minimum tax (AMT) for certain investors. Capital gains, if any, are fully taxable. The fund’s return reflects the absorption of certain fund expenses by BNY Mellon Investment Adviser, Inc. pursuant to an agreement in effect through December 30, 2023, at which time it may be extended, modified or terminated. Had these expenses not been absorbed, returns would have been lower.
2 Source: Lipper Inc. – The Bloomberg U.S. Government 1-3 Year Bond Index comprises the U.S. Treasury and U.S. Agency Indices. The Index includes U.S. dollar-denominated, fixed-rate, nominal U.S. Treasuries and U.S. agency debentures, which reach maturity in 1-3 years. Investors cannot invest directly in any index.
Bonds are subject generally to interest-rate, credit, liquidity and market risks, to varying degrees, all of which are more fully described in the fund’s prospectus. Generally, all other factors being equal, bond prices are inversely related to interest-rate changes, and rate increases can cause price declines. Municipal income may be subject to state and local taxes. Capital gains, if any, are taxable.
5
FUND PERFORMANCE (Unaudited)
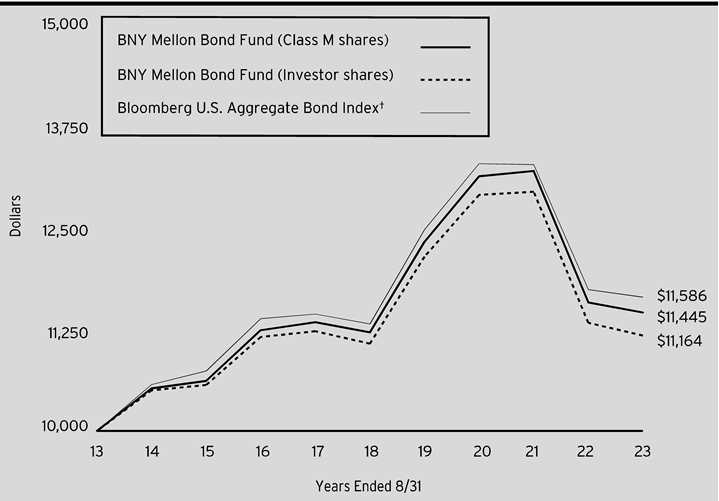
Comparison of change in value of a $10,000 investment in Class M shares and Investor shares of BNY Mellon Bond Fund with a hypothetical investment of $10,000 in the Bloomberg U.S. Aggregate Bond Index (the “Index”).
| | | | |
Average Annual Total Returns as of 8/31/2023 |
| 1 Year | 5 Years | 10 Years |
Class M shares | -1.05% | .43% | 1.36% |
Investor shares | -1.38% | .18% | 1.11% |
Bloomberg U.S. Aggregate Bond Index | -1.19% | .49% | 1.48% |
† Source: Lipper Inc.
The above graph compares a hypothetical $10,000 investment made in each of the Class M shares and Investor shares of BNY Mellon Bond Fund on 8/31/13 to a hypothetical investment of $10,000 made in the Index on that date. All dividends and capital gain distributions are reinvested.
The fund’s performance shown in the line graph above takes into account all applicable fees and expenses for Class M shares and Investor shares. The Index is a broad-based flagship benchmark that measures the investment-grade, U.S. dollar-denominated, fixed-rate taxable bond market. The Index includes Treasuries, government-related and corporate securities, MBS (agency fixed-rate and hybrid ARM pass-throughs), ABS and CMBS (agency and nonagency). Unlike a mutual fund, the Index is not subject to charges, fees and other expenses. Investors cannot invest directly in any index. Further information relating to fund performance, including expense reimbursements, if applicable, is contained in the Financial Highlights section of the prospectus and elsewhere in this report.
The performance data quoted represents past performance, which is no guarantee of future results. Share price and investment return fluctuate and an investor’s shares may be worth more or less than original cost upon redemption. Current performance may be lower or higher than the performance quoted. Go to www.im.bnymellon.com for the fund’s most recent month-end returns.
The fund’s performance shown in the graph and table does not reflect the deduction of taxes that a shareholder would pay on fund distributions or the redemption of fund shares.
6
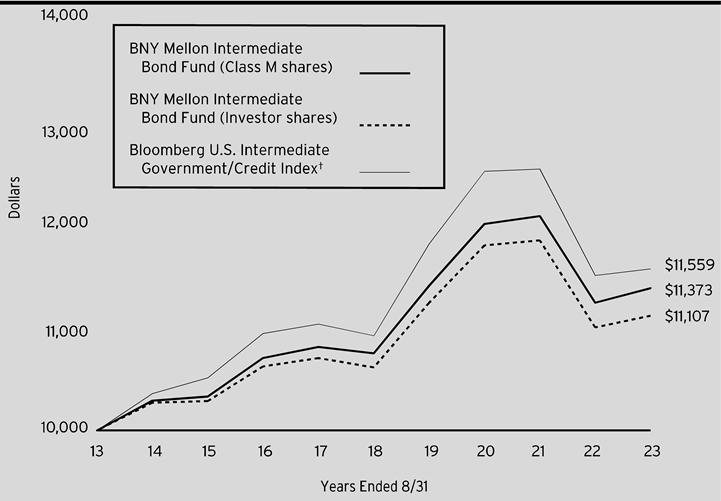
Comparison of change in value of a $10,000 investment in Class M shares and Investor shares of BNY Mellon Intermediate Bond Fund with a hypothetical investment of $10,000 in the Bloomberg U.S. Intermediate Government/Credit Index (the “Index”).
| | | | |
Average Annual Total Returns as of 8/31/2023 |
| 1 Year | 5 Years | 10 Years |
Class M shares | 1.26% | 1.15% | 1.30% |
Investor shares | 1.03% | .92% | 1.06% |
Bloomberg U.S. Intermediate
Government/Credit Index | .55% | 1.16% | 1.46% |
† Source: Lipper Inc.
The above graph compares a hypothetical $10,000 investment made in each of the Class M shares and Investor shares of BNY Mellon Intermediate Bond Fund on 8/31/13 to a hypothetical investment of $10,000 made in the Index on that date. All dividends and capital gain distributions are reinvested.
The fund’s performance shown in the line graph above takes into account all applicable fees and expenses for Class M shares and Investor shares. The Index is a broad-based flagship benchmark that measures the non-securitized component of the Bloomberg U.S. Aggregate Bond Index. Unlike a mutual fund, the Index is not subject to charges, fees and other expenses. Investors cannot invest directly in any index. Further information relating to fund performance, including expense reimbursements, if applicable, is contained in the Financial Highlights section of the prospectus and elsewhere in this report.
The performance data quoted represents past performance, which is no guarantee of future results. Share price and investment return fluctuate and an investor’s shares may be worth more or less than original cost upon redemption. Current performance may be lower or higher than the performance quoted. Go to www.im.bnymellon.com for the fund’s most recent month-end returns.
The fund’s performance shown in the graph and table does not reflect the deduction of taxes that a shareholder would pay on fund distributions or the redemption of fund shares.
7
FUND PERFORMANCE (Unaudited) (continued)
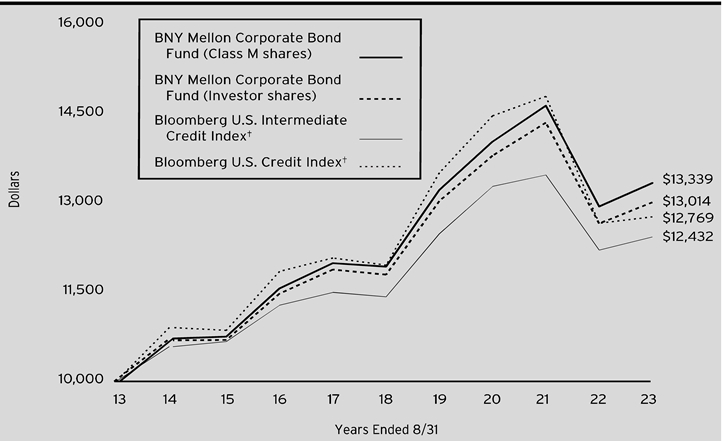
Comparison of change in value of a $10,000 investment in Class M shares and Investor shares of BNY Mellon Corporate Bond Fund with a hypothetical investment of $10,000 in the Bloomberg U.S. Intermediate Credit Index and the Bloomberg U.S. Credit Index.
| | | | | |
Average Annual Total Returns as of 8/31/2023 |
| | 1 Year | 5 Years | 10 Years |
Class M shares | | 3.06% | 2.25% | 2.92% |
Investor shares | | 2.82% | 1.99% | 2.67% |
Bloomberg U.S. Intermediate Credit Index | | 1.81% | 1.71% | 2.20% |
Bloomberg U.S. Credit Index | | .85% | 1.32% | 2.47% |
† Source: Lipper Inc.
The above graph compares a hypothetical $10,000 investment made in each of the Class M shares and Investor shares of BNY Mellon Corporate Bond Fund on 8/31/13 to a hypothetical investment of $10,000 made in each of the Bloomberg U.S. Intermediate Credit Index and the Bloomberg U.S. Credit Index on that date. All dividends and capital gain distributions are reinvested.
The fund’s performance shown in the line graph above takes into account all applicable fees and expenses for Class M shares and Investor shares. The Bloomberg U.S. Intermediate Credit Index measures the investment-grade, U.S. dollar-denominated, fixed-rate, taxable corporate and government-related bond markets with a maturity greater than 1 year and less than 10 years. It is composed of the U.S. Corporate Index and a non-corporate component that includes non-U.S. agencies, sovereigns, supranationals and local authorities constrained by maturity. The U.S. Intermediate Credit Index is a subset of the U.S. Credit Index which feeds into the U.S. Government/Credit Index and U.S. Aggregate Index. The Bloomberg U.S. Credit Index measures the investment-grade, U.S. dollar-denominated, fixed-rate, taxable corporate and government-related bond markets. It is composed of the U.S. Corporate Index and a non-corporate component that includes non-U.S. agencies sovereigns, supranationals and local authorities. Unlike a mutual fund, the indices are not subject to charges, fees and other expenses. Investors cannot invest directly in any index. Further information relating to fund performance, including expense reimbursements, if applicable, is contained in the Financial Highlights section of the prospectus and elsewhere in this report.
The performance data quoted represents past performance, which is no guarantee of future results. Share price and investment return fluctuate and an investor’s shares may be worth more or less than original cost upon redemption. Current performance may be lower or higher than the performance quoted. Go to www.im.bnymellon.com for the fund’s most recent month-end returns.
The fund’s performance shown in the graph and table does not reflect the deduction of taxes that a shareholder would pay on fund distributions or the redemption of fund shares.
8

Comparison of change in value of a $10,000 investment in Class M shares and Investor shares of BNY Mellon Short-Term U.S. Government Securities Fund with a hypothetical investment of $10,000 in the Bloomberg U.S. Government 1-3 Year Bond Index (the “Index”).
| | | | |
Average Annual Total Returns as of 8/31/2023 |
| 1 Year | 5 Years | 10 Years |
Class M shares | 1.33% | .76% | .52% |
Investor shares | 1.09% | .52% | .28% |
Bloomberg U.S. Government
1-3 Year Bond Index | 1.29% | 1.02% | .83% |
† Source: Lipper Inc.
The above graph compares a hypothetical $10,000 investment made in each of the Class M shares and Investor shares of BNY Mellon Short-Term U.S. Government Securities Fund on 8/31/13 to a hypothetical investment of $10,000 made in the Index on that date. All dividends and capital gain distributions are reinvested.
The fund’s performance shown in the line graph above takes into account all applicable fees and expenses for Class M shares and Investor shares. The Index comprises the U.S. Treasury and U.S. Agency Indices. The index includes U.S. dollar-denominated, fixed-rate, nominal U.S. Treasuries and U.S. agency debentures, which reach maturity in 1-3 years. Unlike a mutual fund, the Index is not subject to charges, fees and other expenses. Investors cannot invest directly in any index. Further information relating to fund performance, including expense reimbursements, if applicable, is contained in the Financial Highlights section of the prospectus and elsewhere in this report.
The performance data quoted represents past performance, which is no guarantee of future results. Share price and investment return fluctuate and an investor’s shares may be worth more or less than original cost upon redemption. Current performance may be lower or higher than the performance quoted. Go to www.im.bnymellon.com for the fund’s most recent month-end returns.
The fund’s performance shown in the graph and table does not reflect the deduction of taxes that a shareholder would pay on fund distributions or the redemption of fund shares.
9
UNDERSTANDING YOUR FUND’S EXPENSES (Unaudited)
As a mutual fund investor, you pay ongoing expenses, such as management fees and other expenses. Using the information below, you can estimate how these expenses affect your investment and compare them with the expenses of other funds. You also may pay one-time transaction expenses, including sales charges (loads) and redemption fees, which are not shown in this section and would have resulted in higher total expenses. For more information, see your fund’s prospectus or talk to your financial adviser.
Review your fund’s expenses
The table below shows the expenses you would have paid on a $1,000 investment in each class of each fund from March 1, 2023 to August 31, 2023. It also shows how much a $1,000 investment would be worth at the close of the period, assuming actual returns and expenses.
| | | | | |
Expenses and Value of a $1,000 Investment | |
Assume actual returns for the six months ended August 31, 2023 | |
| | | | |
| | Class M | Investor Shares | |
BNY Mellon Bond Fund | |
Expenses paid per $1,000† | $2.88 | $4.14 | |
Ending value (after expenses) | $1,007.00 | $1,005.40 | |
Annualized expense ratio (%) | .57 | .82 | |
BNY Mellon Intermediate Bond Fund | |
Expenses paid per $1,000† | $2.95 | $4.22 | |
Ending value (after expenses) | $1,017.50 | $1,017.60 | |
Annualized expense ratio (%) | .58 | .83 | |
BNY Mellon Corporate Bond Fund | |
Expenses paid per $1,000† | $3.01 | $4.28 | |
Ending value (after expenses) | $1,024.20 | $1,022.60 | |
Annualized expense ratio (%) | .59 | .84 | |
BNY Mellon Short-Term U.S. Government Securities Fund | |
Expenses paid per $1,000† | $2.54 | $3.81 | |
Ending value (after expenses) | $1,016.90 | $1,015.20 | |
Annualized expense ratio (%) | .50 | .75 | |
† | Expenses are equal to each fund’s annualized expense ratio as shown above, multiplied by the average account value over the period, multiplied by 184/365 (to reflect the one-half year period). |
10
COMPARING YOUR FUND’S EXPENSES WITH THOSE OF OTHER FUNDS (Unaudited)
Using the SEC’s method to compare expenses
The Securities and Exchange Commission (“SEC”) has established guidelines to help investors assess fund expenses. Per these guidelines, the table below shows your fund’s expenses based on a $1,000 investment, assuming a hypothetical 5% annualized return. You can use this information to compare the ongoing expenses (but not transaction expenses or total cost) of investing in the fund with those of other funds. All mutual fund shareholder reports will provide this information to help you make this comparison. Please note that you cannot use this information to estimate your actual ending account balance and expenses paid during the period.
| | | | | |
Expenses and Value of a $1,000 Investment | |
Assuming a hypothetical 5% annualized return for the six months ended August 31, 2023 | |
| | | | |
| | Class M | Investor Shares | |
BNY Mellon Bond Fund | |
Expenses paid per $1,000† | $2.91 | $4.18 | |
Ending value (after expenses) | $1,022.33 | $1,021.07 | |
Annualized expense ratio (%) | .57 | .82 | |
BNY Mellon Intermediate Bond Fund | |
Expenses paid per $1,000† | $2.96 | $4.23 | |
Ending value (after expenses) | $1,022.28 | $1,021.02 | |
Annualized expense ratio (%) | .58 | .83 | |
BNY Mellon Corporate Bond Fund | |
Expenses paid per $1,000† | $3.01 | $4.28 | |
Ending value (after expenses) | $1,022.23 | $1,020.97 | |
Annualized expense ratio (%) | .59 | .84 | |
BNY Mellon Short-Term U.S. Government Securities Fund | |
Expenses paid per $1,000† | $2.55 | $3.82 | |
Ending value (after expenses) | $1,022.68 | $1,021.42 | |
Annualized expense ratio (%) | .50 | .75 | |
† | Expenses are equal to each fund’s annualized expense ratio as shown above, multiplied by the average account value over the period, multiplied by 184/365 (to reflect the one-half year period). |
11
STATEMENT OF INVESTMENTS
August 31, 2023
| | | | | | | | | | |
| |
BNY Mellon Bond Fund |
Description | Coupon
Rate (%) | | Maturity Date | | Principal Amount ($) | | Value ($) | |
Bonds and Notes - 98.7% | | | | | |
Aerospace & Defense - .5% | | | | | |
The Boeing Company, Sr. Unscd. Notes | | 3.63 | | 2/1/2031 | | 6,000,000 | | 5,361,067 | |
Airlines - .6% | | | | | |
American Airlines Pass Through Trust, Ser. 2015-1, Cl. A | | 3.38 | | 5/1/2027 | | 3,690,044 | | 3,292,198 | |
Delta Air Lines Pass Through Trust, Ser. 2019-1, Cl. AA | | 3.20 | | 4/25/2024 | | 4,225,000 | | 4,148,509 | |
| | 7,440,707 | |
Automobiles & Components - .2% | | | | | |
General Motors Financial Co., Inc., Sr. Unscd. Notes | | 3.10 | | 1/12/2032 | | 3,100,000 | | 2,486,236 | |
Banks - 7.4% | | | | | |
Bank of America Corp., Jr. Sub. Notes, Ser. TT | | 6.13 | | 4/27/2027 | | 8,650,000 | a,b | 8,412,125 | |
Barclays PLC, Sr. Unscd. Notes | | 7.33 | | 11/2/2026 | | 7,000,000 | | 7,161,747 | |
Citigroup, Inc., Sub. Notes | | 4.45 | | 9/29/2027 | | 5,100,000 | | 4,877,844 | |
Citigroup, Inc., Sub. Notes | | 6.17 | | 5/25/2034 | | 2,400,000 | | 2,392,962 | |
Citizens Bank NA/Providence RI, Sr. Unscd. Notes | | 2.25 | | 4/28/2025 | | 4,575,000 | | 4,248,406 | |
Deutsche Bank AG, Sr. Unscd. Notes | | 2.55 | | 1/7/2028 | | 8,490,000 | | 7,510,232 | |
HSBC Holdings PLC, Sr. Unscd. Notes | | 4.76 | | 6/9/2028 | | 6,000,000 | | 5,758,653 | |
JPMorgan Chase & Co., Jr. Sub. Bonds, Ser. II | | 4.00 | | 4/1/2025 | | 5,475,000 | a,b | 5,038,643 | |
Morgan Stanley, Sr. Unscd. Notes | | 1.59 | | 5/4/2027 | | 8,000,000 | | 7,180,536 | |
NatWest Group PLC, Sr. Unscd. Notes | | 5.08 | | 1/27/2030 | | 5,500,000 | | 5,241,865 | |
Nordea Bank Abp, Jr. Sub. Notes | | 6.63 | | 3/26/2026 | | 4,280,000 | b,c | 4,065,971 | |
Societe Generale SA, Sub. Notes | | 6.22 | | 6/15/2033 | | 8,000,000 | c | 7,523,594 | |
The Goldman Sachs Group, Inc., Sub. Notes | | 6.75 | | 10/1/2037 | | 8,000,000 | | 8,487,610 | |
UBS Group AG, Sr. Unscd. Notes | | 1.31 | | 2/2/2027 | | 6,500,000 | c | 5,795,167 | |
UBS Group AG, Sr. Unscd. Notes | | 2.59 | | 9/11/2025 | | 4,825,000 | c | 4,654,527 | |
| | 88,349,882 | |
Beverage Products - .5% | | | | | |
Anheuser-Busch Companies LLC/Anheuser-Busch Inbev Worldwide, Inc., Gtd. Notes | | 4.90 | | 2/1/2046 | | 6,250,000 | | 5,818,951 | |
Consumer Discretionary - 1.0% | | | | | |
Warnermedia Holdings, Inc., Gtd. Notes | | 3.76 | | 3/15/2027 | | 7,185,000 | a | 6,741,339 | |
Warnermedia Holdings, Inc., Gtd. Notes | | 4.28 | | 3/15/2032 | | 6,225,000 | a | 5,495,773 | |
| | 12,237,112 | |
Diversified Financials - 2.9% | | | | | |
Aercap Ireland Capital DAC/AerCap Global Aviation Trust, Gtd. Notes | | 2.45 | | 10/29/2026 | | 6,500,000 | | 5,852,055 | |
Aircastle Ltd., Sr. Unscd. Notes | | 2.85 | | 1/26/2028 | | 9,500,000 | c | 8,187,558 | |
Ares Capital Corp., Sr. Unscd. Notes | | 2.88 | | 6/15/2028 | | 6,000,000 | a | 5,066,561 | |
BlackRock TCP Capital Corp., Sr. Unscd. Notes | | 2.85 | | 2/9/2026 | | 3,800,000 | a | 3,437,027 | |
Blackstone Secured Lending Fund, Sr. Unscd. Notes | | 2.85 | | 9/30/2028 | | 6,890,000 | | 5,698,405 | |
Blue Owl Capital Corp., Sr. Unscd. Notes | | 2.63 | | 1/15/2027 | | 2,500,000 | | 2,169,144 | |
Blue Owl Finance LLC, Gtd. Notes | | 4.13 | | 10/7/2051 | | 7,650,000 | c | 4,593,494 | |
| | 35,004,244 | |
Electronic Components - .4% | | | | | |
Jabil, Inc., Sr. Unscd. Notes | | 3.60 | | 1/15/2030 | | 5,500,000 | | 4,923,718 | |
Energy - 2.4% | | | | | |
Boardwalk Pipelines LP, Gtd. Notes | | 3.60 | | 9/1/2032 | | 3,825,000 | | 3,218,316 | |
Diamondback Energy, Inc., Gtd. Notes | | 3.13 | | 3/24/2031 | | 4,800,000 | | 4,130,383 | |
Enterprise Products Operating LLC, Gtd. Notes | | 5.35 | | 1/31/2033 | | 3,375,000 | a | 3,395,757 | |
Marathon Petroleum Corp., Sr. Unscd. Notes | | 3.80 | | 4/1/2028 | | 4,825,000 | | 4,511,107 | |
Sabine Pass Liquefaction LLC, Sr. Scd. Notes | | 4.50 | | 5/15/2030 | | 4,000,000 | | 3,766,346 | |
Targa Resources Partners LP/Targa Resources Partners Finance Corp., Gtd. Notes | | 5.00 | | 1/15/2028 | | 5,750,000 | | 5,538,251 | |
TransCanada PipeLines Ltd., Sr. Unscd. Notes | | 2.50 | | 10/12/2031 | | 4,825,000 | | 3,847,659 | |
| | 28,407,819 | |
Food Products - .4% | | | | | |
The Kroger Company, Sr. Unscd. Notes | | 1.70 | | 1/15/2031 | | 6,500,000 | a | 5,056,086 | |
12
| | | | | | | | | | |
| |
BNY Mellon Bond Fund (continued) |
Description | Coupon
Rate (%) | | Maturity Date | | Principal Amount ($) | | Value ($) | |
Bonds and Notes - 98.7% (continued) | | | | | |
Foreign Governmental - .3% | | | | | |
Province of Quebec, Unscd. Bonds | | 0.60 | | 7/23/2025 | | 4,000,000 | a | 3,684,855 | |
Health Care - 2.0% | | | | | |
AbbVie, Inc., Sr. Unscd. Notes | | 3.20 | | 11/21/2029 | | 6,000,000 | | 5,411,721 | |
Amgen, Inc., Sr. Unscd. Notes | | 5.60 | | 3/2/2043 | | 3,350,000 | | 3,289,992 | |
Amgen, Inc., Sr. Unscd. Notes | | 5.65 | | 6/15/2042 | | 1,605,000 | | 1,581,027 | |
CVS Health Corp., Sr. Unscd. Notes | | 4.78 | | 3/25/2038 | | 7,250,000 | | 6,496,599 | |
Pfizer Investment Enterprises Pte Ltd., Gtd. Notes | | 4.65 | | 5/19/2030 | | 6,520,000 | | 6,420,471 | |
| | 23,199,810 | |
Industrial - .3% | | | | | |
LBJ Infrastructure Group, Sr. Scd. Bonds | | 3.80 | | 12/31/2057 | | 5,000,000 | c | 3,206,764 | |
Information Technology - .3% | | | | | |
Oracle Corp., Sr. Unscd. Notes | | 3.90 | | 5/15/2035 | | 4,790,000 | | 4,092,090 | |
Insurance - .6% | | | | | |
MetLife, Inc., Jr. Sub. Bonds, Ser. G | | 3.85 | | 9/15/2025 | | 1,900,000 | a,b | 1,756,741 | |
Prudential Financial, Inc., Sr. Unscd. Notes | | 4.35 | | 2/25/2050 | | 6,375,000 | | 5,311,017 | |
| | 7,067,758 | |
Internet Software & Services - 1.5% | | | | | |
Amazon.com, Inc., Sr. Unscd. Notes | | 1.65 | | 5/12/2028 | | 7,000,000 | a | 6,122,003 | |
eBay, Inc., Sr. Unscd. Notes | | 1.90 | | 3/11/2025 | | 5,500,000 | | 5,212,811 | |
Meta Platforms, Inc., Sr. Unscd. Notes | | 4.45 | | 8/15/2052 | | 7,700,000 | | 6,539,744 | |
| | 17,874,558 | |
Media - .4% | | | | | |
Comcast Corp., Gtd. Notes | | 5.35 | | 11/15/2027 | | 5,120,000 | | 5,194,165 | |
Metals & Mining - .6% | | | | | |
Glencore Funding LLC, Gtd. Notes | | 2.63 | | 9/23/2031 | | 4,775,000 | c | 3,805,306 | |
Nucor Corp., Sr. Unscd. Notes | | 4.30 | | 5/23/2027 | | 2,875,000 | | 2,789,940 | |
| | 6,595,246 | |
Municipal Securities - .6% | | | | | |
Golden State Tobacco Securitization Corp., Revenue Bonds, Refunding, Ser. A1 | | 3.49 | | 6/1/2036 | | 3,000,000 | | 2,370,485 | |
New York City, GO, Refunding, Ser. D | | 1.92 | | 8/1/2031 | | 3,825,000 | | 3,058,165 | |
Sales Tax Securitization Corp., Revenue Bonds, Refunding (Insured; Build America Mutual) Ser. B | | 3.41 | | 1/1/2043 | | 2,000,000 | | 1,518,638 | |
| | 6,947,288 | |
Real Estate - .9% | | | | | |
Alexandria Real Estate Equities, Inc., Gtd. Notes | | 2.95 | | 3/15/2034 | | 4,775,000 | | 3,783,465 | |
Prologis LP, Sr. Unscd. Notes | | 2.25 | | 1/15/2032 | | 2,825,000 | | 2,269,893 | |
Prologis LP, Sr. Unscd. Notes | | 4.75 | | 6/15/2033 | | 1,900,000 | | 1,822,968 | |
Simon Property Group LP, Sr. Unscd. Notes | | 2.65 | | 2/1/2032 | | 4,000,000 | | 3,215,792 | |
| | 11,092,118 | |
Retailing - .8% | | | | | |
McDonald's Corp., Sr. Unscd. Notes | | 4.60 | | 9/9/2032 | | 4,800,000 | a | 4,698,826 | |
The Home Depot, Inc., Sr. Unscd. Notes | | 1.38 | | 3/15/2031 | | 5,595,000 | | 4,383,927 | |
| | 9,082,753 | |
Semiconductors & Semiconductor Equipment - 1.9% | | | | | |
Broadcom, Inc., Gtd. Notes | | 2.45 | | 2/15/2031 | | 4,000,000 | c | 3,226,779 | |
Broadcom, Inc., Sr. Unscd. Notes | | 3.19 | | 11/15/2036 | | 6,000,000 | c | 4,512,511 | |
Foundry JV Holdco LLC, Sr. Scd. Notes | | 5.88 | | 1/25/2034 | | 5,275,000 | c | 5,208,142 | |
Microchip Technology, Inc., Sr. Unscd. Notes | | 0.97 | | 2/15/2024 | | 3,000,000 | | 2,931,487 | |
Microchip Technology, Inc., Sr. Unscd. Notes | | 0.98 | | 9/1/2024 | | 2,000,000 | | 1,905,380 | |
NXP BV/NXP Funding LLC, Gtd. Notes | | 5.35 | | 3/1/2026 | | 4,500,000 | | 4,473,643 | |
| | 22,257,942 | |
Technology Hardware & Equipment - .3% | | | | | |
Dell International LLC/EMC Corp., Gtd. Notes | | 3.38 | | 12/15/2041 | | 4,800,000 | c | 3,384,283 | |
Telecommunication Services - 1.3% | | | | | |
AT&T, Inc., Sr. Unscd. Notes | | 4.55 | | 3/9/2049 | | 7,000,000 | | 5,608,075 | |
13
STATEMENT OF INVESTMENTS (continued)
| | | | | | | | | | |
| |
BNY Mellon Bond Fund (continued) |
Description | Coupon
Rate (%) | | Maturity Date | | Principal Amount ($) | | Value ($) | |
Bonds and Notes - 98.7% (continued) | | | | | |
Telecommunication Services - 1.3% (continued) | | | | | |
T-Mobile USA, Inc., Gtd. Notes | | 3.00 | | 2/15/2041 | | 6,675,000 | | 4,719,176 | |
Verizon Communications, Inc., Sr. Unscd. Notes | | 2.99 | | 10/30/2056 | | 8,498,000 | | 5,083,388 | |
| | 15,410,639 | |
Transportation - .4% | | | | | |
J.B. Hunt Transport Services, Inc., Gtd. Notes | | 3.88 | | 3/1/2026 | | 5,000,000 | | 4,846,906 | |
U.S. Government Agencies Collateralized Municipal-Backed Securities - .4% | | | | | |
Government National Mortgage Association, Ser. 2012-135, Cl. AE | | 1.83 | | 12/16/2052 | | 5,708,786 | | 4,686,670 | |
U.S. Government Agencies Mortgage-Backed - 26.5% | | | | | |
Federal Home Loan Mortgage Corp.: | | | |
1.50%, 10/1/2050 | | | 5,494,104 | d | 4,043,804 | |
2.00%, 8/1/2041-2/1/2052 | | | 39,036,792 | d | 30,886,885 | |
2.50%, 12/1/2035-12/1/2051 | | | 49,377,501 | d | 42,369,687 | |
3.00%, 11/1/2051-1/1/2052 | | | 14,237,760 | d | 12,311,153 | |
3.50%, 1/1/2052 | | | 7,011,730 | d | 6,272,724 | |
4.00%, 1/1/2052 | | | 9,418,264 | d | 8,707,704 | |
5.00%, 11/1/2052-6/1/2053 | | | 14,721,596 | d | 14,336,580 | |
5.50%, 1/1/2053-4/1/2053 | | | 20,162,138 | d | 19,944,614 | |
Federal National Mortgage Association: | | | |
1.50%, 1/1/2042 | | | 5,544,885 | d | 4,452,755 | |
2.00%, 10/1/2050-1/1/2052 | | | 45,895,275 | d | 36,747,309 | |
2.50%, 6/1/2051-11/1/2051 | | | 35,762,838 | d | 29,625,274 | |
3.00%, 1/1/2035-1/1/2052 | | | 17,862,636 | d | 16,019,884 | |
3.50%, 3/1/2052 | | | 12,399,915 | d | 11,105,767 | |
4.00%, 4/1/2052-6/1/2052 | | | 15,004,827 | d | 13,864,834 | |
4.50%, 3/1/2050-10/1/2052 | | | 15,018,793 | d | 14,294,467 | |
Government National Mortgage Association II: | | | |
2.00%, 8/20/2051-9/20/2051 | | | 8,762,681 | | 6,955,263 | |
2.50%, 5/20/2051 | | | 11,403,299 | | 9,374,937 | |
3.00%, 6/20/2050-11/20/2051 | | | 14,636,923 | | 12,886,436 | |
3.50%, 1/20/2052 | | | 5,577,764 | | 5,068,030 | |
4.00%, 2/20/2051-6/20/2051 | | | 8,630,303 | | 7,918,381 | |
4.50%, 7/20/2052 | | | 8,615,060 | | 8,220,058 | |
| | 315,406,546 | |
U.S. Treasury Securities - 43.3% | | | | | |
U.S. Treasury Bonds | | 2.25 | | 2/15/2052 | | 7,745,000 | | 5,227,270 | |
U.S. Treasury Bonds | | 2.88 | | 5/15/2052 | | 2,750,000 | | 2,135,439 | |
U.S. Treasury Bonds | | 3.00 | | 8/15/2052 | | 18,500,000 | | 14,748,691 | |
U.S. Treasury Bonds | | 3.63 | | 2/15/2053 | | 12,500,000 | | 11,264,649 | |
U.S. Treasury Bonds | | 3.63 | | 5/15/2053 | | 12,390,000 | | 11,177,135 | |
U.S. Treasury Bonds | | 3.88 | | 2/15/2043 | | 19,900,000 | | 18,519,438 | |
U.S. Treasury Bonds | | 4.00 | | 11/15/2052 | | 22,940,000 | | 22,141,580 | |
U.S. Treasury Bonds | | 4.13 | | 8/15/2053 | | 4,000,000 | | 3,947,188 | |
U.S. Treasury Inflation Indexed Notes, US CPI Urban Consumers Not Seasonally Adjusted | | 0.38 | | 1/15/2027 | | 6,315,400 | e | 5,914,444 | |
U.S. Treasury Inflation Indexed Notes, US CPI Urban Consumers Not Seasonally Adjusted | | 0.50 | | 1/15/2028 | | 9,895,440 | e | 9,224,488 | |
U.S. Treasury Notes | | 0.25 | | 6/15/2024 | | 13,250,000 | a | 12,728,769 | |
U.S. Treasury Notes | | 0.75 | | 4/30/2026 | | 11,315,000 | | 10,234,771 | |
U.S. Treasury Notes | | 1.63 | | 8/15/2029 | | 16,810,000 | | 14,561,663 | |
U.S. Treasury Notes | | 1.75 | | 12/31/2026 | | 7,000,000 | | 6,418,125 | |
U.S. Treasury Notes | | 2.38 | | 5/15/2027 | | 18,300,000 | | 17,033,297 | |
U.S. Treasury Notes | | 2.50 | | 3/31/2027 | | 19,500,000 | | 18,275,156 | |
U.S. Treasury Notes | | 2.50 | | 2/28/2026 | | 15,000,000 | a | 14,244,727 | |
U.S. Treasury Notes | | 2.63 | | 7/31/2029 | | 12,790,000 | | 11,716,339 | |
14
| | | | | | | | | | |
| |
BNY Mellon Bond Fund (continued) |
Description | Coupon
Rate (%) | | Maturity Date | | Principal Amount ($) | | Value ($) | |
Bonds and Notes - 98.7% (continued) | | | | | |
U.S. Treasury Securities - 43.3% (continued) | | | | | |
U.S. Treasury Notes | | 2.63 | | 1/31/2026 | | 14,500,000 | a | 13,819,746 | |
U.S. Treasury Notes | | 2.75 | | 8/15/2032 | | 11,840,000 | | 10,629,638 | |
U.S. Treasury Notes | | 2.88 | | 5/15/2032 | | 9,700,000 | | 8,816,770 | |
U.S. Treasury Notes | | 2.88 | | 4/30/2029 | | 15,965,000 | | 14,861,794 | |
U.S. Treasury Notes | | 3.00 | | 7/31/2024 | | 10,490,000 | | 10,264,263 | |
U.S. Treasury Notes | | 3.13 | | 11/15/2028 | | 1,685,000 | | 1,595,682 | |
U.S. Treasury Notes | | 3.25 | | 6/30/2029 | | 25,750,000 | | 24,424,277 | |
U.S. Treasury Notes | | 3.25 | | 6/30/2027 | | 12,615,000 | | 12,112,371 | |
U.S. Treasury Notes | | 3.38 | | 5/15/2033 | | 14,500,000 | a | 13,661,719 | |
U.S. Treasury Notes | | 3.50 | | 1/31/2030 | | 9,295,000 | | 8,917,754 | |
U.S. Treasury Notes | | 3.50 | | 1/31/2028 | | 5,265,000 | | 5,092,037 | |
U.S. Treasury Notes | | 3.50 | | 2/15/2033 | | 23,500,000 | | 22,383,750 | |
U.S. Treasury Notes | | 3.50 | | 4/30/2030 | | 10,000,000 | | 9,589,063 | |
U.S. Treasury Notes | | 3.63 | | 3/31/2030 | | 21,545,000 | a | 20,814,490 | |
U.S. Treasury Notes | | 3.75 | | 5/31/2030 | | 15,000,000 | | 14,597,461 | |
U.S. Treasury Notes | | 4.00 | | 2/29/2028 | | 4,200,000 | | 4,148,648 | |
U.S. Treasury Notes | | 4.00 | | 2/28/2030 | | 13,000,000 | | 12,836,484 | |
U.S. Treasury Notes | | 4.13 | | 11/15/2032 | | 9,435,000 | | 9,432,420 | |
U.S. Treasury Notes | | 4.13 | | 8/31/2030 | | 15,500,000 | | 15,435,820 | |
U.S. Treasury Notes | | 4.25 | | 12/31/2024 | | 10,000,000 | | 9,878,711 | |
U.S. Treasury Notes | | 4.50 | | 11/30/2024 | | 10,000,000 | | 9,911,523 | |
U.S. Treasury Notes | | 4.50 | | 11/15/2025 | | 3,950,000 | | 3,926,547 | |
U.S. Treasury Notes | | 4.63 | | 2/28/2025 | | 10,345,000 | | 10,274,282 | |
U.S. Treasury Notes | | 4.63 | | 6/30/2025 | | 4,755,000 | | 4,728,996 | |
U.S. Treasury Notes | | 4.75 | | 7/31/2025 | | 10,750,000 | a | 10,721,865 | |
U.S. Treasury Notes | | 5.00 | | 8/31/2025 | | 23,000,000 | | 23,066,484 | |
| | 515,455,764 | |
Total Bonds and Notes
(cost $1,279,247,367) | | 1,174,571,977 | |
| Preferred
Dividend
Yield (%) | | | | Shares | | | |
Preferred Stocks - .4% | | | | | |
Telecommunication Services - .4% | | | | | |
AT&T, Inc., Ser. A
(cost $6,500,000) | | 5.00 | | | | 260,000 | | 5,285,800 | |
| 1-Day
Yield (%) | | | | | | | |
Investment Companies - .4% | | | | | |
Registered Investment Companies - .4% | | | | | |
Dreyfus Institutional Preferred Government Plus Money Market Fund, Institutional Shares
(cost $4,489,986) | | 5.41 | | | | 4,489,986 | f | 4,489,986 | |
15
STATEMENT OF INVESTMENTS (continued)
| | | | | | | | | | |
| |
BNY Mellon Bond Fund (continued) |
Description | 1-Day
Yield (%) | | | | Shares | | Value ($) | |
Investment of Cash Collateral for Securities Loaned - 2.8% | | | | | |
Registered Investment Companies - 2.8% | | | | | |
Dreyfus Institutional Preferred Government Plus Money Market Fund, Institutional Shares
(cost $33,666,019) | | 5.41 | | | | 33,666,019 | f | 33,666,019 | |
Total Investments (cost $1,323,903,372) | | 102.3% | 1,218,013,782 | |
Liabilities, Less Cash and Receivables | | (2.3%) | (27,946,893) | |
Net Assets | | 100.0% | 1,190,066,889 | |
GO—General Obligation
a Security, or portion thereof, on loan. At August 31, 2023, the value of the fund’s securities on loan was $87,745,727 and the value of the collateral was $90,403,355, consisting of cash collateral of $33,666,019 and U.S. Government & Agency securities valued at $56,737,336. In addition, the value of collateral may include pending sales that are also on loan.
b Security is a perpetual bond with no specified maturity date. Maturity date shown is next reset date of the bond.
c Security exempt from registration pursuant to Rule 144A under the Securities Act of 1933. These securities may be resold in transactions exempt from registration, normally to qualified institutional buyers. At August 31, 2023, these securities were valued at $58,164,096 or 4.89% of net assets.
d The Federal Housing Finance Agency (“FHFA”) placed the Federal Home Loan Mortgage Corporation and Federal National Mortgage Association into conservatorship with FHFA as the conservator. As such, the FHFA oversees the continuing affairs of these companies.
e Principal amount for accrual purposes is periodically adjusted based on changes in the Consumer Price Index.
f Investment in affiliated issuer. The investment objective of this investment company is publicly available and can be found within the investment company’s prospectus.
| | |
Portfolio Summary (Unaudited) † | Value (%) |
Government | 44.2 |
Mortgage Securities | 26.9 |
Financial | 11.9 |
Communications | 3.7 |
Investment Companies | 3.2 |
Consumer, Non-cyclical | 2.9 |
Consumer, Cyclical | 2.6 |
Technology | 2.5 |
Energy | 2.4 |
Industrial | 1.5 |
Basic Materials | .5 |
| | 102.3 |
† Based on net assets.
See notes to financial statements.
16
| | | | | | | |
BNY Mellon Bond Fund | | |
Affiliated Issuers | | |
Description | Value ($)
8/31/2022 | Purchases ($)† | Sales ($) | Value ($)
8/31/2023 | Dividends/
Distributions ($) | |
Registered Investment Companies - .4% | | |
Dreyfus Institutional Preferred Government Plus Money Market Fund, Institutional Shares - .4% | 9,985,554 | 230,459,006 | (235,954,574) | 4,489,986 | 332,350 | |
Investment of Cash Collateral for Securities Loaned - 2.8%†† | | |
Dreyfus Institutional Preferred Government Plus Money Market Fund, Institutional Shares - 2.8% | - | 146,138,605 | (112,472,586) | 33,666,019 | 14,117 | ††† |
Dreyfus Institutional Preferred Government Plus Money Market Fund, SL Shares - .0% | 40,564,922 | 446,505,681 | (487,070,603) | - | 99,703 | ††† |
Total - 3.2% | 50,550,476 | 823,103,292 | (835,497,763) | 38,156,005 | 446,170 | |
† Includes reinvested dividends/distributions.
†† Effective July 3, 2023, cash collateral for securities lending was transferred from Dreyfus Institutional Preferred Government Plus Money Market Fund, SL Shares to Dreyfus Institutional Preferred Government Plus Money Market Fund, Institutional Shares.
††† Represents securities lending income earned from the reinvestment of cash collateral from loaned securities, net of fees and collateral investment expenses, and other payments to and from borrowers of securities.
See notes to financial statements.
17
STATEMENT OF INVESTMENTS (continued)
| | | | | | | | | | |
| |
BNY Mellon Intermediate Bond Fund |
Description | Coupon
Rate (%) | | Maturity Date | | Principal Amount ($) | | Value ($) | |
Bonds and Notes - 98.4% | | | | | |
Aerospace & Defense - .4% | | | | | |
The Boeing Company, Sr. Unscd. Notes | | 5.15 | | 5/1/2030 | | 2,275,000 | | 2,239,300 | |
Airlines - 1.2% | | | | | |
American Airlines Pass Through Trust, Ser. 2015-1, Cl. A | | 3.38 | | 5/1/2027 | | 3,299,722 | | 2,943,959 | |
Delta Air Lines Pass Through Trust, Ser. 2020-1, Cl. AA | | 2.00 | | 6/10/2028 | | 3,282,473 | | 2,893,429 | |
| | 5,837,388 | |
Automobiles & Components - 2.1% | | | | | |
American Honda Finance Corp., Sr. Unscd. Notes | | 1.30 | | 9/9/2026 | | 3,250,000 | | 2,902,845 | |
General Motors Financial Co., Inc., Sr. Unscd. Notes | | 6.05 | | 10/10/2025 | | 4,500,000 | | 4,507,363 | |
Toyota Motor Credit Corp., Sr. Unscd. Notes | | 2.00 | | 10/7/2024 | | 3,650,000 | | 3,516,386 | |
| | 10,926,594 | |
Banks - 9.2% | | | | | |
Bank of America Corp., Sub. Notes, Ser. L | | 3.95 | | 4/21/2025 | | 4,680,000 | | 4,533,039 | |
Bank of Montreal, Sr. Unscd. Notes, Ser. E | | 3.30 | | 2/5/2024 | | 3,050,000 | | 3,017,037 | |
Barclays PLC, Sr. Unscd. Notes | | 2.28 | | 11/24/2027 | | 4,000,000 | | 3,554,370 | |
Citigroup, Inc., Sub. Bonds | | 4.40 | | 6/10/2025 | | 5,000,000 | | 4,879,213 | |
Cooperatieve Rabobank UA, Gtd. Notes | | 3.75 | | 7/21/2026 | | 4,835,000 | | 4,540,418 | |
HSBC Holdings PLC, Sr. Unscd. Notes | | 2.25 | | 11/22/2027 | | 3,135,000 | | 2,797,342 | |
JPMorgan Chase & Co., Jr. Sub. Bonds, Ser. II | | 4.00 | | 4/1/2025 | | 4,235,000 | a,b | 3,897,470 | |
Royal Bank of Canada, Sub. Notes | | 4.65 | | 1/27/2026 | | 3,710,000 | a | 3,641,395 | |
Societe Generale SA, Sub. Notes | | 4.75 | | 11/24/2025 | | 3,500,000 | c | 3,370,079 | |
Sumitomo Mitsui Financial Group, Inc., Sr. Unscd. Notes | | 0.95 | | 1/12/2026 | | 3,475,000 | | 3,124,643 | |
The Goldman Sachs Group, Inc., Sr. Unscd. Notes | | 1.95 | | 10/21/2027 | | 5,185,000 | | 4,616,066 | |
UBS Group AG, Sr. Unscd. Notes | | 2.59 | | 9/11/2025 | | 5,500,000 | c | 5,305,678 | |
| | 47,276,750 | |
Beverage Products - .8% | | | | | |
Anheuser-Busch Inbev Worldwide, Inc., Gtd. Notes | | 4.75 | | 1/23/2029 | | 4,195,000 | | 4,158,309 | |
Consumer Discretionary - .7% | | | | | |
Warnermedia Holdings, Inc., Gtd. Notes | | 3.76 | | 3/15/2027 | | 3,665,000 | | 3,438,693 | |
Diversified Financials - 3.3% | | | | | |
Aercap Ireland Capital DAC/AerCap Global Aviation Trust, Gtd. Notes | | 2.45 | | 10/29/2026 | | 3,750,000 | | 3,376,185 | |
Air Lease Corp., Sr. Unscd. Notes | | 2.30 | | 2/1/2025 | | 4,500,000 | | 4,262,025 | |
American Express Co., Sr. Unscd. Notes | | 3.38 | | 5/3/2024 | | 3,350,000 | | 3,296,647 | |
Ares Capital Corp., Sr. Unscd. Notes | | 2.88 | | 6/15/2028 | | 1,725,000 | | 1,456,636 | |
Ares Capital Corp., Sr. Unscd. Notes | | 2.88 | | 6/15/2027 | | 1,250,000 | a | 1,100,999 | |
Ares Capital Corp., Sr. Unscd. Notes | | 3.88 | | 1/15/2026 | | 1,500,000 | | 1,404,341 | |
The Andrew W. Mellon Foundation, Unscd. Bonds, Ser. 2020 | | 0.95 | | 8/1/2027 | | 2,350,000 | | 2,032,701 | |
| | 16,929,534 | |
Energy - 2.1% | | | | | |
Cimarex Energy Co., Sr. Unscd. Notes | | 4.38 | | 3/15/2029 | | 3,000,000 | | 2,419,103 | |
ONEOK, Inc., Gtd. Notes | | 4.00 | | 7/13/2027 | | 3,400,000 | | 3,219,331 | |
Sabine Pass Liquefaction LLC, Sr. Scd. Notes | | 5.88 | | 6/30/2026 | | 2,500,000 | | 2,512,117 | |
Spectra Energy Partners LP, Gtd. Notes | | 3.50 | | 3/15/2025 | | 2,760,000 | | 2,664,502 | |
| | 10,815,053 | |
Food Products - .7% | | | | | |
McCormick & Co., Inc., Sr. Unscd. Notes | | 0.90 | | 2/15/2026 | | 3,840,000 | | 3,458,755 | |
Health Care - 5.1% | | | | | |
AbbVie, Inc., Sr. Unscd. Notes | | 3.20 | | 11/21/2029 | | 4,185,000 | | 3,774,676 | |
Amgen, Inc., Sr. Unscd. Notes | | 2.20 | | 2/21/2027 | | 3,960,000 | | 3,600,753 | |
Astrazeneca Finance LLC, Gtd. Notes | | 1.20 | | 5/28/2026 | | 3,540,000 | | 3,196,636 | |
CVS Health Corp., Sr. Unscd. Notes | | 4.30 | | 3/25/2028 | | 4,000,000 | | 3,843,930 | |
Elevance Health, Inc., Sr. Unscd. Notes | | 2.38 | | 1/15/2025 | | 3,000,000 | | 2,869,943 | |
Pfizer Investment Enterprises Pte Ltd., Gtd. Notes | | 4.75 | | 5/19/2033 | | 2,820,000 | | 2,776,469 | |
Shire Acquisitions Investments Ireland DAC, Gtd. Notes | | 3.20 | | 9/23/2026 | | 3,770,000 | | 3,542,085 | |
18
| | | | | | | | | | |
| |
BNY Mellon Intermediate Bond Fund (continued) |
Description | Coupon
Rate (%) | | Maturity Date | | Principal Amount ($) | | Value ($) | |
Bonds and Notes - 98.4% (continued) | | | | | |
Health Care - 5.1% (continued) | | | | | |
UnitedHealth Group, Inc., Sr. Unscd. Notes | | 1.15 | | 5/15/2026 | | 2,915,000 | | 2,638,155 | |
| | 26,242,647 | |
Industrial - 2.5% | | | | | |
Caterpillar Financial Services Corp., Sr. Unscd. Notes | | 0.90 | | 3/2/2026 | | 2,830,000 | | 2,561,906 | |
John Deere Capital Corp., Sr. Unscd. Notes | | 1.05 | | 6/17/2026 | | 4,250,000 | | 3,823,378 | |
Parker-Hannifin Corp., Sr. Unscd. Notes | | 2.70 | | 6/14/2024 | | 3,325,000 | | 3,246,644 | |
Snap-On, Inc., Sr. Unscd. Notes | | 3.25 | | 3/1/2027 | | 3,300,000 | | 3,119,765 | |
| | 12,751,693 | |
Information Technology - 2.1% | | | | | |
Fiserv, Inc., Sr. Unscd. Notes | | 3.50 | | 7/1/2029 | | 4,000,000 | | 3,653,850 | |
Microsoft Corp., Sr. Unscd. Notes | | 3.13 | | 11/3/2025 | | 3,200,000 | | 3,089,174 | |
Oracle Corp., Sr. Unscd. Notes | | 2.50 | | 4/1/2025 | | 4,215,000 | | 4,015,489 | |
| | 10,758,513 | |
Internet Software & Services - 1.4% | | | | | |
Amazon.com, Inc., Sr. Unscd. Notes | | 0.80 | | 6/3/2025 | | 3,670,000 | | 3,409,979 | |
eBay, Inc., Sr. Unscd. Notes | | 1.90 | | 3/11/2025 | | 4,000,000 | | 3,791,135 | |
| | 7,201,114 | |
Media - .6% | | | | | |
Discovery Communications LLC, Gtd. Notes | | 4.90 | | 3/11/2026 | | 3,150,000 | | 3,096,818 | |
Metals & Mining - .6% | | | | | |
Glencore Funding LLC, Gtd. Notes | | 1.63 | | 9/1/2025 | | 3,500,000 | c | 3,239,708 | |
Municipal Securities - 2.5% | | | | | |
Nassau County Interim Finance Authority, Revenue Bonds, Refunding, Ser. B | | 1.28 | | 11/15/2028 | | 2,500,000 | | 2,104,805 | |
New Jersey Turnpike Authority, Revenue Bonds, Refunding, Ser. B | | 1.05 | | 1/1/2026 | | 2,500,000 | | 2,274,522 | |
New York State Dormitory Authority, Revenue Bonds, Refunding, Ser. C | | 1.75 | | 3/15/2028 | | 4,155,000 | | 3,657,175 | |
State Board of Administration Finance Corp., Revenue Bonds, Ser. A | | 1.71 | | 7/1/2027 | | 5,315,000 | | 4,696,538 | |
| | 12,733,040 | |
Real Estate - .8% | | | | | |
Healthcare Realty Holdings LP, Gtd. Notes | | 3.63 | | 1/15/2028 | | 2,375,000 | | 2,146,072 | |
UDR, Inc., Gtd. Notes | | 2.95 | | 9/1/2026 | | 2,205,000 | | 2,034,438 | |
| | 4,180,510 | |
Retailing - 1.5% | | | | | |
Target Corp., Sr. Unscd. Notes | | 2.25 | | 4/15/2025 | | 3,300,000 | | 3,152,044 | |
The TJX Companies, Inc., Sr. Unscd. Notes | | 1.15 | | 5/15/2028 | | 5,500,000 | | 4,676,485 | |
| | 7,828,529 | |
Semiconductors & Semiconductor Equipment - 2.5% | | | | | |
Broadcom Corp./Broadcom Cayman Finance Ltd., Gtd. Notes | | 3.88 | | 1/15/2027 | | 3,600,000 | | 3,421,563 | |
Broadcom, Inc., Sr. Unscd. Notes | | 4.00 | | 4/15/2029 | | 4,000,000 | c | 3,691,612 | |
Foundry JV Holdco LLC, Sr. Scd. Notes | | 5.88 | | 1/25/2034 | | 2,000,000 | c | 1,974,651 | |
Microchip Technology, Inc., Sr. Unscd. Notes | | 0.97 | | 2/15/2024 | | 4,000,000 | | 3,908,649 | |
| | 12,996,475 | |
Technology Hardware & Equipment - .5% | | | | | |
Apple, Inc., Sr. Unscd. Notes | | 2.05 | | 9/11/2026 | | 2,830,000 | | 2,615,805 | |
Telecommunication Services - 3.2% | | | | | |
AT&T, Inc., Sr. Unscd. Notes | | 1.65 | | 2/1/2028 | | 6,000,000 | | 5,133,321 | |
Motorola Solutions, Inc., Sr. Unscd. Notes | | 4.60 | | 5/23/2029 | | 2,420,000 | | 2,333,422 | |
T-Mobile USA, Inc., Gtd. Notes | | 3.88 | | 4/15/2030 | | 4,700,000 | | 4,291,581 | |
Verizon Communications, Inc., Sr. Unscd. Notes | | 2.63 | | 8/15/2026 | | 5,000,000 | | 4,657,308 | |
| | 16,415,632 | |
U.S. Government Agencies Collateralized Municipal-Backed Securities - .5% | | | | | |
Government National Mortgage Association, Ser. 2012-135, Cl. AE | | 1.83 | | 12/16/2052 | | 3,007,152 | | 2,468,744 | |
19
STATEMENT OF INVESTMENTS (continued)
| | | | | | | | | | |
| |
BNY Mellon Intermediate Bond Fund (continued) |
Description | Coupon
Rate (%) | | Maturity Date | | Principal Amount ($) | | Value ($) | |
Bonds and Notes - 98.4% (continued) | | | | | |
U.S. Government Agencies Mortgage-Backed - 1.4% | | | | | |
Federal Home Loan Mortgage Corp.: | | | |
3.50%, 6/1/2035 | | | 5,286,748 | d | 5,056,167 | |
4.50%, 2/1/2034 | | | 230,739 | d | 227,497 | |
Federal National Mortgage Association: | | | |
2.91%, 4/1/2026 | | | 2,000,000 | d | 1,876,142 | |
| | 7,159,806 | |
U.S. Government Agencies Obligations - 5.5% | | | | | |
Federal Farm Credit Bank Funding Corp., Bonds | | 3.33 | | 4/12/2027 | | 6,845,000 | | 6,496,928 | |
Federal Home Loan Bank, Bonds | | 2.20 | | 3/28/2025 | | 2,400,000 | | 2,288,093 | |
Federal Home Loan Bank, Bonds | | 3.00 | | 3/25/2027 | | 6,800,000 | | 6,386,799 | |
Federal Home Loan Mortgage Corp., Notes | | 4.05 | | 8/28/2025 | | 4,900,000 | d | 4,783,086 | |
Federal National Mortgage Association, Notes | | 0.55 | | 8/19/2025 | | 9,250,000 | a,d | 8,465,312 | |
| | 28,420,218 | |
U.S. Treasury Securities - 46.6% | | | | | |
U.S. Treasury Inflation Indexed Notes, US CPI Urban Consumers Not Seasonally Adjusted | | 0.38 | | 1/15/2027 | | 13,893,880 | e | 13,011,776 | |
U.S. Treasury Notes | | 0.25 | | 10/31/2025 | | 4,720,000 | | 4,285,797 | |
U.S. Treasury Notes | | 0.25 | | 9/30/2025 | | 5,440,000 | | 4,957,200 | |
U.S. Treasury Notes | | 0.63 | | 5/15/2030 | | 5,950,000 | | 4,721,650 | |
U.S. Treasury Notes | | 0.75 | | 1/31/2028 | | 3,000,000 | | 2,573,555 | |
U.S. Treasury Notes | | 1.13 | | 2/28/2025 | | 32,705,000 | | 30,853,846 | |
U.S. Treasury Notes | | 1.38 | | 11/15/2031 | | 1,300,000 | | 1,053,762 | |
U.S. Treasury Notes | | 1.63 | | 5/15/2026 | | 12,740,000 | | 11,784,500 | |
U.S. Treasury Notes | | 1.63 | | 8/15/2029 | | 5,245,000 | | 4,543,481 | |
U.S. Treasury Notes | | 2.00 | | 4/30/2024 | | 7,750,000 | | 7,579,200 | |
U.S. Treasury Notes | | 2.38 | | 2/29/2024 | | 7,750,000 | a | 7,634,238 | |
U.S. Treasury Notes | | 2.50 | | 3/31/2027 | | 8,575,000 | | 8,036,383 | |
U.S. Treasury Notes | | 2.63 | | 4/15/2025 | | 10,760,000 | | 10,359,022 | |
U.S. Treasury Notes | | 2.75 | | 7/31/2027 | | 6,250,000 | | 5,884,521 | |
U.S. Treasury Notes | | 2.88 | | 4/30/2029 | | 5,345,000 | | 4,975,652 | |
U.S. Treasury Notes | | 3.00 | | 7/15/2025 | | 11,000,000 | | 10,626,172 | |
U.S. Treasury Notes | | 3.00 | | 7/31/2024 | | 15,000,000 | | 14,677,211 | |
U.S. Treasury Notes | | 3.13 | | 8/15/2025 | | 3,635,000 | | 3,517,288 | |
U.S. Treasury Notes | | 3.13 | | 11/15/2028 | | 8,890,000 | | 8,418,761 | |
U.S. Treasury Notes | | 3.38 | | 5/15/2033 | | 7,000,000 | a | 6,595,312 | |
U.S. Treasury Notes | | 3.50 | | 4/30/2028 | | 7,750,000 | a | 7,493,433 | |
U.S. Treasury Notes | | 3.50 | | 9/15/2025 | | 16,000,000 | | 15,585,625 | |
U.S. Treasury Notes | | 3.63 | | 5/15/2026 | | 1,000,000 | | 975,391 | |
U.S. Treasury Notes | | 3.75 | | 5/31/2030 | | 2,075,000 | | 2,019,315 | |
U.S. Treasury Notes | | 3.88 | | 12/31/2029 | | 9,765,000 | | 9,570,081 | |
U.S. Treasury Notes | | 4.00 | | 2/15/2026 | | 2,250,000 | | 2,214,756 | |
U.S. Treasury Notes | | 4.13 | | 1/31/2025 | | 19,500,000 | | 19,229,590 | |
U.S. Treasury Notes | | 4.38 | | 10/31/2024 | | 14,875,000 | | 14,723,345 | |
U.S. Treasury Notes | | 4.50 | | 11/15/2025 | | 1,735,000 | | 1,724,698 | |
| | 239,625,561 | |
Utilities - .6% | | | | | |
Black Hills Corp., Sr. Unscd. Notes | | 3.05 | | 10/15/2029 | | 3,500,000 | | 3,020,040 | |
Total Bonds and Notes
(cost $533,767,174) | | 505,835,229 | |
| Preferred
Dividend
Yield (%) | | | | Shares | | | |
Preferred Stocks - .6% | | | | | |
Telecommunication Services - .6% | | | | | |
AT&T, Inc., Ser. A
(cost $3,750,000) | | 5.00 | | | | 150,000 | | 3,049,500 | |
20
| | | | | | | | | | |
| |
BNY Mellon Intermediate Bond Fund (continued) |
Description | 1-Day
Yield (%) | | | | Shares | | Value ($) | |
Investment Companies - .3% | | | | | |
Registered Investment Companies - .3% | | | | | |
Dreyfus Institutional Preferred Government Plus Money Market Fund, Institutional Shares
(cost $1,657,876) | | 5.41 | | | | 1,657,876 | f | 1,657,876 | |
| | | | | | | | |
Investment of Cash Collateral for Securities Loaned - 1.0% | | | | | |
Registered Investment Companies - 1.0% | | | | | |
Dreyfus Institutional Preferred Government Plus Money Market Fund, Institutional Shares
(cost $4,751,395) | | 5.41 | | | | 4,751,395 | f | 4,751,395 | |
Total Investments (cost $543,926,445) | | 100.3% | 515,294,000 | |
Liabilities, Less Cash and Receivables | | (0.3%) | (1,292,781) | |
Net Assets | | 100.0% | 514,001,219 | |
a Security, or portion thereof, on loan. At August 31, 2023, the value of the fund’s securities on loan was $30,236,329 and the value of the collateral was $32,291,411, consisting of cash collateral of $4,751,395 and U.S. Government & Agency securities valued at $27,540,016. In addition, the value of collateral may include pending sales that are also on loan.
b Security is a perpetual bond with no specified maturity date. Maturity date shown is next reset date of the bond.
c Security exempt from registration pursuant to Rule 144A under the Securities Act of 1933. These securities may be resold in transactions exempt from registration, normally to qualified institutional buyers. At August 31, 2023, these securities were valued at $17,581,728 or 3.42% of net assets.
d The Federal Housing Finance Agency (“FHFA”) placed the Federal Home Loan Mortgage Corporation and Federal National Mortgage Association into conservatorship with FHFA as the conservator. As such, the FHFA oversees the continuing affairs of these companies.
e Principal amount for accrual purposes is periodically adjusted based on changes in the Consumer Price Index.
f Investment in affiliated issuer. The investment objective of this investment company is publicly available and can be found within the investment company’s prospectus.
| | |
Portfolio Summary (Unaudited) † | Value (%) |
Government | 54.6 |
Financial | 13.3 |
Consumer, Non-cyclical | 6.6 |
Communications | 5.8 |
Consumer, Cyclical | 5.5 |
Technology | 5.1 |
Industrial | 2.9 |
Energy | 2.1 |
Mortgage Securities | 1.9 |
Investment Companies | 1.3 |
Basic Materials | .6 |
Utilities | .6 |
| | 100.3 |
† Based on net assets.
See notes to financial statements.
21
STATEMENT OF INVESTMENTS (continued)
| | | | | | | |
BNY Mellon Intermediate Bond Fund | | |
Affiliated Issuers | | |
Description | Value ($)
8/31/2022 | Purchases ($)† | Sales ($) | Value ($)
8/31/2023 | Dividends/
Distributions ($) | |
Registered Investment Companies - .3% | | |
Dreyfus Institutional Preferred Government Plus Money Market Fund, Institutional Shares - .3% | 4,007,071 | 91,029,398 | (93,378,593) | 1,657,876 | 109,504 | |
Investment of Cash Collateral for Securities Loaned - .9%†† | | |
Dreyfus Institutional Preferred Government Plus Money Market Fund, Institutional Shares - .9% | - | 12,926,439 | (8,175,044) | 4,751,395 | 6,658 | ††† |
Dreyfus Institutional Preferred Government Plus Money Market Fund, SL Shares - .0% | 39,424,308 | 344,789,402 | (384,213,710) | - | 77,282 | ††† |
Total - 1.2% | 43,431,379 | 448,745,239 | (485,767,347) | 6,409,271 | 193,444 | |
† Includes reinvested dividends/distributions.
†† Effective July 3, 2023, cash collateral for securities lending was transferred from Dreyfus Institutional Preferred Government Plus Money Market Fund, SL Shares to Dreyfus Institutional Preferred Government Plus Money Market Fund, Institutional Shares.
††† Represents securities lending income earned from the reinvestment of cash collateral from loaned securities, net of fees and collateral investment expenses, and other payments to and from borrowers of securities.
See notes to financial statements.
22
| | | | | | | | | | |
| |
BNY Mellon Corporate Bond Fund |
Description | Coupon
Rate (%) | | Maturity Date | | Principal Amount ($) | | Value ($) | |
Bonds and Notes - 95.7% | | | | | |
Aerospace & Defense - 1.2% | | | | | |
Rtx Corp., Sr. Unscd. Notes | | 2.25 | | 7/1/2030 | | 2,500,000 | | 2,079,586 | |
The Boeing Company, Sr. Unscd. Notes | | 2.20 | | 2/4/2026 | | 3,250,000 | | 2,999,820 | |
| | 5,079,406 | |
Airlines - 3.3% | | | | | |
Air Canada Pass Through Trust, Ser. 2015-1, Cl. A | | 3.60 | | 3/15/2027 | | 1,939,874 | a | 1,810,877 | |
American Airlines Pass Through Trust, Ser. 2015-1, Cl. A | | 3.38 | | 5/1/2027 | | 3,242,675 | | 2,893,063 | |
JetBlue Pass Through Trust, Ser. 2019-1, CI. A | | 2.95 | | 5/15/2028 | | 4,207,464 | | 3,647,254 | |
United Airlines Pass Through Trust, Ser. 2016-2, Cl. A | | 3.10 | | 10/7/2028 | | 6,217,367 | | 5,405,311 | |
| | 13,756,505 | |
Automobiles & Components - 1.5% | | | | | |
Ford Motor Credit Co., LLC, Sr. Unscd. Notes | | 5.58 | | 3/18/2024 | | 3,000,000 | | 2,987,329 | |
General Motors Financial Co., Inc., Sr. Unscd. Notes | | 2.70 | | 8/20/2027 | | 1,750,000 | | 1,558,084 | |
General Motors Financial Co., Inc., Sr. Unscd. Notes | | 3.10 | | 1/12/2032 | | 2,000,000 | | 1,604,023 | |
| | 6,149,436 | |
Banks - 21.9% | | | | | |
BAC Capital Trust XIV, Ltd. Gtd. Notes, Ser. G, (3 Month LIBOR +0.40%) | | 5.95 | | 10/6/2023 | | 3,000,000 | b,c | 2,374,731 | |
Banco Santander SA, Sr. Unscd. Notes | | 1.72 | | 9/14/2027 | | 2,500,000 | | 2,199,124 | |
Bank of America Corp., Jr. Sub. Bonds, Ser. FF | | 5.88 | | 3/15/2028 | | 3,000,000 | c | 2,772,450 | |
Bank of America Corp., Jr. Sub. Notes, Ser. TT | | 6.13 | | 4/27/2027 | | 1,500,000 | c | 1,458,750 | |
Bank of Ireland Group PLC, Sr. Unscd. Notes | | 2.03 | | 9/30/2027 | | 3,500,000 | a | 3,085,251 | |
Barclays PLC, Jr. Sub. Notes | | 8.00 | | 3/15/2029 | | 2,000,000 | c | 1,792,720 | |
Barclays PLC, Sr. Unscd. Notes | | 5.30 | | 8/9/2026 | | 1,500,000 | | 1,478,571 | |
BNP Paribas SA, Sr. Unscd. Notes | | 1.32 | | 1/13/2027 | | 2,500,000 | a | 2,249,402 | |
BPCE SA, Sub. Notes | | 3.12 | | 10/19/2032 | | 4,000,000 | a | 3,095,461 | |
Citigroup, Inc., Sub. Notes | | 6.17 | | 5/25/2034 | | 2,500,000 | | 2,492,669 | |
Citizens Financial Group, Inc., Sub. Notes | | 3.75 | | 2/11/2031 | | 5,000,000 | | 4,136,776 | |
Cooperatieve Rabobank UA, Gtd. Notes | | 4.38 | | 8/4/2025 | | 2,750,000 | | 2,667,619 | |
Credit Agricole SA, Sub. Notes | | 4.00 | | 1/10/2033 | | 3,500,000 | a | 3,140,638 | |
Danske Bank A/S, Sr. Unscd. Notes | | 0.98 | | 9/10/2025 | | 3,000,000 | a | 2,839,282 | |
Deutsche Bank AG, Sr. Unscd. Notes | | 3.96 | | 11/26/2025 | | 2,500,000 | | 2,414,625 | |
Deutsche Bank AG, Sub. Notes | | 4.88 | | 12/1/2032 | | 5,000,000 | | 4,387,331 | |
HSBC Holdings PLC, Sr. Unscd. Notes | | 3.80 | | 3/11/2025 | | 2,750,000 | | 2,716,263 | |
JPMorgan Chase & Co., Jr. Sub. Bonds, Ser. FF | | 5.00 | | 8/1/2024 | | 4,000,000 | c | 3,920,040 | |
Lloyds Banking Group PLC, Sub. Notes | | 4.58 | | 12/10/2025 | | 2,500,000 | | 2,408,686 | |
M&T Bank Corp., Jr. Sub. Notes, Ser. G | | 5.00 | | 8/1/2024 | | 5,000,000 | c | 4,290,100 | |
Morgan Stanley, Sr. Unscd. Notes | | 6.30 | | 10/18/2028 | | 3,000,000 | | 3,078,844 | |
NatWest Group PLC, Sr. Unscd. Notes | | 4.80 | | 4/5/2026 | | 2,000,000 | | 1,948,079 | |
Nordea Bank Abp, Jr. Sub. Notes | | 6.63 | | 3/26/2026 | | 3,465,000 | a,c | 3,291,727 | |
Santander UK Group Holdings PLC, Sr. Unscd. Notes | | 1.09 | | 3/15/2025 | | 3,000,000 | | 2,908,978 | |
Societe Generale SA, Sub. Notes | | 6.22 | | 6/15/2033 | | 2,500,000 | a | 2,351,123 | |
Standard Chartered PLC, Sr. Unscd. Notes | | 3.97 | | 3/30/2026 | | 3,500,000 | a | 3,378,960 | |
The Bank of Nova Scotia, Jr. Sub. Notes, (3 Month TSFR +2.91%) | | 8.21 | | 1/12/2024 | | 4,000,000 | b,c,d | 3,563,822 | |
The Goldman Sachs Group, Inc., Sub. Notes | | 4.25 | | 10/21/2025 | | 2,250,000 | | 2,184,302 | |
The Toronto-Dominion Bank, Sub. Notes | | 3.63 | | 9/15/2031 | | 3,000,000 | | 2,802,340 | |
UBS Group AG, Sr. Unscd. Notes | | 2.59 | | 9/11/2025 | | 5,250,000 | a | 5,064,511 | |
Westpac Banking Corp., Sub. Notes | | 4.32 | | 11/23/2031 | | 3,000,000 | | 2,803,138 | |
Zions Bancorp NA, Sub. Notes | | 3.25 | | 10/29/2029 | | 3,550,000 | | 2,791,456 | |
| | 92,087,769 | |
Beverage Products - 1.3% | | | | | |
Constellation Brands, Inc., Gtd. Notes | | 3.15 | | 8/1/2029 | | 3,000,000 | | 2,682,770 | |
Suntory Holdings Ltd., Sr. Unscd. Notes | | 2.25 | | 10/16/2024 | | 3,000,000 | a | 2,878,155 | |
| | 5,560,925 | |
23
STATEMENT OF INVESTMENTS (continued)
| | | | | | | | | | |
| |
BNY Mellon Corporate Bond Fund (continued) |
Description | Coupon
Rate (%) | | Maturity Date | | Principal Amount ($) | | Value ($) | |
Bonds and Notes - 95.7% (continued) | | | | | |
Building Materials - 1.2% | | | | | |
CRH America Finance, Inc., Gtd. Notes | | 3.40 | | 5/9/2027 | | 2,000,000 | a | 1,872,292 | |
Masco Corp., Sr. Unscd. Notes | | 1.50 | | 2/15/2028 | | 3,500,000 | d | 2,982,447 | |
| | 4,854,739 | |
Chemicals - 1.4% | | | | | |
Huntsman International LLC, Sr. Unscd. Notes | | 4.50 | | 5/1/2029 | | 3,500,000 | | 3,244,033 | |
Yara International ASA, Sr. Unscd. Notes | | 4.75 | | 6/1/2028 | | 3,000,000 | a | 2,849,739 | |
| | 6,093,772 | |
Commercial & Professional Services - 1.0% | | | | | |
Global Payments, Inc., Sr. Unscd. Notes | | 3.20 | | 8/15/2029 | | 3,000,000 | | 2,614,443 | |
Grand Canyon University, Scd. Bonds | | 3.25 | | 10/1/2023 | | 1,750,000 | | 1,730,313 | |
| | 4,344,756 | |
Consumer Discretionary - 3.8% | | | | | |
Hasbro, Inc., Sr. Unscd. Notes | | 3.90 | | 11/19/2029 | | 3,000,000 | | 2,722,509 | |
Leggett & Platt, Inc., Sr. Unscd. Notes | | 4.40 | | 3/15/2029 | | 2,000,000 | | 1,891,214 | |
Marriott International, Inc., Sr. Unscd. Notes, Ser. II | | 2.75 | | 10/15/2033 | | 3,000,000 | | 2,348,755 | |
Warnermedia Holdings, Inc., Gtd. Notes | | 3.76 | | 3/15/2027 | | 3,000,000 | | 2,814,755 | |
Warnermedia Holdings, Inc., Gtd. Notes | | 4.28 | | 3/15/2032 | | 3,500,000 | d | 3,089,993 | |
Whirlpool Corp., Sr. Unscd. Notes | | 4.75 | | 2/26/2029 | | 3,000,000 | d | 2,921,280 | |
| | 15,788,506 | |
Consumer Durables & Apparel - .7% | | | | | |
Michael Kors USA, Inc., Gtd. Notes | | 4.25 | | 11/1/2024 | | 3,000,000 | a | 2,949,840 | |
Diversified Financials - 6.6% | | | | | |
AerCap Ireland Capital DAC/AerCap Global Aviation Trust, Gtd. Notes | | 5.75 | | 6/6/2028 | | 4,000,000 | | 3,968,570 | |
Aircastle Ltd., Sr. Unscd. Notes | | 2.85 | | 1/26/2028 | | 1,000,000 | a | 861,848 | |
Aircastle Ltd., Sr. Unscd. Notes | | 4.25 | | 6/15/2026 | | 3,000,000 | | 2,849,255 | |
Ares Capital Corp., Sr. Unscd. Notes | | 2.88 | | 6/15/2028 | | 5,000,000 | | 4,222,134 | |
BlackRock TCP Capital Corp., Sr. Unscd. Notes | | 2.85 | | 2/9/2026 | | 3,000,000 | | 2,713,442 | |
Blackstone Secured Lending Fund, Sr. Unscd. Notes | | 2.85 | | 9/30/2028 | | 5,000,000 | | 4,135,272 | |
Blue Owl Capital Corp., Sr. Unscd. Notes | | 2.63 | | 1/15/2027 | | 4,000,000 | | 3,470,630 | |
Blue Owl Finance LLC, Gtd. Notes | | 4.38 | | 2/15/2032 | | 1,000,000 | a | 802,235 | |
Goldman Sachs BDC, Inc., Sr. Unscd. Notes | | 3.75 | | 2/10/2025 | | 3,000,000 | d | 2,905,508 | |
Stifel Financial Corp., Sr. Unscd. Bonds | | 4.25 | | 7/18/2024 | | 2,000,000 | | 1,966,874 | |
| | 27,895,768 | |
Electronic Components - 1.3% | | | | | |
Arrow Electronics, Inc., Sr. Unscd. Notes | | 2.95 | | 2/15/2032 | | 1,500,000 | | 1,204,966 | |
Arrow Electronics, Inc., Sr. Unscd. Notes | | 4.00 | | 4/1/2025 | | 1,500,000 | | 1,457,510 | |
Jabil, Inc., Sr. Unscd. Notes | | 3.60 | | 1/15/2030 | | 3,000,000 | | 2,685,665 | |
| | 5,348,141 | |
Energy - 11.2% | | | | | |
Cenovus Energy, Inc., Sr. Unscd. Notes | | 2.65 | | 1/15/2032 | | 3,000,000 | | 2,418,909 | |
Cheniere Corpus Christi Holdings LLC, Sr. Scd. Notes | | 2.74 | | 12/31/2039 | | 2,000,000 | a | 1,550,812 | |
Cheniere Energy, Inc., Sr. Scd. Notes | | 4.63 | | 10/15/2028 | | 2,000,000 | | 1,884,625 | |
Diamondback Energy, Inc., Gtd. Notes | | 3.50 | | 12/1/2029 | | 3,250,000 | | 2,942,394 | |
El Paso Natural Gas Co., LLC, Gtd. Notes | | 3.50 | | 2/15/2032 | | 3,000,000 | a | 2,519,761 | |
Enbridge, Inc., Gtd. Notes | | 4.25 | | 12/1/2026 | | 2,000,000 | | 1,931,532 | |
Energy Transfer LP, Sr. Unscd. Bonds | | 5.50 | | 6/1/2027 | | 1,500,000 | | 1,492,116 | |
Energy Transfer LP, Sr. Unscd. Notes | | 4.15 | | 9/15/2029 | | 1,500,000 | | 1,380,920 | |
Enterprise Products Operating LLC, Gtd. Notes | | 5.35 | | 1/31/2033 | | 1,500,000 | | 1,509,225 | |
EQM Midstream Partners LP, Sr. Unscd. Notes | | 4.00 | | 8/1/2024 | | 936,000 | | 914,071 | |
EQT Corp., Sr. Unscd. Notes | | 3.90 | | 10/1/2027 | | 3,000,000 | | 2,804,078 | |
Helmerich & Payne, Inc., Sr. Unscd. Notes | | 2.90 | | 9/29/2031 | | 3,000,000 | | 2,440,109 | |
MPLX LP, Sr. Unscd. Notes | | 4.25 | | 12/1/2027 | | 1,500,000 | | 1,428,536 | |
MPLX LP, Sr. Unscd. Notes | | 4.95 | | 9/1/2032 | | 2,000,000 | | 1,890,430 | |
Ovintiv, Inc., Gtd. Notes | | 5.65 | | 5/15/2025 | | 2,000,000 | | 1,995,551 | |
24
| | | | | | | | | | |
| |
BNY Mellon Corporate Bond Fund (continued) |
Description | Coupon
Rate (%) | | Maturity Date | | Principal Amount ($) | | Value ($) | |
Bonds and Notes - 95.7% (continued) | | | | | |
Energy - 11.2% (continued) | | | | | |
Petroleos Mexicanos, Gtd. Notes | | 6.49 | | 1/23/2027 | | 3,500,000 | | 3,068,487 | |
Sabal Trail Transmission LLC, Sr. Unscd. Notes | | 4.25 | | 5/1/2028 | | 3,000,000 | a | 2,853,421 | |
Targa Resources Corp., Gtd. Notes | | 5.20 | | 7/1/2027 | | 3,000,000 | | 2,971,533 | |
The Williams Companies, Inc., Sr. Unscd. Notes | | 3.75 | | 6/15/2027 | | 3,000,000 | | 2,825,503 | |
Transcontinental Gas Pipe Line Co., LLC, Sr. Unscd. Notes | | 3.25 | | 5/15/2030 | | 2,000,000 | | 1,764,735 | |
Valero Energy Corp., Sr. Unscd. Notes | | 2.80 | | 12/1/2031 | | 2,500,000 | | 2,053,972 | |
Var Energi ASA, Sr. Unscd. Notes | | 7.50 | | 1/15/2028 | | 2,310,000 | a | 2,402,723 | |
| | 47,043,443 | |
Environmental Control - .5% | | | | | |
Waste Connections, Inc., Sr. Unscd. Notes | | 3.50 | | 5/1/2029 | | 2,500,000 | | 2,306,008 | |
Financials - .8% | | | | | |
Apollo Management Holdings LP, Gtd. Notes | | 4.00 | | 5/30/2024 | | 1,750,000 | a | 1,722,541 | |
Apollo Management Holdings LP, Gtd. Notes | | 4.95 | | 1/14/2050 | | 2,000,000 | a | 1,841,253 | |
| | 3,563,794 | |
Food Products - 1.6% | | | | | |
Flowers Foods, Inc., Sr. Unscd. Notes | | 3.50 | | 10/1/2026 | | 2,000,000 | | 1,879,229 | |
Grupo Bimbo SAB de CV, Gtd. Notes | | 3.88 | | 6/27/2024 | | 3,000,000 | a | 2,960,040 | |
JBS USA LUX SA/JBS USA Food Co./JBS USA Finance, Inc., Gtd. Notes | | 3.00 | | 2/2/2029 | | 2,000,000 | | 1,717,515 | |
| | 6,556,784 | |
Foreign Governmental - .6% | | | | | |
The Morongo Band of Mission Indians, Unscd. Bonds | | 7.00 | | 10/1/2039 | | 2,500,000 | a | 2,603,088 | |
Health Care - 5.7% | | | | | |
AbbVie, Inc., Sr. Unscd. Notes | | 3.20 | | 11/21/2029 | | 2,750,000 | | 2,480,372 | |
Amgen, Inc., Sr. Unscd. Notes | | 5.25 | | 3/2/2033 | | 3,000,000 | | 2,985,659 | |
Centene Corp., Sr. Unscd. Notes | | 2.50 | | 3/1/2031 | | 3,500,000 | | 2,790,387 | |
CVS Health Corp., Sr. Unscd. Notes | | 4.78 | | 3/25/2038 | | 2,000,000 | | 1,792,165 | |
HCA, Inc., Gtd. Notes | | 3.63 | | 3/15/2032 | | 2,000,000 | | 1,720,828 | |
HCA, Inc., Gtd. Notes | | 5.88 | | 2/1/2029 | | 1,500,000 | | 1,510,061 | |
Pfizer Investment Enterprises Pte Ltd., Gtd. Notes | | 4.65 | | 5/19/2030 | | 3,000,000 | | 2,954,205 | |
Royalty Pharma PLC, Gtd. Notes | | 2.20 | | 9/2/2030 | | 3,000,000 | a,d | 2,392,637 | |
Takeda Pharmaceutical Co. Ltd., Sr. Unscd. Notes | | 5.00 | | 11/26/2028 | | 3,000,000 | | 2,977,232 | |
The Cigna Group, Gtd. Notes | | 4.38 | | 10/15/2028 | | 2,500,000 | | 2,408,964 | |
| | 24,012,510 | |
Industrial - 3.0% | | | | | |
Carlisle Companies, Inc., Sr. Unscd. Notes | | 3.75 | | 12/1/2027 | | 2,500,000 | | 2,359,405 | |
Flowserve Corp., Sr. Unscd. Notes | | 2.80 | | 1/15/2032 | | 2,500,000 | | 1,987,934 | |
Hillenbrand, Inc., Gtd. Notes | | 5.00 | | 9/15/2026 | | 2,500,000 | | 2,434,425 | |
Huntington Ingalls Industries, Inc., Gtd. Notes | | 3.48 | | 12/1/2027 | | 3,000,000 | | 2,765,089 | |
Oshkosh Corp., Sr. Unscd. Notes | | 4.60 | | 5/15/2028 | | 3,000,000 | | 2,934,184 | |
| | 12,481,037 | |
Information Technology - 1.5% | | | | | |
Fidelity National Information Services, Inc., Gtd. Notes | | 4.50 | | 7/15/2025 | | 2,000,000 | | 1,961,576 | |
Fiserv, Inc., Sr. Unscd. Notes | | 3.50 | | 7/1/2029 | | 2,000,000 | | 1,826,925 | |
Oracle Corp., Sr. Unscd. Notes | | 1.65 | | 3/25/2026 | | 3,000,000 | | 2,734,734 | |
| | 6,523,235 | |
Insurance - 2.8% | | | | | |
Assured Guaranty US Holdings, Inc., Gtd. Notes | | 3.15 | | 6/15/2031 | | 3,000,000 | | 2,555,334 | |
MetLife, Inc., Jr. Sub. Bonds, Ser. D | | 5.88 | | 3/15/2028 | | 3,500,000 | c | 3,285,450 | |
Prudential Financial, Inc., Jr. Sub. Notes | | 5.70 | | 9/15/2048 | | 3,000,000 | | 2,844,496 | |
Reinsurance Group of America, Inc., Sr. Unscd. Notes | | 3.90 | | 5/15/2029 | | 3,500,000 | | 3,202,105 | |
| | 11,887,385 | |
Internet Software & Services - .5% | | | | | |
eBay, Inc., Sr. Unscd. Notes | | 5.95 | | 11/22/2027 | | 2,000,000 | d | 2,051,749 | |
25
STATEMENT OF INVESTMENTS (continued)
| | | | | | | | | | |
| |
BNY Mellon Corporate Bond Fund (continued) |
Description | Coupon
Rate (%) | | Maturity Date | | Principal Amount ($) | | Value ($) | |
Bonds and Notes - 95.7% (continued) | | | | | |
Materials - .4% | | | | | |
WRKCo, Inc., Gtd. Notes | | 4.00 | | 3/15/2028 | | 2,000,000 | | 1,871,046 | |
Media - .5% | | | | | |
Charter Communications Operating LLC/Charter Communications Operating Capital, Sr. Scd. Notes | | 4.40 | | 4/1/2033 | | 2,500,000 | d | 2,202,869 | |
Metals & Mining - 1.8% | | | | | |
Anglo American Capital PLC, Gtd. Notes | | 4.50 | | 3/15/2028 | | 3,000,000 | a,d | 2,858,631 | |
Glencore Funding LLC, Gtd. Notes | | 1.63 | | 9/1/2025 | | 1,500,000 | a | 1,388,446 | |
Glencore Funding LLC, Gtd. Notes | | 5.40 | | 5/8/2028 | | 1,500,000 | a | 1,486,258 | |
Nucor Corp., Sr. Unscd. Notes | | 3.13 | | 4/1/2032 | | 2,000,000 | | 1,707,973 | |
| | 7,441,308 | |
Municipal Securities - 2.9% | | | | | |
Detroit, GO, Ser. B1 | | 4.00 | | 4/1/2044 | | 5,000,000 | | 3,741,816 | |
Golden State Tobacco Securitization Corp., Revenue Bonds, Refunding, Ser. A1 | | 3.49 | | 6/1/2036 | | 4,000,000 | | 3,160,646 | |
New York State Dormitory Authority, Revenue Bonds (Montefiore Obligated Group) (Insured; Assured Guaranty Municipal Corp.) Ser. B | | 4.95 | | 8/1/2048 | | 2,500,000 | | 2,223,836 | |
Oklahoma Development Finance Authority, Revenue Bonds (OU Medicine Project) Ser. C | | 5.45 | | 8/15/2028 | | 3,750,000 | | 3,261,203 | |
| | 12,387,501 | |
Real Estate - 6.0% | | | | | |
Alexandria Real Estate Equities, Inc., Gtd. Notes | | 3.95 | | 1/15/2027 | | 3,000,000 | | 2,840,875 | |
Brandywine Operating Partnership LP, Gtd. Notes | | 4.55 | | 10/1/2029 | | 2,000,000 | | 1,565,683 | |
EPR Properties, Gtd. Notes | | 4.95 | | 4/15/2028 | | 4,000,000 | | 3,587,454 | |
Extra Space Storage LP, Gtd. Notes | | 2.35 | | 3/15/2032 | | 2,500,000 | | 1,946,595 | |
Extra Space Storage LP, Gtd. Notes | | 4.00 | | 6/15/2029 | | 3,000,000 | | 2,750,154 | |
Healthcare Realty Holdings LP, Gtd. Notes | | 3.10 | | 2/15/2030 | | 3,000,000 | | 2,559,904 | |
Healthpeak Op LLC, Gtd. Notes | | 2.13 | | 12/1/2028 | | 3,000,000 | | 2,566,550 | |
Highwoods Realty LP, Sr. Unscd. Notes | | 4.20 | | 4/15/2029 | | 3,000,000 | | 2,556,271 | |
Phillips Edison Grocery Center Operating Partnership I LP, Gtd. Notes | | 2.63 | | 11/15/2031 | | 3,000,000 | | 2,250,551 | |
Spirit Realty LP, Gtd. Notes | | 4.00 | | 7/15/2029 | | 3,000,000 | | 2,701,254 | |
| | 25,325,291 | |
Retailing - 3.8% | | | | | |
7-Eleven, Inc., Sr. Unscd. Notes | | 1.80 | | 2/10/2031 | | 3,750,000 | a | 2,943,854 | |
Alimentation Couche-Tard, Inc., Gtd. Notes | | 3.55 | | 7/26/2027 | | 3,000,000 | a,d | 2,804,304 | |
AutoNation, Inc., Sr. Unscd. Notes | | 3.85 | | 3/1/2032 | | 2,000,000 | d | 1,694,339 | |
Dick's Sporting Goods, Inc., Sr. Unscd. Notes | | 3.15 | | 1/15/2032 | | 3,000,000 | d | 2,393,795 | |
Dollar Tree, Inc., Sr. Unscd. Notes | | 2.65 | | 12/1/2031 | | 3,500,000 | d | 2,829,170 | |
Kohl's Corp., Sr. Unscd. Notes | | 4.63 | | 5/1/2031 | | 1,000,000 | | 737,150 | |
O'Reilly Automotive, Inc., Sr. Unscd. Notes | | 4.70 | | 6/15/2032 | | 2,500,000 | | 2,391,714 | |
| | 15,794,326 | |
Semiconductors & Semiconductor Equipment - 4.0% | | | | | |
Broadcom, Inc., Sr. Unscd. Notes | | 3.14 | | 11/15/2035 | | 2,000,000 | a | 1,527,480 | |
Broadcom, Inc., Sr. Unscd. Notes | | 3.47 | | 4/15/2034 | | 3,000,000 | a | 2,452,649 | |
Foundry JV Holdco LLC, Sr. Scd. Notes | | 5.88 | | 1/25/2034 | | 2,500,000 | a | 2,468,314 | |
Microchip Technology, Inc., Gtd. Notes | | 4.25 | | 9/1/2025 | | 3,000,000 | | 2,920,700 | |
NXP BV/NXP Funding LLC, Gtd. Notes | | 4.88 | | 3/1/2024 | | 2,000,000 | | 1,988,302 | |
NXP BV/NXP Funding LLC/NXP USA, Inc., Gtd. Notes | | 4.40 | | 6/1/2027 | | 2,000,000 | | 1,926,200 | |
Renesas Electronics Corp., Sr. Unscd. Notes | | 2.17 | | 11/25/2026 | | 4,000,000 | a | 3,553,993 | |
| | 16,837,638 | |
Technology Hardware & Equipment - .8% | | | | | |
Dell International LLC/EMC Corp., Sr. Unscd. Notes | | 8.10 | | 7/15/2036 | | 3,000,000 | | 3,449,527 | |
Telecommunication Services - 2.1% | | | | | |
Motorola Solutions, Inc., Sr. Unscd. Notes | | 4.60 | | 5/23/2029 | | 3,000,000 | | 2,892,672 | |
T-Mobile USA, Inc., Gtd. Notes | | 3.88 | | 4/15/2030 | | 3,500,000 | | 3,195,858 | |
26
| | | | | | | | | | |
| |
BNY Mellon Corporate Bond Fund (continued) |
Description | Coupon
Rate (%) | | Maturity Date | | Principal Amount ($) | | Value ($) | |
Bonds and Notes - 95.7% (continued) | | | | | |
Telecommunication Services - 2.1% (continued) | | | | | |
Verizon Communications, Inc., Sr. Unscd. Notes | | 2.10 | | 3/22/2028 | | 3,000,000 | | 2,623,490 | |
| | 8,712,020 | |
Total Bonds and Notes
(cost $442,733,428) | | 402,960,122 | |
| Preferred
Dividend
Yield (%) | | | | Shares | | | |
Preferred Stocks - 1.3% | | | | | |
Diversified Financials - .7% | | | | | |
Air Lease Corp., Ser. A | | 6.15 | | | | 120,000 | | 2,868,000 | |
Telecommunication Services - ..6% | | | | | |
AT&T, Inc., Ser. A | | 5.00 | | | | 140,000 | | 2,846,200 | |
Total Preferred Stocks
(cost $6,500,000) | | 5,714,200 | |
| 1-Day
Yield (%) | | | | | | | |
Investment Companies - 2.1% | | | | | |
Registered Investment Companies - 2.1% | | | | | |
Dreyfus Institutional Preferred Government Plus Money Market Fund, Institutional Shares
(cost $8,760,654) | | 5.41 | | | | 8,760,654 | e | 8,760,654 | |
| | | | | | | | |
Investment of Cash Collateral for Securities Loaned - 2.5% | | | | | |
Registered Investment Companies - 2.5% | | | | | |
Dreyfus Institutional Preferred Government Plus Money Market Fund, Institutional Shares
(cost $10,423,207) | | 5.41 | | | | 10,423,207 | e | 10,423,207 | |
Total Investments (cost $468,417,289) | | 101.6% | 427,858,183 | |
Liabilities, Less Cash and Receivables | | (1.6%) | (6,902,478) | |
Net Assets | | 100.0% | 420,955,705 | |
GO—General Obligation
LIBOR—London Interbank Offered Rate
TSFR—Term Secured Overnight Financing Rate Reference Rates
a Security exempt from registration pursuant to Rule 144A under the Securities Act of 1933. These securities may be resold in transactions exempt from registration, normally to qualified institutional buyers. At August 31, 2023, these securities were valued at $84,851,546 or 20.16% of net assets.
b Variable rate security—interest rate resets periodically and rate shown is the interest rate in effect at period end. Security description also includes the reference rate and spread if published and available.
c Security is a perpetual bond with no specified maturity date. Maturity date shown is next reset date of the bond.
d Security, or portion thereof, on loan. At August 31, 2023, the value of the fund’s securities on loan was $16,574,454 and the value of the collateral was $17,135,478, consisting of cash collateral of $10,423,207 and U.S. Government & Agency securities valued at $6,712,271. In addition, the value of collateral may include pending sales that are also on loan.
e Investment in affiliated issuer. The investment objective of this investment company is publicly available and can be found within the investment company’s prospectus.
| | |
Portfolio Summary (Unaudited) † | Value (%) |
Financial | 38.9 |
Consumer, Cyclical | 12.9 |
Energy | 11.2 |
Consumer, Non-cyclical | 9.6 |
Industrial | 7.6 |
Technology | 6.4 |
Investment Companies | 4.6 |
Communications | 3.7 |
Government | 3.5 |
Basic Materials | 3.2 |
| | 101.6 |
† Based on net assets.
See notes to financial statements.
27
STATEMENT OF INVESTMENTS (continued)
| | | | | | | |
BNY Mellon Corporate Bond Fund | | |
Affiliated Issuers | | |
Description | Value ($)
8/31/2022 | Purchases ($)† | Sales ($) | Value ($)
8/31/2023 | Dividends/
Distributions ($) | |
Registered Investment Companies - 2.1% | | |
Dreyfus Institutional Preferred Government Plus Money Market Fund, Institutional Shares - 2.1% | 8,814,007 | 105,826,941 | (105,880,294) | 8,760,654 | 258,285 | |
Investment of Cash Collateral for Securities Loaned - 2.5%†† | | |
Dreyfus Institutional Preferred Government Plus Money Market Fund, Institutional Shares - 2.5% | - | 19,603,417 | (9,180,210) | 10,423,207 | 27,162 | ††† |
Dreyfus Institutional Preferred Government Plus Money Market Fund, SL Shares - .0% | 10,057,024 | 78,318,220 | (88,375,244) | - | 88,092 | ††† |
Total - 4.6% | 18,871,031 | 203,748,578 | (203,435,748) | 19,183,861 | 373,539 | |
† Includes reinvested dividends/distributions.
†† Effective July 3, 2023, cash collateral for securities lending was transferred from Dreyfus Institutional Preferred Government Plus Money Market Fund, SL Shares to Dreyfus Institutional Preferred Government Plus Money Market Fund, Institutional Shares.
††† Represents securities lending income earned from the reinvestment of cash collateral from loaned securities, net of fees and collateral investment expenses, and other payments to and from borrowers of securities.
See notes to financial statements.
28
| | | | | | | | | | |
| |
BNY Mellon Short-Term U.S. Government Securities Fund |
Description | Coupon
Rate (%) | | Maturity Date | | Principal Amount ($) | | Value ($) | |
Bonds and Notes - 98.8% | | | | | |
Municipal Securities - 6.3% | | | | | |
California Earthquake Authority, Revenue Bonds, Ser. A | | 5.49 | | 7/1/2024 | | 2,000,000 | | 1,990,909 | |
Chicago II, GO, Refunding, Ser. B | | 7.75 | | 1/1/2025 | | 2,008,000 | a | 2,055,795 | |
Connecticut, GO, Ser. A | | 0.92 | | 6/1/2025 | | 250,000 | | 232,772 | |
Kentucky Property & Building Commission, Revenue Bonds, Refunding, Ser. D | | 2.08 | | 11/1/2023 | | 500,000 | | 496,980 | |
New York State Dormitory Authority, Revenue Bonds, Refunding (State of New York Personal Income Tax) Ser. C | | 0.49 | | 3/15/2024 | | 1,750,000 | | 1,705,296 | |
Tennessee School Bond Authority, Revenue Bonds, Refunding, Ser.A | | 0.22 | | 11/1/2023 | | 1,500,000 | | 1,487,180 | |
| | 7,968,932 | |
U.S. Government Agencies Collateralized Mortgage Obligations - 16.3% | | | | | |
Federal Home Loan Mortgage Corp., REMIC, Ser. 3563, Cl. BD | | 4.00 | | 8/15/2024 | | 34,804 | b | 34,505 | |
Federal Home Loan Mortgage Corp., REMIC, Ser. 3627, Cl. QH | | 4.00 | | 1/15/2025 | | 161,176 | b | 158,811 | |
Federal Home Loan Mortgage Corp., REMIC, Ser. 3640, Cl. GM | | 4.00 | | 3/15/2025 | | 104,669 | b | 103,197 | |
Federal Home Loan Mortgage Corp., REMIC, Ser. 3780, Cl. AV | | 4.00 | | 4/15/2031 | | 300,926 | b | 292,654 | |
Federal Home Loan Mortgage Corp., REMIC, Ser. 3810, Cl. QB | | 3.50 | | 2/15/2026 | | 211,055 | b | 206,036 | |
Federal Home Loan Mortgage Corp., REMIC, Ser. 3816, Cl. HA | | 3.50 | | 11/15/2025 | | 496,219 | b | 483,985 | |
Federal Home Loan Mortgage Corp., REMIC, Ser. 3820, Cl. TB | | 3.50 | | 3/15/2026 | | 310,903 | b | 303,204 | |
Federal Home Loan Mortgage Corp., REMIC, Ser. 3830, Cl. NB | | 4.50 | | 2/15/2039 | | 58,747 | b | 58,553 | |
Federal Home Loan Mortgage Corp., REMIC, Ser. 3909, Cl. NG | | 4.00 | | 8/15/2026 | | 435,841 | b | 425,377 | |
Federal Home Loan Mortgage Corp., REMIC, Ser. 3964, Cl. QA | | 3.00 | | 11/15/2026 | | 217,222 | b | 210,348 | |
Federal Home Loan Mortgage Corp., REMIC, Ser. 3987, Cl. A | | 2.00 | | 9/15/2026 | | 15,647 | b | 15,438 | |
Federal Home Loan Mortgage Corp., REMIC, Ser. 3998, Cl. KG | | 2.00 | | 11/15/2026 | | 366,583 | b | 360,948 | |
Federal Home Loan Mortgage Corp., REMIC, Ser. 4020, Cl. PC | | 1.75 | | 3/15/2027 | | 87,527 | b | 83,422 | |
Federal Home Loan Mortgage Corp., REMIC, Ser. 4029, Cl. LA | | 2.00 | | 1/15/2027 | | 385,672 | b | 375,494 | |
Federal Home Loan Mortgage Corp., REMIC, Ser. 4216, Cl. KC | | 1.75 | | 6/15/2028 | | 458,763 | b | 435,736 | |
Federal Home Loan Mortgage Corp., REMIC, Ser. 4287, Cl. AB | | 2.00 | | 12/15/2026 | | 122,899 | b | 115,251 | |
Federal Home Loan Mortgage Corp., REMIC, Ser. 4304, Cl. DA | | 2.50 | | 1/15/2027 | | 37,139 | b | 36,782 | |
Federal Home Loan Mortgage Corp., REMIC, Ser. 4313, Cl. ME | | 3.00 | | 4/15/2039 | | 614,369 | b | 581,065 | |
Federal Home Loan Mortgage Corp., REMIC, Ser. 4340, Cl. VD | | 3.00 | | 7/15/2037 | | 455,155 | b | 445,347 | |
Federal Home Loan Mortgage Corp., REMIC, Ser. 4386, Cl. AB | | 3.00 | | 9/15/2029 | | 178,693 | b | 173,684 | |
Federal Home Loan Mortgage Corp., REMIC, Ser. 4425, Cl. VM | | 4.00 | | 1/15/2035 | | 1,228,724 | b | 1,220,520 | |
Federal Home Loan Mortgage Corp., REMIC, Ser. 4465, Cl. BA | | 2.50 | | 12/15/2039 | | 182,232 | b | 179,039 | |
Federal Home Loan Mortgage Corp., REMIC, Ser. 4569, Cl. DV | | 3.00 | | 8/15/2027 | | 790,687 | b | 751,198 | |
Federal Home Loan Mortgage Corp., REMIC, Ser. 5058, Cl. CD | | 1.00 | | 6/15/2027 | | 492,401 | b | 468,477 | |
Federal National Mortgage Association, REMIC, Ser. 2005-63, Cl. HB | | 5.00 | | 7/25/2025 | | 8,781 | b | 8,704 | |
Federal National Mortgage Association, REMIC, Ser. 2010-112, Cl. CY | | 4.00 | | 10/25/2025 | | 225,329 | b | 222,221 | |
Federal National Mortgage Association, REMIC, Ser. 2011-88, Cl. M | | 3.50 | | 9/25/2026 | | 173,949 | b | 169,737 | |
Federal National Mortgage Association, REMIC, Ser. 2012-127, Cl. DH | | 4.00 | | 11/25/2027 | | 200 | b | 199 | |
Federal National Mortgage Association, REMIC, Ser. 2012-148, Cl. DC | | 1.50 | | 1/25/2028 | | 648,500 | b | 610,068 | |
Federal National Mortgage Association, REMIC, Ser. 2012-152, CI. PC | | 1.75 | | 8/25/2042 | | 984,929 | b | 951,744 | |
Federal National Mortgage Association, REMIC, Ser. 2012-78, Cl. KB | | 1.75 | | 7/25/2027 | | 162,284 | b | 153,601 | |
Federal National Mortgage Association, REMIC, Ser. 2012-98, Cl. YM | | 1.50 | | 9/25/2027 | | 535,502 | b | 504,136 | |
Federal National Mortgage Association, REMIC, Ser. 2013-137, Cl. V | | 3.50 | | 10/25/2028 | | 89,191 | b | 85,195 | |
Federal National Mortgage Association, REMIC, Ser. 2013-30, Cl. DA | | 1.75 | | 4/25/2028 | | 188,144 | b | 176,865 | |
29
STATEMENT OF INVESTMENTS (continued)
| | | | | | | | | | |
| |
BNY Mellon Short-Term U.S. Government Securities Fund (continued) |
Description | Coupon
Rate (%) | | Maturity Date | | Principal Amount ($) | | Value ($) | |
Bonds and Notes - 98.8% (continued) | | | | | |
U.S. Government Agencies Collateralized Mortgage Obligations - 16.3% (continued) | | | | | |
Federal National Mortgage Association, REMIC, Ser. 2013-39, Cl. MP | | 1.75 | | 5/25/2028 | | 605,480 | b | 569,928 | |
Federal National Mortgage Association, REMIC, Ser. 2014-34, Cl. LC | | 2.50 | | 6/25/2029 | | 220,477 | b | 211,004 | |
Federal National Mortgage Association, REMIC, Ser. 2015-33, Cl. P | | 2.50 | | 6/25/2045 | | 804,450 | b | 750,370 | |
Federal National Mortgage Association, REMIC, Ser. 2017-9, Cl. HA | | 3.00 | | 12/25/2042 | | 341,342 | b | 333,789 | |
Federal National Mortgage Association, REMIC, Ser. 2017-99, Cl. VM | | 3.50 | | 3/25/2029 | | 1,419,225 | b | 1,351,439 | |
Federal National Mortgage Association, REMIC, Ser. 2020-28, Cl. V | | 3.50 | | 2/25/2048 | | 689,221 | b | 670,792 | |
Government National Mortgage Association, Ser. 2010-6, Cl. AB | | 3.00 | | 11/20/2039 | | 315,690 | | 304,792 | |
Government National Mortgage Association, Ser. 2012-101, Cl. MA | | 2.50 | | 5/20/2040 | | 350,385 | | 333,307 | |
Government National Mortgage Association, Ser. 2012-51, Cl. VQ | | 3.50 | | 4/20/2025 | | 313,392 | | 305,781 | |
Government National Mortgage Association, Ser. 2016-23, CI. KA | | 4.17 | | 1/20/2031 | | 94,431 | | 92,494 | |
Government National Mortgage Association, Ser. 2022-152, Cl. BC | | 3.00 | | 10/20/2035 | | 1,724,490 | | 1,655,985 | |
Government National Mortgage Association, Ser. 2022-87, Cl. A | | 3.50 | | 1/20/2040 | | 1,529,028 | | 1,470,049 | |
Government National Mortgage Association, Ser. 2022-90, CI. KB | | 3.00 | | 9/20/2044 | | 1,395,862 | | 1,316,986 | |
Government National Mortgage Association, Ser. 2022-94, Cl. A | | 3.50 | | 8/20/2031 | | 893,916 | | 881,303 | |
| | 20,649,560 | |
U.S. Government Agencies Collateralized Municipal-Backed Securities - 28.7% | | | | | |
Federal Home Loan Mortgage Corp. Multifamily Structured Pass Through Certificates, Ser. K044, Cl. A2 | | 2.81 | | 1/25/2025 | | 1,429,540 | b | 1,379,207 | |
Federal Home Loan Mortgage Corp. Multifamily Structured Pass Through Certificates, Ser. K045, Cl. A2 | | 3.02 | | 1/25/2025 | | 1,349,619 | b | 1,304,966 | |
Federal Home Loan Mortgage Corp. Multifamily Structured Pass Through Certificates, Ser. K724, Cl. A2 | | 3.06 | | 11/25/2023 | | 1,519,530 | b | 1,510,224 | |
Federal Home Loan Mortgage Corp. Multifamily Structured Pass Through Certificates, Ser. K725, Cl. A2 | | 3.00 | | 1/25/2024 | | 704,239 | b | 696,622 | |
Federal Home Loan Mortgage Corp. Multifamily Structured Pass Through Certificates, Ser. KC03, Cl. A2 | | 3.50 | | 1/25/2026 | | 1,480,742 | b | 1,426,599 | |
Federal Home Loan Mortgage Corp. Multifamily Structured Pass Through Certificates, Ser. KL1P, Cl. A1P | | 2.54 | | 10/25/2025 | | 1,292,925 | b | 1,246,206 | |
Federal Home Loan Mortgage Corp. Multifamily Structured Pass Through Certificates, Ser. KLU1, Cl. A1 | | 2.38 | | 1/25/2025 | | 469,150 | b | 451,758 | |
Federal Home Loan Mortgage Corp. Multifamily Structured Pass Through Certificates, Ser. KW02, Cl. A1 | | 2.90 | | 4/25/2026 | | 1,781,866 | b | 1,746,496 | |
Federal Home Loan Mortgage Corp. Multifamily Structured Pass Through Certificates, Ser. X2FX, Cl. A2 | | 2.41 | | 9/25/2025 | | 697,699 | b | 662,637 | |
Federal Home Loan Mortgage Corp. Multifamily Structured Pass Through Certificates, Ser. X3FX, Cl. A1FX | | 3.00 | | 3/25/2025 | | 1,505,063 | b | 1,466,470 | |
Federal Home Loan Mortgage Corp. Small Business Mortgage Trust, Ser. 2016-SB22, Cl. A7F | | 1.98 | | 9/25/2023 | | 93,696 | b | 93,292 | |
Federal Home Loan Mortgage Corp. Small Business Mortgage Trust, Ser. 2016-SB25, Cl. A7F | | 2.58 | | 10/25/2023 | | 47,699 | b | 47,500 | |
Federal Home Loan Mortgage Corp. Small Business Mortgage Trust, Ser. 2017-SB41, Cl. A10F | | 2.94 | | 9/25/2027 | | 1,598,014 | b | 1,473,365 | |
Federal Home Loan Mortgage Corp. Small Business Mortgage Trust, Ser. 2018-SB51, CI. A5H, (1 Month SOFR +0.81%) | | 5.92 | | 4/25/2038 | | 574,829 | b,c | 570,554 | |
Federal Home Loan Mortgage Corp. Small Business Mortgage Trust, Ser. 2019-SB61, Cl. A5F | | 2.86 | | 1/25/2024 | | 1,257,355 | b | 1,246,022 | |
Federal Home Loan Mortgage Corp. Small Business Mortgage Trust, Ser. 2019-SB67, CI. A5H | | 2.24 | | 8/25/2039 | | 681,171 | b | 656,847 | |
30
| | | | | | | | | | |
| |
BNY Mellon Short-Term U.S. Government Securities Fund (continued) |
Description | Coupon
Rate (%) | | Maturity Date | | Principal Amount ($) | | Value ($) | |
Bonds and Notes - 98.8% (continued) | | | | | |
U.S. Government Agencies Collateralized Municipal-Backed Securities - 28.7% (continued) | | | | | |
Federal Home Loan Mortgage Corp. Small Business Mortgage Trust, Ser. 2019-SB68, CI. A5H | | 2.39 | | 8/25/2039 | | 359,709 | b | 350,388 | |
Federal National Mortgage Association, ACES, Ser. 2014-M13, Cl. A2 | | 3.02 | | 8/25/2024 | | 222,101 | b | 216,575 | |
Federal National Mortgage Association, ACES, Ser. 2014-M3, Cl. A2 | | 3.50 | | 1/25/2024 | | 428,794 | b | 424,119 | |
Federal National Mortgage Association, ACES, Ser. 2017-M10, CI. AV2 | | 2.62 | | 7/25/2024 | | 1,800,391 | b | 1,758,740 | |
Government National Mortgage Association, Ser. 2011-103, Cl. B | | 3.70 | | 7/16/2051 | | 770,979 | | 721,994 | |
Government National Mortgage Association, Ser. 2012-142, CI. BC | | 2.46 | | 3/16/2049 | | 1,200,057 | | 1,097,112 | |
Government National Mortgage Association, Ser. 2012-150, CI. A | | 1.90 | | 11/16/2052 | | 609,803 | | 517,640 | |
Government National Mortgage Association, Ser. 2013-105, Cl. A | | 1.71 | | 2/16/2037 | | 338,636 | | 331,124 | |
Government National Mortgage Association, Ser. 2013-142, Cl. V | | 3.10 | | 2/16/2025 | | 487,542 | | 472,501 | |
Government National Mortgage Association, Ser. 2013-158, Cl. AB | | 3.01 | | 8/16/2053 | | 1,290,685 | | 1,196,823 | |
Government National Mortgage Association, Ser. 2013-29, CI. AB | | 1.77 | | 10/16/2045 | | 155,943 | | 141,583 | |
Government National Mortgage Association, Ser. 2013-29, CI. AD | | 1.51 | | 8/16/2041 | | 291,109 | | 283,207 | |
Government National Mortgage Association, Ser. 2014-82, Cl. VG | | 2.87 | | 12/16/2046 | | 892,357 | | 854,042 | |
Government National Mortgage Association, Ser. 2015-188, CI. VD | | 2.50 | | 3/16/2032 | | 436,933 | | 405,195 | |
Government National Mortgage Association, Ser. 2017-70, CI. A | | 2.50 | | 10/16/2057 | | 81,320 | | 80,327 | |
Government National Mortgage Association, Ser. 2017-94, CI. AK | | 2.40 | | 5/16/2051 | | 1,199,377 | | 1,095,182 | |
Government National Mortgage Association, Ser. 2018-123, Cl. D | | 3.10 | | 1/16/2059 | | 1,254,478 | | 1,187,695 | |
Government National Mortgage Association, Ser. 2018-149, CI. A | | 3.00 | | 7/16/2048 | | 261,294 | | 247,111 | |
Government National Mortgage Association, Ser. 2019-34, Cl. AL | | 3.15 | | 5/16/2059 | | 1,250,346 | | 1,200,020 | |
Government National Mortgage Association, Ser. 2019-55, Cl. AE | | 3.00 | | 12/16/2059 | | 1,035,392 | | 952,463 | |
Government National Mortgage Association, Ser. 2022-147, CI. A | | 2.20 | | 10/16/2062 | | 1,965,741 | | 1,795,178 | |
Government National Mortgage Association, Ser. 2022-3, CI. AM | | 1.60 | | 9/16/2051 | | 963,739 | | 807,083 | |
Government National Mortgage Association, Ser. 2022-53, Cl. AE | | 1.50 | | 4/16/2046 | | 2,809,911 | | 2,488,783 | |
Government National Mortgage Association, Ser. 2022-82, Cl. AC | | 2.00 | | 5/16/2048 | | 1,919,482 | | 1,718,199 | |
| | 36,321,849 | |
U.S. Government Agencies Mortgage-Backed - 23.6% | | | | | |
Federal Home Loan Mortgage Corp.: | | | |
2.50%, 3/1/2027-12/1/2027 | | | 1,948,357 | b | 1,865,417 | |
3.50%, 10/1/2026-5/1/2027 | | | 279,252 | b | 267,058 | |
4.50%, 11/1/2024-2/1/2034 | | | 316,773 | b | 312,090 | |
Federal National Mortgage Association: | | | |
1.91%, 9/1/2051, (1 Month SOFR +2.35%) | | | 2,493,401 | b,c | 2,298,081 | |
2.25%, 1/1/2024 | | | 240,483 | b | 238,134 | |
2.39%, 6/1/2025 | | | 522,066 | b | 505,381 | |
2.45%, 4/1/2025 | | | 2,682,828 | b | 2,559,356 | |
2.50%, 11/1/2026-3/1/2028 | | | 2,374,890 | b | 2,241,589 | |
31
STATEMENT OF INVESTMENTS (continued)
| | | | | | | | | | |
| |
BNY Mellon Short-Term U.S. Government Securities Fund (continued) |
Description | Coupon
Rate (%) | | Maturity Date | | Principal Amount ($) | | Value ($) | |
Bonds and Notes - 98.8% (continued) | | | | | |
U.S. Government Agencies Mortgage-Backed - 23.6% (continued) | | | | | |
2.72%, 3/1/2024 | | | 2,000,000 | b | 1,960,649 | |
2.75%, 1/1/2050, (1 Month LIBOR +1.59%) | | | 1,204,280 | b,c | 1,188,617 | |
2.88%, 6/1/2024 | | | 899,022 | b | 874,410 | |
2.89%, 4/1/2024-1/1/2025 | | | 3,000,000 | b | 2,921,692 | |
2.94%, 9/1/2047, (1 Month LIBOR +1.62%) | | | 1,666,496 | b,c | 1,643,851 | |
2.95%, 11/1/2025 | | | 1,000,000 | b | 954,517 | |
2.96%, 11/1/2049, (1 Month LIBOR +1.61%) | | | 1,744,513 | b,c | 1,720,424 | |
3.00%, 1/1/2028 | | | 290,918 | b | 279,701 | |
3.11%, 12/1/2024 | | | 1,869,478 | b | 1,810,032 | |
3.17%, 11/1/2049, (1 Month LIBOR +1.62%) | | | 1,454,374 | b,c | 1,411,654 | |
3.45%, 7/1/2025 | | | 1,642,571 | b | 1,583,914 | |
3.50%, 2/1/2031 | | | 1,505,576 | b | 1,442,629 | |
4.00%, 7/1/2029-3/1/2034 | | | 696,614 | b | 683,241 | |
5.00%, 3/1/2027 | | | 23,553 | b | 23,300 | |
5.10%, 10/1/2024 | | | 667,733 | b | 660,051 | |
Government National Mortgage Association I: | | | |
4.00%, 8/15/2024-7/15/2027 | | | 167,511 | | 165,037 | |
Government National Mortgage Association II: | | | |
3.50%, 3/20/2026 | | | 86,915 | | 85,117 | |
4.50%, 7/20/2024-5/20/2025 | | | 196,195 | | 190,816 | |
| | 29,886,758 | |
U.S. Government Agencies Obligations - 1.2% | | | | | |
Federal Home Loan Bank, Bonds | | 3.13 | | 4/28/2025 | | 1,500,000 | | 1,448,823 | |
U.S. Treasury Securities - 22.7% | | | | | |
U.S. Treasury Notes | | 1.50 | | 8/15/2026 | | 6,000,000 | | 5,500,547 | |
U.S. Treasury Notes | | 2.75 | | 5/15/2025 | | 4,000,000 | | 3,854,844 | |
U.S. Treasury Notes | | 3.13 | | 8/15/2025 | | 4,000,000 | | 3,870,469 | |
U.S. Treasury Notes | | 3.63 | | 5/15/2026 | | 1,250,000 | | 1,219,238 | |
U.S. Treasury Notes | | 3.75 | | 4/15/2026 | | 3,000,000 | | 2,935,547 | |
U.S. Treasury Notes | | 3.88 | | 1/15/2026 | | 4,000,000 | | 3,924,844 | |
U.S. Treasury Notes | | 4.00 | | 2/15/2026 | | 4,250,000 | | 4,183,428 | |
U.S. Treasury Notes | | 4.50 | | 7/15/2026 | | 3,250,000 | | 3,244,414 | |
| | 28,733,331 | |
Total Bonds and Notes
(cost $130,400,406) | | 125,009,253 | |
| 1-Day
Yield (%) | | | | Shares | | | |
Investment Companies - 1.2% | | | | | |
Registered Investment Companies - 1.2% | | | | | |
Dreyfus Institutional Preferred Government Plus Money Market Fund, Institutional Shares
(cost $1,457,842) | | 5.41 | | | | 1,457,842 | d | 1,457,842 | |
Total Investments (cost $131,858,248) | | 100.0% | 126,467,095 | |
Cash and Receivables (Net) | | 0.0% | 32,998 | |
Net Assets | | 100.0% | 126,500,093 | |
GO—General Obligation
LIBOR—London Interbank Offered Rate
REMIC—Real Estate Mortgage Investment Conduit
SOFR—Secured Overnight Financing Rate
a These securities are prerefunded; the date shown represents the prerefunded date. Bonds which are prerefunded are collateralized by U.S. Government securities which are held in escrow and are used to pay principal and interest on the municipal issue and to retire the bonds in full at the earliest refunding date.
b The Federal Housing Finance Agency (“FHFA”) placed the Federal Home Loan Mortgage Corporation and Federal National Mortgage Association into conservatorship with FHFA as the conservator. As such, the FHFA oversees the continuing affairs of these companies.
c Variable rate security—interest rate resets periodically and rate shown is the interest rate in effect at period end. Security description also includes the reference rate and spread if published and available.
d Investment in affiliated issuer. The investment objective of this investment company is publicly available and can be found within the investment company’s prospectus.
32
| | |
Portfolio Summary (Unaudited) † | Value (%) |
Mortgage Securities | 68.6 |
Government | 30.2 |
Investment Companies | 1.2 |
| | 100.0 |
† Based on net assets.
See notes to financial statements.
| | | | | | | |
BNY Mellon Short-Term U.S. Government Securities Fund | | |
Affiliated Issuers | | |
Description | Value ($)
8/31/2022 | Purchases ($)† | Sales ($) | Value ($)
8/31/2023 | Dividends/
Distributions ($) | |
Registered Investment Companies - 1.2% | | |
Dreyfus Institutional Preferred Government Plus Money Market Fund, Institutional Shares - 1.2% | 3,369,717 | 74,057,555 | (75,969,430) | 1,457,842 | 71,118 | |
Investment of Cash Collateral for Securities Loaned - .0% | | |
Dreyfus Institutional Preferred Government Plus Money Market Fund, SL Shares - .0% | 2,975,863 | 29,369,518 | (32,345,381) | - | 10,869 | †† |
Total - 1.2% | 6,345,580 | 103,427,073 | (108,314,811) | 1,457,842 | 81,987 | |
† Includes reinvested dividends/distributions.
†† Represents securities lending income earned from the reinvestment of cash collateral from loaned securities, net of fees and collateral investment expenses, and other payments to and from borrowers of securities.
See notes to financial statements.
33
STATEMENTS OF ASSETS AND LIABILITIES
August 31, 2023
| | | | | | | | | | | | | |
| | | | | | | | | | | | |
| | | | BNY Mellon Bond Fund | | BNY Mellon Intermediate Bond Fund | | BNY Mellon Corporate Bond Fund | | BNY Mellon Short-Term U.S. Government Securities Fund | | |
Assets ($): | | | | | | | | | | | | |
Investments in securities—See Statements
of Investments† (including securities
on loan)††—Note 1(b) | | | | | | | | | | | | |
Unaffiliated issuers | | | | 1,179,857,777 | | 508,884,729 | | 408,674,322 | | 125,009,253 | | |
Affiliated issuers | | | | 38,156,005 | | 6,409,271 | | 19,183,861 | | 1,457,842 | | |
Dividends, interest and securities lending
income receivable | | | | 7,822,841 | | 3,704,791 | | 5,002,328 | | 438,316 | | |
Receivable for shares of Beneficial
Interest subscribed | | | | 2,593,690 | | 885,814 | | 1,519,800 | | 25,000 | | |
Receivable for investment securities sold | | | | - | | 1,231,624 | | - | | - | | |
Prepaid expenses | | | | 34,439 | | 30,825 | | 20,793 | | 26,306 | | |
| | | | 1,228,464,752 | | 521,147,054 | | 434,401,104 | | 126,956,717 | | |
Liabilities ($): | | | | | | | | | | | | |
Due to BNY Mellon Investment Adviser, Inc.
and affiliates—Note 3(b) | | | | 547,295 | | 244,825 | | 200,441 | | 50,191 | | |
Cash overdraft due to Custodian | | | | 2,673,450 | | 949,224 | | 983,015 | | 201,088 | | |
Liability for securities on loan—Note 1(b) | | | | 33,666,019 | | 4,751,395 | | 10,423,207 | | - | | |
Payable for shares of Beneficial
Interest redeemed | | | | 1,431,130 | | 1,152,408 | | 1,795,189 | | 162,549 | | |
Trustees’ fees and expenses payable | | | | 36,153 | | 14,558 | | 12,909 | | 4,445 | | |
Other accrued expenses | | | | 43,816 | | 33,425 | | 30,638 | | 38,351 | | |
| | | | 38,397,863 | | 7,145,835 | | 13,445,399 | | 456,624 | | |
Net Assets ($) | | | | 1,190,066,889 | | 514,001,219 | | 420,955,705 | | 126,500,093 | | |
Composition of Net Assets ($): | | | | | | | | | | | | |
Paid-in capital | | | | 1,393,821,089 | | 558,522,838 | | 479,782,024 | | 151,575,561 | | |
Total distributable earnings (loss) | | | | (203,754,200) | | (44,521,619) | | (58,826,319) | | (25,075,468) | | |
Net Assets ($) | | | | 1,190,066,889 | | 514,001,219 | | 420,955,705 | | 126,500,093 | | |
† Investments at cost ($) | | | | | | | | | | | | |
Unaffiliated issuers | | | | 1,285,747,367 | | 537,517,174 | | 449,233,428 | | 130,400,406 | | |
Affiliated issuers | | | | 38,156,005 | | 6,409,271 | | 19,183,861 | | 1,457,842 | | |
†† Value of securities on loan ($) | | | | 87,745,727 | | 30,236,329 | | 16,574,454 | | - | | |
Net Asset Value Per Share | | | | | | | | | | | | |
Class M | | | | | | | | | | | | |
Net Assets ($) | | | | 1,181,266,963 | | 506,244,879 | | 416,864,477 | | 124,885,301 | | |
Shares Outstanding | | | | 109,663,521 | | 43,592,149 | | 35,805,199 | | 11,550,543 | | |
Net Asset Value Per Share ($) | | | | 10.77 | | 11.61 | | 11.64 | | 10.81 | | |
Investor Shares | | | | | | | | | | | | |
Net Assets ($) | | | | 8,799,926 | | 7,756,340 | | 4,091,228 | | 1,614,792 | | |
Shares Outstanding | | | | 817,651 | | 666,038 | | 350,770 | | 149,093 | | |
Net Asset Value Per Share ($) | | | | 10.76 | | 11.65 | | 11.66 | | 10.83 | | |
| | | | | | | | | | | | |
See notes to financial statements. | | | | | | | | | | | | |
34
STATEMENTS OF OPERATIONS
Year Ended August 31, 2023
| | | | | | | | | | | | | |
| | | | | | | | | | | | |
| | | | | BNY Mellon Bond Fund | | BNY Mellon Intermediate Bond Fund | | BNY Mellon Corporate Bond Fund | | BNY Mellon Short-Term U.S. Government Securities Fund | |
Investment Income ($): | | | | | | | | | | |
Income: | | | | | | | | | | |
Interest | | | 39,401,614 | | 16,698,793 | | 19,464,304 | | 4,093,761 | |
Dividends: | | | | | | | | | | |
Unaffiliated issuers | | | 325,000 | | 239,062 | | 454,823 | | - | |
Affiliated issuers | | | 332,350 | | 109,504 | | 258,285 | | 71,118 | |
Income from securities lending—Note 1(b) | | | 113,820 | | 83,940 | | 115,254 | | 10,869 | |
Total Income | | | 40,172,784 | | 17,131,299 | | 20,292,666 | | 4,175,748 | |
Expenses: | | | | | | | | | | |
Management fee—Note 3(a) | | | 4,620,890 | | 2,271,296 | | 1,869,636 | | 584,091 | |
Administration fee—Note 3(a) | | | 1,563,011 | | 767,836 | | 631,728 | | 225,597 | |
Trustees’ fees and expenses—Note 3(c) | | | 140,194 | | 68,226 | | 55,196 | | 18,878 | |
Professional fees | | | 81,367 | | 58,871 | | 49,089 | | 39,123 | |
Registration fees | | | 48,791 | | 34,628 | | 35,722 | | 32,838 | |
Loan commitment fees—Note 2 | | | 29,784 | | 10,877 | | 9,053 | | 3,687 | |
Shareholder servicing costs—Note 3(b) | | | 21,898 | | 18,625 | | 11,896 | | 4,433 | |
Custodian fees—Note 3(b) | | | 21,093 | | 10,138 | | 9,461 | | 13,016 | |
Chief Compliance Officer fees—Note 3(b) | | | 19,196 | | 19,196 | | 19,196 | | 19,196 | |
Prospectus and shareholders’ reports | | | 13,618 | | 13,336 | | 14,611 | | 11,181 | |
Miscellaneous | | | 33,447 | | 26,243 | | 35,211 | | 30,807 | |
Total Expenses | | | 6,593,289 | | 3,299,272 | | 2,740,799 | | 982,847 | |
Less—reduction in expenses due to undertakings—Note 3(a) | | | - | | - | | - | | (141,213) | |
Less—reduction in fees due to earnings credits—Note 3(b) | | | (2,239) | | (1,693) | | (759) | | (531) | |
Net Expenses | | | 6,591,050 | | 3,297,579 | | 2,740,040 | | 841,103 | |
Net Investment Income | | | 33,581,734 | | 13,833,720 | | 17,552,626 | | 3,334,645 | |
Realized and Unrealized Gain (Loss)
on Investments—Note 4 ($): | | | | | | | | |
Net realized gain (loss) on investments | (47,956,363) | | (9,432,627) | | (14,407,534) | | (2,055,376) | |
Net change in unrealized appreciation (depreciation)
on investments | | | 368,189 | | 1,803,607 | | 8,694,512 | | 788,161 | |
Net Realized and Unrealized Gain (Loss) on Investments | | | (47,588,174) | | (7,629,020) | | (5,713,022) | | (1,267,215) | |
Net Increase (Decrease) in Net Assets Resulting from Operations | | (14,006,440) | | 6,204,700 | | 11,839,604 | | 2,067,430 | |
| | | | | | | | | | | | |
See notes to financial statements. | | | | | | | | | | | |
35
STATEMENTS OF CHANGES IN NET ASSETS
| | | | | | | | | | | | | | | | |
| | | | BNY Mellon Bond Fund | | BNY Mellon Intermediate Bond Fund | |
| | | | Year Ended August 31, | Year Ended August 31, |
| | | | 2023 | | | | 2022 | | 2023 | | | | 2022 | |
Operations ($): | | | | | | | | | | | | | | |
Net investment income | | | 33,581,734 | | | | 26,308,931 | | 13,833,720 | | | | 13,631,805 | |
Net realized gain (loss) on investments | | (47,956,363) | | | | (33,559,114) | | (9,432,627) | | | | (1,834,562) | |
Net change in unrealized appreciation
(depreciation) on investments | | 368,189 | | | | (158,390,689) | | 1,803,607 | | | | (60,548,888) | |
Net Increase (Decrease) in Net Assets
Resulting from Operations | (14,006,440) | | | | (165,640,872) | | 6,204,700 | | | | (48,751,645) | |
Distributions ($): | | | | | | | | | | | | | | |
Distributions to shareholders: | | | | | | | | | | | | | | |
Class M | | | (34,897,052) | | | | (31,131,402) | | (14,538,574) | | | | (14,937,727) | |
Investor Shares | | | (232,299) | | | | (258,946) | | (170,450) | | | | (183,563) | |
Total Distributions | | | (35,129,351) | | | | (31,390,348) | | (14,709,024) | | | | (15,121,290) | |
Beneficial Interest Transactions ($): | | | | | | | | | | | | | | |
Net proceeds from shares sold: | | | | | | | | | | | | | | |
Class M | | | 291,478,797 | | | | 333,337,287 | | 84,021,568 | | | | 108,679,466 | |
Investor Shares | | | 11,898,300 | | | | 26,277,220 | | 9,219,708 | | | | 11,904,817 | |
Distributions reinvested: | | | | | | | | | | | | | | |
Class M | | | 4,663,377 | | | | 4,723,355 | | 2,835,812 | | | | 2,746,258 | |
Investor Shares | | | 212,724 | | | | 213,651 | | 158,217 | | | | 159,629 | |
Cost of shares redeemed: | | | | | | | | | | | | | | |
Class M | | | (238,452,930) | | | | (309,635,386) | | (191,680,079) | | | | (208,148,635) | |
Investor Shares | | | (13,711,107) | | | | (25,060,677) | | (9,364,779) | | | | (12,401,272) | |
Increase (Decrease) in Net Assets
from Beneficial Interest Transactions | 56,089,161 | | | | 29,855,450 | | (104,809,553) | | | | (97,059,737) | |
Total Increase (Decrease) in Net Assets | 6,953,370 | | | | (167,175,770) | | (113,313,877) | | | | (160,932,672) | |
Net Assets ($): | | | | | | | | | | | | | | |
Beginning of Period | | | 1,183,113,519 | | | | 1,350,289,289 | | 627,315,096 | | | | 788,247,768 | |
End of Period | | | 1,190,066,889 | | | | 1,183,113,519 | | 514,001,219 | | | | 627,315,096 | |
Capital Share Transactions (Shares): | | | | | | | | | | | | | | |
Class Ma | | | | | | | | | | | | | | |
Shares sold | | | 26,675,235 | | | | 27,208,027 | | 7,211,295 | | | | 8,832,056 | |
Shares issued for distributions reinvested | | | 426,937 | | | | 388,791 | | 243,788 | | | | 223,630 | |
Shares redeemed | | | (21,882,809) | | | | (25,328,155) | | (16,475,737) | | | | (16,716,541) | |
Net Increase (Decrease) in
Shares Outstanding | 5,219,363 | | | | 2,268,663 | | (9,020,654) | | | | (7,660,855) | |
Investor Sharesa | | | | | | | | | | | | | | |
Shares sold | | | 1,086,373 | | | | 2,120,229 | | 788,157 | | | | 954,596 | |
Shares issued for distributions reinvested | | | 19,498 | | | | 17,670 | | 13,558 | | | | 12,965 | |
Shares redeemed | | | (1,254,004) | | | | (2,035,089) | | (800,546) | | | | (1,007,444) | |
Net Increase (Decrease) in
Shares Outstanding | (148,133) | | | | 102,810 | | 1,169 | | | | (39,883) | |
| | | | | | | | | | | | | | | |
a | During the period ended August 31, 2023, 1,082,559 Class M Shares representing $11,872,237 were exchanged for 1,084,011 Investor Shares for BNY Mellon Bond Fund and 789,125 Class M Shares representing $9,208,810 were exchanged for 787,230 Investor Shares for BNY Mellon Intermediate Bond Fund. During the period ended August 31, 2022, 2,048,875 Class M Shares representing $25,474,778 were exchanged for 2,053,071 Investor Shares for BNY Mellon Bond Fund and 944,952 Class M Shares representing $11,762,042 were exchanged for 943,238 Investor Shares for BNY Mellon Intermediate Bond Fund. |
See notes to financial statements. | | | | | | | | | | | | | | |
36
| | | | | | | | | | | | | | | | |
| | | | BNY Mellon Corporate Bond Fund | | BNY Mellon Short-Term U.S. Government Securities Fund | |
| | | | Year Ended August 31, | Year Ended August 31, |
| | | | 2023 | | | | 2022 | | 2023 | | | | 2022 | |
Operations ($): | | | | | | | | | | | | | | |
Net investment income | | | 17,552,626 | | | | 21,829,429 | | 3,334,645 | | | | 1,306,023 | |
Net realized gain (loss) on investments | | (14,407,534) | | | | 1,466,603 | | (2,055,376) | | | | (575,281) | |
Net change in unrealized appreciation
(depreciation) on investments | | 8,694,512 | | | | (109,031,132) | | 788,161 | | | | (6,677,551) | |
Net Increase (Decrease) in Net Assets
Resulting from Operations | 11,839,604 | | | | (85,735,100) | | 2,067,430 | | | | (5,946,809) | |
Distributions ($): | | | | | | | | | | | | | | |
Distributions to shareholders: | | | | | | | | | | | | | | |
Class M | | | (17,881,046) | | | | (26,586,001) | | (4,252,621) | | | | (2,978,102) | |
Investor Shares | | | (170,429) | | | | (235,509) | | (36,011) | | | | (57,884) | |
Total Distributions | | | (18,051,475) | | | | (26,821,510) | | (4,288,632) | | | | (3,035,986) | |
Beneficial Interest Transactions ($): | | | | | | | | | | | | | | |
Net proceeds from shares sold: | | | | | | | | | | | | | | |
Class M | | | 83,138,892 | | | | 127,212,542 | | 52,230,516 | | | | 78,219,789 | |
Investor Shares | | | 7,435,178 | | | | 7,793,456 | | 3,205,934 | | | | 3,339,486 | |
Distributions reinvested: | | | | | | | | | | | | | | |
Class M | | | 4,530,497 | | | | 6,552,719 | | 1,335,099 | | | | 604,805 | |
Investor Shares | | | 140,455 | | | | 161,297 | | 31,635 | | | | 54,388 | |
Cost of shares redeemed: | | | | | | | | | | | | | | |
Class M | | | (229,512,790) | | | | (214,957,748) | | (102,015,925) | | | | (68,839,960) | |
Investor Shares | | | (8,785,368) | | | | (7,827,067) | | (3,258,383) | | | | (6,224,947) | |
Increase (Decrease) in Net Assets
from Beneficial Interest Transactions | (143,053,136) | | | | (81,064,801) | | (48,471,124) | | | | 7,153,561 | |
Total Increase (Decrease) in Net Assets | (149,265,007) | | | | (193,621,411) | | (50,692,326) | | | | (1,829,234) | |
Net Assets ($): | | | | | | | | | | | | | | |
Beginning of Period | | | 570,220,712 | | | | 763,842,123 | | 177,192,419 | | | | 179,021,653 | |
End of Period | | | 420,955,705 | | | | 570,220,712 | | 126,500,093 | | | | 177,192,419 | |
Capital Share Transactions (Shares): | | | | | | | | | | | | | | |
Class Ma | | | | | | | | | | | | | | |
Shares sold | | | 7,172,574 | | | | 9,931,460 | | 4,812,237 | | | | 7,047,458 | |
Shares issued for distributions reinvested | | | 391,659 | | | | 510,095 | | 123,335 | | | | 53,785 | |
Shares redeemed | | | (19,881,528) | | | | (17,228,465) | | (9,413,860) | | | | (6,095,882) | |
Net Increase (Decrease) in
Shares Outstanding | (12,317,295) | | | | (6,786,910) | | (4,478,288) | | | | 1,005,361 | |
Investor Sharesa | | | | | | | | | | | | | | |
Shares sold | | | 646,334 | | | | 597,375 | | 295,504 | | | | 295,516 | |
Shares issued for distributions reinvested | | | 12,144 | | | | 12,616 | | 2,917 | | | | 4,811 | |
Shares redeemed | | | (758,321) | | | | (610,242) | | (299,992) | | | | (554,957) | |
Net Increase (Decrease) in
Shares Outstanding | (99,843) | | | | (251) | | (1,571) | | | | (254,630) | |
| | | | | | | | | | | | | | | |
a | During the period ended August 31, 2023, 637,707 Class M Shares representing $7,323,820 were exchanged for 636,952 Investor Shares for BNY Mellon Corporate Bond Fund and 292,365 Class M Shares representing $3,167,818 were exchanged for 291,983 Investor Shares for BNY Mellon Short-Term U.S. Government Securities Fund. During the period ended August 31, 2022, 528,874 Class M Shares representing $6,850,398 were exchanged for 528,459 Investor Shares for BNY Mellon Corporate Bond Fund and 252,548 Class M Shares representing $2,857,242 were exchanged for 252,487 Investor Shares for BNY Mellon Short-Term U.S. Government Securities Fund. |
See notes to financial statements. | | | | | | | | | | | | | | |
37
FINANCIAL HIGHLIGHTS
The following tables describe the performance for each share class of each fund for the fiscal periods indicated. All information (except portfolio turnover) reflects financial results for a single fund share. Net asset value total return is calculated assuming an initial investment made at the net asset value at the beginning of the period, reinvestment of all dividends and distributions at net asset value during the period, and redemption at net asset value on the last day of the period. Net asset value total return includes adjustments in accordance with accounting principles generally accepted in the United States of America and as such, the net asset value for financial reporting purposes and the returns based upon those net asset values may differ from the net asset value and returns for shareholder transactions. These figures have been derived from the funds’ financial statements.
| | | | | | | | | | | | | | | | |
| | | | | | | Class M Shares |
| | | | | | | Year Ended August 31, |
BNY Mellon Bond Fund | | | 2023 | | 2022 | | 2021 | | 2020 | | 2019 | |
Per Share Data ($): | | | | | | | | | | | | |
Net asset value, beginning of period | | | 11.22 | | 13.10 | | 13.63 | | 13.14 | | 12.32 | |
Investment Operations: | | | | | | | | | | | | |
Net investment income a | | | .32 | | .25 | | .23 | | .30 | | .35 | |
Net realized and unrealized
gain (loss) on investments | | | (.44) | | (1.83) | | (.17) | | .54 | | .84 | |
Total from Investment Operations | | | (.12) | | (1.58) | | .06 | | .84 | | 1.19 | |
Distributions: | | | | | | | | | | | | |
Dividends from net investment income | | | (.33) | | (.30) | | (.31) | | (.35) | | (.37) | |
Dividends from net realized gain on investments | | | - | | - | | (.28) | | - | | - | |
Total Distributions | | | (.33) | | (.30) | | (.59) | | (.35) | | (.37) | |
Net asset value, end of period | | | 10.77 | | 11.22 | | 13.10 | | 13.63 | | 13.14 | |
Total Return (%) | | | (1.05) | | (12.19) | | .50 | | 6.49 | | 9.89 | |
Ratios/Supplemental Data (%): | | | | | | | | | | | | |
Ratio of total expenses to average net assets | | | .57 | | .55 | | .55 | | .55 | | .55 | |
Ratio of net expenses to average net assets | | | .57 | | .55 | | .55 | | .55 | | .55 | |
Ratio of net investment income
to average net assets | | | 2.91 | | 2.07 | | 1.71 | | 2.30 | | 2.77 | |
Portfolio Turnover Rate | | | 45.46 | | 88.66 | | 72.04 | | 93.11 | | 79.56 | |
Net Assets, end of period ($ x 1,000) | | | 1,181,267 | | 1,172,292 | | 1,339,003 | | 1,268,576 | | 1,220,362 | |
a Based on average shares outstanding.
See notes to financial statements.
38
| | | | | | | | | | | | | | | | |
| | | | | | | Investor Shares |
| | | | | | | Year Ended August 31, |
BNY Mellon Bond Fund | | | 2023 | | 2022 | | 2021 | | 2020 | | 2019 | |
Per Share Data ($): | | | | | | | | | | | | |
Net asset value, beginning of period | | | 11.21 | | 13.08 | | 13.60 | | 13.11 | | 12.29 | |
Investment Operations: | | | | | | | | | | | | |
Net investment income a | | | .29 | | .23 | | .20 | | .28 | | .32 | |
Net realized and unrealized
gain (loss) on investments | | | (.44) | | (1.83) | | (.16) | | .52 | | .84 | |
Total from Investment Operations | | | (.15) | | (1.60) | | .04 | | .80 | | 1.16 | |
Distributions: | | | | | | | | | | | | |
Dividends from net investment income | | | (.30) | | (.27) | | (.28) | | (.31) | | (.34) | |
Dividends from net realized gain on investments | | | - | | - | | (.28) | | - | | - | |
Total Distributions | | | (.30) | | (.27) | | (.56) | | (.31) | | (.34) | |
Net asset value, end of period | | | 10.76 | | 11.21 | | 13.08 | | 13.60 | | 13.11 | |
Total Return (%) | | | (1.38) | | (12.39) | | .30 | | 6.22 | | 9.60 | |
Ratios/Supplemental Data (%): | | | | | | | | | | | | |
Ratio of total expenses to average net assets | | | .82 | | .80 | | .80 | | .80 | | .80 | |
Ratio of net expenses to average net assets | | | .82 | | .80 | | .80 | | .80 | | .80 | |
Ratio of net investment income
to average net assets | | | 2.66 | | 1.82 | | 1.46 | | 2.08 | | 2.47 | |
Portfolio Turnover Rate | | | 45.46 | | 88.66 | | 72.04 | | 93.11 | | 79.56 | |
Net Assets, end of period ($ x 1,000) | | | 8,800 | | 10,822 | | 11,286 | | 9,204 | | 8,697 | |
a Based on average shares outstanding.
See notes to financial statements.
39
FINANCIAL HIGHLIGHTS (continued)
| | | | | | | | | | | | | | | | |
| | | | | | | Class M Shares |
| | | | | | | Year Ended August 31, |
BNY Mellon Intermediate Bond Fund | | | 2023 | | 2022 | | 2021 | | 2020 | | 2019 | |
Per Share Data ($): | | | | | | | | | | | | |
Net asset value, beginning of period | | | 11.77 | | 12.93 | | 13.11 | | 12.72 | | 12.26 | |
Investment Operations: | | | | | | | | | | | | |
Net investment income a | | | .28 | | .24 | | .24 | | .25 | | .27 | |
Net realized and unrealized
gain (loss) on investments | | | (.13) | | (1.13) | | (.16) | | .41 | | .47 | |
Total from Investment Operations | | | .15 | | (.89) | | .08 | | .66 | | .74 | |
Distributions: | | | | | | | | | | | | |
Dividends from net investment income | | | (.31) | | (.27) | | (.26) | | (.27) | | (.28) | |
Net asset value, end of period | | | 11.61 | | 11.77 | | 12.93 | | 13.11 | | 12.72 | |
Total Return (%) | | | 1.26 | | (6.93) | | .62 | | 5.23 | | 6.09 | |
Ratios/Supplemental Data (%): | | | | | | | | | | | | |
Ratio of total expenses to average net assets | | | .58 | | .56 | | .56 | | .55 | | .55 | |
Ratio of net expenses to average net assets | | | .58 | | .56 | | .56 | | .55 | | .55 | |
Ratio of net investment income
to average net assets | | | 2.44 | | 1.98 | | 1.85 | | 1.97 | | 2.15 | |
Portfolio Turnover Rate | | | 26.10 | | 31.46 | | 19.07 | | 41.86 | | 33.30 | |
Net Assets, end of period ($ x 1,000) | | | 506,245 | | 619,470 | | 779,123 | | 891,782 | | 985,280 | |
a Based on average shares outstanding.
See notes to financial statements.
40
| | | | | | | | | | | | | | | | |
| | | | | | | Investor Shares |
| | | | | | | Year Ended August 31, |
BNY Mellon Intermediate Bond Fund | | | 2023 | | 2022 | | 2021 | | 2020 | | 2019 | |
Per Share Data ($): | | | | | | | | | | | | |
Net asset value, beginning of period | | | 11.80 | | 12.95 | | 13.12 | | 12.73 | | 12.26 | |
Investment Operations: | | | | | | | | | | | | |
Net investment income a | | | .25 | | .22 | | .21 | | .22 | | .23 | |
Net realized and unrealized
gain (loss) on investments | | | (.13) | | (1.13) | | (.16) | | .40 | | .48 | |
Total from Investment Operations | | | .12 | | (.91) | | .05 | | .62 | | .71 | |
Distributions: | | | | | | | | | | | | |
Dividends from net investment income | | | (.27) | | (.24) | | (.22) | | (.23) | | (.24) | |
Net asset value, end of period | | | 11.65 | | 11.80 | | 12.95 | | 13.12 | | 12.73 | |
Total Return (%) | | | 1.03 | | (7.11) | | .42 | | 4.93 | | 5.88 | |
Ratios/Supplemental Data (%): | | | | | | | | | | | | |
Ratio of total expenses to average net assets | | | .83 | | .81 | | .81 | | .80 | | .80 | |
Ratio of net expenses to average net assets | | | .83 | | .81 | | .81 | | .80 | | .80 | |
Ratio of net investment income
to average net assets | | | 2.19 | | 1.73 | | 1.59 | | 1.68 | | 1.88 | |
Portfolio Turnover Rate | | | 26.10 | | 31.46 | | 19.07 | | 41.86 | | 33.30 | |
Net Assets, end of period ($ x 1,000) | | | 7,756 | | 7,845 | | 9,125 | | 8,293 | | 6,225 | |
a Based on average shares outstanding.
See notes to financial statements.
41
FINANCIAL HIGHLIGHTS (continued)
| | | | | | | | | | | | | | | | |
| | | | | | | Class M Shares |
| | | | | | | Year Ended August 31, |
BNY Mellon Corporate Bond Fund | | | 2023 | | 2022 | | 2021 | | 2020 | | 2019 | |
Per Share Data ($): | | | | | | | | | | | | |
Net asset value, beginning of period | | | 11.74 | | 13.80 | | 13.69 | | 13.36 | | 12.52 | |
Investment Operations: | | | | | | | | | | | | |
Net investment income a | | | .43 | | .40 | | .43 | | .45 | | .46 | |
Net realized and unrealized
gain (loss) on investments | | | (.08) | | (1.96) | | .15 | | .35 | | .86 | |
Total from Investment Operations | | | .35 | | (1.56) | | .58 | | .80 | | 1.32 | |
Distributions: | | | | | | | | | | | | |
Dividends from net investment income | | | (.45) | | (.43) | | (.47) | | (.47) | | (.48) | |
Dividends from
net realized gain on investments | | | - | | (.07) | | - | | - | | - | |
Total Distributions | | | (.45) | | (.50) | | (.47) | | (.47) | | (.48) | |
Net asset value, end of period | | | 11.64 | | 11.74 | | 13.80 | | 13.69 | | 13.36 | |
Total Return (%) | | | 3.06 | | (11.58) | | 4.29 | | 6.16 | | 10.81 | |
Ratios/Supplemental Data (%): | | | | | | | | | | | | |
Ratio of total expenses to average net assets | | | .58 | | .56 | | .56 | | .56 | | .56 | |
Ratio of net expenses to average net assets | | | .58 | | .56 | | .56 | | .56 | | .56 | |
Ratio of net investment income
to average net assets | | | 3.76 | | 3.15 | | 3.10 | | 3.39 | | 3.65 | |
Portfolio Turnover Rate | | | 11.99 | | 25.87 | | 18.34 | | 25.67 | | 30.95 | |
Net Assets, end of period ($ x 1,000) | | | 416,864 | | 564,925 | | 757,617 | | 849,166 | | 907,433 | |
a Based on average shares outstanding.
See notes to financial statements.
42
| | | | | | | | | | | | | | | | |
| | | | | | | Investor Shares |
| | | | | | | Year Ended August 31, |
BNY Mellon Corporate Bond Fund | | | 2023 | | 2022 | | 2021 | | 2020 | | 2019 | |
Per Share Data ($): | | | | | | | | | | | | |
Net asset value, beginning of period | | | 11.75 | | 13.81 | | 13.70 | | 13.37 | | 12.53 | |
Investment Operations: | | | | | | | | | | | | |
Net investment income a | | | .40 | | .37 | | .40 | | .43 | | .43 | |
Net realized and unrealized
gain (loss) on investments | | | (.08) | | (1.97) | | .14 | | .34 | | .85 | |
Total from Investment Operations | | | .32 | | (1.60) | | .54 | | .77 | | 1.28 | |
Distributions: | | | | | | | | | | | | |
Dividends from net investment income | | | (.41) | | (.39) | | (.43) | | (.44) | | (.44) | |
Dividends from
net realized gain on investments | | | - | | (.07) | | - | | - | | - | |
Total Distributions | | | (.41) | | (.46) | | (.43) | | (.44) | | (.44) | |
Net asset value, end of period | | | 11.66 | | 11.75 | | 13.81 | | 13.70 | | 13.37 | |
Total Return (%) | | | 2.82 | | (11.82) | | 4.02 | | 5.87 | | 10.50 | |
Ratios/Supplemental Data (%): | | | | | | | | | | | | |
Ratio of total expenses to average net assets | | | .83 | | .81 | | .81 | | .81 | | .81 | |
Ratio of net expenses to average net assets | | | .83 | | .81 | | .81 | | .81 | | .81 | |
Ratio of net investment income
to average net assets | | | 3.51 | | 2.90 | | 2.85 | | 3.12 | | 3.41 | |
Portfolio Turnover Rate | | | 11.99 | | 25.87 | | 18.34 | | 25.67 | | 30.95 | |
Net Assets, end of period ($ x 1,000) | | | 4,091 | | 5,296 | | 6,225 | | 5,448 | | 2,693 | |
a Based on average shares outstanding.
See notes to financial statements.
43
FINANCIAL HIGHLIGHTS (continued)
| | | | | | | | | | | | | | | | |
| | | | | | | Class M Shares |
BNY Mellon Short-Term | | | Year Ended August 31, |
U.S. Government Securities Fund | | | 2023 | | 2022 | | 2021 | | 2020 | | 2019 | |
Per Share Data ($): | | | | | | | | | | | | |
Net asset value, beginning of period | | | 10.95 | | 11.60 | | 11.81 | | 11.70 | | 11.52 | |
Investment Operations: | | | | | | | | | | | | |
Net investment income a | | | .22 | | .09 | | .11 | | .19 | | .21 | |
Net realized and unrealized
gain (loss) on investments | | | (.08) | | (.52) | | (.13) | | .15 | | .20 | |
Total from Investment Operations | | | .14 | | (.43) | | (.02) | | .34 | | .41 | |
Distributions: | | | | | | | | | | | | |
Dividends from net investment income | | | (.28) | | (.22) | | (.19) | | (.23) | | (.23) | |
Net asset value, end of period | | | 10.81 | | 10.95 | | 11.60 | | 11.81 | | 11.70 | |
Total Return (%) | | | 1.33 | | (3.77) | | (.15) | | 2.95 | | 3.61 | |
Ratios/Supplemental Data (%): | | | | | | | | | | | | |
Ratio of total expenses to average net assets | | | .59 | | .59 | | .55 | | .55 | | .55 | |
Ratio of net expenses to average net assets | | | .50 | | .50 | | .54 | | .55 | | .55 | |
Ratio of net investment income
to average net assets | | | 2.00 | | .84 | | .89 | | 1.65 | | 1.84 | |
Portfolio Turnover Rate | | | 51.74 | | 65.86 | | 114.85 | | 65.00 | | 119.53 | |
Net Assets, end of period ($ x 1,000) | | | 124,885 | | 175,541 | | 174,319 | | 234,920 | | 255,767 | |
a Based on average shares outstanding.
See notes to financial statements.
44
| | | | | | | | | | | | | | | | |
| | | | | | | Investor Shares |
BNY Mellon Short-Term | | | Year Ended August 31, |
U.S. Government Securities Fund | | | 2023 | | 2022 | | 2021 | | 2020 | | 2019 | |
Per Share Data ($): | | | | | | | | | | | | |
Net asset value, beginning of period | | | 10.96 | | 11.60 | | 11.80 | | 11.68 | | 11.50 | |
Investment Operations: | | | | | | | | | | | | |
Net investment income a | | | .19 | | .07 | | .08 | | .11 | | .18 | |
Net realized and unrealized
gain (loss) on investments | | | (.07) | | (.53) | | (.12) | | .21 | | .20 | |
Total from Investment Operations | | | .12 | | (.46) | | (.04) | | .32 | | .38 | |
Distributions: | | | | | | | | | | | | |
Dividends from net investment income | | | (.25) | | (.18) | | (.16) | | (.20) | | (.20) | |
Net asset value, end of period | | | 10.83 | | 10.96 | | 11.60 | | 11.80 | | 11.68 | |
Total Return (%) | | | 1.09 | | (3.99) | | (.37) | | 2.73 | | 3.31 | |
Ratios/Supplemental Data (%): | | | | | | | | | | | | |
Ratio of total expenses to average net assets | | | .84 | | .84 | | .80 | | .80 | | .80 | |
Ratio of net expenses to average net assets | | | .75 | | .75 | | .79 | | .80 | | .80 | |
Ratio of net investment income
to average net assets | | | 1.75 | | .59 | | .64 | | .98 | | 1.54 | |
Portfolio Turnover Rate | | | 51.74 | | 65.86 | | 114.85 | | 65.00 | | 119.53 | |
Net Assets, end of period ($ x 1,000) | | | 1,615 | | 1,652 | | 4,703 | | 5,308 | | 1,727 | |
a Based on average shares outstanding.
See notes to financial statements.
45
NOTES TO FINANCIAL STATEMENTS
NOTE 1—Significant Accounting Policies:
BNY Mellon Funds Trust (the “Trust”), a Massachusetts business trust that is registered under the Investment Company Act of 1940, as amended (the “Act”), as an open-end management investment company, operates as a series company currently consisting of nineteen series, including the following diversified funds: BNY Mellon Bond Fund, BNY Mellon Intermediate Bond Fund, BNY Mellon Corporate Bond Fund and BNY Mellon Short-Term U.S. Government Securities Fund (each, a “fund” and collectively, the “funds”). The objectives of the funds are as follows: BNY Mellon Bond Fund, BNY Mellon Intermediate Bond Fund and BNY Mellon Corporate Bond Fund seek total return (consisting of capital appreciation and current income). BNY Mellon Short-Term U.S. Government Securities Fund seeks to provide as high a level of current income as is consistent with the preservation of capital.
BNY Mellon Investment Adviser, Inc. (the “Adviser”), a wholly-owned subsidiary of The Bank of New York Mellon Corporation (“BNY Mellon”), which serves as each fund’s investment adviser. BNY Mellon serves as administrator for the funds pursuant to an Administration Agreement with the Trust (the “Administration Agreement”). BNY Mellon has entered into a Sub-Administration Agreement with the Adviser pursuant to which BNY Mellon pays the Adviser for performing certain administrative services.
BNY Mellon Securities Corporation (the “Distributor”), a wholly-owned subsidiary of the Adviser, is the distributor of each fund’s shares, which are sold without a sales charge. Each fund is authorized to issue an unlimited number of $.001 par value shares of Beneficial Interest in each of the following classes of shares: Class M and Investor. Each class of shares has identical rights and privileges, except with respect to the Shareholder Service Plan and the expenses borne by each class, the allocation of certain transfer agency costs, and certain voting rights. Income, expenses (other than expenses attributable to a specific class), and realized and unrealized gains or losses on investments are allocated to each class of shares based on its relative net assets.
The Trust accounts separately for the assets, liabilities and operations of each series. Expenses directly attributable to each series are charged to that series’ operations; expenses which are applicable to all series are allocated among them on a pro rata basis.
The Financial Accounting Standards Board (“FASB”) Accounting Standards Codification (“ASC”) is the exclusive reference of authoritative U.S. generally accepted accounting principles (“GAAP”) recognized by the FASB to be applied by nongovernmental entities. Rules and interpretive releases of the SEC under authority of federal laws are also sources of authoritative GAAP for SEC registrants. Each fund is an investment company and applies the accounting and reporting guidance of the FASB ASC Topic 946 Financial Services-Investment Companies. Each fund’s financial statements are prepared in accordance with GAAP, which may require the use of management estimates and assumptions. Actual results could differ from those estimates.
The Trust enters into contracts that contain a variety of indemnifications. The funds’ maximum exposure under these arrangements is unknown. The funds do not anticipate recognizing any loss related to these arrangements.
(a) Portfolio valuation: The fair value of a financial instrument is the amount that would be received to sell an asset or paid to transfer a liability in an orderly transaction between market participants at the measurement date (i.e., the exit price). GAAP establishes a fair value hierarchy that prioritizes the inputs of valuation techniques used to measure fair value. This hierarchy gives the highest priority to unadjusted quoted prices in active markets for identical assets or liabilities (Level 1 measurements) and the lowest priority to unobservable inputs (Level 3 measurements).
Additionally, GAAP provides guidance on determining whether the volume and activity in a market has decreased significantly and whether such a decrease in activity results in transactions that are not orderly. GAAP requires enhanced disclosures around valuation inputs and techniques used during annual and interim periods.
Various inputs are used in determining the value of each fund’s investments relating to fair value measurements. These inputs are summarized in the three broad levels listed below:
Level 1—unadjusted quoted prices in active markets for identical investments.
Level 2—other significant observable inputs (including quoted prices for similar investments, interest rates, prepayment speeds, credit risk, etc.).
Level 3—significant unobservable inputs (including the funds’ own assumptions in determining the fair value of investments).
The inputs or methodology used for valuing securities are not necessarily an indication of the risk associated with investing in those securities.
Changes in valuation techniques may result in transfers in or out of an assigned level within the disclosure hierarchy. Valuation techniques used to value each fund’s investments are as follows:
The Trust’s Board of Trustees (the “Board”) has designated the Adviser as each fund’s valuation designee, effective September 8, 2022, to make all fair value determinations with
46
respect to each fund’s portfolio investments, subject to the Board’s oversight and pursuant to Rule 2a-5 under the Act.
Investments in debt securities excluding short-term investments (other than U.S. Treasury Bills) are valued each business day by one or more independent pricing services (each, a “Service”) approved by the Board. Investments for which quoted bid prices are readily available and are representative of the bid side of the market in the judgment of a Service are valued at the mean between the quoted bid prices (as obtained by a Service from dealers in such securities) and asked prices (as calculated by a Service based upon its evaluation of the market for such securities). Securities are valued as determined by a Service, based on methods which include consideration of the following: yields or prices of securities of comparable quality, coupon, maturity and type; indications as to values from dealers; and general market conditions. The Services are engaged under the general supervision of the Board. These securities are generally categorized within Level 2 of the fair value hierarchy.
Each relevant fund: Investments in equity securities are valued at the last sales price on the securities exchange or national securities market on which such securities are primarily traded. Securities listed on the National Market System for which market quotations are available are valued at the official closing price or, if there is no official closing price that day, at the last sales price. For open short positions, asked prices are used for valuation purposes. Bid price is used when no asked price is available. Registered investment companies that are not traded on an exchange are valued at their net asset value. All of the preceding securities are generally categorized within Level 1 of the fair value hierarchy.
Securities not listed on an exchange or the national securities market, or securities for which there were no transactions, are valued at the average of the most recent bid and asked prices. These securities are generally categorized within Level 2 of the fair value hierarchy.
Fair valuing of securities may be determined with the assistance of a Service using calculations based on indices of domestic securities and other appropriate indicators, such as prices of relevant American Depository Receipts and futures. Utilizing these techniques may result in transfers between Level 1 and Level 2 of the fair value hierarchy.
When market quotations or official closing prices are not readily available, or are determined not to reflect accurately fair value, such as when the value of a security has been significantly affected by events after the close of the exchange or market on which the security is principally traded, but before the funds calculate their net asset value, the funds may value these investments at fair value as determined in accordance with the procedures approved by the Board. Certain factors may be considered when fair valuing investments such as: fundamental analytical data, the nature and duration of restrictions on disposition, an evaluation of the forces that influence the market in which the securities are purchased and sold, and public trading in similar securities of the issuer or comparable issuers. These securities are either categorized within Level 2 or 3 of the fair value hierarchy depending on the relevant inputs used.
For securities where observable inputs are limited, assumptions about market activity and risk are used and are generally categorized within Level 3 of the fair value hierarchy.
The following below summarizes the inputs used as of August 31, 2023 in valuing each fund’s investments:
| | | | | | | |
BNY Mellon Bond Fund | |
| | Level 1-Unadjusted Quoted Prices | Level 2- Other Significant Observable Inputs | | Level 3-Significant Unobservable Inputs | Total | |
Assets ($) | | |
Investments in Securities:† | | |
Corporate Bonds | - | 328,390,854 | | - | 328,390,854 | |
Equity Securities - Preferred Stocks | 5,285,800 | - | | - | 5,285,800 | |
Foreign Governmental | - | 3,684,855 | | - | 3,684,855 | |
Investment Companies | 38,156,005 | - | | - | 38,156,005 | |
Municipal Securities | - | 6,947,288 | | - | 6,947,288 | |
U.S. Government Agencies Collateralized Municipal-Backed Securities | - | 4,686,670 | | - | 4,686,670 | |
U.S. Government Agencies Mortgage-Backed | - | 315,406,546 | | - | 315,406,546 | |
U.S. Treasury Securities | - | 515,455,764 | | - | 515,455,764 | |
† See Statement of Investments for additional detailed categorizations, if any.
47
NOTES TO FINANCIAL STATEMENTS (continued)
| | | | | | | |
BNY Mellon Intermediate Bond Fund | |
| | Level 1-Unadjusted Quoted Prices | Level 2- Other Significant Observable Inputs | | Level 3-Significant Unobservable Inputs | Total | |
Assets ($) | | |
Investments in Securities:† | | |
Corporate Bonds | - | 215,427,860 | | - | 215,427,860 | |
Equity Securities - Preferred Stocks | 3,049,500 | - | | - | 3,049,500 | |
Investment Companies | 6,409,271 | - | | - | 6,409,271 | |
Municipal Securities | - | 12,733,040 | | - | 12,733,040 | |
U.S. Government Agencies Collateralized Municipal-Backed Securities | - | 2,468,744 | | - | 2,468,744 | |
U.S. Government Agencies Mortgage-Backed | - | 7,159,806 | | - | 7,159,806 | |
U.S. Government Agencies Obligations | - | 28,420,218 | | - | 28,420,218 | |
U.S. Treasury Securities | - | 239,625,561 | | - | 239,625,561 | |
† See Statement of Investments for additional detailed categorizations, if any.
| | | | | | | |
BNY Mellon Corporate Bond Fund | |
| | Level 1-Unadjusted Quoted Prices | Level 2- Other Significant Observable Inputs | | Level 3-Significant Unobservable Inputs | Total | |
Assets ($) | | |
Investments in Securities:† | | |
Corporate Bonds | - | 387,969,533 | | - | 387,969,533 | |
Equity Securities - Preferred Stocks | 5,714,200 | - | | - | 5,714,200 | |
Foreign Governmental | - | 2,603,088 | | - | 2,603,088 | |
Investment Companies | 19,183,861 | - | | - | 19,183,861 | |
Municipal Securities | - | 12,387,501 | | - | 12,387,501 | |
† See Statement of Investments for additional detailed categorizations, if any.
| | | | | | | |
BNY Mellon Short-Term U.S. Government Securities Fund | |
| | Level 1-Unadjusted Quoted Prices | Level 2- Other Significant Observable Inputs | | Level 3-Significant Unobservable Inputs | Total | |
Assets ($) | | |
Investments in Securities:† | | |
Investment Companies | 1,457,842 | - | | - | 1,457,842 | |
Municipal Securities | - | 7,968,932 | | - | 7,968,932 | |
U.S. Government Agencies Collateralized Mortgage Obligations | - | 20,649,560 | | - | 20,649,560 | |
U.S. Government Agencies Collateralized Municipal-Backed Securities | - | 36,321,849 | | - | 36,321,849 | |
U.S. Government Agencies Mortgage-Backed | - | 29,886,758 | | - | 29,886,758 | |
U.S. Government Agencies Obligations | - | 1,448,823 | | - | 1,448,823 | |
U.S. Treasury Securities | - | 28,733,331 | | - | 28,733,331 | |
† See Statement of Investments for additional detailed categorizations, if any.
48
(b) Securities transactions and investment income: Securities transactions are recorded on a trade date basis. Realized gains and losses from securities transactions are recorded on the identified cost basis. Dividend income is recognized on the ex-dividend date and interest income, including, where applicable, accretion of discount and amortization of premium on investments, is recognized on the accrual basis.
Pursuant to a securities lending agreement with BNY Mellon, the funds may lend securities to qualified institutions. It is the funds’ policy that, at origination, all loans are secured by collateral of at least 102% of the value of U.S. securities loaned and 105% of the value of foreign securities loaned. Collateral equivalent to at least 100% of the market value of securities on loan is maintained at all times. Collateral is either in the form of cash, which can be invested in certain money market mutual funds managed by the Adviser, or U.S. Government and Agency securities. The funds are entitled to receive all dividends, interest and distributions on securities loaned, in addition to income earned as a result of the lending transaction. Should a borrower fail to return the securities in a timely manner, BNY Mellon is required to replace the securities for the benefit of the funds or credit the funds with the market value of the unreturned securities and is subrogated to the funds’ rights against the borrower and the collateral. Additionally, the contractual maturity of security lending transactions are on an overnight and continuous basis. Table 1 summarizes the amount BNY Mellon earned from each fund from lending portfolio securities, pursuant to the securities lending agreement during the period ended August 31, 2023.
| | |
Table 1—Securities Lending Agreement | |
| | |
BNY Mellon Bond Fund | $ 15,517 |
BNY Mellon Intermediate Bond Fund | 11,444 |
BNY Mellon Corporate Bond Fund | 15,714 |
BNY Mellon Short-Term U.S. Government Securities Fund | 1,482 |
(c) Affiliated issuers: Investments in other investment companies advised by the Adviser are defined as “affiliated” under the Act.
(d) Market Risk: The value of the securities in which each fund invests may be affected by political, regulatory, economic and social developments, and developments that impact specific economic sectors, industries or segments of the market. The value of a security may also decline due to general market conditions that are not specifically related to a particular company or industry, such as real or perceived adverse economic conditions, changes in the general outlook for corporate earnings, changes in interest or currency rates, changes to inflation, adverse changes to credit markets or adverse investor sentiment generally. In addition, turbulence in financial markets and reduced liquidity in equity, credit and/or fixed-income markets may negatively affect many issuers, which could adversely affect each fund. Global economies and financial markets are becoming increasingly interconnected, and conditions and events in one country, region or financial market may adversely impact issuers in a different country, region or financial market. These risks may be magnified if certain events or developments adversely interrupt the global supply chain; in these and other circumstances, such risks might affect companies world-wide.
Government Securities Risk: Not all obligations of the U.S. government, its agencies and instrumentalities are backed by the full faith and credit of the U.S. Treasury. Some obligations are backed only by the credit of the issuing agency or instrumentality, and in some cases there may be some risk of default by the issuer. Any guarantee by the U.S. government or its agencies or instrumentalities of a security held by the fund does not apply to the market value of such security or to shares of the fund itself.
Mortgage-Related Securities Risk: Mortgage-related securities are complex derivative instruments, subject to credit, prepayment and extension risk, and may be more volatile, less liquid and more difficult to price accurately than more traditional debt securities. The fund is subject to the credit risk associated with these securities, including the market’s perception of the creditworthiness of the issuing federal agency, as well as the credit quality of the underlying assets. Although certain mortgage-related securities are guaranteed as to the timely payment of interest and principal by a third party (such as a U.S. government agency or instrumentality with respect to government-related mortgage securities) the market prices for such securities are not guaranteed and will fluctuate. As with other interest-bearing securities, the prices of certain mortgage-related securities are inversely affected by changes in interest rates. However, although the value of a mortgage-related security may decline when interest rates rise, the converse is not necessarily true, since in periods of declining interest rates the mortgages underlying the security are more likely to be prepaid causing the fund to purchase new securities at current market rates, which usually will be lower. The loss of higher yielding underlying mortgages and the reinvestment of proceeds at lower interest rates, known as prepayment risk, can reduce the fund’s potential price gain in response to falling interest rates, reduce the fund’s yield and/or cause the fund’s share
49
NOTES TO FINANCIAL STATEMENTS (continued)
price to fall. When interest rates rise, the effective duration of the fund’s mortgage-related and other asset-backed securities may lengthen due to a drop in prepayments of the underlying mortgages or other assets. This is known as extension risk and would increase the fund’s sensitivity to rising interest rates and its potential for price declines.
Short-Term Trading Risk: At times, the fund may engage in short-term trading, which could produce higher transaction costs and taxable distributions and lower the fund’s after-tax performance.
Debt Risk: The funds invest primarily in debt securities. Failure of an issuer of the debt securities to make timely interest or principal payments, or a decline or the perception of a decline in the credit quality of a debt security, can cause the debt security’s price to fall, potentially lowering each fund’s share price. In addition, the value of debt securities may decline due to general market conditions that are not specifically related to a particular issuer, such as real or perceived adverse economic conditions, changes in outlook for corporate earnings, changes in interest or currency rates or adverse investor sentiment. They may also decline because of factors that affect a particular industry.
(e) Dividends and distributions to shareholders: Dividends and distributions payable to shareholders are recorded by each fund on the ex-dividend date. The funds normally declare and pay dividends from net investment income monthly. Dividends from net realized capital gains, if any, are normally declared and paid annually, but each fund may make distributions on a more frequent basis to comply with the distribution requirements of the Internal Revenue Code of 1986, as amended (the “Code”). To the extent that net realized capital gains can be offset by capital loss carryovers of a fund, it is the policy of each fund not to distribute such gains. Income and capital gain distributions are determined in accordance with income tax regulations, which may differ from GAAP.
(f) Federal income taxes: It is the policy of each fund to continue to qualify as a regulated investment company, if such qualification is in the best interests of its shareholders, by complying with the applicable provisions of the Code, and to make distributions of taxable income sufficient to relieve it from substantially all federal income and excise taxes. For federal income tax purposes, each fund is treated as a separate entity for the purpose of determining such qualification.
As of and during the period ended August 31, 2023, the funds did not have any liabilities for any uncertain tax positions. Each fund recognizes interest and penalties, if any, related to uncertain tax positions as income tax expense in the Statements of Operations. During the period ended August 31, 2023, the funds did not incur any interest or penalties.
Each tax year in the four-year period ended August 31, 2023 remains subject to examination by the Internal Revenue Service and state taxing authorities.
Table 2 summarizes each fund’s components of accumulated earnings on a tax basis at August 31, 2023.
Under the Regulated Investment Company Modernization Act of 2010, each fund is permitted to carry forward capital losses for an unlimited period. Furthermore, capital loss carryovers retain their character as either short-term or long-term capital losses.
Table 3 summarizes each relevant fund’s accumulated capital loss carryover available for federal income tax purposes to be applied against future net realized capital gains, if any, realized subsequent to August 31, 2023.
Table 4 summarizes each fund’s tax character of distributions paid to shareholders during the fiscal periods ended August 31, 2023 and August 31, 2022.
| | | | | | | | | | |
Table 2—Components of Accumulated Earnings | |
| | | | Undistributed
Ordinary Income ($) | Accumulated
Capital (Losses) ($) | Unrealized
(Depreciation) ($) | | |
BNY Mellon Bond Fund | | | 920,170 | (96,516,813) | (108,157,557) | | |
BNY Mellon Intermediate Bond Fund | | | 773,734 | (15,332,781) | (29,962,572) | | |
BNY Mellon Corporate Bond Fund | | | 594,304 | (17,414,729) | (42,005,894) | | |
BNY Mellon Short-Term U.S. Government Securities Fund | | | 106,253 | (19,466,338) | (5,715,383) | | |
50
| | | | | | | | | | | |
Table 3—Capital Loss Carryover | | | | | | |
| | | |
Short-Term
Losses ($)
| † | Long-Term
Losses ($) | |
| | | | | | † | Total ($) |
BNY Mellon Bond Fund | | | | 47,138,366 | 49,378,447 | 96,516,813 |
BNY Mellon Intermediate Bond Fund | | | | 3,049,194 | 12,283,587 | 15,332,781 |
BNY Mellon Corporate Bond Fund | | | | 2,384,809 | 15,029,920 | 17,414,729 |
BNY Mellon Short-Term U.S. Government Securities Fund | | | | 8,397,908 | 11,068,430 | 19,466,338 |
† These capital losses can be carried forward for an unlimited period.
| | | | | | | |
Table 4—Tax Character of Distributions Paid | | | | | | |
| | 2023 | | 2022 |
| Ordinary Income ($) | Long-Term
Capital Gains ($) | | Ordinary Income ($) | Long-Term
Capital Gains ($) |
BNY Mellon Bond Fund | 35,129,351 | - | | 31,390,348 | - |
BNY Mellon Intermediate Bond Fund | 14,709,024 | - | | 15,121,290 | - |
BNY Mellon Corporate Bond Fund | 18,051,475 | - | | 23,075,813 | 3,745,697 |
BNY Mellon Short-Term U.S. Government Securities Fund | 4,288,632 | - | | 3,035,986 | - |
(g) New accounting pronouncements: In 2020, the FASB issued Accounting Standards Update No. 2020-04, Reference Rate Reform (Topic 848): Facilitation of the Effects of Reference Rate Reform on Financial Reporting, which provides optional guidance to ease the potential burden in accounting for (or recognizing the effects of) reference rate reform on financial reporting.
The objective of the guidance in Topic 848 is to provide temporary relief during the transition period. The FASB included a sunset provision within Topic 848 based on expectations of when the LIBOR would cease being published. At the time that Update 2020-04 was issued, the UK Financial Conduct Authority (FCA) had established its intent that it would no longer be necessary to persuade, or compel, banks to submit to LIBOR after December 31, 2021. As a result, the sunset provision was set for December 31, 2022—12 months after the expected cessation date of all currencies and tenors of LIBOR.
In March 2021, the FCA announced that the intended cessation date of the overnight 1-, 3-, 6-, and 12-month tenors of USD LIBOR would be June 30, 2023, which is beyond the current sunset date of Topic 848.
Because the current relief in Topic 848 may not cover a period of time during which a significant number of modifications may take place, the amendments in this Update defer the sunset date of Topic 848 from December 31, 2022, to December 31, 2024 (“FASB Sunset Date”), after which entities will no longer be permitted to apply the relief in Topic 848.
Management had evaluated the impact of Topic 848 on the fund’s investments, derivatives, debt and other contracts that will undergo reference rate-related modifications as a result of the Reference Rate Reform. Management has no concerns in adopting Topic 848 by FASB Sunset Date. Management will continue to work with other financial institutions and counterparties to modify contracts as required by applicable regulation and within the regulatory deadlines.
NOTE 2—Bank Lines of Credit:
The funds participate with other long-term open-end funds managed by the Adviser in a $823.5 million unsecured credit facility led by Citibank, N.A. (the “Citibank Credit Facility”) and a $300 million unsecured credit facility provided by BNY Mellon (the “BNYM Credit Facility”), each to be utilized primarily for temporary or emergency purposes, including the financing of redemptions (each, a “Facility”). The Citibank Credit Facility is available in two tranches: (i) Tranche A is in an amount equal to $688.5 million and is available to all long-term open-ended funds, including the funds, and (ii) Tranche B is in amount equal to $135 million and is available only to the BNY Mellon Floating Rate Income Fund, a series of BNY Mellon Investment Funds IV, Inc. In connection therewith, each fund has agreed to pay its pro rata portion of commitment fees for Tranche A of the Citibank Credit Facility and the BNYM Credit Facility. Interest is charged to the funds based on rates determined pursuant to the terms of the respective Facility at the time of borrowing. During the period ended August 31, 2023, the funds did not borrow under the Facilities.
NOTE 3—Management Fee, Administration Fee and Other Transactions with Affiliates:
(a) Pursuant to an investment advisory agreement with the Adviser, the management fee is payable monthly and
51
NOTES TO FINANCIAL STATEMENTS (continued)
computed on the average daily value of each fund’s net assets at the following annual rates: .40% of BNY Mellon Bond Fund, .40% of BNY Mellon Intermediate Bond Fund, .40% of BNY Mellon Corporate Bond Fund and .35% of BNY Mellon Short-Term U.S. Government Securities Fund.
For BNY Mellon Short-Term U.S. Government Securities Fund, the Adviser has contractually agreed, from September 1, 2022 through December 30, 2023, to waive receipt of its fees and/or assume the direct expenses of the fund so that the direct expenses of neither class of fund shares (excluding Shareholder Services Plan fees, taxes, interest expense, brokerage commissions, commitment fees on borrowings and extraordinary expenses) exceed .50% of the value of the fund’s average daily net assets. On or after December 30, 2023, the Adviser may terminate this expense limitation agreement at any time. The reduction in expenses, pursuant to the undertaking, amounted to $141,213 during the period ended August 31, 2023.
Pursuant to the Administration Agreement, BNY Mellon provides or arranges for fund accounting, transfer agency and other fund administration services and receives a fee based on the total net assets of the Trust based on the following rates:
0 up to $6 billion .15%
$6 billion up to $12 billion .12%
In excess of $12 billion .10%
(b) Each fund has adopted a Shareholder Services Plan with respect to its Investor shares. Each fund pays the Distributor at an annual rate of .25% of the value of its Investor shares average daily net assets for the provision of certain services. The services provided may include personal services relating to shareholder accounts, such as answering shareholder inquiries regarding a fund, and services related to the maintenance of such shareholder accounts. The Shareholder Services Plan allows the Distributor to make payments from the shareholder services fees it collects from each fund to compensate service agents (certain banks, securities brokers or dealers and other financial institutions) with respect to these services. Table 5 summarizes the amounts Investor shares were charged during the period ended August 31, 2023, pursuant to the Shareholder Services Plan, which is included in Shareholder servicing costs in the Statements of Operations.
| | |
Table 5—Shareholder Services Plan Fees | |
| | |
BNY Mellon Bond Fund | $ 21,762 |
BNY Mellon Intermediate Bond Fund | 18,467 |
BNY Mellon Corporate Bond Fund | 11,829 |
BNY Mellon Short-Term U.S. Government Securities Fund | 3,982 |
The funds have an arrangement with BNY Mellon Transfer, Inc., (the “Transfer Agent”), a subsidiary of BNY Mellon and an affiliate of the Adviser, whereby the funds may receive earnings credits when positive cash balances are maintained, which are used to offset Transfer Agent fees. For financial reporting purposes, the funds include net earnings credits, if any, as an expense offset in the Statements of Operations.
The funds have an arrangement with The Bank of New York Mellon (the “Custodian”), a subsidiary of BNY Mellon and an affiliate of the Adviser, whereby the funds will receive interest income or be charged overdraft fees when cash balances are maintained. For financial reporting purposes, the funds include this interest income and overdraft fees, if any, as interest income in the Statements of Operations.
Each fund compensates the Transfer Agent, under a transfer agency agreement, for providing cash management services for the funds. The Transfer Agent fees are comprised of amounts paid on cash management fees which are related to fund subscriptions and redemptions. BNY Mellon pays each fund’s Transfer Agent fees comprised of amounts paid on a per account basis out of the administration fee it receives from the Trust. These fees, if any, are included in Shareholder servicing costs in the Statement of Operations. These fees were partially offset by earnings credits for each fund, also summarized in Table 6.
| | |
Table 6—Transfer Agent Fees |
Transfer Agenet
Earnings Credits ($) |
BNY Mellon Bond Fund | (2,239) |
BNY Mellon Intermediate Bond Fund | (1,693) |
BNY Mellon Corporate Bond Fund | (759) |
BNY Mellon Short-Term U.S. Government Securities Fund | (531) |
Each fund compensates the Custodian, under a custody agreement, for providing custodial services for each fund. These fees are determined based on net assets, geographic region and transaction activity. Table 7 summarizes the amount each fund was charged during the period ended August 31, 2023 pursuant to the custody agreement.
| | |
Table 7—Custodian Fees |
| |
BNY Mellon Bond Fund | $ 21,093 |
BNY Mellon Intermediate Bond Fund | 10,138 |
BNY Mellon Corporate Bond Fund | 9,461 |
BNY Mellon Short-Term U.S. Government Securities Fund | 13,016 |
Each fund compensates the Custodian, under a shareholder redemption draft processing agreement, for providing certain services related to the funds’ check writing privilege. Table 8 summarizes the amount each fund was charged during the
52
period ended August 31, 2023 pursuant to the agreement, which is included in Shareholder servicing costs in the Statements of Operations.
| | |
Table 8—BNY Mellon Cash Management Fees |
| | |
BNY Mellon Bond Fund | $ 111 |
BNY Mellon Intermediate Bond Fund | 158 |
BNY Mellon Corporate Bond Fund | 67 |
BNY Mellon Short-Term U.S. Government Securities Fund | 26 |
During the period ended August 31, 2023, each fund was charged $19,196 for services performed by the Chief Compliance Officer and his staff. These fees are included in Chief Compliance Officer fees in the Statements of Operations.
Table 9 summarizes the components of “Due to BNY Mellon Investment Adviser, Inc. and affiliates” in the Statements of Assets and Liabilities for each fund.
(c) Each Board member also serves as a Board member of other funds within the Trust. Annual retainer fees and attendance fees are allocated to each fund based on net assets.
NOTE 4—Securities Transactions:
Table 10 summarizes each fund’s aggregate amount of purchases and sales (including paydowns) of investment securities, excluding short-term securities during the period ended August 31, 2023.
Table 11 summarizes the cost of investments for federal income tax purposes, gross appreciation, gross depreciation and accumulated net unrealized appreciation (depreciation) on investments for each fund at August 31, 2023.
| | | | | | | | |
Table 9—Due to BNY Mellon Investment Adviser, Inc. and Affiliates | | | |
| Management
Fee ($) | Administration
Fee ($) | Shareholder
Services
Plan
Fees ($) | Custodian
Fees ($) | | Chief
Compliance
Officer
Fees ($) | Less Expense
Reimbursement ($) |
BNY Mellon Bond Fund | 399,664 | 135,483 | 1,923 | 7,200 | | 3,025 | - |
BNY Mellon Intermediate Bond Fund | 176,540 | 59,592 | 1,668 | 4,000 | | 3,025 | - |
BNY Mellon Corporate Bond Fund | 143,410 | 48,658 | 848 | 4,500 | | 3,025 | - |
BNY Mellon Short-Term U.S.
Government Securities Fund | 38,559 | 14,839 | 343 | 4,400 | | 3,025 | (10,975) |
| | | | | | |
Table 10—Purchases and Sales |
| | Purchases ($) | | Sales ($) | |
BNY Mellon Bond Fund | | 578,426,030 | | 520,517,918 | |
BNY Mellon Intermediate Bond Fund | | 143,791,074 | | 248,257,321 | |
BNY Mellon Corporate Bond Fund | | 54,956,111 | | 197,929,191 | |
BNY Mellon Short-Term U.S. Government Securities Fund | | 84,714,415 | | 130,796,565 | |
| | | | | | | | | |
Table 11—Accumulated Net Unrealized Appreciation (Depreciation) | | | |
| | | Cost ($) | Gross
Appreciation ($) | Gross
Depreciation ($) | Net ($) |
BNY Mellon Bond Fund | | 1,326,171,339 | 1,736,206 | 109,893,763 | (108,157,557) |
BNY Mellon Intermediate Bond Fund | | 545,256,572 | 11,544 | 29,974,116 | (29,962,572) |
BNY Mellon Corporate Bond Fund | | 469,864,077 | 702,859 | 42,708,753 | (42,005,894) |
BNY Mellon Short-Term U.S. Government Securities Fund | | 132,182,478 | 7,311 | 5,722,694 | (5,715,383) |
53
REPORT OF INDEPENDENT REGISTERED
PUBLIC ACCOUNTING FIRM
To the Shareholders of the Funds and Board of Trustees of
BNY Mellon Funds Trust:
Opinion on the Financial Statements
We have audited the accompanying statements of assets and liabilities of BNY Mellon Bond Fund, BNY Mellon Intermediate Bond Fund, BNY Mellon Corporate Bond Fund and BNY Mellon Short-Term U.S. Government Securities Fund (collectively, the “Funds”), each a series of BNY Mellon Funds Trust, including the statements of investments as of August 31, 2023, the related statements of operations for the year then ended, the statements of changes in net assets for each of the years in the two-year period then ended, and the related notes (collectively, the financial statements) and the financial highlights for each of the years in the five-year period then ended. In our opinion, the financial statements and financial highlights present fairly, in all material respects, the financial position of the Funds as of August 31, 2023, the results of their operations for the year then ended, the changes in their net assets for each of the years in the two-year period then ended, and the financial highlights for each of the years in the five-year period then ended, in conformity with U.S. generally accepted accounting principles.
Basis for Opinion
These financial statements and financial highlights are the responsibility of the Funds’ management. Our responsibility is to express an opinion on these financial statements and financial highlights based on our audits. We are a public accounting firm registered with the Public Company Accounting Oversight Board (United States) (PCAOB) and are required to be independent with respect to the Funds in accordance with the U.S. federal securities laws and the applicable rules and regulations of the Securities and Exchange Commission and the PCAOB.
We conducted our audits in accordance with the standards of the PCAOB. Those standards require that we plan and perform the audit to obtain reasonable assurance about whether the financial statements and financial highlights are free of material misstatement, whether due to error or fraud. Our audits included performing procedures to assess the risks of material misstatement of the financial statements and financial highlights, whether due to error or fraud, and performing procedures that respond to those risks. Such procedures included examining, on a test basis, evidence regarding the amounts and disclosures in the financial statements and financial highlights. Such procedures also included confirmation of securities owned as of August 31, 2023, by correspondence with the custodian and brokers or by other appropriate auditing procedures when replies from brokers were not received. Our audits also included evaluating the accounting principles used and significant estimates made by management, as well as evaluating the overall presentation of the financial statements and financial highlights. We believe that our audits provide a reasonable basis for our opinion.

We have served as the auditor of one or more BNY Mellon Investment Adviser, Inc. investment companies since 1994.
New York, New York
October 23, 2023
54
IMPORTANT TAX INFORMATION (Unaudited)
BNY Mellon Bond Fund
For federal tax purposes, the fund designates the maximum amount allowable but not less than 90.18% as interest-related dividends in accordance with Sections 871(k)(1) and 881(e) of the Internal Revenue Code.
BNY Mellon Intermediate Bond Fund
For federal tax purposes, the fund designates the maximum amount allowable but not less than 89.45% as interest-related dividends in accordance with Sections 871(k)(1) and 881(e) of the Internal Revenue Code.
BNY Mellon Corporate Bond Fund
For federal tax purposes, the fund reports the maximum amount allowable but not less than 69.44% as interest-related dividends in accordance with Sections 871(k)(1) and 881(e) of the Internal Revenue Code.
BNY Mellon Short-Term U.S. Government Securities Fund
For federal tax purposes, the fund reports the maximum amount allowable but not less than 99.84% as interest-related dividends in accordance with Sections 871(k)(1) and 881(e) of the Internal Revenue Code.
55
INFORMATION ABOUT THE RENEWAL OF EACH FUND’S INVESTMENT ADVISORY AND ADMINISTRATION AGREEMENTS (Unaudited)
At a meeting of the Trust’s Board of Trustees held on March 20-21, 2023, the Board considered the renewal of the Trust’s Investment Advisory Agreement and Administration Agreement, pursuant to which the Adviser provides the funds with investment advisory services and The Bank of New York Mellon is responsible for the provision of administrative services to the funds (together, the “Agreement”). The Bank of New York Mellon has entered into a Sub-Administration Agreement with the Adviser pursuant to which The Bank of New York Mellon pays the Adviser for performing certain of these administrative services. The Board members, none of whom are “interested persons” (as defined in the Investment Company Act of 1940, as amended) of the Trust, were assisted in their review by independent legal counsel and met with counsel in executive session separate from representatives of the Adviser. In considering the renewal of the Agreement, the Board considered several factors that it believed to be relevant, including those discussed below. The Board did not identify any one factor as dispositive, and each Board member may have attributed different weights to the factors considered.
Analysis of Nature, Extent, and Quality of Services Provided to the Funds. The Board considered information provided to it at the meeting and in previous presentations from representatives of the Adviser regarding the nature, extent, and quality of the services provided to the funds in the Trust, including the funds. The Adviser provided the number of open accounts in each fund, each fund’s asset size and the allocation of fund assets among distribution channels. The Adviser also had previously provided information regarding the distribution channel(s) of the funds and the need to be able to provide ongoing shareholder services to each distribution channel, as applicable to each fund.
The Board also considered research support available to, and portfolio management capabilities of, each fund’s portfolio management personnel and that the Adviser also provides oversight of day-to-day fund operations, including fund accounting and administration and assistance in meeting legal and regulatory requirements. The Board also considered the Adviser’s extensive administrative, accounting and compliance infrastructures.
Comparative Analysis of the Funds’ Performance and Management Fees and Expense Ratios. For each fund, the Board reviewed reports prepared by Broadridge Financial Solutions, Inc. (“Broadridge”), an independent provider of investment company data based on classifications provided by Thomson Reuters Lipper (“Lipper”), which included information comparing (1) the performance of the fund’s Class M shares with the performance of a group of institutional funds selected by Broadridge as comparable to the fund (the “Performance Group”) and with a broader group of funds consisting of all retail and institutional funds in the particular Lipper classification (the “Performance Universe”), all for various periods ended December 31, 2022, and (2) the fund’s actual and contractual management fees and total expenses with those of the same group of funds in the Performance Group (the “Expense Group”) and with a broader group of all institutional funds in the particular Lipper classification, excluding outliers (the “Expense Universe”). The information for each comparison was derived, in part, from fund financial statements available to Broadridge as of the date of its analysis. The Adviser previously had furnished the Board with a description of the methodology Broadridge used to select the Performance Group and Performance Universe and the Expense Group and Expense Universe.
Performance Comparisons. Representatives of the Adviser stated that the usefulness of performance comparisons may be affected by a number of factors, including different investment limitations and policies that may be applicable to each fund and comparison funds and the end date selected. The Board also considered the funds’ performance in light of overall financial market conditions.
Management Fee and Expense Ratio Comparisons. For each fund, the Board reviewed and considered the contractual management fee rate payable by the fund to the Adviser in light of the nature, extent and quality of the management services provided by the Adviser. In addition, the Board reviewed and considered the actual management fee rate paid by the fund over the fund’s last fiscal year. The Board also reviewed the range of actual and contractual management fees and total expenses as a percentage of average net assets of the Expense Group and Expense Universe funds and discussed the results of the comparisons.
For BNY Mellon Bond Fund, representatives of the Adviser reviewed with the Board the management or advisory fees paid by any funds advised by the Adviser in the same Lipper category as the fund (the “Similar Fund(s)”) and explained the nature of the Similar Fund(s). They discussed differences in fees paid and the relationship of the fees paid in light of any differences in the services provided and other relevant factors. For such fund, the Board considered the relevance of the fee information provided for the Similar Fund(s) to evaluate the appropriateness of the fund’s management fee. As to each other fund, representatives of the Adviser noted that there were no Similar Fund(s).
As to each fund, representatives of the Adviser noted that there were no separate accounts and/or other types of client
56
portfolios advised by the Adviser that are considered to have similar investment strategies and policies as the fund.
BNY Mellon Bond Fund
The information comparing the fund’s performance to that of its Performance Group and Performance Universe consisted of funds classified as core bond funds by Lipper.
The Board discussed with representatives of the Adviser the results of the performance comparisons and considered that the fund’s total return performance was below the Performance Group median for all periods, except for the one- and two-year periods when the fund’s total return performance was above or at, respectively, the Performance Group median, and was below the Performance Universe median for all periods, except for the one- and two-year periods when the fund’s total return performance was above the Performance Universe median. The Board also considered that the fund’s yield performance was at or above the Performance Group median for six of the ten one-year periods ended December 31st and above the Performance Universe median for all ten one-year periods ended December 31st. The Board considered the relative proximity of the fund’s total return performance and yield performance to the Performance Group and Performance Universe medians during the periods under review. The Adviser also provided a comparison of the fund’s calendar year total returns to the returns of the fund’s benchmark index, and it was noted that the fund’s returns were above the returns of the index in five of the ten calendar years shown.
The Board considered that the fund’s contractual management fee was higher than the Expense Group median contractual management fee, the fund’s actual management fee was higher than the Expense Group median and Expense Universe median actual management fee, and the fund’s total expense were higher than the Expense Group median and Expense Universe median total expenses.
BNY Mellon Intermediate Bond Fund
The information comparing the fund’s performance to that of its Performance Group and Performance Universe consisted of funds classified as short-intermediate investment grade debt funds by Lipper.
The Board discussed with representatives of the Adviser the results of the comparisons and considered that the fund’s total return performance was below the Performance Group median for all periods and was below the Performance Universe median for all periods, except for the four-year period when the fund’s total return performance was at the Performance Universe median. The Board also considered that the fund’s yield performance was at or above the Performance Group median for six of the nine one-year periods ended December 31st and above the Performance Universe median for seven of the nine one-year periods ended December 31st. The Board considered the relative proximity of the fund’s total return performance and yield performance to the Performance Group and Performance Universe medians during the periods under review. The Adviser also provided a comparison of the fund’s calendar year total returns of the fund’s benchmark index.
Board considered that the fund’s contractual management fee was higher than the Expense Group median contractual management fee, the fund’s actual management fee was higher than the Expense Group median and Expense Universe median actual management fee, and the fund’s total expenses were higher than the Expense Group median and Expense Universe median total expenses.
BNY Mellon Corporate Bond Fund
The information comparing the fund’s performance to that of its Performance Group and Performance Universe consisted of funds classified as BBB-rated corporate debt funds by Lipper.
The Board discussed with representatives of the Adviser the results of the comparisons and considered that the fund’s total return performance was above the Performance Group median and Performance Universe median for all periods. The Board also considered that the fund’s yield performance was at or above the Performance Group medians for eight out of the nine one-year periods ended December 31st and above the Performance Universe medians for eight of the nine one-year periods ended December 31st. The Adviser also provided a comparison of the fund’s calendar year total returns to the returns of the fund’s benchmark index. The Board also noted that the fund had a five-star rating for each of the five- and ten-year periods, a four-star rating for the 3-year period, and a five-star overall rating from Morningstar based on Morningstar’s risk-adjusted return measures.
The Board considered that the fund’s contractual management fee was slightly higher than the Expense Group median contractual management fee, the fund’s actual management fee was higher than the Expense Group median and Expense Universe median actual management fee, and the fund’s total expenses were slightly higher than the Expense Group median and Expense Universe median total expenses.
BNY Mellon Short-Term U.S. Government Securities Fund
The information comparing the fund’s performance to that of its Performance Group and Performance Universe
57
INFORMATION ABOUT THE RENEWAL OF EACH FUND’S INVESTMENT ADVISORY AND ADMINISTRATION AGREEMENTS (Unaudited) (continued)
consisted of funds classified as short U.S. government funds by Lipper.
The Board discussed with representatives of the Adviser the results of the comparisons and considered that the fund’s total return performance was at or above the Performance Group and above the Performance Universe medians for all periods. The Board also considered that the fund’s yield performance was above the Performance Group median for five of the nine one-year periods ended December 31st and above the Performance Universe median for eight of the ten one-year periods ended December 31st. The Adviser also provided a comparison of the fund’s calendar year total returns to the returns of the fund’s benchmark index. The Board also noted that the fund had a four-star rating for the three-year period from Morningstar based on Morningstar’s risk-adjusted return measures.
The Board considered that the fund’s contractual management fee was higher than the Expense Group median contractual management fee, the fund’s actual management fee was higher than the Expense Group median and Expense Universe median actual management fee, and the fund’s total expenses were equal to the Expense Group median total expenses and higher than the Expense Universe total expenses.
Representatives of the Adviser stated that the Adviser has contractually agreed, until December 30, 2023 to waive receipt of its fees and/or assume the direct expenses of the fund so that the direct expenses of neither class of fund shares (excluding shareholder services fees, taxes, interest expense, brokerage commissions, commitment fees on borrowings and extraordinary expenses) exceed .50% of the fund’s average daily net assets.
Analysis of Profitability and Economies of Scale. Representatives of the Adviser reviewed the expenses allocated and profit received by the Adviser and its affiliates and the resulting profitability percentage for managing each fund and the aggregate profitability percentage to the Adviser and its affiliates for managing the funds in the BNY Mellon fund complex, and the method used to determine the expenses and profit. The Board concluded that the profitability results were not excessive, given the services rendered and service levels provided by the Adviser and its affiliates to each fund. The Board also considered the expense limitation arrangement for BNY Mellon Short-Term U.S. Government Securities Fund and the effect such arrangement had on profitability of the Adviser and its affiliates. The Board also had been provided with information prepared by an independent consulting firm regarding the Adviser’s approach to allocating costs to, and determining the profitability of, individual funds and the entire BNY Mellon fund complex. The consulting firm also had analyzed where any economies of scale might emerge in connection with the management of a fund.
As to each fund, the Board considered, on the advice of its counsel, the profitability analysis (1) as part of its evaluation of whether the fees under the Agreement, considered in relation to the mix of services provided by the Adviser, including the nature, extent and quality of such services, supported the renewal of the Agreement and (2) in light of the relevant circumstances for the fund and the extent to which economies of scale would be realized if the fund grows and whether fee levels reflect these economies of scale for the benefit of fund shareholders. Representatives of the Adviser stated that a discussion of economies of scale is predicated on a fund having achieved a substantial size with increasing assets and that, if a fund’s assets had been stable or decreasing, the possibility that the Adviser may have realized any economies of scale would be less. Representatives of the Adviser also stated that, as a result of shared and allocated costs among funds in the BNY Mellon fund complex, the extent of economies of scale could depend substantially on the level of assets in the complex as a whole, so that increases and decreases in complex-wide assets can affect potential economies of scale in a manner that is disproportionate to, or even in the opposite direction from, changes in the fund’s asset level. The Board also considered potential benefits to the Adviser from acting as investment adviser and took into consideration that there were no soft dollar arrangements in effect for trading the fund’s investments.
At the conclusion of these discussions, the Board agreed that it had been furnished with sufficient information to make an informed business decision with respect to the renewal of the Agreement. Based on the discussions and considerations as described above, the Board concluded and determined as follows.
· The Board concluded that the nature, extent and quality of the services provided by the Adviser to each fund are adequate and appropriate.
· With respect to BNY Mellon Bond Fund, BNY Mellon Corporate Bond Fund and BNY Mellon Intermediate Bond Fund, the Board determined each fund’s overall relative performance was satisfactory in light of the totality of the information presented.
· With respect to and BNY Mellon Short-Term U.S. Government Securities Fund, the Board was satisfied with the fund’s relative performance.
58
· With respect to each fund, the Board concluded that the fees paid pursuant to the Agreement continued to be appropriate under the circumstances and in light of the factors and the totality of the services provided as discussed above.
· The Board determined that the economies of scale which may accrue to the Adviser and its affiliates in connection with the management of the funds had been adequately considered by the Adviser in connection with the fee rate charged to each fund pursuant to the Agreement and that, to the extent in the future it were determined that material economies of scale had not been shared with the fund, the Board would seek to have those economies of scale shared with the fund.
In evaluating the Agreement with respect to each fund, the Board considered these conclusions and determinations and also relied on its previous knowledge, gained through meetings and other interactions with the Adviser and its affiliates, of the Adviser and the services provided to the fund pursuant to the Agreement. The Board also relied on information received on a routine and regular basis throughout the year relating to the operations of the funds and the investment management and other services provided under the Agreement, including information on the investment performance of each fund in comparison to similar mutual funds and benchmark performance indices; general market outlook as applicable to each fund; and compliance reports. In addition, the Board’s consideration of the contractual fee arrangements for each fund had the benefit of a number of years of reviews of the Agreement for the funds, during which lengthy discussions took place between the Board and representatives of the Adviser. Certain aspects of the arrangements may receive greater scrutiny in some years than in others, and the Board’s conclusions may be based, in part, on its consideration of the respective fund’s arrangements, or the arrangements for the other funds in the Trust, in prior years. The Board determined to renew the Agreement for each fund.
59
LIQUIDITY RISK MANAGEMENT PROGRAM (Unaudited)
Each fund adopted a liquidity risk management program (the “Liquidity Risk Management Program”) pursuant to the requirements of Rule 22e-4 under the Investment Company Act of 1940, as amended. Rule 22e-4 requires registered open-end funds, including mutual funds and exchange-traded funds but not money market funds, to establish liquidity risk management programs in order to effectively manage fund liquidity and shareholder redemptions. The rule is designed to mitigate the risk that a fund could not meet redemption requests without significantly diluting the interests of remaining investors.
The rule requires each fund to assess, manage and review their liquidity risk at least annually considering applicable factors such as investment strategy and liquidity during normal and foreseeable stressed conditions, including whether the strategy is appropriate for an open-end fund and whether the fund has a relatively concentrated portfolio or large positions in particular issuers. Each fund must also assess its use of borrowings and derivatives, short-term and long-term cash flow projections in normal and stressed conditions, holdings of cash and cash equivalents, and borrowing arrangements and other funding sources.
The rule also requires each fund to classify its investments as highly liquid, moderately liquid, less liquid or illiquid based on the number of days each fund expects it would take to liquidate the investment, and to review these classifications at least monthly or more often under certain conditions. The periods range from three or fewer business days for a highly liquid investment to greater than seven calendar days for settlement of a less liquid investment. Illiquid investments are those funds do not expect to be able to sell or dispose of within seven calendar days without significantly changing the market value. Each fund is prohibited from acquiring an investment if, after the acquisition, its holdings of illiquid assets will exceed 15% of its net assets. In addition, if a fund permits redemptions in-kind, the rule requires the fund to establish redemption in-kind policies and procedures governing how and when it will engage in such redemptions.
Pursuant to the rule’s requirements, the Liquidity Risk Management Program has been reviewed and approved by the Board. Furthermore, the Board has received a written report prepared by the Program’s Administrator that addresses the operation of the Program, assesses its adequacy and effectiveness and describes any material changes made to the Program.
Assessment of Program
In the opinion of the Program Administrator, the Program approved by the Board continues to be adequate for each fund and the Program has been implemented effectively. The Program Administrator has monitored the funds’ liquidity risk and the liquidity classification of the securities held by each fund and has determined that the Program is operating effectively.
During the period from January 1, 2022 to December 31, 2022, there were no material changes to the Program and no material liquidity events that impacted each fund. During the period, each fund held sufficient highly liquid assets to meet fund redemptions.
Under normal expected foreseeable fund redemption forecasts and foreseeable stressed fund redemption forecasts, the Program Administrator believes that each fund maintains sufficient highly liquid assets to meet expected fund redemptions.
60
BOARD MEMBERS INFORMATION (Unaudited)
INDEPENDENT BOARD MEMBERS
Independent Board Members
Patrick J. O’Connor (80)
Board Member, Chairman of the Board (2000)
Principal Occupation During Past 5 Years:
Attorney, Cozen O’Connor, P.C. (1973-Present), Vice Chairman (1980-2002); and President and Chief Executive Officer (2002-2007)
No. of Portfolios for which Board Member Serves: 19
———————
John R. Alchin (75)
Board Member (2008)
Principal Occupation During Past 5 Years:
· Retired
· The Barnes Foundation, an art museum, Trustee (2017 - Present)
· Metropolitan AIDS Neighborhood Nutrition Alliance, Advisory Board Member (2004 – Present)
· Philadelphia Art Museum, Board Member (2008 - Present)
· Xplornet Communications, Inc., a rural wireless tele-communications provider, Director (2015 –2020)
Other Public Company Board Memberships During Past 5 Years:
· Ralph Lauren Corporation, a retail clothing and home furnishing company, Director (2007-Present), and Chair of Audit Committee (2018-Present)
No. of Portfolios for which Board Member Serves: 19
———————
Ronald R. Davenport (87)
Board Member (2000)
Principal Occupation During Past 5 Years:
· Sheridan Broadcasting Corporation, Chairman (1972-Present)
No. of Portfolios for which Board Member Serves: 19
———————
Kim D. Kelly (67)
Board Member (2008)
Principal Occupation During Past 5 Years:
· Consultant (2005-Present)
Other Public Company Board Memberships During Past 5 Years:
· MCG Capital Corporation, a business development company, Director (2004-2015)
· HITV, broadcasting, President (2015 – 2019)
No. of Portfolios for which Board Member Serves: 19
———————
Kevin C. Phelan (79)
Board Member (2000)
Principal Occupation During Past 5 Years:
· Colliers International Mortgage Banker, (1978-Present) and Co-Chairman (2010-Present)
· A.D. Makepeace Co., cranberry grower and real estate development company, Director (2019-Present)
Other Public Company Board Memberships During Past 5 Years:
· Industrial Logistics Properties Trust, a real estate company, Trustee (2020 - Present)
No. of Portfolios for which Board Member Serves: 19
———————
Patrick J. Purcell (75)
Board Member (2000)
Principal Occupation During Past 5 Years:
· jobfind.com, an employment search site on the world wide web, President and Founder (1996 -– Present)
· The Boston Herald, President and Publisher (1994-2018)
· Herald Media, President and Chief Executive Officer, (2001 – 2018)
No. of Portfolios for which Board Member Serves: 19
———————
Thomas F. Ryan, Jr. (81)
Board Member (2000)
Principal Occupation During Past 5 Years:
· Retired
· Boston College. Trustee Associate (2013 – Present)
· NYISO Independent System Operator, a non-profit organization responsible for managing the state of New York’s electric grid, Director (1998-2021)
Other Public Company Board Memberships During Past 5 Years:
· RepliGen Corporation, a biopharmaceutical company, Director (2002-May 2022)
No. of Portfolios for which Board Member Serves: 19
———————
61
BOARD MEMBERS INFORMATION (Unaudited) (continued)
INDEPENDENT BOARD MEMBERS (continued)
Maureen M. Young (78)
Board Member (2000)
Principal Occupation During Past 5 Years:
· Retired
No. of Portfolios for which Board Member Serves: 19
———————
Once elected all Board Members serve for an indefinite term. The address of the Board Members and Officers is c/o BNY Mellon Investment Adviser, Inc. 240 Greenwich Street, New York, New York 10286. Additional information about each Board Member is available in the fund’s Statement of Additional Information which can be obtained from the Adviser free of charge by calling this toll free number: 1-800-373-9387. For individual account holders for Private Wealth Management clients, please contact your account officer or call 1-866-804-5023.
62
OFFICERS OF THE TRUST (Unaudited)
PATRICK T. CROWE, President since July 2015.
National Director of Investment Advisory, Analytics and Solutions for BNY Mellon Wealth Management since July 2014. He is 59 years old and has served in various capacities with BNY Mellon since 1993.
JAMES WINDELS, Treasurer since November 2001.
Director of the Adviser since February 2023; Vice President of the Adviser since September 2020, and Director- BNY Mellon Fund Administration. He is an officer of 54 investment companies (comprised of 122 portfolios) managed by the Adviser or an affiliate of the Adviser. He is 64 years old and has been an employee of the Adviser since April 1985.
PETER M. SULLIVAN, Chief Legal Officer since July 2021 and Vice President and Assistant Secretary since March 2019.
Chief Legal Officer of the Adviser and Associate General Counsel of BNY Mellon since July 2021; Senior Managing Counsel of BNY Mellon from December 2020 to July 2021; and Managing Counsel of BNY Mellon from March 2009 to December 2020. He is an officer of 54 investment companies (comprised of 122 portfolios) managed by the Adviser or an affiliate of the Adviser. He is 55 years old and has been an employee of BNY Mellon since April 2004.
JAMES BITETTO, Vice President since August 2005 and Secretary since February 2018.
Senior Managing Counsel of BNY Mellon since December 2019; Managing Counsel of BNY Mellon from April 2014 to December 2019; and Secretary of the Adviser. He is an officer of 54 investment companies (comprised of 122 portfolios) managed by the Adviser or an affiliate of the Adviser. He is 57 years old and has been an employee of the Adviser since December 1996.
DEIRDRE CUNNANE, Vice President and Assistant Secretary since February 2019.
Managing Counsel of BNY Mellon since December 2021; and Counsel of BNY Mellon from August 2018 to December 2021. She is an officer of 54 investment companies (comprised of 122 portfolios) managed by BNYM Investment Adviser or an affiliate of BNYM Investment Adviser. She is 33 years old and has been an employee of BNY Mellon since August 2013.
SARAH S. KELLEHER, Vice President and Assistant Secretary since April 2014.
Vice President of BNY Mellon ETF Investment Adviser, LLC since February 2020; Senior Managing Counsel of BNY Mellon since September 2021; and Managing Counsel of BNY Mellon from December 2017 to September 2021. She is an officer of 54 investment companies (comprised of 122 portfolios) managed by the Adviser or an affiliate of the Adviser. She is 47 years old and has been an employee of BNY Mellon since March 2013.
JEFF PRUSNOFSKY, Vice President and Assistant Secretary since August 2015.
Senior Managing Counsel of BNY Mellon. He is an officer of 54 investment companies (comprised of 122 portfolios) managed by the Adviser or an affiliate of the Adviser. He is 58 years old and has been an employee of the Adviser since October 1990.
AMANDA QUINN, Vice President and Assistant Secretary since March 2020.
Counsel of BNY Mellon since June 2019; Regulatory Administration Manager at BNY Mellon Investment Management Services from September 2018 to May 2019; and Senior Regulatory Specialist at BNY Mellon Investment Management Services from April 2015 to August 2018. She is an officer of 54 investment companies (comprised of 122 portfolios) managed by the Adviser or an affiliate of the Adviser. She is 38 years old and has been an employee of BNY Mellon since April 2015.
JOANNE SKERRETT, Vice President and Assistant Secretary since March 2023.
Managing Counsel of BNY Mellon since June 2022; and Senior Counsel with the Mutual Fund Directors Forum, a leading funds industry organization, from 2016 to June 2022. She is an officer of 54 investment companies (comprised of 122 portfolios) managed by BNYM Investment Adviser or an affiliate of BNYM Investment Adviser. She is 51 years old and has been an employee of BNYM Investment Adviser since June 2022.
NATALYA ZELENSKY, Vice President and Assistant Secretary since March 2017.
Chief Compliance Officer since August 2021 and Vice President since February 2020 of BNY Mellon ETF Investment Adviser, LLC; Chief Compliance Officer since August 2021 and Vice President and Assistant Secretary since February 2020 of BNY Mellon ETF Trust; Managing Counsel from December 2019 to August 2021; Counsel of BNY Mellon from May 2016 to December 2019; and Assistant Secretary of the Adviser from April 2018 to August 2021. She is an officer of 54 investment companies (comprised of 122 portfolios) managed by the Adviser or an affiliate of the Adviser. She is 38 years old and has been an employee of BNY Mellon since May 2016.
GAVIN C. REILLY, Assistant Treasurer since December 2005.
Tax Manager - BNY Mellon Fund Administration. He is an officer of 54 investment companies (comprised of 122 portfolios) managed by the Adviser or an affiliate of the Adviser. He is 55 years old and has been an employee of the Adviser since April 1991.
ROBERT SALVIOLO, Assistant Treasurer since July 2007.
Senior Accounting Manager – BNY Mellon Fund Administration. He is an officer of 54 investment companies (comprised of 122 portfolios) managed by the Adviser or an affiliate of the Adviser. He is 56 years old and has been an employee of the Adviser since June 1989.
ROBERT SVAGNA, Assistant Treasurer since December 2002.
Senior Accounting Manager – BNY Mellon Fund Administration. He is an officer of 54 investment companies (comprised of 122 portfolios) managed by the Adviser or an affiliate of the Adviser. He is 56 years old and has been an employee of the Adviser since November 1990.
JOSEPH W. CONNOLLY, Chief Compliance Officer since October 2004.
Chief Compliance Officer of the BNY Mellon Family of Funds and BNY Mellon Funds Trust since 2004; and Chief Compliance Officer of BNYM Investment Adviser from 2004 until June 2021. He is the Chief Compliance Officer of 53 investment companies (comprised of 105 portfolios) managed by BNYM Investment Adviser. He is 66 years old.
CARIDAD M. CAROSELLA, Anti-Money Laundering Compliance Officer since January 2016.
Anti-Money Laundering Compliance Officer of the BNY Mellon Family of Funds and BNY Mellon Funds Trust. She is an officer of 47 investment companies (comprised of 115 portfolios) managed by BNYM Investment Adviser or an affiliate of BNYM Investment Adviser. She is 55 years old and has been an employee of the Distributor since 1997.
63
This page intentionally left blank.
64
This page intentionally left blank.
65
This page intentionally left blank.
66
BNY Mellon Funds Trust
240 Greenwich Street
New York, NY 10286
Adviser
BNY Mellon Investment Adviser, Inc.
240 Greenwich Street
New York, NY 10286
Administrator
The Bank of New York Mellon
240 Greenwich Street
New York, NY 10286
Sub-Administrator
BNY Mellon Investment Adviser, Inc.
240 Greenwich Street
New York, NY 10286
Custodian
The Bank of New York Mellon
240 Greenwich Street
New York, NY 10286
Transfer Agent &
Dividend Disbursing Agent
BNY Mellon Transfer, Inc.
240 Greenwich Street
New York, NY 10286
Distributor
BNY Mellon Securities Corporation
240 Greenwich Street
New York, NY 10286
| | | | | | | | |
Ticker Symbols: | | | | | | | |
BNY Mellon Bond Fund | | Class M: MPBFX | | Investor: MIBDX | | | |
BNY Mellon Intermediate Bond Fund | | Class M: MPIBX | | Investor: MIIDX | | | |
BNY Mellon Corporate Bond Fund | | Class M: BYMMX | | Investor: BYMIX | | | |
BNY Mellon Short-Term U.S. Government Securities Fund | | Class M: MPSUX | | Investor: MISTX | | | |
Telephone Wealth Management (WM) Clients, please contact your Account Officer or call 1-866-804-5023. Brokerage Clients of BNY Mellon Wealth Advisors (BNYMWA), please contact your financial representative or call 1-800-830-0549, Option 2 for BNY Mellon Wealth Management Direct or 1-800-843-5466 for former brokerage clients of BNY Mellon Wealth Advisors whose accounts are now held by BNY Mellon Brokerage Services. Individual Account holders, please call BNY Mellon Investment Advisers at 1-800-373-9387.
Mail WM clients, write to your Account Officer, c/o The Bank of New York Mellon, One Mellon Bank Center, Pittsburgh, PA 15258
BNYMWA Brokerage Clients, write to your financial representative, P.O. Box 9012, Hicksville, NY 11802-9012
Individual Account Holders, write to: BNY Mellon Funds, P.O. Box 534434, Pittsburgh, Pennslylvania 15253-4434
Each fund files its complete schedule of portfolio holdings with the Securities and Exchange Commission (“SEC”) for the first and third quarters of each fiscal year on Form N-PORT. The fund’s Forms N-PORT are available on the SEC’s website at http://www.sec.gov.
A description of the policies and procedures that the fund uses to determine how to vote proxies relating to portfolio securities, and information regarding how the fund voted these proxies for the most recent 12-month period ended June 30 is available at http:// www.im.bnymellon.com and on the SEC’s website at http://www.sec.gov. The description of the policies and procedures is also available without charge, upon request, by calling 1-800-373-9387.
| | |
© 2023 BNY Mellon Securities Corporation | MFTAR0823-TB |
BNY Mellon Funds Trust
BNY Mellon National Intermediate Municipal Bond Fund
BNY Mellon National Short-Term Municipal Bond Fund
BNY Mellon Pennsylvania Intermediate Municipal Bond Fund
BNY Mellon Massachusetts Intermediate Municipal Bond Fund
BNY Mellon New York Intermediate Tax-Exempt Bond Fund
BNY Mellon Municipal Opportunities Fund
| | |
ANNUAL REPORT August 31, 2023 |

| |
Contents
THE FUNDS
FOR MORE INFORMATION
Back Cover
| |
| |
Save time. Save paper. View your next shareholder report online as soon as it’s available. Log into www.im.bnymellon.com and sign up for eCommunications. It’s simple and only takes a few minutes. |
| |
The views expressed herein are current to the date of this report. These views and the composition of the funds’ portfolios are subject to change at any time based on market and other conditions. |
| |
Not FDIC-Insured • Not Bank-Guaranteed • May Lose Value |
DISCUSSION OF FUND PERFORMANCE (Unaudited)
For the period from September 1, 2022, through August 31, 2023, as provided by John F. Flahive, CFA and Mary Collette O’Brien, Portfolio Managers with BNY Mellon Investment Adviser, Inc.
Market and Fund Performance Overview
For the 12-month period ended August 31, 2023, BNY Mellon National Intermediate Municipal Bond Fund’s (the “fund”) Class M shares produced a total return of 2.13%, and Investor shares produced a total return of 1.96%.1 In comparison, the fund’s benchmark, the S&P Municipal Bond Investment Grade Intermediate Index (the “Index”), produced a total return of 1.77%.2
Intermediate municipal bonds gained ground amid aggressive rate hikes implemented by the U.S. Federal Reserve (the “Fed”) in an effort to constrain inflation. The fund outperformed its benchmark largely due to the positive impact of credit and duration positioning.
The Fund’s Investment Approach
The fund seeks to maximize current income exempt from federal income tax to the extent consistent with the preservation of capital. To pursue its goal, the fund normally invests at least 80% of its net assets in municipal bonds that provide income exempt from federal income tax. The fund’s investments in municipal and taxable bonds must be rated investment grade at the time of purchase or, if unrated, deemed of comparable quality by the investment adviser. 5 Generally, the fund’s average effective portfolio maturity will be between three and ten years, and the average effective duration of the fund’s portfolio will not exceed eight years.
Municipal Bonds Outperform Investment-Grade Corporate and Treasury Securities
Bond yields generally rose during the reporting period as the Fed sharply increased the federal funds rate in an effort to curb high levels of inflation. At the same time, bond prices, which tend to move in the opposite direction of yields, declined. Although inflation appeared to peak before the period began, topping at over 9% in June, it remained over 8% at the start of the period, well above the Fed’s 2% target rate. The Fed responded with its third consecutive 0.75% increase to the federal funds rate in September, while indicating that additional increases were likely, increasing concerns of a possible recession.
The economic backdrop began improving in mid-October as inflationary pressures eased, and economic data reassured investors that a recession was not imminent. U.S. inflation levels dropped steadily, dipping below 3% in June 2023 and remaining under 4% through the end of the period. While the Fed continued to hike rates, the scale of increases eased, with a fourth 0.75% increase in November 2022, followed by a 0.50% increase in December and four subsequent 0.25% increases in 2023. At the same time, the U.S. economy continued to grow, bolstered by strong consumer spending, rising wages and robust levels of employment. Different asset classes responded to these developments in different ways. Treasury securities, particularly long-term Treasury bonds, underperformed. The Treasury yield curve remained inverted throughout the period, with short-term Treasury rates exceeding long-term rates. On the other hand, investment-grade corporates registered modest gains, while municipal securities performed stronger still.
Municipal bonds benefited from declining fund outflows and a constrained supply of new issues, which helped support prices. The characteristics of the municipal yield curve further supported the asset class. Municipal yields rose less dramatically than yields for most other fixed-income asset classes. As a result, the municipal yield curve was not completely inverted, with one-year municipal yields approximately equivalent to 15-year municipal yields. For all fixed-income asset classes, municipals included, lower-credit-quality securities tended to outperform their higher-credit-quality counterparts. Short-duration instruments outperformed early in the period, with strength shifting to longer-duration issues later. Yields grew increasingly attractive across the bond spectrum during the period.
Credit and Duration Positioning Bolster Relative Returns
The fund outperformed the Index primarily due to credit and duration positioning. From a credit-quality perspective, the fund held overweight exposure to better-performing, lower-credit-quality municipals, with the greatest overweight exposure among BBB-rated securities. Within each credit rating group, the fund outperformed the Index due to strong issue selection and positive impact of sector-driven positions, including overweight exposure to health care, housing transportation and IDR/PCR (industry development revenue/pollution control revenue). Duration positioning proved positive as well, with fund duration shifting from relatively short compared to the Index at the start of the period, when the market rewarded shorter durations, to approximately neutral toward the end of the period. Returns also benefited from the positive impact of a small allocation to Treasury bond futures, positions designed to dampen volatility and lower the fund’s effective duration. These positions bolstered the fund’s absolute and relative performance as Treasury yields rose more than municipal bond yields. Of the few positions that detracted from relative returns, the most notable was issue-specific underperformance in the utilities sector.
Well Positioned for the Prevailing Environment
While the economy has remained resilient in the face of the Fed’s aggressive efforts to combat inflation, cracks have begun to appear in some areas, including increasing consumer delinquencies and tightening bank credit, with impacts on commercial real estate and commercial and industrial loans. We expect to see further effects if, as expected, the Fed maintains rates at or near current levels for an extended period of time. On the other hand, the level of inflation has declined substantially, and the labor market remains healthy, with the overall economy continuing to benefit from several recent federal programs designed to stimulate growth, including the CHIPS and Science Act, the $1 trillion bipartisan infrastructure bill and the Inflation Reduction Act of 2022. Furthermore, most U.S. municipalities are in strong financial shape, buoyed by rising tax revenues and federal government support. Accordingly, while we expect economic growth to slow modestly in the near term, we do not anticipate a steep recession.
In light of these countervailing forces, we continue to maintain the fund’s yield advantage, while remaining cautious regarding the valuations of positions we add to the portfolio. Specifically, we have maintained the fund’s relatively neutral duration position, with overweight exposure to the short and long ends of the yield curve, where we find the most attractive yield opportunities, and underweight exposure to the middle of the curve. Regarding credit, we continue to emphasize lower-credit-quality issues rated BBB and A, while holding underweight exposure to higher-rated AA and AAA credits. From a geographic perspective, the fund holds overweight exposure to New York and, to a lesser degree, New Jersey and Pennsylvania, and underweight exposure to California. In terms of sectors, the fund holds overweight positions in high yield, housing, transportation and IDR/PCR, and underweight positions in state and local general obligations and utilities, which tend to be higher rated and lower yielding.
September 15, 2023
1 Total return includes reinvestment of dividends and any capital gains paid. Past performance is no guarantee of future results. Share price, yield and investment return fluctuate such that upon redemption, fund shares may be worth more or less than their original cost. Income may be subject to state and local taxes, and some income may be subject to the federal alternative minimum tax (AMT) for certain investors. Capital gains, if any, are fully taxable.
2 Source: FactSet. — The S&P Municipal Bond Investment Grade Intermediate Index consists of bonds in the S&P Municipal Bond Index that are rated at least BBB- by Standard & Poor’s, Baa3 by Moody’s or BBB- by Fitch Ratings. All bonds must also have a minimum maturity of three years and a maximum maturity of up to, but not including, 15 years as measured from the rebalancing date. Investors cannot invest directly in any index.
3 The fund may continue to own investment-grade bonds (at the time of purchase), which are subsequently downgraded to below investment grade.
Bonds are subject generally to interest-rate, credit, liquidity and market risks, to varying degrees, all of which are more fully described in the fund’s prospectus. Generally, all other factors being equal, bond prices are inversely related to interest-rate changes, and rate increases can cause price declines. Municipal income may be subject to state and local taxes. Capital gains, if any, are taxable.
The fund may, but is not required to, use derivative instruments. A small investment in derivatives could have a potentially large impact on the fund’s performance. The use of derivatives involves risks different from, or possibly greater than, the risks associated with investing directly in the underlying assets.
2
For the period from September 1, 2022, through August 31, 2023, as provided by John F. Flahive, portfolio manager with BNY Mellon Investment Adviser, Inc.
Market and Fund Performance Overview
For the 12-month period ended August 31, 2023, BNY Mellon National Short-Term Municipal Bond Fund’s (the “fund”) Class M shares produced a total return of 1.68%, and Investor shares produced a total return of 1.43%.1 In comparison, the fund’s benchmark index, the S&P Municipal Bond Investment Grade Short Index2 (the “Index”), produced a total return of 1.54%.
Short-term municipal bonds gained modest ground amid aggressive rate hikes implemented by the U.S. Federal Reserve (the “Fed”) in an effort to constrain inflation. The fund generated mixed performance compared to the Index, with relatively strong returns in some areas balanced by relatively weak returns in others.
The Fund’s Investment Approach
The fund seeks to maximize current income exempt from federal income tax to the extent consistent with the preservation of capital. To pursue its goal, the fund normally invests at least 80% of its net assets in municipal bonds that provide income exempt from federal income tax. The fund’s investments in municipal and taxable bonds must be rated investment grade at the time of purchase or, if unrated, deemed of comparable quality by the investment adviser.5 Generally, the average effective portfolio maturity and the average effective portfolio duration of the fund’s portfolio will be less than three years.
Municipal Bonds Outperform Investment-Grade Corporate and Treasury Securities
Bond yields generally rose during the reporting period as the Fed sharply increased the federal funds rate in an effort to curb high levels of inflation. At the same time, bond prices, which tend to move in the opposite direction of yields, declined. Although inflation appeared to peak before the period began, topping at over 9% in June, it remained over 8% at the start of the period, well above the Fed’s 2% target rate. The Fed responded with its third consecutive 0.75% increase to the federal funds rate in September, while indicating that additional increases were likely, increasing concerns of a possible recession.
The economic backdrop began improving in mid-October as inflationary pressures eased, and economic data reassured investors that a recession was not imminent. U.S. inflation levels dropped steadily, dipping below 3% in June 2023 and remaining under 4% through the end of the period. While the Fed continued to hike rates, the scale of increases eased, with a fourth 0.75% increase in November 2022, followed by a 0.50% increase in December and four subsequent 0.25% increases in 2023. At the same time, the U.S. economy continued to grow, bolstered by strong consumer spending, rising wages and robust levels of employment. Different asset classes responded to these developments in different ways. Treasury securities, particularly long-term Treasury bonds, underperformed. The Treasury yield curve remained inverted throughout the period, with short-term Treasury rates exceeding long-term rates. On the other hand, investment-grade corporates registered modest gains, while municipal securities performed stronger still.
Municipal bonds benefited from declining fund outflows and a constrained supply of new issues, which helped support prices. The characteristics of the municipal yield curve further supported the asset class. Municipal yields rose less dramatically than yields for most other fixed-income asset classes. As a result, the municipal yield curve was not completely inverted, with one-year municipal yields approximately equivalent to 15-year municipal yields. For all fixed-income asset classes, municipals included, lower-credit-quality securities tended to outperform their higher-credit-quality counterparts. Short-duration instruments outperformed early in the period, with strength shifting to longer-duration issues later. Yields grew increasingly attractive across the bond spectrum during the period.
Mixed Returns from Sector Allocation and Security Selection
During the period, the fund held an average duration shorter than that of the Index, a position that added value, particularly in the earlier portion of the period. From a credit perspective, the fund held slightly overweight exposure to lower-credit-quality bonds rated BBB and A, and underweight exposure to higher-credit-quality bonds rated AA and AAA, with every credit position bolstering relative performance. Most sector positions added value as well, with overweight exposure to lower-credit-quality, higher-yielding revenue bonds in the housing and IDR/PCR (industry development revenue/pollution control revenue), and underweight exposure to higher-credit-quality, lower-yielding prerefunded and state and local general obligation bonds. However, issue-specific underperformance detracted from relative returns in some areas.
Well Positioned for the Prevailing Environment
While the economy has remained resilient in the face of the Fed’s aggressive efforts to combat inflation, cracks have begun to appear in some areas, including increasing consumer delinquencies and tightening bank credit, with impacts on commercial real estate and commercial and industrial loans. We expect to see further effects if, as expected, the Fed maintains rates at or near current levels for an extended period of time. On the other hand, the level of inflation has declined substantially, and the labor market remains healthy, with the overall economy continuing to benefit from several recent federal programs designed to stimulate growth, including the CHIPS and Science Act, the $1 trillion bipartisan infrastructure bill and the Inflation Reduction Act of 2022. Furthermore, most U.S. municipalities are in strong financial shape, buoyed by rising tax revenues and federal government support. Accordingly, while we expect economic growth to slow modestly in the near term, we do not anticipate a steep recession.
In light of these countervailing forces, we continue to maintain the fund’s yield advantage, while remaining cautious regarding the valuations of positions we add to the portfolio. Specifically, we continue to emphasize lower-credit-quality issues rated BBB and A, while holding underweight exposure to higher-rated AA and AAA credits. In terms of sectors, the fund holds overweight positions in relatively high-yielding revenue sectors and underweight positions in lower-yielding state and local general obligation bonds.
September 15, 2023
1 Total return includes reinvestment of dividends and any capital gains paid. Past performance is no guarantee of future results. Share price, yield and investment return fluctuate such that upon redemption, fund shares may be worth more or less than their original cost. Income may be subject to state and local taxes, and some income may be subject to the federal alternative minimum tax (AMT) for certain investors. Capital gains, if any, are fully taxable. The fund’s return reflects the absorption of certain fund expenses by BNY Mellon Investment Adviser, Inc. pursuant to an agreement in effect through December 30, 2023, at which time it may be extended, modified or terminated. Had these expenses not been absorbed, returns would have been lower.
2 Source: FactSet — The S&P Municipal Bond Investment Grade Short Index consists of bonds in the S&P Municipal Bond Index that are rated at least BBB- by Standard &Poor’s, Baa3 by Moody’s or BBB- by Fitch Ratings. All bonds must also have a minimum maturity of six months and a maximum maturity of up to, but not including, four years as measured from the rebalancing date. Investors cannot invest directly in any index.
3 The fund may continue to own investment-grade bonds (at the time of purchase), which are subsequently downgraded to below investment grade.
Bonds are subject generally to interest-rate, credit, liquidity and market risks, to varying degrees, all of which are more fully described in the fund’s prospectus. Generally, all other factors being equal, bond prices are inversely related to interest-rate changes, and rate increases can cause price declines. Municipal bonds may be subject to state and local taxes. Capital gains, if any, are taxable.
3
DISCUSSION OF FUND PERFORMANCE (Unaudited) (continued)
For the period from September 1, 2022, through August 31, 2023, as provided by Gregory J. Conant and Mary Collette O’Brien, Portfolio Managers with BNY Mellon Investment Adviser, Inc.
Market and Fund Performance Overview
For the 12-month period ended August 31, 2023, BNY Mellon Pennsylvania Intermediate Municipal Bond Fund’s (the “fund”) Class M shares produced a total return of 1.98%, and Investor shares produced a total return of 1.72%.1 In comparison, the fund’s benchmark, the S&P Municipal Bond Investment Grade Intermediate Index (the “Index”), produced a total return of 1.77%. 2
Intermediate municipal bonds gained ground amid aggressive rate hikes implemented by the U.S. Federal Reserve (the “Fed”) in an effort to constrain inflation. The fund generated mixed performance compared to the Index, with relatively strong returns in some areas balanced by relatively weak returns in others.
The Fund’s Investment Approach
The fund seeks as high a level of income exempt from federal and Pennsylvania state income taxes as is consistent with the preservation of capital. To pursue its goal, the fund normally invests at least 80% of its net assets in municipal bonds that provide income exempt from federal and Pennsylvania state personal income taxes. These municipal bonds include those issued by the Commonwealth of Pennsylvania, as well as those issued by territories and possessions of the United States and the District of Columbia and their political subdivisions, agencies and instrumentalities, or multistate agencies and authorities, and certain other specified securities. The fund’s investments in municipal and taxable bonds must be rated investment grade (i.e., Baa/BBB or higher) at the time of purchase or, if unrated, deemed of comparable quality by the investment adviser.5 Generally, the fund’s average effective portfolio maturity will be between three and ten years, and the average effective duration of the fund’s portfolio will not exceed eight years.
Municipal Bonds Buck Negative Corporate and Treasury Trends
Bond yields generally rose during the reporting period as the Fed increased the federal funds rate in an effort to curb high levels of inflation. Although inflation appeared to peak before the period began, topping at over 9% in June, it remained over 8% at the start of the period, well above the Fed’s 2% target rate. The Fed responded with its two consecutive 0.75% rate hikes in September and November, followed by additional increases of 0.50% in December and 0.25% in January. Inflation declined to under 7% in January, and economic growth appeared to soften; however, consumer spending, wage growth and employment numbers remained strong, leading to increased speculation in February that the Fed might need to raise rates higher and for longer than previously anticipated.
As yields rose, bond prices generally declined. The sharpest rise in yields occurred in the short end of the yield curve. While the benchmark 10-year Treasury bond yield rose from 3.26% at the beginning of September 2022 to 3.92% as of February 28, 2023, the two-year Treasury bond yield rose from 3.51% to 4.81% during the same period. Short Treasury yields remained higher than long Treasury yields throughout the reporting period, a condition known as an inverted yield curve, generally seen as a precursor to economic recession. Not surprisingly, given the market’s volatility and uncertainty, most short-duration, fixed-income instruments outperformed their longer-duration counterparts during the period.
The municipal bond market bucked the broadly negative trend among Treasury and corporate fixed-income asset classes, delivering positive returns despite headwinds from rising interest rates. While municipal bond yields fluctuated, they generally trended lower during the period. Within the asset class, longer-duration instruments outperformed shorter-duration ones, and higher-credit-quality securities outperformed lower-credit-quality ones.
Curve Positioning Impactful
The fund’s returns relative to the Index benefited from duration positioning, with fund duration shifting from relatively short, compared to the Index at the start of the period when the market rewarded shorter durations, to approximately neutral toward the end of the period. Returns also benefited from the positive impact of overweight exposure to lower-credit-quality, higher-yielding revenue bonds in the education, health care, housing and IDR/PCR (industry development revenue/pollution control revenue) sectors, and underweight exposure to higher-credit-quality, lower-yielding state and local general obligation bonds and utilities. The fund’s credit positioning produced mixed returns, with significantly overweight exposure to lower-quality, higher-yielding BBB securities detracting.
Well Positioned for the Prevailing Environment
While the economy has remained resilient in the face of the Fed’s aggressive efforts to combat inflation, cracks have begun to appear in some areas, including increasing consumer delinquencies and tightening bank credit, with impacts on commercial real estate and commercial and industrial loans. We expect to see further effects if, as expected, the Fed maintains rates at or near current levels for an extended period of time. On the other hand, the level of inflation has declined substantially, and the labor market remains healthy, with the overall economy continuing to benefit from several recent federal programs designed to stimulate growth, including the CHIPS and Science Act, the $1 trillion bipartisan infrastructure bill and the Inflation Reduction Act of 2022. Furthermore, states and municipalities are generally in strong financial shape, buoyed by rising tax revenues and federal government support. Accordingly, while we expect economic growth to slow modestly in the near term, we do not anticipate a steep recession.
In light of these countervailing forces, we continue to maintain the fund’s yield advantage, while remaining cautious regarding the valuations of positions we add to the portfolio. Specifically, we have maintained the fund’s relatively neutral duration position, with overweight exposure to the short and long ends of the yield curve, where we find the most attractive yield opportunities, and underweight exposure to the middle of the curve. Regarding credit, we continue to emphasize lower-credit-quality issues rated BBB and A, while holding underweight exposure to higher-rated AA and AAA credits. In terms of sectors, the fund holds overweight positions in health care, education and housing, and underweight positions in state and local general obligations and utilities, which tend to be higher rated and lower yielding.
September 15, 2023
1 Total return includes reinvestment of dividends and any capital gains paid. Past performance is no guarantee of future results. Share price, yield and investment return fluctuate such that upon redemption, fund shares may be worth more or less than their original cost. Income may be subject to state and local taxes for non-Pennsylvania residents, and some income may be subject to the federal alternative minimum tax (AMT) for certain investors. Capital gains, if any, are fully taxable. The fund’s return reflects the absorption of certain fund expenses by BNY Mellon Investment Adviser, Inc. pursuant to an agreement in effect through December 30, 2023, at which time it may be extended, modified or terminated. Had these expenses not been absorbed, returns would have been lower.
2 Source: FactSet — The S&P Municipal Bond Investment Grade Intermediate Index consists of bonds in the S&P Municipal Bond Index that are rated at least BBB- by Standard & Poor’s, Baa3 by Moody’s or BBB- by Fitch Ratings. All bonds must also have a minimum maturity of three years and a maximum maturity of up to, but not including, 15 years as measured from the rebalancing date. Unlike a mutual fund, the index is not subject to charges, fees and other expenses and is not limited to investments principally in Pennsylvania municipal obligations. Investors cannot invest directly in any index.
3 The fund may continue to own investment-grade bonds (at the time of purchase), which are subsequently downgraded to below investment grade.
Bonds are subject generally to interest-rate, credit, liquidity and market risks, to varying degrees, all of which are more fully described in the fund’s prospectus. Generally, all other factors being equal, bond prices are inversely related to interest-rate changes, and rate increases can cause price declines. Municipal income may be subject to state and local taxes. Capital gains, if any, are fully taxable.
The fund may, but is not required to, use derivative instruments. A small investment in derivatives could have a potentially large impact on the fund’s performance. The use of derivatives involves risks different from, or possibly greater than, the risks associated with investing directly in the underlying assets.
4
For the period from September 1, 2022, through August 31, 2023, as provided by Mary Collette O’Brien and Stephen J. O’Brien, portfolio managers of BNY Mellon Investment Adviser, Inc.
Market and Fund Performance Overview
For the 12-month period ended August 31, 2023, BNY Mellon Massachusetts Intermediate Municipal Bond Fund’s (the “fund”) Class M shares produced a total return of 2.27%, and Investor shares produced a total return of 2.01%.1 In comparison, the fund’s benchmark, the S&P Municipal Bond Investment Grade Intermediate Index (the “Index”), produced a total return of 1.77%.2
Intermediate municipal bonds gained ground amid aggressive rate hikes implemented by the U.S. Federal Reserve (the “Fed”) in an effort to constrain inflation. The fund outperformed its benchmark largely due to the positive impact of duration and sector positioning.
The Fund’s Investment Approach
The fund seeks as high a level of income exempt from federal and Massachusetts state income taxes as is consistent with the preservation of capital. To pursue its goal, the fund normally invests at least 80% of its net assets, plus any borrowings for investment purposes, in municipal bonds that provide income exempt from federal and Massachusetts state personal income taxes. The fund’s investments in municipal and taxable bonds must be rated investment grade at the time of purchase or, if unrated, deemed of comparable quality by the investment adviser.3 Generally, the fund’s average effective portfolio maturity will be between three and ten years, and the average effective duration of the fund’s portfolio will not exceed eight years.
Municipal Bonds Outperform Investment-Grade Corporate and Treasury Securities
Bond yields generally rose during the reporting period as the Fed sharply increased the federal funds rate in an effort to curb high levels of inflation. At the same time, bond prices, which tend to move in the opposite direction of yields, declined. Although inflation appeared to peak before the period began, topping at over 9% in June, it remained over 8% at the start of the period, well above the Fed’s 2% target rate. The Fed responded with its third consecutive 0.75% increase to the federal funds rate in September, while indicating that additional increases were likely, increasing concerns of a possible recession.
The economic backdrop began improving in mid-October as inflationary pressures eased, and economic data reassured investors that a recession was not imminent. U.S. inflation levels dropped steadily, dipping below 3% in June 2023 and remaining under 4% through the end of the period. While the Fed continued to hike rates, the scale of increases eased, with a fourth 0.75% increase in November 2022, followed by a 0.50% increase in December and four subsequent 0.25% increases in 2023. At the same time, the U.S. economy continued to grow, bolstered by strong consumer spending, rising wages and robust levels of employment. Different asset classes responded to these developments in different ways. Treasury securities, particularly long-term Treasury bonds, underperformed. The Treasury yield curve remained inverted throughout the period, with short-term Treasury rates exceeding long-term rates. On the other hand, investment-grade corporates registered modest gains, while municipal securities performed stronger still.
Municipals benefited from declining fund outflows and a constrained supply of new issues, which helped support prices. The characteristics of the municipal yield curve further supported the asset class. Municipal yields rose less dramatically than yields for most other fixed-income asset classes. As a result, the municipal yield curve was not completely inverted, with one-year municipal yields approximately equivalent to 15-year municipal yields. For all fixed-income asset classes, municipals included, lower-credit-quality securities tended to outperform their higher-credit-quality counterparts. Short-duration instruments outperformed early in the period, with strength shifting to longer-duration issues later. Yields grew increasingly attractive across the bond spectrum during the period.
Duration Positioning Bolsters Relative Returns
The fund outperformed the Index due primarily to duration positioning, with fund duration shifting from relatively short compared to the Index at the start of the period, when the market rewarded shorter durations, to approximately neutral toward the end of the period. Returns also benefited from the positive impact of overweight exposure to lower-credit-quality, higher yielding revenue bonds in the education, health care, housing and Industry Development Revenue/Pollution Control Revenue (IDR/PCR) sectors, and underweight exposure to higher-credit-quality, lower-yielding state and local general obligation bonds and utilities. The fund’s credit positioning produced mixed returns, with significantly overweight exposure to lower-quality, higher-yielding BBB securities detracting.
Well Positioned for the Prevailing Environment
While the economy has remained resilient in the face of the Fed’s aggressive efforts to combat inflation, cracks have begun to appear in some areas, including increasing consumer delinquencies and tightening bank credit, with impacts on commercial real estate and commercial and industrial loans. We expect to see further effects if, as expected, the Fed maintains rates at or near current levels for an extended period of time. On the other hand, the level of inflation has declined substantially, and the labor market remains healthy, with the overall economy continuing to benefit from several recent federal programs designed to stimulate growth, including the CHIPS and Science Act, the $1 trillion bipartisan infrastructure bill and the Inflation Reduction Act of 2022. Furthermore, states and municipalities are generally in strong financial shape, buoyed by rising tax revenues and federal government support. Accordingly, while we expect economic growth to slow modestly in the near term, we do not anticipate a steep recession.
In light of these countervailing forces, we continue to maintain the fund’s yield advantage, while remaining cautious regarding the valuations of positions we add to the portfolio. Specifically, we have maintained the fund’s relatively neutral duration position, with overweight exposure to the short and long ends of the yield curve, where we find the most attractive yield opportunities, and underweight exposure to the middle of the curve. Regarding credit, we continue to emphasize lower-credit-quality issues rated BBB and A, while holding underweight exposure to higher-rated AA and AAA credits. In terms of sectors, the fund holds overweight positions in education, health care, housing and IDR/PCR, and underweight positions in state and local general obligations and utilities, which tend to be higher rated and lower yielding.
September 15, 2023
1 Total return includes reinvestment of dividends and any capital gains paid. Past performance is no guarantee of future results. Share price, yield and investment return fluctuate such that upon redemption, fund shares may be worth more or less than their original cost. Income may be subject to state and local taxes, and some income may be subject to the federal alternative minimum tax (AMT) for certain investors. Capital gains, if any, are fully taxable.
2 Source: FactSet — The S&P Municipal Bond Investment Grade Intermediate Index consists of bonds in the S&P Municipal Bond Index that are rated at least BBB- by Standard & Poor’s, Baa3 by Moody’s or BBB- by Fitch Ratings. All bonds must also have a minimum maturity of three years and a maximum maturity of up to, but not including, 15 years as measured from the rebalancing date. Investors cannot invest directly in any index.
3 The fund may continue to own investment-grade bonds (at the time of purchase), which are subsequently downgraded to below investment grade.
Bonds are subject generally to interest-rate, credit, liquidity and market risks, to varying degrees, all of which are more fully described in the fund’s prospectus. Generally, all other factors being equal, bond prices are inversely related to interest-rate changes, and rate increases can cause price declines. The amount of public information available about municipal bonds is generally less than that for corporate equities or bonds. Special factors, such as legislative changes, and state and local economic and business developments, may adversely affect the yield and/or value of the fund’s investments in municipal bonds. Other factors include the general conditions of the municipal bond market, the size of the particular offering, the maturity of the obligation and the rating of the issue. Changes in economic, business or political conditions relating to a particular municipal project, municipality, or state in which the fund invests may have an impact on the fund’s share price.
The fund may, but is not required to, use derivative instruments. A small investment in derivatives could have a potentially large impact on the fund’s performance. The use of derivatives involves risks different from, or possibly greater than, the risks associated with investing directly in the underlying assets.
5
DISCUSSION OF FUND PERFORMANCE (Unaudited) (continued)
For the period from September 1, 2022, through August 31, 2023, as provided by John F. Flahive and Gregory J. Conant, portfolio managers of BNY Mellon Investment Adviser, Inc.
Market and Fund Performance Overview
For the 12-month period ended August 31, 2023, BNY Mellon New York Intermediate Tax-Exempt Bond Fund’s (the “fund”) Class M shares produced a total return of 2.14%, and Investor shares produced a total return of 1.98%.1 In comparison, the fund’s benchmark, the S&P Municipal Bond Investment Grade Intermediate Index (the “Index”), produced a total return of 1.77% for the same period.2
Intermediate municipal bonds gained ground amid aggressive rate hikes implemented by the U.S. Federal Reserve (the “Fed”) in an effort to constrain inflation. The fund outperformed its benchmark largely due to the positive impact of duration and sector positioning.
The Fund’s Investment Approach
The fund seeks as high a level of income exempt from federal, New York State and New York City income taxes as is consistent with the preservation of capital. This objective may be changed without shareholder approval. To pursue its goal, the fund normally invests at least 80% of its net assets in municipal bonds that provide income exempt from federal, New York State and New York City personal income taxes. These municipal bonds include those issued by New York State and New York City, as well as those issued by U.S. territories and possessions of the United States and the District of Columbia and their political subdivisions, agencies and instrumentalities, or multistate agencies and authorities, and certain other specified securities. Generally, the fund’s average effective portfolio maturity will be between three and ten years.
Municipal Bonds Outperform Investment-Grade Corporate and Treasury Securities
Bond yields generally rose during the reporting period as the Fed sharply increased the federal funds rate in an effort to curb high levels of inflation. At the same time, bond prices, which tend to move in the opposite direction of yields, declined. Although inflation appeared to peak before the period began, topping at over 9% in June, it remained over 8% at the start of the period, well above the Fed’s 2% target rate. The Fed responded with its third consecutive 0.75% increase to the federal funds rate in September, while indicating that additional increases were likely, increasing concerns of a possible recession.
The economic backdrop began improving in mid-October as inflationary pressures eased, and economic data reassured investors that a recession was not imminent. U.S. inflation levels dropped steadily, dipping below 3% in June 2023 and remaining under 4% through the end of the period. While the Fed continued to hike rates, the scale of increases eased, with a fourth 0.75% increase in November 2022, followed by a 0.50% increase in December and four subsequent 0.25% increases in 2023. At the same time, the U.S. economy continued to grow, bolstered by strong consumer spending, rising wages and robust levels of employment. Different asset classes responded to these developments in different ways. Treasury securities, particularly long-term Treasury bonds, underperformed. The Treasury yield curve remained inverted throughout the period, with short-term Treasury rates exceeding long-term rates. On the other hand, investment-grade corporates registered modest gains, while municipal securities performed stronger still.
Municipals benefited from declining fund outflows and a constrained supply of new issues, which helped support prices. The characteristics of the municipal yield curve further supported the asset class. Municipal yields rose less dramatically than yields for most other fixed-income asset classes. As a result, the municipal yield curve was not completely inverted, with one-year municipal yields approximately equivalent to 15-year municipal yields. For all fixed-income asset classes, municipals included, lower-credit-quality securities tended to outperform their higher-credit-quality counterparts. Short-duration instruments outperformed early in the period, with strength shifting to longer-duration issues later. Yields grew increasingly attractive across the bond spectrum during the period.
Duration Positioning Bolsters Relative Returns
The fund outperformed the Index due primarily to duration positioning, with fund duration shifting from relatively short compared to the Index at the start of the period, when the market rewarded shorter durations, to approximately neutral toward the end of the period. Returns also benefited from the positive impact of overweight exposure to lower-credit-quality, higher yielding revenue bonds in the education and IDR/PCR (industry development revenue/pollution control revenue) sectors, and underweight exposure to higher-credit-quality, lower yielding state and local general obligation bonds. Among utilities, overweight exposure to public power enhanced returns. Issue-specific factors contributed positively to returns as well, bolstered by sharply improving spreads in the New York market in 2023 after more challenging conditions in 2022. The fund’s credit positioning produced mixed returns.
Well Positioned for the Prevailing Environment
While the economy has remained resilient in the face of the Fed’s aggressive efforts to combat inflation, cracks have begun to appear in some areas, including increasing consumer delinquencies and tightening bank credit, with impacts on commercial real estate and commercial and industrial loans. We expect to see further effects if, as expected, the Fed maintains rates at or near current levels for an extended period of time. On the other hand, the level of inflation has declined substantially, and the labor market remains healthy, with the overall economy continuing to benefit from several recent federal programs designed to stimulate growth, including the CHIPS and Science Act, the $1 trillion bipartisan infrastructure bill and the Inflation Reduction Act of 2022. Furthermore, states and municipalities are generally in strong financial shape, buoyed by rising tax revenues and federal government support. Accordingly, while we expect economic growth to slow modestly in the near term, we do not anticipate a steep recession.
In light of these countervailing forces, we continue to maintain the fund’s yield advantage, while remaining cautious regarding the valuations of positions we add to the portfolio. Specifically, we have maintained the fund’s relatively neutral duration position, with overweight exposure to the short and long ends of the yield curve, where we find the most attractive yield opportunities, and underweight exposure to the middle of the curve. Regarding credit, we continue to emphasize lower-credit-quality issues rated BBB and A, while holding underweight exposure to higher-rated AA and AAA credits. In terms of sectors, the fund holds overweight positions in education and IDR/PCR, and underweight positions in state and local general obligations, which tend to be higher rated and lower yielding.
September 15, 2023
1 Total return includes reinvestment of dividends and any capital gains paid. Past performance is no guarantee of future results. Share price, yield and investment return fluctuate such that upon redemption, fund shares may be worth more or less than their original cost. Income may be subject to state and local taxes, and some income may be subject to the federal alternative minimum tax (AMT) for certain investors. Capital gains, if any, are fully taxable. The fund’s return reflects the absorption of certain fund expenses by BNY Mellon Investment Adviser, Inc. pursuant to an agreement in effect through December 30, 2023, at which time it may be extended, modified or terminated. Had these expenses not been absorbed, returns would have been lower.
2 Source: FactSet — The S&P Municipal Bond Investment Grade Intermediate Index consists of bonds in the S&P Municipal Bond Index that are rated at least BBB- by Standard & Poor’s, Baa3 by Moody’s or BBB- by Fitch Ratings. All bonds must also have a minimum maturity of three years and a maximum maturity of up to, but not including, 15 years as measured from the rebalancing date. Investors cannot invest directly in any index.
Bonds are subject generally to interest-rate, credit, liquidity and market risks, to varying degrees, all of which are more fully described in the fund’s prospectus. Generally, all other factors being equal, bond prices are inversely related to interest-rate changes, and rate increases can cause price declines. Municipal income may be subject to state and local taxes. Capital gains, if any, are taxable.
The fund may, but is not required to, use derivative instruments. A small investment in derivatives could have a potentially large impact on the fund’s performance. The use of derivatives involves risks different from, or possibly greater than, the risks associated with investing directly in the underlying assets.
6
For the period from September 1, 2022, through August 31, 2023, as provided by John F. Flahive, CFA, portfolio manager with BNY Mellon Investment Adviser, Inc.
Market and Fund Performance Overview
For the 12-month period ended August 31, 2023, BNY Mellon Municipal Opportunities Fund’s (the “fund”) Class M shares produced a total return of 2.60%, and Investor shares produced a total return of 2.26%.1 In comparison, the fund’s benchmark, the Bloomberg U.S. Municipal Bond Index (the “Index”), produced a total return of 1.70% for the same period.2
Municipal bonds gained modest ground amid aggressive rate hikes implemented by the U.S. Federal Reserve (the “Fed”) in an effort to constrain inflation. The fund outperformed its benchmark largely due to the positive impact of interest-rate hedges.
The Fund’s Investment Approach
The fund seeks to maximize total return consisting of high current income exempt from federal income tax and capital appreciation. This objective may be changed without shareholder approval. To pursue its goal, the fund normally invests at least 80% of its net assets in U.S. dollar-denominated, fixed-income securities that provide income exempt from federal income tax (municipal bonds). While the fund typically invests in a diversified portfolio of municipal bonds, it may invest up to 20% of its assets in taxable fixed-income securities, including taxable municipal bonds and non-U.S. dollar-denominated, foreign-debt securities, such as Brady bonds and sovereign-debt obligations.
BNY Mellon Investment Adviser, Inc. seeks to deliver value-added, excess returns (“alpha”) by applying an investment approach designed to identify and exploit relative-value opportunities within the municipal bond market. Although the fund seeks to be diversified by geography and sector, it may at times invest a significant portion of its assets in a particular state or region or in a particular sector due to market conditions.
Municipal Bonds Outperform Investment-Grade Corporate and Treasury Securities
Bond yields generally rose during the reporting period as the Fed sharply increased the federal funds rate in an effort to curb high levels of inflation. At the same time, bond prices, which tend to move in the opposite direction of yields, declined. Although inflation appeared to peak before the period began, topping at over 9% in June, it remained over 8% at the start of the period, well above the Fed’s 2% target rate. The Fed responded with its third consecutive 0.75% increase to the federal funds rate in September, while indicating that additional increases were likely, increasing concerns of a possible recession.
The economic backdrop began improving in mid-October as inflationary pressures eased, and economic data reassured investors that a recession was not imminent. U.S. inflation levels dropped steadily, dipping below 3% in June 2023 and remaining under 4% through the end of the period. While the Fed continued to hike rates, the scale of increases eased, with a fourth 0.75% increase in November 2022, followed by a 0.50% increase in December and four subsequent 0.25% increases in 2023. At the same time, the U.S. economy continued to grow, bolstered by strong consumer spending, rising wages and robust levels of employment. Different asset classes responded to these developments in different ways. Treasury securities, particularly long-term Treasury bonds, underperformed. The Treasury yield curve remained inverted throughout the period, with short-term Treasury rates exceeding long-term rates. On the other hand, investment-grade corporates registered modest gains, while municipal securities performed stronger still.
Municipal bonds benefited from declining fund outflows and a constrained supply of new issues, which helped support prices. The characteristics of the municipal yield curve further supported the asset class. Municipal yields rose less dramatically than yields for most other fixed-income asset classes. As a result, the municipal yield curve was not completely inverted, with one-year municipal yields approximately equivalent to 15-year municipal yields. For all fixed-income asset classes, municipals included, lower-credit-quality securities tended to outperform their higher-credit-quality counterparts. Short-duration instruments outperformed early in the period, with strength shifting to longer-duration issues later. Yields grew increasingly attractive across the bond spectrum during the period.
Interest-Rate Futures Enhance Relative Returns
The fund outperformed the Index primarily due to the positive impact of Treasury bond futures, positions designed to dampen volatility and lower the fund’s effective duration. These positions shortened the fund’s effective duration by approximately 1.25–1.50 years, significantly bolstering the fund’s absolute and relative performance as Treasury yields rose more than municipal bond yields. As a result, the fund held effectively overweight exposure to the long end of the yield curve, where yields were most attractive, generating approximately 1.5% greater yield than the Index.
Several other facets of the fund’s multi-pronged investment approach further enhanced the fund’s relative performance. From a credit-quality perspective, the fund held overweight exposure to better-performing, lower-credit-quality municipals, with the greatest overweight exposure among BBB-rated securities. Within each credit rating group, the fund outperformed the Index due to strong issue selection and positive impact of sector-driven positions, including overweight exposure to transportation, charter schools and, to a lesser degree, health care. Duration positioning proved positive, with fund duration shifting from relatively neutral compared to the Index at the start of the period, when the market rewarded shorter durations, to significantly long as of the end of the period. Geographic positioning added value as well, with positive relative performance from major state issuers, led by New York and including California, Texas and Massachusetts. However, the vast majority of the fund’s outperformance was distributed widely across the broad spectrum of state issuers. Of the few positions that detracted from relative returns, the most notable was a small, out-of-Index allocation to bonds from Puerto Rico, some of which were undermined by a negative preliminary court ruling.
Well Positioned for the Prevailing Environment
While the economy has remained resilient in the face of the Fed’s aggressive efforts to combat inflation, cracks have begun to appear in some areas, including increasing consumer delinquencies and tightening bank credit, with impacts on commercial real estate and commercial and industrial loans. We expect to see further effects if, as expected, the Fed maintains rates at or near current levels for an extended period of time. On the other hand, the level of inflation has declined substantially, and the labor market remains healthy, with the overall economy continuing to benefit from several recent federal programs designed to stimulate growth, including the CHIPS and Science Act, the $1 trillion bipartisan infrastructure bill and the Inflation Reduction Act of 2022. Furthermore, most U.S. municipalities are in strong financial shape, buoyed by rising tax revenues and federal government support. Accordingly, while we expect economic growth to slow modestly in the near term, we do not anticipate a steep recession.
In light of these countervailing forces, we continue to maintain the fund’s yield advantage, while remaining cautious regarding the valuations of positions we add to the portfolio. Specifically, we have maintained the fund’s long-duration position, while continuing to employ Treasury futures to shorten the effective duration. We have also maintained the fund’s overweight exposure to lower-credit-quality issues, particularly those rated BBB. At the same time, we have moderately increased exposure to higher-credit-quality securities rated AA and AAA, emphasizing AA-rated bonds in essential services with 5% and greater coupons in the 20-year range, thereby embedding additional liquidity in the fund. We have also added liquidity by moderately increasing the fund’s cash position.
September 15, 2023
1 Total return includes reinvestment of dividends and any capital gains paid. Past performance is no guarantee of future results. Share price, yield and investment return fluctuate such that upon redemption, fund shares may be worth more or less than their original cost. Income may be subject to state and local taxes, and some income may be subject to the federal alternative minimum tax (AMT) for certain investors. Capital gains, if any, are fully taxable.
2 Source: Lipper Inc. — The Bloomberg U.S. Municipal Bond Index covers the USD-denominated, long-term, tax-exempt bond market. Investors cannot invest directly in any index.
Bonds are subject generally to interest-rate, credit, liquidity and market risks, to varying degrees, all of which are more fully described in the fund’s prospectus. Generally, all other factors being equal, bond prices are inversely related to interest-rate changes, and rate increases can cause price declines. Municipal income may be subject to state and local taxes. Capital gains, if any, are taxable.
The fund may, but is not required to, use derivative instruments. A small investment in derivatives could have a potentially large impact on the fund’s performance. The use of derivatives involves risks different from, or possibly greater than, the risks associated with investing directly in the underlying assets.
7
FUND PERFORMANCE (Unaudited)

Comparison of change in value of a $10,000 investment in Class M shares and Investor shares of BNY Mellon National Intermediate Municipal Bond Fund with a hypothetical investment of $10,000 in the S&P Municipal Bond Investment Grade Intermediate Index (the “Index”).
| | | | |
Average Annual Total Returns as of 8/31/2023 | | | |
| | 1 Year | 5 Years | 10 Years |
Class M shares | 2.13% | 1.48% | 2.21% |
Investor shares | 1.96% | 1.23% | 1.95% |
S&P Municipal Bond Investment Grade Intermediate Index | 1.77% | 1.65% | 2.54% |
† Source: FactSet
Past performance is not predictive of future performance.
The above graph compares a hypothetical $10,000 investment made in each of the Class M shares and Investor shares of BNY Mellon National Intermediate Municipal Bond Fund on 8/31/13 to a hypothetical investment of $10,000 made in the Index on that date. All dividends and capital gain distributions are reinvested.
The fund’s performance shown in the line graph above takes into account all applicable fees and expenses for Class M shares and Investor shares. The Index consists of bonds in the S&P Municipal Bond Index that are rated at least BBB- by Standard & Poor’s, Baa3 by Moody’s or BBB- by Fitch Ratings. All bonds must also have a minimum maturity of 3 years and a maximum maturity of up to, but not including, 15 years as measured from the rebalancing date. Unlike a mutual fund, the Index is not subject to charges, fees and other expenses. Investors cannot invest directly in any index. Further information relating to fund performance, including expense reimbursements, if applicable, is contained in the Financial Highlights section of the prospectus and elsewhere in this report.
The performance data quoted represents past performance, which is no guarantee of future results. Share price and investment return fluctuate and an investor’s shares may be worth more or less than original cost upon redemption. Current performance may be lower or higher than the performance quoted. Go to www.im.bnymellon.com for the fund’s most recent month-end returns.
The fund’s performance shown in the graph and table does not reflect the deduction of taxes that a shareholder would pay on fund distributions or the redemption of fund shares.
8
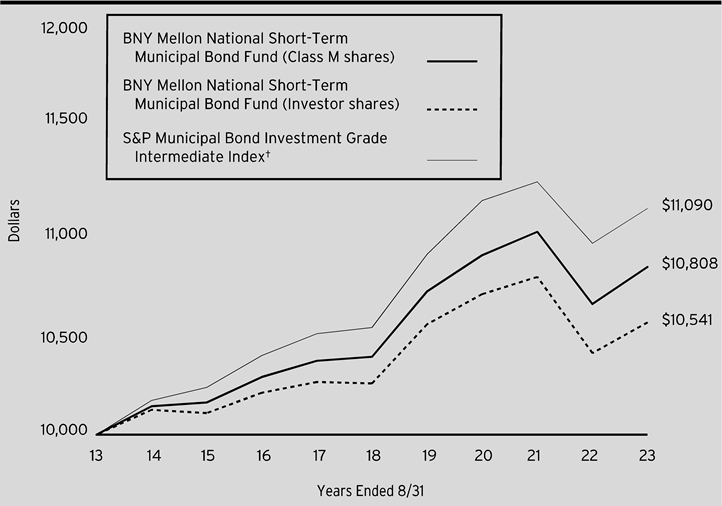
Comparison of change in value of a $10,000 investment in Fund Class M shares and Investor shares of BNY Mellon National Short-Term Municipal Bond with a hypothetical investment of $10,000 in the S&P Municipal Bond Investment Grade Short Index (the “Index”).
| | | | |
Average Annual Total Returns as of 8/31/2023 | | | |
| | 1 Year | 5 Years | 10 Years |
Class M shares | 1.68% | .82% | .78% |
Investor shares | 1.43% | .57% | .53% |
S&P Municipal Bond Investment Grade Short Index | 1.54% | 1.07% | 1.04% |
† Source: FactSet
Past performance is not predictive of future performance.
The above graph compares a hypothetical $10,000 investment made in each of the Class M shares and Investor shares of BNY Mellon National Short-Term Municipal Bond Fund on 8/31/13 to a hypothetical investment of $10,000 made in the Index on that date. All dividends and capital gain distributions are reinvested.
The fund’s performance shown in the line graph above takes into account all applicable fees and expenses for Class M shares and Investor shares. The Index consists of bonds in the S&P Municipal Bond Index that are rated at least BBB- by Standard & Poor’s, Baa3 by Moody’s or BBB- by Fitch Ratings. For the avoidance of doubt, the lowest rating is used in determining if a bond is eligible for the index. S&P Dow Jones Indices looks at the long term rating, either insured or uninsured, and the underlying rating for index inclusion. Bonds that are pre-refunded or escrowed to maturity are included in this index. All bonds must also have a minimum maturity of six months and a maximum maturity of up to, but not including, four years as measured from the rebalancing date. Unlike a mutual fund, the Index is not subject to charges, fees and other expenses. Investors cannot invest directly in any index. Further information relating to fund performance, including expense reimbursements, if applicable, is contained in the Financial Highlights section of the prospectus and elsewhere in this report.
The performance data quoted represents past performance, which is no guarantee of future results. Share price and investment return fluctuate and an investor’s shares may be worth more or less than original cost upon redemption. Current performance may be lower or higher than the performance quoted. Go to www.bnymellonim.com/us for the fund’s most recent month-end returns.
The fund’s performance shown in the graph and table does not reflect the deduction of taxes that a shareholder would pay on fund distributions or the redemption of fund shares.
9
FUND PERFORMANCE (Unaudited) (continued)
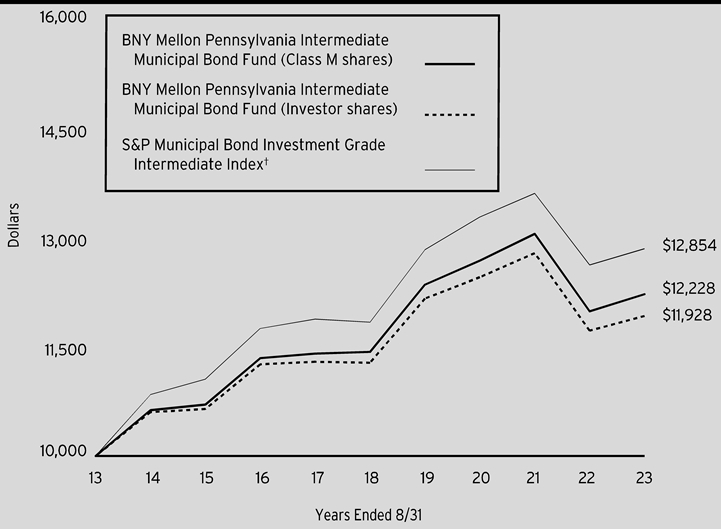
Comparison of change in value of a $10,000 investment in Class M shares and Investor shares of BNY Mellon Pennsylvania Intermediate Municipal Bond Fund with a hypothetical investment of $10,000 in the S&P Municipal Bond Investment Grade Intermediate Index (the “Index”).
| | | | |
Average Annual Total Returns as of 8/31/2023 | | | |
| | 1 Year | 5 Years | 10 Years |
Class M shares | 1.98% | 1.35% | 2.03% |
Investor shares | 1.72% | 1.12% | 1.78% |
S&P Municipal Bond Investment Grade Intermediate Index | 1.77% | 1.65% | 2.54% |
† Source: FactSet
Past performance is not predictive of future performance.
The above graph compares a hypothetical $10,000 investment made in each of the Class M and Investor shares of BNY Mellon Pennsylvania Intermediate Municipal Bond Fund on 8/31/13 to a hypothetical investment of $10,000 made in the Index on that date. All dividends and capital gain distributions are reinvested.
Unlike the Index, the fund invests primarily in Pennsylvania investment-grade municipal bonds. The fund’s performance shown in the line graph above takes into account all applicable fees and expenses for Class M and Investor shares. The Index consists of bonds in the S&P Municipal Bond Index that are rated at least BBB- by Standard & Poor’s, Baa3 by Moody’s or BBB- by Fitch Ratings. All bonds must also have a minimum maturity of 3 years and a maximum maturity of up to, but not including, 15 years as measured from the rebalancing date. Unlike a mutual fund, the Index is not subject to charges, fees and other expenses. Investors cannot invest directly in any index. Further information relating to fund performance, including expense reimbursements, if applicable, is contained in the Financial Highlights section of the prospectus and elsewhere in this report.
The performance data quoted represents past performance, which is no guarantee of future results. Share price and investment return fluctuate and an investor’s shares may be worth more or less than original cost upon redemption. Current performance may be lower or higher than the performance quoted. Go to www.im.bnymellon.com for the fund’s most recent month-end returns.
The fund’s performance shown in the graph and table does not reflect the deduction of taxes that a shareholder would pay on fund distributions or the redemption of fund shares.
10

Comparison of change in value of a $10,000 investment in Class M shares and Investor shares of BNY Mellon Massachusetts Intermediate Municipal Bond Fund with a hypothetical investment of $10,000 in the S&P Municipal Bond Investment Grade Intermediate Index (the “Index”).
| | | | |
Average Annual Total Returns as of 8/31/2023 | | | |
| | 1 Year | 5 Years | 10 Years |
Class M shares | 2.27% | 1.43% | 2.00% |
Investor shares | 2.01% | 1.18% | 1.74% |
S&P Municipal Bond Investment Grade Intermediate Index | 1.77% | 1.65% | 2.54% |
† Source: FactSet
Past performance is not predictive of future performance.
The above graph compares a hypothetical $10,000 investment made in each of the Class M shares and Investor shares of BNY Mellon Massachusetts Intermediate Municipal Bond Fund on 8/31/13 to a hypothetical investment of $10,000 made in the Index on that date. All dividends and capital gain distributions are reinvested.
Unlike the Index, the fund invests primarily in Massachusetts investment-grade municipal bonds. The fund’s performance shown in the line graph above takes into account all applicable fees and expenses for Class M shares and Investor shares. The Index consists of bonds in the S&P Municipal Bond Index that are rated at least BBB- by Standard & Poor’s, Baa3 by Moody’s or BBB- by Fitch Ratings. All bonds must also have a minimum maturity of 3 years and a maximum maturity of up to, but not including, 15 years as measured from the rebalancing date. Unlike a mutual fund, the Index is not subject to charges, fees and other expenses. Investors cannot invest directly in any index. Further information relating to fund performance, including expense reimbursements, if applicable, is contained in the Financial Highlights section of the prospectus and elsewhere in this report.
The performance data quoted represents past performance, which is no guarantee of future results. Share price and investment return fluctuate and an investor’s shares may be worth more or less than original cost upon redemption. Current performance may be lower or higher than the performance quoted. Go to www.im.bnymellon.com for the fund’s most recent month-end returns.
The fund’s performance shown in the graph and table does not reflect the deduction of taxes that a shareholder would pay on fund distributions or the redemption of fund shares.
11
FUND PERFORMANCE (Unaudited) (continued)
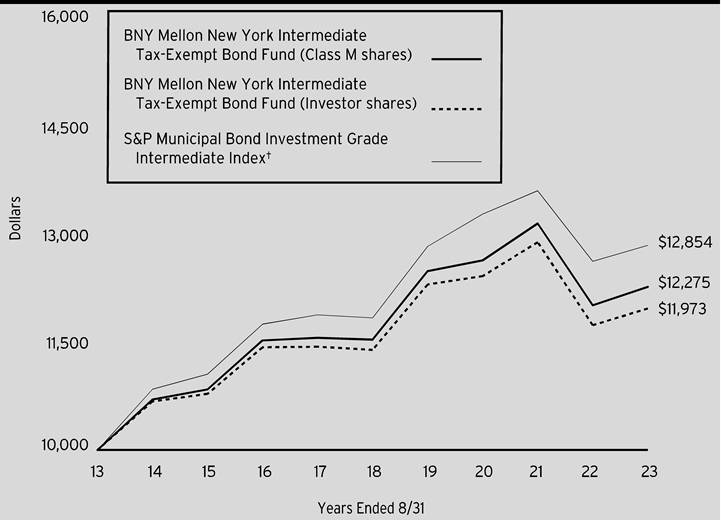
Comparison of change in value of a $10,000 investment in Class M shares and Investor shares of BNY Mellon New York Intermediate Tax-Exempt Bond Fund with a hypothetical investment of $10,000 in the S&P Municipal Bond Investment Grade Intermediate Index (the “Index”).
| | | | | |
Average Annual Total Returns as of 8/31/2023 | | | | |
| | 1 Year | | 5 Years | 10 Years |
Class M shares | 2.14% | | 1.24% | 2.07% |
Investor shares | 1.98% | | .99% | 1.82% |
S&P Municipal Bond Investment Grade Intermediate Index | 1.77% | | 1.65% | 2.54% |
† Source: FactSet
Past performance is not predictive of future performance.
The above graph compares a $10,000 investment made in each of the Class M shares and Investor shares of BNY Mellon New York Intermediate Tax-Exempt Bond Fund on 8/31/13 to a hypothetical investment of $10,000 made in the Index on that date. All dividends and capital gain distributions are reinvested.
Unlike the Index, the fund invests primarily in New York investment-grade municipal bonds. The fund’s performance shown in the line graph above takes into account all applicable fees and expenses for Class M shares and Investor shares. The Index consists of bonds in the S&P Municipal Bond Index that are rated at least BBB- by Standard & Poor’s, Baa3 by Moody’s or BBB- by Fitch Ratings. All bonds must also have a minimum maturity of 3 years and a maximum maturity of up to, but not including, 15 years as measured from the rebalancing date. Unlike a mutual fund, the Index is not subject to charges, fees and other expenses. Investors cannot invest directly in any index. Further information relating to fund performance, including expense reimbursements, if applicable, is contained in the Financial Highlights section of the prospectus and elsewhere in this report.
The performance data quoted represents past performance, which is no guarantee of future results. Share price and investment return fluctuate and an investor’s shares may be worth more or less than original cost upon redemption. Current performance may be lower or higher than the performance quoted. Go to www.im.bnymellon.com for the fund’s most recent month-end returns.
The fund’s performance shown in the graph and table does not reflect the deduction of taxes that a shareholder would pay on fund distributions or the redemption of fund shares.
12
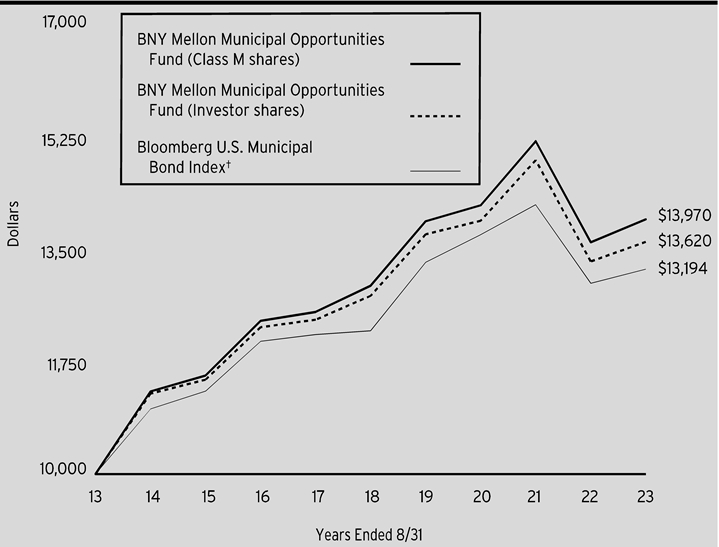
Comparison of change in value of a $10,000 investment in Class M shares and Investor shares of BNY Mellon Municipal Opportunities Fund with a hypothetical investment of $10,000 in the Bloomberg U.S. Municipal Bond Index (the “Index”).
| | | | |
Average Annual Total Returns as of 8/31/2023 | | | |
| | 1 Year | 5 Year | 10 Years |
Class M shares | 2.60% | 1.55% | 3.40% |
Investor shares | 2.26% | 1.28% | 3.14% |
Bloomberg U.S. Municipal Bond Index | 1.70% | 1.52% | 2.81% |
† Source: Lipper Inc.
Past performance is not predictive of future performance.
The above graph compares a hypothetical $10,000 investment made in each of the Class M and Investor shares of BNY Mellon Municipal Opportunities Fund on 8/31/13 to a hypothetical investment of $10,000 made in the Index on that date. All dividends and capital gain distributions are reinvested.
The fund’s performance shown in the line graph above takes into account all applicable fees and expenses for Class M and Investor shares. The Index covers the U.S. dollar-denominated long-term tax-exempt bond market. Unlike a mutual fund, the Index is not subject to charges, fees and other expenses. Investors cannot invest directly in any index. Further information relating to fund performance, including expense reimbursements, if applicable, is contained in the Financial Highlights section of the prospectus and elsewhere in this report.
The performance data quoted represents past performance, which is no guarantee of future results. Share price and investment return fluctuate and an investor’s shares may be worth more or less than original cost upon redemption. Current performance may be lower or higher than the performance quoted. Go to www.im.bnymellon.com for the fund’s most recent month-end returns.
The fund’s performance shown in the graph and table does not reflect the deduction of taxes that a shareholder would pay on fund distributions or the redemption of fund shares.
13
UNDERSTANDING YOUR FUND’S EXPENSES (Unaudited)
As a mutual fund investor, you pay ongoing expenses, such as management fees and other expenses. Using the information below, you can estimate how these expenses affect your investment and compare them with the expenses of other funds. You also may pay one-time transaction expenses, including sales charges (loads) and redemption fees, which are not shown in this section and would have resulted in higher total expenses. For more information, see your fund’s prospectus or talk to your financial adviser.
Review your fund’s expenses
The table below shows the expenses you would have paid on a $1,000 investment in each class of each fund from March 1, 2023 to August 31, 2023. It also shows how much a $1,000 investment would be worth at the close of the period, assuming actual returns and expenses.
| | | | | |
Expenses and Value of a $1,000 Investment | |
Assume actual returns for the six months ended August 31, 2023 | |
| | | | |
| | Class M | Investor Shares | |
BNY Mellon National Intermediate Municipal Bond Fund | |
Expenses paid per $1,000† | $2.58 | $3.85 | |
Ending value (after expenses) | $1,008.90 | $1,007.60 | |
Annualized expense ratio (%) | .51 | .76 | |
BNY Mellon National Short-Term Municipal Bond Fund | |
Expenses paid per $1,000† | $2.18 | $3.45 | |
Ending value (after expenses) | $1,013.50 | $1,012.20 | |
Annualized expense ratio (%) | .43 | .68 | |
BNY Mellon Pennsylvania Intermediate Municipal Bond Fund | |
Expenses paid per $1,000† | $2.99 | $4.25 | |
Ending value (after expenses) | $1,008.20 | $1,006.90 | |
Annualized expense ratio (%) | .59 | .84 | |
BNY Mellon Massachusetts Intermediate Municipal Bond Fund | |
Expenses paid per $1,000† | $2.79 | $4.05 | |
Ending value (after expenses) | $1,011.10 | $1,009.80 | |
Annualized expense ratio (%) | .55 | .80 | |
BNY Mellon New York Intermediate Tax-Exempt Bond Fund | |
Expenses paid per $1,000† | $2.99 | $4.25 | |
Ending value (after expenses) | $1,008.90 | $1,007.60 | |
Annualized expense ratio (%) | .59 | .84 | |
BNY Mellon Municipal Opportunities Fund | |
Expenses paid per $1,000† | $3.91 | $5.17 | |
Ending value (after expenses) | $1,013.70 | $1,012.50 | |
Annualized expense ratio (%) | .77 | 1.02 | |
† | Expenses are equal to each fund’s annualized expense ratio as shown above, multiplied by the average account value over the period, multiplied by 184/365 (to reflect the one-half year period). |
14
COMPARING YOUR FUND’S EXPENSES WITH THOSE OF OTHER FUNDS (Unaudited)
Using the SEC’s method to compare expenses
The Securities and Exchange Commission (“SEC”) has established guidelines to help investors assess fund expenses. Per these guidelines, the table below shows your fund’s expenses based on a $1,000 investment, assuming a hypothetical 5% annualized return. You can use this information to compare the ongoing expenses (but not transaction expenses or total cost) of investing in the fund with those of other funds. All mutual fund shareholder reports will provide this information to help you make this comparison. Please note that you cannot use this information to estimate your actual ending account balance and expenses paid during the period.
| | | | | |
Expenses and Value of a $1,000 Investment | |
Assuming a hypothetical 5% annualized return for the six months ended August 31, 2023 | |
| | | | |
| | Class M | Investor Shares | |
BNY Mellon National Intermediate Municipal Bond Fund | |
Expenses paid per $1,000† | $2.60 | $3.87 | |
Ending value (after expenses) | $1,022.63 | $1,021.37 | |
Annualized expense ratio (%) | .51 | .76 | |
BNY Mellon National Short-Term Municipal Bond Fund | |
Expenses paid per $1,000† | $2.19 | $3.47 | |
Ending value (after expenses) | $1,023.04 | $1,021.78 | |
Annualized expense ratio (%) | .43 | .68 | |
BNY Mellon Pennsylvania Intermediate Municipal Bond Fund | |
Expenses paid per $1,000† | $3.01 | $4.28 | |
Ending value (after expenses) | $1,022.23 | $1,020.97 | |
Annualized expense ratio (%) | .59 | .84 | |
BNY Mellon Massachusetts Intermediate Municipal Bond Fund | |
Expenses paid per $1,000† | $2.80 | $4.08 | |
Ending value (after expenses) | $1,022.43 | $1,021.17 | |
Annualized expense ratio (%) | .55 | .80 | |
BNY Mellon New York Intermediate Tax-Exempt Bond Fund | |
Expenses paid per $1,000† | $3.01 | $4.28 | |
Ending value (after expenses) | $1,022.23 | $1,020.97 | |
Annualized expense ratio (%) | .59 | .84 | |
BNY Mellon Municipal Opportunities Fund | |
Expenses paid per $1,000† | $3.92 | $5.19 | |
Ending value (after expenses) | $1,021.32 | $1,020.06 | |
Annualized expense ratio (%) | .77 | 1.02 | |
† | Expenses are equal to each fund’s annualized expense ratio as shown above, multiplied by the average account value over the period, multiplied by 184/365 (to reflect the one-half year period). |
15
STATEMENT OF INVESTMENTS
August 31, 2023
| | | | | | | | | | |
| |
BNY Mellon National Intermediate Municipal Bond Fund |
Description | Coupon
Rate (%) | | Maturity Date | | Principal Amount ($) | | Value ($) | |
Long-Term Municipal Investments - 100.3% | | | | | |
Alabama - 2.0% | | | | | |
Black Belt Energy Gas District, Revenue Bonds (Gas Project) | | 4.00 | | 12/1/2026 | | 4,250,000 | a | 4,155,398 | |
Black Belt Energy Gas District, Revenue Bonds (Gas Project) Ser. F | | 5.50 | | 12/1/2028 | | 8,000,000 | a | 8,337,684 | |
Black Belt Energy Gas District, Revenue Bonds (Project No. 6) Ser. B | | 4.00 | | 12/1/2026 | | 15,000,000 | a | 14,666,112 | |
Southeast Energy Authority A Cooperative District, Revenue Bonds (Project No. 4) Ser. B1 | | 5.00 | | 8/1/2028 | | 2,150,000 | a | 2,193,877 | |
Southeast Energy Authority A Cooperative District, Revenue Bonds (Project No. 5) Ser. A | | 5.25 | | 7/1/2029 | | 8,075,000 | a | 8,373,116 | |
| | 37,726,187 | |
Alaska - .2% | | | | | |
Alaska Housing Finance Corp., Revenue Bonds, Ser. A | | 3.00 | | 6/1/2051 | | 4,450,000 | | 4,236,596 | |
Arizona - 2.8% | | | | | |
Arizona Industrial Development Authority, Revenue Bonds (Equitable School Revolving Fund Obligated Group) Ser. A | | 4.00 | | 11/1/2049 | | 2,000,000 | | 1,715,866 | |
Arizona Industrial Development Authority, Revenue Bonds (Equitable School Revolving Fund Obligated Group) Ser. A | | 5.00 | | 11/1/2035 | | 850,000 | | 901,319 | |
Arizona Industrial Development Authority, Revenue Bonds (Equitable School Revolving Fund Obligated Group) Ser. A | | 5.00 | | 11/1/2034 | | 1,000,000 | | 1,066,311 | |
Arizona Industrial Development Authority, Revenue Bonds (Equitable School Revolving Fund Obligated Group) Ser. A | | 5.00 | | 11/1/2033 | | 900,000 | | 963,213 | |
Arizona Industrial Development Authority, Revenue Bonds (Great Lakes Senior Living Communities) Ser. A | | 5.00 | | 1/1/2025 | | 650,000 | | 607,839 | |
Arizona Industrial Development Authority, Revenue Bonds (Great Lakes Senior Living Communities) Ser. A | | 5.00 | | 1/1/2027 | | 525,000 | | 460,591 | |
Arizona Industrial Development Authority, Revenue Bonds (Great Lakes Senior Living Communities) Ser. A | | 5.00 | | 1/1/2029 | | 675,000 | | 559,508 | |
Arizona Industrial Development Authority, Revenue Bonds (Great Lakes Senior Living Communities) Ser. A | | 5.00 | | 1/1/2028 | | 1,000,000 | | 853,838 | |
Arizona Industrial Development Authority, Revenue Bonds (Great Lakes Senior Living Communities) Ser. A | | 5.00 | | 1/1/2026 | | 600,000 | | 547,373 | |
Arizona Industrial Development Authority, Revenue Bonds (Greathearts Arizona Project) Ser. A | | 3.00 | | 7/1/2035 | | 795,000 | | 702,533 | |
Arizona Industrial Development Authority, Revenue Bonds (Greathearts Arizona Project) Ser. A | | 3.00 | | 7/1/2036 | | 820,000 | | 708,024 | |
Arizona Industrial Development Authority, Revenue Bonds (Greathearts Arizona Project) Ser. A | | 3.00 | | 7/1/2034 | | 770,000 | | 694,295 | |
Maricopa County Industrial Development Authority, Revenue Bonds, Refunding (Banner Health Obligated Group) | | 5.00 | | 1/1/2035 | | 3,050,000 | | 3,175,218 | |
Maricopa County Industrial Development Authority, Revenue Bonds, Refunding (Banner Health Obligated Group) | | 5.00 | | 1/1/2034 | | 10,000,000 | | 10,427,731 | |
Maricopa County Industrial Development Authority, Revenue Bonds, Refunding (Banner Health Obligated Group) Ser. B | | 5.00 | | 1/1/2034 | | 15,935,000 | | 17,496,665 | |
Maricopa County Special Health Care District, GO, Ser. C | | 5.00 | | 7/1/2035 | | 6,000,000 | | 6,453,617 | |
Maricopa County Special Health Care District, GO, Ser. C | | 5.00 | | 7/1/2029 | | 5,000,000 | | 5,427,033 | |
| | 52,760,974 | |
California - 4.9% | | | | | |
Alameda Corridor Transportation Authority, Revenue Bonds, Refunding, Ser. B | | 5.00 | | 10/1/2036 | | 1,500,000 | | 1,524,679 | |
Bay Area Toll Authority, Revenue Bonds, Refunding, Ser. A | | 2.63 | | 4/1/2026 | | 10,000,000 | a | 9,692,207 | |
California, GO, Refunding | | 3.00 | | 9/1/2030 | | 8,785,000 | | 8,665,997 | |
California Community Choice Financing Authority, Revenue Bonds (Green Bond) (Clean Energy Project) | | 5.25 | | 10/1/2031 | | 3,000,000 | a | 3,111,631 | |
California Community Choice Financing Authority, Revenue Bonds (Green Bond) (Clean Energy Project) Ser. E1 | | 5.00 | | 3/1/2031 | | 5,000,000 | a | 5,240,096 | |
California Community Choice Financing Authority, Revenue Bonds (Green Bond) Ser. B1 | | 4.00 | | 8/1/2031 | | 1,475,000 | a | 1,443,859 | |
16
| | | | | | | | | | |
| |
BNY Mellon National Intermediate Municipal Bond Fund (continued) |
Description | Coupon
Rate (%) | | Maturity Date | | Principal Amount ($) | | Value ($) | |
Long-Term Municipal Investments - 100.3% (continued) | | | | | |
California - 4.9% (continued) | | | | | |
California County Tobacco Securitization Agency, Revenue Bonds, Refunding, Ser. A | | 5.00 | | 6/1/2033 | | 250,000 | | 271,652 | |
California County Tobacco Securitization Agency, Revenue Bonds, Refunding, Ser. A | | 5.00 | | 6/1/2032 | | 300,000 | | 326,186 | |
California Health Facilities Financing Authority, Revenue Bonds (City of Hope Obligated Group) | | 5.00 | | 11/15/2049 | | 5,375,000 | | 5,420,373 | |
California Health Facilities Financing Authority, Revenue Bonds (Lucile Salter Packard Children's Hospital at Stanford Obligated Group) | | 4.00 | | 11/15/2047 | | 1,120,000 | | 1,056,519 | |
California Health Facilities Financing Authority, Revenue Bonds, Refunding (Adventist Health System Obligated Group) Ser. A | | 4.00 | | 3/1/2033 | | 6,990,000 | | 6,693,123 | |
California Health Facilities Financing Authority, Revenue Bonds, Refunding (Children's Hospital of Orange County Obligated Group) | | 3.00 | | 11/1/2036 | | 1,250,000 | | 1,072,771 | |
California Health Facilities Financing Authority, Revenue Bonds, Refunding (Stanford Health Care Obligated Group) | | 3.00 | | 8/15/2025 | | 255,000 | a | 253,319 | |
California Municipal Finance Authority, Revenue Bonds, (Concordia University Irvine) | | 4.00 | | 1/1/2035 | | 315,000 | | 307,386 | |
California Municipal Finance Authority, Revenue Bonds, (Concordia University Irvine) | | 4.00 | | 1/1/2036 | | 385,000 | | 369,970 | |
California Municipal Finance Authority, Revenue Bonds, (Concordia University Irvine) | | 4.00 | | 1/1/2034 | | 250,000 | | 245,967 | |
California Municipal Finance Authority, Revenue Bonds, (Concordia University Irvine) | | 4.00 | | 1/1/2031 | | 315,000 | | 313,153 | |
California Municipal Finance Authority, Revenue Bonds, (Concordia University Irvine) | | 4.00 | | 1/1/2032 | | 225,000 | | 222,964 | |
California Municipal Finance Authority, Revenue Bonds, (Concordia University Irvine) | | 4.00 | | 1/1/2033 | | 235,000 | | 231,857 | |
California Public Finance Authority, Revenue Bonds, Refunding (O'Connor Woods Housing Corp.) | | 4.00 | | 1/1/2028 | | 470,000 | | 484,481 | |
California Public Finance Authority, Revenue Bonds, Refunding (O'Connor Woods Housing Corp.) | | 4.00 | | 1/1/2029 | | 425,000 | | 441,110 | |
Golden State Tobacco Securitization Corp., Revenue Bonds, Refunding, Ser. A1 | | 4.21 | | 6/1/2050 | | 7,250,000 | | 5,193,381 | |
Los Angeles Department of Airports, Revenue Bonds (Green Bond) | | 5.00 | | 5/15/2031 | | 5,875,000 | | 6,441,008 | |
Los Angeles Department of Airports, Revenue Bonds, Refunding | | 5.00 | | 5/15/2033 | | 2,055,000 | | 2,250,128 | |
Los Angeles Department of Airports, Revenue Bonds, Refunding | | 5.00 | | 5/15/2031 | | 4,470,000 | | 4,900,648 | |
Los Angeles Department of Airports, Revenue Bonds, Refunding, Ser. A | | 5.00 | | 5/15/2026 | | 1,500,000 | | 1,553,182 | |
Los Angeles Department of Airports, Revenue Bonds, Refunding, Ser. A | | 5.00 | | 5/15/2025 | | 1,240,000 | | 1,266,170 | |
New Haven Unified School District, GO (Insured; Assured Guaranty Corp.) | | 0.00 | | 8/1/2033 | | 4,000,000 | b | 2,723,259 | |
Sacramento County Water Financing Authority, Revenue Bonds (Insured; National Public Finance Guarantee Corp.) Ser. B, (3 Month LIBOR +0.55%) | | 4.23 | | 6/1/2034 | | 7,885,000 | c | 7,458,530 | |
San Francisco City & County Airport Commission, Revenue Bonds, Refunding, Ser. D | | 5.00 | | 5/1/2024 | | 4,375,000 | | 4,416,678 | |
San Francisco City & County Airport Commission, Revenue Bonds, Refunding, Ser. G | | 5.00 | | 5/1/2027 | | 5,045,000 | | 5,263,585 | |
Santa Maria Joint Union High School District, GO | | 3.00 | | 8/1/2040 | | 2,390,000 | | 1,972,583 | |
Southern California Tobacco Securitization Authority, Revenue Bonds, Refunding (San Diego County Tobacco Asset Securitization Corp.) | | 5.00 | | 6/1/2037 | | 2,000,000 | | 2,124,090 | |
17
STATEMENT OF INVESTMENTS (continued)
| | | | | | | | | | |
| |
BNY Mellon National Intermediate Municipal Bond Fund (continued) |
Description | Coupon
Rate (%) | | Maturity Date | | Principal Amount ($) | | Value ($) | |
Long-Term Municipal Investments - 100.3% (continued) | | | | | |
California - 4.9% (continued) | | | | | |
Southern California Tobacco Securitization Authority, Revenue Bonds, Refunding (San Diego County Tobacco Asset Securitization Corp.) | | 5.00 | | 6/1/2034 | | 500,000 | | 541,974 | |
| | 93,494,516 | |
Colorado - 2.0% | | | | | |
Colorado, COP, Ser. A | | 4.00 | | 12/15/2036 | | 3,000,000 | | 3,013,791 | |
Colorado Energy Public Authority, Revenue Bonds | | 6.13 | | 11/15/2023 | | 1,275,000 | | 1,279,803 | |
Colorado Health Facilities Authority, Revenue Bonds, Refunding (AdventHealth Obligated Group) Ser. B | | 5.00 | | 11/15/2030 | | 10,000,000 | a | 10,941,247 | |
Colorado Housing & Finance Authority, Revenue Bonds (Insured; Government National Mortgage Association) Ser. F | | 4.25 | | 11/1/2049 | | 2,965,000 | | 2,944,434 | |
Colorado Housing & Finance Authority, Revenue Bonds, Ser. B | | 3.75 | | 5/1/2050 | | 3,230,000 | | 3,171,618 | |
Denver City & County, COP, Refunding | | 5.00 | | 12/1/2035 | | 3,250,000 | | 3,710,881 | |
Denver City & County Airport System, Revenue Bonds, Ser. A | | 5.00 | | 11/15/2033 | | 5,000,000 | | 5,003,784 | |
E-470 Public Highway Authority, Revenue Bonds, Refunding, Ser. A | | 5.00 | | 9/1/2040 | | 1,450,000 | | 1,461,249 | |
Regional Transportation District, Revenue Bonds, Refunding (Denver Transit Partners) Ser. A | | 5.00 | | 1/15/2032 | | 1,300,000 | | 1,410,618 | |
Regional Transportation District, Revenue Bonds, Refunding (Denver Transit Partners) Ser. A | | 5.00 | | 7/15/2032 | | 1,905,000 | | 2,065,864 | |
Regional Transportation District, Revenue Bonds, Refunding (Denver Transit Partners) Ser. A | | 5.00 | | 1/15/2029 | | 1,400,000 | | 1,494,849 | |
Regional Transportation District, Revenue Bonds, Refunding (Denver Transit Partners) Ser. A | | 5.00 | | 1/15/2030 | | 1,000,000 | | 1,077,891 | |
| | 37,576,029 | |
Connecticut - 1.1% | | | | | |
Connecticut, GO, Ser. B | | 4.00 | | 1/15/2037 | | 4,425,000 | | 4,492,754 | |
Connecticut Health & Educational Facilities Authority, Revenue Bonds, Refunding (Connecticut College) Ser. M | | 4.00 | | 7/1/2038 | | 1,045,000 | | 993,101 | |
Connecticut Health & Educational Facilities Authority, Revenue Bonds, Refunding (Fairfield University) Ser. R | | 3.25 | | 7/1/2035 | | 1,785,000 | | 1,620,910 | |
Connecticut Health & Educational Facilities Authority, Revenue Bonds, Refunding (The Stamford Hospital Obligated Group) | | 4.00 | | 7/1/2035 | | 4,000,000 | | 3,863,470 | |
Connecticut Health & Educational Facilities Authority, Revenue Bonds, Refunding (The Stamford Hospital Obligated Group) | | 5.00 | | 7/1/2034 | | 4,215,000 | | 4,526,899 | |
Connecticut Health & Educational Facilities Authority, Revenue Bonds, Refunding (The Stamford Hospital Obligated Group) | | 5.00 | | 7/1/2032 | | 2,000,000 | | 2,166,114 | |
Connecticut Housing Finance Authority, Revenue Bonds, Refunding (Insured; GNMA, FNMA, FHLMC) Ser. D1 | | 4.00 | | 11/15/2047 | | 795,000 | | 787,997 | |
Windsor, GO, Refunding | | 2.00 | | 6/15/2030 | | 1,420,000 | | 1,257,622 | |
Windsor, GO, Refunding | | 2.00 | | 6/15/2029 | | 1,420,000 | | 1,276,141 | |
| | 20,985,008 | |
District of Columbia - 2.1% | | | | | |
District of Columbia, Revenue Bonds, Refunding (Friendship Public Charter School) | | 5.00 | | 6/1/2036 | | 3,200,000 | | 3,225,560 | |
District of Columbia, Revenue Bonds, Refunding (KIPP DC Obligated Group) Ser. A | | 5.00 | | 7/1/2042 | | 5,955,000 | | 5,970,656 | |
District of Columbia, Revenue Bonds, Refunding (KIPP DC Obligated Group) Ser. A | | 5.00 | | 7/1/2037 | | 4,925,000 | | 4,996,486 | |
District of Columbia, Revenue Bonds, Refunding (KIPP DC Project) Ser. B | | 5.00 | | 7/1/2037 | | 1,010,000 | | 1,024,660 | |
Metropolitan Washington Airports Authority, Revenue Bonds, Refunding | | 5.00 | | 10/1/2027 | | 10,000,000 | | 10,499,433 | |
Metropolitan Washington Airports Authority, Revenue Bonds, Refunding (Dulles Metrorail) Ser. B | | 4.00 | | 10/1/2038 | | 1,000,000 | | 976,166 | |
Metropolitan Washington Airports Authority, Revenue Bonds, Refunding (Dulles Metrorail) Ser. B | | 4.00 | | 10/1/2036 | | 1,250,000 | | 1,249,943 | |
Metropolitan Washington Airports Authority, Revenue Bonds, Refunding, Ser. A | | 5.00 | | 10/1/2028 | | 5,080,000 | | 5,397,065 | |
18
| | | | | | | | | | |
| |
BNY Mellon National Intermediate Municipal Bond Fund (continued) |
Description | Coupon
Rate (%) | | Maturity Date | | Principal Amount ($) | | Value ($) | |
Long-Term Municipal Investments - 100.3% (continued) | | | | | |
District of Columbia - 2.1% (continued) | | | | | |
Metropolitan Washington Airports Authority, Revenue Bonds, Refunding, Ser. A | | 5.00 | | 10/1/2026 | | 7,000,000 | | 7,259,049 | |
| | 40,599,018 | |
Florida - 4.4% | | | | | |
Broward County Tourist Development, Revenue Bonds, Refunding (Convention Center Expansion Project) | | 4.00 | | 9/1/2036 | | 5,000,000 | | 4,975,566 | |
Florida Development Finance Corp., Revenue Bonds (Mater Academy Project) Ser. A | | 5.00 | | 6/15/2035 | | 1,000,000 | | 1,018,993 | |
Florida Municipal Power Agency, Revenue Bonds, Refunding (St. Lucie Project) Ser. B | | 5.00 | | 10/1/2030 | | 1,100,000 | | 1,196,876 | |
Florida Municipal Power Agency, Revenue Bonds, Refunding (St. Lucie Project) Ser. B | | 5.00 | | 10/1/2029 | | 1,300,000 | | 1,413,524 | |
Florida Municipal Power Agency, Revenue Bonds, Ser. A | | 3.00 | | 10/1/2033 | | 3,610,000 | | 3,283,788 | |
Hillsborough County Industrial Development Authority, Revenue Bonds, Refunding (BayCare Health System Obligated Group) (LOC; TD Bank NA) Ser. C | | 4.00 | | 11/1/2038 | | 5,000,000 | d | 5,000,000 | |
Manatee County Public Utilities, Revenue Bonds, Refunding | | 5.00 | | 10/1/2041 | | 3,000,000 | | 3,284,465 | |
Miami-Dade County, Revenue Bonds, Refunding, Ser. A | | 5.00 | | 10/1/2034 | | 10,000,000 | | 10,052,962 | |
Miami-Dade County, Revenue Bonds, Ser. A | | 5.00 | | 4/1/2044 | | 9,665,000 | | 10,207,105 | |
Miami-Dade County Educational Facilities Authority, Revenue Bonds, Refunding (University of Miami) (Insured; American Municipal Bond Assurance Corp.) Ser. B | | 5.25 | | 4/1/2028 | | 8,360,000 | | 8,961,498 | |
Miami-Dade County Water & Sewer System, Revenue Bonds, Refunding, Ser. A | | 5.00 | | 10/1/2034 | | 5,000,000 | | 5,112,374 | |
Miami-Dade County Water & Sewer System, Revenue Bonds, Refunding, Ser. B | | 4.00 | | 10/1/2036 | | 5,000,000 | | 5,023,955 | |
Orange County Health Facilities Authority, Revenue Bonds, Refunding (Orlando Health Obligated Group) | | 5.00 | | 10/1/2025 | | 3,000,000 | | 3,089,302 | |
Palm Beach County, Revenue Bonds, Ser. C | | 5.00 | | 5/1/2042 | | 3,345,000 | | 3,644,168 | |
Palm Beach County School District, COP, Ser. B | | 5.25 | | 8/1/2036 | | 5,400,000 | | 6,114,872 | |
Sarasota, Revenue Bonds | | 5.00 | | 9/1/2041 | | 2,095,000 | | 2,282,645 | |
Sarasota, Revenue Bonds | | 5.00 | | 9/1/2042 | | 1,100,000 | | 1,194,575 | |
Sarasota, Revenue Bonds | | 5.00 | | 9/1/2043 | | 2,260,000 | | 2,443,548 | |
Sarasota, Revenue Bonds | | 5.00 | | 9/1/2040 | | 1,000,000 | | 1,093,085 | |
Tampa Sports Authority, Revenue Bonds, Refunding | | 5.00 | | 1/1/2024 | | 90,000 | | 90,304 | |
The Miami-Dade County School Board, COP, Refunding, Ser. A | | 5.00 | | 5/1/2032 | | 5,475,000 | | 5,585,966 | |
| | 85,069,571 | |
Georgia - 1.8% | | | | | |
Main Street Natural Gas, Revenue Bonds, Ser. A | | 5.00 | | 5/15/2026 | | 3,000,000 | | 3,024,944 | |
Main Street Natural Gas, Revenue Bonds, Ser. A | | 4.00 | | 9/1/2027 | | 10,000,000 | a | 9,917,218 | |
Main Street Natural Gas, Revenue Bonds, Ser. B | | 5.00 | | 6/1/2029 | | 10,230,000 | a | 10,465,956 | |
Main Street Natural Gas, Revenue Bonds, Ser. C | | 5.00 | | 9/1/2030 | | 5,000,000 | a | 5,193,391 | |
The Burke County Development Authority, Revenue Bonds, Refunding (Georgia Power Co.) | | 2.88 | | 8/19/2025 | | 5,650,000 | a | 5,474,588 | |
| | 34,076,097 | |
Hawaii - .2% | | | | | |
Hawaii Airports System, Revenue Bonds, Ser. A | | 5.00 | | 7/1/2038 | | 2,200,000 | | 2,322,691 | |
Hawaii Airports System, Revenue Bonds, Ser. A | | 5.00 | | 7/1/2030 | | 1,420,000 | | 1,525,859 | |
| | 3,848,550 | |
Idaho - .3% | | | | | |
Idaho Health Facilities Authority, Revenue Bonds, Refunding (St. Luke's Health System Obligated Group) | | 4.00 | | 3/1/2034 | | 400,000 | | 398,606 | |
Idaho Health Facilities Authority, Revenue Bonds, Refunding (St. Luke's Health System Obligated Group) | | 4.00 | | 3/1/2035 | | 275,000 | | 271,018 | |
Idaho Health Facilities Authority, Revenue Bonds, Refunding (St. Luke's Health System Obligated Group) | | 4.00 | | 3/1/2033 | | 575,000 | | 575,394 | |
Idaho Health Facilities Authority, Revenue Bonds, Refunding (St. Luke's Health System Obligated Group) | | 5.00 | | 3/1/2030 | | 500,000 | | 546,063 | |
19
STATEMENT OF INVESTMENTS (continued)
| | | | | | | | | | |
| |
BNY Mellon National Intermediate Municipal Bond Fund (continued) |
Description | Coupon
Rate (%) | | Maturity Date | | Principal Amount ($) | | Value ($) | |
Long-Term Municipal Investments - 100.3% (continued) | | | | | |
Idaho - .3% (continued) | | | | | |
Idaho Health Facilities Authority, Revenue Bonds, Refunding (St. Luke's Health System Obligated Group) | | 5.00 | | 3/1/2031 | | 400,000 | | 441,716 | |
Idaho Health Facilities Authority, Revenue Bonds, Refunding (St. Luke's Health System Obligated Group) | | 5.00 | | 3/1/2032 | | 400,000 | | 445,844 | |
Idaho Housing & Finance Association, Revenue Bonds, Ser. A | | 5.00 | | 8/15/2038 | | 1,030,000 | | 1,138,280 | |
Idaho Housing & Finance Association, Revenue Bonds, Ser. A | | 5.00 | | 8/15/2037 | | 1,140,000 | | 1,268,266 | |
| | 5,085,187 | |
Illinois - 9.7% | | | | | |
Chicago Board of Education, GO, Refunding (Insured; Assured Guaranty Municipal Corp.) Ser. A | | 5.00 | | 12/1/2035 | | 1,000,000 | | 1,037,126 | |
Chicago II, GO, Refunding, Ser. 2005D | | 5.50 | | 1/1/2037 | | 10,010,000 | | 10,135,551 | |
Chicago II, GO, Refunding, Ser. 2007F | | 5.50 | | 1/1/2035 | | 3,750,000 | | 3,800,728 | |
Chicago II, GO, Refunding, Ser. A | | 5.00 | | 1/1/2026 | | 3,000,000 | | 3,070,747 | |
Chicago II, GO, Refunding, Ser. A | | 5.00 | | 1/1/2029 | | 8,000,000 | | 8,433,382 | |
Chicago II, GO, Refunding, Ser. A | | 5.00 | | 1/1/2034 | | 10,000,000 | | 10,626,488 | |
Chicago II, GO, Ser. A | | 5.00 | | 1/1/2026 | | 1,430,000 | | 1,446,777 | |
Chicago II, GO, Ser. A | | 5.00 | | 1/1/2024 | | 4,500,000 | | 4,512,822 | |
Chicago II, GO, Ser. A | | 5.00 | | 1/1/2026 | | 1,570,000 | | 1,602,410 | |
Chicago Il, GO, Refunding, Ser. A | | 5.75 | | 1/1/2034 | | 3,585,000 | | 3,800,640 | |
Chicago Il Wastewater Transmission, Revenue Bonds, Refunding | | 5.00 | | 1/1/2025 | | 375,000 | | 382,741 | |
Chicago Il Wastewater Transmission, Revenue Bonds, Refunding | | 5.00 | | 1/1/2024 | | 1,095,000 | | 1,100,464 | |
Chicago Il Wastewater Transmission, Revenue Bonds, Refunding | | 5.00 | | 1/1/2025 | | 1,735,000 | | 1,760,240 | |
Chicago Il Wastewater Transmission, Revenue Bonds, Refunding | | 5.00 | | 1/1/2024 | | 1,905,000 | | 1,912,353 | |
Chicago O'Hare International Airport, Revenue Bonds, Refunding, Ser. B | | 5.00 | | 1/1/2037 | | 3,000,000 | | 3,185,978 | |
Chicago O'Hare International Airport, Revenue Bonds, Refunding, Ser. B | | 5.00 | | 1/1/2033 | | 1,000,000 | | 1,014,968 | |
Chicago O'Hare International Airport, Revenue Bonds, Refunding, Ser. C | | 5.00 | | 1/1/2038 | | 5,000,000 | | 5,095,649 | |
Chicago O'Hare International Airport, Revenue Bonds, Refunding, Ser. D | | 5.00 | | 1/1/2037 | | 2,350,000 | | 2,566,151 | |
Chicago O'Hare International Airport, Revenue Bonds, Refunding, Ser. D | | 5.00 | | 1/1/2035 | | 2,000,000 | | 2,230,023 | |
Chicago O'Hare International Airport, Revenue Bonds, Refunding, Ser. D | | 5.00 | | 1/1/2036 | | 2,000,000 | | 2,205,221 | |
Chicago Park District, GO, Refunding, Ser. C | | 4.00 | | 1/1/2036 | | 1,000,000 | | 975,826 | |
Chicago Park District, GO, Refunding, Ser. C | | 4.00 | | 1/1/2035 | | 4,250,000 | | 4,192,322 | |
Chicago Park District, GO, Refunding, Ser. C | | 4.00 | | 1/1/2032 | | 1,000,000 | | 1,000,569 | |
Chicago Park District, GO, Refunding, Ser. C | | 4.00 | | 1/1/2034 | | 10,210,000 | | 10,163,780 | |
Chicago Park District, GO, Refunding, Ser. D | | 4.00 | | 1/1/2032 | | 960,000 | | 960,546 | |
Chicago Park District, GO, Refunding, Ser. E | | 4.00 | | 1/1/2034 | | 1,760,000 | | 1,752,033 | |
Chicago Park District, GO, Refunding, Ser. F2 | | 5.00 | | 1/1/2026 | | 975,000 | | 999,842 | |
Chicago Park District, GO, Refunding, Ser. F2 | | 5.00 | | 1/1/2028 | | 1,550,000 | | 1,637,364 | |
Chicago Park District, GO, Refunding, Ser. F2 | | 5.00 | | 1/1/2030 | | 1,700,000 | | 1,828,637 | |
Cook County Community Consolidated School District No. 34, GO, Ser. A | | 3.00 | | 12/1/2036 | | 6,265,000 | | 5,476,258 | |
Cook County Community Unit Elmwood Park School District No. 401, GO (Insured; Assured Guaranty Municipal Corp.) Ser. A | | 4.00 | | 12/1/2031 | | 1,000,000 | | 1,042,423 | |
Cook County Community Unit Elmwood Park School District No. 401, GO (Insured; Assured Guaranty Municipal Corp.) Ser. A | | 4.00 | | 12/1/2030 | | 1,220,000 | | 1,275,820 | |
20
| | | | | | | | | | |
| |
BNY Mellon National Intermediate Municipal Bond Fund (continued) |
Description | Coupon
Rate (%) | | Maturity Date | | Principal Amount ($) | | Value ($) | |
Long-Term Municipal Investments - 100.3% (continued) | | | | | |
Illinois - 9.7% (continued) | | | | | |
Cook County Community Unit Elmwood Park School District No. 401, GO (Insured; Assured Guaranty Municipal Corp.) Ser. A | | 4.00 | | 12/1/2029 | | 1,480,000 | | 1,540,527 | |
Cook County II, GO, Refunding, Ser. A | | 5.00 | | 11/15/2029 | | 3,750,000 | | 4,088,990 | |
Cook County ll, Revenue Bonds, Refunding | | 5.00 | | 11/15/2033 | | 6,050,000 | | 6,388,232 | |
DuPage & Cook Counties Township High School District No. 86 , GO | | 4.00 | | 1/15/2035 | | 5,205,000 | | 5,322,364 | |
DuPage County School District No. 60, GO, Ser. A | | 4.00 | | 12/30/2032 | | 1,500,000 | | 1,506,789 | |
Illinois, GO | | 5.50 | | 1/1/2030 | | 1,855,000 | | 2,056,726 | |
Illinois, GO, Refunding | | 5.00 | | 2/1/2026 | | 5,000,000 | | 5,148,449 | |
Illinois, GO, Refunding, Ser. A | | 5.00 | | 10/1/2025 | | 4,000,000 | | 4,101,602 | |
Illinois, GO, Refunding, Ser. A | | 5.00 | | 10/1/2024 | | 2,000,000 | | 2,026,189 | |
Illinois, GO, Refunding, Ser. A | | 5.00 | | 10/1/2023 | | 1,200,000 | | 1,200,956 | |
Illinois, GO, Ser. A | | 5.00 | | 3/1/2030 | | 5,750,000 | | 6,225,524 | |
Illinois, GO, Ser. A | | 5.00 | | 3/1/2031 | | 480,000 | | 524,809 | |
Illinois, GO, Ser. A | | 5.00 | | 3/1/2032 | | 2,045,000 | | 2,229,840 | |
Illinois, GO, Ser. D | | 5.00 | | 11/1/2028 | | 10,120,000 | | 10,638,750 | |
Illinois, Revenue Bonds (Insured; National Public Finance Guarantee Corp.) | | 6.00 | | 6/15/2025 | | 3,225,000 | | 3,358,252 | |
Illinois, Revenue Bonds (Insured; National Public Finance Guarantee Corp.) | | 6.00 | | 6/15/2026 | | 4,290,000 | | 4,559,579 | |
Illinois, Revenue Bonds (Insured; National Public Finance Guarantee Corp.) | | 6.00 | | 6/15/2024 | | 5,030,000 | | 5,118,408 | |
Illinois Finance Authority, Revenue Bonds, Refunding (OSF Healthcare System Obligated Group) Ser. B2 | | 5.00 | | 11/15/2026 | | 3,000,000 | a | 3,090,022 | |
Illinois Toll Highway Authority, Revenue Bonds, Ser. A | | 5.00 | | 1/1/2042 | | 3,120,000 | | 3,368,588 | |
Kane Cook & DuPage Counties Community College District No. 509, GO, Refunding (Elgin Community College) | | 3.00 | | 12/15/2032 | | 5,000,000 | | 4,841,697 | |
Kendall County Forest Preserve District, GO, Refunding (Insured; Build America Mutual) | | 4.00 | | 1/1/2027 | | 2,270,000 | | 2,289,047 | |
Sales Tax Securitization Corp., Revenue Bonds, Refunding (Insured; Build America Mutual) Ser. A | | 5.00 | | 1/1/2037 | | 3,530,000 | | 3,754,720 | |
| | 184,605,939 | |
Indiana - 1.5% | | | | | |
Indiana Finance Authority, Revenue Bonds (Goshen Health Obligated Group) Ser. A | | 5.00 | | 11/1/2027 | | 740,000 | | 770,863 | |
Indiana Finance Authority, Revenue Bonds (Goshen Health Obligated Group) Ser. A | | 5.00 | | 11/1/2028 | | 775,000 | | 813,691 | |
Indiana Finance Authority, Revenue Bonds (Goshen Health Obligated Group) Ser. B | | 2.10 | | 11/1/2026 | | 2,700,000 | a | 2,525,312 | |
Indiana Finance Authority, Revenue Bonds (Indiana University Health Obligated Group) Ser. B1 | | 5.00 | | 7/1/2028 | | 5,000,000 | a | 5,331,443 | |
Indiana Finance Authority, Revenue Bonds, Refunding (Duke Energy Indiana Project) (LOC; Sumitomo Mitsui Banking) Ser. A4 | | 4.00 | | 12/1/2039 | | 5,100,000 | d | 5,100,000 | |
Whiting, Revenue Bonds, Refunding (BP Products North America) | | 5.00 | | 6/5/2026 | | 14,430,000 | a | 14,786,252 | |
| | 29,327,561 | |
Iowa - .4% | | | | | |
Iowa Finance Authority, Revenue Bonds, Refunding (Green Bonds) | | 5.00 | | 8/1/2039 | | 2,240,000 | | 2,497,303 | |
PEFA, Revenue Bonds (Gas Project) | | 5.00 | | 9/1/2026 | | 5,150,000 | a | 5,200,187 | |
| | 7,697,490 | |
Kentucky - 2.8% | | | | | |
Kentucky Bond Development Corp., Revenue Bonds (Insured; Build America Mutual) | | 5.00 | | 9/1/2029 | | 2,395,000 | | 2,631,933 | |
Kentucky Bond Development Corp., Revenue Bonds (Insured; Build America Mutual) | | 5.00 | | 9/1/2028 | | 2,275,000 | | 2,469,938 | |
21
STATEMENT OF INVESTMENTS (continued)
| | | | | | | | | | |
| |
BNY Mellon National Intermediate Municipal Bond Fund (continued) |
Description | Coupon
Rate (%) | | Maturity Date | | Principal Amount ($) | | Value ($) | |
Long-Term Municipal Investments - 100.3% (continued) | | | | | |
Kentucky - 2.8% (continued) | | | | | |
Kentucky Property & Building Commission, Revenue Bonds (Project No. 112) (Insured; Assured Guaranty Municipal Corp.) Ser. A | | 5.00 | | 2/1/2028 | | 5,150,000 | | 5,350,648 | |
Kentucky Property & Building Commission, Revenue Bonds (Project No. 112) Ser. A | | 5.00 | | 2/1/2031 | | 3,000,000 | | 3,104,629 | |
Kentucky Public Energy Authority, Revenue Bonds, Ser. A1 | | 4.00 | | 6/1/2025 | | 8,000,000 | a | 8,008,029 | |
Kentucky Public Energy Authority, Revenue Bonds, Ser. B | | 4.00 | | 1/1/2025 | | 10,325,000 | a | 10,281,581 | |
Kentucky Public Energy Authority, Revenue Bonds, Ser. C1 | | 4.00 | | 6/1/2025 | | 16,500,000 | a | 16,511,058 | |
Kentucky Turnpike Authority, Revenue Bonds, Refunding, Ser. A | | 5.00 | | 7/1/2027 | | 5,000,000 | | 5,214,439 | |
| | 53,572,255 | |
Louisiana - .2% | | | | | |
East Baton Rouge Sewerage Commission, Revenue Bonds, Refunding, Ser. A | | 1.30 | | 2/1/2028 | | 5,000,000 | a | 4,183,127 | |
Maine - .4% | | | | | |
Maine Governmental Facilities Authority, Revenue Bonds, Ser. A | | 4.00 | | 10/1/2035 | | 5,255,000 | | 5,325,731 | |
Maine State Housing Authority, Revenue Bonds, Ser. B1 | | 3.50 | | 11/15/2046 | | 1,460,000 | | 1,453,954 | |
| | 6,779,685 | |
Maryland - 1.3% | | | | | |
Howard County Housing Commission, Revenue Bonds, Refunding, Ser. A | | 1.20 | | 6/1/2027 | | 2,000,000 | | 1,807,871 | |
Maryland Community Development Administration, Revenue Bonds, Refunding, Ser. B | | 4.00 | | 9/1/2049 | | 2,210,000 | | 2,185,332 | |
Maryland Stadium Authority, Revenue Bonds, Ser. A | | 5.00 | | 9/1/2037 | | 2,805,000 | | 3,097,662 | |
Maryland Stadium Authority, Revenue Bonds, Ser. A | | 5.00 | | 3/1/2031 | | 7,585,000 | | 8,514,514 | |
Montgomery County, GO, Refunding, Ser. A | | 5.00 | | 11/1/2024 | | 10,000,000 | e | 10,193,229 | |
| | 25,798,608 | |
Massachusetts - 1.9% | | | | | |
Massachusetts, GO, Refunding, Ser. B | | 5.00 | | 5/1/2041 | | 9,890,000 | | 10,901,578 | |
Massachusetts, GO, Ser. C | | 5.00 | | 10/1/2035 | | 10,000,000 | | 11,460,014 | |
Massachusetts Development Finance Agency, Revenue Bonds, Refunding (Emerson College) | | 5.00 | | 1/1/2035 | | 2,000,000 | | 2,016,639 | |
Massachusetts Development Finance Agency, Revenue Bonds, Refunding (Emmanuel College) Ser. A | | 5.00 | | 10/1/2033 | | 5,000,000 | | 5,054,738 | |
Massachusetts Development Finance Agency, Revenue Bonds, Refunding (Suffolk University) | | 5.00 | | 7/1/2033 | | 800,000 | | 835,751 | |
Massachusetts Development Finance Agency, Revenue Bonds, Refunding (Suffolk University) | | 5.00 | | 7/1/2031 | | 620,000 | | 651,064 | |
Massachusetts Development Finance Agency, Revenue Bonds, Refunding (Suffolk University) | | 5.00 | | 7/1/2032 | | 770,000 | | 806,398 | |
Massachusetts Development Finance Agency, Revenue Bonds, Refunding (Suffolk University) | | 5.00 | | 7/1/2030 | | 700,000 | | 735,239 | |
Massachusetts Development Finance Agency, Revenue Bonds, Refunding (Suffolk University) | | 5.00 | | 7/1/2034 | | 1,000,000 | | 1,029,854 | |
Massachusetts Development Finance Agency, Revenue Bonds, Refunding (Suffolk University) | | 5.00 | | 7/1/2035 | | 1,000,000 | | 1,024,999 | |
Massachusetts Development Finance Agency, Revenue Bonds, Refunding (Suffolk University) | | 5.00 | | 7/1/2036 | | 1,010,000 | | 1,030,513 | |
The Massachusetts Clean Water Trust, Revenue Bonds, Refunding (MWRA Program) Ser. A | | 5.75 | | 8/1/2029 | | 380,000 | | 380,625 | |
| | 35,927,412 | |
Michigan - 1.3% | | | | | |
Detroit Downtown Development Authority, Tax Allocation Bonds, Refunding (Catalyst Development Project) (Insured; Assured Guaranty Municipal Corp.) Ser. A | | 5.00 | | 7/1/2032 | | 1,000,000 | | 1,005,884 | |
Detroit Downtown Development Authority, Tax Allocation Bonds, Refunding (Catalyst Development Project) (Insured; Assured Guaranty Municipal Corp.) Ser. A | | 5.00 | | 7/1/2031 | | 1,000,000 | | 1,007,496 | |
22
| | | | | | | | | | |
| |
BNY Mellon National Intermediate Municipal Bond Fund (continued) |
Description | Coupon
Rate (%) | | Maturity Date | | Principal Amount ($) | | Value ($) | |
Long-Term Municipal Investments - 100.3% (continued) | | | | | |
Michigan - 1.3% (continued) | | | | | |
Detroit Downtown Development Authority, Tax Allocation Bonds, Refunding (Catalyst Development Project) (Insured; Assured Guaranty Municipal Corp.) Ser. A | | 5.00 | | 7/1/2029 | | 1,350,000 | | 1,363,176 | |
Grand Traverse County Hospital Finance Authority, Revenue Bonds, Refunding (Munson Healthcare Obligated Group) (LOC; PNC Bank NA) Ser. C | | 3.95 | | 7/1/2041 | | 5,900,000 | d | 5,900,000 | |
Grand Valley University, Revenue Bonds, Refunding (LOC; TD Bank NA) Ser. B | | 4.06 | | 12/1/2031 | | 1,800,000 | d | 1,800,000 | |
Michigan Finance Authority, Revenue Bonds (Drinking Water Revolving Fund) | | 5.00 | | 10/1/2043 | | 3,100,000 | | 3,372,167 | |
Michigan Finance Authority, Revenue Bonds, Refunding (McLaren Health Care Corp. Obligated Group) Ser. D2 | | 1.20 | | 4/13/2028 | | 5,000,000 | a | 4,343,493 | |
Michigan Finance Authority, Revenue Bonds, Refunding (Trinity Health Credit Corp. Obligated Group) | | 4.00 | | 12/1/2036 | | 3,000,000 | | 2,970,705 | |
Michigan Finance Authority, Revenue Bonds, Refunding (Trinity Health Credit Corp. Obligated Group) | | 4.00 | | 12/1/2035 | | 2,500,000 | | 2,498,253 | |
Western Michigan University, Revenue Bonds, Refunding (Insured; Assured Guaranty Municipal Corp.) Ser. C | | 5.00 | | 11/15/2029 | | 600,000 | | 656,344 | |
| | 24,917,518 | |
Minnesota - .0% | | | | | |
Minnesota Housing Finance Agency, Revenue Bonds, Refunding (Insured; GNMA, FNMA, FHLMC) Ser. B | | 4.00 | | 7/1/2047 | | 480,000 | | 475,631 | |
Missouri - 1.6% | | | | | |
Cape Girardeau County Industrial Development Authority, Revenue Bonds, Refunding (St. Francis Healthcare System Obligated Group) | | 5.00 | | 6/1/2030 | | 2,000,000 | | 2,155,971 | |
Cape Girardeau County Industrial Development Authority, Revenue Bonds, Refunding (St. Francis Healthcare System Obligated Group) | | 5.00 | | 6/1/2031 | | 2,100,000 | | 2,279,749 | |
Cape Girardeau County Industrial Development Authority, Revenue Bonds, Refunding (St. Francis Healthcare System Obligated Group) | | 5.00 | | 6/1/2032 | | 2,200,000 | | 2,398,566 | |
Cape Girardeau County Industrial Development Authority, Revenue Bonds, Refunding (St. Francis Healthcare System Obligated Group) | | 5.00 | | 6/1/2029 | | 1,700,000 | | 1,818,207 | |
Cape Girardeau County Industrial Development Authority, Revenue Bonds, Refunding (St. Francis Healthcare System Obligated Group) | | 5.00 | | 6/1/2026 | | 1,000,000 | | 1,033,009 | |
Cape Girardeau County Industrial Development Authority, Revenue Bonds, Refunding (St. Francis Healthcare System Obligated Group) | | 5.00 | | 6/1/2027 | | 1,400,000 | | 1,465,377 | |
Cape Girardeau County Industrial Development Authority, Revenue Bonds, Refunding (St. Francis Healthcare System Obligated Group) | | 5.00 | | 6/1/2028 | | 1,655,000 | | 1,753,600 | |
Grain Valley No R-V School District, GO, Ser. A | | 5.00 | | 3/1/2038 | | 5,250,000 | | 5,508,604 | |
Kansas Industrial Development Authority, Revenue Bonds (Kansas City International Airport) | | 4.00 | | 3/1/2035 | | 2,000,000 | | 2,016,535 | |
Kansas Industrial Development Authority, Revenue Bonds (Kansas City International Airport) | | 4.00 | | 3/1/2034 | | 3,500,000 | | 3,545,753 | |
Ladue School District, GO | | 2.00 | | 3/1/2032 | | 5,000,000 | | 4,299,651 | |
The Missouri Health & Educational Facilities Authority, Revenue Bonds (The Washington University) Ser. C | | 4.20 | | 3/1/2040 | | 1,500,000 | d | 1,500,000 | |
| | 29,775,022 | |
Montana - .1% | | | | | |
Montana Board of Housing, Revenue Bonds, Ser. A2 | | 3.50 | | 6/1/2044 | | 1,110,000 | | 1,096,080 | |
Montana Facility Finance Authority, Revenue Bonds, Refunding (Billings Clinic Obligated Group) Ser. 2022A | | 5.00 | | 8/15/2027 | | 500,000 | | 533,697 | |
Montana Facility Finance Authority, Revenue Bonds, Refunding (Billings Clinic Obligated Group) Ser. 2022A | | 5.00 | | 8/15/2029 | | 1,200,000 | | 1,310,395 | |
| | 2,940,172 | |
23
STATEMENT OF INVESTMENTS (continued)
| | | | | | | | | | |
| |
BNY Mellon National Intermediate Municipal Bond Fund (continued) |
Description | Coupon
Rate (%) | | Maturity Date | | Principal Amount ($) | | Value ($) | |
Long-Term Municipal Investments - 100.3% (continued) | | | | | |
Nebraska - .5% | | | | | |
Central Plains Energy, Revenue Bonds, Refunding (Central Plains Energy Project) | | 4.00 | | 8/1/2025 | | 5,000,000 | a | 4,969,353 | |
Nebraska Investment Finance Authority, Revenue Bonds (Insured; GNMA, FNMA, FHLMC) Ser. C | | 5.50 | | 9/1/2053 | | 2,500,000 | | 2,627,840 | |
Nebraska Public Power District, Revenue Bonds, Refunding, Ser. A | | 5.00 | | 7/1/2028 | | 2,750,000 | | 2,954,531 | |
| | 10,551,724 | |
Nevada - 1.6% | | | | | |
Clark County, Revenue Bonds | | 5.00 | | 7/1/2040 | | 10,000,000 | | 10,891,960 | |
Clark County School District, GO, Ser. A | | 5.00 | | 6/15/2038 | | 4,120,000 | | 4,529,222 | |
Clark County Water Reclamation District, GO, Refunding | | 3.00 | | 7/1/2031 | | 2,520,000 | | 2,379,311 | |
Las Vegas Valley Water District, GO, Refunding, Ser. C | | 4.00 | | 6/1/2036 | | 6,295,000 | | 6,469,890 | |
Nevada, GO, Refunding, Ser. A | | 3.00 | | 5/1/2035 | | 4,755,000 | | 4,397,617 | |
Nevada Housing Division, Revenue Bonds (Insured; GNMA, FNMA, FHLMC) Ser. A | | 4.00 | | 4/1/2049 | | 1,895,000 | | 1,873,446 | |
| | 30,541,446 | |
New Jersey - 4.1% | | | | | |
Fair Lawn, GO | | 2.00 | | 9/1/2032 | | 1,580,000 | | 1,347,499 | |
Fair Lawn, GO | | 2.00 | | 9/1/2031 | | 1,315,000 | | 1,140,277 | |
Fair Lawn, GO | | 2.00 | | 9/1/2029 | | 2,215,000 | | 1,984,179 | |
Morris County, GO | | 2.00 | | 2/1/2031 | | 4,315,000 | | 3,771,400 | |
New Jersey, GO (COVID-19 Emergency Bonds) Ser. A | | 3.00 | | 6/1/2032 | | 5,000,000 | | 4,648,923 | |
New Jersey Economic Development Authority, Revenue Bonds, Ser. QQQ | | 4.00 | | 6/15/2034 | | 1,000,000 | | 1,023,750 | |
New Jersey Health Care Facilities Financing Authority, Revenue Bonds, Refunding (Trinitas Regional Medical Center Obligated Group) | | 5.00 | | 7/1/2026 | | 1,000,000 | | 1,046,048 | |
New Jersey Health Care Facilities Financing Authority, Revenue Bonds, Refunding (Trinitas Regional Medical Center Obligated Group) | | 5.00 | | 7/1/2024 | | 1,000,000 | | 1,012,438 | |
New Jersey Health Care Facilities Financing Authority, Revenue Bonds, Refunding (Trinitas Regional Medical Center Obligated Group) | | 5.00 | | 7/1/2025 | | 1,060,000 | | 1,089,649 | |
New Jersey Transportation Trust Fund Authority, Revenue Bonds (Insured; National Public Finance Guarantee Corp.) Ser. A | | 5.75 | | 6/15/2025 | | 4,245,000 | | 4,409,162 | |
New Jersey Transportation Trust Fund Authority, Revenue Bonds, Refunding | | 5.00 | | 12/15/2028 | | 5,000,000 | | 5,401,197 | |
New Jersey Transportation Trust Fund Authority, Revenue Bonds, Refunding, Ser. A | | 5.00 | | 12/15/2033 | | 5,000,000 | | 5,343,448 | |
New Jersey Transportation Trust Fund Authority, Revenue Bonds, Refunding, Ser. AA | | 5.00 | | 6/15/2034 | | 2,500,000 | | 2,774,176 | |
New Jersey Transportation Trust Fund Authority, Revenue Bonds, Refunding, Ser. AA | | 5.00 | | 6/15/2035 | | 2,000,000 | | 2,203,981 | |
New Jersey Transportation Trust Fund Authority, Revenue Bonds, Refunding, Ser. AA | | 5.00 | | 6/15/2036 | | 2,500,000 | | 2,729,979 | |
New Jersey Transportation Trust Fund Authority, Revenue Bonds, Ser. AA | | 5.00 | | 6/15/2035 | | 1,000,000 | | 1,086,755 | |
New Jersey Transportation Trust Fund Authority, Revenue Bonds, Ser. AA | | 5.00 | | 6/15/2036 | | 3,000,000 | | 3,234,943 | |
New Jersey Transportation Trust Fund Authority, Revenue Bonds, Ser. AA | | 5.00 | | 6/15/2037 | | 1,500,000 | | 1,605,207 | |
Sussex County, GO, Refunding | | 2.00 | | 6/15/2030 | | 1,945,000 | | 1,722,588 | |
Sussex County, GO, Refunding | | 2.00 | | 6/15/2029 | | 1,945,000 | | 1,747,954 | |
Tobacco Settlement Financing Corp., Revenue Bonds, Refunding, Ser. A | | 5.00 | | 6/1/2034 | | 8,400,000 | | 8,951,166 | |
Tobacco Settlement Financing Corp., Revenue Bonds, Refunding, Ser. A | | 5.00 | | 6/1/2033 | | 12,000,000 | | 12,811,535 | |
24
| | | | | | | | | | |
| |
BNY Mellon National Intermediate Municipal Bond Fund (continued) |
Description | Coupon
Rate (%) | | Maturity Date | | Principal Amount ($) | | Value ($) | |
Long-Term Municipal Investments - 100.3% (continued) | | | | | |
New Jersey - 4.1% (continued) | | | | | |
Tobacco Settlement Financing Corp., Revenue Bonds, Refunding, Ser. A | | 5.00 | | 6/1/2032 | | 6,000,000 | | 6,414,144 | |
| | 77,500,398 | |
New Mexico - .1% | | | | | |
New Mexico Mortgage Finance Authority, Revenue Bonds (Insured; GNMA, FNMA, FHLMC) Ser. A | | 3.00 | | 3/1/2053 | | 1,920,000 | | 1,828,009 | |
New York - 18.6% | | | | | |
Battery Park Authority, Revenue Bonds | | 5.00 | | 11/1/2048 | | 4,500,000 | | 4,829,625 | |
Metropolitan Transportation Authority, Revenue Bonds (Green Bond) Ser. A | | 5.00 | | 11/15/2035 | | 10,000,000 | | 10,570,003 | |
Metropolitan Transportation Authority, Revenue Bonds, Refunding (Green Bond) (Insured; Assured Guaranty Municipal Corp.) Ser. C | | 5.00 | | 11/15/2038 | | 8,445,000 | | 8,920,357 | |
Metropolitan Transportation Authority, Revenue Bonds, Refunding (Green Bond) Ser. A2 | | 5.00 | | 5/15/2024 | | 10,000,000 | a | 10,074,858 | |
Metropolitan Transportation Authority, Revenue Bonds, Refunding (Green Bond) Ser. B | | 5.00 | | 11/15/2027 | | 2,365,000 | | 2,486,256 | |
Metropolitan Transportation Authority, Revenue Bonds, Refunding (Green Bond) Ser. B1 | | 5.00 | | 11/15/2036 | | 5,000,000 | | 5,223,024 | |
Metropolitan Transportation Authority, Revenue Bonds, Refunding (Green Bond) Ser. B2 | | 5.25 | | 11/15/2033 | | 10,285,000 | | 11,144,342 | |
Metropolitan Transportation Authority, Revenue Bonds, Refunding (Green Bond) Ser. C1 | | 5.00 | | 11/15/2026 | | 10,185,000 | | 10,582,849 | |
Metropolitan Transportation Authority, Revenue Bonds, Refunding (Green Bond) Ser. C1 | | 5.00 | | 11/15/2034 | | 2,500,000 | | 2,624,279 | |
Metropolitan Transportation Authority, Revenue Bonds, Refunding, Ser. C1 | | 5.25 | | 11/15/2031 | | 7,400,000 | | 7,591,984 | |
Metropolitan Transportation Authority, Revenue Bonds, Refunding, Ser. D | | 5.00 | | 11/15/2037 | | 1,580,000 | | 1,631,445 | |
Metropolitan Transportation Authority, Revenue Bonds, Refunding, Ser. D | | 5.00 | | 11/15/2031 | | 10,000,000 | | 10,309,095 | |
Metropolitan Transportation Authority Hudson Rail Yards Trust Obligation, Revenue Bonds, Refunding, Ser. A | | 5.00 | | 11/15/2051 | | 5,000,000 | | 5,008,204 | |
New York City, GO (LOC; Mizuho Bank Ltd.) Ser. A2 | | 4.00 | | 10/1/2038 | | 7,500,000 | d | 7,500,000 | |
New York City, GO (LOC; U.S. Bank NA) Ser. L4 | | 4.25 | | 4/1/2038 | | 4,300,000 | d | 4,300,000 | |
New York City, GO, Refunding, Ser. F1 | | 5.00 | | 8/1/2035 | | 2,000,000 | | 2,266,403 | |
New York City, GO, Refunding, Ser. F1 | | 5.00 | | 8/1/2030 | | 10,000,000 | | 11,206,221 | |
New York City, GO, Refunding, Ser. F1 | | 5.00 | | 8/1/2036 | | 2,000,000 | | 2,240,913 | |
New York City, GO, Ser. B4 | | 3.95 | | 10/1/2046 | | 5,500,000 | d | 5,500,000 | |
New York City, GO, Ser. D1 | | 4.00 | | 3/1/2042 | | 1,500,000 | | 1,452,322 | |
New York City, GO, Ser. E1 | | 5.00 | | 4/1/2037 | | 5,000,000 | | 5,545,601 | |
New York City Housing Development Corp., Revenue Bonds | | 2.15 | | 11/1/2028 | | 1,290,000 | | 1,177,521 | |
New York City Housing Development Corp., Revenue Bonds, Ser. A1 | | 3.38 | | 11/15/2029 | | 3,000,000 | | 2,944,733 | |
New York City Industrial Development Agency, Revenue Bonds, Refunding (Yankee Stadium Project) (Insured; Assured Guaranty Municipal Corp.) | | 5.00 | | 3/1/2028 | | 1,350,000 | | 1,437,049 | |
New York City Industrial Development Agency, Revenue Bonds, Refunding (Yankee Stadium Project) (Insured; Assured Guaranty Municipal Corp.) | | 5.00 | | 3/1/2029 | | 2,000,000 | | 2,158,243 | |
New York City Municipal Water Finance Authority, Revenue Bonds, Refunding, Ser. B1 | | 3.92 | | 6/15/2049 | | 6,100,000 | d | 6,100,000 | |
New York City Municipal Water Finance Authority, Revenue Bonds, Refunding, Ser. DD | | 4.50 | | 6/15/2039 | | 1,000,000 | | 1,003,052 | |
New York City Transitional Finance Authority, Revenue Bonds | | 5.25 | | 8/1/2037 | | 10,000,000 | | 10,737,676 | |
New York City Transitional Finance Authority, Revenue Bonds (LOC; Sumitomo Mitsui Banking) Ser. C5 | | 4.00 | | 11/1/2041 | | 1,000,000 | d | 1,000,000 | |
New York City Transitional Finance Authority, Revenue Bonds, Ser. A1 | | 5.00 | | 5/1/2043 | | 5,520,000 | | 5,955,774 | |
25
STATEMENT OF INVESTMENTS (continued)
| | | | | | | | | | |
| |
BNY Mellon National Intermediate Municipal Bond Fund (continued) |
Description | Coupon
Rate (%) | | Maturity Date | | Principal Amount ($) | | Value ($) | |
Long-Term Municipal Investments - 100.3% (continued) | | | | | |
New York - 18.6% (continued) | | | | | |
New York City Transitional Finance Authority, Revenue Bonds, Ser. E1 | | 5.00 | | 2/1/2037 | | 5,000,000 | | 5,135,593 | |
New York City Transitional Finance Authority, Revenue Bonds, Ser. F1 | | 5.00 | | 2/1/2044 | | 8,145,000 | | 8,749,666 | |
New York Liberty Development Corp., Revenue Bonds, Refunding (Class 1-3 World Trade Center Project) | | 5.00 | | 11/15/2044 | | 15,400,000 | f | 14,739,175 | |
New York Liberty Development Corp., Revenue Bonds, Refunding (Class 2-3 World Trade Center Project) | | 5.15 | | 11/15/2034 | | 3,500,000 | f | 3,487,951 | |
New York Liberty Development Corp., Revenue Bonds, Refunding (Green Bond) Ser. A | | 1.45 | | 11/15/2029 | | 5,000,000 | | 4,262,719 | |
New York Liberty Development Corp., Revenue Bonds, Refunding, Ser. 1WTC | | 3.00 | | 2/15/2042 | | 5,000,000 | | 3,832,367 | |
New York State Dormitory Authority, Revenue Bonds, Refunding (Insured; Assured Guaranty Municipal Corp.) | | 5.00 | | 10/1/2037 | | 5,000,000 | | 5,459,593 | |
New York State Dormitory Authority, Revenue Bonds, Refunding (The New York & Presbyterian Hospital Obligated Group) Ser. A | | 5.00 | | 8/1/2036 | | 5,000,000 | | 5,628,981 | |
New York State Dormitory Authority, Revenue Bonds, Refunding, Ser. A | | 4.00 | | 3/15/2034 | | 7,500,000 | | 7,913,910 | |
New York State Dormitory Authority, Revenue Bonds, Refunding, Ser. A | | 4.00 | | 3/15/2038 | | 5,000,000 | | 5,001,677 | |
New York State Dormitory Authority, Revenue Bonds, Refunding, Ser. A | | 4.00 | | 3/15/2039 | | 4,900,000 | | 4,860,589 | |
New York State Dormitory Authority, Revenue Bonds, Refunding, Ser. A1 | | 5.00 | | 3/15/2040 | | 10,000,000 | | 10,936,892 | |
New York State Dormitory Authority, Revenue Bonds, Ser. A | | 5.00 | | 3/15/2038 | | 8,815,000 | | 9,186,193 | |
New York State Mortgage Agency, Revenue Bonds, Refunding, Ser. 189 | | 3.25 | | 4/1/2025 | | 1,000,000 | | 989,427 | |
New York State Mortgage Agency, Revenue Bonds, Refunding, Ser. 220 | | 2.40 | | 10/1/2034 | | 10,545,000 | | 8,831,691 | |
New York State Mortgage Agency, Revenue Bonds, Ser. 223 | | 2.65 | | 10/1/2034 | | 7,020,000 | | 5,988,244 | |
New York Transportation Development Corp., Revenue Bonds (Delta Air Lines) | | 5.00 | | 1/1/2024 | | 20,000,000 | | 20,042,798 | |
New York Transportation Development Corp., Revenue Bonds (LaGuardia Airport Terminal B Redevelopment Project) Ser. A | | 5.00 | | 7/1/2046 | | 2,500,000 | | 2,492,073 | |
New York Transportation Development Corp., Revenue Bonds (LaGuardia Airport Terminal B Redevelopment Project) Ser. A | | 5.00 | | 7/1/2041 | | 2,000,000 | | 2,000,365 | |
Port Authority of New York & New Jersey, Revenue Bonds, Refunding, Ser. 207 | | 5.00 | | 9/15/2024 | | 10,000,000 | | 10,146,254 | |
Port Authority of New York & New Jersey, Revenue Bonds, Refunding, Ser. 23 | | 5.00 | | 8/1/2042 | | 700,000 | | 759,637 | |
Port Authority of New York & New Jersey, Revenue Bonds, Refunding, Ser. 23 | | 5.00 | | 8/1/2041 | | 730,000 | | 792,862 | |
Port Authority of New York & New Jersey, Revenue Bonds, Refunding, Ser. 23 | | 5.00 | | 8/1/2040 | | 1,000,000 | | 1,090,099 | |
Port Authority of New York & New Jersey, Revenue Bonds, Refunding, Ser. 234 | | 5.25 | | 8/1/2047 | | 5,000,000 | | 5,314,989 | |
St. Lawrence County Industrial Development Agency, Revenue Bonds, Refunding (Clarkson University Project) | | 5.00 | | 9/1/2032 | | 595,000 | | 630,261 | |
Triborough Bridge & Tunnel Authority, Revenue Bonds, Refunding | | 4.00 | | 11/15/2031 | | 2,525,000 | | 2,704,019 | |
Triborough Bridge & Tunnel Authority, Revenue Bonds, Refunding | | 4.00 | | 11/15/2032 | | 2,500,000 | | 2,686,347 | |
Triborough Bridge & Tunnel Authority, Revenue Bonds, Refunding | | 4.00 | | 11/15/2037 | | 1,150,000 | | 1,154,053 | |
Triborough Bridge & Tunnel Authority, Revenue Bonds, Refunding | | 4.00 | | 11/15/2034 | | 1,170,000 | | 1,224,618 | |
26
| | | | | | | | | | |
| |
BNY Mellon National Intermediate Municipal Bond Fund (continued) |
Description | Coupon
Rate (%) | | Maturity Date | | Principal Amount ($) | | Value ($) | |
Long-Term Municipal Investments - 100.3% (continued) | | | | | |
New York - 18.6% (continued) | | | | | |
Triborough Bridge & Tunnel Authority, Revenue Bonds, Refunding | | 5.00 | | 11/15/2037 | | 1,500,000 | | 1,662,310 | |
Triborough Bridge & Tunnel Authority, Revenue Bonds, Refunding | | 5.00 | | 11/15/2030 | | 3,000,000 | | 3,386,640 | |
Triborough Bridge & Tunnel Authority, Revenue Bonds, Refunding | | 5.00 | | 11/15/2036 | | 1,500,000 | | 1,679,948 | |
Triborough Bridge & Tunnel Authority, Revenue Bonds, Refunding (Green Bond) Ser. A | | 4.00 | | 11/15/2035 | | 5,000,000 | | 5,186,269 | |
Triborough Bridge & Tunnel Authority, Revenue Bonds, Refunding (Green Bond) Ser. A | | 4.00 | | 11/15/2037 | | 4,980,000 | | 5,013,529 | |
Triborough Bridge & Tunnel Authority, Revenue Bonds, Refunding, Ser. A | | 0.00 | | 11/15/2029 | | 10,000,000 | b | 7,872,143 | |
Triborough Bridge & Tunnel Authority, Revenue Bonds, Refunding, Ser. C2 | | 3.00 | | 5/15/2033 | | 4,800,000 | | 4,630,686 | |
Triborough Bridge & Tunnel Authority, Revenue Bonds, Ser. C1A | | 5.00 | | 5/15/2040 | | 3,480,000 | | 3,764,465 | |
Troy Capital Resource Corp., Revenue Bonds, Refunding (Rensselaer Polytechnic Institute) | | 5.00 | | 9/1/2031 | | 1,625,000 | | 1,752,738 | |
Webster Central School District, GO, Refunding (Insured; State Aid Withholding) | | 2.00 | | 6/15/2030 | | 1,180,000 | | 1,055,064 | |
| | 355,568,664 | |
North Carolina - .2% | | | | | |
North Carolina Turnpike Authority, Revenue Bonds, Refunding (Insured; Assured Guaranty Municipal Corp.) | | 5.00 | | 1/1/2033 | | 3,400,000 | | 3,641,430 | |
Ohio - 1.4% | | | | | |
Cuyahoga County, Revenue Bonds (Ballpark Imp Project) Ser. A | | 4.00 | | 1/1/2037 | | 4,185,000 | | 4,196,717 | |
Montgomery County, Revenue Bonds, Refunding (Kettering Health Network Obligated Group) | | 4.00 | | 8/1/2037 | | 695,000 | | 681,550 | |
Montgomery County, Revenue Bonds, Refunding (Kettering Health Network Obligated Group) | | 5.00 | | 8/1/2036 | | 500,000 | | 530,953 | |
Ohio Air Quality Development Authority, Revenue Bonds (Ohio Valley Electric Corp.) | | 2.60 | | 10/1/2029 | | 2,500,000 | a | 2,164,963 | |
Ohio Higher Educational Facility Commission, Revenue Bonds, Refunding (John Carroll University) | | 4.00 | | 10/1/2042 | | 3,205,000 | | 2,736,213 | |
Ohio Higher Educational Facility Commission, Revenue Bonds, Refunding (John Carroll University) | | 4.00 | | 10/1/2037 | | 4,835,000 | | 4,390,002 | |
Ohio Housing Finance Agency, Revenue Bonds (Insured; GNMA, FNMA, FHLMC) Ser. A | | 4.50 | | 3/1/2047 | | 830,000 | | 828,757 | |
Ohio Housing Finance Agency, Revenue Bonds, Refunding (Insured; GNMA, FNMA, FHLMC) Ser. D | | 4.00 | | 3/1/2047 | | 1,480,000 | | 1,468,234 | |
The University of Akron, Revenue Bonds, Refunding, Ser. A | | 5.00 | | 1/1/2033 | | 5,000,000 | | 5,139,956 | |
Wadsworth School District, GO | | 3.00 | | 12/1/2045 | | 2,040,000 | | 1,561,459 | |
Wadsworth School District, GO | | 4.00 | | 12/1/2056 | | 1,500,000 | | 1,334,551 | |
Warrensville Heights School District, GO, Refunding (Insured; Build America Mutual) | | 5.00 | | 12/1/2044 | | 600,000 | | 606,257 | |
Warrensville Heights School District, GO, Refunding (Insured; Build America Mutual) | | 5.00 | | 12/1/2024 | | 1,440,000 | e | 1,469,890 | |
| | 27,109,502 | |
Oklahoma - .2% | | | | | |
Oklahoma, GO | | 2.00 | | 3/1/2029 | | 5,190,000 | | 4,685,495 | |
Oregon - 1.9% | | | | | |
Oregon Business Development Commission, Revenue Bonds (Intel Corp. Project) Ser. 232 | | 3.80 | | 6/15/2028 | | 7,000,000 | a | 6,991,726 | |
Oregon Housing & Community Services Department, Revenue Bonds, Ser. A | | 4.00 | | 1/1/2047 | | 980,000 | | 974,375 | |
Portland Sewer System, Revenue Bonds, Ser. A | | 4.50 | | 5/1/2037 | | 13,635,000 | | 13,790,307 | |
Portland Sewer System, Revenue Bonds, Ser. A | | 4.50 | | 5/1/2033 | | 11,435,000 | | 11,727,542 | |
27
STATEMENT OF INVESTMENTS (continued)
| | | | | | | | | | |
| |
BNY Mellon National Intermediate Municipal Bond Fund (continued) |
Description | Coupon
Rate (%) | | Maturity Date | | Principal Amount ($) | | Value ($) | |
Long-Term Municipal Investments - 100.3% (continued) | | | | | |
Oregon - 1.9% (continued) | | | | | |
Salem Hospital Facility Authority, Revenue Bonds, Refunding (Salem Health Project) Ser. A | | 5.00 | | 5/15/2038 | | 2,095,000 | | 2,169,072 | |
| | 35,653,022 | |
Pennsylvania - 6.2% | | | | | |
Allegheny County Higher Education Building Authority, Revenue Bonds, Refunding (Duquesne University of the Holy Spirit) Ser. 20 | | 5.00 | | 3/1/2029 | | 1,005,000 | | 1,077,756 | |
Chester County Health & Education Facilities Authority, Revenue Bonds, Refunding (Main Line Health System Obligated Group) Ser. A | | 4.00 | | 10/1/2037 | | 2,105,000 | | 2,040,034 | |
Commonwealth Financing Authority, Revenue Bonds | | 5.00 | | 6/1/2031 | | 3,500,000 | | 3,715,259 | |
Commonwealth Financing Authority, Revenue Bonds | | 5.00 | | 6/1/2030 | | 4,000,000 | | 4,257,593 | |
Delaware County Industrial Development Authority, Revenue Bonds, Refunding (United Parcel Service) | | 4.10 | | 9/1/2045 | | 9,000,000 | d | 9,000,000 | |
Delaware Valley Regional Finance Authority, Revenue Bonds, Ser. A | | 2.00 | | 10/1/2029 | | 1,000,000 | | 870,500 | |
Geisinger Authority, Revenue Bonds, Refunding (Geisinger Health System Obligated Group) | | 5.00 | | 2/15/2027 | | 12,665,000 | a | 13,177,973 | |
Geisinger Authority, Revenue Bonds, Refunding (Geisinger Health System Obligated Group) | | 5.00 | | 4/1/2030 | | 5,000,000 | a | 5,341,544 | |
Montgomery County Higher Education & Health Authority, Revenue Bonds, Refunding (Thomas Jefferson University Project) | | 4.00 | | 9/1/2034 | | 1,155,000 | | 1,140,486 | |
Pennsylvania, GO | | 3.00 | | 5/15/2035 | | 3,000,000 | | 2,788,535 | |
Pennsylvania, GO | | 3.00 | | 5/15/2034 | | 5,280,000 | | 4,886,622 | |
Pennsylvania, GO | | 3.50 | | 3/1/2031 | | 5,000,000 | | 5,015,391 | |
Pennsylvania Economic Development Financing Authority, Revenue Bonds, Refunding, Ser. A | | 4.00 | | 11/15/2036 | | 3,750,000 | | 3,674,577 | |
Pennsylvania Higher Educational Facilities Authority, Revenue Bonds, Refunding (Drexel University) (Insured; Assured Guaranty Municipal Corp.) Ser. A | | 5.00 | | 5/1/2030 | | 1,795,000 | | 1,967,724 | |
Pennsylvania Higher Educational Facilities Authority, Revenue Bonds, Refunding, Ser. AV1 | | 4.00 | | 6/15/2032 | | 1,355,000 | | 1,372,969 | |
Pennsylvania Higher Educational Facilities Authority, Revenue Bonds, Refunding, Ser. AV1 | | 4.00 | | 6/15/2031 | | 2,505,000 | | 2,544,622 | |
Pennsylvania Higher Educational Facilities Authority, Revenue Bonds, Ser. AT1 | | 5.00 | | 6/15/2029 | | 5,000,000 | | 5,205,144 | |
Pennsylvania Housing Finance Agency, Revenue Bonds, Refunding, Ser. 122 | | 3.65 | | 10/1/2032 | | 4,690,000 | | 4,556,762 | |
Pennsylvania Housing Finance Agency, Revenue Bonds, Refunding, Ser. 122 | | 4.00 | | 10/1/2046 | | 785,000 | | 779,888 | |
Pennsylvania Housing Finance Agency, Revenue Bonds, Ser. 118B | | 3.80 | | 10/1/2035 | | 3,000,000 | | 2,916,824 | |
Pennsylvania Turnpike Commission, Revenue Bonds, Refunding | | 5.00 | | 12/1/2038 | | 10,000,000 | | 10,429,769 | |
Pennsylvania Turnpike Commission, Revenue Bonds, Refunding (Insured; Assured Guaranty Municipal Corp.) Ser. B2 | | 5.00 | | 6/1/2033 | | 5,000,000 | | 5,296,070 | |
Pennsylvania Turnpike Commission, Revenue Bonds, Refunding, Ser. B | | 5.00 | | 6/1/2029 | | 7,925,000 | | 8,249,791 | |
Philadelphia Airport, Revenue Bonds, Refunding, Ser. B | | 5.00 | | 7/1/2025 | | 1,125,000 | | 1,145,089 | |
Philadelphia Industrial Development Authority, Revenue Bonds, Refunding (St. Joseph's University) | | 5.00 | | 11/1/2029 | | 1,000,000 | | 1,064,667 | |
Philadelphia Industrial Development Authority, Revenue Bonds, Refunding (St. Joseph's University) | | 5.00 | | 11/1/2028 | | 1,000,000 | | 1,056,137 | |
Philadelphia Industrial Development Authority, Revenue Bonds, Refunding (St. Joseph's University) | | 5.00 | | 11/1/2025 | | 850,000 | | 869,378 | |
State Public School Building Authority, Revenue Bonds, Refunding (The Philadelphia School District) (Insured; Assured Guaranty Municipal Corp.) Ser. A | | 5.00 | | 6/1/2031 | | 5,000,000 | | 5,190,553 | |
28
| | | | | | | | | | |
| |
BNY Mellon National Intermediate Municipal Bond Fund (continued) |
Description | Coupon
Rate (%) | | Maturity Date | | Principal Amount ($) | | Value ($) | |
Long-Term Municipal Investments - 100.3% (continued) | | | | | |
Pennsylvania - 6.2% (continued) | | | | | |
The Pennsylvania University, Revenue Bonds, Ser. A | | 5.00 | | 9/1/2042 | | 5,000,000 | | 5,182,639 | |
The Philadelphia School District, GO (Insured; State Aid Withholding) Ser. A | | 5.00 | | 9/1/2027 | | 500,000 | | 527,051 | |
The Philadelphia School District, GO (Insured; State Aid Withholding) Ser. A | | 5.00 | | 9/1/2026 | | 500,000 | | 519,633 | |
The Philadelphia School District, GO (Insured; State Aid Withholding) Ser. A | | 5.00 | | 9/1/2024 | | 600,000 | | 607,852 | |
The Philadelphia School District, GO (Insured; State Aid Withholding) Ser. A | | 5.00 | | 9/1/2025 | | 500,000 | | 512,842 | |
West Mifflin School District, GO, Refunding (Insured; Assured Guaranty Municipal Corp.) | | 5.00 | | 4/1/2028 | | 1,000,000 | | 1,042,193 | |
| | 118,023,867 | |
Rhode Island - 1.6% | | | | | |
Rhode Island, GO, Ser. A | | 5.00 | | 8/1/2038 | | 14,075,000 | | 15,599,919 | |
Rhode Island Health & Educational Building Corp., Revenue Bonds (Providence College) | | 5.00 | | 11/1/2047 | | 2,045,000 | | 2,076,388 | |
Rhode Island Health & Educational Building Corp., Revenue Bonds, Refunding (Providence College) Ser. B | | 5.00 | | 11/1/2032 | | 405,000 | | 449,590 | |
Rhode Island Health & Educational Building Corp., Revenue Bonds, Refunding (Providence College) Ser. B | | 5.00 | | 11/1/2033 | | 435,000 | | 481,212 | |
Rhode Island Housing & Mortgage Finance Corp., Revenue Bonds (Insured; Government National Mortgage Association) Ser. 70 | | 4.00 | | 10/1/2049 | | 3,130,000 | | 3,095,252 | |
Rhode Island Housing & Mortgage Finance Corp., Revenue Bonds, Ser. 76A | | 3.00 | | 10/1/2051 | | 6,860,000 | | 6,539,591 | |
Rhode Island Housing & Mortgage Finance Corp., Revenue Bonds, Ser. 76A | | 5.00 | | 10/1/2026 | | 300,000 | | 312,785 | |
Rhode Island Housing & Mortgage Finance Corp., Revenue Bonds, Ser. 76A | | 5.00 | | 4/1/2029 | | 535,000 | | 577,077 | |
Rhode Island Housing & Mortgage Finance Corp., Revenue Bonds, Ser. 76A | | 5.00 | | 4/1/2027 | | 500,000 | | 524,813 | |
Rhode Island Housing & Mortgage Finance Corp., Revenue Bonds, Ser. 76A | | 5.00 | | 10/1/2028 | | 525,000 | | 565,325 | |
| | 30,221,952 | |
South Carolina - 1.1% | | | | | |
Patriots Energy Group Financing Agency, Revenue Bonds, Ser. A | | 4.00 | | 2/1/2024 | | 5,000,000 | a | 4,988,512 | |
South Carolina Public Service Authority, Revenue Bonds (Santee Cooper) Ser. A | | 4.00 | | 12/1/2037 | | 2,750,000 | | 2,692,388 | |
South Carolina Public Service Authority, Revenue Bonds (Santee Cooper) Ser. A | | 5.00 | | 12/1/2033 | | 3,750,000 | | 4,090,529 | |
Spartanburg Regional Health Services District, Revenue Bonds, Refunding | | 5.00 | | 4/15/2032 | | 1,340,000 | | 1,460,746 | |
Spartanburg Regional Health Services District, Revenue Bonds, Refunding | | 5.00 | | 4/15/2033 | | 1,400,000 | | 1,520,074 | |
Spartanburg Regional Health Services District, Revenue Bonds, Refunding | | 5.00 | | 4/15/2031 | | 2,245,000 | | 2,435,697 | |
Spartanburg Regional Health Services District, Revenue Bonds, Refunding | | 5.00 | | 4/15/2029 | | 1,705,000 | | 1,822,002 | |
Spartanburg Regional Health Services District, Revenue Bonds, Refunding | | 5.00 | | 4/15/2030 | | 2,140,000 | | 2,305,181 | |
| | 21,315,129 | |
Tennessee - 1.7% | | | | | |
Knoxville, GO, Refunding | | 3.00 | | 5/1/2036 | | 2,830,000 | | 2,595,202 | |
Nashville & Davidson County Metropolitan Government, GO, Refunding | | 2.50 | | 1/1/2029 | | 5,000,000 | | 4,663,957 | |
Nashville & Davidson County Metropolitan Government, GO, Ser. B | | 4.00 | | 1/1/2031 | | 10,000,000 | | 10,664,358 | |
29
STATEMENT OF INVESTMENTS (continued)
| | | | | | | | | | |
| |
BNY Mellon National Intermediate Municipal Bond Fund (continued) |
Description | Coupon
Rate (%) | | Maturity Date | | Principal Amount ($) | | Value ($) | |
Long-Term Municipal Investments - 100.3% (continued) | | | | | |
Tennessee - 1.7% (continued) | | | | | |
Tennessee Housing Development Agency, Revenue Bonds, Ser. 1B | | 3.50 | | 1/1/2047 | | 645,000 | | 635,066 | |
Tennessee Housing Development Agency, Revenue Bonds, Ser. 2B | | 4.00 | | 1/1/2042 | | 625,000 | | 618,487 | |
The Metropolitan Nashville Airport Authority, Revenue Bonds, Ser. B | | 5.00 | | 7/1/2026 | | 1,900,000 | | 1,954,383 | |
The Metropolitan Nashville Airport Authority, Revenue Bonds, Ser. B | | 5.00 | | 7/1/2027 | | 1,800,000 | | 1,874,658 | |
The Metropolitan Nashville Airport Authority, Revenue Bonds, Ser. B | | 5.00 | | 7/1/2028 | | 2,870,000 | | 3,019,877 | |
The Metropolitan Nashville Airport Authority, Revenue Bonds, Ser. B | | 5.00 | | 7/1/2039 | | 6,000,000 | | 6,213,404 | |
| | 32,239,392 | |
Texas - 12.1% | | | | | |
Alief Independent School District, GO (Insured; Permanent School Fund Guarantee Program) | | 4.00 | | 2/15/2040 | | 3,445,000 | | 3,411,638 | |
Alief Independent School District, GO (Insured; Permanent School Fund Guarantee Program) | | 4.00 | | 2/15/2039 | | 3,605,000 | | 3,596,774 | |
Arlington, Special Tax Bonds, Refunding (Insured; Assured Guaranty Municipal Corp.) | | 5.00 | | 2/15/2034 | | 4,180,000 | | 4,262,517 | |
Arlington Independent School District, GO, Refunding (Insured; Permanent School Fund Guarantee Program) | | 5.00 | | 2/15/2039 | | 1,000,000 | | 1,091,143 | |
Arlington Independent School District, GO, Refunding (Insured; Permanent School Fund Guarantee Program) | | 5.00 | | 2/15/2040 | | 2,000,000 | | 2,172,768 | |
Austin Airport System, Revenue Bonds, Refunding | | 5.00 | | 11/15/2025 | | 5,000,000 | | 5,104,961 | |
Bexar County, Revenue Bonds, Refunding (Tax Exempt Venue Project) | | 5.00 | | 8/15/2027 | | 1,110,000 | | 1,159,648 | |
Central Texas Regional Mobility Authority, BAN, Ser. F | | 5.00 | | 1/1/2025 | | 3,500,000 | | 3,531,610 | |
Clifton Higher Education Finance Corp., Revenue Bonds (IDEA Public Schools) (Insured; Permanent School Fund Guarantee Program) | | 5.00 | | 8/15/2028 | | 1,210,000 | | 1,314,945 | |
Clifton Higher Education Finance Corp., Revenue Bonds (IDEA Public Schools) (Insured; Permanent School Fund Guarantee Program) Ser. T | | 4.00 | | 8/15/2035 | | 1,100,000 | | 1,117,475 | |
Clifton Higher Education Finance Corp., Revenue Bonds (IDEA Public Schools) (Insured; Permanent School Fund Guarantee Program) Ser. T | | 4.00 | | 8/15/2033 | | 2,220,000 | | 2,296,566 | |
Dallas Fort Worth International Airport, Revenue Bonds, Refunding, Ser. B | | 5.00 | | 11/1/2031 | | 5,000,000 | | 5,596,046 | |
Dallas Fort Worth International Airport, Revenue Bonds, Refunding, Ser. B | | 5.00 | | 11/1/2030 | | 10,000,000 | | 11,069,059 | |
Dallas Fort Worth International Airport, Revenue Bonds, Refunding, Ser. C | | 5.00 | | 11/1/2031 | | 5,000,000 | | 5,417,763 | |
Dallas Hotel Occupancy, Revenue Bonds, Refunding | | 4.00 | | 8/15/2036 | | 1,000,000 | | 939,152 | |
Dallas Hotel Occupancy, Revenue Bonds, Refunding | | 4.00 | | 8/15/2038 | | 2,000,000 | | 1,813,828 | |
Dallas Hotel Occupancy, Revenue Bonds, Refunding | | 4.00 | | 8/15/2028 | | 2,220,000 | | 2,232,173 | |
Dallas Hotel Occupancy, Revenue Bonds, Refunding | | 4.00 | | 8/15/2035 | | 2,000,000 | | 1,915,999 | |
Dallas Hotel Occupancy, Revenue Bonds, Refunding (Insured; Assured Guaranty Municipal Corp.) | | 4.00 | | 8/15/2038 | | 1,000,000 | | 922,721 | |
Danbury Higher Education Authority, Revenue Bonds, Ser. A | | 4.00 | | 8/15/2049 | | 690,000 | | 521,460 | |
Danbury Higher Education Authority, Revenue Bonds, Ser. A | | 4.75 | | 8/15/2034 | | 1,000,000 | | 977,021 | |
Fort Bend Grand Parkway Toll Road Authority, Revenue Bonds, Refunding (Insured; County Guaranteed) Ser. A | | 3.00 | | 3/1/2036 | | 4,330,000 | | 3,898,714 | |
Fort Bend Grand Parkway Toll Road Authority, Revenue Bonds, Refunding (Insured; County Guaranteed) Ser. A | | 3.00 | | 3/1/2035 | | 4,310,000 | | 3,975,593 | |
Greater Texoma Utility Authority, Revenue Bonds (Sherman Water & Sewer System Project) (Insured; Build America Mutual) Ser. A | | 5.00 | | 10/1/2039 | | 5,635,000 | | 6,061,913 | |
30
| | | | | | | | | | |
| |
BNY Mellon National Intermediate Municipal Bond Fund (continued) |
Description | Coupon
Rate (%) | | Maturity Date | | Principal Amount ($) | | Value ($) | |
Long-Term Municipal Investments - 100.3% (continued) | | | | | |
Texas - 12.1% (continued) | | | | | |
Harris County Cultural Education Facilities Finance Corp., Revenue Bonds (Memorial Hermann Health System Obligated Group) | | 5.00 | | 12/1/2026 | | 10,795,000 | a | 11,274,340 | |
Harris County Cultural Education Facilities Finance Corp., Revenue Bonds, Refunding (Texas Children's Hospital Obligated Group) | | 5.00 | | 10/1/2031 | | 5,000,000 | a | 5,600,157 | |
Hidalgo County Regional Mobility Authority, Revenue Bonds, Ser. A | | 4.00 | | 12/1/2037 | | 1,545,000 | | 1,441,179 | |
Hidalgo County Regional Mobility Authority, Revenue Bonds, Ser. A | | 4.00 | | 12/1/2038 | | 1,855,000 | | 1,715,571 | |
Hidalgo County Regional Mobility Authority, Revenue Bonds, Ser. A | | 5.00 | | 12/1/2034 | | 500,000 | | 522,880 | |
Hidalgo County Regional Mobility Authority, Revenue Bonds, Ser. A | | 5.00 | | 12/1/2035 | | 700,000 | | 725,498 | |
Hidalgo County Regional Mobility Authority, Revenue Bonds, Ser. A | | 5.00 | | 12/1/2036 | | 1,000,000 | | 1,027,710 | |
Hidalgo County Regional Mobility Authority, Revenue Bonds, Ser. A | | 5.00 | | 12/1/2033 | | 500,000 | | 526,829 | |
Hidalgo County Regional Mobility Authority, Revenue Bonds, Ser. A | | 5.00 | | 12/1/2029 | | 250,000 | | 262,547 | |
Hidalgo County Regional Mobility Authority, Revenue Bonds, Ser. A | | 5.00 | | 12/1/2028 | | 100,000 | | 104,326 | |
Hidalgo County Regional Mobility Authority, Revenue Bonds, Ser. A | | 5.00 | | 12/1/2030 | | 500,000 | | 528,759 | |
Hidalgo County Regional Mobility Authority, Revenue Bonds, Ser. A | | 5.00 | | 12/1/2032 | | 300,000 | | 317,594 | |
Hidalgo County Regional Mobility Authority, Revenue Bonds, Ser. A | | 5.00 | | 12/1/2031 | | 485,000 | | 514,530 | |
Houston, GO, Refunding, Ser. A | | 3.00 | | 3/1/2037 | | 2,305,000 | | 1,936,777 | |
Houston, GO, Refunding, Ser. A | | 3.00 | | 3/1/2036 | | 1,500,000 | | 1,305,986 | |
Houston Airport System, Revenue Bonds, Refunding, Ser. A | | 4.00 | | 7/1/2035 | | 1,145,000 | | 1,133,246 | |
Houston Airport System, Revenue Bonds, Refunding, Ser. A | | 4.00 | | 7/1/2036 | | 2,000,000 | | 1,979,149 | |
Houston Airport System, Revenue Bonds, Refunding, Ser. A | | 5.00 | | 7/1/2033 | | 1,225,000 | | 1,314,259 | |
Houston Combined Utility System, Revenue Bonds, Refunding, Ser. B | | 4.50 | | 11/15/2038 | | 16,540,000 | | 16,637,440 | |
Houston Community College System, GO, Refunding | | 4.00 | | 2/15/2036 | | 5,000,000 | | 5,014,262 | |
Houston Hotel Occupancy, Revenue Bonds, Refunding | | 5.00 | | 9/1/2028 | | 1,350,000 | | 1,448,261 | |
Houston Hotel Occupancy, Revenue Bonds, Refunding | | 5.00 | | 9/1/2026 | | 1,750,000 | | 1,827,295 | |
Houston Hotel Occupancy, Revenue Bonds, Refunding | | 5.00 | | 9/1/2027 | | 1,720,000 | | 1,820,933 | |
North Texas Tollway Authority, Revenue Bonds, Refunding (Insured; Assured Guaranty Municipal Corp.) Ser. B | | 4.00 | | 1/1/2034 | | 5,015,000 | | 5,073,901 | |
North Texas Tollway Authority, Revenue Bonds, Refunding, Ser. A | | 5.00 | | 1/1/2030 | | 3,000,000 | | 3,046,943 | |
North Texas Tollway Authority, Revenue Bonds, Refunding, Ser. A | | 5.00 | | 1/1/2030 | | 8,650,000 | | 8,982,003 | |
North Texas Tollway Authority, Revenue Bonds, Refunding, Ser. B | | 5.00 | | 1/1/2031 | | 1,875,000 | | 1,941,378 | |
North Texas Tollway Authority, Revenue Bonds, Refunding, Ser. B | | 5.00 | | 1/1/2030 | | 1,750,000 | | 1,813,062 | |
Pewitt Consolidated Independent School District, GO (Insured; Permanent School Fund Guarantee Program) | | 5.00 | | 2/15/2039 | | 1,110,000 | | 1,208,850 | |
Pewitt Consolidated Independent School District, GO (Insured; Permanent School Fund Guarantee Program) | | 5.00 | | 2/15/2037 | | 1,005,000 | | 1,111,561 | |
San Antonio Texas Electric & Gas Systems, Revenue Bonds, Refunding | | 4.00 | | 2/1/2030 | | 5,740,000 | | 5,779,633 | |
Southwest Higher Education Authority, Revenue Bonds, Refunding (Southern Methodist University) | | 5.00 | | 10/1/2029 | | 5,000,000 | | 5,246,643 | |
Southwest Higher Education Authority, Revenue Bonds, Refunding (Southern Methodist University) | | 5.00 | | 10/1/2028 | | 4,500,000 | | 4,724,667 | |
31
STATEMENT OF INVESTMENTS (continued)
| | | | | | | | | | |
| |
BNY Mellon National Intermediate Municipal Bond Fund (continued) |
Description | Coupon
Rate (%) | | Maturity Date | | Principal Amount ($) | | Value ($) | |
Long-Term Municipal Investments - 100.3% (continued) | | | | | |
Texas - 12.1% (continued) | | | | | |
Southwest Independent School District, GO (Insured; Permanent School Fund Guarantee Program) | | 5.00 | | 2/1/2041 | | 2,000,000 | | 2,150,545 | |
Southwest Independent School District, GO (Insured; Permanent School Fund Guarantee Program) | | 5.00 | | 2/1/2040 | | 1,965,000 | | 2,119,431 | |
Southwest Independent School District, GO (Insured; Permanent School Fund Guarantee Program) | | 5.00 | | 2/1/2039 | | 1,500,000 | | 1,623,686 | |
Tarrant County Cultural Education Facilities Finance Corp., Revenue Bonds (CHRISTUS Health Obligated Group) Ser. A | | 5.00 | | 7/1/2032 | | 2,750,000 | a | 2,998,110 | |
Tarrant County Cultural Education Facilities Finance Corp., Revenue Bonds (Methodist Hospitals of Dallas Obligated Group) | | 5.00 | | 10/1/2037 | | 1,475,000 | | 1,581,842 | |
Tarrant County Cultural Education Facilities Finance Corp., Revenue Bonds, Refunding (Methodist Hospitals of Dallas Obligated Group) (LOC; TD Bank NA) Ser. B | | 3.90 | | 10/1/2041 | | 2,500,000 | d | 2,500,000 | |
Texarkana Independent School District, GO (Insured; Permanent School Fund Guarantee Program) | | 5.00 | | 2/15/2036 | | 1,400,000 | | 1,572,216 | |
Texarkana Independent School District, GO (Insured; Permanent School Fund Guarantee Program) | | 5.00 | | 2/15/2035 | | 1,520,000 | | 1,729,615 | |
Texarkana Independent School District, GO (Insured; Permanent School Fund Guarantee Program) | | 5.00 | | 2/15/2034 | | 2,500,000 | | 2,864,418 | |
Texas, GO, Ser. A | | 4.15 | | 6/1/2043 | | 600,000 | d | 600,000 | |
Texas, GO, Ser. A | | 4.15 | | 6/1/2044 | | 1,000,000 | d | 1,000,000 | |
Texas, GO, Ser. B | | 4.15 | | 12/1/2043 | | 2,400,000 | d | 2,400,000 | |
Texas Private Activity Bond Surface Transportation Corp., Revenue Bonds, Refunding (LBJ Infrastructure Group) | | 4.00 | | 12/31/2035 | | 1,250,000 | | 1,204,660 | |
Texas Private Activity Bond Surface Transportation Corp., Revenue Bonds, Refunding (LBJ Infrastructure Group) | | 4.00 | | 6/30/2035 | | 1,330,000 | | 1,284,612 | |
Texas Private Activity Bond Surface Transportation Corp., Revenue Bonds, Refunding (LBJ Infrastructure Group) | | 4.00 | | 12/31/2033 | | 1,215,000 | | 1,186,442 | |
Texas Private Activity Bond Surface Transportation Corp., Revenue Bonds, Refunding (LBJ Infrastructure Group) | | 4.00 | | 6/30/2033 | | 2,750,000 | | 2,687,035 | |
Texas Private Activity Bond Surface Transportation Corp., Revenue Bonds, Refunding (LBJ Infrastructure Group) | | 4.00 | | 12/31/2034 | | 1,500,000 | | 1,457,180 | |
Texas Private Activity Bond Surface Transportation Corp., Revenue Bonds, Refunding (LBJ Infrastructure Group) | | 4.00 | | 6/30/2034 | | 1,500,000 | | 1,459,332 | |
Texas Tech University System, Revenue Bonds, Refunding, Ser. A | | 5.00 | | 2/15/2040 | | 3,750,000 | | 4,104,965 | |
Texas Water Development Board, Revenue Bonds | | 4.50 | | 10/15/2037 | | 5,700,000 | | 6,059,835 | |
Texas Water Development Board, Revenue Bonds | | 5.00 | | 8/1/2031 | | 9,575,000 | | 10,846,153 | |
University of Houston, Revenue Bonds, Refunding, Ser. A | | 5.00 | | 2/15/2033 | | 5,000,000 | | 5,181,829 | |
| | 230,921,562 | |
U.S. Related - .3% | | | | | |
Antonio B Won Pat International Airport Authority, Revenue Bonds, Refunding (Insured; Assured Guaranty Municipal Corp.) Ser. B | | 5.50 | | 10/1/2023 | | 1,000,000 | e | 1,001,524 | |
Guam, Revenue Bonds, Refunding, Ser. A | | 5.00 | | 12/1/2029 | | 2,000,000 | | 2,046,070 | |
Guam, Revenue Bonds, Refunding, Ser. A | | 5.00 | | 12/1/2028 | | 2,000,000 | | 2,049,725 | |
Puerto Rico, GO, Ser. A | | 0.00 | | 7/1/2024 | | 3,221 | b | 2,948 | |
Puerto Rico, GO, Ser. A | | 0.00 | | 7/1/2033 | | 25,549 | b | 15,567 | |
Puerto Rico, GO, Ser. A1 | | 4.00 | | 7/1/2037 | | 15,316 | | 13,780 | |
Puerto Rico, GO, Ser. A1 | | 4.00 | | 7/1/2041 | | 20,824 | | 18,008 | |
Puerto Rico, GO, Ser. A1 | | 4.00 | | 7/1/2046 | | 21,657 | | 18,029 | |
Puerto Rico, GO, Ser. A1 | | 4.00 | | 7/1/2035 | | 17,845 | | 16,401 | |
Puerto Rico, GO, Ser. A1 | | 4.00 | | 7/1/2033 | | 19,853 | | 18,590 | |
Puerto Rico, GO, Ser. A1 | | 5.38 | | 7/1/2025 | | 22,111 | | 22,532 | |
Puerto Rico, GO, Ser. A1 | | 5.63 | | 7/1/2027 | | 21,911 | | 22,852 | |
Puerto Rico, GO, Ser. A1 | | 5.63 | | 7/1/2029 | | 21,555 | | 22,806 | |
Puerto Rico, GO, Ser. A1 | | 5.75 | | 7/1/2031 | | 20,937 | | 22,644 | |
32
| | | | | | | | | | |
| |
BNY Mellon National Intermediate Municipal Bond Fund (continued) |
Description | Coupon
Rate (%) | | Maturity Date | | Principal Amount ($) | | Value ($) | |
Long-Term Municipal Investments - 100.3% (continued) | | | | | |
U.S. Related - .3% (continued) | | | | | |
Puerto Rico, Notes | | 0.01 | | 11/1/2043 | | 130,816 | d | 67,534 | |
Puerto Rico Electric Power Authority, Revenue Bonds, Refunding, Ser. ZZ | | 5.25 | | 7/1/2028 | | 2,500,000 | g | 681,250 | |
| | 6,040,260 | |
Utah - .9% | | | | | |
Intermountain Power Agency, Revenue Bonds, Ser. A | | 5.00 | | 7/1/2042 | | 4,000,000 | | 4,322,526 | |
Intermountain Power Agency, Revenue Bonds, Ser. A | | 5.00 | | 7/1/2038 | | 3,000,000 | | 3,309,612 | |
Intermountain Power Agency, Revenue Bonds, Ser. A | | 5.00 | | 7/1/2037 | | 2,000,000 | | 2,222,342 | |
Salt Lake City, Revenue Bonds, Ser. A | | 5.00 | | 7/1/2031 | | 2,400,000 | | 2,501,872 | |
Salt Lake City, Revenue Bonds, Ser. A | | 5.00 | | 7/1/2030 | | 2,000,000 | | 2,083,773 | |
Salt Lake City, Revenue Bonds, Ser. A | | 5.00 | | 7/1/2029 | | 2,500,000 | | 2,603,450 | |
Vineyard Redevelopment Agency, Tax Allocation Bonds, Refunding (Geneva Urban Renewal Project) (Insured; Assured Guaranty Municipal Corp.) | | 5.00 | | 5/1/2030 | | 215,000 | | 237,713 | |
Vineyard Redevelopment Agency, Tax Allocation Bonds, Refunding (Geneva Urban Renewal Project) (Insured; Assured Guaranty Municipal Corp.) | | 5.00 | | 5/1/2031 | | 235,000 | | 262,537 | |
Vineyard Redevelopment Agency, Tax Allocation Bonds, Refunding (Geneva Urban Renewal Project) (Insured; Assured Guaranty Municipal Corp.) | | 5.00 | | 5/1/2028 | | 225,000 | | 242,224 | |
Vineyard Redevelopment Agency, Tax Allocation Bonds, Refunding (Geneva Urban Renewal Project) (Insured; Assured Guaranty Municipal Corp.) | | 5.00 | | 5/1/2029 | | 200,000 | | 218,634 | |
| | 18,004,683 | |
Vermont - .6% | | | | | |
University of Vermont & Agricultural College, Revenue Bonds, Refunding | | 5.00 | | 10/1/2040 | | 740,000 | | 750,294 | |
Vermont Educational & Health Buildings Financing Agency, Revenue Bonds, Refunding (University of Vermont Medical Center Obligated Group) Ser. A | | 5.00 | | 12/1/2032 | | 10,000,000 | | 10,311,125 | |
| | 11,061,419 | |
Washington - 4.0% | | | | | |
Central Puget Sound Regional Transit Authority, Revenue Bonds, Refunding (Green Bond) Ser. S1 | | 3.00 | | 11/1/2036 | | 10,000,000 | | 8,918,225 | |
Energy Northwest, Revenue Bonds, Refunding (Columbia Generating Station) Ser. A | | 5.00 | | 7/1/2036 | | 12,395,000 | | 13,911,889 | |
Franklin County School District No. 1, GO, Refunding (Insured; School Board Guaranty) | | 5.00 | | 12/1/2038 | | 5,000,000 | | 5,520,730 | |
King County Housing Authority, Revenue Bonds (Kirkland Heights Project) Ser. A | | 5.00 | | 1/1/2028 | | 5,225,000 | | 5,359,273 | |
Port of Seattle, Revenue Bonds, Refunding | | 5.00 | | 8/1/2028 | | 5,000,000 | | 5,278,151 | |
Port of Seattle, Revenue Bonds, Refunding, Ser. C | | 5.00 | | 8/1/2030 | | 2,800,000 | | 3,016,542 | |
Port of Seattle, Revenue Bonds, Ser. A | | 5.00 | | 5/1/2026 | | 5,000,000 | | 5,140,879 | |
Washington, GO, Ser. A | | 5.00 | | 8/1/2038 | | 11,705,000 | | 13,064,970 | |
Washington Health Care Facilities Authority, Revenue Bonds, Refunding | | 3.00 | | 12/1/2034 | | 435,000 | f | 386,741 | |
Washington Health Care Facilities Authority, Revenue Bonds, Refunding | | 3.00 | | 12/1/2035 | | 445,000 | f | 383,809 | |
Washington Health Care Facilities Authority, Revenue Bonds, Refunding | | 5.00 | | 3/1/2038 | | 4,500,000 | | 4,537,441 | |
Washington Health Care Facilities Authority, Revenue Bonds, Refunding (Providence St. Joseph Health Obligated Group) Ser. B | | 5.00 | | 10/1/2032 | | 2,500,000 | | 2,604,941 | |
Washington Health Care Facilities Authority, Revenue Bonds, Refunding (Virginia Manson Medical Center Obligated Group) | | 5.00 | | 8/15/2027 | | 2,175,000 | | 2,251,307 | |
Washington Health Care Facilities Authority, Revenue Bonds, Refunding (Virginia Manson Medical Center Obligated Group) | | 5.00 | | 8/15/2026 | | 2,000,000 | | 2,047,248 | |
33
STATEMENT OF INVESTMENTS (continued)
| | | | | | | | | | |
| |
BNY Mellon National Intermediate Municipal Bond Fund (continued) |
Description | Coupon
Rate (%) | | Maturity Date | | Principal Amount ($) | | Value ($) | |
Long-Term Municipal Investments - 100.3% (continued) | | | | | |
Washington - 4.0% (continued) | | | | | |
Washington Health Care Facilities Authority, Revenue Bonds, Refunding (Virginia Manson Medical Center Obligated Group) | | 5.00 | | 8/15/2025 | | 1,700,000 | | 1,722,486 | |
Washington Higher Education Facilities Authority, Revenue Bonds (Seattle University Project) | | 5.00 | | 5/1/2029 | | 500,000 | | 536,676 | |
Washington Higher Education Facilities Authority, Revenue Bonds (Seattle University Project) | | 5.00 | | 5/1/2027 | | 500,000 | | 522,534 | |
Washington Higher Education Facilities Authority, Revenue Bonds (Seattle University Project) | | 5.00 | | 5/1/2032 | | 500,000 | | 540,603 | |
Washington Higher Education Facilities Authority, Revenue Bonds (Seattle University Project) | | 5.00 | | 5/1/2031 | | 790,000 | | 855,017 | |
| | 76,599,462 | |
Wisconsin - .2% | | | | | |
Wisconsin Health & Educational Facilities Authority, Revenue Bonds, Refunding (Ascension Health Credit Group) Ser. A | | 5.00 | | 11/15/2039 | | 4,000,000 | | 4,060,897 | |
Total Investments (cost $1,995,909,308) | | 100.3% | 1,917,026,466 | |
Liabilities, Less Cash and Receivables | | (0.3%) | (6,335,689) | |
Net Assets | | 100.0% | 1,910,690,777 | |
a These securities have a put feature; the date shown represents the put date and the bond holder can take a specific action to retain the bond after the put date.
b Security issued with a zero coupon. Income is recognized through the accretion of discount.
c Variable rate security—interest rate resets periodically and rate shown is the interest rate in effect at period end. Security description also includes the reference rate and spread if published and available.
d The Variable Rate is determined by the Remarketing Agent in its sole discretion based on prevailing market conditions and may, but need not, be established by reference to one or more financial indices.
e These securities are prerefunded; the date shown represents the prerefunded date. Bonds which are prerefunded are collateralized by U.S. Government securities which are held in escrow and are used to pay principal and interest on the municipal issue and to retire the bonds in full at the earliest refunding date.
f Security exempt from registration pursuant to Rule 144A under the Securities Act of 1933. These securities may be resold in transactions exempt from registration, normally to qualified institutional buyers. At August 31, 2023, these securities were valued at $18,997,676 or .99% of net assets.
g Non-income producing—security in default.
| | |
Portfolio Summary (Unaudited) † | Value (%) |
General | 21.8 |
General Obligation | 16.4 |
Medical | 11.2 |
Transportation | 10.1 |
Airport | 8.8 |
Education | 7.1 |
Water | 5.7 |
Development | 4.7 |
School District | 3.9 |
Single Family Housing | 3.3 |
Power | 2.4 |
Tobacco Settlement | 2.3 |
Prerefunded | .7 |
Multifamily Housing | .6 |
Utilities | .3 |
Housing | .3 |
Pollution | .3 |
Special Tax | .2 |
Nursing Homes | .2 |
| | 100.3 |
† Based on net assets.
See notes to financial statements.
34
| | | | | | | | | | | | |
BNY Mellon National Intermediate Municipal Bond Fund | |
Futures | | | |
Description | Number of
Contracts | Expiration | Notional
Value($) | Market
Value ($) | Unrealized
(Depreciation) ($) | |
Futures Short | | |
U.S. Treasury Ultra Long Bond | 41 | 12/19/2023 | 5,228,166 | 5,308,219 | (80,053) | |
Ultra 10 Year U.S. Treasury Notes | 167 | 12/19/2023 | 19,195,041 | 19,390,266 | (195,225) | |
Gross Unrealized Depreciation | | (275,278) | |
See notes to financial statements.
35
STATEMENT OF INVESTMENTS (continued)
| | | | | | | | | | |
| |
BNY Mellon National Short-Term Municipal Bond Fund |
Description | Coupon
Rate (%) | | Maturity Date | | Principal Amount ($) | | Value ($) | |
Long-Term Municipal Investments - 100.7% | | | | | |
Alabama - 3.0% | | | | | |
Black Belt Energy Gas District, Revenue Bonds (Gas Project) | | 4.00 | | 12/1/2023 | | 2,000,000 | | 1,999,729 | |
Black Belt Energy Gas District, Revenue Bonds (Gas Project) | | 4.00 | | 12/1/2024 | | 3,000,000 | | 2,992,584 | |
Black Belt Energy Gas District, Revenue Bonds (Project No. 4) Ser. A1 | | 4.00 | | 12/1/2025 | | 5,000,000 | a | 4,959,963 | |
Black Belt Energy Gas District, Revenue Bonds, Refunding, Ser. D1 | | 4.00 | | 6/1/2026 | | 450,000 | | 448,950 | |
Black Belt Energy Gas District, Revenue Bonds, Refunding, Ser. D1 | | 4.00 | | 12/1/2024 | | 325,000 | | 325,091 | |
Black Belt Energy Gas District, Revenue Bonds, Refunding, Ser. D1 | | 4.00 | | 6/1/2024 | | 275,000 | | 275,069 | |
Black Belt Energy Gas District, Revenue Bonds, Refunding, Ser. D1 | | 4.00 | | 12/1/2025 | | 420,000 | | 419,245 | |
Black Belt Energy Gas District, Revenue Bonds, Refunding, Ser. D1 | | 4.00 | | 6/1/2025 | | 300,000 | | 299,800 | |
Southeast Energy Authority A Cooperative District, Revenue Bonds, Ser. B1 | | 5.00 | | 8/1/2025 | | 1,500,000 | | 1,519,905 | |
Southeast Energy Authority A Cooperative District, Revenue Bonds, Ser. B1 | | 5.00 | | 8/1/2024 | | 1,000,000 | | 1,006,694 | |
| | 14,247,030 | |
Arizona - 3.0% | | | | | |
Arizona Industrial Development Authority, Revenue Bonds (Equitable School Revolving Fund Obligated Group) Ser. A | | 4.00 | | 11/1/2024 | | 870,000 | | 871,148 | |
Chandler Industrial Development Authority, Revenue Bonds (Intel Corp.) | | 5.00 | | 6/3/2024 | | 7,000,000 | a | 7,026,978 | |
Maricopa County Industrial Development Authority, Revenue Bonds (Banner Health Obligated Group) Ser. A1 | | 5.00 | | 5/15/2026 | | 2,750,000 | a | 2,850,365 | |
The Yavapai County Industrial Development Authority, Revenue Bonds (Waste Management Project) Ser. A2 | | 2.20 | | 6/3/2024 | | 3,350,000 | a | 3,301,539 | |
| | 14,050,030 | |
Arkansas - .2% | | | | | |
Arkansas Development Finance Authority, Revenue Bonds (Arkansas Division of Emergency Management Project) | | 4.00 | | 6/1/2029 | | 1,000,000 | | 1,017,410 | |
California - 4.7% | | | | | |
California Infrastructure & Economic Development Bank, Revenue Bonds (Equitable School Revolving Fund Obligated Group) Ser. B | | 4.00 | | 11/1/2025 | | 1,025,000 | | 1,030,752 | |
California Infrastructure & Economic Development Bank, Revenue Bonds, Ser. A | | 3.65 | | 1/31/2024 | | 7,500,000 | a,b | 7,460,953 | |
California Pollution Control Financing Authority, Revenue Bonds, Refunding (American Water Capital Project) | | 0.60 | | 9/1/2023 | | 1,000,000 | a | 1,000,000 | |
California Public Finance Authority, Revenue Bonds (ENSO Village Project) Ser. B3 | | 2.13 | | 11/15/2027 | | 3,000,000 | b | 2,912,214 | |
California Public Finance Authority, Revenue Bonds (Green Bond) (ENSO Village Project) | | 2.38 | | 11/15/2028 | | 1,000,000 | b | 964,507 | |
Vernon Electric System, Revenue Bonds, Refunding, Ser. A | | 5.00 | | 8/1/2025 | | 500,000 | | 508,008 | |
Vernon Electric System, Revenue Bonds, Refunding, Ser. A | | 5.00 | | 8/1/2024 | | 700,000 | | 705,802 | |
Vernon Electric System, Revenue Bonds, Refunding, Ser. A | | 5.00 | | 8/1/2026 | | 600,000 | | 616,374 | |
Vernon Electric System, Revenue Bonds, Ser. A | | 5.00 | | 10/1/2024 | | 1,250,000 | | 1,262,374 | |
Western Placer Unified School District, BAN | | 2.00 | | 6/1/2025 | | 5,000,000 | | 4,777,979 | |
Western Placer Unified School District, BAN | | 2.00 | | 6/1/2025 | | 1,000,000 | | 958,811 | |
| | 22,197,774 | |
Colorado - 1.2% | | | | | |
Colorado Housing & Finance Authority, Revenue Bonds, Refunding (Insured; Government National Mortgage Association Collateral) Ser. K | | 3.88 | | 5/1/2050 | | 2,020,000 | | 1,987,953 | |
Colorado Housing & Finance Authority, Revenue Bonds, Refunding (Insured; Government National Mortgage Association) Ser. B | | 3.00 | | 5/1/2051 | | 2,265,000 | | 2,174,405 | |
36
| | | | | | | | | | |
| |
BNY Mellon National Short-Term Municipal Bond Fund (continued) |
Description | Coupon
Rate (%) | | Maturity Date | | Principal Amount ($) | | Value ($) | |
Long-Term Municipal Investments - 100.7% (continued) | | | | | |
Colorado - 1.2% (continued) | | | | | |
Colorado Housing & Finance Authority, Revenue Bonds, Ser. B | | 3.75 | | 5/1/2050 | | 1,445,000 | | 1,418,882 | |
| | 5,581,240 | |
Connecticut - .9% | | | | | |
Connecticut Health & Educational Facilities Authority, Revenue Bonds, Refunding (The Stamford Hospital Obligated Group) | | 5.00 | | 7/1/2024 | | 340,000 | | 342,220 | |
Connecticut Health & Educational Facilities Authority, Revenue Bonds, Refunding (The Stamford Hospital Obligated Group) | | 5.00 | | 7/1/2026 | | 200,000 | | 205,240 | |
Connecticut Health & Educational Facilities Authority, Revenue Bonds, Refunding (The Stamford Hospital Obligated Group) Ser. L1 | | 4.00 | | 7/1/2025 | | 600,000 | | 594,558 | |
Connecticut Health & Educational Facilities Authority, Revenue Bonds, Refunding (The Stamford Hospital Obligated Group) Ser. L1 | | 4.00 | | 7/1/2024 | | 650,000 | | 647,314 | |
Connecticut Housing Finance Authority, Revenue Bonds, Refunding, Ser. A1 | | 4.00 | | 11/15/2045 | | 2,595,000 | | 2,566,121 | |
| | 4,355,453 | |
District of Columbia - 4.7% | | | | | |
District of Columbia Water & Sewer Authority, Revenue Bonds, Ser. C | | 1.75 | | 10/1/2024 | | 21,000,000 | a | 20,439,239 | |
Metropolitan Washington Airports Authority, Revenue Bonds, Refunding, Ser. A | | 5.00 | | 10/1/2025 | | 1,500,000 | | 1,531,989 | |
| | 21,971,228 | |
Florida - 3.5% | | | | | |
Alachua County Health Facilities Authority, Revenue Bonds, Refunding (Shands Teaching Hospital & Clinics Obligated Group) | | 5.00 | | 12/1/2024 | | 1,900,000 | | 1,927,862 | |
Broward County Port Facilities, Revenue Bonds, Ser. B | | 5.00 | | 9/1/2025 | | 1,875,000 | | 1,917,369 | |
Broward County School District, COP, Ser. A | | 5.00 | | 7/1/2025 | | 5,660,000 | | 5,810,233 | |
Florida Insurance Assistance Interlocal Agency, Revenue Bonds, Refunding, Ser. A1 | | 5.00 | | 9/1/2027 | | 2,500,000 | | 2,605,974 | |
Palm Beach County Housing Finance Authority, Revenue Bonds (Lakeside Commons) | | 5.00 | | 4/1/2025 | | 4,060,000 | a | 4,111,942 | |
| | 16,373,380 | |
Georgia - .9% | | | | | |
Main Street Natural Gas, Revenue Bonds, Ser. B | | 4.00 | | 12/2/2024 | | 2,600,000 | a | 2,595,293 | |
Main Street Natural Gas, Revenue Bonds, Ser. C | | 4.00 | | 12/1/2025 | | 1,000,000 | | 991,243 | |
Main Street Natural Gas, Revenue Bonds, Ser. C | | 4.00 | | 12/1/2024 | | 700,000 | | 696,851 | |
| | 4,283,387 | |
Illinois - 5.7% | | | | | |
Chicago II, GO, Refunding, Ser. A | | 3.00 | | 1/1/2024 | | 850,000 | | 847,054 | |
Chicago II, GO, Refunding, Ser. A | | 5.00 | | 1/1/2025 | | 5,000,000 | | 5,061,844 | |
Chicago II, GO, Refunding, Ser. A | | 5.00 | | 1/1/2024 | | 500,000 | | 501,425 | |
Chicago O'Hare International Airport, Revenue Bonds, Refunding, Ser. C | | 5.00 | | 1/1/2025 | | 2,000,000 | | 2,027,546 | |
Illinois Finance Authority, Revenue Bonds, Refunding (Advocate Aurora Health Obligated Group) | | 5.00 | | 5/1/2025 | | 2,500,000 | c | 2,559,168 | |
Illinois Finance Authority, Revenue Bonds, Refunding (OSF Healthcare System Obligated Group) Ser. B1 | | 5.00 | | 11/15/2024 | | 2,750,000 | a | 2,768,501 | |
Illinois Housing Development Authority, Revenue Bonds (Berry Manor Apartments) | | 4.00 | | 9/1/2024 | | 1,000,000 | a | 997,970 | |
Illinois Housing Development Authority, Revenue Bonds (Ogden Commons) | | 4.00 | | 7/1/2025 | | 2,315,000 | a | 2,306,131 | |
Illinois Housing Development Authority, Revenue Bonds (South Shore) (Insured; Federal Housing Administration) | | 4.00 | | 6/1/2025 | | 1,000,000 | a | 997,671 | |
Illinois Housing Development Authority, Revenue Bonds, Refunding (Insured; GNMA,FNMA,FHLMC) Ser. A2 | | 3.15 | | 8/1/2024 | | 1,185,000 | | 1,173,570 | |
Illinois Toll Highway Authority, Revenue Bonds, Ser. B | | 5.00 | | 1/1/2033 | | 2,500,000 | | 2,510,780 | |
37
STATEMENT OF INVESTMENTS (continued)
| | | | | | | | | | |
| |
BNY Mellon National Short-Term Municipal Bond Fund (continued) |
Description | Coupon
Rate (%) | | Maturity Date | | Principal Amount ($) | | Value ($) | |
Long-Term Municipal Investments - 100.7% (continued) | | | | | |
Illinois - 5.7% (continued) | | | | | |
Springfield IL Electric, Revenue Bonds, Refunding | | 5.00 | | 3/1/2027 | | 5,200,000 | | 5,268,781 | |
| | 27,020,441 | |
Indiana - 3.0% | | | | | |
Indiana Finance Authority, Revenue Bonds, Refunding (Duke Energy Indiana Project) (LOC; Sumitomo Mitsui Banking) Ser. A4 | | 4.00 | | 12/1/2039 | | 4,200,000 | d | 4,200,000 | |
Indiana Finance Authority, Revenue Bonds, Refunding (Indianapolis Power & Light Co.) Ser. B | | 0.95 | | 4/1/2026 | | 3,300,000 | a | 2,947,751 | |
Indiana Finance Authority, Revenue Bonds, Ser. D | | 5.00 | | 8/1/2031 | | 5,000,000 | | 5,257,432 | |
Indiana Health Facility Financing Authority, Revenue Bonds (Ascension Health Credit Group) Ser. A | | 4.00 | | 11/1/2025 | | 690,000 | | 696,438 | |
Indiana Housing & Community Development Authority, Revenue Bonds (Emerald Pointe Apartments) | | 5.00 | | 11/1/2024 | | 1,135,000 | a | 1,143,437 | |
| | 14,245,058 | |
Iowa - 3.1% | | | | | |
Iowa Finance Authority, Revenue Bonds (Green Bond) (Gevo NW Iowa RNG) (LOC; Citibank NA) | | 1.50 | | 4/1/2024 | | 3,000,000 | a | 2,939,629 | |
Iowa Higher Education Loan Authority, Revenue Bonds (Des Moines University Project) | | 5.00 | | 10/1/2025 | | 570,000 | | 579,089 | |
Iowa Higher Education Loan Authority, Revenue Bonds (Des Moines University Project) | | 5.00 | | 10/1/2023 | | 515,000 | | 515,280 | |
Iowa Higher Education Loan Authority, Revenue Bonds (Des Moines University Project) | | 5.00 | | 10/1/2024 | | 540,000 | | 544,837 | |
PEFA, Revenue Bonds (Gas Project) | | 5.00 | | 9/1/2026 | | 10,000,000 | a | 10,097,451 | |
| | 14,676,286 | |
Kentucky - 1.8% | | | | | |
Kentucky Public Energy Authority, Revenue Bonds, Ser. B | | 4.00 | | 1/1/2025 | | 2,500,000 | a | 2,489,487 | |
Owen County, Revenue Bonds, Refunding (Kentucky-American Water Co. Obligated Group) Ser. 2020 | | 0.70 | | 9/1/2023 | | 2,500,000 | a | 2,500,000 | |
Rural Water Financing Agency, Revenue Bonds (Public Construction Project) Ser. A | | 3.90 | | 11/1/2025 | | 3,250,000 | | 3,224,945 | |
| | 8,214,432 | |
Louisiana - 1.8% | | | | | |
Louisiana Gasoline & Fuels Tax, Revenue Bonds, Refunding, Ser. A | | 4.50 | | 5/1/2025 | | 5,000,000 | c | 5,086,561 | |
Louisiana Local Government Environmental Facilities & Community Development Authority, Revenue Bonds (Louisiana Insurance Guaranty Association) | | 5.00 | | 8/15/2025 | | 3,150,000 | | 3,236,672 | |
| | 8,323,233 | |
Maine - .9% | | | | | |
Maine Housing Authority, Revenue Bonds, Ser. C | | 4.00 | | 11/15/2050 | | 1,945,000 | | 1,923,518 | |
Maine Housing Authority, Revenue Bonds, Ser. F | | 4.25 | | 11/15/2048 | | 2,150,000 | | 2,137,128 | |
| | 4,060,646 | |
Maryland - .4% | | | | | |
Maryland Stadium Authority, Revenue Bonds, Ser. A | | 5.00 | | 3/1/2026 | | 2,000,000 | | 2,083,234 | |
Massachusetts - 2.2% | | | | | |
Massachusetts, Revenue Bonds, Ser. A | | 3.68 | | 7/15/2026 | | 10,000,000 | | 9,661,908 | |
Massachusetts Development Finance Agency, Revenue Bonds, Refunding (Insured; Assured Guaranty Municipal Corp.) Ser. C | | 5.00 | | 10/1/2024 | | 720,000 | | 728,789 | |
| | 10,390,697 | |
Michigan - 2.1% | | | | | |
Central Michigan University, Revenue Bonds, Refunding (LOC; TD Bank NA) Ser. A | | 4.06 | | 10/1/2032 | | 2,900,000 | d | 2,900,000 | |
Michigan Strategic Fund, Revenue Bonds (Consumers Energy Co.) | | 1.80 | | 10/1/2024 | | 6,650,000 | a | 6,471,815 | |
38
| | | | | | | | | | |
| |
BNY Mellon National Short-Term Municipal Bond Fund (continued) |
Description | Coupon
Rate (%) | | Maturity Date | | Principal Amount ($) | | Value ($) | |
Long-Term Municipal Investments - 100.7% (continued) | | | | | |
Michigan - 2.1% (continued) | | | | | |
Western Michigan University, Revenue Bonds, Refunding (Insured; Assured Guaranty Municipal Corp.) Ser. C | | 5.00 | | 11/15/2026 | | 450,000 | | 471,603 | |
| | 9,843,418 | |
Minnesota - .2% | | | | | |
Minnesota Housing Finance Agency, Revenue Bonds (Insured; GNMA, FNMA, FHLMC) Ser. B | | 3.50 | | 7/1/2050 | | 1,035,000 | | 1,007,725 | |
Missouri - 1.2% | | | | | |
Cape Girardeau County Industrial Development Authority, Revenue Bonds, Refunding (St. Francis Healthcare System Obligated Group) | | 5.00 | | 6/1/2025 | | 650,000 | | 663,549 | |
Jackson County, Revenue Bonds (RIRR Right Of Way Project) | | 4.00 | | 12/1/2026 | | 1,345,000 | | 1,362,914 | |
Missouri Board of Public Buildings, Revenue Bonds, Refunding, Ser. A | | 4.00 | | 10/1/2026 | | 2,000,000 | | 2,001,054 | |
Missouri Housing Development Commission, Revenue Bonds (Insured; GNMA, FNMA, FHLMC) Ser. A | | 3.50 | | 11/1/2050 | | 1,740,000 | | 1,695,516 | |
| | 5,723,033 | |
Montana - .1% | | | | | |
Montana Facility Finance Authority, Revenue Bonds, Refunding (Billings Clinic Obligated Group) Ser. 2022A | | 5.00 | | 8/15/2025 | | 325,000 | | 334,869 | |
Nebraska - 1.4% | | | | | |
Nebraska Investment Finance Authority, Revenue Bonds (Insured; GNMA, FNMA, FHLMC) Ser. A | | 3.00 | | 9/1/2045 | | 4,195,000 | | 4,017,663 | |
Nebraska Investment Finance Authority, Revenue Bonds, Refunding (Insured; GNMA, FNMA, FHLMC) Ser. E | | 3.75 | | 9/1/2049 | | 2,670,000 | | 2,617,959 | |
| | 6,635,622 | |
Nevada - 1.1% | | | | | |
Clark County, GO, Refunding, Ser. B | | 5.00 | | 11/1/2028 | | 5,000,000 | | 5,262,859 | |
New Hampshire - 1.3% | | | | | |
New Hampshire Business Finance Authority, Revenue Bonds, Refunding (Waste Management) Ser. A3 | | 2.15 | | 7/1/2024 | | 4,000,000 | a | 3,934,617 | |
New Hampshire Business Finance Authority, Revenue Bonds, Refunding (Waste Management) Ser. A4 | | 2.15 | | 7/1/2024 | | 2,000,000 | a | 1,967,308 | |
| | 5,901,925 | |
New Jersey - 2.8% | | | | | |
New Jersey Economic Development Authority, Revenue Bonds, Refunding (Insured; Assured Guaranty Municipal Corp.) Ser. N1 | | 5.50 | | 9/1/2025 | | 1,250,000 | | 1,299,046 | |
New Jersey Economic Development Authority, Revenue Bonds, Refunding, Ser. GGG | | 5.25 | | 9/1/2024 | | 5,000,000 | b | 5,077,464 | |
New Jersey Economic Development Authority, Revenue Bonds, Ser. QQQ | | 5.00 | | 6/15/2025 | | 400,000 | | 409,648 | |
New Jersey Housing & Mortgage Finance Agency, Revenue Bonds, Ser. H | | 3.00 | | 10/1/2052 | | 4,785,000 | | 4,540,944 | |
New Jersey Transportation Trust Fund Authority, Revenue Bonds, Refunding | | 5.00 | | 12/15/2024 | | 1,750,000 | | 1,779,803 | |
| | 13,106,905 | |
New Mexico - 1.6% | | | | | |
New Mexico Mortgage Finance Authority, Revenue Bonds (Santa Fe Apartments) | | 5.00 | | 6/1/2025 | | 2,100,000 | a | 2,121,441 | |
New Mexico Municipal Energy Acquisition Authority, Revenue Bonds, Refunding, Ser. A | | 5.00 | | 5/1/2025 | | 5,500,000 | a | 5,571,120 | |
| | 7,692,561 | |
New York - 13.2% | | | | | |
Long Island Power Authority, Revenue Bonds, Ser. B | | 1.65 | | 9/1/2024 | | 7,000,000 | a | 6,840,039 | |
Metropolitan Transportation Authority, Revenue Bonds, Refunding (Green Bond) Ser. A2 | | 5.00 | | 5/15/2024 | | 2,200,000 | a | 2,216,469 | |
New York City, GO (LOC; U.S. Bank NA) Ser. L4 | | 4.25 | | 4/1/2038 | | 4,700,000 | d | 4,700,000 | |
New York City, GO, Refunding, Ser. F1 | | 5.00 | | 8/1/2026 | | 2,000,000 | | 2,105,635 | |
New York City, GO, Ser. B5 | | 3.95 | | 10/1/2046 | | 300,000 | d | 300,000 | |
39
STATEMENT OF INVESTMENTS (continued)
| | | | | | | | | | |
| |
BNY Mellon National Short-Term Municipal Bond Fund (continued) |
Description | Coupon
Rate (%) | | Maturity Date | | Principal Amount ($) | | Value ($) | |
Long-Term Municipal Investments - 100.7% (continued) | | | | | |
New York - 13.2% (continued) | | | | | |
New York City Housing Development Corp., Revenue Bonds (Insured; Federal Housing Administration) Ser. D2 | | 0.70 | | 11/1/2024 | | 2,000,000 | a | 1,907,181 | |
New York City Housing Development Corp., Revenue Bonds (Insured; Federal Housing Administration) Ser. F2 | | 0.60 | | 7/1/2025 | | 1,965,000 | a | 1,823,220 | |
New York City Municipal Water Finance Authority, Revenue Bonds, Refunding, Ser. B1 | | 3.92 | | 6/15/2049 | | 5,000,000 | d | 5,000,000 | |
New York State Housing Finance Agency, Revenue Bonds (Insured; SONYMA) Ser. M2 | | 0.75 | | 11/1/2025 | | 5,000,000 | | 4,619,351 | |
New York State Housing Finance Agency, Revenue Bonds, Ser. E | | 0.85 | | 11/1/2024 | | 415,000 | | 398,670 | |
New York State Housing Finance Agency, Revenue Bonds, Ser. E | | 0.95 | | 5/1/2025 | | 1,000,000 | | 943,304 | |
New York State Housing Finance Agency, Revenue Bonds, Ser. P | | 1.60 | | 11/1/2024 | | 3,895,000 | | 3,778,518 | |
New York State Mortgage Agency, Revenue Bonds, Refunding, Ser. 186 | | 3.95 | | 4/1/2025 | | 2,860,000 | | 2,854,369 | |
New York State Mortgage Agency, Revenue Bonds, Refunding, Ser. 191 | | 3.00 | | 10/1/2024 | | 1,000,000 | | 989,234 | |
New York Transportation Development Corp., Revenue Bonds, Refunding (JFK International Air Terminal) Ser. A | | 5.00 | | 12/1/2024 | | 1,000,000 | | 1,012,846 | |
Port Authority of New York & New Jersey, Revenue Bonds, Refunding, Ser. 226 | | 5.00 | | 10/15/2025 | | 2,260,000 | | 2,316,690 | |
Triborough Bridge & Tunnel Authority, Revenue Bonds, Refunding, Ser. A2 | | 2.00 | | 5/15/2024 | | 16,875,000 | a | 16,607,359 | |
Triborough Bridge & Tunnel Authority, Revenue Bonds, Refunding, Ser. B2 | | 5.00 | | 5/15/2026 | | 3,500,000 | a | 3,621,360 | |
| | 62,034,245 | |
Ohio - 1.7% | | | | | |
American Municipal Power, Revenue Bonds, Refunding (Combined Hydroelectric) Ser. A2 | | 1.00 | | 8/15/2024 | | 2,000,000 | a | 1,940,931 | |
Lancaster Port Authority, Revenue Bonds, Refunding, Ser. A | | 5.00 | | 2/1/2025 | | 4,260,000 | a | 4,296,214 | |
Ohio Housing Finance Agency, Revenue Bonds (Insured; GNMA, FNMA, FHLMC) Ser. B | | 3.25 | | 3/1/2050 | | 1,675,000 | | 1,622,810 | |
| | 7,859,955 | |
Oklahoma - 1.0% | | | | | |
Tulsa County Independent School District No. 1, GO, Ser. B | | 2.00 | | 8/1/2024 | | 5,000,000 | | 4,910,659 | |
Oregon - 1.8% | | | | | |
Oregon Business Development Commission, Revenue Bonds (Intel Corp. Project) Ser. 232 | | 3.80 | | 6/15/2028 | | 3,000,000 | a | 2,996,454 | |
Oregon Housing & Community Services Department, Revenue Bonds, Ser. C | | 3.00 | | 1/1/2052 | | 3,520,000 | | 3,378,544 | |
Oregon Housing & Community Services Department, Revenue Bonds, Ser. D | | 4.75 | | 1/1/2050 | | 2,080,000 | | 2,086,171 | |
| | 8,461,169 | |
Pennsylvania - 2.8% | | | | | |
Allegheny County Higher Education Building Authority, Revenue Bonds, Refunding (Duquesne University of the Holy Spirit) Ser. 20 | | 5.00 | | 3/1/2026 | | 1,660,000 | | 1,715,019 | |
Allegheny County Higher Education Building Authority, Revenue Bonds, Refunding (Duquesne University of the Holy Spirit) Ser. 20 | | 5.00 | | 3/1/2025 | | 500,000 | | 510,752 | |
Delaware County Industrial Development Authority, Revenue Bonds, Refunding (United Parcel Service) | | 4.10 | | 9/1/2045 | | 1,600,000 | d | 1,600,000 | |
Pennsylvania Economic Development Financing Authority, Revenue Bonds (System of Higher Education) | | 0.74 | | 6/15/2024 | | 4,000,000 | | 3,856,982 | |
Pennsylvania Economic Development Financing Authority, Revenue Bonds (Waste Management Project) | | 1.75 | | 8/1/2024 | | 5,000,000 | a | 4,892,622 | |
40
| | | | | | | | | | |
| |
BNY Mellon National Short-Term Municipal Bond Fund (continued) |
Description | Coupon
Rate (%) | | Maturity Date | | Principal Amount ($) | | Value ($) | |
Long-Term Municipal Investments - 100.7% (continued) | | | | | |
Pennsylvania - 2.8% (continued) | | | | | |
Philadelphia Authority for Industrial Development, Revenue Bonds, Refunding (St. Joseph's University) | | 4.00 | | 11/1/2024 | | 500,000 | | 500,660 | |
| | 13,076,035 | |
Rhode Island - 2.9% | | | | | |
Rhode Island Health & Educational Building Corp., Revenue Bonds, Refunding (Providence Public Building Authority) (Insured; Assured Guaranty Municipal Corp.) | | 5.00 | | 5/15/2027 | | 9,915,000 | | 10,145,844 | |
Rhode Island Housing & Mortgage Finance Corp., Revenue Bonds | | 3.00 | | 10/1/2050 | | 1,620,000 | | 1,555,775 | |
Rhode Island Housing & Mortgage Finance Corp., Revenue Bonds | | 3.50 | | 10/1/2050 | | 2,015,000 | | 1,964,616 | |
| | 13,666,235 | |
South Carolina - 1.9% | | | | | |
South Carolina Housing Finance & Development Authority, Revenue Bonds, Ser. B | | 3.25 | | 1/1/2052 | | 2,625,000 | | 2,539,593 | |
South Carolina Ports Authority, Revenue Bonds | | 5.25 | | 7/1/2025 | | 1,445,000 | c | 1,481,441 | |
South Carolina Ports Authority, Revenue Bonds | | 5.25 | | 7/1/2025 | | 5,000,000 | c | 5,126,093 | |
| | 9,147,127 | |
Texas - 16.1% | | | | | |
Alamo Heights Independent School District, GO (Insured; Permanent School Fund Guarantee Program) Ser. B | | 3.00 | | 2/1/2026 | | 2,500,000 | a | 2,468,060 | |
Aldine Independent School District, GO, Refunding (Insured; Permanent School Fund Guarantee Program) | | 4.00 | | 2/15/2032 | | 3,000,000 | | 3,015,048 | |
Austin Affordable Public Facility Corp., Revenue Bonds (Bridge at Turtle Creek) | | 0.42 | | 12/1/2023 | | 3,350,000 | a | 3,314,870 | |
Dallas Fort Worth International Airport, Revenue Bonds, Refunding, Ser. B | | 5.00 | | 11/1/2027 | | 1,250,000 | | 1,337,388 | |
Dallas Fort Worth International Airport, Revenue Bonds, Refunding, Ser. B | | 5.00 | | 11/1/2026 | | 1,250,000 | | 1,313,369 | |
Dallas Fort Worth International Airport, Revenue Bonds, Refunding, Ser. C | | 5.00 | | 11/1/2026 | | 2,085,000 | | 2,154,781 | |
Dallas Housing Finance Corp., Revenue Bonds (Ash Creek Housing) (Insured; Federal Housing Administration) | | 5.00 | | 12/1/2025 | | 1,750,000 | a | 1,785,794 | |
Denton County, GO, Refunding | | 4.00 | | 7/15/2032 | | 3,700,000 | | 3,722,837 | |
Denton County Housing Finance Corp., Revenue Bonds (Pathway on Woodrow Apartments) | | 5.00 | | 2/1/2025 | | 3,000,000 | a | 3,042,929 | |
El Paso Housing Finance Corp., Revenue Bonds (Columbia Apartments Project) | | 4.50 | | 3/1/2025 | | 2,000,000 | a | 2,012,730 | |
Fort Bend Independent School District, GO, Refunding (Insured; Permanent School Fund Guarantee Program) Ser. B | | 0.72 | | 8/1/2026 | | 1,680,000 | a | 1,485,936 | |
Housing Options, Revenue Bonds (Estelle Village Apartments) | | 3.90 | | 2/1/2025 | | 3,150,000 | a | 3,126,347 | |
Houston Housing Finance Corp., Revenue Bonds (Summerdale Apartments) | | 5.00 | | 8/1/2026 | | 2,500,000 | a | 2,561,244 | |
Hutto Independent School District, GO (Insured; Permanent School Fund Guarantee Program) Ser. 2015 | | 2.00 | | 8/1/2025 | | 2,000,000 | a | 1,936,704 | |
Lone Star College System, GO, Refunding | | 5.00 | | 2/15/2027 | | 3,750,000 | | 3,895,782 | |
Lower Colorado River Authority, Revenue Bonds, Refunding (LCRA Transmission Services Corp.) | | 5.00 | | 5/15/2025 | | 2,125,000 | | 2,183,950 | |
Lubbock County, GO, Ser. A | | 5.00 | | 2/15/2025 | | 2,170,000 | | 2,221,344 | |
Matagorda County Navigation District No. 1, Revenue Bonds, Refunding | | 0.90 | | 9/1/2023 | | 3,750,000 | a | 3,750,000 | |
Pasadena Independent School District, GO (Insured; Permanent School Fund Guarantee Program) Ser. B | | 1.50 | | 8/15/2024 | | 4,000,000 | a | 3,903,059 | |
Permanent University Fund - University of Texas System, Revenue Bonds, Refunding, Ser. B | | 3.50 | | 7/1/2027 | | 9,740,000 | | 9,741,590 | |
Prosper Independent School District, GO (Insured; Permanent School Fund Guarantee Program) | | 3.00 | | 8/15/2025 | | 5,805,000 | a | 5,693,909 | |
Rankin Independent School District, GO (Insured; Permanent School Fund Guarantee Program) | | 5.00 | | 2/15/2028 | | 2,555,000 | | 2,650,064 | |
41
STATEMENT OF INVESTMENTS (continued)
| | | | | | | | | | |
| |
BNY Mellon National Short-Term Municipal Bond Fund (continued) |
Description | Coupon
Rate (%) | | Maturity Date | | Principal Amount ($) | | Value ($) | |
Long-Term Municipal Investments - 100.7% (continued) | | | | | |
Texas - 16.1% (continued) | | | | | |
San Antonio Electric & Gas Systems, Revenue Bonds, Refunding | | 1.75 | | 12/1/2025 | | 2,500,000 | a | 2,341,777 | |
San Antonio Water System, Revenue Bonds, Ser. 2013-F | | 1.00 | | 11/1/2026 | | 1,275,000 | a | 1,126,966 | |
Ysleta Independent School District, GO (Insured; Permanent School Fund Guarantee Program) | | 5.00 | | 8/15/2025 | | 5,000,000 | c | 5,154,402 | |
| | 75,940,880 | |
U.S. Related - .3% | | | | | |
Puerto Rico, Notes | | 0.01 | | 11/1/2051 | | 1,722,505 | d | 891,396 | |
Puerto Rico Highway & Transportation Authority, Revenue Bonds, Ser. A | | 5.00 | | 7/1/2062 | | 271,068 | | 267,341 | |
Puerto Rico Highway & Transportation Authority, Revenue Bonds, Ser. B | | 0.00 | | 7/1/2032 | | 176,158 | e | 113,401 | |
Puerto Rico Highway & Transportation Authority, Revenue Bonds, Ser. C | | 5.00 | | 7/1/2053 | | 301,333 | f | 190,970 | |
| | 1,463,108 | |
Virginia - 1.3% | | | | | |
Greater Richmond Convention Center Authority, Revenue Bonds, Refunding | | 5.00 | | 6/15/2025 | | 1,250,000 | c | 1,284,001 | |
Halifax County Industrial Development Authority, Revenue Bonds (Virginia Electric & Power Co.) | | 1.65 | | 5/31/2024 | | 1,750,000 | a | 1,709,313 | |
Louisa Industrial Development Authority, Revenue Bonds (Virginia Electric & Power Co.) | | 1.65 | | 5/31/2024 | | 3,000,000 | a | 2,930,250 | |
| | 5,923,564 | |
Washington - 2.6% | | | | | |
Benton County School District No. 17, GO (Insured; School Bond Guaranty) | | 5.00 | | 12/1/2031 | | 1,100,000 | | 1,126,334 | |
Everett Housing Authority, Revenue Bonds (Baker Heights Legacy) | | 0.30 | | 9/1/2023 | | 1,000,000 | a | 1,000,000 | |
King County Housing Authority, Revenue Bonds, Refunding | | 2.00 | | 10/1/2023 | | 100,000 | | 99,860 | |
King County Housing Authority, Revenue Bonds, Refunding | | 3.00 | | 10/1/2025 | | 150,000 | | 147,754 | |
King County Housing Authority, Revenue Bonds, Refunding | | 3.00 | | 10/1/2024 | | 100,000 | | 99,285 | |
King County Housing Authority, Revenue Bonds, Refunding | | 4.00 | | 10/1/2026 | | 150,000 | | 151,018 | |
Port of Seattle, Revenue Bonds, Refunding | | 5.00 | | 8/1/2026 | | 4,600,000 | | 4,745,926 | |
Seattle Housing Authority, Revenue Bonds (LAM BOW Apartments Project) | | 1.25 | | 6/1/2024 | | 1,500,000 | | 1,471,315 | |
Spokane County School District No. 356, GO (Insured; School Bond Guaranty) | | 5.00 | | 12/1/2031 | | 2,500,000 | | 2,557,726 | |
Washington Health Care Facilities Authority, Revenue Bonds, Refunding | | 5.00 | | 12/1/2025 | | 275,000 | b | 281,751 | |
Washington Health Care Facilities Authority, Revenue Bonds, Refunding | | 5.00 | | 12/1/2024 | | 200,000 | b | 203,297 | |
Washington Health Care Facilities Authority, Revenue Bonds, Refunding | | 5.00 | | 12/1/2023 | | 250,000 | b | 250,810 | |
| | 12,135,076 | |
Wisconsin - 2.3% | | | | | |
Wisconsin Health & Educational Facilities Authority, Revenue Bonds, Refunding (Advocate Aurora Health Obligated Group) | | 5.00 | | 6/24/2026 | | 1,200,000 | a | 1,245,022 | |
Wisconsin Health & Educational Facilities Authority, Revenue Bonds, Refunding (Advocate Aurora Health Obligated Group) Ser. B2 | | 5.00 | | 6/24/2026 | | 1,000,000 | a | 1,037,519 | |
Wisconsin Health & Educational Facilities Authority, Revenue Bonds, Refunding, Ser. B5 | | 5.00 | | 12/3/2024 | | 4,660,000 | a | 4,724,692 | |
Wisconsin Housing & Economic Development Authority, Revenue Bonds, Refunding, Ser. B | | 0.40 | | 11/1/2023 | | 1,840,000 | a | 1,827,181 | |
42
| | | | | | | | | | |
| |
BNY Mellon National Short-Term Municipal Bond Fund (continued) |
Description | Coupon
Rate (%) | | Maturity Date | | Principal Amount ($) | | Value ($) | |
Long-Term Municipal Investments - 100.7% (continued) | | | | | |
Wisconsin - 2.3% (continued) | | | | | |
Wisconsin Housing & Economic Development Authority, Revenue Bonds, Refunding, Ser. B | | 0.50 | | 11/1/2024 | | 2,000,000 | a | 1,899,748 | |
| | 10,734,162 | |
Total Investments (cost $488,625,340) | | 100.7% | 473,952,091 | |
Liabilities, Less Cash and Receivables | | (0.7%) | (3,275,917) | |
Net Assets | | 100.0% | 470,676,174 | |
a These securities have a put feature; the date shown represents the put date and the bond holder can take a specific action to retain the bond after the put date.
b Security exempt from registration pursuant to Rule 144A under the Securities Act of 1933. These securities may be resold in transactions exempt from registration, normally to qualified institutional buyers. At August 31, 2023, these securities were valued at $17,150,996 or 3.64% of net assets.
c These securities are prerefunded; the date shown represents the prerefunded date. Bonds which are prerefunded are collateralized by U.S. Government securities which are held in escrow and are used to pay principal and interest on the municipal issue and to retire the bonds in full at the earliest refunding date.
d The Variable Rate is determined by the Remarketing Agent in its sole discretion based on prevailing market conditions and may, but need not, be established by reference to one or more financial indices.
e Security issued with a zero coupon. Income is recognized through the accretion of discount.
f Zero coupon until a specified date at which time the stated coupon rate becomes effective until maturity.
| | |
Portfolio Summary (Unaudited) † | Value (%) |
General | 23.2 |
Multifamily Housing | 10.1 |
Development | 9.2 |
Single Family Housing | 8.8 |
Water | 7.1 |
School District | 6.3 |
General Obligation | 6.1 |
Education | 6.0 |
Prerefunded | 4.4 |
Medical | 4.1 |
Power | 3.8 |
Airport | 3.5 |
Utilities | 2.0 |
Pollution | 1.6 |
Transportation | 1.5 |
Special Tax | 1.2 |
Nursing Homes | .8 |
Housing | .6 |
Facilities | .4 |
| | 100.7 |
† Based on net assets.
See notes to financial statements.
43
STATEMENT OF INVESTMENTS (continued)
| | | | | | | | | | |
| |
BNY Mellon Pennsylvania Intermediate Municipal Bond Fund |
Description | Coupon
Rate (%) | | Maturity Date | | Principal Amount ($) | | Value ($) | |
Long-Term Municipal Investments - 100.7% | | | | | |
Alabama - .9% | | | | | |
Black Belt Energy Gas District, Revenue Bonds (Gas Project) | | 4.00 | | 12/1/2026 | | 750,000 | a | 733,305 | |
Illinois - 3.7% | | | | | |
Chicago II, GO, Refunding, Ser. A | | 5.00 | | 1/1/2034 | | 500,000 | | 531,324 | |
Chicago II, GO, Refunding, Ser. A | | 5.00 | | 1/1/2029 | | 500,000 | | 527,086 | |
Chicago II, GO, Refunding, Ser. A | | 5.00 | | 1/1/2026 | | 500,000 | | 511,791 | |
Chicago II, GO, Ser. A | | 5.00 | | 1/1/2024 | | 500,000 | | 501,425 | |
Chicago Park District, GO, Refunding, Ser. C | | 4.00 | | 1/1/2036 | | 1,140,000 | | 1,112,441 | |
| | 3,184,067 | |
Iowa - .6% | | | | | |
PEFA, Revenue Bonds (Gas Project) | | 5.00 | | 9/1/2026 | | 525,000 | a | 530,116 | |
Kentucky - 2.3% | | | | | |
Kentucky Public Energy Authority, Revenue Bonds, Ser. B | | 4.00 | | 1/1/2025 | | 1,000,000 | a | 995,795 | |
Kentucky Public Energy Authority, Revenue Bonds, Ser. C1 | | 4.00 | | 6/1/2025 | | 1,000,000 | a | 1,000,670 | |
| | 1,996,465 | |
New Jersey - 2.2% | | | | | |
Tobacco Settlement Financing Corp., Revenue Bonds, Refunding, Ser. A | | 5.00 | | 6/1/2029 | | 875,000 | | 936,395 | |
Tobacco Settlement Financing Corp., Revenue Bonds, Refunding, Ser. A | | 5.00 | | 6/1/2028 | | 875,000 | | 935,743 | |
| | 1,872,138 | |
New York - 5.9% | | | | | |
New York Liberty Development Corp., Revenue Bonds, Refunding (Bank of America Tower) | | 2.63 | | 9/15/2069 | | 1,675,000 | | 1,503,342 | |
New York Liberty Development Corp., Revenue Bonds, Refunding (Class 1-3 World Trade Center Project) | | 5.00 | | 11/15/2044 | | 2,250,000 | b | 2,153,451 | |
New York Transportation Development Corp., Revenue Bonds (Delta Air Lines) | | 5.00 | | 1/1/2024 | | 1,350,000 | | 1,352,889 | |
| | 5,009,682 | |
Pennsylvania - 84.8% | | | | | |
Allegheny County Higher Education Building Authority, Revenue Bonds, Refunding (Duquesne University) | | 5.00 | | 3/1/2026 | | 1,000,000 | | 1,033,144 | |
Allegheny County Higher Education Building Authority, Revenue Bonds, Refunding (Duquesne University) Ser. A | | 4.00 | | 3/1/2037 | | 1,000,000 | | 977,254 | |
Allegheny County Hospital Development Authority, Revenue Bonds, Refunding (Allegheny Health Network Obligated Group) Ser. A | | 5.00 | | 4/1/2030 | | 1,000,000 | | 1,047,258 | |
Allegheny County Hospital Development Authority, Revenue Bonds, Refunding (UPMC Obligated Group) Ser. A | | 5.00 | | 7/15/2034 | | 690,000 | | 742,728 | |
Bucks County Industrial Development Authority, Revenue Bonds, Refunding (George School Project) | | 3.00 | | 9/15/2038 | | 850,000 | | 718,393 | |
Bucks County Industrial Development Authority, Revenue Bonds, Refunding (George School Project) | | 3.00 | | 9/15/2036 | | 800,000 | | 704,950 | |
Bucks County Industrial Development Authority, Revenue Bonds, Refunding (George School Project) | | 3.00 | | 9/15/2035 | | 775,000 | | 702,616 | |
Chester County Health & Education Facilities Authority, Revenue Bonds (Main Line Health System Obligated Group) Ser. A | | 4.00 | | 9/1/2038 | | 600,000 | | 572,258 | |
Commonwealth Financing Authority, Revenue Bonds | | 5.00 | | 6/1/2034 | | 1,000,000 | | 1,059,456 | |
Commonwealth Financing Authority, Revenue Bonds | | 5.00 | | 6/1/2032 | | 1,500,000 | | 1,591,537 | |
Cumberland Valley School District, GO (Insured; Assured Guaranty Municipal Corp.) Ser. A | | 5.00 | | 11/15/2042 | | 500,000 | | 536,236 | |
Dauphin County General Authority, Revenue Bonds, Refunding (Pinnacle Health Systems Project) Ser. A | | 5.00 | | 6/1/2029 | | 1,000,000 | | 1,031,725 | |
Delaware County Industrial Development Authority, Revenue Bonds, Refunding (United Parcel Service) | | 4.10 | | 9/1/2045 | | 1,300,000 | c | 1,300,000 | |
Delaware Valley Regional Finance Authority, Revenue Bonds, Ser. A | | 2.00 | | 10/1/2029 | | 1,000,000 | | 870,500 | |
44
| | | | | | | | | | |
| |
BNY Mellon Pennsylvania Intermediate Municipal Bond Fund (continued) |
Description | Coupon
Rate (%) | | Maturity Date | | Principal Amount ($) | | Value ($) | |
Long-Term Municipal Investments - 100.7% (continued) | | | | | |
Pennsylvania - 84.8% (continued) | | | | | |
Derry Township Industrial & Commercial Development Authority, Revenue Bonds, Refunding | | 4.00 | | 11/15/2028 | | 425,000 | | 439,692 | |
Derry Township Industrial & Commercial Development Authority, Revenue Bonds, Refunding | | 4.00 | | 11/15/2029 | | 355,000 | | 368,681 | |
Derry Township Industrial & Commercial Development Authority, Revenue Bonds, Refunding | | 4.00 | | 11/15/2027 | | 595,000 | | 613,791 | |
Geisinger Authority, Revenue Bonds, Refunding (Geisinger Health System Obligated Group) | | 5.00 | | 4/1/2035 | | 1,100,000 | | 1,177,921 | |
Geisinger Authority, Revenue Bonds, Refunding (Geisinger Health System Obligated Group) | | 5.00 | | 2/15/2027 | | 500,000 | a | 520,252 | |
Geisinger Authority, Revenue Bonds, Refunding (Geisinger Health System Obligated Group) | | 5.00 | | 4/1/2030 | | 1,005,000 | a | 1,073,650 | |
Haverford Township, GO, Ser. A | | 5.00 | | 10/1/2044 | | 1,000,000 | | 1,094,991 | |
Lancaster County Hospital Authority, Revenue Bonds, Refunding (Masonic Homes Project) (LOC; JPMorgan Chase Bank NA) Ser. D | | 3.90 | | 7/1/2034 | | 1,300,000 | c | 1,300,000 | |
Latrobe Industrial Development Authority, Revenue Bonds, Refunding (Seton Hill University) | | 5.00 | | 3/1/2028 | | 110,000 | | 111,421 | |
Latrobe Industrial Development Authority, Revenue Bonds, Refunding (Seton Hill University) | | 5.00 | | 3/1/2031 | | 175,000 | | 177,507 | |
Latrobe Industrial Development Authority, Revenue Bonds, Refunding (Seton Hill University) | | 5.00 | | 3/1/2030 | | 135,000 | | 136,748 | |
Latrobe Industrial Development Authority, Revenue Bonds, Refunding (Seton Hill University) | | 5.00 | | 3/1/2029 | | 150,000 | | 152,247 | |
Latrobe Industrial Development Authority, Revenue Bonds, Refunding (Seton Hill University) | | 5.00 | | 3/1/2024 | | 80,000 | | 80,132 | |
Latrobe Industrial Development Authority, Revenue Bonds, Refunding (Seton Hill University) | | 5.00 | | 3/1/2027 | | 145,000 | | 146,347 | |
Latrobe Industrial Development Authority, Revenue Bonds, Refunding (Seton Hill University) | | 5.00 | | 3/1/2026 | | 150,000 | | 150,850 | |
Latrobe Industrial Development Authority, Revenue Bonds, Refunding (Seton Hill University) | | 5.00 | | 3/1/2025 | | 115,000 | | 115,482 | |
Lebanon School District, GO, Refunding (Insured; Assured Guaranty Municipal Corp.) | | 4.00 | | 6/15/2031 | | 1,500,000 | | 1,539,103 | |
Lower Merion Township, GO, Ser. B | | 4.00 | | 7/15/2031 | | 460,000 | | 461,125 | |
Lower Merion Township, GO, Ser. B | | 4.00 | | 7/15/2034 | | 515,000 | | 516,160 | |
Montgomery County Higher Education & Health Authority, Revenue Bonds, Refunding (The Hill School Project) | | 5.00 | | 8/15/2037 | | 500,000 | | 512,455 | |
Montgomery County Higher Education & Health Authority, Revenue Bonds, Refunding (Thomas Jefferson University Project) | | 4.00 | | 9/1/2034 | | 1,000,000 | | 987,434 | |
Mount Lebanon Hospital Authority, Revenue Bonds (St. Clair Memorial Hospital Project) | | 5.00 | | 7/1/2036 | | 1,105,000 | | 1,159,723 | |
Mount Lebanon Hospital Authority, Revenue Bonds (St. Clair Memorial Hospital Project) | | 5.00 | | 7/1/2035 | | 1,000,000 | | 1,058,213 | |
Northampton County General Purpose Authority, Revenue Bonds, Refunding (Lafayette College) Ser. A | | 5.00 | | 11/1/2023 | | 1,000,000 | d | 1,002,455 | |
Pennsylvania, GO | | 3.00 | | 5/15/2034 | | 1,000,000 | | 925,497 | |
Pennsylvania Economic Development Financing Authority, Revenue Bonds, Refunding (UPMC Obligated Group) Ser. A | | 4.00 | | 10/15/2037 | | 1,375,000 | | 1,339,422 | |
Pennsylvania Higher Educational Facilities Authority, Revenue Bonds (Insured; Build American Mutual) Ser. AT1 | | 5.00 | | 6/15/2027 | | 1,000,000 | | 1,047,792 | |
Pennsylvania Higher Educational Facilities Authority, Revenue Bonds (The University of Pennsylvania Health System Obligated Group) | | 5.00 | | 8/15/2033 | | 1,000,000 | | 1,091,760 | |
Pennsylvania Higher Educational Facilities Authority, Revenue Bonds, Refunding (Drexel University) | | 5.00 | | 5/1/2028 | | 1,855,000 | | 1,953,418 | |
Pennsylvania Higher Educational Facilities Authority, Revenue Bonds, Refunding (Drexel University) (Insured; Assured Guaranty Municipal Corp.) Ser. A | | 5.00 | | 5/1/2029 | | 1,115,000 | | 1,208,672 | |
45
STATEMENT OF INVESTMENTS (continued)
| | | | | | | | | | |
| |
BNY Mellon Pennsylvania Intermediate Municipal Bond Fund (continued) |
Description | Coupon
Rate (%) | | Maturity Date | | Principal Amount ($) | | Value ($) | |
Long-Term Municipal Investments - 100.7% (continued) | | | | | |
Pennsylvania - 84.8% (continued) | | | | | |
Pennsylvania Higher Educational Facilities Authority, Revenue Bonds, Refunding (The University of Pennsylvania Health System Obligated Group) | | 5.00 | | 8/15/2035 | | 1,200,000 | | 1,239,020 | |
Pennsylvania Higher Educational Facilities Authority, Revenue Bonds, Refunding (University of Sciences in Philadelphia) | | 5.00 | | 11/1/2025 | | 1,000,000 | | 1,022,798 | |
Pennsylvania Housing Finance Agency, Revenue Bonds, Refunding, Ser. 122 | | 3.65 | | 10/1/2032 | | 1,070,000 | | 1,039,602 | |
Pennsylvania Housing Finance Agency, Revenue Bonds, Ser. 141A | | 5.75 | | 10/1/2053 | | 1,250,000 | | 1,321,632 | |
Pennsylvania Housing Finance Agency, Revenue Bonds, Ser. 2019-131A | | 3.50 | | 4/1/2049 | | 1,160,000 | | 1,141,305 | |
Pennsylvania Turnpike Commission, Revenue Bonds, Refunding | | 5.00 | | 12/1/2040 | | 1,260,000 | | 1,308,710 | |
Pennsylvania Turnpike Commission, Revenue Bonds, Refunding | | 5.00 | | 12/1/2038 | | 1,000,000 | | 1,084,025 | |
Pennsylvania Turnpike Commission, Revenue Bonds, Refunding | | 5.00 | | 12/1/2038 | | 1,230,000 | | 1,282,862 | |
Pennsylvania Turnpike Commission, Revenue Bonds, Refunding, Ser. A | | 5.00 | | 12/1/2035 | | 650,000 | | 739,718 | |
Pennsylvania Turnpike Commission, Revenue Bonds, Refunding, Ser. B2 | | 5.00 | | 6/1/2032 | | 1,000,000 | | 1,058,942 | |
Philadelphia Airport, Revenue Bonds, Refunding, Ser. B | | 5.00 | | 7/1/2025 | | 1,000,000 | | 1,017,857 | |
Philadelphia Airport, Revenue Bonds, Refunding, Ser. B | | 5.00 | | 7/1/2027 | | 1,000,000 | | 1,042,199 | |
Philadelphia Airport, Revenue Bonds, Refunding, Ser. B | | 5.00 | | 7/1/2031 | | 1,520,000 | | 1,584,519 | |
Philadelphia Authority for Industrial Development, Revenue Bonds, Refunding (St. Joseph's University) | | 5.00 | | 11/1/2027 | | 850,000 | | 889,103 | |
Philadelphia Authority for Industrial Development, Revenue Bonds, Refunding (St. Joseph's University) | | 5.00 | | 11/1/2026 | | 850,000 | | 878,889 | |
Philadelphia Industrial Development Authority, Revenue Bonds, Refunding (Children's Hospital of Philadelphia Obligated Group Project) | | 4.00 | | 7/1/2036 | | 1,000,000 | | 1,002,712 | |
Philadelphia Water & Wastewater, Revenue Bonds, Ser. C | | 5.00 | | 6/1/2037 | | 1,000,000 | | 1,080,743 | |
Pittsburgh, GO, Refunding, Ser. A | | 3.00 | | 9/1/2033 | | 325,000 | | 299,803 | |
Pittsburgh, GO, Refunding, Ser. A | | 3.00 | | 9/1/2032 | | 500,000 | | 472,202 | |
Pittsburgh & Allegheny County Sports & Exhibition Authority, Revenue Bonds | | 5.00 | | 12/15/2032 | | 1,000,000 | | 1,062,227 | |
Radnor Township School District, GO (Insured; State Aid Withholding) | | 4.00 | | 8/15/2036 | | 1,000,000 | | 1,018,977 | |
Southeastern Pennsylvania Transportation Authority, Revenue Bonds | | 5.00 | | 6/1/2038 | | 1,500,000 | | 1,647,250 | |
Susquehanna Township School District, GO, Refunding (Insured; State Aid Withholding) Ser. R | | 3.00 | | 5/15/2031 | | 1,730,000 | | 1,668,319 | |
Swarthmore Borough Authority, Revenue Bonds, Refunding (Swarthmore College) | | 5.00 | | 9/15/2045 | | 1,030,000 | | 1,113,895 | |
The Canonsburg-Houston Joint Authority, Revenue Bonds, Ser. A | | 5.00 | | 12/1/2023 | | 1,260,000 | | 1,263,870 | |
The Pennsylvania University, Revenue Bonds, Ser. A | | 5.00 | | 9/1/2042 | | 2,000,000 | | 2,073,056 | |
The Pennsylvania University, Revenue Bonds, Ser. A | | 5.00 | | 9/1/2033 | | 1,010,000 | | 1,057,533 | |
The Philadelphia School District, GO (Insured; Assured Guaranty Municipal Corp.) Ser. A | | 5.00 | | 9/1/2034 | | 650,000 | | 697,422 | |
The Philadelphia School District, GO (Insured; State Aid Withholding) Ser. A | | 5.00 | | 9/1/2028 | | 500,000 | | 534,263 | |
Tredyffrin Easttown School District, GO (Insured; State Aid Withholding) | | 5.00 | | 2/15/2034 | | 240,000 | | 257,062 | |
Upper Merion Area School District, GO (Insured; State Aid Withholding) | | 5.00 | | 1/15/2026 | | 275,000 | d | 286,477 | |
Upper Merion Area School District, GO (Insured; State Aid Withholding) | | 5.00 | | 1/15/2026 | | 250,000 | d | 260,434 | |
46
| | | | | | | | | | |
| |
BNY Mellon Pennsylvania Intermediate Municipal Bond Fund (continued) |
Description | Coupon
Rate (%) | | Maturity Date | | Principal Amount ($) | | Value ($) | |
Long-Term Municipal Investments - 100.7% (continued) | | | | | |
Pennsylvania - 84.8% (continued) | | | | | |
Upper Moreland Township School District, GO, Refunding (Insured; State Aid Withholding) | | 4.00 | | 10/1/2033 | | 610,000 | | 618,873 | |
Upper St. Clair Township School District, GO (Insured; State Aid Withholding) | | 5.00 | | 10/1/2041 | | 1,000,000 | | 1,014,171 | |
West Chester Area School District, GO, Refunding (Insured; State Aid Withholding) | | 2.00 | | 3/15/2031 | | 820,000 | | 713,484 | |
West Mifflin School District, GO, Refunding (Insured; Assured Guaranty Municipal Corp.) | | 5.00 | | 4/1/2026 | | 1,000,000 | | 1,039,478 | |
Whitemarsh Township, GO, Refunding | | 4.00 | | 11/15/2039 | | 1,000,000 | | 972,042 | |
| | 72,156,470 | |
U.S. Related - .3% | | | | | |
Puerto Rico, Notes | | 2.28 | | 11/1/2051 | | 560,320 | c | 233,233 | |
Total Investments (cost $89,739,399) | | 100.7% | 85,715,476 | |
Liabilities, Less Cash and Receivables | | (0.7%) | (594,212) | |
Net Assets | | 100.0% | 85,121,264 | |
a These securities have a put feature; the date shown represents the put date and the bond holder can take a specific action to retain the bond after the put date.
b Security exempt from registration pursuant to Rule 144A under the Securities Act of 1933. These securities may be resold in transactions exempt from registration, normally to qualified institutional buyers. At August 31, 2023, these securities were valued at $2,153,451 or 2.53% of net assets.
c The Variable Rate is determined by the Remarketing Agent in its sole discretion based on prevailing market conditions and may, but need not, be established by reference to one or more financial indices.
d These securities are prerefunded; the date shown represents the prerefunded date. Bonds which are prerefunded are collateralized by U.S. Government securities which are held in escrow and are used to pay principal and interest on the municipal issue and to retire the bonds in full at the earliest refunding date.
| | |
Portfolio Summary (Unaudited) † | Value (%) |
Education | 19.9 |
Medical | 16.5 |
School District | 11.3 |
General Obligation | 10.3 |
Development | 9.1 |
Transportation | 6.4 |
General | 6.1 |
Tobacco Settlement | 5.3 |
Airport | 4.3 |
Single Family Housing | 4.1 |
Water | 2.8 |
Prerefunded | 1.8 |
Nursing Homes | 1.5 |
Facilities | 1.3 |
| | 100.7 |
† Based on net assets.
See notes to financial statements.
| | | | | | | | | | | | |
BNY Mellon Pennsylvania Intermediate Municipal Bond Fund | |
Futures | | | |
Description | Number of
Contracts | Expiration | Notional
Value($) | Market
Value ($) | Unrealized
(Depreciation) ($) | |
Futures Short | | |
Ultra 10 Year U.S. Treasury Notes | 8 | 12/19/2023 | 919,523 | 928,875 | (9,352) | |
Gross Unrealized Depreciation | | (9,352) | |
See notes to financial statements.
47
STATEMENT OF INVESTMENTS (continued)
| | | | | | | | | | |
| |
BNY Mellon Massachusetts Intermediate Municipal Bond Fund |
Description | Coupon
Rate (%) | | Maturity Date | | Principal Amount ($) | | Value ($) | |
Long-Term Municipal Investments - 100.0% | | | | | |
Alabama - .8% | | | | | |
Black Belt Energy Gas District, Revenue Bonds (Gas Project) | | 4.00 | | 12/1/2026 | | 1,500,000 | a | 1,466,611 | |
Illinois - 3.2% | | | | | |
Chicago II, GO, Refunding, Ser. A | | 5.00 | | 1/1/2034 | | 1,000,000 | | 1,062,649 | |
Chicago II, GO, Refunding, Ser. A | | 5.00 | | 1/1/2029 | | 1,000,000 | | 1,054,173 | |
Chicago Park District, GO, Refunding, Ser. C | | 4.00 | | 1/1/2036 | | 2,100,000 | | 2,049,234 | |
Illinois, GO, Ser. D | | 5.00 | | 11/1/2026 | | 1,500,000 | | 1,559,257 | |
| | 5,725,313 | |
Iowa - .6% | | | | | |
PEFA, Revenue Bonds (Gas Project) | | 5.00 | | 9/1/2026 | | 1,000,000 | a | 1,009,745 | |
Kentucky - 3.0% | | | | | |
Kentucky Public Energy Authority, Revenue Bonds, Ser. B | | 4.00 | | 1/1/2025 | | 2,500,000 | a | 2,489,487 | |
Kentucky Public Energy Authority, Revenue Bonds, Ser. C1 | | 4.00 | | 6/1/2025 | | 3,000,000 | a | 3,002,011 | |
| | 5,491,498 | |
Massachusetts - 87.7% | | | | | |
Barnstable, BAN | | 6.00 | | 6/7/2024 | | 2,000,000 | | 2,039,886 | |
Berkshire Wind Power Cooperative Corp., Revenue Bonds, Refunding (Green Bond) (Berkshire Wind Project) Ser. 2 | | 5.00 | | 7/1/2028 | | 1,000,000 | | 1,065,966 | |
Boston, GO, Ser. A | | 3.00 | | 11/1/2034 | | 2,035,000 | | 1,941,615 | |
Boston, GO, Ser. A | | 5.00 | | 11/1/2042 | | 1,330,000 | | 1,482,369 | |
Boston, GO, Ser. A | | 5.00 | | 11/1/2037 | | 3,100,000 | | 3,554,392 | |
Boston Housing Authority, Revenue Bonds, Refunding, Ser. B | | 5.00 | | 10/1/2026 | | 565,000 | | 599,396 | |
Boston Housing Authority, Revenue Bonds, Refunding, Ser. B | | 5.00 | | 4/1/2026 | | 615,000 | | 645,474 | |
Gloucester, GO, Refunding | | 3.00 | | 9/15/2033 | | 725,000 | | 691,556 | |
Gloucester, GO, Refunding | | 3.00 | | 9/15/2032 | | 925,000 | | 886,320 | |
Groton, BAN | | 4.50 | | 6/21/2024 | | 2,000,000 | | 2,015,562 | |
Groton, GO | | 3.00 | | 8/15/2033 | | 390,000 | | 377,417 | |
Hingham, GO | | 3.00 | | 2/15/2036 | | 375,000 | | 346,476 | |
Hingham, GO | | 3.00 | | 2/15/2034 | | 1,240,000 | | 1,192,434 | |
Lowell Collegiate Charter School, Revenue Bonds | | 4.00 | | 6/15/2024 | | 110,000 | | 109,222 | |
Lowell Collegiate Charter School, Revenue Bonds | | 5.00 | | 6/15/2039 | | 1,330,000 | | 1,281,532 | |
Lowell Collegiate Charter School, Revenue Bonds | | 5.00 | | 6/15/2029 | | 485,000 | | 487,835 | |
Manchester Essex Regional School District, GO (School Project Loan-Chapter 70B) | | 4.00 | | 2/1/2034 | | 845,000 | | 865,656 | |
Marlborough, BAN | | 4.50 | | 6/13/2024 | | 2,500,000 | | 2,521,184 | |
Massachusetts, GO, Refunding, Ser. A | | 5.00 | | 7/1/2037 | | 1,000,000 | | 1,023,470 | |
Massachusetts, GO, Refunding, Ser. B | | 5.00 | | 5/1/2037 | | 1,000,000 | | 1,134,154 | |
Massachusetts, GO, Refunding, Ser. D | | 4.00 | | 11/1/2035 | | 2,500,000 | | 2,596,115 | |
Massachusetts, GO, Ser. A | | 3.00 | | 2/1/2037 | | 2,000,000 | | 1,789,307 | |
Massachusetts, GO, Ser. A | | 5.00 | | 5/1/2043 | | 1,000,000 | | 1,094,880 | |
Massachusetts, GO, Ser. A | | 5.00 | | 5/1/2041 | | 500,000 | | 551,141 | |
Massachusetts, GO, Ser. C | | 5.00 | | 10/1/2052 | | 2,500,000 | | 2,663,578 | |
Massachusetts, GO, Ser. C | | 5.00 | | 10/1/2035 | | 2,500,000 | | 2,865,003 | |
Massachusetts Bay Transportation Authority, Revenue Bonds, Refunding, Ser. A1 | | 4.00 | | 7/1/2036 | | 4,000,000 | | 4,093,010 | |
Massachusetts Bay Transportation Authority, Revenue Bonds, Refunding, Ser. A1 | | 5.00 | | 7/1/2038 | | 600,000 | | 674,498 | |
Massachusetts Bay Transportation Authority, Revenue Bonds, Ser. A | | 5.00 | | 7/1/2038 | | 600,000 | | 674,498 | |
Massachusetts College Building Authority, Revenue Bonds (Green Bond) Ser. A | | 3.00 | | 5/1/2033 | | 535,000 | | 506,339 | |
Massachusetts Development Finance Agency, Revenue Bonds (Dana-Farber Cancer Institute Obligated Group) Ser. N | | 5.00 | | 12/1/2033 | | 2,500,000 | | 2,614,733 | |
Massachusetts Development Finance Agency, Revenue Bonds (Emerson College) | | 5.00 | | 1/1/2027 | | 280,000 | | 286,286 | |
48
| | | | | | | | | | |
| |
BNY Mellon Massachusetts Intermediate Municipal Bond Fund (continued) |
Description | Coupon
Rate (%) | | Maturity Date | | Principal Amount ($) | | Value ($) | |
Long-Term Municipal Investments - 100.0% (continued) | | | | | |
Massachusetts - 87.7% (continued) | | | | | |
Massachusetts Development Finance Agency, Revenue Bonds (Emerson College) | | 5.00 | | 1/1/2026 | | 170,000 | | 172,442 | |
Massachusetts Development Finance Agency, Revenue Bonds (Emerson College) | | 5.00 | | 1/1/2032 | | 340,000 | | 349,967 | |
Massachusetts Development Finance Agency, Revenue Bonds (Emerson College) | | 5.00 | | 1/1/2031 | | 325,000 | | 334,736 | |
Massachusetts Development Finance Agency, Revenue Bonds (Equitable School Revolving Fund Obligated Group) Ser. C | | 4.00 | | 11/1/2046 | | 500,000 | | 444,236 | |
Massachusetts Development Finance Agency, Revenue Bonds (The Trustees of The Deerfield Academy) | | 5.00 | | 10/1/2032 | | 1,150,000 | | 1,339,131 | |
Massachusetts Development Finance Agency, Revenue Bonds (Wentworth Institute of Technology) | | 5.00 | | 10/1/2024 | | 550,000 | | 554,696 | |
Massachusetts Development Finance Agency, Revenue Bonds, Refunding | | 5.00 | | 7/1/2032 | | 1,910,000 | | 1,962,832 | |
Massachusetts Development Finance Agency, Revenue Bonds, Refunding (Bentley University) Ser. A | | 4.00 | | 7/1/2036 | | 825,000 | | 820,868 | |
Massachusetts Development Finance Agency, Revenue Bonds, Refunding (Bentley University) Ser. A | | 4.00 | | 7/1/2035 | | 1,000,000 | | 1,004,808 | |
Massachusetts Development Finance Agency, Revenue Bonds, Refunding (Boston Medical Center Obligated Group) Ser. E | | 5.00 | | 7/1/2025 | | 500,000 | | 509,281 | |
Massachusetts Development Finance Agency, Revenue Bonds, Refunding (Caregroup) Ser. I | | 5.00 | | 7/1/2029 | | 2,000,000 | | 2,073,882 | |
Massachusetts Development Finance Agency, Revenue Bonds, Refunding (Emerson College) Ser. A | | 5.00 | | 1/1/2033 | | 1,250,000 | | 1,283,903 | |
Massachusetts Development Finance Agency, Revenue Bonds, Refunding (Emmanuel College) Ser. A | | 5.00 | | 10/1/2030 | | 1,000,000 | | 1,014,833 | |
Massachusetts Development Finance Agency, Revenue Bonds, Refunding (Emmanuel College) Ser. A | | 5.00 | | 10/1/2043 | | 1,000,000 | | 945,987 | |
Massachusetts Development Finance Agency, Revenue Bonds, Refunding (Emmanuel College) Ser. A | | 5.00 | | 10/1/2036 | | 500,000 | | 500,260 | |
Massachusetts Development Finance Agency, Revenue Bonds, Refunding (Fisher College) | | 5.00 | | 4/1/2031 | | 350,000 | | 356,295 | |
Massachusetts Development Finance Agency, Revenue Bonds, Refunding (Fisher College) | | 5.00 | | 4/1/2033 | | 390,000 | | 395,895 | |
Massachusetts Development Finance Agency, Revenue Bonds, Refunding (Fisher College) | | 5.00 | | 4/1/2032 | | 370,000 | | 376,228 | |
Massachusetts Development Finance Agency, Revenue Bonds, Refunding (Foxborough Regional Charter School) | | 5.00 | | 7/1/2037 | | 1,600,000 | | 1,575,743 | |
Massachusetts Development Finance Agency, Revenue Bonds, Refunding (Harvard University) Ser. A | | 5.00 | | 7/15/2027 | | 2,000,000 | | 2,109,611 | |
Massachusetts Development Finance Agency, Revenue Bonds, Refunding (MCPHS University) Ser. H | | 5.00 | | 7/1/2037 | | 465,000 | | 476,327 | |
Massachusetts Development Finance Agency, Revenue Bonds, Refunding (Olin College) Ser. E | | 5.00 | | 11/1/2038 | | 2,500,000 | | 2,505,151 | |
Massachusetts Development Finance Agency, Revenue Bonds, Refunding (Olin College) Ser. F | | 5.00 | | 11/1/2037 | | 725,000 | | 799,526 | |
Massachusetts Development Finance Agency, Revenue Bonds, Refunding (Olin College) Ser. F | | 5.00 | | 11/1/2038 | | 755,000 | | 825,645 | |
Massachusetts Development Finance Agency, Revenue Bonds, Refunding (Partners Healthcare System) | | 4.00 | | 7/1/2036 | | 2,480,000 | | 2,467,177 | |
Massachusetts Development Finance Agency, Revenue Bonds, Refunding (Partners Healthcare System) | | 5.00 | | 7/1/2037 | | 705,000 | | 742,012 | |
Massachusetts Development Finance Agency, Revenue Bonds, Refunding (SABIS International Charter School) | | 5.00 | | 4/15/2033 | | 1,500,000 | | 1,505,996 | |
Massachusetts Development Finance Agency, Revenue Bonds, Refunding (SABIS International Charter School) | | 5.00 | | 4/15/2040 | | 1,730,000 | | 1,662,408 | |
Massachusetts Development Finance Agency, Revenue Bonds, Refunding (Simmons College) Ser. J | | 5.25 | | 10/1/2024 | | 465,000 | | 465,575 | |
Massachusetts Development Finance Agency, Revenue Bonds, Refunding (Simmons College) Ser. J | | 5.25 | | 10/1/2039 | | 1,430,000 | | 1,431,767 | |
49
STATEMENT OF INVESTMENTS (continued)
| | | | | | | | | | |
| |
BNY Mellon Massachusetts Intermediate Municipal Bond Fund (continued) |
Description | Coupon
Rate (%) | | Maturity Date | | Principal Amount ($) | | Value ($) | |
Long-Term Municipal Investments - 100.0% (continued) | | | | | |
Massachusetts - 87.7% (continued) | | | | | |
Massachusetts Development Finance Agency, Revenue Bonds, Refunding (Simmons College) Ser. J | | 5.25 | | 10/1/2039 | | 70,000 | | 70,087 | |
Massachusetts Development Finance Agency, Revenue Bonds, Refunding (Simmons College) Ser. K1 | | 5.00 | | 10/1/2029 | | 1,000,000 | | 1,017,240 | |
Massachusetts Development Finance Agency, Revenue Bonds, Refunding (Simmons College) Ser. K1 | | 5.00 | | 10/1/2025 | | 700,000 | | 707,421 | |
Massachusetts Development Finance Agency, Revenue Bonds, Refunding (South Shore Hospital Obligated Group) Ser. I | | 5.00 | | 7/1/2024 | | 530,000 | | 533,289 | |
Massachusetts Development Finance Agency, Revenue Bonds, Refunding (South Shore Hospital Obligated Group) Ser. I | | 5.00 | | 7/1/2028 | | 750,000 | | 773,968 | |
Massachusetts Development Finance Agency, Revenue Bonds, Refunding (South Shore Hospital Obligated Group) Ser. I | | 5.00 | | 7/1/2025 | | 500,000 | | 506,819 | |
Massachusetts Development Finance Agency, Revenue Bonds, Refunding (Sterling & Francine Clark Art Institute) | | 5.00 | | 7/1/2028 | | 1,000,000 | | 1,062,645 | |
Massachusetts Development Finance Agency, Revenue Bonds, Refunding (Suffolk University) | | 5.00 | | 7/1/2033 | | 1,000,000 | | 1,034,076 | |
Massachusetts Development Finance Agency, Revenue Bonds, Refunding (The Broad Institute) | | 5.00 | | 4/1/2036 | | 2,000,000 | | 2,121,067 | |
Massachusetts Development Finance Agency, Revenue Bonds, Refunding (Trustees of Boston University) (LOC; TD Bank NA) Ser. U-6E-R | | 3.80 | | 10/1/2042 | | 1,900,000 | b | 1,900,000 | |
Massachusetts Development Finance Agency, Revenue Bonds, Refunding (Trustees of The College of The Holy Cross) (LOC; Bank of America NA) Ser. A | | 3.95 | | 9/1/2037 | | 400,000 | b | 400,000 | |
Massachusetts Development Finance Agency, Revenue Bonds, Refunding (UMass Memorial Health Care Obligated Group) Ser. I | | 5.00 | | 7/1/2025 | | 2,375,000 | | 2,412,393 | |
Massachusetts Development Finance Agency, Revenue Bonds, Refunding (UMass Memorial Health Care Obligated Group) Ser. I | | 5.00 | | 7/1/2036 | | 1,340,000 | | 1,363,710 | |
Massachusetts Development Finance Agency, Revenue Bonds, Refunding (Wellesley College) | | 4.00 | | 7/1/2036 | | 2,000,000 | | 2,047,758 | |
Massachusetts Development Finance Agency, Revenue Bonds, Refunding (Wellforce) (Insured; Assured Guaranty Municipal Corp.) Ser. C | | 5.00 | | 10/1/2027 | | 475,000 | | 500,561 | |
Massachusetts Development Finance Agency, Revenue Bonds, Refunding (Western New England University) | | 5.00 | | 9/1/2033 | | 500,000 | | 503,752 | |
Massachusetts Development Finance Agency, Revenue Bonds, Refunding (Western New England University) | | 5.00 | | 9/1/2032 | | 500,000 | | 504,569 | |
Massachusetts Development Finance Agency, Revenue Bonds, Refunding (Western New England University) | | 5.00 | | 9/1/2040 | | 1,500,000 | | 1,426,197 | |
Massachusetts Development Finance Agency, Revenue Bonds, Refunding (Western New England University) | | 5.00 | | 9/1/2035 | | 1,000,000 | | 998,560 | |
Massachusetts Development Finance Agency, Revenue Bonds, Refunding (WGBH Educational Foundation) | | 5.00 | | 1/1/2031 | | 415,000 | | 434,841 | |
Massachusetts Development Finance Agency, Revenue Bonds, Refunding (WGBH Educational Foundation) | | 5.00 | | 1/1/2029 | | 200,000 | | 209,419 | |
Massachusetts Development Finance Agency, Revenue Bonds, Refunding (WGBH Educational Foundation) | | 5.00 | | 1/1/2028 | | 140,000 | | 146,397 | |
Massachusetts Development Finance Agency, Revenue Bonds, Refunding (Woods Hole Oceanographic Institution) | | 5.00 | | 6/1/2026 | | 850,000 | | 887,980 | |
Massachusetts Development Finance Agency, Revenue Bonds, Refunding, Ser. A2 | | 5.00 | | 7/1/2037 | | 2,460,000 | | 2,642,421 | |
Massachusetts Development Finance Agency, Revenue Bonds, Refunding, Ser. G | | 5.00 | | 7/1/2032 | | 515,000 | | 557,956 | |
Massachusetts Development Finance Agency, Revenue Bonds, Refunding, Ser. G | | 5.00 | | 7/1/2035 | | 400,000 | | 424,073 | |
Massachusetts Development Finance Agency, Revenue Bonds, Refunding, Ser. G | | 5.00 | | 7/1/2036 | | 450,000 | | 472,695 | |
50
| | | | | | | | | | |
| |
BNY Mellon Massachusetts Intermediate Municipal Bond Fund (continued) |
Description | Coupon
Rate (%) | | Maturity Date | | Principal Amount ($) | | Value ($) | |
Long-Term Municipal Investments - 100.0% (continued) | | | | | |
Massachusetts - 87.7% (continued) | | | | | |
Massachusetts Development Finance Agency, Revenue Bonds, Refunding, Ser. O | | 5.00 | | 12/1/2035 | | 200,000 | | 213,789 | |
Massachusetts Development Finance Agency, Revenue Bonds, Refunding, Ser. O | | 5.00 | | 12/1/2033 | | 160,000 | | 172,990 | |
Massachusetts Development Finance Agency, Revenue Bonds, Refunding, Ser. O | | 5.00 | | 12/1/2034 | | 200,000 | | 215,348 | |
Massachusetts Educational Financing Authority, Revenue Bonds, Refunding, Ser. A | | 5.00 | | 7/1/2024 | | 3,000,000 | | 3,025,880 | |
Massachusetts Health & Educational Facilities Authority, Revenue Bonds (Baystate Medical Center) (LOC; TD Bank NA) | | 3.80 | | 7/1/2039 | | 100,000 | b | 100,000 | |
Massachusetts Health & Educational Facilities Authority, Revenue Bonds (Museum of Fine Arts) Ser. A1 | | 3.87 | | 12/1/2037 | | 3,100,000 | b | 3,100,000 | |
Massachusetts Health & Educational Facilities Authority, Revenue Bonds, Refunding (Partners Healthcare) (LOC; TD Bank NA) Ser. F3 | | 4.00 | | 7/1/2040 | | 2,200,000 | b | 2,200,000 | |
Massachusetts Housing Finance Agency, Revenue Bonds (Insured; Federal Housing Administration) Ser. A1 | | 2.55 | | 12/1/2040 | | 1,500,000 | | 1,114,840 | |
Massachusetts Housing Finance Agency, Revenue Bonds (Insured; Federal Housing Administration) Ser. A3 | | 0.88 | | 12/1/2023 | | 915,000 | | 908,849 | |
Massachusetts Housing Finance Agency, Revenue Bonds, Refunding (Insured; GNMA, FNMA, FHLMC) Ser. 195 | | 4.00 | | 12/1/2048 | | 555,000 | | 549,316 | |
Massachusetts Housing Finance Agency, Revenue Bonds, Refunding (Insured; GNMA, FNMA, FHLMC) Ser. 220 | | 3.00 | | 12/1/2050 | | 1,660,000 | | 1,593,770 | |
Massachusetts Housing Finance Agency, Revenue Bonds, Refunding, Ser. 183 | | 3.50 | | 12/1/2046 | | 280,000 | | 276,282 | |
Massachusetts Housing Finance Agency, Revenue Bonds, Refunding, Ser. 207 | | 4.00 | | 6/1/2049 | | 1,530,000 | | 1,512,658 | |
Massachusetts Housing Finance Agency, Revenue Bonds, Refunding, Ser. 211 | | 3.50 | | 12/1/2049 | | 620,000 | | 605,192 | |
Massachusetts Housing Finance Agency, Revenue Bonds, Refunding, Ser. 221 | | 3.00 | | 12/1/2050 | | 1,355,000 | | 1,300,547 | |
Massachusetts Housing Finance Agency, Revenue Bonds, Ser. F | | 2.95 | | 12/1/2032 | | 1,000,000 | | 917,813 | |
Massachusetts Municipal Wholesale Electric Co., Revenue Bonds (Project 2015-A) Ser. A | | 4.00 | | 7/1/2035 | | 650,000 | | 654,909 | |
Massachusetts Port Authority, Revenue Bonds (Green Bond) Ser. A | | 5.00 | | 7/1/2034 | | 1,500,000 | | 1,656,770 | |
Massachusetts Port Authority, Revenue Bonds, Refunding (Bosfuel Project) Ser. A | | 5.00 | | 7/1/2032 | | 865,000 | | 917,854 | |
Massachusetts Port Authority, Revenue Bonds, Refunding (Bosfuel Project) Ser. A | | 5.00 | | 7/1/2029 | | 1,000,000 | | 1,062,931 | |
Massachusetts Port Authority, Revenue Bonds, Refunding (Bosfuel Project) Ser. A | | 5.00 | | 7/1/2035 | | 500,000 | | 527,247 | |
Massachusetts Port Authority, Revenue Bonds, Refunding, Ser. A | | 5.00 | | 7/1/2027 | | 2,000,000 | | 2,096,735 | |
Massachusetts Port Authority, Revenue Bonds, Refunding, Ser. A | | 5.00 | | 7/1/2028 | | 2,000,000 | | 2,127,098 | |
Massachusetts Port Authority, Revenue Bonds, Refunding, Ser. C | | 5.00 | | 7/1/2030 | | 1,635,000 | | 1,760,372 | |
Massachusetts Transportation Fund, Revenue Bonds (Bridge Program) Ser. A | | 5.00 | | 6/1/2044 | | 1,500,000 | | 1,509,493 | |
Medway, GO | | 3.00 | | 9/1/2031 | | 500,000 | | 495,349 | |
Medway, GO | | 3.00 | | 9/1/2032 | | 700,000 | | 683,327 | |
Middleborough, GO, Refunding | | 3.00 | | 10/1/2034 | | 1,455,000 | | 1,373,729 | |
Minuteman Regional Vocational Technical School District, GO | | 5.00 | | 10/15/2027 | | 525,000 | | 554,273 | |
Mount Greylock Regional School District, GO, Refunding | | 4.00 | | 6/15/2030 | | 315,000 | | 315,413 | |
Natick, GO | | 4.00 | | 7/15/2033 | | 3,000,000 | | 3,083,369 | |
Plainville, GO | | 4.00 | | 10/15/2030 | | 1,210,000 | | 1,246,225 | |
Quincy, GO, Refunding, Ser. A | | 4.00 | | 6/1/2038 | | 500,000 | | 508,657 | |
51
STATEMENT OF INVESTMENTS (continued)
| | | | | | | | | | |
| |
BNY Mellon Massachusetts Intermediate Municipal Bond Fund (continued) |
Description | Coupon
Rate (%) | | Maturity Date | | Principal Amount ($) | | Value ($) | |
Long-Term Municipal Investments - 100.0% (continued) | | | | | |
Massachusetts - 87.7% (continued) | | | | | |
Rockland, GO, Refunding | | 3.00 | | 10/1/2032 | | 1,000,000 | | 957,988 | |
Sharon, GO | | 3.00 | | 2/15/2033 | | 1,750,000 | | 1,673,772 | |
Shrewsbury, GO | | 3.00 | | 1/15/2034 | | 2,160,000 | | 2,078,530 | |
Somerville, GO, Refunding | | 3.00 | | 6/1/2035 | | 1,125,000 | | 1,053,475 | |
Somerville, GO, Refunding | | 3.00 | | 6/1/2034 | | 1,045,000 | | 1,002,535 | |
The Massachusetts Clean Water Trust, Revenue Bonds (Green Bond) Ser. 20 | | 5.00 | | 2/1/2033 | | 2,300,000 | | 2,358,798 | |
The Massachusetts Clean Water Trust, Revenue Bonds (Green Bond) Ser. 21 | | 5.00 | | 8/1/2035 | | 2,250,000 | | 2,437,325 | |
The Massachusetts Clean Water Trust, Revenue Bonds, Refunding (MWRA Program) Ser. A | | 5.75 | | 8/1/2029 | | 155,000 | | 155,255 | |
Waltham, GO | | 3.00 | | 10/15/2032 | | 1,160,000 | | 1,115,792 | |
Westborough, BAN, Refunding | | 5.00 | | 3/28/2024 | | 3,000,000 | | 3,029,365 | |
Winchester, GO, Refunding | | 4.00 | | 3/15/2038 | | 1,065,000 | | 1,070,729 | |
Worcester, GO, Refunding (Insured; Assured Guaranty Municipal Corp.) | | 2.00 | | 2/15/2033 | | 2,000,000 | | 1,675,086 | |
| | 158,328,091 | |
Nebraska - 1.6% | | | | | |
Central Plains Energy, Revenue Bonds, Refunding (Central Plains Energy Project) | | 4.00 | | 8/1/2025 | | 3,000,000 | a | 2,981,611 | |
New York - 2.5% | | | | | |
New York Liberty Development Corp., Revenue Bonds, Refunding (Bank of America Tower) | | 2.63 | | 9/15/2069 | | 2,675,000 | | 2,400,860 | |
New York Liberty Development Corp., Revenue Bonds, Refunding (Class 1-3 World Trade Center Project) | | 5.00 | | 11/15/2044 | | 2,250,000 | c | 2,153,451 | |
| | 4,554,311 | |
U.S. Related - .6% | | | | | |
Puerto Rico, Notes | | 2.28 | | 11/1/2051 | | 455,259 | b | 189,502 | |
Puerto Rico Industrial Tourist Educational Medical & Environmental Control Facilities Financing Authority, Revenue Bonds, Refunding (Hospital Auxilio Mutuo Obligated Group) | | 5.00 | | 7/1/2029 | | 285,000 | | 301,409 | |
Puerto Rico Industrial Tourist Educational Medical & Environmental Control Facilities Financing Authority, Revenue Bonds, Refunding (Hospital Auxilio Mutuo Obligated Group) | | 5.00 | | 7/1/2028 | | 260,000 | | 272,643 | |
Puerto Rico Industrial Tourist Educational Medical & Environmental Control Facilities Financing Authority, Revenue Bonds, Refunding (Hospital Auxilio Mutuo Obligated Group) | | 5.00 | | 7/1/2027 | | 310,000 | | 321,517 | |
| | 1,085,071 | |
Total Investments (cost $189,735,300) | | 100.0% | 180,642,251 | |
Liabilities, Less Cash and Receivables | | 0.0% | (70,641) | |
Net Assets | | 100.0% | 180,571,610 | |
a These securities have a put feature; the date shown represents the put date and the bond holder can take a specific action to retain the bond after the put date.
b The Variable Rate is determined by the Remarketing Agent in its sole discretion based on prevailing market conditions and may, but need not, be established by reference to one or more financial indices.
c Security exempt from registration pursuant to Rule 144A under the Securities Act of 1933. These securities may be resold in transactions exempt from registration, normally to qualified institutional buyers. At August 31, 2023, these securities were valued at $2,153,451 or 1.19% of net assets.
52
| | |
Portfolio Summary (Unaudited) † | Value (%) |
General Obligation | 24.6 |
Education | 20.4 |
General | 13.0 |
Medical | 12.4 |
School District | 8.3 |
Airport | 5.6 |
Development | 3.7 |
Single Family Housing | 3.2 |
Water | 2.7 |
Multifamily Housing | 2.3 |
Student Loan | 1.7 |
Power | 1.0 |
Transportation | .8 |
Housing | .3 |
| | 100.0 |
† Based on net assets.
See notes to financial statements.
| | | | | | | | | | | | |
BNY Mellon Massachusetts Intermediate Municipal Bond Fund | |
Futures | | | |
Description | Number of
Contracts | Expiration | Notional
Value($) | Market
Value ($) | Unrealized
(Depreciation) ($) | |
Futures Short | | |
Ultra 10 Year U.S. Treasury Notes | 16 | 12/19/2023 | 1,839,046 | 1,857,750 | (18,704) | |
Gross Unrealized Depreciation | | (18,704) | |
See notes to financial statements.
53
STATEMENT OF INVESTMENTS (continued)
| | | | | | | | | | |
| |
BNY Mellon New York Intermediate Tax-Exempt Bond Fund |
Description | Coupon
Rate (%) | | Maturity Date | | Principal Amount ($) | | Value ($) | |
Long-Term Municipal Investments - 98.3% | | | | | |
Alabama - .7% | | | | | |
Black Belt Energy Gas District, Revenue Bonds (Gas Project) | | 4.00 | | 12/1/2026 | | 750,000 | a | 733,306 | |
Illinois - 2.4% | | | | | |
Chicago II, GO, Refunding, Ser. A | | 5.00 | | 1/1/2034 | | 500,000 | | 531,324 | |
Chicago II, GO, Refunding, Ser. A | | 5.00 | | 1/1/2029 | | 500,000 | | 527,086 | |
Chicago II, GO, Refunding, Ser. A | | 5.00 | | 1/1/2026 | | 500,000 | | 511,791 | |
Chicago Park District, GO, Refunding, Ser. C | | 4.00 | | 1/1/2036 | | 1,000,000 | | 975,826 | |
| | 2,546,027 | |
Iowa - .5% | | | | | |
PEFA, Revenue Bonds (Gas Project) | | 5.00 | | 9/1/2026 | | 525,000 | a | 530,116 | |
Kentucky - 1.4% | | | | | |
Kentucky Public Energy Authority, Revenue Bonds, Ser. C1 | | 4.00 | | 6/1/2025 | | 1,500,000 | a | 1,501,005 | |
Nebraska - .9% | | | | | |
Central Plains Energy, Revenue Bonds, Refunding (Central Plains Energy Project) | | 4.00 | | 8/1/2025 | | 1,000,000 | a | 993,871 | |
New Jersey - 1.5% | | | | | |
Tobacco Settlement Financing Corp., Revenue Bonds, Refunding, Ser. A | | 5.00 | | 6/1/2029 | | 750,000 | | 802,624 | |
Tobacco Settlement Financing Corp., Revenue Bonds, Refunding, Ser. A | | 5.00 | | 6/1/2028 | | 750,000 | | 802,066 | |
| | 1,604,690 | |
New York - 90.5% | | | | | |
Albany Capital Resource Corp., Revenue Bonds (Equitable School Revolving Fund Obligated Group) Ser. D | | 4.00 | | 11/1/2046 | | 500,000 | | 444,236 | |
Battery Park Authority, Revenue Bonds | | 5.00 | | 11/1/2048 | | 1,000,000 | | 1,073,250 | |
Berne-Knox-Westerlo Central School District, GO, Refunding (Insured; Assured Guaranty Municipal Corp.) | | 2.00 | | 7/1/2031 | | 1,160,000 | | 1,017,954 | |
Brookhaven, GO, Refunding, Ser. C | | 2.00 | | 1/15/2030 | | 1,000,000 | | 906,421 | |
Build NYC Resource Corp., Revenue Bonds (KIPP NYC Public Charter Schools) | | 5.00 | | 7/1/2042 | | 1,000,000 | | 1,004,896 | |
Colonie, GO, Refunding (Insured; Assured Guaranty Municipal Corp.) Ser. A | | 2.00 | | 3/1/2030 | | 1,025,000 | | 908,503 | |
Dutchess County Local Development Corp., Revenue Bonds (Marist College Project) Ser. A | | 5.00 | | 7/1/2040 | | 1,000,000 | | 1,014,364 | |
Dutchess County Local Development Corp., Revenue Bonds, Refunding (The Culinary Institute of America Project) | | 5.00 | | 7/1/2028 | | 1,000,000 | | 1,040,148 | |
Dutchess County Local Development Corp., Revenue Bonds, Refunding (The Culinary Institute of America Project) | | 5.00 | | 7/1/2033 | | 1,150,000 | | 1,189,842 | |
Dutchess County Local Development Corp., Revenue Bonds, Refunding (The Culinary Institute of America Project) | | 5.00 | | 7/1/2026 | | 525,000 | | 536,224 | |
Dutchess County Local Development Corp., Revenue Bonds, Ser. B | | 5.00 | | 7/1/2026 | | 1,000,000 | | 1,016,583 | |
Huntington, GO, Ser. A | | 2.00 | | 6/15/2031 | | 1,635,000 | | 1,442,573 | |
Island Trees Union Free School District, GO, Refunding (Insured; State Aid Withholding) | | 2.00 | | 5/15/2032 | | 1,545,000 | | 1,310,143 | |
Metropolitan Transportation Authority, Revenue Bonds (Green Bond) Ser. A | | 5.00 | | 11/15/2035 | | 1,000,000 | | 1,057,000 | |
Metropolitan Transportation Authority, Revenue Bonds, Refunding (Green Bond) Ser. A2 | | 5.00 | | 5/15/2024 | | 2,300,000 | a | 2,317,217 | |
Metropolitan Transportation Authority, Revenue Bonds, Refunding (Green Bond) Ser. B2 | | 4.00 | | 11/15/2033 | | 1,000,000 | | 1,028,524 | |
Metropolitan Transportation Authority, Revenue Bonds, Refunding (Green Bond) Ser. C1 | | 5.00 | | 11/15/2025 | | 1,000,000 | | 1,027,059 | |
Metropolitan Transportation Authority, Revenue Bonds, Refunding, Ser. B | | 5.00 | | 11/15/2035 | | 1,215,000 | | 1,245,584 | |
Metropolitan Transportation Authority, Revenue Bonds, Refunding, Ser. C1 | | 5.25 | | 11/15/2030 | | 1,000,000 | | 1,027,003 | |
54
| | | | | | | | | | |
| |
BNY Mellon New York Intermediate Tax-Exempt Bond Fund (continued) |
Description | Coupon
Rate (%) | | Maturity Date | | Principal Amount ($) | | Value ($) | |
Long-Term Municipal Investments - 98.3% (continued) | | | | | |
New York - 90.5% (continued) | | | | | |
Monroe County Industrial Development Corp., Revenue Bonds (The Rochester General Hospital) | | 5.00 | | 12/1/2032 | | 1,000,000 | | 1,026,564 | |
Monroe County Industrial Development Corp., Revenue Bonds (The Rochester General Hospital) | | 5.00 | | 12/1/2028 | | 1,095,000 | | 1,128,585 | |
Monroe County Industrial Development Corp., Revenue Bonds, Refunding (University of Rochester Project) Ser. C | | 4.00 | | 7/1/2035 | | 1,000,000 | | 1,007,046 | |
Nassau County, GO, Ser. B | | 5.00 | | 4/1/2024 | | 1,500,000 | b | 1,514,717 | |
Nassau County Local Economic Assistance Corp., Revenue Bonds (Roosevelt Children's Academy Charter School) Ser. A | | 4.00 | | 7/1/2033 | | 730,000 | | 714,428 | |
New York City, GO (LOC; U.S. Bank NA) Ser. L4 | | 4.25 | | 4/1/2038 | | 3,000,000 | c | 3,000,000 | |
New York City, GO, Ser. E1 | | 5.00 | | 4/1/2038 | | 1,500,000 | | 1,646,426 | |
New York City Housing Development Corp., Revenue Bonds | | 2.40 | | 11/1/2030 | | 720,000 | | 644,099 | |
New York City Housing Development Corp., Revenue Bonds, Ser. A1 | | 3.38 | | 11/15/2029 | | 1,000,000 | | 981,578 | |
New York City Industrial Development Agency, Revenue Bonds, Refunding (Queens Baseball Stadium Project) (Insured; Assured Guaranty Municipal Corp.) Ser. A | | 3.00 | | 1/1/2033 | | 1,540,000 | | 1,407,529 | |
New York City Industrial Development Agency, Revenue Bonds, Refunding (Yankee Stadium Project) (Insured; Assured Guaranty Municipal Corp.) | | 5.00 | | 3/1/2030 | | 1,600,000 | | 1,747,402 | |
New York City Municipal Water Finance Authority, Revenue Bonds (LOC; Citibank NA) Ser. F2 | | 4.25 | | 6/15/2035 | | 1,000,000 | c | 1,000,000 | |
New York City Municipal Water Finance Authority, Revenue Bonds, Refunding, Ser. DD | | 3.00 | | 6/15/2038 | | 500,000 | | 421,436 | |
New York City Municipal Water Finance Authority, Revenue Bonds, Refunding, Ser. FF2 | | 5.00 | | 6/15/2035 | | 1,000,000 | | 1,096,080 | |
New York City Transitional Finance Authority, Revenue Bonds | | 5.25 | | 8/1/2037 | | 1,000,000 | | 1,073,768 | |
New York City Transitional Finance Authority, Revenue Bonds, Refunding, Ser. E1 | | 5.00 | | 11/1/2038 | | 1,000,000 | | 1,097,453 | |
New York City Transitional Finance Authority, Revenue Bonds, Ser. B | | 5.00 | | 5/1/2035 | | 1,000,000 | | 1,143,924 | |
New York City Transitional Finance Authority, Revenue Bonds, Ser. E1 | | 4.00 | | 2/1/2040 | | 1,075,000 | | 1,062,430 | |
New York Liberty Development Corp., Revenue Bonds, Refunding (Bank of America Tower) | | 2.63 | | 9/15/2069 | | 1,500,000 | | 1,346,277 | |
New York Liberty Development Corp., Revenue Bonds, Refunding (Class 1-3 World Trade Center Project) | | 5.00 | | 11/15/2044 | | 2,000,000 | d | 1,914,179 | |
New York Liberty Development Corp., Revenue Bonds, Refunding (Class 2-3 World Trade Center Project) | | 5.15 | | 11/15/2034 | | 1,500,000 | d | 1,494,836 | |
New York Liberty Development Corp., Revenue Bonds, Refunding (Green Bond) Ser. A | | 1.90 | | 11/15/2031 | | 1,000,000 | | 853,606 | |
New York Liberty Development Corp., Revenue Bonds, Refunding, Ser. 1WTC | | 3.00 | | 2/15/2042 | | 500,000 | | 383,237 | |
New York State Dormitory Authority, Revenue Bonds (Maimonides Medical Center) (Insured; Federal Housing Administration) | | 4.00 | | 2/1/2037 | | 225,000 | | 226,040 | |
New York State Dormitory Authority, Revenue Bonds (Maimonides Medical Center) (Insured; Federal Housing Administration) | | 4.00 | | 2/1/2038 | | 275,000 | | 273,689 | |
New York State Dormitory Authority, Revenue Bonds (Maimonides Medical Center) (Insured; Federal Housing Administration) | | 4.00 | | 2/1/2039 | | 250,000 | | 246,134 | |
New York State Dormitory Authority, Revenue Bonds (Maimonides Medical Center) (Insured; Federal Housing Administration) | | 4.00 | | 2/1/2040 | | 250,000 | | 244,034 | |
New York State Dormitory Authority, Revenue Bonds, Refunding (New York University) Ser. A | | 4.00 | | 7/1/2037 | | 350,000 | | 350,864 | |
New York State Dormitory Authority, Revenue Bonds, Refunding (The New School) Ser. A | | 5.00 | | 7/1/2036 | | 1,000,000 | | 1,082,168 | |
55
STATEMENT OF INVESTMENTS (continued)
| | | | | | | | | | |
| |
BNY Mellon New York Intermediate Tax-Exempt Bond Fund (continued) |
Description | Coupon
Rate (%) | | Maturity Date | | Principal Amount ($) | | Value ($) | |
Long-Term Municipal Investments - 98.3% (continued) | | | | | |
New York - 90.5% (continued) | | | | | |
New York State Dormitory Authority, Revenue Bonds, Refunding (The New School) Ser. A | | 5.00 | | 7/1/2032 | | 1,420,000 | | 1,450,817 | |
New York State Dormitory Authority, Revenue Bonds, Refunding (The New School) Ser. A | | 5.00 | | 7/1/2025 | | 110,000 | b | 113,273 | |
New York State Dormitory Authority, Revenue Bonds, Refunding (The New York & Presbyterian Hospital Obligated Group) Ser. A | | 5.00 | | 8/1/2038 | | 1,200,000 | | 1,327,824 | |
New York State Dormitory Authority, Revenue Bonds, Refunding (The Rockefeller University) Ser. A | | 5.00 | | 7/1/2035 | | 1,000,000 | | 1,105,945 | |
New York State Dormitory Authority, Revenue Bonds, Ser. A1 | | 4.00 | | 7/1/2027 | | 990,000 | | 1,007,107 | |
New York State Environmental Facilities Corp., Revenue Bonds, Refunding | | 5.00 | | 6/15/2041 | | 1,100,000 | | 1,205,184 | |
New York State Housing Finance Agency, Revenue Bonds (Insured; State of New York Mortgage Agency) Ser. E | | 4.13 | | 11/1/2028 | | 1,000,000 | | 1,000,208 | |
New York State Housing Finance Agency, Revenue Bonds (Insured; State of New York Mortgage Agency) Ser. L1 | | 1.50 | | 11/1/2029 | | 520,000 | | 443,235 | |
New York State Mortgage Agency, Revenue Bonds, Refunding, Ser. 203 | | 3.10 | | 10/1/2032 | | 1,500,000 | | 1,373,718 | |
New York State Mortgage Agency, Revenue Bonds, Ser. 223 | | 2.65 | | 10/1/2034 | | 1,000,000 | | 853,026 | |
New York State Mortgage Agency, Revenue Bonds, Ser. 226 | | 1.70 | | 4/1/2027 | | 1,270,000 | | 1,189,413 | |
New York State Urban Development Corp., Revenue Bonds, Refunding, Ser. E | | 4.00 | | 3/15/2036 | | 1,050,000 | | 1,073,372 | |
New York Transportation Development Corp., Revenue Bonds | | 4.00 | | 10/31/2034 | | 500,000 | | 482,616 | |
New York Transportation Development Corp., Revenue Bonds (Delta Air Lines) | | 5.00 | | 1/1/2024 | | 1,575,000 | | 1,578,370 | |
Niagara Frontier Transportation Authority, Revenue Bonds, Refunding | | 5.00 | | 4/1/2026 | | 925,000 | | 947,745 | |
Niagara Frontier Transportation Authority, Revenue Bonds, Refunding | | 5.00 | | 4/1/2024 | | 1,050,000 | | 1,055,547 | |
Niagara Frontier Transportation Authority, Revenue Bonds, Refunding | | 5.00 | | 4/1/2025 | | 1,330,000 | | 1,348,027 | |
Onondaga County Trust for Cultural Resources, Revenue Bonds, Refunding (Syracuse University Project) | | 5.00 | | 12/1/2040 | | 1,350,000 | | 1,450,564 | |
Port Authority of New York & New Jersey, Revenue Bonds, Refunding, Ser. 222 | | 4.00 | | 7/15/2036 | | 1,000,000 | | 1,019,930 | |
South Glens Falls Central School District, GO, Refunding (Insured; State Aid Withholding) Ser. A | | 2.00 | | 7/15/2030 | | 1,000,000 | | 871,634 | |
St. Lawrence County Industrial Development Agency, Revenue Bonds, Refunding (Clarkson University Project) | | 5.00 | | 9/1/2038 | | 250,000 | | 255,029 | |
St. Lawrence County Industrial Development Agency, Revenue Bonds, Refunding (Clarkson University Project) | | 5.00 | | 9/1/2040 | | 575,000 | | 581,883 | |
St. Lawrence County Industrial Development Agency, Revenue Bonds, Refunding (Clarkson University Project) | | 5.00 | | 9/1/2037 | | 250,000 | | 256,338 | |
St. Lawrence County Industrial Development Agency, Revenue Bonds, Refunding (Clarkson University Project) | | 5.00 | | 9/1/2029 | | 1,000,000 | | 1,037,764 | |
St. Lawrence County Industrial Development Agency, Revenue Bonds, Refunding (Clarkson University Project) | | 5.00 | | 9/1/2035 | | 710,000 | | 741,540 | |
The New York City Cultural Resources Trust, Revenue Bonds, Refunding (Lincoln Center for the Performing Arts) Ser. A | | 4.00 | | 12/1/2035 | | 1,275,000 | | 1,310,525 | |
Triborough Bridge & Tunnel Authority, Revenue Bonds, Refunding | | 4.00 | | 11/15/2038 | | 1,500,000 | | 1,487,620 | |
Triborough Bridge & Tunnel Authority, Revenue Bonds, Refunding, Ser. A2 | | 2.00 | | 5/15/2028 | | 1,500,000 | a | 1,359,937 | |
Triborough Bridge & Tunnel Authority, Revenue Bonds, Refunding, Ser. B | | 5.00 | | 11/15/2036 | | 1,525,000 | | 1,596,682 | |
Triborough Bridge & Tunnel Authority, Revenue Bonds, Refunding, Ser. C2 | | 3.00 | | 5/15/2032 | | 2,500,000 | | 2,462,484 | |
Triborough Bridge & Tunnel Authority, Revenue Bonds, Ser. A | | 5.00 | | 5/15/2044 | | 1,000,000 | | 1,076,916 | |
Troy Capital Resource Corp., Revenue Bonds, Refunding (Rensselaer Polytechnic Institute) | | 5.00 | | 9/1/2028 | | 1,270,000 | | 1,354,032 | |
56
| | | | | | | | | | |
| |
BNY Mellon New York Intermediate Tax-Exempt Bond Fund (continued) |
Description | Coupon
Rate (%) | | Maturity Date | | Principal Amount ($) | | Value ($) | |
Long-Term Municipal Investments - 98.3% (continued) | | | | | |
New York - 90.5% (continued) | | | | | |
TSASC, Revenue Bonds, Refunding, Ser. A | | 5.00 | | 6/1/2024 | | 500,000 | | 503,610 | |
Utility Debt Securitization Authority, Revenue Bonds, Refunding, Ser. A | | 5.00 | | 12/15/2034 | | 1,500,000 | | 1,569,809 | |
Utility Debt Securitization Authority, Revenue Bonds, Refunding, Ser. TE-1 | | 5.00 | | 12/15/2035 | | 2,360,000 | | 2,725,726 | |
Webster Central School District, GO, Refunding (Insured; State Aid Withholding) | | 2.00 | | 6/15/2031 | | 1,105,000 | | 968,348 | |
Westchester County, GO, Ser. A | | 2.00 | | 10/15/2032 | | 1,000,000 | | 848,463 | |
Westchester County Local Development Corp., Revenue Bonds (Purchase Housing Corporation II Project) | | 5.00 | | 6/1/2037 | | 1,000,000 | | 1,008,740 | |
Westchester County Local Development Corp., Revenue Bonds, Refunding (Sarah Lawrence College) Ser. A | | 5.00 | | 6/1/2026 | | 1,210,000 | | 1,232,244 | |
Westchester County Local Development Corp., Revenue Bonds, Refunding (Sarah Lawrence College) Ser. A | | 5.00 | | 6/1/2025 | | 1,105,000 | | 1,115,961 | |
Westchester County Local Development Corp., Revenue Bonds, Refunding (Westchester Medical Center) | | 5.00 | | 11/1/2028 | | 1,000,000 | | 1,003,175 | |
Westchester Tobacco Asset Securitization Corp., Revenue Bonds, Refunding, Ser. B | | 5.00 | | 6/1/2024 | | 1,000,000 | | 1,010,347 | |
Yonkers Economic Development Corp., Revenue Bonds (Charter School of Educational Excellence Project) Ser. A | | 4.00 | | 10/15/2029 | | 200,000 | | 188,063 | |
Yonkers Economic Development Corp., Revenue Bonds (Charter School of Educational Excellence Project) Ser. A | | 5.00 | | 10/15/2039 | | 320,000 | | 298,490 | |
| | 97,627,334 | |
U.S. Related - .4% | | | | | |
Puerto Rico Industrial Tourist Educational Medical & Environmental Control Facilities Financing Authority, Revenue Bonds, Refunding (Hospital Auxilio Mutuo Obligated Group) | | 5.00 | | 7/1/2029 | | 140,000 | | 148,060 | |
Puerto Rico Industrial Tourist Educational Medical & Environmental Control Facilities Financing Authority, Revenue Bonds, Refunding (Hospital Auxilio Mutuo Obligated Group) | | 5.00 | | 7/1/2028 | | 120,000 | | 125,835 | |
Puerto Rico Industrial Tourist Educational Medical & Environmental Control Facilities Financing Authority, Revenue Bonds, Refunding (Hospital Auxilio Mutuo Obligated Group) | | 5.00 | | 7/1/2027 | | 140,000 | | 145,201 | |
| | 419,096 | |
Total Investments (cost $111,289,235) | | 98.3% | 105,955,445 | |
Cash and Receivables (Net) | | 1.7% | 1,869,525 | |
Net Assets | | 100.0% | 107,824,970 | |
a These securities have a put feature; the date shown represents the put date and the bond holder can take a specific action to retain the bond after the put date.
b These securities are prerefunded; the date shown represents the prerefunded date. Bonds which are prerefunded are collateralized by U.S. Government securities which are held in escrow and are used to pay principal and interest on the municipal issue and to retire the bonds in full at the earliest refunding date.
c The Variable Rate is determined by the Remarketing Agent in its sole discretion based on prevailing market conditions and may, but need not, be established by reference to one or more financial indices.
d Security exempt from registration pursuant to Rule 144A under the Securities Act of 1933. These securities may be resold in transactions exempt from registration, normally to qualified institutional buyers. At August 31, 2023, these securities were valued at $3,409,015 or 3.16% of net assets.
57
STATEMENT OF INVESTMENTS (continued)
| | |
Portfolio Summary (Unaudited) † | Value (%) |
Education | 18.0 |
General | 17.0 |
Development | 10.6 |
General Obligation | 10.5 |
Transportation | 8.1 |
Medical | 6.1 |
Airport | 4.1 |
Power | 4.0 |
School District | 3.9 |
Water | 3.4 |
Single Family Housing | 3.2 |
Tobacco Settlement | 2.9 |
Multifamily Housing | 2.8 |
Housing | 2.2 |
Prerefunded | 1.5 |
| | 98.3 |
† Based on net assets.
See notes to financial statements.
| | | | | | | | | | | | |
BNY Mellon New York Intermediate Tax-Exempt Bond Fund | |
Futures | | | |
Description | Number of
Contracts | Expiration | Notional
Value($) | Market
Value ($) | Unrealized
(Depreciation) ($) | |
Futures Short | | |
Ultra 10 Year U.S. Treasury Notes | 9 | 12/19/2023 | 1,034,463 | 1,044,984 | (10,521) | |
Gross Unrealized Depreciation | | (10,521) | |
See notes to financial statements.
58
| | | | | | | | | | |
| |
BNY Mellon Municipal Opportunities Fund |
Description | Coupon
Rate (%) | | Maturity Date | | Principal Amount ($) | | Value ($) | |
Bonds and Notes - .9% | | | | | |
Commercial & Professional Services - .4% | | | | | |
Southern California University, Sr. Unscd. Bonds | | 4.98 | | 10/1/2053 | | 7,500,000 | | 7,370,367 | |
Health Care - .3% | | | | | |
AHS Hospital Corp., Sr. Unscd. Bonds, Ser. 2021 | | 2.78 | | 7/1/2051 | | 5,000,000 | | 3,145,264 | |
WakeMed, Unscd. Notes, Ser. A | | 3.29 | | 10/1/2052 | | 5,000,000 | | 3,459,812 | |
| | 6,605,076 | |
Industrial - .2% | | | | | |
LBJ Infrastructure Group, Sr. Scd. Bonds | | 3.80 | | 12/31/2057 | | 5,000,000 | a | 3,206,764 | |
Total Bonds and Notes
(cost $22,500,000) | | 17,182,207 | |
| | | | | | | | |
Long-Term Municipal Investments - 100.8% | | | | | |
Alabama - 1.4% | | | | | |
Auburn University, Revenue Bonds, Ser. A | | 5.00 | | 6/1/2048 | | 5,000,000 | | 5,182,077 | |
Black Belt Energy Gas District, Revenue Bonds (Project No. 6) Ser. B | | 4.00 | | 12/1/2026 | | 10,000,000 | b | 9,777,408 | |
Southeast Energy Authority A Cooperative District, Revenue Bonds (Project No. 3) Ser. A1 | | 5.50 | | 12/1/2029 | | 5,000,000 | b | 5,244,954 | |
Southeast Energy Authority A Cooperative District, Revenue Bonds (Project No. 4) Ser. B1 | | 5.00 | | 8/1/2028 | | 5,000,000 | b | 5,102,040 | |
Southeast Energy Authority A Cooperative District, Revenue Bonds (Project No. 5) Ser. A | | 5.25 | | 7/1/2029 | | 2,500,000 | b | 2,592,296 | |
| | 27,898,775 | |
Arizona - 2.2% | | | | | |
Arizona Industrial Development Authority, Revenue Bonds (Academies of Math & Science Projects) | | 5.00 | | 7/1/2049 | | 1,000,000 | a | 905,883 | |
Arizona Industrial Development Authority, Revenue Bonds (Academies of Math & Science Projects) Ser. B | | 5.50 | | 7/1/2038 | | 1,165,000 | a | 1,174,385 | |
Arizona Industrial Development Authority, Revenue Bonds (Academies of Math & Science Projects) Ser. B | | 5.63 | | 7/1/2048 | | 2,000,000 | a | 1,985,276 | |
Arizona Industrial Development Authority, Revenue Bonds (Academies of Math & Science Projects) Ser. B | | 5.75 | | 7/1/2053 | | 3,260,000 | a | 3,255,076 | |
Arizona Industrial Development Authority, Revenue Bonds (Doral Academy of Nevada) Ser. A | | 5.00 | | 7/15/2049 | | 1,675,000 | | 1,526,360 | |
Arizona Industrial Development Authority, Revenue Bonds (Doral Academy of Nevada) Ser. A | | 5.00 | | 7/15/2039 | | 1,325,000 | | 1,282,631 | |
Arizona Industrial Development Authority, Revenue Bonds (Equitable School Revolving Fund Obligated Group) Ser. A | | 4.00 | | 11/1/2049 | | 2,000,000 | | 1,715,866 | |
Arizona Industrial Development Authority, Revenue Bonds (Equitable School Revolving Fund Obligated Group) Ser. A | | 5.00 | | 11/1/2044 | | 1,625,000 | | 1,649,755 | |
Arizona Industrial Development Authority, Revenue Bonds (Great Lakes Senior Living Communities) Ser. A | | 5.00 | | 1/1/2043 | | 1,750,000 | | 1,138,825 | |
Arizona Industrial Development Authority, Revenue Bonds (Great Lakes Senior Living Communities) Ser. B | | 5.00 | | 1/1/2049 | | 1,400,000 | | 728,749 | |
Arizona Industrial Development Authority, Revenue Bonds (Great Lakes Senior Living Communities) Ser. B | | 5.00 | | 1/1/2043 | | 1,650,000 | | 898,184 | |
Arizona Industrial Development Authority, Revenue Bonds (JEROME Facility Project) Ser. B | | 4.00 | | 7/1/2061 | | 3,700,000 | | 2,883,034 | |
Arizona Industrial Development Authority, Revenue Bonds (JEROME Facility Project) Ser. B | | 4.00 | | 7/1/2041 | | 720,000 | | 636,594 | |
Arizona Industrial Development Authority, Revenue Bonds (JEROME Facility Project) Ser. B | | 4.00 | | 7/1/2051 | | 1,750,000 | | 1,428,246 | |
Arizona Industrial Development Authority, Revenue Bonds (Lone Mountain Campus Project) Ser. A | | 5.00 | | 12/15/2049 | | 700,000 | a | 614,637 | |
Arizona Industrial Development Authority, Revenue Bonds (Lone Mountain Campus Project) Ser. A | | 5.00 | | 12/15/2039 | | 400,000 | a | 376,178 | |
Arizona Industrial Development Authority, Revenue Bonds (MACOMBS Facility Project) Ser. A | | 4.00 | | 7/1/2041 | | 950,000 | | 839,951 | |
59
STATEMENT OF INVESTMENTS (continued)
| | | | | | | | | | |
| |
BNY Mellon Municipal Opportunities Fund (continued) |
Description | Coupon
Rate (%) | | Maturity Date | | Principal Amount ($) | | Value ($) | |
Long-Term Municipal Investments - 100.8% (continued) | | | | | |
Arizona - 2.2% (continued) | | | | | |
Arizona Industrial Development Authority, Revenue Bonds (NCCU Properties) (Insured; Build America Mutual) Ser. A | | 4.00 | | 6/1/2044 | | 2,000,000 | | 1,831,656 | |
Arizona Industrial Development Authority, Revenue Bonds (Phoenix Children's Hospital Obligated Group) | | 3.00 | | 2/1/2045 | | 1,600,000 | | 1,189,820 | |
Arizona Industrial Development Authority, Revenue Bonds (Somerset Academy of Las Vegas) | | 4.00 | | 12/15/2041 | | 500,000 | a | 400,814 | |
Maricopa County Industrial Development Authority, Revenue Bonds (Banner Health Obligated Group) Ser. 2019 F | | 3.00 | | 1/1/2049 | | 3,000,000 | | 2,148,839 | |
Maricopa County Pollution Control Corp., Revenue Bonds, Refunding (Southern California Edison) | | 2.40 | | 6/1/2035 | | 5,000,000 | | 3,878,560 | |
Maricopa County Special Health Care District, GO, Ser. C | | 5.00 | | 7/1/2036 | | 7,500,000 | | 8,017,767 | |
Pinal County Industrial Development Authority, Revenue Bonds (WOF SW GGP 1 Project) Ser. A | | 5.50 | | 10/1/2033 | | 2,056,000 | a | 1,936,052 | |
| | 42,443,138 | |
Arkansas - .9% | | | | | |
Arkansas Development Finance Authority, Revenue Bonds (Green Bond) (U.S. Steel Corp.) | | 5.45 | | 9/1/2052 | | 2,500,000 | | 2,439,523 | |
Arkansas Development Finance Authority, Revenue Bonds (Green Bond) (U.S. Steel Corp.) | | 5.70 | | 5/1/2053 | | 7,000,000 | | 7,029,542 | |
Arkansas Development Finance Authority, Revenue Bonds, Green Bonds, Ser. A | | 6.88 | | 7/1/2048 | | 2,500,000 | a | 2,559,682 | |
Arkansas University, Revenue Bonds (Fayetteville Campus) | | 5.00 | | 11/1/2042 | | 5,990,000 | | 6,208,589 | |
| | 18,237,336 | |
California - 15.6% | | | | | |
Alameda Corridor Transportation Authority, Revenue Bonds (Insured; Assured Guaranty Municipal Corp.) Ser. C | | 5.00 | | 10/1/2052 | | 2,000,000 | | 2,116,718 | |
California, GO | | 5.00 | | 4/1/2049 | | 2,500,000 | | 2,647,148 | |
California, GO, Refunding | | 5.00 | | 10/1/2045 | | 5,095,000 | | 5,600,721 | |
California, GO, Refunding | | 5.25 | | 10/1/2045 | | 4,000,000 | | 4,483,647 | |
California, GO, Refunding | | 5.25 | | 10/1/2050 | | 6,000,000 | | 6,661,189 | |
California, GO, Refunding | | 5.25 | | 9/1/2047 | | 1,000,000 | | 1,108,956 | |
California University, Revenue Bonds, Refunding, Ser. AZ | | 5.00 | | 5/15/2043 | | 5,000,000 | | 5,322,929 | |
California Community Choice Financing Authority, Revenue Bonds (Green Bond) (Clean Energy Project) | | 5.25 | | 10/1/2031 | | 6,000,000 | b | 6,223,262 | |
California Community Choice Financing Authority, Revenue Bonds (Green Bond) Ser. B1 | | 4.00 | | 8/1/2031 | | 3,000,000 | b | 2,936,663 | |
California Community College Financing Authority, Revenue Bonds (Napa Valley College Project) Ser. A | | 4.25 | | 7/1/2032 | | 500,000 | a | 475,195 | |
California Community College Financing Authority, Revenue Bonds (Napa Valley College Project) Ser. A | | 5.75 | | 7/1/2060 | | 3,000,000 | a | 2,954,569 | |
California Community College Financing Authority, Revenue Bonds (Orange Coast Properties) | | 5.25 | | 5/1/2048 | | 2,750,000 | | 2,767,841 | |
California Community College Financing Authority, Revenue Bonds (Orange Coast Properties) | | 5.25 | | 5/1/2043 | | 1,250,000 | | 1,265,338 | |
California Community Housing Agency, Revenue Bonds (Arbors Apartments) Ser. A | | 5.00 | | 8/1/2050 | | 7,500,000 | a | 6,801,629 | |
California Community Housing Agency, Revenue Bonds (Creekwood Apartments) Ser. A | | 4.00 | | 2/1/2056 | | 5,000,000 | a | 3,120,853 | |
California Community Housing Agency, Revenue Bonds (Fountains at Emerald Park) | | 3.00 | | 8/1/2056 | | 3,000,000 | a | 1,972,010 | |
California Community Housing Agency, Revenue Bonds (Fountains at Emerald Park) | | 4.00 | | 8/1/2046 | | 2,495,000 | a | 1,997,801 | |
California Community Housing Agency, Revenue Bonds (Serenity at Larkspur Apartments) Ser. A | | 5.00 | | 2/1/2050 | | 5,000,000 | a | 3,943,361 | |
California Community Housing Agency, Revenue Bonds (Stoneridge Apartments) Ser. A | | 4.00 | | 2/1/2056 | | 3,250,000 | a | 2,369,621 | |
California Community Housing Agency, Revenue Bonds (Verdant at Green Valley Project) | | 5.00 | | 8/1/2049 | | 5,000,000 | a | 4,586,889 | |
60
| | | | | | | | | | |
| |
BNY Mellon Municipal Opportunities Fund (continued) |
Description | Coupon
Rate (%) | | Maturity Date | | Principal Amount ($) | | Value ($) | |
Long-Term Municipal Investments - 100.8% (continued) | | | | | |
California - 15.6% (continued) | | | | | |
California County Tobacco Securitization Agency, Revenue Bonds, Refunding, Ser. A | | 4.00 | | 6/1/2049 | | 1,750,000 | | 1,587,533 | |
California Educational Facilities Authority, Revenue Bonds (Green Bond) (Loyola Marymount University) | | 5.00 | | 10/1/2048 | | 3,000,000 | | 3,076,847 | |
California Educational Facilities Authority, Revenue Bonds, Refunding (Loma Linda University) Ser. A | | 5.00 | | 4/1/2042 | | 2,000,000 | | 2,042,523 | |
California Educational Facilities Authority, Revenue Bonds, Refunding (Loma Linda University) Ser. A | | 5.00 | | 4/1/2047 | | 2,500,000 | | 2,540,971 | |
California Health Facilities Financing Authority, Revenue Bonds | | 4.35 | | 6/1/2041 | | 2,000,000 | | 1,775,729 | |
California Health Facilities Financing Authority, Revenue Bonds, Refunding (Children's Hospital Los Angeles Obligated Group) Ser. A | | 5.00 | | 8/15/2047 | | 1,000,000 | | 1,000,777 | |
California Health Facilities Financing Authority, Revenue Bonds, Refunding (Lucile Salter Packard Children's Hospital at Stanford Obligated Group) | | 4.00 | | 5/15/2046 | | 5,000,000 | | 4,752,393 | |
California Infrastructure & Economic Development Bank, Revenue Bonds (WFCS Portfolio Project) Ser. A-1 | | 5.00 | | 1/1/2056 | | 1,200,000 | a | 935,475 | |
California Municipal Finance Authority, Revenue Bonds (Bowles Hall Foundation) Ser. A | | 5.00 | | 6/1/2035 | | 600,000 | | 603,128 | |
California Municipal Finance Authority, Revenue Bonds (Bowles Hall Foundation) Ser. A | | 5.00 | | 6/1/2050 | | 2,750,000 | | 2,752,036 | |
California Municipal Finance Authority, Revenue Bonds (CHF-Davis I) | | 5.00 | | 5/15/2048 | | 6,000,000 | | 5,982,680 | |
California Municipal Finance Authority, Revenue Bonds (CHF-Davis I) | | 5.00 | | 5/15/2043 | | 5,000,000 | | 5,026,881 | |
California Municipal Finance Authority, Revenue Bonds (CHF-Davis I) | | 5.00 | | 5/15/2040 | | 5,000,000 | | 5,058,892 | |
California Municipal Finance Authority, Revenue Bonds (CHF-Riverside I) | | 5.00 | | 5/15/2043 | | 2,000,000 | | 2,009,641 | |
California Municipal Finance Authority, Revenue Bonds (CHF-Riverside I) | | 5.00 | | 5/15/2039 | | 3,265,000 | | 3,312,463 | |
California Municipal Finance Authority, Revenue Bonds (CHF-Riverside I) | | 5.00 | | 5/15/2037 | | 2,605,000 | | 2,665,777 | |
California Municipal Finance Authority, Revenue Bonds (CHF-Riverside I) | | 5.00 | | 5/15/2034 | | 2,250,000 | | 2,343,745 | |
California Municipal Finance Authority, Revenue Bonds (CHF-Riverside I) | | 5.00 | | 5/15/2052 | | 7,500,000 | | 7,420,507 | |
California Municipal Finance Authority, Revenue Bonds (CHF-Riverside II) | | 5.00 | | 5/15/2049 | | 2,000,000 | | 1,991,252 | |
California Municipal Finance Authority, Revenue Bonds (Claremont Colleges Project) Ser. A | | 5.00 | | 7/1/2052 | | 2,075,000 | a | 1,814,950 | |
California Municipal Finance Authority, Revenue Bonds (Claremont Colleges Project) Ser. A | | 5.00 | | 7/1/2040 | | 1,515,000 | a | 1,407,302 | |
California Municipal Finance Authority, Revenue Bonds (John Adams Academy - Lincoln) Ser. A | | 5.00 | | 10/1/2049 | | 1,515,000 | a | 1,358,564 | |
California Municipal Finance Authority, Revenue Bonds (John Adams Academy - Lincoln) Ser. A | | 5.00 | | 10/1/2057 | | 1,650,000 | a | 1,439,439 | |
California Municipal Finance Authority, Revenue Bonds (LAX Integrated Express Solutions Project) | | 5.00 | | 12/31/2047 | | 2,250,000 | | 2,222,635 | |
California Municipal Finance Authority, Revenue Bonds (Northbay Healthcare Group Obligated Group) Ser. A | | 5.25 | | 11/1/2041 | | 1,200,000 | | 1,138,244 | |
California Municipal Finance Authority, Revenue Bonds (Northbay Healthcare Group Obligated Group) Ser. A | | 5.25 | | 11/1/2047 | | 700,000 | | 638,637 | |
California Municipal Finance Authority, Revenue Bonds (Palmdale Aerospace Academy Project) Ser. A | | 5.00 | | 7/1/2038 | | 1,100,000 | a | 1,063,042 | |
California Municipal Finance Authority, Revenue Bonds (United Airlines Project) | | 4.00 | | 7/15/2029 | | 3,000,000 | | 2,962,853 | |
California Municipal Finance Authority, Revenue Bonds, Refunding (Community Medical Centers) Ser. A | | 5.00 | | 2/1/2042 | | 1,000,000 | | 1,013,562 | |
61
STATEMENT OF INVESTMENTS (continued)
| | | | | | | | | | |
| |
BNY Mellon Municipal Opportunities Fund (continued) |
Description | Coupon
Rate (%) | | Maturity Date | | Principal Amount ($) | | Value ($) | |
Long-Term Municipal Investments - 100.8% (continued) | | | | | |
California - 15.6% (continued) | | | | | |
California Pollution Control Financing Authority, Revenue Bonds (Rialto Bioenergy Facility Project) | | 7.50 | | 12/1/2040 | | 5,000,000 | a,c | 2,999,956 | |
California Public Finance Authority, Revenue Bonds (ENSO Village Project) Ser. 85 | | 3.13 | | 5/15/2029 | | 1,000,000 | a | 946,989 | |
California Public Finance Authority, Revenue Bonds (Green Bond) (ENSO Village Project) | | 5.00 | | 11/15/2056 | | 500,000 | a | 429,605 | |
California Public Finance Authority, Revenue Bonds (Green Bond) (ENSO Village Project) | | 5.00 | | 11/15/2051 | | 250,000 | a | 218,319 | |
California Public Finance Authority, Revenue Bonds (Green Bond) (ENSO Village Project) | | 5.00 | | 11/15/2036 | | 500,000 | a | 484,468 | |
California Public Finance Authority, Revenue Bonds (Green Bond) (ENSO Village Project) | | 5.00 | | 11/15/2046 | | 780,000 | a | 698,171 | |
California Public Finance Authority, Revenue Bonds (Hoag Memorial Hospital Presbyterian Obligated Group) Ser. A | | 4.00 | | 7/15/2051 | | 3,555,000 | | 3,309,534 | |
California School Finance Authority, Revenue Bonds (Aspire Public Schools Obligated Group) Ser. A | | 4.00 | | 8/1/2051 | | 750,000 | a | 601,732 | |
California School Finance Authority, Revenue Bonds (Aspire Public Schools Obligated Group) Ser. A | | 4.00 | | 8/1/2061 | | 2,270,000 | a | 1,741,575 | |
California School Finance Authority, Revenue Bonds (Aspire Public Schools Obligated Group) Ser. A | | 4.00 | | 8/1/2036 | | 300,000 | a | 279,929 | |
California School Finance Authority, Revenue Bonds (Aspire Public Schools Obligated Group) Ser. A | | 4.00 | | 8/1/2041 | | 500,000 | a | 436,001 | |
California School Finance Authority, Revenue Bonds (Green Dot Public Schools California Project) Ser. A | | 5.00 | | 8/1/2038 | | 1,000,000 | a | 1,004,051 | |
California School Finance Authority, Revenue Bonds (Green Dot Public Schools California Project) Ser. A | | 5.00 | | 8/1/2048 | | 2,750,000 | a | 2,611,076 | |
California School Finance Authority, Revenue Bonds (KIPP LA Project) Ser. A | | 5.00 | | 7/1/2037 | | 590,000 | a | 602,627 | |
California School Finance Authority, Revenue Bonds (KIPP LA Project) Ser. A | | 5.00 | | 7/1/2047 | | 870,000 | a | 872,422 | |
California School Finance Authority, Revenue Bonds (Summit Public Schools Obligated Group) | | 5.00 | | 6/1/2047 | | 1,500,000 | a | 1,328,596 | |
California Statewide Communities Development Authority, Revenue Bonds (Loma Linda University Medical Center Obligated Group) | | 5.00 | | 12/1/2033 | | 1,000,000 | a | 1,008,741 | |
California Statewide Communities Development Authority, Revenue Bonds (Loma Linda University Medical Center Obligated Group) | | 5.25 | | 12/1/2038 | | 1,500,000 | a | 1,503,299 | |
California Statewide Communities Development Authority, Revenue Bonds (Loma Linda University Medical Center Obligated Group) Ser. A | | 5.00 | | 12/1/2036 | | 6,500,000 | a | 6,503,901 | |
California Statewide Communities Development Authority, Revenue Bonds, Refunding (CHF-Irvine) | | 5.00 | | 5/15/2040 | | 2,000,000 | | 2,023,966 | |
California Statewide Communities Development Authority, Revenue Bonds, Refunding (Front Porch Communities & Services Obligated Group) | | 4.00 | | 4/1/2042 | | 1,600,000 | | 1,475,305 | |
California Statewide Communities Development Authority, Revenue Bonds, Refunding (Front Porch Communities & Services Obligated Group) | | 5.00 | | 4/1/2047 | | 1,500,000 | | 1,515,707 | |
California Statewide Communities Development Authority, Revenue Bonds, Refunding (Loma Linda University Medical Center Obligated Group) | | 5.25 | | 12/1/2044 | | 3,000,000 | | 2,975,924 | |
CMFA Special Finance Agency, Revenue Bonds, Ser. A1 | | 3.00 | | 12/1/2056 | | 1,000,000 | a | 655,996 | |
CMFA Special Finance Agency VIII, Revenue Bonds, Ser. A2 | | 4.00 | | 8/1/2047 | | 3,400,000 | a | 2,772,876 | |
CSCDA Community Improvement Authority, Revenue Bonds | | 4.00 | | 2/1/2057 | | 1,000,000 | a | 700,865 | |
CSCDA Community Improvement Authority, Revenue Bonds | | 4.00 | | 12/1/2056 | | 2,500,000 | a | 1,750,566 | |
CSCDA Community Improvement Authority, Revenue Bonds, Ser. A2 | | 4.00 | | 9/1/2056 | | 5,000,000 | a | 3,614,998 | |
Foothill Eastern Transportation Corridor Agency, Revenue Bonds, Refunding, Ser. B1 | | 3.95 | | 1/15/2053 | | 5,000,000 | | 4,478,838 | |
62
| | | | | | | | | | |
| |
BNY Mellon Municipal Opportunities Fund (continued) |
Description | Coupon
Rate (%) | | Maturity Date | | Principal Amount ($) | | Value ($) | |
Long-Term Municipal Investments - 100.8% (continued) | | | | | |
California - 15.6% (continued) | | | | | |
Foothill-Eastern Transportation Corridor Agency, Revenue Bonds, Refunding (Insured; Assured Guaranty Municipal Corp.) Ser. B | | 2.96 | | 1/15/2046 | | 2,000,000 | | 1,388,034 | |
Foothill-Eastern Transportation Corridor Agency, Revenue Bonds, Refunding (Insured; Assured Guaranty Municipal Corp.) Ser. D | | 3.06 | | 1/15/2043 | | 1,000,000 | | 729,746 | |
Foothill-Eastern Transportation Corridor Agency, Revenue Bonds, Refunding, Ser. A | | 4.09 | | 1/15/2049 | | 7,500,000 | | 6,202,371 | |
Fowler Unified School District, GO (Insured; Build America Mutual) Ser. B | | 3.38 | | 8/1/2045 | | 1,200,000 | | 971,401 | |
Fowler Unified School District, GO (Insured; Build America Mutual) Ser. B | | 5.00 | | 8/1/2050 | | 3,000,000 | | 3,184,856 | |
Golden State Tobacco Securitization Corp., Revenue Bonds, Refunding (Insured; State Appropriation) Ser. B | | 2.75 | | 6/1/2034 | | 5,000,000 | | 4,040,650 | |
Golden State Tobacco Securitization Corp., Revenue Bonds, Refunding (Insured; State Appropriation) Ser. B | | 3.29 | | 6/1/2042 | | 6,000,000 | | 4,441,459 | |
Golden State Tobacco Securitization Corp., Revenue Bonds, Refunding, Ser. A1 | | 4.21 | | 6/1/2050 | | 10,410,000 | | 7,456,979 | |
Golden State Tobacco Securitization Corp., Revenue Bonds, Refunding, Ser. B2 | | 0.00 | | 6/1/2066 | | 10,000,000 | d | 994,435 | |
Grant Joint Union High School District, GO (Insured; Assured Guaranty Municipal Corp.) | | 0.00 | | 8/1/2029 | | 2,080,000 | d | 1,680,542 | |
Grant Joint Union High School District, GO (Insured; Assured Guaranty Municipal Corp.) | | 0.00 | | 2/1/2033 | | 4,380,000 | d | 3,062,794 | |
Irvine, Special Assessment Bonds, Refunding | | 4.00 | | 9/2/2029 | | 1,000,000 | | 1,003,464 | |
New Haven Unified School District, GO (Insured; Assured Guaranty Corp.) | | 0.00 | | 8/1/2032 | | 2,500,000 | d | 1,778,632 | |
Norman Y. Mineta San Jose International Airport SJC, Revenue Bonds, Refunding, Ser. A | | 5.00 | | 3/1/2047 | | 8,500,000 | | 8,571,009 | |
Northern California Energy Authority, Revenue Bonds, Ser. A | | 4.00 | | 7/1/2024 | | 10,000,000 | b | 9,985,382 | |
Northern California Gas Authority No. 1, Revenue Bonds (Gas Project) Ser. B, (3 Month TSFR +0.72%) | | 4.41 | | 7/1/2027 | | 400,000 | e | 397,005 | |
Oroville, Revenue Bonds (Oroville Hospital) | | 5.25 | | 4/1/2039 | | 1,750,000 | | 1,052,236 | |
Palomar Health, Revenue Bonds, Refunding | | 5.00 | | 11/1/2039 | | 1,000,000 | | 1,006,602 | |
San Diego County Regional Airport Authority, Revenue Bonds, Ser. A | | 4.00 | | 7/1/2046 | | 2,250,000 | | 2,157,748 | |
San Diego County Regional Airport Authority, Revenue Bonds, Ser. B | | 4.00 | | 7/1/2046 | | 2,000,000 | | 1,812,234 | |
San Diego County Regional Airport Authority, Revenue Bonds, Ser. B | | 4.00 | | 7/1/2051 | | 2,500,000 | | 2,206,600 | |
San Diego County Regional Transportation Commission, Revenue Bonds, Refunding, Ser. A | | 5.00 | | 4/1/2041 | | 1,900,000 | | 2,146,860 | |
San Diego County Regional Transportation Commission, Revenue Bonds, Refunding, Ser. A | | 5.00 | | 4/1/2042 | | 1,750,000 | | 1,967,983 | |
San Diego County Regional Transportation Commission, Revenue Bonds, Refunding, Ser. A | | 5.00 | | 4/1/2040 | | 3,000,000 | | 3,403,063 | |
San Diego Unified School District, GO, Ser. A | | 0.00 | | 7/1/2025 | | 2,385,000 | d | 2,242,839 | |
San Diego Unified School District, GO, Ser. A | | 0.00 | | 7/1/2025 | | 1,615,000 | d | 1,518,736 | |
San Francisco Airport City & County, Revenue Bonds, Refunding, Ser. A | | 5.00 | | 5/1/2044 | | 6,500,000 | | 6,678,996 | |
San Francisco City & County Redevelopment Agency, Special Tax Bonds, Ser. C | | 0.00 | | 8/1/2038 | | 2,000,000 | d | 844,815 | |
San Francisco City & County Redevelopment Agency, Special Tax Bonds, Ser. C | | 0.00 | | 8/1/2043 | | 7,835,000 | d | 2,453,146 | |
Sierra Joint Community College District School Facilities District No. 2, GO (Insured; National Public Finance Guarantee Corp.) Ser. B | | 0.00 | | 8/1/2031 | | 5,330,000 | d | 4,024,330 | |
Sierra Joint Community College District School Facilities District No. 2, GO (Insured; National Public Finance Guarantee Corp.) Ser. B | | 0.00 | | 8/1/2030 | | 3,020,000 | d | 2,360,970 | |
63
STATEMENT OF INVESTMENTS (continued)
| | | | | | | | | | |
| |
BNY Mellon Municipal Opportunities Fund (continued) |
Description | Coupon
Rate (%) | | Maturity Date | | Principal Amount ($) | | Value ($) | |
Long-Term Municipal Investments - 100.8% (continued) | | | | | |
California - 15.6% (continued) | | | | | |
Southern California Tobacco Securitization Authority, Revenue Bonds, Refunding (San Diego County Tobacco Asset Securitization) | | 5.00 | | 6/1/2048 | | 4,000,000 | | 4,131,593 | |
Tender Option Bond Trust Receipts (Series 2022-XL0357), (Los Angeles Department of Airports, Revenue Bonds, Refunding, Ser. H) Non-recourse, Underlying Coupon Rate (%) 5.50 | | 9.68 | | 5/15/2047 | | 8,010,000 | a,f,g | 8,585,067 | |
The Morongo Band of Mission Indians, Revenue Bonds, Ser. A | | 5.00 | | 10/1/2042 | | 1,000,000 | a | 965,508 | |
Tobacco Securitization Authority of Northern California, Revenue Bonds, Refunding (San Diego County Tobacco Asset Securitization) | | 5.00 | | 6/1/2039 | | 2,000,000 | | 2,103,512 | |
Tobacco Securitization Authority of Northern California, Revenue Bonds, Refunding, Ser. A | | 4.00 | | 6/1/2040 | | 500,000 | | 481,047 | |
Tobacco Securitization Authority of Northern California, Revenue Bonds, Refunding, Ser. A | | 4.00 | | 6/1/2037 | | 500,000 | | 494,762 | |
Tobacco Securitization Authority of Northern California, Revenue Bonds, Refunding, Ser. A | | 4.00 | | 6/1/2038 | | 800,000 | | 785,096 | |
Tobacco Securitization Authority of Northern California, Revenue Bonds, Refunding, Ser. A | | 4.00 | | 6/1/2039 | | 1,000,000 | | 972,589 | |
Transbay Joint Powers Authority, Tax Allocation Bonds (Green Bond) Ser. A | | 5.00 | | 10/1/2049 | | 1,000,000 | | 1,004,030 | |
Transbay Joint Powers Authority, Tax Allocation Bonds (Green Bond) Ser. A | | 5.00 | | 10/1/2045 | | 1,000,000 | | 1,010,249 | |
Transbay Joint Powers Authority, Tax Allocation Bonds (Green Bond) Ser. A | | 5.00 | | 10/1/2039 | | 900,000 | | 925,845 | |
Transbay Joint Powers Authority, Tax Allocation Bonds (Green Bond) Ser. A | | 5.00 | | 10/1/2040 | | 1,000,000 | | 1,025,418 | |
Vernon Electric System, Revenue Bonds, Refunding, Ser. 2022-A | | 5.00 | | 8/1/2041 | | 420,000 | | 426,368 | |
Vernon Electric System, Revenue Bonds, Refunding, Ser. 2022-A | | 5.00 | | 8/1/2040 | | 365,000 | | 376,426 | |
Vernon Electric System, Revenue Bonds, Refunding, Ser. 2022-A | | 5.00 | | 8/1/2039 | | 425,000 | | 439,173 | |
| | 306,333,451 | |
Colorado - .9% | | | | | |
Board of Governors of Colorado State University System, Revenue Bonds, Refunding, Ser. C | | 5.00 | | 3/1/2043 | | 1,275,000 | | 1,333,427 | |
Board of Governors of Colorado State University System, Revenue Bonds, Refunding, Ser. C | | 5.00 | | 3/1/2028 | | 1,720,000 | h | 1,866,663 | |
Colorado Health Facilities Authority, Revenue Bonds (CommonSpirit Health Obligated Group) | | 5.25 | | 11/1/2052 | | 1,500,000 | | 1,529,413 | |
Denver City & County Airport System, Revenue Bonds, Refunding, Ser. A | | 4.00 | | 12/1/2048 | | 1,250,000 | | 1,118,022 | |
Denver City & County Airport System, Revenue Bonds, Refunding, Ser. A | | 5.25 | | 12/1/2048 | | 3,500,000 | | 3,575,205 | |
Denver Urban Renewal Authority, Tax Allocation Bonds, Ser. A | | 5.25 | | 12/1/2039 | | 900,000 | a | 903,910 | |
Denver Urban Renewal Authority, Tax Allocation Bonds, Ser. A | | 5.25 | | 12/1/2039 | | 2,405,000 | a | 2,415,448 | |
E-470 Public Highway Authority, Revenue Bonds, Refunding, Ser. A | | 5.00 | | 9/1/2040 | | 1,725,000 | | 1,738,382 | |
Regional Transportation District, Revenue Bonds, Refunding (Denver Transit Partners) Ser. A | | 3.00 | | 7/15/2037 | | 1,000,000 | | 841,025 | |
Regional Transportation District, Revenue Bonds, Refunding (Denver Transit Partners) Ser. A | | 4.00 | | 7/15/2033 | | 1,000,000 | | 1,017,288 | |
Regional Transportation District, Revenue Bonds, Refunding (Denver Transit Partners) Ser. A | | 4.00 | | 7/15/2035 | | 1,000,000 | | 1,005,160 | |
| | 17,343,943 | |
Connecticut - .5% | | | | | |
Connecticut, GO, Ser. B | | 3.00 | | 6/1/2038 | | 5,250,000 | | 4,448,295 | |
64
| | | | | | | | | | |
| |
BNY Mellon Municipal Opportunities Fund (continued) |
Description | Coupon
Rate (%) | | Maturity Date | | Principal Amount ($) | | Value ($) | |
Long-Term Municipal Investments - 100.8% (continued) | | | | | |
Connecticut - .5% (continued) | | | | | |
Connecticut Health & Educational Facilities Authority, Revenue Bonds, Refunding (The Stamford Hospital Obligated Group) Ser. M | | 4.00 | | 7/1/2037 | | 5,000,000 | | 4,752,452 | |
| | 9,200,747 | |
Delaware - .1% | | | | | |
Delaware River & Bay Authority, Revenue Bonds | | 4.00 | | 1/1/2046 | | 1,000,000 | | 937,389 | |
Kent County, Revenue Bonds (CHF-Dover University Project) Ser. A | | 5.00 | | 7/1/2048 | | 1,000,000 | | 953,712 | |
Kent County, Revenue Bonds (CHF-Dover University Project) Ser. A | | 5.00 | | 7/1/2040 | | 750,000 | | 736,560 | |
| | 2,627,661 | |
District of Columbia - 2.2% | | | | | |
District of Columbia, GO, Refunding, Ser. A | | 5.25 | | 1/1/2048 | | 5,375,000 | | 5,882,369 | |
District of Columbia, Revenue Bonds (District of Columbia International School Obligated Group) | | 5.00 | | 7/1/2049 | | 4,265,000 | | 4,175,793 | |
District of Columbia, Revenue Bonds (KIPP DC Project) | | 4.00 | | 7/1/2049 | | 1,375,000 | | 1,139,042 | |
District of Columbia, Revenue Bonds (KIPP DC Project) | | 4.00 | | 7/1/2044 | | 1,240,000 | | 1,067,227 | |
District of Columbia, Revenue Bonds (KIPP DC Project) | | 4.00 | | 7/1/2039 | | 1,275,000 | | 1,154,855 | |
District of Columbia, Revenue Bonds, Refunding (KIPP DC Project) Ser. A | | 5.00 | | 7/1/2048 | | 5,000,000 | | 4,929,815 | |
District of Columbia, Revenue Bonds, Ser. A | | 5.00 | | 7/1/2042 | | 6,000,000 | | 6,558,716 | |
Metropolitan Washington Airports Authority, Revenue Bonds (Dulles Metrorail & Capital Improvement Projects) (Insured; Assured Guaranty Corp.) Ser. B | | 0.00 | | 10/1/2036 | | 6,275,000 | d | 3,588,878 | |
Metropolitan Washington Airports Authority, Revenue Bonds, Refunding (Insured; Assured Guaranty Municipal Corp.) Ser. B | | 4.00 | | 10/1/2053 | | 5,000,000 | | 4,566,676 | |
Washington Metropolitan Area Transit Authority, Revenue Bonds (Green Bond) Ser. A | | 3.00 | | 7/15/2040 | | 9,520,000 | | 7,865,097 | |
Washington Metropolitan Area Transit Authority, Revenue Bonds (Green Bond) Ser. A | | 4.00 | | 7/15/2046 | | 3,000,000 | | 2,848,912 | |
| | 43,777,380 | |
Florida - 3.0% | | | | | |
Capital Trust Agency, Revenue Bonds (Franklin Academy Project) | | 5.00 | | 12/15/2040 | | 1,220,000 | a | 1,086,234 | |
Capital Trust Agency, Revenue Bonds (Franklin Academy Project) | | 5.00 | | 12/15/2035 | | 1,085,000 | a | 1,027,651 | |
Capital Trust Agency, Revenue Bonds (H-Bay Ministries-Superior Residences Project) Ser. A1 | | 5.00 | | 7/1/2048 | | 750,000 | c | 262,500 | |
Capital Trust Agency, Revenue Bonds (H-Bay Ministries-Superior Residences Project) Ser. B | | 5.00 | | 7/1/2053 | | 250,000 | c | 20,000 | |
Collier County Health Facilities Authority, Revenue Bonds, Refunding, Ser. A | | 5.00 | | 5/1/2045 | | 2,500,000 | | 2,502,761 | |
Florida Development Finance Corp., Revenue Bonds (Green Bond) Ser. B | | 7.38 | | 1/1/2049 | | 2,000,000 | a | 2,004,055 | |
Florida Development Finance Corp., Revenue Bonds (Mater Academy Project) Ser. A | | 5.00 | | 6/15/2050 | | 6,500,000 | | 6,238,743 | |
Florida Development Finance Corp., Revenue Bonds (Mater Academy Project) Ser. A | | 5.00 | | 6/15/2040 | | 1,650,000 | | 1,651,696 | |
Florida Development Finance Corp., Revenue Bonds, Refunding (Glenridge on Palmer Ranch Obligated Group) | | 5.00 | | 6/1/2051 | | 1,250,000 | a | 1,014,428 | |
Florida Higher Educational Facilities Financial Authority, Revenue Bonds, Refunding (Rollins College Project) Ser. A | | 3.00 | | 12/1/2048 | | 7,500,000 | | 5,385,330 | |
Florida Higher Educational Facilities Financial Authority, Revenue Bonds, Refunding (Rollins College Project) Ser. A | | 4.00 | | 12/1/2050 | | 10,000,000 | | 8,805,218 | |
Hillsborough County Industrial Development Authority, Revenue Bonds (Tampa General Hospital Project) Ser. A | | 4.00 | | 8/1/2045 | | 2,220,000 | | 1,982,051 | |
Miami Beach Redevelopment Agency, Tax Allocation Bonds, Refunding (Insured; Assured Guaranty Municipal Corp.) | | 5.00 | | 2/1/2040 | | 7,545,000 | | 7,566,573 | |
65
STATEMENT OF INVESTMENTS (continued)
| | | | | | | | | | |
| |
BNY Mellon Municipal Opportunities Fund (continued) |
Description | Coupon
Rate (%) | | Maturity Date | | Principal Amount ($) | | Value ($) | |
Long-Term Municipal Investments - 100.8% (continued) | | | | | |
Florida - 3.0% (continued) | | | | | |
Miami-Dade County Aviation, Revenue Bonds, Refunding, Ser. A | | 4.00 | | 10/1/2041 | | 1,250,000 | | 1,212,630 | |
Miami-Dade County Aviation, Revenue Bonds, Refunding, Ser. A | | 4.00 | | 10/1/2040 | | 1,625,000 | | 1,588,037 | |
Miami-Dade County Aviation, Revenue Bonds, Refunding, Ser. A | | 4.00 | | 10/1/2039 | | 1,500,000 | | 1,472,041 | |
Miami-Dade County Expressway Authority, Revenue Bonds, Refunding, Ser. A | | 5.00 | | 7/1/2040 | | 1,050,000 | | 1,050,230 | |
Miami-Dade County Health Facilities Authority, Revenue Bonds, Refunding (Nicklaus Children's Hospital Obligated Group) | | 5.00 | | 8/1/2042 | | 2,000,000 | | 2,027,863 | |
Miami-Dade County Seaport Department, Revenue Bonds, Refunding (Insured; Assured Guaranty Municipal Corp.) Ser. A1 | | 4.00 | | 10/1/2045 | | 2,500,000 | | 2,261,791 | |
Miami-Dade County Water & Sewer System, Revenue Bonds | | 4.00 | | 10/1/2046 | | 1,250,000 | | 1,187,519 | |
Miami-Dade County Water & Sewer System, Revenue Bonds | | 4.00 | | 10/1/2048 | | 1,500,000 | | 1,404,779 | |
Miami-Dade County Water & Sewer System, Revenue Bonds | | 4.00 | | 10/1/2051 | | 1,000,000 | | 928,767 | |
Pasco County, Revenue Bonds (Insured; Assured Guaranty Municipal Corp.) | | 5.75 | | 9/1/2054 | | 1,000,000 | | 1,102,136 | |
Seminole County, Revenue Bonds, Refunding | | 5.00 | | 10/1/2052 | | 3,600,000 | | 3,801,754 | |
Tampa, Revenue Bonds, Ser. A | | 0.00 | | 9/1/2045 | | 1,850,000 | d | 567,666 | |
Tampa, Revenue Bonds, Ser. A | | 0.00 | | 9/1/2049 | | 1,800,000 | d | 435,349 | |
Tampa, Revenue Bonds, Ser. A | | 0.00 | | 9/1/2041 | | 1,000,000 | d | 391,043 | |
Tampa, Revenue Bonds, Ser. A | | 0.00 | | 9/1/2042 | | 1,000,000 | d | 366,947 | |
| | 59,345,792 | |
Georgia - 1.9% | | | | | |
Fulton County Development Authority, Revenue Bonds, Refunding (Robert W. Woodruff Arts Center) | | 5.00 | | 3/15/2044 | | 6,000,000 | | 6,212,728 | |
George L Smith II Congress Center Authority, Revenue Bonds | | 5.00 | | 1/1/2054 | | 3,000,000 | a | 2,450,756 | |
Georgia Municipal Electric Authority, Revenue Bonds (Plant Vogtle Units 3&4 Project) | | 4.00 | | 1/1/2049 | | 2,000,000 | | 1,800,270 | |
Georgia Municipal Electric Authority, Revenue Bonds (Plant Vogtle Units 3&4 Project) | | 4.00 | | 1/1/2049 | | 2,155,000 | | 1,926,596 | |
Georgia Municipal Electric Authority, Revenue Bonds (Plant Vogtle Units 3&4 Project) | | 5.00 | | 1/1/2056 | | 1,000,000 | | 1,010,579 | |
Georgia Municipal Electric Authority, Revenue Bonds (Plant Vogtle Units 3&4 Project) Ser. A | | 5.00 | | 7/1/2052 | | 2,250,000 | | 2,308,347 | |
Georgia Municipal Electric Authority, Revenue Bonds, Refunding (Plant Vogtle Units 3&4 Project) (Insured; Assured Guaranty Municipal Corp.) Ser. A | | 4.00 | | 1/1/2046 | | 1,200,000 | | 1,115,690 | |
Georgia Municipal Electric Authority, Revenue Bonds, Refunding (Plant Vogtle Units 3&4 Project) Ser. A | | 4.00 | | 1/1/2051 | | 1,000,000 | | 892,721 | |
Georgia Municipal Electric Authority, Revenue Bonds, Refunding (Plant Vogtle Units 3&4 Project) Ser. A | | 5.00 | | 1/1/2056 | | 1,200,000 | | 1,216,113 | |
Georgia Ports Authority, Revenue Bonds | | 4.00 | | 7/1/2047 | | 4,000,000 | | 3,864,184 | |
Georgia Ports Authority, Revenue Bonds | | 5.25 | | 7/1/2043 | | 6,245,000 | | 6,890,750 | |
Main Street Natural Gas, Revenue Bonds, Ser. A | | 5.00 | | 5/15/2043 | | 1,500,000 | | 1,508,349 | |
Main Street Natural Gas, Revenue Bonds, Ser. B | | 5.00 | | 6/1/2029 | | 5,000,000 | b | 5,115,325 | |
The Atlanta Development Authority, Revenue Bonds, Ser. A1 | | 5.25 | | 7/1/2044 | | 1,500,000 | | 1,520,348 | |
| | 37,832,756 | |
Hawaii - .4% | | | | | |
Hawaii Department of Budget & Finance, Revenue Bonds, Refunding (The Queen's Health Systems Obligated Group) Ser. A | | 5.00 | | 7/1/2035 | | 7,000,000 | | 7,175,903 | |
Idaho - .7% | | | | | |
Idaho Health Facilities Authority, Revenue Bonds, Refunding (St. Luke's Health System Obligated Group) | | 4.00 | | 3/1/2051 | | 2,500,000 | | 2,186,562 | |
Idaho Health Facilities Authority, Revenue Bonds, Refunding (St. Luke's Health System Obligated Group) | | 4.00 | | 3/1/2046 | | 2,000,000 | | 1,799,359 | |
66
| | | | | | | | | | |
| |
BNY Mellon Municipal Opportunities Fund (continued) |
Description | Coupon
Rate (%) | | Maturity Date | | Principal Amount ($) | | Value ($) | |
Long-Term Municipal Investments - 100.8% (continued) | | | | | |
Idaho - .7% (continued) | | | | | |
Idaho Housing & Finance Association, Revenue Bonds, Ser. A | | 5.00 | | 8/15/2043 | | 9,655,000 | | 10,452,589 | |
| | 14,438,510 | |
Illinois - 7.7% | | | | | |
Chicago Board of Education, GO, Refunding (Insured; Assured Guaranty Municipal Corp.) Ser. A | | 5.00 | | 12/1/2026 | | 1,170,000 | | 1,203,523 | |
Chicago Board of Education, GO, Refunding, Ser. A | | 4.00 | | 12/1/2027 | | 750,000 | | 743,494 | |
Chicago Board of Education, GO, Refunding, Ser. A | | 7.00 | | 12/1/2044 | | 2,500,000 | | 2,607,548 | |
Chicago Board of Education, GO, Refunding, Ser. B | | 5.00 | | 12/1/2033 | | 600,000 | | 620,019 | |
Chicago Board of Education, GO, Refunding, Ser. B | | 6.75 | | 12/1/2030 | | 7,500,000 | a | 8,254,591 | |
Chicago Board of Education, GO, Refunding, Ser. B | | 7.00 | | 12/1/2042 | | 10,000,000 | a | 10,745,278 | |
Chicago Board of Education, GO, Ser. A | | 5.00 | | 12/1/2041 | | 1,000,000 | | 992,784 | |
Chicago Board of Education, GO, Ser. A | | 7.00 | | 12/1/2046 | | 5,000,000 | a | 5,352,787 | |
Chicago Board of Education, GO, Ser. B | | 6.50 | | 12/1/2046 | | 4,500,000 | | 4,680,789 | |
Chicago Board of Education, Revenue Bonds | | 5.00 | | 4/1/2046 | | 1,600,000 | | 1,611,621 | |
Chicago Board of Education, Revenue Bonds | | 5.00 | | 4/1/2042 | | 1,700,000 | | 1,719,211 | |
Chicago Board of Education, Revenue Bonds | | 6.00 | | 4/1/2046 | | 1,500,000 | | 1,571,797 | |
Chicago II, GO, Refunding, Ser. 2005D | | 5.50 | | 1/1/2040 | | 5,000,000 | | 5,056,377 | |
Chicago II, GO, Refunding, Ser. 2007E | | 5.50 | | 1/1/2042 | | 1,750,000 | | 1,767,235 | |
Chicago II, GO, Refunding, Ser. 2007F | | 5.50 | | 1/1/2042 | | 1,250,000 | | 1,262,311 | |
Chicago II, GO, Refunding, Ser. A | | 5.00 | | 1/1/2032 | | 600,000 | | 634,414 | |
Chicago II, GO, Refunding, Ser. A | | 5.00 | | 1/1/2031 | | 1,300,000 | | 1,370,408 | |
Chicago II, GO, Ser. A | | 5.50 | | 1/1/2049 | | 4,000,000 | | 4,139,248 | |
Chicago II, GO, Ser. B | | 7.75 | | 1/1/2042 | | 1,272,000 | | 1,288,263 | |
Chicago IL Wastewater Transmission, Revenue Bonds (Insured; Assured Guaranty Municipal Corp.) Ser. A | | 5.25 | | 1/1/2041 | | 7,225,000 | | 7,791,193 | |
Chicago IL Waterworks, Revenue Bonds, Refunding (Insured; Assured Guaranty Municipal Corp.) Ser. B | | 5.00 | | 11/1/2038 | | 1,150,000 | | 1,236,190 | |
Chicago IL Waterworks, Revenue Bonds, Refunding (Insured; Assured Guaranty Municipal Corp.) Ser. B | | 5.00 | | 11/1/2039 | | 6,080,000 | | 6,520,159 | |
Chicago Midway International Airport, Revenue Bonds, Refunding, Ser. B | | 5.00 | | 1/1/2046 | | 5,000,000 | | 5,042,925 | |
Chicago O'Hare International Airport, Revenue Bonds (Insured; Assured Guaranty Municipal Corp.) | | 5.50 | | 1/1/2043 | | 4,000,000 | | 4,004,606 | |
Chicago O'Hare International Airport, Revenue Bonds, Refunding, Ser. A | | 5.00 | | 1/1/2038 | | 3,250,000 | | 3,346,870 | |
Chicago O'Hare International Airport, Revenue Bonds, Refunding, Ser. A | | 5.00 | | 1/1/2037 | | 3,000,000 | | 3,119,786 | |
Chicago O'Hare International Airport, Revenue Bonds, Refunding, Ser. A | | 5.00 | | 1/1/2039 | | 3,710,000 | | 3,816,153 | |
Chicago O'Hare International Airport, Revenue Bonds, Refunding, Ser. B | | 5.00 | | 1/1/2041 | | 6,800,000 | | 6,903,987 | |
Cook County II, Revenue Bonds, Refunding, Ser. A | | 5.25 | | 11/15/2045 | | 5,000,000 | | 5,252,054 | |
Illinois, GO | | 5.50 | | 5/1/2039 | | 2,500,000 | | 2,685,033 | |
Illinois, GO | | 5.50 | | 5/1/2030 | | 2,500,000 | | 2,750,847 | |
Illinois, GO, Ser. A | | 5.00 | | 5/1/2042 | | 2,500,000 | | 2,543,131 | |
Illinois, GO, Ser. A | | 5.00 | | 3/1/2046 | | 2,500,000 | | 2,566,333 | |
Illinois, GO, Ser. D | | 5.00 | | 11/1/2028 | | 5,150,000 | | 5,413,988 | |
Illinois Finance Authority, Revenue Bonds, Refunding (Franciscan Communities Obligated Group) Ser. A | | 5.00 | | 5/15/2037 | | 3,000,000 | | 2,944,392 | |
Illinois Toll Highway Authority, Revenue Bonds, Ser. A | | 5.00 | | 1/1/2042 | | 4,000,000 | | 4,318,703 | |
Illinois Toll Highway Authority, Revenue Bonds, Ser. A | | 5.00 | | 1/1/2045 | | 3,215,000 | | 3,389,911 | |
Illinois Toll Highway Authority, Revenue Bonds, Ser. A | | 5.25 | | 1/1/2045 | | 10,000,000 | | 10,916,835 | |
Metropolitan Pier & Exposition Authority, Revenue Bonds (Insured; Assured Guaranty Municipal Corp.) Ser. A | | 0.00 | | 12/15/2040 | | 10,000,000 | d | 4,590,411 | |
Metropolitan Pier & Exposition Authority, Revenue Bonds, Refunding (McCormick Place Expansion Project) | | 4.00 | | 12/15/2042 | | 3,000,000 | | 2,756,973 | |
67
STATEMENT OF INVESTMENTS (continued)
| | | | | | | | | | |
| |
BNY Mellon Municipal Opportunities Fund (continued) |
Description | Coupon
Rate (%) | | Maturity Date | | Principal Amount ($) | | Value ($) | |
Long-Term Municipal Investments - 100.8% (continued) | | | | | |
Illinois - 7.7% (continued) | | | | | |
Metropolitan Pier & Exposition Authority, Revenue Bonds, Refunding (McCormick Place Expansion Project) | | 4.00 | | 12/15/2047 | | 2,000,000 | | 1,749,242 | |
Metropolitan Pier & Exposition Authority, Revenue Bonds, Refunding (McCormick Place Expansion Project) | | 5.00 | | 6/15/2050 | | 2,000,000 | | 2,006,090 | |
| | 151,287,510 | |
Indiana - .8% | | | | | |
Indiana Finance Authority, Revenue Bonds (Butler University Project) | | 4.00 | | 2/1/2044 | | 2,595,000 | | 2,260,850 | |
Indiana Finance Authority, Revenue Bonds (Tippecanoe) Ser. A | | 5.00 | | 6/1/2053 | | 2,300,000 | | 2,307,515 | |
Indiana Finance Authority, Revenue Bonds (Tippecanoe) Ser. A | | 5.00 | | 6/1/2032 | | 320,000 | | 342,654 | |
Indiana Finance Authority, Revenue Bonds (Tippecanoe) Ser. A | | 5.00 | | 6/1/2043 | | 855,000 | | 866,123 | |
Indiana Finance Authority, Revenue Bonds (Tippecanoe) Ser. A | | 5.00 | | 6/1/2033 | | 410,000 | | 440,381 | |
Indiana Finance Authority, Revenue Bonds (Tippecanoe) Ser. A | | 5.00 | | 6/1/2038 | | 750,000 | | 769,137 | |
Indiana Finance Authority, Revenue Bonds (Tippecanoe) Ser. A | | 5.13 | | 6/1/2058 | | 1,650,000 | | 1,664,821 | |
Indiana Finance Authority, Revenue Bonds (U.S. Steel Corp.) Ser. A | | 6.75 | | 5/1/2039 | | 1,000,000 | | 1,097,800 | |
Indiana Finance Authority, Revenue Bonds, Refunding (Duke Energy Indiana Project) (LOC; Sumitomo Mitsui Banking) Ser. A4 | | 4.00 | | 12/1/2039 | | 5,700,000 | f | 5,700,000 | |
Indiana Municipal Power Agency, Revenue Bonds, Refunding (LOC; U.S. Bank NA) Ser. B | | 4.20 | | 1/1/2042 | | 200,000 | f | 200,000 | |
| | 15,649,281 | |
Iowa - .5% | | | | | |
Iowa Finance Authority, Revenue Bonds, Refunding (Green Bonds) | | 5.00 | | 8/1/2042 | | 4,000,000 | | 4,403,460 | |
Iowa Finance Authority, Revenue Bonds, Refunding (Green Bonds) | | 5.00 | | 8/1/2041 | | 4,000,000 | | 4,421,459 | |
Iowa Tobacco Settlement Authority, Revenue Bonds, Refunding, Ser. A2 | | 4.00 | | 6/1/2040 | | 1,000,000 | | 958,302 | |
| | 9,783,221 | |
Kentucky - .2% | | | | | |
Henderson, Revenue Bonds (Pratt Paper Project) Ser. B | | 3.70 | | 1/1/2032 | | 1,395,000 | a | 1,352,098 | |
Kentucky Economic Development Finance Authority, Revenue Bonds, Refunding (Insured; Assured Guaranty Municipal Corp.) Ser. A | | 5.00 | | 12/1/2047 | | 1,660,000 | | 1,653,585 | |
| | 3,005,683 | |
Louisiana - 1.1% | | | | | |
Jefferson Parish Economic Development & Port District, Revenue Bonds (Kenner Discovery Health Sciences Foundation) Ser. A | | 5.50 | | 6/15/2038 | | 3,200,000 | a | 3,139,476 | |
Jefferson Parish Economic Development & Port District, Revenue Bonds (Kenner Discovery Health Sciences Foundation) Ser. A | | 5.63 | | 6/15/2048 | | 4,350,000 | a | 4,108,421 | |
Louisiana Local Government Environmental Facilities & Community Development Authority, Revenue Bonds (Louisiana Utilities Restoration Corp.) Ser. A1A3 | | 5.20 | | 12/1/2039 | | 8,000,000 | | 8,001,052 | |
Louisiana Public Facilities Authority, Revenue Bonds (Louisiana Children's Medical Center Obligated Group) (Insured; Assured Guaranty Municipal Corp.) | | 3.00 | | 6/1/2050 | | 1,000,000 | | 696,259 | |
Louisiana Public Facilities Authority, Revenue Bonds, Refunding (Tulane University) Ser. A | | 4.00 | | 4/1/2030 | | 240,000 | h | 253,126 | |
New Orleans Water System, Revenue Bonds, Refunding | | 5.00 | | 12/1/2024 | | 500,000 | h | 510,073 | |
St. James Parish, Revenue Bonds (NuStar Logistics Project) Ser. 2 | | 6.35 | | 7/1/2040 | | 4,115,000 | a | 4,473,232 | |
| | 21,181,639 | |
Maine - .1% | | | | | |
Maine State Housing Authority, Revenue Bonds, Ser. D | | 4.70 | | 11/15/2053 | | 2,500,000 | | 2,402,266 | |
Maryland - .9% | | | | | |
Anne Arundel County , GO | | 5.00 | | 10/1/2043 | | 2,195,000 | | 2,411,051 | |
68
| | | | | | | | | | |
| |
BNY Mellon Municipal Opportunities Fund (continued) |
Description | Coupon
Rate (%) | | Maturity Date | | Principal Amount ($) | | Value ($) | |
Long-Term Municipal Investments - 100.8% (continued) | | | | | |
Maryland - .9% (continued) | | | | | |
Maryland Economic Development Corp., Revenue Bonds (Seagirt Marine Terminal Project) | | 5.00 | | 6/1/2049 | | 750,000 | | 749,209 | |
Maryland Economic Development Corp., Revenue Bonds (Seagirt Marine Terminal Project) | | 5.00 | | 6/1/2044 | | 200,000 | | 201,245 | |
Maryland Stadium Authority, Revenue Bonds, Ser. A | | 5.00 | | 3/1/2036 | | 3,000,000 | | 3,366,493 | |
Maryland Stadium Authority, Revenue Bonds, Ser. A | | 5.00 | | 3/1/2035 | | 3,500,000 | | 3,970,762 | |
Prince County George's, GO, Refunding, Ser. A | | 5.00 | | 8/1/2040 | | 5,525,000 | | 6,151,053 | |
| | 16,849,813 | |
Massachusetts - 4.1% | | | | | |
Lowell Collegiate Charter School, Revenue Bonds | | 5.00 | | 6/15/2054 | | 770,000 | | 695,225 | |
Lowell Collegiate Charter School, Revenue Bonds | | 5.00 | | 6/15/2049 | | 755,000 | | 693,523 | |
Massachusetts, GO, Refunding, Ser. E | | 1.77 | | 11/1/2032 | | 90,000 | | 69,552 | |
Massachusetts, GO, Ser. 2020 | | 5.00 | | 7/1/2045 | | 5,000,000 | | 5,297,037 | |
Massachusetts, GO, Ser. A | | 5.00 | | 5/1/2048 | | 12,000,000 | | 12,893,179 | |
Massachusetts, GO, Ser. A | | 5.00 | | 5/1/2053 | | 2,500,000 | | 2,669,480 | |
Massachusetts, GO, Ser. E | | 5.00 | | 11/1/2045 | | 7,070,000 | | 7,507,811 | |
Massachusetts Development Finance Agency, Revenue Bonds (Bentley University) | | 5.00 | | 7/1/2040 | | 5,500,000 | | 5,596,605 | |
Massachusetts Development Finance Agency, Revenue Bonds (Dana-Farber Cancer Institute Obligated Group) Ser. N | | 5.00 | | 12/1/2041 | | 3,000,000 | | 3,064,367 | |
Massachusetts Development Finance Agency, Revenue Bonds (Emerson College) Ser. A | | 5.25 | | 1/1/2042 | | 5,500,000 | | 5,526,188 | |
Massachusetts Development Finance Agency, Revenue Bonds (Linden Ponds Inc.) | | 5.13 | | 11/15/2046 | | 1,500,000 | a | 1,506,128 | |
Massachusetts Development Finance Agency, Revenue Bonds (Wentworth Institute of Technology) | | 5.00 | | 10/1/2046 | | 2,015,000 | | 1,900,953 | |
Massachusetts Development Finance Agency, Revenue Bonds, Refunding (Emerson College) Ser. A | | 5.00 | | 1/1/2040 | | 1,000,000 | | 996,879 | |
Massachusetts Development Finance Agency, Revenue Bonds, Refunding (NewBridge Charles Obligated Group) | | 5.00 | | 10/1/2037 | | 1,000,000 | a | 950,474 | |
Massachusetts Development Finance Agency, Revenue Bonds, Refunding (NewBridge Charles Obligated Group) | | 5.00 | | 10/1/2057 | | 2,000,000 | a | 1,723,896 | |
Massachusetts Development Finance Agency, Revenue Bonds, Refunding (NewBridge Charles Obligated Group) | | 5.00 | | 10/1/2047 | | 3,000,000 | a | 2,669,214 | |
Massachusetts Development Finance Agency, Revenue Bonds, Refunding (SABIS International Charter School) | | 5.00 | | 4/15/2040 | | 1,500,000 | | 1,441,394 | |
Massachusetts Development Finance Agency, Revenue Bonds, Refunding (Simmons College) Ser. K1 | | 5.00 | | 10/1/2036 | | 2,115,000 | | 2,123,991 | |
Massachusetts Development Finance Agency, Revenue Bonds, Refunding (Wellforce Obligated Group) (Insured; Assured Guaranty Municipal Corp.) Ser. C | | 4.00 | | 10/1/2045 | | 500,000 | | 459,455 | |
Massachusetts Development Finance Agency, Revenue Bonds, Refunding, Ser. A | | 5.00 | | 7/1/2044 | | 1,375,000 | | 1,336,290 | |
Massachusetts Development Finance Agency, Revenue Bonds, Refunding, Ser. N | | 5.00 | | 10/1/2043 | | 1,000,000 | | 957,756 | |
Tender Option Bond Trust Receipts (Series 2022-XL0371), (Massachusetts School Building Authority, Revenue Bonds, Refunding, Ser. A) Non-recourse, Underlying Coupon Rate (%) 5.25 | | 9.20 | | 2/15/2048 | | 9,500,000 | a,f,g | 9,950,890 | |
Tender Option Bond Trust Receipts (Series 2022-XL0372), (Massachusetts School Building Authority, Revenue Bonds, Ser. B) Non-recourse, Underlying Coupon Rate (%) 5.25 | | 9.20 | | 2/15/2048 | | 10,000,000 | a,f,g | 10,474,621 | |
The Massachusetts Clean Water Trust, Revenue Bonds, Refunding (MWRA Program) Ser. A | | 5.75 | | 8/1/2029 | | 50,000 | | 50,082 | |
| | 80,554,990 | |
Michigan - 2.4% | | | | | |
Central Michigan University, Revenue Bonds, Refunding (LOC; TD Bank NA) Ser. A | | 4.06 | | 10/1/2032 | | 2,400,000 | f | 2,400,000 | |
Detroit, GO | | 5.00 | | 4/1/2034 | | 1,000,000 | | 1,029,805 | |
69
STATEMENT OF INVESTMENTS (continued)
| | | | | | | | | | |
| |
BNY Mellon Municipal Opportunities Fund (continued) |
Description | Coupon
Rate (%) | | Maturity Date | | Principal Amount ($) | | Value ($) | |
Long-Term Municipal Investments - 100.8% (continued) | | | | | |
Michigan - 2.4% (continued) | | | | | |
Detroit, GO | | 5.00 | | 4/1/2033 | | 1,150,000 | | 1,185,183 | |
Detroit, GO | | 5.00 | | 4/1/2035 | | 1,660,000 | | 1,702,409 | |
Detroit, GO | | 5.00 | | 4/1/2038 | | 1,235,000 | | 1,247,763 | |
Detroit, GO | | 5.00 | | 4/1/2036 | | 1,200,000 | | 1,226,533 | |
Detroit, GO | | 5.00 | | 4/1/2029 | | 1,000,000 | | 1,036,027 | |
Detroit, GO | | 5.00 | | 4/1/2028 | | 900,000 | | 934,518 | |
Detroit, GO | | 5.00 | | 4/1/2030 | | 700,000 | | 724,401 | |
Detroit, GO | | 5.00 | | 4/1/2032 | | 850,000 | | 876,791 | |
Detroit, GO | | 5.00 | | 4/1/2031 | | 1,000,000 | | 1,033,403 | |
Detroit, GO, Ser. A | | 5.00 | | 4/1/2050 | | 2,000,000 | | 1,939,417 | |
Detroit, GO, Ser. A | | 5.00 | | 4/1/2046 | | 1,250,000 | | 1,227,883 | |
Detroit Downtown Development Authority, Tax Allocation Bonds, Refunding (Catalyst Development Project) (Insured; Assured Guaranty Municipal Corp.) Ser. A | | 5.00 | | 7/1/2043 | | 10,000,000 | | 10,020,325 | |
Michigan Finance Authority, Revenue Bonds, Refunding, Ser. A | | 4.00 | | 6/1/2038 | | 1,500,000 | | 1,456,307 | |
Michigan Finance Authority, Revenue Bonds, Refunding, Ser. A | | 4.00 | | 6/1/2040 | | 2,100,000 | | 1,996,328 | |
Michigan Finance Authority, Revenue Bonds, Ser. A | | 5.00 | | 10/1/2041 | | 5,075,000 | | 5,559,103 | |
Michigan Finance Authority, Revenue Bonds, Ser. A | | 5.00 | | 10/1/2042 | | 5,330,000 | | 5,819,035 | |
Michigan Tobacco Settlement Finance Authority, Revenue Bonds, Refunding, Ser. C | | 0.00 | | 6/1/2058 | | 30,000,000 | d | 1,209,393 | |
Michigan University, Revenue Bonds, Ser. A | | 3.50 | | 4/1/2052 | | 7,290,000 | | 5,635,295 | |
| | 48,259,919 | |
Minnesota - .5% | | | | | |
Forest Lake, Revenue Bonds, Refunding (North Lakes Academy Project) | | 5.00 | | 7/1/2056 | | 4,000,000 | | 3,334,647 | |
Minneapolis, Revenue Bonds (Allina Health System Obligated Group) | | 4.00 | | 11/15/2038 | | 5,000,000 | | 4,812,724 | |
Rochester, Minnesota, Revenue Bonds, Refunding (Mayo Clinic) | | 5.00 | | 11/15/2057 | | 2,500,000 | | 2,631,520 | |
| | 10,778,891 | |
Mississippi - .2% | | | | | |
Mississippi Development Bank, Revenue Bonds (Insured; Assured Guaranty Municipal Corp.) | | 5.00 | | 12/1/2025 | | 2,500,000 | h | 2,596,224 | |
Mississippi Development Bank, Revenue Bonds (Jackson Water & Sewer System Project) (Insured; Assured Guaranty Municipal Corp.) | | 6.88 | | 12/1/2040 | | 1,625,000 | | 1,634,411 | |
| | 4,230,635 | |
Missouri - .5% | | | | | |
Metropolitan St. Louis Sewer District, Revenue Bonds, Refunding, Ser. B | | 5.00 | | 5/1/2047 | | 2,805,000 | | 3,017,044 | |
Metropolitan St. Louis Sewer District, Revenue Bonds, Refunding, Ser. B | | 5.25 | | 5/1/2052 | | 3,000,000 | | 3,273,388 | |
The Missouri Health & Educational Facilities Authority, Revenue Bonds (The Washington University) Ser. B | | 4.20 | | 2/15/2033 | | 3,200,000 | f | 3,200,000 | |
| | 9,490,432 | |
Montana - .1% | | | | | |
Montana Facility Finance Authority, Revenue Bonds, Refunding (Billings Clinic Obligated Group) Ser. 2022A | | 4.00 | | 8/15/2036 | | 1,250,000 | | 1,238,592 | |
Nebraska - 1.0% | | | | | |
Central Plains Energy, Revenue Bonds, Refunding (Central Plains Energy Project) | | 4.00 | | 8/1/2025 | | 10,000,000 | b | 9,938,705 | |
Tender Option Bond Trust Receipts (Series 2022-XL0356), (Omaha Public Power District, Revenue Bonds, Refunding, Ser. A) Non-recourse, Underlying Coupon Rate (%) 5.00 | | 7.21 | | 2/1/2042 | | 10,000,000 | a,f,g | 10,431,009 | |
| | 20,369,714 | |
Nevada - .5% | | | | | |
Clark County School District, GO (Insured; Assured Guaranty Municipal Corp.) Ser. A | | 4.00 | | 6/15/2040 | | 750,000 | | 732,767 | |
70
| | | | | | | | | | |
| |
BNY Mellon Municipal Opportunities Fund (continued) |
Description | Coupon
Rate (%) | | Maturity Date | | Principal Amount ($) | | Value ($) | |
Long-Term Municipal Investments - 100.8% (continued) | | | | | |
Nevada - .5% (continued) | | | | | |
Clark County School District, GO (Insured; Assured Guaranty Municipal Corp.) Ser. A | | 4.00 | | 6/15/2037 | | 850,000 | | 848,517 | |
Henderson, GO, Ser. A1 | | 4.00 | | 6/1/2045 | | 3,000,000 | | 2,870,490 | |
Nevada Department of Business & Industry, Revenue Bonds (Green Bond) (Fulcrum Sierra Biofuels Project) | | 6.25 | | 12/15/2037 | | 5,000,000 | a | 4,534,392 | |
Nevada Department of Business & Industry, Revenue Bonds (Green Bond) (Fulcrum Sierra Biofuels Project) Ser. B | | 5.13 | | 12/15/2037 | | 1,351,434 | a | 1,056,940 | |
| | 10,043,106 | |
New Hampshire - .1% | | | | | |
New Hampshire Business Finance Authority, Revenue Bonds, Ser. A | | 5.25 | | 7/1/2048 | | 2,500,000 | | 2,465,675 | |
New Jersey - 2.7% | | | | | |
New Jersey Economic Development Authority, Revenue Bonds | | 5.13 | | 1/1/2034 | | 5,325,000 | | 5,342,450 | |
New Jersey Economic Development Authority, Revenue Bonds | | 5.38 | | 1/1/2043 | | 5,500,000 | | 5,507,435 | |
New Jersey Economic Development Authority, Revenue Bonds (Beloved Community Charter School Project) Ser. A | | 5.00 | | 6/15/2049 | | 1,105,000 | a | 994,201 | |
New Jersey Economic Development Authority, Revenue Bonds (Beloved Community Charter School Project) Ser. A | | 5.00 | | 6/15/2054 | | 725,000 | a | 642,145 | |
New Jersey Transportation Trust Fund Authority, Revenue Bonds | | 5.50 | | 6/15/2050 | | 1,000,000 | | 1,090,061 | |
New Jersey Transportation Trust Fund Authority, Revenue Bonds, Refunding | | 4.00 | | 12/15/2039 | | 1,500,000 | | 1,468,460 | |
New Jersey Transportation Trust Fund Authority, Revenue Bonds, Refunding, Ser. A | | 4.00 | | 6/15/2042 | | 3,000,000 | | 2,878,683 | |
New Jersey Transportation Trust Fund Authority, Revenue Bonds, Refunding, Ser. A | | 4.00 | | 6/15/2041 | | 3,000,000 | | 2,901,811 | |
New Jersey Transportation Trust Fund Authority, Revenue Bonds, Refunding, Ser. A | | 5.00 | | 6/15/2031 | | 2,000,000 | | 2,079,345 | |
New Jersey Transportation Trust Fund Authority, Revenue Bonds, Refunding, Ser. A | | 5.00 | | 6/15/2030 | | 3,000,000 | | 3,122,323 | |
New Jersey Transportation Trust Fund Authority, Revenue Bonds, Refunding, Ser. A | | 5.25 | | 6/15/2042 | | 2,000,000 | | 2,164,168 | |
New Jersey Transportation Trust Fund Authority, Revenue Bonds, Refunding, Ser. AA | | 4.25 | | 6/15/2044 | | 1,000,000 | | 982,093 | |
New Jersey Transportation Trust Fund Authority, Revenue Bonds, Ser. A1 | | 5.00 | | 6/15/2030 | | 1,500,000 | | 1,561,162 | |
New Jersey Transportation Trust Fund Authority, Revenue Bonds, Ser. AA | | 4.00 | | 6/15/2045 | | 5,000,000 | | 4,743,431 | |
New Jersey Transportation Trust Fund Authority, Revenue Bonds, Ser. AA | | 4.00 | | 6/15/2050 | | 5,000,000 | | 4,604,862 | |
New Jersey Turnpike Authority, Revenue Bonds, Refunding, Ser. B | | 2.78 | | 1/1/2040 | | 2,000,000 | | 1,449,561 | |
South Jersey Port Corp., Revenue Bonds, Ser. B | | 5.00 | | 1/1/2048 | | 1,500,000 | | 1,485,682 | |
South Jersey Port Corp., Revenue Bonds, Ser. B | | 5.00 | | 1/1/2042 | | 1,250,000 | | 1,255,081 | |
Tobacco Settlement Financing Corp., Revenue Bonds, Refunding, Ser. A | | 5.00 | | 6/1/2046 | | 3,000,000 | | 3,054,199 | |
Tobacco Settlement Financing Corp., Revenue Bonds, Refunding, Ser. A | | 5.25 | | 6/1/2046 | | 5,000,000 | | 5,164,543 | |
| | 52,491,696 | |
New York - 13.0% | | | | | |
Battery Park Authority, Revenue Bonds | | 5.00 | | 11/1/2048 | | 4,500,000 | | 4,829,625 | |
Build New York City Resource Corp., Revenue Bonds (Hellenic Classical Charter Schools) Ser. A | | 5.00 | | 12/1/2051 | | 1,450,000 | a | 1,205,875 | |
Build New York City Resource Corp., Revenue Bonds (Hellenic Classical Charter Schools) Ser. A | | 5.00 | | 12/1/2041 | | 1,200,000 | a | 1,066,709 | |
Build New York City Resource Corp., Revenue Bonds (KIPP NYC Public Charter Schools) | | 5.25 | | 7/1/2057 | | 1,750,000 | | 1,755,947 | |
Build New York City Resource Corp., Revenue Bonds (KIPP NYC Public Charter Schools) | | 5.25 | | 7/1/2052 | | 1,500,000 | | 1,509,613 | |
71
STATEMENT OF INVESTMENTS (continued)
| | | | | | | | | | |
| |
BNY Mellon Municipal Opportunities Fund (continued) |
Description | Coupon
Rate (%) | | Maturity Date | | Principal Amount ($) | | Value ($) | |
Long-Term Municipal Investments - 100.8% (continued) | | | | | |
New York - 13.0% (continued) | | | | | |
Build New York City Resource Corp., Revenue Bonds (Metropolitan Lighthouse Charter School Project) Ser. A | | 5.00 | | 6/1/2047 | | 1,000,000 | a | 899,854 | |
Build New York City Resource Corp., Revenue Bonds (Metropolitan Lighthouse Charter School Project) Ser. A | | 5.00 | | 6/1/2032 | | 500,000 | a | 489,575 | |
Build New York City Resource Corp., Revenue Bonds (Metropolitan Lighthouse Charter School Project) Ser. A | | 5.00 | | 6/1/2037 | | 700,000 | a | 668,451 | |
Build New York City Resource Corp., Revenue Bonds (NY Preparatory Charter School Project) Ser. A | | 4.00 | | 6/15/2056 | | 450,000 | a | 315,213 | |
Build New York City Resource Corp., Revenue Bonds (NY Preparatory Charter School Project) Ser. A | | 4.00 | | 6/15/2041 | | 525,000 | a | 419,994 | |
Build New York City Resource Corp., Revenue Bonds (NY Preparatory Charter School Project) Ser. A | | 4.00 | | 6/15/2051 | | 690,000 | a | 497,164 | |
Build New York City Resource Corp., Revenue Bonds (Shefa School Project) Ser. A | | 2.50 | | 6/15/2031 | | 250,000 | a | 203,740 | |
Build New York City Resource Corp., Revenue Bonds (Shefa School Project) Ser. A | | 5.00 | | 6/15/2051 | | 1,250,000 | a | 1,047,990 | |
Metropolitan Transportation Authority, Revenue Bonds, Refunding (Green Bond) Ser. C1 | | 5.00 | | 11/15/2050 | | 6,000,000 | | 6,071,018 | |
Metropolitan Transportation Authority, Revenue Bonds, Refunding (Green Bond) Ser. C2 | | 5.18 | | 11/15/2049 | | 10,000,000 | | 9,263,863 | |
Metropolitan Transportation Authority, Revenue Bonds, Refunding (Green Bond) Ser. E | | 4.00 | | 11/15/2045 | | 1,630,000 | | 1,492,682 | |
Metropolitan Transportation Authority Hudson Rail Yards Trust, Revenue Bonds, Refunding, Ser. A | | 5.00 | | 11/15/2056 | | 5,000,000 | | 5,000,578 | |
New York City, GO (LOC; U.S. Bank NA) Ser. L4 | | 4.25 | | 4/1/2038 | | 12,100,000 | f | 12,100,000 | |
New York City, GO, Refunding, Ser. F1 | | 5.00 | | 8/1/2037 | | 1,000,000 | | 1,108,229 | |
New York City, GO, Refunding, Ser. F1 | | 5.00 | | 8/1/2036 | | 1,000,000 | | 1,120,456 | |
New York City, GO, Refunding, Ser. F1 | | 5.00 | | 8/1/2038 | | 1,000,000 | | 1,100,421 | |
New York City, GO, Refunding, Ser. F1 | | 5.00 | | 8/1/2034 | | 5,705,000 | | 6,544,923 | |
New York City, GO, Refunding, Ser. F1 | | 5.00 | | 8/1/2039 | | 1,330,000 | | 1,456,081 | |
New York City, GO, Ser. 1 | | 5.00 | | 8/1/2035 | | 3,000,000 | | 3,399,604 | |
New York City, GO, Ser. F1 | | 3.00 | | 3/1/2041 | | 1,215,000 | | 987,071 | |
New York City, GO, Ser. I2 | | 4.00 | | 3/1/2040 | | 5,100,000 | f | 5,100,000 | |
New York City Industrial Development Agency, Revenue Bonds, Refunding (Queens Baseball Stadium Project) (Insured; Assured Guaranty Municipal Corp.) Ser. A | | 3.00 | | 1/1/2039 | | 2,285,000 | | 1,875,675 | |
New York City Industrial Development Agency, Revenue Bonds, Refunding (Queens Baseball Stadium Project) (Insured; Assured Guaranty Municipal Corp.) Ser. A | | 3.00 | | 1/1/2037 | | 2,250,000 | | 1,880,649 | |
New York City Industrial Development Agency, Revenue Bonds, Refunding (Queens Baseball Stadium Project) (Insured; Assured Guaranty Municipal Corp.) Ser. A | | 3.00 | | 1/1/2040 | | 1,750,000 | | 1,411,852 | |
New York City Industrial Development Agency, Revenue Bonds, Refunding (Queens Baseball Stadium Project) (Insured; Assured Guaranty Municipal Corp.) Ser. A | | 3.00 | | 1/1/2046 | | 5,000,000 | | 3,696,077 | |
New York City Industrial Development Agency, Revenue Bonds, Refunding (Yankee Stadium Project) (Insured; Assured Guaranty Municipal Corp.) | | 3.00 | | 3/1/2036 | | 2,500,000 | | 2,182,235 | |
New York City Industrial Development Agency, Revenue Bonds, Refunding (Yankee Stadium Project) (Insured; Assured Guaranty Municipal Corp.) | | 4.00 | | 3/1/2045 | | 5,000,000 | | 4,671,489 | |
New York City Municipal Water Finance Authority, Revenue Bonds (LOC; Citibank NA) Ser. F2 | | 4.25 | | 6/15/2035 | | 10,100,000 | f | 10,100,000 | |
New York City Municipal Water Finance Authority, Revenue Bonds, Refunding, Ser. B1 | | 3.92 | | 6/15/2049 | | 6,900,000 | f | 6,900,000 | |
New York City Transitional Finance Authority, Revenue Bonds (SPA; JP Morgan Chase Bank NA) Ser. E4 | | 4.00 | | 2/1/2045 | | 4,500,000 | f | 4,500,000 | |
New York City Transitional Finance Authority, Revenue Bonds, Refunding (Insured; State Aid Withholding) Ser. S1A | | 3.00 | | 7/15/2039 | | 1,750,000 | | 1,483,852 | |
72
| | | | | | | | | | |
| |
BNY Mellon Municipal Opportunities Fund (continued) |
Description | Coupon
Rate (%) | | Maturity Date | | Principal Amount ($) | | Value ($) | |
Long-Term Municipal Investments - 100.8% (continued) | | | | | |
New York - 13.0% (continued) | | | | | |
New York City Transitional Finance Authority, Revenue Bonds, Refunding, Ser. A4 | | 3.90 | | 11/1/2029 | | 5,000,000 | f | 5,000,000 | |
New York City Transitional Finance Authority, Revenue Bonds, Ser. A1 | | 5.00 | | 5/1/2044 | | 5,000,000 | | 5,379,200 | |
New York City Transitional Finance Authority, Revenue Bonds, Ser. A1 | | 5.00 | | 5/1/2041 | | 6,775,000 | | 7,359,132 | |
New York City Transitional Finance Authority, Revenue Bonds, Ser. B | | 5.00 | | 5/1/2046 | | 5,500,000 | | 5,882,517 | |
New York City Transitional Finance Authority, Revenue Bonds, Ser. D | | 4.00 | | 11/1/2044 | | 3,500,000 | | 3,384,061 | |
New York City Transitional Finance Authority, Revenue Bonds, Ser. E4 | | 3.92 | | 2/1/2045 | | 4,000,000 | f | 4,000,000 | |
New York Counties Tobacco Trust VI, Revenue Bonds, Refunding, Ser. A2B | | 5.00 | | 6/1/2051 | | 4,585,000 | | 4,193,741 | |
New York Liberty Development Corp., Revenue Bonds, Refunding | | 2.80 | | 9/15/2069 | | 4,000,000 | | 3,577,928 | |
New York Liberty Development Corp., Revenue Bonds, Refunding (Class 1-3 World Trade Center Project) | | 5.00 | | 11/15/2044 | | 8,000,000 | a | 7,656,714 | |
New York Liberty Development Corp., Revenue Bonds, Refunding (Green Bond) Ser. A | | 3.00 | | 11/15/2051 | | 2,500,000 | | 1,774,709 | |
New York State Dormitory Authority, Revenue Bonds (Insured; Assured Guaranty Municipal Corp.) Ser. D | | 5.00 | | 10/1/2038 | | 5,000,000 | | 5,429,887 | |
New York State Dormitory Authority, Revenue Bonds, Refunding (Pace University) Ser. A | | 5.00 | | 5/1/2038 | | 500,000 | | 500,026 | |
New York State Urban Development Corp., Revenue Bonds, Ser. A | | 4.00 | | 3/15/2045 | | 2,500,000 | | 2,398,541 | |
New York Transportation Development Corp., Revenue Bonds (Delta Air Lines) | | 4.38 | | 10/1/2045 | | 5,000,000 | | 4,715,405 | |
New York Transportation Development Corp., Revenue Bonds (Delta Air Lines) | | 5.00 | | 10/1/2035 | | 8,000,000 | | 8,260,869 | |
New York Transportation Development Corp., Revenue Bonds (Delta Air Lines) | | 5.00 | | 10/1/2040 | | 5,000,000 | | 5,053,846 | |
New York Transportation Development Corp., Revenue Bonds (Delta Air Lines) | | 5.00 | | 1/1/2036 | | 2,500,000 | | 2,549,124 | |
New York Transportation Development Corp., Revenue Bonds (Delta Air Lines) | | 5.00 | | 1/1/2034 | | 4,000,000 | | 4,113,359 | |
New York Transportation Development Corp., Revenue Bonds (JFK International Air Terminal) | | 5.00 | | 12/1/2039 | | 4,000,000 | | 4,128,176 | |
New York Transportation Development Corp., Revenue Bonds (JFK International Air Terminal) | | 5.00 | | 12/1/2041 | | 8,140,000 | | 8,364,820 | |
New York Transportation Development Corp., Revenue Bonds (JFK International Air Terminal) | | 5.00 | | 12/1/2042 | | 3,000,000 | | 3,068,886 | |
New York Transportation Development Corp., Revenue Bonds, Refunding (American Airlines) | | 2.25 | | 8/1/2026 | | 620,000 | | 592,103 | |
New York Transportation Development Corp., Revenue Bonds, Refunding (American Airlines) | | 3.00 | | 8/1/2031 | | 1,000,000 | | 887,027 | |
New York Transportation Development Corp., Revenue Bonds, Refunding (JFK International Air Terminal) Ser. A | | 4.00 | | 12/1/2039 | | 2,000,000 | | 1,872,386 | |
New York Transportation Development Corp., Revenue Bonds, Refunding (JFK International Air Terminal) Ser. A | | 5.00 | | 12/1/2035 | | 400,000 | | 418,965 | |
New York Transportation Development Corp., Revenue Bonds, Refunding (JFK International Air Terminal) Ser. A | | 5.00 | | 12/1/2037 | | 700,000 | | 722,400 | |
New York Transportation Development Corp., Revenue Bonds, Refunding (JFK International Airport) | | 5.25 | | 8/1/2031 | | 1,380,000 | | 1,426,991 | |
New York Transportation Development Corp., Revenue Bonds, Refunding (JFK International Airport) | | 5.38 | | 8/1/2036 | | 1,000,000 | | 1,019,271 | |
Oneida County Local Development Corp., Revenue Bonds, Refunding (Mohawk Valley Health System Obligated Group) (Insured; Assured Guaranty Municipal Corp.) | | 4.00 | | 12/1/2049 | | 4,000,000 | | 3,421,309 | |
73
STATEMENT OF INVESTMENTS (continued)
| | | | | | | | | | |
| |
BNY Mellon Municipal Opportunities Fund (continued) |
Description | Coupon
Rate (%) | | Maturity Date | | Principal Amount ($) | | Value ($) | |
Long-Term Municipal Investments - 100.8% (continued) | | | | | |
New York - 13.0% (continued) | | | | | |
Port Authority of New York & New Jersey, Revenue Bonds, Refunding, Ser. 226 | | 5.00 | | 10/15/2030 | | 1,675,000 | | 1,816,967 | |
Port Authority of New York & New Jersey, Revenue Bonds, Refunding, Ser. 234 | | 5.50 | | 8/1/2052 | | 4,000,000 | | 4,324,934 | |
Schenectady County Capital Resource Corp., Revenue Bonds, Refunding (Union College Project) | | 5.25 | | 7/1/2052 | | 1,000,000 | | 1,074,729 | |
Tender Option Bond Trust Receipts (Series 2022-XL0388), (New York City Water & Sewer System, Revenue Bonds, Ser. AA1) Non-recourse, Underlying Coupon Rate (%) 5.25 | | 8.22 | | 6/15/2052 | | 8,000,000 | a,f,g | 8,647,354 | |
Triborough Bridge & Tunnel Authority, Revenue Bonds, Ser. A | | 4.00 | | 11/15/2054 | | 1,750,000 | | 1,620,452 | |
Triborough Bridge & Tunnel Authority, Revenue Bonds, Ser. A | | 5.00 | | 5/15/2044 | | 5,000,000 | | 5,384,581 | |
Triborough Bridge & Tunnel Authority, Revenue Bonds, Ser. A | | 5.00 | | 5/15/2043 | | 1,500,000 | | 1,622,559 | |
Triborough Bridge & Tunnel Authority, Revenue Bonds, Ser. A | | 5.00 | | 11/15/2049 | | 5,000,000 | | 5,178,180 | |
Triborough Bridge & Tunnel Authority, Revenue Bonds, Ser. A | | 5.00 | | 5/15/2048 | | 1,875,000 | | 1,994,897 | |
Triborough Bridge & Tunnel Authority, Revenue Bonds, Ser. C | | 4.00 | | 11/15/2040 | | 5,000,000 | | 4,945,617 | |
Triborough Bridge & Tunnel Authority, Revenue Bonds, Ser. C1A | | 5.00 | | 5/15/2040 | | 4,000,000 | | 4,326,971 | |
| | 256,445,139 | |
North Carolina - .2% | | | | | |
Greater Asheville Regional Airport Authority, Revenue Bonds (Insured; Assured Guaranty Municipal Corp.) Ser. A | | 5.50 | | 7/1/2052 | | 2,000,000 | | 2,131,038 | |
North Carolina Turnpike Authority, Revenue Bonds (Insured; Assured Guaranty Municipal Corp.) | | 5.00 | | 1/1/2049 | | 1,500,000 | | 1,536,067 | |
| | 3,667,105 | |
North Dakota - .3% | | | | | |
North Dakota Housing Finance Agency, Revenue Bonds | | 4.50 | | 7/1/2043 | | 2,835,000 | | 2,786,920 | |
North Dakota Housing Finance Agency, Revenue Bonds | | 4.55 | | 7/1/2048 | | 3,410,000 | | 3,347,027 | |
| | 6,133,947 | |
Ohio - 3.0% | | | | | |
Buckeye Tobacco Settlement Financing Authority, Revenue Bonds, Refunding, Ser. B2 | | 5.00 | | 6/1/2055 | | 9,700,000 | | 8,880,117 | |
Cleveland-Cuyahoga County Port Authority, Revenue Bonds, Refunding (Playhouse Square Foundation Project) | | 5.25 | | 12/1/2038 | | 2,420,000 | | 2,420,891 | |
Cleveland-Cuyahoga County Port Authority, Revenue Bonds, Refunding (Playhouse Square Foundation Project) | | 5.50 | | 12/1/2053 | | 1,500,000 | | 1,452,645 | |
Cleveland-Cuyahoga County Port Authority, Revenue Bonds, Refunding (Playhouse Square Foundation Project) | | 5.50 | | 12/1/2043 | | 1,580,000 | | 1,580,564 | |
Montgomery County, Revenue Bonds, Refunding (Kettering Health Network Obligated Group) | | 3.00 | | 8/1/2040 | | 1,600,000 | | 1,238,754 | |
Montgomery County, Revenue Bonds, Refunding (Kettering Health Network Obligated Group) | | 4.00 | | 8/1/2041 | | 500,000 | | 472,710 | |
Ohio, GO, Ser. A | | 3.00 | | 5/1/2039 | | 5,000,000 | | 4,263,843 | |
Ohio, Revenue Bonds (Portsmouth Bypass Project) (Insured; Assured Guaranty Municipal Corp.) | | 5.00 | | 12/31/2035 | | 3,000,000 | | 3,023,403 | |
Ohio, Revenue Bonds (Portsmouth Bypass Project) (Insured; Assured Guaranty Municipal Corp.) | | 5.00 | | 12/31/2039 | | 2,000,000 | | 2,004,521 | |
Ohio, Revenue Bonds, Refunding (University Hospitals Health System Obligated Group) Ser. E | | 4.00 | | 1/15/2039 | | 800,000 | | 759,190 | |
Ohio, Revenue Bonds, Refunding (University Hospitals Health System Obligated Group) Ser. E | | 4.00 | | 1/15/2040 | | 1,300,000 | | 1,223,206 | |
Ohio, Revenue Bonds, Refunding (University Hospitals Health System Obligated Group) Ser. E | | 4.00 | | 1/15/2038 | | 1,600,000 | | 1,534,612 | |
Ohio, Revenue Bonds, Refunding (University Hospitals Health System Obligated Group) Ser. E | | 5.00 | | 1/15/2036 | | 1,400,000 | | 1,466,154 | |
Ohio Air Quality Development Authority, Revenue Bonds (Pratt Paper Project) | | 4.25 | | 1/15/2038 | | 2,500,000 | a | 2,418,870 | |
Ohio Air Quality Development Authority, Revenue Bonds, Refunding (Duke Energy) Ser. A | | 4.25 | | 6/1/2027 | | 1,000,000 | b | 994,453 | |
74
| | | | | | | | | | |
| |
BNY Mellon Municipal Opportunities Fund (continued) |
Description | Coupon
Rate (%) | | Maturity Date | | Principal Amount ($) | | Value ($) | |
Long-Term Municipal Investments - 100.8% (continued) | | | | | |
Ohio - 3.0% (continued) | | | | | |
Ohio Higher Educational Facility Commission, Revenue Bonds, Refunding (John Carroll University) | | 4.00 | | 10/1/2042 | | 5,000,000 | | 4,268,663 | |
Ohio Higher Educational Facility Commission, Revenue Bonds, Refunding (John Carroll University) | | 4.00 | | 10/1/2047 | | 5,000,000 | | 4,082,083 | |
Ohio Turnpike & Infrastructure Commission, Revenue Bonds | | 5.70 | | 2/15/2034 | | 3,000,000 | | 3,532,553 | |
Ohio Water Development Authority Water Pollution Control Loan Fund, Revenue Bonds (Green Bond) Ser. B | | 5.00 | | 12/1/2043 | | 5,000,000 | | 5,490,551 | |
Princeton School District, GO, Refunding | | 5.00 | | 12/1/2024 | | 5,125,000 | h | 5,231,378 | |
Southern Ohio Port Authority, Revenue Bonds (PureCycle Project) Ser. A | | 7.00 | | 12/1/2042 | | 4,000,000 | a | 2,955,845 | |
Toledo-Lucas County Port Authority, Revenue Bonds (University of Toledo Parking Project) | | 4.00 | | 1/1/2051 | | 1,000,000 | | 751,428 | |
| | 60,046,434 | |
Oregon - .1% | | | | | |
Oregon Business Development Commission, Revenue Bonds, Refunding (RED Rock Biofuels) Ser. 248A | | 6.50 | | 4/1/2031 | | 2,000,000 | a,c | 10,000 | |
Oregon Business Development Commission, Revenue Bonds, Refunding (RED Rock Biofuels) Ser. 248D | | 6.50 | | 4/1/2031 | | 2,000,000 | a,c | 10,000 | |
Oregon Business Development Commission, Revenue Bonds, Refunding (RED Rock Biofuels) Ser. 248F | | 11.50 | | 4/1/2031 | | 1,000,000 | c | 10 | |
Warm Springs Reservation Confederated Tribe, Revenue Bonds, Refunding (Green Bond) Ser. B | | 5.00 | | 11/1/2039 | | 700,000 | a | 737,626 | |
Warm Springs Reservation Confederated Tribe, Revenue Bonds, Refunding (Green Bond) Ser. B | | 5.00 | | 11/1/2036 | | 700,000 | a | 748,043 | |
| | 1,505,679 | |
Pennsylvania - 2.3% | | | | | |
Allegheny County Industrial Development Authority, Revenue Bonds, Refunding (U.S. Steel Corp.) | | 4.88 | | 11/1/2024 | | 2,000,000 | | 2,007,567 | |
Allegheny County Industrial Development Authority, Revenue Bonds, Refunding (U.S. Steel Corp.) | | 5.13 | | 5/1/2030 | | 1,750,000 | | 1,784,960 | |
Commonwealth Financing Authority, Revenue Bonds | | 5.00 | | 6/1/2035 | | 3,500,000 | | 3,694,303 | |
Delaware County Industrial Development Authority, Revenue Bonds, Refunding (United Parcel Service) | | 4.10 | | 9/1/2045 | | 9,500,000 | f | 9,500,000 | |
Geisinger Authority, Revenue Bonds, Refunding (Geisinger Health System Obligated Group) | | 4.00 | | 4/1/2050 | | 4,070,000 | | 3,659,809 | |
Geisinger Authority, Revenue Bonds, Refunding (Geisinger Health System Obligated Group) | | 4.00 | | 4/1/2039 | | 1,500,000 | | 1,434,640 | |
Geisinger Authority, Revenue Bonds, Refunding (Geisinger Health System Obligated Group) | | 5.00 | | 4/1/2050 | | 3,000,000 | | 3,047,654 | |
Lancaster County Hospital Authority, Revenue Bonds (Penn State Health Obligated Group) | | 5.00 | | 11/1/2040 | | 1,300,000 | | 1,348,365 | |
Lancaster County Hospital Authority, Revenue Bonds (Penn State Health Obligated Group) | | 5.00 | | 11/1/2041 | | 1,750,000 | | 1,810,877 | |
Lancaster County Hospital Authority, Revenue Bonds (Penn State Health Obligated Group) | | 5.00 | | 11/1/2046 | | 2,000,000 | | 2,049,121 | |
Lancaster County Hospital Authority, Revenue Bonds (Penn State Health Obligated Group) | | 5.00 | | 11/1/2037 | | 600,000 | | 628,753 | |
Lancaster County Hospital Authority, Revenue Bonds (Penn State Health Obligated Group) | | 5.00 | | 11/1/2038 | | 1,085,000 | | 1,133,729 | |
Lancaster County Hospital Authority, Revenue Bonds (Penn State Health Obligated Group) | | 5.00 | | 11/1/2039 | | 1,100,000 | | 1,144,832 | |
Lancaster County Hospital Authority, Revenue Bonds, Refunding (Masonic Homes Project) (LOC; JPMorgan Chase Bank NA) Ser. D | | 3.90 | | 7/1/2034 | | 4,500,000 | f | 4,500,000 | |
Latrobe Industrial Development Authority, Revenue Bonds, Refunding (Seton Hill University) | | 4.00 | | 3/1/2051 | | 700,000 | | 518,216 | |
Latrobe Industrial Development Authority, Revenue Bonds, Refunding (Seton Hill University) | | 4.00 | | 3/1/2046 | | 685,000 | | 528,815 | |
75
STATEMENT OF INVESTMENTS (continued)
| | | | | | | | | | |
| |
BNY Mellon Municipal Opportunities Fund (continued) |
Description | Coupon
Rate (%) | | Maturity Date | | Principal Amount ($) | | Value ($) | |
Long-Term Municipal Investments - 100.8% (continued) | | | | | |
Pennsylvania - 2.3% (continued) | | | | | |
Montgomery County Higher Education & Health Authority, Revenue Bonds, Refunding (Thomas Jefferson University Project) | | 4.00 | | 9/1/2044 | | 1,750,000 | | 1,611,182 | |
Pennsylvania Economic Development Financing Authority, Revenue Bonds (The Penndot Major Bridges) (Insured; Assured Guaranteed Municipal Corp.) | | 5.00 | | 12/31/2057 | | 1,000,000 | | 1,012,390 | |
Pennsylvania Economic Development Financing Authority, Revenue Bonds, Refunding (Tapestry Moon Senior Housing Project) | | 6.50 | | 12/1/2038 | | 3,000,000 | a,c | 1,143,750 | |
Pennsylvania Turnpike Commission Oil Franchise, Revenue Bonds, Refunding, Ser. A | | 3.00 | | 12/1/2051 | | 3,000,000 | | 2,194,526 | |
| | 44,753,489 | |
Rhode Island - .4% | | | | | |
Rhode Island Health & Educational Building Corp., Revenue Bonds | | 5.25 | | 8/15/2043 | | 1,000,000 | | 1,061,337 | |
Rhode Island Health & Educational Building Corp., Revenue Bonds, Refunding (Providence College) | | 5.00 | | 11/1/2045 | | 7,000,000 | | 7,092,228 | |
| | 8,153,565 | |
South Carolina - .5% | | | | | |
South Carolina Public Service Authority, Revenue Bonds, Refunding, Ser. A | | 5.00 | | 12/1/2036 | | 2,000,000 | | 2,033,441 | |
South Carolina Public Service Authority, Revenue Bonds, Refunding, Ser. C | | 5.00 | | 12/1/2046 | | 1,370,000 | | 1,370,497 | |
Spartanburg Regional Health Services District, Revenue Bonds, Refunding | | 4.00 | | 4/15/2036 | | 1,370,000 | | 1,337,560 | |
Spartanburg Regional Health Services District, Revenue Bonds, Refunding | | 4.00 | | 4/15/2037 | | 835,000 | | 801,747 | |
Spartanburg Regional Health Services District, Revenue Bonds, Refunding | | 5.00 | | 4/15/2034 | | 1,505,000 | | 1,629,014 | |
Spartanburg Regional Health Services District, Revenue Bonds, Refunding | | 5.00 | | 4/15/2035 | | 1,580,000 | | 1,698,985 | |
| | 8,871,244 | |
Tennessee - .8% | | | | | |
Metropolitan Government Nashville & Davidson County Sports Authority, Revenue Bonds (Stadium Project) (Insured; Assured Guaranty Municipal Corp.) Ser. A | | 5.25 | | 7/1/2056 | | 3,000,000 | | 3,209,440 | |
Metropolitan Government Nashville & Davidson County Sports Authority, Revenue Bonds (Stadium Project) (Insured; Assured Guaranty Municipal Corp.) Ser. A | | 5.25 | | 7/1/2053 | | 1,000,000 | | 1,073,248 | |
Metropolitan Government Nashville & Davidson County Sports Authority, Revenue Bonds (Stadium Project) (Insured; Assured Guaranty Municipal Corp.) Ser. A | | 5.25 | | 7/1/2048 | | 1,500,000 | | 1,620,310 | |
New Memphis Arena Public Building Authority, Revenue Bonds | | 4.00 | | 4/1/2031 | | 750,000 | i | 661,468 | |
New Memphis Arena Public Building Authority, Revenue Bonds (Memphis Project) | | 0.00 | | 4/1/2032 | | 775,000 | d | 540,258 | |
Tennessee, GO, Ser. A | | 5.00 | | 5/1/2041 | | 8,430,000 | | 9,292,245 | |
| | 16,396,969 | |
Texas - 13.4% | | | | | |
Arlington Higher Education Finance Corp., Revenue Bonds, Refunding (Uplift Education) Ser. A | | 5.00 | | 12/1/2046 | | 1,100,000 | | 1,052,855 | |
Arlington Higher Education Finance Corp., Revenue Bonds, Refunding (Uplift Education) Ser. A | | 5.00 | | 12/1/2036 | | 1,315,000 | | 1,323,362 | |
Arlington Higher Education Finance Corp., Revenue Bonds, Refunding, Ser. A | | 4.00 | | 8/15/2046 | | 860,000 | | 648,023 | |
Arlington Higher Education Finance Corp., Revenue Bonds, Refunding, Ser. A | | 4.00 | | 8/15/2041 | | 610,000 | | 487,949 | |
Arlington Higher Education Finance Corp., Revenue Bonds, Refunding, Ser. A | | 4.00 | | 8/15/2036 | | 330,000 | | 283,752 | |
76
| | | | | | | | | | |
| |
BNY Mellon Municipal Opportunities Fund (continued) |
Description | Coupon
Rate (%) | | Maturity Date | | Principal Amount ($) | | Value ($) | |
Long-Term Municipal Investments - 100.8% (continued) | | | | | |
Texas - 13.4% (continued) | | | | | |
Arlington Higher Education Finance Corp., Revenue Bonds, Ser. A | | 5.00 | | 8/15/2053 | | 925,000 | | 797,053 | |
Arlington Higher Education Finance Corp., Revenue Bonds, Ser. A | | 5.00 | | 8/15/2048 | | 1,900,000 | | 1,666,843 | |
Arlington Higher Education Finance Corp., Revenue Bonds, Ser. A | | 5.00 | | 8/15/2038 | | 1,000,000 | | 933,040 | |
Bexar County Health Facilities Development Corp., Revenue Bonds, Refunding (Army Retirement Residence Foundation) | | 5.00 | | 7/15/2041 | | 1,750,000 | | 1,531,827 | |
Central Texas Regional Mobility Authority, Revenue Bonds, Ser. B | | 4.00 | | 1/1/2051 | | 4,255,000 | | 3,819,976 | |
Central Texas Regional Mobility Authority, Revenue Bonds, Ser. E | | 5.00 | | 1/1/2045 | | 1,250,000 | | 1,290,537 | |
Clifton Higher Education Finance Corp., Revenue Bonds (IDEA Public Schools) | | 5.00 | | 8/15/2032 | | 2,525,000 | | 2,527,107 | |
Clifton Higher Education Finance Corp., Revenue Bonds (IDEA Public Schools) | | 6.00 | | 8/15/2043 | | 2,770,000 | | 2,772,893 | |
Clifton Higher Education Finance Corp., Revenue Bonds (IDEA Public Schools) | | 6.00 | | 8/15/2033 | | 1,500,000 | | 1,502,384 | |
Clifton Higher Education Finance Corp., Revenue Bonds (International Leadership of Texas) Ser. D | | 6.13 | | 8/15/2048 | | 18,000,000 | | 18,004,124 | |
Clifton Higher Education Finance Corp., Revenue Bonds (International Leadership) (Insured; Permanent School Fund Guaranteed) | | 5.00 | | 8/15/2047 | | 4,305,000 | | 4,590,504 | |
Clifton Higher Education Finance Corp., Revenue Bonds (Uplift Education) Ser. A | | 5.00 | | 12/1/2045 | | 3,855,000 | | 3,706,815 | |
Collin County, GO | | 5.00 | | 2/15/2040 | | 5,000,000 | | 5,440,162 | |
Columbia-Brazoria Independent School District, GO | | 5.00 | | 2/1/2044 | | 2,025,000 | | 2,176,972 | |
Columbia-Brazoria Independent School District, GO | | 5.00 | | 2/1/2043 | | 1,935,000 | | 2,084,523 | |
Columbia-Brazoria Independent School District, GO | | 5.00 | | 2/1/2042 | | 1,850,000 | | 1,995,285 | |
Dallas Area Rapid Transit, Revenue Bonds, Refunding, Ser. B | | 4.00 | | 12/1/2051 | | 10,000,000 | | 9,102,543 | |
Dallas Fort Worth International Airport, Revenue Bonds, Refunding | | 4.00 | | 11/1/2045 | | 2,000,000 | | 1,894,038 | |
Dallas Fort Worth International Airport, Revenue Bonds, Refunding, Ser. B | | 5.00 | | 11/1/2047 | | 3,625,000 | | 3,829,323 | |
Danbury Higher Education Authority, Revenue Bonds, Ser. A | | 4.00 | | 8/15/2049 | | 2,290,000 | | 1,730,642 | |
Grand Parkway Transportation Corp., Revenue Bonds, Refunding | | 4.00 | | 10/1/2049 | | 5,000,000 | | 4,525,431 | |
Grand Parkway Transportation Corp., Revenue Bonds, Ser. A | | 5.00 | | 10/1/2043 | | 5,000,000 | | 5,198,707 | |
Grand Parkway Transportation Corp., Revenue Bonds, Ser. B | | 5.20 | | 10/1/2031 | | 2,000,000 | i | 2,172,171 | |
Grand Parkway Transportation Corp., Revenue Bonds, Ser. B | | 5.40 | | 10/1/2033 | | 2,500,000 | i | 2,724,800 | |
Grand Parkway Transportation Corp., Revenue Bonds, Ser. B | | 5.45 | | 10/1/2034 | | 2,235,000 | i | 2,437,489 | |
Greater Texoma Utility Authority, Revenue Bonds (Sherman Water & Sewer System Project) (Insured; Build America Mutual) Ser. A | | 5.25 | | 10/1/2048 | | 5,000,000 | | 5,329,837 | |
Harris County Cultural Education Facilities Finance Corp., Revenue Bonds (Texas Children's Hospital Obligated Group) Ser. A | | 3.00 | | 10/1/2051 | | 5,000,000 | | 3,559,852 | |
Hidalgo County Regional Mobility Authority, Revenue Bonds, Ser. A | | 4.00 | | 12/1/2041 | | 750,000 | | 675,043 | |
Hidalgo County Regional Mobility Authority, Revenue Bonds, Ser. A | | 4.00 | | 12/1/2040 | | 1,000,000 | | 905,462 | |
Hidalgo County Regional Mobility Authority, Revenue Bonds, Ser. A | | 4.00 | | 12/1/2039 | | 900,000 | | 824,145 | |
Houston Airport System, Revenue Bonds (United Airlines) | | 4.00 | | 7/15/2041 | | 2,250,000 | | 1,990,831 | |
Houston Airport System, Revenue Bonds, Refunding (United Airlines) | | 4.75 | | 7/1/2024 | | 1,355,000 | | 1,356,321 | |
Houston Airport System, Revenue Bonds, Refunding (United Airlines) | | 5.00 | | 7/15/2027 | | 1,000,000 | | 1,008,566 | |
77
STATEMENT OF INVESTMENTS (continued)
| | | | | | | | | | |
| |
BNY Mellon Municipal Opportunities Fund (continued) |
Description | Coupon
Rate (%) | | Maturity Date | | Principal Amount ($) | | Value ($) | |
Long-Term Municipal Investments - 100.8% (continued) | | | | | |
Texas - 13.4% (continued) | | | | | |
Houston Airport System, Revenue Bonds, Refunding (United Airlines) Ser. A | | 5.00 | | 7/1/2027 | | 1,000,000 | | 1,008,391 | |
Houston Airport System, Revenue Bonds, Refunding (United Airlines) Ser. C | | 5.00 | | 7/15/2027 | | 1,000,000 | | 1,008,566 | |
Marshall Independent School District, GO (Insured; Permanent School Fund Guarantee Program) | | 4.00 | | 2/15/2039 | | 1,720,000 | | 1,715,165 | |
Mission Economic Development Corp., Revenue Bonds, Refunding (Natgasoline Project) | | 4.63 | | 10/1/2031 | | 3,250,000 | a | 3,176,071 | |
Montgomery Independent School District, GO (Insured; Permanent School Fund Guaranteed) | | 5.00 | | 2/15/2040 | | 4,425,000 | | 4,796,555 | |
New Hope Cultural Education Facilities Finance Corp., Revenue Bonds (Sanctuary LTC Project) Ser. A1 | | 5.25 | | 1/1/2042 | | 5,000,000 | | 3,763,149 | |
Newark Higher Education Finance Corp., Revenue Bonds (A+ Charter Schools) Ser. A | | 5.50 | | 8/15/2035 | | 750,000 | a | 766,316 | |
Newark Higher Education Finance Corp., Revenue Bonds (A+ Charter Schools) Ser. A | | 5.75 | | 8/15/2045 | | 1,000,000 | a | 1,014,706 | |
Permanent University Fund - University of Texas System, Revenue Bonds, Refunding, Ser. A | | 5.00 | | 7/1/2041 | | 10,300,000 | | 11,174,375 | |
Permanent University Fund - University of Texas System, Revenue Bonds, Refunding, Ser. B | | 5.00 | | 7/1/2024 | | 7,435,000 | h | 7,536,558 | |
Port Beaumont Navigation District, Revenue Bonds | | 2.75 | | 1/1/2036 | | 1,000,000 | a | 702,965 | |
Port Beaumont Navigation District, Revenue Bonds | | 2.88 | | 1/1/2041 | | 1,000,000 | a | 642,734 | |
Port Beaumont Navigation District, Revenue Bonds, Refunding, Ser. 234 | | 3.63 | | 1/1/2035 | | 1,500,000 | a | 1,186,365 | |
Port Beaumont Navigation District, Revenue Bonds, Refunding, Ser. A | | 4.00 | | 1/1/2050 | | 1,500,000 | a | 1,051,869 | |
Pottsboro Higher Education Finance Corp., Revenue Bonds, Ser. A | | 5.00 | | 8/15/2046 | | 1,000,000 | | 899,182 | |
Rockwall Independent School District, GO (Insured; Permanent School Fund Guaranteed) | | 5.00 | | 2/15/2025 | | 7,050,000 | h | 7,214,486 | |
San Antonio Electric & Gas Systems, Revenue Bonds, Refunding | | 4.00 | | 2/1/2041 | | 1,000,000 | | 954,320 | |
San Antonio Electric & Gas Systems, Revenue Bonds, Refunding | | 5.00 | | 2/1/2044 | | 2,000,000 | | 2,120,209 | |
Tarrant County Cultural Education Facilities Finance Corp., Revenue Bonds, Refunding (Methodist Hospitals of Dallas Obligated Group) (LOC; TD Bank NA) Ser. B | | 3.90 | | 10/1/2041 | | 10,000,000 | f | 10,000,000 | |
Tender Option Bond Trust Receipts (Series 2022-XL0403), (Austin Texas Airport System, Revenue Bonds, Ser. A) Non-recourse, Underlying Coupon Rate (%) 5.00 | | 7.82 | | 11/15/2046 | | 13,120,000 | a,f,g | 13,299,457 | |
Texas, GO, Ser. A | | 4.15 | | 6/1/2045 | | 1,300,000 | f | 1,300,000 | |
Texas, GO, Ser. B | | 4.15 | | 12/1/2043 | | 1,050,000 | f | 1,050,000 | |
Texas, GO, Ser. B | | 4.15 | | 12/1/2041 | | 2,645,000 | f | 2,645,000 | |
Texas Natural Gas Securitization Finance Corp., Revenue Bonds | | 5.10 | | 4/1/2035 | | 10,000,000 | | 9,988,176 | |
Texas Natural Gas Securitization Finance Corp., Revenue Bonds | | 5.17 | | 4/1/2041 | | 10,000,000 | | 9,982,985 | |
Texas Private Activity Bond Surface Transportation Corp., Revenue Bonds | | 5.50 | | 12/31/2058 | | 7,500,000 | | 7,947,706 | |
Texas Private Activity Bond Surface Transportation Corp., Revenue Bonds (Blueridge Transportation Group) | | 5.00 | | 12/31/2045 | | 1,000,000 | | 1,000,459 | |
Texas Private Activity Bond Surface Transportation Corp., Revenue Bonds (NTE Mobility Partners Segments 3) | | 6.75 | | 6/30/2043 | | 5,000,000 | | 5,008,892 | |
Texas Private Activity Bond Surface Transportation Corp., Revenue Bonds (NTE Mobility Partners Segments 3) | | 7.00 | | 12/31/2038 | | 10,000,000 | | 10,020,667 | |
Texas Private Activity Bond Surface Transportation Corp., Revenue Bonds, Refunding (LBJ Infrastructure Group) | | 4.00 | | 6/30/2040 | | 1,500,000 | | 1,389,072 | |
Texas Private Activity Bond Surface Transportation Corp., Revenue Bonds, Refunding (LBJ Infrastructure Group) | | 4.00 | | 12/31/2037 | | 1,250,000 | | 1,189,177 | |
Texas Private Activity Bond Surface Transportation Corp., Revenue Bonds, Refunding (LBJ Infrastructure Group) | | 4.00 | | 6/30/2036 | | 3,100,000 | | 2,974,951 | |
Texas Private Activity Bond Surface Transportation Corp., Revenue Bonds, Refunding (LBJ Infrastructure Group) | | 4.00 | | 6/30/2037 | | 1,250,000 | | 1,191,844 | |
78
| | | | | | | | | | |
| |
BNY Mellon Municipal Opportunities Fund (continued) |
Description | Coupon
Rate (%) | | Maturity Date | | Principal Amount ($) | | Value ($) | |
Long-Term Municipal Investments - 100.8% (continued) | | | | | |
Texas - 13.4% (continued) | | | | | |
Texas Private Activity Bond Surface Transportation Corp., Revenue Bonds, Refunding (LBJ Infrastructure Group) | | 4.00 | | 6/30/2038 | | 2,000,000 | | 1,893,624 | |
Texas Private Activity Bond Surface Transportation Corp., Revenue Bonds, Refunding (LBJ Infrastructure Group) | | 4.00 | | 12/31/2039 | | 1,600,000 | | 1,502,835 | |
Texas Private Activity Bond Surface Transportation Corp., Revenue Bonds, Refunding (LBJ Infrastructure Group) | | 4.00 | | 6/30/2039 | | 1,500,000 | | 1,410,831 | |
Texas Private Activity Bond Surface Transportation Corp., Revenue Bonds, Refunding (LBJ Infrastructure Group) | | 4.00 | | 12/31/2038 | | 2,000,000 | | 1,891,105 | |
Texas Public Finance Authority, Revenue Bonds (Texas Southern University) (Insured; Build America Mutual) | | 5.25 | | 5/1/2041 | | 1,000,000 | | 1,058,292 | |
Texas Public Finance Authority, Revenue Bonds (Texas Southern University) (Insured; Build America Mutual) | | 5.25 | | 5/1/2040 | | 520,000 | | 552,432 | |
Texas Public Finance Authority, Revenue Bonds (Texas Southern University) (Insured; Build America Mutual) | | 5.25 | | 5/1/2039 | | 300,000 | | 319,624 | |
Texas Transportation Commission Highway 249 System, Revenue Bonds | | 5.00 | | 8/1/2057 | | 2,000,000 | | 1,967,677 | |
Texas Water Development Board, Revenue Bonds | | 5.00 | | 10/15/2057 | | 3,565,000 | | 3,764,980 | |
Texas Water Development Board, Revenue Bonds | | 5.00 | | 8/1/2044 | | 5,600,000 | | 6,057,525 | |
University of Texas System Board of Regents, Revenue Bonds, Refunding, Ser. A | | 5.00 | | 8/15/2043 | | 5,000,000 | | 5,359,388 | |
| | 263,399,868 | |
U.S. Related - 5.3% | | | | | |
Antonio B. Won Pat International Airport Authority, Revenue Bonds, Refunding | | 5.00 | | 10/1/2028 | | 980,000 | | 984,213 | |
Antonio B. Won Pat International Airport Authority, Revenue Bonds, Refunding | | 5.25 | | 10/1/2035 | | 265,000 | | 262,238 | |
Antonio B. Won Pat International Airport Authority, Revenue Bonds, Refunding | | 5.25 | | 10/1/2031 | | 1,515,000 | | 1,530,413 | |
Antonio B. Won Pat International Airport Authority, Revenue Bonds, Refunding | | 5.25 | | 10/1/2036 | | 685,000 | | 669,140 | |
Antonio B. Won Pat International Airport Authority, Revenue Bonds, Refunding | | 5.38 | | 10/1/2033 | | 1,000,000 | | 1,011,766 | |
Antonio B. Won Pat International Airport Authority, Revenue Bonds, Refunding | | 5.38 | | 10/1/2040 | | 525,000 | | 501,678 | |
Antonio B. Won Pat International Airport Authority, Revenue Bonds, Refunding | | 5.38 | | 10/1/2043 | | 1,250,000 | | 1,189,494 | |
Antonio B. Won Pat International Airport Authority, Revenue Bonds, Refunding (Insured; Assured Guaranty Municipal Corp.) Ser. C | | 6.00 | | 10/1/2034 | | 570,000 | | 570,894 | |
Antonio B. Won Pat International Airport Authority, Revenue Bonds, Refunding (Insured; Assured Guaranty Municipal Corp.) Ser. C | | 6.13 | | 10/1/2043 | | 360,000 | | 360,596 | |
Antonio B. Won Pat International Airport Authority, Revenue Bonds, Refunding (Insured; Assured Guaranty Municipal Corp.) Ser. C | | 6.00 | | 10/1/2023 | | 1,430,000 | h | 1,432,243 | |
Antonio B. Won Pat International Airport Authority, Revenue Bonds, Refunding (Insured; Assured Guaranty Municipal Corp.) Ser. C | | 6.13 | | 10/1/2023 | | 1,640,000 | h | 1,642,717 | |
Antonio B. Won Pat International Airport Authority, Revenue Bonds, Refunding, Ser. C | | 6.25 | | 10/1/2034 | | 600,000 | | 601,047 | |
Antonio B. Won Pat International Airport Authority, Revenue Bonds, Refunding, Ser. C | | 6.38 | | 10/1/2043 | | 480,000 | | 480,880 | |
Antonio B. Won Pat International Airport Authority, Revenue Bonds, Refunding, Ser. C | | 6.25 | | 10/1/2023 | | 400,000 | h | 400,698 | |
Antonio B. Won Pat International Airport Authority, Revenue Bonds, Refunding, Ser. C | | 6.38 | | 10/1/2023 | | 520,000 | h | 520,954 | |
Guam, Revenue Bonds, Refunding, Ser. A | | 5.00 | | 12/1/2046 | | 1,500,000 | | 1,405,334 | |
Guam, Revenue Bonds, Refunding, Ser. F | | 4.00 | | 1/1/2036 | | 1,750,000 | | 1,643,557 | |
Guam, Revenue Bonds, Refunding, Ser. F | | 4.00 | | 1/1/2042 | | 2,250,000 | | 1,938,157 | |
79
STATEMENT OF INVESTMENTS (continued)
| | | | | | | | | | |
| |
BNY Mellon Municipal Opportunities Fund (continued) |
Description | Coupon
Rate (%) | | Maturity Date | | Principal Amount ($) | | Value ($) | |
Long-Term Municipal Investments - 100.8% (continued) | | | | | |
U.S. Related - 5.3% (continued) | | | | | |
Guam Government Waterworks Authority, Revenue Bonds, Ser. A | | 5.00 | | 1/1/2050 | | 2,000,000 | | 1,990,699 | |
Matching Fund Special Purpose Securitization Corp., Revenue Bonds, Refunding, Ser. A | | 5.00 | | 10/1/2032 | | 2,090,000 | | 2,097,485 | |
Matching Fund Special Purpose Securitization Corp., Revenue Bonds, Refunding, Ser. A | | 5.00 | | 10/1/2039 | | 8,000,000 | | 7,956,018 | |
Matching Fund Special Purpose Securitization Corp., Revenue Bonds, Refunding, Ser. A | | 5.00 | | 10/1/2030 | | 3,000,000 | | 3,023,505 | |
Puerto Rico, GO, Ser. A | | 0.00 | | 7/1/2024 | | 130,448 | d | 125,711 | |
Puerto Rico, GO, Ser. A | | 0.00 | | 7/1/2033 | | 1,034,664 | d | 630,427 | |
Puerto Rico, GO, Ser. A1 | | 4.00 | | 7/1/2035 | | 722,684 | | 664,189 | |
Puerto Rico, GO, Ser. A1 | | 4.00 | | 7/1/2037 | | 620,253 | | 558,044 | |
Puerto Rico, GO, Ser. A1 | | 4.00 | | 7/1/2046 | | 877,029 | | 730,105 | |
Puerto Rico, GO, Ser. A1 | | 4.00 | | 7/1/2033 | | 803,995 | | 752,846 | |
Puerto Rico, GO, Ser. A1 | | 4.00 | | 7/1/2041 | | 843,308 | | 729,256 | |
Puerto Rico, GO, Ser. A1 | | 5.38 | | 7/1/2025 | | 895,428 | | 912,462 | |
Puerto Rico, GO, Ser. A1 | | 5.63 | | 7/1/2027 | | 887,317 | | 925,431 | |
Puerto Rico, GO, Ser. A1 | | 5.63 | | 7/1/2029 | | 872,922 | | 923,587 | |
Puerto Rico, GO, Ser. A1 | | 5.75 | | 7/1/2031 | | 847,862 | | 917,035 | |
Puerto Rico, Notes | | 2.28 | | 11/1/2051 | | 7,354,199 | f | 3,061,185 | |
Puerto Rico, Notes | | 2.64 | | 11/1/2043 | | 3,800,188 | f | 1,961,847 | |
Puerto Rico, Notes | | 2.98 | | 11/1/2051 | | 338,349 | f | 175,096 | |
Puerto Rico Commonwealth Aqueduct & Sewer Authority, Revenue Bonds, Refunding, Ser. A | | 5.00 | | 7/1/2035 | | 5,000,000 | a | 5,022,597 | |
Puerto Rico Commonwealth Aqueduct & Sewer Authority, Revenue Bonds, Refunding, Ser. A | | 5.00 | | 7/1/2047 | | 7,500,000 | a | 7,206,814 | |
Puerto Rico Commonwealth Aqueduct & Sewer Authority, Revenue Bonds, Refunding, Ser. A | | 5.00 | | 7/1/2030 | | 15,000,000 | a | 15,391,128 | |
Puerto Rico Electric Power Authority, Revenue Bonds, Refunding, Ser. DDD | | 5.00 | | 7/1/2022 | | 2,000,000 | c | 545,000 | |
Puerto Rico Electric Power Authority, Revenue Bonds, Ser. A | | 6.75 | | 7/1/2036 | | 10,000,000 | c | 2,750,000 | |
Puerto Rico GDB Debt Recovery Authority, Revenue Bonds | | 7.50 | | 8/20/2040 | | 3,872,399 | | 3,165,686 | |
Puerto Rico Highway & Transportation Authority, Revenue Bonds, Ser. A | | 5.00 | | 7/1/2062 | | 53,244 | | 52,512 | |
Puerto Rico Highway & Transportation Authority, Revenue Bonds, Ser. B | | 0.00 | | 7/1/2032 | | 34,602 | d | 22,275 | |
Puerto Rico Highway & Transportation Authority, Revenue Bonds, Ser. C | | 5.00 | | 7/1/2053 | | 59,190 | i | 37,512 | |
Puerto Rico Sales Tax Financing Corp., Revenue Bonds, Ser. A1 | | 0.00 | | 7/1/2031 | | 498,000 | d | 355,998 | |
Puerto Rico Sales Tax Financing Corp., Revenue Bonds, Ser. A1 | | 0.00 | | 7/1/2029 | | 387,000 | d | 302,779 | |
Puerto Rico Sales Tax Financing Corp., Revenue Bonds, Ser. A1 | | 0.00 | | 7/1/2033 | | 561,000 | d | 363,050 | |
Puerto Rico Sales Tax Financing Corp., Revenue Bonds, Ser. A1 | | 0.00 | | 7/1/2051 | | 4,350,000 | d | 899,091 | |
Puerto Rico Sales Tax Financing Corp., Revenue Bonds, Ser. A1 | | 0.00 | | 7/1/2046 | | 5,340,000 | d | 1,487,341 | |
Puerto Rico Sales Tax Financing Corp., Revenue Bonds, Ser. A1 | | 0.00 | | 7/1/2027 | | 397,000 | d | 339,827 | |
Puerto Rico Sales Tax Financing Corp., Revenue Bonds, Ser. A1 | | 0.00 | | 7/1/2024 | | 81,000 | d | 78,386 | |
Puerto Rico Sales Tax Financing Corp., Revenue Bonds, Ser. A1 | | 4.50 | | 7/1/2034 | | 4,311,000 | | 4,310,753 | |
Puerto Rico Sales Tax Financing Corp., Revenue Bonds, Ser. A1 | | 4.55 | | 7/1/2040 | | 208,000 | | 202,805 | |
Puerto Rico Sales Tax Financing Corp., Revenue Bonds, Ser. A1 | | 4.75 | | 7/1/2053 | | 1,526,000 | | 1,430,594 | |
Puerto Rico Sales Tax Financing Corp., Revenue Bonds, Ser. A1 | | 5.00 | | 7/1/2058 | | 8,783,000 | | 8,523,072 | |
Puerto Rico Sales Tax Financing Corp., Revenue Bonds, Ser. A2 | | 4.33 | | 7/1/2040 | | 2,112,000 | | 2,005,567 | |
Puerto Rico Sales Tax Financing Corp., Revenue Bonds, Ser. A2 | | 4.54 | | 7/1/2053 | | 63,000 | | 57,018 | |
Puerto Rico Sales Tax Financing Corp., Revenue Bonds, Ser. A2 | | 4.78 | | 7/1/2058 | | 847,000 | | 793,969 | |
Virgin Islands Public Finance Authority, Revenue Bonds, Ser. A | | 5.00 | | 10/1/2034 | | 1,500,000 | a | 1,301,130 | |
Virgin Islands Public Finance Authority, Revenue Bonds, Ser. A | | 5.00 | | 10/1/2029 | | 2,250,000 | a | 2,080,263 | |
| | 104,006,114 | |
Utah - 1.6% | | | | | |
Intermountain Power Agency, Revenue Bonds, Ser. A | | 5.00 | | 7/1/2042 | | 10,000,000 | | 10,806,316 | |
80
| | | | | | | | | | |
| |
BNY Mellon Municipal Opportunities Fund (continued) |
Description | Coupon
Rate (%) | | Maturity Date | | Principal Amount ($) | | Value ($) | |
Long-Term Municipal Investments - 100.8% (continued) | | | | | |
Utah - 1.6% (continued) | | | | | |
Intermountain Power Agency, Revenue Bonds, Ser. A | | 5.00 | | 7/1/2041 | | 5,000,000 | | 5,427,054 | |
Mida Mountain Village Public Infrastructure District, Special Assessment Bonds | | 4.00 | | 8/1/2050 | | 2,000,000 | a | 1,482,760 | |
Mida Mountain Village Public Infrastructure District, Special Assessment Bonds | | 4.00 | | 8/1/2030 | | 1,000,000 | a | 926,341 | |
Military Installation Development Authority, Revenue Bonds, Ser. A1 | | 4.00 | | 6/1/2052 | | 2,000,000 | | 1,470,311 | |
Military Installation Development Authority, Revenue Bonds, Ser. A1 | | 4.00 | | 6/1/2041 | | 1,500,000 | | 1,184,834 | |
Military Installation Development Authority, Revenue Bonds, Ser. A1 | | 4.00 | | 6/1/2036 | | 1,000,000 | | 840,993 | |
Military Installation Development Authority, Revenue Bonds, Ser. A2 | | 4.00 | | 6/1/2052 | | 2,250,000 | | 1,632,149 | |
Salt Lake City Airport, Revenue Bonds, Ser. A | | 5.25 | | 7/1/2048 | | 250,000 | | 263,117 | |
Utah Charter School Finance Authority, Revenue Bonds, Refunding (Summit Academy) Ser. A | | 5.00 | | 4/15/2044 | | 625,000 | | 633,421 | |
Utah Charter School Finance Authority, Revenue Bonds, Refunding (Summit Academy) Ser. A | | 5.00 | | 4/15/2049 | | 1,150,000 | | 1,158,506 | |
Utah County, Revenue Bonds (IHC Health Services Obligated Group) Ser. A | | 4.00 | | 5/15/2043 | | 2,750,000 | | 2,579,022 | |
Utah County, Revenue Bonds (IHC Health Services Obligated Group) Ser. A | | 5.00 | | 5/15/2050 | | 3,000,000 | | 3,093,150 | |
| | 31,497,974 | |
Vermont - .1% | | | | | |
Vermont Educational & Health Buildings Financing Agency, Revenue Bonds (Landmark College Project) (LOC; TD Bank NA) Ser. A | | 3.91 | | 7/1/2039 | | 2,775,000 | f | 2,775,000 | |
Virginia - 3.1% | | | | | |
Arlington County Industrial Development Authority, Revenue Bonds, Refunding (Virginia Hospital Center) | | 4.00 | | 7/1/2045 | | 5,000,000 | | 4,602,130 | |
Chesapeake Expressway, Revenue Bonds, Refunding, Ser. B | | 4.88 | | 7/15/2040 | | 2,000,000 | | 2,029,904 | |
Hampton Roads Transportation Accountability Commission, Revenue Bonds, Ser. A | | 4.00 | | 7/1/2052 | | 13,000,000 | | 12,083,194 | |
Richmond Public Utility, Revenue Bonds, Ser. A | | 4.00 | | 1/15/2050 | | 3,000,000 | | 2,830,562 | |
Roanoke County Economic Development Authority, Revenue Bonds, Refunding (Richfield Living Obligated Group) Ser. A | | 5.25 | | 9/1/2049 | | 10,000,000 | c | 6,000,006 | |
Virginia College Building Authority, Revenue Bonds (21st Century College) | | 5.25 | | 2/1/2042 | | 6,105,000 | | 6,814,754 | |
Virginia Port Authority Commonwealth Port Fund, Revenue Bonds, Ser. A | | 5.00 | | 7/1/2043 | | 3,500,000 | | 3,848,851 | |
Virginia Port Authority Commonwealth Port Fund, Revenue Bonds, Ser. A | | 5.00 | | 7/1/2042 | | 3,000,000 | | 3,305,614 | |
Virginia Small Business Financing Authority, Revenue Bonds (Transform 66 P3 Project) | | 5.00 | | 12/31/2052 | | 4,000,000 | | 3,987,504 | |
Virginia Small Business Financing Authority, Revenue Bonds (Transform 66 P3 Project) | | 5.00 | | 12/31/2049 | | 4,500,000 | | 4,507,427 | |
Virginia Small Business Financing Authority, Revenue Bonds, Refunding (95 Express Lanes) | | 4.00 | | 1/1/2048 | | 3,500,000 | | 3,028,209 | |
Virginia Small Business Financing Authority, Revenue Bonds, Refunding (Elizabeth River Crossings OpCo) | | 4.00 | | 1/1/2040 | | 1,000,000 | | 907,208 | |
Virginia Small Business Financing Authority, Revenue Bonds, Refunding (National Senior Campuses Obligated Group) Ser. A | | 4.00 | | 1/1/2036 | | 2,500,000 | | 2,372,716 | |
Virginia Small Business Financing Authority, Revenue Bonds, Refunding (National Senior Campuses Obligated Group) Ser. A | | 4.00 | | 1/1/2045 | | 3,000,000 | | 2,568,437 | |
Virginia Small Business Financing Authority, Revenue Bonds, Refunding (National Senior Campuses Obligated Group) Ser. A | | 4.00 | | 1/1/2051 | | 2,750,000 | | 2,258,991 | |
| | 61,145,507 | |
81
STATEMENT OF INVESTMENTS (continued)
| | | | | | | | | | |
| |
BNY Mellon Municipal Opportunities Fund (continued) |
Description | Coupon
Rate (%) | | Maturity Date | | Principal Amount ($) | | Value ($) | |
Long-Term Municipal Investments - 100.8% (continued) | | | | | |
Washington - 1.1% | | | | | |
Central Puget Sound Regional Transit Authority, Revenue Bonds, Refunding (Green Bond) Ser. S1 | | 3.00 | | 11/1/2036 | | 5,000,000 | | 4,459,113 | |
Washington, GO, Ser. A | | 5.00 | | 8/1/2040 | | 10,000,000 | | 11,028,045 | |
Washington Health Care Facilities Authority, Revenue Bonds, Refunding | | 4.00 | | 12/1/2045 | | 1,200,000 | a | 1,075,258 | |
Washington Health Care Facilities Authority, Revenue Bonds, Refunding | | 4.00 | | 12/1/2048 | | 1,000,000 | a | 885,743 | |
Washington Health Care Facilities Authority, Revenue Bonds, Refunding | | 4.00 | | 12/1/2040 | | 1,000,000 | a | 933,827 | |
Washington Health Care Facilities Authority, Revenue Bonds, Refunding | | 4.00 | | 9/1/2050 | | 1,000,000 | | 871,241 | |
Washington Health Care Facilities Authority, Revenue Bonds, Refunding | | 5.00 | | 9/1/2050 | | 1,500,000 | | 1,538,064 | |
| | 20,791,291 | |
West Virginia - .7% | | | | | |
Tender Option Bond Trust Receipts (Series 2022-XL0402), (West Virginia State, GO, Ser. B) Non-recourse, Underlying Coupon Rate (%) 5.00 | | 7.21 | | 6/1/2041 | | 10,000,000 | a,f,g | 10,478,550 | |
West Virginia Economic Development Authority, Revenue Bonds (Arch Resources) | | 5.00 | | 7/1/2025 | | 1,000,000 | b | 1,000,943 | |
West Virginia Hospital Finance Authority, Revenue Bonds, Refunding | | 5.00 | | 9/1/2039 | | 1,450,000 | | 1,448,413 | |
West Virginia Hospital Finance Authority, Revenue Bonds, Refunding | | 5.00 | | 9/1/2038 | | 1,500,000 | | 1,508,079 | |
| | 14,435,985 | |
Wisconsin - 1.7% | | | | | |
Public Finance Authority, Revenue Bonds (Maryland Proton Treatment Center) Ser. A1 | | 6.38 | | 1/1/2048 | | 2,500,000 | a | 1,537,500 | |
Public Finance Authority, Revenue Bonds (Piedmont Community Charter School) | | 5.00 | | 6/15/2049 | | 3,440,000 | | 3,205,641 | |
Public Finance Authority, Revenue Bonds (Piedmont Community Charter School) | | 5.00 | | 6/15/2053 | | 1,000,000 | | 920,178 | |
Public Finance Authority, Revenue Bonds (Sky Harbour Capital Obligated Group) | | 4.25 | | 7/1/2054 | | 2,500,000 | | 1,722,473 | |
Public Finance Authority, Revenue Bonds, Refunding (Friends Homes Obligated Group) | | 5.00 | | 9/1/2039 | | 2,230,000 | a | 2,050,054 | |
Public Finance Authority, Revenue Bonds, Refunding (Nevada State College) Ser. A | | 5.00 | | 5/1/2060 | | 3,925,000 | a | 3,365,916 | |
Public Finance Authority, Revenue Bonds, Refunding (Nevada State College) Ser. B | | 9.00 | | 5/1/2071 | | 1,815,000 | a | 1,833,618 | |
Public Finance Authority, Revenue Bonds, Refunding (Renown Regional Medical Center) | | 4.00 | | 6/1/2045 | | 6,515,000 | | 5,777,708 | |
Public Finance Authority, Revenue Bonds, Ser. A | | 5.00 | | 2/1/2062 | | 2,500,000 | | 2,323,258 | |
Wisconsin Center District, Revenue Bonds (Insured; Assured Guaranty Municipal Corp.) Ser. A | | 0.00 | | 12/15/2046 | | 3,990,000 | d | 1,324,787 | |
Wisconsin Center District, Revenue Bonds (Insured; Assured Guaranty Municipal Corp.) Ser. A | | 0.00 | | 12/15/2044 | | 8,735,000 | d | 3,208,482 | |
Wisconsin Health & Educational Facilities Authority, Revenue Bonds, Refunding (Marshfield Clinic Health System Obligated Group) Ser. C | | 5.00 | | 2/15/2047 | | 4,500,000 | | 4,138,458 | |
82
| | | | | | | | | | |
| |
BNY Mellon Municipal Opportunities Fund (continued) |
Description | Coupon
Rate (%) | | Maturity Date | | Principal Amount ($) | | Value ($) | |
Long-Term Municipal Investments - 100.8% (continued) | | | | | |
Wisconsin - 1.7% (continued) | | | | | |
Wisconsin Health & Educational Facilities Authority, Revenue Bonds, Refunding (Medical College of Wisconsin) (LOC; TD Bank NA) Ser. B | | 3.93 | | 12/1/2033 | | 3,000,000 | f | 3,000,000 | |
| | 34,408,073 | |
Total Long-Term Municipal Investments
(cost $2,130,351,219) | | 1,985,171,838 | |
Total Investments (cost $2,152,851,219) | | 101.7% | 2,002,354,045 | |
Liabilities, Less Cash and Receivables | | (1.7%) | (32,542,555) | |
Net Assets | | 100.0% | 1,969,811,490 | |
a Security exempt from registration pursuant to Rule 144A under the Securities Act of 1933. These securities may be resold in transactions exempt from registration, normally to qualified institutional buyers. At August 31, 2023, these securities were valued at $297,789,805 or 15.12% of net assets.
b These securities have a put feature; the date shown represents the put date and the bond holder can take a specific action to retain the bond after the put date.
c Non-income producing—security in default.
d Security issued with a zero coupon. Income is recognized through the accretion of discount.
e Variable rate security—interest rate resets periodically and rate shown is the interest rate in effect at period end. Security description also includes the reference rate and spread if published and available.
f The Variable Rate is determined by the Remarketing Agent in its sole discretion based on prevailing market conditions and may, but need not, be established by reference to one or more financial indices.
g Collateral for floating rate borrowings. The coupon rate given represents the current interest rate for the inverse floating rate security.
h These securities are prerefunded; the date shown represents the prerefunded date. Bonds which are prerefunded are collateralized by U.S. Government securities which are held in escrow and are used to pay principal and interest on the municipal issue and to retire the bonds in full at the earliest refunding date.
i Zero coupon until a specified date at which time the stated coupon rate becomes effective until maturity.
| | |
Portfolio Summary (Unaudited) † | Value (%) |
General | 17.5 |
Education | 14.5 |
General Obligation | 11.0 |
Transportation | 9.4 |
Development | 8.5 |
Medical | 7.5 |
Airport | 6.3 |
Water | 6.2 |
Housing | 3.4 |
School District | 3.3 |
Tobacco Settlement | 3.0 |
Power | 2.7 |
Nursing Homes | 2.6 |
Multifamily Housing | 1.7 |
Prerefunded | 1.5 |
Utilities | 1.3 |
Single Family Housing | .8 |
Pollution | .3 |
Special Tax | .2 |
Facilities | .0 |
| | 101.7 |
† Based on net assets.
See notes to financial statements.
83
STATEMENT OF INVESTMENTS (continued)
| | | | | | | | | | | | |
BNY Mellon Municipal Opportunities Fund | |
Futures | | | |
Description | Number of
Contracts | Expiration | Notional
Value($) | Market
Value ($) | Unrealized
(Depreciation) ($) | |
Futures Short | | |
U.S. Treasury Long Bond | 300 | 12/19/2023 | 36,032,067 | 36,506,250 | (474,183) | |
U.S. Treasury Ultra Long Bond | 500 | 12/19/2023 | 63,758,115 | 64,734,375 | (976,260) | |
Ultra 10 Year U.S. Treasury Notes | 575 | 12/19/2023 | 66,090,713 | 66,762,894 | (672,181) | |
Gross Unrealized Depreciation | | (2,122,624) | |
See notes to financial statements.
84
| | | | |
| |
Summary of Abbreviations (Unaudited) |
| |
ABAG | Association of Bay Area Governments | AGC | ACE Guaranty Corporation |
AGIC | Asset Guaranty Insurance Company | AMBAC | American Municipal Bond Assurance Corporation |
BAN | Bond Anticipation Notes | BSBY | Bloomberg Short-Term Bank Yield Index |
CIFG | CDC Ixis Financial Guaranty | COP | Certificate of Participation |
CP | Commercial Paper | DRIVERS | Derivative Inverse Tax-Exempt Receipts |
EFFR | Effective Federal Funds Rate | FGIC | Financial Guaranty Insurance Company |
FHA | Federal Housing Administration | FHLB | Federal Home Loan Bank |
FHLMC | Federal Home Loan Mortgage Corporation | FNMA | Federal National Mortgage Association |
GAN | Grant Anticipation Notes | GIC | Guaranteed Investment Contract |
GNMA | Government National Mortgage Association | GO | General Obligation |
IDC | Industrial Development Corporation | LIBOR | London Interbank Offered Rate |
LOC | Letter of Credit | LR | Lease Revenue |
NAN | Note Anticipation Notes | MFHR | Multi-Family Housing Revenue |
MFMR | Multi-Family Mortgage Revenue | MUNIPSA | Securities Industry and Financial Markets Association Municipal Swap Index Yield |
OBFR | Overnight Bank Funding Rate | PILOT | Payment in Lieu of Taxes |
PRIME | Prime Lending Rate | PUTTERS | Puttable Tax-Exempt Receipts |
RAC | Revenue Anticipation Certificates | RAN | Revenue Anticipation Notes |
RIB | Residual Interest Bonds | SFHR | Single Family Housing Revenue |
SFMR | Single Family Mortgage Revenue | SOFR | Secured Overnight Financing Rate |
TAN | Tax Anticipation Notes | TRAN | Tax and Revenue Anticipation Notes |
TSFR | Term Secured Overnight
Financing Rate | U.S. T-BILL | U.S. Treasury Bill Money Market Yield |
XLCA | XL Capital Assurance | | |
| | | | |
See notes to financial statements.
85
STATEMENTS OF ASSETS AND LIABILITIES
August 31, 2023
| | | | | | | | | | | | | |
| | | | | | | | | | | | |
| | | | BNY Mellon National Intermediate Municipal Bond Fund | | BNY Mellon National Short-Term Municipal Bond Fund | | BNY Mellon Pennsylvania Intermediate Municipal Bond Fund | | BNY Mellon Massachusetts Intermediate Municipal Bond Fund | | |
Assets ($): | | | | | | | | | | | | |
Investments in securities—See Statements
of Investments† | | | | 1,917,026,466 | | 473,952,091 | | 85,715,476 | | 180,642,251 | | |
Interest receivable | | | | 20,266,731 | | 4,150,842 | | 1,076,972 | | 1,869,026 | | |
Receivable for shares of Beneficial
Interest subscribed | | | | 8,485,980 | | 1,560,000 | | - | | 560,333 | | |
Cash collateral held by broker—Note 4 | | | | 713,600 | | - | | 22,400 | | 44,800 | | |
Prepaid expenses | | | | 49,454 | | 30,662 | | 25,250 | | 24,416 | | |
| | | | 1,946,542,231 | | 479,693,595 | | 86,840,098 | | 183,140,826 | | |
Liabilities ($): | | | | | | | | | | | | |
Due to BNY Mellon Investment Adviser, Inc.
and affiliates—Note 3(b) | | | | 813,357 | | 168,118 | | 39,863 | | 81,668 | | |
Cash overdraft due to Custodian | | | | 353,019 | | 604,609 | | 98,082 | | 244,131 | | |
Payable for investment securities purchased | | | | 30,816,937 | | 7,394,323 | | 736,210 | | 1,333,390 | | |
Payable for shares of Beneficial
Interest redeemed | | | | 3,684,776 | | 794,021 | | 813,380 | | 865,196 | | |
Payable for futures
variation margin—Note 4 | | | | 64,813 | | - | | 2,000 | | 4,000 | | |
Trustees’ fees and expenses payable | | | | 34,479 | | 15,575 | | 2,785 | | 5,256 | | |
Other accrued expenses | | | | 84,073 | | 40,775 | | 26,514 | | 35,575 | | |
| | | | 35,851,454 | | 9,017,421 | | 1,718,834 | | 2,569,216 | | |
Net Assets ($) | | | | 1,910,690,777 | | 470,676,174 | | 85,121,264 | | 180,571,610 | | |
Composition of Net Assets ($): | | | | | | | | | | | | |
Paid-in capital | | | | 2,037,643,831 | | 496,777,105 | | 90,730,983 | | 195,397,075 | | |
Total distributable earnings (loss) | | | | (126,953,054) | | (26,100,931) | | (5,609,719) | | (14,825,465) | | |
Net Assets ($) | | | | 1,910,690,777 | | 470,676,174 | | 85,121,264 | | 180,571,610 | | |
† Investments at cost ($) | | | | 1,995,909,308 | | 488,625,340 | | 89,739,399 | | 189,735,300 | | |
Net Asset Value Per Share | | | | | | | | | | | | |
Class M | | | | | | | | | | | | |
Net Assets ($) | | | | 1,861,356,074 | | 454,866,300 | | 80,208,250 | | 172,978,161 | | |
Shares Outstanding | | | | 146,535,184 | | 36,645,350 | | 7,108,062 | | 14,434,767 | | |
Net Asset Value Per Share ($) | | | | 12.70 | | 12.41 | | 11.28 | | 11.98 | | |
Investor Shares | | | | | | | | | | | | |
Net Assets ($) | | | | 49,334,703 | | 15,809,874 | | 4,913,014 | | 7,593,449 | | |
Shares Outstanding | | | | 3,888,656 | | 1,274,597 | | 435,954 | | 633,891 | | |
Net Asset Value Per Share ($) | | | | 12.69 | | 12.40 | | 11.27 | | 11.98 | | |
| | | | | | | | | | | | |
See notes to financial statements. | | | | | | | | | | | | |
86
| | | | | | | | | |
| | | | | | | | |
| | | | BNY Mellon New York Intermediate
Tax-Exempt Bond Fund | | BNY Mellon Municipal
Opportunities Fund | | |
Assets ($): | | | | | | | | |
Investments in securities—See Statements
of Investments† | | | | 105,955,445 | | 2,002,354,045 | | |
Interest receivable | | | | 1,160,425 | | 20,680,203 | | |
Receivable for shares of Beneficial
Interest subscribed | | | | 928,076 | | 6,468,011 | | |
Cash collateral held by broker—Note 4 | | | | 25,200 | | 5,780,000 | | |
Prepaid expenses | | | | 20,415 | | 57,615 | | |
| | | | 108,089,561 | | 2,035,339,874 | | |
Liabilities ($): | | | | | | | | |
Due to BNY Mellon Investment Adviser, Inc.
and affiliates—Note 3(b) | | | | 47,464 | | 1,088,341 | | |
Cash overdraft due to Custodian | | | | 148,899 | | 3,960,329 | | |
Payable for shares of Beneficial
Interest redeemed | | | | 28,559 | | 2,469,850 | | |
Trustees’ fees and expenses payable | | | | 3,464 | | 53,415 | | |
Payable for futures
variation margin—Note 4 | | | | 2,250 | | 556,250 | | |
Payable for inverse floater rate notes issued—Note 4 | | | | - | | 53,100,000 | | |
Payable for investment securities purchased | | | | - | | 3,865,265 | | |
Interest and expense payable related to
inverse floater notes issued—Note 4 | | | | - | | 342,201 | | |
Other accrued expenses | | | | 33,955 | | 92,733 | | |
| | | | 264,591 | | 65,528,384 | | |
Net Assets ($) | | | | 107,824,970 | | 1,969,811,490 | | |
Composition of Net Assets ($): | | | | | | | | |
Paid-in capital | | | | 116,763,566 | | 2,150,677,579 | | |
Total distributable earnings (loss) | | | | (8,938,596) | | (180,866,089) | | |
Net Assets ($) | | | | 107,824,970 | | 1,969,811,490 | | |
† Investments at cost ($) | | | | 111,289,235 | | 2,152,851,219 | | |
Net Asset Value Per Share | | | | | | | | |
Class M | | | | | | | | |
Net Assets ($) | | | | 99,203,491 | | 1,916,776,704 | | |
Shares Outstanding | | | | 9,725,322 | | 159,332,647 | | |
Net Asset Value Per Share ($) | | | | 10.20 | | 12.03 | | |
Investor Shares | | | | | | | | |
Net Assets ($) | | | | 8,621,479 | | 53,034,786 | | |
Shares Outstanding | | | | 844,776 | | 4,406,699 | | |
Net Asset Value Per Share ($) | | | | 10.21 | | 12.04 | | |
| | | | | | | | |
See notes to financial statements. | | | | | | | | |
87
STATEMENTS OF OPERATIONS
Year Ended August 31, 2023
| | | | | | | | | | | | | |
| | | | | | | | | | | | |
| | | | | BNY Mellon National Intermediate Municipal Bond Fund | | BNY Mellon National Short-Term Municipal Bond Fund | | BNY Mellon Pennsylvania Intermediate Municipal Bond Fund | | BNY Mellon Massachusetts Intermediate Municipal Bond Fund | |
Investment Income ($): | | | | | | | | | | |
Interest Income | | | 57,324,471 | | 12,698,012 | | 2,679,648 | | 5,426,252 | |
Expenses: | | | | | | | | | | |
Management fee—Note 3(a) | | | 6,626,781 | | 2,210,118 | | 457,775 | | 660,530 | |
Administration fee—Note 3(a) | | | 2,559,950 | | 852,606 | | 123,744 | | 254,914 | |
Trustees’ fees and expenses—Note 3(c) | | | 223,311 | | 76,620 | | 11,005 | | 20,935 | |
Shareholder servicing costs—Note 3(b) | | | 131,807 | | 47,385 | | 12,540 | | 23,326 | |
Professional fees | | | 112,912 | | 64,059 | | 45,103 | | 56,115 | |
Registration fees | | | 72,835 | | 51,609 | | 31,447 | | 33,132 | |
Loan commitment fees—Note 2 | | | 47,766 | | 16,103 | | 2,129 | | 4,319 | |
Custodian fees—Note 3(b) | | | 35,726 | | 21,326 | | 5,128 | | 10,003 | |
Prospectus and shareholders’ reports | | | 21,385 | | 15,914 | | 13,255 | | 12,406 | |
Chief Compliance Officer fees—Note 3(b) | | | 19,196 | | 19,196 | | 19,196 | | 19,196 | |
Miscellaneous | | | 96,178 | | 48,160 | | 16,850 | | 21,431 | |
Total Expenses | | | 9,947,847 | | 3,423,096 | | 738,172 | | 1,116,307 | |
Less—reduction in expenses due to undertakings—Note 3(a) | | | - | | (582,665) | | (183,304) | | - | |
Less—reduction in fees due to earnings credits—Note 3(b) | | | (25,938) | | (18,344) | | (3,284) | | (8,080) | |
Net Expenses | | | 9,921,909 | | 2,822,087 | | 551,584 | | 1,108,227 | |
Net Investment Income | | | 47,402,562 | | 9,875,925 | | 2,128,064 | | 4,318,025 | |
Realized and Unrealized Gain (Loss)
on Investments—Note 4 ($): | | | | | | | | |
Net realized gain (loss) on investments | (28,023,819) | | (8,042,674) | | (658,364) | | (3,577,254) | |
Net realized gain (loss) on futures | | | 7,591,593 | | - | | 362,492 | | 823,407 | |
Net Realized Gain (Loss) | | | (20,432,226) | | (8,042,674) | | (295,872) | | (2,753,847) | |
Net change in unrealized appreciation (depreciation)
on investments | | | 5,830,047 | | 7,443,247 | | (436,522) | | 1,268,795 | |
Net change in unrealized appreciation (depreciation)
on futures | | | (1,043,435) | | - | | (49,066) | | (110,935) | |
Net Change in Unrealized Appreciation (Depreciation) | | | 4,786,612 | | 7,443,247 | | (485,588) | | 1,157,860 | |
Net Realized and Unrealized Gain (Loss) on Investments | | | (15,645,614) | | (599,427) | | (781,460) | | (1,595,987) | |
Net Increase in Net Assets Resulting from Operations | | 31,756,948 | | 9,276,498 | | 1,346,604 | | 2,722,038 | |
| | | | | | | | | | | | |
See notes to financial statements. | | | | | | | | | | | |
88
| | | | | | | | | |
| | | | | | | | |
| | | | | BNY Mellon New York Intermediate
Tax-Exempt Bond Fund | | BNY Mellon Municipal
Opportunities Fund | |
Investment Income ($): | | | | | | |
Interest Income | | | 3,167,394 | | 77,312,797 | |
Expenses: | | | | | | |
Management fee—Note 3(a) | | | 545,909 | | 9,196,834 | |
Administration fee—Note 3(a) | | | 147,580 | | 2,487,291 | |
Professional fees | | | 46,960 | | 110,978 | |
Registration fees | | | 32,000 | | 74,281 | |
Shareholder servicing costs—Note 3(b) | | | 22,629 | | 156,335 | |
Chief Compliance Officer fees—Note 3(b) | | | 19,196 | | 19,196 | |
Trustees’ fees and expenses—Note 3(c) | | | 13,127 | | 215,727 | |
Prospectus and shareholders’ reports | | | 12,394 | | 22,667 | |
Custodian fees—Note 3(b) | | | 7,033 | | 38,411 | |
Loan commitment fees—Note 2 | | | 2,699 | | 43,879 | |
Interest and expense related to inverse floater notes issued—Note 4 | | | - | | 1,535,273 | |
Miscellaneous | | | 24,730 | | 118,005 | |
Total Expenses | | | 874,257 | | 14,018,877 | |
Less—reduction in expenses due to undertakings—Note 3(a) | | | (204,922) | | - | |
Less—reduction in fees due to earnings credits—Note 3(b) | | | (4,254) | | (36,406) | |
Net Expenses | | | 665,081 | | 13,982,471 | |
Net Investment Income | | | 2,502,313 | | 63,330,326 | |
Realized and Unrealized Gain (Loss)
on Investments—Note 4 ($): | | | | |
Net realized gain (loss) on investments | (1,541,016) | | (34,211,896) | |
Net realized gain (loss) on futures | | | 395,110 | | 32,191,934 | |
Net Realized Gain (Loss) | | | (1,145,906) | | (2,019,962) | |
Net change in unrealized appreciation (depreciation)
on investments | | | 800,391 | | (24,335,050) | |
Net change in unrealized appreciation (depreciation)
on futures | | | (52,325) | | (3,743,790) | |
Net Change in Unrealized Appreciation (Depreciation) | | | 748,066 | | (28,078,840) | |
Net Realized and Unrealized Gain (Loss) on Investments | | | (397,840) | | (30,098,802) | |
Net Increase in Net Assets Resulting from Operations | | 2,104,473 | | 33,231,524 | |
| | | | | | | | |
See notes to financial statements. | | | | | | | |
89
STATEMENTS OF CHANGES IN NET ASSETS
| | | | | | | | | | | | | | | | |
| | | | BNY Mellon National Intermediate
Municipal Bond Fund | | BNY Mellon National Short-Term
Municipal Bond Fund | |
| | | | Year Ended August 31, | Year Ended August 31, |
| | | | 2023 | | | | 2022 | | 2023 | | | | 2022 | |
Operations ($): | | | | | | | | | | | | | | |
Net investment income | | | 47,402,562 | | | | 52,362,336 | | 9,875,925 | | | | 9,017,686 | |
Net realized gain (loss) on investments | | (20,432,226) | | | | (27,636,419) | | (8,042,674) | | | | (3,460,771) | |
Net change in unrealized appreciation
(depreciation) on investments | | 4,786,612 | | | | (260,732,071) | | 7,443,247 | | | | (33,322,767) | |
Net Increase (Decrease) in Net Assets
Resulting from Operations | 31,756,948 | | | | (236,006,154) | | 9,276,498 | | | | (27,765,852) | |
Distributions ($): | | | | | | | | | | | | | | |
Distributions to shareholders: | | | | | | | | | | | | | | |
Class M | | | (45,891,692) | | | | (64,229,087) | | (9,501,728) | | | | (8,783,825) | |
Investor Shares | | | (1,182,263) | | | | (1,871,289) | | (250,932) | | | | (155,445) | |
Total Distributions | | | (47,073,955) | | | | (66,100,376) | | (9,752,660) | | | | (8,939,270) | |
Beneficial Interest Transactions ($): | | | | | | | | | | | | | | |
Net proceeds from shares sold: | | | | | | | | | | | | | | |
Class M | | | 890,450,284 | | | | 788,877,298 | | 207,572,625 | | | | 443,993,068 | |
Investor Shares | | | 34,515,797 | | | | 63,530,113 | | 14,486,708 | | | | 21,528,902 | |
Distributions reinvested: | | | | | | | | | | | | | | |
Class M | | | 4,664,543 | | | | 10,552,823 | | 1,185,298 | | | | 1,197,389 | |
Investor Shares | | | 981,213 | | | | 1,508,002 | | 191,306 | | | | 129,214 | |
Cost of shares redeemed: | | | | | | | | | | | | | | |
Class M | | | (1,182,562,586) | | | | (1,083,271,304) | | (631,068,258) | | | | (425,650,104) | |
Investor Shares | | | (46,663,957) | | | | (89,816,298) | | (19,366,276) | | | | (19,103,575) | |
Increase (Decrease) in Net Assets
from Beneficial Interest Transactions | (298,614,706) | | | | (308,619,366) | | (426,998,597) | | | | 22,094,894 | |
Total Increase (Decrease) in Net Assets | (313,931,713) | | | | (610,725,896) | | (427,474,759) | | | | (14,610,228) | |
Net Assets ($): | | | | | | | | | | | | | | |
Beginning of Period | | | 2,224,622,490 | | | | 2,835,348,386 | | 898,150,933 | | | | 912,761,161 | |
End of Period | | | 1,910,690,777 | | | | 2,224,622,490 | | 470,676,174 | | | | 898,150,933 | |
Capital Share Transactions (Shares): | | | | | | | | | | | | | | |
Class Ma | | | | | | | | | | | | | | |
Shares sold | | | 69,827,030 | | | | 59,264,067 | | 16,803,149 | | | | 35,404,594 | |
Shares issued for distributions reinvested | | | 366,729 | | | | 770,995 | | 95,767 | | | | 94,775 | |
Shares redeemed | | | (93,438,719) | | | | (82,774,877) | | (51,054,883) | | | | (33,778,890) | |
Net Increase (Decrease) in
Shares Outstanding | (23,244,960) | | | | (22,739,815) | | (34,155,967) | | | | 1,720,479 | |
Investor Sharesa | | | | | | | | | | | | | | |
Shares sold | | | 2,709,823 | | | | 4,771,756 | | 1,172,547 | | | | 1,704,720 | |
Shares issued for distributions reinvested | | | 77,177 | | | | 111,464 | | 15,458 | | | | 10,244 | |
Shares redeemed | | | (3,669,309) | | | | (6,793,068) | | (1,565,581) | | | | (1,511,334) | |
Net Increase (Decrease) in
Shares Outstanding | (882,309) | | | | (1,909,848) | | (377,576) | | | | 203,630 | |
| | | | | | | | | | | | | | | |
a | During the period ended August 31, 2023, 2,686,071 Class M shares representing $34,268,783 were exchanged for 2,689,496 Investor shares for BNY Mellon National Intermediate Municipal Bond Fund and 1,176,797 Class M shares representing $14,549,098 were exchanged for 1,177,620 Investor shares for BNY Mellon National Short-Term Municipal Bond Fund. During the period ended August 31, 2022, 4,743,231 Class M shares representing $63,198,071 were exchanged for 4,749,005 Investor shares for BNY Mellon National Intermediate Municipal Bond Fund and 1,664,401 Class M shares representing $21,029,260 were exchanged for 1,665,563 Investor shares for BNY Mellon National Short-Term Municipal Bond Fund. |
See notes to financial statements. | | | | | | | | | | | | | | |
90
| | | | | | | | | | | | | | | | |
| | | | BNY Mellon Pennsylvania
Intermediate Municipal Bond Fund | | BNY Mellon Massachusetts
Intermediate Municipal Bond Fund | |
| | | | Year Ended August 31, | Year Ended August 31, |
| | | | 2023 | | | | 2022 | | 2023 | | | | 2022 | |
Operations ($): | | | | | | | | | | | | | | |
Net investment income | | | 2,128,064 | | | | 3,082,141 | | 4,318,025 | | | | 6,288,944 | |
Net realized gain (loss) on investments | | (295,872) | | | | (819,983) | | (2,753,847) | | | | (2,977,204) | |
Net change in unrealized appreciation
(depreciation) on investments | | (485,588) | | | | (15,804,762) | | 1,157,860 | | | | (30,218,000) | |
Net Increase (Decrease) in Net Assets
Resulting from Operations | 1,346,604 | | | | (13,542,604) | | 2,722,038 | | | | (26,906,260) | |
Distributions ($): | | | | | | | | | | | | | | |
Distributions to shareholders: | | | | | | | | | | | | | | |
Class M | | | (1,996,837) | | | | (4,288,634) | | (4,160,777) | | | | (6,160,429) | |
Investor Shares | | | (103,122) | | | | (219,289) | | (192,029) | | | | (239,722) | |
Total Distributions | | | (2,099,959) | | | | (4,507,923) | | (4,352,806) | | | | (6,400,151) | |
Beneficial Interest Transactions ($): | | | | | | | | | | | | | | |
Net proceeds from shares sold: | | | | | | | | | | | | | | |
Class M | | | 27,164,451 | | | | 24,149,461 | | 90,049,738 | | | | 96,122,964 | |
Investor Shares | | | 1,257,019 | | | | 2,308,154 | | 4,437,819 | | | | 14,245,882 | |
Distributions reinvested: | | | | | | | | | | | | | | |
Class M | | | 99,202 | | | | 631,940 | | 533,547 | | | | 765,471 | |
Investor Shares | | | 95,466 | | | | 170,844 | | 162,304 | | | | 196,542 | |
Cost of shares redeemed: | | | | | | | | | | | | | | |
Class M | | | (55,709,358) | | | | (84,513,113) | | (169,708,732) | | | | (153,388,964) | |
Investor Shares | | | (2,106,294) | | | | (5,026,387) | | (7,201,632) | | | | (14,321,762) | |
Increase (Decrease) in Net Assets
from Beneficial Interest Transactions | (29,199,514) | | | | (62,279,101) | | (81,726,956) | | | | (56,379,867) | |
Total Increase (Decrease) in Net Assets | (29,952,869) | | | | (80,329,628) | | (83,357,724) | | | | (89,686,278) | |
Net Assets ($): | | | | | | | | | | | | | | |
Beginning of Period | | | 115,074,133 | | | | 195,403,761 | | 263,929,334 | | | | 353,615,612 | |
End of Period | | | 85,121,264 | | | | 115,074,133 | | 180,571,610 | | | | 263,929,334 | |
Capital Share Transactions (Shares): | | | | | | | | | | | | | | |
Class Ma | | | | | | | | | | | | | | |
Shares sold | | | 2,396,933 | | | | 2,044,063 | | 7,503,675 | | | | 7,731,415 | |
Shares issued for distributions reinvested | | | 8,796 | | | | 51,183 | | 44,603 | | | | 60,929 | |
Shares redeemed | | | (4,958,438) | | | | (7,108,747) | | (14,271,814) | | | | (12,444,981) | |
Net Increase (Decrease) in
Shares Outstanding | (2,552,709) | | | | (5,013,501) | | (6,723,536) | | | | (4,652,637) | |
Investor Sharesa | | | | | | | | | | | | | | |
Shares sold | | | 110,460 | | | | 193,166 | | 369,326 | | | | 1,115,928 | |
Shares issued for distributions reinvested | | | 8,460 | | | | 14,131 | | 13,551 | | | | 15,684 | |
Shares redeemed | | | (186,910) | | | | (430,787) | | (598,603) | | | | (1,163,922) | |
Net Increase (Decrease) in
Shares Outstanding | (67,990) | | | | (223,490) | | (215,726) | | | | (32,310) | |
| | | | | | | | | | | | | | | |
a | During the period ended August 31, 2023, 76,414 Class M shares representing $866,426 were exchanged for 76,523 Investor shares for BNY Mellon Pennsylvania Intermediate Municipal Bond Fund and 368,266 Class M shares representing $4,426,906 were exchanged for 368,412 Investor shares for BNY Mellon Massachusetts Intermediate Municipal Bond Fund. During the period ended August 31, 2022, 175,572 Class M shares representing $2,098,861 were exchanged for 175,796 Investor shares for BNY Mellon Pennsylvania Intermediate Municipal Bond Fund and 1,090,110 Class M shares representing $13,872,558 were exchanged for 1,090,507 Investor shares for BNY Mellon Massachusetts Intermediate Municipal Bond Fund. |
See notes to financial statements. | | | | | | | | | | | | | | |
91
STATEMENTS OF CHANGES IN NET ASSETS (continued)
| | | | | | | | | | | | | | | | |
| | | | BNY Mellon New York Intermediate
Tax-Exempt Bond Fund | | BNY Mellon Municipal
Opportunities Fund | |
| | | | Year Ended August 31, | Year Ended August 31, |
| | | | 2023 | | | | 2022 | | 2023 | | | | 2022 | |
Operations ($): | | | | | | | | | | | | | | |
Net investment income | | | 2,502,313 | | | | 2,710,933 | | 63,330,326 | | | | 67,329,436 | |
Net realized gain (loss) on investments | | (1,145,906) | | | | (2,211,604) | | (2,019,962) | | | | (6,587,139) | |
Net change in unrealized appreciation
(depreciation) on investments | | 748,066 | | | | (14,858,113) | | (28,078,840) | | | | (342,991,809) | |
Net Increase (Decrease) in Net Assets
Resulting from Operations | 2,104,473 | | | | (14,358,784) | | 33,231,524 | | | | (282,249,512) | |
Distributions ($): | | | | | | | | | | | | | | |
Distributions to shareholders: | | | | | | | | | | | | | | |
Class M | | | (2,310,284) | | | | (4,144,533) | | (79,516,826) | | | | (68,188,647) | |
Investor Shares | | | (184,932) | | | | (284,882) | | (2,761,398) | | | | (2,494,638) | |
Total Distributions | | | (2,495,216) | | | | (4,429,415) | | (82,278,224) | | | | (70,683,285) | |
Beneficial Interest Transactions ($): | | | | | | | | | | | | | | |
Net proceeds from shares sold: | | | | | | | | | | | | | | |
Class M | | | 41,292,625 | | | | 31,147,086 | | 818,904,327 | | | | 485,528,022 | |
Investor Shares | | | 291,189 | | | | 744,452 | | 39,295,929 | | | | 66,985,321 | |
Distributions reinvested: | | | | | | | | | | | | | | |
Class M | | | 333,577 | | | | 1,000,427 | | 21,093,576 | | | | 16,386,132 | |
Investor Shares | | | 172,305 | | | | 268,625 | | 2,347,675 | | | | 2,092,723 | |
Cost of shares redeemed: | | | | | | | | | | | | | | |
Class M | | | (54,826,532) | | | | (54,102,630) | | (926,871,982) | | | | (680,330,217) | |
Investor Shares | | | (1,277,338) | | | | (1,670,993) | | (62,787,392) | | | | (82,915,701) | |
Increase (Decrease) in Net Assets
from Beneficial Interest Transactions | (14,014,174) | | | | (22,613,033) | | (108,017,867) | | | | (192,253,720) | |
Total Increase (Decrease) in Net Assets | (14,404,917) | | | | (41,401,232) | | (157,064,567) | | | | (545,186,517) | |
Net Assets ($): | | | | | | | | | | | | | | |
Beginning of Period | | | 122,229,887 | | | | 163,631,119 | | 2,126,876,057 | | | | 2,672,062,574 | |
End of Period | | | 107,824,970 | | | | 122,229,887 | | 1,969,811,490 | | | | 2,126,876,057 | |
Capital Share Transactions (Shares): | | | | | | | | | | | | | | |
Class Ma | | | | | | | | | | | | | | |
Shares sold | | | 4,056,740 | | | | 2,909,139 | | 67,396,392 | | | | 36,998,758 | |
Shares issued for distributions reinvested | | | 32,712 | | | | 90,039 | | 1,748,833 | | | | 1,244,028 | |
Shares redeemed | | | (5,401,366) | | | | (5,176,802) | | (76,852,149) | | | | (53,364,116) | |
Net Increase (Decrease) in
Shares Outstanding | (1,311,914) | | | | (2,177,624) | | (7,706,924) | | | | (15,121,330) | |
Investor Sharesa | | | | | | | | | | | | | | |
Shares sold | | | 28,290 | | | | 67,052 | | 3,248,669 | | | | 5,072,526 | |
Shares issued for distributions reinvested | | | 16,865 | | | | 24,456 | | 194,533 | | | | 158,779 | |
Shares redeemed | | | (124,584) | | | | (154,920) | | (5,188,410) | | | | (6,388,866) | |
Net Increase (Decrease) in
Shares Outstanding | (79,429) | | | | (63,412) | | (1,745,208) | | | | (1,157,561) | |
| | | | | | | | | | | | | | | |
a | During the period ended August 31, 2023, 27,699 Class M shares representing $284,948 were exchanged for 27,687 Investor shares for BNY Mellon New York Intermediate Tax-Exempt Bond Fund and 2,763,511 Class M shares representing $33,405,943 were exchanged for 2,762,653 Investor shares for BNY Mellon Municipal Opportunities Fund. During the period ended August 31, 2022, 65,399 Class M shares representing $726,317 were exchanged for 65,361 Investor shares for BNY Mellon New York Intermediate Tax-Exempt Bond Fund and 4,358,685 Class M shares representing $57,315,643 were exchanged for 4,356,476 Investor shares for BNY Mellon Municipal Opportunities Fund. |
See notes to financial statements. | | | | | | | | | | | | | | |
92
FINANCIAL HIGHLIGHTS
The following tables describe the performance for each share class of each fund for the fiscal periods indicated. All information (except portfolio turnover rate) reflects financial results for a single fund share. Net asset value total return is calculated assuming an initial investment made at the net asset value at the beginning of the period, reinvestment of all dividends and distributions at net asset value during the period, and redemption at net asset value on the last day of the period. Net asset value total return includes adjustments in accordance with accounting principles generally accepted in the United States of America and as such, the net asset value for financial reporting purposes and the returns based upon those net asset values may differ from the net asset value and returns for shareholder transactions. These figures have been derived from the funds’ financial statements.
| | | | | | | | | | | | | | | | |
| | | | Class M Shares |
| | | | | | | |
| | | | | | | Year Ended August 31, |
BNY Mellon National Intermediate Municipal Bond Fund | | | 2023 | | 2022 | | 2021 | | 2020 | | 2019 | |
Per Share Data ($): | | | | | | | | | | | | |
Net asset value, beginning of period | | | 12.75 | | 14.23 | | 14.09 | | 14.04 | | 13.29 | |
Investment Operations: | | | | | | | | | | | | |
Net investment incomea | | | .32 | | .27 | | .28 | | .30 | | .33 | |
Net realized and unrealized gain (loss) on investments | | | (.05) | | (1.41) | | .19 | | .05 | | .75 | |
Total from Investment Operations | | | .27 | | (1.14) | | .47 | | .35 | | 1.08 | |
Distributions: | | | | | | | | | | | | |
Dividends from net investment income | | | (.32) | | (.27) | | (.28) | | (.30) | | (.33) | |
Dividends from net realized gain on investments | | | - | | (.07) | | (.05) | | - | | - | |
Total Distributions | | | (.32) | | (.34) | | (.33) | | (.30) | | (.33) | |
Net asset value, end of period | | | 12.70 | | 12.75 | | 14.23 | | 14.09 | | 14.04 | |
Total Return (%) | | | 2.13 | | (8.14) | | 3.34 | | 2.54 | | 8.26 | |
Ratios/Supplemental Data (%): | | | | | | | | | | | | |
Ratio of total expenses to average net assets | | | .52 | | .50 | | .50 | | .50 | | .50 | |
Ratio of net expenses to average net assets | | | .52 | | .50 | | .50 | | .50 | | .50 | |
Ratio of net investment income to average net assets | | | 2.51 | | 1.99 | | 1.95 | | 2.16 | | 2.45 | |
Portfolio Turnover Rate | | | 80.75 | | 65.37 | | 46.51 | | 45.62 | | 61.91 | |
Net Assets, end of period ($ x 1,000) | | | 1,861,356 | | 2,163,888 | | 2,740,368 | | 2,585,034 | | 2,498,913 | |
a Based on average shares outstanding.
b Amount represents less than $.01 per share.
See notes to financial statements.
93
FINANCIAL HIGHLIGHTS (continued)
| | | | | | | | | | | | | | | | |
| | | | | Investor Shares |
| | | | | | | |
| | | | | | | Year Ended August 31, |
BNY Mellon National Intermediate Municipal Bond Fund | | | 2023 | | 2022 | | 2021 | | 2020 | | 2019 | |
Per Share Data ($): | | | | | | | | | | | | |
Net asset value, beginning of period | | | 12.73 | | 14.22 | | 14.07 | | 14.02 | | 13.28 | |
Investment Operations: | | | | | | | | | | | | |
Net investment incomea | | | .29 | | .24 | | .24 | | .27 | | .30 | |
Net realized and unrealized gain (loss) on investments | | | (.04) | | (1.43) | | .20 | | .04 | | .74 | |
Total from Investment Operations | | | .25 | | (1.19) | | .44 | | .31 | | 1.04 | |
Distributions: | | | | | | | | | | | | |
Dividends from net investment income | | | (.29) | | (.23) | | (.24) | | (.26) | | (.30) | |
Dividends from net realized gain on investments | | | - | | (.07) | | (.05) | | - | | - | |
Total Distributions | | | (.29) | | (.30) | | (.29) | | (.26) | | (.30) | |
Net asset value, end of period | | | 12.69 | | 12.73 | | 14.22 | | 14.07 | | 14.02 | |
Total Return (%) | | | 1.96 | | (8.45) | | 3.16 | | 2.29 | | 7.92 | |
Ratios/Supplemental Data (%): | | | | | | | | | | | | |
Ratio of total expenses to average net assets | | | .77 | | .75 | | .75 | | .75 | | .75 | |
Ratio of net expenses to average net assets | | | .77 | | .75 | | .75 | | .75 | | .75 | |
Ratio of net investment income to average net assets | | | 2.26 | | 1.74 | | 1.70 | | 1.92 | | 2.22 | |
Portfolio Turnover Rate | | | 80.75 | | 65.37 | | 46.51 | | 45.62 | | 61.91 | |
Net Assets, end of period ($ x 1,000) | | | 49,335 | | 60,734 | | 94,980 | | 63,920 | | 51,184 | |
a Based on average shares outstanding.
b Amount represents less than $.01 per share.
See notes to financial statements.
94
| | | | | | | | | | | | | | | | |
| | | | | Class M Shares |
| | | | | | | |
| | | | | | | Year Ended August 31, |
BNY Mellon National Short-Term Municipal Bond Fund | | | 2023 | | 2022 | | 2021 | | 2020 | | 2019 | |
Per Share Data ($): | | | | | | | | | | | | |
Net asset value, beginning of period | | | 12.40 | | 12.94 | | 12.95 | | 12.91 | | 12.71 | |
Investment Operations: | | | | | | | | | | | | |
Net investment incomea | | | .19 | | .13 | | .14 | | .17 | | .18 | |
Net realized and unrealized gain (loss) on investments | | | .02 | | (.54) | | (.01) | | .04 | | .20 | |
Total from Investment Operations | | | .21 | | (.41) | | .13 | | .21 | | .38 | |
Distributions: | | | | | | | | | | | | |
Dividends from net investment income | | | (.20) | | (.13) | | (.14) | | (.17) | | (.18) | |
Net asset value, end of period | | | 12.41 | | 12.40 | | 12.94 | | 12.95 | | 12.91 | |
Total Return (%) | | | 1.68 | | (3.17) | | 1.03 | | 1.64 | | 3.03 | |
Ratios/Supplemental Data (%): | | | | | | | | | | | | |
Ratio of total expenses to average net assets | | | .53 | | .51 | | .51 | | .51 | | .50 | |
Ratio of net expenses to average net assets | | | .44 | | .44 | | .48 | | .51 | | .50 | |
Ratio of net investment income to average net assets | | | 1.57 | | 1.05 | | 1.10 | | 1.34 | | 1.44 | |
Portfolio Turnover Rate | | | 101.11 | | 92.90 | | 66.89 | | 92.41 | | 128.58 | |
Net Assets, end of period ($ x 1,000) | | | 454,866 | | 877,683 | | 894,027 | | 1,043,840 | | 1,129,486 | |
a Based on average shares outstanding.
See notes to financial statements.
95
FINANCIAL HIGHLIGHTS (continued)
| | | | | | | | | | | | | | | | |
| | | | | Investor Shares |
| | | | | | | |
| | | | | | | Year Ended August 31, |
BNY Mellon National Short-Term Municipal Bond Fund | | | 2023 | | 2022 | | 2021 | | 2020 | | 2019 | |
Per Share Data ($): | | | | | | | | | | | | |
Net asset value, beginning of period | | | 12.39 | | 12.93 | | 12.94 | | 12.90 | | 12.70 | |
Investment Operations: | | | | | | | | | | | | |
Net investment incomea | | | .16 | | .10 | | .11 | | .14 | | .15 | |
Net realized and unrealized gain (loss) on investments | | | .02 | | (.54) | | (.01) | | .04 | | .20 | |
Total from Investment Operations | | | .18 | | (.44) | | .10 | | .18 | | .35 | |
Distributions: | | | | | | | | | | | | |
Dividends from net investment income | | | (.17) | | (.10) | | (.11) | | (.14) | | (.15) | |
Net asset value, end of period | | | 12.40 | | 12.39 | | 12.93 | | 12.94 | | 12.90 | |
Total Return (%) | | | 1.43 | | (3.42) | | .78 | | 1.39 | | 2.78 | |
Ratios/Supplemental Data (%): | | | | | | | | | | | | |
Ratio of total expenses to average net assets | | | .78 | | .76 | | .76 | | .76 | | .75 | |
Ratio of net expenses to average net assets | | | .69 | | .69 | | .73 | | .76 | | .75 | |
Ratio of net investment income to average net assets | | | 1.32 | | .80 | | .85 | | 1.09 | | 1.20 | |
Portfolio Turnover Rate | | | 101.11 | | 92.90 | | 66.89 | | 92.41 | | 128.58 | |
Net Assets, end of period ($ x 1,000) | | | 15,810 | | 20,468 | | 18,734 | | 13,965 | | 14,608 | |
a Based on average shares outstanding.
See notes to financial statements.
96
| | | | | | | | | | | | | | | | |
| | | | | Class M Shares |
| | | | | | | |
| | | | | | | Year Ended August 31, |
BNY Mellon Pennsylvania Intermediate Municipal Bond Fund | | | 2023 | | 2022 | | 2021 | | 2020 | | 2019 | |
Per Share Data ($): | | | | | | | | | | | | |
Net asset value, beginning of period | | | 11.32 | | 12.69 | | 12.65 | | 12.61 | | 11.95 | |
Investment Operations: | | | | | | | | | | | | |
Net investment incomea | | | .26 | | .24 | | .24 | | .27 | | .29 | |
Net realized and unrealized gain (loss) on investments | | | (.04) | | (1.26) | | .12 | | .06 | | .66 | |
Total from Investment Operations | | | .22 | | (1.02) | | .36 | | .33 | | .95 | |
Distributions: | | | | | | | | | | | | |
Dividends from net investment income | | | (.26) | | (.24) | | (.24) | | (.27) | | (.29) | |
Dividends from net realized gain on investments | | | - | | (.11) | | (.08) | | (.02) | | - | |
Total Distributions | | | (.26) | | (.35) | | (.32) | | (.29) | | (.29) | |
Net asset value, end of period | | | 11.28 | | 11.32 | | 12.69 | | 12.65 | | 12.61 | |
Total Return (%) | | | 1.98 | | (8.18) | | 2.91 | | 2.68 | | 8.09 | |
Ratios/Supplemental Data (%): | | | | | | | | | | | | |
Ratio of total expenses to average net assets | | | .79 | | .73 | | .71 | | .72 | | .70 | |
Ratio of net expenses to average net assets | | | .59 | | .59 | | .66 | | .71 | | .70 | |
Ratio of net investment income to average net assets | | | 2.34 | | 2.02 | | 1.93 | | 2.15 | | 2.41 | |
Portfolio Turnover Rate | | | 109.86 | | 66.46 | | 47.09 | | 51.36 | | 69.91 | |
Net Assets, end of period ($ x 1,000) | | | 80,208 | | 109,376 | | 186,186 | | 183,861 | | 191,702 | |
a Based on average shares outstanding.
b Amount represents less than $.01 per share.
See notes to financial statements.
97
FINANCIAL HIGHLIGHTS (continued)
| | | | | | | | | | | | | | | | |
| | | | | Investor Shares |
| | | | | | | |
| | | | | | | Year Ended August 31, |
BNY Mellon Pennsylvania Intermediate Municipal Bond Fund | | | 2023 | | 2022 | | 2021 | | 2020 | | 2019 | |
Per Share Data ($): | | | | | | | | | | | | |
Net asset value, beginning of period | | | 11.31 | | 12.67 | | 12.63 | | 12.59 | | 11.93 | |
Investment Operations: | | | | | | | | | | | | |
Net investment incomea | | | .24 | | .21 | | .21 | | .24 | | .26 | |
Net realized and unrealized gain (loss) on investments | | | (.05) | | (1.25) | | .12 | | .06 | | .66 | |
Total from Investment Operations | | | .19 | | (1.04) | | .33 | | .30 | | .92 | |
Distributions: | | | | | | | | | | | | |
Dividends from net investment income | | | (.23) | | (.21) | | (.21) | | (.24) | | (.26) | |
Dividends from net realized gain on investments | | | - | | (.11) | | (.08) | | (.02) | | - | |
Total Distributions | | | (.23) | | (.32) | | (.29) | | (.26) | | (.26) | |
Net asset value, end of period | | | 11.27 | | 11.31 | | 12.67 | | 12.63 | | 12.59 | |
Total Return (%) | | | 1.72 | | (8.34) | | 2.65 | | 2.43 | | 7.83 | |
Ratios/Supplemental Data (%): | | | | | | | | | | | | |
Ratio of total expenses to average net assets | | | 1.04 | | .98 | | .96 | | .97 | | .95 | |
Ratio of net expenses to average net assets | | | .84 | | .84 | | .91 | | .97 | | .95 | |
Ratio of net investment income to average net assets | | | 2.09 | | 1.77 | | 1.68 | | 1.90 | | 2.15 | |
Portfolio Turnover Rate | | | 109.86 | | 66.46 | | 47.09 | | 51.36 | | 69.91 | |
Net Assets, end of period ($ x 1,000) | | | 4,913 | | 5,698 | | 9,218 | | 9,255 | | 8,063 | |
a Based on average shares outstanding.
b Not annualized.
See notes to financial statements.
98
| | | | | | | | | | | | | | | | |
| | | | | Class M Shares |
| | | | | | | |
| | | | | | | Year Ended August 31, |
BNY Mellon Massachusetts Intermediate Municipal Bond Fund | | | 2023 | | 2022 | | 2021 | | 2020 | | 2019 | |
Per Share Data ($): | | | | | | | | | | | | |
Net asset value, beginning of period | | | 11.99 | | 13.25 | | 13.12 | | 13.12 | | 12.40 | |
Investment Operations: | | | | | | | | | | | | |
Net investment incomea | | | .27 | | .25 | | .25 | | .27 | | .29 | |
Net realized and unrealized gain (loss) on investments | | | .00 | b,c | (1.26) | | .13 | | (.00) | b | .72 | |
Total from Investment Operations | | | .27 | | (1.01) | | .38 | | .27 | | 1.01 | |
Distributions: | | | | | | | | | | | | |
Dividends from net investment income | | | (.28) | | (.24) | | (.25) | | (.27) | | (.29) | |
Dividends from net realized gain on investments | | | - | | (.01) | | - | | - | | - | |
Total Distributions | | | (.28) | | (.25) | | (.25) | | (.27) | | (.29) | |
Net asset value, end of period | | | 11.98 | | 11.99 | | 13.25 | | 13.12 | | 13.12 | |
Total Return (%) | | | 2.27 | | (7.69) | | 2.89 | | 2.10 | | 8.28 | |
Ratios/Supplemental Data (%): | | | | | | | | | | | | |
Ratio of total expenses to average net assets | | | .58 | | .54 | | .54 | | .54 | | .53 | |
Ratio of net expenses to average net assets | | | .57 | | .54 | | .54 | | .54 | | .53 | |
Ratio of net investment income to average net assets | | | 2.30 | | 1.94 | | 1.87 | | 2.08 | | 2.32 | |
Portfolio Turnover Rate | | | 102.77 | | 49.94 | | 32.82 | | 52.29 | | 80.68 | |
Net Assets, end of period ($ x 1,000) | | | 172,978 | | 253,744 | | 341,935 | | 312,356 | | 316,364 | |
a Based on average shares outstanding.
b Amount represents less than $.01 per share.
c In addition to net realized and unrealized losses on investments, this amount includes an increase in net asset value per share resulting from the timing of issuances and redemptions of shares in relation to fluctuating market values for the fund’s investments.
See notes to financial statements.
99
FINANCIAL HIGHLIGHTS (continued)
| | | | | | | | | | | | | | | | |
| | | | | Investor Shares |
| | | | | | | |
| | | | | | | Year Ended August 31, |
BNY Mellon Massachusetts Intermediate Municipal Bond Fund | | | 2023 | | 2022 | | 2021 | | 2020 | | 2019 | |
Per Share Data ($): | | | | | | | | | | | | |
Net asset value, beginning of period | | | 11.99 | | 13.24 | | 13.11 | | 13.11 | | 12.40 | |
Investment Operations: | | | | | | | | | | | | |
Net investment incomea | | | .25 | | .22 | | .21 | | .24 | | .26 | |
Net realized and unrealized gain (loss) on investments | | | (.01) | | (1.25) | | .13 | | (.00) | b | .71 | |
Total from Investment Operations | | | .24 | | (1.03) | | .34 | | .24 | | .97 | |
Distributions: | | | | | | | | | | | | |
Dividends from net investment income | | | (.25) | | (.21) | | (.21) | | (.24) | | (.26) | |
Dividends from net realized gain on investments | | | - | | (.01) | | - | | - | | - | |
Total Distributions | | | (.25) | | (.22) | | (.21) | | (.24) | | (.26) | |
Net asset value, end of period | | | 11.98 | | 11.99 | | 13.24 | | 13.11 | | 13.11 | |
Total Return (%) | | | 2.01 | | (7.85) | | 2.56 | | 1.92 | | 7.93 | |
Ratios/Supplemental Data (%): | | | | | | | | | | | | |
Ratio of total expenses to average net assets | | | .83 | | .79 | | .79 | | .79 | | .78 | |
Ratio of net expenses to average net assets | | | .82 | | .79 | | .79 | | .79 | | .78 | |
Ratio of net investment income to average net assets | | | 2.05 | | 1.69 | | 1.62 | | 1.83 | | 2.08 | |
Portfolio Turnover Rate | | | 102.77 | | 49.94 | | 32.82 | | 52.29 | | 80.68 | |
Net Assets, end of period ($ x 1,000) | | | 7,593 | | 10,185 | | 11,680 | | 8,253 | | 7,437 | |
a Based on average shares outstanding.
b Amount represents less than $.01 per share.
See notes to financial statements.
100
| | | | | | | | | | | | | | | | |
| | | | | Class M Shares |
| | | | | | | |
| | | | | | | Year Ended August 31, |
BNY Mellon New York Intermediate Tax-Exempt Bond Fund | | | 2023 | | 2022 | | 2021 | | 2020 | | 2019 | |
Per Share Data ($): | | | | | | | | | | | | |
Net asset value, beginning of period | | | 10.22 | | 11.52 | | 11.35 | | 11.53 | | 10.91 | |
Investment Operations: | | | | | | | | | | | | |
Net investment incomea | | | .24 | | .20 | | .21 | | .24 | | .26 | |
Net realized and unrealized gain (loss) on investments | | | (.02) | | (1.18) | | .25 | | (.11) | | .63 | |
Total from Investment Operations | | | .22 | | (.98) | | .46 | | .13 | | .89 | |
Distributions: | | | | | | | | | | | | |
Dividends from net investment income | | | (.24) | | (.20) | | (.21) | | (.24) | | (.26) | |
Dividends from net realized gain on investments | | | - | | (.12) | | (.08) | | (.07) | | (.01) | |
Total Distributions | | | (.24) | | (.32) | | (.29) | | (.31) | | (.27) | |
Net asset value, end of period | | | 10.20 | | 10.22 | | 11.52 | | 11.35 | | 11.53 | |
Total Return (%) | | | 2.14 | | (8.67) | | 4.07 | | 1.20 | | 8.28 | |
Ratios/Supplemental Data (%): | | | | | | | | | | | | |
Ratio of total expenses to average net assets | | | .78 | | .74 | | .72 | | .73 | | .72 | |
Ratio of net expenses to average net assets | | | .59 | | .59 | | .59 | | .59 | | .59 | |
Ratio of net investment income to average net assets | | | 2.31 | | 1.82 | | 1.82 | | 2.12 | | 2.35 | |
Portfolio Turnover Rate | | | 86.42 | | 67.51 | | 64.18 | | 79.52 | | 90.17 | |
Net Assets, end of period ($ x 1,000) | | | 99,203 | | 112,781 | | 152,246 | | 150,490 | | 148,558 | |
a Based on average shares outstanding.
See notes to financial statements.
101
FINANCIAL HIGHLIGHTS (continued)
| | | | | | | | | | | | | | | | |
| | | | | Investor Shares |
| | ) | | | | | |
| | | | | | | Year Ended August 31, |
BNY Mellon New York Intermediate Tax-Exempt Bond Fund | | | 2023 | | 2022 | | 2021 | | 2020 | | 2019 | |
Per Share Data ($): | | | | | | | | | | | | |
Net asset value, beginning of period | | | 10.22 | | 11.53 | | 11.36 | | 11.54 | | 10.92 | |
Investment Operations: | | | | | | | | | | | | |
Net investment incomea | | | .21 | | .17 | | .18 | | .21 | | .23 | |
Net realized and unrealized gain (loss) on investments | | | (.01) | | (1.19) | | .25 | | (.11) | | .63 | |
Total from Investment Operations | | | .20 | | (1.02) | | .43 | | .10 | | .86 | |
Distributions: | | | | | | | | | | | | |
Dividends from net investment income | | | (.21) | | (.17) | | (.18) | | (.21) | | (.23) | |
Dividends from net realized gain on investments | | | - | | (.12) | | (.08) | | (.07) | | (.01) | |
Total Distributions | | | (.21) | | (.29) | | (.26) | | (.28) | | (.24) | |
Net asset value, end of period | | | 10.21 | | 10.22 | | 11.53 | | 11.36 | | 11.54 | |
Total Return (%) | | | 1.98 | | (8.98) | | 3.81 | | .95 | | 8.00 | |
Ratios/Supplemental Data (%): | | | | | | | | | | | | |
Ratio of total expenses to average net assets | | | 1.03 | | .99 | | .97 | | .98 | | .97 | |
Ratio of net expenses to average net assets | | | .84 | | .84 | | .84 | | .84 | | .84 | |
Ratio of net investment income to average net assets | | | 2.07 | | 1.58 | | 1.57 | | 1.88 | | 2.11 | |
Portfolio Turnover Rate | | | 86.42 | | 67.51 | | 64.18 | | 79.52 | | 90.17 | |
Net Assets, end of period ($ x 1,000) | | | 8,621 | | 9,449 | | 11,385 | | 10,509 | | 11,051 | |
a Based on average shares outstanding.
See notes to financial statements.
102
| | | | | | | | | | | | | | | | |
| | | | | Class M Shares |
| | | | | | | |
| | | | | | | Year Ended August 31, |
BNY Mellon Municipal Opportunities Fund | | | 2023 | | 2022 | | 2021 | | 2020 | | 2019 | |
Per Share Data ($): | | | | | | | | | | | | |
Net asset value, beginning of period | | | 12.28 | | 14.10 | | 13.52 | | 13.70 | | 13.12 | |
Investment Operations: | | | | | | | | | | | | |
Net investment incomea | | | .42 | | .36 | | .36 | | .40 | | .43 | |
Net realized and unrealized gain (loss) on investments | | | (.11) | | (1.80) | | .58 | | (.17) | | .57 | |
Total from Investment Operations | | | .31 | | (1.44) | | .94 | | .23 | | 1.00 | |
Distributions: | | | | | | | | | | | | |
Dividends from net investment income | | | (.41) | | (.36) | | (.36) | | (.41) | | (.42) | |
Dividends from net realized gain on investments | | | (.15) | | (.02) | | - | | - | | (.00) | b |
Total Distributions | | | (.56) | | (.38) | | (.36) | | (.41) | | (.42) | |
Net asset value, end of period | | | 12.03 | | 12.28 | | 14.10 | | 13.52 | | 13.70 | |
Total Return (%) | | | 2.60 | | (10.38) | | 7.05 | | 1.79 | | 7.77 | |
Ratios/Supplemental Data (%): | | | | | | | | | | | | |
Ratio of total expenses to average net assets | | | .75 | | .65 | | .65 | | .69 | | .73 | |
Ratio of net expenses to average net assets | | | .75 | | .65 | | .65 | | .69 | | .73 | |
Ratio of interest and expense related to inverse
floater notes issued to average net assets | | | .08 | | - | | - | | .04 | | .08 | |
Ratio of net investment income to average net assets | | | 3.45 | | 2.70 | | 2.61 | | 3.02 | | 3.22 | |
Portfolio Turnover Rate | | | 72.98 | | 57.75 | | 52.25 | | 75.12 | | 72.96 | |
Net Assets, end of period ($ x 1,000) | | | 1,916,777 | | 2,051,296 | | 2,568,933 | | 2,187,170 | | 1,918,499 | |
a Based on average shares outstanding.
b Amount represents less than $.01 per share.
See notes to financial statements.
103
FINANCIAL HIGHLIGHTS (continued)
| | | | | | | | | | | | | | | | |
| | | | | Investor Shares |
| | | | | | | |
| | | | | | | Year Ended August 31, |
BNY Mellon Municipal Opportunities Fund | | | 2023 | | 2022 | | 2021 | | 2020 | | 2019 | |
Per Share Data ($): | | | | | | | | | | | | |
Net asset value, beginning of period | | | 12.29 | | 14.11 | | 13.53 | | 13.70 | | 13.13 | |
Investment Operations: | | | | | | | | | | | | |
Net investment incomea | | | .39 | | .33 | | .33 | | .38 | | .39 | |
Net realized and unrealized gain (loss) on investments | | | (.11) | | (1.81) | | .58 | | (.18) | | .57 | |
Total from Investment Operations | | | .28 | | (1.48) | | .91 | | .20 | | .96 | |
Distributions: | | | | | | | | | | | | |
Dividends from net investment income | | | (.38) | | (.32) | | (.33) | | (.37) | | (.39) | |
Dividends from net realized gain on investments | | | (.15) | | (.02) | | - | | - | | (.00) | b |
Total Distributions | | | (.53) | | (.34) | | (.33) | | (.37) | | (.39) | |
Net asset value, end of period | | | 12.04 | | 12.29 | | 14.11 | | 13.53 | | 13.70 | |
Total Return (%) | | | 2.26 | | (10.60) | | 6.78 | | 1.54 | | 7.50 | |
Ratios/Supplemental Data (%): | | | | | | | | | | | | |
Ratio of total expenses to average net assets | | | 1.00 | | .90 | | .90 | | .94 | | .98 | |
Ratio of net expenses to average net assets | | | 1.00 | | .90 | | .90 | | .94 | | .98 | |
Ratio of interest and expense related to inverse
floater notes issued to average net assets | | | .08 | | - | | - | | .04 | | .08 | |
Ratio of net investment income to average net assets | | | 3.20 | | 2.45 | | 2.36 | | 2.77 | | 2.97 | |
Portfolio Turnover Rate | | | 72.98 | | 57.75 | | 52.25 | | 75.12 | | 72.96 | |
Net Assets, end of period ($ x 1,000) | | | 53,035 | | 75,580 | | 103,130 | | 55,217 | | 63,551 | |
a Based on average shares outstanding.
b Amount represents less than $.01 per share.
See notes to financial statements.
104
NOTES TO FINANCIAL STATEMENTS
NOTE 1—Significant Accounting Policies:
BNY Mellon Funds Trust (the “Trust”), a Massachusetts business trust that is registered under the Investment Company Act of 1940, as amended (the “Act”), as an open-end management investment company, operates as a series company currently consisting of nineteen series, including the following diversified funds: BNY Mellon National Intermediate Municipal Bond Fund, BNY Mellon National Short-Term Municipal Bond Fund, BNY Mellon Pennsylvania Intermediate Municipal Bond Fund, BNY Mellon Massachusetts Intermediate Municipal Bond Fund, BNY Mellon New York Intermediate Tax-Exempt Bond Fund and BNY Mellon Municipal Opportunities Fund (each, a “fund” and collectively, the “funds”). The objectives of the funds are as follows: BNY Mellon National Intermediate Municipal Bond Fund and BNY Mellon National Short-Term Municipal Bond Fund seek to maximize current income exempt from federal income tax to the extent consistent with the preservation of capital. BNY Mellon Pennsylvania Intermediate Municipal Bond Fund seeks as high a level of current income exempt from federal and Pennsylvania state income taxes as is consistent with the preservation of capital. BNY Mellon Massachusetts Intermediate Municipal Bond Fund seeks as high a level of income exempt from federal and Massachusetts state income taxes as is consistent with the preservation of capital. BNY Mellon New York Intermediate Tax-Exempt Bond Fund seeks as high a level of income exempt from federal, New York state and New York city income taxes as is consistent with the preservation of capital. BNY Mellon Municipal Opportunities Fund seeks to maximize total return consisting of high current income exempt from federal income tax and capital appreciation.
BNY Mellon Investment Adviser, Inc. (the “Adviser”), a wholly-owned subsidiary of The Bank of New York Mellon Corporation (“BNY Mellon”), which serves as each fund’s investment adviser. BNY Mellon serves as administrator for the funds pursuant to an Administration Agreement with the Trust (the “Administration Agreement”). BNY Mellon has entered into a Sub-Administration Agreement with the Adviser pursuant to which BNY Mellon pays the Adviser for performing certain administrative services.
BNY Mellon Securities Corporation (the “Distributor”), a wholly-owned subsidiary of the Adviser, is the distributor of each fund’s shares, which are sold without a sales charge. Each fund is authorized to issue an unlimited number of $.001 par value shares of Beneficial Interest in each of the following classes of shares: Class M and Investor. Each class of shares has identical rights and privileges, except with respect to the Shareholder Service Plan and the expenses borne by each class, the allocation of certain transfer agency costs and certain voting rights. Income, expenses (other than expenses attributable to a specific class), and realized and unrealized gains or losses on investments are allocated to each class of shares based on its relative net assets.
The Trust accounts separately for the assets, liabilities and operations of each series. Expenses directly attributable to each series are charged to that series’ operations; expenses which are applicable to all series are allocated among them on a pro rata basis.
The Financial Accounting Standards Board (“FASB”) Accounting Standards Codification (“ASC”) is the exclusive reference of authoritative U.S. generally accepted accounting principles (“GAAP”) recognized by the FASB to be applied by nongovernmental entities. Rules and interpretive releases of the SEC under authority of federal laws are also sources of authoritative GAAP for SEC registrants. Each fund is an investment company and applies the accounting and reporting guidance of the FASB ASC Topic 946 Financial Services-Investment Companies. Each fund’s financial statements are prepared in accordance with GAAP, which may require the use of management estimates and assumptions. Actual results could differ from those estimates.
The Trust enters into contracts that contain a variety of indemnifications. The funds’ maximum exposure under these arrangements is unknown. The funds do not anticipate recognizing any loss related to these arrangements.
(a) Portfolio valuation: The fair value of a financial instrument is the amount that would be received to sell an asset or paid to transfer a liability in an orderly transaction between market participants at the measurement date (i.e., the exit price). GAAP establishes a fair value hierarchy that prioritizes the inputs of valuation techniques used to measure fair value. This hierarchy gives the highest priority to unadjusted quoted prices in active markets for identical assets or liabilities (Level 1 measurements) and the lowest priority to unobservable inputs (Level 3 measurements).
Additionally, GAAP provides guidance on determining whether the volume and activity in a market has decreased significantly and whether such a decrease in activity results in transactions that are not orderly. GAAP requires enhanced disclosures around valuation inputs and techniques used during annual and interim periods.
Various inputs are used in determining the value of each fund’s investments relating to fair value measurements. These inputs are summarized in the three broad levels listed below:
Level 1—unadjusted quoted prices in active markets for identical investments.
Level 2—other significant observable inputs (including quoted prices for similar investments, interest rates, prepayment speeds, credit risk, etc.).
105
NOTES TO FINANCIAL STATEMENTS (continued)
Level 3—significant unobservable inputs (including the funds’ own assumptions in determining the fair value of investments).
The inputs or methodology used for valuing securities are not necessarily an indication of the risk associated with investing in those securities.
Changes in valuation techniques may result in transfers in or out of an assigned level within the disclosure hierarchy. Valuation techniques used to value each fund’s investments are as follows:
The Trust’s Board of Trustees (the “Board”) has designated the Adviser as each fund’s valuation designee, effective September 8, 2022, to make all fair value determinations with respect to each fund’s portfolio investments, subject to the Board’s oversight and pursuant to Rule 2a-5 under the Act.
Investments in municipal securities and futures are valued each business day by an independent pricing service (the “Service”) approved by the Board. Investments for which quoted bid prices are readily available and are representative of the bid side of the market in the judgment of the Service are valued at the mean between the quoted bid prices (as obtained by the Service from dealers in such securities) and asked prices (as calculated by the Service based upon its evaluation of the market for such securities). Municipal investments (which constitute a majority of the portfolio securities) are carried at fair value as determined by the Service, based on methods which include consideration of the following: yields or prices of municipal securities of comparable quality, coupon, maturity and type; indications as to values from dealers; and general market conditions. The Service is engaged under the general oversight of the Board. All of the preceding securities are generally categorized within Level 2 of the fair value hierarchy.
When market quotations or official closing prices are not readily available, or are determined not to reflect accurately fair value, such as when the value of a security has been significantly affected by events after the close of the exchange or market on which the security is principally traded, but before the funds calculate their net asset value, the funds may value these investments at fair value as determined in accordance with the procedures approved by the Board. Certain factors may be considered when fair valuing investments such as: fundamental analytical data, the nature and duration of restrictions on disposition, an evaluation of the forces that influence the market in which the securities are purchased and sold, and public trading in similar securities of the issuer or comparable issuers. These securities are either categorized within Level 2 or 3 of the fair value hierarchy depending on the relevant inputs used.
For securities where observable inputs are limited, assumptions about market activity and risk are used and are generally categorized within Level 3 of the fair value hierarchy.
Futures are valued at the last sales price on the securities exchange on which such securities are primarily traded or at the last sales price on the national securities market on each business day and are generally categorized within Level 1 of the fair value hierarchy.
The following below summarizes the inputs used as of August 31, 2023 in valuing each fund’s investments:
| | | | | | | |
BNY Mellon National Intermediate Municipal Bond Fund | |
| | Level 1-Unadjusted Quoted Prices | Level 2- Other Significant Observable Inputs | | Level 3-Significant Unobservable Inputs | Total | |
Assets ($) | | |
Investments in Securities:† | | |
Municipal Securities | - | 1,917,026,466 | | - | 1,917,026,466 | |
Liabilities ($) | | |
Other Financial Instruments: | | |
Futures†† | (275,278) | - | | - | (275,278) | |
† See Statement of Investments for additional detailed categorizations, if any.
†† Amount shown represents unrealized appreciation (depreciation) at period end, but only variation margin on exchange-traded and centrally cleared derivatives, if any, are reported in the Statement of Assets and Liabilities.
106
| | | | | | | |
BNY Mellon National Short-Term Municipal Bond Fund | |
| | Level 1-Unadjusted Quoted Prices | Level 2- Other Significant Observable Inputs | | Level 3-Significant Unobservable Inputs | Total | |
Assets ($) | | |
Investments in Securities:† | | |
Municipal Securities | - | 473,952,091 | | - | 473,952,091 | |
† See Statement of Investments for additional detailed categorizations, if any.
| | | | | | | |
BNY Mellon Pennsylvania Intermediate Municipal Bond Fund | |
| | Level 1-Unadjusted Quoted Prices | Level 2- Other Significant Observable Inputs | | Level 3-Significant Unobservable Inputs | Total | |
Assets ($) | | |
Investments in Securities:† | | |
Municipal Securities | - | 85,715,476 | | - | 85,715,476 | |
Liabilities ($) | | |
Other Financial Instruments: | | |
Futures†† | (9,352) | - | | - | (9,352) | |
† See Statement of Investments for additional detailed categorizations, if any.
†† Amount shown represents unrealized appreciation (depreciation) at period end, but only variation margin on exchange-traded and centrally cleared derivatives, if any, are reported in the Statement of Assets and Liabilities.
| | | | | | | |
BNY Mellon Massachusetts Intermediate Municipal Bond Fund | |
| | Level 1-Unadjusted Quoted Prices | Level 2- Other Significant Observable Inputs | | Level 3-Significant Unobservable Inputs | Total | |
Assets ($) | | |
Investments in Securities:† | | |
Municipal Securities | - | 180,642,251 | | - | 180,642,251 | |
Liabilities ($) | | |
Other Financial Instruments: | | |
Futures†† | (18,704) | - | | - | (18,704) | |
† See Statement of Investments for additional detailed categorizations, if any.
†† Amount shown represents unrealized appreciation (depreciation) at period end, but only variation margin on exchange-traded and centrally cleared derivatives, if any, are reported in the Statement of Assets and Liabilities.
| | | | | | | |
BNY Mellon New York Intermediate Tax-Exempt Bond Fund | |
| | Level 1-Unadjusted Quoted Prices | Level 2- Other Significant Observable Inputs | | Level 3-Significant Unobservable Inputs | Total | |
Assets ($) | | |
Investments in Securities:† | | |
Municipal Securities | - | 105,955,445 | | - | 105,955,445 | |
Liabilities ($) | | |
Other Financial Instruments: | | |
Futures†† | (10,521) | - | | - | (10,521) | |
† See Statement of Investments for additional detailed categorizations, if any.
†† Amount shown represents unrealized appreciation (depreciation) at period end, but only variation margin on exchange-traded and centrally cleared derivatives, if any, are reported in the Statement of Assets and Liabilities.
107
NOTES TO FINANCIAL STATEMENTS (continued)
| | | | | | | |
BNY Mellon Municipal Opportunities Fund | |
| | Level 1-Unadjusted Quoted Prices | Level 2- Other Significant Observable Inputs | | Level 3-Significant Unobservable Inputs | Total | |
Assets ($) | | |
Investments in Securities:† | | |
Corporate Bonds | - | 17,182,207 | | - | 17,182,207 | |
Municipal Securities | - | 1,985,171,838 | | - | 1,985,171,838 | |
Liabilities ($) | | |
Other Financial Instruments: | | |
Futures††† | (2,122,624) | - | | - | (2,122,624) | |
Inverse Floater Notes†† | - | (53,100,000) | | - | (53,100,000) | |
† See Statement of Investments for additional detailed categorizations, if any.
†† Certain of the fund’s liabilities are held at carrying amount, which approximates fair value for financial reporting purposes.
††† Amount shown represents unrealized appreciation (depreciation) at period end, but only variation margin on exchange-traded and centrally cleared derivatives, if any, are reported in the Statement of Assets and Liabilities.
(b) Securities transactions and investment income: Securities transactions are recorded on a trade date basis. Realized gains and losses from securities transactions are recorded on the identified cost basis. Interest income, adjusted for accretion of discount and amortization of premium on investments, is earned from settlement date and recognized on the accrual basis. Securities purchased or sold on a when-issued or delayed delivery basis may be settled a month or more after the trade date.
BNY Mellon Pennsylvania Intermediate Municipal Bond Fund, BNY Mellon Massachusetts Intermediate Municipal Bond Fund and BNY Mellon New York Intermediate Tax-Exempt Bond Fund each follow an investment policy of investing primarily in municipal obligations of one state. Economic changes affecting the state and certain of its public bodies and municipalities may affect the ability of issuers within the state to pay interest on, or repay principal of, municipal obligations held by the funds.
(c) Market Risk: The value of the securities in which each fund invests may be affected by political, regulatory, economic and social developments, and developments that impact specific economic sectors, industries or segments of the market. The value of a security may also decline due to general market conditions that are not specifically related to a particular company or industry, such as real or perceived adverse economic conditions, changes in the general outlook for corporate earnings, changes in interest or currency rates, changes to inflation, adverse changes to credit markets or adverse investor sentiment generally. In addition, turbulence in financial markets and reduced liquidity in equity, credit and/or fixed-income markets may negatively affect many issuers, which could adversely affect each fund. Global economies and financial markets are becoming increasingly interconnected, and conditions and events in one country, region or financial market may adversely impact issuers in a different country, region or financial market. These risks may be magnified if certain events or developments adversely interrupt the global supply chain; in these and other circumstances, such risks might affect companies world-wide.
Municipal Securities Risk: The amount of public information available about municipal securities is generally less than that for corporate equities or bonds. Special factors, such as legislative changes, and state and local economic and business developments, may adversely affect the yield and/or value of the funds’ investments in municipal securities. Other factors include the general conditions of the municipal securities market, the size of the particular offering, the maturity of the obligation and the rating of the issue. Changes in economic, business or political conditions relating to a particular municipal project, municipality, or state, territory or possession of the United States in which each fund invests may have an impact on the funds’ share price.
State-Specific Risk: BNY Mellon Pennsylvania Intermediate Municipal Bond Fund is subject to the risk that Pennsylvania’s economy, and the revenues underlying its municipal obligations, may decline. Investing primarily in the municipal obligations of a single state makes the fund more sensitive to risks specific to that state and may entail more risk than investing in the municipal obligations of multiple states as a result of potentially less diversification.
BNY Mellon Massachusetts Intermediate Municipal Bond Fund is subject to the risk that Massachusetts’ economy, and the revenues underlying its municipal obligations, may decline. Investing primarily in the municipal obligations of a single state makes the fund more sensitive to risks specific to that state and may entail more risk than investing in the municipal obligations of multiple states as a result of potentially less diversification.
108
BNY Mellon New York Intermediate Tax-Exempt Bond Fund is subject to the risk that New York’s economy, and the revenues underlying its municipal obligations, may decline. Investing primarily in the municipal obligations of a single state makes the fund more sensitive to risks specific to that state and may entail more risk than investing in the municipal obligations of multiple states as a result of potentially less diversification.
Derivatives Risk: A small investment in derivatives could have a potentially large impact on the relevant fund’s performance. The use of derivatives involves risks different from, or possibly greater than, the risks associated with investing directly in the underlying assets, and the relevant fund’s use of derivatives may result in losses to the relevant fund. Derivatives in which the fund may invest can be highly volatile, illiquid and difficult to value, and there is the risk that changes in the value of a derivative held by the relevant fund will not correlate with the underlying assets or the relevant fund’s other investments in the manner intended. Certain derivatives have the potential for unlimited loss, regardless of the size of the initial investment, and involve greater risks than the underlying assets because, in addition to general market risks, they are subject to liquidity risk, credit and counterparty risk (failure of the counterparty to the derivatives transaction to honor its obligation) and pricing risk (risk that the derivative cannot or will not be accurately valued).
(d) Dividends and distributions to shareholders: It is the policy of each fund to declare dividends daily from net investment income. Such dividends are paid monthly. Dividends from net realized capital gains, if any, are normally declared and paid annually, but each fund may make distributions on a more frequent basis to comply with the distribution requirements of the Internal Revenue Code of 1986, as amended (the “Code”). To the extent that net realized capital gains can be offset by capital loss carryovers, it is the policy of each fund not to distribute such gains. Income and capital gain distributions are determined in accordance with income tax regulations, which may differ from GAAP.
(e) Federal income taxes: It is the policy of each fund to continue to qualify as a regulated investment company, which can distribute tax-exempt dividends, by complying with the applicable provisions of the Code, and to make distributions of income and net realized capital gain sufficient to relieve it from substantially all federal income and excise taxes. For federal income tax purposes, each fund is treated as a separate entity for the purpose of determining such qualification.
As of and during the period ended August 31, 2023, the funds did not have any liabilities for any uncertain tax positions. Each fund recognizes interest and penalties, if any, related to uncertain tax positions as income tax expense in the Statements of Operations. During the period ended August 31, 2023, the funds did not incur any interest or penalties.
Each tax year in the four-year period ended August 31, 2023 remains subject to examination by the Internal Revenue Service and state taxing authorities.
Table 1 summarizes each fund’s components of accumulated earnings on a tax basis at August 31, 2023.
Under the Regulated Investment Company Modernization Act of 2010, each fund is permitted to carry forward capital losses for an unlimited period. Furthermore, capital loss carryovers retain their character as either short-term or long-term capital losses.
Table 2 summarizes each fund’s accumulated capital loss carryover available for federal income tax purposes to be applied against future net realized capital gains, if any, realized subsequent to August 31, 2023.
Table 3 summarizes each fund’s tax character of distributions paid to shareholders during the fiscal periods ended August 31, 2023 and August 31, 2022.
| | | | | | |
Table 1—Components of Accumulated Earnings | | | | | |
| Undistributed
Tax-Exempt
Income ($) | | Accumulated Capital Losses ($) | Unrealized
(Depreciation) ($) | Capital (Losses) Realized After October 31, 2022† |
BNY Mellon National Intermediate Municipal Bond Fund | 960,467 | | (50,542,112) | (77,371,409) | - |
BNY Mellon National Short-Term Municipal Bond Fund | 408,939 | | (11,991,290) | (14,506,937) | - |
BNY Mellon Pennsylvania Intermediate Municipal Bond Fund | 175,173 | | (1,743,029) | (3,986,776) | - |
BNY Mellon Massachusetts Intermediate Municipal Bond Fund | 143 | | (5,807,665) | (9,017,943) | - |
BNY Mellon New York Intermediate Tax-Exempt Bond Fund | 31,586 | | (3,651,240) | (5,318,942) | - |
BNY Mellon Municipal Opportunities Fund | 1,850,031 | | - | (149,290,819) | (33,425,301) |
† These losses were deferred for tax purposes to the first day of the following fiscal year.
109
NOTES TO FINANCIAL STATEMENTS (continued)
| | | | | | | |
Table 2—Capital Loss Carryover | | | | | | |
| | | | | Short-Term Losses($)† | Long-Term Losses($)† | Total($) |
BNY Mellon National Intermediate Municipal Bond Fund | | | | 28,013,244 | 22,528,868 | 50,542,112 |
BNY Mellon National Short-Term Municipal Bond Fund | | | | 3,313,665 | 8,677,625 | 11,991,290 |
BNY Mellon Pennsylvania Intermediate Municipal Bond Fund | | | | 1,107,882 | 635,147 | 1,743,029 |
BNY Mellon Massachusetts Intermediate Municipal Bond Fund | | | | 794,778 | 5,012,887 | 5,807,665 |
BNY Mellon New York Intermediate Tax-Exempt Bond Fund | | | | 1,097,461 | 2,553,779 | 3,651,240 |
† These capital losses can be carried forward for an unlimited period.
| | | | | | | | | | | |
Table 3—Tax Character of Distributions Paid | | | | | | | |
| | 2023 | | 2022 |
| Tax-Exempt Income ($) | Ordinary Income ($) | Long-Term
Capital
Gains ($) | | Tax-Exempt Income ($) | Ordinary
Income ($) | Long-Term
Capital
Gains ($) |
BNY Mellon National Intermediate Municipal Bond Fund | 47,065,942 | 8,013 | - | | 52,234,279 | 2,308,078 | 11,558,019 |
BNY Mellon National Short-Term Municipal Bond Fund | 9,596,567 | 156,093 | - | | 8,939,270 | - | - |
BNY Mellon Pennsylvania Intermediate Municipal Bond Fund | 2,099,808 | 151 | - | | 3,070,224 | 280,754 | 1,156,945 |
BNY Mellon Massachusetts Intermediate Municipal Bond Fund | 4,341,661 | 11,145 | - | | 6,222,890 | 18,698 | 158,563 |
BNY Mellon New York Intermediate Tax-Exempt Bond Fund | 2,495,216 | - | - | | 2,709,454 | 692,472 | 1,027,489 |
BNY Mellon Municipal Opportunities Fund | 61,908,903 | 7,769,617 | 12,599,704 | | 66,904,178 | 2,006,156 | 1,772,951 |
(f) New accounting pronouncements: In 2020, the FASB issued Accounting Standards Update No. 2020-04, Reference Rate Reform (Topic 848): Facilitation of the Effects of Reference Rate Reform on Financial Reporting, which provides optional guidance to ease the potential burden in accounting for (or recognizing the effects of) reference rate reform on financial reporting.
The objective of the guidance in Topic 848 is to provide temporary relief during the transition period. The FASB included a sunset provision within Topic 848 based on expectations of when the LIBOR would cease being published. At the time that Update 2020-04 was issued, the UK Financial Conduct Authority (FCA) had established its intent that it would no longer be necessary to persuade, or compel, banks to submit to LIBOR after December 31, 2021. As a result, the sunset provision was set for December 31, 2022—12 months after the expected cessation date of all currencies and tenors of LIBOR.
In March 2021, the FCA announced that the intended cessation date of the overnight 1-, 3-, 6-, and 12-month tenors of USD LIBOR would be June 30, 2023, which is beyond the current sunset date of Topic 848.
Because the current relief in Topic 848 may not cover a period of time during which a significant number of modifications may take place, the amendments in this Update defer the sunset date of Topic 848 from December 31, 2022, to December 31, 2024 (“FASB Sunset Date”), after which entities will no longer be permitted to apply the relief in Topic 848.
Management had evaluated the impact of Topic 848 on the fund’s investments, derivatives, debt and other contracts that will undergo reference rate-related modifications as a result of the Reference Rate Reform. Management has no concerns in adopting Topic 848 by FASB Sunset Date. Management will continue to work with other financial institutions and counterparties to modify contracts as required by applicable regulation and within the regulatory deadlines.
NOTE 2—Bank Lines of Credit:
The funds participate with other long-term open-end funds managed by the Adviser in a $823.5 million unsecured credit facility led by Citibank, N.A. (the “Citibank Credit Facility”) and a $300 million unsecured credit facility provided by BNY Mellon (the “BNYM Credit Facility”), each to be utilized primarily for temporary or emergency purposes, including the financing of redemptions (each, a “Facility”). The Citibank Credit Facility is available in two tranches: (i) Tranche A is in an amount equal to $688.5 million and is available to all long-term open-ended funds, including the funds, and (ii) Tranche B is in amount equal to $135 million and is available only to the BNY Mellon Floating Rate Income Fund, a series of BNY Mellon Investment Funds IV, Inc. In connection therewith, each fund has agreed to pay its pro rata portion of commitment fees for Tranche A of the Citibank Credit Facility and the BNYM Credit Facility. Interest is charged to the funds based on rates determined pursuant to the terms of the respective Facility at the time of borrowing. During the
110
period ended August 31, 2023, the funds did not borrow under the Facilities.
NOTE 3—Management Fee, Administration Fee and Other Transactions with Affiliates:
(a) Pursuant to an investment advisory agreement with the Adviser, the management fee is payable monthly and computed on the average daily value of each fund’s net assets at the following annual rates: .35% of BNY Mellon National Intermediate Municipal Bond Fund, .35% of BNY Mellon National Short-Term Municipal Bond Fund, .50% of BNY Mellon Pennsylvania Intermediate Municipal Bond Fund, .35% of BNY Mellon Massachusetts Intermediate Municipal Bond Fund, .50% of BNY Mellon New York Intermediate Tax-Exempt Bond Fund and .50% of BNY Mellon Municipal Opportunities Fund.
For BNY Mellon National Short-Term Municipal Bond Fund, the Adviser has contractually agreed, from September 1, 2022 through December 30, 2023, to waive receipt of its fees and/or assume the direct expense of the fund so that the direct expense of neither class of fund shares (excluding Shareholder Services Plan fees, taxes, interest expense, brokerage commissions, commitment fees on borrowings and extraordinary expenses) exceed .44% of the fund’s average daily net assets. On or after December 30, 2023, the Adviser may terminate this expense limitation agreement at any time. The reduction in expenses, pursuant to the undertaking, amounted to $582,665 during the period ended August 31, 2023.
For BNY Mellon Pennsylvania Intermediate Municipal Bond Fund, the Adviser has contractually agreed, from September 1, 2022 through December 30, 2023, to waive receipt of its fees and/or assume the direct expense of the fund so that the direct expense of neither class of fund shares (excluding Shareholder Services Plan fees, taxes, interest expense, brokerage commissions, commitment fees on borrowings and extraordinary expenses) exceed .59% of the fund’s average daily net assets. On or after December 30, 2023, the Adviser may terminate this expense limitation agreement at any time. The reduction in expenses, pursuant to the undertaking, amounted to $183,304 during the period ended August 31, 2023.
For BNY Mellon New York Intermediate Tax-Exempt Bond Fund, the Adviser has contractually agreed, from September 1, 2022 through December 30, 2023, to waive receipt of its fees and/or assume the direct expense of the fund so that the direct expense of neither class of fund shares (excluding Shareholder Services Plan fees, taxes, interest expense, brokerage commissions, commitment fees on borrowings and extraordinary expenses) exceed .59% of the fund’s average daily net assets. On or after December 30, 2023, the Adviser may terminate this expense limitation agreement at any time. The reduction in expenses, pursuant to the undertaking, amounted to $204,922 during the period ended August 31, 2023.
Pursuant to the Administration Agreement, BNY Mellon provides or arranges for fund accounting, transfer agency and other fund administration services and receives a fee based on the total net assets of the Trust based on the following rates:
0 up to $6 billion .15%
$6 billion up to $12 billion .12%
In excess of $12 billion .10%
(b) Each fund has adopted a Shareholder Services Plan with respect to its Investor shares. Each fund pays the Distributor at an annual rate of .25% of the value of its Investor shares average daily net assets for the provision of certain services. The services provided may include personal services relating to shareholder accounts, such as answering shareholder inquiries regarding a fund, and services related to the maintenance of such shareholder accounts. The Shareholder Services Plan allows the Distributor to make payments from the shareholder services fees it collects from each fund to compensate service agents (certain banks, securities brokers or dealers and other financial institutions) with respect to these services. Table 4 summarizes the amounts Investor shares were charged during the period ended August 31, 2023, pursuant to the Shareholder Services Plan, which is included in Shareholder servicing costs in the Statements of Operations.
| | |
Table 4—Shareholder Services Plan Fees | |
| | |
BNY Mellon National Intermediate
Municipal Bond Fund | $131,543 |
BNY Mellon National Short-Term
Municipal Bond Fund | 47,301 |
BNY Mellon Pennsylvania Intermediate
Municipal Bond Fund | 12,503 |
BNY Mellon Massachusetts Intermediate
Municipal Bond Fund | 23,216 |
BNY Mellon New York Intermediate
Tax-Exempt Bond Fund | 22,427 |
BNY Mellon Municipal
Opportunities Fund | 156,205 |
The funds have arrangements with the BNY Mellon Transfer, Inc., (the “Transfer Agent”) and The Bank of New York Mellon (the “Custodian”), both a subsidiary of BNY Mellon and an affiliate of the Adviser, whereby the funds may receive earnings credits when positive cash balances are maintained, which are used to offset transfer agency and custody fees. For financial reporting purposes, the funds include net earnings
111
NOTES TO FINANCIAL STATEMENTS (continued)
credits, if any, as expense offsets in the Statements of Operations.
Each fund compensates the Transfer Agent, under a transfer agency agreement, for providing cash management services for the funds. The Transfer Agent fees are comprised of amounts paid on cash management fees which are related to fund subscriptions and redemptions. BNY Mellon pays each fund’s Transfer Agent fees comprised of amounts paid on a per account basis out of the administration fee it receives from the Trust. These fees were partially offset by earnings credits for each relevant fund, also summarized in Table 5.
| | |
Table 5—Transfer Agent Fees | |
| | Transfer Agent
Earnings Credits ($) |
BNY Mellon National Intermediate
Municipal Bond Fund | (3,321) |
BNY Mellon National Short-Term
Municipal Bond Fund | (965) |
BNY Mellon Pennsylvania Intermediate
Municipal Bond Fund | (509) |
BNY Mellon Massachusetts Intermediate
Municipal Bond Fund | (1,264) |
BNY Mellon New York Intermediate
Tax-Exempt Bond Fund | (2,794) |
BNY Mellon Municipal
Opportunities Fund | (1,680) |
Each fund compensates the Custodian, under a custody agreement, for providing custodial services for each fund. These fees are determined based on net assets, geographic region and transaction activity. Table 6 summarizes the amount each fund was charged during the period ended August 31, 2023 pursuant to the custody agreement. These fees were partially offset by earnings credits for each relevant fund, also summarized in Table 6.
Each fund compensates the Custodian, under a shareholder redemption draft processing agreement, for providing certain services related to the funds’ check writing privilege. Table 7 summarizes the amount each fund was charged during the period ended August 31, 2023 pursuant to the agreement, which is included in Shareholder servicing costs in the Statements of Operations.
| | |
Table 7—BNY Mellon Cash Management Fees |
| | |
BNY Mellon National Intermediate
Municipal Bond Fund | $264 |
BNY Mellon National Short-Term
Municipal Bond Fund | 84 |
BNY Mellon Pennsylvania Intermediate
Municipal Bond Fund | 37 |
BNY Mellon Massachusetts Intermediate
Municipal Bond Fund | 110 |
BNY Mellon New York Intermediate
Tax-Exempt Bond Fund | 235 |
BNY Mellon Municipal
Opportunities Fund | 130 |
During the period ended August 31, 2023, each fund was charged $19,196 for services performed by the Chief Compliance Officer and his staff. These fees are included in Chief Compliance Officer fees in the Statements of Operations.
Table 8 summarizes the components of “Due to BNY Mellon Investment Adviser, Inc. and affiliates” in the Statements of Assets and Liabilities for each fund.
(c) Each Board member also serves as a Board member of other funds within the Trust. Annual retainer fees and attendance fees are allocated to each fund based on net assets.
NOTE 4—Securities Transactions:
Table 9 summarizes each fund’s aggregate amount of purchases and sales (including paydowns) of investment securities, excluding short-term securities and futures, during the period ended August 31, 2023.
| | | | |
Table 6—Custodian Fees | |
| | Custodian Fees ($) | Custodian Earnings Credits ($) |
BNY Mellon National Intermediate Municipal Bond Fund | | 35,726 | (22,617) |
BNY Mellon National Short-Term Municipal Bond Fund | | 21,326 | (17,379) |
BNY Mellon Pennsylvania Intermediate Municipal Bond Fund | | 5,128 | (2,775) |
BNY Mellon Massachusetts Intermediate Municipal Bond Fund | | 10,003 | (6,816) |
BNY Mellon New York Intermediate Tax-Exempt Bond Fund | | 7,033 | (1,460) |
BNY Mellon Municipal Opportunities Fund | | 38,411 | (34,726) |
112
| | | | | | | | |
Table 8—Due to BNY Mellon Investment Adviser, Inc. and Affiliates | | | | | |
| | Management
Fee ($) | Administration
Fee ($) | Shareholder
Services Plan
Fees ($) | Custodian
Fees ($) | | Chief
Compliance
Officer Fees ($) | Less Expense
Reimbursement ($) |
BNY Mellon National Intermediate
Municipal Bond Fund | 568,535 | 220,342 | 10,491 | 10,964 | | 3,025 | - |
BNY Mellon National Short-Term
Municipal Bond Fund | 142,106 | 55,009 | 3,250 | 5,600 | | 3,025 | (40,872) |
BNY Mellon Pennsylvania Intermediate
Municipal Bond Fund | 36,877 | 9,873 | 1,045 | 1,200 | | 3,025 | (12,157) |
BNY Mellon Massachusetts Intermediate
Municipal Bond Fund | 53,441 | 20,369 | 1,633 | 3,200 | | 3,025 | - |
BNY Mellon New York Intermediate
Tax-Exempt Bond Fund | 45,113 | 11,204 | 1,841 | 2,328 | | 3,025 | (16,047) |
BNY Mellon Municipal Opportunities Fund | 834,492 | 227,076 | 11,348 | 12,400 | | 3,025 | - |
| | | |
Table 9—Purchases and Sales |
| | Purchases ($) | Sales ($) |
BNY Mellon National Intermediate Municipal Bond Fund | 1,532,345,738 | 1,810,936,106 |
BNY Mellon National Short-Term Municipal Bond Fund | 623,619,459 | 914,908,736 |
BNY Mellon Pennsylvania Intermediate Municipal Bond Fund | 101,120,586 | 128,772,563 |
BNY Mellon Massachusetts Intermediate Municipal Bond Fund | 193,369,998 | 270,826,518 |
BNY Mellon New York Intermediate Tax-Exempt Bond Fund | 93,705,360 | 107,801,146 |
BNY Mellon Municipal Opportunities Fund | 1,340,790,000 | 1,419,415,854 |
Inverse Floater Securities: BNY Mellon Municipal Opportunities Fund participates in secondary inverse floater structures in which fixed-rate, tax-exempt municipal bonds are transferred to a trust (the “Inverse Floater Trust”). The Inverse Floater Trust typically issues two variable rate securities that are collateralized by the cash flows of the fixed-rate, tax-exempt municipal bonds. One of these variable rate securities pays interest based on a short-term floating rate set by a remarketing agent at predetermined intervals (“Trust Certificates”). A residual interest tax-exempt security is also created by the Inverse Floater Trust, which is transferred to the fund, and is paid interest based on the remaining cash flows of the Inverse Floater Trust, after payment of interest on the other securities and various expenses of the Inverse Floater Trust. An Inverse Floater Trust may be collapsed without the consent of the fund due to certain termination events such as bankruptcy, default or other credit event.
The fund accounts for the transfer of bonds to the Inverse Floater Trust as secured borrowings, with the securities transferred remaining in the fund’s investments, and the related floating rate certificate securities reflected as fund liabilities in the Statement of Assets and Liabilities.
The fund may invest in inverse floater securities on either a non-recourse or recourse basis. These securities are typically supported by a liquidity facility provided by a bank or other financial institution (the “Liquidity Provider”) that allows the holders of the Trust Certificates to tender their certificates in exchange for payment from the Liquidity Provider of par plus accrued interest on any business day prior to a termination event. When the fund invests in inverse floater securities on a non-recourse basis, the Liquidity Provider is required to make a payment under the liquidity facility due to a termination event to the holders of the Trust Certificates. When this occurs, the Liquidity Provider typically liquidates all or a portion of the municipal securities held in the Inverse Floater Trust. A liquidation shortfall occurs if the Trust Certificates exceed the proceeds of the sale of the bonds in the Inverse Floater Trust (“Liquidation Shortfall”). When a fund invests in inverse floater securities on a recourse basis, the fund typically enters into a reimbursement agreement with the Liquidity Provider where the fund is required to repay the Liquidity Provider the amount of any Liquidation Shortfall. As a result, a fund investing in a recourse inverse floater security bears the risk of loss with respect to any Liquidation Shortfall.
The average amount of borrowings outstanding under the inverse floater structure during the period ended August 31, 2023, was approximately $41,039,562, with a related weighted average annualized interest rate of 3.74%.
Derivatives: A derivative is a financial instrument whose performance is derived from the performance of another asset. The SEC adopted Rule 18f-4 under the Act, which
113
NOTES TO FINANCIAL STATEMENTS (continued)
regulates the use of derivatives transactions for certain funds registered under the Act. Each fund, with the exception of the BNY Mellon Municipal Opportunities Fund, is deemed a “limited” derivatives user under the rule and is required to limit its derivatives exposure so that the total notional value of derivatives does not exceed 10% of each fund’s net assets, and is subject to certain reporting requirements.
BNY Mellon Municipal Opportunities Fund’s derivative transactions are subject to a value-at-risk leverage limit and certain reporting and other requirements pursuant to a derivatives risk management program adopted by the fund. Each type of derivative instrument that was held by each relevant fund during the period ended August 31, 2023 is discussed below.
Futures: In the normal course of pursuing their investment objective, each relevant fund exposed to market risk, including interest rate risk, as a result of changes in value of underlying financial instruments. The funds invest in futures in order to manage their exposure to or protect against changes in the market. A futures contract represents a commitment for the future purchase or a sale of an asset at a specified date. Upon entering into such contracts, these investments require initial margin deposits with a counterparty, which consist of cash or cash equivalents. The amount of these deposits is determined by the exchange or Board of Trade on which the contract is traded and is subject to change. Accordingly, variation margin payments are received or made to reflect daily unrealized gains or losses which are recorded in the Statements of Operations. When the contracts are closed, the funds recognize a realized gain or loss which is reflected in the Statements of Operations. There is minimal counterparty credit risk to the funds with futures since they are exchange traded, and the exchange guarantees the futures against default. Futures open at August 31, 2023 are set forth in the each relevant fund’s Statements of Investments.
Table 10 summarizes each fund’s average market value of derivatives outstanding during the period ended August 31, 2023.
| | |
Table 10—Average Market Value of Derivatives |
| | Average Market Value ($) |
BNY Mellon National Intermediate
Municipal Bond Fund
Interest rate futures | 60,999,546 |
BNY Mellon Pennsylvania Intermediate
Municipal Bond Fund
Interest rate futures | 2,932,904 |
BNY Mellon Massachusetts Intermediate
Municipal Bond Fund
Interest rate futures | 6,239,976 |
BNY Mellon New York Intermediate
Tax-Exempt Bond Fund
Interest rate futures | 3,329,656 |
BNY Mellon Municipal
Opportunities Fund
Interest rate futures | 222,408,115 |
Table 11 summarizes the cost of investments for federal income tax purposes, gross appreciation, gross depreciation and accumulated net unrealized appreciation (depreciation) on investments for each fund at August 31, 2023.
| | | | | |
Table 11—Accumulated Net Unrealized Appreciation (Depreciation) |
| Cost of
Investments ($) | Gross
Appreciation ($) | Gross
Depreciation ($) | Net ($) |
BNY Mellon National Intermediate Municipal Bond Fund | 1,994,397,875 | 8,206,003 | 85,577,412 | (77,371,409) |
BNY Mellon National Short-Term Municipal Bond Fund | 488,459,028 | 262,156 | 14,769,093 | (14,506,937) |
BNY Mellon Pennsylvania Intermediate Municipal Bond Fund | 89,702,252 | 109,975 | 4,096,751 | (3,986,776) |
BNY Mellon Massachusetts Intermediate Municipal Bond Fund | 189,660,194 | 260,542 | 9,278,485 | (9,017,943) |
BNY Mellon New York Intermediate Tax-Exempt Bond Fund | 111,274,387 | 226,189 | 5,545,131 | (5,318,942) |
BNY Mellon Municipal Opportunities Fund | 2,098,544,864 | 15,226,119 | 164,516,938 | (149,290,819) |
114
REPORT OF INDEPENDENT REGISTERED
PUBLIC ACCOUNTING FIRM
To the Shareholders of the Funds and Board of Trustees of
BNY Mellon Funds Trust:
Opinion on the Financial Statements
We have audited the accompanying statements of assets and liabilities of BNY Mellon National Intermediate Municipal Bond Fund, BNY Mellon National Short-Term Municipal Bond Fund, BNY Mellon Pennsylvania Intermediate Municipal Bond Fund, BNY Mellon Massachusetts Intermediate Municipal Bond Fund, BNY Mellon New York Intermediate Tax-Exempt Bond Fund and BNY Mellon Municipal Opportunities Fund (collectively, the “Funds”), each a series of BNY Mellon Funds Trust, including the statements of investments as of August 31, 2023, the related statements of operations for the year then ended, the statements of changes in net assets for each of the years in the two-year period then ended, and the related notes (collectively, the financial statements) and the financial highlights for each of the years in the five-year period then ended. In our opinion, the financial statements and financial highlights present fairly, in all material respects, the financial position of the Funds as of August 31, 2023, the results of their operations for the year then ended, the changes in their net assets for each of the years in the two-year period then ended, and the financial highlights for each of the years in the five-year period then ended, in conformity with U.S. generally accepted accounting principles.
Basis for Opinion
These financial statements and financial highlights are the responsibility of the Funds’ management. Our responsibility is to express an opinion on these financial statements and financial highlights based on our audits. We are a public accounting firm registered with the Public Company Accounting Oversight Board (United States) (PCAOB) and are required to be independent with respect to the Funds in accordance with the U.S. federal securities laws and the applicable rules and regulations of the Securities and Exchange Commission and the PCAOB.
We conducted our audits in accordance with the standards of the PCAOB. Those standards require that we plan and perform the audit to obtain reasonable assurance about whether the financial statements and financial highlights are free of material misstatement, whether due to error or fraud. Our audits included performing procedures to assess the risks of material misstatement of the financial statements and financial highlights, whether due to error or fraud, and performing procedures that respond to those risks. Such procedures included examining, on a test basis, evidence regarding the amounts and disclosures in the financial statements and financial highlights. Such procedures also included confirmation of securities owned as of August 31, 2023, by correspondence with the custodian and brokers or by other appropriate auditing procedures when replies from brokers were not received. Our audits also included evaluating the accounting principles used and significant estimates made by management, as well as evaluating the overall presentation of the financial statements and financial highlights. We believe that our audits provide a reasonable basis for our opinion.

We have served as the auditor of one or more BNY Mellon Investment Adviser, Inc. investment companies since 1994.
New York, New York
October 23 , 2023
115
IMPORTANT TAX INFORMATION (Unaudited)
BNY Mellon National Intermediate Municipal Bond Fund
In accordance with federal tax law, the fund hereby reports all the dividends paid from investment income-net during its fiscal year ended August 31, 2023 as “exempt-interest dividends” (not generally subject to regular Federal income tax), except $8,013 that is being reported as an ordinary income distribution for reporting purposes. Where required by federal tax law rules, shareholders will receive notification of their portion of the fund’s taxable ordinary dividends (if any), capital gains distributions (if any) and tax-exempt dividends paid for the 2023 calendar year on Form 1099-DIV, which will be mailed in early 2024.
BNY Mellon National Short-Term Municipal Bond Fund
In accordance with federal tax law, the fund hereby reports all the dividends paid from investment income-net during its fiscal year ended August 31, 2023 as “exempt-interest dividends” (not generally subject to regular Federal income tax), except $156,093 that is being reported as an ordinary income distribution for reporting purposes. Where required by federal tax law rules, shareholders will receive notification of their portion of the fund’s taxable ordinary dividends (if any), capital gains distributions (if any) and tax-exempt dividends paid for the 2023 calendar year on Form 1099-DIV, which will be mailed in early 2024.
BNY Mellon Pennsylvania Intermediate Municipal Bond Fund
In accordance with federal tax law, the fund hereby reports all the dividends paid from investment income-net during its fiscal year ended August 31, 2023 as “exempt-interest dividends” (not generally subject to regular Federal income tax), except $151 that is being reported as an ordinary income distribution for reporting purposes. Where required by federal tax law rules, shareholders will receive notification of their portion of the fund’s taxable ordinary dividends (if any), capital gains distributions (if any) and tax-exempt dividends paid for the 2023 calendar year on Form 1099-DIV, which will be mailed in early 2024.
BNY Mellon Massachusetts Intermediate Municipal Bond Fund
In accordance with federal tax law, the fund hereby reports all the dividends paid from investment income-net during its fiscal year ended August 31, 2023 as “exempt-interest dividends” (not generally subject to regular Federal income tax) , except $11,145 that is being reported as an ordinary income distribution for reporting purposes. Where required by federal tax law rules, shareholders will receive notification of their portion of the fund’s taxable ordinary dividends (if any), capital gains distributions (if any) and tax-exempt dividends paid for the 2023 calendar year on Form 1099-DIV, which will be mailed in early 2024.
BNY Mellon New York Intermediate Tax-Exempt Bond Fund
In accordance with federal tax law, the fund hereby reports all the dividends paid from investment income-net during its fiscal year ended August 31, 2023 as “exempt-interest dividends” (not generally subject to regular Federal income tax). Where required by federal tax law rules, shareholders will receive notification of their portion of the fund’s taxable ordinary dividends (if any), capital gains distributions (if any) and tax-exempt dividends paid for the 2023 calendar year on Form 1099-DIV, which will be mailed in early 2024.
BNY Mellon Municipal Opportunities Fund
In accordance with federal tax law, the fund hereby reports all the dividends paid from investment income-net during its fiscal year ended August 31, 2023 as “exempt-interest dividends” (not generally subject to regular Federal income tax). Where required by federal tax law rules, shareholders will receive notification of their portion of the fund’s taxable ordinary dividends (if any), capital gains distributions (if any) and tax-exempt dividends paid for the 2023 calendar year on Form 1099-DIV, which will be mailed in early 2024. Also, the fund reports the maximum amount allowable but not less than $.0926 per share as a capital gain dividend paid on December 23, 2022 in accordance with Section 852(b)(3)(C) of the Internal Revenue Code. Also, the fund reports the maximum amount allowable but not less than $.0570 as a short-term capital gain dividend paid on December 23, 2022 in accordance with Sections 871(k)(2) and 881(e) of the Internal Revenue Code.
116
INFORMATION ABOUT THE RENEWAL OF EACH FUND’S INVESTMENT
ADVISORY AND ADMINISTRATION AGREEMENTS (Unaudited)
At a meeting of the Trust’s Board of Trustees held on March 20-21, 2023, the Board considered the renewal of the Trust’s Investment Advisory Agreement and Administration Agreement, pursuant to which the Adviser provides the funds with investment advisory services and The Bank of New York Mellon is responsible for the provision of administrative services to the funds (together, the “Agreement”). The Bank of New York Mellon has entered into a Sub-Administration Agreement with the Adviser pursuant to which The Bank of New York Mellon pays the Adviser for performing certain of these administrative services. The Board members, none of whom are “interested persons” (as defined in the Investment Company Act of 1940, as amended) of the Trust, were assisted in their review by independent legal counsel and met with counsel in executive session separate from representatives of the Adviser. In considering the renewal of the Agreement, the Board considered several factors that it believed to be relevant, including those discussed below. The Board did not identify any one factor as dispositive, and each Board member may have attributed different weights to the factors considered.
Analysis of Nature, Extent, and Quality of Services Provided to the Funds. The Board considered information provided to it at the meeting and in previous presentations from representatives of the Adviser regarding the nature, extent, and quality of the services provided to the funds in the Trust, including the funds. The Adviser provided the number of open accounts in each fund, each fund’s asset size and the allocation of fund assets among distribution channels. The Adviser also had previously provided information regarding the distribution channel(s) of the funds and the need to be able to provide ongoing shareholder services to each distribution channel, as applicable to each fund.
The Board also considered research support available to, and portfolio management capabilities of, each fund’s portfolio management personnel and that the Adviser also provides oversight of day-to-day fund operations, including fund accounting and administration and assistance in meeting legal and regulatory requirements. The Board also considered the Adviser’s extensive administrative, accounting and compliance infrastructures.
Comparative Analysis of the Funds’ Performance and Management Fees and Expense Ratios. For each fund, the Board reviewed reports prepared by Broadridge Financial Solutions, Inc. (“Broadridge”), an independent provider of investment company data based on classifications provided by Thomson Reuters Lipper (“Lipper”), which included information comparing (1) the performance of the fund’s Class M shares with the performance of a group of institutional funds selected by Broadridge as comparable to the fund (the “Performance Group”) and with a broader group of funds consisting of all retail and institutional funds in the particular Lipper classification (the “Performance Universe”), all for various periods ended December 31, 2022, and (2) the fund’s actual and contractual management fees and total expenses with those of the same group of funds in the Performance Group (the “Expense Group”) and with a broader group of all institutional funds in the particular Lipper classification, excluding outliers (the “Expense Universe”). The information for each comparison was derived, in part, from fund financial statements available to Broadridge as of the date of its analysis. The Adviser previously had furnished the Board with a description of the methodology Broadridge used to select the Performance Group and Performance Universe and the Expense Group and Expense Universe.
Performance Comparisons. Representatives of the Adviser stated that the usefulness of performance comparisons may be affected by a number of factors, including different investment limitations and policies that may be applicable to each fund and comparison funds and the end date selected. The Board also considered the funds’ performance in light of overall financial market conditions.
Management Fee and Expense Ratio Comparisons. For each fund, the Board reviewed and considered the contractual management fee rate payable by the fund to the Adviser in light of the nature, extent and quality of the management services provided by the Adviser. In addition, the Board reviewed and considered the actual management fee rate paid by the fund over the fund’s last fiscal year. The Board also reviewed the range of actual and contractual management fees and total expenses as a percentage of average net assets of the Expense Group and Expense Universe funds and discussed the results of the comparisons.
Representatives of the Adviser reviewed with the Board the management or investment advisory fees paid by one or more funds advised by the Adviser that are in the same Lipper category as BNY Mellon National Intermediate Municipal Bond Fund, BNY Mellon National Short-Term Municipal Bond Fund and BNY Mellon Municipal Opportunities Fund (for each fund, the “Similar Funds”), and explained the nature of the Similar Funds. They discussed differences in fees paid and the relationship of the fees paid in light of any differences in the services provided and other relevant factors. The Board considered the relevance of the fee information provided for the Similar Funds to evaluate the appropriateness of the relevant fund’s management fee. As to each fund, representatives of the Adviser noted that there were no Similar Funds for the other funds and that there
117
INFORMATION ABOUT THE RENEWAL OF EACH FUND’S INVESTMENT
ADVISORY AND ADMINISTRATION AGREEMENTS (Unaudited) (continued)
were no separate accounts and/or other types of client portfolios advised by the Adviser that are considered to have similar investment strategies and policies as the fund.
BNY Mellon National Intermediate Municipal Bond Fund
The information comparing the fund’s performance to that of its Performance Group and Performance Universe consisted of funds classified as intermediate municipal debt funds by Lipper.
The Board discussed with representatives of the Adviser the results of the performance comparisons and considered that the fund’s total return performance was at or above the Performance Group median for all periods, except for the two-, three- and ten-year periods when the fund’s total return performance was below the Performance Group median and was above the Performance Universe median for all periods. The Board also considered that the fund’s yield performance was below the Performance Group median for eight of the nine one-year periods ended December 31st and above the Performance Universe median for eight of the nine one-year periods ended December 31st. The Board considered the relative proximity of the fund’s total return performance and yield performance to the Performance Group and Performance Universe medians during the periods under review. The Adviser also provided a comparison of the fund’s calendar year total returns to the returns of the fund’s benchmark indices.
The Board considered that the fund’s contractual management fee was higher than the Expense Group median contractual management fee, the fund’s actual management fee was higher than the Expense Group median and Expense Universe median actual management fee, and fund’s total expenses were higher than the Expense Group median and Expense Universe median total expenses.
BNY Mellon National Short-Term Municipal Bond Fund
The information comparing the fund’s performance to that of its Performance Group and Performance Universe consisted of funds classified as short municipal debt funds by Lipper.
The Board discussed with representatives of the Adviser the results of the performance comparisons and considered that the fund’s total return performance was below the Performance Group median for all periods, except the one- and two-year periods when the fund’s total return performance was at and above, respectively, the Performance Group median, and was below the Performance Universe median for all periods, except for the one- and two-year periods when the fund’s total return performance was above the Performance Universe median. The Board also considered that the fund’s yield performance was below the Performance Group median for five of the nine one-year periods ended December 31st and was at or above the Performance Universe median for seven of the nine one-year periods ended December 31st. The Board considered the relative proximity of the fund’s total return performance and yield performance to the Performance Group and Performance Universe medians during the periods under review. The Adviser also provided a comparison of the fund’s calendar year total returns to the returns of the fund’s benchmark indices.
The Board considered that the fund’s contractual management fee was higher than the Expense Group median contractual management fee, the fund’s actual management fee was higher than the Expense Group median and Expense Universe median actual management fee, and the fund’s total expenses were higher than the Expense Group median and Expense Universe median total expenses.
Representatives of the Adviser stated that the Adviser has contractually agreed, until December 30, 2023, to waive receipt of its fees and/or assume the direct expenses of the fund, so that the direct expenses of neither class of fund shares (excluding shareholder services fees, taxes, interest expense, brokerage commissions, commitment fees on borrowings and extraordinary expenses) exceed ..44% of the fund’s average daily net assets.
BNY Mellon Pennsylvania Intermediate Municipal Bond Fund
The information comparing the fund’s performance to that of its Performance Group and Performance Universe consisted of funds classified as “other states” intermediate municipal debt funds by Lipper.
The Board discussed with representatives of the Adviser the results of the performance comparisons and considered that the fund’s total return performance was at or above the Performance Group and Performance Universe medians for all periods, except for the one-year period when the fund’s total return performance was below the Performance Group and Performance Universe medians. The Board also considered that the fund’s yield performance was below the Performance Group median for six of the nine one-year periods ended December 31st and at or above the Performance Universe median for seven of the nine one-year periods ended December 31st. The Board considered the relative proximity of the fund’s yield performance to the Performance Group and Performance Universe medians during the periods under review. The Board also considered
118
that there were no other funds that invested primarily in Pennsylvania municipal securities in the Performance Group. The Adviser also provided a comparison of the fund’s calendar year total returns to the returns of the fund’s benchmark indices. The Board noted that the fund had a four-star rating for the three-year period from Morningstar based on Morningstar’s risk-adjusted return measures.
The Board considered that the fund’s contractual management fee was higher than the Expense Group median contractual management fee, the fund’s actual management fee was higher than the Expense Group median and Expense Universe median actual management fee, and the fund’s total expenses were higher than the Expense Group median and Expense Universe median total expenses.
Representatives of the Adviser stated that the Adviser has contractually agreed, until December 30, 2023, to waive receipt of its fees and/or assume the direct expenses of the fund, so that the direct expenses of neither class of fund shares (excluding shareholder services fees, taxes, interest expense, brokerage commissions, commitment fees on borrowings and extraordinary expenses) exceed ..59% of the fund’s average daily net assets.
BNY Mellon Massachusetts Intermediate Municipal Bond Fund
The information comparing the fund’s performance to that of its Performance Group and Performance Universe consisted of funds classified as “other states” intermediate municipal debt funds by Lipper.
The Board discussed with representatives of the Adviser the results of the performance comparisons and considered that the fund’s total return performance was at or above the Performance Group median and above the Performance Universe median for all periods, except for the one-year period when the fund’s total return performance was just below the Performance Universe median. The Board also considered that the fund’s yield performance was below the Performance Group median for six of the nine one-year periods ended December 31st and below the Performance Universe for six of the nine one-year periods ended December 31st. The Board considered the relative proximity of the fund’s yield performance to the Performance Group and Performance Universe medians during the periods under review. The Board also considered that not all the other funds in the Performance Group or Performance Universe invested primarily in Massachusetts municipal securities. The Adviser also provided a comparison of the fund’s calendar year total returns to the returns of the fund’s benchmark indices. The Board noted that the fund had a five-star rating for the three-year period and a four-star rating for the five-year period and a four-star overall rating from Morningstar based on Morningstar’s risk-adjusted return measures.
The Board considered that the fund’s contractual management fee was equal to the Expense Group median contractual management fee, the fund’s actual management fee was higher than the Expense Group median and Expense Universe median contractual management fee, and the fund’s actual total expenses were equal to the Expense Group median and slightly lower than the Expense Universe median total expenses.
BNY Mellon New York Intermediate Tax-Exempt Bond Fund
The information comparing the fund’s performance to that of its Performance Group and Performance Universe consisted of funds classified as New York intermediate municipal debt funds by Lipper.
The Board discussed with representatives of the Adviser the results of the performance comparisons and considered that the fund’s total return performance was below the Performance Group median for all periods, except for the four- and five-year periods when the fund’s total return performance was above the Performance Group median, and was below the Performance Universe median for all periods, except for the four-, five- and ten-year periods when the fund’s total return performance was above the Performance Universe median. The Board also considered that the fund’s yield performance was below the Performance Group median for all nine one-year periods ended December 31st and below the Performance Universe medians for six of the nine one-year periods ended December 31st. The Board considered the relative proximity of the fund’s yield performance to the Performance Group and Performance Universe medians during the periods under review. The Adviser also provided a comparison of the fund’s calendar year total returns to the returns of the fund’s benchmark indices.
The Board considered that the fund’s contractual management fee was higher than the Expense Group median contractual management fee, the fund’s actual management fee was higher than the Expense Group median and Expense Universe median actual management fee, and the fund’s total expenses were slightly higher the Expense Group median and higher than the Expense Universe median total expenses.
Representatives of the Adviser stated that the Adviser has contractually agreed, until December 30, 2023 to waive receipt of its fees and/or assume the direct expenses of the fund so that the direct expenses of neither class of fund shares (excluding shareholder services fees, taxes, interest expense, brokerage commissions, commitment fees on
119
INFORMATION ABOUT THE RENEWAL OF EACH FUND’S INVESTMENT
ADVISORY AND ADMINISTRATION AGREEMENTS (Unaudited) (continued)
borrowings and extraordinary expenses) exceed .59% of the fund’s average daily net assets.
BNY Mellon Municipal Opportunities Fund
The information comparing the fund’s performance to that of its Performance Group and Performance Universe consisted of funds classified as general and insured municipal debt funds by Lipper.
The Board discussed with representatives of the Adviser the results of the performance comparisons and considered that the fund’s total return performance was above the Performance Group and Performance Universe medians for all periods. The Board also considered that the fund’s yield performance was below the Performance Group median for six of the nine one-year periods ended December 31st and above the Performance Universe median for all nine one-year periods ended December 31st. The Board considered the relative proximity of the fund’s yield performance to the Performance Group and Performance Universe medians during the periods under review. The Adviser also provided a comparison of the fund’s calendar year total returns to the returns of the fund’s benchmark index. The Board noted that the fund had a five-star rating for each of the five- and ten-year periods and a five-star overall rating from Morningstar based on Morningstar’s risk-adjusted return measures.
The Board considered that the fund’s contractual management fee was higher than the Expense Group median contractual management fee, the fund’s actual management fee was higher than the Expense Group median and Expense Universe median actual management fee, and the fund’s total expenses were higher than the Expense Group median and Expense Universe median total expenses.
Analysis of Profitability and Economies of Scale. Representatives of the Adviser reviewed the expenses allocated and profit received by the Adviser and its affiliates and the resulting profitability percentage for managing each fund and the aggregate profitability percentage to the Adviser and its affiliates for managing the funds in the BNY Mellon fund complex, and the method used to determine the expenses and profit. The Board concluded that the profitability results were not excessive, given the services rendered and service levels provided by the Adviser and its affiliates to each fund. The Board also considered the expense limitation arrangement for certain funds and the effect such arrangements had on the profitability of the Adviser and its affiliates. The Board also had been provided with information prepared by an independent consulting firm regarding the Adviser’s approach to allocating costs to, and determining the profitability of, individual funds and the entire BNY Mellon fund complex. The consulting firm also had analyzed where any economies of scale might emerge in connection with the management of a fund.
As to each fund, the Board considered, on the advice of its counsel, the profitability analysis (1) as part of its evaluation of whether the fees under the Agreement, considered in relation to the mix of services provided by the Adviser, including the nature, extent and quality of such services, supported the renewal of the Agreement and (2) in light of the relevant circumstances for the fund and the extent to which economies of scale would be realized if the fund grows and whether fee levels reflect these economies of scale for the benefit of fund shareholders. Representatives of the Adviser stated that a discussion of economies of scale is predicated on a fund having achieved a substantial size with increasing assets and that, if a fund’s assets had been stable or decreasing, the possibility that the Adviser may have realized any economies of scale would be less. Representatives of the Adviser also stated that, as a result of shared and allocated costs among funds in the BNY Mellon fund complex, the extent of economies of scale could depend substantially on the level of assets in the complex as a whole, so that increases and decreases in complex-wide assets can affect potential economies of scale in a manner that is disproportionate to, or even in the opposite direction from, changes in the fund’s asset level. The Board also considered potential benefits to the Adviser from acting as investment adviser and took into consideration that there were no soft dollar arrangements in effect for trading the funds’ investments.
At the conclusion of these discussions, the Board agreed that it had been furnished with sufficient information to make an informed business decision with respect to the renewal of the Agreement. Based on the discussions and considerations as described above, the Board concluded and determined as follows.
· The Board concluded that the nature, extent and quality of the services provided by the Adviser to each fund are adequate and appropriate.
· With respect to BNY Mellon National Intermediate Municipal Bond Fund, BNY Mellon National Short-Term Municipal Bond Fund, BNY Mellon Massachusetts Intermediate Municipal Bond Fund, BNY Mellon Pennsylvania Intermediate Municipal Bond Fund and BNY Mellon New York Intermediate Municipal Bond Fund, the Board generally was satisfied with each fund’s overall relative performance.
120
· With respect to BNY Mellon Municipal Opportunities Fund, the Board was satisfied with the fund’s relative performance.
· With respect to each fund, the Board concluded that the fees paid pursuant to the Agreement continued to be appropriate under the circumstances and in light of the factors and the totality of the services provided as discussed above.
· The Board determined that the economies of scale which may accrue to the Adviser and its affiliates in connection with the management of the funds had been adequately considered by the Adviser in connection with the fee rate charged to each fund pursuant to the Agreement and that, to the extent in the future it were determined that material economies of scale had not been shared with the fund, the Board would seek to have those economies of scale shared with the fund.
In evaluating the Agreement with respect to each fund, the Board considered these conclusions and determinations and also relied on its previous knowledge, gained through meetings and other interactions with the Adviser and its affiliates, of the Adviser and the services provided to the fund pursuant to the Agreement. The Board also relied on information received on a routine and regular basis throughout the year relating to the operations of the funds and the investment management and other services provided under the Agreement, including information on the investment performance of each fund in comparison to similar mutual funds and benchmark performance indices; general market outlook as applicable to each fund; and compliance reports. In addition, the Board’s consideration of the contractual fee arrangements for each fund had the benefit of a number of years of reviews of the Agreement for the funds in the Trust, during which lengthy discussions took place between the Board and representatives of the Adviser. Certain aspects of the arrangements may receive greater scrutiny in some years than in others, and the Board’s conclusions may be based, in part, on its consideration of the respective fund’s arrangements, or the arrangements for the other funds in the Trust, in prior years. The Board determined to renew the Agreement for each fund.
121
LIQUIDITY RISK MANAGEMENT PROGRAM (Unaudited)
Each fund adopted a liquidity risk management program (the “Liquidity Risk Management Program”) pursuant to the requirements of Rule 22e-4 under the Investment Company Act of 1940, as amended. Rule 22e-4 requires registered open-end funds, including mutual funds and exchange-traded funds but not money market funds, to establish liquidity risk management programs in order to effectively manage fund liquidity and shareholder redemptions. The rule is designed to mitigate the risk that a fund could not meet redemption requests without significantly diluting the interests of remaining investors.
The rule requires each fund to assess, manage and review their liquidity risk at least annually considering applicable factors such as investment strategy and liquidity during normal and foreseeable stressed conditions, including whether the strategy is appropriate for an open-end fund and whether the fund has a relatively concentrated portfolio or large positions in particular issuers. Each fund must also assess its use of borrowings and derivatives, short-term and long-term cash flow projections in normal and stressed conditions, holdings of cash and cash equivalents, and borrowing arrangements and other funding sources.
The rule also requires each fund to classify its investments as highly liquid, moderately liquid, less liquid or illiquid based on the number of days each fund expects it would take to liquidate the investment, and to review these classifications at least monthly or more often under certain conditions. The periods range from three or fewer business days for a highly liquid investment to greater than seven calendar days for settlement of a less liquid investment. Illiquid investments are those funds do not expect to be able to sell or dispose of within seven calendar days without significantly changing the market value. Each fund is prohibited from acquiring an investment if, after the acquisition, its holdings of illiquid assets will exceed 15% of its net assets. In addition, if a fund permits redemptions in-kind, the rule requires the fund to establish redemption in-kind policies and procedures governing how and when it will engage in such redemptions.
Pursuant to the rule’s requirements, the Liquidity Risk Management Program has been reviewed and approved by the Board. Furthermore, the Board has received a written report prepared by the Program’s Administrator that addresses the operation of the Program, assesses its adequacy and effectiveness and describes any material changes made to the Program.
Assessment of Program
In the opinion of the Program Administrator, the Program approved by the Board continues to be adequate for each fund and the Program has been implemented effectively. The Program Administrator has monitored the funds’ liquidity risk and the liquidity classification of the securities held by each fund and has determined that the Program is operating effectively.
During the period from January 1, 2022 to December 31, 2022, there were no material changes to the Program and no material liquidity events that impacted each fund. During the period, each fund held sufficient highly liquid assets to meet fund redemptions.
Under normal expected foreseeable fund redemption forecasts and foreseeable stressed fund redemption forecasts, the Program Administrator believes that each fund maintains sufficient highly liquid assets to meet expected fund redemptions.
122
BOARD MEMBERS INFORMATION (Unaudited)
INDEPENDENT BOARD MEMBERS
Independent Board Members
Patrick J. O’Connor (80)
Board Member, Chairman of the Board (2000)
Principal Occupation During Past 5 Years:
Attorney, Cozen O’Connor, P.C. (1973-Present), Vice Chairman (1980-2002); and President and Chief Executive Officer (2002-2007)
No. of Portfolios for which Board Member Serves: 19
———————
John R. Alchin (75)
Board Member (2008)
Principal Occupation During Past 5 Years:
· Retired
· The Barnes Foundation, an art museum, Trustee (2017 - Present)
· Metropolitan AIDS Neighborhood Nutrition Alliance, Advisory Board Member (2004 – Present)
· Philadelphia Art Museum, Board Member (2008 - Present)
· Xplornet Communications, Inc., a rural wireless tele-communications provider, Director (2015 –2020)
Other Public Company Board Memberships During Past 5 Years:
· Ralph Lauren Corporation, a retail clothing and home furnishing company, Director (2007-Present), and Chair of Audit Committee (2018-Present)
No. of Portfolios for which Board Member Serves: 19
———————
Ronald R. Davenport (87)
Board Member (2000)
Principal Occupation During Past 5 Years:
· Sheridan Broadcasting Corporation, Chairman (1972-Present)
No. of Portfolios for which Board Member Serves: 19
———————
Kim D. Kelly (67)
Board Member (2008)
Principal Occupation During Past 5 Years:
· Consultant (2005-Present)
Other Public Company Board Memberships During Past 5 Years:
· MCG Capital Corporation, a business development company, Director (2004-2015)
· HITV, broadcasting, President (2015 – 2019)
No. of Portfolios for which Board Member Serves: 19
———————
Kevin C. Phelan (79)
Board Member (2000)
Principal Occupation During Past 5 Years:
· Colliers International Mortgage Banker, (1978-Present) and Co-Chairman (2010-Present)
· A.D. Makepeace Co., cranberry grower and real estate development company, Director (2019-Present)
Other Public Company Board Memberships During Past 5 Years:
· Industrial Logistics Properties Trust, a real estate company, Trustee (2020 - Present)
No. of Portfolios for which Board Member Serves: 19
———————
Patrick J. Purcell (75)
Board Member (2000)
Principal Occupation During Past 5 Years:
· jobfind.com, an employment search site on the world wide web, President and Founder (1996 -– Present)
· The Boston Herald, President and Publisher (1994-2018)
· Herald Media, President and Chief Executive Officer, (2001 – 2018)
No. of Portfolios for which Board Member Serves: 19
———————
Thomas F. Ryan, Jr. (81)
Board Member (2000)
Principal Occupation During Past 5 Years:
· Retired
· Boston College. Trustee Associate (2013 – Present)
· NYISO Independent System Operator, a non-profit organization responsible for managing the state of New York’s electric grid, Director (1998-2021)
Other Public Company Board Memberships During Past 5 Years:
· RepliGen Corporation, a biopharmaceutical company, Director (2002-May 2022)
No. of Portfolios for which Board Member Serves: 19
———————
123
BOARD MEMBERS INFORMATION (Unaudited) (continued)
INDEPENDENT BOARD MEMBERS (continued)
Maureen M. Young (78)
Board Member (2000)
Principal Occupation During Past 5 Years:
· Retired
No. of Portfolios for which Board Member Serves: 19
———————
Once elected all Board Members serve for an indefinite term. The address of the Board Members and Officers is c/o BNY Mellon Investment Adviser, Inc. 240 Greenwich Street, New York, New York 10286. Additional information about each Board Member is available in the fund’s Statement of Additional Information which can be obtained from the Adviser free of charge by calling this toll free number: 1-800-373-9387. For individual account holders for Private Wealth Management clients, please contact your account officer or call 1-866-804-5023.
124
OFFICERS OF THE TRUST (Unaudited)
PATRICK T. CROWE, President since July 2015.
National Director of Investment Advisory, Analytics and Solutions for BNY Mellon Wealth Management since July 2014. He is 59 years old and has served in various capacities with BNY Mellon since 1993.
JAMES WINDELS, Treasurer since November 2001.
Director of the Adviser since February 2023; Vice President of the Adviser since September 2020, and Director- BNY Mellon Fund Administration. He is an officer of 54 investment companies (comprised of 122 portfolios) managed by the Adviser or an affiliate of the Adviser. He is 64 years old and has been an employee of the Adviser since April 1985.
PETER M. SULLIVAN, Chief Legal Officer since July 2021 and Vice President and Assistant Secretary since March 2019.
Chief Legal Officer of the Adviser and Associate General Counsel of BNY Mellon since July 2021; Senior Managing Counsel of BNY Mellon from December 2020 to July 2021; and Managing Counsel of BNY Mellon from March 2009 to December 2020. He is an officer of 54 investment companies (comprised of 122 portfolios) managed by the Adviser or an affiliate of the Adviser. He is 55 years old and has been an employee of BNY Mellon since April 2004.
JAMES BITETTO, Vice President since August 2005 and Secretary since February 2018.
Senior Managing Counsel of BNY Mellon since December 2019; Managing Counsel of BNY Mellon from April 2014 to December 2019; and Secretary of the Adviser. He is an officer of 54 investment companies (comprised of 122 portfolios) managed by the Adviser or an affiliate of the Adviser. He is 57 years old and has been an employee of the Adviser since December 1996.
DEIRDRE CUNNANE, Vice President and Assistant Secretary since February 2019.
Managing Counsel of BNY Mellon since December 2021; and Counsel of BNY Mellon from August 2018 to December 2021. She is an officer of 54 investment companies (comprised of 122 portfolios) managed by BNYM Investment Adviser or an affiliate of BNYM Investment Adviser. She is 33 years old and has been an employee of BNY Mellon since August 2013.
SARAH S. KELLEHER, Vice President and Assistant Secretary since April 2014.
Vice President of BNY Mellon ETF Investment Adviser, LLC since February 2020; Senior Managing Counsel of BNY Mellon since September 2021; and Managing Counsel of BNY Mellon from December 2017 to September 2021. She is an officer of 54 investment companies (comprised of 122 portfolios) managed by the Adviser or an affiliate of the Adviser. She is 47 years old and has been an employee of BNY Mellon since March 2013.
JEFF PRUSNOFSKY, Vice President and Assistant Secretary since August 2015.
Senior Managing Counsel of BNY Mellon. He is an officer of 54 investment companies (comprised of 122 portfolios) managed by the Adviser or an affiliate of the Adviser. He is 58 years old and has been an employee of the Adviser since October 1990.
AMANDA QUINN, Vice President and Assistant Secretary since March 2020.
Counsel of BNY Mellon since June 2019; Regulatory Administration Manager at BNY Mellon Investment Management Services from September 2018 to May 2019; and Senior Regulatory Specialist at BNY Mellon Investment Management Services from April 2015 to August 2018. She is an officer of 54 investment companies (comprised of 122 portfolios) managed by the Adviser or an affiliate of the Adviser. She is 38 years old and has been an employee of BNY Mellon since April 2015.
JOANNE SKERRETT, Vice President and Assistant Secretary since March 2023.
Managing Counsel of BNY Mellon since June 2022; and Senior Counsel with the Mutual Fund Directors Forum, a leading funds industry organization, from 2016 to June 2022. She is an officer of 54 investment companies (comprised of 122 portfolios) managed by BNYM Investment Adviser or an affiliate of BNYM Investment Adviser. She is 51 years old and has been an employee of BNYM Investment Adviser since June 2022.
NATALYA ZELENSKY, Vice President and Assistant Secretary since March 2017.
Chief Compliance Officer since August 2021 and Vice President since February 2020 of BNY Mellon ETF Investment Adviser, LLC; Chief Compliance Officer since August 2021 and Vice President and Assistant Secretary since February 2020 of BNY Mellon ETF Trust; Managing Counsel from December 2019 to August 2021; Counsel of BNY Mellon from May 2016 to December 2019; and Assistant Secretary of the Adviser from April 2018 to August 2021. She is an officer of 54 investment companies (comprised of 122 portfolios) managed by the Adviser or an affiliate of the Adviser. She is 38 years old and has been an employee of BNY Mellon since May 2016.
GAVIN C. REILLY, Assistant Treasurer since December 2005.
Tax Manager - BNY Mellon Fund Administration. He is an officer of 54 investment companies (comprised of 122 portfolios) managed by the Adviser or an affiliate of the Adviser. He is 55 years old and has been an employee of the Adviser since April 1991.
ROBERT SALVIOLO, Assistant Treasurer since July 2007.
Senior Accounting Manager – BNY Mellon Fund Administration. He is an officer of 54 investment companies (comprised of 122 portfolios) managed by the Adviser or an affiliate of the Adviser. He is 56 years old and has been an employee of the Adviser since June 1989.
ROBERT SVAGNA, Assistant Treasurer since December 2002.
Senior Accounting Manager – BNY Mellon Fund Administration. He is an officer of 54 investment companies (comprised of 122 portfolios) managed by the Adviser or an affiliate of the Adviser. He is 56 years old and has been an employee of the Adviser since November 1990.
JOSEPH W. CONNOLLY, Chief Compliance Officer since October 2004.
Chief Compliance Officer of the BNY Mellon Family of Funds and BNY Mellon Funds Trust since 2004; and Chief Compliance Officer of BNYM Investment Adviser from 2004 until June 2021. He is the Chief Compliance Officer of 53 investment companies (comprised of 105 portfolios) managed by BNYM Investment Adviser. He is 66 years old.
CARIDAD M. CAROSELLA, Anti-Money Laundering Compliance Officer since January 2016.
Anti-Money Laundering Compliance Officer of the BNY Mellon Family of Funds and BNY Mellon Funds Trust. She is an officer of 47 investment companies (comprised of 115 portfolios) managed by BNYM Investment Adviser or an affiliate of BNYM Investment Adviser. She is 55 years old and has been an employee of the Distributor since 1997.
125
This page intentionally left blank.
126
BNY Mellon Funds Trust
240 Greenwich Street
New York, NY 10286
Adviser
BNY Mellon Investment Adviser, Inc.
240 Greenwich Street
New York, NY 10286
Administrator
The Bank of New York Mellon
240 Greenwich Street
New York, NY 10286
Sub-Administrator
BNY Mellon Investment Adviser, Inc.
240 Greenwich Street
New York, NY 10286
Custodian
The Bank of New York Mellon
240 Greenwich Street
New York, NY 10286
Transfer Agent &
Dividend Disbursing Agent
BNY Mellon Transfer, Inc.
240 Greenwich Street
New York, NY 10286
Distributor
BNY Mellon Securities Corporation
240 Greenwich Street
New York, NY 10286
| | | | | | | | | |
Ticker Symbols: | | | | | | | | |
BNY Mellon National Intermediate Municipal Bond Fund | | | Class M: MPNIX | | Investor: MINMX | | | |
BNY Mellon National Short-Term Municipal Bond Fund | | Class M: MPSTX | | Investor: MINSX | | | |
BNY Mellon Pennsylvania Intermediate Municipal Bond Fund | Class M: MPPIX | | Investor: MIPAX | | | |
BNY Mellon Massachusetts Intermediate Municipal Bond Fund | Class M: MMBMX | | Investor: MMBIX | | | |
BNY Mellon New York Intermediate Tax-Exempt Bond Fund | Class M: MNYMX | | Investor: MNYIX | | | |
BNY Mellon Municipal Opportunities Fund | | | Class M: MOTMX | | Investor: MOTIX | | | |
Telephone Wealth Management (WM) Clients, please contact your Account Officer or call 1-866-804-5023. Brokerage Clients of BNY Mellon Wealth Advisors (BNYMWA), please contact your financial representative or call 1-800-830-0549, Option 2 for BNY Mellon Wealth Management Direct or 1-800-843-5466 for former brokerage clients of BNY Mellon Wealth Advisors whose accounts are now held by BNY Mellon Brokerage Services. Individual Account holders, please call BNY Mellon Investment Advisers at 1-800-373-9387.
Mail WM clients, write to your Account Officer, c/o The Bank of New York Mellon, One Mellon Bank Center, Pittsburgh, PA 15258
BNYMWA Brokerage Clients, write to your financial representative, P.O. Box 9012, Hicksville, NY 11802-9012
Individual Account Holders, write to: BNY Mellon Funds, P.O. Box 534434, Pittsburgh, Pennslylvania 15253-4434
Each fund files its complete schedule of portfolio holdings with the Securities and Exchange Commission (“SEC”) for the first and third quarters of each fiscal year on Form N-PORT. The fund’s Forms N-PORT are available on the SEC’s website at http://www.sec.gov.
A description of the policies and procedures that the fund uses to determine how to vote proxies relating to portfolio securities, and information regarding how the fund voted these proxies for the most recent 12-month period ended June 30 is available at http:// www.im.bnymellon.com and on the SEC’s website at http://www.sec.gov. The description of the policies and procedures is also available without charge, upon request, by calling 1-800-373-9387.
| | |
© 2023 BNY Mellon Securities Corporation | MFTAR0823-MB |
BNY Mellon Funds Trust
BNY Mellon Government Money Market Fund
BNY Mellon National Municipal Money Market Fund
| | |
ANNUAL REPORT August 31, 2023 |

| |
Contents
THE FUNDS
FOR MORE INFORMATION
Back Cover
| |
| |
Save time. Save paper. View your next shareholder report online as soon as it’s available. Log into www.im.bnymellon.com and sign up for eCommunications. It’s simple and only takes a few minutes. |
| |
The views expressed herein are current to the date of this report. These views and the composition of the funds’ portfolios are subject to change at any time based on market and other conditions. |
| |
Not FDIC-Insured • Not Bank-Guaranteed • May Lose Value |
UNDERSTANDING YOUR FUND’S EXPENSES (Unaudited)
As a mutual fund investor, you pay ongoing expenses, such as management fees and other expenses. Using the information below, you can estimate how these expenses affect your investment and compare them with the expenses of other funds. You also may pay one-time transaction expenses, including sales charges (loads) and redemption fees, which are not shown in this section and would have resulted in higher total expenses. For more information, see your fund’s prospectus or talk to your financial adviser.
Review your fund’s expenses
The table below shows the expenses you would have paid on a $1,000 investment in each class of each fund from March 1, 2023 to August 31, 2023. It also shows how much a $1,000 investment would be worth at the close of the period, assuming actual returns and expenses.
| | | | | |
Expenses and Value of a $1,000 Investment | |
Assume actual returns for the six months ended August 31, 2023 | |
| | | | |
| | Class M | Investor Shares | |
BNY Mellon Government Money Market Fund | |
Expenses paid per $1,000† | $1.53 | $2.80 | |
Ending value (after expenses) | $1,024.20 | $1,022.90 | |
Annualized expense ratio (%) | .30 | .55 | |
BNY Mellon National Municipal Money Market Fund | |
Expenses paid per $1,000† | $1.78 | $3.05 | |
Ending value (after expenses) | $1,015.10 | $1,013.80 | |
Annualized expense ratio (%) | .35 | .60 | |
† | Expenses are equal to each fund’s annualized expense ratio as shown above, multiplied by the average account value over the period, multiplied by 184/365 (to reflect the one-half year period). |
COMPARING YOUR FUND’S EXPENSES WITH THOSE OF OTHER FUNDS (Unaudited)
Using the SEC’s method to compare expenses
The Securities and Exchange Commission (“SEC”) has established guidelines to help investors assess fund expenses. Per these guidelines, the table below shows your fund’s expenses based on a $1,000 investment, assuming a hypothetical 5% annualized return. You can use this information to compare the ongoing expenses (but not transaction expenses or total cost) of investing in the fund with those of other funds. All mutual fund shareholder reports will provide this information to help you make this comparison. Please note that you cannot use this information to estimate your actual ending account balance and expenses paid during the period.
| | | | | |
Expenses and Value of a $1,000 Investment | |
Assuming a hypothetical 5% annualized return for the six months ended August 31, 2023 | |
| | | | |
| | Class M | Investor Shares | |
BNY Mellon Government Money Market Fund | |
Expenses paid per $1,000† | $1.53 | $2.80 | |
Ending value (after expenses) | $1,023.69 | $1,022.43 | |
Annualized expense ratio (%) | .30 | .55 | |
BNY Mellon National Municipal Money Market Fund | |
Expenses paid per $1,000† | $1.79 | $3.06 | |
Ending value (after expenses) | $1,023.44 | $1,022.18 | |
Annualized expense ratio (%) | .35 | .60 | |
† | Expenses are equal to each fund’s annualized expense ratio as shown above, multiplied by the average account value over the period, multiplied by 184/365 (to reflect the one-half year period). |
2
STATEMENT OF INVESTMENTS
August 31, 2023
| | | | | | | |
| |
BNY Mellon Government Money Market Fund |
U.S. Government Agencies Obligations - 14.2% | Annualized
Yield (%) | | Principal
Amount ($) | | Value ($) | |
Federal Farm Credit Banks: | | | | | |
9/1/2023, Bonds (3 Month SOFR +0.05%) | 5.35 | | 3,000,000 | a | 3,000,000 | |
Federal Home Loan Banks: | | | | | |
9/1/2023, Bonds (3 Month SOFR +0.03%) | 5.33 | | 4,000,000 | a | 4,000,000 | |
9/1/2023, Bonds (3 Month SOFR +0.04%) | 5.34 | | 4,000,000 | a | 4,000,000 | |
9/1/2023, Bonds (3 Month SOFR +0.06%) | 5.36 | | 2,000,000 | a | 2,000,000 | |
9/1/2023, Bonds (3 Month SOFR +0.06%) | 5.36 | | 4,000,000 | a | 4,000,000 | |
9/1/2023, Bonds (3 Month SOFR +0.07%) | 5.37 | | 4,000,000 | a | 4,000,000 | |
9/1/2023, Bonds (3 Month SOFR +0.09%) | 5.39 | | 4,000,000 | a | 4,000,000 | |
9/1/2023, Bonds (3 Month SOFR +0.14%) | 5.44 | | 2,000,000 | a | 2,000,000 | |
9/15/2023, Notes | 5.07 | | 2,000,000 | b | 1,996,119 | |
2/9/2024, Notes | 4.95 | | 2,000,000 | b | 1,957,246 | |
3/6/2024, Notes | 5.28 | | 1,000,000 | b | 973,664 | |
4/26/2024, Bonds | 5.35 | | 2,000,000 | | 2,000,000 | |
5/10/2024, Bonds | 5.24 | | 2,000,000 | | 2,000,000 | |
5/28/2024, Bonds | 5.28 | | 2,000,000 | | 2,000,000 | |
5/30/2024, Bonds | 5.35 | | 1,000,000 | | 1,000,000 | |
7/12/2024, Bonds | 5.51 | | 3,000,000 | | 3,000,000 | |
8/19/2024, Bonds | 5.58 | | 3,000,000 | | 3,000,000 | |
8/26/2024, Bonds | 5.62 | | 3,000,000 | | 3,000,000 | |
Federal Home Loan Mortgage Corporation: | | | | | |
6/18/2024, Notes | 5.50 | | 1,000,000 | c | 1,000,000 | |
Total U.S. Government Agencies Obligations (cost $48,927,029) | | | | | 48,927,029 | |
U.S. Treasury Bills - 21.9% |
| |
| | | |
9/12/2023 | 5.36 | | 6,000,000 | b | 5,990,320 | |
9/21/2023 | 5.36 | | 10,000,000 | b | 9,970,694 | |
9/26/2023 | 5.38 | | 7,000,000 | b | 6,974,309 | |
9/28/2023 | 5.38 | | 7,000,000 | b | 6,972,254 | |
10/3/2023 | 5.42 | | 3,000,000 | b | 2,985,800 | |
10/10/2023 | 5.36 | | 8,000,000 | b | 7,954,413 | |
10/12/2023 | 5.40 | | 6,000,000 | b | 5,963,852 | |
10/24/2023 | 5.41 | | 4,000,000 | b | 3,968,848 | |
10/31/2023 | 4.92 | | 5,000,000 | b | 4,958,855 | |
11/14/2023 | 5.39 | | 2,000,000 | b | 1,978,376 | |
11/30/2023 | 5.44 | | 2,000,000 | b | 1,973,550 | |
12/7/2023 | 5.40 | | 4,000,000 | b | 3,943,417 | |
12/14/2023 | 5.31 | | 3,000,000 | b | 2,955,323 | |
1/11/2024 | 5.45 | | 2,000,000 | b | 1,961,353 | |
1/18/2024 | 5.43 | | 2,000,000 | b | 1,959,458 | |
2/29/2024 | 5.57 | | 2,000,000 | b | 1,946,203 | |
6/13/2024 | 5.20 | | 3,000,000 | b | 2,882,502 | |
Total U.S. Treasury Bills (cost $75,339,527) | | | | | 75,339,527 | |
U.S. Treasury Floating Rate Notes - 11.0% |
| |
| | | |
9/6/2023, (3 Month U.S. T-BILL -0.08%) | 5.34 | | 8,000,000 | a | 7,998,005 | |
9/6/2023, (3 Month U.S. T-BILL +0.04%) | 5.45 | | 5,000,000 | a | 5,000,000 | |
9/6/2023, (3 Month U.S. T-BILL +0.04%) | 5.45 | | 10,000,000 | a | 9,997,056 | |
9/6/2023, (3 Month U.S. T-BILL +0.13%) | 5.54 | | 5,000,000 | a | 4,997,691 | |
9/6/2023, (3 Month U.S. T-BILL +0.14%) | 5.55 | | 5,000,000 | a | 4,997,250 | |
9/6/2023, (3 Month U.S. T-BILL +0.20%) | 5.61 | | 5,000,000 | a | 5,000,222 | |
Total U.S. Treasury Floating Rate Notes (cost $37,990,224) | | | | | 37,990,224 | |
3
STATEMENT OF INVESTMENTS (continued)
| | | | | | | |
| |
BNY Mellon Government Money Market Fund (continued) |
Repurchase Agreements - 53.8% | Annualized
Yield (%) | | Principal
Amount ($) | | Value ($) | |
ABN Amro Bank, Tri-Party Agreement thru BNY Mellon, dated 8/31/2023, due at 9/1/2023 in the amount of $65,009,569 (fully collateralized by: U.S. Treasuries (including strips), 0.50%-3.88%, due 3/31/2025-8/15/2046, valued at $66,300,007) | 5.30 | | 65,000,000 | | 65,000,000 | |
Bank of Nova Scotia, Tri-Party Agreement thru BNY Mellon, dated 8/31/2023, due at 9/1/2023 in the amount of $70,010,267 (fully collateralized by: U.S. Treasuries (including strips), 0.00%-4.50%, due 9/14/2023-8/15/2053, valued at $71,410,473) | 5.28 | | 70,000,000 | | 70,000,000 | |
Fixed Income Clearing Corp., Tri-Party Agreement thru Northern Trust Company, dated 8/31/2023, due at 9/1/2023 in the amount of $50,007,361 (fully collateralized by: U.S. Treasuries (including strips), 2.63%, due 5/31/2027, valued at $51,000,000) | 5.30 | | 50,000,000 | | 50,000,000 | |
Total Repurchase Agreements (cost $185,000,000) | | | | | 185,000,000 | |
Total Investments (cost $347,256,780) | | 100.9% | | 347,256,780 | |
Liabilities, Less Cash and Receivables | | (.9%) | | (3,239,288) | |
Net Assets | | 100.0% | | 344,017,492 | |
a Variable rate security—interest rate resets periodically and rate shown is the interest rate in effect at period end. Date shown represents the earlier of the next interest reset date or ultimate maturity date. Security description also includes the reference rate and spread if published and available.
b Security is a discount security. Income is recognized through the accretion of discount.
c The Federal Housing Finance Agency (“FHFA”) placed the Federal Home Loan Mortgage Corporation and Federal National Mortgage Association into conservatorship with FHFA as the conservator. As such, the FHFA oversees the continuing affairs of these companies.
| | |
Portfolio Summary (Unaudited) † | Value (%) |
Repurchase Agreements | 53.8 |
U.S. Treasury Securities | 32.9 |
U.S. Government Agencies Obligations | 14.2 |
| | 100.9 |
† Based on net assets.
See notes to financial statements.
4
| | | | | | | | | | |
| |
BNY Mellon National Municipal Money Market Fund |
Short-Term Investments - 95.7% | Coupon
Rate (%) | | Maturity Date | | Principal Amount ($) | | Value ($) | |
Alabama - 7.3% | | | | | |
Decatur AL,
GO, Refunding, Ser. A | | 2.00 | | 10/1/2023 | | 100,000 | | 99,852 | |
Mobile County Industrial Development Authority,
Revenue Bonds (SSAB Alabama) (LOC; Swedbank AB) Ser. A | | 4.30 | | 9/7/2023 | | 1,000,000 | a | 1,000,000 | |
Mobile County Industrial Development Authority,
Revenue Bonds (SSAB Alabama) (LOC; Swedbank AB) Ser. B | | 4.30 | | 9/7/2023 | | 10,000,000 | a | 10,000,000 | |
| | 11,099,852 | |
California - 4.9% | | | | | |
California Infrastructure & Economic Development Bank,
Revenue Bonds (Society for the Blind Project) (LOC; U.S. Bank NA) | | 4.17 | | 9/7/2023 | | 1,590,000 | a | 1,590,000 | |
Los Angeles,
COP (Kadima Hebrew Academy) (LOC; California Bank & Trust) Ser. A | | 4.57 | | 9/7/2023 | | 5,885,000 | a | 5,885,000 | |
| | 7,475,000 | |
District of Columbia - .5% | | | | | |
District of Columbia,
Revenue Bonds, Refunding (Progressive Life Center) (LOC; Truist Bank) Ser. A | | 4.10 | | 9/7/2023 | | 820,000 | a | 820,000 | |
Florida - 11.4% | | | | | |
Florida Development Finance Corp.,
Revenue Bonds (Center Court Properties Project) (LOC; Wells Fargo Bank NA) | | 4.10 | | 9/7/2023 | | 855,000 | a | 855,000 | |
Manatee County,
Revenue Bonds, Refunding (Florida Power & Light Project) | | 4.50 | | 9/1/2023 | | 2,500,000 | a | 2,500,000 | |
Miami-Dade County Industrial Development Authority,
Revenue Bonds, Refunding (Florida Power & Light Co.) | | 4.20 | | 9/7/2023 | | 4,500,000 | a | 4,500,000 | |
Tender Option Bond Trust Receipts (Series 2022-XM0985),
(Broward County Convention Center Hotel, Revenue Bonds (Liquidity Agreement; JP Morgan Chase Bank NA)), Trust Maturity Date 1/1/2030 | | 4.18 | | 9/7/2023 | | 9,500,000 | a,b,c | 9,500,000 | |
| | 17,355,000 | |
Georgia - 4.6% | | | | | |
Macon Water Authority,
Revenue Bonds, Refunding, Ser. B | | 4.14 | | 9/7/2023 | | 950,000 | a | 950,000 | |
Tender Option Bond Trust Receipts (Series 2018-XF0708),
(Bryan County School District, GO (Insured; State Aid Withholding) (Liquidity Agreement; JPMorgan Chase Bank NA)), Trust Maturity Date 8/1/2024 | | 4.16 | | 9/7/2023 | | 3,200,000 | a,b,c | 3,200,000 | |
Tender Option Bond Trust Receipts (Series 2023-XG0470),
(Georgia Municipal Electric Authority, Revenue Bonds (Plant Vogtle Units 3&4 Project) (LOC; Bank of America NA) Ser. A), Trust Maturity Date 1/1/2059 | | 4.11 | | 9/7/2023 | | 2,800,000 | a,b,c | 2,800,000 | |
| | 6,950,000 | |
Hawaii - .1% | | | | | |
Hawaii,
GO, Ser. ET | | 3.00 | | 10/1/2023 | | 100,000 | | 99,949 | |
Illinois - 2.4% | | | | | |
Illinois Educational Facilities Authority,
Revenue Bonds (The Lincoln Park Society) (LOC; Citibank NA) | | 4.05 | | 9/7/2023 | | 300,000 | a | 300,000 | |
Illinois Educational Facilities Authority,
Revenue Bonds, Refunding (The Newberry Library) (LOC; Northern Trust Company) | | 3.95 | | 9/7/2023 | | 1,400,000 | a | 1,400,000 | |
Illinois Finance Authority,
Revenue Bonds, Refunding (Community Action Partnership of Lake County) (LOC; BMO Harris Bank NA) Ser. A | | 4.21 | | 9/7/2023 | | 1,890,000 | a | 1,890,000 | |
| | 3,590,000 | |
5
STATEMENT OF INVESTMENTS (continued)
| | | | | | | | | | |
| |
BNY Mellon National Municipal Money Market Fund (continued) |
Short-Term Investments - 95.7% (continued) | Coupon
Rate (%) | | Maturity Date | | Principal Amount ($) | | Value ($) | |
Indiana - 2.1% | | | | | |
Indiana Development Finance Authority,
Revenue Bonds (Goodwill Industries of Michiana Project) (LOC; PNC Bank NA) | | 4.10 | | 9/7/2023 | | 235,000 | a | 235,000 | |
Indiana Finance Authority,
Revenue Bonds, Refunding (LOC; Cooperatieve Rabobank) | | 4.25 | | 9/7/2023 | | 3,000,000 | a | 3,000,000 | |
| | 3,235,000 | |
Iowa - .8% | | | | | |
Tender Option Bond Trust Receipts (Series 2022-XF2983),
(Lowa Finance Authority outstanding Midwestern Disaster Area, Revenue Bonds, Refunding (Lowa Fertilizer company project)), Trust Maturity Date 12/1/2050 | | 4.14 | | 9/7/2023 | | 1,145,000 | a,b,c | 1,145,000 | |
Kansas - .3% | | | | | |
Johnson County Unified School District No. 232,
GO, Refunding, Ser. B | | 3.00 | | 9/1/2023 | | 110,000 | | 110,000 | |
Leawood,
GO | | 3.00 | | 9/1/2023 | | 400,000 | | 400,000 | |
| | 510,000 | |
Kentucky - 1.1% | | | | | |
Boone County,
Revenue Bonds, Refunding (Duke Energy) (LOC; Sumitomo Mitsui Banking) | | 4.15 | | 9/7/2023 | | 1,380,000 | a | 1,380,000 | |
Lexington-Fayette Urban County Government,
Revenue Bonds, Refunding (Eastland Parkway) (LOC; Traditional Bank) | | 4.80 | | 9/7/2023 | | 270,000 | a | 270,000 | |
| | 1,650,000 | |
Louisiana - 2.2% | | | | | |
Louisiana Housing Corp.,
Revenue Bonds (Belmont Village Apartments Project) | | 4.16 | | 9/7/2023 | | 3,355,000 | a | 3,355,000 | |
Maryland - 2.8% | | | | | |
Maryland Health & Higher Educational Facilities Authority,
Revenue Bonds, Refunding (Stella Maris) (LOC; M&T Bank) | | 4.26 | | 9/7/2023 | | 4,210,000 | a,b | 4,210,000 | |
Mississippi - 1.3% | | | | | |
Mississippi Business Finance Corp.,
Revenue Bonds, Refunding (Jackson Heart Realty) (LOC; Federal Home Loan Bank) | | 4.13 | | 9/7/2023 | | 1,940,000 | a | 1,940,000 | |
Nebraska - 1.6% | | | | | |
Lincoln Electric System,
CP, Ser. C | | 3.25 | | 9/21/2023 | | 2,500,000 | | 2,498,960 | |
New Jersey - .4% | | | | | |
New Jersey Economic Development Authority,
Revenue Bonds (Somerset Hills YMCA Project) (LOC; TD Bank NA) | | 4.62 | | 9/1/2023 | | 230,000 | a | 230,000 | |
Somerset Hills School District,
GO | | 2.00 | | 9/15/2023 | | 100,000 | | 99,917 | |
Woodbridge,
GO, Refunding | | 2.00 | | 10/15/2023 | | 285,000 | | 284,352 | |
| | 614,269 | |
New York - 10.8% | | | | | |
Blind Brook-Rye Union Free School District,
GO, Refunding (Insured; State Aid Withholding) | | 2.25 | | 10/15/2023 | | 625,000 | | 623,769 | |
Chautauqua County,
GO, Refunding (Insured; Build America Mutual) Ser. A | | 2.00 | | 12/15/2023 | | 800,000 | | 796,733 | |
Harborfields Central School District,
BAN, Refunding (Insured; State Aid Withholding) | | 3.00 | | 9/7/2023 | | 1,020,000 | | 1,019,888 | |
Oneida County Industrial Development Agency,
Revenue Bonds (Mohawk Valley Community College Dormitory Corp.) (LOC; M&T Bank) Ser. A | | 4.21 | | 9/7/2023 | | 4,650,000 | a | 4,650,000 | |
Onondaga County,
GO | | 2.00 | | 10/15/2023 | | 235,000 | | 234,493 | |
6
| | | | | | | | | | |
| |
BNY Mellon National Municipal Money Market Fund (continued) |
Short-Term Investments - 95.7% (continued) | Coupon
Rate (%) | | Maturity Date | | Principal Amount ($) | | Value ($) | |
New York - 10.8% (continued) | | | | | |
Oswego County Industrial Development Agency,
Revenue Bonds (OH Properties Project) (LOC; M&T Bank) Ser. A | | 4.33 | | 9/7/2023 | | 165,000 | a | 165,000 | |
Riverhead Central School District,
GO (Insured; State Aid Withholding) Ser. A | | 4.50 | | 2/23/2024 | | 2,000,000 | | 2,008,620 | |
The Erie County Industrial Development Agency,
Revenue Bonds (Canisius High School) (LOC; M&T Bank) | | 4.23 | | 9/7/2023 | | 6,675,000 | a | 6,675,000 | |
Westchester County Industrial Development Agency,
Revenue Bonds (Westchester Jewish Project) (LOC; JP Morgan Chase Bank NA) | | 4.10 | | 9/7/2023 | | 160,000 | a | 160,000 | |
| | 16,333,503 | |
North Carolina - 1.4% | | | | | |
North Carolina Capital Facilities Finance Agency,
Revenue Bonds, Refunding (Rocky Mount Preparatory School) (LOC; Truist Bank) | | 4.10 | | 9/7/2023 | | 2,160,000 | a | 2,160,000 | |
North Dakota - 1.3% | | | | | |
Tender Option Bond Trust Receipts (Series 2023-XF1520),
(North Dakota State Housing Finance Agency, Revenue Bonds (LOC; TD Bank NA) Ser. A), Trust Maturity Date 7/1/2043 | | 4.11 | | 9/7/2023 | | 2,000,000 | a,b,c | 2,000,000 | |
Ohio - 2.1% | | | | | |
Hamilton County,
Revenue Bonds (The Children's Home of Cincinnati Ohio) (LOC; U.S. Bank NA) | | 4.25 | | 9/7/2023 | | 2,440,000 | a | 2,440,000 | |
Lincolnview Local School District,
GO, Refunding | | 3.00 | | 12/1/2023 | | 325,000 | | 324,474 | |
Ohio,
GO, Ser. A | | 2.00 | | 9/1/2023 | | 100,000 | | 100,000 | |
Port of Greater Cincinnati Development Authority,
Revenue Bonds (Cincinnati Zoo Project) (LOC; U.S. Bank NA) | | 4.25 | | 9/7/2023 | | 105,000 | a | 105,000 | |
Port of Greater Cincinnati Development Authority,
Revenue Bonds (Cincinnati Zoo Project) (LOC; U.S. Bank NA) | | 4.25 | | 9/7/2023 | | 260,000 | a | 260,000 | |
| | 3,229,474 | |
Pennsylvania - 9.1% | | | | | |
Lancaster Industrial Development Authority,
Revenue Bonds, Refunding (The Mennonite Home Project) (LOC; M&T Bank) | | 4.64 | | 9/7/2023 | | 9,000,000 | a | 9,000,000 | |
Montgomery County Industrial Development Authority,
Revenue Bonds (Girl Scouts of Eastern Pennsylvania) (LOC; TD Bank NA) | | 4.21 | | 9/7/2023 | | 340,000 | a | 340,000 | |
Ringgold School District,
GO, Refunding (Insured; Build America Mutual) | | 3.00 | | 9/1/2023 | | 695,000 | | 695,000 | |
Tender Option Bond Trust Receipts (Series 2022-XM1057),
(Southeastern Pennsylvania Transportation Authority, Revenue Bonds (Asset Improvement Program) (Liquidity Agreement; Bank of America NA)), Trust Maturity Date 6/1/2047 | | 4.11 | | 9/7/2023 | | 2,500,000 | a,b,c | 2,500,000 | |
York Redevelopment Authority,
Revenue Bonds (LOC; M&T Bank) | | 4.64 | | 9/7/2023 | | 1,235,000 | a | 1,235,000 | |
| | 13,770,000 | |
Rhode Island - 1.6% | | | | | |
Tender Option Bond Trust Receipts (Series 2022-XM1045),
(Rhode Island State Health & Education Building Corporation Public School, Revenue Bonds (Liquidity Agreement; Royal Bank of Canada) Ser. F), Trust Maturity Date 5/15/2030 | | 4.12 | | 9/7/2023 | | 2,500,000 | a,b,c | 2,500,000 | |
South Carolina - 9.3% | | | | | |
North Charleston Municipal Golf Course,
Revenue Bonds, Refunding | | 4.33 | | 9/7/2023 | | 340,000 | a | 340,000 | |
South Carolina Educational Facilities Authority,
Revenue Bonds (Spartanburg Methodist College) (LOC; Truist Bank) | | 4.10 | | 9/7/2023 | | 850,000 | a | 850,000 | |
7
STATEMENT OF INVESTMENTS (continued)
| | | | | | | | | | |
| |
BNY Mellon National Municipal Money Market Fund (continued) |
Short-Term Investments - 95.7% (continued) | Coupon
Rate (%) | | Maturity Date | | Principal Amount ($) | | Value ($) | |
South Carolina - 9.3% (continued) | | | | | |
Tender Option Bond Trust Receipts (Series 2022-XF3047),
(South Carolina Jobs-Economic Development Authority, Revenue Bonds (The Park at Vietti Apartments Project) (LOC; Mizuho Capital Markets LLC) Ser. A), Trust Maturity Date 6/1/2028 | | 4.46 | | 9/7/2023 | | 6,500,000 | a,b,c | 6,500,000 | |
Tender Option Bond Trust Receipts (Series 2022-XF3075),
(South Carolina Jobs-Economic Development Authority, Revenue Bonds (Park at Sondrio Apartments Project) (LOC; Mizuho Capital Markets LLC) Ser. A), Trust Maturity Date 6/1/2028 | | 4.46 | | 9/7/2023 | | 6,500,000 | a,b,c | 6,500,000 | |
| | 14,190,000 | |
Tennessee - 3.3% | | | | | |
Hawkins County Industrial Development Board,
Revenue Bonds, Refunding (Leggett & Platt Project) (LOC; Wells Fargo Bank NA) Ser. B | | 4.20 | | 9/7/2023 | | 1,750,000 | a | 1,750,000 | |
The Blount County Tennessee Public Building Authority,
Revenue Bonds, Refunding (Insured; County Guaranteed) (LOC; Truist Bank) Ser. 6A | | 4.10 | | 9/7/2023 | | 3,235,000 | a | 3,235,000 | |
| | 4,985,000 | |
Texas - 3.6% | | | | | |
Aledo Independent School District,
GO (Insured; Permanent School Fund Guarantee Program) | | 5.00 | | 2/15/2024 | | 680,000 | | 684,283 | |
Guadalupe-Blanco River Authority,
Revenue Bonds, Refunding | | 3.13 | | 9/1/2023 | | 300,000 | | 300,000 | |
San Antonio Education Facilities Corp.,
Revenue Bonds, Refunding (Trinity University) | | 4.05 | | 9/7/2023 | | 4,000,000 | a | 4,000,000 | |
Sulphur Springs,
GO (Insured; Assured Guaranty Municipal Corp.) | | 2.50 | | 9/1/2023 | | 290,000 | | 290,000 | |
Texas,
GO, Ser. A | | 4.15 | | 9/7/2023 | | 125,000 | a | 125,000 | |
| | 5,399,283 | |
Utah - 2.9% | | | | | |
Tender Option Bond Trust Receipts (Series 2022-XG0364),
(Intermountain Power Agency, Revenue Bonds, Refunding (Liquidity Agreement; Bank of America NA & LOC; Bank of America NA) Ser. A), Trust Maturity Date 7/1/2043 | | 4.12 | | 9/7/2023 | | 4,450,000 | a,b,c | 4,450,000 | |
Washington - 3.1% | | | | | |
King County,
GO, Ser. A | | 3.00 | | 1/1/2024 | | 700,000 | | 699,174 | |
King County Housing Authority,
Revenue Bonds (Insured; County Guaranteed) | | 3.00 | | 11/1/2023 | | 1,175,000 | | 1,173,899 | |
Tender Option Bond Trust Receipts (Series 2023-XG0475),
(Washington State Health Care Facility Authority, Revenue Bonds, Refunding (LOC; Toronto-Dominion Bank)), Trust Maturity Date 9/1/2055 | | 4.11 | | 9/7/2023 | | 2,785,000 | a,b,c | 2,785,000 | |
| | 4,658,073 | |
West Virginia - 1.4% | | | | | |
West Virginia Hospital Finance Authority,
Revenue Bonds, Refunding (Cabell Huntington Hospital Obligated Group) (LOC; Truist Bank) Ser. A | | 4.10 | | 9/7/2023 | | 2,195,000 | a | 2,195,000 | |
8
| | | | | | | | | | | | |
| |
BNY Mellon National Municipal Money Market Fund (continued) |
Short-Term Investments - 95.7% (continued) | Coupon
Rate (%) | | Maturity Date | | Principal Amount ($) | | Value ($) | |
Wisconsin - 2.0% | | | | | |
Door County WI,
GO, Ser. A | | 2.00 | | 9/1/2023 | | 500,000 | | 500,000 | |
Wood County,
NAN | | 4.50 | | 3/14/2024 | | 2,500,000 | | 2,504,625 | |
| | 3,004,625 | |
Total Investments (cost $145,422,988) | | 95.7% | 145,422,988 | |
Cash and Receivables (Net) | | 4.3% | 6,495,928 | |
Net Assets | | 100.0% | 151,918,916 | |
a The Variable Rate is determined by the Remarketing Agent in its sole discretion based on prevailing market conditions and may, but need not, be established by reference to one or more financial indices.
b Security exempt from registration pursuant to Rule 144A under the Securities Act of 1933. These securities may be resold in transactions exempt from registration, normally to qualified institutional buyers. At August 31, 2023, these securities amounted to $48,090,000 or 31.66% of net assets.
c The fund does not directly own the municipal security indicated; the fund owns an interest in a special purpose entity that, in turn, owns the underlying municipal security. The special purpose entity permits the fund to own interests in underlying assets, but in a manner structured to provide certain advantages not inherent in the underlying bonds (e.g., enhanced liquidity, yields linked to short-term rates). These securities are not an underlying piece for any of the Adviser long-term Inverse floater securities.
| | |
Portfolio Summary (Unaudited) † | Value (%) |
Development | 24.0 |
Education | 13.7 |
Multifamily Housing | 11.5 |
Nursing Homes | 8.7 |
General | 6.8 |
Medical | 6.6 |
School District | 5.8 |
Facilities | 4.3 |
Power | 3.5 |
Utilities | 2.9 |
General Obligation | 2.4 |
Pollution | 1.7 |
Transportation | 1.7 |
Single Family Housing | 1.3 |
Water | .8 |
| | 95.7 |
† Based on net assets.
See notes to financial statements.
9
| | | | |
| |
Summary of Abbreviations (Unaudited) |
| |
ABAG | Association of Bay Area Governments | AGC | ACE Guaranty Corporation |
AGIC | Asset Guaranty Insurance Company | AMBAC | American Municipal Bond Assurance Corporation |
BAN | Bond Anticipation Notes | BSBY | Bloomberg Short-Term Bank Yield Index |
CIFG | CDC Ixis Financial Guaranty | COP | Certificate of Participation |
CP | Commercial Paper | DRIVERS | Derivative Inverse Tax-Exempt Receipts |
EFFR | Effective Federal Funds Rate | FGIC | Financial Guaranty Insurance Company |
FHA | Federal Housing Administration | FHLB | Federal Home Loan Bank |
FHLMC | Federal Home Loan Mortgage Corporation | FNMA | Federal National Mortgage Association |
GAN | Grant Anticipation Notes | GIC | Guaranteed Investment Contract |
GNMA | Government National Mortgage Association | GO | General Obligation |
IDC | Industrial Development Corporation | LIBOR | London Interbank Offered Rate |
LOC | Letter of Credit | LR | Lease Revenue |
NAN | Note Anticipation Notes | MFHR | Multi-Family Housing Revenue |
MFMR | Multi-Family Mortgage Revenue | MUNIPSA | Securities Industry and Financial Markets Association Municipal Swap Index Yield |
OBFR | Overnight Bank Funding Rate | PILOT | Payment in Lieu of Taxes |
PRIME | Prime Lending Rate | PUTTERS | Puttable Tax-Exempt Receipts |
RAC | Revenue Anticipation Certificates | RAN | Revenue Anticipation Notes |
RIB | Residual Interest Bonds | SFHR | Single Family Housing Revenue |
SFMR | Single Family Mortgage Revenue | SOFR | Secured Overnight Financing Rate |
TAN | Tax Anticipation Notes | TRAN | Tax and Revenue Anticipation Notes |
TSFR | Term Secured Overnight
Financing Rate | U.S. T-BILL | U.S. Treasury Bill Money Market Yield |
XLCA | XL Capital Assurance | | |
| | | | |
See notes to financial statements.
10
STATEMENTS OF ASSETS AND LIABILITIES
August 31, 2023
| | | | | | | | | |
| | | | | | | | |
| | | | BNY Mellon Government Money Market Fund | | BNY Mellon National Municipal Money Market Fund | | |
Assets ($): | | | | | | | | |
Investments in securities—See Statements
of Investments† | | | | 347,256,780 | †† | 145,422,988 | | |
Cash | | | | 1,241,994 | | 1,388,276 | | |
Interest receivable | | | | 597,573 | | 711,361 | | |
Receivable for investment securities sold | | | | - | | 9,006,598 | | |
Prepaid expenses | | | | 16,121 | | 14,660 | | |
| | | | 349,112,468 | | 156,543,883 | | |
Liabilities ($): | | | | | | | | |
Due to BNY Mellon Investment Adviser, Inc.
and affiliates—Note 2(b) | | | | 94,684 | | 56,546 | | |
Payable for investment securities purchased | | | | 4,958,856 | | 4,513,245 | | |
Trustees’ fees and expenses payable | | | | 17,866 | | 13,884 | | |
Other accrued expenses | | | | 23,570 | | 41,292 | | |
| | | | 5,094,976 | | 4,624,967 | | |
Net Assets ($) | | | | 344,017,492 | | 151,918,916 | | |
Composition of Net Assets ($): | | | | | | | | |
Paid-in capital | | | | 344,017,044 | | 151,854,086 | | |
Total distributable earnings (loss) | | | | 448 | | 64,830 | | |
Net Assets ($) | | | | 344,017,492 | | 151,918,916 | | |
† Investments at cost ($) | | | | 347,256,780 | | 145,422,988 | | |
†† Value of repurchase
agreements—Note 1(b) ($) | | | | 185,000,000 | | - | | |
Net Asset Value Per Share | | | | | | | | |
Class M | | | | | | | | |
Net Assets ($) | | | | 333,171,095 | | 151,878,954 | | |
Shares Outstanding | | | | 333,173,376 | | 152,029,678 | | |
Net Asset Value Per Share ($) | | | | 1.00 | | 1.00 | | |
Investor Shares | | | | | | | | |
Net Assets ($) | | | | 10,846,397 | | 39,962 | | |
Shares Outstanding | | | | 10,846,462 | | 40,002 | | |
Net Asset Value Per Share ($) | | | | 1.00 | | 1.00 | | |
| | | | | | | | |
See notes to financial statements. | | | | | | | | |
11
STATEMENTS OF OPERATIONS
Year Ended August 31, 2023
| | | | | | | | | |
| | | | | | | | |
| | | | | BNY Mellon Government Money Market Fund | | BNY Mellon National Municipal Money Market Fund | |
Investment Income ($): | | | | | | |
Interest Income | | | 17,351,773 | | 7,981,581 | |
Expenses: | | | | | | |
Management fee—Note 2(a) | | | 592,321 | | 411,723 | |
Administration fee—Note 2(a) | | | 534,098 | | 371,124 | |
Trustees’ fees and expenses—Note 2(c) | | | 49,366 | | 35,137 | |
Professional fees | | | 44,058 | | 48,781 | |
Registration fees | | | 33,195 | | 33,184 | |
Shareholder servicing costs—Note 2(b) | | | 24,975 | | 124 | |
Chief Compliance Officer fees—Note 2(b) | | | 19,196 | | 19,196 | |
Custodian fees—Note 2(b) | | | 15,729 | | 15,625 | |
Prospectus and shareholders’ reports | | | 14,264 | | 8,566 | |
Miscellaneous | | | 1,398 | | 14,362 | |
Total Expenses | | | 1,328,600 | | 957,822 | |
Less—reduction in fees due to earnings credits—Note 2(b) | | | (196) | | (9,797) | |
Net Expenses | | | 1,328,404 | | 948,025 | |
Net Investment Income | | | 16,023,369 | | 7,033,556 | |
Net Realized Gain (Loss) on Investments—Note 1(b) ($) | - | | 168,466 | |
Net Increase in Net Assets Resulting from Operations | | 16,023,369 | | 7,202,022 | |
| | | | | | | | |
See notes to financial statements. | | | | | | | |
12
STATEMENTS OF CHANGES IN NET ASSETS
| | | | | | | | | | | | | | | | |
| | | | BNY Mellon Government Money Market Fund | | BNY Mellon National Municipal Money Market Fund | |
| | | | Year Ended August 31, | Year Ended August 31, |
| | | | 2023 | | | | 2022 | | 2023 | | | | 2022 | |
Operations ($): | | | | | | | | | | | | | | |
Net investment income | | | 16,023,369 | | | | 1,574,626 | | 7,033,556 | | | | 883,627 | |
Net realized gain (loss) on investments | | - | | | | - | | 168,466 | | | | 48,754 | |
Net Increase (Decrease) in Net Assets
Resulting from Operations | 16,023,369 | | | | 1,574,626 | | 7,202,022 | | | | 932,381 | |
Distributions ($): | | | | | | | | | | | | | | |
Distributions to shareholders: | | | | | | | | | | | | | | |
Class M | | | (15,628,916) | | | | (1,543,647) | | (7,054,516) | | | | (898,875) | |
Investor Shares | | | (391,497) | | | | (28,560) | | (1,091) | | | | (103) | |
Total Distributions | | | (16,020,413) | | | | (1,572,207) | | (7,055,607) | | | | (898,978) | |
Beneficial Interest Transactions ($1.00 per share): | | | | | | | | | | | |
Net proceeds from shares sold: | | | | | | | | | | | | | | |
Class M | | | 657,813,315 | | | | 567,501,254 | | 657,568,538 | | | | 593,948,050 | |
Investor Shares | | | 22,381,460 | | | | 16,022,669 | | - | | | | - | |
Distributions reinvested: | | | | | | | | | | | | | | |
Class M | | | 10,927 | | | | - | | - | | | | - | |
Investor Shares | | | 390,938 | | | | 28,419 | | 156 | | | | 29 | |
Cost of shares redeemed: | | | | | | | | | | | | | | |
Class M | | | (703,749,280) | | | | (545,106,610) | | (806,922,057) | | | | (614,012,236) | |
Investor Shares | | | (20,934,411) | | | | (18,996,414) | | (15,529) | | | | - | |
Increase (Decrease) in Net Assets
from Beneficial Interest Transactions | (44,087,051) | | | | 19,449,318 | | (149,368,892) | | | | (20,064,157) | |
Total Increase (Decrease) in Net Assets | (44,084,095) | | | | 19,451,737 | | (149,222,477) | | | | (20,030,754) | |
Net Assets ($): | | | | | | | | | | | | | | |
Beginning of Period | | | 388,101,587 | | | | 368,649,850 | | 301,141,393 | | | | 321,172,147 | |
End of Period | | | 344,017,492 | | | | 388,101,587 | | 151,918,916 | | | | 301,141,393 | |
| | | | | | | | | | | | | | | |
See notes to financial statements. | | | | | | | | | | | | | | |
13
FINANCIAL HIGHLIGHTS
The following tables describe the performance for each share class of each fund for the fiscal periods indicated. All information reflects financial results for a single fund share. Net asset value total return is calculated assuming an initial investment made at the net asset value at the beginning of the period, reinvestment of all dividends and distributions at net asset value during the period, and redemption at net asset value on the last day of the period. Net asset value total return includes adjustments in accordance with accounting principles generally accepted in the United States of America and as such, the net asset value for financial reporting purposes and the returns based upon those net asset values may differ from the net asset value and returns for shareholder transactions. These figures have been derived from the funds’ financial statements.
| | | | | | | | | | | | | | | | |
| | | | | | | Class M Shares |
| | | | | | Year Ended August 31, |
BNY Mellon Government Money Market Fund | | 2023 | | 2022 | | 2021 | | 2020 | | 2019 | |
Per Share Data ($): | | | | | | | | | | | | |
Net asset value, beginning of period | | | 1.00 | | 1.00 | | 1.00 | | 1.00 | | 1.00 | |
Investment Operations: | | | | | | | | | | | | |
Net investment income | | | .041 | | .004 | | .000a | | .008 | | .020 | |
Distributions: | | | | | | | | | | | | |
Dividends from net investment income | | | (.041) | | (.004) | | (.000)a | | (.008) | | (.020) | |
Net asset value, end of period | | | 1.00 | | 1.00 | | 1.00 | | 1.00 | | 1.00 | |
Total Return (%) | | | 4.17 | | .39 | | .01 | | .84 | | 2.06 | |
Ratios/Supplemental Data (%): | | | | | | | | | | | | |
Ratio of total expenses to average net assets | | | .33 | | .32 | | .31 | | .31 | | .30 | |
Ratio of net expenses to average net assets | | | .33 | | .19 | | .11 | | .29 | | .30 | |
Ratio of net investment income to average net assets | | | 4.06 | | .40 | | .01 | | .90 | | 2.05 | |
Net Assets, end of period ($ x 1,000) | | | 333,171 | | 379,093 | | 356,696 | | 491,999 | | 812,993 | |
a Amount represents less than $.001 per share.
See notes to financial statements.
14
| | | | | | | | | | | | | | | | | |
| | | | | | | Investor Shares |
| | | | | | | Year Ended August 31, |
BNY Mellon Government Money Market Fund | | 2023 | | 2022 | | 2021 | | 2020 | | 2019 | |
Per Share Data ($): | | | | | | | | | | | | |
Net asset value, beginning of period | | | 1.00 | | 1.00 | | 1.00 | | 1.00 | | 1.00 | |
Investment Operations: | | | | | | | | | | | | |
Net investment income | | | .038 | | .003 | | .000a | | .007 | | .018 | |
Distributions: | | | | | | | | | | | | |
Dividends from net investment income | | | (.038) | | (.003) | | (.000)a | | (.007) | | (.018) | |
Net asset value, end of period | | | 1.00 | | 1.00 | | 1.00 | | 1.00 | | 1.00 | |
Total Return (%) | | | 3.91 | | .31 | | .01 | | .68 | | 1.80 | |
Ratios/Supplemental Data (%): | | | | | | | | | | | | |
Ratio of total expenses to average net assets | | | .58 | | .57 | | .56 | | .56 | | .55 | |
Ratio of net expenses to average net assets | | | .58 | | .25 | | .11 | | .46 | | .55 | |
Ratio of net investment income to average net assets | | | 3.81 | | .34 | | .01 | | .70 | | 1.79 | |
Net Assets, end of period ($ x 1,000) | | | 10,846 | | 9,008 | | 11,954 | | 14,974 | | 17,152 | |
a Amount represents less than $.001 per share.
See notes to financial statements.
15
FINANCIAL HIGHLIGHTS (continued)
| | | | | | | | | | | | | | | | | |
| | | | | | | Class M Shares |
| | | | | | | Year Ended August 31, |
BNY Mellon National Municipal Money Market Fund | | 2023 | | 2022 | | 2021 | | 2020 | | 2019 | |
Per Share Data ($): | | | | | | | | | | | | |
Net asset value, beginning of period | | | 1.00 | | 1.00 | | 1.00 | | 1.00 | | 1.00 | |
Investment Operations: | | | | | | | | | | | | |
Net investment income | | | .026 | | .003 | | .000a | | .007 | | .013 | |
Distributions: | | | | | | | | | | | | |
Dividends from net investment income | | | (.026) | | (.003) | | (.000)a | | (.007) | | (.013) | |
Dividends from net realized gain on investments | | | (.000)a | | (.000)a | | - | | - | | - | |
Total Distributions | | | (.026) | | (.003) | | (.000)a | | (.007) | | (.013) | |
Net asset value, end of period | | | 1.00 | | 1.00 | | 1.00 | | 1.00 | | 1.00 | |
Total Return (%) | | | 2.62 | | .29 | | .01 | | .72 | | 1.31 | |
Ratios/Supplemental Data (%): | | | | | | | | | | | | |
Ratio of total expenses to average net assets | | | .35 | | .33 | | .32 | | .31 | | .30 | |
Ratio of net expenses to average net assets | | | .35 | | .22 | | .13 | | .29 | | .30 | |
Ratio of net investment income to average net assets | | | 2.56 | | .28 | | .01 | | .80 | | 1.30 | |
Net Assets, end of period ($ x 1,000) | | | 151,879 | | 301,086 | | 321,117 | | 361,358 | | 790,984 | |
a Amount represents less than $.001 per share.
See notes to financial statements.
16
| | | | | | | | | | | | | | | | |
| | | | | | | Investor Shares |
| | | | | | Year Ended August 31, |
BNY Mellon National Municipal Money Market Fund | | 2023 | | 2022 | | 2021 | | 2020 | | 2019 | |
Per Share Data ($): | | | | | | | | | | | | |
Net asset value, beginning of period | | | 1.00 | | 1.00 | | 1.00 | | 1.00 | | 1.00 | |
Investment Operations: | | | | | | | | | | | | |
Net investment income | | | .023 | | .002 | | .000a | | .006 | | .011 | |
Distributions: | | | | | | | | | | | | |
Dividends from net investment income | | | (.023) | | (.002) | | (.000)a | | (.006) | | (.011) | |
Dividends from net realized gain on investments | | | (.000)a | | (.000)a | | - | | - | | - | |
Total Distributions | | | (.023) | | (.002) | | (.000)a | | (.006) | | (.011) | |
Net asset value, end of period | | | 1.00 | | 1.00 | | 1.00 | | 1.00 | | 1.00 | |
Total Return (%) | | | 2.36 | | .19 | | .01 | | .56 | | 1.06 | |
Ratios/Supplemental Data (%): | | | | | | | | | | | | |
Ratio of total expenses to average net assets | | | .60 | | .58 | | .57 | | .56 | | .55 | |
Ratio of net expenses to average net assets | | | .60 | | .32 | | .13 | | .44 | | .55 | |
Ratio of net investment income to average net assets | | | 2.31 | | .18 | | .01 | | .55 | | 1.10 | |
Net Assets, end of period ($ x 1,000) | | | 40 | | 55 | | 55 | | 55 | | 55 | |
a Amount represents less than $.001 per share.
See notes to financial statements.
17
NOTES TO FINANCIAL STATEMENTS
NOTE 1—Significant Accounting Policies:
BNY Mellon Funds Trust (the “Trust”), a Massachusetts business trust that is registered under the Investment Company Act of 1940, as amended (the “Act”), as an open-end management investment company, operates as a series company currently consisting of nineteen series, including the following diversified funds: BNY Mellon Government Money Market Fund and BNY Mellon National Municipal Money Market Fund (each, a “fund” and collectively, the “funds”). The objectives of the funds are as follows: BNY Mellon Government Money Market Fund’s investment objective is to seek as high a level of current income as is consistent with the preservation of capital and the maintenance of liquidity. BNY Mellon National Municipal Money Market Fund’s investment objective is to seek as high a level of current income exempt from federal income tax as is consistent with the preservation of capital and the maintenance of liquidity.
Each fund is managed by Dreyfus, a division of BNY Mellon Investment Adviser, Inc. (the “Adviser”), a wholly-owned subsidiary of The Bank of New York Mellon Corporation (“BNY Mellon”), which serves as each fund’s investment adviser. BNY Mellon serves as administrator for the funds pursuant to an Administration Agreement with the Trust (the “Administration Agreement”). BNY Mellon has entered into a Sub-Administration Agreement with the Adviser pursuant to which BNY Mellon pays the Adviser for performing certain administrative services.
Effective September 1, 2023, the Adviser has engaged its affiliate, Dreyfus, to serve as the funds’ sub-investment adviser. Dreyfus is a division of Mellon Investments Corporation, a registered investment adviser and an indirect wholly-owned subsidiary of BNY Mellon, with its principal office located at One Boston Place, 15th Floor, Boston, MA 02108.
BNY Mellon Securities Corporation (the “Distributor”), a wholly-owned subsidiary of the Adviser, is the distributor of the fund’s shares, which are sold without a sales charge. Each fund is authorized to issue an unlimited number of $.001 par value shares of Beneficial Interest in each of the following classes of shares: Class M and Investor. Each class of shares has identical rights and privileges, except with respect to the Shareholder Service Plan and the expenses borne by each class, the allocation of certain transfer agency costs and certain voting rights. Income, expenses (other than expenses attributable to a specific class), and realized and unrealized gains or losses on investments are allocated to each class of shares based on its relative net assets.
As of August 31, 2023, MBC Investments Corporation, an indirect subsidiary of BNY Mellon, held 40,000 shares of investor shares for BNY Mellon National Municipal Money Market Fund.
It is each fund’s policy to maintain a constant net asset value (NAV) per share of $1.00; the funds have adopted certain investment, portfolio valuation and dividend and distribution policies to enable it to do so. There is no assurance, however, that the funds will be able to maintain a constant NAV per share of $1.00.
BNY Mellon National Municipal Money Market Fund operates as a “retail money market fund” as that term is defined in Rule 2a-7 under the Act. Effective October 2, 2023, the fund may no longer impose a fee upon the sale of shares or may temporarily suspend redemptions if the fund’s weekly liquid assets fall below required minimums because of market conditions or other factors. BNY Mellon Government Money Market Fund is a “government money market fund” as that term is defined in Rule 2a-7 under the Act.
The Trust accounts separately for the assets, liabilities and operations of each series. Expenses directly attributable to each series are charged to that series’ operations; expenses which are applicable to all series are allocated among them on a pro rata basis.
The Financial Accounting Standards Board (“FASB”) Accounting Standards Codification (“ASC”) is the exclusive reference of authoritative U.S. generally accepted accounting principles (“GAAP”) recognized by the FASB to be applied by nongovernmental entities. Rules and interpretive releases of the SEC under authority of federal laws are also sources of authoritative GAAP for SEC registrants. Each fund is an investment company and applies the accounting and reporting guidance of the FASB ASC Topic 946 Financial Services-Investment Companies. Each fund’s financial statements are prepared in accordance with GAAP, which may require the use of management estimates and assumptions. Actual results could differ from those estimates.
The Trust enters into contracts that contain a variety of indemnifications. The funds’ maximum exposure under these arrangements is unknown. The funds do not anticipate recognizing any loss related to these arrangements.
(a) Portfolio valuation: Investments in securities are valued at amortized cost in accordance with Rule 2a-7 under the Act. If amortized cost is determined not to approximate fair market value, the fair value of the portfolio securities will be determined by procedures established by and under the general oversight of the Trust’s Board of Trustees (the “Board”) pursuant to Rule 2a-5 under the Act.
The fair value of a financial instrument is the amount that would be received to sell an asset or paid to transfer a liability
18
in an orderly transaction between market participants at the measurement date (i.e., the exit price). GAAP establishes a fair value hierarchy that prioritizes the inputs of valuation techniques used to measure fair value. This hierarchy gives the highest priority to unadjusted quoted prices in active markets for identical assets or liabilities (Level 1 measurements) and the lowest priority to unobservable inputs (Level 3 measurements).
Additionally, GAAP provides guidance on determining whether the volume and activity in a market has decreased significantly and whether such a decrease in activity results in transactions that are not orderly. GAAP requires enhanced disclosures around valuation inputs and techniques used during annual and interim periods.
Various inputs are used in determining the value of each fund’s investments relating to fair value measurements. These inputs are summarized in the three broad levels listed below:
Level 1—unadjusted quoted prices in active markets for identical investments.
Level 2—other significant observable inputs (including quoted prices for similar investments, interest rates, prepayment speeds, credit risk, etc.).
Level 3—significant unobservable inputs (including the funds’ own assumptions in determining the fair value of investments).
The inputs or methodology used for valuing securities are not necessarily an indication of the risk associated with investing in those securities. For example, money market securities are valued using amortized cost, in accordance with rules under the Act. Generally, amortized cost approximates the current fair value of a security, but since the value is not obtained from a quoted price in an active market, such securities are reflected within Level 2 of the fair value hierarchy.
At August 31, 2023, all of the securities in each fund were considered Level 2 within the fair value hierarchy.
(b) Securities transactions and investment income: Securities transactions are recorded on a trade date basis. Interest income, adjusted for accretion of discount and amortization of premium on investments, is earned from settlement date and is recognized on the accrual basis. Realized gains and losses from securities transactions are recorded on the identified cost basis.
BNY Mellon Government Money Market Fund may enter into repurchase agreements with financial institutions, deemed to be creditworthy by the Adviser, subject to the seller’s agreement to repurchase and the fund agreement to resell such securities at a mutually agreed upon price. Pursuant to the terms of the repurchase agreement, such securities must have an aggregate market value greater than or equal to the terms of the repurchase price plus accrued interest at all times. If the value of the underlying securities falls below the value of the repurchase price plus accrued interest, the fund will require the seller to deposit additional collateral by the next business day. If the request for additional collateral is not met, or the seller defaults on its repurchase obligation, the fund maintains its right to sell the underlying securities at market value and may claim any resulting loss against the seller. The collateral is held on behalf of the fund by the tri-party administrator with respect to any tri-party agreement. The fund may also jointly enter into one or more repurchase agreements with other funds managed by the Adviser in accordance with an exemptive order granted by the SEC pursuant to section 17(d) and Rule 17d-1 under the Act. Any joint repurchase agreements must be collateralized fully by U.S. Government securities.
(c) Market Risk: The value of the securities in which each fund invests may be affected by political, regulatory, economic and social developments. Events such as war, acts of terrorism, the spread of infectious illness or other public health issue, recessions, or other events could have a significant impact on the fund and its investments. The value of a security may also decline due to general market conditions that are not specifically related to a particular company or industry, such as real or perceived adverse economic conditions, changes in the general outlook for corporate earnings, changes in interest or currency rates, changes to inflation, adverse changes to credit markets or adverse investor sentiment generally.
Government Securities Risk: Not all obligations of the U.S. government, its agencies and instrumentalities are backed by the full faith and credit of the U.S. Treasury. Some obligations are backed only by the credit of the issuing agency or instrumentality, and in some cases there may be some risk of default by the issuer. Any guarantee by the U.S. government or its agencies or instrumentalities of a security held by the fund does not apply to the market value of such security or to shares of each relevant fund itself.
Municipal Securities Risk: Municipal securities may be fully or partially backed or enhanced by the taxing authority of a local government, by the current or anticipated revenues from a specific project or specific assets, or by the credit of, or liquidity enhancement provided by, a private issuer. Special factors, such as legislative changes, and state and local economic and business developments, may adversely affect the yield and/or each relevant fund's ability to maintain a stable net asset value.
19
NOTES TO FINANCIAL STATEMENTS (continued)
Repurchase Agreement Counterparty Risk: The fund is subject to the risk that a counterparty in a repurchase agreement could fail to honor the terms of the agreement.
(d) Dividends and distributions to shareholders: It is the policy of each fund to declare dividends daily from net investment income. Such dividends are paid monthly. Dividends from net realized capital gains, if any, are normally declared and paid annually, but each fund may make distributions on a more frequent basis to comply with the distribution requirements of the Internal Revenue Code of 1986, as amended (the “Code”). To the extent that net realized capital gains can be offset by capital loss carryovers, it is the policy of each fund not to distribute such gains.
(e) Federal income taxes: It is the policy of BNY Mellon Government Money Market Fund to continue to qualify as a regulated investment company if such qualification is in the best interests of its shareholders, by complying with the applicable provisions of the Code and to make distributions of taxable income sufficient to relieve it from substantially all federal income and excise taxes.
It is the policy of BNY Mellon National Municipal Money Market Fund to continue to qualify as a regulated investment company, which can distribute tax-exempt dividends, by complying with the applicable provisions of the Code and to make distributions of income and net realized capital gain sufficient to relieve it from substantially all federal income and excise taxes.
For federal income tax purposes, each fund is treated as a separate entity for the purpose of determining such qualification.
As of and during the period ended August 31, 2023, the funds did not have any liabilities for any uncertain tax positions. Each fund recognizes interest and penalties, if any, related to uncertain tax positions as income tax expense in the Statements of Operations. During the period ended August 31, 2023, the funds did not incur any interest or penalties.
Each tax year in the four-year period ended August 31, 2023 remains subject to examination by the Internal Revenue Service and state taxing authorities.
Table 1 summarizes each fund’s components of accumulated earnings on a tax basis at August 31, 2023.
Under the Regulated Investment Company Modernization Act of 2010, each fund is permitted to carry forward capital losses for an unlimited period. Furthermore, capital loss carryovers retain their character as either short-term or long-term capital losses.
BNY Mellon Government Money Market Fund has an accumulated capital loss carryover available for federal income tax purposes to be applied against future net realized capital gains, if any, realized subsequent to August 31, 2023. The fund has $222 of short-term capital losses and $4,705 of long-term capital losses which can be carried forward for an unlimited period.
The tax character of distributions paid to shareholders for each fund during the fiscal periods ended August 31, 2023 and August 31, 2022 was all ordinary income for BNY Mellon Government Money Market Fund and for BNY Mellon National Municipal Money Market Fund were as follows: tax exempt income $7,026,672 and $882,458, ordinary income $28,935 and $7,379, and long-term capital gains $0 and $9,141, respectively.
During the period ended August 31, 2023, as a result of permanent book to tax differences, primarily due to treating a portion of the proceeds from redemptions as a distribution for tax purposes, BNY Mellon National Municipal Money Market Fund decreased total distributable earnings (loss) by $110,377 and increased paid-in capital by the same amount. Net assets and net asset value per share were not affected by this reclassification.
At August 31, 2023, the cost of investments for federal income tax purposes for each relevant fund was substantially the same as the cost for financial reporting purposes (see the Statements of Investments).
| | | | | | | | | |
Table 1—Components of Accumulated Earnings | |
| | Undistributed Tax-Exempt Income ($) | Undistributed Ordinary Income ($) | Undistributed Capital Gains (Losses) ($) | | | |
BNY Mellon Government Money Market Fund | | - | 5,375 | (4,927) | | | |
BNY Mellon National Municipal Money Market Fund | | 8,053 | 56,777 | - | | | |
20
NOTE 2—Management Fee, Administration Fee and Other Transactions with Affiliates:
(a) Pursuant to an investment advisory agreement with the Adviser, the management fee is payable monthly and computed on the average daily value of each fund’s net assets at the following annual rates: .15% of BNY Mellon Government Money Market Fund and .15% of BNY Mellon National Municipal Money Market Fund.
Pursuant to the Administration Agreement, BNY Mellon provides or arranges for fund accounting, transfer agency and other fund administration services and receives a fee based on the total net assets of the Trust based on the following rates:
0 up to $6 billion .15%
$6 billion up to $12 billion .12%
In excess of $12 billion .10%
(b) Each fund has adopted a Shareholder Services Plan with respect to its Investor shares. Each fund pays the Distributor at an annual rate of .25% of the value of its Investor shares average daily net assets for the provision of certain services. The services provided may include personal services relating to shareholder accounts, such as answering shareholder inquiries regarding a fund, and services related to the maintenance of such shareholder accounts. The Shareholder Services Plan allows the Distributor to make payments from the shareholder services fees it collects from each fund to compensate service agents (certain banks, securities brokers or dealers and other financial institutions) with respect to these services. Table 2 summarizes the amounts Investor shares were charged during the period ended August 31, 2023, pursuant to the Shareholder Services Plan, which is included in Shareholder servicing costs in the Statements of Operations.
| | |
Table 2 —Shareholder Services Plan Fees | |
| | |
BNY Mellon Government Money Market Fund | $24,951 |
BNY Mellon National Municipal
Money Market Fund | 120 |
The funds have an arrangement with BNY Mellon Transfer, Inc., (the “Transfer Agent”), a subsidiary of BNY Mellon and an affiliate of the Adviser, whereby the funds may receive earnings credits when positive cash balances are maintained, which are used to offset Transfer Agent fees. For financial reporting purposes, the funds include net earnings credits, if any, as an expense offset in the Statements of Operations.
BNY Mellon Government Money Market Fund has an arrangement with The Bank of New York Mellon (the “Custodian”), a subsidiary of BNY Mellon and an affiliate of the Adviser, whereby BNY Mellon Government Money Market Fund will receive interest income or be charged overdraft fees when positive cash balances are maintained. For financial reporting purposes, the fund includes this interest income and overdraft fees, if any, as interest income in the Statements of Operations.
BNY Mellon National Municipal Money Market Fund has an arrangement with the Custodian to receive earnings credits when positive cash balances are maintained, which were used to offset custody fees. For financial reporting purposes, the fund includes net earnings credits, if any, as expense offsets in the Statements of Operations.
Each fund compensates the Transfer Agent, under a transfer agency agreement, for providing cash management services for the funds. The Transfer Agent fees are comprised of amounts paid on cash management fees which are related to fund subscriptions and redemptions. BNY Mellon pays each fund’s Transfer Agent fees comprised of amounts paid on a per account basis out of the administration fee it receives from the Trust. These fees, if any, are included in Shareholder servicing costs in the Statement of Operations. These fees were partially offset by earnings credits for each fund, also summarized in Table 3.
Each fund compensates the Custodian, under a custody agreement, for providing custodial services for each fund. These fees are determined based on net assets, geographic region and transaction activity. Table 4 summarizes the amount each fund was charged during the period ended August 31, 2023 pursuant to the custody agreement. These fees were partially offset by earnings credits for each relevant fund, also summarized in Table 4.
| | | |
Table 3—Transfer Agent Fees |
| Cash Management
Transfer Agent Fees ($) | Transfer Agent
Earnings Credits ($) |
BNY Mellon Government Money Market Fund | 5 | (196) |
BNY Mellon National Municipal Money Market Fund | - | (58) |
21
NOTES TO FINANCIAL STATEMENTS (continued)
| | | |
Table 4—Custodian Fees | | |
| Custodian Fees ($) | Custodian Earnings Credits ($) |
BNY Mellon Government Money Market Fund | 15,729 | - |
BNY Mellon National Municipal Money Market Fund | 15,625 | (9,739) |
Each fund compensates the Custodian, under a shareholder redemption draft processing agreement, for providing certain services related to the funds’ check writing privilege. Table 5 summarizes the amount each fund was charged during the period ended August 31, 2023 pursuant to the agreement, which is included in Shareholder servicing costs in the Statements of Operations.
| | |
Table 5 —BNY Mellon Cash Management Fees | |
| | |
BNY Mellon Government Money Market Fund | 19 |
BNY Mellon National Municipal
Money Market Fund | 4 |
During the period ended August 31, 2023, each fund was charged $19,196 for services performed by the Chief Compliance Officer and his staff. These fees are included in Chief Compliance Officer fees in the Statements of Operations.
Table 6 summarizes the components of “Due to BNY Mellon Investment Adviser, Inc. and affiliates” in the Statements of Assets and Liabilities for each fund.
(c) Each Board member also serves as a Board member of other funds within the Trust. Annual retainer fees and attendance fees are allocated to each fund based on net assets.
NOTE 3—Securities Transactions:
BNY Mellon National Municipal Money Market Fund is permitted to purchase or sell securities from or to certain affiliated funds under specified conditions outlined in procedures adopted by the Board. The procedures have been designed to ensure that any purchase or sale of securities by the fund from or to another fund or portfolio that are, or could be, considered an affiliate by virtue of having a common investment adviser (or affiliated investment adviser), common Trustees and/or common officers, complies with Rule 17a-7 under the Act. During the period ended August 31, 2023, the fund engaged in purchases and sales of securities pursuant to Rule 17a-7 under the Act amounting to $54,370,000 and $204,895,000 respectively.
NOTE 4—Subsequent Event:
On July 12, 2023, the SEC adopted amendments to rules that govern money market funds. The amendments include a mandatory liquidity fee for institutional prime and institutional tax-exempt money market funds, which will apply when a fund experiences daily net redemptions that exceed 5% of net assets. The amendments maintain a fund board’s ability to impose liquidity fees (not to exceed 2% of the value of the shares redeemed) on a discretionary basis for non-government money market funds. The amendments also substantially increase the required minimum levels of daily and weekly liquid assets for all money market funds from 10% and 30%, to 25% and 50%, respectively. Further, the amendments remove a money market fund’s ability to impose temporary “gates” to suspend redemptions in order to prevent dilution and remove the link between a money market fund’s liquidity level and its imposition of liquidity fees. The amendments became effective October 2, 2023 with tiered compliance dates. The removal of the link between liquidity levels and the imposition of liquidity fees, as well as the removal of a money market fund’s ability to impose redemption gates, became effective on October 2, 2023. On April 2, 2024, money market funds will be required to comply with the increased daily and weekly liquid asset minimums, and non-government money market funds will be permitted to impose discretionary liquidity fees. On October 2, 2024, money market fund will be required to comply with the new mandatory liquidity fee framework.
| | | | | | | | |
Table 6—Due to BNY Mellon Investment Adviser, Inc. and Affiliates | |
|
Management
Fees ($)
| Administration
Fees ($) | Shareholder
Services plans
Fees ($) | Custodian
Fees ($) | Chief
Compliance
Officer
Fees ($) |
BNY Mellon Government Money Market Fund | 44,225 | 40,147 | 2,349 | 4,938 | 3,025 |
BNY Mellon National Municipal Money Market Fund | 26,952 | 24,490 | 8 | 2,071 | 3,025 |
22
REPORT OF INDEPENDENT REGISTERED
PUBLIC ACCOUNTING FIRM
To the Shareholders of the Funds and Board of Trustees of
BNY Mellon Funds Trust:
Opinion on the Financial Statements
We have audited the accompanying statements of assets and liabilities of BNY Mellon Government Money Market Fund and BNY Mellon National Municipal Money Market Fund (collectively, the “Funds”), each a series of BNY Mellon Funds Trust, including the statements of investments as of August 31, 2023, the related statements of operations for the year then ended, the statements of changes in net assets for each of the years in the two-year period then ended, and the related notes (collectively, the financial statements) and the financial highlights for each of the years in the five-year period then ended. In our opinion, the financial statements and financial highlights present fairly, in all material respects, the financial position of the Funds as of August 31, 2023, the results of their operations for the year then ended, the changes in their net assets for each of the years in the two-year period then ended, and the financial highlights for each of the years in the five-year period then ended, in conformity with U.S. generally accepted accounting principles.
Basis for Opinion
These financial statements and financial highlights are the responsibility of the Funds’ management. Our responsibility is to express an opinion on these financial statements and financial highlights based on our audits. We are a public accounting firm registered with the Public Company Accounting Oversight Board (United States) (PCAOB) and are required to be independent with respect to the Funds in accordance with the U.S. federal securities laws and the applicable rules and regulations of the Securities and Exchange Commission and the PCAOB.
We conducted our audits in accordance with the standards of the PCAOB. Those standards require that we plan and perform the audit to obtain reasonable assurance about whether the financial statements and financial highlights are free of material misstatement, whether due to error or fraud. Our audits included performing procedures to assess the risks of material misstatement of the financial statements and financial highlights, whether due to error or fraud, and performing procedures that respond to those risks. Such procedures included examining, on a test basis, evidence regarding the amounts and disclosures in the financial statements and financial highlights. Such procedures also included confirmation of securities owned as of August 31, 2023, by correspondence with the custodians, financial institutions and brokers or by other appropriate auditing procedures when replies from brokers were not received. Our audits also included evaluating the accounting principles used and significant estimates made by management, as well as evaluating the overall presentation of the financial statements and financial highlights. We believe that our audits provide a reasonable basis for our opinion.

We have served as the auditor of one or more BNY Mellon Investment Adviser, Inc. investment companies since 1994.
New York, New York
October 23, 2023
23
IMPORTANT TAX INFORMATION (Unaudited)
BNY Mellon Government Money Market Fund
For federal tax purposes the fund reports the maximum amount allowable but not less than 100% as interest-related dividends in accordance with Sections 871(k)(1) and 881(e) of the Internal Revenue Code.
BNY Mellon National Municipal Money Market Fund
In accordance with federal tax law, the fund hereby reports all the dividends paid from investment income-net during its fiscal year ended August 31, 2023 as “exempt-interest dividends” (not generally subject to regular Federal income tax). Where required by federal tax law rules, shareholders will receive notification of their portion of the fund’s taxable ordinary dividends (if any), capital gains distributions (if any) and tax-exempt dividends paid for the 2023 calendar year on Form 1099-DIV, which will be mailed in early 2024. Also, the fund hereby reports $.000107 as a short-term capital gain dividend paid on December 23, 2022.
24
INFORMATION ABOUT THE RENEWAL OF EACH FUND’S INVESTMENT ADVISORY AND ADMINISTRATION AGREEMENTS AND THE APPROVAL OF EACH FUND’S NEW SUB-INVESTMENT ADVISORY AGREEMENTS (Unaudited)
At a meeting of the Trust’s Board of Trustees held on March 20-21, 2023, the Board considered the renewal of the Trust’s Investment Advisory Agreement and Administration Agreement pursuant to which the Adviser provides the funds with investment advisory services and The Bank of New York Mellon is responsible for the provision of administrative services to the funds (together, the “Agreement”). The Bank of New York Mellon has entered into a Sub-Administration Agreement with the Adviser pursuant to which The Bank of New York Mellon pays the Adviser for performing certain of these administrative services. The Board members, none of whom are “interested persons” (as defined in the Investment Company Act of 1940, as amended) of the Trust, were assisted in their review by independent legal counsel and met with counsel in executive session separate from representatives of the Adviser. In considering the renewal of the Agreement, the Board considered several factors that it believed to be relevant, including those discussed below. The Board did not identify any one factor as dispositive, and each Board member may have attributed different weights to the factors considered.
Analysis of Nature, Extent, and Quality of Services Provided to the Funds. The Board considered information provided to it at the meeting and in previous presentations from representatives of the Adviser regarding the nature, extent, and quality of the services provided to the funds in the Trust, including the funds. The Adviser provided the number of open accounts in each fund, each fund’s asset size and the allocation of fund assets among distribution channels. The Adviser also had previously provided information regarding the distribution channel(s) of the funds and the need to be able to provide ongoing shareholder services to each distribution channel, as applicable to each fund.
The Board also considered research support available to, and portfolio management capabilities of, each fund’s portfolio management personnel and that the Adviser also provides oversight of day-to-day fund operations, including fund accounting and administration and assistance in meeting legal and regulatory requirements. The Board also considered the Adviser’s extensive administrative, accounting and compliance infrastructures.
Comparative Analysis of the Funds’ Performance and Management Fees and Expense Ratios. For each fund, the Board reviewed reports prepared by Broadridge Financial Solutions, Inc. (“Broadridge”), an independent provider of investment company data based on classifications provided by Thomson Reuters Lipper (“Lipper”), which included information comparing (1) the performance of the fund’s Class M shares with the performance of a group of money market funds selected by Broadridge as comparable to the fund (the “Performance Group”) and with a broader group of funds consisting of all money market funds in the particular Lipper classification (the “Performance Universe”), all for various periods ended December 31, 2022, and (2) the fund’s actual and contractual management fees and total expenses with those of the same group of funds in the Performance Group (the “Expense Group”) and with a broader group of funds consisting of all money market in the particular Lipper classification, excluding outliers (the “Expense Universe”). The information for each comparison was derived, in part, from fund financial statements available to Broadridge as of the date of its analysis. The Performance Group and Performance Universe comparisons for each fund were provided based on both “gross” (i.e., without including fees and expenses) and “net” (i.e., including fees and expenses) total returns. The Adviser previously had furnished the Board with a description of the methodology Broadridge used to select the Performance Group and Performance Universe and the Expense Group and Expense Universe.
Performance Comparisons. Representatives of the Adviser stated that the usefulness of performance comparisons may be affected by a number of factors, including different investment limitations and policies that may be applicable to each fund and comparison funds and the end date selected. The Board also considered the funds’ performance in light of overall financial market conditions.
Management Fee and Expense Ratio Comparisons. For each fund, the Board reviewed and considered the contractual management fee rate payable by the fund to the Adviser in light of the nature, extent and quality of the management services provided by the Adviser. In addition, the Board reviewed and considered the actual management fee rate paid by the fund over the fund’s last fiscal year. The Board also reviewed the range of actual and contractual management fees and total expenses as a percentage of average net assets of the Expense Group and Expense Universe funds and discussed the results of the comparisons.
For each fund, representatives of the Adviser reviewed with the Board the management or advisory fees paid by funds advised by the Adviser that are in the same Lipper category as the fund (the “Similar Funds”) and explained the nature of the Similar Funds. They discussed differences in fees paid and the relationship of the fees paid in light of any differences in the services provided and other relevant factors. The Board considered the relevance of the fee information provided for the Similar Funds to evaluate the appropriateness of the fund’s management fee. Representatives of the Adviser noted that there were no
25
INFORMATION ABOUT THE RENEWAL OF EACH FUND’S INVESTMENT ADVISORY AND ADMINISTRATION AGREEMENTS AND THE APPROVAL OF EACH FUND’S NEW SUB-INVESTMENT ADVISORY AGREEMENTS (Unaudited) (continued)
separate accounts and/or other types of client portfolios advised by the Adviser that are considered to have similar investment strategies and policies as the fund.
BNY Mellon Government Money Market Fund
The information comparing the fund’s performance to that of its Performance Group and Performance Universe consisted of funds classified as institutional US government money market funds by Lipper.
The Board discussed with representatives of the Adviser the results of the performance comparisons and considered that the fund’s gross total return performance was above the Performance Group and Performance Universe medians for all periods. The Board considered that the fund’s net total return performance was above the Performance Group and Performance Universe medians for all periods.
The Board considered that the fund’s contractual management fee was lower than the Expense Group median contractual management fee, the fund’s actual management fee was higher than the Expense Group median and Expense Universe median actual management fee, and the fund’s total expenses were at the Expense Group median and higher than the Expense Universe median total expenses.
BNY Mellon National Municipal Money Market Fund
The information comparing the fund’s performance to that of its Performance Group consisted of funds classified as retail no-load tax-exempt money market funds by Lipper and to that of its Performance Universe consisted of funds classified as retail tax-exempt money market funds by Lipper.
The Board discussed with representatives of the Adviser the results of the performance comparisons and considered that the fund’s gross total return performance was above the Performance Group and Performance Universe medians for all periods. The Board considered that the fund’s net total return performance was at or above the Performance Group median and was above the Performance Universe median for all periods.
The Board considered that the fund’s contractual management fee was higher than the Expense Group median contractual management fee, the fund’s actual management fee was higher than the Expense Group median and Expense Universe median actual management fee, and the fund’s total expenses were higher than the Expense Group median and Expense Universe median total expenses.
Analysis of Profitability and Economies of Scale. Representatives of the Adviser reviewed the expenses allocated and profit received by the Adviser and its affiliates and the resulting profitability percentage for managing each fund and the aggregate profitability percentage to the Adviser and its affiliates for managing the funds in the BNY Mellon fund complex, and the method used to determine the expenses and profit. The Board concluded that the profitability results were not excessive, given the services rendered and service levels provided by the Adviser and its affiliates to each fund. The Board also had been provided with information prepared by an independent consulting firm regarding the Adviser’s approach to allocating costs to, and determining the profitability of, individual funds and the entire BNY Mellon fund complex. The consulting firm also had analyzed where any economies of scale might emerge in connection with the management of a fund.
As to each fund, the Board considered, on the advice of its counsel, the profitability analysis (1) as part of its evaluation of whether the fees under the Agreement, considered in relation to the mix of services provided pursuant to the Agreement, including the nature, extent and quality of such services, supported the renewal of the Agreement and (2) in light of the relevant circumstances for the fund and the extent to which economies of scale would be realized if the fund grows and whether fee levels reflect these economies of scale for the benefit of fund shareholders. Representatives of the Adviser stated that a discussion of economies of scale is predicated on a fund having achieved a substantial size with increasing assets and that, if a fund’s assets had been stable or decreasing, the possibility that the Adviser may have realized any economies of scale would be less. Representatives of the Adviser also stated that, as a result of shared and allocated costs among funds in the BNY Mellon fund complex, the extent of economies of scale could depend substantially on the level of assets in the complex as a whole, so that increases and decreases in complex-wide assets can affect potential economies of scale in a manner that is disproportionate to, or even in the opposite direction from, changes in the fund’s asset level. The Board also considered potential benefits to the Adviser from acting as investment adviser and took into consideration that there were no soft dollar arrangements in effect for trading the funds’ investments.
At the conclusion of these discussions, the Board agreed that it had been furnished with sufficient information to make an informed business decision with respect to the renewal of the Agreement. Based on the discussions and considerations as described above, the Board concluded and determined as follows.
· The Board concluded that the nature, extent and quality of the services provided by the Adviser to each fund are adequate and appropriate.
26
· With respect to each fund, the Board was satisfied with the fund’s performance.
· With respect to each fund, the Board concluded that the fee paid pursuant to the Agreement continued to be appropriate under the circumstances and considering the factors and the totality of the services provided as discussed above.
· The Board determined that the economies of scale which may accrue to the Adviser and its affiliates in connection with the management of the funds had been adequately considered by the Adviser in connection with the fee rate charged to each fund pursuant to the Agreement and that, to the extent in the future it were determined that material economies of scale had not been shared with the fund, the Board would seek to have those economies of scale shared with the fund.
In evaluating the Agreement with respect to each fund, the Board considered these conclusions and determinations and also relied on its previous knowledge, gained through meetings and other interactions with the Adviser and its affiliates, of the Adviser and the services provided to the fund pursuant to the Agreement. The Board also relied on information received on a routine and regular basis throughout the year relating to the operations of the funds and the investment management and other services provided under the Agreement, including information on the investment performance of each fund in comparison to similar mutual funds and benchmark performance measures; general market outlook as applicable to the fund; and compliance reports. In addition, the Board’s consideration of the contractual fee arrangements for the fund had the benefit of a number of years of reviews of the Agreement for each fund, or for the other funds in the Trust, during which lengthy discussions took place between the Board and representatives of the Adviser. Certain aspects of the arrangements may receive greater scrutiny in some years than in others, and the Board’s conclusions may be based, in part, on its consideration of the respective fund’s arrangements, or the arrangements for the other funds in the Trust, in prior years. The Board determined to renew the Agreement for each fund.
*******
At a meeting of the Trust’s Board of Trustees (the “Board”) held on June 6, 2023 (the “June Meeting”), the Board appointed Mellon Investments Corporation (“Mellon”), through its Dreyfus division (“Dreyfus” or the “Sub-Adviser”), as the funds’ sub-investment adviser and approved a new sub-investment advisory agreement (the “Sub-Advisory Agreement”) between the Adviser and Dreyfus, a division of Mellon, whereby Mellon, through its Dreyfus division, will serve as the funds’ sub-investment adviser and provide day-to-day management of the funds’ investments, effective on or about September 1, 2023 (the “Effective Date”). The Board noted that the portfolio managers who are responsible for managing the investments of the funds are dual employees of the Adviser and Mellon, through the Dreyfus division, and currently manage the funds in their capacity as employees of the Adviser. The Board further noted that the dual employee arrangement between the Adviser and Mellon would be terminated as of the Effective Date, and the portfolio managers would no longer be employees of the Adviser. Accordingly, as of the Effective Date, the portfolio managers will manage each fund’s investments as employees of Mellon, through its Dreyfus division, pursuant to the Sub-Advisory Agreement. Mellon is an affiliate of the Adviser. In addition, at the June Meeting the Board approved revising the Trust’s current Investment Advisory Agreement (the “Current Investment Advisory Agreement”) between the Adviser and the Trust, on behalf of each fund, to reflect the engagement of Mellon, through its Dreyfus division, as sub-adviser to the funds (the “Revised Investment Advisory Agreement” and, together with the Sub-Advisory Agreement, the “Agreements”), to be effective on the Effective Date.
At the June Meeting, the Adviser recommended the approval of the Agreements based on the following considerations, among others: (i) approval of the Agreements would permit the funds’ current portfolio managers to continue to be responsible for the day-to-day management of the funds’ portfolio after the Effective Date as employees of Mellon, through its Dreyfus division; (ii) there will be no material changes to either fund’s investment objective, strategies or policies, no reduction in the nature or level of services provided to the funds, and no increases in the management fee payable by the funds as a result of the proposed changes to the investment advisory arrangements; and (iii) the Adviser (and not the funds) will pay the Sub-Adviser for its sub-investment advisory services. The Adviser also confirmed that the appointment of Mellon, through its Dreyfus division, as each fund’s sub-investment adviser and the adoption of the Sub-Advisory Agreement would not require the approval of the fund’s shareholders under the Investment Company Act of 1940, as amended (the “1940 Act”), or the Investment Advisers Act of 1940, as amended. The Board also considered the fact that the Adviser stated that it believes there are no material changes to the information the Board had previously considered at a Board meeting on March 20-21, 2023 (the “15(c) Meeting”), at which the Board
27
INFORMATION ABOUT THE RENEWAL OF EACH FUND’S INVESTMENT ADVISORY AND ADMINISTRATION AGREEMENTS AND THE APPROVAL OF EACH FUND’S NEW SUB-INVESTMENT ADVISORY AGREEMENTS (Unaudited) (continued)
re-approved the Current Investment Advisory Agreement for the ensuing year, other than information about the appointment of Mellon, through its Dreyfus division, as the funds’ sub-adviser.
At the June Meeting, the Board members, none of whom are “interested persons” (as defined in the 1940 Act) of the funds (“Independent Trustees”), were assisted in their review by independent legal counsel and met with counsel in executive session separate from representatives of the Adviser and Mellon. Since the Board had renewed the Current Investment Advisory Agreement at the 15(c) Meeting, and, other than as discussed below, there had been no material changes in the information presented, the Board addressed certain of the relevant considerations by reference to their considerations and determinations at the 15(c) Meeting. In considering approval of the Agreements, the Board considered several factors that it believed to be relevant, including those discussed below. The Board did not identify any one factor as dispositive, and each Board member may have attributed different weights to the factors considered.
In determining whether to approve the Agreements, the Board considered the materials presented at both the June Meeting and the 15(c) Meeting, and other information, which included: (i) a copy of the Sub-Advisory Agreement; (ii) information regarding the nature, extent and quality of the services Mellon, through its Dreyfus division, would provide to the funds; (iii) information regarding Mellon’s and the Dreyfus division’s reputation, investment management business, personnel, and operations; (iv) information regarding the level of the sub-investment advisory fees to be charged by Mellon, through its Dreyfus division; (v) information regarding Mellon’s compliance program; and (vi) Mellon’s Form ADV. The Board also considered the substance of discussions with representatives of the Adviser at the 15(c) Meeting and the June Meeting. Additionally, the Board reviewed materials supplied by counsel that were prepared for use by the Board in fulfilling its duties under the 1940 Act.
Nature, Extent and Quality of Services to be Provided. In examining the nature, extent and quality of the services that were expected to be provided by the Sub-Adviser to the funds under the Sub-Advisory Agreement, the Board considered: (i) the Sub-Adviser’s organization, history, reputation, qualification and background, as well as the qualifications of its personnel; (ii) the expertise of the personnel providing portfolio management services which would remain the same after the Effective Date; and (iii) the investment strategy for the funds, which would remain the same after the Effective Date. The Board also considered the review process undertaken by the Adviser and the Adviser’s favorable assessment of the nature and quality of the sub-investment advisory services expected to be provided to the funds by the Sub-Adviser after the Effective Date. Based on their consideration and review of the foregoing information, the Board concluded, as to each fund, that the nature, extent and quality of the sub-investment advisory services to be provided by the Sub-Adviser under the Sub-Advisory Agreement, as well as the Sub-Adviser’s ability to render such services based on its resources and the experience of the investment team, which will include the fund’s current portfolio managers, were adequate and appropriate for the fund in light of the respective fund’s investment objective, and supported a decision to approve the Sub-Advisory Agreement. The Board also considered, as it related to the Revised Investment Advisory Agreement, the Adviser’s extensive administrative, accounting and compliance infrastructures, as well as the Adviser’s supervisory activities over each fund’s portfolio management personnel, and the Adviser’s representation that there will be no reduction in the nature, extent or quality of services provided to the funds as a result of the proposed changes to the funds’ investment advisory arrangements.
Investment Performance. The Board had considered each fund’s investment performance and that of the investment team managing each fund’s portfolio at the 15 (c) Meeting (including comparative data provided by Broadridge Financial Solutions, Inc.). At the June Meeting, the Board reviewed updated performance information. The Board considered the performance and that the same investment professionals would continue to manage each fund’s assets after the Effective Date, as factors in evaluating the services to be provided by the Sub-Adviser under the Sub-Advisory Agreement after the Effective Date, and determined that these factors, when viewed together with the other factors considered by the Board, supported a decision to approve the Sub-Advisory Agreement and the Revised Investment Advisory Agreement.
Costs of Services to be Provided and Profitability. The Board considered the proposed fees payable under the Sub-Advisory Agreement, noting that the fees would be paid by the Adviser and, thus, would not impact the fees paid by the funds. The Board considered the fees payable to the Sub-Adviser in relation to the fees paid to the Adviser by each fund and the respective services provided by the Sub-Adviser and the Adviser. The Board recognized that, because the Sub-Adviser’s fee would be paid by the Adviser, and not the funds, an analysis of profitability was more appropriate in the context of the Board’s consideration of the funds’ Current Investment Advisory Agreement, and that the Board had received and considered a profitability analysis of the Adviser
28
and its affiliates, including the Sub-Adviser, at the 15(c) Meeting. The Board concluded that the proposed fees payable to the Sub-Adviser by the Adviser were appropriate and the Adviser’s profitability was not excessive in light of the nature, extent and quality of the services to be provided to the funds by the Adviser under the Revised Investment Advisory Agreement and the Sub-Adviser under the Sub-Advisory Agreement.
Economies of Scale to be Realized. The Board recognized that, because the fees payable to the Sub-Adviser would be paid by the Adviser, and not the funds, an analysis of economies of scale was more appropriate in the context of the Board’s consideration of the Current Investment Advisory Agreement, which had been done at the 15(c) Meeting. At the 15(c) Meeting, the Board determined that the economies of scale which may accrue to the Adviser and its affiliates in connection with the management of the funds had been adequately considered by the Adviser in connection with the fee rate charged to each fund pursuant to the Current Investment Advisory Agreement and that, to the extent in the future it were determined that material economies of scale had not been shared with each fund, the Board would seek to have those economies of scale shared with the funds.
The Board also considered whether there were any ancillary benefits that would accrue to the Sub-Adviser as a result of its relationship with the funds, and such ancillary benefits, if any, were determined to be reasonable.
In considering the materials and information described above, the Independent Trustees received assistance from, and met separately with, their independent legal counsel, and were provided with a written description of their statutory responsibilities and the legal standards that are applicable to the approval of investment advisory and sub-investment advisory agreements.
After full consideration of the factors discussed above, with no single factor identified as being of paramount importance, the Board members, all of whom are Independent Trustees, with the assistance of independent legal counsel, approved the Sub-Advisory Agreement and Revised Investment Advisory Agreement for each fund effective as of the Effective Date.
29
BOARD MEMBERS INFORMATION (Unaudited)
INDEPENDENT BOARD MEMBERS
Independent Board Members
Patrick J. O’Connor (80)
Board Member, Chairman of the Board (2000)
Principal Occupation During Past 5 Years:
Attorney, Cozen O’Connor, P.C. (1973-Present), Vice Chairman (1980-2002); and President and Chief Executive Officer (2002-2007)
No. of Portfolios for which Board Member Serves: 19
———————
John R. Alchin (75)
Board Member (2008)
Principal Occupation During Past 5 Years:
· Retired
· The Barnes Foundation, an art museum, Trustee (2017 - Present)
· Metropolitan AIDS Neighborhood Nutrition Alliance, Advisory Board Member (2004 – Present)
· Philadelphia Art Museum, Board Member (2008 - Present)
· Xplornet Communications, Inc., a rural wireless tele-communications provider, Director (2015 –2020)
Other Public Company Board Memberships During Past 5 Years:
· Ralph Lauren Corporation, a retail clothing and home furnishing company, Director (2007-Present), and Chair of Audit Committee (2018-Present)
No. of Portfolios for which Board Member Serves: 19
———————
Ronald R. Davenport (87)
Board Member (2000)
Principal Occupation During Past 5 Years:
· Sheridan Broadcasting Corporation, Chairman (1972-Present)
No. of Portfolios for which Board Member Serves: 19
———————
Kim D. Kelly (67)
Board Member (2008)
Principal Occupation During Past 5 Years:
· Consultant (2005-Present)
Other Public Company Board Memberships During Past 5 Years:
· MCG Capital Corporation, a business development company, Director (2004-2015)
· HITV, broadcasting, President (2015 – 2019)
No. of Portfolios for which Board Member Serves: 19
———————
Kevin C. Phelan (79)
Board Member (2000)
Principal Occupation During Past 5 Years:
· Colliers International Mortgage Banker, (1978-Present) and Co-Chairman (2010-Present)
· A.D. Makepeace Co., cranberry grower and real estate development company, Director (2019-Present)
Other Public Company Board Memberships During Past 5 Years:
· Industrial Logistics Properties Trust, a real estate company, Trustee (2020 - Present)
No. of Portfolios for which Board Member Serves: 19
———————
Patrick J. Purcell (75)
Board Member (2000)
Principal Occupation During Past 5 Years:
· jobfind.com, an employment search site on the world wide web, President and Founder (1996 -– Present)
· The Boston Herald, President and Publisher (1994-2018)
· Herald Media, President and Chief Executive Officer, (2001 – 2018)
No. of Portfolios for which Board Member Serves: 19
———————
Thomas F. Ryan, Jr. (81)
Board Member (2000)
Principal Occupation During Past 5 Years:
· Retired
· Boston College. Trustee Associate (2013 – Present)
· NYISO Independent System Operator, a non-profit organization responsible for managing the state of New York’s electric grid, Director (1998-2021)
Other Public Company Board Memberships During Past 5 Years:
· RepliGen Corporation, a biopharmaceutical company, Director (2002-May 2022)
No. of Portfolios for which Board Member Serves: 19
———————
30
Maureen M. Young (78)
Board Member (2000)
Principal Occupation During Past 5 Years:
· Retired
No. of Portfolios for which Board Member Serves: 19
———————
Once elected all Board Members serve for an indefinite term. The address of the Board Members and Officers is c/o BNY Mellon Investment Adviser, Inc. 240 Greenwich Street, New York, New York 10286. Additional information about each Board Member is available in the fund’s Statement of Additional Information which can be obtained from the Adviser free of charge by calling this toll free number: 1-800-373-9387. For individual account holders for Private Wealth Management clients, please contact your account officer or call 1-866-804-5023.
31
OFFICERS OF THE TRUST (Unaudited)
PATRICK T. CROWE, President since July 2015.
National Director of Investment Advisory, Analytics and Solutions for BNY Mellon Wealth Management since July 2014. He is 59 years old and has served in various capacities with BNY Mellon since 1993.
JAMES WINDELS, Treasurer since November 2001.
Director of the Adviser since February 2023; Vice President of the Adviser since September 2020, and Director- BNY Mellon Fund Administration. He is an officer of 54 investment companies (comprised of 122 portfolios) managed by the Adviser or an affiliate of the Adviser. He is 64 years old and has been an employee of the Adviser since April 1985.
PETER M. SULLIVAN, Chief Legal Officer since July 2021 and Vice President and Assistant Secretary since March 2019.
Chief Legal Officer of the Adviser and Associate General Counsel of BNY Mellon since July 2021; Senior Managing Counsel of BNY Mellon from December 2020 to July 2021; and Managing Counsel of BNY Mellon from March 2009 to December 2020. He is an officer of 54 investment companies (comprised of 122 portfolios) managed by the Adviser or an affiliate of the Adviser. He is 55 years old and has been an employee of BNY Mellon since April 2004.
JAMES BITETTO, Vice President since August 2005 and Secretary since February 2018.
Senior Managing Counsel of BNY Mellon since December 2019; Managing Counsel of BNY Mellon from April 2014 to December 2019; and Secretary of the Adviser. He is an officer of 54 investment companies (comprised of 122 portfolios) managed by the Adviser or an affiliate of the Adviser. He is 57 years old and has been an employee of the Adviser since December 1996.
DEIRDRE CUNNANE, Vice President and Assistant Secretary since February 2019.
Managing Counsel of BNY Mellon since December 2021; and Counsel of BNY Mellon from August 2018 to December 2021. She is an officer of 54 investment companies (comprised of 122 portfolios) managed by BNYM Investment Adviser or an affiliate of BNYM Investment Adviser. She is 33 years old and has been an employee of BNY Mellon since August 2013.
SARAH S. KELLEHER, Vice President and Assistant Secretary since April 2014.
Vice President of BNY Mellon ETF Investment Adviser, LLC since February 2020; Senior Managing Counsel of BNY Mellon since September 2021; and Managing Counsel of BNY Mellon from December 2017 to September 2021. She is an officer of 54 investment companies (comprised of 122 portfolios) managed by the Adviser or an affiliate of the Adviser. She is 47 years old and has been an employee of BNY Mellon since March 2013.
JEFF PRUSNOFSKY, Vice President and Assistant Secretary since August 2015.
Senior Managing Counsel of BNY Mellon. He is an officer of 54 investment companies (comprised of 122 portfolios) managed by the Adviser or an affiliate of the Adviser. He is 58 years old and has been an employee of the Adviser since October 1990.
AMANDA QUINN, Vice President and Assistant Secretary since March 2020.
Counsel of BNY Mellon since June 2019; Regulatory Administration Manager at BNY Mellon Investment Management Services from September 2018 to May 2019; and Senior Regulatory Specialist at BNY Mellon Investment Management Services from April 2015 to August 2018. She is an officer of 54 investment companies (comprised of 122 portfolios) managed by the Adviser or an affiliate of the Adviser. She is 38 years old and has been an employee of BNY Mellon since April 2015.
JOANNE SKERRETT, Vice President and Assistant Secretary since March 2023.
Managing Counsel of BNY Mellon since June 2022; and Senior Counsel with the Mutual Fund Directors Forum, a leading funds industry organization, from 2016 to June 2022. She is an officer of 54 investment companies (comprised of 122 portfolios) managed by BNYM Investment Adviser or an affiliate of BNYM Investment Adviser. She is 51 years old and has been an employee of BNYM Investment Adviser since June 2022.
NATALYA ZELENSKY, Vice President and Assistant Secretary since March 2017.
Chief Compliance Officer since August 2021 and Vice President since February 2020 of BNY Mellon ETF Investment Adviser, LLC; Chief Compliance Officer since August 2021 and Vice President and Assistant Secretary since February 2020 of BNY Mellon ETF Trust; Managing Counsel from December 2019 to August 2021; Counsel of BNY Mellon from May 2016 to December 2019; and Assistant Secretary of the Adviser from April 2018 to August 2021. She is an officer of 54 investment companies (comprised of 122 portfolios) managed by the Adviser or an affiliate of the Adviser. She is 38 years old and has been an employee of BNY Mellon since May 2016.
GAVIN C. REILLY, Assistant Treasurer since December 2005.
Tax Manager - BNY Mellon Fund Administration. He is an officer of 54 investment companies (comprised of 122 portfolios) managed by the Adviser or an affiliate of the Adviser. He is 55 years old and has been an employee of the Adviser since April 1991.
ROBERT SALVIOLO, Assistant Treasurer since July 2007.
Senior Accounting Manager – BNY Mellon Fund Administration. He is an officer of 54 investment companies (comprised of 122 portfolios) managed by the Adviser or an affiliate of the Adviser. He is 56 years old and has been an employee of the Adviser since June 1989.
ROBERT SVAGNA, Assistant Treasurer since December 2002.
Senior Accounting Manager – BNY Mellon Fund Administration. He is an officer of 54 investment companies (comprised of 122 portfolios) managed by the Adviser or an affiliate of the Adviser. He is 56 years old and has been an employee of the Adviser since November 1990.
JOSEPH W. CONNOLLY, Chief Compliance Officer since October 2004.
Chief Compliance Officer of the BNY Mellon Family of Funds and BNY Mellon Funds Trust since 2004; and Chief Compliance Officer of BNYM Investment Adviser from 2004 until June 2021. He is the Chief Compliance Officer of 53 investment companies (comprised of 105 portfolios) managed by BNYM Investment Adviser. He is 66 years old.
CARIDAD M. CAROSELLA, Anti-Money Laundering Compliance Officer since January 2016.
Anti-Money Laundering Compliance Officer of the BNY Mellon Family of Funds and BNY Mellon Funds Trust. She is an officer of 47 investment companies (comprised of 115 portfolios) managed by BNYM Investment Adviser or an affiliate of BNYM Investment Adviser. She is 55 years old and has been an employee of the Distributor since 1997.
32
This page intentionally left blank.
33
This page intentionally left blank.
34
BNY Mellon Funds Trust
240 Greenwich Street
New York, NY 10286
Adviser
BNY Mellon Investment Adviser, Inc.
240 Greenwich Street
New York, NY 10286
Administrator
The Bank of New York Mellon
240 Greenwich Street
New York, NY 10286
Sub-Administrator
BNY Mellon Investment Adviser, Inc.
240 Greenwich Street
New York, NY 10286
Custodian
The Bank of New York Mellon
240 Greenwich Street
New York, NY 10286
Transfer Agent &
Dividend Disbursing Agent
BNY Mellon Transfer, Inc.
240 Greenwich Street
New York, NY 10286
Distributor
BNY Mellon Securities Corporation
240 Greenwich Street
New York, NY 10286
| | | | | | | | | |
Ticker Symbols: | | | | | | | | |
BNY Mellon Government Money Market Fund | | | Class M: MLMXX | | Investor: MLOXX | | | |
BNY Mellon National Municipal Money Market Fund | | | Class M: MOMXX | | Investor: MNTXX | | | |
Telephone Wealth Management (WM) Clients, please contact your Account Officer or call 1-866-804-5023. Brokerage Clients of BNY Mellon Wealth Advisors (BNYMWA), please contact your financial representative or call 1-800-830-0549, Option 2 for BNY Mellon Wealth Management Direct or 1-800-843-5466 for former brokerage clients of BNY Mellon Wealth Advisors whose accounts are now held by BNY Mellon Brokerage Services. Individual Account holders, please call BNY Mellon Investment Advisers at 1-800-373-9387.
Mail WM clients, write to your Account Officer, c/o The Bank of New York Mellon, One Mellon Bank Center, Pittsburgh, PA 15258
BNYMWA Brokerage Clients, write to your financial representative, P.O. Box 9012, Hicksville, NY 11802-9012
Individual Account Holders, write to: BNY Mellon Funds, P.O. Box 534434, Pittsburgh, Pennslylvania 15253-4434
Each fund will disclose daily, on www.bnymellonim.com/us, the fund’s complete schedule of holdings as of the end of the previous business day. The schedule of holdings will remain on the website for a period of five months. The fund files a monthly schedule of portfolio holdings with the Securities and Exchange Commission (“SEC”) on Form N-MFP. The fund’s Forms N-MFP are available on the SEC’s website at www.sec.gov.
A description of the policies and procedures that the fund uses to determine how to vote proxies relating to portfolio securities, and information regarding how the fund voted these proxies for the most recent 12-month period ended June 30 is available at http:// www.im.bnymellon.com and on the SEC’s website at http://www.sec.gov. The description of the policies and procedures is also available without charge, upon request, by calling 1-800-373-9387.
| | |
© 2023 BNY Mellon Securities Corporation | MFTAR0823-MM |
Item 2. Code of Ethics.
The Registrant has adopted a code of ethics that applies to the Registrant's principal executive officer, principal financial officer, principal accounting officer or controller, or persons performing similar functions. There have been no amendments to, or waivers in connection with, the Code of Ethics during the period covered by this Report.
Item 3. Audit Committee Financial Expert.
The Registrant's Board has determined that Thomas F. Ryan, a member of the Audit Committee of the Board, is an audit committee financial expert as defined by the Securities and Exchange Commission (the "SEC"). Mr. Ryan is "independent" as defined by the SEC for purposes of audit committee financial expert determinations.
Item 4. Principal Accountant Fees and Services.
(a) Audit Fees. The aggregate fees billed for each of the last two fiscal years (the "Reporting Periods") for professional services rendered by the Registrant's principal accountant (the "Auditor") for the audit of the Registrant's annual financial statements or services that are normally provided by the Auditor in connection with the statutory and regulatory filings or engagements for the Reporting Periods, were $606,970 in 2022 and $570,100 in 2023.
(b) Audit-Related Fees. The aggregate fees billed in the Reporting Periods for assurance and related services by the Auditor that are reasonably related to the performance of the audit of the Registrant's financial statements and are not reported under paragraph (a) of this Item 4 were $96,300 in 2022 and $88,300 in 2023. These services consisted of one or more of the following: (i) agreed upon procedures related to compliance with Internal Revenue Code section 817(h), (ii) security counts required by Rule 17f-2 under the Investment Company Act of 1940, as amended, (iii) advisory services as to the accounting or disclosure treatment of Registrant transactions or events and (iv) advisory services to the accounting or disclosure treatment of the actual or potential impact to the Registrant of final or proposed rules, standards or interpretations by the Securities and Exchange Commission, the Financial Accounting Standards Boards or other regulatory or standard-setting bodies.
The aggregate fees billed in the Reporting Periods for non-audit assurance and related services by the Auditor to the Registrant's investment adviser (not including any sub-investment adviser whose role is primarily portfolio management and is subcontracted with or overseen by another investment adviser), and any entity controlling, controlled by or under common control with the investment adviser that provides ongoing services to the Registrant ("Service Affiliates"), that were reasonably related to the performance of the annual audit of the Service Affiliate, which required pre-approval by the Audit Committee were $0 in 2022 and $0 in 2023.
(c) Tax Fees. The aggregate fees billed in the Reporting Periods for professional services rendered by the Auditor for tax compliance, tax advice, and tax planning ("Tax Services") were $0 in 2022 and $0 in 2023. These services consisted of: (i) review or preparation of U.S. federal, state, local and excise tax returns; (ii) U.S. federal, state and local tax planning, advice and assistance regarding statutory, regulatory or administrative developments; (iii) tax advice regarding tax qualification matters and/or treatment of various financial instruments held or proposed to be acquired or held, and (iv) determination of Passive Foreign Investment Companies. The aggregate fees billed in the Reporting Periods for Tax Services by the Auditor to Service Affiliates, which required pre-approval by the Audit Committee were $0 in 2022 and $0 in 2023.
(d) All Other Fees. The aggregate fees billed in the Reporting Periods for products and services provided by the Auditor, other than the services reported in paragraphs (a) through (c) of this Item, were $0 in 2022 and $0 in 2023. These services consisted of a review of the Registrant's anti-money laundering program.
The aggregate fees billed in the Reporting Periods for Non-Audit Services by the Auditor to Service Affiliates, other than the services reported in paragraphs (b) through (c) of this Item, which required pre-approval by the Audit Committee, were $0 in 2022 and $0 in 2023.
(e)(1) Audit Committee Pre-Approval Policies and Procedures. The Registrant's Audit Committee has established policies and procedures (the "Policy") for pre-approval (within specified fee limits) of the Auditor's engagements for non-audit services to the Registrant and Service Affiliates without specific case-by-case consideration. The pre-approved services in the Policy can include pre-approved audit services, pre-approved audit-related services, pre-approved tax services and pre-approved all other services. Pre-approval considerations include whether the proposed services are compatible with maintaining the Auditor's independence. Pre-approvals pursuant to the Policy are considered annually.
(e)(2) Note. None of the services described in paragraphs (b) through (d) of this Item 4 were approved by the Audit Committee pursuant to paragraph (c)(7)(i)(C) of Rule 2-01 of Regulation S-X.
(f) None of the hours expended on the principal accountant's engagement to audit the registrant's financial statements for the most recent fiscal year were attributed to work performed by persons other than the principal accountant's full-time, permanent employees.
Non-Audit Fees. The aggregate non-audit fees billed by the Auditor for services rendered to the Registrant, and rendered to Service Affiliates, for the Reporting Periods were $3,945,912 in 2022 and $4,074,591 in 2023.
Auditor Independence. The Registrant's Audit Committee has considered whether the provision of non-audit services that were rendered to Service Affiliates, which were not pre-approved (not requiring pre-approval), is compatible with maintaining the Auditor's independence.
(j) Not applicable.
Item 5. Audit Committee of Listed Registrants.
Not applicable.
Item 6. Investments.
(a) Not applicable.
| Item 7. | Disclosure of Proxy Voting Policies and Procedures for Closed-End Management Investment Companies. |
Not applicable.
Item 8. Portfolio Managers of Closed-End Management Investment Companies.
Not applicable.
| Item 9. | Purchases of Equity Securities by Closed-End Management Investment Companies and Affiliated Purchasers. |
Not applicable.
| Item 10. | Submission of Matters to a Vote of Security Holders. |
There have been no material changes to the procedures applicable to Item 10.
| Item 11. | Controls and Procedures. |
(a) The Registrant's principal executive and principal financial officers have concluded, based on their evaluation of the Registrant's disclosure controls and procedures as of a date within 90 days of the filing date of this report, that the Registrant's disclosure controls and procedures are reasonably designed to ensure that information required to be disclosed by the Registrant on Form N-CSR is recorded, processed, summarized and reported within the required time periods and that information required to be disclosed by the Registrant in the reports that it files or submits on Form N-CSR is accumulated and communicated to the Registrant's management, including its principal executive and principal financial officers, as appropriate to allow timely decisions regarding required disclosure.
(b) There were no changes to the Registrant's internal control over financial reporting that occurred during the period covered by this report that have materially affected, or are reasonably likely to materially affect, the Registrant's internal control over financial reporting.
| Item 12. | Disclosure of Securities Lending Activities for Closed-End Management Investment Companies. |
Not applicable.
(a)(1) Code of ethics referred to in Item 2.
(a)(2) Certifications of principal executive and principal financial officers as required by Rule 30a-2(a) under the Investment Company Act of 1940.
(a)(3) Not applicable.
(b) Certification of principal executive and principal financial officers as required by Rule 30a-2(b) under the Investment Company Act of 1940.
SIGNATURES
Pursuant to the requirements of the Securities Exchange Act of 1934 and the Investment Company Act of 1940, the Registrant has duly caused this Report to be signed on its behalf by the undersigned, thereunto duly authorized.
BNY Mellon Funds Trust
By: /s/ Patrick T. Crowe
Patrick T. Crowe
President (Principal Executive Officer)
Date: October 20, 2023
Pursuant to the requirements of the Securities Exchange Act of 1934 and the Investment Company Act of 1940, this Report has been signed below by the following persons on behalf of the Registrant and in the capacities and on the dates indicated.
By: /s/ Patrick T. Crowe
Patrick T. Crowe
President (Principal Executive Officer)
Date: October 20, 2023
By: /s/ James Windels
James Windels
Treasurer (Principal Financial Officer)
Date: October 20, 2023
EXHIBIT INDEX
(a)(1) Code of ethics referred to in Item 2.
(a)(2) Certifications of principal executive and principal financial officers as required by Rule 30a-2(a) under the Investment Company Act of 1940. (EX-99.CERT)
(b) Certification of principal executive and principal financial officers as required by Rule 30a-2(b) under the Investment Company Act of 1940. (EX-99.906CERT)