EXHIBIT 1.3

SIERRA WIRELESS, INC.
MANAGEMENT’S DISCUSSION AND ANALYSIS
Table of Contents
| | Page |
| | |
Cautionary Note Regarding Forward-Looking Statements | | 2 |
| | |
Overview | | 3 |
| | |
Consolidated Annual Results of Operations | | 6 |
| | |
Segmented Annual Results | | 11 |
| | |
Fourth Quarter Overview | | 17 |
| | |
Summary of Quarterly Results of Operations | | 19 |
| | |
Liquidity and Capital Resources | | 21 |
| | |
Non-GAAP Financial Measures | | 23 |
| | |
Off-Balance Sheet Arrangements | | 25 |
| | |
Transactions Between Related Parties | | 25 |
| | |
Critical Accounting Policies and Estimates | | 25 |
| | |
Outstanding Share Data | | 29 |
| | |
Impact of Accounting Pronouncements Affecting Future Periods | | 29 |
| | |
Disclosure Controls | | 30 |
| | |
Internal Control Over Financial Reporting | | 31 |
| | |
Legal Proceedings | | 32 |
| | |
Risks and Uncertainties | | 35 |
MANAGEMENT’S DISCUSSION AND ANALYSIS OF
FINANCIAL CONDITION AND RESULTS OF OPERATIONS
The following Management’s Discussion and Analysis of Financial Condition and Results of Operations (“MD&A”) provides information for the year ended December 31, 2011, and up to and including March 5, 2012. This MD&A should be read together with our audited consolidated financial statements and the accompanying notes for the year ended December 31, 2011 (the “consolidated financial statements”). The consolidated financial statements have been prepared in accordance with generally accepted accounting principles in the United States (“U.S. GAAP”). Except where otherwise specifically indicated, all amounts in this MD&A are expressed in United States dollars.
We have prepared this MD&A with reference to National Instrument 51-102 “Continuous Disclosure Obligations” of the Canadian Securities Administrators. Under the U.S./Canada Multijurisdictional Disclosure System, we are permitted to prepare this MD&A in accordance with the disclosure requirements of Canada, which requirements are different than those of the United States.
Certain statements in this MD&A constitute forward-looking statements or forward-looking information within the meaning of applicable securities laws. You should carefully read the cautionary note in this MD&A regarding forward-looking statements and should not place undue reliance on any such forward-looking statements. See “Cautionary Note Regarding Forward-Looking Statements”.
Throughout this document, references are made to certain non-GAAP financial measures that are not measures of performance under U.S. GAAP. Management believes that these non-GAAP financial measures provide useful information to investors regarding the Company’s financial condition and results of operations as they provide additional measures of its performance. These non-GAAP financial measures do not have any standardized meaning prescribed by U.S. GAAP and are therefore unlikely to be comparable to similar measures presented by other issuers. These non-GAAP financial measures are defined and reconciled to their nearest GAAP measure in “Non-GAAP Financial Measures”.
Additional information about the Company, including our most recent consolidated financial statements and our Annual Information Form, is available on our website at www.sierrawireless.com, or on SEDAR at www.sedar.com and on EDGAR at www.sec.gov.
1
Cautionary Note Regarding Forward-looking Statements
Certain statements and information in this MD&A are not based on historical facts and constitute forward-looking statements or forward-looking information within the meaning of the U.S. Private Securities Litigation Reform Act of 1995 and Canadian securities laws (“forward-looking statements”), including our business outlook for the short and longer term and our strategy, plans and future operating performance. Forward-looking statements are provided to help you understand our views of our short and longer term prospects. We caution you that forward-looking statements may not be appropriate for other purposes. We will not update or revise our forward-looking statements unless we are required to do so by securities laws. Forward-looking statements:
· Typically include words and phrases about the future such as “outlook”, “may”, “estimates”, “intends”, “believes”, “plans”, “anticipates” and “expects”;
· Are not promises or guarantees of future performance. They represent our current views and may change significantly;
· Are based on a number of material assumptions, including those listed below, which could prove to be significantly incorrect:
· Our ability to develop, manufacture and sell new products and services that meet the needs of our customers and gain commercial acceptance;
· Our ability to continue to sell our products and services in the expected quantities at the expected prices and expected times;
· Expected transition period to our 4G products;
· Expected cost of goods sold;
· Expected component supply constraints;
· Our ability to “win” new business;
· That wireless network operators will deploy next generation networks when expected;
· Our operations are not adversely disrupted by component shortages or other development, operating or regulatory risks; and
· Expected tax rates and foreign exchange rates.
· Are subject to substantial known and unknown material risks and uncertainties. Many factors could cause our actual results, achievements and developments in our business to differ significantly from those expressed or implied by our forward-looking statements, including, without limitation, the following factors, most of which are discussed in greater detail under “Risks and Uncertainties” and in our other regulatory filings with the U.S. Securities and Exchange Commission (the “SEC”) in the United States and the provincial securities commissions in Canada.
· Actual sales volumes or prices for our products and services may be lower than we expect for any reason including, without limitation, the continuing uncertain economic conditions, price and product competition, different product mix, the loss of any of our significant customers, or competition from new or established wireless communication companies;
· The cost of products sold may be higher than planned or necessary component supplies may not be available, are delayed or are not available on commercially reasonable terms;
· We may be unable to enforce our intellectual property rights or may be subject to litigation that has an adverse outcome;
· The development and timing of the introduction of our new products may be later than we expect or may be indefinitely delayed; and
· Transition periods associated with the migration to new technologies may be longer than we expect.
Investors are cautioned not to place undue reliance on these forward-looking statements. No forward-looking statement is a guarantee of future results.
2
OVERVIEW
Business Overview
Sierra Wireless Inc. (“Sierra Wireless” or the “Company”) is a global leader in the development of wireless technologies and solutions. We focus on wireless devices and applications, offering a comprehensive portfolio of products and services that reduce complexity for our customers. With sales, engineering, and research and development teams located in offices around the world, we provide leading edge wireless solutions for the machine-to-machine (“M2M”) and mobile computing markets. We develop and market a range of products that include wireless modems for mobile computers, embedded modules and software for original equipment manufacturers (“OEMs”), intelligent wireless gateway solutions for industrial, commercial and public safety applications, and an innovative platform for delivering device management and end-to-end application services. We also offer professional services to OEM customers during their product development and launch process, leveraging our expertise in wireless design, software, integration and certification to provide built-in wireless connectivity for mobile computing devices and M2M solutions. Our products, services and solutions connect people, their mobile computers and machines to wireless voice and data networks around the world.
We believe that the markets for wireless solutions in mobile computing and M2M have strong growth prospects. We believe that the key growth enablers for these markets include the continued deployment and upgrade of wireless networks around the world, growth in the number and type of devices being wirelessly connected, a growing strategic focus on M2M services by wireless operators, and an expanding end customer awareness of the availability of such services and their benefits.
While the design and manufacture of mobile computing devices continues to be important to our business, our expansion by acquisition and organic development into M2M now makes us a global leader in this market, placing us in a strong position to benefit from the anticipated growth in both the wireless M2M and mobile computing markets. Our acquisitions have also diversified our revenue base, broadened our product offerings and increased our scale and capabilities throughout the world.
Our line-up of M2M wireless solutions is used by a wide range of OEMs and enterprises to wirelessly enable their products and solutions. Our M2M customers cover a broad range of industries, including automotive, networking equipment, energy, security, sales and payment, industrial control and monitoring, fleet management, field service, healthcare and consumer electronics. Our mobile computing products are used by businesses and consumers to enable mobile broadband access to the Internet, e-mail, remote databases and corporate and consumer applications.
We sell our products primarily through indirect channels including wireless operators, distributors and value-added resellers, as well as directly to OEMs and enterprises.
3
Annual Overview - 2011
Our revenue and profitability in 2011 declined compared to 2010. This was mainly a result of a reduction in revenue from several large customers including Barnes & Noble and Clearwire. We recorded a net loss attributable to the Company of $29.3 million, including an asset impairment charge of $11.2 million primarily related to the write-down of an intangible asset acquired through the purchase of Wavecom, S.A. (“Wavecom”), and non-GAAP net earnings attributable to the Company of $3.6 million in 2011. This compares to a net loss of $14.5 million and non-GAAP net earnings of $20.0 million, respectively, in 2010. The decline in 2011 profitability was partially mitigated by continued steady growth in our core M2M embedded modules business and lower operating expenditures resulting largely from cost reduction initiatives.
Financial results and highlights for 2011:
· Revenue decreased $72.2 million, or 11.1% to $578.2 million. Included in the 2011 revenue result is a reduction in revenue of $87.7 million, compared to 2010, from Barnes & Noble and Clearwire, as we completed shipments of our 3G and 4G products to these customers
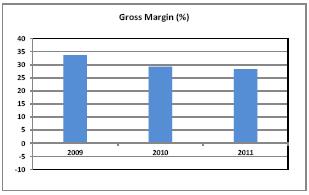
· Gross margin decreased slightly to 28.3% from 2010
· Cash flow from operations increased by $28.1 million from 2010
· Non-GAAP earnings from operations of $2.9 million and diluted earnings per share of $0.12 decreased from Non-GAAP earnings of $22.4 million and diluted earnings per share of $0.64 in 2010
· Solid year-over-year growth in core M2M revenue
· Successful launches or many new products, including the Company’s first 4G LTE AirCards and wireless embedded modules
· Strong year-over-year revenue growth of 61% in our PC OEM business
· Completed the integration of Sierra Wireless and Wavecom and reduced operating expenses by 9.1% compared to 2010, excluding an impairment charge related to intangible assets.

4
Selected annual financial information:
(in thousands of U.S. dollars, except where otherwise stated)
| | 2011 | | 2010 | | 2009 | |
| | | | | | | |
Revenue (GAAP and Non-GAAP) | | $ | 578,185 | | $ | 650,341 | | $ | 526,384 | |
| | | | | | | |
Gross Margin | | $ | 163,450 | | $ | 190,365 | | $ | 177,292 | |
- Non-GAAP (1) | | 163,835 | | 190,856 | | 177,799 | |
| | | | | | | |
Gross Margin % | | 28.3 | % | 29.3 | % | 33.7 | % |
- Non-GAAP (1) | | 28.3 | % | 29.3 | % | 33.8 | % |
| | | | | | | |
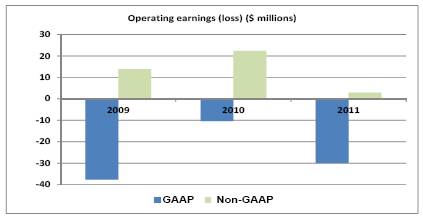
Earnings (loss) from operations | | $ | (29,912 | ) | $ | (10,366 | ) | $ | (37,724 | ) |
- Non-GAAP (1) | | 2,902 | | 22,399 | | 13,808 | |
| | | | | | | |
Net earnings (loss) | | $ | (29,315 | ) | $ | (14,541 | ) | $ | (39,899 | ) |
- Non-GAAP (1) | | 3,633 | | 19,996 | | 13,138 | |
| | | | | | | |
Total assets | | $ | 422,887 | | $ | 469,568 | | $ | 484,519 | |
| | | | | | | |
Total long-term liabilities | | $ | 25,143 | | $ | 24,987 | | $ | 36,105 | |
| | | | | | | |
Basic and diluted earnings (loss) per share (in dollars) | | $ | (0.94 | ) | $ | (0.47 | ) | $ | (1.29 | ) |
- Non-GAAP (1) | | 0.12 | | 0.64 | | 0.42 | |
| | | | | | | |
Common shares (in thousands) | | | | | | | |
At period-end | | 31,307 | | 31,223 | | 31,049 | |
Weighed average - basic and diluted | | 31,275 | | 31,083 | | 31,035 | |
(1) Non-GAAP results exclude the impact of stock-based compensation expense, acquisition amortization, impairment, integration costs, restructuring costs, foreign exchange gains or losses on translation of balance sheet accounts, and certain tax adjustments. Refer to the section on “Non-GAAP financial measures” for additional details.
See discussion under “Consolidated Annual Results of Operations” for factors that have caused period to period variations.
Outlook
In the first quarter of 2012, we expect revenue to be relatively flat compared to the fourth quarter of 2011, which is consistent with typical seasonal patterns. We expect gross margin to increase, returning to approximately the same level experienced in the third quarter of 2011 and we expect operating expenses to increase slightly on a sequential basis from the fourth quarter of 2011.
Gross margin percentage may fluctuate from quarter to quarter depending on product mix, competitive selling prices and our ability to reduce product costs.
5
Key factors that we expect will affect our results in the near term are the relative competitive position of our products within sales channels in any given period, the relative competitive position of our customers versus their direct competitors, the availability of components from key suppliers, timing of deployment of mobile broadband networks by wireless operators, wireless technology transitions, the rate of adoption by end-users, the timely launch and ramp up of sales of our new products currently under development, the level of success our OEM customers achieve with sales of embedded solutions to end users, our ability to secure future design wins with both existing and new OEM customers, general economic conditions in the markets we serve and seasonality in demand. We expect that product and price competition from other wireless device manufacturers will continue to be intense. As a result of these factors, we may experience volatility in our results on a quarter to quarter basis.
CONSOLIDATED ANNUAL RESULTS OF OPERATIONS
(in thousands of U.S. dollars)
| | 2011 | | 2010 | | 2009 | |
| | | | | | | | | | | | | |
Revenue | | $ | 578,185 | | 100.0 | % | $ | 650,341 | | 100.0 | % | $ | 526,384 | | 100.0 | % |
Cost of goods sold | | 414,735 | | 71.7 | % | 459,976 | | 70.7 | % | 349,092 | | 66.3 | % |
Gross margin | | 163,450 | | 28.3 | % | 190,365 | | 29.3 | % | 177,292 | | 33.7 | % |
| | | | | | | | | | | | | |
Expenses | | | | | | | | | | | | | |
Sales and marketing | | 45,499 | | 7.9 | % | 51,599 | | 7.9 | % | 54,835 | | 10.4 | % |
Research and development | | 89,000 | | 15.4 | % | 88,035 | | 13.5 | % | 80,066 | | 15.2 | % |
Administration | | 34,677 | | 6.0 | % | 36,357 | | 5.6 | % | 36,553 | | 7.0 | % |
Transaction costs | | — | | — | | — | | — | | 7,785 | | 1.5 | % |
Restructuring costs | | 837 | | 0.1 | % | 7,640 | | 1.2 | % | 20,605 | | 3.9 | % |
Integration costs | | 1,426 | | 0.2 | % | 5,110 | | 0.8 | % | 3,859 | | 0.7 | % |
Impairment of intangible asset | | 11,214 | | 1.9 | % | — | | — | | — | | — | |
Amortization | | 10,709 | | 1.9 | % | 11,990 | | 1.9 | % | 11,313 | | 2.2 | % |
| | 193,362 | | 33.4 | % | 200,731 | | 30.9 | % | 215,016 | | 40.9 | % |
Loss from operations | | (29,912 | ) | -5.2 | % | (10,366 | ) | -1.6 | % | (37,724 | ) | -7.2 | % |
Foreign exchange gain (loss) | | (460 | ) | | | (7,000 | ) | | | 1,261 | | | |
Other income (expense) | | 35 | | | | (241 | ) | | | (4,399 | ) | | |
Loss before income taxes | | (30,337 | ) | | | (17,607 | ) | | | (40,862 | ) | | |
Income tax expense (recovery) | | (965 | ) | | | (2,808 | ) | | | 340 | | | |
Net loss before non-controlling interest | | (29,372 | ) | | | (14,799 | ) | | | (41,202 | ) | | |
Less: non-controlling interest | | (57 | ) | | | (258 | ) | | | (1,303 | ) | | |
Net loss attributable to the Company | | $ | (29,315 | ) | | | $ | (14,541 | ) | | | $ | (39,899 | ) | | |
Basic and diluted net loss per share attributable to the Company | | $ | (0.94 | ) | | | $ | (0.47 | ) | | | $ | (1.29 | ) | | |
Year ended December 31, 2011 Compared to Year Ended December 31, 2010
Revenue
Revenue in 2011 decreased by 11.1% as a result of a significant reduction in embedded module sales to Barnes & Noble for their e-book reader ($0.7 million in 2011 compared to $64.2 million in 2010), and loss of revenue from Clearwire ($8.4 million in 2011 compared to $32.3 million in 2010). This was partially offset by increased revenue from higher sales of 4G products to Telstra and continued growth in our core M2M business.
6
In 2011, Sprint, AT&T, and Telstra each accounted for more than 10% of our revenue, representing approximately 36% of our revenue in aggregate. In 2010, AT&T and Sprint each accounted for more than 10% of our revenue, and in aggregate, these two customers represented approximately 26% of our revenue.
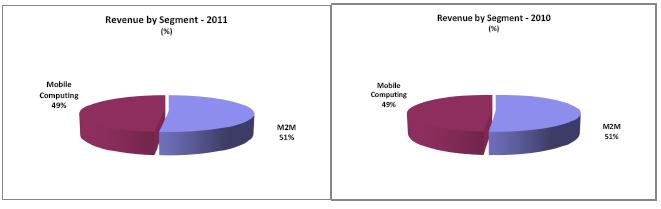
Our segment revenue mix between mobile computing and M2M in 2011 remained unchanged from 2010 at 49% and 51%, respectively.
Our segment revenue mix for the years ended December 31, 2011 and 2010 was as follows:
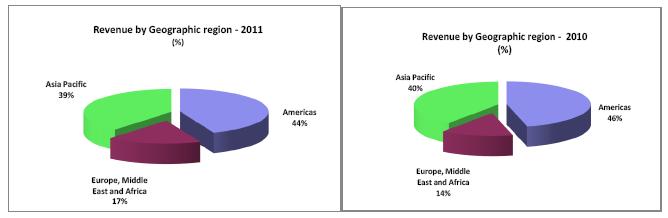
Our geographic revenue mix for the years ended December 31, 2011 and 2010 was as follows:
Gross margin
Gross margin was 28.3% of revenue for the year ended December 31, 2011, compared to 29.3% of revenue in 2010. The decrease in gross margin percentage was primarily related to product mix within our M2M business. Gross margin included $0.4 million of stock-based compensation expense in 2011, compared to $0.5 million in 2010.
Sales and marketing
Sales and marketing expenses decreased by $6.1 million, or 11.7%, and were 7.9% of revenue in both 2011 and 2010. The decrease in sales and marketing expenses was due primarily to cost reduction initiatives, including the final stages of integration of Sierra Wireless and Wavecom. Sales and marketing expenses included $1.3 million of stock-based compensation expense in 2011, compared to $1.4 million in 2010.
7
Research and development
Research and development expenses increased by $1.0 million, or 1.2% in 2011, compared to 2010. The increase in 2011 was primarily related to additional investment in new product development, including those products incorporating new 4G LTE technology. Research and development expenses for 2011 included stock-based compensation expense of $1.6 million and acquisition amortization of $6.9 million, compared to stock-based compensation expense of $1.3 million and acquisition amortization of $6.3 million in 2010.
Administration
Administration expenses decreased by $1.7 million, or 4.3%, in 2011, compared to 2010. The decrease was primarily due to cost reduction initiatives that were implemented in 2011. Included in administration expenses was $3.2 million of stock-based compensation expense in each of 2011 and 2010.
Restructuring
Restructuring costs decreased by $6.8 million, or 89.0%, during 2011, compared to 2010. Restructuring costs in 2011 primarily represented the additional costs incurred for reductions in our workforce resulting from the implementation of the new organizational structure announced in September 2010. Restructuring costs in 2010 were related to reductions in our workforce resulting from the September 2010 organizational structure change.
Impairment of intangible asset
We recorded an $11.2 million impairment charge in 2011, primarily related to a software development program we acquired through the acquisition of Wavecom which we decided to abandon. The program is not part of the Company’s strategic plan and its termination has no impact on our future operations. There was no impairment charge recorded in 2010.
Integration costs
Integration costs decreased by $3.7 million, or 72.1%, in 2011 compared to 2010. Integration costs in 2011 were primarily related to office space optimization in France and for IT consultants retained to implement an integrated CRM system. Integration costs in 2010 included costs for the integration of our Enterprise Resource Planning (“ERP”) system, and employees retained for integration activities.
Amortization
Amortization expense decreased $1.3 million or 10.7%, in 2011 compared to 2010. Amortization expense in 2011 included $6.0 million of acquisition amortization compared to $7.3 million in 2010.
Foreign exchange gain (loss)
Foreign exchange loss decreased $6.5 million in 2011 to $0.5 million. Foreign exchange loss for 2011 includes a net foreign exchange loss of $0.1 million on intercompany balances. Foreign exchange loss for 2010 included a loss of $4.7 million on an intercompany balance that the parent company had with its self-sustaining foreign operations that arose as a result of the Wavecom acquisition.
Foreign exchange rate changes also impact our Euro and Canadian dollar denominated operating expenses. We estimate that changes in exchange rates between 2010 and 2011 negatively impacted operating expenses by approximately $5.0 million in 2011.
Income tax recovery
Income tax recovery decreased by $1.8 million, or 65.6%, in 2011, compared to 2010, primarily driven by changes in the effective tax rate as a result of a shift in earnings among our numerous tax
8
jurisdictions.
Non-controlling interest
Non-controlling interest decreased by $0.2 million in 2011, compared to 2010. The non-controlling interest represented the interest in Wavecom’s loss attributable to the 147,150 vested shares that were held by Wavecom employees under their long-term incentive plan. The vested shares were subject to a hold period for tax purposes that expired June 8, 2011. We exercised our rights under a put/call agreement and as at December 31, 2011 we have purchased 142,400 vested shares at €8.50 per share. The obligation for the remaining 4,750 shares at €8.50 per share has been recorded as at December 31, 2011.
Net earnings (loss) attributable to the Company
Net loss attributable to the Company increased by $14.8 million in 2011, compared to 2010. This was primarily due to a higher after-tax loss from operations of $29.9 million in 2011, compared to $10.4 million in 2010. Net loss for the year ended December 31, 2011 included stock-based compensation of $6.5 million, acquisition amortization of $12.9 million, and an after-tax impairment charge of $11.2 million. Net loss for the year ended December 31, 2010 included stock-based compensation of $7.0 million, acquisition amortization of $13.6 million, and no after-tax impairment charge.
Weighted average number of shares
The weighted average diluted number of shares outstanding was 31.3 million for the year ended December 31, 2011, compared to 31.1 million for the year ended December 31, 2010. The number of shares outstanding was 31.3 million at December 31, 2011, compared to 31.2 million at December 31, 2010.
Year ended December 31, 2010 Compared to Year Ended December 31, 2009
Revenue
Revenue increased by $123.9 million, or 24% in 2010 compared to 2009, primarily as a result of an increase in sales of our embedded M2M products to consumer, payment and automotive OEM customers and the inclusion of Wavecom products for the full twelve months of 2010, compared to ten months in 2009, following the acquisition on February 27, 2009.
In 2010, AT&T and Sprint each accounted for more than 10% of our revenue, representing approximately 26% of our revenue, in aggregate. In 2009, these two customers each accounted for more than 10% of our revenue and, in aggregate, represented approximately 40% of our revenue.
Gross margin
Gross margin in 2010 decreased to 29.3% of revenue from 33.7% of revenue in 2009. The decrease resulted primarily from our newer AirCard products that had a lower gross margin in their early stages of the product cycle, lower selling prices for some of our products and a greater mix of lower margin consumer OEM embedded module sales. Gross margin included $0.5 million of stock-based compensation expense in each of 2010 and 2009.
Sales and marketing
Sales and marketing expenses decreased by $3.2 million, or 6%, in 2010 from 2009. The decrease was primarily due to cost reductions related to the integration of Sierra Wireless and Wavecom. Sales and marketing expenses included $1.4 million of stock-based compensation expense in 2010 and $1.6 million in 2009.
9
Research and development
Research and development expenses increased $7.9 million, or 9.9%, in 2010 compared to 2009. The increase was primarily due to the inclusion of costs from the Wavecom acquisition for the full year, as well as increased investment in new product development, partially offset by cost reductions related to the integration of Sierra Wireless and Wavecom. Included in research and development expenses was $1.3 million of stock-based compensation expense and $6.3 million of acquisition amortization in 2010, compared to $1.4 million of stock-based compensation expense and $4.8 million of acquisition amortization in 2009.
Administration
Administration expenses decreased by $0.2 million, or 0.5%, in 2010 compared to 2009. The cost reductions related to the integration of Wavecom were largely offset by the inclusion of staff and costs from the Wavecom acquisition for a full year in 2010, compared to ten months in 2009. Included in administration expenses was $3.2 million of stock-based compensation expense in 2010, compared to $3.6 million in 2009.
Restructuring costs
Restructuring costs decreased to $7.6 million in 2010, compared to $20.6 million in 2009. Restructuring costs in 2010 were primarily related to the implementation of a new organizational structure in September 2010 which established three business units — M2M Embedded Solutions, Mobile Computing, and Solutions & Services and the elimination of 60 full time positions as a result of expected improved operating efficiencies. We recorded a pre-tax charge of approximately $4.4 million for severance and other costs related to this new organizational structure, including $0.5 million of stock-based compensation expense. Restructuring costs in 2009 were primarily related to cost reduction initiatives related to the integration of Sierra Wireless and Wavecom.
Integration costs
Integration costs increased $1.2 million in 2010, compared to 2009. Integration costs included the cost of IT consultants for the integration of our ERP system, employees retained for integration activities and related travel expenses.
Amortization
Amortization expense increased $0.7 million in 2010, compared to 2009. Amortization expense included $7.3 million of acquisition amortization in 2010 compared to $7.0 million in 2009.
Foreign exchange gain (loss)
Foreign exchange loss was $7.0 million in 2010, compared to a foreign exchange gain of $1.3 million in 2009. Our foreign exchange loss for 2010 included a net foreign exchange loss of $4.7 million on an intercompany balance that the parent company had with its self-sustaining foreign operations that arose as a result of the Wavecom acquisition. Our foreign exchange gain for 2009 included a net foreign exchange gain of $19.5 million on an intercompany balance that the parent company had with its self-sustaining foreign operations that arose as a result of the Wavecom acquisition, partially offset by a realized foreign exchange loss of $15.7 million on Euros that had been held for the Wavecom transaction.
Other expense
Other expense, which includes interest expense and interest income, decreased by $4.2 million in 2010, compared to 2009. Other expense in 2009 included $4.1 million of financing costs and $0.9 million of interest expense, of which $0.7 million related to the credit facilities that were set up in
10
connection with the Wavecom acquisition. Interest income decreased to $0.2 million in 2010, from $0.6 million in 2009 due to a decrease in our cash and short-term investment balances that were used to fund the Wavecom acquisition, as well as a decline in interest rates.
Income tax expense
Income tax recovery increased by $3.1 million in 2010 compared to 2009, due primarily to changes in tax assets as well as a favorable tax provision adjustment relating to actual taxes filed.
Non-controlling interest
Non-controlling interest decreased by $1.0 million in 2010, compared to 2009. The non-controlling interest represented the interest in Wavecom’s loss that resulted from the shares held by Wavecom employees under their long-term incentive plan. The vested shares were subject to a hold period for tax purposes. We had entered into a put/call agreement with these employees to purchase back the shares at €8.50 per share upon expiry of the tax hold period. Until that time, the shares were considered the non-controlling interest. During 2010, the tax hold period expired for 152,672 shares, and we purchased those shares for $1.6 million.
Net earnings (loss) attributable to the Company
Our net loss attributable to the Company decreased by $25.4 million in 2010, compared to 2009. Included in our net loss was $7.0 million of stock-based compensation expense and $13.6 million of acquisition amortization in 2010, compared to $8.1 million and $11.8 million, respectively, in the same period of 2009.
Weighted average number of shares
The weighted average diluted number of shares outstanding increased to 31.1 million for the year ended December 31, 2010, compared to 31.0 million in 2009. The number of shares outstanding at December 31, 2010 was 31.2 million, compared to 31.0 million at December 31, 2009.
SEGMENTED ANNUAL RESULTS
Revenue and gross margin by segment for the years ending December 31 was as follows:
(in thousands of U.S. dollars)
| | 2011 | | 2010 | | 2009 | |
| | | | | | | |
M2M | | | | | | | |
Revenue | | $ | 293,219 | | $ | 332,445 | | $ | 216,468 | |
Cost of goods sold | | 198,271 | | N/A | | N/A | |
Gross margin | | $ | 94,948 | | N/A | | N/A | |
Gross margin % | | 32.4 | % | N/A | | N/A | |
| | | | | | | |
Mobile Computing | | | | | | | |
Revenue | | $ | 284,966 | | $ | 317,896 | | $ | 309,916 | |
Cost of goods sold | | 216,464 | | N/A | | N/A | |
Gross margin | | $ | 68,502 | | N/A | | N/A | |
Gross margin % | | 24.0 | % | N/A | | N/A | |
11
Product line revenue by segment for the years ending December 31 was as follows:
(in thousands of U.S. dollars)
| | 2011 | | 2010 | | 2009 | |
| | | | | | | |
M2M | | | | | | | |
AirPrime Embedded Wireless Modules (excludes PC OEMs) (1) | | $ | 242,791 | | $ | 274,964 | | $ | 168,873 | |
AirLink Intelligent Gateways and Routers | | 39,013 | | 48,626 | | 41,005 | |
AirVantage M2M Cloud Platform and Other | | 11,415 | | 8,855 | | 6,590 | |
| | $ | 293,219 | | $ | 332,445 | | $ | 216,468 | |
| | | | | | | |
Mobile Computing | | | | | | | |
AirCard Mobile Broadband Devices (2) | | $ | 241,454 | | $ | 291,464 | | $ | 294,981 | |
AirPrime Embedded Wireless Modules for PC OEMs | | 39,422 | | 23,420 | | 12,506 | |
Other | | 4,090 | | 3,012 | | 2,429 | |
| | $ | 284,966 | | $ | 317,896 | | $ | 309,916 | |
(1) Barnes & Noble contributed $0.7 million in M2M revenue in 2011 compared to $64.2 million in 2010 and $10.5 million in 2009.
(2) Clearwire contributed $8.4 million in mobile computing revenue in 2011 compared to $32.3 million in 2010 and $nil in 2009.
Machine-to-Machine
Our M2M business includes our AirPrime™ Embedded Wireless Modules (excluding embedded module sales to PC OEMs), AirLink™ Intelligent Gateways and Routers and our AirVantage™ M2M Cloud Platform. We believe that the market for our M2M products offers profitable growth opportunities. The M2M market is competitive and our future success will depend in part on our ability to continue to develop differentiated products and services that meet our customers’ evolving technology, design, schedule and price requirements.
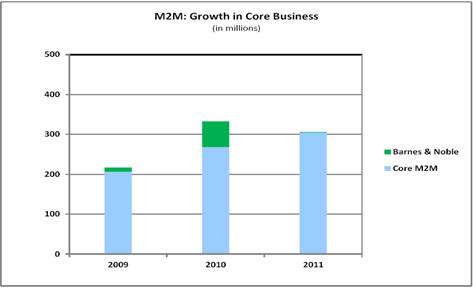
Our M2M revenue decreased $39.2 million, or 11.8%, in 2011 compared to 2010. The decrease in revenue, primarily due to a significant reduction in embedded module sales to Barnes & Noble for their e-book reader, was partially offset by steady growth in our core M2M embedded modules business. Our core M2M revenue, after excluding the impact of Barnes & Noble, increased 9.0%.
Gross margin was $94.9 million for M2M in 2011, or 32.4% of M2M revenue. Comparative prior period information is not available as we began reporting segmented information in the first quarter of 2011 following an organizational structure change that we implemented during the fourth quarter of 2010.
12
AirPrime™ Embedded Wireless Modules (excludes PC OEM embedded modules)
We believe that there are long-term profitable growth prospects in the embedded M2M market and we plan to continue to invest to expand our leadership position. Our expanded line-up of AirPrime Embedded Wireless Modules is used by a wide range of OEMs to wirelessly enable their products and solutions. Our M2M OEM customers cover a broad range of industries including automotive, networking equipment, energy, security, sales and payment, industrial control and monitoring, fleet management, field service, healthcare and consumer electronics.
Sales of our M2M embedded module products decreased $32.2 million, or 11.7%, in 2011 compared to 2010. Higher revenues from increased growth in our core M2M embedded module business partially offset the reduction in embedded module sales to Barnes & Noble. With the completion of embedded module shipments for Barnes & Noble’s first generation NOOK e-book reader, sales of embedded modules to Barnes & Noble in 2011 were $0.7 compared to $64.2 million in 2010. Excluding sales to Barnes & Noble, our core M2M embedded module revenue grew 15% in 2011, compared to the same period in 2010.
During 2011, we introduced industrial-grade HSPA+ and EV-DO wireless modules to our award-winning AirPrime SL Series of wireless embedded modules. Our AirPrime SL809x, for HSPA+ networks, and SL501x, for EV-DO networks, are optimized for applications requiring high bandwith and ability to operate in rugged environments, such as security and video surveillance systems, mobile healthcare devices and industrial terminals. We also introduced new software features that accelerate embedded M2M application development, including a new third-party library, an integrated debugging tool and a new user interface for remote device management.
We achieved an important milestone in our 4G LTE embedded module development programs. Our AirPrime MC7700 embedded wireless module and AirPrime MC7750 embedded wireless module received certification and technical approval for AT&T and Verizon networks, respectively. We also commenced initial commercial shipments of both modules late in 2011.
In November 2011, we launched the world’s smallest cellular module for M2M communications. Our AirPrime WS6318 module provides essential M2M connectivity in a smaller, simpler, and highly innovative package, opening the door to wirelessly connecting devices that were previously impractical due to stringent size constraints.
During 2011, several customers selected our wireless embedded modules for use in their products and services. Notably,
· Ambient Corporation selected our embedded wireless module to provide 3G wireless connectivity for its latest X-series smart grid communications node, used by energy and utility companies for real-time monitoring and communication with the grid.
· Lancom Systems GmbH, a German manufacturer of enterprise network solutions, selected our embedded wireless module to provide 4G wireless connectivity for its new line of cellular broadband virtual private network routers.
· NetComm Limited, an international manufacturer of networking solutions for small business and home users, selected our AirPrime MC7750 and MC7710 embedded modules to provide 4G cellular connectivity for its new router.
13
· PositiveID Corporation, a developer and marketer of healthcare and information management products, selected our embedded wireless module to power its iglucose mobile health solution for real-time diabetes management.
· NETGEAR, Inc., an international provider of networking solutions for business and consumers, chose our 4G wireless embedded modules to provide high speed connectivity for a new series of mobile broadband routers that will take advantage of 4G LTE and Dual-Carrier HSPA+ networks.
· Hughes Telematics, Inc., a leader in providing next-generation connected services, selected our SL6087 EDGE module and XM0110 GPS module to support its award-winning In-Drive™ aftermarket telematics solution.
· EDMI Limited selected our SL6087 embedded wireless module to provide cellular connectivity for its new Mk7B smart metering solution and together, we were awarded the GSMA Global Mobile Award for Best Mobile Innovation for Utilities at the 2011 Mobile World Congress in Barcelona.
· GeaCom selected our MC8355 embedded wireless module to provide the 3G wireless connection for its Phraser®, a handheld multilingual medical communication system that helps patients and caregivers overcome differences in language, culture, or literacy to exchange critical medical information.
· Gorlitz AG, a leading manufacturer of advanced meter reading and energy information management systems, selected Sierra Wireless to provide wireless connectivity solutions for its Ethernet/GPRS router. The router connects to energy meters, allowing utilities to remotely collect energy usage data. Our solution combines an AirPrime Q2686 embedded wireless module with our Open AT® framework, which includes pre-packaged software libraries that accelerate development and time-to-market.
· Harman, a leading global audio and infotainment group, announced that it is now ready to begin road tests with its 4G connected infotainment systems. Test vehicles will be equipped with the latest Harman infotainment system platform technology integrating our 4G AirPrime embedded wireless module.
· Actia Group, an international provider of value-added electronic equipment for the automotive market, selected our AirPrime AR Series modules to provide high-performance connectivity for its latest in-vehicle technology platform. Actia’s new platform uses our AirPrime module to allow drivers to connect and manage various functions of their vehicles through a smartphone application.
AirLink™ Intelligent Gateways and Routers
Our AirLink Intelligent Gateways and Routers are sold to public safety, transportation, field service, energy, industrial, and financial organizations. We believe that there are profitable growth prospects for our AirLink intelligent gateway and router solutions and we intend to capture these opportunities through segment, product line and geographic expansion.
14
Revenue from AirLink Intelligent Gateways and Routers decreased $9.6 million, or 19.8%, in 2011 compared to 2010. The decrease was largely related to deferrals of orders by certain U.S. based public service customers affected by budget constraints and delays caused by technology transitions as customers wait for AirLink solutions that support 4G LTE.
Early in 2011, we announced a multi-purpose wireless gateway that defines next-generation intelligent M2M networking. Our powerful AirLink GX400 gateway offers a leading edge combination of features, including cloud-based device management, extensive hardware and software enhancements, ruggedized construction, GPS and associated location-based services and advanced configuration options. The AirLink GX400 offers myriad configuration options and has a variety of hardware interfaces to suit a wide range of M2M applications. This range of software and hardware configuration options allows system integrators to standardize on a single gateway platform to better serve the needs of their customers. In the second quarter of 2011, we began commercial shipments of the GX400 to Verizon and Sprint, as well as Europe, Middle East and Africa-based customers, and we commercially launched AirLink Management Services (“AMS”), a comprehensive cloud-based remote device management service built on top of the AirVantage platform.
We also introduced a 4G LTE multi-purpose wireless gateway that leverages the power of the Verizon Wireless 4G LTE network. The AirLink GX440 delivers a high bandwidth as required by applications such as high-quality wireless video surveillance, multi-data stream wireless connections to branch locations and mobile office applications for public safety and field service activities. On January 6, 2012, we announced that the AirLink GX440 4G LTE rugged wireless gateway received certification on the Verizon 4G LTE network.
During 2011, Metsaliitto, an international forestry group, selected our AirLink MP895 rugged in-vehicle router to provide fast, 3G connections to its heavy machinery and transport vehicles, enabling real-time transmission of critical information.
AirVantage™ M2M Cloud Platform
Our AirVantage M2M Cloud Platform provides solutions and services that enable application providers, OEMs and mobile network operators to efficiently develop, deploy, and operate complete M2M solutions for managing remote equipment and assets. These solutions are based on tools that facilitate the development and delivery of applications that are hosted on our AirVantage platform which is scalable, secure and compatible with a broad range of available wireless equipment.
Early in 2011, we announced the availability of AirVantage Smart Automation, an extension to our AirVantage M2M Cloud Platform that simplifies the connection to industrial equipment and the creation of embedded business logic without programming. In addition, together with KPN N.V. (“KPN”), the leading mobile network operator in the Netherlands, we are collaborating to bring M2M applications to market faster and at lower cost. KPN and Sierra Wireless are jointly marketing the AirVantage M2M Cloud Platform and KPN’s M2M services. We are also collaborating with Verizon Wireless, AT&T, Sprint and Vodafone to co-market our AirVantage M2M Cloud Platform. As at December 31, 2011, the AirVantage M2M Cloud Platform is available on eight networks worldwide.
On February 21, 2012, we announced that Nestle Nespresso SA, the pioneer and market leader in highest-quality portioned premium coffee, has selected Sierra Wireless to provide a comprehensive M2M cloud platform and hardware solution to provide remote connectivity for its range of professional coffee machines.
15
Mobile Computing
Our mobile computing business includes our AirCard® Mobile Broadband Devices and AirPrime Embedded Wireless Modules for PC OEM customers.
Our mobile computing revenue decreased by $32.9 million, or 10.4%, in 2011, compared to 2010. The year-over-year decline in revenue was largely due to reduction in revenue from Clearwire. This decline was partially offset by the launch of new 4G products, and an increase in revenue of $16.0 million, or 68.3%, from PC OEMs.
Gross margin was 24.0% for the mobile computing segment in 2011. Comparative period information is not available as we began reporting segmented information in the first quarter of 2011 following an organizational structure change that we implemented during the fourth quarter of 2010.
AirCard® Mobile Broadband Devices
Our AirCard mobile broadband device family includes our AirCard-branded USB modems and mobile Wi-Fi hotspots. Our AirCard products, sold to mobile network operators around the world, provide a simple way to connect notebooks, tablets and other electronic devices to the Internet, over 3G and 4G mobile broadband networks.
In 2011, sales of our AirCard products decreased by $50.0 million, or 17.2%, compared to 2010, primarily due to loss of revenue from Clearwire ($8.4 million in 2011 compared to $32.3 million in 2010). This decline was partially offset by an increase in revenue from sales of 4G products to Telstra.
Early in 2011, we introduced our first 4G LTE AirCard products. The AirCard 753S and AirCard 754S Mobile Hotspots each connect up to five Wi-Fi enabled devices simultaneously to the internet over Dual-Carrier HSPA+ and LTE networks, respectively. The new 4G Mobile Hotspots are approximately the size of a deck of cards, lightweight and easy to set up and use. We also introduced the AirCard 319U and AirCard 320U USB modems, with 4G speeds and user friendly design. The AirCard 319U USB modem, launched on the Telus network in Canada in March 2011, is for Dual-Carrier HSPA+ networks and offers download speeds of up to 42 Mbps and upload speeds of up to 5.76 Mbps. The AirCard 320U and AirCard 313U are our first USB modems for LTE networks, offering download speeds of up to 100 Mbps and upload speeds of up to 50 Mbps. We also launched our second generation mobile hotspot with Sprint — the 3G/4G Overdrive Pro (a.k.a AirCard 802S). The Overdrive Pro allows users to connect up to eight Wi-Fi enabled devices simultaneously through a single Wi-Fi connection to Sprint’s 4G and 3G wireless networks.
During the third quarter of 2011, AT&T rolled out its first 4G LTE markets and devices. The AT&T Mobile Hotspot Elevate 4G (a.k.a. Sierra Wireless AirCard 754S mobile hotspot) and the AT&T USBConnect Momentum 4G (a.k.a. Sierra Wireless AirCard 313U USB modem) enable mobile consumers and professionals to connect wirelessly from laptops, tablets, and other mobile devices at LTE speeds. The 4G LTE Sierra Wireless 313U offers similar connection speeds in a simple plug and play form factor. We also launched the AirCard 313U with Rogers Communications for use on their new LTE networks in Canada.
16
We launched our 4G LTE 313U Turbo Stick (a.k.a. Sierra Wireless AirCard 313U) on Bell Mobility’s new LTE network in September 2011 and we also announced that the Telstra USB 4G LTE mobile broadband modem (a.k.a. Sierra Wireless AirCard 320U) is now available to Telstra and BigPond customers, providing laptop users with access to the newly launched Telstra 4G LTE network.
We believe that the market for our new 4G AirCard products offers profitable growth opportunities. Competition in this market continues to be intense and our future success will depend in part on our ability to continue to develop differentiated products that meet our customers’ evolving technology, design, schedule and price requirements.
AirPrime™ Embedded Wireless Modules for PC OEMs
In 2011, revenue from sales of our AirPrime Wireless Embedded Modules to PC OEM customers increased $16.0 million, or 68.3%, compared to 2010, primarily due to increased market demand from our existing PC OEM customers and initial shipments of modules in support of design wins with new customers secured in 2010.
During 2011, Lenovo selected our AirPrime embedded wireless modules to provide embedded 3G connectivity in the latest generation of the Lenovo ThinkPad professional-grade laptop computers. Additionally, Fujitsu Limited selected our AirPrime wireless embedded modules to integrate into its new Lifebook series of notebooks and tablets and Hewlett Packard selected our wireless embedded module for use on several North American networks.
Early in 2012, we announced that Panasonic selected our AirPrime MC series embedded modules to provide 4G LTE mobile-broadband connectivity for its new rugged Toughpad A1 tablet in North America. The tablet is scheduled to start shipping in spring 2012, and targets mission-critical and highly mobile workers in markets like aviation, construction, field sales and the public sector, where exposure to extreme environments is a constant challenge.
Our ability to secure additional design wins in the PC OEM market will depend on our ability to successfully develop products and offer services that meet our customers’ technology, design, schedule and price requirements.
FOURTH QUARTER OVERVIEW
Fourth quarter 2011 revenue remained unchanged from third quarter levels. Increased revenue from our new 4G AirCard® product launches with leading mobile network operators was offset by a decline in revenue from our M2M business, primarily driven by supply challenges related to floods in Thailand and customer product development and launch delays. Gross margins decreased primarily due to a greater mix of mobile computing revenues which typically have a lower gross margin, combined with the impact of a weakening Euro on our Euro denominated revenues. Fourth quarter operating expenses were negatively impacted by an impairment charge of $11.2 million related to intangible assets.
Highlights for the fourth quarter:
· Revenue was $147.2 million, comparable to the third quarter
· Gross margin was 28.2%, down from 29.5% in the third quarter
17
· Non-GAAP earnings from operations of $3.4 million and diluted earnings per share of $0.08 decreased from non-GAAP earnings of $4.0 million and diluted earnings per share of $0.15 in the third quarter
· Net loss of $13.8 million and diluted loss per share was $0.44 increased from the net loss of $1.0 million and diluted loss per share of $0.03 in the third quarter, primary a result of an impairment charge of $11.2 million related to intangible assets
Selected Fourth Quarter Consolidated financial information:
(in thousands of U.S. dollars)
| | Three months ended December 31 | |
| | 2011 | | % of
Revenue | | 2010 | | % of
Revenue | |
| | | | | | | | | |
Revenue | | $ | 147,195 | | 100.0 | % | $ | 167,176 | | 100.0 | % |
Cost of goods sold | | 105,643 | | 71.8 | % | 118,309 | | 70.8 | % |
Gross margin | | 41,552 | | 28.2 | % | 48,867 | | 29.2 | % |
| | | | | | | | | |
Expenses | | | | | | | | | |
Sales and marketing | | 10,747 | | 7.3 | % | 12,123 | | 7.3 | % |
Research and development | | 21,521 | | 14.6 | % | 23,782 | | 14.3 | % |
Administration | | 7,934 | | 5.4 | % | 9,073 | | 5.4 | % |
Restructuring costs | | (19 | ) | 0.0 | % | 132 | | 0.1 | % |
Integration costs | | — | | 0.0 | % | 906 | | 0.5 | % |
Impairment of intangible asset | | 11,214 | | 7.6 | % | — | | 0.0 | % |
Amortization | | 2,620 | | 1.8 | % | 3,026 | | 1.8 | % |
| | 54,017 | | 36.7 | % | 49,042 | | 29.3 | % |
Loss from operations | | (12,465 | ) | -8.5 | % | (175 | ) | -0.1 | % |
Foreign exchange loss | | (507 | ) | | | (241 | ) | | |
Other income (expense) | | 20 | | | | (20 | ) | | |
Earnings (loss) before income taxes | | (12,952 | ) | | | (436 | ) | | |
Income tax loss (recovery) | | 810 | | | | (1,221 | ) | | |
Net earnings (loss) before non-controlling interest | | (13,762 | ) | | | 785 | | | |
Less: non-controlling interest | | — | | | | (40 | ) | | |
Net earnings (loss) attributable to the Company | | $ | (13,762 | ) | | | $ | 825 | | | |
Basic and diluted net earnings (loss) per share attributable to the Company | | $ | (0.44 | ) | | | $ | 0.03 | | | |
Three Months Ended December 31, 2011 Compared to Three Months Ended December 31, 2010
Revenue
Revenue for the three months ended December 31, 2011 decreased $20.0 million, or 12.0%, compared to the same period of 2010. The decrease in revenue was primarily related to the absence of embedded module revenue from Barnes & Noble for its e-book reader (nil for the three months ended December 31, 2011 compared to $8.4 million in the same period of 2010), and loss of revenue from Clearwire (nil for the three months ended December 31, 2011 compared to $6.4 million in the same period of 2010).
18
In the fourth quarter of 2011, AT&T, Sprint and Telstra each accounted for more than 10% of our revenue, representing approximately 42% of our revenue in aggregate. In the fourth quarter of 2010, Sprint and Telstra each accounted for more than 10% of our revenue, and in aggregate, these two customers represented approximately 25% of our revenue.
Gross margin
Gross margin decreased to 28.2% for the three months ended December 31, 2011 compared to 29.2% in the same period of 2010. The decrease in gross margin percentage was primarily driven by changes in product mix within our M2M segment along with generally higher sales of mobile computing products which have lower margins than our M2M products. Gross margin included $0.1 million of stock-based compensation expense in each of the fourth quarters of 2011 and 2010.
Operating expenses
Operating expenses increased by $5.0 million, or 10.1%, in the three months ended December 31, 2011, from the same period of 2010. The increase was a result of an $11.2 million impairment charge in the fourth quarter of 2011 primarily related to a software development program we acquired in the purchase of Wavecom which we decided to abandon. This program had no impact on our operations in prior periods nor do we expect it to have an impact on our future operations. The negative impact of this impairment on our operating expenses in the current quarter was partially offset by lower sales and marketing, research and development, administration, and integration expenses, all related to focused cost reductions, including those from the final stages of integration of Sierra Wireless and Wavecom. Operating expenses for the three months ended December 31, 2011 included stock-based compensation expense of $1.5 million, and acquisition amortization of $3.1 million. Operating expenses for the three months ended December 31, 2010 included stock-based compensation expense of $1.3 million and acquisition amortization of $3.5 million.
Net earnings (loss) attributable to the Company
Net loss attributable to the Company increased by $14.6 million, or $0.47 per share, in the three months ended December 31, 2011, from the same period in 2010. The increase in net loss was largely related to an after-tax impairment charge of $11.2 million related to the impairment of intangible assets and $2.0 million in lower tax recoveries in the current three-month period as a result of a shift in earnings across numerous tax jurisdictions. Included in our net loss was $1.5 million of stock-based compensation expense, and $3.1 million of acquisition amortization in the three months ended December 31, 2011. Net earnings for three months ended December 31, 2010 included stock-based compensation expense of $1.4 million, and acquisition amortization of $3.5 million.
SUMMARY OF QUARTERLY RESULTS OF OPERATIONS
The following tables highlight selected financial information for each of the eight most recent quarters that, in management’s opinion, have been prepared on a basis consistent with the audited consolidated financial statements for the year ended December 31, 2011. The selected financial information presented below reflects all adjustments, consisting primarily of normal recurring adjustments, which are, in the opinion of management, necessary for a fair presentation of results for the interim periods. These results are not necessarily indicative of results for any future period. You should not rely on them to predict future performance.
19
(in thousands of U.S. dollars, except per share amounts and number of shares)
| | 2011 | | 2010 | |
| | TOTAL | | Q4 | | Q3 | | Q2 | | Q1 | | TOTAL | | Q4 | | Q3 | | Q2 | | Q1 | |
| | | | | | | | | | | | | | | | | | | | | |
Revenue | | $ | 578,185 | | $ | 147,195 | | $ | 146,827 | | $ | 139,888 | | $ | 144,275 | | $ | 650,341 | | $ | 167,176 | | $ | 172,732 | | $ | 159,116 | | $ | 151,317 | |
Cost of goods sold | | 414,735 | | 105,643 | | 103,493 | | 100,788 | | 104,811 | | 459,976 | | 118,309 | | 123,778 | | 112,906 | | 104,983 | |
Gross margin | | 163,450 | | 41,552 | | 43,334 | | 39,100 | | 39,464 | | 190,365 | | 48,867 | | 48,954 | | 46,210 | | 46,334 | |
Gross margin % | | 28.3 | % | 28.2 | % | 29.5 | % | 28.0 | % | 27.4 | % | 29.3 | % | 29.2 | % | 28.3 | % | 29.0 | % | 30.6 | % |
| | | | | | | | | | | | | | | | | | | | | |
Expenses | | | | | | | | | | | | | | | | | | | | | |
Sales and marketing | | 45,499 | | 10,747 | | 11,158 | | 11,326 | | 12,268 | | 51,599 | | 12,123 | | 12,137 | | 13,183 | | 14,156 | |
Research and development | | 89,000 | | 21,521 | | 21,942 | | 22,025 | | 23,512 | | 88,035 | | 23,782 | | 22,178 | | 21,534 | | 20,541 | |
Administration | | 34,677 | | 7,934 | | 8,548 | | 8,810 | | 9,385 | | 36,357 | | 9,073 | | 8,865 | | 8,835 | | 9,584 | |
Restructuring costs | | 837 | | (19 | ) | 881 | | (350 | ) | 325 | | 7,640 | | 132 | | 4,316 | | 1,581 | | 1,611 | |
Integration costs | | 1,426 | | — | | 121 | | 765 | | 540 | | 5,110 | | 906 | | 727 | | 1,631 | | 1,846 | |
Amortization of intangible asset | | 11,214 | | 11,214 | | — | | — | | — | | — | | — | | — | | — | | — | |
Amortization | | 10,709 | | 2,620 | | 2,447 | | 2,794 | | 2,848 | | 11,990 | | 3,026 | | 2,939 | | 2,919 | | 3,106 | |
| | 193,362 | | 54,017 | | 45,097 | | 45,370 | | 48,878 | | 200,731 | | 49,042 | | 51,162 | | 49,683 | | 50,844 | |
Loss from operations | | (29,912 | ) | (12,465 | ) | (1,763 | ) | (6,270 | ) | (9,414 | ) | (10,366 | ) | (175 | ) | (2,208 | ) | (3,473 | ) | (4,510 | ) |
Foreign exchange gain (loss) | | (460 | ) | (507 | ) | (154 | ) | (221 | ) | 422 | | (7,000 | ) | (241 | ) | 2,359 | | (5,460 | ) | (3,658 | ) |
Other income (expense) | | 35 | | 20 | | 68 | | (13 | ) | (40 | ) | (241 | ) | (20 | ) | 12 | | (103 | ) | (130 | ) |
Earnings (loss) before income taxes | | (30,337 | ) | (12,952 | ) | (1,849 | ) | (6,504 | ) | (9,032 | ) | (17,607 | ) | (436 | ) | 163 | | (9,036 | ) | (8,298 | ) |
Income tax expense (recovery) | | (965 | ) | 810 | | (851 | ) | 275 | | (1,199 | ) | (2,808 | ) | (1,221 | ) | (499 | ) | (399 | ) | (689 | ) |
Net earnings (loss) before non-controlling interest | | (29,372 | ) | (13,762 | ) | (998 | ) | (6,779 | ) | (7,833 | ) | (14,799 | ) | 785 | | 662 | | (8,637 | ) | (7,609 | ) |
Net loss attributable to non-controlling interest | | (57 | ) | — | | — | | (13 | ) | (44 | ) | (258 | ) | (40 | ) | (48 | ) | (82 | ) | (88 | ) |
Net earnings (loss) attributable to the Company | | $ | (29,315 | ) | $ | (13,762 | ) | $ | (998 | ) | $ | (6,766 | ) | $ | (7,789 | ) | $ | (14,541 | ) | $ | 825 | | $ | 710 | | $ | (8,555 | ) | $ | (7,521 | ) |
| | | | | | | | | | | | | | | | | | | | | |
Earnings (loss) per share: | | | | | | | | | | | | | | | | | | | | | |
Basic | | $ | (0.94 | ) | $ | (0.44 | ) | $ | (0.03 | ) | $ | (0.22 | ) | $ | (0.25 | ) | $ | (0.47 | ) | $ | 0.03 | | $ | 0.02 | | $ | (0.28 | ) | $ | (0.24 | ) |
Diluted | | $ | (0.94 | ) | $ | (0.44 | ) | $ | (0.03 | ) | $ | (0.22 | ) | $ | (0.25 | ) | $ | (0.47 | ) | $ | 0.03 | | $ | 0.02 | | $ | (0.28 | ) | $ | (0.24 | ) |
| | | | | | | | | | | | | | | | | | | | | |
Weighted average number of shares (in thousands): | | | | | | | | | | | | | | | | | | | | | |
Basic | | 31,275 | | 31,298 | | 31,297 | | 31,267 | | 31,237 | | 31,083 | | 31,151 | | 31,077 | | 31,054 | | 31,050 | |
Diluted | | 31,275 | | 31,298 | | 31,297 | | 31,267 | | 31,237 | | 31,083 | | 31,493 | | 31,208 | | 31,054 | | 31,050 | |
The impact of significant items incurred during the first three interim periods of year ended December 31, 2011 are discussed in more detail and disclosed in our quarter reports and management’s discussion and analysis. Factors affecting our quarterly results in 2011 were as follows:
In the first quarter of 2011, our net loss attributable to the company increased $8.6 million, or $0.28 per common share, from the fourth quarter of 2010, due largely to reduction in revenue from Barnes & Noble, lower gross margin resulting from change in mix between higher margin M2M products and lower margin mobile computing products, and unusually high warranty costs.
In the second quarter of 2011, our net loss attributable to the company decreased by $1.0 million, or $0.03 per common share, from the first quarter of 2011. Lower revenues in the second quarter largely due to the loss of revenue from Clearwire, were largely offset by higher gross margin, lower new product development and launch costs, and our intense focus on cost management.
In the third quarter of 2011, our net loss attributable to the company decreased by $5.8 million, or $0.19 per common share, from the second quarter of 2011. Revenue improved as a result of new 4G AirCard launches with leading mobile network operators, we experienced higher gross margins due to product cost reductions and lower operating expenditures.
In the fourth quarter of 2011, our net loss attributable to the company increased $12.8 million, or $0.41 per common share, from the third quarter of 2011. Fourth quarter 2011 revenue remained unchanged from third quarter levels and gross margins decreased due to product mix. Fourth quarter operating expenses were also negatively impacted by an impairment charge of $11.2 million related to intangible assets.
20
LIQUIDITY AND CAPITAL RESOURCES
Selected Annual Financial Information
(in thousands of U.S. dollars, except where otherwise stated)
| | 2011 | | 2010 | | 2009 | |
| | | | | | | |
Cash flows provided (used) before changes in non-cash working capital: | | $ | 17,814 | | $ | 22,970 | | $ | 22,864 | |
| | | | | | | |
Changes in non-cash working capital | | | | | | | |
Accounts receivable | | 9,067 | | (35,671 | ) | 20,175 | |
Inventories | | 5,664 | | (11,399 | ) | 15,676 | |
Prepaid expense and other | | 4,248 | | 7,104 | | 3,888 | |
Accounts payable and accrued liabilities | | (13,783 | ) | 12,116 | | (14,094 | ) |
Deferred revenue and credits | | 733 | | 480 | | (810 | ) |
| | 5,929 | | (27,370 | ) | 24,835 | |
Cash flows provided by (used in): | | | | | | | |
Operations | | 23,743 | | (4,400 | ) | 47,699 | |
| | | | | | | |
Investing activities | | (2,706 | ) | (17,521 | ) | 16,103 | |
Business acquisition | | — | | — | | (26,493 | ) |
Acqusition of OCEANE convertible bonds | | — | | — | | (104,767 | ) |
Decrease in restricted cash | | — | | — | | 175,820 | |
Capital expenditures and increase in intangible assets | | (18,008 | ) | (16,556 | ) | (19,839 | ) |
Net change in short-term investments | | 17,058 | | 489 | | (8,773 | ) |
Purchase of Wavecom S.A. shares | | (1,787 | ) | (1,553 | ) | — | |
| | | | | | | |
Financing activities | | (4,858 | ) | (1,541 | ) | 9,597 | |
| | | | | | | | | | |
Operating Activities
Cash provided by operating activities increased $28.1 million during the year ended December 31, 2011 compared to the same period of 2010. The increase in cash was largely the result of lower accounts receivable and inventory levels in 2011 compared to draws on cash due to higher accounts receivable and inventories in 2010. The positive impact on cash was partially offset by lower accounts payable in 2011 compared to 2010.
During 2011, we made modifications to an agreement with our contract manufacturer which resulted in altering the mix of working capital between Inventories and Prepaid expenses and other on our consolidated balance sheets. Further details can be found in Notes 8 and 9 of our annual consolidated financial statements for the year ended December 31, 2011.
Investing Activities
Cash used by investing activities decreased $14.8 million during the year ended December 31, 2011 compared to the same period of 2010. The decrease was largely related to higher net proceeds from short-term investments.
Cash used for the purchase of capital equipment was primarily for production and tooling equipment, research and development equipment, computer equipment and software, while cash used for intangible assets was driven primarily by patent registration costs and software licenses.
Financing Activities
Cash used for financing activities increased $3.3 million during year ended December 31, 2011 compared to the same period in 2010. The use of cash in 2011 was primarily related to purchases on
21
the TSX and NASDAQ, in the amount of $4.5 million, of the Company’s common shares to satisfy existing obligations under our restricted share unit plan. This was offset by lower use of cash for repayments of our long-term obligations in 2011 compared to 2010.
Cash Requirements
Our near-term cash requirements are primarily related to funding our operations, capital expenditures, IP licenses, and other obligations discussed below. We believe our cash and cash equivalents and short-term investments balance of $110.7 million and cash generated from operations will be sufficient to fund our expected working capital requirements for at least the next twelve months based on current business plans. Our capital expenditures during the first quarter of 2012 are expected to be primarily for research and development equipment, tooling, leasehold improvements, software licenses and patents. However, we cannot assure you that our actual cash requirements will not be greater than we currently expect.
The following table presents the aggregate amount of future cash outflows for contractual obligations as of December 31, 2011.
Payments due by period
(In millions of dollars) | | Total | | Less than 1
year | | 1 to 3 years | | 4 to 5 years | | Thereafter | |
Operating lease obligations | | $ | 14,133 | | $ | 2,780 | | $ | 6,700 | | $ | 1,351 | | $ | 3,302 | |
Capital lease obligations | | 650 | | 261 | | 389 | | — | | — | |
Purchase obligations (1) | | 85,071 | | 85,071 | | — | | — | | — | |
Other long-term liabilities (2) | | 24,754 | | — | | 22,554 | | 1,227 | | 973 | |
Total | | $ | 124,608 | | $ | 88,112 | | $ | 29,643 | | $ | 2,578 | | $ | 4,275 | |
(1) Purchase obligations represent obligations with certain contract manufacturers to buy minimum amount of designated products between January, 2012 and March, 2012. In certain of these arrangements, we may be required to acquire and pay for such products up to the prescribed minimum or forecasted purchases.
(2) Other long-term liabilities include the long-term portions of accrued royalties and marketing development funds.
Capital Resources
(in thousands of dollars)
| | 2011 | | 2010 | |
| | 31-Dec | | 30-Sep | | 30-Jun | | 31-Mar | | 31-Dec | | 30-Sep | | 30-Jun | | 31-Mar | |
Cash and cash equivalents | | $ | 101,375 | | $ | 100,662 | | $ | 101,685 | | $ | 86,197 | | $ | 85,443 | | $ | 102,573 | | $ | 102,009 | | $ | 111,257 | |
Short-term investments | | 9,347 | | — | | 17,470 | | 24,559 | | 26,405 | | 2,413 | | 13,428 | | 11,099 | |
| | 110,722 | | 100,662 | | 119,155 | | 110,756 | | 111,848 | | 104,986 | | 115,437 | | 122,356 | |
Unused credit facilities | | 10,000 | | 10,000 | | 10,000 | | 10,000 | | 10,000 | | 10,000 | | 10,000 | | 10,000 | |
Total | | $ | 120,722 | | $ | 110,662 | | $ | 129,155 | | $ | 120,756 | | $ | 121,848 | | $ | 114,986 | | $ | 125,437 | | $ | 132,356 | |
Credit Facilities
On January 27, 2011, we signed an amended and restated credit agreement with The Toronto-Dominion Bank and Canadian Imperial Bank of Commerce, extending our revolving term, $10.0 million credit facility (the “Revolving Facility”) to January 28, 2013 at similar terms to the expiring facility. The Revolving Facility is for working capital requirements and is secured by a pledge against all of our assets. At December 31, 2011, there were no borrowings under the Revolving Facility and we were in compliance with the covenants associated with the credit facility.
At December 31, 2011 we had $0.3 million (December 31, 2010 — $0.5 million) outstanding under a standby letter of credit facility agreement, which approximates its fair value. The letter of credit expires in June 2012.
22
Normal Course Issuer Bid
On December 13, 2011, we received approval from the Toronto Stock Exchange (“TSX”) of our Notice of Intention to make a Normal Course Issuer Bid (the “Bid”). Pursuant to the Bid, we may purchase for cancellation up to 1,564,914 of our common shares, or approximately 5% of the common shares outstanding as of the date of the announcement. The Bid will terminate on the earlier of: (i) December 18, 2012, (ii) the date Sierra Wireless completes its purchases pursuant to the notice of intention filed with the TSX, or (iii) the date of notice by Sierra Wireless of termination of the Bid.
The actual number of common Shares that are purchased for cancellation under the Bid, if any, and the timing of such purchases will be determined by the Company. As of March 5, 2012, we had purchased 400,000 common shares in the open market at an average price of $7.59 per share.
NON-GAAP FINANCIAL MEASURES
Our consolidated financial statements are prepared in accordance with U.S. GAAP on a basis consistent for all periods presented. In addition to results reported in accordance with U.S. GAAP, we use non-GAAP financial measures as supplemental indicators of our operating performance. The term “non-GAAP financial measure” is used to refer to a numerical measure of a company’s historical or future financial performance, financial position or cash flows that: (i) excludes amounts, or is subject to adjustments that have the effect of excluding amounts, that are included in the most directly comparable measure calculated and presented in accordance with U.S. GAAP in a company’s statement of earnings, balance sheet or statement of cash flows; or (ii) includes amounts, or is subject to adjustments that have the effect of including amounts, that are excluded from the most directly comparable measure so calculated and presented.
Our non-GAAP financial measures include non-GAAP revenue, non-GAAP gross margin, non-GAAP earnings (loss) from operations, EBITDA (earnings before interest, taxes, depreciation and amortization and before impairment charges), non-GAAP net earnings (loss) and non-GAAP diluted earnings (loss) per share, respectively. We disclose non-GAAP amounts as we believe that these measures provide better information on actual operating results and assist in comparisons from one period to another. Readers are cautioned that non-GAAP financial measures do not have any standardized meaning prescribed by U.S. GAAP and therefore may not be comparable to similar measures presented by other companies. Non-GAAP results exclude the impact of stock-based compensation expense, amortization related to acquisitions, restructuring costs, integration costs, impairment, unrealized foreign exchange gains or losses on translation of balance sheet accounts and certain tax adjustments.
EBITDA as defined equates earnings (loss) from operations plus stock-based compensation, restructuring, integration, transaction costs, amortization and impairment. EBITDA can also be calculated as non-GAAP earnings (loss) from operations plus amortization excluding acquisition related amortization.
The following table provides a reconciliation of the non-GAAP financial measures to our U.S. GAAP results by year:
23
(in thousands of U.S. dollars, except where otherwise stated)
| | 2011 | | 2010 | | 2009 | |
| | | | | | | |
Revenue - GAAP and Non-GAAP | | $ | 578,185 | | $ | 650,341 | | $ | 526,384 | |
| | | | | | | |
Gross Margin - GAAP | | $ | 163,450 | | $ | 190,365 | | $ | 177,292 | |
Stock-based compensation | | 385 | | 491 | | 507 | |
Gross Margin - Non-GAAP | | $ | 163,835 | | $ | 190,856 | | $ | 177,799 | |
| | | | | | | |
Loss from operations - GAAP | | $ | (29,912 | ) | $ | (10,366 | ) | $ | (37,724 | ) |
Stock-based compensation | | 6,449 | | 6,957 | | 8,096 | |
Restructuring | | 837 | | 7,100 | | 19,700 | |
Integration | | 1,426 | | 5,110 | | 3,817 | |
Transaction costs | | — | | — | | 7,784 | |
Impairment of intangible asset | | 11,214 | | — | | 332 | |
Acquisition related amortization | | 12,888 | | 13,598 | | 11,803 | |
Earnings (loss) from operations - Non-GAAP | | $ | 2,902 | | $ | 22,399 | | $ | 13,808 | |
Amortization (exluding acquisition related amortization) | | 19,498 | | 21,392 | | 20,901 | |
EBITDA | | $ | 22,400 | | $ | 43,791 | | $ | 34,709 | |
| | | | | | | |
Net loss - GAAP | | $ | (29,315 | ) | $ | (14,541 | ) | $ | (39,899 | ) |
Stock -based compensation, restructuring and other, integration, and acquisition related amortization, net of tax | | 32,713 | | 31,129 | | 50,268 | |
Unrealized foreign exchange loss (gain) | | 267 | | 7,000 | | (1,261 | ) |
Interest expense | | — | | — | | 4,382 | |
Non-controlling interest | | (32 | ) | (182 | ) | (900 | ) |
Tax adjustments | | — | | (3,410 | ) | 548 | |
Net earnings - Non-GAAP | | $ | 3,633 | | $ | 19,996 | | $ | 13,138 | |
| | | | | | | |
Loss per share - GAAP (in dollars) | | $ | (0.94 | ) | $ | (0.47 | ) | $ | (1.29 | ) |
Diluted earnings per share - Non-GAAP (in dollars) | | $ | 0.12 | | $ | 0.64 | | $ | 0.42 | |
The following table provides a reconciliation of the non-GAAP financial measures to our U.S. GAAP results by quarter:
(in thousands of U.S. dollars, except where otherwise stated)
| | 2011 | | 2010 | |
| | TOTAL | | Q4 | | Q3 | | Q2 | | Q1 | | TOTAL | | Q4 | | Q3 | | Q2 | | Q1 | |
| | | | | | | | | | | | | | | | | | | | | |
Revenue - GAAP and Non-GAAP | | $ | 578,185 | | $ | 147,195 | | $ | 146,827 | | $ | 139,888 | | $ | 144,275 | | $ | 650,341 | | $ | 167,176 | | $ | 172,732 | | $ | 159,116 | | $ | 151,317 | |
| | | | | | | | | | | | | | | | | | | | | |
Gross Margin - GAAP | | $ | 163,450 | | $ | 41,552 | | $ | 43,334 | | $ | 39,100 | | $ | 39,464 | | $ | 190,365 | | $ | 48,867 | | $ | 48,954 | | $ | 46,210 | | $ | 46,334 | |
Stock-based compensation | | 385 | | 86 | | 89 | | 97 | | 113 | | 491 | | 121 | | 111 | | 124 | | 135 | |
Gross Margin - Non-GAAP | | $ | 163,835 | | $ | 41,638 | | $ | 43,423 | | $ | 39,197 | | $ | 39,577 | | $ | 190,856 | | $ | 48,988 | | $ | 49,065 | | $ | 46,334 | | $ | 46,469 | |
| | | | | | | | | | | | | | | | | | | | | |
Loss from operations - GAAP | | $ | (29,912 | ) | $ | (12,465 | ) | $ | (1,763 | ) | $ | (6,270 | ) | $ | (9,414 | ) | $ | (10,366 | ) | $ | (175 | ) | $ | (2,208 | ) | $ | (3,473 | ) | $ | (4,510 | ) |
Stock-based compensation | | 6,449 | | 1,533 | | 1,587 | | 1,697 | | 1,632 | | 6,957 | | 1,403 | | 2,108 | | 1,751 | | 1,695 | |
Restructuring and other | | 837 | | (19 | ) | 881 | | (350 | ) | 325 | | 7,100 | | 132 | | 3,776 | | 1,581 | | 1,611 | |
Integration | | 1,426 | | — | | 121 | | 765 | | 540 | | 5,110 | | 906 | | 727 | | 1,631 | | 1,846 | |
Transaction costs | | — | | — | | — | | — | | — | | — | | — | | — | | — | | — | |
Impairment of intangible asset | | 11,214 | | 11,214 | | — | | — | | — | | — | | — | | — | | — | | — | |
Acquisition related amortization | | 12,888 | | 3,090 | | 3,198 | | 3,312 | | 3,288 | | 13,598 | | 3,516 | | 3,403 | | 3,194 | | 3,485 | |
Earnings (loss) from operations - Non-GAAP | | $ | 2,902 | | $ | 3,353 | | $ | 4,024 | | $ | (846 | ) | $ | (3,629 | ) | $ | 22,399 | | $ | 5,782 | | $ | 7,806 | | $ | 4,684 | | $ | 4,127 | |
Amortization (exluding acquisition related amortization) | | 19,498 | | 4,772 | | 4,258 | | 5,144 | | 5,324 | | 21,392 | | 5,298 | | 5,289 | | 5,569 | | 5,236 | |
EBITDA | | $ | 22,400 | | $ | 8,125 | | $ | 8,282 | | $ | 4,298 | | $ | 1,695 | | $ | 43,791 | | $ | 11,080 | | $ | 13,095 | | $ | 10,253 | | $ | 9,363 | |
| | | | | | | | | | | | | | | | | | | | | |
Net earnings (loss) - GAAP | | $ | (29,315 | ) | $ | (13,762 | ) | $ | (998 | ) | $ | (6,766 | ) | $ | (7,789 | ) | $ | (14,541 | ) | $ | 825 | | $ | 710 | | $ | (8,555 | ) | $ | (7,521 | ) |
Stock -based compensation, restructuring and other, integration, impairment of intangible asset and acquisition related amortization, net of tax | | 32,713 | | 15,915 | | 5,570 | | 5,503 | | 5,725 | | 31,129 | | 5,919 | | 9,616 | | 7,518 | | 8,076 | |
Unrealized foreign exchange loss (gain) | | 267 | | 330 | | 34 | | 238 | | (335 | ) | 7,000 | | 241 | | (2,359 | ) | 5,460 | | 3,658 | |
Interest expense | | — | | — | | — | | — | | — | | — | | — | | — | | — | | — | |
Non-controlling interest | | (32 | ) | — | | — | | — | | (32 | ) | (182 | ) | (23 | ) | (34 | ) | (40 | ) | (85 | ) |
Tax adjustments | | — | | — | | — | | — | | — | | (3,410 | ) | (2,022 | ) | (1,388 | ) | — | | — | |
Net earnings (loss) - Non-GAAP | | $ | 3,633 | | $ | 2,483 | | $ | 4,606 | | $ | (1,025 | ) | $ | (2,431 | ) | $ | 19,996 | | $ | 4,940 | | $ | 6,545 | | $ | 4,383 | | $ | 4,128 | |
| | | | | | | | | | | | | | | | | | | | | |
Loss per share - GAAP (in dollars) | | $ | (0.94 | ) | $ | (0.44 | ) | $ | (0.03 | ) | $ | (0.22 | ) | $ | (0.25 | ) | $ | (0.47 | ) | $ | 0.03 | | $ | 0.02 | | $ | (0.28 | ) | $ | (0.24 | ) |
Diluted earnings (loss) per share - Non-GAAP (in dollars) | | $ | 0.12 | | $ | 0.08 | | $ | 0.15 | | $ | (0.03 | ) | $ | (0.08 | ) | $ | 0.64 | | $ | 0.16 | | $ | 0.21 | | $ | 0.14 | | $ | 0.13 | |
24
OFF-BALANCE SHEET ARRANGEMENTS
We did not have any off-balance sheet arrangements during the years ended December 31, 2011 and 2010.
TRANSACTIONS BETWEEN RELATED PARTIES
We did not undertake any transactions with related parties during the years ended December 31, 2011 and 2010.
CRITICAL ACCOUNTING POLICIES AND ESTIMATES
We prepare our consolidated financial statements in accordance with U.S. GAAP and we make certain estimates and assumptions that affect the reported amounts of assets, liabilities, revenue, expenses and the related disclosure of contingent liabilities. Note 2, Summary of significant accounting policies, in the December 31, 2011 consolidated financial statements includes a summary of the significant accounting policies used in the preparation of our consolidated financial statements. While all of the significant accounting policies are important to the annual consolidated financial statements, some of these policies may be viewed as involving a high degree of judgment. On an ongoing basis, we evaluate our estimates and judgments, including those related to revenue recognition, adequacy of allowance for doubtful accounts, adequacy of inventory reserve, valuation of goodwill and intangible assets, income taxes, adequacy of warranty reserve, royalty obligations, contingencies, stock-based compensation, and fair value measurement. We base our estimates on historical experience, anticipated results and trends and on various other assumptions that we believe are reasonable under the circumstances. By their nature, estimates are subject to an inherent degree of uncertainty. Actual results could differ from our estimates.
The following critical accounting policies require management’s most difficult, subjective and complex judgements, and are subject to measurement uncertainty.
Revenue recognition
We recognize revenue from sales of products and services upon the later of transfer of title or upon shipment of the product to the customer or rendering of the service, so long as collectibility is reasonably assured. Customers include resellers, original equipment manufacturers, mobile network operators and end-users. We record deferred revenue when we receive cash in advance of the revenue recognition criteria being met. A significant portion of our revenue is generated from sales to resellers. We recognize revenue on the portion of sales to certain resellers that are subject to contract provisions allowing various rights of return and stock rotation, upon the earlier of when the rights have expired or the products have been reported as sold by the resellers. Revenues from contracts with multiple-element arrangements, such as those including technical support services, are recognized as each element is earned based on the relative fair value of each element and only when there are no undelivered elements that are essential to the functionality of the delivered elements. Revenue from licensed software is recognized at the inception of the license term. Revenue from software maintenance, unspecified upgrades and technical support contracts is recognized over the period such items are delivered or services are provided. Technical support contracts extending beyond the current period are recorded as deferred revenue.
Funding from research and development agreements, other than government research and development arrangements, is recognized as revenue when certain criteria stipulated under the terms of those funding agreements have been met and when there is reasonable assurance the funding will be received. Certain research and development funding will be repayable only on the occurrence of
25
specified future events. If such events do not occur, no repayment would be required. We recognize the liability to repay research and development funding in the period in which conditions arise that would cause research and development funding to be repayable. Government research and development arrangements are recognized as a reduction of the related expense when the criteria stipulated under the terms of the agreements have been met and when there is reasonable assurance the funding will be received.
Allowance for doubtful accounts
We maintain an allowance for doubtful accounts for estimated losses that may arise if any of our customers are unable to make required payments. We consider the following factors when determining whether collection is reasonably assured: customer credit-worthiness, past transaction history with the customer, insured amounts, if any, current economic industry trends and changes in customer payment terms. If we have no previous experience with the customer, we typically obtain reports from credit organizations to ensure that the customer has a history of paying its creditors. We may also request financial information, including financial statements, to ensure that the customer has the means of making payment. If these factors indicate collection is not reasonably assured, revenue is deferred until collection becomes reasonably assured, which is generally upon receipt of cash. If the financial condition of any of our customers deteriorates, we may increase our allowance.
As at December 31, 2011, Accounts receivable comprised 25.4% of total assets. Included in this balance was a provision of $3.6 million for doubtful accounts, or 3.4% of accounts receivable (as at December 31, 2010 - $4.6 million for doubtful accounts, or 3.9% of accounts receivable). We believe our allowance for doubtful accounts as at December 31, 2011 is adequate to provide for probable losses existing in accounts receivable.
Inventory
We value our inventory at the lower of cost, determined on a first-in-first-out basis, and estimated net realizable value. We assess the need for an inventory write-down and/or an accrual for estimated losses on inventory purchase commitments based on our assessment of estimated market value using assumptions about future demand and market conditions. Our reserve requirements generally increase as our projected demand requirements decrease, due to market conditions, technological and product life cycle changes and longer than previously expected usage periods. If market conditions are worse than our projections, we may further write-down the value of our inventory or increase the accrual for estimated losses on inventory purchase commitments.
Goodwill and intangible assets
We currently have goodwill and intangible assets generated primarily from our acquisitions of Wavecom in February 2009, AirLink in May 2007 and AirPrime in August 2003. Goodwill and intangible assets with indefinite life are assessed for impairment on an annual basis and between annual tests whenever circumstances indicate that the carrying value of the goodwill and intangible assets might be impaired. Circumstances may include an adverse change in business climate or a more likely than not expectation that a reporting unit will be sold or disposed. On at least a quarterly basis, we assess whether such circumstances exist.
An evaluation of recoverability of goodwill requires judgment, including the identification of reporting units, assigning assets and liabilities to reporting units, assigning goodwill to reporting units, and determining the estimated fair value of each reporting unit. Significant judgments that are required on our part to estimate the fair value of reporting units include estimating future cash flows, determining appropriate discount rates, consideration of appropriate control premium, market conditions, and other assumptions. Changes in these estimates and assumptions could materially affect
26
the determination of fair value for each reporting unit and may result in impairment charges in future periods.
Effective January 1, 2011, we have two reportable segments as a result of implementing a new organizational structure. We determined that we had three reporting units and tested for goodwill impairment as at December 31, 2011. As the fair value in each reporting unit exceeded the respective carrying amounts, the second step of the impairment test that measures the amount of an impairment loss by comparing the implied fair market value of the reporting unit with the carrying amount of the goodwill of the reporting unit was not required. No impairment of goodwill was recorded during the years ended December 31, 2011 and 2010.
At December 31, 2011, our consolidated goodwill balance was $90.0 million, of which approximately $48 million, $27 million and $15 million was allocated to our Machine-to-Machine, Mobile Computing and Solutions and Services reporting units, respectively.
We determined that there was no impairment as the fair values of our Machine-to-Machine, Mobile Computing, and Solutions and Services reporting units exceeded their respective carrying values by a significant amount. Our analysis took into consideration an income valuation approach using the expected discounted cash flows for each reporting unit. The principal factors used in the discounted cash flow analysis were the projected results of operations, the discount rate based on our estimated weighted average cost of capital, and terminal value assumptions for each reporting unit. The discounted cash flow model used was based on our three year business plan, as approved by our Board of Directors. For years subsequent to those contained in our business plan, we analyzed third party forecasts and other macro-economic indicators that impact our reporting units to provide a reasonable estimate of revenue growth in future periods. Our gross margins and operating expense estimates were consistent with those generated in recent historical periods. We also developed assumptions for the amount of working capital and capital expenditures needed to support each reporting unit.
In addition to the income valuation approach noted above, we also considered the current market capitalization of the Company which was approximately $223 million at December 31, 2011. Although the Company’s book value of $271.9 million exceeds the market capitalization, we do not believe that market capitalization appropriately reflects the value of the Company for the purposes of the goodwill impairment test. We have reconciled our determination of fair value with the market capitalization amount for the purposes of the goodwill impairment test.
During the fourth quarter of 2011, we recorded an impairment charge of $11.2 million related to intangible assets primarily related to a software development program that was acquired during the Wavecom acquisition in 2009. During the fourth quarter of 2011, we determined that this software development program no longer met the long-term objectives of the Company and the program was abandoned. The program had no impact on our operations in prior periods nor do we expect it to have an impact on our future operations.
Income taxes
We recognize and measure each tax position related to income tax positions taken or expected to be taken in a tax return. We have reviewed our tax positions to determine which should be recognized and measured according to the more likely than not threshold requirement. The tax benefits recognized in the financial statements are measured based on the largest benefit that has a greater than fifty percent likelihood of being realized upon ultimate resolution. If the realization of a tax position is not considered more likely than not, we provide for a valuation allowance. The ultimate realization
27
of our deferred tax assets is dependent upon the generation of future taxable income during the periods in which temporary differences become deductible. We consider projected future taxable income and tax planning strategies in making our assessment. If our assessment of our ability to realize our deferred tax assets changes, we may make an adjustment to our deferred tax assets that would be charged to income (loss).
Warranty costs
We accrue product warranty costs in accrued liabilities to provide for the repair or replacement of defective products. Our accrual is based on an assessment of historical experience and management’s estimates. If there is a change in the quality of our products, we adjust our accrual accordingly.
Royalty obligations
We we are committed to royalty payments based on the sales of products using certain technologies under license agreements. We recognize royalty obligations as determinable in accordance with agreement terms. Where agreements are not finalized, we have recognized our current best estimate of the obligation in accrued liabilities and other long-term liabilities. When the agreements are finalized, the estimates are revised accordingly.
Contingencies
We are from time to time involved in litigation, certain other claims and arbitration matters arising in the ordinary course of our business. We accrue for a liability when it is both probable that a liability has been incurred and the amount of the loss can be reasonably estimated. Significant judgment is required in both the determination of probability and the determination as to whether a loss is reasonably estimable. These accruals are reviewed at least quarterly and adjusted to reflect the impacts of negotiations, settlements, rulings, advice of legal counsel and technical experts and other information and events pertaining to a particular matter. To the extent there is a reasonable possibility (within the meaning of ASC 450, Contingencies) that the losses could exceed the amounts already accrued for those cases for which an estimate can be made, management believes that the amount of any such additional loss would not be material to our results of operations or financial condition.
In some instances, we are unable to reasonably estimate any potential loss or range of loss. The nature and progression of litigation can make it difficult to predict the impact a particular lawsuit will have on the company. There are many reasons that we cannot make these assessments, including, among others, one or more of the following: the early stages of a proceeding, which does not require the claimant to specifically identify the patent that has allegedly been infringed; damages sought that are unspecified, unsupportable, unexplained or uncertain; discovery not having been started or incomplete; the complexity of the facts that are in dispute (e.g., once a patent is identified, the analysis of the patent and a comparison to the activities of the Company is a labor-intensive and highly technical process); the difficulty of assessing novel claims; the parties not having engaged in any meaningful settlement discussions; the possibility that other parties may share in any ultimate liability; and the often slow pace of patent litigation.
We are required to apply judgment with respect to any potential loss or range of loss in connection with litigation. While we believe we have meritorious defenses to the claims asserted against us in our currently outstanding litigations, and intend to defend ourselves vigorously in all the cases, in light of the inherent uncertainties in litigation, there can be no assurance that the ultimate resolution of these matters will not significantly exceed the reserves currently accrued by us for those cases for which an estimate can be made, and losses in connection with any litigation for which we are not presently able to reasonable estimate any potential loss or range of loss could be material to our results of operations and financial condition.
28
Stock-based compensation
We recognize stock-based compensation expense for all stock-based compensation awards based on the fair value at grant date. We recognize stock-based compensation expense for those shares expected to vest on a straight-line basis over the requisite service period of the award.
Determining the appropriate fair value model and calculating the fair value of share-based payment awards requires the input of subjective assumptions. The assumptions used in calculating the fair value of share-based payment awards represent management’s best estimates, but these estimates involve inherent uncertainties and the application of management’s judgment. As a result, if factors change and we use different assumptions, our stock-based compensation expense could be materially different in the future.
Fair value measurement
We measure our short-term investments at fair value, defined as the price that would be received from selling an asset or that would be paid to transfer a liability in an orderly transaction between market participants at the measurement date. When determining fair value measurements, we consider the principal or most advantageous market in which it would transact and consider assumptions that market participants would use when pricing the asset or liability, such as inherent risk, transfer restrictions and risk of non-performance.
An established fair value hierarchy requires the company to maximize the use of observable inputs and minimize the use of unobservable inputs when measuring fair value. A financial instrument’s categorization within the fair value hierarchy is based upon the lowest level of input that is both available and significant to the fair value measurement. Three levels of inputs may be used to measure fair value:
Level 1 - Quoted prices in active markets for identical assets or liabilities.
Level 2 - Observable inputs other than quoted prices in active markets for identical assets and liabilities, such as quoted prices for identical or similar assets or liabilities in markets that are not active, or other inputs that are observable or can be corroborated by observable market data for substantially the full term of the assets or liabilities.
Level 3 - Inputs that are generally unobservable and are supported by little or no market activity and that are significant to the fair value determination of the assets or liabilities.
The determination of fair value requires judgments, assumptions and estimates and may change over time.
OUTSTANDING SHARE DATA
As of the date of this MD&A, the Company had 30,908,926 common shares issued and outstanding, stock options exercisable into 2,279,314 common shares and 415,005 restricted share units outstanding.
IMPACT OF ACCOUNTING PRONOUNCEMENTS AFFECTING FUTURE PERIODS
In September 2011, the FASB issued ASU 2011-08, Intangibles — goodwill and other. This guidance amends the guidance in ASU 350-20 on testing goodwill for impairment. Entities testing goodwill for impairment now have the option of performing a qualitative assessment before calculating the fair value of the reporting unit (i.e. step 1 of the goodwill impairment test). If entities determine, on the basis of qualitative factors, that the fair value of the reporting unit is more likely than not less than the
29
carrying amount, the two-step impairment test would be required. The ASU does not amend the requirement to test goodwill for impairment between annual tests if events or circumstances warrant; however, it does revise the examples of events and circumstances that an entity should consider. The amendments are effective for annual and interim goodwill impairments tests performed for fiscal years beginning after December 15, 2011 and early adoption is permitted. We early adopted this guidance for our annual goodwill impairment test for the year ended December 31, 2011.
In June 2011, the FASB issued ASU 2011-05, Comprehensive Income — Presentation. This guidance increases the prominence of other comprehensive income by requiring comprehensive income to be reported in either a single statement or two consecutive statements. This eliminates the option to report other comprehensive income and its components in the statement of changes in stockholders’ equity. The amendments do not change what items are reported in other comprehensive income. This ASU is effective on a retrospective basis for public entities for fiscal years, and interim periods within those years, beginning after December 15, 2011. This guidance is not expected to have an impact on our consolidated financial statements as we currently report comprehensive income as a single statement.
In November 2008, the SEC announced a proposed roadmap for comment regarding the potential use by U.S. registrants of financial statements prepared in accordance with International financial reporting standards (“IFRS”). IFRS is a comprehensive series of accounting standards published by the International Accounting Standards Board. On February 24, 2010, the SEC issued a statement describing its position regarding global accounting standards. Among other things, the SEC stated that it has directed its staff to execute a work plan, which will include consideration of IFRS as it exists today and after completion of various “convergence” projects currently underway between U.S. and international accounting standards setters. By the end of 2012, assuming completion of certain projects and the SEC staff’s work plan, it is expected that the SEC will decide whether to incorporate IFRS into the U.S. financial reporting system. We will continue to monitor the development of the potential implementation of IFRS.
DISCLOSURE CONTROLS
Our management is responsible for establishing and maintaining adequate disclosure controls and procedures for the Company. Our disclosure controls and procedures are designed to ensure that information required to be disclosed in our reports filed with securities regulatory authorities is recorded, processed, summarized and reported within time periods specified in applicable securities regulations, and is accumulated and communicated to our management, including our Chief Executive Officer and our Chief Financial Officer, as appropriate, to allow timely decisions regarding required disclosure.
We conducted an evaluation of the effectiveness of our disclosure controls and procedures. An evaluation was carried out under the supervision of, and with the participation of, our management, including our Chief Executive Officer and our Chief Financial Officer, as of December 31, 2011. Based on that evaluation, our Chief Executive Officer and our Chief Financial Officer have concluded that our disclosure controls and procedures were effective as of December 31, 2011 to ensure that information required to be disclosed by us in the reports we file or submit under applicable securities laws and regulations is recorded, processed, summarized, and reported within the time periods specified thereby.
We do not expect that our disclosure controls and procedures will prevent all errors and all fraud, if any. Control procedures, no matter how well conceived and operated, can provide only reasonable, not
30
absolute, assurance that the objectives of the control procedures are met. Because of the inherent limitations in all control procedures, no evaluation of controls can provide absolute assurance that all control issues and instances of fraud, if any, within our company have been detected. These inherent limitations include the realities that judgments in decision-making can be faulty, and that breakdowns can occur because of simple error or mistake. Additionally, controls can be circumvented by the individual acts of some persons, by collusion of two or more people, or by management override of the control. We considered these limitations during the development of our disclosure controls and procedures and will periodically re-evaluate them to ensure they provide reasonable assurance that such controls and procedures are effective.
INTERNAL CONTROL OVER FINANCIAL REPORTING
Management’s Annual Report on Internal Control over Financial Reporting
Our management is responsible for establishing and maintaining adequate internal control over financial reporting, as such term is defined in Rules 13a-15(f) and 15d-15(f) under the U.S. Securities Exchange Act of 1934 and has designed such internal control over financial reporting to provide reasonable assurance regarding the reliability of financial reporting and the preparation of financial statements for external purposes in accordance with United States generally accepted accounting principles (“U.S. GAAP”).
Our internal control over financial reporting includes those policies and procedures that: (1) pertain to the maintenance of records that, in reasonable detail, accurately and fairly reflect the transactions and dispositions of our assets; (2) provide reasonable assurance that transactions are recorded as necessary to permit preparation of financial statements in accordance with U.S. GAAP, and that our receipts and expenditures are being made only in accordance with authorizations of our management and directors; and (3) provide reasonable assurance regarding prevention or timely detection of unauthorized acquisition, use or disposition of our assets that could have a material effect on the financial statements.
Because of its inherent limitations, internal control over financial reporting may not prevent or detect misstatements on a timely basis. Also, projections of any evaluation of effectiveness of internal control over financial reporting to future periods are subject to the risk that controls may become inadequate because of changes in conditions, or that the degree of compliance with the policies or procedures may deteriorate.
Under the supervision and with the participation of our Chief Executive Officer and our Chief Financial Officer, management conducted an evaluation of the effectiveness of our internal control over financial reporting, as of December 31, 2011, based on the framework set forth in Internal Control-Integrated Framework issued by the Committee of Sponsoring Organizations of the Treadway Commission (COSO). Based on its evaluation under this framework, management concluded that our internal control over financial reporting was effective as of that date.
KPMG LLP (“KPMG”), an independent registered public accounting firm, who audited and reported on our consolidated financial statements as at December 31, 2011 and 2010, has issued an attestation report on management’s assessment of our internal control over financial reporting as of December 31, 2011. The attestation report is included in our consolidated financial statements.
31
There were no changes in our internal control over financial reporting during the year ended December 31, 2011 that materially affected, or are reasonably likely to materially affect, our internal control over financial reporting. The design of any system of controls and procedures is based in part upon certain assumptions about the likelihood of certain events. There can be no assurance that any design will succeed in achieving its stated goals under all potential future conditions, regardless of how remote.
LEGAL PROCEEDINGS
In January 2012, a patent holding company, M2M Solutions LLC, filed a patent litigation lawsuit in the United States District Court for the District of Delaware asserting patent infringement by us. We are currently assessing our obligations and our liability, if any, in respect of this litigation. Although there can be no assurance that an unfavorable outcome would not have a material adverse effect on our operating results, liquidity or financial position, we believe the claims are without merit and will vigorously defend the lawsuit.
In September 2011, a patent holding company, Wi-Lan, Inc., filed a patent litigation lawsuit in the United States District Court for the Eastern District of Texas asserting patent infringement by a number of parties, including us. We are currently assessing our obligations and our liability, if any, in respect of this litigation. Although there can be no assurance that an unfavorable outcome would not have a material adverse effect on our operating results, liquidity or financial position, we believe the claims are without merit and will vigorously defend the lawsuit.
In September 2011, a patent holding company, Mayfair Wireless, LLC, filed a patent litigation lawsuit in the United States District Court for the District of Delaware asserting patent infringement by one or more of our customers. The litigation makes certain allegations concerning the wireless hotspots sold to certain telecommunication carriers by us and our competitors. We are currently assessing our obligations and our liability, if any, in respect of this litigation. In December 2010, this same plaintiff filed a similar lawsuit in the same court assessing patent infringement by a number of parties, including us. The plaintiff filed a Notice of Voluntary Dismissal Without Prejudice in respect of this earlier lawsuit in March 2011.
In August 2011, a patent holding company, Brandywine Communications Technologies, LLC, filed a patent litigation lawsuit in the United States District Court for the Middle District of Florida asserting patent infringement by a number of parties including Sprint Spectrum L.P. and Sprint Nextel Corporation. Sprint has notified us that the lawsuit makes certain allegations concerning the modems sold to them by us and our competitors. We are currently assessing our obligations and our liability, if any, in respect of this litigation. Although there can be no assurance that an unfavorable outcome would not have a material adverse effect on our operating results, liquidity or financial position, we believe the claims are without merit and will vigorously defend our products.
In July 2011, a patent holding company, GPNE Corp., filed a patent litigation lawsuit in the United States District Court for the District of Hawaii asserting patent infringement by a number of parties including Barnes & Noble Inc., selling e-readers and computerized tablet and communication devices with the ability to function with GPRS. Barnes & Noble has notified us that the lawsuit makes certain allegations concerning the modules sold by us and incorporated in their Nook e-reader. Although there can be no assurance that an unfavorable outcome would not have a material adverse effect on our operating results, liquidity or financial position, we believe the claims are without merit and will vigorously defend the lawsuit.
32
In October 2010, a patent holding company, Eon Corp. IP Holdings, LLC, filed a patent litigation lawsuit in the United States District Court for the Eastern District of Texas asserting patent infringement by a number of parties including one or more of our customers. In January 2012, the lawsuit was transferred to the United States District Court for the Northern District of California. Also in January 2012, the plaintiff filed a patent litigation lawsuit in the United States District Court for the District of Puerto Rico asserting patent infringement by a number of parties, including one or more of our customers. In each case, the litigation makes certain allegations concerning the wireless modems sold to certain telecommunication carriers by us and our competitors. We are currently assessing our obligations and our liability, if any, in respect of this litigation. Although there can be no assurance that an unfavorable outcome would not have a material adverse effect on our operating results, liquidity or financial position, we believe the claims are without merit and will vigorously defend our products.
In July 2010, Americans for Fair Patent Use, LLC filed a lawsuit in the United States District Court for the Eastern District of Texas asserting false patent marking by a number of device manufacturers, including Sierra Wireless America, Inc., and telecommunication carrier companies, including Sprint Nextel Corporation and Cellco Partnership d/b/a Verizon Wireless. The litigation made certain allegations that products sold by us and our competitors were falsely marked with a number of patents that had expired or that did not cover the marked products. In April 2011, a mutually agreeable settlement was reached by the parties which will not have a material adverse effect on our operating results.
In May 2010, a patent holding company, Golden Bridge Technology Inc., filed a patent litigation lawsuit in the United States District Court for the District of Delaware asserting patent infringement by a number of telecommunication carrier companies, including AT&T Mobility LLC. AT&T Mobility LLC has since been dismissed from this lawsuit. In February 2011, the plaintiff filed a similar lawsuit in the same court asserting patent infringement by a number of additional parties, including us and certain of our customers. In both cases, the litigation makes certain allegations concerning the wireless modems sold by us and our competitors. Both lawsuits have been stayed pending the outcome of mediation occurring in Q1, 2012. We are currently assessing our obligations and our liability, if any, in respect of this litigation. Although there can be no assurance that an unfavorable outcome would not have a material adverse effect on our operating results, liquidity or financial position, we believe the claims are without merit and will vigorously defend the lawsuit.
In February 2010, a patent holding organization, Commonwealth Scientific and Industrial Research Organization, filed a patent litigation lawsuit in the United States District Court for the Eastern District of Texas asserting patent infringement by a number of telecommunication carrier, including one or more of our customers. The litigation initially made certain allegations concerning the wireless modems sold to the carriers by us; however, these allegations have since been withdrawn.
In September 2009, a patent holding company, Xpoint Technologies Inc., filed a patent litigation lawsuit in the United States District Court for the District of Delaware asserting patent infringement by a number of parties, including AT&T Mobility LLC. In the first quarter of 2011, the plaintiff filed a third amended complaint asserting a number of allegations including certain allegations concerning the wireless modems sold to AT&T Mobility LLC by us. AT&T Mobility LLC has advised us that this litigation has been settled, and we believe that the settlement will have no adverse material effect upon us.
In July 2009, a patent holding company, WIAV Networks, LLC, filed a patent litigation lawsuit in the United States District Court for the Eastern District of Texas asserting patent infringement by a
33
number of wireless device manufacturers, including us. The Texas court has transferred the litigation to the United States District Court for the Northern District of California. The California court has dismissed the litigation against a number of parties, including us, and there is no right of appeal with respect to this decision.
In July 2009, a patent holding company, SPH America, LLC, filed a patent litigation lawsuit in the United States District Court for the Eastern District of Virginia asserting patent infringement by a number of device manufacturers, including us, and computer manufacturers, including one or more of our customers. The litigation, which has been transferred to the United States District Court for the Southern District of California and is in the discovery stage, makes certain allegations concerning the wireless modules sold to the computer manufacturers by us or our competitors. Although there can be no assurance that an unfavorable outcome would not have a material adverse effect on our operating results, liquidity or financial position, we believe the claims are without merit and will vigorously defend the lawsuit.
In July 2009, a patent holding company, Celltrace, LLC, filed a patent litigation lawsuit in the United States District Court for the Eastern District of Texas asserting patent infringement by a number of telecommunication carrier companies including Sprint Spectrum, LP and AT&T Mobility LLC. The litigation makes certain allegations concerning the wireless modems sold to the carriers by us and our competitors. The Court issued a Final Judgment on July 5, 2011 dismissing all claims, counterclaims and third-party claims.
In March and June 2009, a patent holding company, MSTG Inc., filed patent litigation lawsuits in the United States District Court for the Northern District of Illinois asserting patent infringement by a number of telecommunication carrier companies, including AT&T Mobility LLC and Sprint Spectrum, LP, respectively. The carriers have notified us that the lawsuits make certain allegations concerning the wireless data cards and modems sold to those carriers by us and our competitors. In respect of the first matter, the claim construction process has concluded and discovery in the matter is ongoing. The second matter has been settled by Sprint Spectrum, LP, and we believe that the settlement will have no adverse material effect on our operating results. Although there can be no assurance that an unfavorable outcome would not have a material adverse effect on our operating results, liquidity or financial position, we believe the claims are without merit and will vigorously defend the lawsuit.
In September 2007, a patent holding company, NTP, Inc., filed a patent litigation lawsuit in the United States District Court for the Eastern District of Virginia asserting patent infringement by a telecommunication carrier, AT&T Mobility LLC. In December 2010, AT&T Mobility LLC made certain allegations concerning the wireless modems sold to them by us and we have responded to them. A decision of the Court of Appeal for the Federal Circuit ordered reconsideration by the Patent Office of its re-examination decision regarding the patent that the plaintiff claims has been infringed in this lawsuit. Although there can be no assurance that an unfavorable outcome would not have a material adverse effect on our operating results, liquidity or financial position, we believe the claims are without merit and will vigorously defend the lawsuit.
In November 2007, a patent holding company, Technology Patents LLC, filed a patent litigation lawsuit in the United States District Court for the Southern Division of the District of Maryland asserting patent infringement by companies in the cellular phone industry, including a telecommunication carrier, AT&T Mobility LLC. In August 2010, AT&T Mobility LLC made certain allegations concerning the wireless modems sold to them by us and we have responded to them. On summary judgment, AT&T Mobility LLC was found not to have infringed the asserted patents. In
34
September 2011, Technology Patents LLC filed an appeal to the Federal Circuit. Although there can be no assurance that an unfavorable outcome would not have a material adverse effect on our operating results, liquidity or financial position, we believe the claims are without merit and will vigorously defend the lawsuit.
We are engaged in certain other claims, legal actions and arbitration matters, all in the ordinary course of business, and believe that the ultimate outcome of these claims, legal actions and arbitration matters will not have a material adverse effect on our operating results, liquidity or financial position.
RISKS AND UNCERTAINTIES
Our business is subject to significant risks and uncertainties and past performance is no guarantee of future performance. The risks and uncertainties described below are those which we currently believe to be material, and do not represent all of the risks that we face. Other risks and uncertainties may become material in the future or ones we currently believe to be immaterial may become material in the future. If any of the following risks actually occurs, our business, financial condition and results of operations, as well as the market price of our common shares, could be materially adversely affected.
Our financial results are subject to fluctuations that could affect the market price of our common shares.
Our revenue, gross margin, operating earnings and net earnings may vary from quarter to quarter and could be significantly impacted by a number of factors, including:
· Price and product competition, which may result in lower selling prices for some of our products or lost market share;
· Price and demand pressure on our products from our customers as they experience pressure in their businesses;
· Concentration in our customer base;
· The development and timing of the introduction of our new products;
· Transition periods associated with the migration of new technologies;
· The securing of channel slots for new products and the timing of sales orders and OEM and carrier customer sell through;
· Design win cycles in our embedded module business;
· Potential commoditization and saturation in certain markets;
· The ability to accurately forecast demand in order to properly align the purchase of components and the appropriate level of manufacturing capability;
· Product mix of our sales. Our products have different gross margins — for example the embedded module product line has lower gross margins than the higher margin rugged mobile product line;
· Possible delays or shortages in component supplies;
· Possible delays in the manufacture or shipment of current or new products;
· Possible product quality or factory yield issues that may increase our cost of goods sold;
35
· Seasonality in demand;
· The amount of inventory held by our channel partners;
· Possible fluctuations in certain foreign currencies relative to the U.S. dollar affect foreign denominated revenue, cost of goods sold and operating expenses;
· The achievement of milestones related to our professional services contracts; and
· Possible cyclical fluctuations related to the evolution of wireless technologies;
· Operating expenses are generally fixed in the short-term and therefore difficult to rapidly adjust to different levels of business.
Any of the factors listed above could cause significant variations in our revenues, gross margin and earnings in any given quarter. Therefore, our quarterly results are not necessarily indicative of our overall business, results of operations, and financial condition.
Quarterly variations in operating results or any of the other factors listed above, changes in financial estimates by securities analysts, or other events or factors may result in wide fluctuations in the market price of our common shares. In addition, the global financial markets have experienced significant price and volume fluctuations that have particularly affected the market prices of equity securities of many technology companies and that often have been unrelated to the operating performance of these companies or have resulted from the failure of the operating results of such companies to meet market expectations in a particular quarter. Broad market fluctuations or any failure of the Company’s operating results in a particular quarter to meet market expectations may adversely affect the market price of our common shares.
Competition from new or established wireless communication companies or from those with greater resources may prevent us from increasing or maintaining our market share and could result in price reductions and/or loss of business with resulting reduced revenues and gross margins.
The wireless communications industry is highly competitive and we have experienced and expect to continue to experience intense competition. More established and larger companies with different business models, strong brands and greater financial, technical and marketing resources sell products that compete with ours and we expect this competition to intensify. Business combinations by our competitors or the network carriers could weaken our competitive position. We also may introduce new products that will put us in direct competition with major new competitors. Existing or future competitors may be able to respond more quickly to technological developments and changes and introduce new products before we do, or may independently develop and patent technologies and products that are superior to ours or achieve greater acceptance due to factors such as more favourable pricing, more desired or better quality features or more efficient sales channels. If we are unable to compete effectively with our competitors’ pricing strategies, technological advances and other initiatives, we may lose customer orders and market share and we may need to reduce the price of our products, resulting in reduced revenue and reduced gross margins.
The loss of any of our significant customers could adversely affect our revenue and profitability, and therefore shareholder value.
We sell our products through network carriers, resellers and OEMs and we are dependent on a limited number of customers for a significant portion of our revenue. Most of these network carriers, resellers and OEMs also sell products of our competitors. Accordingly, our business and future success depends on our ability to maintain and build on existing relationships and develop new relationships with network carriers, resellers and OEMs. If any of our significant customers, for any reason,
36
discontinues their relationship with us or reduces or postpones current or expected purchase orders for products, or suffers from business failure, our revenues and profitability could decline, perhaps materially. We expect that a limited number of significant customers will account for a significant portion of our revenues for the foreseeable future. In the year ended December 31, 2011, three customers individually accounted for more than 10% of our revenue and represented approximately 36% of our revenue. In the year ended December 31, 2010, two customers individually accounted for more than 10% of our revenue, and in aggregate, these two customers represented approximately 26% of our revenue.
In addition, our current customers purchase our products under purchase orders. Our customers have no contractual obligation to continue to purchase our products following our fulfillment of current purchase orders and if they do not continue to make purchases, our revenue and our profitability could decline, perhaps materially.
We may infringe on the intellectual property rights of others.
Our business success depends on us not infringing on the intellectual property rights owned by others. The industry in which we operate has many participants that own, or claim to own, proprietary intellectual property. In the past we have received, and in the future may receive assertions or claims from third parties alleging that our products violate or infringe their intellectual property rights. We may be subject to these claims directly or through indemnities against these claims which we have provided to certain customers and other third parties. Our component suppliers and technology licensors do not typically indemnify us against these claims and therefore we do not have recourse against them in the event a claim is asserted against us or a customer we have indemnified. Activity in this area by third parties, particularly those with tenuous claims, is increasing, resulting in us taking a more aggressive defensive approach, which may result in increased litigation. In the last few years, patent claims have been brought against us by third parties whose primary (or sole) business purpose is to acquire patents and other intellectual property rights, and not to manufacture and sell products and services. These entities aggressively pursue patent litigation, resulting in increased litigation costs for us. We expect that this recent development will continue for the foreseeable future. Rights to intellectual property can be difficult to verify and litigation may be necessary to establish whether or not we have infringed the intellectual property rights of others. In many cases, these third parties are companies with substantially greater resources than us, and they may be able to, and may choose to, pursue complex litigation to a greater degree than we could. Regardless of whether these infringement claims have merit or not, we may be subject to the following:
· We may be liable for potentially substantial damages, liabilities and litigation costs, including attorneys’ fees;
· We may be prohibited from further use of our intellectual property and may be required to cease selling our products that are subject to the claim;
· We may have to license third party intellectual property, incurring royalty fees that may or may not be on commercially reasonable terms. In addition, there is no assurance that we will be able to successfully negotiate and obtain such a license from the third party;
· We may have to develop a non-infringing alternative, which could be costly and delay or result in the loss of sales. In addition, there is no assurance that we will be able to develop such a non-infringing alternative;
· Management’s attention and resources may be diverted;
· Our relationships with customers may be adversely affected; and
37
· We may be required to indemnify our customers for certain costs and damages they incur in such a claim.
In addition to being liable for substantial damages in the event of an unfavourable outcome in such a claim and our inability to either obtain a license from the third party on commercial terms or develop a non-infringing alternative, our business, operating results and financial condition may be materially adversely affected and we may have to cease the sale of certain products and restructure our business.
We license technology, intellectual property and software from third parties for use in our products and from time to time may be required to license additional intellectual property. In some cases, these licenses provide us with certain pass-through rights for the use of other third party intellectual property. There is no assurance that we will be able to maintain our third party licenses or obtain new licenses when required and this inability could materially adversely affect our business and operating results and the quality and functionality of our products. In addition, there is no assurance that third party licenses we execute will be on commercially reasonable terms.
Under purchase orders and contracts for the sale of our products we may provide indemnification to our customers for potential intellectual property infringement claims for which we may have no corresponding recourse against our third party licensors. This potential liability, if realized, could materially adversely affect our business, operating results and financial condition.
We depend on a limited number of third parties to purchase certain components and manufacture our products. If they do not manufacture our products properly or cannot meet our needs in a timely manner, we may be unable to fulfill our product delivery obligations and our costs may increase, and our revenue and margins could decrease.
We outsource the purchase of certain components and the manufacturing of our products to a limited number of third parties and depend heavily on the ability of these manufacturers to meet our needs in a timely and satisfactory manner at a reasonable cost. We primarily rely on one manufacturer, who may terminate the manufacturing contract with us at the end of any contract year. Our reliance on third party manufacturers subjects us to a number of risks, including the following:
· The absence of guaranteed or adequate manufacturing capacity;
· Reduced control over delivery schedules, production levels, manufacturing yields, costs and product quality;
· Potential business interruption due to unexpected events such as natural disasters, labor unrest or geopolitical events;
· Their inability to secure adequate volumes of components in a timely manner at a reasonable cost; and
· Unexpected increases in manufacturing costs.
If we are unable to successfully manage any of these risks or to locate alternative or additional manufacturers or suppliers in a timely and cost-effective manner, we may not be able to deliver products in a timely manner. In addition, our results of operations could be harmed by increased costs, reduced revenues and reduced margins.
Under our manufacturing agreements, in many cases we are required to place binding purchase orders with our manufacturers well in advance of our receipt of binding purchase orders from our customers. In this situation, we consider our customers’ good faith, non-binding forecasts of demand for our products. As a result, if the number of actual products ordered by our customers is materially
38
different from the number of products we have instructed our manufacturer to build (and purchase components in respect of), then, if too many components have been purchased by our manufacturer, we may be required to purchase such excess component inventory, or, if an insufficient number of components have been purchased by our manufacturer, we may not be in a position to meet all of our customers’ requirements. If we are unable to successfully manage our inventory levels and respond to our customers’ purchase orders based on their forecasted quantities, our business, operating results and financial condition could be adversely affected.
We depend on single source suppliers for some components used in our products and if these suppliers are unable to meet our demand the availability of our products may be materially adversely affected.
Our products are comprised of components some of which are procured from single source suppliers, including where we have licensed certain software embedded in a component. From time to time, certain components used in our products have been, and may continue to be in short supply worldwide and shortages in allocation of components may result in a delay in filling orders from our customers, which may adversely affect our business. In addition, our single source suppliers may experience damage or interruption in their operations, become insolvent or bankrupt, or experience claims of infringement, all of which could delay or stop their shipment of components to us, which may adversely affect our business, operating results and financial condition. Alternate sources of components may not be available. If there is a shortage of any such components and we cannot obtain an appropriate substitute, we may not be able to deliver sufficient quantities of our products, we may lose business or customers and our operating results and financial condition may be materially adversely affected.
We may have difficulty responding to changing technology, industry standards and customer requirements, which could cause us to be unable to develop new products in a timely manner which meet the needs of our customers.
The wireless communications industry is subject to rapid technological change. Our business and future success will depend, in part, on our ability to accurately predict and anticipate evolving wireless technology standards and develop products that keep pace with the continuing changes in technology, evolving industry standards and changing customer and end-user preferences and requirements. Our products embody complex technology that may not meet those standards, preferences and requirements. Our ability to design, develop and commercially launch new products depends on a number of factors, including, but not limited to the following:
· Our ability to attract and retain skilled technical employees;
· The availability of critical components from third parties;
· Our ability to successfully complete the development of products in a timely manner;
· The ability of third parties to complete and deliver on outsourced product development engagements; and
· Our ability to design and manufacture products at an acceptable cost and quality.
A failure by us, or our suppliers, in any of these areas, or a failure of new products to obtain commercial acceptance, could mean we receive less revenue than we anticipate and we may be unable to recover our research and development expenses, and such a failure may result in a decrease in the market price for our shares.
39
We develop products to meet our customers’ requirements. OEM customers award design wins for the integration of wide area wireless embedded modules on a platform by platform basis. Current design wins do not guarantee future design wins. If we are unable or choose not to meet our customers’ future needs, we may not win their future business and our revenue and profitability may decrease.
In addition, wireless communications service providers require that wireless data systems deployed on their networks comply with their own standards, which may differ from the standards of other providers. We may be unable to successfully address these developments on a timely basis or at all. Our failure to respond quickly and cost-effectively to new developments through the development of new products or enhancements to existing products could cause us to be unable to recover significant research and development expenses and reduce our revenues.
Continued difficult or uncertain economic conditions could adversely affect our revenue and profitability.
A significant portion of our business is in the United States, Europe and the Asia-Pacific region and we are particularly exposed to the downturns and current uncertainties in those economies. The global market turmoil could lead to an increased level of commercial and consumer delinquencies, lack of consumer confidence, increased market volatility and widespread reduction of business activity generally. To the extent that we experience further global economic deterioration, or deterioration in one of our large markets in the United States, Europe or the Asia-Pacific region, the resulting economic pressure on our customers may cause them to end their relationship with us, reduce or postpone current or expected purchase orders for our products, or suffer from business failure, resulting in a decline in our revenues and profitability that could be material.
It is difficult to estimate or project the level of economic activity, including economic growth, in the markets we serve. As our budgeting and forecasting is based on the demand for our products and services, these economic uncertainties result in it being difficult for us to estimate future revenue and expenses.
Fluctuations in exchange rates between the U.S. dollar and other currencies, including the Canadian dollar, Euro and Australian dollar may affect our operating results.
We are exposed to currency fluctuations and exchange rate risk on all operations conducted in currencies other than the United States dollar. We cannot accurately predict the future effects of foreign currency fluctuations on our financial condition or results of operations.
The majority of our revenues are denominated in U.S. dollars while a significant amount of our research and development, marketing and administration costs are denominated in currencies other than the U.S. dollar; primarily the Canadian dollar and the Euro. To the extent that exchange rates between the U.S. dollar and the Canadian dollar and Euro fluctuate, we will experience an impact on our earnings.
As our business expands internationally, we will be exposed to additional risks relating to international operations.
We intend to continue to grow our international business. Our expansion into international operations exposes us to additional risks unique to such international markets, including the following:
· Increased credit management risks and greater difficulties in collecting accounts receivable;
40
· Unexpected changes in regulatory requirements, wireless communications standards, exchange rates, trading policies, tariffs and other barriers;
· Uncertainties of international laws and enforcement relating to the protection of intellectual property;
· Economic or political instability;
· Potential adverse tax consequences;
· Difficulty in managing a worldwide workforce in compliance with local laws, that vary from country to country; and
· Consumer protection laws that impose additional requirements on us or restrict our ability to provide limited warranty protection.
We may be unable to attract or retain key personnel which may harm our ability to compete effectively.
Our success depends in large part on the abilities and experience of our executive officers and other key employees. Competition for highly skilled management, technical, research and development and other key employees is intense in the wireless communications industry. We may not be able to retain our current executive officers or key employees and may not be able to hire and transition in a timely manner experienced and highly qualified additional executive officers and key employees as needed to achieve our business objectives. We do not have fixed-term employment agreements with our key personnel. The loss of executive officers and key employees could disrupt our operations and our ability to compete effectively could be adversely affected.
We rely on certain internal processes, networks and systems to efficiently operate and report on our business.
Failure of these internal processes, networks or systems could negatively impact our ability to operate or accurately report on our business.
Acquisitions of companies or technologies may result in disruptions to our business or may not achieve the anticipated benefits.
As part of our business strategy, we have acquired and may continue to acquire additional assets and businesses principally relating to or complementary to our current operations. On February 27, 2009, we completed our acquisition of Wavecom. Any acquisitions and/or mergers by us will be accompanied by the risks commonly encountered in acquisitions of companies. These risks include, among other things:
· Exposure to unknown liabilities of acquired companies, including unknown litigation related to acts or omissions of our acquired company and/or its directors and officers prior to the acquisition;
· Higher than anticipated acquisition and integration costs and expenses;
· Effects of costs and expenses of acquiring and integrating new businesses on our operating results and financial condition;
· The difficulty and expense of integrating the operations and personnel of the acquired companies;
· Possible use of cash to support the operations of an acquired business;
41
· Possible increase in foreign exchange translation risk depending on the denomination of the revenue and expenses of the acquired business;
· Disruption of our ongoing business;
· Diversion of management’s time and attention away from our existing business during the integration process;
· Failure to maximize our financial and strategic position by the successful incorporation of acquired technology;
· The inability to implement uniform standards, controls, procedures and policies;
· The loss of key employees and customers as a result of changes in management;
· A possible decrease in our share price, if, as a result of the growth of the Company, we decide to raise additional capital through an offering of common shares, preference shares or debt; and
· Possible dilution to our shareholders if the purchase price is paid in common shares or securities convertible into common shares.
In addition, geographic distances may make integration of businesses more difficult. We may not be successful in overcoming these risks or any other problems encountered in connection with any acquisitions. If realized, these risks could reduce shareholder value.
Misappropriation of our intellectual property could place us at a competitive disadvantage.
Our intellectual property is important to our success. We rely on a combination of patent protection, copyrights, trademarks, trade secrets, licenses, non-disclosure agreements and other contractual agreements to protect our intellectual property. Third parties may attempt to copy aspects of our products and technology or obtain information we regard as proprietary without our authorization. If we are unable to protect our intellectual property against unauthorized use by others it could have an adverse effect on our competitive position.
Our strategies to deter misappropriation could be inadequate due to the following risks:
· Non-recognition of the proprietary nature or inadequate protection of our methodologies in the United States, Canada, France or other foreign countries;
· Undetected misappropriation of our intellectual property;
· The substantial legal and other costs of protecting and enforcing our rights in our intellectual property; and
· Development of similar technologies by our competitors.
In addition, we could be required to spend significant funds and our managerial resources could be diverted in order to defend our rights, which could disrupt our operations.
We have been subject to, and may in the future be subject to, certain class action lawsuits, which if decided against us, could require us to pay substantial judgments, settlements or other penalties.
In addition to being subject to litigation in the ordinary course of business, in the future, we may be subject to class actions and other securities litigation and investigations. We expect that this type of litigation will be time consuming, expensive and distracting from the conduct of our daily business. It is possible that we will be required to pay substantial judgments, settlements or other penalties and
42
incur expenses that could have a material adverse effect on our operating results, liquidity or financial position. Expenses incurred in connection with these lawsuits, which include substantial fees of lawyers and other professional advisors and our obligations to indemnify officers and directors who may be parties to such actions, could materially adversely affect our operating results, liquidity or financial position. We do not know if any of this type of litigation and resulting expenses will be covered by insurance. In addition, these lawsuits may cause our insurance premiums to increase in future periods.
We depend on wireless network carriers to offer acceptable wireless data and voice communications services for our products to operate.
Our products can only be used over wireless data and voice networks operated by third parties. Our business and future growth depends, in part, on the successful deployment by network carriers of next generation wireless data and voice networks and the network carriers’ ability to grow their subscriber base. If these network carriers delay the deployment or expansion of next generation networks or fail to offer effective and reliable service, or fail to price and market their services effectively, sales of our products will decline and our revenues will decrease.
Government regulation could result in increased costs and inability to sell our products.
Our products are subject to certain mandatory regulatory approvals in the United States, Canada, the European Union, the Asia-Pacific region and other regions in which we operate. For example, in the United States, the Federal Communications Commission regulates many aspects of communications devices. In Canada, similar regulations are administered by the Ministry of Industry, through Industry Canada. European Union directives provide comparable regulatory guidance in Europe. Although we have obtained all the necessary Federal Communications Commission, Industry Canada and other required approvals for the products we currently sell, we may not obtain approvals for future products on a timely basis, or at all. In addition, regulatory requirements may change or we may not be able to obtain regulatory approvals from countries in which we may desire to sell products in the future.
43